Understanding Materials Behavior form Atomistic Simulations
104
UNDERSTANDING MATERIALS BEHAVIOR FROM ATOMISTIC SIMULATIONS: CASE STUDY OF Al-CONTAINING HIGH ENTROPY ALLOYS AND THERMALLY GROWN ALUMINUM OXIDE by Yinkai Lei Submitted to the Graduate Faculty of the Swanson School of Engineering in partial fulfillment of the requirements for the degree of Doctor of Philosophy University of Pittsburgh 2015
-
Upload
khangminh22 -
Category
Documents
-
view
0 -
download
0
Transcript of Understanding Materials Behavior form Atomistic Simulations
UNDERSTANDING MATERIALS BEHAVIOR
FROM ATOMISTIC SIMULATIONS: CASE STUDY
OF Al-CONTAINING HIGH ENTROPY ALLOYS
AND THERMALLY GROWN ALUMINUM OXIDE
by
Yinkai Lei
Submitted to the Graduate Faculty of
the Swanson School of Engineering in partial fulfillment
of the requirements for the degree of
Doctor of Philosophy
University of Pittsburgh
2015

UNIVERSITY OF PITTSBURGH
SWANSON SCHOOL OF ENGINEERING
This dissertation was presented
by
Yinkai Lei
It was defended on
October 1, 2015
and approved by
Guofeng Wang, Ph.D., Associate Professor, Department of Mechanical Engineering and
Materials Science
Brian M. Gleeson, Ph.D., Harry S. Track Chair Professor and Department Chair,
Department of Mechanical Engineering and Materials Science
Jorg M. K. Wiezorek, Ph.D., Professor, Department of Mechanical Engineering and
Materials Science
Scott X. Mao, Ph.D., Professor, Department of Mechanical Engineering and Materials
Science
John A. Keith, Ph.D., Assistant Professor, Department of Chemical and Petroleum
Engineering
Dissertation Director: Guofeng Wang, Ph.D., Associate Professor, Department of
Mechanical Engineering and Materials Science
ii

UNDERSTANDING MATERIALS BEHAVIOR FROM ATOMISTIC
SIMULATIONS: CASE STUDY OF Al-CONTAINING HIGH ENTROPY
ALLOYS AND THERMALLY GROWN ALUMINUM OXIDE
Yinkai Lei, PhD
University of Pittsburgh, 2015
Atomistic simulation refers to a set of simulation methods that model the materials on the
atomistic scale. These simulation methods are faster and cheaper alternative approaches
to investigate thermodynamics and kinetics of materials compared to experiments. In this
dissertation, atomistic simulation methods have been used to study the thermodynamic and
kinetic properties of two material systems, i.e. the entropy of Al-containing high entropy
alloys (HEAs) and the vacancy migration energy of thermally grown aluminum oxide.
In the first case study of the dissertation, a computational scheme for evaluating the
entropy of HEAs has been developed. Entropy is a key factor for the phase stability of
HEAs. However, it has not been well understood yet. In this study, atomistic simulation
methods have been used to quantify the configurational and vibrational entropy of HEAs
for the first time. Modified embedded atom method was used to describe the interatomic
interactions in HEAs. Monte Carlo simulation and thermodynamic integration method were
used to calculate the thermodynamic properties such as entropy and free energy. This scheme
has been tested on AlxCoCrFeNi HEAs. The results show that a reasonable evaluation of
the entropy of AlxCoCrFeNi HEAs can be obtained by the developed scheme. The FCC
to BCC phase transition in this alloy system has also been captured by the calculated free
energy. Importantly, it is found that atomic vibrations have an important effect on the
quantitative prediction of the compositional boundary of the FCC-BCC duplex region in the
AlxCoCrFeNi HEA system. The calculated entropy has been validated by comparing the
iii

atomic ordering in the simulated HEAs to the HEAs in experiments. The good agreement
between the simulations and experiments indicates that the developed computational scheme
captured the non-ideality in HEAs which is the key to understand the entropy of HEAs.
In the second case study of this dissertation, the charge effect on the vacancy diffusion
in α-Al2O3 has been investigated. It has been known that the charge state has an effect
on the formation energy of vacancies. However, the relation between the charge state and
the migration energy of vacancies is unknown yet. In this study, density functional theory
calculations have been used to investigate the charge effect on the vacancy migration energy.
It is found that the vacancy migration energy depends strongly on the charge state of the
vacancy. This dependency is explained by the shift of the defect levels associated with the
vacancy and the electron occupancy on the defect levels. These findings for the first time
built a link between the electronic structure and the migration of vacancy in metal oxides.
This information indicates a novel approach to tune the diffusion kinetics by modifying the
electronic structure of metal oxides.
Keywords: atomistic simulations, Monte Carlo, density functional theory, modified em-
bedded atom method, thermodynamic integration, high entropy alloy, configurational
entropy, vibrational entropy, α-Al2O3, vacancy migration energy, charge effect, defet
level.
iv
TABLE OF CONTENTS
1.0 OVERVIEW . . . . . . . . . . . . . . . . . . . . . . . . . . . . . . . . . . . . . 1
1.1 Introduction . . . . . . . . . . . . . . . . . . . . . . . . . . . . . . . . . . . 1
1.2 Hypotheses of the study . . . . . . . . . . . . . . . . . . . . . . . . . . . . . 3
1.3 Objectives of the study . . . . . . . . . . . . . . . . . . . . . . . . . . . . . 4
1.4 Significances of the study . . . . . . . . . . . . . . . . . . . . . . . . . . . . 5
2.0 LITERATURE REVIEW . . . . . . . . . . . . . . . . . . . . . . . . . . . . . 7
2.1 Entropy of high entropy alloys . . . . . . . . . . . . . . . . . . . . . . . . . 7
2.1.1 Entropy in alloys . . . . . . . . . . . . . . . . . . . . . . . . . . . . . 7
2.1.2 Ordering effect in alloys . . . . . . . . . . . . . . . . . . . . . . . . . . 9
2.1.3 Al Effect on the FCC-BCC phase transition in AlxCoCrFeNi HEA system 11
2.2 Vacancy diffusion in α-Al2O3 . . . . . . . . . . . . . . . . . . . . . . . . . . 13
2.2.1 Diffusion of Al and O in α-Al2O3 . . . . . . . . . . . . . . . . . . . . . 13
2.2.2 Electronic structure of vacancies in insulating metal oxides . . . . . . 15
3.0 METHODOLOGY: ATOMISTIC SIMULATIONS . . . . . . . . . . . . . 17
3.1 Overview . . . . . . . . . . . . . . . . . . . . . . . . . . . . . . . . . . . . . 17
3.2 Entropy of of high entropy alloys . . . . . . . . . . . . . . . . . . . . . . . . 20
3.2.1 Modified-embedded-atom-method potential developing . . . . . . . . . 21
3.2.2 Monte Carlo simulation method . . . . . . . . . . . . . . . . . . . . . 26
3.2.3 Free energy and entropy evaluation method . . . . . . . . . . . . . . . 27
3.3 Vacancy diffusion in α-Al2O3 . . . . . . . . . . . . . . . . . . . . . . . . . . 30
3.3.1 Density functional theory simulations . . . . . . . . . . . . . . . . . . 30
3.3.2 Evaluation of vacancy formation energy . . . . . . . . . . . . . . . . . 33
v
3.3.3 Calculations of vacancy migration energy . . . . . . . . . . . . . . . . 36
4.0 RESULTS AND DISCUSSIONS: ENTROPY OF HIGH ENTROPY
ALLOYS . . . . . . . . . . . . . . . . . . . . . . . . . . . . . . . . . . . . . . . 38
4.1 MEAM potential for Al-Co-Cr-Fe-Ni alloy system . . . . . . . . . . . . . . . 38
4.2 Entropy and Enthalpy of AlxCoCrFeNi alloys . . . . . . . . . . . . . . . . . 41
4.3 FCC to BCC phase transition of AlxCoCrFeNi alloys . . . . . . . . . . . . . 44
4.4 Ordering effect in AlxCoCrFeNi alloys . . . . . . . . . . . . . . . . . . . . . 46
5.0 RESULTS AND DISCUSSIONS: VACANCY DIFFUSION IN α-Al2O3 51
5.1 Crystal structure of α-Al2O3 . . . . . . . . . . . . . . . . . . . . . . . . . . 51
5.2 Vacancy formation energy in bulk alumina . . . . . . . . . . . . . . . . . . . 53
5.3 Migration energy for vacancy diffusion in bulk alumina . . . . . . . . . . . . 55
5.4 Kinetic Monte Carlo simulation of diffusivity . . . . . . . . . . . . . . . . . 65
5.5 Hf effect on Al vacancy diffusion in bulk . . . . . . . . . . . . . . . . . . . . 66
5.6 Structure of near Σ11 grain boundary of α-Al2O3 . . . . . . . . . . . . . . . 67
5.7 Hf effect on Al vacancy diffusion in grain boundary of α-Al2O3 . . . . . . . 70
6.0 CONCLUDING REMARKS . . . . . . . . . . . . . . . . . . . . . . . . . . 73
6.1 Conclusions . . . . . . . . . . . . . . . . . . . . . . . . . . . . . . . . . . . . 73
6.2 Remaining Problems . . . . . . . . . . . . . . . . . . . . . . . . . . . . . . . 76
APPENDIX. MEAM POTENTIAL FOR Al-Co-Cr-Fe-Ni ALLOY SYSTEM 79
BIBLIOGRAPHY . . . . . . . . . . . . . . . . . . . . . . . . . . . . . . . . . . . . 84
vi

LIST OF TABLES
4.1 Formation enthalpy and lattice parameter of B2 phase . . . . . . . . . . . . . 39
4.2 Formation enthalpy of ordered quaternary alloys . . . . . . . . . . . . . . . . 40
4.3 Lattice parameter of of AlxCoCrFeNi alloys . . . . . . . . . . . . . . . . . . . 41
5.1 Vacancy formation energy in bulk α-Al2O3 . . . . . . . . . . . . . . . . . . . 53
5.2 Vacancy migration energy in bulk α-Al2O3 . . . . . . . . . . . . . . . . . . . 57
5.3 Vacancy formation energy in near Σ11 GB of α-Al2O3 . . . . . . . . . . . . . 71
A1 MEAM potentials for pure metals . . . . . . . . . . . . . . . . . . . . . . . . 80
A2 MEAM potentials for binary alloys . . . . . . . . . . . . . . . . . . . . . . . 81
A3 MEAM screen parameters for ternary alloys . . . . . . . . . . . . . . . . . . 82
A4 Formation enthalpy and lattice parameter of L10 and L12 phases . . . . . . . 83
vii
LIST OF FIGURES
3.1 Unit cell of B2, L10 and L12 phase . . . . . . . . . . . . . . . . . . . . . . . . 25
4.1 Simulation cell of ordered quaternary alloys . . . . . . . . . . . . . . . . . . . 40
4.2 Entropy of AlxCoCrFeNi alloys . . . . . . . . . . . . . . . . . . . . . . . . . . 42
4.3 Enthalpy of AlxCoCrFeNi alloys . . . . . . . . . . . . . . . . . . . . . . . . . 43
4.4 Free energy of AlxCoCrFeNi alloys . . . . . . . . . . . . . . . . . . . . . . . . 45
4.5 Simulated XRD pattern of AlxCoCrFeNi alloys . . . . . . . . . . . . . . . . . 47
4.6 Equilibrium atomic structure of AlxCoCrFeNi alloys . . . . . . . . . . . . . . 47
4.7 Nearest neighbor analysis of BCC AlxCoCrFeNi alloys . . . . . . . . . . . . . 49
4.8 Nearest neighbor analysis of FCC AlxCoCrFeNi alloys . . . . . . . . . . . . . 49
5.1 Crystal Structure of α-Al2O3 . . . . . . . . . . . . . . . . . . . . . . . . . . . 52
5.2 Local atomic structure of O and Al in bulk α-Al2O3 . . . . . . . . . . . . . . 52
5.3 Vacancy formation energy in bulk α-Al2O3 as a function of chemical potential
of electron . . . . . . . . . . . . . . . . . . . . . . . . . . . . . . . . . . . . . 54
5.4 Diffusion paths of O vacancy in bulk α-Al2O3 . . . . . . . . . . . . . . . . . . 56
5.5 Diffusion paths of Al vacancy in bulk α-Al2O3 . . . . . . . . . . . . . . . . . 58
5.6 Charge density and electronic structure of a diffusion path of O vacancy . . . 60
5.7 Charge density and electronic structure of a diffusion path of Al vacancy . . 61
5.8 Correlation between the migration energy and the energy shift of the defect
levels . . . . . . . . . . . . . . . . . . . . . . . . . . . . . . . . . . . . . . . . 62
5.9 Potential energy surface of near Σ11 GB of α-Al2O3 . . . . . . . . . . . . . . 68
5.10 Equilibrium structure of near Σ11 GB α-Al2O3 . . . . . . . . . . . . . . . . . 69
5.11 Possible vacancy sites in near Σ11 GB α-Al2O3 . . . . . . . . . . . . . . . . . 71
viii

1.0 OVERVIEW
The ultimate goal of materials science is to develop materials that satisfy the needs of people.
By controlling the chemical composition, crystal structure and microstructure of materials,
material scientists produce materials with all kinds of properties. The thermodynamics and
kinetics of materials are the two most important factors which tells us how to realize desir-
able compositions and structures of materials during processing. The former determines the
processing conditions, while the latter determines the time table of processing. Tradition-
ally, the thermodynamics and kinetics of materials are investigated by extensive experiments,
which are usually time-consuming and costly. The fast development of computational ma-
terials science in the past two decades, however, provides us a faster and cheaper approach
to explore the thermodynamics and kinetics of materials. In this dissertation, atomistic
simulation methods have been used to investigate the thermodynamic and kinetic properties
of materials. Two different material systems, i.e. high-entropy alloy (HEA) and aluminum
oxide, were investigated separately. This chapter begins with a brief introduction of the re-
search problems in these two case studies. Then the hypotheses, objectives and significances
of these two case studies have been discussed.
1.1 INTRODUCTION
This dissertation is composed of two case studies, each one focusing on applying atomistic
simulation methods to explore certain properties of a material system. The subject of the
first case study is the entropy of HEAs. High entropy alloys (HEAs, also known as multi-
principle element or compositionally complex alloys) refer to single phase alloys with five
1
or more principle elements in equiatomic or near-equiatomic ratios [1]. The solid solution
phase has been stabilized by the large mixing entropy of HEAs [2]. However, the only current
model to calculate the mixing entropy of HEAs is the model of ideal solutions. This model is
successful in predicting the mixing entropy of dilute solutions, but it fails for HEAs at near-
equiatomic concentrations due to the complex interactions between different components. It
has already been found that the model of ideal solutions overestimated the stability of the
solid solution phase in HEAs [3]. Therefore, a new model to incorporate the non-ideality and
non-configurational effects into the evaluation of the mixing entropy of HEAs needs to be
developed. The first case study is focused on developing such a new model. In addition, the
results of the developed model has been benchmarked on an experimentally well characterized
HEA, i.e. AlxCoCrFeNi alloy. Its FCC to BCC phase transition and atomic ordering have
been investigated and compared to experimental results.
The subject of the second case study is the vacancy migration in α-Al2O3. α-Al2O3 is
commonly used as a diffusion barrier on the surface of superalloys to prevent the internal
alloy from being oxidized. Its performance is largely determined by the vacancy diffusivity
in it. The vacancy diffusivity depends on the formation energy and the migration energy of
a vacancy. Previous studies showed that the vacancy formation energy, hence the vacancy
concentration, is sensitive to the charge state and the electronic structure of a vacancy [4, 5].
However, whether there is such a charge effect on the vacancy migration energy is still
unknown. Moreover, current theoretical predictions of the activation energy for vacancy
diffusion [6, 7] are inconsistent with experimental measurements [8]. In these simulations,
only neutral vacancies have been investigated. But it is believed that the charged vacancies
are the diffusion species in α-Al2O3. Therefore, the diffusion of the charged vacancies in
α-Al2O3 should be investigated. The second case study focuses on the diffusion of charged
vacancies in α-Al2O3. The charge effect on the vacancy migration energy and its relation
with the electronic structure have been discussed.
2
1.2 HYPOTHESES OF THE STUDY
In the first case study of the entropy of HEAs, following hypotheses have been tested:
• Al addition reduces the configurational entropy of AlxCoCrFeNi alloys. It has been
found that the chemical long-range order is absent in CoCrFeNi alloy [9]. But in BCC
AlxCoCrFeNi alloy, the B2-type long-range order has been found [10, 11]. Therefore, Al
addition enhanced the ordering effect, hence the non-ideality, in AlxCoCrFeNi alloys. It
is believed that the non-ideality in an alloy reduces its configurational entropy. So, it is
hypothesized that Al addition will reduce the configurational entropy of AlxCoCrFeNi
alloys.
• Considering the atomic vibration effect will improve the prediction of the compositional
boundary of the FCC-BCC duplex region in the AlxCoCrFeNi HEA system. Current
theoretical predictions [12, 13] of the upper compositional boundary of the FCC-BCC
duplex region in the AlxCoCrFeNi HEA system are all much greater than the exper-
imental result [14]. Only configurational entropy has been considered in these works.
It is suspected that non-configurational entropy may have an effect on the quantitative
prediction of the compositional boundary of this FCC-BCC duplex region. Vibrational
entropy, as an example of non-configurational entropy, has been found to be important to
the FCC-BCC phase transition of pure metals [15, 16]. Therefore, it is hypothesized that
considering the atomic vibration effect will improve the prediction of the compositional
boundary of the FCC-BCC duplex region in the AlxCoCrFeNi HEA system.
In the second case study of the vacancy diffusion in α-Al2O3, following hypotheses have
been tested:
• The greater the charge of a vacancy in α-Al2O3, the lower its migration energy. The
formation energy and the migration energy of the neutral vacancies in α-Al2O3 have been
found to be extremely large [6, 7]. The calculated migration energy itself is comparable
to the experimental activation energy which should be the sum of the formation energy
and the migration energy. However, the charged vacancies are usually considered as
the diffusion species in α-Al2O3. It has been found that the charged vacancy has a
3
lower migration energy than the neutral vacancy in GaN [17] and ZnO [18]. It is highly
possible that such charge effect on the vacancy migration energy also exists in α-Al2O3.
Therefore, it is hypothesized that the greater the charge of a vacancy in α-Al2O3, the
lower its migration energy.
• The greater the defect level shift during the vacancy migration, the greater the difference in
the migration energy between the vacancies in different charge states. Vacancies introduce
defect levels in the band gap of metal oxides [19, 20, 21]. There are different numbers
of electrons filled in these defect levels of the vacancies in different charge states. Due
to the change in structure during the diffusion, these defect levels may shift. This shift
will contribute to the vacancy migration energy if there are electrons in the defect levels.
Therefore, it is hypothesized that the greater the defect level shift during the vacancy
migration, the greater the difference in the migration energy between the vacancies in
different charge states.
1.3 OBJECTIVES OF THE STUDY
The major objective of the first case study is to develop and test a computational scheme
for evaluating the entropy of HEAs. To achieve such an objective, an empirical potential for
energy calculation needs to be developed and the algorithm of thermodynamic integration
needs to be implemented. The AlxCoCrFeNi HEA system was chosen as the testing sys-
tem. Its phase stability and the atomic ordering in it have been extensively investigated in
experiments [10, 22, 23, 11, 24, 25]. Therefore, these two properties of AlxCoCrFeNi HEAs
were modelled for testing purpose. To test the two hypotheses of this case study, the config-
urational and vibrational entropy of AlxCoCrFeNi HEAs have been calculated. The effect
of Al addition on the configurational entropy has been investigated, and its relation to the
atomic ordering effect in the alloys has been inspected. The compositional boundary of the
FCC-BCC duplex region has been predicted by using only the configurational entropy and
both the configurational and vibrational entropy. The results have been compared with each
other to check the effect of the vibrational entropy.
4

For the second case study, the major objective is to build a link between the electronic
structure and the diffusion kinetics of the vacancies in α-Al2O3. This objective requires the
employment of atomistic simulation methods based on quantum mechanics which provide
the information of electronic structures. It also requires identification of the possible charge
states and the diffusive paths of the vacancies in α-Al2O3. Moreover, the impurity atom
effect on the electronic structure of vacancies was investigated as a potential way to control
the diffusion kinetics of point defects. To test the two hypotheses of this case study, the
migration energy of the vacancies in different charge states has been calculated. The defect
level shift during the diffusion has also been investigated by checking the density of states
of electrons. The relation between the defect level shift and the migration energy of the
vacancies in different charge states has been discussed.
1.4 SIGNIFICANCES OF THE STUDY
The study is significant in following ways:
1. The entropy evaluation scheme is the first attempt to quantify the mixing entropy of a
non-ideal solid solution. Though mixing entropy is an important thermodynamic variable
for alloy design, the only model before this study for mixing entropy evaluation is the
ideal solution model. This study, however, emphasized on the effect of the non-ideality
in alloys. It essentially challenged materials scientists to revisit the concept of mixing
entropy.
2. HEAs such as AlxCoCrFeNi alloy have an extremely large configurational space. The
study on HEAs shows that Monte Carlo simulation is an efficient tool to sample such a
large configurational space. It reveals that the thermodynamic properties of HEAs can
be obtained by averaging over a manageable number of possible atomic configurations.
The developed method is worth to be further extended to other HEAs and materials.
3. The study on the vacancy diffusion in alumina for the first time established a link between
the electronic structure and the diffusion kinetics of the point defects in metal oxides.
It is already known that the defect concentration can be tuned by adjusting the Fermi
5

energy of metal oxides [4]. But the link built in this study provides a new possibility
to tune the point defect diffusivity by modifying the behavior of the electronic structure
during the diffusion. This is a new degree of freedom for defect engineering that can be
further explored.
4. Linking diffusion kinetics to defect electronic structure offers a new perspective to un-
derstand the reactive element effect which reduces the diffusivity of Al in alumina. Con-
ventionally, the reactive element effect is explained by geometric blockage. However, this
study shows that the reactive element effect could be partially a result of the electronic
structure modification. This reveals the importance of the electronic structure to the
properties of materials that are not electromagnetic properties.
6

2.0 LITERATURE REVIEW
2.1 ENTROPY OF HIGH ENTROPY ALLOYS
2.1.1 Entropy in alloys
In general, there are two types of entropy in an alloy system, namely, the configurational
entropy and the non-configurational entropy. The configurational entropy originated from
the mixing of different atoms. It is a measure of possible atomic arrangements in a certain
lattice structure. Thus for pure metals or intermetallic compounds without defects, which
have a unique arrangement of atoms, the configurational entropy is 0. Only solid solutions
with many possible atomic arrangements have a positive configurational entropy. So, the
configurational entropy is considered as the major driving force of solid solution formation
in HEAs [1]. On the contrary, non-configurational entropy is non-zero for all the solids.
Several aspects of the solid can contribute to the non-configurational entropy. For example,
the thermal vibrations of atoms around its equilibrium position produces the vibrational
entropy [26], while the different arrangements of local magnetic moment on the magnetic
atoms in an alloys brings about the magnetic entropy [27]. Moreover, the partial occupancy
of electrons on the electronic bands near the Fermi energy of an alloy introduces the electronic
entropy [28]. Non-configurational entropies were ignored in most studies of HEAs. However,
the vibrational entropy of disordered Ni3Al alloy is found to be about 0.3 R greater than
that of L12 phase [29]. This value is less than the 0.56 R of the configurational entropy but
is large enough to affect the relative stability between the disordered and L12 Ni3Al alloy.
7

Therefore, it is also important to evaluate the non-configurational entropy of HEAs. In this
study, vibrational entropy is investigated in this work as an example of non-configurational
entropy in HEAs.
Current model for evaluating the configurational entropy of HEAs is the model of ideal
solution [12, 30, 31]. In the ideal solution model, the configurational entropy is calculated by
Sc = R ln Ω, (2.1)
where R is the gas constant and Ω is the total number of possible atomic configurations for
a given lattice structure. The underlying assumption of this model is that all the atomic
arrangements has an equal probability to occur in the alloy. However, this assumption is
hardly true in any real alloy, in which some atomic arrangements are usually more probable
to occur than others [32, 33, 34, 35]. This, in some cases, are caused by the size mismatch
between atoms of different element, which effect on the configuration entropy has been
considered by Ye et al [36]. But, mostly, the different bonding energy between different
element pairs is a more important factor than atomic size [37, 3]. Otto et al investigated the
element effect on the mixing entropy by substituting elements in CoCrFeMnNi alloy, which
is a single phase alloy in FCC structure [3]. By substituting one element in CoCrFeMnNi
by another element with same crystal structure, similar size and similar electronegativity,
five new quinary alloys have been synthesized. None of these new alloys were found to be
in single phase of solid-solution as for CoCrFeMnNi. This shows clearly the importance
of element effect. Therefore, a model that incorporates the interaction between different
elements is needed for evaluating the entropy of HEAs, which, unfortunately, has not been
developed yet.
The most commonly used method in vibrational entropy calculation is based on harmonic
approximation of atomic vibrations. Under this approximation, atomic vibrations in the alloy
can be decomposed into vibrations of 3N independent harmonic oscillators (phonons), where
N is the number of atoms in an alloy. Knowing the vibrational frequency of these phonons,
the vibrational entropy of the alloy is calculated by [38]
Sv = kB
3N∑i
hνi
2kBTcoth
[hνi
2kBT
]− ln
[2 sinh
(hνi
2kBT
)](2.2)
8
where kB is the Boltzmann constant, h is the reduced Planck constant and νi is the vibra-
tional frequency of the i-th phonon. This method can provide predictions of thermodynamic
properties of alloys in good agreement with experimental results at low temperature [16, 39].
But it fails to capture the anharmonic vibrational effect which becomes important at high
temperature [40, 41]. Moreover, current method for phonon frequency calculations relies
on the crystal symmetry to reduce the essential numbers of calculations [42, 43]. But the
absent long-range chemical ordering in HEAs makes this type of calculations intractable.
Therefore, a method to evaluate the vibrational entropy in HEAs is also lacking just as that
for configurational entropy.
In summary, the method to calculate the configurational and vibrational entropy of HEAs
is needed to be developed. In this work, an entropy evaluating scheme to calculate both
the configurational and vibrational entropy in HEAs has been developed. In this method,
empirical potential was used as the energy calculator and a set of MC simulations was used
to evaluate the thermodynamic properties of HEAs. The configurational and vibrational
entropy of AlxCoCrFeNi alloys were investigated by this method.
2.1.2 Ordering effect in alloys
The investigation of atomic ordering effect in alloys is an important tool to understand the
thermodynamic properties of HEAs. The ordering effect in alloys often indicates an enthalpy
effect which makes the alloy deviate from an ideal solution [44, 45, 46]. Therefore, it provides
information on the origin of the non-ideality in HEAs, which explains the reduction of the
entropy from the entropy of ideal solution. Moreover, the atomic ordering in alloys can be
extracted from the experimental structure factor obtained by diffraction experiments using
X-ray [9, 47], electron [48, 49] or neutron [50, 47]. Hence, the analysis of atomic ordering in
HEAs can be used to connect the experiments with theoretical works, thus offering evidences
to validate and improve current theory.
In general, three types of ordering effect can be found in an alloy, namely, long-range-
order (LRO), short-range-order (SRO) and medium-range-order(MRO). LRO is the repeti-
tion of a certain pattern of atomic structure over a large distance compared to interatomic
9

distance. It can be found in the ordered alloys such as Cu3Au (L12 structure) [51], NiAl (B2
structure) [52] and NiPt (L10 structure) [53]. In these alloys, a group of atoms is arranged
in a three dimensional (3D) lattice structure, which makes the atomistic structure of these
alloys invariant under the translation by any integer linear combination of lattice vectors.
Because of this 3D periodic arrangement, the structure factor of these alloys is also a 3D
lattice in the reciprocal space. Thus, in the diffraction pattern of these alloys, a set of dis-
crete peaks can be observed. It is commonly believed that the chemical LRO is absent in
HEAs [9]. X-ray and neutron scattering investigation of CoCrFeNi HEA shows that, though
the discrete peaks of FCC phase can be observed in the diffraction pattern, the superlattice
peaks indicative of chemical ordering are lacking in CoCrFeNi HEA. This shows that the
topological LRO of FCC lattice has been kept in this HEA but the chemical LRO is missing
in it. However, the X-ray diffraction pattern of AlxCoCrFeNi and AlxCoCrCuFeNi alloy
shows clear evidence of ordered B2 phase [10, 11, 37]. The atomic structure of this B2 phase
is identified to be Al and small fraction of Fe in one sublattice while Ni and Co in another
sublattice [37, 54]. Therefore, there could still be partial chemical LRO existed in HEAs.
Contrary to the LRO, SRO is the atomic ordering over the distance comparable to the
interatomic distance. It has been found in amorphous alloys, e.g. Zr62−xTixAl10Cu20Ni8 [55]
and Zr66.7Ni33.3 [48] and disordered alloys, e.g. FeCr alloy [34]. In these alloys, a certain
local structure, e.g. icosahedral cluster [32, 33] or typical occupancies in the first and second
nearest neighbor of atoms of an element [34, 35], can be found to be dominant. But these
structures are packed in a random way so that no LRO was detected. The structure factor
of alloys with SRO usually has one or two peaks near the origin of the reciprocal space and
a flat tail oscillating around unity [56, 57, 55]. Though there has been a lack of experiments,
the SRO in Al1.3CoCrCuFeNi alloy has been investigated by ab initio MD [37]. It is found
that the bonds of Al-Ni, Fe-Cr and Cu-Cu are largely preferred in the alloy while Al-Al and
Cr-Ni bonds are unfavored. Moreover, there are also evidences from both DFT calculations
and MC simulations which show that Cr brings SRO in CoCrFeNi alloy [46, 58, 59]. These
studies show that chemical SRO can cause non-ideality in HEA even if the chemical LRO
is lacking.
10
MRO is the atomic ordering over the range between, roughly speaking, 5 A and 20 A [60].
It is related to SRO for that it usually depicts a certain packing method of the SRO clusters.
For example, in Ni81B19, Ni80P20 and Zr84Pt16 alloys, the solute center SRO clusters are
found to packed with icosahedral topological order due to the correlation between solute
atoms [32]. Percolated network of fivefold SRO clusters has also been found in Al75Cu25
liquid alloys [61]. Experimentally, a prepeak in the structure factor is a typical feature of
an alloy with MRO [56, 57, 62]. At present, the investigations of MRO in HEAs are still
lacking. Studies, either experimental or theoretical, are needed to identify the existence of
MRO in HEAs.
In summary, LRO, SRO and MRO can all exist in HEAs and may cause the reduction of
entropy from that of ideal solutions. In this work, the atomic ordering effect in AlxCoCrFeNi
alloys were investigated. This information of atomic ordering provides a description of the
non-ideality in AlxCoCrFeNi, which can be validated by experiments.
2.1.3 Al Effect on the FCC-BCC phase transition in AlxCoCrFeNi HEA system
It is known that Al stabilizes BCC phase in HEAs. Al has been found to stabilize the
BCC phase in AlxCoCrCuFeNi, AlxCoCrFeNi, AlxCrFe1.5MnNi0.5, AlxCoCrFeNiTi, and
AlxCrCuFeNi2 alloys [25]. With the addition of Al content, these alloys transit from FCC
phase into BCC phase and B2 phase. In the binary phase diagram of Al-Ni [52], Al-Fe [63]
and Al-Co [64], all alloys form intermetallic compound in B2 structure at equiatomic con-
centration. Therefore, it is not surprising that Al stabilizes BCC structure in HEA systems
containing Ni, Fe and Co.
The interactions between Al and transition metals are different from the interactions
between transition metals. Unlike transition metals the bonds between whom are usually
s-s or s-d bonds, Al forms bonds with transition metals through s-p or p-d bonds. These
p-orbital related bonds are usually stronger than bonds between transition metals and shows
strong directionality. Therefore, Al usually forms intermetallic compounds, which stays in an
ordered crystal structure such as BCC related B2 phase [52, 63, 64], with transition metals.
11
The BCC stabilizing effect of Al in AlxCoCrFeNi alloys has been extensively explored
in experiments. Kao et al [10] investigated the FCC to BCC transition in AlxCoCrFeNi
(0 ≤ x ≤ 2) alloys which have been annealed at 1373 K for 24 hours. The X-ray diffraction
(XRD) pattern reveals that the FCC phase is stable when x ≤ 0.375 while the BCC phase is
stable when x ≥ 1.25 for as-homogenized alloy. It is found that the BCC phase is composed
of Ni-Al enriched B2 phase and Fe-Cr enriched BCC phase [24] and the phase transition is
mainly caused by the precipitates of B2 phase [10]. The temperature effect on the phase
stability of AlxCoCrFeNi (0 ≤ x ≤ 1.8) has been studied by Wang et al [11] as well. It is
found that when x ≤ 0.3, the alloy was kept in FCC structure for the whole temperature
range between room temperature and 1373 K. When x ≥ 1.5, the alloy was in BCC structure
in the whole temperature range but has a transition from disordered phase to ordered phase
following temperature increases. Moreover, σ phase was found in the alloy when x is between
0.9 and 1.2 in the temperature range from 873 K to 1173 K. The existence of σ phase is
not surprising for that it has been found in binary alloy of Fe-Cr and Co-Cr alloys, but a
transition from disordered phase to ordered phase with increasing temperature is unusual,
for that entropy has a larger effect at higher temperature, which favors the formation of
disordered phase.
Other than experiments, theoretical method has also been used to predict the phase
stability of AlxCoCrFeNi alloys. Tian et al [12] investigated the FCC to BCC transition
of AlxCoCrFeNi by DFT calculations. The range of Al concentration when FCC and BCC
coexisting was determined to be 0.597 ≤ x ≤ 1.229 at 300 K. CALPHAD approach using
the database of binary and ternary alloys was also used to build the phase diagram of
AlxCoCrFeNi alloys [13]. The FCC-BCC duplex region at 1100 C is predicted to be between
x = 0.35 and x = 1.65. Though the stabilization of BCC phase by Al addition has been
captured, none of the methods provides a satisfied prediction of the boundary of the FCC-
BCC duplex region as compared to the latest experimental range of 0.3 ≤ x ≤ 0.7 [14]. The
reason for this discrepancy may come from the ignorance of non-configurational entropy in
these simulations. In this work, vibrational entropy has been evaluated as an example of
non-configurational entropy. It is found that atomic vibration has an strong effect on the
relative stability between the FCC and BCC phase.
12
2.2 VACANCY DIFFUSION IN α-Al2O3
2.2.1 Diffusion of Al and O in α-Al2O3
The diffusivity of oxygen anions and aluminum cations in α-Al2O3 have been extensively
measured in experiments [65, 66, 67, 68, 69, 70, 71, 72, 73, 74, 75]. Oxygen diffusion in
undoped α-Al2O3 single crystals and polycrystals have been measured by several research
groups using either secondary ion mass spectroscopy (SIMS) or nuclear reaction analysis
(NRA) techniques to determine the 18O depth profiles following high temperature exchange
with 18O-enriched oxygen gas. From Arrhenius plots of diffusion coefficient data with respect
to reciprocal temperature, the activation energy for O diffusion in α-Al2O3 could be obtained
in these measurements. The currently available experimental results indicated that the
activation energy for O lattice diffusion fell into the range between 531 kJ/mol (i.e., 5.50
eV) [72] and 787 kJ/mol (i.e., 8.15 eV) [67] while the activation energy for O grain-boundary
diffusion varied from 294 kJ/mol (i.e., 3.05 eV) [69] to 896 kJ/mol (i.e., 9.29 eV) [70]. It is
notable above that the measured activation energy for O grain-boundary diffusion could be
even higher than that for O lattice diffusion. Indeed, Prot et al found the activation energy
for O lattice diffusion to be 636 kJ/mol (i.e., 6.59 eV) while that for O grain-boundary
diffusion to be 896 kJ/mol (i.e., 9.29 eV) in their measurement [70]. Moreover, Nakagawa
et al reported their measured activation energy for O grain-boundary diffusion to be 627
kJ/mol (i.e., 6.50 eV) [73] which was also higher than their own value (531 kJ/mol) [72] for
O lattice diffusion. This finding in α-Al2O3 is contrary to what is normally found in metals.
Furthermore, recent experimental data revealed that the O diffusion coefficients could vary
up to 103 times along different grain boundaries (GBs) in α-Al2O3 and were closely related
to the local arrangement of atoms on the GBs [75].
As compared to O diffusion, the experimental studies on Al diffusion in alumina are rela-
tively scarce. So far, there are only two measurements of Al diffusion processes by analyzing
the attained profiles of 26Al tracers in undoped α-Al2O3 samples at elevated temperatures.
It was found that the activation energy for Al diffusion was 477 kJ/mol (i.e., 4.94 eV) [66]
in polycrystal alumina and 510 kJ/mol (i.e., 5.29 eV) [68] in single crystal alumina. These
13

results suggested that the Al lattice diffusion (with activation energy of 5.29 eV) would be
faster than the O lattice diffusion (with activation energy of at least 5.50 eV) in α-Al2O3.
In addition, Ref. [68] reported that the Al grain-boundary diffusion could also have higher
activation energy [850 kJ/mol (i.e., 8.81 eV)] than the Al lattice diffusion in alumina.
Complementary to experimental measurements, computer simulation techniques have
already been employed to elucidate the mechanism of diffusion processes in alumina at an
atomistic scale [6, 76, 77, 7, 78]. Jacobs et al calculated the activation energy for O vacancy
migration in α-Al2O3 lattice to be about 1 to 2.5 eV using both the semi-empirical model
and pair-wise Buckingham empirical potentials [79]. As compared with experimental data
(i.e., 5.50 to 8.15 eV), these theoretical predictions were obviously too low. Achieving an
improved agreement between theory and experiment, Aschauer et al extracted the activation
energy for O lattice diffusion to be 510.83 kJ/mol (i.e., 5.29 eV) from their empirical pair
potential based metadynamics and the kinetic Monte Carlo simulations [7]. Both studies
(Refs. [6] and [7]) pointed out that there were multiple elementary routes contributing to the
overall O diffusion processes in alumina. Regarding the short-circuit diffusion mechanisms
in alumina, Harding et al [76] calculated the activation energies for Al vacancy migration
along various GBs using the same empirical pair potential employed in Ref. [7]. They found
that not only the metal vacancy diffusion behavior varied greatly from one GB to another
but also the individual hops within the same GB differed considerably. Relevantly, Milas
et al investigated the diffusion of Al and O atoms on the (0001) surface of α-Al2O3 DFT
calculations [78]. It was predicted that Al surface diffusion would be facile with activation
energy of 0.73 eV but O surface diffusion would involve intermediate metastable state with
an overall energy barrier of 1.67 eV.
The difference between the theoretical and experimental activation energy reveals that
some aspects are missing in present theoretical models. Charge state of the vacancy could be
the missing piece. It has been found that the migration energy of N in GaN can be changed
by tuning the charge state of N vacancy [17]. Similar charge state dependence of vacancy
migration energy has also been found in ZnO [18]. It is also known that the formation
energy of vacancy in α-Al2O3 depends on the charge state [5]. Therefore, the charge state of
vacancy is worth to be considered. A recent work by Yang et al [80] shows that the migration
14

energy of O vacancy has a strong dependence on the charge state of it. However, whether
the migration of Al vacancy has the same dependence is not explore. More importantly,
no explanation of this charge effect has been provided yet. Therefore, it is interesting to
investigate the dependence of migration energy on the charge state of vacancy in α-Al2O3.
2.2.2 Electronic structure of vacancies in insulating metal oxides
Most metal oxides are insulating [81]. For an ideal insulating metal oxides without defects,
an energy gap exists in the band structure which separates the fully occupied valence band
(VB) and the empty conduction band (CB). Usually, for binary metal oxides, the VB edge
consists mostly of 2p orbital of oxygen while the CB edge is dominated by the empty valence
orbitals of metal atoms [82, 83, 84]. When vacancies exist in metal oxides, however, defect
energy levels will be introduced in the band gap or near the band edges [19, 20, 21]. These
defect levels could be donors, acceptors or traps of electrons, which modify the electronic
and optical properties of metal oxides, e.g. change the electric conductivity and the color
of TiO2 [85].
The physical reason for the formation of defect levels can be understood by a simple idea
from the hydrogenic effective-mass theory [21, 20]. In a perfect crystal of metal oxides at
0 K, when an extra electron is introduced in, it will fill the CB edge for that the CB edge
is the lowest available energy state. However, when an anion is removed from the lattice
site, extra positive charges are introduced around the vacancy as compared to the perfect
crystal. In this case, when an extra electron is added to metal oxides, it will be attracted to
the anion vacancy and form a bounded state whose energy is lower than the CB edge. Only
when more electrons are introduced in so that the positive charges near the anion vacancy
are neutralized, the excess electrons will start to occupy the CB edge. Therefore, anion
vacancies introduce defect levels, which can accommodate number of electrons equal to the
positive charges of the vacancy, below the CB edge. For the cation vacancy, on the contrary,
there are extra negative charges near it. So the electrons are repelled from and the holes
15

are attracted to the vacancy. Therefore, bounded states of holes above the VB edge will be
introduced by cation vacancies. These levels can accommodate holes with the same number
as the negative charges of the vacancy.
These defect levels play an important role in controlling the properties of metal oxides.
When the defect levels are close to the VB or CB edge, which means that the energy difference
between the defect levels and the VB or CB edge is comparable to kBT , electrons can be
easily moved to or removed from the defect levels by thermal excitations. This allows the
controlling of the electric conductivity of metal oxides [19]. On the contrary, when the
defect levels are far away from the VB and CB edge, which means that the energy difference
between the defect levels and the VB and CB edge is much greater than kBT , electrons and
holes are trapped in the defect levels so that they do not have much effect on the electric
conductivity. However, these deep levels are recombination centers of electrons and holes
that can change the adsorption and emission spectrum of metal oxides [86]. Moreover, the
position of these defect levels also have an impact on the relative stability of the vacancies
in different charge states [5].
Because of their importance, extensive simulation works have been done to investigate
the defect levels of vacancy in metal oxides using DFT simulations [5, 19, 84, 87]. In these
works, the relative stability of the vacancies in different charge states and the position of
defect levels in the band gap of metal oxides have been studied. However, these works
only focused on the relation between the electronic structure and the equilibrium state of
vacancies. In this study, on the contrary, DFT calculations have been used to investigate
the motion of defect levels during the vacancy migration. During the migration process, the
charged vacancy moved from one site to another site. This must correspond to a charge
redistribution near the vacancy which could lead to a shift of the defect levels. If there are
electrons in the defect levels, this shift may have an effect on the vacancy migration energy.
DFT calculation is known to underestimate the band gap of metal oxides. This prevents
the accurate prediction of the defect level position. However, a qualitative inspection of
the electronic structure change during the vacancy migration can still be obtained by DFT
calculations. This information can be used as a starting point for future simulations using
more advanced techniques such as quantum Monte Carlo method [88].
16

3.0 METHODOLOGY: ATOMISTIC SIMULATIONS
3.1 OVERVIEW
Atomistic simulations refer to a set of simulation methods that model the materials on the
atomistic scale. Starting from the most basic ideal that materials are made of atoms, the
properties of materials are calculated by applying fundamental physical laws such as New-
ton’s second law, Schrodinger equation and statistic mechanics. Thus, atomistic simulation is
considered to be a research method which is independent of experiments. Usually, it requires
very few inputs from experimental data. This independence makes atomistic simulation a
good complement to experiments in material science.
Atomistic simulations complement experiments in several ways. First, all conditions in
atomistic simulation are controllable. Thus, by comparing experimental results to simulation
results, whether there is any uncontrollable factor can be detected and how large these factors
influence the experimental results can be determined. Traditionally, uncontrollable factor
in experiments can only be ruled out by largely repeating of experiments. With the help of
atomistic simulations, the number of repeated experiments can be reduced to a small number.
Second, atomistic simulations provide information of materials that are hard to, or some-
times cannot, be measured in experiments. Restricted by the spatial and temporal resolution
of experimental equipment, certain information, such as vacancy concentration in materials,
nucleation mechanism of dislocations and changing in electronic structure during diffusion,
can rarely be measured in experiments. On the contrary, this information can be obtained by
several runs of atomistic simulations. This detailed information offers better understanding
of material behavior, sometimes can be used as guidance for developing of new materials [89].
17
Third, atomistic simulation can be used in researching material behavior under extreme
conditions, e.g. high temperature, high pressure and/or under nuclear radiations. Experi-
ments in these conditions are difficult either because of a lack of experimental equipment or
simply because it is too dangerous. Atomistic simulations, however, can always be done for
that these conditions are just numbers stored in computer memory. Properties of materials
working in nuclear reactor have been long investigated by atomistic simulations. For in-
stance, atomistic simulations has been done to investigate the defect production in collision
cascade in Zr [90]. The primary damage due to α-decay self-radiation in UO2 is also studied
by atomistic simulations [91].
Atomistic simulation methods link the microscopic properties of atoms and the macro-
scopic properties of materials following the rules of statistic mechanics. Therefore, there
are two levels of atomistic simulation methods, i.e. energy calculators which describe the
interaction between atoms and modelling methods which model the behavior of a large num-
ber of atoms. Energy calculators can be based on quantum mechanics or empirical models.
Modelling methods can be deterministic or stochastic.
The most commonly used energy calculator for solid-state system is the density func-
tional theory (DFT) [92, 93] which originated from quantum mechanics. Compared to other
quantum-mechanics-based energy calculators such as Hartree-Fock method [94] and Quan-
tum Monte Carlo [88], DFT has the advantage of relatively low computational cost but still
reasonable accuracy. Therefore, it has been widely used in calculating materials properties
such as the formation energy of alloys [46, 95], the vacancy formation and migration energy
in metal oxides [5, 77], and the electronic structure and magnetic properties of nanopar-
ticles [96, 97]. Rooted in quantum mechanics, DFT requires almost no experimental data
as input. So DFT calculation is sometimes also referred to as ab initio or first principle
calculation in computational materials science.
Another commonly used energy calculator is the empirical potential, such as modified
embedded atom method (MEAM) [98] and reaction force field [99]. Instead of simulating the
interaction between atoms on the electronic structure level, empirical potentials describe the
interatomic interactions by model functions. In these model functions, there are adjustable
parameters which need to be determined for a specific material system. These parameters are
18
usually fitted to materials properties from experimental measurements or DFT calculations.
Compared to quantum-mechanics-based energy calculator such as DFT, the computational
cost of empirical potentials is much lower. Therefore, they have been extensively used in large
scale simulations with millions of atoms. However, one empirical potential cannot accurately
reproduce all the properties of a material at the same time. The parameters may need to be
tuned for each specific problem. Moreover, without the information of electrons, empirical
potentials can only be used in simulations of mechanical and thermodynamic properties.
Quantum-mechanics-based energy calculators are necessary for simulations of electronic,
magnetic and optical properties of materials.
Molecular dynamic (MD) [100] simulation models the behavior of a group of atoms in
a deterministic way. The ideal of MD simulation is considering atoms as mass points in
classical mechanics, then solving the equations of motion for given initial and boundary con-
ditions. The energies and forces used in the equations of motion need to be generated by an
energy calculator either based on quantum mechanics or model functions. The deterministic
trajectories of all the atoms are traced during the simulation. The macroscopic properties
of materials can be calculated by the time average of the microscopic properties of atoms
over the simulation process. The deterministic nature of MD simulation makes it a very
good tool for investigations of the dynamic and kinetic processes in materials. Large amount
of works have been done by MD simulations on the deformation mechanism of metals and
alloys [101, 102], the diffusion of atoms in grain boundary and triple junction [103, 104], the
motion of proteins [105, 106], etc.
Monte Carlo (MC) [107] simulation, on the contrary, models the behavior of a group
of atoms in a stochastic way. It is a sampling method which generates configurations of
atoms from a certain probability distribution. Then the macroscopic properties of mate-
rials can be calculated by averaging the microscopic properties of atoms over the sampled
configurations. This stochasticity makes MC simulations efficient in evaluating the equilib-
rium properties of a material. Several varieties of MC simulations, e.g. Metropolis algo-
rithm [108], Wang-Landau Sampling [109] and thermodynamic integration [110], have been
developed for the purpose of evaluating equilibrium properties of materials. These methods
19
have been used to investigate materials properties such as the equilibrium concentration on
segregated surface [111], the free energy of alloys [112] and the equilibrium concentration of
hydrogen adsorption [113].
Though they have been widely used in studies of materials properties, there are two
common limitations of all atomistic simulation methods, i.e. the small spatial and temporal
scales. Despite the rapid development of the computing power of modern supercomputers,
usually no more than millions of atoms can be simulated by atomistic simulation methods.
For three dimensional bulk materials, this corresponds to a grain with a diameter less than
one micron. Moreover, the temporal scale that can be treated by atomistic simulations is at
most several nanoseconds. Clearly the manageable spatial and temporal scale of atomistic
simulations are way too small compared to that of real material systems. This usually leads to
unrealistic conditions such as extremely large defect concentration, high strain rate and small
correlation length in atomistic simulations. Moreover, the approximations used in energy
calculators and modelling methods also introduce errors in the simulation results. In this
sense, atomistic simulations should be considered more as tools for qualitative analyses than
quantitative predictions. Cautions are needed when interpreting the meaning of simulation
results. Detailed discussions of the limitations of each study in this dissertation are given in
the corresponding chapters.
3.2 ENTROPY OF OF HIGH ENTROPY ALLOYS
In the developed computational scheme for entropy evaluation, modified embedded atom
method potential [98, 114] has been used to describe the interatomic interactions in HEAs.
Then Monte Carlo simulation with conventional Metropolis algorithm [108] has been used
to calculate the equilibrium configuration and energy, and thermodynamic integration [110,
115] has been used to evaluate the free energy and entropy. When testing this scheme on
AlxCoCrFeNi alloys, several assumptions have been made during the simulations. First, the
configurational and vibrational entropy were calculated separately for practical calculation
issue, as discussed in section 3.2.3. It has been assumed that the cross effect between these
20
two entropies is small and will not qualitatively change the whole picture of the FCC to BCC
phase transition. Second, the BCC phase was treated as a whole despite that two phases, i.e.
Ni-Al enriched B2 phase and Fe-Cr enriched BCC phase, were found in experiments. It has
been assumed that the phase separation between these two phases could be captured in MC
simulations. Third, only the FCC and BCC phase related structures were used to develop the
MEAM potential of Al-Co-Cr-Fe-Ni alloy system. All the simulations are performed at 1373
K, at which temperature only FCC and BCC phase are found in AlxCoCrFeNi alloys [11]. It
has been assumed that the ignorance of other phases, such as σ phase, does not have large
effect on the accuracy of the potential.
3.2.1 Modified-embedded-atom-method potential developing
Modified embedded atom method [98, 114] potential is the most successful empirical potential
for metal and alloy systems. Within the frame of MEAM, the energy of an alloy system is
expressed as
E =∑i
[F (ρi) +
1
2
∑j 6=i
φ (rij)
](3.1)
where ρi is the electron density at the position of atom i, rij is the separation between two
atoms i and j, F (ρ) is the energy of an atom embedded in the electron background ρ at
its site, and φ(r) is the pair potential between two atoms with a separation of length r.
The formula of both the embedded function and the pair potential depends on a predefined
reference crystal structure. In this work, the reference structure for the potential of the pure
metals is chosen to be the most stable crystal structure of each element, i.e. FCC for Al
and Ni, BCC for Cr and Fe, and HCP for Co. For the cross potentials between all pairs of
elements, the reference structure was chosen to be B2 structure.
The embedding function is defined by
F (ρi) = AiEci (ρi) ln (ρi) (3.2)
Here ρi is the electron density at the site of atom i, Ai is a parameter which needs to be
fitted, and Eci is the cohesive energy of the reference structure of atom i. For each element,
there is a unique set of Ai and Eci , which needs to be determined for the potential.
21

Four terms contributed to the electron density ρi in MEAM potential, i.e. a spherically
symmetric partial electron density ρ(0)i and the angular contributions ρ
(1)i , ρ
(2)i , and ρ
(3)i .
These electron densities are calculated from equations listed below:
(ρ(0)i )2 =
[∑j 6=i
ρa(0)j (Rij)
]2
, (3.3)
(ρ(1)i )2 =
∑α
[∑j 6=i
Rαij
Rij
ρa(1)j (Rij)
]2
, (3.4)
(ρ(2)i )2 =
∑α,β
[∑j 6=i
RαijR
βij
R2ij
ρa(2)j (Rij)
]2
− 1
3
[∑j 6=i
ρa(2)j (Rij)
]2
, (3.5)
(ρ(3)i )2 =
∑α,β,γ
[∑j 6=i
RαijR
βijR
γij
R3ij
ρa(3)j (Rij)
]2
− 3
5
∑α
[∑j 6=i
Rαij
Rij
ρa(3)j (Rij)
]2
. (3.6)
Here, ρa(h)j (Rij) (h = 0, 1, 2, 3) is the atomic electron density contributed by atom j at the
position of atom i. Rαij and Rij are the α (α = x, y, z) components and norm, respectively,
of the vector pointing from atoms j to atom i. These electron densities are combined by the
following equation:
ρi = ρ(0)i
2
1 + e−Γi, (3.7)
where
Γi =3∑
h=1
t(h)i
[ρ
(h)i
ρ(0)i
]2
(3.8)
and t(h)i (h = 0, 1, 2, 3) are parameters that need to be fitted. The atomic electron density
is given by
ρa(h)j (R) = ρ0
je−β(h)
j ( Rrej−1), (3.9)
where β(h)j (h = 0, 1, 2, 3) are again adjustable parameters, rej is the nearest-neighbor
distance of the reference structure of atom j, and ρ0j is the density scaling factor of atom j.
Similar to Ai and Eci , t
(h)i , β
(h)j , rej and ρ0
j are the parameters of the potential which has a
unique value for each element.
Different from the embedded function, the pair potential φ(Rij) in MEAM is not explicitly
defined. It is calculated from the embedding function and a universal equation of state
proposed by Rose et al [116]. The Rose equation of state for a reference structure is a
22

function of nearest-neighbor (NN) distance R, i.e.
Eu(R) = −Ec(1 + a∗)e−a∗, (3.10)
where
a∗ = α(R
re− 1) (3.11)
and
α =
√9BΩ
Ec(3.12)
Here, Eu(R) is the energy per atom of the reference structure with a NN distance of R, Ec
and re are the equilibrium cohesive energy and NN distance of the reference structure, and
B and Ω are the bulk modulus and the equilibrium atomic volume of the reference structure.
In the original MEAM [98] potential, only interactions between the NN atoms are con-
sidered. In this case, the energy per atom of the reference structure with the NN distance
of R is
Eu(R) = F [ρ0(R)] +Z
2φ(R) (3.13)
Here, Z is the number of NN atoms and ρ0(R) is the background electron density for the
reference structure when the NN distance is R, which is calculated by
ρ0(R) =
Zρa(0)(R) for FCC and BCC
Zρa(0)(R)
√1 + t(3)
3Z2
[ρa(3)(R)
ρa(0)(R)
]2
for HCP(3.14)
Then the pair potential for pure element is
φ(R) =2
Z
Eu(R)− F [ρ0(R)]
(3.15)
When interactions between the second nearest-neighbor (2NN) atoms are also considered,
Eq. 3.15 is still valid. However, in 2NN MEAM, the background density ρ0(R) becomes [114]
ρ0(R) =
Zρa(0)(R) + Zbρa(0)(aR) for FCC and BCC
Zρa(0)(R)
√1 + t(3)
3Z2
[ρa(3)(R)
ρa(0)(R)
]2
+ Zbρa(0)(aR) for HCP(3.16)
where b is the ratio between the number of 2NN and NN atoms and a is the ratio between
2NN and NN distance in the reference structure.
23
In the cross potential, the pair potential φAB(R) takes a different form. In B2 structure,
there are two atoms in a cubic unit cell, with element A occupies the corner and element B
occupies the body center. Each atom has 8 NN atoms with different element type. Therefore,
the energy per unit cell is
2Eu(R) = F[ρ0A(R)
]+ F
[ρ0B(R)
]+ 8φAB(R) (3.17)
where
ρ0A = 8ρ
a(0)B (R), (3.18)
ρ0B = 8ρ
a(0)A (R), (3.19)
(3.20)
Therefore, for B2 reference structure, the pair potential φAB(R) is
φAB(R) =1
8
2Eu(R)− F
[ρ0A(R)
]− F
[ρ0B(R)
](3.21)
In current form of MEAM potential, only the pair interactions up to 2NN are considered.
However, in the electron density calculations, the density contributions from farther atoms
are also counted in. Therefore, a screen function is introduced to eliminate these contribu-
tions. The many-body screen function Sij between two atom i and j is defined by [98, 114]
Sij =∏k 6=i,j
Sikj (3.22)
where Sikj is the screening factor of atom k to the interaction between atom i and j. The
screen factor Sikj is calculated by
Sikj = fc
(C − Cmin
Cmax − Cmin
)(3.23)
where Cmax and Cmin are adjustable parameters, fc(x) is a smooth function, which is given by
fc(x) =
1 x ≥ 1
[1− (1− x)2]2
0 < x < 1
0 x ≤ 0
(3.24)
24
and C is calculated by
C =2(Xik +Xkj)− (Xik −Xkj)
2 − 1
1− (Xik −Xkj)2(3.25)
where Xik = (Rik/Rij)2 and Xkj = (Rkj/Rij)
2 with Rij the separation between atom i and j.
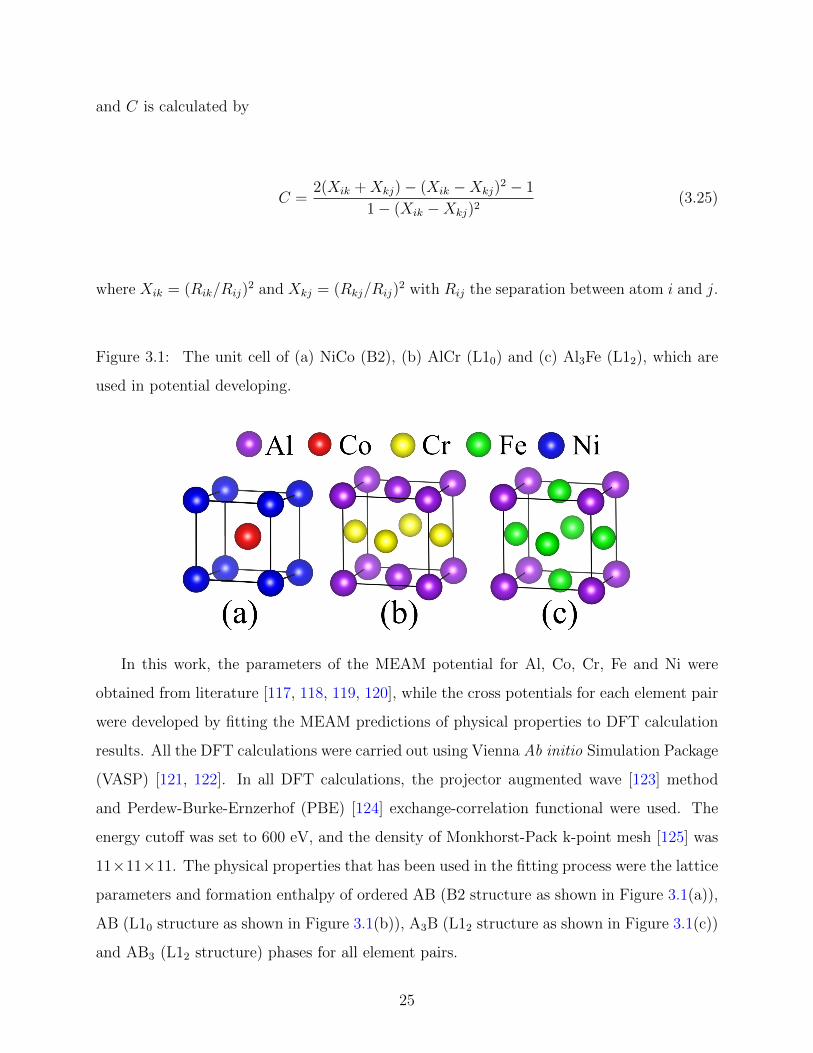
Figure 3.1: The unit cell of (a) NiCo (B2), (b) AlCr (L10) and (c) Al3Fe (L12), which are
used in potential developing.
In this work, the parameters of the MEAM potential for Al, Co, Cr, Fe and Ni were
obtained from literature [117, 118, 119, 120], while the cross potentials for each element pair
were developed by fitting the MEAM predictions of physical properties to DFT calculation
results. All the DFT calculations were carried out using Vienna Ab initio Simulation Package
(VASP) [121, 122]. In all DFT calculations, the projector augmented wave [123] method
and Perdew-Burke-Ernzerhof (PBE) [124] exchange-correlation functional were used. The
energy cutoff was set to 600 eV, and the density of Monkhorst-Pack k-point mesh [125] was
11×11×11. The physical properties that has been used in the fitting process were the lattice
parameters and formation enthalpy of ordered AB (B2 structure as shown in Figure 3.1(a)),
AB (L10 structure as shown in Figure 3.1(b)), A3B (L12 structure as shown in Figure 3.1(c))
and AB3 (L12 structure) phases for all element pairs.
25
3.2.2 Monte Carlo simulation method
In order to evaluate the thermodynamic properties and to obtain the equilibrium atomic
structure of HEAs, Metropolis-type MC simulations algorithm [108] was used to sample the
possible atomic configurations. In a system with constant number of atoms, volume and
temperature, the probability of finding the system stay in an atomic configuration is the
canonical distribution, i.e.
p(E) = exp
(− E
kBT
)(3.26)
where E is the energy of the configuration, T is the temperature and kB is the Boltzmann
constant. The macroscopic property of the system is the average of the microscopic physical
quantity over all atomic configurations weighted by this probability distribution. Using
Metropolis algorithm, a sample of atomic configurations can be generated from the desired
probability distribution. Then the average properties of these sample configurations can
used be an approximation of the properties of an alloy.
To model the equilibrium AlxCoCrFeNi alloys by MC simulations, a 8× 8× 8 supercell
of FCC crystal structure (2048 lattice points) and a 10 × 10 × 10 supercell of BCC crystal
structure (2000 lattice points) were built at first. In each model, Al atoms were filled in the
lattice points randomly with a mole ratio of x/(x+ 4). Then Co, Cr, Fe and Ni atoms were
filled in the rest lattice points randomly with equimolar concentrations. Starting from this
random structure, one of two trial motions were chosen to be done in each MC iterations.
The first one is swapping two atoms with different element type. This swapping can happen
between any two atoms regardless of the distance between them, once they have different
element types. Therefore, every swapping generates a new configuration. The second one
is displacing an atom by a small amount. This trial motion kicks the atom away from
the equilibrium position thus induced the effect of vibration into the simulations. At every
MC iteration, the energy difference ∆E of the alloy after and before the trial motion was
calculated, and the new configuration was retained with a probability of
p = min
[1, exp
(−∆E
kBT
)](3.27)
26
After several MC iterations, the models of AlxCoCrFeNi evolved into a state in which the
energy of the system was oscillating around a constant value. This state is the equilibrium
state and the alloy properties can be extracted from the atomic configurations in this state.
In this work, two types of MC simulations have been done for the purpose of separating
the configurational and vibrational entropy. In the simulations of configurational entropy,
only swapping of atoms was performed at each iterations. It has been found that the models
entered the equilibrium state in 100 thousands MC iterations. Therefore, 2 million iterations
in total were used in this MC simulations and the thermodynamic and structural properties
of the alloy were obtained by averaging the corresponding properties over the configurations
generated every 1000 MC iterations in the last 1 million iterations. In the simulations of
vibrational entropy, only displacing of atoms was performed. In this case, the system needs
2 million iterations to reach equilibrium. Hence, 5 million iterations were used and the
properties of the alloy were averaged over the configurations generated very 1000 iterations
in the last 2 million iterations. The simulation temperature was set to 1373 K, which is
the experimental annealing temperature of AlxCoCrFeNi alloys [10]. Periodic boundary
condition was assumed in all MC simulations.
3.2.3 Free energy and entropy evaluation method
In this study, thermodynamic integration (TI) [110, 115] was used to evaluate the free energy
of HEAs. TI starts from the observation that the free energy difference of two systems can
be evaluated by an adiabatic integration. Suppose there are two systems, 0 and 1, with same
number of atoms, whose potential energy are V0 and V1 respectively. Then the Hamiltonian
of these two systems are H0 = T + V0 and H1 = T + V1 respectively, where T is the kinetic
energy of the system. Considering a system whose Hamiltonian is
H(λ) = T + λV1 + (1− λ)V0 (3.28)
the free energy of this system is
F (λ) = −kBT ln
[∫exp
(−H(λ)
kBT
)d~pd~q
](3.29)
27
where ~p and ~q are the momentums and the positions of all the atoms. Using the identity
F (1)− F (0) =
∫ 1
0
∂F
∂λdλ, (3.30)
and noticing that F (1) and F (0) are the free energy of system 1 and 0 respectively, one can
obtain a formula to calculate the free energy difference of these two systems, i.e.
∆F = F (1)− F (0) =
∫〈V0 − V1〉λ dλ, (3.31)
where 〈V0 − V1〉λ is the equilibrium ensemble average of the potential difference at a certain
value of λ. Thus, if the free energy of one system is known, the free energy of the other
system can be obtained.
However, to calculate the free energy difference by Eq. 3.31, one has to do MC or MD
simulations at different λ to obtain the ensemble average of the potential difference. This
can be very time consuming for that a large number of different λs are needed to get an
accurate integration result. This problem can be solved by employing a time dependent
λ [115]. Using a continuous function changing from 0 to 1, the free energy difference can be
calculated by
∆F =
∫ t1
t0
[V0(λ(t))− V1(λ(t))]∂λ(t)
∂tdt. (3.32)
This formula allows the calculation of the free energy difference in one simulation without
large error once the time step dt is small enough.
In order to use TI to calculate the free energy of HEA, a reference state with already
known free energy is needed. If only configurational entropy is considered, it is natural to
use the ideal solid solution whose potential energy is a constant
V =N∑i
Ei (3.33)
and free energy is
F =N∑i
Ei − TSideal (3.34)
28
where N is the number of atoms, Ei is the energy of each atom in their standard state,
e.g. energy of Ni atom in FCC lattice, and Sideal is the entropy of ideal solution, which is
calculated by
Sideal = −kB∑i
xi lnxi (3.35)
If vibrational configuration is also considered, an Einstein crystal [126] of ideal solution can
be used as the reference state. The potential and free energy of this system are
V =N∑i
Ei +1
2K
3N∑i
(∆xi)2 (3.36)
F =N∑i
Ei − TSideal +3Nhν
2+ 3NkBT ln
[1− exp
(− hν
kBT
)](3.37)
where, K and ν are the stiffness and vibrational frequency of all oscillators, which are
related by
ν =
√K
m(3.38)
Here, m is the average mass weighted by the mole fraction of each element. Once the free
energy of a system is obtained, the entropy of the system can be calculated by
S =F − UT
(3.39)
where U is the internal energy of the alloy, which can be evaluated by an independent
Metropolis MC simulation.
Ideally, the total free energy and entropy including both configurational and vibrational
contribution can be obtained in one TI simulation. Practically, however, the required number
for MC iterations to achieve a converged estimation of free energy and entropy is too large, if
the configurational and vibrational effect are considered together. Moreover, to understand
the individual effect of configurational and vibrational entropy respectively, it is better to
evaluate them separately. Fortunately, the cross effect between the configurational and
vibrational effect on the free energy is small, for that the difference in the vibrational free
energy calculated on 10 different atomic configurations of the same alloy has been found to
be less than 0.1%. Therefore, two types of TI simulations were performed to evaluate the
configurational and vibrational free energy separately. In the simulation of configurational
29

entropy, the vibrations of atoms were switched off. 2 million MC iterations was used in this
type of simulations, which is long enough to obtain a converged estimation of the free energy.
For the vibrational entropy simulations, the atom swapping was turned off. This type of
simulations requires 10 million MC iterations to get a converged value of free energy. The
stiffness constant K of the Einstein crystal was set to 2 eV/A2 for all simulations. Periodic
boundary condition was assumed in all MC simulations.
3.3 VACANCY DIFFUSION IN α-Al2O3
3.3.1 Density functional theory simulations
Density functional theory [92, 93] is a modelling method which is used to investigate the
ground state properties of a many electron system. Using electron density as the variable
which uniquely determines the energy of the system, Kohn et al [92, 93] prove that a many-
electron Schrodinger equation can be reduce to a set of effective single-electron equations,
i.e. the famous Kohn-Sham equations,
− h2
2m∇2 + vext(~r) + e2
∫n(~r′)
|~r − ~r′|d~r′ + vXC[n(~r)]
φi(~r) = εiφi(~r) (3.40)
with
n(~r) =∑i
|φi(~r)|2 (3.41)
where φi(~r) is the effective single-electron wave function of the i-th electron, n(~r) is the
electron density, vext(~r) is the external potential, e.g. Coulomb potential between nuclei
and electrons, at position ~r, and vXC[n(~r)] = δEXC[n(~r)]/δn(~r) is the exchange-correlation
potential, which describes the exchange energy of electrons caused by the Pauli exclusion
principle and the energy difference, i.e. the correlation energy, between a set of interacting
and non-interacting electrons. It is noteworthy that the term e2∫ n(~r′)|~r−~r′|d~r
′, which describes
the interaction between electrons, is also implicitly depends on the effective single-electron
wave functions. Therefore, these equations have to be solved in a self-consistent way.
30
To solve Kohn-Sham equation numerically, it is necessary to discretize it into a matrix
equation. This is done by choosing a set of basis functions so that the wave function and
the Hamiltonian are represented by vectors and matrices in the linear space spanned by
these basis functions. There are three types of basis functions commonly used in DFT
simulations [127], namely, localized orbitals, plane waves and augmented functions. For
crystals, which are translationally invariant, plane waves are the natural choice. Using
plane-wave basis-set, all the components of the wave function and Hamiltonian can be easily
calculated by fast Fourier transformation. Then the Kohn-Sham equation is solved in the
Fourier space. In most plane-wave basis-set DFT codes, the number of plane waves used
in one calculation is determined by an energy cutoff Ecut =h2G2
cut
2m, where m is the mass of
electron and Gcut is the length of the largest wave vector of the plane wave. This energy
cutoff needs to be large enough to obtain accurate results of energy and wave functions.
With an appropriate energy cutoff, the ground state energy of a many-electron system can
be calculated once the external potential and the exchange-correlation potential are known.
The most trivial form of the external potential is simply the summation of Coulomb
potential centered on each nucleus. In this case all electrons in the system were treated
explicitly. However, most properties of materials are determined by the valence electrons,
while the core electrons are in most cases chemically inert. Therefore, it is reasonable to
approximate the nucleus together with the core electrons of an atom as an ionic core and
use an effective potential (pseudopotential) to describe the interaction between the core and
valence electrons. In this way, the number of single-electron wave function that needs to
be solved in a system can be largely reduced. Moreover, the orthonormality between the
wave functions of core and valence electrons causes wiggles in the wave function of valence
electrons near the core region. Using pseudopotential smooths out the wiggles and reduces
the number of plane waves required to expand the wave function. Therefore, pseudopo-
tentials are largely used in plane-wave basis-set DFT codes to accelerate the calculations.
Three types of pseudopotentials were commonly used in plane-wave basis-set DFT calcu-
lations, i.e. norm-conserving pseudopotential (NCPP) [128, 129], ultrasoft pseudopotential
(USPP) [130, 131, 132] and projector augmented wave method (PAW) [133, 134]. Both
three pseudopotentials can provide accurate predictions of materials properties once they
31
have been carefully tuned [134, 135]. However, USPP are the fastest for that its energy
cutoff is only a third to a half of the energy cutoff of other pseudopotentials, while PAW
method provide the most accurate predictions in systems with strong magnetic moments
or large difference in electronegativity. So a suitable pseudopotential needs to be chosen to
balance the computational cost and accuracy.
The only term that is unknown in the Kohn-Sham equation is the exchange-correlation
potential. Though the exact exchange energy between the electrons can be calculated from
the exchange term in Hartree-Fock theory, i.e.
EX [n] = −1
2
∑i,j
∫φ∗i (~r)φ
∗j(~r′)φj(~r)φi(~r
′)
|~r − ~r′|d~rd~r′ (3.42)
the exact form of correlation energy remains unknown. Even for the exchange energy in
Eq. 3.42, the form of its variation with respect to the electron density n is too complicated
to be implemented in an efficient way. Therefore, several approximations have been proposed
to provide a simple but reasonably accurate description of the exchange-correlation energy.
The first level approximation is the local density approximation (LDA), which approximates
the exchange energy by
ELDAX [n] = −3
4
(3
π
) 13∫n(~r
43 )d~r (3.43)
and parametrizes the correlation energy from quantum Monte Carlo simulations [136]. Be-
ing a rough approximation, the cohesive energy of molecules and crystals are usually over-
estimated by 10%-20% in LDA. However, LDA provides surprisingly accurate prediction of
lattice parameters and bond lengths (within 1%) [137]. The generalized gradient approxima-
tion (GGA) take one step further to add the dependence of the gradient of electron density
into the exchange-correlation functional. Several forms of GGA has been proposed such
as Becke-Lee-Yang-Parr (BLYP) [138, 139], Perdew-Wang 1991 (PW91) [140] and Perdew-
Burke-Ernzerhof (PBE) [124]. These exchange-correlation functionals provide more accurate
predictions of cohesive energy compared to LDA. However, the lattice parameters are usually
overestimated by GGA [141]. Moreover, both LDA and GGA severely underestimates the
band gap of semiconductors and insulators. This band gap problem in DFT calculations is
largely due to the self-interaction error (SIE) [19, 142, 143] which arises from the factor that
32

the Coulomb interaction of an electron with itself is not totally cancelled by the approximated
exchange-correlation energy in the Kohn-Sham Hamiltonian. There is no universal scheme
to completely correct SIE in DFT currently. However, it is found that SIE in Hartree-Fock
exchange energy and LDA/GGA exchange-correlation energy have opposite behaviors [142].
Therefore it is expected that the band gap prediction from DFT can be improved due to
the SIE cancellation if Hartree-Fock exchange energy and LDA/GGA exchange-correlation
energy are mixed. This leads to the hybrid functional such as PBE0 [144] and Heyd-Scuseria-
Ernzerhof (HSE) [145]. In these functionals, the mixing coefficients are either predefined
or fitted to experimental results. Hybrid functionals can partially improve the prediction
of band gap [146], but are much more expensive than calculations using LDA and GGA.
Therefore, just like pseudopotentials, a trade off between computational cost and accuracy
has to be made when choosing exchange-correlation functional.
In this work, the plane-wave basis-set pseudopotential DFT calculations have been per-
formed on VASP [121, 122] to investigate the charge effect on the vacancy migration energy
in α-Al2O3. The PAW method [123] and PBE exchange-correlation functional were used
in all calculations. The energy cutoff was set to 500 eV and the Monkhorst-Pack k-point
mesh [125] with a density of 3×3×2 was used for k-space integration. All the crystal struc-
tures were optimized under constant-volume restriction until the Hellman-Feynman force
exerted on each ion is less than 0.01 eV/A.
3.3.2 Evaluation of vacancy formation energy
The vacancy formation energy ∆Ef is calculated by
∆Ef = Eqv − Eperf + µi + qµe (3.44)
where Eqv and Eperf are the energies of the simulation cell with and without a vacancy whose
charge is q, µi (i=Al or O) is the chemical potential of Al or O and µe is the chemical
potential of electrons. µe can be defined as a Fermi level εF relative to the valence-band
maximum (VBM) of the perfect crystal, i.e. µe = EperfV BM + εF . According to this definition,
33

the type of majority charge carriers in Al2O3 can be characterized by εF . If εF is close to
zero, then Al2O3 is p-type. On the contrary, if εF is close to the conduction-band minimum
(CBM), then Al2O3 is n-type .
The vacancies investigated in this work are oxygen vacancies with a charge of 0 (V 0O), +1
(V 1+O ) and +2 (V 2+
O ) and aluminum vacancies with a charge of 0 (V 0Al), −1 (V 1−
Al ), −2 (V 2−Al )
and −3 (V 3−Al ). These vacancies in different charge states were modelled by changing the total
number of electrons in the simulation cell. The calculations of charged defects with periodic
boundary condition introduces a spurious interaction between the defect and its periodic
copies. Hence a correction of the defect-defect interaction is needed. Here, this spurious
interaction has been corrected by using the scheme proposed by Makov and Payne [147] and
Neugebauer et al [148]. The finite size errors estimated in this study are 0.72 eV for V 2+O
and 1.63 eV for V 3−Al . These values are found to be within the 0.2 eV uncertainty range, as
compared to the predictions from improved fitting method for finite size corrections. In the
hexagonal structure, the dielectric constant of alumina varies in the direction perpendicular
(9.5) and parallel (11.6) to c axis [149]. Therefore, an average value of 10.6 is used to estimate
the correction.
The chemical potential of Al and O has been determined following the method suggested
by Finnis et al [150]. The chemical potential of oxygen µO at temperature T and oxygen
partial pressure pO2 is
µO = µ0O + ∆µO(T ) +
kBT
2lnpO2
p0(3.45)
where µ0O is the chemical potential of oxygen at a standard state with temperature T 0=298.15
K and pressure p0=1 atm. and ∆µO(T ) is the chemical potential difference of oxygen be-
tween temperature T and T 0 at the standard pressure p0. The latter can be obtained from
thermodynamic tables [151], while the former can be determined by a combination of DFT
and experimental results. For the reaction 2Al + 32O2 = Al2O3, the standard Gibbs free
energy change is
∆G0Al2O3
= µ0Al2O3
− 2µ0Al − 3µ0
O (3.46)
where µ0Al2O3
and µ0Al are the chemical potential of Al2O3 and Al at standard state respec-
tively. For a solid, the Gibbs free energy change is small between 0 K and 298.15 K [150].
Therefore, µ0Al2O3
and µ0Al can be approximated by the energy at 0 K from DFT calculations.
34

Meanwhile, ∆G0Al2O3
can be obtained from thermodynamic tables [151]. So the chemical
potential of oxygen at standard state is calculated by
µ0O =
1
3
(EAl2O3 − 2EAl −∆G0
Al2O3
)(3.47)
where EAl2O3 and EAl are the energy of Al2O3 and Al which are again from DFT calculations.
With Eq. 3.46 and 3.47, the chemical potential of oxygen can be determined. Then at
equilibrium condition, the chemical potential of aluminum is calculated by µAl = 12(µAl2O3 −
3µO) with µAl2O3 approximated by EAl2O3 .
The Fermi energy εF of intrinsic Al2O3 can be determined by enforcing the charge of
the whole crystal to be zero. For a certain εF , the formation energy of each vacancy can be
determined by Eq. 3.44. Then the net charge introduced by all the vacancies is
Qvac(εF ) =∑i
qiNi exp
(−
∆Eif (εF )
kBT
)(3.48)
where qi and Ni are the charge and number of possible sites of defect i (i=V 0O, V 1+
O , V 2+O ,
V 0Al, V
1−Al , V 2−
Al , V 3−Al ). Meanwhile, εF also determines the number of electrons in conduction
band and holes in valence band. The net charge of electrons and holes is calculated by
Qeh(εF ) =
∫ εF
−∞[1− f(E; εF , T )]g(E)dE −
∫ ∞εF
f(E; εF , T )g(E)dE (3.49)
where f(E; εF , T ) = 1/[1 + exp
(−E−εF
T
)]is the Fermi-Dirac distribution and g(E) is the
density of states of electrons in Al2O3. Then the total charge in Al2O3 can be determined
at a specific εF by Qtot(εF ) = Qvac(εF ) +Qeh(εF ). The intrinsic crystal should be electrically
neutral, so the Fermi energy εF is determined by solving the equation Qtot(εF ) = 0.
35

3.3.3 Calculations of vacancy migration energy
The migration energy of vacancies was calculated using the nudged elastic band (NEB)
method [152]. The ideal of NEB method is based on the concept of potential energy surface
(PES). PES is a hypersurface in 3N -dimensional space (N is the number of atoms) defined by
y = E(~R). Here ~R is a vector in the 3N -dimensional whose components are the coordinates
of atoms. On the PES, each stable structure corresponds to a local minimum, and the path
from local minimum A to local minimum B with the lowest energy is called the minimum
energy path (MEP) between A and B. The point with the highest energy on a MEP is called
the saddle point. The structure corresponds to the saddle point is the transition state, which
determines the rate for the system transiting between A and B. NEB method is designed
to find the MEP between two fixed local minima. At first step, several images are created
to represent an initial guess of the MEP. Linear interpolation is commonly used to generate
these images. Then, the force defined by ~F = −∇~RE(~R) was calculated for each image.
Next, the force is decomposed into two components, i.e. one parallel ~F‖ and the other
perpendicular ~F⊥ to the tangent direction ~τi defined by
~τi =~Ri − ~Ri−1∣∣∣~Ri − ~Ri−1
∣∣∣ +~Ri+1 − ~Ri∣∣∣~Ri+1 − ~Ri
∣∣∣ , (3.50)
where ~Ri is the position of the i-th image. After this, the force exerted on the i-th image is
replaced by
~FNEB = ~F⊥ + k(∣∣∣~Ri+1 − ~Ri
∣∣∣− ∣∣∣~Ri − ~Ri−1
∣∣∣)~τi (3.51)
The second term on the right hand side is a spring force with stiffness k which tries to keep
the distances between any two neighboring images equal. This force prevents all the images
from falling into one of the two local minima. Then the MEP is obtained by minimizing
~FNEB for each image.
The original NEB method provides an efficient way to calculate the MEP. However, a
rigorous convergence to a transition state cannot be obtained for that there is no guarantee
that one of the images will fall onto the saddle point. This can be solved by a simple
modification called climb image NEB (CI-NEB) [152]. In CI-NEB, the NEB force ~FNEB was
ignored on the image with the highest energy after several iterations. Instead, the parallel
36

component ~F‖ was inverted in direction and minimized so that the image climbs to the saddle
point. With this modification, both the MEP and transition state between two structures
can be obtained at the same time.
In this work, CI-NEB method with 5 images (including two local minima) was used to
search for MEP and transition state of vacancy migration in α-Al2O3. The force exerted on
each image is minimized to be less than 0.05 eV/A. The migration energy is calculated by
the energy difference between the transition state and the vacancy state.
37
4.0 RESULTS AND DISCUSSIONS: ENTROPY OF HIGH ENTROPY
ALLOYS
4.1 MEAM POTENTIAL FOR Al-Co-Cr-Fe-Ni ALLOY SYSTEM
The parameters of the MEAM potential for Al-Co-Cr-Fe-Ni alloy system used in this work
are given in the appendix. The comparison between the MEAM and DFT predictions of the
formation enthalpy and lattice parameter of ordered AB (B2) alloy for all element pairs are
given in Table 4.1 as an example. The same comparison for AB (L10), AB3 (L12) and A3B
(L12) phase are shown in the appendix. The difference in enthalpy of formation predicted
by MEAM and DFT are in most cases less than 0.03 eV/atom. More importantly, the sign
of the formation enthalpy, which indicates the stability of B2 phase, was correctly predict in
all cases. In addition, the discrepancies in the predicted lattice parameter between MEAM
and DFT are all less than 3%. This consistency between MEAM and DFT predictions shows
that this potential can provide reasonable description of the properties of binary alloys.
38
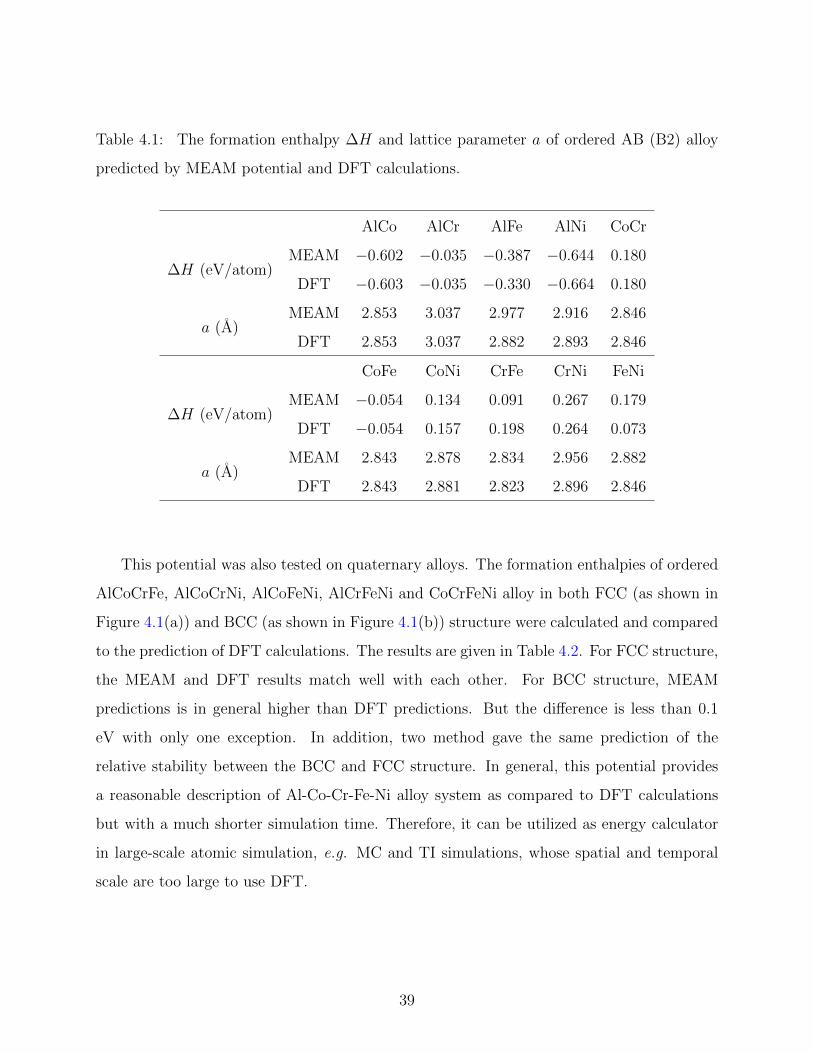
Table 4.1: The formation enthalpy ∆H and lattice parameter a of ordered AB (B2) alloy
predicted by MEAM potential and DFT calculations.
AlCo AlCr AlFe AlNi CoCr
∆H (eV/atom)MEAM −0.602 −0.035 −0.387 −0.644 0.180
DFT −0.603 −0.035 −0.330 −0.664 0.180
a (A)MEAM 2.853 3.037 2.977 2.916 2.846
DFT 2.853 3.037 2.882 2.893 2.846
CoFe CoNi CrFe CrNi FeNi
∆H (eV/atom)MEAM −0.054 0.134 0.091 0.267 0.179
DFT −0.054 0.157 0.198 0.264 0.073
a (A)MEAM 2.843 2.878 2.834 2.956 2.882
DFT 2.843 2.881 2.823 2.896 2.846
This potential was also tested on quaternary alloys. The formation enthalpies of ordered
AlCoCrFe, AlCoCrNi, AlCoFeNi, AlCrFeNi and CoCrFeNi alloy in both FCC (as shown in
Figure 4.1(a)) and BCC (as shown in Figure 4.1(b)) structure were calculated and compared
to the prediction of DFT calculations. The results are given in Table 4.2. For FCC structure,
the MEAM and DFT results match well with each other. For BCC structure, MEAM
predictions is in general higher than DFT predictions. But the difference is less than 0.1
eV with only one exception. In addition, two method gave the same prediction of the
relative stability between the BCC and FCC structure. In general, this potential provides
a reasonable description of Al-Co-Cr-Fe-Ni alloy system as compared to DFT calculations
but with a much shorter simulation time. Therefore, it can be utilized as energy calculator
in large-scale atomic simulation, e.g. MC and TI simulations, whose spatial and temporal
scale are too large to use DFT.
39

Figure 4.1: (a) The unit cell of FCC AlCoCrFe alloy and (b) the 2× 2× 2 spuercell of BCC
CoCrFeNi alloy with ordered arrangement of atoms used for potential developing.
Table 4.2: The formation enthalpy (in eV/atom) of ordered AlCoCrFe, AlCoCrNi, Al-
CoFeNi, AlCrFeNi and CoCrFeNi alloy in both BCC and FCC structure predicted by MEAM
potential and DFT calculations.
AlCoCrFe AlCoCrNi AlCoFeNi AlCrFeNi CoCrFeNi
FCCMEAM −0.088 −0.168 −0.227 −0.053 −0.011
DFT −0.016 −0.122 −0.256 −0.063 0.066
BCCMEAM 0.100 0.064 −0.112 0.148 0.205
DFT 0.001 −0.018 −0.147 −0.019 0.156
40

4.2 ENTROPY AND ENTHALPY OF AlXCoCrFeNi ALLOYS
The entropy and enthalpy of AlxCoCrFeNi alloys were evaluated by the combination of MC
and TI simulations. The lattice parameter of AlxCoCrFeNi alloys was determined at each
x by enforcing the averaged pressure of the modelled alloy to be zero. In this case, the
enthalpy and the Gibbs free energy are equal to the internal energy and the free energy of
the alloy respectively. The sampled values of x and the equilibrium lattice parameters were
given in Table 4.3. It shows that the Al addition increased the lattice parameter of FCC
phase by 5.4%, but has a much smaller effect on the lattice parameter of BCC phase, i.e.
less than 1.3%.
Table 4.3: The lattice parameter (in A) of AlxCoCrFeNi alloys in both FCC and BCC
phase. The mole fraction of Al is calculated by cAl = x/(x+ 4).
x 0.000 0.100 0.200 0.300 0.400 0.500 1.000 1.200
cAl 0.000 0.024 0.048 0.070 0.091 0.111 0.200 0.231
FCC 3.621 3.621 3.622 3.632 3.633 3.639 3.661 3.665
BCC 2.916 2.913 2.908 2.904 2.889 2.892 2.893 2.896
x 1.300 1.400 1.500 1.600 1.700 2.000 2.500 4.000
cAl 0.245 0.259 0.273 0.286 0.298 0.333 0.385 0.500
FCC 3.675 3.678 3.688 3.689 3.699 3.726 3.760 3.830
BCC 2.897 2.899 2.900 2.901 2.902 2.906 2.913 2.956
The configurational and vibrational entropy are given in Figure 4.2(a) and 4.2(b) sepa-
rately. The configurational entropy of all the alloys is always less than the entropy of ideal
solution. So none of the AlxCoCrFeNi alloys is an ideal solution. The configurational en-
tropy of CoCrFeNi alloy in FCC phase is 1.301 R, which is only slightly lower than the
1.386 R of the ideal solution. This indicates that the FCC CoCrFeNi alloy is a near ideal
solution, which is consistent with the experiments finding that chemical LRO is absent in
this alloy [9]. However, with the addition of Al, the configurational entropy of FCC phase
41
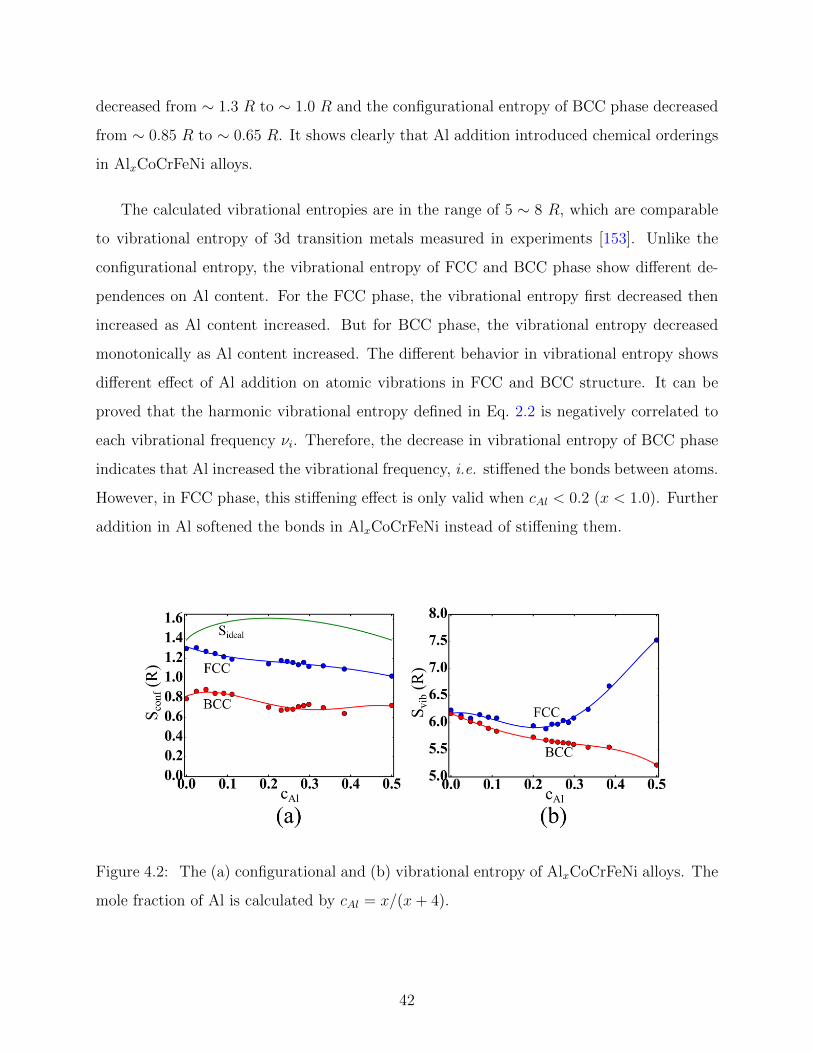
decreased from ∼ 1.3 R to ∼ 1.0 R and the configurational entropy of BCC phase decreased
from ∼ 0.85 R to ∼ 0.65 R. It shows clearly that Al addition introduced chemical orderings
in AlxCoCrFeNi alloys.
The calculated vibrational entropies are in the range of 5 ∼ 8 R, which are comparable
to vibrational entropy of 3d transition metals measured in experiments [153]. Unlike the
configurational entropy, the vibrational entropy of FCC and BCC phase show different de-
pendences on Al content. For the FCC phase, the vibrational entropy first decreased then
increased as Al content increased. But for BCC phase, the vibrational entropy decreased
monotonically as Al content increased. The different behavior in vibrational entropy shows
different effect of Al addition on atomic vibrations in FCC and BCC structure. It can be
proved that the harmonic vibrational entropy defined in Eq. 2.2 is negatively correlated to
each vibrational frequency νi. Therefore, the decrease in vibrational entropy of BCC phase
indicates that Al increased the vibrational frequency, i.e. stiffened the bonds between atoms.
However, in FCC phase, this stiffening effect is only valid when cAl < 0.2 (x < 1.0). Further
addition in Al softened the bonds in AlxCoCrFeNi instead of stiffening them.
Figure 4.2: The (a) configurational and (b) vibrational entropy of AlxCoCrFeNi alloys. The
mole fraction of Al is calculated by cAl = x/(x+ 4).
42

Figure 4.3: (a) The configurational enthalpy of mixing and (b) the vibrational enthalpy of
AlxCoCrFeNi alloys. The mole fraction of Al is calculated by cAl = x/(x+ 4).
Both the configurational and vibrational entropy of FCC phase are greater than that of
BCC phase. Thus the entropy of AlxCoCrFeNi alloys tends to stabilize the FCC phase. The
enthalpy, however, has a different effect. Figure 4.3 shows that the configurational enthalpy
of mixing and the vibrational enthalpy of AlxCoCrFeNi alloys. The configurational enthalpy
of mixing reduced as Al content increased. The reducing effect is much stronger in BCC
phase so that the BCC phase is stabilized at Al-rich end. For the vibrational part, the
enthalpy of BCC phase is always lower than that of FCC phase by ∼ 0.1 eV. It seems that
the thermal motion of atoms destabilizes a close-packed structure, such as FCC structure,
more than an open structure, such as BCC structure.
43
4.3 FCC TO BCC PHASE TRANSITION OF AlXCoCrFeNi ALLOYS
With the calculated enthalpy and entropy, the FCC to BCC phase transition in AlxCoCrFeNi
alloys has been investigated. An excess free energy of AlxCoCrFeNi alloys was defined as
suggested in Ref. [12], i.e.
∆G = G(cAl)− (1− 2cAl)GFCC(0)− 2cAlG
BCC(0.5) (4.1)
where cAl is the mole fraction of Al, and GFCC(0) and GBCC(0.5) are the free energy of FCC
CoCrFeNi alloy and BCC Al4.0CoCrFeNi alloy respectively. The curve of this excess free
energy for AlxCoCrFeNi alloys in both BCC and FCC phases were plotted in Figure 4.4, and
the common tangent was used to determine the boundary of the FCC-BCC duplex region in
which FCC and BCC are in equilibrium with each other. In the case shown in Figure 4.4(a),
only the configurational effect was considered. The FCC-BCC duplex region was found to
be between x = 0.36 and x = 2.11. This range is similar to what has been found in DFT [12]
and CALPHAD [13] calculations, whose lower bound is close to, but the upper bound is
much higher than the experimental value [14]. However, in the case shown in Figure 4.4(b),
the vibrational effect has been added in. The boundary of the FCC-BCC duplex region
becomes x = 0.21 and x = 1.08. The upper boundary is largely reduced and is much closer
to the experimental value of 0.7. This shows that the vibrational effect is important to
determining the relative phase stability of AlxCoCrFeNi and cannot be ignored.
44

Figure 4.4: The excess free energy (a) with configurational effect and (b) with both config-
urational and vibrational effect of AlxCoCrFeNi alloys. The mole fraction of Al is calculated
by cAl = x/(x+ 4).
This dramatic change in the upper boundary of the FCC-BCC duplex region is a re-
sult of the destabilization of FCC phase caused by the atomic vibration. As discussed in
section 4.2, FCC phase is stabilized by the vibrational entropy but destabilized by the vi-
brational enthalpy. In the interested FCC-BCC duplex region (0 < x < 2), the vibrational
entropy of FCC phase is in general greater than that of BCC phase by ∼ 0.3 R. At 1373
K, this difference downshifted the free energy curve of FCC phase by ∼ 0.03 eV. However,
the vibrational enthalpy of FCC is in general greater than that of BCC phase by ∼ 0.1 eV.
Therefore, the net effect of vibration is to upshift the free energy curve of FCC phase by
∼ 0.06 eV, which moves the upper boundary from x = 2.11 to x = 1.08.
It has been mentioned in section 4.1 that the prediction of quaternary BCC alloys from
the MEAM potential is higher than the prediction from DFT calculations. Moreover, two
phases have been found in the BCC model as discussed in section 4.4. The interface between
these two phases may not be fully relaxed due to the limited size of the simulation cell.
Therefore, it is expected that the free energy of real BCC alloys should be lower than the
value presented in Figure 4.4, which may further decrease the upper boundary of the FCC-
BCC duplex region. These errors will quantitatively change the compositional boundary of
the FCC-BCC duplex region. However, the qualitative picture that FCC is stable at low Al
45

concentration, and BCC is stable at high Al concentration will not be changed. These results
show that the FCC to BCC phase transition caused by Al addition is mainly controlled by
the configurational enthalpy and entropy. But the non-configurational enthalpy and entropy
also have an important effect on the compositional boundary of the FCC-BCC duplex region.
4.4 ORDERING EFFECT IN AlXCoCrFeNi ALLOYS
As mentioned in section 2.1.2, atomic ordering can be used to validate the entropy evaluation
scheme developed in this study. Therefore, the atomic ordering effect in AlxCoCrFeNi alloys
has been investigated and compared them to experiments. The ordering effects in four
example alloys have been investigated, namely, FCC Al0.1CoCrFeNi alloy for FCC region,
BCC Al2.0CoCrFeNi alloy for BCC region, and FCC Al0.3CoCrFeNi and BCC Al1.0CoCrFeNi
alloy for the FCC-BCC duplex region. These four alloys can all be found in experiments.
The simulated XRD pattern of these four alloys are given in Figure 4.5. These patterns are
calculated by assuming the atomic structure of the alloys to be the periodic repetition of
the equilibrium supercell obtained by MC simulations. The full width at half maximum was
set to 0.1 for each peak. The XRD pattern of Ni, Cr and ordered AlNi3 (L12) and AlCo
(B2) alloy are given as references. It is clear that no L12 type LRO can be detected in FCC
alloys of Al0.1CoCrFeNi and Al0.3CoCrFeNi, while a B2 type ordering exists in BCC alloys of
Al1.0CoCrFeNi and Al2.0CoCrFeNi. This is consistent with experiments that AlxCoCrFeNi
alloys in FCC phase are solid solutions while AlNi enriched B2 precipitates are found in BCC
phase [10, 24, 11]. In addition, the equilibrium atomic structure of FCC Al0.1CoCrFeNi and
BCC Al1.0CoCrFeNi alloy are given in Figure 4.6. Similar to the XRD pattern, no LRO
can be seen in the atomic structure of FCC Al0.1CoCrFeNi alloy. However, the ordered B2
structure with Al and Fe on one sublattice and Ni and Co on the other is dominating in the
atomic structure of BCC Al1.0CoCrFeNi alloy. Besides, a Cr and Fe enriched phase can also
be seen in Figure 4.6(b), which is also consistent with experiments [24, 37].
46

Figure 4.5: The simulated XRD pattern of FCC Al0.1CoCrFeNi, FCC Al0.3CoCrFeNi, BCC
Al1.0CoCrFeNi and BCC Al2.0CoCrFeNi alloy. The simulated XRD pattern of Ni, Cr, AlNi3
(L12) and AlCo (B2) are given as references.
Figure 4.6: The equilibrium atomic structure of (a) FCC Al0.1CoCrFeNi and (b) BCC
Al1.0CoCrFeNi alloy. For the visualization purpose, the structures without thermal motion
are given here.
47
The B2 phase in stable BCC AlxCoCrFeNi (x ≥ 1.0) alloy was investigated by checking
the element distribution in the 1NN and 2NN sites of Al. Figure 4.7 shows the average
occupation possibility of each element in the 1NN sites of Al as a function of Al content. It
shows that the 1NN sites of Al in Al1.0CoCrFeNi alloy were occupied by Ni (∼ 55%) and Co
(∼ 45%), while the 2NN sites were occupied by Al (∼ 60%) and Fe (∼ 40%). This agrees
with the experimental finding that the atomic structure of this B2 phase is that Al and Fe on
one sublattice and Ni and Co on the other. [37, 54] Clearly, this partially ordered structure
explains the low configurational entropy of BCC AlxCoCrFeNi alloys. With the increasing of
Al content, Fe moved from the 2NN site to the 1NN site of Al. Then in Al4.0CoCrFeNi alloy,
the Cr-Fe enriched phase was absorbed into the B2 phase, and a B2 type structure with Al
on one sublattice and Co, Cr, Fe and Ni on the other is formed. This trend is consistent
with the phase diagram and calculated enthalpy of formation of B2 phase for Al-containing
binary alloys. B2 phase can be found in the phase diagram of Al-Ni [52], Al-Co [64] and
Al-Fe [63], while equiatomic Al-Cr alloy separates into Al8Cr5 intermetallic compound and
BCC Cr-Al solid solution at 1373 K [154]. In addition, Table 4.1 shows that the B2 phase of
AlNi and AlCo has large negative enthalpy of formation, while the enthalpy of formation of
AlFe in B2 phase is about a half of that of AlNi and AlCo. On the contrary, the enthalpy of
formation of AlCr alloy in B2 phase is close to 0. Thus when Al added to CoCrFeNi alloy,
Ni and Co were first attracted by Al to form B2 phase, while the left Fe and Cr form BCC
solid solution. With the addition of Al content, all the Ni and Co atoms formed B2 phase
with Al. Then Fe start to form B2 phase with excess Al atoms. Finally, when all the Fe
atoms formed B2 phase with Al, the excess Al atoms start to form bonds with Cr atoms. A
pseudo binary B2 compound is formed between Al and (Co, Cr, Fe, Ni).
Similar Al-induced ordering has also been found in the stable FCC AlxCoCrFeNi (x ≤
0.3) alloy. Figure 4.8 shows the average possibility of a first-nearest-neighboring lattice site
of an atom occupied by a specified element in CoCrFeNi and Al0.3CoCrFeNi alloy in their
equilibrium state. For CoCrFeNi alloy, the near 25% occupancy probability for each element
pair is an indication of near-ideal solution. Meanwhile, the formation of excess Co-Cr and
Ni-Fe nearest-neighboring pairs were also found in Figure 4.8(a), which explains the 0.085
R discrepancy in configurational entropy between CoCrFeNi alloy and ideal solution. This
48
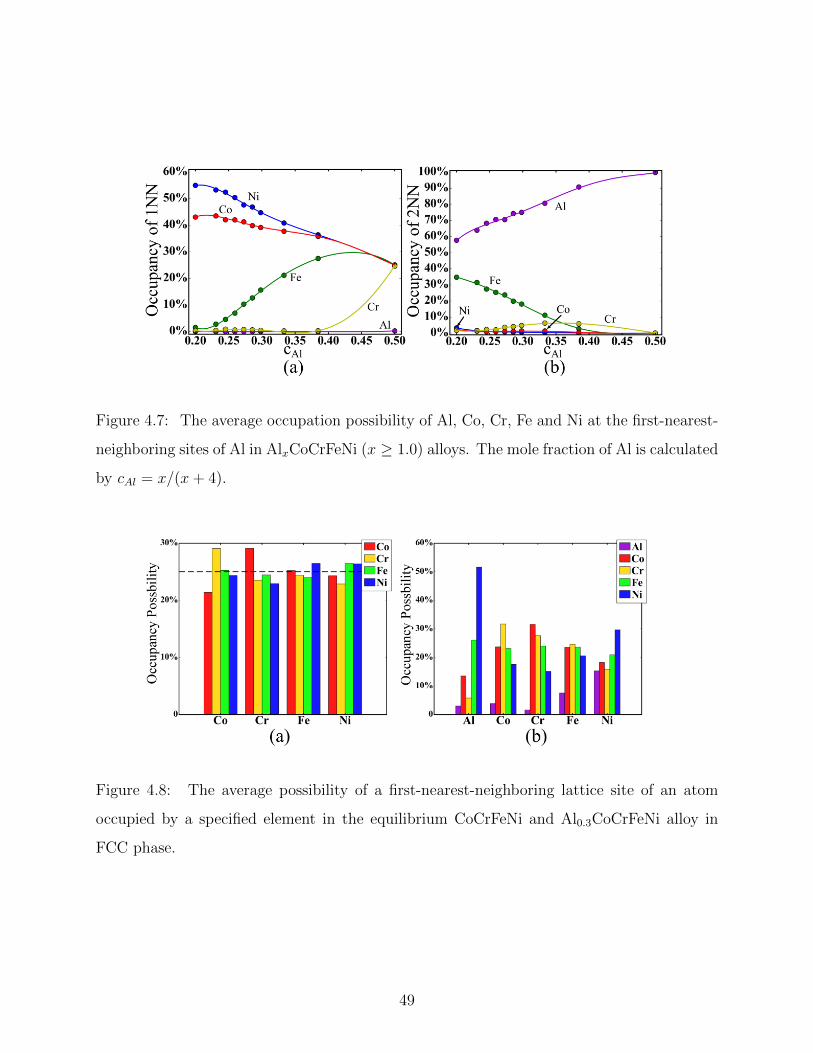
Figure 4.7: The average occupation possibility of Al, Co, Cr, Fe and Ni at the first-nearest-
neighboring sites of Al in AlxCoCrFeNi (x ≥ 1.0) alloys. The mole fraction of Al is calculated
by cAl = x/(x+ 4).
Figure 4.8: The average possibility of a first-nearest-neighboring lattice site of an atom
occupied by a specified element in the equilibrium CoCrFeNi and Al0.3CoCrFeNi alloy in
FCC phase.
49
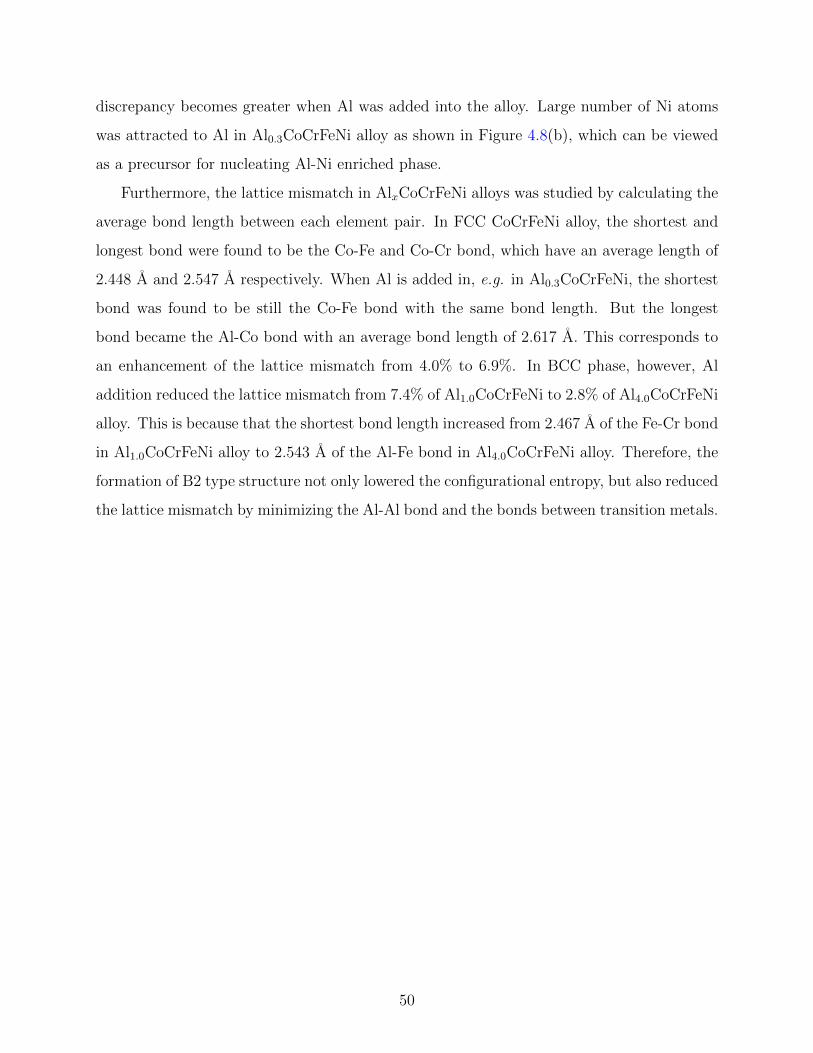
discrepancy becomes greater when Al was added into the alloy. Large number of Ni atoms
was attracted to Al in Al0.3CoCrFeNi alloy as shown in Figure 4.8(b), which can be viewed
as a precursor for nucleating Al-Ni enriched phase.
Furthermore, the lattice mismatch in AlxCoCrFeNi alloys was studied by calculating the
average bond length between each element pair. In FCC CoCrFeNi alloy, the shortest and
longest bond were found to be the Co-Fe and Co-Cr bond, which have an average length of
2.448 A and 2.547 A respectively. When Al is added in, e.g. in Al0.3CoCrFeNi, the shortest
bond was found to be still the Co-Fe bond with the same bond length. But the longest
bond became the Al-Co bond with an average bond length of 2.617 A. This corresponds to
an enhancement of the lattice mismatch from 4.0% to 6.9%. In BCC phase, however, Al
addition reduced the lattice mismatch from 7.4% of Al1.0CoCrFeNi to 2.8% of Al4.0CoCrFeNi
alloy. This is because that the shortest bond length increased from 2.467 A of the Fe-Cr bond
in Al1.0CoCrFeNi alloy to 2.543 A of the Al-Fe bond in Al4.0CoCrFeNi alloy. Therefore, the
formation of B2 type structure not only lowered the configurational entropy, but also reduced
the lattice mismatch by minimizing the Al-Al bond and the bonds between transition metals.
50

5.0 RESULTS AND DISCUSSIONS: VACANCY DIFFUSION IN α-Al2O3
5.1 CRYSTAL STRUCTURE OF α-Al2O3
In α-Al2O3, as shown Figure 5.1, O atoms are arranged in a HCP lattice while Al atoms
occupy 2/3 of the possible octahedral sites. The DFT calculations gave the optimized lat-
tice parameters for the hexagonal unit cell of α-Al2O3 to be a=4.81 A and c=13.31 A, the
optimized internal parameter of Al atoms to be u=0.352, and the optimized internal pa-
rameter of O atoms to be v=0.306. These results are consistent with previous theoretical
predictions [155] and experimental measurements [156].
It has been well-recognized that the energetics of atomic diffusion processes is closely
related to local atomic structures. So the local atomic structures of bulk alumina crystal
has been examined. In bulk α-Al2O3 (shown in Figure 5.2), the O atom lies at the center
of a tetrahedron whose four vertices are Al atoms and the Al atom lies at the center of an
octahedron whose six vertices are occupied by O atoms. It notes that the distance between
the central O (or Al) atoms to their neighboring Al (or O) atoms are not always equal in
alumina crystal. The DFT calculations showed that the half of the Al-O bonds have bond
length of 1.87 A and the other half have slightly longer bond length of 1.99 A in α-Al2O3.
Moreover, the adjacent Al-O bonds form an angle of about 110 around the O atom and
form an angle of about 90 around the Al atom.
51
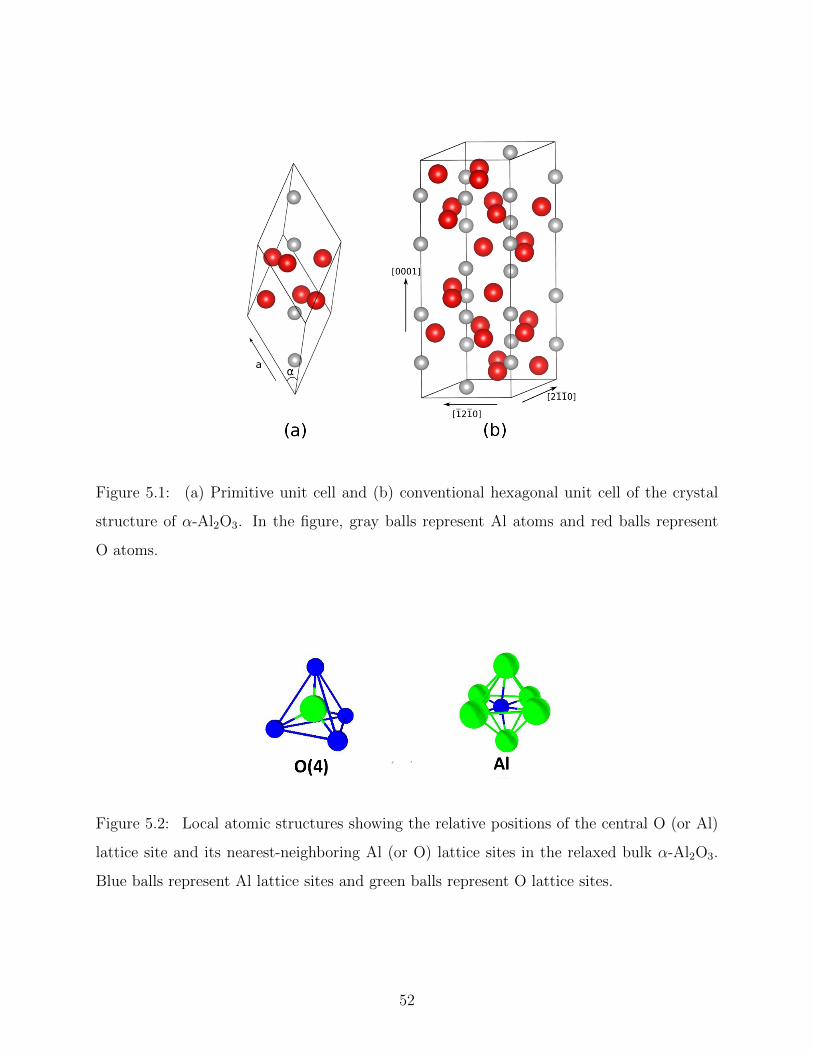
Figure 5.1: (a) Primitive unit cell and (b) conventional hexagonal unit cell of the crystal
structure of α-Al2O3. In the figure, gray balls represent Al atoms and red balls represent
O atoms.
Figure 5.2: Local atomic structures showing the relative positions of the central O (or Al)
lattice site and its nearest-neighboring Al (or O) lattice sites in the relaxed bulk α-Al2O3.
Blue balls represent Al lattice sites and green balls represent O lattice sites.
52
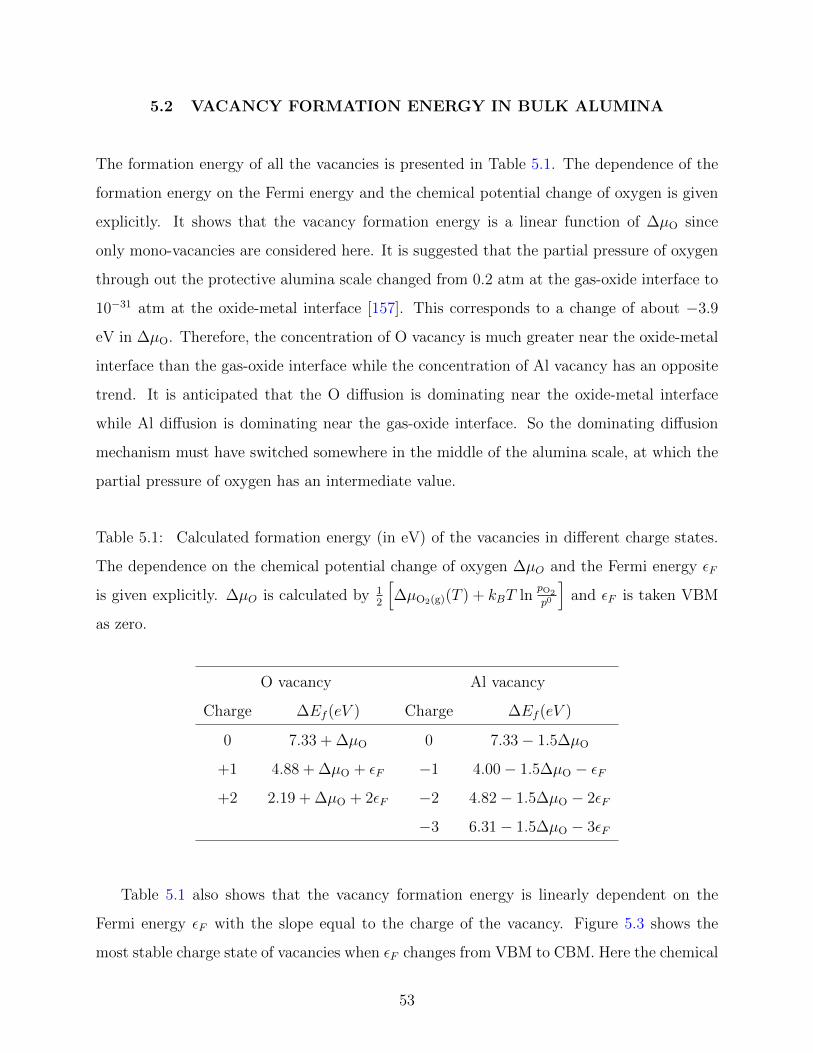
5.2 VACANCY FORMATION ENERGY IN BULK ALUMINA
The formation energy of all the vacancies is presented in Table 5.1. The dependence of the
formation energy on the Fermi energy and the chemical potential change of oxygen is given
explicitly. It shows that the vacancy formation energy is a linear function of ∆µO since
only mono-vacancies are considered here. It is suggested that the partial pressure of oxygen
through out the protective alumina scale changed from 0.2 atm at the gas-oxide interface to
10−31 atm at the oxide-metal interface [157]. This corresponds to a change of about −3.9
eV in ∆µO. Therefore, the concentration of O vacancy is much greater near the oxide-metal
interface than the gas-oxide interface while the concentration of Al vacancy has an opposite
trend. It is anticipated that the O diffusion is dominating near the oxide-metal interface
while Al diffusion is dominating near the gas-oxide interface. So the dominating diffusion
mechanism must have switched somewhere in the middle of the alumina scale, at which the
partial pressure of oxygen has an intermediate value.
Table 5.1: Calculated formation energy (in eV) of the vacancies in different charge states.
The dependence on the chemical potential change of oxygen ∆µO and the Fermi energy εF
is given explicitly. ∆µO is calculated by 12
[∆µO2(g)(T ) + kBT ln
pO2
p0
]and εF is taken VBM
as zero.
O vacancy Al vacancy
Charge ∆Ef (eV ) Charge ∆Ef (eV )
0 7.33 + ∆µO 0 7.33− 1.5∆µO
+1 4.88 + ∆µO + εF −1 4.00− 1.5∆µO − εF+2 2.19 + ∆µO + 2εF −2 4.82− 1.5∆µO − 2εF
−3 6.31− 1.5∆µO − 3εF
Table 5.1 also shows that the vacancy formation energy is linearly dependent on the
Fermi energy εF with the slope equal to the charge of the vacancy. Figure 5.3 shows the
most stable charge state of vacancies when εF changes from VBM to CBM. Here the chemical
53
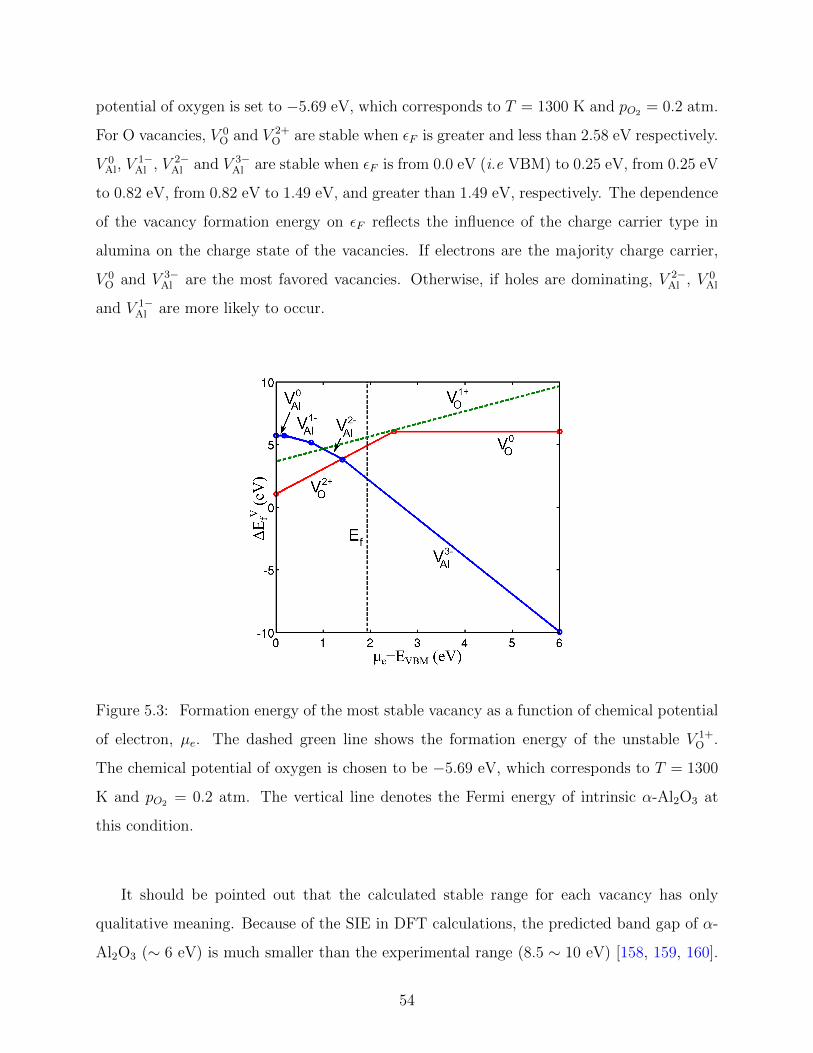
potential of oxygen is set to −5.69 eV, which corresponds to T = 1300 K and pO2 = 0.2 atm.
For O vacancies, V 0O and V 2+
O are stable when εF is greater and less than 2.58 eV respectively.
V 0Al, V
1−Al , V 2−
Al and V 3−Al are stable when εF is from 0.0 eV (i.e VBM) to 0.25 eV, from 0.25 eV
to 0.82 eV, from 0.82 eV to 1.49 eV, and greater than 1.49 eV, respectively. The dependence
of the vacancy formation energy on εF reflects the influence of the charge carrier type in
alumina on the charge state of the vacancies. If electrons are the majority charge carrier,
V 0O and V 3−
Al are the most favored vacancies. Otherwise, if holes are dominating, V 2−Al , V 0
Al
and V 1−Al are more likely to occur.
Figure 5.3: Formation energy of the most stable vacancy as a function of chemical potential
of electron, µe. The dashed green line shows the formation energy of the unstable V 1+O .
The chemical potential of oxygen is chosen to be −5.69 eV, which corresponds to T = 1300
K and pO2 = 0.2 atm. The vertical line denotes the Fermi energy of intrinsic α-Al2O3 at
this condition.
It should be pointed out that the calculated stable range for each vacancy has only
qualitative meaning. Because of the SIE in DFT calculations, the predicted band gap of α-
Al2O3 (∼ 6 eV) is much smaller than the experimental range (8.5 ∼ 10 eV) [158, 159, 160].
54

This large band gap error leads to an underestimation of the position of the defect levels
locating in the band gap. Therefore, the formation energy of V 0O, V 1+
O , V 1−Al , V 2−
Al and V 3−Al is
underestimated for that there are electrons filled in the defect levels of these vacancies (see
section 5.3). It is anticipated that V 2+O is stable in a wider range of εF while the stable range
of V 3−Al is narrower than the reported value.
As mentioned in section 3.3.2, the Fermi energy of intrinsic α-Al2O3 can be determined
at a certain temperature and oxygen partial pressure. At an example condition of T=1300
K and pO2=0.2 atm, the Fermi energy is determined to be 1.93 eV above VBM. Under this
condition, V 3−Al is the most stable Al vacancy with a formation energy of 2.24 eV while the
most stable O vacancy is V 2+O with a formation energy of 4.91 eV.
5.3 MIGRATION ENERGY FOR VACANCY DIFFUSION IN BULK
ALUMINA
Referencing to the equilibrium structure of α-Al2O3 crystal (show in Figure 5.1), Multiple
elementary diffusive jumps have been identified for O and Al atoms to diffuse in bulk alumina
through vacancy-atom exchange mechanism. As shown in Figure 5.4(a), there are two types
of O elementary diffusive jumps (jump O1-O2 and jump O3-O4) in the (0001) plane and two
types of elementary diffusive jumps (jump O1-O3 and jump O1-O4) connecting the two (0001)
planes (i.e. along [0001] direction). All the other long-range diffusive paths for O atom in
alumina can be attained by combining these four elementary jumps. In Figure 5.4(b)-(e),
the minimum energy path (marked in arrows) and transition state (denoted with a red ball)
of O lattice diffusion along the four elementary diffusive jumps were plotted, respectively.
In all the starting and ending positions of the four jumps, the O atom has four nearest
neighboring Al atoms and thus be four-fold coordinated. However, the migrating O atom
would be four-fold coordinated in the transition state of jump O1-O2, three-fold coordinated
in the transition state of jump O1-O3, and two-fold coordinated in the transition state of
jump O1-O4 and O3-O4. Compared to the migration energy in Table 5.2, it appears that
55

Figure 5.4: (a) Schematics of four elementary O diffusive jumps in bulk α-Al2O3 on the
(1210) projection of the crystal lattice. Gray balls represent Al atoms, red balls represent O
atoms, and black arrows delineate various vacancy-O atom exchange. Local atomic structures
of the migrating O atom are depicted in (b) for jump O1-O2, in (c) for jump O1-O3, in (d) for
jump O1-O4 and in (e) for jump O3-O4. In (b)-(e), yellow balls are used to mark the initial
and final positions of the migrating O atom, red balls mark the location of the migrating O
atom in the transition states, red arrows indicate the direction of the diffusive jumps, and
blue balls represent surrounding Al lattice sites.
56
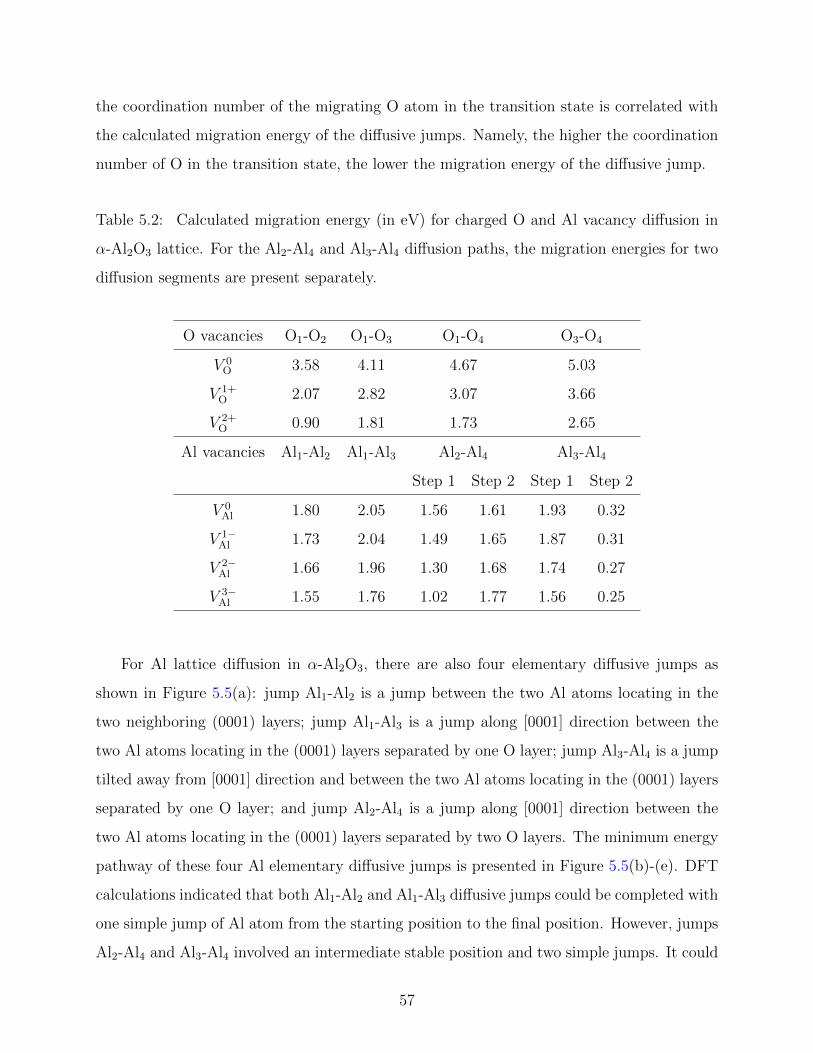
the coordination number of the migrating O atom in the transition state is correlated with
the calculated migration energy of the diffusive jumps. Namely, the higher the coordination
number of O in the transition state, the lower the migration energy of the diffusive jump.
Table 5.2: Calculated migration energy (in eV) for charged O and Al vacancy diffusion in
α-Al2O3 lattice. For the Al2-Al4 and Al3-Al4 diffusion paths, the migration energies for two
diffusion segments are present separately.
O vacancies O1-O2 O1-O3 O1-O4 O3-O4
V 0O 3.58 4.11 4.67 5.03
V 1+O 2.07 2.82 3.07 3.66
V 2+O 0.90 1.81 1.73 2.65
Al vacancies Al1-Al2 Al1-Al3 Al2-Al4 Al3-Al4
Step 1 Step 2 Step 1 Step 2
V 0Al 1.80 2.05 1.56 1.61 1.93 0.32
V 1−Al 1.73 2.04 1.49 1.65 1.87 0.31
V 2−Al 1.66 1.96 1.30 1.68 1.74 0.27
V 3−Al 1.55 1.76 1.02 1.77 1.56 0.25
For Al lattice diffusion in α-Al2O3, there are also four elementary diffusive jumps as
shown in Figure 5.5(a): jump Al1-Al2 is a jump between the two Al atoms locating in the
two neighboring (0001) layers; jump Al1-Al3 is a jump along [0001] direction between the
two Al atoms locating in the (0001) layers separated by one O layer; jump Al3-Al4 is a jump
tilted away from [0001] direction and between the two Al atoms locating in the (0001) layers
separated by one O layer; and jump Al2-Al4 is a jump along [0001] direction between the
two Al atoms locating in the (0001) layers separated by two O layers. The minimum energy
pathway of these four Al elementary diffusive jumps is presented in Figure 5.5(b)-(e). DFT
calculations indicated that both Al1-Al2 and Al1-Al3 diffusive jumps could be completed with
one simple jump of Al atom from the starting position to the final position. However, jumps
Al2-Al4 and Al3-Al4 involved an intermediate stable position and two simple jumps. It could
57

Figure 5.5: (a) Schematics of four elementary Al diffusive jumps in bulk α-Al2O3 on the
(1210) projection of the crystal lattice. In the figure, gray balls represent Al atoms, red balls
represent O atoms, and black arrows delineate various vacancy-Al atom exchange paths.
Local atomic structures of the migrating Al atom are depicted in (b) for jump Al1-Al2, in (c)
for jump Al1-Al3, in (d) for jump Al3-Al4, and in (e) for jump Al2-Al4. In (b)-(e), yellow balls
are used to mark the initial, intermediate (marked with symbol m), and final positions of the
migrating Al atom, red balls mark the location of the migrating Al atom in the transition
states, and red arrows indicate the direction of the diffusive jumps, green balls represent
surrounding O lattice sites. Also, in (d) and (e), the calculated minimum energy path for
the Al atom diffusion through jumps Al3-Al4 and Al2-Al4 have been plotted, respectively.
58

be seen in Figure 5.5(d) and 5.5(e) that there was a locally minimum-energy position (marked
as m) between the two facing triangular facets of the two O octahedrons for the migrating
Al atom to stay. Consequently, it involved two simple jumps (Al3-m (or Al2-m) and m-Al4),
whose transition state was the migrating Al atom lying at the center of the triangular facet of
the O octahedron, to complete these two jumps. The coordination number of the transition
state of jump Al1-Al2 is two, while for all the other jumps, the moving Al atom in transition
state is three-fold coordinated. Unlike O vacancies, the migration energy of Al vacancies in
Table 5.2 shows no dependence on the coordination number of Al in the transition state.
It is worth noting that the migration energy in Table 5.2 shows a clear dependence on
the charge state of vacancies. For the four diffusive paths studied, the average migration
energy for diffusion of V 0O was computed to be 4.35 eV as compared to 1.77 eV for diffusion
V 2+O . Consequently, a significant enhancement (average diffusion migration energy reduced
by 2.58 eV) has been predicted in O vacancy mobility when the charge of the O vacancy
changes from 0 to +2 . The variation of the diffusion migration energy with the charge of
the Al vacancy was found to be relatively small. Compared to the value of 1.55 eV for V 0Al,
the average diffusion migration energy was predicted to decrease by 0.03 eV for V 1−Al , 0.11
eV for V 2−Al , and 0.23 eV for V 3−
Al . Nevertheless, the vacancy diffusion in alumina crystal is
strongly depends on the charge state of the vacancy involved.
This charge dependency can be explained by checking the electronic structure of α-Al2O3.
The valence band of perfect alumina is just the O 2p band near the VBM whereas the con-
duction band is mainly composed of Al 3s and 3p bands. When vacancies are introduced
to alumina, extra defect states could be observed inside the band gap. The defect state
associated to O vacancy was located at 2.41 eV above VBM and composed of the 3s and 3p
orbitals from the nearest-neighboring Al atoms (illustrated in Figure 5.6(a)-(b)). The defect
state associated to Al vacancy was found to posit at 0.58 eV above VBM and composed
of the 2p orbitals from the nearest-neighboring O atoms (illustrated in Figure 5.7(a)-(b)).
Comparing the electronic structures of the O vacancy at its relaxed state (Figure 5.6(a)-
(b)) and its transition state of jump O1-O2 (Figure 5.6(c)-(d)), it is noticed that the energy
level of the defect state shifted up by 1.51 eV at the transition state accompanying to the
spreading of defect electron density from one local Al tetrahedron to the two neighboring Al
59

Figure 5.6: Isosurface (isovalue of 0.015) of electron density and calculated densities of
states (DOS) associated to the defect state of O vacancy in α-Al2O3 at (a), (b) the relaxed
state and (c), (d) the transition state of diffusive path O1-O2. The DOSs of Al, AlI, and AlII
are those from all the six surrounding Al atoms, the two Al atoms adjacent to the relaxed
O vacancy, and the two Al atoms farther away from the relaxed O vacancy.
60
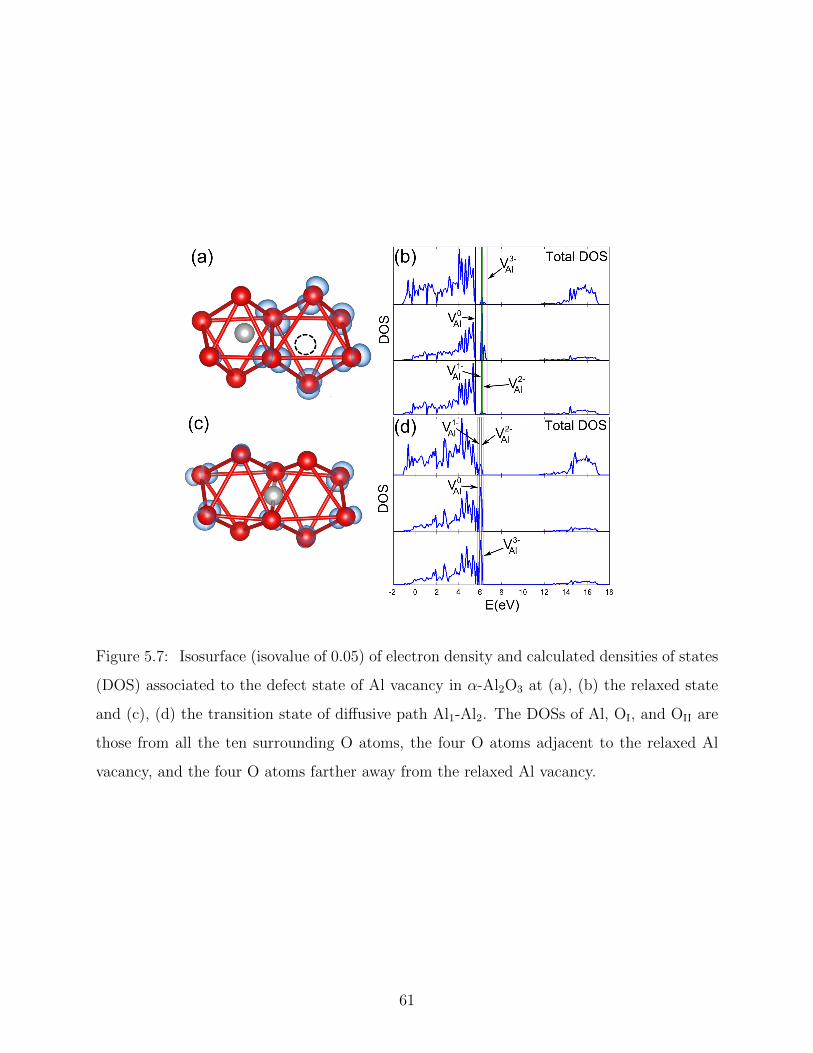
Figure 5.7: Isosurface (isovalue of 0.05) of electron density and calculated densities of states
(DOS) associated to the defect state of Al vacancy in α-Al2O3 at (a), (b) the relaxed state
and (c), (d) the transition state of diffusive path Al1-Al2. The DOSs of Al, OI, and OII are
those from all the ten surrounding O atoms, the four O atoms adjacent to the relaxed Al
vacancy, and the four O atoms farther away from the relaxed Al vacancy.
61

tetrahedrons. Examination of the other O vacancy diffusion paths yields similar results. It
is apparent that the O vacancy diffusion through alumina crystal involves an upshift of the
energy level of the defect state (composted of Al 3s and 3p bands) toward the conduction
band of the crystal. Regarding to Al vacancy diffusion in α-Al2O3, Figure 5.7 shows that
the energy level of the defect state (composted of O 2p band) actually shift down toward
the valence band of the crystal at the transition state in which the defect electron density is
evenly distributed between the two neighboring O octahedrons.
Figure 5.8: The calculated difference in migration energy for (a) O vacancies and (b) Al
vacancies with different charges as a function of the energy shift (∆EV) of the defect state
(with a single electron occupancy) for the corresponding diffusive paths. The dashed lines
shows the theoretical prediction of the migration energy difference calculated by the product
of the electron occupancy difference and the energy shift.
The migration energy for vacancy diffusion can be considered as the sum of the energy
changes of the electrons occupying the valence band of the crystal and those of the electrons
occupying the vacancy defect states in the diffusion process. For O vacancy, the charge
induced relaxation happened mainly on nearest neighbor Al atoms, hence has limited effect
on the valence band which is mainly contributed by O atoms. For Al vacancy, this relaxation
is found to be small. Both of these imply that the energy change related to valence electrons
62

of the crystal could be small. However, the electron occupancy on defect states would vary
greatly with variations of the vacancy charge. For the O vacancy in alumina, the defect state
is unoccupied for V 2+O , singly occupied for V 1+
O and doubly occupied for V 0O (as marked in
Figure 5.6 (b),(d)). For the Al vacancy in alumina, the defect state contains no electron for
V 0Al, one electron for V 1−
Al , two electrons for V 2−Al , and three electrons for V 3−
Al (as marked in
Figure 5.7(b),(d)). Hence, the calculated migration energy difference between the vacancies
with different charges should be approximately equal to a product of the electron occupancy
difference in the defect state and the energy shift of the defect state for the same diffusive
path. In Figure 5.8, the change in diffusion migration energy due the vacancy charge against
the change in defect state energy level during the vacancy diffusion has been plotted. The
dashed lines are the theoretical prediction of the migration energy difference calculated by
the product of the electron occupancy difference and the energy shift. It shows that these
two sets of data agree well with each other. Therefore, it has been uncovered in this study
that the energy shift in the electronic defect state during diffusion is responsible for the
observed charge-dependent vacancy migration energy in alumina.
Just as in the vacancy formation energy, SIE in DFT calculations also causes an error in
the vacancy migration energy. However, this error has not been well understood yet. Indeed,
the position of defect levels in the band gap has been underestimated. But this underesti-
mation occurs both in the electronic structure of the transition state and the vacancy state.
Therefore, it is expected that the error in the vacancy migration energy and the defect level
shift is partially cancelled. In addition, there is another error in the evaluation of the defect
level shift. This error is caused by the artificial dispersion of the defect levels which is a result
of the limited size of the simulation cell [19]. The dispersion causes a trouble in locating
the exact position of the defect levels. This dispersion effect is strong in the defect levels
of Al vacancy. It could partially be the reason of the discrepancy between the calculated
migration energy difference of the Al vacancies in different charge states and the theoretical
prediction in Figure 5.8(b).
However, none of these errors would qualitatively change the picture of that, for most
cases, the migration energy of the charged vacancy is lower than that of the neutral vacancy.
This is because that the energy shift is a result of the charge redistribution around the
63
vacancy site. As discussed in section 2.2.2, defect levels are introduced by the localized
charges which distributed around the vacancy. When vacancy diffuses from one site to
another, these extra charges redistributed. It can be seen in Figure 5.6 and 5.7 that these
extra charges equally distributed near the original site and the destiny site at the transition
state. This will cause a reduction in the depth of the potential well which is localized
near the vacancy site. Therefore, it is anticipated that the defect level of oxygen vacancies
moves up toward CB and the defect levels of aluminum vacancies move down toward VB
during the migration. That is what has been found in most cases. However, this analysis
is only valid if two vacancy sites of a diffusive path are located next to each other. When
an intermediate state exists in the diffusive path such as Al2-Al4 and Al3-Al4, these extra
charges near the vacancy are localized around neither the original site nor the destiny site
in both the intermediate state and the transition state. Therefore, to which band edge
the defect levels will shift during the vacancy migration from the intermediate state to the
transition state is unknown. This explains the exception occurs in the second segment of the
diffusive path Al2-Al4.
64
5.4 KINETIC MONTE CARLO SIMULATION OF DIFFUSIVITY
With the migration energy of individual diffusion paths, the diffusivity of O and Al in
Al2O3 has been determined by performing Kinetic Monte Carlo (KMC) simulations [161].
Vibrational frequencies of both the vacancies and the transition states were used to provide
the rates of each diffusion path. The rate of one diffusion path is determined by the harmonic
approximation, i.e.
r =
∏i νi∏i ν′i
exp
(−∆E
kBT
)(5.1)
where νi and ν ′i are the vibration frequencies of vacancies and transition states respectively,
while ∆E is the migration energy of one single jump. As mentioned in section 5.3, there
are two diffusion paths of Al vacancies, i.e. Al2-Al4 and Al3-Al4, in which an intermediate
stable state exists. An effective diffusion rate was defined for these paths, i.e.
1
reff=
1
r1
+1
r2
(5.2)
where r1 and r2 are the diffusion rate of the first and the second segment of the diffusion
path. The mean square displacements of atoms are used to evaluate the diffusivity in KMC
simulations and this diffusivity is scaled by the equilibrium vacancy concentration to get
the real diffusivity. The diffusivity of O and Al atoms through exchanging with charged
vacancies in Al2O3 crystal in the temperature range of 1300 K to 1800 K were calculated.
Then the relation between the diffusivity and the temperature was fitted to the Arrhenius’
law to obtain the activation energy of diffusion. The activation energy for the O diffusion
through exchanges with V 0O, V 1+
O and V 2+O were predicted to be 11.91 eV, 9.49 eV, and 7.21
eV, respectively. The activation energy for the Al diffusion through exchanges with V 0Al, V
1−Al ,
V 2−Al and V 3−
Al were determined to be 4.76 eV, 3.57 eV, 2.98 eV, and 2.99 eV, respectively.
In addition, the results indicated that the prefactor of the O diffusion through V 2+O had a
smaller value than through other possible charged O vacancies whereas the prefactor of the
Al diffusion through V 3−Al had the largest value among all the possible charged Al vacancies.
In summary, it has been found that V +2O and V 3−
Al vacancies respectively led to the fastest
65

diffusion of O and Al in alumina. In particular, our predicted activation energy (7.21 eV)
and prefactor (3.27 × 10⁻⁴ m2/s) for O diffusion through V 2+O fall well into the range of
experimental values summarized in Ref. [8]
5.5 Hf EFFECT ON Al VACANCY DIFFUSION IN BULK
The charge-dependent vacancy migration energy discussed in section 5.3 shows that the
diffusivity of vacancies in α-Al2O3 can be tuned by changing the charge state of vacancy.
However, the band gap of α-Al2O3 is very large, which makes it hard to change the charge
state of a vacancy. Fortunately, there is another possible way to tune the migration energy
of vacancies, that is, modifying the defect level shift during the vacancy migration.
The interaction between Al vacancy and substitution Hf atoms in bulk has also been
investigated. As Hf is doped in Al2O3, V 3−Al will be introduced to keep the charge neutrality
by following equation [162]
2HfO2 + 4Al0Al ↔ 3Hf1+Al + V 3−
Al + Al2O3 (5.3)
Therefore, the number of Hf1+Al is about 3 times of V 3−
Al . So one V 3−Al has been put at the
nearest neighbor site of Hf1+Al . It is found that the Al vacancy next to Hf1+
Al is still V 3−Al and
the binding energy is −1.70 eV, which indicates a strong binding between these two point
defects. The binding energy is calculated by
∆Eb = EHf1+Al +V 3−Al
+ Eperf − EHf1+Al− EV 3−
Al(5.4)
where EHf1+Al +V 3−Al
, EHf1+Aland EV 3−
Alare the energy of the model contains the defect pair, single
Hf1+Al , and single V 3−
Al , respectively, and Eperf is the energy of the model without any defect.
Moreover, the migration energy of diffuse away from along the path Al1-Al2 is calculated.
The migration energy is 1.93 eV comparing to the 1.55 eV without Hf. A detailed analysis
of DOS shows that the energy shift of the defect states of the Hf doped model is 0.04 eV less
than the energy shift without Hf. Since the energy shift of the defect states of Al vacancy is
downward, this corresponds to an increasing in migration energy by 0.12 eV, which is 32%
66
of the total increasing in migration energy. Therefore, Hf not only modified the diffusion
path of V 3−Al geometrically, but also changed the electronic structure to make V 3−
Al harder to
diffuse away. It is possible that this electronic structure modification also happens at the
grain boundary of α-Al2O3 which slows down the diffusion of Al.
5.6 STRUCTURE OF NEAR Σ11 GRAIN BOUNDARY OF α-Al2O3
The Al vacancy diffusion in the near Σ11 grain boundary (GB) was investigated. This GB
was modelled by Kenway model [163, 164, 165] with 180 atoms. In the Kenway model, the
(1011) plane of one grain is parallel to the (1011) plane of the other. Therefore, the two
axes of the surface supercell have been chosen to be along [1210] and [2111] direction for one
grain and along [1210] and [2111] direction for the other. With [2111] direction of the former
grain parallel to [2111] direction of the later grain, the GB model can be built without lattice
mismatch. In the direction perpendicular to the GB plane, each grain has a thickness of
11.9 A, which results in 90 atoms for each grain. The out most 12 atoms for each grain were
kept in bulk structure during the relaxation and a vacuum layer of around 10 A was added
into the supercell to eliminate the interaction between the periodic images of the slab. The
density of the k-point mesh used in all the GB calculations is 5× 5× 1.
Though crystal orientation between two grains has been defined, there are still several
internal degrees of freedom to be determined in the model. First is the possible termination
of the (1011) and (1011) plane. Here, the most stable termination of these two surfaces
reported in Ref. [165] has been used. The surface energy is calculated to be 2.10 J/m2 for
(1011) plane and 2.02 J/m2 for (1011) plane. The former is very close to the 2.08 J/m2
reported in Ref. [165], but the later is greater than the reported 1.81 J/m2 by 0.21 J/m2,
which is a result of the different energy cutoff used in two calculations.
The second internal degree of freedom is the relative displacement between two grains
in the GB plane. To determine the relative displacement corresponding to the most stable
structure, The energy of the GB with the relative displacement satisfying ~R = x~a + y~b has
been calculated, where ~a and ~b are the two axes (along [1210] and [2111]/[2111] direction
67
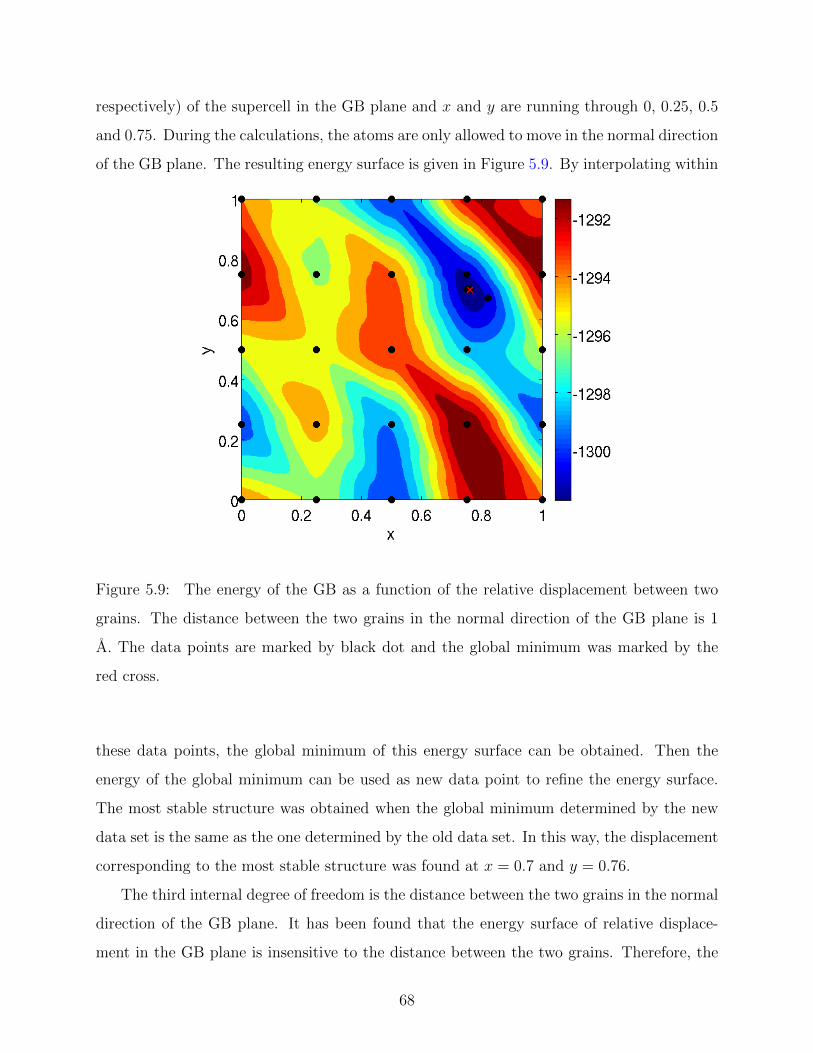
respectively) of the supercell in the GB plane and x and y are running through 0, 0.25, 0.5
and 0.75. During the calculations, the atoms are only allowed to move in the normal direction
of the GB plane. The resulting energy surface is given in Figure 5.9. By interpolating within
Figure 5.9: The energy of the GB as a function of the relative displacement between two
grains. The distance between the two grains in the normal direction of the GB plane is 1
A. The data points are marked by black dot and the global minimum was marked by the
red cross.
these data points, the global minimum of this energy surface can be obtained. Then the
energy of the global minimum can be used as new data point to refine the energy surface.
The most stable structure was obtained when the global minimum determined by the new
data set is the same as the one determined by the old data set. In this way, the displacement
corresponding to the most stable structure was found at x = 0.7 and y = 0.76.
The third internal degree of freedom is the distance between the two grains in the normal
direction of the GB plane. It has been found that the energy surface of relative displace-
ment in the GB plane is insensitive to the distance between the two grains. Therefore, the
68

equilibrium distance is determined by sampling different distances at the fixed displacement
in the GB plane, i.e. 0.7~a+0.76~b. In these calculations, the atoms are allowed to move in
all directions and the equilibrium distance is found to be 0.86 A between the two grains.
The most stable structure of the near Σ11 GB is given in Figure 5.10. The formation
energy of GB is calculated by
∆EGBf =
EGB − nEbulk
A− σunrel1011 − σ
unrel1011 (5.5)
where EGB is the total energy of the GB slab, n is the number of atoms in the GB slab,
i.e. 180, Ebulk is the energy per atom in bulk α-Al2O3, A is the area of GB and σunrel1011 and
σunrel1011 are the surface energy of the unrelaxed (1011) and (1011) surface respectively. The
formation energy of the most stable structure of the near Σ11 GB is calculated to be 2.13
J/m2. This formation energy is 0.58 J/m2 lower than the GB formation energy reported in
Ref. [165] calculated in the same sense.
Figure 5.10: The equilibrium structure of the near Σ11 GB. The Al and O atoms are
represented by the gray and red balls respectively.
69
5.7 Hf EFFECT ON Al VACANCY DIFFUSION IN GRAIN BOUNDARY
OF α-Al2O3
With the stable structure, the vacancy formation energy at the near Σ11 GB of α-Al2O3
has been investigated. 12 Al atoms has been identified near the GB plane, as shown in
Figure 5.11. These Al atoms were removed one by one and the formation energy of the
vacancy was calculated by
∆Ef = Ev − Eslab + µAl (5.6)
where Ev and Eslab is the energy of the GB model with and without an Al vacancy and
µAl is the chemical potential of Al. Here, only the formation energy of neutral vacancy was
considered for that the energy of charged slab is divergent respect to the vacuum thickness 1.
The formation energy of neutral Al vacancy at the example condition of T = 1300 K and
pO2 = 0.2 atm is given in Table 5.3. It shows that the most stable site of neutral Al vacancy
is site 4.
Site 4 has two nearest GB sites, i.e. site 3 (2.99 A) and 5 (2.96 A). The segregation
energy of Hf, which was calculated by the energy difference between the models with Hf at
GB site and bulk site as denoted in Figure 5.11, was determined to be 0.11 eV and −0.16 eV
for site 3 and 5 respectively. This shows that Hf tends to segregate to site 5 rather than site
3. Therefore, the migration energy of neutral Al vacancy from site 4 to site 3 was studied
with and without Hf segregated to site 5.
The migration energy of neutral Al vacancy between site 4 and 3 was calculated to be
1.17 eV and 1.05 eV for forward (4 to 3) and backward (3 to 4) diffusion respectively. With
Hf segregation, the migration energy for the forward and backward diffusion becomes 1.08 eV
and 1.30 eV. Thus, when Al vacancy diffuse away from Hf, the migration energy is lowered
by 0.09 eV. But when Al vacancy diffuse toward Hf, the migration energy is risen by 0.25
eV. This is a result of destabilizing of Al vacancy near Hf. With Hf occupying site 5, the
energy difference between the vacancy at site 3 and site 4 changed from 0.12 eV to −0.22
eV. Therefore, unlike in the bulk where Al vacancies are attracted to Hf atoms, Al vacancies
in GB are repelled from Hf atoms.
1VASP manual : http://cms.mpi.univie.ac.at/vasp/vasp/vasp.html
70

Figure 5.11: The 12 GB sites (green balls) used in vacancy calculations. The blue ball
marks the bulk site used in calculations of Hf segregation.
Table 5.3: The formation energy (in eV) of Al vacancy to the 12 GB sites shown in Fig-
ure 5.11. The chemical potential of Al is chosen to be −4.30 eV at the example condition of
T = 1300 K and pO2 = 0.2 atm.
Site 1 2 3 4 5 6
∆Ef 9.91 8.75 9.33 7.87 8.29 9.17
Site 7 8 9 10 11 12
∆Ef 10.01 9.65 9.20 9.58 9.12 11.08
71
However, these results are valid for the neutral vacancy only. For intrinsic α-Al2O3, V 3−Al
is more likely to be the diffusion species. Though the charged slab cannot be handled by
VASP, the correlation between the defect level shift and migration energy difference can be
used to evaluate the migration energy of V 3−Al . By defining the position of the defect levels
to be the energy to which the integration of the density of states from the highest occupied
energy is half of the total number of states in the defect levels, the level shift was determined
to be −0.08 eV and −0.01 eV for the forward and backward vacancy diffusion without Hf
segregation. With Hf segregation, the defect level shift was −0.04 eV (forward) and 0.03 eV
(backward). For the vacancy diffusion without Hf, the defect levels were empty. But when
Hf is added in, the defect levels were occupied by one electron for that Hf is tetravalent.
Therefore, when the Al vacancy is V 3−Al , the forward and backward migration energy become
0.93 eV and 1.02 eV without Hf segregation and 1.00 eV and 1.36 eV with Hf segregation.
This indicate that Hf in GB can tune the defect level shift during the diffusion of V 3−Al , which
slows down the Al diffusion in α-Al2O3.
Again, the SIE and the dispersion error mentioned in section 5.3 could be important to
the evaluation of the defect level shift during the vacancy migration. Moreover, there are
d-electrons in Hf, whose behavior is not accurately described in DFT-GGA calculations [19].
Therefore, the Hf effect on the migration energy and the defect level shift of the bulk and
grain boundary diffusion of Al vacancy still need more investigations. Nevertheless, these
results show that doping in α-Al2O3 may change the diffusivity of Al vacancies through
modifying the electronic structure during the vacancy migration.
72

6.0 CONCLUDING REMARKS
6.1 CONCLUSIONS
In this dissertation, atomistic simulation methods have been used to investigate the proper-
ties of two material systems, i.e. AlxCoCrFeNi HEAs and α-Al2O3. These two case studies
demonstrated that atomistic simulation methods are efficient tools for materials researches.
They can provide information, such as configurational and vibrational entropy, short range
order in alloys and defect level shift during vacancy migration, that are hard to be mea-
sured in experiments. This information complements experimental results and improves our
understanding in materials systems.
The specific conclusions of each case study are given below:
In the first case study, an atomistic simulation method has been developed for calculating
the configurational and vibrational entropy of HEAs. This method combines the power of
MEAM potential, MC simulation and TI method to calculate the thermodynamic properties
of HEAs. For the testing purpose, the thermodynamic properties of AlxCoCrFeNi HEAs
have been investigated. The results show that the developed method provides a reasonable
estimation of the entropy in this quinary alloy system. The calculated free energy captured
the FCC to BCC phase transition caused by Al addition in AlxCoCrFeNi HEAs. Particularly,
it has been found that the FCC-BCC duplex region lies between x = 0.36 and x = 2.11 when
only configurational entropy is considered. But with atomic vibrations included in, the region
becomes between x = 0.21 and x = 1.08, which is much closer to the experimental range of
0.3 < x < 0.7 [14]. This reveals that the configurational enthalpy and entropy determine the
overall picture of the FCC to BCC transition caused by Al addition in AlxCoCrFeNi HEA
system. But the vibrational enthalpy and entropy are also important to the quantitative
73
prediction of the compositional boundary of the FCC-BCC duplex region. This effect of
atomic vibrations may not be important at low temperature for that the vibrational entropy
is small compared to the configurational entropy in this case. However, it is significant and
cannot be ignored at high temperature such as 1373 K. In addition, there is still a gap in the
upper boundary of the FCC-BCC duplex region between the improved theoretical prediction
and the experimental result. This indicates that other non-configurational entropy, such as
magnetic entropy, may also contribute to the quantitative prediction of the compositional
boundary of the FCC-BCC duplex region.
Moreover, the ordering effect in AlxCoCrFeNi alloys has been investigated to validate
the calculated configurational entropy. The LRO of the simulated atomic structure of
AlxCoCrFeNi alloys agrees well with experiments, which supported the developed scheme
for entropy evaluation. Specifically, it has been found that the FCC CoCrFeNi alloy is a
near-ideal solution, with a configurational entropy of 1.301 R. The discrepancy between
the calculated value and the prediction of the ideal solution model (1.386 R) is a result of
the formation of Co-Cr and Ni-Fe nearest neighboring pairs. It has also been found that
Al addition enhanced the ordering effect in AlxCoCrFeNi alloys. In FCC phase, SRO was
enhanced by the enrichment of Ni around Al. In BCC phase, LRO was introduced by the
formation of the Al-Ni enriched B2 phase and the Fe-Cr enriched BCC phase. The structure
of the B2 phase was found to be that Al and Fe on one sublattice while Co and Ni on the
other. This B2 phase not only lowered the configurational entropy but also reduced the
lattice mismatch in AlxCoCrFeNi alloys.
The two hypotheses mentioned in section 1.2 have been tested. It has been found that
Al enhanced the atomic ordering effect by forming Al-Ni bonds in FCC phase and the B2
type ordering in BCC phase. These ordering effects reduced the configurational entropy
of AlxCoCrFeNi alloy in both FCC and BCC phase. Therefore, the hypothesis that Al
addition reduces the configurational entropy of AlxCoCrFeNi alloys is valid. It has also been
found that the vibrational effect destabilized FCC phase and improved the prediction of the
compositional boundary of the FCC-BCC duplex region in AlxCoCrFeNi HEA system. This
74
destabilization is mainly contributed by the vibrational enthalpy. Therefore, the hypothesis
that considering the atomic vibration effect will improve the prediction of the compositional
boundary of the FCC-BCC duplex region in the AlxCoCrFeNi HEA system is valid.
In the second case study, the vacancy migration in α-Al2O3 has been investigated using
DFT calculations. It has been found that the migration energy of vacancies in α-Al2O3
has a strong dependence on the charge state of the vacancy. It has also been found that
the observed charge-dependent vacancy migration energy is the result of the defect level
shift during the migration and the different electron occupancies on the defect levels of the
vacancies in different charge states. These findings for the first time build the link between
the electronic structure and the vacancy migration energy. It suggests a novel route for
engineering the diffusion kinetics by changing the charge state of vacancy or tuning the
defect level shift during vacancy migration. Moreover, the calculations of Hf effect on Al
vacancy diffusion in bulk and near Σ11 grain boundary of α-Al2O3 show that Hf doping can
tune the defect level shift, which slows down the Al vacancy diffusion in α-Al2O3. It provides
a new perspective of the reactive element effect in α-Al2O3, that is, the reduced diffusivity of
Al could be partially attributed to the modification in the defect levels of Al vacancy caused
by reactive elements.
The two hypotheses mentioned in section 1.2 have also been tested. The results in
Table 5.2 show that in most cases, the greater the charge of a vacancy, the lower its migration
energy. However, there is one exception, i.e. the second segment of Al2-Al4 diffusive path.
This is because that the vacancy migration energy is not only determined by the charge state
of the vacancy but also determined by the defect level shift during the vacancy migration.
Therefore, the hypothesis that the greater the charge of a vacancy in α-Al2O3, the lower its
migration energy is invalid. However, the data points in Figure 5.8 show that the migration
energy difference between two vacancies in different charge states increased as the defect
level shift increased. Therefore, the second hypothesis that the greater the defect level shift
during the vacancy migration, the greater the difference in the migration energy between the
vacancies in different charge states is valid.
75
6.2 REMAINING PROBLEMS
Despite these findings, there are several problems remaining in this study which should be
investigated in future works:
1. The configurational and vibrational free energy are treated separately in this study.
One needs to bear in mind that the cross effect between these two free energies can be
important. Because of the size mismatch between the atoms, the equilibrium position
of each atom may not be exactly on the lattice site. This may lead to a reduction in
configurational entropy for that the local strain of each atom is no longer the same. Thus,
the configurational entropy may still be overestimated in this study. This cross effect
needs to be investigated in future works.
2. The empirical potential used in this study is fitted to mostly the properties of binary
alloys. Though tested on five ordered quaternary alloys, there are still many parameters
in the potential that have not been fine tuned. Hence the interactions between the atoms
in AlxCoCrFeNi HEAs may not be described as accurately as in binary alloys. The inter-
actions between Al and transition metals are qualitatively different from the interactions
between transition metals. So the results related to the Al induced phase transition and
atomic ordering should be reliable. But the SRO formed between transition metals needs
further investigation.
3. Magnetic interactions between transition metals are not fully included in the framework
of MEAM potential. Despite that they may not qualitatively change the general pic-
ture at high temperature such as 1373 K, their effect on the enthalpy and entropy of
AlxCoCrFeNi HEAs could quantitatively change the SRO and phase stability of this
alloy system. Therefore, future works need to be done to incorporate the magnetic
interactions, e.g. using micromagnetic model, into the computational scheme.
4. The Al induced phase transition in AlxCoCrFeNi HEAs is treated as a two-phase equilib-
rium in this study. However, BCC phase is composed of the Ni-Al enriched B2 phase and
the Fe-Cr enriched solid solution. Therefore, there should be a three-phase equilibrium
76
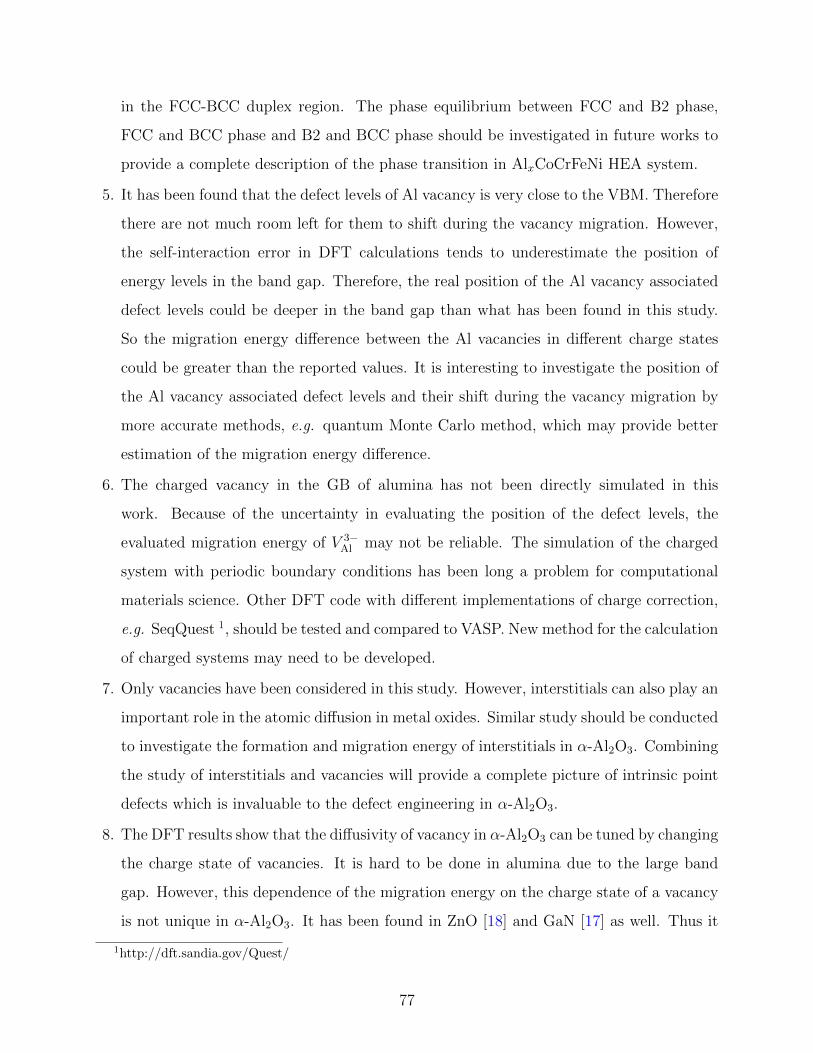
in the FCC-BCC duplex region. The phase equilibrium between FCC and B2 phase,
FCC and BCC phase and B2 and BCC phase should be investigated in future works to
provide a complete description of the phase transition in AlxCoCrFeNi HEA system.
5. It has been found that the defect levels of Al vacancy is very close to the VBM. Therefore
there are not much room left for them to shift during the vacancy migration. However,
the self-interaction error in DFT calculations tends to underestimate the position of
energy levels in the band gap. Therefore, the real position of the Al vacancy associated
defect levels could be deeper in the band gap than what has been found in this study.
So the migration energy difference between the Al vacancies in different charge states
could be greater than the reported values. It is interesting to investigate the position of
the Al vacancy associated defect levels and their shift during the vacancy migration by
more accurate methods, e.g. quantum Monte Carlo method, which may provide better
estimation of the migration energy difference.
6. The charged vacancy in the GB of alumina has not been directly simulated in this
work. Because of the uncertainty in evaluating the position of the defect levels, the
evaluated migration energy of V 3−Al may not be reliable. The simulation of the charged
system with periodic boundary conditions has been long a problem for computational
materials science. Other DFT code with different implementations of charge correction,
e.g. SeqQuest 1, should be tested and compared to VASP. New method for the calculation
of charged systems may need to be developed.
7. Only vacancies have been considered in this study. However, interstitials can also play an
important role in the atomic diffusion in metal oxides. Similar study should be conducted
to investigate the formation and migration energy of interstitials in α-Al2O3. Combining
the study of interstitials and vacancies will provide a complete picture of intrinsic point
defects which is invaluable to the defect engineering in α-Al2O3.
8. The DFT results show that the diffusivity of vacancy in α-Al2O3 can be tuned by changing
the charge state of vacancies. It is hard to be done in alumina due to the large band
gap. However, this dependence of the migration energy on the charge state of a vacancy
is not unique in α-Al2O3. It has been found in ZnO [18] and GaN [17] as well. Thus it
1http://dft.sandia.gov/Quest/
77

could be expected that this charge effect on vacancy migration energy can also exist in
other metal oxides or even nitrides. It is interesting to check the charge dependence of
the vacancy migration energy in the metal oxide which has a much narrower band gap.
In these systems, changing the charge state of vacancy may be a promising way to tune
the diffusivity of vacancies.
78

APPENDIX
MEAM POTENTIAL FOR Al-Co-Cr-Fe-Ni ALLOY SYSTEM
All the fitted parameters of the MEAM potential for Al-Co-Cr-Fe-Ni alloy are given in Ta-
ble A1, A2 and A3. The comparison between MEAM and DFT predictions of the formation
enthalpy and lattice parameters of AB (L10), AB3 (L12) and A3B (L12) phase are given in
Table A4
79
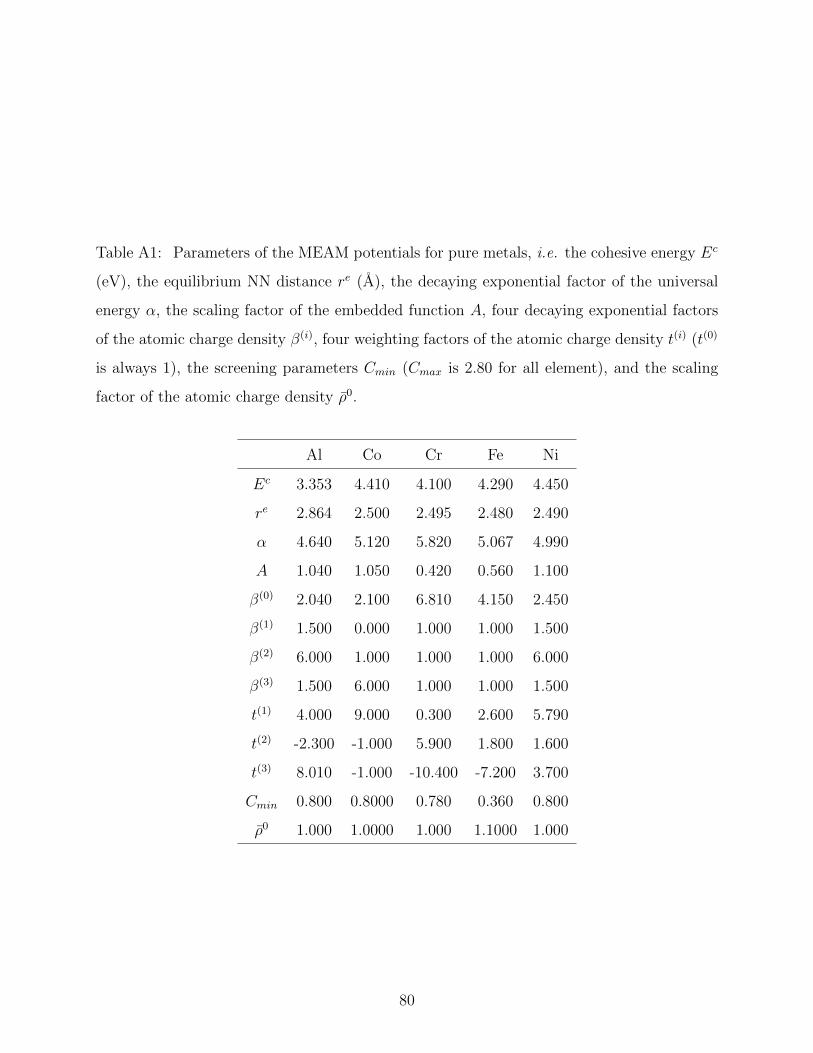
Table A1: Parameters of the MEAM potentials for pure metals, i.e. the cohesive energy Ec
(eV), the equilibrium NN distance re (A), the decaying exponential factor of the universal
energy α, the scaling factor of the embedded function A, four decaying exponential factors
of the atomic charge density β(i), four weighting factors of the atomic charge density t(i) (t(0)
is always 1), the screening parameters Cmin (Cmax is 2.80 for all element), and the scaling
factor of the atomic charge density ρ0.
Al Co Cr Fe Ni
Ec 3.353 4.410 4.100 4.290 4.450
re 2.864 2.500 2.495 2.480 2.490
α 4.640 5.120 5.820 5.067 4.990
A 1.040 1.050 0.420 0.560 1.100
β(0) 2.040 2.100 6.810 4.150 2.450
β(1) 1.500 0.000 1.000 1.000 1.500
β(2) 6.000 1.000 1.000 1.000 6.000
β(3) 1.500 6.000 1.000 1.000 1.500
t(1) 4.000 9.000 0.300 2.600 5.790
t(2) -2.300 -1.000 5.900 1.800 1.600
t(3) 8.010 -1.000 -10.400 -7.200 3.700
Cmin 0.800 0.8000 0.780 0.360 0.800
ρ0 1.000 1.0000 1.000 1.1000 1.000
80

Table A2: Parameters of the MEAM cross potentials for element pairs, i.e. the cohesive
energy Ec (eV), the equilibrium NN distance re (A), the decaying exponential factor of the
universal energy α, and the screening parameters Cmax and Cmin.
X Al Al Al Al Co Co Co Cr Cr Fe
Y Co Cr Fe Ni Cr Fe Ni Fe Ni Ni
Ec 4.485 3.762 4.152 4.566 4.075 4.404 4.273 3.997 4.011 4.297
re 2.471 2.630 2.496 2.525 2.465 2.462 2.495 2.448 2.508 2.465
α 4.000 5.000 4.280 4.600 5.950 5.370 5.000 5.370 5.160 5.000
CXYXmin 1.680 1.800 1.000 1.550 1.800 1.800 1.210 1.000 1.200 1.600
CY XYmin 1.630 2.330 2.000 1.360 2.000 1.800 1.420 1.000 0.000 1.170
CXXYmin 1.780 1.810 2.000 1.940 1.900 2.000 1.590 0.000 0.800 1.800
CXY Ymin 1.900 0.200 0.600 1.380 0.700 2.000 1.620 0.000 1.900 1.110
CXYXmax 3.530 4.200 2.000 3.590 3.800 3.800 3.510 4.200 4.000 4.000
CY XYmax 3.300 4.060 4.000 3.270 4.000 3.800 3.560 4.200 2.000 2.500
CXXYmax 4.100 4.140 4.000 4.000 3.900 4.000 4.140 5.000 2.800 4.000
CXY Ymax 4.210 3.300 2.800 3.460 2.800 4.000 4.150 5.200 3.800 2.470
81

Table A3: The screen parameters Cmax and Cmin of MEAM potential for ternary system.
X Al Al Al Al Al Al Co Co Co Cr
Y Co Co Co Cr Cr Fe Cr Cr Fe Fe
Z Cr Fe Ni Fe Ni Ni Fe Ni Ni Ni
CXY Zmin 1.800 2.000 2.000 2.000 2.000 2.000 2.000 1.400 1.400 2.000
CXZYmin 2.000 2.000 2.000 1.800 1.800 2.000 1.400 1.400 2.000 2.000
CY XZmin 2.000 2.000 1.400 2.000 2.000 1.400 2.000 2.000 2.000 2.000
CXY Zmax 3.800 4.000 4.000 4.000 4.000 4.000 3.850 3.400 3.400 3.850
CXZYmax 4.000 4.000 4.000 3.800 3.800 4.000 3.400 3.400 3.850 3.850
CY XZmax 4.000 4.000 3.400 4.000 4.000 3.400 3.850 3.850 4.000 4.000
82
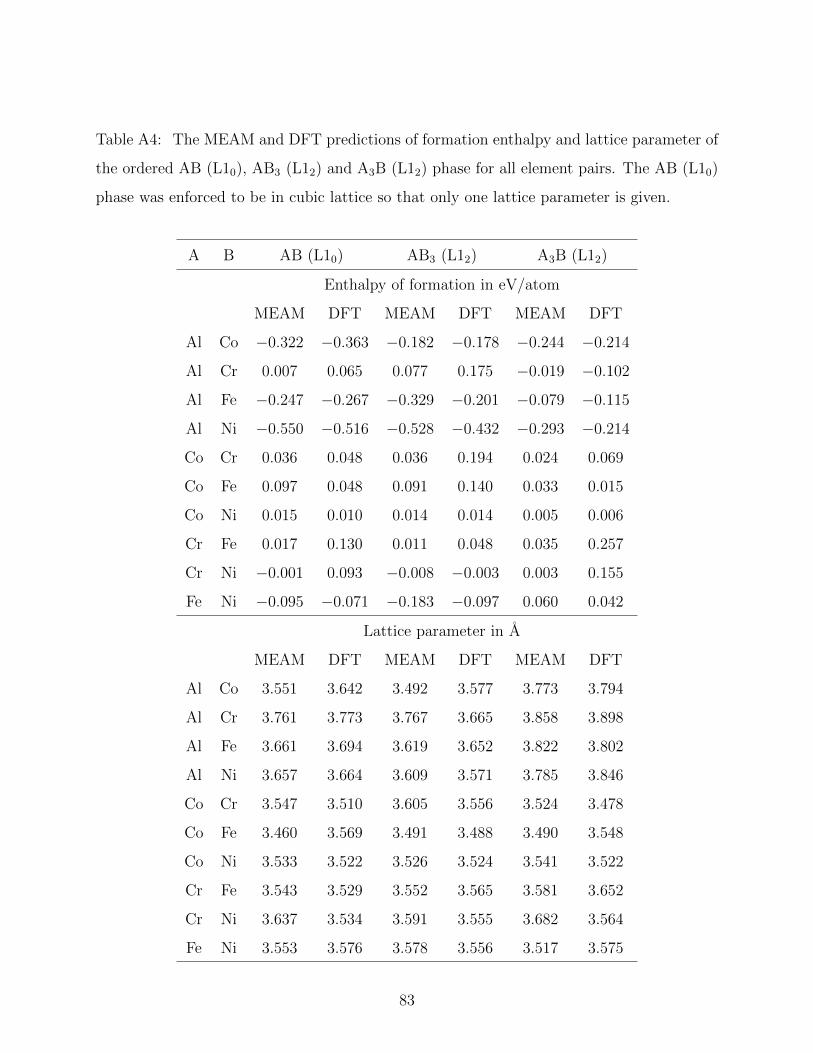
Table A4: The MEAM and DFT predictions of formation enthalpy and lattice parameter of
the ordered AB (L10), AB3 (L12) and A3B (L12) phase for all element pairs. The AB (L10)
phase was enforced to be in cubic lattice so that only one lattice parameter is given.
A B AB (L10) AB3 (L12) A3B (L12)
Enthalpy of formation in eV/atom
MEAM DFT MEAM DFT MEAM DFT
Al Co −0.322 −0.363 −0.182 −0.178 −0.244 −0.214
Al Cr 0.007 0.065 0.077 0.175 −0.019 −0.102
Al Fe −0.247 −0.267 −0.329 −0.201 −0.079 −0.115
Al Ni −0.550 −0.516 −0.528 −0.432 −0.293 −0.214
Co Cr 0.036 0.048 0.036 0.194 0.024 0.069
Co Fe 0.097 0.048 0.091 0.140 0.033 0.015
Co Ni 0.015 0.010 0.014 0.014 0.005 0.006
Cr Fe 0.017 0.130 0.011 0.048 0.035 0.257
Cr Ni −0.001 0.093 −0.008 −0.003 0.003 0.155
Fe Ni −0.095 −0.071 −0.183 −0.097 0.060 0.042
Lattice parameter in A
MEAM DFT MEAM DFT MEAM DFT
Al Co 3.551 3.642 3.492 3.577 3.773 3.794
Al Cr 3.761 3.773 3.767 3.665 3.858 3.898
Al Fe 3.661 3.694 3.619 3.652 3.822 3.802
Al Ni 3.657 3.664 3.609 3.571 3.785 3.846
Co Cr 3.547 3.510 3.605 3.556 3.524 3.478
Co Fe 3.460 3.569 3.491 3.488 3.490 3.548
Co Ni 3.533 3.522 3.526 3.524 3.541 3.522
Cr Fe 3.543 3.529 3.552 3.565 3.581 3.652
Cr Ni 3.637 3.534 3.591 3.555 3.682 3.564
Fe Ni 3.553 3.576 3.578 3.556 3.517 3.575
83

BIBLIOGRAPHY
[1] B.S. Murty, J.W. Yeh, and S. Ranganathan. High-Entropy Alloys. Elsevier Science,2014.
[2] J.-W. Yeh, S.-K. Chen, S.-J. Lin, J.-Y. Gan, T.-S. Chin, T.-T. Shun, C.-H. Tsau, andS.-Y. Chang. Nanostructured high-entropy alloys with multiple principal elements:Novel alloy design concepts and outcomes. Advanced Engineering Materials, 6(5):299–303, 2004.
[3] F. Otto, Y. Yang, H. Bei, and E.P. George. Relative effects of enthalpy and entropyon the phase stability of equiatomic high-entropy alloys. Acta Materialia, 61(7):2628– 2638, 2013.
[4] Arthur H. Heuer, David B. Hovis, James L. Smialek, and Brian Gleeson. Alumina scaleformation: A new perspective. Journal of the American Ceramic Society, 94:s146–s153,2011.
[5] N. D. M. Hine, K. Frensch, W. M. C. Foulkes, and M. W. Finnis. Supercell sizescaling of density functional theory formation energies of charged defects. Phys. Rev.B, 79:024112, Jan 2009.
[6] Patrick W. M. Jacobs and Eugene A. Kotomin. Modeling of point defets in corundumcrystals. Journal of the American Ceramic Society, 77(10):2505–2508, 1994.
[7] U. Aschauer, P. Bowen, and S.C. Parker. Oxygen vacancy diffusion in alumina: Newatomistic simulation methods applied to an old problem. Acta Materialia, 57(16):4765–4772, 2009.
[8] A.H. Heuer. Oxygen and aluminum diffusion in α-Al2O3: How much do we reallyunderstand? Journal of the European Ceramic Society, 28(7):1495 – 1507, 2008.
[9] M. S. Lucas, G. B. Wilks, L. Mauger, J. A. Muoz, O. N. Senkov, E. Michel, J. Hor-wath, S. L. Semiatin, M. B. Stone, D. L. Abernathy, and E. Karapetrova. Absenceof long-range chemical ordering in equimolar FeCoCrNi. Applied Physics Letters,100(25):251907, 2012.
84

[10] Yih-Farn Kao, Ting-Jie Chen, Swe-Kai Chen, and Jien-Wei Yeh. Microstructure andmechanical property of as-cast, -homogenized, and -deformed AlxCoCrFeNi (0 ≤ x ≤2) high-entropy alloys. Journal of Alloys and Compounds, 488(1):57–64, 2009.
[11] Woei-Ren Wang, Wei-Lin Wang, and Jien-Wei Yeh. Phases, microstructure and me-chanical properties of AlxCoCrFeNi high-entropy alloys at elevated temperatures. Jour-nal of Alloys and Compounds, 589:143–152, 2014.
[12] Fuyang Tian, Lorand Delczeg, Nanxian Chen, Lajos Karoly Varga, Jiang Shen, andLevente Vitos. Structural stability of NiCoFeCrAlx high-entropy alloy from ab initiotheory. Phys. Rev. B, 88:085128, Aug 2013.
[13] Chuan Zhang, Fan Zhang, Shuanglin Chen, and Weisheng Cao. Computational ther-modynamics aided high-entropy alloy design. JOM, 64(7):839–845, 2012.
[14] Zhi Tang, Oleg N. Senkov, Chuan Zhang, Fan Zhang, Carl D. Lundin, and Peter K.Liaw. Al-Co-Cr-Fe-Ni Phase Equilibria and Properties. In TMS 2015 SupplementalProceedings. Wiley, 2015.
[15] Pasquale Pavone, Stefano Baroni, and Stefano de Gironcoli. α↔β phase transition intin: A theoretical study based on density-functional perturbation theory. Phys. Rev.B, 57:10421–10423, May 1998.
[16] Jurgen Neuhaus, Michael Leitner, Karl Nicolaus, Winfried Petry, Bernard Hennion,and Arno Hiess. Role of vibrational entropy in the stabilization of the high-temperaturephases of iron. Phys. Rev. B, 89:184302, May 2014.
[17] M. G. Ganchenkova and R. M. Nieminen. Nitrogen vacancies as major point defectsin gallium nitride. Phys. Rev. Lett., 96:196402, May 2006.
[18] Paul Erhart and Karsten Albe. Diffusion of zinc vacancies and interstitials in zincoxide. Applied Physics Letters, 88(20):201918, 2006.
[19] Christoph Freysoldt, Blazej Grabowski, Tilmann Hickel, Jorg Neugebauer, GeorgKresse, Anderson Janotti, and Chris G. Van de Walle. First-principles calculationsfor point defects in solids. Rev. Mod. Phys., 86:253–305, Mar 2014.
[20] F Bassani, G Iadonisi, and B Preziosi. Electronic impurity levels in semiconductors.Reports on Progress in Physics, 37(9):1099, 1974.
[21] Sokrates T. Pantelides. The electronic structure of impurities and other point defectsin semiconductors. Rev. Mod. Phys., 50:797–858, Oct 1978.
[22] C. Li, J.C. Li, M. Zhao, and Q. Jiang. Effect of aluminum contents on microstruc-ture and properties of AlxCoCrFeNi alloys. Journal of Alloys and Compounds, 504,Supplement 1:S515–S518, 2010.
85
[23] Chun-Ming Lin and Hsien-Lung Tsai. Evolution of microstructure, hardness, andcorrosion properties of high-entropy Al0.5CoCrFeNi alloy. Intermetallics, 19(3):288–294, 2011.
[24] Woei-Ren Wang, Wei-Lin Wang, Shang-Chih Wang, Yi-Chia Tsai, Chun-Hui Lai, andJien-Wei Yeh. Effects of al addition on the microstructure and mechanical property ofAlxCoCrFeNi high-entropy alloys. Intermetallics, 26:44–51, 2012.
[25] Zhi Tang, Michael C. Gao, Haoyan Diao, Tengfei Yang, Junpeng Liu, Tingting Zuo,Yong Zhang, Zhaoping Lu, Yongqiang Cheng, Yanwen Zhang, Karin A. Dahmen, Pe-ter K. Liaw, and Takeshi Egami. Aluminum alloying effects on lattice types, microstruc-tures, and mechanical behavior of high-entropy alloys systems. JOM, 65(12):1848–1858,2013.
[26] A. van de Walle and G. Ceder. First-principles computation of the vibrational entropyof ordered and disordered Pd3V. Phys. Rev. B, 61:5972–5978, Mar 2000.
[27] Yi Wang and Yunfeng Sun. First-principles thermodynamic calculations for δ-Pu andε-Pu. Journal of Physics: Condensed Matter, 12(21):L311, 2000.
[28] Sven P. Rudin, M. D. Jones, and R. C. Albers. Thermal stabilization of the hcp phasein titanium. Phys. Rev. B, 69:094117, Mar 2004.
[29] L. Anthony, J. K. Okamoto, and B. Fultz. Vibrational entropy of ordered and disor-dered Ni3Al. Phys. Rev. Lett., 70:1128–1130, Feb 1993.
[30] X. Yang and Y. Zhang. Prediction of high-entropy stabilized solid-solution in multi-component alloys. Materials Chemistry and Physics, 132(23):233 – 238, 2012.
[31] Sheng Guo, Qiang Hu, Chun Ng, and C.T. Liu. More than entropy in high-entropyalloys: Forming solid solutions or amorphous phase. Intermetallics, 41:96 – 103, 2013.
[32] H. W. Sheng, W. K. Luo, F. M. Alamgir, J. M. Bai, and E. Ma. Atomic packing andshort-to-medium-range order in metallic glasses. Nature, 439:419–425, 2006.
[33] W. K. Luo, H. W. Sheng, F. M. Alamgir, J. M. Bai, J. H. He, and E. Ma. Icosahedralshort-range order in amorphous alloys. Phys. Rev. Lett., 92:145502, Apr 2004.
[34] S. M. Dubiel and J. Cieslak. Short-range order in iron-rich Fe-Cr alloys as revealed byMossbauer spectroscopy. Phys. Rev. B, 83:180202, May 2011.
[35] H. L. Hong, Q. Wang, C. Dong, and Peter K. Liaw. Understanding the Cu-Zn brassalloys using a short-range-order cluster model: significance of specific compositions ofindustrial alloys. Sci. Rep., 4:7065, 2014.
[36] Y.F. Ye, Q. Wang, J. Lu, C.T. Liu, and Y. Yang. The generalized thermodynamic rulefor phase selection in multicomponent alloys. Intermetallics, 59:75–80, 2015.
86

[37] Louis J. Santodonato, Yang Zhang, Mikhail Feygenson, Chad M. Parish, Michael C.Gao, Richard J.K. Weber, Joerg C Neuefeind, Zhi Tang, and Peter K Liaw. Devia-tion from high-entropy configurations in the atomic distributions of a multi-principal-element alloy. Nat Commun, 6:5964, 2013.
[38] W. Jones and N.H. March. Theoretical Solid State Physics: Perfect lattices in equilib-rium. Dover Books on Physics Series. Dover Publications, 1973.
[39] H. Peng, C.L. Wang, J.C. Li, H.C. Wang, Y. Sun, and Q. Zheng. Elastic and vibra-tional properties of Mg2Si1−xSnx alloy from first principles calculations. Solid StateCommunications, 152(9):821–824, 2012.
[40] Olle Eriksson, J. M. Wills, and Duane Wallace. Electronic, quasiharmonic, and anhar-monic entropies of transition metals. Phys. Rev. B, 46:5221–5228, Sep 1992.
[41] P. Souvatzis and S. P. Rudin. Dynamical stabilization of cubic ZrO2 by phonon-phononinteractions: Ab initio calculations. Phys. Rev. B, 78:184304, Nov 2008.
[42] Dario Alfe. Phon: A program to calculate phonons using the small displacementmethod. Computer Physics Communications, 180(12):2622–2633, 2009.
[43] D. Alfe, G. D. Price, and M. J. Gillan. Thermodynamics of hexagonal-close-packediron under earth’s core conditions. Phys. Rev. B, 64:045123, Jul 2001.
[44] R Oriani and W.K Murphy. Thermodynamics of ordering alloys-IV heats of formationof some alloys of transition metals. Acta Metallurgica, 10(9):879–885, 1962.
[45] A. V. Ruban, P. A. Korzhavyi, and B. Johansson. First-principles theory of magnet-ically driven anomalous ordering in bcc Fe-Cr alloys. Phys. Rev. B, 77:094436, Mar2008.
[46] Zhenyu Liu, Yinkai Lei, Corinne Gray, and Guofeng Wang. Examination of solid-solution phase formation rules for high entropy alloys from atomistic monte carlo sim-ulations. JOM, 67(10):2364–2374, 2015.
[47] Wei Guo, Wojciech Dmowski, Ji-Yong Noh, Philip Rack, Peter K. Liaw, and TakeshiEgami. Local atomic structure of a high-entropy alloy: An X-ray and neutron scatteringstudy. Metallurgical and Materials Transactions A, 44(5):1994–1997, 2013.
[48] Akihiko Hirata, Pengfei Guan, Takeshi Fujita, Yoshihiko Hirotsu, Akihisa Inoue,Alain Reza Yavari, Toshio Sakurai, and Mingwei Chen. Direct observation of localatomic order in a metallic glass. Nat Mater, 10:28–33, 2011.
[49] M M J Treacy, J M Gibson, L Fan, D J Paterson, and I McNulty. Fluctuation mi-croscopy: a probe of medium range order. Reports on Progress in Physics, 68(12):2899,2005.
87
[50] C. G. Shull and Sidney Siegel. Neutron diffraction studies of order-disorder in alloys.Phys. Rev., 75:1008–1010, Apr 1949.
[51] H. Okamoto, D.J. Chakrabarti, D.E. Laughlin, and T.B. Massalski. The Au-Cu (gold-copper) system. Journal of Phase Equilibria, 8(5):454–474, 1987.
[52] H. Okamoto. Al–Ni (aluminum-nickel). Journal of Phase Equilibria, 14(2):257–259,1993.
[53] P. Nash and M.F. Singleton. The Ni–Pt (nickel-platinum) system. Bulletin of AlloyPhase Diagrams, 10(3):258–262, 1989.
[54] Brian A. Welk, Robert E.A. Williams, Gopal B. Viswanathan, Mark A. Gibson, Pe-ter K. Liaw, and Hamish L. Fraser. Nature of the interfaces between the constituentphases in the high entropy alloy CoCrCuFeNiAl. Ultramicroscopy, 134:193–199, 2013.
[55] N. Mattern, U. Khn, H. Hermann, H. Ehrenberg, J. Neuefeind, and J. Eckert. Short-range order of Zr62−xTixAl10Cu20Ni8 bulk metallic glasses. Acta Materialia, 50(2):305–314, 2002.
[56] N. A. Mauro, V. Wessels, J. C. Bendert, S. Klein, A. K. Gangopadhyay, M. J. Kramer,S. G. Hao, G. E. Rustan, A. Kreyssig, A. I. Goldman, and K. F. Kelton. Short- andmedium-range order in Zr80Pt20 liquids. Phys. Rev. B, 83:184109, May 2011.
[57] W. Hoyer and R. Jdicke. Short-range and medium-range order in liquid Au–Ge alloys.Journal of Non-Crystalline Solids, 192193:102–105, 1995. Structure of Non-CrystallineMaterials 6.
[58] S.C. Middleburgh, D.M. King, G.R. Lumpkin, M. Cortie, and L. Edwards. Segregationand migration of species in the CrCoFeNi high entropy alloy. Journal of Alloys andCompounds, 599:179–182, 2014.
[59] C. Niu, A. J. Zaddach, A. A. Oni, X. Sang, J. W. Hurt, J. M. LeBeau, C. C. Koch,and D. L. Irving. Spin-driven ordering of Cr in the equiatomic high entropy alloyNiFeCrCo. Applied Physics Letters, 106(16):161906, 2015.
[60] S. R. Elliott. Medium-range structural order in covalent amorphous solids. Nature,354:445–452, 1991.
[61] Joongoo Kang, Junyi Zhu, Su-Huai Wei, Eric Schwegler, and Yong-Hyun Kim. Per-sistent medium-range order and anomalous liquid properties of Al1-xCux alloys. Phys.Rev. Lett., 108:115901, Mar 2012.
[62] Li Wang, Yuqing Wang, Chuanxiao Peng, and Yanning Zhang. Medium-range struc-tural order in liquid Ni20Al80 alloy: Experimental and molecular dynamics studies.Physics Letters A, 350(56):405 – 409, 2006.
88
[63] UR Kattner and BP Burton. Al–Fe (aluminum-iron). Phase Diagrams of Binary IronAlloys, pages 12–28, 1993.
[64] A.J. McAlister. The Al–Co (aluminum-cobalt) system. Bulletin of Alloy Phase Dia-grams, 10(6):646–650, 1989.
[65] Y. Oishi and W. D. Kingery. Self-diffusion of oxygen in single crystal and polycrystallinealuminum oxide. The Journal of Chemical Physics, 33(2), 1960.
[66] A. E. Paladino and W. D. Kingery. Aluminum ion diffusion in aluminum oxide. TheJournal of Chemical Physics, 37(5), 1962.
[67] DAVID J. REED and B. J. WUENSCH. Ion-probe measurement of oxygen self-diffusion in single-crystal Al2O3. Journal of the American Ceramic Society, 63(1-2):88–92, 1980.
[68] M. Le Gall, B. Lesage, and J. Bernardini. Self-diffusion in α-Al2O3 i. aluminiumdiffusion in single crystals. Philosophical Magazine A, 70(5):761–773, 1994.
[69] D. Clemens, K. Bongartz, W.J. Quadakkers, H. Nickel, H. Holzbrecher, and J.-S.Becker. Determination of lattice and grain boundary diffusion coefficients in protectivealumina scales on high temperature alloys using SEM, TEM and SIMS. FreseniusJournal of Analytical Chemistry, 353(3-4):267–270, 1995.
[70] D. Prot and C. Monty. Self-diffusion in α-Al2O3. ii. oxygen diffusion in undoped singlecrystals. Philosophical Magazine A, 73(4):899–917, 1996.
[71] A.H. Heuer and K.P.D. Lagerlof. Oxygen self-diffusion in corundum (α-Al2O3): Aconundrum. Philosophical Magazine Letters, 79(8):619–627, 1999.
[72] Tsubasa NAKAGAWA, Atsutomo NAKAMURA, Isao SAKAGUCHI, Naoya SHI-BATA, K. Peter. D. LAGERLOF, Takahisa YAMAMOTO, Hajime HANEDA, andYuichi IKUHARA. Oxygen pipe diffusion in sapphire basal dislocation. Journal of theCeramic Society of Japan, 114(1335):1013–1017, 2006.
[73] Tsubasa Nakagawa, Isao Sakaguchi, Naoya Shibata, Katsuyuki Matsunaga, TeruyasuMizoguchi, Takahisa Yamamoto, Hajime Haneda, and Yuichi Ikuhara. Yttrium dopingeffect on oxygen grain boundary diffusion in α-Al2O3. Acta Materialia, 55(19):6627–6633, 2007.
[74] P. Fielitz, G. Borchardt, S. Ganschow, R. Bertram, and A. Markwitz. 26Al tracer dif-fusion in titanium doped single crystalline α-Al2O3. Solid State Ionics, 179(1112):373–379, 2008.
[75] Tsubasa Nakagawa, Hitoshi Nishimura, Isao Sakaguchi, Naoya Shibata, KatsuyukiMatsunaga, Takahisa Yamamoto, and Yuichi Ikuhara. Grain boundary character de-pendence of oxygen grain boundary diffusion in α-Al2O3 bicrystals. Scripta Materialia,65(6):544–547, 2011.
89
[76] J. H. Harding and D. J. Harris. Simulation of grain-boundary diffusion in ceramics bykinetic Monte Carlo. Phys. Rev. B, 63:094102, Jan 2001.
[77] J. Carrasco, N. Lopez, and F. Illas. First principles analysis of the stability and diffusionof oxygen vacancies in metal oxides. Phys. Rev. Lett., 93:225502, Nov 2004.
[78] Ivan Milas, Berit Hinnemann, and Emily A. Carter. Diffusion of Al, O, Pt, Hf, andy atoms on α-Al2O3(0001): implications for the role of alloying elements in thermalbarrier coatings. J. Mater. Chem., 21:1447–1456, 2011.
[79] R. Prescott and M.J. Graham. The formation of aluminum oxide scales on high-temperature alloys. Oxidation of Metals, 38(3-4):233–254, 1992.
[80] Moon Young Yang, Katsumasa Kamiya, Blanka Magyari-Kpe, Masaaki Niwa, YoshioNishi, and Kenji Shiraishi. Charge-dependent oxygen vacancy diffusion in Al2O3-basedresistive-random-access-memories. Applied Physics Letters, 103(9):–, 2013.
[81] Jerry B. Torrance, Philippe Lacorre, Chinnarong Asavaroengchai, and Robert M. Met-zger. Why are some oxides metallic, while most are insulating? Physica C: Supercon-ductivity, 182(46):351 – 364, 1991.
[82] M Landmann, E Rauls, and W G Schmidt. The electronic structure and opticalresponse of rutile, anatase and brookite TiO2. Journal of Physics: Condensed Matter,24(19):195503, 2012.
[83] T.V. Perevalov, A.V. Shaposhnikov, V.A. Gritsenko, H. Wong, J.H. Han, and C.W.Kim. Electronic structure of α-Al2O3: Ab initio simulations and comparison withexperiment. JETP Letters, 85(3):165–168, 2007.
[84] M. Vernica Ganduglia-Pirovano, Alexander Hofmann, and Joachim Sauer. Oxygenvacancies in transition metal and rare earth oxides: Current state of understandingand remaining challenges. Surface Science Reports, 62(6):219 – 270, 2007.
[85] Ulrike Diebold. The surface science of titanium dioxide. Surface Science Reports,48(58):53 – 229, 2003.
[86] S Lettieri, L Santamaria Amato, P Maddalena, E Comini, C Baratto, and S Todros.Recombination dynamics of deep defect states in zinc oxide nanowires. Nanotechnology,20(17):175706, 2009.
[87] Anderson Janotti and Chris G Van de Walle. Fundamentals of zinc oxide as a semi-conductor. Reports on Progress in Physics, 72(12):126501, 2009.
[88] W. M. C. Foulkes, L. Mitas, R. J. Needs, and G. Rajagopal. Quantum monte carlosimulations of solids. Rev. Mod. Phys., 73:33–83, Jan 2001.
90

[89] Jens K. Norskov, Frank Abild-Pedersen, Felix Studt, and Thomas Bligaard. Den-sity functional theory in surface chemistry and catalysis. Proceedings of the NationalAcademy of Sciences, 108(3):937–943, 2011.
[90] R. Devanathan, L.R. Corrales, W.J. Weber, A. Chartier, and C. Meis. Molecular dy-namics simulation of defect production in collision cascades in zircon. Nuclear Instru-ments and Methods in Physics Research Section B: Beam Interactions with Materialsand Atoms, 228(14):299–303, 2005.
[91] L. Van Brutzel, M. Rarivomanantsoa, and D. Ghaleb. Displacement cascade initiatedwith the realistic energy of the recoil nucleus in UO2 matrix by molecular dynamicssimulation. Journal of Nuclear Materials, 354(13):28 – 35, 2006.
[92] P. Hohenberg and W. Kohn. Inhomogeneous electron gas. Phys. Rev., 136:B864–B871,Nov 1964.
[93] W. Kohn and L. J. Sham. Self-consistent equations including exchange and correlationeffects. Phys. Rev., 140:A1133–A1138, Nov 1965.
[94] Charlotte Froese Fischer. General hartree-fock program. Computer Physics Commu-nications, 43(3):355 – 365, 1987.
[95] Stefano Curtarolo, Wahyu Setyawan, Shidong Wang, Junkai Xue, Kesong Yang,Richard H. Taylor, Lance J. Nelson, Gus L.W. Hart, Stefano Sanvito, MarcoBuongiorno-Nardelli, Natalio Mingo, and Ohad Levy. Aflowlib.org: A distributedmaterials properties repository from high-throughput ab initio calculations. Computa-tional Materials Science, 58:227 – 235, 2012.
[96] Yinkai Lei, Huijun Liu, and Wei Xiao. First principles study of the size effect ofTiO2 anatase nanoparticles in dye-sensitized solar cell. Modelling and Simulation inMaterials Science and Engineering, 18(2):025004, 2010.
[97] Hongyan Lv, Yinkai Lei, Aditi Datta, and Guofeng Wang. Influence of surfacesegregation on magnetic properties of FePt nanoparticles. Applied Physics Letters,103(13):132405, 2013.
[98] M. I. Baskes. Modified embedded-atom potentials for cubic materials and impurities.Phys. Rev. B, 46:2727–2742, Aug 1992.
[99] Adri C. T. van Duin, Siddharth Dasgupta, Francois Lorant, and William A. GoddardIII. Reaxff: a reactive force field for hydrocarbons. The Journal of Physical ChemistryA, 105(41):9396–9409, 2001.
[100] D. Frenkel and B. Smit. Understanding Molecular Simulation: From Algorithms toApplications. Computational science series. Elsevier Science, 2001.
[101] Jakob Schiøtz and Karsten W. Jacobsen. A maximum in the strength of nanocrystallinecopper. Science, 301(5638):1357–1359, 2003.
91

[102] Jonathan Schafer and Karsten Albe. Influence of solutes on the competition betweenmesoscopic grain boundary sliding and coupled grain boundary motion. Scripta Ma-terialia, 66(5):315–317, 2012.
[103] T. Frolov and Y. Mishin. Molecular dynamics modeling of self-diffusion along a triplejunction. Phys. Rev. B, 79:174110, May 2009.
[104] V. Yamakov, D. Wolf, S.R. Phillpot, and H. Gleiter. Grain-boundary diffusion creepin nanocrystalline palladium by molecular-dynamics simulation. Acta Materialia,50(1):61–73, 2002.
[105] David E. Shaw, Paul Maragakis, Kresten Lindorff-Larsen, Stefano Piana, Ron O. Dror,Michael P. Eastwood, Joseph A. Bank, John M. Jumper, John K. Salmon, YibingShan, and Willy Wriggers. Atomic-level characterization of the structural dynamics ofproteins. Science, 330(6002):341–346, 2010.
[106] Kresten Lindorff-Larsen, Stefano Piana, Ron O. Dror, and David E. Shaw. How fast-folding proteins fold. Science, 334(6055):517–520, 2011.
[107] D.P. Landau and K. Binder. A Guide to Monte Carlo Simulations in Statistical Physics.Cambridge University Press, 2009.
[108] Nicholas Metropolis, Arianna W. Rosenbluth, Marshall N. Rosenbluth, Augusta H.Teller, and Edward Teller. Equation of state calculations by fast computing machines.The Journal of Chemical Physics, 21(6), 1953.
[109] Fugao Wang and D. P. Landau. Efficient, multiple-range random walk algorithm tocalculate the density of states. Phys. Rev. Lett., 86:2050–2053, Mar 2001.
[110] Daan Frenkel and Anthony J. C. Ladd. New Monte Carlo method to compute the freeenergy of arbitrary solids. application to the fcc and hcp phases of hard spheres. TheJournal of Chemical Physics, 81(7):3188–3193, 1984.
[111] Zhiyao Duan, Jun Zhong, and Guofeng Wang. Modeling surface segregation phenom-ena in the (111) surface of ordered Pt3Ti crystal. The Journal of Chemical Physics,133(11):114701, 2010.
[112] A van de Walle and M Asta. Self-driven lattice-model Monte Carlo simulations of alloythermodynamic properties and phase diagrams. Modelling and Simulation in MaterialsScience and Engineering, 10(5):521, 2002.
[113] Sivakumar R. Challa, David S. Sholl, and J. Karl Johnson. Adsorption and separationof hydrogen isotopes in carbon nanotubes: Multicomponent grand canonical MonteCarlo simulations. The Journal of Chemical Physics, 116(2), 2002.
[114] Byeong-Joo Lee and M. I. Baskes. Second nearest-neighbor modified embedded-atom-method potential. Phys. Rev. B, 62:8564–8567, Oct 2000.
92
[115] M. de Koning and A. Antonelli. Einstein crystal as a reference system in free energyestimation using adiabatic switching. Phys. Rev. E, 53:465–474, Jan 1996.
[116] James H. Rose, John R. Smith, Francisco Guinea, and John Ferrante. Universal fea-tures of the equation of state of metals. Phys. Rev. B, 29:2963–2969, Mar 1984.
[117] Byeong-Joo Lee, M.I. Baskes, Hanchul Kim, and Yang Koo Cho. Second nearest-neighbor modified embedded atom method potentials for bcc transition metals. Phys.Rev. B, 64:184102, Oct 2001.
[118] M.I. Baskes. Determination of modified embedded atom method parameters for nickel.Materials Chemistry and Physics, 50(2):152 – 158, 1997.
[119] M I Baskes and R A Johnson. Modified embedded atom potentials for hcp metals.Modelling and Simulation in Materials Science and Engineering, 2(1):147, 1994.
[120] B. Jelinek, S. Groh, M. F. Horstemeyer, J. Houze, S. G. Kim, G. J. Wagner, A. Moitra,and M. I. Baskes. Modified embedded atom method potential for Al, Si, Mg, Cu, andFe alloys. Phys. Rev. B, 85:245102, Jun 2012.
[121] G. Kresse and J. Hafner. Ab initio molecular dynamics for liquid metals. Phys. Rev.B, 47:558–561, Jan 1993.
[122] G. Kresse and J. Furthmuller. Efficient iterative schemes for ab initio total-energycalculations using a plane-wave basis set. Phys. Rev. B, 54:11169–11186, Oct 1996.
[123] G. Kresse and D. Joubert. From ultrasoft pseudopotentials to the projector augmented-wave method. Phys. Rev. B, 59:1758–1775, Jan 1999.
[124] John P. Perdew, Kieron Burke, and Matthias Ernzerhof. Generalized gradient approx-imation made simple. Phys. Rev. Lett., 77:3865–3868, Oct 1996.
[125] Hendrik J. Monkhorst and James D. Pack. Special points for brillouin-zone integra-tions. Phys. Rev. B, 13:5188–5192, Jun 1976.
[126] Charles Kittel. Introduction to Solid State Physics. John Wiley & Sons, Inc., NewYork, 6th edition, 1986.
[127] R.M. Martin. Electronic Structure: Basic Theory and Practical Methods. CambridgeUniversity Press, 2004.
[128] D. R. Hamann, M. Schluter, and C. Chiang. Norm-conserving pseudopotentials. Phys.Rev. Lett., 43:1494–1497, Nov 1979.
[129] D. R. Hamann. Generalized norm-conserving pseudopotentials. Phys. Rev. B, 40:2980–2987, Aug 1989.
93
[130] David Vanderbilt. Soft self-consistent pseudopotentials in a generalized eigenvalueformalism. Phys. Rev. B, 41:7892–7895, Apr 1990.
[131] Kari Laasonen, Roberto Car, Changyol Lee, and David Vanderbilt. Implementationof ultrasoft pseudopotentials in ab initio molecular dynamics. Phys. Rev. B, 43:6796–6799, Mar 1991.
[132] Kari Laasonen, Alfredo Pasquarello, Roberto Car, Changyol Lee, and David Vander-bilt. Car-parrinello molecular dynamics with vanderbilt ultrasoft pseudopotentials.Phys. Rev. B, 47:10142–10153, Apr 1993.
[133] P. E. Blochl. Projector augmented-wave method. Phys. Rev. B, 50:17953–17979, Dec1994.
[134] G. Kresse and D. Joubert. From ultrasoft pseudopotentials to the projector augmented-wave method. Phys. Rev. B, 59:1758–1775, Jan 1999.
[135] G Kresse and J Hafner. Norm-conserving and ultrasoft pseudopotentials for first-rowand transition elements. Journal of Physics: Condensed Matter, 6(40):8245, 1994.
[136] J. P. Perdew and Alex Zunger. Self-interaction correction to density-functional ap-proximations for many-electron systems. Phys. Rev. B, 23:5048–5079, May 1981.
[137] W. Kohn. Nobel lecture: Electronic structure of matter–wave functions and densityfunctionals. Rev. Mod. Phys., 71:1253–1266, Oct 1999.
[138] A. D. Becke. Density-functional exchange-energy approximation with correct asymp-totic behavior. Phys. Rev. A, 38:3098–3100, Sep 1988.
[139] Chengteh Lee, Weitao Yang, and Robert G. Parr. Development of the Colle–Salvetticorrelation-energy formula into a functional of the electron density. Phys. Rev. B,37:785–789, Jan 1988.
[140] John P. Perdew, J. A. Chevary, S. H. Vosko, Koblar A. Jackson, Mark R. Pederson,D. J. Singh, and Carlos Fiolhais. Atoms, molecules, solids, and surfaces: Applicationsof the generalized gradient approximation for exchange and correlation. Phys. Rev. B,46:6671–6687, Sep 1992.
[141] Jorg Neugebauer and Tilmann Hickel. Density functional theory in materials sci-ence. Wiley Interdisciplinary Reviews: Computational Molecular Science, 3(5):438–448, 2013.
[142] Paula Mori-Sanchez, Aron J. Cohen, and Weitao Yang. Localization and delocalizationerrors in density functional theory and implications for band-gap prediction. Phys. Rev.Lett., 100:146401, Apr 2008.
94
[143] Ilaria Ciofini, Carlo Adamo, and Henry Chermette. Self-interaction error in densityfunctional theory: a mean-field correction for molecules and large systems. ChemicalPhysics, 309(1):67 – 76, 2005. Electronic Structure Calculations for UnderstandingSurfaces and Molecules. In Honor of Notker Roesch.
[144] John P. Perdew, Matthias Ernzerhof, and Kieron Burke. Rationale for mixing exactexchange with density functional approximations. The Journal of Chemical Physics,105(22), 1996.
[145] Jochen Heyd, Gustavo E. Scuseria, and Matthias Ernzerhof. Hybrid functionals basedon a screened coulomb potential. The Journal of Chemical Physics, 118(18), 2003.
[146] C. Franchini, R. Podloucky, J. Paier, M. Marsman, and G. Kresse. Ground-stateproperties of multivalent manganese oxides: Density functional and hybrid densityfunctional calculations. Phys. Rev. B, 75:195128, May 2007.
[147] G. Makov and M. C. Payne. Periodic boundary conditions in ab initio calculations.Phys. Rev. B, 51:4014–4022, Feb 1995.
[148] Jorg Neugebauer and Matthias Scheffler. Adsorbate-substrate and adsorbate-adsorbateinteractions of Na and K adlayers on Al(111). Phys. Rev. B, 46:16067–16080, Dec 1992.
[149] Seinosuke Onari, Toshihiro Arai, and Keiei Kudo. Infrared lattice vibrations anddielectric dispersion in α-Fe2O3. Phys. Rev. B, 16:1717–1721, Aug 1977.
[150] M.W. Finnis, A.Y. Lozovoi, and A. Alavi. The oxidation of NiAl: What can we learnfrom ab initio calculations? Annual Review of Materials Research, 35(1):167–207,2005.
[151] R. C. Weast, M. J. Astle, and W. H. Beyer, editors. CRC Handbook of Chemistry andPhysics. CRC Press, Inc., 69th edition, 1988-1989.
[152] Graeme Henkelman, Blas P. Uberuaga, and Hannes Jonsson. A climbing image nudgedelastic band method for finding saddle points and minimum energy paths. The Journalof Chemical Physics, 113(22), 2000.
[153] R.R. Hultgren. Selected values of thermodynamic properties of metals and alloys. Wileyseries on the science and technology of materials. Wiley, 1963.
[154] H. Okamoto. Al–Cr (aluminum-chromium). Journal of Phase Equilibria and Diffusion,29(1):112–113, 2008.
[155] J. C. Boettger. High-precision, all-electron, full-potential calculation of the equationof state and elastic constants of corundum. Phys. Rev. B, 55:750–756, Jan 1997.
[156] H. d’Amour, D. Schiferl, W. Denner, Heinz Schulz, and W. B. Holzapfel. Highpres-sure singlecrystal structure determinations for ruby up to 90 kbar using an automaticdiffractometer. Journal of Applied Physics, 49(8), 1978.
95

[157] A.H. Heuer, T. Nakagawa, M.Z. Azar, D.B. Hovis, J.L. Smialek, B. Gleeson, N.D.M.Hine, H. Guhl, H.-S. Lee, P. Tangney, W.M.C. Foulkes, and M.W. Finnis. On thegrowth of Al2O3 scales. Acta Materialia, 61(18):6670 – 6683, 2013.
[158] Roger H. French. Electronic band structure of Al2O3, with comparison to Alon andAIN. Journal of the American Ceramic Society, 73(3):477–489, 1990.
[159] E.T. Arakawa and M.W. Williams. Optical properties of aluminum oxide in the vacuumultraviolet. Journal of Physics and Chemistry of Solids, 29(5):735 – 744, 1968.
[160] J. Olivier and R. Poirier. Electronic structure of Al2O3 from electron energy lossspectroscopy. Surface Science, 105(1):347 – 356, 1981.
[161] Daniel T. Gillespie. Stochastic simulation of chemical kinetics. Annual Review ofPhysical Chemistry, 58(1):35–55, 2007.
[162] K.J.W. Atkinson, Robin W. Grimes, Mark R. Levy, Zoe L. Coull, and Tim English. Ac-commodation of impurities in α-Al2O3, α-Cr2O3 and α-Fe2O3. Journal of the EuropeanCeramic Society, 23(16):3059–3070, 2003.
[163] Thomas Hoche, Philip R. Kenway, Hans-Joachim Kleebe, Michael W. Finnis, andManfred Rhle. The structure of special grain boundaries in α-Al2O3. Journal ofPhysics and Chemistry of Solids, 55(10):1067–1082, 1994.
[164] Philip R. Kenway. Calculated structures and energies of grain boundaries in α-Al2O3.Journal of the American Ceramic Society, 77(2):349–355, 1994.
[165] I. Milas, B. Hinnermann, and E. A. Carter. Structure of and ion segregation to analumina grain boundary: Implications for growth and creep. Journal of MaterialsResearch, 23(5):1494–1508, 2008.
96