Atomistic Simulations of 1emNickel-Titanium Shape-Memory ...
132
Delft University of Technology Atomistic Simulations of Nickel-Titanium Shape-Memory Alloys Srinivasan, Prashanth DOI 10.4233/uuid:2f6f7731-fdb3-4a90-b1ba-5d275b1979d3 Publication date 2020 Document Version Final published version Citation (APA) Srinivasan, P. (2020). Atomistic Simulations of Nickel-Titanium Shape-Memory Alloys. https://doi.org/10.4233/uuid:2f6f7731-fdb3-4a90-b1ba-5d275b1979d3 Important note To cite this publication, please use the final published version (if applicable). Please check the document version above. Copyright Other than for strictly personal use, it is not permitted to download, forward or distribute the text or part of it, without the consent of the author(s) and/or copyright holder(s), unless the work is under an open content license such as Creative Commons. Takedown policy Please contact us and provide details if you believe this document breaches copyrights. We will remove access to the work immediately and investigate your claim. This work is downloaded from Delft University of Technology. For technical reasons the number of authors shown on this cover page is limited to a maximum of 10.
-
Upload
khangminh22 -
Category
Documents
-
view
2 -
download
0
Transcript of Atomistic Simulations of 1emNickel-Titanium Shape-Memory ...
Delft University of Technology
Atomistic Simulations of Nickel-Titanium Shape-Memory Alloys
Srinivasan, Prashanth
DOI10.4233/uuid:2f6f7731-fdb3-4a90-b1ba-5d275b1979d3Publication date2020Document VersionFinal published versionCitation (APA)Srinivasan, P. (2020). Atomistic Simulations of Nickel-Titanium Shape-Memory Alloys.https://doi.org/10.4233/uuid:2f6f7731-fdb3-4a90-b1ba-5d275b1979d3
Important noteTo cite this publication, please use the final published version (if applicable).Please check the document version above.
CopyrightOther than for strictly personal use, it is not permitted to download, forward or distribute the text or part of it, without the consentof the author(s) and/or copyright holder(s), unless the work is under an open content license such as Creative Commons.
Takedown policyPlease contact us and provide details if you believe this document breaches copyrights.We will remove access to the work immediately and investigate your claim.
This work is downloaded from Delft University of Technology.For technical reasons the number of authors shown on this cover page is limited to a maximum of 10.

ATOMISTIC SIMULATIONS OF
NICKEL-TITANIUM SHAPE-MEMORY ALLOYS

ATOMISTIC SIMULATIONS OF
NICKEL-TITANIUM SHAPE-MEMORY ALLOYS
Proefschrift
ter verkrijging van de graad van doctoraan de Technische Universiteit Delft,
op gezag van de Rector Magnificus prof. dr. ir. T.H.J.J. van der Hagen,voorzitter van het College voor Promoties,
in het openbaar te verdedigen opdonderdag 5 maart 2020 om 12:30 uur
door
Prashanth SRINIVASAN
Master of Technology in Civil Engineering and Applied Mechanics,Indian Institute of Technology Madras, India
geboren te Chennai, India.
This dissertation has been approved by the promotors.
Composition of the doctoral committee:Rector Magnificus, chairpersonProf. dr. ir. L. J. Sluys Delft University of Technology, promotorProf. dr. ir. L. Nicola Delft University of Technology, promotorProf. dr. ir. A. Simone University of Padova, Italy, promotor
Independent members:Prof. dr. B. Grabowski University of Stuttgart, GermanyProf. dr. M. J. Santofimia Navarro Delft University of TechnologyProf. dr. ir. T. J. H. Vlugt Delft University of TechnologyDr. M. Amirthalingam Indian Institute of Technology Madras, India
Keywords: shape memory alloys, molecular dynamics, interatomic poten-tial fitting, martensitic transformation.
Printed by: Ipskamp PrintingCover: An OVITO image of a martensitic structure colored according to
a local order parameter. Color code: red and blue - different vari-ants of martensite; green - untransformed austenite.
Copyright © 2020 by P. Srinivasan.
ISBN 978-94-6384-106-1
An electronic version of this dissertation is available athttp://repository.tudelft.nl/.

To Amma and Appa

CONTENTS
Summary xi
Samenvatting xiii
1 Introduction 1
1.1 General Introduction. . . . . . . . . . . . . . . . . . . . . . . . . . . 2
1.2 Objective and Outline of the Thesis . . . . . . . . . . . . . . . . . . . 4
References . . . . . . . . . . . . . . . . . . . . . . . . . . . . . . . . . . . 7
2 Modeling Pseudo-elasticity: MEAM vs EAM 9
2.1 Introduction . . . . . . . . . . . . . . . . . . . . . . . . . . . . . . . 10
2.2 Method . . . . . . . . . . . . . . . . . . . . . . . . . . . . . . . . . . 11
2.3 Results. . . . . . . . . . . . . . . . . . . . . . . . . . . . . . . . . . . 14
2.4 Lattice Deformation Model . . . . . . . . . . . . . . . . . . . . . . . 18
2.5 Concluding remarks . . . . . . . . . . . . . . . . . . . . . . . . . . . 20
References . . . . . . . . . . . . . . . . . . . . . . . . . . . . . . . . . . . 26
3 Orientation-dependent Pseudo-elasticity 29
3.1 Introduction . . . . . . . . . . . . . . . . . . . . . . . . . . . . . . . 30
3.2 Methodology . . . . . . . . . . . . . . . . . . . . . . . . . . . . . . . 31
3.3 Results. . . . . . . . . . . . . . . . . . . . . . . . . . . . . . . . . . . 33
3.3.1 Loading in ⟨110⟩-direction . . . . . . . . . . . . . . . . . . . 33
3.3.2 Loading in ⟨111⟩-direction . . . . . . . . . . . . . . . . . . . 38
3.3.3 Loading in ⟨100⟩-direction . . . . . . . . . . . . . . . . . . . 41
3.3.4 Discussion . . . . . . . . . . . . . . . . . . . . . . . . . . . . 42
3.3.5 Validation of MD results . . . . . . . . . . . . . . . . . . . . . 45
3.3.6 Effect of temperature . . . . . . . . . . . . . . . . . . . . . . . 47
3.4 Nano-wires under bending . . . . . . . . . . . . . . . . . . . . . . . 48
3.5 Conclusions. . . . . . . . . . . . . . . . . . . . . . . . . . . . . . . . 52
References . . . . . . . . . . . . . . . . . . . . . . . . . . . . . . . . . . . 54
vii
viii CONTENTS
4 A new Potential for Nickel-Titanium 59
4.1 Introduction . . . . . . . . . . . . . . . . . . . . . . . . . . . . . . . 60
4.2 Methodology . . . . . . . . . . . . . . . . . . . . . . . . . . . . . . . 62
4.2.1 The RF-MEAM potential . . . . . . . . . . . . . . . . . . . . . 62
4.2.2 Fitting methodology including stress tensors . . . . . . . . . 63
4.3 A new RF-MEAM for NiTi . . . . . . . . . . . . . . . . . . . . . . . . 64
4.3.1 Constructing the DFT database . . . . . . . . . . . . . . . . . 64
4.3.2 Optimization of the RF-MEAM parameters. . . . . . . . . . . 65
4.3.3 Performance of the RF-MEAM potential . . . . . . . . . . . . 65
4.4 A RF-MEAM potential for the NbMoTaWhigh-entropy alloy . . . . . . . . . . . . . . . . . . . . . . . . . . . . 71
4.5 Concluding remarks . . . . . . . . . . . . . . . . . . . . . . . . . . . 73
Appendix . . . . . . . . . . . . . . . . . . . . . . . . . . . . . . . . . . . . 74
4.A Using RF-MEAM in LAMMPS . . . . . . . . . . . . . . . . . . . . . . 74
4.A.1 Improvements to MEAMfit . . . . . . . . . . . . . . . . . . . . 74
4.A.2 LAMMPS implementation of the RF-MEAM potential. . . . . 74
4.B Benefits of stress tensor fitting: Example using B2 NiTi . . . . . . . . 74
4.C NiTi RF-MEAM potential parameters . . . . . . . . . . . . . . . . . . 79
References . . . . . . . . . . . . . . . . . . . . . . . . . . . . . . . . . . . 81
5 Influence of Defects on Phase Transformation 85
5.1 Introduction . . . . . . . . . . . . . . . . . . . . . . . . . . . . . . . 86
5.2 Modeling details . . . . . . . . . . . . . . . . . . . . . . . . . . . . . 88
5.3 Results and Discussion. . . . . . . . . . . . . . . . . . . . . . . . . . 89
5.3.1 Transformation in perfect NiTi . . . . . . . . . . . . . . . . . 89
5.3.2 Influence of anti-site defects. . . . . . . . . . . . . . . . . . . 90
5.3.3 Influence of Ni content. . . . . . . . . . . . . . . . . . . . . . 91
5.3.4 Influence of vacancies . . . . . . . . . . . . . . . . . . . . . . 94
5.3.5 Simulating bi-crystal behavior. . . . . . . . . . . . . . . . . . 96
5.3.6 Transformation in cylindrical NiTi nano-wires . . . . . . . . . 98
5.4 Conclusion . . . . . . . . . . . . . . . . . . . . . . . . . . . . . . . . 100
References . . . . . . . . . . . . . . . . . . . . . . . . . . . . . . . . . . . 102
6 Conclusions 105
6.1 Outlook . . . . . . . . . . . . . . . . . . . . . . . . . . . . . . . . . . 108
Acknowledgements 111
Curriculum Vitæ 113

CONTENTS ix
List of Publications 115

SUMMARY
S Hape-memory Alloys (SMAs) exhibit tremendous mechanical properties ow-ing to their reversible phase transformation between the austenitic and the
martensitic phase. Out of these, equi-atomic nickel-titanium (NiTi) alloys arethe most widely used SMAs for various applications since the transformation oc-curs close to room temperature. Advances in SMA engineering can be propelledby understanding the fundamental behavior of these materials. Atomistic scalecomputational techniques provide an efficient way of doing this. The accuracyof such techniques is based on the underlying model that is used in these simula-tions. With advancements in computational power, the scope for building moreaccurate material models and simulating bigger and more realistic systems haveincreased. This thesis is focused on understanding NiTi behavior at an atomisticscale using such accurate models. The work done as a part of this thesis is two-fold. Firstly, previously existing interatomic potential models are used to performmolecular dynamics (MD) simulations to describe various phase transformationphenomena in NiTi SMAs including pseudo-elasticity and shape-memory effect,thereby comparing the performance of these existing models. Secondly, a newNiTi interatomic potential is developed, using a database generated by perform-ing Density Functional Theory (DFT) calculations, the performance of which isbetter than existing models.
In Chapter 2, a comparison of two existing interatomic potentials, theembedded-atom method (EAM) and the second nearest neighbor modifiedembedded-atom method (2NN-MEAM) potential, is made by performing MDsimulations of uniaxial tensile and compressive loading of a single crystal NiTialong a particular orientation. It is observed that, although the EAM predictsa phase transformation, the transformation strains and the Young’s modulusof the two phases are inaccurately estimated. The same simulations, whenperformed with a 2NN-MEAM potential, yield more accurate results in compar-ison to experimental and theoretical values. The results indicate the superiorperformance and predictive capabilities of the 2NN-MEAM, thereby validatingits usage for further calculations.
The 2NN-MEAM is then used to analyze orientation-dependent behavior inthese NiTi alloys. In particular, Chapter 3 discusses the orientation-dependent
xi
xii SUMMARY
pseudo-elasticity in single crystals. Three different initial orientations are cho-sen and uniaxial loading is applied to model the martensitic transformation inthese single crystals. Given the predictive capacity of the 2NN-MEAM, it capturesaccurate transformation strains in comparison to ab initio calculations. The MDsimulations also reveal differences in the martensitic transformation mechanismalong different orientations.
Although the 2NN-MEAM outperforms earlier potentials and can capturetransformation strains along multiple orientations, some of the elastic constantsof the martensitic phase and the transformation temperatures are still incorrectlypredicted in comparison to ab initio and experimental values. Keeping this inmind, a new reference-free form of the MEAM potential (RF-MEAM) is devel-oped and optimized for NiTi as described in Chapter 4. Ab initio MD runs areperformed for both the austenitic and martensitic phase at different tempera-tures to generate configurations for the fitting of the RF-MEAM potential. Stresstensors of various configurations are also added to the fitting set, in additionto the energies and atomic forces. The new potential predicts elastic constantsand the transformation temperatures more accurately than existing interatomicmodels, making it more suitable for performing MD simulations on generic NiTisystems.
Chapter 5 demonstrates the predictive power of the RF-MEAM potential.Although the fitting database during the optimization consisted only of equi-atomic defect-free configurations, the potential captures the effect of various de-fects on the phase transformation in single-crystal NiTi as well. Presence of pointdefects reduces the austenitic transformation temperature drastically, getting itfurther close to experimentally known values. Grain boundaries and free sur-faces in NiTi systems act as a nucleation site for the austenitic transformation,thereby reducing the forward transformation temperature.
To summarize, the interatomic potential is the most critical part of any MDsimulation. The validity of the potential for a particular application needs tobe verified before drawing conclusions based on the MD results. Here, this isdemonstrated for the NiTi SMA, and the reader is given a newly developed po-tential that can be used to generate results for fine-tuning the engineering of NiTidevices for various applications.

SAMENVATTING
G Eheugenmetalen (GM) vertonen geweldige mechanische eigenschappendie te danken zijn aan hun omkeerbare fasetransformatie tussen de auste-
nitische en martensitische fasen. Van deze legeringen zijn nikkel-titaan (NiTi)legeringen met evenveel Ni als Ti de meest gebruikte GM voor verschillendetoepassingen aangezien de transformatie dicht bij kamertemperatuur plaatsvindt. Vooruitgang in GM kan worden bewerkstelligd door begrip van het funda-mentele gedrag van deze materialen. Rekentechnieken op atomistische schaalbieden een efficiënte manier om dit te doen. De nauwkeurigheid van dergelijketechnieken is gebaseerd op het onderliggende model dat in deze simulatieswordt gebruikt. Met de vooruitgang in rekenkracht zijn de mogelijkheden voorhet bouwen van nauwkeurigere materiaalmodellen en het simuleren van grotereen meer realistische systemen toegenomen. Deze dissertatie is er op gerichthet gedrag van NiTi op een atomistische schaal te begrijpen met behulp vandergelijke nauwkeurige modellen. Het werk dat voor dit proefschrift is gedaanbestaat uit twee delen. Als eerste worden al bestaande interatomaire potenti-aalmodellen gebruikt om moleculaire dynamica (MD) simulaties uit te voerenom verschillende fasetransformatieverschijnselen in NiTi GM te beschrijven,waaronder pseudo-elasticiteit en het vorm-geheugen effect. Daarbij wordthet presteren van deze bestaande modellen vergeleken. Als tweede wordt eennieuwe NiTi interatomaire potentiaal ontwikkeld, gebruik makend van eendatabase gegenereerd d.m.v. Density Functional Theory (DFT) berekeningen.DFT berekeningen presteren beter dan de bestaande modellen.
In Hoofdstuk 2 wordt een vergelijking gemaakt tussen twee bestaandeinteratomaire potentialen, de embedded-atom-methode (EAM) en de een-na-naaste buur gemodificeerde embedded-atom-methode (2NN-MEAM)potentiaal. Dit wordt gedaan door het uitvoeren van MD-simulaties waarinuniaxiale trek- en drukbelasting langs een bepaalde oriëntatie wordt opgelegdaan een NiTi éénkristal. Er wordt waargenomen dat, hoewel de EAM eenfasetransformatie voorspelt, de transformatierekken en de E-modulus van detwee fasen onnauwkeurig worden voorspeld. Wanneer dezelfde simulatiesworden uitgevoerd met een 2NN-MEAM potentiaal, zijn de resultaten nauwerin overeenstemming met experimentele en theoretische waarden. De resultaten
xiii

xiv SAMENVATTING
geven aan dat de 2NN-MEAM beter presteert en betere voorspellingen doet, wathet gebruik ervan voor verdere berekeningen rechtvaardigt.
De 2NN-MEAM wordt vervolgens gebruikt om oriëntatie-afhankelijk gedragin deze NiTi legeringen te analyseren. Hoofdstuk 3 bespreekt met name deoriëntatie-afhankelijke pseudo-elasticiteit in eenkristallen. Drie verschillendeinitiële oriëntaties zijn gekozen en er wordt een eenassige belasting toegepastom de martensitische transformatie in deze eenkristallen te modelleren. Gezienhet voorspellend vermogen van de 2NN-MEAM, produceert deze nauwkeurigtransformatierekken in vergelijking met ab initio berekeningen. De MD simu-laties tonen ook verschillen in het martensitische transformatiemechanisme inverschillende oriëntaties.
Hoewel de 2NN-MEAM beter presteert dan eerdere potentialen en de trans-formatierekken in meerdere richtingen kan reproduceren, worden sommige vande elastische constanten van de martensitische fase en de transformatietempe-raturen nog steeds verkeerd voorspeld vergeleken met ab initio en experimen-tele waarden. Met dit in het achterhoofd wordt een nieuwe referentie-vrije vormvan de MEAM-potentiaal (RF-MEAM) ontwikkeld en geoptimaliseerd voor NiTi,zoals beschreven in hoofdstuk 4. Ab initio MD runs worden uitgevoerd voor zo-wel de austenitische als martensitische fasen bij verschillende temperaturen omconfiguraties te genereren voor het fitten van het RF-MEAM-potentiaal. Naast deenergieën en atoomkrachten worden ook spanningssensoren van verschillendeconfiguraties aan de fittingset toegevoegd. De nieuwe potentiaal voorspelt elasti-sche constanten en de transformatietemperaturen nauwkeuriger dan bestaandeinteratomaire modellen, waardoor deze beter geschikt is voor het uitvoeren vanMD-simulaties op generieke NiTi-systemen.
Hoofdstuk 5 toont de voorspellende kracht van de RF-MEAM-potentiaal.Hoewel de fitting-database tijdens de optimalisatie alleen bestond uit defectvrijeconfiguraties met evenveel Ni als Ti, reproduceert de potentiaal ook het effectvan defecten op de fasetransformatie in een NiTi eenkristal. De aanwezigheidvan puntdefecten verlaagt de austenitische transformatietemperatuur drastisch,waardoor deze dichter in de buurt komt van experimenteel bekende waar-den. Korrelgrenzen en vrije oppervlakken in NiTi-systemen fungeren als eennucleatieplaats voor de austenitische transformatie, waardoor de voorwaartsetransformatietemperatuur wordt verlaagd.
Samengevat is de interatomaire potentiaal het meest kritische onderdeel vanelke MD-simulatie. De validiteit van de potentiaal voor een bepaalde toepassingmoet worden geverifieerd alvorens conclusies te trekken op basis van de MD-resultaten. Hier wordt dit gedemonstreerd voor NiTi GM, en de lezer krijgt een

SAMENVATTING xv
nieuw ontwikkelde potentiaal die gebruikt kan worden om resultaten te genere-ren voor het fine-tunen van NiTi-apparaten voor verschillende toepassingen.

1INTRODUCTION
க க கசடற க பைவ க றபிநி க அத தக.
தி ற , ற 391
Learn without flaws what is worthy of being learned, andlive by it.
Thirukkural, Kural 391
1

1
2 1. INTRODUCTION
1.1. GENERAL INTRODUCTION
S Hape-memory alloys (SMAs) are a unique class of metal alloys that show in-teresting deformation behavior. They can undergo large deformations in the
order of 10% that can be recovered upon heating above a particular temperature.This leads to some fascinating phenomena such as the one-way and two-wayshape-memory effects and pseudo/super-elasticity. Hence these materials havefound widespread applications. Among the various shape-memory alloys thathave been discovered so far, the equi-atomic nickel-titanium (NiTi) SMA, alsoknown as Nitinol, has been the most widely used for different practical applica-tions owing to their superior mechanical behavior, corrosion resistance, and theability to recover its original shape close to room temperature [1].
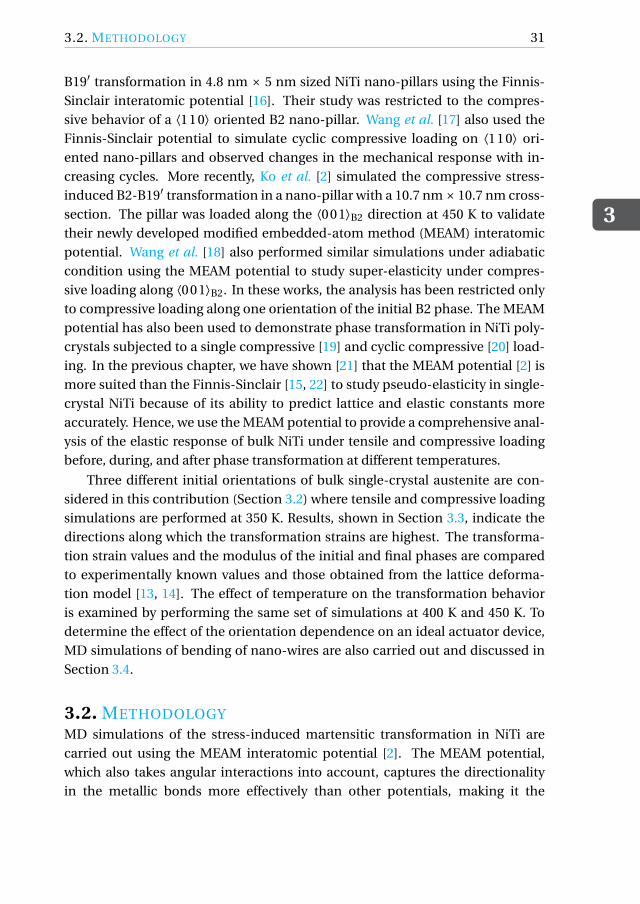
The shape-memory, or the ability to exist in two different shapes, arises dueto a reversible phase transformation between two crystalline phases of NiTi. Theparent phase, known as austenite, has a B2 (body centered cubic) crystal struc-ture with Ni atoms at the corner and Ti atoms at the center of the cube andvice-versa. Upon cooling, or under the application of stress (or strain), the par-ent phase transforms into the product martensite phase which has a monoclinicB19′ crystal structure with a monoclinic angle close to 97.7°. The martensiticdistortion of the B2 to the B19′ is schematically represented in Fig. 1.1. The fig-ure on the left hand side shows four cubic B2 cells in black, with Ni atoms atthe corner (blue colored balls) and Ti atoms at the center (red colored balls) ofthe cube. Upon a (110)[110]B2 basal shear and a (001)[110]B2 non-basal shear,the B2 structure transforms into the B19′ structure. The B19′ crystal structure isshown with respect to the B2 crystal in Fig. 1.1(b). During a thermal or a loadingcycle, NiTi transforms between these two crystal structures leading to its uniqueproperties.
Although NiTi SMAs have been extensively used in the industry, there are stilla number of fundamental ambiguities over the past couple of decades that haveinterested researchers. For instance, the crystal structure of the martensitic B19′
phase was not unambiguously established until 2003, when Huang et al. [3] per-fomed ab initio studies to obtain a stable B19′ crystal structure in their calcula-tions. More recently, development of nano-crystalline NiTi alloys have attracteda lot of attention. Their excellent strength and thermo-mechanical behavior atthe nano-scale have led to a number of ongoing experimental research on thenano-scale phase transformation mechanism and the differences with respectto their bulk counterparts. Another area of ambiguity is the formation and roleof martensitic twins during temperature- and stress-induced phase transforma-tion. Performing such transformation experiments on nano-crystalline or single-

1.1. GENERAL INTRODUCTION
1
3
i, i′ a0
j
k
j′ k′
(a)
i′
j′ k′
am
bmcm
β
(b)
Figure 1.1: Schematic of the B2-B19′ lattice deformation in NiTi [2]: (a) Ni atoms are representedby blue colored balls and Ti atoms are represented by red colored balls; (i , j ,k) represent the B2reference frame; i ′, j ′ and k ′ lie along the [001], [110] and [110] direction of the reference frame;B2 is represented by blue dotted lines viewed in the (i ′, j ′,k ′) reference frame; (b) distortion of B2(blue dotted lattice) to B19′ (red lattice); the lattice constant of B2 is a0 and the lattice constants ofB19′ are am, bm, cm and β.
crystal SMAs is also challenging due to the difficulty involved in processing them.
In this regard, a theoretical approach towards studying and analyzing SMAbehavior is useful in overcoming such ambiguities and supplementing experi-mental results. Computational simulation techniques including density func-tional fheory (DFT) and molecular dynamics (MD) provide a fundamental un-derstanding of the various mechanisms during phase transformation in these al-loys. Although DFT calculations are more accurate, they are limited by the lengthand time-scale of these simulations. MD simulations provide a faster approachtowards modeling transformations in larger systems at a nano-scale. The accu-racy of any MD simulation is based on the underlying interatomic potential thatdrives the motion of atoms in the system. The interatomic potential is an analyt-ical expression describing the energy of two interacting particles. In general, theinteratomic potentials are parametrized using a database of energies and atomicforces in various configurations generated from ab initio calculations. To modelthe phase transformations in NiTi, a number of interatomic potential modelshave been developed and parametrized in literature. As global computationalpower increases, more complex potentials are being optimized with a growingdatabase, and the accuracy of the models is always increasing.
For instance, the first potentials that were developed were simple Lennard-

1
4 1. INTRODUCTION
Jones type potentials that were built to qualitatively model the square-tetragonaltransformation in a model 2-D NiTi structure [4, 5]. In 2010, Zhong et al. [6] andMutter and Nielaba [7] independently obtained parameters for a embedded-atom method (EAM) potential that predicted temperature- and stress-inducedphase transformations in single-crystal NiTi nano-wires and bulk oriented alonga particular direction. A more recent and accurate parametrization of the EAMwas obtained by Ren and Sehitoglu [8] to model the B2-B19′ transformation.More recently, a second nearest neighbor modified embedded-atom method(2NN-MEAM) potential was parametrized by Ko et al. [9], which included three-body terms and accounted for the directionality of bonds in NiTi. The MEAMpotential was able to predict phase transformation mechanisms in poly-crystalNiTi and free-standing NiTi nano-particles [10, 11]. Each of these potentialshave their own merits and demerits and are restricted simultaneously in termsof accuracy and applicability. Since the interatomic potential is the most crit-ical aspect of the MD simulations, their validity and applicability needs to betested before drawing any conclusions from the MD results. With increasingcomputing power and advent of new fitting techniques, there is always scopeto build better-tailored potentials by varying the underlying dataset used foroptimization. Keeping this in mind, this thesis focuses on two aspects of MDsimulations of NiTi SMAs. MD runs are performed using existing potentialsto describe interesting shape-memory phenomena and to draw comparisonsbetween different potentials and discuss their drawbacks. In addition, a newreference free formalism of the MEAM potential is developed for NiTi. Thisnew potential outperforms existing interatomic potentials in predicting thedeformation behavior of NiTi.
1.2. OBJECTIVE AND OUTLINE OF THE THESISThe main objective of the thesis is to perform MD simulations on various NiTisystems and develop an interatomic potential that predicts thermo-mechanicalbehavior that closely resembles experimental data. By doing so, the potentialcan be used to run MD simulations whose results would help in optimizing theproduction of SMA devices for certain applications. To this end, a reference-freeversion of the MEAM potential, called RF-MEAM potential, is developed for NiTi.
The thesis begins with a comparison of the performance of two existing in-teratomic potentials, the EAM-Finnis-Sinclair potential and the 2NN MEAM po-tential, in predicting SMA behavior. Chapter 2 discusses why the MEAM outper-forms the EAM potential by demonstrating a simple uni-axial loading simulationof a NiTi single crystal along a particular orientation. Although both interatomic
1.2. OBJECTIVE AND OUTLINE OF THE THESIS
1
5
potentials predict the stress-induced martensitic transformation, the deforma-tion properties (Young’s modulus of both phases and the transformation strain)are wrongly predicted by the EAM potential. The results are compared to thosecalculated using a single cell lattice deformation model (LDM) [12]. The rea-son for the superior performance of the MEAM potential is attributed to the in-accurate lattice and elastic constants of both phases predicted by the EAM incomparison to the MEAM potential. The predictive power of the MEAM poten-tial is expressed in Chapter 3 in which MD results describing the orientation-dependent pseudo-elastic behavior of NiTi single-crystals are shown. Strain-controlled loading simulations are performed to predict phase transformationmechanisms along various directions. The effect of temperature on the stress-induced transformation behavior is also analyzed. The consequence of orienta-tion dependence and tension-compression asymmetry on deformation of NiTisingle-crystal systems is also demonstrated by performing bending simulationsof three differently oriented nano-wires.
While performing stress-induced transformation simulations along differentorientations, it is noticed that, although the MEAM potential is quite suitable tomodel NiTi behavior, there are still differences in certain properties with respectto experimental results. For instance, the predicted values of the transforma-tion temperatures and the hysteresis during the cooling-heating cycle, and someelastic constants of the martensitic phase, are inaccurate by more than 10% whencompared to experimental values. In view of this, Chapter 4 discusses the devel-opment of a new interatomic potential for NiTi, named the reference-free MEAM(RF-MEAM) potential. The primary advantage of this potential formalism is thatthe dependency of the pair potential part of the MEAM formalism on the refer-ence structure is completely removed by also defining the pair potential part asan analytical function. Besides this, the potential is also fit to stress tensors ofdifferent martensitic and austenitic configurations, in addition to energies andatomic forces. The result is a new parametrization for NiTi, whose predictive per-formance of the thermo-mechanical properties is better than that of the MEAMpotential. A section towards the end of this chapter also describes, as a proof-of-concept, the extension of the RF-MEAM fitting and MD simulation methodologyto a multi-component (four component) high entropy alloy. In Chapter 5, therobustness of the new NiTi RF-MEAM potential is demonstrated by performingMD simulations on defective NiTi systems. The effect of point defects like anti-sites, vacancies and compositional defects, and the effect of grain boundariesand free surfaces on the phase transformation behavior is studied. MD simu-lations using the RF-MEAM potential predict that the presence of such defects
1
6 1. INTRODUCTION
drastically reduces the austenitic transformation temperature, bringing it closerto experimentally observed values. Grain boundaries and free surfaces act asa nucleation site for the forward transformation to the austenitic phase. Whileonly ideal defect-free single crystals are a part of the fitting database, the qualityof these results demonstrates the predictive power of the newly developed po-tential.
REFERENCES
1
7
REFERENCES[1] K. Otsuka and C. Wayman, Shape Memory Materials (Oxford University
Press, 1999).
[2] S. Mao, J. Luo, Z. Zhang, M. Wu, Y. Liu, and X. Han, EBSD studies of thestress-induced B2-B19’ martensitic transformation in NiTi tubes under uni-axial tension and compression, Acta Materialia 58, 3357 (2010).
[3] X. Huang, G. J. Ackland, and K. M. Rabe, Crystal structures and shape-memory behaviour of NiTi, Nature Materials 2, 307 (2003).
[4] O. Kastner, Molecular-dynamics of a 2D model of the shape memory effect,Continuum Mechanics and Thermodynamics 15, 487 (2003).
[5] O. Kastner, G. Eggeler, W. Weiss, and G. Ackland, Molecular dynamics sim-ulation study of microstructure evolution during cyclic martensitic transfor-mations, Journal of the Mechanics and Physics of Solids 59, 1888 (2011).
[6] Y. Zhong, K. Gall, and T. Zhu, Atomistic study of nanotwins in NiTi shapememory alloys, Journal of Applied Physics 110, 033532 (2011).
[7] D. Mutter and P. Nielaba, Simulation of the shape memory effect in a NiTinano model system, Condensed Matter and Materials Science 577, S83(2013).
[8] G. Ren and H. Sehitoglu, Interatomic potential for the NiTi alloy and its ap-plication, Computational Materials Science 123, 19 (2016).
[9] W.-S. Ko, B. Grabowski, and J. Neugebauer, Development and application ofa Ni-Ti interatomic potential with high predictive accuracy of the martensiticphase transition, Physical Review B 92, 134107 (2015).
[10] W.-S. Ko, S. B. Maisel, B. Grabowski, J. B. Jeon, and J. Neugebauer, Atomicscale processes of phase transformations in nanocrystalline NiTi shape-memory alloys, Acta Materialia 123, 90 (2017).
[11] S. B. Maisel, W.-S. Ko, J. L. Zhang, B. Grabowski, and J. Neugebauer, Thermo-mechanical response of NiTi shape-memory nanoprecipitates in TiV alloys,Physical Review Materials 1, 033610 (2017).
[12] T. Saburi, M. Yoshida, and S. Nenno, Deformation behaviour of shape mem-ory TiNi crystals, Scripta Metallurgica 18, 363 (1984).

2MODELING PSEUDO-ELASTICITY:
MEAM VS EAM
A comparison of the EAM-Finnis-Sinclair and the MEAM potential, two of the re-cently developed potentials to model NiTi, is carried out. The potentials are com-pared by studying the pseudo-elastic behavior in bulk NiTi for one specific crystal-lographic orientation. To this end we perform, for the first time, simulations wherethe transformation occurs not only under compressive but also under tensile load-ing along ⟨100⟩B2 using both potentials. Results indicate that in both cases theMEAM potential captures the pseudo-elastic behavior more accurately. By using alattice deformation model, it is demonstrated that the inaccurate transformationstrains predicted by the EAM-Finnis-Sinclair potential are a direct consequence ofits inability to predict experimental values of the lattice constants. Similarly, it isshown that the more precise values of the Young’s modulus of the initial austeniticand the final martensitic phase estimated by the MEAM potential are the resultof its ability to predict elastic constants more accurately than the EAM-Finnis-Sinclair potential. As a result, it is concluded that the MEAM potential is bettersuited to study the overall pseudo-elastic behavior in NiTi.
This chapter has been published in Computational Materials Science 134, 145-152 (2017) [1]
9
2
10 2. MODELING PSEUDO-ELASTICITY: MEAM VS EAM
2.1. INTRODUCTION
Pseudo-elasticity in nickel-titanium (NiTi) shape-memory alloys (SMAs) arisesdue to a reversible stress-induced phase transformation from the austenitic tothe martensitic phase. Molecular dynamics (MD) simulations are employed tomodel this transformation. They can provide insights into changes in the nanos-tructure of the alloy that cannot be easily identified through experiments. Inthis work, we demonstrate the superior performance of the MEAM potential [2],compared to the EAM-Finnis-Sinclair (EAM-FS) potential [3, 4], to study pseudo-elastic behavior of bulk NiTi.
Actuation and damping devices made from SMAs rely on pseudo-elasticityof the alloy. During pseudo-elasticity, the alloy transforms into a monoclinicB19′ martensitic phase from the austenitic B2 (BCC) phase. In general, pseudo-elasticity in NiTi single-crystals depends on the orientation of the crystal [5, 6].In polycrystals, the effect of the distribution and orientation of the crystals onthe mechanical behavior of the alloy becomes progressively more important asthe specimen dimensions decrease and can be significant in micro and nano-scale devices [7–9] where the specific orientation of a few crystals determinesthe overall mechanical response. Hence it becomes important to describe themechanical response of single crystals. In this respect, MD simulations consti-tute a versatile platform that allows, contrary to experiments, to load a singlecrystal with simple geometry along any crystallographic direction.
Two of the recently developed interatomic potentials to model NiTi are theembedded atom Method - Finnis-Sinclair (EAM-FS) potential [3, 4] and theModified embedded atom Method (MEAM) potential [2], both described inSection 2.2. Ko et al. [2] showed that the MEAM potential accurately predictspseudo-elastic behavior in ⟨100⟩B2 oriented NiTi nano-pillars under com-pression. They obtained a transformation strain of 5% during the B2-B19′
transformation, a value close to that obtained with the Lattice DeformationModel (LDM) proposed by Saburi and Nenno [10, 11]. This model, based oncalculation of lattice distortion during the B2-B19′ transformation of an isolatedand unconstrained B2 lattice, predicts the final variant of martensite that isformed when austenite is loaded along a generic direction. From this, it ispossible to calculate the transformation strain of a single B2 unit cell along ageneric orientation. The results in this work, reported in Section 2.3, show thatthe simulation reported by Ko et al. [2], performed with the EAM-FS potential,does not predict the correct transformation behavior although the EAM-FSpotential has been reported to predict pseudo-elasticity during compressionalong ⟨110⟩B2 [3, 4]. Here, we have also performed, for the first time, simulations
2.2. METHOD
2
11
of the tensile behavior of bulk NiTi along ⟨100⟩B2 using both potentials. TheMEAM potential appears to outperform the EAM-FS as it predicts the elasticdeformation of the austenitic and martensitic phase, separated by a stressplateau under both tension and compression, and correct transformation strainvalues.
To validate the results obtained using the MEAM potential, the predictedtransformation strain values are compared to those obtained with the LDM inSection 2.4. The coefficients of the elastic tensor of the initial B2 phase and thefinal B19′ variants obtained under compressive and tensile loading are comparedto those obtained with ab initio simulations. The results confirm that the MEAMpotential is better suited to study the overall pseudo-elastic behavior in NiTi andalso the mechanical behavior of the individual phases. The reason for the limita-tions of the EAM-FS potential and how the MEAM potential overcomes them aredescribed in Section 2.5.
2.2. METHODThere is general consensus that the most important aspect of any MD simulationis the choice of the interatomic potential. In the case of SMAs this is particularlychallenging because the alloy has a different stable phase at high temperatureand low temperature. The potential must predict accurate material propertiesfor both phases, apart from predicting the phase transformation. Two of the re-cently developed interatomic potentials to model NiTi are employed in this workand their capability to predict pseudo-elastic behavior is assessed.
The EAM-FS potential originates from the second-moment approximationof the tight-binding model and was developed by Finnis and Sinclair [12]. In theEAM-FS formulation, the total energy of the system is expressed as
E =∑i
Aαβ exp
[−pαβ
(ri j
dαβ−1
)]−
√∑j =i
F (ri j )
with
F (ri j ) = ξ2αβ exp
[−2qαβ
(ri j
dαβ−1
)]where ri j denotes the distance between atoms i and j , and indices αβ repre-sent the different atomic interaction combinations Ni-Ni, Ni-Ti and Ti-Ti. Thefirst term in the summation is a repulsion term and the second term representsmetallic bonding. The 15 parameters for the binary NiTi alloy (ξ, p, d , A and
2
12 2. MODELING PSEUDO-ELASTICITY: MEAM VS EAM
q for Ni-Ni, Ti-Ti and Ni-Ti interaction) were determined by Lai and Liu [13].To reduce the computational effort, Mutter and Nielaba [3] and Zhong et al. [4]chose a cut-off radius of 4.2 Å disregarding weak long-range interactions. Theyalso proposed, independently, a smooth cut-off function between 4 Å and 4.2 Åto avoid diverging forces at a distance corresponding to the cut-off radius.
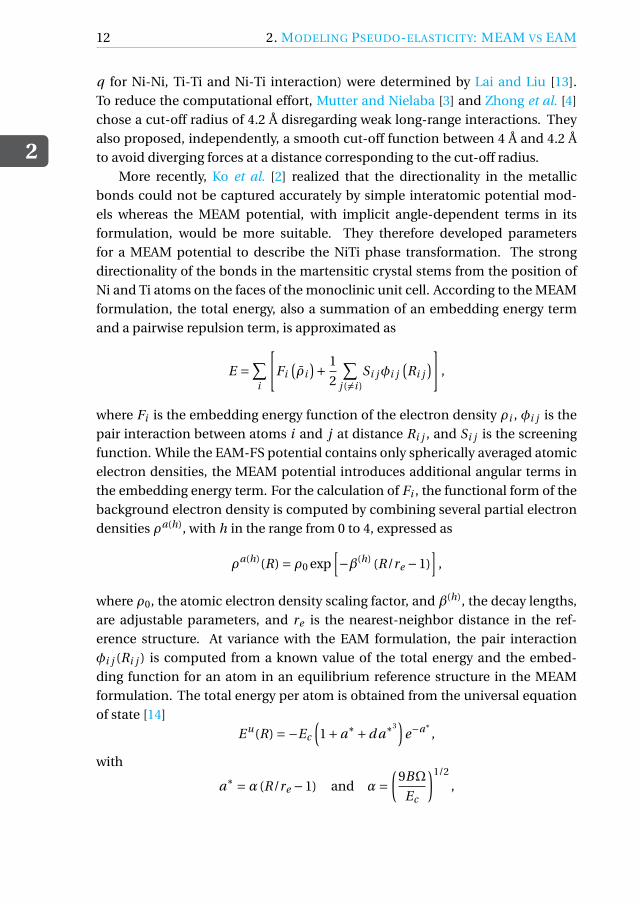
More recently, Ko et al. [2] realized that the directionality in the metallicbonds could not be captured accurately by simple interatomic potential mod-els whereas the MEAM potential, with implicit angle-dependent terms in itsformulation, would be more suitable. They therefore developed parametersfor a MEAM potential to describe the NiTi phase transformation. The strongdirectionality of the bonds in the martensitic crystal stems from the position ofNi and Ti atoms on the faces of the monoclinic unit cell. According to the MEAMformulation, the total energy, also a summation of an embedding energy termand a pairwise repulsion term, is approximated as
E =∑i
[Fi
(ρi
)+ 1
2
∑j ( =i )
Si jϕi j(Ri j
)],
where Fi is the embedding energy function of the electron density ρi , ϕi j is thepair interaction between atoms i and j at distance Ri j , and Si j is the screeningfunction. While the EAM-FS potential contains only spherically averaged atomicelectron densities, the MEAM potential introduces additional angular terms inthe embedding energy term. For the calculation of Fi , the functional form of thebackground electron density is computed by combining several partial electrondensities ρa(h), with h in the range from 0 to 4, expressed as
ρa(h)(R) = ρ0 exp[−β(h) (R/re −1)
],
where ρ0, the atomic electron density scaling factor, and β(h), the decay lengths,are adjustable parameters, and re is the nearest-neighbor distance in the ref-erence structure. At variance with the EAM formulation, the pair interactionϕi j (Ri j ) is computed from a known value of the total energy and the embed-ding function for an atom in an equilibrium reference structure in the MEAMformulation. The total energy per atom is obtained from the universal equationof state [14]
E u(R) =−Ec
(1+a∗+d a∗3
)e−a∗
,
with
a∗ =α (R/re −1) and α=(
9BΩ
Ec
)1/2
,
2.2. METHOD
2
13
x
y
z
27 nm
loading
〈010〉B2
〈100〉B2〈001〉B2
(a)
strain
stre
ss
εtrans
σtrans
(b)
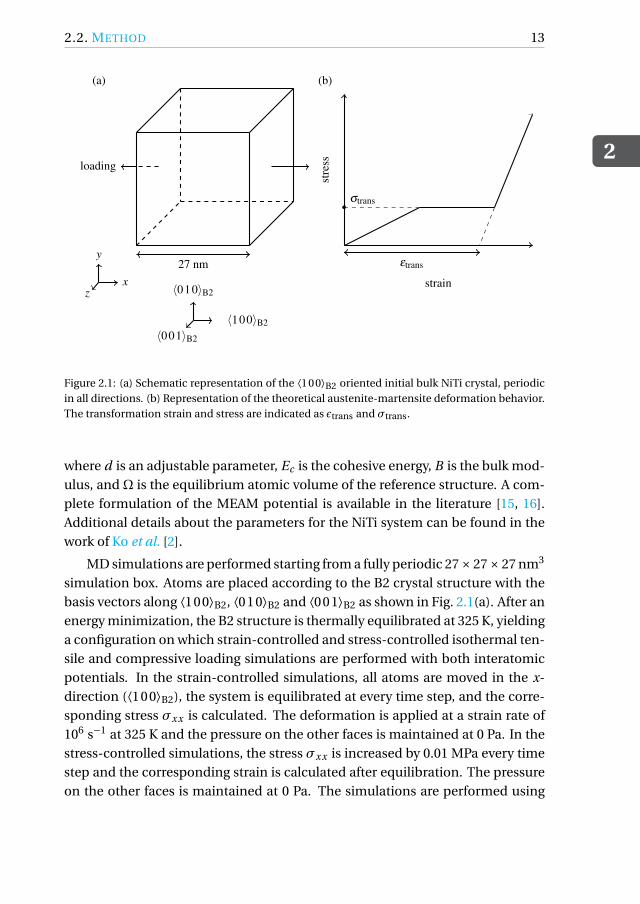
Figure 2.1: (a) Schematic representation of the ⟨100⟩B2 oriented initial bulk NiTi crystal, periodicin all directions. (b) Representation of the theoretical austenite-martensite deformation behavior.The transformation strain and stress are indicated as ϵtrans and σtrans.
where d is an adjustable parameter, Ec is the cohesive energy, B is the bulk mod-ulus, and Ω is the equilibrium atomic volume of the reference structure. A com-plete formulation of the MEAM potential is available in the literature [15, 16].Additional details about the parameters for the NiTi system can be found in thework of Ko et al. [2].
MD simulations are performed starting from a fully periodic 27× 27× 27 nm3
simulation box. Atoms are placed according to the B2 crystal structure with thebasis vectors along ⟨100⟩B2, ⟨010⟩B2 and ⟨001⟩B2 as shown in Fig. 2.1(a). After anenergy minimization, the B2 structure is thermally equilibrated at 325 K, yieldinga configuration on which strain-controlled and stress-controlled isothermal ten-sile and compressive loading simulations are performed with both interatomicpotentials. In the strain-controlled simulations, all atoms are moved in the x-direction (⟨100⟩B2), the system is equilibrated at every time step, and the corre-sponding stress σxx is calculated. The deformation is applied at a strain rate of106 s−1 at 325 K and the pressure on the other faces is maintained at 0 Pa. In thestress-controlled simulations, the stress σxx is increased by 0.01 MPa every timestep and the corresponding strain is calculated after equilibration. The pressureon the other faces is maintained at 0 Pa. The simulations are performed using
2
14 2. MODELING PSEUDO-ELASTICITY: MEAM VS EAM
LAMMPS [17]. A constant timestep (0.5 fs) is used. Temperature and pressure arecontrolled using a Langevin thermostat [18] and a Berendsen barostat [19], re-spectively. The deformation behavior is described by plotting the virial stress [20]on the x-plane in the x-direction against the corresponding engineering straincomponent.
The theoretical stress-strain response of the alloy under stress-controlledloading is schematically shown in Fig. 2.1(b). Here it is assumed that duringtransformation all austenite transforms into martensite, and this happens atconstant stress σtrans. The stress at which the behavior of the initial austeniticphase deviates from elasticity is defined as the transformation stress σtrans.When the fully martensitic elastic loading part of the curve is extended to anull stress level, the corresponding strain is defined as the transformation strainϵtrans.
In a strain-controlled simulation, when the atoms are displaced such thatthe resulting strain is more than the strain corresponding to σtrans, the responseis characterized by a combination of stress increase due to the elastic loadingof untransformed austenite, stress increase due to the elastic loading of trans-formed martensite, and stress drop caused by the transformation, until the entirecrystal is transformed. Hence a perfect plateau cannot be achieved in a strain-controlled phase transformation simulation. The lack of a perfect stress plateauhas also been observed in strain-controlled experiments [21] and earlier MD sim-ulation results [22]. This is also reflected in the MD results described next.
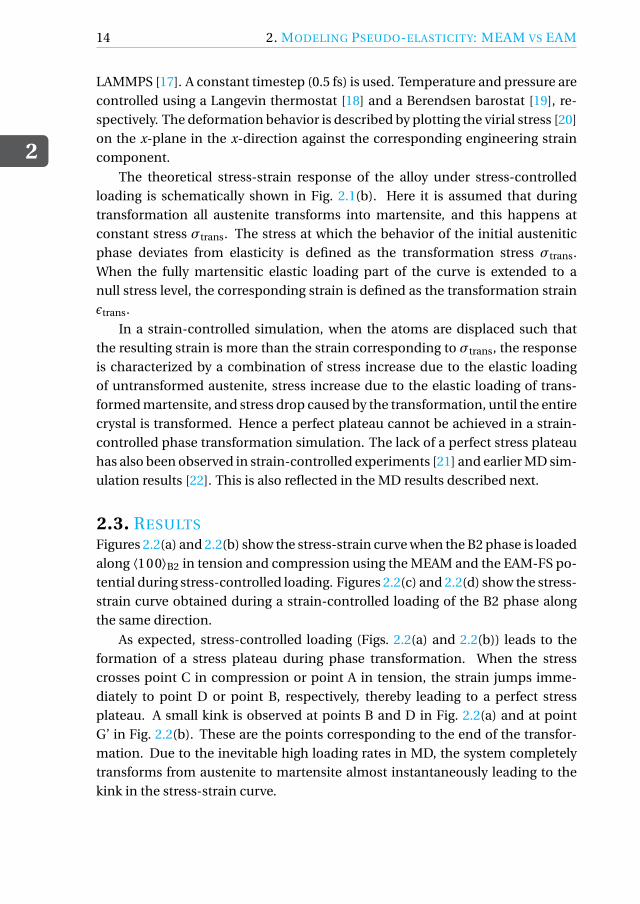
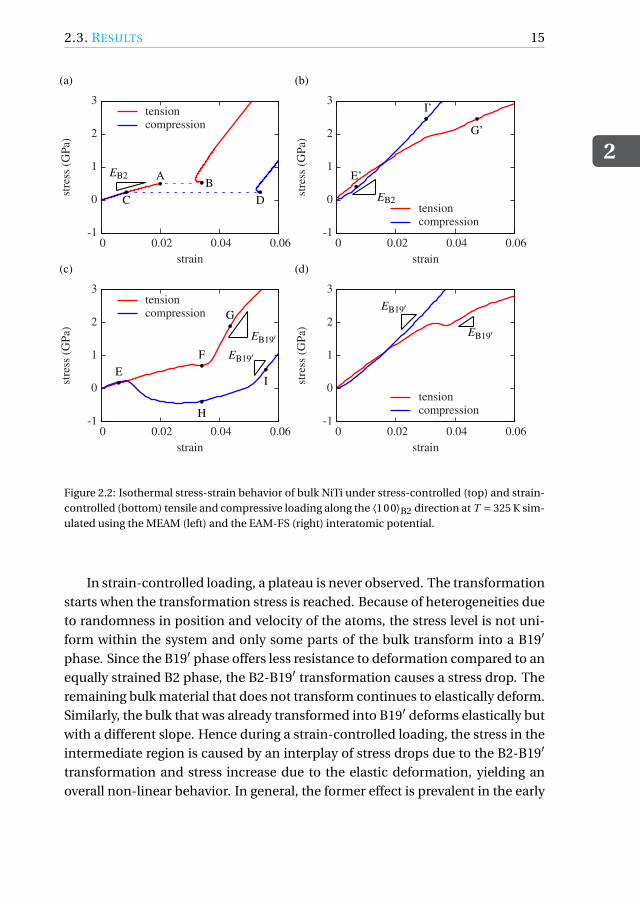
2.3. RESULTSFigures 2.2(a) and 2.2(b) show the stress-strain curve when the B2 phase is loadedalong ⟨100⟩B2 in tension and compression using the MEAM and the EAM-FS po-tential during stress-controlled loading. Figures 2.2(c) and 2.2(d) show the stress-strain curve obtained during a strain-controlled loading of the B2 phase alongthe same direction.
As expected, stress-controlled loading (Figs. 2.2(a) and 2.2(b)) leads to theformation of a stress plateau during phase transformation. When the stresscrosses point C in compression or point A in tension, the strain jumps imme-diately to point D or point B, respectively, thereby leading to a perfect stressplateau. A small kink is observed at points B and D in Fig. 2.2(a) and at pointG’ in Fig. 2.2(b). These are the points corresponding to the end of the transfor-mation. Due to the inevitable high loading rates in MD, the system completelytransforms from austenite to martensite almost instantaneously leading to thekink in the stress-strain curve.
2.3. RESULTS
2
15
compressiontension
strain
stre
ss(G
Pa)
0.060.040.020
3
2
1
0
-1
(a)
compressiontension
strain
stre
ss(G
Pa)
0.060.040.020
3
2
1
0
-1
(b)
compressiontension
strain
stre
ss(G
Pa)
0.060.040.020
3
2
1
0
-1
(c)
compressiontension
strain
stre
ss(G
Pa)
0.060.040.020
3
2
1
0
-1
(d)
EB2 AB
C D EB2
E’
I’
G’
EB19′
EB19′
EF
G
H
I
EB19′
EB19′
Figure 2.2: Isothermal stress-strain behavior of bulk NiTi under stress-controlled (top) and strain-controlled (bottom) tensile and compressive loading along the ⟨100⟩B2 direction at T = 325 K sim-ulated using the MEAM (left) and the EAM-FS (right) interatomic potential.
In strain-controlled loading, a plateau is never observed. The transformationstarts when the transformation stress is reached. Because of heterogeneities dueto randomness in position and velocity of the atoms, the stress level is not uni-form within the system and only some parts of the bulk transform into a B19′
phase. Since the B19′ phase offers less resistance to deformation compared to anequally strained B2 phase, the B2-B19′ transformation causes a stress drop. Theremaining bulk material that does not transform continues to elastically deform.Similarly, the bulk that was already transformed into B19′ deforms elastically butwith a different slope. Hence during a strain-controlled loading, the stress in theintermediate region is caused by an interplay of stress drops due to the B2-B19′
transformation and stress increase due to the elastic deformation, yielding anoverall non-linear behavior. In general, the former effect is prevalent in the early

2
16 2. MODELING PSEUDO-ELASTICITY: MEAM VS EAM
Tension
Compression
B2
B19’
Other
E F G
E H I
〈110〉B2
〈100〉B2
Figure 2.3: Sectional view of NiTi bulk cut along the ⟨110⟩B2 plane colored according to the com-mon neighbor analysis (CNA) pattern. Blue atoms represent B2, red atoms represent B19′ andwhite atoms represent those that are neither B2 nor B19′. The simulation is performed understrain control with the MEAM potential. Refer to Fig. 2.2(c) for the labels E to I. The austenitetransforms into martensite through the formation of Lüders-like bands.
stages of the phase transformation and causes a stress drop; the stress howevergradually increases towards the end of the intermediate region since the effect ofelastic deformation becomes more dominant as more atoms have already trans-formed into the B19′ phase.
Most importantly, comparison of the left and the right hand side of Fig. 2.2shows that a clear phase transformation is observed under tension and compres-sion only using the MEAM potential. On the contrary, when NiTi is modeled us-ing the EAM-FS potential, an intermediate plateau-like region is not observed atall in compression and is almost negligible in tension although the crystal trans-forms from the B2 to the B19′ phase.
However, the elastic slopes of the B2 and the B19′ phase along the ⟨100⟩B2
are differently predicted by the two potentials. From Fig. 2.2(a) (or Fig. 2.2(c))and with the MEAM potential, the Young’s modulus of the B2 phase is 31 GPa andthat of B19′ phase formed under tensile (compressive) loading is 122 (113) GPa.The Young’s modulus of the martensitic phase is different under tension andcompression because a different variant of martensite is formed under tensionand compression as shown in Fig. 2.4. From Fig. 2.2(b) (or Fig. 2.2(d)) and with
2.3. RESULTS
2
17
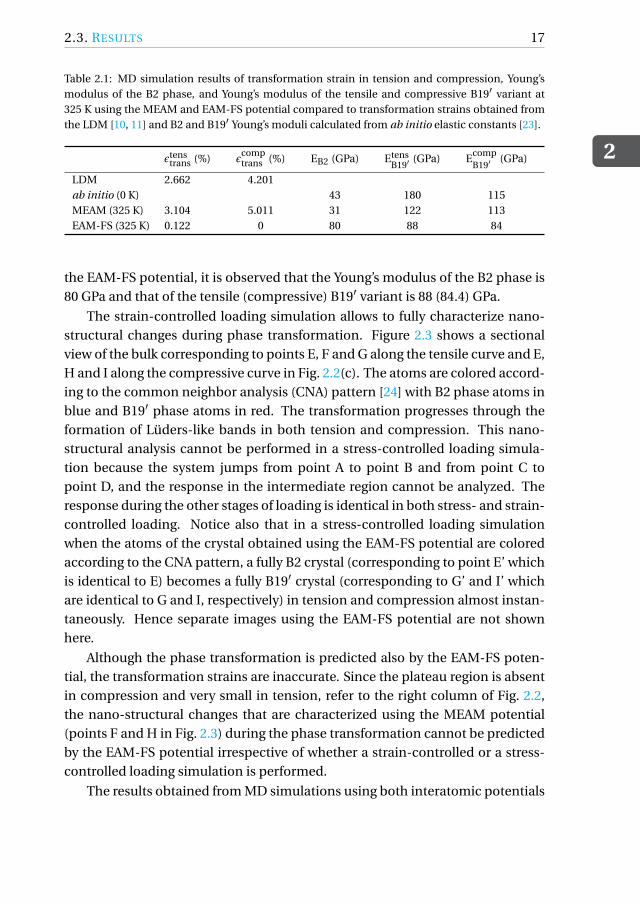
Table 2.1: MD simulation results of transformation strain in tension and compression, Young’smodulus of the B2 phase, and Young’s modulus of the tensile and compressive B19′ variant at325 K using the MEAM and EAM-FS potential compared to transformation strains obtained fromthe LDM [10, 11] and B2 and B19′ Young’s moduli calculated from ab initio elastic constants [23].
ϵtenstrans (%) ϵ
comptrans (%) EB2 (GPa) Etens
B19′ (GPa) EcompB19′ (GPa)
LDM 2.662 4.201ab initio (0 K) 43 180 115MEAM (325 K) 3.104 5.011 31 122 113EAM-FS (325 K) 0.122 0 80 88 84
the EAM-FS potential, it is observed that the Young’s modulus of the B2 phase is80 GPa and that of the tensile (compressive) B19′ variant is 88 (84.4) GPa.
The strain-controlled loading simulation allows to fully characterize nano-structural changes during phase transformation. Figure 2.3 shows a sectionalview of the bulk corresponding to points E, F and G along the tensile curve and E,H and I along the compressive curve in Fig. 2.2(c). The atoms are colored accord-ing to the common neighbor analysis (CNA) pattern [24] with B2 phase atoms inblue and B19′ phase atoms in red. The transformation progresses through theformation of Lüders-like bands in both tension and compression. This nano-structural analysis cannot be performed in a stress-controlled loading simula-tion because the system jumps from point A to point B and from point C topoint D, and the response in the intermediate region cannot be analyzed. Theresponse during the other stages of loading is identical in both stress- and strain-controlled loading. Notice also that in a stress-controlled loading simulationwhen the atoms of the crystal obtained using the EAM-FS potential are coloredaccording to the CNA pattern, a fully B2 crystal (corresponding to point E’ whichis identical to E) becomes a fully B19′ crystal (corresponding to G’ and I’ whichare identical to G and I, respectively) in tension and compression almost instan-taneously. Hence separate images using the EAM-FS potential are not shownhere.
Although the phase transformation is predicted also by the EAM-FS poten-tial, the transformation strains are inaccurate. Since the plateau region is absentin compression and very small in tension, refer to the right column of Fig. 2.2,the nano-structural changes that are characterized using the MEAM potential(points F and H in Fig. 2.3) during the phase transformation cannot be predictedby the EAM-FS potential irrespective of whether a strain-controlled or a stress-controlled loading simulation is performed.
The results obtained from MD simulations using both interatomic potentials
2
18 2. MODELING PSEUDO-ELASTICITY: MEAM VS EAM
at 325 K are summarized in Table 2.1 and are compared to transformation strainvalues obtained from the lattice deformation model (LDM) [10, 11] described indetail in the next section and 0 K Young’s modulus calculated from ab initio val-ues of the elastic constants [23]. Table 2.1 shows that the LDM transformationstrain of 2.662% (4.201%) during tension (compression) is not predicted by theEAM-FS potential (0.12% and 0% in tension and compression, respectively). TheEAM-FS potential also predicts a stiffer initial B2 phase and less stiff B19′ vari-ants than those calculated from ab initio elastic constants. The reason for thedifference is further discussed in the next section.
2.4. LATTICE DEFORMATION MODEL
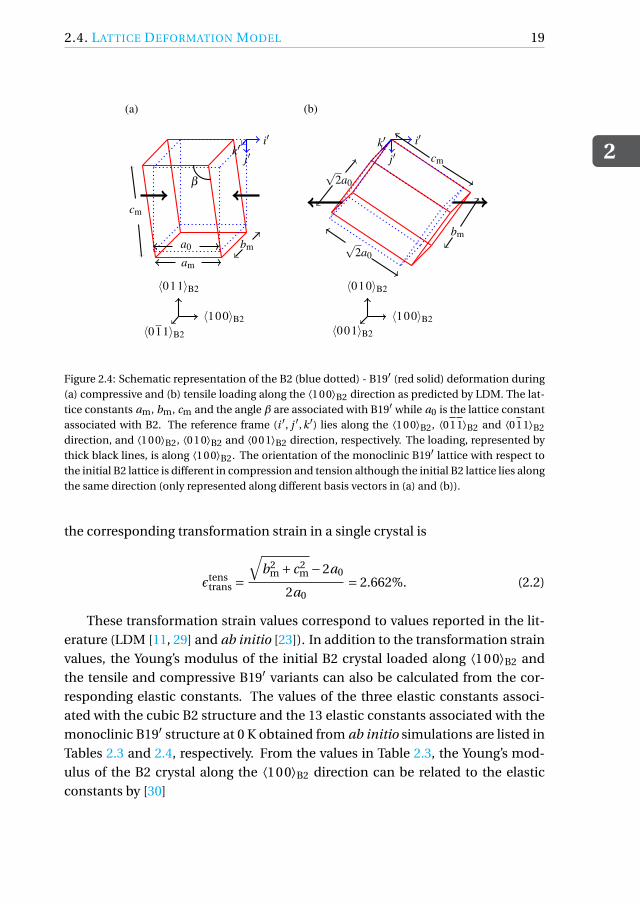
During a stress-induced phase transformation, the symmetric B2 austenite crys-tal transforms into a monoclinic B19′ crystal. The B19′ crystal can be oriented indifferent ways with respect to the initial B2 crystal. Hence a phase transforma-tion from B2 to B19′ can lead to any of the 12 equivalent lattice correspondingmartensite variant pairs (CVP), which differ in orientation with respect to theparent B2 crystal. The Lattice Deformation Model (LDM) [10, 11] allows to iden-tify the B19′ variant that forms at the end of the stress-induced transformation.According to the LDM, the variant of B19′ that forms when B2 is loaded in anyarbitrary direction is the one that produces the maximum strain along that par-ticular loading direction. By applying LDM, the variant that is formed and thetransformation strains have been calculated for all loading directions for a singleB2 crystal in [11, 25, 26]. The calculations have been experimentally validatedthrough various single crystal uniaxial loading experiments in [11, 27, 28]. Forthe current study, where B2 is loaded along the ⟨100⟩B2 direction, Fig. 2.4 showsthe initial B2 crystal (dotted blue lines) and the B19′ variant (solid red lines) thatforms according to the LDM under compression and tension.
The transformation strain values for the two B19′ variants shown in Fig. 2.4are calculated from the experimentally known lattice constants of B2 and B19′
listed in Table 2.2 using the LDM. When B2 is loaded in compression along⟨100⟩B2, the B19′ variant (Fig. 2.4(a)) that forms is oriented in a way that theside corresponding to the lattice constant am of B19′ falls along the loadingaxis. The LDM transformation strain in a single crystal corresponding to thistransformation is
ϵcomptrans = am −a0
a0= 4.201%. (2.1)
Likewise, the B19′ variant that forms under tension is shown in Fig. 2.4(b), and
2.4. LATTICE DEFORMATION MODEL
2
19
i′
j′k′
a0
am
bm
cm
β
〈100〉B2
〈011〉B2
〈011〉B2
(a)
i′
j′k′
bm
cm
√2a0
√2a0
〈100〉B2
〈010〉B2
〈001〉B2
(b)
Figure 2.4: Schematic representation of the B2 (blue dotted) - B19′ (red solid) deformation during(a) compressive and (b) tensile loading along the ⟨100⟩B2 direction as predicted by LDM. The lat-tice constants am, bm, cm and the angle β are associated with B19′ while a0 is the lattice constantassociated with B2. The reference frame (i ′, j ′,k ′) lies along the ⟨100⟩B2, ⟨011⟩B2 and ⟨011⟩B2direction, and ⟨100⟩B2, ⟨010⟩B2 and ⟨001⟩B2 direction, respectively. The loading, represented bythick black lines, is along ⟨100⟩B2. The orientation of the monoclinic B19′ lattice with respect tothe initial B2 lattice is different in compression and tension although the initial B2 lattice lies alongthe same direction (only represented along different basis vectors in (a) and (b)).
the corresponding transformation strain in a single crystal is
ϵtenstrans =
√b2
m + c2m −2a0
2a0= 2.662%. (2.2)
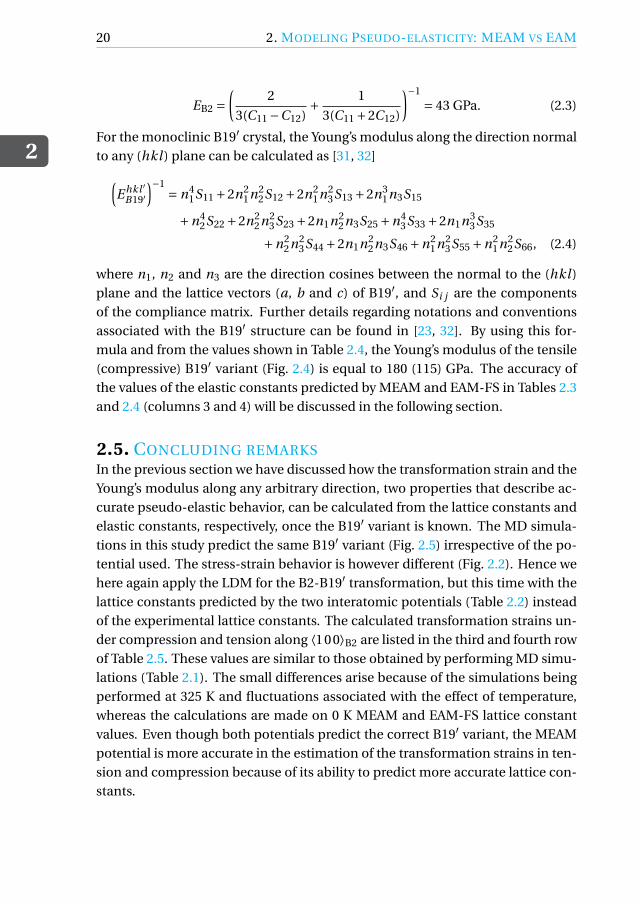
These transformation strain values correspond to values reported in the lit-erature (LDM [11, 29] and ab initio [23]). In addition to the transformation strainvalues, the Young’s modulus of the initial B2 crystal loaded along ⟨100⟩B2 andthe tensile and compressive B19′ variants can also be calculated from the cor-responding elastic constants. The values of the three elastic constants associ-ated with the cubic B2 structure and the 13 elastic constants associated with themonoclinic B19′ structure at 0 K obtained from ab initio simulations are listed inTables 2.3 and 2.4, respectively. From the values in Table 2.3, the Young’s mod-ulus of the B2 crystal along the ⟨100⟩B2 direction can be related to the elasticconstants by [30]
2
20 2. MODELING PSEUDO-ELASTICITY: MEAM VS EAM
EB2 =(
2
3(C11 −C12)+ 1
3(C11 +2C12)
)−1
= 43 GPa. (2.3)
For the monoclinic B19′ crystal, the Young’s modulus along the direction normalto any (hkl ) plane can be calculated as [31, 32](
E hkl ′B19′
)−1 = n41S11 +2n2
1n22S12 +2n2
1n23S13 +2n3
1n3S15
+n42S22 +2n2
2n23S23 +2n1n2
2n3S25 +n43S33 +2n1n3
3S35
+n22n2
3S44 +2n1n22n3S46 +n2
1n23S55 +n2
1n22S66, (2.4)
where n1, n2 and n3 are the direction cosines between the normal to the (hkl )plane and the lattice vectors (a, b and c) of B19′, and Si j are the componentsof the compliance matrix. Further details regarding notations and conventionsassociated with the B19′ structure can be found in [23, 32]. By using this for-mula and from the values shown in Table 2.4, the Young’s modulus of the tensile(compressive) B19′ variant (Fig. 2.4) is equal to 180 (115) GPa. The accuracy ofthe values of the elastic constants predicted by MEAM and EAM-FS in Tables 2.3and 2.4 (columns 3 and 4) will be discussed in the following section.
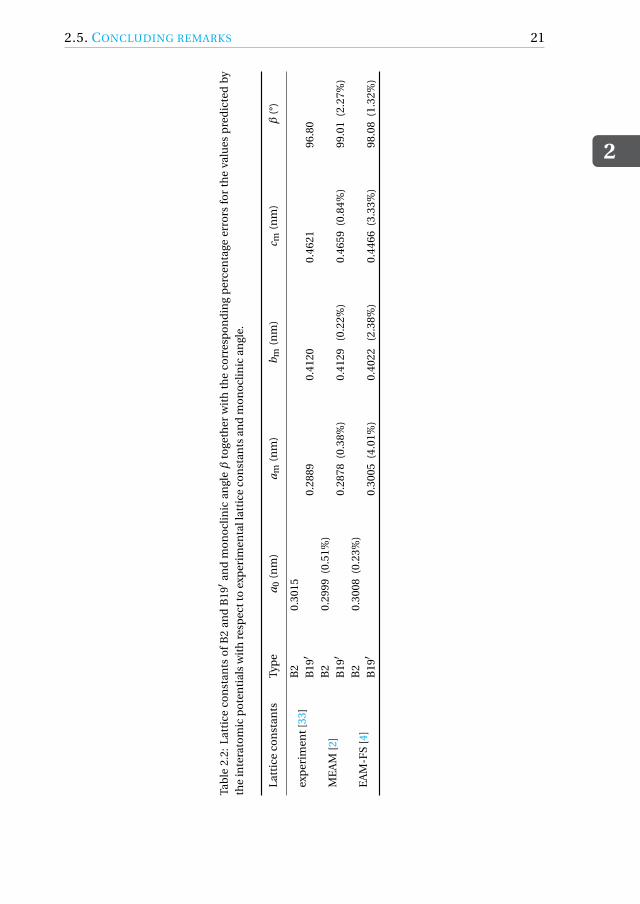
2.5. CONCLUDING REMARKSIn the previous section we have discussed how the transformation strain and theYoung’s modulus along any arbitrary direction, two properties that describe ac-curate pseudo-elastic behavior, can be calculated from the lattice constants andelastic constants, respectively, once the B19′ variant is known. The MD simula-tions in this study predict the same B19′ variant (Fig. 2.5) irrespective of the po-tential used. The stress-strain behavior is however different (Fig. 2.2). Hence wehere again apply the LDM for the B2-B19′ transformation, but this time with thelattice constants predicted by the two interatomic potentials (Table 2.2) insteadof the experimental lattice constants. The calculated transformation strains un-der compression and tension along ⟨100⟩B2 are listed in the third and fourth rowof Table 2.5. These values are similar to those obtained by performing MD simu-lations (Table 2.1). The small differences arise because of the simulations beingperformed at 325 K and fluctuations associated with the effect of temperature,whereas the calculations are made on 0 K MEAM and EAM-FS lattice constantvalues. Even though both potentials predict the correct B19′ variant, the MEAMpotential is more accurate in the estimation of the transformation strains in ten-sion and compression because of its ability to predict more accurate lattice con-stants.
2.5. CONCLUDING REMARKS
2
21
Tab
le2.
2:La
ttic
eco
nst
ants
of
B2
and
B19
′ and
mo
no
clin
ican
gleβ
toge
ther
wit
hth
eco
rres
po
nd
ing
per
cen
tage
erro
rsfo
rth
eva
lues
pre
dic
ted
by
the
inte
rato
mic
po
ten
tial
sw
ith
resp
ectt
oex
per
imen
tall
atti
ceco
nst
ants
and
mo
no
clin
ican
gle.
Latt
ice
con
stan
tsTy
pe
a0
(nm
)a
m(n
m)
bm
(nm
)c m
(nm
)β
(°)
exp
erim
ent[
33]
B2
0.30
15B
19′
0.28
890.
4120
0.46
2196
.80
ME
AM
[ 2]
B2
0.29
99(0
.51%
)B
19′
0.28
78(0
.38%
)0.
4129
(0.2
2%)
0.46
59(0
.84%
)99
.01
(2.2
7%)
EA
M-F
S[4
]B
20.
3008
(0.2
3%)
B19
′0.
3005
(4.0
1%)
0.40
22(2
.38%
)0.
4466
(3.3
3%)
98.0
8(1
.32%
)
2
22 2. MODELING PSEUDO-ELASTICITY: MEAM VS EAM
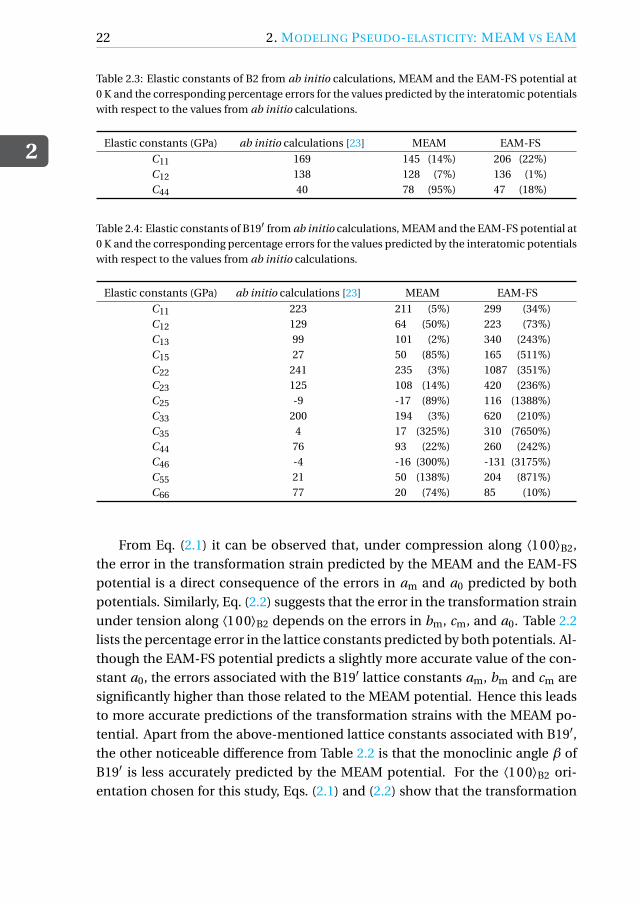
Table 2.3: Elastic constants of B2 from ab initio calculations, MEAM and the EAM-FS potential at0 K and the corresponding percentage errors for the values predicted by the interatomic potentialswith respect to the values from ab initio calculations.
Elastic constants (GPa) ab initio calculations [23] MEAM EAM-FS
C11 169 145 (14%) 206 (22%)C12 138 128 (7%) 136 (1%)C44 40 78 (95%) 47 (18%)
Table 2.4: Elastic constants of B19′ from ab initio calculations, MEAM and the EAM-FS potential at0 K and the corresponding percentage errors for the values predicted by the interatomic potentialswith respect to the values from ab initio calculations.
Elastic constants (GPa) ab initio calculations [23] MEAM EAM-FS
C11 223 211 (5%) 299 (34%)C12 129 64 (50%) 223 (73%)C13 99 101 (2%) 340 (243%)C15 27 50 (85%) 165 (511%)C22 241 235 (3%) 1087 (351%)C23 125 108 (14%) 420 (236%)C25 -9 -17 (89%) 116 (1388%)C33 200 194 (3%) 620 (210%)C35 4 17 (325%) 310 (7650%)C44 76 93 (22%) 260 (242%)C46 -4 -16 (300%) -131 (3175%)C55 21 50 (138%) 204 (871%)C66 77 20 (74%) 85 (10%)
From Eq. (2.1) it can be observed that, under compression along ⟨100⟩B2,the error in the transformation strain predicted by the MEAM and the EAM-FSpotential is a direct consequence of the errors in am and a0 predicted by bothpotentials. Similarly, Eq. (2.2) suggests that the error in the transformation strainunder tension along ⟨100⟩B2 depends on the errors in bm, cm, and a0. Table 2.2lists the percentage error in the lattice constants predicted by both potentials. Al-though the EAM-FS potential predicts a slightly more accurate value of the con-stant a0, the errors associated with the B19′ lattice constants am, bm and cm aresignificantly higher than those related to the MEAM potential. Hence this leadsto more accurate predictions of the transformation strains with the MEAM po-tential. Apart from the above-mentioned lattice constants associated with B19′,the other noticeable difference from Table 2.2 is that the monoclinic angle β ofB19′ is less accurately predicted by the MEAM potential. For the ⟨100⟩B2 ori-entation chosen for this study, Eqs. (2.1) and (2.2) show that the transformation
2.5. CONCLUDING REMARKS
2
23
a0
√2a0
am
cmβ
(a)
〈100〉B2
〈110〉B2
a0
a0 bmcm
〈100〉B2
〈010〉B2
(b)
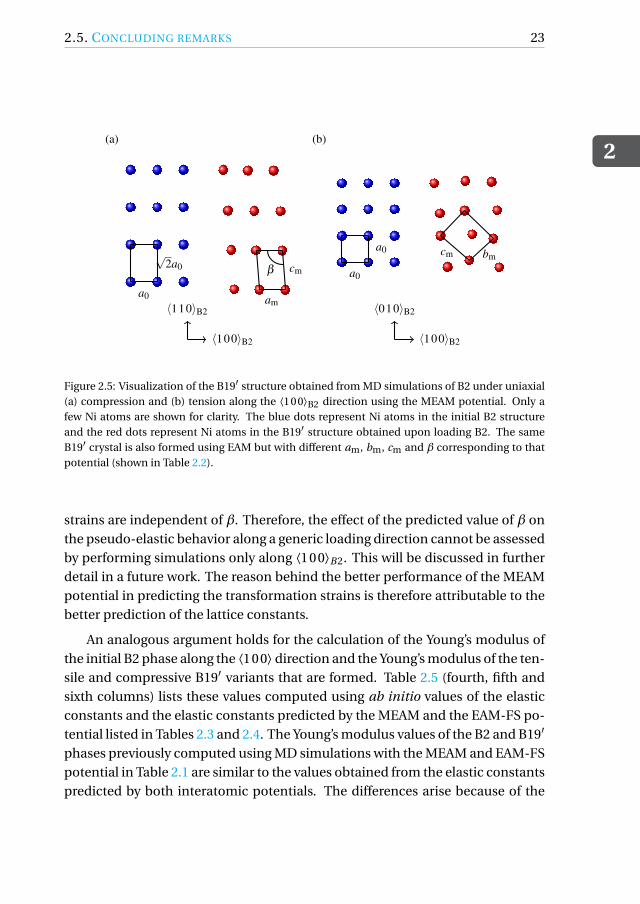
Figure 2.5: Visualization of the B19′ structure obtained from MD simulations of B2 under uniaxial(a) compression and (b) tension along the ⟨100⟩B2 direction using the MEAM potential. Only afew Ni atoms are shown for clarity. The blue dots represent Ni atoms in the initial B2 structureand the red dots represent Ni atoms in the B19′ structure obtained upon loading B2. The sameB19′ crystal is also formed using EAM but with different am, bm, cm and β corresponding to thatpotential (shown in Table 2.2).
strains are independent of β. Therefore, the effect of the predicted value of β onthe pseudo-elastic behavior along a generic loading direction cannot be assessedby performing simulations only along ⟨100⟩B2. This will be discussed in furtherdetail in a future work. The reason behind the better performance of the MEAMpotential in predicting the transformation strains is therefore attributable to thebetter prediction of the lattice constants.
An analogous argument holds for the calculation of the Young’s modulus ofthe initial B2 phase along the ⟨100⟩ direction and the Young’s modulus of the ten-sile and compressive B19′ variants that are formed. Table 2.5 (fourth, fifth andsixth columns) lists these values computed using ab initio values of the elasticconstants and the elastic constants predicted by the MEAM and the EAM-FS po-tential listed in Tables 2.3 and 2.4. The Young’s modulus values of the B2 and B19′
phases previously computed using MD simulations with the MEAM and EAM-FSpotential in Table 2.1 are similar to the values obtained from the elastic constantspredicted by both interatomic potentials. The differences arise because of the
2
24 2. MODELING PSEUDO-ELASTICITY: MEAM VS EAM
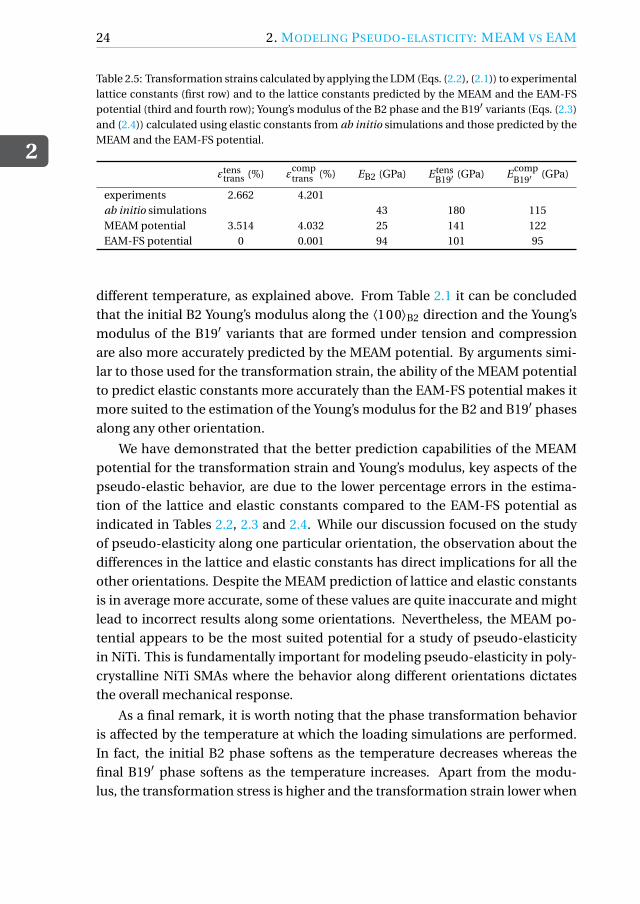
Table 2.5: Transformation strains calculated by applying the LDM (Eqs. (2.2), (2.1)) to experimentallattice constants (first row) and to the lattice constants predicted by the MEAM and the EAM-FSpotential (third and fourth row); Young’s modulus of the B2 phase and the B19′ variants (Eqs. (2.3)and (2.4)) calculated using elastic constants from ab initio simulations and those predicted by theMEAM and the EAM-FS potential.
εtenstrans (%) ε
comptrans (%) EB2 (GPa) E tens
B19′ (GPa) EcompB19′ (GPa)
experiments 2.662 4.201ab initio simulations 43 180 115MEAM potential 3.514 4.032 25 141 122EAM-FS potential 0 0.001 94 101 95
different temperature, as explained above. From Table 2.1 it can be concludedthat the initial B2 Young’s modulus along the ⟨100⟩B2 direction and the Young’smodulus of the B19′ variants that are formed under tension and compressionare also more accurately predicted by the MEAM potential. By arguments simi-lar to those used for the transformation strain, the ability of the MEAM potentialto predict elastic constants more accurately than the EAM-FS potential makes itmore suited to the estimation of the Young’s modulus for the B2 and B19′ phasesalong any other orientation.
We have demonstrated that the better prediction capabilities of the MEAMpotential for the transformation strain and Young’s modulus, key aspects of thepseudo-elastic behavior, are due to the lower percentage errors in the estima-tion of the lattice and elastic constants compared to the EAM-FS potential asindicated in Tables 2.2, 2.3 and 2.4. While our discussion focused on the studyof pseudo-elasticity along one particular orientation, the observation about thedifferences in the lattice and elastic constants has direct implications for all theother orientations. Despite the MEAM prediction of lattice and elastic constantsis in average more accurate, some of these values are quite inaccurate and mightlead to incorrect results along some orientations. Nevertheless, the MEAM po-tential appears to be the most suited potential for a study of pseudo-elasticityin NiTi. This is fundamentally important for modeling pseudo-elasticity in poly-crystalline NiTi SMAs where the behavior along different orientations dictatesthe overall mechanical response.
As a final remark, it is worth noting that the phase transformation behavioris affected by the temperature at which the loading simulations are performed.In fact, the initial B2 phase softens as the temperature decreases whereas thefinal B19′ phase softens as the temperature increases. Apart from the modu-lus, the transformation stress is higher and the transformation strain lower when

2.5. CONCLUDING REMARKS
2
25
the loading simulation is performed at a higher temperature. Although not ad-dressed in this study, the influence of temperature is captured accurately in theMD simulations and will be discussed in a forthcoming publication.

2
26 REFERENCES
REFERENCES[1] P. Srinivasan, L. Nicola, and A. Simone, Modeling pseudo-elasticity in NiTi:
Why the MEAM potential outperforms the EAM-FS potential, ComputationalMaterials Science 134, 145 (2017).
[2] W.-S. Ko, B. Grabowski, and J. Neugebauer, Development and application ofa Ni-Ti interatomic potential with high predictive accuracy of the martensiticphase transition, Physical Review B 92, 134107 (2015).
[3] D. Mutter and P. Nielaba, Simulation of the shape memory effect in a NiTinano model system, Condensed Matter and Materials Science 577, S83(2013).
[4] Y. Zhong, K. Gall, and T. Zhu, Atomistic study of nanotwins in NiTi shapememory alloys, Journal of Applied Physics 110, 033532 (2011).
[5] C. Frick, S. Orso, and E. Arzt, Loss of pseudoelasticity in nickel-titanium sub-micron compression pillars, Acta Materialia 55, 3845 (2007).
[6] J. Ye, R. K. Mishra, A. R. Pelton, and A. M. Minor, Direct observation of theNiTi martensitic phase transformation in nanoscale volumes, Acta Materi-alia 58, 490 (2010).
[7] J. S. Juan, M. L. No, and C. A. Schuh, Nanoscale shape-memory alloys forultrahigh mechanical damping, Nature Nanotechnology 4, 415 (2009).
[8] K. Bhattacharya and R. D. James, The material is the machine, Science 307,53 (2005).
[9] M. Kohl, Shape Memory Microactuators (Springer, 2004).
[10] T. Saburi and S. Nenno, The shape memory effect and related phenomena,Proceedings of the International Conference on Solid-Solid Phase Transfor-mations , 1455 (1981).
[11] T. E. Buchheit and J. A. Wert, Predicting the orientation-dependent stress-induced transformation and detwinning response of shape memory alloysingle crystals, Metallurgical and Materials transactions A 27A, 269 (1996).
[12] M. Finnis and J. Sinclair, A simple empirical n-body potential for transitionmetals, Philosophical Magazine A 50, 45 (1984).
REFERENCES
2
27
[13] W. Lai and B. Liu, Lattice stability of some NiTi alloy phasesversus their chem-ical composition and disordering, Journal of Physics: Condensed Matter 12,L53 (2000).
[14] J. H. Rose, J. R. Smith, F. Guinea, and J. Ferrante, Universal features of theequation of state of metals, Physical Review B 29, 2963 (1984).
[15] Y.-M. Kim, B.-J. Lee, and M. I. Baskes, Modified embedded-atom methodinteratomic potentials for Ti and Zr, Physical Review B 74, 014101 (2006).
[16] B.-J. Lee, A modified embedded-atom method interatomic potential for theFe–C system, Acta Materialia 54, 701 (2006).
[17] S. J. Plimpton, Fast parallel algorithms for short-range molecular dynamics,Journal of Computer Physics 117, 1 (1995).
[18] T. Schneider and E. Stoll, Molecular-dynamics study of a three-dimensionalone-component model for distortive phase transitions, Physical Review B 17(1978).
[19] H. Berendsen, J. Postma, W. van Gunsteren, A. DiNola, and J. Haak,Molecular-dynamics with coupling to an external bath, Journal of ChemicalPhysics 81 (1984).
[20] D. H. Tsai, The virial theorem and stress calculation in molecular dynamics,Journal of Chemical Physics 70, 1375 (1979).
[21] L. Brinson, I. Schmidt, and R. Lammering, Stress-induced transformationbehavior of a polycrystalline NiTi shape memory alloy: Micro and macrome-chanical investigations via in situ optical microscopy, Journal of Mechanicsand Physics of Solids 52, 1549 (2004).
[22] Y. Zhong, K. Gall, and T. Zhu, Atomistic characterization of pseudoelasticityand shape memory in NiTi nanopillars, Acta Materialia 60, 6301 (2012).
[23] M. F.-X. Wagner and W. Windl, Lattice stability, elastic constants and macro-scopic moduli of NiTi martensites from first principles, Acta Materialia 56,6232 (2008).
[24] J. D. Honeycutt and H. C. Andersen, Molecular dynamics study of meltingand freezing of small Lennard-Jones clusters, Journal of Physical Chemistry91, 4950 (1987).
2
28 REFERENCES
[25] K. Gall, H. Sehitoglu, R. Anderson, I. Karaman, Y. I. Chumlyakov, and I. V.Kireeva, On the mechanical behavior of single crystal NiTi shape memoryalloys and related polycrystalline phenomenon, Materials Science and Engi-neering 317, 85 (2001).
[26] S. Mao, J. Luo, Z. Zhang, M. Wu, Y. Liu, and X. Han, EBSD studies of thestress-induced B2-B19’ martensitic transformation in NiTi tubes under uni-axial tension and compression, Acta Materialia 58, 3357 (2010).
[27] H. Sehitoglu, R. Hamilton, D. Canadinc, X. Y. Zhang, K. Gall, I. Karaman,Y. Chumlykov, and H. J. Maier, Detwinning in NiTi alloys, Metallurgical andMaterials transactions A 34A, 5 (2003).
[28] O. Matsumoto, S. Miyazaki, K. Otsuka, and H. Tamura, Crystallography ofmartensitic transformation in TiNi single crystals, Acta Materialia 35, 2137(1987).
[29] T. Saburi, M. Yoshida, and S. Nenno, Deformation behaviour of shape mem-ory TiNi crystals, Scripta Metallurgica 18, 363 (1984).
[30] J. Turley and G. Sines, The anisotropy of Young’s modulus, shear modulusand Poisson’s ratio in cubic materials, Journal of Physics D: Applied Physics4, 264 (1971).
[31] S. Qiu, B. Clausen, S. A. P. II, R. D. Noebe, and R. Vaidyanathan, On elastimoduli and elastic anisotropy in polycrystalline martensitic NiTi, Acta Ma-terialia 59, 5055 (2011).
[32] J. Wang and H. Sehitoglu, Martensitic modulus dilemma in monoclinic NiTi-theory and experiments, International Journal of Plasticity 61, 17 (2014).
[33] K. M. Knowles and D. A. Smith, The crystallography of the martensitic trans-formation in equiatomic nickel-titanium, Acta Metallurgica 29, 101 (1981).
3ORIENTATION-DEPENDENT
PSEUDO-ELASTICITY
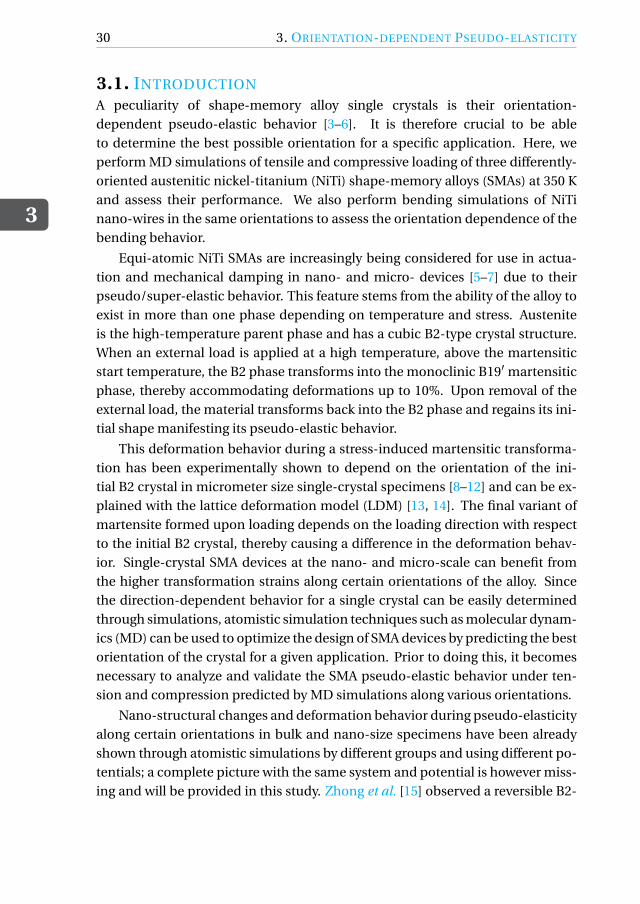
Pseudo-elasticity in NiTi shape-memory alloy single crystals depends on theloading direction. Here, we present a comprehensive study in which moleculardynamics simulations of austenitic bulk single crystals under strain-controlledtensile and compressive loading along the ⟨110⟩, ⟨111⟩, and ⟨100⟩ directionsare performed, and the mechanical response of the crystals are contrasted. Allsimulations are performed using the MEAM interatomic potential proposed byKo et al., 2015 [2]. The transformation strains and the Young’s modulus of theinitial austenitic and the final martensitic phases are compared with valuesobtained from the lattice deformation model and experimental results from theliterature. Results show that depending on orientation the transformation occurseither through the formation of martensitic Lüders bands or through the transientformation of a multivariant martensite which, upon reorientation, becomes adominant final single variant.
Simulations are also performed to assess the orientation-dependent behavior ofnano-wires subjected to bending, since the flexibility of the wires is orientationdependent.
This chapter has been published in Computational Materials Science 154, 25-36 (2018) [1]
29
3
30 3. ORIENTATION-DEPENDENT PSEUDO-ELASTICITY
3.1. INTRODUCTION
A peculiarity of shape-memory alloy single crystals is their orientation-dependent pseudo-elastic behavior [3–6]. It is therefore crucial to be ableto determine the best possible orientation for a specific application. Here, weperform MD simulations of tensile and compressive loading of three differently-oriented austenitic nickel-titanium (NiTi) shape-memory alloys (SMAs) at 350 Kand assess their performance. We also perform bending simulations of NiTinano-wires in the same orientations to assess the orientation dependence of thebending behavior.
Equi-atomic NiTi SMAs are increasingly being considered for use in actua-tion and mechanical damping in nano- and micro- devices [5–7] due to theirpseudo/super-elastic behavior. This feature stems from the ability of the alloy toexist in more than one phase depending on temperature and stress. Austeniteis the high-temperature parent phase and has a cubic B2-type crystal structure.When an external load is applied at a high temperature, above the martensiticstart temperature, the B2 phase transforms into the monoclinic B19′ martensiticphase, thereby accommodating deformations up to 10%. Upon removal of theexternal load, the material transforms back into the B2 phase and regains its ini-tial shape manifesting its pseudo-elastic behavior.
This deformation behavior during a stress-induced martensitic transforma-tion has been experimentally shown to depend on the orientation of the ini-tial B2 crystal in micrometer size single-crystal specimens [8–12] and can be ex-plained with the lattice deformation model (LDM) [13, 14]. The final variant ofmartensite formed upon loading depends on the loading direction with respectto the initial B2 crystal, thereby causing a difference in the deformation behav-ior. Single-crystal SMA devices at the nano- and micro-scale can benefit fromthe higher transformation strains along certain orientations of the alloy. Sincethe direction-dependent behavior for a single crystal can be easily determinedthrough simulations, atomistic simulation techniques such as molecular dynam-ics (MD) can be used to optimize the design of SMA devices by predicting the bestorientation of the crystal for a given application. Prior to doing this, it becomesnecessary to analyze and validate the SMA pseudo-elastic behavior under ten-sion and compression predicted by MD simulations along various orientations.
Nano-structural changes and deformation behavior during pseudo-elasticityalong certain orientations in bulk and nano-size specimens have been alreadyshown through atomistic simulations by different groups and using different po-tentials; a complete picture with the same system and potential is however miss-ing and will be provided in this study. Zhong et al. [15] observed a reversible B2-
3.2. METHODOLOGY
3
31
B19′ transformation in 4.8 nm × 5 nm sized NiTi nano-pillars using the Finnis-Sinclair interatomic potential [16]. Their study was restricted to the compres-sive behavior of a ⟨110⟩ oriented B2 nano-pillar. Wang et al. [17] also used theFinnis-Sinclair potential to simulate cyclic compressive loading on ⟨110⟩ ori-ented nano-pillars and observed changes in the mechanical response with in-creasing cycles. More recently, Ko et al. [2] simulated the compressive stress-induced B2-B19′ transformation in a nano-pillar with a 10.7 nm × 10.7 nm cross-section. The pillar was loaded along the ⟨001⟩B2 direction at 450 K to validatetheir newly developed modified embedded-atom method (MEAM) interatomicpotential. Wang et al. [18] also performed similar simulations under adiabaticcondition using the MEAM potential to study super-elasticity under compres-sive loading along ⟨001⟩B2. In these works, the analysis has been restricted onlyto compressive loading along one orientation of the initial B2 phase. The MEAMpotential has also been used to demonstrate phase transformation in NiTi poly-crystals subjected to a single compressive [19] and cyclic compressive [20] load-ing. In the previous chapter, we have shown [21] that the MEAM potential [2] ismore suited than the Finnis-Sinclair [15, 22] to study pseudo-elasticity in single-crystal NiTi because of its ability to predict lattice and elastic constants moreaccurately. Hence, we use the MEAM potential to provide a comprehensive anal-ysis of the elastic response of bulk NiTi under tensile and compressive loadingbefore, during, and after phase transformation at different temperatures.
Three different initial orientations of bulk single-crystal austenite are con-sidered in this contribution (Section 3.2) where tensile and compressive loadingsimulations are performed at 350 K. Results, shown in Section 3.3, indicate thedirections along which the transformation strains are highest. The transforma-tion strain values and the modulus of the initial and final phases are comparedto experimentally known values and those obtained from the lattice deforma-tion model [13, 14]. The effect of temperature on the transformation behavioris examined by performing the same set of simulations at 400 K and 450 K. Todetermine the effect of the orientation dependence on an ideal actuator device,MD simulations of bending of nano-wires are also carried out and discussed inSection 3.4.
3.2. METHODOLOGYMD simulations of the stress-induced martensitic transformation in NiTi arecarried out using the MEAM interatomic potential [2]. The MEAM potential,which also takes angular interactions into account, captures the directionalityin the metallic bonds more effectively than other potentials, making it the
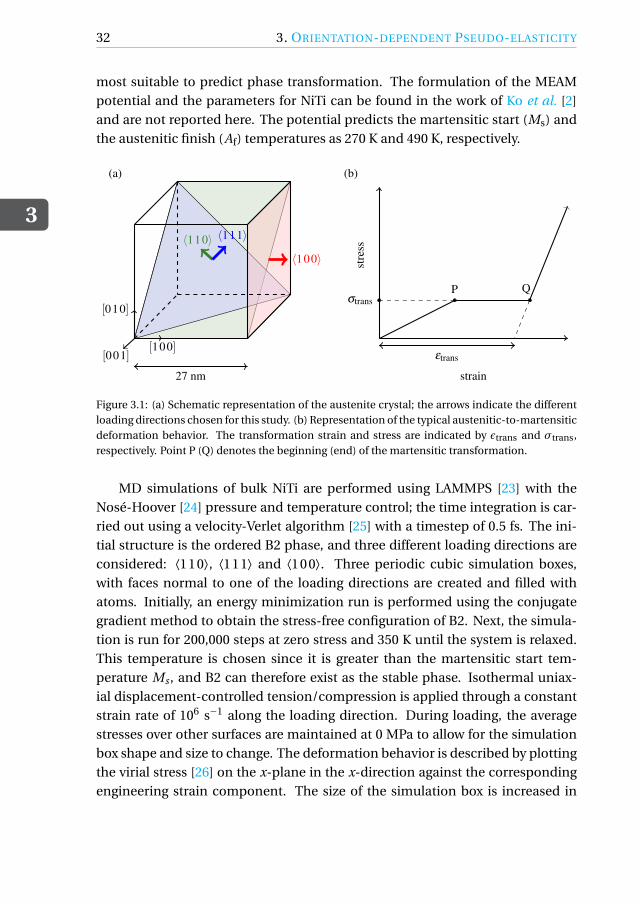
3
32 3. ORIENTATION-DEPENDENT PSEUDO-ELASTICITY
most suitable to predict phase transformation. The formulation of the MEAMpotential and the parameters for NiTi can be found in the work of Ko et al. [2]and are not reported here. The potential predicts the martensitic start (Ms) andthe austenitic finish (Af) temperatures as 270 K and 490 K, respectively.
〈100〉〈110〉 〈111〉
[100]
[010]
[001]
27 nm
(a)
strainst
ress
εtrans
σtransP Q
(b)
Figure 3.1: (a) Schematic representation of the austenite crystal; the arrows indicate the differentloading directions chosen for this study. (b) Representation of the typical austenitic-to-martensiticdeformation behavior. The transformation strain and stress are indicated by ϵtrans and σtrans,respectively. Point P (Q) denotes the beginning (end) of the martensitic transformation.
MD simulations of bulk NiTi are performed using LAMMPS [23] with theNosé-Hoover [24] pressure and temperature control; the time integration is car-ried out using a velocity-Verlet algorithm [25] with a timestep of 0.5 fs. The ini-tial structure is the ordered B2 phase, and three different loading directions areconsidered: ⟨110⟩, ⟨111⟩ and ⟨100⟩. Three periodic cubic simulation boxes,with faces normal to one of the loading directions are created and filled withatoms. Initially, an energy minimization run is performed using the conjugategradient method to obtain the stress-free configuration of B2. Next, the simula-tion is run for 200,000 steps at zero stress and 350 K until the system is relaxed.This temperature is chosen since it is greater than the martensitic start tem-perature Ms , and B2 can therefore exist as the stable phase. Isothermal uniax-ial displacement-controlled tension/compression is applied through a constantstrain rate of 106 s−1 along the loading direction. During loading, the averagestresses over other surfaces are maintained at 0 MPa to allow for the simulationbox shape and size to change. The deformation behavior is described by plottingthe virial stress [26] on the x-plane in the x-direction against the correspondingengineering strain component. The size of the simulation box is increased in
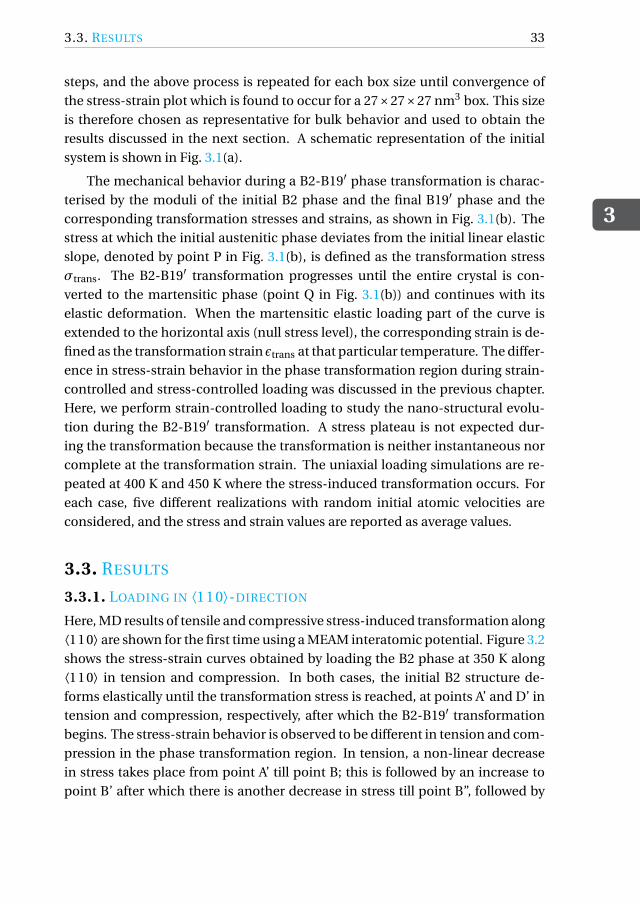
3.3. RESULTS
3
33
steps, and the above process is repeated for each box size until convergence ofthe stress-strain plot which is found to occur for a 27×27×27 nm3 box. This sizeis therefore chosen as representative for bulk behavior and used to obtain theresults discussed in the next section. A schematic representation of the initialsystem is shown in Fig. 3.1(a).
The mechanical behavior during a B2-B19′ phase transformation is charac-terised by the moduli of the initial B2 phase and the final B19′ phase and thecorresponding transformation stresses and strains, as shown in Fig. 3.1(b). Thestress at which the initial austenitic phase deviates from the initial linear elasticslope, denoted by point P in Fig. 3.1(b), is defined as the transformation stressσtrans. The B2-B19′ transformation progresses until the entire crystal is con-verted to the martensitic phase (point Q in Fig. 3.1(b)) and continues with itselastic deformation. When the martensitic elastic loading part of the curve isextended to the horizontal axis (null stress level), the corresponding strain is de-fined as the transformation strain ϵtrans at that particular temperature. The differ-ence in stress-strain behavior in the phase transformation region during strain-controlled and stress-controlled loading was discussed in the previous chapter.Here, we perform strain-controlled loading to study the nano-structural evolu-tion during the B2-B19′ transformation. A stress plateau is not expected dur-ing the transformation because the transformation is neither instantaneous norcomplete at the transformation strain. The uniaxial loading simulations are re-peated at 400 K and 450 K where the stress-induced transformation occurs. Foreach case, five different realizations with random initial atomic velocities areconsidered, and the stress and strain values are reported as average values.
3.3. RESULTS
3.3.1. LOADING IN ⟨110⟩-DIRECTION
Here, MD results of tensile and compressive stress-induced transformation along⟨110⟩ are shown for the first time using a MEAM interatomic potential. Figure 3.2shows the stress-strain curves obtained by loading the B2 phase at 350 K along⟨110⟩ in tension and compression. In both cases, the initial B2 structure de-forms elastically until the transformation stress is reached, at points A’ and D’ intension and compression, respectively, after which the B2-B19′ transformationbegins. The stress-strain behavior is observed to be different in tension and com-pression in the phase transformation region. In tension, a non-linear decreasein stress takes place from point A’ till point B; this is followed by an increase topoint B’ after which there is another decrease in stress till point B”, followed by

3
34 3. ORIENTATION-DEPENDENT PSEUDO-ELASTICITY
0 0.02 0.04 0.06 0.08−1
0
1
2
3
4
strain
stre
ss(G
Pa)
tension
A
A’
B
B’
B”C
(a)
0 0.03 0.06 0.09 0.1202468
101214
strain
stre
ss(G
Pa)
compression
D D’E
E’
F
F’
(b)
Figure 3.2: Isothermal stress-strain behavior of bulk NiTi under tensile (a) and compressive (b)loading along the ⟨110⟩B2 direction at T = 350 K .
Tension
Compression
B2
B19/B19’
Other
A B C
D E F
〈001〉B2
〈110〉B2
Figure 3.3: Sectional view of NiTi bulk cut along the ⟨110⟩B2 plane colored according to the com-mon neighbor analysis (CNA) pattern. Blue atoms represent B2, red atoms represent B19/B19′,and white atoms represent those that are neither B2 nor B19′. Refer to Fig. 3.2 for the labels A to F.
a linear increase in stress. Upon analyzing the structural changes in the crystal,it is observed that the first decrease in stress after A’ occurs due to the transfor-mation from B2 to an orthorhombic B19 intermediate phase. This intermediateB19 phase has also been observed by Zhong et al. [27] and Ko et al. [2] duringMD simulations of stress-induced B2-B19′ transformation. Notice that this is adisplacement controlled simulation and, while the strain is increased, the over-
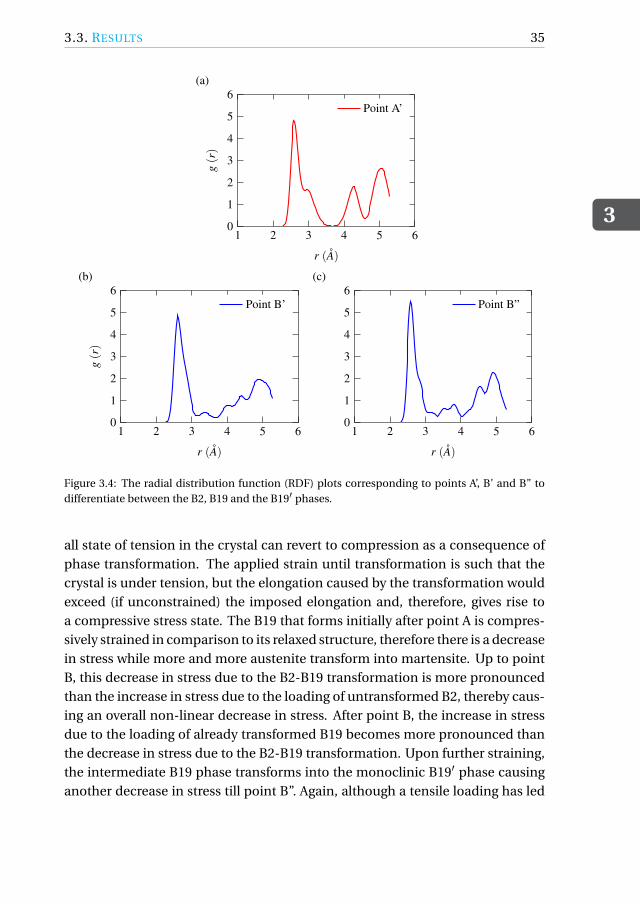
3.3. RESULTS
3
35
1 2 3 4 5 60
1
2
3
4
5
6
r (A)
g(r)
Point A’
(a)
1 2 3 4 5 60
1
2
3
4
5
6
r (A)
g(r)
Point B’
(b)
1 2 3 4 5 60
1
2
3
4
5
6
r (A)
Point B”
(c)
Figure 3.4: The radial distribution function (RDF) plots corresponding to points A’, B’ and B” todifferentiate between the B2, B19 and the B19′ phases.
all state of tension in the crystal can revert to compression as a consequence ofphase transformation. The applied strain until transformation is such that thecrystal is under tension, but the elongation caused by the transformation wouldexceed (if unconstrained) the imposed elongation and, therefore, gives rise toa compressive stress state. The B19 that forms initially after point A is compres-sively strained in comparison to its relaxed structure, therefore there is a decreasein stress while more and more austenite transform into martensite. Up to pointB, this decrease in stress due to the B2-B19 transformation is more pronouncedthan the increase in stress due to the loading of untransformed B2, thereby caus-ing an overall non-linear decrease in stress. After point B, the increase in stressdue to the loading of already transformed B19 becomes more pronounced thanthe decrease in stress due to the B2-B19 transformation. Upon further straining,the intermediate B19 phase transforms into the monoclinic B19′ phase causinganother decrease in stress till point B”. Again, although a tensile loading has led
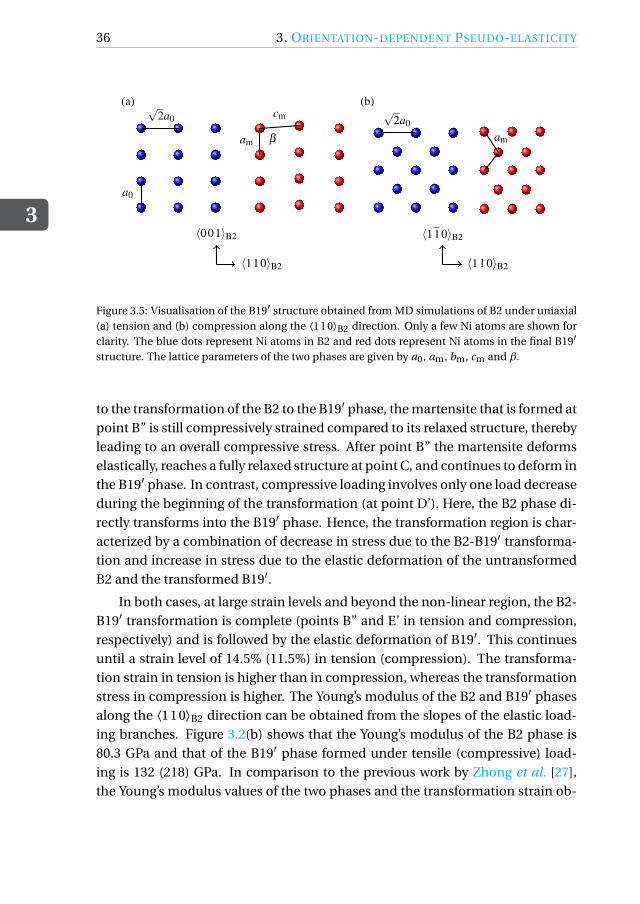
3
36 3. ORIENTATION-DEPENDENT PSEUDO-ELASTICITY
a0
√2a0 cm
am β
(a)
〈110〉B2
〈001〉B2
√2a0
am
(b)
〈110〉B2
〈110〉B2
Figure 3.5: Visualisation of the B19′ structure obtained from MD simulations of B2 under uniaxial(a) tension and (b) compression along the ⟨110⟩B2 direction. Only a few Ni atoms are shown forclarity. The blue dots represent Ni atoms in B2 and red dots represent Ni atoms in the final B19′structure. The lattice parameters of the two phases are given by a0, am, bm, cm and β.
to the transformation of the B2 to the B19′ phase, the martensite that is formed atpoint B” is still compressively strained compared to its relaxed structure, therebyleading to an overall compressive stress. After point B” the martensite deformselastically, reaches a fully relaxed structure at point C, and continues to deform inthe B19′ phase. In contrast, compressive loading involves only one load decreaseduring the beginning of the transformation (at point D’). Here, the B2 phase di-rectly transforms into the B19′ phase. Hence, the transformation region is char-acterized by a combination of decrease in stress due to the B2-B19′ transforma-tion and increase in stress due to the elastic deformation of the untransformedB2 and the transformed B19′.
In both cases, at large strain levels and beyond the non-linear region, the B2-B19′ transformation is complete (points B” and E’ in tension and compression,respectively) and is followed by the elastic deformation of B19′. This continuesuntil a strain level of 14.5% (11.5%) in tension (compression). The transforma-tion strain in tension is higher than in compression, whereas the transformationstress in compression is higher. The Young’s modulus of the B2 and B19′ phasesalong the ⟨110⟩B2 direction can be obtained from the slopes of the elastic load-ing branches. Figure 3.2(b) shows that the Young’s modulus of the B2 phase is80.3 GPa and that of the B19′ phase formed under tensile (compressive) load-ing is 132 (218) GPa. In comparison to the previous work by Zhong et al. [27],the Young’s modulus values of the two phases and the transformation strain ob-

3.3. RESULTS
3
37
tained here are closer to experimentally known values, as discussed later. In ad-dition, the asymmetry between tensile and compressive behavior is captured.Since the orientation of B19′ with respect to the initial B2 structure is differentunder tension and compression, the Young’s modulus is also different.
Figure 3.3 shows sectional views of the bulk, cut along the ⟨110⟩B2 plane, sub-ject to tension and compression, with atoms depicted according to the commonneighbor analysis (CNA) pattern. The CNA pattern differentiates the B2 and theB19′ phases, but is not able to differentiate between the intermediate B19 andthe B19′ phases. Atoms with B2 structure are represented in blue and atoms withB19/B19′ structure are represented in red. Points A, B and C along the tensilecurve and points D, E and F along the compressive curve in Fig. 3.2 are chosenfor representation: one along the initial linear elastic loading of B2, one along theB19′ elastic loading, and one in between, where the transformation occurs. FromFig. 3.3, it is observed that MD simulations predict the B2-B19 transformationin tension and the B2-B19′ transformation in compression to progress throughthe formation of Lüders-like bands along the ⟨112⟩B2 direction. The width ofthe bands increases with the strain until the entire bulk is transformed into B19(B19′) in tension (compression). Lüders-like bands have also been experimen-tally observed during stress-induced transformation in NiTi [28] and in previousMD simulations of stress-induced transformations in NiTi [22, 27]. To differenti-ate between B19 and B19′ phases, three points along the tensile curve (points A’,B’ and B”) are chosen and the radial distribution function (RDF) at these pointsis depicted in Fig. 3.4. The peaks in Fig. 3.4(a) correspond to the peaks of the B2phase (at point A’), which has a cubic structure. B2 (BCC) has fewer neighborshells in comparison to the B19 or the B19′ phase, and hence the RDF has fewerpeaks as compared to the other two RDF’s. By comparing Figs. 3.4(b) and 3.4(c), itis noted that the RDF corresponding to point B” has additional peaks in between3 Å and 4 Å. This arises due to the extra neighbor shells created due to an addi-tional shear in the monoclinic B19′ crystal structure (at point B”) in comparisonto the orthorhombic B19 crystal structure (at point B’), thereby differentiatingthe two phases.
The B19′ that forms at the end of the tensile and compressive loadings is ori-ented differently with respect to the initial B2 crystal, as shown in Fig. 3.5. Onlyfew Ni atoms are visualized to clearly illustrate the difference in the final B19′
variant. The difference in orientation of the monoclinic structure is what leads tothe tension-compression asymmetry associated with the transformation. Dur-ing loading of B2 along any particular orientation, the final martensite variant isformed in such a way that the transformation strain is highest along that partic-
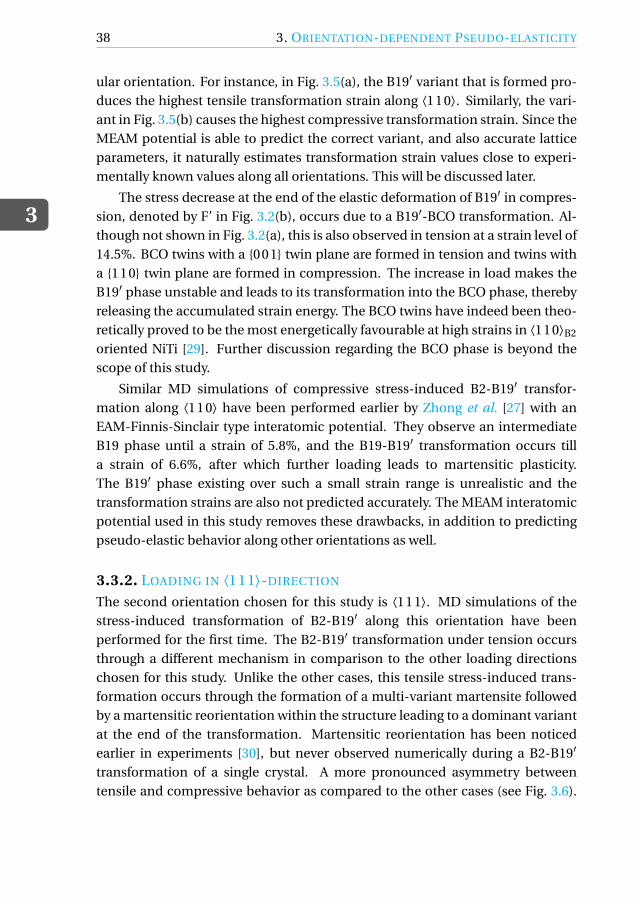
3
38 3. ORIENTATION-DEPENDENT PSEUDO-ELASTICITY
ular orientation. For instance, in Fig. 3.5(a), the B19′ variant that is formed pro-duces the highest tensile transformation strain along ⟨110⟩. Similarly, the vari-ant in Fig. 3.5(b) causes the highest compressive transformation strain. Since theMEAM potential is able to predict the correct variant, and also accurate latticeparameters, it naturally estimates transformation strain values close to experi-mentally known values along all orientations. This will be discussed later.
The stress decrease at the end of the elastic deformation of B19′ in compres-sion, denoted by F’ in Fig. 3.2(b), occurs due to a B19′-BCO transformation. Al-though not shown in Fig. 3.2(a), this is also observed in tension at a strain level of14.5%. BCO twins with a 001 twin plane are formed in tension and twins witha 110 twin plane are formed in compression. The increase in load makes theB19′ phase unstable and leads to its transformation into the BCO phase, therebyreleasing the accumulated strain energy. The BCO twins have indeed been theo-retically proved to be the most energetically favourable at high strains in ⟨110⟩B2
oriented NiTi [29]. Further discussion regarding the BCO phase is beyond thescope of this study.
Similar MD simulations of compressive stress-induced B2-B19′ transfor-mation along ⟨110⟩ have been performed earlier by Zhong et al. [27] with anEAM-Finnis-Sinclair type interatomic potential. They observe an intermediateB19 phase until a strain of 5.8%, and the B19-B19′ transformation occurs tilla strain of 6.6%, after which further loading leads to martensitic plasticity.The B19′ phase existing over such a small strain range is unrealistic and thetransformation strains are also not predicted accurately. The MEAM interatomicpotential used in this study removes these drawbacks, in addition to predictingpseudo-elastic behavior along other orientations as well.
3.3.2. LOADING IN ⟨111⟩-DIRECTION
The second orientation chosen for this study is ⟨111⟩. MD simulations of thestress-induced transformation of B2-B19′ along this orientation have beenperformed for the first time. The B2-B19′ transformation under tension occursthrough a different mechanism in comparison to the other loading directionschosen for this study. Unlike the other cases, this tensile stress-induced trans-formation occurs through the formation of a multi-variant martensite followedby a martensitic reorientation within the structure leading to a dominant variantat the end of the transformation. Martensitic reorientation has been noticedearlier in experiments [30], but never observed numerically during a B2-B19′
transformation of a single crystal. A more pronounced asymmetry betweentensile and compressive behavior as compared to the other cases (see Fig. 3.6).

3.3. RESULTS
3
39
0 0.03 0.06 0.09 0.120
1
2
3
4
5
strain
stre
ss(G
Pa)
tension
A A’
B
C
C’
D
(a)
0 0.03 0.06 0.09 0.12
0
4
8
12
16
20
strain
stre
ss(G
Pa)
compression
EE’FF’
G
(b)
Figure 3.6: Isothermal stress-strain behavior of bulk NiTi under tensile (a) and compressive (b)loading along the ⟨111⟩B2 direction at T = 350 K .
Tension
Compression B2
B19’ (A)
B19’ (B)
A B C D
E F G
〈001〉B2
〈110〉B2
Figure 3.7: Sectional view of NiTi bulk cut along the ⟨110⟩B2 plane colored according to the lo-cal order parameter (bottom-right). Green atoms represent B2 and red and blue atoms representdifferent variants of B19′. Refer to Fig. 3.6 for labels A to G. Martensitic bands are observed onlyduring tensile stress-induced transformation.
The modulus of the B2 phase along ⟨111⟩B2 is estimated as 125 GPa, and themodulus of the final B19′ variant in tension (compression) is 159.2 (242) GPa.The results also indicate that the transformation strain in tension is much higherthan that in compression, and the transformation stress is smaller in tension.The region between points A’ and C’ corresponding to the tensile stress-induced
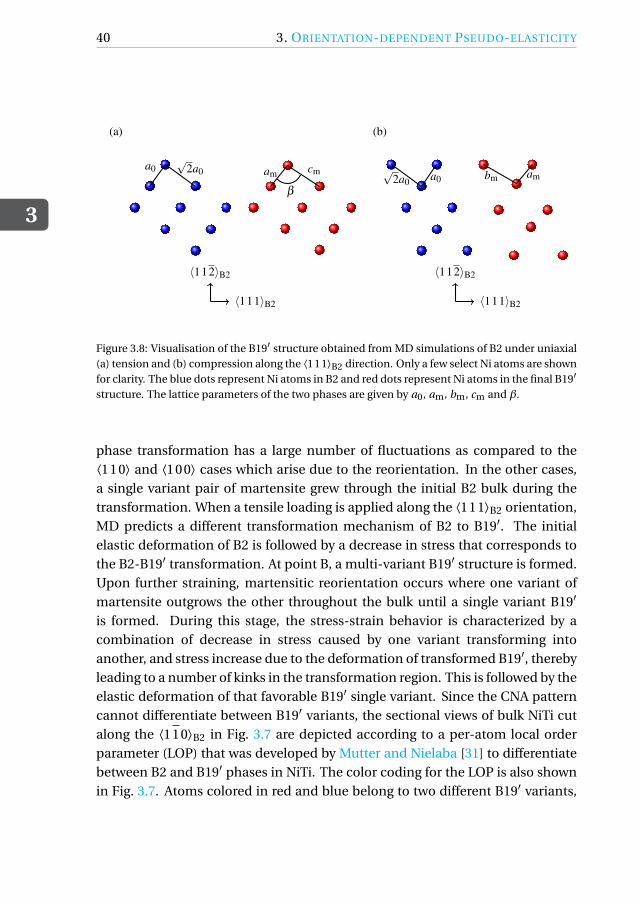
3
40 3. ORIENTATION-DEPENDENT PSEUDO-ELASTICITY
√2a0a0 cmam
β
(a)
〈111〉B2
〈112〉B2
√2a0 a0 bm am
(b)
〈111〉B2
〈112〉B2
Figure 3.8: Visualisation of the B19′ structure obtained from MD simulations of B2 under uniaxial(a) tension and (b) compression along the ⟨111⟩B2 direction. Only a few select Ni atoms are shownfor clarity. The blue dots represent Ni atoms in B2 and red dots represent Ni atoms in the final B19′structure. The lattice parameters of the two phases are given by a0, am, bm, cm and β.
phase transformation has a large number of fluctuations as compared to the⟨110⟩ and ⟨100⟩ cases which arise due to the reorientation. In the other cases,a single variant pair of martensite grew through the initial B2 bulk during thetransformation. When a tensile loading is applied along the ⟨111⟩B2 orientation,MD predicts a different transformation mechanism of B2 to B19′. The initialelastic deformation of B2 is followed by a decrease in stress that corresponds tothe B2-B19′ transformation. At point B, a multi-variant B19′ structure is formed.Upon further straining, martensitic reorientation occurs where one variant ofmartensite outgrows the other throughout the bulk until a single variant B19′
is formed. During this stage, the stress-strain behavior is characterized by acombination of decrease in stress caused by one variant transforming intoanother, and stress increase due to the deformation of transformed B19′, therebyleading to a number of kinks in the transformation region. This is followed by theelastic deformation of that favorable B19′ single variant. Since the CNA patterncannot differentiate between B19′ variants, the sectional views of bulk NiTi cutalong the ⟨110⟩B2 in Fig. 3.7 are depicted according to a per-atom local orderparameter (LOP) that was developed by Mutter and Nielaba [31] to differentiatebetween B2 and B19′ phases in NiTi. The color coding for the LOP is also shownin Fig. 3.7. Atoms colored in red and blue belong to two different B19′ variants,
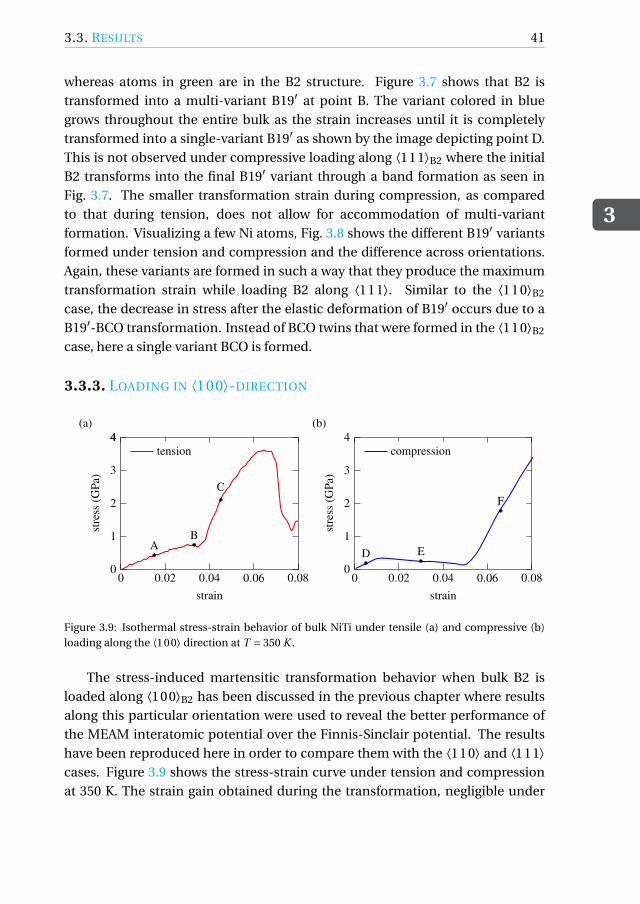
3.3. RESULTS
3
41
whereas atoms in green are in the B2 structure. Figure 3.7 shows that B2 istransformed into a multi-variant B19′ at point B. The variant colored in bluegrows throughout the entire bulk as the strain increases until it is completelytransformed into a single-variant B19′ as shown by the image depicting point D.This is not observed under compressive loading along ⟨111⟩B2 where the initialB2 transforms into the final B19′ variant through a band formation as seen inFig. 3.7. The smaller transformation strain during compression, as comparedto that during tension, does not allow for accommodation of multi-variantformation. Visualizing a few Ni atoms, Fig. 3.8 shows the different B19′ variantsformed under tension and compression and the difference across orientations.Again, these variants are formed in such a way that they produce the maximumtransformation strain while loading B2 along ⟨111⟩. Similar to the ⟨110⟩B2
case, the decrease in stress after the elastic deformation of B19′ occurs due to aB19′-BCO transformation. Instead of BCO twins that were formed in the ⟨110⟩B2
case, here a single variant BCO is formed.
3.3.3. LOADING IN ⟨100⟩-DIRECTION
0 0.02 0.04 0.06 0.080
1
2
3
44
strain
stre
ss(G
Pa)
tension
AB
C
(a)
0 0.02 0.04 0.06 0.080
1
2
3
4
strain
stre
ss(G
Pa)
compression
D E
F
(b)
Figure 3.9: Isothermal stress-strain behavior of bulk NiTi under tensile (a) and compressive (b)loading along the ⟨100⟩ direction at T = 350 K .
The stress-induced martensitic transformation behavior when bulk B2 isloaded along ⟨100⟩B2 has been discussed in the previous chapter where resultsalong this particular orientation were used to reveal the better performance ofthe MEAM interatomic potential over the Finnis-Sinclair potential. The resultshave been reproduced here in order to compare them with the ⟨110⟩ and ⟨111⟩cases. Figure 3.9 shows the stress-strain curve under tension and compressionat 350 K. The strain gain obtained during the transformation, negligible under
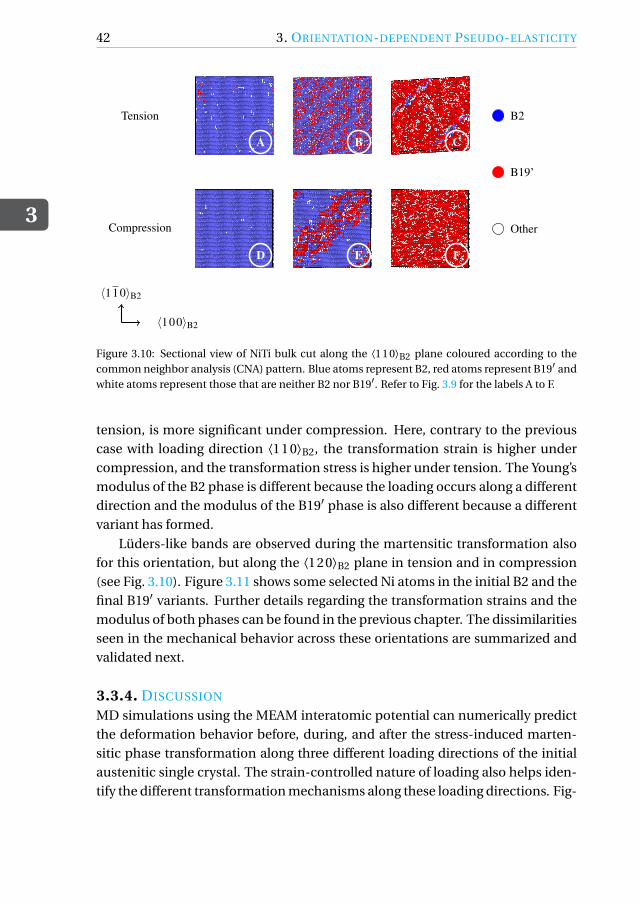
3
42 3. ORIENTATION-DEPENDENT PSEUDO-ELASTICITY
Tension
Compression
B2
B19’
Other
A B C
D E F
〈110〉B2
〈100〉B2
Figure 3.10: Sectional view of NiTi bulk cut along the ⟨110⟩B2 plane coloured according to thecommon neighbor analysis (CNA) pattern. Blue atoms represent B2, red atoms represent B19′ andwhite atoms represent those that are neither B2 nor B19′. Refer to Fig. 3.9 for the labels A to F.
tension, is more significant under compression. Here, contrary to the previouscase with loading direction ⟨110⟩B2, the transformation strain is higher undercompression, and the transformation stress is higher under tension. The Young’smodulus of the B2 phase is different because the loading occurs along a differentdirection and the modulus of the B19′ phase is also different because a differentvariant has formed.
Lüders-like bands are observed during the martensitic transformation alsofor this orientation, but along the ⟨120⟩B2 plane in tension and in compression(see Fig. 3.10). Figure 3.11 shows some selected Ni atoms in the initial B2 and thefinal B19′ variants. Further details regarding the transformation strains and themodulus of both phases can be found in the previous chapter. The dissimilaritiesseen in the mechanical behavior across these orientations are summarized andvalidated next.
3.3.4. DISCUSSION
MD simulations using the MEAM interatomic potential can numerically predictthe deformation behavior before, during, and after the stress-induced marten-sitic phase transformation along three different loading directions of the initialaustenitic single crystal. The strain-controlled nature of loading also helps iden-tify the different transformation mechanisms along these loading directions. Fig-
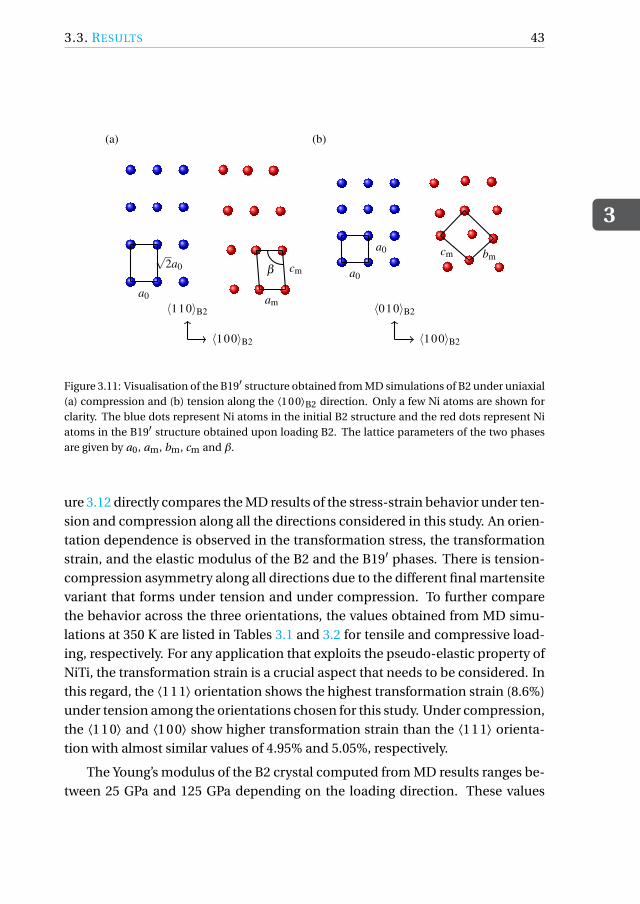
3.3. RESULTS
3
43
a0
√2a0
am
cmβ
(a)
〈100〉B2
〈110〉B2
a0
a0 bmcm
〈100〉B2
〈010〉B2
(b)
Figure 3.11: Visualisation of the B19′ structure obtained from MD simulations of B2 under uniaxial(a) compression and (b) tension along the ⟨100⟩B2 direction. Only a few Ni atoms are shown forclarity. The blue dots represent Ni atoms in the initial B2 structure and the red dots represent Niatoms in the B19′ structure obtained upon loading B2. The lattice parameters of the two phasesare given by a0, am, bm, cm and β.
ure 3.12 directly compares the MD results of the stress-strain behavior under ten-sion and compression along all the directions considered in this study. An orien-tation dependence is observed in the transformation stress, the transformationstrain, and the elastic modulus of the B2 and the B19′ phases. There is tension-compression asymmetry along all directions due to the different final martensitevariant that forms under tension and under compression. To further comparethe behavior across the three orientations, the values obtained from MD simu-lations at 350 K are listed in Tables 3.1 and 3.2 for tensile and compressive load-ing, respectively. For any application that exploits the pseudo-elastic property ofNiTi, the transformation strain is a crucial aspect that needs to be considered. Inthis regard, the ⟨111⟩ orientation shows the highest transformation strain (8.6%)under tension among the orientations chosen for this study. Under compression,the ⟨110⟩ and ⟨100⟩ show higher transformation strain than the ⟨111⟩ orienta-tion with almost similar values of 4.95% and 5.05%, respectively.
The Young’s modulus of the B2 crystal computed from MD results ranges be-tween 25 GPa and 125 GPa depending on the loading direction. These values
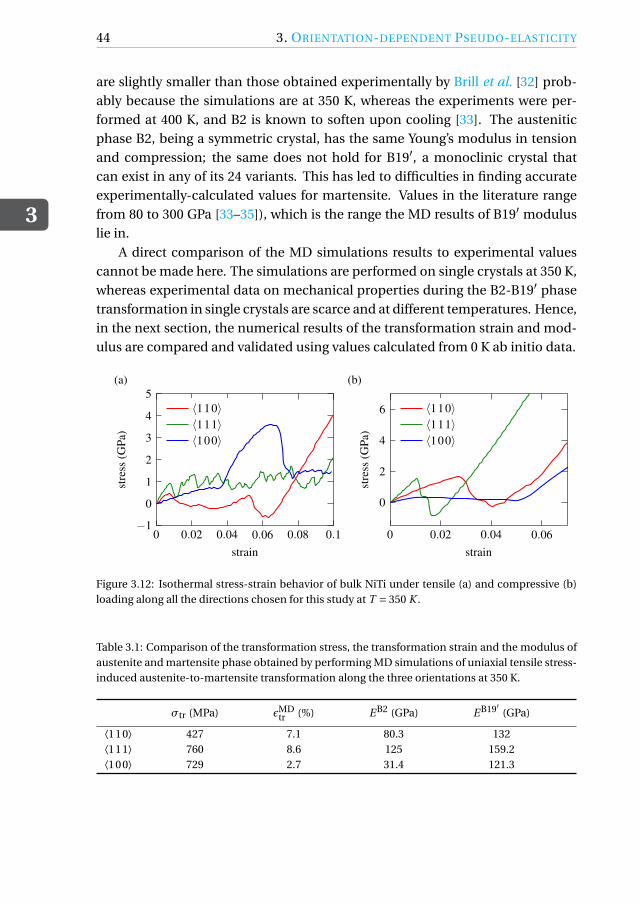
3
44 3. ORIENTATION-DEPENDENT PSEUDO-ELASTICITY
are slightly smaller than those obtained experimentally by Brill et al. [32] prob-ably because the simulations are at 350 K, whereas the experiments were per-formed at 400 K, and B2 is known to soften upon cooling [33]. The austeniticphase B2, being a symmetric crystal, has the same Young’s modulus in tensionand compression; the same does not hold for B19′, a monoclinic crystal thatcan exist in any of its 24 variants. This has led to difficulties in finding accurateexperimentally-calculated values for martensite. Values in the literature rangefrom 80 to 300 GPa [33–35]), which is the range the MD results of B19′ moduluslie in.
A direct comparison of the MD simulations results to experimental valuescannot be made here. The simulations are performed on single crystals at 350 K,whereas experimental data on mechanical properties during the B2-B19′ phasetransformation in single crystals are scarce and at different temperatures. Hence,in the next section, the numerical results of the transformation strain and mod-ulus are compared and validated using values calculated from 0 K ab initio data.
0 0.02 0.04 0.06 0.08 0.1−1
0
1
2
3
4
5
strain
stre
ss(G
Pa)
〈110〉〈111〉〈100〉
(a)
0 0.02 0.04 0.06
0
2
4
6
strain
stre
ss(G
Pa)
〈110〉〈111〉〈100〉
(b)
Figure 3.12: Isothermal stress-strain behavior of bulk NiTi under tensile (a) and compressive (b)loading along all the directions chosen for this study at T = 350 K .
Table 3.1: Comparison of the transformation stress, the transformation strain and the modulus ofaustenite and martensite phase obtained by performing MD simulations of uniaxial tensile stress-induced austenite-to-martensite transformation along the three orientations at 350 K.
σtr (MPa) ϵMDtr (%) E B2 (GPa) E B19′ (GPa)
⟨110⟩ 427 7.1 80.3 132⟨111⟩ 760 8.6 125 159.2⟨100⟩ 729 2.7 31.4 121.3
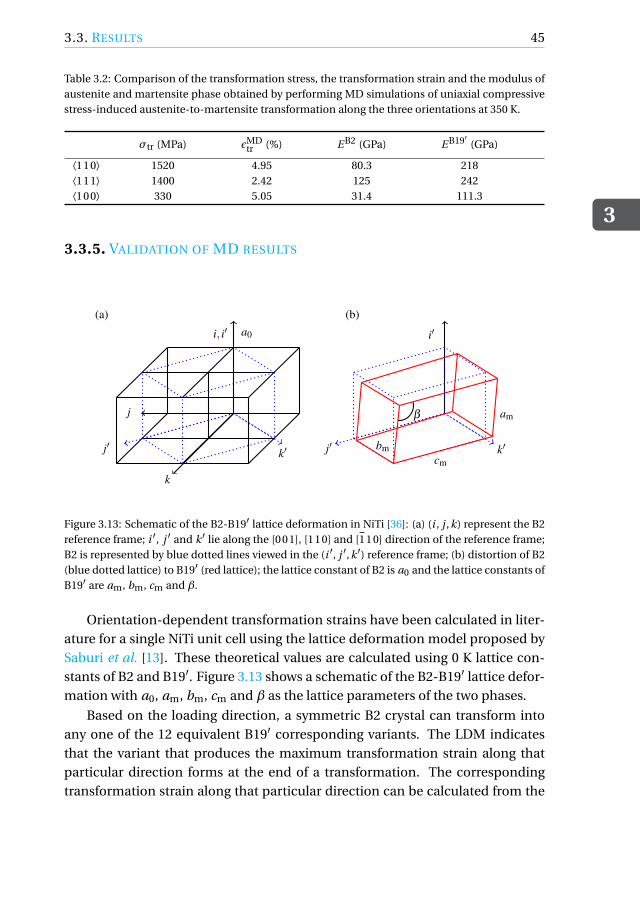
3.3. RESULTS
3
45
Table 3.2: Comparison of the transformation stress, the transformation strain and the modulus ofaustenite and martensite phase obtained by performing MD simulations of uniaxial compressivestress-induced austenite-to-martensite transformation along the three orientations at 350 K.
σtr (MPa) ϵMDtr (%) E B2 (GPa) E B19′ (GPa)
⟨110⟩ 1520 4.95 80.3 218⟨111⟩ 1400 2.42 125 242⟨100⟩ 330 5.05 31.4 111.3
3.3.5. VALIDATION OF MD RESULTS
i, i′ a0
j
k
j′ k′
(a)
i′
j′ k′
am
bmcm
β
(b)
Figure 3.13: Schematic of the B2-B19′ lattice deformation in NiTi [36]: (a) (i , j ,k) represent the B2reference frame; i ′, j ′ and k ′ lie along the [001], [110] and [110] direction of the reference frame;B2 is represented by blue dotted lines viewed in the (i ′, j ′,k ′) reference frame; (b) distortion of B2(blue dotted lattice) to B19′ (red lattice); the lattice constant of B2 is a0 and the lattice constants ofB19′ are am, bm, cm and β.
Orientation-dependent transformation strains have been calculated in liter-ature for a single NiTi unit cell using the lattice deformation model proposed bySaburi et al. [13]. These theoretical values are calculated using 0 K lattice con-stants of B2 and B19′. Figure 3.13 shows a schematic of the B2-B19′ lattice defor-mation with a0, am, bm, cm and β as the lattice parameters of the two phases.
Based on the loading direction, a symmetric B2 crystal can transform intoany one of the 12 equivalent B19′ corresponding variants. The LDM indicatesthat the variant that produces the maximum transformation strain along thatparticular direction forms at the end of a transformation. The correspondingtransformation strain along that particular direction can be calculated from the
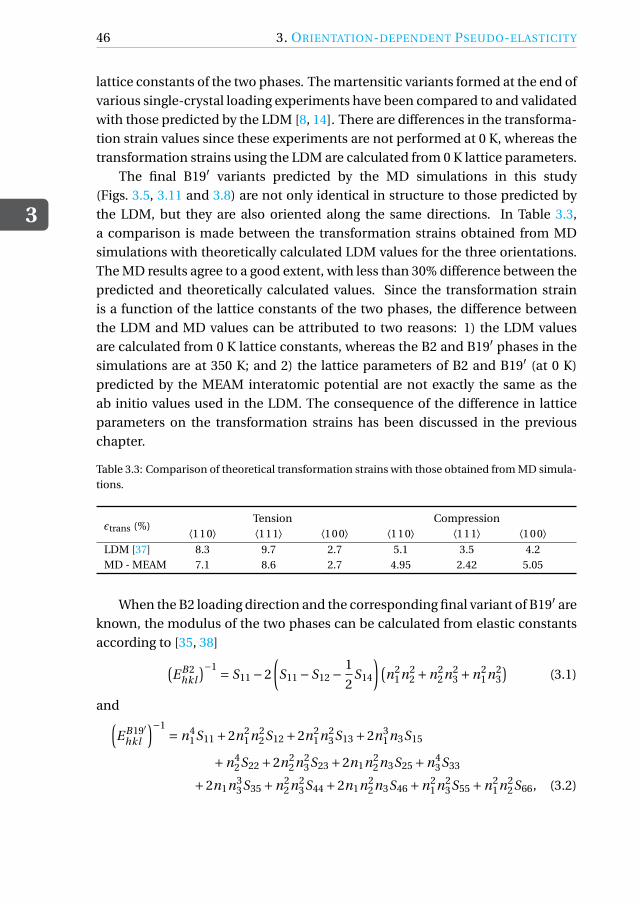
3
46 3. ORIENTATION-DEPENDENT PSEUDO-ELASTICITY
lattice constants of the two phases. The martensitic variants formed at the end ofvarious single-crystal loading experiments have been compared to and validatedwith those predicted by the LDM [8, 14]. There are differences in the transforma-tion strain values since these experiments are not performed at 0 K, whereas thetransformation strains using the LDM are calculated from 0 K lattice parameters.
The final B19′ variants predicted by the MD simulations in this study(Figs. 3.5, 3.11 and 3.8) are not only identical in structure to those predicted bythe LDM, but they are also oriented along the same directions. In Table 3.3,a comparison is made between the transformation strains obtained from MDsimulations with theoretically calculated LDM values for the three orientations.The MD results agree to a good extent, with less than 30% difference between thepredicted and theoretically calculated values. Since the transformation strainis a function of the lattice constants of the two phases, the difference betweenthe LDM and MD values can be attributed to two reasons: 1) the LDM valuesare calculated from 0 K lattice constants, whereas the B2 and B19′ phases in thesimulations are at 350 K; and 2) the lattice parameters of B2 and B19′ (at 0 K)predicted by the MEAM interatomic potential are not exactly the same as theab initio values used in the LDM. The consequence of the difference in latticeparameters on the transformation strains has been discussed in the previouschapter.
Table 3.3: Comparison of theoretical transformation strains with those obtained from MD simula-tions.
ϵtrans (%)Tension Compression
⟨110⟩ ⟨111⟩ ⟨100⟩ ⟨110⟩ ⟨111⟩ ⟨100⟩LDM [37] 8.3 9.7 2.7 5.1 3.5 4.2MD - MEAM 7.1 8.6 2.7 4.95 2.42 5.05
When the B2 loading direction and the corresponding final variant of B19′ areknown, the modulus of the two phases can be calculated from elastic constantsaccording to [35, 38](
E B2hkl
)−1 = S11 −2
(S11 −S12 − 1
2S14
)(n2
1n22 +n2
2n23 +n2
1n23
)(3.1)
and(E B19′
hkl
)−1 = n41S11 +2n2
1n22S12 +2n2
1n23S13 +2n3
1n3S15
+n42S22 +2n2
2n23S23 +2n1n2
2n3S25 +n43S33
+2n1n33S35 +n2
2n23S44 +2n1n2
2n3S46 +n21n2
3S55 +n21n2
2S66, (3.2)

3.3. RESULTS
3
47
where n1, n2 and n3 are cosines of the angles between the direction normal to the(hkl ) plane and the lattice vectors of B2 and B19′, respectively, and Si j are thecomponents of the compliance matrix. Wagner and Windl [34] have performed0 K ab initio calculations and estimated the values of the three elastic constantsof B2 and the 13 elastic constants of B19′. The modulus of B2 along ⟨110⟩, ⟨100⟩and ⟨111⟩ and the six B19′ structures (three in tension and three in compression)can hence be calculated using the values of elastic constants from Reference [34]in the above formulas. The modulus of the phases obtained from MD is com-pared with the theoretically calculated 0 K values in Table 3.4. The differencesbetween the theoretical moduli and those obtained from MD simulations arisedue to the same reasons discussed earlier for the differences in transformationstrain values. The next section further describes the effect of temperature on thedeformation behavior as predicted by MD simulations.
Table 3.4: Comparison of the 0 K theoretical modulus with those from MD simulations.
Modulus (GPa)⟨110⟩ ⟨111⟩ ⟨100⟩
EB2 E tensB19′ E
compB19′ EB2 E tens
B19′ EcompB19′ EB2 E tens
B19′ EcompB19′
theory [34] 81 175 156 110 99 215 45 180 115MD-MEAM 80.3 132 218 125 159.2 242 31.4 121.3 111.3
3.3.6. EFFECT OF TEMPERATURE
Uniaxial tensile and compressive loading simulations are also performed at 400 Kand 450 K, temperatures at which NiTi exhibits pseudo-elastic behavior. Temper-ature does not affect the transformation mechanism in any of the three tensile orcompressive loading directions, but has an effect on the transformation stress,the modulus of the two phases, and the transformation strain. The effect is thesame for all the loading directions, and hence only two cases (one in tension andone in compression) are presented in Fig. 3.14. The trend observed here is ob-served for all other loading directions.
Figure 3.14 shows the variation of the stress-strain curve with temperaturefor tensile loading along ⟨111⟩ and compressive loading along ⟨100⟩. It is knownthat austenite softens mildly upon cooling, whereas martensite softens uponheating [33]. From Fig. 3.14 it is observed that the MD simulations capture thiseffect. The influence of temperature on the Young’s modulus of the two phaseshas an effect also on the stress plateau and the transformation strain. The trans-formation strain along all orientations decreases as the temperature at which theloading is performed increases. The other noticeable trend is the increase in the
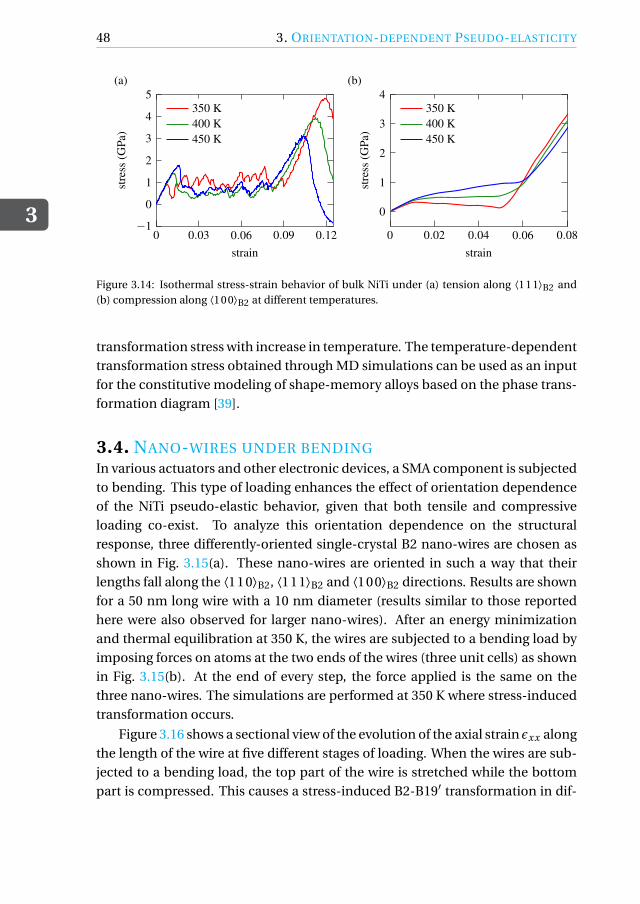
3
48 3. ORIENTATION-DEPENDENT PSEUDO-ELASTICITY
0 0.03 0.06 0.09 0.12−1
0
1
2
3
4
5
strain
stre
ss(G
Pa)
350 K400 K450 K
(a)
0 0.02 0.04 0.06 0.08
0
1
2
3
4
strain
stre
ss(G
Pa)
350 K400 K450 K
(b)
Figure 3.14: Isothermal stress-strain behavior of bulk NiTi under (a) tension along ⟨111⟩B2 and(b) compression along ⟨100⟩B2 at different temperatures.
transformation stress with increase in temperature. The temperature-dependenttransformation stress obtained through MD simulations can be used as an inputfor the constitutive modeling of shape-memory alloys based on the phase trans-formation diagram [39].
3.4. NANO-WIRES UNDER BENDINGIn various actuators and other electronic devices, a SMA component is subjectedto bending. This type of loading enhances the effect of orientation dependenceof the NiTi pseudo-elastic behavior, given that both tensile and compressiveloading co-exist. To analyze this orientation dependence on the structuralresponse, three differently-oriented single-crystal B2 nano-wires are chosen asshown in Fig. 3.15(a). These nano-wires are oriented in such a way that theirlengths fall along the ⟨110⟩B2, ⟨111⟩B2 and ⟨100⟩B2 directions. Results are shownfor a 50 nm long wire with a 10 nm diameter (results similar to those reportedhere were also observed for larger nano-wires). After an energy minimizationand thermal equilibration at 350 K, the wires are subjected to a bending load byimposing forces on atoms at the two ends of the wires (three unit cells) as shownin Fig. 3.15(b). At the end of every step, the force applied is the same on thethree nano-wires. The simulations are performed at 350 K where stress-inducedtransformation occurs.
Figure 3.16 shows a sectional view of the evolution of the axial strain ϵxx alongthe length of the wire at five different stages of loading. When the wires are sub-jected to a bending load, the top part of the wire is stretched while the bottompart is compressed. This causes a stress-induced B2-B19′ transformation in dif-

3.4. NANO-WIRES UNDER BENDING
3
49
50 nm
10 nm
x
y
z
〈110〉B2
〈110〉B2〈001〉B2
〈112〉B2
〈111〉B2
〈110〉B2
〈110〉B2
〈001〉B2
〈110〉B2
(a)t = 0 ps
F(0) F(0)
t = T
F(T ) F(T )
(b)
Figure 3.15: (a) Schematic of the ⟨110⟩, ⟨111⟩ and ⟨100⟩ oriented initial B2 nano-wires.(b) Schematic of the bending load applied to the nano-wires cut along the z-plane at the beginningof loading and at time T .
ferent regions of the wires, and the transformation can be identified through asudden increase (or decrease) in the axial strain ϵxx that manifests as patchesof different phases in Fig. 3.16. As expected, it is observed that the strain evo-lution is different in differently-oriented nano-wires. For instance, in the ⟨110⟩and ⟨111⟩ oriented nano-wires, the tensile stress-induced transformation in thetop part of the wires occurs before there is a transformation in the compressiveregion of the wire, as opposed to the ⟨100⟩ oriented nano-wire. This can also bevisualized at time t = t4 where a larger part of the ⟨110⟩ and ⟨111⟩ oriented wireshas undergone tensile stress-induced transformation. Similarly, a very small partof the ⟨111⟩ oriented wire has undergone a compressive stress-induced transfor-mation.
A few conclusions regarding the orientation dependence on the bending be-havior can be drawn by correlating the transformation mechanism in the threewires during bending to the values listed in Tables 3.1 and 3.2. The B19′ transfor-mation stress in tension is lower than the transformation stress in compressionalong the ⟨110⟩ and ⟨111⟩ orientations when compared to the ⟨100⟩ orienta-tion. This is directly mirrored by the strain evolution, where the tensile trans-formation (red patches) happens before the compressive transformation in the⟨110⟩ and ⟨111⟩ nano-wires. The ⟨111⟩ oriented nano-wire shows the largestdifference between the tensile- and the compressive-transformed parts due to
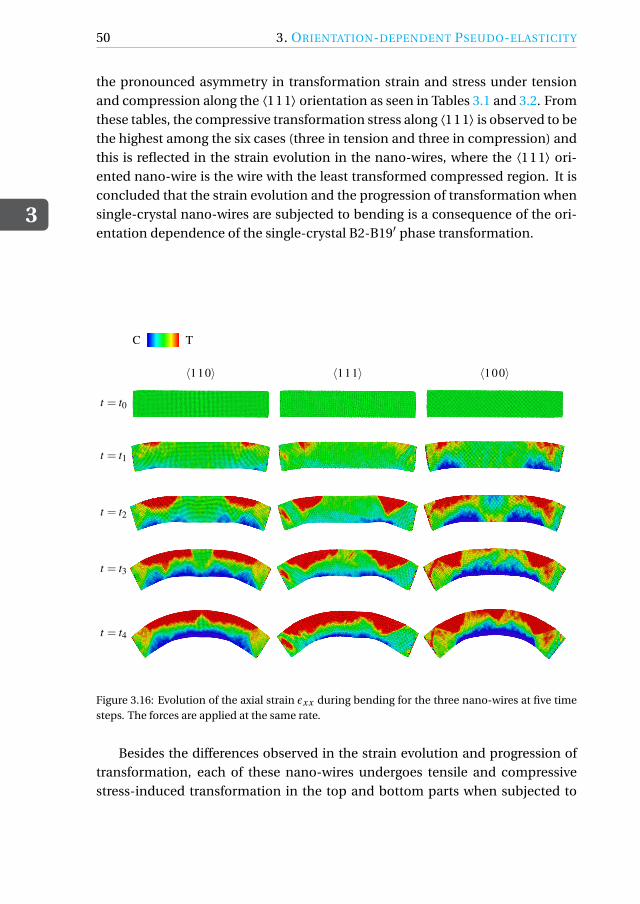
3
50 3. ORIENTATION-DEPENDENT PSEUDO-ELASTICITY
the pronounced asymmetry in transformation strain and stress under tensionand compression along the ⟨111⟩ orientation as seen in Tables 3.1 and 3.2. Fromthese tables, the compressive transformation stress along ⟨111⟩ is observed to bethe highest among the six cases (three in tension and three in compression) andthis is reflected in the strain evolution in the nano-wires, where the ⟨111⟩ ori-ented nano-wire is the wire with the least transformed compressed region. It isconcluded that the strain evolution and the progression of transformation whensingle-crystal nano-wires are subjected to bending is a consequence of the ori-entation dependence of the single-crystal B2-B19′ phase transformation.
C T
〈110〉 〈111〉 〈100〉
t = t0
t = t1
t = t2
t = t3
t = t4
Figure 3.16: Evolution of the axial strain ϵxx during bending for the three nano-wires at five timesteps. The forces are applied at the same rate.
Besides the differences observed in the strain evolution and progression oftransformation, each of these nano-wires undergoes tensile and compressivestress-induced transformation in the top and bottom parts when subjected to
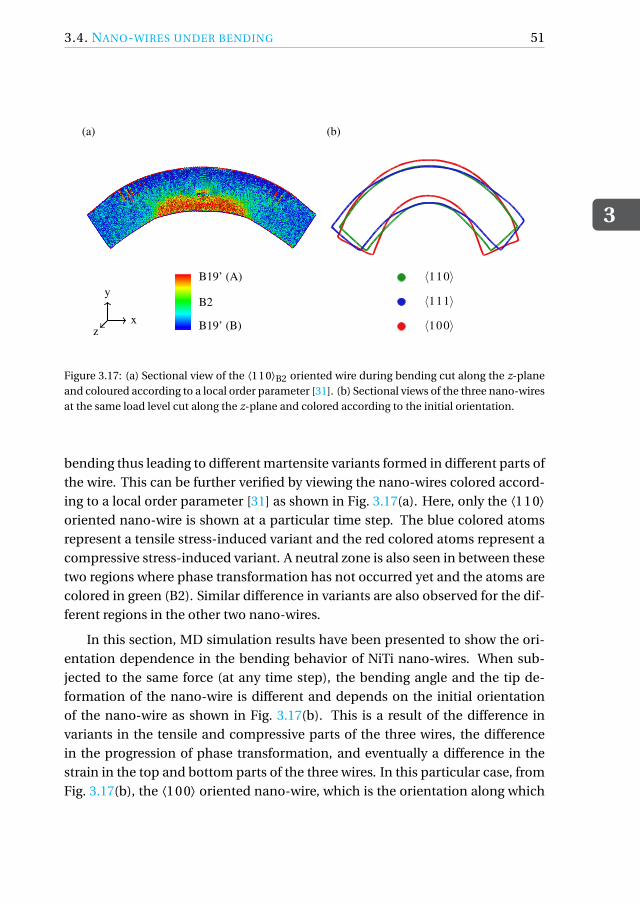
3.4. NANO-WIRES UNDER BENDING
3
51
(a)
x
y
z
B2
B19’ (A)
B19’ (B)
〈110〉
〈111〉
〈100〉
(b)
Figure 3.17: (a) Sectional view of the ⟨110⟩B2 oriented wire during bending cut along the z-planeand coloured according to a local order parameter [31]. (b) Sectional views of the three nano-wiresat the same load level cut along the z-plane and colored according to the initial orientation.
bending thus leading to different martensite variants formed in different parts ofthe wire. This can be further verified by viewing the nano-wires colored accord-ing to a local order parameter [31] as shown in Fig. 3.17(a). Here, only the ⟨110⟩oriented nano-wire is shown at a particular time step. The blue colored atomsrepresent a tensile stress-induced variant and the red colored atoms represent acompressive stress-induced variant. A neutral zone is also seen in between thesetwo regions where phase transformation has not occurred yet and the atoms arecolored in green (B2). Similar difference in variants are also observed for the dif-ferent regions in the other two nano-wires.
In this section, MD simulation results have been presented to show the ori-entation dependence in the bending behavior of NiTi nano-wires. When sub-jected to the same force (at any time step), the bending angle and the tip de-formation of the nano-wire is different and depends on the initial orientationof the nano-wire as shown in Fig. 3.17(b). This is a result of the difference invariants in the tensile and compressive parts of the three wires, the differencein the progression of phase transformation, and eventually a difference in thestrain in the top and bottom parts of the three wires. In this particular case, fromFig. 3.17(b), the ⟨100⟩ oriented nano-wire, which is the orientation along which
3
52 3. ORIENTATION-DEPENDENT PSEUDO-ELASTICITY
the compressive transformation strain is the largest and the tensile transforma-tion strain is the smallest, shows the maximum bending as compared to the othertwo wires. In comparison, the ⟨111⟩ oriented nano-wire, which is the orientationwith the least compressive transformation strain and the most tensile transfor-mation strain, shows the least bending among the three wires when subjectedto the same load. Although the exact values of bending forces and bending an-gles during different stages of loading have not been presented here, the crucialaspect to note is that the deformation behavior during bending is a direct con-sequence of the orientation dependence of the B2-B19′ phase transformation insingle-crystals.
3.5. CONCLUSIONSIn this study, MD simulations of uniaxial tensile and compressive loading of threedifferently-oriented bulk B2 NiTi have been performed. The results indicate astrong orientation dependence and tension-compression asymmetry arising pri-marily due to the different orientations of the monoclinic crystal structure of theB19′ phase.
The MD results suggest that the production of single crystal NiTi SMAs can beoptimised based on the transformation stress and transformation strain that areneeded for a particular application. For instance, NiTi actuator devices that re-quire large tensile stress-induced deformations can be made in such a way thatthe ⟨111⟩ orientation of the B2 single crystal falls along the loading axis. Sim-ilarly, a device that relies on compressive stress-induced transformation wouldbenefit from a ⟨110⟩ or a ⟨100⟩ oriented NiTi single crystal. In the case of bend-ing, one should take into account that the deformation does not occur homoge-neously, the curvature of the bended crystal is not constant, and the neutral axisis offset from the center because of the tension-compression asymmetry.
This study also lays the basis for a better understanding of polycrystal behav-ior [19]. When a polycrystal is loaded, the local mechanical behavior will dependon the orientation of the grains. Transformation will begin earlier in favorably-oriented grains, and the evolution of the martensitic transformation will dependon the size and orientation of individual grains and on the way each grain willdeform to accommodate the deformation of its neighbors.
The other noticeable difference in behavior for the three orientations is in thenano-structural changes associated with the phase transformation. Earlier MDsimulations predicted the formation of Lüders-like B19′ bands during pseudo-elastic behavior along the ⟨110⟩ orientation. In the simulations presented here,the martensitic transformation occurs through the formation of such bands

3.5. CONCLUSIONS
3
53
when the austenitic bulk is loaded both along the ⟨110⟩ or ⟨100⟩ orientation,whereas the transformation progresses through the formation of a multi-variantB19′ structure and the subsequent reorientation into a single-variant B19′ whenloaded along the ⟨111⟩ orientation.
3
54 REFERENCES
REFERENCES[1] P. Srinivasan, L. Nicola, and A. Simone, Atomistic modeling of the orien-
tation dependent pseudo-elasticity in NiTi: Normal loading and bending,Computational Materials Science 154, 25 (2018).
[2] W.-S. Ko, B. Grabowski, and J. Neugebauer, Development and application ofa Ni-Ti interatomic potential with high predictive accuracy of the martensiticphase transition, Physical Review B 92, 134107 (2015).
[3] C. Frick, S. Orso, and E. Arzt, Loss of pseudoelasticity in nickel-titanium sub-micron compression pillars, Acta Materialia 55, 3845 (2007).
[4] J. Ye, R. K. Mishra, A. R. Pelton, and A. M. Minor, Direct observation of theNiTi martensitic phase transformation in nanoscale volumes, Acta Materi-alia 58, 490 (2010).
[5] J. S. Juan, M. L. No, and C. A. Schuh, Nanoscale shape-memory alloys forultrahigh mechanical damping, Nature Nanotechnology 4, 415 (2009).
[6] M. Kohl, Shape Memory Microactuators (Springer, 2004).
[7] K. Bhattacharya and R. D. James, The material is the machine, Science 307,53 (2005).
[8] O. Matsumoto, S. Miyazaki, K. Otsuka, and H. Tamura, Crystallography ofmartensitic transformation in TiNi single crystals, Acta Materialia 35, 2137(1987).
[9] R. M. Manjeri, S. Qiu, N. Mara, A. Misra, and R. Vaidyanathan, Superelasticresponse of [111] and [101] oriented micropillars, Journal of Applied Physics108 (2010).
[10] K. Gall, H. Sehitoglu, R. Anderson, I. Karaman, Y. I. Chumlyakov, and I. V.Kireeva, On the mechanical behavior of single crystal NiTi shape memoryalloys and related polycrystalline phenomenon, Materials Science and Engi-neering 317, 85 (2001).
[11] J. Pfetzing-Micklich, R. Ghisleni, T. Simon, C. Somsen, J. Michler, andG. Eggeler, Orientation dependence of stress-induced phase transformationand dislocation plasticity in NiTi shape memory alloys on the micro scale,Materials Science and Engineering A 538, 265 (2012).
REFERENCES
3
55
[12] G. Laplanche, J. Pfetzing-Micklich, and G. Eggeler, Orientation depen-dence of stress-induced martensite formation during nanoindentation inNiTi shape memory alloys, Acta Materialia 68, 19 (2014).
[13] T. Saburi, M. Yoshida, and S. Nenno, Deformation behaviour of shape mem-ory TiNi crystals, Scripta Metallurgica 18, 363 (1984).
[14] T. E. Buchheit and J. A. Wert, Predicting the orientation-dependent stress-induced transformation and detwinning response of shape memory alloysingle crystals, Metallurgical and Materials transactions A 27A, 269 (1996).
[15] Y. Zhong, K. Gall, and T. Zhu, Atomistic study of nanotwins in NiTi shapememory alloys, Journal of Applied Physics 110, 033532 (2011).
[16] M. Finnis and J. Sinclair, A simple empirical n-body potential for transitionmetals, Philosophical Magazine A 50, 45 (1984).
[17] B. Wang, G. Z. Kang, Q. H. Kan, K. Zhou, and Y. Chao, Molecular dynamicssimulations to the pseudo-elasticity of NiTi shape memory alloy nano-pillarsubjected to cyclic compression, Computational Materials Science 131, 132(2017).
[18] B. Wang, G. Z. Kang, Q. H. Kan, K. Zhou, and Y. Chao, Atomistic study on thesuper-elasticity of single crystal bulk NiTi shape memory alloy under adia-batic condition, Computational Materials Science 142, 38 (2018).
[19] W.-S. Ko, S. B. Maisel, B. Grabowski, J. B. Jeon, and J. Neugebauer, Atomicscale processes of phase transformations in nanocrystalline NiTi shape-memory alloys, Acta Materialia 123, 90 (2017).
[20] B. Wang, G. Z. Kang, Q. H. Kan, W. P. Wu, K. Zhou, and Y. Chao, Atom-istic study on the super-elasticity of nanocrystalline NiTi shape memory alloysubjected to a cyclic deformation, Computational Materials Science 152, 85(2018).
[21] P. Srinivasan, L. Nicola, and A. Simone, Modeling pseudo-elasticity in NiTi:Why the MEAM potential outperforms the EAM-FS potential, ComputationalMaterials Science 134, 145 (2017).
[22] D. Mutter and P. Nielaba, Simulation of the shape memory effect in a NiTinano model system, Condensed Matter and Materials Science 577, S83(2013).
3
56 REFERENCES
[23] S. J. Plimpton, Fast parallel algorithms for short-range molecular dynamics,Journal of Computer Physics 117, 1 (1995).
[24] S. Nose, A unified formulation of the constant temperature molecular-dynamics methods, Journal of Chemical Physics 81, 511 (1984).
[25] W. C. Swope, H. C. Anderson, P. H. Berens, and K. R. A. Wilson, A computersimulation method for the calculation of equilibrium constants for the for-mation of physical clusters of molecules: Application to small water clusters,Journal of Chemical Physics 76, 637 (1982).
[26] D. H. Tsai, The virial theorem and stress calculation in molecular dynamics,Journal of Chemical Physics 70, 1375 (1979).
[27] Y. Zhong, K. Gall, and T. Zhu, Atomistic characterization of pseudoelasticityand shape memory in NiTi nanopillars, Acta Materialia 60, 6301 (2012).
[28] G. Tan, Y. Liu, P. Sittner, and M. Saunders, Lüders-like deformation associ-ated with stress-induced martensitic transformation in NiTi, Scripta Materi-alia 50, 193 (2004).
[29] T. Ezaz, H. Sehitoglu, and H. Maier, Energetics of twinning in martensiticNiTi, Acta Materialia 59, 5893 (2011).
[30] Y. Liu, Z. Xie, J. V. Humbeeck, L. Delaey, and Y. Liu, On the deformation ofthe twinned domain in NiTi shape memory alloys, Philosophical MagazineA 80, 1935 (2000).
[31] D. Mutter and P. Nielaba, Simulation of thermally induced austenite phasetransformation in shape memory alloy, The European Physics Journal B 84,109 (2011).
[32] T. M. Brill, S. Mittelbach, W. Assmus, M. Mullner, and B. Luthi, Elastic prop-erties of NiTi, Journal of Physics: Condensed Matter 3, 9621 (1991).
[33] P. Sittner, L. Heller, J. Pilch, C. Curfs, T. Alonso, and D. Favier, Young’s mod-ulus of austenite and martensite phases in superelastic NiTi wires, Journal ofMaterials Engineering and Performance 23 (2014).
[34] M. F.-X. Wagner and W. Windl, Lattice stability, elastic constants and macro-scopic moduli of NiTi martensites from first principles, Acta Materialia 56,6232 (2008).
REFERENCES
3
57
[35] S. Qiu, B. Clausen, S. A. P. II, R. D. Noebe, and R. Vaidyanathan, On elastimoduli and elastic anisotropy in polycrystalline martensitic NiTi, Acta Ma-terialia 59, 5055 (2011).
[36] S. Mao, J. Luo, Z. Zhang, M. Wu, Y. Liu, and X. Han, EBSD studies of thestress-induced B2-B19’ martensitic transformation in NiTi tubes under uni-axial tension and compression, Acta Materialia 58, 3357 (2010).
[37] T. Saburi, Y. Watanabe, and S. Nenno, Morphological characteristics of theorthorhombic martensite in shape memory Ti-Ni-Cu alloy, ISIJ International29, 405 (1989).
[38] J. Turley and G. Sines, The anisotropy of Young’s modulus, shear modulusand Poisson’s ratio in cubic materials, Journal of Physics D: Applied Physics4, 264 (1971).
[39] S. Marfia and R. Rizzoni, One-dimensional constitutive SMA model with twomartensite variants: Analytical and numerical solutions, European Journalof Mechanics - A/Solids 40, 166 (2013).

4A NEW POTENTIAL FOR
NICKEL-TITANIUM
The reference-free version of the MEAM (RF-MEAM) potential provides more flex-ibility for fitting than the 2NN-MEAM because it also describes the pair potentialas an explicit function. Here, we present a methodology to fit RF-MEAM poten-tials to DFT data. We then evaluate the performance of the fitted potential bycomparing MD simulations with experimental and DFT data. The methodol-ogy is applied to a binary and a quaternary alloy, namely NiTi and NbMoTaW.For NiTi, our attention focuses on designing a potential that properly captures itsmechanical behavior, given that the existing potentials fail to predict elastic con-stants in agreement with experiments. To reach our aim, we included the stresstensors of different high-temperature configurations in the fitting database. Theobtained RF-MEAM outperforms existing EAM and MEAM potentials in predict-ing the lattice and elastic constants of austenitic and martensitic phases as well asthe corresponding transformation temperatures. To demonstrate the suitability ofthis methodology also for more complex systems, a RF-MEAM potential is fitted tomodel the multi-component NbMoTaW high-entropy alloy. Validation is achievedthrough comparison between observables obtained through the MD output and abinitio data.
This chapter has been published in Modelling and Simulation in Materials Science and Engineer-ing 27, 6 (2019) [1]
59
4
60 4. A NEW POTENTIAL FOR NICKEL-TITANIUM
4.1. INTRODUCTION
Interatomic potentials that reproduce ab initio data accurately are the most cru-cial ingredient of any molecular dynamics (MD) simulation. It is therefore ofgreat importance to design potentials that satisfy this requirement. In this work,we have developed reference-free modified MEAM (RF-MEAM) potentials for thenickel-titanium (NiTi) shape-memory alloy and the NbMoTaW high-entropy al-loy. We have then tested their performance by comparing results from MD sim-ulations to data obtained through density functional theory (DFT) and experi-ments.
Since DFT simulations are restricted to a few hundred atoms due to the heavycomputational burden, larger systems are usually modeled using molecular dy-namics (MD) simulations, relying on interatomic potentials fitted to DFT data.The performance of an MD simulation clearly depends on the quality of the em-ployed interatomic potential. Out of the many potential functions that have beendeveloped, parametrized, and used to perform MD simulations of metals andmetal alloys, the most recent and widely used formalisms are the embedded-atom method (EAM) [2] and the modified embedded-atom method (MEAM) [3,4] interatomic potentials.
Parameters of any potential function are optimized by fitting them to DFTdata. In the original MEAM [3, 4] formalism, which has been parametrized to rep-resent a number of metals and metal alloys accurately, the interatomic potentialis tied to a particular equilibrium reference structure. The pair interaction energyis calculated from known values of the total and embedding function energies inan equilibrium reference structure, with the total energy obtained analyticallyfrom the zero-temperature Rose universal equation of state [5]. In the RF-MEAMformalism, the potential is no longer bound to the Rose equation, and the pairinteraction is instead defined as an explicit function, with parameters that can beoptimized during the fitting process. The energies of any structure can hence bereproduced by fitting those parameters. This formalism is therefore termed thereference-free MEAM [6, 7] formalism because the dependency on the referencestructure is removed.
In this work, we use MEAMfit v2 [8], the latest version of the optimizationcode MEAMfit [9, 10] to perform the fitting. The optimized potential can thenbe directly used to perform MD simulations in LAMMPS. The fitting methodol-ogy to develop RF-MEAM potentials is applied to two systems: the equi-atomicnickel-titanium shape-memory alloy (SMA), and the multi-component niobiummolybdenum tantalum tungsten (NbMoTaW) high-entropy alloy.
The NiTi SMA has been modeled so far either through the EAM Finnis-

4.1. INTRODUCTION
4
61
Sinclair (EAM-FS) potential [11, 12] or the 2NN-MEAM [13–19] potential. The2NN-MEAM potential was developed because of the difficulties in describing thecomplex B19′ martensitic structure using the simple potential parametrizationin the EAM formalism. The parameters for the 2NN-MEAM potential by Koet al. [13] were obtained by fitting them to a database consisting primarily ofproperties related to the unary Ni and Ti systems with the addition of 0 K NiTiB2 and B19′ structures. In Chapter 2, we have shown that the 2NN-MEAMperforms better than EAM-FS in capturing the overall NiTi phase transformationsince lattice and elastic constants of both phases are in better agreement withexperimental data. There is however still room for improvement as some of theelastic constants of the martensitic phase differ by up to 300% (C35 and C46 intable 4.3) from experimental data. Since each elastic constant differs by a differ-ent percentage from the corresponding experimental data, this implies that thepotential cannot predict the correct mechanical response in complex systemssuch as polycrystals. Moreover, the transformation temperatures (martensiticstart Ms and austenitic finish Af) are not captured accurately, and the structuralenergy differences predicted by DFT cannot be reproduced.
Here, we are interested in developing a potential that models the mechani-cal behavior of the B2 and B19′ phases more accurately, in addition to predictingthe reversible phase transformation. This can be achieved thanks to the flexibil-ity of the RF-MEAM potential, where a broader dataset can be used for fitting,compared to the one used for 2NN-MEAM. The database used in this work com-prises results of extensive DFT simulations of the B2 and B19′ phases. In additionto the 0 K energies, finite temperature energies, atomic forces and stress tensorsof 120 different configurations of B2 and B19′ are included. It is mostly the addi-tion of the stress tensors to the database that leads to a better prediction of themechanical behavior of NiTi. Indeed, the newly developed RF-MEAM potentialconsiderably improves the predicition of most of the 0 K lattice and elastic con-stants, and cohesive energies of both B2 and the B19′ phases. We then performMD simulations using the new RF-MEAM potential to model pseudo-elasticityand shape-memory behavior in single-crystal NiTi. The 0 K results are comparedto the ab initio data used for fitting. The transformation temperatures, transfor-mation strains, and elastic moduli of the two phases predicted by the RF-MEAMpotential are compared to those predicted by the 2NN-MEAM potential. Theseresults, along with the fitting details used for NiTi, are reported in Section 4.3.
The fitting methodology to build a potential, described in Section 4.2,can also be extended to a multi-component system. This is demonstrated inSection 4.4 for a NbMoTaW high-entropy alloy where observables from DFT are
4
62 4. A NEW POTENTIAL FOR NICKEL-TITANIUM
compared with the MD output for a sample fitting set and a sample testing set.Improvements in MEAMfit v2, the LAMMPS implementation of the RF-MEAMpotential and instructions on how to download the corresponding computersubroutines can be found in Appendix 4.A.
4.2. METHODOLOGY
4.2.1. THE RF-MEAM POTENTIAL
Reference-free versions of the MEAM potential have been developed and usedearlier for Si by Timonova and Thijsse [7] and for Al-O by Lazic and Thijsse [6].Scopece and Thijsse [20] also performed MD simulations for Al-O using the RF-MEAM potential. According to the formalism, the total energy of an N -atom sys-tem is given by
E =N∑
i=1E emb
i (ρi )+ 1
2
N∑i = j
ϕi , j (ri j ), (4.1)
where E embi (ρi ) is the embedding energy function, ρi is the fictitious electron
density at site i and ϕi , j (ri j ) is the pair potential between atoms i and j sepa-rated by a distance ri j . The embedding term is described as a function of thefictitious partial electron densities. The partial electron densities and the pairpotentials are written as
f (l )i (r ) =
N1∑n=1
a(n,l )i
(r (n,l )
i − r)3θ
(r (n,l )
i − r)
, (4.2)
and
ϕ(l )i , j (r ) =
N2∑n=1
b(n)i , j
(s(n)
i , j − r)3θ
(s(n)
i , j − r)
. (4.3)
Here, a(n,l )i , b(n)
i , j , r (n,l )i , and s(n)
i , j (l = 0,1,2,3) are parameters to be optimized. Thenumber of terms in the summation (N1 and N2) should be chosen so that thereare sufficient data-points per parameter to avoid over-fitting the potential. Fit-ting to larger datasets with higher N1 and N2 values results in more accurate po-tentials overall, but the fitting will take a longer time due to the greater numberof parameters to optimize as well as the higher number of fitting points. In addi-tion, choosing high N1 and N2 values also results in slower MD simulations sincemore calculations are involved per step. For instance, for both systems discussedin this article where we choose N1 = N2 = 3, a MD step using the RF-MEAM takesapproximately twice the time per atom in comparison to a MD step using the2NN-MEAM potential with the same cut-off.
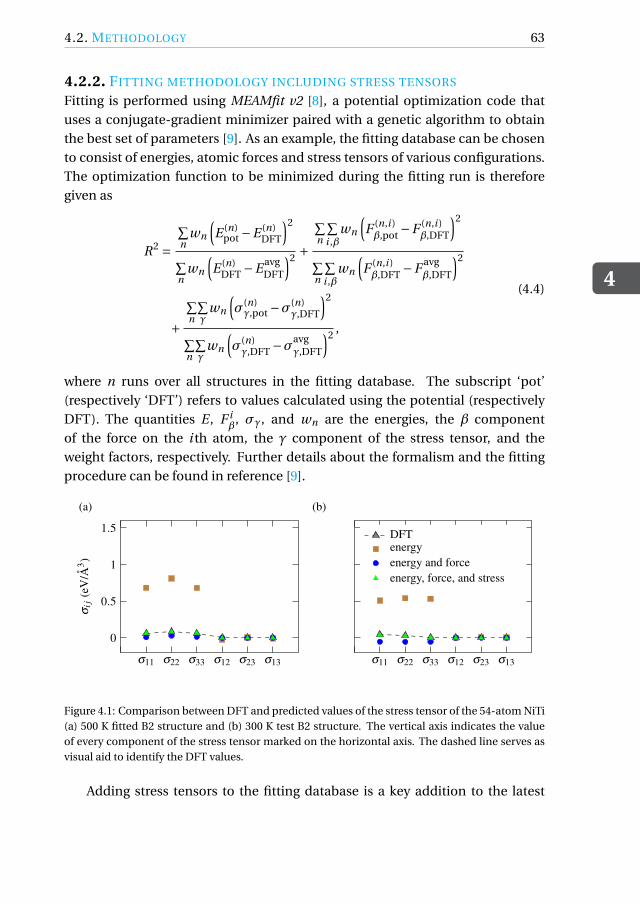
4.2. METHODOLOGY
4
63
4.2.2. FITTING METHODOLOGY INCLUDING STRESS TENSORS
Fitting is performed using MEAMfit v2 [8], a potential optimization code thatuses a conjugate-gradient minimizer paired with a genetic algorithm to obtainthe best set of parameters [9]. As an example, the fitting database can be chosento consist of energies, atomic forces and stress tensors of various configurations.The optimization function to be minimized during the fitting run is thereforegiven as
R2 =∑n
wn
(E (n)
pot −E (n)DFT
)2
∑n
wn
(E (n)
DFT −E avgDFT
)2 +
∑n
∑i ,β
wn
(F (n,i )β,pot −F (n,i )
β,DFT
)2
∑n
∑i ,β
wn
(F (n,i )β,DFT −F avg
β,DFT
)2
+
∑n
∑γ
wn
(σ(n)γ,pot −σ(n)
γ,DFT
)2
∑n
∑γ
wn
(σ(n)γ,DFT −σ
avgγ,DFT
)2 ,
(4.4)
where n runs over all structures in the fitting database. The subscript ‘pot’(respectively ‘DFT’) refers to values calculated using the potential (respectivelyDFT). The quantities E , F i
β, σγ, and wn are the energies, the β component
of the force on the i th atom, the γ component of the stress tensor, and theweight factors, respectively. Further details about the formalism and the fittingprocedure can be found in reference [9].
σ11 σ22 σ33 σ12 σ23 σ13
0
0.5
1
1.5
σij
(eV
/A3 )
(a)
σ11 σ22 σ33 σ12 σ23 σ13
DFTenergyenergy and forceenergy, force, and stress
(b)
Figure 4.1: Comparison between DFT and predicted values of the stress tensor of the 54-atom NiTi(a) 500 K fitted B2 structure and (b) 300 K test B2 structure. The vertical axis indicates the valueof every component of the stress tensor marked on the horizontal axis. The dashed line serves asvisual aid to identify the DFT values.
Adding stress tensors to the fitting database is a key addition to the latest
4
64 4. A NEW POTENTIAL FOR NICKEL-TITANIUM
version of the optimization code, the benefits of which are demonstrated inFigs. 4.1(a) and (b) that show stress tensor values of a 500 K B2 structure anda 300 K B2 structure predicted by potentials that are fitted only to energies, toenergies and forces, and to energies, forces, and stress tensors of a 500 K B2structure. The energies and forces predicted by the three potentials are foundto be very close to the DFT values. The stress tensor is also predicted accuratelyfor both fitted and test structures, however only by the potential for which thestress tensor was included in the fitting set. This example calculation, along withfurther details about Fig. 4.1, including a comparison of the energies and forcespredicted by the potentials to the DFT values, is described in Appendix 4.B.
The result validates the importance of adding stress tensors to the fittingdatabase to accurately capture the overall mechanical behavior. This procedureis followed in the development of the new RF-MEAM potential for NiTi as de-scribed in the next section.
4.3. A NEW RF-MEAM FOR NITI
4.3.1. CONSTRUCTING THE DFT DATABASE
The DFT database built for fitting the RF-MEAM potential contains properties re-lated to both the B2 and the B19′ phases. The configurations include a 128-atom0 K perfect B2 structure, a 108-atom 0 K perfect B19′ structure, 60 500 K ab ini-tio MD configurations each of 54-atom B2 and 32-atom B19′, and 60 1,000 K abinitio MD configurations each of 54-atom B2 and 32-atom B19′. Configurationsrelated to different temperatures for these phases are chosen to ensure trans-ferability of the potential to predict B2 and B19′ behavior as accurately as possi-ble. DFT simulations are run using VASP [21] within the Perdew-Burke-Ernzerhof(PBE) generalized gradient approximation (GGA) [22] for the exchange correla-tion function. A cut-off energy of 450 eV for the plane wave basis set and theMethfessel-Paxton smearing method with a width of 0.1 eV is used. The chosencut-off energy is a converged value above which the difference in stress tensors isless than 10−4 eV/Å3 . A 23×23×23 k-point mesh is selected for the B2 primitiveunit cell and the same k-point density is used for other structures. Magnetismis included by considering spin-polarized calculations. Ab initio MD simula-tions are performed to obtain configurations at finite temperatures. In the firststep, low convergence parameters are used to sample the configuration space ef-fectively. MD runs with a single k-point are performed for 10,000 steps with atime step of 1.5 fs corresponding to ionic temperatures of 500 K and 1000 K. Inthe next step, 60 uncorrelated snapshots from each of these runs are extracted

4.3. A NEW RF-MEAM FOR NITI
4
65
and recalculated with the previously mentioned high convergence criteria and adenser k-point mesh, thereby providing more accurate values of energies, atomicforces, and stress tensors. This procedure generates 120 configurations each forB2 and B19′. The use of low parameters to efficiently sample the phase space,with subsequent higher parameters to obtain accurate observables, is identicalto the upsampling approach within the “upsampled thermodynamic integrationusing Langevin dynamics” (UP-TILD) [23] method.
4.3.2. OPTIMIZATION OF THE RF-MEAM PARAMETERS
For the fitting procedure, three summation terms are chosen for the partial elec-tron densities and the pair potential; equal weights are then assigned to the ener-gies of the two 0 K structures and to the energies, atomic forces, and stress tensorsof the 120, 500 K and 1,000 K configurations. This yields a total of 78 parametersof the RF-MEAM potential fitted to 32,642 data points. The parameters of thebest-fitted potential are listed in table 4.C1 in Appendix 4.C and details regard-ing obtaining and using the best-fitted interatomic potential file for LAMMPS isdescribed in Appendix 4.A.
The optimization function value R (see Eq. (4.4)) for the best-fitted set of pa-rameters is 0.37. The RMS errors in energies, forces, and stresses of the configura-tions used in the fitting database calculated with the best-fitted set of parametersare 0.019 eV/atom, 0.226 eV/Å and 5.7 meV/Å3, respectively. Next, we report theresults of molecular statics and molecular dynamics runs using this potential toverify its performance.
4.3.3. PERFORMANCE OF THE RF-MEAM POTENTIAL
Table 4.1 shows the lattice parameters of the B2 and B19′ phases obtained by per-forming molecular statics calculations at 0 K using the RF-MEAM potential. Thetable also includes the volume and cohesive energy difference between the twophases. The values are compared to the results from ab initio calculations andthose predicted by the 2NN-MEAM potential [13]. The percentage error of thevalues predicted by the RF-MEAM and the 2NN-MEAM is also specified—this iscalculated as the difference between predicted and ab initio values with respectto the ab initio values. The monoclinic angle of B19′ and the energy differencebetween the two phases are more accurately predicted by the newly developedRF-MEAM potential. The predicted value of the other lattice parameters and thevolume difference between B2 and B19′ are similar to those predicted by the pre-vious 2NN-MEAM potential. Results from experiments [24] are also added to thetable to demonstrate the accuracy of the ab initio values and the RF-MEAM pre-
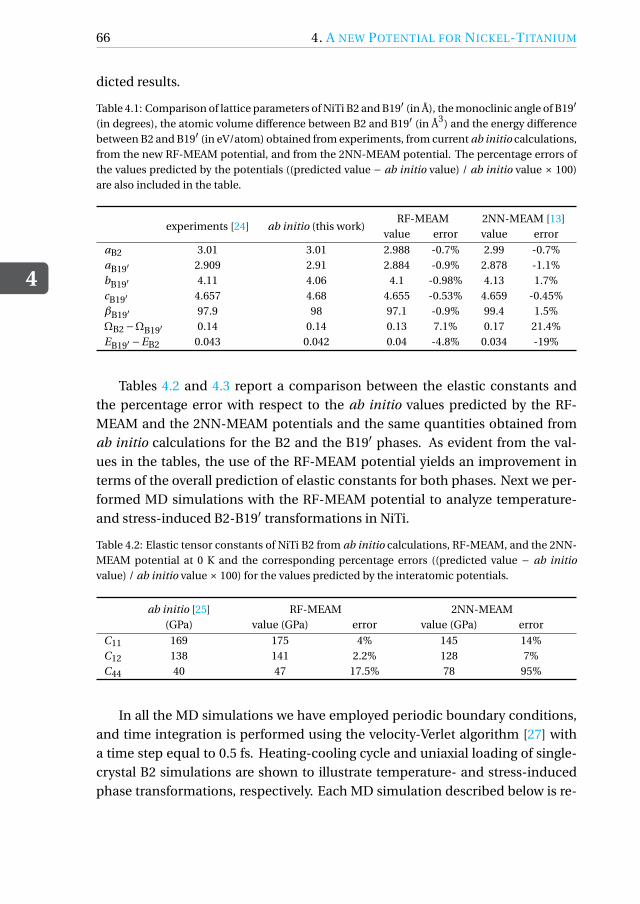
4
66 4. A NEW POTENTIAL FOR NICKEL-TITANIUM
dicted results.
Table 4.1: Comparison of lattice parameters of NiTi B2 and B19′ (in Å), the monoclinic angle of B19′(in degrees), the atomic volume difference between B2 and B19′ (in Å3) and the energy differencebetween B2 and B19′ (in eV/atom) obtained from experiments, from current ab initio calculations,from the new RF-MEAM potential, and from the 2NN-MEAM potential. The percentage errors ofthe values predicted by the potentials ((predicted value − ab initio value) / ab initio value × 100)are also included in the table.
experiments [24] ab initio (this work)RF-MEAM 2NN-MEAM [13]
value error value error
aB2 3.01 3.01 2.988 -0.7% 2.99 -0.7%aB19′ 2.909 2.91 2.884 -0.9% 2.878 -1.1%bB19′ 4.11 4.06 4.1 -0.98% 4.13 1.7%cB19′ 4.657 4.68 4.655 -0.53% 4.659 -0.45%βB19′ 97.9 98 97.1 -0.9% 99.4 1.5%ΩB2 −ΩB19′ 0.14 0.14 0.13 7.1% 0.17 21.4%EB19′ −EB2 0.043 0.042 0.04 -4.8% 0.034 -19%
Tables 4.2 and 4.3 report a comparison between the elastic constants andthe percentage error with respect to the ab initio values predicted by the RF-MEAM and the 2NN-MEAM potentials and the same quantities obtained fromab initio calculations for the B2 and the B19′ phases. As evident from the val-ues in the tables, the use of the RF-MEAM potential yields an improvement interms of the overall prediction of elastic constants for both phases. Next we per-formed MD simulations with the RF-MEAM potential to analyze temperature-and stress-induced B2-B19′ transformations in NiTi.
Table 4.2: Elastic tensor constants of NiTi B2 from ab initio calculations, RF-MEAM, and the 2NN-MEAM potential at 0 K and the corresponding percentage errors ((predicted value − ab initiovalue) / ab initio value × 100) for the values predicted by the interatomic potentials.
ab initio [25] RF-MEAM 2NN-MEAM(GPa) value (GPa) error value (GPa) error
C11 169 175 4% 145 14%C12 138 141 2.2% 128 7%C44 40 47 17.5% 78 95%
In all the MD simulations we have employed periodic boundary conditions,and time integration is performed using the velocity-Verlet algorithm [27] witha time step equal to 0.5 fs. Heating-cooling cycle and uniaxial loading of single-crystal B2 simulations are shown to illustrate temperature- and stress-inducedphase transformations, respectively. Each MD simulation described below is re-
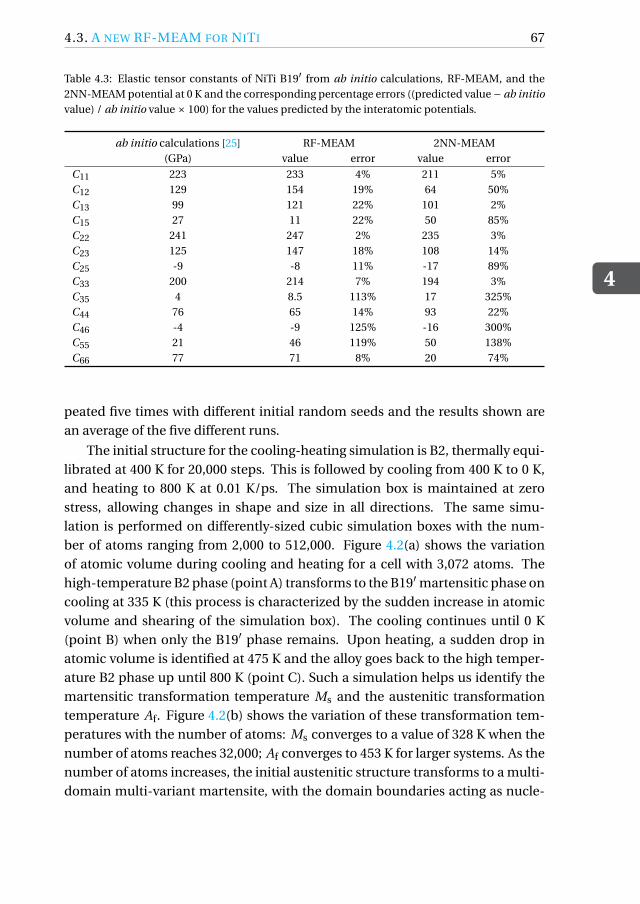
4.3. A NEW RF-MEAM FOR NITI
4
67
Table 4.3: Elastic tensor constants of NiTi B19′ from ab initio calculations, RF-MEAM, and the2NN-MEAM potential at 0 K and the corresponding percentage errors ((predicted value − ab initiovalue) / ab initio value × 100) for the values predicted by the interatomic potentials.
ab initio calculations [25] RF-MEAM 2NN-MEAM(GPa) value error value error
C11 223 233 4% 211 5%C12 129 154 19% 64 50%C13 99 121 22% 101 2%C15 27 11 22% 50 85%C22 241 247 2% 235 3%C23 125 147 18% 108 14%C25 -9 -8 11% -17 89%C33 200 214 7% 194 3%C35 4 8.5 113% 17 325%C44 76 65 14% 93 22%C46 -4 -9 125% -16 300%C55 21 46 119% 50 138%C66 77 71 8% 20 74%
peated five times with different initial random seeds and the results shown arean average of the five different runs.
The initial structure for the cooling-heating simulation is B2, thermally equi-librated at 400 K for 20,000 steps. This is followed by cooling from 400 K to 0 K,and heating to 800 K at 0.01 K/ps. The simulation box is maintained at zerostress, allowing changes in shape and size in all directions. The same simu-lation is performed on differently-sized cubic simulation boxes with the num-ber of atoms ranging from 2,000 to 512,000. Figure 4.2(a) shows the variationof atomic volume during cooling and heating for a cell with 3,072 atoms. Thehigh-temperature B2 phase (point A) transforms to the B19′ martensitic phase oncooling at 335 K (this process is characterized by the sudden increase in atomicvolume and shearing of the simulation box). The cooling continues until 0 K(point B) when only the B19′ phase remains. Upon heating, a sudden drop inatomic volume is identified at 475 K and the alloy goes back to the high temper-ature B2 phase up until 800 K (point C). Such a simulation helps us identify themartensitic transformation temperature Ms and the austenitic transformationtemperature Af. Figure 4.2(b) shows the variation of these transformation tem-peratures with the number of atoms: Ms converges to a value of 328 K when thenumber of atoms reaches 32,000; Af converges to 453 K for larger systems. As thenumber of atoms increases, the initial austenitic structure transforms to a multi-domain multi-variant martensite, with the domain boundaries acting as nucle-

4
68 4. A NEW POTENTIAL FOR NICKEL-TITANIUM
Table
4.4:C
om
pariso
no
fthe
NiT
imarten
sitican
dau
stenitic
transfo
rmatio
ntem
peratu
resan
dth
etran
sform
ation
strains
du
ring
tensile
and
com
-p
ressivestress-in
du
cedB
2-B19 ′
ph
asetran
sform
ation
alon
gd
ifferent
directio
ns
calculated
usin
gth
eR
F-M
EA
Man
dth
e2N
N-M
EA
Mp
oten
tialsto
know
nvalu
es(exp
erimen
tsfro
mliteratu
rean
dlattice
defo
rmatio
nm
od
el(LD
M)
on
abin
itiolattice
con
stants).
Th
ep
ercentage
errors
inth
ep
redicted
values
arecalcu
latedw
ithresp
ectto
the
experim
ental
and
LDM
(0K
)valu
esfo
rth
etran
sform
ation
temp
eratures
and
transfo
rmatio
nstrain
s.
experim
ents
[26]LD
M(0K
)R
F-M
EA
M2N
N-M
EA
M[13]
RF
-(0K)-LD
M2N
N-(0K
)-LDM
(K)
(%)
value
(K)
error
value
(K)
error
value
(%)
error
value
(%)
error
Ms
337328
-2.7%270
-21%A
f400
45313.25%
49022%
ϵ tens
⟨10
0⟩3.2
3.613%
425%
ϵ com
p⟨1
00⟩
3.43.5
3%3.7
9%
ϵ tens
⟨11
0⟩9.4
106%
10.29%
ϵ com
p⟨1
10⟩
5.14.6
-10%6
17%
ϵ tens
⟨11
1⟩11.4
11.51%
125%
ϵ com
p⟨1
11⟩
3.43.2
-6%2.8
-18%
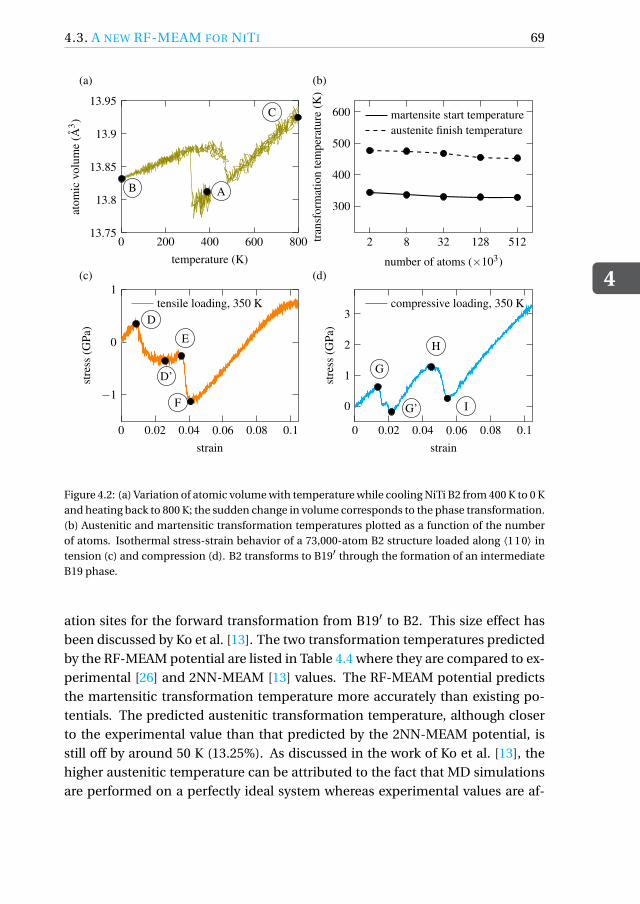
4.3. A NEW RF-MEAM FOR NITI
4
69
0 200 400 600 80013.75
13.8
13.85
13.9
13.95
temperature (K)
atom
icvo
lum
e(A
3 )
B A
C
(a)
2 8 32 128 512
300
400
500
600
number of atoms (×103)
tran
sfor
mat
ion
tem
pera
ture
(K)
martensite start temperatureaustenite finish temperature
(b)
0 0.02 0.04 0.06 0.08 0.1
−1
0
1
strain
stre
ss(G
Pa)
tensile loading, 350 K
(c)
D
D’
E
F
0 0.02 0.04 0.06 0.08 0.1
0
1
2
3
strain
stre
ss(G
Pa)
compressive loading, 350 K
(d)
G
G’
H
I
Figure 4.2: (a) Variation of atomic volume with temperature while cooling NiTi B2 from 400 K to 0 Kand heating back to 800 K; the sudden change in volume corresponds to the phase transformation.(b) Austenitic and martensitic transformation temperatures plotted as a function of the numberof atoms. Isothermal stress-strain behavior of a 73,000-atom B2 structure loaded along ⟨110⟩ intension (c) and compression (d). B2 transforms to B19′ through the formation of an intermediateB19 phase.
ation sites for the forward transformation from B19′ to B2. This size effect hasbeen discussed by Ko et al. [13]. The two transformation temperatures predictedby the RF-MEAM potential are listed in Table 4.4 where they are compared to ex-perimental [26] and 2NN-MEAM [13] values. The RF-MEAM potential predictsthe martensitic transformation temperature more accurately than existing po-tentials. The predicted austenitic transformation temperature, although closerto the experimental value than that predicted by the 2NN-MEAM potential, isstill off by around 50 K (13.25%). As discussed in the work of Ko et al. [13], thehigher austenitic temperature can be attributed to the fact that MD simulationsare performed on a perfectly ideal system whereas experimental values are af-
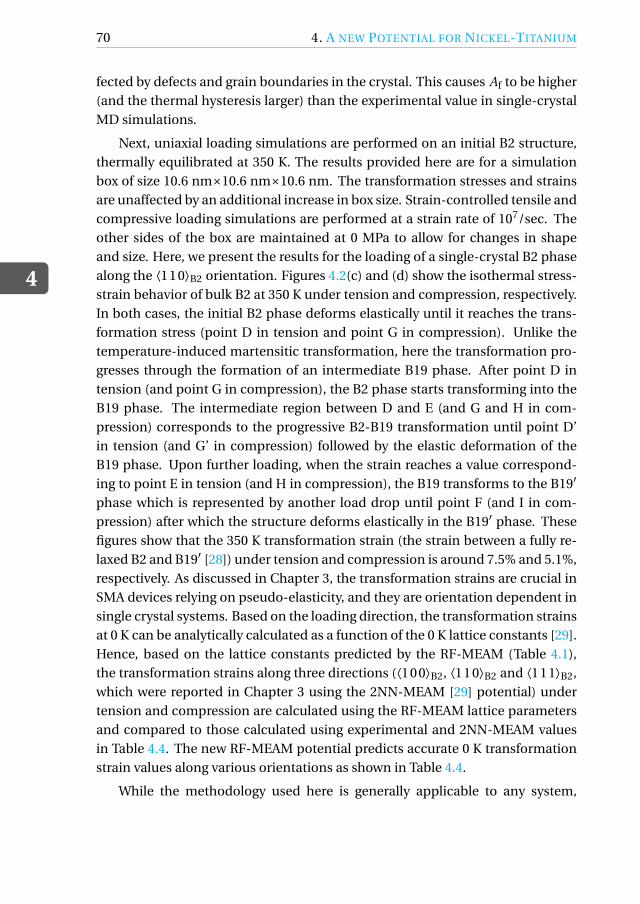
4
70 4. A NEW POTENTIAL FOR NICKEL-TITANIUM
fected by defects and grain boundaries in the crystal. This causes Af to be higher(and the thermal hysteresis larger) than the experimental value in single-crystalMD simulations.
Next, uniaxial loading simulations are performed on an initial B2 structure,thermally equilibrated at 350 K. The results provided here are for a simulationbox of size 10.6 nm×10.6 nm×10.6 nm. The transformation stresses and strainsare unaffected by an additional increase in box size. Strain-controlled tensile andcompressive loading simulations are performed at a strain rate of 107/sec. Theother sides of the box are maintained at 0 MPa to allow for changes in shapeand size. Here, we present the results for the loading of a single-crystal B2 phasealong the ⟨110⟩B2 orientation. Figures 4.2(c) and (d) show the isothermal stress-strain behavior of bulk B2 at 350 K under tension and compression, respectively.In both cases, the initial B2 phase deforms elastically until it reaches the trans-formation stress (point D in tension and point G in compression). Unlike thetemperature-induced martensitic transformation, here the transformation pro-gresses through the formation of an intermediate B19 phase. After point D intension (and point G in compression), the B2 phase starts transforming into theB19 phase. The intermediate region between D and E (and G and H in com-pression) corresponds to the progressive B2-B19 transformation until point D’in tension (and G’ in compression) followed by the elastic deformation of theB19 phase. Upon further loading, when the strain reaches a value correspond-ing to point E in tension (and H in compression), the B19 transforms to the B19′
phase which is represented by another load drop until point F (and I in com-pression) after which the structure deforms elastically in the B19′ phase. Thesefigures show that the 350 K transformation strain (the strain between a fully re-laxed B2 and B19′ [28]) under tension and compression is around 7.5% and 5.1%,respectively. As discussed in Chapter 3, the transformation strains are crucial inSMA devices relying on pseudo-elasticity, and they are orientation dependent insingle crystal systems. Based on the loading direction, the transformation strainsat 0 K can be analytically calculated as a function of the 0 K lattice constants [29].Hence, based on the lattice constants predicted by the RF-MEAM (Table 4.1),the transformation strains along three directions (⟨100⟩B2, ⟨110⟩B2 and ⟨111⟩B2,which were reported in Chapter 3 using the 2NN-MEAM [29] potential) undertension and compression are calculated using the RF-MEAM lattice parametersand compared to those calculated using experimental and 2NN-MEAM valuesin Table 4.4. The new RF-MEAM potential predicts accurate 0 K transformationstrain values along various orientations as shown in Table 4.4.
While the methodology used here is generally applicable to any system,
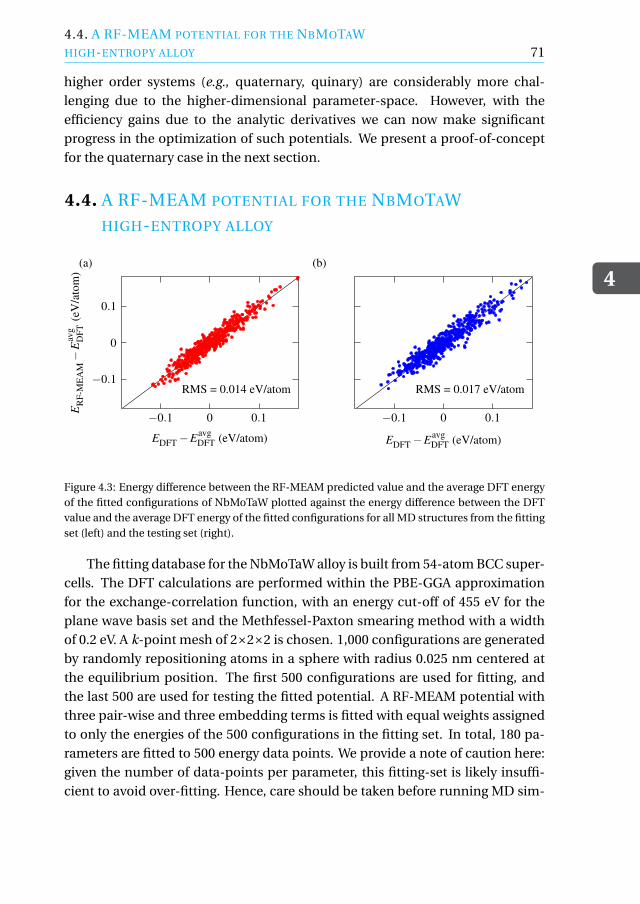
4.4. A RF-MEAM POTENTIAL FOR THE NBMOTAWHIGH-ENTROPY ALLOY
4
71
higher order systems (e.g., quaternary, quinary) are considerably more chal-lenging due to the higher-dimensional parameter-space. However, with theefficiency gains due to the analytic derivatives we can now make significantprogress in the optimization of such potentials. We present a proof-of-conceptfor the quaternary case in the next section.
4.4. A RF-MEAM POTENTIAL FOR THE NBMOTAW
HIGH-ENTROPY ALLOY
−0.1 0 0.1
−0.1
0
0.1
EDFT −EavgDFT (eV/atom)
ER
F-M
EA
M−
Eav
gD
FT(e
V/a
tom
)
(a)
RMS = 0.014 eV/atom
−0.1 0 0.1
EDFT −EavgDFT (eV/atom)
(b)
RMS = 0.017 eV/atom
Figure 4.3: Energy difference between the RF-MEAM predicted value and the average DFT energyof the fitted configurations of NbMoTaW plotted against the energy difference between the DFTvalue and the average DFT energy of the fitted configurations for all MD structures from the fittingset (left) and the testing set (right).
The fitting database for the NbMoTaW alloy is built from 54-atom BCC super-cells. The DFT calculations are performed within the PBE-GGA approximationfor the exchange-correlation function, with an energy cut-off of 455 eV for theplane wave basis set and the Methfessel-Paxton smearing method with a widthof 0.2 eV. A k-point mesh of 2×2×2 is chosen. 1,000 configurations are generatedby randomly repositioning atoms in a sphere with radius 0.025 nm centered atthe equilibrium position. The first 500 configurations are used for fitting, andthe last 500 are used for testing the fitted potential. A RF-MEAM potential withthree pair-wise and three embedding terms is fitted with equal weights assignedto only the energies of the 500 configurations in the fitting set. In total, 180 pa-rameters are fitted to 500 energy data points. We provide a note of caution here:given the number of data-points per parameter, this fitting-set is likely insuffi-cient to avoid over-fitting. Hence, care should be taken before running MD sim-
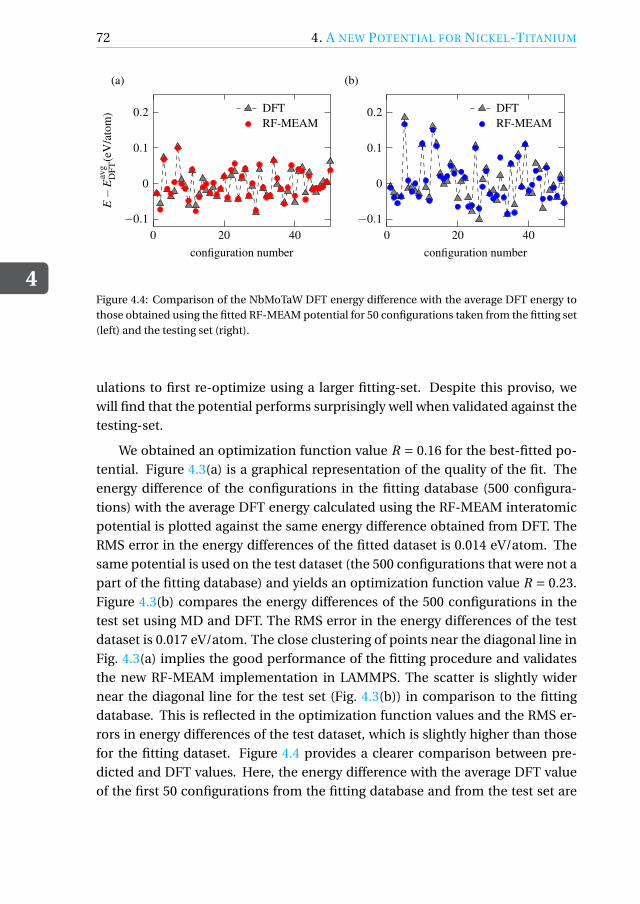
4
72 4. A NEW POTENTIAL FOR NICKEL-TITANIUM
0 20 40−0.1
0
0.1
0.2
configuration number
E−
Eav
gD
FT(e
V/a
tom
) DFTRF-MEAM
(a)
0 20 40−0.1
0
0.1
0.2
configuration number
DFTRF-MEAM
(b)
Figure 4.4: Comparison of the NbMoTaW DFT energy difference with the average DFT energy tothose obtained using the fitted RF-MEAM potential for 50 configurations taken from the fitting set(left) and the testing set (right).
ulations to first re-optimize using a larger fitting-set. Despite this proviso, wewill find that the potential performs surprisingly well when validated against thetesting-set.
We obtained an optimization function value R = 0.16 for the best-fitted po-tential. Figure 4.3(a) is a graphical representation of the quality of the fit. Theenergy difference of the configurations in the fitting database (500 configura-tions) with the average DFT energy calculated using the RF-MEAM interatomicpotential is plotted against the same energy difference obtained from DFT. TheRMS error in the energy differences of the fitted dataset is 0.014 eV/atom. Thesame potential is used on the test dataset (the 500 configurations that were not apart of the fitting database) and yields an optimization function value R = 0.23.Figure 4.3(b) compares the energy differences of the 500 configurations in thetest set using MD and DFT. The RMS error in the energy differences of the testdataset is 0.017 eV/atom. The close clustering of points near the diagonal line inFig. 4.3(a) implies the good performance of the fitting procedure and validatesthe new RF-MEAM implementation in LAMMPS. The scatter is slightly widernear the diagonal line for the test set (Fig. 4.3(b)) in comparison to the fittingdatabase. This is reflected in the optimization function values and the RMS er-rors in energy differences of the test dataset, which is slightly higher than thosefor the fitting dataset. Figure 4.4 provides a clearer comparison between pre-dicted and DFT values. Here, the energy difference with the average DFT valueof the first 50 configurations from the fitting database and from the test set are
4.5. CONCLUDING REMARKS
4
73
represented. The trends observed by DFT are well reproduced by the RF-MEAMpotential, both in the fitted and test sets. While the energy difference of everyconfiguration in the fitted database (Fig. 4.4(a)) is captured accurately, there area few outliers in the testing set which are also responsible for the wider scatter ofpoints in Fig. 4.3(b). This also suggests that the fitting can be improved further byusing more data points (more than 500 energies): more DFT runs and data pointscorresponding to atomic forces and stresses will improve the accuracy and relia-bility of the fitted potentials for such high-entropy alloy systems.
The procedure presented in this study and the increasing availability of accu-rate ab initio models for high-entropy and compositionally-complex alloys (see,e.g., reference [30]) allow to fit interatomic potentials that can effectively predictthe behavior of these complex materials.
4.5. CONCLUDING REMARKSRF-MEAM potentials, by virtue of their reference-free formalism, are well suitedto be fitted in a feasible time to broad DFT data sets. In this work we have demon-strated that for NiTi the use of a RF-MEAM potential leads to prediction of thepseudoelastic and shape-memory behavior of the alloy that are in better agree-ment with experimental results when compared with existing potentials. For thisspecific application, the inclusion of the stress tensor in the fitting database im-proved the quality of the potential. In general, the fitting database can be alteredand broadened based on the target properties that need to be captured. A RF-MEAM potential was also developed for a quaternary alloy to demonstrate thatthe number of components is not a limitation to the feasibility of the method-ology. Obviously, with increasing complexity of the alloy there is an increase inthe time required for fitting. Herein, recent advances in machine learning tech-niques [31, 32] will complement the fitting and modeling of such complex sys-tems.
The implementation of the RF-MEAM potential in LAMMPS and the com-patibility with MEAMfit v2 offer this methodology to a wide community of users.(https://github.com/PrashanthSri/RF-MEAM-LAMMPS-sub-routines)
4
74 4. A NEW POTENTIAL FOR NICKEL-TITANIUM
APPENDIX
4.A. USING RF-MEAM IN LAMMPS4.A.1. IMPROVEMENTS TO MEAMfitMEAMfit v2 has three key improvements in comparison to the previous versionof the code MEAMfit v1.02 [10]. The RF-MEAM potential formalism is imple-mented as a ‘pair style’ in LAMMPS and is made compatible with MEAMfit v2(discussed in Appendix 4.A.2). Stress tensors can now be fitted in addition toenergies and atomic forces of configurations. Stress tensor fitting was includedin the RF-MEAM developed for NiTi that was discussed in the article. Addingstress tensors has some benefits that are illustrated in Appendix 4.B. Lastly, thederivatives of the optimization function are calculated analytically during fitting(instead of numerically, as in the previous version) improving the efficiency byan order of magnitude in the presently tested systems. In terms of running time,the MEAMfit v2 code was run on a single Intel Xeon X5650 (2010) core for oneweek before obtaining the parameters for the NiTi potential, and for one day forthe proof-of-concept NbMoTaW HEA potential.
4.A.2. LAMMPS IMPLEMENTATION OF THE RF-MEAM POTENTIAL
New subroutines are written to use the RF-MEAM potential as a part of LAMMPS.Once LAMMPS is re-compiled with the new subroutines, ‘rfmeam’ can be usedas a pair_style in the input script. The LAMMPS implementation is also compat-ible with the MEAMfit v2 code. When a RF-MEAM potential is selected, the codeproduces interatomic potential files of the form library.rfmeam.XY_#, where Xand Y are elements of the system. Files of this form can be used directly inthe pair_coeff command as the corresponding RF-MEAM interatomic potentialfile. The new LAMMPS subroutines are not part of the MEAMfit v2 distribution.They can be downloaded, along with a manual discussing its usage and the in-teratomic potential files for NiTi and NbMoTaW, from https://github.com/PrashanthSri/RF-MEAM-LAMMPS-sub-routines.
4.B. BENEFITS OF STRESS TENSOR FITTING: EXAMPLE USING
B2 NITIAdding weights to stress tensors during fitting increases the capability of the fit-ted potential to predict accurate structural behavior. This is demonstrated herethrough a very simple example. Two structures are chosen for the fitting set: a0 K 128-atom perfect B2 NiTi structure, and a randomly generated 500 K 54-atomB2 NiTi structure. The computational settings for running the DFT simulations
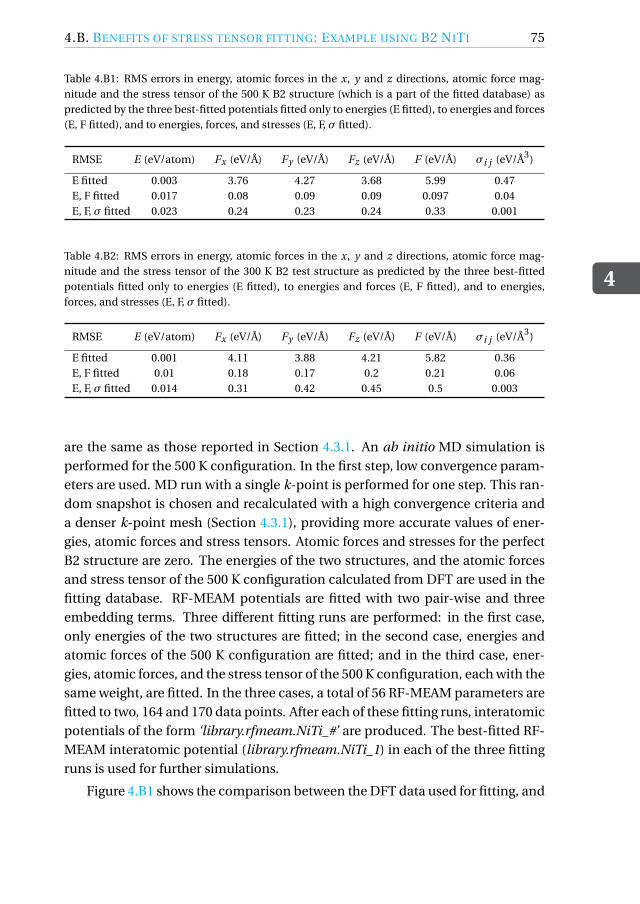
4.B. BENEFITS OF STRESS TENSOR FITTING: EXAMPLE USING B2 NITI
4
75
Table 4.B1: RMS errors in energy, atomic forces in the x, y and z directions, atomic force mag-nitude and the stress tensor of the 500 K B2 structure (which is a part of the fitted database) aspredicted by the three best-fitted potentials fitted only to energies (E fitted), to energies and forces(E, F fitted), and to energies, forces, and stresses (E, F, σ fitted).
RMSE E (eV/atom) Fx (eV/Å) Fy (eV/Å) Fz (eV/Å) F (eV/Å) σi j (eV/Å3)
E fitted 0.003 3.76 4.27 3.68 5.99 0.47E, F fitted 0.017 0.08 0.09 0.09 0.097 0.04E, F, σ fitted 0.023 0.24 0.23 0.24 0.33 0.001
Table 4.B2: RMS errors in energy, atomic forces in the x, y and z directions, atomic force mag-nitude and the stress tensor of the 300 K B2 test structure as predicted by the three best-fittedpotentials fitted only to energies (E fitted), to energies and forces (E, F fitted), and to energies,forces, and stresses (E, F, σ fitted).
RMSE E (eV/atom) Fx (eV/Å) Fy (eV/Å) Fz (eV/Å) F (eV/Å) σi j (eV/Å3)
E fitted 0.001 4.11 3.88 4.21 5.82 0.36E, F fitted 0.01 0.18 0.17 0.2 0.21 0.06E, F, σ fitted 0.014 0.31 0.42 0.45 0.5 0.003
are the same as those reported in Section 4.3.1. An ab initio MD simulation isperformed for the 500 K configuration. In the first step, low convergence param-eters are used. MD run with a single k-point is performed for one step. This ran-dom snapshot is chosen and recalculated with a high convergence criteria anda denser k-point mesh (Section 4.3.1), providing more accurate values of ener-gies, atomic forces and stress tensors. Atomic forces and stresses for the perfectB2 structure are zero. The energies of the two structures, and the atomic forcesand stress tensor of the 500 K configuration calculated from DFT are used in thefitting database. RF-MEAM potentials are fitted with two pair-wise and threeembedding terms. Three different fitting runs are performed: in the first case,only energies of the two structures are fitted; in the second case, energies andatomic forces of the 500 K configuration are fitted; and in the third case, ener-gies, atomic forces, and the stress tensor of the 500 K configuration, each with thesame weight, are fitted. In the three cases, a total of 56 RF-MEAM parameters arefitted to two, 164 and 170 data points. After each of these fitting runs, interatomicpotentials of the form ‘library.rfmeam.NiTi_#’ are produced. The best-fitted RF-MEAM interatomic potential (library.rfmeam.NiTi_1) in each of the three fittingruns is used for further simulations.
Figure 4.B1 shows the comparison between the DFT data used for fitting, and
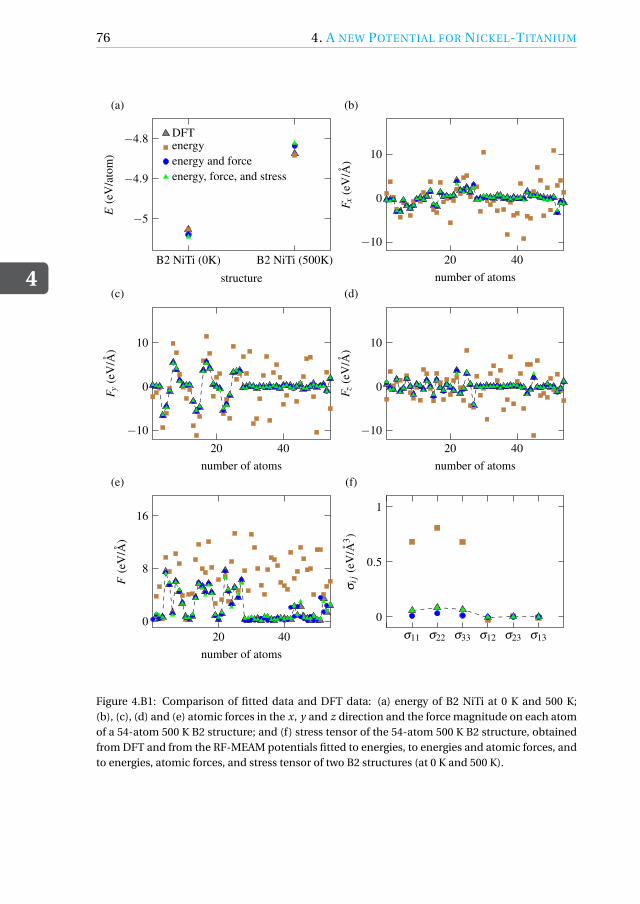
4
76 4. A NEW POTENTIAL FOR NICKEL-TITANIUM
B2 NiTi (0K) B2 NiTi (500K)
−5
−4.9
−4.8
structure
E(e
V/a
tom
)
DFTenergyenergy and forceenergy, force, and stress
(a)
20 40−10
0
10
number of atoms
F x(e
V/A
)
(b)
20 40−10
0
10
number of atoms
F y(e
V/A
)
(c)
20 40−10
0
10
number of atoms
F z(e
V/A
)
(d)
20 400
8
16
number of atoms
F(e
V/A
)
(e)
σ11 σ22 σ33 σ12 σ23 σ13
0
0.5
1
σij
(eV
/A3 )
(f)
Figure 4.B1: Comparison of fitted data and DFT data: (a) energy of B2 NiTi at 0 K and 500 K;(b), (c), (d) and (e) atomic forces in the x, y and z direction and the force magnitude on each atomof a 54-atom 500 K B2 structure; and (f) stress tensor of the 54-atom 500 K B2 structure, obtainedfrom DFT and from the RF-MEAM potentials fitted to energies, to energies and atomic forces, andto energies, atomic forces, and stress tensor of two B2 structures (at 0 K and 500 K).
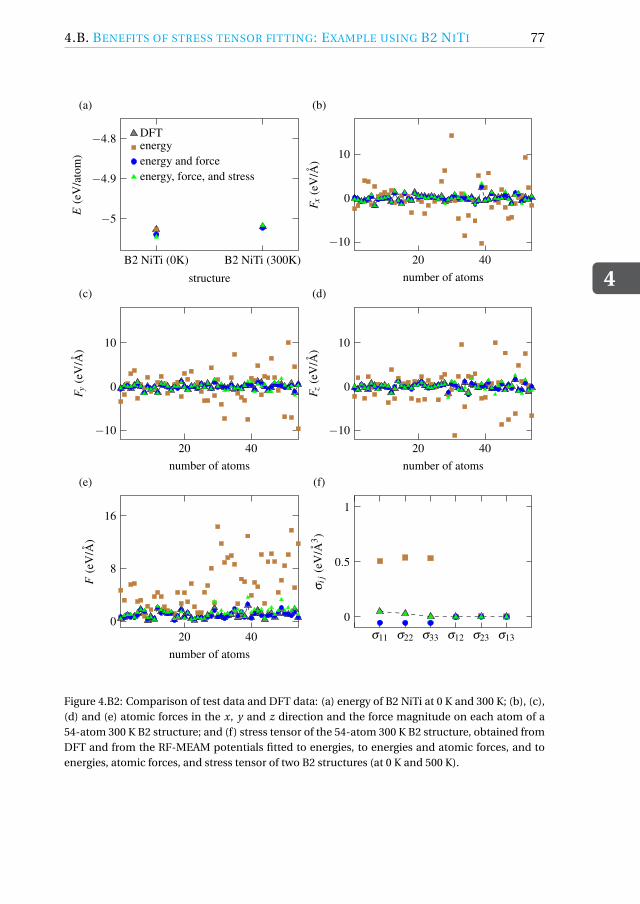
4.B. BENEFITS OF STRESS TENSOR FITTING: EXAMPLE USING B2 NITI
4
77
B2 NiTi (0K) B2 NiTi (300K)
−5
−4.9
−4.8
structure
E(e
V/a
tom
)
DFTenergyenergy and forceenergy, force, and stress
(a)
20 40−10
0
10
number of atoms
F x(e
V/A
)
(b)
20 40−10
0
10
number of atoms
F y(e
V/A
)
(c)
20 40−10
0
10
number of atoms
F z(e
V/A
)
(d)
20 400
8
16
number of atoms
F(e
V/A
)
(e)
σ11 σ22 σ33 σ12 σ23 σ13
0
0.5
1
σij
(eV
/A3 )
(f)
Figure 4.B2: Comparison of test data and DFT data: (a) energy of B2 NiTi at 0 K and 300 K; (b), (c),(d) and (e) atomic forces in the x, y and z direction and the force magnitude on each atom of a54-atom 300 K B2 structure; and (f) stress tensor of the 54-atom 300 K B2 structure, obtained fromDFT and from the RF-MEAM potentials fitted to energies, to energies and atomic forces, and toenergies, atomic forces, and stress tensor of two B2 structures (at 0 K and 500 K).
4
78 4. A NEW POTENTIAL FOR NICKEL-TITANIUM
the values predicted by the three best-fitted RF-MEAM potentials fitted only toenergies, fitted to energies and forces, and fitted to energies, forces, and stresses.From Fig. 4.B1(a), it is seen that the energy of the two structures used for fit-ting is captured accurately in all three cases. The largest deviation of around25 meV/atom from the DFT value happens for the potential fitted to energies,forces, and stress. The deviation from the DFT value increases as the number ofdata points increase, since other properties apart from the energies are consid-ered in the fitting process. Figures 4.B1(b) to (e) are a comparison of the atomicforces (in the x, y and z direction and the magnitude, respectively) on the 54-atom 500 K B2 structure predicted by the three best-fitted potentials to the DFTdata. The x-axis is the number of the atom. The forces predicted by the potentialfitted only to the energies of the two structures (brown marks) are completely offfrom the DFT data, whereas the forces predicted by the other two potentials (blueand green marks) are almost identical to the DFT data. Although most of theforces are captured accurately, the potential fitted to energies, forces, and stress(green marks) shows a few outliers to the DFT data. Finally, Fig. 4.B1(f) comparesthe stress tensor values of the 500 K structure predicted by the three potentialsare compared to the DFT values of the stress on the 500 K structure. The valuesof the stress components σ11, σ22 and σ33 predicted by the first potential (brownmarks) are way off from DFT data. The second potential, although able to pre-dict atomic forces accurately, fails to capture reasonable values of these stresstensor components (blue marks). Only the potential in the third case predictsthese stresses accurately. DFT values of σ12, σ23 and σ13 on the 500 K structureare very close to zero. Hence the differences between the DFT and fitted datafor the first two cases do not appear to be as pronounced as those observed forthe other three stress tensor components. The above results are also reflectedin Table 4.B1 which compares the RMS error in the predicted values of energy,forces and stress using the three potentials. The first best-fitted potential has alarge RMS error in forces and stress. Although the second best-fitted potentialpredicts energies and forces with a small error, the error on the stress is 40 timesthat of the potential that is fitted to energies, forces, and stress tensor.
A similar trend in the predictive capabilities of the three potentials is also ob-served on a test set, which is another randomly configured 54-atom 300 K B2 NiTistructure which is not a part of the fitting database. The same three best-fittedRF-MEAM potentials are now used to calculate the energy, the atomic forces andstress tensor of this 300 K structure. Figures 4.B2(a)-(f) are a comparison of val-ues of the 300 K test structure between DFT and using the three potentials. Thefirst best-fitted potential predicts only the energy of the test structure accurately,
4.C. NITI RF-MEAM POTENTIAL PARAMETERS
4
79
the second one predicts both energy and atomic forces of the test structure, andthe best-fitted potential to energies, forces, and stress tensor is able to capturethe energy, atomic forces and the stress tensor of the 300 K test structure as well.These are also reflected in Table 4.B2 which shows the RMS error in the predictedvalues of the test structure using the three potentials. Increasing the weights onthe stress tensors might lead to a slightly larger deviation in energy and atomicforce values, but would improve the prediction of stresses in the structure andhence can be used to fit potentials that predict the overall structural behaviormore accurately.
4.C. NITI RF-MEAM POTENTIAL PARAMETERS
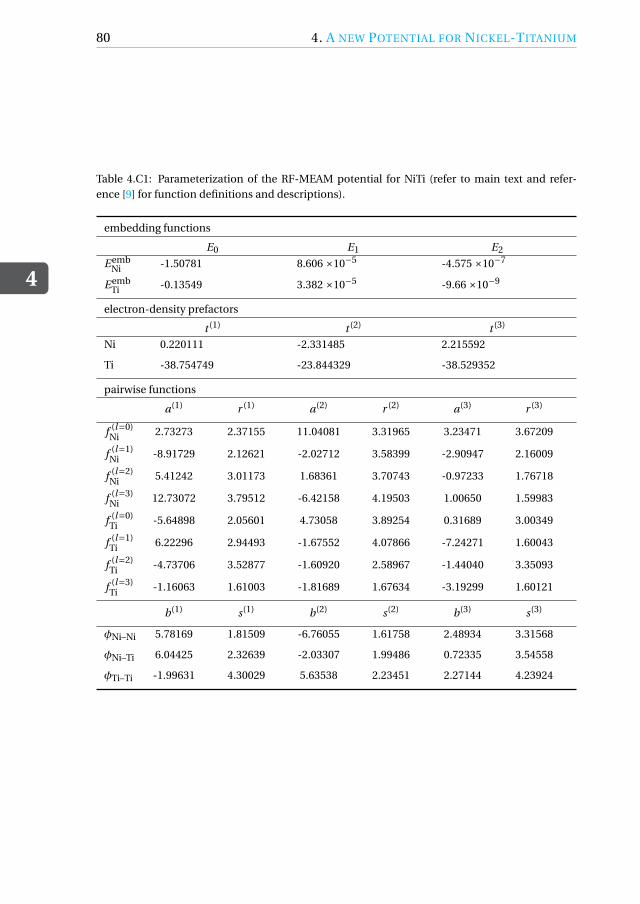
4
80 4. A NEW POTENTIAL FOR NICKEL-TITANIUM
Table 4.C1: Parameterization of the RF-MEAM potential for NiTi (refer to main text and refer-ence [9] for function definitions and descriptions).
embedding functions
E0 E1 E2
E embNi -1.50781 8.606 ×10⁻⁵ -4.575 ×10⁻⁷
E embTi -0.13549 3.382 ×10⁻⁵ -9.66 ×10⁻⁹
electron-density prefactors
t (1) t (2) t (3)
Ni 0.220111 -2.331485 2.215592
Ti -38.754749 -23.844329 -38.529352
pairwise functions
a(1) r (1) a(2) r (2) a(3) r (3)
f (l=0)Ni 2.73273 2.37155 11.04081 3.31965 3.23471 3.67209
f (l=1)Ni -8.91729 2.12621 -2.02712 3.58399 -2.90947 2.16009
f (l=2)Ni 5.41242 3.01173 1.68361 3.70743 -0.97233 1.76718
f (l=3)Ni 12.73072 3.79512 -6.42158 4.19503 1.00650 1.59983
f (l=0)Ti -5.64898 2.05601 4.73058 3.89254 0.31689 3.00349
f (l=1)Ti 6.22296 2.94493 -1.67552 4.07866 -7.24271 1.60043
f (l=2)Ti -4.73706 3.52877 -1.60920 2.58967 -1.44040 3.35093
f (l=3)Ti -1.16063 1.61003 -1.81689 1.67634 -3.19299 1.60121
b(1) s(1) b(2) s(2) b(3) s(3)
ϕNi–Ni 5.78169 1.81509 -6.76055 1.61758 2.48934 3.31568
ϕNi–Ti 6.04425 2.32639 -2.03307 1.99486 0.72335 3.54558
ϕTi–Ti -1.99631 4.30029 5.63538 2.23451 2.27144 4.23924
REFERENCES
4
81
REFERENCES[1] P. Srinivasan, A. I. Duff, T. Mellan, M. H. F. Sluiter, L. Nicola, and A. Si-
mone, The effectiveness of reference-free modified embedded atom methodpotentials demonstrated for NiTi and NbMoTaW, Modelling and Simulationin Materials Science and Engineering 27, 065013 (2019).
[2] M. S. Daw and M. I. Baskes, Embedded-atom method: Derivation and appli-cation to impurities, surfaces, and other defects in metals, Physical Review B29, 6443 (1984).
[3] Y.-M. Kim, B.-J. Lee, and M. I. Baskes, Modified embedded-atom methodinteratomic potentials for Ti and Zr, Physical Review B 74, 014101 (2006).
[4] B.-J. Lee, A modified embedded-atom method interatomic potential for theFe–C system, Acta Materialia 54, 701 (2006).
[5] J. H. Rose, J. R. Smith, F. Guinea, and J. Ferrante, Universal features of theequation of state of metals, Physical Review B 29, 2963 (1984).
[6] I. Lazic and B. J. Thijsse, An improved molecular dynamics potential for theAl-O system, Computational Materials Science 53, 483 (2012).
[7] M. Timonova and B. J. Thijsse, Optimizing the MEAM potential for silicon,Modeling and Simulation in Materials Science and Engineering 19, 015003(2010).
[8] MEAMfit2 is an interatomic potential optimization package which can beobtained from STFC’s Daresbury laboratory via the website https: // www.scd. stfc. ac. uk/ Pages/ MEAMfit-v2. aspx , .
[9] A. I. Duff, M. W. Finnis, P. Maugis, B. J. Thijsse, and M. H. F. Sluiter, Meamfit:A reference-free modified embedded atom method (RF-MEAM) energy andforce-fitting code, Computer Physics Communications 196, 439 (2015).
[10] A. I. Duff, MEAMfit: A reference-free modified embedded atom method (RF-MEAM) energy and force-fitting code, Computer Physics Communications203, 354 (2016).
[11] Y. Zhong, K. Gall, and T. Zhu, Atomistic study of nanotwins in NiTi shapememory alloys, Journal of Applied Physics 110, 033532 (2011).
4
82 REFERENCES
[12] D. Mutter and P. Nielaba, Simulation of the shape memory effect in a NiTinano model system, Condensed Matter and Materials Science 577, S83(2013).
[13] W.-S. Ko, B. Grabowski, and J. Neugebauer, Development and application ofa Ni-Ti interatomic potential with high predictive accuracy of the martensiticphase transition, Physical Review B 92, 134107 (2015).
[14] W.-S. Ko, S. B. Maisel, B. Grabowski, J. B. Jeon, and J. Neugebauer, Atomicscale processes of phase transformations in nanocrystalline NiTi shape-memory alloys, Acta Materialia 123, 90 (2017).
[15] S. B. Maisel, W.-S. Ko, J. L. Zhang, B. Grabowski, and J. Neugebauer, Thermo-mechanical response of NiTi shape-memory nanoprecipitates in TiV alloys,Physical Review Materials 1, 033610 (2017).
[16] W.-S. Ko, B. Grabowski, and J. Neugebauer, Impact of asymmetric marten-site and austenite nucleation and growth behavior on the phase stability andhysteresis of freestanding shape-memory nanoparticles, Physical Review Ma-terials 2, 030601 (2018).
[17] M. Wang, S. Jiang, and Y. Zhang, Phase transformation, twinning, anddetwinning of NiTi shape-memory alloy subject to a shock wave based onmolecular-dynamics simulation, Materials 11, 2334 (2018).
[18] H.-Y. Lu, C.-H. Chen, and N.-T. Tsou, The analysis of superelasticity and mi-crostructural evolution in NiTi single crystals by molecular dynamics, Mate-rials 12, 57 (2018).
[19] Y.-K. Kim, H.-K. Kim, W.-S. Jung, and B.-J. Lee, Development and applica-tion of Ni-Ti and Ni-Al-Ti 2NN-MEAM interatomic potentials for Ni-base su-peralloys, Computational Materials Science 139, 225 (2017).
[20] D. Scopece and B. J. Thijsse, Comment on: “An improved molecular dynam-ics potential for the Al-O system” Computational Materials Science 53, 483(2012), Computational Materials Science 104, 143 (2015).
[21] G. Kresse and J. Hafner, Ab initio molecular-dynamics simulation of theliquid-metal–amorphous-semiconductor transition in germanium, PhysicalReview B 49, 14251 (1994).
[22] J. P. Perdew, K. Burke, and M. Ernzerhof, Generalized gradient approxima-tion made simple, Physical Review Letters 78, 3865 (1996).
REFERENCES
4
83
[23] B. Grabowski, L. Ismer, T. Hickel, and J. Neugebauer, Ab initio up to themelting point: Anharmonicity and vacancies in aluminum, Physical ReviewB 79, 134106 (2009).
[24] S. D. Prokoshkin, A. V. Korotitskiy, V. Brailovski, S. Turenne, I. Y.Khmelevskaya, and I. B. Trubitsyna, On the lattice parameters of phases inbinary Ti-Ni shape memory alloys, Acta Materialia 52, 4479 (2004).
[25] M. F.-X. Wagner and W. Windl, Lattice stability, elastic constants and macro-scopic moduli of NiTi martensites from first principles, Acta Materialia 56,6232 (2008).
[26] J. Frenzel, E. P. George, A. Dlouhy, C. Somsen, M. F.-X. Wagner, andG. Eggeler, Influence of Ni on martensitic phase transformations in NiTishape memory alloys, Acta Materialia 58, 3444 (2010).
[27] W. C. Swope, H. C. Anderson, P. H. Berens, and K. R. A. Wilson, A computersimulation method for the calculation of equilibrium constants for the for-mation of physical clusters of molecules: Application to small water clusters,Journal of Chemical Physics 76, 637 (1982).
[28] P. Srinivasan, L. Nicola, and A. Simone, Modeling pseudo-elasticity in NiTi:Why the MEAM potential outperforms the EAM-FS potential, ComputationalMaterials Science 134, 145 (2017).
[29] P. Srinivasan, L. Nicola, and A. Simone, Atomistic modeling of the orien-tation dependent pseudo-elasticity in NiTi: Normal loading and bending,Computational Materials Science 154, 25 (2018).
[30] Y. Ikeda, B. Grabowski, and F. Körmann, Ab initio phase stabilities and me-chanical properties of multicomponent alloys: A comprehensive review forhigh entropy alloys and compositionally complex alloys, Materials Charac-terization 147, 464 (2019).
[31] A. V. Shapeev, Moment tensor potentials: A class of systematically improvableinteratomic potentials, Multiscale Modeling and Simulation 14, 1153 (2016).
[32] B. Grabowski, Y. Ikeda, F. Körmann, C. Freysoldt, A. I. Duff, A. V. Shapeev,and J. Neugebauer, Ab initio vibrational free energies including anharmonic-ity for multicomponent alloys, arXiv preprint arXiv:1902.11230 .


5INFLUENCE OF DEFECTS ON PHASE
TRANSFORMATION
We study the influence of various defects on the reversible martensitic-austeniticphase transformation in equi-atomic and almost equi-atomic nickel-titanium.Vacancies, anti-site defects, compositional defects and grain boundaries (GBs) inNiTi are modeled and studied using molecular dynamics (MD). MD simulationsare performed using the RF-MEAM potential. Martensitic and austenitic transfor-mation temperatures decrease with increasing vacancies and anti-sites, with theaustenitic transformation temperature decreasing more drastically. Increasing theconcentration of Ni to more than 50% leads to a decrease in both transformationtemperatures. GBs act as nucleation sites for the austenitic transformation therebyaffecting the transformation temperature and mechanism. In addition, the effectof free surfaces on the transformation behavior is also analyzed by performing MDsimulations on differently sized single-crystal nano-wires.
85
5
86 5. INFLUENCE OF DEFECTS ON PHASE TRANSFORMATION
5.1. INTRODUCTION
Crystallographic defects in SMAs affect the reversible martensitic-austenitictransformation properties. It is crucial to study and understand how suchdefects alter transformation temperatures and mechanism in such materials.Molecular dynamics (MD) offers a convenient way to analyze this behavior.Here, we perform MD simulations on single-crystal nickel-titanium (NiTi) withthe presence of point defects such as anti-sites, vacancies, and compositionaldefects. We also perform MD simulations on a bi-crystal and compare the resultto that of the individual grains that the bi-crystal is composed of, to observe theeffect of the grain boundary (GB) on the phase transformation.
NiTi is an ideal candidate for various engineering applications owing toits super-elasticity and shape-memory behavior. These properties arise dueto its ability to undergo a reversible diffusionless transformation betweentwo phases: the high temperature parent phase (B2 austenite) and the lowtemperature product phase (B19′ martensite). The transformation can beachieved through an external load or heating and cooling. In literature, thematerial has been investigated through experiments [1–3] and computationaltechniques [4–8]. One of the common computational techniques that hasbeen used to study NiTi is molecular dynamics (MD). Various studies describethe stress-induced and temperature-induced reversible martensitic transfor-mation in NiTi using different interatomic potentials like the Lennard-Jonespotential [9], the embedded-atom method - Finnis Sinclair (EAM-FS) poten-tial [6, 7, 10], the second nearest neighbor - modified embedded-atom method(2NN-MEAM) potential [8], and the reference free - modified embedded-atommethod (RF-MEAM) potential [11]). All these works focus on perfect, defect-freesingle-crystal equi-atomic NiTi.
Experimental and first principle studies have shown that vacancies and anti-site defects are energetically favorable in NiTi. Lu et al. [12] used first-principlecalculations to suggest the formation of Ti-rich domains in stoichiometric NiTi,and the presence of considerable amount of vacancies in Ti-rich NiTi at hightemperatures. Weber et al. [13] examined NiTi with vacancies using positronDoppler broadening to calculate the positive vacancy formation enthalpy. Ex-periments performed by Frenzel et al. [14] reported a decrease in the marten-sitic transformation temperature with an increase in Ni concentration. Besidesexpecting the presence of such defects in NiTi products, it is also difficult tomanufacture perfect single-crystal NiTi structures without the presence of grainboundaries (GBs). A few MD articles in the literature report the effect of such de-fects on NiTi behavior, but the MD simulations are performed with various older

5.1. INTRODUCTION
5
87
potentials that do not predict the transformation behavior accurately and henceprovide only a qualitative insight into the effect of defects. These studies are alsorestricted to only some defects in the system. For instance, Tehrani et al. [15] re-ported a decrease in the phase transformation temperatures with an increasingconcentration of vacancies and anti-sites in the system using the EAM-FS poten-tial. Ko et al. [16] simulated a poly-crystal behavior using the 2NN-MEAM po-tential to study the effect of GBs on stress-induced and temperature-induced re-versible phase transformation. Their MD simulations revealed that the marten-sitic transformation begins in the bulk of the grain and progresses towards GBswhereas the GBs acted as a nucleation site for the forward transformation to theaustenite phase. Lai and Liu [17] modeled anti-site defects using the EAM-FSpotential to understand the crystalline to amorphous transition of NiTi.
Earlier works [8, 18] have reported the benefits of using the MEAM potentialover the EAM-FS potential to study NiTi behavior arising mainly due to the direc-tional dependency in bonding in the MEAM formalism. As a result, lattice andelastic constants are predicted more accurately. In chapter 4, we have demon-strated the superior performance of a newly developed reference free version ofthe MEAM potential. Besides capturing accurate values of lattice and elastic con-stants, the potential also predicts transformation temperatures closer to exper-imentally known values in comparison to the other potentials. Hence, here weuse the RF-MEAM potential described in more detail in the next section.
Although the newly developed RF-MEAM potential predicts transformationtemperatures closer to experimentally known values in comparison to other po-tentials, the austenitic transformation temperature is still higher. The reason wasattributed to the fact that the simulations were performed on ideal single-crystalsystems [8, 11]. In this work, by introducing defects to the initial structure, wemake the simulations more realistic and compare the transformation tempera-tures and transformation strains to experimental values. Besides validating thevalues to experimental values, we also demonstrate the effect that the defectshave on the phase transformation. The parameters for the RF-MEAM potentialwere optimized by fitting it to a density functional theory (DFT) database con-sisting only of equi-atomic configurations. Hence, the predictive power of theRF-MEAM is also demonstrated in this work by performing simulations on non-equiatomic defective structures.
The work presented here focuses on four different defects: vacancies, anti-site defects, compositional defects and grain boundaries; MD runs of stress- andtemperature-induced phase transformations on initial structures with such de-fects are performed using the RF-MEAM potential, and results about transforma-
5
88 5. INFLUENCE OF DEFECTS ON PHASE TRANSFORMATION
tion temperatures and strains are presented in Section 3. The results show thatthe B19′-B2 transformation temperature is the most affected (decreases drasti-cally) with an increasing presence of vacancies and anti-sites in the initial struc-ture. An increase in Ni content (more than 50%) also lowers the transformationtemperatures as observed experimentally [14]. The role of grain boundaries inthe transformation behavior is demonstrated through a simple bi-crystal simu-lation. The GB acts as a nucleation site for the B19′-B2 transformation therebyconsiderably reducing the austenitic start temperature. Additionally, simula-tions on single-crystal nano-wires are also included to study the role of free sur-faces on the phase transformation, which, although not related to defects, affectthe transformation behavior similarly to GBs. The simulations, summarised inthe last section, highlight the effect of different defects on transformation prop-erties in NiTi and provide an understanding on how defects affect the structuraltransformation.
5.2. MODELING DETAILSMD simulations are performed using LAMMPS [19]. The newly developed RF-MEAM potential [11, 20] for NiTi is used as the interatomic interaction model.According to the RF-MEAM formalism, the total energy of an N-atom system isgiven as
E =N∑
i=1E emb
i (ρi )+ 1
2
N∑i = j
ϕi , j (ri j ),
where E embi (ρi ) is the embedding energy function, ρi is the fictitious electron
density at site i and ϕi , j (ri j ) is the pair potential between atoms i and j sep-arated by a distance ri j . The embedding function is described as a functionof the partial electron densities, and the partial electron densities and the pair-potentials are written as sums over cubic terms as
f (l )i (r ) =
N1∑n=1
a(n,l )i (r (n.l )
i − r )3θ(r (n.l )i − r ),and
ϕ(l )i , j (r ) =
N2∑n=1
b(n)i , j (s(n)
i , j − r )3θ(s(n)i , j − r ),
respectively. Here, a(n,l )i , b(n)
i , j , r (n.l )i and s(n)
i , j (l = 0,1,2,3) are parameters listedin the previous chapter. The parameters have been optimized by fitting to 0 Kand high-temperature equi-atomic NiTi data. The fitting database does not con-tain configurations with defects. The 0 K lattice parameters and elastic constants

5.3. RESULTS AND DISCUSSION
5
89
and the cohesive energies of the B2 and the B19′ phases of an equi-atomic NiTipredicted by the RF-MEAM are in chapter 4. The results shown in this work forsystems with defects demonstrate the power and predictive capabilities of theRF-MEAM potential.
Periodic boxes are employed for all simulations. The effect of the simula-tion box size on the transformation temperature was shown in chapter 4. Here,we choose a 10 nm × 10 nm × 10 nm box. This is a converged box size beyondwhich the effect on transformation properties is negligible. The cooling-heatingsimulations are performed at 0.01 K/ps during which the simulation box is main-tained at zero stress, allowing the box to change shape and size in all dimensions.The strain-controlled loading simulations are performed at 107/sec during whichother sides of the box are maintained at 0 MPa to allow for changes in shape andsize. Temperature and pressure control is done using the Nose-Hoover thermo-stat algorithm [21] and the Parrinello-Rahman method, respectively. Time inte-gration is performed using the velocity-Verlet algorithm [22] using a time step of0.5 fs. Visualization is done using OVITO software [23]. All the results shown inthis work are an average of the results obtained using five different random ini-tial seeds. The details of the initial structure with various defects are mentionedin the corresponding subsections. Similarly, the details of the nano-wire simula-tions are described in Section 3.6.
5.3. RESULTS AND DISCUSSION
5.3.1. TRANSFORMATION IN PERFECT NITI
Before studying the effect of defects, we show the MD results of an ideal single-crystal equi-atomic NiTi using the RF-MEAM potential as an aid for the compar-isons in following subsections. More details on the perfect crystal behavior canbe found in the previous chapter. Results of temperature- and stress-inducedphase transformation are shown here. Both simulations start with a perfect B2structure. In the first simulation, the B2 structure is thermally equilibrated at400 K, after which the system is cooled to 100 K and heated back to 600 K. In thesecond simulation, a tensile load is applied on the B2 structure at 350 K along⟨110⟩B2.
In Fig. 5.1(a), sudden jumps indicate phase transformation; the B2 trans-forms to B19′ on cooling which transforms back to B2 on heating. Non-zerolattice parameters of B2 and B19′ and the transformation temperatures (Ms andA f ) are tabulated and compared to experimentally known values in Table 5.1.Figure 5.1(b) demonstrates the stress-induced transformation of B2 to B19′. Two

5
90 5. INFLUENCE OF DEFECTS ON PHASE TRANSFORMATION
linear elastic loading regions corresponding to the deformation of the initial B2and the fully transformed B19′ phase are separated by a non-linear region wherethe phase transformation occurs. Similar behavior is observed for other orienta-tions as well as discussed in chapter 3. In the following subsections, we presentthe results of such MD simulations on systems with various defects.
temperature (K)
atom
icvo
lum
e(A
3 )
600400200
13.9
13.86
13.82
13.78
(a)
strain
stre
ss(G
Pa)
0.10.080.060.040.020
1
0.5
0
-0.5
-1
-1.5
(b)
Figure 5.1: (a) Variation of atomic volume with temperature during a cooling-heating cycle from400 K to 200 K back to 600 K for an initial defect-free single-crystal B2 structure. (b) Isothermalstress-strain behavior of defect-free B2 NiTi loaded in tension along ⟨110⟩B2 at 350 K.
Table 5.1: Calculated lattice parameters of B2 at 400 K and B19′ at 300 K (in Å), the monoclinicangle of B19′ at 300 K (in degrees) and the transformation temperatures (in K) compared againstpreviously reported experimental values.
a0 am bm cm γ Ms A f
B2 - MD (400 K) 3.015B2 - Expt. (400 K) [24] 3.013B19′ - MD (300 K) 2.924 4.55 4.177 96B19′ - Expt. (300 K) [25] 2.909 4.657 4.114 97.9B2-B19′ - MD 328 463B2-B19′ - Expt. [14] 337 400
5.3.2. INFLUENCE OF ANTI-SITE DEFECTS
Anti-site defects are the most commonly-occurring point defects in NiTi whereNi atoms swap positions with Ti atoms. When NiTi is produced from the melt,
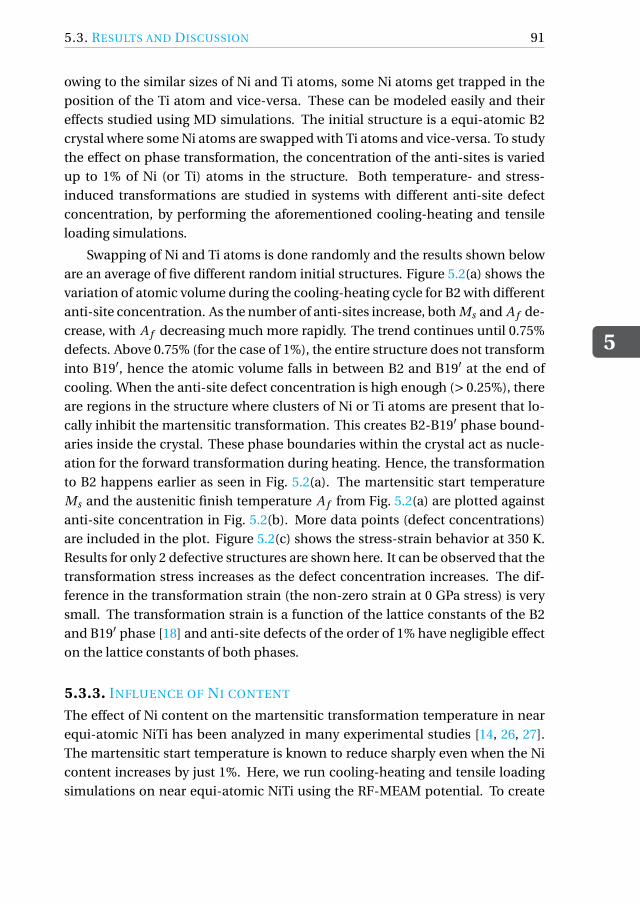
5.3. RESULTS AND DISCUSSION
5
91
owing to the similar sizes of Ni and Ti atoms, some Ni atoms get trapped in theposition of the Ti atom and vice-versa. These can be modeled easily and theireffects studied using MD simulations. The initial structure is a equi-atomic B2crystal where some Ni atoms are swapped with Ti atoms and vice-versa. To studythe effect on phase transformation, the concentration of the anti-sites is variedup to 1% of Ni (or Ti) atoms in the structure. Both temperature- and stress-induced transformations are studied in systems with different anti-site defectconcentration, by performing the aforementioned cooling-heating and tensileloading simulations.
Swapping of Ni and Ti atoms is done randomly and the results shown beloware an average of five different random initial structures. Figure 5.2(a) shows thevariation of atomic volume during the cooling-heating cycle for B2 with differentanti-site concentration. As the number of anti-sites increase, both Ms and A f de-crease, with A f decreasing much more rapidly. The trend continues until 0.75%defects. Above 0.75% (for the case of 1%), the entire structure does not transforminto B19′, hence the atomic volume falls in between B2 and B19′ at the end ofcooling. When the anti-site defect concentration is high enough (> 0.25%), thereare regions in the structure where clusters of Ni or Ti atoms are present that lo-cally inhibit the martensitic transformation. This creates B2-B19′ phase bound-aries inside the crystal. These phase boundaries within the crystal act as nucle-ation for the forward transformation during heating. Hence, the transformationto B2 happens earlier as seen in Fig. 5.2(a). The martensitic start temperatureMs and the austenitic finish temperature A f from Fig. 5.2(a) are plotted againstanti-site concentration in Fig. 5.2(b). More data points (defect concentrations)are included in the plot. Figure 5.2(c) shows the stress-strain behavior at 350 K.Results for only 2 defective structures are shown here. It can be observed that thetransformation stress increases as the defect concentration increases. The dif-ference in the transformation strain (the non-zero strain at 0 GPa stress) is verysmall. The transformation strain is a function of the lattice constants of the B2and B19′ phase [18] and anti-site defects of the order of 1% have negligible effecton the lattice constants of both phases.
5.3.3. INFLUENCE OF NI CONTENT
The effect of Ni content on the martensitic transformation temperature in nearequi-atomic NiTi has been analyzed in many experimental studies [14, 26, 27].The martensitic start temperature is known to reduce sharply even when the Nicontent increases by just 1%. Here, we run cooling-heating and tensile loadingsimulations on near equi-atomic NiTi using the RF-MEAM potential. To create
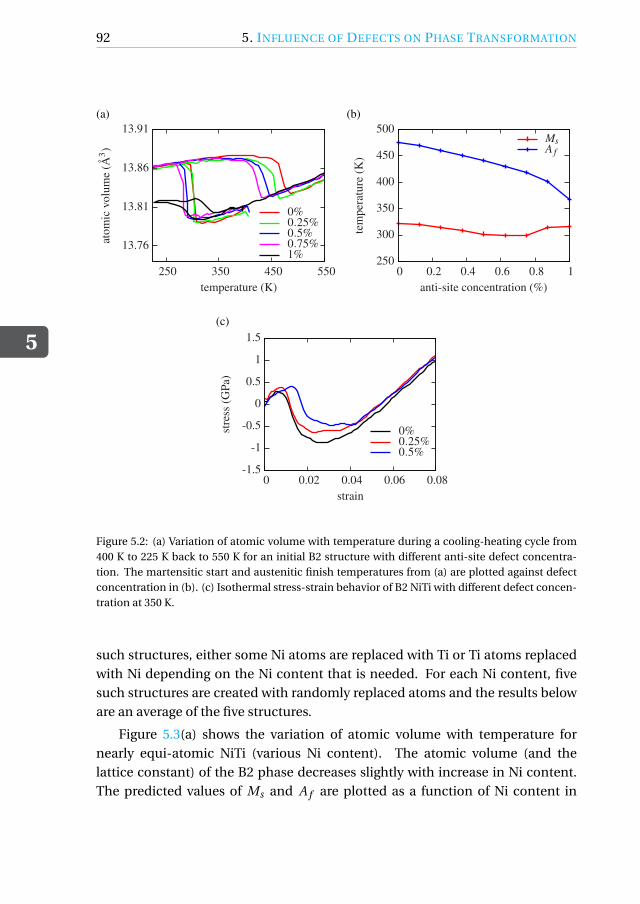
5
92 5. INFLUENCE OF DEFECTS ON PHASE TRANSFORMATION
1%0.75%0.5%0.25%0%
temperature (K)
atom
icvo
lum
e(A
3 )
550450350250
13.91
13.86
13.81
13.76
(a)
A fMs
anti-site concentration (%)
tem
pera
ture
(K)
10.80.60.40.20
500
450
400
350
300
250
(b)
0.5%0.25%0%
strain
stre
ss(G
Pa)
0.080.060.040.020
1.5
1
0.5
0
-0.5
-1
-1.5
(c)
Figure 5.2: (a) Variation of atomic volume with temperature during a cooling-heating cycle from400 K to 225 K back to 550 K for an initial B2 structure with different anti-site defect concentra-tion. The martensitic start and austenitic finish temperatures from (a) are plotted against defectconcentration in (b). (c) Isothermal stress-strain behavior of B2 NiTi with different defect concen-tration at 350 K.
such structures, either some Ni atoms are replaced with Ti or Ti atoms replacedwith Ni depending on the Ni content that is needed. For each Ni content, fivesuch structures are created with randomly replaced atoms and the results beloware an average of the five structures.
Figure 5.3(a) shows the variation of atomic volume with temperature fornearly equi-atomic NiTi (various Ni content). The atomic volume (and thelattice constant) of the B2 phase decreases slightly with increase in Ni content.The predicted values of Ms and A f are plotted as a function of Ni content in
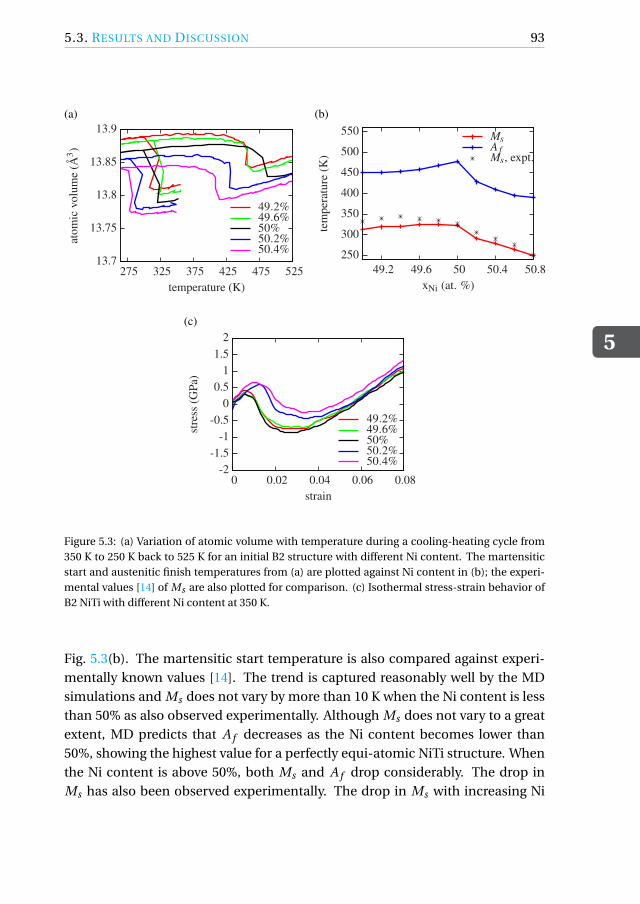
5.3. RESULTS AND DISCUSSION
5
93
50.4%50.2%50%49.6%49.2%
temperature (K)
atom
icvo
lum
e(A
3 )
525475425375325275
13.9
13.85
13.8
13.75
13.7
(a)
Ms, expt.A fMs
xNi (at. %)
tem
pera
ture
(K)
50.850.45049.649.2
550
500
450
400
350
300
250
(b)
50.4%50.2%50%49.6%49.2%
strain
stre
ss(G
Pa)
0.080.060.040.020
21.5
10.5
0-0.5
-1-1.5
-2
(c)
Figure 5.3: (a) Variation of atomic volume with temperature during a cooling-heating cycle from350 K to 250 K back to 525 K for an initial B2 structure with different Ni content. The martensiticstart and austenitic finish temperatures from (a) are plotted against Ni content in (b); the experi-mental values [14] of Ms are also plotted for comparison. (c) Isothermal stress-strain behavior ofB2 NiTi with different Ni content at 350 K.
Fig. 5.3(b). The martensitic start temperature is also compared against experi-mentally known values [14]. The trend is captured reasonably well by the MDsimulations and Ms does not vary by more than 10 K when the Ni content is lessthan 50% as also observed experimentally. Although Ms does not vary to a greatextent, MD predicts that A f decreases as the Ni content becomes lower than50%, showing the highest value for a perfectly equi-atomic NiTi structure. Whenthe Ni content is above 50%, both Ms and A f drop considerably. The drop inMs has also been observed experimentally. The drop in Ms with increasing Ni
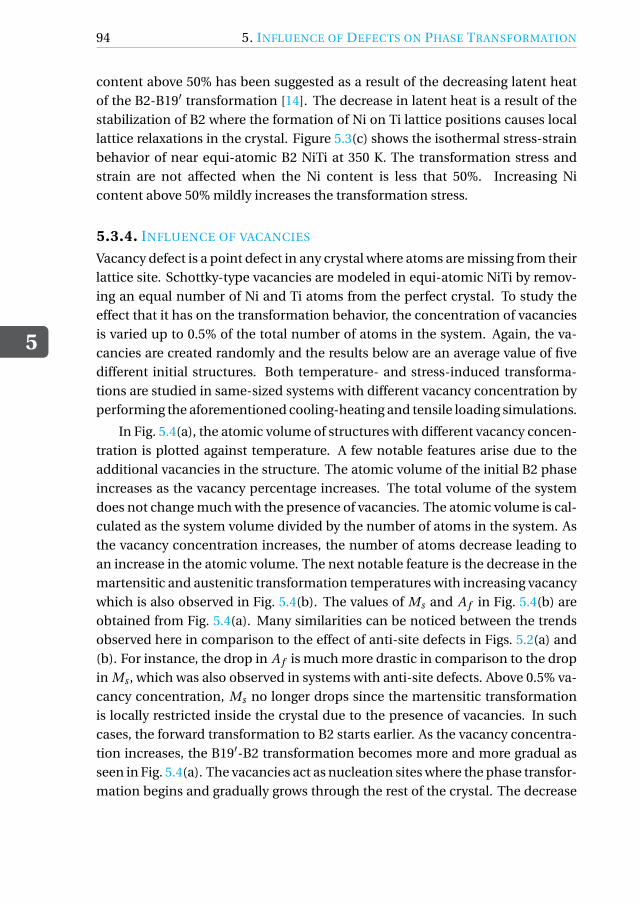
5
94 5. INFLUENCE OF DEFECTS ON PHASE TRANSFORMATION
content above 50% has been suggested as a result of the decreasing latent heatof the B2-B19′ transformation [14]. The decrease in latent heat is a result of thestabilization of B2 where the formation of Ni on Ti lattice positions causes locallattice relaxations in the crystal. Figure 5.3(c) shows the isothermal stress-strainbehavior of near equi-atomic B2 NiTi at 350 K. The transformation stress andstrain are not affected when the Ni content is less that 50%. Increasing Nicontent above 50% mildly increases the transformation stress.
5.3.4. INFLUENCE OF VACANCIES
Vacancy defect is a point defect in any crystal where atoms are missing from theirlattice site. Schottky-type vacancies are modeled in equi-atomic NiTi by remov-ing an equal number of Ni and Ti atoms from the perfect crystal. To study theeffect that it has on the transformation behavior, the concentration of vacanciesis varied up to 0.5% of the total number of atoms in the system. Again, the va-cancies are created randomly and the results below are an average value of fivedifferent initial structures. Both temperature- and stress-induced transforma-tions are studied in same-sized systems with different vacancy concentration byperforming the aforementioned cooling-heating and tensile loading simulations.
In Fig. 5.4(a), the atomic volume of structures with different vacancy concen-tration is plotted against temperature. A few notable features arise due to theadditional vacancies in the structure. The atomic volume of the initial B2 phaseincreases as the vacancy percentage increases. The total volume of the systemdoes not change much with the presence of vacancies. The atomic volume is cal-culated as the system volume divided by the number of atoms in the system. Asthe vacancy concentration increases, the number of atoms decrease leading toan increase in the atomic volume. The next notable feature is the decrease in themartensitic and austenitic transformation temperatures with increasing vacancywhich is also observed in Fig. 5.4(b). The values of Ms and A f in Fig. 5.4(b) areobtained from Fig. 5.4(a). Many similarities can be noticed between the trendsobserved here in comparison to the effect of anti-site defects in Figs. 5.2(a) and(b). For instance, the drop in A f is much more drastic in comparison to the dropin Ms , which was also observed in systems with anti-site defects. Above 0.5% va-cancy concentration, Ms no longer drops since the martensitic transformationis locally restricted inside the crystal due to the presence of vacancies. In suchcases, the forward transformation to B2 starts earlier. As the vacancy concentra-tion increases, the B19′-B2 transformation becomes more and more gradual asseen in Fig. 5.4(a). The vacancies act as nucleation sites where the phase transfor-mation begins and gradually grows through the rest of the crystal. The decrease

5.3. RESULTS AND DISCUSSION
5
95
0.6%0.4%0.2%0%
temperature (K)
atom
icvo
lum
e(A
3 )
550450350250
13.94
13.88
13.82
13.76
(a)
A fMs
vacancy concentration (%)
tem
pera
ture
(K)
0.60.50.40.30.20.10
500
450
400
350
300
(b)
0.6%0.4%0.2%0%
strain
stre
ss(G
Pa)
0.080.060.040.020
2
1.5
1
0.5
0
-0.5
-1
-1.5
(c)
Figure 5.4: (a) Variation of atomic volume with temperature during a cooling-heating cycle from425 K to 225 K back to 550 K for an initial B2 structure with different vacancy concentration. Themartensitic start and austenitic finish temperatures obtained from (a) are plotted against vacancyconcentration in (b). (c) Isothermal stress-strain behavior of B2 NiTi with different vacancy con-centration at 350 K.
in A f (and the eventual decrease in Ms) can also be explained as suggested inRef. [15]. Introducing vacancies increases the configurational entropy [9]. Thisfavours the austenitic phase over the martensitic phase [28] and a greater driv-ing force is required for the martensitic transformation. The system favors theaustenitic phase thereby reducing both Ms and A f . Figure 5.4(c) is the isother-mal stress-strain behavior of B2 with different vacancy concentration at 350 K. Asthe number of vacancies increase, the transformation stress also increases. Thepresence of vacancies mildly affects the lattice constants of both phase. Hence, a
5
96 5. INFLUENCE OF DEFECTS ON PHASE TRANSFORMATION
15% decrease in the transformation strain (which is a function of the lattice con-stants of B2 and B19′) is also noticed as vacancy concentration increases from0% to 0.6%.
5.3.5. SIMULATING BI-CRYSTAL BEHAVIOR
Besides point defects, 2D defects in the form of grain boundaries (GBs) also affectphase transformation behavior. Ko et al. [8] studied the effect of GBs on phasetransformation using the 2NN-MEAM potential by simulating poly-crystals withdifferently-sized grains. In small-sized grains, the B2-B19′ transformation beganin the interior of the grains and eventually grew outwards towards the GBs. TheGBs acted as nucleation sites for the forward transformation of B19′-B2, startingat the GB and growing through the interior of the crystal. Here, we perform MDsimulations using the RF-MEAM potential to analyze the effect of GBs on phasetransformation. We do so by simulating cooling-heating and tensile loading sim-ulations on a simple bi-crystal with a GB and comparing the results to that of asingle-crystal.
A random mixed grain GB is created by choosing a bi-crystal with two stackedgrains, the first grain oriented along [100]B2, [010]B2 and [001]B2 and the sec-ond grain oriented along [110]B2, [110]B2 and [001]B2 . Atoms at the GB thatlie within half the lattice constant of B2 (1.5 nm) are removed and a 0 K en-ergy minimization is performed on the bi-crystal. The simulation box is peri-odic in all directions, which makes all the GBs identical. The size of each grainis 10 nm×10 nm×10 nm. This is chosen such that the GBs do not interact witheach other and the effect of the GB on the phase transformation can be stud-ied independently. Following a thermal equilibration at 350 K, cooling-heatingand tensile loading simulations are performed. Figure 5.5(a) shows the variationof atomic volume with temperature during the cooling-heating cycle for the bi-crystal in comparison to that of a single-crystal. The GB does not affect Ms butA f reduces by around 70 K. The presence of the GB also makes the transforma-tions more gradual than in a single-crystal. This is attributed to the aforemen-tioned reason wherein the martensitic transformation begins in the grain inte-rior and progresses to the GB, and the austenitic transformation nucleates at theGB and progresses through the entire grain. The effect of the GB on making thephase transformation more gradual can also be validated by visualizing the bi-crystal during the cooling-heating cycle as shown in Fig. 5.5(c). Here, atoms arecolored according to the common neighbor analysis (CNA) pattern that differen-tiates atoms in the B2 phase (blue colored) from the other atoms (red colored).Labels A to C correspond to the cooling stage at 375 K, 280 K and 225 K respec-

5.3. RESULTS AND DISCUSSION
5
97
bi-crystalsingle-crystal
temperature (K)
atom
icvo
lum
e(A
3 )
550450350250
13.9
13.86
13.82
13.78
(a)
bi-crystalgrain 2grain 1
strain
stre
ss(G
Pa)
0.080.060.040.020
2
1.5
1
0.5
0
-0.5
-1
-1.5
(b)
A B C D E F G H(c)
Figure 5.5: (a) Variation of atomic volume with temperature during a cooling-heating cycle from375 K to 225 K back to 550 K for the bi-crystal and a single-crystal. (b) Isothermal stress-strainbehavior of the bi-crystal loaded perpendicular to the GB plane and the corresponding single-crystals at 350 K. (c) Evolution of the phase transformation in the bi-crystal during cooling (A toC) and heating (D to H). Atoms are colored according to the common neighbor analysis (CNA)pattern; blue colored balls represent atoms in the B2 (BCC) structure and the red colored ballsrepresent atoms not in the B2 phase (atoms at the GB and the transformed B19′ inside the grains).Figures E to F illustrate that the martensitic domain boundaries and the GB acts as nucleation forthe austenitic transformation.
tively. In A, the GBs are distinctly seen as lines of red colored balls. Since thesimulation box is periodic, the GBs are identical. As the system is cooled, redpatches are observed in the interior of the grains indicating the transformationto the B19′ phase. In C, the martensitic transformation is complete. In the grainon top, it can be seen that a single domain of B19′ is formed at the end of cooling,whereas in the grain below, multiple domains of B19′ are formed with untrans-
5
98 5. INFLUENCE OF DEFECTS ON PHASE TRANSFORMATION
formed B2 as the domain boundaries between them. Figs. D to H correspondto the heating stage at 400 K, 440 K, 450 K, 465 K and 500 K respectively. It is ob-served that the forward transformation to the parent B2 phase is nucleated eitherfrom the domain boundaries (bottom grain) or the GBs (top grain) and then pro-gresses through the rest of the grain, thereby initiating the transformation earlierand making the transformation more gradual in comparison to a single-crystal.Figure 5.5(b) shows the isothermal stress strain behavior of the bi-crystal loadedperpendicular to the GB in comparison to the two individual grains loaded along⟨100⟩B2 and ⟨110⟩B2 at 350 K. The modulus of both the B2 and B19′ phases andthe transformation strain of the bi-crystal falls in between that of the individualsingle crystals.
5.3.6. TRANSFORMATION IN CYLINDRICAL NITI NANO-WIRES
Apart from crystalline defects in the system, transformation properties andthe transformation mechanism are also affected by the presence of free sur-faces which is especially true in nano-scaled structures with a high surfacearea-volume ratio. To investigate this, we perform MD simulations using theRF-MEAM potential on differently sized cylindrical nano-wires. In earlierworks [8, 11], the effect of the simulation box size of a fully periodic systemon the transformation temperature was studied. As the box size increased, amulti-variant martensitic structure was formed upon cooling austenite. Thevariant boundaries act as nucleation sites for the forward transformation therebyreducing the transformation temperature. Here, we study the effect of size onnon-periodic nano-wire systems to also include the effect of free surfaces on thephase transformation.
The initial B2 nano-wires are periodic along the axis, aligned in the ⟨110⟩B2
direction. Nano-wires ranging from d = 5 nm to d = 24 nm are chosen. Thelength of the simulation box along the axis is 32 nm, above which the resultsare not affected by the periodic length of the box. After thermal equilibration at400 K, the nano-wires are cooled to 200 K and heated back to 500 K. The pres-sure along the face of the nano-wires is maintained at 0 Pa to allow for changein length during the cooling-heating process. The axial strain in the nano-wireis plotted against temperature. Figure 5.6(a) shows the variation of the axialstrain with temperature for three differently-sized nano-wires. The first wire withd = 5 nm does not show a phase transformation, i.e., there is no sudden changein the axial strain. There is no transformation observed until d = 8 nm. Abovethis diameter, the wires start showing phase transformation as observed for thed = 12 nm, d = 20 nm and d = 24 nm wires. As the diameter of the wires in-
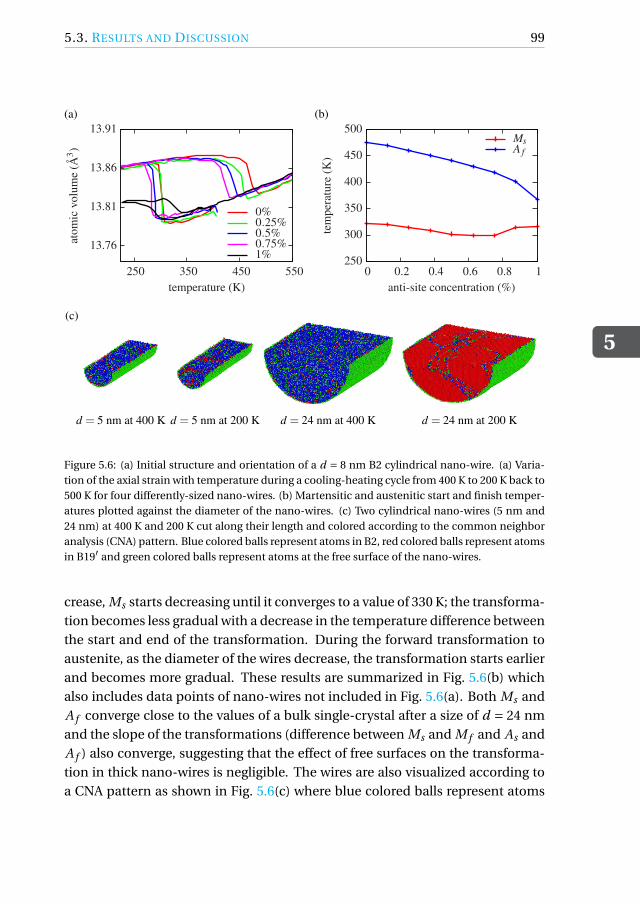
5.3. RESULTS AND DISCUSSION
5
99
1%0.75%0.5%0.25%0%
temperature (K)
atom
icvo
lum
e(A
3 )
550450350250
13.91
13.86
13.81
13.76
(a)
A fMs
anti-site concentration (%)
tem
pera
ture
(K)
10.80.60.40.20
500
450
400
350
300
250
(b)
(c)
d = 5 nm at 400 K d = 5 nm at 200 K d = 24 nm at 400 K d = 24 nm at 200 K
Figure 5.6: (a) Initial structure and orientation of a d = 8 nm B2 cylindrical nano-wire. (a) Varia-tion of the axial strain with temperature during a cooling-heating cycle from 400 K to 200 K back to500 K for four differently-sized nano-wires. (b) Martensitic and austenitic start and finish temper-atures plotted against the diameter of the nano-wires. (c) Two cylindrical nano-wires (5 nm and24 nm) at 400 K and 200 K cut along their length and colored according to the common neighboranalysis (CNA) pattern. Blue colored balls represent atoms in B2, red colored balls represent atomsin B19′ and green colored balls represent atoms at the free surface of the nano-wires.
crease, Ms starts decreasing until it converges to a value of 330 K; the transforma-tion becomes less gradual with a decrease in the temperature difference betweenthe start and end of the transformation. During the forward transformation toaustenite, as the diameter of the wires decrease, the transformation starts earlierand becomes more gradual. These results are summarized in Fig. 5.6(b) whichalso includes data points of nano-wires not included in Fig. 5.6(a). Both Ms andA f converge close to the values of a bulk single-crystal after a size of d = 24 nmand the slope of the transformations (difference between Ms and M f and As andA f ) also converge, suggesting that the effect of free surfaces on the transforma-tion in thick nano-wires is negligible. The wires are also visualized according toa CNA pattern as shown in Fig. 5.6(c) where blue colored balls represent atoms
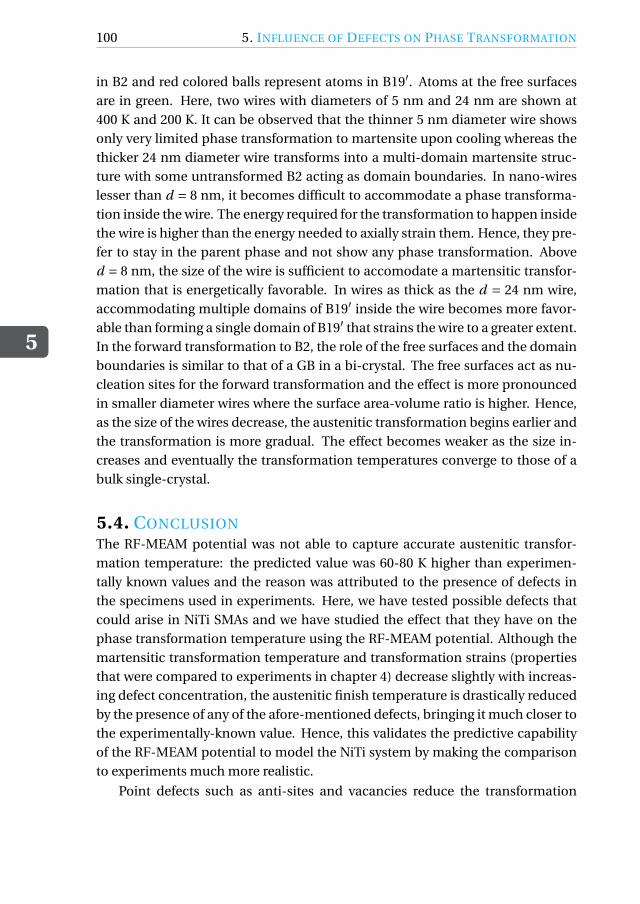
5
100 5. INFLUENCE OF DEFECTS ON PHASE TRANSFORMATION
in B2 and red colored balls represent atoms in B19′. Atoms at the free surfacesare in green. Here, two wires with diameters of 5 nm and 24 nm are shown at400 K and 200 K. It can be observed that the thinner 5 nm diameter wire showsonly very limited phase transformation to martensite upon cooling whereas thethicker 24 nm diameter wire transforms into a multi-domain martensite struc-ture with some untransformed B2 acting as domain boundaries. In nano-wireslesser than d = 8 nm, it becomes difficult to accommodate a phase transforma-tion inside the wire. The energy required for the transformation to happen insidethe wire is higher than the energy needed to axially strain them. Hence, they pre-fer to stay in the parent phase and not show any phase transformation. Aboved = 8 nm, the size of the wire is sufficient to accomodate a martensitic transfor-mation that is energetically favorable. In wires as thick as the d = 24 nm wire,accommodating multiple domains of B19′ inside the wire becomes more favor-able than forming a single domain of B19′ that strains the wire to a greater extent.In the forward transformation to B2, the role of the free surfaces and the domainboundaries is similar to that of a GB in a bi-crystal. The free surfaces act as nu-cleation sites for the forward transformation and the effect is more pronouncedin smaller diameter wires where the surface area-volume ratio is higher. Hence,as the size of the wires decrease, the austenitic transformation begins earlier andthe transformation is more gradual. The effect becomes weaker as the size in-creases and eventually the transformation temperatures converge to those of abulk single-crystal.
5.4. CONCLUSIONThe RF-MEAM potential was not able to capture accurate austenitic transfor-mation temperature: the predicted value was 60-80 K higher than experimen-tally known values and the reason was attributed to the presence of defects inthe specimens used in experiments. Here, we have tested possible defects thatcould arise in NiTi SMAs and we have studied the effect that they have on thephase transformation temperature using the RF-MEAM potential. Although themartensitic transformation temperature and transformation strains (propertiesthat were compared to experiments in chapter 4) decrease slightly with increas-ing defect concentration, the austenitic finish temperature is drastically reducedby the presence of any of the afore-mentioned defects, bringing it much closer tothe experimentally-known value. Hence, this validates the predictive capabilityof the RF-MEAM potential to model the NiTi system by making the comparisonto experiments much more realistic.
Point defects such as anti-sites and vacancies reduce the transformation

5.4. CONCLUSION
5
101
temperatures. The drop in A f is much sharper. Both anti-sites and vacanciescreate local inhibitions to the martensitic transformation. The effect of Ni con-tent on the phase transformation is compared and validated with experimentaldata. Both Ms and A f drop when Ni content is more than 50%. 2D defects(GB) are also studied by simulating a mixed GB bi-crystal. The GB acts as anucleation site for the forward austenitic transformation, causing it to startearlier and making it more gradual as the temperature increases. A similar effectis also produced by free surfaces on the phase transformation; this is analyzedby performing cooling-heating simulations on differently sized nano-wires.

5
102 REFERENCES
REFERENCES[1] O. Matsumoto, S. Miyazaki, K. Otsuka, and H. Tamura, Crystallography of
martensitic transformation in TiNi single crystals, Acta Materialia 35, 2137(1987).
[2] S. Mao, J. Luo, Z. Zhang, M. Wu, Y. Liu, and X. Han, EBSD studies of thestress-induced B2-B19’ martensitic transformation in NiTi tubes under uni-axial tension and compression, Acta Materialia 58, 3357 (2010).
[3] J. M. Jani, M. Leary, A. Subic, and M. A. Gibson, A review of shape mem-ory alloy research, applications and opportunities, Materials and Design 56,1078 (2014).
[4] X. Huang, G. J. Ackland, and K. M. Rabe, Crystal structures and shape-memory behaviour of NiTi, Nature Materials 2, 307 (2003).
[5] O. Kastner, G. Eggeler, W. Weiss, and G. Ackland, Molecular dynamics sim-ulation study of microstructure evolution during cyclic martensitic transfor-mations, Journal of the Mechanics and Physics of Solids 59, 1888 (2011).
[6] D. Mutter and P. Nielaba, Simulation of the shape memory effect in a NiTinano model system, Condensed Matter and Materials Science 577, S83(2013).
[7] Y. Zhong, K. Gall, and T. Zhu, Atomistic study of nanotwins in NiTi shapememory alloys, Journal of Applied Physics 110, 033532 (2011).
[8] W.-S. Ko, B. Grabowski, and J. Neugebauer, Development and application ofa Ni-Ti interatomic potential with high predictive accuracy of the martensiticphase transition, Physical Review B 92, 134107 (2015).
[9] O. Kastner, Molecular-dynamics of a 2D model of the shape memory effect,Continuum Mechanics and Thermodynamics 15, 487 (2003).
[10] G. Ren and H. Sehitoglu, Interatomic potential for the NiTi alloy and its ap-plication, Computational Materials Science 123, 19 (2016).
[11] P. Srinivasan, A. I. Duff, T. Mellan, M. H. F. Sluiter, L. Nicola, and A. Si-mone, The effectiveness of reference-free modified embedded atom methodpotentials demonstrated for NiTi and NbMoTaW, Modelling and Simulationin Materials Science and Engineering 27, 065013 (2019).

REFERENCES
5
103
[12] J. Lu, Q. Hu, L. Wang, Y. Li, D. Xu, and R. Yang, Point defects and their inter-action in TiNi from first-principles calculations, Physical Review B 75 (2007).
[13] M. Weber, T. Ablekim, and K. Lynn, Vacancies in NiTi shape memory alloys,Journal of Physics: Conference Series 505 (2014).
[14] J. Frenzel, E. P. George, A. Dlouhy, C. Somsen, M. F.-X. Wagner, andG. Eggeler, Influence of Ni on martensitic phase transformations in NiTishape memory alloys, Acta Materialia 58, 3444 (2010).
[15] A. M. Tehrani, H. Shahrokhshahi, N. Parvin, and J. Brgoch, Influencing themartensitic phase transformation in NiTi through point defects, Journal ofApplied Physics 118 (2015).
[16] W.-S. Ko, S. B. Maisel, B. Grabowski, J. B. Jeon, and J. Neugebauer, Atomicscale processes of phase transformations in nanocrystalline NiTi shape-memory alloys, Acta Materialia 123, 90 (2017).
[17] W. Lai and B. Liu, Lattice stability of some NiTi alloy phasesversus their chem-ical composition and disordering, Journal of Physics: Condensed Matter 12,L53 (2000).
[18] P. Srinivasan, L. Nicola, and A. Simone, Modeling pseudo-elasticity in NiTi:Why the MEAM potential outperforms the EAM-FS potential, ComputationalMaterials Science 134, 145 (2017).
[19] S. J. Plimpton, Fast parallel algorithms for short-range molecular dynamics,Journal of Computer Physics 117, 1 (1995).
[20] M. Timonova and B. J. Thijsse, Optimizing the MEAM potential for silicon,Modeling and Simulation in Materials Science and Engineering 19, 015003(2010).
[21] S. Nose, A unified formulation of the constant temperature molecular-dynamics methods, Journal of Chemical Physics 81, 511 (1984).
[22] W. C. Swope, H. C. Anderson, P. H. Berens, and K. R. A. Wilson, A computersimulation method for the calculation of equilibrium constants for the for-mation of physical clusters of molecules: Application to small water clusters,Journal of Chemical Physics 76, 637 (1982).
5
104 REFERENCES
[23] A. Stukowski, Visualization and analysis of atomistic simulation data withOVITO–the open visualization tool, Modeling and Simulation in MaterialsScience and Engineering 18, 015012 (2010).
[24] P. Sittner, P. Lukas, D. Neov, V. Novak, and D. Toebbens, In situ neutrondiffraction studies of martensitic transformations in NiTi, J. Phys. IV France112 (2003).
[25] S. D. Prokoshkin, A. V. Korotitskiy, V. Brailovski, S. Turenne, I. Y.Khmelevskaya, and I. B. Trubitsyna, On the lattice parameters of phases inbinary Ti-Ni shape memory alloys, Acta Materialia 52, 4479 (2004).
[26] W. Tang, B. Sundman, R. Sandstrom, and C. Qiu, New modelling of the B2phase and its associated martensitic transformation in the Ti–Ni system, ActaMaterialia 47, 3457 (1999).
[27] T. Waitz, D. Spisak, J. Hafner, and H. Karnthaler, Size-dependent martensitictransformation path causing atomic-scale twinning of nanocrystalline NiTishape memory alloys, Europhysics Letters 71, 98 (2005).
[28] R. Elliott and D. Karls, Entropic stabilization of austenite in shape memoryalloys, Journal of the mechanics and physics of solids 61, 2522 (2013).
6CONCLUSIONS
Every science has a beginning but no end.
Anton Chekhov
105

6
106 6. CONCLUSIONS
T HE objective of the thesis was to perform MD simulations of equi-atomicNiTi systems and obtain their thermo-mechanical behavior. During the
course of the study, the necessity to build a reliable and robust interatomicpotential was realized. To this end, a new reference-free MEAM potential hasbeen developed for NiTi by optimizing the parameters to ab initio data, and itsperformance is better than existing potentials. Along with predicting accuratethermo-mechanical behavior along different orientations, the quality of thepotential is also demonstrated by performing simulations on systems with pointand line defects. Next, a chapter-wise summary of results and conclusions isprovided.
The drawbacks of the EAM-Finnis-Sinclair potential, one of the earlier devel-oped potentials for NiTi, were highlighted in Chapter 2. The 2NN-MEAM inter-atomic potential predicts more accurate values of lattice and elastic constants incomparison to experimental/ab initio data than the EAM potential. Hence, thetransformation strain and the modulus of the austenitic and martensitic phases,which are functions of the lattice and elastic constants, are better captured bythe MEAM potential. This was demonstrated by showing results of a uniaxialloading simulation along ⟨100⟩B2 on a single-crystal bulk, which were then com-pared to a lattice deformation model. At this stage, it was concluded that theMEAM potential is the most suited potential for a study of pseudo-elasticity inNiTi, especially in poly-crystals with grains along different orientations.
In Chapter 3 the predictive power of the 2NN-MEAM was highlightedby showing MD simulation results of the orientation-dependent martensitictransformation in single-crystal NiTi nano-wires during normal loading andbending. The transformation strain varies along different loading directions,since a different final variant of martensite is formed at the end of the trans-formation. Loading along ⟨111⟩B2 showed the highest transformation strainin tension out of the three orientations chosen for the study. Similarly, load-ing along ⟨110⟩B2 and ⟨100⟩B2 showed the highest transformation strain incompression. Besides stress-strain behavior, there is also a difference in themartensitic phase transformation mechanism based on the orientation, withsome orientations transforming through the formation of Lüders-like bandswhereas some orientations preferring the formation of a multi-variant marten-site followed by reorientation to a single variant. The orientation dependenceand tension-compression asymmetry affects the transformation in differentlysized and shaped NiTi systems with different boundary conditions. This wasdemonstrated by comparing the difference in curvature upon bending of threedifferently oriented nano-wires.

6
107
The need to build an even more robust potential was considered in Chap-ter 4. The 2NN-MEAM lacks predictive capabilities because it estimates inaccu-rate transformation temperatures and martensitic elastic constants in compari-son to experiments. A reference-free version of the MEAM potential provides anopportunity to fit to an even broader dataset by virtue of its reference-free for-malism of the pair potential term. The methodology was described in Chapter 4where a new parametrization of the RF-MEAM for NiTi was developed by also fit-ting to stress tensors of configurations in addition to energies and atomic forces.The RF-MEAM predicts thermo-mechanical properties in closer agreement toexperiments in comparison to existing potentials. The methodology was alsoextended and results compared for a four-component NbMoTaW high entropyalloy. The methodology provides a way to build accurate potentials for complexsystems with large fitting datasets. The fitting code is also compatible with MDpackages which makes it convenient to build models and perform MD simula-tions for such systems.
The predicted value of the austenitic transformation temperature by usingthe RF-MEAM potential in single-crystal NiTi bulk is approximately 80 K higherthan the experimentally known value. The reason was attributed, in Chapter 4, tothe presence of small defects in the experimental specimens whereas MD runswere performed on ideal defect-free single crystals. To verify this, the effect ofvarious defects on the phase transformation behavior was investigated in Chap-ter 5. The austenitic transformation temperature reduces drastically due to thepresence of various defects in the system, bringing the value much closer to theexperimental one. Presence of anti-sites and vacancies in the system create localinhibitions to the martensitic transformation during cooling. Excessive Ni con-tent reduces both the transformation temperatures and this trend is comparedand validated with experimental results. Grain boundaries in crystals and freesurfaces in NiTi nano-wires act as a nucleation site for the austenitic transforma-tion, thereby initiating it at a much lower temperature.
The validity of an interatomic potential for a particular system under certainboundary conditions is very crucial before performing any analysis. Once theapplicability of a potential is exhibited, the predictive powers of MD simulationsusing that particular potential can be used to optimize and fine-tune the man-ufacturing and production of devices for different applications. In this thesis,a new RF-MEAM potential is developed and tested for NiTi, the capabilities ofwhich can be exploited in the future.
6
108 6. CONCLUSIONS
6.1. OUTLOOK
This thesis discussed two main topics: interatomic potential fitting and MD sim-ulations. With a continual increase in computing power, the scope for both thesetopics is vast.
Firstly, more accurate interatomic potentials can be fit for various systemsby broadening the database for fitting. Potentials can be tailored for a partic-ular phase space focusing more on accuracy rather than robustness. Similarly,interatomic potentials can also be fit for highly complex multi-component sys-tems with several fitting parameters. In either case, extensive computing powerenables access to a highly complex phase space with several local minima andhelps in efficiently navigating through this to reach a satisfactory point (parame-ter set) that would best describe the material for a particular application. Differ-ent potential formalisms have their own merits and demerits. Analytical formsof the energy as a function of interatomic distance as in the case of EAMs andMEAMs, although robust and amenable to optimization for small systems, donot describe the exact physics (e.g., bond formation and breaking). Another formof potentials, the bond order potentials (BOPs), are derived from ab initio equa-tions that describes the physics, but these are limited in terms of the databasethat can be used for fitting and the complexity of the fit. More recently, severalmachine learning based interatomic potentials have been developed where ba-sis functions are defined based on atomic environments present in the fittingdatabase. These potentials can capture a large part of the phase space accuratelyand efficiently, thereby enabling its usage to even several multi-component sys-tems. Through active learning, configurations that the potentials are not familiarwith can be learnt on the fly hence improving their robustness. Choosing an in-teratomic potential for a study hinges on several factors: the robustness that isneeded, the complexity of the system, time taken for fitting, and eventually timetaken to perform MD runs using the fitted potential.
Once the right interatomic potential is chosen for a study, large-scale MDruns can be performed with relatively affordable computing resources. MD sim-ulations of poly-crystals of the order of hundreds of nanometers, simulations ofaccurate dislocation motion with crystals, high temperature simulations of large-sized multi-component systems etc. can be performed to understand the mate-rial behavior in more detail. Large-scale simulation results can also be used forobtaining parameters for a meso-scale model, facilitating the multi-scale model-ing of any system. With respect to the equi-atomic NiTi system, MD runs can beperformed for further investigation of the effect of various GBs and dislocationmotion, twin formation and twin boundary effects on the phase transformation,
6.1. OUTLOOK
6
109
effect of precipitates on the physical and transformation properties etc. Sincethe RF-MEAM potential (and the 2NN-MEAM potential) is applicable across var-ious orientations to predict transformation behavior, MD simulation results onNiTi nano-wires can be used to develop stress-temperature-size phase diagrams.Based on this, constitutive models for NiTi nano-wires can be parametrized andused for the meso-scale modeling of much larger NiTi systems.

ACKNOWLEDGEMENTS
This thesis, and my PhD, would not have been possible without the guidance,help and support of a lot of people. Firstly, I would like to thank Angelo and Lu-cia, my two supervisors, for their support, critical analysis and perfectionism.They provided me with a lot of freedom with regards to my project for which Iam thankful. I would like to thank Bert, my promoter, and Barend for introduc-ing me to molecular dynamics. I am also grateful to Peter Klaver, who, along withBarend, taught me the basics of MD and LAMMPS, which eventually became thecore of my work. My thanks also goes out to Marcel and Andy who were involvedin the later part of my PhD, for their collaboration, insights and knowledge shar-ing. The PhD topic wouldn’t have reached a satisfying conclusion without theirassistance. This project would not have been possible without the funding pro-vided by Shell and FOM/NWO and I would like to thank all people involved inthe construction and development of the FOM-Shell PhD75 program for hiring,funding, assisting and supporting me during the course of my PhD. For the lastyear or so, I have been working as a researcher in the 3ME department, in closecollaboration with the Max Planck Institute in Dusseldorf. I have gained valuableknowledge during this time, and it has also helped to further tune my results thatI have obtained towards the end of my PhD and for this, I am grateful to Fritz.A special thanks also to Anneke, Annette and Maria, who helped me before andduring my move to the Netherlands, eased my arrival considerably and assistedwith all the non-technical aspects and paper work associated with the university.
My years in the Netherlands have been the best years of my life so far and itwouldn’t have been the same without mentioning these friends, colleagues andcomrades; Ashwath, Wilco, Siddharth and Danilo for all the good times - Delftwouldn’t have been the same otherwise; Erik, Kai and Marcelo, for all the con-versations over coffee and being my first office mates; other colleagues in Civilincluding Wouter, Luiz, Mohsen, Fariborz, YaoLu, Anupam, Mani, Tao, Liting,Mehdi, Richard, Lu, Dongyu, Tiziano, Adriaan, Davide, Ali, Jafar, MZ, Sanaz, Os-valds, Behrouz, Jaap, Rafit, Frank, Frans, and others that I might have missed; col-leagues in 3ME - Casper, Kelvin, RJ, Astrid, Neha, Mohsen, Nilgoon, Ann-sophie,Alexandra, Biswanath, Poulumi, Mathias, Jan, Sorosh, Farnaz, Geeske and oth-ers that I might have missed; Locus people - Walter, Vikram, Adarsha, Nico, Jim,
111
6
112 6. CONCLUSIONS
Tjarky and the list goes on; Concordia, where I played cricket for 3 seasons - Sid,Charan, Tiggy, Menon, Shukla, Manu Bhai, Aggu, Reddy, Adi, Hari and other Con-cordians for your passion for the game; Chilli and Pottan for the social network-ing, and JP, Dhev, Psych, Seef, and other insti junta; KS, Sudha, Daga, Shreya,Dericae, Ajay, Khaba, Sindu, Padaf, Deb, Akshay and a bunch of aforementionedand unmentioned people with whom I travelled and explored Europe over thelast 5 years; Attila, Tob, Kerim, Sai, Piero, and all the others that I have missed out- a big thank you. My sincere apologies if I have missed anyone here. I have meta lot of interesting people from different walks of life over the last 5 years in theNetherlands and Europe in general, through travelling, hiking, going to confer-ences etc., all of whom have directly or indirectly affected me in some small wayor the other, and all of which wouldn’t have been possible without my pursuit fora PhD.
Last but not the least, I would like to thank Amma and Appa, for all the sup-port, encouragement and toleration. The thesis is an outcome of 5 years of re-search in TU Delft, and hence my final thanks goes to the TU and to the city ofDelft, my second home.
CURRICULUM VITÆ
Prashanth SRINIVASAN
08-08-1991 Born in Chennai, India.
EDUCATION
1998–2008 Senior Secondary SchoolD.A.V Mogappair, Chennai
2008–2013 B. Tech in Civil Engineering and M. Tech in Applied MechanicsIndian Institute of Technology, MadrasThesis: Large Deflections of Shape Memory Alloys: 3D
Wire Forms Analysis
2013-2018 PhD. in Civil EngineeringDelft University of TechnologyThesis: Atomistic Simulations of Nickel-Titanium
Shape Memory Alloys
113

LIST OF PUBLICATIONS
5. P. Srinivasan, A.I. Duff, M.H.F. Sluiter, L. Nicola, A. Simone, Effect of defects onphase transformations in NiTi studied using molecular dynamics simulations, inpreparation.
4. P. Srinivasan, A.I. Duff, T. Mellan, M.H.F. Sluiter, L. Nicola, A. Simone, The ef-fectiveness of reference-free modified embedded atom method potentials demon-strated for NiTi and NbMoTaW, Modelling and Simulation in Materials Scienceand Engineering 27, 6 (2019).
3. P. Srinivasan, L. Nicola, A. Simone, Atomistic modeling of the orientation depen-dent pseudo-elasticity in NiTi: normal loading and bending, Computational Ma-terials Science 154, 25-36 (2018).
2. P. Srinivasan, L. Nicola, A. Simone, Modeling pseudo-elasticity in NiTi: Why theMEAM potential outperforms the EAM-FS potential, Computational Materials Sci-ence 134, 145-152 (2017).
1. P. Srinivasan, L. Nicola, B.J. Thijsse, A. Simone, Molecular dynamics simulationsof the two-way shape-memory effect in NiTi nanowires, MRS Symposium Proceed-ings 1782, 35-40 (2015).
115