Understanding low achievement in English Schools
64
i Understanding low achievement in English Schools Geeta Kingdon and Robert Cassen Contents 1. Introduction............................................................................................................... 5 2. The data .................................................................................................................... 6 3. The role of pupil background ..................................................................................... 9 3.1 Ethnicity ................................................................................................................... 10 3.2 Gender ...................................................................................................................... 17 4. Role of sorting into schools, LAs and neighbourhoods, and measuring school value- added ...................................................................................................................... 20 4.1 Role of sorting into schools, LAs and neighbourhoods ........................................... 20 4.2 Explaining school value-added ................................................................................ 23 5. The effect of school resources .................................................................................. 26 6. Conclusions............................................................................................................. 30 References ...................................................................................................................... 33 CASE/118 Centre for Analysis of Social Exclusion June 2007 London School of Economics Houghton Street London WC2A 2AE CASE enquiries – tel: 020 7955 6679
-
Upload
khangminh22 -
Category
Documents
-
view
0 -
download
0
Transcript of Understanding low achievement in English Schools

i
Understanding low achievement in English Schools
Geeta Kingdon and Robert Cassen Contents 1. Introduction...............................................................................................................5 2. The data ....................................................................................................................6 3. The role of pupil background .....................................................................................9
3.1 Ethnicity...................................................................................................................10 3.2 Gender......................................................................................................................17
4. Role of sorting into schools, LAs and neighbourhoods, and measuring school value-added ......................................................................................................................20
4.1 Role of sorting into schools, LAs and neighbourhoods...........................................20 4.2 Explaining school value-added ................................................................................23
5. The effect of school resources ..................................................................................26 6. Conclusions.............................................................................................................30 References......................................................................................................................33 CASE/118 Centre for Analysis of Social Exclusion June 2007 London School of Economics Houghton Street London WC2A 2AE CASE enquiries – tel: 020 7955 6679

ii
Centre for Analysis of Social Exclusion The ESRC Research Centre for Analysis of Social Exclusion (CASE) was established in October 1997 with funding from the Economic and Social Research Council. It is located within the Suntory and Toyota International Centres for Economics and Related Disciplines (STICERD) at the London School of Economics and Political Science, and benefits from support from STICERD. It is directed by Howard Glennerster, John Hills, Kathleen Kiernan, Julian Le Grand, Anne Power and Carol Propper. In addition to our discussion paper series (CASEpapers), we produce occasional summaries of our research in CASEbriefs, and reports from various conferences and activities in CASEreports. All these publications are available to download free from our website. Limited printed copies are available on request. For further information on the work of the Centre, please contact the Centre Manager, Jane Dickson, on:
Telephone: UK+20 7955 6679 Fax: UK+20 7955 6951 Email: [email protected] Web site: http://sticerd.lse.ac.uk/case
© Geeta Kingdon
Robert Cassen All rights reserved. Short sections of text, not to exceed two paragraphs, may be quoted without explicit permission provided that full credit, including © notice, is given to the source.

iii
Editorial Note
Geeta Kingdon is Research Fellow at the Department of Economics, University of Oxford. Robert Cassen is Professor Emeritus of Social Policy at the London School of Economics, and a CASE Associate. Corresponding author Geeta Kingdon ([email protected]). Acknowledgments
We are very grateful to the DFES and Anna Vignoles for providing various datasets for this project, to Kirsty McNay who worked for this project at an early stage and to Florencia Lopez Boo for providing excellent research assistance. We are also grateful to members of the Project Advisory Group, including William Atkinson, Audrey Brown, Leon Feinstein, Martin Johnson, John Mattick, Hilary Steedman and Alison Wolf. James Turner of the Sutton Trust and Helen Barnard of the Joseph Rowntree Foundation also served as valuable members of the Advisory Group. We are indebted to seminar participants at the Institute of Education, London University; Institute of Fiscal Studies, and CASE at LSE for helpful comments on this work. In particular, we are grateful to Becky Allen, Simon Burgess, David Ewens, Steve Gibbons, Howard Glennerster, John Hills, Graham Hobbs, Ramesh Kapadia, Joanne Lukes, Ian McCallum, Steve Machin, Anna Vignoles and Anne West. Finally, we are grateful to Jane Dickson, Gillian Coates and Rose Page for providing administrative support on this project. The project was funded by grants from the Joseph Rowntree Foundation and the Sutton Trust.

iv
Abstract
Tens of thousands of young people leave school with no or very few qualifications in England. This paper seeks to build a fuller picture of Key Stage 4 low achievement and its correlates than available hitherto. We focus on three aspects. Firstly, the role of students’ personal characteristics, especially gender, ethnicity and past achievement, in explaining the incidence of low achievement at age 16. Secondly, we investigate the extent to which particular personal characteristics constitute direct risk factors for low achievement and the extent to which they lead to low achievement because of their correlation with unobserved school and neighborhood quality, i.e. the role of sorting into schools and neighborhoods of different quality. We suggest a method of calculating school quality (how effective a school is in helping its pupils to avoid low achievement) which is akin to the value-added concept, and examine which specific observed school characteristics predict this measure of ‘school quality’. Thirdly, the paper examines the relationship between school resources – particularly per pupil expenditure – and the avoidance of low achievement, exploiting the panel nature of the National Pupil Database. Going beyond simple discrete choice models, the paper employs school fixed effects regression to reduce endogeneity problems and employs panel data at the student level to analyse school resource effects. A number of interesting findings emerge about the correlates of low achievement and of school quality, and we consider the policy implications of our findings. JEL classification: I21, I28 Keywords: Low achievement, school fixed effects, panel data, school resources, England

5
1. Introduction
The purpose of this paper is to advance understanding of the factors associated with low achievement at Key Stage 4 in England. We seek to do this in three dimensions. Firstly, we analyse the (conditional) correlation of low achievement with risk factors on which data are available. Secondly, we analyse the role played by school quality in explaining students’ chances of low achievement. Lastly, we investigate whether and to what extent school resources affect chances of low achievement1. The first part of the paper examines the relationship of KS4 low achievement on the one hand and both exogenous and endogenous characteristics of students. Gender, ethnicity and (to some extent) first language are exogenous as they are immutable and typically not chosen. Less exogenous characteristics are free school meal (FSM) status, special education need (SEN), mover-status, neighbourhood characteristics and past achievement. While the correlations established here may not be interpreted as causal2, conditional correlations are informative in building a fuller picture of low achievement. We focus mainly on the exogenous variables – gender and ethnicity. We address several questions in relation to ethnicity. Firstly, is the relationship between ethnicity and achievement symmetrical with the relationship between ethnicity and the incidence of low achievement? Secondly, is economic disadvantage an equally large risk factor for low achievement among pupils of all ethnicities? Thirdly, does the way in which ethnicity is related to low achievement vary by peer group, i.e. whether the size of ethnic minority students’ achievement disadvantage (or advantage) over the White British students depends on the peer group. Lastly we ask whether the relationship between ethnicity and incidence of low achievement changes with age. We ask similar questions for gender. The second part of the paper focuses on the role of student sorting into schools, and the role of school quality, in explaining low achievement. Within-school analysis is used to identify whether and to what extent certain risk factors for low achievement (such as FSM or SEN) act via sorting into particular schools rather than only directly. The marginal effect on the dummy variable for each school (known as the ‘school fixed effect’), estimated from a fixed effects probit equation of low achievement, may be interpreted (without necessarily implying causation) as the total ‘effect’ of a school on its students’ chances of low achievement, after controlling for pupil intake, i.e. 1 A less technical summary of the findings of the current paper, with more descriptive statistics,
is published in Cassen and Kingdon (2007). 2 For instance, SEN status could conceivably be jointly determined with low achievement for
some students (i.e. causality may run from low achievement to SEN) or it could be that both SEN and low achievement are driven by some unobserved characteristics of the student or their household, such as poor parenting or poor health endowment. In this case, the cross-section correlation between SEN and low achievement does not necessarily reflect causation from SEN to low achievement. Similarly for mover status, neighbourhood (which may be chosen by the household on the basis of unobserved traits such as taste for good education and thus proximity to particular schools), and perhaps to a lesser extent FSM status.

6
after controlling for student characteristics, as well as for past achievement of the students. It is essentially a measure of school value-added and may be interpreted as a measure of a school’s effectiveness in helping its pupils to avoid low achievement. In this sense it may be regarded as a measure of school quality. We regress the school fixed effect (school value-added) on observed school characteristics to examine which specific observed school factors are associated with school ‘quality’. This also permits us to quantify what proportion of the variation in school ‘quality’ can be explained by measured school characteristics. Introduction of LA dummies helps us to see what proportion of school quality differences are due to LAs. The third and last part of the paper attempts to examine the relationship between school resources and students’ chances of low achievement using pupil level panel data. This is possible because we have both pupils’ marks and their school’s characteristics at two points in time, 2001 and 2003 (Key stages 3 and 4). Pupil fixed effects estimation effectively regresses change in a student’s low achievement status over time on the change in school resources over the same time period and, as such, it nets out the effect of any (time-invariant) student unobservables such as ability, motivation, ambition etc. Thus, it provides a powerful way of purging the effect of unobserved student characteristics that otherwise undermine the ability to interpret school resource effects, though other sources of bias remain which we attempt to address using an instrumental variables strategy.
2. The data
The data used are the Pupil Level Annual School Census (or PLASC) matched with information on students’ achievement at Key Stages 2, 3 and 4 (years 1998, 2001 and 2003) and also matched with data on schools, LAs, and 2001 census data on super output area deprivation indices. While information on student achievement and on school characteristics is available at two points in time, unfortunately, data on student characteristics are available only at one point in time, in 2003, when the student is aged 16. The variables used in the analysis are defined in Appendix Table 1 and their descriptive statistics are presented in Appendix Table 2. We considered four different measures of low achievement at Key Stage 4 (KS4). The percentage of students who were low achievers by these four measures in 2003 was as shown in Table D1: ‘nopass’ 5.5%; ‘nopass_em’ 8.6%; NOT5EM 13.4%; and NOPASS>D 25.2%. Table D1 also shows another commonly used measure of low achievement, namely not getting at least 5 passes at grades A*-C (49.4%).

7
Table D1: Percentage of students in low achievement, by alternative definition of low achievement
Measure of low achievement at Key Stage 4 i.e. at GCSE level, age 16
Percentage low achievers by this measure in England
in 2003 (%) No passes in any subject (NOPASS) 5.5 No pass in at least one of English or Maths (NOPASS_EM) 8.6 Not at least 5 subjects including English and Maths (NOT5EM)
13.4
No pass at a grade better than D (NOPASS>D) 25.2 Not at least 5 passes at grades A*-C 49.4
Data on past achievement at age 11 – an important control variable – are missing for about 13% of KS4 takers. Since our equations are fitted on the sub-sample of only those for whom prior achievement at age 11 is available, it is useful to consider the effect of sample selectivity on the estimated marginal effects. Unfortunately, we do not have credible identifying exclusion restrictions with which to correct for the selectivity bias, i.e. we do not have variables which affect the chances of having missing achievement for age 11 but do not affect the chances of being a low achiever at age 16. However, it is possible to sign the selectivity bias, which will downward bias coefficients towards zero3. To our knowledge, no study has considered the impact of missing past achievement on statistical analysis of achievement. Missing past achievement implies that studies using past achievement as a control variable (for ability, for example) are necessarily confined to analysing just the sub-sample of those Key Stage 4 students for whom prior achievement at Key Stage 2 is available. In Appendix Table 3, we analyse the student characteristics associated with missing past achievement. For a fuller analysis of this issue, see Kingdon (2007). The dependent variable of interest is low achievement. Since this measure is inherently a binary one (low achiever or not), we use the binary probit model for analysis. In order to estimate such an equation, the dependent variable should take the value of 1 for a sufficiently large proportion of the sample – typically 10% or more of the sample. Of the four measures of low achievement which we considered, only one gives a sufficiently large sample of low achievers to permit discrete choice analysis: 3 For instance, consider the coefficient on FSM. Appendix Table 3 shows the binary probit of
whether prior achievement is missing and shows that FSM raises probability of having missing achievement at KS2. If student motivation is positively related to having non-missing prior achievement (as is likely since absence is an important reason for missing the test), then FSM students with non-missing prior achievement must be more motivated than the average FSM students. Thus, in the sample on which the low achievement equation is fitted, FSM is positively correlated with lowachKS4 and its coefficient will be downward biased since it picks up the negative effect of motivation on lowachKS4.

8
“no passes > D” (NOPASS>D) which, after observations with missing values are excluded, takes a value of 1 for 17.1% of the population of KS4 takers. The variable ‘not at least 5 passes including English and Maths’ (NOT5EM) takes a value of 1 for just 6.3% of KS4 takers. Consequently, this paper focuses only on the NOPASS>D measure of low achievement, though we also present results of the NOT5EM measure in some tables. One thing it is useful to establish at the outset, by means of descriptive analysis, is whether the unconditional relationship between any given risk factor and low achievement is simply the opposite of the relationship of that risk factor with achievement. To see this, we estimated kernel densities of total point score at KS4 for different groups, to see the distribution of KS4 achievement by FSM status, gender and ethnic group. The one for FSM is shown in Figure 1. It is clear that the FSM non-FSM difference in achievement is much larger at the lower end of the distribution of achievement than in the rest of the distribution. Similarly, the densities by gender and ethnic group (later in the paper) show that gender and ethnicity difference in achievement at the low end of the distribution of achievement differ from those in the rest of the distribution. These clear asymmetries imply that one cannot merely look at the relationship between these risk factors and achievement in order to infer their relationship with the likelihood of low achievement. The way in which they are related to chances of low achievement will differ from the way they are related to achievement taken as a whole. Figure 1: Kernel density of standardized total points score at KS4, by FSM status
FSM
sco
re
stdpoints
FSM score Not FSM score
-2 0 2 4 6
0
.2
.4

9
3. The role of pupil background
Table 1 examines the basic relationship between the probability of being a low achiever at Key Stage 4, (defined as having no passes above grade D, or ‘NOPASS>D’) on the one hand, and pupils’ personal and neighbourhood characteristics and ability, on the other. Ability is measured by prior achievement at Key Stage 2. The first column shows the familiar importance of a number of personal characteristics – gender, within-year age (number of months above 15th birthday), moving school, abnormal start (non-September start) at school, ethnicity, SEN, and FSM status – in explaining low achievement. Even so, these characteristics together explain only less than 11% of the variation in the probability of low achievement, unsurprising since no information is available on parental background and the home educational environment, and since the measure for economic status (FSM) is crude. The addition of neighbourhood variables in column 2 raises explanatory power substantially to about 15% and the marginal effects have the expected signs and are very statistically significant. The neighbourhood is defined as the census Super Output Area of the child’s residence. As there are on average 400 addresses per Super Output Area in England, this represents a small geographical unit and furnishes a versatile indicator of a child’s circumstances. Finally, the last column is a value-added equation. Adding student ability – as measured by achievement point scores at Key Stage 2 – doubles explained variation from 15% to about 30%. We also include a dummy variable for low reading achievement (obtaining Level 3 or less) at KS2 since the qualitative literature emphasises its importance for later achievement. Low reading achievement at age 11 is about half as important a risk factor for low achievement at age 16 as FSM status, suggesting that early attention on reading can avert or powerfully ameliorate later achievement disadvantage. We have chosen low reading achievement at age 11 as against other components of English (choosing writing scores gave similar results) or indeed low achievement in other subjects (maths or science) because, as shown in Appendix 4, after controlling for overall achievement (average point score) at Key Stage 2, prior low achievement in Reading at age 11 is a more important predictor of low achievement at age 16 than either prior low achievement in English as a whole or prior low achievement in maths or science4. Table 2 is structured in a similar fashion but the dependent variable there is ‘not at least 5 passes including English and maths’ (NOT5EM)5. The results are qualitatively similar in Tables 1 and 2 except the effect of gender, which is discussed in more detail
4 Indeed low KS2 achievement in science is curiously associated with smaller chances of low
achievement at age 16. 5 We have not included an indicator for ‘English is not the child’s first language’. This is
because when we include it, it enters with a large and statistically powerful perverse (negative) sign, suggesting that it picks up the effect of ethnicity with which it is strongly correlated.

10
in the gender section below. We now examine the roles of ethnicity and gender in more detail. 3.1 Ethnicity We address several questions. Firstly, is the relationship between ethnicity and achievement symmetrical with the relationship between ethnicity and the incidence of low achievement? Secondly, is economic disadvantage an equally large risk factor for low achievement among pupils of all ethnicities? Thirdly, does the way in which ethnicity is related to low achievement vary by peer group, i.e. whether the size of ethnic minority students’ achievement disadvantage (or advantage) over White British students depends on the peer group. Lastly we ask whether the relationship between ethnicity and incidence of low achievement changes with age. Symmetry with findings for achievement It is not inevitable that the relationship between ethnicity and incidence of low achievement will be the opposite of the relationship between ethnicity and achievement, since ethnicity and indeed other factors could have a greater (or lesser) association with achievement at the bottom of the distribution than across the rest of the distribution of achievement. Figure 2 shows kernel densities of Key Stage 4 total point score for three ethnicities – White British, Indian and Black Caribbean. It shows that while the White distribution dominates the Black Caribbean distribution over most the range of achievement, the raw achievement advantage of White students over the Caribbeans is much smaller at the bottom end of distribution. Similarly, the Indian achievement advantage over White students is greater nearer the bottom one third of the achievement distribution than in the top half. Thus, in raw achievement data, there is clear asymmetry: the relative performance of the different ethnic groups vis a vis each other at the bottom end of the achievement distribution (which is what we are concerned with in this paper) differs from that at the middle or the top of the distribution. But what happens to ethnic differences after controlling for background? To see this we compare the raw ethnicity gaps in the incidence of NOPASS>D with the standardized ethnicity gaps i.e. after standardizing for pupils’ social and economic background. Table D2 shows that 17.3% of White British students had NOPASS>D. Black Caribbean students are 6 percentage points more likely to have NOPASS>D than the white British students (23.3% rather than 17.3%). However, when we control for economic and social background in column 2 of Table 1a, this 6 point disadvantage disappears and indeed becomes a nearly 1 point advantage, suggesting that when we compare equally economically and socially placed Black Caribbeans and White British, the Caribbean students are no more likely to be low achievers than the Whites. Similarly, compared with the White British low achievement rate of 17.3%, only 12.5% of Black Africans and 14.3% of Bangladeshis had NOPASS>D. Thus, the raw advantage of Black Africans and Bangladeshis over the White British was equal to 4.8 and 3.0 percentage points respectively. When FSM and SEN status and neighbourhood characteristics etc. are controlled (column 2, Table 1a), the advantage of Bangladeshis and Black Africans over White British students increases

11
from 4.8 and 3.0 points to 8.3 and 8.5 points respectively. Bangladeshis and Black Africans have higher FSM rates and live in more deprived communities; when we take into account their greater socio-economic deprivation in a regression context, their true advantage over the White British becomes visible, and it is large.
Figure 2: Distribution of Key Stage 4 standardized total points score, by ethnic group
stdpoints
White British score Indian score Black Caribbean score
-2 0 2 4
0
.2
.4
.6
The results in Tables 1a and 1b show that controlling for other factors, all ethnic minority (except traveller group) students’ chances of low achievement are significantly lower than those of the majority White group. Even Black Caribbean students’ ceteris paribus chances of low achievement are significantly smaller than those of the white students. This is different to the findings for achievement and thus confirms what we saw in Figure 2 namely that the relationship between ethnicity and achievement is not always symmetrical with the relationship between ethnicity and the incidence of low achievement. Previous research finds that children of Black Caribbean, other Black and Pakistani ethnicities have significantly lower achievement scores than white pupils (Wilson, Burgess and Briggs, 2005, Table 6). Bradley and Taylor (2004) using 1990s data find that Afro-Caribbeans perform significantly worse than the white group at KS4. Modood (2003; 2005) finds that Black Caribbean, Pakistani and Bangladeshi children underperform relative to White students.

12
Table D2: Percentage of students with NOPASS>D, by ethnic group
% NOPASS>D White British
Race % NOPASS>D By Ethnic Group
White British – ethnic group
difference 0.173 Bangladeshi 0.143 0.030 0.173 Indian 0.074 0.099 0.173 Pakistani 0.166 0.007 0.173 Asian other 0.088 0.085 0.173 Black African 0.125 0.048 0.173 Black Caribbean 0.233 -0.060 0.173 Black other 0.256 -0.083 0.173 Chinese 0.035 0.138 0.173 Mixed ethnicity 0.153 0.020 0.173 Race missing 0.195 -0.022 0.173 White British 0.173 0.000 0.173 White traveller 0.273 -0.100 0.173 White other 0.120 0.053
The best way to test the symmetry issue is to estimate an OLS equation of achievement score as well as a binary probit equation of low achievement on the same sample of students using the same identical specification. Table D3 shows such equations and shows that results for incidence of low achievement differ from the results for achievement. While Black Caribbean and Black other students have significantly lower achievement scores that white British students (column 1), their chances of being ‘low achievers’ i.e. of getting no passes above grade D are no different to those of white students. Indeed, when we control for pupils’ prior achievement at age 11 (a proxy for ability), Black Caribbean students’ chances of low achievement are significantly lower than white British students’ (last column, Table 1a). The findings on low achievement concur with Wilson et al’s (2005) results for pupils’ progress in achievement between ages 11 and 16: when we control for pupils’ prior achievement at age 11 in column 3 of Table 1a, all ethnic minority groups are more successful than white pupils in avoiding low achievement. The ethnic advantage is about 7-8 percentage points in the case of all non-white groups other than Black Caribbeans and Black other heritage, for whom the advantage over white pupils is smaller. A similar story emerges from Table 1b where the dependent variable is NOT5EM.

13
Table D3: Relationship of ethnicity with achievement and with incidence of low achievement at Key Stage 4, 2003
OLS equation of achievement(total points score)
Binary probit of Low achievement (NOPASS > D)
coefficient Robust t Marginal effect Robust t Bangladeshi 7.376 11.2 -0.085 -11.4 Indian 6.297 19.7 -0.084 -17.0 Pakistani 3.456 9.2 -0.056 -10.6 Asian other 7.421 12.0 -0.077 -8.1 Black African 5.898 14.4 -0.083 -12.3 Black Caribbean -1.716 -5.8 -0.008 -1.5 Black other -2.006 -4.0 0.008 0.8 Chinese 13.307 26.1 -0.116 -11.9 Mixed ethnicity 3.367 11.7 -0.034 -6.6 Ethnicity missing -1.550 -4.8 0.014 3.2 White traveller -3.410 -2.7 0.071 2.6 White other 4.180 9.6 -0.053 -8.2 Personal variables yes yes Output area variables yes yes N 463,594 463,594
Is the effect of economic disadvantage similar for all ethnic groups? Table D4 presents the percentage of students with NOPASS>D by FSM status. It shows that 35.1% of FSM students but only 14.8% of non-FSM students were low achievers, thus the overall FSM non-FSM difference in the incidence of low achievement was 20.3 percentage points. This is of course driven by the majority group, the White British, for whom the FSM non-FSM difference is a very large 25.1 percentage points. The corresponding difference is very considerably smaller for other ethnic groups. For instance, the FSM non-FSM difference in the incidence of low achievement is only 1.8 points for Bangladeshis, 8 points for Black Caribbeans, 0 points for Chinese and 7.1 points for Black Africans. What happens when we control for socio-economic background and prior achievement at age 11? To see this we interacted ethnicity with FSM in Table 2a. For white British students, the FSM non-FSM gap falls from a raw gap of 25.1 points to a standardized gap of 6.8 points. For Black Caribbeans, it falls from a raw gap of 8.0 points to a standardized gap of 2.6 points (0.068 – 0.042). While for White British pupils, FSM increases the probability of NOPASS>D by 6.8 percentage points, FSM is a smaller risk factor for pupils of all other ethnicities. For instance, among black Caribbean pupils, FSM increases the probability of NOPASS>D by only 2.6 points and among Bangladeshis by just 1.3 points. Thus, almost all ethnic minorities weather economic disadvantage much better than do the White British; poor ethnic minority

14
students are significantly less susceptible to low achievement than poor white British students. One explanation for this finding may be that FSM may mean different things for ethnic minorities from what it means for white families. For example, Hobbs and Vignoles (2007) point out that among whites and blacks, FSM is more associated with single parenthood than among Asians. It might also be that the perceived stigma of being FSM is lower for ethnic minorities since a higher proportion of them have FSM status than the White British.
Table D4: Percentage of students with NOPASS>D, by FSM status
FSM Non-FSM Difference Bangladeshi 0.150 0.132 0.018 Indian 0.140 0.066 0.074 Pakistani 0.217 0.134 0.083 Asian other 0.164 0.071 0.093 Black African 0.171 0.100 0.071 Black Caribbean 0.292 0.212 0.080 Black other 0.350 0.219 0.132 Chinese 0.039 0.034 0.004 Mixed ethnicity 0.318 0.117 0.201 Race missing 0.353 0.175 0.179 White British 0.401 0.150 0.251 White traveller 0.444 0.231 0.213 White other 0.238 0.101 0.136 Total 0.351 0.148 0.203
Similarly, Table 2b shows that low reading achievement at age 11 is a significantly smaller risk factor for most ethnic groups compared with the white British group. Thus, ethnic minority groups are less susceptible to low achievement than whites on account of both economic disadvantage and early reading disadvantage. Does the effect of ethnicity change with age? Table 4 shows binary probit equations of low achievement at ages 11, 14 and 16. Since 17 percent of the sample are low achievers at KS4, we have taken the bottom 17 percentile of achievers according to total marks at Key Stage 2 and Key Stage 3 to be ‘low achiever’6. Thus, the mean of the dependent variable is 0.17 in all three equations in Table 4. The top panel presents results without the ‘First language is not English’ 6 The bottom 17th percentile of total mark (english, maths, science) were used instead of the
average point score at KS2 and KS3 since the APS variable is not as continuous as the total mark variable. For instance, APS at KS2 takes only 24 different values (from 15 to 39).

15
dummy variable and the bottom panel with it. At age 11, the probability of low achievement is significantly higher for most ethnic groups compared to the White British (the exceptions are Chinese and mixed ethnicity students) and this ethnic disadvantage is particularly large for Pakistani, Bangladeshi and Black other students. However, a large part of this disadvantage is due to language: in the bottom panel where we control for first language, these disadvantages fall greatly or turn into ethnic advantages, and those with English not as their first language are 5.7 percentage points more likely to be low achievers than their opposite numbers. By age 14, the disadvantage becomes smaller for several ethnic groups (but not for Black Caribbeans and Black other) and turns into a positive advantage for Indians and Asian other, and language is roughly only half as important as a determinant of low achievement as it was at age 11. By age 16, however, having English as first language is no advantage at all. Indeed the sign is negative, indicating that having English as first language makes one more likely to be a low achiever. Clearly by this age, it represents not the effect of language but probably of ethnicity, with which it is highly correlated. The top panel of Table 4 shows that between Key Stages 3 and 4, there is dramatic improvement in the position of all ethnicities relative to White British, except for the traveller and missing ethnicity groups. Bangladeshis, for instance, improve their position relative to the White group by 16.7 percentage points, a huge increase given that the low achiever rate is 17%. The corresponding improvement for Pakistanis is 15.5 points, for Indians 11.1 points, for Black Africans 14.7 points, and for Black Caribbeans 10.2 points. Thus, the story is one of progressively lower disadvantage of ethnic minorities vis à vis the white group when moving from age 11 to 14, and of a transformation from achievement disadvantage to an achievement advantage vis à vis the White group when moving from age 14 to 16. These findings for low achievement are similar to those in Wilson, Burgess and Briggs (2005) who investigate the relationship between ethnicity and achievement. There are various potential explanations for the improvement of the position of minorities relative to the White group over time and, more generally, for the fact that ethnic minorities weather economic disadvantage and early reading disadvantage significantly better than Whites. While ‘first language not English’ is a risk factor for low achievement, its effect is strong only at the younger ages and wanes with age. While economic disadvantage may be a factor, our estimations control for it by inclusion of FSM, a crude proxy for socio-economic status (although we have that only at age 16 and its inclusion in all equations in Table 6 supposes that FSM status did not change over time). Two other potential explanations have been suggested in the literature – the importance of Asian values which emphasize education and encourage social mobility (Modood, 2005) and the ‘immigrant paradigm’ (Winder, 2004) which suggests that immigrants devote themselves more to the acquisition of knowledge than the native population as they lack financial capital. The latter explanation could be tested if we had data on the number of years since the student’s family emigrated from its home country. Wilson, Burgess and Briggs (2005) believe

16
that the fact that much improvement in ethnic achievement occurs in the run up to the high-stakes KS4 exams lends support to the explanation that Asians may be more aspirational and seeking to get on in the professions. One potential but untested explanation for the ethnic minority advantage could be that minorities have a higher rate of taking GNVQs than White British students. We first examined the incidence of low achievement by GNVQ taking. Table 4a shows that the percentage of students with NOPASS>D is 27% for GCSE-only takers but only 20% for GNVQ takers. In other words, GCSE-only takers were 7 percentage points more likely to be low achievers than GNVQ takers for the sample as a whole (though the gap is larger for most minority ethnicities). If the more academically able students do not systematically sort into GNVQ-taking, then the better achievement of GNVQ takers could be because it is easier to get good grades in GNVQ than in GCSE qualifications. Secondly, we asked whether ethnic minority groups are more likely to take the GNVQ qualifications than White British students. Table 4a shows that most minority ethnicity pupils are indeed more likely to take GNVQs than White British pupils. While 21% of White British students took one or more GNVQs, the corresponding figure for Indians was 26%, Pakistanis 30%, Bangladeshis 32%, Black African 24% and Black Caribbean 25%. Thus, one explanation for ethnic minorities’ smaller incidence of low achievement than the White British could be their higher rate of taking GNVQs where the rate of passing with grades better than D is higher. Another explanation for ethnic minorities’ advantage could be that they take easier subjects than the White group but this is not supported by the data: rates of taking different subjects do not differ significantly by ethnicity. Yet another explanation could be that minority groups are better at coursework skills. This is potentially testable by asking whether white achievement levels declined more than minority students’ achievement levels when GCSE by coursework was introduced in the late 1990s. If it did then this would be similar to Machin and McNally’s (2004) finding for gender. One final potential explanation for the ethnic advantage we consider is that ethnic minority youth may not imbibe any detrimental influences from mainstream media as much as White youth because they may take others of their own ethnic group as their relevant comparators and not the predominantly white characters portrayed on mainstream TV/radio. To test whether ethnicity is a relevant source of identity in forming academic comparator groups, we examined whether a student’s probability of low achievement is better related to the average achievement of others of their own ethnicity within the Super Output Area (and LA) than to the average achievement of all others in their Super Output Area (and LA). The results in Table 2c show that ethnicity is an important source of identity within both the output area and the LA: a student’s achievement is positively and significantly related to own ethnicity group’s mean achievement in the output area or LA, and unrelated to mean achievement of all KS4 takers in the output area or LA. Thus, ethnicity is a relevant source of identity for forming academic comparator groups. This phenomenon may insulate ethnic minority students from any detrimental effects of the media but its disadvantage is that equally

17
it prevents less well performing ethnic groups to learn from the better performing groups. Does the effect of ethnicity differ by peer group Table 5 investigates the effect of peer groups and finds that being in a poor peer group (whether an economically poor peer group or an academically badly performing peer group) does not affect the different ethnicities differentially. We first created two peer group variables: ‘Poorest 20% of schools by %FSM pupils’ and ‘Worst performing 20% of schools by %NOPASS>D’. The first column of table 5 interacts ‘Poorest 20% of schools’ with ethnicity dummies and the second column interacts ‘Worst performing 20% of schools’ with ethnicity dummies. The size of the ethnic advantage is generally unchanged when the peer-group is really poor, barring a few exceptions. For instance, Indians and ‘ethnicity missing’ students weather economically disadvantaged peer groups better than do the White British. A student’s FSM eligibility itself is a significantly smaller risk factor for low achievement when the percentage of FSM students in her peer group is high. The first column in Table 5 shows that a FSM student is 7.3 percentage points more likely to be a low achiever than a non-FSM student but that within the poorest 20% of schools (where percentage of FSM students is high), a FSM student is only 4.6 points more likely to be a low achiever than a non-FSM student. There are two potential explanations of this result. Firstly, if FSM status demotivates a person due to perceived stigma, then it could be that one’s own FSM status has a less depressing effect on motivation when a high proportion of others in one’s school are also FSM students. Thus, position vis à vis others in one’s school seems to matter to achievement. The second explanation is that the differing effect of FSM by peer group could be the effect of endogenous selectivity, but this does not hold because it is unlikely that more motivated or more able FSM students are systematically selecting into high FSM schools. 3.2 Gender It is well known that girls outperform boys not just in England but also in other countries, as seen from the PISA. The relative underperformance of boys is a matter of serious concern. Machin and McNally (2005) show that the gender gap problem has become worse over time in the UK even though overall achievement for both boys and girls has improved. One question we ask is whether the gender gap is substantially different at the low end of the achievement distribution than in the rest of the distribution of achievement, and whether the gender gap differs equally for different measures of low achievement. We also ask whether the gender gap in the chances of low achievement varies by ethnicity and by age. Descriptive statistics show that the incidence of low achievement varies strongly by gender, irrespective of the measure of low achievement used. Table 1 shows that boys are about 6 percentage points more likely to have NOPASS>D than girls of the same personal and neighbourhood characteristics. However, boys’ disadvantage is
18
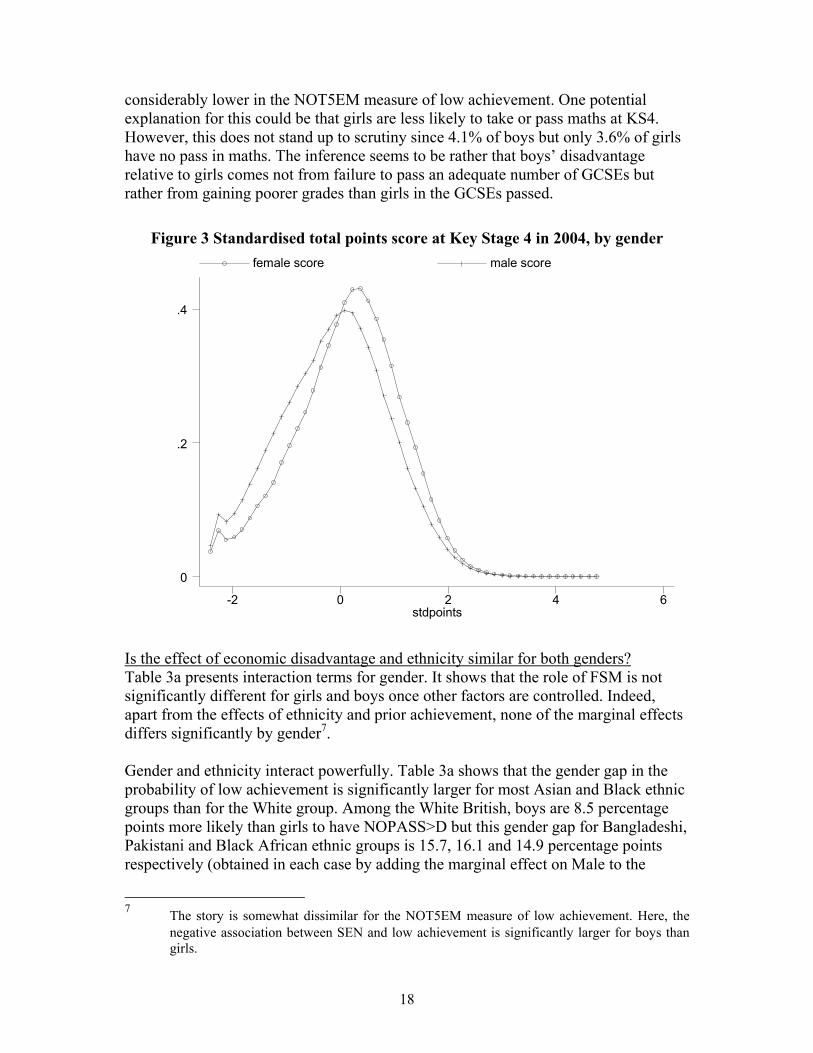
considerably lower in the NOT5EM measure of low achievement. One potential explanation for this could be that girls are less likely to take or pass maths at KS4. However, this does not stand up to scrutiny since 4.1% of boys but only 3.6% of girls have no pass in maths. The inference seems to be rather that boys’ disadvantage relative to girls comes not from failure to pass an adequate number of GCSEs but rather from gaining poorer grades than girls in the GCSEs passed.
Figure 3 Standardised total points score at Key Stage 4 in 2004, by gender
stdpoints
female score male score
-2 0 2 4 6
0
.2
.4
Is the effect of economic disadvantage and ethnicity similar for both genders? Table 3a presents interaction terms for gender. It shows that the role of FSM is not significantly different for girls and boys once other factors are controlled. Indeed, apart from the effects of ethnicity and prior achievement, none of the marginal effects differs significantly by gender7. Gender and ethnicity interact powerfully. Table 3a shows that the gender gap in the probability of low achievement is significantly larger for most Asian and Black ethnic groups than for the White group. Among the White British, boys are 8.5 percentage points more likely than girls to have NOPASS>D but this gender gap for Bangladeshi, Pakistani and Black African ethnic groups is 15.7, 16.1 and 14.9 percentage points respectively (obtained in each case by adding the marginal effect on Male to the
7 The story is somewhat dissimilar for the NOT5EM measure of low achievement. Here, the
negative association between SEN and low achievement is significantly larger for boys than girls.

19
marginal effect on the interaction term Male*ethnicity dummy). However, this does not carry through to the NOT5EM measure of low achievement in Table 3b. Here, except for Pakistani and Black Caribbean children, the gender gap is not larger for ethnic minorities than for Whites. This says that while minority ethnicity girls are very substantially better than minority ethnicity boys at avoiding NOPASS>D, they are not so differentially advantaged in terms of avoiding NOT5EM. Gender also interacts with past achievement. Higher achievement at age 11 reduces the chances of low achievement at age 16 very slightly more for boys than girls (by 0.1 percentage points; 0.033 for boys and 0.032 for girls). Low reading achievement at age 11 increase a girl’s chances of being a low achiever at age 16 by 3.1 points but a boys’ by 2.4 percentage points. Prior low achievement in reading is less of a risk factor for boys and they recover from it somewhat better than do girls. Symmetry with findings for achievement Is the association of gender and low achievement symmetrical with the association of gender and achievement? By standardized total points score, the raw achievement advantage of girls over boys at KS4 is 0.24 SDs. When we estimate an OLS equation of standardized points score with the same specification as for low achievement (not reported), we find that conditional on other factors girls’ achievement advantage over boys falls to 0.20 SD. Since mean of total point score at KS4 is 44.2 and SD 18.9, a 0.2 SD disadvantage for boys is equal to 3.8 score points, which is equal to 9% of overall mean achievement. Boys’ disadvantage vis à vis girls in terms of low achievement status is considerably larger. Table 1a shows that boys are 6.7 points more likely to be low achievers than girls. This is equal to 39% of the mean of the dependent variable (17.1). In other words, taking the distribution of achievement as a whole, boys’ disadvantage vis à vis girls is smaller than when looking at the bottom part of the distribution of achievement. This is borne out in Figure 3 which shows that at about 2 SDs below mean achievement, boys’ disadvantage is much larger than at 2 SDs above the mean, and more generally boys’ disadvantage is greater in the bottom half of the distribution than in the top half. Does the effect of gender change with age? Table 4 shows that boys’ disadvantage vis à vis girls in terms of low achievement (being in the bottom 17 percentiles of achievement) emerges only at age 16. At ages 11 and 14, boys have no higher probability of being low achievers than girls. This finding for low achievement is similar to that for achievement by Wilson, Burgess and Briggs (2005). They find that while boys have no strong advantage or disadvantage vis à vis girls in achievement at either age 11 or 14, by age 16 they have a substantial disadvantage of 0.19 SD. The findings in Table 4 are also consistent with Table 1 which shows that the gender gap does not change much when we control for past achievement. This suggests that policy has to address problems at secondary school as well and cannot rely solely on focusing remedies at primary school age.

20
Does the role of gender differ by peer group Table 5 shows that boys’ disadvantage vis à vis girls is not significantly different in high-FSM schools compared with that in all schools, according to the NOPASS>D measure. Thus, having a disadvantaged peer group does not hurt boys more than it hurts girls. Similarly, being in a worse performing peer group does not affect boys differently from the way it affects girls. The interaction of ‘worst performing 20% of schools’ with male is statistically insignificant and the marginal effect is also very small. The addition of school variables (equation not shown) does not alter the marginal effect on gender much either in the NOPASS>D equation or the Not5em equation, though since the gender effect is so precisely estimated, even a tiny change in the marginal effect is statistically significant. This suggests that school quality does not differentially affect girls and boys. However, we can include only the observed school quality measures. It may be that unobserved ways in which schools treat boys and girls differently do matter for achievement8. Overall our findings for gender suggest that explanations for the gender gap in achievement at age 16 cannot be found in the experience of girls and boys in the primary school years. Our findings suggest that boys are not more affected than girls by adverse circumstances such as being in economically disadvantaged peer groups, though there is some suggestion that SEN boys have higher chances of being low achievers by the NOT5EM measure than SEN girls. Other explanations in the literature for achievement could not be tested for low achievement here. Thomas Dee (2005) finds that in the US, girls’ achievement benefits from having female teachers and boys’ from having male teachers. It is not known whether this effect operates here and we do not have data on the percentage of teachers in secondary school that are male. This would be an interesting line of research. Machin and McNally (2005) find that the change in gender gap at age 16 coincided exactly with the introduction of GCSE examinations which require coursework. This suggests that the assessment system rewards skills which girls are better at.
4. Role of sorting into schools, LAs and neighbourhoods, and measuring school value-added
4.1 Role of sorting into schools, LAs and neighbourhoods Any given characteristic can act on a student’s chances of low achievement either directly or because it makes a student more likely to attend poorer quality schools/LAs, or both. It is of interest to understand to what extent the total effect of any given risk factor is a direct effect and to what extent an indirect effect working via 8 E.g. at the primary school level both the National Literacy and National Numeracy strategies
have had a differential impact (on achievement) by gender (Machin and McNally, 2005).

21
sorting into good or bad schools/LAs. To distinguish these two channels, we estimate school fixed effects and LA fixed effects equations. These permit within-school (and within LA) analysis which we can compare with across-school (and across LA) analysis. If the within-school effect of a variable differs from its across-school effect, this suggests that its coefficient in the across school equation is biased because it is capturing the effect of school unobserved characteristics, with which the variable is correlated. For instance, the detrimental effect of FSM on probability of low achievement at KS4 may be over-estimated if FSM acts on low achievement not directly but mostly by making a student more likely to attend worse quality schools. Adding LA fixed effects (results not shown) did not increase the pseudo R-square of the low achievement equations for NOPASS>D or NOT5EM. Moreover, the marginal effects of most of the variables did not change statistically significantly due to the inclusion of LA fixed effects. Sorting into schools While there are only 149 LAs, there are more than 3000 secondary schools in England. STATA cannot handle fixed effects probits of that size. This is a commonly encountered problem and it has become standard to use the familiar OLS (called linear probability model or LPM) with discrete 0/1 dependent variables9. LPM permits estimation of school fixed effects and also other statistical procedures. However, while use of the LPM is expedient, it is not unproblematic: the marginal effects of several variables in a LPM differ significantly from those in the probit model in across school analysis10. We found that LIMDEP now permits estimation of fixed effects probits with up to 20000 groups. Consequently we have used that to estimate our school fixed effects model of low achievement. Table 6a presents the across- and within-school models of low achievement (NOPASS>D). It shows that the marginal effects of several variables change significantly when moving from across-school (OLS) to within-school (fixed effects) estimation. For example, FSM status acts on low achievement partly via making a child more likely to attend worse quality schools. The marginal effect of FSM in the first column is 0.9 percentage points higher than in the second column and the difference is statistically significant. This 0.9 point change ceteris paribus is small compared with when FSM is the only included variable, when the change is equal to 5 percentage points. While these results support the notion that FSM students attend worse quality schools, as found in Burgess and Briggs (2006), only about 6% (0.009/0.142) of the association between FSM and low achievement is due to FSM
9 E.g. see Machin, McNally and Meghir (2006) whose dependent variable is whether a child
‘achieves level 5 or above in Key Stage 3 exams’ or not; also Burgess and Briggs (2006) whose dependent variable is whether a school is ‘high quality or not’.
10 Appendix Table 5 shows that the marginal effects of several variables in a probit model differ significantly from the coefficients in a LPM and that this continues when we compare marginal effects from a fixed effects probit to those from a fixed effects OLS (LPM) of low achievement.

22
students attending worse quality schools; the bulk of the effect of FSM is the direct effect of being in FSM status. The change in marginal effects is larger for other risk factors. Within school the marginal effect of non-statemented SEN is 11.3 percentage points but across schools it is 14.2 percentage points. Thus, about 20% of the total association between SEN and low achievement is due to SEN being associated with attendance at poorer quality schools. The changes in the marginal effects of ethnicity are economically very large in size. For instance, the marginal effect on Bangladeshi ethnicity changes from -0.076 to -0.127 and for the Chinese it nearly doubles from -0.083 to -0.157. The changes are also large for Indian, Pakistani, Asian other and black African ethnic groups. This suggests that part of the reason for low achievement among children from these ethnic groups is that they tend to attend significantly worse quality schools than the white British students. These results are somewhat at odds with those in Burgess and Briggs (2006, p21) who find that children from minority ethnic backgrounds tend to attend better schools than white students, i.e. they are significantly more likely to attend schools in the top tercile of the distribution of schools by ‘proportion of takers in the school with ≥5A*-C grades’. The marginal effects of neighbourhood variables also change when moving from across to within school estimation in Table 6a. The detrimental effect of ‘Percentage of adults without any qualifications’ and of ‘Percentage of single parent homes’ in the student’s census Super Output Area both are larger across schools than within school. Coming from such a neighbourhood raises the chances of low achievement but its effect works partly via children from such neighbourhoods being more likely to attend lower quality schools. The pseudo R-square at the bottom of Table 6a increases from 29.7% to 33.8%. A chi square test based on the likelihood ratios shows that the school fixed effects are jointly highly significant at the 0.001 percent level. These findings further suggest that schools do make a difference to students’ low achievement status, i.e. school quality matters. Sorting into neighbourhoods What is the role of sorting into particular neighbourhoods? Different neighbourhoods have different characteristics such as public amenities, opportunities for youth activities, crime rates , unemployment rates, community environment, etc. and all of these could affect child learning outcomes. While we have already included some of these community characteristics (census output area variables), data are not available on all of these and thus they are unobserved and in the error term of the low achievement equation. People often choose to live in particular localities not only on the basis of locality characteristics but also on the basis of their own goals/preferences. Families with a higher taste for good quality education may move to neighbourhoods with better schools or with better peers. If such taste and

23
preferences are or unobserved community characteristics are systematically correlated with included student characteristics such as ethnicity or FSM, then the marginal effects of these characteristics on the probability of low achievement will be biased due to their correlation with unobserved traits, which are in the error term of the equation. We estimate a neighbourhood fixed effects equation to help us to get closer to the true causal effect of particular characteristics, purged of the confounding effect of locality amenities, community environment, and preferences with which a characteristic may be correlated. There are about 143,000 census super output areas in England. Thus, an output area fixed effects probit equation is not possible with any existing statistical package. Table 6b shows neighbourhood fixed effects OLS equations of low achievement estimated using output area fixed effects. When the effect of neighbourhood is taken out i.e. when estimation is within neighbourhood, the marginal effect of FSM falls and that of ethnicity increases, as in the school fixed effects equation. In other words, economically disadvantaged students are more likely to be low achievers than non-disadvantaged students not only because of their economic disadvantage per se but also because they are more likely to be living in poorer quality neighbourhoods, e.g. where the educational environment is not salubrious. Similarly, ethnic minorities’ advantage over the White British group is far bigger within neighbourhoods than across, suggesting they live in considerably poorer quality neighbourhoods than the White British. However, somewhat surprisingly, the marginal effects of SEN and mover status become bigger in second column. As this is an OLS rather than a probit equation, some caution is warranted in interpreting these results. 4.2 Explaining school value-added Having estimated the school fixed effect, it is of interest to ask whether and how much measured school characteristics explain it. The school fixed effect (FE) is the coefficient on a dummy variable for the school in the student-level equation of low achievement. As such, it is the total ‘effect’ of a school on the probability of low achievement, after controlling for the background characteristics of the school’s pupils. It is a measure of everything about the school that matters to the avoidance of low achievement. Since our dependent variable is probability of low achievement, the school fixed effect is a measure of the opposite of school quality and might be thought of as school ‘disquality’. Figures 4 and 5 show the kernel density of the school FE calculated without and with prior achievement in the low achievement equation, and they show that the school FE is normally distributed. We regress this measure of (the opposite of) school quality on measured school characteristics and the results are presented in Table 6c. This shows that about 41% of total school disquality is explained by observed school characteristics (first column) when disquality is measured from the NOPASS>D equation without control for student ability. When we use school disquality estimated from an equation that includes student ability (which is akin to a value-added measure), the proportion of explained variation in school quality (column 2) falls to about half – only 23%. More than 75% of what makes schools effective is not

24
observed/measured. Results from the NOT5EM equation were weaker – only less than 20% of school disquality is explained by observed school characteristics. These small proportions of explained variation highlight the importance of unmeasured factors such as school processes, head-teacher leadership, school ethos, etc. The results in Table 6c are themselves interesting too, though clearly they establish only correlations and not causation. School resources are associated with school quality: higher per pupil expenditure is associated with lower school disquality (i.e. with higher school quality) and when we include pupil teacher ratio instead of per pupil expenditure (results not shown), it comes in with a positive and significant coefficient. The composition of the student body is also related to overall school quality. A poorer student body (higher proportion of FSM students) lowers school quality. A higher percentage of abnormal starters (those who started their current school in a month other than September) is associated with higher school quality and this may reflect that higher quality schools attract those wishing to move from other (presumably less good) schools. The ethnic composition of the school has only a weak association with school quality. Grammar schools are strongly higher quality than non-Grammar schools in terms of helping their students to avoid low achievement. Voluntary aided schools are of better quality than community schools which is the base school governance category. Specialist schools are of higher quality than non-specialist and schools in Special Measures are – understandably – of sharply lower quality. Schools which have adopted various policy initiatives (other than leadership incentive grant schools) are higher quality schools, which is encouraging news from the point of view of this crude impact evaluation. The positive association of these schools with school quality is unlikely to represent the effect of endogeneity or omitted variable bias since, if anything, these schools have are in disadvantaged areas or are for disadvantaged students. The final column of Table 6c presents a binary probit equation of a school ‘being in the best 10% of schools’ i.e. having the lowest 10 percent of the school fixed effects. Schools with higher per pupil expenditure, greater proportion of non-September starters, Grammar schools, Voluntary aided schools, Specialist schools and schools with several of the policy initiatives are significantly more likely to be in the top 10% of schools in terms of helping their students to avoid low achievement. Tables 6d and 6e show the school and LA codes of the top 1 percent of schools by our measure of school quality.

25
Figure 4: Kernel density of School Fixed Effect estimated from binary probit of Nopass>D (without prior achievement)
Figure 5: Kernel density of School Fixed Effect estimated from binary probit of
Nopass>D (with prior achievement)
26
5. The effect of school resources
Whether resources matter in addressing low achievement is a question of considerable policy interest in education because school resources are arguably more policy amenable than the home environment (economically and educationally). Whether additional resources can improve the learning outcomes of the ‘hard to reach’ students whose achievement levels are low and whose numbers are sizeable in England, is an important question. Whether school inputs matter is controversial. Hanushek (2003) produces evidence from nearly 400 estimates of the ‘achievement production function’ to show that school resources do not consistently raise achievement levels. However, his meta-analysis is criticized by Krueger (2003) on the basis of faulty methodology. In the international literature, a randomized experiment study for the US by Krueger (1999), a discontinuity design study for Israel by Angrist and Lavy (1999) and an achievement production function study for South Africa by Case and Deaton (1999) each find that class-size does matter to student achievement when the researcher carefully addresses various potential sources of bias. In the UK there is also some evidence on the effect of pupil teacher ratios (PTR) on student achievement but a mixed picture emerges. For instance, Bradley and Taylor (1998) find that PTR has no effect on the level of exam performance at age 16, though change in PTR does have a very small effect on change in exam performance. Dearden, Ferri and Meghir (2002) and Feinstein and Symons (1999) find that PTR has no impact on educational qualifications. Levacic, Jenkins, Vignoles, Steele and Allen (2005) find that while teacher pupil ratio and per pupil expenditure both raise student achievement, the effects are small and subject specific. Graddy and Stevens (2006) using a dataset of private schools in UK find that PTR has a consistent negative effect on examination results at age 18. We ask the question whether resources matter to the incidence of low achievement, for both our measures of low achievement – NOPASS>D and NOT5EM. In addition, we are interested particularly to ask whether school resources matter differentially for different gender, economic and ethnic groups. Obstacles to identifying causal effects of resources There are two main obstacles to identifying the effects of school resources such as per pupil expenditure (PPEXP). Firstly, omitted variable bias. Suppose ability, motivation and ambition matter to achievement and for the sake of simplicity we refer to them as simply ‘ability’. If more able students systematically choose schools with higher resources and if they are also less likely to be low achievers, then in an equation of low achievement, the (anticipated negative) coefficient on PPEXP will suffer from downward bias, i.e. the estimated coefficient on PPEXP will be a bigger negative than the true causal coefficient. This ‘ability bias’ problem arises because ability is omitted, i.e. it is in the error term. A similar problem of omitted variable bias arises if schools deliberately give low ability students higher resources. In this case, ability is

27
negatively correlated to PPEXP and any negative impact of PPEXP on the probability of low achievement will be upward biased towards zero, i.e. it will be a smaller negative than the true causal effect of PPEXP. Which of these two opposing biases dominates, i.e. whether net omitted variable bias is upward or downward, is an empirical question. The second obstacle to identifying the causal effect of school resources on the probability of low achievement is simultaneity bias. If resources are allocated to schools in a compensatory fashion, i.e. if schools with a higher proportion of low achievers receive larger resources, then this positive correlation will undermine the ability to measure any true negative impact of resources on the probability of low achievement. That is, the (anticipated negative) coefficient on PPEXP, for example, will be a smaller negative than the true causal coefficient. Strategy for addressing endogeneity We use pupil fixed effects estimation to net out the effect of ability (dealing with omitted variable bias), and will use instrumental variable estimation to address simultaneity bias and any measurement error bias. It was possible to construct a pupil level panel data by using information on two waves of student achievement data: in 2001 (at Key Stage 3) and again on the same students in 2003 (at Key Stage 4). We matched that with school- and LA-level resourcing variables and also constructed peer-group variables at the school level, e.g. percentage of students of particular ethnicities in the school, percentage of FSM students in the school etc. Since data on the same students is available at two points in time, the only reason why a student’s peer group (by ethnicity, gender, FSM etc) can change over time is due to movers. About 5% of students moved between Key Stages 3 and 4. Among pupils for whom data on past achievement is available, 17% had no passes above grade D at KS4 in 2003. We define these as ‘low achievers’ in 2003. To create a matching low achievement variable for 2001, we take those as low achievers who were in the bottom 17th percentile of the distribution of total marks at Key Stage 3. Pupil fixed effects is a powerful way of dealing with the effects of student and school unobservable factors. It differences out time-invariant ability and school quality. Since no existing statistical package can handle a pupil fixed effects probit model with more than 400,000 groups, we use the linear (OLS) model. Table 7a presents the first set of results. PPEXP, adjusted for area cost of living differences, comes in with a tiny and statistically insignificant negative coefficient in the OLS equation of the first column. Percentage of students with FSM and SEN both increase the probability of low achievement substantially. When we use pupil Fixed Effects estimation instead of OLS in the next column, the identification of effects relies entirely on the way in which a change in PPEXP affects change in low achievement status. The Pupil FE equation powerfully controls for all the time-invariant unobserved characteristics of students and schools. The fact that the negative coefficient on PPEXP becomes statistically significantly larger in pupil FE than in OLS regression (t-value of difference in the coefficients is 4.3) is consistent with the

28
story that schools allocate resources in a compensatory fashion, i.e. devote more resources to less able students. Thus, even if there is selection by able students into the higher PPEXP schools, the upward biasing effect of that is more than counteracted by the schools’ compensatory allocation policies. Table 7b first column includes variables percentage of ethnicity minority students in the school and this reduces the coefficient on PPEXP somewhat. This size of effect implies that increasing per pupil expenditure by £1000 from its mean level would reduce the incidence of low achievement by 1.2 percentage points. Given that 17% of students are low achievers at Key Stage 4 (NOPASS>D), this is a very small reduction in low achievement incidence for a large implied increase in expenditure. However, as we show later when discussing Table 7d, the effect of PPEXP is much larger for certain student groups and it would not be a high return activity to increase PPEXP uniformly across the board. One final source of bias is simultaneity bias. If schools with higher proportions of low achievers are given higher resources, this positive correlation between low achievement and PPEXP undermines the ability to identify the otherwise causal negative relationship between PPEXP and low achievement. That is, the coefficient on PPEXP (-0.012) is biased towards zero because of the positive feedback effect from low achievement to PPEXP. In order to address this issue (and also the issue of any attenuating measurement error bias which is exacerbated in panel data models), we use two stage least squares estimation in the context of pupil fixed effects. The middle column of Table 7b presents the results and it shows that the coefficient on PPEXP does indeed become a bigger negative (-0.032) with 2SLS estimation. The identifying instruments used for school PPEXP were indicators of the political party in control of the LA lagged by three years as well as the school’s full time equivalent students lagged by 2 years, i.e. using the longest lags available in our dataset. The first stage pupil fixed effects equation of per pupil expenditure (last column of Table 7b) shows that the identifying instruments are statistically very significant in explaining PPEXP. Under the maintained hypothesis of the exogeneity of our instruments, the size of effect of resources is modest. It implies that a £1000 increase in per pupil expenditure would reduce the probability of low achievement by 3.2 percentage points. A 1 SD increase in PPEXP (1 SD = £530 in year 2003) reduces the probability of low achievement by 1.7 percentage point. A £120 increase in PPEXP – which is equal to the extra money given per pupil to schools that participate in the ‘Excellence in Cities’ policy initiative, for instance – reduces the incidence of low achievement by 0.4 percentage points (coefficient -0.033 x 0.12 = -0.004)11. We believe, a priori, that our instruments for school resources are exogenous since the party in control of the LA lagged by 3 years is decided in elections in which low achievement of secondary students is unlikely to be the only voting issue and because school size of two years previous should not affect current student achievement except through being positively correlated with current school resources. Table 7c last 11 We use 0.120 rather than 120 since PPEXP in the equation is divided by 1000.

29
column presents a reduced form pupil fixed effects equation of low achievement and it shows that the instruments affect the incidence of low achievement. Compared with the omitted category (other party or no party in overall control), Conservative and Labour party control are both associated with a significantly greater likelihood of low achievement, though the detrimental effect of Conservative party is 67% larger and the difference is statistically significant. The first two columns present the same equation with each of the endogenous variables (PPEXP and PTR) included. For the instruments to be valid, they must not affect the chances of low achievement other than through their effect on the endogenous variable. However, we see that party in control of the LA (even lagged by 3 years) does exert a direct effect on NOPASS>D even after the inclusion of PPEXP and PTR. This could be because party control can affects student achievement not only via increasing school resources but also through institutional policy changes that may affect teacher incentives, for instance. Since the test of overidentifying restrictions is not passed, we cannot pronounce the estimated effect of PPEXP in the second column of Table 7b as the true causal effect. What we can say is that the coefficient on PPEXP of -0.012 in the first column of Table 7b is likely downward biased towards zero both due to simultaneity bias and measurement error bias and that instrumentation ought to (and does) raise it to a bigger negative. Though we cannot be confident about how big the true effect is, we can take -0.012 as the lower bound estimate of the causal effect of PPEXP on the probability of low achievement. We also examined the effect of pupil teacher ratio (PTR) on student achievement and find that our instruments are again not accepted as valid which is unsurprising, given the results of Table 7c. The effect of class size is very small. We do not report the full equations for PTR. The existence of a resource effect from per pupil expenditure is consistent with the findings in Machin, McNally and Meghir (2006) who use a propensity score matching technique for identification of causal effects of school resources given as part of the Excellence in Cities and associated programmes. It is also consistent with findings in Levacic et. al. (2005) who use a similar IV strategy in the context of cross-section data. Their IV effects from PPEXP to KS3 achievement are smaller than ours for low achievement at KS4. It may be that resources are more effective at the lower end of the achievement distribution than overall. However, Levacic found small effects from PTR as well which we do not, for most student groups. Reducing low achievement by means of resource increases is not cheap: a 3.2 point reduction in the low achievement rate (e.g. from the mean of 17% to 14% NOPASS>D) will require PPEXP to increase by 32% if the intervention is applied to all students12. Of course it may not make sense to apply it equally across all students if certain groups profit more from increased resources than others. 12 Mean PPEXP in 2003 was £3117, an increase of £1000 reduces low achievement incidence
by 3.2 percentage points and 1000/3317 = 32% of mean PPEXP.

30
Table 7d shows the impact of PPEXP and PTR on achievement separately for different groups. The second column, which gives lower bound estimates of the impact of PTR, shows that reducing pupil teacher ratios would have only tiny effects on incidence of low achievement, though as we have said, these are lower bound estimates. The first column of Table 7d gives lower bound estimates of the effect of per pupil expenditure, taken from the pupil FE equation of low achievement without correction for simultaneity or measurement error bias (i.e. without instrumentation). It shows important differences between groups in terms of the extent to which their chances of low achievement respond to additional resources. The low achievement status of students with some description of disadvantage (FSM and SEN) is generally much more amenable to remedy via increased resources than of their opposite numbers. For instance, among FSM students, an increase of PPEXP by £1000 reduces chances of low achievement by 4.9 percentage points and this is a lower bound estimate, while for non-FSM students the effect is small (only 0.9 percentage points) though even that is statistically significantly different from a zero effect. The fact that disadvantaged groups profit more from resources is clearly good news. White students’ low achievement status is far less responsive to increased resources than that of ethnic minority groups. Resources matter twice as much to girls as to boys. If this boy-girl difference is due to differences in motivation levels by gender and if the White non-White difference is also due to differential motivation by ethnicity, then it could be said that extra resources benefit students with higher motivation levels. This of course has the disappointing implication that male and White low achievers are ‘harder to reach’, at least by means of resource based policies. There are two clear policy messages. Firstly, increased resources can reduce the incidence of low achievement, particularly for those from economically disadvantaged backgrounds and with Special Education Needs. Secondly, low achieving white students, the majority group, constitute the ‘hard to reach’ whose academic disadvantage is less addressable by input based policy interventions.
6. Conclusions
Tens of thousands of young people leave school with no or very few qualifications in England. This wide-ranging paper has sought to build a fuller picture of low achievement and its correlates than available hitherto. We have focused on three aspects. Firstly, we examined the role of students’ personal characteristics, especially gender, ethnicity and past achievement, in explaining the incidence of low achievement. Secondly, we investigated the extent to which particular personal characteristics constituted direct risk factors for low achievement and the extent to which they led to low achievement because of their correlation with unobserved school and neighborhood quality, i.e. the role of sorting into schools and neighborhoods of different quality. We also suggested a method of calculating school quality which is akin to the value-added concept of school quality, and examined

31
which specific observed school characteristics predicted this measure of ‘school quality’. Thirdly, the paper examined the relationship between school resources – particularly per pupil expenditure – and the avoidance of low achievement, exploiting the panel nature of the National Pupil Database. While we go well beyond descriptive statistics and simple regressions, the analysis here does not necessarily establish causality, and much of the analysis is about correlations and not about effects (despite the use of the econometric term ‘marginal effect’). We employ school fixed effects regression to reduce endogeneity problems and utilize panel data at the student level to analyse school resource effects. We have a number of interesting findings. Firstly, we find that the way in which student characteristics are related to achievement in the lower part of the distribution of achievement often differs from the way they are related to achievement in the remainder of the distribution of achievement. This asymmetry means that one cannot infer the relationship between a given factor and low achievement from knowing the relationship between that factor and achievement. Secondly, we have a number of interesting findings in relation to ethnicity. Controlling for observed personal, home background and neighborhood characteristics and for ability, most ethnic minority group students including Black Caribbeans have significantly smaller chances of being low achievers (NOPASS>D) than White British students. Ethnic minority students also weather economic disadvantage better than White British students in the sense that being in receipt of free school meals is a significantly lesser risk factor for low achievement for them. While belonging to an ethnic minority is associated with greater chances of being a low achiever at age 11 (largely due to first language not being English), by age 16 this language and ethnic disadvantage is powerfully reversed. It appears that ethnic minority students choose others of their own ethnicity as their academic comparator groups and thus may apply different standards and work ethics and be more insulated from external influences than their White counterparts who follow mainstream mores and study habits. Thirdly, the way in which most personal and background factors are associated with the chances of low achievement does not vary much by gender. However, we have two interesting findings on gender in relation to low achievement. Gender interacts powerfully with ethnicity. The gender gap in the chances of being a low achiever is far greater for the ethnic minorities than it is for the White British. Also, the gender gap in likelihood of being a low achiever emerges only at age 16, with the policy implication that remedies for ameliorating the gender gap in achievement need to address what happens in secondary school between ages 14 and 16 and not only at fixing problems in primary school attainment. Fourthly, we find that sorting of students into low and high quality schools and neighbourhoods plays an important part in explaining low achievement. In particular, characteristics such as ethnic minority status, special education needs status and free school meal status affect the chances of being in low achievement partly via making
32
such students more likely to attend worse quality schools. We devised a way of calculating school quality which is akin to a value-added measure and showed how school characteristics on which we have data are associated with this measure of school value-added (in terms of schools helping their students to avoid low achievement). The expected correlations are found with per pupil expenditure and grammar school and voluntary status. Interestingly, various school policy initiatives are associated with higher school quality, which is encouraging news for education policy makers. Even so, the results suggest that our rich set of observed school characteristics explain only at best about 30% of school quality, suggesting that 70% of what makes a school high quality is unobserved, consisting perhaps of headmaster and teacher quality, school ethos, and school working practices and processes, factors on which no data are available. Fifthly, we find that higher per pupil expenditure reduces the chances of low achievement by a small amount but that the size of the effect is larger for certain groups of students. In particular, girls, ethnic minority students and students with some description of disadvantage (such as FSM or SEN) benefit much more from increased school resources than their opposite numbers. This suggests that targeted resource increases can help to reduce the incidence of low achievement but it also implies that some hard-to-reach groups’ low achievement status may not be amenable to remedy through increased school resources.

33
References
Angrist, J. and V. Lavy (1999) ‘Using Maimonides' Rule to Estimate the Effect of Class Size on Scholastic Achievement’, Quarterly Journal of Economics 114:2, pp. 533-75.
Bradley, S. and J. Taylor (2004) ‘Ethnicity, educational attainment and the transition from school’, Manchester School, University of Manchester, 72:3, pp. 317-346, 06.
Burgess, S. and Briggs, A. (2006) ‘School Assignment, School Choice and Social Mobility’, CMPO Working Paper 157, CMPO, University of Bristol.
Case, A. and A. Deaton (1999) ‘School Inputs and Educational Outcomes in South Africa’, Quarterly Journal of Economics 114:3, pp. 1047-84.
Cassen, R. and G. Kingdon (2007) Tackling Low Educational Achievement, Joseph Rowntree Foundation Report.
Dearden, L., J. Ferri and C. Meghir (2002) ‘The effect of school quality on educational attainment and wages’, Review of Economics and Statistics 84, pp. 1-20.
Dee, T. (2005) ‘Teachers and the Gender Gaps in Student Achievement’, NBER Working Paper No. W11660, Cambridge MA: National Bureau of Economic Research.
Feinstein, L. and J. Symons (1999) ‘Attainment in secondary school’, Oxford Economic Papers 51, pp. 300–21.
Graddy, K. and M. Stevens (2006) ‘The Impact of School Inputs on Student Performance: An Empirical Study of Private Schools in the United Kingdom’, Economics Series Working Papers 146, University of Oxford: Department of Economics.
Hanushek, E. (2003) ‘Improving the quality of schools: The failure of input-based policies’, Economic Journal, 113: 485, pp 64-98.
Hobbs, G. and A. Vignoles (2007) ‘Is Free School Meal Status a Valid Proxy for Socio-Economic Status (in Schools Research)?’ Centre for Economics of Education Discussion Paper No. 84, CEE, London School of Economics.
Kingdon, G. (2007) ‘Analysing patterns of missing prior achievement in the National Pupil Database’, mimeo, University of Oxford.
Krueger, A. (1999) ‘Experimental Estimates of Education Production Functions’, Quarterly Journal of Economics 114:2, pp. 497-532.
Krueger, A. (2003) ‘Economic considerations and class size’, Economic Journal 113:485, pp. F34-63.
Levacic, R., A. Jenkins, A.Vignoles, Steele and Allen (2005) ‘Estimating the Relationship between School Resources and Pupil Attainment at GCSE’, Research Report RR 727, London: DfES.

34
Machin, S. and S. McNally (2004) ‘The literacy hour’, CEE Discussion Paper 0043, London: LSE, Centre for the Economics of Education.
Machin, S. and S. McNally (2005) ‘Gender and student achievement in English schools’, Oxford Review Of Economic Policy, 21:3, pp. 357-372.
Machin, S., S. McNally and C. Meghir (2006) ‘Resources and standards in urban schools’, London: UCL.
Modood, T. (2003) ‘Ethnic Differentials in Educational Performance’. in Mason, D. (ed.), Explaining Ethnic Differences: Changing Patterns of Disadvantage in Britain. Bristol; The Policy Press.
Modood, T. (2005) ‘The educational attainments of ethnic minorities in Britain’, in G. Loury, T. Modood and S. Teles (eds.), Ethnicity, Social Mobility, and Public Policy, Cambridge: Cambridge University Press, pp. 288-308.
Wilson, D., S. Burgess and A. Briggs (2005) ‘The dynamics of school attainment of England’s ethnic minorities’, CMPO Working Paper No. 05/130, Bristol: Centre for Market and Public Organisation.
Winder, R. (2004), Bloody Foreigners: The Story of Immigration to Britain, London: Abacus.

35
Table 1a: Binary probit of ‘Nopass >D”
Personal variables Plus output area
variables Plus prior
achievement ME Robust-t ME Robust-t ME Robust-t Male 0.064 38.0 0.067 43.9 0.055 47.0 Age at start 02-03 -0.002 -10.4 -0.002 -12.7 0.002 17.0 SEN statement 0.279 42.0 0.279 43.0 0.076 16.4 SEN non-statement 0.335 101.1 0.314 97.4 0.142 56.4 FSM 0.188 69.1 0.097 46.1 0.056 33.8 Mover 0.099 10.7 0.096 13.1 0.076 13.3 Abnormal start 0.055 12.5 0.045 11.7 0.033 11.3 Ethnicity variables Bangladeshi -0.091 -12.5 -0.085 -11.4 -0.076 -14.7 Indian -0.095 -17.7 -0.084 -17.0 -0.075 -21.7 Pakistani -0.055 -10.4 -0.056 -10.6 -0.068 -20.2 Asian other -0.089 -9.3 -0.077 -8.1 -0.065 -9.9 Black African -0.088 -11.9 -0.083 -12.3 -0.071 -15.9 Black Caribbean 0.004 0.6 -0.008 -1.5 -0.025 -6.3 Black other 0.025 2.4 0.008 0.8 -0.011 -1.6 Chinese -0.126 -12.7 -0.116 -11.9 -0.083 -10.8 Mixed ethnicity -0.038 -6.8 -0.034 -6.6 -0.021 -5.0 Ethnicity missing 0.009 1.9 0.014 3.2 0.011 3.2 White traveller 0.067 2.5 0.071 2.6 0.043 2.0 White other -0.064 -8.4 -0.053 -8.2 -0.045 -8.4 Output area variables % ethnicity_black -0.032 -1.6 -0.022 -1.3 % ethnicity_asian -0.025 -2.5 -0.010 -1.3 % unemployed 0.414 11.1 0.247 8.0 % no qualifications 0.372 45.4 0.192 28.8 % lone parent families 0.168 25.3 0.107 19.6 Prior achievement Average point score KS2 -0.033 -140.1 Low reading ach. at KS2 0.026 20.3 N 463589 463589 463589 Pseudo R-sq 0.1113 0.1519 0.2972 Mean of dependent var 0.171 0.171 0.171
Note: ME is marginal effects. The t-values are based on standard errors that are corrected for clustering at the school level.
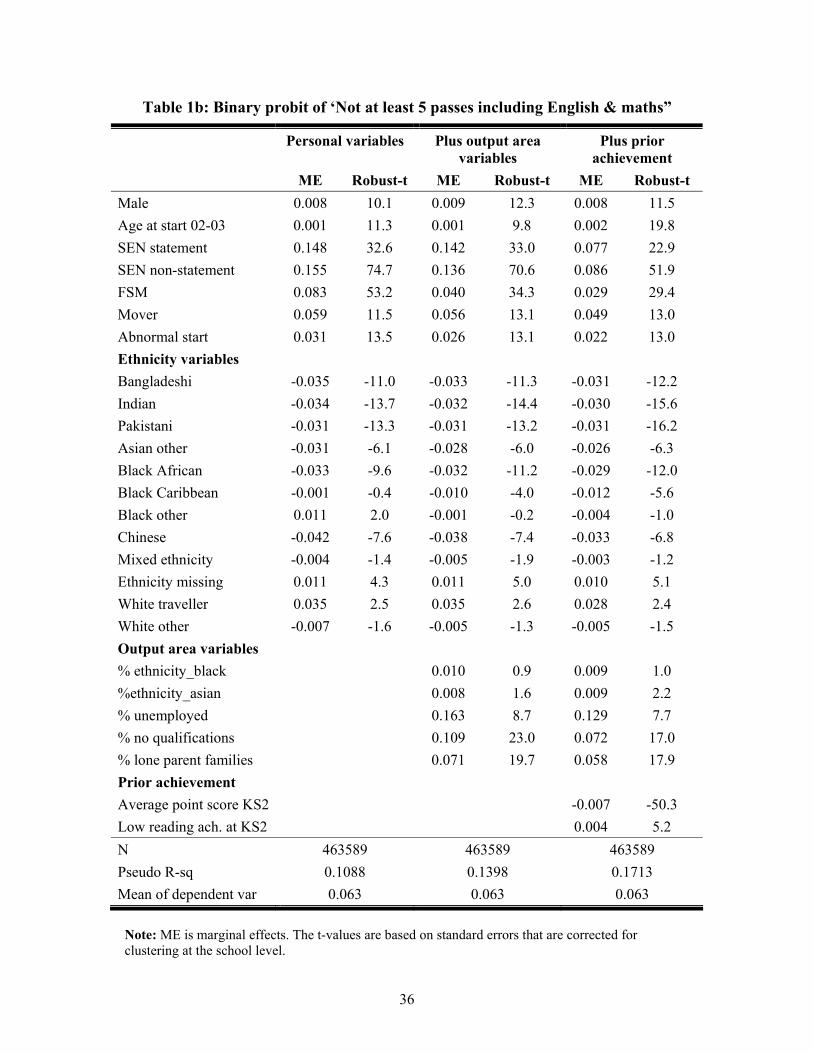
36
Table 1b: Binary probit of ‘Not at least 5 passes including English & maths”
Personal variables Plus output area
variables Plus prior
achievement ME Robust-t ME Robust-t ME Robust-t Male 0.008 10.1 0.009 12.3 0.008 11.5 Age at start 02-03 0.001 11.3 0.001 9.8 0.002 19.8 SEN statement 0.148 32.6 0.142 33.0 0.077 22.9 SEN non-statement 0.155 74.7 0.136 70.6 0.086 51.9 FSM 0.083 53.2 0.040 34.3 0.029 29.4 Mover 0.059 11.5 0.056 13.1 0.049 13.0 Abnormal start 0.031 13.5 0.026 13.1 0.022 13.0 Ethnicity variables Bangladeshi -0.035 -11.0 -0.033 -11.3 -0.031 -12.2 Indian -0.034 -13.7 -0.032 -14.4 -0.030 -15.6 Pakistani -0.031 -13.3 -0.031 -13.2 -0.031 -16.2 Asian other -0.031 -6.1 -0.028 -6.0 -0.026 -6.3 Black African -0.033 -9.6 -0.032 -11.2 -0.029 -12.0 Black Caribbean -0.001 -0.4 -0.010 -4.0 -0.012 -5.6 Black other 0.011 2.0 -0.001 -0.2 -0.004 -1.0 Chinese -0.042 -7.6 -0.038 -7.4 -0.033 -6.8 Mixed ethnicity -0.004 -1.4 -0.005 -1.9 -0.003 -1.2 Ethnicity missing 0.011 4.3 0.011 5.0 0.010 5.1 White traveller 0.035 2.5 0.035 2.6 0.028 2.4 White other -0.007 -1.6 -0.005 -1.3 -0.005 -1.5 Output area variables % ethnicity_black 0.010 0.9 0.009 1.0 %ethnicity_asian 0.008 1.6 0.009 2.2 % unemployed 0.163 8.7 0.129 7.7 % no qualifications 0.109 23.0 0.072 17.0 % lone parent families 0.071 19.7 0.058 17.9 Prior achievement Average point score KS2 -0.007 -50.3 Low reading ach. at KS2 0.004 5.2 N 463589 463589 463589 Pseudo R-sq 0.1088 0.1398 0.1713 Mean of dependent var 0.063 0.063 0.063
Note: ME is marginal effects. The t-values are based on standard errors that are corrected for clustering at the school level.

37
Table 2a: Binary probit model of low achievement, with interaction of ethnicity and FSM
No passes > D Not at least 5 passes including English and Maths
Marginal effect Robust-t Marginal effect Robust-t Bangladeshi -0.059 -7.1 -0.026 -6.5 Indian -0.074 -20.0 -0.029 -14.0 Pakistani -0.064 -16.0 -0.028 -12.0 Asian other -0.061 -7.6 -0.025 -5.1 Black African -0.064 -11.3 -0.025 -7.1 Black Caribbean -0.015 -3.0 -0.007 -2.6 Black other -0.007 -0.8 -0.001 -0.3 Chinese -0.077 -9.1 -0.030 -5.8 Mixed ethnicity -0.023 -4.8 -0.005 -1.7 Ethnicity missing 0.017 5.0 0.014 6.3 White traveller 0.053 2.1 0.028 1.9 White other -0.038 -7.5 -0.003 -0.8 FSM 0.068 36.8 0.034 30.7 FSM* Bangladeshi -0.055 -5.8 -0.018 -3.3 FSM* Indian -0.021 -2.1 -0.011 -1.9 FSM* Pakistani -0.030 -5.1 -0.015 -4.2 FSM* Asian other -0.039 -2.6 -0.008 -0.7 FSM* Black African -0.041 -4.5 -0.020 -3.3 FSM* Black Caribbean -0.042 -5.9 -0.017 -4.3 FSM* Black other -0.020 -1.6 -0.009 -1.2 FSM* Chinese -0.076 -3.3 -0.030 -2.0 FSM* Mixed ethnicity 0.003 0.3 0.005 0.9 ESM* Ethnicity missing -0.033 -6.9 -0.012 -5.1 FSM*White traveller -0.031 -0.8 -0.001 0.0 FSM*White other -0.044 -4.5 -0.012 -2.2 N 463,589 463,589 Pseudo R-square 0.2978 0.1718 Mean of dependent var 0.171 0.063 Individual level variables yes yes Output area variable yes yes Prior achievement yes yes Note: The estimated equation contained all variables as in the final column of Table 1 but also includes interaction terms between FSM and ethnicity dummies. The marginal effects of all variables are not reported.

38
Table 2b: Binary probit model of low achievement, with interaction of ethnicity and ‘Low Reading Achievement at KS2’ (LRA)
No passes > D Not at least 5 passes including English and Maths
Marginal effect Robust-t Marginal effect Robust-t Bangladeshi -0.073 -12.0 -0.030 -8.5 Indian -0.071 -17.4 -0.028 -12.6 Pakistani -0.067 -17.2 -0.031 -13.4 Asian other -0.062 -7.6 -0.023 -4.7 Black African -0.066 -11.4 -0.027 -8.4 Black Caribbean -0.020 -4.1 -0.012 -4.7 Black other 0.000 0.0 -0.003 -0.5 Chinese -0.078 -7.1 -0.032 -5.0 Mixed ethnicity -0.016 -3.3 0.000 0.0 Ethnicity missing 0.017 5.0 0.011 5.6 White traveller 0.032 1.3 0.016 1.1 White other -0.032 -5.6 -0.003 -0.9 Low Reading Ach at KS2 0.031 22.0 0.005 5.9 LRA* Bangladeshi -0.019 -2.2 -0.007 -1.0 LRA* Indian -0.021 -3.0 -0.011 -2.8 LRA* Pakistani -0.010 -1.6 -0.001 -0.2 LRA* Asian other -0.019 -1.2 -0.014 -1.5 LRA* Black African -0.027 -2.8 -0.015 -2.3 LRA* Black Caribbean -0.017 -2.3 0.001 0.2 LRA* Black other -0.028 -2.3 -0.003 -0.5 LRA* Chinese -0.033 -1.4 -0.010 -0.6 LRA* Mixed ethnicity -0.015 -1.7 -0.009 -1.8 LRA* Ethnicity missing -0.018 -4.7 -0.003 -1.1 LRA*White traveller 0.025 0.6 0.025 1.0 LRA*White other -0.044 -6.2 -0.006 -1.2 N 463,589 463,589 Pseudo R-square 0.2974 0.1714 Mean of dependent var 0.171 0.063 Individual level variables yes yes Output area variable yes yes Prior achievement yes yes
Note: The estimated equation contained all variables as in the final column of Table 1 but also includes interaction terms between ‘Low reading achievement at KS2’ and ethnicity dummies. The marginal effects of all variables are not reported.

39
Table 2c: Binary probit equation of NOPASS>D with mean NOPASS>D rate of other students in the output area or LA
Including mean low achievement rate of other
students of one’s own ethnicity in the Super Output
area
Including mean low achievement rate of other
students of one’s own ethnicity in the LA
Marginal effect Robust t Marginal effect Robust t Mean achievement of others of own ethnicity in output area 0.033 5.9 --- --- of all ethnicities in output area 0.004 0.8 --- --- of own ethnicity in LA 0.193 7.1 of all ethnicities in LA -0.002 0.0 Personal variables yes yes Ethnicity variables yes yes Output area variables yes yes Prior achievement yes yes N 378,723 463,427 Pseudo-sq 0.3034 0.2984 Mean dependent variable 0.173 0.171

40
Table 3a: Binary probit of ‘Nopass > D’, with gender interaction terms
Variables interacted with
MALE Marginal effect Robust-t Marginal effect Robust-t Male 0.085 7.8 Age at start 02-03 0.002 11.5 0.000 -0.5 SEN statement 0.070 7.5 0.006 0.6 SEN non-statement 0.143 39.5 -0.001 -0.3 FSM 0.059 26.5 -0.004 -1.7 Mover 0.081 12.7 -0.006 -1.4 Abnormal start 0.033 10.2 0.000 -0.1 Ethnicity variables Bangladeshi -0.084 -15.0 0.072 4.4 Indian -0.079 -16.7 0.023 2.5 Pakistani -0.080 -18.7 0.076 7.2 Asian other -0.069 -7.8 0.020 1.1 Black African -0.080 -12.1 0.064 3.7 Black Caribbean -0.035 -6.8 0.025 2.9 Black other -0.020 -2.1 0.019 1.3 Chinese -0.084 -7.2 0.016 0.5 Mixed ethnicity -0.021 -3.5 0.000 0.0 Ethnicity missing 0.009 2.2 0.003 0.7 White traveller 0.094 2.8 -0.055 -2.0 White other -0.046 -6.2 0.002 0.2 Output area variables % ethnicity_black -0.026 -1.3 0.011 0.5 %ethnicity_asian -0.011 -1.1 0.003 0.2 % unemployed 0.287 7.2 -0.078 -1.6 % no qualifications 0.191 21.9 0.001 0.1 % lone parent families 0.114 15.6 -0.014 -1.6 Prior achievement Average point score KS2 -0.032 -99.6 -0.001 -2.3 Low reading ach. at KS2 0.031 15.4 -0.007 -2.9 N 463,589 Pseudo R-sq 0.2977 Mean of dep var 0.171

41
Table 3b: Binary probit of ‘Not at least 5 passes incl. English and Maths’, with gender interaction terms
Variables interacted with
MALE Marginal effect Robust-t Marginal effect Robust-t Male 0.014 2.3 Age at start 02-03 0.002 13.3 0.000 0.0 SEN statement 0.059 9.9 0.012 2.5 SEN non-statement 0.080 34.3 0.004 2.4 FSM 0.030 22.2 -0.001 -0.5 Mover 0.049 11.6 -0.001 -0.3 Abnormal start 0.025 11.9 -0.003 -1.9 Ethnicity variables Bangladeshi -0.032 -9.2 0.012 1.4 Indian -0.029 -10.7 -0.001 -0.2 Pakistani -0.035 -13.0 0.040 4.8 Asian other -0.025 -3.8 -0.004 -0.4 Black African -0.031 -8.6 0.011 1.2 Black Caribbean -0.017 -5.9 0.016 3.0 Black other -0.007 -1.3 0.008 1.0 Chinese -0.032 -4.4 -0.003 -0.2 Mixed ethnicity 0.000 -0.1 -0.006 -1.2 Ethnicity missing 0.013 5.2 -0.004 -1.7 White traveller 0.021 1.3 0.011 0.5 White other -0.002 -0.4 -0.006 -1.2 Output area variables % ethnicity_black -0.001 -0.1 0.020 1.3 %ethnicity_asian 0.013 2.3 -0.008 -1.1 % unemployed 0.153 7.2 -0.048 -1.8 % no qualifications 0.072 13.2 0.001 0.1 % lone parent families 0.057 13.3 0.002 0.4 Prior achievement Average point score KS2 -0.006 -36.7 0.000 -1.2 Low reading ach. at KS2 0.003 2.3 0.002 1.3 N 463,589 Pseudo R-sq 0.1718 Mean of dep var 0.063

42
Table 4: Comparing determinants of low achievement at KS2, KS3 and KS4
Key Stage 2 Key Stage 3 Key Stage 4 Marginal
Effect Robust t Marginal
Effect Robust t Marginal
Effect Robust t
Panel A (excluding ‘First language not English’ variable) Male 0.003 1.6 -0.002 -1.1 0.051 29.4 SEN statement 0.357 52.0 0.252 33.0 0.344 49.7 SEN non-statement 0.312 97.8 0.249 71.6 0.385 105.9 FSM 0.126 53.9 0.124 45.1 0.214 72.9 Bangladeshi 0.073 8.9 0.080 6.7 -0.087 -11.4 Indian 0.032 6.0 0.013 1.8 -0.098 -18.6 Pakistani 0.123 20.0 0.098 12.4 -0.057 -9.7 Asian other 0.003 0.3 -0.006 -0.6 -0.090 -8.5 Black African 0.042 5.5 0.061 5.9 -0.086 -11.3 Black Caribbean 0.060 10.0 0.121 13.8 0.020 2.8 Black other 0.073 7.0 0.117 9.8 0.042 3.8 Chinese -0.048 -4.9 -0.069 -6.8 -0.130 -12.0 Mixed ethnicity -0.019 -3.2 -0.017 -2.7 -0.032 -5.8 Ethnicity missing 0.002 0.6 0.004 0.7 0.019 3.7 White traveller 0.041 1.7 0.043 1.7 0.085 3.4 White other -0.003 -0.4 0.010 1.1 -0.048 -5.3 N 463,589 433,717 463,589 Adj R-square 0.0740 0.0497 0.1231 Mean dependent variable 0.173 0.174 0.173

43
Table 4 (continued)
Key Stage 2 Key Stage 3 Key Stage 4 Marginal
Effect Robust t Marginal
Effect Robust t Marginal
Effect Robust t
Panel B (including ‘First language not English’ variable) Male 0.003 1.6 -0.002 -1.2 0.051 29.4 SEN statement 0.357 52.0 0.253 33.0 0.345 49.7 SEN non-statement 0.311 97.7 0.248 71.6 0.385 106.1 FSM 0.124 53.2 0.123 44.6 0.215 73.3 First lang. not English 0.057 11.8 0.042 7.0 -0.032 -5.0 Bangladeshi 0.015 1.7 0.035 2.9 -0.067 -7.2 Indian -0.014 -2.5 -0.020 -2.7 -0.083 -12.1 Pakistani 0.061 8.5 0.053 5.9 -0.032 -3.9 Asian other -0.031 -3.4 -0.031 -3.2 -0.077 -6.8 Black African 0.009 1.2 0.035 3.5 -0.074 -9.3 Black Caribbean 0.057 9.6 0.118 13.6 0.021 3.0 Black other 0.066 6.4 0.112 9.5 0.046 4.2 Chinese -0.076 -8.1 -0.088 -8.8 -0.124 -10.4 Mixed ethnicity -0.024 -4.2 -0.021 -3.3 -0.030 -5.2 Ethnicity missing -0.002 -0.5 0.001 0.1 0.022 4.1 White traveller 0.040 1.7 0.042 1.7 0.086 3.5 White other -0.020 -3.2 -0.004 -0.5 -0.039 -4.2 N 463, 253 433,717 463,589 Adj R-square 0.0745 0.0499 0.1233 Mean dep variable 0.173 0.174 0.173
Note: Low achievement here is defined in such a way as to give the same proportion of low achievers at each key stage and that proportion is 17.3%.
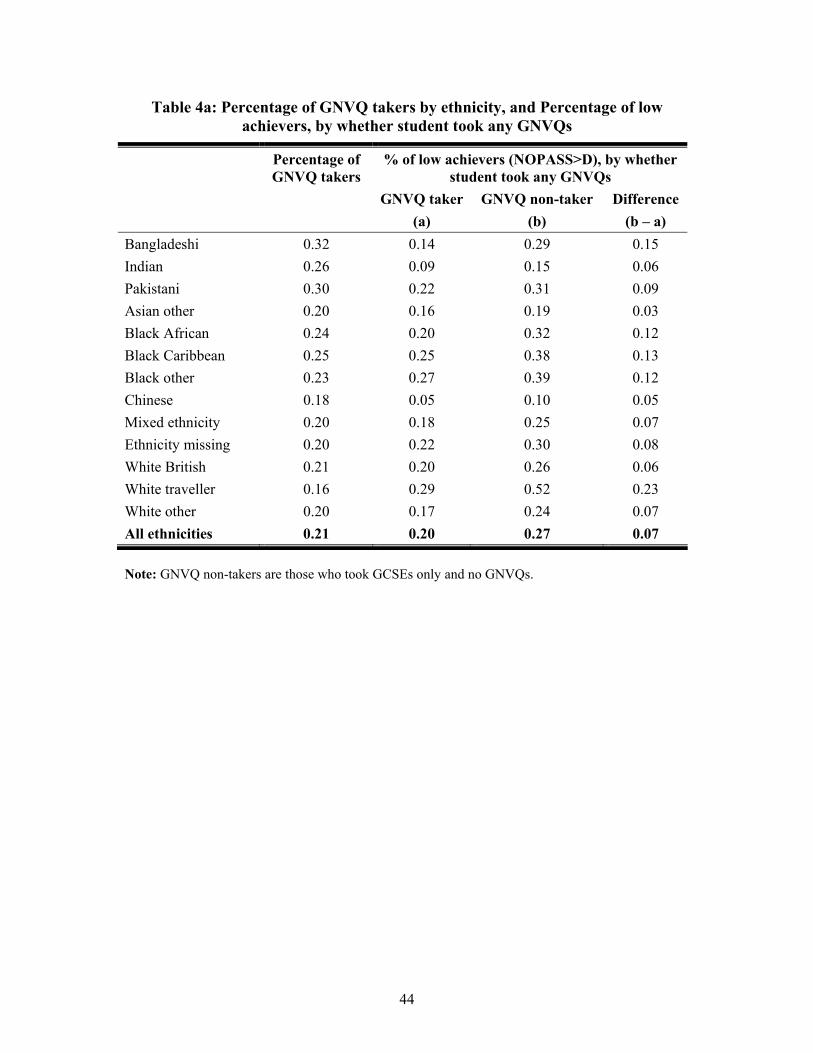
44
Table 4a: Percentage of GNVQ takers by ethnicity, and Percentage of low achievers, by whether student took any GNVQs
Percentage of GNVQ takers
% of low achievers (NOPASS>D), by whether student took any GNVQs
GNVQ taker(a)
GNVQ non-taker (b)
Difference (b – a)
Bangladeshi 0.32 0.14 0.29 0.15 Indian 0.26 0.09 0.15 0.06 Pakistani 0.30 0.22 0.31 0.09 Asian other 0.20 0.16 0.19 0.03 Black African 0.24 0.20 0.32 0.12 Black Caribbean 0.25 0.25 0.38 0.13 Black other 0.23 0.27 0.39 0.12 Chinese 0.18 0.05 0.10 0.05 Mixed ethnicity 0.20 0.18 0.25 0.07 Ethnicity missing 0.20 0.22 0.30 0.08 White British 0.21 0.20 0.26 0.06 White traveller 0.16 0.29 0.52 0.23 White other 0.20 0.17 0.24 0.07 All ethnicities 0.21 0.20 0.27 0.07 Note: GNVQ non-takers are those who took GCSEs only and no GNVQs.

45
Table 5: Binary probit of ‘NOPASS>D’, with interacting with “poorest 20% of schools” and “worst performing 20% schools”
Interactions with “poorest
20% of schools” Interactions with “worst
performing 20% of schools” ME Robust t ME Robust t Male 0.056 42.9 *** 0.054 40.2 *** Age at start 02-03 0.002 16.9 *** 0.002 16.4 *** SEN statement 0.076 16.3 *** 0.077 16.7 *** SEN non-statement 0.142 56.0 *** 0.141 60.1 *** FSM 0.073 34.6 *** 0.058 28.4 *** Mover 0.076 13.5 *** 0.071 14.7 *** Abnormal start 0.033 11.3 *** 0.034 13.1 *** Ethnicity variables Bangladeshi -0.078 -10.2 *** -0.074 -13.3 *** Indian -0.073 -15.1 *** -0.072 -18.5 *** Pakistani -0.067 -14.5 *** -0.067 -17.7 *** Asian other -0.068 -7.5 *** -0.063 -8.8 *** Black African -0.070 -9.0 *** -0.070 -13.3 *** Black Caribbean -0.022 -3.2 *** -0.026 -5.3 *** Black other -0.009 -0.9 -0.017 -2.0 ** Chinese -0.084 -9.1 *** -0.081 -8.9 *** Mixed ethnicity -0.025 -4.7 *** -0.025 -5.1 *** Ethnicity missing 0.019 5.2 *** 0.014 4.0 *** White traveller 0.057 2.4 *** 0.064 2.6 *** White other -0.039 -6.4 *** -0.047 -9.4 *** Output area variables % ethnicity_black -0.016 -1.0 -0.037 -2.7 *** %ethnicity_asian -0.009 -1.1 -0.002 -0.3 % unemployed 0.232 7.6 *** 0.145 5.1 *** % no qualifications 0.187 27.9 *** 0.144 24.5 *** % lone parent families 0.103 19.1 *** 0.094 18.6 *** Prior achievement Average point score KS2 -0.033 -139.8 *** -0.032 -140.1 *** Low reading ach. at KS2 0.026 20.4 *** 0.026 20.1 ***

46
Table 5 (continued)
Interactions with “poorest
20% of schools” Interactions with “worst
performing 20% of schools” ME Robust t ME Robust t Interaction terms Interaction term 0.020 6.0 *** 0.085 29.0 *** I*male -0.004 -1.6 -0.003 -1.4 I*FSM -0.027 -10.9 *** -0.013 -4.6 *** I*bangladeshi 0.009 0.5 0.002 0.2 I*indian -0.018 -1.7 * -0.001 -0.1 I*pakistani -0.009 -0.9 0.000 0.0 I*othasian 0.009 0.5 -0.001 0.0 I*black_african -0.009 -0.6 0.024 1.6 I*black_caribbean -0.013 -1.4 0.006 0.6 I*black_other -0.009 -0.6 0.008 0.5 I*chinese 0.018 0.6 -0.004 -0.1 I*mixed_race 0.009 1.0 0.020 2.0 ** I*missing_race -0.031 -4.4 *** -0.008 -1.4 I*white_traveller -0.047 -1.2 -0.041 -1.1 I*white_other -0.025 -1.9 * 0.008 0.6 Note: ***, ** and * denote statistical significance at the 1%, 5% and 10% respectively. N=463,589. R-sq is 0.30.
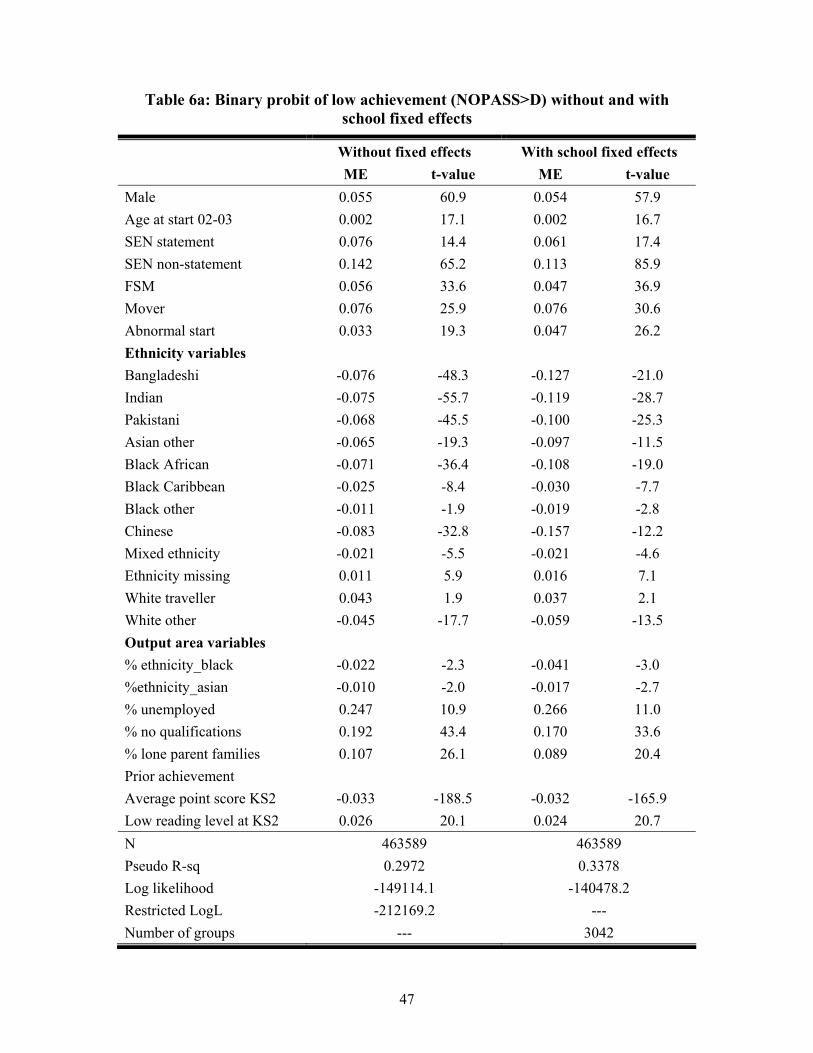
47
Table 6a: Binary probit of low achievement (NOPASS>D) without and with school fixed effects
Without fixed effects With school fixed effects ME t-value ME t-value Male 0.055 60.9 0.054 57.9 Age at start 02-03 0.002 17.1 0.002 16.7 SEN statement 0.076 14.4 0.061 17.4 SEN non-statement 0.142 65.2 0.113 85.9 FSM 0.056 33.6 0.047 36.9 Mover 0.076 25.9 0.076 30.6 Abnormal start 0.033 19.3 0.047 26.2 Ethnicity variables Bangladeshi -0.076 -48.3 -0.127 -21.0 Indian -0.075 -55.7 -0.119 -28.7 Pakistani -0.068 -45.5 -0.100 -25.3 Asian other -0.065 -19.3 -0.097 -11.5 Black African -0.071 -36.4 -0.108 -19.0 Black Caribbean -0.025 -8.4 -0.030 -7.7 Black other -0.011 -1.9 -0.019 -2.8 Chinese -0.083 -32.8 -0.157 -12.2 Mixed ethnicity -0.021 -5.5 -0.021 -4.6 Ethnicity missing 0.011 5.9 0.016 7.1 White traveller 0.043 1.9 0.037 2.1 White other -0.045 -17.7 -0.059 -13.5 Output area variables % ethnicity_black -0.022 -2.3 -0.041 -3.0 %ethnicity_asian -0.010 -2.0 -0.017 -2.7 % unemployed 0.247 10.9 0.266 11.0 % no qualifications 0.192 43.4 0.170 33.6 % lone parent families 0.107 26.1 0.089 20.4 Prior achievement Average point score KS2 -0.033 -188.5 -0.032 -165.9 Low reading level at KS2 0.026 20.1 0.024 20.7 N 463589 463589 Pseudo R-sq 0.2972 0.3378 Log likelihood -149114.1 -140478.2 Restricted LogL -212169.2 --- Number of groups --- 3042
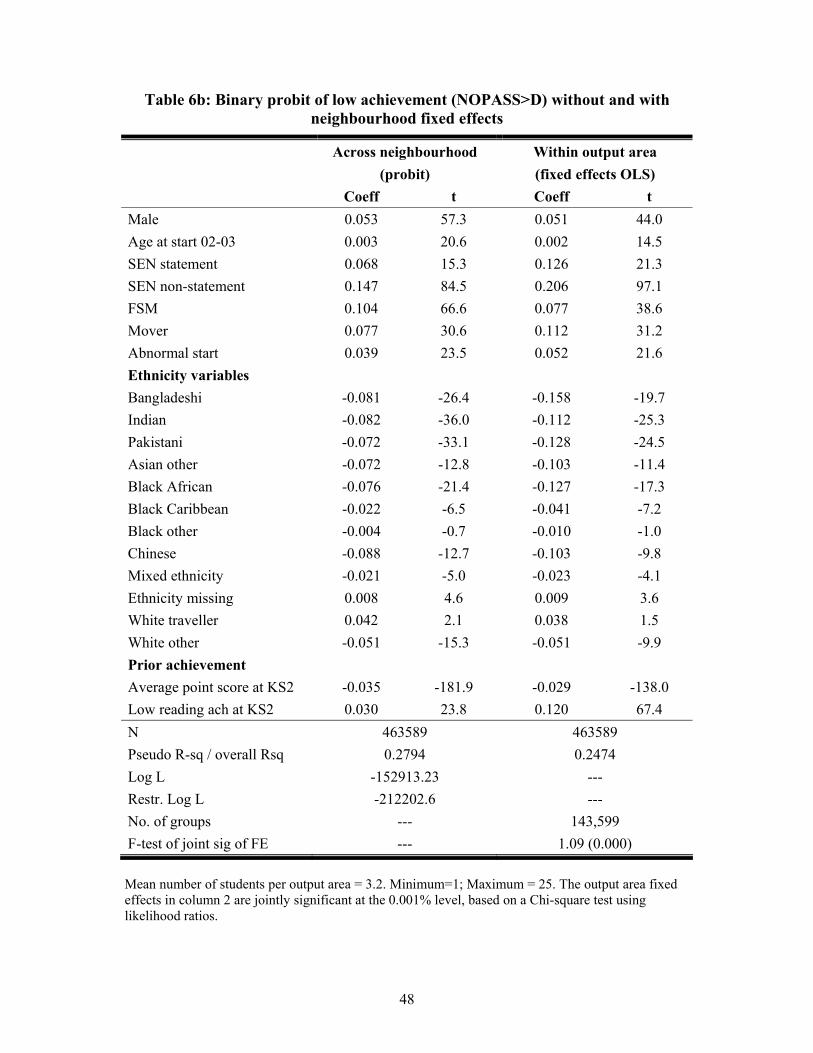
48
Table 6b: Binary probit of low achievement (NOPASS>D) without and with neighbourhood fixed effects
Across neighbourhood (probit)
Within output area (fixed effects OLS)
Coeff t Coeff t Male 0.053 57.3 0.051 44.0 Age at start 02-03 0.003 20.6 0.002 14.5 SEN statement 0.068 15.3 0.126 21.3 SEN non-statement 0.147 84.5 0.206 97.1 FSM 0.104 66.6 0.077 38.6 Mover 0.077 30.6 0.112 31.2 Abnormal start 0.039 23.5 0.052 21.6 Ethnicity variables Bangladeshi -0.081 -26.4 -0.158 -19.7 Indian -0.082 -36.0 -0.112 -25.3 Pakistani -0.072 -33.1 -0.128 -24.5 Asian other -0.072 -12.8 -0.103 -11.4 Black African -0.076 -21.4 -0.127 -17.3 Black Caribbean -0.022 -6.5 -0.041 -7.2 Black other -0.004 -0.7 -0.010 -1.0 Chinese -0.088 -12.7 -0.103 -9.8 Mixed ethnicity -0.021 -5.0 -0.023 -4.1 Ethnicity missing 0.008 4.6 0.009 3.6 White traveller 0.042 2.1 0.038 1.5 White other -0.051 -15.3 -0.051 -9.9 Prior achievement Average point score at KS2 -0.035 -181.9 -0.029 -138.0 Low reading ach at KS2 0.030 23.8 0.120 67.4 N 463589 463589 Pseudo R-sq / overall Rsq 0.2794 0.2474 Log L -152913.23 --- Restr. Log L -212202.6 --- No. of groups --- 143,599 F-test of joint sig of FE --- 1.09 (0.000) Mean number of students per output area = 3.2. Minimum=1; Maximum = 25. The output area fixed effects in column 2 are jointly significant at the 0.001% level, based on a Chi-square test using likelihood ratios.

49
Table 6c: Regression of school fixed effects on school variables (school fixed effects estimated from a fixed effects probit of NOPASS>D)
OLS OLS Binary probit
without
LA Fixed Effects with
LA Fixed Effects Best 10% of schools
(lowest 10% of school FE ) coeff robust t coeff robust t Marg effect robust t School resources Per pupil expenditure/1000 -0.060 -3.2 -0.071 -2.8 0.036 2.5 Peer group variables Percent eligible for FSM 0.003 2.3 0.005 4.1 -0.001 -0.7 Percent with stat. SEN 0.001 0.3 -0.002 -0.2 0.002 0.5 Percent girls 0.063 0.2 0.116 0.3 0.236 0.6 Percent girls squared -0.027 -0.1 -0.206 -0.5 -0.291 -0.6 Percent movers -0.318 -3.5 -0.354 -2.4 0.094 3.2 Percent abnormal start -0.236 -5.3 -0.238 -4.7 0.092 5.3 Percent Asian 0.342 1.8 0.139 0.8 -0.096 -0.9 Percent Asian squared -0.502 -2.0 -0.394 -1.5 0.096 0.7 Percent Black 0.142 1.2 0.340 2.0 -0.023 -0.4 School type & location Grammar* -0.897 -7.0 -0.827 -6.7 0.549 4.7 Secondary modern* -0.032 -1.3 0.020 0.5 0.027 1.4 Urban 0.025 1.3 0.016 0.8 -0.009 -0.7 Boys school++ -0.112 -1.2 -0.109 -1.0 0.152 1.1 Girls school++ -0.126 -0.9 -0.010 -0.1 0.194 0.7 Boarding school** 0.075 0.8 0.060 0.7 0.031 0.7 Roman Catholic+ 0.229 3.4 0.227 3.5 -0.058 -2.9 CofE and Christian other+ 0.100 1.6 0.098 1.5 -0.033 -1.3 School governance Voluntary aided~ -0.334 -5.5 -0.330 -5.5 0.200 5.0 Voluntary controlled~ -0.012 -0.2 -0.026 -0.5 -0.023 -1.0 Foundation~ -0.054 -2.6 -0.053 -2.6 0.033 1.8

50
Table 6c (continued)
OLS OLS Binary probit
without
LA Fixed Effects with
LA Fixed Effects Best 10% of schools
(lowest 10% of school FE ) coeff robust t coeff robust t Marg effect robust t School policy initiatives Specialist -0.092 -6.8 -0.081 -5.7 0.042 4.2 Special measures 0.284 6.0 0.254 4.9 -0.068 -2.4 Education action zone -0.098 -3.0 -0.119 -3.7 0.046 1.4 Beacon school -0.173 -5.9 -0.165 -5.4 0.108 5.2 Excellence in cities -0.142 -4.2 -0.116 -3.2 0.062 2.2 Leading edge partner -0.238 -5.0 -0.214 -4.4 0.208 5.0 Leadership incentive grant 0.179 6.9 0.164 6.1 -0.070 -2.9 _cons 3.226 34.3 3.391 27.6 --- --- N 2806 2806 2806 R-sq / pseudo Rsq 0.2256 0.3057 0.1476 Mean of dep var 3.005 3.005 0.100
Note: School fixed effects were estimated in a probit fixed effects estimator of NOPASS>D in LIMDEP. Standard errors are corrected for clustering at the level of the LA. Number of clusters (LAs) is 145. If in columns 1 and 2 here we include pupil teacher ratio instead of per pupil expenditure, it comes in with a positive and statistically significant coefficient sized about 0.025 (t=4.1) and R-sq is very similar to above.

51
Table 6d: Best 1% of schools, in terms of avoiding low achievement (NOPASS>D), (not excluding Grammar Schools)
Sch. LA School Fixed Effect
Grammar Voluntary aided
Voluntary control
Founation Specialist Roman Catholic
CofE & Other
Christian
613 Bradford 0.042 0 1 0 0 0 0 0 108 Birmingham 0.411 0 0 0 0 1 0 0 092 Kent 0.690 1 0 0 0 0 0 0 406 Plymouth 0.787 1 0 0 1 1 0 0 810 Manchester 0.793 0 1 0 0 0 0 0 628 Westminster 0.870 0 1 0 0 1 0 1 009 Bucking’shire 0.958 1 0 0 0 1 0 0 029 Trafford 0.964 1 0 0 0 1 0 0 467 Kent 0.993 1 0 0 1 0 0 0 530 Medway 1.039 1 0 1 0 1 0 0 608 North Yorkshire 1.042 1 1 0 0 0 0 0 406 Kent 1.112 1 0 0 1 1 0 0 333 Birmingham 1.123 0 0 0 0 0 0 0 703 Barking & D’ham 1.124 0 1 0 0 1 1 0 409 Poole 1.148 1 0 0 1 1 0 0 416 Kent 1.152 1 1 0 0 0 0 1 459 Kent 1.205 1 0 0 1 0 0 0 682 Greenwich 1.222 0 1 0 0 0 1 0 403 Walsall 1.242 1 1 0 0 1 0 0 025 Redbridge 1.378 1 0 0 0 0 0 0 603 Ealing 1.454 0 1 0 0 1 1 0 130 Hampshire 1.472 0 0 0 0 1 0 0 405 Lancashire 1.525 0 1 0 0 1 0 1 010 Worcestershire 1.536 0 0 0 0 1 0 0 606 Gateshead 1.540 0 1 0 0 1 1 0 300 Birmingham 1.654 1 0 0 0 0 0 0 334 Birmingham 1.761 0 1 0 0 0 0 0 045 Leicestershire 1.797 0 0 0 0 1 0 0
Note: The first digit of the school ID has been deliberately removed to prevent identification of individual schools. There were no secondary modern schools and no special measures schools in the top 1% of schools. The lower the School Fixed Effect, the better the ‘quality’ of the school in terms of helping its pupils to avoid low achievement.

52
Table 6e: Best 1% of schools, in terms of avoiding low achievement (NOPASS>D), (excluding Grammar Schools)
Sch. LA
School Fixed Effect
Voluntary aided
Voluntarycontrol
Found-ation
Specialist
Roman Catholic
CofE & Other
Christian 613 Bradford 0.042 1 0 0 0 0 0 334 Birmingham 0.411 1 0 0 0 0 0 810 Manchester 0.793 1 0 0 0 0 0 628 Westminster 0.870 1 0 0 1 0 1 703 Barking & D’ham 1.124 1 0 0 1 1 0 682 Greenwich 1.222 1 0 0 0 1 0 603 Ealing 1.454 1 0 0 1 1 0 130 Hampshire 1.472 0 0 0 1 0 0 405 Lancashire 1.525 1 0 0 1 0 1 010 Worcestershire 1.536 0 0 0 1 0 0 606 Gateshead 1.540 1 0 0 1 1 0 333 Birmingham 1.654 0 0 0 0 0 0 108 Birmingham 1.761 0 0 0 1 0 0 045 Leicestershire 1.797 0 0 0 1 0 0 423 Liverpool 1.826 0 0 0 0 0 0 400 Hertfordshire 1.855 0 0 1 1 0 0 622 Surrey 1.856 1 0 0 0 0 1 603 Stoke-on-Trent 1.857 1 0 0 1 0 1 405 Southwark 1.873 1 0 0 1 1 0 426 Essex 1.873 1 0 0 1 0 1 404 Northamptonshire 1.884 0 0 1 1 0 0 014 Solihull 1.892 0 0 0 1 0 0 411 Birmingham 1.910 0 0 1 1 0 0 435 Essex 1.920 0 0 1 1 0 0 601 Northamptonshire 1.920 1 0 0 1 0 1 627 Lancashire 1.935 1 0 0 0 1 0 603 Bristol city 1.959 1 0 0 0 0 1
Note: The first digit of the school ID has been deliberately removed to prevent identification of individual schools. There were no secondary modern schools and no special measures schools in the top 1% of schools. 13 are Christian schools, 18 are specialist, 16 are voluntary aided; 4 are Foundation schools; none are Voluntary control schools. The lower the School Fixed Effect, the better the ‘quality’ of the school in terms of helping its pupils to avoid low achievement.

53
Table 7a: OLS and Pupil Fixed effects regression of “No passes > D” (with Per Pupil Expenditure)
OLS Pupil FE coeff t-value coeff t-value Per pupil expenditure / 1000 -0.002 -1.9 -0.015 -10.1 year 0.003 7.1 0.002 4.5 %pupils FSM 0.519 144.7 0.110 5.4 %pupils SEN stat 1.475 57.2 0.060 0.8 N 847840 847840 Number of groups --- 423,920 N obs per group --- 2 Adjusted R-square 0.0404 0.0268 F-test of joint sig. of pupil FE (p) --- 2.23 (0.000)
Note : Constant included but not shown.

54
Table 7b: OLS and Pupil Fixed effects regression of “No passes > D” (with Per Pupil Expenditure)
Pupil FE Pupil FE with IV First Stage coeff t-value coeff t-value Coeff t-value Per pupil expenditure /1000 -0.012 -7.9 -0.032 -1.0 --- --- year 0.000 0.8 0.006 0.7 0.252 608.4 % FSM -0.600 -14.2 -0.535 -5.9 2.536 59.0 % FSM, square 1.173 19.0 1.063 7.2 -4.256 -67.9 % SEN stat -0.074 -0.6 -0.034 -0.3 1.457 11.5 % SEN stat, square 1.068 1.1 0.630 0.6 -15.868 -15.9 % Female -0.005 -0.3 0.000 0.0 -0.033 -1.6 % Indian -0.259 -5.8 -0.269 -5.9 0.217 4.7 % Bangladeshi -0.226 -3.0 -0.226 -3.0 0.119 1.6 % Pakistani -0.141 -3.2 -0.138 -3.0 0.265 5.8 % Other asian -0.096 -0.5 -0.089 -0.5 -0.126 -0.7 % Black African -0.331 -3.5 -0.285 -2.8 0.937 9.5 % Black Caribbean 0.114 1.2 0.103 1.1 -0.146 -1.6 % Other ethnicity -0.002 -0.1 -0.004 -0.2 0.004 0.2 lag2_Full time equiv students 0.000 -24.8 lag3_party conservative 0.034 12.1 lag3_party labour -0.044 -14.9 lag3_party liberal 0.013 3.5 N 847840 846,477 846477 Number of groups 423920 423920 423920 Mean no. of obs per group 2 2 2 Overall R-square 0.0115 0.0122 0.2245 F-test of joint sig. of pupil FE (p) 2.22 (0.000) 2.22 (0.000) 3.58 (0.000) Overid test of validity of IVs --- Chi-sq 80.45 (p = 0.000)
Note : Constant included but not shown.

55
Table 7c:Equation of ‘Nopass_aboveD’ with IVs, and reduced form
With per pupil expenditure
With pupil teacher ratio
Reduced form
coeff t coeff t coeff t pelfsm -0.582 -13.7 -0.610 -15.0 -0.610 -15.0 pelfsm_sq 1.146 18.5 1.258 20.9 1.259 20.9 pcssen -0.102 -0.8 -0.115 -1.0 -0.116 -1.0 pcssen_sq 1.067 1.1 0.989 1.0 0.977 1.0 per_girl 0.000 0.0 0.001 0.0 0.001 0.0 per_asian1 -0.273 -6.0 -0.273 -6.2 -0.272 -6.2 per_asian2 -0.230 -3.1 -0.264 -3.6 -0.264 -3.6 per_asian3 -0.140 -3.1 -0.126 -3.0 -0.127 -3.0 per_asian4 -0.080 -0.4 -0.138 -0.8 -0.144 -0.8 per_blackafr -0.305 -3.2 -0.343 -3.7 -0.340 -3.7 per_blackcar 0.109 1.2 0.129 1.5 0.126 1.5 per_othrace -0.005 -0.3 0.000 0.0 0.000 0.0 year 0.000 0.4 -0.002 -4.1 -0.002 -5.2 Per pupil exp -0.013 -8.4 --- --- --- --- tchp --- --- 0.001 1.9 --- --- lag2_ftepup 0.000 2.4 0.000 2.0 0.000 1.9 lag3_parcon 0.015 5.4 0.014 6.6 0.014 6.6 lag3_parlab 0.008 2.7 0.011 4.0 0.011 4.1 lag3_parlib 0.002 0.4 0.009 2.7 0.009 2.7 _cons 0.246 16.0 0.195 10.5 0.218 15.3 N 846477 846477 846477 No. of groups 423920 423920 423920 Mean N in group 2 2 2 Overall R-sq 0.0120 0.0077 0.0075 F-test of joint sig of pupil FE (p-value)
2.22 (0.000) 2.28 (0.000) 2.28 (0.000)

56
Table 7d: Coefficient on Per pupil expenditure in a Pupil Fixed effects regression of low achievement (nopass>D), Per pupil expenditure not instrumented
Per pupil expenditure** Pupil teacher ratio coeff t-value coeff t-value All pupils -0.012 -7.9 0.001 1.8 Male -0.008 -3.6 -0.001 -0.7 Female -0.016 -8.2 0.004 4.0 NO-SEN -0.010 -6.7 0.001 1.6 SEN school action -0.034 -4.4 0.007 2.3 SEN school action plus -0.039 -3.3 0.006 1.3 SEN statement -0.030 -1.9 -0.004 -0.6 NON-FSM -0.009 -5.6 0.002 2.3 FSM -0.049 -8.3 -0.000 -0.0 White British 0.001 0.9 0.001 1.8 Indian -0.059 -5.7 -0.006 -1.7 Pakistani -0.041 -3.5 -0.003 -0.7 Black African -0.084 -5.1 0.005 0.8 Black Caribbean -0.054 -4.1 0.002 0.4 All other ethnicities -0.029 -7.5 0.001 0.3
Note: **Per pupil expenditure has been divided by 1000. The table shows the coefficient on the per pupil expenditure variable in a pupil fixed effects regression of low achievement, and the associated t-value.

57
Appendix Table 1: Definitions of variables
Definition Pupil characteristics Female Female = 1; Male = 0 Age at start 02-03 Number of months above 15th birthday at the start of the 2002-03 school year SEN base = no SEN SEN statement Has statemented special education need? Yes =1; no =0 SEN non-statement Has non-statemented special education need? Yes =1; no =0 FSM Is eligible to receive a free school meal? Yes=1; no=0 First lang. not English First language is not English? Yes=1; no=0 Mover Child moved school between Key Stage 3 and Key Stage 4? Yes=1; no=0 Abnormal start Started at current school in/before August or in/after October? Yes=1; no=0 Ethnicity Ethnicity base=white british Bangladeshi Bangladeshi =1; not Bangladeshi = 0 Indian Indian = 1; not Indian =0 Pakistani Pakistani = 1; not Pakistani =0 Asian other Asian other=1; not Asian other =0 Black African Black African=1; not Black African =0 Black Caribbean Black Caribbean =1; not Black Caribbean = 0 Black other Black other = 1; not Black other =0 Chinese Chinese = 1; not Chinese = 0 Mixed ethnicity Mixed ethnicity = 1; not mixed ethnicity =0 Ethnicity missing Ethnicity missing = 1; ethnicity not missing = 0 White traveller White traveller = 1; not white traveller = 0 White other White other = 1; not white other = 0 Output area variables % ethnicity black Percentage of population in the census output area that is Black % ethnicity asian Percentage of population in the census output area that is Asian % unemployed Percentage of labour force participants in the output area that are unemployed % no qualifications Percentage of the 16+ population in the output area that has no qualifications % lone parent families Percentage of families in the output area that are single parent families Pupils’ prior achievement Average point score KS2 Average point score Key Stage 2 (i.e. at age 11) Low reading level at KS2 Reading attainment level of 3 or below at Key Stage 2? Yes=1; no=0

58
Appendix Table 1 (continued)
Variable name Definition School variables Per pupil expenditure 02-03 Per pupil expenditure of the school in 2002-03 Pupil teacher ratio 02-03 Pupil teacher ratio of the school in 2002-03 Capacity utilisation 02-03 Capacity utilisation of the school in 2002-03 FTE_pupils 02-03 Total number of Full Time Equivalent students in the school in 2002-03 Urban School located in urban area? Yes=1; no=0 Peer group variables Percent_FSM Percent of Key Stage 4 takers in the school who are eligible for a free
school meal Percent_SEN Percent of Key Stage 4 takers in the school with any form of special
education need percent_Girls Percent of Key Stage 4 takers in the school who are girls percent_Movers Percent of Key Stage 4 takers in the school who moved school between
KS3 and KS4 percent_Abnormal_start Percent of Key Stage 4 takers in the school who did not start this school in
September percent_Flang_not_Eng Percent of Key Stage 4 takers in the school whose first language is not
English percent_Asian Percent of KS4 takers in school who are Asian (Indian, Bangla, Pakistani,
other Asian) percent_Black Percent of KS4 takers in school who are Black (African, Caribbean, or
Other Black) School governance & type Voluntary aided* Voluntary aided=1; else=0 Voluntary controlled* Voluntary controlled=1; else=0 Foundation* Foundation school=1; else=0 Specialist Specialist school=1; else=0 Special measures School in special measures =1; else =0 Ed_action_zone Education action zone school =1; else=0 Beacon school Beacon school =1; else=0 Excellence_in_cities Excellence in cities school=1; else=0 Leading Edge Partner Leading Edge Partner school=1; else=0 Leadership_incen-gr Leadership incentive grant school=1; else=0 Grammar Grammar school=1; else=0 Secondary_modern Secondary modern school=1; else=0 Religious denomination Roman Catholic* Roman Catholic =1; else=0 Ch of England & oth Chr* Church of England and other Christian= 1; else =0

59
Appendix Table 2: Descriptive Statistics
N Mean SD Minimum Maximum Personal characteristics Male 463657 0.497 0.50 0.00 1.00 Age at start 02-03 463657 5.428 3.47 -1.00 12.00 SEN statement 463657 0.010 0.10 0.00 1.00 SEN non-statement 463654 0.090 0.29 0.00 1.00 FSM 463657 0.113 0.32 0.00 1.00 Mover 463657 0.045 0.21 0.00 1.00 Abnormal start 463657 0.101 0.30 0.00 1.00 Ethnicity variables Bangladeshi 463657 0.008 0.09 0.00 1.00 Indian 463657 0.025 0.16 0.00 1.00 Pakistani 463657 0.020 0.14 0.00 1.00 Asian other 463657 0.004 0.06 0.00 1.00 Black African 463657 0.008 0.09 0.00 1.00 Black Caribbean 463657 0.013 0.11 0.00 1.00 Black other 463657 0.004 0.06 0.00 1.00 Chinese 463657 0.003 0.06 0.00 1.00 Mixed ethnicity 463657 0.011 0.10 0.00 1.00 Missing ethnicity 463657 0.067 0.25 0.00 1.00 White traveller 463657 0.000 0.02 0.00 1.00 White other 463657 0.014 0.12 0.00 1.00 Output area variables % ethnicity_black 463657 0.020 0.06 0.00 0.72 %ethnicity_asian 463657 0.047 0.12 0.00 0.98 % unemployed 463657 0.034 0.03 0.00 0.29 % no qualifications 463657 0.304 0.13 0.00 0.85 % lone parent families 463597 0.205 0.14 0.00 1.00 Prior achievement Average point score KS2 463657 26.395 3.51 15.00 39.00 Low reading level at KS2 463657 0.201 0.40 0.00 1.00

60
Appendix Table 2 (continued)
N Mean SD Mininum MaximumSchool variables Per pupil expenditure/1000 448833 3.161 0.38 1.66 12.14 Pupil to teacher ratio 463526 16.316 1.30 4.99 28.99 Pupil to support staff ratio 463526 83.549 41.51 11.38 1823.48 Pupil to admin staff ratio 463526 152.256 48.92 16.87 574.07 Capacity utilisation 461227 1.002 0.14 0.34 1.95 Full time equivalent pupils 463526 1132.714 341.04 53.00 2624.00 Peergroup variables Percent_FSM 463526 13.787 12.20 0.00 83.98 Percent_SEN 463526 2.358 1.56 0.00 21.12 percent_Girls 463657 0.497 0.17 0.00 1.00 percent_Movers 463657 0.048 0.13 0.00 1.00 percent_Abnormal_start 463657 0.112 0.20 0.00 1.00 percent_Asian 463657 0.061 0.14 0.00 1.00 percent_Black 463657 0.026 0.07 0.00 0.97 School type Grammar 463657 0.041 0.20 0.00 1.00 Secondary Modern 463657 0.035 0.18 0.00 1.00 Urban 463657 0.720 0.45 0.00 1.00 Boys only school 463657 0.046 0.21 0.00 1.00 Girls only school 463657 0.065 0.25 0.00 1.00 Boarding school 463657 0.012 0.11 0.00 1.00 Voluntary aided* 463657 0.147 0.35 0.00 1.00 Voluntary controlled* 463657 0.037 0.19 0.00 1.00 Foundation* 463657 0.169 0.37 0.00 1.00 Specialist 463657 0.518 0.50 0.00 1.00 Special measures 463657 0.014 0.12 0.00 1.00 Ed_action_zone 463657 0.057 0.23 0.00 1.00 Beacon school 463657 0.091 0.29 0.00 1.00 Excellence_in_cities 463657 0.318 0.47 0.00 1.00 Leading Edge Partner 463657 0.037 0.19 0.00 1.00 Leadership_incen-grant 463657 0.407 0.49 0.00 1.00 Religious denomination Roman Catholic* 463657 0.101 0.30 0.00 1.00 Ch of England & oth Christn* 463657 0.050 0.22 0.00 1.00

61
Appendix Table 2 (continued) Descriptive statistics of variables used in Pupil Fixed Effects equations
Year = 2001 Year = 2003 Mean SD Mean SD Percent_FSM 0.1518 0.132 0.1405 0.126 Percent_FSM squared 0.0405 0.073 0.0356 0.067 Percent_SEN 0.0248 0.017 0.0236 0.016 Percent_SEN squared 0.0009 0.002 0.0008 0.001 Percent_Girls 0.4975 0.181 0.4974 0.180 Percent_Indian 0.0264 0.079 0.0269 0.081 Percent_Bangladeshi 0.0096 0.055 0.0097 0.056 Percent_Pakistani 0.0224 0.077 0.0229 0.079 Percent_otherAsian 0.0049 0.014 0.0050 0.014 Percent_BlackAfrican 0.0111 0.037 0.0111 0.038 Percent_BlackCaribbean 0.0142 0.039 0.0142 0.039 Percent_otherRaces 0.1074 0.164 0.1057 0.166 Lagged FTE pupils 1047.3060 325.652 1096.3350 334.740 Conservative party in power 0.1724 0.378 0.1941 0.395 Labour party in power 0.4916 0.500 0.4301 0.495 Liberal party in power 0.0578 0.233 0.0731 0.260 Pupil teacher ratio 16.8185 1.229 16.2937 1.307 Per pupil expenditure / 1000 2.6285 0.282 3.1176 0.530 Capacity utilisation 0.9880 0.144 0.9985 0.142 Nopasses above grade D 0.1826 0.386 0.1783 0.383 Not>=5 passes incl English & maths 0.0620 0.241 0.0615 0.240 N 423,920 423,920
Note: The omitted category for party in power in the LA is ‘no party in overall control’. Some values were missing for per pupil expenditure and capacity utilisation for 2001.

62
Appendix Table 3: Binary probit equations of “Missing Prior Achievement”
Missing KS2 achievement
Missing KS3 achievement
Missing KS2 or KS3 achievement
Marginal
effect Robust-t Marginal
effect Robust-t Marginal
effect Robust-t Male -0.002 -2.0 0.013 8.4 0.008 4.5 SEN statement 0.315 80.4 0.406 66.7 0.512 89.4 SEN non-statement 0.162 79.9 0.216 63.9 0.286 85.8 FSM 0.052 31.4 0.089 36.1 0.119 43.2 Mover 0.133 18.0 0.256 21.4 0.220 15.8 Abnormal start 0.083 22.6 0.049 10.5 0.109 17.4 Ethnicity Bangladeshi 0.093 16.1 0.006 0.7 0.066 7.7 Indian 0.031 6.5 -0.039 -6.8 -0.019 -2.6 Pakistani 0.101 23.5 0.015 2.6 0.076 12.0 Asian other 0.209 23.5 0.047 6.4 0.157 14.8 Black African 0.308 36.0 0.090 12.0 0.247 23.1 Black Caribbean 0.083 14.7 0.021 3.6 0.058 8.1 Black other 0.079 9.6 0.030 4.1 0.073 7.4 Chinese 0.170 18.3 -0.007 -0.9 0.100 8.7 Mixed ethnicity 0.041 11.1 0.006 1.3 0.029 5.4 Ethnicity missing 0.038 10.1 0.019 3.3 0.036 5.7 White traveller 0.104 6.0 0.147 7.5 0.203 8.4 White other 0.170 26.2 0.047 8.7 0.139 17.6 N 575,146 575,146 575,146 Log Likelihood -222453 -230077 -300068 Pseudo R-square 0.1288 0.1630 0.1453 Mean of dependent var. 0.1302 0.1373 0.2159
Note: Standard errors are corrected for clustering at the school level. There are 3042 school ‘clusters’. While according to PLASC data KS2 achievement is non-missing for about 500,000 KS4 students, our main equations are fitted on a sample of only about 464,000 students. This is because the full set of school variables are only available for these students.

63
Appendix Table 4: Binary probit of low achievement at age 16 (NOPASS>D) With alternative measures of past achievement at Key Stage 2
Using ‘Average point score’ at KS2 and
low achievement by subject Plus low achievement in
Reading at KS2 ME Robust t ME Robust t Male 0.055 46.9 0.054 45.6 Age at start 02-03 0.002 16.9 0.002 17.1 SEN statement 0.078 16.5 0.074 15.9 SEN non-statement 0.142 56.9 0.141 56.1 FSM 0.055 33.9 0.055 33.9 Mover 0.075 13.3 0.075 13.3 Abnormal start 0.033 11.3 0.033 11.3 Ethnicity variables Bangladeshi -0.073 -14.1 -0.074 -14.2 Indian -0.073 -21.7 -0.073 -21.8 Pakistani -0.066 -19.6 -0.067 -19.8 Asian other -0.063 -9.7 -0.063 -9.7 Black African -0.069 -15.8 -0.070 -15.9 Black Caribbean -0.025 -6.2 -0.025 -6.3 Black other -0.010 -1.4 -0.011 -1.5 Chinese -0.080 -10.5 -0.081 -10.7 Mixed ethnicity -0.019 -4.7 -0.020 -4.8 Ethnicity missing 0.011 3.2 0.011 3.2 White traveller 0.042 2.0 0.042 2.0 White other -0.044 -8.3 -0.044 -8.4 Output area variables % ethnicity_black -0.020 -1.3 -0.020 -1.2 %ethnicity_asian -0.009 -1.2 -0.009 -1.2 % unemployed 0.246 8.2 0.244 8.0 % no qualifications 0.190 29.1 0.189 28.9 % lone parent families 0.104 19.5 0.105 19.6 Prior achievement Average point score at KS2 -0.034 -68.0 -0.034 -67.8 Low English level at KS2 0.013 7.7 -0.001 -0.8 Low Maths level at KS2 -0.001 -0.5 -0.001 -0.5 Low Science level at KS2 -0.008 -5.1 -0.010 -6.4 Low reading ach at KS2 ---- ---- 0.026 17.8 N 461732 461732 Pseudo R-sq 0.2948 0.2956 Mean dep var 0.170 0.170

64
Appendix Table 5: Across and within school estimation using OLS and probit estimators
PROBIT RESULTS OLS RESULTS
Across school (probit)
Within school (fixed effects probit)
Across school (OLS)
Within school (fixed effects
OLS) ME t ME t coeff t Male 0.055 60.9 0.054 57.9 0.049 50.2 0.050 49.2 Age at start 02-03 0.002 17.1 0.002 16.7 0.002 17.7 0.002 17.8 SEN statement 0.076 14.4 0.061 17.4 0.127 25.8 0.126 25.8 SEN non-statement 0.142 65.2 0.113 85.9 0.204 117.0 0.211 118.1 FSM 0.056 33.6 0.047 36.9 0.081 49.3 0.078 47.5 Mover 0.076 25.9 0.076 30.6 0.084 33.4 0.111 34.9 Abnormal start 0.033 19.3 0.047 26.2 0.035 20.2 0.064 29.1 Ethnicity variables Bangladeshi -0.076 -48.3 -0.127 -21.0 -0.163 -28.4 -0.156 -23.9 Indian -0.075 -55.7 -0.119 -28.7 -0.105 -29.9 -0.109 -29.5 Pakistani -0.068 -45.5 -0.100 -25.3 -0.122 -30.2 -0.121 -28.2 Asian other -0.065 -19.3 -0.097 -11.5 -0.084 -11.1 -0.092 -12.2 Black African -0.071 -36.4 -0.108 -19.0 -0.130 -22.2 -0.121 -20.5 Black Caribbean -0.025 -8.4 -0.030 -7.7 -0.035 -7.7 -0.038 -8.2 Black other -0.011 -1.9 -0.019 -2.8 -0.014 -1.7 -0.024 -3.0 Chinese -0.083 -32.8 -0.157 -12.2 -0.101 -11.8 -0.108 -12.7 Mixed ethnicity -0.021 -5.5 -0.021 -4.6 -0.018 -3.9 -0.020 -4.3 Ethnicity missing 0.011 5.9 0.016 7.1 0.010 5.1 0.013 5.4 White traveller 0.043 1.9 0.037 2.1 0.053 2.5 0.049 2.3 White other -0.045 -17.7 -0.059 -13.5 -0.051 -12.6 -0.054 -12.8 Output area variables % ethnicity_black -0.022 -2.3 -0.041 -3.0 -0.091 -8.3 -0.101 -6.4 %ethnicity_asian -0.010 -2.0 -0.017 -2.7 -0.027 -5.0 -0.036 -5.3 % unemployed 0.247 10.9 0.266 11.0 0.464 17.2 0.466 16.3 % no qualifications 0.192 43.4 0.170 33.6 0.192 38.7 0.186 33.0 % lone parent families 0.107 26.1 0.089 20.4 0.128 27.0 0.104 21.1 Prior achievement Average point score at KS2 -0.033 -188.5 -0.032 -165.9 -0.029 -165.6 -0.029 -162.0 Low reading ach at KS2 0.026 20.1 0.024 20.7 0.121 80.9 0.117 78.7 N 463,589 463,589 463,589 463,589 Log L -149114.1 -140478.2 --- --- Restr. Log L -212169.2 -212169.2 --- --- Pseudo R-sq / overall Rsq 0.2972 0.3379 0.2613 0.2602 No. of groups --- 3042 --- 3042
Note: Mean number of observations per group is 152.4.