Physics Class 12 Chapter 14 NCERT Solution-semiconductor ...
Upload
khangminh22Category
view
1download
0
Supported byssa – technical cooperation fund
NATIONAL ACHIEVEMENT SURVEYCLASS V

NATIONAL ACHIEVEMENT SURVEYCLASS V
Supported byssa – technical cooperation fund
2012

ii

PROJECT TEAM
Faculty Dr. Avtar Singh Professor & HeadDr. Mamta Agrawal Professor (retired on Sep.30, 2011)Dr. Amba Dutt Tewari Associate ProfessorDr. Santosh Kumar Associate Professor ( Coordinator)Dr. Veer Pal Singh Associate ProfessorDr. Indrani S. Bhaduri Associate ProfessorDr. K. Chandershekhar Assistant Professor
Consultants TSA Dr. Jayshree Oza Team Leader, SSA-TC Fund-TSA, New DelhiDr. George Bethell Director, Angilia Assessment Ltd. United KingdomDr. Mary J. Pitoniak Strategic Advisor, Educational Testing Service (ETS), Princeton, USADr. Eugene Gonzalez Programme Administrator, Educational Testing Service (ETS), Princeton,
USADr. Algirdas Zabulionis Sr. Consultant, Angilia Assessment Ltd. United KingdomDr. Mamta Agrawal SSA-TC Fund-TSA, New Delhi (w.e.f. 1.11.2011)Dr. Mee Young Han Assessment and Programme Evaluation Specialist, SSA-TC Fund-TSA,
New Delhi
Consultants DEME Mr. Rudra Narayan Sahoo DEME, NCERT, New Delhi (till 24 Jan. 2011)Mr. Rohit Kumar Palai DEME, NCERT, New Delhi (till Feb 2012)Dr. Manika Sharma DEME, NCERT, New Delhi (w.e.f. 20 May 2011)Ms. Harmeet Kaur DEME, NCERT, New Delhi (w.e.f. 23 May 2011-till March 2012)
Technical Supporting Staff Mr. Parash Ram Kaushik AssistantMr. Puneet Kumar Sharma Sr. System AnalystDr. Sunita Kumari Survey AssociateMs. Varuna Mittal Survey Associate (till Sept. 2011)Ms. Kamlesh Arya DTP Operator
Administrative Supporting Staff Mr. Sasidharan.P Assistant Programme CoordinatorMr. V. Vasudevan Assistant Programme ManagerMs. Anita Kumari Mahato Project Assistant (Accounts)Mr. Vikram Project HelperMr. Rachit Sharma Project Helper
iii

iv

v
TABLE OF CONTENTS
List of Figures ix
List of Tables xii
Abbreviations xvii
Preface xix
Executive Summary xxi
Chapter 1 Introduction 1
1.1 History of NAS in India 3
1.2 Development of Tools 4
1.3 Th e NAS Sample 11
1.4 Participating States and Sample Coverage 12
1.5 Characteristics of Participating States 13
1.6 Administration of Tools 15
1.7 Monitoring 15
1.8 Data Management 15
1.9 Analysis of Data 17
1.10 Understanding the results 18
1.11 Organisation of the Report 21
1.12 Limitations 22
Chapter 2 Student Achievement in Language 23
2.1 How did the states and UTs perform in Reading Comprehension? 25
2.2 How did various groups perform in Reading Comprehension? 30
2.3 Conclusion 33
Chapter 3 Language: What Students Know and Can Do 35
3.1 Overview of the Reading Comprehension Tests 37
3.2 Item Mapping 37
3.3 Sample Item and Reading Passage 39
3.4 What can students do in Reading Comprehension? 43
Chapter 4 Achievement of Students in Mathematics 45
4.1 How did the states and UTs perform in Mathematics? 47
4.2 How did various groups perform in Mathematics? 52
4.3 Conclusion 56
Chapter 5 Mathematics: What Students Know and Can Do 59
5.1 Overview of the Mathematics tests 61
5.2 Item Mapping 61

vi
5.3 Sample Items 63
5.4 What can students do in Mathematics? 69
Chapter 6 Student Achievement in Environmental Studies 73
6.1 How did the states and UTs perform in Environmental Studies? 75
6.2 How did various groups perform in Environmental Studies? 80
6.3 Conclusion 84
Chapter 7 Environmental Studies: What Students Know and Can Do 85
7.1 Overview of the Environmental Studies Tests 87
7.2 Item Mapping 87
7.3 Sample Items 89
7.4 What can students do in EVS? 95
Chapter 8 Student-related Variables 101
Part I-Profi le
8.1 Students’ Background 103
8.2 Resources Available at Home 105
8.3 Resources Available in School 107
8.4 Students’ Activities outside the School 109
Part II-Student Background and Attainment
8.5 Socio-economic Index 110
8.6 Language Spoken at Home 110
8.7 Treatment given to Variables used in Analysis 110
8.8 Student Background Factors 111
8.9 Conclusion 117
Chapter 9 School-related Variables 119
Part I-Profi le
9.1 School Background 121
9.2 Home–School Interaction 124
9.3 Teaching and Learning Process 125
9.4 School Social Climate 127
Part II-Student Background and Attainment
9.5 Treatment given to Variables used in Analysis 128
9.6 School Facilities and Resources 130
9.7 School Governance 131
9.8 Compositional and Contextual Factors 136
9.9 Accountability-related procedures 134
9.10 Conclusion 135

vii
Chapter 10 Teacher-related Variables 137
Part I-Profi le
10.1 Teachers’ Background 139
10.2 Teacher Training 141
10.3 Teaching Learning Process 142
10.4 Problems in School 146
10.5 Teachers’ Opinion about the School 147
Part II-Teacher Factors and Student Attainment
10.6 Treatment given to Variables used in Analysis 149
10.7 Personal Characteristics 150
10.8 Academic and Professional Qualifi cations 150
10.9 In-service Training 151
10.10 Teaching Experience and Employment Status 152
10.11 Teaching Practices 153
10.12 Teaching Resources 154
10.13 Attitudes and Views 155
10.14 Conclusion 156
Chapter 11 Equity and the Success of the Sarva Shikhsa Abhiyan Programme in providing Equality of Opportunity 159
11.1 Investigating Disadvantage: Findings 163
11.2 Summary of Findings 164
11.3 Scheduled Tribes 165
11.4 Summary of Findings 167
References 169
Appendices 173
Appendix – I: Sample Design and Procedures 174
Appendix – II: Scaling the NAS data and estimating sampling variance 180
Appendix – III: Performance in Anchor Items 184
Appendix – IV: Item description with percent correct 196
Appendix – V: Socioeconomic Index 199
Appendix – VI: Variance Components 204
Appendix – VII: Student Related Variables 207
Appendix – VIII: School Related Variables 214
Appendix – IX: Teacher Related Variables 215
Appendix – X: List of Surveyed States, Districts, Schools, Teachers, and Students 226
List of State Coordinators and Associate Coordinators 227

viii

ix
LIST OF FIGURES
Figure 2.1 : Percentile scores in Reading Comprehension for States where Class V students were tested and population coverage was >80% 28
Figure 2.2 : Percentile scores in Reading comprehension for States where Class V students were tested and population coverage was <80% 29
Figure 2.3 : Percentile scores in Reading Comprehension for States where Class VI students were tested 29
Figure 3.1 : (Item 46) Percentage of students in each response category 39
Figure 3.2 : (Item 47) Percentage of students in each response category 40
Figure 3.3 : (Item 48) Percentage of students in each response category 41
Figure 3.4 : (Item 49) Percentage of students in each response category 41
Figure 3.5 : (Item 50) Percentage of students in each response category 42
Figure 4.1 : Percentile scores in Mathematics for states where Class V students were tested and where adequate population coverage was achieved 50
Figure 4.2 : Percentile scores in Mathematics for States where Class V students were tested and where population coverage was <80% 51
Figure 4.3 : Percentile scores in Mathematics States where Class VI students were tested 52
Figure 5.1 : (Item 71) Percentage of students in each response category 64
Figure 5.2 : (Item 3) Percentage of students in each response category 64
Figure 5.3 : (Item 49) Percentage of students in each response category 65
Figure 5.4 : (Item 44) Percentage of students in each response category 65
Figure 5.5 : (Item 45) Percentage of students in each response category 66
Figure 5.6 : (Item 28) Percentage of students in each response category 66
Figure 5.7 : (Item 42) Percentage of students in each response category 67
Figure 5.8 : (Item 38) Percentage of students in each response category 68
Figure 5.9 : (Item 80) Percentage of students in each response category 68
Figure 6.1 : Percentile scores in EVS for States where Class V students were tested and the population coverage was >80% 78
Figure 6.2 : Percentile scores in EVS for States where Class V students were tested and the population coverage was <80% 79
Figure 6.3 : Percentile scores in EVS for States where Class VI students were tested 80
Figure 7.1 : (Item 61) Percentage of students in each response category 89
Figure 7.2 : (Item 33) Percentage of students in each response category 90
Figure 7.3 : (Item 44) Percentage of students in each response category 90
Figure 7.4 : (Item 3) Percentage of students in each response category 91
Figure 7.5 : (Item 9) Percentage of students in each response category 92
Figure 7.6 : (Item 49) Percentage of students in each response category 92
Figure 7.7 : (Item 46) Percentage of students in each response category 93

x
Figure 7.8 : (Item 45) Percentage of students in each response category 94
Figure 7.9 : (Item 47) Percentage of students in each response category 94
Figure 8.1 : Gender of students 103
Figure 8.2 : Student Categories 104
Figure 8.3 : Language Used at Home 104
Figure 8.4 : Number of Siblings 105
Figure 8.5 : Physically Challenged Students 105
Figure 8.6 : Parental Education 105
Figure 8.7 : Parental Occupation 106
Figure 8.8 : Below Poverty Line 106
Figure 8.9 : Resources in Home 107
Figure 8.10 : Books in the Home 107
Figure 8.11 : Help with Homework 108
Figure 8.12 : Private Tuition 108
Figure 8.13 : Have Textbook? 109
Figure 9.1 : Schools by management type 121
Figure 9.2 : Location of School 122
Figure 9.3 : Physical Facilities 122
Figure 9.4 : Teaching Learning Materials 123
Figure 9.5 : Ancillary Facilities 123
Figure 9.6 : Shortages and inadequacies aff ecting teaching capacity 124
Figure 9.7 : Attitudes to School 125
Figure 9.8 : Availability of Instructional Materials 126
Figure 9.9 : Internet Access 126
Figure 9.10 : ICT Facilities 126
Figure 9.11 : Methods of Teacher Evaluation 127
Figure 10.1 : Male and Female Teachers 140
Figure 10.2 : Age of Teachers 140
Figure 10.3 : Educational Qualifi cations of Teachers 140
Figure 10.4 : Employment Status of Teachers 141
Figure 10.5 : Professional Qualifi cation of Teachers 141
Figure 10.6 : In-service Training Programme attended by Teachers 142
Figure 10.7 : Teachers Attended Training based on NCF 2005 142
Figure 10.8 : Teachers give Homework 143
Figure 10.9 : Teacher’s Diary 144
Figure 10.10 : Academic Facilities Available in Schools 144
Figure 10.11 : Discuss how to teach a particular concept 145

xi
Figure 10.12 : Working on Preparing Instructional Materials 145
Figure 10.13 : Visit to observe another Teacher’s Classroom 145
Figure 10.14 : Informal Observation of Classroom by another Teacher 146
Figure 10.15 : Visit to observe another Teacher’s Classroom 146
Figure 10.16 : Informal Observation of Classroom by another Teacher 147
Figure 10.17 : Teachers’ Perceptions of School Safety 148

xii
LIST OF TABLES
Table 1.1 : Timeline for NAS under SSA 3
Table 1.2 : Th ree Dimensional Grid for Tests 10
Table 1.3 : Sample Coverage and Reporting Classifi cation by State 12
Table 1.4 : Selected physical, demographic and socio-economic indicators for the states and UTs of India 14
Table 1.5: Regression Results – Students having subject textbooks 20
Table 1.6: Regression results– School management-wise 20
Table 1.7: Regression Results – Siblings-wise 21
Table 2.1 : Average Reading Comprehension scores for States and Union Territories where Class V students were tested and population coverage was >80% 25
Table 2.2 : Average Reading Comprehension scores for States and Union Territories where Class V students were tested and population coverage was <80% 26
Table 2.3 : Average Reading Comprehension scores for States where Class VI students were tested 26
Table 2.4 : Percentile scores in Reading Comprehension for States where Class V students were tested and population coverage was >80% 27
Table 2.5 : Percentile scores in Reading Comprehension for States where Class V students were tested and achieved population coverage was <80% 28
Table 2.6 : Percentile scores in Reading Comprehension for States where Class VI students were tested 29
Table 2.7 : Average Reading Comprehension scores for groups by Gender (Class V) 30
Table 2.8 : Average Reading Comprehension scores, by Gender, for States and UTs where Class V students were tested and population coverage was >80% 30
Table 2.9 : Average Reading Comprehension scores, by Gender, for States and UTs where Class V students were tested and population coverage was <80% 31
Table 2.10 : Average Reading Comprehension scores, by gender, for States and UTs where Class VI students were tested 31
Table 2.11 : Average Reading Comprehension scores for groups by Location (Class V) 31
Table 2.12 : Average Reading Comprehension scores by Location for States and UTs where Class V students were tested and population coverage was >80% 32
Table 2.13 : Average Reading Comprehension scores, by Location, for States and UTs where Class V students were tested and population coverage was <80% 32
Table 2.14 : Average Reading Comprehension scores by Location for States and UTs where Class VI students were tested 33
Table 2.15 : Average Reading Comprehension scores for groups by social category (Class V) 33
Table 3.1 : Item Map in Reading Comprehension 38
Table 3.2 : Performance on the Sample Items (46-50) in States 42
Table 3.3 : Performance of Class V students on the cognitive process of locating information 43
Table 3.4 : Performance of Class V students on the cognitive process of Grasp Ideas/interpret 44

xiii
Table 3.5 : Performance of Class V students on the cognitive process of infer/evaluate 44
Table 4.1 : Average Mathematics scores for States and Union Territories where Class V students were tested and population coverage was >80% 47
Table 4.2 : Average Mathematics scores for States and Union Territories where Class V students were tested and population coverage was <80% 48
Table 4.3 : Average Mathematics scores for States where Class VI students were tested 48
Table 4.4 : Percentile scores in Mathematics for States where Class V students were tested and where adequate population coverage was achieved 49
Table 4.5 : Percentile scores in Mathematics for States where Class V students were tested and achieved population coverage was <80% 51
Table 4.6 : Percentile scores in Mathematics for States where Class VI students were tested 51
Table 4.7 : Average Mathematics scores for groups by Gender and by Location (Class V) 52
Table 4.8 : Average Mathematics scores, by Gender, for States and UTs where Class V students were tested and population coverage >80% was achieved 53
Table 4.9 : Average Mathematics scores, by Gender, for States and UTs where Class V students were tested and population coverage was <80% 53
Table 4.10 : Average Mathematics scores, by gender, for States and UTs where Class VI students were tested 54
Table 4.11 : Average Mathematics scores for groups by Location (Class V) 54
Table 4.12 : Average mathematics scores, by Location, for States and UTs where Class V students were tested and population coverage was >80% 54
Table 4.13 : Average Mathematics scores, by Location, for States and UTs where Class V students were tested and population coverage was <80% 55
Table 4.14 : Average mathematics scores, by Location, for States and UTs where Class VI students were tested 55
Table 4.15 : Average Mathematics scores for groups by social category (Class V) 56
Table 5.1 : Item map for selected items from the Class V NAS in Mathematics 62
Table 5.2 : Th e proportion of students selecting the correct option in each of the nine sample items given above by State/UT 69
Table 5.3 : Performance of Class V students on the Basic Operations 70
Table 5.4 : Performance of Class V students on the Geometry 70
Table 5.5 : Performance of Class V students on the Measurement 71
Table 5.6 : Performance of Class V students on the Number System 72
Table 6.1 : Average EVS scores for States and Union Territories where Class V students were tested and the population coverage was >80% 75
Table 6.2 : Average EVS scores for States and Union Territories where Class V students were tested and the population coverage was <80% 76
Table 6.3 : Average EVS scores for States where Class VI students were tested 76
Table 6.4 : Percentile scores in EVS for States where Class V students were tested and the population coverage was >80% 77

xiv
Table 6.5 : Percentile scores in EVS for States where Class V students were tested and the population coverage was <80% 79
Table 6.6 : Percentile scores in EVS for States where Class VI students were tested 79
Table 6.7 : Average EVS scores for groups by Gender (Class V) 80
Table 6.8 : Average EVS scores, by Gender, for States and UTs where Class V students were tested and population coverage was >80% 81
Table 6.9 : Average EVS scores, by gender, for States and UTs where Class V students were tested and population coverage was <80% 81
Table 6.10 : Average EVS scores, by Gender, for States and UTs where Class V students were tested 82
Table 6.11 : Average EVS scores for groups by Location (Class V) 82
Table 6.12 : Average EVS scores, by Location, for States and UTs where Class V students were tested and population coverage was >80% 82
Table 6.13 : Average EVS scores, by Location, for States and UTs where Class V students were tested and population coverage was <80% 83
Table 6.14 : Average EVS scores, by Location, for States and UTs where Class VI students were tested 83
Table 6.15 : Average EVS scores for groups by social category (Class V) 84
Table 7.1 : Item Map in Environmental Studies 88
Table 7.2 : Performance on the Sample Items in States 95
Table 7.3 : Performance of Class V students on the content area of Family and Friends 97
Table 7.4 : Performance of Class V students on the content area of Food 98
Table 7.5 : Performance of Class V students on the content area of Shelter 98
Table 7.6 : Performance of Class V students on the content area of Water 99
Table 7.7 : Performance of Class V students on the content area of Travel 99
Table 7.8 : Performance of Class V students on the content area of Real Life 100
Table 8.1 : Pupil Related Variables and its treatment for regression variables 111
Table 8.2 : Regression Results– Gender wise 111
Table 8.3 : Regression Results– Category wise 112
Table 8.4 : Regression Results– Siblings wise 112
Table 8.5 : Regression Results– Students Belonging to Physically Challenged 113
Table 8.6 : Regression Results– Students using Diff erent Modes of Conveyance 113
Table 8.7 : Regression Results– Students having subject textbooks 114
Table 8.8 : Regression Results– Students Attitude towards diff erent subjects 114
Table 8.9 : Regression Results– Students Getting Help in Studies 114
Table 8.10 : Regression Results– Students Taking Private Tuition 114
Table 8.11 : Regression Results– Students getting Homework Checked at Home 115
Table 8.12 : Regression Results– Students getting Homework Checked at School 115
Table 8.13 : Regression Results– Students Who Read Material Other than Course Material Outside the School 115

xv
Table 8.14 : Regression Results– Students Doing Various Activities Outside the School 116
Table 8.15 : Regression Results– Students Doing Household tasks 117
Table 9.1 : Problem Behaviours amongst Students 128
Table 9.2 : School Related Variables and its treatment for regression analysis 129
Table 9.3 : Regression Results – schools facilities 130
Table 9.4 : Regression Results– Student computer ratio 130
Table 9.5 : Regression Results– Access to Internet 131
Table 9.6 : Regression Results– Use of ICT 131
Table 9.7 : Regression Results – School Management 131
Table 9.8 : Regression Results– Preschool attached 132
Table 9.9 : Regression Results– Students background 132
Table 9.10 : Regression Results– Instructional materials 133
Table 9.11 : Regression Results– School perception 133
Table 9.12 : Regression Results – Behaviour problem of students 134
Table 9.13 : Regression Results – Evaluation of Classroom Teaching 134
Table 10.1 : Teachers Included in Survey 139
Table 10.2 : Teacher Related Variables and its treatment for regression variables 148
Table 10.3 : Regression Results– Gender wise 148
Table 10.4 : Regression Results– Category wise 148
Table 10.5 : Regression Results– Age wise 148
Table 10.6 : Regression Results– Academic qualifi cation 151
Table 10.7 : Regression Results– Professional qualifi cation 151
Table 10.8 : Regression Results– In-service training programmes 151
Table 10.9 : Regression Results– Attended training programme based on NCF-2005 151
Table 10.10 : Regression Results– Participation in Professional development activities 152
Table 10.11 : Regression Results– Years of teaching experience 152
Table 10.12 : Regression Results– Years in the school 152
Table 10.13 : Regression Results– Employment Status 152
Table 10.14 : Regression Results– Regular homework 153
Table 10.15 : Regression Results– Teachers’ diary 153
Table 10.16 : Regression Results– Periods/week 153
Table 10.17 : Regression Results– Interaction with other teachers 153
Table 10.18 : Regression Results– Regular activities in class 154
Table 10.19 : Regression Results– Teaching resources 154
Table 10.20 : Regression Results– Problems with facilities: one rated as ‘serious’ 154
Table 10.21 : Regression Results– TLM Grant 155
Table 10.22 : Regression Results– School is safe 155

xvi
Table 10.23 : Regression Results– Teachers’ high job satisfaction 155
Table 10.24 : Regression Results– Teachers’ high understanding of curriculum goals 155
Table 10.25 : Regression Results– Teachers’ high degree of success in implementing the curriculum 156
Table 10.26 : Regression Results– Teachers’ high expectations for student achievement 156
Table 11.1 : School facilities 163
Table 11.2 : Teachers 164
Table 11.3 : Atmosphere and ethos 164
Table 11.4 : Home-school interaction 164
Table 11.5 : School facilities 166
Table 11.6 : Teachers 166
Table 11.7 : Atmosphere and ethos 166
Table 11.8 : Home-school interaction 166

xvii
ABBREVIATIONS
BAS Baseline Achievement SurveyB.Ed Bachelor of EducationBRC Block Resource CentreBPL Below Poverty LineCRC Cluster Resource CentreCTT Classical Test Th eoryDEME Department of Educational Measurement and EvaluationDI Discrimination IndexDIET District Institute of Education and TrainingDISE District Information System for EducationDRC District Resource CentreEVS Environmental StudiesETS Educational Testing ServiceGDP Gross Domestic ProductHCF Highest Common FactorICC Item Characteristic CurveICT Information and Communication Technology IRT Item Response Th eoryLCM Lowest Common MultipleMAS Mid-term Achievement Survey M.Ed Master in EducationMCQ Multiple Choice QuestionMHRD Ministry of Human Resource Development NAS National Achievement SurveyNAEP National Assessment of Educational ProgressNCERT National Council for Educational Research and TrainingNCF National Curriculum FrameworkNUEPA National University of Educational Planning and AdministrationOBC Other Backward ClassesPIRLS Progress in International Reading Literacy StudyPISA Programme for International Student AssessmentPPS Probability proportional to sizePTA Parent Teacher AssociationSC Scheduled CastesSCERT State Council for Educational Research and TrainingSES Socio-Economic StatusSIE State Institute for EducationSRS Simple Random SamplingSSA Sarva Shiksha AbhiyanST Scheduled TribesTAS Terminal Achievement Survey TIMSS Trends in International Mathematics and Science StudiesTLM Teaching Learning Material TRC Teacher Resource CentresUT Union TerritoryVEC Village Education Committee

xviii

xix
PREFACE
Sarva Shiksha Abhiyan (SSA), a fl agship programme of the Government of India, provides a variety of inputs designed to ensure access, equity and quality in elementary education. As concerted eff orts are made to achieve the objectives of SSA, it becomes important to gather information about what the children in schools know and can do at diff erent stages of elementary education. In other words, an accurate measure of the learning achievement of children at diff erent stages of education can provide important insights as to whether the inputs made into the elementary education system had a benefi cial eff ect or not. Such evidence is provided by the National Achievement Surveys (NAS) carried out by NCERT every three years. Th is series of surveys not only provides policy makers, planners, curriculum developers and other practitioners with a ‘snapshot’ of what students have learnt in main subjects, but also provides a baseline against which changes in educational standards can be monitored.
Th e present survey is the third cycle of Class V in which the children’s learning achievement has been measured in Language, Mathematics and Environmental Studies. Th is report is based on the data collected through standardized achievement tests administered to 122,543 students and through questionnaires from 6602 schools, 10851 teachers and 117,653 students from 31 States and Union Territories of the country.
Th is survey diff ers from those conducted previously in several important aspects. Most importantly, in this survey student responses to questions in the tests were analysed using modern Item Response Th eory (IRT) rather than the classical techniques used in earlier surveys. As a result, all the scores in this report are located on standardised scales from
0-500. (Scores on earlier surveys were reported simply as the percentage of correct answers– a value which varies according to the tests takers.) Th is practice is consistent with that of major international surveys such as the Programme for International Student Assessment (PISA), Progress in International Reading Literacy Study (PIRLS) and Trends in International Mathematics and Science Studies (TIMSS).
Th is report presents the national picture of Class V students’ learning achievement in three subject areas: Language (Reading Comprehension); Mathematics; and Environmental Studies (EVS). For each subject, fi ndings are reported in two complementary chapters. Th e fi rst summarises achievement results for the participating states and UTs. Th e second describes what students at diff erent levels of achievement know and can do in that particular subject based on evidence from the test results.
In addition to measuring student achievement in main curricular areas, questionnaires were administered to students, teachers and school principals to collect information about a wide range of background variables that may have impact on learning. Th e data collected is summarised in this report giving an objective overview of the present situation. Th is information, together with the student results database, will be shared with states so that they can, in collaboration with NCERT, prepare state-specifi c reports and conduct further analysis for the benefi t of states.
In conducting such surveys, the quality of data is of paramount importance. All eff orts, therefore, have been made by the Department of Educational Measurement and Evaluation, NCERT to ensure quality in data collection, analysis and reporting. Th e Department has benefi tted from the continuous support of the Technical Support Agency (TSA). Th e agency has helped us to improve the study and, as a result, has allowed us to report on student achievement following international patterns. I am grateful for the valuable inputs provided by TSA’s team at NCERT and its international consultants.

xx
Prof. Krishna Kumar, former Director, NCERT has been a great source of inspiration to accomplish this gigantic task. I am grateful for his guidance and contribution. My thanks are also due to MHRD particularly Ms Anita Kaul, Additional Secretary for providing both fi nancial and administrative support. I also acknowledge the support of NUEPA for providing DISE data.
Th e present study could not have been completed without the active participation of State Councils of Educational Research and Training (SCERTs) and other state agencies SCERTs, DTERTs, SIEs, Directorates of Education, School Education Boards, etc. Th e Directors and other associated staff from these organizations are to be complimented for completing the arduous task of administering tools in time.
I thank Dr Santosh Kumar, Coordinator of the survey, and members of the project team who worked hard in analysing and interpreting the data, and preparing the report in time. I also thank other project staff for their support.
Finally I thank one and all who have contributed to this study in some or other way. I earnestly hope that it will be useful to policy makers, planners, researchers and all others in raising the quality of elementary education in India.
Avtar SinghProfessor and Head
New Delhi Department of Educational Measurement and EvaluationApril, 2012 National Council of Educational Research and Training

xxi
EXECUTIVE SUMMARY
Introduction
National Achievement Surveys (NAS) are conducted under the Government’s fl agship programme Sarva Shiksha Abhiyan (SSA). NAS is designed to provide information about the learning achievement of students in the elementary sector of education in government and government-aided schools. Th is is achieved by administering standardized tests to students of Classes III, V and VIII. NAS also collects information about relevant background factors related to the school environment, instructional practices, the home backgrounds of students, teachers’ qualifi cation etc. NAS data gives policy makers, curriculum specialists, researchers and other stake holders a ‘snapshot’ of what students know and can do in key subjects at a particular point in time. Th e results also serve as a baseline against which future progress in education may be evaluated.
Th is report presents the fi ndings of the third cycle of the national achievement survey of students studying in Class V conducted from November 2010 to March 2011. Th e subjects covered were Language (including Reading Comprehension), Mathematics, and Environmental Studies (EVS).
Methodology
Sample selection
Selecting a representative sample in India is a challenging yet critical part of the survey process. For Class V NAS, government and government-aided schools having Class V were included in the sample frame. Th e general selection procedure was:
Selection of districts within a state (Probability Proportional to Size (PPS) sampling)
Selection of schools (PPS within each selected district)
Selection of students (randomly within selected schools)
Th is survey saw tests and questionnaires administered to a sample of 1,22,543 students, and 10851 teachers from 6,602 schools across 27 States and 4 Union Territories.
Tool development
For any large survey, the tools employed need to be accessible, valid and reliable. In order to measure reliably the achievement levels of class V students, tests in three subjects, viz. Language, Mathematics and Environmental Studies (EVS) were developed. In view of the wide variation in course content across the states, developing suitable tests was big challenge. Th e fi rst step was to collect the syllabuses and the text books of Language, Mathematics and Environmental Studies from the states/UTs. Th ese were then analysed from the point of view of the content areas covered and the competencies to be developed. In each subject, common core content and competencies were identifi ed. Based on this analysis, subject-specifi c assessment frameworks were developed. Th ese described the content areas and competencies to be covered and prescribed the number and type of items to be used for testing each domain. In order to provide suffi cient information, three test forms were developed for each subject. For the Class V NAS, each test for EVS and Mathematics consisted of 40 multiple-choice items. Of these, 20 were common ‘anchor items’ which appeared in all test forms. Th us, overall 80 unique items were used in each subject to measure

xxii
learning achievement. Each Language test form consisted of 35 multiple-choice items with 20 serving as anchor items. Texts and items testing reading comprehension were used in direct translation in all states and UTs. Items testing language elements such as grammar were developed specifi cally for each language and were not used in translation. Finally, scoring keys were developed and checked for each test form in each subject.
Translation workshops were conducted in which invited experts translated the tests into 15 languages. Checks were undertaken to see that each item tallied with the items in the master tests in English. In this way, multiple test forms in Language, Mathematics and EVS were fi nalised in 15 languages for administration across the diff erent states/UTs of India.
Test administration
NAS is conducted by the National Council of Educational Research and Training (NCERT). To coordinate the NAS project in the States/ UTs, NCERT takes the help of state agencies – notably SCERTs and SIEs. For the current survey, each participating state designated a State Coordinator who was responsible for implementing the NAS in their State/UT in accordance with NAS guidelines. State coordinators were given training on how to collect data in the fi eld. For this a detailed training manual was developed by DEME. Th ereafter, State Coordinators provided training to district coordinators about the conduct of main achievement survey. In each selected district, district coordinators appointed 10 to 12 teams of fi eld investigators. Each team comprised two fi eld investigators. Th ey were given a rigorous training about selection of sections and students in the sampled schools, administration of tools and transfer of responses from test booklets to separate response sheets. Th ese response sheets were collected by the district coordinators and then sent to the state coordinator after checking. Th ese response sheets were dispatched by the state coordinator to the NCERT where they were scored and analyzed. State Coordinators and their teams are to be commended for their eff orts. Without their help and professionalism, the massive task of data collection for the National Achievement Survey would not have been possible.
Use of IRT
In earlier two cycles of surveys, the data was analysed using Classical Test Th eory (CTT) and average scores were reported as the ‘proportion of answers correct’. However, this approach has signifi cant limitations. To overcome these, data from the present Survey was analysed using Item Response Th eory (IRT) in addition to the classical approach as is the practice of major international surveys. IRT uses a mathematical model to link a student’s chance of success on a particular item to two main factors: the student’s level of ability and the item’s level of diffi culty. In this model, the diffi culty of an item does not depend on the group of test takers. Th is allows the use of multiple test booklets which can be linked. It also allows scores from tests used in diff erent cycles to be compared - an essential characteristic for monitoring progress over time.
Th roughout this report, results are reported using ‘scale scores’ calculated using IRT in place of the percentage correct scores. For this, the chosen scale is from 0 to 500. Th e average score for the whole population is initially set at 250. Th e standard deviation of the scale is initially set at 50 for the whole population. Th is means that the majority of students (about 70%) will have scores in the range 200 to 300. (See fi gure below.)
The Reporting Scale
100 200 300 400
Low achievement Mid - point = 250 High achievement

xxiii
Th is executive summary presents the major fi ndings of the survey about the achievement of Class V students in Language, Mathematics, and EVS. Selected background characteristics of schools, teachers and students are also reported. Regression analysis was used to see the impact of these background variables on student achievement.
Achievement in Language (Reading Comprehension)
Th e average Reading Comprehension achievement of students varied greatly across the states and UTs of India. Th ere was a highly signifi cant diff erence between outcomes in high scoring states such as Uttar Pradesh (282), Tamil Nadu (278) and Kerala (277), and low scoring states/UTs such as Puducherry (222), Bihar (228) and Chhattisgarh (229).
States also varied greatly in the range between their lowest and highest achieving students as revealed by their inter-quartile score ranges. Some States/UTs, e.g. Puducherry (39), Sikkim (44) and A & N Islands (51) had relatively homogeneous cohorts whilst in others students demonstrated far more diverse abilities e.g. Uttar Pradesh (93), Tamil Nadu (85) and Jharkhand (81).
Overall, no signifi cant diff erences were detected in the average achievement of girls and boys. Similarly, no signifi cant diff erence was detected between the achievement level of rural and urban students although exceptions were found in a small number of States/UTs. Th e survey did fi nd that students from the General category outperformed their peers in the SC, ST and OBC categories by a statistically signifi cant margin.
What Class V students know and can do in Reading Comprehension
In reading comprehension three cognitive processes were identifi ed: locating information; grasping ideas and interpreting them; and, inferring and evaluating. Across this domain of Reading Comprehension, Class V students demonstrated a wide range of ability.
Students at the lower end of the scale (i.e. within 200 to 240 scale scores) could demonstrate all three cognitive processes – provided that the context was clear and the tasks non-complex. For example, they were able to use information from a table, to locate the time and the occurrence of a phenomenon, recognize a particular text type, and also make simple inferences.
Students performing in the intermediate range of the scale (say, 240 to 275 scale score) could do more. Th ey could determine the causes, frequency, duration and sequence of events described in a variety of texts. Th ey could also identify cause and eff ect relationships and make complex inferences about the qualities of characters from their actions.
Students performing at higher end of the scale (i.e. those with scale scores above 275) could do more. In addition, they could identify the main theme of a given passage. Th ey could also identify the relationship between events, ideas and phenomena, and recognize the likely thoughts of characters in the text.
It was also seen what the majority of students could do in Reading Comprehension. On an average about half of the students could locate information from the given text, make inference about the cause of an act or event and were able to draw simple conclusion about the usefulness of an object. More than 60% students in the country could gather information from a given table about a particular event and could recognize the text type as a notice. On the other hand only one third of students were able to identify the main theme and evaluate the title of a given passage.

xxiv
Achievement in Mathematics
Th e results show that the average mathematical achievement of students varied greatly across the states and UTs. Great diff erences were observed in outcomes in the group of high scoring states such as Uttar Pradesh (298) Tamil Nadu (279) and Karnataka (269) and the low scoring states/UTs such as Puducherry (217), Andaman & Nicobar Islands (226) and Chandigarh (226).
States also varied greatly in the range between their lowest and highest achieving students as revealed by their inter-quartile score ranges. Some states/UTs, e.g. Chandigarh (36), Andaman & Nicobar Islands (37) and Puducherry (40) had relatively homogeneous cohorts whilst others had students far more diverse in achievement e.g. Uttar Pradesh (85), Tamil Nadu (84) and Karnataka (81).
Overall, no signifi cant diff erence was found in the average achievement of girls and boys in Mathematics. Some readers may be surprised by this fi nding. However, the large sample size (>55,000) and the consistency of this fi nding across states suggest that this is a robust conclusion. Similarly, with a few exceptions, no signifi cant diff erence was detected between the average achievement level in Mathematics of rural and urban students. Data from the survey indicated that students from the General category outperformed their peers in the SC, ST and OBC categories by a statistically signifi cant margin.
What Class V students know and can do in Mathematics
Class V students demonstrated a wide range of abilities in the domain of Mathematics.
Students performing at the lower end of the ability scale, (i.e. within the range 175 to 230 scale scores) could demonstrate basic mathematical knowledge e.g. they knew the place value of digits in the number system and could recognise geometrical shapes. Th ey could also apply fundamental concepts and perform basic operations in simple situations.
Students performing in the intermediate range (i.e. those with scale scores of, say, 230 to 275) could do more. Th ey could perform a wider range of mathematical operations including multiplication and division; work competently with basic units; and, apply their knowledge to a range of problems set in authentic contexts (e.g. money calculations in the market) provided that the context was clear.
Students performing at higher end of the scale, (i.e. those with scale scores above, say, 275) could do still more. In addition, they could apply most or all of the mathematical operations required by the curriculum; demonstrate understanding of fractions; add decimal fractions; work confi dently in a range of units including those of area; and solve more complex problems involving time and money calculations - even when these were set in less familiar contexts.
In order to fi nd out what majority of students could do in diff erent areas of Mathematics, the percentage correct on each item was calculated. It was seen that more than 70% students could count the sides of a given fi gure and identify the largest angle among the given angles in a geometrical fi gure. About 60% of students could solve simple problems of basic operations and measurement and could fi nd out the multiplier of a given numbers. However, only one third of students could compute the diff erence between two decimal numbers and only 22% students could do word problems based on memory.

xxv
Achievement in Environmental Studies
Th e average achievement of Class V students in Environmental Studies varied greatly across the participating states and UTs. Highly signifi cant diff erences were seen between outcomes in high scoring states such as Tamil Nadu (288), Uttar Pradesh (284) and Karnataka (275) and low scoring states/UTs such as Puducherry (222), Chandigarh (226) and Haryana (232).
Inter-quartile score ranges also varied greatly across the states. Some states/UTs, e.g. Chandigarh (38), Puducherry (43) and Sikkim (44), had relatively homogeneous group of students in terms of ability whilst others showed far more diversity e.g. Uttar Pradesh (89), Karnataka (84) and Madhya Pradesh (83).
Overall no signifi cant diff erences were detected in the average achievement of girls and boys. Similarly, no signifi cant diff erence was detected between the achievement level of rural and urban students although exceptions were found in a small number of states/UTs. Th e survey did show that, as in the other subjects tested, students from the General category outperformed their peers in the SC, ST and OBC categories by a statistically signifi cant margin.
What Class V students know and can do in Environmental Studies
Th e items of the EVS test booklets were designed to assess three cognitive processes or ‘skills’: knowing, applying, and reasoning.
From the EVS item map it was seen that students at the lower end of the scale (say, 170 to 225) could demonstrate, albeit to a limited extent, all three cognitive processes. For example, they could use information from a table and locate places and directions on a map. Th ey could also classify animals and plants on the basis of their characteristics.
Students performing in the intermediate range of ability (say, scores of 225 to 275) could do more. Th ey could analyze issues, interpret information, establish relationships, relate information, and fi nd solutions in diff erent situations. Th ey could also identify cause and eff ect relationships and make inferences in various situations.
Students performing at higher end of the scale (i.e. those with scores above 275) could do more. In addition, they could explain the components of diet and their functions, identify sources of energy and their by products, and demonstrate understanding of the importance of the natural environment to human life. Th ey could also explain observed phenomena in terms of physical processes.
It was found that in the cognitive process of ‘knowing’, more than three-quarters of students could identify the name of fl ightless birds and knew about amphibians and the spread of disease by mosquitoes.
In the process of ‘applying’ about 75% students could classify the animals into groups identify the footprints of birds, work out that salt can dissolve in water and about 60% understood that motor driven vehicles caused pollution. Only one third of students knew about the source of energy which produces carbon dioxide.
In the process of ‘reasoning’ nearly three-quarters of students could interpret a given weather graph and more than 50% could reason out that paint dissolves in kerosene, why the Earth looks blue from the outer space and that overpopulation is the main cause of unemployment and housing problems in India. However, only one third of students could explain the benefi ts of forests.

xxvi
School-related Variables
Th e survey collected information about the school environment in four categories - School Background, Home-School Interaction, Teaching Learning Process, and School Social Climate.
School Background
Overall, approximately 70% of the schools surveyed were managed by State Governments, 83% were rural, 67% had a pre-school attached, 68% schools were inspected, and 73% followed a six-day week. However, in these as in other variables, there was wide variation amongst the states and UTs surveyed.
Th e majority of schools reported having no or few vacancies to fi ll. In states such as Punjab, Orissa, Jammu and Kashmir, and Assam, there were more vacancies and schools found these diffi cult to fi ll.
In the vast majority of the schools sampled, basic facilities such as playgrounds and safe drinking water are in place. Similarly, basic teaching materials and library books are available in more than 90% of schools. However, computers and musical instruments are less common being available in about 50% of schools only.
Th e survey showed that the mid-day meal scheme was functioning in more than 90% of schools, free uniform in about 50% of schools, and the free textbooks scheme in 95% of schools for students of all social categories.
Home-school Interaction
Th e Home-school interaction category represented those variables which were jointly infl uenced by both home and school factors. Overall, more than 90% of the schools asked parent to attend special events, to ensure that the child completed his/her homework, and to serve on school committee but only 49% of schools asked parent to raise funds for the school. About 40% schools rated parents’ support as medium.
Th e participation of the Village Education Committee (VEC) and the Parent Teacher Association (PTA) were available in majority of the schools (95% and 82% respectively).
More than 50% of the schools rated teachers’ job satisfaction, teachers’ understanding of the curricular goals, teachers’ degree of success in implementing the curricula and teachers’ expectation of student achievement as high. Also 47% of the schools rated student desire to do well as high.
Teaching Learning Process
Grouping of classes and availability of various kinds of instructional materials were considered under this variable. It was found that in more than 78% of the schools, the students’ were grouped on the basis of ability in EVS and in Mathematics and that the level of achievement was signifi cantly higher in such schools.
In about 85% of the schools enrichment as well as a remedial programmes in EVS and in Mathematics were in place. Such programmes were found to have a positive eff ect on the achievement of the schools.
Th e survey also disclosed that 99% of the schools had textbooks in all the subjects, and more than 80% had workbooks and teacher handbooks available. Teaching learning material was available in more than 96% of the

xxvii
sampled schools. All these had positive impact on the learning of diff erent subjects. However, science laboratory, access to internet, and ICT facilities were not available in more than 70% schools.
Social Climate of School
School climate infl uences the behaviour of both teachers and students. Under this, behavioural problems of students were studied. Th e analysis revealed that overall the social climate in schools was good as very few schools reported any problematic behaviours by students. For example, late arrival to school in 66% and absenteeism in 59% schools was rarely seen. Skipping classes, indulging in cheating, and disturbing the classroom decorum were never observed in 53% to 64% of the schools. Students using profanity, indulgence in vandalism and activities of theft were never observed 68% to 77% schools. Causing physical injuries to other students was never observed in 60% of the schools and intimidation/verbal abuse or physical injuries to teachers were never experienced by majority of schools (more than 88%).
When the impact of school variables was seen on student achievement, it was found at that the factors like equipment, school governance, availability of help in ICT schools having more middle income group students, schools which involve parents, pupil desire to do well etc., have a positive eff ect on attainment whereas internet access, attachment of pre school with the main school, problem behaviour of students and schools having more disadvantage students have shown negative impact.
Students -related Variables
Student Background
Overall 49% boys and 51% girls participated in this survey. About 66% students were 10-11 years old. From among the sampled students there were 21% SC, 17% ST, 34% OBC and 25% other categories students. Nearly 70% students spoke the same language at home as the one used in the school as medium of instruction. On an average nearly half of the students had three or more siblings. In this survey only 6% students belonged to physically challenged group.
Parents of about 2/3rd students had the educational status from literate/primary to higher secondary. Nearly 1/3rd students reported that their parents were agricultural labourer/daily wagers or street vendor. Further, it was found that in the sampled schools nearly half of the students belonged to below poverty line families, i.e. BPL card holders. It was also observed that the students belonging to BPL card holder families could not do as well as the other students in all the three subjects. Th e data indicated that the educational status of parents had positive impact on their wards’ achievement.
Availability of Resources at Home
Th e survey showed that less than half (30% - 47%) students had literary resources such as daily newspaper, dictionary, calculator, books other than course books and study desk available at home.
About 60% students received help from their family members and 44% from their tutor. Approximately, 30% students took private tuitions. Th e highest percentage of students taking tuitions (83%) was seen in West Bengal. Almost all the students (97%) reported having textbooks for all three subjects.

xxviii
Availability of Educational Resources at School
As far as the availability of educational resources is concerned, 44% students reported that computers were available in their schools but 55% students said they never used the computers. Similarly, availability of library in the school did not ensure that the students would use the library. For example in Sikkim 71% students reported that their schools had library but 61% said that they never used it.
Teaching Learning Process
Students reported about the frequency of home work in diff erent subjects. On an average in Language 72 %, in Mathematics 44%, and in EVS only 57% students reported that they were given homework daily.
Th e largest percentage of students (56%) reported liking language as a subject followed by Mathematics (30%) and EVS (14%). Almost 90 % students liked to be in school.
Activities Outside School
For the overall development of students, activities outside the school are important. When asked about various activities it was found that nearly 67% students watched TV, 79% interacted with their friends, and 83% played games/sports, 82% did the homework given at school and 33% read books for enjoyment. Further 71% students reported that they looked after their family members, 63% helped in cleaning the house and 33% helped in preparing food daily.
Teacher-related Variables
In this survey information was collected from the teachers under four heads – teacher background, teacher training, teaching learning process, and teachers’ opinion about the school.
Teacher Background
A total of 10851 teachers fi lled the Teacher Questionnaire. Out of these, there were 55% male and 45% female teachers. In contrast to this in Delhi the female teachers were 86% while male teachers were only 14%. Majority of the teachers were between 31 to 51 years of age. Most of the teachers, i.e. 63% were graduates or post graduates, 23 % qualifi ed at higher secondary and only 13% teachers were qualifi ed at secondary level or below. About two third of the teachers in Chandigarh were postgraduates whereas in Gujarat 54% teachers were qualifi ed only at the middle level.
Overall 79% teachers were regular teachers and 12 % were para teachers in the surveyed schools. But in Chhattisgarh the percentage of para teachers was 82 %.
Teacher Training
65% teachers were primary/elementary teaching certifi cate or diploma holders. Th ere was a lot of variation among the states regarding the professional qualifi cation of the teachers. Highest number of teachers with master’s degree in professional qualifi cations were in Jammu and Kashmir state.

xxix
Of the sampled teachers, 82% had attended 1-5 in-service training programmes. However, in Haryana and Meghalaya around 50 % Teachers had not attended any in-service training program. In most of the states maximum training programs were organized by school complex, CRC and BRC. In Meghalaya DIET/DRC were more active in providing in service training programs.
Teaching Learning Process
Among the sampled teachers, 85% teachers gave homework regularly. Besides, it was seen that 83 % teachers maintained Teacher’s Diary to keep a record of their day to day activities planned and executed in the class. Such a record helps teachers as well as supervisors to know what teachers did on a particular day in a period in a class.
As far as Teaching Support Material is concerned, it was found that 84% teachers had Teacher’s Handbook, 93% teachers had TLM, 39% teachers had Audio-Video facilities and 75% had received TLM Grant. In Kerala and Daman & Diu all teachers had Teaching Learning Material. In Andhra Pradesh, Haryana and Kerala Audio-Video facilities were available to less than 3% teachers. Overall 41 % teachers reported that they had received the academic support 1-5 times in the academic year 2009-2010.
Regarding teacher interaction with each other, it was found that more than 40% teachers interacted with each other 2-3 times a week regarding how to teach a particular concept or preparation of instructional material and also visited another teacher’s classroom to observe his/her teaching 1-3 times per week.
When asked about the problems in schools, more than 65% teachers in West Bengal responded that overcrowded classes were a serious problem. Overall only 15% teachers reported not having adequate workspace outside their classroom as a serious problem. 50% teachers considered non-availability of materials for conducting experiments as a minor problem.
In order to know the status of revised text books on the basis of National Curriculum Framework (NCF)-2005 in the states, the teachers were asked whether they used the revised text books based on the NCF-2005 for Class V. Th eir responses indicated those revised textbooks based on NCF-2005 were being used by almost all the teachers in Language, Mathematics and Environmental Studies (EVS).
Overall 38% teachers had attended a training programme based on NCF-2005. In Uttarakhand 75% teachers had attended NCF-2005 based training programmes and in Jharkhand, Maharashtra and Uttar Pradesh nearly 62% teachers attended the training programmes based on NCF-2005.
Teachers’ Opinion about School-related Factors
Teachers opinions were sought on various school related factors. More than 50% teachers reported that the teachers were highly satisfi ed with their job, teachers’ degree of success in implementing curriculum was high, and that students wanted to do well in their schools. 47% teachers reported the teacher’s expectations from their students, and students’ regard for school property was high. However, more than 40% teachers reported that the parental support and their involvement in school activities were low.
Regression Analysis: Summary of Findings
Th e table which follows summarises the outcomes of the regression analyses described in chapters 8, 9 and 10. Th e factors listed appear to have a robust eff ect on attainment in diff erent subjects in the sense that the relationship is statistically signifi cant and is not extinguished by allowing for key variables including home resources and speaking the language of instruction at home.

xxx
Student-related factors School-related factors Teacher-related factors
Factors associated with a
positive effect on attainment
Having a subject textbook
Positive attitude to learning
Help in studies
Homework checked at school
Homework checked at home
Reading out of school
Watching TV
Hanging out with friends
Discussing school at home
Mode of transport to school
Equipment
School governance
Student:computer ratio
Help in ICT
Middle income
School involves parents
Pupils desire to do well
Teacher peer review.
Years of teaching at the current
school
Keeping teacher’s diary
Range of activities in the
classroom
Teacher’s handbook
Audio-Visual facilities
Factors associated with
a negative effect on
attainment
Number of siblings
Being physically challenged
Working with the computer
Disadvantaged pupils
Problem behaviour
Pre-school attached
Internet access
Para teachers, shiksha karmi,
etc.
Severe problems with facilities
Receipt of TLM grant
Limitations
Th is survey undoubtedly represents a signifi cant step forward in the development of national achievement surveys in India. However, as with all such enterprises, lessons have been learnt. In conducting the Class V NAS, the following limitations have been noted so that they may be addressed in future achievement surveys:
Th e survey used DISE 2007–08 data from the National University of Educational Planning and Administration (NUEPA) as the primary sample frame. Once in the fi eld, signifi cant discrepancies between the DISE data and actual school enrolments were noticed.
In some states, sampled schools were changed by the state personnel because of disturbances in states due to various reasons. Hence, the data collected in such states may not be as representative as initially planned.
Due to discrepancies in the sample frame, deviation from agreed sampling procedures, and loss of information during administration, it was not possible to estimate sample weights for the survey.
In the states of Jharkhand, Meghalaya, Mizoram, Nagaland, Sikkim and West Bengal, the tests had to be administered at the beginning of class VI rather than at the end of class V due to administrative reasons.
In most of the states, responsibility for data collection was given to DIET faculty who, in turn, used their students as fi eld investigators. On refl ection, the training and hands-on practice given to these fi eld investigators may not have been suffi cient resulting in ineffi ciencies in the data collection procedure and, hence, increased demands during the data cleaning process.
In order to meet the key objectives of this survey, schools and students were sampled in a systematic fashion. Th is meant that teachers could not be explicitly sampled in the same way. As a result, the analysis of teacher-related variables vis-à-vis student attainment could not be made in a comprehensive manner.
In past surveys, the CTT model was used for developing tests and analysing the results. In this survey, IRT was used. Th ese two methodologies are quite diff erent. Th erefore, the results of this survey are not directly comparable with those of past surveys.
For the fi rst time, NCERT used IRT for analysis of results instead of CTT. Th erefore, results are reported in terms of scale scores rather than percentage correct scores. Whilst this is an important step towards emulating international best practice, unfamiliarity with this approach has undoubtedly made it more diffi cult for the lay reader to interpret results. It is hoped that as IRT becomes more widely used in India, understanding will improve.

1
Introduction
Chapter 1
In t roduct ion

2
National Achievement Survey

3
Introduction
CHAPTER 1 INTRODUCTION
Th is report summarises the fi ndings of the National Achievement Survey (NAS) of class V students conducted in 2010 by the National Council for Educational Research and Training (NCERT) through its Department of Educational Measurement and Evaluation (DEME). It is based on information gathered through tests and questionnaires administered to a sample comprising 1,22,543 students in 6,602 schools across 31 States and Union Territories (UTs). Th e subjects covered were Mathematics, Language (including Reading Comprehension) and Environmental Studies (EVS).
Th is survey is the latest in an ongoing programme of such studies available to all 35 States and UTs of the nation. Th e aim of each NAS is to provide reliable information on the achievement of students in the elementary sector of education in government and government-aided schools. Th is is achieved not only by applying standardised tests to students, but also collecting information about relevant background factors including the school environment, instructional practices, qualifi cation and experience of teachers, and the home background of students. Th e data from each NAS gives policy makers, curriculum specialists, researchers and, most importantly, school principals and teachers a ‘snapshot’ of what students are achieving in key subjects at a particular point in time. By repeating such measurements at regular intervals, trends can be explored providing an invaluable perspective from which to consider educational reform and improvement.
It should be noted that whilst each NAS provides achievement scores for the nation, for each participating state and for certain groups (e.g. females, students in rural schools, etc.), it does not give scores to individual students or schools.
1.1 History of NAS in India
In the year 2000, the programme of NAS, originally conceived by NCERT as an independent project, was incorporated into the Government’s fl agship project Sarva Shiksha Abhiyan (SSA). NCERT is responsible for developing and conducting the surveys whilst funding is provided by the Ministry of Human Resource Development (MHRD).
Under SSA, three cycles of NAS were planned. Each cycle was to cover three key grades: class III, class V and class VII/VIII. Th e fi rst cycle conducted in the period 2001-04 was named the Baseline Achievement Survey (BAS). Th e second cycle, conducted during 2005-08 was the Mid-term Achievement Survey (MAS). Th e third planned cycle was originally named the Terminal Achievement Survey (TAS). However, the importance of these surveys and the experience gained through the fi rst two cycles made it clear that this programme should be an ongoing feature of the national education system. Th erefore, the current series of NAS is more correctly known as ‘Cycle 3’ as given in the Table 1.1 below:
Table 1.1: Timeline for NAS under SSA
2001 2002 2003 2004 2005 2006 2007 2008 2009 2010 2011 2012
Cycle 1
(formerly BAS)
Cycle 2
(formerly MAS)
Cycle 3
(NAS)
Class V Class III Class V Class III *Class V Class III
Class VII & VIII Class VII & VIII Class VIII**
* The findings of the Cycle 3, Class V (NAS) are reported herein. **Cycle 3 (NAS) for Class VIII is in progress while Class III has been initiated.

4
National Achievement Survey
At the class III level, assessment is made in two subjects, i.e., Mathematics and Language. For class V, assessment is carried in three subjects: Mathematics, Language and EVS. For class VII/VIII, four subjects are assessed, i.e., Mathematics, Language, Science and Social Science.
Th e comprehensiveness and coverage of these surveys provide very useful data to capture the progress of the education system as well as to enhance the quality of elementary education.
Th e survey reported herein represented a quantum leap forward in the methods used to analyse the results. NCERT’s belief that these surveys should be an ongoing feature of the national education system encouraged the project to introduce a new method of scoring the test results, namely Item Response Th eory (IRT) (see 1.9 below). Th is off ers the exciting possibility of linking and thus comparing national and state test scores over time, even though diff erent tests are used. Th is requires a survey design which specifi es some repetition of items between the tests to be linked, and that sampling and weighting details should be comparable. IRT methods are described in more mathematical detail in Appendix II.
1.2 Development of Tools
For any large survey, the tools employed need to be simple, understandable, valid and reliable. For measuring reliably the learning levels of class EVS are important. Th e tests need to be pegged at the level that they measure the abilities developed in children across the states. In view of variation in course content and other factors, developing tests is a big challenge. Th erefore, before undertaking the test development, it was necessary to know what was taught at class V level by diff erent states in diff erent subjects. Th e fi rst exercise, hence, was to collect the syllabuses and the textbooks of Language, Mathematics and EVS from the states/UTs. Th ese were then analysed from the point of view of the content areas covered and competencies acquired. Th e common core content and competencies were identifi ed for developing the tests.
Based on the analysis, assessment frameworks were developed in each subject. Th e frameworks described the competencies to be covered in the tests, the number and type of items to be used for testing each competency, the structure of the test forms and number of tests forms to be used.
For measuring each learning outcome with suffi cient precision, it was necessary to construct multiple test forms in each subject. A three dimensional grid was prepared in each subject indicating the content areas to be covered, skills to be tested, the diffi culty level of items under each skill along with the number of items.
Item writing workshop
General
Th e item writing workshop included plenary sessions on fundamental principles of test development and subject-specifi c workshops for writing and reviewing/editing draft items.
Th e general principles covered were:
Characteristics of sample-based achievement surveys (national and international)
Test specifi cations and their role in test development
Item writing rules and guidelines

5
Introduction
Procedures and checklists for reviewing the quality of items
Introduction to classical item statistics.
1.2.1 Language
Th ere were two sub-groups – English and Hindi. Th e work was guided by the draft specifi cations for the language test prepared by DEME, text and item types from MAS and international examples from various sources including National Assessment of Educational Progress (NAEP) reading. Th e tasks covered were:
Reading texts and questions (4-option mcq)
Error correction (3-option mcq)
Discrete items on ‘language structures’ (4-option mcq)
Writing tasks and scoring criteria
Th e Hindi group checked that the English reading passages could be translated. Th ey also produced an original Hindi reading passage for translation into English.
Suffi cient passages, discrete items and writing tasks were prepared and reviewed to create three booklets for pre-testing having the following structures:
Th e next steps undertaken were:
Entering all items, reading passages, marking keys etc. into the computer and checking.
Preparing artwork for reading passages.
Translating English reading tasks to Hindi and vice versa.
Selecting the passages and items for three booklets for pre-testing.
Reviewing, checking and proofreading all booklets.
Forming the Hindi pre-test booklets from translated reading items, translating writing tasks and original Hindi language structure multiple-choice questions.
Checking again before ‘passing for print’ to ensure that the English and Hindi versions were ‘camera-ready’.
Booklet 1
Reading passage 1 (New)
Reading passage 2 (New)
Reading passage 3 (New)
Language structure block 1
(5 items)
Language structure block 2
(5 items)
Language structure block 3
(5 items)
Language structure block 4
(5 items)
Language structure block 5
(5 items)
Writing task 1 (letter)
Booklet 2
Reading passage 4 (New)
Reading passage 5 (New)
Reading passage 6 (New)
Language structure block 6
(5 items)
Language structure block 7
(5 items)
Language structure block 8
(5 items)
Language structure block 9
(5 items)
Language structure block 9
(5 items)
Writing task 2 (narrative/creative)
Booklet 3
Reading passage 7 (New)
Reading passage 8 (New)
Reading passage 9 (New)
Language structure block 11
(5 items)
Language structure block 12
(5 items)
Language structure block 13
(5 items)
Language structure block 14
(5 items)
Language structure block 15
(5 items)
Writing task 3 (descriptive)

6
National Achievement Survey
1.2.2 Mathematics
Th e work was guided by the draft specifi cations for the Mathematics test prepared by NCERT, items from MAS and international examples from various sources [(including NAEP and Trends in International Mathematics and Science Studies (TIMSS)], and traditional and modern textbooks used in schools for Mathematics.
Review of the textbooks immediately revealed that the approach to teaching/learning Mathematics advocated by the National Curriculum Framework (NCF) 2005 is signifi cantly diff erent from that of traditional syllabuses. Th ere is a signifi cant shift from formally setting out concepts and procedures to be learnt to an informal approach where topics related to Mathematics were discussed and explored through activities – rather than simply being presented from authority and then practised. Th is is obvious from the new textbooks which are signifi cantly diff erent in terms of content, complexity, language and even presentation.
Th e child-friendly approach used here was in sharp contrast to the more formal approach used in traditional books. Th e lack of formal mathematical language which is a feature not only of the old textbooks but also the test items used in MAS for class V was also noted.
Th e Working Group ran a simple analysis to check the extent to which the Mathematics test used for MAS is covered by the textbook for the new curriculum (‘Math-Magic’, NCERT 2008). Th is analysis showed that more than half of the 40 items used for MAS would not formally have been covered by students taught using this new textbook. Th ere were some topics which, according to the NCF and the textbook, were not taught at class V. Th ese include Highest Common Factor (HCF), Lowest Common Multiple (LCM), operations with decimals, types of triangles (acute, obtuse), meaning and calculation of average, percentages, and symbols </> (more/less). Th is would make the MAS test unfair for these students. Because of this, new tests for NAS, Cycle 3 were developed.
Activities carried out in Mathematics Group
Th e Working Group came to a common understanding of the main principles of item writing and quality control.
Th e Working Group drafted more than 100 items.
All these items were peer reviewed.
Th e Working Group proposed the use of the following classifi cation system for Mathematics topics:
T1: Number System
T2: Computations (operations)
T3: Measurement
T4: Geometry
1.2.3 Environmental Studies
Th e work was guided by the draft specifi cations for the EVS test prepared by the department, items from MAS and international examples from various sources (including NAEP), and traditional and modern textbooks used in schools for EVS.
Prior to the seminar, DEME collected syllabuses and other information from the states. Not all states responded, but from those that did, a very complicated picture emerged.

7
Introduction
In EVS, as in Mathematics, the approach advocated by NCF 2005 is signifi cantly diff erent from that of traditional syllabuses. Th ere is a signifi cant shift from setting out a body of knowledge to be learnt to a less prescriptive approach where topics are discussed with students rather than simply being presented as correct. Th is is refl ected in the new textbooks which are signifi cantly diff erent in terms of content, complexity, language and even presentation.
Th e uptake of new syllabuses and materials has not been universal. Some states have adopted syllabuses and textbooks true to NCF whilst others have chosen not to make the transition. Even in states where new syllabuses have been developed, many schools continue to use old textbooks and, one suspects, traditional approaches.
Th is situation poses signifi cant challenges for the development of EVS test booklets for the achievement survey. It was to decide whether the items be based on the old syllabus, the new syllabus, or something in between. What about the anchor items from MAS? Will these be equally appropriate in all states? Should anchor items that do not appear in NCF be deleted from TAS or not?
Given this dilemma, the EVS subject group worked hard to generate items targeting fundamental concepts and principles of EVS. Th e focus was on what was important both for the students and for the achievement survey.
Th e group developed a number of items designed to test ‘enabling skills’ such as reading information from a graph, bar chart or table. Items targeting the skill of inference from unfamiliar, given information were also developed. For achievers at the lower end of the ability spectrum, several items based on pictorial information were developed to lower the reading load. For example, some items provide four pictures showing a procedure and the child is asked to put them in the correct order. Some questions were based on the science of everyday situations, e.g., an item involving the evaporation of liquid from an open dish was designed to test children’s understanding of the underlying principle, i.e., ‘where has the water gone?’.
All draft items were reviewed by the whole group to ensure that major concerns were heard and that a consensus could be reached on the suitability of each item. In this way, more than 140 items were drafted covering all the major themes of EVS.
After the development of the items in EVS, the DEME faculty carried out the following activities:
Entered all items, prepared marking keys etc. into the computer.
Prepared artwork (maps, diagrams, charts, tables etc.) for items.
Selected the items for three booklets for pre-testing.
Reviewed, checked and did proof reading of the booklets.
Translated the English versions to Hindi and checked that the translations were valid.
Checked again before ‘passing for print’ to ensure that the English and Hindi versions were ‘camera-ready’.
1.2.4 Translation of items
NCERT arranged a workshop for the translation of all items for pre-testing into 13 languages to be used in the survey. One person in each subject area was invited from each state to do this work. In a subsequent workshop, representatives of the states reviewed the translated items vis-à-vis English/Hindi items and made required corrections and modifi cations. Finally, in a training programme for administration of the assessment tools, state coordinators revisited all items selected for piloting and, where necessary, improved them.

8
National Achievement Survey
Th e items were received using certain parameters like what subject matter is being tested; which cognitive behaviour is being exhibited in answering the question; is the key indisputably correct; is the task clean and the distractions plausible; is the language used of the level of the Class V students; and fi nally, are the items likely to be biased against any particular gender or ethnic group.
1.2.5 Piloting of the test items
In order to standardise the tests, they were piloted in 21 states to see how the items worked in diff erent languages. Th e diffi culty level (p-value) and discrimination index (DI) were computed using specialist software for each item. Item Characteristic Curves (ICC) were prepared and were carefully scrutinised to select suitable items for the fi nal tests. By and large, the items having diffi culty indices (p-values) between 0.2 and 0.8 were selected.
1.2.6 Sampling for piloting
Th e sampling procedure for the piloting of items was discussed. Given the time constraints and the need to gather meaningful data, the following procedures were used:
1. A sampling strategy was developed based on District Information System for Education (DISE) data for the school year 2007-08.
2. Th e sample would not be random, but based on expert judgement taking into account the statistical requirement of having enough records for each item for analysis and at the same time, diversity of the students/schools in the education system.
3. Each item should be answered at least by 500 students for classical item analysis. As teach language version was considered a new item, so we needed 500 students per language version per item.
4. Each item appeared in only one booklet.
5. All students in a selected class participated in piloting where booklets in diff erent subjects were more or less equally distributed among them.
6. Schools in the state were selected taking into account the diversity of socio-economic background variables, i.e., some schools were selected from cities, some from small towns, some from rural areas, etc. (Since the expected number of students in rural schools is smaller than in urban schools, the overall number of selected rural schools was greater than urban schools.)
7. All the three booklets in each subject were tested in all languages. However, in one state, only one medium was used.
8. 225 students per district were selected (Hindi and English versions) with similar numbers achieved in other languages.
1.2.7 Administration of tests for piloting
For piloting, DEME developed a handbook for district coordinators and test administrators.
Coordinators were trained in the required procedures.
Lists of selected schools were prepared for selected districts.
Field investigators were instructed as to how to administer tests in schools.
Field investigators visited each school on two successive days so that selected students could take tests in all three subjects.

9
Introduction
Student responses were transferred to data sheets by the fi eld investigators after the completion of test administration. Data sheets were received by NCERT through state coordinators.
1.2.8 Data analysis
Data entry was carried out by a private agency, but the quality of the data entry was controlled by NCERT.
Data was analysed by the psychometricians from Educational Testing Service (ETS). Th eir main task was to analyse data from the piloting exercise, including a trial application of IRT to the data for tests.
Data fi les from the piloting were analysed to give classical test and item statistics by using special analytical software.
Item parameters were used to select the items in the context of national assessment surveys.
In addition to classical statistics, IRT parameters were estimated using specialist software including Bilog-MG and Parscale. Item response curves were generated and discussed in the group when considering the selection of items.
Th e performance of all items was reviewed in all regional languages, particularly in reference to English and Hindi.
Poorly performing and fl awed items were rejected.
1.2.9 Test booklet construction
For the construction of booklets for the main survey, the following steps were taken:
Reviewed all ‘new’ items by considering classical item statistics, parameters and ‘fi t’ from the IRT analysis, and evidence of diff erential item functioning for diff erent groups/languages.
Reviewed ‘old’ items, including those being considered for use as anchor items by considering statistical evidence of previous performance. Selected ‘good’ items.
Grouping of cognate items (i.e., by assessment objective) into time-limited ‘blocks’.
It was decided that within a subject, all the three forms would contain a block of anchor items. In EVS and Mathematics, a minimum of 20 anchor items would be used. In Language, 15 items of reading comparison and 5 items of language elements would be used as anchors. Th erefore, three common passages would be used in each booklet. And each booklet would have a new passage also. Th e structure of the Mathematics and EVS booklet was as under.
Form 1 Form 2 Form 3
B
C
D
E
F
G
A Anchor Block

10
National Achievement Survey
Table 1.2: Three dimensional grid for tests
Skills\Contents Skill 1 Skill 2 Skill 3 Total
Topic 1 easy-2
medium-1
hard-1
easy-3
medium-4
hard-2
easy-0
medium-4
hard-3
20 Items
Topic 2 20 Items
Topic 3 15 Items
Topic 4 25 Items
Total 25 Items 30 Items 25 Items 80 Items
In all the subjects, the following domains were identifi ed:
Language Mathematics EVS
Language Elements Arithmetic Social Studies
Reading Comprehension Algebra Science
Writing Geometry -
In each domain, there were a number of sub-domains or topics. Th ese items were again vetted by subject experts. Each test was reviewed in the light of the content area covered, competency covered, appropriate language, estimated diffi culty level and also the homogeneity of distractors. A similar procedure was used for developing tests in diff erent languages. While undertaking the translation activity, back translation was one of the ways adopted to authenticate whether the translated version retains the original meaning.
Finally, for class V (NAS), each test form for EVS and Mathematics consisted of 40 multiple choice items. Th us, overall 80 unique items were used in each subject to measure learning achievement. In Language, in addition, each booklet included a writing task to test the writing skills of class V students. Scoring keys were also developed for each test form in each subject.
In the cover page of the test, instructions for students and examples indicating how to record responses and change the response in case of any mistake on the test booklet were also prepared and translated in various languages for all the three subjects.
1.2.10 Questionnaires
Questionnaires for class V (NAS) were built upon experience from the earlier BAS and MAS surveys and incorporated ideas from international assessment instruments. For this survey, three questionnaires were developed to collect information on a) schools, b) teachers, and c) pupils and their backgrounds. Th e process of drafting questionnaires began in September 2009 and the pupil questionnaire was piloted in the fi eld trial of the test booklets in November/December 2009.
Draft questionnaires were prepared and sent to international experts for review.
Amended student questionnaires were tried out with test booklets, using a group of 100+ students chosen for convenience. Responses were then analysed and linkage with test booklets checked.
Amended teacher questionnaires were tried out by a group of invited teachers.
Th e fi nal version of the pupil questionnaire was translated into 15 Indian languages. Th e school and teacher

11
Introduction
questionnaires were produced in Hindi and English only, as it was considered that school principals and teachers were profi cient at least in one of these languages.
Th e pupil questionnaire was strongly infl uenced by international best practices. Students selected for TAS were not tested in all three subjects. Th erefore, the student questionnaire was revised so that it fi ts the new test administration procedures—especially the distribution of the various test booklets among students (‘spiralling’).
Th e pupil questionnaire contained questions pertaining to the home background of students. Areas touched upon included parents’ level of education and occupation; help available at home for studies from parents and siblings; and the study materials and resources available at home. Th e questionnaire also investigated the experience of pupils in school. Th is included questions about class work and homework given by teachers, and whether they liked coming to school etc.
Th e school questionnaire sought information on the location, enrolment and structure of the school; the number of school days; and the school’s infrastructure and environment. Other questions related to teachers’ job satisfaction and their professional development opportunities, curriculum transaction strategies, and problems existing in schools.
Th e teacher questionnaire comprised questions regarding the age of teachers, academic and professional qualifi cations, training programmes attended, teaching and evaluation practices, teaching materials available to them, interaction with other teachers and the school head, and their job satisfaction.
Th e teacher and school questionnaires should be analysed to check that the information which is available from other sources is not being gathered (e.g. the school database used for drawing the sample). Avoiding duplication will improve effi ciency.
1.3 Th e NAS Sample
Th e class V (NAS) was designed to investigate learning achievement in the government system at the state/UT level. Hence, the target population for the survey was all class V children studying in government schools, local body schools, and government-aided schools. Completely private schools were not included in this survey. Th e proportion of pupils in private schools varies between states.
In general, the sample design for each state/UT involved a three-stage cluster design which used a combination of two probability sampling methods. In the fi rst stage, districts were selected using Probability Proportional to Size (PPS) sampling principles. Th is means that the probability of selecting a particular district depended on the number of class V students enrolled in that district. In the second stage, the requisite number of schools was selected in the chosen districts,. Once again, PPS principles were used so that large schools had a higher probability of selection than small schools. In the third stage, the required number of students in each school were selected using the Simple Random Sampling (SRS) method. In schools where class V had multiple sections, an extra stage of selection was added with one section being sampled at random.
In the survey, PPS sampling was based on class V enrolment data from the DISE 2007–08. SRS sampling was conducted according to the class registers available in sampled schools. Although the DISE data was not free from criticism, it was used because it was considered to be the most complete and up-to-date enrolment data available at the time of sampling. Unfortunately, due to discrepancies in the DISE data, limitations in the sampling method and loss of information at the sampling and administration stages of the survey, it was impossible to estimate sample weights for the survey. Appendix I provides further details about the sampling design and procedures of the survey.

12
National Achievement Survey
1.4 Participating States and Sample Coverage
Th e survey was intended to cover all 35 states and UTs, but Arunachal Pradesh, Dadra and Nagar Haveli, and Lakshadweep could not participate in this endeavour. Manipur participated in the survey administration, but faced problems in data collection and failed to report its data on time. Among the 31 participating states and UTs, six states – Jharkhand, Meghalaya, Mizoram, Nagaland, Sikkim and West Bengal – could not test class V students at the end of their academic year, i.e., December 2009. Th erefore, it was decided to test class VI children at the beginning of the next academic year.
Exclusions of sub-populations from the total target population of NAS class V were made at the initial stage of sampling. Large scale educational surveys allow such exclusions for reasons such as ensuring administrative effi ciency, as long as the excluded population does not critically aff ect the quality of the survey. For example, the exclusion of very small schools from a target population is often accepted. Th e class V (NAS) excluded schools having fewer than fi ve students, or in some cases, nine students, depending on the enrolment characteristics of the state/UT. In addition to the small school exclusion, Upper Primary Only schools were excluded due to a classifi cation error. As a result of these exclusions, population coverage of the class V sample varies from 7% to 99%. In fi ve states/UTs of Assam, Daman & Diu, Goa, Kerala and Maharashtra, the population coverage fell below 80% mainly due to the Upper Primary Only school exclusion. It should be noted that it is virtually impossible in such surveys to achieve a sample which covers the entire population. However, if too many possible respondents are excluded, then the sample loses much of its value as a description of the population. NCERT set 80% coverage and above as acceptable for a representative picture for this study. Because of the arrangements for replacing non-cooperating schools with an equivalent (see Appendix II), it is considered that response rates at the school level are satisfactory. Unfortunately, no data is available for non-response within selected schools.
Th e survey classifi es the participating states/UTs into three diff erent reporting groups according to their population coverage and the class tested. A group of 20 states is classifi ed as having ‘coverage of 80 % or more’. Another group of fi ve states has ‘coverage less than 80%’. Finally, a group of six states is classifi ed as having ‘tested class VI students’. Table 1.3 summarises sampling coverage and reporting classifi cation of the survey by state.
Table 1.3: Sample coverage and reporting classification by state
S.No. States and
UTs
Population
Coverage
Reporting
Classification
S.No. States and
UTs
Population
Coverage
Reporting
Classification
1. A & N Islands 96% Class V, Adequate
Coverage
19. Lakshadweep -- Did Not Participate
2. Andhra
Pradesh
84% Class V, Adequate
Coverage
20. Manipur -- Incomplete and late
submission of Data (Not
Reported)
3. Arunachal
Pradesh
-- Not Participated 21. Madhya
Pradesh
91% Class V, Adequate
Coverage
4. Assam 7% Class V, Inadequate
Coverage
22. Maharashtra 53% Class V, Inadequate
Coverage
5. Bihar 98% Class V, Adequate
Coverage
23. Meghalaya NA Class VI
6. Chandigarh 96% Class V, Adequate
Coverage
24. Mizoram NA Class VI
7. Chhattisgarh 87% Class V, Adequate
Coverage
25. Nagaland NA Class VI

13
Introduction
8. Dadra & Nagar
Haveli
-- Not Participated 26. Orissa 93% Class V, Adequate
Coverage
9. Daman & Diu 50% Class V, Inadequate
Coverage
27. Puducherry 99% Class V, Adequate
Coverage
10. Delhi 99% Class V, Adequate
Coverage
28. Punjab 92% Class V, Adequate
Coverage
11. Goa 51% Class V, Inadequate
Coverage
29. Rajasthan 84% Class V, Adequate
Coverage
12. Gujarat 96% Class V, Adequate
Coverage
30. Sikkim NA Class VI
13. Haryana 94% Class V, Adequate
Coverage
31. Tamil Nadu 94% Class V, Adequate
Coverage
14. Himachal
Pradesh
93% Class V, Adequate
Coverage
32. Tripura 99% Class V, Adequate
Coverage
15. Jammu &
Kashmir
92% Class V, Adequate
Coverage
33. Uttar Pradesh 98% Class V, Adequate
Coverage
16. Jharkhand NA Class VI 34. Uttarakhand 92% Class V, Adequate
Coverage
17. Karnataka 90% Class V, Adequate
Coverage
35. West Bengal NA Class VI
18. Kerala 59% Class V, Inadequate
Coverage
1.5 Characteristics of Participating States
Table 1.4 shows that the states and UTs that participated in this survey vary greatly in their physical, demographic and socio-economic characteristics. For example, Bihar, Maharashtra and Uttar Pradesh each have populations of more than 100,000,000 whilst Daman & Diu, and the Andaman and Nicobar Islands have fewer than 400,000 inhabitants. Mizoram has a population density of just 52 people per square kilometre whilst the corresponding fi gure for Delhi is over 11,000. Th e great disparity in the economic resources of states and hence the funding available for education is exemplifi ed by the diff erences between economically advantaged states such as Delhi, Goa, Maharashtra and Haryana (each with GDP per capita greater than INR 50,000) to those with relatively low incomes such as Bihar and Madhya Pradesh (each with GDP per capita less than INR 20,000).
Of particular importance in this survey are the signifi cant diff erences in the provision of education at the class V level. For example, the target population for this survey was all class V students enrolled in government-run and government-aided schools. However, the proportion of class V students in such schools varied signifi cantly amongst states. For example, in Bihar, West Bengal and Goa, nearly 100% of class V students are in government schools with an insignifi cant proportion in private schools. By way of contrast, in Nagaland, fewer than 50% of class V students are enrolled in government schools.
Th ese and associated factors are likely to infl uence student achievement and other educational outcomes. Th erefore, when considering the fi ndings of this survey and, in particular, when comparing the achievement levels of diff erent states, it is important to take the prevailing conditions into account to ensure that like is being compared with like.

14
National Achievement SurveyTa
ble
1.4
: Se
lect
ed p
hys
ical,
dem
ogra
ph
ic a
nd s
oci
o-eco
nom
ic in
dic
ato
rs f
or
the s
tate
s an
d U
Ts o
f In
dia
State
s an
d
UTs
Popula
tion
+Are
a (
sq.
km
)
Popula
tion
Den
sity
(per
sq.
km
)+
GDP(I
NR
million
s)***
GDP p
er
capit
a
(IN
R)*
**
Per-
capit
a
Inco
me
(IN
R)-
2010
**
Class
V
en
rolm
en
t
(All
sch
ools
)*
Class
V
en
rolm
en
t
(Govt.
&
Govt.
-
aid
ed)*
Sex r
ati
o
(fem
ale
per
1000
male
s)+
Rati
o G
ovt:
All s
chools
*
Lite
racy
Rate
+
Gro
ss
Enro
lmen
t
Rati
o
(Cla
ss
I-V)
++
A &
N Is
land
s3,
79,9
448,
249
4615
,620
43,8
7674
,340
7,561
6,47
187
80.
8686
.27
101.
8
Andh
ra
Prad
esh
8,46
,65,
533
275,
045
308
2,69
1,730
33,2
0051
,025
1,355
,758
890,
628
992
0.66
67.6
695
.5
Assa
m3,
11,69
,272
78,4
8339
757
5,97
021
,607
27,19
768
7088
6429
8495
40.
9473
.1810
6.1
Biha
r10
,38,
04,6
3794
,164
1102
796,
820
9,61
416
,119
1,872
,017
1,867
,758
916
1.00
63.8
210
4.4
Chan
diga
rh10
,54,
686
144
9252
98,7
2010
9,68
812
0,91
216
,606
11,31
581
80.
6886
.43
96.1
Chha
ttisg
arh
2,55
,40,
196
135,
194
189
519,
210
24,9
2138
,059
500,
598
436,
829
991
0.87
71.0
412
5.5
Dam
an &
Diu
2,42
,911
122
2169
5,02
831
,781
39,9
702,
890
2,38
761
80.
8387
.07
135.
9
Delh
i1,6
7,53,
235
1,483
11,29
71,0
53,8
5676
,087
116,8
8628
9,14
319
1,010
866
0.66
86.3
410
9.1
Goa
14,5
7,723
3,70
239
412
4,00
092
,010
132,
719
21,9
4421
,795
968
0.99
87.4
012
9.6
Guja
rat
6,03
,83,
628
196,
024
308
2,16
6,51
043
,330
63,9
611,0
48,2
8084
5,99
891
80.
8179
.31
123.
0
Hary
ana
2,53
,53,
081
44,2
1257
31,0
63,8
5050
,312
78,7
8135
8,62
226
3,77
387
70.
7476
.64
90.4
Him
acha
l
Prad
esh
68,5
6,50
955
,673
123
254,
350
45,3
9150
,365
136,
668
107,5
4097
40.
7983
.78
111.7
Jam
mu
and
Kash
mir
1,25,
48,9
2622
2,23
612
426
4,88
026
,488
30,5
8222
2,32
913
6,87
788
30.
6268
.74
103.
2
Jhar
khan
d3,
29,6
6,23
879
,700
414
629,
500
23,3
6130
,719
800,
019
752,
206
947
0.94
67.6
315
3.9
Karn
atak
a6,
11,30
,704
191,7
9631
91,7
07,4
1235
,818
50,6
761,1
06,5
8686
6,32
396
80.
7875
.60
106.
1
Kera
la3,
33,8
7,677
38,8
6385
91,1
89,9
8036
,030
59,17
946
6,42
444
0,48
710
840.
9493
.91
92.3
Mad
hya
Prad
esh
7,25,
97,5
6530
8,14
423
61,1
63,2
2019
,274
27,2
502,
019,
792
1,471
,511
930
0.73
70.6
315
3.4
Mah
aras
htra
11,23
,72,
972
307,7
1336
54,
324,
131
69,3
7774
,027
1,957
,729
1,762
,636
925
0.90
82.9
110
1.8
Meg
hala
ya29
,64,
007
22,4
2913
264
,700
28,13
042
,601
63,4
7557
,550
986
0.91
75.4
819
1.5
Miz
oram
10,9
1,014
21,0
8152
26,9
7030
,346
45,9
8231
,840
21,6
5297
50.
6891
.58
171.
0

15
Introduction
Naga
land
19,8
0,60
216
,579
11956
,412
28,3
4621
,434
41,4
5116
,631
931
0.40
80.11
92.5
Oriss
a4,
19,4
7,358
155,
707
269
785,
360
21,3
3833
,226
859,
069
822,
711
978
0.96
73.4
5117
.0
Pudu
cher
ry12
,44,
464
492
2598
57,0
0058
,684
82,7
6721
,373
14,18
410
380.
6686
.55
144.
4
Punj
ab2,
77,0
4,23
650
,362
550
1,097
,350
44,9
0162
,153
309,
554
259,
748
893
0.84
76.6
892
.8
Raja
stha
n6,
86,2
1,012
342,
236
201
1,242
,240
24,9
2134
,189
1,375
,324
880,
421
866
0.64
67.0
611
8.3
Sikk
im6,
07,6
887,0
9686
18,0
3025
,018
48,9
3714
,490
12,9
6088
90.
8982
.20
148.
0
Tam
il Na
du7,2
1,38,
958
130,
058
555
2,46
2,66
039
,300
62,4
991,2
13,6
0790
3,89
099
50.
7483
.33
116.1
Trip
ura
36,7
1,032
10,4
9235
091
,240
28,5
1235
,799
85,17
881
,519
961
0.96
87.7
514
7.8
Utta
r Pra
desh
19,9
5,81
,477
240,
928
828
2,36
0,44
215
,600
23,13
24,
133,
429
3,06
3,24
890
80.
7469
.72
113.7
Utta
rakh
and
1,01,1
6,75
253
,566
189
257,7
6030
,362
55,8
7718
5,98
013
3,50
096
30.
7279
.63
119.4
Wes
t Ben
gal
9,13
,47,7
3688
,752
1029
2,36
0,34
030
,950
41,4
691,7
94,8
621,7
32,3
7694
70.
9777
.08
112.9
Indi
a1,2
1,01,9
3,42
23,
287,2
4038
237
,900
,630
46,4
9294
074
.04
114.
0
Sour
ce :
The
Dist
rict I
nfor
mat
ion
Syst
em fo
r Edu
catio
n 20
07–
08.
+ So
urce
: Cen
sus o
f Ind
ia 2
011,
Prov
ision
al P
opul
atio
n To
tals
++ S
ourc
e: E
cono
mic
Sur
vey
2010
–20
11, G
over
nmen
t of I
ndia
, Oxf
ord
Univ
ersit
y Pr
ess
**So
urce
: Dat
a ex
clus
ivel
y co
mpi
led
by th
e VM
W A
naly
tic S
ervi
ces a
nd p
rovi
ded
by th
e Fe
dera
l Sta
te G
over
nmen
ts.
*Thr
ee S
tate
s/UT
s do
not a
nnou
nce
thei
r res
pect
ive
econ
omie
s, h
ence
, VM
W A
naly
tic co
me
out w
ith th
e ro
ugh
inco
me
estim
ates
.

16
National Achievement Survey
1.6 Administration of Tools
When conducting NAS, NCERT takes the help of state agencies like SCERTs and SIEs to coordinate survey activities in the states/ UTs. Each participating state designates a state coordinator who has the responsibility of implementing the NAS in his/her state/UT in accordance with the NAS guidelines. Th e state coordinators are given training on how to collect data in the fi eld. For this, a detailed guideline-cum-training manual was developed by DEME. Further, state coordinators provide training to district coordinators about the conduct of main achievement survey. In each selected district, district coordinators appoint 10 to 12 teams of fi eld investigators. Each team comprises two fi eld investigators. Th ey are given rigorous training about selection of section and students in the sampled schools, administration of tools and transfer of response from test booklet to separate response sheet. Th ese response sheets are collected by the district coordinators and then sent to the state coordinator after checking their number, coding of schools, and whether they have been properly fi lled by the investigators. Th ese response sheets are dispatched by the state coordinator to NCERT where they are scored and analysed. Without the help, dedication, competence and experience of the state coordinators and their teams for which they should be commended, the massive task of data collection for the National Achievement Survey would not have been possible.
1.7 Monitoring
For monitoring, a fi nancial provision at the state and district levels was made and funds were provided to states. It was communicated to the states that at least 10–15 schools are to be monitored randomly during the actual conduct of the survey by the SCERT faculty. Similarly, 5–10 schools in each district are to be monitored by the District Institute of Education and Training (DIET) faculty. Th e responses on questions regarding monitoring during the test administration and data collection did not reveal any clear system of monitoring. While 84% of the state offi cials and 95% of the district coordinators stated that they visited schools to monitor the administration of NAS but when asked how many times they visited the fi eld, response from state coordinators revealed that 21% made visits to the fi eld once and 21% said twice. Th e response of the district coordinators to the same question revealed that 23% made fi eld visits twice and 16% said fi ve times.
NCERT team refl ected that there was no monitoring done from their end while the survey was being conducted and they relied too heavily on the state and district coordinators to carry out the monitoring tasks.
1.8 Data Management
NCERT received material from all states regarding NAS fi eld work. After getting material from the states, NCERT project team checked and organised materials school-wise and prepared batches having details about the school code, district code, number of response sheets, number of pupils and teachers, and school questionnaire and fi eld notes. Th e codes of questionnaires and response sheets were matched and needful corrections were made wherever there was any discrepancy.
Work was outsourced to a computer agency for transfer of data from paper forms to electronic format. Data entry plan and data analysis plan were developed in the department keeping in mind the objectives of the study. Both plans were provided to the computer agency for doing the assigned task in a systematic manner.
Th e computer agency provided soft copy of the data entered. In the department, the project team checked and verifi ed the quality of the data and resolved problems of mismatching fi les. Files of clean data were fi nalized for

17
Introduction
further analysis. Data analysis was carried out by using both Classical Test Th eory (CTT) and IRT. Th e analysis of data carried out is given in next section.
1.9 Analysis of Data
In earlier surveys (i.e. BAS and MAS), the learning achievement data was analysed using CTT and average scores were reported simply as the percentage of correct answers. Th is approach, whilst valid, has signifi cant limitations. In particular, the results are linked to particular tests and groups of students so it is very diffi cult to use multiple tests or to link results from one year to another. Th erefore, it was decided to analyse the data for this and future surveys using Item Response Th eory (IRT) in addition to the classical approach. Th is is in keeping with the best practice of major international surveys such as Programme for International Student Assessment (PISA), Progress in International Reading Literacy Study (PIRLS) and TIMSS. In this survey, a two-parameter logistic model was used (Appendix II).
Th e main reason for administering the tests in this study was to obtain an estimate of the overall ability of the students tested. Previous studies have reported proportion correct scores on a range of items. Th is survey has seen the mode of reporting scores changed to the more widely accepted IRT method. IRT assumes that there is a statistical connection between the diffi culty of an item, the ability of the student, and the probability of being successful on the item. Students with higher ability scale scores are more likely to succeed on any item than their peers of lower ability, while all students are less likely to succeed on items with higher diffi culty scores. In fact, a student’s probability of success on a particular item is dependent on the diff erence between the ability of the student and the diffi culty of the item.
Whilst this method makes the analysis more complex than traditional methods, it has many advantages. Firstly, it places students and test items on the same numerical scale. Th is enables us to produce meaningful ‘maps’ of items and students. Secondly, in IRT, the diffi culty parameter for an item does not depend on the group of test takers. Th is allows us to use multiple test booklets which can be ‘linked’ or equated. Th is can also be used, for example, to compare scores from tests used in diff erent years/cycles – an essential characteristic for monitoring progress over time.
In preparation for data analysis, data fi les and supporting documents were collated, checked and forwarded to ETS. Th e following fi les were provided:
Data entry manual and coding instructions
Copies of the fi nal test booklets – 9 booklets (English language versions)
Spreadsheet showing structure and item positions for each booklet
Answer keys
Student responses (all test booklets) for Goa and Chandigarh
Corresponding responses for the school, pupil and teacher questionnaires
ETS experts, after doing preliminary analyses, decided what kind of classical and IRT test analyses would be used for the analysis of the full dataset received from 31 states/UTs. Under CTT, the performance of students on anchor items was carried out by computing percentage correct scores and averages, standard deviations of test scores, and t-values between diff erent groups. Under IRT, a detailed analysis was carried out to determine the scaled scores, standard errors, percentile scores, signifi cant diff erences between the groups etc. Th e detail of the IRT model used is provided in Appendix II.

18
National Achievement Survey
Besides, impact of the intervening variables was analysed by using statistical techniques of regression analysis.
Regression analysis
Regression analysis was used to see the impact of underlying variables in more detail. Regression analyses of outcome were conducted for a range of pupil and school factors, fi rst for the factor on its own, and then after allowing for two ‘key’ factors:
a) Socio-economic status
b) Speaking language of instruction at home
Th e variables analysed under pupil and school, and teacher related variables were of three types: dichotomous variables having only two possible discrete values; categorical variables having more than two possible discrete values; and, quasi-continuous variables having a wide range of possible values across a numerical scale (e.g., number of siblings). Th e treatment applied to each type of variable is described in chapter 8.
1.10 Understanding the results
1.10.1 Th e reporting scale
Th roughout this report, results are reported using ‘scale scores’ calculated using IRT. Th ese replace the percentage correct scores that were used in previous reports. Th is change brings important advantages. Most importantly, the scale will be fi xed so that results from future surveys can be reported on the same scale. Th us, provided adequate linking procedures through common items are incorporated, a score of, say, 270 today will be equivalent to a score of 270 in three years’ time, even though the items used are not the same.
So if, for example, over a three-year period, a state’s average score in Mathematics rises from 248 to 254, we can compare these directly and draw meaningful conclusions about changes in student achievement. Th is is possible because even though the scores have been derived from diff erent students taking diff erent tests at diff erent times, the reporting scale is fi xed.
Th e average score for the whole population tested is initially set at 250, with a standard deviation of 50. However, if educational standards improve, the overall average will rise.
The Reporting Scale
Th is means that the majority of students (about 70%) will have scores in the range 200 to 300. On this scale, a score of more than 400 would represent an extraordinarily high level of achievement.
It should be noted that the adoption of this more sophisticated reporting scale means that it is not possible to make direct comparisons with the values reported in earlier surveys.
100 200 300 400
Low achievement Mid - point = 250 High achievement

19
Introduction
In this report, all values related to the achievement of students are given on scales calibrated to have 250 in the centre as described above. However, the scores for Mathematics, Reading Comprehension and EVS are derived by applying the same principles but independently. Th erefore, it is important that readers do not compare scores across subjects.
1.10.2 Tables of Results
Tables of results presented in diff erent chapters record basic statistics such as the average score achieved by students in a particular state in a particular subject. Average scores indicate how typical students performed in the survey’s tests. However, in order to give information about the performance of lower-, middle- and higher-performing students, results are also reported at fi ve key percentiles (10th, 25th, 50th, 75th and 90th). For example, the score at the 25th percentile is the score which 75% of students achieve or surpass, and the score at the 90th percentile is the score that 10% of students achieve or surpass. Th e range between the 25th and 75th percentiles (the inter-quartile range) represents the performance of the middle 50% of students. Th is, therefore, is a good indicator of the degree of homogeneity within a state’s student cohort.
Where average scores are reported, these have been calculated for the students who were selected to take part in this survey. If other students had, by chance, been selected, then it is possible that a slightly diff erent average would have been recorded. Th e likely size of this sampling error – an inevitable consequence of the student selection process – can be estimated and a measure of this is reported as the standard error associated with a value.
Th e size of the standard error of a measurement should be taken into account when considering reported values. For example, the average EVS score for students in Gujarat was ‘250’ with an estimated standard error of about three scale points. Th is means that we can be 70% confi dent that the ‘true’ value of Gujarat’s average EVS score lies in the range 247 to 253 (i.e. 250 ± 3). Furthermore, we can be 95% confi dent that the ‘true’ value of Gujarat’s average EVS score lies in the range 244 to 256 (i.e. 250 ± 6).
Th e fact that all calculated values have an associated error is of particular importance when comparing, for example, the average scores of two states. For example, Gujarat has an average EVS score of ‘250’ which is lower that Orissa’s average EVS score of ‘253’. But the standard error in both cases is approximately three scale points. Th is means that if we were to repeat the measurement using diff erent samples of students, there is a signifi cant chance that Gujarat’s score would now be higher than that of Orissa.
To help readers make valid comparisons, many tables include the results of tests of signifi cance. Th ese are statistical checks which, by taking into account the two values being compared and their standard errors, indicate whether an observed diff erence is likely to be a true diff erence or whether it may have happened by chance. In this report, such tests have a confi dence level of 95%. Th is means that if a diff erence is marked as being ‘statistically signifi cant’, then the probability of it happening by chance is less than 5%.
1.10.3 Tables related to pupil, teacher and school variables
Th e nature of the pupil, teacher and school related variables is of diff erent types – therefore, a diff erent type of treatment was given for analysing data related to them. Th e information provided in the data tables is complicated in nature, therefore, some examples regarding reading tables and interpretation of data are given below. Th ese show the regression results between diff erent intervening variables and language achievement scores. Similar tables were created for Mathematics and EVS and all fi ndings are given in chapters 8, 9 and 10. Th e three columns under the subject show the relation between the variables and subject score without and with allowing key background variables, namely the socio-economic background variables and speaking the language of instruction at home.

20
National Achievement Survey
To understand the data provided in the table, an example for each type of variable is explained below.
1. Dichotomous Variables
In dichotomous variables such as ‘having a subject textbook’ there are only two possible discrete values: ‘have’ and ‘don’t have’. One of these is taken as the base category and assigned a value of zero. Diff erences with respect to this base category are reported. Th e interpretation of dichotomous variables is given below:
Table 1.5: Regression Results – Students having subject textbooks
Variables Language
Coeff SE Sig.
Without key variables 8.46 1.75 **
With key variables 7.75 1.70 **
*Significant if P<.05 , **Significant if P<.01, NS-Not Significant
In this case, ‘not having a textbook’ is taken as the base category. Th e coeffi cient of 8.46 (without including key variables) means that, on average, students with a Language textbook outscore those without by 8.46 scale score points. Th is diff erence is statistically signifi cant. Taking the key variables into account reduces the coeffi cient slightly to 7.75, but the positive eff ect of having a textbook remains signifi cant.
2. Categorical Variables (with more than two values)
Th e interpretation of categorical variables (with more than two values) is given in Table 1.6:
Table 1.6: Regression results– School management-wise
Variables Language
Coeff SE Sig.
Without key variables Zila Parishad 9.28 2.11 **
Local Body/Municipal Committee 9.34 2.25 **
Tribal Social Dept. 12.91 7.46 NS
Private aided 16.96 1.88 **
With key variables Zila Parishad 9.42 2.15 **
Local Body/Municipal Committee 7.78 2.17 **
Tribal Social Dept. -9.03 7.28 NS
Private aided 13.90 1.83 **
*Significant if P<.05, **Significant if P<.01, NS-Not Significant
Under this variable, there are fi ve possible responses – government managed, zila parishad, local body, tribal schools and private aided. Th e largest category (government managed) is taken as the base category and its scores taken as the zero point, and regressions for the other categories expressed as deviations from this. Th e table shows that, for example, pupils from private aided schools perform signifi cantly better than those from government managed schools in Language. On average, those in private aided schools outperform pupils in government managed schools by 16.96 score points. After including key variables, the diff erence is reduced slightly but still remains statistically signifi cant.

21
Introduction
3. Quasi-continuous Variables
Finally for variables treated as quasi-continuous, the minimum number is taken as a base value. For example, the variable ‘number of siblings’ can have values 0, 1, 2,…, 10 or more and so is treated as quasi-continuous. In this case, zero is taken as the base value.
Th e interpretation of continuous variables is given in Table 1.7:
Table 1.7: Regression Results – Siblings-wise
Variables Language
Coeff SE Sig.
Without key variables -1.87 0.21 **
With key variables -0.99 0.21 **
*Significant if P<.05 , **Significant if P<.01, NS-Not Significant
Here the coeffi cient -1.87 means that for each additional sibling, pupils on average score 1.87 points lower in Language. Th erefore, pupils with two siblings will, on average, score 1.87 scale score points lower than their peers with a single brother or sister. Correspondingly, pupils with three siblings will, on average, score 3*(1.87) = 5.61 points lower than those who have no brothers or sisters. Th is eff ect is lower when the key variables are taken into account but remains statistically signifi cant.
1.11 Organisation of the Report
Th e report contains 11 chapters and appendices.
Student achievement: In chapters 2, 4 and 6, achievement of class V students is presented. Th eir achievement in Language, Mathematics and EVS are separately reported vis-à-vis the overall achievement of the other participating states in diff erent groups. In addition, information about diff erences in achievement by students’ gender, school location and social category is also provided.
What students know and can do: Chapters 3, 5 and 7 describe what class V students know and can do in Language (Reading Comprehension and Language elements), Mathematics and EVS respectively. For each subject, the test description is given along with the cognitive processes tested. To understand student performance in diff erent subjects, item maps were prepared using the scale scores, mental processes and item description.
Impact of student, school and teacher related variables on achievement of students: Chapters 8, 9 and 10 are each divided in two parts. Part 1 deals with profi les of student, school and teacher respectively. Whereas in Part II, an attempt is made to see the impact of student, school and teacher related variables on students’ attainment by using regression analysis.
Th e last chapter of this report deals with equity and the success of the Sarva Shiksha Abhiyan programme in providing equality of opportunity.
Besides the above stated chapters, the report contains a number of appendices providing more information about sample design and procedures, scaling the NAS data and estimating sampling variance, performance on anchor

22
National Achievement Survey
items, creating a socio-economic index, list of surveyed states, districts, schools, teachers and students, list of state coordinators etc.
1.12 Limitations
Th is survey undoubtedly represents a signifi cant step forward in the development of national achievement surveys in India. However, as with all such enterprises, lessons have been learnt. In conducting the Class V NAS, the following limitations have been noted so that they may be addressed in future achievement surveys:
Th e survey used DISE 2007–08 data from the National University of Educational Planning and Administration (NUEPA) as the primary sample frame. Once in the fi eld, signifi cant discrepancies between the DISE data and actual school enrolments were noticed.
In some states, sampled schools were changed by the state personnel because of disturbances in states due to various reasons. Hence, the data collected in such states may not be as representative as initially planned.
Due to discrepancies in the sample frame, deviation from agreed sampling procedures, and loss of information during administration, it was not possible to estimate sample weights for the survey.
In the states of Jharkhand, Meghalaya, Mizoram, Nagaland, Sikkim and West Bengal, the tests had to be administered at the beginning of class VI rather than at the end of class V due to administrative reasons.
In most of the states, responsibility for data collection was given to DIET faculty who, in turn, used their students as fi eld investigators. On refl ection, the training and hands-on practice given to these fi eld investigators may not have been suffi cient resulting in ineffi ciencies in the data collection procedure and, hence, increased demands during the data cleaning process.
In order to meet the key objectives of this survey, schools and students were sampled in a systematic fashion. Th is meant that teachers could not be explicitly sampled in the same way. As a result, the analysis of teacher-related variables vis-à-vis student attainment could not be made in a comprehensive manner.
In past surveys, the CTT model was used for developing tests and analysing the results. In this survey, IRT was used. Th ese two methodologies are quite diff erent. Th erefore, the results of this survey are not directly comparable with those of past surveys.
For the fi rst time, NCERT used IRT for analysis of results instead of CTT. Th erefore, results are reported in terms of scale scores rather than percentage correct scores. Whilst this is an important step towards emulating international best practice, unfamiliarity with this approach has undoubtedly made it more diffi cult for the lay reader to interpret results. It is hoped that as IRT becomes more widely used in India, understanding will improve.

23
Introduction
Chapter 2
S tudent Achievement in Language

24
National Achievement Survey

25
Student Achievement in Language
CHAPTER 2 STUDENT ACHIEVEMENT IN LANGUAGE
Th e Language tests used in the NAS included three categories of items: those testing ‘reading comprehension’; those testing ‘language-specifi c elements’ such as vocabulary and grammar; and ‘extended writing’ tasks. Th e tests were administered in 15 languages. Within these, the reading comprehension passages and their associated items were translated directly and hence, are comparable. Th e language-specifi c items were of necessity, unique to each language. Th e writing tasks were common across languages, but the variability of marking was too great to allow meaningful comparisons to be made. Th erefore, this report focuses on student achievement in the reading comprehension domain only. Information from the other language items will be subjected to secondary analysis and reported separately.
Overall achievement in the reading domain is reported for each of the participating states and UTs. In addition, information about diff erences in achievement by student gender, school location and social category is provided. In the majority of states, students nearing the end of class V were tested. However, in a few states, the arrangement of the school year meant that students had to be tested at the beginning of class VI. Results for these groups are presented separately to reduce the chance of readers inadvertently comparing diff erent cohorts.
2.1 How did the states and UTs perform in Reading Comprehension?
Tables 2.1, 2.2 and 2.3 show the distribution of student achievement for the 31 participating states and UTs. Each table represents one of the three categories: those where class V students were tested and where sample coverage was adequate; those where class V students were tested but where sample coverage was inadequate; and those where class VI students were tested. Within each group, states are listed in alphabetical order.
Th e tables list each state’s average score on a scale from 0 to 500. For each score, the ‘standard error’ is given to indicate the degree of imprecision arising from the sampling process. Finally, the tables indicate whether a state’s average score is signifi cantly diff erent from the group’s average or not.
Table 2.1: Average Reading Comprehension scores for states and UTs where class V students were tested and
population coverage was >80%
States and UTs Average Score Standard Error Significant Difference
A & N Islands 233 2.1
Andhra Pradesh 244 2.1
Bihar 228 2.6
Chandigarh 245 2.5
Chhattisgarh 229 3.2
Delhi 258 3.4
Gujarat 251 2.7
Haryana 236 1.9
Himachal Pradesh 241 2.4
Jammu & Kashmir 250 2.8
Karnataka 262 2.7
Madhya Pradesh 250 3.9
Orissa 253 3.5

26
National Achievement Survey
Puducherry 222 2.1
Punjab 252 2.7
Rajasthan 251 3.0
Tamil Nadu 278 2.5
Tripura 253 2.8
Uttar Pradesh 282 3.4
Uttarakhand 232 2.8
Group Average 247 0.6
The state’s average score is not significantly different from that of the group.
The state’s average score is significantly above that of the group.
The state’s average score is significantly below that of the group.
Twenty states and UTs represented in Table 2.1 are those in which class V students were tested and where the sample covered at least 80% of the target population. Th e average score for this group was 247 (with a standard error of 0.6). Th e results reveal substantial diff erences in Reading Comprehension achievement between the highest performing state (282 for Uttar Pradesh) and the lowest performing state (222 for Puducherry). Four states had average scores signifi cantly above that of the group; seven states had average scores signifi cantly below that of the group; and nine states had average scores that were not signifi cantly diff erent from that of the group.
Th e group included nine states in which the language of assessment was Hindi. Amongst this group, there was a wide range of outcomes. Uttar Pradesh had the highest average level of achievement (282) and Bihar the lowest (228). Th e performance levels of the other states in the Hindi group fell between these extremes: Delhi (258); Rajasthan (251); Madhya Pradesh (250); Himachal Pradesh (241); Haryana (236); Uttarakhand (232); and Chhattisgarh (229).
Table 2.2: Average Reading Comprehension scores for states and UT where class V students were tested and
population coverage was <80%
States and UT Average Score Standard Error Significant Difference
Assam 240 2.3
Daman & Diu 255 4.3
Goa 257 4.4
Kerala 277 1.9
Maharashtra 266 2.1
Group Average 259 1.4
The state’s average score is not significantly different from that of the group.
The state’s average score is significantly above that of the group.
The state’s average score is significantly below that of the group.
Th e fi ve states and UTs represented in Table 2.2 are those in which class V students were tested but where the sample covered less than 80% of the target population. For this group, great care should be taken when considering an average score as it may not be a reliable measure for the whole state/UT.
Table 2.3: Average Reading Comprehension scores for states where class VI students were tested
States Average Score Standard Error Significant Difference
Jharkhand 237 3.0
Meghalaya 250 2.5
Mizoram 260 1.1

27
Student Achievement in Language
Nagaland 248 2.8
Sikkim 246 1.7
West Bengal 266 2.3
Group Average 251 1.0
The state’s average score is not significantly different from that of the group.
The state’s average score is significantly above that of the group.
The state’s average score is significantly below that of the group.
Th e six states represented in Table 2.3 are those in which class VI students were tested. For this group, the average score was 251 (Standard Error 1.0). Mizoram and West Bengal performed signifi cantly better than the group average whereas the average scores of Sikkim and Jharkhand were signifi cantly below the group average.
Th e tables and fi gures that follow illustrate the range of achievement within states and across groups of states. Th e tables list the scores achieved by students at key percentiles. For example, the score at the 25th percentile is the score which 75% of students achieve or surpass; the score at the 90th percentile is the score that 10% of students achieve or surpass.
Th e range between the 25th and 75th percentiles (the inter-quartile range) represents the performance of the middle 50% of students. Hence, this is a good indicator of the state’s degree of homogeneity in terms of the Reading Comprehension achievement of its students.
Table 2.4: Percentile scores in Reading Comprehension for states and UTs where class V students were tested and
population coverage was >80%
States and UTs 10th
percentile
25th
percentile
50th
percentile
75th
percentile
90th
percentile
Range 75–25 Range 90–10
A & N Islands 183 208 227 259 291 51 108
Andhra Pradesh 191 215 236 274 307 59 116
Bihar 175 193 223 258 297 65 122
Chandigarh 192 216 238 275 303 57 111
Chhattisgarh 171 190 220 263 303 73 132
Delhi 195 223 258 295 326 73 130
Gujarat 192 219 250 282 310 63 118
Haryana 181 205 227 268 301 62 119
Himachal Pradesh 185 207 230 273 312 65 128
Jammu & Kashmir 183 217 245 284 325 67 142
Karnataka 200 224 263 297 328 73 128
Madhya Pradesh 185 215 243 280 327 66 142
Orissa 190 216 245 290 329 74 139
Puducherry 179 197 219 236 274 39 95
Punjab 190 219 247 285 321 66 131
Rajasthan 187 214 244 285 323 71 137
Tamil Nadu 216 235 276 320 352 85 137
Tripura 187 219 253 285 322 66 134
Uttar Pradesh 195 238 290 331 352 93 157
Uttarakhand 173 197 226 268 302 70 128
Group Distribution 188 214 243 281 315 67 127
Note : Ranges may not agree due to rounding.

28
National Achievement Survey
Figure 2.1: Percentile scores in Reading Comprehension for states and UTs where class V students were tested and
population coverage was >80%
Th e inter-quartile range (i.e. the range between the 75th and 25th percentiles) is highly variable. For example, Puducherry has an inter-quartile range of just 39 whilst Uttar Pradesh has a corresponding value of 93. Th ese values suggest that the class V population in Puducherry is far more homogeneous than that of Uttar Pradesh. In most states, the range of performance for the middle group was between 55 and 75 scale-score points. Performance at the 10th and 90th percentiles respectively shows extremes in low and high achievement. Th e range between these two points, which includes 90 percent of the population, is highly variable ranging from 95 (Puducherry) to 157 (Uttar Pradesh).
Th e percentiles provide additional information when comparing Reading Comprehension performance amongst states. For example, when the states are arranged in order of average score, the diff erences between adjacent states tend to be small. However, the range of scores may not be similar. For example, there is no signifi cant diff erence between the median score of the Andaman and Nicobar Islands (227) and Uttarakhand (226). However, the score ranges between the 25th and 75th percentiles are very diff erent: A & N Islands’ range is 51 compared with Uttarakhand’s range of 70. Th is indicates that whilst average achievement is very similar in the two areas, Uttarakhand has a more heterogeneous group of class V students than the A & N Islands.
Table 2.5: Percentile scores in Reading Comprehension for states and UT where class V students were tested and
achieved population coverage was <80%
States and UT 10th
percentile
25th
percentile
50th
percentile
75th
percentile
90th
percentile
Range 75–25 Range 90–10
Assam 182 205 229 275 313 70 131
Daman & Diu 202 224 250 285 321 62 119
Goa 204 225 252 285 321 61 117
Kerala 216 238 280 314 335 76 120
Maharashtra 206 228 269 302 330 74 124
A & N IslandsAndhra Pradesh
BiharChandigarh
ChhattisgarhDelhi
GujaratHaryana
Himachal PradeshJammu & Kashmir
KarnatakaMadhya Pradesh
OrissaPuducherry
PunjabRajasthan
Tamil NaduTripura
Uttar PradeshUttarakhand
Group Distribution
150 175 200 225 250 275 300 325 350 375
25th
50th
75th
90th

29
Student Achievement in Language
Figure 2.2: Percentile scores in Reading Comprehension for states and UT where class V students were tested and
population coverage was <80%
Table 2.6: Percentile scores in Reading Comprehension for states where class VI students were tested
States 10th
percentile
25th
percentile
50th
percentile
75th
percentile
90th
percentile
Range 75–25 Range 90–10
Jharkhand 169 196 227 277 321 81 151
Nagaland 185 212 236 282 330 70 145
Meghalaya 197 220 242 277 314 57 117
Mizoram 214 230 263 285 313 55 100
Sikkim 207 223 241 268 287 44 80
West Bengal 205 227 267 302 331 75 126
Group Distribution 196 218 246 282 316 64 120
Figure 2.3: Percentile scores in Reading Comprehension for states where class VI students were tested
Jharkhand
Meghalaya
Mizoram
Nagaland
Sikkim
West Bengal
Group Distribution
Assam
Daman & Diu
Goa
Kerala
Maharashtra
Group Distribution
150 175 200 225 250 275 300 325 350
150 175 200 225 250 275 300 325 350
25th
50th
75th
90th

30
National Achievement Survey
Th e inter-quartile range for the states where class VI students were tested varied considerably from about 44 scale points in Sikkim to more than 80 points in Jharkhand. Th e range of scale points covering the population from the 10th to the 90th percentile varied dramatically from the diverse states of Jharkhand (151) to Sikkim (80) where relatively little diff erence between high and low performing students was detected. It can be seen that even though West Bengal has a signifi cantly higher median score than Nagaland (267 and 236 respectively), their scores at the 90th percentile are comparable (331 and 330). Th is suggests that very high achieving students in Nagaland are at par with their peers in West Bengal.
2.2 How did various groups perform in Reading Comprehension?
Th e table below compares the average performances of diff erent groups. Performance is compared by gender, school location, and social category. (Th e quoted scores were calculated for the 20 states and UTs where students were tested in class V and coverage of the population was at least 80% as this group gives the most reliable picture.)
2.2.1 Are there any gender-related diff erences in Reading Comprehension?
Table 2.7 compares the average Reading Comprehension scores achieved by boys and girls. It shows that within this group of states, no signifi cant diff erence was detected in the average achievement levels of the two groups.
Table 2.7: Average Reading Comprehension scores for groups by gender (class V)
Boys’ Average (SE) Girls’ Average (SE) Significant Difference
Group (by gender) 247 (0.7) 248 (0.7)
No significant difference between the average performance of girls and boys.
Tables 2.8, 2.9 and 2.10 show that, in general, the general result, i.e., no signifi cant diff erence between the average achievement of boys and girls, holds for all states and UTs. Only three exceptional cases were detected: the Andaman & Nicobar Islands, Kerala and Mizoram. In these, girls in the sample outperformed boys by a margin which is statistically signifi cant.
Table 2.8: Average Reading Comprehension scores, by gender, for states and UTs where class V students were tested
and population coverage was >80%
States and UTs Boys’ Average (SE) Girls’ Average (SE) Significant Difference
A & N Islands 229 (2.3) 237 (2.6)
Andhra Pradesh 244 (2.7) 245 (2.2)
Bihar 229 (2.5) 226 (3.3)
Chandigarh 244 (2.5) 247 (2.8)
Chhattisgarh 229 (3.5) 228 (3.5)
Delhi 255 (4.1) 261 (4.8)
Gujarat 250 (3.0) 251 (3.4)
Haryana 233 (2.1) 237 (2.5)
Himachal Pradesh 239 (2.7) 242 (2.5)
Jammu & Kashmir 250 (3.0) 251 (3.1)
Karnataka 261 (3.1) 262 (2.9)
Madhya Pradesh 253 (5.0) 246 (4.1)
Orissa 254 (3.4) 253 (4.3)

31
Student Achievement in Language
Puducherry 220 (2.1) 225 (2.8)
Punjab 251 (3.1) 254 (2.8)
Rajasthan 251 (3.3) 251 (3.4)
Tamil Nadu 278 (2.9) 279 (2.6)
Tripura 252 (3.1) 253 (3.3)
Uttar Pradesh 284 (3.5) 283 (3.6)
Uttarakhand 232 (2.7) 232 (3.3)
Group Average 247 (0.7) 248 (0.7)
No significant difference between the average performance of girls and boys.
Girls’ average performance is significantly greater than that of boys.
Table 2.9: Average Reading Comprehension scores, by gender, for states and UT where class V students were tested
and population coverage was <80%
States and UT Boys’ Average (SE) Girls’ Average (SE) Significant Difference
Assam 238 (2.3) 242 (2.9)
Daman & Diu 251 (4.4) 258 (4.1)
Goa 250 (4.7) 263 (5.1)
Kerala 272 (2.8) 280 (1.9)
Maharashtra 264 (2.4) 267 (2.3)
No significant difference between the average performance of girls and boys.
Girls’ average performance is significantly greater than that of boys.
Table 2.10: Average Reading Comprehension scores, by gender, for states where class VI students were tested
States Boys’ Average (SE) Girls’ Average (SE) Significant Difference
Jharkhand 239 (3.5) 234 (3.3)
Meghalaya 248 (2.5) 251 (2.9)
Mizoram 257 (1.3) 264 (1.3)
Nagaland 251 (2.9) 248 (3.4)
Sikkim 246 (1.8) 245 (2.1)
West Bengal 268 (2.8) 263 (2.8)
Group Average 252 (1.1) 251 (1.1)
No significant difference between the average performance of girls and boys.
Girls’ average performance is significantly greater than that of boys.
2.2.2 Are there any diff erences in Reading Comprehension achievement related to school location?
Table 2.11 compares the average Reading Comprehension scores achieved by students in rural and urban schools. It shows that, within this group of states, no signifi cant diff erence was detected in the average achievement levels of the two groups.
Table 2.11: Average Reading Comprehension scores for groups by location (class V)
Rural Average (SE) Urban Average (SE) Significant Difference
Group (by school location) 248 (0.7) 249 (1.9)
No significant difference between the average performance of urban and rural schools.

32
National Achievement Survey
Tables 2.12, 2.13 and 2.14 show that, in general, the general result, i.e., no signifi cant diff erence between rural and urban students holds for all states and UTs. However, fi ve exceptional cases were detected: in Andaman & Nicobar Islands, the rural students outperformed the urban students whereas in four other states, namely, Orissa, Assam, Mizoram and Sikkim, urban students in the sample outperformed rural students by a statistically signifi cant margin.
Table 2.12: Average Reading Comprehension scores, by location, for states and UTs where class V students were tested
and population coverage was >80%
States and UTs Rural Average (SE) Urban Average (SE) Significant Difference
A & N Islands 239 (3) 225 (2.7)
Andhra Pradesh 245 (2.5) 241 (3.5)
Bihar 227 (2.7) 238 (10.7)
Chandigarh 244 (3.8) 245 (3.1)
Chhattisgarh 228 (3.3) 238 (12.3)
Delhi 263 (5.7) 257 (4)
Gujarat 249 (2.8) 261 (8.7)
Haryana 234 (2.1) 243 (3.8)
Himachal Pradesh 241 (2.7) 240 (6)
Jammu & Kashmir 251 (2.7) 240 (12.6)
Karnataka 263 (3) 259 (6.3)
Madhya Pradesh 250 (4.3) 244 (8.6)
Orissa 251 (3.5) 280 (12)
Puducherry 220 (2.3) 227 (3.8)
Punjab 253 (3) 249 (5.8)
Rajasthan 251 (3.5) 251 (5.7)
Tamil Nadu 278 (2.9) 279 (5.5)
Tripura 252 (3.4) 255 (5.8)
Uttar Pradesh 283 (3.4) 278 (15.2)
Uttarakhand 233 (2.7) 227 (11.9)
Group Average 248 (0.7) 249 (1.9)
No significant difference between the average performance of rural and urban students.
Rural students’ average performance is significantly higher than that of urban students.
Rural students’ average performance is significantly lower than that of urban students.
Table 2.13: Average Reading Comprehension scores, by location, for states and UT where class V students were tested
and population coverage was <80%
States and UT Rural Average (SE) Urban Average (SE) Significant Difference
Assam 238 (2.2) 256 (8.4)
Daman & Diu 257 (5) 245 (7.8)
Goa 253 (6.6) 262 (5.8)
Kerala 276 (2.1) 283 (4.4)
Maharashtra 265 (2.3) 269 (4.7)
Group Average 258 (1.8) 263 (2.9)
No significant difference between the average performance of rural and urban students.
Rural students’ average performance is significantly lower than that of urban students.

33
Student Achievement in Language
Table 2.14: Average Reading Comprehension scores, by location, for states where class VI students were tested
States Rural Average (SE) Urban Average (SE) Significant Difference
Jharkhand 237 (3.3) 235 (9.5)
Meghalaya 250 (3.3) 250 (4.1)
Mizoram 258 (1.6) 264 (1.6)
Nagaland 251 (3.3) 238 (6.2)
Sikkim 242 (1.9) 255 (2.6)
West Bengal 265 (2.6) 267 (5.4)
Group Average 250 (1.1) 252 (2.3)
No significant difference between the average performance of rural and urban students.
Rural students’ average performance is significantly lower than that of urban students.
2.2.3 Are there any diff erences in Reading Comprehension achievement related to caste category?
Table 2.15 compares the average Reading Comprehension scores achieved by students in diff erent social categories. It shows that within this group of states, no signifi cant diff erence was detected in the average achievement levels of students in the Scheduled Caste (SC) and Other Backward Class (OBC) categories. Students classifi ed as being in the OBC category signifi cantly outperformed those in the Scheduled Tribe (ST) group. On average, students in the General category achieved signifi cantly higher scores than those in other categories.
Table 2.15: Average Reading Comprehension scores for groups by social category (class V)
Average (SE) SC ST OBC General
SC 245 (1.0) -
ST 240 (1.6) -
OBC 247 (1.0) -
General 253 (1.2) -
The average scores of the two categories being compared are not significantly different.
The average score of the category given in the first column is significantly higher than that of the category with which it is being compared.
The average score of the category given in the first column is significantly lower than that of the category with which it is being compared.
2.3 Conclusion
Th e average achievement of students in Reading Comprehension varies greatly across the states and UTs of India. Th ere is a highly signifi cant diff erence between outcomes in high scoring states such as Uttar Pradesh (282), Tamil Nadu (278) and Kerala (277), and low scoring states/UTs such as Puducherry (222), Bihar (228) and Chhattisgarh (229).
States also vary greatly in the range between their lowest and highest achieving students as revealed by their inter-quartile score ranges. Some states/UTs such as Puducherry (39), Sikkim (44) and A & N Islands (51) have relatively homogeneous cohorts whilst others have far more diverse outcomes, e.g., Uttar Pradesh (93), Tamil Nadu (85) and Jharkhand (81).

34
National Achievement Survey
Overall, no signifi cant diff erences were detected in the average achievement of girls and boys. Similarly, no signifi cant diff erence was detected between the achievement level of rural and urban students although exceptions were found in a small number of states/UTs.
Th e survey did fi nd that students from the General category outperformed their peers in the SC, ST and OBC categories by a statistically signifi cant margin.
Th e following chapter provides more information about what class V students at various levels of achievement know and can do in the domain of Reading Comprehension.

35
Student Achievement in Language
Chapter 3
Language: What Students Know and Can Do

36
National Achievement Survey

37
Language: What Students Know and Can Do
CHAPTER 3 LANGUAGE: WHAT STUDENTS KNOW AND CAN DO
3.1 Overview of the Reading Comprehension Tests
Th e Reading Comprehension tests given to class V students consisted of three test booklets, each containing four reading passages with fi ve multiple choice items on each passage. Th e passages were chosen to represent a range of text types including informational passages, tables, public notices and stories. Th ree reading passages were common across all test forms. Th ese served as ‘anchors’ so that the diff erent test booklets could be linked together and hence, all items could be placed on a common scale. (See below.) In addition, each test form contained an extra, unique passage. Th us, altogether the Reading Comprehension instruments used in the survey comprised six passages and 30 items.
Th e items were designed to test a range of relevant cognitive processes or ‘reading skills’. Th ese are classifi ed as ‘locate information’, ‘grasp ideas and interpret’ and ‘infer and evaluate’ as defi ned below:
Cognitive Processes for Reading Comprehension
Locate information: In items testing this process, students need to find and extract a specific piece of information explicitly stated in the text. ‘Locating’ requires students to focus on a specific element of the given piece.
Grasp ideas and interpret: In items testing this process, students need to demonstrate that they have understood an idea being conveyed in the text and have interpreted it correctly. For example, students may need to identify the text’s main idea and/or the sequence of events and/or relationships between ideas, events or characters across the text. In addition, students may need to draw simple conclusions based on their interpretation of the text.
Infer and evaluate: In items testing this process, students need to demonstrate understanding beyond the information and/or ideas stated explicitly in the text. They are asked to read between the lines and, for example, make inferences about the qualities or actions of characters. They may be asked to identify the text’s underlying theme and/or evaluate its title by examining the text from more than one perspective.
3.2 Item Mapping
Following testing, the responses of students to the various tasks were analysed using IRT (see Appendix II). Th e three test forms were then aligned using the anchor items, thereby placing all items on a single Reading Comprehension scale comprising scores from 0 to 500. On this scale, the mean score was set at 250 with a standard deviation of 50. Calibrating the items according to their levels of diffi culty places them on an ‘item map’ with the more demanding items at the top and the easiest items at the bottom. Such item maps give us a picture as to what students at diff erent levels of ability know and can do.
Th e item map for Reading Comprehension is given below. Th e scale score in the fi rst column shows the level of diffi culty for each item. Th is score also represents the score on the ability scale necessary for a student to have 50:50 chance of success on the item. Th e map also includes a brief description of what students needed to do to answer the item correctly, i.e., each item is classifi ed according to the cognitive process being evaluated. A student’s scale score gives an indication of the possibility of success on an item, if the item diffi culty is known. Th e higher the scale score, the more likely the student is to be able to answer; the higher the item diffi culty, the less likely the student is to be able to answer correctly. Th us, the item with a diffi culty of 313 was diffi cult for this population except for the high ability students, while the item with the diffi culty of 203 is likely to be relatively easy on an average.
Th e map shows that class V students demonstrate a wide range of ability in the domain of Reading Comprehension.

38
National Achievement Survey
Students at the lower end of the scale, i.e., those with scale scores in the range of, say, 200 to 240 can demonstrate all three cognitive processes—provided that the context is clear and the tasks non-complex. For example, they are able to use information from a table to locate the time and the occurrence of a phenomenon, recognise a particular text type, and also make simple inferences about the causes of an act described in the text.
Students performing in the intermediate range of the scale (say, 240 to 275) can do more. In addition to that described above, they can determine the causes, frequency, duration and sequence of events described in a variety of texts. Th ey can also identify cause and eff ect relationships and make complex inferences about the qualities of characters from their actions, and identify the eff ect of a given activity on the characters within a text.
Students performing at higher end of the scale, i.e., those with scale scores above, say, 275 can do more. In addition to that described above, they can identify the main theme of a given passage and evaluate the title. Th ey can also
Table 3.1: Item map in Reading Comprehension
Scale Score Mental Processes Question Description
313 Infer/Evaluate Use information to identify the main theme and evaluate the title
305 Grasp ideas/Interpret Identify relationship between a pronoun and the object/person
300 (no item appeared at this difficulty level)
293 Grasp ideas/Interpret Use information in the text to identify the solution to a problem
292 Grasp ideas/Interpret Identify the causal relationship of two events
285 Grasp ideas/Interpret Identify relationship between an abstract idea and a concrete phenomenon
279 Grasp ideas/Interpret Grasp the relevant idea about the thinking of people from the text
279 Grasp ideas/Interpret Use information from a notice to conclude timing of an event
279 Locate Identify the correct place name from those given in the notice
275 (no item appeared at this difficulty level)
274 Locate Use information from a table to determine the frequency of an event
265 Grasp ideas/Interpret Identify relationship between an object and its characteristics
264 Grasp ideas/Interpret Determine the sequence of activities in a process
259 Grasp ideas/Interpret Use information in the story to identify the cause of an event
258 Grasp ideas/Interpret Use information in the story to grasp the problem
255 Grasp ideas/Interpret Use information in the story to determine the cause of an event
252 Grasp ideas/Interpret Use information from the notice to derive the duration of an event
250 Locate Use information from a table to determine the frequency of an event
249 Infer/Evaluate Make complex inference about the quality of persons from their activities
247 Infer/Evaluate Use information in the text to make inference about the cause of an act
247 Infer/Evaluate Make complex inference about the effect of an activity on concerned persons
246 Grasp ideas/Interpret Use information to draw simple conclusion about the usefulness of an object
244 Grasp ideas/Interpret Use information in the text to identify the ingredients of an object
244 Locate Use information in a table to identify the most frequent event
242 Infer/Evaluate Use information in the text to infer the cause of an event
234 Locate Recognise appropriate information about the action to be taken by a person
231 Infer/Evaluate Use information in a story to make a simple inference about the cause of an act
231 Infer/Evaluate Use information from a notice to make a simple inference about the participation in a sport
228 Infer/Evaluate Use information in a story to make a simple inference about the cause of an act
225 (no item appeared at this difficulty level)
217 Grasp ideas/Interpret Recognise the text type as a notice from the format and the content
213 Locate Use information in a table to identify the time for a phenomenon
203 Locate Use information in a table to identify phenomena occurring at a particular time
Note: Percent correct values from classical test theory are given in Appendix IV.

39
Language: What Students Know and Can Do
identify the relationship between a pronoun and the relevant object/person even when this is not immediately obvious. Furthermore, Table 3.1 of item map suggests that students at this level can identify the relationship between events, ideas and phenomena, and recognise the likely thoughts of characters in the text.
3.3 Sample Item and Reading Passage
Th e passage and items reproduced below were used in one of the tests of Reading Comprehension. Statistics showing how students responded to these items are given. Th ese items can also be located on the item map.
Direction: Read the following passage carefully and answer the questions given below it. Encircle the number of the correct answer.
Millions of people in the world are blind. Formerly, people thought that blind people could not do anything. But nowadays, many blind schools have been opened. All these facilities are available to the blind for studying. Now many blind students are earning their livelihood after fi nishing their studies. Many blind people have become scholars in the world. Apart from this, the doctors are trying to prevent blindness among children by providing appropriate medical care and prescribing nutritious diet.
Today, many people donate their eyes. After their death, their eyes are transplanted in the blind people’s eyes. Th us, many blind persons are able to see.
Sample item: Infer/Evaluate Scale score: 247
Item 46. Why do many people donate their eyes?
1. Their eyes are weak.
2. Blind people can become scholars.
3. Their eyes will enable a blind person to see.
4. They want to become famous.
Th is item requires students to make inference about the cause of an action. Th e scaled score of this item was 247, i.e., very close to the average level of diffi culty of items in the Reading Comprehension survey. Around 52% of students in the sample were able to select the correct answer (3). Th e fi gure shows how the remaining 48% responded.
Figure 3.1 (Item 46): Percentage of students in each response category
60
50
40
30
20
10
01 2 3 4
1418
52
8 8
Omitted

40
National Achievement Survey
Sample item: Grasp ideas/Interpret Scale score: 293
Item 47. The blindness can be removed through
1. nutritious diet.
2. eye transplant.
3. higher education.
4. some training.
Th is item requires students to integrate and use the information given in the text to arrive at the solution to a problem. Th e scale score of this item was 293, i.e., signifi cantly above than the average level of diffi culty of items in the survey. Only 39% of students in the sample were able to select the correct answer (2). Th e fi gure shows how the remaining 61% responded.
Figure 3.2 (Item 47) : Percentage of students in each response category
Sample item: Grasp ideas/Interpret Scale score: 292
Item 48. The blind can become scholars by
1. taking nutritious diet.
2. getting back their eyesight.
3. eye transplant.
4. studying hard.
Th is item requires students to grasp ideas and interpret the text to make an inference about the causal relationship of two events. Th e scale score of this item was 292, i.e., signifi cantly above than the average level of diffi culty of items in the survey. Only 40% of students in the sample were able to select the correct answer (4). Th e fi gure shows how the remaining 60% responded.
45
40
35
30
25
20
15
10
5
0
1 2 3 4
30
39
16
9
6
Omitted

41
Language: What Students Know and Can Do
Figure 3.3 (Item 48): Percentage of students in each response category
Sample item: Locate information Scale score: 234
Item 49. What can a doctor do to prevent blindness?
1. Provide medical care.
2. Train blind people.
3. Provide nutritious diet.
4. Turn the blind people into scholars.
Th is item requires students to locate a specifi c piece of information given explicitly in the text. Th e scale score of this item was 234, i.e., below the average level of diffi culty of items in the Reading Comprehension survey. As many as 54% of students in the sample were able to select the correct answer (1). Th e fi gure shows how the remaining 46% responded.
Figure 3.4 (Item 49): Percentage of students in each response category
60
50
40
30
20
10
01 2 3 4
54
11
21
68
Omitted
45
40
35
30
25
20
15
10
5
0
1 2 3 4
1618
20
40
6
Omitted

42
National Achievement Survey
Sample item: Grasp ideas/Interpret Scale score: 279
Item 50. What did people think about the blind in the past?
1. There is no cure for blindness.
2. Blind can get training.
3. Blind cannot do anything.
4. Blind can donate their eyes.
Th e item requires students to interpret and grasp the relevant idea from the text. Th e scaled score of this item was 279, i.e., signifi cantly above the average level of diffi culty of items in the survey. Only 40% of students in the sample were able to select the correct answer (3). Th e fi gure shows how the remaining 60% responded.
Figure 3.5 (Item 50): Percentage of students in each response category
Performance on the sample items reproduced here (i.e., items 46–50) varied across the country. Table 3.2 shows the proportion of students in each state or UT correctly responding to each item. Th e states/UTs are grouped according to the language in which the reading texts were presented as some variation in performance may be due to translation eff ects.
Table 3.2: Performance on the sample items (46–50) in states and UTs
States and UTs Medium Item 46 (%) Item 47 (%) Item 48 (%) Item 49 (%) Item 50 (%)
All Sample 52 39 41 54 40
Tripura Bengali 56 38 22 41 35
West Bengal** Bengali 68 37 23 39 47
A & N Islands English 41 32 38 40 30
Chandigarh English 41 30 55 58 33
Goa* English 37 42 36 52 46
Meghalaya** English 47 39 34 53 43
Nagaland** English 47 43 36 51 45
Sikkim** English 41 40 27 52 35
Daman & Diu* Gujarati 67 56 44 54 46
45
40
35
30
25
20
15
10
5
01 2 3 4
24
13
40
16
7
Omitted

43
Language: What Students Know and Can Do
Gujarat Gujarati 59 52 43 49 45
Bihar Hindi 34 24 51 53 32
Chhattisgarh Hindi 43 31 48 52 36
Delhi Hindi 51 35 59 63 36
Haryana Hindi 43 31 58 65 33
Himachal Pradesh Hindi 43 26 54 58 33
Jharkhand** Hindi 42 30 50 50 31
Madhya Pradesh Hindi 53 45 42 52 38
Rajasthan Hindi 51 41 51 50 33
Uttar Pradesh Hindi 65 59 59 56 55
Uttarakhand Hindi 39 30 51 55 30
Karnataka Kannada 64 35 32 51 47
Kerala* Malayalam 56 46 34 51 49
Maharashtra* Marathi 68 42 48 48 57
Mizoram** Mizo 77 73 51 61 45
Orissa Oriya 52 33 31 49 42
Punjab Punjabi 49 42 30 62 36
Puducherry Tamil 33 --- 25 50 26
Tamil Nadu Tamil 62 --- 19 66 44
Andhra Pradesh Telugu 51 22 48 62 43
Assam multiple 44 31 23 57 39
Jammu & Kashmir multiple 57 42 34 57 34
1. Performance by states/UTs on the five items based on the reading passage about blindness.
2. States/UTs marked * achieved samples representing <80% of the target population.
3. States/UTs marked ** tested students in class VI.
4. Item 47 was deleted for Puducherry and Tamil Nadu because the characteristics for the translated item (Tamil) did not fit the IRT model.
5. Assam tested students in Assamese and Bengali. Jammu & Kashmir tested students in English, Hindi and Urdu.
3.4 What can students do in Reading Comprehension?
3.4.1 Locating information
In this chapter, it has already been mentioned what the students performing at diff erent levels of scale scores of the Reading Comprehension items can do.
Table 3.3 shows the performance of class V students on the cognitive process of locating information.
Table 3.3: Performance of class V students on the cognitive process of locating information
Item No. Locate information Scale Value % Correct
20 Place name 279 41
28 Frequency of events 274 41
29 244 52
30 250 50
49 Action to be taken by a person 234 54
27 Time for a phenomenon 213 68
26 Identifying an event 203 71

44
National Achievement Survey
About 71% students can use information in a table to identify an event occurring at a particular time. However, only 41% students can determine the frequency of events and identify the place name from the given information.
3.4.2 Grasp ideas/Interpret
Table 3.4 shows the performance of class V students on the cognitive process of grasp ideas/interpret.
Table 3.4: Performance of class V students on the cognitive process of grasp ideas/interpret
Item No. Grasp ideas/Interpret Scale Value % Correct
16 Recognise the text type as a notice 217 63
21 Identify the ingredients of an object, identify the solution to a
problem
244 52
47 293 39
23 Draw simple conclusion about the usefulness of an object 246 51
19 Derive duration of an event, timing of an event 252 49
18 279 39
35 Determine the cause of an event 255 47
34 259 46
33 Grasp the problem, the idea about people’s thinking 258 46
50 279 40
24 Determine the sequence of activities 264 43
22 Identify relationships 265 44
25 285 40
48 292 41
44 305 33
More than 60% students in the country can recognise the text type as a notice from the format and the content.
Only one-third of the students can identify relationship between a pronoun and the object or person.
About 50% students were able to draw simple conclusion about the usefulness of an object.
3.4.3 Infer/Evaluate
Table 3.5 shows the performance of class V students on the cognitive process of infer/evaluate.
Table 3.5: Performance of class V students on the cognitive process of infer/evaluate
Item No. Infer/evaluate Scale Value % Correct
31 Make a simple inference about the cause of an event/act, about
the participation in a sport
228 60
17 231 58
32 231 59
46 247 51
41 242 52
43 Make complex inference about the effect of an activity on
concerned persons, about the quality of persons
247 50
42 249 50
45 Identify the main theme and evaluate the title 313 32
Only one-third of the students are able to use information given in the text to identify the main theme and evaluate the title.

45
Language: What Students Know and Can Do
Chapter 4
Ach ievement o f Students in Mathemat ics

46
National Achievement Survey

47
Achievement of Students in Mathematics
CHAPTER 4 ACHIEVEMENT OF STUDENTS IN MATHEMATICS
Th is chapter summarises the achievement of class V students in Mathematics in the National Achievement Survey conducted in 2010. Overall achievement for each of the participating states and UTs is reported. In addition, information about diff erences in achievement by student gender, school location and social category is provided. In the majority of states, students nearing the end of class V were tested. However, in a few states, the arrangement of the school year meant that students had to be tested at the beginning of class VI. Results for these groups are presented separately to reduce the chance of readers inadvertently comparing diff erent cohorts.
For each state, a sample was drawn which was designed to be representative of the entire target population, i.e., all class V students studying in government and government-aided schools. In most states, the sample coverage achieved was regarded as satisfactory as it covered more than 80% of the target population. However, in some states, local logistical challenges and resource constraints meant that this criterion was not fully met and so the sample coverage, although signifi cant, was deemed ‘inadequate’. To ensure that readers are aware of this when comparing achievement levels, results for states with adequate and inadequate sample coverage are reported separately.1
4.1 How did the states and UTs perform in Mathematics?
Th e distribution of student achievement in Mathematics for the 31 participating states is given in Tables 4.1, 4.2 and 4.3. Each table represents one of the three categories described above: those where class V students were tested and sample coverage was adequate; those where class V students were tested and sample coverage was less than adequate; and those where class VI students were tested. Within each group, states are listed in alphabetical order.
Th e tables list each state’s average score on a scale from 0 to 500. For each score, the ‘Standard Error’ is given to indicate the degree of imprecision arising from the sampling process. Finally, where such comparisons are appropriate, the tables indicate whether a state’s average score is signifi cantly diff erent from the group’s average or not.
Table 4.1: Average Mathematics scores for states and UTs where class V students were tested
and population coverage was >80%
State or UT Average Score Standard Error Significant Difference
A & N Islands 226 2.8
Andhra Pradesh 238 2.2
Bihar 242 3.4
Chandigarh 229 2.0
Chhattisgarh 232 3.4
Delhi 260 3.4
Gujarat 256 3.2
Haryana 240 2.5
Himachal Pradesh 243 2.4
Jammu & Kashmir 262 2.9
1 Th is follows the practice adopted in international surveys such as TIMSS and PISA where countries that do not meet sampling requirements are reported ‘below the line’.

48
National Achievement Survey
Karnataka 269 2.9
Madhya Pradesh 265 3.5
Orissa 257 3.0
Puducherry 217 3.6
Punjab 252 2.6
Rajasthan 257 3.2
Tamil Nadu 279 2.8
Tripura 260 3.0
Uttar Pradesh 298 3.1
Uttarakhand 241 2.7
Group Average 251 0.7
The state’s average score is not significantly different from that of the group.
The state’s average score is significantly above that of the group.
The state’s average score is significantly below that of the group.
Th e 20 states and UTs represented in Table 4.1 are those in which class V students were tested and where the sample covered at least 80% of the target population. Th e average score for this group was 251 (with a standard error of 0.7).
Th e results reveal substantial diff erences in Mathematics achievement between the highest performing states (298 for Uttar Pradesh and 279 for Tamil Nadu) and the lowest performing states/UTs (217 for Puducherry and 226 for the Andaman and Nicobar Islands). In Mathematics, seven states had average scores signifi cantly above that of the group; nine states had average scores signifi cantly below that of the group; and four states had average scores that were not signifi cantly diff erent from that of the group.
Table 4.2: Average Mathematics scores for states and UTs where class V students were tested
and population coverage was <80%
State or UT Average Score Standard Error Significant Difference
Assam 241 2.3
Daman & Diu 259 5.7
Goa 241 3.9
Kerala 244 1.5
Maharashtra 264 3.1
Group Average 250 1.6
The state’s average score is not significantly different from that of the group.
The state’s average score is significantly above that of the group.
The state’s average score is significantly below that of the group.
Th e fi ve states and UTs represented in Table 4.2 are those in which class V students were tested but where the sample covered less than 80% of the target population. For this group, great care should be taken when considering an average score or comparing it with that of other states as it may not be a reliable measure for the whole state/UT.
Table 4.3: Average Mathematics scores for states where class VI students were tested
State or UT Average Score Standard Error Significant Difference
Jharkhand 247 3.0
Meghalaya 244 2.9
Mizoram 233 1.0

49
Achievement of Students in Mathematics
Nagaland 251 3.5
Sikkim 234 1.8
West Bengal 267 2.4
Group Average 246 1.1
The state’s average score is not significantly different from that of the group.
The state’s average score is significantly above that of the group.
The state’s average score is significantly below that of the group.
Th e six states represented in Table 4.3 are those in which, due to local circumstances, class VI students had to be tested. For this group, the average Mathematics score was 246 (Standard Error 1.1). West Bengal performed signifi cantly better than the group average whereas the average scores of Sikkim and Mizoram were signifi cantly below the group average.
4.1.1 How did scores vary within states and UTs?
Tables 4.4, 4.5 and 4.6 and Figures 4.1, 4.2 and 4.3 illustrate the range of achievement within states and across groups of states. Th e tables list the scores achieved by students at key percentiles. For example, the score at the 25th percentile is the score which 75% of students achieve or surpass; the score at the 90th percentile is the score that 10% of students achieve or surpass.
Th e range between the 25th and 75th percentiles (the inter-quartile range) represents the performance of the middle 50% of students. Hence, this is a good indicator of the state’s degree of homogeneity in terms of the achievement of its students in Mathematics.
Table 4.4: Percentile scores in Mathematics for states and UTs where class V students were tested and where
adequate population coverage was achieved
State or UT 10th
percentile
25th
percentile
50th
percentile
75th
percentile
90th
percentile
Range 75–25 Range 90–10
A & N Islands 182 200 224 237 276 37 94Andhra Pradesh 185 212 228 271 291 59 107Bihar 178 204 230 275 321 71 143Chandigarh 185 212 226 248 273 36 88Chhattisgarh 165 200 226 269 316 69 151Delhi 201 226 262 292 325 66 124Gujarat 194 224 255 287 320 63 126Haryana 183 212 229 271 305 59 122Himachal Pradesh 187 220 233 273 301 52 114Jammu & Kashmir 189 225 268 303 333 78 144Karnataka 206 228 273 308 331 81 125Madhya Pradesh 202 227 270 302 329 75 126Orissa 186 222 253 298 329 75 143Puducherry 179 187 216 227 265 40 86Punjab 191 225 250 276 314 51 123Rajasthan 190 224 257 288 324 64 133Tamil Nadu 224 234 275 318 342 84 118Tripura 184 225 268 305 336 80 151Uttar Pradesh 223 261 310 346 377 85 154Uttarakhand 182 212 230 273 306 62 124Group Distribution 191 219 249 283 316 64 125
Note: Ranges may not agree due to rounding.

50
National Achievement Survey
Figure 4.1: Percentile scores in Mathematics for states and UTs where class V students were tested and where
adequate population coverage was achieved
Th e fi gure shows that the inter-quartile range is highly variable. For example, Chandigarh has an inter-quartile range of just 36 whilst Uttar Pradesh has a corresponding value of 85. Th ese values suggest that in terms of Mathematics achievement, the class V population in Chandigarh is far more homogeneous than that of Uttar Pradesh. In most states, the range of performance for the middle group was between 50 and 80 scale-score points. Performance at the 10th and 90th percentiles respectively shows extremes in low and high achievement. Th e range between these two points, which includes 90 percent of the population, is highly variable ranging from 86 (Puducherry) to 154 (Uttar Pradesh).
Th e percentiles provide additional information when comparing Mathematics performance amongst states. For example, when the states are arranged in order of average score, the diff erences between adjacent states tend to be small. However, the range of scores may not be similar. For example, there is no signifi cant diff erence between the average score of Bihar (242) and Andhra Pradesh (238). However, the score ranges between the 25th and 75th percentiles are very diff erent: Bihar’s range is 71 compared with Andhra Pradesh’s range of 59. Th is indicates that whilst average performance in the two states is approximately the same, the class V cohort in Bihar is more diverse in its mathematical achievement.
A & N Islands
Andhra Pradesh
Bihar
Chandigarh
Chhattisgarh
Delhi
Gujarat
Haryana
Himachal Pradesh
Jammu & Kashmir
Karnataka
Madhya Pradesh
Orissa
Pondicherry
Punjab
Rajasthan
Tamil Nadu
Tripura
Uttar Pradesh
Uttarakhand
Group Distribution
150 175 200 225 250 275 300 325 350 375 400
25th
50th
75th
90th

51
Achievement of Students in Mathematics
Table 4.5: Percentile scores in Mathematics for states and UTs where class V students were tested and achieved
population coverage was <80%
State or UT 10th
percentile
25th
percentile
50th
percentile
75th
percentile
90th
percentile
Range 75–25 Range 90–10
Assam 182 212 228 273 312 62 130
Daman & Diu 206 225 256 291 324 65 118
Goa 189 219 230 269 291 51 101
Kerala 198 224 234 272 288 48 90
Maharashtra 203 226 268 299 331 72 128
Group Distribution 195 221 243 281 309 60 113
Figure 4.2: Percentile scores in Mathematics for states where class V students were tested and where population
coverage was <80%
Table 4.6: Percentile scores in Mathematics for states where class VI students were tested
State or UT 10th
percentile
25th
percentile
50th
percentile
75th
percentile
90th
percentile
Range 75–25 Range 90–10
Jharkhand 180 215 234 279 324 64 143
Meghalaya 194 222 230 272 310 50 117
Mizoram 196 221 227 248 273 27 76
Nagaland 187 219 236 282 324 62 138
Sikkim 197 223 228 256 273 33 76
West Bengal 211 227 270 299 332 71 122
Group Distribution 194 221 238 272 306 51 112
Assam
Daman & Diu
Goa
Kerala
Maharashtra
Group Distribution
150 175 200 225 250 275 300 325 350
25th
50th
75th
90th

52
National Achievement Survey
Figure 4.3: Percentile scores in Mathematics states where class VI students were tested
Th e inter-quartile range for the states where class VI students were tested varied considerably from about 27 scale points in Mizoram to 71 points in West Bengal. Th e range of scale points covering the population from the 10th to the 90th percentile (i.e., the range which includes 90 percent of the population) varied dramatically from the highly diverse state of Jharkhand (143) to Sikkim (76) where relatively little diff erence between high and low performing students was detected.
Interestingly, the data shows that whilst West Bengal has by far the highest median performance (270) in this group, Nagaland and Jharkhand have scores at the 90th percentile which are comparable to that of West Bengal (324 cf. 332). Th is suggests that high achieving students in Nagaland and Jharkhand are not lagging behind their peers in West Bengal.
4.2 How did various groups perform in Mathematics?
Th e tables below compare the average performances of diff erent groups. Performance is compared by gender, by school location and by social category. (Th e quoted scores were calculated for the 20 states and UTs where students were tested in class V and satisfactory coverage of the population was achieved. Th is was to ensure that comparisons were made with the most reliable class V available).
Table 4.7: Average Mathematics scores for groups by gender and by location (class V)
Average Score Standard Error Significant Difference
Gender Girls (N=28445) 252 0.7
Boys (N= 27337) 251 0.8
No significant difference between the average performance of girls and boys.
150 175 200 225 250 275 300 325 350
25th
50th
75th
90th
Jharkhand
Meghalaya
Mizoram
Nagaland
Sikkim
West Bengal
Group Distribution

53
Achievement of Students in Mathematics
Analysis of the results of 55,782 students within the states/UTs where adequate samples were achieved shows that there is no statistically signifi cant diff erence in the average achievement levels of girls and boys in Mathematics.
4.2.1 Are there any gender diff erences in Mathematics achievement at the state level?
As seen in Table 4.7, there is no signifi cant diff erence in the average performance of girls and boys in Mathematics. Tables 4.8, 4.9 and 4.10 show that the general result holds for all states and UTs
Table 4.8: Average Mathematics scores, by gender, for states and UTs where class V students were tested and
population coverage >80% was achieved
State or UT Boys’ Average (SE) Girls’ Average (SE) Significant Difference
A & N Islands 224 (2.8) 228 (3.1)
Andhra Pradesh 236 (2.3) 239 (2.6)
Bihar 244 (3.1) 240 (4.3)
Chandigarh 231 (2.2) 227 (2.2)
Chhattisgarh 231 (3.5) 233 (4.0)
Delhi 264 (4.3) 258 (5.0)
Gujarat 255 (3.3) 258 (3.9)
Haryana 242 (2.9) 238 (2.7)
Himachal Pradesh 243 (2.5) 244 (2.6)
Jammu & Kashmir 263 (3.0) 262 (3.5)
Karnataka 269 (3.0) 269 (3.4)
Madhya Pradesh 266 (3.9) 265 (4.3)
Orissa 257 (3.2) 257 (3.6)
Puducherry 212 (1.9) 222 (6.4)
Punjab 254 (2.7) 250 (2.9)
Rajasthan 258 (3.7) 256 (3.1)
Tamil Nadu 279 (3.0) 280 (3.1)
Tripura 261 (3.2) 260 (3.6)
Uttar Pradesh 302 (3.8) 295 (3.4)
Uttarakhand 243 (2.8) 239 (3.0)
Group Average 252 (0.7) 251 (0.8)
No significant difference between the average performance of girls and boys.
Th ere is no signifi cant diff erence in the average performance of girls and boys in Mathematics in any of the states/UTs where class V students were tested and where population coverage was adequate.
Table 4.9: Average Mathematics scores, by gender, for states and UTs where class V students were tested and
population coverage was <80%
State or Union Territory Boys’ Average (SE) Girls’ Average (SE) Significant Difference
Assam 242 (2.3) 240 (2.7)
Daman & Diu 259 (6.2) 259 (6.2)
Goa 238 (4.3) 244 (4.8)
Kerala 245 (2.0) 243 (1.6)
Maharashtra 265 (3.1) 263 (3.2)
No significant difference between the average performance of girls and boys.

54
National Achievement Survey
Th e data in Table 4.9 shows that there is no signifi cant diff erence in the average performance of girls and boys in Mathematics in any of the states/UTs where class V students were tested and where adequate population coverage (>80%) was achieved.
Table 4.10: Average Mathematics scores, by gender, for states and UTs where class VI students were tested
State or UT Boys’ Average (SE) Girls’ Average (SE) Significant Difference
Jharkhand 252(3.6) 243 (3.1)
Meghalaya 245 (3.1) 243 (2.9)
Mizoram 233(1.3) 232 (1.1)
Nagaland 255 (3.6) 253 (3.9)
Sikkim 239 (2.0) 230 (1.7)
West Bengal 269 (3.1) 265 (3.2)
Group Average 249 (1.2) 244 (1.1)
No significant difference between the average performance of girls and boys.
Significant difference between the average performance of girls and boys favouring boys.
Table 4.10 shows that in Jharkhand and Sikkim, (where Class VI students were tested), signifi cant diff erences were detected in the average scores of girls and boys, with boys outperforming girls in both cases.
4.2.2 Are there any diff erences in Mathematics achievement related to school location?
Table 4.11 compares the average Mathematics scores achieved by students in rural and urban schools. It shows that within this group of states, no signifi cant diff erence was detected in the average achievement levels of the two groups.
Table 4.11: Average Mathematics scores for groups by location (class V)
Average Score Standard Error Significant Difference
School location Rural (N=42297) 252 0.8
Urban (N= 13802) 250 1.9
No significant difference was observed in the average achievement of urban and rural schools.
Tables 4.12, 4.13 and 4.14 show average Mathematics scores by states/UTs and by location of school.
Table 4.12: Average Mathematics scores, by location, for states and UTs where class V students were tested and
population coverage was >80%
State or UT Rural Average (SE) Urban Average (SE) Significant Difference
A & N Islands 234 (3.9) 215 (2.8)
Andhra Pradesh 238 (2.6) 239 (4.6)
Bihar 242 (3.4) 249 (15.5)
Chandigarh 230 (3) 229 (2.6)
Chhattisgarh 232 (4.2) 233 (10.3)
Delhi 267 (7.1) 259 (4.2)
Gujarat 256 (3.5) 256 (7.6)
Haryana 241 (2.8) 232 (4.6)
Himachal Pradesh 243 (2.5) 246 (7.7)

55
Achievement of Students in Mathematics
Jammu & Kashmir 264 (2.9) 248 (13.5)
Karnataka 273 (3.3) 260 (5.9)
Madhya Pradesh 265 (3.7) 267 (12)
Orissa 254 (3) 273 (11.2)
Puducherry 215 (3) 221 (8.6)
Punjab 251 (3.1) 255 (5.5)
Rajasthan 256 (3.7) 258 (6.4)
Tamil Nadu 277 (3.3) 284 (5.4)
Tripura 257 (3.4) 279 (6.2)
Uttar Pradesh 300 (3.9) 280 (13)
Uttarakhand 242 (2.7) 229 (6.8)
Group Average 252 (0.8) 251 (1.9)
No significant difference between the average performance in rural and urban students.
Rural students’ average performance is significantly greater than that of urban students.
Rural students’ average performance is significantly lower than that of the urban students.
Table 4.12 reveals that there was no signifi cant diff erence in average Mathematics of students from rural and urban schools with two exceptions. In the case of the Andaman & Nicobar Islands, students from rural schools outperformed those from urban schools by a signifi cant margin (mean scores of 234 and 215 respectively). Conversely, in Tripura, students in urban schools had a signifi cantly higher average score than their peers in rural schools (mean scores of 279 and 257 respectively).
Table 4.13: Average Mathematics scores, by location, for states and UTs where class V students were tested and
population coverage was <80%
State or UT Rural Average (SE) Urban Average (SE) Significant Difference
Assam 241 (2.6) 240 (6.1)
Daman & Diu 263 (6.3) 244 (10.6)
Goa 233 (3.6) 256 (8.2)
Kerala 244 (1.7) 242 (4)
Maharashtra 267 (3.5) 258 (6)
No significant difference between the average performance of girls and boys.
Rural students’ average performance is significantly lower than that of the urban students.
Table 4.13 generally reinforces the data that suggests that there is no signifi cant diff erence between Mathematics performance in rural and urban schools. Goa is a possible exception since, for this sample, urban students have outperformed rural students by a signifi cant margin (256 cf. 233). However, given that population coverage here was less than 80%, this result should be treated with some caution.
Table 4.14: Average Mathematics scores, by location, for states where class VI students were tested
State Rural Average (SE) Urban Average (SE) Significant Difference
Jharkhand 246 (3.4) 251 (6.6)
Meghalaya 246 (3.3) 240 (5.8)
Mizoram 231 (1.3) 235 (1.4)
Nagaland 256 (4.0) 234 (7.7)

56
National Achievement Survey
Sikkim 232 (2.1) 243 (2.9)
West Bengal 266 (2.7) 271 (5.9)
Group Average 246 (1.2) 246 (2.2)
No significant difference between the average performance of girls and boys.
Rural students’ average performance is significantly greater than that of urban students.
Rural students’ average performance is significantly lower than that of the urban students.
Table 4.14 tends to confi rm the view that, overall, these is little or no signifi cant diff erence in achievement of students in urban or rural schools. Sikkim (where urban students appear to do better than those in urban schools) is one exception. However, the most notable exception is that of Nagaland where the absolute diff erence (22 scale scores) in favour of rural schools is very large.
4.2.3 Are there any diff erences in Mathematics achievement related to social category?
Table 4.15 below compares the average Mathematics scores achieved by students in diff erent social categories. It shows that students in the General category achieved signifi cantly higher average scores than those in other categories. Students classifi ed as being in the OBC category signifi cantly outperformed those in the ST category. No signifi cant diff erence was detected in the average achievement levels of students in the SC and ST categories.
Table 4.15: Average Mathematics scores for groups by social category (class V)
Category Average (SE) SC ST OBC General
SC 247 (1.2) -
ST 245 (1.5) -
OBC 251 (1.0) -
General 257 (1.2) -
The average scores of the two categories being compared are not significantly different.
The average scores of the category in the first column is significantly higher than that of the category with which it is being compared.
The average score of the category given in the first column is significantly lower than that of the category with which it is being compared.
4.3 Conclusion
Th e average Mathematics achievement of students varies greatly across the states and UTs of India. Th ere is a great diff erence in outcomes in the group of high scoring states such as Uttar Pradesh (298), Tamil Nadu (279) and Karnataka (269) and the low scoring states/UTs such as Puducherry (217), Andaman & Nicobar Islands (226) and Chandigarh (229).
States also vary greatly in the range between their lowest and highest achieving students as revealed by their inter-quartile score ranges. Some states/UTs, e.g., Chandigarh (36), Andaman & Nicobar Islands (37) and Puducherry (40) have relatively homogeneous cohorts whilst others—Uttar Pradesh (85), Tamil Nadu (84) and Karnataka (81)—have far more diverse outcomes. Th erefore, when looking at Mathematics performance within a state/UT, it is important to consider not only the average score, but also the distribution of percentile scores.
Overall, the survey found no signifi cant diff erence in the average achievement of class V girls and boys studying Mathematics in government and government-aided schools. Some readers may be surprised by this fi nding. However, the large sample size (>55.000) and the consistency of results across states suggest that this is a robust conclusion.

57
Achievement of Students in Mathematics
Similarly, with a few exceptions, no signifi cant diff erence was detected between the average achievement level in Mathematics of rural and urban students. In cases such as Tripura (favouring rural) and the Andaman & Nicobar Islands (favouring urban), further investigations may be necessary at the local level to explain these exceptional outcomes.
Data from the survey confi rms that overall, in Mathematics, students from the General category outperform their peers in the SC, ST and OBC categories by a statistically signifi cant margin.
Th e chapter which follows provides more information about what class V students at various levels of achievement know and can do in the domain of Mathematics.

58
National Achievement Survey

59
Achievement of Students in Mathematics
Chapter 5
Mathemat ics : What Students Know and Can Do

60
National Achievement Survey

61
Mathematics: What Students Know and Can Do
CHAPTER 5 MATHEMATICS: WHAT STUDENTS KNOW AND CAN DO
5.1 Overview of the Mathematics tests
Th e Mathematics achievement survey given to class V students consisted of three test booklets, each containing 40, four-option multiple choice items. Twenty items were common across all test forms. Th ese served as ‘anchors’ so that the diff erent test booklets could be linked together and hence, all items could be placed on a common scale. In total, the Mathematics assessment instrument comprised 80 unique items.
Th e items in each text booklet were chosen to cover the following range of mathematical domains from the Mathematics curriculum: the number system, basic operations, measurement, geometry and patterns. In addition to the content domains listed above, items were constructed to test a range of cognitive processes or skills in a variety of contexts. Th ese were classifi ed as Knowing ‘Skill 1’, Applying ‘Skill 2’ and Reasoning ‘Skill 3’ as described below:
Skills classification for test construction in Mathematics
Knowing (Skill 1): In items testing this process, students are expected to answer using simple knowledge (recall) or recognition of
terms and/or concepts familiar from their lessons. This skill also includes the application of basic operations in straightforward tasks.
Applying (Skill 2): In items testing this process, students are expected to solve non-complex problems set in familiar situations by
way of simple application of the operations/concepts learned in class V.
Reasoning (Skill 3): In items testing this process, students are expected to use Mathematics concepts, principles, facts, etc. learned
in the class in new or less familiar situations. In particular, students are expected to apply their Mathematical abilities to solving real
world problems.
5.2 Item Mapping
Following testing, the responses of students to the various Mathematics tasks were analysed using Item Response Th eory (see Appendix II). Th e three test forms were then aligned using the anchor items, thereby placing all items on a single Mathematics achievement scale comprising scores from 0 to 500. On this scale, the mean score was set at 250 with a standard deviation of 50. Calibrating the items according to their levels of diffi culty places them on an ‘item map’ with the more demanding items at the top and the easiest items at the bottom. Such item maps give us a picture as to what students at diff erent levels of ability know and can do.
Th e map for selected items from the Mathematics tests is given below. Th e scale score in the fi rst column shows the level of diffi culty for each item. Perhaps more importantly, this score also represents the minimum score on the ability scale necessary for a student to have an even (i.e., 50:50) chance of success on the item. Th e map (Table 5.1) also includes a brief description of what students needed to do to answer the item correctly.

62
National Achievement Survey
Table 5.1: Item map for selected items from the class V NAS in Mathematics
Scale Score Mental Processes Question Description
...
325 Applying Addition of two fractions
321 Reasoning Calculate the perimeter of squares *
...
304 Reasoning Calculate the difference between two decimal numbers*
300 (no item appeared at this difficulty level)
292 Reasoning Identify smallest number divisible by two single digit numbers
290 Applying Identify the difference between fractions
289 Reasoning Can subtract distance given in different units
280 Reasoning Find the difference between numbers after changing position of digits*
278 Reasoning Solve money problems involving fractions
277 Reasoning Solve an equation with one unknown
275 Reasoning Calculate an average of given values
267 Applying Calculate the radius of a circle from given information *
266 Applying Calculate the perimeter of a square of given side
262 Applying Identify the largest number made from given three digits*
261 Applying Calculate the difference described in word problem*
260 Applying Able to convert minutes into hours
258 Applying Find the difference between two large numbers
257 Applying Identify the smallest angle in a given figure
254 Applying Select appropriate units for measuring length
250 Applying Identify 45° as ‘half of a right angle’
249 Applying Calculate the area of a rectangle
248 Applying Calculate the period between two given times
245 Applying Find the difference between two digits in a number
244 Applying Calculate the number of hours in a week
240 Applying Multiply two digit numbers
237 Knowing Find the angle between the hands of a clock
232 Applying Solve the word ‘problem’
228 Applying Multiply two given numbers
225 (no item appeared at this difficulty level)
224 Knowing Convert volume of liquid into different units
223 Knowing Find the place value of a digit in given number*
214 Applying Calculate time period from a given clock
208 Knowing Identify the rectangle among given shapes*
205 Applying Understand the conversion of metres and centimeters
200 (no item appeared at this difficulty level)
184 Applying Add two four-digit numbers*
168 Knowing Identify the triangle among given shapes
Items marked with an asterisk (*) are given as examples at the end of this chapter together with information as to how students performed.
Note: Percent correct values from classical test theory are given in Appendix IV.

63
Mathematics: What Students Know and Can Do
Items ranged in diffi culty from the easiest with a scale score of 168 (recognising a triangle amongst other geometrical shapes) to the most diffi cult with a scale score of 422 (comparing three fractions in an authentic context). Using the item map and similar information for all the other test items, descriptions of what students know and can do at diff erent levels of ability can be developed. Such descriptions based on evidence from the survey are given below. In addition, exemplar items are given to help subject teachers understand the statements.
Students performing at the lower end of the ability scale, i.e., those with scale scores in the range of, say, 175 to 230, can:
demonstrate basic mathematical knowledge, e.g., they know the place value of digits in the number system and can recognise
geometrical shapes; and
apply fundamental concepts and perform basic operations in simple situations, e.g., they can use familiar units of time and
linear measure, and can perform one step calculations involving whole numbers.
Students performing in the intermediate range of the scale, i.e., those with scale scores in the range of, say, 230 to 275, can do more.
In addition to that described above, they can:
perform a wider range of mathematical operations including multiplication and division;
work with basic units and, where necessary, transform units such as g and kg, m and km, hours and minutes, etc.; and
apply their knowledge to a range of problems set in authentic contexts (e.g., money calculations in the market) provided that
the context is clear.
Students performing at higher end of the scale, i.e., those with scale scores above, say, 275, can do still more. In addition to that
described above, they can:
apply most or all of the mathematical operations required by the curriculum;
demonstrate understanding of fractions and fractional notation by comparing their sizes etc.;
add decimal fractions and work confidently in a range of physical units including those of area; and
solve more complex problems including authentic tasks such as those involving time and money calculations—even when
these are set in less familiar contexts.
5.3 Sample Items
Th e sample items given below are intended to exemplify student achievement in selected mathematical domains at three distinct levels within the ability range. For each item, the proportion of students choosing the correct answer (marked *) and each of the incorrect options is given. A table at the end of this section shows the proportion of students selecting the correct answer within each participating state/UT.
5.3.1 Number system
Sample item: Find Place Value Scale score: 223 (easy)
Item 71. The place value of 4 in 294301 is...
1. 4 2. 40
3. 400 4. 4000
Th is item requires student to fi nd out place value of a digit in a given number. Th e scale value of the item is 223, signifi cantly below average diffi culty of all items used in the survey. A total of 61% students have identifi ed the correct answer as (4). Th e fi gure shows distribution of remaining 39% responses.

64
National Achievement Survey
Figure 5.1 (Item 71): Percentage of students in each response category
Sample item: Find largest number Scale score: 262 (intermediate)
Item 3. Renu has the following three number cards:
7 5 8
Which is the largest 3-digit number she can make using all cards?
1. 578 2. 857
3. 875 4. 999
Th is item requires student to form the largest three digit number using all three numbers written in cards. Th e scale value of the item is 262, i.e., close to the average diffi culty of all items in the survey. In this item, 45% of students chose the correct answer as (3). Note that 37% chose incorrect option (4) which is the largest three digit number but is not made using the given numbers. Th e fi gure shows the remaining 18% responses.
Figure 5.2 (Item 3): Percentage of students in each response category
Sample item: Number difference Scale score: 280 (hard)
Item 49. The digits 3 and 4 of the number 354 are inter-changed to form a new number. What is the difference between the new
number and the original number?
1. 99 2. 101
3. 109 4. 199
50
40
30
20
10
0
1 2 3 4
6 8
45
37
4
Omitted
70
60
50
40
30
20
10
0
1 2 3 4
9914
61
7
Omitted

65
Mathematics: What Students Know and Can Do
Th is item requires students to not only transform a given number, but also calculate simple diff erence of numbers. Th e scale value of the item is 280, signifi cantly above average diffi culty of all items used in the survey. A total of 40% students have identifi ed the correct answer as (1). Th e fi gure shows distribution of remaining 60% responses.
Figure 5.3 (Item 49): Percentage of students in each response category
5.3.2 Computations (Operations)
Sample item: Calculation Scale score: 184 (easy)
Item 44. 7010
+ 2699 ?
1. 9799 2. 9709
3. 9699 4. 9609
Th is item requires students to calculate simple addition with carrying of two four-digit numbers. Th e scale value of the item is 184, signifi cantly below average diffi culty of all items used in the survey. A total of 76% students have identifi ed the correct answer as (2). Th e fi gure depicts distribution of remaining 24% responses.
Figure 5.4 (Item 44): Percentage of students in each response category
50
40
30
20
10
0
1* 2 3 4
40
1714
20
9
Omitted
100
80
60
40
20
0
1 2 3 4
5
76
6 7 5
Omitted

66
National Achievement Survey
Sample item: Calculate the difference Scale score: 261 (intermediate)
Item 45. How much greater is 555 than 198?
1. 357 2. 358
3. 367 4. 753
Th is item requires students to calculate the diff erence satisfying the given condition. Th e scale value of the item is 261 which is close to the average diffi culty of all items used in the survey. In this item, 45% of students chose the correct answer (1). Note that 26% chose incorrect option (4) which is the sum of 555 and 198 rather than the diff erence. Th e fi gure shows how the remaining 29% responded.
Figure 5.5 (Item 45): Percentage of students in each response category
Sample item: Calculate the difference in decimal numbers Scale score: 304 (hard)
Item 28. What is the difference between 500.2 and 499.101?
1. 1.099 2. 1.101
3. 1.109 4. 1.99
Th is item requires student to calculate diff erence between two decimal numbers. Th e scale value of the item is 304, signifi cantly above average diffi culty of all items used in the survey. A total of 34% students have identifi ed the correct answer as (1). Th e fi gure depicts distribution of remaining 66% responses.
Figure 5.6 (Item 28): Percentage of students in each response category
50
40
30
20
10
01* 2 3 4
45
12 12
26
5
Omitted
40
30
20
10
01* 2 3 4
34
28
15 14
9
Omitted

67
Mathematics: What Students Know and Can Do
5.3.3 Geometry
Sample item: Identify desired shape Scale score: 208 (easy)
Item 42. Which of the following figures is a rectangle?
1. (a) 2. (b) 3.(c) 4. (d)
Th is item requires students to identify the rectangle from amongst given shapes. Th e scale value of the item is 208, signifi cantly below average diffi culty of all items used in the survey. A total of 68% students have identifi ed the correct answer as (2). Th e fi gure depicts distribution of remaining 32% responses.
Figure 5.7 (Item 42): Percentage of students in each response category
Sample item: Find the radius Scale score: 267 (intermediate)
Item 38. In the figure given here, the radius of the smaller circle is 3 cm. What is the radius of the larger circle having centre O?
1. 3 cm
2. 6 cm
3. 9 cm
4. 12 cm
Th is item requires student to fi nd the radius of a circle from information given in the diagram. Th e scale score of the item is 267, i.e., close to average level of diffi culty of item in the survey. About 43% of students chose the correct answer (2). Note that 24% chose incorrect option (1) which suggests that they read the diameter of the smaller circle to be 3 cm. Th e fi gure shows how the remaining 33% responded.
70
60
50
40
30
20
10
01 2* 3 4
68
6
14
48
Omitted

68
National Achievement Survey
Figure 5.8 (Item 38): Percentage of students in each response category
Sample item: Calculate the perimeter Scale score: 321 (hard)
Item 80. In the figure given here, there are four equal squares, each of perimeter 24 cm, joined together. What is the perimeter of
the shaded part of the figure?
1. 36 cm
2. 42 cm
3. 48 cm
4. 60 cm
Th is item requires students to calculate perimeter of a rectangle formed by a number of squares of known perimeter. Th e scale score of the item is 321, i.e., above average level of diffi culty of item used in the survey. About 36% chose the correct option (3) and 24% chose incorrect option (4) in this item. Th is suggests that they included the two internal edges that do not constitute part of the perimeter. Th e fi gure shows the response pattern of remaining 40% students.
Figure 5.9 (Item 80): Percentage of students in each response category
Table 5.2 shows the proportion of students responding correctly to the sample items given above.
50
40
30
20
10
01 2* 3 4
24
43
1114
8
Omitted
40
30
20
10
01 2 3* 4
14
36
15
24
11
Omitted

69
Mathematics: What Students Know and Can Do
Table 5.2: The proportion of students selecting the correct option in each of the
nine sample items given above by state/UT
State/ UT Number system Calculations Geometry
Item 71 Item 3 Item 49 Item 44 Item 45 Item 28 Item 42 Item 38 Item 80
A & N Islands 50 32 28 72 27 29 60 30 32
Andhra Pradesh 60 38 41 73 46 28 57 34 37
Assam* 48 42 36 67 39 29 54 36 29
Bihar 55 38 34 67 51 30 60 34 32
Chandigarh 49 26 25 83 31 28 68 28 29
Chhattisgarh 51 28 38 62 41 34 61 31 27
Daman & Diu* 68 51 42 83 45 48 82 49 39
Delhi 59 51 42 78 48 32 77 44 27
Goa* -- 40 29 84 34 25 58 41 --
Gujarat 65 51 42 79 46 35 80 52 38
Haryana 57 36 38 75 42 32 53 36 37
Himachal Pradesh 54 38 33 77 43 33 60 38 35
Jammu & Kashmir 64 52 38 71 50 37 65 46 35
Jharkhand** 56 44 35 71 50 34 69 35 30
Karnataka 76 51 46 79 47 42 82 59 40
Kerala* 60 64 41 81 51 22 89 60 32
Madhya Pradesh 71 61 41 76 58 35 72 42 36
Maharashtra* 67 61 50 83 48 33 83 48 38
Meghalaya** 66 32 34 77 44 29 42 38 36
Mizoram** 51 26 34 83 45 24 37 38 31
Nagaland** 54 50 35 75 39 35 55 45 40
Orissa 64 55 41 78 43 26 72 43 33
Puducherry 48 28 22 64 19 27 62 34 30
Punjab 68 40 37 84 41 38 63 47 37
Rajasthan 59 49 38 71 46 32 68 44 31
Sikkim** 77 19 30 78 30 24 41 42 40
Tamil Nadu 75 66 64 78 51 57 86 66 55
Tripura 64 47 44 79 48 41 75 49 30
Uttar Pradesh 75 74 57 82 68 52 84 60 44
Uttarakhand 59 42 31 67 43 28 68 28 30
West Bengal** 59 41 47 88 59 40 80 45 42
All sample 61 45 40 76 45 34 68 43 36
1. States/UTs marked * achieved samples representing <80% of the target population.
2. States/UTs marked ** tested students in Class VI.
3. Due to translation effects, items 31 and 40 were deleted in Goa.
5.4 What can students do in Mathematics?
5.4.1 Computations (Operations)
In this chapter it has already been mentioned what the students performing at diff erent levels of content domain on Mathematics items can do. Table 5.3 shows the performance of students of class V on various cognitive processes or skills on Basic Operations.

70
National Achievement Survey
Table 5.3: Performance of class V students on Computations (Operations)
Knowing (Skill 1) Applying (Skill 2) Reasoning (Skill 3)
Item No. Scale Value % Correct Item No. Scale Value % Correct Item No. Scale Value % Correct
1 241 53 3 262 44 28 304 34
41 216 63 43 242 53
61 224 61 63 290 34
31 211 66 33 254 48
51 210 67 53 307 35
71 223 61 73 233 57
11 247 51 17 245 51
18 205 69
19 224 62
Knowing (Skill 1)
About two-thirds of the students can identify the smallest four digit number (Item 51) and can also write the four-digit numeral in words (Item 31).
Applying (Skill 2)
About half of the students can use the knowledge of basic operations in solving the items such as to fi nd out the place value of a number in a six-digit number (Item 19).
Nearly one-third students can solve the question based on fractions such as identifi cation of equivalent fractions (Item 53) and diff erentiate between equivalent and non-equivalent fractions (Item 63).
Reasoning (Skill 3)
Only one-third of the students can compute the diff erence between two decimal numbers (Item 28).
5.4.2 Geometry
Table 5.4 shows the performance of class V students in Geometry in terms of percent.
Table 5.4: Performance of class V students in Geometry
Knowing (Skill 1) Applying (Skill 2) Reasoning (Skill 3)
Item No. Scale Value % Correct Item No. Scale Value % Correct Item No. Scale Value % Correct
2 252 49 8 179 79
-
42 208 67 48 257 47
62 323 26 68 318 30
32 285 38 38 267 43
52 235 56 58 250 49
72 223 62 78 298 34
14 168 84 26 261 44
15 237 54 27 260 45
16 265 44 - - -

71
Mathematics: What Students Know and Can Do
Knowing (Skill 1)
Above 80% students can identify the fi gure of a triangle (Item 14).
About three-fourths of the students cannot identify the largest angle among the given angles in a geometrical fi gure (Item 62).
Applying (Skill 2)
About 79% students can count the sides of a given fi gure (Item 8).
About 70% students cannot identify the number of triangles embedded in a large triangular fi gure (Item 68).
More than 65% students cannot compute area from the given side in a square (Item 78).
5.4.3 Measurement
Table 5.5 shows the performance of class V students in Measurement in terms of percent.
Table 5.5: Performance of class V students in Measurement
Knowing (Skill 1) Applying (Skill 2) Reasoning (Skill 3)
Item No. Scale Value % Correct Item No. Scale Value % Correct Item No. Scale Value % Correct
13 224 59 6 248 50 10 278 38
46 214 67 50 422 22
66 232 57 70 229 58
7 249 50 40 271 41
47 266 44 60 289 35
67 266 44 80 321 35
37 227 60 30 283 37
57 260 45
77 239 55
23 246 51
24 274 40
25 268 43
Knowing (Skill 1)
About 59% students can do simple measurement problems (Item 13).
Applying (Skill 2)
Nearly half of the students can apply the knowledge of measurement in solving problems like computation of area of a rectangle of given dimensions (Item 7).
About two-thirds of the students can read the time given in a clock (Item 37).
About 60% students cannot match equivalence of measurement scales/units (Item 24).
More than half of the students cannot compute the perimeter of a given square (Item 67).
Reasoning (Skill 3)
Only 22% students can do word problem based on money spent on diff erent heads (Item 50).

72
National Achievement Survey
5.4.4 Number System
Table 5.6 shows the performance of class V students on the Number System in terms of percent.
Table 5.6: Performance of class V students on the Number System
Knowing (Skill 1) Applying (Skill 2) Reasoning (Skill 3)
Item No. Scale Value % Correct Item No. Scale Value % Correct Item No. Scale Value % Correct
12 239 54 4 252 48 9 292 34
44 184 76 49 280 39
64 228 58 69 229 58
5 258 46 39 277 38
45 261 45 59 275 40
65 278 39 79 271 41
34 261 44 29 227 61
54 240 54
74 261 44
35 254 47
55 276 39
75 325 26
36 244 52
56 271 42
76 257 48
20 237 55
21 192 72
22 258 46
Knowing (Skill 1)
About 54% students can do simple problems of number system (Item 12).
Applying (Skill 2)
More than two-thirds of the students can add two four-digit numbers (Item 44) and can also add two-digit numbers with carry (Item 21).
About three-fourths of the students cannot compute sum of the fractional number with diff erent denominator (Item 75).
Reasoning (Skill 3)
About 60% students can fi nd multiplier of a given number (Item 29).

73
Mathematics: What Students Know and Can Do
Chapter 6
S tudent Achievement in Env i ronmenta l Stud ies

74
National Achievement Survey

75
Student Achievement in Environmental Studies
CHAPTER 6 STUDENT ACHIEVEMENT IN ENVIRONMENTAL STUDIES
Th is chapter summarises the achievement of students in EVS in the NAS. Overall achievement for each of the participating states and UTs is reported. In addition, information about diff erences in achievement by student gender, school location and social category is provided. In the majority of states, students nearing the end of class V were tested. However, in a minority of states, the arrangement of the school year meant that students had to be tested at the beginning of class VI. Results for these groups are presented separately to reduce the chance of readers inadvertently comparing diff erent cohorts.
For each state, a sample was drawn which was designed to be representative of the entire target population. In most states, the sample coverage achieved was regarded as satisfactory as it covered more than 80% of the target population. However, in some states, local logistical challenges and resource constraints meant that this criterion was not met and so the sample coverage, although signifi cant, was deemed inadequate. To ensure that readers are aware of this when comparing achievement levels, results for states with inadequate sample coverage are reported separately.
6.1 How did the states and UTs perform in Environmental Studies?
Tables 6.1, 6.2 and 6.3 show the distribution of student achievement for the 31 participating states and UTs. Each table represents one of the three categories: those where class V students were tested and where sample coverage was adequate; those where class V students were tested but where sample coverage was inadequate; and those where class VI students were tested. Within each group, states are listed in alphabetical order.
Th e tables list each state’s average score on a scale from 0 to 500. For each score, the ‘standard error’ is given to indicate the degree of imprecision arising from the sampling process. Finally, the tables indicate whether a state’s average score is signifi cantly diff erent from the group’s average or not.
Table 6.1: Average EVS scores for states and UTs where class V students were tested
and the population coverage was >80%
States and UTs Average Score Standard Error Significant Difference
A & N Islands 233 3.1
Andhra Pradesh 238 2.0
Bihar 236 3.1
Chandigarh 226 2.1
Chhattisgarh 234 3.7
Delhi 262 3.2
Gujarat 250 2.9
Haryana 232 2.2
Himachal Pradesh 243 2.9
Jammu & Kashmir 258 2.9
Karnataka 275 2.7
Madhya Pradesh 264 3.3
Orissa 253 3.0
Puducherry 222 3.1

76
National Achievement Survey
Punjab 245 2.9
Rajasthan 246 3.1
Tamil Nadu 288 2.7
Tripura 257 3.3
Uttar Pradesh 284 3.6
Uttarakhand 237 3.0
Group Average 249 0.7
The state’s average score is not significantly different from that of the group.
The state’s average score is significantly above that of the group.
The state’s average score is significantly below that of the group.
Th e 20 states and UTs represented in Table 6.1 are those in which class V students were tested and where the sample covered at least 80% of the target population. Th e average score for this group was 249 (with a standard error of 0.7). Th e results reveal substantial diff erences in EVS achievement between the highest performing state (288 for Tamil Nadu) and the lowest performing state (222 for Puducherry). In EVS, seven states had average scores signifi cantly above that of the group; nine states had average scores signifi cantly below that of the group; and four states had average scores that were not signifi cantly diff erent from that of the group.
Table 6.2: Average EVS scores for states and UT where class V students were tested
and the population coverage was <80%
States and UT Average Score Standard Error Significant Difference
Assam 239 2.1
Daman & Diu 255 6.8
Goa 235 3.2
Kerala 252 1.6
Maharashtra 263 2.3
Group Average 250 1.7
The state’s average score is not significantly different from that of the group.
The state’s average score is significantly above that of the group.
The state’s average score is significantly below that of the group.
Th e fi ve states and UT represented in Table 6.2 are those in which class V students were tested but where the sample covered less than 80% of the target population. For this group, great care should be taken when considering an average score as it may not be a reliable measure for the whole state/UT.
Table 6.3: Average EVS scores for states where class VI students were tested
States Average Score Standard Error Significant Difference
Jharkhand 245 3.6
Meghalaya 256 2.7
Mizoram 255 1.0
Nagaland 255 3.7
Sikkim 245 1.8
West Bengal 266 2.4
Group Average 254 1.1
The state’s average score is not significantly different from that of the group.
The state’s average score is significantly above that of the group.
The state’s average score is significantly below that of the group.

77
Student Achievement in Environmental Studies
Th e six states represented in Table 6.3 are those in which class VI students were tested. For this group, the average EVS score was 254 (standard error 1.1). West Bengal performed signifi cantly better than the group average whereas the average scores of Sikkim and Jharkhand were signifi cantly below the group average.
Th e tables and fi gures that follow illustrate the range of achievement within states and across groups of states. Th e tables list the scores achieved by students at key percentiles. For example, the score at the 25th percentile is the score which 75% of students achieve or surpass; the score at the 90th percentile is the score that 10% of students achieve or surpass. Th e range between the 25th and 75th percentiles (the inter-quartile range) represents the performance of the middle 50% of students. Hence, this is a good indicator of the state’s degree of homogeneity in terms of the EVS achievement of its students.
Table 6.4: Percentile scores in EVS for states and UTs where class V students were
tested and the population coverage was >80%
States and UTs 10th
percentile
25th
percentile
50th
percentile
75th
percentile
90th
percentile
Range 75–25 Range 90–10
A & N Islands 182 204 227 260 290 56 108
Andhra Pradesh 184 215 228 269 292 54 108
Bihar 177 194 227 274 315 80 138
Chandigarh 183 203 226 241 272 38 89
Chhattisgarh 170 190 227 271 318 81 149
Delhi 201 227 263 292 332 66 131
Gujarat 186 222 240 280 319 58 133
Haryana 180 203 227 259 290 56 110
Himachal Pradesh 184 216 231 272 309 56 125
Jammu & Kashmir 182 222 265 300 331 78 148
Karnataka 212 232 275 316 341 84 129
Madhya Pradesh 186 225 271 308 335 83 149
Orissa 181 222 250 292 324 69 143
Puducherry 179 192 223 235 271 43 92
Punjab 186 219 232 273 314 54 128
Rajasthan 181 212 236 280 320 68 139
Tamil Nadu 225 250 283 327 356 77 132
Tripura 186 224 263 295 326 70 140
Uttar Pradesh 218 239 281 328 355 89 137
Uttarakhand 179 207 229 271 300 63 121
Group Distribution 188 216 245 282 316 66 128
Note: Ranges may not agree due to rounding.
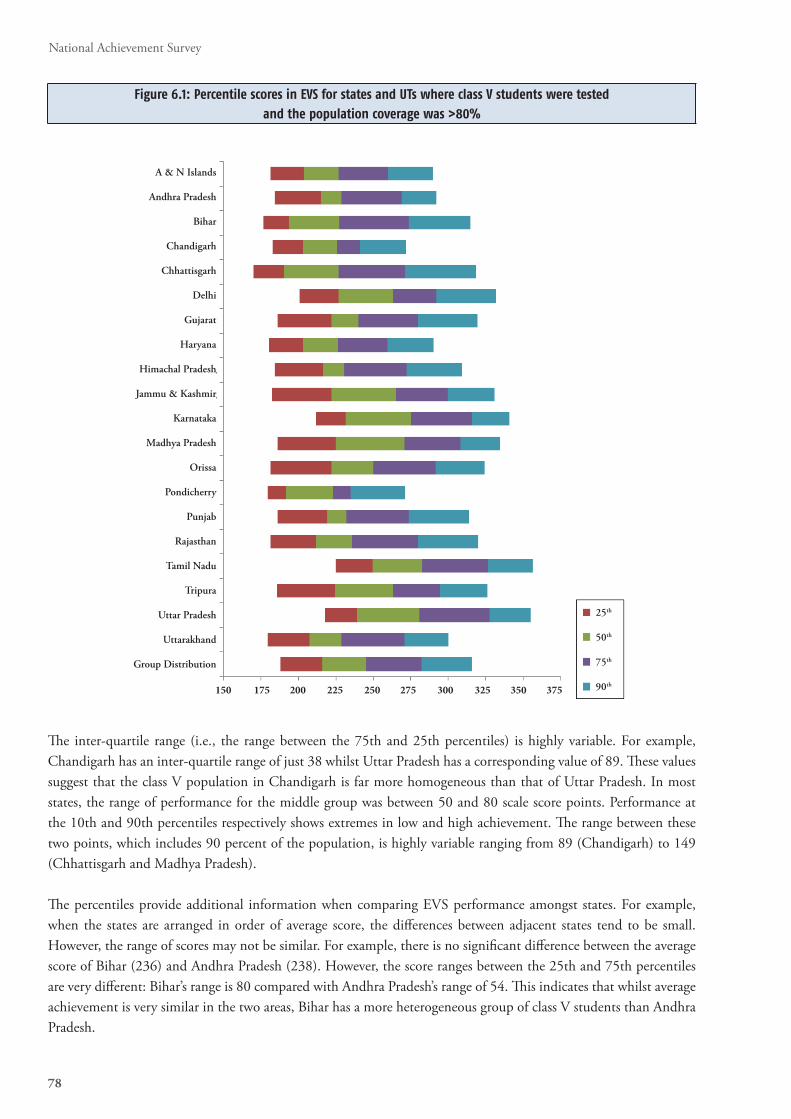
78
National Achievement Survey
Figure 6.1: Percentile scores in EVS for states and UTs where class V students were tested
and the population coverage was >80%
Th e inter-quartile range (i.e., the range between the 75th and 25th percentiles) is highly variable. For example, Chandigarh has an inter-quartile range of just 38 whilst Uttar Pradesh has a corresponding value of 89. Th ese values suggest that the class V population in Chandigarh is far more homogeneous than that of Uttar Pradesh. In most states, the range of performance for the middle group was between 50 and 80 scale score points. Performance at the 10th and 90th percentiles respectively shows extremes in low and high achievement. Th e range between these two points, which includes 90 percent of the population, is highly variable ranging from 89 (Chandigarh) to 149 (Chhattisgarh and Madhya Pradesh).
Th e percentiles provide additional information when comparing EVS performance amongst states. For example, when the states are arranged in order of average score, the diff erences between adjacent states tend to be small. However, the range of scores may not be similar. For example, there is no signifi cant diff erence between the average score of Bihar (236) and Andhra Pradesh (238). However, the score ranges between the 25th and 75th percentiles are very diff erent: Bihar’s range is 80 compared with Andhra Pradesh’s range of 54. Th is indicates that whilst average achievement is very similar in the two areas, Bihar has a more heterogeneous group of class V students than Andhra Pradesh.
A & N Islands
Andhra Pradesh
Bihar
Chandigarh
Chhattisgarh
Delhi
Gujarat
Haryana
Himachal Pradesh
Jammu & Kashmir
Karnataka
Madhya Pradesh
Orissa
Pondicherry
Punjab
Rajasthan
Tamil Nadu
Tripura
Uttar Pradesh
Uttarakhand
Group Distribution
150 175 200 225 250 275 300 325 350 375
25th
50th
75th
90th

79
Student Achievement in Environmental Studies
Table 6.5: Percentile scores in EVS for states and UT where class V students were tested
and the population coverage was <80%
States and UT 10th
percentile
25th
percentile
50th
percentile
75th
percentile
90th
percentile
Range 75–25 Range 90–10
Assam 182 211 230 272 296 60 114
Daman & Diu 194 224 250 283 326 59 132
Goa 188 214 228 261 284 47 96
Kerala 207 227 257 275 296 48 90
Maharashtra 199 227 265 299 334 72 135
Figure 6.2: Percentile scores in EVS for states where class V students were tested
and the population coverage was <80%
Table 6.6: Percentile scores in EVS for states where class VI students were tested
States and UT 10th
percentile
25th
percentile
50th
percentile
75th
percentile
90th
percentile
Range 75–25 Range 90–10
Jharkhand 178 202 231 281 328 79 150
Meghalaya 199 225 250 281 322 56 123
Mizoram 220 230 263 275 289 46 69
Nagaland 185 220 242 296 332 76 147
Sikkim 209 226 237 271 282 44 73
Group Distribution 201 222 249 283 313 61 112
Assam
Daman & Diu
Goa
Kerala
Maharashtra
150 175 200 225 250 275 300 325 350 375
25th
50th
75th
90th

80
National Achievement Survey
Figure 6.3: Percentile scores in EVS for states where class VI students were tested
Th e inter-quartile range for the states where class VI students were tested varied considerably from about 44 scale points in Sikkim and Mizoram to more than 75 points in Nagaland and Jharkhand. Th e range of scale points covering the population from the 10th to the 90th percentile varied dramatically from the diverse state of Jharkhand (150) to Mizoram (69) where relatively little diff erence between high and low performing student was detected.
Performance between 10th and 90th percentile, which includes 90 percent of the population, was between 69 for Mizoram and 150 points for Jharkhand. It can be seen that even though West Bengal has the highest median performance (270), Nagaland has a higher score at the 90th percentile, suggesting that its high achieving students do extremely well.
6.2 How did various groups perform in Environmental Studies?
Th e tables below compare the average performances of diff erent groups. Performance is compared by gender, by school location, and by social category. (Th e quoted scores were calculated for the 20 states and UTs where students were tested in class V and coverage of the population was at least 80% since this group gives the most reliable picture.)
6.2.1 Are there any gender-related diff erences in EVS achievement?
Table 6.7 compares the average EVS scores achieved by boys and girls. It shows that, within this group of states, no signifi cant diff erence was detected in the average achievement levels of the two groups.
Table 6.7: Average EVS scores for groups by gender (class V)
Boys’ Average(SE) Girls’ Average(SE) Significant Difference
249 (0.7) 250 (0.8)
No significant difference between the average performance of girls and boys.
150 175 200 225 250 275 300 325 350
25th
50th
75th
90th
Jharkhand
Meghalaya
Mizoram
Nagaland
Sikkim
West Bengal
Group Distribution

81
Student Achievement in Environmental Studies
Tables 6.8, 6.9 and 6.10 below show that, in general, the general result, i.e., no signifi cant diff erence between the average achievement of boys and girls holds for all states and UTs.
Table 6.8: Average EVS scores, by gender, for states and UTs where class V students were tested and population
coverage was >80%
States and UTs Boys’ Average (SE) Girls’ Average (SE) Significant Difference
A & N Islands 230 (2.6) 236 (3.8)
Andhra Pradesh 240 (2.3) 236 (2.2)
Bihar 236 (3.2) 236 (3.7)
Chandigarh 227 (2.3) 225 (2.3)
Chhattisgarh 234 (3.7) 233 (4.5)
Delhi 263 (4.3) 263 (4.8)
Gujarat 250 (3.2) 250 (3.5)
Haryana 233 (2.5) 231 (2.4)
Himachal Pradesh 242 (2.9) 244 (3.2)
Jammu & Kashmir 259 (2.9) 258 (3.4)
Karnataka 274 (2.9) 277 (3.1)
Madhya Pradesh 263 (3.6) 265 (4.0)
Orissa 252 (3.2) 254 (3.3)
Puducherry 218 (2.0) 225 (4.9)
Punjab 246 (3.1) 245 (3.0)
Rajasthan 246 (3.0) 250 (4.0)
Tamil Nadu 288 (2.7) 287 (3.0)
Tripura 253 (3.9) 261 (3.5)
Uttar Pradesh 283 (3.8) 284 (3.8)
Uttarakhand 238 (3.0) 237 (3.2)
Group Average 249 (0.7) 250 (0.8)
No significant difference between the average performance of girls and boys.
Table 6.9: Average EVS scores, by gender, for states and UT where class V students were tested and population
coverage was <80%
States and UTs Boys’ Average (SE) Girls’ Average (SE) Significant Difference
Assam 238 (2.1) 240 (2.6)
Daman & Diu 250 (6.2) 262 (7.1)
Goa 233 (5.0) 237 (4.0)
Kerala 252 (2.0) 252 (1.7)
Maharashtra 264 (2.6) 262 (2.5)
No significant difference between the average performance of girls and boys.

82
National Achievement Survey
Table 6.10: Average EVS scores, by gender, for states where class V students were tested
States Boys’ Average (SE) Girls’ Average (SE) Significant Difference (girls
> boys)
Jharkhand 247 (4.0) 242 (3.8)
Meghalaya 254 (2.9) 257 (3.0)
Mizoram 256 (1.3) 254 (1.3)
Nagaland 259 (4.1) 255 (4.0)
Sikkim 248 (2.0) 242 (2.0)
West Bengal 264 (2.9) 267 (3.3)
Group Average 255 (1.2) 253 (1.3)
No significant difference between the average performance of girls and boys.
6.2.2 Are there any diff erences in EVS achievement related to school location?
Table 6.11 compares the average EVS scores achieved by students in rural and urban schools. It shows that within this group of states, no signifi cant diff erence was detected in the average achievement levels of the two groups.
Table 6.11: Average EVS scores for groups by location (class V)
Rural Average (SE) Urban Average (SE) Significant Difference
Group (by school location) 250 (0.8) 247 (1.7)
No significant difference was observed in the average achievement of urban and rural schools.
Tables 6.12, 6.13 and 6.14 below show that, in general, the general result, i.e., no signifi cant diff erence between rural and urban students holds for all states and UTs. However, four exceptional cases were detected: in A & N Islands, Daman and Diu and Nagaland, the rural students outperformed the urban students whereas in Goa, the urban students outperformed the rural students by a margin which is statistically signifi cant.
Table 6.12: Average EVS scores, by location, for states and UTs where class V students were tested and population
coverage was >80%
States and UTs Rural Average (SE) Urban Average (SE) Significant Difference (Urban/
Rural)
A & N Islands 239 (3.9) 224 (4.7)
Andhra Pradesh 239 (2.3) 234 (4.3)
Bihar 237 (3.5) 227 (5.5)
Chandigarh 226 (2.8) 226 (2.8)
Chhattisgarh 235 (4.3) 227 (8.8)
Delhi 259 (5.6) 262 (3.7)
Gujarat 251 (3.0) 241 (9.7)
Haryana 232 (2.4) 233 (5.4)
Himachal Pradesh 243 (3.2) 242 (5.1)
Jammu & Kashmir 259 (3.0) 248 (15.0)
Karnataka 278 (3.3) 270 (5.4)
Madhya Pradesh 261 (3.5) 279 (9.7)

83
Student Achievement in Environmental Studies
Orissa 252 (3.3) 259 (9.2)
Puducherry 218 (2.1) 230 (7.9)
Punjab 247 (3.3) 237 (4.3)
Rajasthan 248 (3.3) 246 (8.6)
Tamil Nadu 290 (3.3) 282 (5.1)
Tripura 256 (3.6) 259 (10.0)
Uttar Pradesh 284 (4.0) 278 (9.4)
Uttarakhand 237 (3.0) 239 (7.4)
Group Average 250 (0.8) 247 (1.7)
No significant difference between the average performance in rural and urban students.
Rural students’ average performance is significantly greater than that of urban students.
Table 6.13: Average EVS scores, by location, for states and UT where class V students were tested and population
coverage was <80%
States and UT Rural Average (SE) Urban Average (SE) Significant Difference (Urban/
Rural)
Assam 238 (2.2) 250 (7.3)
Daman & Diu 262 (8.3) 231 (8.1)
Goa 228 (3.0) 244 (6.3)
Kerala 252 (1.8) 252 (4.0)
Maharashtra 265 (3.1) 259 (4.5)
Group Average 249 (1.9) 247 (2.8)
No significant difference between the average performance of girls and boys.
Rural students’ average performance is significantly greater than that of urban students.
Rural students’ average performance is significantly lower than that of the urban students.
Table 6.14: Average EVS scores, by location, for states where class VI students were tested
States Rural Average (SE) Urban Average (SE) Significant Difference
(Urban/Rural)
Jharkhand 245 (4.1) 244 (9.2)
Meghalaya 257 (3.4) 252 (4.0)
Mizoram 255 (1.5) 256 (1.6)
Nagaland 259 (4.3) 242 (7.1)
Sikkim 244 (2.1) 250 (4.8)
West Bengal 265 (2.8) 266 (4.6)
Group Average 254 (1.3) 252 (2.4)
No significant difference between the average performance of girls and boys.
Rural students’ average performance is significantly greater than that of urban students.
6.2.3 Are there any diff erences in EVS achievement related to caste category?
Table 6.15 compares the average EVS scores achieved by students in diff erent social categories. It shows that within this group of states, no signifi cant diff erence was detected in the average achievement levels of students in the SC and ST categories. Students classifi ed as being in the OBC category signifi cantly outperformed those in the ST category. On an average, students in the General category achieved signifi cantly higher scores than those in other categories.

84
National Achievement Survey
Table 6.15: Average EVS scores for groups by social category (class V)
Category Average (SE) SC ST OBC General
SC 245 (1.1) -
ST 245 (1.8) -
OBC 250 (1.1) -
General 254 (1.2) -
The average scores of the two categories being compared are not significantly different.
The average scores of the category given in the first column is significantly higher than that of the category with which it is being compared.
The average score of the category given in the first column is significantly lower than that of the category with which it is being compared.
6.3 Conclusion
Th e average achievement of students in EVS varies greatly across the states and UTs of India. Th ere is a highly signifi cant diff erence between outcomes in high scoring states such as Tamil Nadu (288), Uttar Pradesh (284) and Karnataka (275) and low scoring states/UTs such as Puducherry (222), Chandigarh (226) and Haryana (232).
States also vary greatly in the range between their lowest and highest achieving students as revealed by their inter-quartile score ranges. Some states/UTs, e.g., Chandigarh (38), Puducherry (43) and Sikkim (44) have relatively homogeneous cohorts whilst others have far more diverse outcomes, e.g., Uttar Pradesh (89), Karnataka (84) and Madhya Pradesh (83).
Overall, no signifi cant diff erences were detected in the average achievement of girls and boys. Similarly, no signifi cant diff erence was detected between the achievement level of rural and urban students.
Th e survey did fi nd that students from the General Category outperformed their peers in the SC, ST and OBC categories by a statistically signifi cant margin.
Th e following chapter provides more information about what class V students at various levels of achievement know and can do in the domain of Environmental Studies.

85
Student Achievement in Environmental Studies
Chapter 7
Env i ronmenta l Stud ies : What Students Know and Can Do

86
National Achievement Survey

87
Environmental Studies: What Students Know and Can Do
CHAPTER 7 ENVIRONMENTAL STUDIES: WHAT STUDENTS KNOW AND CAN DO
7.1 Overview of the Environmental Studies Tests
Th e EVS tests given to class V students consisted of three test booklets, each containing 40 multiple choice items. Th e items were chosen keeping in view the whole range of the content. Out of 40 items, 20 items were common across all test forms. Th ese served as ‘anchors’ so that the diff erent test booklets could be linked together and hence, all items could be placed on a common scale (See below). In addition, each test form contained an extra, 20 unique items. Th us, altogether the EVS tests used in the survey comprised 80 items.
Th e items were designed to test a range of relevant cognitive processes or ‘skills’. Th ese are classifi ed as knowing, applying and reasoning as defi ned below:
Cognitive Processes for Environmental Studies
Knowing (Skill 1): In items testing this process, students are expected to recall or recognise terms, facts, symbols, units, and basic
scientific/social concepts. They select appropriate apparatus and measurement devices for conducting experiments/investigations.
Applying (Skill 2): The items in this cognitive domain are designed to involve the application of knowledge and understanding
in straightforward situations. The items testing ‘applying’ require students to compare, contrast and classify, and to interpret
information in light of a concept. Students are also expected to use and apply their understanding of concepts and principles in the
known situations. Simple, i.e., single step problems requiring a numerical solution are also included.
Reasoning (Skill 3): In items testing ‘reasoning’, students need to demonstrate their ability to solve problems, draw conclusions
and make decisions. For this, students are required to analyse a problem (perhaps in new situation), identify relationships,
determine underlying principles, devise and explain strategies for problem solving.
7.2 Item Mapping
Following testing, the responses of students to the various tasks were analysed using Item Response Th eory (Appendix II). Th e three test forms were then aligned using the anchor items, thereby placing all items on a single scale comprising scores from 0 to 500. On this scale, the mean score was set at 250 with a standard deviation of 50. Calibrating the items according to their levels of diffi culty places them on an ‘item map’ with the more demanding items at the top and the easiest items at the bottom. Such item maps give us a picture as to what students at diff erent levels of ability know and can do.
Th e item map for EVS is given below. Th e scale score in the fi rst column shows the level of diffi culty for each item. Perhaps more importantly, this score also represents the minimum score on the ability scale necessary for a student to have an even chance of success on the item. Th e map also includes a brief description of what students needed to do to answer the item correctly, i.e., each item is classifi ed according to the cognitive process being evaluated.

88
National Achievement Survey
Table 7.1: Item map in EVS
Scale Score Mental Processes Question Description
351 Applying Understand the phenomena of lunar eclipse
338 Knowing Know the importance of forest in human life
333 Reasoning Establish relationship between measuring apparatus and quantity of water
302 Applying Find the effect of exhaled air on mirror
300 (no item appeared at this difficulty level)
296 Knowing Know the sources of energy and their by products
290 Knowing Know the components of food/diet and their functions
284 Applying Understand the process of breathing
277 Applying Find out the least polluting fuel on the basis of their combustion
275 (no item appeared at this difficulty level)
272 Applying Establish relationship between wind strength and flags’ position
269 Applying Reason out the importance of wild animals in ecosystem
264 Applying Identify the stages of the seed germination
263 Reasoning Reason out to find the direction in the map
260 Knowing Know about the neighboring countries of India
256 Knowing Know the edible part of a carrot
253 Applying Interpret the graph to find out heartbeats of the mouse
251 Reasoning Explain the reason behind the construction of dams
250 Reasoning Analyse the family tree and find solution
249 Applying Interpret the graph to find out rainfall on Wednesday
246 Reasoning Find out the trend of growth in a plant
241 Applying Identify the location of Jim Corbett Park in the map
240 Reasoning Understand the family tree and interpret the relationship
237 Knowing Know the animal source of food
234 Reasoning Establish relationships on the basis of family tree
231 Knowing Know the sources of water and their usage
228 Reasoning Relate different types of clothes with their properties
225 Applying Interpret the graph to identify the animal that has lowest heartbeats
224 Applying Apply knowledge to find the direction in the map
218 Knowing Know the suitable conditions for breeding of mosquitoes
215 Reasoning Find out solution for patient when doctor is not available
213 Applying Compare the means of transportation causing pollution
211 Applying Interpret the graph to find out the most rainy day
209 Knowing Know the national game of India
200 (no item appeared at this difficulty level)
199 Knowing Know the properties of solutes and solvents
185 Knowing Know the name of disease spread by mosquitoes
182 Applying Classify the group of domestic animals
172 Knowing Recognise birds on the basis of their features
Note: Percent correct values from classical test theory are given in Appendix IV.
Th e map shows that class V students demonstrate a wide range of ability in the domain of EVS.
Students at the lower end of the scale, i.e., those with scale scores in the range of, say, 170 to 225 can demonstrate all three cognitive processes—provided that the context is clear and the tasks non-complex. For example, they are able to use information from a table to locate the places and direction in the map, to classify animals and plants on

89
Environmental Studies: What Students Know and Can Do
the basis of their specifi c characteristics, to recall the disease spread by mosquitoes and suitable conditions of their spreading, to identify living organism on the basis of their features, habits and habitats etc.
Students performing in the intermediate range of the scale (say, 225 to 275) can do more. In addition to that described above, they can analyse the issues, interpret information, establish relationships, relate information, and fi nd out solutions in diff erent situations. Th ey can also locate places in the map, reason out the construction of a dam etc. Th ey can also identify cause and eff ect relationships and make inferences in various situations.
Students performing at higher end of the scale, i.e., those with scale scores above, say, 275 can do more. In addition to that described above, they know and can explain the components of diet and their functions, sources of energy and their by products, and the importance of forest in human life. Th ey can also establish relationships, and explain physical eff ects, e.g., exhaled air on a mirror, the phenomena of lunar eclipses etc.
7.3 Sample Items
Items reproduced below were used in the tests of EVS. Statistics showing how students responded to these items are given. Th ese items are arranged in increasing order of diffi culty. Th ey can also be located on the item map.
Sample item: Knowing Scale score: 172
Item 61. Which of the following birds can NOT fly?
1. Parrot
2. Crow
3. Eagle
4. Ostrich
Th e item requires students to recall the bird that cannot fl y. Th e scale score of this item was 172, i.e., signifi cantly below the average level of diffi culty of items in the survey. As many as 81% of students in the sample were able to select the correct answer (4). Th e fi gure shows how the remaining 19% responded.
Figure 7.1 (Item 61): Percentage of students in each response category
Sample item: Knowing Scale score: 256
Item 33. Which part of the carrot plant is eaten?
1. flower
2. leaves
3. stem
4. root
100
80
60
40
20
01 2 3 4
64 7
81
2
Omitted
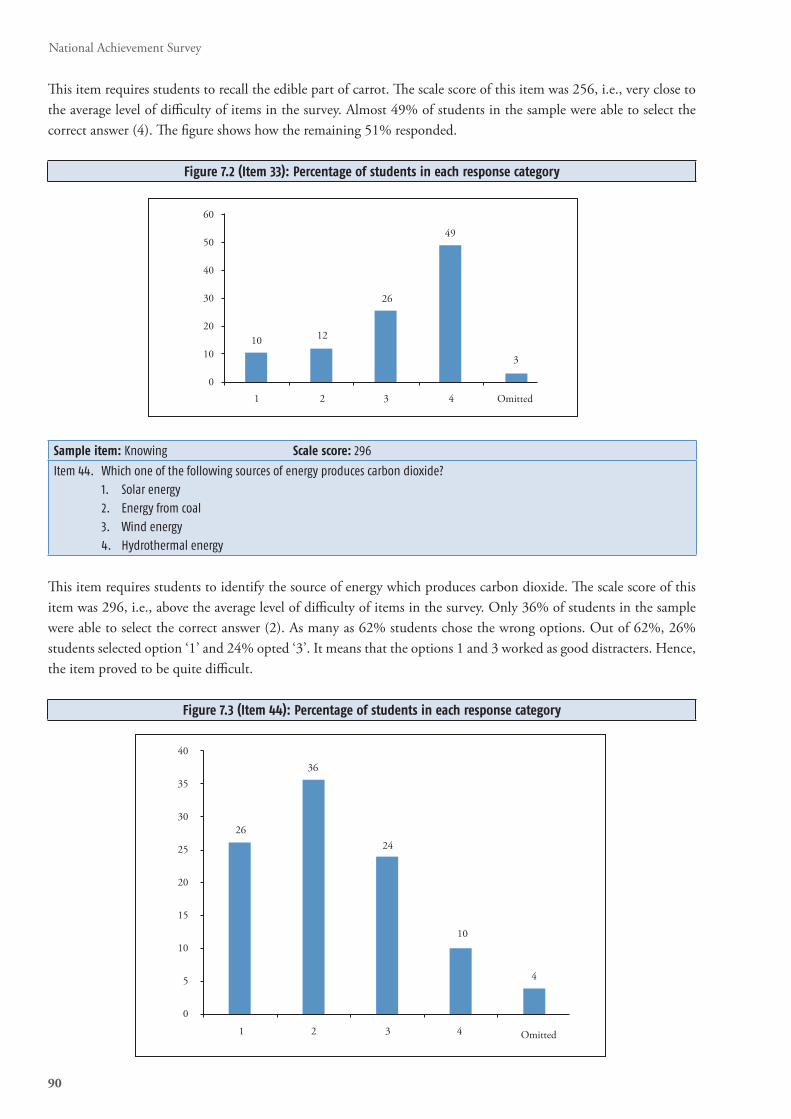
90
National Achievement Survey
Th is item requires students to recall the edible part of carrot. Th e scale score of this item was 256, i.e., very close to the average level of diffi culty of items in the survey. Almost 49% of students in the sample were able to select the correct answer (4). Th e fi gure shows how the remaining 51% responded.
Figure 7.2 (Item 33): Percentage of students in each response category
Sample item: Knowing Scale score: 296
Item 44. Which one of the following sources of energy produces carbon dioxide?
1. Solar energy
2. Energy from coal
3. Wind energy
4. Hydrothermal energy
Th is item requires students to identify the source of energy which produces carbon dioxide. Th e scale score of this item was 296, i.e., above the average level of diffi culty of items in the survey. Only 36% of students in the sample were able to select the correct answer (2). As many as 62% students chose the wrong options. Out of 62%, 26% students selected option ‘1’ and 24% opted ‘3’. It means that the options 1 and 3 worked as good distracters. Hence, the item proved to be quite diffi cult.
Figure 7.3 (Item 44): Percentage of students in each response category
40
35
30
25
20
15
10
5
0
1 2 3 4
26
36
24
10
4
Omitted
60
50
40
30
20
10
01 2 3 4
10 12
26
49
3
Omitted

91
Environmental Studies: What Students Know and Can Do
Sample item: Knowing Applying Scale score: 182
Item 3. Which of the following groups contains only domestic animals?
1. tiger, lion, leopard
2. cow, dog, cat
3. crow, peacock, owl
4. deer, bear, cheetah
Th is item requires students to classify the group of domestic animals. Th e scaled score of this item was 182, i.e., below the average level of diffi culty of items in the EVS survey. As many as 79% of students in the sample were able to select the correct answer (2). Th e fi gure shows how the remaining 21% responded.
Figure 7.4 (Item 3): Percentage of students in each response category
Direction: Renu’s classmates measured rainfall for a week. Based on the chart, please answer the following question:
Sample item: Applying Scale score: 249
Item 9. What was the rainfall on Wednesday?
1. 8 mm
2. 7 mm
3. 5 mm
4. 4 mm
10
8
6
4
2
0Monday Tuesday Wednesday Th ursday Friday Saturday Sunday
Mill
imet
res (
mm
)
90
80
70
60
50
40
30
20
10
01 2 3 4
8
79
355
Omitted

92
National Achievement Survey
Th is item requires students to interpret the given graph and fi nd out the measurement of rainfall on Wednesday. Th e scale score of this item was 249, i.e., very close to the average level of diffi culty of items in the survey. Around 50% of students in the sample were able to select the correct answer (2). Th e fi gure shows how the remaining 50% responded.
Figure 7.5 (Item 9): Percentage of students in each response category
Sample item: Applying Scale score: 302
Item 49. A part of the mirror clouds up when you breathe on it because of_____________ .
1. water vapour from your breath
2. carbon dioxide from your breath
3. oxygen from your breath
4. nitrogen around you
Th e item requires students to explain the eff ect of exhaled air on the mirror. Th e scale score of this item was 302, i.e., signifi cantly above the average level of diffi culty of items in the survey. Only 36% of students in the sample were able to select the correct answer (1). Th e fi gure shows how the remaining 64% responded. It is clear from the fi gure that options 2nd and 3rd worked as strong distracters. Perhaps, students thought that carbon dioxide and oxygen were also present in the air. Hence, the item was hard in nature.
Figure 7.6 (Item 49): Percentage of students in each response category
60
50
40
30
20
10
01 2 3 4
24
50
1011
5
Omitted
40
35
30
25
20
15
10
5
0
1 2 3 4
28
36
20
10
6
Omitted

93
Environmental Studies: What Students Know and Can Do
Direction: Family tree of Meena is shown below. Based on the fi gure, answer the questions 45, 46 and 47.
Sample item: Reasoning Scale score: 234
Item 46. Rakesh and his wife are blessed with a son. What will be the son’s relationship with Dinanath?
1. Grandson
2. Son
3. Brother
4. Brother-in-law
Th is item requires students to fi nd out the relationship on the basis of information given in the family tree. Th e scale score of this item was 234, i.e., below the average level of diffi culty of items in the survey. As many as 58% of students in the sample were able to select the correct answer (1). Th e fi gure shows how the remaining 42% responded.
Figure 7.7 (Item 46): Percentage of students in each response category
Sample item: Reasoning Scale score: 240
Item 45. Rakesh gets married. What will be the relation of his wife with Meena?
1. Sister
2. Sister-in-law
3. Mother
4. Daughter-in-law
Bimla (M other)
Sunita (S is te r)
Meena Rakesh (B ro ther)
Dinanath (Fa ther)
70
60
50
40
30
20
10
01 2 3 4
58
18
13
83
Omitted

94
National Achievement Survey
Th is item requires students to think about the relationship as per information given in the family tree. Th e scale score of this item was 240, i.e., close to the average level of diffi culty of items in the survey. As many as 54% of students in the sample were able to select the correct answer (2). Th e fi gure shows how the remaining 46% responded.
Figure 7.8 (Item 45): Percentage of students in each response category
Sample item: Reasoning Scale score: 250
Item 47. Rakesh is transferred to some other place and lives like a nuclear family.
Now how many members are staying in Meena’s family?
1. 4
2. 5
3. 6
4. 7
Th is item requires students to analyse the situation and fi nd out the number of persons in the family. Th e scale score of this item was 250, i.e., the average level of diffi culty of items in the survey. As many as 51% of students in the sample were able to select the correct answer (1). Th e fi gure shows how the remaining 49% responded.
Figure 7.9 (Item 47): Percentage of students in each response category
60
50
40
30
20
10
01 2 3 4
51
18
12127
Omitted
60
50
40
30
20
10
01 2 3 4
15
54
4
1215
Omitted

95
Environmental Studies: What Students Know and Can Do
Performance on the sample items reproduced here varied across the country. Table 7.2 shows the proportion of students in each state or UT correctly responding to each item. Th e states/UTs are grouped according to the language in which the EVS tests were presented as some variation in performance may be due to translation eff ect.
Table 7.2: Performance on the sample Items in states and UTs
States and UTs Medium Item 3
(%)
Item 9
(%)
Item 33
(%)
Item 44
(%)
Item 45
(%)
Item 46
(%)
Item 47
(%)
Item 49
(%)
Item 61
(%)
All sample 79 50 49 36 54 58 51 36 81
Tripura Bengali 50 57 55 69 57 69 58 47 88
West Bengal** Bengali 90 58 69 32 65 76 64 30 93
A & N Islands English 69 37 41 31 42 42 36 28 77
Chandigarh English 69 49 31 24 42 51 42 29 86
Goa* English 77 57 19 22 50 45 41 34 78
Meghalaya** English 73 39 50 35 47 49 43 41 76
Nagaland** English 78 52 56 34 51 52 31 36 78
Sikkim** English 85 44 42 20 42 42 36 25 80
Gujarat Gujarati 81 59 53 33 80 30 43 22 70
Daman & Diu* Gujarati 79 61 52 34 72 24 50 25 76
Bihar Hindi 76 43 61 41 44 56 41 30 76
Chhattisgarh Hindi 70 44 46 34 45 60 48 40 64
Delhi Hindi 85 40 47 40 57 70 58 38 90
Haryana Hindi 70 34 31 26 40 53 49 29 87
Himachal Pradesh Hindi 76 45 39 30 49 56 53 33 80
Madhya Pradesh Hindi 83 60 68 53 53 70 58 36 84
Rajasthan Hindi 72 39 48 47 54 61 55 39 80
Uttar Pradesh Hindi 87 65 64 64 64 77 68 53 89
Uttarakhand Hindi 78 43 47 38 44 52 44 26 82
Jharkhand** Hindi 80 51 53 47 52 59 43 35 82
Karnataka Kannada 86 64 45 39 61 64 52 35 82
Kerala* Malayalam 89 64 27 20 64 66 81 50 88
Maharashtra* Marathi 86 48 52 35 56 68 56 45 83
Mizoram** Mizo 87 56 60 21 38 58 68 38 93
Orissa Oriya 77 52 58 38 57 67 41 33 72
Punjab Punjabi 72 36 50 26 39 51 45 28 91
Puducherry Tamil 75 43 37 18 38 37 39 17 64
Tamil Nadu Tamil 89 70 71 60 72 66 70 57 88
Andhra Pradesh Telugu 70 48 24 29 70 64 40 39 81
Assam* Multiple 81 52 32 23 61 64 51 31 74
Jammu & Kashmir Multiple 74 54 56 54 58 60 46 43 71
1. States/UTs marked * achieved samples representing <80% of the target population.
2. States/UTs marked ** tested students in Class VI.
3. Assam tested students in Assamese and Bengali. Jammu & Kashmir tested students in English, Hindi and Urdu.
7.4 What can students do in EVS?
In this chapter it has already been mentioned what the students performing at diff erent levels of content domain on EVS items can do. Th e items in EVS were developed on the following content areas:

96
National Achievement Survey
• Family and Environment
i) Family life
ii) Work and play
iii) Animal life
iv) Plant life
• Food
i) Food hygiene
ii) Preservation
iii) Cooking
iv) Eating habits
v) Nutritional defi ciencies and related diseases
vi) Sense of taste and digestion
• Shelter
i) Diff erent types of housing
ii) Need for sharing resources and space
iii) Neighbourhood and community living
iv) Times of emergency
• Water
i) Sources of water and irrigation
ii) Animals and plant life in water
iii) Floating and solubility in water
iv) Stagnant and fl owing water
• Travel
i) Fuels used in vehicles
ii) Renewable and non-renewable energy
iii) Travelling in the mountains
iv) Expedition and spirit of adventure
v) Diff erent modes of transport
• Real Life
i) Th ings we make and do
ii) Children’s ideas
iii) Observation reports
iv) Expression of experiences
v) Process of experiment

97
Environmental Studies: What Students Know and Can Do
Given below are the tables showing the performance of students of class V on various cognitive processes or skills on diff erent content areas.
7.4.1 Family & Environment
Table 7.3: Performance of class V students on the content area of Family and Environment
Knowing (Skill 1) Applying (Skill 2) Reasoning (Skill 3)
Item No Scale value % correct Item No Scale value % correct Item No Scale value % correct
11 235 56 18 197 73 27 264 44
2 184 75 19 185 74 40 249 50
51 209 68 26 251 49 47 250 50
61 172 81 3 182 79 50 225 60
71 225 59 5 211 68 70 338 34
33 256 48 78 253 48
34 273 42 79 246 51
36 264 42 80 254 47
45 240 54
43 284 41
46 234 57
53 228 60
58 291 39
63 203 70
64 269 41
72 225 59
77 214 65
Knowing (Skill 1)
Around 80% students in the country know the name of the bird (ostrich) which cannot fl y (Item 61).
About half of the students can relate characteristics of plants with their habitat (Item 11).
Applying (Skill 2)
Nearly three-fourths of the students can classify the animals in two groups, i.e., domestic and wild animals (Item 3) and can identify the footprints of birds (Item 19).
Only 41% students are able to know the relationship between inhaling and exhaling of air and expansion of chest (Item 43).
Reasoning (Skill 3)
Nearly 60% students can reason out that the larger animals have low heartbeat per minute as compared to smaller size animals (Item 50).
About one-third students can explain the benefi ts of forests for human beings (Item 70).

98
National Achievement Survey
7.4.2 Food
Table 7.4: Performance of class V students on the content area of Food
Knowing (Skill 1) Applying (Skill 2) Reasoning (Skill 3)
Item No Scale value % correct Item No Scale value % correct Item No Scale value % correct
12 249 50 21 290 42 22 228 54
1 230 56 35 250 50
41 290 40 48 333 31
52 270 42 76 237 54
62 289 44
Knowing (Skill 1)
About 50% students know about the best source of iron (Item 1) and the cause of night blindness (Item 12).
Applying (Skill 2)
More than half of the students can identify the foods that come from animals (Item 76).
Less than one-third students in the country can select the food material which can give energy to human body (Item 48).
Reasoning (Skill 3)
More than half of the students can reason out that it is safe to wear cotton clothes rather than silk, nylon and terricot clothes while cooking food (Item 22).
7.4.3 Shelter
Table 7.5 : Performance of class V students on the content area of Shelter
Knowing (Skill 1) Applying (Skill 2) Reasoning (Skill 3)
Item No Scale value % correct Item No Scale value % correct Item No Scale value % correct
14 215 66 24 240 54 28 240 53
32 251 49
Knowing (Skill 1)
Nearly two-thirds of the students know how to fi nd the solution in a given situation (Item 14).
Applying (Skill 2)
Nearly half of the students can relate the diff erent types of roofs with geographical condition and can also explain the reason behind the construction of dams (Item 24, 32).
Reasoning (Skill 3)
About half of the students can reason out that population explosion is the root cause of unemployment and housing problems in India (Item 28).

99
Environmental Studies: What Students Know and Can Do
7.4.4 Water
Table 7.6: Performance of class V students on the content area of Water
Knowing (Skill 1) Applying (Skill 2) Reasoning (Skill 3)
Item No Scale value % correct Item No Scale value % correct Item No Scale value % correct
13 185 77 20 231 58 30 250 50
42 201 72 6 218 63 38 215 66
9 249 50 8 211 68
55 199 71 67 218 63
75 220 63
Knowing (Skill 1)
About three-fourths of the students know about the diseases spread by mosquitoes (Item 13) and the animals that can live both on land and water (Item 42).
Applying (Skill 2)
More than half of the students know the sources of water and its usage (Item 20).
Nearly three-fourths of the students know that salt can dissolve in water (Item 55).
Reasoning (Skill 3)
Nearly three-fourths of the students in the country can interpret the given graph and fi nd out the particular day on which maximum rainfall occurred (Item 8) and know about the best usage of water (Item 38).
7.4.5 Travel
Table 7.7: Performance of class V students on the content area of Travel
Knowing (Skill 1) Applying (Skill 2) Reasoning (Skill 3)
Item No Scale value % correct Item No Scale value % correct Item No Scale value % correct
15 262 44 17 264 45 25 238 55
4 218 62
37 252 49
44 296 35
54 213 66
57 261 46
65 277 41
Knowing (Skill 1)
Less than half of the students know about the forms of energy commonly used at home (Item 15).
Applying (Skill 2)
About two-thirds of the students in the country understand that motor driven vehicles cause more pollution as compared to non-motor driven vehicles (Item 54).
Only one-third students know about the sources of energy which produces carbon dioxide (Item 44).

100
National Achievement Survey
Reasoning (Skill 3)
More than half of the students know the reason that Earth looks bluish in colour when seen from the outer space due to the oceans (Item 25).
7.4.6 Real Life
Table 7.8: Performance of class V students on the content area of Real Life
Knowing (Skill 1) Applying (Skill 2) Reasoning (Skill 3)
Item No Scale value % correct Item No Scale value % correct Item No Scale value % correct
16 351 30 23 333 26 29 242 53
7 250 50 66 263 47 39 272 42
31 260 45 68 224 59 10 272 42
73 245 51 69 263 44 49 302 35
74 245 51 56 237 55
59 241 54
60 238 55
Knowing (Skill 1)
Nearly half of the students know about the instrument used for measuring the body temperature (Item 73).
Only 30% students know that lunar eclipse occurs when the earth is between the sun and the moon (Item 16).
Applying (Skill 2)
About half of the students can identify the substances which cannot absorb in water from the given picture (Item 74).
Only 26% students can relate the measuring apparatus with the quantity of water (Item 23).
Reasoning (Skill 3)
More than half of the students can reason out that paint does not dissolve in water but it dissolves in kerosene (Item 56).
Less than 40% students know that it is the water vapour that clouds the mirror when we breathe on it (Item 49).

101
Environmental Studies: What Students Know and Can Do
Chapter 8
S tudent-re la ted Var iab les

102
National Achievement Survey

103
Student-related Variables
CHAPTER 8 STUDENT-RELATED VARIABLES
Part I-Profi le
Th e majority of results in this chapter relate to the total respondents to the student questionnaire without weighting. Overall fi gures are reported, as well as some illustrative results from individual states/UTs. It should, however, be noted that in fi ve states/UTs— Assam, Daman & Diu, Goa, Kerala and Maharashtra—the population coverage fell below 80% mainly due to the Upper Primary Only school exclusion (see Chapter 1). Some results connect the background variables with test scores on the three subjects. In this situation, results refer to approximately two-thirds of respondents with both background factors and test scores on the relevant subject. Again, these results are presented without weighting.
Th e data in this chapter is derived from questionnaires completed by 1,17,653 students studying in 6,411 schools of 274 districts of 31 states all over the country. Th is chapter covers detailed information on the students and school-related variables which have been categorised as follows:
Students’ background
Resources available at home
Resources available in school
Students’ activities outside the school
In the tables and fi gures of this chapter, standard errors are reported in brackets along with relevant statistics unless otherwise mentioned.
8.1 Students’ Background
Th e variables covered in this category are gender, social groups, language used at home and school, number of siblings, and whether they are physically challenged etc.
8.1.1 Student Gender
Th e gender distribution of students is given in Figure 8.1. Overall the sample comprises 49% boys and 51% girls. In Appendix VII, Table A-7.1 gives the percentage of sampled boys and girls by state.
Figure 8.1: Gender of Students
49% 51%
Boy Girl

104
National Achievement Survey
8.1.2 Category distribution of students
Th e Government of India has offi cially documented castes and sub-castes, primarily to determine those deserving reservation in education and jobs. Th e whole population is divided into four caste categories – SC, ST, OBC and Others. Figure 8.2 shows that 20% of those in the survey were SC students, 19% ST students, 32% OBC students, and 29% Other students.
Figure 8.2: Student categories
8.1.3 Language used at home
Teaching to students in their mother tongue is emphasised by the government and policy makers. Figure 8.3 shows the percentage of students speaking the same language at home as the one used in the school. As many as 66% of students reported that they spoke the same language at home and remaining 34% of students used a diff erent language.
Figure 8.3: Language usee in home
8.1.4 Number of siblings
Figure 8.4 shows the percentage distribution of number of siblings, categorised into having no sibling, one sibling, two siblings and three and more siblings. Around 52% of students had three or more siblings and 9% of students had no siblings.
20%
19%
32%
29%
66%
34%
SC ST OBC Others...
Yes No

105
Student-related Variables
Figure 8.4: Number of siblings
8.1.5 Physically challenged students
Figure 8.5 indicates that 7% of students were physically challenged.
Figure 8.5: Physically challenged students
8.2 Resources Available at Home
Students with more educational resources tend to attain better than those who do not. Th is survey focused on some of the variables such as parents’ level of education, their occupation and resources available at home that facilitate learning of the students.
8.2.1 Educational status of parents
Parents are the fi rst teachers of the students and they play a pivotal role in the achievement of their children. Figure 8.6 describes the educational status of the parents of class V students.
Figure 8.6: Parental education
9% 17%
22%
52%
7%
93%
No Yes
0 1 2 3 or more
Illitrate
Literate / Primary
Secondary
Graduate and above
Don’t know / Not applicable
16
41
37
6
5

106
National Achievement Survey
8.2.2 Parents’ occupation
In this survey, occupations have been grouped into broader categories. Figure 8.7 provides the distribution of students on the basis of their parents’ occupation. Results reported were unemployed (12%), housewives (2%), agricultural labourer/servant/vendor/ street labourer (35%), farmer (22%), skilled/offi ce worker/ shopkeeper/businessman (24%), teacher/professor/manager (4%).
Figure 8.7: Parental occupation
8.2.3 Below Poverty Line (BPL) card
Th e Poverty Line is an economic benchmark and threshold used by the Government of India, but varies between states, to identify individuals and households in need of government assistance and aid. Overall, 47% of students reported their family had a BPL card and 21% of students do not know (Figure 8.8).
Figure 8.8: Below Poverty Line
8.2.4 Literacy resources at home
In view of the importance of literacy resources in enhancing the learning of the students, information was sought about the availability of some literacy resources, e.g., calculator, computer, study desk, dictionary, internet, daily newspapers and magazines at home. A wide variation from study desk (49%) to internet access (7%) was observed. Th ese are shown in Figure 8.9.
12
2
35
22
24
4
Unemployed
Housewife
Agri labour/Servant etc .
Farmer
Skilled/ Office/ Business
Teacher/ Professor/Manager
47%
32%
21%
Yes No Don’t Know

107
Student-related Variables
Figure 8.9: Resources in home
8.2.5 Books at home
Th e availability of books at home has been categorised into having no books, 10 books, 11–25 books and more than 25 books. Figure 8.10 shows that 40% students reported having no books in their home and the highest percentage (41%) of students reported having 1–10 books. Only 11% reported having more than 25 books and 8% had 11–25 books.
Figure 8.10: Books in the home
8.3 Resources Available in School
Schools are almost like a second home for the children as this is the place where they spend one-third of their time. Th is survey has covered some of the important variables like what they think about their school, teaching and learning processes in the school, etc.
8.3.1 Teaching and learning process
Teaching and learning process includes many activities inside and outside the school. Some of the variables which play a signifi cant role in the process such as homework, textbooks and activities important for teaching have been covered.
8.3.2 Help in studies
Figure 8.11 shows the percentage of students getting help from diff erent quarters. More than 58% of students reported getting help in their studies from diff erent members of their families such as father (66%), mother (58%),
40%
41%
8% 11%
No book 1-10 11-25 More then 25
Maga
zine
Calc
ulator
Compu
ter
Stud
ydesk
Intern
et
Diction
ary
Newspa
per
36
49
9
35
7
31
19

108
National Achievement Survey
elder brother and sister (69%), and 32% of students reported that they did not get any help from anybody. Around 44% of students reported getting help from tutor.
Figure 8.11: Help with homework
8.3.3 Private tuition
Taking private tuition is a common practice nowadays. Keeping in mind that quality education should be provided by the teacher in the classroom, government has restricted the school teachers from providing tuition. However, it exists in one way or the other in response to parental demand. Figure 8.12 shows that overall, 31% of students said they were taking private tuition.
Figure 8.12: Private Tuition
8.3.4 Having textbooks
Not much variation was found across the states. Overall, at least 97% of students reported having textbooks of each of the three subjects (Figure 8.13).
69%
31%
Yes No
Father Mother Eldersib Tutor None
66 69
43
32
58

109
Student-related Variables
Figure 8.13: Have textbook?
8.3.5 Students’ attitude towards school
Students were asked about their likes and dislikes about school. On an average, over 90% reported that they liked to be in school and that their teachers wanted them to do their best. About 81% of students said that students in their school tried to do their best.
8.4 Students’ Activities outside the School
All-round development of the students comes not just from what they learn from the school but also from activities outside the school. Th e survey gathered information on some of the important activities outside the school, such as their reading habits (books, newspapers, magazines), watching television, interaction with their friends, discussion with their friends about the lessons in the school, sharing with their parents what they learn in school, helping family members by doing household chores, and how often they mixed with their peer group.
Th e data indicated that daily, nearly 67% students watched TV, 78% interacted with their friends, 82% played sports/games, 33% read books for enjoyment, 81% did the homework given at school and 64% shared with their family what they learnt in the school. As many as 75% of students never used a computer outside the school.
When asked about helping in the household chores, about 69% of students reported that they looked after the family members, 62% helped in cleaning the house and 32% helped in preparing food daily.
Part II-Student Background and Attainment
Home background is a crucial factor in the development of intellectual abilities. Th ese can include personal characteristics that aff ect the way a young person’s abilities can progress, such as gender, geographical region and social labels such as caste. Chapters 2, 4 and 6 of this report have already indicated for diff erent subjects the apparent lack of an overall eff ect of gender and region, and the substantial eff ect of caste on performance of the students.
It is also true worldwide that socio-economic circumstances and the correspondence of the home language and the language of school instruction have a major eff ect on the success of individuals in the education system (OECD, 2010). In all the analyses in this chapter, the relation with aspects of these is considered on its own. An index of socio-economic situation is then derived from a combination of such background factors.
Language Mathematics EVS
97(0.1) 98(0.1) 97(0.1)

110
National Achievement Survey
Because of their importance to educational success, socio-economic status and language together are described as ‘key variables’ and the following method of analysis is adopted:
First, the raw relation (‘bivariate’) between the background variable and the outcome, in diff erent subjects, is presented and then the relation is presented after allowing for these two ‘key’ variables.
One category, usually the largest, is designated as a ‘base’ category and assigned a zero value, and all other categories are defi ned in terms of their diff erence from the base result.
Since these key variables are a very important aspect of attainment, it often, though by no means unfailingly, happens that including such other key variables in the regression means that the apparent univariate relationship is diluted.
If a relation between a factor and an outcome is not extinguished by making such allowances, it is reasonable to suggest that the factor is having an eff ect on the outcome.
Th e information in this chapter comes from the pupil questionnaire. Some studies of student attainment include a parental questionnaire, but, while further information on parental practices in encouraging education would have been of interest, it is important to bear in mind that the primary focus of this study was not to explain diff erences in attainment, but to compare the levels of attainment of entities in the national system, and hopefully, to lay the foundation for a comparative series investigating the progress of attainment over time. Th e study was also primarily a very ambitious school-based exercise, and so practicalities meant that contacting large numbers of parents for this purpose would not have been feasible. Activities related to academic learning and students’ characteristics were considered for analyses.
8.5 Socio-economic Index
Th e fi rst ‘key’ variable is socio-economic index in which literary and other resources at home were combined to form an index of socio-economic resources. Th e details of its construction are described more fully in Appendix V. It is a weighted combination of parental education, parental occupation, number of possessions, and number of books at home.
8.6 Language Spoken at Home
Th e second ‘key’ variable considered is speaking the language of instruction at home. It is to be expected that students familiar with the language used will fi nd coping with the day-to-day business of school easier, and are likely to make more progress.
8.7 Treatment given to Variables used in Analysis
Th e variables considered under the pupil background are as under:

111
Student-related Variables
Table 8.1: Pupil-related variables and its treatment for regression variables
Variables Categories Treatment
Gender a) Boys, b) Girls ‘BOYS’ as a base category
Category a) Scheduled Castes, b) Scheduled Tribes, c) OBCs, d) Others ‘OTHERS’ as a base category
Mode of conveyance a) Walk, b) On cycle or rickshaw, c) By bus, d) Other modes ‘WALK’ as a base category
Number of siblings 0, 1, 2, or more As quasi-continuous variables
Physically challenged a) Yes, b) No ‘NO’ as a base category
Subject textbooks a) Yes, b) No ‘NO’ as a base category
Getting help in studies a) Father, b) Mother, c) Elder sibling, d) Tutor, e) None ‘NONE’ as a base category
Taking private tuition a) Yes, b) No ‘NO’ as a base category
Homework checked at
home
a) Family member, b) Tutor, c) Friend, d) None ‘NONE’ as a base category
Homework checked at
school
a) Family member, b) Tutor, c) Friend, d) None ‘NONE’ as a base category
Read material other
than course material
a) Read comic books, b) Read stories or novels, c) Read books that
explain things,
As quasi-continuous variables
Activities outside the
school
a) Watch television or videos, b) Work with computer, c) Interact with
friends, d) Play sports or games, e) Read a book for enjoyment, f) Use
the internet, g) Do your homework, h) Discuss with your friends what
you learned in school, i) Tell your family about what you learned in
school
As quasi-continuous variables
Household tasks a) Looking after your family, b) Preparing food, c) Cleaning the house As quasi-continuous variables
Attitude towards
subject
LANGUAGE: a) You enjoy learning Language, b) Language is easier for
you than other subjects, c) Language is easier for you than for other
students, d) You read silently on your own
Sum of agree responses to the
questions
MATHEMATICS : a) You usually do well in mathematics, b) You would
like to do more mathematics in school, c) Mathematics is harder for you
than for many of your classmates
EVS: a) You usually do well in EVS/Science/Social Science, b) You would
like to do more EVS/Science/ Social Science in school, c) EVS/Science/
Social Science is harder for you than for many of your classmates, d)
You like to ask questions in your EVS/Science/Social Science class, e) You
learn things quickly in EVS/Science/Social Science, f) EVS/Science/Social
Science is boring, g) You enjoy learning EVS/Science/Social Science, h)
Your teacher asks questions in the class
8.8 Student Background Factors
8.8.1 Gender-wise
Table 8.2: Regression results – Gender-wise
Variables Language Mathematics EVS
Coeff SE Sig. Coeff SE Sig. Coeff SE Sig.
Without key variables Girls 1.85 0.64 ** -1.70 0.61 ** -0.12 0.51 NS
With key variables Girls 1.74 0.63 ** -1.65 0.61 ** -0.15 0.51 NS
*Significant if P<.05 , **Significant if P<.01, NS-Not Significant

112
National Achievement Survey
Table 8.2 indicates that only in Mathematics do boys appear to do better than girls. Th e coeffi cient of -1.70 means that, on average, girls scored 1.70 scale score points less than the boys. Th is diff erence is small but, for this subset of the population, it is statistically signifi cant. In the case of Language, girls in this sample performed better than boys by a small but statistically signifi cant margin. In EVS, there is no signifi cant diff erence in the performance of boys and girls. Th e same trends were observed after entering the key variables.
8.8.2 Category-wise
Table 8.3: Regression results – Category-wise
Variables Language Mathematics EVS
Coeff SE Sig. Coeff SE Sig. Coeff SE Sig.
Without key variables SC -6.65 0.97 ** -6.42 1.28 ** -5.83 1.06 **ST -8.08 1.13 ** -13.16 1.27 ** -4.39 1.50 **OBC -2.82 1.09 ** -0.38 1.12 -0.73 1.01 NS
With key variables SC -5.00 0.93 ** -6.10 1.24 ** -5.21 1.07 **ST -5.64 1.08 ** -11.74 1.26 ** -2.66 1.45 NSOBC -1.76 1.04 NS -0.19 1.09 NS -0.42 1.01 NS
*Significant if P<.05, **Significant if P<.01, NS-Not Significant
Table 8.3 reveals that the SC and ST category students signifi cantly underperformed as compared to students of ‘Others’ category in all the three subjects. Th e same trend is observed with key variables.
In case of Language only, the students of OBC category poorly performed as compared to students of ‘Others’ category without key variables only. However, with the key variables, the diff erence was not signifi cant.
8.8.3 Siblings-wise
Th e number of siblings a child has is likely to aff ect the amount of attention which his or her parents can accord, though to some extent, this can be off set by the other members of the family. It is also likely to aff ect the amount of other resources available to each member. Table 8.4 shows the relationship between number of siblings and attainment in diff erent subjects.
Table 8.4: Regression results – Siblings-wise
Variables Language Mathematics EVS
Coeff SE Sig. Coeff SE Sig. Coeff SE Sig.
Without key variables -1.87 0.21 ** -0.44 0.21 * -1.04 0.19 **
With key variables -0.99 0.21 ** -0.08 0.21 NS -0.63 0.20 **
*Significant if P<.05 , **Significant if P<.01, NS-Not Significant
Table 8.4 shows that for each additional sibling, there is, on an average, a decline in attainment of 1.87, 0.44 and 1.04 scale score points in Language, Mathematics and EVS respectively. Th e size of this relationship is reduced, though not removed, by allowing for key variables, suggesting that some of this diff erence may be due to scarcity of resources.

113
Student-related Variables
8.8.4 Physically challenged
Table 8.5: Regression results – Physically challenged students
Variables Language Mathematics EVS
Coeff SE Sig. Coeff SE Sig. Coeff SE Sig.
Without key variables -13.06 1.16 ** -14.22 1.43 ** -10.61 1.71 **With key variables -13.27 1.15 NS -14.07 1.42 NS -10.55 1.69 NS
*Significant if P<.05, **Significant if P<.01, NS-Not Significant
It is evident from Table 8.5 that pupils classifi ed as physically challenged performed substantially low than the rest of the students both without and with key variables in all the three subjects.
Physically challenged students do substantially worse than the rest of the population, suggesting that more could be done improve their access to education.
8.8.5 Mode of conveyance
An important aspect of school attendance is, naturally, getting there. Unfortunately, the question on length of time to get to school gave some diffi culties to respondents, and it has not proved possible to use the responses to this question. Students were also asked what means of transport they used to get to school.
Table 8.6: Regression results – Students using different modes of conveyance
Variables Language Mathematics EVS
Coeff SE Sig. Coeff SE Sig. Coeff SE Sig.
Without key variables Bicycle 2.68 1.33 * -2.21 1.52 NS -3.58 1.33 **Bus 7.74 1.72 ** -5.00 2.05 * -2.52 1.80 NSOther 10.81 2.12 ** -1.11 2.20 NS -1.06 2.00 NS
With key variables Bicycle -1.69 1.28 NS -3.26 1.45 * -5.27 1.32 **Bus 3.69 1.61 * -5.71 1.97 ** -4.07 1.75 *Other 5.14 2.00 * -2.52 2.08 NS -3.24 1.96 NS
Significant if P<.05 , **Significant if P<.01, NS-Not Significant
Table 8.6 indicates that the mode of conveyance to school does not impact the achievement level of students substantially. In Mathematics it was seen that the students using bus as a means of conveyance underperformed signifi cantly than the students who walked to school.
In Language, students using other means to attend the school do slightly better, but this is halved for bus and other, and disappears entirely for bicycle transport after allowing for key variables, suggesting that much of this apparent diff erence may be due to resources. However, in EVS, students using bicycle to attend the school performed signifi cantly lower than the students who walked to school.
Th e trend in diff erent subjects clearly indicates that the performance of the students who walked to school was better than those students who are using other means of conveyance.
8.8.6 Subject textbooks
One other important resource is a textbook in the subject.

114
National Achievement Survey
Table 8.7: Regression Results – Students having subject textbooks
Variables Language Mathematics EVS
Coeff SE Sig. Coeff SE Sig. Coeff SE Sig.
Without key variables 8.46 1.75 ** 11.82 2.13 ** 8.58 2.15 **With key variables 7.75 1.70 ** 11.17 2.20 ** 8.05 2.09 **
*Significant if P<.05 , **Significant if P<.01, NS-Not Significant
Students who do not have a textbook in the subject performed poorly as compared to those who have a textbook in all the subjects.
8.8.7 Attitude towards subject
Having a positive attitude to the subject is related to better performance.
Table 8.8: Regression results – Students attitude towards different subjects
Variables Language Mathematics EVS
Coeff SE Sig. Coeff SE Sig. Coeff SE Sig.
Without key variables 3.74 0.36 ** 2.84 0.28 ** 3.19 0.27 **With key variables 3.16 0.35 ** 2.68 0.28 ** 3.01 0.26 **
*Significant if P<.05, **Significant if P<.01, NS-Not Significant
Positive attitude of students towards diff erent subjects has shown positive impact on their achievement.
In each case, better performance accompanies more positive views. Allowing for resources has little eff ect.
8.8.8 Getting help in studies
Table 8.9: Regression results – Students getting help in studies
Variables Language Mathematics EVS
Coeff SE Sig. Coeff SE Sig. Coeff SE Sig.
Without key variables 5.04 1.13 ** 2.84 1.37 * 3.19 1.18 **With key variables -0.18 1.15 NS 1.32 1.34 NS 1.08 1.21 NS
*Significant if P<.05 , **Significant if P<.01, NS-Not Significant
From Table 8.9 it can be seen that there was positive impact of getting help in studies from the family members on achievement of students in all the three subjects without including key variables.
8.8.9 Taking private tuition
Table 8.10: Regression results – Students taking private tuition
Variables Language Mathematics EVS
Coeff SE Sig. Coeff SE Sig. Coeff SE Sig.
Without key variables -0.83 0.84 NS 0.11 0.86 NS -1.41 0.92 NSWith key variables -3.65 0.85 ** -0.84 0.84 NS -2.82 0.92 **
*Significant if P<.05 , **Significant if P<.01, NS-Not Significant

115
Student-related Variables
From the table it can be interpreted that private tuition did not have signifi cant eff ect on students’ achievement without key variable. However, after allowing for key background variables, it was seen that pupils who had a tutor do well in Language and EVS.
8.8.10 Homework checked at home
Table 8.11 Regression results – Students getting homework checked at home
Variables Language Mathematics EVS
Coeff SE Sig. Coeff SE Sig. Coeff SE Sig.
Without key variables 2.75 0.95 ** 3.36 1.05 ** 1.77 0.93 NSWith key variables -1.21 0.95 ** 2.12 1.04 * 0.27 0.97 NS
*Significant if P<.05, **Significant if P<.01, NS-Not Significant
Generally it is thought that pupils who have their homework checked at home would do better than those who don’t. Th e survey confi rms the same in case of Language and Mathematics also. But when key variables were allowed, the results appear diff erently in case of Language.
8.8.11 Homework checked at school
Table 8.12: Regression results – Students getting homework checked at school
Variables Language Mathematics EVS
Coeff SE Sig. Coeff SE Sig. Coeff SE Sig.
Without key variables 12.77 1.89 ** 11.86 1.93 ** 11.30 1.98 **With key variables 11.50 1.80 ** 11.74 1.89 ** 11.26 1.96 **
*Significant if P<.05, **Significant if P<.01, NS-Not Significant
Pupils who have their homework checked at school by the teacher do substantially better than those who don’t. Th is was proved by the results in all the three subjects. It was also true when key variables were allowed.
8.8.12 Learning-related home activities
In addition to formal homework or tutoring, students’ out-of-school activities may infl uence their learning development in other ways, either positive or negative. Some activities may be directly related to subject taught in school, others less so.
Table 8.13: Regression results – Students who read material other than course material outside the school
Variables Language Mathematics EVS
Coeff SE Sig. Coeff SE Sig. Coeff SE Sig.
Without key
variables
Comic books 2.20 0.37 **Stories or novels 2.36 0.45 **Books that explain things 3.09 0.36 ** 3.15 0.43 **Magazine 2.12 0.37 ** 2.45 0.40 **Newspaper 4.26 0.35 ** 4.00 0.40 **Read directions 3.30 0.39 ** 3.07 0.41 ** 3.64 0.37 **
With key
variables
Comic books 1.11 0.37 **Stories or novels 1.16 0.43 **Books that explain things 2.34 0.36 ** 2.77 0.42 **Magazine 1.13 0.37 ** 1.92 0.40 **Newspaper 2.98 0.37 ** 3.49 0.41 **Read directions 2.60 0.39 ** 2.79 0.41 ** 3.28 0.37 **
*Significant if P<.05, **Significant if P<.01, NS-Not Significant

116
National Achievement Survey
All activities indicated above are related with better performance in diff erent school subjects, even the less likely activities such as reading comic books or reading directions or instructions—and the more frequently, the higher the performance. Allowing for the key variables reduces the relationship but it is still signifi cant. While it seems likely that such activities would relate, at least to some extent, to reading performance, some other activities are clearly not directly related and might be thought to subtract from learning opportunities.
8.8.13 Other home activities
Students were asked whether they indulged in non-reading activities at home.
Table 8.14: Regression results – Students doing various activities outside the school
Variables Language Mathematics EVS
Coeff SE Sig. Coeff SE Sig. Coeff SE Sig.
Without key
variables
TV 2.11 0.42 ** 0.46 0.50 NS 1.56 0.45 **
Computer 0.15 0.38 NS -1.81 0.50 ** -0.82 0.47 NS
Friends 1.72 0.48 ** 1.78 0.47 ** 1.77 0.52 **
Sports 0.67 0.57 NS 4.42 0.45 ** 2.89 0.54 **
Internet 1.47 0.36 ** 1.98 .47 ** 2.13 0.37 **
Tell friends
about school
4.70 0.42 ** 5.12 .42 ** 5.45 .41 **
Tell family
about school
4.54 0.41 ** 3.23 .43 ** 3.94 .47 **
With key
variables
TV 0.85 0.42 * -0.01 0.50 NS 0.99 0.45 *
Computer -0.98 0.37 ** -2.18 0.49 ** -1.40 0.47 **
Friends 1.31 0.47 ** 1.62 0.46 ** 1.59 0.52 **
Sports 0.36 0.55 NS 4.21 0.45 ** 2.77 0.52 **
Internet 0.98 0.37 ** 1.59 .46 ** 1.77 0.37 **
Tell friends
about school
4.14 0.41 ** 4.88 .42 ** 5.15 .41 **
Tell family
about school
3.70 0.41 ** 3.13 .43 ** 3.63 .47 **
*Significant if P<.05, **Significant if P<.01, NS-Not Significant
Watching TV, hanging out with friends, using internet, and telling friends and family about the studies in school all appear to be related to higher attainment, though on the whole, less so after allowing for the key variables in Language. However, in Mathematics and EVS, hanging out with friends, participation in sports, using internet, and telling friends and family about the studies in school have also shown positive eff ect on achievement of students.
8.8.14 Household tasks
While it seems obvious that reading-related activities are likely to be related to performance, other activities could possibly have a negative impact. Th us, if a student has to spend too much time doing household or family chores, then he or she would have less time for school work.

117
Student-related Variables
Table 8.15: Regression results – Students doing household tasks
Variables Language Mathematics EVS
Coeff SE Sig. Coeff SE Sig. Coeff SE Sig.
Without key
variables
Looking family
member
0.84 0.39 * 3.10 .47 ** 2.28 .43 **
Prepare food -0.50 0.32 NS -1.23 .35 ** -.18 .31 NS
House cleaning 0.61 0.34 NS -.47 .38 NS 1.35 .39 **
With key
variables
Looking family
member
0.88 0.38 * 3.10 .47 ** 2.28 .43 **
Prepare food -0.29 0.32 NS -1.23 .35 ** -.18 .31 NS
House cleaning 0.80 0.34 * -.47 .38 NS 1.35 .39 **
*Significant if P<.05, **Significant if P<.01, NS-Not Significant
Perhaps surprisingly, there is no evidence that the load of domestic tasks is negatively related to attainment, at least at the level encountered here. Th ere is even some evidence that time spent caring for the family and cleaning the home is associated with slightly higher attainment. However, in Mathematics, preparing food hampered achievement of students.
8.9 Conclusion
Students from affl uent families and having more educational resources have better chance to outperform at school than their counterparts. Some interesting fi ndings were observed with regard to the educational resources available in schools. It was observed that more number of students were taking private tuitions and getting help in studies from their family members. On a positive note it was found that overall, 90% of students liked their school and tried to do their best.
For analysis, parental education, parental occupation, number of books at home, and possessions at home were combined to form an index of socio-economic status.
Th e relation between attainment in diff erent subjects and a wide range of factors connected with students’ home and background was analysed. It is well known that one cannot make defi nite causal inferences from a cross-sectional study as one cannot be sure of the direction of causation, nor that both the outcome and the potential cause are not caused by a third variable. Also, much of the information relates to relatively recent time rather than the students’ whole experience. However, we carry out comparisons between a factor (such as mode of transport) fi rst on its own and then simultaneously allowing for the key variables, socio-economic status and language spoken at home. If making this allowance gives rise to a substantial diff erence to the factor’s relationship with the outcome, then it is likely that both are a product of socio-economic factors. For example, students from better off families are likely to do better at school and not walk to school. Conversely, if a relation between a factor and an outcome is not extinguished by making such allowances, it is reasonable to suggest that the factor is having an eff ect on the outcome.
Factors investigated included gender, caste category, number of siblings, being physically challenged, mode of transport to school, and having a subject textbook. All these are related to attainment as might be predicted. Generally the relationship is weakened by allowing for the key variables, but not extinguished, suggesting that the key variables do not entirely explain the connection.

118
National Achievement Survey
In addition to resources and other home factors, students’ attitude to subject is likely to be related to performance. Students who had a positive attitude to learning in diff erent subjects did better than their counterparts. Homework is generally accepted in the profession to improve performance, though evidence from international studies is not clear cut. It is likely that successful students may well do homework, but it is also likely that struggling students may be given extra homework to help them to catch up. Students who get help at home and whose homework is checked at home do better, as do the vast majority whose homework is checked in class by the teacher. Interestingly, the relation with help at home is reduced if not removed after allowing for the key background factors, while that with setting homework and checking it at school is eff ectively unchanged. Is it only the resources in general that contribute to the eff ect of homework, or is it only better off families in general who do this? Students who have private tutoring do not do any better, and indeed do worse after allowing for the key variables, suggesting that tutoring is mainly used as a way of helping struggling students than as a means of getting ahead.
Some behaviours could be expected to be associated with better attainment at school, especially if on the face of it they are related to school subjects. Th us, students who read out of school perform better. Th is diff erence seems to be observed for any type of reading. It is largest for reading newspapers, but is still signifi cant even where the reading consists of material not strongly associated with learning, such as reading comics or instructions. Th ese relationships are reduced but not removed after allowing for the key variables. Other activities less directly related to school subject show a more mixed picture. Watch television or videos, hanging out with friends, using the internet, discussing with your friends about what you learn in school and telling your family about learning in school are all associated with better performance, both with and without allowing for key variables. Working with computer and playing sports or games are not signifi cantly associated with better performance, and indeed the former is associated with poorer performance after allowing for the key variables. One might expect that having to perform domestic chores would be associated with poorer performance if it took time away from school work. However, this does not seem to be the case: there is even a small positive association with some aspects of household duties.
Th e following factors appear to have a robust eff ect on attainment in diff erent subjects, in the sense that the relationship is statistically signifi cant and is not extinguished by allowing for other important variables including home resources and speaking the language of instruction at home:
Number of siblings (negative)
Being physically challenged (negative)
Mode of transport
Having a subject textbook
Positive attitude to learning
Help in studies
Homework checked at school and at home
Reading out of school
Watching TV
Hanging out with friends
Discussing school at home
Working with the computer (negative)
Using the internet

119
Student-related Variables
Chapter 9
School- re la ted Var iab les

120
National Achievement Survey

121
School-related Variables
CHAPTER 9 SCHOOL-RELATED VARIABLES
Part I-Profi le
Th e success of schools in delivering quality teaching is clearly something that both federal and provincial governments need to monitor if they are to identify the characteristics of a healthy learning environment which maximises student achievement. Th is chapter reports the fi ndings of the NAS in terms of the school variables. A questionnaire was used to collect information on 25 variables from school principals. Th ese variables were grouped into four categories:
School Background: Th is category consists of variables that are indicative of school management, location, basic infrastructure and facilities, and classes for which school is providing education.
Home-School Interaction: Included here are those variables that may be infl uenced by both home and school factors. Th ese included attitudes of students, teachers and parents to the school.
Teaching and Learning Process: Th is includes variables that describe aspects of classroom instruction, such as availability of computers and internet facilities, methods of teacher evaluation etc.
School Social Climate: Th e school social climate consists of factors that are conducive to a safe, organised and productive learning environment. Included are school discipline problems, such as absenteeism and more serious misbehaviour.
9.1 School Background
Th e school background variables were:
School management
Location
Resources available in the school
Inadequacies in the school aff ecting educational interaction
9.1.1 School management
Of the schools surveyed, approximately 70% were managed by the state government and the schools managed by the Tribal Social Department constituted only 1% of the sample. Th e rest of the schools were almost equally distributed amongst zila parishad, local body and private aided.
Figure 9.1: School by management type
69% 11%
10% 9%
State govt/Dept Zila parishad
Tribal social Dept Private aided
Local body
1%

122
National Achievement Survey
9.1.2 School location
Of the schools surveyed, one-fi fth were urban and the rest rural.
Figure 9.2: Location of school
9.1.3 Facilities available in the school
Th e data regarding the availability of the following facilities in the school was collected. Th ese were categorised into three groups:
Physical facilities: Electricity connection, safe drinking water, water pitchers, mats and furniture, dustbins, playground facilities, toilets, separate toilets for girls, pucca buildings.
Teaching and learning materials: Mini toolkit, mathematics and science kit, globe, books for library/reference books/encyclopedia/children’s books, newspaper/ magazines/journals, blackboard, television, computers.
Ancillary facilities: Games equipment, play material, musical instruments, fi rst-aid, annual medical inspection, immunisations.
Figure 9.3 shows that the basic physical facilities are available in a substantial majority of the schools sampled. Approximately two-thirds of the schools have playground facilities, three quarters have separate toilets for girls and 85% have safe drinking water.
Figure 9.3: Physical facilities
20%
80%
Pucca Building
Separate girls toilet
Toilet Facilities
Playground
Dustbin
Mat Furniture
Water Picher
Safe Water
Electric Connection
88
88
67
80
73
74
85
67
75
Rural
Urban

123
School-related Variables
Figure 9.4 shows the availability of teaching and learning materials in the schools sampled. Mathematics kit, globe, books for library, and children’s books are available in more than 70% of the schools sampled. Although under the SSA programme, state governments have put in place reforms to improve the delivery of computer systems in schools, computers are still available in fewer than half of the schools sampled.
Figure 9.4: Teaching and learning materials
Under SSA, health registers are to be maintained in all the schools. Th e nodal offi cer is identifi ed and nominated by the Department of School Education for each school for health checkups. Of the ancillary facilities available, in over 70% of the schools, a medical checkup is carried out. Games equipment is available in 75% of the schools sampled whereas musical instruments are available in only 41% of the schools (Figure 9.5).
Figure 9.5: Analysis facilities
45
35
96
50
86
39
81
92
56
56
41
73
68
53
75
77
74
Computer
Television
Blackboard
Magazines
Children’s book
Encyclopedia
Reference book
Globe
Science kit
Maths kit
Mini tool kit
Musical Instrument
Medical check-up
immunization facility
First aid
Games Equipment
Play material

124
National Achievement Survey
9.1.4 Shortages and inadequacies in school aff ecting educational interaction
Th e extent to which schools felt that shortages or inadequacies in schools aff ected their ability to provide instruction was stratifi ed into four grades: none, a little, some, and a lot. Th e necessities were as follows:
Instructional materials
Budgets for supplies
School buildings and grounds
Heating/Cooling and lighting system
Instructional space
Special equipment for handicapped pupils
Of the schools sampled, fewer than 20% felt that shortages or inadequacies in instructional materials, budget for suppliers, school buildings and grounds, heating/cooling and lighting systems, instructional space, and special equipment for challenged students did have a lot of eff ect on the school’s capacity to provide instruction. Also, over one-third of the schools sampled did not feel that the shortage of the above had any eff ect on the school’s capacity to provide instruction and 62% of the schools sampled did not feel that their capacity to provide instruction was aff ected by shortage of special equipment for challenged students (Figure 9.6).
Figure 9.6: Shortages and inadequacies affecting teaching capacity
9.2 Home–School Interaction
Th e involvement of parents in various activities of the schools like attending special events, raising funds, ensuring that the child completes homework, membership of school committees etc. contributes to a healthy learning atmosphere as well as to eff ective home–school interaction. Th e home–school interaction category represents those variables which are jointly infl uenced by both home and school factors. Th e aspects surveyed in this were attitudes of students, teachers and parents towards the school and the process of educational transaction.
9.2.1 Factors related to attitudes of students, teachers and parents towards the school
Th e attitudes of the primary stakeholders, i.e., students, teachers and parents, to education in general and their child’s school in particular, are extremely important factors aff ecting the teaching and learning process. Th is study
Instr
uctio
nal m
ater
ial
Budg
et su
pplie
s
Scho
ol b
uild
ing
Hea
ting–
Coo
ling
Instr
uctio
nal S
pace
Equp
men
t for
han
dica
pped

125
School-related Variables
has collected information on the following factors: teachers’ job satisfaction, teachers’ understanding of curricular goals, teachers’ degree of success in implementing the curriculum, teachers’ expectations of students’ achievement, parental support for students’ achievement, parental involvement in school activities, students’ regard for school property, and students’ desire to do well in school. All the above factors were collected in fi ve levels—very high, high, medium, low and very low. Overall, the majority of responses are in the high and medium zones. More than 50% of the schools reported teachers’ job satisfaction, teachers’ understanding of the curricular goals, teachers’ degree of success in implementing the curricula and teachers’ expectation of student achievement as high (Figure 9.7). Approximately 40% of the schools reported parental support for students’ achievement, parental involvement in school activities, and students’ regard for school property as medium. Over 60% of the schools rated students’ desire to do well in school as high.
Figure 9.7: Attitudes to school
9.3 Teaching and Learning Process
Teaching and learning is a process that includes many variables. Th ese variables interact as learners work towards their goals and incorporate new knowledge, behaviours and skills that add to their learning experiences. Th e present survey included the following variables:
Availability of instructional materials
Availability of computers and internet facilities
Availability of assistants to teachers in using information and communication technology (ICT)
Methods of teacher evaluation
9.3.1 Instructional materials
Th e availability of instructional materials in the form of textbooks, workbooks, teacher handbooks, and Teaching Learning Material (TLM) contributes to eff ective classroom interaction and provides invaluable help in ensuring quality and uniformity in teaching and learning process. It was found that 90% of the schools had textbooks in EVS, Mathematics and Language, 57% had workbooks in all the three subjects, a teachers’ handbook was available in 70% of the schools and TLM was available in more than 80% of the schools sampled.
Teac
her j
ob sa
tisfa
ctio
n
Teac
her u
nder
stand
ant c
ubic
goa
ls
Teac
hers
suc
cess
impl
emen
tatio
n
teac
hers
exp
ecta
tion
for s
tude
nt
Pare
ntal
supp
ort f
or st
uden
t
Pare
ntal
inv
olve
in sc
hool
Rega
rd sc
hool
pro
pert
y
Stud
ent a
mbi
tion

126
National Achievement Survey
Figure 9.8: Availability of instructional materials
9.3.2 Availability of computers, internet facilities and assistance to teachers in using ICT
Th e survey asked for the number of computers in the school for educational purposes, access to internet facilities for educational purposes and availability of help to teachers to use ICT for teaching and learning. Th e average number of computers per school was 1.59 in the participated schools; 85% of the schools sampled did not have access to the internet (Figure 9.9); and around 72% of the schools did not have ICT facilities (Figure 9.10).
Figure 9.9: Internet access Figure 9.10: ICT facilities
9.3.3 Methods of teacher evaluation
Th e study carried out teacher evaluation in the schools by the following methods:
Observations by the principal
Observations by inspectors
Students’ achievements
Teacher peer review
Each of these types of evaluation is used in most schools. As shown in Figure 9.11, the schools reported that 92% used observations by the principal, 77% observations by inspectors, 94% students’ achievement and 82% teacher peer review.
85% 72%
28%
Textbook Workbook Handbook TLM
90
57
70
8
All5%
Most(more then half )
3%
Some(below half )
7%
None
Yes No

127
School-related Variables
Figure 9.11: Methods of teacher evaluation
9.4 School Social Climate
Th e school climate is concerned with the psychological context in which school behaviour is rooted. School climate is considered to be a relatively enduring quality of the school that is experienced by the teachers and students and which in turn infl uences their behaviour. Th e school social climate category here consisted of problem behaviours amongst students.
9.4.1 Problem behaviours amongst students
Behavioural problem areas of the students were graded into fi ve frequencies of occurrences of such behaviour—never, rarely, monthly, weekly and daily. Th e major areas probed were:
Late arrival to school
Absenteeism
Skipping classes
Non-adherence to the school dress code
Disturbing the classroom decorum
Indulgence in cheating
Using profanity
Indulgence in vandalism
Activities of theft
Intimidation/Verbal abuse to other students
Causing physical injuries to others students
Intimidation/Verbal abuse to teachers
Causing physical injuries to teachers
Fortunately, such aberrant behaviour was rarely seen in most of the schools sampled
Obs
erva
tion
prin
cipa
l
Obs
erva
tor i
nspe
ctor
Stud
ent a
chie
ves
Teac
her p
eer r
evie
w
9277
9482

128
National Achievement Survey
(Table 9.1). Nearly 90% of the schools never or rarely saw late arrival to school. Absenteeism was rare in 59% of the schools. In 53% of the schools, skipping classes by students was never observed. Non-adherence to the school dress code was never observed in 45% schools. Disturbing the classroom decorum was never observed in 53% of the schools. 64% of the schools never observed student indulgence in cheating. 68% of the schools never observed students using profanity. Indulgence in vandalism was never observed in 71% of the schools. Activities of theft were never observed in 77% of the schools. Intimidation/Verbal abuse to other students was never observed in 54% of the schools. Causing physical injuries to other students was never observed in 60% of the schools. Intimidation/Verbal abuse to teachers was never observed in 88% of the schools, and causing physical injuries to teachers was never observed in 94% of the schools.
Table 9.1: Problem behaviours amongst students
Never Rarely Monthly Weekly Daily
Arriving late at school 23% 66% 5% 5% 2%
Absenteeism 19% 59% 10% 9% 3%
Skipping class 53% 33% 4% 7% 3%
Violating dress code 45% 42% 3% 5% 5%
Classroom disturbance 53% 40% 2% 2% 3%
Cheating 64% 32% 1% 1% 1%
Profanity 68% 30% 1% 1% 1%
Vandalism 71% 26% 2% 1% 1%
Theft 77% 21% 1%
Intimidation/Verbal abuse of other students 54% 41% 2% 1% 1%
Physical injury to other students 60% 37% 2% 1%
Intimidation/Verbal abuse of teachers/staff 88% 10% 1% 1%
Physical injury to other teachers 94% 6%
Part II-School Factors and Student Attainment
In the previous chapter, we looked at the relation between home background and attainment in diff erent subjects, and found it substantial in many ways. However, no matter how strong the relation is, the relation with school characteristics has to be central since with all due acknowledgment of home tutoring and homework, essentially, school is where academic learning takes place.
Because this is a cross-sectional study, it is of course not possible unambiguously to assign causality to possible contributory factors. In particular, many of the possible factors are likely to be related to social resources available to the students. To attempt to take some account of this, in chapter 8 we considered the relation between outcomes and factors investigated, fi rst on their own and then allowing for socio-economic background and language spoken: these are described as key variables. In this chapter, we follow the same approach, fi rst consider the relationship on its own, and then after allowing for key variables. If a relation between a factor and an outcome is not extinguished by making such allowances, it is reasonable to suggest that the factor is having an eff ect on the outcome.
9.5 Treatment given to Variables used in Analysis
School-related variables were treated in the following manner:

129
School-related Variables
Table 9.2: School-related variables and its treatment for regression analysis
Variables Categories of Variables Treatment
School management a) State Government/Department of Education, b) Zila Parishad, c)
Local body, d) Tribal social department, e) Private aided
‘STATE GOVERNMENT/DEPARTMENT
OF EDUCATION’ as a base category
Attachment of pre
school
a) Yes, b) No ‘NO’ as a base category
Students’ background a) Economically disadvantaged homes, b) Middle income homes, c)
Economically affluent homes
Three dichotomous variables
were created to indicate schools
with more than 50 per cent of
pupils from each of the three
categories.
Infrastructural
facilities
a) Games equipment, b) Play material and toys, c) Mini toolkit, d)
Mathematics kit, e) Science kit, f) Globe, g) Books for library, h)
Musical instruments, i) Notice board, j) Blackboard, k) Television, l)
Computer, m) Electric connection, n) First aid, o) Medical checkup, p)
Immunisation facility, q) Safe drinking water, r) Water pitcher, s) Mats
and furniture, t) Dustbin, u) Playground facilities, v) Toilet facilities, w)
Separate toilets for girls, x) Pucca building
A scale was created by summing
the number of ‘YES’ responses
Instructional
materials
a) Textbooks, b) Workbooks, c) Teacher Handbooks, d) Teaching and
learning material
A scale was created by summing
the number of ‘YES’ responses
School perception a) Teacher’s job satisfaction, b) Teacher’s understanding, c) Teacher’s
degree, d) Teacher’s expectation, e) Parental support, f) Parental
involvement, g) Students’ regard for school property, f) Students’
desire to do well in school
Responses were coded from very
high to very low
Evaluation of practice
of teachers
a) Observations by the principal, b) Observations by the inspectors, c)
Students’ achievement, d) Teacher peer review
‘NO’ as a base category
Behaviour problems a) Arriving late at school, b) Absenteeism, c) Skipping class, d)
Violating dress code, e) Classroom disturbance, f) Cheating, g)
Profanity, h) Vandalism, i) Theft, j) Verbal abuse of other students,
k) Physical injury to other students, l) Verbal abuse of teachers, m)
Physical injury to teachers
Treated as quasi-continuous
variables
Inadequacy of
facilities
a) Instructional materials, b) Budget for supplies, c) School building
and grounds d) Heating/Cooling and lighting, e) Instructional space,
f) Equipment for handicapped students, g) Computers for Math
instruction, h) Computer software for Mathematics, i) Library materials,
j) Audio-visual resources, k) Science laboratory, l) Computer for EVS,
m) Computer software for EVS, n) Library materials to EVS instruments,
o) Audio-visual resources, p) Teachers, q) Computer support staff
A scale was created of the
number of resource problems.
Student computer
ratio
Ratio of number of pupils to number of computers was calculated
Access to internet a) All, b) Most, c) Most, d) None ‘NONE’ as a base category
Use of ICT a) Yes, b) No ‘NO’ as a base category
As in the previous chapter in the regressions described here, one category, usually the largest, is designated as a ‘base’ category and assigned a zero value, and all other categories were defi ned in terms of their diff erence from the base result.
Since students were the basis for sampling, the student remains the unit of analysis, regardless of the source of information from the questionnaires. Th at is, the results shown in the tables in this chapter are the percentages of

130
National Achievement Survey
students whose school principals reported on a particular activity or characteristic and who completed a test on the relevant subject, in this case Language. Typically, because of the matrix sampling scheme which means that no students were tested in all the subjects, this is of the order of two-thirds of the number with questionnaire responses. When a teacher or principal did not complete the assigned questionnaire, background data was not available for those students.
9.6 School Facilities and Resources
Under this, the information regarding games equipment, play material and toys, mini toolkit, globe etc. were collected from school. Th ese facilities were treated as infrastructural facilities available in the school. Further, information was gathered regarding inadequacy or shortage of facilities such as instructional materials, school buildings and grounds, heating/cooling and lighting systems, instructional space (e.g., classrooms), special equipment for handicapped students etc. Besides, information about availability of computer, access to internet and assistance to use ICT to teachers for teaching and learning process was also sought.
Possessing a resource does not mean that it is used wisely, or even at all, and it could be that some resources are less relevant in this day and age with the wide availability of information from the internet. Another way of looking at the same question is to ask whether school’s capacity to provide instruction is aff ected by a shortage or inadequacy of resources. Th e answer to this could be none, a little, some or a lot.
9.6.1 Infrastructural facilities
Table 9.3: Regression results – Schools facilities
Variables Language Mathematics EVS
Coeff SE Sig. Coeff SE Sig. Coeff SE Sig.
Without key variables 0.77 0.12 ** .30 .15 * .27 .13 *
With key variables 0.56 0.11 ** .21 .15 NS .15 .13 NS
*Significant if P<.05, **Significant if P<.01, NS-Not Significant
Pupils in schools with more infrastructural facilities performed signifi cantly better as compared to the pupils in schools with fewer facilities in all the three subjects.
9.6.2 ICT facility
Of particular contemporary interest is access to computer facilities. Schools were asked about internet access, the number of students per computer and whether the school had communication technology help.
9.6.2.1 Student–Computer ratio
Table 9.4 : Regression results – Student–Computer ratio
Variables Language Mathematics EVS
Coeff SE Sig. Coeff SE Sig. Coeff SE Sig.
Without key variables 0.95 0.30 ** .47 .23 * .77 .23 **
With key variables 0.90 0.31 ** .42 .23 NS .72 .23 **
*Significant if P<.05, **Significant if P<.01, NS-Not Significant

131
School-related Variables
Pupils in schools with a higher ratio of computers performed better than the pupils in schools with a lower ratio of computers in Language, Mathematics and EVS.
9.6.2.2 Access to internet
Table 9.5: Regression results – Access to internet
Variables Language Mathematics EVS
Coeff SE Sig. Coeff SE Sig. Coeff SE Sig.
Without key variables -.94 -.95 NS -4.10 .94 ** -4.35 .77 **
With key variables -1.87 .93 * -4.34 .93 ** -4.72 .76 **
*Significant if P<.05 , **Significant if P<.01, NS-Not Significant
Access to internet has shown negative eff ect on achievement of students in diff erent subjects.
9.6.2.3 Use of ICT
Table 9.6: Regression results – Use of ICT
Variables Language Mathematics EVS
Coeff SE Sig. Coeff SE Sig. Coeff SE Sig.
Without key variables 6.14 1.46 ** -1.67 1.73 NS 2.92 1.16 *
With key variables 3.96 1.43 ** -2.30 1.74 NS 1.95 1.18 NS
*Significant if P<.05, **Significant if P<.01, NS-Not Significant
Availability of help to the teachers to use ICT for teaching and learning had positive impact on achievement in Language and EVS.
As far as students in schools with internet access are concerned, the majority did worse than those without. However, students in schools with communication technology help performed better than students in schools without.
9.7 School Governance
Another important aspect of a school’s function is its context, including its governance and composition.
9.7.1 School management-wise
Table 9.7: Regression results – School management
Variables Language Mathematics EVS
Coeff SE Sig. Coeff SE Sig. Coeff SE Sig.
Without key
variables
Zila Parishad 8.9 2.13 ** 11.35 2.26 ** 8.87 2.03 **
Local Body/Mun. Com. 9.17 2.22 ** 8.09 2.19 ** 9.30 2.07 **
Tribal Social Dept. -12.82 7.53 NS -.78 9.77 NS -15.17 12.29 NS
Private aided 17.26 1.86 ** 6.88 1.79 ** 11.11 2.04 **

132
National Achievement Survey
With key
variables
Zila Parishad 9.28 2.17 ** 11.12 2.30 ** 8.62 2.01 **
Local Body/Mun. Com. 7.61 2.13 ** 7.31 2.20 ** 8.29 2.10 **
Tribal Social Dept. -7.1 7.47 NS .27 9.63 NS -12.33 12.33 NS
Private aided 13.09 1.79 ** 5.79 1.78 ** 9.72 2.07 **
*Significant if P<.05, **Significant if P<.01, NS-Not Significant
Nearly two-thirds of the sample attended schools managed by the state government/department of education, 1% in tribal and approximately 10% in each of the other categories. Students in private aided schools, zila parishad and local body/municipal committee/urban local body perform better, and while this is slightly reduced in local body schools by allowing for key variables, the diff erence is still substantial. By contrast, though the pupils in the tribal schools showed a poor performance but the results were not signifi cant statistically.
9.7.2 Attachment of pre-school
Table 9.8: Regression results – Pre-school attached
Variables Language Mathematics EVS
Coeff SE Sig. Coeff SE Sig. Coeff SE Sig.
Without key variables 1.35 0.66 ** -4.80 1.31 ** -5.76 1.57 **
With key variables 1.34 0.34 ** -5.00 1.33 ** -6.01 1.56 **
*Significant if P<.05 , **Significant if P<.01, NS-Not Significant
It is known that students with experience of pre-school are likely to perform better than those without any comparable experience. Th ere is no information about the length of pre-school experience of the sample, but students who attend a school with a pre-school attached do worse.
9.8 Compositional and Contextual Factors
Value-added investigations of school performance have shown that the main factor in determining the attainment of a school’s graduates is the characteristics of the intake.
Table 9.9 presents the characteristics of the sample, and shows the relation between average characteristics of the pupils and performance in diff erent subjects.
9.8.1 Students’ background
Table 9.9: Regression results – Students’ background
Variables Language Mathematics EVS
Coeff SE Sig. Coeff SE Sig. Coeff SE Sig.
Without
key
variables
Economically
disadvantaged
-4.02 1.32 ** -1.53 1.15 NS -1.39 1.33 NS
Middle Income 5.77 1.93 ** 3.88 2.09 NS 4.21 1.93 *
Economically
affluent
1.47 3.82 NS .14 3.32 NS -5.09 3.44 NS
*Significant if P<.05, **Significant if P<.01, NS-Not Significant

133
School-related Variables
Diff erence in the achievement of pupils in schools with more than 50% from disadvantaged backgrounds, pupils in schools with more than 50% from middle income backgrounds and pupils in schools with more than 50% from affl uent backgrounds was not statistically signifi cant in Mathematics. In Language, pupils in schools with more than 50% from middle income group have shown signifi cantly better performance while pupils in schools with more than 50% from economically disadvantaged group have shown poor performance. However, in EVS, pupils in schools with more than 50% from middle income group were found to have signifi cant positive eff ect on their achievement.
9.8.2 Instructional materials
Table 9.10: Regression results – Instructional materials
Variables Language Mathematics EVS
Coeff SE Sig. Coeff SE Sig. Coeff SE Sig.
Without key variables -5.06 4.94 NS .95 4.39 NS .13 2.41 NSWith key variables -5.27 4.71 NS .13 4.30 NS -.16 2.43 NS
*Significant if P<.05, **Significant if P<.01, NS-Not Significant
Availability of instructional materials like textbooks, workbooks, teacher’s handbooks and TLM has not shown any positive eff ect on achievement of students.
9.8.3 School perception
Table 9.11: Regression results – School perception
Variables Language Mathematics EVS
Coeff SE Sig. Coeff SE Sig. Coeff SE Sig.
Without key
variables
Teachers’ job satisfaction -0.71 0.86 NS 3.90 .86 ** 1.39 .95 NS
Teachers’ understanding -0.45 0.81 NS 4.96 1.01 ** .73 .96 NS
Teachers’ degree of success 1.14 0.84 NS 4.90 .94 ** 2.55 1.00 *
Teachers’ expectations 0.49 0.84 NS 2.64 .88 ** 1.65 .79 *
Parental support 2.66 0.67 ** 2.13 .67 ** 2.61 .61 **
Parental involvement 2.21 0.63 ** 2.49 .73 ** 2.49 .70 **
Students’ regard for school
property
1.30 0.66 * 3.35 .80 ** 1.71 .87 *
Students’ desire to do well 0.81 0.68 NS 2.67 .86 ** .58 .88 NS
With key
variables
Teachers’ job satisfaction -0.55 0.85 NS 3.83 .84 ** 1.47 .96 NS
Teachers’ understanding -0.39 0.78 NS 4.88 1.00 ** .80 .95 NS
Teachers’ degree of success 0.97 0.82 NS 4.65 .93 ** 2.37 .98 *
Teachers’ expectations 0.47 0.82 NS 2.60 .87 ** 1.62 .79 *
Parental support 2.01 0.67 ** 1.84 .67 ** 2.27 .62 **
Parental involvement 1.71 0.64 ** 2.21 .74 ** 2.20 .72 **
Students’ regard for school
property
1.31 0.67 NS 3.31 .80 ** 1.79 .87 *
Students’ desire to do well 0.82 0.69 NS 2.60 .85 ** .57 .88 NS
*Significant if P<.05, **Significant if P<.01, NS-Not Significant
A range of school-related variables as assessed by the principals were considered. Parental support, parental involvement and students’ regard for school property were found to be positively associated with pupil attainment

134
National Achievement Survey
in all the subjects. Further, teachers’ degree of success in implementing curriculum and teachers’ expectations for student achievement have signifi cant positive eff ect on Mathematics and EVS achievement. Besides this, teachers’ job satisfaction and students’ desire to do well were found to have positive infl uence on Mathematics achievement scores.
9.8.4 Behaviour problems
Table 9.12: Regression results – Behaviour problem of students
Variables Language Mathematics EVS
Coeff SE Sig. Coeff SE Sig. Coeff SE Sig.
Without key variables -0.37 0.12 ** -.45 .13 ** -.45 .11 **
With key variables -0.36 0.12 ** -.44 .13 ** -.46 .11 **
*Significant if P<.05, **Significant if P<.01, NS-Not Significant
Pupils in schools where the pupils as a whole exhibit more anti-social behaviour performed relatively poorly in all three subjects.
9.9 Accountability-related procedures
It is widely considered that some form of assessment or accountability is an important aspect of educational progress. Th us, for example, while considering giving homework in chapter 8, it was observed that it was not suffi cient just to give homework: the pupils who performed well attended schools where the homework was marked in school. We next consider the information the study provides on assessment and accountability.
Teachers too can be assessed. Table 9.13 shows four possible methods of assessing a teacher’s competence.
9.9.1 Evaluation of practice of teachers
Table 9.13: Regression results – Evaluation of classroom teaching
Variables Language Mathematics EVS
Coeff SE Sig. Coeff SE Sig. Coeff SE Sig.
Without key
variables
Observation by principal 2.02 2.2 NS 3.38 2.75 NS 3.47 2.75 NS
Observation by inspectors 2.17 1.39 NS 5.64 1.44 ** 4.39 1.34 **
Student achievement -3.06 3.15 NS 3.06 3.77 NS 2.48 3.08 NS
Teacher peer review 6.8 1.85 ** 6.47 1.96 ** 7.23 1.89 **
With key
variables
Observation by principal 0.78 2.18 NS 3.08 2.73 NS 3.00 2.70 NS
Observation by inspectors 3.13 1.33 ** 5.86 1.49 ** 4.88 1.33 **
Student achievement -2.52 3.01 NS 3.30 3.71 NS 2.82 3.05 NS
Teacher peer review 6.54 1.75 ** 6.16 1.96 ** 6.86 1.89 **
*Significant if P<.05, **Significant if P<.01, NS-Not Significant
According to principals, all four methods are used by 80% of schools. Interestingly, peer review and observation by inspectors were associated with higher attainment.

135
School-related Variables
9.10 Conclusion
Students from better equipped schools have performed better than the students studying in less equipped schools. With regard to availability of physical facilities in schools, a large variation was seen. For example, whereas the blackboard, globe, children’s books etc. were available in more than 85% of schools, computer, television, mini toolkit etc. were available in less than 45% schools. While pucca building, safe drinking water and toilet facilities were available in more than 85% schools, necessary facilities like playground and electric connection were available only in 67% schools. On a positive note, over 90% schools reported that they asked the parents to get involved in their child’s learning process and over 60% schools reported that their students desired to do well in studies.
Th is chapter has also considered the relationship between student attainment and school factors as gathered by a questionnaire from head teachers/school principals. It goes without saying that it is the place where the majority of transmission of academic knowledge takes place. Nevertheless, home infl uences are paramount in the progress of learning: some students learn more quickly than others, and very often this can be linked to home background. To take some account of this, the relation between school factors and student attainment is presented in two ways, fi rst on its own, and then after allowing for key home factors, socio-economic status, and speaking the language of instruction at home.
Schools were asked whether they possessed a wide range of resources for education. It was found that students in schools which possessed nearly all the possible resources performed well. Allowing for home key variables did not remove the better performance of the best-equipped schools. Th ere is little point in having resources if they are not used; perhaps a more important indicator is whether a school feels that a lack of resources is inhibiting it. Nearly half of the students were in schools where principals had quite a high perception of being inhibited in this way, yet there was no signifi cant diff erence in performance of their students.
Computing resources are an increasingly important aspect of school facilities, but fi ndings are somewhat mixed. Pupils in schools with higher ratio of computers performed better than those with low ratio of computers. Pupils in schools with internet access do worse than those without. Students in schools with communication technology help perform better than schools without communication technology.
Another important aspect of a school’s function is its context, including its governance and composition. Principals were asked which of these bodies managed their school. State schools (the majority) did worse than schools under diff erent types of management, except those which were under the tribal social department. Pupils in schools where 50% of pupils are from middle income families do better, while pupils in schools where 50% of pupils are from disadvantaged families do worse.
School ethos and atmosphere is generally considered to be essential in promoting pupils attainment. Pupils in schools in which parents are asked to take part in a range of activities do better than those in less inclusive schools. Th is diff erence largely disappears after allowing for student key variables. Pupils in schools where the principal considers that parents have a high degree of involvement in school activities do better, but parental support for pupil attainment is not signifi cantly related. Parental involvement and inputs are generally only indirect factors - though obviously very important ones - in the more important ones of pupils attitude towards school. Pupils in schools where the principal considers that they have a high desire to do well are likely to attain (slightly) better, and this diff erence is little aff ected by allowing for background key variables. Having a high regard for school property is signifi cantly related to attainment.

136
National Achievement Survey
Principals were asked about problem behaviour in the school. It was found that the majority did not have frequent problem behaviour in their school, but where there was any frequent problem behaviour, pupil attainment was lower.
It is arguable that some form of assessment or accountability is an important aspect of educational progress. It is not just students who can be assessed: principals were asked whether teachers were assessed by observations by the principal or senior staff ; observations by inspectors or other persons external to the school; student achievement; or teacher peer review. Only teacher peer review and observation by inspectors were associated with better performance by pupils to any great extent.
Th e following factors appear to have a robust eff ect on attainment in diff erent subjects, in the sense that the relationship is statistically signifi cant and are not extinguished by allowing for other important variables including home resources and speaking the language of instruction at home:
Equipment
School governance
Pre-school attached (negative)
Student–Computer ratio
Internet access (negative)
Help in communication technology
Middle income
Disadvantaged pupils (negative)
School involves parents
Pupils desire to do well
Problem behaviour (negative)
Teacher peer review.
It is interesting to note that the diff erences relating to school factors are considerably smaller than those relating to student factors.

137
School-related Variables
Chapter 10
Teacher-re la ted Var iab les

138
National Achievement Survey

139
Teacher-related Variables
CHAPTER 10 TEACHER-RELATED VARIABLES
Part I-Profi le
Teachers are a vital component of the educational process and it is therefore important to know the characteristics of teachers, the strategies they use in the classroom, and their general attitudes towards teaching in schools. Th is chapter provides information about some of the important characteristics of the class V teachers in the survey, categorised into four headings: teacher background, teacher training, teaching learning process, and teachers’ opinion about their school. Th e teachers who taught the sampled students in the subjects tested were asked to complete a Teachers’ Questionnaire. A total of 10,851 teachers responded as shown in Table 10.1.
Table 10.1: Teachers included in survey
S.No. State/UT Number responding S.No. State/UT Number responding
1. Andhra Pradesh 318 17. Mizoram 520
2. Assam 590 18. Nagaland 295
3. Bihar 420 19. Orissa 416
4. Chhattisgarh 257 20. Punjab 261
5. Delhi 148 21. Rajasthan 290
6. Goa 105 22. Sikkim 263
7. Gujarat 362 23. Tamil Nadu 324
8. Haryana 241 24. Tripura 392
9. Himachal Pradesh 329 25. Uttar Pradesh 326
10. Jammu & Kashmir 651 26. Uttarakhand 463
11. Jharkhand 622 27. West Bengal 561
12. Karnataka 406 28. A & N Islands 257
13. Kerala 365 29. Chandigarh 113
14. Madhya Pradesh 324 30. Puducherry 171
15. Maharashtra 480 31. Daman & Diu 102
16. Meghalaya 479 Total 10851
10.1 Teachers’ Background
Th e questionnaire collected information on a wide range of background factors as set out in the paragraphs that follow. Th is chapter summarises fi ndings for all teachers in the sample.
10.1.1 Gender
Of the teachers from class V who took part in this survey, half were female and half male.

140
National Achievement Survey
Figure 10.1: Male and Female Teachers
10.1.2 Age
Th e age profi le of the teachers completing the survey questionnaire is given in Figure 10.2. In our sample, 23% of teachers were below the age of 30, whilst about 13% were above 50 years of age.
Figure 10.2: Age of teachers
10.1.3 Educational qualifi cation
Th e survey asked primary school teachers about their highest educational qualifi cation. Th e results showed that overall, 64% of the teachers in the sample were graduates or post graduates, 24% were qualifi ed at higher secondary level, and 10% of teachers were qualifi ed at secondary level.
Figure 10.3: Educational qualifications of teachers
50% 50%
23%
39%
25%
13%
24%
40%
24%
10%
Below 30 Year 31-40 Years 41-50 Years 51-65 Years
Male Female
Middle(2%)
SecondaryHigh or Senior
Graduation
PostGraduation

141
Teacher-related Variables
10.1.4 Teachers’ employment status
In India, states diff er from one another on policies and requirements for appointing teachers. Under SSA and the Right to Education Act (2009), enrolment in schools up to upper primary classes has substantially increased. Th e Government of India and state governments are making eff orts to provide basic infrastructure to all schools to meet the immediate demand. Many states have appointed para teachers, shiksha karmi and part-time teachers to meet this demand. Th e employment status of teachers is presented in Figure 10.4.
Figure 10.4: Employment states of teachers
Figure 10.4 shows that the majority of teachers, (nearly four-fi fths), were regular or full time teachers, whereas around 1% were working against leave vacancies and 11% were para teachers. Th e para teachers were appointed by some states to meet the immediate demand of teachers in schools.
10.2 Teacher Training
To ensure high quality education in schools, it is necessary that teachers should be trained. Th ere are two types of teacher training programmes, namely pre-service training and in-service training, prevalent in our education system. Th e basic pre-service qualifi cation necessary to be appointed as a teacher in a school is a certifi cate level/diploma or degree programme, e.g. JBT, B.Ed., M.Ed. etc. In-service training is provided for further development of those teachers who are teaching in schools.
10.2.1 Professional qualifi cation
In India, a professional qualifi cation is essential for getting a regular/permanent job in government and government aided schools. A professional qualifi cation helps teachers to understand various methods of teaching, school environment and psychological aspects of the students’ personality. Th e distribution of the professional qualifi cations of teachers is presented in Figure 10.5.
Figure 10.5: Professional qualification of teachers
64%
34%
Regular full time
79%
Against leave(1%)
Temporary(6%)
Para teacher(11%)
Other(3%)
MEd andothers(2%)
Primary or elementary
GraduateTraining

142
National Achievement Survey
Survey data shows that 64% of teachers were primary/elementary teaching certifi cate or diploma holders. Th e percentages of graduate and post-graduate degree in professional courses were 34% and 2% respectively.
10.2.2 In-service training programme
In the states, various agencies such as SCERT, DIET, BRC, CRC etc. organise in-service training programmes for teachers to update them with the latest trends and build their capacity for their classroom teaching. Teachers were asked how many such programmes they attended during the last two years. Th e information collected refl ects the activeness of various academic agencies in organising in-service training programmes.
Figure 10.6: In-service training programme attended by teachers
Number of training programmes attended: Figure 10.6 shows that nearly a quarter of teachers did not attend any training programmes, 12% of teachers attended one, 21% two and 43% three or more training programmes.
10.2.3 Attending training programmes based on NCF-2005
NCERT gave academic help to states for providing training to teachers in the National Curriculum Framework (NCF), 2005. NCERT also organised many training programmes at Delhi and also in states to train key resource persons. Figure 10.7 indicates that overall 37% of teachers attended a training programme based on NCF 2005.
Figure 10.7: Teachers attended training based on NCF-2005
10.3 Teaching Learning Process
With the introduction of NCF-2005, there was a paradigm shift in the teaching learning process. Th e new option was a constructive approach which believed that pupils construct their own knowledge and that the teacher was a
24%
12%
21%
43%
37%
63%
None
One
Two
3 or more
No Yes

143
Teacher-related Variables
facilitator who guided the pupils to think, to solve problems and to learn on their own. Th is demanded a change in role of teachers, learning environment, instructional strategy, methods of teaching, curriculum and assessment of students. Information on some of the above variables such as teaching style, academic facilities and modifi cation of curriculum according to NCF-2005 etc. was sought in this questionnaire.
10.3.1 Teaching style and academic facilities
To teach in the classroom and track the progress of students’ learning, teachers use various strategies. Giving homework is one of the techniques used and the assessment of homework helps teachers to know the students’ pace of learning. Teachers are also provided with a ‘Teacher’s Diary’ to maintain a day-to-day record of activities planned and executed in the class. Th is helps teachers as well as supervisors to know what teachers did on a particular day in a period in a class. It also helps teachers in planning for a lesson to be taught in the class as well as to note down specifi c queries made by the students on a particular topic. If required, the teacher’s diary may also be used as a tool for assessment of teachers’ work in the school.
For teaching in the class, teachers use the teacher’s handbook, teaching learning material (TLM), and audio-visual facilities. Under SSA, there is a provision of Rs. 500 per annum for a teacher for development of TLM. Readymade TLMs are also available for the use of teachers on diff erent topics in a subject.
Further under SSA, teacher resource centres (TRC), cluster resource centres (CRC) and block resource centres (BRC) have been developed in each district of the country. Th e role of these agencies is to provide academic support to teachers to accelerate the teaching learning process. To understand the status of all these, the information was collected under the following heads:
Homework
Teacher’s diary
Resources available
Academic support
Th e outcomes are presented below:
10.3.2 Homework
Figure 10.8 shows that fewer than 1% of teachers did not give homework at all, while 14% of teachers gave homework sometimes, and 85% of teachers gave homework regularly.
Figure 10.8: Teachers give homework
85%
14% 1%
Regularly
Sometime
Not at all

144
National Achievement Survey
10.3.3 Teacher’s diary
Figure 10.9 indicates that 87% of teachers reported maintaining a teacher’s diary.
Figure 10.9: Teachers diary
10.3.4 Teaching aids and TLM grant
Figure 10.10 shows the availability of teaching aids – teacher’s handbook (82%), TLM 94%, audio-video facilities (43%), and TLM grant (77%).
Figure 10.10: Academic facilities available in schools
10.3.5 Interaction with other teachers
Interaction among teachers helps to clear up doubts in organising content for development of a lesson plan and using TLMs. It also helps teachers to improve teaching methodology and cover concepts in an improved way. Anecdotal evidence suggests that the practice is fairly unusual and that schools do not encourage such type of practices. To compare this perception with the situation on the ground, teachers were asked about their experience in this.
Discussion about how to teach a particular concept: According to Figure 10.11, 56% of teachers reported that discussion among teachers about how to teach a particular concept took place “1 to 3 times per week”, 40% of reported “2 to 3 times per month” and 4% of teachers said that such discussions almost never took place.
13%
87%
TLM Grant Hbk TLM AVS
43
94
8277
Yes No

145
Teacher-related Variables
Figure 10.11: Discuss how to teach a particular concept
Working on preparing instructional materials: Figure 10.12 shows that 41% of teachers reported interacting with colleagues to develop instructional materials 1–3 times in a week, 50% of teachers 3–5 times a week but 9% of teachers almost never interacted in this way.
Figure 10.12: Working preparing instructional materials
Visit to another teacher’s classroom: Figure 10.13 indicates that 30% of the teachers almost never visited another teacher’s classroom to observe his/her teaching, and 29% and 41% of teachers reported that they visited another teacher’s classroom to observe his/her teaching 1–3 times per week and 2–3 times per week respectively.
Figure 10.13: Visit to observe another teacher’s classroom
40%
56%
4%
41%
50%
9%
29%
41%
30%
1 to 3 times per week2 to 3 times per
month
Almost never
1 to 3 times per week2 to 3 times per
month
Almost never
1 to 3 times per week
2 to 3 times per month
Almost never

146
National Achievement Survey
Informal observation of my classroom by another teacher: Figure 10.14 indicates that overall, 28% of teachers reported that their classroom teaching was almost never observed by another teacher, 47% of teachers were observed 2–3 times per month by another teacher and 25% of teacher’s classroom teaching was observed 1–3 times per week by another teacher.
Figure 10.14: Informal observation of classroom by another teacher
10.4 Problems in School
Under the drive to Universalisation of Elementary Education, Central Government and State Governments have made heroic eff orts to bring all the children of 6–14 years in school. To give it legal back up, the Government of India passed the Right to Education Act (2009). In addition under SSA since 2000, the Government of India has provided large sums of money to the states for implementing the minimum required infrastructure for schools to provide quality education to our children. In spite of the eff orts made under SSA, there is need to work more in this area.
a) School building needs signifi cant repair: Figure 10.15 shows that overall 16% of teachers felt that the need of signifi cant repair in the school building was a serious problem whereas 51% of teachers felt that it was a minor problem. Overall, only one-third of school buildings do not need repairing.
Figure 10.15: Visit to observe another Teacher’s Classroom
b) Classrooms are overcrowded: For a healthy atmosphere in the classroom, the teacher–pupil ratio should be appropriate and there should be proper space for sitting of the students. Figure 10.15 shows that overall, 17% of teachers considered it as a serious problem, 28% as a minor problem and for the rest it was not a problem.
25%
47%
28%
1 to 3 times per week
2 to 3 times per month
Almost never
Buildings
Not a problem
Overcrowded
Miner problem
Workspace
Serious problem
Materials

147
Teacher-related Variables
c) Inadequate workspace outside the classroom: Teachers need some space outside the classroom for preparation of TLM and organising relevant activities. Teachers were asked to respond about the working space outside the classroom. Th e responses are presented in Figure 10.15. Around 13% of teachers reported that they did not have adequate workspace outside their classroom and that it was a serious problem, 33% of teachers considered it as a minor problem and remaining 55% of teachers considered it as not a problem at all.
d) Materials are not available: Figure 10.15 indicates that 28% of teachers reported non-availability of material as a serious problem, 41% of teachers reported it as a minor problem and 31% did not consider this a problem.
10.5 Teachers’ Opinion about the School
It is important to know how well the teachers are aware about the curriculum goals, whether they are satisfi ed with their job, and what are their expectations from students and parents. Opinion about these factors directly or indirectly indicates teacher’s motivation and school environment where he/she is teaching.
Figure 10.16: Informal Observation of Classroom by another Teacher
Th e responses on each sub-item were analysed separately and are presented below:
a) Teacher’s job satisfaction: 60% of teachers reckoned that teachers in their school were highly satisfi ed with their job while only 9% reckoned that teachers had low job satisfaction.
b) Understanding of curriculum goals: Understanding of curriculum goals is very important for planning of teaching learning strategies and classroom activities. If a teacher does not understand curriculum goals, then it will be diffi cult for him/her to translate it into the classroom. Figure 10.16 indicates that 64% of teachers thought that teachers in their schools had a high understanding of curriculum goals whereas only 8% reckoned that teachers had a low/very low understanding of curriculum goals.
c) Success in implementing the curriculum: About half of the teachers feel that teachers’ degree of success in implementing curriculum is high or very high in their schools.
d) Expectations for student achievement: 62% of teachers reported their expectations for their students were high, whereas only 9% of teachers reported low expectations for the students.
e) Teachers’ view regarding parents support and involvement: One-fi fth of the teachers were of the opinion that parental support was very high.
f) Parents’ involvement in school activities: Overall, 17% of teachers reported parents’ involvement was high and very high whereas 44% of teachers reported it as low.
Very high High Medium Low Very low
Teacher job satisfaction
Teacher understandant
cubic goals
Teachers success implementation
Teachers expectation for
student
Parental support for student
Parentalinvolvement
Regard school property
Student ambition

148
National Achievement Survey
g) Student regard for school property: Around 41% of teachers answered that students in their schools had high or very high regard for school property but 17% of teachers reported that their students had low or very low regard for school property.
h) Students’ desire to do well in school: 52% of teachers reported their students had the desire to do well in school and 11% of teachers thought that students did not have the desire to do well in the school.
Teachers were asked about their perception of school safety, whether the school was located in a safe neighborhood, whether they felt safe at the school, and whether the school’s security policies were suffi cient (Figure 10.17). A substantial majority considered that the school and its environs were safe, but rather worryingly, approximately one-fi fth of those responding considered that at least one of these was unsafe.
Figure 10.17: Teachers’ perception of school safety
Part II-Teacher Factors and Student Attainment
In this survey, teachers were asked about their qualifi cations and experience, the subjects they taught, classroom processes, and their views about the school.
Teachers are generally accepted to be the most important system input into the learning process. However, it is easier to say this than actually to assess teacher eff ects, especially from a survey of this nature. First, the study deals with students who have been in school for at least fi ve years. Encountering a range of teachers during that time and cross-sectional studies such as NAS will deal only with the last of these. Second, information in a teacher questionnaire, especially relating to classroom practice, is typically self-reported: it is well known that teacher and student reports of the same classroom frequently do not agree. Also, it is diffi cult in this study to ensure that teachers’ data is related to the students they teach. Around 10% of the teachers did not indicate which subjects they taught. Th is is in addition to the usual caveats over direction of causation and the possibility that both learning attainment and its supposed cause are in fact the products of some more fundamental infl uence, such as home background and resources. To some extent we can investigate this last possibility by allowing simultaneously for the infl uence of the key variables, socio-economic status and home language. If a relation between a factor and an outcome is not extinguished by making such allowances, it is reasonable to suggest that the factor is having an eff ect on the outcome. Inferences will however be less reliable based on the teacher questionnaire because of the factors noted earlier in this paragraph.
Many teachers (over 40% of respondents) answered more than one section of the questionnaire and will have taught more than one of the three subjects, and over a quarter appear to have taught all three. All teachers who replied to the section in the questionnaire relating to Language teaching are included in the analyses.
79%
21%
Not so safeFeel safe

149
Teacher-related Variables
10.6 Treatment given to Variables used in Analysis
Th e variables considered under the teacher background are as under:
Table 10.2: Teacher-related variables and its treatment for regression variables
Variables Categories of Variables Treatment
Gender a) Male, b) Female ‘MALE’ as a base category
Category a) Scheduled Castes, b) Scheduled Tribes, c) OBCs, d) Others ‘OTHERS’ as a base category
Age a) Below 30 yrs, b) 31–40 yrs., c) 41–50 yrs., d) 51–65 yrs ‘Below 30 yrs’ as a base category
Academic qualification a) Middle or secondary, b) Higher/Sr secondary, c)
Graduation, d) Post graduation
‘Middle or secondary’ as a base
category
Professional qualification a) Graduate, b) Others ‘Others’ as a base category
Training programmes a) One, b)Two, c) More than three, d) None ‘None’ as a base category
Training programme based
on NCF-2005
a) Yes, b) No ‘NO’ as a base category
Professional development
activities
a) Yes, b) No ‘NO’ as a base category
Teaching experience a) Up to 5 yrs, b) 5–20 yrs, c) More than 20 yrs ‘Up to 5 yrs’ as a base category
Years in school a) Up to 5 yrs, b) 5–10 yrs., c) More than 10 yrs ‘Up to 5 yrs’ as a base category
Employment status a) Regular full time, b) Para teacher, etc ‘Regular full time’ as a base category
Regular homework a) Yes, b) No ‘NO’ as a base category
Teacher’s diary a) Yes, b) No ‘NO’ as a base category
Periods per week a) 1–21, b) 22–34, c) 35 and above ‘1–21’ as a base category
Interaction with other
teachers
a) Discussions about how to teach a particular concept, b)
Working on preparing instructional materials, c) Visits to
another teacher’s classroom to observe his/her teaching, d)
Informal observations of my classroom by other teachers
‘NO’ as a base category
Activities in Language class a) Listen to a story and answer the questions put by you,
b) Talk to each other on a given topic and come out with
observations/conclusions, c) Work together in pairs or small
groups and report the conclusions orally in the class, d) Read
storybooks/ newspapers /magazines on their own, e) Use
dictionary to work out meaning of the unknown words used
in the text, f) Write compositions on given topics, g) Relate
what you read in the text with your real life experiences
‘At least once a week’ as a base
category
Teaching resources a) Teacher’s handbook, b) Teaching learning material, c)
Audio-video facilities
‘NO’ as a base category
Problems with facilities a) The school building needs significant repair, b) Classrooms
are overcrowded, c) Teachers do not have adequate
workspace outside their classroom, d) Materials are not
available to conduct experiments/investigations
‘NO’ as a base category
TLM grant a) Yes, b) No ‘NO’ as a base category
Safety in School a) This school is located in a safe neighbourhood, b) I feel
safe at this school, c) This school’s security policies and
practices are sufficient.
‘NO’ as a base category
Teachers’ Attitude a) Teachers’ job satisfaction, b) Teachers’ understanding
of cuuriculum goals, c) Teachers’ high degree of success in
implementing the curriculum, d) Teachers’ high expectations
for student achievement
‘NO’ as a base category

150
National Achievement Survey
10.7 Personal Characteristics
Personal characteristics of teachers such as gender, category and age were considered.
Table 10.3: Regression results – Gender-wise
Variables Coeff SE Sig.
Without key variables Girls 3.74 1.31 **
With key variables Girls 2.09 1.28 NS
*Significant if P<.05, **Significant if P<.01, NS-Not Significant
Table 10.4: Regression results – Category-wise
Variables Coeff SE Sig.
Without key variables SC -3.47 2.04 NS
ST -3.74 1.8 NS
OBC -0.99 1.77 NS
With key variables SC -1.85 2 NS
ST -2.5 1.72 NS
OBC -0.1 1.71 NS
*Significant if P<.05, **Significant if P<.01, NS-Not Significant
Table 10.5: Regression results – Age-wise
Variables Coeff SE Sig.
Without key variables 31-40 1.1 1.84 NS
41 to50 3.66 2.01 NS
51 to 65 0.91 2.17 NS
With key variables 31-40 0.54 1.82 NS
41 to50 2.46 1.97 NS
51 to 65 -0.27 2.09 NS
*Significant if P<.05, **Significant if P<.01, NS-Not Significant
Category and age of the teachers did not have a statistically signifi cant relation with the attainment of the students. Female teachers were associated with slightly higher attainment, but this diff erence was not statistically signifi cant after allowing for the key student variables of socio-economic status and student’s home language.
10.8 Academic and Professional Qualifi cations
Teachers’ education is an important aspect of their effi cacy. Th ey were asked about their academic and professional qualifi cations.

151
Teacher-related Variables
Table 10.6: Regression results – Academic qualification
Variables Coeff SE Sig.
Without key variables Higher secondary 1.88 2.24 NS
Graduate 0.38 1.93 NS
Post grad 3.24 2.27 NS
With key variables Higher secondary 1.53 2.21 NS
Graduate -0.56 1.93 NS
Post grad 1.49 2.26 NS
*Significant if P<.05, **Significant if P<.01, NS-Not Significant
Teachers’ highest academic qualifi cations are not signifi cantly related to attainment.
Table 10.7: Regression results – Professional qualification
Variables Coeff SE Sig.
Without key variables Graduates 3.43 1.41 *
With key variables Graduates 1.98 1.36 NS
*Significant if P<.05, **Significant if P<.01, NS-Not Significant
Teachers with graduate professional qualifi cations are more likely to be in schools with higher attaining students, but this diff erence is relatively small and is not statistically signifi cant after allowing for key student variables.
10.9 In-service Training
Teaching ability is not something that stands still as teachers are regularly off ered the opportunity to attend in-service training courses. Teachers were asked about the number of in-service training programmes they had attended during the past two years and, more specifi cally, whether they had attended any training programme based on NCF-2005.
Table 10.8: Regression results – In-service training programmes
Variables Coeff SE Sig.
Without key variables One 1.02 2.08 NSTwo 2.02 1.67 NSMore than 3 2.04 1.62 NS
With key variables One 0.67 1.94 NSTwo 2.81 1.58 NSMore than 3 2.23 1.56 NS
*Significant if P<.05, **Significant if P<.01, NS-Not Significant
Table 10.9: Regression results – Attended training programme based on NCF-2005
Variables Coeff SE Sig.
Without key variables Yes 0.23 1.13 NS
With key variables Yes 0.48 1.12 NS
*Significant if P<.05, **Significant if P<.01, NS-Not Significant
Th e majority had attended one or more in-service training course, including an NCF-based one. However, there is no statistically signifi cant relationship with the attainment of students in these schools.

152
National Achievement Survey
Table 10.10: Regression results – Participation in professional development activities
Variables Coeff SE Sig.
Without key variables Yes 0.84 1.87 NS
With key variables Yes 1.19 1.79 NS
*Significant if P<.05, **Significant if P<.01, NS-Not Significant
Teachers were also asked whether they had participated in any professional development activities. Th e majority had participated in one or more of these but this showed no statistically signifi cant relationship with the performance of the students in the school.
10.10 Teaching Experience and Employment Status
Of course teachers’ training and formal qualifi cations are not the only indicator of how capable they are. Experience is also a major contributor.
Table 10.11: Regression results – Years of teaching experience
Variables Coeff SE Sig.
Without key variables Over 5 up to 20 1.57 1.37 NS
Over 20 1.74 1.79 NS
With key variables Over 5 up to 20 1.78 1.33 NS
Over 20 1.17 1.75 NS
*Significant if P<.05, **Significant if P<.01, NS-Not Significant
Table 10.12: Regression results – Years in the school
Variables Coeff SE Sig.
Without key variables Over 5 up to 10 1.12 1.44 NS
Over 10 4.35 1.33 **
With key variables Over 5 up to 10 1.09 1.45 NS
Over 10 2.45 1.32 NS
*Significant if P<.05, **Significant if P<.01, NS-Not Significant
Length of time in the school of the surveyed teacher is positively related with students doing better in schools where the teacher has been for over 10 years, though the strength of this relation is reduced by allowing for the key background factors of the students. It may be that teachers fi nd schools with a higher socio-economic intake more congenial and consequently stay there longer.
Table 10.13: Regression results – Employment status
Variables Coeff SE Sig.
Without key variables ‘Para’, etc -8.67 1.95 **
Other -7.68 2.28 **
With key variables ‘Para’, etc -6.2 1.92 **
Other -6.6 2.08 **
*Significant if P<.05, **Significant if P<.01, NS-Not Significant

153
Teacher-related Variables
Conversely, students do not achieve as well in schools where the surveyed teacher is a temporary or para teacher and these relationships remain statistically signifi cant and fairly sizeable after allowing for key student background factors. Para and shiksha karmi teachers are often a part of a programme to reach children in remote rural areas.
10.11 Teaching Practices
Teachers were also asked about how they taught. Th e majority gave regular homework and kept a teacher’s diary. Only the latter showed a statistically signifi cant association with the attainment of the students at their school.
Table 10.14: Regression results – Regular homework
Variables Coeff SE Sig.
Without key variables Yes -1.59 1.67 NS
With key variables Yes 0.05 1.58 NS
*Significant if P<.05, **Significant if P<.01, NS-Not Significant
Table 10.15: Regression results – Teachers’ diary
Variables Coeff SE Sig.
Without key variables Yes 6.82 1.86 **
With key variables Yes 7.79 1.8 **
*Significant if P<.05, **Significant if P<.01, NS-Not Significant
Table 10.16: Regression results – Periods/Week
Variables Coeff SE Sig.
Without key variables 22 to 34 -0.26 1.53 NS
35 and over 1.16 1.34 NS
With key variables 22 to 34 -1.02 1.52 NS
35 and over 2.15 1.31 NS
*Significant if P<.05, **Significant if P<.01, NS-Not Significant
Number of periods taught per week is not related to the attainment of the students in the study.
It is likely that an enquiring attitude and enthusiasm for communicating knowledge will lead to increased contacts with other members of staff in the school. Teachers were asked about interacting with other teachers.
Table 10.17: Regression results – Interaction with other teachers
Variables Coeff SE Sig.
Without key variables Yes 1.60 1.34 NS
With key variables Yes 2.27 1.31 NS
*Significant if P<.05, **Significant if P<.01, NS-Not Significant
Over three quarters of the surveyed teachers were doing this regularly in one or more of these ways, but the attainment diff erence was not statistically signifi cant.

154
National Achievement Survey
Th e respondents were divided into two groups – those who, on an average, carried out all these activities at least once a week, and the rest.
Table 10.18: Regression results – Regular activities in class
Variables Coeff SE Sig.
Without key variables No -2.13 1.13 NS
With key variables No -2.67 1.1 *
*Significant if P<.05, **Significant if P<.01, NS-Not Significant
Th ere was no statistically signifi cant relationship between this and attainment of the students in their schools on its own but there was a weak positive relationship with number of activities in the classroom after allowing for the key variables of socio-economic background and language spoken at home.
10.12 Teaching Resources
Having proper resources is an important adjunct of successful teaching.
Table 10.19: Regression results – Teaching resources
Variables Coeff SE Sig.
Teacher’s handbook Without key variables Yes 8.45 1.64 **
With key variables Yes 7.82 1.6 **
Teaching Learning
Material (TLM)
Without key variables Yes -1.93 2.37 NS
With key variables Yes -0.81 2.26 NS
Audio-Video
facilities
Without key variables Yes 4.69 1.1 **
With key variables Yes 3.75 1.08 **
*Significant if P<.05, **Significant if P<.01, NS-Not Significant
Attainment in Language has a statistically signifi cant positive relation with having a teacher’s handbook and audio-visual services, and these relationships are not substantially reduced by allowing for key background student variables. Th ere is no statistically signifi cant relation with the availability of TLM.
Teachers were asked about the severity of some possible problems with the school facilities. Table 10.20 shows those where at least one of the problems was rated as ‘serious’.
Table 10.20: Regression results – Problems with facilities: one rated as ‘serious’
Variables Coeff SE Sig.
Without key variables Yes -6.2 1.25 **
With key variables Yes -5.07 1.17 **
*Significant if P<.05, **Significant if P<.01, NS-Not Significant
Fewer than half reported having at least one as a serious problem. Students in these schools were less successful. Th is diff erence was not substantially aff ected by allowing for key background variables.

155
Teacher-related Variables
Table 10.21: Regression results – TLM grant
Variables Coeff SE Sig.
Without key variables Yes -3.51 1.55 *
With key variables Yes -3.07 1.49 *
*Significant if P<.05, **Significant if P<.01, NS-Not Significant
Teachers were asked if they had got TLM grants for this year. Th ree quarters of respondents stated that they had, but this was related to slightly poorer performance by students. Th is relation was not substantially aff ected by allowing for key background variables.
10.13 Attitudes and Views
Attitudes of staff are also important. Perhaps most important is whether they feel the school is a safe place for them.
Th ese were combined to form an indicator of whether teachers fi nd the school safe. Teachers were divided into two groups—those answering negatively to any of these questions, and the rest.
Table 10.22: Regression results – School is safe
Variables Coeff SE Sig.
Without key variables Yes 2.86 1.52 NS
With key variables Yes 1.52 1.47 NS
*Significant if P<.05, **Significant if P<.01, NS-Not Significant
Teachers considered their schools safe by a large majority, but this did not appear to be related to student attainment in a statistically signifi cant degree. It is perhaps worrying that nearly one in fi ve teachers felt that the school or its surroundings were not safe.
Teachers were also asked to assess qualities of staff in the school. Teachers’ job satisfaction and expectations for student achievement had a statistically signifi cant but small relationship with attainment in their school, but this became non-signifi cant after allowing for key student variables. Teachers’ understanding of curriculum goals and teachers’ degree of success in implementing the curriculum did not have a statistically signifi cant relation with attainment.
Table 10.23: Regression results – Teachers’ high job satisfaction
Variables Coeff SE Sig.
Without key variables Yes 2.63 1.17 *
With key variables Yes 2.13 1.13 NS
*Significant if P<.05, **Significant if P<.01, NS-Not Significant
Table 10.24: Regression results – Teachers’ high understanding of curriculum goals
Variables Coeff SE Sig.
Without key variables Yes 1.48 1.2 NS
With key variables Yes 0.8 1.16 NS
*Significant if P<.05, **Significant if P<.01, NS-Not Significant

156
National Achievement Survey
Table 10.25: Regression results – Teachers’ high degree of success in implementing the curriculum
Variables Coeff SE Sig.
Without key variables Yes 0.45 1.34 NS
With key variables Yes -0.06 1.33 NS
*Significant if P<.05, **Significant if P<.01, NS-Not Significant
Table 10.26: Regression results – Teachers’ high expectations for student achievement
Variables Coeff SE Sig.
Without key variables Yes 2.77 1.27 *
With key variables Yes 2.08 1.27 NS
*Significant if P<.05, **Significant if P<.01, NS-Not Significant
10.14 Conclusion
Any conclusions from these results have to be extremely tentative because of the precarious nature of the link between teachers and students in this study as the teacher may not have been with the student concerned for more than one year. Th is also means that any relationships found may well be underestimates of their actual size. Statements about positive (negative) relationships between teacher aspects and student attainment should be interpreted to say that on an average, students in a school where the teachers were surveyed had a particular tendency to do better (less well). Th ese comparisons are made fi rst as a straightforward univariate comparison and then allowing for the key variables of socio-economic status and home language. If a relation between a factor and an outcome is not extinguished by making such allowances, it is reasonable to suggest that the factor is having an eff ect on the outcome. Inferences will however be less reliable based on the teacher questionnaire because of the factors noted earlier in this paragraph.
With these caveats, it can be noted that teachers’ personal characteristics (age, category) do not have a statistically signifi cant relation with attainment, and nor does highest academic qualifi cation. Gender (female) has a small positive correlation but this is not statistically signifi cant after allowing for the key variables.
Th ere is a small positive relation with having a post graduate professional qualifi cation, though this is no longer statistically signifi cant after allowing for the student key variables of socio-economic status and language spoken at home. Recent in-service training and participation in professional development do not appear to be related to attainment.
Years of teaching experience does not have a statistically signifi cant correlation with attainment, but years of teaching in that school does, though this relation is substantially decreased by allowing for key student variables.
Students at schools with para teachers, shiksha karmi or comparable arrangements have lower attainment. Th is may be because such teachers are often a part of a programme to reach children in remote rural areas. Lower attainment also occurs where the teachers are temporary. Th is could be because they have not had time to settle in, or because such appointments are an indication of problems in recruiting.
Giving homework regularly is not related to higher performance, though this fi nding disagrees with the analogous results from the student and school questionnaires. On balance, the other two results seem to be more credible for the reasons described above. Keeping a teacher’s diary is positively related to attainment. Number of periods taught per week does not show a statistically signifi cant relation with student attainment. Extent of interaction with other

157
Teacher-related Variables
teachers is also not related to student attainment, but engaging regularly in a wide range of Language activities has a (weak) positive relationship.
Proper resources are an important contributor to successful teaching. Having a copy of the teachers’ handbook and audio-video facilities are positively related to student attainment. However there is no statistically signifi cant relation with having TLM. In schools where teachers reckoned that there were severe problems in some aspects of school facilities, attainment was lower. Performance was slightly lower in schools where the surveyed teacher reported having received a TLM grant that year.
Teachers were also asked about attitudes and opinions. Most teachers considered their school to be safe. However, one-fi fth of students in the sample were taught by teachers who did not feel that their school was entirely safe. Th e relation with student attainment was not statistically signifi cant. Having a high degree of job satisfaction and high expectations for student achievement were slightly related to achievement, though these relations became non-statistically signifi cant after allowing for student background factors. Surprisingly, teachers’ high understanding of curriculum goals and high degree of success in implementing the curriculum were not related to school attainment. It should be noted that these questions relate to a teacher’s opinion of the staff in general, not necessarily to his or her own situation.
Th e following factors appear to have a robust eff ect on attainment in Language, in the sense that the relationship is statistically signifi cant and is not extinguished by allowing for other important variables including home resources and language of instruction spoken at home:
Years of teaching at the current school
Para teachers, shikshakbadh or shiksha karmi (negative)
Teacher’s diary
Range of activities in the classroom
Teacher’s handbook
Audio-Visual facilities
Severe problems with facilities (negative)
TLM grant (negative)

158
National Achievement Survey

159
Teacher-related Variables
Chapter 11
Equi ty and the Success of the Sarva Shikhsa Abhiyan
Programme in prov id ing Equal i ty o f Oppor tun i ty

160
National Achievement Survey

161
Equity and the Success of the Sarva Shikhsa Abhiyan Programme in providing Equality of Opportunity
CHAPTER 11 EQUITY AND THE SUCCESS OF THE SARVA SHIKHSA ABHIYAN PROGRAMME IN PROVIDING
EQUALITY OF OPPORTUNITY
Sarva Shiksha Abhiyan (SSA), a fl agship programme of the Government of India, provides a variety of inputs designed to ensure access, equity and quality in elementary education. Th is will not necessarily provide equality of attainment, since, as this report documents, there are factors which promote educational success other than those provided by offi cial school-based inputs. Such factors include home resources and the relationship between the language spoken at home and the language of tuition.
Th is chapter looks at the extent to which the programme has succeeded in providing equal school and school-related resources and facilities for all, regardless of background. Th is could be characterised as equality of opportunity or equity of treatment. To this end, we consider the qualities of the schools and teachers who are engaged in providing the education in them. Of course this can be only a partial snapshot, since it relates to the most recent year, not to the whole education career of the students in the study. However, this can give a picture of where the SSA project has arrived at most recently, if not during the entire career of the students. Similarly, the teachers in the study, in many cases, will have taught the students for the most recent year, and indeed some of them may not have taught the students concerned at all. We are however able to get a picture of the current state of the schools at which the study pupils are attending. Another caveat is also relevant: these results apply only to government and government-aided schools. As discussed earlier, a proportion of pupils attend private schools, and these proportions vary from state to state. Not all such private schools will have superior facilities, however.
We investigate the success of the project in building on existing circumstances in providing equity by comparing the facilities to two particularly disadvantaged groups with more favoured groups. As is well known throughout the world, young people from houses with low socio-economic resources do less well, on average, than those in better-off homes. Th is project therefore compares the educational experience, as identifi ed by this study, of the students identifi ed as in the lowest fi fth of the socio-economic index, with the rests of the population. Th e groups in the lowest fi fth are designated as disadvantaged for the purposes of this chapter.
Th e second comparison has a particularly Indian reference. Chapter 2 showed that students in the three scheduled groups – SC, ST and OBC – were substantially less successful in Language than those in the General or Other group, and chapters 4 and 6 showed the same pattern in Mathematics and EVS. Of the three scheduled groups, the least successful was the ST group. Th e second set of analyses described in this chapter therefore compare the education circumstances of the ST group with those of the General or Other group.
A selection of educational circumstances is compared between the less favoured groups and the comparison groups. Th e circumstances to be compared come from the school and teacher questionnaires, and comprise ones discovered to be related to outcomes in this study, and some other ones which would generally be considered important when the topic is discussed. Th ey are grouped into four categories, namely Physical Resources, Characteristics of Teachers, Atmosphere and Ethos of School Attended, and School-related Home Behaviour.
Physical Resources
1. Well-resourced: Schools are divided into well-resourced (20 or more of the 26 resources asked about in the study), and those less well-resourced.

162
National Achievement Survey
2. High student–teacher ratio: Schools are divided into those with a student–teacher ratio of 40 or less, and over 40.
3. School has a computer (Yes/No).
4. Ratio of students to computer less than 2.0 vs the rest.
5. Days in school year 200 or more vs those which for whatever reason were unable to manage this.
6. School has a Science lab (Yes/No).
7. School has a member of staff to help with Science experiments.
8. School has offi cial SSA textbooks in all three subjects (Language, Mathematics and EVS).
9. School has offi cial SSA workbooks in all three subjects.
10. School has offi cial SSA handbooks in all three subjects .
11. School has teaching and learning materials in all three subjects.
Qualities of Teaching Staff
Th is combines formal qualifi cations and experience.
1. It is generally accepted that it is important that teachers should have undergone a formal training. Th is variable compares the proportions with Graduate qualifi cations in the groups.
2. Formal qualifi cations are not the only consideration. It is often considered that teachers need to have a degree of practical experience to be able to utilise their full potential. Th e variable identifi ed those with more than fi ve years experience.
3. Age also goes with experience, and often authority. We compare the proportions of teachers aged over 30.
4. Stability of staff is important. We compare the proportions of teachers who have been for over fi ve years in their current school.
5. Classroom practice is important so we compare the proportions who keep a teacher’s diary
6. We also compare the proportions who report using the teacher’s handbook
7. State that they give regular homework. It is not enough of course just to give homework. It is important to ensure that it is done and checked. (Pupils’ reports of homework given and checked are described separately below under home–school interaction.)
School Atmosphere and Ethos
It is not suffi cient to have good facilities and well-qualifi ed staff , though obviously this will be very important. It is important that the school atmosphere and general ethos both of students and teachers are positive.
1. Unpleasant experiences: Students were asked about a number of unpleasant experiences at school, namely, something of yours was stolen; you were hit or hurt by other pupils; you were made to do things that you did not want to; you were called by names; you were left out. Th is variable compares the number of these unpleasant experiences that students reported.
2. Problem behaviour: School principals were asked about problem behaviours amongst students, specifi cally, arriving late at school; absenteeism; skipping class; violating dress code; classroom disturbance; cheating; profanity; vandalism; theft; intimidation/verbal abuse of other students; physical injury to other students; intimidation/verbal abuse of teachers/staff ; physical injury to other teachers. If the school encountered any of these once a week or more, it was considered to have problem behaviours among students.

163
Equity and the Success of the Sarva Shikhsa Abhiyan Programme in providing Equality of Opportunity
3. Feel safe: Teachers were asked about their perception of school safety, whether the school was located in a safe neighborhood, whether they felt safe at the school, and whether the school’s security policies and practices were suffi cient. If they were happy with all of these, then the school was described as having teachers who felt safe.
4. Diffi culty recruiting. Th is was where a school reported that it was very diffi cult to fi ll vacancies.
5. Understanding curriculum. Respondents to the teacher questionnaire reported that teachers’ understanding of the curricular goals was high or very high.
6. Success implementing curriculum. Respondents to the teacher questionnaire reported that teachers’ degree of success in implementing the curriculum was high or very high.
Home–School Interaction
1. Absenteeism. Elsewhere in this report, it was found that the proportion of pupils being absent for a substantial proportion of the previous month was rather high. For whatever reason, illness or simply non-attendance, this is likely to aff ect attendance, and this was confi rmed in chapter 8 of this report. Th is variable looked at the proportion of students absent from school for one week or more in the previous month.
2. Homework every day. In chapter 8 it was found that giving homework every day was related to attainment in Language.
3. Homework checked at home. Th is was found to be related to attainment in Language, but not after allowing for other home circumstances.
4. Homework checked at school. Th ere was little variation in this as vast majority of pupils reported that their homework was checked in school, but such variation as there was certainly related to attainment.
11.1 Investigating Disadvantage: Findings
Tables 11.1 to 11.5 compare the proportion of the disadvantaged group of students (defi ned as those coming from the lowest fi fth of the socio-economic index) falling in a particular category with the corresponding proportion for the rest (i.e., more advantaged students). In an equitable situation, the proportions for the two groups will not be signifi cantly diff erent.
Table 11.1: School facilities
Characteristic Rest s.e. Disadvantaged s.e signif
Well-resourced 0.36 0.04 0.26 0.02 *
Student–Teacher ratio (More than 40) 0.12 0.01 0.15 0.02
Pupils per computer (Less than 2) 0.52 0.09 0.53 0.09
School has computer 0.47 0.00 0.30 0.01 **
200 days per year 0.78 0.01 0.83 0.01 **
Science laboratory 0.3 0.01 0.17 0.01 **
Help with Experiments 0.63 0.01 0.55 0.01 **
Problems with facilities 0.49 0.01 0.49 0.01
Textbooks in all subjects 0.89 0.01 0.88 0.01 *
Workbooks in all subjects 0.61 0.01 0.61 0.01
Handbooks in all subjects 0.73 0.02 0.69 0.02 *
Teaching and learning material in all subjects 0.82 0.02 0.83 0.01
SE is the standard error associated with the measured proportion for the group.
** P<.01 and * P< .05

164
National Achievement Survey
Table 11.2: Teachers
Characteristic Rest s.e. Disadvantaged s.e signif
More than 5 years in a school 0.47 0.04 0.41 0.01
Teaching experience (More than 5 years) 0.68 0.01 0.66 0.02
Age (More than 30 years) 0.8 0.01 0.78 0.01
Graduate Qualification 0.65 0.01 0.64 0.02
Regular teachers 0.83 0.02 0.79 0.02
Keep teacher’s diary 0.86 0.01 0.89 0.01
Teacher’s handbook 0.84 0.01 0.83 0.01
Give regular homework 0.87 0 0.9 0.01 **
** P<.01 and * P< .05
Table 11.3: Atmosphere and Ethos
Characteristic Rest s.e. Disadvantaged s.e signif
Unpleasant experiences 1.27 0.01 0.98 0.03 **
Problem behaviour 0.23 0.02 0.25 0.02
Feel safe 0.74 0.01 0.72 0.02
Difficulty in recruiting 0.14 0.02 0.16 0.02
Understanding curriculum 0.65 0.09 0.65 0.04
Success in implementing curriculum 0.53 0.08 0.53 0.02
SE is the standard error associated with the measured proportion for the group. For this variable, students were asked about the frequency of unpleasant experiences;
hence the reported value is a number not a proportion.
** P<.01 and * P< .05
Table 11.4: Home–School Interaction
Characteristic Rest s.e. Disadvantaged s.e signif
Absent for 1 week or more 0.68 0.00 0.73 0.01 **
Homework every day 0.71 0.01 0.77 0.01 **
Homework checked at home 0.85 0.01 0.7 0.01 **
Homework checked in school 0.97 0.002 0.97 0.002 **
** P<.01 and * P< .05
11.2 Summary of Findings
Facilities
Table 11.1 compares the ‘disadvantaged’ group (the lowest fi fth on the socio-economic index) with the remainder of the population on a range of school physical resources. It can be seen that there still is a gap in provision of school resources between the two groups and provision, or lack of it, seems to reinforce socio-economic inequalities. Students from a disadvantaged background are less likely to be in schools which:
Are well-resourced
Have a computer
Have a Science lab

165
Equity and the Success of the Sarva Shikhsa Abhiyan Programme in providing Equality of Opportunity
Have assistance with Science experiments
Textbooks in all three subjects
Handbooks in all three subjects
Th ey are also less likely to be in schools which have had fewer than 200 days per year. If this result is reliable, it may be that teachers in this type of school are working harder to compensate for the other disadvantages, but it is diffi cult to interpret without knowing more of the background.
Th ere is no detectible diff erence on schools having:
High number of students per teacher
Fewer than 2 pupils per computer
Serious problems with facilities
Workbooks in all three subjects
Teaching and learning materials
Teachers
Th ere is no detectible diff erence in teacher qualifi cations or experience, but teachers of the disadvantaged group are more likely to report that they ‘give regular homework’.
Atmosphere and Ethos
Th ere is only one diff erence in atmosphere and experience, namely that disadvantaged students are less likely to report having had unpleasant experiences in school.
Home–School Interaction
Pupils from disadvantaged homes are more likely to:
Exhibit absenteeism
Have homework every day
And less likely to:
Have their homework checked at home.
Th ere is a small diff erence on having homework checked in school, but only in the third decimal place.
11.3 Scheduled Tribes
Tables 11.5 to 11.8 show the results of comparing the students in the ST category with those in General or Other group.

166
National Achievement Survey
Table 11.5: School facilities
Characteristic Other s.e. ST s.e signif
Well-resourced 0.39 0.01 0.22 0.01 **
Student teacher ratio (More than 40) 0.13 0.01 0.09 0.01 **
Pupils per computer (Less than 2) 0.51 0.02 0.58 0.02 **
School has computer 0.48 0.01 0.51 0.01 *
200 days per year 0.79 0.01 0.76 0.01
Science laboratory 0.34 0.01 0.26 0.01 **
Help with Experiments 0.66 0.01 0.52 0.01 **
Problems with facilities 0.49 0.01 0.43 0.01 **
Textbooks in all subjects 0.89 0.01 0.89 0.01
Workbooks in all subjects 0.6 0.01 0.56 0.01 *
Handbooks in all subjects 0.71 0.01 0.74 0.01 *
Teaching and learning material in all subjects 0.84 0.01 0.73 0.01 **
** P<.01 and * P< .05
Table 11.6: Teachers
Characteristic Other s.e. ST s.e signif
Unpleasant experiences 0.46 0.03 0.53 0.02
Problem behaviour 0.68 0.02 0.63 0.01 *
Feel safe 0.82 0.01 0.76 0.01 **
Difficulty in recruiting 0.69 0.04 0.60 0.04
Understanding curriculum 0.88 0.01 0.79 0.02 **
Success in implementing curriculum 0.83 0.01 0.83 0.04
Unpleasant experiences 0.89 0.01 0.78 0.02 **
** P<.01 and * P< .05
Table 11.7: Atmosphere and Ethos
Characteristic Other s.e. ST s.e signif
Unpleasant experiences 1.19 0.02 1.32 0.02 **
Problem behaviour 0.22 0.01 0.22 0.01
Feel safe 0.74 0.01 0.69 0.01 **
Difficulty in recruiting 0.14 0.01 0.15 0.01
Understanding curriculum 0.7 0.02 0.54 0.01 **
Success in implementing curriculum 0.57 0.02 0.42 0.02 **
** P<.01 and * P< .05
Table 11.8: Home–School interaction
Characteristic Other s.e. ST s.e signif
Absent for 1 week or more 0.69 0.00 0.69 0.01
Homework every day 0.74 0.01 0.60 0.01 **
Homework checked at home 0.86 0.00 0.69 0.01 **
Homework checked in school 0.97 0.00 0.97 0
** P<.01 and * P< .05

167
Equity and the Success of the Sarva Shikhsa Abhiyan Programme in providing Equality of Opportunity
11.4 Summary of Findings
Resources
Th e picture is less clear cut for the comparison between STs and the General or Other category. ST students are less likely to be in schools which:
Are well-resourced
Have a Science lab
Have help with experiments
Have serious problems with facilities
Have all three workbooks
Have teaching and learning materials
However, they are also less likely to be in schools which:
Have student:teacher ratio over 40
Have more than 2 pupils/computer
Be open less than 200 days/year
Th ey are more likely to have:
All three workbooks
Teachers
Teachers in the schools where ST students attend are less experienced, younger and less likely to be full time regular teachers. Th ey are less likely to keep a teacher’s diary or to claim that they give regular homework.
Atmosphere and Ethos
ST students are more likely to have had unpleasant experiences at school and less likely to feel safe. Th ere is no detectible diff erence in misbehaviour and diffi culties in recruiting. Th ey are less likely to feel that teachers in their schools:
Understand the goals of the curriculum
Be successful in implementing the curriculum
Home/School
ST pupils are less likely to have homework every day, or to have it checked at home. Th ere is no detectible diff erence in absenteeism or in having their homework checked at school.

168
National Achievement Survey

169
Equity and the Success of the Sarva Shikhsa Abhiyan Programme in providing Equality of Opportunity
References

170
National Achievement Survey

171
References
REFERENCES
Avtar Singh et al., (2006). Learning Achievement of Class V Children - A Baseline Study, NCERT.
Avtar Singh et al., (2007). Learning Achievement of Class III Children - A Baseline Study, NCERT.
Avtar Singh et al., (2008). Learning Achievement of Class V Children - A Mid Term Study, NCERT.
Avtar Singh et al., (2008). Learning Achievement of Class III Children - A Mid Term Study, NCERT.
Andrich, D. (1988). Rasch Models for Measurement. Newbury Park, CA, Sage.
Beaton, A.E. (ed.) (1987). Implementing the new design: Th e NAEP 1983–84 technical report. Princeton, NJ: Educational Testing Service, National Assessment of Educational Progress.
Foy, P. & Olson, J.F. (2009). TIMSS 2007 user guide for the international database. Chestnut Hill, MA: TIMSS & PIRLS International Study Center, Boston College.
Foy, P., Galia, F & Isac, L. (2008). Scaling the Data from the TIMSS 2007 Mathematics and Science Assessments. Chapter 11 in Olsen et al (eds.) TIMSS 2007 Technical Report.
Foy, P. & Olson, J. F. (2009). TIMSS 2007 User Guide for the International Database. Chestnut Hill, MA: Boston College.
Hambleton, R. & Swaminathan, H (1985). Item Response Th eory: principles and applications. Boston: Kluwer-Nijhoff .
Foxman, D., Hutchison, D. & Bloomfi eld B. (1991). Th e APU Experience. HMSO.
Leeson, H. and Fletcher, R. (n.d.) An Investigation of Fit: Comparison of the 1-, 2-, 3-Parameter IRT Models to the Project as TTle Data. Unpublished working paper. Massey University, Albany Campus New Zealand.
Olson, J. F., Martin, M. O. and Mullis, I. V. S (2009). TIMSS 2007 Technical Report (revised 2009). Boston: TIMSS & PIRLS International Study Center, Lynch School of Education, Boston College.
Th issen, D. & Wainer, H. (2001). Test Scoring. Mahwah, New Jersey: Lawrence Erlbaum Associates.
Zimowski, M., Muraki, E., Mislevy, R. & Bock, D. (1996). BILOG-MG (Computer programme). Available from Scientifi c Software International, Inc. 7383 N. Lincoln Avenue, Suite 100 Lincolnwood, IL 60712-1747 USA.

172
National Achievement Survey

173
References
Appendices

174
National Achievement Survey

175
Appendices
Appendix – I
Sample Design and Procedures
Th is appendix to the class V National Achievement Survey (NAS) report explains the sample design and the sampling methods of the survey. It describes the target and sample populations and the sample selection procedures. It sets out the necessary exceptions and their impact on the achieved sample. It also discusses sample weights and sample variance estimation within the survey.
Class V (NAS) Target Population
Th e class V (NAS) was designed to investigate learning achievement in the government system at the level of the state or union territory (UT). Hence, the target population was all class V children studying in government and government-aided schools. Sample schools included those managed by the Department of Education, Tribal/Social Welfare Departments and local bodies as well as private-but-government-aided schools. Th is follows the classifi cation categories of the District Information System for Education (DISE). Completely private schools were not included in this survey. Zila Parishad (ZPH) is a local government body at the district level in India. It looks after the administration of the rural area of the district and its offi ce is located at the district headquarters. ZPH translates to District Council. Th ese schools are established, supervised and funded by the ZPH district level authorities. ZPH schools provide education for students from grades 6-10 of the Secondary School Certifi cate. Schools run by the central, state or local governments are referred to as ‘government’ schools. Schools run by private managements but funded largely by government grant-in-aid are known as private aided or just ‘aided’ schools.
Th e survey was available to all 35 states and UTs. However, Arunachal Pradesh, Dadra Nagar Haveli and Lakshadweep could not participate. Manipur participated in the survey’s administration but faced problems in data collection and failed to report its data on time. Among the 31 participating states and UTs, six states - Jharkhand, Meghalaya, Mizoram, Nagaland, Sikkim and West Bengal - could not test class V students at the end of their school year and so decided to test class VI children at the beginning of the next school year. For the states which tested class VI students instead of class V students, the sampling rules described here do not apply. Th e coverage in these states was considered adequate, bearing in mind, however, that the target sample was not exactly as defi ned in the remaining population.
Population Exclusions
As is the case in other large-scale educational surveys, some sub-populations were excluded from the total target population at the initial stage of sampling. For logistical reasons, the class V (NAS) excluded schools with fewer than nine or, in some cases, fi ve students depending on the enrolment characteristics of the state/UT. In addition to this ‘small school exclusion’, the survey excluded ‘Upper Primary Only’ schools due to a classifi cation error.
As a result of these exclusions, population coverage of the class V sample varied from 99% in Tripura down to 7% in Assam. In fi ve states/UTs - Assam, Daman & Diu, Goa, Kerala and Maharashtra - the population coverage fell below 80%, mainly due to the exclusion of Upper Primary Only schools. Table A-1.1 shows population coverage of the class V (NAS) sample after the sub-population exclusions.

176
National Achievement Survey
Table A-1.1: Effect of sub-population exclusions on population coverage in states and UTs where Class V students
were tested (data from DISE 2007-8)
Group State or Union Territory Target
population
size
Criteria of
small school
exclusion
Class V
in Upper
Primary
Population
size after all
exclusions
Population
coverage
(percent)
Coverage 80% or
greater
A & N Islands 6,471 Enrolment < 5 6,185 96
Andhra Pradesh 8,90,628 Enrolment < 9 Yes 7,48,686 84
Bihar 18,67,758 Enrolment < 9 18,29,071 98
Chandigarh 11,315 Enrolment < 5 10,880 96
Chhattisgarh 4,36,829 Enrolment < 9 3,78,128 87
Delhi 1,91,010 Enrolment < 9 1,88,360 99
Gujarat 8,45,998 Enrolment < 9 Yes 8,12,042 96
Haryana 2,63,773 Enrolment < 9 2,48,801 94
Himachal Pradesh 1,07,540 Enrolment < 5 1,00,447 93
Jammu & Kashmir 1,36,877 Enrolment < 5 1,26,546 92
Karnataka 8,66,323 Enrolment < 9 7,83,450 90
Madhya Pradesh 14,71,511 Enrolment < 9 13,34,000 91
Manipur 25,071 Enrolment < 5 24,315 97
Orissa 8,22,711 Enrolment < 9 Yes 7,64,962 93
Puducherry 14,184 Enrolment < 5 14,055 99
Punjab 2,59,748 Enrolment < 9 2,39,451 92
Rajasthan 8,80,421 Enrolment < 9 7,38,258 84
Tamil Nadu 9,03,890 Enrolment < 9 8,47,321 94
Tripura 81,519 Enrolment < 5 80,658 99
Uttar Pradesh 30,63,248 Enrolment < 9 30,08,197 98
Uttarakhand 1,33,500 Enrolment < 5 1,23,251 92
Coverage less than
80%
Assam 6,42,984 Enrolment < 9 Yes 43,888 7
Daman & Diu 2,387 Enrolment < 5 Yes 1,196 50
Goa 21,795 Enrolment < 9 Yes 11,007 51
Kerala 4,40,487 Enrolment < 9 Yes 2,58,722 59
Maharashtra 17,62,636 Enrolment < 9 Yes 9,36,810 53
Sample Design and Selection
In general, developing the sample for each state/UT involved a three-stage cluster design which used a combination of two probability sampling methods, Probability Proportional to Size (PPS) sampling and Simple Random Sampling (SRS). In SRS, all sampling units have an equal probability of being selected. When PPS is applied, larger sampling units have a higher probability of selection than smaller units.
At the fi rst stage of sampling, districts were selected using PPS sampling principles. Th is means that the probability of selecting a particular district depended on the number of class V students enrolled in that district. Th e number of districts to be selected from a state/UT was determined using an adaptation of the Finite Population Correction (FPC) formula in which it was assumed that a sample of twenty districts was suffi cient for representing an infi nite population of districts. Hence, the following formula was used to calculate the number of sample districts from each state:

177
Appendices
ni = n0/(1 + n0/Ni)whereni = number of districts to be sampled from ith state/UT;n0 = number of districts required to represent infi nite population of districts (taken as 20);Ni = number of districts in ith state/UT.
At the second stage, in the chosen districts, the requisite number of schools was selected using the PPS principles. Th e measure of size was based on class V enrolment data from the District Information System for Education (DISE) 2007/08. Within selected districts, schools were sorted according to this measure of size to give an implicit stratifi cation before taking a systematic sample. (In Goa and some north eastern states, the PPS approach was not applied due to administrative error and/or discrepancies between the sampling frame data and the reality in the fi eld.) Th e number of schools to be sampled from a district was determined by the total number of students required for testing and the average class size within the state/ UT. Th e number of selected schools for each district varied between 20 and 60. One replacement school was assigned for each sample school. Twice as many schools as required were selected in pairs, with one of each pair being selected and the other being utilised as a reserve, in case it was not possible to collect data from the original.
Th e class V (NAS) covered three subjects: Language, Mathematics and Environmental Studies (EVS). In most schools, two of the three subjects were assigned for testing. However, in Mizoram, Nagaland, Chandigarh, Pudducherry, Daman & Diu, and Andaman & Nicobar Islands students were tested in all three subjects.
At the third stage, the required number of students in each school was selected using SRS. In schools where class V had multiple sections, an extra stage of selection was added with one section being sampled at random. A lottery method was used to choose a section and students in a sample school. Th e maximum number of students to be tested from a school was set as 36 with exceptions in several UTs. In the absence of prior information on the magnitude of design eff ects, the project followed the eff ective practice of international studies and aimed for a sample with a target size in the neighbourhood of 4.000 except for the smallest states.
Once students were selected, they were tested in the assigned subjects of their schools. Th ree diff erent test forms of each subject were evenly distributed among selected students. Table A-1.2 summarises the criteria applied to the sampling of the survey by state. One aspect of this table may come as something of a surprise to readers not familiar with the details of sampling theory. Th e precision of a statistic from a sample is a function of the size of the sample and is essentially independent of the size of the population from which it comes. So, from tables A-1.1 and A-1.2, it can be seen that the size of the target samples from Uttar Pradesh (school Year V population 30,63,248) and Himachal Pradesh (school Year V population 1,07,540) are comparable, despite the wide range in population sizes.
Table A-1.2: Sampling criteria by state
State or Union Territory Total number
of districts
Number of
districts to
be used
Average
sampled
class size
Number of
schools to be
selected per
district
Estimated total
number of
students to be
tested
Maximum number
of students per
school to be
tested
Andhra Pradesh 23 11 18 23 4,554 36
Assam 23 12 18 23 4,968 36
Bihar 37 13 18 20 4,680 36
Chhattisgarh 16 11 18 23 4,554 36
Delhi 9 7 27 23 4,347 36
Goa 2 2 36 50 3,600 45

178
National Achievement Survey
Gujarat 25 11 18 23 4,554 36
Haryana 20 11 18 23 4,554 36
Himachal Pradesh 12 9 9 50 4,050 36
Jammu & Kashmir 22 10 9 50 4,500 36
Karnataka 33 11 18 23 4,554 36
Kerala 14 8 24 23 4,416 36
Madhya Pradesh 48 14 18 20 5,040 36
Maharashtra 35 15 18 20 5,400 36
Orissa 30 13 18 20 4,680 36
Punjab 20 11 18 23 4,554 36
Rajasthan 32 11 18 23 4,554 36
Tamil Nadu 30 11 18 23 4,554 36
Tripura 4 4 24 50 4,800 36
Uttar Pradesh 70 16 18 20 5,760 36
Uttarakhand 13 9 9 50 4,050 36
A & N Islands 3 2 18 50 2,700 all
Chandigarh 1 1 36 60 2,160 45
Daman & Diu 2 2 36 50 1,800 all
Puducherry 4 2 18 50 2,700 45
Sampling Frame, Sample Weights and Sample Variance Estimation
In the survey, the PPS sampling method for districts and schools was based on class V enrolment data from the DISE 2007/08. Simple random sampling was conducted according to the class registers available in selected schools. Although the DISE data was not free from criticism, it was used because it was considered to be the most complete and up to date enrolment data available at the time of sampling. Unfortunately, due to discrepancies in the DISE data, limitations in the sampling method and loss of information at the sampling and administration stages of the survey, it was impossible to estimate sample weights for the survey. Th erefore, student responses of class V (NAS) data were equally weighted within their state/UT data and each state/UT carried equal weight as a reporting unit. Because of the arrangements for replacing non-co-operating schools with an equivalent (see above), it is considered that response rates at the school level are essentially satisfactory, though no data is available on this. Unfortunately, no data is available for non-response within selected schools.
Class V (NAS) adopted systematic probability sampling techniques and matrix sampling methods to improve its cost-eff ectiveness and to reduce the burden on students of responding to a long test. However, improving the effi ciency of the survey came at a cost of some variance or uncertainty in the analysis. In order to quantify this uncertainty, the survey estimated the standard errors due to sampling for all reported statistics. Various techniques were explored. For the key statistical indicators, a replication procedure (jack-knife method) was used to estimate standard errors.
Aggregation of results
Th ere is no completely satisfactory resolution to the question of how to aggregate data from this study. Th e project’s approach to analyses was to include all data weighted equally no matter from which state it originated. In practice, this meant a slightly diff erent practice for overall scores as well as for comparisons between population subgroups. In the overall state scores (Chapters 2, 4, and 6), results were reported separately for states with over 80% coverage and those with below 80%. States which tested in school Year VI formed a separate reporting group.

179
Appendices
It was considered that the 80% threshold meant that state results were suffi ciently robust to compare with each other. Th e overall results reported for this group were simply the results for the aggregate of the pupils in the analyses. It is important to note that such results are not the average for the pupils nationally since states with larger populations are not weighted more highly, as they would be, for a national or group pupil average. Overall mean results reported are a close approximation to a ‘state’ average where each state’s performance is weighted equally. In contrast, overall results from ‘below 80% states’ were not considered suffi ciently robust to compare with each other or with the ‘over 80%’ states.
Analyses comparing results within states were not partitioned into the three groups according to coverage, since all results within a state would have been selected according to the same sampling procedure and, thus, closer to being equivalent. Th is also applies to subgroup comparisons, such as between genders or categories.
Design Eff ects
Th e design of the sample, whereby schools were sampled, and then pupils within the sampled schools, rather than a simple random sample, meant considerable advantages in terms of convenience of administration and in effi ciency of use of school time. Conversely, it meant that it reduced the precision of results in comparison with a simple random sample. Th e impact of sampling clusters rather than individual students is known as the design eff ect, and can be of considerable use in planning future surveys with a similar design. One commonly used measure of the design eff ect is the statistic ‘rho’ defi ned below.
Use capital E in estimated variance of achieved sample
estimated variance of achieved sampleRho =Estimated variance of a simple random sample of the same size
Th e design eff ect for the three subjects tested in the class V NAS calculated from the survey data is shown in Table A-1.3 below.
Table A-1.3: Design effects NAS Class V
Subject outcome deff sqrt_deff
Language 6.54 2.56
Mathematics 8.32 2.88
EVS 8.81 2.97
Th ese results mean that, for example, the variance of the estimate of the mean language score is over six times as large as that of a simple random sample of pupils of the same size, and that to give the same degree of precision, the sample would need to be over six times as large for estimating the mean of the Language score, and over eight times as large for Mathematics and EVS. Th e last column, labelled sqrt_deff , shows the ratio of the standard errors; thus, the standard error for Language for the achieved design would be two and a half times as large as that for a comparable simple random sample.

180
National Achievement Survey
Appendix – II
Scaling the NAS data and estimating sampling variance
IRT scaling of the NAS data
Th e aim of the NAS 2010 survey was to achieve an assessment of a wide coverage of the class V curricula in Mathematics, EVS and Language. Th is meant that a relatively large number of items was required to cover the curriculum adequately. Th us, there were a total of 80 items in Mathematics and EVS while there were 50 items in Language. Since the number of items in each subject was far too many to present in a single test booklet, a complex matrix-sampling booklet design was adopted with individual students responding to a subset of the items in the assessment and not the entire assessment item pool. Th is meant that the entire set of items was taken - but not by any single student. Th e sample design is described in more detail in Appendix - 1.
Th e survey used Item Response Th eory (IRT) scaling to describe student achievement on the assessment. Th is allowed comparable achievement scores to be calculated for each student, even though individuals responded to diff erent parts of the item pool.
A total of nine assessment booklets were prepared, three for each subject, covering the entire set of items and linked to each other by a set of ‘anchor’ items which were included in all three booklets for any subject. An example is given in Figure A-2.1 below. Th is is for Mathematics, but the design is the same for EVS and very similar for Language.
Figure A-2.1
Th is chapter reviews the psychometric models used in scaling the 2010 class V (NAS) data. Th e project used the commercially available software BILOG-MG 3 (Zimowski, Muraki, Mislevy and Bock, 1996) in order to apply IRT models.
Th e IRT scaling approach used here is similar to that used in the international survey Trends in Mathematics and Science Study (TIMSS). Th is was originally developed in the US by the Educational Testing Service (ETS) for use in the National Assessment of Educational Progress (NAEP) and in the UK by the National Foundation for Educational Research for the Assessment of Performance Unit (Beaton [ed.], 1987; Foxman, Hutchison and Bloomfi eld, 1993).
new items new items new items
new items new items new items
Form 1 (75 min) Form 2 (75 min) Form 3 (75 min)
anchor items anchor items anchor items

181
Appendices
Th ree distinct IRT models, depending on item type and scoring procedure, are most generally used in the analysis of assessment data. Th ese are the one-parameter, two-parameter and three-parameter logistic models. Each is a ‘latent variable’ model that describes the probability that a student will respond in a specifi c way to an item in terms of the student’s unobserved attainment level and various characteristics of the item. For a description of IRT scaling, see Hambleton and Swaminathan (1985), Th issen & Wainer (2001).
One-parameter logistic model (1-PL model)
Th e expression for Pij the probability of the ith examinee, ability qi, being successful on the jth item, diffi culty bj is given by
)](exp[11
)exp(1)exp(
ji
ji
jiij
b
bb
P
−−+=
−+
−=
θ
θθ
Th ere is only one parameter for each item, namely the diffi culty bj. Th e one parameter logistic model is mathematically equivalent to the Rasch model (Andrich, 1988).
Two-parameter logistic model (2-PL model)
Th e expression for Pij the probability of the ith examinee, ability qi, being successful on the jth item, diffi culty bj is given by (Th issen and Wainer, 2002).
)](exp[11
)](exp[1)](exp[
jij
jij
jijij
ba
baba
P
−−+=
−+−
=
θ
θθ
Th is is comparable to the 1-PL model with the addition of a scaling or slope parameter aj which varies between items. (Th is parameter is related to the item’s power of discrimination across the ability scale.)
Th ree-parameter logistic model (3-PL model)
Th e expression for Pij the probability of the ith examinee, ability q, being successful on the jth item, diffi culty bj is given by (Th issen and Wainer, 2002).
)](exp[11)1(
)](exp[1)](exp[
)1(
jijjj
jij
jijjjij
bacc
baba
ccP
−−+−+=
−+−
−+=
θ
θθ
where aj is a scaling parameter which varies between items, and cj is the lower asymptote, or ‘pseudo-guessing’ parameter.
Th e 2-PL model was used to calibrate the test items. Under assumptions of the 2-PL model, the probability of a response to an item is modelled based on the examinee’s ability, the item diffi culty, and the item discrimination. While other models are available for calibrating the items, the 2-PL model was chosen over the 1-PL or Rasch Model

182
National Achievement Survey
because upon inspection of the item characteristics, the item discriminations were not seen as comparable across the pool of items (an assumption of the Rasch model). Th e 2-PL was chosen over the 3-PL model because the 3-PL model has stricter assumptions over the other models and also has higher requirements with regards to sample size and coverage of the ability distribution in order to be able to obtain reliable estimates of all item parameters, in particular, the ‘guessing’ parameter. Th is results in unstable and often inestimable parameters for some of the test items. Th e 2-PL model off ered a widely acceptable compromise between the lesser and more restrictive IRT models available.
Using this approach, a separate scale was developed for each subject. Th e mean of each of these three scales was set to 250 and the standard deviation to 50. For Mathematics and EVS, this meant that achieved scores ranged approximately between 100 and 400, while the range for Language was slightly less.
Th e joint probability of a particular response pattern across a set of items is given by:
where Pij is the probability of the ith individual being successful on the jth item.
Th is likelihood function is maximised to estimate item parameters and these parameters, in turn, are used to score observed student responses on the assessments.
Item calibration for the class V (NAS) 2010 was conducted using the commercially-available BILOG software (Zimowski et al., 1996). All student samples were weighted so that each state contributed equally to the item calibration.
Omitted and Not-Reached Responses
Th e matrix-sampling design meant that each student only got the opportunity to see the items in the booklet which they were given. Items which were not included in the booklet taken were treated as ‘not presented’, i.e., they were ignored in the analysis of the data. However, students could also fail to provide an answer to an item which was in their test booklet and which, in principle, they could have seen. Th ere are various possible reasons for this: they could fail to make an attempt on an item by mistake because they didn’t feel it was worth attempting or because they had given up or run out of time before reaching the end of the test. An item was considered ‘not reached’ when the item itself, all subsequent items and the item immediately preceding it were not answered.
Such ‘not reached’ items were treated diff erently in estimating item parameters and student profi ciency scores. In estimating the values of the item parameters, items in the assessment booklets that were considered not to have been reached by students were treated as if they had not been administered. Conversely, ‘not-reached’ items were considered as incorrect responses when student achievement scores were generated.
Item Fit
Th e fi t of the 2-PL model to the items was examined graphically and using a chi-squared fi t index. Th is was done on a state by state basis. Items identifi ed as problematic were investigated to see if there were any obvious faults and where possible, these were rectifi ed. If it proved impossible to remedy the problems of an item, then that item was dropped from the scoring for the state concerned.

183
Appendices
Reliability
Reliability of the test score scales was estimated from the IRT scaling BILOG (Zimowski et al., 1996) runs. For simplicity and familiarity, the marginal reliability coeffi cient is quoted here, rather than showing test information graphs (Th issen and Wainer, 2001). Th is is given by
Where sq2 is the variance of the test score scale in the sample and se
2 is the mean error variance of scores, both available from BILOG output. Th e values estimated here are 0.83 for Language, 0.89 for Mathematics and 0.89 for EVS.
Estimating Sampling Variance
As described in Appendix A1, the NAS 2010 sampling design applied a stratifi ed three stage cluster sampling technique in selecting pupils. Th is design was administratively convenient and caused minimal upheaval in schools. However, since pupils within a school generally are more similar to each other than they are to the population in general, this approach to sampling eff ectively provides less independent information than a simple random sample of the same size. Th is design eff ect means that standard errors cannot be accurately estimated using the usual formulae which are derived for use with simple random sample designs.
Th e jackknife repeated replication technique (JRR) was used in the class V (NAS) 2010 to calculate standard errors because it is computationally straightforward and provides approximately unbiased estimates of the sampling errors of means, totals and percentages. Th e procedure used follows the variation on the JRR technique used in TIMSS 2007 (Foy, Galia and Isaac 2008). It assumes that the primary sampling units (PSUs) can be paired in a manner consistent with the sampling design, with each pair regarded as members of a pseudo-stratum for variance estimation purposes. When used in this way, the JRR technique appropriately accounts for the combined eff ect of the between-and-within-PSU contributions to the sampling variance. Th e general application of JRR entails systematically assigning pairs of schools to sampling zones. Th en, one of the schools is selected at random to have its contribution doubled, whilst the other school in the pair has its contribution set to zero. Th is constructs a number of ‘pseudo-replicates’ of the original sample. Th e statistic of interest (e.g., the state’s mean achievement score) is computed once for the entire original sample, and once again for each jackknife ‘pseudo-replicate’ sample. Th e variation between the estimates for each of the jackknife replicate samples and the original sample estimate is the jackknife estimate of the sampling error of the statistic.
To produce a jackknife estimate of the sampling variance of a statistic t for a state, the schools in that state were paired to produce up to 100 paired zones. One hundred jackknife replicate samples were then created. For the hth zone, one of the two schools was selected at random and its weight was doubled, while at the same time, the weight of the other was set to zero. Weights in all other zones were left unchanged. t(Jh), which is the value of the statistic for the hth replicate sample was then estimated. Th is process was repeated for all such strata. Th e jackknife sampling estimate for the sampling variance was then given by the following equation:
where H is the total number of sampling zones in the sample of the state under consideration, in this case 100. Th e term t(S) corresponds to the statistic of interest for the state computed with the overall sampling weights unchanged.Th ese calculations were carried out using the IDB Analyser (Foy and Olson 2009), which automatically computes standard errors as described in this section. Some specially written Statistical Packages for the Social Sciences (SPSS) routines were also used.

184
National Achievement Survey
Appendix – III
Performance in Anchor Items
PERFORMANCE IN LANGUAGE
Table A-3.1: Distribution of students on the basis of percent of scores obtained on anchor items in Language
S.
No.
State or Union
Territory
Distribution
0 0-10 11-20 21-30 31-40 41-50 51-60 61-70 71-80 81-90 91 +
1. A & N Islands 0.3 1.8 8.9 16.4 19.6 17.4 13.0 9.2 6.9 5.2 1.4
2. Andhra Pradesh 0.1 0.6 4.4 10.3 15.1 16.1 16.4 14.4 11.4 8.3 2.9
3. Assam 0.1 1.5 5.7 14.4 17.4 15.1 11.9 11.2 10.7 8.5 3.7
4. Bihar 0.3 2.8 10.7 17.0 18.7 15.1 11.9 8.8 8.8 4.8 1.2
5. Chandigarh 0.0 0.6 3.8 9.4 16.9 17.5 16.4 15.2 12.5 6.5 1.3
6. Chhattisgarh 0.0 1.8 10.5 19.6 18.1 13.2 10.4 8.5 8.3 6.0 3.7
7. Daman & Diu 0.0 0.2 3.6 8.8 16.4 18.5 17.4 10.6 10.3 10.6 3.7
8. Delhi 0.0 0.7 3.7 8.6 12.0 12.7 14.6 14.2 14.6 13.4 5.5
9. Goa 0.0 0.8 4.2 10.1 12.9 16.7 15.5 12.4 12.8 10.0 4.7
10. Gujarat 0.0 1.0 4.8 9.6 13.9 13.8 16.4 16.1 14.7 7.7 2.1
11. Haryana 0.0 1.2 5.8 14.1 19.9 16.7 14.3 10.9 8.3 5.9 2.9
12. Himachal Pradesh 0.0 1.3 5.2 12.6 18.6 16.4 14.1 12.1 8.6 6.2 4.8
13. Jammu & Kashmir 0.0 1.6 6.2 9.9 12.1 13.7 13.3 14.3 12.7 10.5 5.7
14. Jharkhand 0.3 2.6 9.2 14.3 16.2 13.5 10.5 8.7 9.0 9.5 6.1
15. Karnataka 0.0 0.6 3.5 7.9 11.0 12.8 14.2 14.8 15.4 13.7 6.0
16. Kerala 0.0 0.5 2.7 5.7 7.8 10.4 12.7 17.6 20.5 16.9 5.0
17. Madhya Pradesh 0.0 0.8 3.4 10.4 13.4 15.3 14.0 15.5 10.4 10.3 6.3
18. Maharashtra 0.1 0.5 2.2 6.2 10.0 12.2 14.2 14.4 16.5 15.1 8.7
19. Meghalaya 0.0 0.9 5.1 10.9 18.6 16.5 14.1 11.3 9.4 9.7 3.7
20. Mizoram 0.0 0.1 1.0 4.1 9.7 15.6 19.0 21.5 17.1 9.7 2.2
21. Nagaland 0.1 1.7 7.2 13.8 15.0 14.8 11.4 10.2 8.1 9.8 8.1
22. Orissa 0.1 1.0 5.4 10.4 13.4 13.6 11.7 12.2 12.2 12.5 7.8
23. Puducherry 0.0 2.0 10.3 21.1 22.7 17.1 11.4 6.7 4.1 2.5 2.2
24. Punjab 0.2 2.8 10.3 14.8 15.9 15.5 13.8 13.6 10.5 2.7 0.0
25. Rajasthan 0.0 0.7 5.2 10.9 15.2 12.6 12.5 13.6 13.1 10.3 6.0
26. Sikkim 0.0 0.5 2.6 8.8 16.8 23.2 21.6 13.8 7.2 4.3 1.3
27. Tamil Nadu 0.0 0.4 1.6 5.0 9.8 11.0 13.9 15.4 15.2 17.4 10.3
28. Tripura 0.0 0.7 3.9 8.5 11.0 12.8 13.7 15.9 15.6 12.5 5.3
29. Uttar Pradesh 0.0 0.8 2.8 4.9 6.0 6.5 8.2 13.0 15.3 21.1 21.3
30. Uttarakhand 0.1 2.0 6.5 14.2 18.5 15.3 14.0 11.0 9.2 6.8 2.5
31. West Bengal 0.0 0.4 3.0 5.3 8.5 13.4 14.3 14.9 15.9 15.7 8.8

185
Appendices
Table A-3.2: Area wise average achievement on anchor items in Language
S.
No.
State or Union
Territory
Rural Urban Mean Diff
(U-R)N Mean % SD N Mean % SD
1 Orissa 1,581 56.87 24.13 118 72.42 18.6 15.55
2 Chhattisgarh 1,484 46.33 23.11 122 57.05 21.01 10.72
3 Bihar 2,340 44.63 21.5 268 52.82 21.65 8.19
4 Assam 3,117 51.34 22.36 417 59.28 22.42 7.94
5 Sikkim 1,636 50.59 16.81 579 57.72 16.93 7.13
6 Goa 524 54.28 20.36 414 59.96 22.97 5.68
7 Gujarat 3,109 54.87 20.52 458 60.03 21.58 5.16
8 Haryana 2,830 49.66 21.04 427 53.19 20.57 3.53
9 Kerala 2,306 64.44 20.65 358 67.89 19.07 3.45
10 Puducherry 1,511 41.62 18.22 774 44.98 21.24 3.36
11 Mizoram 1,628 60.27 17.31 1,238 63.28 17.26 3.01
12 Meghalaya 1,696 52.99 22.59 767 55.42 19.57 2.43
13 West Bengal 2,475 64.01 21.57 551 65.52 21.27 1.51
14 Himachal Pradesh 2,124 52.1 22.14 302 53.13 19.41 1.03
15 Tamil Nadu 2,612 65.64 20.81 938 66.57 21.34 0.93
16 Maharashtra 3,293 63.79 21.25 1012 64.12 22.67 0.33
17 Chandigarh 880 53.91 19.05 1569 54.22 19.61 0.31
18 Jharkhand 2,790 50.72 25.16 447 50.98 23.93 0.26
19 Tripura 1,491 59.95 21.94 294 60.02 22.3 0.07
20 Rajasthan 1,879 56.97 23.2 440 56.47 21.36 -0.5
21 Punjab 2,209 47.01 20.68 378 46.12 19.45 -0.89
22 Andhra Pradesh 2,134 55.3 21.22 689 54.06 18.77 -1.24
23 Uttar Pradesh 2,730 71.27 23.7 302 69.77 25.33 -1.5
24 Karnataka 2,572 61.61 21.79 928 59.54 22.19 -2.07
25 Madhya Pradesh 1,515 57.61 22.35 187 54.22 21.44 -3.39
26 Uttarakhand 2,432 50.02 21.69 235 46.36 22.47 -3.66
27 Delhi 439 63.29 19.28 1867 59.09 22.59 -4.2
28 Jammu & Kashmir 2,424 57 23.36 251 51.77 23.23 -5.23
29 Daman & Diu 990 57.14 21.41 270 51.24 16.53 -5.9
30 Nagaland 1,079 56.42 24.23 249 42.77 22.79 -13.65
31 A & N Islands 2,372 46.72 20.7 -46.72

186
National Achievement Survey
Table A-3.3: Gender wise average achievement on anchor items in Language
S. No. State or Union Territory Boys Girls
N Mean % SD N Mean % SD
1. A & N Islands 1,194 44.44 20.15 1,178 49.03 21.00
2. Andhra Pradesh 1,261 54.74 20.83 1,562 55.20 20.51
3. Assam 1,717 51.55 22.04 1,817 52.97 22.93
4. Bihar 1,346 45.75 21.24 1,262 45.18 22.09
5. Chandigarh 1,248 53.65 19.82 1,201 54.59 18.97
6. Chhattisgarh 744 47.44 22.97 862 46.89 23.27
7. Daman & Diu 643 54.62 19.30 617 57.19 21.81
8. Delhi 980 58.12 22.31 1,326 61.20 21.79
9. Goa 435 52.97 20.89 503 60.10 21.90
10. Gujarat 1,819 55.48 20.40 1,748 55.60 21.08
11. Haryana 1,482 49.28 20.49 1,775 50.82 21.42
12. Himachal Pradesh 1,150 51.65 22.04 1,276 52.75 21.61
13. Jammu & Kashmir 1,365 56.18 23.63 1,310 56.85 23.14
14. Jharkhand 1,596 51.81 24.95 1,641 49.73 25.00
15. Karnataka 1,800 60.51 22.49 1,700 61.65 21.27
16. Kerala 1,147 62.76 21.52 1,517 66.52 19.50
17. Madhya Pradesh 883 58.74 21.70 819 55.62 22.77
18. Maharashtra 2,110 63.28 21.69 2,195 64.44 21.48
19. Meghalaya 1,061 53.20 21.77 1,402 54.17 21.68
20. Mizoram 1,461 60.09 17.53 1,405 63.10 17.03
21. Nagaland 622 54.89 24.72 706 52.96 24.37
22. Orissa 855 57.72 24.03 844 58.19 24.19
23. Puducherry 1,097 41.03 18.09 1,188 44.36 20.33
24. Punjab 1,311 46.32 20.60 1,276 47.45 20.39
25. Rajasthan 1,157 57.15 22.49 1,162 56.61 23.23
26. Sikkim 1,024 52.68 17.00 1,191 52.25 17.24
27. Tamil Nadu 1,698 65.78 20.94 1,852 65.98 20.97
28. Tripura 924 59.27 22.15 861 60.71 21.81
29. Uttar Pradesh 1,400 71.39 23.81 1,632 70.89 23.92
30. Uttarakhand 1,242 49.61 20.92 1,425 49.78 22.51
31. West Bengal 1,590 65.10 21.92 1,436 63.38 21.03

187
Appendices
Table A-3.4: Social group wise average achievement on anchor items in Language
State or Union
Territory
SC ST OBC Other
N Mean
%
SD N Mean
%
SD N Mean
%
SD N Mean
%
SD
A & N Islands 83 39.64 21.31 100 50.15 22.69 286 48.23 20.55 1,903 46.62 20.52
Andhra Pradesh 702 54.14 20.43 247 52.04 20.33 1114 54.63 20.6 760 57.3 20.87
Assam 446 51.52 22.65 491 44.6 19.41 1000 53.91 21.9 1,597 53.82 23.24
Bihar 415 45.75 20.74 113 39.69 20.53 1421 45.52 22.05 659 46.18 21.43
Chandigarh 415 51.82 18.67 34 54.12 15.3 108 54.91 19.68 1,892 54.57 19.6
Chhattisgarh 270 52.37 24.31 486 42.7 22.23 715 48.85 23.24 135 43.67 19.97
Daman & Diu 55 54.18 17.37 213 50.14 19.48 859 57.9 21.09 133 52.71 18.22
Delhi 347 58.96 22.34 101 49.11 22.82 212 58.49 22.34 1,646 60.93 21.74
Goa 24 43.13 22.01 135 50.04 20.67 125 57.48 19.76 654 58.56 21.88
Gujarat 364 53.3 20.78 323 50.5 20.93 2065 55.56 21.33 815 58.47 18.49
Haryana 1,250 47.86 20.99 150 49.9 24.05 918 50.66 19.92 939 52.63 21.28
Himachal Pradesh 786 51.83 22.33 120 48.92 21.5 320 46.08 20.75 1,200 54.45 21.44
Jammu & Kashmir 240 51.63 21.62 372 51.91 22.72 668 53.66 24.38 1,395 59.94 22.86
Jharkhand 418 46.5 24.31 595 48.16 24.27 1507 53.97 25.69 717 48.65 23.66
Karnataka 856 59.89 21.29 378 61.32 21.17 1487 61.42 22.83 779 61.53 21.13
Kerala 278 60.97 21.33 63 53.25 20.87 1230 65.44 20.56 1,093 65.97 19.84
Madhya Pradesh 339 56.02 20.6 320 57.7 22.82 830 56.07 22.16 213 63.05 23.64
Maharashtra 614 64.32 22.17 694 57.46 22.45 1138 64.3 20.97 1,859 65.84 21.01
Meghalaya 112 52.9 19.83 2107 54.03 21.85 42 48.57 17.51 202 52.33 22.1
Mizoram 104 63.13 17.38 2621 61.46 17.47 19 65.26 14.57 122 62.05 14.95
Nagaland 30 57.67 26.38 1125 53.84 24.88 40 49.88 26.08 133 54.4 20.59
Orissa 381 53.19 24.2 310 53.11 22.43 469 60.51 25.12 539 61.87 23.06
Puducherry 636 41.44 18.77 1 40 1333 44.13 20.01 315 39.62 17.15
Punjab 1,453 47.08 20.57 16 36.88 22.05 491 45.42 20.44 627 47.82 20.29
Rajasthan 575 53.55 23.21 339 53.39 22.01 1021 58.77 22.35 384 59.91 23.46
Sikkim 163 48.87 18.57 820 50.41 16.47 849 53.3 16.87 383 56.46 17.56
Tamil Nadu 889 66.1 20.64 96 61.77 19.93 1856 66.5 21.11 709 64.58 20.99
Tripura 374 59.65 21.42 496 57.35 23.62 350 60.77 21.37 565 61.96 21.06
Uttar Pradesh 716 71.96 24.05 62 66.05 23.92 1653 70.32 23.88 601 72.84 23.49
Uttarakhand 804 49.19 22.49 120 45.96 21.12 357 46.9 21.72 1,386 51.05 21.33
West Bengal 789 62.61 21.68 209 57.32 20.55 285 61.47 22.18 1,743 66.34 21.17

188
National Achievement Survey
PERFORMANCE IN MATHEMATICS
Table A-3.5: Distribution of students on the basis of percent of score obtained on anchor items in Mathematics
State or Union
Territory
Distribution
0 0-10 11-20 21-30 31-40 41-50 51-60 61-70 71-80 81-90 91 +
Nagaland 0.0 1.5 6.7 11.5 17.2 16.4 11.8 10.8 9.6 8.5 6.1
Rajasthan 0.0 1.7 6.0 11.5 13.7 13.5 13.1 12.6 13.3 9.9 4.7
Tamil Nadu 0.0 0.2 2.2 5.4 8.8 12.1 13.6 14.7 17.4 18.1 7.5
West Bengal 0.0 0.5 3.4 8.9 13.2 16.2 17.0 13.9 11.7 10.2 4.9
Daman & Diu 0.0 0.6 4.8 13.5 15.3 13.0 13.4 16.9 13.5 8.4 0.7
Andhra Pradesh 0.1 2.0 7.7 16.6 19.1 17.7 13.3 10.8 6.9 4.5 1.3
Delhi 0.1 1.4 3.5 9.4 12.8 14.3 14.0 13.2 12.5 11.9 6.9
Himachal
Pradesh
0.1 1.3 4.9 10.8 17.6 19.6 16.8 12.0 8.0 5.9 3.1
Karnataka 0.1 0.4 3.1 7.7 11.5 13.1 12.3 15.1 16.5 14.6 5.6
Kerala 0.1 1.3 5.8 13.4 19.1 21.5 17.4 12.0 7.0 2.3 0.4
Madhya Pradesh 0.1 1.6 4.2 9.3 12.4 14.7 12.1 14.1 12.3 13.2 6.0
Mizoram 0.1 0.7 5.8 16.7 25.2 24.4 16.5 7.0 2.7 1.0 0.1
Sikkim 0.1 1.6 2.9 10.9 20.3 26.4 19.8 11.3 5.7 0.8 0.3
Puducherry 0.1 3.4 13.0 25.1 26.1 16.8 7.4 4.0 2.0 0.8 1.4
Haryana 0.2 2.2 7.2 12.8 19.9 17.9 14.4 10.2 7.3 5.4 2.6
Maharashtra 0.2 0.9 3.7 9.7 13.5 15.7 14.7 12.5 12.8 10.1 6.2
Meghalaya 0.2 0.7 4.8 12.6 19.3 20.3 15.5 11.2 7.2 6.2 2.0
Goa 0.3 1.0 7.5 14.7 21.5 22.1 15.0 9.0 5.4 2.5 1.1
Punjab 0.3 1.7 4.3 8.7 13.4 16.5 17.1 16.6 11.7 6.9 3.0
A & N Islands 0.3 1.7 7.9 20.6 25.0 17.6 11.0 6.7 4.3 4.1 0.8
Chandigarh 0.3 1.3 6.4 15.3 25.0 24.9 15.4 7.1 2.9 1.0 0.5
Jammu &
Kashmir
0.4 1.8 5.1 9.6 11.7 13.6 12.0 13.4 12.8 12.9 6.6
Gujarat 0.5 1.8 7.1 13.7 16.0 14.8 14.3 14.8 9.7 5.9 1.6
Orissa 0.5 2.1 5.6 12.1 12.2 13.5 12.8 11.7 13.4 11.7 4.6
Uttar Pradesh 0.5 1.2 2.4 4.5 5.8 8.0 7.7 11.5 14.2 18.1 26.2
Uttarakhand 0.5 2.4 7.9 14.4 16.9 15.5 12.6 12.2 9.2 6.5 2.1
Assam 0.6 2.4 7.9 15.0 17.1 16.1 12.4 10.3 9.0 6.1 3.1
Jharkhand 0.8 3.6 7.3 12.7 15.1 14.1 11.8 10.4 11.3 8.8 4.2
Tripura 0.8 3.1 4.6 9.7 10.1 12.7 12.7 12.3 13.2 13.0 7.9
Bihar 0.9 4.6 9.4 13.0 15.6 14.2 12.1 10.4 9.0 6.9 4.0
Chhattisgarh 1.5 11.1 5.0 12.8 18.1 15.6 11.7 8.6 7.2 6.2 2.2

189
Appendices
Table A-3.6: Area wise average achievement on anchor items in Mathematics
State or Union Territory Rural Urban
N Mean % SD N Mean % SD
A & N Islands 2,395 43.56 18.61
Andhra Pradesh 2,183 46.54 20.36 710 48.81 19.24
Assam 3,143 49.17 22.33 413 51.39 20.83
Bihar 2,323 49.29 23.96 264 50.42 22.04
Chandigarh 880 44.32 15.2 1,521 43.83 15.89
Chhattisgarh 1,428 46.31 23.97 267 42.27 22.87
Daman & Diu 986 56.44 20.93 270 45.8 17.41
Delhi 546 64.71 23.43 2,044 57.34 22.3
Goa 626 42.88 16.9 322 52.45 18.09
Gujarat 3,063 51.11 20.6 594 48.63 23.17
Haryana 2,771 49.28 21.22 427 47.1 18.77
Himachal Pradesh 2,182 51.61 20.27 242 56.07 18.55
Jammu & Kashmir 2,534 59 23.38 247 52.29 24.41
Jharkhand 2,818 52.37 24.29 570 50.81 21.41
Karnataka 2,520 63.66 21.99 1,156 56.88 20.51
Kerala 2,334 48.19 17.9 510 47.01 16.72
Madhya Pradesh 1,453 58.72 22.81 292 58.49 23.56
Maharashtra 3,203 59.17 22.08 1,260 53.94 22.13
Meghalaya 1,634 51.18 19.87 794 50.13 19.16
Mizoram 1,612 42.7 14.57 1,265 45.55 15.24
Nagaland 1,122 56.54 23.39 248 40.02 16.04
Orissa 1,506 55.03 23.67 275 61.47 22.39
Puducherry 1,510 37.58 16.07 775 37.93 18.72
Punjab 2,099 55.03 20.76 537 56.15 19.8
Rajasthan 1,937 54.47 23.14 533 59.44 22.41
Sikkim 1,696 47.05 15.39 483 52.62 15.32
Tamil Nadu 2,681 65.09 20.49 1,181 66.3 21.96
Tripura 1,574 58.13 24.68 272 63.24 23.31
Uttar Pradesh 2,709 72.88 23.56 362 72.94 26.95
Uttarakhand 2,546 50.23 21.95 321 46.09 19.87
West Bengal 2,480 57.4 21 674 58.99 21.65

190
National Achievement Survey
Table A-3.7: Gender wise average achievement on anchor items in Mathematics
Boys Girls
N Mean % SD N Mean % SD
A & N Islands 1,212 42.78 19.03 1,183 44.36 18.14
Andhra Pradesh 1,331 45.91 19.52 1,562 48.11 20.56
Assam 1,733 49.26 22.05 1,823 49.59 22.28
Bihar 1,360 49.19 23.76 1,227 49.64 23.79
Chandigarh 1,222 44.07 15.79 1,179 43.96 15.49
Chhattisgarh 807 45.94 23.34 888 45.42 24.29
Daman Diu 639 53.51 19.82 617 54.81 21.53
Delhi 1,227 59.73 22.28 1,363 58.14 23.12
Goa 471 45.11 17.7 477 47.15 18.03
Gujarat 1,928 49.82 20.68 1,729 51.69 21.42
Haryana 1,431 49.40 21.27 1,767 48.66 20.63
Himachal Pradesh 1,141 51.78 20.23 1,283 52.31 20.08
Jammu Kashmir 1,427 58.42 23.25 1,354 58.39 23.87
Jharkhand 1,563 53.68 24.51 1,825 50.76 23.17
Karnataka 1,779 61.29 21.68 1,897 61.75 21.85
Kerala 1,198 48.28 18.33 1,646 47.76 17.23
Madhya Pradesh 907 58.73 22.35 838 58.64 23.56
Maharashtra 2,196 58.27 21.87 2,267 57.14 22.55
Meghalaya 1,076 51.04 19.95 1,352 50.68 19.4
Mizoram 1,469 43.97 15.28 1,408 43.93 14.57
Nagaland 638 54.41 22.47 732 52.80 23.67
Orissa 906 55.25 23.39 875 56.83 23.78
Puducherry 1,095 36.01 14.99 1,190 39.25 18.55
Punjab 1,337 55.49 20.87 1,299 55.02 20.25
Rajasthan 1,322 56.22 23.23 1,148 54.76 22.87
Sikkim 1,019 49.81 15.93 1,160 46.94 15.07
Tamil Nadu 1,858 65.15 20.9 2,004 65.74 21.01
Tripura 944 57.98 24.1 902 59.82 24.99
Uttar Pradesh 1,446 73.34 24.1 1,625 72.49 23.88
Uttarakhand 1,325 51.02 21.6 1,542 48.70 21.86
West Bengal 1,610 58.37 20.76 1,544 57.09 21.53

191
Appendices
Table A-3.8: Social groups wise average achievement on anchor items in Mathematics
State or Union
Territory
SC ST OBC Other
N Mean
%
SD N Mean
%
SD N Mean
%
SD N Mean
%
SD
A & N Islands 84 41.55 20.71 100 44.55 18.92 287 44.16 18.49 1,924 43.51 18.52
Andhra Pradesh 733 46.77 20.35 263 45.97 19.47 1,194 47.59 20.31 703 47.03 19.78
Assam 437 46.26 21.62 541 44.04 20.97 992 50.26 20.7 1,586 51.61 23.19
Bihar 371 46.91 23.11 116 44.61 24.79 1,332 48.99 23.85 768 52.05 23.54
Chandigarh 405 41.3 14.89 34 45.88 18.07 99 44.95 14.42 1,863 44.52 15.76
Chhattisgarh 290 44.19 21.92 486 43.84 25.24 756 48.33 23.87 163 41.44 21.4
Daman & Diu 55 51.73 21.41 213 48.64 21.51 858 56.34 20.27 130 49.73 19.35
Delhi 351 57.18 22.62 79 51.65 20.42 201 60.35 22.63 1,959 59.34 22.8
Goa 28 36.79 14.86 79 40.32 13.64 105 46.57 17.14 736 47.05 18.31
Gujarat 286 51.36 21.87 248 48.19 21.26 2,152 51.17 21.39 971 50.12 19.95
Haryana 1,201 47.35 20.81 127 49.02 21.33 901 50.51 21.74 969 49.61 20.09
Himachal Pradesh 754 50.34 19.44 124 53.63 18.16 336 48.66 20.16 1,210 53.91 20.57
Jammu & Kashmir 293 51.04 24.31 439 52.23 22.79 677 57.9 23.07 1,372 62.2 23.06
Jharkhand 460 49.79 23.56 613 46.91 23.49 1,532 55.6 23.91 783 50.7 23.09
Karnataka 820 62.53 21.86 433 61.35 20.71 1,529 60.77 22.69 894 61.99 20.51
Kerala 303 46.53 18.11 75 39 18.47 1,236 48.8 17.34 1,230 48.07 17.76
Madhya Pradesh 360 58.28 22.31 266 60.62 22.16 922 57.66 23.16 197 61.62 23.77
Maharashtra 710 56.1 22.09 660 56.72 21.82 1,145 59.62 22.12 1,948 57.48 22.4
Meghalaya 66 50.45 19.84 2,132 50.94 19.73 51 48.43 17.96 179 50.45 19.13
Mizoram 104 43.51 14.04 2,632 43.82 14.94 19 54.74 17.75 122 45.45 14.67
Nagaland 30 52.33 23.99 1,161 53.74 23.18 40 53.13 17.71 139 52.34 24
Orissa 366 51.02 23.06 331 51.07 23.35 516 57 22.73 568 61.25 23.63
Puducherry 636 36.1 15.95 1 15 1,334 38.56 17.54 314 37.32 16.57
Punjab 1,420 55.08 20.75 18 53.33 13.83 479 53.44 21.38 719 56.86 19.68
Rajasthan 602 50.34 24.08 356 50.97 22.18 1,096 57.74 22.62 416 61.19 21.29
Sikkim 149 47.89 15.71 883 46.55 14.58 833 48.99 15.17 314 51.5 18.25
Tamil Nadu 969 64.71 21.13 90 57.83 20.64 2,036 66.5 20.77 767 64.53 21.06
Tripura 437 58.92 23.86 515 55.58 25.08 320 58.02 24.31 574 62.29 24.33
Uttar Pradesh 653 73.28 25.03 47 74.57 20.27 1,585 72.28 23.64 786 73.68 23.99
Uttarakhand 927 48.62 22.16 118 46.4 23.98 320 46.16 21.89 1,502 51.51 21.15
West Bengal 780 56.5 20.9 184 51.68 19.89 301 56.06 20.97 1,889 59.11 21.26

192
National Achievement Survey
PERFORMANCE IN ENVIRONMENTAL STUDIES
Table A-3.9: Distribution of students on the basis of percent of score obtained on anchor items in EVS
State or Union
Territory
Distribution
0 0-10 11-20 21-30 31-40 41-50 51-60 61-70 71-80 81-90 91 +
Andaman &
Nicobar Islands
0.2 1.3 7.7 15.3 21.1 19.7 14.0 9.2 6.2 4.0 1.5
Andhra Pradesh 0.1 1.5 6.6 15.2 19.4 19.2 15.6 9.7 7.8 4.1 1.0
Assam 0.2 1.9 6.9 14.0 17.7 18.5 15.3 12.6 8.4 3.7 0.7
Bihar 0.8 4.5 10.4 16.4 14.9 14.3 10.7 9.8 9.3 6.6 2.4
Chandigarh 0.2 1.4 10.8 23.4 26.4 21.4 9.5 4.3 2.2 0.4 0.0
Chhattisgarh 3.4 12.5 6.9 13.4 15.7 14.7 6.5 8.5 8.3 6.9 3.4
Daman & Diu 0.0 1.3 6.3 13.1 16.2 13.3 10.4 12.1 17.2 10.0 0.2
Delhi 0.1 1.1 4.8 9.9 15.8 15.1 13.0 12.1 12.8 12.7 2.7
Goa 0.1 2.4 12.5 23.7 26.6 20.4 8.5 4.4 1.3 0.1 0.0
Gujarat 0.2 2.1 8.2 12.4 16.3 13.7 13.5 12.1 14.9 6.7 0.1
Haryana 0.5 2.8 9.5 19.6 20.1 16.7 11.3 7.4 7.7 3.9 0.6
Himachal
Pradesh
0.3 1.2 7.3 14.4 19.0 17.7 14.3 10.2 7.0 4.3 4.5
Jammu &
Kashmir
0.4 2.3 6.7 9.4 10.0 11.0 12.1 13.9 15.7 12.0 6.4
Jharkhand 0.5 4.2 8.8 13.6 16.1 12.4 10.7 10.2 9.1 11.1 3.5
Karnataka 0.0 0.5 2.9 5.5 8.4 9.9 12.4 13.8 17.0 18.0 11.6
Kerala 0.1 0.9 4.1 9.0 15.7 21.0 21.7 16.2 8.3 2.5 0.4
Madhya
Pradesh
0.0 1.5 5.7 10.5 10.6 9.9 12.3 15.2 17.0 13.3 4.1
Maharashtra 0.1 1.0 4.2 9.4 13.3 15.9 13.8 12.9 11.2 12.8 5.4
Meghalaya 0.0 0.6 2.4 8.6 13.7 19.6 17.0 14.3 12.2 9.7 1.9
Mizoram 0.0 0.5 1.6 6.0 13.0 20.9 27.3 21.8 7.7 1.1 0.2
Nagaland 0.1 0.6 5.0 12.5 17.3 14.3 13.8 11.0 9.6 11.7 4.3
Orissa 0.3 2.5 7.9 9.5 12.6 13.9 13.1 16.3 14.9 6.6 2.3
Puducherry 0.0 2.0 10.9 18.7 24.3 20.3 13.7 6.0 1.5 1.3 1.3
Punjab 0.3 1.4 6.9 13.6 17.9 17.0 13.8 9.9 10.8 7.2 1.2
Rajasthan 0.2 2.2 8.5 14.6 14.5 12.5 12.7 12.7 10.2 10.2 1.7
Sikkim 0.0 1.4 2.1 7.1 17.6 26.4 24.0 14.1 6.0 1.2 0.1
Tamil Nadu 0.0 0.5 2.7 3.4 5.1 7.2 10.4 13.3 16.7 21.2 19.6
Tripura 0.4 3.1 4.1 9.3 13.4 12.0 13.8 16.2 13.5 11.3 2.8
Uttar Pradesh 0.3 1.1 3.5 4.3 7.2 9.4 11.5 14.5 17.2 20.1 10.9
Uttarakhand 0.5 3.6 8.9 14.8 15.9 14.8 12.8 13.0 8.3 5.6 2.0
West Bengal 0.0 0.5 2.9 7.4 12.7 15.5 16.5 17.0 13.7 10.0 4.0

193
Appendices
Table A-3.10: Area wise average achievement on anchor Items in EVS
State or Union
Territory
Rural Urban
N Mean % SD N Mean % SD
A & N Islands 2,423 47.00 19.32
Andhra Pradesh 2,208 48.45 19.57 693 46.30 18.05
Assam 3,351 48.14 19.53 316 52.28 19.40
Bihar 2,287 47.88 23.50 319 44.31 21.36
Chandigarh 882 38.35 14.08 1,566 39.36 14.95
Chhattisgarh 1,368 46.56 26.04 211 36.54 21.52
Daman & Diu 944 56.80 22.11 269 42.49 17.21
Delhi 405 54.54 21.08 1,890 56.47 22.31
Goa 493 35.07 14.10 417 40.40 14.27
Gujarat 3,132 51.42 21.01 530 49.15 23.43
Haryana 2,838 44.17 20.17 435 45.76 18.96
Himachal Pradesh 2,182 49.72 21.87 272 48.18 14.55
Jammu & Kashmir 2,638 58.80 24.11 203 53.89 24.70
Jharkhand 2,876 51.54 24.75 523 47.87 22.73
Karnataka 2,442 67.64 22.41 1,028 64.08 21.85
Kerala 2,225 51.43 17.26 445 52.44 16.19
Madhya Pradesh 1,505 57.75 22.66 359 63.47 24.78
Maharashtra 3,126 58.86 22.33 1,245 55.18 22.30
Meghalaya 1,816 57.46 20.39 716 53.85 16.80
Mizoram 1,628 53.80 14.21 1,247 54.83 14.97
Nagaland 1,118 57.25 22.85 246 44.19 17.58
Orissa 1,481 53.60 22.32 223 54.89 21.18
Puducherry 1,512 40.61 16.01 759 43.06 19.03
Punjab 1,977 51.29 21.28 452 47.46 19.65
Rajasthan 1,857 52.16 23.09 362 48.25 21.42
Sikkim 1,743 50.46 15.10 477 51.48 14.97
Tamil Nadu 2,643 73.06 21.64 1,135 70.52 22.02
Tripura 1,421 56.59 21.88 264 55.42 25.53
Uttar Pradesh 2,716 67.33 22.58 394 65.96 21.75
Uttarakhand 2,435 48.66 22.31 211 46.42 19.63
West Bengal 2,424 58.98 20.11 566 57.79 20.62

194
National Achievement Survey
Table A-3.11: Gender wise average achievement on anchor items in EVS
State or Union Territory Boys Girls
N Mean % SD N Mean % SD
Andaman & Nicobar
Islands
1,232 45.69 18.82 1,191 48.36 19.75
Andhra Pradesh 1,372 48.52 19.33 1,529 47.41 19.14
Assam 1,761 48.39 19.49 1,906 48.59 19.62
Bihar 1,262 46.90 22.84 1,344 47.95 23.67
Chandigarh 1,249 39.40 14.71 1,199 38.59 14.58
Chhattisgarh 772 46.88 25.27 807 43.63 26.03
Daman & Diu 639 50.27 21.52 574 57.37 21.81
Delhi 1,143 57.09 22.03 1,152 55.17 22.15
Goa 445 36.19 14.51 465 38.77 14.23
Gujarat 1,925 50.66 20.96 1,737 51.57 21.85
Haryana 1,536 44.62 20.10 1,737 44.17 19.96
Himachal Pradesh 1,193 49.36 21.08 1,261 49.72 21.30
Jammu & Kashmir 1,432 58.90 24.07 1,409 57.98 24.30
Jharkhand 1,643 51.67 24.64 1,756 50.33 24.33
Karnataka 1,731 66.49 22.62 1,739 66.68 21.98
Kerala 1,122 51.85 17.12 1,548 51.41 17.07
Madhya Pradesh 932 58.18 22.78 932 59.52 23.58
Maharashtra 2,105 57.98 22.51 2,266 57.66 22.26
Meghalaya 1,074 55.66 19.37 1,458 57.02 19.60
Mizoram 1,468 54.67 14.89 1,407 53.81 14.19
Nagaland 637 55.35 21.97 727 54.50 23.06
Orissa 855 52.81 21.85 849 54.73 22.46
Puducherry 1,093 40.33 16.00 1,178 42.44 18.03
Punjab 1,227 50.75 21.23 1,202 50.40 20.85
Rajasthan 1,143 50.89 21.76 1,076 52.19 23.98
Sikkim 1,059 51.23 15.25 1,161 50.18 14.90
Tamil Nadu 1,776 72.39 21.69 2,002 72.22 21.88
Tripura 836 54.79 22.22 849 58.00 22.64
Uttar Pradesh 1,365 66.79 22.71 1,745 67.44 22.29
Uttarakhand 1,258 47.93 22.02 1,388 48.97 22.19
West Bengal 1,623 58.07 20.03 1,367 59.56 20.40

195
Appendices
Table A-3.12: Social groups wise average achievement on anchor items in EVS
State or Union
Territory
SC ST OBC Other
N Mean
%
SD N Mean
%
SD N Mean
%
SD N Mean
%
SD
A & N Islands 91 38.68 16.51 99 48.54 19.59 289 47.98 18.67 1,944 47.17 19.45
Andhra Pradesh 595 47.69 18.42 221 43.35 18.81 1,362 47.65 19.2 723 50.07 19.82
Assam 450 48.86 20.52 612 46.24 17.99 940 49.63 19.97 1,665 48.59 19.55
Bihar 436 45.78 20.98 111 46.8 23.93 1,393 47.43 23.58 666 48.67 23.93
Chandigarh 415 37.69 15.07 34 39.41 14.29 108 38.56 13.88 1,891 39.3 14.6
Chhattisgarh 253 47.92 24.78 382 40.88 27.68 787 47 24.75 157 42.48 25.52
Daman & Diu 53 50.57 22.09 212 53.56 21.89 818 53.96 21.83 130 52.88 22.75
Delhi 302 57.15 22.55 92 53.37 23.61 136 56.99 23.37 1,765 56.03 21.86
Goa 33 34.7 12.31 115 33.96 14.09 115 35.48 12.01 647 38.65 14.83
Gujarat 308 46.35 19.86 309 53.53 19.53 2,174 50.56 21.74 871 53.23 21.33
Haryana 1,175 43.12 19.82 175 46.29 21.41 972 43.66 19.86 951 46.31 20.03
Himachal
Pradesh
772 48.32 22.37 162 50.28 21.69 292 46.75 20.47 1,228 50.89 20.43
Jammu &
Kashmir
254 50.47 27.8 416 55.87 22.55 762 56.55 23.92 1,409 61.67 23.58
Jharkhand 422 50.92 25.78 643 46.23 21.72 1,582 53.18 25.06 752 50.43 24.19
Karnataka 819 64.94 23.07 368 72.47 21.36 1,433 66.31 22.23 850 66.09 21.68
Kerala 286 51.15 17.51 85 42.94 17.92 1,243 51.86 16.65 1,056 52.1 17.24
Madhya Pradesh 394 60.1 23.43 344 59.4 22.22 901 57.15 23.69 225 62.6 21.68
Maharashtra 628 58.81 23.05 736 54.22 21.86 1,028 58.01 21.29 1,979 58.73 22.79
Meghalaya 130 54.69 18.96 2,216 56.75 19.55 29 53.97 20.19 157 53.98 19.1
Mizoram 103 54.76 12.35 2,631 54.19 14.69 19 53.42 14.53 122 55.04 13.28
Nagaland 30 48.33 18.49 1,157 55.62 22.82 40 56.5 17.44 137 49.74 21.7
Orissa 344 47.08 22.25 316 52.71 21.6 493 56.6 21.9 551 56.02 21.82
Puducherry 630 40.61 16.29 1 35 1,327 42.05 18.07 313 40.46 14.3
Punjab 1,376 49.85 20.8 20 37 20.22 431 52.87 20.88 602 51.05 21.51
Rajasthan 539 46.78 23.26 349 50.77 21.64 980 54.09 23.45 351 52.38 20.56
Sikkim 149 48.59 15.24 849 50.22 14.52 841 50.28 15.23 381 53.43 15.59
Tamil Nadu 893 72.64 21.74 55 74.82 20.68 2043 72.19 21.76 787 72.01 22
Tripura 363 55.39 22.92 397 52.61 22 361 58.03 22.12 564 58.7 22.43
Uttar Pradesh 717 68.1 22.03 55 65.64 20.88 1,705 67.33 22.59 633 65.73 22.77
Uttarakhand 831 45.26 21.83 135 45.7 20.73 279 48.8 22.47 1,401 50.59 22.1
West Bengal 767 57.39 19.24 183 50 18.72 295 55.69 20.97 1,745 60.79 20.3

196
National Achievement Survey
Appendix – IV
Item description with percent correct
Table A-4.1: Item description with percent correct in Reading Comprehension
Mental processes Question description Percent correct
Infer/evaluate Use information to identify the main theme and evaluate the title 32
Grasp ideas/interpret Identify relationship between a pronoun and the object/ person 33
Grasp ideas/interpret Use information in the text to identify the remedy of a problem 39
Grasp ideas/interpret Identify the causal relationship of two events 41
Grasp ideas/interpret Identify relationship between an abstract idea and a concrete phenomenon 40
Grasp ideas/interpret Grasp the relevant idea about the thinking of people from the text 40
Grasp ideas/interpret Use information from a notice to conclude timing of an event 39
Locate Identify the correct place name from those given in the notice 41
Locate Use information from a table to determine the frequency of an event 41
Grasp ideas/interpret Identify relationship between an object and its characteristics 44
Grasp ideas/interpret Determine the sequence of activities in a process 43
Grasp ideas/interpret Use information in the story to identify the cause of an event 46
Grasp ideas/interpret Use information in the story to grasp the problem 46
Grasp ideas/interpret Use information in the story to determine the cause of an event 47
Grasp ideas/interpret Use information from the notice to derive the duration of an event 49
Locate Use information from a table to determine the frequency of an event 50
Infer/evaluate Make complex inference about the quality of persons from their activities 50
Infer/evaluate Use information in the text to make inference about the cause of an act 51
Infer/ evaluate Make complex inference about the effect of an activity on concerned persons 50
Grasp ideas/ interpret Use information to draw a simple conclusion about the usefulness of an object 51
Grasp ideas/ interpret Use information in the text to identify the ingredients of an object 52
Locate Use information in a table to identify the most frequent event 52
infer/evaluate Use information in the text to infer the cause of an event 52
Locate Recognise appropriate information about the action to be taken by a person 54
infer/evaluate Use information in a story to make a simple inference about the cause of an act 59
Infer/evaluate Use information from a notice to make a simple inference about participation in a sport 58
Infer/evaluate Use information in a story to make a simple inference about the cause of an act 60
Grasp ideas/ interpret Recognise the text type as a notice from the format and the content 63
Locate Use information in a table to identify the time for a phenomenon 68
Locate Use information in a table to identify phenomena occurring at a particular time 71

197
Appendices
Table A-4.2: Item description with percent correct in Mathematics
Mental processes Question description Percent correct
Applying Addition of two fractions 26
Reasoning Calculate the perimeter of squares * 35
Reasoning Calculate the difference between two decimal numbers* 34
Reasoning Identify smallest number divisible by two single digit numbers 34
Applying Identify the difference between fractions 34
Reasoning Can subtract distance given in different units 35
Reasoning Find the difference between numbers after changing position of digits* 39
Reasoning Solve money problems involving fractions 38
Reasoning Solve an equation with one unknown 38
Reasoning Calculate an average of given values 40
Applying Calculate the radius of a circle from given information * 43
Applying Calculate the perimeter of a square of a given side 44
Applying Identify the largest number made from given three digits* 44
Applying Calculate the difference described in word problem* 45
Applying Able to convert minutes into hours 45
Applying Find the difference between two large numbers 46
Applying Identify the smallest angle in a given figure 47
Applying Select appropriate units for measuring length 48
Applying Identify 45° as ‘half of a right angle’ 49
Applying Calculate the area of a rectangle 50
Applying Calculate the period between two given times 50
Applying Find the difference between two digits in a number 51
Applying Calculate the number of hours in a week 52
Applying Multiply two digit numbers 54
Knowing Find the angle between the hands of a clock 54
Applying Solve the word problem 57
Applying Multiply two given numbers 58
Knowing Convert volume of liquid into different units 60
Knowing Find the place value of a digit in given number* 61
Applying Calculate time period from a given clock 67
Knowing Identify the rectangle among given shapes* 67
Applying Understand the conversion of metres and centimetres 69
Applying Add two four digit numbers* 76
Knowing Identify the triangle among given shapes 84

198
National Achievement Survey
Table A-4.3: Item description with percent correct in EVS
Mental processes Question description Percent correct
Applying Understand the phenomena of lunar eclipse 30
Knowing Know the importance of forests in human life 34
Reasoning Establish the relationship between a measuring apparatus and the quantity of water 26
Applying Find the effect of exhaled air on a mirror 35
Knowing Know the sources of energy and their by products 35
Knowing Know the components of food / diet and their functions 40
Applying Understand the process of breathing 41
Applying Find out the least polluting fuel on the basis of their combustion 41
Applying Establish the relationship between wind strength and a flag’s position 42
Applying Reasons out the importance of wild animals in the eco system 41
Applying Identify the stages of seed germination 44
Reasoning Reasons out to find directions in the map 44
Knowing Know about the neighbouring countries of India 45
Knowing Know the edible part of a carrot 48
Applying Interpret the graph to find out heartbeats of the mouse 48
Reasoning Explain the reason behind the construction of dams 49
Reasoning Analyse the family tree and find solutions 50
Applying Interpret the graph to find out the rainfall on Wednesday 50
Reasoning Find out the trend of growth in a plant 51
Applying Identify the location of Jim Corbett Park in the map 54
Reasoning Understand the family tree and interpret the relationship 54
Knowing Know the animal source of food 54
Reasoning Establish relationships on the basis of a family tree 57
Knowing Know the sources of water and their usage 58
Reasoning Relate different types of clothes with their properties 60
Applying Interpret the graph to identify the animal that has the lowest heartbeats. 60
Applying Apply knowledge to find the direction in a map 59
Knowing Know the suitable conditions for breeding of mosquitoes 63
Reasoning Find out the solution for a patient when a doctor is not available 66
Applying Compare the means of transportation that causes pollution 66
Applying Interpret the graph to find out the day with the highest rainfall 68
Knowing Know the national game of India 68
Knowing Know the properties of solutes and solvents 71
Knowing Know the name of the disease spread by mosquitoes 77
Applying Classify the group of domestic animals 79
Knowing Recognise birds on the basis of their features 81

199
Appendices
Appendix – V
Socioeconomic Index
Home and circumstances are a crucial factor in the development of intellectual abilities. Th ese can include personal characteristics such as gender and geographical region and social labels such as caste that aff ect the way a young person’s abilities may progress. It is also true worldwide, that socioeconomic circumstances have a major eff ect on the success of individuals in the education system (OECD, 2010). In this report, an Index of Socio-Economic situation is used extensively, especially where looking at the relation between background factors and the outcome. It is derived from a combination of such background factors and the means of construction is described in this Appendix.
Index of Parental Education
Th e categories collected for parental education (mother’s or father’s) in NAS were
Table A-5.1: Parental education
Level Father Mother
Illiterate (not able to read and write) 18.4 30.6Literate (no formal schooling, can read or write) 13.2 13.5Primary 23.8 21.3Secondary 21.2 15.2Higher Secondary 10 5.3Degree and above 4.6 2.5Do not know 3.4 3.2Not applicable 0.7 0.5Missing 4.6 7.7
Total 100 100
How does one defi ne equidistance of categories? Since the outcomes of the NAS studies are achievement scale scores, there is a case for defi ning this in terms of a linear or near-linear relation with one of the scale scores. One scale score, namely Language, is considered here in this process. Figure A-5.1 shows the means of Mathematics scale scores by the categories of Father’s and Mother’s education.
Figure A-5.1: Parental education and Language score
270.00
265.00
260.00
255.00
250.00
245.00
240.00
235.00
230.00
225.00
Illiterate Literate Primary Secondary HigherSecondary
Degree and above
Don’t know Not applicable
Missing
Father’s education
Mother’s education

200
National Achievement Survey
Discounting the last three categories on the right which have all kinds of missing data, the score means increase monotonically as the category number increases. Th ere is little diff erence in the outcome for Literate and Primary, so the linearity of the relationship can be improved by combining category 2 (Literate) with category 3 (Primary School). Th e proportion of missing values is small (in the neighbourhood of 10% in total), but it seems intuitively at least reasonable to combine ‘Don’t Know’ with the largest category (Literate/ Primary) and put Not Applicable equal to No Education. As in PISA, the higher of the two parental education categories is then taken as the indicator of parental education. Figure A-5.2 shows the result of these manipulations by comparing mean scores for the six resulting categories.
Figure A-5.2: Language score and higher parent education
Th ere is little diff erence in the outcome for Literate and Primary and so these are combined as shown in Figure A-5.3.
Figure A-5.3: Language score and higher parent education
Index of Parental Occupation
A similar process is undertaken for parental occupation. Table A-4.2 shows the total number in each category.
Language score
Language score
265
260
255
250
245
240
235
230
265
260
255
250
245
240
235
230
Illiterate Literate Primary Secondary Senior Secondary Degree
Literate Primary Secondary Senior Secondary Degree

201
Appendices
Table A-5.2: Parental occupation
Level Father Mother
N % N %
Unemployed 11,051 9.4 12,575 10.7
Housewife 3,729 3.2 68,176 57.9
Agri labourer/ servant/ daily wager/ street vendor 38,894 33.1 14,681 12.5
Farmer 24,302 20.7 6,021 5.1
Skilled or office worker 14,064 12 2,465 2.1
Shopkeeper or businessman 12,175 10.3 1,517 1.3
Teacher or professor 2,042 1.7 1,082 0.9
Manager or professional 1,432 1.2 226 2
Don’t know 1,459 1.2 635 0.5
NA 1,860 1.6 532 0.5
Total valid 1,11,008 94.4 1,07,910 91.7
Missing 6,645 5.6 9,743 8.3
Total 1,17,653 100 1,17,653 7653 100
Figure A-5.4 shows the results for mean Language score against Father’s and Mother’s occupation. Th e result for male Housewives is somewhat surprising in an Indian context, and these respondents have been grouped together with the Unemployed group. Among Father’s occupation, the trend is monotonic for the non-missing categories, except for the Manager/ Professional category. In further analyses, these respondents have been grouped with the Teacher/Professor category. Th e two missing categories have been grouped with the largest category (3=Agricultural labourer etc.,), to which they mostly correspond in any case in attainment. In the fi nal combination, the parental occupation whichever is higher, that of the father or the mother is taken, with the exception that the category Housewife is not included in this process.
Figure A-5.4: Mean student language score and parental occupation
275
270
265
260
255
250
245
240
235
230
225
Father
Mother
Unemplo
yed
Housew
ife
Labou
rer
Farmer
Skille
d / offi
ce
Shop
/ Busi
ness
Teache
r
Profes
siona
ll
Don’t k
nowNA
Miss
ing

202
National Achievement Survey
Figure A-5.5 shows the fi nal result. Th is is not quite so linear as in the result for education, perhaps not surprisingly, but it is at least monotonic.
Figure A-5.5: Higher parent occupation and mean Language score
Th e third element of the socio-economic index comes from the Number of Possessions index. As its title suggests, this is simply the number of possessions owned by the pupil’s family, from a list in the pupil questionnaire. Th ese are: calculator, computer, study desk, dictionary, internet connection, daily newspaper and magazine. Th e elements computer and internet connection are not included in the construction of this index as preliminary analyses have shown them to be negatively related to attainment.
Th e mean test score in Language is shown graphed against the number of possessions in Figure A-5.6. It shows that the relationship between the two is very close to linear.
Figure A-5.6: Language score and number of possessions
Response rates for the three variables Parental Education, Parental Occupation and Number of Possessions are shown in Table A-5.3
Unemplo
yed
Labou
rer
Farmer
Skille
d / offi
ce
Shop
/ Busi
ness
Teache
r/ pro
f.
270
265
260
255
250
245
240
235
230
225
280
275
270
265
260
255
250
245
240
235
230
Mean Language score
1 2 3 4 5 6 7 8
Language score

203
Appendices
Table A-5.3: Response rates for constituent variables
Variable Response rate
Parental education 97.4
Parental occupation 95.4
Number of possessions 92.6
Th ese were already high, but in order to increase the coverage further, missing values on any of the three variables in turn were replaced by a prediction based on regression on the other two.
Finally a principal components analysis of the three variables was undertaken and the fi rst principal component, which accounted for approximately half of the total variation, was taken as the socioeconomic indicator.
Note: A similar procedure was used to create the socio economic status for Mathematics and EVS.

204
National Achievement Survey
Appendix – VI
Variance Components
Variance Components: Language
Th is looked at the proportion of the variance in the Language scale score that can be accounted for by pupil and school characteristics derived from the school and pupil background questionnaires. Variables have been selected in the light of the results of the regression analyses already carried out, fi rstly with predictor variable taken singly, and then after including the ‘key’ variable, in this case, the socio-economic status and speaks the language of instruction at home. Th ere are a very large number of possible candidate variables and in some instances, cognate variables have been grouped together to form scales.
Th e predictor variables have been grouped into categories, as follows:
From Pupil questionnaire.
Group 1. Home and personal characteristics
Socio-economic scale
Speak instruction language at home
Gender
Category
Number of siblings
Physically challenged
Transport to school
Absent in the last month
Group 2. School-related home factors
Use of school computer
Use of school library
Given homework
Help with homework at home
Child has a tutor
Homework checked at home
Homework checked at school
Language textbook
Learning oriented home activities
Group 3 Non-school home factors
Other out-of-school activities
Domestic chores
Group 4. Attitudes etc.,
Likes school
Bad things happen at school
Scale of language attitude items

205
Appendices
Group 5. Teaching practices
Reading activities in class
From school questionnaire
Group 5. Resources.
Number of types of equipment
Ratio pupils/computer
Internet access
Communication technology help
Lack of resources
Difficulty filling teacher vacancies
Group 6. Structure
Administration
Preschool attached
Proportion male teachers
Proportion girls
Days/year
Days/week
Education committee
PTA
Under SSA
Group 7. Activities of the Principal
Administration
Group 8. Accountability
Frequency of testing
Teacher evaluation
Inspected
Group 9. School composition and pupil attitudes/behaviour.
Pupil composition
Pupil behaviour problems
Group 10. Parents
Qualities of parents
Group 11. Incentives
Some incentive scheme in place
Procedures for dealing with omitted data
Th e large number of variables involved has led to problems in another way. Response rates for individual variables are high, typically in the region of 85-90%. However, after excluding cases on the standard list wise basis and attempting to include all the above variables as regression predictors, the eff ect on the sample size is extreme. Including all the ‘pupil’ variables above reduces the eff ective sample size by nearly half, from 72,205 to 38,164 and including ‘school’ variables reduces sample size to 2,444, while including both, reduces it still further to 1,033.

206
National Achievement Survey
For this reason, it was decided that some kind of non-response adjustment process was required. A regression approach was used. Th e procedure diff ered somewhat between ‘pupil’ and ‘school’ variables. ‘Pupil’ variables were predicted by regression from the other variables in the thematic group. Because of the extreme eff ect of non-response among the ‘school’ variables, the regression was carried out on the variables collected from pupils relating to their school. After running these regressions, missing values were imputed using the relevant regression predictions. After this procedure, even after including all relevant variables, the sample size was 58,875, i.e., over 80% of the original sample.
Variance components: Language
Table A-6.1 shows the contributions of the various variable groupings when introduced sequentially as a proportion of the total variation.
Table A-6.1: Language: contributions to variance
Variable group R-Sq R-Sq Increase
Home and personal characteristics 0.038 0.038
School-related home inputs 0.048 0.011
Non-school home activities 0.048 0.000
Attitudes etc., 0.054 0.006
Reading activities in class 0.057 0.003
School resources 0.060 0.003
School structure 0.068 0.008
Activities of the Principal 0.068 0.000
Accountability 0.069 0.001
School composition and atmosphere 0.070 0.001
Parents 0.070 0.000
Incentives 0.071 0.001
Conclusions
Th e fi rst grouping (home and personal characteristics) accounts for more than half the total rather disappointing proportion of variance explained of 0.071, i.e., slightly over 7%. Other relatively large contributors are school-related home inputs, mainly homework-related), pupil attitudes, and school structure (e.g., governance and composition of staff and pupils). It is important to remember that an apparently small contribution does not necessarily mean that a given input area has relatively little impact; it could be that the items which it was possible to measure were not the most important aspect of the area.

207
Appendices
Appendix – VII
Student Related Variables
Table A-7.1: Gender wise distribution of students
State or Union Territory Boy Girl Total N
% (SE) % (SE)
A & N Islands 50 (1.2) 50 (1.2) 2,439
Andhra Pradesh 47 (1.0) 53 (1.0) 4,357
Assam 49 (0.9) 51 (0.9) 5,473
Bihar 52 (1.1) 48 (1.1) 3,943
Chandigarh 53 (1.3) 47 (1.3) 2,462
Chhattisgarh 50 (1.5) 50 (1.5) 2,543
Daman & Diu 49 (10.4) 51 (10.4) 1,286
Delhi 48 (3.3) 52 (3.3) 3,764
Goa 48 (2.8) 52 (2.8) 1,437
Gujarat 51 (1.8) 49 (1.8) 5,502
Haryana 47 (1.8) 53 (1.8) 4,846
Himachal Pradesh 47 (0.8) 53 (0.8) 3,830
Jammu & Kashmir 49 (1.1) 51 (1.1) 4,212
Jharkhand 49 (1.3) 51 (1.3) 5,246
Karnataka 50 (1.2) 50 (1.2) 5,359
Kerala 42 (1.1) 58 (1.1) 4,161
Madhya Pradesh 51 (2.0) 49 (2.0) 2,687
Maharashtra 49 (1.0) 51 (1.0) 6,701
Meghalaya 44 (1.4) 56 (1.4) 3,767
Mizoram 52 (1.2) 48 (1.2) 2,897
Nagaland 48 (1.3) 52 (1.3) 1,565
Orissa 49 (1.2) 51 (1.2) 2,665
Puducherry 48 (2.2) 52 (2.2) 2,287
Punjab 51 (1.2) 49 (1.2) 3,914
Rajasthan 51 (1.2) 49 (1.2) 3,518
Sikkim 47 (1.4) 53 (1.4) 3,330
Tamil Nadu 48 (1.0) 52 (1.0) 5,776
Tripura 51 (1.4) 49 (1.4) 2,727
Uttar Pradesh 46 (1.0) 54 (1.0) 4,721
Uttarakhand 47 (1.0) 53 (1.0) 4,212
West Bengal 53 (2.3) 47 (2.3) 4,539
Overall average 49 (0.3) 51 (0.3) 1,16,166

208
National Achievement Survey
Table A-7.2: State wise highest level of education of either parents
State or Union Territory Illiterate Literate or
Primary
Secondary/
Higher Secondary
Degree &
above
Do not know/
Not Applicable
Total (N)
% (SE) % (SE) % (SE) % (SE) % (SE)
A & N Islands 11 (1.5) 26 (1.8) 51 (2.1) 7 (1.5) 5 (1.2) 2,389
Andhra Pradesh 28 (1.3) 43 (1.4) 21 (1.0) 3 (0.4) 5 (0.6) 4,354
Assam 13 (0.9) 39 (1.4) 36 (1.4) 5 (0.4) 7 (0.7) 5,297
Bihar 23 (1.2) 35 (1.4) 30 (1.5) 8 (0.8) 4 (0.5) 3,787
Chandigarh 10 (1.3) 21 (2.5) 51 (2.3) 10 (1.4) 8 (1.5) 2,459
Chhattisgarh 19 (1.1) 40 (1.5) 33 (1.3) 4 (0.7) 3 (0.5) 2,517
Daman & Diu 8 (3.1) 43 (4.3) 38 (3.1) 5 (0.9) 6 (1.8) 1,280
Delhi 11 (0.9) 31 (1.6) 41 (1.7) 7 (0.8) 10 (1.3) 3,711
Goa 7 (1.2) 23 (2.4) 45 (2.7) 19 (2.7) 5 (0.8) 1,411
Gujarat 13 (1.0) 54 (1.4) 26 (1.3) 4 (0.5) 3 (0.4) 5,526
Haryana 22 (1.1) 32 (1.2) 38 (1.5) 3 (0.4) 5 (0.5) 4,801
Himachal Pradesh 8 (1.0) 21 (1.2) 59 (1.6) 5 (0.5) 8 (1.0) 3,774
Jammu & Kashmir 33 (1.1) 33 (1.1) 29 (1.2) 2 (0.4) 3 (0.4) 4,180
Jharkhand 22 (1.1) 40 (1.2) 27 (1.2) 8 (0.7) 3 (0.5) 5,061
Karnataka 23 (1.2) 44 (1.3) 25 (1.2) 4 (0.5) 4 (0.5) 5,203
Kerala 1 (0.2) 34 (1.5) 49 (1.4) 10 (0.8) 7 (0.9) 4,164
Madhya Pradesh 23 (1.6) 35 (1.6) 35 (1.6) 3 (0.4) 4 (0.8) 2,701
Maharashtra 14 (0.8) 37 (1.3) 39 (1.2) 8 (0.7) 2 (0.4) 6,561
Meghalaya 9 (0.9) 40 (1.5) 30 (1.4) 8 (0.8) 12 (1.1) 3,671
Mizoram 2 (0.5) 33 (1.5) 46 (1.5) 6 (0.7) 13 (1.3) 2,869
Nagaland 15 (1.6) 47 (2.6) 27 (2.3) 4 (1.0) 7 (1.6) 1,501
Orissa 15 (1.3) 27 (1.6) 35 (1.8) 8 (1.0) 15 (1.3) 2,543
Puducherry 7 (0.8) 26 (1.6) 59 (2.2) 2 (0.4) 6 (1.4) 2,293
Punjab 21 (1.3) 40 (1.2) 34 (1.4) 2 (0.5) 3 (0.4) 3,905
Rajasthan 29 (1.4) 47 (1.5) 18 (1.1) 4 (0.5) 2 (0.4) 3,459
Sikkim 10 (0.9) 47 (1.8) 31 (1.3) 3 (0.5) 9 (1.2) 3,302
Tamil Nadu 8 (0.6) 30 (0.9) 58 (1.2) 3(0.3) 2 (0.3) 5,766
Tripura 11 (1.0) 54 (1.7) 22 (1.3) 6 (0.8) 7 (0.8) 2,718
Uttar Pradesh 22 (1.4) 42 (1.6) 27 (1.2) 5 (0.7) 3 (0.5) 4,646
Uttarakhand 15 (1.1) 44 (1.7) 34 (1.4) 3 (0.5) 3 (0.5) 4,134
West Bengal 7 (0.6) 35 (1.6) 35 (1.3) 11 (0.9) 12 (1.0) 4,606
Overall average 15 (0.2) 38 (0.3) 36 (0.3) 6 (0.1) 5 (0.1) 1,14,589

209
Appendices
Table A-7.3: Student’s achievement in Language with relation to parents’ highest level of education
State or Union
Territory
Illiterate Literate & Primary Secondary & Higher
Secondary
Degree & above
Average
achievement
SE of
Mean
Average
achievement
SE of
Mean
Average
achievement
SE of
Mean
Average
achievement
SE of
Mean
A & N Islands 228 2.4 235 1.9 234 1.2 233 3.1
Andhra Pradesh 240 1.5 245 1.3 249 1.9 254 5.3
Assam 227 2.0 236 1.3 246 1.4 255 4.0
Bihar 222 1.8 229 1.6 234 1.8 235 3.1
Chandigarh 242 2.7 240 1.8 246 1.2 254 2.9
Chhattisgarh 216 2.8 226 1.9 239 2.3 257 7.4
Delhi 253 3.1 256 1.9 259 1.6 270 4.0
Goa 239 5.1 240 2.5 260 2.0 284 3.7
Gujarat 250 2.3 251 1.0 251 1.4 258 4.0
Haryana 226 1.7 236 1.5 241 1.3 251 4.4
Himachal Pradesh 233 3.4 233 2.2 245 1.3 249 4.2
Jammu & Kashmir 247 1.6 248 1.8 257 1.9 257 9.2
Jharkhand 230 2.0 238 1.6 240 1.9 245 3.7
Karnataka 259 1.7 263 1.3 264 1.7 274 4.6
Kerala 242 12.8 275 1.6 274 1.3 293 2.7
Madhya Pradesh 247 2.4 251 2.2 252 2.2 274 6.7
Maharashtra 258 2.1 262 1.2 273 1.1 276 2.6
Meghalaya 243 2.9 251 1.5 255 1.6 251 2.9
Mizoram 238 4.6 256 1.3 262 1.1 274 3.0
Nagaland 237 3.7 250 2.2 250 2.8 243 6.6
Orissa 232 3.3 251 2.4 260 2.1 281 5.0
Puducherry 217 2.7 215 1.4 226 1.1 230 5.7
Punjab 244 2.0 253 1.5 263 1.7 256 6.5
Rajasthan 247 1.9 253 1.5 255 2.7 255 5.7
Sikkim 237 2.1 243 1.1 252 1.3 247 5.5
Tamil Nadu 275 3.0 275 1.6 281 1.1 282 5.4
Tripura 249 3.4 249 1.6 263 2.5 256 4.8
Uttar Pradesh 284 2.3 281 1.7 286 2.0 287 4.4
Uttarakhand 226 2.6 233 1.5 235 1.6 239 4.5
West Bengal 243 3.1 260 1.4 270 1.5 291 2.7
Overall average 243 0.5 250 0.3 255 0.3 263 0.8

210
National Achievement Survey
Table A-7.4: Students achievement in Mathematics with relation to parents’ highest level of education
State or Union
Territory
Illiterate Literate & Primary Secondary & Higher
Secondary
Degree & above
Average
achievement
SE of
Mean
Average
achievement
SE of
Mean
Average
achievement
SE of
Mean
Average
achievement
SE of
Mean
Andaman & Nicobar
Islands
225 2.4 227 1.7 226 1.1 227 2.7
Andhra Pradesh 229 1.4 241 1.2 244 1.7 256 5.9
Assam 233 2.2 238 1.3 245 1.4 248 4.4
Bihar 235 2.2 245 1.9 248 2 249 3.5
Chandigarh 230 2.3 228 1.5 228 1 231 2.1
Chhattisgarh 217 3.2 225 2.3 235 2.3 252 5.1
Delhi 254 2.8 257 1.7 265 1.5 263 3.8
Goa 223 3.4 227 2.5 241 1.8 261 3.1
Gujarat 259 2.2 257 1.1 256 1.6 253 3.4
Haryana 237 1.9 238 1.4 244 1.3 255 4.5
Himachal Pradesh 237 2.9 237 1.8 247 1.1 250 4.2
Jammu & Kashmir 260 1.7 261 1.7 272 2 245 8
Jharkhand 239 2.1 253 1.5 248 1.7 251 3.6
Karnataka 267 1.7 268 1.2 272 1.6 288 3.8
Kerala 223 6.7 242 1.2 243 0.9 252 2.4
Madhya Pradesh 265 2.8 263 2 266 1.9 289 6
Maharashtra 259 2.2 263 1.3 267 1.2 267 3
Meghalaya 240 3 250 1.4 246 1.6 236 2.8
Mizoram 219 3.8 231 0.9 233 0.8 240 2.4
Nagaland 247 3.4 256 2.1 247 2.6 247 7
Orissa 241 3.2 257 2.5 265 2.2 281 4.3
Puducherry 214 2.8 210 1.4 220 1.1 216 4.5
Punjab 250 2.2 251 1.4 257 1.5 249 5.4
Rajasthan 247 1.8 261 1.5 260 2.5 263 5.1
Sikkim 232 2 233 0.9 238 1.2 242 5.5
Tamil Nadu 272 2.7 276 1.4 282 1 281 4.2
Tripura 249 3.7 260 1.9 273 2.8 253 6.3
Uttar Pradesh 300 2.2 298 1.8 299 2.1 303 4.7
Uttarakhand 238 2.4 242 1.3 240 1.5 232 4.8
West Bengal 249 3.2 260 1.4 267 1.4 291 2.6
Overall Average 248 0.5 252 0.3 252 0.3 258 0.8

211
Appendices
Table A-7.5: Students achievement in EVS related to parents’ highest level of education
State or Union
Territory
Illiterate Literate & Primary Secondary & Higher
Secondary
Degree & Above
Average
achievement
SE of
Mean
Average
achievement
SE of
Mean
Average
achievement
SE of
Mean
Average
achievement
SE of
Mean
Andaman & Nicobar
Islands
232 2.7 232 1.9 234 1.2 233 2.8
Andhra Pradesh 235 1.4 239 1.1 240 1.7 252 4.9
Assam 230 1.9 237 1.2 244 1.3 249 3.3
Bihar 223 2.2 238 1.8 243 2.0 239 3.8
Chandigarh 230 2.1 226 1.4 224 0.9 229 2.4
Chhattisgarh 213 3.2 229 2.2 240 2.5 247 5.2
Delhi 259 2.8 261 1.9 263 1.7 263 4.3
Goa 219 4.3 223 2.2 234 1.6 259 3.1
Gujarat 248 2.1 250 1.1 254 1.6 251 4.1
Haryana 226 1.6 229 1.3 238 1.3 245 4.7
Himachal Pradesh 235 3.2 239 2.0 246 1.3 251 4.4
Jammu & Kashmir 261 1.8 254 1.8 264 2.0 239 7.1
Jharkhand 240 2.1 247 1.6 245 1.8 250 3.6
Karnataka 273 2.0 277 1.3 276 1.6 293 5.0
Kerala 224 6.8 251 1.2 251 1.0 263 2.1
Madhya Pradesh 262 2.7 268 2.0 266 2.1 292 7.3
Maharashtra 257 2.1 262 1.3 268 1.2 263 2.6
Meghalaya 250 3.1 258 1.5 261 1.8 257 2.9
Mizoram 230 4.7 252 1.0 256 0.9 263 2.4
Nagaland 245 3.5 258 2.1 254 2.7 237 6.2
Orissa 236 3.4 251 2.7 267 2.1 273 4.4
Puducherry 217 2.7 215 1.4 224 1.0 225 4.6
Punjab 237 1.9 248 1.6 251 1.6 261 7.4
Rajasthan 241 2.0 253 1.6 248 2.6 243 5.5
Sikkim 243 2.2 243 0.9 249 1.3 242 4.9
Tamil Nadu 286 3.3 284 1.6 290 1.1 291 4.9
Tripura 254 4.4 256 1.7 264 2.6 261 6.8
Uttar Pradesh 284 2.2 284 1.6 283 1.9 277 4.7
Uttarakhand 235 2.5 236 1.4 241 1.5 248 5.0
West Bengal 246 3.0 262 1.4 269 1.3 281 2.4
Overall Average 246 0.5 251 0.3 254 0.3 257 0.8

212
National Achievement Survey
Table A-7.6: Availability of computers in schools
State or Union Territory Yes No Total (N)
% (SE) % (SE)
A & N Islands 69 (5.4) 31 (5.4) 2,408
Andhra Pradesh 21 (2.0) 79 (2.0) 4,244
Assam 31 (2.7) 69 (2.7) 5,057
Bihar 8 (1.2) 92 (1.2) 3,704
Chandigarh 94 (2.2) 6 (1.2) 2,462
Chhattisgarh 6 (1.2) 94 (1.2) 2,518
Delhi 81 (2.7) 19 (2.7) 3,766
Goa 90 (3.5) 10 (3.5) 1,429
Gujarat 65 (2.7) 35 (2.7) 5,234
Haryana 17 (2.2) 83 (2.2) 4,816
Himachal Pradesh 9 (1.4) 91 (1.4) 3,765
Jammu & Kashmir 16 (1.6) 84 (1.6) 4,171
Jharkhand 24 (2.4) 76 (2.4) 5,010
Karnataka 35 (3.1) 65 (3.1) 5,290
Kerala 95 (1.2) 5 (1.2) 4,149
Madhya Pradesh 7 (1.6) 93 (1.6) 2,680
Maharashtra 74 (2.2) 26 (2.2) 6,610
Meghalaya 65 (2.9) 35 (2.9) 3,725
Mizoram 62 (2.9) 38 (2.9) 2,899
Nagaland 92 (2.0) 8 (2.0) 1,538
Orissa 17 (2.9) 83 (2.9) 2,614
Puducherry 97 (1.2) 3 (1.2) 2,292
Punjab 28 (3.4) 72 (3.4) 3,903
Rajasthan 26 (3.1) 74 (3.1) 3,445
Sikkim 96 (1.2) 4 (1.2) 3,317
Tamil Nadu 55 (3.1) 45 (3.1) 5,730
Tripura 37 (3.3) 63 (3.3) 2,670
Uttar Pradesh 4 (0.9) 96 (0.9) 4,664
Uttarakhand 14 (2.2) 86 (2.2) 4,137
West Bengal 53 (2.9) 47 (2.9) 4,530
Overall Average 44 (0.5) 56 (0.5) 1,13,978

213
Appendices
Appendix – VIII
School Related Variables
Table A-8.1: Comparison of school averages on the basis of school management
School Management EVS Reading Comprehension Mathematics
Mean SE Mean SE Mean SE
State Govt./Dept. of Education 256 0.80 254 0.92 257 0.84
Zila Parishad 262 2.27 262 2.32 262 2.50
Local body 263 2.50 262 2.81 259 2.25
Tribal social dept. 230 9.65 240 8.97 238 10.50
Private aided 263 2.44 269 2.42 258 1.97
Table A-8.2: Comparison of school averages by inspection status
Inspected EVS Language Mathematics
Mean SE Mean SE Mean SE
Yes 258 0.80 257 0.87 258 0.73
No 254 1.56 257 1.19 256 1.42
Table A-8.3: Comparison of school averages by parents’ participation status
Parents’ participation EVS Reading Comprehension Mathematics
Attend special events Yes 258 0.69 257 0.77 259 0.69
No 252 3.05 251 2.95 245 2.23
Table A-8.4: Comparison of school averages by parents’ involvement
Parents’ participation EVS Reading Comprehension Mathematics
Mean SE Mean SE Mean SE
VEC Yes 258 0.64 257 0.77 259 0.70
No 252 3.71 247 3.64 252 2.86
PTA Yes 259 0.67 258 0.89 259 0.74
No 254 1.93 253 1.67 251 1.61
Table A-8.5: Comparison of school averages by ability grouping status
Students grouped
by ability
Mathematics EVS
Mean SE Mean SE
Yes 260 0.86 259 0.72
No 251 1.55 253 1.54

214
National Achievement Survey
Table A-8.6: Comparison of school averages by programmes offered by schools
Mathematics EVS
Mean SE Mean SE
Offer enrichment Yes 258 0.69 257 0.72
No 255 1.95 254 2.06
Offer remedial Yes 258 0.75 258 0.71
No 254 2.06 251 1.79
Table A-8.7: Comparison of school averages by availability of instructional material
Instructional material EVS Reading Comprehension Mathematics
Mean SE Mean SE Mean SE
Textbooks Yes 258 0.68 257 0.77 258 0.68
No 244 5.69 245 9.48 247 9.60
Workbooks Yes 258 0.93 257 1.11 260 0.97
No 253 2.18 252 2.11 252 1.86
Teachers’
Handbook
Yes 260 1.05 259 1.05 260 0.85
No 249 2.10 250 2.33 252 2.19
TLM Yes 258 0.83 257 0.89 260 0.72
No 255 4.15 251 4.48 247 3.98
Table A-8.8: Comparison of school averages by problem behaviour status
Problem (frequency)
Behaviour
EVS Reading Comprehension Mathematics
Mean SE Mean SE Mean SE
Arriving late
at School
Never 263 1.55 262 1.71 263 1.55
Rarely 257 0.89 256 0.91 256 0.95
Monthly 253 3.81 252 3.31 252 3.95
Weekly 250 3.38 252 3.62 253 3.72
Daily 253 6.09 250 5.67 264 5.88
Cheating Never 260 0.95 259 0.87 260 0.80
Rarely 254 1.31 253 1.39 254 1.35
Monthly 251 6.63 252 7.85 250 6.59
Weekly 244 9.57 249 7.87 253 8.10
Daily 234 7.64 230 7.69 228 7.40

215
Appendices
Appendix - IX
Teacher Related Variables
Table A-9.1: Distribution of teachers on the basis of age
State or Union
Territory
Below 30 years 31-40 years 41 to 50 years 51 years and above
% (SE) % (SE) % (SE) % (SE)
Andhra Pradesh 27.8 (3.6) 38.8 (3.2) 25.8 (3.1) 7.7 (2)
Assam 3.9 (1.2) 26.8 (2.8) 51.3 (2.9) 18 (2)
Bihar 27.7 (3.1) 40.1 (3.4) 18 (2.5) 14.2 (2.2)
Chandigarh 25.2 (4.1) 47.8 (5.2) 11.7 (3) 15.3 (3.9)
Chhattisgarh 47.7 (4.1) 30.1 (3.8) 9.2 (2.4) 13.1 (3.1)
Daman & Diu 28.7 (4.7) 43.6 (5.2) 22.8 (4.5) 5 (1.7)
Delhi 24.7 (4.3) 50.6 (5.6) 20 (4.8) 4.7 (2.4)
Goa 16.9 (4.73) 29.6 (4.65) 29.6 (5.56) 23.9 (4.47)
Gujarat 19.1 (2.6) 48.3 (3.5) 20.9 (2.9) 11.7 (2.1)
Haryana 24.4 (3.5) 48.8 (4.4) 13.1 (2.7) 13.8 (2.7)
Himachal Pradesh 10.4 (2.2) 45.3 (3.2) 35.8 (3.1) 8.6 (2.1)
Jammu & Kashmir 30.1 (2.7) 48.9 (2.3) 16.9 (1.9) 4.1 (1)
Jharkhand 18.7 (2.4) 37.9 (3.2) 26.5 (2.5) 17 (2)
Karnataka 19.7 (2.9) 35.3 (3.2) 28.5 (2.9) 16.5 (2.7)
Kerala 10.3 (1.9) 41.5 (3.1) 39.7 (3.6) 8.5 (2.1)
Madhya Pradesh 14.9 (2.6) 44.1 (3.6) 29.2 (3.3) 11.8 (2.4)
Maharashtra 23.7 (2.7) 48.3 (2.8) 20.7 (2.6) 7.3 (1.5)
Meghalaya 46 (3.2) 33.8 (2.9) 16.7 (2.4) 3.5 (1.1)
Mizoram 11.8 (1.4) 35.3 (2.5) 34.3 (2.5) 18.5 (1.9)
Nagaland 25 (3.1) 48.5 (3.2) 23.5 (3.3) 3.1 (1.2)
Orissa 14.9 (2.2) 36.2 (3.1) 38.1 (3.2) 10.8 (1.8)
Puducherry 48.8 (4.8) 18.2 (2.6) 15.3 (2.6) 17.7 (3.6)
Punjab 30 (3.8) 43.5 (3.8) 12.4 (2.2) 14.1 (2.7)
Rajasthan 18.9 (3.1) 44 (3.6) 28 (3.5) 9.1 (1.8)
Sikkim 18.8 (3) 24.2 (3.9) 44.9 (3.4) 12.1 (2.6)
Tamil Nadu 10.3 (2.2) 35.8 (3.6) 38.2 (3.7) 15.7 (2.7)
Tripura 6.2 (1.7) 36.2 (3.5) 38.9 (3) 18.9 (2.8)
Uttar Pradesh 23.6 (3.2) 37 (3.7) 11.5 (2.1) 27.9 (3)
Uttarakhand 6.4 (1.5) 48.1 (3) 22.3 (2.4) 23.3 (2.6)
West Bengal 27.2 (2.5) 44.3 (2.3) 17.5 (2.1) 11.1 (1.7)
Overall average 21 (0.5) 39.7 (0.6) 26.4 (0.5) 12.9 (0.4)

216
National Achievement Survey
Table A-9.2: Teacher’s educational qualification
State or Union
Territory
Middle Higher or Senior
Secondary
Secondary Graduation Post graduation
% (SE) % (SE) % (SE) % (SE) % (SE)
Andhra Pradesh 1 (0.7) 8.6 (2.1) 2.9 (1.4) 59.1 (3.6) 28.6 (3.1)
Assam 0.8 (0.5) 33.7 (2.5) 11.8 (1.7) 48.6 (2.7) 5.1 (1.3)
Bihar 2.6 (0.8) 31.9 (3.1) 8.9 (1.6) 46.7 (3.7) 10 (1.9)
Chandigarh 0 (0) 3.6 (2.2) 3.6 (1.3) 25.5 (3.8) 67.3 (4.4)
Chhattisgarh 2.6 (1.3) 38.3 (4.1) 2 (1.1) 37 (4) 20.1 (3.5)
Daman & Diu 6.9 (2.9) 9.9 (3.2) 15.8 (3.6) 25.7 (5.5) 41.6 (6.9)
Delhi 0 (0) 11.6 (3.3) 1.2 (1.2) 31.4 (4.4) 55.8 (5.4)
Goa 4.2 (3.2) 9.9 (4.2) 11.3 (4.3) 35.2 (6.6) 39.4 (6)
Gujarat 15.4 (2.7) 27.3 (3.1) 32.6 (3.6) 15.4 (2.4) 9.3 (2)
Haryana 3.8 (1.3) 19.6 (3.3) 10.1 (2.2) 48.1 (3.9) 18.4 (3.3)
Himachal Pradesh 7.7 (1.9) 35.6 (3.5) 8.6 (2.1) 21.6 (3.1) 26.6 (3.5)
Jammu & Kashmir 0.2 (0.2) 14.3 (1.8) 7.8 (1.4) 44.9 (2.3) 32.8 (2.4)
Jharkhand 0.8 (0.6) 17.7 (2.1) 4.4 (1) 61.7 (2.4) 15.5 (1.9)
Karnataka 4 (1.5) 52 (3.3) 18.8 (2.4) 20.4 (2.7) 4.8 (1.4)
Kerala 1.4 (0.8) 25.6 (3.5) 8.1 (1.9) 52.5 (3.7) 12.6 (2.5)
Madhya Pradesh 1.5 (0.9) 34.5 (3.5) 0.5 (0.5) 39.6 (3.7) 23.9 (3.1)
Maharashtra 2 (1.1) 22.7 (2.5) 11.4 (2) 47.2 (3.3) 16.7 (2.5)
Meghalaya 0.6 (0.5) 38.1 (2.9) 4.2 (1.2) 48.7 (3) 8.3 (1.7)
Mizoram 4.1 (1) 21.9 (2.2) 7.7 (1.4) 61.6 (2.6) 4.7 (1)
Nagaland 2.3 (1.3) 18.3 (2.7) 5.3 (1.9) 65.4 (3.4) 8.8 (2.1)
Orissa 0.7 (0.5) 28.3 (3.1) 22.3 (2.6) 39.4 (3.2) 9.3 (1.9)
Puducherry 0.6 (0.6) 21.1 (3.4) 7 (2.3) 49.1 (3.7) 22.2 (3.3)
Punjab 0.6 (0.6) 13.5 (2.6) 11.8 (2.3) 31.2 (3.7) 42.9 (4.1)
Rajasthan 5.2 (1.7) 20.1 (2.9) 5.2 (1.7) 37.4 (3.8) 32.2 (3.9)
Sikkim 3 (1.6) 44.9 (4.6) 16.2 (2.7) 29.3 (4) 6.6 (2.3)
Tamil Nadu 1 (0.7) 23.3 (3.2) 23.3 (3.5) 25.7 (3.4) 26.7 (3.6)
Tripura 9.3 (2.2) 19.7 (2.4) 34.4 (3.2) 30.5 (3.2) 6.2 (1.8)
Uttar Pradesh 0.5 (0.5) 15.1 (2.7) 6.6 (1.8) 30.7 (3.3) 47.2 (3.7)
Uttarakhand 0 (0) 16.5 (2.5) 6 (1.3) 34 (2.7) 43.5 (3)
West Bengal 0 (0) 0.8 (0.6) 0.6 (0.4) 50.4 (2.8) 48.2 (2.8)
Overall average 2.6 (0.2) 10.3 (0.3) 23.2 (0.6) 42.7 (0.6) 21.3 (0.4)

217
Appendices
Table A-9.3: Employment status of teachers
State or Union
Territory
Regular full time Against leave
vacancy
Temporary Para teacher Other
% (SE) % (SE) % (SE) % (SE) % (SE)
Andhra Pradesh 81.3 (2.9) 0.5 (0.5) 5.3 (1.9) 10.5 (2.2) 2.4 (1.3)
Assam 97.1 (0.9) 0 (0) 1 (0.5) 0.3 (0.3) 1.6 (0.6)
Bihar 54.9 (3.5) 1.6 (0.8) 4.9 (1.7) 29.7 (3.3) 8.9 (2.3)
Chandigarh 66.7 (3.9) 0 (0) 3.9 (2) 4.9 (4.9) 24.5 (4.2)
Chhattisgarh 30.4 (3.4) 0.7 (0.7) 4.7 (1.8) 63.5 (3.5) 0.7 (0.7)
Daman & Diu 76.6 (5.8) 2.1 (1.5) 3.2 (1.8) 18.1 (0) 0 (0)
Delhi 95.3 (2.3) 0 (0) 3.5 (2) 0 (0) 1.2 (1.2)
Goa 87.3 (4.3) 7 (3) 4.2 (2.4) 0 (0) 1.4 (1.3)
Gujarat 85.2 (2.7) 0 (0) 8.7 (2.3) 0.4 (0.4) 5.7 (1.8)
Haryana 81.9 (3.1) 0 (0) 2.5 (1.2) 13.8 (2.6) 1.9 (1.1)
Himachal Pradesh 85.1 (2.4) 0.5 (0.5) 1.9 (0.9) 6.5 (1.6) 6 (2)
Jammu & Kashmir 76.6 (2.3) 0 (0) 1.7 (0.8) 17.5 (1.9) 4.2 (1.2)
Jharkhand 48.2 (3.4) 0 (0) 2.5 (0.8) 49 (3.4) 0.3 (0.3)
Karnataka 99.2 (0.6) 0.4 (0.4) 0.4 (0.4) 0 (0) 0 (0)
Kerala 97.7 (1.4) 0.9 (0.9) 0.9 (0.9) 0 (0) 0.5 (0.5)
Madhya Pradesh 53.4 (4) 1.9 (0.8) 5.8 (1.9) 35.4 (4.1) 5.3 (1.7)
Maharashtra 95 (1.5) 0 (0) 2.3 (1) 1.7 (0.9) 1 (0.6)
Meghalaya 81.3 (2.7) 0 (0) 14.2 (2.4) 0.3 (0.3) 2.3 (1.1)
Mizoram 82.5 (2) 1.2 (0.5) 8.2 (1.6) 5.2 (1.2) 3 (0.8)
Nagaland 52.6 (3.5) 4.1 (1.4) 39.8 (3.4) 0 (0) 3.4 (1.2)
Orissa 63.9 (2.9) 0 (0) 1.5 (0.8) 25.6 (2.8) 9 (2)
Puducherry 86.4 (2.4) 0.6 (0.6) 12.4 (2.4) 0 (0) 0.6 (0.6)
Punjab 76.3 (3.6) 0.6 (0.6) 4.1 (1.8) 8.9 (2.4) 10.1 (2.5)
Rajasthan 81.3 (3.1) 1.2 (0.8) 4.7 (1.6) 7.6 (2.1) 5.3 (1.7)
Sikkim 95.1 (1.9) 0.6 (0.6) 3 (1.6) 0.6 (0.6) 0.6 (0.6)
Tamil Nadu 99.5 (0.5) 0 (0) 0 (0) 0.5 (0.5) 0 (0)
Tripura 83.5 (2.4) 0.8 (0.6) 6.7 (1.9) 6.3 (1.9) 2.7 (1.3)
Uttar Pradesh 82.8 (2.5) 0 (0) 7.4 (1.5) 9.3 (2) 0.5 (0.5)
Uttarakhand 84 (2.3) 0.7 (0.7) 4.3 (1.5) 9.9 (1.7) 1.1 (0.6)
West Bengal 79.7 (2.3) 0.6 (0.4) 0.8 (0.6) 18.6 (2.2) 0.3 (0.3)
Overall average 78.7 (0.5) 0.7 (0.1) 5.7 (0.3) 11.8 (0.4) 3.1 (0.2)

218
National Achievement Survey
Table A-9.4: Professional qualifications of teachers
State or Union Territory Primary or elementary teaching
certificate or diploma
Graduate Training B.Ed. M.Ed. and others
% (SE) % (SE) % (SE)
Andhra Pradesh 28.9 (2.9) 69.2 (3) 2 (1)
Assam 89.4 (2) 9.9 (1.9) 0.7 (0.5)
Bihar 86.4 (2.7) 12.1 (2.7) 1.5 (0.8)
Chandigarh 34.2 (5.4) 56.8 (5.5) 9 (3.2)
Chhattisgarh 81.5 (3) 17.6 (2.9) 0.8 (0.8)
Daman & Diu 42.6 (4.6) 56.4 (4.9) 1 (1)
Delhi 42.5 (5) 56.3 (4.9) 1.1 (1.1)
Goa 38.2 (7.5) 61.8 (7.5) 0 (0)
Gujarat 84.3 (2.5) 13.5 (2.2) 2.2 (1)
Haryana 66.2 (3.4) 32.5 (3.3) 1.3 (0.9)
Himachal Pradesh 74.2 (3.6) 24.4 (3.4) 1.4 (0.8)
Jammu & Kashmir 28.6 (3) 60 (3.4) 11.4 (2.1)
Jharkhand 74.2 (3) 25.2 (2.9) 0.6 (0.4)
Karnataka 96 (1.1) 3.6 (1.1) 0.4 (0.4)
Kerala 52.5 (3.6) 46.6 (3.6) 0.9 (0.6)
Madhya Pradesh 83.8 (2.9) 14.5 (2.9) 1.7 (1)
Maharashtra 82.1 (2.4) 17.2 (2.3) 0.7 (0.5)
Meghalaya 68.5 (3.7) 29.5 (3.7) 2 (1.2)
Mizoram 73.7 (2.2) 25.9 (2.2) 0.4 (0.3)
Nagaland 49 (5.2) 50.3 (5.3) 0.7 (0.7)
Orissa 77.5 (2.6) 20.6 (2.5) 2 (0.9)
Puducherry 74.9 (3.4) 24 (3.5) 1.2 (0.8)
Punjab 44.4 (3.9) 51.5 (3.8) 4.1 (1.6)
Rajasthan 34.5 (3.6) 63.6 (3.6) 1.8 (1.1)
Sikkim 87.9 (3.5) 11.4 (3.4) 0.7 (0.7)
Tamil Nadu 81.3 (2.7) 15.3 (2.6) 3.4 (1.3)
Tripura 78.4 (3.4) 20.3 (3.5) 1.3 (0.8)
Uttar Pradesh 48.7 (4) 45.7 (4.1) 5.6 (1.9)
Uttarakhand 66.2 (2.9) 32.7 (2.9) 1.1 (0.4)
West Bengal 10.9 (2.2) 86.5 (2.3) 2.6 (1)
Overall average 65.2 (0.5) 32.8 (0.6) 2.1 (0.2)

219
Appendices
Table A-9.5: Agencies who provide in-service training
State or Union
Territory
BRC CRC DIET or DRC Other SCERT or SIE School
complex
TRC
% (SE) % (SE) % (SE) % (SE) % (SE) % (SE) % (SE)
Andhra Pradesh 2.8 (1.5) 5.7 (2) 5.7 (2.1) 0 (0) 0 (0) 72.2 (3.6) 13.6 (2.8)
Assam 19.6 (2.4) 56 (2.6) 12.3 (2) 0 (0) 0.6 (0.6) 6.3 (1.7) 5.1 (1.5)
Bihar 24.9 (3.5) 24.5 (3.2) 7 (2.1) 0.8 (0.8) 4.7 (1.4) 35 (3.7) 3.1 (1.4)
Chandigarh 0 (0) 67.5 (5.5) 7.8 (3.2) 0 (0) 15.6 (3.9) 7.8 (3.2) 1.3 (1.3)
Chhattisgarh 36.4 (4.2) 12.9 (3.2) 10 (2.2) 0 (0) 7.9 (2.1) 30 (3.8) 2.9 (1.4)
Daman & Diu 46.5 (6.3) 47.5 (4.8) 3 (3) 0 (0) 2 (2) 0 (0) 1 (1)
Delhi 0 (0) 1.5 (1.5) 35.8 (5.9) 0 (0) 53.7 (6.3) 4.5 (2.6) 4.5 (2.5)
Goa 19.6 (5.6) 13.7 (6.7) 9.8 (4.6) 2 (2) 5.9 (3.1) 37.3 (6.5) 11.8 (4.4)
Gujarat 5.7 (1.8) 76.1 (3.5) 13 (2.5) 0 (0) 2.2 (1.3) 3 (1.4) 0 (0)
Haryana 26.7 (6.1) 11.7 (4.3) 6.7 (3.2) 0 (0) 31.7 (6.1) 16.7 (5) 6.7 (3.2)
Himachal Pradesh 40.8 (3.9) 14.6 (2.6) 29.1 (3.8) 0 (0) 0 (0) 10.2 (2.4) 5.3 (1.9)
Jammu & Kashmir 43.2 (3.1) 31.4 (2.8) 23.9 (3) 0 (0) 0 (0) 1.3 (0.6) 0.3 (0.3)
Jharkhand 24.4 (3.4) 32.2 (3.7) 4.7 (1.9) 0 (0) 1.3 (0.8) 31.9 (3.7) 5.6 (2.1)
Karnataka 43.8 (3.7) 45 (3.7) 2.1 (1.1) 0.4 (0.4) 0 (0) 7 (1.7) 1.7 (1)
Kerala 77.9 (3.3) 16.2 (2.4) 1.4 (1) 0 (0) 0 (0) 3.6 (1.7) 0.9 (0.6)
Madhya Pradesh 7.3 (1.8) 53.6 (2.8) 23.4 (2.2) 0 (0) 0 (0) 14.1 (2.3) 1.6 (0.9)
Maharashtra 57.2 (3.8) 10.7 (2.7) 8.5 (2) 0 (0) 12.5 (2.2) 2.6 (1) 8.5 (1.8)
Meghalaya 17.8 (3.1) 6.7 (1.8) 62 (4.5) 0 (0) 1.8 (1) 6.7 (2.2) 4.9 (1.9)
Mizoram 39.8 (2.9) 23 (2.5) 28.5 (2.3) 0 (0) 3.2 (0.9) 4.8 (1.5) 0.7 (0.4)
Nagaland 46.8 (4.5) 7.7 (2.9) 16 (3) 1.9 (1.1) 19.9 (3.9) 3.2 (1.4) 4.5 (1.7)
Orissa 61.1 (4) 32 (3.6) 1.6 (1) 0 (0) 1.6 (1) 2.4 (1.1) 1.2 (0.7)
Puducherry 52.3 (6.4) 7.5 (3.2) 13.1 (4.2) 4.7 (1.6) 12.1 (4.8) 0 (0) 10.3 (3.8)
Punjab 24.8 (3.4) 39 (3.8) 8.5 (2.2) 0 (0) 5.7 (1.7) 20.6 (2.6) 1.4 (1)
Rajasthan 33.6 (4.1) 18.5 (3.4) 11.6 (2.1) 0.7 (0.7) 4.8 (1.8) 25.3 (3.8) 5.5 (1.9)
Sikkim 21.5 (4.1) 5.4 (2.8) 51.6 (5.5) 3.2 (1.9) 14 (3.5) 1.1 (1.1) 3.2 (1.9)
Tamil Nadu 24 (3.4) 74.3 (3.6) 0 (0) 0 (0) 0 (0) 1.8 (1) 0 (0)
Tripura 78.3 (3.3) 6.4 (1.8) 7.7 (1.9) 0.9 (0.9) 1.7 (1) 2.6 (1.2) 2.6 (1.2)
Uttar Pradesh 50 (3.8) 8.5 (2) 29.8 (3.8) 0.5 (0.5) 1.6 (0.9) 5.3 (1.9) 4.3 (1.7)
Uttarakhand 20.6 (2.5) 36.5 (3.5) 17.7 (2.8) 0 (0) 2.2 (1) 21.7 (2.7) 1.4 (0.7)
West Bengal 17.3 (2.8) 19.1 (3.7) 45.8 (4.2) 0 (0) 0.9 (0.6) 7.6 (2.2) 9.3 (1.7)
Overall average 33.6 (0.7) 29.3 (0.6) 16.4 (0.5) 0.3 (0.1) 4.7 (0.3) 11.7 (0.5) 3.8 (0.3)

220
National Achievement Survey
Table A-9.6: Teachers giving homework
State or Union Territory Regularly Sometimes Not at all
% (SE) % (SE) % (SE)
Andhra Pradesh 91.9 (1.9) 7.6 (1.9) 0.5 (0.5)
Assam 83.2 (2.5) 16.5 (2.5) 0.3 (0.3)
Bihar 91.8 (2.0) 8.2 (2.0) 0 (0)
Chandigarh 91.1 (2.8) 8.9 (2.8) 0 (0)
Chhattisgarh 92.9 (2.2) 6.5 (2.1) 0.6 (0.7)
Daman & Diu 78.2 (6.2) 21.8 (6.2) 0 (0)
Delhi 87.4 (3.5) 12.6 (3.5) 0 (0)
Goa 81.7 (5.5) 16.9 (5.3) 1.4 (1.4)
Gujarat 89.1 (2.2) 10.9 (2.2) 0 (0)
Haryana 100.0 (0.0) 0 (0) 0 (0)
Himachal Pradesh 98.6 (0.8) 1.4 (0.8) 0 (0)
Jammu & Kashmir 93.2 (1.4) 6.6 (1.4) 0.2 (0.2)
Jharkhand 83.8 (2.6) 15.9 (2.5) 0.3 (0.3)
Karnataka 92.4 (1.7) 7.6 (1.7) 0 (0)
Kerala 69.7 (3.5) 29 (3.4) 1.4 (1.0)
Madhya Pradesh 93.9 (1.8) 6.1 (1.8) 0 (0)
Maharashtra 96.7 (1.1) 3.3 (1.1) 0 (0)
Meghalaya 76.5 (2.8) 23.5 (2.8) 0 (0)
Mizoram 62.9 (2.9) 36.9 (2.9) 0.2 (0.2)
Nagaland 62.5 (3.5) 36.7 (3.5) 0.8 (0.8)
Orissa 80.7 (3.2) 19.0 (3.2) 0.4 (0.4)
Puducherry 94.7 (1.7) 5.3 (1.7) 0 (0)
Punjab 98.8 (0.8) 0.6 (0.6) 0.6 (0.6)
Rajasthan 94.8 (1.7) 5.2 (1.7) 0 (0)
Sikkim 77.7 (3.3) 22.3 (3.3) 0 (0)
Tamil Nadu 98.2 (1.3) 0.6 (0.6) 1.2 (1.2)
Tripura 76 (3.2) 19.7 (2.9) 4.3 (1.5)
Uttar Pradesh 94.8 (1.7) 5.2 (1.7) 0 (0)
Uttarakhand 91.4 (1.8) 8.6 (1.8) 0 (0)
West Bengal 74.9 (2.7) 23.5 (2.7) 1.7 (0.8)
Overall average 85.1 (0.5) 14.4 (0.5) 0.5 (0.1)

221
Appendices
Table A-9.7: Maintain teacher’s diary
State or Union Territory Yes No
% (SE) % (SE)
Andhra Pradesh 95.7 (1.7) 4.3 (1.7)
Assam 71.8 (3.1) 28.2 (3.1)
Bihar 82.6 (2.9) 17.4 (2.9)
Chandigarh 99.1 (0.9) 0.9 (0.9)
Chhattisgarh 90.2 (2.3) 9.8 (2.3)
Daman & Diu 95.0 (1.7) 5.0 (1.7)
Delhi 100.0 (0.0) 0 (0)
Goa 91.5 (2.8) 8.5 (2.8)
Gujarat 98.7 (0.8) 1.3 (0.8)
Haryana 93.1 (2.1) 6.9 (2.1)
Himachal Pradesh 86.7 (2.9) 13.3 (2.9)
Jammu & Kashmir 97.8 (0.9) 2.2 (0.9)
Jharkhand 77.0 (3.0) 23.0 (3.0)
Karnataka 93.6 (1.8) 6.4 (1.8)
Kerala 90.0 (2.3) 10.0 (2.3)
Madhya Pradesh 88.7 (2.3) 11.3 (2.3)
Maharashtra 91.9 (2.0) 8.1 (2.0)
Meghalaya 81.9 (2.7) 18.1 (2.7)
Mizoram 41.1 (3.1) 58.9 (3.1)
Nagaland 88.0 (2.5) 12.0 (2.5)
Orissa 96.2 (1.3) 3.8 (1.3)
Puducherry 71.7 (4.2) 28.3 (4.2)
Punjab 98.8 (0.8) 1.2 (0.8)
Rajasthan 92.4 (1.8) 7.6 (1.8)
Sikkim 91.0 (2.8) 9.0 (2.8)
Tamil Nadu 82.2 (3.9) 17.8 (3.9)
Tripura 70.0 (3.8) 30.0 (3.8)
Uttar Pradesh 98.5 (1.1) 1.5 (1.1)
Uttarakhand 77.0 (3.1) 23.0 (3.1)
West Bengal 69.8 (3.2) 30.2 (3.2)
Overall average 83.5 (0.5) 16.5 (0.5)

222
National Achievement Survey
Table A-9.8: Status of Teacher’s Handbook, TLM grant, TLM and audio-visual facilities
State or Union
Territory
Teacher’s Handbook TLM grant TLM Audio-visual facilities
% (SE) % (SE) % (SE) % (SE)
Andhra Pradesh 94.6 (1.8) 64 (3.2) 97.1 (2.9) 49.7 (4)
Assam 77.7 (2.8) 81 (2.7) 98.5 (1.5) 22.5 (2.9)
Bihar 68 (3.5) 74.5 (3.4) 94.4 (5.6) 37.2 (3.9)
Chandigarh 87.9 (3.6) 84.9 (3.8) 97.2 (2.8) 63.3 (6.1)
Chhattisgarh 93.4 (2.1) 82.9 (3.2) 92.6 (7.4) 55.2 (4.5)
Daman & Diu 72.3 (7.9) 93.9 (2.5) 100 (0) 72.5 (5.9)
Delhi 69.3 (5.1) 88 (3.8) 98.8 (1.2) 75.3 (4.7)
Goa 80 (6.7) 83.3 (5.1) 97.1 (2.9) 47.5 (7.9)
Gujarat 72.2 (3.9) 96.4 (1.7) 98.3 (1.7) 81.7 (3.5)
Haryana 78.6 (3.2) 81.8 (3.1) 96.1 (3.9) 84.9 (3.1)
Himachal Pradesh 93.6 (2.1) 92.8 (1.8) 99.5 (0.5) 46.8 (4.8)
Jammu & Kashmir 79 (2.7) 68.7 (2.9) 97.8 (2.2) 11.4 (2.1)
Jharkhand 79 (2.7) 63.7 (3.9) 96.4 (3.6) 45.9 (3.9)
Karnataka 94.8 (1.4) 90.8 (2.2) 98 (2) 60.2 (3.8)
Kerala 100 (0) 96.8 (1) 100 (0) 82 (3.4)
Madhya Pradesh 94.2 (1.6) 81.9 (2.9) 100 (0) 64.2 (3.4)
Maharashtra 93.2 (1.6) 84.1 (2.4) 98.3 (1.7) 70.2 (3.1)
Meghalaya 84.3 (2.8) 36.2 (3.5) 71.4 (28.6) 6.8 (1.9)
Mizoram 83 (2.1) 56.3 (2.8) 71.4 (28.6) 12.3 (2.2)
Nagaland 83.9 (3.3) 75.7 (4.2) 84.6 (15.4) 10.8 (2.8)
Orissa 90 (2.1) 86.5 (2.5) 98.5 (1.5) 8.9 (2.1)
Puducherry 76.9 (4.2) 91.2 (3.2) 98.2 (1.8) 55.3 (6.7)
Punjab 81.1 (3.1) 89.3 (2.9) 94.7 (5.3) 38.2 (3.9)
Rajasthan 83.7 (3) 77.4 (2.8) 92.4 (7.6) 45.5 (3.7)
Sikkim 87.8 (2.8) 36.9 (4.7) 64.4 (35.6) 11.6 (3.3)
Tamil Nadu 92.1 (2.4) 16.5 (3.3) 98.8 (1.2) 87 (3.4)
Tripura 66.2 (4.1) 82.4 (2.8) 98 (2) 5 (2)
Uttar Pradesh 95.1 (1.8) 71.2 (4.3) 95.7 (4.3) 32.1 (4.6)
Uttarakhand 87.7 (2) 86.2 (2.6) 98.2 (1.8) 28.6 (3.1)
West Bengal 75.1 (2.9) 72 (3.4) 92.2 (7.8) 9.6 (2.4)
Overall average 83.9 (0.5) 75.2 (0.6) 93.1 (6.9) 38.8 (0.6)

223
Appendices
Table A-9.9: Teachers’ interactions
State or
Union
Territory
Discussion about how
to teach a particular
concept
Preparing instructional
material
Visit to another teacher’s
classroom to observe his/
her teaching
Informal observation of
classroom observation
by other teachers
1 to 3
times
per
week
2 to 3
times
per
month
Almost
never
1 to 3
times
per
week
2 to 3
times
per
month
Almost
never
1 to 3
times
per
week
2 to 3
times
per
month
Almost
never
1 to 3
times
per
week
2 to 3
times
per
month
Almost
never
% (SE) % (SE) % (SE) % (SE) % (SE) % (SE) % (SE) % (SE) % (SE) % (SE) % (SE) %( SE)
Andhra
Pradesh
49.3
(4.2)
44.4
(4.0)
6.3
(2.2)
38.0
(3.6)
57.5 (3.7) 4.5
(1.9)
30.5
(3.5)
48.0
(3.9)
21.5
(2.9)
28.1
(3.6)
50.8
(4.2)
21.1
(3.2)
Assam 58.3
(3.2)
38.5
(3.1)
3.1 (1.2) 38.7
(3.0)
55.2 (3.1) 6.1
(1.6)
25.3
(2.7)
52.2
(3.2)
22.4
(2.7)
25.9
(2.9)
45.8
(3.5)
28.3
(2.8)
Bihar 54.8
(3.6)
40.7
(3.5)
4.6
(1.6)
37.8
(3.9)
47.7 (3.6) 14.5
(2.4)
34.4
(3.4)
39.5
(3.1)
26.1
(3.4)
34.0
(3.7)
43.1
(3.6)
22.9
(3.4)
Chandigarh 60.4
(3.9)
36.9
(3.7)
2.7 (1.5) 35.5
(5.5)
60.0(4.9) 4.5
(2.4)
20.8
(4.5)
41.5
(4.7)
37.7
(5.1)
21.7
(4.3)
46.2
(4.4)
32.1
(5.2)
Chhattisgarh 67.3
(4.1)
31.3
(4.1)
1.3
(0.9)
39.3
(4.9)
55.7 (4.6) 5.0
(1.9)
40.9
(4.4)
51 (4.3) 8.1 (2.6) 26.5
(3.9)
52.4
(4.5)
21.1
(3.8)
Daman &
Diu
57.1
(6.9)
38.8
(7.3)
4.1
(3.2)
29.5
(5.1)
49.5 (6.2) 21.1
(4.4)
29.3
(6.9)
47.5
(7.2)
23.2
(7.0)
26.5
(8.0)
57.1
(6.4)
16.3
(5.4)
Delhi 70.1
(5.2)
29.9
(5.2)
0 (0) 51.9
(6.3)
44.4 (6.1) 3.7 (2.1) 24.7
(4.8)
50.6
(5.9)
24.7
(3.8)
21.2
(4.9)
58.8
(6.1)
20.0
(3.6)
Goa 43.5
(7.1)
49.3
(7.3)
7.2 (3.1) 33.8
(6.8)
57.4 (7.1) 8.8
(2.9)
13.4
(4.9)
25.4
(6.6)
61.2
(8.2)
24.2
(5.1)
36.4
(7.1)
39.4
(6.8)
Gujarat 59.1
(4.5)
37.3
(4.1)
3.6
(1.7)
35.7
(4.1)
57.3 (4.4) 7.0
(1.8)
36.9
(3.9)
50.9
(4.1)
12.1
(3.0)
27.0
(3.6)
62.3
(3.9)
10.7
(2.5)
Haryana 61.2
(3.7)
32.9
(3.5)
5.9
(2.0)
53.0
(4.2)
39.6 (4.3) 7.4
(2.0)
45.7
(4.0)
38.4
(3.6)
15.9
(2.9)
35.1
(4.2)
51.0
(4.3)
13.9
(2.7)
Himachal
Pradesh
53.9
(3.8)
45.7
(3.8)
0.5
(0.5)
37.1
(3.6)
60 (3.7) 2.9
(1.2)
31.8
(3.7)
53.9
(4.0)
14.3
(2.9)
26.5
(3.6)
61.4
(4.1)
12.1
(2.6)
Jammu &
Kashmir
55.4
(2.9)
41.5
(2.8)
3.2
(0.9)
50.1
(2.7)
46.2 (2.8) 3.7
(1.0)
33 (2.7) 45.8
(2.9)
21.2
(2.4)
30.9
(2.6)
50.5
(2.8)
18.6
(2.3)
Jharkhand 59.2
(3.4)
37.7
(3.2)
3.0
(1.2)
35.8
(3.5)
55.1 (3.7) 9.1
(2.2)
31.3
(3.1)
49.7
(3.4)
19 (3.2) 24.1
(3.0)
53.8
(3.5)
22.1
(3.0)
Karnataka 60.1
(3.4)
37.5
(3.4)
2.4
(1.3)
55.6
(3.4)
42.0 (3.4) 2.4 (1.1) 30.9
(3.3)
50.8
(3.7)
18.3
(2.7)
26.7
(3.0)
56.0
(3.7)
17.3
(2.8)
Kerala 52.3
(4.1)
46.8
(4.0)
0.9
(0.6)
51.6
(4.6)
46.6
(4.6)
1.8
(0.9)
13 (2.4) 48.6
(4.0)
38.4
(3.7)
15.6
(3.2)
55.0
(4.3)
29.4
(3.5)
Madhya
Pradesh
52.0
(3.8)
45.4
(3.8)
2.6 (1.1) 40.4
(3.1)
46.8
(3.4)
12.8
(2.4)
55.3
(3.5)
33.7
(3.2)
11.1 (2.3) 33.2
(3.6)
51.3
(3.8)
15.5
(2.7)
Maharashtra 59.7
(2.8)
38.9
(2.8)
1.3
(0.7)
48.6
(3.3)
50.3 (3.3) 1.0
(0.6)
29.3
(2.9)
55.2
(3.3)
15.5
(2.3)
26.6
(2.9)
60.6
(3.5)
12.8
(2.3)
Meghalaya 53.3
(3.5)
40.5
(3.3)
6.2
(1.6)
33.9
(3.8)
45.0 (3.8) 21.1
(3.0)
12.7
(2.1)
28.8
(3.4)
58.5
(3.4)
12.3
(2.5)
31.4
(3.6)
56.3
(4.0)
Mizoram 38.2
(2.4)
45.0
(2.9)
16.9
(2.1)
27.3
(2.7)
42.4 (3.1) 30.3
(2.8)
9.1 (1.6) 14.7
(2.0)
76.3
(2.2)
8.7
(1.5)
15.2
(2.0)
76.1
(2.4)
Nagaland 53.2
(3.3)
42.2
(3.3)
4.6
(1.1)
36.1
(3.5)
53.6 (3.9) 10.3
(2.6)
14.1
(3.3)
31.7
(3.5)
54.2
(3.5)
13.1
(2.8)
38.2
(3.6)
48.6
(4.0)

224
National Achievement Survey
Orissa 54.5
(3.5)
42.2
(3.4)
3.4
(1.2)
51.9
(3.5)
44.8
(3.4)
3.4
(1.2)
33.5
(3.2)
42.5
(3.7)
24.1
(2.8)
32.6
(3.4)
46.2
(3.9)
21.2
(3.3)
Puducherry 50.3
(4.4)
43.9
(4.3)
5.8
(1.7)
45.0
(4.2)
44.4 (3.9) 10.5
(2.6)
17.1
(3.6)
37.1
(4.4)
45.9
(5.2)
14.8
(3.4)
41.4
(3.8)
43.8
(5.0)
Punjab 60.0
(3.8)
34.7
(3.5)
5.3
(2.3)
40.6
(3.9)
50.6 (3.9) 8.8
(2.5)
46.2
(3.9)
40.2
(3.7)
13.6
(2.5)
35.9
(3.7)
50.9
(3.9)
13.2
(3.0)
Rajasthan 57.6
(3.7)
37.1
(3.6)
5.3 (1.7) 41.9
(4.0)
46.3 (3.8) 11.9
(2.6)
38.9
(3.6)
43.7
(3.6)
17.4
(3.0)
29.8
(3.6)
47.6
(3.8)
22.6
(3.1)
Sikkim 47.3
(4.7)
46.1
(5.0)
6.6
(2.5)
34.1
(3.8)
48.8
(4.8)
17.1
(3.6)
11.7
(2.9)
23.9
(4.2)
64.4
(4.7)
13.6
(2.9)
29.0
(3.0)
57.4
(4.6)
Tamil Nadu 62.4
(4.5)
35.2
(4.5)
2.4
(1.2)
62.3
(4.4)
34.0 (4.3) 3.7 (1.5) 32.5
(3.7)
41.7
(4.5)
25.8
(4.1)
26.3
(4.1)
45.0
(4.7)
28.8
(4.2)
Tripura 55.7
(3.9)
40.3
(3.8)
4.0
(1.5)
57.8
(3.6)
37.5 (3.5) 4.8
(1.6)
36.4
(4.3)
37.6
(3.4)
26 (4.0) 37.1
(4.0)
32.7
(3.4)
30.2
(3.9)
Uttar
Pradesh
63.2
(4.0)
35.4
(3.9)
1.4
(0.8)
35.8
(4.1)
56.0
(4.4)
8.3
(2.5)
55.6
(4.3)
37.4
(4.0)
7.1 (2.2) 32.1
(3.8)
51.5
(4.3)
16.3
(2.7)
Uttarakhand 55.3
(3.7)
38.7
(3.7)
6.0
(1.6)
39.6
(3.7)
51.5 (3.7) 9.0
(2.1)
40.4
(3.4)
37.2
(3.5)
22.4
(3.1)
27.5
(3.2)
45.8
(3.2)
26.7
(3.3)
West Bengal 63.1
(3.0)
33.0
(3.0)
3.9
(1.0)
40.2
(3.5)
46.8
(3.4)
12.9
(2.3)
16.1
(2.5)
22.7
(2.7)
61.2
(3.7)
19.9
(2.9)
30.5
(3.4)
49.6
(3.8)
Overall
average
55.5
(0.6)
39.9
(0.6)
4.6
(0.3)
41.7
(0.7)
48.7
(0.8)
9.7
(0.4)
28.7
(0.7)
40
(0.7)
31.3
(0.6)
24.6
(0.7)
45.0
(0.7)
30.4
(0.6)
Table A-9.10: School related problems
State or
Union
Territory
School building needs
repair
Classroom overcrowded No workspace outside
classroom
Material not available for
experiments
Not a
problem
Serious
problem
Minor
problem
Minor
problem
Not a
problem
Serious
problem
Minor
problem
Not a
problem
Serious
problem
Minor
problem
Not a
problem
Serious
problem
% (SE) % (SE) % (SE) % (SE) % (SE) % (SE) % (SE) % (SE) % (SE) % (SE) % (SE) % (SE)
Andhra
Pradesh
43.1 (4) 9.1 (2.3) 47.8 (4.1) 21.8 (3.3) 68.4
(3.9)
9.7 (2.4) 25.4 (3.7) 65.7 (4.1) 9 (1.9) 38.3
(3.7)
42.2
(3.9)
19.4
(2.9)
Assam 13.1 (2.1) 24 (2.7) 62.9
(3.2)
45.3
(3.4)
31.1 (3.2) 23.6
(2.8)
44.5
(3.4)
40.9
(3.5)
14.6
(2.4)
59.8
(3.1)
18.8
(2.6)
21.4 (2.7)
Bihar 25.7 (3.5) 24.2
(3.2)
50.2
(3.6)
32.7 (3.5) 32 (3.8) 35.3
(3.6)
44.4
(3.3)
31.6 (3.2) 24 (3.3) 37.4
(3.8)
13.4
(2.6)
49.2
(3.9)
Chhattisgarh 34.8
(4.3)
15.5 (3.2) 49.7
(4.4)
33.1 (4) 61 (4.2) 5.8 (2) 39.9
(4.7)
54.7
(4.7)
5.4 (1.9) 45.4
(4.4)
29.6
(4.2)
25 (3.9)
Delhi 52.4
(5.7)
6 (2.7) 41.7 (5.3) 19.8
(4.8)
66.3
(5.3)
14 (2.9) 42.7
(5.4)
53.7 (5.5) 3.7 (2.1) 19.8
(3.9)
75.6
(4.2)
4.7 (2.3)
Goa 31 (6.7) 7 (3.8) 62 (6.4) 22.5 (6.1) 70.4 (6.1) 7 (3.8) 32.9
(5.5)
57.1 (6) 10 (3.9) 30 (6) 65.7
(5.2)
4.3 (3.2)
Gujarat 48.5 (4) 14 (3.1) 37.6 (4) 30.5
(3.4)
57.4 (3.9) 12.1 (3) 20.4
(3.2)
66.8
(3.6)
12.8 (2.3) 53.5
(4.5)
38.2
(4.4)
8.3 (2.1)
Haryana 53.2
(3.8)
10.1 (2.5) 36.7 (3.7) 20.8
(2.9)
70.4
(3.4)
8.8 (2.4) 26 (3.5) 70.7 (3.4) 3.3 (1.5) 27.7 (3.3) 63.5
(3.4)
8.8 (2.2)
Himachal
Pradesh
23.9
(3.2)
18.5
(3.2)
57.7 (3.9) 16.5 (2.9) 79.4 (3.1) 4.1 (1.4) 41.5 (4.1) 47.3 (4) 11.1 (2.9) 45.3
(3.7)
32.2 (3.3) 22.4
(3.2)
Jammu &
Kashmir
10.1 (1.9) 34 (2.7) 55.9
(2.9)
26.8
(2.5)
31.5 (2.8) 41.6
(2.8)
28.1
(2.8)
32.2 (2.9) 39.7 (3.1) 23.3 (2.2) 16.3 (2.1) 60.4
(2.7)

225
Appendices
Jharkhand 26.8
(3.2)
16.7 (2.9) 56.6
(3.9)
39.2
(3.8)
35.9
(3.8)
24.9
(3.6)
39.8
(3.4)
36.4
(3.4)
23.8
(3.5)
46.7
(3.9)
27.2 (3) 26.1 (3.1)
Karnataka 38.4
(3.7)
10 (2.4) 51.6
(3.9)
25 (3.2) 69.8
(3.2)
5.2 (1.6) 23.5 (3) 70.4
(3.6)
6.1 (2) 42.7 (3.7) 42.3 (3.7) 14.9
(2.6)
Kerala 48.2
(4.2)
7.6 (1.8) 44.2
(3.9)
25.9 (4.1) 59.4
(4.3)
14.7 (3.3) 32.9 (4.1) 54.1
(4.5)
13.1 (2.8) 37.6 (4.1) 57.5 (4) 5 (1.9)
Madhya
Pradesh
35.9
(3.8)
10.3
(2.4)
53.8
(3.6)
28.4 (3.1) 58.2
(3.4)
13.4 (2.4) 30.7
(3.4)
56.8
(3.5)
12.5 (2.5) 35.3
(3.8)
35.3 (3.2) 29.5
(3.6)
Maharashtra 40.8
(3.5)
12 (2.3) 47.2 (3.4) 30.9 (3.1) 60.4
(3.3)
8.7 (2.1) 35.3 (3.1) 59.7
(3.4)
5.1 (1.6) 43.6
(3.6)
47 (3.5) 9.5 (2.1)
Meghalaya 8.4 (1.9) 24.4
(3.2)
67.2 (3.3) 41.2 (3.6) 28.1 (3.4) 30.7 (3.5) 48.7
(3.4)
33.9 (3.3) 17.4 (2.6) 40.8
(3.2)
9.5 (2) 49.7
(3.5)
Mizoram 17.6 (2.2) 21.7 (2.6) 60.7
(2.8)
25.9
(2.8)
62.9
(3.3)
11.2 (2) 29.5
(2.5)
63.1 (3) 7.4 (1.6) 41.1 (2.7) 16.4
(2.2)
42.5
(2.8)
Nagaland 6.2 (1.8) 38.1
(3.9)
55.8
(3.8)
36.9 (3.7) 32.7 (3.8) 30.4
(3.5)
50.6
(4.2)
31 (3.4) 18.4
(2.9)
39.2 (4) 8.4 (2.1) 52.5 (4)
Orissa 11.5 (2.6) 33.5 (4) 55 (4.2) 37 (4.1) 32.8 (4) 30.2
(3.9)
46.9
(3.6)
34.7
(3.4)
18.3 (2.7) 49.2
(4.1)
21 (3.1) 29.8
(3.5)
Punjab 34.7
(4.2)
10 (2.3) 55.3
(4.3)
18.8
(3.3)
75.9 (3.7) 5.3 (1.8) 20.1 (3.5) 75.7 (3.8) 4.1 (1.6) 31 (3.6) 46.4 (4) 22.6
(3.7)
Rajasthan 37.7 (3.5) 14.3
(2.6)
48 (3.6) 25.7 (3.1) 66.9
(3.5)
7.4 (1.7) 33.1 (3.4) 60.5
(3.6)
6.4 (1.9) 30.4
(3.4)
44 (3.5) 25.6
(3.2)
Sikkim 13.7 (3.4) 36.3
(5.2)
50 (4.9) 29.8 (3.7) 36.9
(4.2)
33.3 (4) 30.5
(4.2)
43.1 (4.5) 26.3 (3.7) 46.7
(4.7)
13.8
(2.9)
39.5
(4.8)
Tamil Nadu 60 (4.3) 3.5 (1.5) 36.5
(4.5)
16.1 (3.3) 79.8
(3.2)
4.2 (1.8) 15.3 (3.5) 84 (3.6) 0.6 (0.6) 28.6
(4.1)
68.9
(4.2)
2.5 (1.2)
Tripura 21.4
(2.9)
11.3 (2.3) 67.3 (3.4) 39.3
(3.8)
42 (3.6) 18.7 (3.1) 37.5 (4) 49.4
(4.2)
13 (2.4) 44.9 (4) 32.3
(3.6)
22.8
(2.9)
Uttar
Pradesh
39 (4.1) 7.5 (2.1) 53.5
(4.5)
20.3
(3.6)
70.3
(4.4)
9.4 (2.6) 36.7
(4.4)
54.1
(4.5)
9.2 (2.5) 40.6
(3.6)
28.5
(3.9)
30.9
(4.2)
Uttarakhand 29.2
(3.3)
18 (3) 52.8
(3.3)
33.7 (3.7) 56.7
(3.8)
9.6 (1.8) 35.6
(3.2)
54.4
(3.3)
10 (1.9) 56.2 (3.1) 18.5 (2.7) 25.3 (3)
West Bengal 14.1 (1.9) 31.6 (3.2) 54.2
(3.3)
26.2 (3.3) 10.1 (2.1) 63.7
(3.6)
38.7
(3.9)
28.5
(3.5)
32.8
(3.5)
48.3
(3.6)
19.3 (2.7) 32.4
(3.3)
Chandigarh 58 (5.9) 6.3 (3.3) 35.7
(5.4)
36.6
(5.7)
33.9
(6.6)
29.5
(5.3)
27.7 (5.3) 54.5
(6.5)
17.9 (5.3) 33 (4.1) 58.9
(4.4)
8 (2.4)
Puducherry 50 (6.2) 9.4 (3.3) 40.6
(5.8)
21.2 (3.7) 67.1 (4.5) 11.8 (3.2) 23.1 (4.6) 63.3
(5.2)
13.6 (4) 34.7
(4.6)
47.6
(5.3)
17.6
(4.4)
Daman &
Diu
55.4 (7.7) 2 (1.4) 42.6 (7.1) 13.9 (4.5) 81.2
(5.9)
5 (3.3) 25 (7.1) 62 (6) 13 (4.9) 48 (7.3) 34 (6.6) 18 (5.2)
Overall
average
28.4
(0.7)
18.6
(0.6)
52.9
(0.7)
29.6
(0.7)
50.2
(0.7)
20.2
(0.6)
34.6
(0.6)
50.4
(0.6)
15 (0.6) 41.5
(0.8)
30.6
(0.6)
28 (0.5)

226
National Achievement Survey
Appendix - X
List of Surveyed States, Districts, Schools, Teachers, and Students
S.
No.
State/ Union
Territory
No. of
selected
district
District name School Teacher Student
28 A & N Islands 2 Middle And North Andamans, South Andamans 86 257 2,461
1 Andhra
Pradesh
11 Adilabad, Nizamabad, Karimnagar, Hyderabad,
Mahbubnagar, Nalgonda, Warangal, Visakhapatnam, East
Godavari, West Godavari, Anantapur
250 318 4,429
2 Assam 12 Dhubri, Goalpara, Bongaigaon, Kamrup, Nalbari, Darrang,
Nagaon, Lakhimpur, Dhemaji, Dibrugarh, Cachar, Karimganj
294 590 5,536
3 Bihar 13 Pashchim Champaran, Madhubani, Purnia, Darbhanga,
Muzaffarpur, Saran, Begusarai, Bhagalpur, Nalanda, Patna,
Gaya, Nawada
224 420 3,997
29 Chandigarh 1 Chandigarh 59 113 2,479
4 Chhattisgarh 11 Furguja, Jashpur, Raigarh (Chhattisgarh), Janjgir - Champa,
Bilaspur (Chhattisgarh), Rajnandgaon, Durg, Raipur,
Mahasamund, Dhamtari, Baster
247 257 2,565
31 Daman & Diu 2 Daman, Diu 35 102 1,293
5 Delhi 7 North West Delhi, North East Delhi, East Delhi, Central Delhi,
West Delhi, South West Delhi, South Delhi
139 148 3,864
6 Goa 2 North Goa, South Goa 55 105 1,443
7 Gujarat 11 Kachchh, Banas Kantha, Patan, Mahesana, Sabar Kantha,
Ahmedabad, Junagadh, Bhavnagar, Anand, Kheda,
Bharuch
212 362 5,621
8 Haryana 12 Yamunanagar, Kurukshetra, Sonepat, Jind, Fatehabad,
Sirsa, Hisar, Bhiwani, Jhajjar, Mahendragarh, Faridabad,
Palwal
239 241 4,889
9 Himachal
Pradesh
9 Chamba, Kangra, Kullu, Mandi, Hamirpur, Una, Solan,
Sirmaur, Shimla
248 329 3,844
10 Jammu and
Kashmir
10 Kupwara, Baramulla, Pulwama, Anantnag, Doda,
Udhampur, Punch, Rajauri Jammu, Leh (Ladakh)
400 651 4,306
11 Jharkhand 11 Hazaribag, Kodarma, Giridih, Deoghar, Sahibganj, Pakaur,
Dhanbad, Bokaro, Ranchi, Pashchimi Singhbhum, Purbi
Singhbhum
223 622 5,326
12 Karnataka 11 Belgaum, Bijapur, Gulbarga, Raichur, Haveri, Bellary, Kolar,
Bangalore, Mandya, Dakshina Kannada, Chamrajnagar
248 406 5,397
13 Kerala 8 Kannur, Wayanad, Kozhikode, Malappuram, Palakkad,
Thrissur, Ernakulam, Kollam
186 365 4,217
14 Madhya
Pradesh
14 Morena, Bhind, Gwalior, Guna, Tikamgarh, Sagar,
RewaSidhi, Mandsaur, Ujjain, Jhabua, Betul, Hoshangabad,
Narsimhapur
258 324 2,711
15 Maharashtra 14 Nandurbar, Nagpur, Jalna, Aurangabad (Maharashtra),
Nashik, Thane, Pune, Ahmadnagar, Bid, Osmanabad,
Solapur, Ratnagiri, Kolhapur, Yavatmal
275 480 6,743
16 Meghalaya 5 East Garo Hills, West Khasi Hills, Ri Bhoi, East Khasi Hills,
Jaintia Hills
246 479 3,812

227
Appendices
17 Mizoram 5 Mamit, Aizamel, Champhai, Lawngilai, Saiha 174 520 2,941
18 Nagaland 8 MON, TUENSANG, Mokokchung, Zunheboto, Wokha,
Dimapur, Kohima, Phek
104 295 1,578
19 Orissa 13 Keonjhar, Mayurbhanj, Balasore, Bhadrak, Jagatsinghapur,
Cuttack, Angul, Khordha, Ganjam, Bolangir, Kalahandi,
Rayagada, Malkangiri
266 416 2,665
30 Puducherry 2 Pondicherry, Karaikal 73 171 2,312
20 Punjab 11 Gurdaspur, Amritsar, Kapurthala, Jalandhar, Hoshiarpur,
Nawanshahr, Ludhiana, Firozpur, Muktsar, Sangrur, Patiala
251 261 3,963
21 Rajasthan 11 Hanumangarh, Jhunjhunu, Karauli, Dausa, Jaipur, Nagaur,
Jodhpur, Barmer, Jalor, Pali, Bhilwara
268 290 3,539
22 Sikkim 4 West Sikkim (Geyzing), East Sikkim, South Sikkim, North
Sikkim (Mangan)
133 263 3,343
23 Tamil Nadu 11 Chennai, Kanchipuram, Vellore, Thiruvannamalai,
Vilappuram, Salem, Coimbatore, Tiruchirappalli,
Ramanthapuram, Thoothukudi, Kanniyakumari
230 324 5,836
24 Tripura 4 West Tripura, South Tripura, East Tripura (Dhalai), North
Tripura
196 392 2,768
25 Uttar Pradesh 16 Moradabad, Rampur, Meerut, Ghaziabad, Aligarh, Etah,
Bareilly, Sitapur, Etawah, Kanpur Nagar, Allahabad,
Bahraich, Basti, Kushinagar, Ballia, Varanasi
241 326 4,789
26 Uttarakhand 9 Chamoli, Tehri Garhwal, Dehradun, Garhwal, Pithoragarh,
Almora, Champawat, Nainital, Haridwar
296 463 4,285
27 West Bengal 11 Jalpaiguri Cooch Bihar, Murshidabad,Barddhaman,North
Twenty Four Parganas, Hoogly, Purulia, Howrah,
Kolkata,South Twenty Four Parganas, Paschim Medinipur
255 561 4,701
Total 271 6,411 10,851 1,17,653
List of State Coordinators and Associate Coordinators
S. No State Coordinator Associate Coordinator
1. Andhra Pradesh Director, SCERT, Hyderabad
Andhra Pradesh
Dr. S. Vijay Kumar
SCERT, Hyderabad, Andhra Pradesh
2. Assam Director, SCERT
Gauhati, Assam
Mr. Laxmikamt Das
SCERT, Assam
4. Bihar Director, SCERT
Mahendru, Patna, Bihar
Dr. Syed Abdul Moin
Head, Technical Education, SCERT, Bihar
5. Chhattisgarh Director, SCERT, and State Project Officer, Rajiv
Gandhi Shiksha Mission, Raipur
Ms. Archana Verulkar
SCERT, Sankar Nagar, Raipur, chhattisgarh
6. Delhi Dr. V.P. Singh
SPD,
SPD Office Road, U.E Mission
7. Goa Director, SCERT
Panaji, Goa.
Dr. Richard Kalbarl
SCERT, Goa
8. Gujarat Director, GCERT
Gandhinagar, Gujarat
Dr. Bhaumik Trivedi
GCERT
9. Haryana Director SCERT,
Gurgaon, Haryana
Dr. Yogesh Vasishtha
SCERT, Gurgaon, Haryana

228
National Achievement Survey
10. Himachal Pradesh Principal, SIE
Himachal Pradesh Primary Education Society,
Shimla-171001
Mr. Shiv Kumar Sharma
Sr. Lecturer, SIE, Himachal Pradesh
11. Jammu & Kashmir Principal, State Institute of Education, Jammu.
Principal, State Institute of Education, Srinagar
Mr. A.R. Bhatt,
SIE, Srinagar
12. Jharkhand Director, Elementary & Secondary Education,
HRD
JEPC, New Cooperative Building
Shyamli Colony, Ranchi-834002
Dr. Pramod Kumar Sinha
Jharkhand Education Project Council, Shyamali
Colony, Doranda, Ranchi
13. Karnataka Director, DSERT
No.8, KSCMF Building, MSB, 3rd Block, 2nd
Floor
Cunningham Road, Bangalore-560052
Ms. A. Subhadra
DSERT
No.8, KSCMF Building, MSB, 3rd Block, 2nd Floor
Cunningham Road, Bangalore-560052
14. Kerala Director, SCERT
Thiruvananathapuram
Kerala
Mr. C. Gokul Dasan Pillai
Head Curriculum , SCERT, Poojappura,
Thiruvananthapuram, Kerela
15. Madhya Pradesh Director, State Education Centre
Pustak Bhawan, B-Wing, TBC
Arera Hills, Bhopal
Mr. P.L. Dongre
SCERT, Arera Hills, Bhopal-462021
16. Maharashtra Director, MSCERT
708, Sadashiv Kumtekar Marg
Pune-411 030
Shri K.D. Panage
MSCERT
Pune, Maharashtra
17. Manipur Secretary, Board of Secondary Education
Manipur
Mr. S. Mangi Singh
Mr. S. Jitelal Sharma
Under Secretary , Board of Secondary Education,
Manipur
18. Meghalaya Director
Directorate of Educational Research and
Training
Shillong-793 011, Meghalaya
Mr. P.B. Lartang,
Sr. Lecturer, DERT, Shillong
19. Mizoram Ms. Sangthanmawii
Joint Director
School Education & SCERT
Aizawal, Mizoram
Ms. D. Ramdinthangi
SCERT, Aizawal, Mizoram
20. Nagaland Director , SCERT
Nagaland, Kohima
Mr. Daniel Thong Seb
Lecturer, SCERT, Kohima, Nagaland-797001.
21. Orissa Director, SCERT
Bhubaneswar, Orissa
Dr. Trllotama Senapapi, Assistant Director, SCERT,
Orissa
Dr. Namita Chhotroy, Coordinator
SCERT, Bhubaneshwar.
22. Punjab Director, SCERT
Punjab, Chandigarh
Mr. Jagtar Singh
SCERT, Punjab, Chandigarh.
23. Rajasthan Director, SCERT
Udaipur, Rajasthan
Mr. Aditya Mishra,
Assistant Director, SCERT, Udaipur,
Rajasthan.
24. Sikkim Dr. (Mrs.) Indira Joshi, Joint Director, SCERT,
Sikkim
Mr. Suraj Bir Singh SCERT, Sikkim
25. Tamil Nadu Dr. R. Elangovan,
Director, DTERT
Tamil Nadu Chennai
Dr. L. Radha
Asst. Professor, DTERT

229
Appendices
26. Tripura Director, SCERT
Agartala-799 005, Tripura
Mr. Nilkanta Singha
SCERT, Agartala, Tripura.
27. Uttar Pradesh Principal, SIE,
Allahabad, U.P
Mr. Sanjay Yadav
Ms. Mamta Dubey
SIE, Allahabad, U.P
28. Uttarakhand Director, SCERT,
Tehri Garhwal, Uttarakhand
Dr. D.S Lingual
SCERT, Narendra Nagar, Tehri Garhwal,
Uttarakhand.
29. West Bengal Dr. R.N. De, Director, SCERT
28/3, Ballygunj Circular Road,
Kolkata -700019 (West Bengal)
Mr. Subrat Kumar Biswas
Mr. Gautam Bhattacharya
SCERT (WB), 25/3, Ballygunj Circular Rd., Kolkata,
West Bengal.
30. Andaman & Nicobar
Islands
Dr. R. Devdas,
Principal, SIE, Port Blair
Andaman & Nicobar Islands
Dr. M. Ayyaraju,
Assistant Director of Education (Monitoring), State
Project Officer, SSA, Port Blair, Andaman & Nicobar
Islands.
31. Chandigarh Dr. S.S. Dahiya, Director, SIE
Chandigarh
Dr. Savita Sridhar
Lecturer, SIE, Chandigarh.
32. Puducherry Director of School Education,
Puducherry
Puducherry-605 008
Mr. R. Valavan
Principal, Dist. Institute of Education and Training,
Puducherry-605 008.

sri Auronindo marg, new delhiwww.ncert.nic.in
WHAT ARE NATIONAL ACHIEVEMENT SURVEYS?
National achievement surveys are large-scale assessment exercises designed to determine educational standards across the country.
They use a representative sample of students and must be carefully designed to fit the group being assessed.
National achievement surveys are not examinations. They check the general health of the education system: they don’t test individual students!
The main purposes of large-scale education assessments are:
to measure typical levels of achievement – i.e. find out what students achieve in key subjects
to make comparisons – e.g. between girls and boys, among states etc.
to monitor trends over time – i.e. track progress
to investigate background factors that may affect educational outcomes – e.g. home context and school environment.
WHAT ARE NATIONAL ACHIEVEMENT SURVEYS?
National achievement surveys are large-scale assessment exercises designed to determineeducational standards across the country.
They use a representative sample of students and must be carefully designed to fit the groupbeing assessed.
National achievement surveys are not examinations. They check the general health of theeducation system: they don’t test individual students!
The main purposes of large-scale education assessments are:
to measure typical levels of achievement – i.e. find out what students achieve in key subjects
to make comparisons – e.g. between girls and boys, among states etc.
to monitor trends over time – i.e. track progress
to investigate background factors that may affect educational outcomes – e.g. home context and school environment.
Cover im
age: Fabrice Florin
Copyright © 2022 FDOKUMEN