The Determinants of Student Achievement in Government and Private Schools in Pakistan
35
The Pakistan Development Review 42 : 4 Part II (Winter 2003) pp. 841–876 The Determinants of Student Achievement in Government and Private Schools in Pakistan MONAZZA ASLAM * 1. INTRODUCTION This study is driven by some fundamental issues evolving in Pakistan’s educational set-up. In the past few decades, the country has been experiencing what can only be termed a dramatic revolution in education provision. There has been an explosion of private schooling mostly at the primary but at higher levels as well and, somewhat surprisingly, private schooling cannot be relegated the status of an urban èlite phenomenon alone [Andrabi, et al. (2002)]. This has taken the form of many poor households and those in rural areas opting to send their children to fee-paying private schools rather than the non-fee charging government schools. This transformation of the education sector has generated many concerns among which the ‘equity’ issue has been raised to the fore. The unprecedented growth of cheap private schooling has also raised questions regarding the role of these institutions in the delivery of education, the question of parental ‘choice’ 1 as well as the future of government educational policy. In this scenario, it has become critical to understand how pupils educated in the two broadly divided school types—government and private—fare in terms of measures of achievement and skills in literacy and numeracy. This is primarily because achievement scores are one of the main ways in which policy-makers can analyse the translation of educational inputs into outputs, one of the ways of measuring which is achievement scores. Additionally, the question of which inputs Monazza Aslam is reading Economics at Wolfson College, University of Oxford, England. Auther’s Note: This is a preliminary paper based on my current doctoral research at the University of Oxford. I am particularly grateful to G. G. Kingdon for the ideas, comments, and suggestions on this paper, as well as tremendous help in the fieldwork stage from which the data for this paper were gathered. I would also like to thank the participants of the CSAE lunchtime seminar series at the Department of Economics, University of Oxford, for their suggestions, and the participants at the 19th AGM of the Pakistan Society of Development Economists (PSDE) for their feedback and hospitality. Any errors and omissions are, of course, mine. 1 Irvine (2004) provides a recent and highly comprehensive analysis of the myth of choice in education among Pakistani households in Sheikhupura district in the Punjab.
Transcript of The Determinants of Student Achievement in Government and Private Schools in Pakistan

The Pakistan Development Review 42 : 4 Part II (Winter 2003) pp. 841–876
The Determinants of Student Achievement in Government and Private Schools
in Pakistan
MONAZZA ASLAM*
1. INTRODUCTION
This study is driven by some fundamental issues evolving in Pakistan’s educational set-up. In the past few decades, the country has been experiencing what can only be termed a dramatic revolution in education provision. There has been an explosion of private schooling mostly at the primary but at higher levels as well and, somewhat surprisingly, private schooling cannot be relegated the status of an urban èlite phenomenon alone [Andrabi, et al. (2002)]. This has taken the form of many poor households and those in rural areas opting to send their children to fee-paying private schools rather than the non-fee charging government schools. This transformation of the education sector has generated many concerns among which the ‘equity’ issue has been raised to the fore. The unprecedented growth of cheap private schooling has also raised questions regarding the role of these institutions in the delivery of education, the question of parental ‘choice’1 as well as the future of government educational policy.
In this scenario, it has become critical to understand how pupils educated in the two broadly divided school types—government and private—fare in terms of measures of achievement and skills in literacy and numeracy. This is primarily because achievement scores are one of the main ways in which policy-makers can analyse the translation of educational inputs into outputs, one of the ways of measuring which is achievement scores. Additionally, the question of which inputs
Monazza Aslam is reading Economics at Wolfson College, University of Oxford, England. Auther’s Note: This is a preliminary paper based on my current doctoral research at the University
of Oxford. I am particularly grateful to G. G. Kingdon for the ideas, comments, and suggestions on this paper, as well as tremendous help in the fieldwork stage from which the data for this paper were gathered. I would also like to thank the participants of the CSAE lunchtime seminar series at the Department of Economics, University of Oxford, for their suggestions, and the participants at the 19th AGM of the Pakistan Society of Development Economists (PSDE) for their feedback and hospitality. Any errors and omissions are, of course, mine.
1Irvine (2004) provides a recent and highly comprehensive analysis of the myth of choice in education among Pakistani households in Sheikhupura district in the Punjab.
Monazza Aslam 842
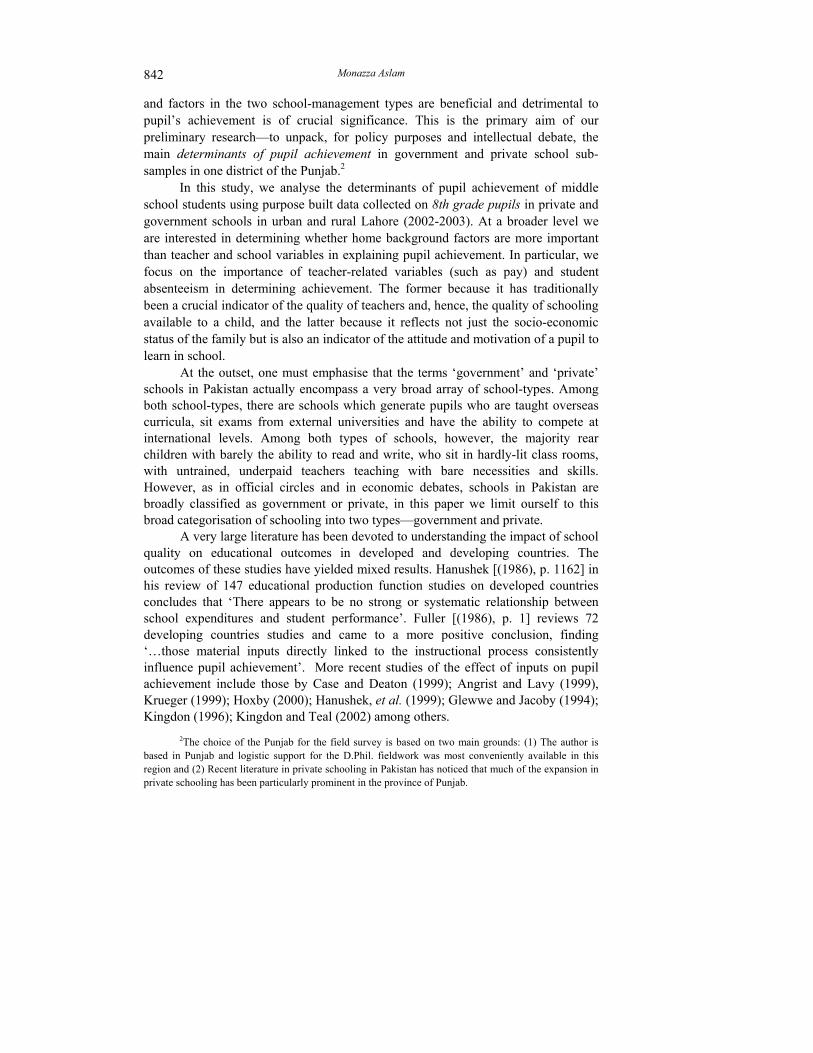
and factors in the two school-management types are beneficial and detrimental to pupil’s achievement is of crucial significance. This is the primary aim of our preliminary research—to unpack, for policy purposes and intellectual debate, the main determinants of pupil achievement in government and private school sub-samples in one district of the Punjab.2
In this study, we analyse the determinants of pupil achievement of middle school students using purpose built data collected on 8th grade pupils in private and government schools in urban and rural Lahore (2002-2003). At a broader level we are interested in determining whether home background factors are more important than teacher and school variables in explaining pupil achievement. In particular, we focus on the importance of teacher-related variables (such as pay) and student absenteeism in determining achievement. The former because it has traditionally been a crucial indicator of the quality of teachers and, hence, the quality of schooling available to a child, and the latter because it reflects not just the socio-economic status of the family but is also an indicator of the attitude and motivation of a pupil to learn in school.
At the outset, one must emphasise that the terms ‘government’ and ‘private’ schools in Pakistan actually encompass a very broad array of school-types. Among both school-types, there are schools which generate pupils who are taught overseas curricula, sit exams from external universities and have the ability to compete at international levels. Among both types of schools, however, the majority rear children with barely the ability to read and write, who sit in hardly-lit class rooms, with untrained, underpaid teachers teaching with bare necessities and skills. However, as in official circles and in economic debates, schools in Pakistan are broadly classified as government or private, in this paper we limit ourself to this broad categorisation of schooling into two types—government and private.
A very large literature has been devoted to understanding the impact of school quality on educational outcomes in developed and developing countries. The outcomes of these studies have yielded mixed results. Hanushek [(1986), p. 1162] in his review of 147 educational production function studies on developed countries concludes that ‘There appears to be no strong or systematic relationship between school expenditures and student performance’. Fuller [(1986), p. 1] reviews 72 developing countries studies and came to a more positive conclusion, finding ‘…those material inputs directly linked to the instructional process consistently influence pupil achievement’. More recent studies of the effect of inputs on pupil achievement include those by Case and Deaton (1999); Angrist and Lavy (1999), Krueger (1999); Hoxby (2000); Hanushek, et al. (1999); Glewwe and Jacoby (1994); Kingdon (1996); Kingdon and Teal (2002) among others.
2The choice of the Punjab for the field survey is based on two main grounds: (1) The author is based in Punjab and logistic support for the D.Phil. fieldwork was most conveniently available in this region and (2) Recent literature in private schooling in Pakistan has noticed that much of the expansion in private schooling has been particularly prominent in the province of Punjab.
Students Achievement in Government and Private Schools 843
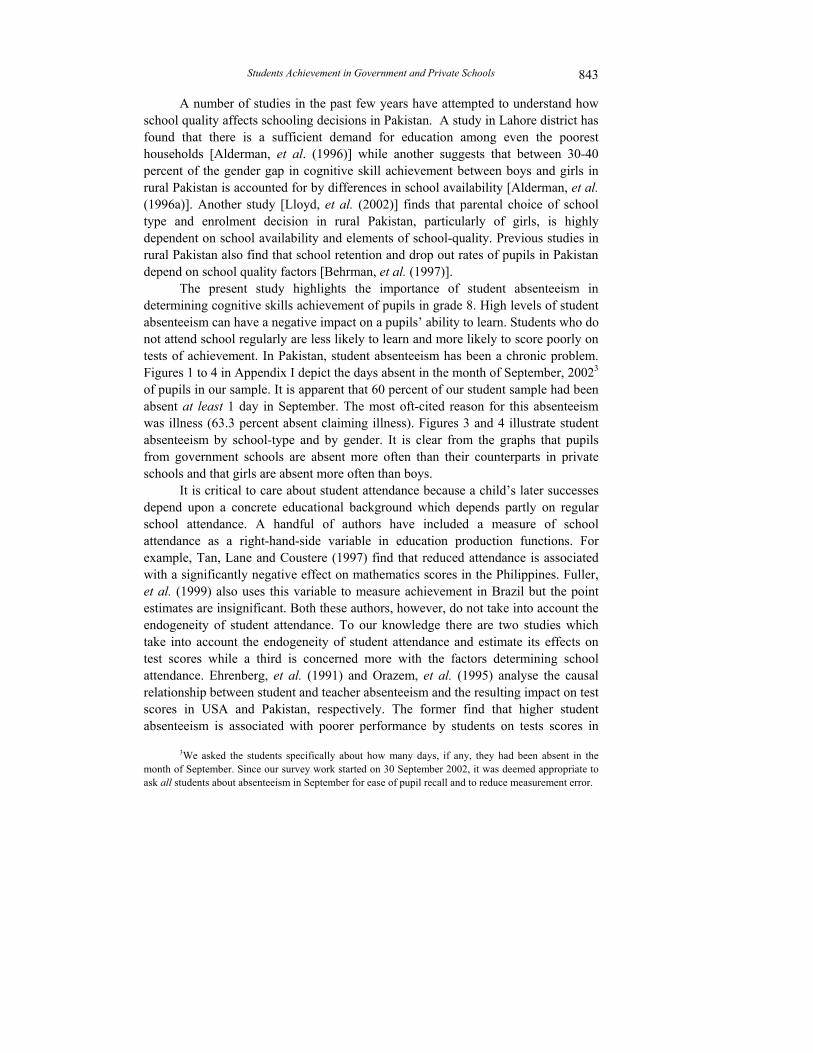
A number of studies in the past few years have attempted to understand how school quality affects schooling decisions in Pakistan. A study in Lahore district has found that there is a sufficient demand for education among even the poorest households [Alderman, et al. (1996)] while another suggests that between 30-40 percent of the gender gap in cognitive skill achievement between boys and girls in rural Pakistan is accounted for by differences in school availability [Alderman, et al. (1996a)]. Another study [Lloyd, et al. (2002)] finds that parental choice of school type and enrolment decision in rural Pakistan, particularly of girls, is highly dependent on school availability and elements of school-quality. Previous studies in rural Pakistan also find that school retention and drop out rates of pupils in Pakistan depend on school quality factors [Behrman, et al. (1997)].
The present study highlights the importance of student absenteeism in determining cognitive skills achievement of pupils in grade 8. High levels of student absenteeism can have a negative impact on a pupils’ ability to learn. Students who do not attend school regularly are less likely to learn and more likely to score poorly on tests of achievement. In Pakistan, student absenteeism has been a chronic problem. Figures 1 to 4 in Appendix I depict the days absent in the month of September, 20023 of pupils in our sample. It is apparent that 60 percent of our student sample had been absent at least 1 day in September. The most oft-cited reason for this absenteeism was illness (63.3 percent absent claiming illness). Figures 3 and 4 illustrate student absenteeism by school-type and by gender. It is clear from the graphs that pupils from government schools are absent more often than their counterparts in private schools and that girls are absent more often than boys.
It is critical to care about student attendance because a child’s later successes depend upon a concrete educational background which depends partly on regular school attendance. A handful of authors have included a measure of school attendance as a right-hand-side variable in education production functions. For example, Tan, Lane and Coustere (1997) find that reduced attendance is associated with a significantly negative effect on mathematics scores in the Philippines. Fuller, et al. (1999) also uses this variable to measure achievement in Brazil but the point estimates are insignificant. Both these authors, however, do not take into account the endogeneity of student attendance. To our knowledge there are two studies which take into account the endogeneity of student attendance and estimate its effects on test scores while a third is concerned more with the factors determining school attendance. Ehrenberg, et al. (1991) and Orazem, et al. (1995) analyse the causal relationship between student and teacher absenteeism and the resulting impact on test scores in USA and Pakistan, respectively. The former find that higher student absenteeism is associated with poorer performance by students on tests scores in
3We asked the students specifically about how many days, if any, they had been absent in the month of September. Since our survey work started on 30 September 2002, it was deemed appropriate to ask all students about absenteeism in September for ease of pupil recall and to reduce measurement error.

Monazza Aslam 844
USA (pp. 99) and the latter find that student attendance has a consistently negative but imprecisely measured effect on pupil achievement (pp. 13) in Pakistan. The final study by Bedi and Marshall (2000) analyses the determinants of student absenteeism in Honduras, treating pupil achievement as endogenous. The authors find that the expected human capital benefit, or pupil achievement, is an important determinant of school attendance (pp. 22).
Our study is one of the only attempts to address the impact of student absenteeism on achievement for Punjab, Pakistan. The only other published study we are aware of is by Orazem, et al. (1995) but this study has a number of methodological drawbacks. Orazem, et al.’s study also focuses on a different province and at a different level of education. Another unique feature of our study is that we have individual level data available to us. Ehrenberg, et al. (1991) themselves note that perhaps one of the problems in their study is that by aggregating across school districts, their variables may face substantial measurement error. We do not face this problem due to the nature of our data set.
It is worth emphasising that this paper presents preliminary evidence rather than definitive conclusions. Although the results provide food for thought, there is room for considerable improvement. This pertains specifically to dealing with endogeniety of inputs to schooling as well as sample selectivity problems. This paper is structured into 7 sections. Section 2 analyses the economic model and the conceptual and econometric limitations of educational production function analysis. Section 3 describes the data utilised in this study. Section 4 reviews the method adopted. Section 5 estimates the main relationships in the educational achievement function and Section 6 provides a comparison of the results with some results obtained by other studies while Section 7 concludes.
2. ECONOMIC MODELLING OF ACHIEVEMENT AND ESTIMATION ISSUES
The proposal that educational inputs should be important determinants of educational outcomes is one that appeals to common sense. A priori, existing empirical literature and logic seem to suggest a number of determinants of pupil achievement. One way of quantifying the determinants of students’ achievement is to take the production function (also known as the ‘input-output’) approach. The model underlying this approach is straightforward and postulates that the output of the educational process is related to a series of measurable inputs:4
Aij = f ( Iij, Fij, Pj, Sj, Tj, єij) … … … … … (1)
4The education production model portrays the relationship as cumulative, i.e. past inputs are important in determining current achievement. Given this, an alternative specification would be to estimate the ‘value-added’ production function which necessitates achievement data at two points in time so as to capture the change in achievement over time. These data requirements, however, are hardly ever met in developing countries.
Students Achievement in Government and Private Schools 845
Where
Aij = Educational achievement (measured by test scores) of student i in school j.
Iij = Individual characteristics of pupil i such as age, gender, ability etc. Fij = Family background/parental characteristics of pupil i such as parental
education, family income/wealth, household size and structure etc. Pj = Peer group variables of student i in school j such as average ability of
students in the same class/section, proportion of females in class/section, average mother’s education etc.
Sj = Characteristics of school j, such as school type, location (urban/rural), level of the school such as middle, high etc., class size, resources available in the school etc.
Tj = Teacher characteristics in school j such as gender, teacher pay, education, training, experience, tenure etc.
єi = unexplained variation in Aij, assumed to be distributed normally with mean zero and constant variance.
Unfortunately, standard textbook analyses of production function specifications provide very little insight into the appropriate specifications of the educational production function, considering only stylised relationships between capital, labour and output. The education production function is unknown and has to be estimated using imperfect, and often, incomplete data. Also, unlike the standard production function of the firm, where various variables are amenable to variation, at least in the long run, as already mentioned, there are various inputs into the education production function (such as pupil genetic endowment and socio-economic status) that cannot be varied by policy-makers.
Despite these conceptual problems, the ‘technological’ relationship in (1) has become quite popular and controversial at the same time. Its popularity stems from its simplicity in explaining a crucial relationship. However, controversy surrounds the estimation of this deceptively simple relationship and it is to the limitations of this approach that we turn before estimating an education production function for Pakistan. 2.1. Conceptual Difficulties and Limitations to Empirical Analysis 2.1.1. Endogeneity
One of the potentially most serious problems associated with the above function is the fact that a number of inputs entered as explanatory variables are endogenous. Inability to address endogeneity and naively estimating Equation (1) using OLS can give biased coefficients of all included variables. At best, in the presence of endogeneity, one can only give a correlational interpretation to the
Monazza Aslam 846
results, rather than a causal one. Since this is one of the most frequent problems faced, it is worth analysing in more detail and understanding not only why it might be a problem but also how solutions can be found for it.
One of the most likely reasons to encounter endogeneity in education production is the fact that a number of the inputs are choice variables. Not only parents, but also children, teachers and their schools have a considerable amount of discretion in choosing the inputs that go into learning, and hence, pupil achievement. When some of these are unobservable by the researcher, such as parental or child motivation and teacher effort, they are captured in the error term and are correlated with an included regressor, and we cannot be sure that the estimated parameter of this regressor is capturing just the effect of this regressor on the dependent variable. The observed association between the outcome and explanatory variable of interest, therefore, is likely to be misleading because it partly reflects the effect of omitted factors (captured in εi) that are related to the regressor and the dependent variable. If one could estimate these ‘unobservables’, this ‘omitted variable bias’ could be considerably reduced. In practice, however, there are many variables which cannot be successfully measured as independent regressors in the equation of interest. This problem of endogenous variables is likely to lead to biased parameter estimates in naive OLS regression analysis. Two of the variables we are particularly interested in—teacher pay and student absenteeism—are potentially endogenous. Let us analyse each in turn.
It has been argued that higher teacher pay may increase pupil achievement if teacher pay is decidedly linked to teacher quality. Evidence from developed countries provides limited evidence of a systematic relationship. A study by Hanushek, Kain and Rivkin (1999), found only a modest impact of teacher salary on student performance using data on the USA. If, however, a causal relationship exists, there are various possibilities that can explain it. Firstly, higher teacher pay may be used to attract a better pool of applicants from the job market. By offering wages higher than the market alternatives, the school may be able to improve the average quality of the pool of applicants applying for jobs in that school, which may arguably be translated into higher pupil achievement. Secondly, higher pay may be used by schools to prevent their employees from leaving—retention objectives. This is because the existence of turnover and training costs makes it very costly for a school to lose an employee. Thirdly, more within the realms of the efficiency wage literature, higher teacher pay may be used to motivate teachers to work harder. In reality, however, higher teacher pay is often associated with schools serving students from a better socio-economic status. In addition, if schools pay teachers ‘performance-related pay’ as the motivating rationale of efficiency wages would suggest, one may find a reverse causality between teacher pay and pupil achievement (higher pupil achievement may be rewarded by higher teacher pay). It is difficult to disentangle the true relationship between teacher pay and pupil achievement due to

Students Achievement in Government and Private Schools 847
this possible endogeneity, stemming from the economists inability to ‘observe’ key variables.
Student Absenteeism is, surprisingly, a variable that has not been given much attention in studies of student achievement. What is even more surprising is how it has not figured much in the debate on pupil achievement in Pakistan, where student absenteeism from school remains a persistent and ever-present problem. In our data set, Head Teachers’ response to the ‘Attendance rate of students at the Primary, Middle and Higher levels’ revealed that the attendance is an average5 of 74 percent at the Primary, and 78 percent at Secondary and Higher levels—for every 100 pupils in Middle level, for example, 22 pupils are absent daily on average.
Student absence may be due to illness, which draws attention to the nutritional and health aspects of child development. Alternatively, it may be related to socio-economic status—self-employed parents may need sons to help with work, in particular, in rural areas farmers may need seasonal help in harvesting seasons.6 In addition, girls may be absent from school because the burden of household chores (such as looking after babies or the elderly, or other domestic work) may fall on them. Another potential factor leading to absenteeism could very well be pupil ability. Intuitively, one expects a negative relationship—a less able child may also be less motivated to attend school, which in turn, could decrease his achievement. Therefore, much as in the case of teacher pay, if student absenteeism is tied to student achievement, a reverse causality emerges in estimating achievement using student absenteeism as a regressor. In a similar vein, we expect teacher absenteeism to be endogenous—if lower pupil achievement leads to lower teacher morale which generates higher teacher absenteeism, we expect teacher attendance to be endogenous. Moreover, if an unobservable captured in the error term, such as pupil ability or unmeasured elements of child health, is also correlated with teacher absenteeism, endogeneity of teacher absenteeism can emerge.
To sum up, endogeneity lies at the root of a number of theoretical and empirical critiques of the findings of the literature in this field of study. Empirically, it is possible to deal with this problem in a number of ways and many of these various methods have been adopted and experimented with in the literature. These approaches can be categorised as those based on panel data, randomised experiments, exogenous inputs and instrumental variable estimation (IV), where IV methods can be further classified as those using instruments based on some ‘natural experiment’7 and those which appeal to empirical significance in the data set.
5The averages are taken across the 65 sample schools. 6Although Lahore is primarily a metropolitan district, the rural areas are still agricultural. In fact,
46.5 percent of the children in the sample mentioned parents who were self-employed and, although our data does not allow us to make this distinction, in the field we found that self-employment was almost always among the following categories: father was a farmer, had his own shop or retail business, or for children from wealthier families, father had a more profitable and wide-spread business.
7Angrist and Lavy (2001).

Monazza Aslam 848
Ideally, one would want to identify school-reforms or laws which induce exogenous variation in school resources as in the study above. In reality, such exogenous variation is difficult to locate and data limitations prevail. An alternative route is to seek ‘instruments’ in the form of exclusion restrictions—in our case, variables that help explain teacher pay and student absenteeism but do not directly enter as explanatory variables in Equation (1). Kingdon and Teal (2002) use this method to find instruments which are well correlated with achievement and teacher pay to deal with the endogeniety of both these variables in their analysis of performance related pay and pupil achievement in India. In the private school sector, for example, they instrument teacher pay with permanence of status and gender on the empirical belief that in the private sector these variables directly enter the teacher pay equation but only influence pupil achievement indirectly through their effect on teacher pay. Instrumental variable estimation, therefore, relies on finding credible instruments for the endogenous variables. In this paper, lack of convincing variables restricts us to reporting OLS parameter estimates alone but we recognise the possible biases in our parameter estimates.8 2.1.2 Sample Selection
Sample selection bias is another potentially important problem in estimating education production functions. When the sample used in a statistical analysis in not randomly drawn from the population, selection bias may arise.9 In such a situation, OLS estimation will lead to misleading inferences. In the discussion which follows, we provide an introduction of the primary issue followed by an intuitive and theoretical analysis of how sample selectivity may lead to biased estimates and how solutions may be found.
As an example, consider the case where we have data only on a sample of private school pupils (or equivalently, only on government school pupils). If we are interested in estimating an achievement production function on this sample of private school pupils, and if they are also more likely to be more motivated and have higher achievement, our sample will be endogenously selected and failure to account for
8We attempted to address possible endogeneity of student teacher-ratio, teacher pay, student
absenteeism and teacher absenteeism by attempting to seek valid instruments for the endogenous variables. However, given the constraints of our data set—in particular the fact that different endogenous variables are at different levels of aggregation, such as the individual, the teacher and the school—it is not possible to address the endogeneity of all the aforementioned variables. At this point, it is pertinent to point out that our measure of pupil’s innate ability, as measured by the score on Raven’s Standard Progressive Matrices test, has also been criticised for being possibly endogenous on the claim that this score is not independent of the child’s home and school environment. In the absence of any control for ability this score provides a measure, albeit imperfect, and potentially endogenous.
9See Lee (1983); Maddala (1983); Nakosteen and Zimmer (1980); Willis, et al. (1979); Kingdon (1996); Greene (2000); Newey, et al. (1990) and Heckman (1990) for literature on sample selection and applications to education, migration and private/public school choice.

Students Achievement in Government and Private Schools 849
that would lead to biased parameter estimates. If pupil motivation is an unobserved variable captured in the error term, and if more motivated pupils are not only likely to choose private schools (so that this variable is in the school choice error term) but also greater motivation leads to higher achievement (motivation lurks in the error term of the achievement equation), we can see it is correlated error terms which explain sample selectivity.
Let us consider now why endogenously selected samples lead to biased parameter estimates in an OLS regression. Suppose we have data only on a sample of private school pupils and we are interested in analysing the importance of parental wealth in determining pupil achievement in private schools. To do so, we fit the following equation on the sample of private school pupils:
Ai = β Xi + ui … … … … … … (2)
where Ai is the achievement score of student i, Xi is a vector of the ith student’s parental characteristics, β is a vector of parameters and ui is the disturbance term assumed to be normally distributed with mean 0 and variance σ u2.
Now, given the institutional educational set-up in Pakistan, we know that there are two types of schools to which parents can send their children—private and government. We can model parental choice of school type as a binary choice variable as follows. Suppose now that Z* is a continuous and unobserved latent variable which determines parental choice of school type. We can represent Z* as:
Zi* = γ Wi + εi … … … … … … (3)
where Wi is a vector of variables influencing type of school parents send their children to, γ is a vector of parameters and εi is the normally distributed error term with mean 0 and variance σε2. Since Z* is assumed unobserved/latent, we can define it as:
Zi = 1 if Zi* > 0
Zi = 0 if Zi* 0
where 1 represents private and 0 represents government schools, respectively. Since we are interested in estimating Equation (2) on private school pupils only, the selection rule of Zi
* > 0 suggests that (3) becomes:
Zi* = γ Wi + εi > 0
i.e. εi >– γ Wi
If we are to take the conditional expectation of (2) given the sample selection rule it becomes:
E (Ai ׀ εi > – γ Wi) = β Xi + E (ui ׀ εi >– γ Wi) … (4)

Monazza Aslam 850
If there is any correlation between unobserved factors determining achievement (captured in ui) and unobservables determining school choice (in ׀ εi), then the conditional expectation E (ui ׀ εi > – γ Wi) would be non zero. Since one of the fundamental conditions of OLS would be violated, we can expect the parameter estimates of (1) estimated using simple OLS to be biased. It is also fairly easy to show that if the corr (ui, ׀ εi) 0 then E (ui ׀ εi > – γ Wi) 0 but we will not do so here due to space constraints.
Intuitively, suppose that parental wealth is an important determinant of school choice (Wi) and pupil achievement (Xi). Also suppose that child motivation is an unobservable determining school-choice (captured in ׀ εi) and pupil achievement (captured in ui) conditional on school chosen. This suggests that at given levels of parental wealth, more motivated children are more likely to be in private schools and also likely to be high achievers—corr (ui, ׀ εi) > 0, the error terms are positively correlated.
First, consider the case when a child’s parents wealth suggests that the child is equally likely to be in a private or a government school (in other words that γ Wi = 0). For this child, therefore, we will observe her in the private school sample if she is highly motivated i.e. if ׀ εi > 0 and in the government school if she lacks much ambition so that ׀ εi < 0. Since we have said that the error terms are positively correlated, E (ui ׀ εi > – γ Wi) > 0.
Secondly, consider the case where a child’s observed parental wealth suggests that she is highly likely to attend private school i.e. γ Wi > 0. In this case, this child’s ability or motivation is irrelevant in determining school choice and an observable (parental wealth) will capture the whole effect and we can argue that E (ui ׀ εi ) 0. If we are to average over all children in the private school sample, E (ui ׀ εi > – γ Wi) 0, is effectively an omitted variable and it is correlated with the included Xi. It is because of these problems that OLS estimation will yield biased parameter estimates. It is also pertinent to point out that there will be a negative correlation between observed parental wealth and the omitted variable. This stems from our observation that when parental wealth is low, E (ui εi > – γ Wi) > 0 but when parental wealth is high and the child is assumed to almost certainly to go to private school, E (ui εi > – γ Wi) 0. This observation reveals to us a possible downward bias in the OLS parameter estimates.10
Heckman (1979) in his seminal paper suggested a method of overcoming the bias associated with sample selectivity. Recognising sample selectivity essentially as a bias due to the misspecification of the conditional mean of Ai because E (ui ׀ εi > – γ Wi) 0, Heckman suggested a two-step procedure which involves the inclusion of a correction term. To employ his approach, one has to adopt the assumption that ui and ׀ εi are independently and identically distributed N (0, Σ) where:
10Draws heavily from Kingdon (1994), Thesis.
Students Achievement in Government and Private Schools 851
2
2µ µε
µε ε
σ σσ σ
∑ =
and where (ui, εi) are independent of Wi. Given this and the formula for the conditional expectation of a truncated random variable, note:
E (ui ׀ εi > – γ Wi) = (σ ε u / σ u2 ) {φ(γ Wi) / Ф(γ Wi)}
where φ(.) and Ф(.) are the probability density and cumulative distribution functions of the standard normal distribution. The term {φ(γ Wi) / Ф(γ Wi)} is known as the inverse Mills ratio (IMR) commonly denoted as λi, and is a monotone decreasing function of the probability that an observation is selected into the given sample, in this case of private school pupils. However, to estimate λi we need the parameters γ and σε. This is where the ‘two-step’ comes into the picture. Heckman suggested calculating λi by estimating a probit for the selection equation in the first stage. Using the computed IMR, we can plug it into Equation (2) as an additional regressor which effectively becomes:
Ai = β Xi + c λi + ui … … … … … … (5)
where c = σ u ρ. Estimating (5) using OLS in step two yields consistent estimates of β and c.
The t-test of c is a test of sample selectivity—a significant t-statistic suggests sample selection is indeed taking place while an insignificant t-statistic suggests otherwise. In reality the two-step method is fairly easy to implement but a common concern is that the inclusion of the IMR introduces a particular form of heteroskedasticty and the second step standard errors need to be adjusted to account for the first step estimation. However, most econometric packages including STATA automatically adjust the standard errors.
The main issue in the two-step method is that of identification. Although the non-linearity of the probit function can identify the parameters of interest, the Wi vector in many instances needs to contain additional variables as identifying restrictions. In our example, we need at least one variable that directly affects choice of school type but does not directly explain pupil achievement (is not in Xi). In reality there are very few candidates that meet this requirement. Often economists have to rely on the empirical significance of a variable in the probit selection equation (and lack of significance in the equation of interest) as an identifying restriction. This technique is very open to econometric criticism although it may be the only alternative to OLS given data constraints. Once again, lack of suitable exclusion restrictions restricts us in this paper to analysing a sample of government and private school pupils which is possibly endogenously selected which may yield biased parameter estimates.
Monazza Aslam 852
3. DATA
The data for this study comes from a purpose-built school-based survey conducted by the author in Lahore district in Punjab province, Pakistan in 2002-2003. Using stratified random sampling on 65 schools (25 government and 40 private) in urban and rural Lahore, data was collected on 1887 pupils in grade 8th.
The survey collected data on pupils in any one section/class of grade 8 in the sample schools. The exception to this was the case where the private school sampled was effectively ‘mixed’ in name but not co-educational in the normal sense of the word. We found three possibilities. Either private schools were purely co-educational – the pupils of both genders interacted with each other, had the same facilities, and sat in mixed classes. This case was fairly normal and was easiest to deal with. The other possibility was where the school was constructed or deliberately made to operate in two-separate wings which were independent of each other, financially, and in terms of facilities available. This meant that any ‘wing’ could be randomly selected (boys wing or girls wing) and dealt as a ‘boys only school’ or a ‘girls only school’ respectively. The complicated scenario arose when the school visited was ‘mixed’ in the sense that boys and girls were both housed in the same building of the school, but were made to sit in gender-specific sections. Often, the teachers and even the class room facilities facing pupils of different genders in the same building were different. In this complicated scenario, the author randomly sampled one section/class each of both genders from grade 8 in that school. To ensure the right teachers were matched with the right pupils, and to take into account possible differences in teaching and even facilities for the pupils in the same building, the schools were entered as two separate schools.
Each pupil filled out a questionnaire containing questions on personal characteristics (age, motivation11, gender etc.), parental and family background (parental education and occupation, family structure and size, wealth and income etc.), schooling (books prescribed in school, length of the school week, family expenditure on schooling in the past year, hours of home tuition taken etc.) and opinions on various issues such as how important did they think schooling was for girls as compared to boys.
In addition, each child took the Raven’s Standard Progressive Matrices test and tests of numeracy and literacy. The Raven’s Progressive Matrices test has been used extensively in studies around the world in an attempt to control for the ever-elusive ‘ability’ of a child. The test consists of 60 items arranged in five sets (A, B, C, D, and E) of 12 items each. Each item contains a figure with a missing piece.
11In most studies, motivation or child’s educational aspirations are not controlled for. In our purpose designed study, special care was taken to obtain a measure, albeit not a perfect one, to capture child motivation. We asked the child the question: ‘What is the highest level of education you wish to attain?’ with all possible educational levels (such as Middle school or upto 8th grade, Matric or grade 10 etc.) as answer choices.
Students Achievement in Government and Private Schools 853
Below the figure are either six or eight alternative pieces to complete the figure, only one of which is correct. Each set involves a different principle or “theme” for obtaining the missing piece, and within a set and across the sets, the items are roughly arranged in increasing order of difficulty. This test was designed to measure a person’s ability to reason by analogy independent of language and formal schooling. Although there is some controversy about how independent this instrument really is of formal schooling, the raw score yields an estimate of ability which is arguably better than not having any estimate at all.
The literacy and numeracy tests were developed by the Educational Testing Service (ETS) for use by Knight and Sabot in their study in Africa [see Boissiere, et al. (1985)] and have been discussed extensively in Knight and Sabot (1990). Since then, these tests have been used successfully in studies of achievement, labour markets and schooling in various studies around the world [see Behrman and Lavy (1994) and Kingdon (1996)]. We adapted these tests to the Pakistani context, reduced the number of questions to test the pupils within a given time frame, and translated the tests into Urdu to administer them to children in the national language when the school was Urdu-medium.
Additionally, each child was weighed and their height and arm circumference measured to obtain anthropometric variables. The survey also collected information on a total of 339 teachers who taught the pupils in the section of grade 8 that was sampled in each school and collected data on school resources and expenditures by interviewing head teachers of the schools. Finally, mostly for consistency checks and for additional information, each child was sent home with a ‘parents questionnaire’ which was filled out by the parent (or the child asking the parent questions if parent was illiterate) and returned to school authorities the next day. Information on 1770 parent questionnaires was collected and collated.
4. METHOD
We are interested in investigating the factors that explain variations in student achievement. Different approaches exist in the literature modelling student achievement: (i) change in achievement regressed on change in inputs, (ii) experimental data, (iii) IV methods. We do not have panel data nor do we have data generated through a randomised experiment for Pakistan. The only approach available to us, therefore, is the OLS method supplemented with IV estimation to control for endogeneity bias and the Heckman two-step to control for the endogenous sample selection of students into private and government schools. In this paper we present estimates from the simple OLS models and relegate IV and sample selectivity corrected results to future work.
We will first fit OLS functions of pupil achievement. This will be a pooled model i.e. fitted on students in both types of schools—government and private. However, pooling across school-types imposes the constraint that, except for the

Monazza Aslam 854
intercept term, the vector of all other coefficients is identical across school-types. Therefore, as a second exercise, we report OLS parameter estimates of achievement production functions separately for government and private schools. However, as mentioned in detail above, estimating separate production functions for private and public schools involves the problem that the sub-samples of private and government school students may not be random draws from the student population but, rather, may be endogenously self selected. To avoid inconsistent OLS estimates, we should control for sample selectivity bias in the private and public school achievement functions using the Heckman two-step method. Inability to find credible exclusion restrictions limits us to reporting the results of the simple OLS and we recognise the parameter estimates are likely to be biased. Future work will address the issues of endogeneity and sample selectivity in some detail.
5. DISCUSSION OF RESULTS
Table 1 provides the definitions, means and standard deviations of all the variables included in the parsimonious models and future regressions. The descriptive statistics are presented by school-type to provide a better picture of the stark differences among the achievement, family background and school characteristics of children belonging to government and private schools.
5.1. The Pooled Model of Pupil Achievement
Achievement production functions are employed to fit two different pooled models—OLS with and without the private school dummy (PRIVATE). The independent variables or inputs into the educational production function fall into the following categories: characteristics of the pupils, their family background and household structure and characteristics of their teachers, schools and peer groups.
We are particularly interested in analysing how important institutional variables are, as compared to family background variables, in determining pupil achievement. Also, our more ‘micro’ concern is to analyse the impact of teacher pay and student absenteeism on student’s achievement levels. Since our unique data set and sample size allow us to experiment with a number of regressors, we adopt Hendry’s general to specific approach, including a number of variables in the initial regressions, and paring down the model to a more parsimonious one.
Our dependent variable of interest is the achievement score of the pupil in tests of numeracy and literacy respectively. These tests were composed of 25 questions each; therefore, the highest possible score in ACHIEVE (sum of READING and MATH tests) is 50 while that in MATH and READING is 25 each. The highest attainable score in RAVEN is 60 but the maximum score obtained by our sample is 54. The distributions of the test scores are not truncated, exhibit

Table 1
Definitions, Means, Standard Deviations, and Minimum and Maximum Values of Variables Total Government Private
Variable Description Mean S.D Mean S.D Mean S.D Pupil Characteristics
ACHIEVE Student’s total achievement score, i.e. sum of READING and MATH 23.29 7.21 20.79 5.76 26.59 7.58
READING Student’s score on reading (literacy) test 14.38 4.07 13.30 3.61 15.80 4.21 MATH Student’s score on math (numeracy) test 8.91 4.21 7.48 3.31 10.79 4.51 RAVEN
Student’s score on the ability test (Raven’s Progressive Matrices Test) 28.77 10.49 25.79 9.74 32.69 10.15
FEMALE12 Student’s gender; female = 1, male =0 0.53 0.49 0.53 0.49 0.54 0.49 EDU_WISH Child’s educational aspirations; index from 1-6, for e.g.
1= up to class 8th, 2 = up to Matric (grade 10) etc. 4.76 1.37 4.46 1.39 5.15 1.25 AGE_YRS Age of child, in years 13.63 1.13 13.71 1.26 13.52 0.94 BMI Body Mass Index computed as: child weight (kg) /
(height of child in meters)2 17.32 3.46 16.99 3.16 17.76 3.79 BMI2 Square of the BMI 312.10 141.93 298.72 125.49 329.72 159.43 TIRED Index of how often child feels tired in class; 1= very
rarely, 2= sometimes, 3 = quite often and 4 = most of the times 1.46 0.69 1.43 0.66 1.49 0.73
SABSENT13 Number of days pupil absent from school in September 1.87 2.66 1.89 2.04 1.65 2.14 HTU_TAKEN Hours of home tuition taken by student in January –
August, 2002. 264.44 294.64 282.95 291.09 240.14 297.67 HOME_HELP Hours of home help/week provided by student in
various tasks 8.26 9.49 10.46 10.86 5.32 6.16 Continued—
12For 0/1 variables mean represents the proportion of ones in the sample. 13This variable was highly skewed with a very large proportion of values (40 percent) taking the value 0. Only 19 students were outliers (being absent for
more than 10 days). This variable was censored at 10 so as to reduce the skewness of the distribution and the effect of outliers.

Table 1—(Continued)
Family Background FEDYRS Father’s education in years 9.77 4.73 8.68 4.66 11.19 4.44 FED2 Square of father’s education (yrs) 117.73 80.67 97.14 72.99 144.83 82.29 MEDYRS Mother’s education in years 7.07 5.08 5.79 4.82 8.76 4.92 MED2 Square of mother’s education (yrs) 76.19 71.47 56.90 61.59 101.76 75.56 NUMBRO Total number of brothers child has (younger and older) 1.98 1.29 2.16 1.30 1.74 1.23 NUMSIS Total number of sisters (younger and older) 1.94 1.42 2.08 1.48 1.76 1.32 BOOKS Quantity of books at home 162.96 300.49 116.73 211.59 223.73 379.16 FREEHELP
Hours/week mother or father or other siblings help pupil with school work 8.39 10.66 10.14 11.79 6.19 8.55
WEALTH1_2 Wealth index squared 42641.44 43155.47 30860.54 35800.14 58170.80 46966.02 Teacher Characteristics
AVG_TEDU Average of teachers’ education in years 14.46 0.92 14.43 0.78 14.49 1.07
LNAVG_TPAY Average staff salaries in rupees per month 5691.41 2357.82 8.85 0.17 7.98 0.71 AVG_TRAI Average teacher training in years 1.01 0.66 1.40 0.55 0.50 0.40 AVG_TENU Average years teachers have been in given school 7.10 4.44 8.88 4.00 4.77 3.87 AVG_TEXP Average years of experience teacher has 12.15 5.97 15.83 4.07 7.30 4.39 AVGT_ABS14 Average days teacher was absent from school in past
year 19.21 19.04 21.20 9.40 9.05 4.99 MT_EDU Math teachers years of education 14.65 1.15 14.47 1.08 14.89 1.19 LN_MTPAY Salary of the Math teacher teaching grade 8th 6408.39 3582.77 8.93 0.33 8.06 0.70 MT_TRAIN Training of Mathematics teachers 0.71 0.93 0.92 1.06 0.43 0.64 MT_TENU Years Math teacher has been in given school 3.95 4.29 4.39 4.16 3.36 4.39
Continued—
14This variable was highly skewed with a very small proportion of teachers in government schools being absent for up to 115 days in a year. In
government schools, this variable was truncated at 50.
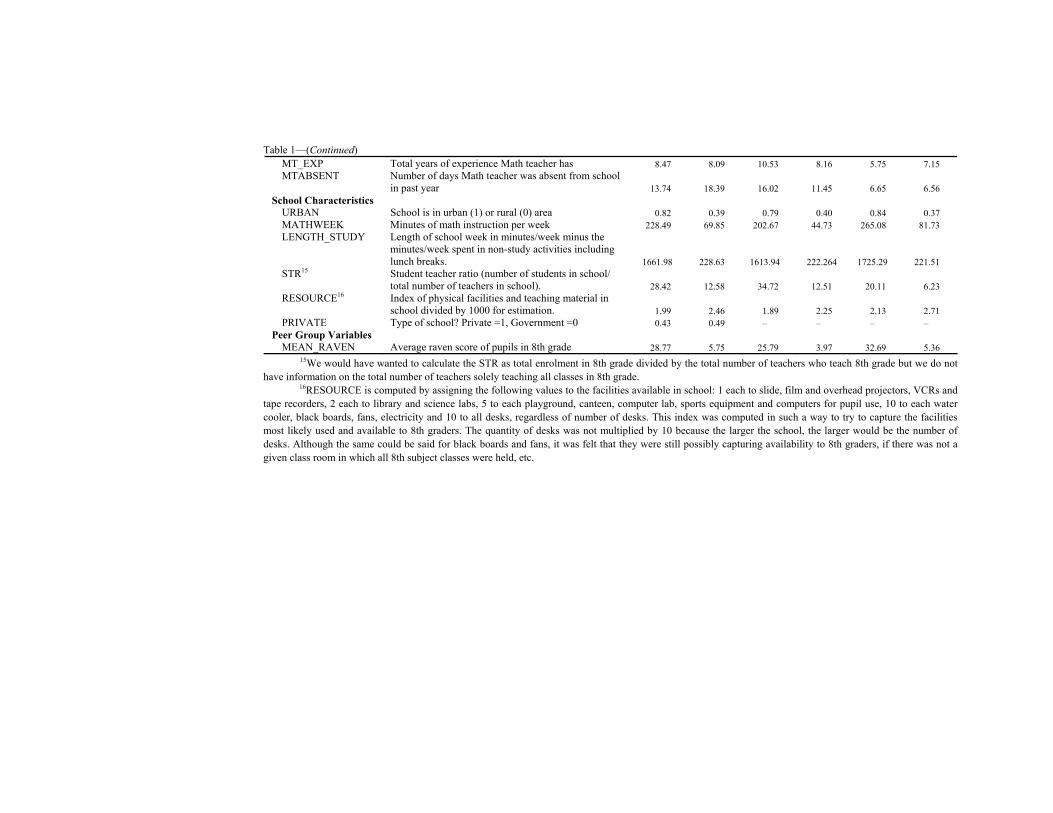
Table 1—(Continued) MT_EXP Total years of experience Math teacher has 8.47 8.09 10.53 8.16 5.75 7.15 MTABSENT Number of days Math teacher was absent from school
in past year 13.74 18.39 16.02 11.45 6.65 6.56 School Characteristics
URBAN School is in urban (1) or rural (0) area 0.82 0.39 0.79 0.40 0.84 0.37 MATHWEEK Minutes of math instruction per week 228.49 69.85 202.67 44.73 265.08 81.73 LENGTH_STUDY Length of school week in minutes/week minus the
minutes/week spent in non-study activities including lunch breaks. 1661.98 228.63 1613.94 222.264 1725.29 221.51
STR15 Student teacher ratio (number of students in school/ total number of teachers in school). 28.42 12.58 34.72 12.51 20.11 6.23
RESOURCE16 Index of physical facilities and teaching material in school divided by 1000 for estimation. 1.99 2.46 1.89 2.25 2.13 2.71
PRIVATE Type of school? Private =1, Government =0 0.43 0.49 – – – – Peer Group Variables
MEAN_RAVEN Average raven score of pupils in 8th grade 28.77 5.75 25.79 3.97 32.69 5.36 15We would have wanted to calculate the STR as total enrolment in 8th grade divided by the total number of teachers who teach 8th grade but we do not
have information on the total number of teachers solely teaching all classes in 8th grade. 16RESOURCE is computed by assigning the following values to the facilities available in school: 1 each to slide, film and overhead projectors, VCRs and
tape recorders, 2 each to library and science labs, 5 to each playground, canteen, computer lab, sports equipment and computers for pupil use, 10 to each water cooler, black boards, fans, electricity and 10 to all desks, regardless of number of desks. This index was computed in such a way to try to capture the facilities most likely used and available to 8th graders. The quantity of desks was not multiplied by 10 because the larger the school, the larger would be the number of desks. Although the same could be said for black boards and fans, it was felt that they were still possibly capturing availability to 8th graders, if there was not a given class room in which all 8th subject classes were held, etc.
Monazza Aslam 858
substantial variance and appear to be normally distributed, which suggests that the tests are appropriate measures of achievement for the sampled population.
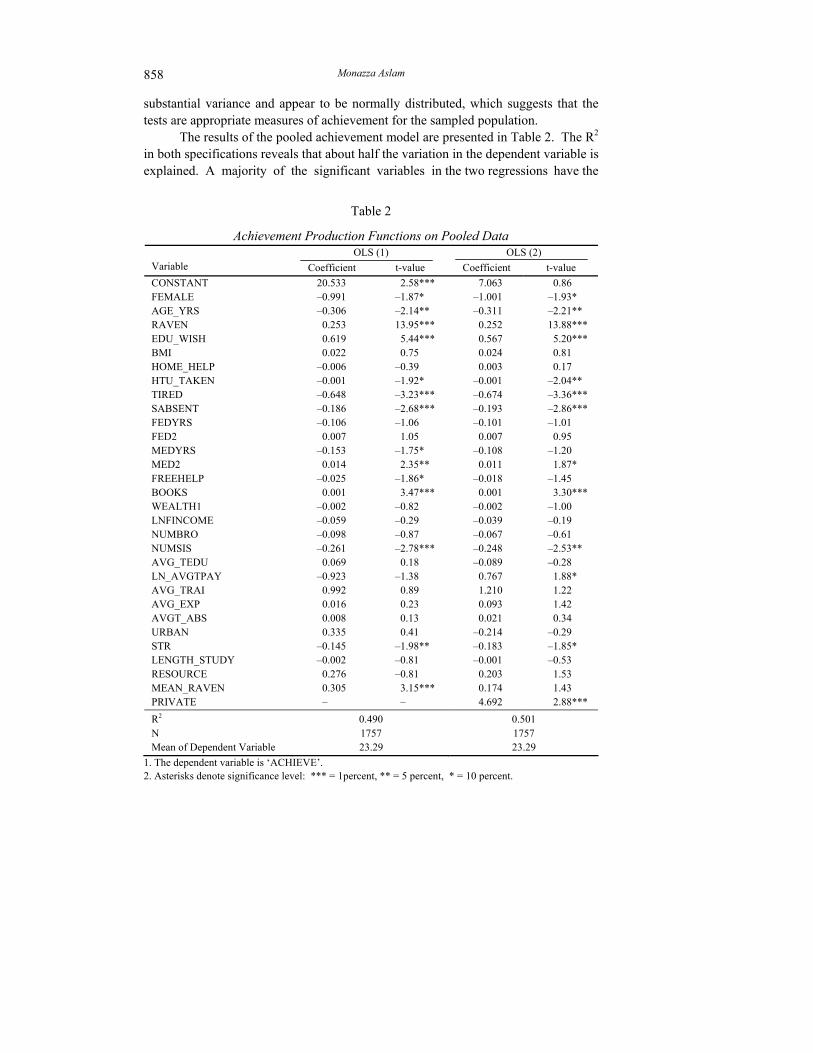
The results of the pooled achievement model are presented in Table 2. The R2 in both specifications reveals that about half the variation in the dependent variable is explained. A majority of the significant variables in the two regressions have the
Table 2
Achievement Production Functions on Pooled Data OLS (1) OLS (2)
Variable Coefficient t-value Coefficient t-value CONSTANT 20.533 2.58*** 7.063 0.86 FEMALE –0.991 –1.87* –1.001 –1.93* AGE_YRS –0.306 –2.14** –0.311 –2.21** RAVEN 0.253 13.95*** 0.252 13.88*** EDU_WISH 0.619 5.44*** 0.567 5.20*** BMI 0.022 0.75 0.024 0.81 HOME_HELP –0.006 –0.39 0.003 0.17 HTU_TAKEN –0.001 –1.92* –0.001 –2.04** TIRED –0.648 –3.23*** –0.674 –3.36*** SABSENT –0.186 –2.68*** –0.193 –2.86*** FEDYRS –0.106 –1.06 –0.101 –1.01 FED2 0.007 1.05 0.007 0.95 MEDYRS –0.153 –1.75* –0.108 –1.20 MED2 0.014 2.35** 0.011 1.87* FREEHELP –0.025 –1.86* –0.018 –1.45 BOOKS 0.001 3.47*** 0.001 3.30*** WEALTH1 –0.002 –0.82 –0.002 –1.00 LNFINCOME –0.059 –0.29 –0.039 –0.19 NUMBRO –0.098 –0.87 –0.067 –0.61 NUMSIS –0.261 –2.78*** –0.248 –2.53** AVG_TEDU 0.069 0.18 –0.089 –0.28 LN_AVGTPAY –0.923 –1.38 0.767 1.88* AVG_TRAI 0.992 0.89 1.210 1.22 AVG_EXP 0.016 0.23 0.093 1.42 AVGT_ABS 0.008 0.13 0.021 0.34 URBAN 0.335 0.41 –0.214 –0.29 STR –0.145 –1.98** –0.183 –1.85* LENGTH_STUDY –0.002 –0.81 –0.001 –0.53 RESOURCE 0.276 –0.81 0.203 1.53 MEAN_RAVEN 0.305 3.15*** 0.174 1.43 PRIVATE – – 4.692 2.88*** R2 0.490 0.501 N 1757 1757 Mean of Dependent Variable 23.29 23.29
1. The dependent variable is ‘ACHIEVE’. 2. Asterisks denote significance level: *** = 1percent, ** = 5 percent, * = 10 percent.
Students Achievement in Government and Private Schools 859
expected signs—older children achieve less, possibly reflecting class repetition; tiredness decreases achievement as does student absenteeism, and so on. Mother’s education has a positive effect on pupil achievement only if the mother has achieved at least five years of education. It is pertinent to point out the sign and significance of FEMALE in OLS(1) and OLS(2)—female students appear to achieve significantly less than their male counterparts in both specifications of the education production function.
The coefficient on PRIVATE suggests that, ceteris paribus pupils in PRIVATE schools achieve on average 4.69 points more as compared to government school students. It is apparent that the inclusion of PRIVATE has little effect on most of the coefficients that were previously significant in column 1. However, there are some changes in teacher characteristics. The sensitivity of some teacher variables with school type is understandable given the correlation between many teacher variables and the type of school they belong to. For example, we expect a negative correlation between LN_AVGTPAY and PRIVATE—teachers in private schools are paid significantly less than those in government schools. In column 1 we expect a downward bias in the coefficient on LN_AVGTPAY. The true effect of LN_AVGTPAY should be larger and more significant in column 2 which is what we observe. As mentioned before, however, the pooled model imposes constraints which can be overcome by estimating separate achievement production functions on the two sub-samples and we turn to these in the next sub-section. 5.2. Achievement Production Functions by School Type
In this section, we fit three separate production functions for pupil achievement, reading and mathematics scores. By doing so, we are able to analyse how pupils across private and public schools differ in terms of skills in the different subjects. In addition, when fitting production functions for Maths, we introduce characteristics of the Mathematics teacher/s and the amount of Maths instruction received by the pupils in a given week. This is based on the notion that although pupils’ general achievement and reading skills are likely to be affected by interaction with teachers in all subject areas such as Science, English and Social Studies etc., Mathematics skills are likely to be highly dependent on the quality and competence of the Mathematics teacher.
Tables 3, 4 and 5 report the results of these specifications by school-type. Note that the R2 of the government sub-samples in the Achievement, Reading and Maths production functions is much less than in the private sample. Firstly, we have a smaller sample of 25 government schools as compared to a larger sample of 40 private schools. Secondly, the variation in the dependent variables ‘ACHIEVE’, ‘READ’ and ‘MATHS’ in the government sample is much less than in the private sample (Table 1).

Monazza Aslam 860
Table 3
Achievement (OLS), Government and Private Schools OLS (1) OLS (2)
Variable Coefficient t-value Coefficient t-value Constant –15.103 –0.36 22.074 2.91*** FEMALE –5.818 –3.78*** –0.781 –1.16 AGE_YRS –0.369 –2.57** –0.459 –1.95*
RAVEN 0.219 9.81*** 0.289 10.55***
EDU_WISH 0.627 5.42*** 0.757 3.82***
BMI 0.003 0.07 0.034 1.01
HOME_HELP –0.006 –0.39 0.054 1.34
HTU_TAKEN –0.002 –3.00*** –0.001 –1.10
TIRED –0.233 –1.11 –0.715 –2.74***
SABSENT –0.157 –2.07** –0.149 –1.94*
FEDYRS –0.295 –2.70*** 0.056 0.37
FED2 0.024 2.99*** –0.004 –0.44
FREEHELP –0.028 –2.05** 0.009 0.32
BOOKS 0.001 1.33 0.001 4.10***
WEALTH1 0.001 0.51 –0.002 –0.62
LNFINCOME –0.326 –1.13 0.453 2.03**
NUMBRO 0.013 0.12 –0.148 –0.79
NUMSIS –0.187 –1.40 –0.422 –3.36***
AVG_TEDU 0.224 0.41 –1.391 –3.81***
LN_AVGTPAY 4.701 0.77 –0.696 –0.66
AVG_TRAI 1.608 1.19 0.654 0.54
AVG_EXP 0.004 0.01 0.143 1.49
AVGT_ABS –0.078 –1.29 –0.024 –0.26
URBAN –0.134 –0.09 –0.354 –0.34
STR –0.023 –0.50 –0.051 –0.65
LENGTH_STUDY –0.002 –1.47 0.002 1.22
RESOURCE 0.509 2.21** 0.484 2.27**
MEAN_RAVEN –0.206 –1.61 0.483 5.74***
R2 0.318 0.563
N 976 786
1. The dependent variables are ‘ACHIEVE’, ‘READ’ and ‘MATHS’, respectively. 2. Asterisks denote significance level: *** = 1 percent ** = 5 percent * = 10 percent.

Students Achievement in Government and Private Schools 861
Table 4
Reading (OLS), Government and Private Schools OLS (1) OLS (2)
Variable Coefficient t-value Coefficient t-value Constant 18.208 0.81 20.768 4.29*** FEMALE –0.871 –1.18 0.450 1.28 AGE_YRS –0.318 –2.96*** –0.545 –3.37*** RAVEN 0.109 9.58*** 0.137 9.47*** EDU_WISH 0.337 3.88*** 0.519 3.53*** BMI –0.010 –0.39 0.025 1.11 HOME_HELP –0.011 –1.00 0.049 1.92* HTU_TAKEN –0.001 –3.10*** –0.0003 -0.85 TIRED –0.3111 –2.45** –0.570 –3.09*** SABSENT –0.063 –1.42 –0.079 –1.25 FEDYRS –0.197 –2.97*** 0.178 1.79* FED2 0.014 2.84*** –0.010 –1.89* FREEHELP –0.011 –1.23 –0.006 –0.39 BOOKS 0.0003 0.64 0.001 2.00** WEALTH1 0.001 0.96 –0.0005 –0.28 LNFINCOME –0.217 –1.19 0.139 0.86 NUMBRO –0.002 –0.03 –0.099 –0.94 NUMSIS –0.076 –0.93 –0.226 –2.39** AVG_TEDU 0.089 0.29 –0.858 –3.04** LN_AVGTPAY 0.134 0.04 –0.636 –1.16 AVG_TRAI 1.079 1.39 –0.467 –0.50 AVG_EXP 0.042 0.31 0.131 1.65* AVGT_ABS –0.073 –2.27** –0.013 –0.20 URBAN 0.064 0.08 –0.561 –0.90 STR –0.016 –0.59 0.010 0.20 LENGTH_STUDY –0.001 –1.24 0.003 2.12** RESOURCE 0.319 2.51** 0.402 2.46** MEAN_RAVEN –0.151 –2.09** 0.168 2.86*** R2 0.254 0.437
N 976 788 1. The dependent variables are ‘ACHIEVE’, ‘READ’ and ‘MATHS’, respectively. 2. Asterisks denote significance level: *** = 1 percent ** = 5 percent * = 10 percent.
Monazza Aslam 862
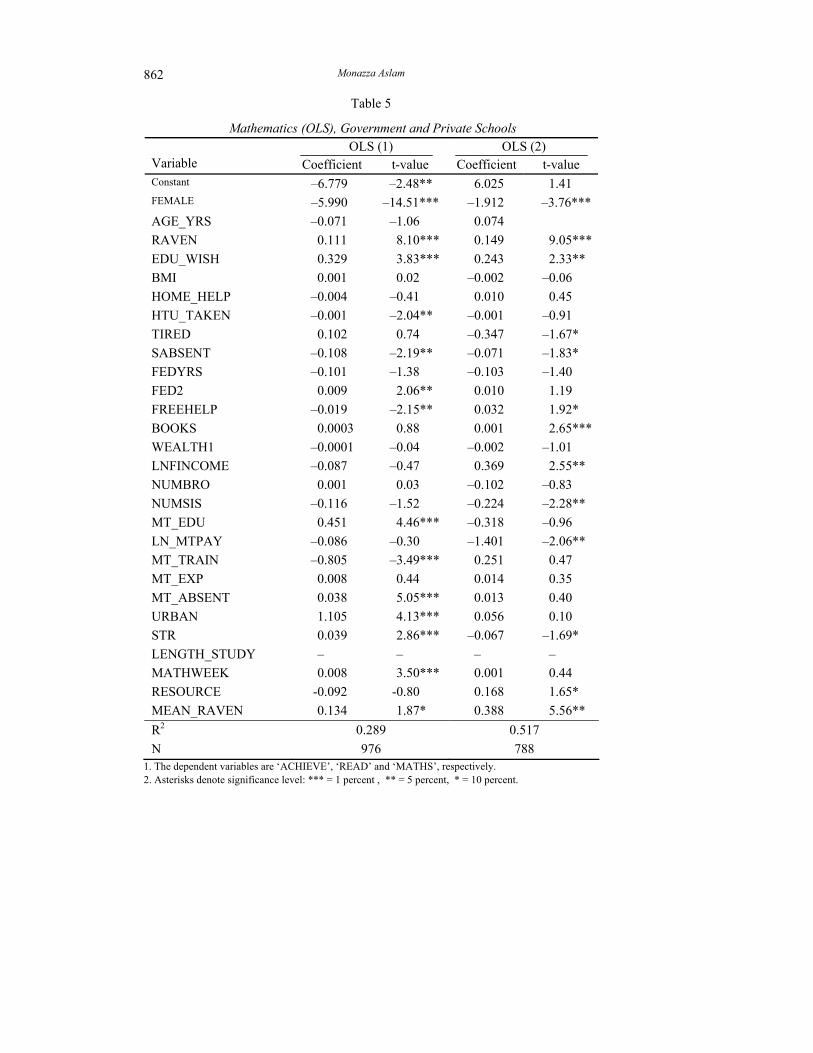
Table 5
Mathematics (OLS), Government and Private Schools OLS (1) OLS (2)
Variable Coefficient t-value Coefficient t-value Constant –6.779 –2.48** 6.025 1.41 FEMALE –5.990 –14.51*** –1.912 –3.76*** AGE_YRS –0.071 –1.06 0.074 RAVEN 0.111 8.10*** 0.149 9.05*** EDU_WISH 0.329 3.83*** 0.243 2.33** BMI 0.001 0.02 –0.002 –0.06 HOME_HELP –0.004 –0.41 0.010 0.45 HTU_TAKEN –0.001 –2.04** –0.001 –0.91 TIRED 0.102 0.74 –0.347 –1.67* SABSENT –0.108 –2.19** –0.071 –1.83* FEDYRS –0.101 –1.38 –0.103 –1.40 FED2 0.009 2.06** 0.010 1.19 FREEHELP –0.019 –2.15** 0.032 1.92* BOOKS 0.0003 0.88 0.001 2.65*** WEALTH1 –0.0001 –0.04 –0.002 –1.01 LNFINCOME –0.087 –0.47 0.369 2.55** NUMBRO 0.001 0.03 –0.102 –0.83 NUMSIS –0.116 –1.52 –0.224 –2.28** MT_EDU 0.451 4.46*** –0.318 –0.96 LN_MTPAY –0.086 –0.30 –1.401 –2.06** MT_TRAIN –0.805 –3.49*** 0.251 0.47 MT_EXP 0.008 0.44 0.014 0.35 MT_ABSENT 0.038 5.05*** 0.013 0.40 URBAN 1.105 4.13*** 0.056 0.10 STR 0.039 2.86*** –0.067 –1.69* LENGTH_STUDY – – – – MATHWEEK 0.008 3.50*** 0.001 0.44 RESOURCE -0.092 -0.80 0.168 1.65* MEAN_RAVEN 0.134 1.87* 0.388 5.56** R2 0.289 0.517
N 976 788 1. The dependent variables are ‘ACHIEVE’, ‘READ’ and ‘MATHS’, respectively. 2. Asterisks denote significance level: *** = 1 percent , ** = 5 percent, * = 10 percent.
Students Achievement in Government and Private Schools 863
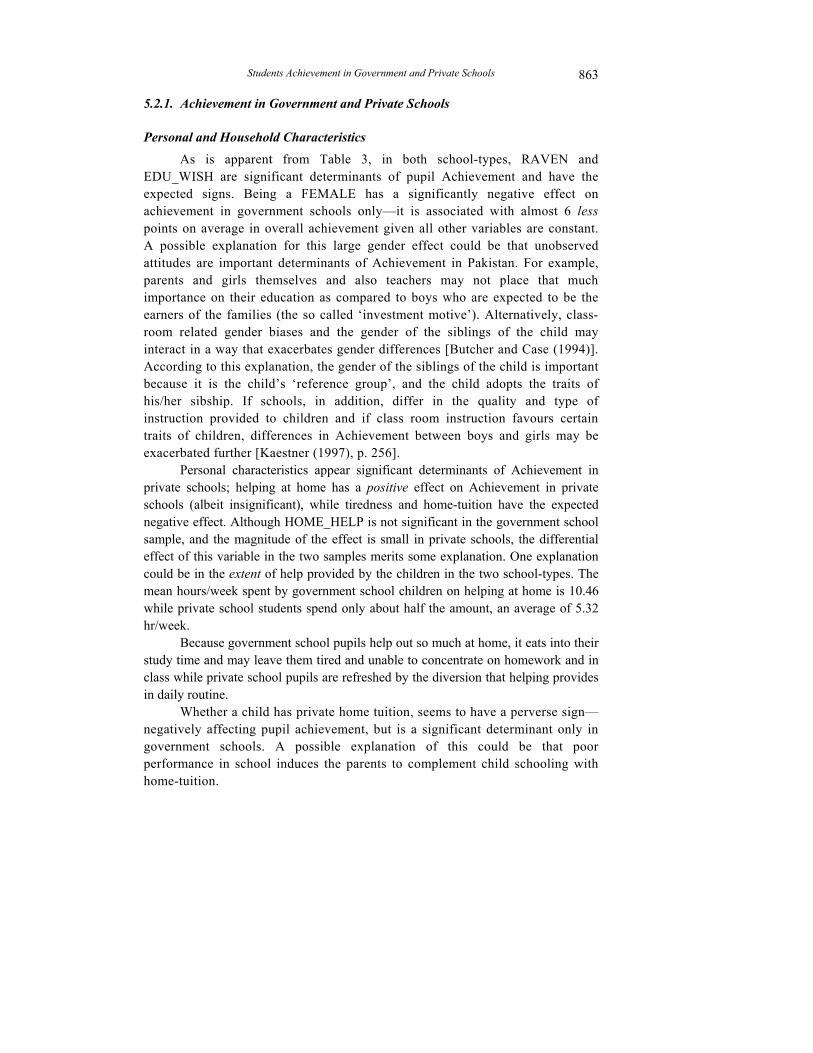
5.2.1. Achievement in Government and Private Schools Personal and Household Characteristics
As is apparent from Table 3, in both school-types, RAVEN and EDU_WISH are significant determinants of pupil Achievement and have the expected signs. Being a FEMALE has a significantly negative effect on achievement in government schools only—it is associated with almost 6 less points on average in overall achievement given all other variables are constant. A possible explanation for this large gender effect could be that unobserved attitudes are important determinants of Achievement in Pakistan. For example, parents and girls themselves and also teachers may not place that much importance on their education as compared to boys who are expected to be the earners of the families (the so called ‘investment motive’). Alternatively, class-room related gender biases and the gender of the siblings of the child may interact in a way that exacerbates gender differences [Butcher and Case (1994)]. According to this explanation, the gender of the siblings of the child is important because it is the child’s ‘reference group’, and the child adopts the traits of his/her sibship. If schools, in addition, differ in the quality and type of instruction provided to children and if class room instruction favours certain traits of children, differences in Achievement between boys and girls may be exacerbated further [Kaestner (1997), p. 256].
Personal characteristics appear significant determinants of Achievement in private schools; helping at home has a positive effect on Achievement in private schools (albeit insignificant), while tiredness and home-tuition have the expected negative effect. Although HOME_HELP is not significant in the government school sample, and the magnitude of the effect is small in private schools, the differential effect of this variable in the two samples merits some explanation. One explanation could be in the extent of help provided by the children in the two school-types. The mean hours/week spent by government school children on helping at home is 10.46 while private school students spend only about half the amount, an average of 5.32 hr/week.
Because government school pupils help out so much at home, it eats into their study time and may leave them tired and unable to concentrate on homework and in class while private school pupils are refreshed by the diversion that helping provides in daily routine.
Whether a child has private home tuition, seems to have a perverse sign—negatively affecting pupil achievement, but is a significant determinant only in government schools. A possible explanation of this could be that poor performance in school induces the parents to complement child schooling with home-tuition.

Monazza Aslam 864
Father’s education has a convex relationship with pupil Achievement which is captured by the positive coefficient on FED2 in the government school sample.17 The home educational environment is captured by the number of books at home. The effect of BOOKS is positive in both school types and although the magnitude is small and significant only for the private sample, it is strikingly similar across the two school-types. At closer inspection we find that the proportion of government school pupils with more than 100 books at home is 23 percent while it is 27 percent in the private sample. Given this small difference, we are not surprised by the similar coefficient across government and private schools.
One of the most interesting results of our analysis is the insignificance of the family economic status in the Achievement functions in government and private schools. The insignificance of the WEALTH18 index even in quadratics comes as a surprise. This is contrary to the results in other studies. Kingdon (1996), for neighbouring India, found a family’s financial status as proxied by WEALTH, to be a significant determinant of achievement of 8th graders [Kingdon (1996), p. 69]. However, it could be argued that since WEALTH is an index of assets held, it may not be a determinant of pupil achievement as it fails to capture the ‘liquid’ assets which may determine parental ability to provide achievement-friendly inputs to the child such as fan and electricity, desks and stationary etc., for instance to facilitate home study. In that case father’s income should emerge as an important determinant of achievement and we do find that father’s income has a significant positive effect on pupil achievement in private schools.
A larger number of sisters in the household decreases Achievement in both samples. A priori, we would expect a larger number of siblings in the house to have a negative effect on pupil achievement—parents may be able to devote less time to each child or additional children may distract a child from his or her studies. The signs on NUMBRO and NUMSIS are consistent with this explanation. There is no apparent definitive explanation for this effect of the ‘sibship’ on child achievement. One would have to analyse achievement differentials by gender to be able to argue whether these differences could possibly be caused by factors such as parental fertility behaviour or differential treatment in intra-household allocation which manifest themselves in differential schooling outcomes. Jensen (2002) proposes
17Insignificance of maternal education even in quadratics is somewhat surprising particularly
since Alderman, et al. (1996) found mother’s education to be a key determinant of pupil achievement (pp. 20). However, their study was based on a sample of primary-school children and it is possible that maternal education has a significant effect at that level and not at the secondary level. Mother’s education is not included in the parsimonious and preferred regression reported in the tables above.
18In computing the WEALTH index, we experimented with a wide array of weights for different owned assets but none of the indices yielded a significant coefficient on WEALTH.
Students Achievement in Government and Private Schools 865
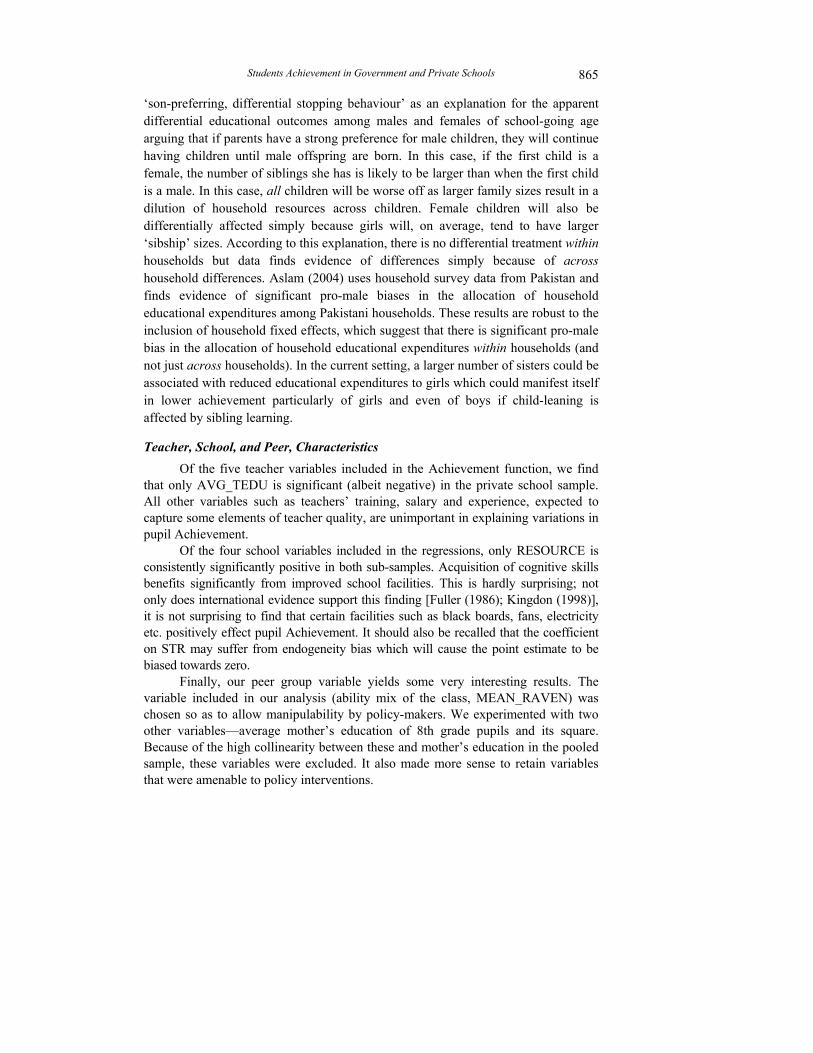
‘son-preferring, differential stopping behaviour’ as an explanation for the apparent differential educational outcomes among males and females of school-going age arguing that if parents have a strong preference for male children, they will continue having children until male offspring are born. In this case, if the first child is a female, the number of siblings she has is likely to be larger than when the first child is a male. In this case, all children will be worse off as larger family sizes result in a dilution of household resources across children. Female children will also be differentially affected simply because girls will, on average, tend to have larger ‘sibship’ sizes. According to this explanation, there is no differential treatment within households but data finds evidence of differences simply because of across household differences. Aslam (2004) uses household survey data from Pakistan and finds evidence of significant pro-male biases in the allocation of household educational expenditures among Pakistani households. These results are robust to the inclusion of household fixed effects, which suggest that there is significant pro-male bias in the allocation of household educational expenditures within households (and not just across households). In the current setting, a larger number of sisters could be associated with reduced educational expenditures to girls which could manifest itself in lower achievement particularly of girls and even of boys if child-leaning is affected by sibling learning.
Teacher, School, and Peer, Characteristics Of the five teacher variables included in the Achievement function, we find
that only AVG_TEDU is significant (albeit negative) in the private school sample. All other variables such as teachers’ training, salary and experience, expected to capture some elements of teacher quality, are unimportant in explaining variations in pupil Achievement.
Of the four school variables included in the regressions, only RESOURCE is consistently significantly positive in both sub-samples. Acquisition of cognitive skills benefits significantly from improved school facilities. This is hardly surprising; not only does international evidence support this finding [Fuller (1986); Kingdon (1998)], it is not surprising to find that certain facilities such as black boards, fans, electricity etc. positively effect pupil Achievement. It should also be recalled that the coefficient on STR may suffer from endogeneity bias which will cause the point estimate to be biased towards zero.
Finally, our peer group variable yields some very interesting results. The variable included in our analysis (ability mix of the class, MEAN_RAVEN) was chosen so as to allow manipulability by policy-makers. We experimented with two other variables—average mother’s education of 8th grade pupils and its square. Because of the high collinearity between these and mother’s education in the pooled sample, these variables were excluded. It also made more sense to retain variables that were amenable to policy interventions.

Monazza Aslam 866
The ability mix of students in a class has a significant effect only in the private school sub-sample. While the effect is negative in government schools, MEAN_RAVEN has a significant and positive effect in private schools: pupils of higher abilities are selected into private schools and interaction amongst them improves pupil Achievement while the opposite holds in government schools. 5.2.2. Reading Skills in Government and Private Schools
The personal and household characteristics that affect Reading scores are the same as those that affect overall pupil achievement. The only difference from the above analysis is the fact that females do not seem to achieve less than males in either government or private schools. This finding is consistent with that in a number of studies which reveal significant female disadvantage in Maths skills but no disadvantage in Reading skills. We note that father’s education has a significant effect on Language/Reading scores in government and private schools.
Once again, of the five teacher variables included in the Reading specifications only teacher education (AVGT_EDU) and the log of average teacher pay (LN_AVGTPAY) appear to be significant determinants of Reading skills in the private sample. The fact that both are negative is a somewhat anomalous finding which appears to have no outright theoretical explanation. As before, RESOURCE is a significant positive determinant of reading skills in both sub-samples while length of the school day spent studying appears to enhance private pupil skills positively.
5.2.3. Mathematics skills in Government and Private Schools
It is apparent that females are at a very significant disadvantage in acquiring Maths skills as compared to males in government and private schools. The gender effect in the Maths equation in government schools is almost 70 percent higher than in private schools: being female is associated with a reduction in Maths scores by 1.9 points in private schools as compared to 5.9 points in government schools. This suggests, as before, either that there is less gender gap in the amount of attention paid by teachers to girl or boy students in private schools or that more motivated girls attend private schools.
We also note that help provided by parents or other siblings (FREEHELP) has a significant and positive effect on Maths scores in the private sub-sample while the effect is significantly negative in the government schools. The average hours/week of such help in school-work differs significantly by school-type—government school pupils get roughly 10 hours of help in a week as compared to 6 hours/week for private school pupils. Why FREEHELP does not have a similar effect in the government sample can possibly be explained by the quality of help received; both parents in the private schools are more educated and come from better social

Students Achievement in Government and Private Schools 867
backgrounds as compared to the government sample. In addition, note that in both school types, fathers must have at least primary education (5 years) to significantly improve their child’s Maths scores.
Finally, it is apparent that in government schools, a larger number of teacher characteristics affect pupil achievement as compared to both overall Achievement and Language skills and compared to private schools. Also, the mix of teacher characteristics affecting Maths skills changes substantially.
In private schools, once again teacher pay emerges as a significant determinant of pupil test scores. Increasing teacher pay has a negative effect on Maths scores and is only just significant at the 10 percent level. Although surprising, this does suggest that some of the common measures of teacher quality, namely teacher pay and in most instances even teacher education are in fact very poor indicators of teacher quality. This conclusion is corroborated by the signs on MT_ABSENT and MT_TRAI in the government sub-sample where it appears that higher teacher absenteeism and less training actually improve pupil’s Maths score. The only finding consistent with expectation is that Maths teachers with more education significantly improve government school pupils Maths achievement.
Finally, increased student-teacher ratio (STR) significantly negatively affects Maths achievement in private and positively affects that in government schools. This suggests that larger class sizes induce interaction among pupils in government schools but have a detrimental effect on private school pupils.
5.2.4. Effect of Student Absenteeism on Achievement
Table 6 presents the coefficients on SABSENT from the OLS specifications (Tables 3, 4 and 5) in the government and private school samples. A priori, we expected the coefficient on SABSENT to be negative—an increase in student absenteeism decreases achievement. In OLS we expected a downward bias—low achievers were expected to be absent more often and, hence, this feedback effect was expected to be captured in the OLS coefficient making it a bigger negative.
How does pupil absenteeism affect pupil achievement in the two school-types? It is apparent that the OLS coefficients are small and negative in all instances—pupil achievement in government and private schools and maths skills development in both school-types is negatively affected by absenteeism. However, these coefficients are possibly downward biased and one would need to instrument SABSENT to arrive at more conclusive results.19
19Future work addresses possible endogeneity of SABSENT.

Monazza Aslam 868
Table 6
OLS Coefficients on SABSENT SABSENTOLS
Achievement –0.157** Reading –0.063
Government
Maths –0.108** Achievement –0.149* Reading –0.079
Private
Maths –0.071* 5.2.5. Are Home Background Factors More Important Than
School-related Factors?
As concerns the question: ‘Are home background factors more important determinants of pupil achievement as compared to school-related factors?’ it can be argued that a mix of these variables determine pupil achievement. An exercise to disentangle the effects involved regressing pupil achievement only on personal and home background factors and then only on school related factors and comparing the R2. The OLS results in the government and private sectors differed but the main conclusion was that both home and school factors seem to explain variation in pupil achievement in Pakistan. For example, in the private sector the R2 of the regression on just personal and home background factors was 0.47 while that on just school-related factors was 0.38.
The problem of disentangling the effects of personal and home background factors and teacher and school variables is that there is a correlation between home background and school quality. When we regress pupil achievement on just home background factors, the coefficients are upward biased and capture the effects of omitted school quality effects. The same is true of a regression of pupil achievement on just school and teacher characteristics. Therefore, this analysis has its drawbacks and the results can be biased. 5.2.6. Conclusions
We have focussed on the factors which determine pupils’ overall Achievement, Reading and Math skills across the government and private sectors. In particular, we wanted to address the question: ‘how important are teacher pay and student absenteeism in determining pupil achievement in Pakistan?’ The answer is, in our data set, not very important. We find a large number of personal and home background factors determining achievement in both sub-samples. Most common measures of teacher quality such as teachers’ education, training and pay seem to be very poor indicators of quality. Other school variables, such as pupil-teacher ratio, peer group variables and school resources, which are more amenable to policy

Students Achievement in Government and Private Schools 869
intervention, seem to be significant determinants of pupil achievement but differ across subject areas and by school-type. Initial student absenteeism results suggest that absenteeism does appear to have a negative affect on pupils achievement and particularly on maths skill development in both school types. However, these estimates are possibly biased and one can only draw causal inferences from them. Finally, both home background and school-related factors are found important in explaining pupil achievement in Pakistan.
6. COMPARISON WITH OTHER STUDIES
How do our results compare with studies done internationally and in Pakistan? Although Hanushek (1986) was highly pessimistic about the effect of school resources on pupil achievement, Fuller (1986) and Harbison and Hanushek (1992) in their meta-studies on developing countries conclude that physical school facilities seem to be more important in developing countries than they are in developed economies. Fuller (1986) in his review of 72 studies, for example, finds that class size and teacher pay are not important determinants of pupil achievement in developing countries while availability of instructional material and teacher training are. Kingdon (1998), for neighbouring India, also found that “Cognitive skills acquisition benefits systematically and strongly from schools’ improved physical and teaching facilities” (p. 13). However, Kingdon (1998) also found that class size does not seem to explain overall achievement and Maths scores for 8th grade pupils in India. Our findings corroborate the main conclusion that school facilities seem to matter for pupil achievement in Pakistan. But we also conclude that class size appears to be an important determinant of Maths scores across school-types although we do not find any effect of class size in overall achievement and reading skills development. Our findings of a negative class size effect are more consistent with Case and Deaton (1999) in South Africa, Krueger (1999) for USA, Angrist and Lavy (1999) for Israel and Alderman, et al. (1996) for Lahore, Pakistan.20
Alderman, et al. (1995) use the IFPRI data set on two districts in rural Pakistan and analyse the determinants of schooling attainment, pupil achievement and labour market productivity. For this initial study, the following conclusions of Alderman, et al. are of importance: reducing the student-teacher ratio improves Maths attainment; increasing teacher quality improves Reading and Maths scores; girls appear to be at a disadvantage in numeracy skills but not in Reading and school facilities do not seem to explain pupil achievement. Some of these findings are consistent with our results. Behrman, et al. (1997) in rural Pakistan also using the IFPRI data set find certain teacher characteristics (such as teacher experience and better teacher degree performance) to have a positive effect on pupil achievement
20These results have to be taken with a pinch of salt as the estimates do not correct for possible endogeneity of the class size variable.
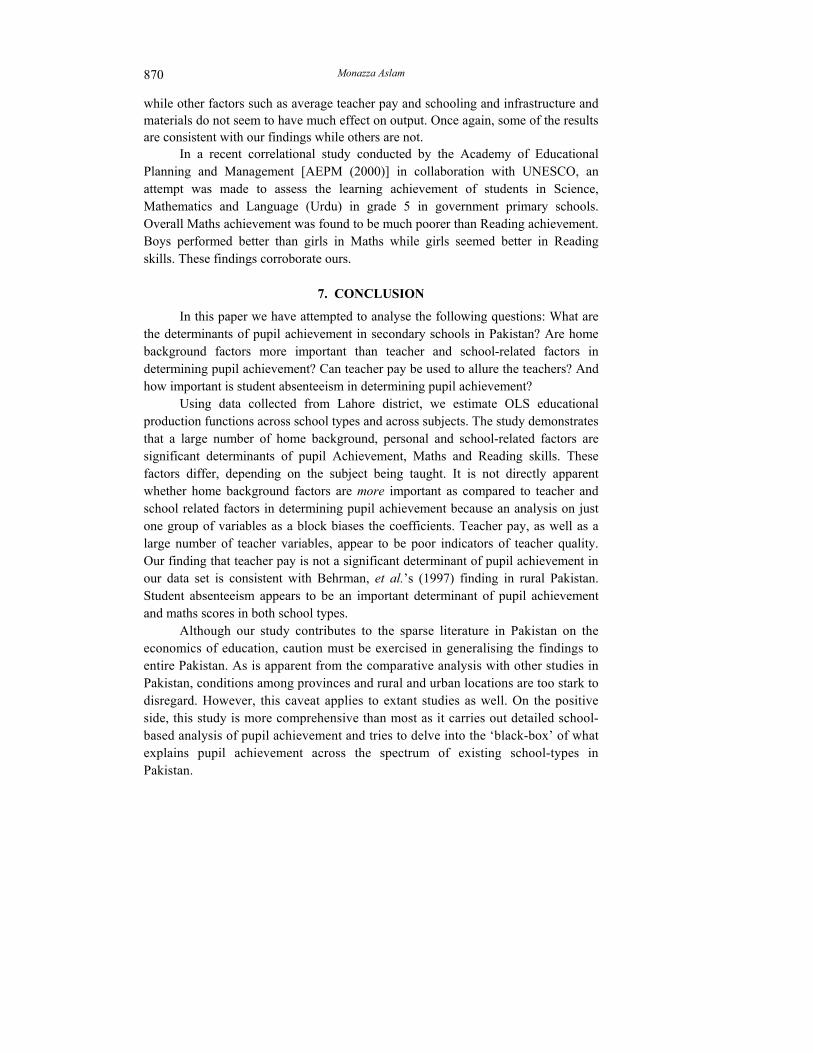
Monazza Aslam 870
while other factors such as average teacher pay and schooling and infrastructure and materials do not seem to have much effect on output. Once again, some of the results are consistent with our findings while others are not.
In a recent correlational study conducted by the Academy of Educational Planning and Management [AEPM (2000)] in collaboration with UNESCO, an attempt was made to assess the learning achievement of students in Science, Mathematics and Language (Urdu) in grade 5 in government primary schools. Overall Maths achievement was found to be much poorer than Reading achievement. Boys performed better than girls in Maths while girls seemed better in Reading skills. These findings corroborate ours.
7. CONCLUSION
In this paper we have attempted to analyse the following questions: What are the determinants of pupil achievement in secondary schools in Pakistan? Are home background factors more important than teacher and school-related factors in determining pupil achievement? Can teacher pay be used to allure the teachers? And how important is student absenteeism in determining pupil achievement?
Using data collected from Lahore district, we estimate OLS educational production functions across school types and across subjects. The study demonstrates that a large number of home background, personal and school-related factors are significant determinants of pupil Achievement, Maths and Reading skills. These factors differ, depending on the subject being taught. It is not directly apparent whether home background factors are more important as compared to teacher and school related factors in determining pupil achievement because an analysis on just one group of variables as a block biases the coefficients. Teacher pay, as well as a large number of teacher variables, appear to be poor indicators of teacher quality. Our finding that teacher pay is not a significant determinant of pupil achievement in our data set is consistent with Behrman, et al.’s (1997) finding in rural Pakistan. Student absenteeism appears to be an important determinant of pupil achievement and maths scores in both school types.
Although our study contributes to the sparse literature in Pakistan on the economics of education, caution must be exercised in generalising the findings to entire Pakistan. As is apparent from the comparative analysis with other studies in Pakistan, conditions among provinces and rural and urban locations are too stark to disregard. However, this caveat applies to extant studies as well. On the positive side, this study is more comprehensive than most as it carries out detailed school-based analysis of pupil achievement and tries to delve into the ‘black-box’ of what explains pupil achievement across the spectrum of existing school-types in Pakistan.

Students Achievement in Government and Private Schools 871
APPENDIX I
Fig. 1.
Number of Days Absent
Days absent
3025
1716
1514
1312
1110
98
76
54
32
10
% o
f pup
ils
50
40
30
20
10
0
N = 1887
Fig. 2.
Reasons for Absenteeism
1.6%
19.9%
12.2%
2.9%
63.3%
Other
Family committment
Didn't feel like it
No transport
Was ill
N = 1123
Family Commitment
19.9%
Didn’t feel like it
12.2%
No Transport
2.9%
Other
1.6%
Was ill
63.3%
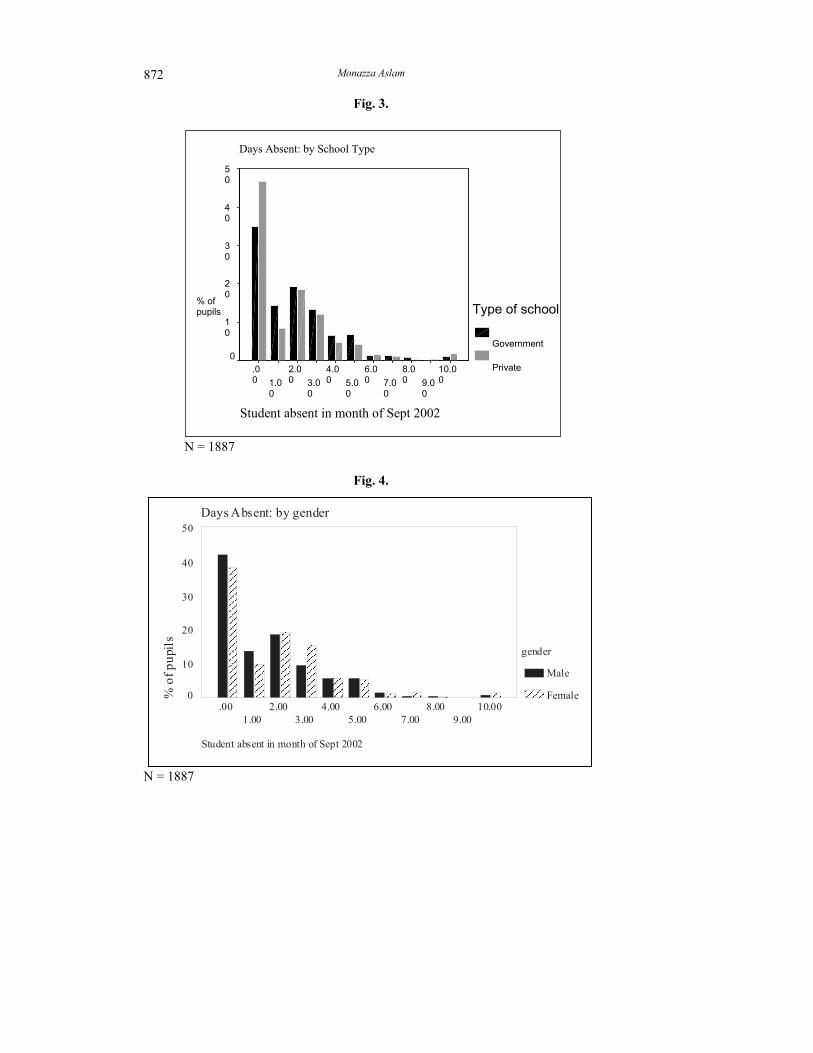
Monazza Aslam 872
Fig. 3.
N = 1887
Fig. 4.
Days Absent: by gender
% o
f pup
ils
50
40
30
20
10
0.00 2.00 4.00 6.00 8.00 10.00
gender
Male
Female
9.007.005.003.001.00
Student absent in month of Sept 2002 N = 1887
Days Absent: by School Type
Student absent in month of Sept 2002
10.009.0
0
8.007.0
0
6.005.0
0
4.003.0
0
2.00 1.0
0
.00
% of pupils
50
40
30
20
10
0
Type of school
Government Private
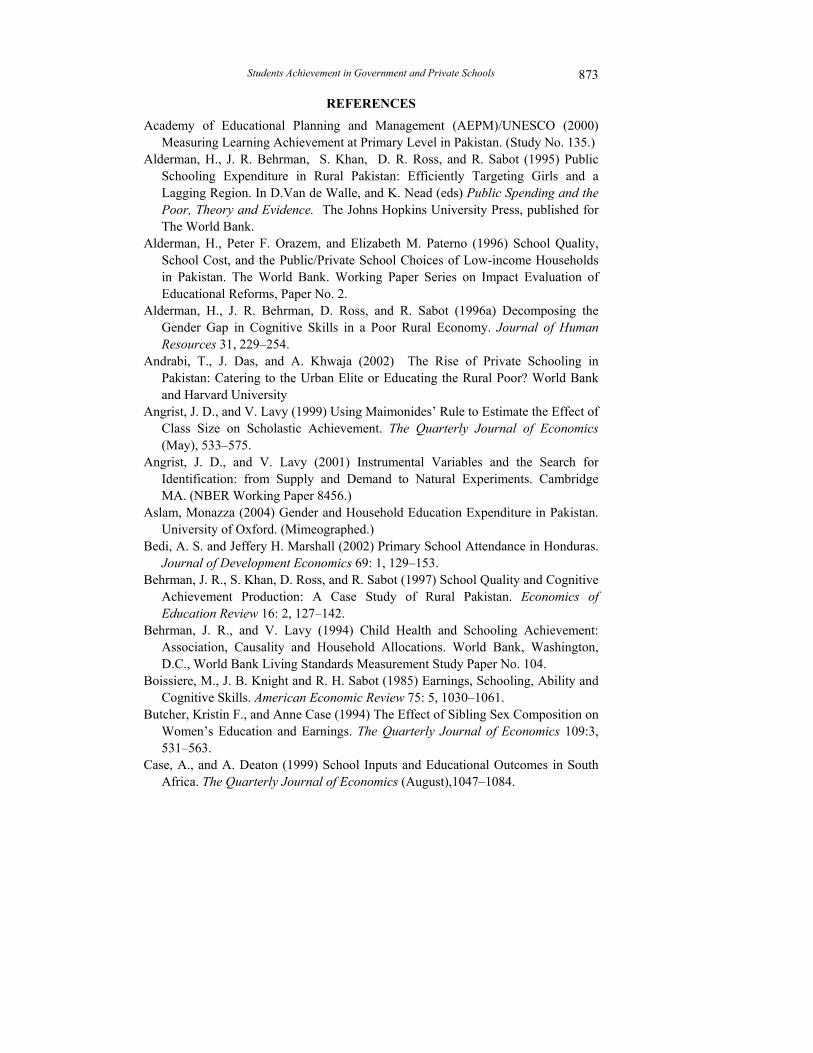
Students Achievement in Government and Private Schools 873
REFERENCES
Academy of Educational Planning and Management (AEPM)/UNESCO (2000) Measuring Learning Achievement at Primary Level in Pakistan. (Study No. 135.)
Alderman, H., J. R. Behrman, S. Khan, D. R. Ross, and R. Sabot (1995) Public Schooling Expenditure in Rural Pakistan: Efficiently Targeting Girls and a Lagging Region. In D.Van de Walle, and K. Nead (eds) Public Spending and the Poor, Theory and Evidence. The Johns Hopkins University Press, published for The World Bank.
Alderman, H., Peter F. Orazem, and Elizabeth M. Paterno (1996) School Quality, School Cost, and the Public/Private School Choices of Low-income Households in Pakistan. The World Bank. Working Paper Series on Impact Evaluation of Educational Reforms, Paper No. 2.
Alderman, H., J. R. Behrman, D. Ross, and R. Sabot (1996a) Decomposing the Gender Gap in Cognitive Skills in a Poor Rural Economy. Journal of Human Resources 31, 229–254.
Andrabi, T., J. Das, and A. Khwaja (2002) The Rise of Private Schooling in Pakistan: Catering to the Urban Elite or Educating the Rural Poor? World Bank and Harvard University
Angrist, J. D., and V. Lavy (1999) Using Maimonides’ Rule to Estimate the Effect of Class Size on Scholastic Achievement. The Quarterly Journal of Economics (May), 533–575.
Angrist, J. D., and V. Lavy (2001) Instrumental Variables and the Search for Identification: from Supply and Demand to Natural Experiments. Cambridge MA. (NBER Working Paper 8456.)
Aslam, Monazza (2004) Gender and Household Education Expenditure in Pakistan. University of Oxford. (Mimeographed.)
Bedi, A. S. and Jeffery H. Marshall (2002) Primary School Attendance in Honduras. Journal of Development Economics 69: 1, 129–153.
Behrman, J. R., S. Khan, D. Ross, and R. Sabot (1997) School Quality and Cognitive Achievement Production: A Case Study of Rural Pakistan. Economics of Education Review 16: 2, 127–142.
Behrman, J. R., and V. Lavy (1994) Child Health and Schooling Achievement: Association, Causality and Household Allocations. World Bank, Washington, D.C., World Bank Living Standards Measurement Study Paper No. 104.
Boissiere, M., J. B. Knight and R. H. Sabot (1985) Earnings, Schooling, Ability and Cognitive Skills. American Economic Review 75: 5, 1030–1061.
Butcher, Kristin F., and Anne Case (1994) The Effect of Sibling Sex Composition on Women’s Education and Earnings. The Quarterly Journal of Economics 109:3, 531–563.
Case, A., and A. Deaton (1999) School Inputs and Educational Outcomes in South Africa. The Quarterly Journal of Economics (August),1047–1084.

Monazza Aslam 874
Ehrenberg, Ronald G., Randy A. Ehrenberg, Daniel I. Rees, and Eric L. Ehrenberg (1991) School District Leave Policies, Teacher Absenteeism, and Student Achievement. The Journal of Human Resources 26: 1, 72–105.
Fuller, B. (1986) Raising School Quality in Developing Countries: What Investments Boost Learning? The World Bank, Washington, D.C. (World Bank Discussion Paper No. 2.)
Fuller, B., L. Dellagnello, A. Strath, E. B. B. Bastos, M. H. Maia, K. S. L. Matos, A. L. Portela, and Sofia L. Vieira (1999) How to Raise Children’s Early Literacy? The Influence of Family, Teacher, and Classroom in Northeast Brazil. Comparative Education Review 43: 1, 1–35.
Glewwe P., and H. Jacoby (1994) Student Achievement and Student Choice in Low Income Countries: Evidence from Ghana. Journal of Human Resources 29:3, 231–258.
Greene, W. H. (2000) Econometric Analysis (4th Edition). New York: Macmillan, Chapter 20, Section 20.4, 926– 934.
Harbison, R. W. and E. A. Hanushek (1992) Educational Performance of the Poor: Lessons from Rural Northwest Brazil. New York: Oxford University Press.
Hanushek, E. A. (1986) The Economics of Schooling: Production and Efficiency in Public Schools. The Journal of Economic Literature 24: 3, 1141–1177.
Hanushek, E., J. Kain, and S. Rivkin (1999) Do Higher Salaries Buy Better Teachers? Cambridge, MA. (NBER Working Paper 7082.)
Hoxby, M. Caroline (2000) The Effects of Class Size on Student Achievement: New Evidence from Population Variation. The Quarterly Journal of Economics (November).
Heckman, James (1974) Shadow Prices, Market Wages and Labor Supply. Econometrica 42: 4, 679–694.
Heckman, James (1979) Sample Selection Bias as Specification Error. Econometrica 47: 1, 153–161.
Heckman, James (1990) Varieties of Selection Bias. American Economic Review 80: 2, May 313–318.
Irvine, Renwick. (2004) The Myth of Choice in Education ‘Quasi-markets’: The Nature and Implications of the Emergence of Private Schools in Punjab, Pakistan. Dissertation (MPhil.), Institute of Development Studies, University of Sussex.
Jensen, Robert (2002) Equal Treatment, Unequal Outcomes? Generating Sex Inequality Through Fertility Behaviour. John F. Kennedy School of Government, Harvard University. (Mimeographed.)
Kaestner, R. (1997) Are Brothers Really Better? Sibling Sex Composition and Educatinal Achievement Revisited. The Journal of Human Resources 32:2, 250–284.
Kingdon, Geeta G. (1996) The Quality and Efficiency of Private and Public Education: A Case Study of Urban India. Oxford Bulletin of Economics and Statistics 58: 1, February 57–81.
Students Achievement in Government and Private Schools 875
Kingdon, Geeta G. (1998) How Much Do Schools Matter to Pupil Achievement in India? Journal of Educational Planning and Administration 12: 1 January 5–25.
Kingdon, Geeta G., and Teal, F. (2002) Does Performance Related Pay for Teachers Improve Student Performance? Some Evidence from India. Department of Economics Working Paper Series November.
Knight, J. and R. Sabot (1990) Education, Productivity and Inequality: The East African Natural Experiment. Oxford: Oxford University Press.
Kruger, Alan B. (1999) Experimental Estimates of Education Production Functions. The Quarterly Journal of Economics May, 497–532.
Lee, Lung-Fei (1983) Generalised Econometric Models with Selectivity. Econometrica 51:2, (March) 502–512.
Lloyd, Cynthia B., C. Mete. and Zeba A. Sathar (2002) The Effect of Gender Differences in Primary School Access, Choice and Quality on the Decision to Enroll in Rural Pakistan. Population Council Working Paper presented at the South Asia Meeting of the Econometric Society in Lahore, Pakistan.
Maddala, G. S. (1983) Limited Dependent and Qualitative Variables in Econometrics. New York : Cambridge University Press.
Nakosteen and Zimmer (1980) Migration and Income: The Question of Self Selection. Southern Economic Journal 46: (January), 840–851.
Newey, W., J. Powell, and J. Walker (1990) Semiparametric Estimation of Selection Models: Some Empirical Results. American Economic Review 80: 2, (May) 324–328.
Orazem, Peter F., Elizabeth M. Paterno, and Leah Giuttierez (1995) Teacher Attendance, Student Attendance, and Student Achievement in Northwest Frontier Province, Pakistan. Unpublished Working Paper.
Tan, J. P., J. Lane, and P. Coustere (1997) Putting Inputs to Work in Elementary Schools: What can be done in the Philippines? Economic Development and Cultural Change 45, 857–879.
Willis, R., and S. Rosen (1979) Education and Self-Selection. Journal of Political Economy 87: 5, (October) Supplement S7–S36.
World Bank (1996) Improving Basic Education in Pakistan: Community Participation, System Accountability, and Efficiency’ Economic and Sector Work, http://www.worldbank.org/gender/projects_programs/ pakedes2.htm.