Musical achievement and attitude of beginning piano students ...
Upload
khangminh22Category
view
0download
0
NA
S 2018, C
lass X (C
ycle 2)L
earnin
g Ach
ievemen
t of Stu
den
ts32130
ISBN 978-93-5292-393-9

NA
S 2018, C
lass X (C
ycle 2)L
earnin
g Ach
ievemen
t of Stu
den
ts
NAS 2018National Achievement Survey
LEARNING ACHIEVEMENT OF STUDENTSClass X (Cycle 2)
Prelims.indd 1 02-03-2021 11:17:19

ISBN 978-93-5292-393-932130 – NAS 2018Class X (Cycle 2)
Publication Team
Head, Publication : Anup Kumar RajputDivisionChief Editor : Shveta UppalChief Production : Arun ChitkaraOfficerChief Business : Vipin DewanManager (In charge)Production Assistant : Rajesh Pippal
OFFICES OF THE PUBLICATION DIVISION, NCERT
NCERT CampusSri Aurobindo MargNew Delhi 110 016 Phone : 011-26562708
108, 100 Feet Road Hosdakere Halli ExtensionBanashankari III StageBengaluru 560 085 Phone : 080-26725740
Navjivan Trust BuildingP.O.Navjivan Ahmedabad 380 014 Phone : 079-27541446
CWC CampusOpp. Dhankal Bus StopPanihatiKolkata 700 114 Phone : 033-25530454
CWC ComplexMaligaon Guwahati 781 021 Phone : 0361-2674869
ALL RIGHTS RESERVED No part of this publication may be reproduced, stored in a retrieval
system or transmitted, in any form or by any means, electronic, mechanical, photocopying, recording or otherwise without the prior permission of the publisher.
This book is sold subject to the condition that it shall not, by way of trade, be lent, re-sold, hired out or otherwise disposed of without the publisher’s consent, in any form of binding or cover other than that in which it is published.
The correct price of this publication is the price printed on this page, Any revised price indicated by a rubber stamp or by a sticker or by any other means is incorrect and should be unacceptable.
First EditionFebruary 2021 Magha 1942
PD 1T SU
© National Council of Educational Research and Training, 2021
` 285.00
Printed on 80 GSM paper
Published at the Publication Division by the Secretary, National Council of Educational Research and Training, Sri Aurobindo Marg, New Delhi 110 016 and printed at Stallion Graphics Pvt. Ltd. B-3, Sector-65, (Ground Floor) Noida 201 301 (U.P.)
Cover and LayoutDTP Cell, Publication Division
Prelims.indd 2 02-03-2021 11:17:19

Foreword
Education in the 21st century has emerged as one of the most essential components of leading a prosperous life, as well as, for the long-term sustainable growth of the society. Achieving good quality education for all is the most cherished objective of policymakers and educationists in a democratic country like India. With education being seen as the prerogative of every citizen, over the years it has emerged as a vital link in socio-economic transformation. Over the past decade, much efforts are being diverted to improve the accessibility, affordability and quality of school education. In this regard, the roles of assessments at different levels are considered of immense importance since they capture the status of learning performance of children in specific age groups in a given time period and also help in monitoring the student learning during that time. These exercises, therefore, evidently help in identifying the existing gaps in the system and lay provisions for future improvements with much more targeted approach.
In light of this, the Ministry of Human Resource Development, Government of India, has entrusted the National Council of Educational Research and Training (NCERT) to conduct a nation-wide achievement survey of students at different levels since the year 2000 on sample basis, with the primary role of providing the ’snapshot’ of learning performances of children in different classes across various subjects. While several rounds of achievement surveys have been successfully conducted by NCERT at the elementary stage of school education (at Classes III, V and VIII), the first ever effort for Class X was attempted in 2015, wherein for the first time a holistic picture on ’What students know and can do’ was provided through the NAS survey. The current attempt made by the Educational Survey Division (ESD), NCERT is second in line for providing a systematic understanding of learning performances of Class X students in various subjects with much more broadened objectives of providing system–level reflection to facilitate necessary policy interventions in future.
NAS Cycle 2 for Class X was initiated by NCERT from 2017 onwards and was successfully conducted on a sample basis in 34 states and UTs of India in February 2018. The NAS Cycle 2 Class X, was a first ever exercise, where district administrative units were chosen as survey and reporting units, against state units which were chosen in Cycle 1, to provide more realistic regional picture of the status of learning in schools. The survey tools used multiple test booklets in primarily five subjects, i.e., Mathematics, Modern Indian Languages, English, Science and Social Science. Along with test items, a questionnaire pertaining to students, teachers and school were also used to provide relevant additional information.
The technical report presented by NCERT is a cumulative document providing details of the entire process of survey, sampling and methodology used during the process, the execution of the assessment process, the analysis and presentation of achievements, outcome according to gender, social category and location of students and finally providing a detailed subject-wise account of learning achievement by the students of Class X in various government and government-aided schools across India. The document, by highlighting the level of learning performances of the children in Class X, comprehensively provides a constructive feedback so as to identify the existing gaps in the processes, systems, performances related to school education in general and Class X in particular.
The document, by providing a system–level reflection, will surely serve its purpose in guiding policymakers, planners, education experts, curriculum developers and other practitioners in initiating well-structured education strategies and focussed policy interventions in future. Also, at regional level, the document will be useful in assisting States/UTs/Boards in understanding student performances, facilitating them to prepare,
Prelims.indd 3 02-03-2021 11:17:19

iv
contextualise strategies for enhancing student learning in a holistic manner. The document will also aid periodic monitoring of the status of school education, facilitating establishment of trends and patterns of school education dynamics in India serving as a base for all future endeavours.
I would like to express my gratitude to the institutional and individual support provided for this undertaking from the Minister, Secretary and Joint Secretary School Education and Literacy, Ministry of Human Resource Development (MHRD). The cooperation of and contributions made by the Ministry of Human Resource Development (MHRD), Samagra Siksha steering committee, States/UTs, District authorities, School Board administrations and SCERTs/SIEs, teachers, children has been indispensable in successfully completing the monumental task and in the process of planning, developing and producing this NAS Class X Cycle 2 technical report.
Hrushikesh SenapatyDirector
New Delhi National Council of Educational3 November 2019 Research and Training
Prelims.indd 4 02-03-2021 11:17:19

Preface
Our world is constantly transforming and so is the essence of education, which has evolved from mere congregation of information and facts in the past to be the indispensable driver of socio-economic transformation in the 21st century. It has emerged as a decisive link in acquiring or enhancing essential skills and knowledge, predominant for leading a prosperous life, and apparently becoming productive member of a civilised society. India’s adherence to Millennium Development Goals (MDGs) are well reflected in its proactive actions towards improving standard of education especially in the last decade. Actions are oriented to bring holistic development of children in schools through improvement in accessibility, affordability, quality and equity in school education. However, over the last decade the focus has shifted from dealing with the challenges pertaining to accessibility of education to ameliorating the quality of learning amongst children. This mandate has intensified the policy initiatives, planning and implementation of education in general and school education in particular.
The NCERT being the apex planning, execution and monitoring body with respect to school education in India, devised the National Achievement Survey in the year 2000, as large scale assessment survey primarily to monitor the performance of students, learning. The research study was led by the Educational Survey Division, NCERT and MHRD to understand the effectiveness of the school system in the country by evaluating the learning performance of students at various levels. The programme later on, in 2002 was subsumed under the Sarva Siksha Abhiyan— one of the government’s flagship educational programmes. NAS was not designed as a school examination tool, rather it was conceived as a survey system to comprehensively reflect national, state and district level education achievement picture. NAS became a regular and ongoing feature of the education system to reflect the periodic achievement of learners in schools. Subsequently, various cycles of NAS were proposed for Classes III, V and VIII, which were designed to provide an accurate measure of the learning achievement of children at different stages of education providing important insights as to whether the inputs made into the elementary education system had a beneficial effect on learners or not. The third cycle of NAS conducted during 2009–13 made a distinctive shift from past in terms of analysing the assessment results which were analysed trough a new method called Item Response Theory (IRT), which effectively increased the reliability, facilitated multispectral comparisons even with large datasets, and was time and cost-effective too.
Realising the importance of secondary education, from a learner’s perspective, which is critical to enhance preparedness and competitiveness in rapidly globalising world, in 2015 under the Rashtriya Madhyamik Siksha Abhiyan (RMSA), NAS was extended to Class X. NAS Cycle 1 for Class X was thereafter successfully conducted in 2015, where multiple test booklets in multiple subjects were prepared in 15 languages to assure linguistic equality. The survey was conducted on a sample of 2,77,416 students in 7,216 schools across 33 states/UTs and Boards. The primary outcomes along with baseline observations were shared with the institutions, schools and teachers. Reports were prepared and shared with the MPs of all states and UTs and was put on public domain for wider dissemination.
To observe the improvement in the learning of the students, MHRD decided to conduct the second cycle of the Survey and NAS Cycle 2 for Class X, was initiated by Educational Survey Division, NCERT in 2017. This particular report is a compendium of approaches, practices, process and outcomes pertaining to the National Achievement Survey of Class X, Cycle 2. For the first time in Cylcle 2 district administrative units were chosen as survey and reporting units, as against state units which were chosen in Cycle 1 of the survey, to provide
Prelims.indd 5 02-03-2021 11:17:19

vi
a more realistic regional picture of the status of learning in schools. The objectives of NAS were broadened where in it was developed to provide system–level reflections based on policy directions for systemic interventions with a view to improve quality of education. Extensive training programs and workshops for preparing items were conducted at the National level by NCERT and MHRD. The state and district level institutions were prepared for successful implementation of NAS in their respective areas. In Cycle 2 it covered all the districts in 34 States/UTs and within the districts, sample schools were randomly chosen from all the government, government-aided and private schools having Class X, either affiliated from State Education boards, National Education Boards, CBSE or ICSE board. A sample of 80 schools per district, and 45 students per school from Class X have been included in the survey. Assessment of Achievement Levels was done in five main curricular areas, namely English, Mathematics, Science, Social Science and one Modern Indian Language (MIL) using 60 multiple choice items, based on subject-wise common content domain with varying degree of difficulty. Technology was vastly used in every step including preparation, during survey, reporting, collecting information, creating database, result analysis preparing reports, etc., at every administrative hierarchy involved from District, to National level.
A comprehensive account of the perspective of learning achievement of Class X learners in different subjects has been presented through this NAS technical report of Class X Cycle 2. The report is divided in to nine chapters. Chapter 1 of the report provides a glimpse of the historical evolution of NAS in India, its objectives and the assessment framework along with the details of NAS administration, monitoring, reporting, dissemination, post-NAS interventions and the limitations of NAS. The second chapter presents the methodology followed and the entire process of conducting the survey nationwide. Modern techniques of analysis and interpretation of data are applied to produce findings, using Item Response Theory. The third chapter is based on providing details related to the participating schools, students and different variables of the survey. Chapters 4, 5, 6, 7 and 8 contemplates the class-wise students’ achievements in Mathematics, Science, Social Sciences, English and Modern Indian Languages, respectively. The ninth and final chapter of the report is based on the contextual analysis of the background variables used in the report.
This technical report, therefore, is a compendium of perceptible information regarding learning achievements of children in Class X. It not only highlights the achievement of learning outcomes by the learners, but also facilitates comparative analysis against the achievement levels in previous cycles, thus providing a system level reflection on core areas of educational development in India over the years. The document also helps in accentuating the regional trends and patterns across India in the achievement level of learning outcomes amongst the learners of Class X. The detailed contemplation of district-wise information on various subject areas have been done for the first time, which showed a realistic scenario of the performance of the children in various subjects facilitating inter-state and intra-state comparisons at the same time. The collated information through Cycle 2 NAS, Class X, thus can be significantly used in directing policymakers, planners, curriculum developers and other practitioners in initiating relevant policy interventions wherever required with a view to holistically improve and monitor the quality of education at present and in future.
To strengthen the division’s capacities in future and to undertake such programmes with more rigour NCERT welcomes comments and suggestions. For any further clarification/query related to the report you may contact the division through e-mail: [email protected].
Indrani BhaduriHead, Educational Survey Division,
NCERT, New Delhiand
National Coordinator, National Achievement Survey
Prelims.indd 6 02-03-2021 11:17:19

Executive Summary
National Achievement Survey (NAS) has been one of the most significant research projects undertaken by the MHRD, Government of India, which have been administered periodically since 2001 at the elementary level and since 2015 at the secondary level. The NAS Class X (Cycle 2) was initiated by the NCERT under the guidance of MHRD from 2017 onwards and was successfully conducted on a sample basis, in 36 States/UTs and Boards of India in February 2018.
This technical report of Class X presented by NCERT is a cumulative document, divided into nine chapters providing details of the entire process of survey, sampling and methodology used during the process, the execution of the assessment process, analysis and achievement, outcomes according to gender, social category and location of students and finally providing a detailed subject-wise account of learning achievement by the students of Class X in various government and government-aided schools across India. The document by highlighting the level of learning performances of the children in Class X, comprehensively provides a constructive feedback so as to identify the existing gaps in the processes, systems, performances related to school education in general and Class X in particular.
The First chapter provides a glimpse of the historical evolution of NAS in India, its objectives and the assessment framework along with the details of NAS administration, monitoring, reporting, dissemination, post-NAS interventions and the limitations of NAS. The assessment survey was conducted in all the 36 States/UTs and boards of the country, to provide a systematic understanding of learning performances of Class X students in various subjects with much more broadened objectives of providing system–level reflection to facilitate necessary policy interventions in future. The NAS Class X (Cycle 2) assessment emphasised on providing assessment output pertaining to five main curricular subjects, namely English, Mathematics, Science, Social Science and Modern Indian Language (MIL). The assessment was also significant from the view of its coverage, since it was first ever exercised where district administrative units were chosen as survey and reporting units, against state units, which were chosen in Cycle 1, to provide a realistic regional picture of the status of learning in schools.
The second chapter presents the methodology followed during the assessment process, which was developed around three basic parameters, i.e., Design, which includes sample designing and procedures, secondly Reporting, which includes the entire process of Data management, and thirdly Analysis, which is related to the data analysis using Item Response Theory method and preparation of the report. This chapter also provides details on the entire process of conducting the survey nationwide. The target population included Class X students from all the districts, studying in government, government-aided and private schools affiliated with State and National Boards. A comprehensive national sampling plan considering the targeted population was framed and desired school sample was derived based on predefined designated criteria, and a sample of 80 schools was selected from each participating district and from each selected school. A maximum of 45 students were selected through systemic random sampling procedure. Extensive use of information technology for data collection, data analysis and generation of report was done for the first time. Elaborated codebooks were developed based on all variables, mentioned in the assessment data sets. NAS web application was also developed to smoothly conduct the assessment programme. Modern techniques of analysis and interpretation of data have been applied to produce findings, using Item Response Theory, which provide much reliable output for assessment. Item response theory allows to evaluate student’s ability
Prelims.indd 7 02-03-2021 11:17:19

viii
and uses mathematical model to link a student’s probability of correctly responding to a particular item in the test. Based on the results, a comprehensive reporting scale was chosen from 0–500 with an average score of 250 initially, on which the performance of children was rated.
The third chapter is based on providing essential details about the three primary aspects of the survey: The school, the student and the teachers, which were crucial for the entire assessment process and outcome. The details related to the participating schools like defining management categories of the schools into government, government-aided and private schools. The Selection of school location as per rural and urban areas along with their affiliation to either national boards like CBSE, ICSE and various state boards have also been considered. Additional information was also undertaken which included— availability and adequacy of facilities in the school, parent-teacher association, attitude of the students, parents, and teachers towards the school, teacher learning process and other behavioural aspects. The student related information includes— gender, social categories, home location, languages spoken by the child, disabilities among children, resources available at home, educational, occupational status of mother and father of the child, distance of school from home, student experience and preference of subject among children. The teacher related information includes educational and professional qualification, employment status, teaching experience, opinion about workload, teaching practices and teaching methods.
Chapters 4, 5, 6, 7 and 8 contemplates Class X students’ achievements in the five selected subjects, i.e., Mathematics, Science, Social Sciences, English and Modern Indian Languages, respectively.
Chapter 4 specifically highlights the state-wise assessment outcome in the subject mathematics. The average national score of 254 was achieved from all the participating states with 10 states either performing above or at the same level of national average of 254. The state of Andra Pradesh with 269 points is the best performing state in mathematics and Sikkim with 226 points remain the least performing state for the subject. The gender-wise analysis reveal that in 8 out of 36 States/UTs and boards the performance of girls was better than boys. Similarly, the assessment output has been generated for location of school, Social Category, School Management. Different content domains, specifically seven domains— Algebra, Geometry, Mensuration, Trigonometry, Coordinate Geometry, Number system, Statistics were assessed against the range of relevant cognitive process, viz., abilities of learners to remember, understand, and apply their knowledge in attempting an item. The average score of 36 per cent in remembering, 33.9 per cent in understanding and 30.9 per cent in applying was achieved for mathematics. Learners have also been categories into five proficiency level categories ranging from least (less than 200) to highest (greater than 350) and 41 per cent (maximum) of learners in mathematics were observed to be falling in category ranging between 201–250 followed by 31 per cent falling in range 251–300 scores.
Chapter 5 specifically highlights the state-wise assessment outcome in the subject Science. The average national score of 253 was achieved from all the participating states with 14 states either performing above or at same level of national average of 253. The state of Andra Pradesh with 271 points is the best performing state in Science and Dadra and Nagar Haveli UT with 227s point remain the least performing state for the subject. The gender-wise analysis reveal that in 9 out of 36 States/UTs and Boards the performance of girls was better than boys. Similarly, the assessment output has been generated for location of school, Social Category and School Management. Different content domains, specifically seven— Food, How things work, Material, Moving things, Natural Phenomena, Natural resources, The Living world, were assessed against the range of relevant cognitive process, viz., abilities of learners to remember, understand, and apply their knowledge in attempting an item. The average score of 38 per cent in remembering, 33 per cent in understanding and 34 per cent in applying was achieved for Science. Learners have also been categorized into five proficiency level categories based on their
Prelims.indd 8 02-03-2021 11:17:19

ix
Exe
cutiv
e S
umm
ary
achieved scores ranging from least score (less than 200) to highest score (greater than 350) and 36 per cent, i.e., maximum of learners in sciences were observed to be falling in category ranging between 201–250 followed by 33 per cent falling in range 251–300.
Chapter 6 specifically highlights the state-wise assessment outcome in the subject Social Sciences. The average national score of 254 was achieved from all the participating districts with 16 States either performing above or at the same level of national average of 254. The state of Delhi with 273 points is the best performing state in Social Science and Jammu and Kashmir with 229 points remain the least performing state in subject. The gender-wise analysis reveal that in 18 States and UTs there was no significant difference in performance of boys and girls, however, in 11 out of 36 States/UTs and boards the performance of girls was better than the boys. Similarly, the assessment output has also been generated for location of school, social category, school management. Different content domains, specifically four— Economics, Geography, History, Political Science have been assessed against the range of relevant cognitive process, viz., abilities of learners to remember, understand, and apply their knowledge in attempting an item. The average score of 41 per cent in rembering, 40 per cent in understanding and 37 per cent in applying was achieved for Social Science by the learners. Learners have also been categorized into 5 proficiency level categorized based on their achieved scores ranging from least score (less than 200) to highest score (greater than 350) and 37 per cent, i.e., maximum of learners in Social sciences were observed to be falling in the category ranging between 201-250 followed by 251–300 score achieved by learners.
Chapter 7 specifically highlights the state-wise assessment outcome in the subject English. The average national score of 253 was achieved from all the participating districts with 22 States/UTs either performing above or at the same level of national average of 253. The tate of Nagaland with 306 points is the best performing state and Madhya Pradesh State with 229 points remain the least performing state in English. The overall performance of girls was found to be better in 15 of 36 States/UTs and boards. Similarly, the assessment output has been generated for location of school, social category, school management. Two specific content domains were identified with respect to English, i.e., Reading Comprehension and Language Element (Grammar) and range of relevant cognitive process (skills of children), viz., abilities of learners to remember, understand, and apply their knowledge in attempting an item were identified for each domain. The average score of 38 per cent in remembering, 33 per cent in understanding and 34 per cent in applying was achieved for English by the learners. Learners have also been categorised into five proficiency levels based on their achieved scores ranging from the least (less than 200) to highest score (greater than 350) and 44 per cent i.e., maximum of learners in English scored between 201–250 score range, followed by 28 per cent of them lying between proficiency level of 251 to 300 score.
Chapter 8 specifically highlights the state-wise assessment outcome in the subject of Modern Indian Language (MIL). In the MIL only 33 States/UTs and boards participated and the average national score of 254 was achieved from all the participating districts with 17 states either performing above or at same level of national average of 254. The state of Kerala with 279 points is the best performing state in MIL and the state of Manipur with 187 point remains the least performing state in the subject, which reflects a wide gap between the highest and lowest scores achieved. The gender-wise analysis reveal that the performance of girls was better than boys in MIL. Similarly, the assessment output has been generated for location of school, social category, school Management. Learners have also been categorised into five proficiency level categories based on their achieved scores ranging from least score (less than 200) to highest score (greater than 350) and majority of students in MIL were found to have scored between 251–300.
The ninth and final chapter of the report is based on the contextual analysis of the background variables pertaining to three main key elements of the assessment exercise,
Prelims.indd 9 02-03-2021 11:17:19

x
i.e., the school, the students and the teachers. The school factors like learning facilities, resources available, school participation in various academic and cultural activities have been assessed in relation to the achievement output. The student factors and background information of students with respect to student achievement (like distance to school, facilities at home, etc., also have to be assessed. Finally, various academic, professional aspects of the teachers like educational qualifications, experience of teaching, etc., have also been assessed in relation assessment outcome. The analysis of various aspects related to the given three key elements of assessment have been done to provide much realistic and comprehensive picture of the assessment outcome across India and to facilitate comparison in existing socio-economic conditions in different parts of the country to showcase their indirect and direct impact on the learning of children.
This technical report, therefore, is a compendium of perceptible information regarding learning achievements of children in Class X. It not only highlights the achievement of learning outcomes by the learners, but also facilitates comparative analysis against the achievement levels in previous cycles, thus providing a system level reflection on core areas of educational development in India over the years. The document also helps in accentuating the regional trends and patterns across India in the achievement level of learning outcomes amongst the learners of Class X. The detailed contemplation of district-wise information on various subject areas have been done for the first time, which showed a realistic scenario of the performance of the children in various subjects facilitating inter-state and intra-state comparisons at the same time. The collated information through NAS Class X (Cycle 2), thus can be significantly used in directing policymakers, planners, curriculum developers and other practitioners in initiating relevant policy interventions wherever required with a view to holistically improve and monitor the quality of education at present and in future.
Prelims.indd 10 02-03-2021 11:17:19

xi
Content
Foreword iii
Preface v
Executive Summary vii
Chapter 1 1Introduction
Chapter 2 9Methodology
Chapter 3 22Our Schools, Students and Teachers
Chapter 4 46Students’ Achievement in Mathematics
Chapter 5 65Students’ Achievement in Science
Chapter 6 85Students’ Achievement in Social Science
Chapter 7 104Students’ Achievement in English
Chapter 8 123Students’ Achievements in Modern Indian Language (MIL)
Chapter 9 136Contextual Analysis of Background Variables
References 146
Prelims.indd 11 02-03-2021 11:17:19

Prelims.indd 12 02-03-2021 11:17:19

C H A P T E R 1
Introduction
The National Achievement Survey (NAS) is a large-scale assessment survey to monitor students’ learning. NAS is not a school examinations, instead it is a survey that provides National, State and District level pictures of learning levels of students. It is not a reflection on individual student’s, teacher’s or school’s achievement. NAS has been administered
periodically, since 2001 at the elementary level and since 2015 at the secondary level. At the elementary level, NAS assesses the learning levels of children studying in government and government-aided schools, while, at the secondary level, it shows the learning levels of children studying in schools belonging to all managements and boards.
Fig. 1.1: Difference between Examination and Assessment Survey
Chapter_1 Introduction.indd 1 18-02-2021 14:32:23

Learning Achievement of Students — NAS Class X (Cycle 2) 20182
1.1. History of NAS and NAS 2018 in India
BackgroundThe National Achievement Survey was originally planned and designed by NCERT as a research project to assess the quality of education. However, in the year 2000, NAS got subsumed under the Sarva Shiksha Abhiyan (SSA) of MHRD. Over the last two decades of SSA implementation, the focus shifted from dealing with challenges around access, to improving quality of learning. NAS emerged as a tool for giving periodic feedback to the system on the health of the education system. NAS became a regular and ongoing feature of the Indian education system, each round of NAS being referred to as a ‘Cycle’. Under SSA, the original strategy was to administer three NAS cycles, wherein, each cycle would cover Classes III, V and VIII. The three cycles were to be called as Baseline, Mid-term and Terminal Achievement Surveys. The Baseline Achievement Survey (BAS) was carried out in 2001–04 was termed as Cycle 1, followed by the Mid-term Achievement Survey (MAS) in 2005–08 was named as Cycle 2, and Terminal Achievement Survey 2009–13 was termed as Cycle 3. Students of Classes III, V and VIII were to be tested once every three years. In the year 2017–18 NAS was administered simultaneously in Classes III, V and VIII on one single day. The NAS 2017–18
had many new landmarks first and foremost being the assessment of competencies at different grade levels.
Under Rashtriya Madhyamik Shiksha Abhiyan (RMSA), NAS was extended to Class X in 2015. NCERT completed the first Cycle NAS for secondary level (Class X) in 2015. NAS Class X (Cycle 1) assessed student learning at the end of the secondary stage. In NAS X Cycle 1 there were 15 languages of instruction across the country to ensure linguistic quality assurance. Multiple tests (three for each subject), in five subjects, namely Mathematics, Science, Social Science, English and Modern Indian Language (MIL) were developed and used to assess learning achievement. Three questionnaires (school, pupil and teacher) were designed to capture the background information. Item Response Theory (IRT) was used in NAS X Cycle 1, that measures the ability of students to respond correctly to different levels of difficulty in tests. This survey was conducted on a sample comprising 2,77,416 students in 7,216 schools across 33 States/Union Territories (UTs) and Boards.
To observe the improvement in the learning of the students, the MHRD decided to conduct the second Cycle of the Survey. The Educational Survey Division of NCERT initiated the NAS Class X (Cycle 2) in the year 2017. In the previous cycle of NAS Class X, the reporting unit was State however, in Cycle 2 the reporting unit is District.
Figure 1.2: NAS Timeline
Survey Cycle
Cycle I
Class
Subjects Tested
Mathematics and
Language
Background Questionnaires – Student, Teacher and School
Mathematics, Language and
Environmental Studies
Mathematics, Language and
Environmental Studies
Mathematics, Language and
Environmental Studies
III V VIII X
Class Class Class
Cycle II
Cycle III
Cycle IV
2003–2004 2003–2002 2003–2004 2015–2016
2007–2008 2007–2006 2007–2008 2017–2018
2012–2013 2012–2011 2012–2013
2015–2016 2015–2015 2015–2016
Chapter_1 Introduction.indd 2 18-02-2021 14:32:24

3
Intro
duct
ion
NAS Class X Cycle 2 (2018): Salient Features NAS Class X Cycle 2 significantly improved upon its previous cycles (Table 1.1). This section summarises the salient features of NAS Class X Cycle 2:
1. It included all the districts of 34 States and Union Territories of the country.
2. In this study random samples of schools were taken from all the schools in the country having secondary classes (Class X) and recognised by State Education Boards or National Boards of Education [Central Board of Secondary Education (CBSE) and The Indian Certificate of Secondary Education (ICSE)].
3. Assessment of achievement levels of Class X students was done in five main curricular/subjects areas, namely English, Mathematics, Science, Social Science and one Modern Indian Language (MIL).
4. A sample of 80 schools per district from each State/Board and maximum 45 students from each sampled school were included in the survey.
5. Technology was extensively used for uploading data into a central web application by States/UTs for analysis and report generation.
6. District Reports were put in to public domain for wider dissemination.
1.2. NAS Objectives The purpose of NAS is to derive policy directions for systemic interventions with a view to improve the quality of school education. NAS also diagnoses hard spots in learning and consequently provide pointers for restructuring the in-service teacher education programs, as well as, curriculum renewal. NAS Class X Cycle 2 was designed with the following objectives—
Table 1.1: Key Difference between NAS Class X Cycle 1 and Cycle 2
Dimensions NAS Class X Cycle 1 NAS Class X Cycle 2
Objectives yy Systemic Feedback at State/UT level
yy Decentralised systemic feedback at District, State and National levels
Level of Sampling yy State level yy District level
Timeline yy Once in 3 yearsyy Once in 2 yearsyy District and State level results released within the same
academic year
Monitoring yy State level officials yy NCERT, MHRD yy District Monitoring Unit (DMU)
Survey Outcomes yy State Reportsyy National Report
yy District Report Cardsyy State Report Cards
Dissemination Strategy
yy Joint Review Missions (JRMs)
yy MHRD/NCERT website
yy MHRD/NCERT websiteyy District level workshopsyy State level workshops yy Sharing the results with State Level Education Functionaries,
such as Principal Secretaries, SPDs and SCERT Directors yy NAS Mobile Application
Partners
yy MHRDyy Technical Partners brought
in by funding agencies yy SCERTsyy RMSA officesyy DIETs
yy MHRDyy NAS Steering Committeeyy NCERTyy The World Bankyy SCERTsyy SPD SSA officesyy DIETsyy District level education functionaries
Chapter_1 Introduction.indd 3 18-02-2021 14:32:24

Learning Achievement of Students — NAS Class X (Cycle 2) 20184
1. To report performance on different subjects on content domain
2. To compare the average performance of the following group of children—a) Girls and boysb) Rural and urban childrenc) Students studying in government,
government-aided and private schoolsd) Students belonging to different
categories, i.e., Scheduled Caste, Scheduled Tribes, other Backward Classes and others
During the preparatory phase of NAS Class X Cycle 2, it became evident that, NAS could be potentially used to give systemic level feedback on students’ attainment against content domain and hence Post NAS Interventions Strategy was planned to be undertaken at districts and States/UTs level.The key objectives of the Post NAS Intervention phase are—
1. Support States/UTs/Districts/Blocks/Schools to interpret and understand the findings of NAS
2. Support State/UT/District/Block to improve school-wise attainment of content domain
3. Ensure administrative/budgetary support for design and implementation of interventions to improve student attainment of content domain
1.3. NAS Class X Cycle 2 Coverage and Process
CoverageNAS X Cycle 2 provides reliable information to various stakeholders on the efficacy of the education system, with specific reference to issues of quality, equity and efficiency. The test is expected to assess learning levels of the students of Class X studying in secondary schools (Govt, Govt-aided and private) in India. In each of the five subject areas (Mathematics, Science, Social Science, English and Modern Indian Language), common core contents have been identified after analysing the syllabi of States/Boards as compared to the syllabus prescribed by NCERT based on National Curriculum Framework (NCF) 2005.
During the try out at the national level, 220–230 items were administered in each of the five subjects. At the State level, up to 20 per cent more items specially in Social Science were included in each subject to cover state-specific curricula. The number of items for each test in all five subjects for the main survey were decided after the try out only.
ProcessActivities were designed, implemented and reported using international best practices and met the highest standard of technical rigour (Figure 1.3).
Fig. 1.3: NAS Class X Process Flow
Chapter_1 Introduction.indd 4 18-02-2021 14:32:24

5
Intro
duct
ion
1.4. NAS Assessment Framework
Test Design For Class X, students were tested in Mathematics, Science, Social Science, English and MIL. Three test booklets were developed for each subject. Each test booklet included 60 items (MCQs) based on common core content domain.
Details of subject-wise test forms are summarised in Table 1.2.
Test ContentNAS Class X Cycle 2 mapped questions to subject-wise common content. The subject-wise common content list is given in Table 1.3:
Table 1.2: Details of Test Forms
Class Subjects Test Forms
Number of Questions Question Type
Class X
Englishyy 11yy 12yy 13
60 questions included in each test form
yy 48 unique questions across the three test formsyy 12 common questions
Mathematicsyy 21yy 22yy 23
yy 40 unique questions across the three test formsyy 20 common questions
Scienceyy 31yy 32yy 33
yy 43 unique questions across the three test formsyy 17 common questions
Social Scienceyy 41yy 42yy 43
yy 40 unique questions across the three test formsyy 20 common questions
Modern Indian Language (MIL)
yy 51yy 52yy 53
yy 48 unique questions across the three test formsyy 12 common questions
Table 1.3: Subject-wise Common Content
Subject Common Content
English Reading Comprehension and Grammar
Mathematics
yy Number systems including real numbersyy Algebra including polynomials, pair of linear equations in two variables, quadratic equations,
arithmetic progressionsyy Trigonometry including introduction to trigonometry, height and distanceyy Statistics and Probabilityyy Coordinate Geometry including Lines (In two-dimensions)yy Geometry including Triangles, Circles, and Constructionsyy Mensuration including areas related to circle, surface areas and volumes
Science
yy Food including higher yieldsyy Materials used in our clothes, different kinds of materials, what are things made of, what is
there inside an atom, how things change/react with one another, materials of common uses and how are elements classified
yy The world of the living including biological diversity, what is the living being made up of, how do we fall sick, how do substances move from cell to cell, our environment, how do we stay alive
yy Reproduction in the living, heredity and evolution
Chapter_1 Introduction.indd 5 18-02-2021 14:32:24

Learning Achievement of Students — NAS Class X (Cycle 2) 20186
yy Moving things, people and ideas including motion, force and Newton’s law, gravitation, work energy and how things work including electric circuits and magnets
yy Natural phenomenayy Natural resources including balance in nature, conservation of natural resources, the regional
environment and Sources of energy
Social Science
GeographyIndia—Land the Peopleyy Indiayy Climateyy Drainageyy Natural Vegetationyy Wildlife and Population
India—Resources and their Developmentyy Natural Resourcesyy Forest and Wild life Resourcesyy Agricultureyy Water Resourcesyy Mineral Resourcesyy Power Resourcesyy Manufacturing Industries
HistoryIndia and the Contemporary World I and IIyy Events and processes: French revolution, Russian revolution, Rise of nazism, Nationalism in
Europe, Nationalist movement in Indo-China and Nationalism in India: Civil Disobedience Movement.
yy Economies and livelihoods: Pastoralists in the modern world, forest society and colonialism and farmers and peasants, Industrialisation 1850s–1950s, Urbanisation and Urban Lives and Trade and Globalisation.
yy Culture, Identity and Society: Sports and politics, clothes and cultures, Print Culture and Nationalism, History of Novel.
Social Science
Political ScienceDemocratic Politics I and II yy Democracy in contemporary worldyy What is democracy? Why democracy?yy Designing of democracy in Indiayy Electoral politics in democracyyy Institutions of parliamentary democracyyy Citizens’ rights in democracyyy Working of democracyyy Power sharing mechanism in democracyyy Competition and contestations in democracyyy Outcomes of democracyyy Challenges to democracy
EconomicsThe Story of village Palampuryy People as resourcesyy Poverty as a challenge facing Indiayy Food securityyy The story of developmentyy Money and credit yy The role of service sector in Indian economyyy Globalisationyy Consumer awareness
Modern Indian Language (MIL) Reading Comprehension and Grammar
Chapter_1 Introduction.indd 6 18-02-2021 14:32:25

7
Intro
duct
ion
Skills Coverage (Common to Mathematics, Science and Social Science)From each concept or sub-concept of content area, three types of items were constructed to test— skill 1, skill 2 and skill 3. Under each skill, the question constructed belonged to the categories— easy, average and difficult.
Skill-wise instructions are summarised in Table 1.4.
1.5. NAS Administration Preparatory work for NAS Class X Cycle 2 commenced several months prior to the actual date of NAS Administration. At the central level, preparatory work was led by MHRD and NCERT in collaboration with NAS Programme Management Unit. A Steering Committee was established to guide and facilitate the activities of NAS.
At the state and district levels, SPD RMSA, SCERTs/SIEs and MIS coordinators undertook preparatory tasks for successful implementation of NAS Class X Cycle 2 in their respective areas.
Key Roles and Responsibilities of Various Organisations/Functionaries y● SPD
SPD and his office ensured availability of funds and infrastructure for NAS Class X Cycle 2 administration and post NAS activities. SPD’s office also identified nominated and trained personnel and teams for monitoring the survey.y● SCERTs
Academic activities of the survey were spearheaded by SCERTs. Tasks, such as, vetting and translations of tests, communication of the final list of sample schools to NCERT, design and framing of post NAS interventions were led
by SCERTs. SCERTs also nominated the District Coordinators.y● District Coordinators (DCs)
DCs lead the school related communication and activities, such as verification of NCERT’s sample school lists and communication of date of assessment to the school, etc. DCs also conducted trainings of Field Investigators (FIs).y● Field Investigators (FIs)
FIs administered the survey on February 5, 2018. District Institute of Education and Training (DIET) students were enrolled as FIs. However, in Districts/States/UTs where absence of DIETs or shortage in FI members was reported, B.Ed./M.Ed. trainees from government colleges; B.Ed./M.Ed. trainees from Private Teacher Education Institutes (TEI); trained teachers who were not working in government schools; retired school teachers; Master of Social Work students and private school teachers, (in the given order of preference) were used as FIs.Successful completion of NAS activities required
the above mentioned organisations and personnel to work in collaboration with each other. Printing of tests, providing sealed test material to districts and upload of data on the web application are examples of few activities which required coordinated efforts from all.
1.6. NAS Monitoring NAS Class X Cycle 2 was monitored and quality was assured at various levels. At the central level, MHRD and NCERT kept a thorough vigil over the completion of the NAS preparatory activities. Control units were set up at MHRD, NCERT and SCERTs prior to the day of NAS administration. At the state level the District Monitoring Unit (DMU), overviewed and reviewed the NAS preparatory activities.
Table 1.4: Skill-wise Instructions
Skills Expectation
Skill 1 Students are expected to answer using simple knowledge (recall) or recognition of terms and/or concepts familiar from their lessons. This skill also included the application of basic operations in straightforward tasks.
Skill 2 Students are expected to solve non-complex problems set in familiar situations by way of simple application of the operations/concepts learned in Classes IX and X.
Skill 3 Students are expected to use concepts, principles, facts, etc., learned in the class in new or less familiar situations. In particular, students are expected to apply their abilities to solving real-world problems.
Chapter_1 Introduction.indd 7 18-02-2021 14:32:25

Learning Achievement of Students — NAS Class X (Cycle 2) 20188
NAS on the day of its administration was monitored by an independent observer, who was nominated from the office of the Chief Secretary. Each Observer was to fill a Monitoring Proforma1 and submit to the SPD’s office. The SPD’s office was required to send in a single State Monitoring Report to NCERT.
1.7. NAS Reporting Under NAS Class X Cycle 2, for the first time, results have been reported at district level. Auto generated District Report Cards (DRCs) were put in the public domain within two months of the conduction of survey. Subsequently, State Report Cards (SRCs) were also released.
This national report which includes all the details of the technical aspects would be the last in the series of reports for NAS Class X Cycle 2. The reports at all levels, i.e., District, State and National levels focus on student performance in the attainment of learning in the desired specific content.
Achievement has been aggregated at the district level in the DRCs. Similar aggregation has been shown at the State and National level in the SRCs and the National Report, respectively. Analysis of pupil, teacher and school questionnaires have been included in SRC and the National Report.
Under the leadership of NCERT, Districts and States are expected to design interventions for improving learning at district and state level.
1.8. NAS Dissemination and Post NAS Interventions
Several regional workshops were organised to disseminate and discuss the findings of the DRCs and SRCs.
The objectives of the workshops were:1. To sensitise the participants on how
assessment helps to transform education systems
2. To share the experiences of the States/UTs in the conduct of the NAS
3. To develop a common understanding on how NAS data will be used in policy, planning and improving pedagogical interventions
NCERT in collaboration with UNICEF also developed a Data Visualisation Application, which enables viewers to see the complex NAS data analytics in a simple and user-friendly manner.
NCERT has also developed a document on ’Post NAS Interventions: Communication and Understanding of the DRCs’, which clearly articulates the way to interpret and understand the DRCs. The document also entails the actions, which NCERT proposes to be taking as a follow up of NAS. Follow up steps have been classified under short-, mid- and long-term interventions, as summarised below in Table 1.5.
1.9. Limitations 1. Languages across India have differences
in Grammar. This leads to difficulty in standardising the procedures for scoring. Thus, only reading comprehension could be tested across classes in the language subject.
1 Monitoring proformas were received by the observers prior to 5 February, 2018.
Table 1.5: Short, Mid and Long-term NAS Interventions
Duration Interventions
Short-term Training of State Level Master Trainers (SLMTs) in communication and understanding of the DRCs
Mid-term
Development of an intervention planStrengthening of State AWPBs by using NAS data Development of an Item Bank (Dynamic)Development of ICT-based Learning Resources/Materials and LMSData Sharing with States/UTsAdoption of Lowest Performing Districts in States for improving Learning Levels
Long-term Development of National Policy Perspectives Curriculum Review and Reform
Chapter_1 Introduction.indd 8 18-02-2021 14:32:25

This chapter deals with the sample design and procedure followed to conduct NAS Class X (Cycle 2). Sample design and sampling method have been discussed in detail. This is followed by the management of data with the help of single web application. The learning achievement data was analysed using Item Response Theory (IRT).
2.1. Target Population
The Class X (Cycle 2) NAS was designed to investigate learning achievement in the system at the level of the state or union territory. Hence, the target population was all Class X children studying in government, government-aided and private schools affiliated with the State Board and private schools affiliated with national level boards.
National Desired Target PopulationAll students enrolled in Class X in government, government-aided and private schools belong to the national desired target population. In simple terms,
C H A P T E R 2
Methodology
Fig. 2.1: NAS Class X (Cycle 2) Methodology
the national desired target population was intended to provide full coverage of all eligible students studying in Class X in government, government-aided and private schools.
National Defined Target PopulationThe national defined target population is the national desired target population minus certain exclusions. For example, the schools having enrolment less than 8 were removed from the District sampling frame. All exclusions must not exceed 5 per cent of the desired target population, State/UT that exceed this limit will be annotated in the national report.
District Desired Target PopulationAll students enrolled in Class X in government, government-aided and private schools in a particular district belonged to the district desired target population.
Chapter_2_Methodology.indd 9 18-02-2021 10:33:18

Learning Achievement of Students — NAS Class X (Cycle 2) 201810
In cases where district desired target population deviates from the full district coverage of all eligible students, the deviations were described and enrolment data was provided to measure the extent of the reduced coverage.
District Defined Target PopulationThe district defined target population is essentially the school sampling frame. Differences between the district desired and defined target populations will generally arise out of practical considerations and should be kept to a minimum. All exclusions must not exceed 5 per cent of the district desired target population.
For example, for Sitamarhi district of Bihar, the desired and defined target population is given as below.
ExclusionsThe District Defined Target Population represented a subset of the District Desired Target Population. All the excluded schools and students from the District Desired Target Population are referred to as the excluded population.
Usually, practical reasons are invoked for excluding schools and students, such as increased survey costs, increased complexity in the sample
Example 1: Sitamarhi District of BiharAn example of Sitamarhi District from the state of Bihar: Desired Target Population and Defined Target Population
Desired Target PopulationTotal No. of Schools Total Enrolment
989 70745
Defined Target Population
Exclusion Category Values to be Excluded
Total number
of Schools
Total Enrolment excluded
Defined Target
Population
% of Exclusions
School Management 5,6,7,8,97,98 78 3,551 67,194 5.00
Invalid School Category 1,8,10 0 0 67,194 0.00
<8 5 21 67,173 0.02
Total - 83 3,572 67,173 5.0It should be less than or equal to 5%
Rest 906 67,173
Total Defined Target Population is 906 schools with enrolment of 67,173 studentsNote: The target population was limited to schools that contain the target class. Schools that did not contain the target class were, therefore, not considered part of the excluded population.
design and difficult test conditions. Exclusions can occur at the school-level, i.e., the entire school is excluded, or specific students within sampled schools, or sections, are excluded.
School Level ExclusionsThe schools were excluded for the following reasons: ●● They were geographically inaccessible.●● They were of extremely small size. ●● They offered a curriculum, or school structure,
radically different from the mainstream educational system.
Coverage and Exclusions The distinctions among the Target Population, Desired and Defined Target Populations can be
nebulous. In this survey, we aimed to achieve full coverage of the National Target Population among all participating districts and to keep all exclusions to a minimum.
At district level all other sources of exclusions would constitute exclusions from the District Desired Target Population. Exclusions, therefore, describe the difference between the District Desired and District Defined Target Populations. Ultimately, the
Chapter_2_Methodology.indd 10 18-02-2021 10:33:19

11
Met
hodo
logy
district effective target population is the population that the sample of participating students effectively represent, after all sources of exclusions have been taken into account.
The term ‘within-sample exclusions’ is used to describe exclusions found among the sampled schools, sections and students. All within-school exclusions will fall in this category. The sizes of the district effective target population and within-sample exclusions will be estimated from the weighted sample.
Example 1: District Defined Target PopulationThe following is a fictitious example of a District Defined Target population. In this example, District A has chosen to exclude the South Island because of its remote location, special needs schools because their curriculum is different from the mainstream educational system and very small because of its reduction in sample yield. These school level exclusions account for 3.1 per cent of eligible students in the State Desired Target Population.
District A also expects to exclude disabled students within schools. This would add another 0.8 per cent to this exclusion rate. Bringing the total exclusion rate to 3.9 per cent which is below the acceptable limit of 5 per cent.
2.2. StratificationOverviewPrior to sampling, schools were ordered, or stratified, in the sampling frame. Stratification consisted of grouping schools into strata according to some grouping, or stratification variables. Stratification is generally used for the improvement of the efficiency of the sample design, thereby making survey estimates more reliable.
Explicit Stratification Explicit stratification consisted of building separate school lists, or sampling frames, according to the set of explicit stratification variables under consideration. For example, district was considered as an explicit stratification variable, therefore, separate school sampling frames were constructed for each district. A constant sample size, was then applied to each school sampling frame to select the sample of schools at district level.
In this survey, the major reason for considering explicit stratification is to implement a disproportionate allocation of the school sample to the explicit strata. For example, the same number of
schools could be sampled from each explicit stratum, regardless of the relative size of each stratum. The objective in this situation was to produce equally reliable estimates for each District.
Another important reason for defining explicit strata was to deal with specific sample design issues. For example, explicit strata might be required to deal with very large schools. Very large schools are discussed in Section 2.4.
Implicit Stratification Implicit stratification consisted of sorting the school sampling frame by a set of implicit stratification variables. It is a very simple way of ensuring a strictly proportional sample allocation of schools across all implicit strata. It can also lead to improved reliability of survey estimates, provided the implicit stratification variables being considered are known to be significant between strata variance component. The implicit strata used in NAS Class X Cycle 2 are—●● Block●● Location/area●● Management●● Type of school●● Medium of instruction
Example 2: Stratification in NAS Class X Cycle 2The following is an example of the stratification variables using Bihar’s Sitamarhi district’s data in NAS Class X (Cycle 2). ‘District’ was defined as its explicit stratification variable and five implicit stratification variables and their levels, listed below:
1. Block: This variable refers to the 17 blocks within Sitamarhi district.
2. School Management: This variable refers to the three major school management groups in Sitamarhi district: government, government-aided and private.
3. Location: This variable refers to the two main locations of Sitamarhi schools— Rural and Urban.
4. Medium of Instruction: This variable refers to two medium of instruction, namely Hindi and Urdu across schools of Sitamarhi district.
5. School Type: This variable refers to the gender composition of schools in Sitamarhi district of Bihar. That is, co-educational, all boys and all girls schools.
Sitamarhi district defined a total of one explicit stratum and five implicit strata with various levels per explicit stratum, for a total of 408 implicit strata.
Chapter_2_Methodology.indd 11 18-02-2021 10:33:19

Learning Achievement of Students — NAS Class X (Cycle 2) 201812
2.3. The National Sampling Plan
Introduction The NAS Class X technical standards had set a high benchmark for sampling precision, participation rates and implementation of sampling plans. These standards were said to result in samples of the highest quality and consequently survey estimates, which are unbiased, accurate and comparable.
Effective Sample Size Before sampling it is important to set the level of precision. As a thumb rule precision should be around +/- 5 per cent. The NAS Class X standard for sampling precision requires that all state and territory samples achieve an effective sample size, for the main criterion variables, of at least 400 students.
In other words, all state or territory samples should yield sampling errors that are no greater than the sampling errors that would be obtained from a simple random sample of 400 students.
Since NAS Class X will also produce data at the school and section levels, a minimum of 80 schools must be selected from each district and minimum 360 schools in participating States or Union Territories.
The proposed NAS Class X sample design is a two-stage stratified cluster sample, which is far less efficient than a simple random sample. The actual sample sizes will, therefore, be much larger than 400 students. For example, by sampling one section of 45 students from each of 80 schools, sample sizes of approximately 3645 students can be expected from each district.
Participation Rates The NAS Class X required maximum participation rates for schools and students. This requirement minimised the potential for response biases.
Schools NAS Class X requires a minimum participation rate of 85 per cent of sampled schools as set in technical standards. Non-participating sampled schools will be substituted with ’replacement schools’ to meet sample size requirements. The use of replacement schools does not guarantee that potential response biases have been reduced. State coordinators were encouraged to persuade as many sampled schools as possible to participate in the main survey.
Sections Section participation rates will not be computed since generally only one section per school was sampled and a non-participating section will result in the school not participating. It is important to mention, however, that the substitution of sampled sections was not allowed. Substituted sections would affect the status of their respective schools, by demotion to either replacement or non-participating school status, resulting in a lower participation rate of sampled schools. If a substituted section did not meet any of these conditions, then its respective school was treated as a non-participating school.
Students NAS Class X also required a minimum participation rate of 85 per cent of students among participating schools. Student participation rates were calculated for over all participating schools, whether sampled schools or replacement schools. The student participation rate requirement of 85 per cent was met at the district level, not necessarily for each participating school.
Sampling StepsOverall, there are eight key steps followed to successfully prepare, draw and check the sample of schools. The eight key steps are—
1. Preparation of the sampling frame file2. Identification of certainties3. Determine sample selections4. Sorting the frame and sample selection 5. Checking the assigned replacement schools 6. Handling the certainties 7. Generating a school participation file 8. Populating population and sample summary
statistics
Sample Design FrameworkThe general sample design framework adopted for this study is a two-stage stratified cluster sample design. State or territory sampling plans relied on sound and defensible sampling methods. These methods are briefly described in the following points.●● For the first stage of sampling, schools were
stratified, explicitly and/or implicitly, and selected with Probabilities Proportional to Size (PPS). The sampling method is called a PPS systematic sampling method.●● The second stage of sampling consisted of the
selection of one section, from each sampled school.
Chapter_2_Methodology.indd 12 18-02-2021 10:33:19

13
Met
hodo
logy
2.4. The School Sampling Frame
School Measure of Size A suitable school measure of size (MOS) is a critical component of a school sampling frame, since school selection probabilities are based on this MOS. Possible school MOS, in decreasing order of suitability, are—
1. Student enrolment in the medium of instruction
2. Student enrolment in the target class3. Average student enrolment per section,
i.e., total student enrolment divided by the number of sections in the school
4. Number of sections in the target class 5. Total student enrolmentIn NAS Class X (Cycle 2), total student enrolment
is used as MOS.
School Sample Allocation For the main survey, a minimum of 80 schools were sampled from each district. If a state or territory has two or more explicit strata, State Coordinators were required to calculate the proportional allocation of 360 schools across the explicit strata.
Excluding Schools from the Sampling Frame Based on the information reported in Sampling Form 2 (National Defined Target Population), some schools were excluded from the school sampling frame.
Sorting the Sampling Frame Each school in the sampling frame was assigned a value for each implicit stratification variable. For example, if location (rural or urban) and school management (government or private) are used, each school must be classified as either rural or urban and as either government or private.
The school sampling frame was then sorted by the implicit stratification variables. The schools were first sorted by the first implicit stratification variable, then by the second implicit stratification variable, and so on, until all implicit stratification variables exhausted. The result was a cross-classification structure that represented the implicitly stratified school sampling frame.
Very Large Schools The district sampling frame contained schools wherein MOS was greater than the calculated
sampling interval. In theory, this would mean that some of these very large schools are sampled more than once. This situation could be problematic during survey operations as this would require sampling more sections in those schools. It also complicates the data base design and computation of sampling weights. In order to avoid these problems, an explicit stratum of very large schools was constructed. This stratum contained all schools wherein MOS was greater than the calculated sampling interval.
Identifying Replacement Schools It is not always possible to obtain the participation of all sampled schools. In order to avoid the resulting sample size losses, a mechanism of field verification of schools was adopted to identify a priori replacement schools for non-participating sampled schools. Another, perhaps more important, reason for identifying replacement schools a priori was to avoid the haphazard use of alternate schools as replacements, which may amplify response biases. Although this approach does not necessarily avoid non-response bias, it tends to minimise the potential for bias. Furthermore, it is conceptually more palatable than over-sampling to accommodate a low participation rate.
The districts were asked to make every effort to get as many of the sampled schools to participate as possible. In some cases, however, districts are needed to consider the use of replacement schools. To allow for this, where possible, each sampled school in the main survey was assigned two replacement schools in the sampling frame.
2.5. The Sampling of Schools
Overview Schools were selected once the school sampling frames were sorted according to the implicit stratification variables and had been constructed for each explicit stratum. School samples were selected separately for each explicit stratum, with each explicit stratum having its own sampling frame. Each school entry in the sampling frame contained:
1. a unique national school ID (this should be numerical),
2. school contact information, such as name, address, email address, phone number, etc.,
3. all implicit stratification variables and4. a suitable school measure of size (MOS).
Chapter_2_Methodology.indd 13 18-02-2021 10:33:19

Learning Achievement of Students — NAS Class X (Cycle 2) 201814
Before progressing further, it was ensured that sampling forms 1 to 4 had been completed. The sampling forms were used as a reference to indicate the implicit stratification variables, their order of importance and their levels. The information outlined in the sampling forms was reflected in the sampling frame and sample selection process.
2.6. Data ManagementNAS Class X (Cycle 2) was a paper and pencil test, which was administered pan India, following uniform and standardised procedures. Post data collection,
the OMR sheets were scanned and converted into .csv files. Cleaned .csv files were uploaded into a web application, which was developed specifically for NAS Class X (Cycle 2).
Use of a single web application to collate, carry out preliminary analysis and generation of District Report Cards (DRCs) was a novel feature of NAS Class X (Cycle 2).
Class X Data Management Sequence in NAS Cycle 2Several preparatory activities were undertaken prior to the development of NAS Class X web application. Key preparatory activities are shown in Figure 2.2.
Fig. 2.2: Preparatory Activities for Development of NAS Class X (Cycle 2) Web Application
Fig. 2.3: NAS Class X (Cycle 2) Web Application Screenshot
Chapter_2_Methodology.indd 14 18-02-2021 10:33:21

15
Met
hodo
logy
Codebook DevelopmentA codebook includes details on all the variables mentioned in the assessment data set. Details commonly included in the codebook are related to variable definitions/descriptions, variable codes/values, validity parameters and codes for missing values.
For NAS Class X (Cycle 2), codebook was developed and stored within the NAS web application. The codebook served as a structural database, wherein, details on NAS variables were stored. Information on items, form numbers, and keys were all stored in the NAS Class X (Cycle 2) codebook. All the above information was saved separately for each tested subject.
NAS Class X (Cycle 2) online codebook was used to analyse the uploaded raw data and auto-generate DRCs from the web application.
NAS Web Application: Hardware and SoftwareThe NAS web application was hosted on a NIC cloud-based server. Details on the backend infrastructure used to configure the application are given below.
Setting up of Web Application Access ProcessesThe following 3 category of users were provided access to the web application— (i) National level (ii) State level and (iii) District level.
Each level of user could access the application by logging in through a distinct username and
password. A specific SMS and e-mail system was activated to transmit the username and passwords to the web application users.
Each level of user could perform only pre-defined set of activities on the web application (details on the same are provided in Table 2.1).
Setting up of Data Entry and Upload ProtocolsThe web application supported two forms of data entry — manual and non-manual. Manual data entry required the DCs to physically enter data into the web application. The information, such as number of FIs, number of students present or absent on the day of assessment, etc., had to be entered manually into the application.
Test and questionnaire data could only be uploaded or entered into the system using the non-manual/software facilitated mode of data entry.
Detailed procedures on uploading test and questionnaire data were mentioned in the Data Capturing Manual (DCM)1 developed by NCERT.
Web Server: LAMP or NGINX
Database Server: MySQL 5.5.54
Database Cache: Redis 2.4.10
Application Development Framework: CodeIgniter (CI) 3.1.0
Server Side Language: PHP 5.6.30
Programming Language: PHP, Javascript (Jquery), HTML
1 http://www.ncert.nic.in/programmes/NAS/pdf/Data_Capturing_Manual.pdf
Table 2.1: NAS Class X (Cycle 2) Web Application User Levels and Activities Performed
User Level Personnel/Organisations Involved Activities to be performed on the NAS Class X (Cycle 2) Web application
National ●y Educational Survey Division (ESD), NCERT
●y View progress of activities at the national level●y Correct/Modify the Codebook●y Create State Level Users●y Download National Data ●y Download DRCs
State ●y State Coordinator●y View progress of activities at the State/UT level●y Create District Level Users●y Download DRCs
District ●y District Coordinator
●y Upload District Level Data ●y View Progress of activities at the district level ●y Manually enter details, such as FIs number, contact
details, etc.●y Download DRCs
Chapter_2_Methodology.indd 15 18-02-2021 10:33:21

Learning Achievement of Students — NAS Class X (Cycle 2) 201816
The DCM clearly specified and explained the fields which needed to be filled and completed at the time of upload. The document also specified the validation checks for each of the above mentioned fields. Validation checks referred to the values and its ranges which could be filled and accepted by the application.
Each district uploaded six .csv files — three .csv files for achievement tests and one each for PQ, SQ and TQ data. Each of the achievement .csv files included data on all the subjects tested for a particular class. However, in case of questionnaires, districts uploaded all the data across classes for a particular questionnaire in a single .csv file.
Setting up of Database Security Measures Several measures were put in place to ensure that the datasets entered into the application were secure and error free. Given below are some key safety measures instituted within the application.●● Username and password based entry: A user
could enter the application only after entering a preset username and password.●● All passwords were encrypted: Plain text
passwords were not accepted by the application.●● File upload: The application rejected any other
type of upload apart from .csv files.●● Different captchas were built into the application
for login, data upload and DRC download: Users were required to correctly enter a captcha before entering the application, uploading data and downloading DRCs.●● Access to the application was based on
approvals: People could not independently access or register themselves on the application. Only pre-defined users could access the application. The application accepted only three levels of users— National Level Users (NLUs), State Level Users (SLUs) and District Level Users (DLUs). NLUs could only create SLUs, SLUs could only create DLUs. ●● Any users could not change, update or modify
data of other users.
Setting up of Backup ProceduresWithin the application, the NAS Class X (Cycle 2) database, was set up in a table format and had the following functionalities:●● A login tracker to track the user IDs who logged
into the web application along with the date and time of the login.
●● A .csv upload tracker to track the user ID who uploaded the file along with the format of the file and the time of modification (if any).●● LO code book along with number and times of
modification.●● National/State/District Response Master
Trackers which tracked and created back up of all the achievement and questionnaire data, along with the number and date of modifications. Information on the IDs through which the modifications were made and also stored.
Setting up of Data Cleaning and Validation Processes All efforts were taken to ensure that only clean data got uploaded into the web application. Preliminary levels of data cleaning were done by DCs, following the procedures mentioned in the DCM. While preparing files for upload, the DCs manually scrutinised the OMR sheets to correct errors and cases of duplication.
Post this initial round of manual correction, the data files were scanned and converted into .csv files using specialised scanning software. The .csv files were put through an offline correction tool1, which helped to identify errors, specifically, in fields which were present as mandatory. Mandatory fields were defined as fields for which entry in a specified format was needed and essential. Fields which required details on UDISE Code, Student ID, Social Group, Area Code, School Management, Gender, and Medium (Language) and Test forms were defined as mandatory.
Data collected in the mandatory fields were crucial to the analysis of NAS Class X (Cycle 2).
A guideline2 was also developed to help users understand the procedures of cleaning the data using the tool. Prior to data upload, the offline tool along with its guideline was hosted on the web application.
The NAS Class X (Cycle 2) offline tool was a simple macro-based excel sheet with in-built validations that helped users clean their data. Validation ranges for the mandatory fields were same as those mentioned in the DCM and offline tool guidelines. In addition to the above, item responses were restricted to 1–4 and 8, 9 were affixed for multiple and no responses, respectively. Mandatory fields and columns in which values deviated from the present values/ not filled in 1 http://www.ncert.nic.in/programmes/NAS/offline.html2 http://www.ncert.nic.in/programmes/NAS/pdf/NAS_Correction_
Guidelines.pdf
Chapter_2_Methodology.indd 16 18-02-2021 10:33:21

17
Met
hodo
logy
as expected were shown as errors in the offline tool. Upon putting the .csv file through the offline tool, in case of error generation the DCs were expected to check and correct the errors. The final cleaned file was also saved as .csv file which could be uploaded into the application.
Offline cleaning tool was only developed for achievement data in NAS Class X (Cycle 2).
Figure 2.4 gives a snapshot of the offline tool.
Validations ResultsTotal number of errors 0UDISE School Code
Save file for uploadStudent IDSocial Group Area CodeSchool Management Gender MediumTest from Questions Errors
Fig. 2.4: NAS Offline Tool Upon completion of data upload, UDISE codes
of schools included in the .csv files uploaded into the web application were matched against the UDISE codes mentioned in NCERT’s verified sample school lists. This step became a precursor to DRC generation.
DRC results were computed for the number of schools which matched between the uploaded .csv file and the NCERT’s verified sample school lists.
Setting up of Quality Assurance MeasuresAn attempt was made to set up stringent quality control processes at every step of data collection, cleaning, verification and upload.
Listed below are few quality control measures which were set up with regards to data management:●● Prior to data upload, all achievement test data
had to be screened and corrected using the data offline tool.●● Only .csv files could be uploaded into the web
application.
Click here to check for errors
●● DRC generation relied completely on the list of sampled schools verified by States/UTs and shared with NCERT making result computation a transparent and bias-free process.●● The web application was screened through a
security audit before being put into the public domain.
2.7. Item Response Theory (IRT)IRT allows to evaluate student ability and to describe how well items on the test are performing. Instead of treating ability solely as a function of a student’s score, IRT uses the concept of an Item Characteristic Curve (ICC) to show the relationship between students’ ability and performance on an item. In IRT, both ability of students and item parameters are estimated which are based on student’s response patterns on the test.
IRT uses a mathematical model to link a student’s probability of responding correctly to a particular item, thus taking care of the two main factors, i.e., the student’s level of ability and the item’s level of difficulty. Therefore, analysis in IRT is more complex than traditional methods like CTT. IRT uses the concept of an Item Characteristic Curve (ICC) to show the relationship between students’ ability and performance on an item.
It is true that IRT method makes the analysis more complex than traditional methods, however, it has many advantages. Firstly, it places students and test items on the same numerical scale which enables us to produce meaningful ‘maps’ of items and students. Secondly, in IRT, the difficulty parameter for an item does not depend on the group of test takers. This allows us to use multiple test booklets which can be ‘linked’ or equated, thus facilitating the comparison of scores from tests used in different years/cycles an essential characteristic for monitoring progress over time.
In Table 2.2, students’ responses on five items have been indicated.
Table 2.2: Item-wise Raw Responses of Children Item 1 Item 2 Item 3 Item 4 Item 5 Average
Student 1 1 1 1 1 1 1Student 2 0 1 1 1 1 0.8Student 3 0 0 1 1 1 0.6Student 4 0 0 0 1 1 0.4Student 5 0 0 0 0 1 0.2Average 0.8 0.6 0.4 0.2 0
Chapter_2_Methodology.indd 17 18-02-2021 10:33:21

Learning Achievement of Students — NAS Class X (Cycle 2) 201818
First student answers all five items correctly and is tentatively considered as possessing 100 per cent proficiency. Similarly, second and third students are attributed to have 80 per cent and 60 per cent proficiency levels. However, under IRT, the above assertions are considered tentative. Student’s abilities cannot be judged based on the number of correct items alone. For accurate ability estimation, item attributes, such as discrimination/difficulty also need be taken into account. For example, two children (student 6 and 8) get the same raw scores on a test (shown in Table 2.3). However, it is difficult to state that, whether both the students have the same level of proficiency attainment. The eighth student may have answered two easy items correctly and the sixth student may have answered two difficult items correctly. Hence, both the item attributes and the examinee proficiency need to be measured before estimating student performance.
CTT can help us get estimate only ‘tentative item difficulty’ and ‘tentative student proficiency levels’.
In IRT, tentative proficiency and item difficulty levels are used to fit a model, which is then employed to predict the data. Given the proficiency level of a student, the probability of answering a particular item correctly is computed by the following equation:
Probabilityproficiency difficulty
11[ exp{ ( )}]
Item ParametersItem parameter is a fundamental concept of IRT and is used to judge the quality of an item within both Classical Test Theory as well as in IRT itself. Common IRT models are based on one, two, or three parameters.
Item Discrimination (The ‘a’ Parameter)A good test item should have a characteristic that high-ability students may more frequently answer it correctly than lower-ability students. The ‘a’ parameter expresses how well an item can differentiate among students with different ability levels. This is judged by studying the correlation between the right or wrong scores that students receive when their scores are summed up across the remaining items. Good items usually have discrimination values ranging from 0.5 to 0.7. In Table 2.4 an attempt has been made to interpret the discrimination values with respect to quality of an item.
Item Difficulty (The ‘b’ parameter)Item difficulty is most commonly measured by calculating the percentage of students who
Table 2.4: Discrimination Values and Interpretation
Discrimination Value Interpretation
>0.40 (>40%) Strong, positive discrimination
0.25 – 0.40 (25% – 40%) Moderate, positive discrimination
0.10 – 0.25 (0% – 25%) Weak discrimination
=0.00 (0%) No discrimination
<0.00 (<0%) Negative discrimination
Table 2.3: Item-wise Raw Responses of Children
Item 1 Item 2 Item 3 Item 4 Item 5 Average
Student 6 0 0 0 1 1 0.4
Student 7 0 0 0 0 1 0.2
Student 8 1 1 0 0 0 0.4
Chapter_2_Methodology.indd 18 18-02-2021 10:33:23

19
Met
hodo
logy
answer the item correctly. If the item is responded to correctly by only a few students out of a large number of students then that item is considered to be difficult. For example, if out of 100 students only 30 students respond to an item correctly then its difficulty will be 0.3 (30/100). Generally, items with ‘p’ values between 0.21 to 0.79 are considered for inclusion in tests where the average difficulty scores are nearly 0.5. Item difficulty is denoted by letter ‘p’ and its interpretation for dichotomous item is summarised in Table 2.5 below.
Pseudo-guessing (The ‘c’ parameter)Some IRT models include a pseudo-guessing parameter, known as the ‘c’ parameter. This provides information about the students with low ability of guessing the correct response to an item and therefore has a greater-than-zero probability of responding correctly.
IRT ModelsItem response models are classified on the basis of item parameter(s) used in it. Some of them are described as under:i) One–parameter model: It includes only the item difficulty parameter (b). The expression for Pij the probability of the ith examinee, having ability θi, being successful on the item is
exp( )
1 exp( )
1
1 exp[ ( )]
i jij
i j
i j
bP
b
b
−=
+ −
=+ − −
θθ
θ
There is only one parameter for each item, namely the difficulty and is known as Rasch model. ii) Two–parameter model: It includes difficulty (b) and discrimination (a) of the item. The expression for Pij the probability of the ith examinee, ability θi, being successful on the jth item.
exp[ ( )]
1 exp[ ( )]
1
1 exp[ ( )]
j i jij
j i j
j i j
a bP
a b
a b
−=
+ −
=+ − −
θθ
θ
This is comparable to the 1-PL model with the addition of a scaling or slope parameter, which varies between items (This parameter is related to the item’s power of discrimination across the ability scale).iii) Three–parameter model: It includes item difficulty (b), item discrimination (a), and guessing(c). The expression for Pij the probability of the ith examinee, ability θi, being successful on the jth item.
exp[ ( )](1 )
1 exp[ ( )]
1(1 )
1 exp[ ( )]
θθ
θ
−= + −
+ −
= + −+ − −
j i jij j j
j i j
j jj i j
a bP c c
a b
c ca b
Where aj is a scaling parameter which varies between items, and cj is the lower asymptote, or ‘pseudo-guessing’ parameter.
Generally, two important functions are derived from IRT parameters that are used to explain how well a test is functioning. These functions are as follows:
Table 2.5: p-Values and Interpretation for Dichotomous Items
p-Value Interpretational for dichotomous items
1.00 Items are extremely easy (everyone gets it right)
0.80 Items are easy (80% get it right)
0.50 Items are of medium difficulty (half get it right; half get it wrong)
0.30 Items are difficult (70% get it wrong)
0.00 Items are difficult (everyone gets it wrong)
Chapter_2_Methodology.indd 19 18-02-2021 10:33:23

Learning Achievement of Students — NAS Class X (Cycle 2) 201820
●● Test Characteristic Function: It represents the average of all ICCs on the test.●● Test Information Function: It reflects the test’s
reliability by providing the overall test precision information.Both test characteristic function and test
information function play a critical role in test development and test evaluation.
Use of IRT in NAS Class X (Cycle 2)The IRT scaling approach used for NAS Class X (Cycle 2) is at par with some international large scale surveys. The psychometric model was used in scaling the Class X (NAS) data and for this commercially available software CONQUEST was used in order to apply IRT models.
In order to calibrate the test items, the 2-PL model was used in NAS Class X (Cycle 2). Under assumptions of the 2-PL model, the probability of a response to an item is modelled based on the examinee’s ability, the item difficulty and the item discrimination. This model was chosen over the 1-PL or Rasch Model because the inspection of the item characteristics showed that the item discriminations were not comparable across the pool of items (an assumption of the Rasch model). Considering these limitations, the 2-PL offered a widely acceptable compromise between the lesser and the more restrictive IRT models available.
Using this approach, a separate scale was developed for each subject; wherein the mean of each of these four scales was set to 250 and the standard deviation to 50. This meant, for English, Mathematics, Science, Social Science and Language other than English the achieved scores ranged approximately from 100 to 450.
Item FitThe fit of the 2-PL model to the items was examined graphically using a chi-squared fit index and this was done on a state-to-state basis. Items identified as problematic were investigated to see if there were any obvious faults and these were rectified wherever possible. Moreover, if it proved impossible to remedy the problems of an item, then that item was dropped from the scoring for the state concerned.
ReliabilityReliability of the test score scales was estimated from the IRT scaling. For simplicity and familiarity the marginal reliability coefficient is quoted here. This is given by
2 2
2θ
θ
σ σρσ−
= e
Where 2θσ is the variance of the test score scale
in the sample and is 2eσ the mean error variance of
scores; both available from BILOG output.
Estimating Sampling VarianceThe NAS Class X (Cycle 2) sampling design applied a stratified three-stage cluster sampling technique to the process of student selection. This design was administratively convenient and caused minimal upheaval in schools. However, since pupils within a school are generally more similar to each other than they are to the population in general, this approach of effective sampling provides less independent information than a simple random sample of the same size. Further, this design effect means that standard errors cannot be accurately estimated using the usual formulae which are derived for use with the simple random sample designs.
The Jackknife Repeated Replication (JRR) technique was used to calculate standard errors because it is computationally straightforward and provides approximately unbiased estimates of the sampling errors of means, totals and percentages. The general application of JRR entails systematically assigning pairs of schools to sampling zones. Following this, while one of the schools is selected at random to have its contribution doubled, the other school in the pair has its contribution set to zero. This constructs a number of ‘pseudo-replicates’ of the original sample. Conclusively, the statistics of interest (e.g., the states mean achievement score) is computed once for the entire original sample and once again for each Jackknife pseudo replicate sample. The resultant variation between the estimates for each of the Jackknife replicate samples and the original sample is the Jackknife estimate of the sampling error of the statistics.
To produce a Jackknife estimate of the sampling variance of a statistics t for a state, the schools in that state were paired to produce up to 100 paired zones and 100 Jackknife replicate samples were then created. For the jth zone one of the two schools was selected at random and its weight was doubled; while at the same time the weight of the other was set to zero leaving all the other zones unchanged. The hth, the value of the statistics for the replicate sample was then estimated and this process was repeated for all such strata. Subsequently, the Jackknife sampling
Chapter_2_Methodology.indd 20 18-02-2021 10:33:23

21
Met
hodo
logy
estimate for the sampling variance was given by the following equation:
( ) ( )2
1
( )H
jrr hh
V t t J t S=
= − ∑
where H is the total number of sampling zones in the sample of the state under consideration, in this case 100. The term t(S) corresponds to the statistic of interest for the state computed with the overall sampling weights unchanged.
The Reporting ScaleIn NAS Class X (Cycle 2), the scale chosen is from 0 to 500 and the average score for the whole population is initially set at 250. However, if educational standards improve, the overall average will rise from this ‘baseline’. The standard deviation of the scale is initially set at 50 for the whole population, which means that the majority of students (about 70%) will have scores in the range of 200 to 300 and on a scale like this, a score of more than 400 would represent an extraordinarily high level of achievement (see Figure 2.5).
The average score for the whole population tested is initially set at 250, with a standard deviation of 50. However, if educational standards improve the overall average will rise.
Throughout the NAS Class X report, results are reported using ‘scale scores’ calculated using IRT and these replace the percentage correct scores that were used in previous reports. This change brings along important advantages; with the most vital being that the scale will be fixed so that results from future surveys can be reported on the same scale by incorporating common items that provide adequate linking procedures. A score of, say, 270 today will be equivalent to a score of 270 in three years’ time, even though the items used are not the same. This is obviously an advance on using percentage correct scores where there is no rationale for assuming that a score of 70 per cent will be true for another test.
It should be noted that the adoption of this more sophisticated reporting scale means that it is not possible to make direct comparisons with the values reported in earlier surveys.
In this report, all values related to the achievement of students are given on scales calibrated to have 250 in the centre as described above. However, the scores for Mathematics, English, Science, Social Science and Language other than English are derived by applying the same principles, but independently. Therefore, it is important that readers do not compare scores across subjects.
Fig. 2.5: The Reporting Scale
Chapter_2_Methodology.indd 21 18-02-2021 10:33:23

The National Achievement Survey of Class X Cycle 2 was designed to decipher into the learning achievement of students studying across different school managements in various States and UTs across the country. In this regard, schools were selected at the district level of all 36 States and Union Territories and Boards in the country having secondary classes through a rigorous sampling technique. A sample of 80 schools were taken from each participating district. Then from each selected school, a maximum of 45 students studying in the sampled schools were selected through systematic random sampling procedure to assess the average performance among the group of student. Besides, teachers teaching these selected students were also considered for this study. Furthermore, it is a known fact that learning never takes place in isolation and is influenced by the school environment. Hence, before presenting the learning achievement of students in different subjects, there arises a need for making the readers aware of where these students study, what background they come from, what kind of facilities they have at home, who supports them in their studies, etc. Similarly, what is the learning environment in the schools, what are infrastructural facilities are available what are the educational and professional qualification of teachers, whether they have undergone in-service training programme or not, what strategies they use for teaching students, what is their employment status, how do they interact with fellow colleagues, what is their opinion
C H A P T E R 3
Our Schools, Students and Teachers
about the school in general, etc. In this chapter, an attempt has been made to provide highlights on some of these important variables.
3.1. Schools Clearly, the success of schools in providing quality of learning is something that governments at various levels need to monitor. This helps in identifying the characteristics of a healthy learning environment, which further maximises student achievement.
In order to access the school related variables, a school questionnaire was used to collect information from school principals. The information asked on various variables in school questionnaire were grouped into four categories—
yy School Backgroundyy Home-school Interactionyy Teaching-learning Processyy School Social Climate
School BackgroundThe variables under the category of school background were school management, school location, school affiliation, adequacy of basic facilities available in the school, attitudes of students, teachers and parents towards school and behavioural aspects among students and teachers.
School Management Out of the total schools that participated in NAS, approximately 56 per cent were government
Chapter_3_Our Schools.indd 22 18-02-2021 10:54:07

23
Our
Sch
ools
, Stu
dent
s an
d Te
ache
rs
managed schools, 24 per cent were private schools and other 20 per cent were government-aided schools. Figure 3.1 shows the proportion of each school type.
Fig. 3.1: School Management
School Location
Of the sample surveyed, majority of schools, i.e., 71 per cent of them were located in rural areas and rest 29 per cent of schools were in urban areas (Figure 3.2).
Fig. 3.2: School Location
School Affiliation Figure 3.3 indicates that a vast majority of schools around 94 per cent of them were affiliated to state education boards for secondary education, whereas only 5 per cent were affiliated to Central Board of
Secondary Education and 1 per cent were affiliated to Indian Certificate of Secondary Examination.
Fig. 3.3: School Affiliation
Facilities Available in the SchoolThe data regarding the availability of various facilities in the schools was obtained and categorised into following three groups:
● Physical facilities: Electric connection, safe drinking water, furniture for students, staff room for teachers, Library, Classroom access to children with special needs (CWSN), toilets access to CWSN, and playground.
● Teaching-learning material: Science Laboratory, Mathematics Laboratory, Language Laboratory, Social Science room, Library, Indoor Game(s), Computer/ICT labs, trained ICT personnel and, trained physical education teachers.
● Ancillary facilities: Audio-visual resources in classrooms, and library resources relevant to subject instruction.
Figure 3.4 shows the availability of physical facilities in the sampled senior secondary schools. Approximately 84 per cent schools had staffroom for
Fig. 3.4: Physical Facilities
Chapter_3_Our Schools.indd 23 18-02-2021 10:54:08

Learning Achievement of Students — NAS Class X (Cycle 2) 201824
teachers. Almost 92 per cent of schools had electricity connection, 92 per cent of schools had access to drinking water facilities and 83 per cent of senior secondary schools had playground facilities. Around 37 per cent schools had special classrooms for CWSN and 43 per cent schools had toilets for CWSN.
Figure 3.5 depicts the availability of teaching-learning material in the sampled schools. Library, science and ICT labs were available in more than 70 per cent of the schools. At the secondary level it becomes even more critical to have well-equipped laboratories for enhancing teaching-learning process. However, only 31 per cent, 21 per cent and 19 per cent of schools had mathematics laboratory, social science room and language laboratory, respectively. Moreover, games are also an interesting way for making the learning process interesting for students. In the sampled schools, almost 49 per cent of schools had facility of indoor games.
Figure 3.6 shows that 34 per cent and 43 per cent of schools had audio-visual resources and library resources relevant to subject instruction, respectively, available at schools.
Fig. 3.5: Ancillary Facilities
In the sampled schools, 76 per cent of schools participated in the science exhibitions at secondary stage. Similarly, majority of sampled schools approximately 80 per cent and beyond were found to be participating in sports, cultural and quiz-based activities. Similarly participation in such activities enriches the learning process in the classroom. Specifically, involvement of students in different types of sports brings them pleasant and joyous experiences and provides a breakthrough from routine classroom’s teaching-learning activity. While art education is an integral part of curriculum at different stages of education however, only 62 per cent of schools were found to be participating in art activities (Figure 3.7).
Fig. 3.6: Teaching Learning Material
Fig. 3.7: Extracurricular Activities
-
Chapter_3_Our Schools.indd 24 18-02-2021 10:54:08

25
Our
Sch
ools
, Stu
dent
s an
d Te
ache
rs
Home School Interaction The involvement of parents in various school activities like attending special events, funds, membership of school committees, etc., contributes towards a healthy learning atmosphere and effective home-school interaction.
Parent Teacher AssociationThe visible involvement of parents around the school makes school authorities accountable and attentive towards issues conducive for school environment. In the sampled schools, almost 88 per cent had parent-teacher association (Figure 3.8).
Fig. 3.8: Parent-teacher Association
School Management CommitteeSchool Management Committees (SMCs) act as an important bridge between the community and the school. Active community participation has the potential to improve the efficacy in schools as
stakeholders (parents and community) have the incentive to demand quality education for their children. In the sampled schools, majority of them i.e., 95 per cent of schools have constituted SMCs in their schools (Figure 3.9).
Fig. 3.9: School Management Committee
Attitudes of Students, Teachers and Parents towards the SchoolThis study collected information on the factors relating to teachers, students and parental involvement in school activities. Information relating to teachers pertained to the following factors— teachers’ degree of success in implementing the curriculum, teachers’ expectations for student achievement, teachers working together to improve students achievement, teachers’ ability to inspire students, teachers’ professional development, equity in school and quality of teaching and learning. All the above factors were collected at three levels— high, medium and low.
Fig. 3.10: Attitude of Teachers towards the School
Chapter_3_Our Schools.indd 25 18-02-2021 10:54:09

Learning Achievement of Students — NAS Class X (Cycle 2) 201826
Around 78 per cent of the schools reported that teachers working together to improve student achievement are able to inspire students to be at a higher level. Approximately, 61 per cent of the sampled schools also revealed teachers’ degree of success in implementing the curriculum and teachers’ expectations for students achievement to be at a higher level. However, only 56 per cent of schools observed teachers professional development to be at high level and remaining reported to have teachers’ professional development ranging from medium to low. With respect to quality parameters, approximately 65 per sent of schools proclaimed quality of teaching and learning in schools to be at a higher level (Figure 3.10).
Parental involvement is significantly linked with improved behaviour, regular attendance and positive attitude. In this regard, in the sampled schools, approximately 50 per cent of schools corroborated parental involvement in school activities and parental support for students’ achievement to be average or medium. Similarly, 48 per cent and 57 per cent of schools reported students desire to do well in school and students ability to reach school’s academic goals to be medium (Figure 3.11).
Teaching-learning ProcessTeaching-learning is a process that includes many variables that interact and facilitate the learners towards achieving their goals and incorporate new knowledge, behaviours and skills that add to their learning experiences. The present survey included following parameters influencing the teachings learning process:
● Adequacy of basic facilities, resources and staff in schools
● Viewpoints on External Evaluation/ Assessment
Adequacy of Basic Facilities, Resources and Staff in Schools This study collected information relating to what extent schools were affected by the shortage or inadequacy of resources, facilities and staff, which significantly impacts the teaching-learning process and hence, students achievement. Information obtained on whether schools were affected by the shortage or inadequacy of facilities, resources and learners’ achievement were graded into three categories on the basis of their frequency of occurrence, i.e., not at all, some or a lot. The major areas explored were:
● Resources: Instructional material, audio-visual resources, library resources relevant to subject instruction, classrooms, furniture for students, drinking water, electric connection/ fans, staffroom for teachers.
● Staff: Teaching staff, qualified teaching staff and availability of support staff.
Nearly 20 per cent of schools reported they were affected by the inadequacy of facilities, such as drinking water, electric connections and staffroom for teachers in their schools. However, equivalent number of schools were observed to being affected by the inadequacy of these facilities. Similarly, 16 per cent of schools attributed to have affected by the shortages of instructional materials.
With respect to audio-visual resources, 20 per cent of schools were affected by its shortage. A large number of schools corroborated that they were affected by the shortages of library resources relevant to subject, i.e., 15 per cent.
Around 23 per cent and 19 per cent of sampled schools were reported to be affected by the inadequacy of classrooms and furniture for students, respectively (Figure 3.12).
Fig. 3.11: Attitudes of Parents and Students towards the School
Chapter_3_Our Schools.indd 26 18-02-2021 10:54:09

27
Our
Sch
ools
, Stu
dent
s an
d Te
ache
rs
Approximately 20 per cent of sampled schools reported the inadequacy of teaching staff in the schools. These schools were affected due to the shortage of teaching staff in the schools. Relevance of qualified teaching is a critical factor having an immense impact on the teaching-learning process and learners achievement due to the expertise possessed by them.
Almost 23 per cent of schools were reported to face difficulties in the teaching-learning process due to the inadequacy of qualified teaching staff. Approximately 19 per cent schools reported to being impacted due to shortages or inadequacy of support staff in their schools (Figure 3.13).
Viewpoints on External Evaluation and Assessment Data from the Figure 3.14 shows that about 88 per cent of the schools reported that evaluations
Fig. 3.12: Shortage or Inadequacy of Resources and Facilities in Schools
Fig. 3.13: Shortage or Inadequacy of Staff in Schools
Fig. 3.14: Viewpoints on External Evaluation
led to changes in school development. Majority of schools, i.e., 90 per cent expressed utilising the external evaluation data to plan specific actions for school development and towards the improvement of teaching and learning process in the schools. Finally, 88 per cent of schools proclaimed putting these evaluations into practice promptly.
School Social ClimateThe school social climate is concerned with the psychological context in which school behaviour is rooted and is considered to be a relatively enduring quality of the school. The school social climate category here consists of behavioural aspects both among students and teachers.
Chapter_3_Our Schools.indd 27 18-02-2021 10:54:09

Learning Achievement of Students — NAS Class X (Cycle 2) 201828
Behavioural Aspects among StudentsBehavioural aspects of students were graded into three categories on the basis of the frequency of occurrence, i.e., not at all, some, a lot. The major areas explored were:
● Student absenteeism ● Students skipping classes ● Students lacking respect for teachers ● Students use of alcohol or illegal drugs ● Students intimidating or teasing other
students Nearly, 17 per cent of schools (’a lot’) observed
students skipping classes, students lacking respect for teachers were also found in the only 15 per cent of the sampled schools. Further, 12 per cent of the schools observed the students using alcohol or illegal drugs. These results indicate that such types of problems did not occur ‘frequently’ in the schools surveyed (Figure 3.15).
Behavioural Aspects among Teachers Even with respect to teachers, such a typical behaviour was also not evident among teachers in most of the sampled schools. Nearly, 11 per cent of the schools observed teachers not meeting individual students’ needs. Additionally, only 7 per cent of schools reported to have experienced staff resisting to changes made in the school, while, 9 per cent even expressed that
Fig. 3.15: Behavioural aspects among Students
Fig. 3.16: Behavioural aspects among Teachers
they found the teachers to be too strict with students. Further, 11–14 per cent of them, experienced issues relating to teacher absenteeism and teachers not being well prepared for class (Figure 3.16).
3.2. Students This section details the information gathered from students regarding the various student related variables, categorised as follows:
• Students, background• Resources available at home• Resources available in school• Students, experiences
Students, BackgroundIn this sub-section, students’ variables covered here are age, gender, social groups, proximity of home location to school, whether they are physically challenged, repeated a grade, language used at home and students, aspiration for further education.
Students’ AgeThe age distribution of the students is given in Figure 3.17 which shows that overall 82 per cent of the students were in the age group 15–16 years. Moreover, only 10 per cent were in the age group of 17–21 years and 8 per cent of the students belonged to the age group of 12 to 14 years.
Chapter_3_Our Schools.indd 28 18-02-2021 10:54:10
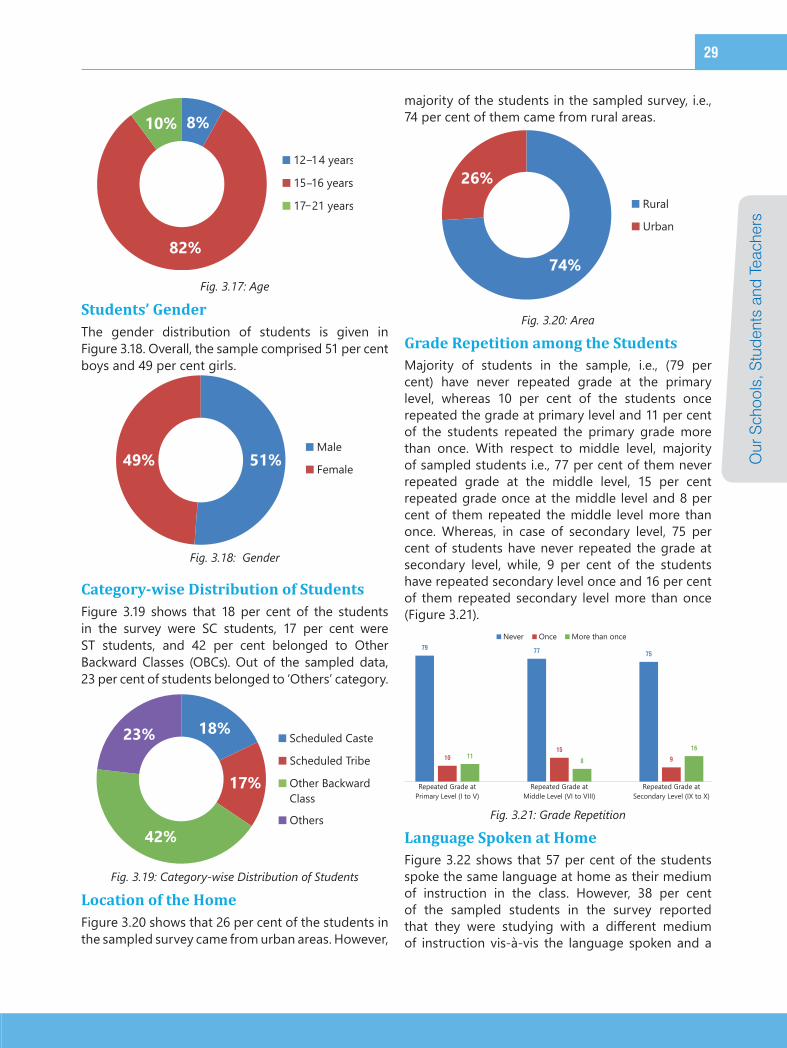
29
Our
Sch
ools
, Stu
dent
s an
d Te
ache
rs
Fig. 3.17: Age
Students’ GenderThe gender distribution of students is given in Figure 3.18. Overall, the sample comprised 51 per cent boys and 49 per cent girls.
Fig. 3.18: Gender
Category-wise Distribution of StudentsFigure 3.19 shows that 18 per cent of the students in the survey were SC students, 17 per cent were ST students, and 42 per cent belonged to Other Backward Classes (OBCs). Out of the sampled data, 23 per cent of students belonged to ‘Others’ category.
Fig. 3.19: Category-wise Distribution of Students
Location of the HomeFigure 3.20 shows that 26 per cent of the students in the sampled survey came from urban areas. However,
majority of the students in the sampled survey, i.e., 74 per cent of them came from rural areas.
Fig. 3.20: Area
Grade Repetition among the Students Majority of students in the sample, i.e., (79 per cent) have never repeated grade at the primary level, whereas 10 per cent of the students once repeated the grade at primary level and 11 per cent of the students repeated the primary grade more than once. With respect to middle level, majority of sampled students i.e., 77 per cent of them never repeated grade at the middle level, 15 per cent repeated grade once at the middle level and 8 per cent of them repeated the middle level more than once. Whereas, in case of secondary level, 75 per cent of students have never repeated the grade at secondary level, while, 9 per cent of the students have repeated secondary level once and 16 per cent of them repeated secondary level more than once (Figure 3.21).
Fig. 3.21: Grade Repetition
Language Spoken at Home Figure 3.22 shows that 57 per cent of the students spoke the same language at home as their medium of instruction in the class. However, 38 per cent of the sampled students in the survey reported that they were studying with a different medium of instruction vis-à-vis the language spoken and a
Chapter_3_Our Schools.indd 29 18-02-2021 10:54:10

Learning Achievement of Students — NAS Class X (Cycle 2) 201830
small percentage of 5 per cent students in the survey tend to speak English at home.
Fig. 3.22: Language spoken at Home
Disabilities among the Students In the survey, data was also gathered from the sampled students regarding disabilities. It was found 3.6% students with disabilities took part in the achievement survey.
Figure 3.23: Students with disability
Students Aspiring for Further EducationThe graph shown in Figure 3.24 depicts students’ aspiring for higher education. Out of the sampled survey, 7 per cent students aspired to study only till secondary level of education, whereas 19 per cent reported that they aim to complete higher/senior secondary level of education. Approximately, 20 per cent of students aspired to complete education up to graduation level or equivalent, further, 24 per cent of students aimed to study up to post graduation
level. Interestingly, 30 per cent of students in the sample surveyed reported to go till the research level studies.
Resources Available at HomeStudents with more educational resources tend to achieve better than those who do not have any. The data is collected on some of the variables, such as parents’ level of education, their occupation and literacy resources available at home that often facilitate students’ learning.
Educational Status of ParentsParents are the first teachers of the child and they play a pivotal role in providing the stimulating environment to facilitate cognitive development of their child. The educational status of the surveyed students’ fathers and mothers are discussed in the following sections.
Educational Status of FatherFor educational status of father, it is found that 18 per cent of the students’ fathers were illiterate, nearly 41 per cent of them had basic literacy or competency of being able to read and write. Almost 26 per cent of the students’ fathers had completed the formal level of schooling. While, only 10 per cent of students reported of their fathers’ attaining graduation degree and approximately 5 per cent of the fathers were reported to have completed the masters level of education or beyond that (Figure 3.25).
Educational Status of MotherFigure 3.26 indicates that about 31 per cent of the students’ mothers were illiterate and they cannot read and write, and nearly, 34 per cent of the students’ mothers had basic level of literacy of being able to read and write. Additionally, approximately 26 per cent of the students reported that their mothers had undergone basic level of formal
’
Fig. 3.24: Students aspiring for Higher Education
Chapter_3_Our Schools.indd 30 18-02-2021 10:54:11

31
Our
Sch
ools
, Stu
dent
s an
d Te
ache
rs
schooling. However, only 7 per cent of the mothers had completed education till graduation level and only around 3 per cent had done master’s level of education.
Occupational Status of Parents The occupational status of the surveyed students’ father and mother are depicted in the following section.
Occupational Status of FatherAbout occupational status of the father indicated that 6 per cent of them were unemployed and another 5 per cent of them were engaged in the household chores. Majority of fathers, i.e., 47 per cent were involved in farming activities. However, 9 per cent of fathers had government jobs and 14 per cent of fathers had private jobs. Approximately, 15 per cent were being engaged in self-employed or professional activities (Figure 3.27).
Occupational Status of MothersThe occupational status of mothers show that 7 per cent of them were unemployed and another 61 per cent of them were involved in household work. Further, 19 per cent of the mothers were farmers. Around 4 per cent of mothers had government and private employment. Moreover, sampled data asserted that mothers of 3 per cent were self-employed or involved in a professional activity (Figure 3.28).
Resources at HomeIn the view of the importance of resources in enhancing students’ learning, information was collected about the availability of resources, such as newspaper, magazine, radio, television, calculator, mobile phones, computer and Internet facilities at home. With respect to this, wide variety of variations was observed in the availability of these facilities at home. Approximately, 43 per cent of students
Fig. 3.25: Educational Qualification of Father
Fig. 3.26: Educational Qualification of Mother
Chapter_3_Our Schools.indd 31 18-02-2021 10:54:11

Learning Achievement of Students — NAS Class X (Cycle 2) 201832
Fig. 3.27: Fathers’ Occupation
Fig. 3.28: Mothers’ Occupation
reported that they had newspapers coming to their homes, however; only 26 per cent of them had the provision of magazines at home. A vast majority of 69 per cent of students had television available at home, but only 38 per cent of them had the radio facility. Similarly, 58 per cent of students had the provision of calculators at home. Rapid growth of technology and its growing accessibility lead to greater mobile usage across rural-urban areas, i.e., 94 per cent, similarly 28 per cent of the sample surveyed students having computer facility at home and approximately 44 per cent students reported of having internet services available at home (Figure 3.29).
Resources Available at SchoolsSchools are almost like a second home for children as they usually spend one third of their time in schools.
The survey conducted covered information relating to important variables, such as distance from home to school, availability of library and its usage, and availability of science laboratory and opportunity to conduct practical experiments in the laboratory.
Distance from Home to School School distance acts as an important impeding to students growth, because in this case a child has to cover long distances daily to reach school. With respect to gender, accessibility of school within few kilometers from home serves as an impetus for families to send their girls to school regularly. In the sampled data, 76 per cent of the surveyed students reported that their school was within five-kilometer distance from their residence. While, only 24 per cent of sampled schools mentioned that they have to
Chapter_3_Our Schools.indd 32 18-02-2021 10:54:11

33
Our
Sch
ools
, Stu
dent
s an
d Te
ache
rs
travel more than 5 kilometers of distances everyday to reach school (Figure 3.30).
Fig. 3.30: Distance from Home to School
Availability of Library and Reference Books in LibraryFigure 3.31 depicts that approximately 82 per cent of the students had library facilities in their schools. Within this, the question of availability of reference books is pivotal towards effective teaching-learning environment conducive for students’ learning outcomes. In response to this, 74 per cent of the sampled students reported available reference books in library. Availability of Science LaboratoryIt was reported that approximately 79 per cent of schools had the provision of science laboratory in their schools. Additionally, 69 per cent of sampled students in the survey highlighted of getting opportunities to conduct practical/experiments in the laboratory (Figure 3.32).
Students’ Experiences Secondary school students’ viewpoints about learning and schooling experiences are important considerations in teaching-learning environment. Students’ comprehensions are critical parameters for their active and productive involvement and when
there is motivation to improve learning outcomes. Today, students’ views and experiences play an important role in enriching the learners’ experiences and needs of the students. Therefore, information relating to students experiences preference of subjects, utilising Internet in completing schoolwork or homework, self-assessment, parental support, teachers support, peer behaviour in the schools and students confident in seeking support from parents or teachers was sought in this questionnaire.
Students’ Preference of SubjectsStudents’ preferences of the subjects were graded into three categories on the basis of their frequency of inclination towards the subjects, i.e., most, least and not at all. In the graph, of the sampled surveyed students, 49 per cent of them preferred English ‘most’. Similarly, in case of Language other than English, 45 per cent of the sampled students seemed preferring language other than English.
With respect to other subjects, 39 per cent of the students mentioned having inclination towards mathematics.
However, a percentage of approximately 46 per cent of students reported their preference for science as ‘most’. For social sciences, 46 per cent mentioned to be preferring social science ‘most’ (Figure 3.33).
Utilising Internet Facility for Completing School Work or Homework Figure 3.34 shows the students usage of Internet for completing school work or homework. Information was sorted from sampled students on various aspects for which they used Internet facilities in completing their tasks. Responses gathered reflected that majority of students, i.e., 52 per cent of them utilised Internet for communicating with classmates, roughly 40 per cent of students also reported to using Internet for doing school assignments and
Figure 3.29: Literacy Resources at Home
Chapter_3_Our Schools.indd 33 18-02-2021 10:54:12

Learning Achievement of Students — NAS Class X (Cycle 2) 201834
projects. Students also seemed to be using Internet to communicate with teachers i.e., 44 per cent of them and 49 per cent of students mentioned of using Internet to read textbook or reference materials for completing school work or homework.
Self Assessment Students’ self assessment is an important tool, which involves learners evaluating their own learning progress. It is a valuable tool of learning through which students stay involved, motivated, encourage self reflection and are responsible for their learning outcomes. Students’ responses were taken on 4 point scale with four labels ‘strongly disagree’, ‘disagree’, ‘agree’ and ‘strongly agree’. In the first parameter 15 per cent of the students ‘strongly agreed’ about worrying of getting poor grades at school. Further, 33 per cent of them ‘agreed’ that they feel very anxious for the test even if they are prepared well.
Additionally, 39 per cent of students ‘agreed’ that they could have asked teachers more questions about which they are not clear, 29 per cent of them ‘strongly agreed’ to asking teachers questions
for which students were not clear. With respect to grades, 51 per cent of the sampled students in the survey ‘strongly agreed’ of getting top grades in most or all of their course (Figure 3.35).
Parental SupportAn attempt was made to look into parental support in terms of students opinion. Responses were graded into four categories strongly disagree, disagree, agree and strongly agree. The responses collated that parents supported their children in their schooling. Around 32 per cent and 28 per cent of the sample of surveyed students reported that they ‘agreed’ and ‘strongly agree’ with the statement that their parents were interested in school activities.
Similarly, 28 per cent of the students were reported to ‘agree’ and 39 per cent of them ‘strongly agreed’ with the assertion that their parents supported them in their educational efforts and achievements. Finally, majority of students affirmed that is, 32 per cent of them ‘agreed’ and 44 per cent of them ‘strongly agreed’ that parents encourage them to be confident (Figure 3.36).
Fig. 3.32: Availability and Utilisation of Laboratory
Fig. 3.31: Availability and Utilisation of Library
Fig. 3.33: Students’ Preference of the Subject
Chapter_3_Our Schools.indd 34 18-02-2021 10:54:12

35
Our
Sch
ools
, Stu
dent
s an
d Te
ache
rs
Fig. 3.35: Self Assessment
Fig. 3.34: Students using Internet for Completing School Work or Homework
Fig. 3.36: Parental Support
Chapter_3_Our Schools.indd 35 18-02-2021 10:54:13

Learning Achievement of Students — NAS Class X (Cycle 2) 201836
Teachers’ SupportStudents were also sought to give opinion regarding teachers’ support for their academic work. Figure 3.37 depicts that 36 per cent of students ‘agreed’ and 27 per cent of students ‘strongly agreed’ with the statement that they find it easy to understand the way teachers teach in the class. Similarly, 37 per cent of students ‘agreed’ that teachers give interesting activities to do in the class. Another, 30 per cent of them ‘strongly agreed’ with this aspect of teacher conducting interesting activities during the classroom transactions. However, there were 37 per cent of students who reported to being in disagreement with the statement that they find it easy to understand what teacher teaches in class. Another, 33 per cent of sampled students were also under disagreement regarding teachers using interesting activities for the teaching-learning process.
However, in Figure 3.38, almost 41 per cent of students ‘agreed’ to the statement that they
need more help from teachers to understand a topic and another 26 per cent also ‘strongly agreed’ to this statement that they tend to need extra support from teachers to develop an understanding on a topic. Whereas, 33 per cent of students reported to being in disagreement that they needed any extra support from teachers for understanding the topic. Further, teachers’ encouragement tends to act as an important tool for students’ behaviour, performance and shaping up their future opportunities. With respect to this, 45 per cent of students ‘strongly agreed’ that teachers encouraged them to ask questions and address their queries. Another 30 per cent of students also ‘agreed’ with the statement that teachers encouraged them to ask questions. However, 16 per cent of students ‘strongly disagreed’ and 9 per cent of students ‘disagreed’ that teachers encouraged them to ask questions (Figure 3.38).
Fig. 3.37: Teachers’ Support
Fig. 3.38: Teachers’ support
Chapter_3_Our Schools.indd 36 18-02-2021 10:54:13

37
Our
Sch
ools
, Stu
dent
s an
d Te
ache
rs
Students’ Schooling Experiences with PeersIt is widely acknowledged that peers have a dual influence in the students’ participation and learning in the school. In general peers are a network of support and encouragement in their studies depending upon the students’ experiences in the school.
Approximately, 63 per cent of the students reported that they ‘never’ experienced any erratic behaviour from their peers in the school. However, 37 per cent of students mentioned that they were teased by other students out of which 17 per cent said few times a year, 10 per cent reported few times a month and 10 per cent said once a week. Similarly, 36 per cent mentioned of being purposefully left out of group activities. Students making fun of others was in fact experienced by 42 per cent of sampled students. Nearly, 17 per cent of them reported to experience this few times a year, 14 per cent of them experienced this few times a month and 11 per cent mentioned encountering this frequently ‘once a week’.
While 68 per cent of students reported that other students ‘never’ threatened them but 13 per cent mentioned that they were threatened ‘few times a year’ from other students, another 8 per cent of students mentioned that they were threatened from fellow students few times a month. Moreover, 11 per cent of students also highlighted that they were threatened from other peers once a week.
Students also responded to their experiences of other students taking away or destroying their things with 66 per cent of them never experiencing such behaviour towards them. While, 34 per cent of students reported of other students taking or destroying their things. Almost 68 per cent of students mentioned that they ‘never’ experienced
other students either hitting or pushing them in the school. While 32 per cent of students pointed that they experienced such behaviour from their fellow schoolmates (Table 3.1).
Students’ Experiences In general students’ experiences with regard to parents, teachers and their fellow schoolmates were graded on the basis of their frequency of occurrence, i.e., never, sometimes and frequently. The major areas explored were:
yy Sharing schooling activities with parentsyy Discussing difficult concepts with teachersyy Discussing problems with friendsyy Seeking help from parents or teachers with a
problemyy Parental support in homeworkyy Punishment by teachersNearly, 83 per cent of students shared what
is happening at school with their parents either sometimes (47%) or often (36%). While only 17 per cent did not share their school experiences with parents. Similarly, 47 per cent of surveyed students reported that they ‘sometimes’ discussed difficult concepts with teachers and 36 per cent of them ‘often’ discussed difficult concepts with teachers. Only, 17 per cent of them ‘never’ discussed difficult problems with teachers. Interestingly, 49 per cent of students reported that they ‘often’ discuss problems with their friends; another 34 per cent mentioned that ‘sometimes’ even they tend to discuss problems with friends. Additionally, 80 per cent of students sought help from parents/teachers if stuck with a problem either often (40%) or sometimes (40%). Only 20 per cent of students ‘never’ sought help from parents or teachers.
Table 3.1: Students’ Experiences with Peers at School
Students’ Experiences with Peers at School Never Few times a year
Few times a month
Once a week
Got teased by other students 63% 17% 10% 10%
Purposefully left out of group activities 64% 19% 9% 8%
Other students made fun of me 58% 17% 14% 11%
Other students threatened me 68% 13% 8% 11%
Other students took away or destroyed my things 66% 15% 9% 10%
I got hit or pushed around by other students 68% 13% 8% 11%
Chapter_3_Our Schools.indd 37 18-02-2021 10:54:13

Learning Achievement of Students — NAS Class X (Cycle 2) 201838
Students reported that 24 per cent of parents ‘never’ checked their homework. However, 40 per cent of students mentioned that ‘sometimes’ parents checked their homework and another 36 per cent highlighted that parents ‘often’ checked their homework. Around 39 per cent of students reported that they ‘never’ got any punishment by teachers. While, 43 per cent of sampled students mentioned that ‘sometimes’ they did get punishment from teachers and only 18 per cent reported of getting punishment ‘often’ by teachers (Table 3.2).
3.3. Teachers This section provides information about teachers’ characteristics and perceptions of teachers, such as teachers’ background, teaching experience and training, teachers’ professional engagement, teachers’ opinion about schools, fellow teachers and teaching practices. Table 3.3 represents the responses collected from a total of 2,05,447 teachers.
Teachers’ BackgroundThe teacher questionnaire collected information on a wide range of background factors as set out in the paragraphs that follow.
Gender Of the surveyed Class X teachers, nearly 39 per cent were males and 61 per cent were females (Figure 3.39).
Fig. 3.39: Gender
AgeTable 3.4 depicts the age profile of the teachers which revealed that 15 per cent of the teachers were between the age group of 20–30 years, 33 per cent of the teachers were in the age group of 31–40 years of age, 32 per cent of them were in the age group of 41–50 years and remaining, i.e., 20 per cent of them were above the age of 50 years. About 2/3rd of teachers are in the age group of 31–50 years.
Table 3.4: Age
Age Total
20–30 years 15%
31–40 years 33%
41–50 years 32%
Above 50 Years 20%
Category Figure 3.40 indicates the social categories to which teachers belonged. Approximately 41 per cent of teachers belonged to ‘Others’ category in the sample, 38 per cent of them reported to be belonged to ‘Other Backward Classes’. Moreover, 12 per cent of teachers belonged to ‘Scheduled Caste’ category and remaining 9 per cent belonged to ‘Scheduled Tribe’ category.
Fig. 3.40: Social Categories of Teachers
Table 3.2: Students’ Experiences
Students Experiences Never Sometimes Often
Share with my parents what is happening at school 17% 47% 36%
Discuss the difficult concepts with teachers 17% 47% 36%
Discuss problems with my friends 17% 34% 49%
Ask help from parents or teachers if stuck with a problem 20% 40% 40%
Parents check if I do homework or not 24% 40% 36%
Got punished by teachers 39% 43% 18%
Chapter_3_Our Schools.indd 38 18-02-2021 10:54:14

39
Our
Sch
ools
, Stu
dent
s an
d Te
ache
rs
Educational and Professional Qualification The graph below shows that overall, 63 per cent of the teachers in the sample were postgraduates, 31 per cent of them were graduates. Almost 3 per cent of the teachers had M.Phil. degrees and another 2 per cent had Ph.D. degree. A small percentage of teachers, i.e., 1 per cent had qualification only till higher secondary (Figure 3.41).
It is acknowledged that teachers possessing educational training are found to be more effective
in classrooms as compared to teachers who do not possess any training. There are two types of teacher training programmes prevalent in our education system, namely pre-service training and in-service training. The basic pre-service qualification which is essential for appointing a regular teacher in any recognised school is a certificate diploma or degree programme, for example, JBT, B.Ed., M.Ed., etc. In this section we are considering information relating to pre-service qualification quintessential for entering into the field of teaching. Majority of teachers in
Table 3.3: Teachers included in Survey
State/UT/BoardNumber of
Teachers Participated
State/UT/Board Number of Teachers
ParticipatedAndaman and Nicobar Islands 519 Madhya Pradesh 19,091Andhra Pradesh 5213 Maharashtra 13,459Arunachal Pradesh 1521 Manipur 2257Assam 9883 Meghalaya MeghalayaBihar 11,021 Mizoram 1153Chandigarh 445 Nagaland 1623
Chhattisgarh 9269 Odisha 10,446
Dadra and Nagar Haveli 162 Puducherry 800Daman and Diu 160 Punjab 7997Delhi 4181 Rajasthan 12,564Goa 1662 Sikkim 882Gujarat 10,855 Tamil Nadu 12,246Haryana 7727 Telangana 12,107Himachal Pradesh 3357 Tripura 2896Jammu and Kashmir 7915 Uttarakhand 4873Jharkhand 6905 CBSE 970Karnataka 13,413 ICSE 802Kerala 5364
National 20,5,447Lakshadweep 48
Fig. 3.41: Educational Qualification of Teachers
Chapter_3_Our Schools.indd 39 18-02-2021 10:54:14

Learning Achievement of Students — NAS Class X (Cycle 2) 201840
the sample possessed B.Ed. degree which acts as mandatory criteria to teach at secondary levels. Approximately 7 per cent of teachers had M.Ed. degree however, 14 per cent of teachers in the sample reported of not possessing any educational training (Figure 3.42).
Teaching Experience and Training This section caters to information relating to teaching experience in terms of employment status, teaching experience at secondary stage and in-service training programmes attended.
Employment Status The employment status of teachers is presented in Figure 3.43. While majority of teachers, nearly 84 per cent were found to be working as permanent/contractual/regular employees. Whereas 16 per cent of teachers in the sample reported to being working on a temporary/part time/against leave vacancy position.
Fig. 3.43:
-
Employment Status
Teaching Experience at Secondary Stage The data reveals that around 45 per cent of the teachers had teaching experience of more than 10 years of teaching at secondary stage. Moreover,
Fig. 3.44: Teaching Experience at Secondary Stage
25 per cent of teachers reported of having teaching experience ranging between 6 to 10 years at secondary stages and remaining 30 per cent of teachers in the sample asserted teaching experience from 0 to 5 years for teaching at secondary level of classes (Figure 3.44).
Attended In-service Training Programmes Figure 3.45 depicts that 46 per cent of teachers in the sample reported that they attended 1 to 2 programmes over the last year and 22 per cent of them mentioned that they attended 3 to 5 programmes under in-service teacher training during the last one year. However, almost 32 per cent of teachers did not attend any programme during the past year, which could be a matter to reflect upon for the states.
Fig. 3.45: In-service Training Programmes Attended
Teachers’ Opinion about the SchoolIt is important to know how well teachers are aware about their profession, teaching methods and the curriculum goals, whether they are satisfied with their job and what are their expectations from fellow teachers, their school and students. In this regard, information was sought on parameters, such as teachers’ professional engagement, problems in school facilities, opinions relating to fellow teachers and workload.
Teachers’ Professional Engagement Engagement of teachers in different professional activities to augment interesting teaching-learning practices in the classroom can play a vital role in improving the quality of teaching across rural-urban segmentation. It is asserted that teacher-centered
Fig. 3.42: Teacher Training Qualification
Chapter_3_Our Schools.indd 40 18-02-2021 10:54:14

41
Our
Sch
ools
, Stu
dent
s an
d Te
ache
rs
collaborative activities to learn about effective teaching and learning through collaboration and communication between teachers are found to be effective in improving the learning achievements.
Figure 3.46 depicts the opinion of teachers on the professional activities that they were engaged over the last year. With regard to this, 41 per cent of teachers were engaged in the teachers qualification enrichment programme. Similarly, 50 per cent of teachers participated in professional development program. Around 31 per cent of teachers involved themselves in some independent or collaborative research on a topic of interest. However, 51 per cent reported to be engaged in mentoring and peer-observation as a part of formal school management. However, majority of teachers i.e., 81 per cent were engaged in informal dialogues in order to improve their teaching practices.
Physical Facilities in the School As a part of universalising secondary education, central government and state governments made substantive efforts by launching Rashriya Madhyamik Shiksha Abhiyan to enhance the access and improve the quality of schooling at secondary stages of education. Some of the critical aspects relating to the quality of education pertain to make all secondary school conform to prescribed norms, standards and removing gender socio-economic and disability barriers thereby increasing the enrollment and achieving universal retention. While considerable improvement have been made in this regard in the elementary stages however, at secondary stage there
is a need to work more in this area. The observations of teachers on certain aspects are given as under: • Schoolbuildingneedssignificantrepair: Table
3.5 shows that 15 per cent of teachers felt ‘a lot’ that school building needs significant repair, whereas 42 per cent teachers felt to ‘some’ extent school building requires some repair and 43 per cent of teachers did not feel at all that school building required any repairs.
• Teachersdonothaveadequatespace:Teachers need adequate space for effective classroom transaction for organising activities and conducting games in the classroom. Almost 43 per cent of teachers reported that there was no issue pertaining to adequate workspace in the schools. However, 43 per cent of teachers felt to ‘some’ extent that they did not have adequate workspace and 14 per cent attributed a feeling of ‘a lot’ inadequacy relating to workspace available in schools.
• Teachers do not have adequate instructionalmaterial and supplies: Table 3.5 collates that 48 per cent of sampled teachers reported to ‘some’ extent that do not have adequate instructional material and supplies facilitating the teaching-learning process in the classroom. Whereas, 15 per cent greatly asserted that they did not have adequate materials to help them in teaching practice and 37 per cent of teachers reported that they ‘not at all’ have any inadequacy relating to instructional materials in their schools.
Fig. 3.46: Teachers, Professional Engagement
Chapter_3_Our Schools.indd 41 18-02-2021 10:54:15

Learning Achievement of Students — NAS Class X (Cycle 2) 201842
• Lack of drinkingwater: With respect to basic facilities, 59 per cent of teachers reported they ‘not at all’ have any shortages relating to the availability of drinking water facilities. However, 27 per cent of teachers reported that to ‘some’ extent there was a lack of drinking water facilities and 14 per cent of teachers felt ‘a lot’ schools did not have proper drinking water facilities.
• Lack of adequate toilet facilities: Around 53 per cent of teachers reported schools did not have any inadequacy relating to toilet facilities, however, 32 per cent felt to ‘some’ extent schools faced issues relating to adequacy of toilet facilities and almost 15 per cent mentioned that their schools suffered ‘a lot’ due to inadequacy of toilet facilities.
Teachers Opinions about Workload Information was collated from teachers relating to their opinions about the workload faced by them in schools. Most of the teachers in the sample
tend to disagree with workload aspects in school. Around 59 per cent of teachers disagreed with the perception that there are too many students in the class; however, 41 per cent agreed that there are too many students in the class. Similarly, 54 per cent disagreed if they had too much syllabus to cover, whereas 46 per cent agreed that they indeed have too much syllabus to cover in class. Almost 60 per cent of teachers in the sampled disagreed if they have too many teaching hours however, only 40 per cent felt that teaching hours were sufficient. Almost 71 per cent of teachers agreed that they need more time to assist individual students. While 61 per cent teachers disagreed that there were too many administrative tasks, 39 per cent reported to being in agreement with respect to ‘too many administrative tasks’. Around 66 per cent of teachers disagreed to encountering any difficulty in keeping up with all of the changes to curriculum while 34 per cent agreed to have difficulties in the keeping up with the changes to the curriculum (Table 3.6).
Table 3.5: Physical facilities in the schools
Frequency
School building needs
significant repair
Teachers do not have adequate
workspace
Teachers do not have adequate
instructional material and supplies
Lack of drinking
water
Lack of adequate toilet
facilities
Not at all 43% 43% 37% 59% 53%
Some 42% 43% 48% 27% 32%
A lot 15% 14% 15% 14% 15%
Table 3.6: Workload on Teachers in Schools
Teachers' Opinion about Workload Strongly Disagree Disagree Agree Strongly
Agree
There are too many students in the class 24% 35% 25% 16%
There is too much syllabus to cover in class 16% 38% 32% 14%
There are too many teaching hours 16% 44% 31% 9%
Need more time to assist individual students 8% 21% 50% 21%
There are too many administrative tasks 19% 42% 28% 11%
Difficulty in keeping up with all of the changes to the curriculum
22% 44% 27% 7%
Chapter_3_Our Schools.indd 42 18-02-2021 10:54:15

43
Our
Sch
ools
, Stu
dent
s an
d Te
ache
rs
Teaching Practices The teachers were asked to fill-up a questionnaire where information on teaching style, academic facilities and modification of curriculum according to NCF-2005, etc., was sought in the questionnaire.
Utilising Different Teaching Activities while Teaching StudentsThe graph shown in Figure 3.47 teacher responses towards using activities while teaching students. These responses were graded into three categories on the basis of their occurrence, i.e., almost, sometimes and never. Around 62 per cent of teachers reported ̔almost’ of utilising students’ daily life experiences for transacting a lesson. Whereas 33 per cent of teachers reported to be
using students’ daily experiences ‘sometimes’ for relating to the lesson in the classroom transaction. With respect to using questions to elicit responses from students, 68 per cent of teachers utilised this activity ‘almost’ every time, 29 per cent utilised this activity sometimes and 3 per cent of teachers used this activity ‘never’. ‘Almost’ 74 per cent of teachers constantly encouraged discussions in the classroom, only 23 per cent utilised discussion ‘sometimes’ and remaining 3 per cent of teachers ‘never’ encouraged discussion in the classroom. Further, ‘almost’ 86 per cent of teachers tend to praise students for their good effort. Around 73 per cent of teachers reported that they ‘almost’ deployed problem solving techniques while teaching students, only 24 per cent used this technique ‘sometimes’ and remaining 3 per cent ‘never’ deployed it during classroom engagement.
Fig. 3.48: Utilising Assessment Techniques on Students of Class X
Fig. 3.47: Utilising Teaching Activities while Teaching Students
Chapter_3_Our Schools.indd 43 18-02-2021 10:54:15

Learning Achievement of Students — NAS Class X (Cycle 2) 201844
Utilising Student Assessment TechniquesIn response to assessment techniques used, teachers reported that they tend to deploy varieties of assessment measures in the classroom to facilitate learning outcomes among students (Figure 3.48). ‘Almost’ 68 per cent of teachers reported of using traditional measure of written tests to assess students, while 27 per cent of teachers ‘sometimes’ and 5 per cent of them ‘never’ used tests to assess students in Class X. However, only 44 per cent of teachers ‘almost’ used achievement tests (MCQs) to assess students, with 51 per cent of teachers ‘sometimes’ assess students through achievement tests and only 5 per cent of teachers in the sample ‘never’ utilised MCQs for assessment.
With respect to oral tests, ‘almost’ 60 per cent of teachers used them for assessment techniques, 37 per cent of teachers used it ‘sometimes’ and 3 per cent of them ‘never’ utilised it. Observation of students appeared to be popular assessment techniques among teachers as 79 per cent of teachers reported of utilising this technique as ‘almost’, whereas 18 per cent of them used it ‘sometimes’ for making students assessments. Even students performance in the written homework assignments came out to be an evident method for making student assessments. Around 73 per cent of teachers reported that ‘almost’ most of the times they used written homework assignments as a means of assessments.
However, only 55 per cent of teachers reported of using student self-assessments techniques
‘sometimes’ to assess Class X students. Only 40 per cent of teachers mentioned that they ‘almost’ used student self-assessments techniques to assess students and 5 per cent of teachers ‘never’ used this measure. Formulation of portfolios or projects appeared to be least utilised as a means of students assessments since 60 per cent of teachers reported of deploying this technique only ‘sometimes’, while 35 per cent of teachers did utilise projects or portfolio creation as ‘almost’ every time for assessing students. But still 5 per cent of teachers never deployed this technique for student assessment in their classes.
Utilising Different Teaching Methods and Approaches in the ClassroomThe data was collected from teachers on how confident they feel while deploying different teaching methods and approaches in the classroom while giving their opinion in three categories— always, sometimes and never (Figure 3.49). These results bring forth interesting dimensions about teachers perception regarding their capabilities while using these teaching approaches. Almost 45 per cent of teachers reported that they ‘never’ felt confident in using peer and group learning approach in the classroom. Whereas 48 per cent of teachers reported that were ‘sometime’ confident to deploy this approach. Interestingly, a large number of teachers, i.e., 62 per cent ‘never’ felt confident with the problem solving approach in teaching-learning
Fig. 3.49: Teachers Confidence in Using Different Teaching Methods and Approaches
Chapter_3_Our Schools.indd 44 18-02-2021 10:54:15

45
Our
Sch
ools
, Stu
dent
s an
d Te
ache
rs
process. In case of role playing or simulation, 63 per cent of teachers were confident ‘sometimes’ to utilise during teaching topics. However, almost 61 per cent of teachers in the sample ‘never’ felt confident in using discussion as a method for teaching but 62 per cent of teachers were found to be confident ‘sometimes’ in using project work. While 50 per cent
of teachers reported that they were ‘never’ confident in utilising lecturing as teaching method. Similarly, teachers also reported that approximately 50 per cent and 58 per cent were ‘sometimes’ confident in using Laboratory and ICT-supported activities as teaching approach in subjects for the classroom transaction.
Chapter_3_Our Schools.indd 45 18-02-2021 10:54:16

This chapter describes the achievement of students in mathematics in NAS Class X (Cycle 2). The achievement in mathematics is reported for each of the participating States/Union Territories (UTs) and two National boards. The achievement is reported by student gender, school location, social category and school management.
4.1. State-wise Performance of Students in Mathematics
Table 4.1 lists each State/UT wise average score on a scale from 0 to 500 with a SD of 50. The ‘standard
error’ is given for each score to indicate the degree of imprecision arising from the sampling process. Finally, these tables indicate whether a state’s average score is significantly different from the overall average of 34 States/UTs.
In NAS Class X (Cycle 2), a total of 34 States/UTs participated along with two National boards (CBSE and ICSE).Table 4.1 indicates that the average score for 34 States and UTs and national boards is 254 (with a standard error of 0.4). Further, the results reveal substantial differences in mathematics achievement
Table 4.1: Average Mathematics Scores for States/UTs/Boards
States/UTs/Boards Average Score Standard Error Significant Difference
Andaman and Nicobar Islands 243 7.2 ↓
Andhra Pradesh 269 1.6 ↑
Arunachal Pradesh 238 1.7 ↓
Assam 267 0.5 ↑
Bihar 256 1.0 ↔
Chandigarh 252 2.2 ↔
Chhattisgarh 237 0.7 ↓
Dadra and Nagar Haveli 236 4.3 ↓
Daman and Diu 237 7.9 ↓
Delhi 262 0.6 ↑
C H A P T E R 4Students’ Achievement in Mathematics
Chapter_4_Mathematics.indd 46 18-02-2021 10:39:12

47
Stud
ents’
Ach
ieve
men
t in
Mat
hem
atic
s
between the highest performing state (269 for Andhra Pradesh) and the lowest performing state (226 for Sikkim). Also, while six States/UTs showed average scores significantly above that of the group; 24 States/UTs depicted average scores significantly below that of the overall average and four States/UTs presented average scores that were not significantly different from that of the overall.
4.2. Percentile Scores in Mathematics for States/UTs
Table 4.2 and Figure 4.1 illustrate the range of achievement within and across the states. The table list the scores achieved by students at key percentiles. For example, the score at the 25th percentile is the score which 75 per cent of students achieve or
States/UTs/Boards Average Score Standard Error Significant Difference
Goa 244 1.8 ↓
Gujarat 246 0.6 ↓
Haryana 244 1.1 ↓
Himachal Pradesh 235 1.6 ↓
Jammu and Kashmir 235 2.7 ↓
Jharkhand 248 0.5 ↓
Karnataka 263 0.3 ↑
Kerala 251 1.1 ↓
Lakshdweep 241 12.5 ↓
Madhya Pradesh 240 0.3 ↓
Maharashtra 254 2.4 ↔
Manipur 238 1.6 ↓
Meghalaya 232 1.0 ↓
Mizoram 245 1.3 ↓
Nagaland 241 1.1 ↓
Odisha 269 0.4 ↑
Puducherry 242 2.3 ↓
Punjab 248 0.5 ↓
Rajasthan 265 1.0 ↑
Sikkim 226 4.4 ↓
Tamil Nadu 240 1.0 ↓
Telangana 253 1.3 ↔
Tripura 236 3.6 ↓
Uttarakhand 247 1.8 ↓
CBSE 294 3.0 ↑
ICSE 294 2.9 ↑
National 254 0.4
Chapter_4_Mathematics.indd 47 18-02-2021 10:39:12

Learning Achievement of Students — NAS Class X (Cycle 2) 201848
surpass: the score at the 90th percentile is the score that 10 per cent of students achieve or surpass. The range between the 25th and 75th percentiles (the inter-quartile range) represents the performance of
the middle 50 per cent of students. Hence, this is a good indicator of the State’s degree of homogeneity in terms of the Mathematics achievement of its students.
Table 4.1: Percentile Scores in Mathematics for States/UTs/Boards
States/UTs/Boards P10 P25 P50 P75 P90 P75 - P25 P90-P10
Andaman and Nicobar Islands 197 216 239 264 300 48 103Andhra Pradesh 200 227 262 309 354 82 154Arunachal Pradesh 189 212 236 262 290 50 101Assam 199 227 262 304 350 77 151Bihar 189 219 251 290 332 71 143Chandigarh 202 223 245 277 305 54 103Chhattisgarh 182 209 234 265 292 56 110Dadra and Nagar Haveli 203 217 234 261 273 44 70Daman and Diu 168 201 241 270 284 69 116Delhi 200 225 256 293 335 68 135Goa 190 218 243 269 297 51 107Gujarat 194 218 242 272 300 54 106Haryana 188 214 240 271 306 57 118Himachal Pradesh 186 209 232 262 288 53 102Jammu and Kashmir 184 210 234 261 285 51 101Jharkhand 186 216 244 280 318 64 132Karnataka 201 228 261 296 331 68 130Kerala 201 225 249 278 301 53 100Lakshdweep 211 211 241 259 259 48 48Madhya Pradesh 190 213 236 266 293 53 103Maharashtra 194 221 250 287 321 66 127Manipur 180 205 232 268 305 63 125Meghalaya 186 209 231 255 280 46 94Mizoram 194 219 243 269 300 50 106Nagaland 188 217 242 271 292 54 104Odisha 200 227 261 305 355 78 155Puducherry 187 210 242 271 299 61 112Punjab 192 217 243 276 312 59 120Rajasthan 191 224 262 306 349 82 158Sikkim 183 206 225 247 267 41 84Tamil Nadu 193 215 236 265 289 50 96Telangana 197 222 249 281 317 59 120Tripura 179 204 232 264 295 60 116
Chapter_4_Mathematics.indd 48 18-02-2021 10:39:12

49
Stud
ents’
Ach
ieve
men
t in
Mat
hem
atic
s
States/UTs/Boards P10 P25 P50 P75 P90 P75 - P25 P90-P10
Uttarakhand 192 215 242 276 309 61 117CBSE 222 254 293 336 376 82 154ICSE 223 255 291 341 368 86 145National 194 221 249 285 326 64 132
Fig. 4.1: Percentile scores in Mathematics for States/UTs/Boards
Chapter_4_Mathematics.indd 49 18-02-2021 10:39:13

Learning Achievement of Students — NAS Class X (Cycle 2) 201850
The inter-quartile range (i.e., the range between the 75th and 25th percentiles) is highly variable between States/UTs. For example, Sikkim has an inter-quartile range of just 41 while Andhra Pradesh and Rajasthan has a corresponding value of 82. These values suggest that spread of achievement in Mathematics in Sikkim is far more homogeneous as regard to the learning levels than that of Andhra Pradesh and Rajasthan. In most states, the range of performance for the middle group was between 55 and 75 scale-score points.
Performance at the 10th and 90th percentiles, respectively, shows extremes in low and high achievement. The range between these two points, which includes 80 per cent of the population, is highly variable ranging from 84 (Sikkim), Lakshdaweep (48) to 158 (Rajasthan).
The percentiles provide additional information when comparing mathematics performance amongst states. For example, when the states are arranged in order of average score, the differences between adjacent states tend to be small. However, the inter-quartile range of scores may not be similar. For example, there is no significant difference between the median score of Himachal Pradesh, Manipur, Tripura and Chhattisgarh. However, the range of scores between the 25th and 75th percentiles is very different— Himachal Pradesh (53), Mizoram (50), Tamil Nadu (50), Goa (51) and Jammu and Kashmir (51).
4.3. Group-wise Performance in Mathematics
One of the objectives of the study is to find the performance of Class X students across gender, location, social category and school management, for giving specific interventions to improve the health of the system.
Table 4.3 below compares the average performance of different groups based on gender, school location, social category and school management.
GenderTable 4.3 depicts the average mathematics scores achieved by boys and girls and shows that, the overall performance of girls is lower in terms of average score than boys but difference is not statistically significant. It was observed that the girls performed lower than the boys and the difference in achievement score was statistically significant in 13 States/UTs, i.e., Chandigarh, Bihar, Telangana, Arunachal Pradesh, Andaman and Nicobar Islands, Dadra and Nagar Haveli, Mizoram, Assam, Jharkhand, Odisha, Chhattisgarh, Daman and Diu, Maharashtra. However, in 8 States/UTs like Punjab, Uttarakhand, Meghalaya, Karnataka, Goa, Lakshadweep, Kerala, Tamil Nadu girls performed significantly better than boys. In the remaining States/UTs there was no significant difference between performance of boys and girls.
Table 4.2: Average Mathematics scores by Gender
States/UTs/Boards Boys’ Average Score (Standard Error)
Girls’ Average Score (Standard Error)
Significant Difference
Andaman and Nicobar Islands 249(7.6) 239(7.2) ↓
Andhra Pradesh 268(1.8) 270(1.8) ↔
Arunachal Pradesh 246(3.4) 231(1) ↓
Assam 272(0.5) 263(1.2) ↓
Bihar 261(0.8) 251(1.8) ↓
Chandigarh 258(5.2) 246(6.2) ↓
Chhattisgarh 240(0.8) 234(1.1) ↓
Dadra and Nagar Haveli 240(1.2) 233(7.5) ↓
Daman and Diu 245(7.5) 223(12.5) ↓
Delhi 262(1) 260(1.4) ↔
Goa 242(2.7) 246(2.5) ↑
Gujarat 246(0.9) 245(1.7) ↔
Haryana 244(1.1) 243(2.1) ↔
Chapter_4_Mathematics.indd 50 18-02-2021 10:39:13

51
Stud
ents’
Ach
ieve
men
t in
Mat
hem
atic
s
Location of SchoolsTable 4.4 compares the average mathematics scores achieved by students in rural and urban schools. It is found that overall rural students did slightly lower than urban counterparts. In 6 States/UTs, i.e. Mizoram, Daman and Diu, Bihar, Chhattisgarh, Karnataka and Andhra Pradesh where the rural
States/UTs/Boards Boys’ Average Score (Standard Error)
Girls’ Average Score (Standard Error)
Significant Difference
Himachal Pradesh 235(1.9) 235(2.4) ↔
Jammu and Kashmir 234(3.4) 236(2.7) ↔
Jharkhand 251(0.9) 245(0.4) ↓
Karnataka 261(0.9) 265(0.4) ↑
Kerala 249(1.2) 253(1.8) ↑
Lakshdweep 231(8.7) 252(20.5) ↑
Madhya Pradesh 241(0.6) 239(0.4) ↔
Maharashtra 259(3.5) 248(1.2) ↓
Manipur 239(1.1) 237(2.8) ↔
Meghalaya 229(1.6) 234(0.8) ↑
Mizoram 248(2.2) 243(2.5) ↓
Nagaland 241(2.7) 242(1.2) ↔
Odisha 272(0.7) 265(1) ↓
Puducherry 243(3.5) 240(5.4) ↔
Punjab 246(1.4) 250(1.9) ↑
Rajasthan 266(0.8) 263(1.7) ↔
Sikkim 225(4.3) 227(6.2) ↔
Tamil Nadu 237(1.3) 243(2.1) ↑
Telangana 255(2.9) 251(1) ↓
Tripura 235(1.5) 237(5.4) ↔
Uttarakhand 246(2.3) 251(3.9) ↑
CBSE 289(3.4) 301(3) ↑
ICSE 298(3) 290(3.1) ↓
National 255(0.6) 253(0.3) ↔
students’ average performance was significantly better than students of urban schools. The difference between the performances is also significant in 21 States/UTs where rural schools’ students performed significantly lower than urban schools’ students. In the remaining States/UTs there is no difference in performance of rural and urban students.
Table 4.3: Average Mathematics Scores by Location
States/UTs/Boards Rural Urban Significant Difference
A & N Islands 242(8.2) 249(13.4) ↓
Andhra Pradesh 274(1.7) 262(1.8) ↑
Chapter_4_Mathematics.indd 51 18-02-2021 10:39:13

Learning Achievement of Students — NAS Class X (Cycle 2) 201852
States/UTs/Boards Rural Urban Significant Difference
Arunachal Pradesh 235(1.9) 244(2.4) ↓
Assam 266(0.4) 272(1.5) ↓
Bihar 256(1) 250(2.5) ↑
Chandigarh 243(3.8) 256(3) ↓
Chhattisgarh 238(0.5) 232(2.6) ↑
Dadra and Nagar Haveli 233(3) 246(17) ↓
Daman and Diu 241(21.1) 235(13.1) ↑
Delhi 251(3.5) 263(0.2) ↓
Goa 242(1.4) 248(2.9) ↓
Gujarat 242(0.8) 252(1.5) ↓
Haryana 242(0.9) 249(2) ↓
Himachal Pradesh 234(1.8) 245(6.3) ↓
Jammu and Kashmir 234(1.6) 239(10.6) ↓
Jharkhand 248(0.4) 248(1.3) ↔
Karnataka 266(0.8) 258(0.5) ↑
Kerala 249(1.3) 255(1.3) ↓
Lakshdweep 235(9.7) 250(21.7) ↓
Madhya Pradesh 240(0.3) 241(0.8) ↔
Maharashtra 250(1.1) 258(4.5) ↓
Manipur 237(2.5) 239(4.3) ↔
Meghalaya 229(1.5) 237(2.2) ↓
Mizoram 248(1.6) 243(2) ↑
Nagaland 241(2.9) 242(1.9) ↔
Odisha 269(0.4) 267(1.7) ↔
Puducherry 241(4.7) 242(4.2) ↔
Punjab 246(0.9) 252(1.3) ↓
Rajasthan 264(0.7) 268(2.7) ↓
Sikkim 225(4.4) 242(8.2) ↓
Tamil Nadu 237(1.2) 244(2) ↓
Telangana 246(0.7) 260(2.5) ↓
Tripura 236(4.3) 239(1) ↔
Uttarakhand 248(1.9) 243(1.5) ↓
CBSE 302(1.9) 290(4) ↑
ICSE 305(4.6) 291(3.1) ↑
National 253(0.2) 256(1.2) ↔
Chapter_4_Mathematics.indd 52 18-02-2021 10:39:13

53
Stud
ents’
Ach
ieve
men
t in
Mat
hem
atic
s
Table 4.4: Average Mathematics Scores by Social Category
States/UTs/Boards Others Schedule Caste Sig. Schedule
Tribe Sig.Other
Backward Classes
Sig.
Andaman and Nicobar Islands 240(7.3) ↓ 248(13.7) ↑ 245(6.1) ↑
Andhra Pradesh 285(2.6) 253(2.9) ↓ 264(3.3) ↓ 268(2.1) ↓
Arunachal Pradesh 236(5.3) 204(13.4) ↓ 239(1.3) ↑ 235(8.4) ↔
Assam 273(0.9) 266(2) ↓ 256(1.5) ↓ 266(1) ↓
Bihar 260(2.1) 245(2.7) ↓ 257(4.1) ↔ 257(1.1) ↔
Chandigarh 251(2.4) 245(3.8) ↓ 348(24.6) ↑
Chhattisgarh 237(5.4) 233(1.5) ↔ 241(1.7) ↔ 235(0.7) ↔
Dadra and Nagar Haveli 240(12.8) 234(4.4) ↓
Daman and Diu 247(11.2) 249(26.5) ↔ 247(24) ↔ 228(11.8) ↓
Delhi 265(0.6) 240(3.6) ↓ 258(25.9) ↓ 267(5.2) ↔
Goa 245(2.8) 218(9.1) ↓ 249(6.5) ↔ 242(5.1) ↔
Gujarat 256(1.3) 241(2.1) ↓ 237(2) ↓ 243(0.5) ↓
Haryana 252(1.9) 234(1.9) ↓ 243(1.6) ↓
Himachal Pradesh 237(2.9) 230(2.9) ↓ 231(8.8) ↓ 242(5) ↑
Jammu and Kashmir 236(1.6) 222(15.2) ↓ 240(4.3) ↓ 241(3.4) ↑
Jharkhand 244(3.1) 238(4.1) ↓ 245(1) ↔ 251(0.5) ↑
Karnataka 263(1.9) 262(1.5) ↔ 265(1.4) ↔ 263(0.3) ↔
Kerala 254(1.9) 244(4.4) ↓ 234(8.5) ↓ 251(0.7) ↔
Lakshdweep 241(12.5)
Social Category
Table 4.5 compares the average Mathematics scores achieved by students in different social categories and shows that significant difference was detected in the average achievement levels of students in the SC, ST and OBC categories. Students of SC, ST and OBC groups performed significantly lower than Others (General) category group while there was no significant difference between SC and ST category students.
In SC category while 4 States/UTs, i.e., Tripura, Meghalaya, Nagaland and Manipur showed average scores significantly above that those of Others (General) category group; 22 States/UTs depicted average scores significantly below that of the overall average score of Others and rest of the States/UTs presented average scores that were not significantly different from that of Others category.
In ST category while 4 States/UTs, i.e., Andaman and Nicobar Islands, Arunachal Pradesh, Manipur, Tripura showed average scores significantly above that of the Others group; 18 States/UTs depicted average scores significantly below that of Others (General) and rest of States/UTs presented average scores that were not significantly different from that of the Others.
In OBC category while 8 States/UTs, i.e., Jammu and Kashmir, Jharkhand, Himachal Pradesh, Chandigarh, Nagaland, Manipur, Tripura, Andaman and Nicobar Islands showed average scores significantly above that those of Others (General) category group; 12 States/UTs depicted average scores significantly below that of the Others category and rest of the States/UTs presented average scores that were not significantly different from that of the Others category.
Chapter_4_Mathematics.indd 53 18-02-2021 10:39:13

Learning Achievement of Students — NAS Class X (Cycle 2) 201854
Uttarakhand, Rajasthan, Bihar, Assam, Madhya Pradesh. The performance of students in government-aided schools was better than government schools in 12 States/UTs while in rest of the states the difference in performance between the two was not significant.
Private schools performed lower than government schools in 3 States/UTs, i.e., Uttarakhand, Rajasthan, Karnataka. The performance of students in private schools was better than that of government schools in 24 states while in rest of the states the performance between the two was comparable.
States/UTs/Boards Others Schedule Caste Sig. Schedule
Tribe Sig.Other
Backward Classes
Sig.
Madhya Pradesh 242(1.1) 241(0.7) ↔ 229(1.5) ↓ 243(0.6) ↔
Maharashtra 262(4.9) 246(0.6) ↓ 237(1.7) ↓ 251(1.5) ↓
Manipur 221(4.7) 228(14.1) ↑ 249(2.6) ↑ 236(7.5) ↑
Meghalaya 233(10.2) 244(6.9) ↑ 232(0.9) ↔ 237(17.6) ↔
Mizoram 312(32.7) 245(1.6)Nagaland 246(5.6) 252(32.7) ↑ 241(0.9) ↓ 259(9.9) ↑
Odisha 276(1.3) 259(3.2) ↓ 258(0.2) ↓ 274(0.8) ↔
Puducherry 270(3.8) 232(6.1) ↓ 240(3) ↓
Punjab 259(0.8) 239(0.9) ↓ 204(43.6) ↓ 246(2.9) ↓
Rajasthan 275(3.2) 259(2.7) ↓ 253(1.5) ↓ 267(0.9) ↓
Sikkim 229(4) 216(22.7) ↓ 223(5.7) ↓ 230(7.8) ↔
Tamil Nadu 248(3.9) 233(2.3) ↓ 241(9.4) ↓ 242(0.8) ↓
Telangana 277(4) 238(2.3) ↓ 245(2.4) ↓ 251(1.3) ↓
Tripura 228(4) 237(3.4) ↑ 233(2.4) ↑ 243(9.3) ↑
Uttarakhand 252(2.2) 242(2.6) ↓ 242(10) ↓ 248(4.7) ↓
CBSE 301(2.9) 267(8.7) ↓ 312(13.6) ↑ 287(4.8) ↓
ICSE 296(3.3) 295(4.8) ↔ 264(8.7) ↓ 290(4.9) ↓
National 262(1.4) 247(0.6) ↓ 246(0.3) ↓ 255(0.2) ↓
School Management
Table 4.6 compares the average Mathematics scores achieved by students across government schools, government-aided schools and private schools. It can be deciphered that significant difference exists in the average achievement levels of students based on the type of school management. Private Schools significantly outperformed government and government-aided schools.
Government-aided schools performed lower than government schools in 5 States/UTs, i.e.,
Table 4.5: Average Mathematics scores by School Management
States/UTs/Boards Government Government-aided
Significant Difference Private Significant
DifferenceAndaman and Nicobar Islands 242(7.4) 249(7.9) ↑
Andhra Pradesh 252(3.2) 262(2.5) ↑ 282(2.2) ↑
Arunachal Pradesh 230(0.9) 269(6.6) ↑ 252(5.3) ↑
Assam 265(0.6) 256(3.9) ↓ 287(0.2) ↑
Bihar 256(0.9) 244(2.9) ↓ 272(3.8) ↑
Chapter_4_Mathematics.indd 54 18-02-2021 10:39:14

55
Stud
ents’
Ach
ieve
men
t in
Mat
hem
atic
s
containing 60 items pertaining to various themes like Algebra, Trigonometry, Geometry, Statistics and Mensuration. The items were designed to test a range of relevant cognitive processes classified as
States/UTs/Boards Government Government-aided
Significant Difference Private Significant
Difference
Chandigarh 252(2.3) 253(8.1) ↔
Chhattisgarh 236(1.1) 231(5.1) ↔ 238(1.5) ↔
Dadra and Nagar Haveli 234(4.8) 255(21.5) ↑ 243(8.1) ↑
Daman and Diu 219(18.4) 258(10.7) ↑ 267(23.4) ↑
Delhi 249(2) 256(6.5) ↑ 287(2.6) ↑
Goa 230(4.6) 247(2.2) ↑ 272(25.5) ↑
Gujarat 237(3.4) 240(1.1) ↔ 260(2.1) ↑
Haryana 236(0.8) 239(3.2) ↔ 257(1.7) ↑
Himachal Pradesh 233(1.5) 254(5.7) ↑
Jammu and Kashmir 229(2.2) 246(13.3) ↑ 247(5.9) ↑
Jharkhand 248(0.6) 246(4.5) ↔ 250(1.1) ↔
Karnataka 265(1.4) 265(1.5) ↔ 258(0.6) ↓
Kerala 248(1.6) 251(2.4) ↔ 257(4.2) ↑
Lakshdweep 241(12.5)Madhya Pradesh 240(0.3) 234(4) ↓ 240(1.3) ↔
Maharashtra 250(4.8) 246(0.9) ↔ 284(11) ↑
Manipur 229(3.1) 228(8.1) ↔ 243(3.3) ↑
Meghalaya 235(5) 230(1.3) ↔ 243(4.2) ↑
Mizoram 242(2.4) 250(2.7) ↑ 256(4.4) ↑
Nagaland 235(3.4) 244(2.8) ↑
Odisha 268(0.5) 279(3) ↑ 281(6.3) ↑
Puducherry 230(5) 255(6.9) ↑ 247(5.7) ↑
Punjab 241(1) 252(1.4) ↑ 258(1.1) ↑
Rajasthan 268(1.1) 244(12.9) ↓ 262(1.7) ↓
Sikkim 226(4.5) 226(27.9) ↔
Tamil Nadu 233(0.6) 238(2.8) ↑ 248(1.8) ↑
Telangana 241(1) 240(9.6) ↔ 265(2.9) ↑
Tripura 236(3.6)Uttarakhand 249(2.6) 243(3.1) ↓ 242(0.9) ↓
CBSE 252(16.6) 295(2.9) ↑
ICSE 294(2.9)National 252(0.3) 249(0.7) ↓ 263(1.7) ↑
4.4. Overview of the Mathematics Tests
The mathematics tests administered to Class X students consisted of three test booklets, individually
Chapter_4_Mathematics.indd 55 18-02-2021 10:39:14

Learning Achievement of Students — NAS Class X (Cycle 2) 201856
abilities to ‘remember’, ‘understand’ and ‘apply’ as defined below.
What Majority of Students Can do in Mathematics The prime objective of this chapter is to highlight what the students can perform at different level of content domain on mathematics items. Before providing exemplifiers of the items tested in mathematics, this section gives a brief synopsis of content areas on which above three skills among learners were tested:
yy Algebrayy Geometryyy Mensuration yy Trigonometry yy Coordinate Geometryyy Number Systemyy Statistics
Performance of Class X Students on the Various Content Areas in MathematicsThe overall average performance of Class X students in mathematics was around a mean of 254 out of 500 with a standard error of 0.4. In the content area of ’Algebra’ the mean performance of students was similar to overall performance, i.e., 254. In the content areas of ‘Geometry’ and ‘Mensuration’ the mean performance of students revolved around the score of 251 which was significantly below the overall average performance of students in mathematics. Similarly, in the content areas of ‘Trigonometry’ and
‘Number System’ the mean performance of students was 252, which was significantly below the overall average score in mathematics. In the content areas of ‘Statistics’ and ‘Coordinate Geometry’ while the mean score of students was 250 but again students performed significantly below the overall average in the mathematics score.
Contents Mean SE Sig.
Mathematics 254 0.4
Algebra 254 0.2 ↔
Geometry 251 0.6 ↓
Mensuration 251 0.2 ↓
Trigonometry 252 0.2 ↓
Coordinate Geometry 250 0.3 ↓
Number System 252 1.0 ↓
Statistics 250 0.6 ↓
4.5. Sample ItemsThe sample items given below are intended to exemplify student achievement in selected mathematical domains at three distinct levels within the ability range. For each item, the proportion of students choosing the correct answer (marked *) and each of the incorrect options are given. A table at the end of this section shows the proportion of students selecting the correct answer within each participating States/UTs.
Cognitive Processes for Mathematics Literacy
Chapter_4_Mathematics.indd 56 18-02-2021 10:39:14

57
Stud
ents’
Ach
ieve
men
t in
Mat
hem
atic
s
Sample Item: 1
This item required students to compute the value of constant c, using the quadratic equation. In this item, 19.8 per cent of student’s chose the correct answer as (4). Remaining 80.2 per cent students either selected wrong answers or gave multiple responses or did not attempt.
Skill: Skill 3 item Content Domain: Algebra
Item 45: If ax2 +bx +c = 0 has equal roots, then c is equal to
1.
2. b
a2
3.
4. b
a
2
4
% Answers1. 30.0%2. 25.1%3. 19.5%4. 19.8%
Multiple response 0.7%Not attempted 5.0%
Sample Item: 2
This item required students to find the 30th term of an arithmetic progression using the expression of nth term. While a total of 32 per cent students identified the correct answer as (2). About 68 per cent students selected either wrong answers or gave multiple responses or did not attempt.
Skill: Skill 2 item Content Domain: Algebra
Item 33: If the nth term of an A.P. is (3n + 1), then its 30th term is
1. 31
2. 91
3. 90
4. 94
% Answers1. 25.8%2. 32.0%3. 27.8%4. 8.9%
Multiple response 0.6%Not attempted 4.9%
�ba2
�ba
2
4
Chapter_4_Mathematics.indd 57 18-02-2021 10:39:15

Learning Achievement of Students — NAS Class X (Cycle 2) 201858
Sample Item: 3
This item required students to apply the congruency property and find the relations corresponding the same. While a total of 56.5 per cent students identified the correct answer as (4). About 43.5 per cent students selected either incorrect answers or gave multiple responses or did not attempt.
Skill: Skill 1 item Content Domain: Geometry
Item 17: If ∆ ABC ∆ PQR, then which of the following is true?
1. B ↔ R
2. C ↔ Q
3. A ↔ R
4. A ↔ P
% Answers1. 11.1%2. 13.2%3. 15.8%4. 56.5%
Multiple response 0.6%Not attempted 2.8%
Sample Item: 4
These item required students to find the value of cot theta based on the value of Tan use theta symbol. About 71.1 per cent students in the sample were able to select the correct answer (1), whereas the remaining 28.9 per cent students selected either incorrect answers or gave multiple responses or did not attempt.
Skill: Skill 1 item Content Domain: Algebra
Item 11: If 3
tan4
θ = , then cot q is equal to
41.
33
2.74
3.77
4.4
% Answers1. 71.1%2. 11.4%3. 9.2%4. 5.5%
Multiple response 0.6%Not attempted 2.2%
Chapter_4_Mathematics.indd 58 18-02-2021 10:39:15

59
Stud
ents’
Ach
ieve
men
t in
Mat
hem
atic
s
Performance on the sample items reproduced here varied across the country. Table 4.7 shows
the proportion of students in each state or union territory responding correctly to each item.
Table 4.6: Performance on Sample Items in States/UTs/Boards
States/UTs/Boards Q45 Q33 Q21 Q17 Q11
Andaman and Nicobar Islands 20.00% 25.70% 52.00% 57.80% 74.30%
Andhra Pradesh 24.10% 41.70% 53.40% 63.70% 76.10%
Arunachal Pradesh 16.90% 24.40% 48.30% 49.60% 65.60%
Assam 28.90% 32.80% 58.40% 54.40% 76.10%
Bihar 16.00% 35.00% 53.30% 44.80% 69.40%
Chandigarh 19.20% 31.90% 57.90% 59.80% 77.70%
Chhattisgarh 15.10% 24.00% 49.20% 53.60% 72.70%
Dadra and Nagar Haveli 17.90% 23.90% 42.70% 59.50% 59.80%
Daman and Diu 16.70% 40.80% 53.70% 66.70% 74.60%
Delhi 19.90% 35.30% 52.70% 64.00% 80.50%
Goa 15.80% 23.50% 59.20% 69.80% 73.30%
Gujarat 19.10% 29.20% 48.50% 64.00% 62.30%
Haryana 16.40% 26.30% 50.40% 46.80% 68.60%
Himachal Pradesh 15.70% 20.60% 48.10% 50.40% 67.50%
Jammu and Kashmir 14.10% 25.30% 37.10% 42.30% 59.20%
Jharkhand 14.40% 25.50% 52.90% 50.90% 67.20%
Karnataka 27.00% 46.10% 40.70% 70.20% 84.00%
Kerala 19.90% 43.70% 36.80% 53.90% 49.40%
Lakshadweep 18.20% 24.00% 45.20% 50.00% 64.00%
Madhya Pradesh 15.40% 22.80% 52.40% 54.10% 74.20%
Maharashtra 15.50% 36.50% 45.20% 69.40% 71.00%
Manipur 18.60% 28.80% 48.70% 55.30% 68.30%
Meghalaya 19.40% 24.00% 46.90% 48.40% 68.50%
Mizoram 19.10% 26.60% 52.20% 50.10% 71.40%
Nagaland 18.00% 23.50% 52.00% 54.90% 70.40%
Odisha 21.90% 38.50% 50.30% 52.80% 67.10%
Puducherry 26.60% 34.70% 53.80% 58.40% 62.10%
Punjab 19.60% 27.50% 53.60% 58.40% 70.90%
Rajasthan 24.80% 34.00% 52.70% 60.50% 74.60%
Sikkim 11.80% 18.00% 46.10% 44.20% 72.60%
Tamil Nadu 26.40% 34.60% 53.00% 51.20% 70.30%
Chapter_4_Mathematics.indd 59 18-02-2021 10:39:15

Learning Achievement of Students — NAS Class X (Cycle 2) 201860
States/UTs/Boards Q45 Q33 Q21 Q17 Q11
Telangana 19.60% 32.50% 45.70% 56.50% 73.40%
Tripura 22.80% 24.00% 44.00% 38.90% 67.80%
Uttarakhand 19.90% 31.60% 52.90% 54.80% 76.30%
CBSE 29.7% 50.4% 65.2% 76.2% 87.6%
ICSE 41.0% 55.5% 42.7% 77.2% 88.1%
National 19.8% 32.0% 49.6% 56.5% 71.1%
4.6. Skill-wise PerformanceTable 4.8 summarises the state-wise performance of students in the three cognitive processes, i.e., Remembering, Understanding and Applying (Skill 1, Skill 2, Skill 3).
Table 4.7: State-wise Performance of Students in the Three Skills
States/UTs/BoardsSkill 1
(Correct Average score in Per cent)
Skill 2 (Correct Average score in Per cent)
Skill 3 (Correct Average score in Per cent)
Andaman and Nicobar Islands 36.5 33.9 31.5
Andhra Pradesh 43.5 40.6 36.8
Arunachal Pradesh 30.4 29.3 27.2
Assam 43.4 38.5 34.9
Bihar 39.8 35.7 32.4
Chandigarh 39.1 35.6 32.1
Chhattisgarh 32.7 30.1 27.1
Dadra and Nagar Haveli 28.4 27.9 26.1
Daman and Diu 34.2 31.9 29.6
Delhi 40.5 37.4 34.7
Goa 34.7 32.4 31.5
Gujarat 32 32.6 29.8
Haryana 32.9 31.5 28.7
Himachal Pradesh 31.2 29.3 27.3
Jammu and Kashmir 29.8 28.2 25.3
Jharkhand 34.3 32.1 29.6
Karnataka 42 37.6 33.6
Kerala 34.5 33.5 29.8
Lakshadweep 28.9 29.4 28.1
Madhya Pradesh 32.3 30.3 27.8
Maharashtra 35 33.4 30.7
Chapter_4_Mathematics.indd 60 18-02-2021 10:39:15

61
Stud
ents’
Ach
ieve
men
t in
Mat
hem
atic
s
States/UTs/BoardsSkill 1
(Correct Average score in Per cent)
Skill 2 (Correct Average score in Per cent)
Skill 3 (Correct Average score in Per cent)
Manipur 33.4 31 28.7
Meghalaya 29.5 28.4 25
Mizoram 33.1 32.1 29.9
Nagaland 31.6 28.8 28.6
Odisha 40.1 38.4 35
Puducherry 31.6 31.4 30.6
Punjab 35.3 32.8 30.1
Rajasthan 41.7 38.2 33.6
Sikkim 28.2 27.8 26.6
Tamil Nadu 30.3 31 30.4
Telangana 36.2 33.8 30.9
Tripura 32.2 30.4 28.1
Uttarakhand 37.5 34.5 31.2
CBSE 56.0 51.3 48.2
ICSE 54.5 50.8 45.4
National 36.1 33.9 30.9
4.7. Proficiency LevelsProficiency levels provide a convenient way to describe profiles of student achievement. Children whose results are located within a particular level of proficiency are expected to understand the competencies and skills associated with that and lower levels. In NAS Class X Cycle 2 student’s
performance in mathematics was gauged using 5 proficiency levels based on the numeric scores achieved in the assessment.
Classification of Students based on Proficiency LevelFigure 4.2 depicts the distribution of average Mathematics scores achieved by students into
Fig. 4.2: Proficiency Level in Mathematics
Chapter_4_Mathematics.indd 61 18-02-2021 10:39:15

Learning Achievement of Students — NAS Class X (Cycle 2) 201862
five proficiency levels. Each level comprises the percentage of students and a range of mean score for that level. It can be observed that maximum number of student’s, i.e., 41 per cent lied between proficiency level of 201 to 250, whereas only 14 per cent students belonged to a lower proficiency level of less than 200.
Distribution of Students Performing less than 200
Figure 4.2 classifies the students who belong to proficiency level of less than 200 based on four different parameter, namely Gender, Area, School Management and Category.
yy Gender: It was observed that percentage of males (48%) was slightly less than those of females (52%) in this category.
yy Location: It was observed that majority of students who belonged in performance level of less than 200 belonged to schools in rural areas, i.e., 74 per cent while only 26 per cent of students belonged to urban areas.
yy School Management: A large majority of students (61%) who performed in performance
level of less than 200 studied in government schools while 20 per cent students in this level belongs to government-aided and private schools each.
yy Social Groups: The distribution of students was skewed favouring OBC category students which comprised 42 per cent of the population while SC, ST and others (General) were 19%, 19% and 20 per cent respectively.
Distribution of Students based on Score RangeTable 4.10 depicts the distribution of student’s performance using absolute scores into four groups, i.e., 0–35 per cent, 36–50 per cent, 51–75 per cent, 75–100 per cent. The percentage of students in 0–35 per cent was 60.74 which was much greater than those in other percentage levels like for 36–50 per cent where it was 21.4, for 51–75 per cent where it was 15.47 and for 75–100 per cent it was 2.66, respectively. There was a huge variation in the performance of students across States. In States like Nagaland, Manipur, Goa, Bihar, Chattisgarh, Madhya Pradesh and Dadra and Nagar Haveli majority of the students belong in the range of 0–35 per cent.
-
Fig. 4.3: Characteristics of Students Performing below the Mean Score of 250 by Gender, Location, School Management and Social Groups
Chapter_4_Mathematics.indd 62 18-02-2021 10:39:16

63
Stud
ents’
Ach
ieve
men
t in
Mat
hem
atic
s
Table 4.8: Students’ Performance using Absolute Scores
States/UTs/Boards (0–35 %) (36–50 %) (51–75 %) (76–100 %)
Andaman and Nicobar Islands 69 17 12 3
Andhra Pradesh 52 22 20 7
Arunachal Pradesh 82 12 5 1
Assam 53 24 17 6
Bihar 60 21 15 4
Chandigarh 64 21 12 3
Chhattisgarh 76 16 7 1
Dadra and Nagar Haveli 85 12 2
Daman and Diu 71 21 8 1
Delhi 58 23 14 5
Goa 69 23 6 1
Gujarat 74 17 7 1
Haryana 73 18 8 1
Himachal Pradesh 80 16 4 0
Jammu and Kashmir 82 15 3 0
Jharkhand 70 20 10 1
Karnataka 53 27 18 2
Kerala 67 27 6 0
Lakshadweep 85 15
Madhya Pradesh 77 16 5 1
Maharashtra 67 23 9 1
Manipur 72 19 8 1
Meghalaya 85 13 2 0
Mizoram 71 23 5 1
Nagaland 77 18 4 1
Odisha 59 20 15 6
Puducherry 76 18 5 1
Punjab 70 18 10 2
Rajasthan 54 24 18 5
Sikkim 86 12 2 0
Chapter_4_Mathematics.indd 63 18-02-2021 10:39:16

Learning Achievement of Students — NAS Class X (Cycle 2) 201864
States/UTs/Boards (0–35 %) (36–50 %) (51–75 %) (76–100 %)
Tamil Nadu 77 18 5 0
Telangana 67 20 10 2
Tripura 75 14 9 3
Uttarakhand 64 22 13 2
CBSE 28 23 30 18
ICSE 27 27 32 14
National 67 20 11 2
4.8. ConclusionThe average achievement of students in Mathematics varies across the States and UTs of India. There is visible difference between performance in high scoring States/UTs, such as Odisha (269), Andhra Pradesh (269), Assam (267) and Rajasthan (265), and low scoring States, such as Sikkim (226), Meghalaya (232), Himachal Pradesh (235) and Jammu and Kashmir (235).
Besides this, states also vary greatly in the range between their lowest and highest achieving students as revealed by their inter-quartile score ranges. Some States/UTs have relatively homogeneous cohorts whilst others have far more diverse performance. No significant difference was observed in the average achievement of girls and boys. Similarly, no significant difference was observed between the achievement level of rural and urban students.
Nearly 83 per cent of the students belong to a proficiency level of 201–350 however, a smaller percentage of students (4%) did belong to high proficiency levels (greater than 350) as well. A detailed analysis of students belonging to 0–200 performance level is also carried out based on gender, location, school management and social groups.
Also, the survey did find that students from the General Category and OBC categories outperformed as compared to SC category students by a statistically significant margin.
Information about what Class X students at various cognitive skills domain of mathematics was also tested. It was found that on a national level students possess greater Remembering Skill (Skill 1) in comparison to Applying (Skill 2) and Understanding (Skill 3).
Chapter_4_Mathematics.indd 64 18-02-2021 10:39:16

65
This chapter summarises the achievement of Class X students in science. The overall achievement in science domain for each of the participating States, Union Territories and Boards is reported here, along with the information on differences in achievement by student gender, school location, social category and school management. This chapter also maps the proficiency levels of Class X students in science; characteristics of students scoring below the average score in science and also demonstrate the wide range of ability in domain of science.
5.1. State-wise Performance of Students in Science
This section shows the distribution of students’ achievement in science for the 36 participating States, UTs and Boards. Table 5.1 lists average
C H A P T E R 5
Students’ Achievement in Science
achievement score of each States/UT/Board on a scale ranging 0 to 500 with a SD of 50. The ‘standard error’ is given for each score, to indicate the degree of imprecision arising from the sampling process. Finally, the table also indicate whether of State/UT/Board average score is significantly different from the overall average of 36 States/UTs and Boards or not.
Table 5.1 indicates that the average score for 36 States, UTs and Boards was 253 (with a standard error of 0.2). Further, results reveal substantial differences in science achievement between the highest performing States/ UTs (271 for Andhra Pradesh) and the lowest performing States/UTs (227 for Dadra and Nagar Haveli). Ten States/UTs, i.e., Chandigarh, Delhi, Rajasthan, Manipur, Assam, Odisha, Andhra Pradesh, Karnataka, Goa and Telangana performed significantly above that of the national average.
Table 5.1: Average Science Scores for States/UTs/Boards
States/UTs/Boards Average Score Standard Error Significant Difference
Andaman and Nicobar Islands 251 5.5 ↔
Andhra Pradesh 271 1.0 ↑
Arunachal Pradesh 240 1.5 ↓
Assam 261 1.0 ↑
Bihar 239 0.6 ↓
Chandigarh 263 4.2 ↑
Chhattisgarh 240 1.2 ↓
Chapter_5_Science.indd 65 18-02-2021 10:38:49

Learning Achievement of Students — NAS Class X (Cycle 2) 201866
Almost 20 States/UTs, namely Jammu and Kashmir, Himachal Pradesh, Uttarakhand, Haryana, Bihar, Daman and Diu, Puducherrry, Arunachal Pradesh,
Nagaland, Mizoram, Tripura, Meghalaya, Jharkhand, Chhattisgarh, Madhya Pradesh, Gujarat, Tamil Nadu, Maharashtra, Lakshadweep, Dadra and Nagar Haveli
States/UTs/Boards Average Score Standard Error Significant Difference
Dadra and Nagar Haveli 227 3.8 ↓
Daman and Diu 243 11.4 ↓
Delhi 267 1.5 ↑
Goa 258 1.7 ↑
Gujarat 246 1.8 ↓
Haryana 241 0.7 ↓
Himachal Pradesh 243 2.6 ↓
Jammu and Kashmir 241 1.4 ↓
Jharkhand 238 1.4 ↓
Karnataka 261 0.8 ↑
Kerala 251 1.4 ↔
Lakshadweep 238 8.8 ↓
Madhya Pradesh 238 0.4 ↓
Maharashtra 250 0.6 ↓
Manipur 263 3.2 ↑
Meghalaya 237 2.7 ↓
Mizoram 238 2.8 ↓
Nagaland 246 3.3 ↓
Odisha 256 0.6 ↑
Puducherry 246 1.5 ↓
Punjab 254 1.2 ↔
Rajasthan 264 0.9 ↑
Sikkim 252 3.1 ↔
Tamil Nadu 246 1.3 ↓
Telangana 260 1.0 ↑
Tripura 239 1.2 ↓
Uttarakhand 244 1.0 ↓
CBSE 306 4.3 ↑
ICSE 308 2.4 ↑
National 253 0.2
↔ The State’s average score is not significantly different from that of the National.↑ The State’s average score is significantly above that of the National.↓ The State’s average score is significantly below that of the National.
Chapter_5_Science.indd 66 18-02-2021 10:38:49

67
Stud
ents’
Ach
ieve
men
t in
Scie
nce
depicted average scores that were significantly below that of the overall average. Four States/UTs of Punjab, Sikkim, Kerala and Andaman and Nicobar Islands demonstrated average scores that were not significantly different from that of the national score.
5.2. Percentile Scores in Science for States/UTs/Boards
The percentile scores assist to develop a better understanding about students, of low and high ability, by locating the scores gained by students at different parts of ability distribution as reported at different percentiles. This section of the NAS
report percentile Table 5.2 and Figure 5.1 illustrating the range of achievement within and across the States by listing the scores achieved by students at key percentiles. For example, the score at the 25th percentile is the score which shows that 75 per cent of students achieve or surpass, while the score at the 90th percentile is the score that 10 per cent of students achieve or surpass. The range between the 25th and 75th percentile (the inter-quartile range) represents the performance of the middle 50 per cent of students. Therefore, both inter-quartile range and range between 90th percentile and 10th percentile is a good indicator of reflecting the degree of homogeneity in achievement of students across States/UTs.
Table 5.1: Percentile Scores in Science for States/UTs/Boards
States/UTs/Boards P10 P25 P50 P75 P90 P 75–P 25 P 90–P 10Andaman and Nicobar Islands 197 222 251 278 306 56 109Andhra Pradesh 207 235 269 304 341 69 134Arunachal Pradesh 176 208 240 273 305 65 129Assam 197 226 257 294 332 68 135Bihar 177 206 239 269 304 63 127Chandigarh 201 232 262 291 323 59 122Chhattisgarh 182 210 240 268 300 58 118Dadra and Nagar Haveli 179 203 224 257 276 54 97Daman and Diu 196 216 240 268 294 52 98Delhi 203 230 263 303 338 73 135Goa 200 225 259 292 316 67 116Gujarat 191 218 247 274 302 56 111Haryana 181 211 242 270 301 59 120Himachal Pradesh 186 214 243 271 298 57 112Jammu and Kashmir 179 210 242 272 302 62 123Jharkhand 172 205 238 272 306 67 134Karnataka 200 229 260 295 323 66 123Kerala 197 223 251 280 305 57 108Lakshadweep 184 210 228 272 304 62 120Madhya Pradesh 182 208 238 266 295 58 113Maharashtra 191 219 250 281 311 62 120Manipur 201 229 259 302 331 73 130Meghalaya 185 209 237 266 290 57 105Mizoram 181 211 239 264 292 53 111Nagaland 200 225 247 269 290 44 90Odisha 194 222 253 288 326 66 132Puducherry 186 215 246 273 310 58 124Punjab 192 220 252 285 319 65 127
Chapter_5_Science.indd 67 18-02-2021 10:38:50

Learning Achievement of Students — NAS Class X (Cycle 2) 201868
States/UTs/Boards P10 P25 P50 P75 P90 P 75–P 25 P 90–P 10
Rajasthan 194 226 261 302 343 76 149Sikkim 191 222 251 283 313 61 122Tamil Nadu 195 220 247 273 298 53 103Telangana 199 226 257 290 327 64 128Tripura 175 212 245 266 296 54 121Uttarakhand 183 213 244 273 304 60 121CBSE 232 260 307 348 383 88 151ICSE 231 270 316 345 369 75 138National 191 220 251 284 318 64 127
Note: Ranges may not agree due to rounding.
Fig. 5.1: Percentile Scores in Science for States/UTs/Boards
Chapter_5_Science.indd 68 18-02-2021 10:38:50

69
Stud
ents’
Ach
ieve
men
t in
Scie
nce
It is evident from Figure 5.1 that the range between the 90th and 10th percentiles between States/UTs varies more than the inter-quartile range (i.e., the range between the 75th and 25th percentiles). For instance, Nagaland has an inter-quartile range of 44 while Rajasthan has corresponding value of 76. The percentiles provide additional information when comparing science performance amongst States. For instance, when the States are arranged in order of average score, the differences between adjacent States tend to be small. However, the range of scores may not be similar. For example, there is no significant difference among the median score of Madhya Pradesh, Jharkhand, Bihar and Mizoram (238–239). However, the range of scores between the 75th and 25th percentiles is very different: Mizoram (53), Madhya Pradesh (58), Bihar (63) and Jharkhand (67). This implies that while the average achievement is quite similar in the States, Jharkhand (67) has more heterogeneous achievement with regard to the learning levels of Class X students than the State of Mizoram (53). Further, 50th percentile of States/UTs, such as Telangana (257), Goa (259), Assam (257), Rajasthan (261), Karnataka (260) and Manipur (259) is far better than 75th percentile of
States and UTs, such as Dadra and Nagar Haveli (257), Mizoram (264), Meghalaya (266), Tripura (266) and Lakshadweep (272).
5.3. Group-wise Performance in Science
In this section, analysis results comparing the average performance of different groups in science based on gender, school location, social category and school management type are presented.
Gender
The results in Table 5.3 reflect that there was no significant difference in the achievement scores between boys and girls. However, it is reported that in nine States/UTs, namely, Daman and Diu, Kerala, Andaman and Nicobar Islands, Andhra Pradesh, Goa, Meghalaya, Lakshadweep, Punjab and Tamil Nadu, girls outperformed boys significantly. Whereas in Arunachal Pradesh, Dadra and Nagar Haveli, Manipur and Tripura girls performed significantly less than boys in science. In the remaining States/UTs there was no significant difference in the performance of boys and girls.
Table 5.2: Average Science Scores by Gender
States/UTs/Boards Boys' Average (Standard Error)
Girls' Average (Standard Error)
Significant Difference
Andaman and Nicobar Islands 248(10.7) 254(3.6) ↑
Andhra Pradesh 269(1.2) 274(1.2) ↑
Arunachal Pradesh 242(3.2) 236(5) ↓
Assam 260(0.7) 261(1.6) ↔
Bihar 241(1.6) 237(0.8) ↔
Chandigarh 261(8.1) 265(6.4) ↔
Chhattisgarh 242(1.8) 239(1.2) ↔
Dadra and Nagar Haveli 240(7.9) 212(7.2) ↓
Daman and Diu 239(13.8) 247(10.3) ↑
Delhi 269(2.2) 265(2.8) ↔
Goa 256(3) 262(2.1) ↑
Gujarat 246(1) 246(3) ↔
Haryana 240(1.1) 242(1.7) ↔
Himachal Pradesh 242(3.6) 245(3.4) ↔
Jammu and Kashmir 240(3.4) 242(3.3) ↔
Jharkhand 238(1.7) 237(1.7) ↔
Karnataka 262(1.2) 260(0.5) ↔
Kerala 247(0.8) 257(3.5) ↑
Chapter_5_Science.indd 69 18-02-2021 10:38:50

Learning Achievement of Students — NAS Class X (Cycle 2) 201870
Location of Schools Overall, students in rural schools performed lower than the students in urban schools. However, there persist huge inter-state variations in the performance of students studying in urban and rural areas. In 6 States and UTs, i.e, Karnataka, Daman and Diu, Dadra and Nagar Haveli, Himachal Pradesh, Lakshadweep
States/UTs/Boards Boys' Average (Standard Error)
Girls' Average (Standard Error)
Significant Difference
Lakshadweep 209(21) 249(12.2) ↑
Madhya Pradesh 238(0.4) 239(0.4) ↔
Maharashtra 248(0.5) 252(1.3) ↔
Manipur 267(6.6) 260(2.5) ↓
Meghalaya 234(3.5) 240(4.2) ↑
Mizoram 236(4.4) 239(3.4) ↔
Nagaland 247(2.1) 245(6.1) ↔
Odisha 257(1.2) 256(0.3) ↔
Puducherry 245(4) 246(3.4) ↔
Punjab 247(1.7) 261(2) ↑
Rajasthan 262(1.6) 266(1.4) ↔
Sikkim 253(4.5) 251(4.2) ↔
Tamil Nadu 243(2) 249(0.7) ↑
Telangana 258(1.6) 262(0.6) ↔
Tripura 243(4.4) 234(3.6) ↓
Uttarakhand 243(1.4) 245(1.7) ↔
CBSE 301(7.7) 313(4.3) ↑
ICSE 310(2.6) 306(2) ↔
National 252(0.2) 253(0.2) ↔
↔ No significant difference between the average performance of girls and boys.↑ Girls’ average performance is significantly greater than that of boys.↓ Boys’ average performance is significantly greater than that of girls.
and Tripura, the rural students’ average performance was significantly better than students’ of urban schools. However, in another 15 States and UTs, students in rural schools in science performed significantly lower than urban students. Moreover, results in the remaining States/UTs have found no significant difference in the performance of rural and urban students in science.
Table 5.3: Average Science Scores by Location
States/UTs/Boards Rural Average (Standard Error)
Urban Average (Standard Error)
Significant Difference
Andaman and Nicobar Islands 247(7.6) 259(4.6) ↓
Andhra Pradesh 270(1.3) 273(3.2) ↔
Arunachal Pradesh 238(2.5) 243(3.5) ↓
Assam 259(1.2) 269(1.9) ↓
Bihar 239(0.3) 241(3.4) ↔
Chandigarh 260(6) 263(6.5) ↔
Chapter_5_Science.indd 70 18-02-2021 10:38:50
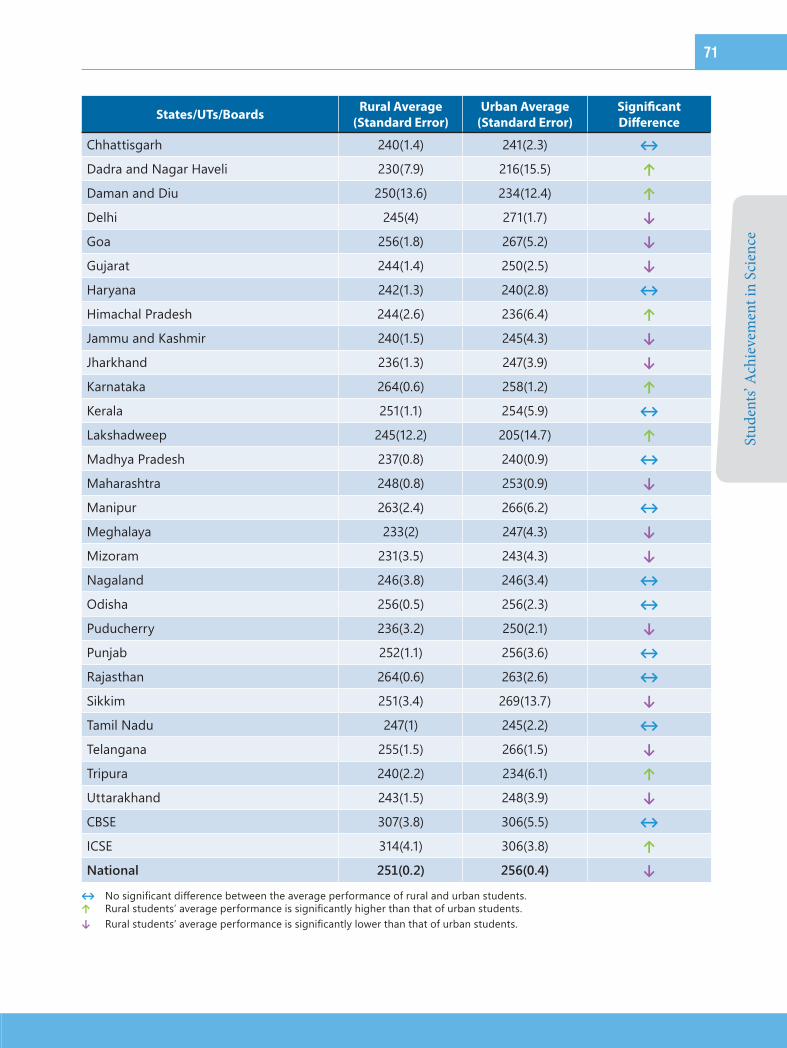
71
Stud
ents’
Ach
ieve
men
t in
Scie
nce
States/UTs/Boards Rural Average (Standard Error)
Urban Average (Standard Error)
Significant Difference
Chhattisgarh 240(1.4) 241(2.3) ↔
Dadra and Nagar Haveli 230(7.9) 216(15.5) ↑
Daman and Diu 250(13.6) 234(12.4) ↑
Delhi 245(4) 271(1.7) ↓
Goa 256(1.8) 267(5.2) ↓
Gujarat 244(1.4) 250(2.5) ↓
Haryana 242(1.3) 240(2.8) ↔
Himachal Pradesh 244(2.6) 236(6.4) ↑
Jammu and Kashmir 240(1.5) 245(4.3) ↓
Jharkhand 236(1.3) 247(3.9) ↓
Karnataka 264(0.6) 258(1.2) ↑
Kerala 251(1.1) 254(5.9) ↔
Lakshadweep 245(12.2) 205(14.7) ↑
Madhya Pradesh 237(0.8) 240(0.9) ↔
Maharashtra 248(0.8) 253(0.9) ↓
Manipur 263(2.4) 266(6.2) ↔
Meghalaya 233(2) 247(4.3) ↓
Mizoram 231(3.5) 243(4.3) ↓
Nagaland 246(3.8) 246(3.4) ↔
Odisha 256(0.5) 256(2.3) ↔
Puducherry 236(3.2) 250(2.1) ↓
Punjab 252(1.1) 256(3.6) ↔
Rajasthan 264(0.6) 263(2.6) ↔
Sikkim 251(3.4) 269(13.7) ↓
Tamil Nadu 247(1) 245(2.2) ↔
Telangana 255(1.5) 266(1.5) ↓
Tripura 240(2.2) 234(6.1) ↑
Uttarakhand 243(1.5) 248(3.9) ↓
CBSE 307(3.8) 306(5.5) ↔
ICSE 314(4.1) 306(3.8) ↑
National 251(0.2) 256(0.4) ↓
↔ No significant difference between the average performance of rural and urban students.↑ Rural students’ average performance is significantly higher than that of urban students.↓ Rural students’ average performance is significantly lower than that of urban students.
Chapter_5_Science.indd 71 18-02-2021 10:38:50

Learning Achievement of Students — NAS Class X (Cycle 2) 201872
Table 5.4: Average Science Scores by Social Category
States/UTs/Boards Others Scheduled Caste Sig. Scheduled
Tribe Sig.Other
Backward Classes
Sig.
Andaman and Nicobar Islands
246(8.3) 214(52.9) ↓ 274(9.4) ↑ 257(10.6) ↑
Andhra Pradesh 275(3.7) 264(2) ↓ 256(7.2) ↓ 274(1.3) ↔
Arunachal Pradesh 231(7) 270(19.5) ↑ 240(0.9) ↑ 307(14.1) ↑
Assam 265(0.8) 261(2.7) ↓ 252(2.2) ↓ 259(1.1) ↓
Bihar 243(1.5) 230(2.2) ↓ 238(4.7) ↓ 240(1.1) ↔
Chandigarh 267(4.2) 244(14.3) ↓ 296(10) ↑
Chhattisgarh 235(4) 240(2.1) ↓ 242(1.9) ↑ 240(1.5) ↑
Dadra and Nagar Haveli 224(18.8) 227(9.6) ↔ 231(24.4) ↑
Daman and Diu 237(12.1) 223(39.3) ↓ 248(12.3) ↑
Social CategoryIn this sub-section, we are comparing average science scores achieved by students in different social categories, which show that there is significant variation between the average achievement of students belonging to categories of SC and Others, ST and Others and OBC and Others. The first classification of achievement performance among SC and Others in science reflected that overall ‘SC’ category students significantly performed lower than ‘Others’ category. In respect to inter-state variations as depicted in the Table 5.5 below, four States/UTs, namely Rajasthan, Arunachal Pradesh, Meghalaya and Nagaland ‘SC’ students have significantly outperformed ‘Others’ category students in science. Whereas in majority, 22 States/UTs i.e; Andaman and Nicobar Islands, Jammu and Kashmir, Bihar, Chhattisgarh, Assam, Jharkhand, Himachal Pradesh, Puducherry, Sikkim, Haryana, Uttarakhand, Kerala, Gujarat, Tamil Nadu, Chandigarh, Maharashtra, Odisha, Manipur, Punjab, Telangana, Delhi and Andhra Pradesh students belong to ‘SC’ category performed significantly lower than ‘Other’ category students. In the remaining eight States/UTs, there was no significant difference between the performances of two categories of students.
In the second classification based on social categories, overall students belonging to ST categories tend to perform significantly lower from
students belonging to Other category. This pattern is visible in 16 States/UTs i.e., Andhra Pradesh, Assam, Bihar, Daman and Diu, Gujarat, Haryana, Jammu and Kashmir, Kerala, Maharashtra, Nagaland, Odisha, Punjab, Sikkim, Telangana, Tripura and Uttarakhand. Whereas in five States/UTs of Arunachal Pradesh, Goa, Andaman and Nicobar Islands, Chhattishgarh, and Himachal Pradesh, STs students performed significantly better in Science than ‘Other’ students. In remaining nine States/UTs no significant difference in the average scores of ‘Others’ and STs in Science.
In comparing the overall average score of students belonging to ‘OBCs’ and ‘Others’ category, ‘OBC’ categories tend to perform significantly lower than ‘Others’ category in Science. In 10 States/UTs, such as Assam, Goa, Maharashtra, Nagaland, Puducherry, Punjab, Sikkim, Tamil Nadu, Telangana, Uttarakhand ‘OBC’ category students have performed lower than ‘Others’ category students. However, in States/UTs like Arunachal Pradesh, A & N Islands, Chandigarh, Chhattishgarh, Dadra and Nagar Haveli, Daman & Diu, Delhi and Meghalaya OBCs students have significantly outperformed better than other students. In remaining 13 States/UTs of Andhra Pradesh, Bihar, Haryana, Himachal Pradesh, Jammu and Kashmir, Jharkhand, Kerala, Madhya Pradesh, Manipur, Rajasthan, Odisha and Tripura there was no significant difference between the average scores of OBCs and Others’ students in Science.
* Sig. - Significant Difference.
Chapter_5_Science.indd 72 18-02-2021 10:38:51

73
Stud
ents’
Ach
ieve
men
t in
Scie
nce
States/UTs/Boards Others Scheduled Caste Sig. Scheduled
Tribe Sig.Other
Backward Classes
Sig.
Delhi 268(2.1) 257(1.7) ↓ 273(3.5) ↑
Goa 259(2.5) 255(16.8) ↔ 268(7.5) ↑ 249(4.8) ↓
Gujarat 251(1.3) 242(5.6) ↓ 240(3.3) ↓ 246(1.4)
Haryana 245(1.1) 236(1.9) ↓ 191(15) ↓ 242(1.6) ↔
Himachal Pradesh 245(2.2) 236(3) ↓ 252(9.6) ↑ 247(8.1) ↔
Jammu and Kashmir 245(2.8) 228(6.1) ↓ 231(9.1) ↓ 241(6.5) ↔
Jharkhand 240(4) 234(4.2) ↓ 240(2.3) ↔ 237(1.2) ↔
Karnataka 262(2.7) 261(2.8) ↔ 264(2.4) ↔ 261(0.7) ↔
Kerala 254(2.3) 242(2.6) ↓ 226(5.2) ↓ 253(1.4) ↔
Lakshadweep 238(8.8)
Madhya Pradesh 237(1) 236(1.1) ↔ 236(2.2) ↔ 240(0.7) ↔
Maharashtra 253(1.2) 247(1.6) ↓ 246(3.4) ↓ 249(1.2) ↓
Manipur 266(6.5) 249(13.6) ↓ 262(2.9) ↔ 266(7.9) ↔
Meghalaya 234(12.7) 239(10.7) ↑ 237(3.6) ↔ 257(15.6) ↑
Mizoram 238(22.4) 242(35.8) ↔ 238(2.1) ↔
Nagaland 251(6.9) 264(18.7) ↑ 246(3.1) ↓ 222(20.6) ↓
Odisha 263(1.8) 248(2.3) ↓ 253(1.6) ↓ 259(1.1) ↔
Puducherry 246(3.1) 226(4.9) ↓ 251(3.2) ↓
Punjab 261(0.6) 248(2.4) ↓ 244(11.4) ↓ 249(2.7) ↓
Rajasthan 262(3.2) 271(2.1) ↑ 260(1.6) ↔ 263(1.9) ↔
Sikkim 270(5.5) 224(11.9) ↓ 254(4.1) ↓ 252(2.2) ↓
Tamil Nadu 256(4.8) 241(1.6) ↓ 249(7.3) ↔ 248(1.4) ↓
Telangana 275(2.5) 257(1.9) ↓ 262(0.7) ↓ 255(1.3) ↓
Tripura 243(3.9) 238(3.6) ↔ 237(5.7) ↓ 242(4.2) ↔
Uttarakhand 253(2.1) 238(1.8) ↓ 229(14.5) ↓ 236(2.4) ↓
CBSE 307(4) 280(8.8) ↓ 322(11.4) ↑ 308(6.7) ↔
ICSE 309(3.1) 321(13.9) ↑ 336(24.2) ↑ 300(5.9) ↓
National 257(0.4) 249(0.5) ↓ 248(5) ↓ 253(0.4) ↓
* Sig. - Significant Difference.
Chapter_5_Science.indd 73 18-02-2021 10:38:51

Learning Achievement of Students — NAS Class X (Cycle 2) 201874
School ManagementThis survey also revealed the average science scores achieved by students in Class X across various school managements— government, government-aided and private. The results reflect interesting variations when comparing the achievement results nationally and inter-state across various school managements. At national level, while there was no overall significant difference in science scores of students from government and government-aided schools but privately managed schools, performed significantly better than the government schools in science for Class X.
In respect to the inter-state variation in science scores across government and government-aided schools revealed that in nine States/UTs, i.e., Jammu and Kashmir, Chandigarh, Delhi, Arunachal Pradesh, Jharkhand, Gujarat, Dadra and Nagar Haveli, Andhra Pradesh and Odisha students from government-aided schools performed significantly better than government school students. While in the majority of 15 states/UTs of Punjab, Uttarakhand, Haryana, Rajasthan, Bihar, Sikkim, Manipur, Mizoram, Meghalaya, Chhattisgarh, Madhya Pradesh, Daman
Table 5.5: Average Science Scores by School Management
States/UTs/Boards Government Government-aided
Significant Difference Private Significant
Difference
Andaman and Nicobar Islands
243(7) 225(39.4) ↓ 288(6.1) ↑
Andhra Pradesh 255(2.4) 271(1.5) ↑ 276(3) ↑
Arunachal Pradesh 230(3.6) 271(13.8) ↑ 257(2.6) ↑
Assam 260(0.7) 256(3.2) ↔ 272(2) ↑
Bihar 240(0.7) 223(7.1) ↓ 234(4.6) ↓
Chandigarh 262(4.9) 274(12.7) ↑
Chhattisgarh 241(1.5) 227(3.8) ↓ 239(2.6) ↔
Dadra and Nagar Haveli 225(5.3) 235(14.2) ↑ 231(24.4) ↑
Daman and Diu 249(9.6) 226(19.3) ↓ 252(24.2) ↔
Delhi 251(1.3) 257(2.9) ↑ 303(3.4) ↑
Goa 260(4.4) 258(2.2) ↔ 269(7.9) ↑
Gujarat 239(4.8) 243(1.6) ↑ 254(1.9) ↑
and Diu, Maharashtra, Karnataka and Andaman and Nicobar Islands students in government-aided schools scored significantly lower than government schools in science. In six states/UTs of Assam, Telangana, Goa, Kerala, Tamil Nadu and Puducherry there was no significant difference in scores of students from government and government-aided schools.
The comparison of average science scores between private and government schools depicted students in 17 States/UTs of Jammu and Kashmir, Delhi, Arunachal Pradesh, Jharkhand, Gujarat, Andhra Pradesh, Telangana, Uttarakhand, Maharashtra, Andaman and Nicobar Islands, Assam, Odisha, Goa, Dadra and Nagar Haveli, Punjab, Haryana and Himachal Pradesh of private schools performed significantly better than government schools. Private schools in the five States/UTs of Rajasthan, Bihar, Manipur, Meghalaya and Karnataka scored significantly lower in science than government schools. In eight states of Tamil Nadu, Nagaland, Mizoram, Daman and Diu, Chhattisgarh, Madhya Pradesh, Kerala and Puducherry, there is no significant difference in students’ achievement from different school managements.
Chapter_5_Science.indd 74 18-02-2021 10:38:51

75
Stud
ents’
Ach
ieve
men
t in
Scie
nce
States/UTs/Boards Government Government-aided
Significant Difference Private Significant
Difference
Haryana 240(1.7) 221(11.2) ↓ 244(1.1) ↑
Himachal Pradesh 240(2.1) 264(8.9) ↑
Jammu and Kashmir 235(1.9) 260(11) ↑ 251(3.9) ↑
Jharkhand 236(1.6) 252(3.2) ↑ 242(2.3) ↑
Karnataka 265(1.3) 259(1.5) ↓ 257(1.1) ↓
Kerala 253(2.1) 250(1.4) ↔ 257(9) ↔
Lakshadweep 238(8.8)
Madhya Pradesh 239(0.9) 227(3.8) ↓ 237(0.7) ↔
Maharashtra 256(7.7) 247(0.6) ↓ 262(2.3) ↑
Manipur 270(4.2) 236(6.9) ↓ 263(3.2) ↓
Meghalaya 248(4.5) 236(2.7) ↓ 242(5.7) ↓
Mizoram 239(2.8) 229(7.6) ↓ 242(4.9) ↔
Nagaland 244(7.8) 247(1.6) ↔
Odisha 256(0.7) 264(2.6) ↑ 263(5.4) ↑
Puducherry 244(4.9) 241(16.5) ↔ 248(3.9) ↔
Punjab 250(1.5) 239(4.1) ↓ 261(1.5) ↑
Rajasthan 273(1) 231(23.4) ↓ 255(1.2) ↓
Sikkim 252(3.3) 237(28.6) ↓
Tamil Nadu 245(1.9) 245(3.7) ↔ 248(1.3) ↔
Telangana 251(1.6) 253(8.5) ↔ 269(0.7) ↑
Tripura 239(1.2)
Uttarakhand 244(1.6) 234(4.1) ↓ 248(2.2) ↑
CBSE 267(14.8) 300(27.6) ↑ 307(4.2) ↑
ICSE 308(2.4)
National 251(0.4) 250(0.4) ↔ 259(0.4) ↑
Overview of the Science TestsThe science tests used in NAS X consisted of three test booklets, each containing 60 multiple choice items. The items were chosen keeping in view the whole range of the content. Seventeen out of the sixty items were common across all test forms and served as ‘anchors’, so that all the test booklets could
be linked together and all items could be placed on a common scale. In addition to this, the test forms contained an extra of 43 unique items in each test form.
The items were designed to test a range of relevant cognitive processes or ‘skills’, classified as remembering, understanding and applying as defined below.
Chapter_5_Science.indd 75 18-02-2021 10:38:51

Learning Achievement of Students — NAS Class X (Cycle 2) 201876
What Majority of Students Can do in Science The prime objective of this chapter is to highlight what the students can perform at different level of content domain on science items. Before providing exemplifiers of the items tested in Science, this section gives a brief synopsis of content areas on which above three skills among learners were tested:
yy Foodyy How Things Workyy Materialyy Moving Thingsyy Natural Phenomenayy Natural Resourcesyy The Living World
Performance of Class X Students on the Various Content Areas in ScienceThe overall average performance of Class X students in science was around a mean of 253 out of 500 with a standard error (SE) of 0.20. In the content areas of ‘‘food’ and ‘Moving things’ the mean performance of students revolved around the score of 251 which was significantly below the overall average performance of students in science. Similarly, in
the content areas of ‘How things work’, ‘Natural phenomena’, ‘Natural resources’ and ‘The living world’ the mean performance of students was 250, which was significantly below the overall average score in science. In the last content area of ‘Material’ while the mean score of students was ‘252’, but again students performed significantly below the overall average in the science score.
Contents Mean SE Sig.
Science 253 0.20
Food 251 0.37 ↓
How Things Work 250 0.53 ↓
Material 252 0.19 ↓
Moving Things 251 0.32 ↓
Natural Phenomena 250 0.15 ↓
Natural Resources 250 0.30 ↓
The Living World 250 0.36 ↓
5.4. Sample Items Listed below are some of the items that were used in the science tests. Arranged in no order of difficulty, statistics show how students responded to the items and these can be located on the item map.
COGNITIVE PROCESSES FOR SCIENCE
Remembering (Skill 1)In items testing thisprocess, the students areexpected to recall orrecognise terms, facts,symbols, units and basicscientific/social concepts.They identify thephenomenon involved incertain processes/investigations.
Understanding (Skill 2)In items testing understanding, thestudents need to demonstrate theirability to solve problems, drawconclusions and make decisions. Forthis, the students are required toanalyse a problem (perhaps in anew situation), identify relationships,determine underlying principles,devise and explain strategies forproblem solving.
Applying (Skill 3)The items in this cognitive domain aredesigned to involve the application ofknowledge and understanding instraight forward situations and requirethe students to compare, contrast,classify and interpret information in lightof a concept. The students are alsoexpected to use and apply theirunderstanding of concepts andprinciples for situations familiar to them.
Chapter_5_Science.indd 76 18-02-2021 10:38:52

77
Stud
ents’
Ach
ieve
men
t in
Scie
nce
Sample Item 1 The item required students to use the information for computing the current produce in the circuit. Only 18.2 per cent of students in the sample were able to answer the correct response (4), while the chart shows that 81.8 per cent of students have selected either the wrong responses or given multiple responses or not attempted. In respect to inter-state variation, 14 States/UTs i.e., Telangana, Odisha, Gujarat, Manipur, Andaman and Nicobar Islands, Lakswadeep, Daman and Diu, Uttarakhand, Andhra Pradesh, Delhi, Assam, Rjasthan and Chandigarh more than 18 per cent of students selected the correct response where as more that 20 States/UTs, i.e., Dadra and Nagar Haveli, Nagaland, Chhattisgarh, Goa, Madhya Pradesh, Himachal Pradesh, Sikkim, Kerala, Tamil Nadu, Jammu and Kashmir, Haryana, Bihar, Tripura, Meghalaya, Karnataka, Mizoram, Maharashtra, Punjab, Arunachal Pradesh and Puducherry had students less than 18 per cent who answered this question correctly.
Skill: Skill 3 item Content Domain: Physics
58. The current I in the circuit shown in the figure is
1. 0.1A
2. 0.2A
3. 0.3A
4. 0.4A
% Answers1. 20.2%2. 38.0%3. 17.9%4. 18.2%
Multiple response 0.7%Not attempted 5.0%
Sample Item 2
The item required students to find out the understanding about the concept of retina and formation of images. Approximately 31.7 per cent of students in the sample were able to select the correct answer (2). The chart shows the way remaining 67.3 per cent of students responded either the wrong responses or given multiple responses or not attempted. However, 18 States/UTs, i.e., Daman and Diu, Maharashtra, Arunachal Pradesh, Bihar, Rajasthan, Nagaland, Andaman and Nicobar Islands, Jammu and Kashmir, Sikkim, Telangana, Karnataka, Odisha, Andhra Pradesh, Delhi, Mizoram, Lakshawadeep, Kerala and Goa performed significantly better than average number of students performed correctly this question.
Skill: Skill 2 item Content Domain: Physics
13. The image of an object formed by your eye lens on the retina is
1. erect and real
2. inverted and real
3. erect and virtual
4. inverted and virtual.
% Answers1. 33.1%2. 31.7%3. 21.7%4. 10.9%
Multiple response 0.6%Not attempted 2.1%
Chapter_5_Science.indd 77 18-02-2021 10:38:52

Learning Achievement of Students — NAS Class X (Cycle 2) 201878
Sample Item 3
The item required students understanding about the nitrogen gas, its nature and uses. Approximately 53.4 per cent of students in the sample were able to select the correct answer (2). The chart shows the way remaining 46.6 per cent of students responded either the wrong responses or given multiple responses or not attempted. However, 14 States/UTs, i.e., Chhattisgarh, Jharkhand, Andaman and Nicobar Islands, Assam, Karnataka, Maharashtra, Haryana, Punjab, Rajasthan, Andhra Pradesh, Chandigarh, Uttarakhand, Delhi and Goa more than 53 per cent of students responded correctly to the question investigating basic properties of nitrogen gas.
Skill: Skill 2 item Content Domain: Chemistry
17. Packets of potato chips are filled with nitrogen gas in order to avoid
1. Rusting
2. Rancidity
3. Reduction
4. Decomposition
% Answers1. 11.3%2. 53.4%3. 19.0%4. 14.1%
Multiple response 0.6%Not attempted 1.6%
Sample Item 4
The item required students to recall the unit of work. Almost 61.5 per cent of students could respond to answer it correctly (1), while the chart shows that 38.5 per cent of students selected either the wrong responses or gave multiple responses or did not attempt.
Skill: Skill 1 item Content Domain: Physics
8. The unit of work is
1. joule
2. newton
3. newton/meter
4. watt
% Answers1. 61.5%2. 12.0%3. 11.5%4. 12.4%
Multiple response 0.6%Not attempted 1.9%
Chapter_5_Science.indd 78 18-02-2021 10:38:52

79
Stud
ents’
Ach
ieve
men
t in
Scie
nce
Sample Item 5
The item is to assess the understanding about the biological concept relating to mouth fluids and food composition. Almost 71 per cent of students in the sample were able to answer the question correctly (3). The Table depicts the way remaining 29 per cent of students responded either the wrong responses or given multiple responses or not attempted. However, 18 States/UTs, i.e., Gujarat, Maharashtra, Himachal Pradesh, Punjab, Manipur, Uttarakhand, Karnataka, Chandigarh, Nagaland, Rajasthan, Kerala, Chhattisgarh, Sikkim, Assam, Telangana, Andhra Pradesh, Delhi and Goa had more than 71 per cent of its students responded correctly to this question. Whereas, remaining 16 States/UTs of Odisha, Mizoram, Bihar, Arunachal Pradesh, Jammu and Kashmir, Madhya Pradesh, Lakshadweep, Tripura, Meghalaya, Jharkhand, Tamil Nadu, Haryana, Daman and Diu, Dadra and Nagar Haveli, Puducherry and Andaman and Nicobar Islands had students less than 71 per cent of students responding to this question correctly.
Skill: Skill 2 item Content Domain: Biology
23. The fluid secreted in our mouth that mixes with food making it slippery and easy to swallow is
1. gastric juice
2. hormones
3. saliva
4. bile
% Answers1. 11.1%2. 10.0%3. 71.0%4. 5.6%
Multiple response 0.6%Not attempted 1.7%
Performance on the sample items reproduced here varied across the country. Table 5.6 shows the proportion of students in each State/UT responding correctly to each item.
Table 5.6: Performance on Sample Items in States/UTs/Boards
States/UTs/Boards Q58 Q13 Q17 Q8 Q23
Andaman and Nicobar Islands 20.70% 35.90% 55.60% 66.20% 69.80%Andhra Pradesh 24.10% 40.30% 67.80% 52.00% 81.30%Arunachal Pradesh 17.90% 34.20% 43.70% 66.20% 60.30%Assam 24.50% 28.30% 59.10% 80.30% 78.30%Bihar 15.60% 34.40% 49.10% 57.70% 60.20%Chandigarh 28.40% 31.50% 67.80% 69.70% 77.10%Chhattisgarh 13.40% 22.00% 55.20% 55.90% 77.70%Dadra and Nagar Haveli 12.20% 18.20% 33.30% 45.50% 68.90%Daman and Diu 21.70% 32.50% 20.30% 50.60% 68.10%Delhi 24.40% 40.40% 75.20% 77.10% 82.60%Goa 13.60% 52.30% 79.70% 72.20% 83.50%Gujarat 19.70% 20.80% 42.50% 62.10% 72.40%Haryana 14.90% 27.90% 60.20% 58.70% 68.00%Himachal Pradesh 14.00% 28.10% 42.50% 59.20% 73.20%Jammu and Kashmir 14.70% 36.40% 46.70% 61.00% 61.20%
Chapter_5_Science.indd 79 18-02-2021 10:38:52

Learning Achievement of Students — NAS Class X (Cycle 2) 201880
States/UTs/Boards Q58 Q13 Q17 Q8 Q23
Jharkhand 18.50% 29.30% 55.50% 59.50% 66.20%Karnataka 15.90% 37.90% 59.10% 68.50% 76.70%Kerala 14.40% 48.50% 34.90% 44.60% 77.70%Lakshadweep 20.80% 45.20% 33.30% 32.30% 62.50%Madhya Pradesh 13.80% 24.50% 53.50% 63.40% 62.10%Maharashtra 16.80% 33.10% 60.10% 56.90% 73.10%Manipur 20.50% 29.90% 52.80% 78.10% 74.20%Meghalaya 15.80% 27.80% 38.30% 69.80% 65.50%Mizoram 16.10% 41.70% 43.30% 69.50% 58.50%Nagaland 13.30% 35.80% 34.50% 58.20% 77.30%Odisha 19.30% 37.90% 46.40% 49.10% 56.70%Puducherry 18.00% 31.10% 37.80% 42.50% 69.20%Punjab 17.30% 24.30% 60.50% 69.00% 73.40%Rajasthan 28.30% 34.80% 62.60% 75.90% 77.50%Sikkim 14.20% 37.60% 54.30% 75.90% 78.20%Tamil Nadu 14.60% 26.70% 42.70% 48.20% 67.40%Telangana 18.60% 37.70% 44.40% 49.70% 79.70%Tripura 15.70% 21.40% 44.00% 69.00% 64.30%Uttarakhand 23.10% 26.20% 68.10% 70.10% 74.20%CBSE 44.2% 63.7% 82.5% 84.8% 86.5%ICSE 56.0% 69.3% 50.3% 83.8% 90.0%National 18.2% 31.7% 53.4% 61.5% 71.0%
5.5. Skill-wise performanceIn this sub-section, analysis of students’ performance in various States pertaining to skills, such as remembering, understanding and applying of
scientific concepts (Skill 1, Skill 2, Skill 3). Table 5.7 summarises the State wise performance of students in the three cognitive processes, i.e., Remembering, Understanding and Applying (Skill 1, Skill 2, Skill 3)
Table 5.7: State-wise Performance of Students in the Three Skills
States/UTs/BoardsSkill 1
(Correct Average score in Per cent)
Skill 2 (Correct Average score in Per cent)
Skill 3 (Correct Average score in Per cent)
Andaman and Nicobar Islands 40 34 36
Andhra Pradesh 43 40 41
Arunachal Pradesh 37 32 33
Assam 42 36 37
Bihar 35 29 31
Chapter_5_Science.indd 80 18-02-2021 10:38:52
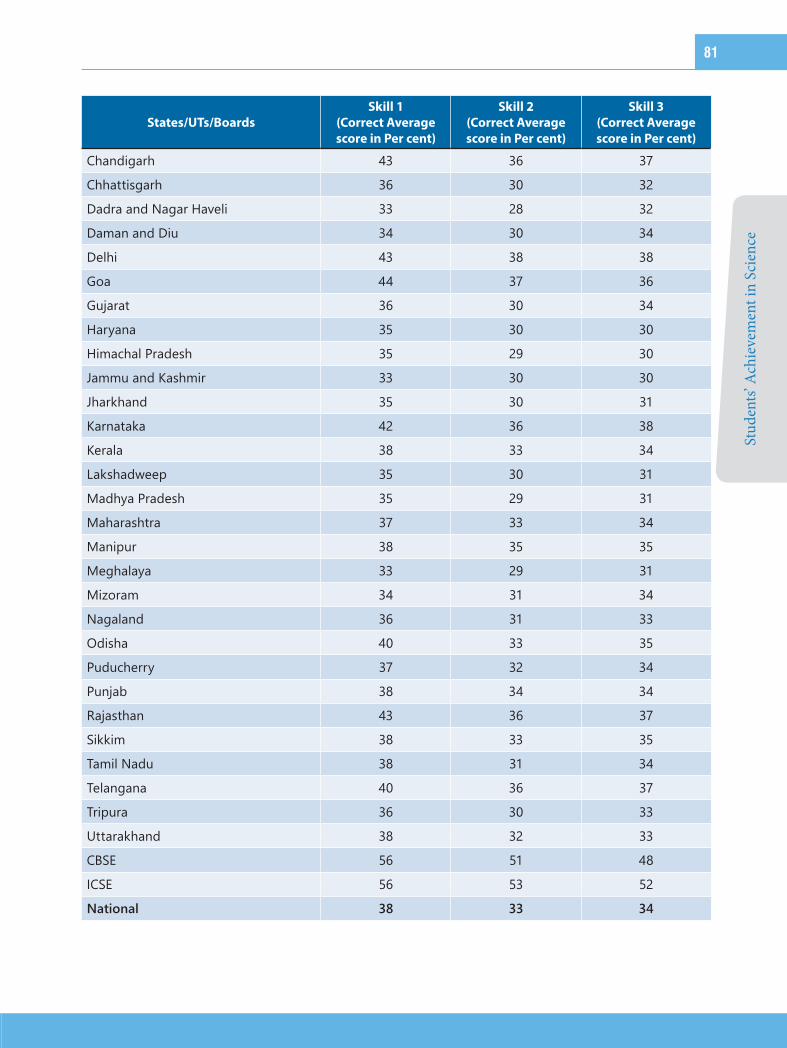
81
Stud
ents’
Ach
ieve
men
t in
Scie
nce
States/UTs/BoardsSkill 1
(Correct Average score in Per cent)
Skill 2 (Correct Average score in Per cent)
Skill 3 (Correct Average score in Per cent)
Chandigarh 43 36 37
Chhattisgarh 36 30 32
Dadra and Nagar Haveli 33 28 32
Daman and Diu 34 30 34
Delhi 43 38 38
Goa 44 37 36
Gujarat 36 30 34
Haryana 35 30 30
Himachal Pradesh 35 29 30
Jammu and Kashmir 33 30 30
Jharkhand 35 30 31
Karnataka 42 36 38
Kerala 38 33 34
Lakshadweep 35 30 31
Madhya Pradesh 35 29 31
Maharashtra 37 33 34
Manipur 38 35 35
Meghalaya 33 29 31
Mizoram 34 31 34
Nagaland 36 31 33
Odisha 40 33 35
Puducherry 37 32 34
Punjab 38 34 34
Rajasthan 43 36 37
Sikkim 38 33 35
Tamil Nadu 38 31 34
Telangana 40 36 37
Tripura 36 30 33
Uttarakhand 38 32 33
CBSE 56 51 48
ICSE 56 53 52
National 38 33 34
Chapter_5_Science.indd 81 18-02-2021 10:38:52

Learning Achievement of Students — NAS Class X (Cycle 2) 201882
Proficiency Levels Proficiency scores are used to measure learners’ competency in the science content which directly or indirectly assess the target skills. Proficiency levels provide a convenient way to describe profiles of student achievement. Children whose results are located within a particular level of proficiency are expected to understand the competencies and skills associated with that and lower levels. In NAS Class X Cycle 2 Student’s performance in Science was gauged using five proficiency levels based on the numeric scores achieved in the assessment.
Figure 5.2 shows the division of average science scores achieved by students into five proficiency levels. Each level comprises the percentage of students and a mean score for that level of proficiency. It can be observed that maximum number of students, i.e., 36 per cent lied between proficiency levels of 201 to 250. Approximately 33 per cent of students belonged to higher proficiency levels of 251 to 300. Another 15 per cent of students fall under the category of lower proficiency levels of below 200. And 3 per cent of students belonged to a higher proficiency level of more than 350.
Distribution of Students Performing less than 200 In this section classification of students relating to performance in the proficiency band of less than 200 are analysed relating to following parameters:
yy Gender: It was observed that 51 per cent of males and 49 per cent females of students performed below the score of 200 in science achievement tests.
yy Location: The graph revealed that majority of students performing in the proficiency band of less than 200 were studying in schools located in rural areas, i.e., 75 per cent and remaining 25 per cent of students in the same proficiency score studied in schools located in urban areas.
yy School Management: Around 60 per cent of students belonging to government schools were found scoring less than the score of 200 in the achievement tests for science. Additionally, 21 per cent of students in private schools and 19 per cent of students in government-aided schools performed below the 200 score in Class X science achievement tests.
yy Social Groups: Information was gathered relating to social composition of students falling under the proficiency score of less than 200 which revealed that the distribution of students were skewed in favour of students belonging to OBC category constituting 43 per cent of the students performing at this level. While students belonging to SCs, STs and Others category constituted 19 per cent, 18 per cent and 20 per cent of those performing within the proficiency band of less than 200 score in science.
Distribution of Students based on Score RangeTable 5.9 shows the range of students’ ability to correctly answer across States/UTs in science in four ranges. It shows the proportion of students who answered 0 to 35 per cent of questions correctly, 36
Fig. 5.2: Proficiency Levels in Science
Chapter_5_Science.indd 82 18-02-2021 10:38:53

83
Stud
ents’
Ach
ieve
men
t in
Scie
nce
per cent to 50 per cent of questions correctly, 51 per cent to 75 per cent of questions correctly and the proportion of students who answered more than 75 per cent of questions correctly. At national level, majority of students, i.e., 62.2 per cent answered
Table 5.8: Students’ Performance using Absolute Scores
States/UTs/Boards (0–35 %) (36–50 %) (51–75 %) (76–100 %)
Andaman and Nicobar Islands 59.4 28.5 10.6 1.6Andhra Pradesh 42.4 33.7 21.9 2Arunachal Pradesh 66.7 24.6 8.1 0.7Assam 52.8 30.8 15 1.4Bihar 71.9 19.4 8.3 0.3Chandigarh 49.5 33.7 16.4 0.4Chhattisgarh 70.2 22.4 6.9 0.4Dadra and Nagar Haveli 80.3 18.6 1.1Daman and Diu 67.1 31.4 1.4Delhi 48.5 31.8 17 2.6Goa 45.8 40 13.7 0.5Gujarat 68.4 26.4 5 0.1Haryana 71.3 22.1 6.2 0.4Himachal Pradesh 75 21.9 3 0Jammu and Kashmir 72.4 20.2 7.1 0.3
Fig. 5.3: Characteristics of Students Performing below the Mean Score of 250 by Gender, Location, School Management and Social Groups
correctly in the range of 0 to 35 per cent of questions. Majority of States tend to perform in this range in science. A small percentage of students 0.7 performed in the range of 76 per cent to 100 per cent in science.
Chapter_5_Science.indd 83 18-02-2021 10:38:53

Learning Achievement of Students — NAS Class X (Cycle 2) 201884
States/UTs/Boards (0–35 %) (36–50 %) (51–75 %) (76–100 %)
Jharkhand 70.1 22.6 7.1 0.2Karnataka 47.8 36.3 15.8 0.1Kerala 58.4 35.7 5.7 0.2Lakshadweep 72 25.3 2.7Madhya Pradesh 74.7 20.6 4.1 0.6Maharashtra 60.9 30 8.6 0.5Manipur 55.7 33 10.7 0.6Meghalaya 76.1 21.1 2.8 0Mizoram 69.6 26.1 4.3Nagaland 64.9 32 3 0Odisha 61.1 26 12 1Puducherry 64.7 29 5.9 0.4Punjab 59.8 29.1 10.2 0.9Rajasthan 52.3 27.5 18.3 1.9Sikkim 59.8 32.6 7.5 0.1Tamil Nadu 63.6 32.3 4.1 0.1Telangana 52.7 33.9 12.7 0.8Tripura 68.2 24.2 6.9 0.8Uttarakhand 64.3 27.2 8.2 0.2CBSE 22.9 27.9 39.5 9.8ICSE 16.7 24.8 50.5 8.0National 62.2 27.3 9.8 0.7
Conclusion The average achievement of students in science varies greatly across the States and UTs of India. There is a highly significant difference between performances in high scoring States/UTs, such as Chandigarh, Delhi, Rajasthan, Manipur, Assam, Odisha, Andhra Pradesh, Karnataka, Goa and Telangana.
Besides this, States also vary greatly in the range between their lowest and highest achieving students as revealed by their inter-quartile score ranges; that present relatively homogeneous cohorts in some States/UTs and far more diverse performances amongst the others. Overall no significant differences were found in the average achievement of girls and boys. However, significant difference was observed between the achievement level of rural and urban students across States/UTs although exceptions were found in case of some States/UTs like Andhra
Pradesh, Bihar, Chandigarh, Kerala and Madhya Pradesh. Also, the survey did find that students from the General Category outperformed their peers in the SC, ST and OBC categories by a statistically significant margin.
This survey also observed significant difference in the achievement level of students studying in different categories of school management. While there was no overall significant difference in science scores of students from government and government-aided schools, but privately managed schools performed significantly better than the government schools in science for Class X.
Moreover, majority of students in science were found to score between 201 to 250 on the scale of 500 whereas 60 per cent of students from the government schools across the States/UTs performed below the score of 200 in science.
Chapter_5_Science.indd 84 18-02-2021 10:38:53

85
This chapter summarises two important aspects of the achievement of students in social science under National Achievement Survey (NAS) for Class X. In the first section, the overall achievement in the social science domain is reported for each participating State/UT and Board. In addition, information about differences in achievement by gender, school location, social category and school management type is provided. The objective of second part of the chapter, is to present students performance levels in the domain of social science subject to various aspects of content areas and skills mapped in items testing these contents.
C H A P T E R 6
Students’ Achievement in Social Science
6.1. State-wise Performance of Students in Social Science
This section shows the distribution of students’ achievement in social science for the 36 participating States/UTs and Boards. Table 6.1 lists average achievement score of States/UTs on a scale of from 0 to 500 with a SD of 50. The ‘standard error’ is given for each score, to indicate the degree of imprecision arising from the sampling process. Finally, these tables also indicate whether a State’s or UT’s average score is significantly different from the overall average of 36 States/UTs and Boards or not.
Table 6.1: Average Social Science Scores for States/UTs/Boards
States/UTs/Boards Average Score Standard Error Significant Difference
Andaman and Nicobar Islands 254 4.1 ↔Andhra Pradesh 260 1.3 ↑Arunachal Pradesh 252 2.2 ↔Assam 255 1.1 ↔Bihar 243 1.2 ↓Chandigarh 253 3.5 ↔Chhattisgarh 241 0.2 ↓Dadra and Nagar Haveli 254 4.6 ↔Daman and Diu 237 5.9 ↓Delhi 273 1.7 ↑Goa 265 1.8 ↑
Chapter_6_Social Science.indd 85 18-02-2021 10:43:43

Learning Achievement of Students — NAS Class X (Cycle 2) 201886
States/UTs/Boards Average Score Standard Error Significant Difference
Gujarat 247 0.6 ↓Haryana 245 0.9 ↓Himachal Pradesh 248 1.9 ↓Jammu and Kashmir 229 1.6 ↓Jharkhand 244 1.3 ↓Karnataka 270 0.6 ↑Kerala 256 1.3 ↔Lakshadweep 255 8.6 ↑Madhya Pradesh 237 0.5 ↓Maharashtra 254 1.0 ↔Manipur 240 1.6 ↓Meghalaya 238 1.5 ↓Mizoram 236 1.4 ↓Nagaland 268 1.5 ↑Odisha 247 1.4 ↓Puducherry 238 3.6 ↓Punjab 247 0.9 ↓Rajasthan 267 0.8 ↑Sikkim 259 2.9 ↑Tamil Nadu 250 1.0 ↓Telangana 249 0.4 ↓Tripura 236 2.0 ↓Uttarakhand 254 0.7 ↔CBSE 292 4.6 ↑ICSE 285 2.1 ↑National 254 0.2
↔ The State’s average score is not significantly different than that of the National.↑ The State’s average score is significantly above than that of the National.↓ The State’s average score is significantly below than that of the National.
Table 6.1 indicates that the average score was 254 (with a standard error of 0.2). The table revealed variations in social science achievement across high achieving States/UTs, such as 273 for Delhi, 270 for Karnataka and 268 for Nagaland and the low performing States/UTs are 229 for Jammu and Kashmir, 237 for Daman and Diu, 238 for Meghalaya, Madhya Pradesh and Tripura. Eight States/UTs— Sikkim, Andhra Pradesh, Goa, Nagaland, Rajasthan, Karnataka, Lakshadweep and Delhi, showed average
scores significantly above that of the group with mean scores ranging 255 to 273. There were 18 States/UTs depicted the average scores significantly ranging from 229 to 250, which are below that of the national average. Eight States/UTs— Arunachal Pradesh, Andaman and Nicobar Islands, Uttarakhand, Maharashtra, Assam, Chandigarh, Dadra and Nagar Haveli and Kerala reported the scores from 252 to 305 that were not significantly different from that of the overall average scores in social science.
Chapter_6_Social Science.indd 86 18-02-2021 10:43:44

87
Stud
ents’
Ach
ieve
men
t in
Soci
al S
cien
ce
6.2. Percentile Scores in Social Science for States/UTs
The percentile scores assist to develop a better understanding about students, of low and high ability, by locating the scores gained by students at different parts of ability distribution as reported at different percentiles. This section illustrates the range of achievement within and across the States/UTs by students at key percentiles. For example, the score at the 25th percentile is the score which
75 per cent of students achieve or surpass, whereas the score at the 90th percentile is the score that 10 per cent of students achieve or surpass (Table 6.2).
The range between the 25th and 75th percentile (the inter-quartile range) represents the performance of the middle 50 per cent of students. Therefore, both inter-quartile range and range between 90th percentile and 10th percentile is a good indicator of reflecting the degree of homogeneity in achievement of students across States/UTs (Figure 6.1).
Table 6.2: Percentile Scores in Social Science for States/UTs/Boards
States/UTs/Boards P10 P25 Mean P75 P90 Range P75–P25
Range P90–P10
Andaman and Nicobar Islands 196 218 256 288 320 70 124Andhra Pradesh 198 224 259 294 327 70 129Arunachal Pradesh 185 213 244 289 332 76 147Assam 193 223 256 289 318 66 125Bihar 174 205 240 281 318 76 144Chandigarh 191 219 247 289 327 70 136Chhattisgarh 184 211 239 272 299 61 115Dadra and Nagar Haveli 197 219 257 282 310 63 113Daman and Diu 206 219 239 259 277 40 71Delhi 210 240 274 306 337 66 127Goa 204 231 269 298 321 67 117Gujarat 191 218 246 278 302 60 111Haryana 186 213 244 278 308 65 122Himachal Pradesh 191 219 248 279 303 60 112Jammu and Kashmir 161 195 227 266 298 71 137Jharkhand 175 206 241 282 320 76 145Karnataka 203 233 272 307 334 74 131Kerala 199 225 258 288 314 63 115Lakshadweep 183 200 219 342 342 142 159Madhya Pradesh 181 208 235 267 293 59 112Maharashtra 194 223 255 286 316 63 122Manipur 162 204 243 279 318 75 156Meghalaya 184 210 237 267 293 57 109Mizoram 182 207 235 266 287 59 105Nagaland 212 234 267 298 330 64 118Odisha 189 217 246 279 305 62 116Puducherry 182 208 237 269 292 61 110Punjab 189 218 245 277 307 59 118Rajasthan 195 228 269 307 340 79 145Sikkim 204 230 259 291 318 61 114
Chapter_6_Social Science.indd 87 18-02-2021 10:43:44

Learning Achievement of Students — NAS Class X (Cycle 2) 201888
States/UTs/Boards P10 P25 Mean P75 P90 Range P75–P25
Range P90–P10
Tamil Nadu 194 222 251 280 304 58 110Telangana 190 218 248 280 309 62 119Tripura 175 204 234 269 299 65 124Uttarakhand 192 222 255 285 314 63 122CBSE 216 258 297 333 362 75 146ICSE 223 254 290 322 348 68 125National 191 221 253 288 321 67 130
Note: Ranges may not agree due to rounding.
Fig. 6.1: Percentile Scores in Social Science for States/UTs/Boards
Chapter_6_Social Science.indd 88 18-02-2021 10:43:44

89
Stud
ents’
Ach
ieve
men
t in
Soci
al S
cien
ce
The inter-quartile range (i.e., the range between the 75th and 25th percentiles) between States/UTs is highly variable. For example, States/UTs like Daman and Diu, Meghalaya and Mizoram has an inter-quartile range of just 40, 57 and 59, respectively, while Karnataka, Rajasthan and Lakshadweep has a corresponding value of 74, 79 and 142, respectively. The values suggest that the Class X population in Daman and Diu, Mizoram and Meghalaya is far more homogenous as regard to the learning levels than that of Karnataka, Rajasthan and Lakshadweep. In most States, the range of performance for middle group is between 60 to 75 scale-score points.
Further, the performances of States and UTs at the 10th and 90th percentiles, respectively, show extremes in low and high achievement. The range between these two points, which includes 90 per cent of the population, is highly variable ranging from 71 for Daman and Diu to 159 for Lakshadweep.
The percentiles provide additional information when comparing performance amongst States/UTs. For example, when the States are arranged in order of average score, the differences between adjacent States tend to be small. However, the range of Scores many not be similar. For example, there is no
significant difference between the median score of Himachal Pradesh and Telangana (248). However, the range of Scores between the 25th and 75th for these three States is very different— Himachal Pradesh (60) and Telangana (62). This indicates that the average achievement is very similar in two States.
6.3. Group-wise Performance in Social Science
In this section, analyses are brought forth, which compare the average performance of different groups in social science based on gender, school location, social category and school management.
GenderThis section compares the average social science scores achieved by the boys and girls. It shows that overall, there was no significant difference in the performance of boys and girls in social science. Similarly observed that in 18 States/UTs, there was no significant difference in performance of boys and girls. Girls performed significantly better in terms of average achievement in 11 States/UTs. In five States/UTs, girls scored significantly lower than the boys in social science (Table 6.3).
Table 6.3: Average Social Science Scores by Gender
States/UTs/Boardss Boys' Average (Standard Error)
Girls' Average (Standard Error)
Significant Difference
Andaman and Nicobar Islands 254(4.7) 254(5.1) ↔
Andhra Pradesh 256(1.4) 263(1.9) ↑Arunachal Pradesh 244(4.7) 258(3.9) ↑Assam 258(0.6) 253(1.8) ↓Bihar 242(1.2) 245(1.3) ↔Chandigarh 255(5.5) 252(6.1) ↔Chhattisgarh 242(1.5) 240(1.3) ↔Dadra and Nagar Haveli 256(1.0) 251(8.6) ↓Daman and Diu 235(11.0) 238(5.6) ↑Delhi 267(0.9) 279(3.0) ↑Goa 258(2.5) 271(3.2) ↑Gujarat 244(0.5) 250(1.3) ↑
Haryana 243(2.0) 248(1.4) ↑
Himachal Pradesh 249(2.5) 246(2.5) ↔
Chapter_6_Social Science.indd 89 18-02-2021 10:43:44

Learning Achievement of Students — NAS Class X (Cycle 2) 201890
States/UTs/Boardss Boys' Average (Standard Error)
Girls' Average (Standard Error)
Significant Difference
Jammu and Kashmir 232(2.0) 227(2.7) ↔Jharkhand 245(1.3) 243(2.3) ↔Karnataka 270(0.6) 270(1.2) ↔Kerala 255(1.7) 257(1.3) ↔Lakshadweep 266(11.1) 192(26.0) ↓Madhya Pradesh 237(1.1) 237(0.5) ↔Maharashtra 256(1.1) 252(1.5) ↓Manipur 239(3.3) 242(5.2) ↔Meghalaya 243(4.2) 235(1.2) ↓Mizoram 227(3.9) 243(4.3) ↑Nagaland 271(3.6) 264(2.9) ↑Odisha 245(1.2) 248(1.5) ↔
Puducherry 235(2.7) 239(4.8) ↔
Punjab 243(0.9) 252(1.1) ↑Rajasthan 269(1.2) 265(1.2) ↔Sikkim 258(2.0) 261(5.3) ↔Tamil Nadu 249(0.9) 251(1.4) ↔Telangana 247(1.3) 252(0.9) ↑
Tripura 233(1.8) 237(3.2) ↔
Uttarakhand 254(1.7) 254(1.8) ↔CBSE 299(5.4) 286(7.2) ↓ICSE 277(1.9) 294(4.2) ↑National 254(0.4) 254(0.4) ↔
↔ No significant difference between the average performance of girls and boys.↑ Girls’ average performance is significantly greater than that of boys.↓ Boys’ average performance is significantly greater than that of girls.
Location of Schools Table 6.4 reveals that students in rural schools performed significantly lower than students in urban schools. In 14 States/UTs of Jammu and Kashmir, Himachal Pradesh, Delhi, Arunachal Pradesh, Nagaland, Tripura, Meghalaya, Jharkhand, Gujarat, Daman and Diu, Chandigarh, Goa, Kerala, Andaman and Nicobar Islands, students in rural schools performed lower than urban areas.
A significant difference was also observed in eight States/UTs of Punjab, Haryana, Sikkim, Manipur, Mizoram, Dadra and Nagar Haveli, Karnataka and Lakshadweep, where students in rural schools performed better than their urban counterparts. While in remaining 12 States/UTs of Assam, Madhya Pradesh, Uttarakhand, Rajasthan, Bihar, Maharashtra, Odisha, Chhattisgarh, Andhra Pradesh, Tamil Nadu, Puducherry and Telangana there was no significant difference in average performance of students in social science studying either in rural or urban schools.
Chapter_6_Social Science.indd 90 18-02-2021 10:43:45

91
Stud
ents’
Ach
ieve
men
t in
Soci
al S
cien
ce
Table 6.4: Average Social Science Scores by Location
States/UTs/Boardss Rural Average (Standard Error)
Urban Average (Standard Error)
Significant Difference
Andaman and Nicobar Islands 251(4.6) 269(7.9) ↓Andhra Pradesh 261(1.6) 258(1.3) ↔Arunachal Pradesh 249(2.7) 258(4.0) ↓Assam 255(1.0) 253(2.5) ↔Bihar 243(1.2) 243(2.6) ↔Chandigarh 249(5.4) 255(5.8) ↓Chhattisgarh 241(0.5) 241(1.8) ↔Dadra and Nagar Haveli 256(2.9) 242(24.0) ↑Daman and Diu 233(8.8) 246(13.8) ↓Delhi 255(3.7) 275(1.6) ↓Goa 262(3.3) 273(5.5) ↓Gujarat 244(0.7) 251(1.3) ↓Haryana 247(0.7) 242(1.7) ↑Himachal Pradesh 246(2.3) 260(8.3) ↓Jammu and Kashmir 224(1.8) 254(3.5) ↓Jharkhand 243(1.5) 250(2.0) ↓Karnataka 273(1.1) 266(0.9) ↑Kerala 254(1.7) 263(3.0) ↓Lakshadweep 279(21.4) 224(18.9) ↑Madhya Pradesh 238(0.4) 236(0.9) ↔Maharashtra 253(1.2) 256(1.4) ↔Manipur 246(2.0) 226(5.2) ↑Meghalaya 237(1.3) 240(4.4) ↓Mizoram 239(3.8) 233(3.7) ↑Nagaland 265(2.7) 270(2.7) ↓Odisha 247(1.3) 246(2.3) ↔Puducherry 238(3.4) 238(6.3) ↔Punjab 248(1.2) 244(1.0) ↑Rajasthan 268(0.6) 266(1.5) ↔Sikkim 260(2.7) 241(14.1) ↑Tamil Nadu 249(1.3) 251(1.1) ↔Telangana 249(1.0) 249(1.1) ↔Tripura 233(2.7) 249(2.7) ↓
Chapter_6_Social Science.indd 91 18-02-2021 10:43:45

Learning Achievement of Students — NAS Class X (Cycle 2) 201892
States/UTs/Boardss Rural Average (Standard Error)
Urban Average (Standard Error)
Significant Difference
Uttarakhand 253(1.3) 256(3.1) ↔CBSE 290(5.8) 294(6.3) ↔ICSE 274(5.9) 292(4.2) ↓National 253(0.2) 256(0.3) ↓
↔ No significant difference between the average performance of rural and urban students.↑ Rural students’ average performance is significantly higher than that of urban students.↓ Rural students’ average performance is significantly lower than that of urban students.
Social CategoryThis sub-section presents a comparative analysis of average social science scores achieved by students belonging to different social categories. It shows that there was a significant difference between the achievement levels of students in SC, ST, OBC and other categories. Wherein, students from SC, ST and OBC category performed significantly lower than other students.
While Students in ‘SC’ category scored lower than Others students in majority of 20 States/UTs, but there were six States/UTs which demonstrated reverse trend of SCs performing better than Others
students. Similarly, in majority of 19 States/UTs ST performed significantly lower than Others, but in six States/UTs, STs outperformed than Others in Social Science achievement Scores.
In comparing the performance of achievement Scores of OBC and Others’ category students revealed that in 18 States/UTs there persisted significant lower performance in OBCs than Others. However, results of six States/UTs revealed better performance of OBCs than Others in social science scores. In the remaining 8 States/UTs there was no significant difference between the performance of OBCs and Others (Table 6.5).
Table 6.5: Average Social Science Scores by Social Category
States/UTs/Boards Others Scheduled Caste Sig. Scheduled
Tribe Sig.Other
Backward Classes
Sig.
Andaman and Nicobar Islands
265(5.7) – – 225(7.6) ↓ 248(6.1) ↓
Andhra Pradesh 265(1.6) 263(2.7) ↔ 234(5.5) ↓ 259(1.4) ↓
Arunachal Pradesh 242(5) 248(13.1) ↑ 254(2) ↑ 256(9.8) ↑
Assam 257(2.5) 249(2.9) ↓ 250(2.3) ↓ 257(1.5) ↔
Bihar 251(3.3) 243(2.2) ↓ 229(4) ↓ 242(1.1) ↓
Chandigarh 259(4.2) 244(5.5) ↓ 259(26.4) ↔ 230(5.5) ↓
Chhattisgarh 248(2.3) 235(1.7) ↓ 241(1.5) ↓ 242(1) ↓
Dadra and Nagar Haveli 270(23.9) 257(23.3) ↓ 255(4.1) ↓ 204(18.3) ↓
Daman and Diu 238(11.9) 236(30.2) ↔ 266(19.1) ↑ 234(3.4) ↔
Delhi 275(2.2) 264(3) ↓ 260(15.9) ↓ 276(3.6) ↔
Goa 271(2.7) 264(20) ↓ 262(4.5) ↓ 252(2.4) ↓
Gujarat 248(2) 248(3.5) ↔ 248(1.5) ↔ 246(0.5) ↔
Haryana 250(2.1) 242(1.2) ↓ – – 245(1.7) ↓
Himachal Pradesh 254(3.5) 242(2.8) ↓ 248(5.4) ↓ 242(4.8) ↓
Chapter_6_Social Science.indd 92 18-02-2021 10:43:45

93
Stud
ents’
Ach
ieve
men
t in
Soci
al S
cien
ce
States/UTs/Boards Others Scheduled Caste Sig. Scheduled
Tribe Sig.Other
Backward Classes
Sig.
Jammu and Kashmir 232(2.1) 210(6.2) ↓ 211(5.7) ↓ 241(5.6) ↑
Jharkhand 255(5.1) 232(6) ↓ 249(3.7) ↓ 241(0.8) ↓
Karnataka 277(2.5) 267(1.2) ↓ 268(3.7) ↓ 270(0.9) ↓
Kerala 257(2.5) 250(2.7) ↓ 230(4.9) ↓ 257(1.3) ↔
Lakshadweep – – – 255(8.6) – – –
Madhya Pradesh 232(2) 237(1) ↑ 236(1.5) ↔ 239(1.1) ↑
Maharashtra 258(1.4) 251(1) ↓ 243(1.2) ↓ 253(1) ↓
Manipur 236(7.5) 260(6.9) ↑ 256(3.6) ↑ 226(2.6) ↓
Meghalaya 233(8) 247(13.7) ↑ 238(1.2) ↑ 227(38.3) ↓
Mizoram – 254(39.6) – 236(1.3) – – –
Nagaland 259(8.3) 289(7.1) ↑ 268(1.6) ↑ 267(14.5) ↑
Odisha 251(3) 246(1.8) ↓ 247(1.1) ↓ 246(1.5) ↓
Puducherry 235(4.7) 238(10.4) ↔ – – 238(4) ↔
Punjab 253(1.1) 238(1.3) ↓ – – 249(1.3) ↓
Rajasthan 272(2.2) 266(1) ↓ 264(1.2) ↓ 267(1) ↓
Sikkim 248(4.6) 178(20.8) ↓ 263(3.8) ↑ 259(4.3) ↑
Tamil Nadu 252(2.4) 246(1.9) ↓ 247(6.5) ↔ 251(1.3) ↔
Telangana 249(1.4) 250(3.3) ↔ 241(2.6) ↓ 250(1.5) ↔
Tripura 235(1.8) 244(1.2) ↑ 227(2.2) ↓ 242(5.3) ↑
Uttarakhand 262(0.6) 246(2.5) ↓ 240(6.2) ↓ 247(3.6) ↓
CBSE 294(6.7) 309(11.1) ↑ 286(10.9) ↓ 288(3.6) ↔
ICSE 282(3.1) 287(23) ↑ 262(11.3) ↓ 295(3.7) ↑
National 258(0.4) 251(0.5) ↓ 248(0.8) ↓ 255(0.2) ↓
↔ No significant difference (Sig.) between the average performance of SC/ST/OBC students and Others students.↑ SC/ST/OBC students’ average performance is significantly higher than that of Others students.↓ SC/ST/OBC students’ average performance is significantly lower than that of Others students.
School Management This survey also revealed average social science scores achieved by students in Class X across various school managements— government, government-aided and private. There was a significant difference in Scores of student from government, government-aided schools and private schools. While in 14 States/UTs government-aided schools performed better than the government schools but in 10 States/UTs government-aided schools were significantly lower than the government schools in social sciences. In
remaining six States/UTs there was no significant difference in Scores of students from government and government-aided schools.
Further, there was significant difference in scores of government and private schools. Private schools in majority of 22 States/UTs outperformed than the government schools. In only 5 States/UTs private schools performed significantly lower than government schools and in remaining three States/UTs there was no significant difference between the average scores of private and government schools (Table 6.6).
Chapter_6_Social Science.indd 93 18-02-2021 10:43:45

Learning Achievement of Students — NAS Class X (Cycle 2) 201894
Table 6.6: Average Social Science Scores by School Management
States/UTs/Boards Government Government-aided
Significant Difference Private Significant
Difference
Andaman and Nicobar Islands 246(3.1) 326(29.5) ↑ 305(12.6) ↑Andhra Pradesh 251(6.6) 262(0.9) ↑ 260(0.9) ↑Arunachal Pradesh 243(2.2) 257(6.8) ↑ 283(5.3) ↑Assam 254(1.3) 254(4.7) ↔ 264(3.7) ↑Bihar 244(1.2) 229(4.0) ↓ 240(4.2) ↓Chandigarh 253(3.7) 250(12.7) ↔ – –
Chhattisgarh 241(0.3) 248(3.5) ↑ 241(0.8) ↔Dadra and Nagar Haveli 252(5.2) 266(9.4) ↑ 265(10.7) ↑Daman and Diu 239(11.2) 249(13.7) ↑ 224(8.0) ↓Delhi 262(2.2) 267(3.5) ↓ 300(1.5) ↑Goa 240(3.5) 272(2) ↑ 297(10.2) ↑Gujarat 246(3.1) 244(0.7) ↔ 252(1.4) ↑Haryana 241(0.7) 243(3.9) ↔ 252(1.3) ↑Himachal Pradesh 246(2.2) – – 259(6.7) ↑Jammu and Kashmir 219(1.4) 231(20.7) ↑ 248(3.4) ↑Jharkhand 242(2.4) 252(3.7) ↑ 250(3.6) ↑Karnataka 274(1.2) 270(1.4) ↓ 265(0.8) ↓Kerala 258(4.0) 255(1.7) ↔ 255(2.6) ↔Lakshadweep 255(8.6) – – – –
Madhya Pradesh 239(0.2) 229(5.3) ↓ 235(1.3) ↓Maharashtra 254(3.8) 253(0.8) ↔ 259(2.5) ↑Manipur 227(5.2) 220(9.2) ↓ 251(3.1) ↑Meghalaya 226(11.8) 237(3.2) ↑ 249(5.4) ↑Mizoram 236(3.1) 214(10.3) ↓ 246(9.4) ↑Nagaland 251(7.2) – – 273(1.3) ↑Odisha 246(1.5) 261(4.3) ↑ 258(2.9) ↑Puducherry 237(5.9) 232(14.0) ↓ 240(5.2) ↔Punjab 244(0.9) 239(6.5) ↓ 251(1.4) ↑Rajasthan 271(1.1) 255(14.7) ↓ 264(0.8) ↓Sikkim 259(2.9) 268(10.7) ↑ – –
Tamil Nadu 245(2.3) 252(1.0) ↑ 254(0.8) ↑Telangana 247(1.2) 252(9.7) ↑ 251(0.9) ↑Tripura 236(2.0) – – – –
Chapter_6_Social Science.indd 94 18-02-2021 10:43:45

95
Stud
ents’
Ach
ieve
men
t in
Soci
al S
cien
ce
States/UTs/Boards Government Government-aided
Significant Difference Private Significant
Difference
Uttarakhand 254(0.5) 245(3.5) ↓ 259(2.3) ↑
CBSE 265(12.3) – – 293(4.7) ↑
ICSE – – – 285(2.1) –
National 251(0.3) 255(0.5) ↑ 259(0.4) ↑
↔ No significant difference between the average performance of government-aided/private students and government students.↑ Government-aided/private students’ average performance is significantly higher than that of government students.↓ Government-aided/private students’ average performance is significantly lower than that of government students.
Overview of the Social Science TestsThe social science tests administered to Class X students consisted of two test booklets, each containing 60 multiple choice items. The items were chosen keeping in view a whole range of the content. Around 20 out of the 60 items were common across both test forms and served as ‘anchors’, so that the different test booklets could be linked together and, hence, all items could be placed on a common scale. In addition to this, the test forms contained an extra of 20 unique items, thus amounting to a total of 120 items* in each of the social science tests used in the survey.
The items were designed to test a range of relevant cognitive processes or ‘skills’, classified as remembering, understanding and applying as defined below.
What Majority of Students Can do in Social Science The prime objective of this chapter is to highlight what the students can perform at different level of content domain on social science items. Before providing exemplifiers of the items tested in social science, this section gives a brief synopsis of content areas on which above three skills among learners were tested:
yy Economicsyy Geographyyy Historyyy Political Science
Performance of Class X Students on the Various Content Areas in Social ScienceThe overall average performance of Class X students in social science was around a mean of 254 out of 500 with a standard error (SE) of 0.20. In the content area of ‘Economics’ the mean performance of students revolved around the score of 254 which was similar with overall performance of students in social science. In the content areas of ‘Geography’, ‘History’ and ‘Political Science’ the mean performance of students was 252, which was significantly below the overall average score in social science.
Contents Mean SE
Social Science 254 0.2
Economics 254 0.3
Geography 252 0.2
History 252 0.2
Political Science 252 0.1
6.4. Sample Items Listed below are some of the items that were used in the social science tests. Arranged in no order of difficulty statistics show how students responded to the items and these can be located on the item map.
Chapter_6_Social Science.indd 95 18-02-2021 10:43:46

Learning Achievement of Students — NAS Class X (Cycle 2) 201896
Sample Item 1
The item required students recall the knowledge on the list of subjects in the Union List in India. Only 19.9 per cent of students in the sample were able to give the correct response (4), while the result shows that 80.1 per cent of students responded either incorrectly (1, 2 and 3) or gave multiple responses or did not attempt. In 16 States/UTs more than 20 per cent of students gave the correct answer while, remaining 18 States/UTs had proportion of students below the national average of 19.9 per cent of students who gave correct response.
Skill: Skill 1 item Content Domain: Political Science
15. The legislative powers for the Union List in India does not include
1. Foreignaffairs
2. Banking
3. Defense
4. Police
% Answers1. 43.6%2. 19.5%3. 14.6%4. 19.9%
Multiple response 0.5%Not attempted 1.9%
Sample Item 2
The item required students to construct meaning of educational achievement date of rural population of a State. Around 30.1 per cent of students in the sample were able to select the correct answer (1). The result shows the remaining 69.9 per cent gave either the wrong responses (2, 3 and 4) or gave multiple responses or did not attempt.
Skill: Skill 2 item Content Domain: Economics
20. Observe the table regarding hypothetical data of educational achievement of rural population of a State is given below. Choose one option and fill in the blanks.
Educational Achievement of Rural Population of a StateCategory Male (%) Female (%)Literacy rate for rural population 54 21Literacy rate for children in age group 10–14 years 69 41Percentage of rural children aged 10–14 attending school 64 34
_______of rural girls are not attending school
1. 66%
2. 64%
3. 54%
4. 34%
% Answers1. 30.1%2. 15.4%3. 14.6%4. 35.5%
Multiple response 0.5%Not attempted 3.8%
Chapter_6_Social Science.indd 96 18-02-2021 10:43:46

97
Stud
ents’
Ach
ieve
men
t in
Soci
al S
cien
ce
Sample Item 3
The item required students to construct what constitutes money in an economy. Around 47.4 per cent of students in the sample were able to answer the correct response (4). The result shows the remaining 52.6 per cent of students gave either the wrong responses (1, 2 and 3) or gave multiple responses or did not attempt.
Skill: Skill 2 item Content Domain: Economics
36. Which of the following is NOT money?
1. Currency Notes
2. Deposits
3. Coins
4. Credit Card
% Answers1. 11.2%2. 29.9%3. 8.8%4. 47.4%
Multiple response 0.6%Not attempted 2.1%
Sample Item 4
The item required students to recall knowledge relating to usage of deposits in banking system. Around 60.5% of students in the sample were able to answer correctly (4). The result shows the remaining 39.5% of students responded either incorrectly (1, 2 and 3) or gave multiple responses or did not attempt.
Skill: Skill 1 item Content Domain: Economics
11. Which of the following Statement is incorrect?
1. People make deposits in bank
2. People takes loans from banks
3. People receives interests from banks
4. People repay loans without interest
% Answers1. 10.7%2. 9.10%3. 17.20%4. 60.50%
Multiple response 0.8%Not attempted 1.7%
Sample Item 5
The item required students to recall knowledge relating to usage of deposits in banking system. Around 79.6 per cent of students in the sample were able to answer correctly (3). The table shows the remaining 20.4 per cent of students responded either incorrectly (1, 2 and 4) or gave multiple responses or did not attempt.
Skill: Skill 1 item Content Domain: Political Science
7. India is an example of which of the following system?
1. Monarchy
2. Autocracy
3. Democracy
4. Anarchy
% Answers1. 8.40%2. 5.80%3. 79.60%4. 4.30%
Multiple response 0.5%Not attempted 1.4%
Chapter_6_Social Science.indd 97 18-02-2021 10:43:46

Learning Achievement of Students — NAS Class X (Cycle 2) 201898
Performance of the sample items reproduced here varied across the country. Table 6.7 shows the
proportion of students in its States/UTs responding correctly to each item.
Table 6.7: Performance on Sample Items in States/UTs/Boards
States/UTs/Boards Q15 Q20 Q36 Q11 Q07
Andaman and Nicobar Islands 25.8% 33.8% 44.5% 60.3% 79.3%Andhra Pradesh 26.0% 36.2% 51.3% 58.6% 82.6%Arunachal Pradesh 31.8% 29.2% 43.9% 60.5% 83.1%Assam 25.2% 32.1% 63.8% 52.2% 84.2%Bihar 20.2% 28.2% 36.1% 55.5% 73.7%Chandigarh 18.1% 31.5% 46.8% 62.9% 80.7%Chhattisgarh 13.6% 25.9% 41.0% 70.8% 77.6%Dadra and Nagar Haveli 14.0% 32.3% 37.2% 53.0% 84.9%Daman and Diu 11.3% 26.3% 32.3% 54.2% 87.5%Delhi 21.6% 34.0% 43.5% 69.6% 86.3%Goa 17.9% 26.1% 50.5% 72.5% 88.2%Gujarat 18.3% 29.0% 40.9% 49.8% 84.6%Haryana 17.5% 27.5% 47.5% 60.3% 71.5%Himachal Pradesh 10.6% 28.1% 39.8% 64.6% 77.3%Jammu and Kashmir 29.3% 27.0% 38.8% 42.1% 74.2%Jharkhand 20.1% 27.3% 41.9% 63.0% 76.2%Karnataka 23.8% 33.3% 44.3% 63.2% 87.2%Kerala 15.7% 31.0% 67.6% 68.2% 84.4%Lakshadweep 24.1% 48.3% 42.9% 61.9% 62.1%Madhya Pradesh 12.5% 26.5% 44.2% 61.3% 71.9%Maharashtra 19.4% 31.1% 61.4% 64.7% 83.9%Manipur 32.1% 28.4% 49.5% 61.5% 85.7%Meghalaya 14.8% 27.6% 30.5% 52.6% 75.6%Mizoram 16.6% 30.2% 42.2% 55.5% 82.4%Nagaland 24.7% 31.9% 49.9% 68.5% 83.9%Odisha 16.6% 31.0% 38.4% 69.4% 71.5%Puducherry 17.6% 30.3% 45.4% 55.3% 87.0%Punjab 19.1% 30.6% 55.7% 53.2% 74.7%Rajasthan 30.6% 36.3% 50.3% 67.3% 79.5%Sikkim 29.7% 25.7% 42.5% 68.1% 88.1%Tamil Nadu 15.7% 27.0% 59.8% 50.2% 89.1%Telangana 17.8% 33.5% 45.0% 54.3% 78.1%Tripura 22.7% 26.3% 30.7% 52.1% 80.2%
Chapter_6_Social Science.indd 98 18-02-2021 10:43:46

99
Stud
ents’
Ach
ieve
men
t in
Soci
al S
cien
ce
States/UTs/Boards Q15 Q20 Q36 Q11 Q07
Uttarakhand 20.1% 26.7% 51.2% 71.3% 79.2%CBSE 40.2% 49.7% 48.4% 78.9% 92.2%ICSE 35.6% 53.8% 61.6% 81.9% 92.7%National 19.9% 30.1% 47.4% 60.5% 79.6%
6.6. Skill-wise performanceThis sub-section deals with, analysis of students’ performance in various States pertaining to skills, such as remembering, understanding and application of social science concepts (Skill 1, Skill 2, Skill 3). Overall, the average score of students performing in questions conferring to remembering skills was 41 per cent. However, there were 15 States/UTs of Maharashtra, Andaman and Nicobar Islands, Kerala, Tamil Nadu, Sikkim, Manipur, Assam, Chandigarh, Uttarakhand, Andhra Pradesh, Goa, Nagaland, Rajasthan, Karnataka and Delhi performed above the national average in the questions relating to remembering skills whereas 19 States/UTs tend to perform below the national average in questions testing the remembering skills.
With respect to second skill of understanding, overall the mean score was 40 per cent. However, within these huge inter-State disparities remain with
majority of 21 States/UTs performed significantly below the overall average in questions based on understanding skills. The score ranged from 34 to 29 in the States performing below the national average. There were 13 States/UTs, which had an average score ranging from 41 per cent to 46 performed better than national average in the question pertaining to understanding skills.
Finally, questions relating to third skill of applying had an average performance of 37 per cent score with 18 States and UTs performing below the national average in the questions relating to third skills in social science. In these States, the average performance ranged between the score of 33 per cent to 37 per cent. However, results found that there were 16 States and UTs performed above the national average in questions testing the application skills of students in social science with score ranging from 38 per cent to 46 per cent (Table 6.8).
Table 6.8: State-wise Performance of Students in the Three Skills
States/UTs/BoardsSkill 1
(Average score in Percent Correct)
Skill 2 (Average score in Percent Correct)
Skill 3 (Average score in Percent Correct)
Andaman and Nicobar Islands 42 41 38Andhra Pradesh 44 43 41Arunachal Pradesh 40 39 38Assam 43 42 37Bihar 38 38 35Chandigarh 44 43 41Chhattisgarh 40 39 36Dadra and Nagar Haveli 37 36 33Daman and Diu 34 35 34Delhi 49 46 46Goa 45 43 40Gujarat 40 38 36Haryana 40 40 36Himachal Pradesh 40 39 38Jammu and Kashmir 34 35 33Jharkhand 41 40 36
Chapter_6_Social Science.indd 99 18-02-2021 10:43:46

Learning Achievement of Students — NAS Class X (Cycle 2) 2018100
States/UTs/BoardsSkill 1
(Average score in Percent Correct)
Skill 2 (Average score in Percent Correct)
Skill 3 (Average score in Percent Correct)
Karnataka 48 44 42Kerala 42 43 37Lakshadweep 37 40 37Madhya Pradesh 38 38 34Maharashtra 42 40 39Manipur 43 41 39Meghalaya 38 37 36Mizoram 36 36 34Nagaland 46 43 41Odisha 39 38 34Puducherry 39 37 36Punjab 39 39 34Rajasthan 47 46 42Sikkim 43 42 42Tamil Nadu 42 38 36Telangana 41 40 38Tripura 36 37 34Uttarakhand 44 42 39CBSE 55 53 52ICSE 53 51 48Total 41 40 37
6.7 Proficiency Levels Proficiency Scores are used to measure learners’ competency in the social science content, which directly or indirectly assess the target skills. Proficiency levels provide a convenient way to describe profiles of student achievement. Children whose results are located within a particular level of proficiency are expected to understand the competencies and skills associated with that and lower levels. In NAS Class X Cycle 2 student’s performance in social science was gauged using six proficiency levels based on the numeric scores achieved in the assessment.
Figure 6.2 divides the average social science scores achieved by students into five proficiency levels. Each level comprises the percentage of students and a mean score for that level of proficiency. It can be observed that maximum number of students, i.e., 37 per cent lied between proficiency levels of 201 to 250. Approximately 33 per cent of students belonged
to proficiency levels of 251 to 300. Another 13 per cent of students fall under the category of lower proficiency levels of below 301 to 350. Around 2 per cent of students fell the highest proficiency levels of greater than 350. Remaining 15 per cent students lied in lowest proficiency level of below 200.
Fig. 6.2: Proficiency Level in Social Science
Chapter_6_Social Science.indd 100 18-02-2021 10:43:47

101
Stud
ents’
Ach
ieve
men
t in
Soci
al S
cien
ce
Distribution of Students Performing Less than 200 In this section classification of students relating to performance in the proficiency band of less than 250 are analysed (Figure 6.3) relating to following parameters:
yy Gender: It was observed that equal percentage of males and females, i.e., 50 per cent of students performed below the score of 200 in social science achievement tests.
yy Location: The graph revealed that majority of students performing in the proficiency band of less than 200 were studying in schools located in rural areas, i.e., 75 per cent and remaining 25 per cent of students in the same proficiency score studied in schools located in urban areas.
yy Social Groups: Information was gathered relating to social composition of students falling under the proficiency score of less than 200 which revealed that the distribution of students were skewed in favour of students belonging to OBC category constituting 44 per cent of students performing at this level. While students belonging to SC, ST and others category constituted 18 per cent, 18 per cent
and 20 per cent of those performing within the proficiency band of less than 200 score in social science.
yy School Management: Around 62 per cent of students belonging to government schools were found scoring less than the score of 200 in the achievement tests for social science. Additionally, 20 per cent of students in private schools performed below the proficiency band of 200 and 18 per cent of students in government-aided schools performed within this band.
Distribution of Students based on Score RangeThis sub-section shows the range of students’ ability in correct answers across States/UTs in social science. Table 6.9 shows the proportion of students answering correctly in four ranges. It shows the proportion of students who answered 0 to 35 per cent of questions correctly, 36 per cent to 50 per cent of questions correctly, 51 per cent to 75 per cent of questions correctly and the proportion of students who answered more than 75 per cent of questions correctly. At national level, majority of students, i.e., 43. per cent answered correctly in the range of 0 to 35 per sent of questions. Majority of States tend to
Fig. 6.3: Characteristics of Students Performing below the Mean Score of 250 by Gender, Location, School Management and Social Groups
Chapter_6_Social Science.indd 101 18-02-2021 10:43:47

Learning Achievement of Students — NAS Class X (Cycle 2) 2018102
perform in this range of social science. In the range of 36 per cent to 50 per cent of questions being answered correctly, 38 per cent of students could do that. Whereas another 17 per cent of students
answered 51 per cent to 75 per cent of questions correctly and only a small proportion of about 1 per cent of students could answer questions correctly in the range of 76 per cent to 100 per cent.
Table 6.9: Students’ Performance using Absolute Scores
States/UTs/Boards (0–35 %) (36–50 %) (51–75 %) (76–100 %)
Andaman and Nicobar Islands 46.11 32.38 19.88 1.64Andhra Pradesh 35.35 37.14 25.92 1.58Arunachal Pradesh 48.73 32.18 17.76 1.33Assam 38.83 41.87 19.02 0.28Bihar 54.46 29.07 15.59 0.89Chandigarh 35.17 41.82 21.27 1.74Chhattisgarh 48.61 38.11 13.04 0.23Dadra and Nagar Haveli 55.73 38.17 6.11 –Daman and Diu 63.73 33.33 2.94 –Delhi 25.00 40.60 31.17 3.24Goa 29.61 45.54 24.45 0.40Gujarat 47.03 40.90 12.04 0.03Haryana 46.96 36.81 15.79 0.44Himachal Pradesh 44.56 43.26 12.12 0.06Jammu and Kashmir 63.03 26.29 10.41 0.27Jharkhand 47.11 33.43 18.76 0.70Karnataka 29.17 38.94 30.6 1.29Kerala 34.84 46.61 18.43 0.12Lakshadweep 45.07 46.48 8.45 Madhya Pradesh 52.81 37.43 9.67 0.09Maharashtra 39.01 42.63 17.99 0.38Manipur 39.97 36.46 22.59 0.97Meghalaya 51.44 36.71 11.78 0.08Mizoram 58.64 32.71 8.33 0.31Nagaland 29.47 42.76 27.46 0.31Odisha 48.82 39.43 11.72 0.03Puducherry 50.46 39.72 9.63 0.20Punjab 47.39 38.40 13.42 0.80Rajasthan 32.57 34.76 30.10 2.56Sikkim 30.95 47.76 21.20 0.09Tamil Nadu 41.03 47.70 11.22 0.05
Chapter_6_Social Science.indd 102 18-02-2021 10:43:47

103
Stud
ents’
Ach
ieve
men
t in
Soci
al S
cien
ce
States/UTs/Boards (0–35 %) (36–50 %) (51–75 %) (76–100 %)
Telangana 45.01 38.82 15.76 0.41Tripura 53.39 35.20 11.13 0.27Uttarakhand 36.33 41.59 21.62 0.46CBSE 16.26 27.77 46.90 9.07ICSE 14.58 32.85 50.15 2.42Total 43.43 38.44 17.46 0.67
6.8. Conclusion The average achievement of students in social science varies greatly across the States and UTs of India. There is a highly significant difference between performances in high scoring States/UTs, such as Delhi (273), Karnataka (270), Rajasthan (267) and in low scoring States/UTs, such as Jammu and Kashmir (229), Tripura (236), Daman and Diu (237), Madhya Pradesh (237) and Meghalaya (238).
Besides this, states also vary greatly in the range between their lowest and highest achieving students as revealed by their inter-quartile score ranges; that present relatively homogeneous cohorts in some States/UTs and far more diverse performances amongst the others. Overall there was a significant difference in the average achievement of girls and boys where former tend to perform significantly better than the latter in social science. Moreover, significant difference was also observed between the achievement level of rural and urban students although exceptions were found in some States/UTs,
such as Punjab, Haryana, Sikkim, Manipur, Mizoram, Dadra and Nagar Haveli, Karnataka and Lakshadweep where students in rural schools performed better than their urban counterparts. Also, the survey did find that students from the Others category outperformed their peers in the SC, ST and OBC categories by a statistically significant margin.
This survey also observed significant difference in the achievement level of students studying in different categories of school management. Government-aided and private schools were found to perform significantly better than the government schools in social science in Class X NAS. Moreover, majority of students, i.e., 37 per cent of sample in social science were found to score between 201 to 250. It was observed that 62 per cent of students belonging to government schools were scoring less than the proficiency score of 200 in the achievement tests for social science. At the National level, 43 per cent of students’ ability to answer correctly lay in the lowest range of 0 to 35 per cent of questions in social sciences.
Chapter_6_Social Science.indd 103 18-02-2021 10:43:47

The English language tests used in the National Achievement Survey (NAS) comprised two categories of items, viz., those testing ‘Reading Comprehension’ and those testing ‘language-specific elements’, such as vocabulary and grammar. This chapter focusses on student achievement in the English language domain. The overall achievement in the English language domain is reported for each of the participating states and union territories along with the participating boards. In addition, information about differences in achievement by student gender, school location, social category
and school management is also presented in this chapter.
7.1. State-wiSe Performance of StudentS in engliSh
Table 7.1 shows the distribution of student achievement for the 27 participating States, seven UTs and two Boards. Finally, the table indicates whether average score of a State is significantly different from the overall average score of 34 States/UTs or not. The National average score and standard error is also presented in the Table 7.1.
Table 7.1: Average English Scores for States/UTs/Boards
States/UTs/Boards Average Score Standard Error Significant Difference
Andaman and Nicobar Islands 251 2.4 ↔
Andhra Pradesh 274 0.9 ↑
Arunachal Pradesh 269 1.8 ↑
Assam 263 0.7 ↑
Bihar 230 0.8 ↓
Chandigarh 253 2.7 ↔
Chhattisgarh 231 0.2 ↓
Dadra and Nagar Haveli 236 2.2 ↓
Daman and Diu 257 8.1 ↑
Delhi 259 1.2 ↑
Goa 297 1.8 ↑
Gujarat 240 0.6 ↓
C H A P T E R 7Students’ Achievement in English
Chapter_7_ English.indd 104 18-02-2021 10:45:33

105
Stud
ents’
Ach
ieve
men
t in
Engl
ish
States/UTs/Boards Average Score Standard Error Significant Difference
Haryana 239 0.9 ↓
Himachal Pradesh 242 2.0 ↓
Jammu and Kashmir 252 1.8 ↔
Jharkhand 238 0.5 ↓
Karnataka 269 0.4 ↑
Kerala 263 0.8 ↑
Lakshadweep 228 9.5 ↓
Madhya Pradesh 229 0.4 ↓
Maharashtra 254 0.3 ↔
Manipur 267 1.9 ↑
Meghalaya 261 1.3 ↑
Mizoram 277 3.6 ↑
Nagaland 306 0.6 ↑
Odisha 254 0.2 ↔
Puducherry 255 5.0 ↑
Punjab 252 0.6 ↔
Rajasthan 253 0.7 ↔
Sikkim 273 2.1 ↑
Tamil Nadu 249 0.3 ↓
Telangana 264 0.6 ↑
Tripura 235 1.8 ↓
Uttarakhand 242 0.6 ↓
CBSE 318 1.0 ↑
ICSE 351 1.9 ↑
National 253 0.1
↔ The state’s average score is not significantly different to that of the overall.↑ The state’s average score is significantly above that of the overall.↓ The state’s average score is significantly below that of the overall.
Table 7.1 indicates that the average score for 34 States and UTs was 253 (with a standard error of 0.1). Further, the results reveal substantial differences in English language achievement between the highest performing state (306 for Nagaland) and the lowest performing state (229 for Madhya Pradesh). Also, while 15 States/UTs showed average scores significantly above that of the national; 12 States/UTs depicted average scores significantly below that of the national average and 7 States/UTs presented average scores that were not significantly different
from that of the overall. CBSE and ICSE boards showed average scores significantly above that of the national.
7.2. Percentile ScoreS in engliSh for StateS/utS
Table 7.2 and Figure 7.1 illustrate the range of achievement within and across the states. The table list the scores achieved by students at key percentiles. For example, the score at the 25th percentile is the score
Chapter_7_ English.indd 105 18-02-2021 10:45:33

Learning Achievement of Students — NAS Class X (Cycle 2) 2018106
which 75 per cent of students achieve or surpass: the score at the 90th percentile is the score that 10 per cent of students achieve or surpass. The range between the 25th and 75th percentiles (the inter-quartile
range) represents the performance of the middle 50 per cent of students. Hence, this is a good indicator of the state’s degree of homogeneity in terms of the English language achievement of its students.
Table 7.2: Percentile Scores in Reading for States/UTs/Boards
State/UTs/Boards P10 P25 P50 P75 P90 P75–P25 P90–P10
Andaman and Nicobar Islands 206 224 236 267 329 43 123
Andhra Pradesh 210 234 268 313 346 79 136
Arunachal Pradesh 195 229 264 315 346 86 151
Assam 200 225 256 297 337 72 137
Bihar 184 205 227 251 281 46 97
Chandigarh 207 228 250 272 304 44 97Chhattisgarh 186 207 228 253 280 46 94Dadra and Nagar Haveli 193 212 229 256 292 44 99
Daman and Diu 205 228 248 284 330 56 125
Delhi 198 221 248 289 338 68 140Goa 227 258 294 335 370 77 143Gujarat 196 214 236 258 288 44 92
Haryana 190 212 235 262 295 50 105
Himachal Pradesh 194 215 238 264 295 49 101
Jammu and Kashmir 193 219 246 282 322 63 129
Jharkhand 186 207 232 261 301 54 115
Karnataka 208 233 262 302 340 69 132
Kerala 211 233 258 291 326 58 115
Lakshadweep 183 206 230 252 264 46 81
Madhya Pradesh 185 206 228 250 274 44 89
Maharashtra 198 222 247 280 325 58 127
Manipur 193 228 261 312 349 84 156
Meghalaya 205 229 253 289 330 60 125
Mizoram 219 246 274 307 340 61 121
Nagaland 236 271 308 342 372 71 136
Odisha 198 221 248 283 322 62 124
Puducherry 198 217 246 289 323 72 125
Punjab 197 219 245 279 324 60 127
Rajasthan 193 220 247 285 326 65 133
Sikkim 218 243 273 303 326 60 108
Tamil Nadu 201 220 243 274 310 54 109
Telangana 203 227 256 300 335 73 132
Tripura 183 204 229 256 300 52 117
Uttarakhand 197 218 239 264 293 46 96
Chapter_7_ English.indd 106 18-02-2021 10:45:33

107
Stud
ents’
Ach
ieve
men
t in
Engl
ish
State/UTs/Boards P10 P25 P50 P75 P90 P75–P25 P90–P10
CBSE 230 270 317 371 413 101 183
ICSE 279 320 355 395 419 75 140
National 196 219 246 282 326 63 130Note: Ranges may not agree due to rounding.
Andaman and Nicobar Islands
Fig. 7.1: Percentile scores in English for States/UTs/Boards
Chapter_7_ English.indd 107 18-02-2021 10:45:33

Learning Achievement of Students — NAS Class X (Cycle 2) 2018108
The inter-quartile range (i.e., the range between the 75th and 25th percentiles) is highly variable between States/UTs. For example, Andaman and Nicobar Islands has an inter-quartile range of just 43 while Arunachal Pradesh has a corresponding value of 86. These values suggest that the achievement in English subject of Class X population in Andaman and Nicobar is far more homogeneous as regard to the learning levels than that of Arunachal Pradesh. In most states, the inter-quartile range of performance for the middle group was between 55 and 75 scale-score points.
Performance at the 10th and 90th percentiles respectively shows extremes in low and high achievement. The range between these two points, which includes 80 per cent of the population, is highly variable ranging from 81 (Lakshadweep) to 156 (Manipur).
The percentiles provide additional information when comparing English performance amongst states. For example, when the states are arranged in order of average score, the differences between adjacent states tend to be small. However, the range of scores may not be similar. For example, there is no significant difference between the median score of Delhi, Maharashtra, Punjab, Odisha and Daman and
Diu (246–248). However, the range of scores between the 25th and 75th percentiles is very different: Delhi (68), Maharashtra (58), Daman and Diu (56) and Odisha (62). This indicates that while the average achievement is very similar in the states, Delhi has a more heterogeneous group of Class X students than Maharashtra.
7.3. grouP-wiSe Performance in engliSh
The table below compares the average performance of different groups based on gender, school location social category and school management.
Gender
Table 7.3 compares the average English language scores achieved by boys and girls and shows that, the overall performance by girls was significantly better than boys. This trend may be observed in 15 States/UTs like, Himachal Pradesh, Punjab, Manipur, Chandigarh and Rajasthan. However, in seven States/UTs like Tripura, Assam, Odisha, Delhi, Goa, Daman and Diu and Lakshadweep girls performed significantly lower than the boys. In the remaining States/UTs there was no significant difference in performance of boys and girls.
Table 7.3: Average English Scores by Gender
States/UTs/Boards Boys Girls Sig.
Andaman and Nicobar Islands 245(3.5) 257(2.6) ↑
Andhra Pradesh 274(1.4) 273(0.7) ↔
Arunachal Pradesh 269(1.8) 268(2.4) ↔
Assam 265(1.0) 261(0.8) ↓
Bihar 230(1.7) 230(0.4) ↔
Chandigarh 248(4.5) 256(2.7) ↑
Chhattisgarh 231(0.9) 231(0.5) ↔
Dadra and Nagar Haveli 234(4.4) 239(10.4) ↑
Daman and Diu 258(6.0) 255(11.8) ↓
Delhi 260(1.6) 257(1.1) ↓
Goa 299(1.8) 296(2.8) ↓
Gujarat 239(0.7) 242(1.1) ↑
Haryana 239(1.0) 240(1.1) ↔
Himachal Pradesh 238(2.2) 246(2.8) ↑
Jammu and Kashmir 252(3.0) 252(2.4) ↔
Chapter_7_ English.indd 108 18-02-2021 10:45:34

109
Stud
ents’
Ach
ieve
men
t in
Engl
ish
States/UTs/Boards Boys Girls Sig.
Jharkhand 237(1.0) 239(0.6) ↔
Karnataka 266(0.4) 272(0.5) ↑
Kerala 255(1.0) 271(1.5) ↑
Lakshadweep 226(5.6) 229(13.7) ↓
Madhya Pradesh 229(0.7) 229(0.3) ↔
Maharashtra 251(0.5) 257(0.5) ↑
Manipur 259(3.0) 275(2.9) ↑
Meghalaya 259(1.1) 262(1.9) ↑
Mizoram 275(4.6) 279(3.5) ↑
Nagaland 305(1.3) 307(0.9) ↔
Odisha 255(0.4) 253(0.7) ↓
Puducherry 255(4.9) 255(5.7) ↔
Punjab 249(0.8) 256(0.4) ↑
Rajasthan 251(0.7) 257(0.8) ↑
Sikkim 272(4.7) 273(2.3) ↔
Tamil Nadu 246(0.5) 253(0.3) ↑
Telangana 260(1.8) 267(0.5) ↑
Tripura 238(2.1) 232(2.5) ↓
Uttarakhand 243(1.0) 241(0.6) ↔
CBSE 303(2.2) 340(1.5) ↑
ICSE 344(2.3) 357(2.6) ↑
National 251(0.1) 255(0.1) ↑
↔ No significant difference between the average performance of girls and boys.↑ Girls’ average performance is significantly greater than that of boys.↓ Boys’ average performance is significantly greater than that of girls.
Location of Schools
Table 7.4 compares the average English language scores achieved by students in rural and urban schools and found that the overall students in rural schools did significantly lower than urban counterparts besides Manipur, Chhattisgarh and Lakshadweep, where the rural students’ average performance was significantly better than students of urban schools. The difference between the
performances is particularly significant in 23 States/UTs like Jammu and Kashmir, Arunachal Pradesh, Delhi, Himachal Pradesh, etc., where rural schools students performed significantly lower than urban schools. In the remaining States/UTs there is no significant difference in performance of urban and rural students. In the State of Chhattisgarh and Manipur the performance of rural schools is better than the urban school.
Chapter_7_ English.indd 109 18-02-2021 10:45:34

Learning Achievement of Students — NAS Class X (Cycle 2) 2018110
Table 7.4: Average English Scores by Location
States/UTs/Boards Rural Urban Sig.
Andaman and Nicobar Islands 238(4.1) 285(3.5) ↓
Andhra Pradesh 269(1.0) 282(1.1) ↓
Arunachal Pradesh 263(1.8) 279(2.4) ↓
Assam 261(0.6) 272(2.2) ↓
Bihar 230(0.9) 229(1.3) ↔
Chandigarh 252(3.8) 253(4.0) ↔
Chhattisgarh 232(0.3) 227(1.1) ↑
Dadra and Nagar Haveli 234(3.5) 246(14.6) ↓
Daman and Diu 243(6.6) 276(10.7) ↓
Delhi 233(3.4) 263(1.7) ↓
Goa 294(1.8) 306(2.6) ↓
Gujarat 236(0.6) 245(0.7) ↓
Haryana 239(1.2) 239(0.7) ↔
Himachal Pradesh 239(1.7) 260(6.8) ↓
Jammu and Kashmir 246(1.9) 271(5.8) ↓
Jharkhand 237(0.6) 243(1.8) ↓
Karnataka 267(0.6) 270(0.7) ↔
Kerala 260(1.0) 274(2.0) ↓
Lakshadweep 235(12.8) 195(17.1) ↑
Madhya Pradesh 228(0.4) 231(1.0) ↔
Maharashtra 248(0.5) 262(0.4) ↓
Manipur 272(1.6) 250(4.2) ↑
Meghalaya 252(1.7) 287(2.9) ↓
Mizoram 275(4.0) 280(3.6) ↓
Nagaland 304(0.3) 308(1.0) ↓
Odisha 254(0.3) 256(1.0) ↔
Puducherry 242(8.8) 265(2.8) ↓
Punjab 248(0.5) 260(0.9) ↓
Rajasthan 253(1.0) 254(0.3) ↔
Sikkim 273(2.3) 271(4.6) ↔
Tamil Nadu 248(0.9) 252(0.7) ↓
Telangana 247(0.7) 283(1.0) ↓
Tripura 233(2.3) 242(2.6) ↓
Chapter_7_ English.indd 110 18-02-2021 10:45:34

111
Stud
ents’
Ach
ieve
men
t in
Engl
ish
States/UTs/Boards Rural Urban Sig.
Uttarakhand 242(0.4) 245(2.3) ↓
CBSE 305(1.8) 325(2.0) ↓
ICSE 332(6.5) 355(1.6) ↓
National 249(0.1) 262(0.2) ↓
↔ No significant difference between the average performance of rural and urban students.↑ Rural students’ average performance is significantly higher than that of urban students.↓ Rural students’ average performance is significantly lower than that of urban students.
Social Category
Table 7.5 compares the average English language scores achieved by students across social categories and shows that significant difference was detected in the average achievement levels of students in the SC, ST and OBC categories. Students from SC, ST and OBC category group significantly performed lower than Other group, while there was no significant difference between SC and ST category students. On an average, students in the Other category achieved significantly higher scores than those of SC/ST and OBC.
In SC category while five States/UTs, i.e., Chandigarh, Arunachal Pradesh, Tripura, Daman and Diu and Dadra and Nagar Haveli showed average scores significantly above that those of Others (General) category group; 24 States/UTs depicted average scores significantly below that of the overall
average and rest of the States/UTs presented average scores that were not significantly different from that of the overall.
In ST category while six States/UTs, i.e., Delhi, Uttakhand, Arunachal Pradesh, Nagaland, Manipur and Mizoram having average scores significantly above that of the group; 20 States/UTs depicted average scores significantly below that of others (General) and rest of States/UTs presented average scores that were not significantly different from that of the overall.
In OBC category while three States/UTs, i.e., Chandigarh, Delhi, Daman and Diu showed average scores significantly above those of others (General) category group; 22 States/UTs depicted average scores significantly below that of the overall average and rest of the States/UTs presented average scores that were not significantly different from that of the overall.
Table 7.5: Average English Scores by Social Category
States/UTs/Boards Others Scheduled Caste Sig. Scheduled
Tribe Sig.Other
Backward Classes
Sig.
Andaman and Nicobar Islands 257(4.0) – – 227(5.6) ↓ 257(6.7) ↔
Andhra Pradesh 292(1.4) 262(1.8) ↓ 249(2.7) ↓ 272(0.8) ↓
Arunachal Pradesh 245(2.7) 255(6.9) ↑ 274(1.9) ↑ 280(7.2) ↓
Assam 266(1.0) 250(2.3) ↓ 261(1.6) ↓ 263(1.0) ↔
Bihar 238(1.3) 222(1.8) ↓ 227(1.3) ↓ 229(0.5) ↓
Chandigarh 250(3.9) 255(2.6) ↑ – – 288(7.7) ↑
Chhattisgarh 233(4.1) 230(1.4) ↔ 236(1.1) ↔ 228(0.8) ↓
Dadra and Nagar Haveli 249(7.6) 297(15.2) ↑ 232(2.9) ↓ – –
Daman and Diu 240(4.4) 275(16.9) ↑ 219(10.5) ↓ 266(10.0) ↑
Delhi 261(1.7) 242(1.6) ↓ 284(15.9) ↑ 266(1.6) ↑
Goa 301(2.0) 263(10.3) ↓ 289(4.0) ↓ 295(2.1) ↓
Gujarat 254(0.5) 238(1.2) ↓ 232(0.3) ↓ 234(1.4) ↓
Haryana 245(0.9) 230(1.4) ↓ – – 242(0.9) ↔* Sig. - Significant Difference
Chapter_7_ English.indd 111 18-02-2021 10:45:34

Learning Achievement of Students — NAS Class X (Cycle 2) 2018112
States/UTs/Boards Others Scheduled Caste Sig. Scheduled
Tribe Sig.Other
Backward Classes
Sig.
Himachal Pradesh 247(2.1) 238(4.0) ↓ 247(4.0) ↔ 238(4.6) ↓
Jammu and Kashmir 262(2.4) 242(4.8) ↓ 229(6.1) ↓ 241(3.9) ↓
Jharkhand 241(3.2) 239(2.1) ↔ 239(1.2) ↔ 237(0.9) ↓
Karnataka 298(1.5) 263(1.0) ↓ 262(1.7) ↓ 267(0.8) ↓
Kerala 277(1.1) 251(3.3) ↓ 228(7.5) ↓ 262(0.6) ↓
Lakshadweep – – – 228(9.5) – – –
Madhya Pradesh 235(1.0) 225(1.8) ↓ 221(0.8) ↓ 231(0.7) ↔
Maharashtra 262(0.8) 247(1.1) ↓ 241(0.8) ↓ 251(0.4) ↓
Manipur 271(1.8) 243(4.4) ↓ 308(1.7) ↑ 244(4.5) ↓
Meghalaya 274(3.8) 244(9.6) ↓ 260(1.4) ↓ – –
Mizoram 268(23.4) – – 277(3.5) ↑ – –
Nagaland 302(4.9) 289(10.8) ↓ 307(0.7) ↑ 287(7.3) ↓
Odisha 266(0.5) 248(0.8) ↓ 248(0.7) ↓ 255(0.7) ↓
Puducherry 270(15.9) 245(2.9) ↓ – – 256(5.4) ↓
Punjab 265(0.5) 239(1.5) ↓ 240(16.3) ↓ 254(1.2) ↓
Rajasthan 264(0.7) 256(1.6) ↓ 243(2.1) ↓ 252(0.6) ↓
Sikkim 275(3.9) 253(3.1) ↓ 271(3.7) ↔ 276(1.9) ↔
Tamil Nadu 262(2.6) 238(0.8) ↓ 234(4.7) ↓ 253(0.3) ↓
Telangana 290(2.2) 245(1.4) ↓ 251(1.8) ↓ 263(0.4) ↓
Tripura 243(2.7) 255(4.1) ↑ 222(4.2) ↓ 229(2.8) ↓
Uttarakhand 247(1.6) 236(1.5) ↓ 260(5.2) ↑ 238(1.5) ↓
CBSE 332(1.9) 312(5.8) ↓ 392(23.0) ↑ 292(3.0) ↓
ICSE 358(2.3) 346(9.3) ↓ 292(7.5) ↓ 335(1.6) ↓
National 264(0.2) 246(0.1) ↓ 245(0.5) ↓ 252(0.1) ↓
↔ No significant difference between the average performance of SC/ST/OBC students and Others students.↑ SC/ST/OBC students’ average performance is significantly higher than that of Others students.↓ SC/ST/OBC students’ average performance is significantly lower than that of Others students.
School Management
Table 7.6 compares the average English language scores achieved by students of by government schools, government-aided schools and private schools. It can be deciphered that significant difference exists in the average achievement levels of students based on the type of school management.
Private schools significantly outperformed government and government-aided schools.
Government-aided schools performed lower than government schools in six States/UTs. The performance of students in government-aided schools was better than that of government schools in 17 States/UTs while in rest of the States and UTs
Chapter_7_ English.indd 112 18-02-2021 10:45:34

113
Stud
ents’
Ach
ieve
men
t in
Engl
ish
the performance between the government and government-aided schools was similar.
Private schools performed lower than government schools in Rajasthan. The performance
of students in private schools was better than that of government schools in 24 States/UTs while in rest of the States/UTs the performance between the two was similar.
Table 7.6: Average English Scores by School Management
States/UTs/Boards Government Government-aided Sig. Private Sig.
Andaman and Nicobar Islands 235(3.4) – – 328(3.2) ↑
Andhra Pradesh 245(2.7) 260(1.3) ↑ 295(0.9) ↑
Arunachal Pradesh 246(1.2) 314(3.8) ↑ 322(4.9) ↑
Assam 260(0.7) 253(1.8) ↓ 293(1.8) ↑
Bihar 230(0.8) 227(2.3) ↔ 232(2.2) ↔
Chandigarh 252(2.8) 266(11.3) ↑ – –
Chhattisgarh 231(0.2) 236(2.8) ↑ 227(1.2) ↔
Dadra and Nagar Haveli 233(3.3) 222(17.4) ↓ 297(10.0) ↑
Daman and Diu 248(8.6) 279(15.1) ↑ 255(8.0) ↑
Delhi 238(1.4) 264(1.9) ↑ 313(1.2) ↓
Goa 265(3.8) 305(1.6) ↑ 300(27.3) ↑
Gujarat 231(1.1) 235(0.8) ↑ 252(1.0) ↑
Haryana 233(1.1) 236(2.3) ↔ 248(1.0) ↑
Himachal Pradesh 233(1.7) – – 277(6.2) ↑
Jammu and Kashmir 241(2.0) 250(11.8) ↑ 269(3.3) ↑
Jharkhand 237(0.8) 244(1.5) ↑ 239(0.7) ↔
Karnataka 265(0.8) 259(0.5) ↓ 285(0.3) ↑
Kerala 252(0.4) 266(1.3) ↑ 287(3.4) ↑
Lakshadweep 228(9.5) – – – –
Madhya Pradesh 229(0.5) 225(2.6) ↑ 229(0.7) ↔
Maharashtra 247(2.4) 248(0.3) ↔ 289(1.7) ↑
Manipur 259(6.2) 253(5.1) ↓ 273(1.7) ↑
Meghalaya 254(7.3) 258(1.5) ↑ 280(3.9) ↑
Mizoram 275(3.4) 275(4.8) ↔ 292(8.4) ↑
Nagaland 285(1.3) – – 314(0.9) ↑
Odisha 253(0.3) 277(3.1) ↑ 269(2.4) ↑
Puducherry 230(3.8) 254(6.1) ↑ 279(8.8) ↑
Punjab 236(0.4) 244(3.8) ↑ 272(0.9) ↑
Rajasthan 262(1.3) 230(13.4) ↓ 245(0.8) ↓
Sikkim 273(2.1) – – – –
Tamil Nadu 235(0.9) 236(0.9) ↔ 272(1.1) ↑
Chapter_7_ English.indd 113 18-02-2021 10:45:34
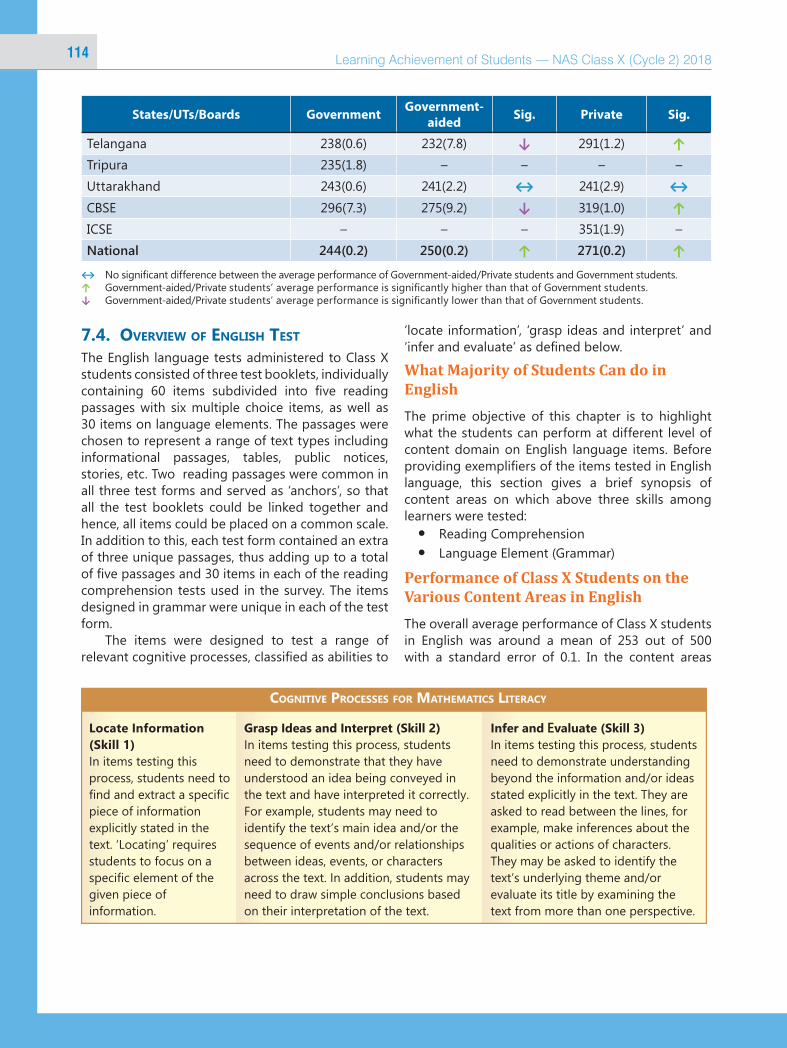
Learning Achievement of Students — NAS Class X (Cycle 2) 2018114
States/UTs/Boards Government Government-aided Sig. Private Sig.
Telangana 238(0.6) 232(7.8) ↓ 291(1.2) ↑Tripura 235(1.8) – – – –Uttarakhand 243(0.6) 241(2.2) ↔ 241(2.9) ↔
CBSE 296(7.3) 275(9.2) ↓ 319(1.0) ↑ICSE – – – 351(1.9) –National 244(0.2) 250(0.2) ↑ 271(0.2) ↑
↔ No significant difference between the average performance of Government-aided/Private students and Government students.↑ Government-aided/Private students’ average performance is significantly higher than that of Government students.↓ Government-aided/Private students’ average performance is significantly lower than that of Government students.
7.4. overview of engliSh teSt The English language tests administered to Class X students consisted of three test booklets, individually containing 60 items subdivided into five reading passages with six multiple choice items, as well as 30 items on language elements. The passages were chosen to represent a range of text types including informational passages, tables, public notices, stories, etc. Two reading passages were common in all three test forms and served as ‘anchors’, so that all the test booklets could be linked together and hence, all items could be placed on a common scale. In addition to this, each test form contained an extra of three unique passages, thus adding up to a total of five passages and 30 items in each of the reading comprehension tests used in the survey. The items designed in grammar were unique in each of the test form.
The items were designed to test a range of relevant cognitive processes, classified as abilities to
‘locate information’, ‘grasp ideas and interpret’ and ‘infer and evaluate’ as defined below.
What Majority of Students Can do in English
The prime objective of this chapter is to highlight what the students can perform at different level of content domain on English language items. Before providing exemplifiers of the items tested in English language, this section gives a brief synopsis of content areas on which above three skills among learners were tested:
yy Reading Comprehension yy Language Element (Grammar)
Performance of Class X Students on the Various Content Areas in English
The overall average performance of Class X students in English was around a mean of 253 out of 500 with a standard error of 0.1. In the content areas
cognitive ProceSSeS for mathematicS literacy
Chapter_7_ English.indd 114 18-02-2021 10:45:35

115
Stud
ents’
Ach
ieve
men
t in
Engl
ish
of ‘reading comprehension’ the mean performance of students was similar with overall performance, i.e., no significant difference between ‘reading comprehension’ and overall average performance of students in English. In the content area of ‘language element’ the mean performance of students was 251, which was significantly below the overall average score in English.
Contents Mean Standard ErrorEnglish 253 0.1Reading Comprehension 253 0.2Language Element 251 0.2
7.5. SamPle item and reading PaSSage
Listed below are the passage and the items that were used in the English language test. Statistics describing how students responded to these items are given and these can also be located on the item map.
Sample Items
Read the chart given below and answer the following questions. A school decided to celebrate Book Week. The chart below shows the schedule of activities planned. Study the chart carefully and answer the questions that follow.
Day Class/ Activity in school Venue Class/Outdoor activities
Monday
Class 1–2: Designing bookmarks ClassroomsClass8:VisittoNationalLibrary
Class 3–4: Role play Hall-1
Class 5–6: My favourite book–talk Library
TuesdayClass 3–4: Chain story telling Auditorium
Class5–6:Film:TheJungleBook
Class 7–8: Theatre workshop by Barry John Hall-1
Wednesday
Class 1–2: Meet the fairy tale characters Auditorium
Class 3–4: Show and tell Hall-1
Class 5–6: Poetry recitation Hall-2
Class 7–8: Designing a bookcover-by Santosh Rai Art room
ThursdayClass 7–8: Quiz: conducted by Mandeep Kaur Hall-2
Class3–4:VisittoNationalBookTrust
Class 9–10: Meet the author–Ruskin Bond Library
Friday Class 5–6: Book reading by students Classrooms
Chapter_7_ English.indd 115 18-02-2021 10:45:35

Learning Achievement of Students — NAS Class X (Cycle 2) 2018116
Sample Item: 1
This item required students to grasp ideas and interpret the text to make an inference about. While only 29.7 per cent students in the sample were able to select the correct answer (3), the chart shows how the remaining 70.3 per cent gave either wrong responses or multiple responses or did not attempt the item.
Skill: Skill 2 item Content Domain: Reading Comprehension
ITEM 19: The school has invited ------------------ experts for different events.
1. Two
2. Six
3. Four
4. Five
% Answers1. 19.9%2. 24.5%3. 29.7%4. 21.5%
Multiple response 0.7%Not attempted 3.7%
Sample Item: 2These item required students to read the chart, comprehend the details and relate the classes to day to day experiences to arrive at correct answer. Around 51 per cent students in the sample were able to select the correct answer (4), whereas the chart shows how the remaining 49 per cent gave either wrong responses or multiple responses or did not attempt the item.
Skill: Skill 1 item Content Domain: Reading Comprehension
ITEM 18: Which classes will go to see ‘The Jungle Book’ and when?
1. Class 7 and 8, Tuesday
2. Class 3 and 4, Wednesday
3. Class 9 and 10, Thursday
4. Class 5 and 6, Tuesday
% Answers1. 12.4%2. 16.9%3. 16.6%4. 51.0%
Multiple response 0.7%Not attempted 2.3%
Sample Item: 3
This item required students to locate the information given in the text to know that the children met Ruskin Bond on Thursday. Only 62.4 per cent students in the sample were able to select the correct answer (3), while the chart shows how the remaining 37.6 per cent gave either wrong responses or multiple responses or did not attempt the item.
Skill: Skill 1 item Content Domain: Reading Comprehension
ITEM 17: On which day can the children meet Ruskin Bond?
1. Monday
2. Wednesday
3. Thursday
4. Friday
% Answers1. 13.3%2. 10.8%3. 62.4%4. 10.9%
Multiple response 0.6%Not attempted 2.1%
Chapter_7_ English.indd 116 18-02-2021 10:45:35
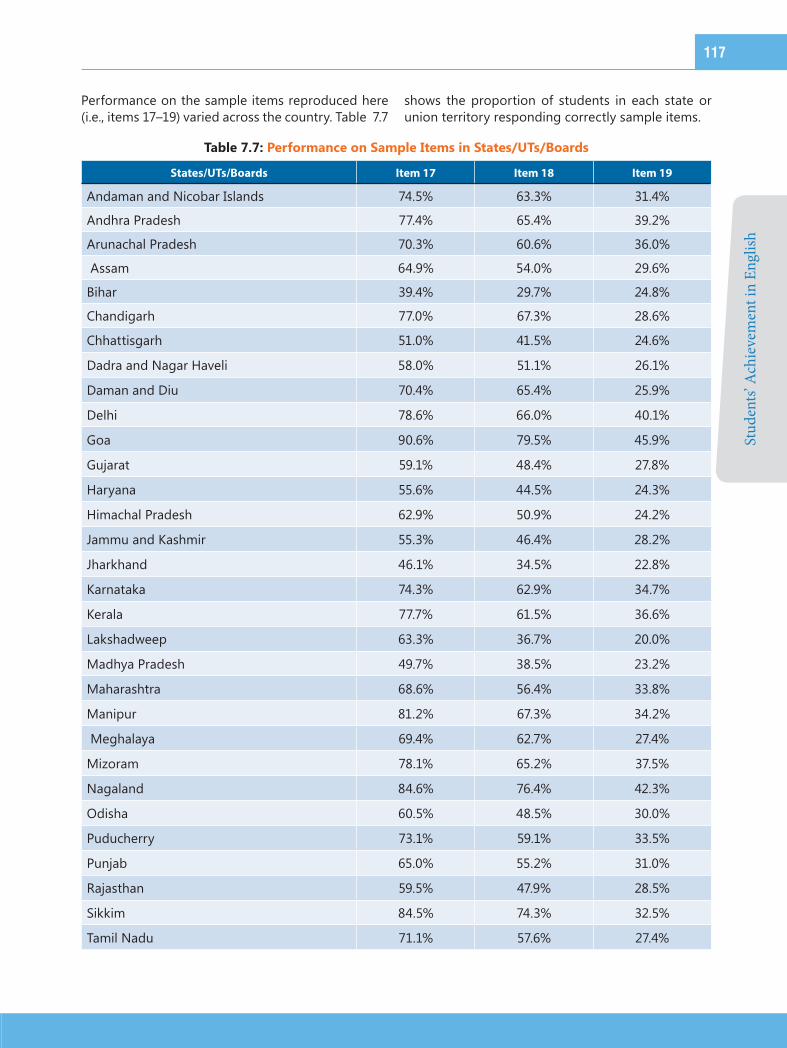
117
Stud
ents’
Ach
ieve
men
t in
Engl
ish
Performance on the sample items reproduced here (i.e., items 17–19) varied across the country. Table 7.7
shows the proportion of students in each state or union territory responding correctly sample items.
Table 7.7: Performance on Sample Items in States/UTs/Boards
States/UTs/Boards Item 17 Item 18 Item 19
Andaman and Nicobar Islands 74.5% 63.3% 31.4%
Andhra Pradesh 77.4% 65.4% 39.2%
Arunachal Pradesh 70.3% 60.6% 36.0%
Assam 64.9% 54.0% 29.6%
Bihar 39.4% 29.7% 24.8%
Chandigarh 77.0% 67.3% 28.6%
Chhattisgarh 51.0% 41.5% 24.6%
Dadra and Nagar Haveli 58.0% 51.1% 26.1%
Daman and Diu 70.4% 65.4% 25.9%
Delhi 78.6% 66.0% 40.1%
Goa 90.6% 79.5% 45.9%
Gujarat 59.1% 48.4% 27.8%
Haryana 55.6% 44.5% 24.3%
Himachal Pradesh 62.9% 50.9% 24.2%
Jammu and Kashmir 55.3% 46.4% 28.2%
Jharkhand 46.1% 34.5% 22.8%
Karnataka 74.3% 62.9% 34.7%
Kerala 77.7% 61.5% 36.6%
Lakshadweep 63.3% 36.7% 20.0%
Madhya Pradesh 49.7% 38.5% 23.2%
Maharashtra 68.6% 56.4% 33.8%
Manipur 81.2% 67.3% 34.2%
Meghalaya 69.4% 62.7% 27.4%
Mizoram 78.1% 65.2% 37.5%
Nagaland 84.6% 76.4% 42.3%
Odisha 60.5% 48.5% 30.0%
Puducherry 73.1% 59.1% 33.5%
Punjab 65.0% 55.2% 31.0%
Rajasthan 59.5% 47.9% 28.5%
Sikkim 84.5% 74.3% 32.5%
Tamil Nadu 71.1% 57.6% 27.4%
Chapter_7_ English.indd 117 18-02-2021 10:45:35

Learning Achievement of Students — NAS Class X (Cycle 2) 2018118
States/UTs/Boards Item 17 Item 18 Item 19
Telangana 71.2% 58.3% 34.4%
Tripura 54.8% 43.6% 24.5%
Uttarakhand 59.0% 47.2% 22.8%
CBSE 92.2% 83.8% 60.0%
ICSE 90.8% 84.8% 70.6%
National 62.4% 51.0% 29.7%
7.6. Skill-wiSe Performance analySiS of StudentS
Table 7.8 summarises the state wise performance of students in the three cognitive processes, i.e., Ability
to locate information, Ability to grasp ideas and interpret and Ability to infer and evaluate (Skill 1, Skill 2, Skill 3)
Table 7.8: State-wise Performance of Students in the Three Cognitive Processes
States/UTs/BoardsSkill 1
(Correct Average score in Per cent)
Skill 2 (Correct Average score in Per cent)
Skill 3 (Correct Average score in Per cent)
Andaman and Nicobar Islands 51 40 37
Andhra Pradesh 53 43 42
Arunachal Pradesh 54 42 40
Assam 47 36 35
Bihar 35 28 28
Chandigarh 50 40 35
Chhattisgarh 37 30 29
Dadra and Nagar Haveli 39 29 30
Daman and Diu 47 35 34
Delhi 54 42 41
Goa 65 46 50
Gujarat 40 32 31
Haryana 39 30 29
Himachal Pradesh 41 32 30
Jammu and Kashmir 42 34 33
Jharkhand 36 29 29
Karnataka 50 38 40
Kerala 52 39 42
Lakshadweep 44 31 35
Madhya Pradesh 35 29 27
Maharashtra 46 36 36
Manipur 58 45 44
Chapter_7_ English.indd 118 18-02-2021 10:45:35

119
Stud
ents’
Ach
ieve
men
t in
Engl
ish
States/UTs/BoardsSkill 1
(Correct Average score in Per cent)
Skill 2 (Correct Average score in Per cent)
Skill 3 (Correct Average score in Per cent)
Meghalaya 50 40 38Mizoram 54 41 40Nagaland 64 47 50Odisha 42 33 34Puducherry 49 38 36Punjab 47 37 35Rajasthan 43 34 35Sikkim 56 41 41Tamil Nadu 44 34 31Telangana 48 39 38Tripura 38 31 29Uttarakhand 40 31 30CBSE 56 51 48ICSE 56 53 52National 38 33 34
7.7. Proficiency levelS
The goals of a language assessment are two folds attainment of a basic proficiency, and the development of language as an instrument for basic interpersonal communication and later for abstract thought and knowledge acquisition. Proficiency levels provide a convenient way to describe profiles of student achievement.
Children whose results are located within a particular level of proficiency are expected to
understand the competencies and skills associated with that and lower levels. In NAS Class X Cycle 2, Student’s performance in English language was gauged using six proficiency levels based on the numeric scores achieved in the assessment.
Figure 7.2 divides the average English language scores achieved by students into five proficiency levels. Each level comprises the percentage students and a mean score for that level. It can be observed that maximum number of student’s, i.e., 44 per cent
Fig. 7.2: Proficiency Levels in English
Chapter_7_ English.indd 119 18-02-2021 10:45:36

Learning Achievement of Students — NAS Class X (Cycle 2) 2018120
lied between proficiency level of 201 to 250 whereas only 13 per cent students belonged to a lower proficiency level of less than 200.
Distribution of Students Performing Less than 200
The percentage of students who performed in proficiency band of less than 200 were analysed using various parameters.
yy Gender: It was observed that percentage of males (49%) was slightly less than those of females (51%) in this category.
yy Location: It was observed that majority of students who belong to rural area performance level of less than 200, i.e., 76 per cent while 24 per cent of students belonged to urban areas.
yy School Management: Majority of students (67%) who performed in performance level of less than 200 studied in government schools while 17 per cent and 16 per cent students in this level belongs to government-aided and private schools, respectively.
yy Social Groups: The distribution of students was skewed favouring OBC category students which comprised 44 per cent of the population while SC, ST and others (General) were 18 per cent, 19 per cent and 19 per cent, respectively.
Distribution of Students based on Score Range
Table 7.9 summarises the student’s performance using absolute scores into four percentage groups, i.e., 0–35 per cent, 36–50 per cent, 51–75 per cent, 76–100 per cent. The percentage of students in 0–35 per cent was 60.74 which was much greater than those in other percentage levels like for 36–50 per cent where it was 21.4, for 51–75 per cent where it was 15.47 and for 76–100 per cent it was 2.66, respectively. There was a huge variation in the performance of students across States. In States like Nagaland, Manipur and Goa majority of the students belong to the range of 51–75 per cent while in States/UTs like Bihar, Chattisgarh, Madhya Pradesh, Dadra and Nagar Haveli majority belonged to 0–35 per cent category.
Fig. 7.3: Characteristics of Students Performing below the Mean Score of 250 by Gender, Location, School Management and Social Groups
Chapter_7_ English.indd 120 18-02-2021 10:45:36

121
Stud
ents’
Ach
ieve
men
t in
Engl
ish
Table 7.9: Students’ Performance using Absolute Scores
States/UTs/Boards (0–35 %) (36–50 %) (51–75 %) (76–100 %)
Andaman and Nicobar Islands 52.55 23.72 18.98 4.74
Andhra Pradesh 41.94 24.86 28.98 4.23
Arunachal Pradesh 45.90 21.26 26.71 6.14
Assam 48.73 24.06 22.43 4.77
Bihar 80.23 12.47 6.59 0.71
Chandigarh 48.26 28.82 20.51 2.41
Chhattisgarh 76.69 15.47 7.24 0.60
Dadra and Nagar Haveli 76.49 16.42 7.09 –
Daman and Diu 62.66 23.65 13.28 0.41
Delhi 49.13 23.57 18.62 8.68
Goa 19.89 29.16 40.94 10.01
Gujarat 72.39 19.55 7.31 0.75
Haryana 71.67 18.85 8.92 0.56
Himachal Pradesh 71.12 20.65 7.76 0.46
Jammu and Kashmir 63.49 20.17 14.15 2.19
Jharkhand 71.57 17.64 9.67 1.11
Karnataka 41.14 29.62 25.84 3.41
Kerala 47.60 29.30 20.96 2.14
Lakshadweep 70.37 24.69 4.94 –
Madhya Pradesh 80.01 14.12 5.47 0.41
Maharashtra 56.64 25.29 15.37 2.70
Manipur 30.66 24.79 35.79 8.76
Meghalaya 45.96 25.72 24.79 3.53
Mizoram 35.82 31.77 27.52 4.89
Nagaland 16.52 23.11 46.73 13.65
Odisha 60.09 21.84 16.39 1.68
Puducherry 52.82 25.85 18.89 2.44
Punjab 59.32 21.42 15.81 3.46
Rajasthan 54.81 23.41 18.96 2.82
Sikkim 36.97 36.73 24.10 2.20
Tamil Nadu 62.83 22.27 13.56 1.34
Telangana 55.65 22.30 19.70 2.35
Tripura 74.19 14.40 9.20 2.21
Uttarakhand 68.15 21.68 9.75 0.42
Chapter_7_ English.indd 121 18-02-2021 10:45:36
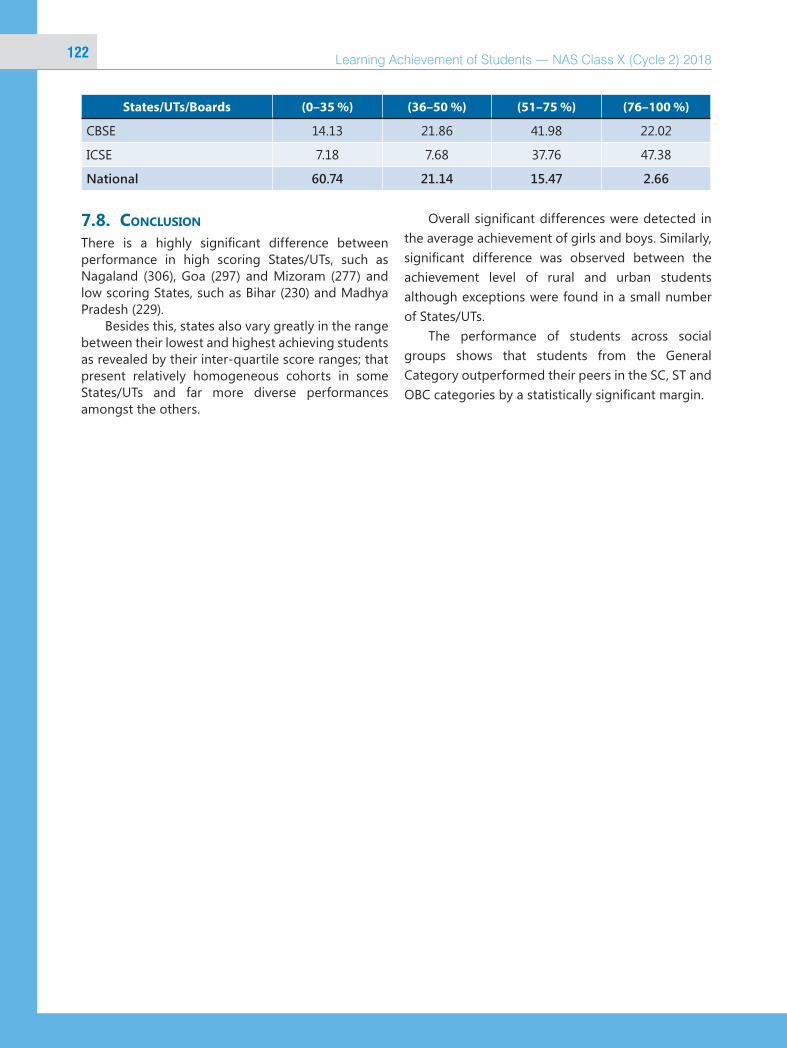
Learning Achievement of Students — NAS Class X (Cycle 2) 2018122
States/UTs/Boards (0–35 %) (36–50 %) (51–75 %) (76–100 %)
CBSE 14.13 21.86 41.98 22.02
ICSE 7.18 7.68 37.76 47.38
National 60.74 21.14 15.47 2.66
7.8. concluSion There is a highly significant difference between performance in high scoring States/UTs, such as Nagaland (306), Goa (297) and Mizoram (277) and low scoring States, such as Bihar (230) and Madhya Pradesh (229).
Besides this, states also vary greatly in the range between their lowest and highest achieving students as revealed by their inter-quartile score ranges; that present relatively homogeneous cohorts in some States/UTs and far more diverse performances amongst the others.
Overall significant differences were detected in the average achievement of girls and boys. Similarly, significant difference was observed between the achievement level of rural and urban students although exceptions were found in a small number of States/UTs.
The performance of students across social groups shows that students from the General Category outperformed their peers in the SC, ST and OBC categories by a statistically significant margin.
Chapter_7_ English.indd 122 18-02-2021 10:45:36

123
Stud
ents’
Ach
ieve
men
ts in
Mod
ern
Indi
an
Lang
uage
(MIL
)
The Modern Indian Language (MIL) tests used in the National Achievement Survey (NAS) comprised two types of items— reading comprehension and language-specific elements, such as vocabulary and grammar, etc. These tests were administered in 20 languages. The reading comprehension passages were translated from the base language, i.e., Hindi to make them comparable. The language specific items, were unique in each language, hence student’s achievement in the reading comprehension has been reported.
The overall achievement in the reading comprehension domain is reported for each of the participating States, UTs and Boards in this
C H A P T E R 8Students’ Achievements in Modern Indian Language (MIL)
report. In addition, information about differences in achievement by gender, school location, social category and school management is also provided.
8.1. State-wiSe Performance of StudentS in reading comPrehenSion
Table 8.1 shows the distribution of student achievement for the 33 participating States/UTs/Boards. Finally, the table indicates whether average score of a State is significantly different from the overall average score of 31 States/UTs or not. The National average score and standard error is also presented in the Table 8.1.
Table 8.1: Average Reading Comprehension Scores for States/UTs/Boards
States/UTs/Boards Average Score Standard Error Significant Difference
Andaman and Nicobar Islands 253 3.8 ↔
Andhra Pradesh 255 0.6 ↑
Arunachal Pradesh 234 1.7 ↓
Assam 253 0.6 ↔
Bihar 230 1.1 ↓
Chandigarh 264 4.3 ↑
Chhattisgarh 258 1.0 ↑
Dadra and Nagar Haveli 246 3.1 ↓
Daman and Diu 232 4.4 ↓
Delhi 272 0.8 ↑
Chapter_8_ Modern Indian Language (MIL).indd 123 18-02-2021 10:46:14
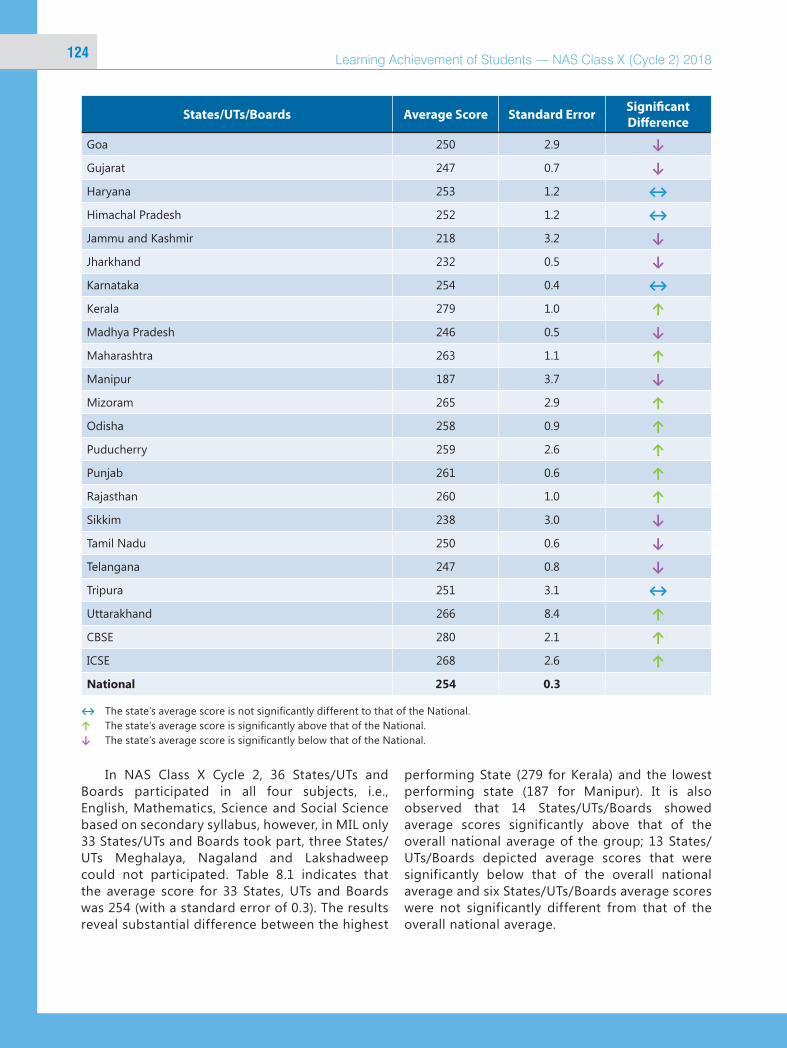
Learning Achievement of Students — NAS Class X (Cycle 2) 2018124
States/UTs/Boards Average Score Standard Error Significant Difference
Goa 250 2.9 ↓
Gujarat 247 0.7 ↓
Haryana 253 1.2 ↔
Himachal Pradesh 252 1.2 ↔
Jammu and Kashmir 218 3.2 ↓
Jharkhand 232 0.5 ↓
Karnataka 254 0.4 ↔
Kerala 279 1.0 ↑
Madhya Pradesh 246 0.5 ↓
Maharashtra 263 1.1 ↑
Manipur 187 3.7 ↓
Mizoram 265 2.9 ↑
Odisha 258 0.9 ↑
Puducherry 259 2.6 ↑
Punjab 261 0.6 ↑
Rajasthan 260 1.0 ↑
Sikkim 238 3.0 ↓
Tamil Nadu 250 0.6 ↓
Telangana 247 0.8 ↓
Tripura 251 3.1 ↔
Uttarakhand 266 8.4 ↑
CBSE 280 2.1 ↑
ICSE 268 2.6 ↑
National 254 0.3
↔ The state’s average score is not significantly different to that of the National.↑ The state’s average score is significantly above that of the National.↓ The state’s average score is significantly below that of the National.
In NAS Class X Cycle 2, 36 States/UTs and Boards participated in all four subjects, i.e., English, Mathematics, Science and Social Science based on secondary syllabus, however, in MIL only 33 States/UTs and Boards took part, three States/UTs Meghalaya, Nagaland and Lakshadweep could not participated. Table 8.1 indicates that the average score for 33 States, UTs and Boards was 254 (with a standard error of 0.3). The results reveal substantial difference between the highest
performing State (279 for Kerala) and the lowest performing state (187 for Manipur). It is also observed that 14 States/UTs/Boards showed average scores significantly above that of the overall national average of the group; 13 States/UTs/Boards depicted average scores that were significantly below that of the overall national average and six States/UTs/Boards average scores were not significantly different from that of the overall national average.
Chapter_8_ Modern Indian Language (MIL).indd 124 18-02-2021 10:46:15

125
Stud
ents’
Ach
ieve
men
ts in
Mod
ern
Indi
an
Lang
uage
(MIL
)
8.2. Percentile ScoreS in reading comPrehenSionS for StateS/utS
Table 8.2 and Figure 8.1 illustrate the range of achievement within and across the States/UTs/Boards. A percentile score indicates that scale score below which a certain percentage of students fall. For example, the 10th percentile score means that 10 per cent of students found at or below it. In other way, it also connotes that 90 per cent of students found above it. Similarly, the score at the 90th percentile is the score that 10 per cent of students achieve above it.
The report lists scores achieved by students at key percentiles. Among these are the 25th (first quartile), 50th (second quartile), 75th (third quartile) and the 90th percentiles. The range between the 25th and 75th percentile (inter-quartile range) represents the performance of the middle 50 per cent of students. Hence, both inter-quartile range and range between 90th percentile and 10th percentile is a good indicator of reflecting degree of homogeneity in terms of the reading comprehension achievement in MIL across States/UTs/Boards.
Table 8.2: Percentile Scores in MIL for States/UTs/Boards
States/UTs/Boards P10 P25 P50 P75 P90 P75– P25 P90–P10Andaman and Nicobar Islands 187 212 250 294 321 82 134
Andhra Pradesh 194 226 258 286 313 60 119
Arunachal Pradesh 158 191 225 278 321 87 163
Assam 195 224 254 284 309 60 114Bihar 165 196 228 265 296 69 131Chandigarh 198 229 267 297 333 68 135
Chhattisgarh 192 223 261 290 320 67 128
Dadra and Nagar Haveli 205 224 243 267 294 43 89
Daman and Diu 174 199 236 263 281 64 107
Delhi 206 242 276 307 331 65 125
Goa 193 220 251 281 304 61 111Gujarat 187 217 246 279 307 62 120Haryana 187 220 255 289 318 69 131
Himachal Pradesh 198 221 251 282 310 61 112
Jammu and Kashmir 162 186 211 245 286 59 124
Jharkhand 170 198 231 267 296 69 126Karnataka 196 224 255 285 311 61 115Kerala 216 247 283 312 335 65 119Madhya Pradesh 184 214 245 279 308 65 124
Maharashtra 196 229 265 298 329 69 133
Manipur 145 159 187 212 230 53 85Mizoram 220 238 268 290 308 52 88
Odisha 191 222 260 294 325 72 134
Puducherry 203 226 260 291 320 65 117
Punjab 197 228 263 294 324 66 127
Rajasthan 192 226 264 296 326 70 134
Sikkim 185 212 235 260 296 48 111
Tamil Nadu 194 222 251 279 302 57 108
Telangana 188 218 246 279 306 61 118
Tripura 185 222 255 285 312 63 127
Chapter_8_ Modern Indian Language (MIL).indd 125 18-02-2021 10:46:15

Learning Achievement of Students — NAS Class X (Cycle 2) 2018126
States/UTs/Boards P10 P25 P50 P75 P90 P75– P25 P90–P10Uttarakhand 202 240 265 296 332 56 130
CBSE 215 241 282 318 347 77 132
ICSE 192 230 275 303 331 73 139
National 189 221 255 287 317 66 128
Andaman and Nicobar Islands
Fig. 8.1: Percentile Scores in MIL for States/UTs/Boards
Chapter_8_ Modern Indian Language (MIL).indd 126 18-02-2021 10:46:15

127
Stud
ents’
Ach
ieve
men
ts in
Mod
ern
Indi
an
Lang
uage
(MIL
)
The inter-quartile range (that is the range between the 75th and 25th percentiles) at national level is a score of 66 which represents a more homogenous scenario in comparison to the variation of scores among the individual States. For example, Dadra and Nagar Haveli has an inter-quartile range of 43 score while Arunachal Pradesh has a corresponding value of 87. These values represent that the Class X population in Dadra and Nagar Haveli is far more homogeneous as regard to the learning levels than that of Arunachal Pradesh. In most States, the range of performance for the middle group was between 60 and 70 scale-score points. Performance at the 10th and the 90th percentiles, respectively, shows extreme in low and high achievements. The range between these two points, which includes 80 per cent of the population, is highly varying, ranging from 85 (Manipur) to 163 (Arunachal Pradesh).
The percentile scores provide additional information when comparing Reading Comprehension achievement scores amongst States. For example, when the States are arranged in order of average score, the difference between adjacent States tend to be small. However, the range of scores may not be similar. For example, there is no significant difference between the median score of Andaman and Nicobar Islands, Goa, Tamil Nadu and Himachal Pradesh (250–251). However, the range of scores between the 25th percentile and 75th percentiles are very different— Andaman and Nicobar Islands (82), Goa and Himachal Pradesh (61), Tamil Nadu (57). This indicates that while the average achievement is similar in the States, Tamil Nadu has a homogenous
group of Class X students than Andaman and Nicobar Islands.
Moreover, the 50th percentile scores of the students of Kerala (283) are far better than 75th percentile scores of 14 States, i.e., Manipur (212), Jammu and Kashmir (245), Sikkim (260), Daman and Diu (263), Bihar (265), Dadra and Nagar Haveli (267), Jharkhand (267), Arunachal Pradesh (278), Telangana (279), Gujarat (279), Tamil Nadu (279), Madhya Pradesh (279) and Goa (281).
8.3. grouP-wiSe Performance in reading comPrehenSion
In this section performance of various categories are reflected. Within the group significant difference is also measured in this part.
Gender
Table 8.3 compares the average Reading comprehension scores achieved by boys and girls. Overall performance by girls (255) was significantly better than boys (253). This trend was observed in States/UTs like Punjab, Chandigarh, Delhi, Assam, Chhattisgarh, Gujarat, Dadra and Nagar Haveli, Maharashtra, Himachal Pradesh, Andhra Pradesh and Tamil Nadu. In Uttarakhand, Arunachal Pradesh, Tripura, Jharkhand and Puducherry girls are significantly performing lower than boys. In remaining States/UTs like Jammu and Kashmir, Haryana, Rajasthan, Bihar, Sikkim, Manipur, Mizoram, Odisha, Madhya Pradesh, Daman and Diu, Karnataka, Goa, Kerala, Andaman and Nicobar Islands and Telangana there was no significant difference between the performance of girls and boys.
Table 8.3: Average Reading Comprehension Scores by Gender
States/UTs/Boards Boys' Average (Standard Error)
Girls' Average (Standard Error)
Significant Difference
Andaman and Nicobar Islands 255(4.6) 250(4.5) ↔
Andhra Pradesh 250(1.5) 260(0.5) ↑
Arunachal Pradesh 239(2.4) 228(2.5) ↓
Assam 251(1.3) 255(0.4) ↑
Bihar 232(0.7) 229(1.4) ↔
Chandigarh 259(5.6) 271(3.7) ↑
Chhattisgarh 254(0.6) 261(1.5) ↑
Dadra and Nagar Haveli 236(5.2) 252(4.5) ↑
Daman and Diu 233(5.6) 232(4.5) ↔
Chapter_8_ Modern Indian Language (MIL).indd 127 18-02-2021 10:46:15

Learning Achievement of Students — NAS Class X (Cycle 2) 2018128
States/UTs/Boards Boys' Average (Standard Error)
Girls' Average (Standard Error)
Significant Difference
Delhi 268(1.3) 276(1.5) ↑
Goa 250(2.1) 250(4.7) ↔
Gujarat 245(1.3) 250(0.5) ↑
Haryana 253(1.3) 254(1.6) ↔
Himachal Pradesh 249(1.7) 255(2.4) ↑
Jammu and Kashmir 214(5.4) 221(2.5) ↔
Jharkhand 236(1.3) 230(1.1) ↓
Karnataka 253(0.6) 255(0.7) ↔
Kerala 276(1.0) 281(2.1) ↔
Madhya Pradesh 246(1.1) 246(0.6) ↔
Maharashtra 260(1.3) 266(1.2) ↑
Manipur 187(4.2) 186(5.4) ↔
Mizoram 266(4.8) 264(1.6) ↔
Odisha 257(1.7) 260(0.4) ↔
Puducherry 270(2.0) 245(5.1) ↓
Punjab 256(1.3) 268(1.1) ↑
Rajasthan 261(1.4) 259(0.5) ↔
Sikkim 238(3.6) 237(3.4) ↔
Tamil Nadu 248(0.6) 251(1.0) ↑
Telangana 247(1.6) 247(1.6) ↔
Tripura 256(5.1) 243(2.2) ↓
Uttarakhand 272(10.9) 250(0.9) ↓
CBSE 284(1.8) 275(6.0) ↓
ICSE 260(1.8) 278(5.4) ↑
National 253(0.6) 255(0.2) ↑
↔ No significant difference between the average performance of girls and boys.↑ Girls’ average performance is significantly greater than that of boys.↓ Boys’ average performance is significantly greater than that of girls.
Location of Schools
Table 8.4 depicts the average Reading Comprehension scores achieved by students in rural and urban schools. Results reveal that overall there was a significant difference observed between the performance of rural and urban students. Performance of rural students was significantly lower
than the urban students in reading comprehension achievements. Similar trend showing in 15 States/UTs of Jammu and Kashmir, Uttarakhand, Haryana, Delhi, Rajasthan, Sikkim, Manipur, Mizoram, Jharkhand, Chhattisgarh, Madhya Pradesh, Gujarat, Daman and Diu, Goa and Puducherry, i.e., rural students significantly performed lower than urban students.
Chapter_8_ Modern Indian Language (MIL).indd 128 18-02-2021 10:46:15

129
Stud
ents’
Ach
ieve
men
ts in
Mod
ern
Indi
an
Lang
uage
(MIL
)
Table 8.4: Average Reading Comprehension Scores by Location
States/UTs/Boards Rural Average (Standard Error)
Urban Average (Standard Error)
Significant Difference
Andaman and Nicobar Islands 255(5.1) 241(7.2) ↑
Andhra Pradesh 251(0.5) 249(0.9) ↔
Arunachal Pradesh 239(1.9) 224(3.4) ↑
Assam 253(0.7) 254(2.3) ↔
Bihar 230(1.3) 230(1.4) ↔
Chandigarh 264(6.5) 264(4.8) ↔
Chhattisgarh 252(0.5) 272(3.2) ↓
Dadra and Nagar Haveli 245(6.0) 249(10.8) ↔
Daman and Diu 225(7.8) 243(7.3) ↓
Delhi 263(3.8) 274(0.8) ↓
Goa 247(3.9) 260(2.9) ↓
Gujarat 241(0.8) 257(1.1) ↓
Haryana 251(1.2) 262(2.4) ↓
Himachal Pradesh 252(1.3) 252(3.1) ↔
Jammu and Kashmir 213(3.5) 239(5.1) ↓
Jharkhand 232(0.5) 238(2.1) ↓
Karnataka 258(0.4) 249(0.7) ↑
Kerala 278(0.9) 279(2.5) ↔
Madhya Pradesh 243(0.7) 250(0.4) ↓
Maharashtra 263(0.8) 262(2.3) ↔
Manipur 180(3.1) 194(7.0) ↓
Mizoram 260(2.6) 268(3.6) ↓
Odisha 258(0.6) 261(2.4) ↔
Puducherry 253(5.3) 263(6.0) ↓
Punjab 261(0.3) 261(1.2) ↔
Rajasthan 256(1.0) 269(1.3) ↓
Sikkim 236(2.9) 263(8.3) ↓
Tamil Nadu 249(1.2) 251(0.5) ↔
Telangana 246(0.6) 248(1.8) ↔
Tripura 252(3.6) 241(2.7) ↑
Uttarakhand 244(0.6) 282(14.0) ↓
CBSE 276(6.2) 282(2.4) ↓
ICSE 254(4.9) 271(3.3) ↓
National 251(0.2) 258(0.6) ↓↔ No significant difference between the average performance of rural and urban students.↑ Rural students’ average performance is significantly higher than that of urban students.↓ Rural students’ average performance is significantly lower than that of urban students.
Chapter_8_ Modern Indian Language (MIL).indd 129 18-02-2021 10:46:15

Learning Achievement of Students — NAS Class X (Cycle 2) 2018130
Social Category
Table 8.5 shows the average Reading Comprehension scores achieved by students in social categories across States/UTs. At National level SC, ST and OBC category students were performing lower than the ‘Others’. SC and OBC students were performing significantly better than the ST students
Table 8.5: Average Reading Comprehension Scores by Social Category
States/UTs/Boards Others Scheduled Caste Sig. Scheduled
Tribe Sig.Other
Backward Classes
Sig.
Andaman and Nicobar Islands 253(3.4) – – 203(11.3) ↓ 276(6.0) ↑
Andhra Pradesh 264(1.5) 254(1.1) ↓ 242(5.2) ↓ 254(0.8) ↓
Arunachal Pradesh 234(5.7) 205(14.3) ↓ 235(1.5) ↔ 252(5.7) ↑
Assam 254(1.0) 252(1.9) ↔ 250(2.0) ↔ 255(1.0) ↔
Bihar 236(2.4) 226(1.5) ↓ 222(2.3) ↓ 230(1.3) ↓
Chandigarh 265(4.7) 270(3.7) ↑ 149(25.2) ↓ 261(17.0) ↓
Chhattisgarh 266(3.8) 251(2.0) ↓ 266(3.1) ↔ 255(1.9) ↓
Dadra and Nagar Haveli 246(10.0) 262(23.4) ↑ 245(5.2) ↔ – –
Daman and Diu 237(7.3) – – 223(11.4) ↓ 231(4.7) ↔
Delhi 274(1.0) 268(2.4) ↓ 278(12.0) ↑ 268(3.3) ↔
Goa 256(3.7) 245(9.4) ↓ 237(7.5) ↓ 245(3.9) ↓
Gujarat 260(1.3) 251(2.2) ↓ 233(1.5) ↓ 245(1.4) ↓
Haryana 263(2.2) 245(1.5) ↓ – – 251(1.1) ↓
Himachal Pradesh 253(1.7) 251(4.4) ↔ 245(4.5) ↓ 254(2.0) ↔
Jammu and Kashmir 218(2.3) 237(5.4) ↑ 206(5.5) ↓ 210(13.0) ↓
Jharkhand 241(2.9) 224(1.6) ↓ 232(1.4) ↓ 233(0.7) ↓
Karnataka 254(1.8) 251(1.8) ↔ 251(2.2) ↔ 255(0.3) ↔
Kerala 277(1.3) 265(4.0) ↓ 274(2.3) ↔ 281(1.5) ↔
Madhya Pradesh 251(1.2) 244(0.8) ↓ 237(0.7) ↓ 248(0.9) ↔
Maharashtra 266(2.4) 263(1.0) ↔ 245(1.1) ↓ 264(0.6) ↔
Manipur 182(6.2) 170(2.7) ↓ 182(12.9) ↔ 192(6.0) ↑
Mizoram – 274(21.2) – 265(3.0) – – –
Odisha 270(3.0) 255(1.6) ↓ 249(1.3) ↓ 260(1.0) ↓
Puducherry 269(4.9) 239(7.3) ↓ – – 263(4.1) ↓
Punjab 265(1.2) 257(0.6) ↓ 191(19.8) ↓ 257(1.7) ↓
Rajasthan 271(1.0) 256(2.0) ↓ 243(2.5) ↓ 262(2.1) ↓
Sikkim 251(4.5) 223(8.9) ↓ 233(4.2) ↔ 245(4.7) ↓
in MIL (Reading Comprehension). In Jammu and Kashmir, Chandigarh and Dadra and Nagar Haveli SC students performed better than the ‘Others’ category students. The States of Arunachal Pradesh, Manipur, Tamil Nadu and Andaman and Nicobar Islands Islands, OBC students performed better than ‘Others’ category students.
* Sig - Significant Difference
Chapter_8_ Modern Indian Language (MIL).indd 130 18-02-2021 10:46:16

131
Stud
ents’
Ach
ieve
men
ts in
Mod
ern
Indi
an
Lang
uage
(MIL
)
States/UTs/Boards Others Scheduled Caste Sig. Scheduled
Tribe Sig.Other
Backward Classes
Sig.
Tamil Nadu 245(4.4) 246(1.6) ↔ 225(4.0) ↓ 252(0.9) ↑
Telangana 254(2.9) 243(2.5) ↓ 244(3.3) ↓ 246(1.1) ↓
Tripura 252(2.2) 254(1.9) ↔ 253(8.3) ↔ 247(5.2) ↓
Uttarakhand 276(14.4) 266(8.4) ↓ 210(2.6) ↓ 243(2.0) ↓
CBSE 288(4.0) 278(5.8) ↓ – – 269(5.6) ↓
ICSE 269(3.7) 237(12.1) ↓ 270(19.3) ↑ 275(6.2) ↑
National 261(0.6) 252(0.5) ↓ 244(1.0) ↓ 253(0.3) ↓
↔ No significant difference between the average performance of SC/ST/OBC students and Others students.↑ SC/ST/OBC students’ average performance is significantly higher than that of Others students.↓ SC/ST/OBC students’ average performance is significantly lower than that of Others students.
School Management
Table 8.6 shows the average reading comprehension scores achieved by students in different management categories across States/UTs. There was significant difference in scores of students from government, government-aided and private schools. Data also revealed significant difference in scores of government and government-aided schools. Government-aided schools performed significantly better than the government schools. Government-aided schools in States/UTs like Chandigarh, Uttarakhand, Delhi, Rajasthan, Sikkim, Arunachal Pradesh, Chhattisgarh, Daman and Diu, Dadra and Nagar Haveli, Maharashtra, Andhra Pradesh, Goa, Tamil Nadu, Gujarat, Haryana, Jharkhand and
Telangana performed better than government schools.
Private schools performed significantly better than the government schools in 17 States/UTs, namely Jammu and Kashmir, Punjab, Uttarakhand, Haryana, Delhi, Rajasthan, Assam, Jharkhand, Madhya Pradesh, Gujarat, Daman and Diu, Dadra and Nagar Haveli, Maharashtra, Andhra Pradesh, Tamil Nadu, Andaman and Nicobar Islands and Telangana. However, in States/UTs like Himachal Pradesh, Goa, Manipur, Mizoram, and Puducherry, private schools performed significantly lower than government schools. In remaining States/UTs, there was no significant difference in the scores of private and government schools.
Table 8.6: Average Reading Comprehension Scores by School Management
States/UTs/Boards Government Government-aided
Significant Difference Private Significant
Difference
Andaman and Nicobar Islands 242(3.4) – – 291(8.2) ↑
Andhra Pradesh 245(3.3) 255(0.9) ↑ 258(2.5) ↑
Arunachal Pradesh 233(1.0) 244(8.9) ↑ 234(6.7) ↔
Assam 253(0.6) 251(1.2) ↔ 264(3.2) ↑
Bihar 230(1.1) 220(1.3) ↓ 231(1.6) ↔
Chandigarh 262(4.7) 333(17.1) ↑ – –
Chhattisgarh 257(0.9) 265(4.1) ↑ 259(3.9) ↔
Dadra and Nagar Haveli 244(3.3) 277(21.8) ↑ 298(24.1) ↑
Daman and Diu 222(6.2) 280(10.7) ↑ 251(5.7) ↑
Delhi 268(0.8) 278(4.5) ↑ 280(3.0) ↑
Chapter_8_ Modern Indian Language (MIL).indd 131 18-02-2021 10:46:16

Learning Achievement of Students — NAS Class X (Cycle 2) 2018132
States/UTs/Boards Government Government-aided
Significant Difference Private Significant
Difference
Goa 244(6.9) 252(3.8) ↑ 219(15.1) ↓
Gujarat 238(3.2) 244(0.7) ↑ 257(1.7) ↑
Haryana 246(0.9) 251(4.0) ↑ 264(2.0) ↑
Himachal Pradesh 253(1.4) – – 244(3.4) ↓
Jammu and Kashmir 205(3.6) 188(17.1) ↓ 237(3.3) ↑
Jharkhand 231(0.8) 238(3.5) ↑ 239(1.4) ↑
Karnataka 255(0.6) 254(1.0) ↔ 252(1.3) ↔
Kerala 280(1.4) 278(1.8) ↔ 277(3.4) ↔
Madhya Pradesh 243(0.6) 236(4.8) ↓ 251(0.7) ↑
Maharashtra 230(5.5) 262(0.7) ↑ 272(5.3) ↑
Manipur 190(7.6) 178(5.8) ↓ 185(3.6) ↓
Mizoram 267(4.2) 261(5.4) ↓ 259(6.9) ↓
Odisha 258(0.8) 263(2.9) ↔ 262(3.5) ↔
Puducherry 269(6.6) 256(7.8) ↓ 252(1.9) ↓
Punjab 258(0.8) 260(3.5) ↔ 264(1.0) ↑
Rajasthan 254(0.6) 261(9.5) ↑ 265(1.4) ↑
Sikkim 237(2.9) 252(27.7) ↑ – –
Tamil Nadu 246(1.3) 253(0.6) ↑ 251(1.0) ↑
Telangana 245(0.3) 250(6.6) ↑ 249(1.7) ↑
Tripura 251(3.1) – – – –
Uttarakhand 244(1.2) 252(1.7) ↑ 282(14.0) ↑
CBSE 291(15.4) – – 280(2.0) ↓
ICSE – – – 268(2.6) –
National 248(0.2) 257(0.4) ↑ 259(0.6) ↑
↔ No significant difference between the average performance of government-aided/private students and government students.↑ Government Aided/private students’ average performance is significantly higher than that of government students.↓ Government Aided/private students’ average performance is significantly lower than that of government students.
8.4. Proficiency levelS Proficiency levels provide a convenient way to describe profiles of student achievement. Children whose results are located within a particular level of proficiency are expected to understand the competencies and skills associated with that and lower levels. In NAS Class X Cycle 2 student’s performance in MIL was gauged using five proficiency levels based on the numeric scores achieved in the assessment.
Figure 8.2 divides the average MIL scores achieved by students into five proficiency levels. Each level comprises of the percentage of the students for that level. It can be observed that maximum number of students that is 35 per cent lied between proficiency level 251–300 whereas 16 per cent students belong to lower proficiency level of less than 200. Only 2 per cent students belong to the highest proficiency levels, i.e., greater than 350.
Chapter_8_ Modern Indian Language (MIL).indd 132 18-02-2021 10:46:16

133
Stud
ents’
Ach
ieve
men
ts in
Mod
ern
Indi
an
Lang
uage
(MIL
)
Fig. 8.2: Proficiency Levels in MIL
yy Management: 16 per cent and 20 per cent of students from government-aided schools and private schools, respectively, performed in this category, whereas 64 per cent of students from government schools performed below score 200.
yy Social Groups: On an average, 45 per cent of OBC category students scored in this category whereas 17 per cent of students belonging to SC category, 17 per cent of students belonging ST category and 21 per cent of students belonging to ‘Others’ category performed below the score of 200 in reading comprehension in MIL.
Distribution of Students Performing Less than 200
Figure 8.3 shows the distribution of students’ characteristics performing below score 200 in reading comprehension.
yy Gender: The graphs shows that overall 50 per cent of male and 50 per cent of female students performed below the 200 score in MIL.
yy Location: It was observed that 77 per cent of rural students performed in this category, whereas only 23 per cent of urban students performed below score 200 in reading comprehension in MIL.
Fig. 8.3: Characteristics of Students Performing below the Mean Score of 200 by Gender, Location, School Management, and Social Groups
Chapter_8_ Modern Indian Language (MIL).indd 133 18-02-2021 10:46:17

Learning Achievement of Students — NAS Class X (Cycle 2) 2018134
Distribution of Students based on Score Range
Table 8.7 depicts the distribution of the range of students’ ability in terms of correct answers across States/UTs. The table shows the proportion of students answering correctly in four ranges. It shows the proportion of students who scored 0–35 per cent, 36–50 per cent, 51–75 per cent and the proportion of students who scored more than 75 per cent. At national level, majority of students i.e.,
39 per cent students scored in range of 51–75 per cent. There is a huge inter-state variation with respect to proportion of students answering correctly in varied four ranges. For instance, more than 50 per cent of students in States/UTs like Jammu and Kashmir, Sikkim, Manipur and Arunachal Pradesh scored in the range of 0 to 35 per cent whereas on an average 50 per cent of students in States/UTs like Kerala, Karnataka, Mizoram and Delhi scored in the range of 51–75 per cent.
Table 8.7: Students’ Performance using Absolute Scores
States/UTs/Boards (0–35 %) (36–50 %) (51–75 %) (76–100 %)
Andaman and Nicobar Islands 34.76 27.04 28.97 9.23
Andhra Pradesh 32.76 39.05 26.81 1.38
Arunachal Pradesh 51.65 22.47 23.13 2.75
Assam 18.87 28.39 46.37 6.37
Bihar 45.88 22.85 25.88 5.40
Chandigarh 15.57 23.44 44.83 16.16
Chhattisgarh 22.93 28.04 41.63 7.40
Dadra and Nagar Haveli 35.00 43.08 21.15 0.77
Daman and Diu 32.71 39.25 27.57 0.47
Delhi 11.31 20.77 51.00 16.92
Goa 23.01 36.41 37.73 2.84
Gujarat 25.39 29.88 40.30 4.43
Haryana 26.72 25.65 37.91 9.71
Himachal Pradesh 21.18 27.35 43.46 8.01
Jammu and Kashmir 72.26 20.37 6.40 0.97
Jharkhand 35.56 26.02 32.56 5.86
Karnataka 13.96 22.84 54.90 8.30
Kerala 13.00 22.65 59.21 5.13
Madhya Pradesh 27.09 28.61 37.10 7.20
Maharashtra 21.93 31.72 40.94 5.41
Manipur 53.74 39.70 6.56 –
Mizoram 8.77 15.27 68.07 7.88
Odisha 26.59 25.46 38.37 9.58
Puducherry 30.18 31.40 36.75 1.67
Punjab 22.68 29.44 42.19 5.69
Rajasthan 16.47 20.23 43.93 19.38
Chapter_8_ Modern Indian Language (MIL).indd 134 18-02-2021 10:46:17

135
Stud
ents’
Ach
ieve
men
ts in
Mod
ern
Indi
an
Lang
uage
(MIL
)
States/UTs/Boards (0–35 %) (36–50 %) (51–75 %) (76–100 %)
Sikkim 50.38 29.70 19.08 0.85
Tamil Nadu 23.99 34.90 38.63 2.49
Telangana 27.18 32.75 36.29 3.78
Tripura 46.56 36.78 16.66 –
Uttarakhand 20.80 26.25 44.34 8.61
CBSE 10.49 16.15 49.13 24.23
ICSE 21.81 20.64 43.46 14.09
National 26.51 27.46 38.98 7.05
8.5. concluSion The average achievement of students in Reading Comprehension varies across the States and UTs of India. There is a significant difference between performances in high scoring States/UTs, such as Kerala (279), Delhi (272), Uttarakhand (266), Maharashtra (263) and low scoring States/UTs such as Manipur (187), Jammu and Kashmir (218), Bihar (230) and Daman and Diu (232).
Besides this, States also vary in the range between their lowest and highest achieving students as revealed by their inter-quartile score ranges; that presents relatively homogeneous cohorts in some States/UTs and far more diverse performances amongst the others. Overall significant difference was observed in the average achievement of girls and boys. Similarly, significant difference was observed between the achievement level of rural and urban
students. Further, the students of general category outperformed their peers from the SC, ST and OBC categories by a statistically significant margin.
The significant difference was also observed in the achievement level of students studying in schools managed by different managements. While students in private schools significantly performed better than government and government-aided schools, there persisted variation in the performance of students from government and government-aided schools and later was found to outperform than former.
Moreover, majority of students in MIL were found to score between 251 to 300, whereas 64 per cent of students from the government schools across States performed below the average score of 200 in the reading comprehension. Further, at National level, majority of students answered the items correctly and are lying between the range of 51–75 per cent.
Chapter_8_ Modern Indian Language (MIL).indd 135 18-02-2021 10:46:17

The relationship between learning achievement of students and some variables related to student’s home background and school were analysed by using regression technique. International studies (OECD, 2001, 2004 and 2007) indicate that the student’s related variables and learning achievement of students does not vary markedly across the subjects.
For analysis three key variables have been included because of their importance in attainment of educational success, i.e., socio-economic status, language spoken at home and location (urban/rural) of the school.The following method of analysis is adopted:• The relation (‘bivariate’) between the background variable and the outcome in five subjects arepresented without key variables and then the relation is presented after allowing for these three ‘key’ variables altogether.
• One category, usually the largest, is designated as a ‘base’ category/group, and assigned a zero value,andallothercategories/groupsaredefinedin terms of their difference from the result of base category.
• Since key variables are a very important aspect of attainment, it often, though by no means unfailingly, happens that including such other, key variables in the regression means that the apparent univariate relationship is diluted.
The information in this chapter comes from the pupil and school questionnaires. It is important to keep in mind that the primary focus of this study was not to explain differences in attainment, but to compare the levels of attainment of entities in the national educational system.
9.1. School FactorS and Student achievement
The earlier National Achievement Survey conducted by NCERT supported the hypothesis that student performance is directly linked with the quality of education provided in the schools. Learning environment and school infrastructural facilities also contribute in all round development of the students. This section attempts to analyse the relationship of students’ achievement with some school related variables.
Table 9.1: School Participation
School Participation Without Key Variable With Key Variable
Coeff. SE Coeff. SEScience Exhibition -0.41 0.93 -0.27 1.06Art club Activities 2.82 0.83 3.33 0.93
C H A P T E R 9
Contextual Analysis of Background Variables
Chapter_9_Contextual Analysis.indd 136 18-02-2021 14:34:38

137
Con
text
ual A
naly
sis o
f Bac
kgro
und
Varia
bles
Sports Activities 1.67 1.38 2.21 1.58Cultural Activities 0.67 1.2 -1.06 1.35Quiz 0.42 1.05 1.64 1.17
Table 9.1 shows that schools’ participation in various activities like art club activities, sports activities, cultural activities and quiz had positive association with the achievement of students without key variables. The similar kind of positive association was found between the achievement of students and their school participation after including key variables except for participation in science exhibition and cultural activities after including key variables.
Table 9.2 shows that schools having the learning facilities of language laboratory, library, computer lab and audio-video resources had positive association with the achievement of students.
Table 9.2: Learning Facilities
Learning Facilities Without Key Variable With Key Variable
Coeff. SE Coeff. SEScience Laboratory -1.24 1.03 -1.23 1.16Mathematics Laboratory -0.86 0.93 -0.21 1.07Language Laboratory 1.47 1.08 -0.18 1.25Social Science Room -1.37 0.95 -2 1.09Indoor Games -0.85 0.76 -1.25 0.87Library 1.72 1.25 1.23 1.4Computer Lab 4.15 0.93 3.24 1.05Audio Video Resources 1.8 0.82 1.59 0.93
Table 9.3: School Facilities
Facilities in SchoolWithout Key Variable With Key Variable
Coeff. SE Coeff. SE
Trained ICT Personnel 2.33 0.81 2.8 0.92
Electric Connection 0.32 0.03 0.33 0.03
Staff Room 0.54 1.13 -0.01 1.25
Drinking Water 0.04 1.7 1.74 1.88Classroom Access to Children with Special Needs (CWSN) 1.82 0.85 1.67 0.96
Toilet Access to CWSN 1.35 0.82 0.23 0.94
Playground 0.06 1.03 0.63 1.17
Trained Physical Education Teachers 3.5 0.84 2.82 0.94
Parent Teacher Association 2.45 1.13 3.22 1.29
However, the difference is very small or negligible. The similar kind of positive association was observed with achievement for the learning facilities library, computer lab and audio-video resources after including key variables. On the other hand science laboratory, mathematics laboratory, social science room and indoor games had negative association with achievement of students in school. The similar kind of negative association was observed after including key variables for the learning facilities, science laboratory, mathematics laboratory, language laboratory, social science and indoor games.
Chapter_9_Contextual Analysis.indd 137 18-02-2021 14:34:38

Learning Achievement of Students — NAS Class X (Cycle 2) 2018138
Table 9.3 shows the infrastructure facilities that affect the achievement of students. Trained ICT personnel, electric connection, staff room, drinking water, classroom access to Children with Special Needs (CWSN), toilet access to CWSN, playground, trained physical education teachers and parent-teacher association had positive association with the achievement of students in school. However, the difference is very small or negligible. After including key variables, the similar kind of positive association was observed with the achievement of students for the facilities.
9.2. StudentS‘ Background and achievement
Student learning never takes place in isolation. It is influenced by various factors, such as homebackground, school environment and socio-cultural environment. This section seeks to understand the relationship between students’ home background and their achievement in Mathematics.
The same method of analysis is used to understandtheinfluenceofstudentbackgroundonachievement. First the relationship was considered on its own, and then after allowing for key variables. If a relation between a variable and an outcome is not extinguished by making such allowances, it is reasonable to suggest that the variable is associated with the outcome.
9.2.1 Mathematics
Table 9.4: Distance to School
Distance to School
Without Key Variable
With Key Variable
Coeff. SE Coeff. SE
More than 10 km. 0.5 0.81 0.74 1.12
Table 9.4 shows that the distance of school from residence of the students is positively associated
with achievement of students in Mathematics. The similar kind of positive association was observed after including key variables.
Table 9.5: Facilities at Home
Facilities at Home
Without Key Variable
With Key Variable
Coeff. SE Coeff. SE
Newspaper -1.07 0.82 -0.38 1.2
Magazine 1.89 0.84 0.82 1.22
Radio 0.5 0.89 1.39 1.3
Television -1.97 0.96 -3.7 1.44
Calculator 2.44 1.22 3.45 1.97
Computer 0.38 0.83 -0.04 1.22
Internet -0.38 0.84 -0.21 1.25
Table 9.5 shows that the availability of facilities at home, such as magazine, radio, calculator and computer had positive association with achievement of students. The similar kind of positive association was observed for the availability of facilities like magazine, radio and calculator with achievement of students in mathematics after including key variables.
Table 9.6 shows that the assignments/projects posted online by school and communication with teachers using the Internet had positive association with achievements of students, without and with key variables. However, reading the textbook/reference materials and communication with classmates showed negative impact on achievement of students in mathematics, both before and after including key variables.
Table 9.6: Use of Internet for Completing Homework or School Work
Use of Internet for Completing Homework/School Work
Without Key Variable With Key Variable
Coeff. SE Coeff. SE
Read the textbook/reference materials -2.74 1.08 -3.34 1.2
Assignments/projects, posted online by school 1.36 0.99 0.45 1.1
Communicate with classmates -0.66 1.21 -0.76 1.32
Communicate with the teachers 2.14 1.15 2.34 1.25
Chapter_9_Contextual Analysis.indd 138 18-02-2021 14:34:38

139
Con
text
ual A
naly
sis o
f Bac
kgro
und
Varia
bles
9.2.2 English
Table 9.7: Distance to School
Distance to School
Without Key Variable
With Key Variable
Coeff. SE Coeff. SEMore than 10 km. -1.40 0.72 -2.57 1.09
Table 9.7 shows that, the distance of school from residence of the students was negatively associated with achievement of students in English. The similar kind of negative association was observed after including key variables.
Table 9.8: Facilities at Home
Facilities at Home
Without Key Variable
With Key Variable
Coeff. SE Coeff. SE
Newspaper -1.62 0.81 0.27 1.18
Magazine 0.53 0.83 0.83 1.19
Radio 1.82 0.88 0.74 1.27
Television -0.80 0.95 -0.45 1.41
Calculator 0.94 0.95 0.25 1.93
Computer -0.37 0.82 -0.44 1.19
Internet 0.75 0.83 1.69 1.22
Table 9.8 shows that the availability of magazine, radio, calculator and Internet facilities at home had positive association with achievement of students, without and with key variables and other facilities had negative impact on achievement of students in English.
Table 9.9 shows that the assignments and projects posted online by school and communication with teachers using Internet had positive association with achievements of students and tasks like assignments/
projects and communication with classmates were negatively associated with achievement of students in English. The similar kind of positive and negative associations were observed for other tasks using Internet with the achievement of students in English after including key variables.
9.2.3 Modern Indian Language (MIL)
Table 9.10: Distance to School
Distance to School
Without Key Variable
With Key Variable
Coeff. SE Coeff. SE
More than 10 km -0.56 0.81 -1.30 1.09
Table 9.10 shows that, the distance of school from residence of the students is negatively associated with achievement of students in MIL. The similar kind of negative association was observed after including key variables.
Table 9.11: Facilities at Home
Facilities at Home
Without Key Variable
With Key Variable
Coeff. SE Coeff. SE
Newspaper -0.55 0.81 -0.18 1.17
Magazine 1.69 0.83 2.57 1.19
Radio 0.58 0.88 0.02 1.26Television -2.12 0.95 -1.18 1.40Calculator 1.11 1.21 0.86 1.92
Computer -0.45 0.82 -1.12 1.19Internet 0.19 0.83 0.24 1.22
Table 9.11 shows that the magazine, radio, calculator and Internet facilities at home show positive impact on achievement of students and other facilities had negative impact on achievement of students in MIL. The similar kind of positive and negative associations
Table 9.9: Use of Internet for Completing Homework or School Work
Use of Internet for Completing Homework/School work
Without Key Variable With Key Variable
Coeff. SE Coeff. SE
Read the textbook/reference materials 0.93 1.07 1.01 1.17
Assignments/projects, posted online by school -3.78 0.98 -4.26 1.08
Communicate with classmates -1.00 1.19 -1.79 1.29
Communicate with the teachers 0.92 1.13 2.04 1.22
Chapter_9_Contextual Analysis.indd 139 18-02-2021 14:34:38

Learning Achievement of Students — NAS Class X (Cycle 2) 2018140
were observed with the achievement of students in MIL after including key variables.
Table 9.12 shows that, completing assignments/projects, communication with teachers and communication with classmates using Internet facility had positive impact on achievement of students without and with key variables.
9.2.4 ScienceTable 9.13: Distance to School
Distance to School
Without Key Variable
With Key Variable
Coeff. SE Coeff. SEMore than 10 km -0.94 0.76 -1.48 1.10
Table 9.13 shows that, the distance of school from residence of the students is negatively associated with achievement of students in science. The similar kind of negative association with achievement of students was observed after including key variables.
Table 9.14: Facilities at Home
Facilities at Home
Without Key Variable
With Key Variable
Coeff. SE Coeff. SE
Newspaper 0.05 0.81 1.48 1.18
Magazine 1.92 0.83 0.65 1.20
Radio 1.47 0.88 1.15 1.28
Television -1.11 0.96 -0.34 1.42
Calculator -1.68 1.21 -1.06 1.94
Computer -0.84 0.82 -0.89 1.20
Internet 0.38 0.83 1.60 1.23
Table 9.14 shows that the newspaper, magazine, radio, Internet facilities have positive impact on achievement of students, while other facilities had negative impact on achievement of students in science. The similar kind of positive and negative association with achievement of students was observed after including key variables.
Table 9.15 shows that, the assignments/projects, posted online by school and communication with classmates using Internet had positive impact on achievements of students while communication with classmates using Internet showed negative impact on attainment after including key variable. Reading the textbook/references materials and communication with teachers using Internet had negative impact on science achievement. The similar kind of negative association was observed for the same after including key variables.
Table 9.12: Use of Internet for Completing Homework/School Work
Use of Internet for Completing HomeWork/School work
Without Key Variable With Key Variable
Coeff. SE Coeff. SE
Read the textbook/reference materials -2.58 1.06 -2.37 1.17
Assignment and projects, posted online by school 0.12 0.97 0.13 1.07
Communicate with classmates 0.25 1.18 0.38 1.29
Communicate with the teachers 1.10 1.12 1.15 1.21
Table 9.15: Use of Internet for Completing Homework or School Work
Use of Internet for Completing Homework/School work
Without Key Variable With Key Variable
Coeff. SE Coeff. SE
Read the textbook/reference materials -1.34 1.07 -1.83 1.18
Assignments/projects, posted online by school 0.62 0.98 0.01 1.08
Communicate with classmates 0.32 1.19 -0.21 1.30
Communicate with the teachers -0.49 1.13 -0.28 1.23
Chapter_9_Contextual Analysis.indd 140 18-02-2021 14:34:38

141
Con
text
ual A
naly
sis o
f Bac
kgro
und
Varia
bles
9.2.5 Social ScienceTable 9.16: Distance to School
Distance to School
Without Key Variable
With Key Variable
Coeff. SE Coeff. SE
More than 10 km. -0.24 0.76 -0.02 1.11
Table 9.16 shows that, the distance of school from residence of the students is negatively associated with achievement of students in social science. The similar kind of negative association with achievement of students in social science was observed after including key variables.
Table 9.17: Facilities at Home
Facilities at Home
Without Key Variable
With Key Variable
Coeff. SE Coeff. SENewspaper 0.08 0.81 0.39 1.19Magazine -0.29 0.83 -2.41 1.21Radio 3.17 0.88 1.98 1.29Television 0.18 0.96 0.80 1.43Calculator -0.37 1.21 -0.68 1.95Computer -1.00 0.82 -0.38 1.21Internet -0.78 0.83 -0.47 1.24
Table 9.17 shows that, the facilities, such as newspaper, radio and television had positive association with achievement of students, while other facilities available at home showed negative impact on achievement of students in social science. The similar kind of positive and negative association with achievement of students was observed after including key variables.
Table 9.18 shows that, usage of Internet for the assignments/projects and reading the textbook/reference material had positive impact on achievement of students while communication
with teachers and classmates using internet had negative impact in social science achievement. The similar kind of positive and negative association was observed after including key variables.
9.3. teacher FactorS and Student achievement
The earlier National Achievement Survey conducted by NCERT shows that teacher performance is directly linked with the quality of education. Learning environment and school infrastructural facilities also contribute in all round development of the students. This section attempts to analyse the relationship of students’ achievement with some teacher related variables. Teachers are a vital component of the educational process and it is very important to know the characteristics of teachers, the strategies they use in the classroom and their general attitudes towards teaching in schools, etc.
9.3.1 Student Achievement of English
Table 9.19: Highest Educational Qualification
Highest Educational Qualification
Coeff. SE
Graduation 7.52 2.14
Post-graduation 4.94 2.14
M.Phil./Ph.D 1.62 2.40
From the results shown in Table 9.19 interpreted that teacher’s educational qualification, i.e., graduation,post-graduation, M.Phil./Ph.D. had positive association with attainment of students.
Table 9.20: Highest Teacher Training
Highest Teacher Training Coeff. SE
B.Ed. -3.45 0.50
M.Ed. -5.26 0.81
Table 9.18: Use of Internet for Completing Homework or School Work
Use of Internet for Completing Homework/School work
Without Key Variable With Key Variable
Coeff. SE Coeff. SE
Read the textbook/reference materials 0.72 1.08 2.13 1.19
Assignments/projects, posted online by school 2.22 0.99 3.09 1.09
Communicate with classmates -0.29 1.20 -0.50 1.31
Communicate with the teachers -0.63 1.14 -1.26 1.23
Chapter_9_Contextual Analysis.indd 141 18-02-2021 14:34:39

Learning Achievement of Students — NAS Class X (Cycle 2) 2018142
Table9.20showsthatteacher’strainingqualifications,i.e., Secondary Teacher Training (B.Ed. and M.Ed.) had negative association with achievement of students.
Table 9.21: Teaching Experience
Teaching Experience Coeff. SE6–10 year 3.24 0.53More than 10 year 6.97 0.55
Table 9.21 shows that teacher’s teaching experience is positively associated with achievement of students.
Table 9.22: In-service Training
In-service Training Coeff. SE3–5 month -0.85 0.48None 0.60 0.46
Table 9.22 shows that teacher’s having attended in-service training programmes had negative association with achievement of students.
Table 9.23: Participation in Activities
Participation in Activities Coeff. SEQualificationEnrichmentProgramme -2.29 0.42
Participation in Professional Development Programme 0.64 0.43
Individual or Collaborative Research 0.32 0.45
Mentoring/Peer Observation 2.61 0.41
Engaging in infomal dialogue with colleagues to improve teaching 3.08 0.51
Table 9.23 shows that teacher’s participation in activities, such as participation in professional development programme, individual or collaborative research, mentoring/peer observation as part of a formal school management and engaging in informal dialogue with colleagues to improve teaching had positive association with achievement of students. However, teacher’s participation in qualificationenrichment programme had negative association with achievement of students.
9.3.2 Student Achievement of MathematicsTable 9.24: Highest Educational Qualification
Highest educational qualification
Coeff. SE
Graduation -9.45 7.55Post-graduation -4.81 7.52M.Phil./Ph.D. -6.44 8.52
Results shown in the Table 9.24 reveal that teachers’ educational qualification i.e., graduation, post-graduation, M.Phil. /Ph.D. had negative association with achievement of students.
Table 9.25: Highest Teacher Training
Highest teacher training
Coeff. SE
B.Ed. -0.94 2.42
M.Ed. -2.36 3.12
According to the results shown in Table 9.25 the teacher’s profes sional qualification i.e., SecondaryTeacher Training (B.Ed.) and M.Ed. had negative association with achievement of students.
Table 9.26: Teaching Experience
Teaching Experience Coeff. SE
06–10 years 4.76 2.08
More than 10 years -1.02 2.20
Teacher’s teaching experience of 6–10 years had positive association and experience of more than 10 years had negative association with achievement of students in mathematics (Table 9.26).
Table 9.27: In-service Training
In-service Training Coeff. SE
3–5 years 3.98 2.33
None 4.85 1.89
Teachers having attended in-service training programme had positive association with achievement of students (Table 9.27).
Table 9.28: Participation in Activities
Participation in Activities Coeff. SEQualificationEnrichmentProgramme -1.75 1.99
Participation in Professional Development Programme 2.92 1.81
Individual or Collaborative Research 1.38 2.04
Mentoring/Peer Observation 3.83 1.74
Engaging in informal dialogue with colleagues to improve teaching
2.69 2.17
Table 9.28 shows that teacher’s participation in activities, such as participation in professional
Chapter_9_Contextual Analysis.indd 142 18-02-2021 14:34:39

143
Con
text
ual A
naly
sis o
f Bac
kgro
und
Varia
bles
development programme, individual or collaborative research, mentoring/peer observation and engagement in informal dialogue with colleagues to improve teaching had positive association with achievement of students. On the other hand teacher’s participationinqualificationenrichmentprogrammehad negative association with achievement of students.
9.3.3 Student Achievement of MILTable 9.29: Highest Educational Qualification
Highest Educational Coeff. SE
Graduation 6.90 2.16
Post-graduation 5.63 2.15
M.Phil./Ph.D. 6.28 2.41
Teacher’s educational qualification, i.e., graduation,post-graduation, M.Phil./Ph.D. had positive association with achievement of students (Table 9.29).
Table 9.30: Highest Teacher Training
Highest Teacher Training
Coeff SE
B.Ed. 3.75 0.52
M.Ed. 1.61 0.82
Table9.30showsthatteacher’strainingqualifications,i.e., Teacher Training (B.Ed.) and M.Ed. had positive association with achievement of students.
Table 9.31: Teaching Experience
Teaching Experience Coeff. SE
06–10 years 3.02 0.53
More than 10 years 5.50 0.55
Table 9.31 shows that teacher’s teaching experience is positively associated with achievement of students.
Table 9.32: In-service Training
In-service Training Coeff. SE
3–5 month 1.41 0.48
None -0.06 0.46
Teachers were asked whether they had attended the in-service training programmes and in-service training of teachers had positive association with achievement of students (Table 9.32).
Table 9.33: Participation in Activities
Participation in Activities Coeff. SE
QualificationEnrichmentProgramme
0.51 0.42
Participation in Professional Development Programme
1.01 0.43
Individual or Collaborative Research
-0.48 0.45
Mentoring/Peer Observation 0.42 0.41
Engaging in informal dialogue with colleagues to improve teaching
2.82 0.51
Teacher’s participation in qualification enrichmentprogramme, professional development programme, mentoring/peer observation and engagement in informal dialogue with colleagues to improve teaching had positive association with achievement of students. On the other hand teacher’s participation in individual or collaborative research had negative association with achievement of students (Table 9.33).
9.3.4 Student Achievement of ScienceTable 9.34: Highest Educational Qualification
Highest Educational Qualification Coeff. SE
Graduation 2.18 2.09
Post-graduation 2.11 2.09
M.Phil./Ph.D -1.83 2.36
From the results shown in Table 9.34 interpreted that teacher’s educational qualification, i.e., graduationand post-graduation had positive association with attainment of students while higher qualificationssuch as M.Phil./Ph.D. had negative association with achievement of students.
Table 9.35: Highest Teacher Training
Highest Teacher Training Coeff. SE
B.Ed. -1.82 0.79
M.Ed. -1.37 0.61
Table9.35showsthatteacher’strainingqualifications,i.e., B.Ed. and M.Ed. had negative association with achievement of students.
Chapter_9_Contextual Analysis.indd 143 18-02-2021 14:34:39

Learning Achievement of Students — NAS Class X (Cycle 2) 2018144
Table 9.36: Teaching ExperienceTeaching Experience Coeff. SE
6–10 year 3.09 0.54More than 10 year 3.26 0.56
Table 9.36 shows that teacher’s teaching experience is positively associated with achievement of students.
Table 9.37: In-service Training
In-service Training Coeff. SE3–5 month 0.05 0.49None 0.01 0.47
Table 9.37 shows that teacher’s having attended in-service training programmes had positive association with achievement of students.
Table 9.38: Participation in Activities
Participation in Activities Coeff. SE
QualificationEnrichmentProgramme -1.71 0.43
Participation in Professional Development Programme 3.05 0.44
Individual or Collaborative Research 1.01 0.46
Mentoring/Peer Observation 0.45 0.42
Engaging in informal dialogue with colleagues to improve teaching
1.24 0.52
Table 9.38 shows that teacher’s participation in activities, such as participation in professional development programme, individual or collaborative research, mentoring/peer observation as part of a formal school management and engaging in informal dialogue with colleagues to improve teaching had positive association with achievement of students. However, teacher’s participation in qualificationenrichment programme had negative association with achievement of students.
9.3.5 Student Achievement of Social ScienceTable 9.39: Highest Educational Qualification
Highest Educational Qualification
Coeff. SE
Graduation 7.34 2.06Post-graduation 7.71 2.06M.Phil./Ph.D. 4.68 2.33
From the results sown in Table 9.39 interpreted that teacher’s educational qualification, i.e., graduation,post-graduation, M.Phil./Ph.D. had positive association with attainment of students.
Table 9.40: Highest Teacher Training
Highest Teacher Training Coeff. SEB.Ed. -0.32 0.78M.Ed. -1.93 0.60
Table9.40showsthatteacher’strainingqualifications,i.e., Secondary Teacher Training (B.Ed. and M.Ed.) had negative association with achievement of students.
Table 9.41: Teaching Experience
Teaching Experience Coeff. SE6–10 years -0.46 0.54More than 10 year -0.08 0.55
Table 9.41 shows that teacher’s teaching experience is negatively associated with achievement of students.
Table 9.42: In-service Training
In-service Training Coeff. SE3–5 months 0.74 0.49None -0.27 0.47
Table 9.42 shows that teacher’s having attended in-service training programmes had positive association with achievement of students.
Table 9.43: Participation in Activities
Participation in Activities Coeff. SE
QualificationEnrichmentProgramme
-0.64 0.43
Participation in Professional Development Programme
0.81 0.44
Individual or Collaborative Research
0.89 0.45
Mentoring/Peer Observation 0.40 0.42
Engaging in informal dialogue with colleagues to improve teaching
1.38 0.51
Table 9.43 shows that teacher’s participation in activities, such as participation in professional development programme, individual or collaborative research, mentoring/peer observation as part of a
Chapter_9_Contextual Analysis.indd 144 18-02-2021 14:34:39

145
Con
text
ual A
naly
sis o
f Bac
kgro
und
Varia
bles
formal school management and engaging in informal dialogue with colleagues to improve teaching had positive association with achievement of students.
However, teacher’s participation in qualificationenrichment programme had negative association with achievement of students.
Chapter_9_Contextual Analysis.indd 145 18-02-2021 14:34:39

Learning Achievement of Students — NAS Class X (Cycle 2) 2018146
reFerenceSNCF. 2005. National Curriculum Framework 2005. NCERT, New Delhi. http://www.ncert.nic.in/rightside/links/pdf/framework/english/nf2005.pdf (accessed July 11, 2019).
OECD. 2001. OECD Annual Report 2001, OECD Publishing: Paris. https://doi.org/10.1787/annrep-2001-en. (accessed July 11, 2019).
———. 2004. OECD Annual Report 2004, OECD Publishing: Paris. https://doi.org/10.1787/annrep-2004-en. (accessed July 11, 2019).
———. 2007. OECD Annual Report 2007. OECD Publishing: Paris. https://doi.org/10.1787/annrep-2007-en. (accessed July 11, 2019)
Chapter_9_Contextual Analysis.indd 146 18-02-2021 14:34:39

147
Con
text
ual A
naly
sis o
f Bac
kgro
und
Varia
bles
MHRD
• RinaRay,IAS,Secretary, SchoolEducationandLiteracy(SE&L)
• ManeeshGarg,Joint Secretary,SchoolEducationandLiteracy(SE&L)
• RajnishKumar,Director,SchoolEducationandLiteracy(SE&L)
• NigarFatimaHusain, Director (RMSA-I)
• NazliJafariShayin,Director (RMSA-II)
• LethaRamMohan,Chief Consultant,QualityandInnovation,(TSG)
• MuktarAlam,Sr Consultant,QualityandInnovation,(TSG)
NCERT
• HrushikeshSenapaty,Director,NCERT
• Gulfam,Assistant Professor,ESD,Ncert
• IndraniBhaduri,Head,ESDandNationalCoordinator,NAS
• Md.ArifSadiq,Programmer, ESD,Ncert
• N.L.Srinivas,Sr System Analyst, ESD,Ncert
• PratimaKumari, Associate Professor,ESD,Ncert
• RejaulKarimBarbhuiya,Assistant Professor, DESM,Ncert
• SatyaBhushan,Assistant Professor,ESD,Ncert
• Sukhvinder,Assistant Professor,ESD,Ncert
• VeerPalSingh,Professor,ESD
• VishalD.Pajankar,Assistant Professor,ESD,Ncert
• VishwaBandhu,Programmer,ESD,Ncert
Project Supporting Staff• AerumKhan,Senior Consultant
• BhaswatiDe,Survey Associate
• PallaviUpreti,Senior Consultant
• PinkySingh,Senior Consultant
• SajidKhalil,Senior Graphic Designer-cum-Visualiser
External• WorldBank,India
State FunctionariesSchoolBoards,CBSE,ICSE,StateDirectorateofEducation,SCERTs,SIEs,Schools
core team
Chapter_9_Contextual Analysis.indd 147 18-02-2021 14:34:39

noteS
Chapter_9_Contextual Analysis.indd 148 18-02-2021 14:34:39

NA
S 2018, C
lass X (C
ycle 2)L
earnin
g Ach
ievemen
t of Stu
den
ts

NA
S 2018, C
lass X (C
ycle 2)L
earnin
g Ach
ievemen
t of Stu
den
ts
32130
ISBN 978-93-5292-393-9
Copyright © 2022 FDOKUMEN