The Impact of Homework on the Achievement of Students with ...
55
Eastern Illinois University e Keep Masters eses Student eses & Publications 2015 e Impact of Homework on the Achievement of Students with Varying Science Aptitudes in High School Physics Mahew Deets Eastern Illinois University is research is a product of the graduate program in Natural Sciences at Eastern Illinois University. Find out more about the program. is is brought to you for free and open access by the Student eses & Publications at e Keep. It has been accepted for inclusion in Masters eses by an authorized administrator of e Keep. For more information, please contact [email protected]. Recommended Citation Deets, Mahew, "e Impact of Homework on the Achievement of Students with Varying Science Aptitudes in High School Physics" (2015). Masters eses. 2251. hps://thekeep.eiu.edu/theses/2251
-
Upload
khangminh22 -
Category
Documents
-
view
0 -
download
0
Transcript of The Impact of Homework on the Achievement of Students with ...
Eastern Illinois UniversityThe Keep
Masters Theses Student Theses & Publications
2015
The Impact of Homework on the Achievement ofStudents with Varying Science Aptitudes in HighSchool PhysicsMatthew DeetsEastern Illinois UniversityThis research is a product of the graduate program in Natural Sciences at Eastern Illinois University. Find outmore about the program.
This is brought to you for free and open access by the Student Theses & Publications at The Keep. It has been accepted for inclusion in Masters Thesesby an authorized administrator of The Keep. For more information, please contact [email protected].
Recommended CitationDeets, Matthew, "The Impact of Homework on the Achievement of Students with Varying Science Aptitudes in High School Physics"(2015). Masters Theses. 2251.https://thekeep.eiu.edu/theses/2251
The Graduate School~ EA)rEJ~ ILLINOIS UNIVERSITY-
Th es is Maintenance and Reproduction Certificate
FOR: Graduate Candidates Completing Theses in Partial Fulfillment of the Degree Graduate Faculty Advisors Directing the Theses
RE: Preservation, Reproduction, and Distribution of Thesis Research
Preserving, reproducing, and distributing thesis research is an important part of Booth Library's responsibility to provide access to scholarship. [n order to further this goal, Booth Library makes all graduate theses completed as part of a degree program at Eastern Illinois University available for personal study, research, and other not-for-profit educational purposes. Under 17 U.S.C. § 108, the library may reproduce and distribute a copy without infringing on copyright; however, professional courtesy dictates that permission be requested from the author before doing so.
Your signatures affirm the following: • The graduate candidate is the author of this thesis. • The graduate candidate retains the copyright and intellectual property rights associated with the
original research, creative activity, and intellectual or artistic content of the thesis. • The graduate candidate certifies her/his compliance with federal copyright law (Title 17 of the U.
S. Code) and her/his right to authorize reproduction and distribution of all copyrighted materials included in this thesis.
• The graduate candidate in consultation with the faculty advisor grants Booth Library the nonexclusive, perpetual right to make copies of the thesis freely and publicly available without restriction, by means of any current or successive technology, including by not limited to photocopying, microfilm, digitization, or internet.
• The graduate candidate acknowledges that by depositing her/his thesis with Booth Library, her/his work is available for viewing by the public and may be borrowed through the library's circulation and interlibrary loan departments, or accessed electronically.
• The graduate candidate waives the confidentiality provisions of the Family Educational Rights and Privacy Act (FERPA) (20 U.S. C. § 1232g; 34 CFR Part 99) with respect to the contents of the thesis and with respect to information concerning authorship of the thesis, including name and status as a student at Eastern Illinois University.
I have conferred with my graduate faculty advisor. My signature below indicates that I have read and agree with the above statements, and hereby give my permission to allow Booth Library to reproduce and distribute my thesis. My adviser's signature indicates concurrence ore roduce and distribute the thesis.
Graduate Degree Program Date
Please submit in duplicate.
The Impact of Homework on the Achievement of Students
with Varying Science Aptitudes in High School Physics
(TITLE)
BY
Matthew Deets
THESIS
SUBMITTED IN PARTIAL FULFILLMENT OF THE REQUIREMENTS FOR THE DEGREE OF
Masters of Science in Natural Sciences
IN THE GRADUATE SCHOOL, EASTERN ILLINOIS UNIVERSITY CHARLESTON, ILLINOIS
2015 YEAR
I HEREBY RECOMMEND THAT THIS THESIS BE ACCEPTED AS FULFILLING THIS PART OF THE GRADUATE DEGREE CITED ABOVE
THESIS COMMITTEE MEMBER DATE THESIS COMMITTEE MEMBER DATE

Copyright 2015
By
Matthew Deets

Abstract
When students in a high school physics class are separated into high, middle, and
low aptitude levels, it was discovered that they do not all show the same benefits
from completing homework assignments. The focus of this study was to analyze the
relationship between the amount of homework that students complete and their
performance on quizzes and exams. The results indicate that middle and high
aptitude students benefit from completing greater amounts of homework, however,
low aptitude students show no improvement by completing a greater number of
problems.
2
Acknowled~ments
I would like to recognize the following individuals from Eastern Illinois University
for their guidance throughout the completion of this thesis.
Dr. Steven Daniels
Dr. James Riley
Dr. James Conwell
Dr. James Novak
Dr. Andrew Methven
Dr. Diane Burns
I would also like to thank my wife Lauryn. Without her love and support none of this
would have been possible.
3
Table of Contents
List of Figures and Tables ................................................................................................. 5
Introduction ........................................................................................................................ 6
Literature Review ............................................................................................................... 8
Methodology
Student Population ... .. ......................................................................................... 25
Homework Methods ............................................................................................. 26
Results .............................................................................................................................. 30
Discussion
Discussion of Results ............................................................................................. 38
Discussion of Student Surveys ............................................................................ 41
Conclusion ........................................................................................................................ 45
References ........................................................................................................................ 4 7
Appendices ....................................................................................................................... 48
4
List of Fi~ures
Figure 1: Homework Completion based on Overall Homework Percentage ............ 10
Figure 2: Homework Completion as a function of Perceived Value ........................... 12
Figure 3: Exam Scores based on Aptitude ..................................................................... 17
Figure 4: Average Slope ohhe Lines from the Aptitude Graphs ................................. 18
Figure 5: Features and Goals of a Flexible Homework Method ................................... 21
Figure 6: Survey Results on Student Motivation to Complete Homework ................. 23
Figure 7: Geneseo High School State Report Card ........................................................ 25
Figure 8: Correlation Between Percent of HW Completed and Exam Scores ............ 30
Figure 9: Average Exam Score Based on ACT and HW Quiz Scores ............................ 31
Figure 10: Average Final Exam and ACT Score Based on Percentage of HW
Completed ........................................................................................................................ 33
Figure 11: Average Exam Scores based on Frequency of Solution Review ................ 34
Figure 12: Average FCI Scores based on Percentage of HW Completed ..................... 35
Figure 13: Average Exam Score Based on Aptitude and HW Completed ................... .37
List of Tables
Table 1: Data from Varying Aptitude Levels over 5 Semesters of Study .................... 18
5
Introduction
In our modern society, students are becoming increasingly involved with
extracurricular activities that extend beyond the school day. These extracurricular
activities often involve athletics, music, religious groups, as well as maintaining a
part time job. These activities are added to an already strenuous 7 - 8 hour school
day where the students are engaged in learning activities. Research by Galloway et.
al that was completed on 4,317 high performing students showed that students
have difficulty balancing their personal lives, extracurricular activities, and
homework (Galloway, 2013). By assigning large amounts of homework that may not
have any specific goal besides additional practice, teachers are hindering the
development of their students in other areas where the students may also be finding
success. Students surveyed by Galloway explained that they viewed homework as
"pointless" or "mindless," however they completed the tasks simply to keep their
grades up (Galloway, 2013). Stanford researcher Denise Hope states, "this kind of
busy work, by its very nature, discourages learning and instead promotes doing
homework simply to get points" (Parker, 2014). Homework should be a strategy
used to challenge students and should force them to think critically about the task
they are trying to master. Homework should not be used strictly for practice, but
should be assigned with a specific purpose. Unfortunately, these assumptions are
not always adhered to with the type of homework assignments given to our
students today. Many students report that they are often able to complete
assignments without having to think critically about the material and that they are
just completing the assignment to maintain a good grade in class (Cushman). This
6

mentality towards homework does not lead to an increased understanding of the
material. Instead, if the amount of homework is too substantial students could be
put under too large of a cognitive load, which may actually decrease their
performance in the classroom. A large cognitive load involves students being
introduced to too much material in a short amount of time not giving their minds
enough time to thoroughly process the information. Students should be focused on
deliberate practice where they focus all of their energy on the concepts that they
find most difficult and are able to pass over concepts that they have already
mastered.
In this study we will consider the impact of allowing the students to focus their time
on areas where they are struggling without the added fear of receiving a poor grade
on homework assignments. By employing a more flexible homework technique
where students complete optional homework assignments and daily homework
quizzes covering problems from those homework assignments, students may focus
on areas that give them trouble and skip the assignments that cover material of
which they already have a complete understanding. By giving homework quizzes
based on problems from the assignments and allowing students to use their
homework as a resource when completing the quiz, students can complete only the
problems with which they struggle before coming to class. This gives students the
extrinsic motivation they need to complete the homework and allows them to be
deliberate about their study habits, while allowing them the option of not
completing the entire assignment if they feel confident they have already mastered
7

the concepts. The mastery approach gives students an increased ownership of their
own learning and assists them in gaining the ability to identify concepts that they
are struggling with and concepts where they have a solid understanding. The goal of
this study is to look for correlations between how much homework students
complete and their performance on assessments. Due to the fact that students come
into the class with differing levels of knowledge base and other preparations we
must take these factors into account, thus, students' overall aptitude toward science
is taken into consideration to analyze the relationship between how much
homework is completed and their overall assessment scores when separating the
student population between high and low aptitude.
Literature Review
Providing students with homework to increase their educational achievement is a
strategy that has been used throughout our educational history; however it has also
been one of the most debated strategies as well. Throughout the late 1800s until the
launch of Sputnik in 1957, there was a strong anti-homework mentality in the
United States (Eren, 2011). Critics of giving large amounts of homework began to
argue that it was taking away from music lessons, family time, and play without
having any benefit to the students' academic achievement (Gill, 2014). With the
launch of Sputnik there was a belief that the education system in the United States
was falling behind the Soviet Union. Thus, since the 1960s there has been a drastic
increase in the amount of homework students receive on a daily basis (Eren, 2011).
It was a common belief among the country that the reason the USSR launched the
8
first satellite is because their students were working harder both inside and outside
of the classroom. This led to an increase in homework as education became an
"instrument of national defense" for the United States (Gill, 2004, pg 177). By 1980,
the average high school student spent approximately thirty minutes on math and
science homework each night (Maltese, 2012). In 2002, that number increased to
one hour in each subject (Maltese, 2012). There has been much debate on whether
this increase in homework has resulted in an increase in student achievement, or if
it has simply increased our students' workload.
A study completed by Frederick Kontur and Nathan Terry at the United States Air
Force Academy (USAFA) tested students' motivation to complete homework
assignments when they were not given credit for completing homework as a part of
the overall course grade. They found that only forty five percent of their students
completed homework assignments when no credit was awarded (Kontur, 2014).
Many students believe that homework is not worth doing if they will not receive
credit for completing it. Students, especially at the high school level, only have
extrinsic motivation to complete assignments, which includes getting good grades,
maintaining a high GPA, and graduating (Scharff, 2010). If no points are given on
assignments this motivation is taken away because students do not see the point in
putting forth extra effort if they will not be awarded for it. Many students do not
make the connection between homework practice and exam performance. There is
very little intrinsic motivation in adolescents, which is based on interests and a
desire to learn new things (Scharff, 2010). What Knotur and Terry found when they
9
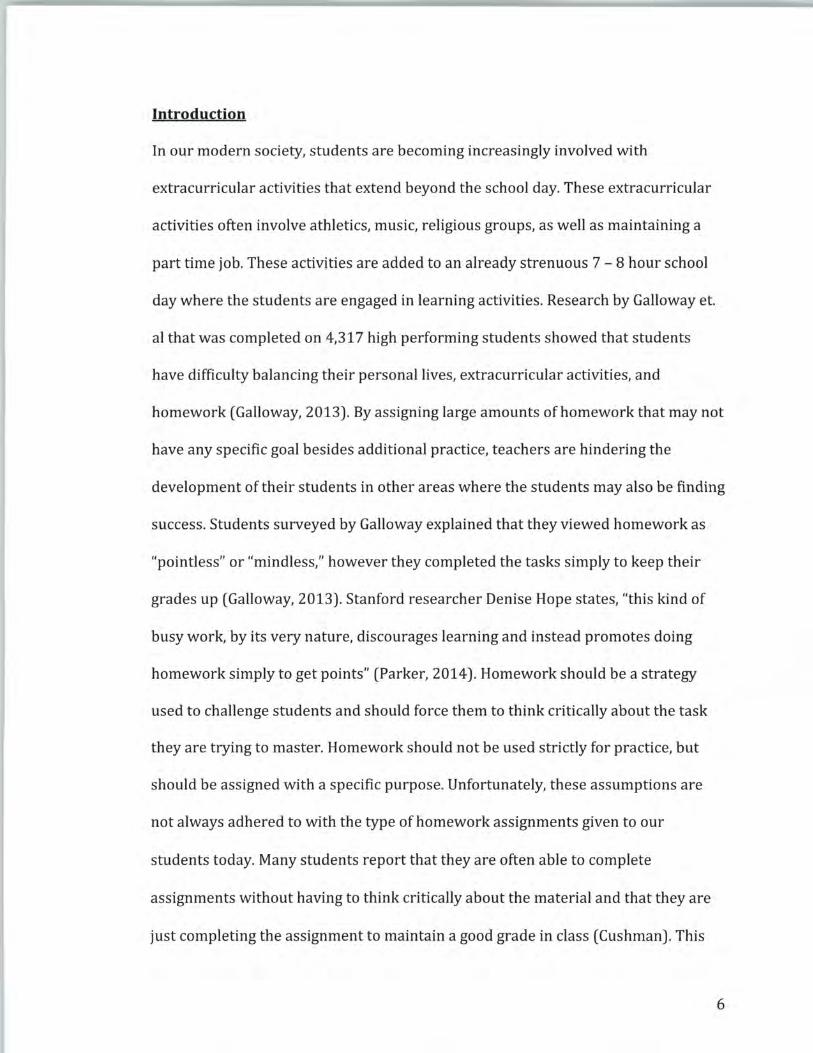
increased the value of their homework to 10 percent of the overall course grade
they were able to tap into the students' extrinsic motivation and increased the
average amount of homework completed to 80 percent (Kontur, 2014). It is
extrapolated by a line of best fit that by increasing the overall percentage of
homework to 15 percent that the percentage of homework completed by the
students could be increased to 100 percent (Kontur, 2014). This is theoretical
because it is unlikely to get 100 percent completion on assignments by students, but
according to the graph we could be close to 100 percent if homework were made to
be 15 percent of the overall course grade.
100% '$.
= a 0
; a; 6:)% a. e 43',r;, 8 3: 2a'1> ::c ~
HW Completion in Both Courses
O'Jr,
... -------~ ; .78 + 0.45
= U.
2% 4% 6% 8'.11- 1re:.
t-tW % in Ove~ll Co.umt Grade
FIG. 1. Graph of homework completion percentage plotted against the amount of credit the students receive for homework in their overall grade (Kontur, 2014, pg 295) .
A second technique that Kontur and Terry performed to try to increase the students'
motivation to complete homework was giving students homework quizzes based off
of the homework assignments, while once again making homework worth zero
percent of the overall course grade. During the course of the first semester 8-10
homework quizzes were given with problems based on the homework assignments.
10
The only thing different about the problems is that numbers were changed, but the
wording remained the same. The students were also allowed to use their homework
assignments as a resource when completing the quizzes. The second semester the
homework quizzes were not directly from the homework assignments, but were
conceptually similar. When comparing the two semesters, Kontur and Terry found
that homework completion for the first semester was on average 53 percent and
second semester was an average of 38 percent (Kontur, 2014). This was a significant
increase and students found more incentive to complete the assignments when it
would directly and obviously assist them in completing homework quizzes.
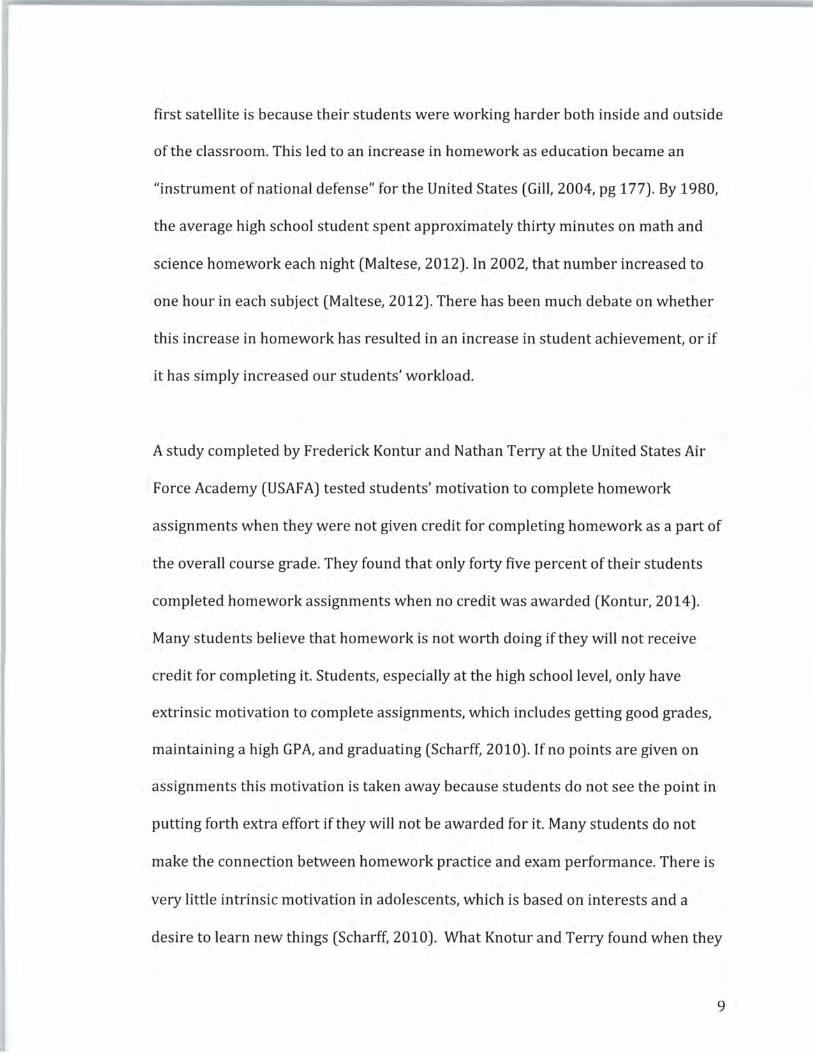
Kontur and Terry also wanted to get insight on the value that students put on the
homework assignments and how that impacted how much homework the students
were willing to complete. The following questions were given to the students by an
anonymous survey: 1) Completing homework problems helps me understand the
physics concepts, and 2) I tend to perform better on exams when I do all of the
homework problems (Kontur, 2014, pg 296). The students responded to the
questions on a four-point scale: 4 - strongly agree, 3 - agree, 2 - disagree, 1 -
strongly disagree (Kontur, 2014, pg 296). The surveys were averaged from each
class and according to the results the more value the students put on the homework
assignments, the more homework they were willing to complete. Students are
willing to complete assignments as long as they believe that it is assisting them in
understanding the material. Once again, even though students that completed a
11
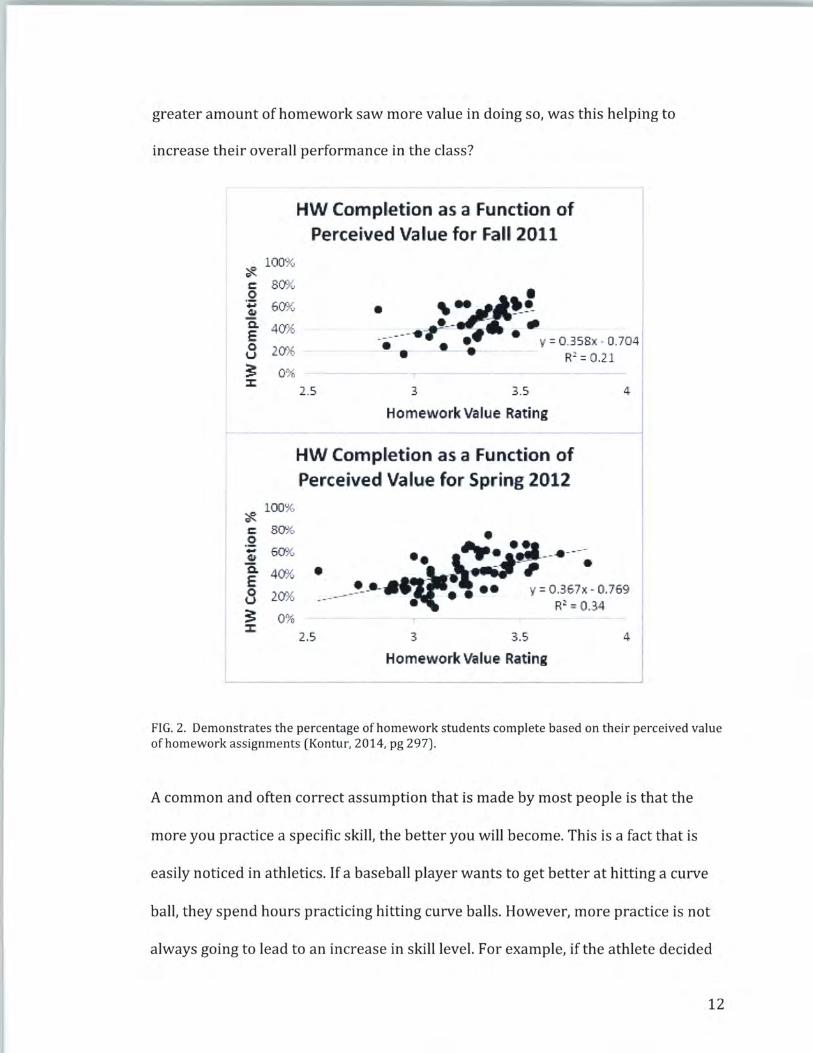
greater amount of homework saw more value in doing so, was this helping to
increase their overall performance in the class?
'*' 100%
c: 301(. 0 ·z; 6()3{, <LI -0. 40">6 e 0 icrro u ;: 0% :c
'$. 100%
c 80% . 2
60% -<lt Q. 4006 E 0 2.0% u ~ 0% :c
HW Completion as a Function of Perceived Value for Fall 2011
• ' .. ...,. ,41.l: . .t--er:'-.;' •
__ ___ .. ___ .. •• • y = 0.358.x . 0.70 4 1
e e R~ = 0.21
2.5 3 3 .5
Homework Value Rating
HW Completion as a Function of Perceived Value for Spring 2012
• -, .
4 I
.. (!-=...i.:l--·----. ~ -• • • _______ ._ • • •• y = 0.367x - 0.769 - • R~ • 0.34
25 3 3.5
Homework Value Rating
FIG. 2. Demonstrates the percentage of homework students complete based on their perceived value of homework assignments (Kontur, 2014, pg 297).
A common and often correct assumption that is made by most people is that the
more you practice a specific skill, the better you will become. This is a fact that is
easily noticed in athletics. If a baseball player wants to get better at hitting a curve
ball, they spend hours practicing hitting curve balls. However, more practice is not
always going to lead to an increase in skill level. For example, if the athlete decided
12
they need to improve their skills at hitting curve balls and all they practice hitting is
fast balls when they are already proficient at hitting fast balls, this practice is not
going to assist them in becoming a better batter. Instead their focus needs to be
directed toward the areas where they need improvement and practicing the correct
technique. Ericsson focuses on the concept of "deliberate practice". The idea behind
deliberate practice is that individuals are completely focused on a specific skill for a
limited amount of time. People cannot focus on one task for long periods of time;
instead, daily practice should be completed for limited amounts of time each day in
order to master a skill (Ericsson, 1993). If individuals practice for too much time on
a daily basis this will lead to exhaustion and may begin to reduce the gains earned
from the practice they completed (Ericsson, 1993). Exhaustion is something
commonly seen in high school students. Many of them receive a limited amount of
sleep each night from being over worked, which causes exhaustion during the
school day. This can lead to a reduction in focus and will diminish the possible gains
from completing assignments for practice. Ericsson states, "I would argue that
students do not always care about improving, because they have so much work to
do their only focus is on getting homework done as fast as possible, instead of
focusing on mastering the task," (Ericsson, 1993, pg 365). Ericsson explains that the
most effective amount of deliberate practice is approximately an hour per day
(Ericsson, 1993). The following study completed by Maltese et. al. reinforces
Ericsson's findings.
13
A study completed by Maltese et. al. using the National Education Longitudinal
Study (NELS) demonstrates that students who complete 30-61 minutes of
homework each night scored 1.8-2.2 points higher on standardized exams, and
students that completed 61- 120 minutes of homework each day has been shown to
increase standardized test scores by 2.9 - 3.0 points over students that complete
zero homework. However, any amount of time over 120 minutes and the scores
begin to decrease once again. This study was completed on approximately 25,000
students from 1990 to 2002 (Maltese, 2012). The result from this study come from
using the students standardized exam scores and their final course grades in the
science class that they were taking at the time of the study. The students were also
given surveys to record how much homework they completed in science each week
during the study (Maltese, 2012). There are some assumptions that are made when
it comes to the purpose of homework in this study. First, homework is seen as a way
to extend the school day and provide opportunities for students to practice concepts
and prepare for future material. It is also assumed that the homework being
assigned is based on the learning goals of the class and is not simply for repetition.
Secondly, students are on task and focused while completing homework
assignments. Lastly, we assume that students have a correct understanding of the
material before completing the assignments otherwise negative affects can take
place leading to an increased misunderstanding of the material. If students
misunderstand the material it is often difficult to rid them of this misconception
(Maltese, 2012). One argument made against this study is that higher achieving
students typically take the more advanced classes where more homework is given.
14

Thus, it is more likely that these students will produce higher standardized exam
scores and better final grades in classes because they are higher achieving students.
Lower achieving students typically take lower level classes where less homework is
given and they most likely receive lower scores on standardized testing and final
grades. These factors are not taken into consideration in this study.
A study completed by Kontur et al. demonstrates a different outcome than the
previous study completed by Maltese and analyzes students that are all taking the
same course. Kontur did not just study the effects on the amount of homework
students completed on their overall grade. Instead, he broke approximately 1000
students down into four separate groups to study the impact of vary amounts of
homework on high, medium high, medium low, and low aptitude science students in
an electricity and magnetism course at the United States Air Force Academy
(USAF A) (Kontur, 2015). All students at the USAF A are required to complete two
semesters of calculus-based physics: mechanics, and electricity and magnetism
(E&M). The students were separated into their varying aptitude levels based on the
following criteria: their ACT math and science scores, their score on the Force
Concept Inventory (FCI), their overall grade in calculus 1 and 2, and their overall
score in the mechanics physics course which was taken previously to E&M (Kontur,
2015). The homework that was completed during this study was online homework
from Mastering Physics and was a compilation of both conceptual based questions
and problems. Students were given five attempts at each question and the
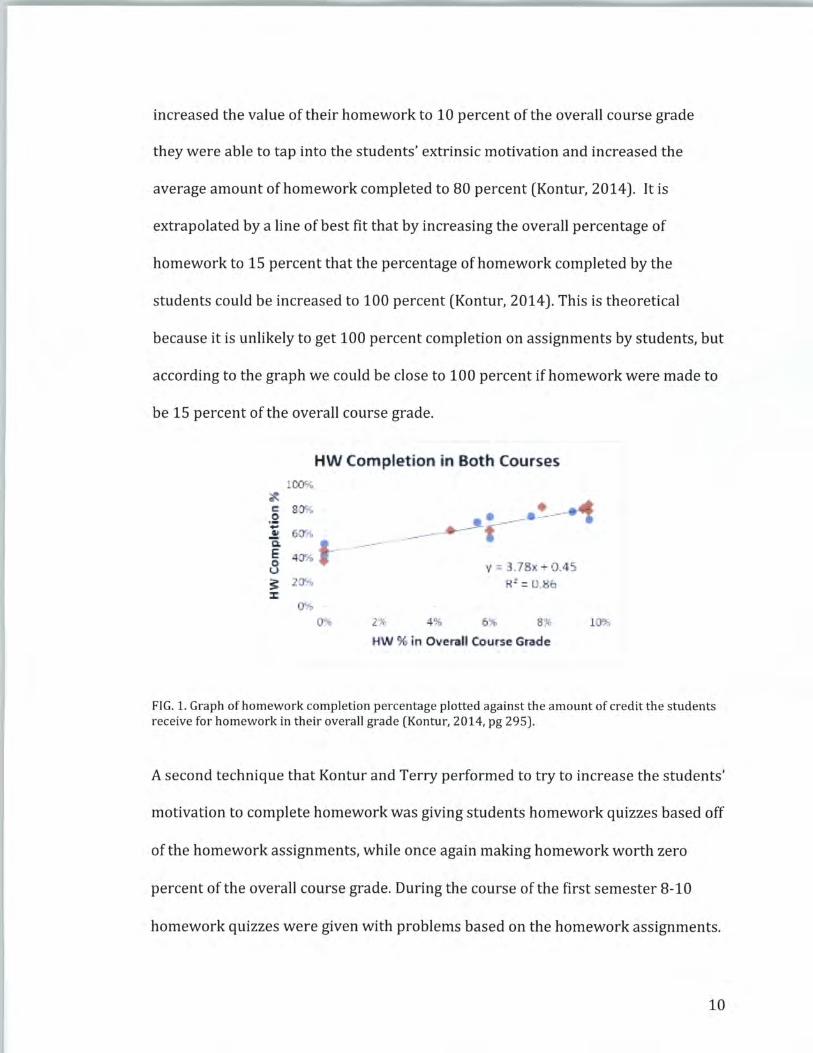
homework was graded for the purpose of the graphs by completion. The graphs
15

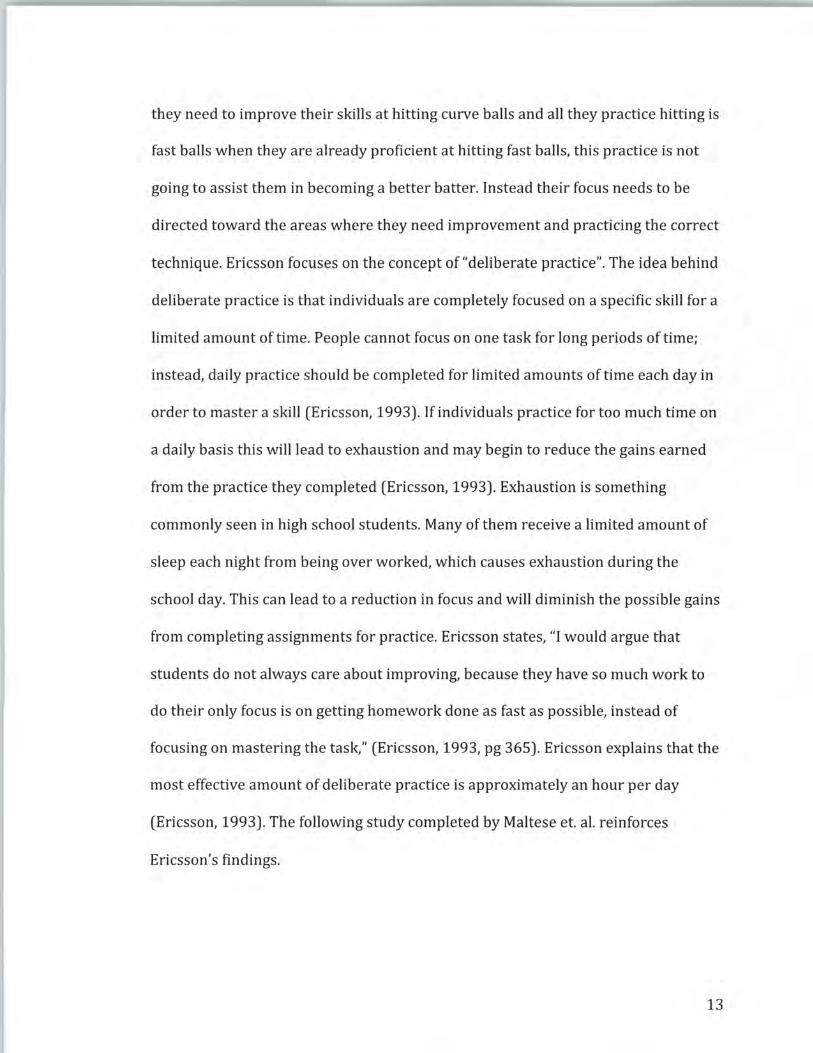
below demonstrate the correlation between the percent of homework completed
and the students' average exam scores during the term. The average exam scores
are composed of two mid-term exams and a final exam. Each exam is composed of
approximately 30-35 conceptual based multiple-choice questions and two or three
homework based problems (Kontur, 2015). This data was taken for five semesters
of electricity and magnetism classes. After analyzing the graphs Kontur et al.
determined that high aptitude students benefitted from completing a greater
amount of homework. The slope of the best-fit line indicates that for high aptitude
students on average the more homework that is completed, the higher students
scored on exams. However, a negative correlation was found for the low aptitude
students. It appeared that the more homework that the low aptitude students
completed the lower the students scored on the exam. The following graphs and
tables show the data that was collected during the course of the study.
16
. - _.... ..i::;.-
o.::'li
Fall 2010 ftil;lh Apt itvde
•
0 O\; 20 (J":O: •It) (II{ $:l ~ 8(1 ::n, 100 l)'i
l OC l'.'b
•
!: oo·.
Homework Completion Sc.ore
.... ·e····· ...... .. ... . . . .. . . • • •
FalJ 2010
Med ium-Hhth Aptitude
J.~"' 7'~ 1:4, 40 c~·. liQ.(I;(, RO.~ - a~ .
~ g ftt)(l'\;
~ e 6 (!'\,
~
J1 ·1 \, ;; ~ ~L\(f'b
nm. J .: •(
C ao.~.
"' V)
E EO.Cl'll.
,S .io.a.~
~ w.a~ ~
:.a~
Homework Co mpletion Sc;ore
• • •• ...... ~ . . · ·. - ..... ~ .
•• • . '
Fa I 2010 Medium-Low Aptitude
:?: .i;y, 40 Q,1', EO.CU 30.~ :oo.o •~
Homewa rtc CampletiDn Score
• Fall 2010 low Apt itude
.i.;;.".t •10 0.1. bO.tl'>l ~.C<l>
Homewotk compJetron Score
100l11i
Q CJ':(
•
.... 'c . __ . ___ .. -;;. ....... -- . . ,,--Spring 2.011 H~B.h Aplitud~
•
HomewCl'rk. Com 11letio111 S<ore
• • •
• •. •a L •:.• . l''· niJ • I•••
Sp fl 2.011 Medium-High Aptitude
o .J >; 20.a . · 40 e111 6 0.cr. so.i:w. 100 a ..
Ill ~ UJ O'• ... E b:JO'• ftl
~ CJ O'.~ ii ~ zm ·
J ;J ,.
Homewo rk Completio n Score
. ,,, . :-. ..~-=' • • Sprine:20ll
Medium~Low Aptitude
~.J l& 20.0!S L) ()' ~ ;r . so.°" 100.) Jf
ll'<:.l1X.
E c-0.ax.
5
Homeworle Completion Score
• • ..- -- --- -;1t~· • Sp rlne:ZOll
Low Aptitude
ltHr.~ 4JJ.(1.J> I.<•(!, Wt!\
Homework Completion Score
FIG. 3. Demonstrates the correlation between the percent of homework completed by each student and their average exam score (Kontur, 2015, pg 8).
17
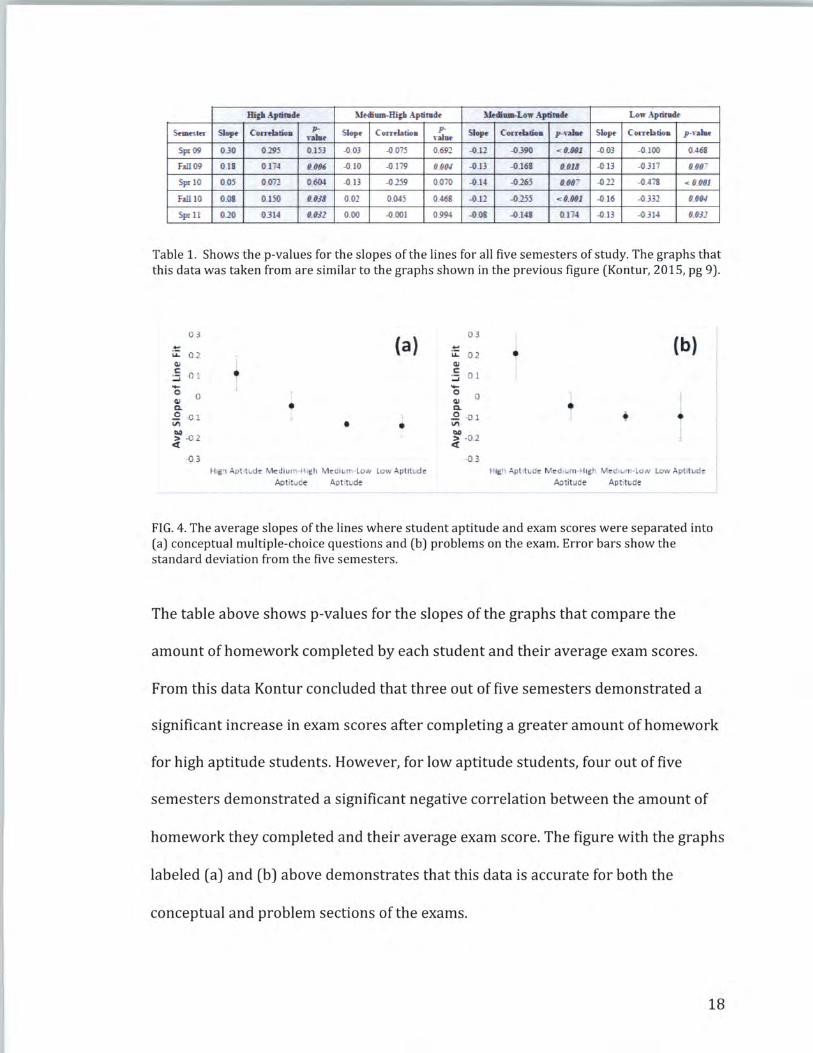
mp .-\piited< M•dium--Higll Aptited• lU~di---Lo..- .\ptitack Lo..-Aprihd•
~-ft' Slop• Corrob tioa p-Slo~ Cornbtioa p-
Slop• Cornbtioa p--nlv Sle~ Cornbtioa p-nlar nlat valur
Spr09 0.lO 0295 0.153 -0.03 ..Q_(J75 0.692 -0.12 -0390 < OJ/81 -003 -0.100 0.468
Fall 09 0.18 0.17.f II.Off -0.10 -0.179 0.00.J -0.13 -0.168 IJ.01& -013 -0-317 fl.IJO-
Spr 10 0.05 0 .072 0.604 -0.13 -0.259 0.070 -0.l~ -026.5 uo- -022 -0-47& <0.IJOI
Fall 10 0.011 O.llO 0.0!& 0.02 0.<»5 0.46& -0.12 ..o.:m <0.HI ..0 16 -0.331 UO.J
Spr 11 020 0314 '-0!1 0.00 -0.001 0.994 -0.0S -0.148 0.174 -0.13 -0.314 IJ.OJl
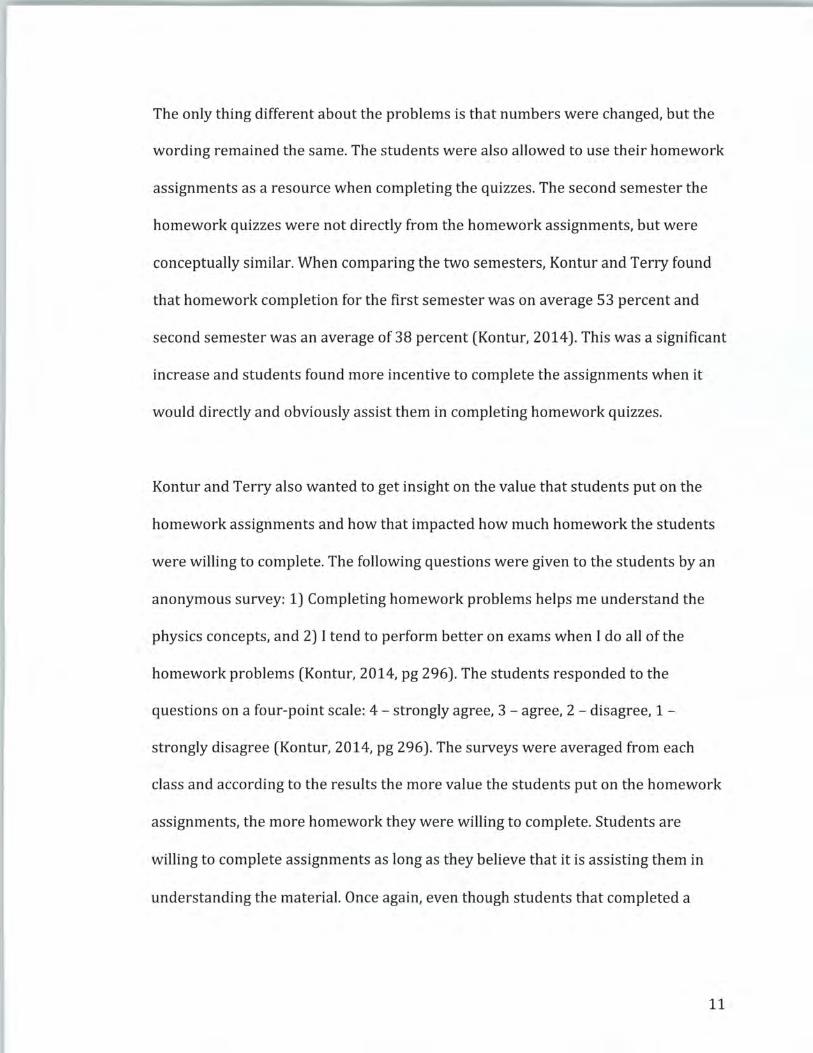
Table 1. Shows the p-values for the slopes of the lines for all five semesters of study. The graphs that this data was taken from are similar to the graphs shown in the previous figure (Kontur, 2015, pg 9)-
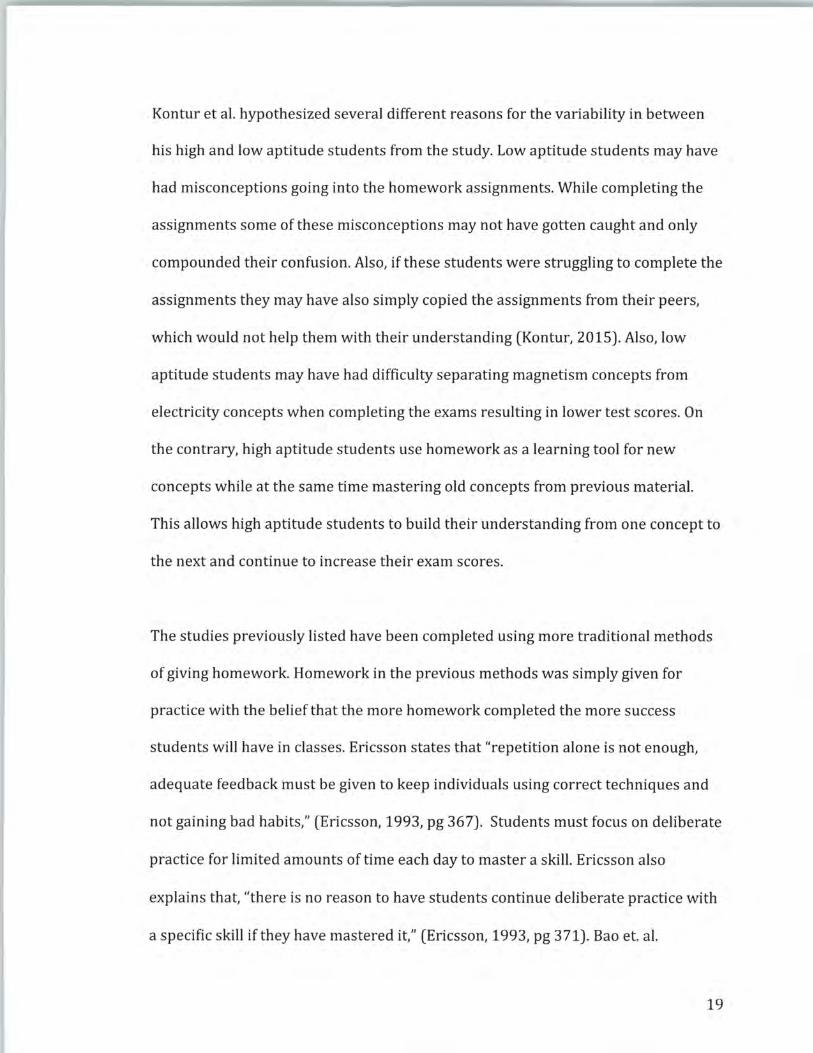
() 3
(a) 03
(b) .'!:: ... ...... 0 .2 u::: 02 • QI I Cll I c
0 1 • c 01 j :.::;
l :.::;
0 -0 0 0 T QI QI Q. • CL • E. 0 ! .2 0 l 1 + VI • • VI
~ -02 ~ -02 <l <l
0.3 0.3 Higi Aptit d e Med1u m·H1gh Medtur Low Low Aptitude High Aptitude lv' e d•um -4 1gt- Wed1u • ON Low Apt.Lud~
Apr t.<!e Act 1t de A;>tit ude Aprtude
FIG. 4. The average slopes of the lines where student aptitude and exam scores were separated into (a) conceptual multiple-choice questions and (b) problems on the exam. Error bars show the standard deviation from the five semesters.
The table above shows p-values for the slopes of the graphs that compare the
amount of homework completed by each student and their average exam scores.
From this data Kontur concluded that three out of five semesters demonstrated a
significant increase in exam scores after completing a greater amount of homework
for high aptitude students. However, for low aptitude students, four out of five
semesters demonstrated a significant negative correlation between the amount of
homework they completed and their average exam score. The figure with the graphs
labeled (a) and (b) above demonstrates that this data is accurate for both the
conceptual and problem sections of the exams.
18
Kontur et al. hypothesized several different reasons for the variability in between
his high and low aptitude students from the study. Low aptitude students may have
had misconceptions going into the homework assignments. While completing the
assignments some of these misconceptions may not have gotten caught and only
compounded their confusion. Also, if these students were struggling to complete the
assignments they may have also simply copied the assignments from their peers,
which would not help them with their understanding (Kontur, 2015). Also, low
aptitude students may have had difficulty separating magnetism concepts from
electricity concepts when completing the exams resulting in lower test scores. On
the contrary, high aptitude students use homework as a learning tool for new
concepts while at the same time mastering old concepts from previous material.
This allows high aptitude students to build their understanding from one concept to
the next and continue to increase their exam scores.
The studies previously listed have been completed using more traditional methods
of giving homework. Homework in the previous methods was simply given for
practice with the belief that the more homework completed the more success
students will have in classes. Ericsson states that "repetition alone is not enough,
adequate feedback must be given to keep individuals using correct techniques and
not gaining bad habits," (Ericsson, 1993, pg 36 7). Students must focus on deliberate
practice for limited amounts of time each day to master a skill. Ericsson also
explains that, "there is no reason to have students continue deliberate practice with
a specific skill if they have mastered it," (Ericsson, 1993, pg 371). Bao et. al.
19
discusses what he calls a "flexible homework method" to allow students to focus
their deliberate practice time on areas where they need improvement, not on areas
they have previously been mastered (Bao, 2008).
Bao and his colleagues compared a traditional style of homework to teaching with a
more flexible homework method. The traditional style of homework entailed giving
approximately 10 problems per week and the professor grading all of the
homework (Bao, 2008). The traditional style is difficult for the teacher, because if
the teacher were to have 60 students in class then this means that they would have
to grade 600 problems. This takes a considerable amount of time and if the teacher
were to give constructive feedback on every missed problem the students would not
get the assignments back for at least a few days. The other method of grading would
be only grading a couple of the problems on each assignment, so once again, not
enough feedback is given to the student. Bao quotes one of his students when they
discussed homework on a survey given to the class, "I had no idea how to do it
(homework), and when I get it back, I would still not have any idea how to do it,"
(Bao, 2008, pg 878).
Bao compared this method with a more flexible method at Ohio State University in a
calculus based physics class with 85 students. In the flexible method the students
are given 30 homework questions on a weekly basis and they must complete 10 out
of the 30 questions to turn in. Each question in the assignment was labeled with an
(A), (B), or (C) to indicate to the student the level of difficulty of the problem, with
20
(A) being the most difficult. The professors discussed with the students that if they
were able to work out the (A) problems on their own that they would likely receive
a high grade in the class and would do well on the exams (Bao, 2008). The solutions
to the entire assignment were given to the students three to four days prior to the
assignment being turned in so they could use the solutions as a guide. However, the
students had to show their own work and method of completing the problems and
were encouraged not to simply copy the solutions. The students were also told by
their professors that 30-40 percent of the exam questions would come directly from
the homework. The professors found that students were often completing more
than the minimum 10 problems to help them prepare for the exams.
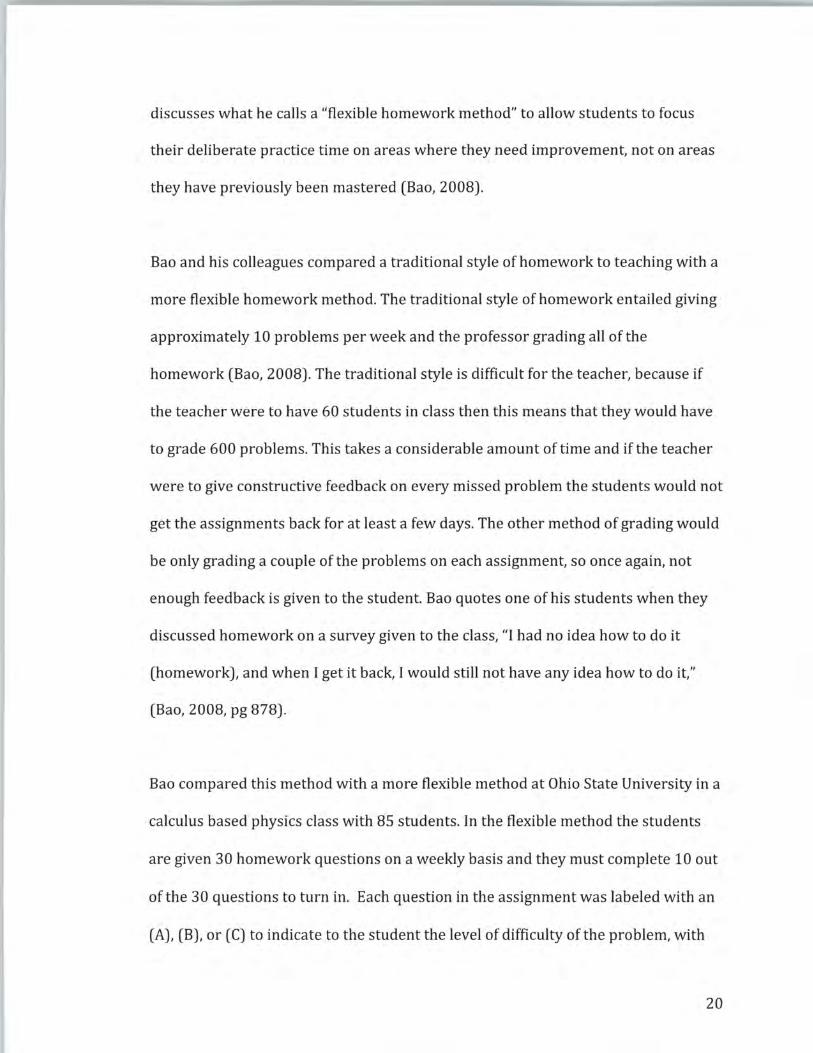
Design feature
Solutions gi \•en in advance.
J\llorc q ucs Lion · lhan requested.
Rating ol' difficulti ~s
Goal
Provide Limcly fct:<lback and ·upport to :sludcnt.:s so that they might engage in cliocLivc problem solving practice.
Allo\\' sLLlld >:nts LO make choicc:s that personalize and hopefully optimize lhcir fom:ning. Allow students LO monitor their own progress.
FIG. 5. The features of the flexible homework method and their corresponding goals (Bao, 2008, pg 879).
The results from the experiment showed that 75 percent of the students preferred
the flexible method of completing homework assignments over the more traditional
method. The study also demonstrated that over 70 percent of the students did not
21
copy the solutions to the assignments but used their own methods to solve the
problems. This data was reported from the students' observations of the homework
that was turned in. Students reported that they were happier, more relaxed, and
more motivated to complete the assignments. Students reported that they were
completing the assignments to learn the material instead of just trying to get them
done by the due date (Bao, 2008). The flexible homework method also led to a 5-7
percent increase on the mechanics baseline exam over the traditional method. This
was after no significant difference in the students' background scores (Bao, 2008).
The mechanics baseline exam that was given was used as a pre and post-test during
the semester. By allowing the students to choose and giving them all of the solutions
it allows the students to focus on the concepts with which they have the most
difficulty.
Similarly, Boon Leong Lan a professor of Physics at Monash University in Selangor,
Malaysia has also used a more flexible method of homework to motivate his
students to be deliberate about their study time. Professor Lan does not collect
homework for credit, instead, he gives the students one to two weeks to complete a
homework set before coming to a tutorial class where the students have the
opportunity to work through problems. Then, at the beginning of each tutorial he
gives the students a 10 minute quiz on a random problem from the homework
assignment (Lan, 2011). Once the students have completed the quiz they
immediately go over the assignment and any other questions that the students may
have from the homework. This is a way for the students to receive instantaneous
22

feedback about how they are doing on the assignment, instead of waiting a few days
for the professor to grade it. Lan does not only give a pre-tutorial quiz, but he also
gives the students another quiz at the end of the tutorial which encourages the
students to actively participate when reviewing the problems because there will be
a quiz with a problem very similar at the end of the session. At the completion of the
semester, Professor Lan gave the students a survey asking the following two
questions: "1) The beginning-of-tutorial quiz (on one of the homework problems)
motivated me to try solving all homework problems before the tutorial. 2) The end-
of-tutorial quiz (on a new problem) motivated me to learn during the tutorial how
to solve problems I did not know how to solve" (Lan, 2011, pg 581). The graph
below shows that approximately 87 percent of the students were motivated by the
quizzes to complete their assignments before the tutorial.
stro g disagree
disagree
neutral
agree
strongly ag ee
0.0 10.0 20.0 30.0 40.0 50.0 60.0 70.0
2
• •
FIG. 6. demonstrates the percentage of students and their rating of each question (Lan, 2011, pg 581).
23
For high school and college students the research has shown that just by increasing
the amount of homework students complete can lead to mixed results. Some
students, such as the high aptitude students from the study by Kontur, and the
25,000 students that were studied in the NELS study showed that increasing
homework can lead to higher exam scores. Other studies, such as the study
completed with low aptitude students by Kontur showed that more homework can
actually decrease test scores with low aptitude students. Ericsson's study of a
shorter amount of time on homework with deliberate practice was shown to
increase students' abilities. Lastly, the sources listed in this section emphasized
extrinsic motivation for students, such as grades and test scores. Each homework
method used tried to increase the students' confidence and ability to have success to
reach those extrinsic goals.
24
Methodolol:Y
Student Population
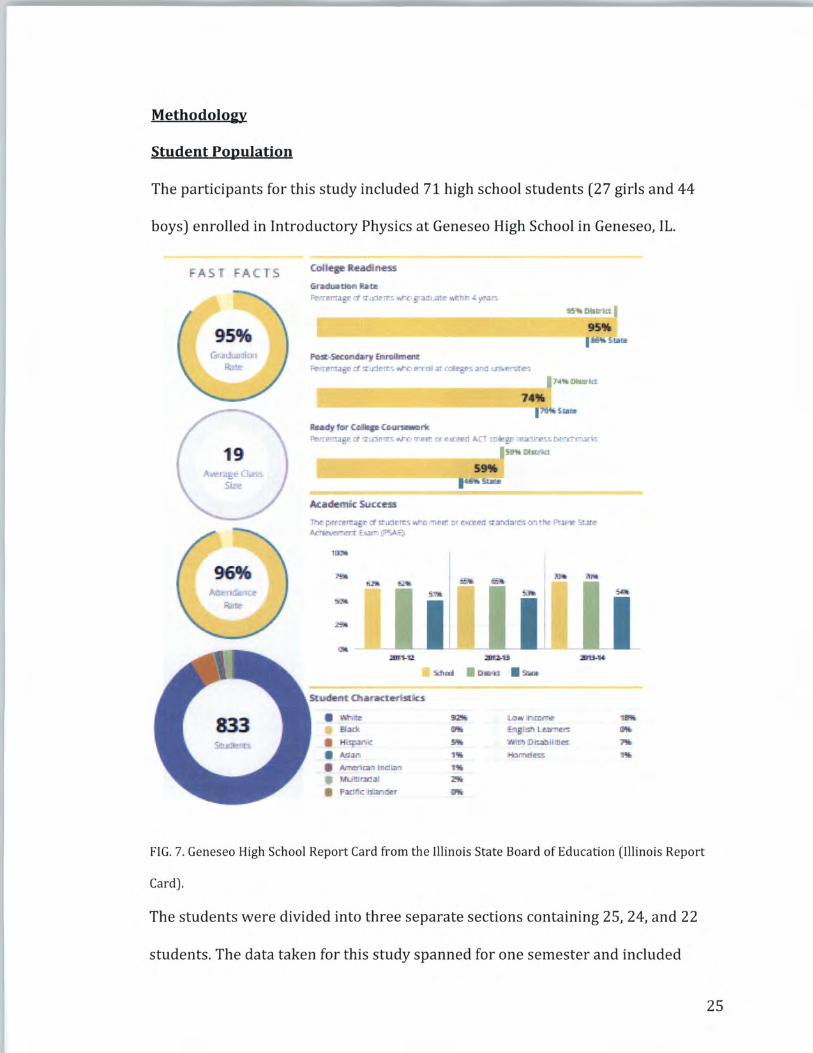
The participants for this study included 71 high school students (27 girls and 44
boys) enrolled in Introductory Physics at Geneseo High School in Geneseo, IL.
ACiS
19
COii
GnwhatlDtl llHe
~'"'l!tlr .Y T ..:Ir ~ 14t"c· pnu:n.i; .. "" .L ~!'l
95 .. ~~~~~~~~~~~~-.-~~wm
PtHt.S.:llf'I &ll'lllllln.-i:.,'TI'ntol!!,r J 7..:lrIT'< lllt"C· ftTDl Jl' ~~31'111 vr; l"l
8-!lyfm' Cdllp eour-l!k ""'"~=sr a- 7.idr ~...re mlffl: "e-«"ffn ACT mt:'RJ' ~j "f!ztor.vr.u~'
st'lllllUda
SK
t-.r prrnm:asr a i:r <>:in ~"'°a -nrl!'. !H' t!•Il'f'I! O:::rd3 ': J1 rllf Fn1~ '>Law· 6.c"il'."C":l!'.rt h1r7 ~ :;,
J~i I i 8 At" ~ • ' t"1.tllt"llt'
Elxk ft !: Sl1 lmnte<s
Hlsj?W-1C w 'l lb:'I D&allllhR
• M:in , .. J'l:ll"!lllll!m
8 k'!ll1ctll lndlrl , .. • Mu r.xl 2'!ll
• fXl~C l:=iril!l!r
FIG. 7. Geneseo High School Report Card from the Illinois State Board of Education (Illinois Report
Card) .
The students were divided into three separate sections containing 25, 24, and 22
students. The data taken for this study spanned for one semester and included
25
topics dealing with Newtonian Mechanics. Some statistics of Geneseo High school,
which are highlighted in FIG. 7., include a 95% graduation rating, an average class
size of 19 students, average attendance rate of 96% and contains a total of 83 3
students, with the vast majority of the students being caucasian. During the 2013-
2014 school year Geneseo High School had an average of 70% of the junior class
meet or exceed on the PSAE, 16% above the state average. Many of the students that
take physics are on the upper end of these averages and are typically higher
performing students.
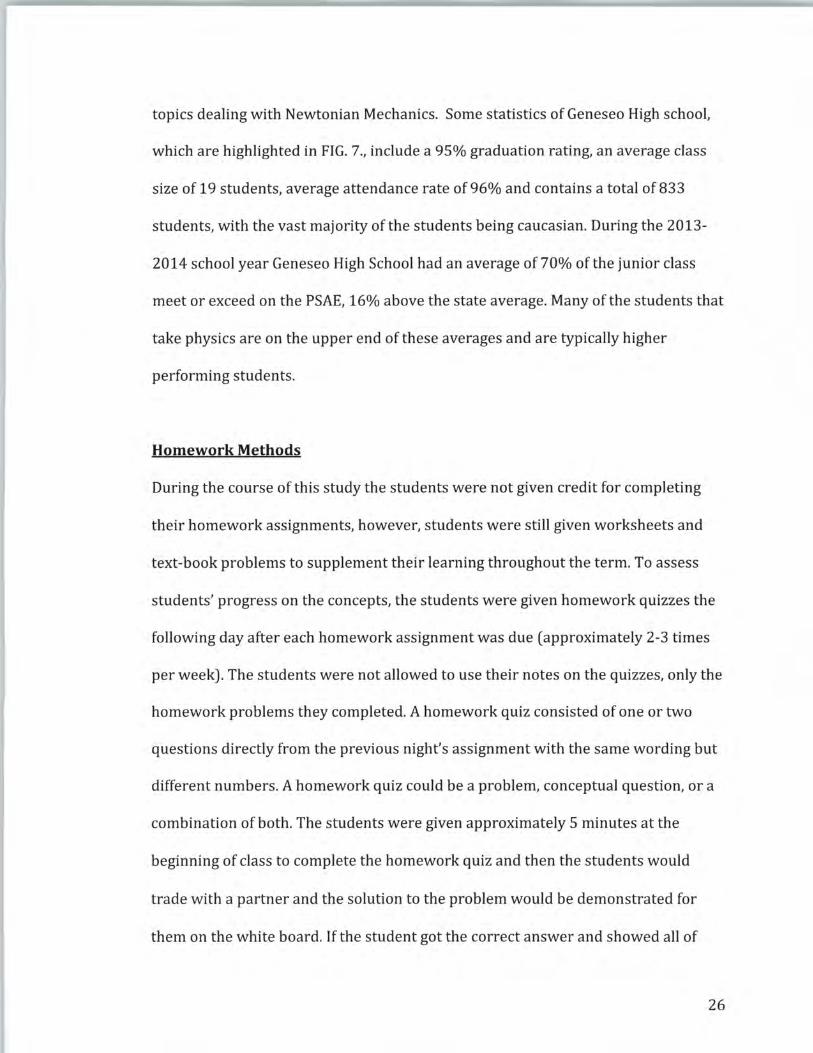
Homework Methods
During the course of this study the students were not given credit for completing
their homework assignments, however, students were still given worksheets and
text-book problems to supplement their learning throughout the term. To assess
students' progress on the concepts, the students were given homework quizzes the
following day after each homework assignment was due (approximately 2-3 times
per week). The students were not allowed to use their notes on the quizzes, only the
homework problems they completed. A homework quiz consisted of one or two
questions directly from the previous night's assignment with the same wording but
different numbers. A homework quiz could be a problem, conceptual question, or a
combination of both. The students were given approximately 5 minutes at the
beginning of class to complete the homework quiz and then the students would
trade with a partner and the solution to the problem would be demonstrated for
them on the white board. If the student got the correct answer and showed all of
26

their work they would receive 5 points, decreasing from there depending on the
quality of their work and how close they were to the correct answer. Homework
quizzes were designated as 15% of the students' overall grade in the course. The
decision to make homework quizzes worth 15% of the overall course grade was
because Kontur found that 15% is the optimal percentage to get students to
complete the maximum amount of homework (Kontur, 2014). During the semester
the students completed 15 homework quizzes for a possible 75 points. Following
the homework quizzes the solutions to the complete homework assignment would
be posted online for the students to review. An example of a homework quiz is
located in (Appendix A). Sample homework assignments are also included in
(Appendix B) and (Appendix C) to demonstrate the type of problems that students
complete before taking their homework quizzes. Typically, homework assignments
would include 2-3 basic level questions, 2-3 mid-level questions, and 2-3 more
complex problems connecting more than one concept at the end of the assignment.
This helps students gradually increase the difficulty of problems they complete and
gives them an idea of their level of understanding of the problems.
Students' average exam scores and final exam score was also included in the data for
this research. Each exam was composed of approximately 30-50% conceptual
multiple choice or short answer questions and between 50-70% problems. A total of
four exams were given during the course of the term and were used to calculate the
average exam score for each student. To examine the students' progress and long
term retention of the concepts, the students took the Force Concept Inventory (FCI)
27
at the beginning and at the end of the school year. The FCI is based solely on
Newtonian Mechanics and these concepts are only taught during the first semester
of this physics course. It was given at the end of the course to see how well the
students internalized the physics principles and if they could still apply the
information after not specifically using it for almost four months. The Force Concept
Inventory was designed to focus on force concepts such as, Newton's three laws of
motion, forces, friction, the superposition principle, and kinematics. The FCI
contains 30 multiple choice questions with one correct answer and four other
incorrect answers that make sense, but deal with the students' misconceptions. For
example, (Appendix D) gives a question from the FCI dealing with a car pushing a
truck. This uses Newton's Third Law that states, "for every action there is an equal
and opposite reaction." The correct answer to the question is (A) explaining that the
force the truck feels from the car and the force the car feels from the truck are equal
but opposite according to Newton's Third Law. Many students would believe that
the force from the car on the truck is greater because it is the car that is pushing the
truck. Many students have a difficult time internalizing these concepts and don't
realize that when they push something, they also feel the same force back on them
from the object. This test was developed to help students identify their
misconceptions and to try to help them learn from those mistakes. The FCI was used
in this study to assess student improvement and internalization of the concepts
when compared to the percentage of homework students completed during the
duration of the semester.
28
Another assessment that was used is the ACT. The students' math and science ACT
scores were used to evaluate each student's aptitude towards math and science. The
average of science and math ACT scores ranged from a 17 to a 33 between the 71
students. The students were broken into three groups based on their ACT scores.
The groups were separated as follows: high aptitude (top 2S% of the class), medium
aptitude (middle SO% of the class), and low aptitude (bottom 2S% of the class). The
high aptitude students had a range of math and science ACT scores from 26.S - 33,
the medium aptitude students ranged from 23.S - 26, and the low aptitude students
ranged from 17 - 23. Each of these groups were tested to find the relationship
between how much homework they completed and their average exam score during
the course of the semester.
At the end of the term students were asked to complete a survey (Appendix E) about
the flexible homework strategy based on taking homework quizzes and not turning
in assignments. One question was an estimate of how much homework they
completed throughout the term. To make this estimation the students opened up
their folders and took out their homework assignments from the term and
estimated the total percentage of problems that they completed during the term.
The scale ranged from 0 - 2S percent, 2S - SO percent, SO - 7S percent, and 7S - 100
percent of the problems assigned during the semester. The students were also asked
with what frequency they reviewed the solutions to the problems online after the
homework quizzes were given. The scale for this answer included: 1 - never, 2 -
29
rarely, 3 - most, 4 - all. The students wrote their names on the surveys and turned
them in so their survey answers could be correlated to the remainder of their data.
Results
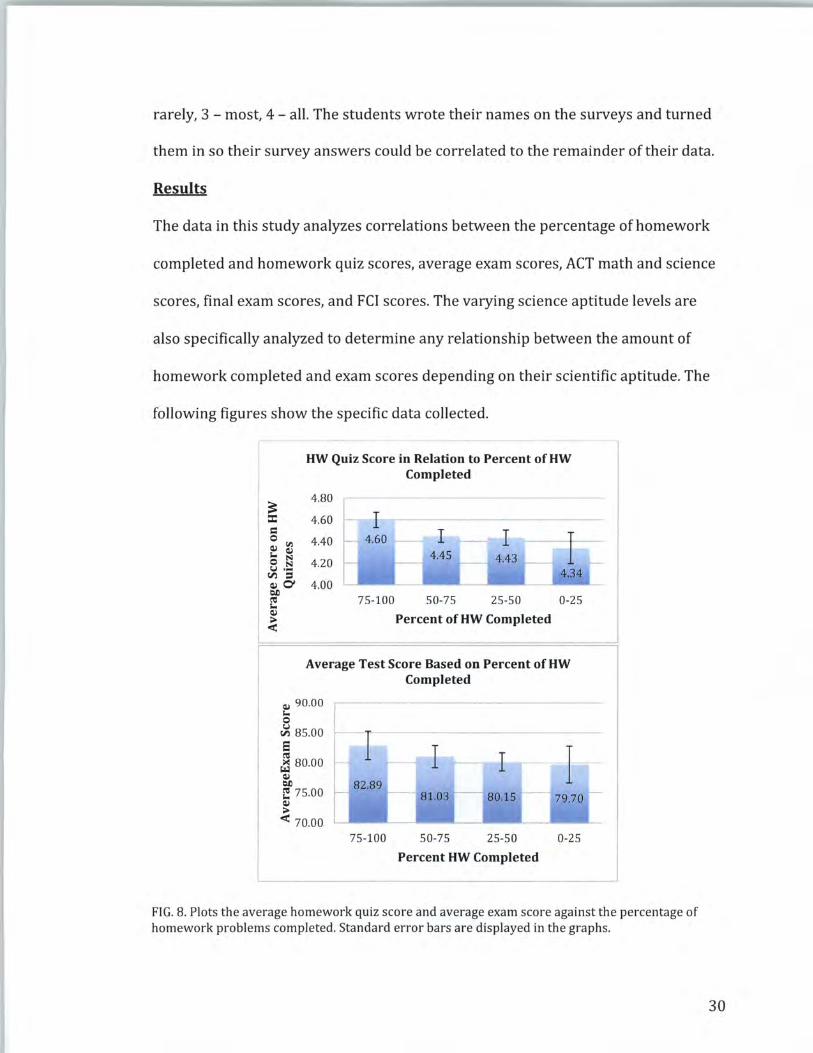
The data in this study analyzes correlations between the percentage of homework
completed and homework quiz scores, average exam scores, ACT math and science
scores, final exam scores, and FCI scores. The varying science aptitude levels are
also specifically analyzed to determine any relationship between the amount of
homework completed and exam scores depending on their scientific aptitude. The
following figures show the specific data collected.
r I
HW Quiz Score in Relation to Percent of HW Completed
4.80
4.60
4.40
4.20
4.00
1~------
I -- I
75-100 50-75 25-50 0-25
Percent of HW Completed
Average Test Score Based on Percent ofHW Completed
C1I 90.00 ~ 0
~ 85.00 e ~ ~ 80.00 C1I ~
~ 75.00 C1I > < 70.00
r-
75-100
I r-- I ~--I-
50-75 25-50 0-25
Percent HW Completed
FIG. 8. Plots the average homework quiz score and average exam score against the percentage of homework problems completed. Standard error bars are displayed in the graphs.
30
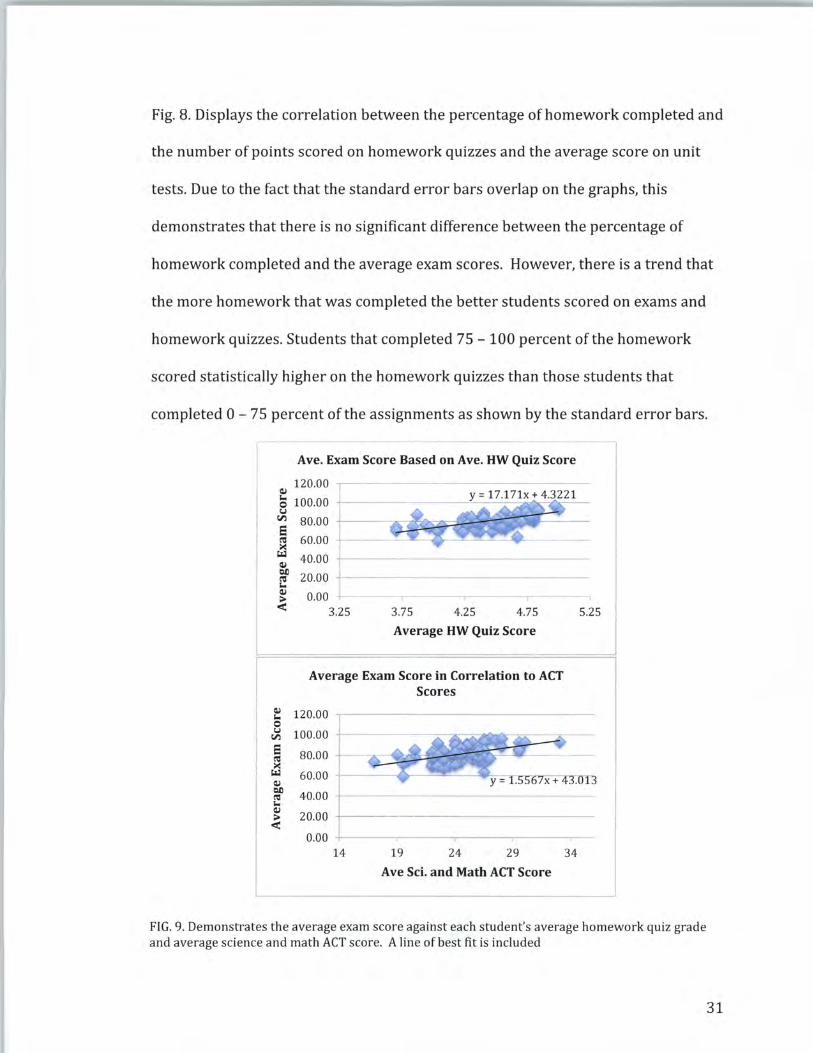
Fig. 8. Displays the correlation between the percentage of homework completed and
the number of points scored on homework quizzes and the average score on unit
tests. Due to the fact that the standard error bars overlap on the graphs, this
demonstrates that there is no significant difference between the percentage of
homework completed and the average exam scores. However, there is a trend that
the more homework that was completed the better students scored on exams and
homework quizzes. Students that completed 75 - 100 percent of the homework
scored statistically higher on the homework quizzes than those students that
completed 0 - 75 percent of the assignments as shown by the standard error bars.
Ave. Exam Score Based on Ave. HW Quiz Score
120.00 -.---------------Q,j s 100.00 -+----I.I
5 80.00 l'S~bt~~~~~~r:---~ ~ 60.00
~ 40.00
~ 20.00 -+----------------""' Q,j
~ 0.00 3.25 3.75 4.25 4.75
Q,j
""' 0 I.I
Vl
s cu ><
i:..i Q,j
00 cu ""' Q,j
> <!
Average HW Quiz Score
Average Exam Score in Correlation to ACT Scores
120.00
100.00
80.00
60.00
40.00
20.00
0.00 14 19 24 29
Ave Sci. and Math ACT Score
5.25
34
FIG. 9. Demonstrates the average exam score against each student's average homework quiz grade and average science and math ACT score. A line of best fit is included
31

The data from FIG. 9. was expected when completing this research. The best fit line
on the graphs confirm the assumption that students who score better on the
homework quizzes and that earned the highest ACT scores would receive the
highest average grades on the exams. Both of the graphs have a p-value < 0.001 and
are statistically significant. This correlation could be attributed to the confidence
level of students that did well on the ACT and on the exams. Students that are
confident in their abilities may be more likely to perform at a higher level on
summative assessments.
32
Ave. Final Exam Score in Correlation to Percent HW Completed
95.00% Cl.I r.. 0 u Vl 6 90.00% cu ~ ~
c;; 85.00% c ~ Cl.I
~ 80.00% r.. Cl.I
~ 75.00%
L_
I 85.38%
75-100 50-75 25-50 0-25
Percent Homework Completed
Ave. ACT Score Based on Percent of HW Completed
Cl.I r.. 0 u Vl
26.00 ,.-
f---r-1--r---i t---24.58
E-- 25.00 u <
Cl.I ~ 24.00 Cl.I ·o Vl
24.76 t--- 24.80
"Cl 23.00 c cu fl cu 22.00 :::;: a) > <
75-100 50-75 25-50 0-25
Percent Homework Completed
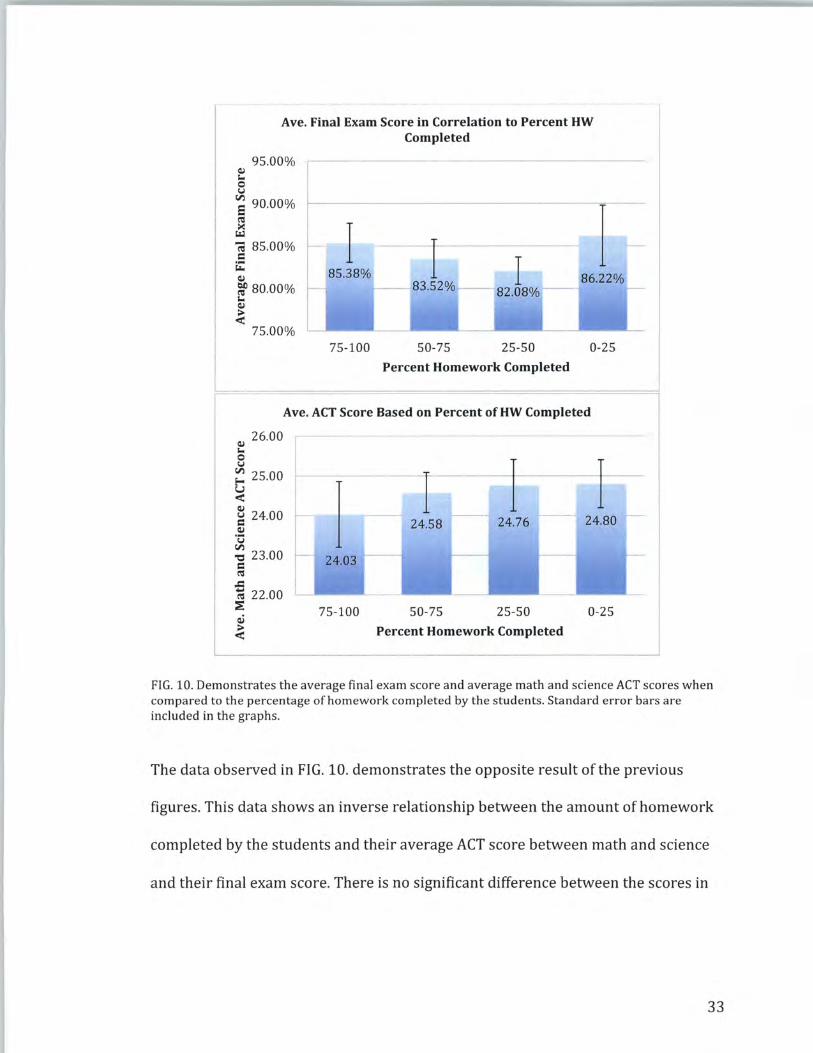
FIG. 10. Demonstrates the average final exam score and average math and science ACT scores when compared to the percentage of homework completed by the students. Standard error bars are included in the graphs.
The data observed in FIG. 10. demonstrates the opposite result of the previous
figures. This data shows an inverse relationship between the amount of homework
completed by the students and their average ACT score between math and science
and their final exam score. There is no significant difference between the scores in
33

either of the graphs, however, students that completed between 0-25 percent of
their homework assignments achieved the highest scores in both categories.
Average Exam Score Based on Frequency of Solution Review
95.00% cu ~ 90.00% u Vl
~ 85.00% ><
(.'-l
~ 80.00% ~ ~ 75.00% <
70.00% 1 2 3
Frequency of Solution Review
Final Exam Score Based on Frequency of Solution Review
100.00
cu 95.00 i... 0
90.00 u Vl
e 85.00 "' ><
(.'-l
iii 80.00 s:: ~ 75.00 79.33
70.00 1 2 3
Frequency of Solution Review
-----
4
4
FIG. 11. Compares the final exam and average exam scores in relation to the frequency with which they reviewed the homework solutions online. Standard error bars are included.
The two graphs in FIG. 11. show the correlation between how often students
reviewed the homework solutions online after the homework quiz and their
performance on both the unit exams and the final exam. The scale for the frequency
of solution review is as follows: 1 - never, 2 - rarely, 3 - often, 4 - always. There is
no statistical relationship in either graph, however, in the second graph there is a
34
trend that as the frequency of homework review increased the students performed
better on the final exam. The reason that the standard error is greatest in the final
bar is due to the fact that there were fewer students in that category and a wider
range of scores.
Average Improvement on FCI Based on Percent HW Completed
- 6.00 u ~ 5.00 0 Cl,,) 4.00 fll
"' ~ 3.00 ~
.5 2.00 Cl,,) tlD ~ 1.00 Cl,,)
~ 0.00
I 3.14
------i-~-4.25 _ 1 r --
75-100 50-75 25-50 0-25 Percent HW Completed
Average FCI Score Based on Percentage of
14.00 12.00 10.00
8.00 6.00 4.00 2.00 0.00
HW Completed
I I 10.63 10.27
75-100 50-75 25-50 0-25
Percent HW Completed
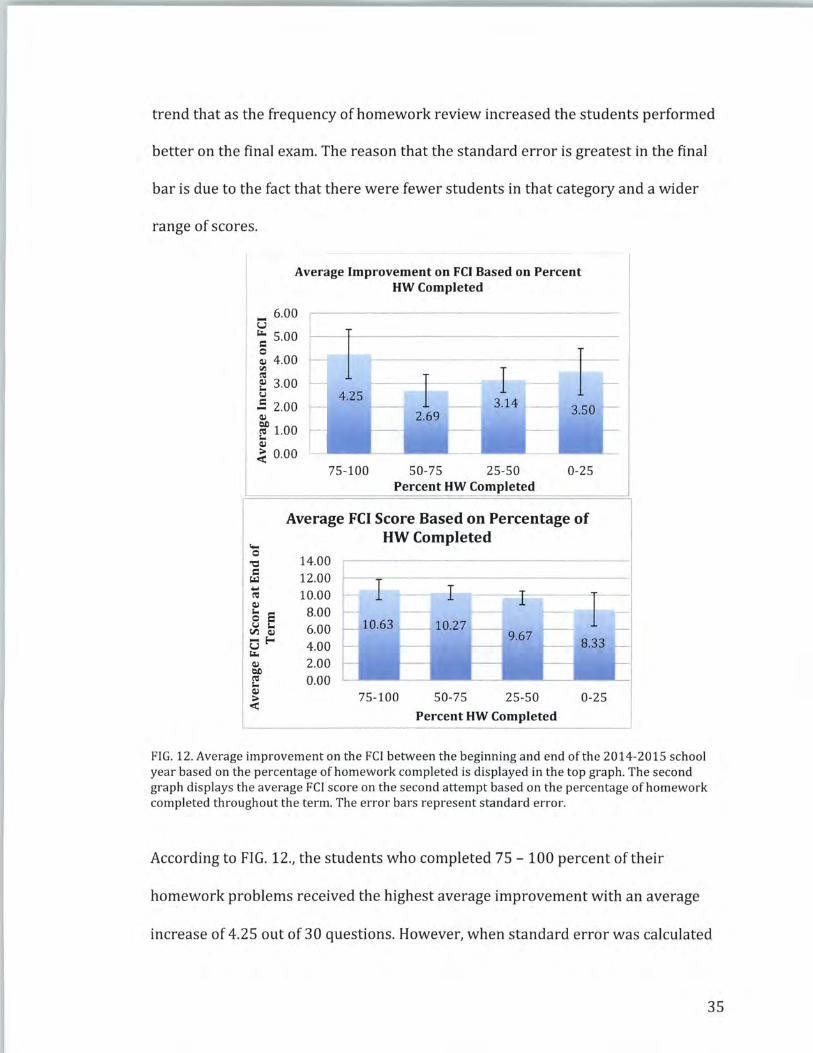
FIG. 12. Average improvement on the FCI between the beginning and end of the 2014-2015 school year based on the percentage of homework completed is displayed in the top graph. The second graph displays the average FCI score on the second attempt based on the percentage of homework completed throughout the term. The error bars represent standard error.
According to FIG. 12., the students who completed 75 -100 percent of their
homework problems received the highest average improvement with an average
increase of 4.25 out of 30 questions. However, when standard error was calculated
35
there was no significant difference demonstrated between any of the four groups.
The FCI was given at the beginning of first semester and at the end of the second
semester to test students' long-term retention of mechanics concepts. The second
graph demonstrates the average score students received on the FCI at the end of the
semester based on the percentage of homework that they completed throughout the
term. Once again there is a trend that the more homework students completed the
better they performed on the FCI on average, however, there is no statistical
difference. This data is similar to the physics class of 2013-2014 when every
homework assignment was collected and graded during the term. That year 78
students took the FCI at the beginning and at the end of the school year receiving a
pre-test average of 7.5, a post-test average of 11.61, and an average increase of 4.11
points. The 2014-2015 students focused on for this study scored an average of 6.84
on the pre-test, and the 75-100 percent homework group scored an average post
test of 10.63. Even though the 2013-2014 group scored approximately one point
higher on the post-test, they also averaged one point higher than the 2014-2015
group on the pre-test and showed an average improvement .14 lower than the
students that completed 75-100 percent of their homework in 2014-2015.
36
High Aptitude
120.00 = 0.0944x + 85.566 Qi
8 100.00 t------- -Vl
8 80.00 ('1:1
~ 60.00
~ 40.00 ~ ~ 20.00 <
0.00
120.00 Qi r..
100.00 0 u Vl
e 80.00 ('1:1
>< 60.00 ~ Qi 40.00 tlD ('1:1 r.. 20.00 Qi
> < 0.00
120.00 Qi r.. 0 100.00 u Vl
e 80.00 ('1:1 >< 60.00 ~ Qi
40.00 tlD ('1:1 r.. Qi 20.00 > < 0.00
1 2 2 2 2 2 3 3 3 3 3 3 3 3 4 4 4
Percent HW Completed
Medium Aptitude y = 0.2321x + 77.717
I
+--n M II
t - - -1 ----------~-- - - - - - - - -· -
._....,_... _ _. _ - - - ----- --- - - - - - - - _ ,..._..,___.
.-.,, ____ _. - - - - - i-- 1-- i-- 1-- ~ 1-- ~ ;...._ ...._ - - - - - ~ ~
1 1 1 1 2 2 2 2 2 2 2 2 2 2 3 3 3 3 3 3 3 3 3 3 3 4 4 4 4 4 4
Percent HW Completed
,_
,_
Low Aptitude = -0.0427x + 76.535 -- -
'--'
- - - ---- - - - ~- - - >-- - >-- - ._.. - ._..
._.. - ._.. - - ,__ - >-- - ,__ - ,__ -
~ ~ - - - - ,__ - - -~I 11!'.' I I•
~! r ~ I f{i I lie ~ r . , ... I"'
2 2 2 2 2 2 3 3 3 3 3 3 4 4 4 4 4 4 4
Percent HW Complete
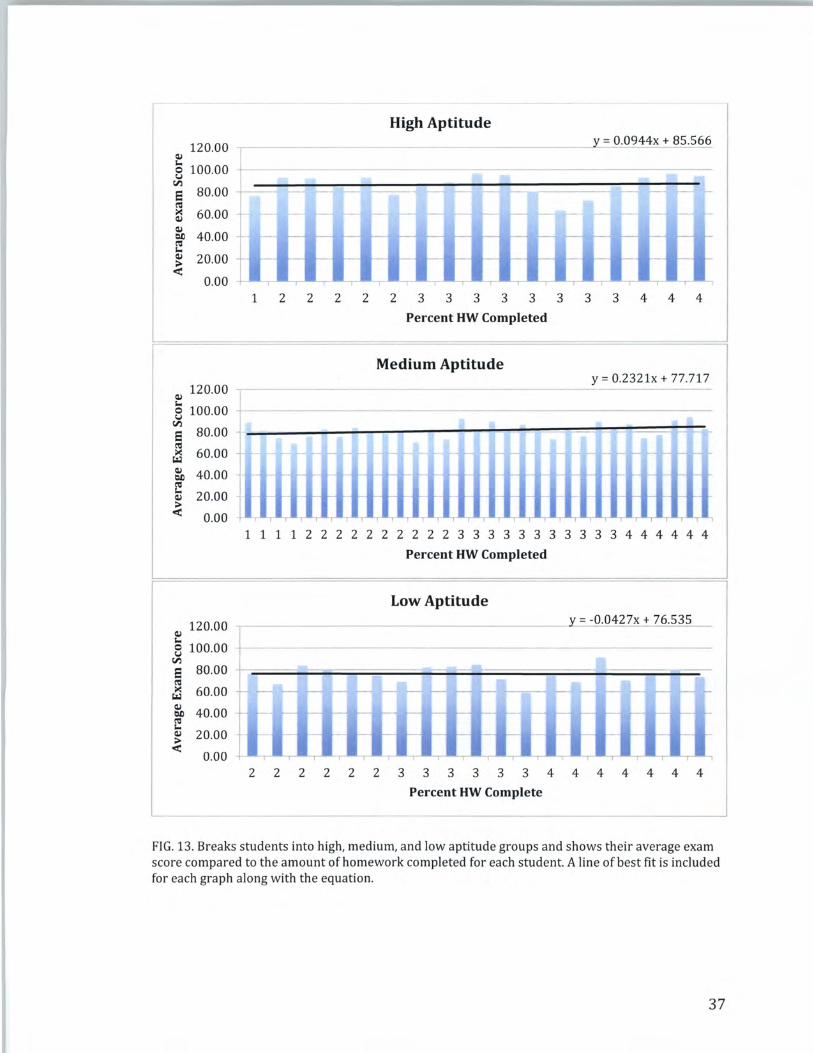
FIG. 13. Breaks students into high, medium, and low aptitude groups and shows their average exam score compared to the amount of homework completed for each student. A line of best fit is included for each graph along with the equation.
37
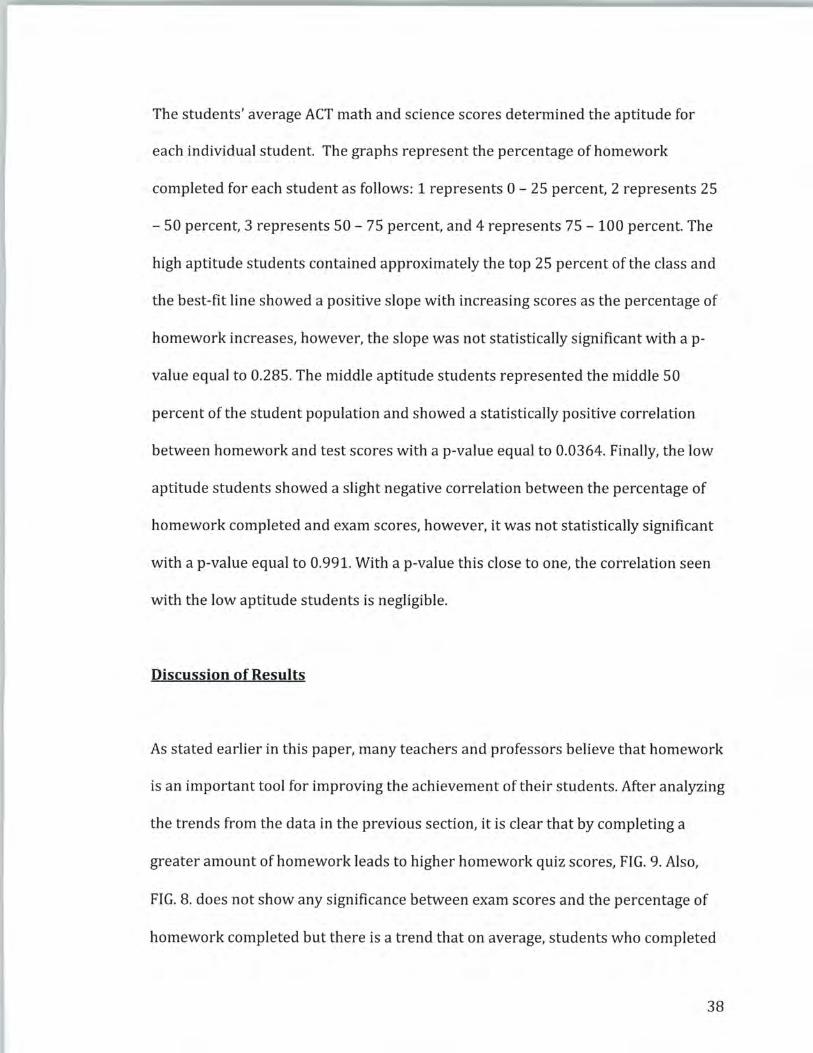
The students' average ACT math and science scores determined the aptitude for
each individual student. The graphs represent the percentage of homework
completed for each student as follows: 1 represents 0 - 25 percent, 2 represents 25
- 50 percent, 3 represents 50 - 75 percent, and 4 represents 75 - 100 percent. The
high aptitude students contained approximately the top 25 percent of the class and
the best-fit line showed a positive slope with increasing scores as the percentage of
homework increases, however, the slope was not statistically significant with a p
value equal to 0.285. The middle aptitude students represented the middle 50
percent of the student population and showed a statistically positive correlation
between homework and test scores with a p-value equal to 0.0364. Finally, the low
aptitude students showed a slight negative correlation between the percentage of
homework completed and exam scores, however, it was not statistically significant
with a p-value equal to 0.991. With a p-value this close to one, the correlation seen
with the low aptitude students is negligible.
Discussion of Results
As stated earlier in this paper, many teachers and professors believe that homework
is an important tool for improving the achievement of their students. After analyzing
the trends from the data in the previous section, it is clear that by completing a
greater amount of homework leads to higher homework quiz scores, FIG. 9. Also,
FIG. 8. does not show any significance between exam scores and the percentage of
homework completed but there is a trend that on average, students who completed
38
greater amounts of homework received higher test grades. Also, in FIG. 12. students
that completed greater amounts of homework had the greatest improvement and
overall best FCI score by the end of the term. Unfortunately, there is no significant
relationship demonstrated with the FCI scores, but there is a trend in the data. This
data leads me to believe that on average, there is a slight correlation between the
amount of homework that is completed and the performance of students on
assessments.
When the students were separated into high, middle, and low aptitude levels based
on their math and science ACT scores, there was no statistical evidence that the
percentage of homework that they completed impacted their exam scores. However,
there were some slight trends in the data that correlated with Kontur's study based
on aptitude. Kontur found that high aptitude students benefit from completing a
greater amount of homework, and that a greater amount of homework has a
negative impact on low aptitude students (Kontur, 2015). The data displayed in FIG.
13. demonstrates a similar trend. The high aptitude students evaluated in this study
showed a slight increase in test scores the more homework they completed. One
reason for this trend may be that high aptitude students have a greater ability to
connect different concepts together and to build off prior knowledge at a higher rate
than lower aptitude students. The low aptitude students in the study showed a
slight negative correlation between the percentage of homework they completed
and their exam scores. It is believed that these students may struggle with concepts
learned in class and can be confused when they have to connect multiple concepts
39
into one problem. Thus, if they are confused completing more problems will not
assist them in learning the material, but it may have a negative impact and reaffirm
some of the students' misconceptions. This result could call for a change in the
teaching of these students. One option would be to differentiate instruction for these
students by giving them a greater number of examples and explanations during
class while higher-level students are allowed to work individually or in small groups
after only one or two examples. This could allow for the high level students to
practice on their own and come to their own conclusions while also giving the lower
level students the support they need to succeed. The middle level students in this
study showed a significant improvement on exam scores from completing greater
amounts of homework. In Kontur's study the middle aptitude students
demonstrated mainly negative correlations between homework and exam scores.
The discrepancy could be based on the level of difficulty of the material and the rate
of the class. Kontur completed his study on college students in a calculus based
course, which would move at a much higher rate than a high school course. In high
school, students have an easier time catching up if they get behind, however, in
college it is more difficult because of the rate at which concepts are covered. Thus, it
is my belief that the middle level students increased their scores by completing
more homework problems because there was opportunity to take their time and
learn the material at a slower rate than at the college level.
40

Discussion of Student Surveys
Throughout this class the students completed homework assignments purely for
practice and the homework assignments were not graded. However, the students
did have a homework quiz over one or two questions based on each assignment.
Typically the questions were similar to the assignment with only the numbers
changed. The students were able to use their homework as a resource on the quiz.
Immediately following the completion of homework quizzes in class the students
would trade quizzes and they would be graded. The students would follow along
with the instructor as the solution was explained and the students would mark the
quizzes as correct or incorrect. The instructor would specifically grade each one
after class and would designate how many points each student should receive based
on the correctness of the quiz. By reviewing the answer immediately after the
students took the quiz it gave the students instantaneous feedback on the
assignment and let the students know if they were completing the assignment
correctly or had some misunderstanding. Also, after the quiz if students had
questions over any other problems from the assignment they would have a chance
to ask questions. After the students completed the homework quiz, the complete
solutions to the assignments were posted online so the students could review all of
the solutions to the homework on their own. The instant feedback that the students
received from the online solutions and the explanation of the homework quiz was
much more effective than the students waiting one to two days for the teacher to
grade the assignments. This led to more self-reflection by the students on what they
41

were doing correctly, and what concepts they should focus their study time on.
According to the data shown in FIG. 11., the more assignments the students
reviewed online the higher final exam score they achieved. There was no significant
relationship from FIG. 11. most likely because the group that looked up the solutions
to every assignment was small resulting in a large standard error. However, I do
believe that by giving the students the solutions after each assignment helped the
stu,dents that took the time to look up the answers perform at a higher level on the
final.
At the culmination of the data collection for this study the students were asked to
complete a survey. This survey asked the students a series of questions about the
method of assessment involving homework quizzes vs. students completing every
assignment and every assignment being graded by the instructor. The first question
asked the students to give an explanation as to why they did not complete all of the
questions to each assignment if they did not do 100 percent of the problems. The
typical explanation that was given by the students was that by the time they
completed homework from other classes, practice for other activities, family time,
and work they simply did not have time to do the entire physics assignment. Many
of the students taking physics were in more than one AP course and also in
advanced math courses so they typically had homework in other areas every night.
Another explanation that students gave was that they skipped the problems they
knew how to complete and focused on the problems that they struggled on. Many
students explained that they did not want to waste their time doing problems if they
42

already knew how to do it. One of the goals of this strategy was to allow students to
focus their study time only where they needed the most assistance.
Another question from the survey asked, " Do you want to continue the current
method of teaching being used in physics where homework quizzes are given
instead of each assignment being graded?" Out of 71 students 68 of them wanted to
continue completing homework quizzes with optional homework. The students
were also asked to explain why they liked or disliked the homework method. The
students that stated that they would prefer being graded on every assignment said,
"I do not see the point in completing homework if I am not going to be graded on it."
I would agree that many students feel this same way. They do not believe that they
should do something if they are not getting credit for it. This goes back to there
being a lack of extrinsic motivation, such as grades, for completing work. However,
what many students fail to realize is that the assignments are there to prepare them
not only for the homework quizzes, but for the exams as well. Several students that
liked completing homework quizzes gave this statement, "Taking homework quizzes
actually shows if we can apply our knowledge of the subject to a given problem
instead of copying the homework off of someone else. Doing homework quizzes
encourages us to do our own work because there is no consequence for getting one
wrong on the homework." There were four or five students that gave a similar
answer to this student about reducing the frequency with which students copy
homework. This study was not meant to reduce the frequency with which students
43
copy assignments, but by reducing the pressure to complete the entire assignment,
it alleviates the students' urge to cheat.
The final question that the students answered asked, "In your opinion, were you
able to learn more effectively from daily homework quizzes and checking the
solutions online than you are from the more traditional way of turning in all
assignments?" Once again, many similar answers were given by the students, such
as, "Not every teacher gets the homework back to you fast enough, using this
method I get instant confirmation whether I am doing the assignment right or not."
With this method of giving assignments and posting the solutions online students
are able to receive instant feedback from the instructor. With the traditional method
of homework, it takes a good teacher one to two days to return the assignments. As
a teacher, I have found that sometimes after two days the students have already
forgotten what they understood or did not comprehend on an assignment. Also, it is
difficult as a teacher to write a detailed explanation on every problem as to why the
students may have missed a question. This method gives the students the tools to
look up all of the solutions to the problems and reflect if they missed a question by
analyzing the solutions themselves. Another student said, "I like homework quizzes
because it allows me to focus on the problems that I need practice on and doesn't
waste my time filling out a whole worksheet that I already know how to do." This
was a common opinion among the students. Many students felt that by making the
assignment optional they could focus only on the problems where they have the
most difficulty. If the students were assigned the entire worksheet, they would have
44
to spend much of that time doing problems that they find easy. The homework
assignments given in this class were similar to the way most teachers give
assignments. There are problems at varying difficulty levels. Some students easily
understand how to do the easy problems and can only focus on the hard problems.
In the literature review of this study the topic of" deliberate practice" was discussed.
If students are able to focus for a shorter period of time on more difficult problems
instead of easy problems this is making their study time more deliberate, thus
allowing the students to focus more critically for a shorter amount of time.
Conclusion
Assessment methods continue to be a topic that is commonly debated among
today's educators. It is clear that there are a variety of methods varying from
traditional to more flexible methods of assessment. Based on the results of this
study there is no significant data that suggests the homework method described in
this study either increases or decreases the achievement of high school physics
students. However, there were some trends in the data that showed that high and
middle aptitude students showed an increase in achievement by completing a
greater number of homework problems. Unfortunately, a different strategy may
need to be developed to increase the achievement of low-level students in physics
classes as their performance on exams decreased when more homework was
completed. This trend agreed with Kontur's study at the United States Air Force
Academy with their introductory Electricity and Magnetism course where high
45

aptitude students improved by increasing their homework load, and low-aptitude
students' performances decreased.
A second goal of this study was to give students the opportunity to be more
deliberate about their study time and to focus on the concepts that they found to be
the most difficult. By giving the students the solutions after they completed the
assignments it also allowed students to be more reflective about their own learning
and gave them the chance to analyze what they were doing correctly or incorrectly.
The data demonstrated that students that the more solutions the students viewed
online the better they performed on the final exam. Through student surveys it was
found that the students' stress levels were decreased because they were more
focused on learning the material than they were about just finishing each
assignment. Another benefit to this method was that it reduced the frequency of
cheating on assignments and forced the students to take ownership of their own
work on the homework quizzes. The students had a more positive outlook on the
way class was run and found the assignments to have more purpose if they could
focus solely on the areas where they were struggling. I believe that the homework
method discussed in this study has many benefits and is worth continuing to use in
my classroom.
46
References
Bao, L., Stonebraker, S., & Sadaghiani, H. (2008). A flexible homework method. American journal of Physics, 76(9), 878-881. doi:l0.1119/1.2955791
Cushman, K. (2010). Show us what homework's for. Educational Leadership, 74-78.
Eren, 0., & Henderson, D. (2011). Are We Wasting Our Children's Time By Giving Them More Homework? Economics of Education Review, 950-961.
Ericsson, K., Krampe, R., & Tesch-Romer, C. (1993). The Role Of Deliberate Practice In The Acquisition Of Expert Performance. Psychological Review, 363-406.
Fraser, J., Timan, A, Miller, K., Dowd, J., Tucker, L., & Mazur, E. (2014). Teaching and physics education research: Bridging the gap. Rep. Prag. Phys. Reports on Progress in Physics, 1-17. doi:l0.1088/0034-4885/77 /3/032401
Galloway, M., Conner, J., & Pope, D. (2013). Nonacademic Effects of Homework in Privileged, High-Performing High Schools. The journal of Experimental Education, 490-510.
Gill, B., & Schlossman, S. (2004). Villain or Savior? The American Discourse on Homework, 1850-2003. Theory Into Practice, 43(3), 174-181.
Hestenes, D., Wells, M., & Swackhamer, G. (1992). Force Concept Inventory. The Physics Teacher.
Illinois Report Card. (2014). Retrieved June 22, 2015.
Kontur, F., Harpe, K., & Terry, N. (2015). Benefits of completing homework for students with different aptitudes in an introductory electricity and magnetism course. Physical Review Special Topics - Physics Education Research Phys. Rev. ST Phys. Educ. Res., 1-16.
Kontur, F., & Terry, N. (2014). Motivating Students to Do Homework. The Physics Teacher Phys. Teach., 295-297. doi:l0.1119/1.4872413
Lan, B. (2011). Quizzes that foster and motivate learning. The Physics Teacher Phys. Teach., 49, 581-581. doi:l0.1119/1.3661111
Maltese, A, Tai, R., & Fan, X. (2012). When is Homework Worth the Time?: Evaluating the Association Between Homework and Achievement in High School Science and Math. The High School journal, 52-72.
47
Parker, C. (2014, March 10). Stanford research shows pitfalls of homework I Stanford News ... Retrieved June 22, 2015.
Scharff, L., Rolf, J., Novotny, S., & Lee, R. (2010). Factors impacting completion of preclass assignments in Physics, Math, and Behavioural Sciences. 1-11.
Appendices
Appendix A
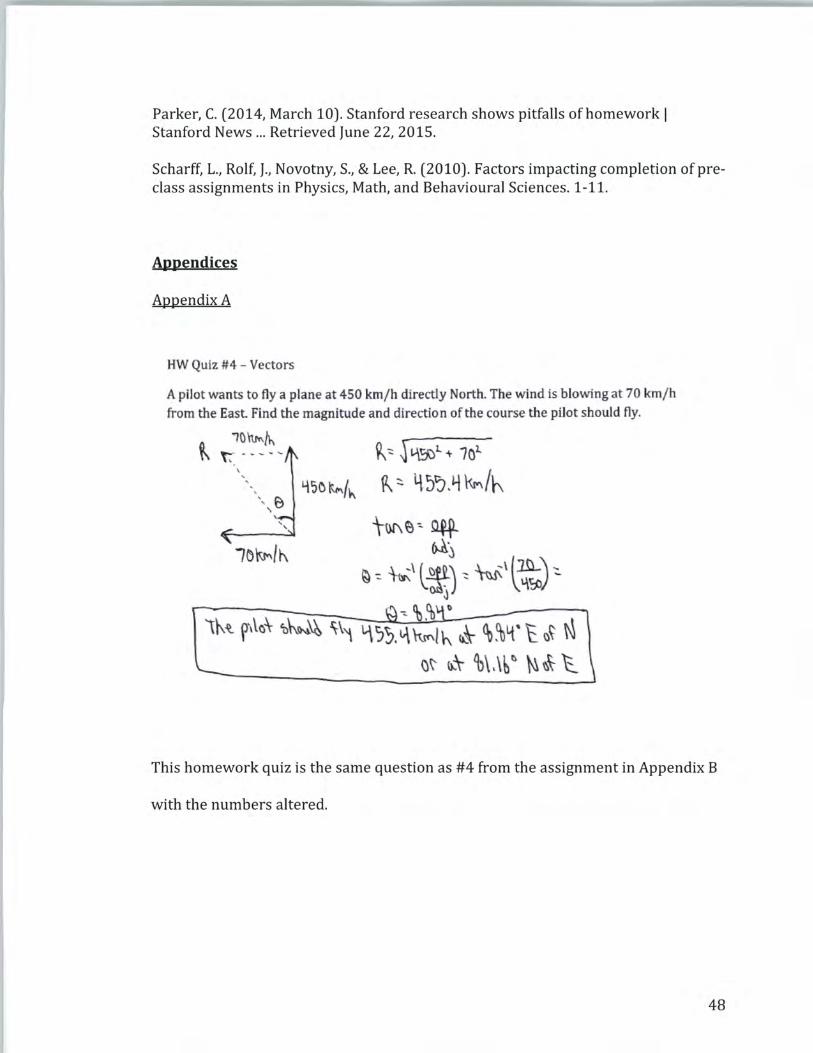
HW Quiz #4 - Vectors
A pilot wants to tly a plane at 450 km/h directly North. The wind is blowing at 70 km/h from the East Find the magnitude and direction of the course the pilot should fly.
R ~ J L-\3:>1. + 1oi.
~ ~ 45':).i.t ~/"' \ e ...
\}\~ f\o\ 'o~IN.~ \\~ \.\ t;;, l.\ \\~/~ ~ ~~1f t ~~ N ()~ ()..\- 'b\.\b ~ ~ti\- 't.
This homework quiz is the same question as #4 from the assignment in Appendix B
with the numbers altered.
48
Appendix B
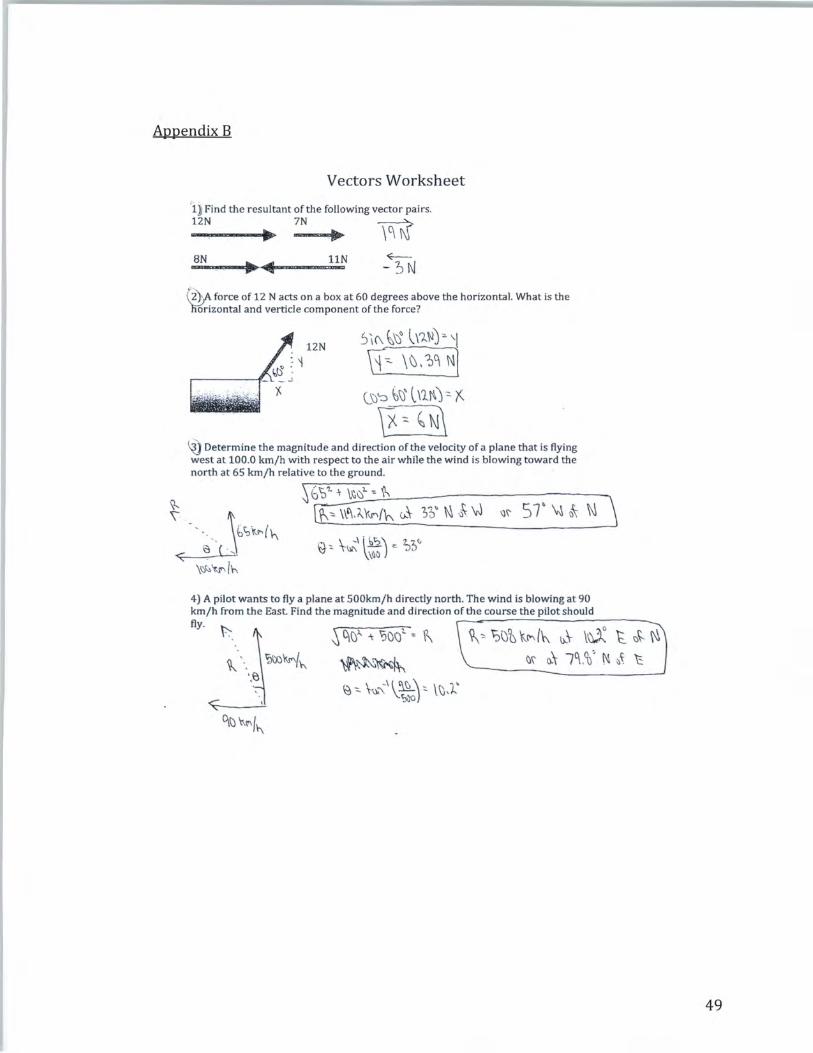
Vectors Worksheet
'i~ Find the resultant of the following vector pairs. 12N 7N ------;:'(-
----•• ... \t\1\) SN UN
(2},A force of 12 N acts on a box at 60 degrees above the horizontal. What is the ffi>rizontal and verticle component of the force?
12N ~ \(\ ~~ ( \?-"1J :, ' t \i~ \\),~~ ~
l 'V'::l ~\H \11'~) ::. K
v ~ ~Nj ~Determine the magnitude and direction of the velocity of a plane that is flying west at 100.0 km/h with respect to the air while the wind is blowing toward the north at 65 km/h relative to the ground.
4) A pilot wants to fly a plane at SOOkm/h directly north. The wind is blowing at 90 km/h from the East Find the magnitude and direction of the course the pilot should fly.
~ ~ l '·, ~~1~ "e
s I
~(,)~~th.
~ eic:ii. -'r 'ij()Ql. " ~
\f\i~~
~" 'S\Jt f\.M {\\ \)..\. \~ t 1:1\. ~ ()\ (}.\ 7~ .<\)' N ~~ 't
49
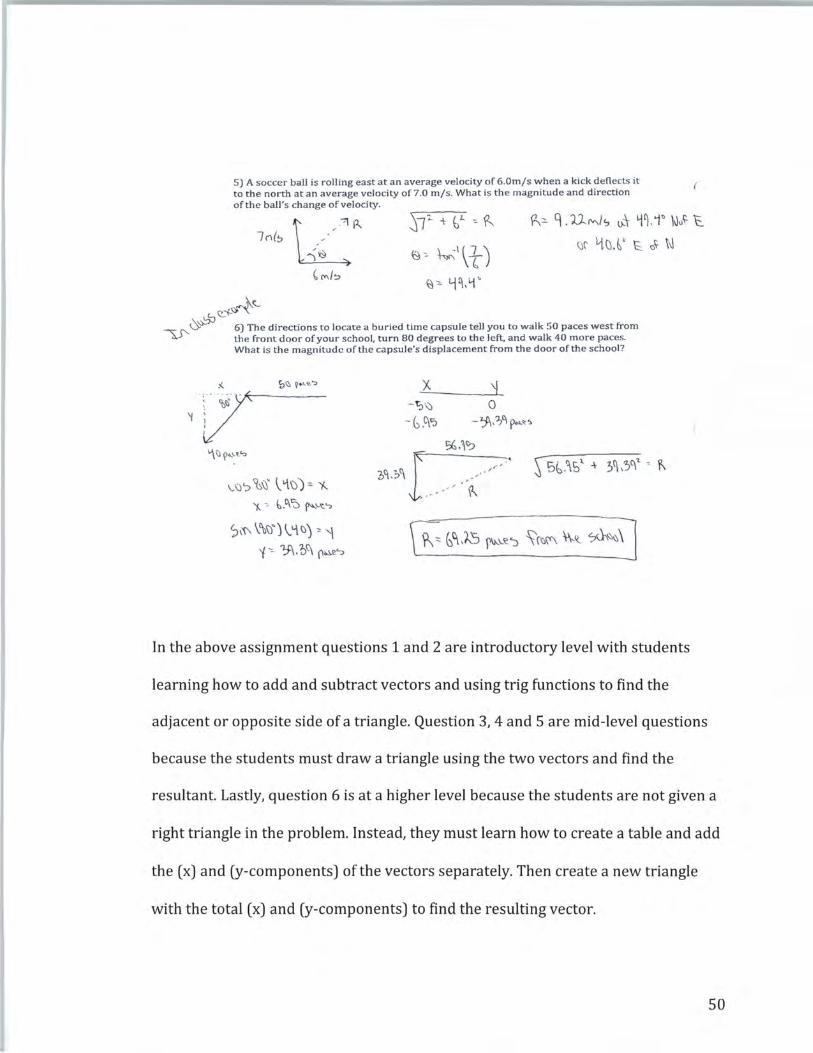
S) A soccer ball is rolling east at a n ave rage velocity of 6 .0m/s when a kick deflects it ( to the north at an average velocity of 7.0 m/s. What is the magnitude and direction of the ball's cha nge of velocity.
:S1._ * V- ~ R
~ °" ~\l) \j "- l-j q, i.j'
{J,:::. q. UMIS l}.\ Y~ . i~ Nu~ "t_
\)(' 11. Cl. b' B_ o"- \\\
b~"{..~(._ ""'"r--. \:>~ 6) The directions to locate a buried time capsule tell you to walk SO paces west from
"'-' · the front door of your school, turn 80 degrees to the left, and walk 40 more paces. What is the magnitude of the cap sule's d isplacement from the door of the school?
\..\)'::> ~\)' \. "\.\) J '"- '/.... '/.. .,_ b .t\~ f"-'-1:.">
s\~ \.\\l~ ) '-'-\ ~) ,,, "
'f ";. :Pl, ol\ r~'?
x ,, - T; '\:l 0 -(:,,C\t;i -~,?C\f>""-<t '>
In the above assignment questions 1 and 2 are introductory level with students
learning how to add and subtract vectors and using trig functions to find the
adjacent or opposite side of a triangle. Question 3, 4 and 5 are mid-level questions
because the students must draw a triangle using the two vectors and find the
resultant. Lastly, question 6 is at a higher level because the students are not given a
right triangle in the problem. Instead, they must learn how to create a table and add
the (x) and (y-components) of the vectors separately. Then create a new triangle
with the total ( x) and (y-components) to find the resulting vector.
50
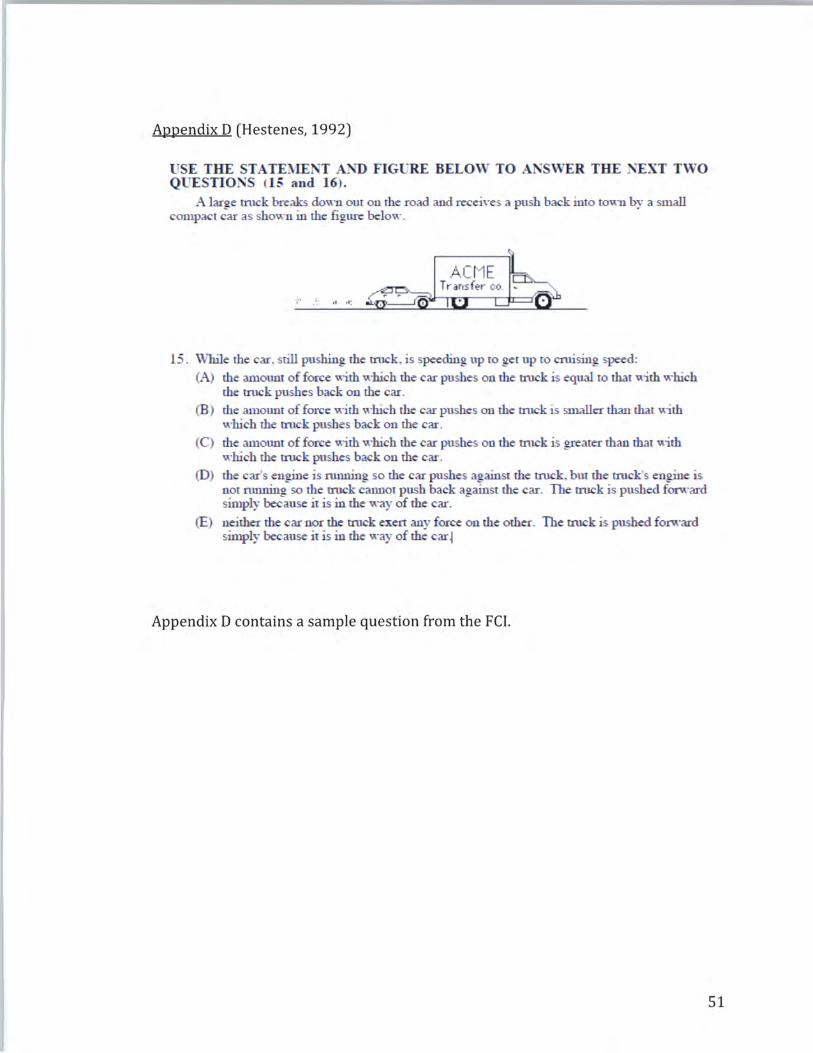
Appendix D (Hestenes, 1992)
USE THE STATK\tlENT AND FIGGRE BELOW TO ANSWER THE NEXT TWO QUESTIONS (15 and 16).
A large truck breaks do'l.\n out on the road and recei,·es a push back into tov;n by a small ompact car as shown in the figure helm'' ·
15 . While the car. still pushing. the truck, is speeding up to get up to cruising speed:
(A) the amount of force with which the car pushes on the truck is equal to that with which the truck pushes back on the car.
(B) the amount of force with ·which the car pushes on the truck is smaller than that with which the truck pushes back on the car.
(C ) the amount of force v;-ith which the car pushes on the truck is greater than that \\'i.th which the truck pushes back on the car.
(D) the car's engine is running so the car pushes against the truck, but the truck's engine is not running so the truck cannot push back against the car. The truck is pushed forward sin1ply because it is in the way of the car.
(E) neither the car nor the truck exert any force on the other. The truck is pushed forward simply because it is in the way of the car~
Appendix D contains a sample question from the FCI.
51

Appendix E
Physics Semester 1 Survey 1. Based on percentage, how much of the homework did you complete this past
semester? a. 0-25% b. 25-50% c. 50-75% d. 75-100%
2. If you did not complete all of the assignments please give a short explanation as to why you did not complete all of the homework assignments.
3. How many times did you use Mr. Deets' website to look up the solutions to assignments during first semester?
a. never b. rarely c. most of the time d. I looked up every assignment
4. Do you want to continue the current method of teaching being used in Physics where homework quizzes are given?
a. Yes b. No
5. Please give your reasoning as to why you like or disliked taking homework quizzes instead of the more traditional method of turning in every assignment.
6. In your opinion, are you able to learn more effectively from daily homework quizzes and checking the solutions online than you are from the more traditional way of turning in all assignments and waiting for the teacher to grade them? Explain.
7. Is there anything that Mr. Deets could do differently next semester to help you learn more effectively?
52