Uncertainty associated with river health assessment in a varying environment: The case of a...
10
Ecological Indicators 43 (2014) 195–204 Contents lists available at ScienceDirect Ecological Indicators j o ur na l ho me page: www.elsevier.com/locate/ecolind Uncertainty associated with river health assessment in a varying environment: The case of a predictive fish-based index in France Anahita Marzin ∗ , Olivier Delaigue, Maxime Logez, Jérôme Belliard, Didier Pont Irstea, UR HBAN, 1 rue Pierre-Gilles de Gennes, CS 10030, 92761 Antony Cedex, France a r t i c l e i n f o Article history: Received 12 April 2013 Received in revised form 6 February 2014 Accepted 10 February 2014 Keywords: Ecological river assessment Multi-metric index Functional traits Uncertainty Bayesian modelling Water framework directive a b s t r a c t Sensitive biological measures of river ecosystem quality are needed to assess, maintain or restore eco- logical conditions of water bodies. Since our understanding of these complex systems is imperfect, decision-making requires recognizing uncertainty. In this study, a new predictive multi-metric index based on fish functional traits was developed to assess French rivers. Information on fish assemblage structure, local environment and human-induced disturbances of 1654 French river sites was compiled. A Bayesian framework was used to predict theoretical metric values in absence of human pressure and to estimate the uncertainty associated with these predictions. The uncertainty associated with the index score gives the confidence associated with the evaluation of site ecological conditions. Among the 228 potential metrics tested, only 11 were retained for the index computation. The final index is independent from natural variability and sensitive to human-induced disturbances. In partic- ular, it is affected by the accumulation of different degradations and specific degradations including hydrological perturbations. Predictive uncertainty is globally lower for IPR+ than for underlying metrics. This new methodology seems appropriate to develop bio-indication tools accounting for uncertainty related to reference condition definition and could be extended to other biological groups and areas. Our results support the use of multi-metric indexes to assess rivers and strengthen the idea that examination of uncertainty could contribute greatly to the improvement of the assessment power of bio-indicators. © 2014 Elsevier Ltd. All rights reserved. 1. Introduction Over the past 50 years, humans have changed ecosystems more rapidly and extensively than in any comparable period of time in human history (Millennium Ecosystem Assessment, 2005). One of the major challenges of the 21th century is to reverse the degrada- tion of ecosystems while meeting increasing demands for natural resources such as food, fresh water and fuel. However, knowledge and understanding of the functioning of these complex systems are imperfect. Bio-indicators aim at giving a synthetic view of this complexity to facilitate decision-making. Each step of the develop- ment of a bio-indicator (from site selection and sampling protocol to metric selection and index calculation) implies making choices Abbreviations: CAL, calibration sites; CON, construction sites; DE, discrimina- tory efficiencies; EQR, ecological quality ratio; IPR+, Indice Poisson Rivière, new French fish index; MMI, multi-metric index; PDF, probability density function; REF, reference sites; WFD, water framework directive. ∗ Corresponding author at: Irstea, UR HBAN, HYNES (Irstea – EDF R&D), 1 rue Pierre-Gilles de Gennes, CS 10030, 92761 Antony Cedex, France. Tel.: +33 01 40 96 61 21; fax: +33 01 40 96 61 99. E-mail address: [email protected] (A. Marzin). that will influence the degree to which it reflects the actual com- plex situation (Clarke et al., 1996; Clarke and Hering, 2006; Hughes et al., 2000). These multiple sources of uncertainty could have repercussions on bio-indicator scores and thus affect the final diagnostics and water-manager decisions (e.g. Clarke and Hering, 2006). Therefore, the recognition of uncertainty is a major challenge and is indispensable for environmental management (Demars, 2013; Hering et al., 2010). In the field of environmental manage- ment, the main sources of uncertainty have been acknowledged as statistical uncertainty, subjective judgement, systematic error, incomplete knowledge, temporal variation and inherent stochas- ticity (Todd and Burgman, 1998). In water body health assessment, the main sources of uncertainty are recognized as the incomplete acknowledgement of the natural temporal and spatial variation of communities and errors associated with sampling processing methods and modelling (Clarke and Hering, 2006). Freshwater scientists (e.g. Hughes et al., 1986; Stoddard et al., 2006) and the European Water Framework Directive (WFD; EC, 2000) recommends the use of multi-metric bio-indicators (MMI; Karr, 1981) based on the Reference Condition Approach (Bailey et al., 1998) to assess river ecological conditions while account- ing for the natural heterogeneity of communities. Consequently, http://dx.doi.org/10.1016/j.ecolind.2014.02.011 1470-160X/© 2014 Elsevier Ltd. All rights reserved.
Transcript of Uncertainty associated with river health assessment in a varying environment: The case of a...

Ue
AI
a
ARRA
KEMFUBW
1
rhttraacmt
tFr
PT
h1
Ecological Indicators 43 (2014) 195–204
Contents lists available at ScienceDirect
Ecological Indicators
j o ur na l ho me page: www.elsev ier .com/ locate /eco l ind
ncertainty associated with river health assessment in a varyingnvironment: The case of a predictive fish-based index in France
nahita Marzin ∗, Olivier Delaigue, Maxime Logez, Jérôme Belliard, Didier Pontrstea, UR HBAN, 1 rue Pierre-Gilles de Gennes, CS 10030, 92761 Antony Cedex, France
r t i c l e i n f o
rticle history:eceived 12 April 2013eceived in revised form 6 February 2014ccepted 10 February 2014
eywords:cological river assessmentulti-metric index
unctional traitsncertaintyayesian modellingater framework directive
a b s t r a c t
Sensitive biological measures of river ecosystem quality are needed to assess, maintain or restore eco-logical conditions of water bodies. Since our understanding of these complex systems is imperfect,decision-making requires recognizing uncertainty. In this study, a new predictive multi-metric indexbased on fish functional traits was developed to assess French rivers. Information on fish assemblagestructure, local environment and human-induced disturbances of 1654 French river sites was compiled.A Bayesian framework was used to predict theoretical metric values in absence of human pressure andto estimate the uncertainty associated with these predictions. The uncertainty associated with the indexscore gives the confidence associated with the evaluation of site ecological conditions.
Among the 228 potential metrics tested, only 11 were retained for the index computation. The finalindex is independent from natural variability and sensitive to human-induced disturbances. In partic-ular, it is affected by the accumulation of different degradations and specific degradations including
hydrological perturbations. Predictive uncertainty is globally lower for IPR+ than for underlying metrics.This new methodology seems appropriate to develop bio-indication tools accounting for uncertaintyrelated to reference condition definition and could be extended to other biological groups and areas. Ourresults support the use of multi-metric indexes to assess rivers and strengthen the idea that examinationof uncertainty could contribute greatly to the improvement of the assessment power of bio-indicators.
© 2014 Elsevier Ltd. All rights reserved.
. Introduction
Over the past 50 years, humans have changed ecosystems moreapidly and extensively than in any comparable period of time inuman history (Millennium Ecosystem Assessment, 2005). One ofhe major challenges of the 21th century is to reverse the degrada-ion of ecosystems while meeting increasing demands for naturalesources such as food, fresh water and fuel. However, knowledgend understanding of the functioning of these complex systemsre imperfect. Bio-indicators aim at giving a synthetic view of this
omplexity to facilitate decision-making. Each step of the develop-ent of a bio-indicator (from site selection and sampling protocolo metric selection and index calculation) implies making choices
Abbreviations: CAL, calibration sites; CON, construction sites; DE, discrimina-ory efficiencies; EQR, ecological quality ratio; IPR+, Indice Poisson Rivière, newrench fish index; MMI, multi-metric index; PDF, probability density function; REF,eference sites; WFD, water framework directive.∗ Corresponding author at: Irstea, UR HBAN, HYNES (Irstea – EDF R&D), 1 rueierre-Gilles de Gennes, CS 10030, 92761 Antony Cedex, France.el.: +33 01 40 96 61 21; fax: +33 01 40 96 61 99.
E-mail address: [email protected] (A. Marzin).
ttp://dx.doi.org/10.1016/j.ecolind.2014.02.011470-160X/© 2014 Elsevier Ltd. All rights reserved.
that will influence the degree to which it reflects the actual com-plex situation (Clarke et al., 1996; Clarke and Hering, 2006; Hugheset al., 2000). These multiple sources of uncertainty could haverepercussions on bio-indicator scores and thus affect the finaldiagnostics and water-manager decisions (e.g. Clarke and Hering,2006). Therefore, the recognition of uncertainty is a major challengeand is indispensable for environmental management (Demars,2013; Hering et al., 2010). In the field of environmental manage-ment, the main sources of uncertainty have been acknowledgedas statistical uncertainty, subjective judgement, systematic error,incomplete knowledge, temporal variation and inherent stochas-ticity (Todd and Burgman, 1998). In water body health assessment,the main sources of uncertainty are recognized as the incompleteacknowledgement of the natural temporal and spatial variationof communities and errors associated with sampling processingmethods and modelling (Clarke and Hering, 2006).
Freshwater scientists (e.g. Hughes et al., 1986; Stoddard et al.,2006) and the European Water Framework Directive (WFD; EC,
2000) recommends the use of multi-metric bio-indicators (MMI;Karr, 1981) based on the Reference Condition Approach (Baileyet al., 1998) to assess river ecological conditions while account-ing for the natural heterogeneity of communities. Consequently,
1 l Indic
ntOhi(2liaute
dgcociotac
torsod
2
2d
bwspi
jis2stlrdF
(tcaAdd(dPo
96 A. Marzin et al. / Ecologica
umerous MMI were developed and many of them use predic-ive methods to define reference condition (Logez and Pont, 2011;berdorff et al., 2002; Pont et al., 2006, 2007). Yet, few indicatorsave been evaluated regarding their uncertainties and most stud-
es focused on errors related to monitoring and sampling strategyBady et al., 2005; Clarke et al., 1996; Ostermiller and Hawkins,004; Staniszewski et al., 2006). Reference condition is the base-
ine of the assessment and evaluation of the uncertainty related tots definition appears essential to estimate the uncertainty aroundn index value and the constituent metrics. More recently, studiessing Bayesian framework to quantified bio-assessment uncer-ainty have shown the strength of these methods (e.g. Drouineaut al., 2012; Tableau et al., 2013; Webb and King, 2009).
Based on these considerations, the aim of this study was toevelop a predictive MMI for French rivers based on fish functionaluilds (IPR+, Indice Poisson Rivière), delivering an index score asso-iated with a confidence measure for decision-makers. The IPR+ isriginal in that it: (i) defines reference conditions from objectiveriteria based on pressure levels, (ii) controls the natural variabil-ty of the metric to ensure that metric deviation measures the effectf anthropogenic disturbances, (iii) estimates the predictive uncer-ainty associated with metric values within a Bayesian frameworknd (iv) propagates uncertainty throughout the computation pro-ess to estimate final index predictive uncertainty.
Besides the description and discussion of this new methodology,his paper evaluates (1) the capacity of IPR+ to quantify the impactf different types of human disturbances on local fish assemblages,egardless of the natural environmental conditions (abiotic land-cape features) and (2) the variations in the predictive uncertaintyf IPR+ with human pressure levels and natural environmental con-itions.
. Materials and methods
.1. Site selection and classification of human-inducedisturbances
Data were obtained from national fisheries surveys conductedetween 1998 and 2007 (Poulet et al., 2011). A total of 1654 sitesere sampled once using electric fishing (Fig. 1; CON dataset). To
tandardize the sampling effort, only fish collected during the firstass were considered. Seventy different fish species were caught
n total.Anthropogenic alterations of rivers were assessed by expert
udgement after practical training of the operators to standard-ze classification (Table 1). Based on this alteration evaluation, twoubsets of reference sites (REF, 266 sites) and calibration sites (CAL,78 sites) were selected (see appendix A for selection criteria). REFites were defined as not or slightly disturbed sites (“minimally dis-urbed condition” as defined by Stoddard et al., 2006). To cover theargest environmental gradients in the modelling process, the crite-ia used to define the CAL data set were more severe upstream thanownstream following the classical Huet zonation (Huet, 1954).inally, 194 sites were shared by the two subsets.
Global human pressures (PGlobal), water quality degradationPWQ), hydrological degradation (PH) and morphological degrada-ion indexes (PM) were summarized by the first axes of multipleorrespondence analyses (Tenenhaus and Young, 1985). Theyccounted for 9.3%, 17%, 14% and 20%, respectively, of the inertia.long the first axes of the analyses, categories reflecting no or slightisturbances were opposed to categories reflecting higher level ofisturbances. Four classes of disturbance level ranging from “None”
minimally disturbed sites) to “High” (heavily disturbed sites) wereefined by a K-means algorithm (Hartigan and Wong, 1979). PWQ,H and PM were computed on sub-datasets presenting a single typef pressure (454, 786 and 850 sites, respectively). Subsequently,ators 43 (2014) 195–204
four subsets of strongly impaired sites were considered: “High”pressure level of PGlobal (N = 357), PWQ (N = 128), PH (N = 149) andPM (N = 140).
2.2. Environmental variables
Six environmental descriptors known to influence fish assem-blages (Pont et al., 2005) were chosen so as to minimize correlationsbetween descriptors: catchment area (0.7–110,248 km2), streampower (39–114,400,000 kg m s−3), mean annual air temperature(6–17 ◦C), mean annual air temperature amplitude (9–20 ◦C), catch-ment geological type (siliceous, 738 sites; calcareous, 916 sites)and hydrological regime (pluvial strong, 499 sites; pluvial moder-ate, 959 sites; nival-Glacial, 196 sites). They were either measuredin the field or derived from geographical information systems. Cli-matic data were provided by the French Meteorological Institute(Vidal et al., 2010) and averaged for the 10 years previous to samp-ling. These variables were assumed to be not or slightly modifiedby local anthropogenic activities. Due to the skewness of theirdistributions, catchment area and stream power variables werelog-transformed.
2.3. Potential metrics for the calculation of IPR+
Twelve biological and ecological traits were considered accord-ing to previous classifications of European fish traits at the specieslevel with regard to reproduction, trophic position, habitat prefer-ence, sensitivity to water quality, habitat alteration, and migratorybehaviour (Logez et al., 2013; Noble et al., 2007; see Table B.1 inappendix B). Each species was assigned to one of the different cate-gories of a trait (12 traits, 37 categories; see appendix B). Each traitwas considered either in absolute or relative density (N, N%), num-ber of species (S, S%) or biomass (B, B%) leading to 222 potentialmetrics. To account for WFD requirements, six metrics based ontrout young of the year were tested as age-class metrics (Logez andPont, 2011). The selected “trout” metric was calculated and will beapplicable only for sites belonging to trout or grayling zones. The228 potential metrics were log-transformed (log (X + 1)).
In absence of human-induced changes, the evaluation of eco-logical status should be consistent between years. In preliminaryanalyses, some richness metrics showed strong inter-annual vari-ability in constant human disturbance conditions due to fewindividuals of a species caught some years and not the others. Thisvariability could blur the signal and reduce the robustness of thefinal index. To overcome this data flaw, those individuals wereremoved from the samples (N < 2 for samples with fewer than 200fish caught, N < 3 for other samples).
2.4. Metric modelling and selection
To predict metric values in the reference condition, metrics weremodelled (generalized linear model) as a function of the six descrip-tors in absence of significant human disturbance (CAL dataset).Poisson regressions were chosen to model richness metrics (S)and negative binomial models were used for abundance (N)and biomass (B) metrics. Offset parameters, log (ST), log (NT) andlog (BT), were added for relative metrics (S%, N% and B%; rela-tive richness, abundance and biomass, respectively; McCullagh andNelder, 1989). Based on the Akaike information criterion (Akaike,1974), a stepwise selection of the environmental variables wasapplied separately for each model.
Models were then used to predict metric theoreti-
cal values in reference conditions at any site. Predictionswere compared with observations and residuals (residuals =log (observations + 1) − log (predictions + 1)) were standardized.Assuming that most of the natural variability of the metrics was
A. Marzin et al. / Ecological Indicators 43 (2014) 195–204 197
F ts, 266s
ivpf
iT
TD
ig. 1. Localization of the 1654 sites used for IPR+ development (CON). (a) Black doites (CAL).
ncluded in the models, the metric residuals were supposed toary according to the intensity of human disturbances and inde-endently of natural environmental variables (see Pont et al., 2006or details).
Eleven metrics were selected regarding model quality (graph-cal analysis of the residuals and Pseudo-R2; Faraway, 2006;able D.1), metric sensitivity to the different types of human
able 1escription of human-induced disturbances at the 1654 French sites.
Variables Categories of the variables (numbe
No Slight
Hydrological regime modifieda,b 803 408
Hydropeakinga,b 1355 159
By-pass channela,b 1482 104
Water abstractiona,b 808 580
Presence of an impoundmenta,b 1290 172
Artificial embankmenta,c 1174 278
Riparian vegetation modifieda,c 850 437
Sedimentationa,c 667 547
Toxic pollutiona,d 542 505
Organic pollutiona,d 404 481
Nutrient pollutiona,d 277 457
Eutrophicationa,d 710 394
Organic pollution classa,d 328 670
No
Acid pollutiona,d 1120
Upstream lakea 1183
Navigationa 1515
Downstream barriera 896
Channel form modifieda,c 1132
Cross-section modifieda,c 1065
Channel incision or aggradationa,c 1063
Water temperature modifieda No (1259)/cooling (56)/wa
None Low
Water quality degradation index (PWQ) 160 77
Morphological degradation index (PM) 425 167Hydrological degradation index (PH) 316 206Global disturbance index (PGlobal) 359 386Number of disturbance types (NDisturb) 0 (400)/1 (299)/2 (228)/3 (16
a Variables used in the global disturbance indices (PGlobal and NDisturb).b Variables used in the hydrological disturbance index (PH).c Variables used in the morphological disturbance index (PM).d Variables used in the water quality disturbance index (PWQ; MEDD and Agence de l’ea
reference sites (REF) and grey dots the other 1388 sites. (b) 278 model calibration
disturbances and contributing non-redundant information (corre-lations |r| < 0.7; Stoddard et al., 2008): trout juveniles (N%-Trout),oxyphilous species (N%-O2INTOL and S%-O2INTOL), species intol-erant to habitat degradation (N%-HINTOL), species preferring to
spawn in running (N%-RHPAR) or stagnant waters (S-LIPAR), tol-erant (S-TOL), stenothermal (S-STTHER), omnivorous (S-OMNI)intolerant (S%-INTOL) and limnophilic species (S%-LIMNO).r of sites)
Moderate High No data
276 167 –68 72 –54 14 –131 135 –44 148 –112 90 –207 160 –266 174 –132 117 358152 86 531258 72 590169 68 313327 228 101
Partial Yes No data
– 35 499256 153 7431 39 74337 370 51303 219 –318 271 –412 179 –
rming (299) No data (40)
Medium High No data
89 128 1200 109 149 804
124 140 868 328 357 2247)/4 (143)/5 (113)/>6 (262)
u, 2003).
1 l Indic
2
oqeT(Fagt�aspeGaulpt
cdaiD(lwo
2
2
urdo(boE
2
ivmotfidm(w2of
2
s
98 A. Marzin et al. / Ecologica
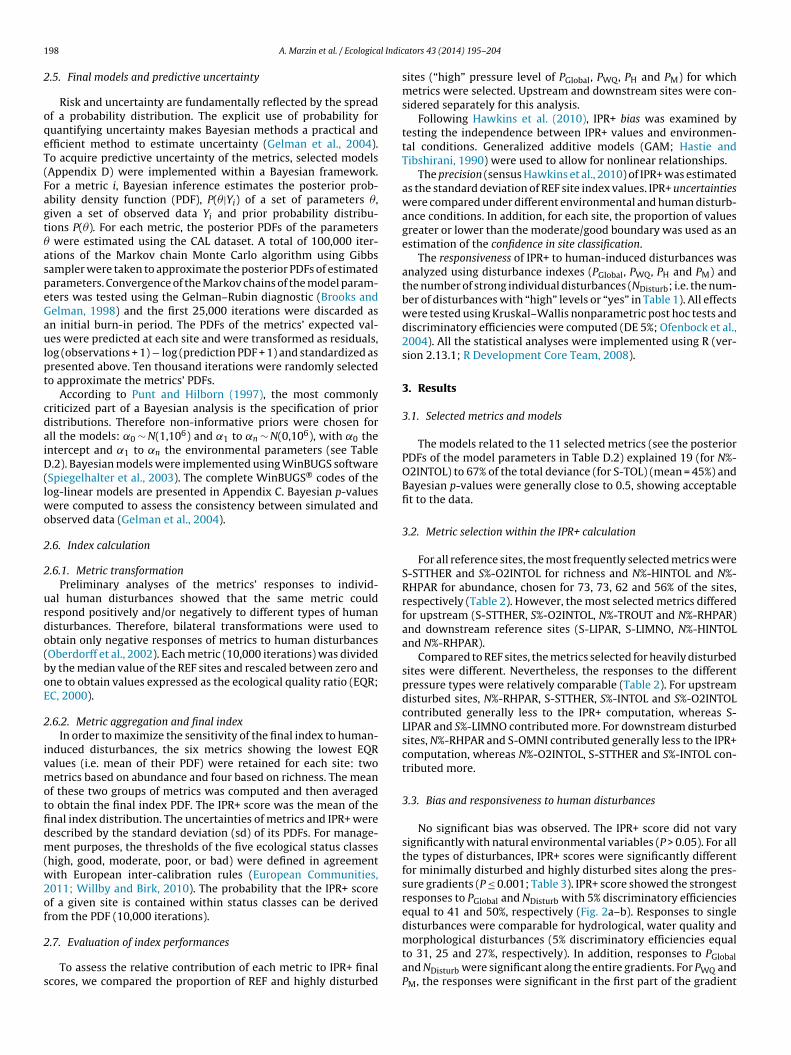
.5. Final models and predictive uncertainty
Risk and uncertainty are fundamentally reflected by the spreadf a probability distribution. The explicit use of probability foruantifying uncertainty makes Bayesian methods a practical andfficient method to estimate uncertainty (Gelman et al., 2004).o acquire predictive uncertainty of the metrics, selected modelsAppendix D) were implemented within a Bayesian framework.or a metric i, Bayesian inference estimates the posterior prob-bility density function (PDF), P(�|Yi) of a set of parameters �,iven a set of observed data Yi and prior probability distribu-ions P(�). For each metric, the posterior PDFs of the parameters
were estimated using the CAL dataset. A total of 100,000 iter-tions of the Markov chain Monte Carlo algorithm using Gibbsampler were taken to approximate the posterior PDFs of estimatedarameters. Convergence of the Markov chains of the model param-ters was tested using the Gelman–Rubin diagnostic (Brooks andelman, 1998) and the first 25,000 iterations were discarded asn initial burn-in period. The PDFs of the metrics’ expected val-es were predicted at each site and were transformed as residuals,
og (observations + 1) − log (prediction PDF + 1) and standardized asresented above. Ten thousand iterations were randomly selectedo approximate the metrics’ PDFs.
According to Punt and Hilborn (1997), the most commonlyriticized part of a Bayesian analysis is the specification of prioristributions. Therefore non-informative priors were chosen forll the models: ˛0 ∼ N(1,106) and ˛1 to ˛n ∼ N(0,106), with ˛0 thentercept and ˛1 to ˛n the environmental parameters (see Table.2). Bayesian models were implemented using WinBUGS software
Spiegelhalter et al., 2003). The complete WinBUGS® codes of theog-linear models are presented in Appendix C. Bayesian p-values
ere computed to assess the consistency between simulated andbserved data (Gelman et al., 2004).
.6. Index calculation
.6.1. Metric transformationPreliminary analyses of the metrics’ responses to individ-
al human disturbances showed that the same metric couldespond positively and/or negatively to different types of humanisturbances. Therefore, bilateral transformations were used tobtain only negative responses of metrics to human disturbancesOberdorff et al., 2002). Each metric (10,000 iterations) was dividedy the median value of the REF sites and rescaled between zero andne to obtain values expressed as the ecological quality ratio (EQR;C, 2000).
.6.2. Metric aggregation and final indexIn order to maximize the sensitivity of the final index to human-
nduced disturbances, the six metrics showing the lowest EQRalues (i.e. mean of their PDF) were retained for each site: twoetrics based on abundance and four based on richness. The mean
f these two groups of metrics was computed and then averagedo obtain the final index PDF. The IPR+ score was the mean of thenal index distribution. The uncertainties of metrics and IPR+ wereescribed by the standard deviation (sd) of its PDFs. For manage-ent purposes, the thresholds of the five ecological status classes
high, good, moderate, poor, or bad) were defined in agreementith European inter-calibration rules (European Communities,
011; Willby and Birk, 2010). The probability that the IPR+ scoref a given site is contained within status classes can be derivedrom the PDF (10,000 iterations).
.7. Evaluation of index performances
To assess the relative contribution of each metric to IPR+ finalcores, we compared the proportion of REF and highly disturbed
ators 43 (2014) 195–204
sites (“high” pressure level of PGlobal, PWQ, PH and PM) for whichmetrics were selected. Upstream and downstream sites were con-sidered separately for this analysis.
Following Hawkins et al. (2010), IPR+ bias was examined bytesting the independence between IPR+ values and environmen-tal conditions. Generalized additive models (GAM; Hastie andTibshirani, 1990) were used to allow for nonlinear relationships.
The precision (sensus Hawkins et al., 2010) of IPR+ was estimatedas the standard deviation of REF site index values. IPR+ uncertaintieswere compared under different environmental and human disturb-ance conditions. In addition, for each site, the proportion of valuesgreater or lower than the moderate/good boundary was used as anestimation of the confidence in site classification.
The responsiveness of IPR+ to human-induced disturbances wasanalyzed using disturbance indexes (PGlobal, PWQ, PH and PM) andthe number of strong individual disturbances (NDisturb; i.e. the num-ber of disturbances with “high” levels or “yes” in Table 1). All effectswere tested using Kruskal–Wallis nonparametric post hoc tests anddiscriminatory efficiencies were computed (DE 5%; Ofenbock et al.,2004). All the statistical analyses were implemented using R (ver-sion 2.13.1; R Development Core Team, 2008).
3. Results
3.1. Selected metrics and models
The models related to the 11 selected metrics (see the posteriorPDFs of the model parameters in Table D.2) explained 19 (for N%-O2INTOL) to 67% of the total deviance (for S-TOL) (mean = 45%) andBayesian p-values were generally close to 0.5, showing acceptablefit to the data.
3.2. Metric selection within the IPR+ calculation
For all reference sites, the most frequently selected metrics wereS-STTHER and S%-O2INTOL for richness and N%-HINTOL and N%-RHPAR for abundance, chosen for 73, 73, 62 and 56% of the sites,respectively (Table 2). However, the most selected metrics differedfor upstream (S-STTHER, S%-O2INTOL, N%-TROUT and N%-RHPAR)and downstream reference sites (S-LIPAR, S-LIMNO, N%-HINTOLand N%-RHPAR).
Compared to REF sites, the metrics selected for heavily disturbedsites were different. Nevertheless, the responses to the differentpressure types were relatively comparable (Table 2). For upstreamdisturbed sites, N%-RHPAR, S-STTHER, S%-INTOL and S%-O2INTOLcontributed generally less to the IPR+ computation, whereas S-LIPAR and S%-LIMNO contributed more. For downstream disturbedsites, N%-RHPAR and S-OMNI contributed generally less to the IPR+computation, whereas N%-O2INTOL, S-STTHER and S%-INTOL con-tributed more.
3.3. Bias and responsiveness to human disturbances
No significant bias was observed. The IPR+ score did not varysignificantly with natural environmental variables (P > 0.05). For allthe types of disturbances, IPR+ scores were significantly differentfor minimally disturbed and highly disturbed sites along the pres-sure gradients (P ≤ 0.001; Table 3). IPR+ score showed the strongestresponses to PGlobal and NDisturb with 5% discriminatory efficienciesequal to 41 and 50%, respectively (Fig. 2a–b). Responses to singledisturbances were comparable for hydrological, water quality and
morphological disturbances (5% discriminatory efficiencies equalto 31, 25 and 27%, respectively). In addition, responses to PGlobaland NDisturb were significant along the entire gradients. For PWQ andPM, the responses were significant in the first part of the gradient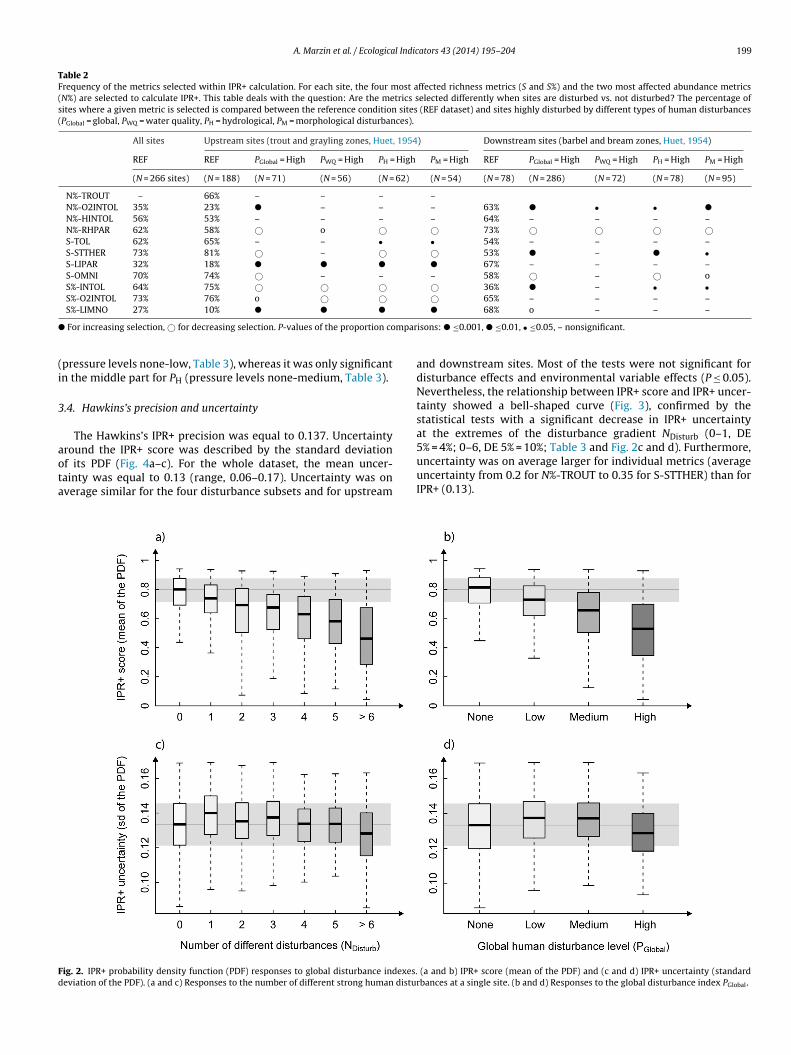
A. Marzin et al. / Ecological Indicators 43 (2014) 195–204 199
Table 2Frequency of the metrics selected within IPR+ calculation. For each site, the four most affected richness metrics (S and S%) and the two most affected abundance metrics(N%) are selected to calculate IPR+. This table deals with the question: Are the metrics selected differently when sites are disturbed vs. not disturbed? The percentage ofsites where a given metric is selected is compared between the reference condition sites (REF dataset) and sites highly disturbed by different types of human disturbances(PGlobal = global, PWQ = water quality, PH = hydrological, PM = morphological disturbances).
All sites Upstream sites (trout and grayling zones, Huet, 1954) Downstream sites (barbel and bream zones, Huet, 1954)
REF REF PGlobal = High PWQ = High PH = High PM = High REF PGlobal = High PWQ = High PH = High PM = High
(N = 266 sites) (N = 188) (N = 71) (N = 56) (N = 62) (N = 54) (N = 78) (N = 286) (N = 72) (N = 78) (N = 95)
N%-TROUT – 66% – – – –N%-O2INTOL 35% 23% � – – – 63% � • • �
N%-HINTOL 56% 53% – – – – 64% – – – –N%-RHPAR 62% 58% © o © © 73% © © © ©S-TOL 62% 65% – – • • 54% – – – –S-STTHER 73% 81% © – © © 53% � – � •S-LIPAR 32% 18% � � � � 67% – – – –S-OMNI 70% 74% © – – – 58% © – © oS%-INTOL 64% 75% © © © © 36% � – • •S%-O2INTOL 73% 76% o © © © 65% – – – –
� mpar
(i
3
aota
Fd
S%-LIMNO 27% 10% � � �
For increasing selection, © for decreasing selection. P-values of the proportion co
pressure levels none-low, Table 3), whereas it was only significantn the middle part for PH (pressure levels none-medium, Table 3).
.4. Hawkins’s precision and uncertainty
The Hawkins’s IPR+ precision was equal to 0.137. Uncertainty
round the IPR+ score was described by the standard deviationf its PDF (Fig. 4a–c). For the whole dataset, the mean uncer-ainty was equal to 0.13 (range, 0.06–0.17). Uncertainty was onverage similar for the four disturbance subsets and for upstreamig. 2. IPR+ probability density function (PDF) responses to global disturbance indexes.eviation of the PDF). (a and c) Responses to the number of different strong human distu
� 68% o – – –
isons: � ≤0.001, � ≤0.01, • ≤0.05, – nonsignificant.
and downstream sites. Most of the tests were not significant fordisturbance effects and environmental variable effects (P ≤ 0.05).Nevertheless, the relationship between IPR+ score and IPR+ uncer-tainty showed a bell-shaped curve (Fig. 3), confirmed by thestatistical tests with a significant decrease in IPR+ uncertaintyat the extremes of the disturbance gradient NDisturb (0–1, DE
5% = 4%; 0–6, DE 5% = 10%; Table 3 and Fig. 2c and d). Furthermore,uncertainty was on average larger for individual metrics (averageuncertainty from 0.2 for N%-TROUT to 0.35 for S-STTHER) than forIPR+ (0.13).(a and b) IPR+ score (mean of the PDF) and (c and d) IPR+ uncertainty (standardrbances at a single site. (b and d) Responses to the global disturbance index PGlobal.

200 A. Marzin et al. / Ecological Indicators 43 (2014) 195–204
F(
3
oabdlo(du(omb
4
bgt
Table 3IPR+ responses to human disturbances (score and uncertainty). DE 5%, discrimina-tory efficiency: the percentage of sites affected with IPR+ score less than the 5%extreme percentile of the minimally disturbed sites (number of disturbances = 0,indexes level “None”).
IPR+ score (mean) IPR+ uncertainty (sd)
DE 5% p-Value DE 5% p-Value
Number of human disturbances (NDisturb)0–1 8% *** 4% **
0–2 19% *** –0–3 12% *** –0–4 24% *** –0–5 30% *** –0–>6 50% *** 10% ***
Global disturbance index (PGlobal)None-low 10% *** –None-medium 20% *** –None-high 41% *** 7% **
Water quality degradation index (PWQ)None-low 10% * 1% **
None-medium 26% *** –None-high 25% *** 2% ***
Hydrological degradation index (PH)None-low – –None-medium 22% *** –None-high 31% *** –
Morphological degradation index (PM)None-low 14% *** –None-medium 18% *** –None-high 28% *** –
–, Nonsignificant test.* p-value ≤0.05.
Fa
ig. 3. IPR+ uncertainty (standard deviation of the PDF) in function of IPR+ scoremean of the PDF).
.5. Confidence in site classification
On average, the sites of the CON dataset had an 80% probabilityf being classified in the right side of the good or moderate bound-ry (range, 48–100%). Confidence in site classification as “good oretter” or “moderate or worse” was on average greater for highlyisturbed sites (mean = 87 and 89% probability for sites with “High”
evel of PGlobal and sites highly perturbed by more than six typesf disturbance, respectively) and smaller for least disturbed sites77 and 76% probability for “None” level of PGlobal sites and one-isturbance sites; P ≤ 0.001). In addition, in absence of disturbance,pstream sites had a greater probability of being well classifiedmean = 81%) than downstream sites (mean = 70%; P ≤ 0.001). Outf the 1654 CON sites, 420 (555, 845, 1147, 1407 and 1636) hadore than 95% probability (90, 80, 70, 60 and 50%, respectively) of
eing well classified.
. Discussion
The main purpose of this study was to develop a predictive MMIased on fish functional guilds, relevant for French rivers and inte-rating uncertainties associated with reference condition predic-ions. IPR+ is based on the deviation of 11 functional metrics (four
ig. 4. Examples of IPR+ probability density function (PDF) for three river stations: (a) tht Montcel. Percentages correspond to the probability of the station being in each of the fi
** p-value ≤0.01.*** p-value ≤0.001.
abundance metrics and seven richness metrics) from expected val-ues in minimally disturbed conditions. Probability distributions ofthe expected metrics in minimally disturbed conditions were pre-dicted within a Bayesian framework from models integrating envi-ronmental variables such as temperature or the site’s geology. IPR+scores and uncertainty were independent of natural environmen-tal factor variability and responded significantly to the gradients of
physical and chemical disturbances. Finally, the confidence in siteclassification (“good and better” versus “moderate and worse”) wasgreater for highly perturbed sites than slightly disturbed sites.e river Slack at Ambleteuse, (b) the river Oise at Macquigny and (c) the river Sierreve status classes. Black stars indicate IPR+ scores.

l Indic
4v
baladOibipIt
uiriThstcbc
4
ts(mb2eaaMbpaaStMdaatooI1tshithur
A. Marzin et al. / Ecologica
.1. Metric modelling as a function of natural environmentalariables
Some authors advocated that reference conditions should be aalance between truly pristine sites and acquiring enough sites tollow meaningful statistical relationships (Pardo et al., 2012). Asowland rivers are rarely unimpaired, we advocate that moder-tely altered lowland sites should be included in the calibrationataset to cover the largest gradient of environmental conditions.bviously, this compromise decreases the index’s power by remov-
ng some of the disturbance effect from the signal, but indices cane used for lowland rivers. Furthermore, this method seems sat-
sfactory since IPR+ Hawkins’s precision was acceptable (Hawkins’recision ranging from 0.11 to 0.17 in Hawkins et al., 2010) and
PR+ scores were independent of the physiographical features, par-icularly those related to river size.
In addition, our method explicitly considers the river a contin-um (Vannote et al., 1980) by modelling fish assemblage structure
n minimally disturbed conditions as a function of natural envi-onmental variables (Oberdorff et al., 2002). Almost all the modelsncluded the upstream catchment area and the climatic variables.hese results are consistent with previous studies showing thatydraulic and temperature conditions are key abiotic componentstructuring fish assemblages (Blanck et al., 2007). By includingemperature and stream power reflecting the mid-term climateondition (10 years preceding the sampling), it would be possi-le to consider future shift in reference condition due to climatehange (Logez and Pont, 2013).
.2. Metric selection within IPR+ calculation
IPR+ relies on metrics based on functional traits ratherhan taxonomic metrics for comparison of rivers and sites pre-enting similar ecosystem functioning but different species poolsHoeinghaus et al., 2007; Lamouroux et al., 2002). Moreover, such
etrics are generally better indicators of human-induced pertur-ation impacts on the biota than taxonomic metrics (Doledec et al.,006; Marzin et al., 2012). In contrast to classical MMI (Gabrielst al., 2010; McCormick et al., 2001), for each site, different metricsre used to compute the index (the six most degraded). Intoler-nt metrics (S-STTHER, N%HINTOL) were most frequently selected.etric selection does not seem to depend on the type of distur-
ances but on the level of disturbance and upstream–downstreamosition. In minimally disturbed conditions, the metrics selectedre those naturally highly represented in fish assemblages. Intoler-nce metrics were selected for upstream sites while S%-LIMNO and-LIPAR were selected downstream in accordance with the longi-udinal variation of fish assemblage structure (Blanck et al., 2007;
arsh-Matthews and Matthews, 2000). By contrast, for heavilyisturbed sites, the metrics naturally under-represented in fishssemblages were selected: tolerant metrics for upstream sitesnd intolerant metrics for downstream sites. These results suggesthat IPR+ is consistent with the MMIs theory, i.e. the sensitivityf individual metrics incorporated in index vary along a gradientf disturbances (Angermeier and Karr, 1986; Karr and Chu, 2000).n addition, consistently with previous studies (e.g. Lyons et al.,996; Snyder et al., 2003), responses of the metrics to human dis-urbances seems to be different along the longitudinal gradientuggesting complex interaction effects between environmental anduman factors. For instance, Snyder et al. (2003) demonstrated that
n catchments with steeper channel slopes, the decreased contact
ime between riparian areas and stream channels (during whichuman-induced disturbances are mitigated) results in strongerrban land use impacts on fish assemblages. Future advancedesearch on the complex effects of the interactions among humanators 43 (2014) 195–204 201
disturbances and the environment would advance both manage-ment and understanding of river ecosystems.
4.3. IPR+ responses to human disturbances
French rivers and more globally European rivers are often dis-turbed by multiple overlapping stressors (Schinegger et al., 2012)and it is therefore almost impossible to consistently assess theimpacts of individual stressors on MMI (Van Sickle, 2013). For thisreason, we advocate that only sites altered by one type of dis-turbances should be considered when aiming for improving ourunderstanding of human disturbance impacts. In agreement withprevious studies (e.g. Hering et al., 2006; Schinegger et al., 2013),IPR+ was affected by all the types of disturbance but more stronglyby the combination of different degradations (PGlobal, NDisturb).More interestingly, whereas previous index IPR demonstrated alack of sensitivity to severe hydrological degradations (Marzinet al., 2012), IPR+ responses were comparable to morphological andwater quality degradations. Nevertheless, IPR+ responded to slightmorphological and water quality degradations, although only tomedium hydrological degradations, indicating that the index haddifferent sensitivities to disturbance types. These results illustratethe value of the differential selection of the most degraded metricsat each site to adapt the index to different conditions (longitudinalposition and level of degradation). At each site, the most sensitivemetrics to the actual condition are used to reflect the ecosystemstatus improving the index sensitivity to human disturbances.
4.4. IPR+ predictive uncertainty
As bio-indicators are devoted to evaluating the ecological qual-ity of water bodies, their uncertainty and uncontrolled variabilityhave crucial implications for water management decisions andneed to be acknowledged (van der Sluijs, 2007). Since modeladjustments and predictions relied on fish assemblage estimation(samples) and the metrics’ environmental variability was not fullyexplained by the model, metric values predicted for the referencecondition can be uncertain. Explicitly taking into account the uncer-tainty due to sampling is only possible if several replicates areperformed (Clarke et al., 1996). In the current study, this informa-tion was not available, but uncertainty was minimized as advocatedby Angermeier et al. (2000) by considering samples that were suf-ficient to evaluate abundance and species richness. Nonetheless,the uncertainty associated with the metric values that would havebeen observed in reference conditions was successfully computedusing Bayesian models and propagated through the index calcula-tion (Bevington and Robinson, 2003).
Predictive uncertainty was generally greater for individualmetrics than for IPR+. This result suggests that multiple correla-tions among metrics have been successfully limited (Van Sickle,2010). For a MMI the choice and combination of particular metricsmay reduce the index’s predictive uncertainty and enables a morereliable assessment of stream ecological conditions.
The uncertainty around IPR+ scores does not seem to vary withthe environment suggesting that models have the same predictivepower along environmental gradients.
Larger uncertainty for middle-range IPR+ scores (moderate sta-tus) and lower uncertainty on the margins (bad and high status)is consistent with the fact that IPR+ is a random variable boundedbetween 0 and 1. However, it would be valuable to understandthe factors structuring the high variability in predictive uncertainty
for moderate-status sites. A complementary analysis attempting torelate this variation in uncertainty with environmental variables(e.g. distance to the source, geology) has been conducted, but theresults did not highlight any relevant pattern.
2 l Indic
4i
tmfitbtficcrrecc9ctrw2iattaa
4
imoe
aiPmcSsfshowocpie
etacodces
02 A. Marzin et al. / Ecologica
.5. Predictive uncertainty as a decision-making tool, confidencen classification
The use of probability density functions to evaluate the uncer-ainty around the index score is particularly well suited to river
anagement decision-making as it is easily transformed into con-dence in site classification. The question asked by the analysis ofhe confidence in site classification was: “Is the site truly above orelow the good/moderate boundary?” of major importance withinhe scope of the WFD. Once the probability distribution and con-dence in site classification have been determined, different rulesan be used to decide whether or not a site is truly in good ecologi-al health. The same probability distribution could lead to oppositeesults and decisions depending on the rule used. Intermediateules will be to let the score (mean of the distribution) decide thecological condition or simply which side of the good/moderatelass limit includes the greatest share of the distribution. The “pre-autionary approach” will be to consider that only sites that have5% or greater chances of being good are truly in good ecologi-al “health”. At the opposite, if the final goal is to save money inhe short-term, one might want to choose the benefit-of-the-doubtule, i.e. all the sites that have less than 95% of chance to be inorse than good condition are considered in good condition (Ellis,
007). In our opinion, rule definition belongs to water managers ast should be in agreement with the final objectives of river man-gement. In a further step, the evaluation of bio-indicators shouldest the implications of the different rules on the national evalua-ion. In longer-term perspectives, IPR+ might be used as a screeningssessment tool indicating where further monitoring and researchre needed, or where to focus rehabilitation efforts.
.6. Towards better assessment performances
Acknowledgement of the uncertainty is also a first step inmproving bio-assessment. Indeed, it is crucial to attempt to mini-
ize index predictive uncertainty in order to improve the reliabilityf bio-indicators and their power to detect human pressures. Sev-ral levers can be pulled to reduce predictive uncertainty.
A first one is the quality of the data used to calibrate the modelsnd to predict the metrics in reference conditions (e.g. sampling,dentification). Compared to some countries (e.g. USA; Hughes andeck, 2008), electrofishing sampling efforts used in French nationalonitoring programmes are restricted. As a result, richness metrics
ould vary strongly over time reducing robustness of the final index.ubsequently, for each sample, when only few individuals of apecies were caught, they were discarded from the sample (N < 2or samples with fewer than 200 fish caught in total, N < 3 for otheramples). This choice might reduce sensitivity of richness metrics touman disturbances but increases the robustness and consistencyf the index over time. Although an increase in sampling effortould increase the data quality and particularly the estimation
f richness metrics, large scale monitoring protocols are always aompromise between accuracy versus repeatability and cost of therotocol. Several studies are currently investigating these aspects
n French methods (Virginie Archaimbault, pers. comm.; Tomanovat al., 2013).
In addition, the degree of human-induced disturbances is gen-rally determined by qualitative or judgmental indicators, as it ishe case in our study for hydro-morphological disturbances. Theccuracy in estimating the degree of degradations is primordial toorrectly defined minimally disturbed sites that are the base linef the assessment. In this study, to improve and standardize the
isturbance assessment, expert criteria were guide by quantitativeriteria and operators were trained before evaluation. In Drouineaut al. (2012), probabilities of being at a certain anthropogenic pres-ure level were estimated using pressure-impact statistical modelsators 43 (2014) 195–204
in the Bayesian framework. This approach allows combining quan-titative criteria and expert knowledge (Tableau et al., 2013).Furthermore, some authors recommend the consideration of quan-titative landscape disturbance predictors at the catchment-scale(Brazner et al., 2007; Ligeiro et al., 2013) in addition to local descrip-tors of the human disturbances to complete human disturbanceevaluation at broader scales.
Finally, more sophisticated statistical methods such as hierar-chical Bayesian models could also be a lead to explore for reducingpredictive uncertainty (Gelman et al., 2004). More generally, usingminimal predictive uncertainty as an additional criterion for met-ric selection could greatly improve the quality of the assessment ofthe resulting MMI.
5. Conclusion
This study proposes a method to treats uncertainty morerobustly in bio-assessment. IPR+ integrated the uncertainty associ-ated with establishing reference conditions for present and futureclimatic conditions. In light of these results, Bayesian modellingseems a suitable method to acquire an explicit measurement ofthe uncertainty around reference conditions essential for decision-making and more generally to answer bio-assessment issues. Thisnew methodology is relatively generic and could be extended toother biological groups and over larger spatial extents. These stud-ies confirm the advantages of the MMI based on ecological andbiological functional metrics for the assessment of river ecologicalhealth.
Finally, one type of uncertainty in river management decision-making was examined as a first step in IPR+ uncertaintyrecognition: the predictive uncertainty of IPR+ score. In futuresteps, it would be advantageous to find ways to minimize uncer-tainty. Improved data quality as well as advanced Bayesianmethods could be one of the leads for this challenging quest.
Acknowledgements
This study was funded by the French National Agency for Waterand Aquatic Environment (ONEMA) and the “HYNES” collaborativeproject of Irstea and the French Electric Company (EDF). We wishto acknowledge the contribution of the ONEMA engineers to thedatabase compilation. We thank also Météo-France and the Hydrol-ogy Research Team, Irstea Antony for their support on climaticdata.
Appendix A. Supplementary data
Supplementary data associated with this article can befound, in the online version, at http://dx.doi.org/10.1016/j.ecolind.2014.02.011.
References
Akaike, H., 1974. A new look at the statistical model identification. IEEE Trans. Autom.Control 19 (6), 716–723.
Angermeier, P.L., Karr, J.R., 1986. Applying an index of biotic integrity based onstream-fish communities: considerations in sampling and interpretation. N. Am.J. Fish. Manag. 6 (3), 418–429.
Angermeier, P.L., Smogor, R.A., Stauffer, J.R., 2000. Regional frameworks and can-didate metrics for assessing biotic integrity in mid-atlantic highland streams.Trans. Am. Fish. Soc. 129 (4), 962–981.
Bady, P., Doledec, S., Fesl, C., Gayraud, S., Bacchi, M., Scholl, F., 2005. Use of inver-tebrate traits for the biomonitoring of European large rivers: the effects ofsampling effort on genus richness and functional diversity. Freshw. Biol. 50 (1),
159–173.Bailey, R.C., Kennedy, M.G., Dervish, M.Z., Taylor, R.M., 1998. Biological assessmentof freshwater ecosystems using a reference condition approach: comparing pre-dicted and actual benthic invertebrate communities in Yukon streams. Freshw.Biol. 39 (4), 765–774.

l Indic
B
B
B
B
C
C
D
D
D
E
E
E
F
G
G
H
H
H
H
H
H
H
H
H
H
K
KL
L
L
L
A. Marzin et al. / Ecologica
evington, P.R., Robinson, D.K., 2003. Data Reduction and Error Analysis for thePhysical Sciences. McGraw-Hill, New York.
lanck, A., Tedesco, P.A., Lamouroux, N., 2007. Relationships between life-historystrategies of European freshwater fish species and their habitat preferences.Freshw. Biol. 52 (5), 843–859.
razner, J.C., Danz, N.P., Niemi, G.J., Regal, R.R., Trebitz, A.S., Howe, R.W., Hanowskib,J.M., Johnson, L.B., Ciborowski, J.J.H., Johnston, C.A., Reavie, E.D., Brady, V.J., Sgro,G.V., 2007. Evaluation of geographic, geomorphic and human influences onGreat Lakes wetland indicators: a multi-assemblage approach. Ecol. Indic. 7 (3),610–635.
rooks, S.P., Gelman, A., 1998. General methods for monitoring convergence of iter-ative simulations. J. Comput. Graph. Stat. 7 (4), 434–455.
larke, R.T., Furse, M.T., Wright, J.F., Moss, D., 1996. Derivation of a biological qualityindex for river sites: comparison of the observed with the expected fauna. J.Appl. Stat. 23 (2–3), 311–332.
larke, R.T., Hering, D., 2006. Errors and uncertainty in bioassessment methods –major results and conclusions from the STAR project and their application usingSTARBUGS. Hydrobiologia 566 (1), 433–439.
emars, B.O.L., 2013. Uncertainties in biotic indicators and a corrigendum to Ponaderet al. (2007). Ecol. Indic. 27, 44–47.
oledec, S., Phillips, N., Scarsbrook, M., Riley, R.H., Townsend, C.R., 2006. Compari-son of structural and functional approaches to determining landuse effects ongrassland stream invertebrate communities. J. N. Am. Benthol. Soc. 25 (1), 44–60.
rouineau, H., Lobry, J., Delpech, C., Bouchoucha, M., Mahévas, S., Courrat, A.,Pasquaud, S., Lepage, M., 2012. A Bayesian framework to objectively combinemetrics when developing stressor specific multimetric indicator. Ecol. Indic. 13(1), 314–321.
llis, J., 2007. Combining Multiple Quality Elements and Defining Spatial Rules forWFD Classification. Environment Agency, UK.
uropean Commission (EC), 2000. Directive 2000/60/EC of the European Parliamentand of the council establishing a framework for the community action in thefield of water policy. Off. J. Eur. Commun. L327, 1–72.
uropean Communities, 2011. Implementation Strategy for the Water FrameworkDirective (2000/60/Ec) Guidance Document no. 14. Guidance document on theIntercalibration Process 2008–2011. European Communities.
araway, J.J., 2006. Extending the Linear Model with R: Generalized Linear, MixedEffects and Nonparametric Regression Models. Chapman & Hall/CRC, Boca Raton,FL, pp. 59.
abriels, W., Lock, K., De Pauw, N., Goethals, P.L.M., 2010. Multimetric Macroinver-tebrate Index Flanders (MMIF) for Biological Assessment of Rivers and Lakes inFlanders (Belgium). Limnologica 40 (3), 199–207.
elman, A., Carlin, J.B., Stern, H.S., Rubin, D.B., 2004. Bayesian Data Analysis.Chapman and Hall, London.
artigan, J.A., Wong, M.A., 1979. Algorithm AS136: a k-means clustering algorithm.Appl. Stat. 28, 100–108.
astie, T.J., Tibshirani, R.J., 1990. Generalized Additive Models. Chapman and Hall,New York.
awkins, C.P., Cao, Y., Roper, B., 2010. Method of predicting reference conditionbiota affects the performance and interpretation of ecological indices. Freshw.Biol. 55 (5), 1066–1085.
ering, D., Johnson, R.K., Kramm, S., Schmutz, S., Szoszkiewicz, K., Verdonschot,P.F.M., 2006. Assessment of European streams with diatoms, macrophytes,macroinvertebrates and fish: a comparative metric-based analysis of organismresponse to stress. Freshw. Biol. 51 (9), 1757–1785.
ering, D., Borja, A., Carstensen, J., Carvalho, L., Elliott, M., Feld, C.K., Heiskanen,A.-S., Johnson, R.K., Moe, J., Pont, D., Solheim, A.L., de Bund, W.v., 2010. TheEuropean Water Framework Directive at the age of 10: a critical review of theachievements with recommendations for the future. Sci. Total Environ. 408,4007–4019.
oeinghaus, D.J., Winemiller, K.O., Birnbaum, J.S., 2007. Local and regional determi-nants of stream fish assemblage structure: inferences based on taxonomic vs.functional groups. J. Biogeogr. 34 (2), 324–338.
uet, M., 1954. Biologie, profils en long et en travers des eaux courantes. Bull. fr.Piscic. 175, 41–53.
ughes, R., Larsen, D., Omernik, J., 1986. Regional reference sites: a method forassessing stream potentials. Environ. Manag. 10 (5), 629–635.
ughes, R.M., Paulsen, S.G., Stoddard, J.L., 2000. EMAP-surface waters: a multi-assemblage, probability survey of ecological integrity in the U.S.A. Hydrobiologia422–423, 429–443.
ughes, R.M., Peck, D.V., 2008. Acquiring data for large aquatic resource surveys:the art of compromise among science, logistics, and reality. J. N. Am. Benthol.Soc. 27 (4), 837–859.
arr, J.R., 1981. Assessment of biotic integrity using fish communities. Fisheries 6(6), 21–27.
arr, J.R., Chu, E.W., 2000. Sustaining living rivers. Hydrobiologia 422–423, 1–14.amouroux, N., Poff, N.L., Angermeier, P.L., 2002. Intercontinental convergence of
stream fish community traits along geomorphic and hydraulic gradients. Ecol-ogy 83 (7), 1792–1807.
igeiro, R., Hughes, R.M., Kaufmann, P.R., Macedo, D.R., Firmiano, K.R., Ferreira,W.R., Oliveira, D., Melo, A.S., Callisto, M., 2013. Defining quantitative streamdisturbance gradients and the additive role of habitat variation to explain
macroinvertebrate taxa richness. Ecol. Indic. 25, 45–57.ogez, M., Pont, D., 2011. Development of metrics based on fish body size and speciestraits to assess European coldwater streams. Ecol. Indic. 11, 1204–1215.
ogez, M., Bady, P., Melcher, A., Pont, D., 2013. A continental-scale analysis of fishassemblage functional structure in European rivers. Ecography 36, 80–91.
ators 43 (2014) 195–204 203
Logez, M., Pont, D., 2013. Global warming and potential shift in reference conditions:the case of functional fish-based metrics. Hydrobiologia 704 (1), 417–436.
Lyons, J., Wang, L., Simonson, T.D., 1996. Development and validation of an indexof biotic integrity for coldwater streams in Wisconsin. N. Am. J. Fish. Manag. 16(2), 241–256.
Marsh-Matthews, E., Matthews, W.J., 2000. Geographic, terrestrial and aquatic fac-tors: which most influence the structure of stream fish assemblages in themidwestern United States? Ecol. Freshw. Fish. 9 (1–2), 9–21.
Marzin, A., Archaimbault, V., Belliard, J., Chauvin, C., Delmas, F., Pont, D., 2012.Ecological assessment of running waters: do macrophytes, macroinvertebrates,diatoms and fish show similar responses to human pressures? Ecol. Indic. 23,56–65.
McCormick, F.H., Hughes, R.M., Kaufmann, P.R., Peck, D.V., Stoddard, J.L., Herlihy, A.T.,2001. Development of an index of biotic integrity for the Mid-Atlantic Highlandsregion. Trans. Am. Fish. Soc. 130 (5), 857–877.
McCullagh, P., Nelder, J.A., 1989. Generalized Linear Models. Chapman and Hall,London.
MEDD and Agence de l’eau, 2003. Système d’évaluation de la qualité de l’eau descours d’ eau (SEQ-Eau). Grilles d’évaluation (version 2).
Millennium Ecosystem Assessment, 2005. Ecosystems and Human Well-being: Syn-thesis. Island Press, Washington, DC.
Noble, R.A.A., Cowx, I.G., Goffaux, D., Kestemont, P., 2007. Assessing the health ofEuropean rivers using functional ecological guilds of fish communities: stan-dardising species classification and approaches to metric selection. Fish. Manag.Ecol. 14 (6), 381–392.
Oberdorff, T., Pont, D., Hugueny, B., Porcher, J.P., 2002. Development and validationof a fish-based index for the assessment of ‘river health’ in France. Freshw. Biol.47 (9), 1720–1734.
Ofenbock, T., Moog, O., Gerritsen, J., Barbour, M., 2004. A stressor specific mul-timetric approach for monitoring running waters in Austria using benthicmacro-invertebrates. Hydrobiologia 516 (1–3), 251–268.
Ostermiller, J.D., Hawkins, C.P., 2004. Effects of sampling error on bioassessments ofstream ecosystems: application to RIVPACS-type models. J. N. Am. Benthol. Soc.23 (2), 363–382.
Pardo, I., Gomez-Rodriguez, C., Wasson, J.G., Owen, R., van de Bund, W., Kelly, M.,Bennett, C., Birk, S., Buffagni, A., Erba, S., Mengin, N., Murray-Bligh, J., Ofenboeck,G., 2012. The European reference condition concept: a scientific and technicalapproach to identify minimally-impacted river ecosystems. Sci. Total Environ.420, 33–42.
Pont, D., Hugueny, B., Oberdorff, T., 2005. Modelling habitat requirement of Europeanfishes: do species have similar responses to local and regional environmentalconstraints? Can. J. Fish. Aquat. Sci. 62 (1), 163–173.
Pont, D., Hugueny, B., Beier, U., Goffaux, D., Melcher, A., Noble, R., Rogers, C., Roset,N., Schmutz, S., 2006. Assessing river biotic condition at a continental scale: aEuropean approach using functional metrics and fish assemblages. J. Appl. Ecol.43 (1), 70–80.
Pont, D., Hugueny, B., Rogers, C., 2007. Development of a fish-based index for theassessment of river health in Europe: the European Fish Index. Fish. Manag. Ecol.14 (6), 427–439.
Poulet, N., Beaulaton, L., Dembski, S., 2011. Time trends in fish populations inmetropolitan France: insights from national monitoring data. J. Fish Biol. 79 (6),1436–1452.
Punt, A.E., Hilborn, R., 1997. Fisheries stock assessment and decision analysis: theBayesian approach. Rev. Fish Biol. Fish. 7 (1), 35–63.
R Development Core Team, 2008. R: A Language and Environment for StatisticalComputing Vienna, Austria.
Schinegger, R., Trautwein, C., Melcher, A., Schmutz, S., 2012. Multiple humanpressures and their spatial patterns in European running waters. Water Environ.J. 26, 261–273.
Schinegger, R., Trautwein, C., Schmutz, S., 2013. Pressure-specific and multiple pres-sure response of fish assemblages in European running waters. Limnol. Ecol.Manag. Inland Waters 43, 348–361.
Spiegelhalter, D.T.A., Best, N., Lunn, D., 2003. WinBUGS User Manual. Version 1.4,Available at: http://www.mrc-bsu.cam.ac.uk/bugs
Snyder, C.D., Young, J.A., Villella, R., Lemarie, D.P., 2003. Influences of upland andriparian land use patterns on stream biotic integrity. Landsc. Ecol. 18 (7),647–664.
Staniszewski, R., Szoszkiewicz, K., Zbierska, J., Lesny, J., Jusik, S., Clarke, R.T., 2006.Assessment of sources of uncertainty in macrophyte surveys and the conse-quences for river classification. Hydrobiologia 566 (1), 235–246.
Stoddard, J.L., Larsen, D.P., Hawkins, C.P., Johnson, R.K., Norris, R.H., 2006. Settingexpectations for the ecological condition of streams: the concept of referencecondition. Ecol. Appl. 16 (4), 1267–1276.
Stoddard, J.L., Herlihy, A.T., Peck, D.V., Hughes, R.M., Whittier, T.R., Tarquinio, E.,2008. A process for creating multimetric indices for large-scale aquatic surveys.J. N. Am. Benthol. Soc. 27 (4), 878–891.
Tableau, A., Drouineau, H., Delpech, C., Pierre, M., Lobry, J., Le Pape, O., Breine, J.,Lepage, M., 2013. A fish-based index of estuarine ecological quality incorporatinginformation from both scientific fish survey and experts knowledge. Ecol. Indic.32, 147–156.
Tenenhaus, M., Young, F.W., 1985. An analysis and synthesis of multiple corre-
spondence analysis, optimal scaling, dual scaling, homogeneity analysis andother methods for quantifying categorical multivariate data. Psychometrika 50,91–119.Todd, C.R., Burgman, M.A., 1998. Assessment of threat and conservation prioritiesunder realistic levels of uncertainty and reliability. Conserv. Biol. 12, 966–974.

2 l Indic
T
v
V
V
04 A. Marzin et al. / Ecologica
omanova, S., Tedesco, P.A., Roset, N., Berrebi dit Thomas, R., Belliard, J., 2013.Systematic point sampling of fish communities in medium and large-sizedrivers: sampling procedure and effort. Fish. Manag. Ecol., http://dx.doi.org/10.1111/fme.12045.
an der Sluijs, J.P., 2007. Uncertainty and precaution in environmental management:
insights from the UPEM conference. Environ. Model. Softw. 22 (5), 590–598.annote, R.L., Minshall, G.W., Cummins, K.W., Sedell, J.R., Cushing, C.E., 1980. Theriver continuum concept. Can. J. Fish. Aquat. Sci. 37 (1), 130–137.
an Sickle, J., 2010. Correlated metrics yield multimetric indices with inferior per-formance. Trans. Am. Fish. Soc. 139 (6), 1802–1817.
ators 43 (2014) 195–204
Van Sickle, J., 2013. Estimating the risks of multiple, covarying stressors in theNational Lakes Assessment. Freshw. Sci. 32 (1), 204–216.
Vidal, J.-P., Martin, E., Franchistéguy, L., Baillon, M., Soubeyroux, J.-M., 2010. A 50-year high-resolution atmospheric reanalysis over France with the Safran system.Int. J. Climatol. 30 (11), 1627–1644.
Webb, J.A., King, E.L., 2009. A Bayesian hierarchical trend analysis finds strong evi-dence for large-scale temporal declines in stream ecological condition aroundMelbourne. Aust. Ecogr. 32 (2), 215–225.
Willby, N., Birk, S., 2010. IC Guidance Annex V: Definition of Comparability Criteriafor Setting Class Boundaries. WG ECOSTAT.