U-251 revisited: genetic drift and phenotypic consequences of long-term cultures of glioblastoma...
13
ORIGINAL RESEARCH U-251 revisited: genetic drift and phenotypic consequences of long-term cultures of glioblastoma cells Anja Torsvik 1 , Daniel Stieber 2 , Per Øyvind Enger 1,3 , Anna Golebiewska 2 , Anders Molven 4,5 , Agnete Svendsen 1 , Bengt Westermark 6 , Simone P. Niclou 2 , Thale Kristin Olsen 7 , Martha Chekenya Enger 1 & Rolf Bjerkvig 1,2 1 Department of Biomedicine, University of Bergen, Bergen, Norway 2 NorLux Neuro-Oncology Laboratory, Department of Oncology, Centre de Recherche Public de la Sant e (CRP-Sant e), Luxembourg, Luxembourg 3 Department of Neurosurgery, Haukeland University Hospital, Bergen, Norway 4 The Gade Institute/Section of Pathology, Institute of Medicine, University of Bergen, Bergen, Norway 5 Department of Pathology, Haukeland University Hospital, Bergen, Norway 6 Department of Genetics and Pathology, Uppsala University, Uppsala, Sweden 7 Section for Cancer Cytogenetics, Oslo University Hospital, The Norwegian Radium Hospital, Oslo, Norway Keywords aCGH, cell lines, cross-contamination, GBM, in vitro models, STR, U251, U373 Correspondence Rolf Bjerkvig, Department of Biomedicine, University of Bergen, Jonas Lies vei 91, N-5020 Bergen. Tel: +47 55586352; Fax: +47 55586360; E-mail: [email protected] Funding Information The project was supported by the Norwegian Cancer Society, the Norwegian Research Council, Innovest AS, Helse Vest, Haukeland University, Hospital, and the Bergen Medical Research Fund, The University of Bergen, Centre de Recherche Public de la Sant e through a grant from the Ministry of Research and Higher Education in Luxembourg and the Fonds National de la Recherche, Luxembourg. Received: 26 November 2013; Revised: 1 December 2013; Accepted: 13 January 2014 doi: 10.1002/cam4.219 Abstract It is well known that in vitro subculture represents a selection pressure on cell lines, and over time this may result in a genetic drift in the cancer cells. In addition, long-term cultures harbor the risk of cross-contamination with other cell lines. The consequences may have major impact on experimental results obtained in various laboratories, where the cell lines no longer reflect the origi- nal tumors that they are supposed to represent. Much neglected in the scientific community is a close monitoring of cell cultures by regular phenotypic and genetic characterization. In this report, we present a thorough characterization of the commonly used glioblastoma (GBM) model U-251, which in numerous publications has been wrongly identified as U-373, due to an earlier cross- contamination. In this work, the original U-251 and three subclones of U-251, commonly referred to as U-251 or U-373, were analyzed with regard to their DNA profile, morphology, phenotypic expression, and growth pattern. By array comparative genomic hybridization (aCGH), we show that only the original low-passaged U-251 cells, established in the 1960s, maintain a DNA copy num- ber resembling a typical GBM profile, whereas all long-term subclones lost the typical GBM profile. Also the long-term passaged subclones displayed variations in phenotypic marker expression and showed an increased growth rate in vitro and a more aggressive growth in vivo. Taken together, the variations in geno- type and phenotype as well as differences in growth characteristics may explain different results reported in various laboratories related to the U-251 cell line. Introduction Since the isolation of the first human immortal cancer cell line (HeLa; from a cervical cancer) in 1952, cell lines represent important biological model systems that are both easily accessible and easy to handle. Cell lines have thus facilitated cancer research in many ways, such as the study of functional aspects of tumor transformation and gene expression, the elucidation of mechanisms of resis- tance to therapy, drug screening, and the development of ª 2014 The Authors. Cancer Medicine published by John Wiley & Sons Ltd. This is an open access article under the terms of the Creative Commons Attribution License, which permits use, distribution and reproduction in any medium, provided the original work is properly cited. 1 Cancer Medicine Open Access
-
Upload
independent -
Category
Documents
-
view
1 -
download
0
Transcript of U-251 revisited: genetic drift and phenotypic consequences of long-term cultures of glioblastoma...

ORIGINAL RESEARCH
U-251 revisited: genetic drift and phenotypic consequencesof long-term cultures of glioblastoma cellsAnja Torsvik1, Daniel Stieber2, Per Øyvind Enger1,3, Anna Golebiewska2, Anders Molven4,5,Agnete Svendsen1, Bengt Westermark6, Simone P. Niclou2, Thale Kristin Olsen7,Martha Chekenya Enger1 & Rolf Bjerkvig1,2
1Department of Biomedicine, University of Bergen, Bergen, Norway2NorLux Neuro-Oncology Laboratory, Department of Oncology, Centre de Recherche Public de la Sant�e (CRP-Sant�e), Luxembourg, Luxembourg3Department of Neurosurgery, Haukeland University Hospital, Bergen, Norway4The Gade Institute/Section of Pathology, Institute of Medicine, University of Bergen, Bergen, Norway5Department of Pathology, Haukeland University Hospital, Bergen, Norway6Department of Genetics and Pathology, Uppsala University, Uppsala, Sweden7Section for Cancer Cytogenetics, Oslo University Hospital, The Norwegian Radium Hospital, Oslo, Norway
Keywords
aCGH, cell lines, cross-contamination, GBM,
in vitro models, STR, U251, U373
Correspondence
Rolf Bjerkvig, Department of Biomedicine,
University of Bergen, Jonas Lies vei 91,
N-5020 Bergen. Tel: +47 55586352;
Fax: +47 55586360;
E-mail: [email protected]
Funding Information
The project was supported by the Norwegian
Cancer Society, the Norwegian Research
Council, Innovest AS, Helse Vest, Haukeland
University, Hospital, and the Bergen Medical
Research Fund, The University of Bergen,
Centre de Recherche Public de la Sant�e
through a grant from the Ministry of
Research and Higher Education in
Luxembourg and the Fonds National de la
Recherche, Luxembourg.
Received: 26 November 2013; Revised: 1
December 2013; Accepted: 13 January 2014
doi: 10.1002/cam4.219
Abstract
It is well known that in vitro subculture represents a selection pressure on cell
lines, and over time this may result in a genetic drift in the cancer cells. In
addition, long-term cultures harbor the risk of cross-contamination with other
cell lines. The consequences may have major impact on experimental results
obtained in various laboratories, where the cell lines no longer reflect the origi-
nal tumors that they are supposed to represent. Much neglected in the scientific
community is a close monitoring of cell cultures by regular phenotypic and
genetic characterization. In this report, we present a thorough characterization
of the commonly used glioblastoma (GBM) model U-251, which in numerous
publications has been wrongly identified as U-373, due to an earlier cross-
contamination. In this work, the original U-251 and three subclones of U-251,
commonly referred to as U-251 or U-373, were analyzed with regard to their
DNA profile, morphology, phenotypic expression, and growth pattern. By array
comparative genomic hybridization (aCGH), we show that only the original
low-passaged U-251 cells, established in the 1960s, maintain a DNA copy num-
ber resembling a typical GBM profile, whereas all long-term subclones lost the
typical GBM profile. Also the long-term passaged subclones displayed variations
in phenotypic marker expression and showed an increased growth rate in vitro
and a more aggressive growth in vivo. Taken together, the variations in geno-
type and phenotype as well as differences in growth characteristics may explain
different results reported in various laboratories related to the U-251 cell line.
Introduction
Since the isolation of the first human immortal cancer
cell line (HeLa; from a cervical cancer) in 1952, cell lines
represent important biological model systems that are
both easily accessible and easy to handle. Cell lines have
thus facilitated cancer research in many ways, such as the
study of functional aspects of tumor transformation and
gene expression, the elucidation of mechanisms of resis-
tance to therapy, drug screening, and the development of
ª 2014 The Authors. Cancer Medicine published by John Wiley & Sons Ltd. This is an open access article under the terms of
the Creative Commons Attribution License, which permits use, distribution and reproduction in any medium,
provided the original work is properly cited.
1
Cancer MedicineOpen Access

new therapeutic principles. Cancer cell lines also represent
important tools to study genetic aberrations and molecu-
lar pathways in cancer. Cell lines are known to provide
more consistent and reproducible research data than the
more heterogeneous and more limited biopsy material,
however, subculture may select for a specific genetic clone
within the patient biopsy. Cell lines thus represent only a
small subpopulation of the original tumor. Furthermore,
long-term tissue cultures are susceptible to genetic drift,
which may result in altered phenotypes and growth pat-
terns. Also the consistency and reproducibility of cell line
studies between different laboratories represents a major
challenge based on genetic drift upon long-term subcul-
ture and potential cross-contamination.
Glioblastoma (GBM) represents a tumor of complex
cellular heterogeneity, and numerous GBM cell lines have
been established as tools to unravel molecular mecha-
nisms related to the disease. In this study, we have
assessed in detail the genetic drift in the commonly used
U-251 GBM cell line, which is widely used as a GBM
model. The U-251 cell line was established at the Wallen-
berg laboratory, Uppsala, Sweden, almost more than
40 years ago along with several other cell lines derived
from human gliomas [1–3], and was derived from a male
patient with malignant astrocytoma [2]. In addition to
the original U-251, two subclones with different morphol-
ogy have been described for U-251, namely the astrocy-
toid U-251MGAg Cl1 and the fascicular U-251MGsp [4].
In 1999, it was reported that another GBM cell line
(U-373) was cross-contaminated by U-251 [5], and it was
later shown that the misidentified U-251 cells had been
wrongly distributed by all the major cell banks [6, 7],
(http://www.lgcstandards-atcc.org/MisidentifiedCellLines/
tabid/1171/Default.aspx, http://www.hpa.org.uk). Accord-
ing to a comprehensive list of misidentified cell lines pub-
lished by Capes-Davis and colleagues [8], the U-251 cell
line has also cross-contaminated the so called human glio-
sarcoma cell line KNS-89 and the human GBM cell lines
SNB-19 and TK-1 (http://www.cellbankaustralia.com/
Misidentified-Cell-Line-List/default.aspx). Despite repeated
efforts to clear this confusion, researchers around the world
have continued to use the misidentified U-251 along with
the original U-251. A Pubmed search for U-373 returns 731
results (September 2013), however, by a review of these
articles it is clear that it is rarely clarified if the authors have
used the true U-373 or the cross-contaminated U-251 cell
line. This is also the case for the most recently published
articles, in spite of a considerable focus on cell line misiden-
tification that has been extensively addressed over the past
years [8–11]. In the summer of 2010, the original U-373
line was made available at the Health Protection Agency
(HPA) cultures in the UK, and the short tandem repeat
(STR) profile of this cell line clearly differs from that of the
U-251 cell line and the misidentified U-251, wrongly
distributed as “U-373” (http://www.hpa.org.uk).
The objective of this study was to characterize the vari-
ous subclones of U-251 and compare them to the original
U-251MG obtained from Uppsala, Sweden. When working
with these various clones in our laboratory, we noticed sev-
eral differences in their cellular morphology and behavior,
which led us to perform a functional comparison with
regard to cell growth in vitro and in vivo, clonogenicity,
and radiation resistance. To determine the genetic profiles
of the cell lines we performed high-resolution array com-
parative genomic hybridization (aCGH) profiling. The
aCGH data showed a typical cell line profile for the long-
term passaged subclones, with accumulation of additional
genetic changes compared to the original U-251MG (col-
lected from cells frozen in Uppsala in 1969), which had a
profile more consistent with human GBMs with several
focal chromosomal amplifications and deletions. These
data demonstrate how aCGH can be used to evaluate if
subclones carry cell line-specific DNA copy number altera-
tions. Our data show that subclones derived from U-
251MG have experienced extensive genetic alterations
indicative of genetic drift. This genetic drift is accompanied
by phenotypic changes such as altered morphology, vari-
able cell surface marker expression, increased growth rate
and more aggressive cell growth both in vitro and in vivo.
Materials and Methods
Cell lines and cell culture
U-251N was kindly provided by Dr. J. Carlsson, Uppsala
University, Sweden. U-251-FGA20gain is a subclone of U-
251N. U-251-4q12 was obtained from ATCC as “U-373”
HTB-17. U-251MG was stored at the Uppsala University,
Sweden, at passage 64 in 1969 and thawed in November
2011. U-251MG was cultured in minimum essential med-
ium (MEM) (Lonza, Basel, Switzerland) supplemented
with 10% fetal bovine serum (FBS), 4mmol/L L-Glutamine,
100 U/mL penicillin, and 100 lg/mL streptomycin. In
addition, U-251MG cells were also cultured in the medium
which was routinely used for the other subclones, namely
Dulbecco’s modified Eagle’s medium (DMEM; Sigma-
Aldrich Inc., St. Louis, MO) supplemented with 10%
FBS, 3.2% nonessential amino acids (NEEA), 4 mmol/L
L-Glutamine and 100 U/mL penicillin, 100 lg/mL strepto-
mycin. All supplements were from Lonza. The cells were
cultured at 37°C and 5% CO2.
Small tandem repeat analysis
Genomic DNA was purified by the DNeasy Blood &
Tissue Kit (Qiagen, Hilden, Germany) according to the
2 ª 2014 The Authors. Cancer Medicine published by John Wiley & Sons Ltd.
The U-251 Glioma Cell Line Revisted A. Torsvik et al.
manufacturer’s protocol for purification of total DNA
from animal cells. The AmpFlSTR Profiler Plus PCR
Amplification Kit (Applied Biosystems, Foster City, CA)
was used according to the manufacturer’s protocol. This
kit amplifies nine tetranucleotide STR loci and the amelo-
genin (sex determination) locus in a single reaction. The
samples were run and allele sizes interpreted on an
ABI3100 Genetic Analyzer (Applied Biosystems). We also
confirmed that none of our cells matched the STR profile
of the true U-373 cell line (kindly provided by HPA cul-
tures, (http://www.HPA.org.uk).
aCGH analysis
Genomic DNA was extracted from cell lines using the
DNAeasy Blood and Tissue Kit (Qiagen) following the
manufacturer’s instructions. DNA was eluted in water,
fragmented to an average size of 200–500 bp using
DNAse1 (rDNAse1, Ambion, Life Technology Ltd., Pais-
ley, UK) and labeled using the BioPrime aCGH Genomic
labeling Kit (Invitrogen, Paisley, UK) and Cy3 and Cy5
dyes purchased from GE Healthcare (Chalfont St. Giles,
UK) following standard protocols for Agilent aCGH.
Commercially available female DNA pooled from multiple
anonymous donors (Promega, Madison, WI) was used as
a reference for each of the aCGH experiments. Labeled
DNA was competitively hybridized to SurePrint G3
Human 2 9 400 k CGH microarrays (Agilent Technolo-
gies, Santa Clara, CA) following standard Agilent
protocols. The slides were scanned at 3 lm resolution
using the Agilent High-Resolution Microarray scanner
and the image data were extracted using Feature Extrac-
tion (Agilent Technologies). FE extraction files were
imported into Genomic Workbench 7.0 (Agilent Technol-
ogies) for visualization and analysis. Aberrations were
called using the Aberration Detection Method 2 (ADM2)
algorithm with a threshold setting of 25, centralization on
with threshold of 25, and an aberration filter min
Probes = 3 and minAvgAbsLogRatio = 0.25. The ADM-2
algorithm identifies all aberrant intervals in a given sam-
ple with consistently high or low log ratios based on the
statistical score that represents the deviation of the aver-
age of the log2 ratios from the expected value of zero.
Hierarchical clustering was done by using the clustering
analysis implemented in the Genomic Workbench soft-
ware. This is based on Euclidian distance calculations
using aberration scores.
Gene expression analysis
Total RNA was isolated from cultured cells using Trizol
reagent (Life Technologies Ltd., Paisley, UK). cDNA was
synthesized by using iScript cDNA Synthesis Kit (Bio-Rad
Laboratories Inc., Hercules, CA). Amplification and quan-
tification of the platelet-derived growth factor receptor a(PDGFRa) gene was done by quantitative PCR (qPCR)
using the following primer sequences (50?30): Forward
primer: GGCCGTGGGCACGCTCTTTA; Reverse primer:
ACCAGGAACGCCGGATGGGA. As internal control we
used 18S ribosomal RNA with the following primer
sequences (50?30): Forward primer: CGGCTACCACATC
CAAGGAA; Reverse primer: GCTGGAATTACCGCGGCT.
Real-time fluorescence detection was performed by using
iQ SYBR Green Supermix (Bio-Rad Laboratories Inc.),
and the samples were run on a Roche Light Cycler 480
(F. Hoffmann-La Roche Ltd, Basel, Switzerland). The fol-
lowing temperature settings were used: Initial denatur-
ation at 95°C for 5 min, followed by 35 cycles of
denaturation at 95°C for 20 sec, annealing at 60°C for
20 sec, and extension at 72°C for 20 sec. Melting curves
for the amplicons were performed after the last PCR-cycle
with a temperature interval from 55°C to 95°C. Fold
change was calculated by subtracting the cycle threshold
(Ct) value of the reference sample from the target sample
to obtain a DCt value. When comparing two samples,
DDCt is the difference between the two samples and the
fold change = 2DDCt. Fold change for each U-251 sub-
clone was calculated relative to U-251MG.
DNA ploidy analysis and cell cycledistribution
Subconfluent monolayers were harvested by trypsiniza-
tion, washed, and fixed in ice-cold 70% ethanol, added
dropwise while vortexing. The samples were stored at 4°Cuntil use. Prior to analysis, the samples were washed in
phosphate buffered saline (PBS; Sigma-Aldrich), resus-
pended in 1 mg/mL RNase (Sigma-Aldrich) and 50 lg/lLpropidium iodide (PI; Sigma-Aldrich), and incubated for
30 min at room temperature prior to analysis on a FACS
Accuri C6 (Accuri Cytometers Inc., Ann Arbor, MI).
Lymphocytes were used as an internal diploid control and
prepared for DNA analysis as described above. Cell cycle
data were analyzed in ModFit LT 3.3 (Verity Software
House, Topsham, ME). DNA Index (DI), which measures
variations in ploidy, was calculated by the following for-
mula: Mean G1 DNA fluorescence of cell sample/mean
G1 DNA fluorescence of lymphocytes. Aneuploid cells are
defined as cells which differ with more than 10% from a
diploid DI = 1.0.
Giemsa banding and karyotyping
Cell cultures were treated with colcemid (Gibco by Life
Technologies, Grand Island, NY) and harvested manually
according to Mandahl et al. [12]. The chromosomal
ª 2014 The Authors. Cancer Medicine published by John Wiley & Sons Ltd. 3
A. Torsvik et al. The U-251 Glioma Cell Line Revisted
preparations were then G-banded using Wright stain
(Merck KGaA, Darmstadt, Germany). In order to describe
ploidy, the number of chromosomes in each metaphase
was counted manually.
Immunocytochemistry
Cells seeded for immunocytochemistry were fixed and
permeabilized in cold methanol for 10 min at �20°C, fol-lowed by cold acetone for 1 min at �20°C. The cells wereincubated in 19 PBS with 0.5% bovine serum albumin
(BSA; Sigma-Aldrich) for 15 min, prior to antibody stain-
ing with mouse anti-a-Tubulin IgG1 MAb (Sigma-
Aldrich) for 45 min at 37°C. After washing twice in 19
PBS the secondary antibody FITC-conjugated goat-anti-
mouse IgG1 antibody (Southern Biotech, Birmingham,
AL) was applied for 45 min at 37°C. The cells were then
washed and mounted with Vectashield with DAPI (Vector
Laboratories Inc., Burlingame, CA). Imaging was per-
formed on a Leica SP2 confocal microscope.
Cell surface marker phenotyping
A single-cell suspension of cultured cell lines was obtained
by trypsinization (0.25% trypsin, Lonza) at 37°C for
2–3 min. For cell membrane staining cells were
resuspended in Hank’s balanced salt solution w/o Ca2+/
Mg2+ (HBSS), 2% FBS, 10 mmol/L HEPES pH 7.4 buffer
(106cells/100 lL/test) and incubated with LIVE/DEAD�
Fixable Dead Cell Stains (Invitrogen, Life Technology
Ltd.; 1 lg/mL) and appropriate pre-conjugated antibodies
(CD133/1-PE, Miltenyi Biotec, Bergisch Gladback, Ger-
many, 10 lL/test; CD15-PE Immunotools, Friesoythe,
Germany, 10 lL/test; A2B5-APC Miltenyi Biotec, 10 lL/test; CD44-FITC, Immunotools, 10 lL/test) 30 min in the
dark. Data acquisition was performed with a FACS AriaTM
SORP cytometer (BD Biosciences, San Jose, CA) and flow
graphs were prepared with the FlowJo software (Tree Star,
Inc., Ashland, OR).
Cell proliferation
Growth curves were generated by plating 7000 cells/cm2
of each subclone was plated in duplicate in T25 tissue
culture flasks. Every 24 h, two parallel flasks were trypsi-
nized and counted. The experiment was repeated four
times. Population doubling level (PDL), that is the total
number of times a cell line doubles its population during
a given time period in vitro, was calculated using the fol-
lowing formula: PDL = (log10F � log10I)/log (2), where F
indicates the number of cells at the end of the passage
and I equals the number of cells initially plated. Popula-
tion doubling time (PD) was calculated for a selected
interval during the logarithmic growth phase, by the for-
mula: hours in culture/PDL.
The fraction of actively proliferating cells was measured
by BrdU incorporation, using the FITC BrdU Flow Kit
(BD Biosciences). Samples were prepared according to the
manufacturer’s instructions and analyzed on a FACS
Accuri C6 (Accuri Cytometers Inc.). Cell cycle distribu-
tion in G1/G0, S, and G2M phases were analyzed by the
FlowJo software.
Clonogenic assays and irradiation
Clonogenic assays were performed as described previously
[13]. In short 200–375 cells/well were plated in six-well
plates in triplicates, and cultured in conditioned media at
37°C, 5% CO2 for 10 days (>6 PD). After incubation, the
cells were fixed in fixation-staining-solution consisting of
6% v/v glutaraldehyde and 0.5% w/v crystal violet (both
reagents from Sigma-Aldrich) in H2O. A colony was
defined as a cluster of minimum 50 cells and plating effi-
ciency (PE) was calculated as described [13]. PE is the
ratio of the number of colonies to the number of cells
seeded. P-values were calculated by GraphPad Software
(www.graphpad.com).
In vitro doses of ionizing radiation were 2, 5, and
10 Gy, and were given at a rate of 3.1 Gy/min with a
Clinac 600C/D linear accelerator irradiator (Varian Medi-
cal Systems Inc., Palo Alto, CA) to cells plated for clono-
genic growth and allowed to adhere prior to irradiation.
Surviving fraction was calculated as described [13] and is
based on the number of clones surviving irradiation, cor-
related to the PE of nonirradiated control cells.
In vivo experiments
Immunodeficient NOD.CB17.PrkdcscidNOD/SCID mice
(Jackson Laboratory, Bar Harbor, ME) were anesthetized
with Hypnorm-Dormicum (0.4 mL/kg) s.c., whereupon
the head was secured in a stereotactic frame (Benchmark;
Neurolab, St Louis, MO) and a short longitudinal inci-
sion was made in the scalp exposing the calvarium. A
burr hole was made 0.5 mm posterior to the bregma and
1.5 mm to the right of the sagittal suture using a micro-
drill with a bit diameter of 2.9 mm. A Hamilton syringe
was introduced to a depth of 1.5 mm below the brain
surface, and 5 9 104 tumor cells were slowly injected into
the brain. Each U-251 subclone was implanted in five ani-
mals. The mice were monitored on a daily basis, and were
sacrificed upon signs of tumor burden/sickness, such as
weight loss, stooped posture, and altered behavior. The
experiments were approved by the Norwegian Animal
Research Authority. Kaplan-Meier survival curves were
generated using the GraphPad Software.
4 ª 2014 The Authors. Cancer Medicine published by John Wiley & Sons Ltd.
The U-251 Glioma Cell Line Revisted A. Torsvik et al.
Results
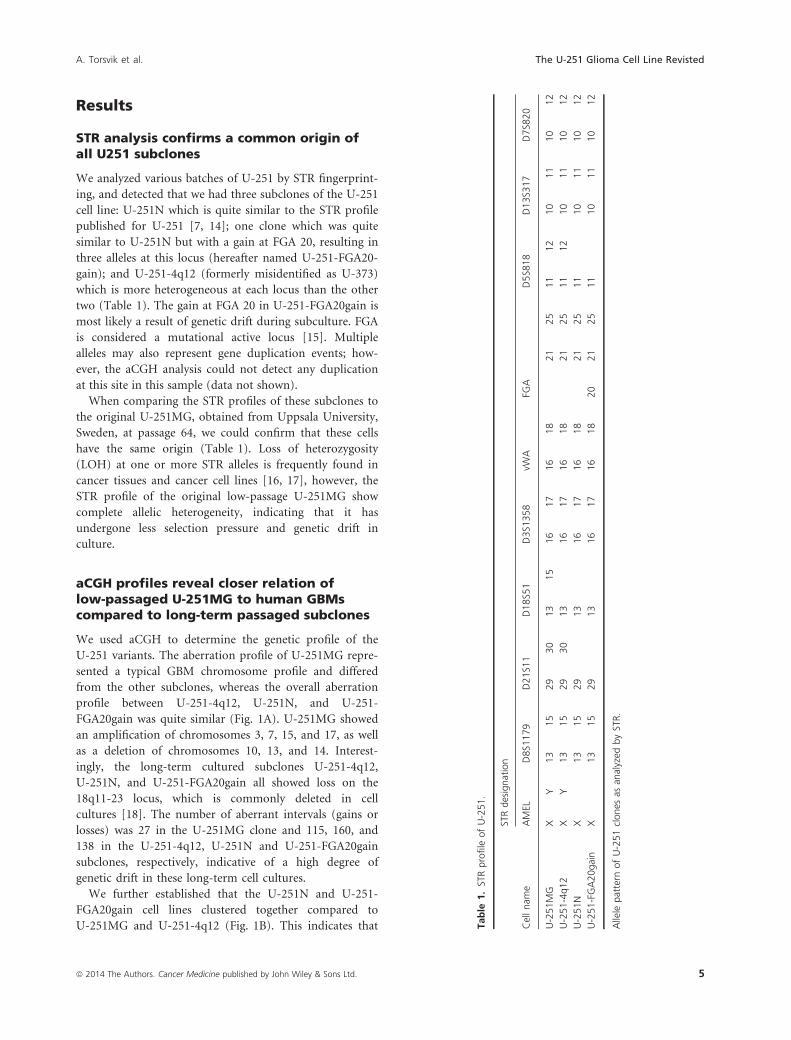
STR analysis confirms a common origin ofall U251 subclones
We analyzed various batches of U-251 by STR fingerprint-
ing, and detected that we had three subclones of the U-251
cell line: U-251N which is quite similar to the STR profile
published for U-251 [7, 14]; one clone which was quite
similar to U-251N but with a gain at FGA 20, resulting in
three alleles at this locus (hereafter named U-251-FGA20-
gain); and U-251-4q12 (formerly misidentified as U-373)
which is more heterogeneous at each locus than the other
two (Table 1). The gain at FGA 20 in U-251-FGA20gain is
most likely a result of genetic drift during subculture. FGA
is considered a mutational active locus [15]. Multiple
alleles may also represent gene duplication events; how-
ever, the aCGH analysis could not detect any duplication
at this site in this sample (data not shown).
When comparing the STR profiles of these subclones to
the original U-251MG, obtained from Uppsala University,
Sweden, at passage 64, we could confirm that these cells
have the same origin (Table 1). Loss of heterozygosity
(LOH) at one or more STR alleles is frequently found in
cancer tissues and cancer cell lines [16, 17], however, the
STR profile of the original low-passage U-251MG show
complete allelic heterogeneity, indicating that it has
undergone less selection pressure and genetic drift in
culture.
aCGH profiles reveal closer relation oflow-passaged U-251MG to human GBMscompared to long-term passaged subclones
We used aCGH to determine the genetic profile of the
U-251 variants. The aberration profile of U-251MG repre-
sented a typical GBM chromosome profile and differed
from the other subclones, whereas the overall aberration
profile between U-251-4q12, U-251N, and U-251-
FGA20gain was quite similar (Fig. 1A). U-251MG showed
an amplification of chromosomes 3, 7, 15, and 17, as well
as a deletion of chromosomes 10, 13, and 14. Interest-
ingly, the long-term cultured subclones U-251-4q12,
U-251N, and U-251-FGA20gain all showed loss on the
18q11-23 locus, which is commonly deleted in cell
cultures [18]. The number of aberrant intervals (gains or
losses) was 27 in the U-251MG clone and 115, 160, and
138 in the U-251-4q12, U-251N and U-251-FGA20gain
subclones, respectively, indicative of a high degree of
genetic drift in these long-term cell cultures.
We further established that the U-251N and U-251-
FGA20gain cell lines clustered together compared to
U-251MG and U-251-4q12 (Fig. 1B). This indicates that Table
1.STRprofile
ofU-251.
Cellnam
e
STRdesignation
AMEL
D8S1
179
D21S1
1D18S5
1D3S1
358
vWA
FGA
D5S8
18
D13S3
17
D7S8
20
U-251MG
XY
13
15
29
30
13
15
16
17
16
18
21
25
11
12
10
11
10
12
U-251-4q12
XY
13
15
29
30
13
16
17
16
18
21
25
11
12
10
11
10
12
U-251N
X13
15
29
13
16
17
16
18
21
25
11
10
11
10
12
U-251-FGA20gain
X13
15
29
13
16
17
16
18
20
21
25
11
10
11
10
12
Allele
pattern
ofU-251clones
asan
alyzed
bySTR.
ª 2014 The Authors. Cancer Medicine published by John Wiley & Sons Ltd. 5
A. Torsvik et al. The U-251 Glioma Cell Line Revisted

A
B C
D E
6 ª 2014 The Authors. Cancer Medicine published by John Wiley & Sons Ltd.
The U-251 Glioma Cell Line Revisted A. Torsvik et al.

U-251-4q12 diverged early from the ancestral U-251MG
clone and that the divergence of U-251-FGA20gain from
U-251N was a relatively late event. Samples U-251MG, U-
251-4q12, and U-251N were cytogenetically male as they
all carry the male Y chromosome as determined by aCGH
whereas U-251-FGA20gain has lost the Y chromosome
(Fig. 1A). Interestingly, the male amelogenin marker was
not recognized in the U-251N sample when analyzed by
STR profiling (Table 1), indicating loss of the amelogenin
locus but not the whole Y chromosome in this sample.
A tool for unambiguously tracing common lineages in
different cell clones is to focus on homozygous deletions
and their chromosomal breakpoints. If these are shared
between several cell lines it is evident that these cell lines
have a common ancestor. We have identified and mapped
several common homozygous deletions in all four cell
lines studied. For example CDKN2A (p16/p14 ARF)
homozyguous deletion was identified in all four cell lines,
and the chromosomal breakpoints were identical support-
ing the monoclonal origin of the four cell lines (Fig. 1C).
Furthermore, the accumulation of additional homozygous
deletions over time can also be used to trace the lineages
of the different subclones (see examples in Table 2).
Unlike many primary GBM samples, we did not detect
typical focal gene amplification events in the U-251N or
U-251-FGA20gain cell lines. This is not surprising as such
extra-chromosomal elements are typically lost in cell
culture. For instance, GBMs frequently carry amplification
of the endothelial growth factor receptor (EGFR) gene at
chromosome 7. Chromosome 7 is duplicated in the
U-251MG cell line, and the descendants all have a dupli-
cation of the EGFR locus, albeit the overall pattern of
chromosome 7 of the descendant cell lines is more com-
plex. The locus is thus duplicated in the U-251 subclones;
Table 2. Homozygous deletions in U-251 subclones.
Cell line Chr Cytoband
Start (bp
on Chr)
Stop (bp
on Chr) # Probes
Deletion (mean
log2 ratio) P-value Gene names
U-251MG Chr9 P21.3 21908956 22148414 37 �2,598,488 0.000 C9orf53, CDKN2A,
CDKN2BAS, CDKN2B
Chr11 q11 55124730 55187341 12 �2,848,753 1.553e-161 OR4C11, OR4P4, OR4S2
U-251-4q12 Chr2 q22.1 141427652 142052932 119 �310,064 0.000 LRP1B
Chr9 p21.3 21908956 22148414 37 �3,344,793 0.000 C9orf53, CDKN2A,
CDKN2BAS, CDKN2B
Chr10 q21.3 67748408 67784515 9 �4,727,192 5.978e-160 CTNNA3
Chr11 q11 55124730 55187341 12 �4,244,455 7.253e-209 OR4C11, OR4P4, OR4S2
U-251N Chr1 p33 51135519 51218298 18 �3,424,784 1.032e-151 FAF1, CDKN2C
Chr2 q13 112607949 112672009 14 �3,144,469 8.919e-220 FBLN7
Chr2 q22.1 14127652 142052932 119 �5,079,372 0.000 LRP1B
Chr9 p21.3 21908956 22148414 37 �386,988 0.000 C9orf53, CDKN2A,
CDKN2BAS, CDKN2B
Chr10 q21.3 67748408 67784515 9 �434,557 2.586e-149 CTNNA3
Chr11 q11 55124730 55187341 12 �4,281,094 4.431e-205 OR4C11, OR4P4, OR4S2
Chr16 q23.1 77669056 77772300 22 �4,400,907 0.000 WWOX
U-251-FGA20gain Chr2 q13 112607949 112672009 14 �299,373 6774e-186 FBLN7
Chr2 q22.1 14127652 142052932 119 �440,903 0.000 LRP1B
Chr9 p21.3 21908956 22148414 37 �3,257,158 0.000 C9orf53, CDKN2A,
CDKN2BAS, CDKN2B
Chr10 q21.3 67748408 67784515 9 �4,369,498 2.843e-140 CTNNA3
Chr11 q11 55124730 55187341 12 �3,963,717 2.537ee-209 OR4C11, OR4P4, OR4S2
Chr16 q23.1 77669056 77772300 22 �3,828,185 0.000 WWOX
White background, deletions common to all; black background, deletions common to 3 subclones; light gray background, common to U-251N
and U-251-FGA20gain; dark gray background, proprietary to U-251N.
Figure 1. Array comparative genomic hybridization (CGH) data of U-251 clones reveal accumulation of genetic alterations after long-term
culture. (A) The aCGH profile shows complete chromosomal duplications and hemizygous losses (trisomies and monosomies) in U-251MG typical
of primary glioblastoma (GBM), while the profiles of the other subclones have a more complex pattern. Several homozygous deletions (arrows)
are detected (B) Eucledian distance calculation indicates that U-251-4q12 diverged earlier from an ancestral U-251MG clone than U-251N and
U-251-FGA20gain, and that the divergence of U-251 and U-251-FGA20gain is a relatively late event. (C) All subclones show homozygous deletion
of CDKN2A (p16/p14 ARF). (D) U-251-4q12 has an amplification at chromosome 4q12. (E) platelet-derived growth factor receptor a (PDGFRa)
mRNA expression is increased in all three long-term passaged U-251 subclones compared to U-251MG.
ª 2014 The Authors. Cancer Medicine published by John Wiley & Sons Ltd. 7
A. Torsvik et al. The U-251 Glioma Cell Line Revisted

however, the cell lines do not have a focal amplification
of this region (data not shown).
In the U-251-4q12 cell line a complex amplified struc-
ture was detected on chromosome 4 including PDGFRa,receptor tyrosine kinases KIT, and vascular EGFR 2 (VEG-
FR2) (Fig. 1D). In order to determine if the 4q12 ampli-
con was functional with respect to PDGFRa expression,
we performed qPCR to determine the expression level of
the PDGFRa mRNA. Interestingly, all long-term passaged
subclones showed a similar upregulated expression level of
PDGFRa, which differed significantly from the PDGFRaexpression in U-251MG (P ≤ 0.025, Fig. 1E), therefore, it
appears that subculturing selects for high PDGFRa expres-
sion independent of 4q12 amplification in this cell line.
Variations in DNA ploidy and karyotype
DNA ploidy analysis shows that the four subclones
also vary in their DI, and interestingly, the original
U-251MG and U-251-4q12 are more aneuploid than the
other two long-term passaged clones. U-251MG and
U-251-4q12 have DI of 1.75 � 0.07 and 1.65 � 0.08,
respectively, while U-251N and U-251-FGA20gain
have DI of 1.20 � 0.03 and 1.20 � 0.04, respectively
(Fig. 2A). This variation in DNA ploidy was further
confirmed by karyotyping which showed a median chro-
mosome number of 66 for U-251MG, 59 for U-251-
4q12, and 50 for both U-251N and U-251-FGA20gain
(Fig. 2B).
A
B
Figure 2. DNA ploidy and karyotyping. Flow cytometric DNA ploidy analyses show that the U-251 subclones differ in their DNA ploidy.
Lymphocytes (representing diploid DNA) are shown in gray. (A) Manual count of chromosomes in G-banded metaphases showing different ploidy
levels in the U-251 subclones.
8 ª 2014 The Authors. Cancer Medicine published by John Wiley & Sons Ltd.
The U-251 Glioma Cell Line Revisted A. Torsvik et al.

The U.251 subclones show alterations incellular morphology, growth pattern, andcell surface marker expression
U-251MG and U-251-4q12 cells are quite similar with
respect to morphology and growth pattern, but they
clearly differ from that of U-251N and U-251-FGA20gain
cells (Fig. 3A). U-251MG and U-251-4q12 grow evenly
distributed within the culture flasks while U-251N and
U-251-FGA20gain grow in clusters. Also the morphology
of the cells was different. Cytoskeleton staining with a-Tubulin shows a more compact cytoskeleton with fewer
protrusions in the longest passaged subclones compared
to U-251MG. Also the cell size decrease with increased
subculture (Fig. 3B, all scale bars = 50 lm). Flow cyto-
metric analysis of cell membrane markers revealed that
U-251MG, U-251-4q12 and U-251N cells express a uni-
form high level of classical glioma cell markers such as
A
B
C
Figure 3. Phenotypic characterization and DNA analysis of U-251 clones. (A) Phase contrast images of U-251MG, U-251-4q12, U-251N, and
U251-FGA20gain show variation in morphology and growth pattern. Scale bars = 100 lm. (B) a-tubulin staining of U-251 subclones show
variation in size and cytoskeleton organization. Scale bars = 50 lm. (C) Flow cytometric histograms of cell surface marker expression profiling of
U-251MG, U-251-4q12, and U251N shows high level of CD44 expression and low levels of CD133/1 and CD15. Subpopulations of CD15high and
A2B5high cells are present only in U-251N cells (boxed area). Expression levels of analyzed markers are presented in comparison to negative
controls (“black dotted” profiles).
ª 2014 The Authors. Cancer Medicine published by John Wiley & Sons Ltd. 9
A. Torsvik et al. The U-251 Glioma Cell Line Revisted

CD44 (Fig. 3C), CD56, CD90, and CD29 (not shown).
All cell lines also expressed low levels of CD133/1 and
CD15, which were previously associated with glioma can-
cer stem-like cells (CSCs); however, only U-251N cells
displayed a CD15high subpopulation (15 � 2.7%). A2B5
was detected at a very low level in U-251MG and U-251N
cells, where again A2B5high subpopulation (26 � 2.3%)
was detected only in the latter. As CD15high and A2B5high
cells are only present in U-251N cells and not in the
original U-251MG, indicates an acquisition of these
markers during culture.
Cell lines experience increased cell growthand clonogenicity upon in vitro passaging
To compare the proliferation rate between the four sub-
clones, we performed growth curve analyses, determined
the PD time, and the proportion actively cycling cells by
BrdU analysis. The growth rate of U-251MG was mea-
sured in both MEM-based medium and DMEM-based
medium. After an initial boost in the growth factors rich
DMEM-based medium, the growth rate of U-251MG was
similar in both culture media. U-251MG and U-251-4q12
grow more slowly than the other two (Fig. 2A), with a
PD of 33.05 � 5.76 and 33.63 � 3.28 h, respectively,
whereas the PD for U-251N is 23.79 � 2.26 h and that of
U-251-FGA20gain is 21.09 � 1.23 h (average from four
growth curve replicates). The BrdU analysis also showed
variation in the cell cycle distribution among the four
subclones (Fig. 2B), with a slight increase in the frac-
tion of actively proliferating cells in U-251-FGA20gain
(P-values: U-251MG = 0.057, U-251-4q12 = 0.004, and
U-251N = 0.018). However, the proportion of actively
proliferating cells does not correlate to the difference in
growth rate, indicating that the total cell cycle time is
longer for the U-251MG and the U-251-4q12 cells.
A
C
DE
B
Figure 4. In vitro and in vivo growth U-251 clones. (A) Growth curves of U-251MG in MEM, U-251MG in DMEM, U-251-4q12, U-251N, and
U251-FGA20gain. (B) BrdU incorporation shows various distributions of the S-phase cells. One representative figure is shown, while numbers are
the mean from three replicate analyses. (C) Examples of variation in colony formation obtained by U-251MG (left), U-251-4q12 (middle left),
U-251N (middle right), and U-251-FGA20gain (right). Single colonies are shown as insets with scale bars = 100 lm. (D) Survival of clonogenic
colonies after irradiation at 2, 5, and 10 Gy. U-251-4q12, U-251N, and U-251-FGA20gain. (E) Kaplan-Meier survival curves after intracranial
implantation of the U-251 subclones in NOD/SCID mice.
10 ª 2014 The Authors. Cancer Medicine published by John Wiley & Sons Ltd.
The U-251 Glioma Cell Line Revisted A. Torsvik et al.

Clonogenic assays are commonly used to assess tumori-
genicity of cell lines in vitro. We performed a compara-
tive study of the clonogenic growth of the four subclones
as well as their response to irradiation. In comparison
with U-251N and U-251-FGA20gain, the U-251MG and
U-251-4q12 colonies were much smaller and less dense
(Fig. 2C). One limitation with this clonogenic assay is
that the definition of a colony is difficult if cells are
migrating and showing dispersed growth. The U-251MG
cells showed a high migratory pattern and the colonies
were difficult to define. Consequently, these were not
included in the calculation of PE and irradiation
response. The PE was significant lower for U-251-4q12
(PE = 23.8 � 4.47) compared to U-251N (PE = 42.5 �4.66, P = 0.0075) and U-251-FGA20gain (PE = 46.56 �7.70, P = 0.0115). Irradiation at 2 and 5 Gy show that
U-251-4q12 cells are more sensitive than U-251N and
U-251-FGA20gain (Fig. 2D), however, the difference is
only significant for U-251-4q12 compared to U-251-
FGA20gain at 5 Gy (P = 0.0248). This indicates that the
U-251 subclones with higher growth rate and more clus-
tered growth pattern also show more clonogenic growth
and a tendency to higher tolerance of ionizing radiation.
Increased in vivo tumorigenicity afterlong-term in vitro culture
In order to assess whether the variations in growth patterns
observed in vitro were reflected in vivo, we implanted
50,000 cells intracranially in NOD/SCID mice to evaluate
tumor take and survival time of the mice. The average
survival of U-251-FGA20gain and U-251N was 41 and
52 days, respectively. In contrast, some of the U-251MG
and U-251-4q12 mice survived more than 130 days, with
average survival time of 111 days for U-251MG and
97 days for U-251-4q12 (P-values: U-251MG ≤0.0451(U-251N) and <0.0134 (U-251-FGA20gain); U-251-4q12 =<0.0391 (U-251N) and <0.0050 (U-251-FGA20gain). In
close agreement with the in vitro assays, the cells with a
higher growth rate and higher clonogenicity in vitro also
had a more aggressive growth in the mice (Fig. 4E).
Discussion
The aim of this study was to characterize the genetic,
phenotypic, and functional differences of the original U-
251 and various subclones of this cell line, including one
that in numerous publications have been referred to as
U-373 (named here U251-4q12). Similar variations may
be found in any cancer cell line that have been extensively
subcultured over many years, underlining the importance
of strict cell culture routines and restricted time of sub-
culturing according to cell bank guidelines.
aCGH is an important tool to identify genetic signatures
common to different cancer types [19]. The most promi-
nent difference as analyzed by aCGH was the loss of a
typical primary GBM profile for all subclones other than
U-251MG. U-251MG has DNA copy number aberrations
typical of a human GBM profile [19], with gains of chro-
mosomes 3, 7, 15, and 17, and losses of chromosomes 10,
13, and 14. The long-term cultured subclones U-251-4q12,
U-251N, and U-251-FGA20gain had lost these charac-
teristics. These three subclones all carried a deletion of
18q11-23, which has been described as a cell culture-
induced phenomenon in GBMs [17] and also in cell lines
derived from other tumor types [20]. The reason for this is
not known. Interestingly, the U-251-4q12 cell line has an
amplification of chromosome 4. This amplification was not
detected in the original U-251MG cell line, and may
indicate that U-251-4q12 is derived from a different cell
within the original U-251MG cell line, although it cannot
be ruled out the possibility that this is a culture-induced
amplification phenomenon. In this context it should be
recognized that amplification of 4q12 has been reported in
a subset of GBMs [21, 22]. The amplicon on 4q12 contains
a cluster of genes including PDGFRa, KIT and VEGFR2.
Interestingly, Holtkamp and colleagues [22] reported a
remarkable amplification pattern in U-373 cells with a
19-fold increase in the central portion of the amplicon.
Amplification of 4q12 was also detected in SNB-19. This
can potentially be explained by the fact that both of these
cell lines are of the same origin as U-251 [7].
GBMs frequently carry mutations in PTEN and TP53
as well as p16/p14ARF deletions [23]. Mutations in these
genes have also been reported for U-251 [5, 6]. By aCGH
we confirmed that the p16/p14ARF locus was homozy-
gously deleted in all U-251 subclones.
The STR profiles among the four U-251 clones are very
similar, with some LOH at some loci. The allele gain at
FGA locus 20 in the subclone U-251-FGA20gain does not
seem to affect the character of the cell line, with respect
to its growth pattern, morphology, proliferation, clonoge-
nicity, and radiation response. It also does not seem to
change the genetic profile, when analyzed by aCGH. The
U-251MG and U-251-4q12 cells clearly differ from the
other two U-251 clones by all parameters measured in
this study. Both U-251MG and U-251-4q12 cells are mor-
phologically larger and grow flatter and more evenly dis-
tributed in the tissue culture flasks compared to the two
clustered subclones. Furthermore, they proliferate more
slowly and are less tumorigenic in vivo. However, both
the STR analysis and the aCGH clearly show a common
origin for all U-251 clones.
When choosing an in vitro model for cancer, the most
important criteria are that the model reflects the tumor
type it is supposed to represent and that the correlation
ª 2014 The Authors. Cancer Medicine published by John Wiley & Sons Ltd. 11
A. Torsvik et al. The U-251 Glioma Cell Line Revisted

between tumor model and tumor type is high. The genomic
profiles of human GBMs cultured as monolayers are fre-
quently deviant from the parental tumors and during pro-
longed culture genetic changes accumulate [24]. Quite
disturbing are data showing that cell lines appear more
similar to each other, regardless of the tissue of origin, than
the tumors that they are supposed to model, both with
respect to their genetic profile and at the transcriptional
level [18, 25]. Furthermore, in a comparative study to
investigate the multidrug resistance transcriptome of vari-
ous cancer cell types, no correlation was found between
clinical samples and established cancer cell lines [25]. Yet,
one study concluded that commonly used breast cancer cell
lines to a large extent reflect the features of cancer cells in
vivo [26].
In this study, we found a clear variation in the aCGH
profile of the long-term passaged U-251 subclones com-
pared to aCGH profile of low-passaged U-251MG. During
long-term subculture the cell lines seem to lose much of
the typical GBM signature, and they gain a large number
of local duplications and/or deletions that probably accu-
mulates over time. This phenomenon may obscure com-
parative results obtained by testing drug effects in
different laboratories.
Since several of the major cell deposits have distributed
the cross-contaminated U-251, there is reason to believe
that most articles referring to U-373 are in fact referring
to the subclone U-251-4q12, in particular those submitted
before the correct U-373 was made available at HPA
medio 2010. In order to fight the problem of cross-
contamination, several journals now require cell line veri-
fication before publication, yet there are continuously
new articles published with experimental data from the
U-251 and U-373 cell lines, in which it is not obvious if
the authors have used the cross-contaminated U-251 or
the correct one. Whether the cells have been authenti-
cated before publication is thus not obvious to the read-
ers. It is, therefore, highly recommended that cell line
authenticity should be stated in the material and method
section of all published articles along with the cell source.
In summary, cell lines represent simple model systems
that have contributed extensively to elucidate various
biological functions of cancer cells. In addition, the
glioma cell line U-251 and other cell lines isolated by the
group in Uppsala, Sweden, have provided important new
insight into GBM biology. Yet, given the high number of
articles published each year related to the U-251 cell line,
which in fact may represent different subclones with
different biological properties, a further specification of
the subclone used is mandatory. Such a specification,
which is provided in this study, is important in order to
justify in-depth comparisons of results obtained between
different laboratories.
Conflict of Interest
None declared.
References
1. Ponten, J., and B. Westermark. 1978. Properties of human
malignant glioma cells in vitro. Med. Biol. 56:184–193.
2. Westermark, B., J. Ponten, and R. Hugosson. 1973.
Determinants for the establishment of permanent tissue
culture lines from human gliomas. Acta Pathol. Microbiol.
Scand. A 81:791–805.
3. Ponten, J., and E. H. Macintyre. 1968. Long term culture
of normal and neoplastic human glia. Acta Pathol.
Microbiol. Scand. 74:465–486.
4. Nister, M., T. A. Libermann, C. Betsholtz, M. Pettersson,
L. Claesson-Welsh, C. H. Heldin, et al. 1988. Expression of
messenger RNAs for platelet-derived growth factor and
transforming growth factor-alpha and their receptors in
human malignant glioma cell lines. Cancer Res. 48:3910–
3918.
5. Ishii, N., D. Maier, A. Merlo, M. Tada, Y. Sawamura,
A. C. Diserens, et al. 1999. Frequent co-alterations of
TP53, p16/CDKN2A, p14ARF, PTEN tumor suppressor
genes in human glioma cell lines. Brain Pathol. 9:469–479.
6. Fuxe, J., G. Akusjarvi, H. M. Goike, G. Roos, V. P. Collins,
and R. F. Pettersson. 2000. Adenovirus-mediated
overexpression of p15INK4B inhibits human glioma cell
growth, induces replicative senescence, and inhibits
telomerase activity similarly to p16INK4A. Cell Growth
Differ. 11:373–384.
7. Azari, S., N. Ahmadi, M. J. Tehrani, and F. Shokri. 2007.
Profiling and authentication of human cell lines using
short tandem repeat (STR) loci: report from the National
Cell Bank of Iran. Biologicals 35:195–202.
8. Capes-Davis, A., G. Theodosopoulos, I. Atkin, H. G.
Drexler, A. Kohara, R. A. MacLeod, et al. 2010. Check
your cultures! A list of cross-contaminated or
misidentified cell lines. Int. J. Cancer 127:1–8.
9. Chatterjee, R. 2009. Cell biology. Cases of mistaken
identity. Science 315:928–931.
10. Editorial. 2009. Identity crisis. Nature 457:935–936.
11. ASN-0002 ATCCSDOW. 2010. Cell line misidentification:
the beginning of the end. Nat. Rev. Cancer 10:441–448.
12. Mandahl, N. 2001. Methods in solid tumor cytogenetics.
Pp. 165–203 in D. E. Rooney, ed. Human Cytogenetics – a
practical approach: malignancy and acquired
abnormalities. Vol. II. Oxford University Press, Oxford,
U.K.
13. Franken, N. A., H. M. Rodermond, J. Stap, J. Haveman,
and C. van Bree. 2006. Clonogenic assay of cells in vitro.
Nat. Protoc. 1:2315–2319.
14. Lorenzi, P. L., W. C. Reinhold, S. Varma, A. A.
Hutchinson, Y. Pommier, S. J. Chanock, et al. 2005. DNA
12 ª 2014 The Authors. Cancer Medicine published by John Wiley & Sons Ltd.
The U-251 Glioma Cell Line Revisted A. Torsvik et al.

fingerprinting of the NCI-60 cell line panel. Mol. Cancer
Ther. 8:713–724.
15. Parson, W., R. Kirchebner, R. Muhlmann, K. Renner, A.
Kofler, S. Schmidt, et al. 2005. Cancer cell line
identification by short tandem repeat profiling: power and
limitations. FASEB J. 19:434–436.
16. Poetsch, M., A. Petersmann, C. Woenckhaus, C. Protzel,
T. Dittberner, E. Lignitz, et al. 2004. Evaluation of allelic
alterations in short tandem repeats in different kinds of
solid tumors–possible pitfalls in forensic casework.
Forensic Sci. Int. 145:1–6.
17. Masters, J. R., J. A. Thomson, B. Daly-Burns, Y. A. Reid, W.
G. Dirks, P. Packer, et al. 2001. Short tandem repeat
profiling provides an international reference standard for
human cell lines. Proc. Natl Acad. Sci. USA 98:8012–8017.
18. Li, A., J. Walling, Y. Kotliarov, A. Center, M. E. Steed, S.
J. Ahn, et al. 2008. Genomic changes and gene expression
profiles reveal that established glioma cell lines are poorly
representative of primary human gliomas. Mol. Cancer
Res. 6:21–30.
19. Beroukhim, R., G. Getz, L. Nghiemphu, J. Barretina, T.
Hsueh, D. Linhart, et al. 2007. Assessing the significance of
chromosomal aberrations in cancer: methodology and
application to glioma. Proc. Natl Acad. Sci. USA
104:20007–20012.
20. Greshock, J., K. Nathanson, A. M. Martin, L. Zhang, G.
Coukos, B. L. Weber, et al. 2007. Cancer cell lines as
genetic models of their parent histology: analyses based on
array comparative genomic hybridization. Cancer Res.
67:3594–3600.
21. Joensuu, H., M. Puputti, H. Sihto, O. Tynninen, and N. N.
Nupponen. 2005. Amplification of genes encoding KIT,
PDGFRalpha and VEGFR2 receptor tyrosine kinases is
frequent in glioblastoma multiforme. J. Pathol. 207:224–
231.
22. Holtkamp, N., N. Ziegenhagen, E. Malzer, C. Hartmann,
A. Giese, and A. von Deimling. 2007. Characterization of
the amplicon on chromosomal segment 4q12 in
glioblastoma multiforme. Neuro. Oncol. 9:291–297.
23. Kanu, O. O., B. Hughes, C. Di, N. Lin, J. Fu, D. D. Bigner,
et al. 2009. Glioblastoma multiforme oncogenomics and
signaling pathways. Clin. Med. Oncol. 3:39–52.
24. De Witt Hamer, P. C., A. A. Van Tilborg, P. P. Eijk, P.
Sminia, D. Troost, C. J. Van Noorden, et al. 2008. The
genomic profile of human malignant glioma is altered
early in primary cell culture and preserved in spheroids.
Oncogene 27:2091–2096.
25. Gillet, J. P., A. M. Calcagno, S. Varma, M. Marino, L. J.
Green, M. I. Vora, et al. 2004. Redefining the relevance of
established cancer cell lines to the study of mechanisms of
clinical anti-cancer drug resistance. Proc. Natl. Acad. Sci.
USA 108:18708–18713.
26. Lacroix, M., and G. Leclercq. 2004. Relevance of breast
cancer cell lines as models for breast tumours: an update.
Breast Cancer Res. Treat. 83:249–289.
ª 2014 The Authors. Cancer Medicine published by John Wiley & Sons Ltd. 13
A. Torsvik et al. The U-251 Glioma Cell Line Revisted


![[251].pdf - Research Journal of Pharmaceutical, Biological ...](https://static.fdokumen.com/doc/165x107/631c85af76d2a4450503946f/251pdf-research-journal-of-pharmaceutical-biological-.jpg)