Twentieth-century trends in the thermal growing season in the Greater Baltic Area
15
Twentieth-century trends in the thermal growing season in the Greater Baltic Area Hans W. Linderholm & Alexander Walther & Deliang Chen Received: 13 October 2005 / Accepted: 27 July 2007 # Springer Science + Business Media B.V. 2007 Abstract Phenological data have shown an increase of ca. 10 days in European growing season length in the latter part of the twentieth century. In general, these changes have been associated with global warming. Here we present a study of thermal growing season (GS) trends in the Greater Baltic Area, northern Europe. Yearly dates for the start, end and length of the GS were computed for 49 stations in the studied area, using daily mean temperature measurements. Trends and tendencies of the GS parameters were analysed within the twentieth century. We also examined GS trends in long records (starting before 1850) from the region. The results show a general increase of the length of the GS of ca one week since 1951 in the area, where the most considerable change has occurred in spring (starting ∼6 days earlier). The largest increases were found at stations adjacent to the Baltic Sea and North Sea, where some Danish stations showed significant increasing trends in the length of the GS of more than 20 days. The only tendency for a shorter GS was found in Archangelsk, north western Russia. The three longest records displayed large inter-annual and decadal variability, with tendencies for increased frequencies of longer growing seasons since the 1950s. 1 Introduction In the past decade, a growing number of studies have reported on a late-twentieth century lengthening of the growing season for most of the Northern Hemisphere, associated with increasing temperatures (e.g., Frich et al. 2002; Parmesan and Yohe 2003; Root et al. 2003). The relationship between climate and growing season (GS) parameters (start, end and length), makes GS variability an important indicator of climate change. Evidence for lengthening of the growing season in the late twentieth century has come from satellite data, phenological and meteorological observations. Keeling et al. (1996) showed an association between surface air temperatures and variations in the timing and amplitude of the seasonal Climatic Change DOI 10.1007/s10584-007-9327-3 H. W. Linderholm (*) : A. Walther : D. Chen Regional Climate Group, Earth Sciences Centre, Göteborg University, 405 30 Göteborg, Sweden e-mail: [email protected] H. W. Linderholm : D. Chen Laboratory for Climate Studies, National Climate Center, China Meteorological Administration, 46 Zhongguancun Nandajie, Haidian, Beijing 100081, China
Transcript of Twentieth-century trends in the thermal growing season in the Greater Baltic Area

Twentieth-century trends in the thermal growing seasonin the Greater Baltic Area
Hans W. Linderholm & Alexander Walther &
Deliang Chen
Received: 13 October 2005 /Accepted: 27 July 2007# Springer Science + Business Media B.V. 2007
Abstract Phenological data have shown an increase of ca. 10 days in European growingseason length in the latter part of the twentieth century. In general, these changes have beenassociated with global warming. Here we present a study of thermal growing season (GS)trends in the Greater Baltic Area, northern Europe. Yearly dates for the start, end and lengthof the GS were computed for 49 stations in the studied area, using daily mean temperaturemeasurements. Trends and tendencies of the GS parameters were analysed within thetwentieth century. We also examined GS trends in long records (starting before 1850) fromthe region. The results show a general increase of the length of the GS of ca one week since1951 in the area, where the most considerable change has occurred in spring (starting∼6 days earlier). The largest increases were found at stations adjacent to the Baltic Sea andNorth Sea, where some Danish stations showed significant increasing trends in the length ofthe GS of more than 20 days. The only tendency for a shorter GS was found inArchangelsk, north western Russia. The three longest records displayed large inter-annualand decadal variability, with tendencies for increased frequencies of longer growing seasonssince the 1950s.
1 Introduction
In the past decade, a growing number of studies have reported on a late-twentieth centurylengthening of the growing season for most of the Northern Hemisphere, associated withincreasing temperatures (e.g., Frich et al. 2002; Parmesan and Yohe 2003; Root et al. 2003).The relationship between climate and growing season (GS) parameters (start, end andlength), makes GS variability an important indicator of climate change. Evidence forlengthening of the growing season in the late twentieth century has come from satellite data,phenological and meteorological observations. Keeling et al. (1996) showed an associationbetween surface air temperatures and variations in the timing and amplitude of the seasonal
Climatic ChangeDOI 10.1007/s10584-007-9327-3
H. W. Linderholm (*) : A. Walther : D. ChenRegional Climate Group, Earth Sciences Centre, Göteborg University, 405 30 Göteborg, Swedene-mail: [email protected]
H. W. Linderholm : D. ChenLaboratory for Climate Studies, National Climate Center, China Meteorological Administration,46 Zhongguancun Nandajie, Haidian, Beijing 100081, China

cycle of atmospheric CO2. An increase of the annual amplitude of the seasonal CO2 cycleby 40% in the Arctic (20% in Hawaii) since the early 1960s, where warmer temperaturespromote increases in plant growth in summer and/or respiration in winter, was linked to alengthening of the GS by about 7 days. Furthermore, the photosynthetic activity ofterrestrial vegetation, as seen in satellite data, increased from 1981 to 1991 which is alsoassociated with a lengthening of the active growing season (Myneni et al. 1997).
A large number of phenological studies have reported on recent changes in timing of GSstart and end, resulting in an extension of the GS. Phenology studies plant and animal lifestages driven by environmental factors (Schwartz 1999). Species whose phenophases (e.g.flowering, leafing, breeding, leaf fall etc.) are linked to temperatures, will respond tochanging temperatures with shifts in the phenophases. Phenological data have indicatedshifts to earlier start of the GS in the latter half of the twentieth century, which has beencoupled to warmer winters associated with the variation in the North Atlantic Oscillation,NAO (Chmielewski and Rötzer 2001; Ahas et al. 2002; D’Odorico et al. 2002; Scheifingeret al. 2002; Menzel 2003; Ahas et al. 2004), warming in spring (Cayan et al. 2001;Chmielewski and Rötzer 2002; Chmielewski et al. 2004) and increases in minimumtemperatures or longer frost-free period (Abu-Asab et al. 2001; Scheifinger et al. 2003).Common results for most recent phenological studies are an extended GS, which is mainlycaused by earlier onset of the GS start in spring (Ahas 1999; Menzel and Fabian 1999;Menzel 2000; Menzel et al. 2001; Ahas et al. 2002; Peñuelas et al. 2002). Similar findings,i.e. an extended GS during the late twentieth century, have also been observed when theclimatological GS is studied for large parts of the Northern Hemisphere (Frich et al. 2002).The reported increases in growing season length (GSL) are in a range of ca. 1 to 3 weeks(Skaggs and Baker 1985; Carter 1998; Hasenauer et al. 1999; Robeson 2002; Schwartz andChen 2002; Menzel et al. 2003). However, Kozlov and Berlina (2002) found a shift to latersnow-melt by 16 days in spring in the northern Russian taiga for the period 1930 to 1998.In addition, there was a shift of 13 days towards earlier dates of permanent snow in thesame area during that period.
Future climate change is projected to increase the length of the growing season (e.g.IPCC 2001). An increase in GSL, together with a warmer climate during GS, may advancethe potential for crop production at high northern latitudes and increase the potentialnumber of harvests and hence seasonal yields for perennial forage crops (ACIA 2004).Effects at high northern latitudes could be elevated tree line, improved forest productivityand favourable conditions for growing more southerly fruits (e.g. Hasenauer et al. 1999;Wielgolaski 2003). However, the accelerated rates of change seen in the past three decadesindicate that in a near future we will see large changes in ecosystems which may havenegative effects on ecosystems, such as extension of species’ range boundaries byestablishment of new local populations causing extinction of former populations, andprogressive decoupling of species interaction (e.g. plants and pollinators) because of out-of-phase phenology (e.g. Hughes 2000; Peñuelas and Filella 2001). Barford et al. (2001) foundthat seasonal and annual fluctuations of the uptake of CO2 in a northern hardwood forestwere regulated by weather and seasonal climate (e.g. variations in growing-season length).Consequently, persistent increases in GSL may lead to long-term increases in carbonstorage (White et al. 1999).
In this paper we analyse twentieth century trends in the GS from a network of stations in“the Greater Baltic Area” (GBA, Walther and Linderholm 2006). This region, which largelybelongs to the boreal region, may be especially sensitive to changes in the growing season.Recent climate warming in the boreal region has increased the probability of occurrence ofcritical temperature thresholds for the production of existing agricultural crops. Possible
Climatic Change
future climate warming would increase the land area on which crops could be producedsuccessfully, and the variety of agricultural crops that could be grown (Juday et al. 2005).
2 Data
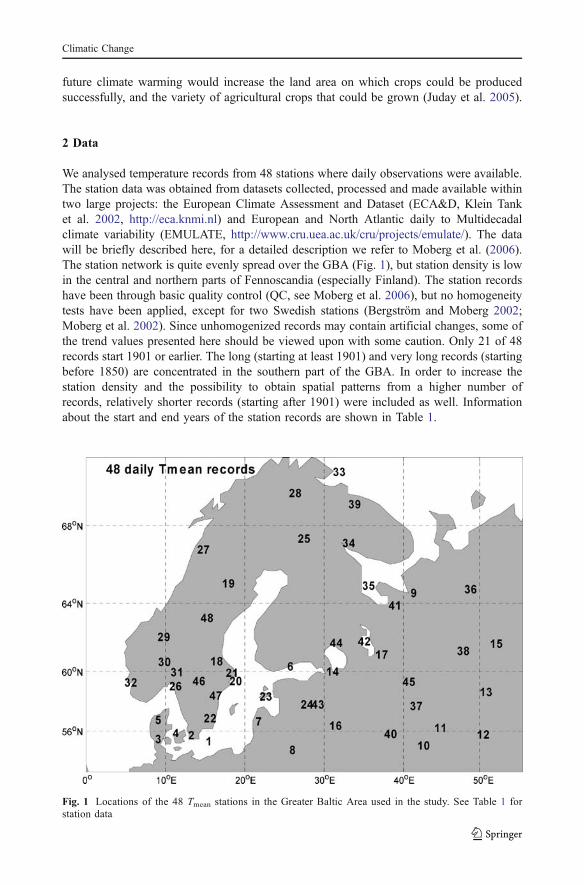
We analysed temperature records from 48 stations where daily observations were available.The station data was obtained from datasets collected, processed and made available withintwo large projects: the European Climate Assessment and Dataset (ECA&D, Klein Tanket al. 2002, http://eca.knmi.nl) and European and North Atlantic daily to Multidecadalclimate variability (EMULATE, http://www.cru.uea.ac.uk/cru/projects/emulate/). The datawill be briefly described here, for a detailed description we refer to Moberg et al. (2006).The station network is quite evenly spread over the GBA (Fig. 1), but station density is lowin the central and northern parts of Fennoscandia (especially Finland). The station recordshave been through basic quality control (QC, see Moberg et al. 2006), but no homogeneitytests have been applied, except for two Swedish stations (Bergström and Moberg 2002;Moberg et al. 2002). Since unhomogenized records may contain artificial changes, some ofthe trend values presented here should be viewed upon with some caution. Only 21 of 48records start 1901 or earlier. The long (starting at least 1901) and very long records (startingbefore 1850) are concentrated in the southern part of the GBA. In order to increase thestation density and the possibility to obtain spatial patterns from a higher number ofrecords, relatively shorter records (starting after 1901) were included as well. Informationabout the start and end years of the station records are shown in Table 1.
Fig. 1 Locations of the 48 Tmean stations in the Greater Baltic Area used in the study. See Table 1 forstation data
Climatic Change

Table 1 Station data for the 48 station used in the analyses
Lat. (°N) Lon. (°E) Elev. (m) Station country start end Ref.a
1 55.3 14.8 12 Hammer-Odde-Fyr DK 1874 2004 (1)2 55.7 12.5 9 Koebenhavn DK 1874 2003 (1)3 55.5 8.4 4 Nordby DK 1874 2003 (1)4 55.9 10.6 11 Tranebjerg DK 1873 2003 (1)5 56.8 8.3 18 Vestervig DK 1874 2003 (1)6 60.3 25.0 51 Helsinki FIN 1828 2001 (4)7 56.7 21.0 4 Liepaja LV 1881 1989 (2)8 54.6 25.3 162 Vilnjus LT 1881 1989 (1,2)19 64.6 40.5 8 Archangelsk RUS 1881 1999 (1)10 55.0 41.8 132 Elatma RUS 1886 1999 (1)11 56.2 43.8 161 Gorkij RUS 1881 1989 (2)12 55.8 49.2 116 Kazan RUS 1881 1989 (2)13 58.7 49.6 165 Kirov RUS 1881 1989 (2)14 60.0 30.3 4 St-Petersburg RUS 1743 1999 (3)15 61.7 50.9 96 Syktyvar RUS 1888 1999 (1)16 56.4 30.6 98 Velikie-Luki RUS 1881 1999 (1)17 61.0 36.5 55 Vytegra RUS 1881 1999 (1)18 60.6 15.7 157 Falun S 1860 200219 65.1 17.2 325 Stensele S 1918 200320 59.4 18.1 44 Stockholm S 1756 2003 (5)21 59.9 17.6 13 Uppsala S 1722 2001 (5)22 56.9 14.8 166 Vaexjoe S 1918 200323 58.4 21.8 6 Vilsandi EST 1920 2004 (1)24 57.9 27.0 82 Voru EST 1923 2001 (1)25 62.4 25.7 137 Jyvaskyla FIN 1951 2004 (1)26 59.0 10.5 6 Faerder-Fyr N 1951 2004 (1)27 66.8 14.0 39 Glomfjord N 1943 2001 (1)28 69.5 25.5 129 Karasjok N 1943 2001 (1)29 62.1 9.1 626 Kjoeremsgrende N 1954 2004 (1)30 60.6 9.1 167 Nesbyen-Skoglund N 1943 2004 (1)31 60.0 10.7 94 Oslo-Blindern N 1938 2004 (1)32 59.3 4.9 55 Utsira-Fyr N 1943 2003 (1)33 70.4 31.1 14 Vardoe N 1951 2004 (1)34 67.2 32.4 25 Kandalaksa RUS 1912 2004 (1)35 65.0 34.8 8 Kem RUS 1916 2000 (1)36 64.8 47.7 64 Kojnas RUS 1912 1999 (1)37 57.7 40.8 126 Kostroma RUS 1925 1999 (1)38 61.2 46.7 56 Kotlas RUS 1936 1999 (1)39 69.0 33.1 51 Moermansk RUS 1936 1999 (1)40 55.8 37.6 156 Moskow RUS 1948 1999 (1)41 63.9 38.1 13 Onega RUS 1936 2004 (1)42 61.8 34.3 110 Petrozawodsk RUS 1936 1999 (1)43 57.8 28.4 45 Pskow RUS 1936 2004 (1)44 61.7 30.7 19 Sortavala RUS 1945 2004 (1)45 59.3 39.9 130 Wologda RUS 1938 1999 (1)46 59.4 13.5 46 Karlstad S 1918 2001 (1)47 58.4 15.5 93 Linkoeping S 1931 2004 (1)48 63.2 14.5 376 Oestersund S 1918 2004 (1)
a References: (1) European Climate Assessment & Dataset (ECA&D): http://eca.knmi.nl; (2) Carbon DioxideInformation Analysis Centre (CDIAC): http://cdiac.ornl.gov/ftp/ndp040; (3) Jones and Lister 2002; (4) Heino1994; (5) Moberg et al. 2002
Climatic Change

3 Methods
The climatological growing season can be defined as the entire period in which growth cantheoretically take place; it is not the period of actual growth. There are a number of ways todefine start, end and length of the growing season. One definition of GSL that has been used inUSA is the period between the date of the last spring frost and first autumn frost (e.g. Skaggsand Baker 1985; Robeson 2002), where the frost may be determined by thresholds of dailyminimum temperatures. Other investigations have used threshold temperatures in a predefinednumber of days to start and end the growing season. In Bootsma’s (1994) definition of thegrowing season in Canada, it starts at the date when the 5-day weighted mean temperaturesreached and stayed above 5.5°C and ends when the weighted temperatures fall below 5.5°C.Jones and Briffa (1995) defined the start of the growing season in Russia as the fourth day ofthe first sequence of 4 consecutive days with temperatures above the 5°C threshold, and theend was defined as the last day of the last 4-day sequence above the 5°C. Later, Jones et al.(2002) revised the definition, so that the growing season start/end was defined as the first/lastfive-day period occurring after/before the last/first frost of the winter season. Frich et al.(2002), in a global study, used the period when daily temperatures remain above 5°C for>5 days and below 5°C for >5 days. Carter (1998) defined the start of the growing season as>5°C for ≥5 days and the end when the 10-day running mean of mean daily temperatures fallsbelow 5°C. In a comparison of different indices for the start and end of the growing season inthe Greater Baltic Area (GBA), Walther and Linderholm (2006) noted that disregarding thefrost criteria might lead to false starts and ends of the growing season. In this study we usethe definitions of GS parameters that were suggested for the GBA, where the start day ofthe growing season is defined as the last day of the first six-day spell with daily Tmean
above 5°C after the last winter/spring frost (based on Tmean). The end-day of the growingseason is defined as the first day of the first 10-day period with a mean below 5°C. Finally,the GSL is the number of days between the particular start- and end-day. Using the 5°Cthreshold in northern Europe can be justified, since the growing season is largely temperaturelimited. The physiological significance of this period naturally differs among plant types, butit can be assumed to be relevant to perennial plants that are exposed to weather throughout theyear, e.g. trees and shrubs (Carter 1998).
Using these definitions we produced time series of the start, end and length of the GS foreach station included in the data set. Trend analyses were made in three time periods: 1901–1950, 1951–2000 and 1901–2000. The periods were chosen for several reasons. Thedivision of the 20th century provides a comparison of the sub-periods. 50 years providesufficient data for the trend method to work. Analyses of the 100-year period provide long-term results. Besides, the 50 and 100 year periods are commonly used in climate changestudies. Two main problems are data availability and temporal coverage of the respectivetime-series. In order to use the series available as much and efficient as possible, we alsocomputed the linear trends for the entire record of each station. In this way we also includeresults from three very long time-series starting in the 1700s. An overall missing valuecriteria was applied when computing the growing season parameters. Up to 12 missingvalues in the particular annual Tmean series were allowed (=1 missing value/month). If aseries contains more missing values, the growing season parameters were set missing valuesas well. The temperature series generally contained either high or very low rates of missingvalues. In order to be able to include also series with high missing value rates, we looked atthe distribution of these within the series. In this context the growing season parameters wascomputed, if the dates of the missing values clearly did not affect the start or the end of the
Climatic Change

particular growing season (e.g. missing values before the last spring frost or after the first10-day mean period below 5°C). For computing the linear trends up to 5% missing growingseason parameters in the particular period to be analysed were allowed (=5 years missing/100 years). The growing season time-series was analysed for linear trends using theordinary least squares method (OLS). The significance of the trends was tested using theMann–Kendall test (Yue et al. 2002). Trends were defined to be significant at p<0.05 andhighly significant with p<0.01.
4 Twentieth-century trends and tendencies
Due to the large variation in station record lengths and occasionally large numbers ofmissing values, the number of stations in each period analyzed was lower than expected,especially in the periods starting before 1951; 1901–1950: 11 stations, 1951–2000: 37stations and 1901–2000: 11 stations. The results of the trend analyses of start, end andlength of the growing season are shown in Fig. 2 and Table 2.
GS
star
t
1901-1950 (=5>5F)
0o 10oE 20oE 30oE 40oE 50oE 52oN
56oN
60oN
64oN
68oN
72oN 1951-2000 (=5>5F)
0o 10oE 20oE 30oE 40oE 50oE 52oN
56oN
60oN
64oN
68oN
72oN 1901-2000 (=5>5F)
0o 10oE 20oE 30oE 40oE 50oE 52oN
56oN
60oN
64oN
68oN
72oN
GS
end
1901-1950 (10d<5)
0o 10oE 20oE 30oE 40oE 50oE 52oN
56oN
60oN
64oN
68oN
72oN 1951-2000 (10d<5)
0o 10oE 20oE 30oE 40oE 50oE 52oN
56oN
60oN
64oN
68oN
72oN 1901-2000 (10d<5)
0o 10oE 20oE 30oE 40oE 50oE 52oN
56oN
60oN
64oN
68oN
72oN
GS
leng
th
1901-1950 (=5>5Fr|10d)
0o 10oE 20oE 30oE 40oE 50oE 52oN
56oN
60oN
64oN
68oN
72oN 1951-2000 (=5>5Fr|10d)
0o 10oE 20oE 30oE 40oE 50oE 52oN
56oN
60oN
64oN
68oN
72oN 1901-2000 (=5>5Fr|10d)
0o 10oE 20oE 30oE 40oE 50oE 52oN
56oN
60oN
64oN
68oN
72oN
Fig. 2 Trends in start, end and length of the thermal growing season for three periods in the twentiethcentury (see text for explanation of definitions)
Climatic Change

4.1 Start
Between 1901 and 1950 a significant trend in the start of the GS was only found forKoebenhavn, Denmark, with an earlier onset of almost 20 days. Similar tendencies (i.e. notsignificant trends) of shifts by >−10–<−20 days were found at the remaining Danishstations, Stockholm and Uppsala. The remaining stations in the central part of the GBA
Table 2 Linear trends in growing season parameters for three periods in the twentieth century
1901–1950 1951–2000 1901–2000
Start End Length Start End Length Start End Length
1 Hammer-Odde-Fyr DK −11.1 9.0 20.2 – – – −0.3 10.2 10.52 Koebenhavn DK −19.2 5.7 24.9 −24.5a −4.0a 17.2a −22.8 12.6 33.53 Nordby DK −13.9 −0.8 13.1 −18.1 4.0 22.5 −18.2 8.3 26.55 Vestervig DK −10.9 −7.3 3.6 −22.1 −3.3 18.8 −16.5 6.1 22.66 Helsinki FIN −6.6 0.8 7.3 −1.0 2.8 3.8 −9.5 10.5 19.99 Archangelsk RUS −1.1 3.8 4.9 −4.5a −4.0a 0.5a −3.6 −7.1 −3.610 Elatma RUS – – – −0.9 −6.7 −5.8 – – –14 St-Petersburg RUS −2.9 2.0 4.9 −10.7 −3.1 7.6 −10.6 3.5 14.215 Syktyvar RUS 5.7 3.0 −2.7 −5.5a −1.1a 4.3a −9.1 0.2 9.216 Velikie-Luki RUS – – – −5.1b −3.3b 1.8b – – –18 Falun S −6.7 2.9 9.6 −2.4 5.5 7.9 −8.6 1.1 9.719 Stensele S – – – −1.4 1.0 2.3 – – –20 Stockholm S −10.5 5.1 15.6 −5.2 5.5 10.6 −6.2 11.7 17.921 Uppsala S −11.0 2.9 13.9 −4.7 1.4 6.1 −7.8 7.6 15.422 Vaexjoe S – – – −4.8 1.3 6.2 – – –23 Vilsandi EST – – – −10.8 1.4 12.2 – – –24 Voru EST – – – −8.7 2.8 11.5 – – –25 Jyvaskyla FIN – – – −1.5 3.7 5.2 – – –26 Faerder-Fyr N – – – −16.6 3.5 20.0 – – –27 Glomfjord N – – – −2.9 −1.1 1.8 – – –28 Karasjok N – – – −7.1 0.4 7.5 – – –29 Kjoeremsgrende N – – – −3.0a, b −3.0a, b 0.0a, b – – –30 Nesbyen-Skoglund N – – – −4.4 1.4 5.8 – – –31 Oslo-Blindern N – – – −7.3 2.8 10.1 – – –32 Utsira-Fyr N – – – −19.1 −4.8 14.3 – – –33 Vardoe N – – – 3.0 8.4 5.5 – – –34 Kandalaksa RUS – – – 1.2 0.9 −0.3 – – –35 Kem RUS – – – −6.1b 5.0b 11.1b – – –37 Kostroma RUS – – – −4.3b −0.9b 3.3b – – –40 Moskow RUS – – – 0.5b −9.3b −9.8b – – –41 Onega RUS – – – −4.9 2.3 7.2 – – –42 Petrozawodsk RUS – – – −5.9b 2.0b 7.9b – – –43 Pskow RUS – – – −7.6 −1.3 6.3 – – –44 Sortavala RUS – – – −5.6 −1.9 3.7 – – –46 Karlstad S – – – −4.8 −0.2 4.5 – – –47 Linkoeping S – – – −4.1 2.8 6.9 – – –48 Oestersund S – – – 2.0 0.6 −1.3 – – –
See text for definitions of start and end. A few series were included which started later than 1950 (a start year1954) and ended before 2000 (b end year 1999). For a number of stations more than 5% of the data wasmissing, so they were excluded from the analyses (station No: 4, 7, 8, 11–13, 17, 36, 38, 39 and 45, see tablefor station locations). Significant trends (95% level) in bold.
Climatic Change

indicated an earlier GS onset as well (>0–≤−10 days). In the eastern parts, the tendency atSyktyvar, Russia, showed a delay in the GS start of 5.7 days. Between 1951 and 2000, themajority of the stations show tendencies for an earlier GS start of around >0–≤−10 days.Significant trends of ca. 10 days were only found in St Petersburg (Russia) and Vilsandi(Estonia). The largest changes, though not significant, were found in the south-western partof the GBA: Koebenhavn, Vestervig and Norby (Denmark, −24.5, −22.1 and −18.1 daysrespectively) and Utsira Fyr-Faerder Fyr (Norway, −19.1 and −16.6 days respectively).Four stations indicated a delayed (not significant) GS start in this period: Oestersund(Sweden, +2 days), Vardoe (Norway, +3 days) and Moskow and Kandalaksa (Russia, +0.5and +1.2 days respectively). For the whole 1901 to 2000 period, all available stationsshowed earlier starts of the GS, and significant trends were found in Koebenhavn, Nordbyand Vestervig (Denmark, −22,8, −18.2 and −16.5 days respectively), Helsinki (Finland,−9.5 days), St Petersburg (Russia, −10.6 days) and Falun (Sweden, −8.6 days). There weretendencies for earlier GS starts at the remaining stations of >0–≤−10 days.
4.2 End
No significant trends in GS end were found in 1901–1950. However, general tendenciestowards later GS ends (0.5 to 10 days) at all stations were observed, except in Vestervig andNordby (Denmark), where tendencies for a shift of 7.3 and 0.8 days respectively to anearlier GS end were found. In the following period (1951–2000) stations close to the NorthAtlantic, nine of the Russian stations and Karlstad (Sweden) show tendencies for an earlierend of the GS (>0–≤−10 days), where Elatma and Moskow show earlier GS ends of ca oneweek. The remaining stations display tendencies for later GS end (>0–≤+10 days). Thesignificant trends in GS end for the 1901 to 2000 period were found around the Baltic Sea(Koebenhavn: +12.6 days, Stockholm: +11.7 days and Helsinki: +10.5 days). Tendenciesfor later GS ends (>0–<+10 days) were found at the remaining stations. In Archangelsk(Russia), there was a significant trend of earlier GS end of 1 week.
4.3 GSL
Significant trends in the GSL in 1901–1950 were found in the two eastern Danish stations(Koebenhavn and Hammer-Odde Fyr). These showed increased trends of more than20 days in the fifty-year period. All other stations close to the Baltic Sea or North Atlanticcoasts displayed tendencies for increased GSL of >0–≤10 days, where the tendencies inNordby, Stockholm and Uppsala were of >10–≤20 days. One Russian station (Syktyvar) inthe easternmost part of GBA showed a negative tendency for GSL (−2.7 days). Nosignificant trends were found in 1951–2000, but tendencies show increased GSL in mostparts of the GBA of >0−≤20 days: over 10 days increase in Estonia, Stockholm, Kem(Russia) and the south western part GBA (including a increases of ≥20 days at Nordby andFaerder Fyr in western Norway). In Oestersund (Sweden), Moscou, Kandalaksa and Elatma(Russia), this period displayed a tendency for shorter GSL. There is a clear trend towardsand increasing GSL around the Baltic Sea in 1901 to 2000. The significant increasesof >10–≤20 days were found in Stockholm, Uppsala, Helsinki and St Petersburg, and,slightly lower, in Falun (+9.7 days), Hammer-Odde Fyr (+10.5 days, not significant) andSyktyvar (+9.2 days, not significant). Three Danish mainland stations show and evengreater trends: +22.6 days in Vestervig, +26.5 days in Nordby and +33.5 days inKoebenhavn. The only tendency for a twentieth century shortening of the GSL was foundin Archangelsk in Russia (−3.6 days).
Climatic Change

4.4 Long-term trends
When the linear trends of growing season parameters was computed for the longestconsecutive period, with less than 5% missing values, for each record, an increasinggrowing season is the main feature in the GBA (Table 3). The most prominent changeshave occurred in Denmark with increases in GSL of up to 40 days since the late nineteenthcentury. Significant increases are also observed in central Sweden and St. Petersburg andKirov in Russia, but not of the same magnitude. The remaining stations that displaytendencies for extended GS are in the range of 0.3 to 14.1 days. Only 7 stations out of 49show tendencies for a shorter GS, but only with a few days (−1.4 to −9.6 days). Moresignificant changes in GS start (all earlier) were observed than in GS end (all later exceptKandalaksa, Russia). Only five stations (out of 48) disclosed tendencies for later GS start(Liepaja, Latvia; Vilnjus, Lithuania; Moscow, Russia; Karlstad and Linkoeping, Sweden).Twenty one (21) stations disclosed earlier GS ends, the majority being Russian stations(17 out of 21 stations), but also one Lithuanian and three Norwegian (two coastal) stations.
5 Trends in the longest records
The long-term growing season trends in the three longest records show increases in GSL of6.2 (Uppsala, 1722–2001, not significant), 8.9 (Stockholm, 1756–2003, significant atp<0.05) and 22.9 (St. Petersburg, 1805–1999, significant at p<0.05) days respectivelysince the eighteenth century (Fig. 3, Table 3). In the Swedish records, the increased GSLwas foremost due to significantly delayed GS end (4.6 days in Uppsala and 7.6 days inStockholm, p<0.05), since the earlier GS starts were small and not significant in bothrecords. However, at St. Petersburg, earlier GS start of 15.5 days (p<0.01) had greaterimpact on the large increase in GSL, but still there was an delay of the GS end of one week.The shorter Helsinki record (1828–2001) displayed significant increases in GSL of31.9 days (p<0.01), where the increase was due to almost equal changes in spring andautumn: an advance of the GS start by 18.0 days (p<0.01) and delayed GS end of 13.8 days(p<0.01). The three longest GS records display high inter-annual and decadal variability,and there are tendencies for increased frequencies of longer growing seasons since the1950s.
6 Discussion
6.1 General trends in the GBA
Unfortunately, the many missing values in the analysed data set make it difficult to evaluatethe evolution of GSL within the entire twentieth century over the entire GBA. The reasonfor the general lack of significant trends in growing season parameters may be attributed tothe large inter-annual variability in the records. This is exemplified by the long records inFig. 3, especially the Stockholm and Uppsala records, where the observed trend is far lessimportant than the yearly and decadal variations. This has also been observed inclimatological growing season records for North America (Bootsma 1994; Robeson 2002).
Our results show that, in general, there is a trend in the twentieth century for earlier startsand delayed end, and thus a prolongation, of the GS in the GBA. Averaged over 36 stationsin the 1951 to 2000 period, the growing season started 6.3 days earlier, ended 1.1 days later,
Climatic Change

Table 3 Linear trends in growing season parameters over longest consecutive periods with missing values<5%
Trend period start end length
1 Hammer-Odde-Fyr DK 1875–2003 −13.6 12.9 26.52 Koebenhavn DK 1874–2003 −22.6 18.2 40.83 Nordby DK 1875–2003 −17.2 4.4 21.64 Tranebjerg DK 1874–1938 −11.5 12.8 24.45 Vestervig DK 1874–2003 −19.5 12.3 31.86 Helsinki FIN 1834–2001 −18.0 13.8 31.97 Liepaja LV 1946–1989 2.7 10.6 7.98 Vilnjus LT 1945–1989 7.2 −0.2 −7.49 Archangelsk RUS 1883–1999 −5.6 −2.0 3.610 Elatma RUS 1922–1999 −7.5 −7.2 0.311 Gorkij RUS 1923–1989 −13.3 −4.9 8.412 Kazan RUS 1881–1983 −5.1 −2.3 2.813 Kirov RUS 1940–1989 −8.4 6.6 15.014 St-Petersburg RUS 1805–1999 −15.5 7.5 22.915 Syktyvar RUS 1896–1998 −8.0 −0.9 7.116 Velikie-Luki RUS 1947–1999 −4.5 −2.1 2.417 Vytegra RUS 1933–1998 −6.4 −4.8 1.718 Falun S 1897–2002 −10.6 0.8 11.519 Stensele S 1918–2003 −7.6 7.8 15.420 Stockholm S 1756–2003 −1.4 7.6 8.921 Uppsala S 1722–2001 −1.6 4.6 6.222 Vaexjoe S 1918–2003 −3.6 4.4 8.023 Vilsandi EST 1948–2001 −8.5 2.3 10.824 Voru EST 1945–2001 −6.8 5.7 12.525 Jyvaskyla FIN 1951–2003 −3.0 2.7 5.826 Faerder-Fyr N 1951–2003 −15.9 −1.8 14.127 Glomfjord N 1956–2001 −4.8 0.7 5.628 Karasjok N 1951–2001 −5.7 1.3 7.029 Kjoeremsgrende N 1954–2001 −3.1 −2.6 0.530 Nesbyen-Skoglund N 1943–2002 −0.5 1.2 1.731 Oslo-Blindern N 1938–2003 −0.3 1.6 1.932 Utsira-Fyr N 1943–2003 −1.4 −3.7 −2.233 Vardoe N 1951–2003 −2.6 7.7 10.334 Kandalaksa RUS 1912–2003 −2.6 −6.7 −4.135 Kem RUS 1917–2000 −5.6 −1.0 4.536 Kojnas RUS 1922–1998 −3.2 −4.6 −1.437 Kostroma RUS 1925–1999 −7.8 −3.3 4.638 Kotlas RUS 1936–1999 −6.3 −4.3 2.039 Moermansk RUS 1938–1998 −10.3 −6.0 4.340 Moskow RUS 1949–1999 0.2 −9.4 −9.641 Onega RUS 1936–2002 −3.1 −1.2 2.042 Petrozawodsk RUS 1945–1999 −0.3 1.1 1.443 Pskow RUS 1945–2002 −7.5 0.9 8.344 Sortavala RUS 1945–2000 −2.9 −0.4 2.545 Wologda RUS 1939–1998 −5.2 −1.9 3.346 Karlstad S 1918–2001 5.2 2.2 −3.047 Linkoeping S 1931–2003 4.9 1.7 −3.148 Oestersund S 1918–2003 −3.5 0.3 3.9
See Fig. 1 for station locations and text for start and end definitions. Bold: significant trends (p<0.05)
Climatic Change

yielding an increased GSL of 7.4 days. Consequently, on regional (GBA) scale, the largestchanges have occurred in spring, because of warmer temperatures and earlier last frost.Regional changes in autumn are less pronounced, and were only significant for threestations for the 1901–2000 period. Larger changes in spring than autumn in Europe havealso been observed in phenological records (e.g. Menzel et al. 2001; Sparks and Menzel2002). Our results agree well with those obtained for 9 stations in the Nordic region byCarter (1998). He found that the GSL had increased considerably in the past century,between 1 to 3 weeks, but that the lengthening had been less pronounced since the 1960 inmost parts. Also, he noted that the absolute magnitude of lengthening showed a decliningwest-east gradient between Denmark and Finland, and higher inter-annual variability at thewestern sites. In Germany, Menzel et al. (2003) analysed 41 stations for the 1951–2000period. The growing season was defined by single-value thresholds of daily minimum andmean air temperatures, and during this 50-year period they found a lengthening of thegrowing season of 5.5 to 24.5 days depending on the definition used. The greatest changewas found in the frost-free period, due to stronger increase in daily minimum rather thanmaximum temperatures. Similar results of increased frost-free period were found in Austria,Switzerland (both 25 days) and Estonia (18 days). Furthermore, they noted that the trendwas weakening at high-elevation stations (>950 m a.s.l.).
The averaged changes in GBA growing season parameters agree fairly well withprevious phenological studies in Europe. Estonian springs had advanced 8 days on averageover the 1919–1996 period (Ahas 1999), Dates for phenological phases (e.g., leafunfolding, flowering and leaf fall), from the International Phenological Gardens, a
1750 1800 1850 1900 1950 2000
Uppsala
jan
feb
mar
apr
may
jun
jul
aug
sep
oct
nov
dec
GS
sta
rt
G
S e
nd
-1.6
4.6*
0
50
100
150
200
250
300
GS
Len
gth
[day
s]
6.2
1750 1800 1850 1900 1950 2000
Stockholm
jan
feb
mar
apr
may
jun
jul
aug
sep
oct
nov
dec
GS
sta
rG
S e
nd
-1.4
7.6**
0
50
100
150
200
250
300
GS
Len
gth
[day
s]
8.9*
1800 1820 1840 1860 1880 1900 1920 1940 1960 1980 2000
St-petersburg
jan
feb
mar
apr
may
jun
jul
aug
sep
oct
nov
dec
GS
sta
rt
G
S e
nd
-15.5**
7.5**
0
50
100
150
200
250
300G
S L
engt
h [d
ays]22.9**
1840 1860 1880 1900 1920 1940 1960 1980 2000
Helsinki
jan
feb
mar
apr
may
jun
jul
aug
sep
oct
nov
dec
GS
sta
rt
G
S e
nd
-18.0**
13.8**
0
50
100
150
200
250
300
GS
Len
gth
[day
s]
31.9**
Fig. 3 Trends in growing season start, end and length in the longest records (starting before 1850) in theGreater Baltic Area. Significant trends are indicated by *p<0.05 and **p<0.01
Climatic Change

Europe-wide network with a large spatial coverage (42°N–69°N, 10°W–27°E), showed thatfrom 1959 to 1996, spring events had advanced on average 6.3 days and autumn events haddelayed on average by 4.5 days, resulting in an average lengthening of the growing seasonby 10.8 days (Menzel and Fabian 1999; Menzel 2000). In Germany, phenological datasuggested a GSL increased by ca. 9 days over the 1951–96 period, with less changes duringautumn than during spring (Menzel et al. 2001).
6.2 Regional patterns
Due to the low spatial coverage of station data over the 1901–2000 period, together with ageneral lack in significant trends in 1951–2000, it is difficult to draw any conclusions aboutregional patterns. However, the observed tendencies suggest that earlier GS start andextended GSL is a more prominent feature in coastal areas in the southern part of the GBA.Furthermore, the most pronounced changes have occurred in Denmark, where a significantextension of the GSL of 30–40 days was observed. This is in agreement with the findingsof Ahas (1999) who, using phenological data, found that spring was advancing morerapidly in coastal regions than in inland areas.
The only station of those covering the entire twentieth century showing a tendency for ashorter GS was Archangelsk, in NW Russia. This station is located close to the KolaPeninsula, where Kozlov and Berlina (2002) examined a number of phenological variablesfrom 1930–1998 and found that snow-melt in spring occurred 16 days later and that thedates of permanent snow cover in the forests began 13 days earlier at the end of the studyperiod than at its beginning. They concluded that the length of the growing season on theKola Peninsula declined during the past 60 years, due to delayed spring and advancedautumn/winter. However, the station record from Moermansk (150 km north of their studyarea) showed a significant trend towards earlier GS start (−10.3 days) and despite atendency for an earlier end of the GS (−6 days), our data suggests an increase of the GS(4.3 days, not significant) from 1938 to 1998 (Table 3).
The GS pattern during 1951–2000 studied here corresponds to the results of satellitestudy of GS changes in Fennoscandia, Denmark and the Kola Peninsula by Hogda et al.(2001). Using the GIMMS NDVI dataset for the period 1981 to 1998, they found a delay ofspring in the alpine belts and the northern boreal zone, where the strongest delay occurredon the most continental parts of the northern boreal zone. They also noted that springstarted earlier in southern Fennoscandia and western Norway. However, their result that theautumn was delayed in the whole area, except for the most continental part of northernScandinavia, does not agree with our results, where tendencies for earlier GS ends werefound at coastal as well as continental stations within the GBA.
On the long term, the longest records show that there is a substantial variability in GSparameters on inter-annual to decadal time scales. In the two Swedish station records fromStockholm and Uppsala, the trend shows an increase in GSL of only around one week inthe last 250 years. This is much less that the short-term variability in those records.Furthermore, longer growing seasons need not necessarily be warmer in terms of number ofdays above a certain temperature threshold. This has previously been shown in Russia andnorthern Europe by Jones and Briffa (1995) and Jones et al. (2002). Vedin (1990) notedwhen studying the GS in northernmost Sweden in two 10-year periods, one warm (1931–1940) and one colder (1979–1988), that GSL was shorter in the warm period than the coldone. Also, examining the relationship between NDVI and tree rings in North America andEurasia, Kaufmann et al. (2004) suggested that summer temperatures were more importantto tree growth than the duration of the GS.
Climatic Change
6.3 Implications of an extended GS
Our data suggests that during the period when a significant part of the increase in globaltemperatures of ca. 0.6°C (IPCC 2001), the GS has become on average one week longer inthe GBA. Future climate change is projected to increase the length of the growing seasoneven further (e.g. IPCC 2001; ACIA 2004; EEA 2004). Such an increase in GSL, togetherwith a warmer growing season, is expected to advance the potential for crop production athigh northern latitudes and increase the potential number of harvests and hence seasonalyields for perennial forage crops (ACIA 2004). Effects in Fennoscandia could be (but seeabove) elevated tree line and favourable conditions for growing of more southerly fruits(Wielgolaski 2003), and in alpine areas with maximum precipitation during the growingseason, lengthening if the growing season as a result of warmer temperatures could lead toimproved forest productivity (Hasenauer et al. 1999). However, in climates with distinctseasonality, the vegetation adapts to this seasonality by its phenology, and if a significantclimate change occurs, plant species will be less adaptive to this new climate (Kramer et al.2000). Thus, a rapid climate change, occurring within the next hundred years, could have alarge impact on already living trees which would be less adaptive to the prevailing climate.This has been shown in two recent studies, where recent warming has been associated withnegative growth responses of trees at treeline sites in Alaska and the central ScandinavianMountains (Linderholm and Linderholm 2004; Wilmking et al. 2004). Also, if tree speciesrespond differently to climate change, then the competitive relationships between specieswill alter and hence, in the long run, the species composition of forests and possibly thegeographical ranges of species (Kramer et al. 2000).
7 Conclusions
This study of trends in growing season parameters from a network of stations in the GreaterBaltic Area (GBA), disclosed that, in general, the growing season has been extended in thetwentieth century. Averaged for the 1951–2000 period, the GS has become ∼7 days longer,where most of this change is due to earlier onsets of the GS in spring (−6 days). However,there are large spatial and temporal differences in GS evolution in the GBA, where thelargest changes have occurred in the south western part of the area. Examination of thelongest records available, two of them starting in the 1700s, suggested that over the past200–250 years, the trend in GSL has been moderate, and that inter-annual to decadalvariability is much more pronounced. However, the general tendency towards a longer GSmainly due to an earlier onset was still found for all periods analyzed.
Acknowledgements This work was part of EMULATE (European and North Atlantic daily to Multidecadalclimate variability) supported from the European Commission under the Fifth Framework Programme,contract no: EVK2-CT-2002–00161 EMULATE. It was also supported by the Swedish Research Council(VR, grants to Hans Linderholm and Deliang Chen respectively). This paper is contribution No. 4 fromTELLUS - The Center for Earth Systems Science at Göteborg University.
References
Abu-Asab MS, Peterson PM, Shelter SG, Orli SS (2001) Earlier plant flowering in spring as a response toglobal warming in the Washington, DC, area. Biodivers Conserv 10:597–612
ACIA (2004) Impacts of a warming Arctic: arctic climate impact assessment. Cambridge University Press,Cambridge, UK, p 140
Climatic Change

Ahas R (1999) Long-term phyto-, ornitho- and ichthyophenological time-series analyses in Estonia. Int JBiometeorol 42:119–123
Ahas R, Aasa A, Menzel A, Fedotova VG, Scheifinger H (2002) Changes in European spring phenology. IntJ Climatol 22:1727–1738
Ahas A, Jaagus J, Ahas R, Sepp M (2004) The influence of atmospheric circulation on plant phenologicalphases in central and eastern Europe. Int J Climatol 24:1551–1564
Barford CC, Wofsy SC, Goulden ML, Munger JW, Pyle EH, Ubranski SP, Hutyra L, saleska SR, FitzjarraldD, Moore K (2001) Factors controlling long- and short-term sequestration of atmospheric CO2 in a mid-latitude forest. Science 294:1688–1691
Bergström H, Moberg A (2002) Daily air temperature and pressure series for Uppsala (1722–1998). ClimChange 53:213–252
Bootsma A (1994) Long term (100 yr) climate trends for agriculture at selected locations in Canada. ClimChange 26:65–88
Carter TR (1998) Changes in the thermal growing season in Nordic countries during the past century andprospects for the future. Agric Food Sci Finl 7:161–179
Cayan DR, Kammerdiener SA, Dettinger MD, Caprio JM, Peterson DH (2001) Changes in the onset ofspring in the western United States. Bull Am Meteorol Soc 82:399–415
Chmielewski F-M, Rötzer T (2001) response to phenology to climate change across Europe. Agric ForMeteorol 108:101–112
Chmielewski F-M, Rötzer T (2002) Annual and spatial variability of the beginning of growing season inEurope in relation to air temperature changes. Clim Res 19:257–264
Chmielewski F-M, Müller A, Bruns E (2004) Climate changes and trends in phenology of fruit trees andfield crops in Germany, 1961–2000. Agric For Meteorol 121:69–78
D’Odorico P, Yoo J-C, Jaeger S (2002) Changing seasons: an effect of the North Atlantic Oscillation. JClimate 15:435–445
EEA (2004) Impacts of Europe’s changing climate—an indicator based assessment. European EnvironmentAgency report no 2/2004, p 107
Frich P, Alexander LV, Della-Marta P, Gleason B, Haylock M, Klein Tank AMG, Peterson T (2002)Observed coherent changes in climatic extremes during the second half of the twentieth century. ClimRes 19:193–212
Hasenauer H, Nemani RR, Schadauer K, Running SW (1999) Forest growth response to changing climatebetween 1961 and 1990 in Austria. For Ecol Manag 122:209–219
Heino R (1994) Climate in Finland during the period of meteorological observations. Finnish MeteorologicalInstitute Contributions, No. 12, Finnish Meteorological Institute, p 209
Hogda KA, Karlsen SR, Solheim I (2001) Climatic change impact on growing season in Fennoscandiastudied by a time series of NOAA AVHRR NDVI data. Proceedings of IGARSS. 9–13 July 2001,Sydney, Australia. ISBN 0–7803–7033–3
Hughes L (2000) Biological consequences of global warming: is the signal already apparent. Trends inEcological Evolution 15:56–61
IPCC (2001) Climate change 2001: the scientific basis. Contribution of working group I to the thirdassessment report of the international panel on climate change. In: Houghton JT, Ding Y, Griggs DJ,Noguer M, van der Linden PJ, Dai X, Manskell K, Johnson CA (eds). Cambridge University Press,Cambridge, United Kingdom and New York, NY, USA, p 881
Jones PD, Briffa KR (1995) Growing season temperatures over the former Soviet Union. Int J Climatol15:943–959
Jones PD, Lister DH (2002) The daily temperature record for St. Petersburg. Clim Change 53:253–267Jones PD, Briffa KR, Osborn TJ, Moberg A, Bergström H (2002) Relationships between circulation strength
and the variability of growing-season and cold-season climate in northern and central Europe. TheHolocene 12:643–656
Juday GP, Barber V, Duffy P, Linderholm H, Rupp S, Sparrow S, Vaganov E, Yarie J, Berg E, D’Arrigo R,Eggertsson O, Furyaev VV, Hogg EH, Huttunen S, Jacoby G, Kaplunov VY, Kellomaki S, KirdyanovAV, Lewis CE, Linder S, Naurzbaev MM, Pleshikov FI, Runesson UT, Savva YV, Sidorova OV,Stakanov VD, Tchebakova NM, Valendik EN, Vedrova EF, Wilmking M (2005) The Arctic climateimpact assessment- the scientific report, Chapter 14: forests, land management and agriculture.Cambridge University Press, Cambridge, UK, pp 781–862
Kaufmann RK, D’Arrigo RD, Laskowski C, Myneni RB, Zhou L, Davi NK (2004) The effects of growingseason and summer greenness on northern forests. Geophys Res Lett 31:L09205
Keeling CD, Chin JFS, Whorf TP (1996) Increased activity of northern vegetation inferred from atmosphericCO2 measurements. Nature 382:146–149
Klein Tank AMG et al (2002) Daily dataset of 20th-century surface air temperature and precipitation seriesfor the European Climate Assessment. Int J of Climatol 22:1441–1453
Climatic Change

Kozlov MV, Berlina NG (2002) Decline in length of the summer season on the Kola Peninsula, Russia. ClimChange 54:387–398
Kramer K, Leinonen I, Loustau D (2000) The importance of phenology for the evaluation of impact ofclimate change on growth of boreal, temperate and Mediterranean forests ecosystems: an overview. Int JBiometeorol 44:67–75
Linderholm HW, Linderholm K (2004) Age-dependent climate sensitivity of Pinus sylvestris L. in the centralScandinavian Mountains. Boreal Environ Res 9:307–317
Menzel A (2000) Trends in phenological phases in Europe between 1951 and 1996. Int J Biometeorol 44:76–81Menzel A (2003) Phenological anomalies in Germany and their relation to air temperature and NAO. Clim
Change 57:243–263Menzel A, Fabian P (1999) Growing season extended in Europe. Nature 397:659Menzel A, Estrella N, Fabian P (2001) Spatial and temporal variability of the phenological seasons in
Germany from 1951–1996. Glob Chang Biol 7:657–666Menzel A, Jakobi G, Ahas R, Scheifinger H, Estrella N (2003) Variations of the climatological growing
season (1951–2000) in Germany compared with other countries. Int J Climatol 23:793–812Moberg A, Bergström H, Ruiz Krigsman J, Svanered O (2002) Daily air temperature and pressure series for
Stockholm (1756–1998). Clim Change 53:171–212Moberg A, Jones PD, Lister D, Walther A, Brunet M, Jacobeit J, Saladie O, Sigro J, Aguilar E, Della-Marta
P, Luterbacher J, Yiou P, Alexander LV, Chen D, Klein Tank AMG, Alexandersson H, Almarza C, AuerI, Barriendos M, Begert M, Bergström H, Böhm R, Butler J, Caesar J, Drebs1 A, Founda1 D,Gerstengarbe F-W, Giusi M, Jónsson T, Maugeri M, Österle H, Pandzic K, Petrakis M, Srnec L, TolaszR, Tuomenvirta H, Werner PC, Linderholm H, Philipp A, Wanner H, Xoplaki E (2006) Indices for dailytemperature and precipitation extremes in Europe analyzed for the period 1901–2000. J Geophys Res111:D22106, doi:10.1029/2006JD007103
Myneni RC, Keeling CD, Tucker CJ, Asrar G, Nemani RR (1997) Increased plant growth in the northernhigh latitudes from 1981 to 1991. Nature 386:698–702
Parmesan C, Yohe G (2003) A globally coherent fingerprint of climate change impacts across naturalsystems. Nature 421:37–42
Peñuelas J, Filella I (2001) Responses to a warming world. Science 294:793–794Peñuelas J, Filella I, Comas P (2002) Changed plant and animal life cycles from 1952 to 2000 in the
Mediterranean region. Glob Chang Biol 8:531–544Robeson SM (2002) Increasing growing-season length in Illinois during the 20th century. Clim Change
52:219–238Root TL, Price JT, Hall KR, Schneider SH, Rosenzweig C, Pounds JA (2003) Fingerprints of global
warming on wild animals and plants. Nature 421:57–60Scheifinger H, Menzel A, Koch E, Peter C, Ahas R (2002) Atmospheric mechanisms governing the spatial
and temporal variability of phenological phases in central Europe. Int J Climatol 22:1739–1755Scheifinger H, Menzel A, Koch E, Peter C (2003) Trends of spring time frost events and phenological dates
in Central Europe. Theor Appl Climatol 74:41–51Schwartz MD (1999) advancing to full bloom: planning phenological research for the 21st century. Int J
Biometeorol 42:113–118Schwartz MD, Chen X (2002) Examining the onset of spring in China. Clim Res 21:157–164Skaggs RH, Baker DG (1985) Fluctuations in the length of the growing season in Minnesota. Clim Change
7:403–414Sparks T, Menzel A (2002) Observed changes in seasons: an overview. Int J Climatol 22:1715–1725Vedin H (1990) Frequency of rare weather events during periods of extreme climate. Geografiska Annaler
72A:151–155Walther A, Linderholm HW (2006) A comparison of growing season indices for the Greater Baltic Area. Int
J Biometeorol 51:107–118, doi:10.1007/s00484-006-0048-5White MA, Running SW, Thornton PE (1999) The impact of growing-season length variability on carbon
assimilation and evapotranspiration over 88 years in the eastern US deciduous forest. Int J Biometeorol42:139–145
Wielgolaski F-E (2003) Climatic factors governing plant phenological phases along a Norwegian fjord. Int JBiometeorol 47:213–220
Wilmking M, Juday GP, Barber VA, Zald HSJ (2004) Recent climate warming forces contrasting growthresponses of white spruce at treeline in Alaska through temperature thresholds. Glob Chang Biol10:1742–1736
Yue S, Pilon P, Cavadias G (2002) Power of the Mann-Kendall and Spearman’s rho tests for detectingmonotonous trends in hydrological series. J Hydrol 259:254–271
Climatic Change