Biological interactions between fish and jellyfish in ... - UPCommons
Upload
independentCategory
view
0download
0
MARINE ECOLOGY PROGRESS SERIESMar Ecol Prog Ser
Vol. 325: 43–58, 2006 Published November 7
INTRODUCTION
Although many fish, turtles, birds and invertebratesfeed on jellyfish, top-down trophic control of jellyfishpopulations is often lacking, and populations maytherefore grow large (Arai 2005). This pattern, com-bined with the reputation of jellyfish as voraciouspredators of zooplankton (Purcell & Arai 2001, Purcell& Decker 2005), other jellyfish (Purcell 1997), fish eggsand larvae (Purcell & Arai 2001), has led to the tradi-tional view of jellyfish representing trophic dead endsor sinks in pelagic foodwebs (Hansson & Norrman1995, Arai 2005). Although challenged, some reportssuggest that jellyfish biomass has increased in the pastdecades (Mills 2001), and that jellyfish biomass may belinked to climatic variability and change (Brodeur et al.
1999, Lynam et al. 2004, Purcell 2005, Purcell & Decker2005). In any case, mass-occurrences of jellyfish arecommon, often seasonal, features of many coastal sys-tems (Schneider 1989, Hansson 1997, Mills 2001) andmay contribute substantially to the carbon standingstock of planktonic foodwebs (e.g. Schneider 1989,Graham et al. 2001). Yet the fate of the carbon andnutrients bound in these populations after their crashesis unknown.
Bacteria thrive in the dissolved organic carbon (DOC)released by live jellyfish, both in the laboratory (Hansson& Norrman 1995) and the field (Riemann et al. 2006, thisvolume). We therefore expect that dead jellyfish returnenergy and nutrients to the foodweb via rapid degrada-tion and remineralization processes in the water columnand on the seafloor by components of the microbial loop.
© Inter-Research 2006 · www.int-res.com*Email: [email protected]
Turnover of dead jellyfish: stimulation and retardation of microbial activity
Josefin Titelman1,*, Lasse Riemann2, Tom A. Sørnes1, Trygve Nilsen3, Petra Griekspoor2, Ulf Båmstedt1, 4
1Department of Biology, University of Bergen, PO Box 7800, 5020 Bergen, Norway2Department of Natural Sciences, Kalmar University, 39182 Kalmar, Sweden
3Department of Mathematics, University of Bergen, PO Box 7800, 5020 Bergen, Norway4Umeå Marine Science Centre, University of Umeå, Norrbyn, 91020 Hörnefors, Sweden
ABSTRACT: Little is known about the fate of jellyfish biomass after their populations crash. We mea-sured turnover rates of dead Periphylla periphylla in a pelagic in situ experiment in Raunefjorden,Norway. Decay was exponential, with decay-coefficients of 0.67 to 1.12 d–1; smaller jellyfish turnedover faster than larger ones. The rapid turnover suggests that large amounts of carbon and nitrogenare transferred to the pelagic and/or benthic foodwebs at the collapse of jellyfish blooms. The inter-actions between bacteria and dead jellyfish were examined in a shipboard experiment in Lurefjor-den, Norway, using natural bacterial assemblages. Growth and morphology of the bacteria in theincubations suggested that only certain morphotypes proliferated in the vicinity of jellyfish tissue. Subsequent experiments with homogenized P. periphylla tissue and bacterial isolates from variousphylogenetic groups confirmed that some bacteria could use jellyfish as substrate, while others wereinhibited. Tests with sensitive isolates revealed that inhibition of bacterial growth depended on thebody part, size and concentration of P. periphylla used. Because only some bacteria were able to useP. periphylla as a substrate, we suggest that the role of dead jellyfish as trophic links in specificpelagic foodwebs depends partly on bacterial community composition.
KEY WORDS: Periphylla periphylla · Degradation · Bacteria · Inhibition · Growth
Resale or republication not permitted without written consent of the publisher

Mar Ecol Prog Ser 325: 43–58, 2006
Other gelatinous material, such as abandoned appendic-ularian houses and other marine snow particles provideboth food and habitats for microbes and larger animals(e.g. Alldredge 1972, Kiørboe 2000). Small structures,such as houses from the appendicularian Oikopleuradioica, may be completely disintegrated in deep watercolumns (Davoll & Silver 1986), or sink to the bottom atspeeds exceeding 100 m d–1 in shallower environments(e.g. Hansen et al. 1996). Stemman et al. (2004) esti-mated that 90% of the particles <1 cm are remineralizedwithin the euphotic zone in oceanic environments. Incontrast, in the Gulf of Oman, dead jellyfish (Cram-bionella orsini) have been observed by video to roll downthe continental slope and form meter sized benthicpatches at 3300 m depth (Billet et al. 2006). Direct mea-surements of degradation rates of larger, dead gelati-nous zooplankton are scarce, and little is known aboutthe contribution of dead jellyfish to the pelagicnutrient pool. Larger live medusae accumulate damagethrough the season and are gradually broken down inthe water column (Mills 1993). Mesocosm experimentswith the moon jellyfish Aurelia aurita suggest pelagicturnover rates of ~4 to 5 days (Hansson 1997). This resultimplies that turnover rates may be sufficiently high tomake jellyfish quantitatively important as nutrientsources during breakdown of blooms.
In Lurefjorden, western Norway, the coronatescyphomedusa Periphylla periphylla abounds yearround and performs daily vertical migrations betweenthe surface and several hundred meters (Fosså 1992,Youngbluth & Båmstedt 2001, Sørnes 2005). Thismakes P. periphylla well suited for experiments wherelarge quantities of similarly sized animals are needed.Here, we used P. periphylla to study the degradation ofdead gelatinous zooplankton. We quantified turnoverrates of dead medusae through time in a pelagic in situexperiment and conducted a shipboard experimentthat targeted the microbial activity associated withdecaying jellyfish. A final series of laboratory incuba-tions using bacterial isolates was executed to furtherassess positive and negative effects on specific bacter-ial species. In a companion paper, we examined thedistribution of bacterial activity and microbial commu-nity composition relative to jellyfish biomass in Lure-fjorden (Riemann et al. 2006).
MATERIALS AND METHODS
We carried out a series of experiments aimed atquantifying decomposition rates of various sizes of jel-lyfish in an in situ pelagic setting, as well as a series ofshipboard and laboratory experiments investigatingthe interactions between dead jellyfish and the micro-bial community.
In situ degradation experiment. Experimental set-up: Periphylla periphylla were collected with a MIKnet (2 m mouth diameter, 1 to 3 mm graded mesh)between 300 m and the surface in the deep basin ofLurefjorden, on 8 October 2003. On board the ship thejellyfish were emptied into clean, water filled bucketsand stored at 5°C in darkness during transport back tothe laboratory. P. periphylla were weighed individually(wet weight, to nearest 0.1 g) and placed individuallyin tagged nylon mesh bags (80% polyamide, 20% elas-tane). The bags stretched with their contents and had amesh size of ~5 to 10 mm. This large mesh size allowedfor colonization of both microbes and zooplankters,while ensuring transport of solutes and materials to thesurrounding water. The bags were horizontally spacedat approximately 30 cm intervals and suspended indi-vidually at 1 or 8 m depth with fishing lines from themesocosm platform in Raunefjorden, off EspegrendMarine Biological Station. These depths represented 2different temperatures; mean temperature (±SD) was10.1 ± 0.5°C at 1 m and 12.5 ± 0.1°C at 8 m. A smalllead weight anchored the bag in the water. A total of250 jellyfish, equally divided between 4 size categories(42.6 ± 8.14, 121 ± 12.3, 223 ± 12.3 and 300 ± 36.1 g,mean ± SD), were suspended, with the 3 smallest cate-gories at the shallower depth. The size groups werechosen such that their initial weights did not overlap.We estimated that this number of jellyfish would allowfor daily sampling for several weeks if needed, whileallowing for randomization of samples. Because weneeded to process many individuals, the time fromcapture until the last jellyfish had been suspended wasapproximately 12 h. Temperature and salinity weremonitored throughout the study period.
At each daily sampling, 3 jellyfish of each size cate-gory were gently pulled to the surface and weighed intheir bags, but without the line, weight and label. Wetweights were subsequently corrected for bag weight(mean ± SD, 14.8 ± 0.62 g in seawater, n = 7 bags), andthe rate of change in wet weight was used as a proxyfor degradation rates. The largest jellyfish werehomogenized and frozen for subsequent determinationof carbon and nitrogen content. Sampled jellyfish werediscarded.
Carbon and nitrogen analysis: Known volumes ofjellyfish homogenate were collected on precombusted(450°C for 4 h) Whatman GF/F filters. The filters wereanalyzed with a Carlo Erba model 1108 high-tempera-ture combustion elemental analyzer, using standardprocedures and a combustion temperature of 1030°C.Acetanilide was used for standardization and resultswere corrected for carbon content of blank filters. Thefirst sample was taken after 6 h.
Shipboard experiments. We conducted 2 shipboardexperiments in Lurefjorden to investigate the de-
44

Titelman et al.: Degradation of jellyfish
velopment of bacteria around dead Periphylla peri-phylla.
Experimental set-up: In the first experiment we incu-bated 6 large dead Periphylla periphylla (101 ± 13.6 g,mean ± SD) individually in 5 l containers and monitoredthe development of the bacterial community. We alsoincluded 3 controls without P. periphylla. In the secondexperiment, we monitored bacterial abundance in 2 lcontainers with individual small (31.0 ± 1.0 g, mean ±SD, n = 3) or medium (63.8 ± 6.0 g, n = 4) dead P. peri-phylla and in 5 controls without P. periphylla. The set-ups for both experiments were similar, and the experi-ments were conducted in parallel in Lurefjorden on 23to 25 April 2004. All materials were acid washed in 1 MHCl, and gloves were used at all times.
Sterile seawater for the incubation experiments wasobtained by filtering seawater from ~100 m depth inLurefjorden, obtained with a Rosette sampler, througha polypropylene capsule filter (5 to 10 μm nominal poresize, Advantec MFS) followed by a 0.22 μm capsulefilter (Millipak-40, Millipore). Prior to filtration, thevirgin capsule filters were flushed with ~5 l Milli-Q.The containers were inoculated with a 10% volume ofsurface (5 m) seawater, which had been 1.0 μm filtered(polycarbonate, MSI) to remove flagellates. The totalvolume was 4820 ml for the large and 1650 ml for thesmall containers.
Small and medium sized Periphylla periphylla werecaught in MIK nets between 300 m and the surface.Larger specimens were scooped up directly from thesurface water with buckets at night. We selectedhealthy looking intact animals and suffocated these inair for half an hour before the start of the experiment.At this time the jellyfish were also weighed and mea-sured. The jellyfish were rinsed in 3 successive baths of0.2 μm filtered seawater and subsequently added tothe pre-filled containers. We denoted this t = 0. Theexperimental chambers were gently aerated to ensureoxic conditions and covered at all times to preventlight-generated breakdown of the porphyrin of theP. periphylla. The containers were partly submerged ina flowing surface-water-bath with a temperature of 10to 11.5°C. The temperature at the inflow and outflow ofthe water bath was always the same. The ambientwater temperature was ~8°C at the surface (Riemannet al. 2006).
We monitored the experiments for ~50 h and sam-pled approximately every 8 h (i.e. t = 2, 10, 18, 26, 33,42 and 50 h). Samples were taken for determination ofbacterial abundance in both the small and large con-tainers (see below). The large containers were alsosampled for total organic carbon (TOC), nutrients andbacterial production (see below). The required watervolumes for the latter analyses made these unfeasiblein the small containers.
Bacterial abundance: Aliquots of 25 (small contain-ers) or 50 ml (large containers) were fixed with 0.2 μmfiltered formalin and stored at 4°C for one monthbefore bacterial enumeration. Bacteria in samples fromthe control incubations without added jellyfish werestained with SYTO 13 (Molecular Probes) and countedon a Becton Dickinson FACSCalibur flow cytometer(Gasol & del Giorgio 2000) using fluorescent beads(True counts, Becton Dickinson) as standards. In incu-bations with jellyfish, interference from released jelly-fish cells prevented enumeration by flow cytometry.Instead, bacteria were stained with SYBR Green I(Molecular probes), filtered onto 0.22 μm black poly-carbonate filters (Osmonics) and mounted in glycerol(Noble & Fuhrman 1998). More than 200 bacteria or>15 fields filter–1 were counted at 1250× using epifluo-rescence microscopy (Axioplan, Zeiss). Pictures weretaken using an Olympus DP50 camera. To estimatevariability among filters, duplicate filters were countedon 3 occasions. The average SD among filters was 6%.
Bacterial production: Bacterial production was mea-sured by [3H]-thymidine incorporation (Fuhrman &Azam 1982). For each sample, triplicate aliquots(10 ml) and a fixed blank were incubated with [methyl-3H]-thymidine (10 nM final, Amersham PharmaciaBiotech) in polyethylene vials in a water bath withflowing surface seawater for ca. 1 h. Samples with 5%trichloroacetic acid added prior to the addition of[3H]-thymidine served as blanks. Samples were fil-tered onto 0.2 μm mixed cellulose ester filters (AdvantecMFS), rinsed carefully with ice-cold 5% trichloroaceticacid and counted by liquid scintillation spectrometry.Bacterial carbon production was calculated using 1.1 ×10¹⁸ cells mole–1 thymidine incorporated (Riemann etal. 1987) and a carbon-to-cell ratio of 20 fg C bac-terium–1 (Lee & Fuhrman 1987).
TOC: Duplicate 12 ml samples were frozen in 15 mlpolypropylene tubes and analyzed with a ShimadzuTOC-5000 high temperature catalytic oxidation instru-ment. Samples were acidified and sparged prior toanalysis. Calculation of carbon concentrations wasmade using potassium hydrogen phthalate as a stan-dard.
Nutrients: Three 12 ml samples were filteredthrough glass fiber filters (GF/F, Whatman) into 15 mlpolypropylene tubes and frozen for subsequent ana-lysis of ammonia, phosphate and nitrate/nitrite on aBran & Luebbe TRAACS 800 autoanalyzer (Grasshoffet al. 1983).
Growth of bacterial isolates in response to Peri-phylla periphylla. To complement the shipboardexperiments, we examined effects of P. periphylla ongrowth of marine bacterial isolates from various phylo-genetic groups (Tables 1 & 2) in a laboratory setting.Generally, overnight bacterial cultures were diluted,
45

Mar Ecol Prog Ser 325: 43–58, 2006
exposed to P. periphylla homogenate (see below), andoptical density (OD) was monitored over time. Sincethe inhibition of bacterial growth observed in the ship-board experiments was suspected to be caused by aproteinaceous toxin (B. Johnston, pers. comm.), weincluded a control consisting of autoclaved P. peri-phylla homogenate in our set-up. Further, we includeda negative control in which the added P. periphyllavolume was substituted by sterile seawater (salinity =33‰), to control for added salt from the P. periphyllatissue.
Periphylla periphylla homogenate: In all experi-ments, we used homogenate made immediately priorto each experiment. P. periphylla were caught in Lure-fjorden 12 January 2005. Individual live animals of var-ious sizes and individual body parts were blended witha food processor and immediately frozen in 50 mlFalcon tubes. Immediately prior to each experiment,P. periphylla samples were thawed and further homo-genized with an Ultra-Turrax T25 (Janke & Kundel) at24 000 rpm for several minutes. The homogenates weresubsequently centrifuged (10 000 × g, 10 min, 4°C) to
remove particles, which would otherwise interferewith OD measurements. Half of the supernatant wasused untreated and the other half was autoclaved andused as control. Thawed samples and homogenateswere stored on ice in darkness during set-up of ex-periments. The concentration of homogenate wasquantified volumetrically, i.e. as ml added homogenateper ml ready solution, in all experiments. The homo-genates were not characterized further.
The use of diluted, non-concentrated homogenatesimplies that the concentration in the experiments bydefinition can never exceed concentrations in a real,dead jellyfish. In the experiments with isolates, thehomogenate was diluted ~8 to 100 times in the bacter-ial growth medium depending on the experiment. Innature, concentrations of solutes will build up in theboundary layer around the dead Periphylla periphyllaand decrease with distance away from the jellyfish.The concentration will also depend on the amount,size and abundance of dead P. periphylla, moleculardiffusion and ambient water flow.
General experimental set-up: The general set-upwas similar for all experiments with bacterial isolates.While details pertaining only to specific experimentsare described in their respective sections below, thegeneral set-up was as follows. Bacterial isolates grownovernight in ZoBell medium (5 g peptone, 1 g yeastextract, 800 ml filtered seawater, 200 ml Milli-Q water,autoclaved 121°C, 20 min) were diluted with freshZoBell medium to an OD of 0.04 to 0.06 and aliquotedinto autoclaved sodium glass-tubes (VWR 109986-17).Periphylla periphylla homogenate, autoclaved P. peri-phylla homogenate or sterile seawater (negative con-trol) was added to a final volume of 4 ml. Bacterialgrowth, measured as OD directly in the tubes, wasmonitored over time using a Biowave CO8000 celldensity meter (600 nm, VWR). Each measurement wascorrected for background OD with a blank samplewithout bacteria. Separate blanks were used foreach treatment (P. periphylla homogenate, autoclavedP. periphylla homogenate and seawater [salinity =
46
Table 1. Bacterial isolates used in incubation experiments with Periphylla periphylla homogenate
Name GenBank accession numberc Phylogeny
BAL3a U63935 α-ProteobacteriaBAL11a U63939 α-ProteobacteriaBAL18a U63944 γ-ProteobacteriaBAL203b AY962019 γ-ProteobacteriaBAL37a U63953 β-ProteobacteriaBAL208b AY962020 Actinobacteria BAL209b AY962021 Actinobacteria BAL22a U63946 Bacteroidetes BAL17a U63943 Bacteroidetes
aIsolated by Pinhassi & Hagström (2000)bIsolated from the Baltic Sea Proper on ZoBell plates 17May 2004
cNucleotide sequences and information can be accessedvia www.ncbi.nlm.nih.gov/Entrez/
Table 2. Summary of experiments with bacterial isolates and Periphylla periphylla homogenate
Experiment Isolates Final P. periphylla Contents of homogenateconcentration (ml ml–1) (weight of animals used)
Screening BAL3, BAL11, BAL18, BAL203, BAL208, 0.04 Whole animal (92 g)BAL209, BAL37, BAL22, BAL17
Concentration BAL18, BAL208, BAL3 0.0125, 0.025, 0.05, 0.10, 0.15 Whole animal (~600 g)
Body parts BAL18, BAL208 0.05 Tentacles from 5 animals (nodata), tops from 5 animals (nodata), bodies from 5 animals(no data), whole animal (83 g)
Size BAL18, BAL208 0.05 Whole animals (5.9–900 g)

Titelman et al.: Degradation of jellyfish
33‰], as well as for different concentrations of addi-tions when applicable) as optical properties of these 3treatments differ. All experiments were carried out intriplicate in darkness at room temperature (18 to 19°C)on a shaking table. Size and parts of P. periphylla spec-imens, concentration of homogenate and bacteria usedin the various experiments are summarized in Table 2.
Screening: In the first experiment, we monitored thegrowth of 9 different bacterial isolates of various phyla,when exposed to Periphylla periphylla homogenate ata concentration of 0.04 ml P. periphylla homogenateml–1 culture (Table 2). The volumetric concentrationsof homogenate used were chosen to approximate con-centrations in the shipboard experiment where wholejellyfish were added to 2 to 5 l volumes, correspondingto enrichment of ~0.02 to 0.05 g P. periphylla ml–1
seawater. An assumed density of P. periphylla of ~1 gcm–3 was applied in the conversion. The size of theP. periphylla used (Table 2) was approximately that ofan average P. periphylla at the time of capture inLurefjorden (Riemann et al. 2006). From this experi-ment, isolates were selected for further experimen-tation.
Response to increasing concentration of Periphyllaperiphylla homogenate: We estimated growth of 3bacterial strains as a function of increasing volumetricconcentrations of P. periphylla homogenate. 0, 50, 100,200, 400, or 600 μl of homogenate was added to 3.4 mlmedium with bacteria (Table 2). Sterile seawater wasadded to a final volume of 4 ml to ensure similar saltcontent in all treatments. The P. periphylla used herewas larger than in the first experiment in order toensure that all treatments got homogenate from thesame animal, i.e. a comparable exposure. OD mea-surements were conducted using separate blankswithout bacteria for each concentration and treatment(P. periphylla homogenate, autoclaved P. periphyllahomogenate and seawater).
Impact of Periphylla periphylla size: Differentlysized P. periphylla may possibly contain different com-pounds or amounts of growth suppressants per unitvolume. We therefore examined the effect of P. peri-phylla size on bacterial growth by exposing 2 bacterialstrains to equal volumetric amounts of homogenate,made from each of 10 whole animals ranging in sizefrom 5.9 to 900 g wet weight (Table 2). In this experi-ment, separate P. periphylla size-specific and treat-ment-specific blanks without bacteria were used toensure that the bacterial growth signal, measuredas OD, was independent of potential differences inoptical properties between homogenates.
Impact of Periphylla periphylla body parts: Whilelarger metazoans are generally sensitive to nematocysttoxin, we hypothesized that microbes may react tocomponents present in the body tissue of the jellyfish,
rather than to the nematocyst toxins per se. We exam-ined this by exposing 2 bacterial isolates to equal volu-metric amounts of homogenate made from either ten-tacles, top dome (i.e. the ectoderm and mesogleaabove the coronal furrow in the exumbrella), body (i.e.all other tissue except the tentacles), tentacles, andwhole animals (Table 2). As the compounds affectingbacterial growth were unknown, no corrections weremade for potential differences in tissue structure,chemical composition or density. Tissue specific blankswere used to ensure that the bacterial growth signal,measured as OD, was independent of any differencesin optical properties between homogenates from dif-ferent tissues.
Statistical analyses. Statistical analyses were doneusing the software R (R development Core Team 2005)and the package nlme (Pinheiro et al. 2005), unlessotherwise noted. Details pertaining to statistical analy-ses are incorporated in the results.
RESULTS
In situ degradation experiment
We analyzed the degradation data by fitting expo-nential decay models to the wet weights as a functionof time for each size group. The overall fits, as well asthe coefficients were statistically significant for allsizes, with b-coefficients of 0.67 to 1.12 d–1 (Fig. 1A).We tested for differences between size groups in theexponentially decreasing part of the degradationcurves with a homogeneity-of-slopes-model on thenatural logarithms of wet weights. This analysisincluded the first 2 time-points for the small size groupand the first 5 time-points for the other size groups.The slopes of the size groups were different as indi-cated by the interaction between initial size and time(p < 0.000001). A Tukey Honest Significant Difference(Tukey HSD) test revealed that all groups differedfrom one another (all p-values ≤0.0008). For the 3 sizegroups placed at a common temperature, turnoverscaled with initial weight to a power of –0.43 ± 0.09,which is similar to the hypothesized 1/3 from surface tovolume relationships (Fig. 1B), i.e. for similarly shapedobjects with a linear dimension r :
The C:N ratio of the decaying jellyfish increased in thebeginning of the experiment and then decreased(Fig. 1C,D). The fit (not shown) of a second order poly-nomial confirmed this pattern; it gave a parabola witha maximum C:N at 3.4 d and a significant negativecoefficient of the quadratic term (p = 0.0055).
surfacevolume
rr r weight
∝ = ∝2
3 13
1 1
47

Mar Ecol Prog Ser 325: 43–58, 2006
Shipboard experiments: development of microbesaround dead Periphylla periphylla
We hypothesized that the rapid breakdown observedin the in situ experiment in Raunefjorden was duemainly to microbial colonization and a large release ofdissolved organic matter. This was further examined inthe shipboard experiment where we monitored bacte-rial growth, carbon and nutrient release around deadPeriphylla periphylla.
TOC and nutrients in the Periphylla periphyllaenriched containers increased with time (Fig. 2C,D).We modeled the TOC data by linear regression withindividual components in the slope, allowing for differ-ent variations in the 2 groups. The fixed effects of theslope differed between the enriched containers andthe non-enriched controls (p < 0.0001). A Mann-Whit-ney test confirmed that PO4
3– (p = 0.020) and NH4+ (p =
0.020) concentrations were higher in the enriched con-
tainers than in the controls, while NO2– + NO3
– concen-trations were not (p = 0.12).
Despite the tremendous amount of released carbonand nutrients, bacteria showed strong bimodality intheir response to the jellyfish enrichment. Growth washigh in some experimental chambers, while negativein others (Fig. 2A,B). Growth rates varied between –0.2and 7.0 d–1 during the first 40 h. The pattern wasrepeated in both experiments, and the controls weregenerally stable in all parameters measured, indicat-ing a true experimental signal (Fig. 2). To statisticallyconfirm this visual impression, we regressed the loga-rithms of the bacterial abundances on the time for eachindividual container separately. A Siegel-Tukey test(Lehman 1975) applied the individual slopes revealeda difference in the spreads between the Periphyllaperiphylla enriched group and the controls for bothsmall (p = 0.005) and large (p = 0.024) containers(Fig. 2A,B).
48
0 5 10 15
Wet
wei
ght
(g)
0
100
200
300 small, 1 mmedium, 1 mlarge, 1 mextra large, 8 m
A
Initial wet weight (g)
0 50 100 150 200 250
b (d
–1)
0
1
2
Curve fitHypothesizedb ± SE, from Fig. 1A
B
Time (d)
Time (d)
Time (d)0 1 2 3 4 5 6 7 0 1 2 3 4 5 6 7C
and
N c
onte
nt (%
dry
wei
ght)
0
10
20
30
CN
C
C:N
2
4
6
8
D
Fig. 1. Periphylla periphylla. In situ degradation experiment. (A) P. periphylla degradation. Data are mean ± SD. The curve fitsare exponential decay models to the original non-averaged data; y = ae–bx, where y is wet weight (g) and x is time. Curve fits withSE of coefficients in parentheses for the different size categories are: small y = 42.08(±0.91)e–1.12(± 0.22)x, R2 = 0.93, n = 82; mediumy = 121.2(±1.4)e–0.716(± 0.056)x, R2 = 0.98, n = 84; large y = 222.6(±1.6)e–0.666(± 0.031)x, R2 = 0.99, n = 80; extra large y = 299.3(±4.1)e–0.844(± 0.031)x, R2 = 0.97, n = 84. All coefficients and curve fits are statistically significant with p-values <0.05. Temperature duringthe first week was 10.1 ± 0.5°C at 1 m and 12.5 ± 0.1°C at 8 m. (B) Rate coefficients as a function of initial P. periphylla wet weightfor the 3 size groups kept at the shallow depth. The dashed line is a power function with a forced slope of –1/3, which is thathypothesized from surface to volume ratio (see ‘Results’), while the fitted solid line has a power of ~0.4 ± 0.09. (C) Carbon andnitrogen contents as a function of time for the extra large category. Data are only shown for the first week because 95% of the
initial wet weight was degraded during the first 5 d. (D) C:N ratios from individual data points reported in (C)

Titelman et al.: Degradation of jellyfish
We examined bacterial morphology in the samples(Fig. 3). The bacterial assemblage used as inoculum inthe incubations, the communities growing in the con-trol incubations, as well as the bacterial communitiesin incubations where a decrease in bacterial abun-dance was seen, consisted of a mix of different bacter-ial morphotypes (e.g. Fig. 3A). In contrast, incubationswith pronounced bacterial growth towards the end ofthe experiment were dominated (>90% of all cells) bysingle morphotypes (Fig. 3B–E). These monoculture-like bacteria extensively colonized cnidocytes releasedfrom Periphylla periphylla (Fig. 3H–J). Although thesemorphotypes varied between incubations, they gener-ally consisted of large rod-shaped cells. In one incuba-tion, only small coccoid cells were seen (Fig. 3B). Noflagellates were observed, indicating that flagellategrazing during incubations was insignificant.
When overlaying the data in Fig. 2A,B with the bac-terial morphology information (Fig. 3) and correctingfor Periphylla periphylla sizes and water volumes used,an interaction between cell type and P. periphylla
enrichment appears (Fig. 4A). Linear regressionsrevealed a biomass increase of the monoculture-likecells (p = 0.0065) and a decrease of the other cell types(p = 0.012) with increasing enrichment (Fig. 4A). Theslopes of these lines differed (p = 0.0065). In thisregression analysis we allowed for heteroscedasitywhen using the function gls of nlme (Pinheiro et al.2005). The bacterial production measured in the largecontainers partially mirrored this picture (Fig. 4B).However, the large individual variation with time pre-vented adequate statistical analysis.
Growth of bacterial isolates in response to Periphylla periphylla
Screening
We hypothesized that inhibiting compounds in Peri-phylla periphylla would be destroyed by autoclavation.Thus, a lower OD in P. periphylla than in autoclaved
49
B(small containers)
105
106
107
108
Nutrient
Nut
rient
con
cent
ratio
n (µ
M)
0
5
10
15
20
Periphylla enrichedControls
A(large containers)
Bac
teria
l ab
und
ance
(ml–1
)
Bac
teria
l ab
und
ance
(ml–1
)
105
106
107
108
Periphylla enrichedControls
Time (h)
0 10 20 30 40 50
Time (h)
0 10 20 30 40 50
Time (h)
0 10 20 30 40 50
TOC
(mg
Cl–1
)
0
5
10
15
20
25
30C(large containers)
D(large containers)
PO43– NH4
+ NO2– + NO3
–
Fig. 2. Shipboard incubation experiment with natural bacterial assemblages from Lurefjorden. Development of bacterial concen-trations in the incubation experiments in (A) large and (B) small containers. Symbol types represent individual containers, whilefill represents treatment; black: containers with added Periphylla periphylla substrate; white: control containers without addedsubstrate. (C) Mean (± SD) total organic carbon (TOC) content as a function of time in the large containers. Fills as in (A,B).
(D) Mean (+ SD) nutrient concentrations in the large containers at the termination of the experiment

Mar Ecol Prog Ser 325: 43–58, 2006
P. periphylla treatments would suggest a net inhibitoryeffect of the P. periphylla, while a higher OD in auto-claved or raw P. periphylla than in the seawater con-trols would suggest a net enrichment. The screeningexperiment confirmed that different bacteria responddifferently to P. periphylla (Fig. 5). We analyzed theOD curves as a function of time, accounting for the lon-gitudinal data of the individual test tubes:
(1)
Here, yij denotes the OD of test tube i at the j’th time-point tij. Greek letters denote fixed effects, lower caseRoman letters denote tube specific random effects andεij denotes the homoscedastic normal errors. Pi and Ci
are binary variables taking the value 1 if test tube icontains raw Periphylla periphylla (for Pi) or seawater(for Ci), and 0 otherwise. Thus, β1 and β2 are inter-
y b P C b tij i i i i ij= +( ) + + + +( )β β γ δ0 0 1 1 1 1
+ + +( ) +β γ δ ε2 2 22P C ti i ij ij
50
Fig. 3. Bacterial development in the shipboard incubationexperiment. Scale bars = 10 μm. (A) Inoculum showing differ-ent cell morphologies at t = 0 h. (B–E) The different morpho-types, with monoculture-like appearance contributing >90%dominance at t = 40 h. (F–J) Periphylla periphylla cnidocytesand bacterial colonization of these. (F–G) Cells from P. peri-phylla at t = 8 h. (H–J) Colonization by bacterial
morphotypes shown in (C–E) at t = 40 h
A
Initial Periphylla enrichment (g ml–1)
0.00 0.01 0.02 0.03 0.04 0.05Bac
teria
l bio
mas
s at
t =
48
h (µ
g C
l–1)
0
100
200
300
400
500 Normal cellsMonoculture, small cellsMonocultureRegression, normal cellsRegression, monoculture
B
Time (h)0 10 20 30 40 50
Bac
teria
l pro
duc
tion
(µg
C l–1
d–1
)
0
50
100
150
200
250 Normal cellsMonoculture, small cellsMonocultureControls, normal cells
Fig. 4. Bacterial (A) biomass and (B) production in theshipboard incubation experiment. The cell morphotypes dom-inating in the microscopical counts (cf. Fig. 3, see also‘Results’) are indicated by fills. ‘Normal’ cells imply a varietyof cell types similar to that in Fig. 3A, and ‘monoculture’,implies cell morphologies similar to that in Fig. 3B–E. (A) Bac-terial biomass as a function of initial enrichment. Large circlesindicate the large container experiment (cf. Fig. 2A) and smallcircles the small container experiment (cf. Fig. 2B). Biomass att = 48 h was calculated by assuming 20 fg C bacterium–1 (Lee& Fuhrman 1987). (B) Bacterial production as a function oftime in the large container incubations as measured by thymi-dine incorporation. Dotted lines connect individual containers

Titelman et al.: Degradation of jellyfish
preted as the average contribution to the linear andquadratic terms, respectively, for autoclaved P. peri-phylla and the corresponding γ’s and δ’s show howmuch P. periphylla and seawater deviate from theautoclaved P. periphylla. The differences (δ1 – γ1) and
(δ2 – γ2) show how much larger the sea-water controls are than the P. periphyllatreatments. The linear and quadraticterms represent the initial growth andthe slowing down of the growth forlarger time values, respectively.
Periphylla periphylla had no effecton the 2 α-Proteobacteria (BAL3 andBAL11) (Fig. 5, Table 3). The β-Pro-teobacterium (BAL37) grew better onraw and autoclaved P. periphylla rela-tive to the seawater controls, whilethere were no differences between rawand autoclaved P. periphylla (Fig. 5,Table 3). Similarly, BAL17 (Bactero-idetes) grew slower in the seawatertreatment than in the P. periphyllatreatments, but growth did not slowdown as fast as in the P. periphyllatreatments (Fig. 5, Table 3). The otherBacteroidetes isolate (BAL22) also grewbetter in the P. periphylla treatmentthan in the seawater control, whilethere were no differences between theraw and autoclaved P. periphylla treat-ments (Fig. 5, Table 3). P. periphyllaaffected the Actinobacteria (BAL208,BAL209) negatively. For BAL208, theinitial growth was lower in the P. peri-phylla treatment than in the othertreatments and growth also leveled offmost rapidly in the P. periphylla treat-ment (Fig 5, Table 3). For BAL209 thegrowth curves were so linear that thequadratic term could be dropped.Doing so revealed that initial (linear)growth was lowest in the P. periphyllatreatment (Fig. 5, Table 3). For BAL18(γ-Proteobacteria) initial growth didnot differ between treatments; how-ever, the P. periphylla treatment sloweddown most rapidly (Fig. 5, Table 3).BAL3, BAL18, and BAL208 wereselected for further experiments.
Concentration experiment
While BAL208 responded negativelyto increasing Periphylla periphylla con-
centrations, the signal was less obvious for BAL3 andBAL18 (Fig. 6). To quantify the signal as a function ofhomogenate addition we adjusted Eq. 1 to let coeffi-cients depend linearly on P. periphylla concentration(x, dimensionless):
51
BAL3α-Proteobacteria α-Proteobacteria
γ-Proteobacteria γ-Proteobacteria
0.0
0.5
1.0BAL11
0.0
0.5
1.0
BAL37
Time (h)0 10 20 30
Time (h)0 10 20 30
0.0
0.2
0.4
0.6
BAL18
0.0
0.5
1.0
1.5BAL203
0.0
0.5
1.0
1.5
BAL209Actinobacteria
0.0
0.5
1.0BAL208Actinobacteria
Op
tical
den
sity
(arb
itrar
y un
its)
0.0
0.5
1.0
BAL22Bacteroidetes
0.0
0.5
1.0
1.5BAL17Bacteroidetes
0.0
0.2
0.4
0.6
PeriphyllaAutoclaved PeriphyllaControl (seawater)
β-Proteobacteria
Fig. 5. Screening experiment with bacterial isolates. Optical density as a func-tion of time for cultures with various bacterial isolates with added Periphyllaperiphylla homogenate, autoclaved P. periphylla homogenate or sterile sea-water at equal volumetric concentrations. Name and phylogeny of isolates are
indicated in the panels. Data are mean ± SD

Mar Ecol Prog Ser 325: 43–58, 2006
(2)
Eq. 2 is the model that gave the lowest value for theBIC criterion among different similar choices (see Pin-heiro et al. 2005). Here, the variables have the samemeaning as in Eq. 1, and xij denotes the Periphyllaperiphylla concentration at the j’ th time point tij. Thecoefficients γ1 and γ2 represent the average differencefor the concentration dependence of the coefficientsbetween the P. periphylla and the autoclaved P. peri-phylla treatments.
For BAL3 the δ1 and δ2 do not differ from 0 (Table 4)implying that OD for the autoclaved Periphylla peri-phylla treatment was independent of concentration.There was, however, an effect of the raw P. periphyllatreatment as γ1 > 0 and γ2 < 0 (Table 4). Thus, for smalltime values the P. periphylla treatment grew faster thanthe autoclaved P. periphylla treatment. As time in-creases, the quadratic term becomes more important,and the P. periphylla curve slows down faster than theautoclaved P. periphylla curve. This effect increasesslightly with increasing concentration (Fig. 6, Table 4).
For BAL18, neither γ1 nor γ2 differ from 0 indicatingthat there were no differences between the 2 treat-ments (Table 4). However, because δ1 > 0 and δ2 < 0(Table 4) small concentrations of both raw and auto-claved Periphylla periphylla enhance OD, while largeconcentrations suppress OD.
For BAL208, δ1 > 0, while δ2 does not differ from 0(Table 4). This implies an increase in OD with increas-ing concentrations for the autoclaved Periphylla peri-phylla treatment. While γ1 does not differ from 0, γ2 <0(Table 4). This means that the OD-curves start outequal, but for larger time values the P. periphylla curveturns downwards away from the autoclaved P. peri-phylla curve. This effect increases with increasing con-centration (Table 4). We note that although the qualita-tive effect is similar in the P. periphylla treatment forBAL3 and BAL208, this effect is quantitatively muchstronger on BAL208 than on BAL3; i.e. γ2(BAL208) /γ2(BAL3) ≈ 5 (Table 4).
Impact of Periphylla periphylla size
We examined if Periphylla periphylla of various sizessuppress bacterial growth differently by exposing bac-teria to the same volumetric concentration of homo-genates made from P. periphylla of widely differentsizes (xi) (Fig. 7). Optical density (yi) was measuredafter ~19 h. We fitted the non-linear model
(3)
separately for the raw and autoclaved P. periphyllatreatments by the package nls of R. The errors εi areassumed to be independently normally distributedvariables with the same variance.
y xi i iexp= + −( ) +β β θ ε0 1
y b P x b tij i i ij i ij= +( ) + + +( ) +[ ]β β δ γ0 0 1 1 1 1
+ + +( )[ ] +β δ γ ε2 2 22P x ti ij ij ij
52
Table 3. Results from statistical analysis (Eq. 1) of screening experiment (Fig. 5). Estimated coefficients and their respective indi-vidual p-value in parentheses. Bold indicates statistical significance (i.e. p < 0.05). For BAL209 the growth curves were so linearthat the quadratic term could be dropped. The lower of the 2 BAL209 lines reports the analysis without the quadratic term
Isolate γ1 δ1 δ1 – γ1 γ2 δ2 δ2 – γ2
Periphylla vs. Seawater vs. Seawater vs. Periphylla vs. Seawater vs. Seawater vs.Autoclaved Autoclaved Periphylla Autoclaved Autoclaved Periphylla
BAL3 0.0050 –0.0023 –0.0073 –0.0023 0.000053 0.00028(α-Proteobacteria) (p = 0.27) (p = 0.63) (p = 0.12) (p = 0.15) (p = 0.75) (p = 0.87) BAL11 0.0021 –0.0029 –0.0050 –0.00099 0.00081 0.00018(α-Proteobacteria) (p = 0.53 (p = 0.34) (p = 0.14) (p = 0.39) (p = 0.43) (p = 0.12) BAL37 0.0039 –0.0107 –0.015 –0.00013 0.00027 0.00040(β-Proteobacteria) (p = 0.14) (p = 0.0001) (p = 0.0001) (p = 0.17) (p = 0.0043) (p = 0.00001) BAL18 0.0044 0.0056 0.00115 –0.00040 –0.00023 0.00017(γ-Proteobacteria) (p = 0.25) (p = 0.15) (p = 0.76) (p = 0.0037) (p = 0.091) (p = 0.205) BAL203 –0.0076 –0.023 –0.015 0.00017 0.00055 0.00037(γ-Proteobacteria) (p = 0.26) (p = 0.0006) (p = 0.0190) (p = 0.42) (p = 0.0135) (p = 0.088) BAL17 0.0032 –0.0077 –0.011 –0.000008 0.00024 0.00025(Bacteroidetes) (p = 0.24) (p = 0.0058) (p = 0.0002) (p = 0.92) (p = 0.0076) (p = 0.0058)BAL22 0.0089 –0.015 –0.0242 –0.0030 0.00032 0.00062(Bacteroidetes) (p = 0.25) (p = 0.051) (p = 0.0025) (p = 0.28) (p = 0.25) (p = 0.027)BAL208 –0.012 –0.0016 –0.013 –0.00031 0.000072 0.00038(Actinobacteria) (p = 0.0061) (p = 0.070) (p = 0.0020) (p = 0.042) (p = 0.63) (p = 0.0127)BAL209 –0.0011 –0.0021 –0.0010 –0.000023 0.00015 0.00017(Actinobacteria) (p = 0.77) (p = 0.56) (p = 0.78) (p = 0.86) (p = 0.26) (p = 0.19)BAL209 –0.0017 0.0019 0.0036(Actinobacteria) (p = 0.048) (p = 0.024) (p = 0.001)
Titelman et al.: Degradation of jellyfish
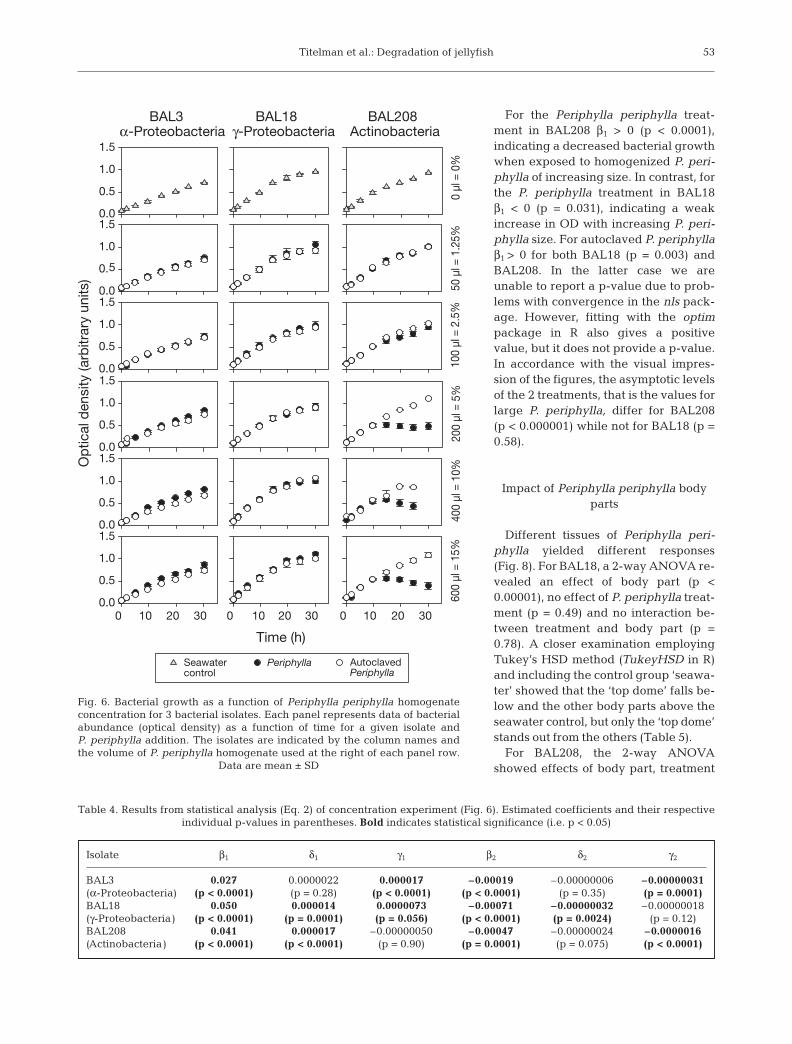
For the Periphylla periphylla treat-ment in BAL208 β1 > 0 (p < 0.0001),indicating a decreased bacterial growthwhen exposed to homogenized P. peri-phylla of increasing size. In contrast, forthe P. periphylla treatment in BAL18β1 < 0 (p = 0.031), indicating a weakincrease in OD with increasing P. peri-phylla size. For autoclaved P. periphyllaβ1 > 0 for both BAL18 (p = 0.003) andBAL208. In the latter case we areunable to report a p-value due to prob-lems with convergence in the nls pack-age. However, fitting with the optimpackage in R also gives a positivevalue, but it does not provide a p-value.In accordance with the visual impres-sion of the figures, the asymptotic levelsof the 2 treatments, that is the values forlarge P. periphylla, differ for BAL208(p < 0.000001) while not for BAL18 (p =0.58).
Impact of Periphylla periphylla bodyparts
Different tissues of Periphylla peri-phylla yielded different responses(Fig. 8). For BAL18, a 2-way ANOVA re-vealed an effect of body part (p <0.00001), no effect of P. periphylla treat-ment (p = 0.49) and no interaction be-tween treatment and body part (p =0.78). A closer examination employingTukey’s HSD method (TukeyHSD in R)and including the control group ‘seawa-ter’ showed that the ‘top dome’ falls be-low and the other body parts above theseawater control, but only the ‘top dome’stands out from the others (Table 5).
For BAL208, the 2-way ANOVAshowed effects of body part, treatment
53
0 µl
= 0
%
0.0
0.5
1.0
1.5
50 µ
l = 1
.25%
0.0
0.
1.0
1.5
100
µl =
2.5
%
Op
tical
den
sity
(arb
itrar
y un
its)
0.0
0.5
1.0
1.5
200
µl =
5%
0.0
0.5
1.0
1.5
400
µl =
10%
0.0
0.5
1.0
1.560
0 µl
= 1
5%
0 10 20 30 0 10 20 30 0 10 20 300.0
0.5
1.0
1.5
BAL3
Time (h)
BAL18γ-Proteobacteriaα-Proteobacteria
Time (h)
BAL208Actinobacteria
AutoclavedPeriphylla
PeriphyllaSeawatercontrol
5
Fig. 6. Bacterial growth as a function of Periphylla periphylla homogenateconcentration for 3 bacterial isolates. Each panel represents data of bacterialabundance (optical density) as a function of time for a given isolate and P. periphylla addition. The isolates are indicated by the column names andthe volume of P. periphylla homogenate used at the right of each panel row.
Data are mean ± SD
Table 4. Results from statistical analysis (Eq. 2) of concentration experiment (Fig. 6). Estimated coefficients and their respectiveindividual p-values in parentheses. Bold indicates statistical significance (i.e. p < 0.05)
Isolate β1 δ1 γ1 β2 δ2 γ2
BAL3 0.027 0.0000022 0.000017 –0.00019 –0.00000006 –0.00000031(α-Proteobacteria) (p < 0.0001) (p = 0.28) (p < 0.0001) (p < 0.0001) (p = 0.35) (p = 0.0001) BAL18 0.050 0.000014 0.0000073 –0.00071 –0.00000032 –0.00000018(γ-Proteobacteria) (p < 0.0001) (p = 0.0001) (p = 0.056) (p < 0.0001) (p = 0.0024) (p = 0.12)BAL208 0.041 0.000017 –0.00000050 –0.00047 –0.00000024 –0.0000016(Actinobacteria) (p < 0.0001) (p < 0.0001) (p = 0.90) (p = 0.0001) (p = 0.075) (p < 0.0001)

Mar Ecol Prog Ser 325: 43–58, 2006
and an interaction between body part and treatment(all p-values <0.000001). Tukey’s HSD method gener-ally revealed that the autoclaved treatments did notdiffer from the seawater control, while OD in the Peri-phylla periphylla treatments were lower than in thecontrols (Table 6). The P. periphylla treatments ‘body’and ‘top dome’ did not differ from one another (Fig. 8).Apparently, the growth suppressing compounds arestrongest or more concentrated in the top dome andweakest in the tentacles (Fig. 8, Table 6). Most of thiseffect is destroyed in the autoclavation.
DISCUSSION
Degradation of jellyfish
The shipboard and laboratory experiments sug-gested that only some bacterial species thrive arounddead Periphylla periphylla, while others are inhibitedby this jellyfish (Figs. 2 to 5). Despite this, pelagicturnover of jellyfish is rapid (Fig. 1). If correcting fortemperature differences, assuming a Q10 of 2.3 (Bidleet al. 2002), the decay times of 4.1 to 7 d (10 to 12°C)observed here (Fig. 1) are faster than those measuredon Aurelia aurita immobilized in nets in large tankswith Swedish fjord water (4.9 d, 15 to 17°C, initialweight 149 to 428 g, Hansson 1997). Assuming exten-sive microbial colonization and degradation of P. peri-phylla tissue, nitrogen-rich compounds would pre-sumably be hydrolyzed faster than carbon-rich poolssuch as polysaccharides, analogous to degradation ofmarine snow (Smith et al. 1992). In accordance, theC:N ratio increased during the first 3 to 4 days (Fig. 1D)of degradation. We did not quantify bacterial produc-tion or colonizers in the in situ experiment. Whenpulling up the jellyfish, clouds of motile organisms,including oncaid and harpacticoid copepods, as well asparticulate matter originating from the jellyfish werevisible (J. Titelman, T. Sørnes, pers. obs.). Presumably,colonizers consist of organisms such as bacteria, flagel-lates, ciliates and copepods, similar to those observedon marine snow (Kiørboe 2000). Ultimately, the resi-dence time in suspension determines the contributionof dead jellyfish as a substrate for pelagic organisms.Settling rates are a function of diameter and density,both of which may be affected by differential reminer-alization (Berelson 2002). Inhibitory effects on micro-bial activity by P. periphylla are apparently size andtissue dependent (Figs. 7 & 8), perhaps affecting resi-dence time in the water column.
Some jellyfish regulate their buoyancy to becomeneutral or even positively buoyant, while others arenegatively buoyant (Mills 1981, Graham et al. 2001).Live Periphylla periphylla in Lurefjorden hang motion-
54
BAL18
Op
tical
den
sity
(arb
itrar
y un
its)
0.0
0.2
0.4
0.6
0.8
1.0
1.2
PeriphyllaAutoclaved PeriphyllaSeawater control
BAL208
Periphylla wet weight (g)0 200 400 600 800 1000
0.0
0.2
0.4
0.6
0.8
Fig. 7. Response of 2 isolates to homogenate made from differ-ently sized Periphylla periphylla. Data are reported as opticaldensity at t = 19 h and are mean ± SD. The isolate names are
indicated in the panels
BAL18
0.0
0.5
1.0
t21t0
t21t0
Autoclaved PeriphyllaPeriphylla seawater controls
BAL208
whole body top tentacles control
Op
tical
den
sity
(arb
itrar
y un
its)
0.0
0.5
1.0
Fig. 8. Optical density at t = 21 h for 2 bacterial isolatesexposed to homogenate made from different Periphylla peri-phylla tissues. The seawater control is given also for t = 0 andequals the start concentration for all treatments. The isolatenames are indicated in the panels. BAL18 was also observed
at t = 30 h with similar results (not shown)

Titelman et al.: Degradation of jellyfish
less for up to 2 h at mid depths (Youngbluth & Båm-stedt 2001), while they sink slowly if not pulsing whenresiding in the less saline surface water (Sørnes 2005).Similarly, live hydromedusae sink at rates from 0 to~1700 m d–1 in the laboratory, depending on speciesand condition (Mills 1981). Unfortunately, there arefew published sinking rates available, and dead andlive jellyfish likely sink at different rates. For compara-tive purposes only, abandoned houses (mean length 68± 24 cm) of the large appendicularian Bathochordeaussink at ~820 m d–1 (Hamner & Robison 1992), whilehouses (mean diameter = 1.13 mm) of the smaller Oiko-pleura dioica sink at ~120 m d–1 (Hansen et al. 1986),and dead Aurelia aurita medusae are often found drift-ing at the surface (pers. obs.).
Live jellyfish release DOC at a rate of ~0.012 mg C gwet weight–1 d–1 (Aurelia aurita, in Hansson & Nor-rman 1995) and may contribute substantially to thepool of TOC in jellyfish rich environments (Periphylla
periphylla, in Riemann et al. 2006). Incomparison dead jellyfish leak DOC tothe surrounding water at a rate of~0.36 mg C g wet weight–1 d–1 (calcu-lated from Fig. 2), suggesting that deadjellyfish may provide hotspots of sub-strate in pelagic (and benthic) environ-ments. Rapid turnover of dead jellyfishby microbes and zooplankters (Fig. 1)may be quantitatively important forreturning energy to the pelagic food-web at times of high jellyfish abun-dance. However, the extent of degrada-
tion mediated by bacteria varies with jellyfish species,size and body part, as well as with the composition ofthe local bacterial assemblage.
Periphylla periphylla as a substrate
In Lurefjorden, the density gradients are weakbelow ~50 m (Eiane et al. 1999, Riemann et al. 2006).The density of Periphylla periphylla from Lurefjordenis crudely estimated at ~1.05 ± 0.02 g cm–3 (mean ± SD,from wet weights and morphometrics of 15 animals),suggesting that dead P. periphylla would sink slowlyout of the water column. Given decay coefficients of0.67 to 1.12 d–1 (Fig. 1) a significant portion of deadjellyfish in such systems remain subject to somepelagic degradation, and the weight of dead jellyfishwould be substantially reduced, of course dependingon the depth at which the final travel started (cf. Fig. 1).
55
Table 5. Results from Tukey HSD test of body part experiment for BAL18. Val-ues are Bonferroni adjusted p-values. Bold indicates significant differences. Thetested groups correspond to those depicted in Fig. 8. Treatments were not con-sidered in this analysis as the 2-way ANOVA showed no effect of treatment
for this isolate
Top Body Tentacles Whole Seawater control
Top –Body 0.00005 –Tentacles 0.0012 0.69 –Whole 0.016 0.14 0.79 –Seawater 0.093 0.23 0.80 0.99 –
Table 6. Tukey HSD test of Periphylla body part experiment for BAL208. Values are Bonferroni adjusted p-values resulting fromtesting the groups in the vertical list against the groups in the horizontal header (all against all). Bold indicates significant
differences. The tested groups correspond to those depicted in Fig. 8. Treatments are indicated in parentheses
Top Top Body Body Tentacles Tentacles Whole Whole Seawater (Periphylla) (autoclaved) (Periphylla) (autoclaved) (Periphylla) (autoclaved) (Periphylla) (autoclaved) control
Top –(Periphylla)Top <0.00001 –(autoclaved)Body 0.786 <0.00001 –(Periphylla)Body <0.00001 0.366 <0.00001 –(autoclaved)Tentacles <0.00001 <0.00001 <0.00001 0.00039 –(Periphylla)Tentacles <0.00001 0.00441 <0.00001 0.00004 <0.00001 –(autoclaved)Whole <0.00001 <0.00001 <0.00001 <0.00001 <0.00001 <0.00001 –(Periphylla)Whole <0.00001 0.366 <0.00001 0.00440 <0.00001 0.366 <0.00001 –(autoclaved)Seawater <0.00001 0.999 <0.00001 0.236 <0.00001 0.00809 <0.00001 0.529 –control

Mar Ecol Prog Ser 325: 43–58, 2006
Youngbluth & Båmstedt (2001) suggested that P. peri-phylla in Lurefjorden die a natural death in absenceof predators. Video observations with the ROV‘Aglantha’ at the bottom of Lurefjorden and neigh-boring fjords (e.g. Sognefjorden, ~1200 m) from 1997 to2004 have usually revealed few dead jellyfish (J. Titel-man, T. Sørnes & U. Båmstedt pers. obs.), suggestinglow mortality or that P. periphylla are degraded or con-sumed before reaching the bottom. Also, occasionalobservations from shallow-water bottoms (5 m) sug-gest that dead P. periphylla may rapidly attract benthicscavengers.
To examine the degradation of Periphylla periphylla,we conducted a shipboard experiment using naturalbacterial assemblages from Lurefjorden. Despite tre-mendous carbon and nutrient release from the dead jel-lyfish (Fig. 2), only some bacterial morphotypes wereapparently able to use this substrate while others wereinhibited (Figs. 2 to 4). The positive response wasobserved as extensive growth and a monoculture-likeappearance in some incubations, and as pronouncedcolonization of P. periphylla cells. In corroboration,our laboratory experiments using 9 bacterial isolates,demonstrated that homogenized P. periphylla tissue se-lectively inhibited several bacteria, one γ-Proteobac-terium (BAL18) and 2 Actinobacteria (BAL208 andBAL209) (Fig. 5). Hence, some, but not all, bacterial spe-cies can actively degrade P. periphylla tissue. Therefore,the bacterial community composition may affect the roleof jellyfish as trophic links in specific pelagic foodwebs.
We chose bacterial isolates from various phyloge-netic groups to get an indication of whether certaingroups were inhibited by Periphylla periphylla. Ourfinding that a γ-Proteobacterium (BAL18) and the Acti-nobacteria (BAL208 and BAL209) are sensitive toP. periphylla contrast with those of Long & Azam (2001)and Grossart et al. (2004), who showed that these phy-logenetic groups were the most prolific producers ofantagonistic molecules and also the most resilient tothem, while members of Bacteroidetes were the mostsensitive to antagonistic compounds. Here, membersof Bacteroidetes rather benefited from the P. periphyllahomogenate in the laboratory experiments (Fig. 5).Bacteroidetes also dominated in Lurefjorden, thrivingat depths with high P. periphylla biomass (Riemann etal. 2006). The likely functional variability of bacterialspecies within these broad phylogenetic groups andthe unknown resemblance of inhibitory compoundsproduced by P. periphylla (this study) and by bacteria(Long & Azam 2001, Grossart et al. 2004) make directcomparisons between these studies speculative. Still,our findings demonstrate that P. periphylla specificallyinhibits certain bacteria. Similarly, methanolic extractsof the jellyfish Cassiopeia sp. inhibited some strains ofBacillus and Pseudomonas (Bhosale et al. 2002).
Inhibition of bacterial growth
Bacteria that responded negatively to fresh Peri-phylla periphylla generally grew well on autoclavedextract. This suggests that at least one of the com-pounds inhibiting bacterial growth is of proteinaceousnature and denatured by autoclavation. However,some inhibition occurred also in the autoclaved treat-ments, albeit with signals of a lower magnitude. Forexample, the scaling to P. periphylla size and bodytissue resembled those in the fresh treatments (Figs. 7& 8). Thus, several compounds, probably of differentnature, likely interact to cause the inhibition. Interest-ingly, the non-pigmented top dome generated thestrongest inhibition (Fig. 8). This tissue is generally lowin protein and contains only ~1/9 the amount of proteinper unit dry weight relative to the pigmented musculartissue and tentacles (U. Båmstedt et al. unpubl.). Thereddish pigment in P. periphylla is porphyrin (Jarms etal. 2002), which becomes toxic to the jellyfish itself andalso to many Gram-positive bacteria (but not Gram-negative bacteria) when photoactivated (Malik et al.1990). Apart from the Actinobacteria (BAL208 andBAL209), all isolates were Gram-negative, amongthem BAL18 that responded negatively to P. periphylla(Figs. 5 & 7). The top dome does not contain pigments.Also, our experiments were conducted in darkness toavoid photoactivation. An alternative inhibitor may benematocyst toxin. Cnidarian nematocyst toxins aregenerally cytolytic, hemolytic and neurotoxic (Bailey etal. 2003). Analyses of the sodium channel neurotoxinfrom nematocysts of another cnidarian (a sea anemone,Actinia equina) demonstrated a conserved stretch ofresidues that were similar to precursors of antimicro-bial peptides from frogs (Anderluh et al. 2000). How-ever, in the present study the response to tentacles,where nematocyst density is highest, was less dramaticthan to other tissues (Fig. 8). Thus, neither porphyrinnor nematocyst toxin solely explain the inhibitoryeffects of P. periphylla on bacterial growth. Antimicro-bial properties of different tissues may also depend ontheir enervation (Kasahara & Bosch 2003). In the fresh-water cnidarian Hydra, tissue lacking neurons induceda stronger inhibitory response of strains of Escherichiacoli and Bacillus subtilis than did tissue with neurons(Kasahara & Bosch 2003). Such an explanation maycontribute to the strong signal observed for the dometissue (Fig. 8).
The concentration experiment suggested that theinhibitory compounds generally decreased the maxi-mum sustainable bacterial concentration for BAL208(Actinobacteria) (Fig. 6, Table 4). The negative effectsof increasing Periphylla periphylla concentration existalso for the α-Proteobacterium (BAL3), despite itsgrowth being generally higher in the P. periphylla
56

Titelman et al.: Degradation of jellyfish
treatment than in the autoclaved treatment (Fig. 6,Table 4). This indicates that higher concentration ofjellyfish compounds (or more dead jellyfish) may nega-tively affect bacteria that are seemingly unaffected atlower concentrations. The isolates’ different growthdynamics were also evident in the ‘body part’ experi-ment. The variable response of BAL18 between exper-iments may stem from variation in P. periphylla sizesused (cf. Fig. 7, Table 2).
While both BAL18 and BAL208 responded nega-tively to Periphylla periphylla homogenate in general,the response of BAL18 was more pronounced for smallP. periphylla than for large, while for BAL208, theopposite was the case (Fig. 7). Given that bacterialgrowth depended on P. periphylla size (Fig. 7), it ispossible that additional isolates would have reactednegatively to the P. periphylla homogenate had weused a differently sized animal to make homogenatefor the initial screening (Fig. 5). P. periphylla sizevaries over several orders of magnitude (0.1 to ~5000 gwet weight) (Youngbluth & Båmstedt 2001, Sørnes2005, Riemann et al. 2006). In addition to being subjectto potential differential degradation of various tissues,a dead large P. periphylla would thus potentiallyincrease both the power and amount of inhibitory com-pounds available to sensitive bacteria. Given the vari-ation in bacterial inhibition to various P. periphyllasizes, concentrations and tissues, it seems likely thatP. periphylla contain several compounds probably bothof non-nematocystic (cf. Zhang et al. 2003) and nema-tocystic origin to which bacteria respond.
CONCLUSION
Dead jellyfish, and the chemical plumes (cf. Kiørboe& Jackson 2001) around them, constitute habitats andfood for both microorganisms and larger invertebrates.The fate of dead jellyfish and the role of jellyfish assinks or links in pelagic foodwebs are determined by acombination of (1) physical and chemical constraintspreventing or facilitating break-up, degradation andsinking and (2) species-specific suitability as a substratefor microbes and the specific microbial communitycomposition (cf. Riemann et al. 2006). In addition, otherstudies (Bullard & Hay 2002) have revealed that (3) spe-cies-specific palatability to scavenging animals is alsoof importance for the fate of dead gelatinous matter.
Acknowledgements. We thank the crews of the RVs ‘HaakonMosby’ and ‘Hans Brattstrøm’, and Vera Ronning for assistancein the field, Umeå Marine Science Centre for CN analyses, andthe reviewers for constructive comments. This work formed partof the EUROGEL project funded by the European Commission(EVK3-CT-2002-00074) (U.B., J.T., T.S.). Additional financialsupport was given by FORMAS (2004-2539) (L.R., J.T.).
LITERATURE CITED
Alldredge AL (1972) Abandoned larvacean houses, a uniquefood source in the pelagic environment. Science 177:885–887
Anderluh G, Podlesek Z, Macek P (2000) A common motif inproparts of Cnidarian toxins and nematocyst collagensand its putative role. Biochim Biophys Acta — Prot StructMol Enzymol 1476:372–376
Arai MN (2005) Predation on pelagic coelenterates: a review.J Mar Biol Assoc UK 85:523–536
Bailey PM, Little M, Jelinek GA, Wilce JA (2003) Jellyfishenvenoming syndromes: unknown toxic mechanisms andunproven therapies. Med J Aust 178:34–37
Berelson WM (2002) Particle settling rates increase withdepth in the ocean. Deep-Sea Res II 49:237–251
Bhosale SH, Nagle VL, Jagtap TG (2002) Antifouling poten-tial of some marine organisms from India against speciesof Bacillus and Pseudomonas. Mar Biotechnol 4:111–118
Bidle KD, Manganelli M, Azam F (2002) Regulation of oceanicsilicon and carbon preservation by temperature control onbacteria. Science 298:1980–1984
Billett DSM, Bett BJ, Jacobs CL, Rouse IP, Wigham BD (2006)Mass deposition of jellyfish in the deep Arabian Sea.Limnol Oceanogr 51:2077–2083
Brodeur RD, Mills CE, Overland JE, Walters GE, SchumacherJD (1999) Evidence for a substantial increase in gelatinouszooplankton in the Bering Sea, with possible links toclimate change. Fish Oceanogr 8:296–306
Bullard SG, Hay ME (2002) Palatability of marine macro-holoplankton: nematocysts, nutritional quality, and chem-istry as defenses against consumers. Limnol Oceanogr 47:1456–1467
Davoll PJ, Silver MW (1986) Marine snow aggregates: lifehistory sequence and microbial community of abandonedlarvacean houses from Monterey Bay, California. Mar EcolProg Ser 33:111–120
Eiane K, Aksnes DL, Bagøien E, Kaartvedt S (1999) Fish orjellies — a question of visibility? Limnol Oceanogr 44:1352–1357
Fosså JH (1992) Mass occurrence of Periphylla periphylla(Scyphozoa, Coronatae) in a Norwegian fjord. Sarsia 77:237–251
Fuhrman JA, Azam F (1982) Thymidine incorporation as ameasure of heterotrophic bacterioplankton production inmarine surface waters: evaluation and field results. MarBiol 66:109–120
Gasol JM, del Giorgio PA (2000) Using flow cytometry forcounting natural planktonic bacteria and understandingthe structure of planktonic bacterial communities. Sci Mar64:197–224
Graham WM, Pages F, Hamner WM (2001) A physical contextfor gelatinous zooplankton aggregations: a review. Hydro-biol 451:199–212
Grasshoff K, Ehrhardt M, Kremling K (1983) Methods ofseawater analysis. Verlag Chemie, Weinheim
Grossart HP, Schlingloff A, Bernhard M, Simon M, BrinkhoffT (2004) Antagonistic activity of bacteria isolated fromorganic aggregates of the German Wadden Sea. FEMSMicrobiol Ecol 47:387–396
Hamner WM, Robison BH (1992) In situ observations of giantappendicularians in Monterey Bay. Deep-Sea Res A 39:1299–1313
Hansen JLS, Kiørboe T, Alldredge AL (1996) Marine snowderived from abandoned larvacean houses: Sinking rates,particle content and mechanisms of aggregate formation.Mar Ecol Prog Ser 141:205–215
57

Mar Ecol Prog Ser 325: 43–58, 2006
Hansson LJ (1997) Effect of temperature on growth rate ofAurelia aurita (Cnidaria, Scyphozoa) from Gullmars-fjorden, Sweden. Mar Ecol Prog Ser 161:145–153
Hansson LJ, Norrman B (1995) Release of dissolved organiccarbon (DOC) by the scyphozoan jellyfish Aurelia auritaand its potential influence on the production of planktonicbacteria. Mar Biol 121:527–532
Jarms G, Tiemann H, Båmstedt U (2002) Development andbiology of Periphylla periphylla (Scyphozoa: Coronatae) ina Norwegian fjord. Mar Biol 141:647–657
Kasahara S, Bosch TCG (2003) Enhanced antibacterial activ-ity in Hydra polyps lacking nerve cells. Dev CompImmunol 27:79–85
Kiørboe T (2000) Colonization of marine snow aggregates byinvertebrate zooplankton: abundance, scaling, and possi-ble role. Limnol Oceanogr 45:479–484
Kiørboe T, Jackson GA (2001) Marine snow, organic soluteplumes, and optimal chemosensory behavior of bacteria.Limnol Oceanogr 46:1309–1318
Lee SH, Fuhrman JA (1987) Relationships between bio-volume and biomass of naturally derived marine bacterio-plankton. Appl Environ Microbiol 53:1298–1303
Lehmann EL (1975) Nonparametrics: Statistical methodsbased on ranks. Holden-Day, San Francisco, CA
Long RA, Azam F (2001) Antagonistic interactions amongmarine pelagic bacteria. Appl Environ Microbiol 67:4975–4983
Lynam CP, Hay SJ, Brierly AS (2004) Interannual variability inabundance of North Sea jellyfish and links to the NorthAtlantic Oscillation. Limnol Oceanogr 49:637–643
Malik Z, Hanania J, Nitzan Y (1990) Bactericidal effects ofphotoactivated porphyrins — an alternative approach toantimicrobial drugs. J Photochem Photobiol B 5:281–293
Mills CE (1981) Diversity of swimming behaviors in hydrome-dusae as related to feeding and utilization of space. MarBiol 64:185–189
Mills CE (1993) Natural mortality in NE Pacific coastalhydromedusae — grazing predation, wound-healing andsenescence. Bull Mar Sci 53:194–203
Mills CE (2001) Jellyfish blooms: Are populations increasingglobally in response to changing ocean conditions?Hydrobiol 451:55–68
Noble RT, Fuhrman JA (1998) Use of SYBR Green I for rapidepifluorescence counts of marine viruses and bacteria.Aquat Microb Ecol 14:113–118
Pinhassi J, Hagström Å (2000) Seasonal succession in marinebacterioplankton. Aquat Microb Ecol 21:245–256
Pinheiro J, Bates D, DebRoy S, Sarkar D (2005). nlme: linearand nonlinear mixed effects models, R package version3.1–65
Purcell JE (1997) Pelagic cnidarians and ctenophores aspredators: selective predation, feeding rates, and effectson prey populations. Ann Inst Oceanogr Paris 73:125–137
Purcell JE (2005) Climate effects on formation of jellyfish andctenophore blooms: a review. J Mar Biol Assoc UK 85:461–476
Purcell JE, Arai MN (2001) Interactions of pelagic cnidariansand ctenophores with fish: a review. Hydrobiol 451:27–44
Purcell JE, Decker MB (2005) Effects of climate on relativepredation by scyphomedusae and ctenophores on cope-pods in Chesapeake Bay during 1987–2000. LimnolOceanogr 50:376–387
R Development Core Team (2005) R: a language and environ-ment for statistical computing. The R Foundation for statis-tical computing, Vienna
Riemann B, Bjørnsen PK, Newell S, Fallon R (1987) Calcu-lation of cell production of coastal marine bacteria basedon measured incorporation of (3H)thymidine. LimnolOceanogr 32:471–476
Riemann L, Titelman J, Båmstedt U (2006) Links betweenjellyfish and microbes in a jellyfish dominated fjord. MarEcol Prog Ser 325:29–42
Schneider G (1989) The common jellyfish, Aurelia aurita:standing stock, excretion and nutrient regeneration in theKiel Bight, Western Baltic. Mar Biol 100:507–514
Smith DC, Simon M, Alldredge AL, Azam F (1992) Intensehydrolytic enzyme activity on marine aggregates andimplications for rapid particle dissolution. Nature 359:139–142
Sørnes T (2005) Visual or tactile zooplanktivores — structur-ing effects of the underwater visusal environment. PhDthesis, University of Bergen, Bergen
Stemman L, Jackson GA, Ianson D (2004) A vertical model ofparticle size distributions and fluxes in the midwater col-umn that includes biological and physical processes —Part I: model formulation. Deep Sea Res I 51:865–884
Youngbluth MJ, Båmstedt U (2001) Distribution, abundance,behavior and metabolism of Periphylla periphylla, amesopelagic coronate medusa in a Norwegian fjord.Hydrobiol 451:321–333
Zhang ML, Fishman Y, Sher D, Zlotkin E (2003) Hydralysin, anovel animal group-selective paralytic and cytolytic pro-tein from a noncnidocystic origin in Hydra. Biochemistry42:8939–8944
58
Editorial responsibility: Howard Browman (Associate Editor-in-Chief), Storebø, Norway
Submitted: May 4, 2005; Accepted: March 31, 2006Proofs received from author(s): October 24, 2006
Copyright © 2022 FDOKUMEN