Turkey Real Estate Sector 2021 2nd Quarter Report - Issue: 25
80
GYODER GÖSTERGE INDICATOR Turkey Real Estate Sector 2021 2 nd Quarter Report - Issue: 25 with contrubutions of
-
Upload
khangminh22 -
Category
Documents
-
view
0 -
download
0
Transcript of Turkey Real Estate Sector 2021 2nd Quarter Report - Issue: 25

GYODER GÖSTERGE
INDICATORTurkey Real Estate Sector 20212nd Quarter Report - Issue: 25
with contrubutions of

GYODER INDICATOR, TURKEY REAL ESTATE SECTOR 2021 Q2 REPORT Issue:25, 1 September 2021
EDITORIAL COORDINATIONNeşecan Çekici, Vice Chairman of GYODER
Prof. Ali Hepşen, Training, Publications, Information Production Committee Chairman Murat Berberoğlu, PhD, GYODER Secretary General
CONTENT PROVIDER INSTITUTIONS Council of Shopping Centers
Cushman & Wakefield Dalfin Financial and Governance Solutions
EndeksaEpos Property Consulting and Valuation Plc.
EVA Real Estate Appraisal ConsultancyGaranti BBVA Mortgage
İTÜ Urban and Environmental Planning and Research Center JLL Turkey
Public Disclosure PlatformCentral Securities Depository Institution
Özyeğin UniversityREIDIN
Servotel CorporationSMR STRATEGY Strategy, Management, Research
TSKB Real Estate Appraisal
EDITORIAL CONSULTANTProf. Ali Hepşen, Istanbul University, Faculty of Management, Department of Finance, Academic Member
EDITORServet Şahin
CORPORATE COMMUNICATION AND DATA COORDINATION Sinem Tekin, GYODER Corporate Communications Coordinator
GRAPHIC DESIGNMint Creative House
This publication belongs to
PUBLISHING SPONSOR
Please do not cite without making reference. All rights reserved. 2021
Disclaimer: The GYODER Indicator Report is prepared to inform all segments of the real estate sector. All data are taken from sources believed to be reliable by GYODER Real Estate Research and Report Generation Committee. The prices, data and information contained herein can not be guaranteed to be proper
and accurate. The report does not aim to create a basis for any investment decision. GYODER and the institutions contributing to the report are not responsible for any errors that may arise due to the use of this source. The contents of the report may be changed without prior notice.

INTRODUCTION AND EVALUATION
1https://www.tcmb.gov.tr/wps/wcm/connect/TR/TCMB+TR/Main+Menu/Istatistikler/Reel+Sektor+Istatistikleri/Konut+Fiyat+Endeksi/
The Covid-19 pandemic, increasingly spreading throughout the world as of 2020, has had an impact on almost every economic and social variable. As an unprecedented systemic risk, many administrative processes from global business manners to decision-making processes have had to be reshaped according to new circumstances. It is inevitable that such unprecedented and wide spread insistence of events, called “black swan”, have impacts on industries as well. As in other industries, the construction and real estate sectors have been affected by both business manners and demand-side processes.
The pandemic and the related vaccination process reveal a situation that should be monitored quite carefully by economy administrations and financial decision makers. The acceleration of the efforts for the development of Covid-19 vaccine by the end of 2020, followed by the initiation of vaccination practices in the world and in Turkey can be regarded as an extremely important development. The initiation of vaccination has raised the expectation that the normalization process in economic and social life will gain momentum. However, as of 2021 H1, the fast-spreading coronavirus variant has started to threaten the economies again by the lockdowns, especially in India, Brazil and several EU countries. On the other hand, the fact that the effect of the “delta” variant is increasing even in countries that have taken earlier action in vaccination is noteworthy.
As per the analyses and observations made, it is highly expected that there will be no lockdowns as in the past in many countries. Therefore, it can be considered that the increase in the number of cases may have less impact on the economy than in the past.
When we look at the growth projections, which are one of the critical indicators of the course of global economy, it is possible to have a general outlook. In the World Economic Outlook report for July, the International Monetary Fund (IMF) kept its forecast unchanged that the global economy will grow by 6% in 2021 and 4.9% in 2022. In the said report, while the economic growth expectation in developing economies, especially in Asia, was marked down, it was revised up for advanced economies. While the IMF’s April report projected that the Turkish economy would grow by 6% in 2021 and 3.5% in 2022, it revised the 2022 growth forecast to 3.3% in its latest report.
The most critical impact of both the pandemic and various country-specific problems has been on income distribution and earnings. Therefore, many sectors and consumers have had to shape their tendencies accordingly. The real estate and construction industry has also been affected by this process.When we look at the “home sales” figures, one of the most important indicators of the construction and real estate sector
Real Estate and Construction Sector Overview
Presentation And Evaluation 4

in our country, the situation is as follows. In 2021 H1, there was a slight slowdown in home sales. The total sales figure was 552 thousand whereas it was 624 thousand in the same period of the previous year. In fact the substantial decrease was recorded in mortgage sales in parallel with the increase in loan interest rates. The total mortgage sales that was 266 thousand in 2020 H1 decreased by 60.9% in the same period of 2021 to nearly 104 thousand.
The factors that triggered the decrease in sales can be summarized as the decline experienced in the winter months due to seasonal effects, the pandemic (lockdowns) and demand fluctuation, and the alternative costs and expectations caused by increasing interest rates. On the other hand, the slump experienced for a long while in commercial real estate seems to continue. During this process, there are also the effects of shift in trade understanding, impacts of pandemic and the relatively high supply.
On the other hand, since 2020, it is observed that the rising demand has increased the housing prices and inflationary expectations have also affected the process. In May 2021 data released by the CBRT, compared to the same month of the previous year, there has been an increase of 29.1% in nominal terms and 10.7% in real terms . Regarding the price dynamics, it can be said that the increase in prices is due
to the strong demand, as well as the stabilization of prices, which could not rise in real terms in previous years, and the increasing construction costs.
If we make a brief assessment in terms of the sector as of 2021 H1, the effects of the pandemic that has not been seen for the last 100 years on a global basis have radically changed many elements from sales to the construction system, from the structure of the spaces to the materials used, from consumer behaviors to general trends.
It is obvious that the components of the construction and real estate sector need a significant transformation, both with the changes that have occurred due to the pandemic and what needs to be done for a sustainable world. In this respect, it would be appropriate for the relevant institutions as well as the professional associations and academic circles to develop and implement joint solutions.
The sector is able to act in accordance with the conditions by achieving the necessary flexibility to a great extent with its experience and knowhow in our country. During this process, however, it has been understood that risk and fund management as well as socio-psychological factors are at least as important as macroeconomic variables, and the lack of structuring in such issues has stood out.
Presentation And Evaluation 5
17,53% 1,76% 26,2% 13,2%
27% 35%
$ €20%
15%
5%
10%
2016 2017 2018
22,5% 25$ / m2 / month
163 m2
30643
6,46 million m2
54,336 m2
2,1 billion $
Average SpendingPer Capita 694$
Istanbul35,1%
Turkey36,2%
Total Stock10.516.763 m2
Under Construction2.227.041 m2
Under Project558.231 m2
4,2%2,7%
4,1%
105,6% 4,76%81.900 qty 168.400 qty
Q1’20 End156.000 qty
Q1’21 End159.200 qty
Q1’21 EndQ1’20 End
Q2’21 End
289.760 qty
Q2’20 End
283.731 qty2,1% 2,12% 320%
10.601 qty
Q2’21 End
3.314 qty
Q2’20 End
1,39%
18,00%
Q4’20END
Q1’21END
Q1’21END
Q2’21END
Q2’21END
Q2’21
Q2’21Q2’21
Q2’21
Q1’21END Q4’20
ENDMAY’21
Q2’21
Q2’21
Q2’21
Q2’21
Q1’21Q2’21
180.219 m2
Q2’21END
JUN’21 JUN’21
MAY’21
JUN’21
JUN’21
Number of REITs Trading(Q2’21) 33 unit
REIT Market Value(Q2’21) 63.273,16 million TRY
Transaction Volume (Q2’21) 64.137,68 million TRY
Q2’206.816.191.628
Q2’219.814.438.173
MAIN ECONOMIC DATA
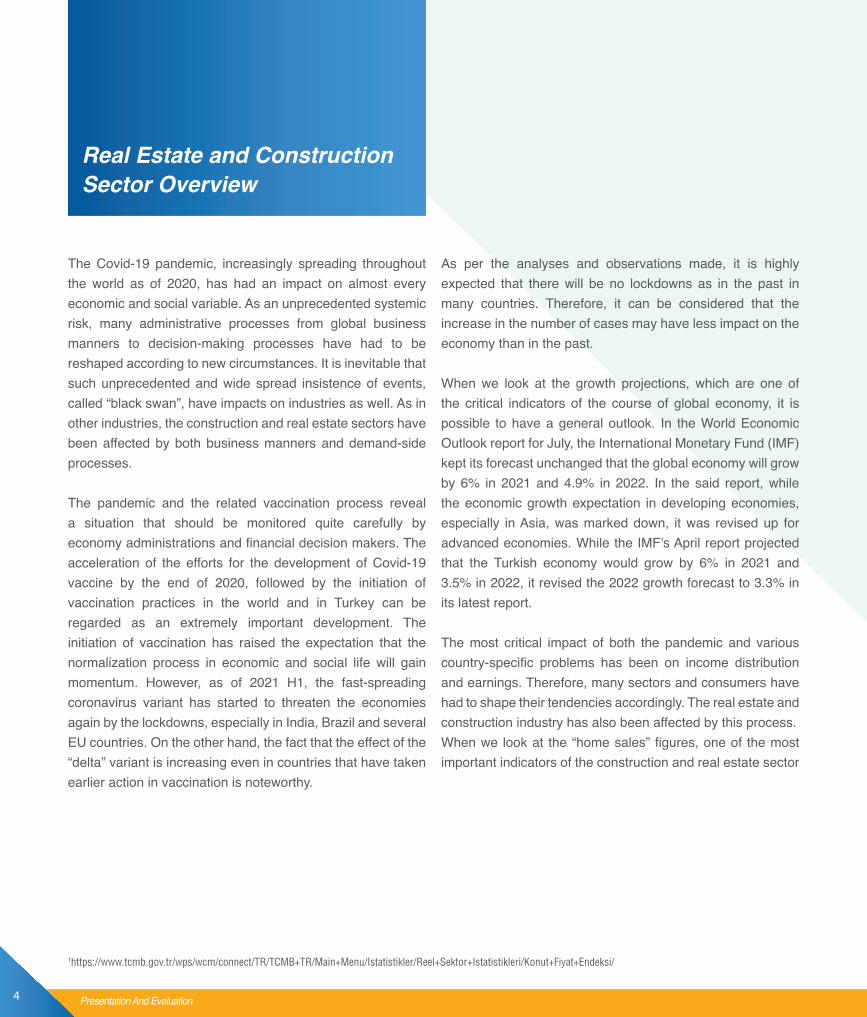
Annual Growth (TRY) Inflation Construction SectorGrowth Rate*
*As chain volume index (2009=100)
*As chain volume index (2009=100)
HOUSING
Construction Permits Occupancy Permits Housing Sales
SHOPPING MALLS
Total Stock Leasable Area Per 1.000 persons
Turnover Index Visitor Index
442 Shopping malls
Under Project 39 shopping malls13 million 605 thousand m2 GLA
TOURISM AND HOTEL
Number of Total Visitors Tourism Revenue Occupancy Rates
5,7 million toTurkey
2,72 thousand toIstanbul
Unemployment Rate GDP Exchange Rate Increase5 trillion 47 billion 909 million TRY
Housing Sales to Foreigners New HousingPrice Index
Housing LoanStock
Monthly Interest
Compound Interest
30,25% increase275 billion 164 million TRY
Vacancy Rates Leasing Transaction Volume
LOGISTICS
Koca
eli
Ista
nbul
(Eur
ope)
Ista
nbul
(A
sia)
REITs
OFFICE
Total Stock Vacancy Rates Primary Rent
Leasing TransactionVolume
REIFs
REIF Total Market Size
*Rates of change are given according to the same period of the previous year.
2nd Q
UART
ER A
T A
GLA
NCE
6 2nd Quarter at a Glance

17,53% 1,76% 26,2% 13,2%
27% 35%
$ €20%
15%
5%
10%
2016 2017 2018
22,5% 25$ / m2 / month
163 m2
30643
6,46 million m2
54,336 m2
2,1 billion $
Average SpendingPer Capita 694$
Istanbul35,1%
Turkey36,2%
Total Stock10.516.763 m2
Under Construction2.227.041 m2
Under Project558.231 m2
4,2%2,7%
4,1%
105,6% 4,76%81.900 qty 168.400 qty
Q1’20 End156.000 qty
Q1’21 End159.200 qty
Q1’21 EndQ1’20 End
Q2’21 End
289.760 qty
Q2’20 End
283.731 qty2,1% 2,12% 320%
10.601 qty
Q2’21 End
3.314 qty
Q2’20 End
1,39%
18,00%
Q4’20END
Q1’21END
Q1’21END
Q2’21END
Q2’21END
Q2’21
Q2’21Q2’21
Q2’21
Q1’21END Q4’20
ENDMAY’21
Q2’21
Q2’21
Q2’21
Q2’21
Q1’21Q2’21
180.219 m2
Q2’21END
JUN’21 JUN’21
MAY’21
JUN’21
JUN’21
Number of REITs Trading(Q2’21) 33 unit
REIT Market Value(Q2’21) 63.273,16 million TRY
Transaction Volume (Q2’21) 64.137,68 million TRY
Q2’206.816.191.628
Q2’219.814.438.173
MAIN ECONOMIC DATA
Annual Growth (TRY) Inflation Construction SectorGrowth Rate*
*As chain volume index (2009=100)
*As chain volume index (2009=100)
HOUSING
Construction Permits Occupancy Permits Housing Sales
SHOPPING MALLS
Total Stock Leasable Area Per 1.000 persons
Turnover Index Visitor Index
442 Shopping malls
Under Project 39 shopping malls13 million 605 thousand m2 GLA
TOURISM AND HOTEL
Number of Total Visitors Tourism Revenue Occupancy Rates
5,7 million toTurkey
2,72 thousand toIstanbul
Unemployment Rate GDP Exchange Rate Increase5 trillion 47 billion 909 million TRY
Housing Sales to Foreigners New HousingPrice Index
Housing LoanStock
Monthly Interest
Compound Interest
30,25% increase275 billion 164 million TRY
Vacancy Rates Leasing Transaction Volume
LOGISTICS
Koca
eli
Ista
nbul
(Eur
ope)
Ista
nbul
(A
sia)
REITs
OFFICE
Total Stock Vacancy Rates Primary Rent
Leasing TransactionVolume
REIFs
REIF Total Market Size
*Rates of change are given according to the same period of the previous year.
2nd Q
UART
ER A
T A
GLA
NCE
72nd Quarter at a Glance

MAIN ECONOMICDATA

In 2021 Q2, while the COVID-19 pandemic slowed down around the globe, it was observed that vaccination became widespread even though it varies from country to country. In addition, while the number of cases due to the delta variant increased in some countries, there were disruptions in the production of some products. On the other hand, the inflationary risks that increased on a global scale in Q2 led to normalization in the monetary policy interest rates of developing economies. While interest rates increased in some emerging economies, volatilities declined due to the decrease in uncertainties in the markets. However, towards the end of June, the number of new COVID-19 cases with the delta variant rose in some economies and a fragile outlook emerged in the risk appetite.
In parallel with the global trend, the vaccination process has speeded up in Turkey and the number of COVID-19 cases has slowed down. In July, there was a rapid rise in the number of delta variant COVID-19 cases, again in line with the global trend. Q1 growth data pointed to a strong performance, with the continued impact of monetary and financial aids offered during the pandemic and the continuation of strong foreign demand. In 2021 Q1, GDP achieved strong growth. According to the calendar and seasonally adjusted data, the gross domestic product (GDP) grew by 1.7% compared to the previous period, while the calendar adjusted annual growth rate was 7.3%. In unadjusted data, the growth realized as 7%. With these results, annualized growth performance increased from 1.8% to 2.4%. In dollar terms, GDP increased from US$ 717.4 billion at the end of 2020 to US$ 728.5 billion. On the expenditure side, while the highest contribution to growth acquired from private sector consumption, the annual growth was achieved in all business lines.
Forecasted data for 2021 Q2 indicated that the slowdown in the economy remained limited. After contracting by 0.8% in April, industrial production grew by 1.3% in May. There were 5.8% and 6.1% decreases, respectively, in retail sales during the same period. On the other hand, while turnover indices contracted by 1.3% in April, an increase of 3.3% was recorded in May. A complex outlook emerged in the labor market due to the pandemic and restriction measures. According to
seasonally adjusted data, the unemployment rate, which was 13.2% in March 2021, rose to 13.8% in April, and then fell to 13.2% in May. Even though the broadly defined unemployment indicators decreased marginally in May, they maintained their high level. Although the lockdown measures in April and the first half of May pointed to a slowdown in domestic demand, the normalization process in June supported domestic demand. With these results, the manufacturing industry Purchasing Managers’ Index (PMI), capacity utilization rate, confidence indices and banking sector loan volume first results for June and July confirmed that the weakening in domestic demand remained limited, and that external demand continued to support the economic activity.
In 2021 Q2, fluctuations were observed in inflation due to exchange rate volatility and cumulative costs triggered by global commodity prices. Annual inflation in the general consumer price index (CPI), which was 16.2% in March 2021, fell to 16.6% in May after rising to 17.1% in April. However, it increased again to 17.5% in June. During the same period, core inflation (C index) increased from 16.9% to 17.8% in April and decreased to 17.0% in May. In June, it was recorded as 17.5%. Annual inflation in the general domestic producer price index (D-PPI), which was 31.2% in March 2021, rose continually in Q2 and reached 42.9% as of June. In the upcoming period, in addition to cost factors, the public price adjustments, cumulative costs and high expectations preserve upward risks in inflation.
While the CBRT has kept the policy rate unchanged at 19.0% since March due to the upward risks in inflation, it has been restated that the current stance will be maintained decisively until a significant decrease in inflation is achieved. Additionally, the CBRT made significant changes in the FX reserve requirement ratios at the beginning of July in order to improve the effectiveness of monetary transmission mechanism. In the meanwhile, the Banking Regulation and Supervision Agency took a series of macro precautionary measures in coordination with the relevant institutions at the beginning of July.
Forecasted Data In 2021 Q2 Indicated That TheSlowdown In The Economy Remained Limited
Main Economic Data 9

Source: TurkStat*End of Q1**Chain Volume Index (2009=100)
Year GDP(million TRY)
Income perCapita (TRY)
GDP(million USD)
Income per Capita (TRY) Growth* (%)
Avarage rate during the
year2015 2.350.941 30.056 861.467 11.085 6,10 2,73
2016 2.626.560 33.131 862.744 10.964 3,30 3,04
2017 3.133.704 39.019 852.618 10.696 7,50 3,68
2018 3.758.316 46.167 797.124 9.792 3,00 4,71
2019 4.320.191 52.316 760.778 9.213 0,90 5,68
2020 5.047.909 60.537 717.049 8.599 1,80 7,04
2021* 1.386.347 - 188.065 - 7,00 7,37
Cumulatively, as of the end of Q4, Gross Domestic Product grew by 1.76% compared to the same period of the previous year as the chain volume index (2009=100)
Consumer Price Index (CPI) increased by 1.94% in June compared to the previous month, 8.5% compared to December of the previous year, 17.53% compared to the same month of the previous year and 14.55% on the twelve months moving average basis.
10,35 10,26 10,23 10,85
12,15 15,39 15,85
17,90
24,52 25,2421,62
20,3020,35 19,67 19,71 19,50 18,71
15,7216,65
15,01
9,26 8,5510,56
11,84
12,15 12,37 11,86 10,94
11,39 12,62 11,76 11,77
11,75 11,8914,03 14,6014,97 15,61 16,19
17,14 16,59
17,53
0
5
10
15
20
25
30
2018 2019 2020 2021
January February March April May June July August September October November December
Main Economic Data
Annual Inflation*
Gross Domestic Product by Expenditures at Current Prices
Q1 Q2 Q3 Q4
Source: TurkStat*Change according to the same month of the previous year
10

When the house price increase as well as the increase and return performance of financial investment instruments in 2021 Q2 are analyzed, 0.29% return was observed in Government Debt Securities and 19.67% in Bullion.
Period TR-81REIDIN*
REIDINGYODER
New HousePrice Index**
DepositRate
BIST 100 Index USD Euro Gold
(Bullion)
Goverment Debt
Securities
Q2'17 3,08 0,86 2,62 10,27 -4,06 0,84 -1,44 4,46
Q3'17 2,33 1,03 3,03 7,16 -1,26 4,78 2,68 1,61
Q4'17 2,76 0,85 3,08 3,11 10,53 9,78 6,55 -1,84
Q1'18 2,55 0,90 3,18 6,58 1,25 5,51 5,93 2,08
Q2'18 1,73 0,78 3,27 -17,83 19,15 12,82 14,76 -6,29
Q3'18 0,82 0,50 3,79 -0,41 36,84 36,59 28,06 -8,12
Q4'18 0,58 0,77 5,26 -3,81 -16,2 -18,17 -12,18 15,40
Q1’19 0,97 0,27 5,53 9,89 2,72 2,04 7,03 5,81
Q2'19 1,97 0,92 4,79 -7,25 6,4 6,28 11,35 1,81
Q3'19 2,01 0,38 5,31 8,30 -1,74 -4,23 8,60 12,90
Q4'19 3,07 1,34 3,92 9,18 2,49 3,44 0,68 9,40
Q1'20 2,61 2,43 2,63 -13,9 8,27 7,82 16,1 2,61
Q2'20 5,52 2,06 2,36 17,11 7,58 9,45 17,49 5,89
Q3'20 8,92 2,12 1,93 -1,09 10,53 15,79 22,91 -2,2
Q4'20 8,23 0,89 2,74 25,85 2,36 5,61 -1,61 2,57
Q1'21 6,8 0,79 3,95 7,4 -0,46 -2,64 -7,7 -1,62
Q2'21 7,42 0,88 4,34 -4,86 12,19 13,61 19,67 0,29
Q3’19 Q4’19 Q1’20 Q2’20 Q3’20 Q4’20 Q1’21 Q2’21
US Dollar, which closed 2021 Q1 at 8.34, rose to 8.69 in June 2021 and Euro rose to 10.34 in June 2021, which closed Q1 at 9.78.
6,45 6,18 6,38 6,33 6,67 6,60 6,87 7,22 7,59 7,59 7,68 8,16 8,74 9,09 9,71 9,34 9,13 8,88 8,959,78 9,97 10,38 10,34
5,82 5,65 5,72 5,75 5,95 5,98 6,24 6,58 6,98 6,82 6,85 6,94 7,33 7,76 8,32 7,80 7,43 7,33 7,388,34 8,24 8,51 8,69
1,11 1,09 1,12 1,10 1,12 1,10 1,10 1,10 1,09 1,11 1,12 1,18 1,19 1,17 1,17 1,20 1,23 1,21 1,21 1,17 1,21 1,22 1,19
0
2
4
6
8
10
12
Aug
’19
Sep
’19
Oct
’19
Nov
’19
Dec
’19
Jan’
20
Feb’
20
Mar
’20
Apr
’20
May
’20
Jun’
20
Jul’2
0
Aug
’20
Sep
’20
Oct
’20
Nov
’20
Dec
’20
Jan’
21
Feb’
21
Mar
’21
Apr
’21
May
’21
Jun’
21
EURO/TRY DOLLAR/TRY EURO/DOLLAR
Main Economic Data
Exchange Rate*
Comparison of Investment Instruments (%)
Source: CBRT*By the last day of each month
Source:REIDIN and TurkStat*REIDIN Turkey Residential Property Price Index (81 province average)**REIDIN-GYODER New Home Price Index is calculated on 70 projects and with a monthly average number of 22.500 properties presented by 34 developers.
11

At the end of May 2021, the net foreign direct investment inflow (actual/net inflow) was realized as US$ 1.224 million. Compared to the investment inflow of US$ 547 million in the same period of 2020, an increase of 224% was recorded in 2021.
Mar’20 Apr’20 May’20 Jun’20 Jul’20 Aug’20 Sep'20 Oct’20 Nov’20 Dec'20 Jan’21 Feb’21 Mar’21 Apr’21 May’21
13,00 13,50 13,50 13,30 14,40 13,00 12,60 12,90 13,00 12,70 12,70 13,30 13,20 13,80 13,20
The number of unemployed of aged 15 and above in overall Turkey in May 2021 decreased by 265 thousand compared to the previous month and was recorded as 4 million 237 thousand. The unemployment rate fell 0.6 percentage point to 13.2%.
2.955
2.0092.686
3.180
2.3622.941
3.420
4.440
2.640
2.141 1.8012.472 2.635
547
2.196 2.4462.135
1.2241.061 1.363961 1.087 1.177 1.423
2.228
1.328 895 9901.766
1.279
495
1.161 1.467 1.240
731
0
1.000
2.000
3.000
4.000
5.000
1.258
Q1'17 Q2'17 Q3’17 Q4’17 Q1'18 Q2'18 Q3'18 Q4'18 Q1'19 Q2'19 Q3'19 Q4'19 Q1'20 Q2'20 Q3'20 Q4'20 Q1'21 Q2'21*
FDI FDI in Real Estate
13.337
19.263
13.83511.042
12.8229.266
7.824
3.3594.321 4.156 4.6435.915 4.979 4.402
7310
5.000
10.000
15.000
20.000
25.000
2014 2015 2016 2017 2018 2019 2020 2021*
3.890
FDI FDI in Real Estate
Foreign Direct Investment Inflow
Foreign Direct Investment (million USD)
Foreign Direct Investment (million USD)
Age 15+ Unemployment*
Monthly Average (%)
Main Economic Data
Source: The Ministry of Treasury and Finance *Data of 2021 April - May
Source: The Ministry of Treasury and Finance *Data of 2021 April - May
Source: TurkStat*Labour Force Status (Seasonally-adjusted)
12
8,4010,30 10,50 10,80 10,60 10,20 10,30 11,00
14,0011,90
9,80 9,20 9,70 10,30 10,4012,10
9,90
12,80 13,30 12,70
468
10121416
2001 2002 2003 2004 2005 2006 2007 2008 2009 2010 2011 2012 2013 2014 2015 2016 2017 2018 2019 2020
Annual Average
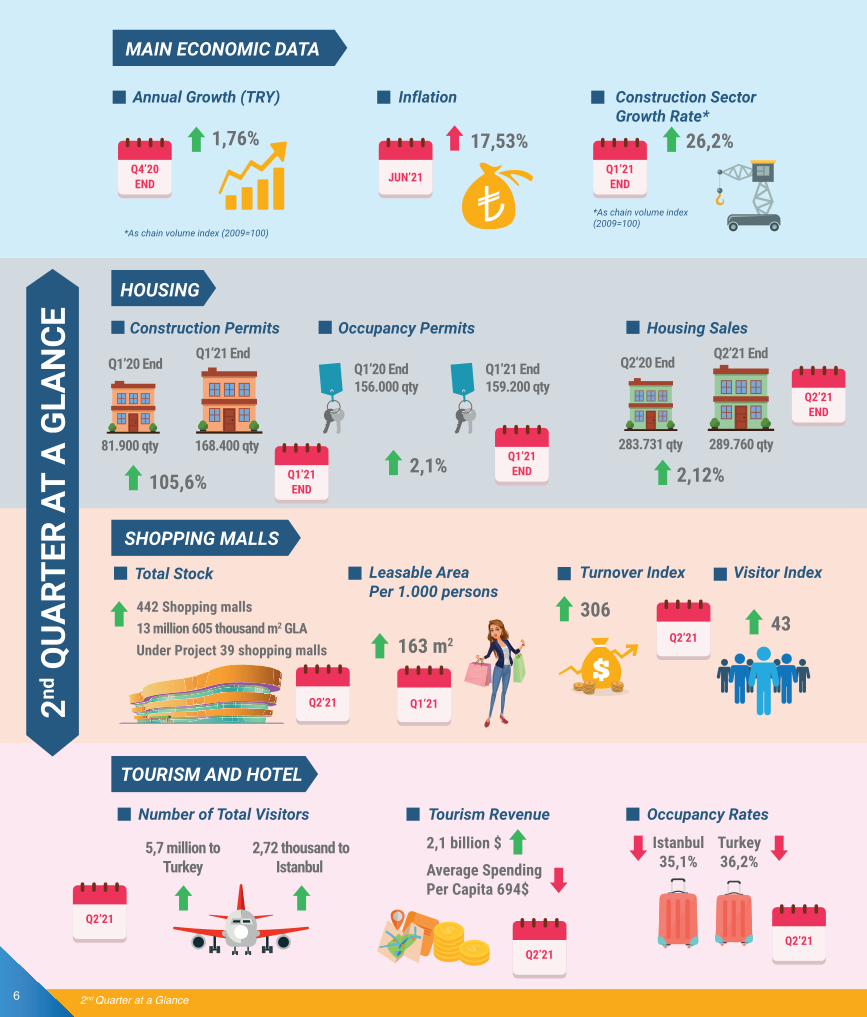
The population of Istanbul decreased by 56 thousand 815 compared to the previous year and was recorded as 15 million 462 thousand 452. Istanbul, constituting 18.49% of Turkey’s population, was followed by Ankara with 5 million 663 thousand 322, Izmir with 4 million 394 thousand 694, Bursa with 3 million 101 thousand 833 and Antalya with 2 million 548 thousand 308.
2016 2017 2018 2019 2020Istanbul 14.804 15.029 15.068 15.519 15.462
Ankara 5.347 5.445 5.504 5.639 5.663
Izmir 4.224 4.280 4.321 4.367 4.395
Bursa 2.901 2.937 2.995 3.056 3.102
Antalya 2.329 2.364 2.426 2.512 2.548
0 1.000.0001.000.000 2.000.0002.000.000 3.000.0003.000.000 4.000.0004.000.000 0-4 5-9
10-1415-1920-2425-2930-3435-3940-4445-4950-5455-5960-6465-6970-7475-7980-8485-89
90+
The population ratio of the 15-64 age group, defined as the working age population, was 66.5% in 2007 and 67.7% in 2020. On the other hand, the population ratio of the 0-14 age group, defined as the child age group, decreased from 26.4% to 22.8%, while the population ratio of aged 65 and over increased from 7.1% to 9.5%.
Annual Average (%)
Population Growth in Major Cities (thousand)
Population by Age Group and Gender, 2020
Main Economic Data
Source: TurkStat
FemaleMale
Source: TurkStat*Labour Force Status (Seasonally-adjusted)**Data has been revised by TurkStat.
41.915.985
41.698.377
83.614.362
MaleFemaleTotal
Source: TurkStat
13
2021
2018
2019
2020
71,90 73,10
59,30
50,20
59,50
57,7055,10
58,06
58,20
62,80
50
60
70
80
Q1 Q2 Q3 Q4
110,80
111,20113,00
102,70
90,40 91,50
99,30102,50
98,80 102,1098,60 92,60
105,30
110,40
90
100
110
120
88,05
79,8080,02 81,97
ConfidenceIndex
ExpectationIndex
4,5 4,6 5,3 5,5 6,3 6,7 6,8 5,6 6,1 7,1 7,4 8,0 8,1 8,1 8,5 8,5 7,1 5,4 5,4
43,0
33,242,6
21,3
32,5
20,113,7
-17,2
25,5
41,6
17,324,6
13,2 15,1 16,9 19,5
0,6
-12,8-20-10
01020304050
2002
2003
2004
2005
2006
2007
2008
2009
2010
2011
2012
2013
2014
2015
2016
2017
2018
2019
2020
*
16,7
Sector Percentages (%) Growth Rate (%)
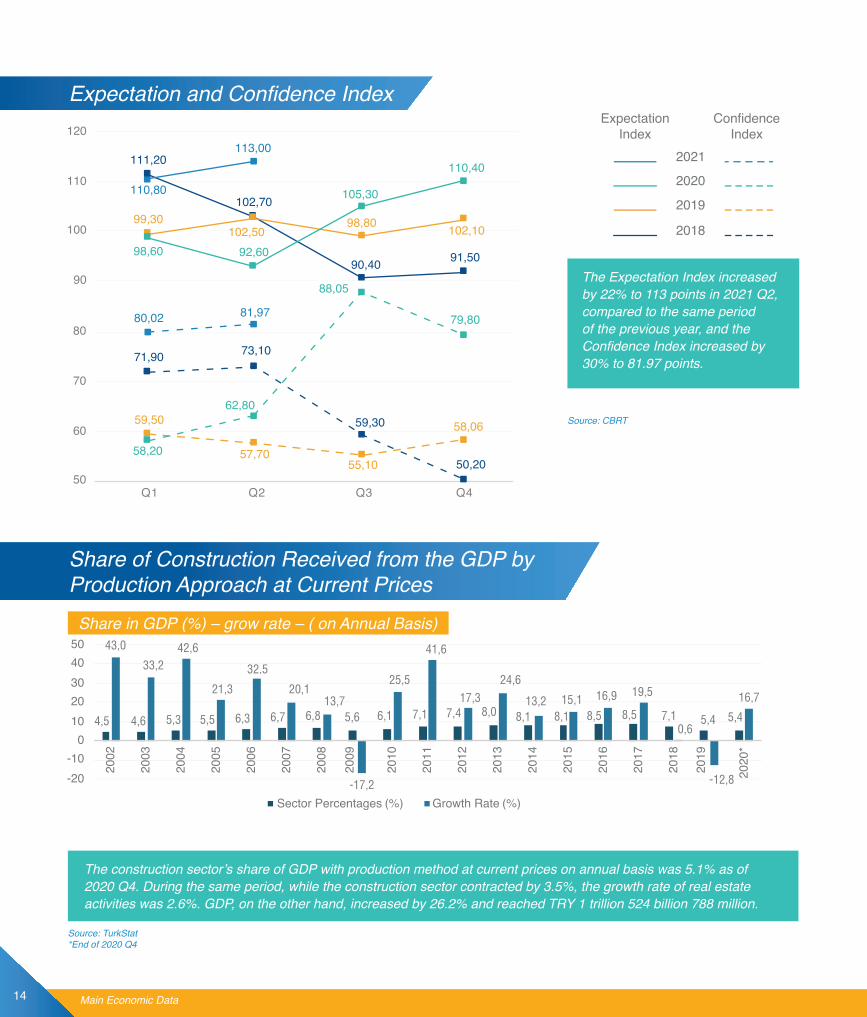
The construction sector’s share of GDP with production method at current prices on annual basis was 5.1% as of 2020 Q4. During the same period, while the construction sector contracted by 3.5%, the growth rate of real estate activities was 2.6%. GDP, on the other hand, increased by 26.2% and reached TRY 1 trillion 524 billion 788 million.
The Expectation Index increased by 22% to 113 points in 2021 Q2, compared to the same period of the previous year, and the Confidence Index increased by 30% to 81.97 points.
Share of Construction Received from the GDP by Production Approach at Current Prices
Share in GDP (%) – grow rate – ( on Annual Basis)
Expectation and Confidence Index
Main Economic Data
Source: CBRT
Source: TurkStat*End of 2020 Q4
14

7,7 7,86,2 5,5 5,4
9,18,4
5,56,6
8,7
6,34,7 4,8
8,3
6,35,4 5,1
02468
1012
2017 2018 2019 2020 2021
Q1 Q2 Q3 Q4
14,1
23,5
-8,4
3,0
26,2
14,2 11,8
-24,9
20,8
32,1
-10,5-16,4
23,417,0
-14,0
0,6
19,6
-40-30-20-10
010203040
2017 2018
2019
2020 2021
Q1 Q2 Q3 Q4
21,7 21,3 23,414,2 16,2 14,5 11,7
17,7 16,0
0,7
29,123,5
11,8
-10,5-14,0
-8,4
-24,9-16,4
0,6 3,3
20,8
-30-20-10
010203040
Q1'18 Q2'18 Q3'18 Q4'18 Q1'19 Q2'19 Q3'19 Q4'19 Q1'20 Q2'20 Q3'20 Q4'20 Q1'21
22,123,4 26,2
19,626,2
GDP Growth Rate (%) Construction Sector Growth Rate (%)
Main Economic Data
Share of Construction Received from the GDP by Production Approach at Current Prices
Share in GDP on Quarter Basis (%)
Growth on Quarter Basis (%)*
Construction Sector - National Income Growth Figures Comparison (%)*
Source: TurkStat*Comparison with the same period of the previous year.**Previous period figures have been updated.
Source: TurkStat
Source: TurkStat*Comparison with the same period of the previous year.
15

HOUSING
In 2021 Q2, housing sales increased by around 10.2% compared to the previous quarter and reached 289.760 units. 2.1% increase was recorded in housing sales compared to the same period of the previous year.
First-hand sales rose by 8.9% compared to the previous quarter and was recorded as 87.508 units. This figure was the second lowest quarterly figure of the first-hand sales. Second-hand sales increased by 10.7%, and 202.252 second-hand houses were exchanged in Q2. The ratio of first-hand sales to total sales dropped to 30.2%.
Despite a limited decline in housing loan interest rates, there was a 20.6% increase in mortgage sales in Q2 compared to the previous quarter. While 56.952 mortgage houses were sold, other sales were recorded as 232.808. Compared to the same period of the previous year, mortgage sales fell by
58.5%, while other sales rose by 58.7%, with the effect of mortgage sales in June, when the reduction in housing loan interest rates began.
Housing prices reached 32.39% in April, the all-time high in historical data, and dropped to 29.07% as of May due to the base effect. The new house price index was 32.27% in May. Yet, as of May, the real return on housing prices decreased to 10.7% and to 13.4% for new houses.
On the other hand, sales to foreigners increased by 7.2% compared to the previous quarter. In Q2, 10.601 houses were sold to foreigners and 20.488 in the first half. Both were the highest sales figures in the data set. In housing sales to foreigners in Q2, Istanbul ranked first with a 48% share, followed by Antalya with a 19.9% share.
Housing Unit Prices In Overall TurkeyReached 4.415 TRY/m²
Housing 17

In 2021 H1, the building permits granted by municipalities increased by 88.4% on the basis of number of buildings, 45.3% on the basis of area, 93.7% on the basis of value and 49.8% on the basis of number of apartments, compared to the same period of the previous year.
Year Housing Stock Rate of Change
2014 28.252.598 14%
2015 28.727.506 2%
2016 29.340.118 2%
2017 32.802.435 12%
2018 35.040.843 7%
2019 38.801.537 11%
2020 39.307.621 1%
32,2
45,5
31,440,3
19,811,5 14,5
28,8
17,7
27,6 27,9
39,233,2
40,9 39,3 39,9
54,5 52,6
29,0 30,038,8
31,8 31,0 33,2
0102030405060
Q1’18 Q2’18 Q3’18 Q4’18 Q1’19 Q2'19 Q3'19 Q4'19 Q1’20 Q2’20 Q3'20 Q4’20 Q1’21
23,5
35,7
Construction permits Occupancy Permits
142,1
220,2
139,8167,0
77,445,6 58,0
143,9
81,9
138,7 141,9
192,9 168,4207,5 204,2
280,0250,5
146,0 148,4195,4
156,0 153,9 175,8 159,2
050
100150200250300
Q1’18 Q2’18 Q3’18 Q4’18 Q1’19 Q2'19 Q3'19 Q4'19 Q1’20 Q2’20 Q3'20 Q4’20 Q1’21
202,4
114,6
Construction permits Occupancy Permits
Building Permits Statistics and Percantage Changes
Number of Flats (thousands)
Surface Area (million m2)
Building Inventory Data
Housing
Source: TurkStat
Source: TurkStat
Source: TurkStat
18
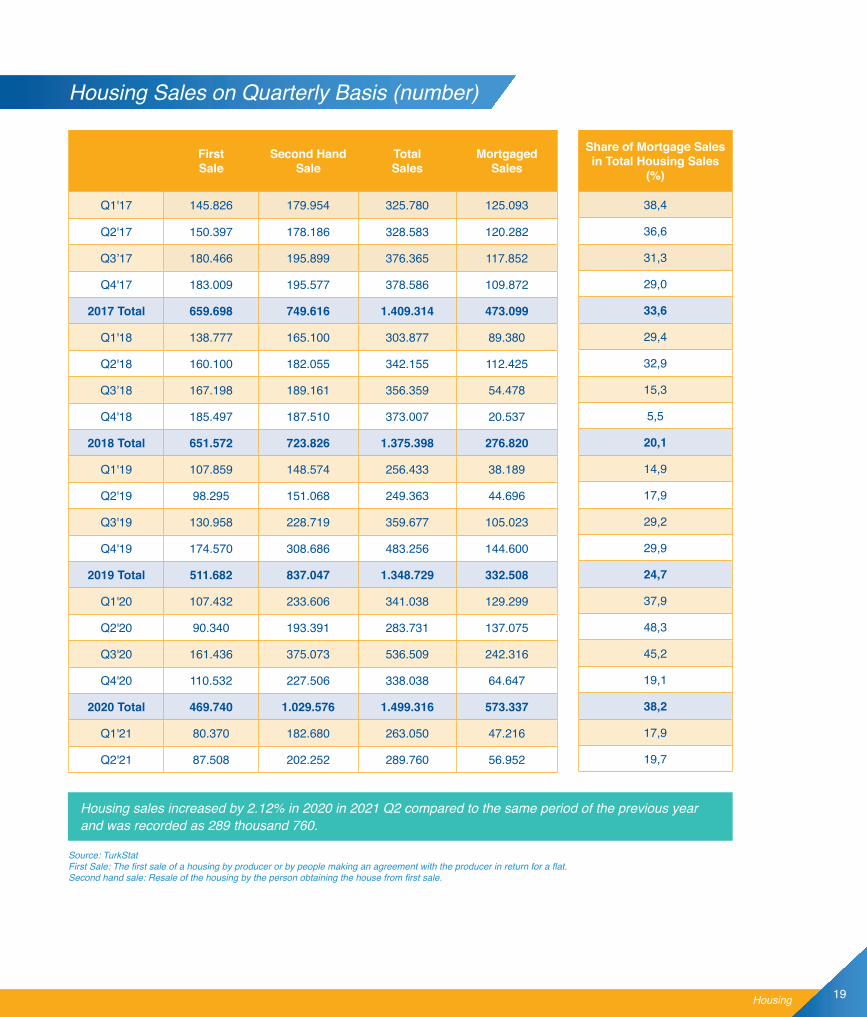
Housing sales increased by 2.12% in 2020 in 2021 Q2 compared to the same period of the previous year and was recorded as 289 thousand 760.
FirstSale
Second Hand Sale
TotalSales
MortgagedSales
Q1'17 145.826 179.954 325.780 125.093
Q2'17 150.397 178.186 328.583 120.282
Q3’17 180.466 195.899 376.365 117.852
Q4'17 183.009 195.577 378.586 109.872
2017 Total 659.698 749.616 1.409.314 473.099
Q1'18 138.777 165.100 303.877 89.380
Q2'18 160.100 182.055 342.155 112.425
Q3’18 167.198 189.161 356.359 54.478
Q4'18 185.497 187.510 373.007 20.537
2018 Total 651.572 723.826 1.375.398 276.820
Q1'19 107.859 148.574 256.433 38.189
Q2'19 98.295 151.068 249.363 44.696
Q3'19 130.958 228.719 359.677 105.023
Q4'19 174.570 308.686 483.256 144.600
2019 Total 511.682 837.047 1.348.729 332.508
Q1'20 107.432 233.606 341.038 129.299
Q2'20 90.340 193.391 283.731 137.075
Q3'20 161.436 375.073 536.509 242.316
Q4'20 110.532 227.506 338.038 64.647
2020 Total 469.740 1.029.576 1.499.316 573.337
Q1'21 80.370 182.680 263.050 47.216
Q2'21 87.508 202.252 289.760 56.952
Share of Mortgage Sales in Total Housing Sales
(%)
38,4
36,6
31,3
29,0
33,6
29,4
32,9
15,3
5,5
20,1
14,9
17,9
29,2
29,9
24,7
37,9
48,3
45,2
19,1
38,2
17,9
19,7
Housing
Housing Sales on Quarterly Basis (number)
Source: TurkStatFirst Sale: The first sale of a housing by producer or by people making an agreement with the producer in return for a flat.Second hand sale: Resale of the housing by the person obtaining the house from first sale.
19
17.0
88
18.4
83
101.
504
130.
721
76.0
19
35.5
76
25.5
66
24.4
50
14.6
31
10.7
32
14.6
69
21.8
15
17.5
14
10.5
60
28.8
78
42.7
83
50.9
36
190.
012
229.
357
170.
408
136.
744
119.
574
112.
483
105.
981
70.5
87
81.2
22
111.
241
95.8
63
59.1
66
134.
731
0
50.000
100.000
150.000
200.000
250.000
300.000
Nis’20 May’20 Haz’20 Tem’20 A u’20 Eyl’20 Eki’20 Kas’20 Ara’20 Oca’21 ub’21 Mar’21 Nis’21 May’21 Haz’21
Mortgage Housing Sales (qty) Total
Jul’20 Aug’20 Sep’20 Oct’20 Nov’20 Dec’20Jun’20Apr’20 Jan’21 Feb’21 Mar’21May’20 Jun’21Apr’21 May’21
40.6
34
51.3
93
50.1
81
48.9
09
75.4
80
36.0
40
37.3
03
34.0
89
14.8
48
16.8
60
58.6
32
67.9
37
52.1
23
41.3
76
36.9
76
36.6
58
36.8
98
22.2
68
24.7
37
33.3
65
29.2
12
18.2
04
40.0
92
69.9
04
95.5
10
92.6
29
89.4
63
126.
594
77.5
75
81.4
50
74.5
81
27.9
35
34.0
76
131.
380
161.
420
118.
285
95.3
68
82.5
98
75.8
25
69.0
83
48.3
19
56.4
85
77.8
76
66.6
51
40.9
62
94.6
39
0
50.000
100.000
150.000
200.000
250.00011
0.53
8
146.
903
142.
810
138.
372
202.
074
113.
615
118.
753
50.9
36
190.
012 22
9.35
7
170.
408
136.
744
119.
574
112.
483
105.
981
70.5
87
81.2
22 11
1.24
1
95.8
63
59.1
66
134.
731
42.7
83
108.
670
Aug
’19
Sep
’19
Oct
’19
Nov
’19
Dec
’19
Jan’
20
Feb’
20
Mar
’20
Apr
’20
May
’20
Jun’
20
Jul’2
0
Aug
’20
Sep
’20
Oct
’20
Nov
’20
Dec
’20
Jan’
21
Feb’
21
Mar
’21
Apr
’21
May
’21
Jun’
21
First Sale (number) Second Hand Sales (number)
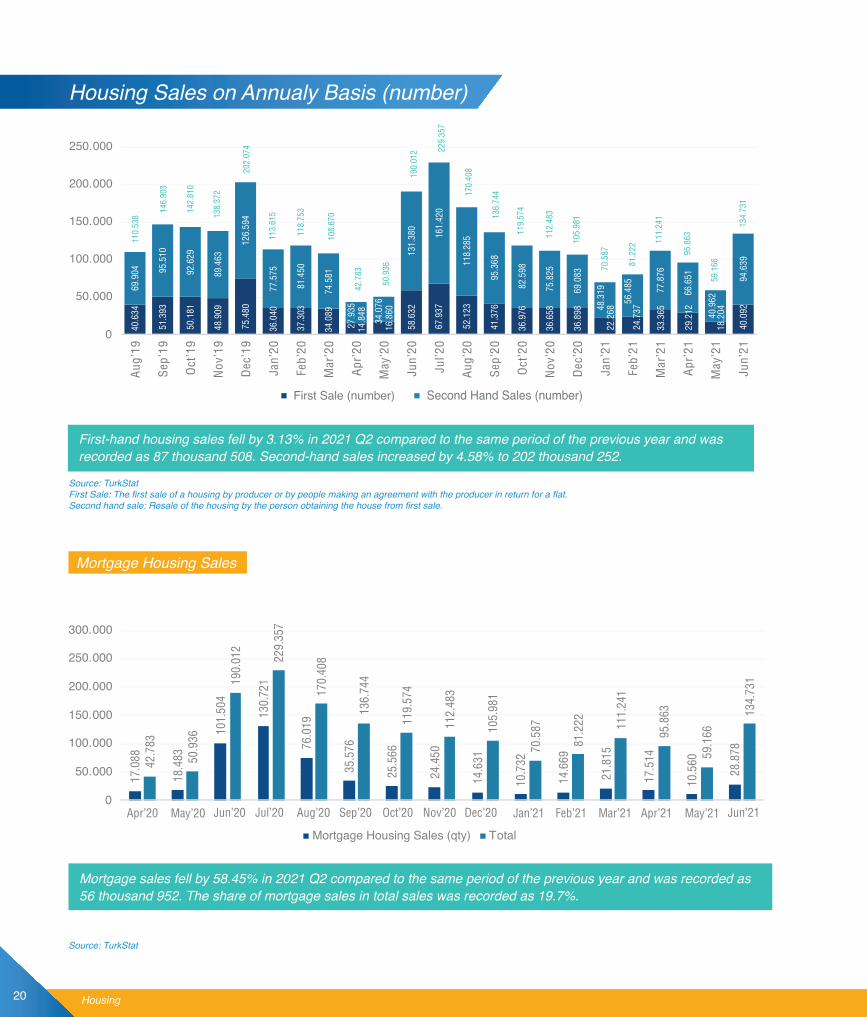
Mortgage sales fell by 58.45% in 2021 Q2 compared to the same period of the previous year and was recorded as 56 thousand 952. The share of mortgage sales in total sales was recorded as 19.7%.
First-hand housing sales fell by 3.13% in 2021 Q2 compared to the same period of the previous year and was recorded as 87 thousand 508. Second-hand sales increased by 4.58% to 202 thousand 252.
Mortgage Housing Sales
Housing Sales on Annualy Basis (number)
Housing
Source: TurkStatFirst Sale: The first sale of a housing by producer or by people making an agreement with the producer in return for a flat.Second hand sale: Resale of the housing by the person obtaining the house from first sale.
Source: TurkStat
20

207,2
4,76%
0,44%
107,20%
359,2
35,24%
2,51%
259,20%
According to the REIDIN-GYODER New Housing Price Index, there was a price increase of 0.44% in June 2021 compared to the previous month and of 4.76% compared to the same period of the previous year.
283,3
22,11%
2,64%
183,30%
181,5 186 197,8 207,2
050
100150200250
Jun'18 Jun'19 Jun'20 Jun'21
223,5 233,3 265,6
359,2
0
100
200
300
400
Jun'18 Jun'19 Jun'20 Jun'21
193,5 204,1232,0
283,3
0
100
200
300
Jun'18 Jun'19 Jun'20 Jun'21
Housing
Housing Price Indexes (Country-wide)
REIDIN GYODER New Home Price Index (January 2010=100)*
REIDIN Turkey Residential Property Price Index (January 2012=100)**
REIDIN Residential Rent Value Index (Ocak 2012=100)**
Source: REIDIN*REIDIN-GYODER New Home Price Index is calculated on 50 projects and with a monthly average number of 16.000 properties presented by 26 developers.**REIDIN Turkey Residential Property Price Index (81 province average)
Index Value: June 2021
Annual Nominal Change (%)
Monthly Nominal Change (%)
Nominal Change According to Start Period
Index Value: June 2021
Annual Nominal Change (%)
Monthly Nominal Change (%)
Nominal Change According to Start Period
Index Value: June 2021
Annual Nominal Change (%)
Monthly Nominal Change (%)
Nominal Change According to Start Period
21
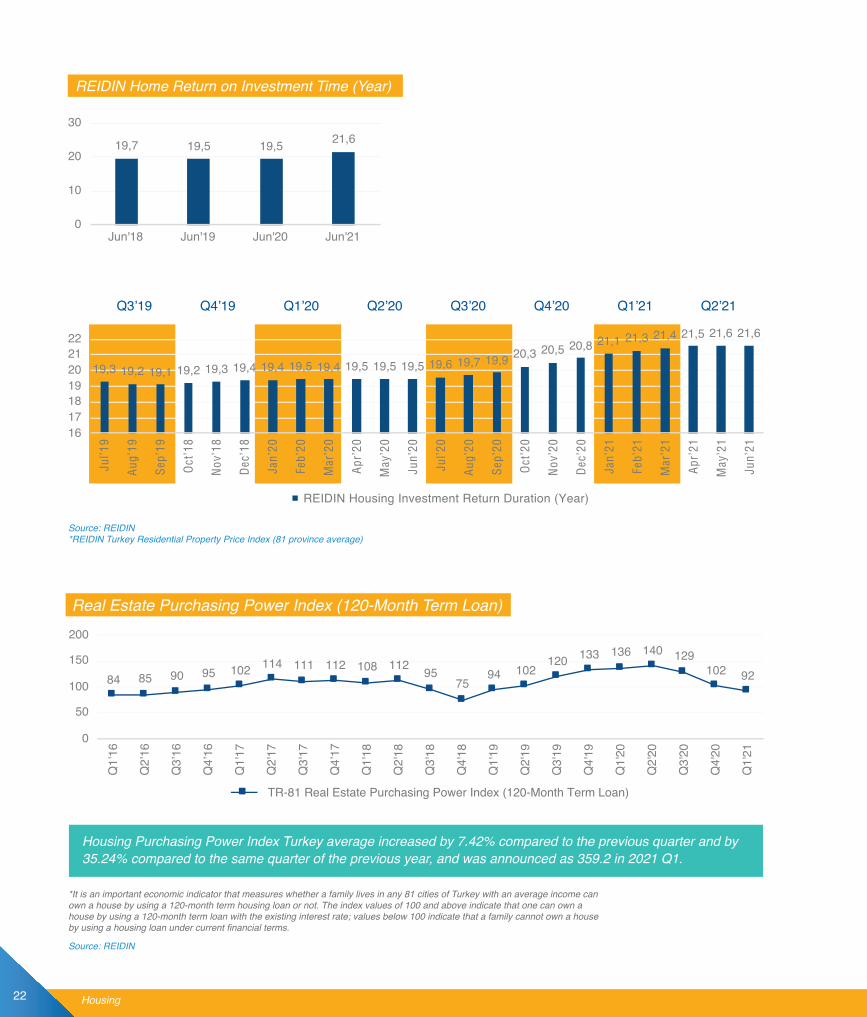
Housing Purchasing Power Index Turkey average increased by 7.42% compared to the previous quarter and by 35.24% compared to the same quarter of the previous year, and was announced as 359.2 in 2021 Q1.
Q1’20 Q1’21 Q2’21Q2’20 Q3’20 Q4’20Q3’19 Q4’19
84 85 90 95 102 114 111 112 108 112 9575
94 102120 133 136 140 129
102 92
0
50
100
150
200
Q1’
16
Q2’
16
Q3’
16
Q4’
16
Q1'
17
Q2'
17
Q3'
17
Q4’
17
Q1'
18
Q2'
18
Q3'
18
Q4'
18
Q1'
19
Q2'
19
Q3'
19
Q4'
19
Q1'
20
Q2'
20
Q3'
20
Q4'
20
Q1'
21
TR-81 Real Estate Purchasing Power Index (120-Month Term Loan)
19,7 19,5 19,5 21,6
0
10
20
30
Jun'18 Jun'19 Jun'20 Jun'21
19,3 19,2 19,1 19,2 19,3 19,4 19,4 19,5 19,4 19,5 19,5 19,5 19,6 19,7 19,9 20,3 20,5 20,8 21,1 21,3 21,4 21,5 21,6 21,6
16171819202122
REIDIN Housing Investment Return Duration (Year)
Jul’1
9
Aug
’19
Sep
’19
Oct
’18
Nov
’18
Dec
’18
Jan’
20
Feb’
20
Mar
’20
Apr
’20
May
’20
Jun’
20
Jul’2
0
Aug
’20
Sep
’20
Oct
’20
Nov
’20
Dec
’20
Jan’
21
Feb’
21
Mar
’21
Apr
’21
May
’21
Jun’
21
Real Estate Purchasing Power Index (120-Month Term Loan)
REIDIN Home Return on Investment Time (Year)
Housing
Source: REIDIN*REIDIN Turkey Residential Property Price Index (81 province average)
Source: REIDIN
*It is an important economic indicator that measures whether a family lives in any 81 cities of Turkey with an average income can own a house by using a 120-month term housing loan or not. The index values of 100 and above indicate that one can own a house by using a 120-month term loan with the existing interest rate; values below 100 indicate that a family cannot own a house by using a housing loan under current financial terms.
22
108,5114,4
129,3
92,868,7
106,3104,0
92,0 85,0 94,0
98,0
75,0 76,0 84,3
95,6110,6126,8
61,0
112,3 94,7 118,7120,4
123,8
0
50
100
150
Q3’
16
Q4’
16
Q1'
17
Q2'
17
Q3'
17
Q4'
17
Q1'
18
Q2'
18
Q3'
18
Q4'
18
Q1’
19
Q2’
19
Q3’
19
Q4’
19
Q1'
20
Q2'
20
Q3’
20
Q4'
20
Q1'
21
Q2'
21
Q3'
21Confidence Index
Last 2 years averageLast 1 years average
83,582,5
121,4
87,7
62,7
112,5 109,0
86,095,0 99,0
86,0
59,0 65,981,4 88,0
104,1 103,8
33,3
96,5
59,577,0
90,3103,4
0
50
100
150
Q3’
16
Q4’
16
Q1'
17
Q2'
17
Q3'
17
Q4'
17
Q1'
18
Q2'
18
Q3'
18
Q4'
18
Q1’
19
Q2’
19
Q3’
19
Q4’
19
Q1'
20
Q2'
20
Q3’
20
Q4'
20
Q1'
21
Q2'
21
Q3'
21
Confidence Index
Last 2 years averageLast 1 years average
2,82%
14,51%
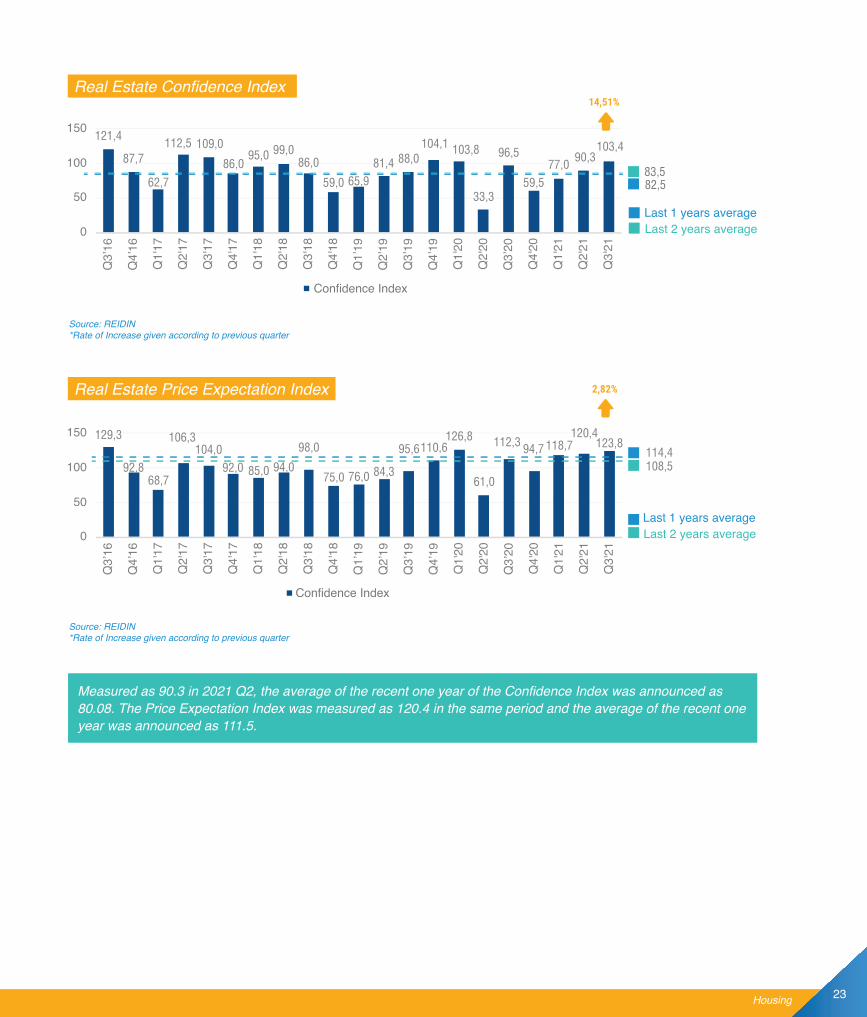
Measured as 90.3 in 2021 Q2, the average of the recent one year of the Confidence Index was announced as 80.08. The Price Expectation Index was measured as 120.4 in the same period and the average of the recent one year was announced as 111.5.
Real Estate Confidence Index
Real Estate Price Expectation Index
Housing
Source: REIDIN*Rate of Increase given according to previous quarter
Source: REIDIN*Rate of Increase given according to previous quarter
23
29,1
423
,17
21,4
310
,90
5,64
5,61
4,45
3,70 6,
10 8,50 12
,80
15,0
05,
50 7,30
6,90
6,51 9,
835,
09 6,86 7,88
7,19
4,95
0
10
20
30
40
Housing Sales Rate to Foreigners (%)
Q1’
16Q
2’16
Q3’
16Q
4’16
Q1'
17Q
2'17
Q3'
17Q
4'17
Q1'
18
Q2'
18Q
3'18
Q4’
18Q
1'19
Q2'
19Q
3'19
Q4'
19Q
1'20
Q2'
20Q
3'20
Q4'
20
Q2'
21Q
1'21
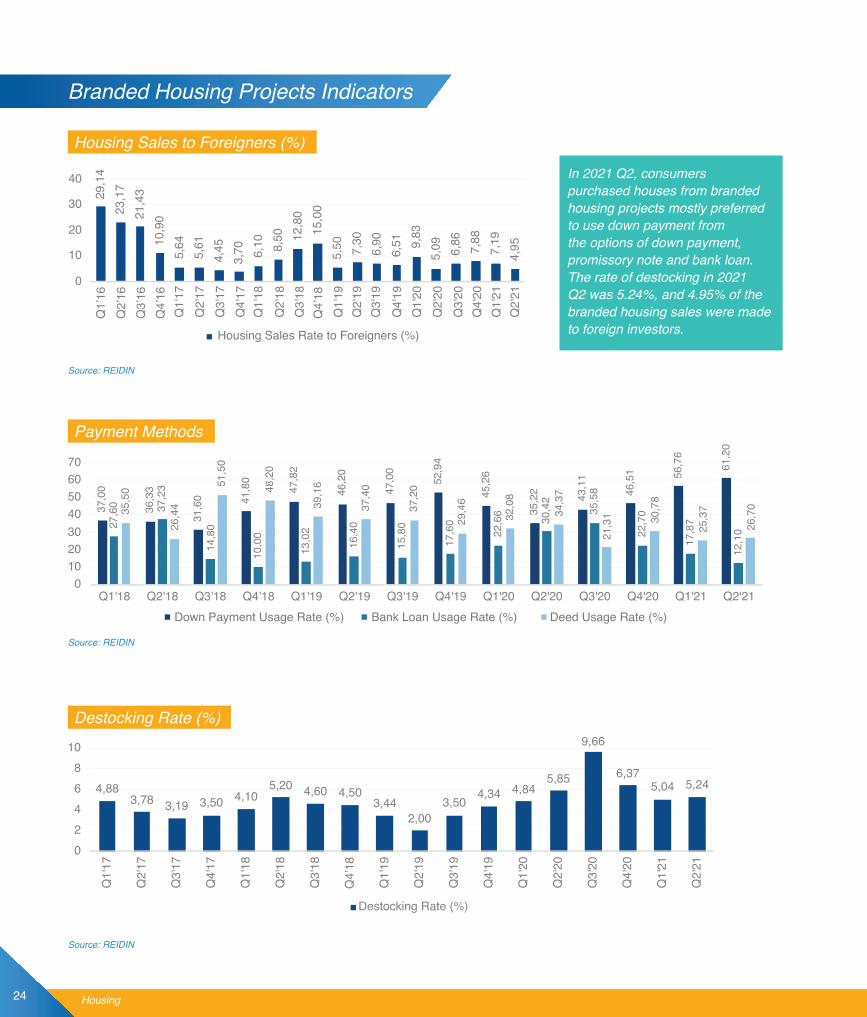
In 2021 Q2, consumers purchased houses from branded housing projects mostly preferred to use down payment from the options of down payment, promissory note and bank loan. The rate of destocking in 2021 Q2 was 5.24%, and 4.95% of the branded housing sales were made to foreign investors.
37,0
0
36,3
3
31,6
0 41,8
0
47,8
2
46,2
0
47,0
0
52,9
4
45,2
6
35,2
2 43,1
1
46,5
1 56,7
6
27,6
0 37,2
3
14,8
0
10,0
0
13,0
2
16,4
0
15,8
0
17,6
0
22,6
6 30,4
2
35,5
8
22,7
0
17,8
7
12,1
0
35,5
0
26,4
4
51,5
0
48,2
0
39,1
6
37,4
0
37,2
0
29,4
6
32,0
8
34,3
7
21,3
1 30,7
8
25,3
7
26,7
0
010203040506070
Q1'18 Q2'18 Q3'18 Q4’18 Q1'19 Q2'19 Q3'19 Q4'19 Q1'20 Q2'20 Q3'20 Q4'20 Q1'21 Q2'21
61,2
0
Down Payment Usage Rate (%) Bank Loan Usage Rate (%) Deed Usage Rate (%)
4,883,78 3,19 3,50 4,10
5,20 4,60 4,503,44
2,003,50
4,34 4,845,85
9,66
6,375,04 5,24
02468
10
Q1'
17
Q2'
17
Q3'
17
Q4'
17
Q1'
18
Q2'
18
Q3'
18
Q4’
18
Q1'
19
Q2'
19
Q3'
19
Q4'
19
Q1'
20
Q2'
20
Q3'
20
Q4'
20
Q1'
21
Q2'
21
Destocking Rate (%)
Housing
Destocking Rate (%)
Payment Methods
Housing Sales to Foreigners (%)
Source: REIDIN
Branded Housing Projects Indicators
Source: REIDIN
Source: REIDIN
24

The number of housing sales to foreigners was recorded as 10 thousand 601 as of the end of 2021 Q2, with an increase of 320% compared to the same period of the previous year.
2.675
2.964
4.2484.077
4.748
1.776
3.9074.005
3.036
790 860
1.664
2.741
3.893
5.269 5.258
4.962
4.427
3.1683.321
3.129
3.720
3.925
2.689
4.192
3.604
4.1774.272
3.988
5.298
1.742 1.729 1.8272.043
2.415
2.060
2.858
3.866
5.615
6.276
4.672 4.560
1.386 1.306
1.578 1.6241.775
1.926 1.726
1.684
2.236
2.677
2.152 2.164
0
1000
2000
3000
4000
5000
6000
7000
2021 2020 2019 2018 2017
Jan Mar Apr May Jun Jul Aug Sep Oct Nov DecFeb
Number of House Sales to Foreigners in Turkey
Q1 Q2 Q3 Q4
Housing
Source: TurkStat
25

In 2021 Q2, the most preferred province by foreigners in real estate investments was Istanbul. When we examine all kinds of real estate investments of foreigners made in Turkey in 2020 and 2021, 64.7% increase was recorded at the end of 2021 Q2 on the basis of number of real estates compared to the same period of 2020.
Q2’21 Q2’20
Q2’21 Ranking (Q2’20 Ranking)
First 10Cities
Total Number of Real Estates
Total Number of Real Estates
1(1) Istanbul 12.176 7.562
2(2) Antalya 4.388 2.517
3(3) Ankara 1.404 908
4(6) Mersin 1.029 357
5(5) Yalova 751 398
6(4) Bursa 690 492
7(9) Sakarya 492 260
8(8) Muğla 464 304
9(7) Izmir 431 355
10(10) Samsun 349 239
Other 2.600 1.653
Total 24.774 15.045
Total Citizenship Acquisition 2.963 3.374
Citizenship AcquisitionShare in Total (%) 24,0 30,0
Top 10 Cities Preferred by Foreigners for Housing Purchase
Housing
Source: General Directorate of Land Registers Department of Foreign Affairs*Figures include all real estate sales.*End of 2021 Q2
26

Q2’21 Q2’20
Q2’21 Ranking (Q2’20 Ranking)
First 10Cities
Total Number of Real Estates
Total Number of Real Estates
1 (2) Iranian 3.495 2.496
2 (1) Iraq 3.419 2.147
3 (4) Russian Federation 1.926 900
4 (3) Afghanistan 1.678 925
5 (7) Germany 974 501
6 (-) Kazakhistan 836 0
7 (6) Yemen 743 513
8 (-) United States of America 682 0
9 (9) Azerbaijan 675 454
10 (10) Palestine 658 430
- (5) Chinese 0 540
- (8) Jordan 0 456
Other 9.688 6.139
Total 24.774 15.045
Gulf Countries 6.914 4.643
Ratio of Gulf Countries in Total Investments 28,0 31,0
When we examine all kinds of real estate investments of foreigners made in Turkey, we observe that Kazakhstan and the U.S. took part in top 10 countries that preferred Turkey in 2021 Q2, different from the same period of 2020.
Top Ten Countries Preferring to Purchase Housing from Turkey*
Housing
Source: General Directorate of Land Registers Department of Foreign Affairs*Figures include all real estate sales.**End of 2021 Q2***Total number of real estate sales according to the nationalities can be higher than the total sales made to foreigners, as different nationals are able to buy different properties.
27

HOUSINGLOANS

The upward trend in housing loan interest rates that started in September 2020 continued until the end of June 2021. Having started to move upward in the beginning of September 2020 and realized as 1.08%, the housing loan interest rate increased to 1.39% in June 2021. Likewise, the annual interest rate, which started to move upward at the beginning of September 2020 and was realized as 13.80%, increased by 4.20 points to 18.00% at the end of June 2021.
At the end of May 2021, the volume of housing loans was recorded as TRY 275.1 billion. While the share of public deposit banks in the total housing loan volume was 57.3% in May 2020, it rose to 62.07% in May 2021. In May 2021, the share of domestic private banks decreased from 20.62% to 17.40%, and the share of foreign deposit banks from 14.38%
to 11.7%, compared to the same period of the previous year. While the ratio of non-performing housing loans to total housing loans showed an upward trend since the beginning of September 2018, the downward trend started as of October 2019 and was recorded as 0.30% as of May 2021.
The total volume of consumer loans, on the other hand, was TRY 695.7 billion in May. The share of housing loans in total consumer loans that was 39% in May 2020 was recorded as 39.5% with 0.5 points increase as of May 2021. While the total loan was around TRY 3.855 trillion, the share of personal loans in total loans was 22.1%. This rate was around 20.5% in May 2020.
At The End Of May 2021, The Volume OfHousing Loans Recorded As TRY 275.1 Billion
Housing Loans 29
Q1’21Q2’20 Q2’21Q3’20 Q4’20
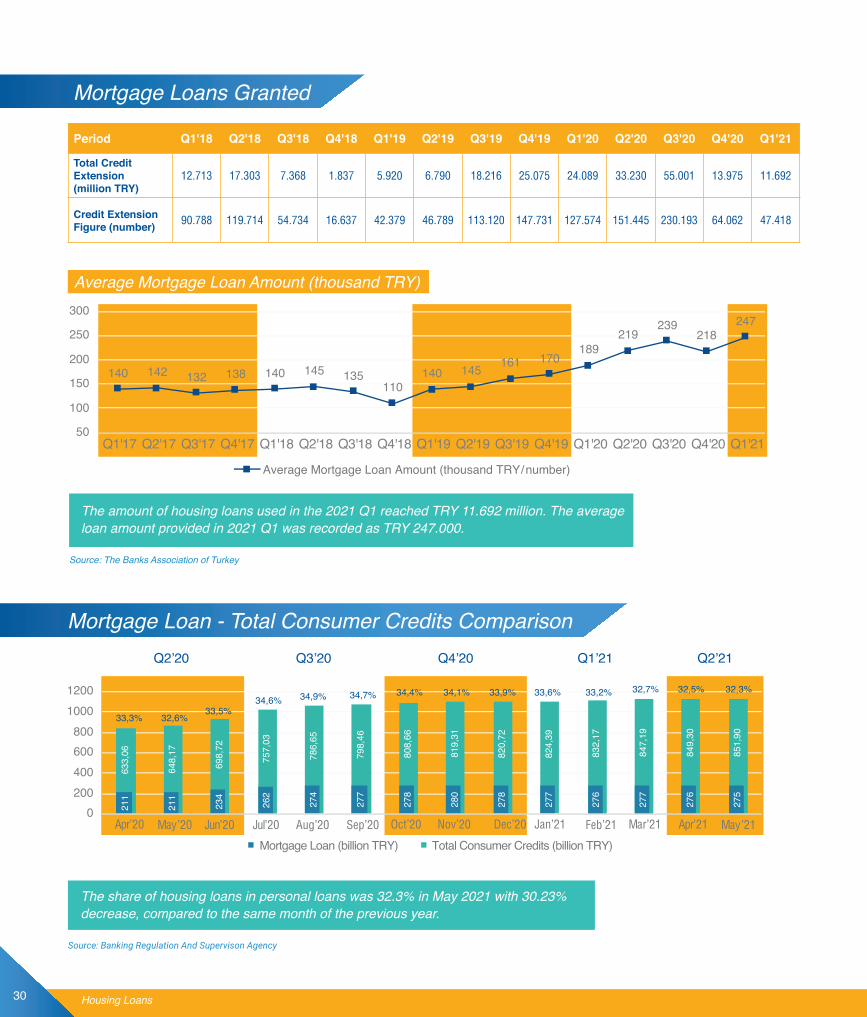
The amount of housing loans used in the 2021 Q1 reached TRY 11.692 million. The average loan amount provided in 2021 Q1 was recorded as TRY 247.000.
The share of housing loans in personal loans was 32.3% in May 2021 with 30.23% decrease, compared to the same month of the previous year.
Period Q1'18 Q2'18 Q3'18 Q4'18 Q1'19 Q2'19 Q3'19 Q4'19 Q1'20 Q2'20 Q3'20 Q4'20 Q1'21
Total Credit Extension(million TRY)
12.713 17.303 7.368 1.837 5.920 6.790 18.216 25.075 24.089 33.230 55.001 13.975 11.692
Credit Extension Figure (number) 90.788 119.714 54.734 16.637 42.379 46.789 113.120 147.731 127.574 151.445 230.193 64.062 47.418
140 142 132 138 140 145 135110
140 145161 170
189219
239218
50
100
150
200
250
Ç1'17 Ç2'17 Ç3'17 Ç4'17 Ç1'18 Ç2'18 Ç3'18 Ç4'18 Ç1'19 Ç2'19 Ç3'19 Ç4'20 Ç1'20 Ç2'20 Ç3'20 Ç4'20
Konut ortalama kredi tutarı (bin TL/adet)
140 142 132 138 140 145 135110
140 145 161 170189
219239
218247
50
100
150
200
250
300
Q1'17 Q2'17 Q3'17 Q4'17 Q1'18 Q2'18 Q3'18 Q4'18 Q1'19 Q2'19 Q3'19 Q4'19 Q1'20 Q2'20 Q3'20 Q4'20 Q1'21
Average Mortgage Loan Amount (thousand TRY/ number)
32,7% 32,5% 32,3%
33,3% 32,6%33,5%
34,6% 34,9% 34,7% 34,4% 34,1% 33,9% 33,6% 33,2%
211
211
234
262
274
277
278
280
278
277
276
277
276
275
633,
06
648,
17
698,
72
757,
03
786,
65
798,
46
808,
66
819,
31
820,
72
824,
39
832,
17
847,
19
849,
30
851,
90
0200400600800
10001200
Oct’20 Nov’20 Dec’20 Jan’21 Feb’21 Mar’21Sep’20Jul’20 Aug’20Apr’20 May’20 Apr’21 May’21Jun’20
Mortgage Loan (billion TRY) Total Consumer Credits (billion TRY)
Kullandırılan Konut Kredisi
Mortgage Loan - Total Consumer Credits Comparison
Average Mortgage Loan Amount (thousand TRY)
Housing Loans
Mortgage Loans Granted
Source: Banking Regulation And Supervison Agency
Source: The Banks Association of Turkey
30

As of June 2021, monthly interest rate on housing loans was 1.39% and compound annual interest rate was 18%.
Q1’20 Q1’21 Q2’21Q2’20 Q3’20 Q4’20
The total housing loan volume was around TRY 275 billion 130 million as of May 2021.
51 %100,0 275.130
250.860
170.786
47.883
32.191
0,78
24.270
%91,2
%62,1
%17,4
%11,7
%0,0
%8,8
32
21
13
3
8
6
0,91 0,90 0,90 0,91 0,88 0,72 0,74 1,05 1,16 1,18 1,25 1,44 1,40 1,38 1,38 1,40 1,37 1,39
11,50
11,32
11,41
11,49
11,13
9,01
9,22 13
,31 14,78 15
,18 16,10 18
,6918
,1317
,8517
,8818
,1117
,7918
,00
05
10152025
Jan’
20
Feb’
20
Mar
’20
Apr’2
0
May
’20
Jun’
20
May
’21
Jun’
21
Jul’2
0
Aug’
20
Sep’
20
Oct
’20
Nov
’20
Dec
’20
Jan’
21
Feb’
21
Mar
’21
Apr’2
1
Monthly Interest Compound Interest
Source: Banking Regulation And Supervison Agency*The latest published data are the data of BDDK 2020 December.**The number of participation banks increased to 6 with Türkiye Emlak Katılım Bankası A.Ş. upon the official authorization received on February 27, 2019.
Mortgage Loan Interest Rate (%)
Distribution of Mortgage Loan According to Banks
Housing Loans
Source: Central Bank of Turkey
Distribution of Sector in General
Number of Banks
SectorShares
Distribution of Mortgage Loan Volume
(billion TRY)*
Total Banking Sector
Public DepositMoney Banks
Deposit Banks withForeign Partners
Private DepositBanks
Total DepositBanks
Participation Banks
Development andInvestment Banks
31

The share of nonperforming loans in total housing loans was recorded as 0.30% as of May 2021.
Q3’20 Q4’20 Q1’21 Q2’2123
3.93
8
261.
682
274.
364
277.
343
278.
288
279.
618
278.
289
276.
824
276.
300
276.
723
276.
360
275.
164
1.0891.054 1.028 1.008 980 949 907 896 869 831 816 815
050.000
100.000150.000200.000250.000300.000
0,46%0,37% 0,36% 0,35% 0,34% 0,32% 0,32% 0,31% 0,30% 0,30%0,29%0,40%
Ratio of Non-Performing Loans to Total Stock (%)Total Stock (million TRY) Total Loans Under Supervision (million TRY)
Jan’21 Feb’21 Mar’21 Apr’21 May’21Jun’20 Jul’20 Aug’20 Sep’20 Oct’20 Nov’20 Dec’20
Mortgage Loan Stock and Non-performing Loan*
Housing Loans
Source: Banking Regulation And Supervison Agency*Cumulative total of Mortgage Loan Stock and Non-performing Loan
32

As of the end of 2021 Q2, Istanbul was the city where housing loans are mostly used in total housing loans with 43%. Istanbul was followed by Ankara with 18% and by Izmir with 11%.
Kırşehir
Düzce
Eskişehir
Kütahya
Tekirdağ
Çorum
Çanakkale
İzmir
Muğla
Uşak
İçel
Kahramanmaraş
Iğdır
Ağrı
Gümüşhane
Bingöl
Şanlıurfa
Muş
Şırnak
Elazığ
Batman
İstanbul
Niğde
Ankara
Karabük
Çankırı
Kocaeli
Bursa Bilecik
Edirne
301
7650
24 26 18 21 14 17 120
20.000
40.000
60.000
80.000
100.000
Istanbul Ankara Izmir Bursa Antalya Kocaeli Adana Mersin Gaziantep Manisa
80.858
33.342 21.823
10.738 8.853 7.620 6.488 6.023 5.209 4.780
0,37%
0,23%0,23%
0,22% 0,29% 0,24% 0,32% 0,23% 0,33% 0,25%
Ratio of Non-Performing Loans to Total Stock (%)Total stock (million TRY) Total of non-performing loans (million TRY)
Top 10 Cities Borrowed Housing Loans
Housing Loans
Source: BRSA-FinTürk*End of Q2’21**Cumulative total of Mortgage Loan Stock and Non-performing Loan
33

OFFICE ANDCOMMERCIAL REAL ESTATE
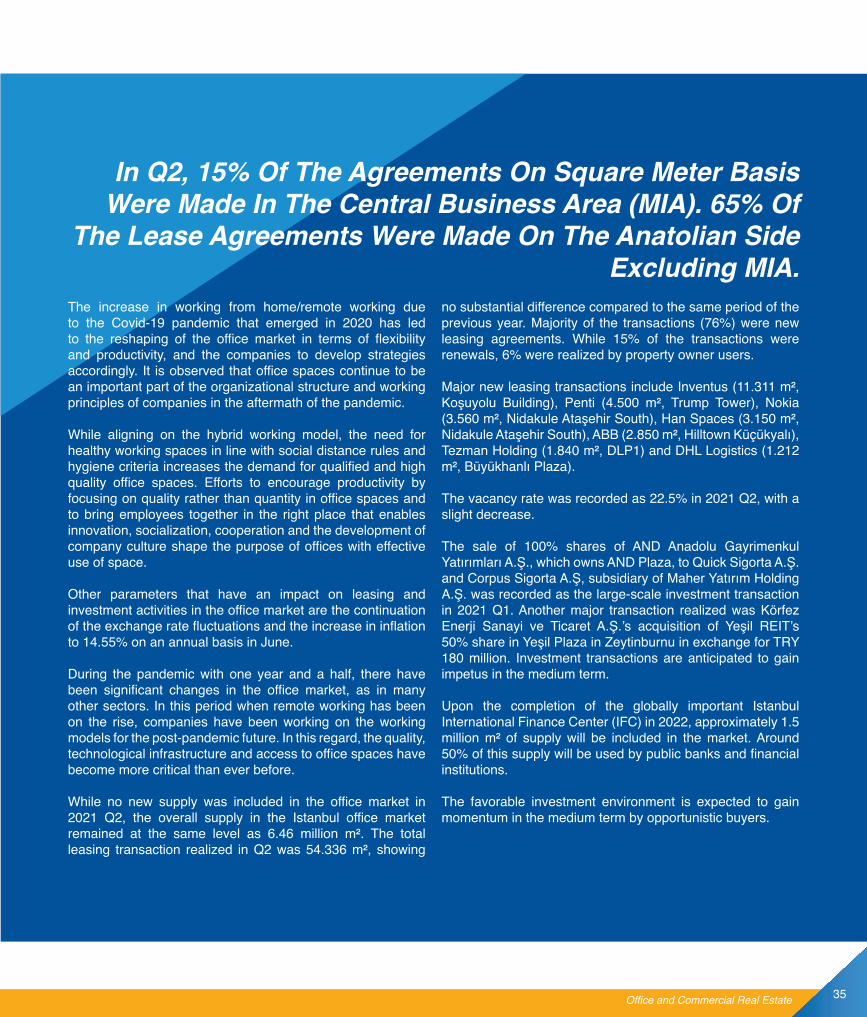
The increase in working from home/remote working due to the Covid-19 pandemic that emerged in 2020 has led to the reshaping of the office market in terms of flexibility and productivity, and the companies to develop strategies accordingly. It is observed that office spaces continue to be an important part of the organizational structure and working principles of companies in the aftermath of the pandemic.
While aligning on the hybrid working model, the need for healthy working spaces in line with social distance rules and hygiene criteria increases the demand for qualified and high quality office spaces. Efforts to encourage productivity by focusing on quality rather than quantity in office spaces and to bring employees together in the right place that enables innovation, socialization, cooperation and the development of company culture shape the purpose of offices with effective use of space.
Other parameters that have an impact on leasing and investment activities in the office market are the continuation of the exchange rate fluctuations and the increase in inflation to 14.55% on an annual basis in June.
During the pandemic with one year and a half, there have been significant changes in the office market, as in many other sectors. In this period when remote working has been on the rise, companies have been working on the working models for the post-pandemic future. In this regard, the quality, technological infrastructure and access to office spaces have become more critical than ever before.
While no new supply was included in the office market in 2021 Q2, the overall supply in the Istanbul office market remained at the same level as 6.46 million m². The total leasing transaction realized in Q2 was 54.336 m², showing
no substantial difference compared to the same period of the previous year. Majority of the transactions (76%) were new leasing agreements. While 15% of the transactions were renewals, 6% were realized by property owner users.
Major new leasing transactions include Inventus (11.311 m², Koşuyolu Building), Penti (4.500 m², Trump Tower), Nokia (3.560 m², Nidakule Ataşehir South), Han Spaces (3.150 m², Nidakule Ataşehir South), ABB (2.850 m², Hilltown Küçükyalı), Tezman Holding (1.840 m², DLP1) and DHL Logistics (1.212 m², Büyükhanlı Plaza).
The vacancy rate was recorded as 22.5% in 2021 Q2, with a slight decrease.
The sale of 100% shares of AND Anadolu Gayrimenkul Yatırımları A.Ş., which owns AND Plaza, to Quick Sigorta A.Ş. and Corpus Sigorta A.Ş, subsidiary of Maher Yatırım Holding A.Ş. was recorded as the large-scale investment transaction in 2021 Q1. Another major transaction realized was Körfez Enerji Sanayi ve Ticaret A.Ş.’s acquisition of Yeşil REIT’s 50% share in Yeşil Plaza in Zeytinburnu in exchange for TRY 180 million. Investment transactions are anticipated to gain impetus in the medium term.
Upon the completion of the globally important Istanbul International Finance Center (IFC) in 2022, approximately 1.5 million m² of supply will be included in the market. Around 50% of this supply will be used by public banks and financial institutions.
The favorable investment environment is expected to gain momentum in the medium term by opportunistic buyers.
In Q2, 15% Of The Agreements On Square Meter Basis Were Made In The Central Business Area (MIA). 65% Of
The Lease Agreements Were Made On The Anatolian Side Excluding MIA.
Office and Commercial Real Estate 35
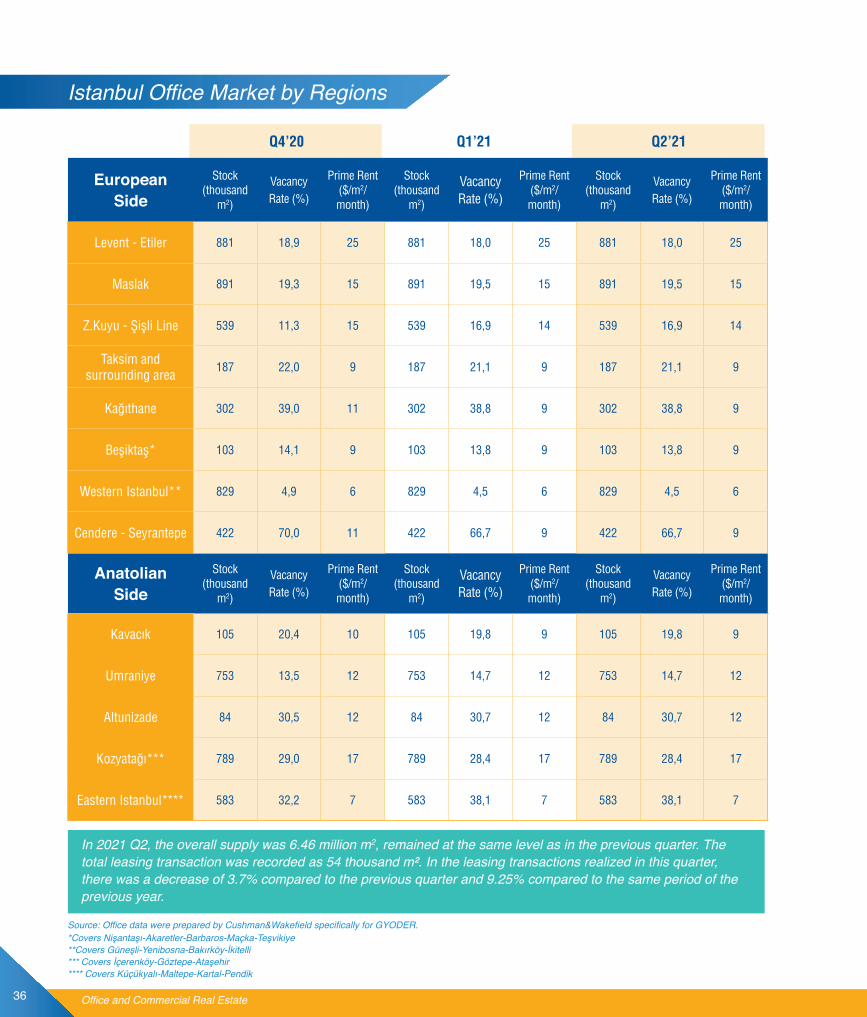
In 2021 Q2, the overall supply was 6.46 million m2, remained at the same level as in the previous quarter. The total leasing transaction was recorded as 54 thousand m². In the leasing transactions realized in this quarter, there was a decrease of 3.7% compared to the previous quarter and 9.25% compared to the same period of the previous year.
EuropeanSide
Stock(thousand
m2)
VacancyRate (%)
Prime Rent($/m2/month)
Stock(thousand
m2)
VacancyRate (%)
Prime Rent($/m2/month)
Stock(thousand
m2)
VacancyRate (%)
Prime Rent($/m2/month)
Levent - Etiler 881 18,9 25 881 18,0 25 881 18,0 25
Maslak 891 19,3 15 891 19,5 15 891 19,5 15
Z.Kuyu - Şişli Line 539 11,3 15 539 16,9 14 539 16,9 14
Taksim andsurrounding area
187 22,0 9 187 21,1 9 187 21,1 9
Kağıthane 302 39,0 11 302 38,8 9 302 38,8 9
Beşiktaş* 103 14,1 9 103 13,8 9 103 13,8 9
Western Istanbul** 829 4,9 6 829 4,5 6 829 4,5 6
Cendere - Seyrantepe 422 70,0 11 422 66,7 9 422 66,7 9
AnatolianSide
Stock(thousand
m2)
VacancyRate (%)
Prime Rent($/m2/month)
Stock(thousand
m2)
VacancyRate (%)
Prime Rent($/m2/month)
Stock(thousand
m2)
VacancyRate (%)
Prime Rent($/m2/month)
Kavacık 105 20,4 10 105 19,8 9 105 19,8 9
Umraniye 753 13,5 12 753 14,7 12 753 14,7 12
Altunizade 84 30,5 12 84 30,7 12 84 30,7 12
Kozyatağı*** 789 29,0 17 789 28,4 17 789 28,4 17
Eastern Istanbul**** 583 32,2 7 583 38,1 7 583 38,1 7
Q4’20 Q2’21Q1’21
Istanbul Office Market by Regions
Office and Commercial Real Estate
*Covers Nişantaşı-Akaretler-Barbaros-Maçka-Teşvikiye**Covers Güneşli-Yenibosna-Bakırköy-İkitelli*** Covers İçerenköy-Göztepe-Ataşehir **** Covers Küçükyalı-Maltepe-Kartal-Pendik
Source: Office data were prepared by Cushman&Wakefield specifically for GYODER.
36

The total leasing transactions in 2021 Q2 was 25 thousand m² and the vacancy rate was recorded as 22.5% in total.
Leasing Q2'20 Q1'21 Q2'21
Total Occurring Take-up Transactions(thousand m2) 59 56 54
Prime Rent (USD/m2/month) 30,0 25,0 25,0
Prime Yield (%) 7,8 7,8 7,8
Stock Vacancy Rate (%) 24,1 22,9 22,5
Office and Commercial Real Estate
Office - Current and Future Stock Information
*It is the average of the rental values in the highest quarter segment excluding extreme values within the actual leasing transactions.
Source: EVA Real Estate Appraisal Consultancy
Source: Office data were prepared by Cushman&Wakefield specifically for GYODER.
6.460 6.460 6.460
2.203 2.203 2.203
0
2.000
4.000
6.000
8.000
Q2'20 Q1'21 Q2'21
1.55
4
1.55
4
1.55
4
Total Stock (thousand m2) Future Supply (Under construction, thousand m2)
Green building Certificate Office Stock (thousand m2)
37
CityCommercial Real
Estate Average Unit Sale Price (TRY/m2)
Shop and Store Average Unit Sale
Price (TRY/m2)
Office AverageUnit Sale Price
(TRY/m2)
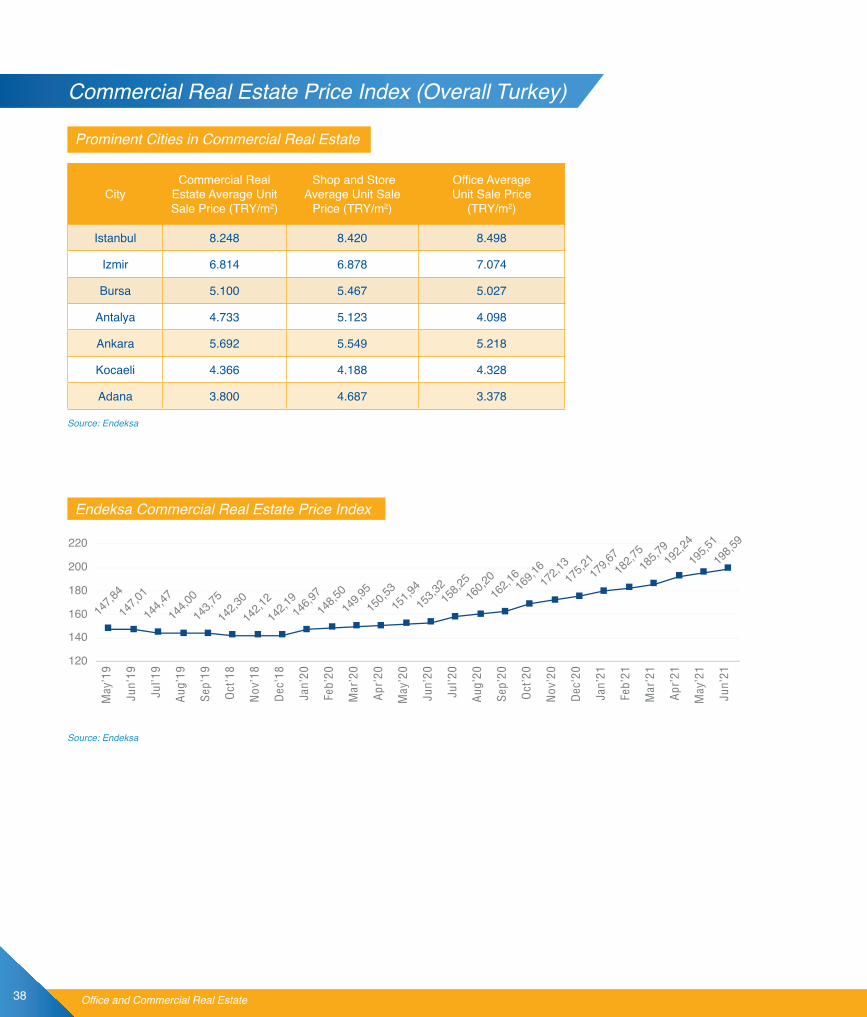
Istanbul 8.248 8.420 8.498
Izmir 6.814 6.878 7.074
Bursa 5.100 5.467 5.027
Antalya 4.733 5.123 4.098
Ankara 5.692 5.549 5.218
Kocaeli 4.366 4.188 4.328
Adana 3.800 4.687 3.378
147,8
4
147,0
1
144,4
7
144,0
0
143,7
5
142,3
0
142,1
214
2,1914
6,9714
8,5014
9,9515
0,5315
1,9415
3,3215
8,2516
0,2016
2,1616
9,1617
2,1317
5,2117
9,6718
2,7518
5,7919
2,24
195,5
1
198,5
9
120
140
160
180
200
220
May
'19
Haz
'19
Tem
’19
Au’
19
Eyl’1
9
Eki’1
9
Kas’
19
Ara’
19
Oca
’20
ub’2
0
Mar
’20
Nis
'20
May
'20
Haz
'20
Tem
’20
Au’
20
Eyl’2
0
Eki’2
0
Kas’
20
Ara’
20
Oca
’21
ub’2
1
Mar
’21
Nis
’21
May
’21
Haz
'21
May
’19
Jun’
19
Jul’1
9
Aug
’19
Sep
’19
Oct
’18
Nov
’18
Dec
’18
Jan’
20
Feb’
20
Mar
’20
Apr
’20
May
’20
Jun’
20
Jul’2
0
Aug
’20
Sep
’20
Oct
’20
Nov
’20
Dec
’20
Jan’
21
Feb’
21
Mar
’21
Apr
’21
May
’21
Jun’
21
Commercial Real Estate Price Index (Overall Turkey)
Prominent Cities in Commercial Real Estate
Endeksa Commercial Real Estate Price Index
Office and Commercial Real Estate
Source: Endeksa
Source: Endeksa
38

198,59
29,53% 98,59%
1,58%
Turkey Commercial Property Index was recorded as 198.59 points as of the end of June 2021.
The index increased by 29.53 points compared to the same month of the previous year, rising by 1.58 points on monthly basis. Starting from 175.21 points in 2021, the index increased by 23.38 points in 6-month period.
141,32 147,01 153,32198,59
0
100
200
Jun’18 Jun’19 Jun’20 Jun’21
Endeksa Commercial Real Estate Price Index (January 2014=100)*
Office and Commercial Real Estate
Source: Endeksa
Index Value: June 2021
Annual Nominal Change (%)
Monthly Nominal Change (%)
Nominal Change According to Start Period
39

SHOPPING MALLS

Istanbul has the majority of the existing supply with a 37% share. On the other hand, 30 shopping malls have a leasable area of nearly 924 thousand m² under construction. With the supply projected to be finalized by the end of 2022, the total supply is expected to exceed 14.5 million m².
When the organized retail density is examined, it is seen that there is 163 m² leasable area per 1.000 people across the country. While Istanbul appears to have twice the density of the country with its 330 m² retail density, Ankara stands out as another city with a retail density of 299 m².
As Of 2021 Q2, The Existing Shopping Mall Supply In Turkey Was Recorded As
13.6 Million m2 In 442 Shopping Malls.
Shopping Malls 41

Kırşehir
Düzce
Eskişehir
Kütahya
Tekirdağ
Çorum
Çanakkale
İzmir
Muğla
Uşak
İçel
Kahramanmaraş
Iğdır
Ağrı
Gümüşhane
Bingöl
Şanlıurfa
Muş
Şırnak
Elazığ
3
4
2
3
19
27
4
3
95
4
610
10
5
7
13
1
3
6
5
47
5
22
3
2
3
2227
2
1
1
2
2
21
7
11
1
1
1
1
1
1
1
1
1
2
11
Batman
1
1
İstanbul
Niğde
132
3
Ankara
44
2
17
Karabük
3
2
95Çankırı
207 232264 296 326 346 364 390 429 453 454 447 442
5.800 6.5337.615 8.229
9.247 10.023 10.799 11.35912.611 13.453 13.508 13.591 13.605
0
200
400
600
800
2009 2010 2011 2012 2013 2014 2015 2016 2017 2018 2019 2020 2021*0
4.000
8.000
12.000
16.000
Opened Shopping Centers (number) Opened GLA (thousand sqm)
151 +
101-150m2
51-100m2
0-50m2
As of 2021 Q2, the total number of shopping malls was 442 and the total leasable area stock reached 13 million 605 thousand m2. Istanbul constitutes approximately 37% of the total leasable area stock. In overall Turkey, the leasable area per 1.000 people is 163 m2.
Growth of Shopping Mall in Turkey
GLA* Volume and Number of Shopping Malls according to Cities
Shopping Malls Opened by Years and GLA
Shopping Malls
Source: Jones Lang Laselle *Shopping mall area per 1,000 persons as of the 2021 Q2
Source: Jones Lang Laselle Shopping Mall definition: Leasable area over 5.000 m2, at least 15 independent sections organized shopping areas that create synergy with centralized and common management approach*End of Q2’21
42

267
248 281
281
303 34
7
311 344
294 321 352
375
340
305
159
40 40
227 30
3
291
293 34
9
313
248
214
236
340
273
187
457
0100200300400500
Ocak ubat Mart Nisan Mayıs Haziran Temmuz A ustos Eylül Ekim Kasım Aralık
2019 2020 2021
Jan Mar Apr May Jun Jul Aug Sep Oct Nov DecFeb
When it is compared with the same period of the previous year, an increase of 107.3% is seen (not inflation-adjusted).
When it is compared with the same period of the previous year, an increase of 95.5% is seen.
Current Status Active Under Construction Total
İstanbulQuantity 132 14 146
TLA (m²) 5.101.005 474.486 5.575.491
AnkaraQuantity 44 3 47
TLA (m²) 1.692.464 107.000 1.799.464
OtherCities
Quantity 266 22 288
TLA (m²) 6.812.275 598.000 7.410.275
TurkeyQuantity 442 39 481
TLA (m²) 13.605.744 1.179.486 14.785.230
New Shopping
Mall Supply
To Be Active At The End Of The Period
Expected to be Completed at the End of the Period
Quantity TLA (m²) Quantity TLA (m²)
2021 455 14.056.744 13 451.000
2022 472 14.529.744 17 473.000
2023 476 14.745.230 8 215.486
Intensity TLA (m²)(Per 1.000 persons)
Istanbul 330
Ankara 299
Other 109
Turkey 163
105
91 99 96 94 104
98 98 91 97 99 104
103
92
50
4 9
43
59 59 55 64 54
3332 35
53
31 24
61
0
50
100
150
Ocak ubat Mart Nisan Mayıs Haziran Temmuz A ustos Eylül Ekim Kasım Aralık
2019 2020 2021
Jan Mar Apr May Jun Jul Aug Sep Oct Nov DecFeb
Retail Turnover Index
Shopping Malls
Source: Jones Lang Laselle *Data of Q2’21
Source: Council of Shopping Centers Turkey
Source: Council of Shopping Centers Turkey
43

TOURISM AND HOTEL

The expenditures of the 12.7 million tourists visiting Turkey in 2020 indicate that an average spending per capita was US$ 716. Considering that the average spending per capita in 2019 was US$ 642, it is seen that per capita expenditures increased within the last year. It is observed that 3.7 million foreign tourists visiting Turkey in 2021 Q2 spent US$ 694 dollars per capita.
According to the data obtained from the Ministry of Culture and Tourism, while the total number of foreign visitors coming to Turkey was nearly 4.5 million in 2020 Q2, it was 5.7 million in 2021 Q2.
In 2021 Q2, 53% of the 5.7 million foreign tourists visiting Turkey came to Istanbul, 10% to Antalya and 2% to Ankara. These three cities were followed by İzmir and Muğla with 1.9% and 0.1%. When the number of tourists is compared with 2020 Q2, it is observed that there is an increase of 27%. Covid-19 outbreak started in China in early February began to show its effect in European countries, especially in Italy as of early March, and then it started to affect Turkey considerably in the second week of March. It can be said that Turkey’s tourism performance, with the increasing number of visitors compared to the previous year, has started to recover.
When the number of facilities with Operation Certificates and Investment Certificates are examined, it is seen that there are 4.260 facilities holding operation certificates with a total capacity of 488 thousand rooms and 606 facilities holding investment certificates with 73 thousand rooms in overall Turkey. Considering the facilities with operation certificates, Antalya has the biggest share with 804 facilities and a room capacity of 214 thousand. It is followed by Istanbul with 652 facilities and a room capacity of 64 thousand and by Muğla with 417 facilities and a room capacity of 51 thousand.
Considering the facilities with investment certificates, Antalya has the biggest share with 101 facilities and 21 thousand rooms among 606 facilities to be included in the existing hotel supply in the near future. It is followed by Istanbul with 75 facilities and a room capacity of 8 thousand and by Muğla with 60 facilities and a room capacity of 7 thousand.
The occupancy rate of facilities with operation certificates in overall Turkey was 58% in 2019, whereas it was 19% in 2020. The city with the highest occupancy rate was Istanbul with 25%, followed by İzmir and Antalya with 23% and 22%. Occupancy rates of Ankara and Muğla were nearly 21% and 16%, respectively. As of the first 5 months of 2021, the occupancy rate of facilities holding operation certificates in overall Turkey was 20.88%.
In 2016, the occupancy rates and prices in Istanbul and other regions experienced a serious decline due to the slowdown in tourism, and then showed an effective recovery between 2017 and 2020, nearing pre-2016 levels. In parallel with the world, hotel performance in Turkey has also been adversely affected by the Covid-19 pandemic since January.
While the occupancy rate for 2020 was calculated as 34% for overall Turkey, the occupancy rate for Istanbul was 37%. While the average room rate in Turkey for the same period was € 58, it was € 78 in Istanbul. In 2021 Q2, the occupancy rate, which was 36% in overall Turkey, was 35% in Istanbul. The average room rate in this period was € 64.9 in overall Turkey and € 76 in Istanbul. It can be said that the negative impact of the Covid-19 pandemic on occupancy and room rates has decreased compared to the previous year.
5.7 Million Foreign Tourists VisitedOur Country In The First Half Of 2021
Tourism And Hotel 45

Yatırım BelgeliThere are 4.260 facilities holding operation certificates with a total capacity of 488 thousand rooms and 606 facilities holding investment certificates with 73 thousand rooms in overall Turkey.
When it is compared with the same period of the previous year, an increase of 95.5% is seen. 47.7% of 5.7 million foreign tourists coming to Turkey in 2021 H1 visited Istanbul, 26.1% came to Antalya and 2.7% to Muğla. These three cities were followed by Izmir and Ankara with 2.1% and 1.7%, respectively. When the number of tourists is compared with 2020 H1, an increase of 27% is observed.
Source: Republic of Turkey Ministry of Culture and Tourism*Q2 data includes January-June period.
Antalya
Muğla
Istanbul
Izmir
Ankara
Other2017
Turkey 32,40
9,40 1,98 10,70 0,76 0,50 9,06
2018
Turkey 39,40
12,40 2,70 13,40 0,95 0,58 9,37
2019
Turkey 45,00
14,60 3,20 14,90 1,20 0,59 10,51
2020
2021*
Turkey 12,70
Turkey 5,70
3,30
1,49
0,67
0,15
5,00
2,72
0,30
0,12
0,18
0,10
3,25
1,12
Facility Room Facility Room
Antalya 804 214.638 101 21.500
Muğla 417 51.537 60 7.058
Istanbul 652 64.241 75 8.207Izmir 225 19.932 33 3.080Ankara 180 14.394 11 1.060
Other 1.982 123.926 326 32.754
Turkey 4.260 488.668 606 73.659
Tourism and Hotel Performance
Total Number of Foreign Visitors (million people)
Tourism And Hotel
Number of Facilities with Investment and Operating Permits
With Operating Permit With Investment Permit
Source: Republic of Turkey Ministry of Culture and Tourism*Updated on 02.08.21
46

The expenditures of the 3.1 million tourists visiting Turkey in 2021 Q2 indicate that an average spending per capita was US$ 694.
Period Total ForeignTourist
Per CapitaExpenditure ($)
Q1’15 4.314.332 884
Q2’15 9.637.458 691
Q3’15 14.761.540 670
Q4’15 6.878.830 737
2015 35.592.160 715
Q1'16 4.014.546 717
Q2'16 6.330.571 602
Q3'16 9.466.509 622
Q4'16 5.453.780 626
2016 25.265.406 633
Q1'17 3.772.293 637
Q2'17 7.675.032 570
Q3'17 13.770.308 634
Q4'17 6.861.894 687
2017 32.079.527 630
Q1'18 4.908.831 682
Q2'18 9.855.102 602
Q3'18 15.904.734 589
Q4'18 8.283.235 649
2018 38.951.902 617
Q1'19 5.460.380 678
Q2'19 11.499.211 607
Q3'19 18.438.139 623
Q4'19 9.315.240 702
2019 44.712.970 642
Q1'20 4.635.845 710
Q2'20
Q3'20 4.430.053 649
Q4'20 3.642.367 804
2020 12.708.265 716
Q1'21 1.826.227 918
Q2'21 3.144.815 694
Total Tourists & Expenditures
Tourism And Hotel
Source: TurkStat*Updated on 02.08.21**Data for 2020 Q2 not published by TUIK yet.
47
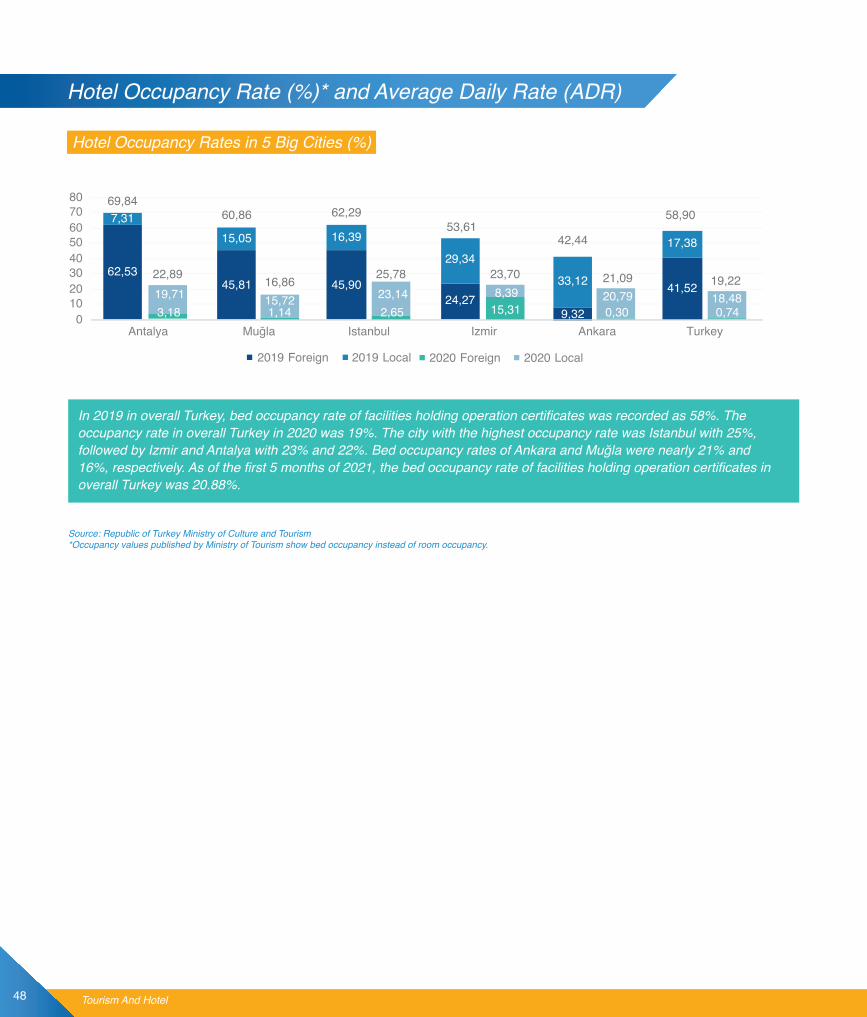
In 2019 in overall Turkey, bed occupancy rate of facilities holding operation certificates was recorded as 58%. The occupancy rate in overall Turkey in 2020 was 19%. The city with the highest occupancy rate was Istanbul with 25%, followed by Izmir and Antalya with 23% and 22%. Bed occupancy rates of Ankara and Muğla were nearly 21% and 16%, respectively. As of the first 5 months of 2021, the bed occupancy rate of facilities holding operation certificates in overall Turkey was 20.88%.
01020304050607080
Antalya Muğla Istanbul Izmir Ankara Turkey
62,53
7,31
45,81
15,05
45,90
16,39
24,27
29,34
9,32
33,12 41,52
17,3842,44
58,9053,61
62,2960,8669,84
22,89
3,1819,71
23,70
15,318,39
25,78
2,6523,14
21,09
0,3020,79
19,22
0,7418,48
16,86
1,1415,72
2019 Foreign 2019 Local 2020 Foreign 2020 Local
Hotel Occupancy Rates in 5 Big Cities (%)
Hotel Occupancy Rate (%)* and Average Daily Rate (ADR)
Tourism And Hotel
Source: Republic of Turkey Ministry of Culture and Tourism*Occupancy values published by Ministry of Tourism show bed occupancy instead of room occupancy.
48
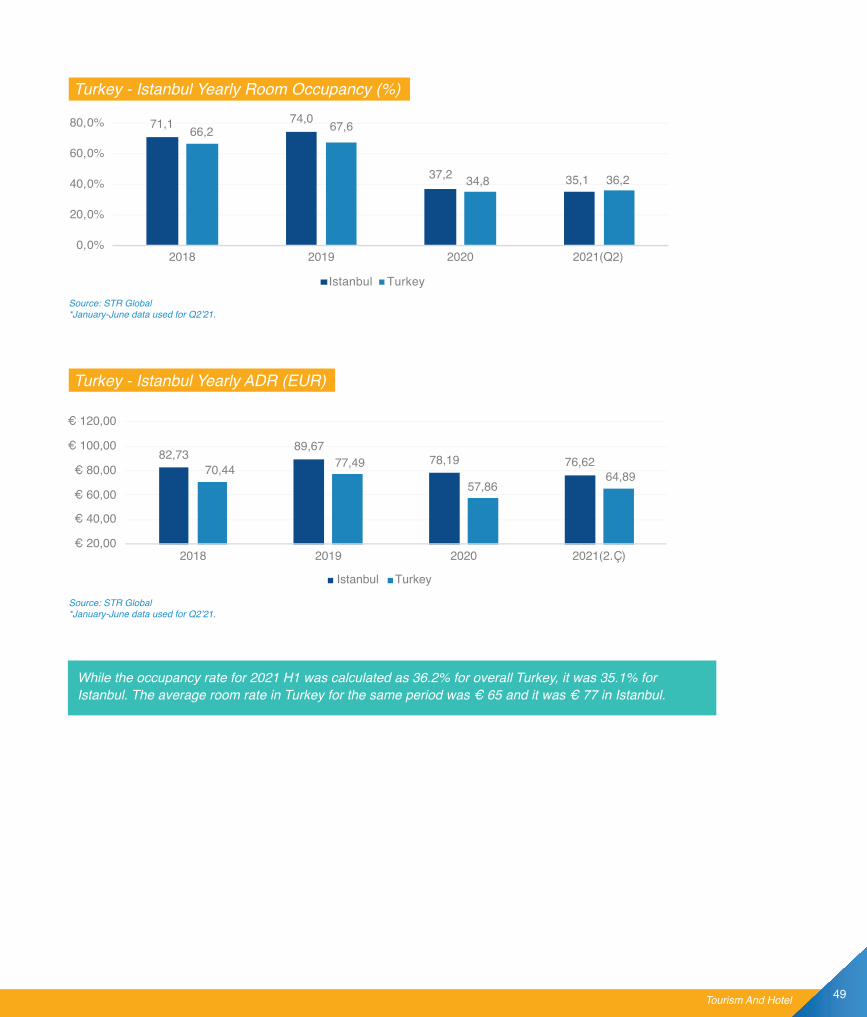
71,1 66,2
0,0%
20,0%
40,0%
60,0%
80,0%
2018 2019 2020 2021(Q2)
Istanbul Turkey
74,0 67,6
37,2 35,1 36,234,8
While the occupancy rate for 2021 H1 was calculated as 36.2% for overall Turkey, it was 35.1% for Istanbul. The average room rate in Turkey for the same period was € 65 and it was € 77 in Istanbul.
82,7389,67
78,19 76,6270,44 77,49
57,8664,89
20,00
40,00
60,00
80,00
100,00
120,00
2018 2019 2020 2021(2.Ç)
Istanbul Turkey
Turkey - Istanbul Yearly Room Occupancy (%)
Turkey - Istanbul Yearly ADR (EUR)
Tourism And Hotel
Source: STR Global*January-June data used for Q2’21.
Source: STR Global*January-June data used for Q2’21.
49

LOGISTICS

According to the available data, there is 6.74 million m2 of logistics supply for commercial use in the total warehouse stock of nearly 10.50 million m2 in the Istanbul-Kocaeli region, which is the primary logistics market. As of 2021 H2, the vacancy rate decreased and was recorded as 11%. The volume of projects under construction was recorded nearly as 558 thousand m2 and almost all of such projects appear to be the logistics supply for commercial use.
Having increased due to the Covid-19 pandemic since 2020, e-commerce continued to maintain its influence in the logistics market in 2021 H1. While leasing transactions were realized at a similar level with the same period of the previous year as 204 thousand m2, the demand for logistics warehouses was
mostly from 3PL (third-party logistics), e-commerce, retail and fast moving consumer goods companies. Due to the limited supply –both existing and under construction- the upward pressure on rental prices in response to high demand in the market is expected to be effective also in H2.
The “urban logistics” concept that steadily became more popular continued its growth in 2021 H1 as the customers of e-commerce continued to expand. Companies offering home delivery service are expanding their distribution networks by increasing the number of warehouses in the city, in addition to their main warehouses, due to their promise to provide fast service to their customers.
In 2021 H1, The Primary Rent Per Square MeterIs At The Level Of US$ 5 And TRY 45.
Logistics 51
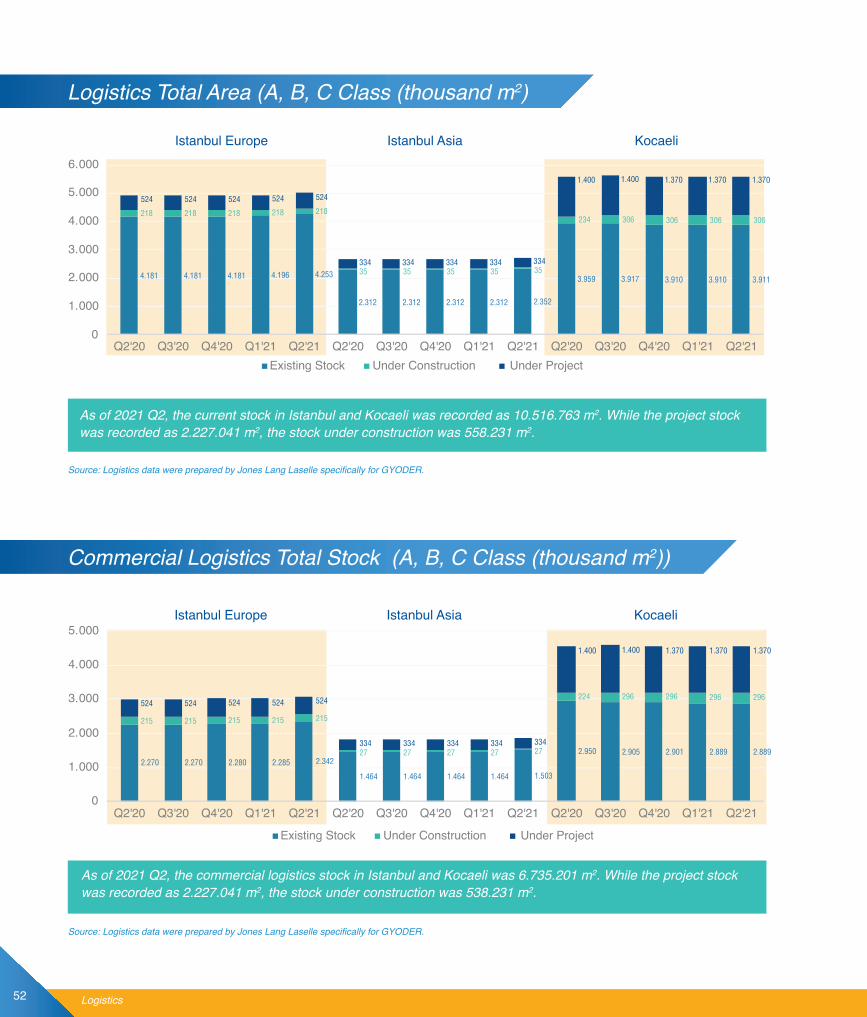
As of 2021 Q2, the current stock in Istanbul and Kocaeli was recorded as 10.516.763 m2. While the project stock was recorded as 2.227.041 m2, the stock under construction was 558.231 m2.
As of 2021 Q2, the commercial logistics stock in Istanbul and Kocaeli was 6.735.201 m2. While the project stock was recorded as 2.227.041 m2, the stock under construction was 538.231 m2.
4.181 4.181 4.181 4.196 4.253
2.312 2.312 2.312 2.312 2.352
3.959 3.917 3.910 3.910 3.911
218 218 218 218 218
35 35 35 35 35
234 306 306 306 306
524 524 524 524 524
334 334 334 334 334
1.400 1.400 1.370 1.370 1.370
0
1.000
2.000
3.000
4.000
5.000
6.000
Q2'20 Q3'20 Q4'20 Q1'21 Q2'21 Q2'20 Q3'20 Q4'20 Q1'21 Q2'21 Q2'20 Q3'20 Q4'20 Q1'21 Q2'21Existing Stock Under Construction Under Project
2.270 2.270 2.280 2.285 2.342
1.464 1.464 1.464 1.464 1.503
2.950 2.905 2.901 2.889 2.889
215 215 215 215 215
27 27 27 27 27
224 296 296 296 296524 524 524 524 524
334 334 334 334 334
1.400 1.400 1.370 1.370 1.370
0
1.000
2.000
3.000
4.000
5.000
Q2'20 Q3'20 Q4'20 Q1'21 Q2'21 Q2'20 Q3'20 Q4'20 Q1'21 Q2'21 Q2'20 Q3'20 Q4'20 Q1'21 Q2'21
Existing Stock Under Construction Under Project
Logistics
Logistics Total Area (A, B, C Class (thousand m2)
Commercial Logistics Total Stock (A, B, C Class (thousand m2))
Istanbul Europe Istanbul Asia Kocaeli
Source: Logistics data were prepared by Jones Lang Laselle specifically for GYODER.
Istanbul Europe Istanbul Asia Kocaeli
Source: Logistics data were prepared by Jones Lang Laselle specifically for GYODER.
52

As of the end of 2021 Q2, 204.266 leasing transactions were realized in Istanbul and Kocaeli.
As of 2021 Q2, 89% of the total logistics stock was used in Istanbul and Kocaeli. This was 88.1% in the same period of the previous year.
139
260
119
490
2438
193
344
205
57
111
6633 24
13890
25 27
89
0
100
200
300
2016 2017 2018 2019 2020 2021
Q1 Q2 Q3 Q4
180
4,6 4,6 4,6 5,0 5,0 5,0 5,04,2
3,2 3,2 3,22,7 2,7 2,7 2,7 2,7
4,4 4,4 4,4 4,3 4,3 4,2 4,2 4,1
0123456
Q3’19 Q4’19 Q1’20 Q2’20 Q3’20 Q4’20 Q1’21 Q2’21
Istanbul Europe Istanbul Asia Kocaeli
Logistics
Total Leasing Transactions (thousand m2)
Free Space Ratio (%)
Source: Logistics data were prepared by Jones Lang Laselle specifically for GYODER.
Source: Logistics data were prepared by Jones Lang Laselle specifically for GYODER.
53

REIF’s

A total of 70 real estate funds received investments, including those still in the issuance period and the ones received investments for the first time. During the period between March and June 2021, the CMB granted the establishment permission for 1 new real estate investment fund, and the approval of issuance certificate for 1 real estate investment fund.
The number of funds with a volume over TRY 10 million has reached 49. The total volume of 2 funds issued in 2016, 7 funds issued in 2017, 16 funds issued in 2018, 10 funds issued in 2019 and 14 funds issued after 2020 exceeded TRY 10 million.
7 real estate investment funds are traded on Borsa Istanbul Offering Market for Qualified Investors (OMQI). Real estate investment funds traded on OMQI are Qinvest Asset Management Re-Pie REIF (QPERP), Re-Pie Asset Management Eurasia Strategic REIF (RPAVS), Fiba Portfolio Management Inc. Re-Pie REIF (FPREP) Albaraka Portfolio Management Batışehir REIF (ALBTS), Albaraka Portfolio Management Dükkân REIF (ALDUK), Albaraka Asset Management One Tower REIF (ALONE), Mükafat Portfolio Management Ataşehir Metropol REIF (MPATA).
The Market Size Of Real Estate Investment FundsIn Turkey Reached TRY 9.8 Billion
As Of The End Of June 2021.
Reif’s 55

0% 5% 10% 15% 20% 25% 30%
Oragon GPY
Kalender GPY
Aura PY
Atlas PY
Oyak PY
24 GGSPY
Ünlü PY
Neo PY
Mükafat PY
Ziraat PY
Akfen GPY
Omurga GGSPY
Arz GGSPY
Re-Pie PY
Ak PY
Albaraka PY
PYİş Asset Management Company
Albaraka Asset Management Company
Ak Asset Management Company
Re-Pie Asset Management Company
Arz Real Estate and PrivateEquity Asset Management Company
Omurga Real Estate and PrivateEquity Asset Management Company
Akfen Real EstateAsset Management Company
Ziraat Asset Management Company
Mükafat Asset Management Company
Neo Asset Management Company
Ünlü Asset Management Company
24 Real Estate and PrivateEquity Asset Management Company
Oyak Asset Management Company
Atlas Asset Management Company
Aura Asset Management Company
Kalender Real EstateAsset Management Company
Oragon Real EstateAsset Management Company
0
2.000.000.000
4.000.000.000
6.000.000.000
8.000.000.000
10.000.000.000
Real Estate Investment Fund Market Size
3.42
7.32
1.68
4
4.94
9.91
6.69
0
5.11
9.95
0.73
8
5.49
9.82
2.91
8
6.15
9.71
0.98
1
6.48
4.52
0.69
3
6.81
6.19
1.62
8
6.97
0.11
6.70
1
8.47
0.05
5.36
7
8.95
6.23
1.02
0
9.81
4.43
8.17
3
Q1'19Q4'18 Q2'19 Q3'19 Q4'19 Q1'20 Q2'20 Q3'20 Q4'20 Q1'21 Q2'21
Reif’s
Real Estate Investment Fund Market Size
Source: PortfolioBase
Source: PortfolioBase
Market Shares of Real Estate Investment Funds Managed by Real Estate Management Companies as per their Volume
56
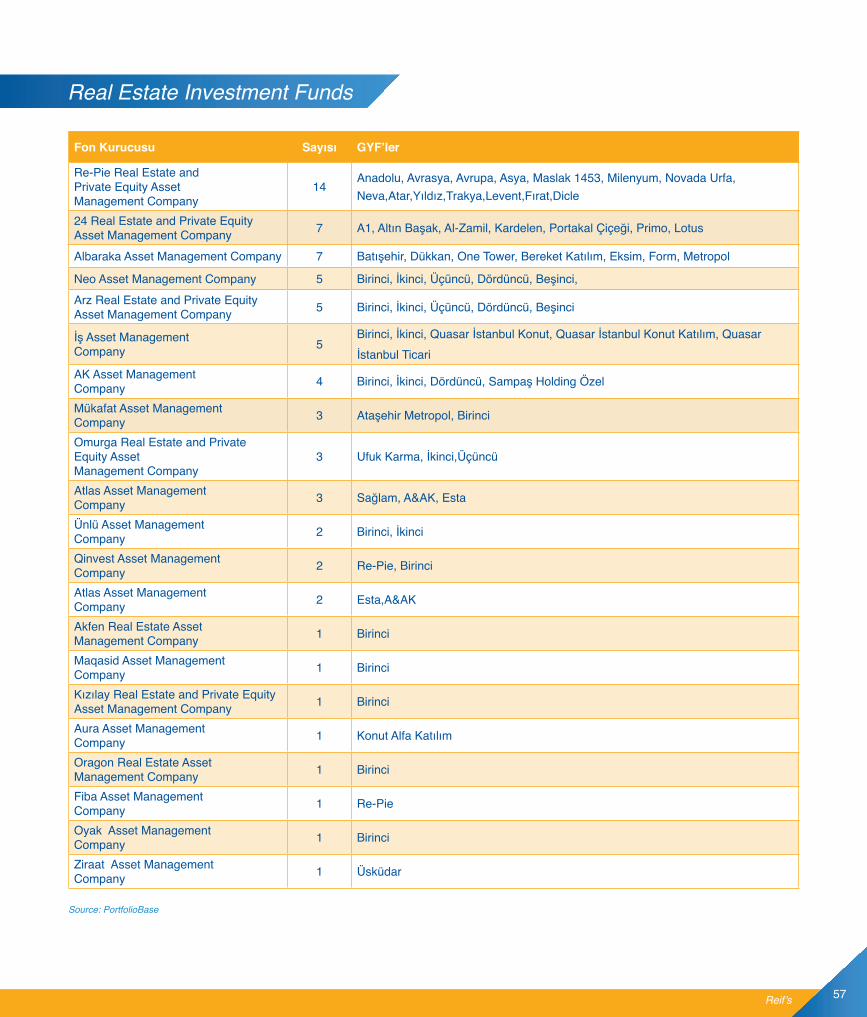
Fon Kurucusu Sayısı GYF’ler
Re-Pie Real Estate and Private Equity Asset Management Company
14Anadolu, Avrasya, Avrupa, Asya, Maslak 1453, Milenyum, Novada Urfa, Neva,Atar,Yıldız,Trakya,Levent,Fırat,Dicle
24 Real Estate and Private Equity Asset Management Company 7 A1, Altın Başak, Al-Zamil, Kardelen, Portakal Çiçeği, Primo, Lotus
Albaraka Asset Management Company 7 Batışehir, Dükkan, One Tower, Bereket Katılım, Eksim, Form, Metropol
Neo Asset Management Company 5 Birinci, İkinci, Üçüncü, Dördüncü, Beşinci,Arz Real Estate and Private Equity Asset Management Company 5 Birinci, İkinci, Üçüncü, Dördüncü, Beşinci
İş Asset Management Company 5
Birinci, İkinci, Quasar İstanbul Konut, Quasar İstanbul Konut Katılım, Quasar İstanbul Ticari
AK Asset Management Company 4 Birinci, İkinci, Dördüncü, Sampaş Holding Özel
Mükafat Asset Management Company 3 Ataşehir Metropol, Birinci
Omurga Real Estate and Private Equity Asset Management Company
3 Ufuk Karma, İkinci,Üçüncü
Atlas Asset Management Company 3 Sağlam, A&AK, Esta
Ünlü Asset Management Company 2 Birinci, İkinci
Qinvest Asset Management Company 2 Re-Pie, Birinci
Atlas Asset Management Company 2 Esta,A&AK
Akfen Real Estate Asset Management Company 1 Birinci
Maqasid Asset Management Company 1 Birinci
Kızılay Real Estate and Private Equity Asset Management Company 1 Birinci
Aura Asset Management Company 1 Konut Alfa Katılım
Oragon Real Estate Asset Management Company 1 Birinci
Fiba Asset Management Company 1 Re-Pie
Oyak Asset Management Company 1 Birinci
Ziraat Asset Management Company 1 Üsküdar
Reif’s
Real Estate Investment Funds
Source: PortfolioBase
57
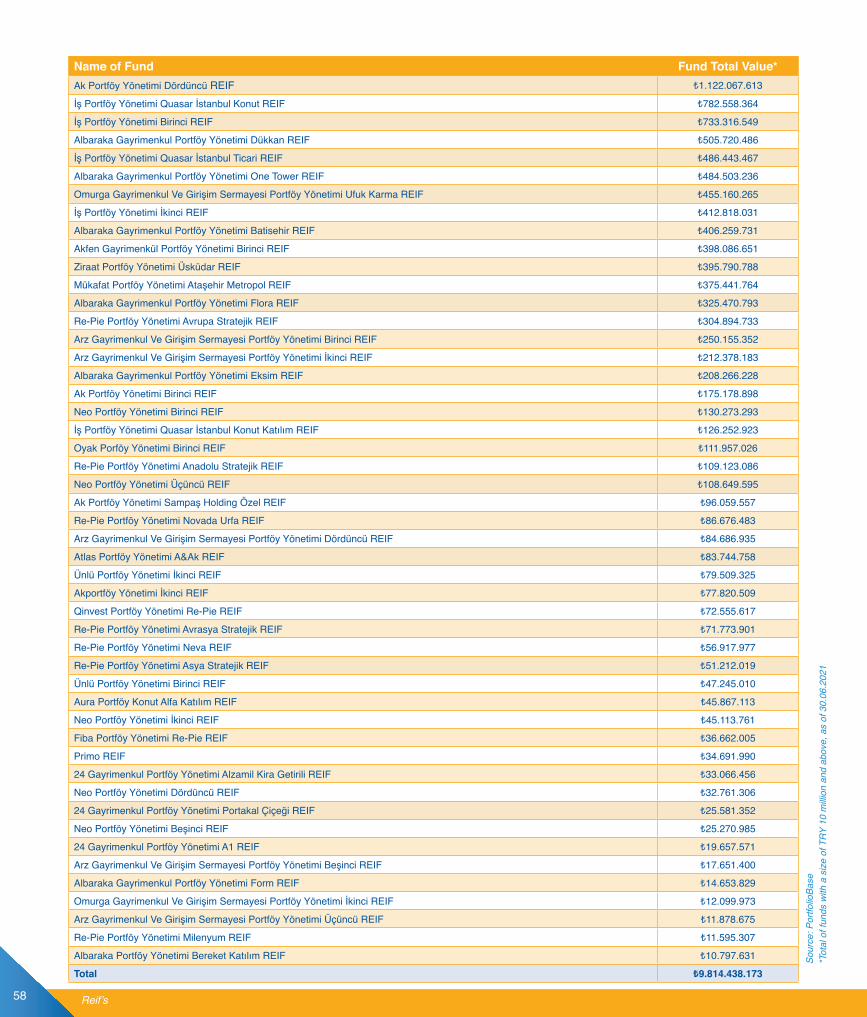
Name of Fund Fund Total Value*Ak Portföy Yönetimi Dördüncü REIF ₺1.122.067.613
İş Portföy Yönetimi Quasar İstanbul Konut REIF ₺782.558.364
İş Portföy Yönetimi Birinci REIF ₺733.316.549
Albaraka Gayrimenkul Portföy Yönetimi Dükkan REIF ₺505.720.486
İş Portföy Yönetimi Quasar İstanbul Ticari REIF ₺486.443.467
Albaraka Gayrimenkul Portföy Yönetimi One Tower REIF ₺484.503.236
Omurga Gayrimenkul Ve Girişim Sermayesi Portföy Yönetimi Ufuk Karma REIF ₺455.160.265
İş Portföy Yönetimi İkinci REIF ₺412.818.031
Albaraka Gayrimenkul Portföy Yönetimi Batisehir REIF ₺406.259.731
Akfen Gayrimenkül Portföy Yönetimi Birinci REIF ₺398.086.651
Ziraat Portföy Yönetimi Üsküdar REIF ₺395.790.788
Mükafat Portföy Yönetimi Ataşehir Metropol REIF ₺375.441.764
Albaraka Gayrimenkul Portföy Yönetimi Flora REIF ₺325.470.793
Re-Pie Portföy Yönetimi Avrupa Stratejik REIF ₺304.894.733
Arz Gayrimenkul Ve Girişim Sermayesi Portföy Yönetimi Birinci REIF ₺250.155.352
Arz Gayrimenkul Ve Girişim Sermayesi Portföy Yönetimi İkinci REIF ₺212.378.183
Albaraka Gayrimenkul Portföy Yönetimi Eksim REIF ₺208.266.228
Ak Portföy Yönetimi Birinci REIF ₺175.178.898
Neo Portföy Yönetimi Birinci REIF ₺130.273.293
İş Portföy Yönetimi Quasar İstanbul Konut Katılım REIF ₺126.252.923
Oyak Porföy Yönetimi Birinci REIF ₺111.957.026
Re-Pie Portföy Yönetimi Anadolu Stratejik REIF ₺109.123.086
Neo Portföy Yönetimi Üçüncü REIF ₺108.649.595
Ak Portföy Yönetimi Sampaş Holding Özel REIF ₺96.059.557
Re-Pie Portföy Yönetimi Novada Urfa REIF ₺86.676.483
Arz Gayrimenkul Ve Girişim Sermayesi Portföy Yönetimi Dördüncü REIF ₺84.686.935
Atlas Portföy Yönetimi A&Ak REIF ₺83.744.758
Ünlü Portföy Yönetimi İkinci REIF ₺79.509.325
Akportföy Yönetimi İkinci REIF ₺77.820.509
Qinvest Portföy Yönetimi Re-Pie REIF ₺72.555.617
Re-Pie Portföy Yönetimi Avrasya Stratejik REIF ₺71.773.901
Re-Pie Portföy Yönetimi Neva REIF ₺56.917.977
Re-Pie Portföy Yönetimi Asya Stratejik REIF ₺51.212.019
Ünlü Portföy Yönetimi Birinci REIF ₺47.245.010
Aura Portföy Konut Alfa Katılım REIF ₺45.867.113
Neo Portföy Yönetimi İkinci REIF ₺45.113.761
Fiba Portföy Yönetimi Re-Pie REIF ₺36.662.005
Primo REIF ₺34.691.990
24 Gayrimenkul Portföy Yönetimi Alzamil Kira Getirili REIF ₺33.066.456
Neo Portföy Yönetimi Dördüncü REIF ₺32.761.306
24 Gayrimenkul Portföy Yönetimi Portakal Çiçeği REIF ₺25.581.352
Neo Portföy Yönetimi Beşinci REIF ₺25.270.985
24 Gayrimenkul Portföy Yönetimi A1 REIF ₺19.657.571
Arz Gayrimenkul Ve Girişim Sermayesi Portföy Yönetimi Beşinci REIF ₺17.651.400
Albaraka Gayrimenkul Portföy Yönetimi Form REIF ₺14.653.829
Omurga Gayrimenkul Ve Girişim Sermayesi Portföy Yönetimi İkinci REIF ₺12.099.973
Arz Gayrimenkul Ve Girişim Sermayesi Portföy Yönetimi Üçüncü REIF ₺11.878.675
Re-Pie Portföy Yönetimi Milenyum REIF ₺11.595.307
Albaraka Portföy Yönetimi Bereket Katılım REIF ₺10.797.631
Total ₺9.814.438.173
Sour
ce: P
ortfo
lioBa
se*T
otal
of f
unds
with
a s
ize
of T
RY 1
0 m
illion
and
abo
ve, a
s of
30.
06.2
021
Reif’s58

%19,18
%49,71
%20,03
%8,26
%1,96
%0,52
%0,34
Housing
LandFuel
School
Office
Mixed
Shopping Mall/Retail
ALBARAKA PY BATIŞEHİR REIFRE-PIE AVRASYA STRATEJİK REIFFİBA PORTFÖY YÖNETİMİ RE-PIE REIF
QINVEST PY RE-PIE REIF MUKAFAT ATAŞEHIR METROPOL REIFALBARAKA PY DÜKKAN REIF ALBARAKA PY ONE TOWER REIF
1000
1100
1200
1300
1400
1500
1600
1700
29.1
1.20
1722
.12.
2017
17.0
1.20
1809
.02.
2018
06.0
3.20
1829
.03.
2018
24.0
4.20
1818
.05.
2018
12.0
6.20
1806
.07.
2018
31.0
7.20
1829
.08.
2018
24.0
9.20
1817
.10.
2018
12.1
1.20
1805
.12.
2018
28.1
2.20
1815
.02.
2019
12.0
3.20
1904
.04.
2019
30.0
4.20
1924
.05.
2019
21.0
6.20
1917
.07.
2019
9.08
.201
99.
09.2
019
2.10
.201
925
.10.
2019
20.1
1.20
1913
.12.
2019
8.01
.202
031
.01.
2020
25.0
2.20
2019
.03.
2020
13.0
4.20
208.
05.2
020
5.06
.202
030
.06.
2020
24.0
7.20
2020
.08.
2020
14.0
9.20
207.
10.2
020
2.11
.202
025
.11.
2020
18.1
2.20
2013
.01.
2021
5.02
.202
12.
03.2
021
25.0
3.20
2119
.04.
2021
17.0
5.20
2110
.06.
2021
Strategic Breakdown of Real Estate Investment Funds
Performance of Publicly-Traded REIFs
Source: PortfolioBase, KAP
Source: Borsa İstanbul
Reif’s 59

REIT’s
With the 2 new REITs established in 2021 Q2, the number of REITs in Turkey rose to 35 after a long time, and the total market capitalization of REITs reached TRY 63.7 billion. The pullback in the indexes that started in February continued in Q2, and the index dropped to 551 points at the end of Q2, with a loss of 13.23% compared to Q1, which it closed at 635 points. The volatility in the exchange rates, the increase in inflation and the high interest rate, the uncertainties due to the new Covid-19 variants in the markets continue to pose a risk both to the overall economy and to the real estate sector.
In 2021 Q2, we see that the tradeable shares rate has decreased to 48.8% and the active circulation rate to 26.6%. On the other hand, the fact that the total market capitalization of REITs has increased with the inclusion of newly established companies and that the total amount of dividends distributed in 2021 H1 (TRY 367.1 million) exceeded the total amount distributed in 2020 (TRY 358.9 million) has been a positive impact on the sector.
In 2021 Q2, the ratio of institutional investors rose to 51.3%, but the foreign transaction volume by nationality remained at 16% on a quarterly basis and 21% on a half-yearly basis. From a market capitalization perspective, the fact that the foreign ratio decreased to the level of 9% shows us the insufficiency of foreign investors in terms of the REIT sector as well as the stock market in general. In the ranking of foreign investors, the U.S. took over the first place from the Netherlands, and other countries in the top 5 list are the United Kingdom, Bahrain and the Virgin Islands (British).
New public offerings in the near future, minimization of Covid-19 uncertainties with the rise in vaccination rates, increase in the appetite of foreign investors with the expectations of normalization process in the economy in the second half of the year, and strategies that can be carried out jointly with other real estate capital market instruments may lead to positive developments for the future of the sector.
In 2021 Q2, The Number Of REITs Was Recorded As 35 And The Market Value As TRY 63.7 Billion
Reit’s 61
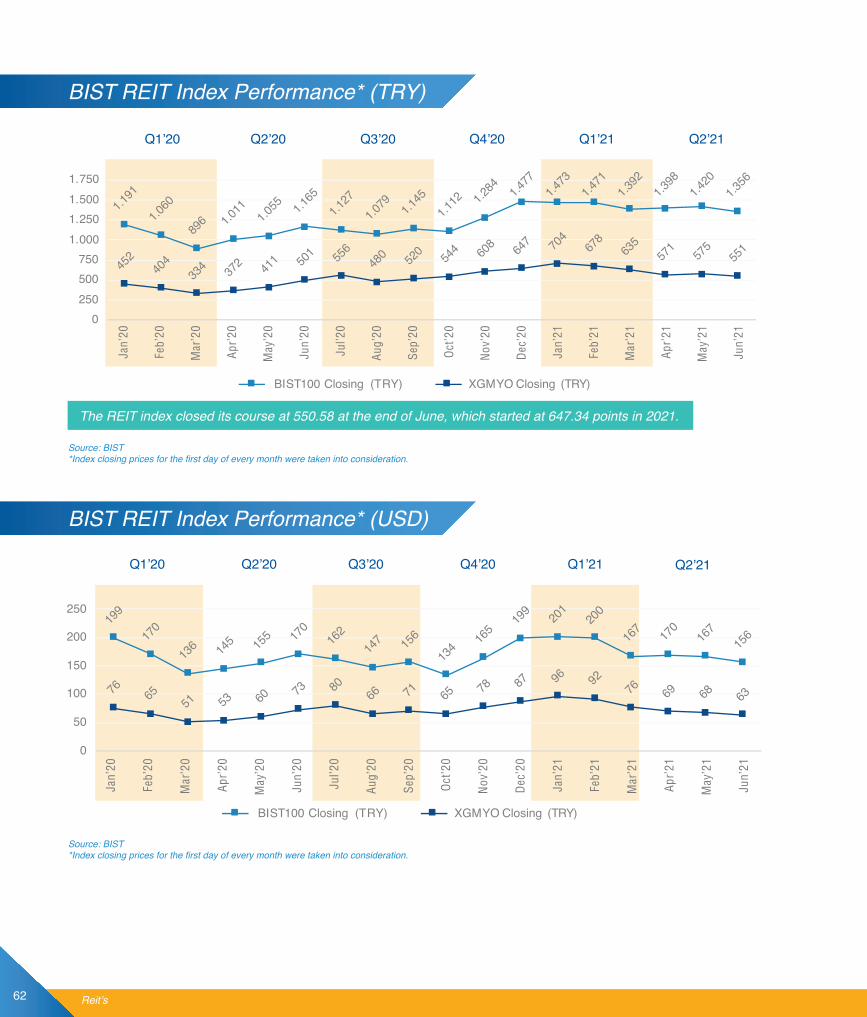
1.191
1.060
896 1.0
111.0
55 1.165
1.127
1.079 1.1
451.1
12 1.284 1.4
771.4
731.4
711.3
921.3
981.4
201.3
56
452
404
334 37
2 411 50
1 556
480 52
0 544 60
8 647 70
467
863
557
157
555
1
0250500750
1.0001.2501.5001.750
Jan’
20
Feb’
20
Mar
’20
Apr’
20
May
’20
Jun’
20
Jul’2
0
Aug’
20
Sep’
20
Oct
’20
Nov
’20
Dec
’20
Jan’
21
Feb’
21
Mar
’21
Apr’
21
May
’21
Jun’
21
BIST100 Closing (TRY) XGMYO Closing (TRY)
Q1’20 Q2’20
Q1’20 Q1’21 Q2’21Q2’20 Q3’20 Q4’20
Q3’20 Q1’21 Q2’21Q4’20
The REIT index closed its course at 550.58 at the end of June, which started at 647.34 points in 2021.
BIST REIT Index Performance* (TRY)
BIST REIT Index Performance* (USD)
Reit’s
Source: BIST*Index closing prices for the first day of every month were taken into consideration.
Source: BIST*Index closing prices for the first day of every month were taken into consideration.
199
170
136 14
5 155 17
016
214
7 156
134
165
199 20
120
0
167 17
016
715
6
76 65 51 53 60 73 8066 71 65 78 87 96 92
76 69 68 63
0
50
100
150
200
250
Jan’
20
Feb’
20
Mar
’20
Apr’
20
May
’20
Jun’
20
Jul’2
0
Aug’
20
Sep’
20
Oct
’20
Nov
’20
Dec
’20
Jan’
21
Feb’
21
Mar
’21
Apr’
21
May
’21
Jun’
21
BIST100 Closing (TRY) XGMYO Closing (TRY)
62

60% 62% 55% 55% 54%
26%14%
1% 1% 6%0%
20%
40%
60%
80%
Q1’19 Q2’19 Q3’19 Q4’19 Q1’20 Q2’20 Q3’20 Q4’20 Q1’21 Q2’21
REIT Stock Discount Rate
REIT Stock Discount Rate
Liquidity Ratio
2012 2013 2014 2015 2016 2017 2018 2019 2020 2021-Q1 2021-Q2
25% 37% 37% 42% 39% 39% 38% 36% 32% 31% 27%
2012 2013 2014 2015 2016 2017 2018 2019 2020 2021-Q1 2021-Q2
38% 51% 52% 52% 51% 50% 53% 53% 53% 56% 49%
Tradable Shares Rate
2012 2013 2014 2015 2016 2017 2018 2019 2020 2021-Q1 2021-Q2
273,15 -210,40 142,56 -18,63 130,01 -143,63 -38,81 -82,44 -145,12 -68,25 -19,57
Foreign Investor Transactions - Net Inflow, Outflow (Million US$)
Number of REITs in BIST
2012 2013 2014 2015 2016 2017 2018 2019 2020 2021-Q1 2021-Q2
26 30 31 31 32 31 33 33 33 33 35
Reit’s
Source: Central Securities Depository Institution (CSD)All data obtained from CSD
63

Years 2013 2014 2015 2016 2017 2018 2019 2020 2021-Q1 2021-Q2
Foreign 1.390 1.406 1.402 1.378 1.250 1.053 1.096 1.640 1.783 1.867
Local 143.312 134.521 132.375 129.320 145.995 154.833 181.382 357.362 400.657 467.765
Total 144.702 135.927 133.777 130.698 147.245 155.886 182.478 359.002 402.440 469.632
Years 2013 2014 2015 2016 2017 2018 2019 2020 2021-Q1 2021-Q2
Foreign 3.673 4.875 4.601 5.618 5.040 3.045 3.184 4.004 3.234 2.627
Local 5.595 6.452 6.619 7.453 8.554 6.648 11.512 24.789 29.229 28.259
Total 9.268 11.328 11.221 13.071 13.594 9.693 14.696 28.794 32.463 30.886
Number Of Investors On The Basis Of Nationality (Qty)
Market Values on Nationality Basis (Million TRY)
Transaction Volumes (Million)*
Value 2013 2014 2015 2016 2017 2018 2019 2020 2021-Q1 2021-Q2
Transaction Amount 15.669 18.255 14.587 15.356 32.351 26.701 48.836 189.698 59.000 27.922
Transaction Value (TRY) 34.113 38.088 33.581 37.003 74.348 49.174 70.436 445.147 173.392 64.138
Transaction Value (USD) 17.496 17.427 12.519 12.334 20.464 11.230 12.376 62.354 23.658 7.666
Years 2013 2014 2015 2016 2017 2018 2019 2020 2021-Q1 2021-Q2
Foreign 16% 18% 22% 20% 14% 16% 11% 16% 23% 16%
Local 84% 82% 78% 80% 86% 84% 89% 84% 77% 84%
Transaction Volume Distribution On The Basis Of Nationality
2012 2013 2014 2015 2016 2017 2018 2019 2020 2021-Q1 2021-Q2
8.888 8.505 9.339 7.356 7.231 7.138 3.481 4.676 7.379 6.935 7.268
Market Capitalization (Million US$)
2012 2013 2014 2015 2016 2017 2018 2019 2020 2020-Q1 2020-Q2
15.800 18.119 21.731 21.465 25.447 26.924 18.384 27.777 54.163 57.745 63.273
Market Capitalization (Million TRY)
*CBRT buying rate on the trading day is used for the calculation of the USD value.
Source: Central Securities Depository Institution (CSD)All data obtained from CSD
Reit’s64
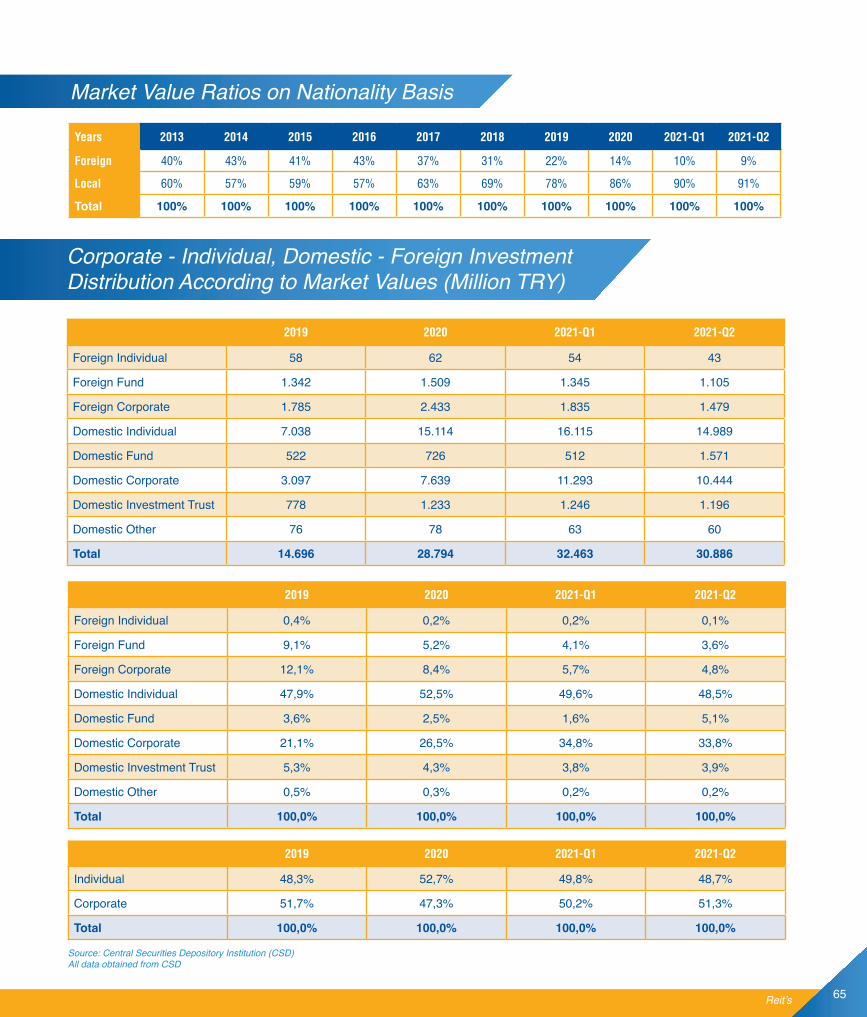
Corporate - Individual, Domestic - Foreign Investment Distribution According to Market Values (Million TRY)
2019 2020 2021-Q1 2021-Q2
Foreign Individual 58 62 54 43
Foreign Fund 1.342 1.509 1.345 1.105
Foreign Corporate 1.785 2.433 1.835 1.479
Domestic Individual 7.038 15.114 16.115 14.989
Domestic Fund 522 726 512 1.571
Domestic Corporate 3.097 7.639 11.293 10.444
Domestic Investment Trust 778 1.233 1.246 1.196
Domestic Other 76 78 63 60
Total 14.696 28.794 32.463 30.886
2019 2020 2021-Q1 2021-Q2
Foreign Individual 0,4% 0,2% 0,2% 0,1%
Foreign Fund 9,1% 5,2% 4,1% 3,6%
Foreign Corporate 12,1% 8,4% 5,7% 4,8%
Domestic Individual 47,9% 52,5% 49,6% 48,5%
Domestic Fund 3,6% 2,5% 1,6% 5,1%
Domestic Corporate 21,1% 26,5% 34,8% 33,8%
Domestic Investment Trust 5,3% 4,3% 3,8% 3,9%
Domestic Other 0,5% 0,3% 0,2% 0,2%
Total 100,0% 100,0% 100,0% 100,0%
2019 2020 2021-Q1 2021-Q2
Individual 48,3% 52,7% 49,8% 48,7%
Corporate 51,7% 47,3% 50,2% 51,3%
Total 100,0% 100,0% 100,0% 100,0%
Market Value Ratios on Nationality Basis
Years 2013 2014 2015 2016 2017 2018 2019 2020 2021-Q1 2021-Q2
Foreign 40% 43% 41% 43% 37% 31% 22% 14% 10% 9%
Local 60% 57% 59% 57% 63% 69% 78% 86% 90% 91%
Total 100% 100% 100% 100% 100% 100% 100% 100% 100% 100%
Source: Central Securities Depository Institution (CSD)All data obtained from CSD
Reit’s 65
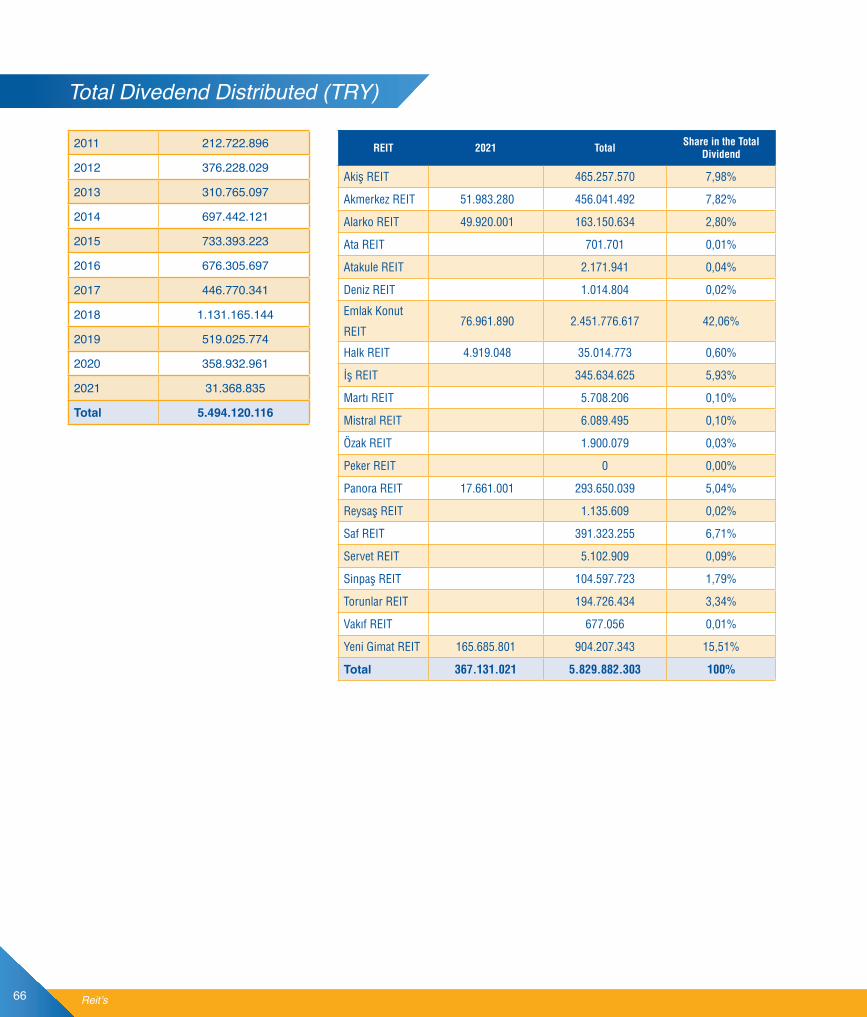
2011 212.722.896
2012 376.228.029
2013 310.765.097
2014 697.442.121
2015 733.393.223
2016 676.305.697
2017 446.770.341
2018 1.131.165.144
2019 519.025.774
2020 358.932.961
2021 31.368.835
Total 5.494.120.116
Total Divedend Distributed (TRY)
REIT 2021 Total Share in the Total Dividend
Akiş REIT 465.257.570 7,98%
Akmerkez REIT 51.983.280 456.041.492 7,82%
Alarko REIT 49.920.001 163.150.634 2,80%
Ata REIT 701.701 0,01%
Atakule REIT 2.171.941 0,04%
Deniz REIT 1.014.804 0,02%
Emlak Konut
REIT 76.961.890 2.451.776.617 42,06%
Halk REIT 4.919.048 35.014.773 0,60%
İş REIT 345.634.625 5,93%
Martı REIT 5.708.206 0,10%
Mistral REIT 6.089.495 0,10%
Özak REIT 1.900.079 0,03%
Peker REIT 0 0,00%
Panora REIT 17.661.001 293.650.039 5,04%
Reysaş REIT 1.135.609 0,02%
Saf REIT 391.323.255 6,71%
Servet REIT 5.102.909 0,09%
Sinpaş REIT 104.597.723 1,79%
Torunlar REIT 194.726.434 3,34%
Vakıf REIT 677.056 0,01%
Yeni Gimat REIT 165.685.801 904.207.343 15,51%
Total 367.131.021 5.829.882.303 100%
Reit’s66

Top 10 Countries as per the Addresses of Foreign Investors
30.09.2020
Country of Investor Market Value (TL)
The Netherlands 1.474.582.621
United States of America 944.991.624
United Kingdom 508.680.549
Bahrein 150.510.000
Kuwait 98.708.695
Afghanistan 72.241.766
Ireland 66.676.437
Luxemburg 59.381.422
Canada 57.016.006
Virjin Islands (England) 53.726.431
31.12.2020
Country of Investor Market Value (TL)
United States of America 1.177.112.277
The Netherlands 1.116.808.634
United Kingdom 596.023.751
Bahrein 186.180.000
Kuwait 159.838.610
Afghanistan 83.955.555
Ireland 75.243.638
Jersey 72.438.347
Luxemburg 71.788.442
Virjin Islands (England) 58.624.950
31.03.2021 30.06.2021
Country of Investor Market Value (TL)
The Netherlands 911.187.511
United States of America 892.879.780
United Kingdom 501.437.920
Bahrein 166.170.000
Kuwait 155.343.059
Virjin Islands (England) 130.166.798
Switzerland 74.623.485
Luxemburg 67.548.972
Jersey 45.543.108
Ireland 37.884.897
Country of Investor Market Value (TL)
United States of America 818.029.886
The Netherlands 713.114.992
United Kingdom 325.631.800
Bahrein 162.690.000
Virjin Islands (England) 111.895.502
Luxemburg 63.764.486
Switzerland 55.895.262
Ireland 44.708.220
Jersey 41.539.761
Poland 40.152.608
67Reit’s

TOR
UN
LAR
REI
TTR
GYO
2,85
21%
2.85
0.00
060
1.81
667
%
PEKE
R R
EIT
PEKG
Y1,
0060
%25
3.00
015
2.86
263
%
ÖZA
K R
EIT
OZK
GY
3,86
23%
1.40
5.04
032
5.36
362
%
AKİŞ
REI
TAK
SGY
1,77
45%
1.42
4.85
063
8.24
760
%
İŞ R
EIT
ISG
YO1,
8841
%1.
802.
450
737.
820
56%
REY
SAŞ
REI
TRY
GYO
4,04
38%
993.
840
377.
288
53%
EMLA
K KO
NU
T R
EIT
EKG
YO1,
8751
%7.
106.
000
3.59
9.83
953
%
PAN
OR
A R
EIT
PAG
YO6,
1445
%53
4.18
024
0.06
942
%
ALAR
KO R
EIT
ALG
YO19
,98
49%
1.28
6.71
262
6.41
033
%
VAKI
F R
EIT
VKG
YO1,
4431
%1.
440.
000
452.
986
29%
AKFE
N R
EIT
AKFG
Y3,
7013
%1.
275.
191
161.
742
16%
HAL
K R
EIT
HLG
YO2,
4821
%2.
529.
600
521.
961
14%
KİLE
R R
EIT
KLG
YO1,
7647
%1.
091.
200
508.
449
13%
MAR
TI R
EIT
MR
GYO
1,06
59%
153.
818
91.4
4412
%
ÖZD
ERİC
İ REI
TO
ZGYO
1,51
49%
377.
500
185.
171
11%
AVR
ASYA
REI
TAV
GYO
2,45
87%
273.
420
238.
013
1%
ATAK
ULE
REI
TAG
YO2,
0318
%53
4.58
094
.764
-2%
YEN
İ GİM
AT R
EIT
YGG
YO13
,93
82%
2.24
6.63
01.
842.
937
-5%
ZİR
AAT
REI
TZR
GYO
1,60
5%7.
509.
792
383.
530
-7%
DEN
İZ R
EIT
DZG
YO1,
8325
%73
2.00
018
2.48
0-1
6%
PER
A R
EIT
PEG
YO1,
2598
%17
8.20
017
4.23
7-4
4%
SİN
PAŞ
REI
TSN
GYO
4,15
31%
3.62
3.75
31.
117.
486
-87%
MİS
TRAL
REI
TM
SGYO
4,54
24%
609.
356
145.
226
-110
%
SER
VET
REI
TSR
VGY
79,5
511
%4.
136.
600
442.
275
-121
%
KOR
AY R
EIT
KGYO
5,43
45%
217.
200
96.7
19-1
58%
KÖR
FEZ
REI
TKR
GYO
5,18
22%
341.
880
74.6
98-1
80%
ATA
REI
TAT
AGY
3,45
73%
81.9
3860
.167
-186
%
TSKB
REI
TTS
GYO
2,94
11%
1.47
0.00
015
8.00
6-2
29%
BAŞK
ENT
REI
TBA
SGZ
11,3
210
%7.
924.
000
821.
558
-278
%
İDEA
LİST
REI
TID
GYO
5,88
76%
58.8
0044
.682
-329
%
TREN
D R
EIT
TDG
YO7,
0036
%21
0.00
075
.403
-330
%
DO
ĞU
Ş R
EIT
DG
GYO
7,86
6%2.
609.
581
144.
379
-425
%
AKM
ERKE
Z R
EIT
AKM
GY
40,9
87%
1.52
7.07
910
9.45
2-6
94%
NU
RO
L R
EIT
NU
GYO
12,6
226
%3.
914.
724
1.01
2.15
7-1
445%
YEŞİ
L R
EIT
YGYO
1,06
84%
249.
223
208.
841
-
TOTA
L TR
Y26
%62
.972
.137
16.6
48.4
756,
2%
TOTA
L U
S$7.
254.
604
1.91
7.96
1
Shar
e Pr
ices
And
Mar
ket C
apiti
lazi
ton
of R
EITs
- 30
.06.
2021
Sour
ce: C
entra
l Sec
uriti
es D
epos
itory
Inst
itutio
n (C
SD)
Con
solid
ated
fina
ncia
l sta
tem
ents
of c
ompa
nies
that
ann
ounc
e co
nsol
idat
ed fi
nanc
ial s
tate
men
ts a
nd s
olo
finan
cial
sta
tem
ents
of c
ompa
nies
that
do
not a
nnou
nce
cons
olid
ated
fina
ncia
l sta
tem
ents
are
use
d.Th
e ex
chan
ge ra
te is
the
CBR
T U
SD b
uyin
g ra
te a
t the
end
of J
une
2021
.*D
isco
unt o
f the
mar
ket v
alue
acc
ordi
ng to
the
equi
ty a
t the
end
of t
he y
ear.
Neg
ativ
e va
lue
prem
ium
rate
.
Clos
ing
Pric
eSy
mbo
lAc
tual
Cir
cula
tion
Rat
e (%
) M
arke
t Va
lue
Mar
ket V
alue
in A
ctua
l Cir
cula
tion
Rat
e of
Dis
coun
t*
Reit’s68
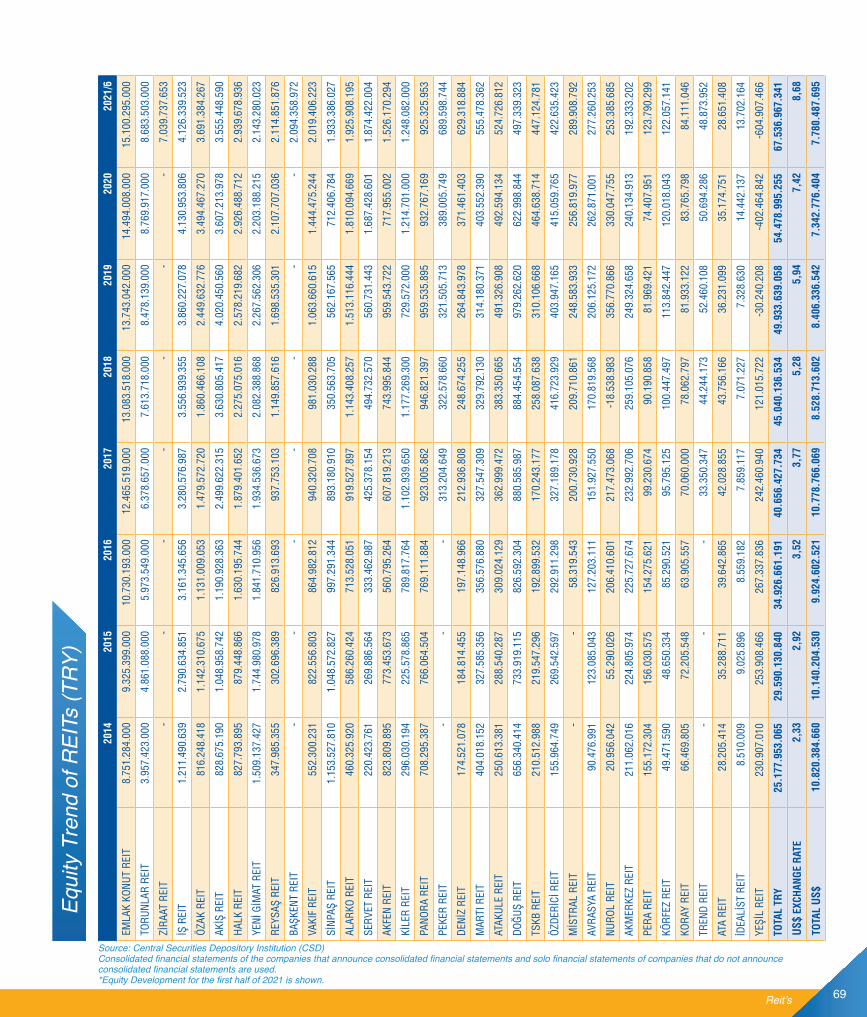
69
Source: Central Securities Depository Institution (CSD)Consolidated financial statements of the companies that announce consolidated financial statements and solo financial statements of companies that do not announce consolidated financial statements are used.*Equity Development for the first half of 2021 is shown.
Equi
ty T
rend
of R
EITs
(TRY
)20
1420
1520
1620
1720
1820
1920
2020
21/6
EMLA
K KO
NU
T R
EIT
8.75
1.28
4.00
09.
325.
399.
000
10.7
30.1
93.0
0012
.465
.519
.000
13.0
83.5
18.0
00 1
3.74
3.04
2.00
0 1
4.49
4.00
8.00
0 1
5.10
0.29
5.00
0
TOR
UN
LAR
REI
T3.
957.
423.
000
4.86
1.08
8.00
05.
973.
549.
000
6.37
8.65
7.00
07.
613.
718.
000
8.4
78.1
39.0
00
8.7
69.9
17.0
00
8.6
83.5
03.0
00
ZİR
AAT
REI
T-
--
--
--
7.03
9.73
7.65
3
İŞ R
EIT
1.21
1.49
0.63
92.
790.
634.
851
3.16
1.34
5.65
63.
280.
576.
987
3.55
6.93
9.35
5 3
.860
.227
.078
4
.130
.953
.806
4
.126
.339
.523
ÖZA
K R
EIT
816.
248.
418
1.14
2.31
0.67
51.
131.
009.
053
1.47
9.57
2.72
01.
860.
466.
108
2.4
49.6
32.7
76
3.4
94.4
67.2
70
3.6
91.3
84.2
67
AKİŞ
REI
T82
8.67
5.19
01.
048.
958.
742
1.19
0.92
8.36
32.
499.
622.
315
3.63
0.80
5.41
7 4
.020
.450
.560
3
.607
.213
.978
3
.555
.448
.590
HAL
K R
EIT
827.
793.
895
879.
448.
866
1.63
0.19
5.74
41.
879.
401.
652
2.27
5.07
5.01
6 2
.578
.219
.682
2
.926
.488
.712
2
.939
.678
.936
YEN
İ GİM
AT R
EIT
1.50
9.13
7.42
71.
744.
980.
978
1.84
1.71
0.95
61.
934.
536.
673
2.08
2.38
8.86
8 2
.267
.562
.306
2
.203
.188
.215
2
.143
.280
.023
REY
SAŞ
REI
T34
7.98
5.35
530
2.69
6.38
982
6.91
3.69
393
7.75
3.10
31.
149.
857.
616
1.6
98.5
35.3
01
2.1
07.7
07.0
36
2.1
14.8
51.8
76
BAŞK
ENT
REI
T-
--
--
--
2.09
4.35
8.97
2
VAKI
F R
EIT
552.
300.
231
822.
556.
803
864.
982.
812
940.
320.
708
981.
030.
288
1.0
63.6
60.6
15
1.4
44.4
75.2
44
2.0
19.4
06.2
23
SİN
PAŞ
REI
T1.
153.
527.
810
1.04
8.57
2.82
799
7.29
1.34
489
3.18
0.91
035
0.56
3.70
5 5
62.1
67.5
65
712
.406
.784
1
.933
.386
.027
ALAR
KO R
EIT
460.
325.
920
586.
260.
424
713.
528.
051
919.
527.
897
1.14
3.40
8.25
7 1
.513
.116
.444
1
.810
.094
.669
1
.925
.908
.195
SER
VET
REI
T22
0.42
3.76
126
9.88
6.56
433
3.46
2.98
742
5.37
8.15
449
4.73
2.57
0 5
60.7
31.4
43
1.6
87.4
28.6
01
1.8
74.4
22.0
04
AKFE
N R
EIT
823.
809.
895
773.
453.
673
560.
795.
264
607.
819.
213
743.
995.
844
959
.543
.722
7
17.9
55.0
02
1.5
26.1
70.2
94
KİLE
R R
EIT
296.
030.
194
225.
578.
865
789.
817.
764
1.10
2.93
9.65
01.
177.
269.
300
729
.572
.000
1
.214
.701
.000
1
.248
.082
.000
PAN
OR
A R
EIT
708.
295.
387
766.
064.
504
769.
111.
884
923.
005.
862
946.
821.
397
959
.535
.895
9
32.7
67.1
69
925
.325
.953
PEKE
R R
EIT
--
-31
3.20
4.64
932
2.57
8.66
0 3
21.5
05.7
13
389
.005
.749
6
89.5
98.7
44
DEN
İZ R
EIT
174.
521.
078
184.
814.
455
197.
148.
966
212.
936.
808
248.
674.
255
264
.843
.978
3
71.4
61.4
03
629
.318
.884
MAR
TI R
EIT
404.
018.
152
327.
585.
356
356.
576.
880
327.
547.
309
329.
792.
130
314
.180
.371
4
03.5
52.3
90
555
.478
.362
ATAK
ULE
REI
T25
0.61
3.38
128
8.54
0.28
730
9.02
4.12
936
2.99
9.47
238
3.35
0.66
5 4
91.3
26.9
08
492
.594
.134
5
24.7
26.8
12
DO
ĞU
Ş R
EIT
656.
340.
414
733.
919.
115
826.
592.
304
880.
585.
987
884.
454.
554
979
.262
.620
6
22.9
98.8
44
497
.339
.323
TSKB
REI
T21
0.51
2.98
821
9.54
7.29
619
2.89
9.53
217
0.24
3.17
725
8.08
7.63
8 3
10.1
06.6
68
464
.638
.714
4
47.1
24.7
81
ÖZD
ERİC
İ REI
T15
5.96
4.74
926
9.54
2.59
729
2.91
1.29
832
7.18
9.17
841
6.72
3.92
9 4
03.9
47.1
65
415
.059
.765
4
22.6
35.4
23
MİS
TRAL
REI
T-
-58
.319
.543
200.
730.
928
209.
710.
861
248
.583
.933
2
56.8
19.9
77
289
.908
.792
AVR
ASYA
REI
T90
.476
.991
123.
085.
043
127.
203.
111
151.
927.
550
170.
819.
568
206
.125
.172
2
62.8
71.0
01
277
.260
.253
NU
RO
L R
EIT
20.9
56.0
4255
.290
.026
206.
410.
601
217.
473.
068
-18.
538.
983
356
.770
.866
3
30.0
47.7
55
253
.385
.685
AKM
ERKE
Z R
EIT
211.
062.
016
224.
805.
974
225.
727.
674
232.
992.
706
259.
105.
076
249
.324
.658
2
40.1
34.9
13
192
.333
.202
PER
A R
EIT
155.
172.
304
156.
030.
575
154.
275.
621
99.2
30.6
7490
.190
.858
81.
969.
421
74.
407.
951
123
.790
.299
KÖR
FEZ
REI
T49
.471
.590
48.6
50.3
3485
.290
.521
95.7
95.1
2510
0.44
7.49
7 1
13.8
42.4
47
120
.018
.043
1
22.0
57.1
41
KOR
AY R
EIT
66.4
69.8
0572
.205
.548
63.9
05.5
5770
.060
.000
78.0
62.7
97 8
1.93
3.12
2 8
3.76
5.79
8 8
4.11
1.04
6
TREN
D R
EIT
--
-33
.350
.347
44.2
44.1
73 5
2.46
0.10
8 5
0.69
4.28
6 4
8.87
3.95
2
ATA
REI
T28
.205
.414
35.2
88.7
1139
.642
.865
42.0
28.8
5543
.756
.166
36.
231.
099
35.
174.
751
28.
651.
408
İDEA
LİST
REI
T8.
510.
009
9.02
5.89
68.
559.
182
7.85
9.11
77.
071.
227
7.3
28.6
30
14.
442.
137
13.
702.
164
YEŞİ
L R
EIT
230.
907.
010
253.
908.
466
267.
337.
836
242.
460.
940
121.
015.
722
-30.
240.
208
-402
.464
.842
-6
04.9
07.4
66
TOTA
L TR
Y25
.177
.953
.065
29.5
90.1
30.8
4034
.926
.661
.191
40.6
56.4
27.7
3445
.040
.136
.534
49.9
33.6
39.0
5854
.478
.995
.255
67.5
36.9
67.3
41
US$
EXC
HAN
GE
RAT
E2,
332,
923,
523,
775,
285,
947,
428,
68
TOTA
L U
S$10
.820
.384
.660
10.1
40.2
04.5
309.
924.
602.
521
10.7
78.7
66.0
698.
528.
713.
602
8.40
6.33
6.54
27.
342.
776.
404
7.78
0.48
7.69
5
Reit’s

2013
2014
2015
2016
2017
2018
2019
2020
EMLA
K KO
NU
T R
EIT
3.80
0.00
0.00
03.
800.
000.
000
3.80
0.00
0.00
03.
800.
000.
000
3.80
0.00
0.00
03.
800.
000.
000
3.80
0.00
0.00
03.
800.
000.
000
TOR
UN
LAR
REI
T50
0.00
0.00
050
0.00
0.00
050
0.00
0.00
050
0.00
4.00
01.
000.
000.
000
1.00
0.00
0.00
01.
000.
000.
000
1.00
0.00
0.00
0
HAL
K R
EIT
673.
638.
704
697.
900.
000
743.
000.
000
790.
000.
000
820.
000.
000
858.
000.
000
928.
000.
000
970.
000.
000
İŞ R
EIT
630.
000.
000
680.
400.
000
746.
000.
000
850.
000.
000
913.
750.
000
958.
750.
000
958.
750.
000
958.
750.
000
SİN
PAŞ
REI
T60
0.00
0.00
060
0.00
0.00
060
0.00
0.00
060
0.00
0.00
060
0.00
0.00
087
3.19
3.43
287
3.19
3.43
287
3.19
3.43
2
KİLE
R R
EIT
124.
000.
000
124.
000.
000
124.
000.
000
124.
000.
000
124.
000.
000
124.
000.
000
124.
000.
000
620.
000.
000
AKİŞ
REI
T12
8.20
0.84
120
0.00
0.00
020
0.00
0.00
020
0.00
0.00
043
0.09
1.85
043
0.09
1.85
043
0.09
1.85
055
4.69
9.85
0
TSKB
REI
T15
0.00
0.00
015
0.00
0.00
015
0.00
0.00
015
0.00
0.00
015
0.00
0.00
030
0.00
0.00
030
0.00
0.00
050
0.00
0.00
0
VAKI
F R
EIT
106.
200.
000
203.
319.
794
205.
400.
000
213.
000.
000
217.
500.
000
225.
000.
000
230.
000.
000
460.
000.
000
ÖZA
K R
EIT
157.
000.
000
157.
000.
000
250.
000.
000
250.
000.
000
250.
000.
000
250.
000.
000
364.
000.
000
364.
000.
000
DO
ĞU
Ş R
EIT
227.
208.
155
227.
208.
155
227.
208.
155
239.
000.
331
332.
007.
786
332.
007.
786
332.
007.
786
332.
007.
786
NU
RO
L R
EIT
40.0
00.0
0040
.000
.000
40.0
00.0
0080
.000
.000
80.0
00.0
0080
.000
.000
205.
000.
000
295.
000.
000
PEKE
R R
EIT
--
--
30.0
00.0
0073
.100
.000
73.1
00.0
0025
3.00
0.00
0
ÖZD
ERİC
İ REI
T10
0.00
0.00
010
0.00
0.00
010
0.00
0.00
010
0.00
0.00
010
0.00
0.00
025
0.00
0.00
025
0.00
0.00
025
0.00
0.00
0
REY
SAŞ
REI
T21
7.00
0.00
024
0.00
0.00
024
6.00
0.00
124
6.00
0.00
124
6.00
0.00
124
6.00
0.00
124
6.00
0.00
124
6.00
0.00
1
YEŞİ
L R
EIT
235.
115.
706
235.
115.
706
235.
115.
706
235.
115.
706
235.
115.
706
235.
115.
706
235.
115.
706
235.
115.
706
ATAK
ULE
REI
T84
.000
.000
84.0
00.0
0084
.000
.000
84.0
00.0
0015
4.00
0.00
015
4.00
0.00
023
1.00
0.00
023
1.00
0.00
0
AKFE
N R
EIT
184.
000.
000
184.
000.
000
184.
000.
000
184.
000.
000
184.
000.
000
184.
000.
000
184.
000.
000
184.
000.
000
YEN
İ GİM
AT R
EIT
53.7
60.0
0053
.760
.000
107.
520.
000
107.
520.
000
107.
520.
000
161.
280.
000
161.
280.
000
161.
280.
000
DEN
İZ R
EIT
50.0
00.0
0050
.000
.000
50.0
00.0
0050
.000
.000
50.0
00.0
0050
.000
.000
50.0
00.0
0015
0.00
0.00
0
MİS
TRAL
REI
T-
--
39.0
00.0
0039
.000
.000
134.
219.
462
134.
219.
462
134.
219.
462
MAR
TI R
EIT
110.
000.
000
110.
000.
000
110.
000.
000
110.
000.
000
110.
000.
000
110.
000.
000
110.
000.
000
110.
000.
000
PER
A R
EIT
89.1
00.0
0089
.100
.000
89.1
00.0
0089
.100
.000
89.1
00.0
0089
.100
.000
89.1
00.0
0089
.100
.000
PAN
OR
A R
EIT
87.0
00.0
0087
.000
.000
87.0
00.0
0087
.000
.000
87.0
00.0
0087
.000
.000
87.0
00.0
0087
.000
.000
AVR
ASYA
REI
T72
.000
.000
72.0
00.0
0072
.000
.000
72.0
00.0
0072
.000
.000
72.0
00.0
0072
.000
.000
72.0
00.0
00
KÖR
FEZ
REI
T-
66.0
00.0
0066
.000
.000
66.0
00.0
0066
.000
.000
66.0
00.0
0066
.000
.000
66.0
00.0
00
ALAR
KO R
EIT
10.6
50.7
9410
.650
.794
10.6
50.7
9410
.650
.794
10.6
50.7
9410
.650
.794
10.6
50.7
9464
.400
.000
SER
VET
REI
T52
.000
.000
52.0
00.0
0052
.000
.000
52.0
00.0
0052
.000
.000
52.0
00.0
0052
.000
.000
52.0
00.0
00
YAPI
KR
EDİ K
OR
AY R
EIT
40.0
00.0
0040
.000
.000
40.0
00.0
0040
.000
.000
40.0
00.0
0040
.000
.000
40.0
00.0
0040
.000
.000
AKM
ERKE
Z R
EIT
37.2
64.0
0037
.264
.000
37.2
64.0
0037
.264
.000
37.2
64.0
0037
.264
.000
37.2
64.0
0037
.264
.000
TREN
D R
EIT
--
--
30.0
00.0
0030
.000
.000
30.0
00.0
0030
.000
.000
ATA
REI
T23
.750
.000
23.7
50.0
0023
.750
.000
23.7
50.0
0023
.750
.000
23.7
50.0
0023
.750
.000
23.7
50.0
00
İDEA
LİST
REI
T10
.000
.000
10.0
00.0
0010
.000
.000
10.0
00.0
0010
.000
.000
10.0
00.0
0010
.000
.000
10.0
00.0
00
TOTA
L TR
Y8.
591.
888.
200
8.92
4.46
8.44
99.
190.
008.
656
9.43
9.40
4.83
210
.490
.750
.137
11.3
46.5
23.0
3111
.737
.523
.031
13.2
53.7
80.2
37
US$
EXC
HAN
GE
RAT
E2,
132,
332,
923,
523,
775,
285,
947,
42
TOTA
L U
S$4.
032.
992.
959
3.83
5.34
6.79
13.
149.
312.
449
2.68
2.25
8.70
42.
781.
290.
633
2.14
8.55
5.77
21.
976.
013.
978
1.78
6.36
8.20
2
Cap
ital T
rend
of R
EITs
(TRY
)
Sour
ce: C
entra
l Sec
uriti
es D
epos
itory
Inst
itutio
n (C
SD)
Con
solid
ated
fina
ncia
l sta
tem
ents
of t
he c
ompa
nies
that
ann
ounc
e co
nsol
idat
ed fi
nanc
ial s
tate
men
ts a
nd s
olo
finan
cial
sta
tem
ents
of c
ompa
nies
that
do
not a
nnou
nce
cons
olid
ated
fina
ncia
l sta
tem
ents
are
use
d.Si
nce
Mar
tı R
EIT
publ
ishe
s its
fina
ncia
ls a
ccor
ding
to th
e Sp
ecia
l Acc
ount
ing
Perio
d, 9
-mon
th d
ata
has
been
take
n in
to c
onsi
dera
tion.
Reit’s70

71
REI
T’s
Equi
ty C
apita
l Rat
io*
Sour
ce: C
entra
l Sec
uriti
es D
epos
itory
Inst
itutio
n (C
SD)
Con
solid
ated
fina
ncia
l sta
tem
ents
of t
he c
ompa
nies
that
ann
ounc
e co
nsol
idat
ed fi
nanc
ial s
tate
men
ts a
nd s
olo
finan
cial
sta
tem
ents
of c
ompa
nies
that
do
not a
nnou
nce
cons
olid
ated
fina
ncia
l sta
tem
ents
are
use
d.*E
quity
/ Pa
id-in
Cap
ital.
Sinc
e M
artı
REI
T pu
blis
hes
its fi
nanc
ials
acc
ordi
ng to
the
Spec
ial A
ccou
ntin
g Pe
riod,
9-m
onth
dat
a ha
s be
en ta
ken
into
con
side
ratio
n.
2013
2014
2015
2016
2017
2018
2019
2020
ALAR
KO R
EIT
36,
3
43,
2
55,
0
67,
0
86,
3
107
,4
1
42,1
28,
1
SER
VET
REI
T 3
,7
4
,2
5
,2
6
,4
8
,2
9
,5
1
0,8
3
2,5
YEN
İ GİM
AT R
EIT
27,
1
28,
1
16,
2
17,
1
18,
0
12,
9
14,
1
13,
7
PAN
OR
A R
EIT
7,5
8,1
8,8
8,8
10,
6
10,
9
11,
0
10,
7
ÖZA
K R
EIT
3,4
5,2
4,6
4,5
5,9
7,4
6,7
9,6
TOR
UN
LAR
REI
T 6
,0
7
,9
9
,7
1
1,9
6
,4
7
,6
8
,5
8
,8
REY
SAŞ
REI
T 1
,6
1
,4
1
,2
3
,4
3
,8
4
,7
6
,9
8
,6
AKİŞ
REI
T 5
,7
4
,1
5
,2
6
,0
5
,8
8
,4
9
,3
6
,5
AKM
ERKE
Z R
EIT
5,2
5,7
6,0
6,1
6,3
7,0
6,7
6,4
İŞ R
EIT
1,8
1,8
3,7
3,7
3,6
3,7
4,0
4,3
AKFE
N R
EIT
4,9
4,5
4,2
3,0
3,3
4,0
5,2
3,9
EMLA
K KO
NU
T R
EIT
2,2
2,3
2,5
2,8
3,3
3,4
3,6
3,8
MAR
TI R
EIT
1,1
3,7
3,0
3,2
3,0
3,0
2,9
3,7
AVR
ASYA
REI
T 1
,2
1
,3
1
,7
1
,8
2
,1
2
,4
2
,9
3
,7
VAKI
F R
EIT
1,9
2,7
4,0
4,1
4,3
4,4
4,6
3,1
HAL
K R
EIT
1,1
1,2
1,2
2,1
2,3
2,7
2,8
3,0
DEN
İZ R
EIT
3,4
3,5
3,7
3,9
4,3
5,0
5,3
2,5
ATAK
ULE
REI
T 2
,8
3
,0
3
,4
3
,7
2
,4
2
,5
2
,1
2
,1
YAPI
KR
EDİ K
OR
AY R
EIT
0,9
1,7
1,8
1,6
1,8
2,0
2,0
2,1
KİLE
R R
EIT
2,4
2,4
1,8
6,4
8,9
9,5
5,9
2,0
MİS
TRAL
REI
T-
--
1,5
5,1
1,6
1,9
1,9
DO
ĞU
Ş R
EIT
2,7
2,9
3,2
3,5
2,7
2,7
2,9
1,9
KÖR
FEZ
REI
T-
0,7
0,7
1,3
1,5
1,5
1,7
1,8
TREN
D R
EIT
--
--
1,1
1,5
1,7
1,7
ÖZD
ERİC
İ REI
T 1
,2
1
,6
2
,7
2
,9
3
,3
1
,7
1
,6
1
,7
PEKE
R R
EIT
--
--
10,
4
4,4
4,4
1,5
ATA
REI
T 1
,2
1
,2
1
,5
1
,7
1
,8
1
,8
1
,5
1
,5
İDEA
LİST
REI
T 0
,9
0
,9
0
,9
0
,9
0
,8
0
,7
0
,7
1
,4
NU
RO
L R
EIT
1,3
0,5
1,4
2,6
2,7
-0,2
1,7
1,1
TSKB
REI
T 1
,4
1
,4
1
,5
1
,3
1
,1
0
,9
1
,0
0
,9
PER
A R
EIT
1,7
1,7
1,8
1,7
1,1
1,0
0,9
0,8
SİN
PAŞ
REI
T 1
,8
1
,9
1
,7
1
,7
1
,5
0
,4
0
,6
0
,8
YEŞİ
L R
EIT
1,1
1,0
1,1
1,1
1,0
0,5
-0,1
-1,7
SECT
OR
RAT
IO 2
,6
2
,8
3
,2
3
,7
3
,9
4
,0
4
,3
4
,1
Reit’s

Tren
d of
Tot
al A
sset
s of
REI
Ts (T
RY)
Sour
ce: C
entra
l Sec
uriti
es D
epos
itory
Inst
itutio
n (C
SD)
Con
solid
ated
fina
ncia
l sta
tem
ents
of t
he c
ompa
nies
that
ann
ounc
e co
nsol
idat
ed fi
nanc
ial s
tate
men
ts a
nd s
olo
finan
cial
sta
tem
ents
of c
ompa
nies
that
do
not a
nnou
nce
cons
olid
ated
fina
ncia
l sta
tem
ents
are
use
d.Si
nce
Mar
tı R
EIT
publ
ishe
s its
fina
ncia
ls a
ccor
ding
to th
e Sp
ecia
l Acc
ount
ing
Perio
d, 9
-mon
th d
ata
has
been
take
n in
to c
onsi
dera
tion.
2013
2014
2015
2016
2017
2018
2019
2020
EMLA
K KO
NU
T R
EIT
13.4
70.9
82.0
0014
.953
.485
.000
17.2
27.5
04.0
0018
.702
.367
.000
20.6
23.6
60.0
0023
.319
.270
.000
24.
185.
242.
000
28.
644.
290.
000
TOR
UN
LAR
REI
T6.
351.
971.
000
7.24
2.47
7.00
08.
862.
509.
000
10.3
77.6
80.0
0011
.335
.817
.000
12.2
74.4
39.0
00 1
3.72
0.07
3.00
0 1
3.71
4.78
7.00
0
AKİŞ
REI
T1.
254.
791.
303
1.35
1.95
9.33
41.
785.
492.
929
2.00
2.99
5.10
34.
272.
504.
797
5.61
1.71
6.96
7 6
.298
.884
.591
6
.104
.877
.531
ÖZA
K R
EIT
1.27
7.92
0.83
61.
523.
313.
553
1.67
1.66
3.69
61.
779.
081.
234
2.40
3.71
3.83
73.
572.
298.
881
4.7
79.5
23.3
74
5.8
75.3
58.2
20
SİN
PAŞ
REI
T2.
303.
899.
843
1.97
9.48
1.56
32.
001.
837.
323
2.21
0.60
2.42
21.
994.
659.
933
5.02
0.17
5.51
1 5
.290
.965
.091
5
.806
.556
.401
İŞ R
EIT
1.66
8.72
0.43
71.
859.
866.
857
4.12
5.20
0.57
94.
887.
020.
194
5.31
1.94
7.25
65.
222.
332.
924
5.7
16.3
56.8
86
5.2
25.4
05.4
67
HAL
K R
EIT
890.
131.
894
928.
406.
666
974.
715.
777
1.85
4.83
9.97
52.
376.
933.
740
2.62
6.87
9.48
5 3
.039
.209
.130
3
.514
.726
.080
REY
SAŞ
REI
T50
7.54
8.17
468
1.25
8.17
591
4.18
0.14
51.
518.
565.
929
1.89
5.92
6.95
52.
280.
416.
105
2.7
97.6
60.5
67
3.4
88.9
87.9
51
VAKI
F R
EIT
198.
991.
299
553.
866.
019
856.
907.
521
1.02
9.30
3.67
01.
152.
183.
130
1.69
5.76
9.58
3 1
.781
.467
.349
2
.928
.981
.416
AKFE
N R
EIT
1.51
8.52
6.03
21.
445.
949.
859
1.58
5.85
7.95
71.
498.
018.
392
1.76
3.19
5.28
62.
436.
937.
014
2.6
62.9
35.7
47
2.9
03.9
64.6
39
SER
VET
REI
T35
3.43
6.44
940
4.39
9.79
452
0.49
2.63
959
8.23
4.86
576
5.34
7.26
198
2.98
2.53
7 1
.130
.380
.497
2
.633
.369
.710
YEN
İ GİM
AT R
EIT
1.46
7.15
7.00
81.
523.
789.
187
1.75
6.93
9.25
71.
860.
018.
068
1.95
4.23
4.95
12.
109.
119.
413
2.3
01.9
84.9
60
2.2
34.5
41.6
46
YEŞİ
L R
EIT
1.00
8.52
3.82
81.
248.
566.
092
1.48
9.15
4.29
61.
999.
498.
467
2.18
5.59
7.58
72.
265.
040.
280
2.2
85.7
60.3
16
2.0
33.9
90.6
07
DO
ĞU
Ş R
EIT
720.
327.
204
756.
620.
015
829.
353.
366
1.04
1.88
4.68
11.
165.
054.
708
1.83
5.87
0.49
7 1
.963
.079
.100
1
.963
.246
.567
KİLE
R R
EIT
602.
835.
810
583.
008.
732
629.
257.
454
1.39
0.58
9.18
21.
941.
060.
448
2.18
7.07
0.53
6 1
.406
.889
.000
1
.852
.128
.000
ALAR
KO R
EIT
388.
760.
710
463.
942.
210
590.
429.
307
718.
210.
559
926.
964.
533
1.15
2.29
0.28
3 1
.531
.391
.235
1
.827
.244
.961
NU
RO
L R
EIT
840.
484.
393
1.13
8.34
3.14
51.
581.
008.
870
1.86
0.93
6.72
41.
841.
010.
507
1.78
1.23
1.50
9 1
.743
.949
.491
1
.640
.071
.662
DEN
İZ R
EIT
172.
834.
827
175.
286.
593
188.
960.
936
198.
272.
777
249.
961.
059
563.
326.
508
848
.898
.118
1
.053
.516
.529
PAN
OR
A R
EIT
659.
316.
154
713.
072.
098
770.
546.
701
789.
965.
218
928.
574.
062
956.
398.
113
969
.316
.969
9
58.3
29.4
23
MAR
TI R
EIT
241.
362.
532
555.
610.
167
487.
752.
674
564.
485.
912
533.
327.
575
609.
751.
232
658
.878
.752
9
21.2
86.6
48
TSKB
REI
T37
6.18
8.28
236
6.79
2.21
542
1.68
5.49
543
7.65
4.30
646
6.56
3.93
550
9.42
7.25
7 5
75.2
00.1
86
603
.049
.652
ATAK
ULE
REI
T24
0.32
0.55
125
2.81
7.24
329
2.03
3.10
032
2.23
0.67
138
4.98
3.09
948
7.32
4.30
9 5
26.8
78.5
23
528
.413
.783
PEKE
R R
EIT
--
--
629.
115.
637
526.
457.
046
542
.358
.817
5
08.1
44.9
08
ÖZD
ERİC
İ REI
T18
4.35
4.50
126
4.36
8.24
541
9.18
7.19
547
0.07
9.39
254
0.54
0.36
555
4.87
2.64
1 5
05.5
51.4
47
465
.314
.478
AKM
ERKE
Z R
EIT
197.
524.
098
217.
637.
601
234.
424.
252
233.
113.
523
240.
541.
899
265.
538.
439
258
.501
.624
2
65.7
47.1
22
MİS
TRAL
REI
T-
--
334.
494.
323
287.
432.
737
236.
072.
425
257
.289
.455
2
64.6
84.6
96
AVR
ASYA
REI
T89
.284
.453
98.9
76.2
5513
3.58
6.88
213
1.79
8.16
017
5.46
0.85
618
0.49
1.36
6 2
07.4
02.0
98
264
.113
.051
KÖR
FEZ
REI
T-
83.0
47.7
9110
3.30
7.23
012
6.16
8.78
210
7.45
8.47
810
8.17
7.01
5 1
23.4
84.7
05
166
.389
.870
PER
A R
EIT
217.
564.
039
197.
811.
868
197.
094.
357
206.
796.
273
166.
088.
353
135.
207.
980
128
.009
.298
1
26.2
30.1
64
YAPI
KR
EDİ K
OR
AY R
EIT
122.
432.
236
184.
608.
611
181.
539.
713
105.
958.
732
89.5
11.5
3393
.296
.774
97.
183.
978
97.
400.
240
ATA
REI
T29
.434
.267
33.3
59.3
9865
.710
.862
69.5
97.8
6196
.717
.405
100.
529.
319
90.
263.
702
86.
955.
492
TREN
D R
EIT
--
--
82.1
55.1
1310
6.36
5.49
0 7
7.31
9.20
9 6
9.36
2.21
7
İDEA
LİST
REI
T8.
842.
471
8.53
1.29
09.
048.
130
8.60
8.23
78.
153.
067
10.0
49.7
86 1
6.44
0.57
9 2
9.91
5.30
2
TOTA
L TR
Y37
.364
.466
.631
41.7
90.6
52.5
7650
.907
.381
.643
59.3
29.0
70.6
3268
.896
.397
.102
81.8
17.1
26.2
25 8
8.51
8.72
9.79
4 9
8.80
1.38
1.43
3
US$
EXC
HAN
GE
RAT
E2,
132,
332,
923,
523,
775,
285,
947,
42
TOTA
L U
S$17
.538
.709
.459
17.9
59.7
97.4
0317
.445
.386
.259
16.8
58.6
81.1
3018
.265
.700
.867
15.4
92.7
33.6
16 1
4.90
2.14
3.06
3 1
3.31
6.62
6.87
5
Reit’s72

73
Tren
d of
Act
ive
Inde
bted
ness
* of R
EITs
Sour
ce: C
entra
l Sec
uriti
es D
epos
itory
Inst
itutio
n (C
SD)
Con
solid
ated
fina
ncia
l sta
tem
ents
of t
he c
ompa
nies
that
ann
ounc
e co
nsol
idat
ed fi
nanc
ial s
tate
men
ts a
nd s
olo
finan
cial
sta
tem
ents
of c
ompa
nies
that
do
not a
nnou
nce
cons
olid
ated
fina
ncia
l sta
tem
ents
are
use
d.* T
otal
Lia
bilit
ies
/ Tot
al A
sset
s.Si
nce
Mar
tı R
EIT
publ
ishe
s its
fina
ncia
ls a
ccor
ding
to th
e Sp
ecia
l Acc
ount
ing
Perio
d, 9
-mon
th d
ata
has
been
take
n in
to c
onsi
dera
tion.
2013
2014
2015
2016
2017
2018
2019
2020
AVR
ASYA
REI
T0%
9%8%
3%13
%5%
1%0,
5%
ALAR
KO R
EIT
1%1%
1%1%
1%1%
1%1%
YEN
İ GİM
AT R
EIT
1%1%
1%1%
1%1%
1%1%
PAN
OR
A R
EIT
1%1%
1%3%
1%1%
1%3%
MİS
TRAL
REI
T-
--
83%
30%
11%
3%3%
ATAK
ULE
REI
T1%
1%1%
4%6%
21%
7%7%
AKM
ERKE
Z R
EIT
2%3%
4%3%
3%2%
4%10
%
ÖZD
ERİC
İ REI
T38
%41
%36
%38
%39
%25
%20
%11
%
YAPI
KR
EDİ K
OR
AY R
EIT
71%
64%
60%
40%
22%
16%
16%
14%
HAL
K R
EIT
14%
11%
10%
12%
21%
13%
15%
17%
İŞ R
EIT
31%
35%
32%
35%
38%
32%
32%
21%
TSKB
REI
T44
%43
%48
%56
%64
%49
%46
%23
%
PEKE
R R
EIT
--
--
50%
39%
41%
23%
TREN
D R
EIT
--
--
59%
58%
32%
27%
KÖR
FEZ
REI
T-
40%
53%
32%
11%
7%8%
28%
KİLE
R R
EIT
51%
49%
64%
43%
43%
46%
48%
34%
SER
VET
REI
T46
%45
%48
%44
%44
%50
%50
%36
%
TOR
UN
LAR
REI
T53
%45
%45
%42
%44
%38
%38
%36
%
REY
SAŞ
REI
T33
%49
%67
%46
%51
%50
%39
%40
%
ÖZA
K R
EIT
58%
46%
32%
36%
38%
48%
49%
41%
AKİŞ
REI
T42
%39
%41
%41
%41
%35
%36
%41
%
PER
A R
EIT
28%
22%
21%
25%
40%
33%
36%
41%
EMLA
K KO
NU
T R
EIT
38%
41%
46%
43%
40%
44%
43%
49%
VAKI
F R
EIT
1%0%
4%16
%18
%42
%40
%51
%
İDEA
LİST
REI
T0%
0%0%
1%4%
30%
55%
52%
MAR
TI R
EIT
50%
27%
33%
37%
39%
46%
52%
56%
ATA
REI
T4%
15%
46%
43%
57%
56%
60%
60%
DEN
İZ R
EIT
2%0%
2%1%
15%
56%
69%
65%
DO
ĞU
Ş R
EIT
16%
13%
12%
21%
24%
52%
50%
68%
AKFE
N R
EIT
41%
43%
51%
63%
66%
69%
64%
75%
NU
RO
L R
EIT
94%
98%
97%
89%
88%
101%
80%
80%
SİN
PAŞ
REI
T53
%42
%48
%55
%55
%93
%89
%88
%
YEŞİ
L R
EIT
75%
82%
83%
87%
89%
95%
101%
120%
SECT
OR
RAT
IO40
%40
%42
%41
%41
%45
%44
%45
%
Reit’s

Prof
it Tr
end
of R
EITs
(TRY
)
Sour
ce: C
entra
l Sec
uriti
es D
epos
itory
Inst
itutio
n (C
SD)
Con
solid
ated
fina
ncia
l sta
tem
ents
of t
he c
ompa
nies
that
ann
ounc
e co
nsol
idat
ed fi
nanc
ial s
tate
men
ts a
nd s
olo
finan
cial
sta
tem
ents
of c
ompa
nies
that
do
not a
nnou
nce
cons
olid
ated
fina
ncia
l sta
tem
ents
are
use
d.* T
otal
Lia
bilit
ies
/ Tot
al A
sset
s.Si
nce
Mar
tı R
EIT
publ
ishe
s its
fina
ncia
ls a
ccor
ding
to th
e Sp
ecia
l Acc
ount
ing
Perio
d, 9
-mon
th d
ata
has
been
take
n in
to c
onsi
dera
tion.
2013
2014
2015
2016
2017
2018
2019
2020
SER
VET
REI
T2.
032.
687
29.6
08.0
6647
.069
.232
40.1
02.3
3170
.335
.221
49.0
45.8
6652
.356
.278
903.
633.
477
EMLA
K KO
NU
T R
EIT
1.0
60.5
37.0
00
954
.397
.000
9
52.6
05.0
00
1.7
61.2
76.0
00
1.7
56.0
94.0
00
1.2
69.9
07.0
00
778
.369
.000
8
36.2
58.0
00
ÖZA
K R
EIT
-4.2
34.4
9522
0.26
0.36
819
1.73
5.94
214
.028
.274
259.
392.
437
234.
955.
963
311.
378.
318
617.
541.
014
REY
SAŞ
REI
T24
.636
.912
7.39
5.79
3-4
3.05
4.12
013
1.38
0.94
010
5.57
8.39
021
2.10
8.68
154
8.70
6.85
341
0.42
6.47
4
HAL
K R
EIT
867.
259.
000
61.3
47.1
4657
.423
.905
107.
667.
056
252.
108.
771
394.
801.
082
321.
408.
214
352.
452.
465
ALAR
KO R
EIT
84.3
85.0
3978
.151
.728
131.
791.
243
133.
207.
239
152.
357.
089
269.
599.
472
389.
574.
941
330.
185.
303
TOR
UN
LAR
REI
T19
0.55
6.00
01.
058.
919.
000
953.
604.
000
1.17
2.38
4.00
045
5.10
8.00
01.
287.
204.
000
865.
790.
000
293.
001.
000
İŞ R
EIT
116.
156.
720
86.7
71.7
6755
5.93
2.86
742
0.51
1.40
217
9.95
6.83
734
1.61
0.87
329
7.38
9.77
926
6.50
2.00
3
SİN
PAŞ
REI
T18
.545
.007
89.4
66.8
39-5
2.22
0.53
6-5
4.84
6.91
4-8
7.03
9.59
5-1
96.8
82.4
3721
5.03
6.24
115
0.33
2.54
0
VAKI
F R
EIT
4.35
8.38
921
.854
.652
74.1
43.7
2742
.424
.825
75.3
56.6
2540
.755
.562
96.1
52.2
6811
8.59
2.11
1
YEN
İ GİM
AT R
EIT
220.
498.
852
107.
820.
624
302.
766.
482
185.
919.
977
189.
964.
446
275.
718.
990
342.
865.
730
108.
873.
811
PEKE
R R
EIT
--
--
49.1
45.9
779.
364.
465
-1.0
96.3
7667
.428
.985
AKM
ERKE
Z R
EIT
59.8
41.9
6565
.687
.893
73.3
25.0
4577
.821
.662
77.8
07.4
4088
.649
.656
81.5
58.1
2956
.870
.007
AVR
ASYA
REI
T10
.193
.578
1.49
4.95
38.
883.
075
4.11
6.10
424
.714
.756
12.5
62.9
8533
.935
.679
51.7
61.4
74
PAN
OR
A R
EIT
76.0
63.2
1683
.138
.916
95.8
99.7
6142
.005
.980
192.
069.
578
66.1
93.2
3562
.539
.398
29.4
33.2
74
MİS
TRAL
REI
T-
--
-3.5
48.0
1714
2.38
5.84
56.
103.
327
34.8
93.3
8212
.599
.942
ÖZD
ERİC
İ REI
T11
.034
.112
40.7
61.1
0411
3.46
2.01
023
.525
.439
33.9
30.8
19-6
0.78
8.63
2-1
2.91
6.25
811
.126
.261
İDEA
LİST
REI
T-3
40.2
15-3
15,0
551
6.50
5-3
09.7
41-6
97.7
63-1
.008
.898
273.
605
7.10
4.73
8
DEN
İZ R
EIT
-2.4
28.0
815.
127.
562
10.2
93.3
7712
.334
.511
15.7
87.8
4238
.243
.618
13.3
42.9
456.
528.
523
KÖR
FEZ
REI
T-
-383
.141
-762
.396
36.6
42.7
0610
.509
.081
4.65
7.05
213
.420
.572
6.27
7.61
9
YAPI
KR
EDİ K
OR
AY R
EIT
-19.
778.
518
31.0
61.0
485.
844.
853
-9.0
48.7
411.
702.
026
8.46
4.91
73.
878.
313
1.54
0.39
6
ATAK
ULE
REI
T-7
.305
.137
12.3
47.4
4537
.939
.105
20.4
96.6
40-1
6.01
7.59
120
.349
.204
31.0
98.3
781.
273.
350
ATA
REI
T82
0.08
276
3.95
77.
083.
297
4.35
4.15
42.
385.
990
1.72
7.31
1-7
.525
.067
-1.0
56.3
48
TREN
D R
EIT
--
--
-3.2
33.1
4410
.919
.027
8.18
5.20
8-1
.735
.827
PER
A R
EIT
-4.2
07.6
68-5
00.3
8384
2.73
5-1
.753
.341
-55.
048.
881
-8.9
62.9
72-8
.202
.160
-7.5
05.3
53
KİLE
R R
EIT
-11.
065.
189
-57.
713
-70.
624.
573
30.7
50.4
9131
3.09
5.67
114
4.23
0.99
0-4
47.6
38.0
00-1
2.91
0.00
0
MAR
TI R
EIT
-19.
344.
721
209.
249.
664
-132
.876
.490
-23.
052.
529
1.21
1.70
1-2
5.94
8.29
44.
740.
638
-38.
824.
528
TSKB
REI
T-2
6.16
6.85
01.
543.
143
9.03
6.38
1-2
6.64
5.07
0-2
2.67
2.73
2-6
1.88
8.53
752
.113
.273
-45.
781.
223
NU
RO
L R
EIT
-17.
288.
835
-31.
593.
612
-105
.613
.041
151.
070.
362
11.0
69.8
18-2
35.9
60.0
59-2
90.5
16.4
89-2
17.2
08.4
70
YEŞİ
L R
EIT
39.0
01.9
95-2
4.35
2.19
31.
067.
993
-13.
409.
358
-5.3
92.1
74-1
57.8
00.0
20-1
16.5
63.0
51-2
37.9
11.5
20
AKFE
N R
EIT
118.
002.
845
-2.4
47.7
87-4
6.98
3.07
9-2
56.9
08.9
0739
.410
.018
104.
492.
321
165.
355.
553
-240
.424
.726
DO
ĞU
Ş R
EIT
21.9
15.2
6751
.828
.245
77.6
01.5
1658
.650
.926
54.0
65.5
133.
933.
529
95.0
44.8
20-3
60.8
65.1
88
AKİŞ
REI
T25
.039
.578
58.6
34.0
1629
1.94
7.32
516
9.92
9.18
949
0.55
1.21
11.
029.
882.
607
549.
043.
489
-458
.444
.388
TOTA
L TR
Y2.
838.
718.
535
3.21
8.29
5.78
53.
548.
681.
141
4.25
1.07
7.59
04.
765.
993.
222
5.17
6.24
1.88
44.
483.
993.
603
3.01
7.07
5.19
6
CBRT
JU
NE-
END
US$
BU
YIN
G R
ATE
1,92
2,12
2,69
2,88
3,52
4,56
5,76
6,84
TOTA
L U
S$1.
474.
812.
206
1.51
6.20
4.55
31.
321.
668.
954
1.47
3.61
2.58
71.
355.
207.
354
1.13
4.96
6.53
777
9.13
3.91
744
0.88
6.60
2
Reit’s74

75
Asse
t Pro
fitab
ility*
of R
EITs
Sour
ce: C
entra
l Sec
uriti
es D
epos
itory
Inst
itutio
n (C
SD)
Con
solid
ated
fina
ncia
l sta
tem
ents
of t
he c
ompa
nies
that
ann
ounc
e co
nsol
idat
ed fi
nanc
ial s
tate
men
ts a
nd s
olo
finan
cial
sta
tem
ents
of c
ompa
nies
that
do
not a
nnou
nce
cons
olid
ated
fina
ncia
l sta
tem
ents
are
use
d.*P
erio
d Pr
ofit
/ Tot
al A
sset
s.Si
nce
Mar
tı R
EIT
publ
ishe
s its
fina
ncia
ls a
ccor
ding
to th
e Sp
ecia
l Acc
ount
ing
Perio
d, 9
-mon
th d
ata
has
been
take
n in
to c
onsi
dera
tion.
2013
2014
2015
2016
2017
2018
2019
2020
SER
VET
REI
T1%
7%9%
7%9%
5%5%
34%
İDEA
LİST
REI
T-4
%0%
6%-4
%-9
%-1
0%2%
24%
AKM
ERKE
Z R
EIT
30%
30%
31%
33%
32%
33%
32%
21%
AVR
ASYA
REI
T11
%2%
7%3%
14%
7%16
%20
%
ALAR
KO R
EIT
22%
17%
22%
19%
16%
23%
25%
18%
PEKE
R R
EIT
0%0%
0%0%
8%2%
0%13
%
REY
SAŞ
REI
T5%
1%-5
%9%
6%9%
20%
12%
ÖZA
K R
EIT
0%14
%11
%1%
11%
7%7%
11%
HAL
K R
EIT
97%
7%6%
6%11
%15
%11
%10
%
İŞ R
EIT
7%5%
13%
9%3%
7%5%
5%
YEN
İ GİM
AT R
EIT
15%
7%17
%10
%10
%13
%15
%5%
MİS
TRAL
REI
T0%
0%0%
-1%
50%
3%14
%5%
VAKI
F R
EIT
2%4%
9%4%
7%2%
5%4%
KÖR
FEZ
REI
T0%
0%-1
%29
%10
%4%
11%
4%
PAN
OR
A R
EIT
12%
12%
12%
5%21
%7%
6%3%
EMLA
K KO
NU
T R
EIT
8%6%
6%9%
9%5%
3%3%
SİN
PAŞ
REI
T1%
5%-3
%-2
%-4
%-4
%4%
3%
ÖZD
ERİC
İ REI
T6%
15%
27%
5%6%
-11%
-3%
2%
TOR
UN
LAR
REI
T3%
15%
11%
11%
4%10
%6%
2%
YAPI
KR
EDİ K
OR
AY R
EIT
-16%
17%
3%-9
%2%
9%4%
2%
DEN
İZ R
EIT
-1%
3%5%
6%6%
7%2%
1%
ATAK
ULE
REI
T-3
%5%
13%
6%-4
%4%
6%0%
KİLE
R R
EIT
-2%
0%-1
1%2%
16%
7%-3
2%-1
%
ATA
REI
T3%
2%11
%6%
2%2%
-8%
-1%
TREN
D R
EIT
0%0%
0%0%
-4%
10%
11%
-3%
MAR
TI R
EIT
-8%
38%
-27%
-4%
0%-4
%1%
-4%
PER
A R
EIT
-2%
0%0%
-1%
-33%
-7%
-6%
-6%
AKİŞ
REI
T2%
4%16
%8%
11%
18%
9%-8
%
TSKB
REI
T-7
%0%
2%-6
%-5
%-1
2%9%
-8%
AKFE
N R
EIT
8%0%
-3%
-17%
2%4%
6%-8
%
YEŞİ
L R
EIT
4%-2
%0%
-1%
0%-7
%-5
%-1
2%
NU
RO
L R
EIT
-2%
-3%
-7%
8%1%
-13%
-17%
-13%
DO
ĞU
Ş R
EIT
3%7%
9%6%
5%0%
5%-1
8%
SECT
OR
RAT
IO7,
6%7,
7%7,
0%7,
2%6,
9%6,
3%5,
1%3,
1%
Reit’s

NOTES


Esentepe Mahallesi Büyükdere Caddesi Yonca Apt. C Blok No: 151-1 D: 43Zincirlikuyu - Şişli / İstanbul
Tel: (212) 282 53 65 - 325 28 25 Fax: (212) 282 53 93
www.gyoder.org.tr gyodergosterge.com [email protected]
GYODERR gyoderonline gyoderonline GYODER Türkiye’nin Gayrimenkul Platformu
With the Contributions of