Supplementary Data on Financial Results for 2nd Quarter ...
16
November 9, 2011 Supplementary Data on Financial Results for 2nd Quarter(cumulative) of FY2011 Ending March 2012
-
Upload
khangminh22 -
Category
Documents
-
view
1 -
download
0
Transcript of Supplementary Data on Financial Results for 2nd Quarter ...

November 9, 2011
Supplementary Data on Financial Results for 2nd
Quarter(cumulative) of FY2011 Ending March 2012

page
1 Review of orders received, net sales and carried-forward contracts (non-consolidated) 1
2 Breakdown of contracts from domestic public sector (non-consolidated) 2
3 Breakdown of contracts from domestic private sector (non-consolidated) 3
4 Construction business - classified by region (non-consolidated) 6
5 Construction business - classified by purpose (non-consolidated) 7
6 Orders received - renovation projects (non-consolidated) 10
7 Breakdown of orders received - classified by contract amount (non-consolidated) 10
8 Breakdown of orders received - sole source or tender bid (non-consolidated) 10
9 Net sales of real estate business and other - classified by type of business (non-consolidated) 11
10 Breakdown of capital expenditure 11
11 Depreciation, research and development expense and number of personnel 11
12 Net sales and operating income by segment (consolidated) 12
13 Net sales by region (consolidated) 12
14 Performance of major subsidiaries 13
15 Major private finance initiative (PFI) business 14
Contents
This "Supplementary data on Financial Results" contains predictions and forecasts regarding the future plans, strategies, and performance of Obayashi Corporation and the Obayashi Group. These statements are forward-looking statements based on the assumptions and opinions made in light of information available to the Company at the time of writing, and are subject to risks and uncertainties related to economic trends, market demand, currency exchange rates, taxation and various other systems. Actual results may therefore differ from forecasts.

1 Review of orders received, net sales and carried-forward contracts (non-consolidated)
(1)Orders received
Amount Proportion Amount Proportion Amount Proportion Amount Variance rate
Domestic public 28,043 6.7% 20,929 5.3% 37,817 10.3% 16,888 80.7%
Domestic private 34,885 8.3 35,220 8.8 41,940 11.5 6,719 19.1
Domestic total 62,928 15.0 56,150 14.1 79,758 21.8 23,608 42.0
Overseas 14,951 3.6 12,029 3.0 1,890 0.5 (10,139) ( 84.3)
Subtotal 77,880 18.6 68,180 17.1 81,649 22.3 13,469 19.8
Domestic public 20,406 4.8 22,145 5.5 10,118 2.8 (12,026) ( 54.3)
Domestic private 269,435 64.2 291,823 73.0 249,940 68.4 (41,882) ( 14.4)
Domestic total 289,841 69.0 313,968 78.5 260,059 71.2 (53,909) ( 17.2)
Overseas 42,035 10.0 5,632 1.4 14,689 4.0 9,057 160.8
Subtotal 331,877 79.0 319,601 79.9 274,748 75.2 (44,852) ( 14.0)
Domestic public 48,449 11.5 43,074 10.8 47,936 13.1 4,861 11.3
Domestic private 304,320 72.5 327,044 81.8 291,881 79.9 (35,162) ( 10.8)
Domestic total 352,770 84.0 370,119 92.6 339,817 93.0 (30,301) ( 8.2)
Overseas 56,987 13.6 17,662 4.4 16,580 4.5 (1,082) ( 6.1)
Subtotal 409,758 97.6 387,781 97.0 356,398 97.5 (31,383) ( 8.1)
Real estate business and other 9,965 2.4 12,056 3.0 9,022 2.5 (3,033) ( 25.2)
Total 419,723 100 399,837 100 365,420 100 (34,417) ( 8.6)
(2) Net sales
Amount Proportion Amount Proportion Amount Proportion Amount Variance rate
Domestic public 57,393 10.2% 52,006 12.1% 38,766 9.2% (13,240) ( 25.5%)
Domestic private 41,195 7.3 33,652 7.8 30,154 7.1 (3,497) ( 10.4)
Domestic total 98,588 17.5 85,659 19.9 68,920 16.3 (16,738) ( 19.5)
Overseas 62,406 11.2 17,905 4.2 5,674 1.3 (12,231) ( 68.3)
Subtotal 160,995 28.7 103,565 24.1 74,595 17.6 (28,969) ( 28.0)
Domestic public 37,631 6.7 32,299 7.5 20,406 4.8 (11,893) ( 36.8)
Domestic private 349,726 62.3 269,423 62.8 309,125 73.1 39,701 14.7
Domestic total 387,358 69.0 301,723 70.3 329,532 77.9 27,808 9.2
Overseas 4,274 0.7 12,071 2.8 9,966 2.4 (2,105) ( 17.4)
Subtotal 391,633 69.7 313,795 73.1 339,498 80.3 25,703 8.2
Domestic public 95,024 16.9 84,306 19.6 59,172 14.0 (25,134) ( 29.8)
Domestic private 390,922 69.6 303,076 70.6 339,280 80.2 36,204 11.9
Domestic total 485,947 86.5 387,383 90.2 398,452 94.2 11,069 2.9
Overseas 66,681 11.9 29,977 7.0 15,640 3.7 (14,336) ( 47.8)
Subtotal 552,629 98.4 417,360 97.2 414,093 97.9 (3,266) ( 0.8)
Real estate business and other 8,884 1.6 11,834 2.8 8,850 2.1 (2,983) ( 25.2)
561,513 100 429,194 100 422,944 100 (6,250) ( 1.5)
(Unit: million yen)
(Unit: million yen)
Result-2Q/FY2011
Civil eng.
Variance (2Q/FY2011-2Q/FY2010)
Construction
business
Result-2Q/FY2009 Result-2Q/FY2010
Building
const.
Total
const.
business
Total
Result-2Q/FY2009
Construction
business
Variance (2Q/FY2011-2Q/FY2010)Result-2Q/FY2010 Result-2Q/FY2011
Civil eng.
Building
const.
Total
const.
business
0%
10%
20%
30%
40%
50%
60%
70%
80%
90%
100%
2009/9 2010/9 2011/9
①Civil eng. -
domestic public
②Civil eng. -
domestic private
③Civil eng. -
overseas
④Building const. -
domestic public
⑤Building const. -
domestic private
⑥Building const. -
overseas
⑦Real estate
business and other
(Proportion)
0%
10%
20%
30%
40%
50%
60%
70%
80%
90%
100%
2009/9 2010/9 2011/9
①Civil eng. -
domestic public
②Civil eng. -
domestic private
③Civil eng. -
overseas
④Building const. -
domestic public
⑤Building const. -
domestic private
⑥Building const. -
overseas
⑦Real estate
business and other ⑥
⑥
①
③ ④
②
⑦
⑤
③
⑤
⑦
②
①
④
(Proportion)
⑥
1

(3)Carried-forward contracts
Amount Proportion Amount Proportion Amount Proportion Amount Variance rate
Domestic public 164,195 13.8% 160,643 12.7% 169,566 13.6% 8,923 5.6%
Domestic private 103,877 8.7 92,310 7.3 94,037 7.5 1,727 1.9
Domestic total 268,073 22.5 252,954 20.0 263,604 21.1 10,650 4.2
Overseas 37,997 3.2 62,969 5.0 29,740 2.4 (33,229) ( 52.8)
Subtotal 306,071 25.7 315,924 25.0 293,345 23.5 (22,578) ( 7.1)
Domestic public 96,794 8.1 83,578 6.6 57,647 4.6 (25,931) ( 31.0)
Domestic private 711,291 59.8 805,782 63.6 834,993 66.9 29,211 3.6
Domestic total 808,086 67.9 889,360 70.2 892,641 71.5 3,280 0.4
Overseas 74,095 6.2 59,624 4.7 61,194 4.9 1,570 2.6
Subtotal 882,182 74.1 948,985 74.9 953,836 76.4 4,851 0.5
Domestic public 260,990 21.9 244,222 19.3 227,214 18.2 (17,007) ( 7.0)
Domestic private 815,169 68.5 898,092 70.9 929,031 74.4 30,938 3.4
Domestic total 1,076,159 90.4 1,142,315 90.2 1,156,246 92.6 13,931 1.2
Overseas 112,093 9.4 122,594 9.7 90,935 7.3 (31,658) ( 25.8)
Subtotal 1,188,253 99.8 1,264,909 99.9 1,247,181 99.9 (17,727) ( 1.4)
Real estate business and other 1,897 0.2 1,160 0.1 1,264 0.1 104 9.0
1,190,151 100 1,266,069 100 1,248,446 100 (17,623) ( 1.4)
2 Breakdown of contracts from domestic public sector - government institution and local government (non-consolidated)
(1)Orders received
Amount Proportion Amount Proportion Amount Proportion Amount Variance rate
34,634 71.5% 25,461 59.1% 22,061 46.0% (3,399) ( 13.4%)
13,815 28.5 17,612 40.9 25,874 54.0 8,261 46.9
48,449 100 43,074 100 47,936 100 4,861 11.3
(2)Net Sales
Amount Proportion Amount Proportion Amount Proportion Amount Variance rate
84,229 88.6% 69,240 82.1% 45,403 76.7% (23,836) ( 34.4%)
10,795 11.4 15,065 17.9 13,768 23.3 (1,297) ( 8.6)
95,024 100 84,306 100 59,172 100 (25,134) ( 29.8)
(3)Carried-forward contracts
Amount Proportion Amount Proportion Amount Proportion Amount Variance rate
203,622 78.0% 175,039 71.7% 151,237 66.6% (23,801) ( 13.6%)
57,367 22.0 69,183 28.3 75,976 33.4 6,793 9.8
260,990 100 244,222 100 227,214 100 (17,007) ( 7.0) Total
Local government and other
Local government and other
Government institution
Result-2Q/FY2010
Result-2Q/FY2010
Variance (2Q/FY2011-2Q/FY2010)
Civil eng.
Building
const.
Total
const.
business
Result-2Q/FY2011Result-2Q/FY2010
(Unit: million yen)
Result-2Q/FY2009
Result-2Q/FY2009
Result-2Q/FY2010
Result-2Q/FY2011
Result-2Q/FY2011
Result-2Q/FY2011
Result-2Q/FY2009
Total
Total
(Unit: million yen)
Variance (2Q/FY2010-2Q/FY2009)
Variance (2Q/FY2010-2Q/FY2009)
Variance (2Q/FY2010-2Q/FY2009)
(Unit: million yen)
(Unit: million yen)
Government institution
Government institution
Construction
business
Local government and other
Total
Result-2Q/FY2009
0%
10%
20%
30%
40%
50%
60%
70%
80%
90%
100%
2009/9 2010/9 2011/9
①Civil eng. -
domestic public
②Civil eng. -
domestic private
③Civil eng. -
overseas
④Building const. -
domestic public
⑤Building const. -
domestic private
⑥Building const. -
overseas
⑦Real estate
business and other
①
③
⑥
②
⑦
④
⑤
(Proportion)
2

(1)Orders received (Unit: million yen)
Amount Proportion Amount Proportion Amount Proportion Amount Variance rate
3,842 11.0% 8,596 24.4% 10,712 25.5% 2,115 24.6%
Textile 38 0.1 292 0.8 241 0.6 (50) ( 17.4)
Chemical 592 1.7 349 1.0 1,232 2.9 883 253.1
Steel 1,776 5.1 3,360 9.5 4,059 9.7 699 20.8
Electric machinery 244 0.7 567 1.6 240 0.6 (326) ( 57.6)
Transportal machinery 215 0.6 3,028 8.6 598 1.4 (2,430) ( 80.2)
Other machinery - - 380 1.1 2,831 6.8 2,451 645.0
Food 1 0.0 - - 188 0.4 188 -
Other 973 2.8 618 1.8 1,318 3.1 700 113.1
31,042 89.0 26,624 75.6 31,228 74.5 4,604 17.3
Agriculture and fishery - - - - 34 0.1 34 -
Mining and construction 672 1.9 988 2.8 4,497 10.7 3,508 354.9
Electric and gas 11,420 32.7 4,735 13.4 10,980 26.2 6,244 131.9
Transport 13,992 40.1 17,876 50.8 10,480 25.0 (7,396) ( 41.4)
- - 4 0.0 256 0.6 251 -
Commerce 59 0.2 7 0.0 (16) ( 0.0) (23) ( 336.2)
Finance and insuarance 64 0.2 192 0.6 39 0.1 (153) ( 79.7)
Real estate 249 0.7 857 2.4 2,030 4.8 1,172 136.8
Service 4,561 13.1 1,905 5.4 2,906 6.9 1,000 52.5
Other 22 0.1 56 0.2 20 0.0 (35) ( 63.9)
34,885 100 35,220 100 41,940 100 6,719 19.1
(2)Net Sales
Amount Proportion Amount Proportion Amount Proportion Amount Variance rate
9,411 22.8% 5,566 16.5% 7,018 23.3% 1,452 26.1%
31,783 77.2 28,086 83.5 23,136 76.7 (4,950) ( 17.6 )
41,195 100 33,652 100 30,154 100 (3,497) ( 10.4 )
(3)Carried-forward contracts
Amount Proportion Amount Proportion Amount Proportion Amount Variance rate
11,542 11.1% 12,827 13.9% 14,519 15.4% 1,692 13.2%
92,335 88.9 79,482 86.1 79,518 84.6 35 0.0
103,877 100 92,310 100 94,037 100 1,727 1.9 Total
Manucacturer
Non-Manufacturer
Result-2Q/FY2009 Result-2Q/FY2010 Result-2Q/FY2011 Variance (2Q/FY2011-2Q/FY2010)
Manucacturer
Non-Manufacturer
Total
(Unit: million yen)
Result-2Q/FY2009 Result-2Q/FY2010 Result-2Q/FY2011 Variance (2Q/FY2011-2Q/FY2010)
Non-Manufacturer
Information and commiunication
Total
(Unit: million yen)
Manufacturer
Result-2Q/FY2009 Result-2Q/FY2010 Result-2Q/FY2011 Variance (2Q/FY2011-2Q/FY2010)
3-1 Breakdown of contracts from domestic private sector - manufacturer and non-manufacturer
(non-consolidated, civil engineering)
3

(1)Orders received (Unit: million yen)
Amount Proportion Amount Proportion Amount Proportion Amount Variance rate
34,078 12.6% 43,171 14.8% 82,228 32.9% 39,057 90.5%
Textile 3,579 1.3 2,117 0.7 2,300 0.9 183 8.6
Chemical 9,225 3.4 9,534 3.3 14,914 6.0 5,379 56.4
Steel 1,766 0.7 1,093 0.4 8,146 3.2 7,053 645.1
Electric machinery 8,770 3.2 14,334 4.9 5,225 2.1 (9,109) ( 63.5)
Transportal machinery 5,939 2.2 2,726 0.9 13,996 5.6 11,270 413.3
Other machinery (874) ( 0.3) 5,783 2.0 18,670 7.5 12,886 222.8
Food (2) ( 0.0) 2,070 0.7 6,198 2.5 4,128 199.4
Other 5,673 2.1 5,510 1.9 12,774 5.1 7,264 131.8
235,357 87.4 248,652 85.2 167,712 67.1 (80,939) ( 32.6)
Agriculture and fishery 0 0.0 - - 141 0.1 141 -
Mining and construction 12,643 4.7 15,446 5.3 15,834 6.3 387 2.5
Electric and gas 4,905 1.8 2,360 0.8 5,844 2.3 3,483 147.6
Transport 15,869 5.9 12,067 4.2 19,741 7.9 7,673 63.6
1,622 0.6 4,247 1.5 3,888 1.6 (359) ( 8.5)
Commerce 17,801 6.6 11,766 4.0 23,012 9.2 11,245 95.6
Finance and insuarance 13,076 4.9 9,917 3.4 27,259 10.9 17,342 174.9
Real estate 36,211 13.5 129,652 44.4 23,797 9.5 (105,855) ( 81.6)
Service 130,782 48.5 56,989 19.5 46,498 18.6 (10,490) ( 18.4)
Other 2,443 0.9 6,203 2.1 1,694 0.7 (4,508) ( 72.7)
269,435 100 291,823 100 249,940 100 (41,882) ( 14.4)
(2)Net Sales
Amount Proportion Amount Proportion Amount Proportion Amount Variance rate
104,061 29.8% 43,147 16.0% 65,593 21.2% 22,446 52.0%
245,664 70.2 226,276 84.0 243,531 78.8 17,255 7.6
349,726 100 269,423 100 309,125 100 39,701 14.7
(3)Carried-forward contracts
Amount Proportion Amount Proportion Amount Proportion Amount Variance rate
110,163 15.5% 76,684 9.5% 114,790 13.7% 38,105 49.7%
601,128 84.5 729,097 90.5 720,203 86.3 (8,894) ( 1.2 )
711,291 100 805,782 100 834,993 100 29,211 3.6 Total
Variance (2Q/FY2011-2Q/FY2010)
Manucacturer
Non-Manufacturer
Total
(Unit: million yen)
Non-Manufacturer
Information and commiunication
Total
(Unit: million yen)
Manufacturer
Result-2Q/FY2009
Manucacturer
Non-Manufacturer
Result-2Q/FY2009 Result-2Q/FY2010 Result-2Q/FY2011
Result-2Q/FY2009 Result-2Q/FY2010 Result-2Q/FY2011 Variance (2Q/FY2011-2Q/FY2010)
Result-2Q/FY2010 Result-2Q/FY2011 Variance (2Q/FY2011-2Q/FY2010)
3-2 Breakdown of contracts from domestic private sector - manufacturer and non-manufacturer
(non-consolidated, building construction)
4

3-3 Breakdown of contracts from domestic private sector - manufacturer and non-manufacturer (non-consolidated)
(1)Orders received (Unit: million yen)
Amount Proportion Amount Proportion Amount Proportion Amount Variance rate
37,921 12.5% 51,768 15.8% 92,940 31.8% 41,172 79.5%
Textile 3,618 1.2 2,409 0.7 2,542 0.9 132 5.5
Chemical 9,818 3.2 9,883 3.0 16,146 5.5 6,263 63.4
Steel 3,542 1.2 4,453 1.4 12,206 4.2 7,752 174.1
Electric machinery 9,014 3.0 14,902 4.5 5,466 1.9 (9,435) ( 63.3)
Transportal machinery 6,155 2.0 5,755 1.8 14,595 5.0 8,839 153.6
Other machinery (874) ( 0.3) 6,164 1.9 21,502 7.3 15,338 248.8
Food (0) ( 0.0) 2,070 0.6 6,387 2.2 4,317 208.6
Other 6,646 2.2 6,129 1.9 14,093 4.8 7,964 129.9
266,399 87.5 275,276 84.2 198,940 68.2 (76,335) ( 27.7)
Agriculture and fishery 0 0.0 - - 176 0.1 176 -
Mining and construction 13,316 4.4 16,435 5.0 20,332 7.0 3,896 23.7
Electric and gas 16,325 5.3 7,096 2.2 16,824 5.8 9,728 137.1
Transport 29,862 9.8 29,944 9.2 30,221 10.4 276 0.9
1,622 0.5 4,252 1.3 4,144 1.4 (107) ( 2.5)
Commerce 17,861 5.9 11,773 3.6 22,995 7.9 11,221 95.3
Finance and insuarance 13,141 4.3 10,109 3.1 27,298 9.3 17,189 170.0
Real estate 36,460 12.0 130,510 39.9 25,827 8.8 (104,682) ( 80.2)
Service 135,343 44.5 58,895 18.0 49,405 16.9 (9,489) ( 16.1)
Other 2,465 0.8 6,259 1.9 1,714 0.6 (4,544) ( 72.6)
304,320 100 327,044 100 291,881 100 (35,162) ( 10.8)
(2)Net Sales
Amount Proportion Amount Proportion Amount Proportion Amount Variance rate
113,473 29.0% 48,713 16.1% 72,612 21.4% 23,898 49.1%
277,448 71.0 254,362 83.9 266,668 78.6 12,305 4.8
390,922 100 303,076 100 339,280 100 36,204 11.9
(3)Carried-forward contracts
Amount Proportion Amount Proportion Amount Proportion Amount Variance rate
121,705 14.9% 89,512 10.0% 129,310 13.9% 39,797 44.5%
693,463 85.1 808,580 90.0 799,721 86.1 (8,858) ( 1.1 )
815,169 100 898,092 100 929,031 100 30,938 3.4 Total
Variance (2Q/FY2011-2Q/FY2010)
Manucacturer
Non-Manufacturer
Total
(Unit: million yen)
Non-Manufacturer
Information and commiunication
Total
(Unit: million yen)
Manufacturer
Result-2Q/FY2009
Manucacturer
Non-Manufacturer
Result-2Q/FY2009 Result-2Q/FY2010 Result-2Q/FY2011
Result-2Q/FY2009 Result-2Q/FY2010 Result-2Q/FY2011 Variance (2Q/FY2011-2Q/FY2010)
Result-2Q/FY2010 Result-2Q/FY2011 Variance (2Q/FY2011-2Q/FY2010)
5

4 Construction business - classified by region (non-consolidated)
(1) Orders received (Unit: million yen)
Amount Proportion Amount Proportion Amount Proportion Amount Variance rate
189,605 46.3% 153,903 39.7% 131,324 36.8% (22,578) ( 14.7%)
83,167 20.3 118,953 30.6 86,648 24.3 (32,305) ( 27.2)
79,997 19.5 97,261 25.1 121,844 34.2 24,582 25.3
352,770 86.1 370,119 95.4 339,817 95.3 (30,301) ( 8.2)
27,212 6.6 11,119 2.9 (699) ( 0.2) (11,818) ( 106.3)
29,762 7.3 6,538 1.7 16,462 4.6 9,924 151.8
12 0.0 4 0.0 816 0.3 811 -
56,987 13.9 17,662 4.6 16,580 4.7 (1,082) ( 6.1)
409,758 100 387,781 100 356,398 100 (31,383) ( 8.1)
(2) Net sales (Unit: million yen)
Amount Proportion Amount Proportion Amount Proportion Amount Variance rate
195,917 35.4% 177,052 42.4% 169,527 40.9% (7,525) ( 4.3%)
147,128 26.6 103,573 24.8 105,935 25.6 2,361 2.3
142,901 25.9 106,756 25.6 122,990 29.7 16,233 15.2
485,947 87.9 387,383 92.8 398,452 96.2 11,069 2.9
7,014 1.3 5,603 1.4 5,874 1.4 271 4.8
59,654 10.8 24,368 5.8 9,761 2.4 (14,607) ( 59.9)
12 0.0 5 0.0 5 0.0 (0) ( 0.5)
66,681 12.1 29,977 7.2 15,640 3.8 (14,336) ( 47.8)
552,629 100 417,360 100 414,093 100 (3,266) ( 0.8)
(3)Carried-forward contracts (Unit: million yen)
Amount Proportion Amount Proportion Amount Proportion Amount Variance rate
524,136 44.1% 478,523 37.8% 505,521 40.5% 26,998 5.6%
283,235 23.9 396,263 31.3 396,471 31.8 208 0.1
268,787 22.6 267,528 21.2 254,252 20.4 (13,276) ( 5.0)
1,076,159 90.6 1,142,315 90.3 1,156,246 92.7 13,931 1.2
45,982 3.9 47,161 3.7 48,258 3.9 1,096 2.3
66,105 5.5 75,430 6.0 41,863 3.3 (33,567) ( 44.5)
6 0.0 2 0.0 814 0.1 811 -
112,093 9.4 122,594 9.7 90,935 7.3 (31,658) ( 25.8)
1,188,253 100 1,264,909 100 1,247,181 100 (17,727) ( 1.4)
Result-2Q/FY2009 Result-2Q/FY2010 Result-2Q/FY2011 Variance (2Q/FY2011-2Q/FY2010)
Variance (2Q/FY2011-2Q/FY2010)
Subtotal
Others
Kanto region
Kansai region
Others
Subtotal
North America
Asia
Subtotal
Overseas
Total
Asia
Others
Subtotal
Domestic
North America
Kanto region
Kansai region
Others
Subtotal
Variance (2Q/FY2011-2Q/FY2010)Result-2Q/FY2009 Result-2Q/FY2011
Overseas
DomesticOthers
Subtotal
North America
Asia
Others
Result-2Q/FY2010
Result-2Q/FY2010
Total
Kanto region
Kansai region
Result-2Q/FY2011Result-2Q/FY2009
Total
Overseas
Domestic
0%
10%
20%
30%
40%
50%
60%
70%
80%
90%
100%
2009/9 2010/9 2011/9
①Kanto
②Kansai
③Domestic - others
④North America
⑤Asia
⑥Overseas - others
(Proportion)
0%
10%
20%
30%
40%
50%
60%
70%
80%
90%
100%
2009/9 2010/9 2011/9
①Kanto
②Kansai
③Domestic - others
④North America
⑤Asia
⑥Overseas - others
(Proportion)
②
④
③
⑥
①
⑤
②
③
④ ⑤
⑥
①
0%
10%
20%
30%
40%
50%
60%
70%
80%
90%
100%
2009/9 2010/9 2011/9
①Kanto
②Kansai
③Domestic - others
④North America
⑤Asia
⑥Overseas - others
①
②
③
④ ⑤ ⑥
(Proportion)
6

5 Construction business - classified by purpose (non-consolidated)
(1)Orders received
Civil engineering (Unit: million yen)
Purpose Amount Proportion Amount Proportion Amount Proportion Amount Variance rate
% % % %
Soil and river conservation 6,411 8.2 8,309 12.2 4,124 5.1 (4,184) (50.4)
Railroads 20,027 25.7 16,776 24.6 5,251 6.4 (11,525) (68.7)
Water supply and sewers 2,047 2.6 8,972 13.1 9,682 11.9 709 7.9
Land development 2,711 3.5 4,612 6.8 4,341 5.3 (271) (5.9)
Ports and airports 7,479 9.6 6,389 9.4 5,525 6.8 (864) (13.5)
Roads 24,044 30.9 11,027 16.2 23,538 28.8 12,511 113.5
Power lines 340 0.5 64 0.1 286 0.3 221 340.8
Others 14,818 19.0 12,028 17.6 28,900 35.4 16,872 140.3
[of the above, civil work inside factories] [ 9,489] [ 12.2] [ 10,655] [ 15.6] [ 17,617] [ 21.6] [ 6,961] [ 65.3]
Total 77,880 100 68,180 100 81,649 100 13,469 19.8
Building construction (Unit: million yen)
Purpose Amount Proportion Amount Proportion Amount Proportion Amount Variance rate
% % % %
Office / government buildings 68,251 20.6 123,845 38.7 68,904 25.1 (54,940) (44.4)
Accommodations 59,455 17.9 9,156 2.9 10,358 3.8 1,201 13.1
Stores 26,528 8.0 12,420 3.9 24,662 9.0 12,241 98.6
Factories and power plants 30,255 9.1 42,534 13.3 86,259 31.4 43,725 102.8
Warehouse and logistics 3,036 0.9 7,860 2.5 13,707 5.0 5,846 74.4
Houses 45,014 13.6 47,073 14.7 11,973 4.3 (35,100) (74.6)
Education and research 30,249 9.1 26,447 8.3 19,302 7.0 (7,145) (27.0)
Medical and welfare 15,389 4.6 32,649 10.2 26,481 9.6 (6,168) (18.9)
Amusement 4,749 1.4 4,316 1.3 2,416 0.9 (1,899) (44.0)
Others 48,945 14.8 13,296 4.2 10,683 3.9 (2,612) (19.6)
合 計 Total 331,877 100 319,601 100 274,748 100 (44,852) (14.0)
Result-2Q/FY2009
Result-2Q/FY2010 Result-2Q/FY2011 Variance (2Q/FY2011-2Q/FY2010)Result-2Q/FY2009
Result-2Q/FY2010 Result-2Q/FY2011 Variance (2Q/FY2011-2Q/FY2010)①
②
0%
10%
20%
30%
40%
50%
60%
70%
80%
90%
100%
2009/9 2010/9 2011/9
①Soil and river
conservation
②Railroads
③Water supply and
sewers
④Land development
⑤Ports and airports
⑥Roads
⑦Power lines and
others
0%
10%
20%
30%
40%
50%
60%
70%
80%
90%
100%
2009/9 2010/9 2011/9
①Office / government
buildings
②Accommodations
③Stores
④Factories and power
plants
⑤Warehouses and
logistics
⑥Houses
⑦Education and
research
⑧Medical and welfare
⑨Amusement
⑩Others
②
④
⑤
⑥
③
⑦
①
②
⑥
⑦
⑤
⑩
⑧
③
⑨
④
①
(Proportion)
(Proportion)
7

(2)Net sales
Civil engineering (Unit: million yen)
Purpose Amount Proportion Amount Proportion Amount Proportion Amount Variance rate
% % % %
Soil and river conservation 4,119 2.6 12,033 11.6 6,240 8.4 (5,793) (48.1)
Railroads 80,668 50.1 26,610 25.7 14,685 19.7 (11,925) (44.8)
Water supply and sewers 6,309 3.9 3,124 3.0 5,397 7.2 2,272 72.8
Land development 5,209 3.3 3,930 3.8 3,323 4.4 (607) (15.4)
Ports and airports 9,020 5.6 13,560 13.1 1,790 2.4 (11,769) (86.8)
Roads 34,641 21.5 30,764 29.7 27,598 37.0 (3,166) (10.3)
Power lines 531 0.3 806 0.8 590 0.8 (215) (26.8)
Others 20,495 12.7 12,734 12.3 14,969 20.1 2,235 17.6
[of the above, civil work inside factories] [ 13,508] [ 8.4] [ 6,727] [ 6.5] [ 9,174] [ 12.3] [ 2,446] [ 36.4]
Total 160,995 100 103,565 100 74,595 100 (28,969) (28.0)
Building construction (Unit: million yen)
Purpose Amount Proportion Amount Proportion Amount Proportion Amount Variance rate
% % % %
Office / government buildings 96,243 24.6 98,087 31.2 87,840 25.9 (10,246) (10.4)
Accommodations 12,495 3.2 12,556 4.0 26,838 7.9 14,281 113.7
Stores 48,570 12.4 43,208 13.8 35,122 10.3 (8,085) (18.7)
Factories and power plants 84,021 21.4 38,786 12.4 59,570 17.5 20,783 53.6
Warehouse and logistics 8,984 2.3 2,406 0.8 4,929 1.5 2,523 104.9
Houses 51,187 13.1 51,891 16.5 34,015 10.0 (17,875) (34.4)
Education and research 22,629 5.8 25,700 8.2 41,802 12.3 16,101 62.7
Medical and welfare 34,130 8.7 17,963 5.7 30,441 9.0 12,478 69.5
Amusement 4,393 1.1 1,507 0.5 1,435 0.4 (71) (4.8)
Others 28,975 7.4 21,686 6.9 17,500 5.2 (4,186) (19.3)
合 計 Total 391,633 100 313,795 100 339,498 100 25,703 8.2
Result-2Q/FY2009
Result-2Q/FY2010 Result-2Q/FY2011 Variance (2Q/FY2011-2Q/FY2010)Result-2Q/FY2009
Result-2Q/FY2010 Result-2Q/FY2011 Variance (2Q/FY2011-2Q/FY2010)
②
0%
10%
20%
30%
40%
50%
60%
70%
80%
90%
100%
2009/9 2010/9 2011/9
①Soil and river
conservation
②Railroads
③Water supply and
sewers
④Land development
⑤Ports and airports
⑥Roads
⑦Power lines and
others
⑥
②
④ ⑤
③
⑦
①
0%
10%
20%
30%
40%
50%
60%
70%
80%
90%
100%
2009/9 2010/9 2011/9
①Office / government
buildings
②Accommodations
③Stores
④Factories and power
plants
⑤Warehouses and
logistics
⑥Houses
⑦Education and research
⑧Medical and welfare
⑨Amusement
⑩Others
(Proportion)
(Proportion)
②
⑥
⑤
⑩
⑧
③
④
①
⑦
⑨
8

(3)Carried-forward contracts
Civil engineering (Unit: million yen)
Purpose Amount Proportion Amount Proportion Amount Proportion Amount Variance rate
% % % %
Soil and river conservation 29,009 9.5 35,695 11.3 27,893 9.5 (7,801) (21.9)
Railroads 57,070 18.6 74,740 23.7 34,467 11.7 (40,272) (53.9)
Water supply and sewers 21,708 7.1 25,050 7.9 29,170 9.9 4,120 16.4
Land development 12,164 4.0 11,453 3.6 7,481 2.6 (3,972) (34.7)
Ports and airports 18,816 6.1 6,390 2.0 10,192 3.5 3,801 59.5
Roads 119,226 39.0 123,420 39.1 125,459 42.8 2,038 1.7
Power lines 5,093 1.7 1,113 0.4 688 0.2 (425) (38.2)
Others 42,982 14.0 38,058 12.0 57,991 19.8 19,933 52.4
[of the above, civil work inside factories] [ 31,700] [ 10.4] [ 30,770] [ 9.7] [ 36,496] [ 12.4] [ 5,725] [ 18.6]
Total 306,071 100 315,924 100 293,345 100 (22,578) (7.1)
Building construction (Unit: million yen)
Purpose Amount Proportion Amount Proportion Amount Proportion Amount Variance rate
% % % %
Office / government buildings 265,655 30.1 310,752 32.7 324,548 34.0 13,796 4.4
Accommodations 82,712 9.4 68,901 7.3 22,525 2.4 (46,375) (67.3)
Stores 108,547 12.3 85,002 9.0 72,543 7.6 (12,458) (14.7)
Factories and power plants 82,701 9.4 52,680 5.6 104,313 10.9 51,632 98.0
Warehouse and logistics 1,964 0.2 6,085 0.6 14,686 1.5 8,600 141.3
Houses 138,658 15.7 174,581 18.4 173,526 18.2 (1,054) (0.6)
Education and research 72,401 8.2 104,004 11.0 77,016 8.1 (26,988) (25.9)
Medical and welfare 55,391 6.3 86,782 9.1 102,469 10.8 15,686 18.1
Amusement 7,091 0.8 2,173 0.2 2,212 0.2 38 1.8
Others 67,058 7.6 58,020 6.1 59,995 6.3 1,974 3.4
合 計 Total 882,182 100 948,985 100 953,836 100 4,851 0.5
Result-2Q/FY2009
Result-2Q/FY2010 Result-2Q/FY2011 Variance (2Q/FY2011-2Q/FY2010)Result-2Q/FY2009
Result-2Q/FY2010 Result-2Q/FY2011 Variance (2Q/FY2011-2Q/FY2010)
⑩ 0%
10%
20%
30%
40%
50%
60%
70%
80%
90%
100%
2009/9 2010/9 2011/9
①Office / government
buildings
②Accommodations
③Stores
④Factories and
power plants
⑤Warehouses and
logistics
⑥Houses
⑦Education and
research
⑧Medical and welfare
⑨Amusement
⑩Others
(Proportion)
0%
10%
20%
30%
40%
50%
60%
70%
80%
90%
100%
2009/9 2010/9 2011/9
①Soil and river
conservation
②Railroads
③Water supply and
sewers
④Land development
⑤Ports and airports
⑥Roads
⑦Power lines and
others
(Proportion)
④
②
⑤
⑥
③
⑦
①
②
⑥
⑦
⑤
⑧
③
⑨
④
①
⑩
9

6 Orders received - renovation projects (non-consolidated)
7 Breakdown of orders received - classified by contract amount (non-consolidated)
8 Breakdown of orders received - sole source or tender bid (non-consolidated)(Unit: million yen)
Amount Proportion Amount Proportion Amount Proportion Amount Variance rate
26,979 34.6% 26,995 39.6% 29,674 36.3% 2,678 9.9%
50,901 65.4 41,184 60.4 51,975 63.7 10,790 26.2
77,880 100 68,180 100 81,649 100 13,469 19.8
122,173 36.8 125,707 39.3 155,243 56.5 29,535 23.5
209,704 63.2 193,893 60.7 119,505 43.5 (74,388) ( 38.4)
331,877 100 319,601 100 274,748 100 (44,852) ( 14.0)
149,152 36.4 152,703 39.4 184,917 51.9 32,214 21.1
260,605 63.6 235,078 60.6 171,480 48.1 (63,597) ( 27.1)
409,758 100 387,781 100 356,398 100 (31,383) ( 8.1)
Result-2Q/FY2009 Result-2Q/FY2010 Result-2Q/FY2011 Variance (2Q/FY2011-2Q/FY2010)
Total
Sole source
Tender bid
Sole source
Sole source
Tender bid
Total
Civil
Eng.
Subtotal
Building
Const.Tender bid
Subtotal
0%
10%
20%
30%
40%
50%
60%
70%
80%
90%
100%
2009/9 2010/9 2011/9
①Over five billion
yen
②Less than five
billion yen and over two billion yen
③Less than two
billion yen
0%
10%
20%
30%
40%
50%
60%
70%
80%
90%
100%
2009/9 2010/9 2011/9
①Civil eng. sole
source
②Civil eng. tender
bid
③Building const.
sole source
④Building const.
tender bid
①
②
③
④
①
②
③
(Proportion)
(Proportion)
(Unit: million yen)
Number Amount Proportion Number Amount Proportion Number Amount Proportion Number Amount Variance Rate
% % % %
13 206,760 50.5 10 155,513 40.1 13 94,417 26.5 3 (61,095) (39.3 )
23 65,312 15.9 17 53,891 13.9 20 62,601 17.6 3 8,709 16.2
- 137,684 33.6 - 178,376 46.0 - 199,379 55.9 - 21,002 11.8
- 409,758 100 - 387,781 100 - 356,398 100 - (31,383) (8.1 )
Variance (2Q/FY2011-2Q/FY2010)Result-2Q/FY2010 Result-2Q/FY2011Result-2Q/FY2009
Total
Less than two billion yen
Less than five billion yen
and over two billion yen
Over five billion yen
(Unit: million yen)
Amount Proportion* Amount Proportion* Amount Proportion* Amount Variance rate
47,708 16.5% 60,005 19.1% 74,888 28.8% 14,882 24.8%
Note : "Proportion" shows ratio of "orders received of renovation projects" to "orders received of domestic building construction"
Total of orders received
Variance (2Q/FY2011-2Q/FY2010)Result-2Q/FY2010 Result-2Q/FY2011Result-2Q/FY2009
10
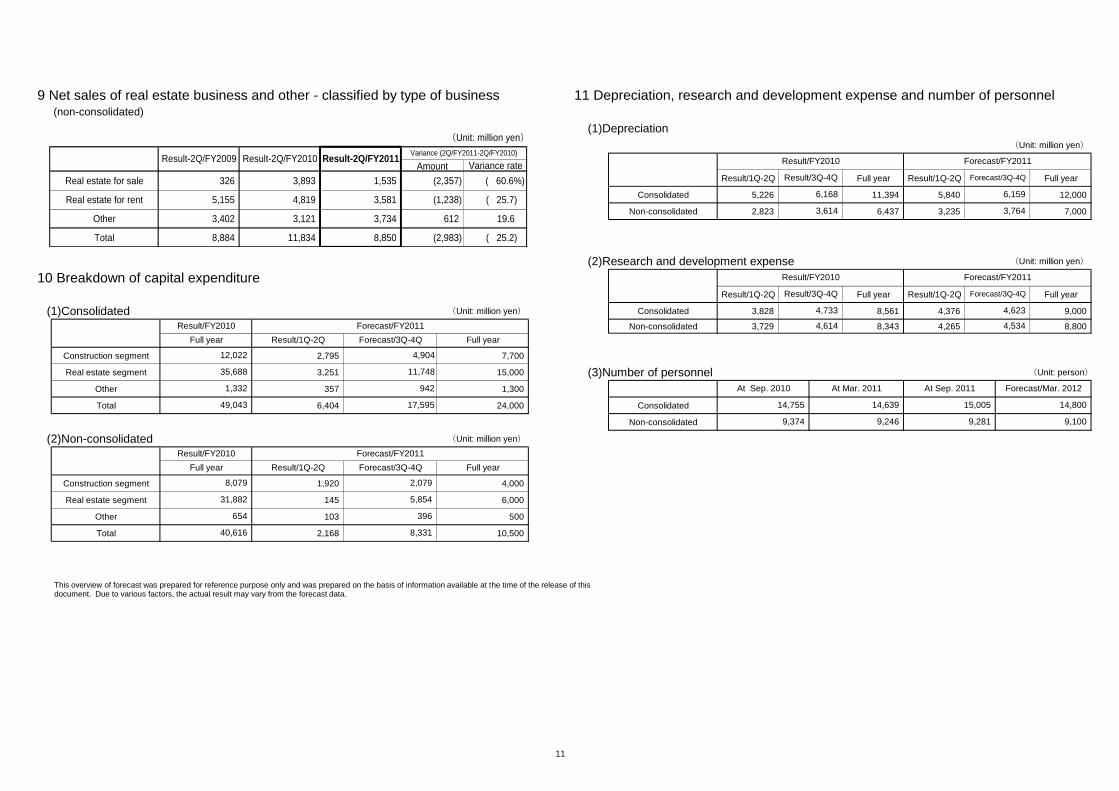
9 Net sales of real estate business and other - classified by type of business 11 Depreciation, research and development expense and number of personnel(non-consolidated)
(1)Depreciation
(Unit: million yen)
Result/1Q-2Q Full year Result/1Q-2Q Full year
Consolidated 5,226 11,394 5,840 12,000
Non-consolidated 2,823 6,437 3,235 7,000
(2)Research and development expense (Unit: million yen)
10 Breakdown of capital expenditureResult/1Q-2Q Full year Result/1Q-2Q Full year
(1)Consolidated (Unit: million yen) Consolidated 3,828 8,561 4,376 9,000
Non-consolidated 3,729 8,343 4,265 8,800
Construction segment 2,795 7,700
Real estate segment 3,251 15,000 (3)Number of personnel (Unit: person)
Other 357 1,300
Total 6,404 24,000 Consolidated
Non-consolidated
(2)Non-consolidated (Unit: million yen)
Construction segment 1,920 4,000
Real estate segment 145 6,000
Other 103 500
Total 2,168 10,500
1,332
Result/FY2010
40,616
Forecast/FY2011
Full year Result/1Q-2Q Forecast/3Q-4Q
Result/FY2010
49,043
4,614
12,022
35,688
Forecast/FY2011
Full year Result/1Q-2Q
At Sep. 2010 At Mar. 2011
9,374 9,246
6,168 6,159
Result/FY2010 Forecast/FY2011
Result/3Q-4Q Forecast/3Q-4Q
3,614 3,764
8,331
8,079
31,882
654
Forecast/3Q-4Q Full year
4,904
11,748
942
17,595
Full year
2,079
5,854
396
Result/3Q-4Q Forecast/3Q-4Q
4,733 4,623
Result/FY2010 Forecast/FY2011
9,281 9,100
4,534
Forecast/Mar. 2012
14,755 14,639 15,005 14,800
At Sep. 2011
This overview of forecast was prepared for reference purpose only and was prepared on the basis of information available at the time of the release of this document. Due to various factors, the actual result may vary from the forecast data.
(Unit: million yen)
Amount Variance rate
Real estate for sale 326 3,893 1,535 (2,357) ( 60.6%)
Real estate for rent 5,155 4,819 3,581 (1,238) ( 25.7)
Other 3,402 3,121 3,734 612 19.6
Total 8,884 11,834 8,850 (2,983) ( 25.2)
Variance (2Q/FY2011-2Q/FY2010)Result-2Q/FY2009 Result-2Q/FY2010 Result-2Q/FY2011
11

12 Net sales and operating income by segment (consolidated)
(Unit: million yen)
Net salesOperating
income
Operating
income ratioNet sales
Operating
income
Operating
income ratioNet sales
Operating
income
Operating
income ratioNet sales
Operating
income
Domestic civil eng. 118,183 3,840 3.2% 93,608 (2,205) ( 2.4% ) (24,575) (6,045)
Overseas civil eng. 17,905 (2,089) ( 11.7) 13,744 682 5.0 (4,161) 2,772
Domestic building const. 316,485 2,046 0.6 338,944 4,008 1.2 22,459 1,961
Overseas building const. 52,003 (148) ( 0.3) 65,374 1,540 2.4 13,371 1,688
504,578 3,648 0.7 511,672 4,025 0.8 7,094 376
15,010 4,271 28.5 15,320 2,071 13.5 310 (2,200)
15,982 309 1.9 17,867 224 1.3 1,885 (84)
700,430 5,828 0.8% 535,570 8,229 1.5 544,860 6,321 1.2 9,289 (1,908)
13 Net sales by region (consolidated)
(Unit: million yen)
Amount Proportion (Ovs. proportion) Amount Proportion (Ovs. proportion) Amount Proportion (Ovs. proportion) Amount Proportion
553,568 79.0% 464,660 86.8% 464,883 85.3% 222 0.0%
146,862 23.5 ( 100 % ) 70,910 13.2 ( 100 % ) 79,977 14.7 ( 100 % ) 9,067 12.8
North America 73,242 10.5 ( 49.9 ) 37,069 6.9 ( 52.3 ) 47,401 8.7 ( 59.3 ) 10,332 27.9
Asia 72,741 10.4 ( 49.5 ) 33,049 6.2 ( 46.6 ) 31,812 5.8 ( 39.8 ) (1,237) ( 3.7)
Others 878 0.1 ( 0.6 ) 791 0.1 ( 1.1 ) 763 0.2 ( 0.9 ) (28) ( 3.6 )
700,430 100 535,570 100 544,860 100 9,289 1.7
Result-2Q/FY2011
Total
Japan
Overseas
Others
Total
Variance(2Q/FY2011-2Q/FY2010)Result-2Q/FY2009 Result-2Q/FY2010
Construction business
Real estate business
Result-2Q/FY2009 Result-2Q/FY2010 Result-2Q/FY2011 Variance(2Q/FY2011-2Q/FY2010)
Note: "Net sales" shows "Net sales on external sales" and "Operating income" shows "Operating income on external sales". The total "Net sales" and "Operating income" equals to "Net sales" and "Operating income" as shown in the quarterly consolida ted statements of income. As result of 2Q/FY2009, segment information according to “Accounting Standard for Disclosures about Segments of an Enterprise and Related I nformation” (ASBJ Statement No. 17, issued on March 27, 2009) is not disclosed, the chart shows only total amount.
12

14 Performance of major subsidiaries
(Unit: million yen, person)
(1)Domestic subsidiaries
No. Name of company Segment% held by
the GroupNet sales Operating income Ordinary income Net income Net sales Operating income Ordinary income Net income Net sales Operating income Ordinary income Net income Total assets Net assets
Interest-bearing
Liabilities
Number of
personnel
1 Obayashi Road Domestic Civil
Eng.40.3% 87,445 757 715 216 85,000 850 830 300 30,838 (767) (759) (504) 55,832 23,608 2,000 1,092
2 Naigai TechnosDomestic
Building const.100.0% 61,427 64 69 37 68,620 303 299 168 32,720 129 128 70 31,433 4,023 1,800 145
3 Obayashi FacilitiesDomestic
Building const.100.0% 18,999 1,232 1,266 949 19,881 1,328 1,360 757 9,907 674 698 383 11,466 7,393 - 825
4 Oak Setsubi Domestic
Building const.100.0% 14,591 269 277 859 17,250 237 250 275 6,887 251 260 149 7,796 1,464 - 255
5 Obayashi Real EstateReal Estate
Business100.0% 10,030 3,058 2,150 484 8,707 2,159 1,339 300 4,568 1,344 933 532 88,705 9,578 57,990 72
6 Seiwa Real EstateReal Estate
Business100.0% - - - - 22,805 1,800 1,286 1,559 5,312 113 (147) 731 43,176 4,079 34,215 118
7 Oak Information System Other 100.0% 7,602 263 280 159 7,773 268 279 156 3,657 94 100 51 4,524 2,981 - 184
8 OC Finance Other 100.0% 1,021 413 413 299 1,049 463 463 335 690 395 395 291 65,174 2,685 52,879 -
9 Ibaraki Green Other 100.0% 1,579 564 517 172 1,502 333 302 150 792 227 219 102 6,367 1,374 4,220 50
10 HR Osaka Other 100.0% 4,156 (159) (145) (150) 4,203 (90) (93) (74) 2,039 (128) (129) (98) 1,296 (3,090) 2,525 295
11 28 PFI Subsidiaries Other 19,356 264 266 44 21,410 244 292 67 12,849 224 268 96 92,677 526 84,540 79
Others 8,552 230 279 (35) 8,901 153 197 104 3,545 (42) (6) 15
234,762 6,958 6,090 3,037 267,103 8,050 6,807 4,101 113,811 2,518 1,961 1,820
(Unit: million yen, person)
(2)Overseas subsidiaries
No. Name of company Segment% held by
the GroupNet sales Operating income Ordinary income Net income Net sales Operating income Ordinary income Net income Net sales Operating income Ordinary income Net income Total assets Net assets
Interest-bearing
Liabilities
Number of
personnel
12 E.W. Howell Co., LLCOverseas
Building const.95.0% 20,648 476 486 480 19,887 304 315 311 8,197 169 175 173 7,268 1,741 - 95
13 John S.Clark Company, LLCOverseas
Building const.100.0% 12,512 (487) (475) (466) 13,024 (256) (252) (253) 7,230 (135) (134) (135) 3,419 181 - 176
14 Webcor, LPOverseas
Building const.70.0% 24,779 (1,934) (1,913) (1,921) 42,560 (1,408) (1,413) (1,452) 19,116 (757) (738) (783) 17,923 2,196 2,421 634
15 Kenaidan Group Ltd.Overseas Civil
Eng.51.0% - - - - 18,253 1,009 1,054 772 7,953 385 408 298 8,324 1,865 104 133
16 Thai ObayashiOverseas
Building const.49.0% 17,234 721 973 675 28,497 654 986 678 14,010 568 726 493 22,018 17,182 - 986
17 PT. Jaya ObayashiOverseas
Building const.85.0% 2,963 83 33 (57) 9,452 376 371 87 4,775 283 269 126 2,085 295 - 126
18 Taiwan ObayashiOverseas
Building const.100.0% 1,801 13 14 11 4,566 135 138 112 724 18 20 17 3,193 876 - 68
19 Obayashi VietnamOverseas
Building const.100.0% 4,906 167 301 226 5,734 270 406 304 2,556 215 331 248 2,189 1,264 - 226
Others 266 (150) (390) 2 470 (112) (197) (198) 205 (109) (160) (162)
85,114 (1,109) (970) (1,049) 142,446 973 1,408 363 64,769 638 899 277
319,876 5,848 5,120 1,987 409,549 9,023 8,216 4,465 178,581 3,156 2,861 2,097
Overseas subsidiaries(Total 35) total
Subsidiaries(Total 87) total
Result FY2010 Result-2Q/FY2011Forecast FY2011
Result FY2010 Result-2Q/FY2011Forecast FY2011
Domestic subsidiaries(Total 52) total
Note: This overview of forecast was prepared for reference purpose only and was prepared on the basis of information available at the time of the release of this document. Due to various factors, the actual result may vary from the forecast data.
" 2Q" represents the cumulative second quarter, i.e. the first six months of a given fiscal year.
*1 E.W. Howell Co., LLC, John S. Clark Company,LLC and Webcor, LP are consolidated subsidiaries of Obayashi USA, LLC.
*2 Kenaidan Group Ltd. is a consolidated subsidiary of Obayashi Canada Holdings Ltd.
*2
*1
13

15 Major private finance initiative (PFI) business
No. LocationType of
business
Business termDate of
establishmentcapital stock % held by Obayashi Co.
1 Chiyoda-ku, Tokyo BTO HOR Kaikan PFI 105.8billion yen
Aug. 2007 - Mar. 2020 (13 years) 12/26/2005 500million yen 41%(Affiliated company)
2 Hamada City, Shimane BOT Shimane Asahi Social Support 87.8billion yen
Oct. 2008 - Mar. 2026 (17 years) 3/20/2006 10million yen 48%(Subsidiary)
3 Yokohama City, Kanagawa BTO Kanagawa Medical Service 63.2billion yen
Nov. 2013 - Mar. 2034 (20 years) 2/25/2010 100million yen 55%(Subsidiary)
4 Yokosuka City, Kanagawa BTO PFI Kanagawa 32.3billion yen
Feb. 2003 - Mar. 2033 (30 Years) 5/25/2000 10million yen 99.5%(Subsidiary)
5 Suginami-ku, Tokyo BOT PFI Suginami Koukaidou Hall 25.8billion yen
Jun. 2006 - Mar. 2036 (30 years) 1/16/2003 10million yen 61%(Subsidiary)
6 Saitama City, kanagawa BTO PFI Okubo Techno Resource 24.2billion yen
Apr. 2008 - Mar. 2028 (20 years) 12/3/2004 10million yen 20%(Affiliated Company)
7 Kakogawa City, Hyogo O&M Harima Social Support 23.5billion yen
Oct. 2007 - Mar. 2022 (15 years) 5/24/2007 50million yen 67%(Subsidiary)
Note: This chart does not contain the projects that already finished. Other 28 projects 211.2billion yen
Total 35 projects 573.8billion yen
Special purpose company Gross business
expensesName of business
Shimane Asahi Rehabilitation Program Center construction and
operation project
Kanagawa Cancer Center construction and operation project
Suginami Koukaidou Hall reconstruction, management and
operation project
New Office for the Members of the House of Representatives
construction and operation project
Okubo Drainage and Purification Plant construction and
operation project
Kanagawa University of Human Services construction project
Harima Rehabilitation Program Center operation project
14