Trends in Technology and Materials Columns in Landscape ...
263
The authors are solely responsible for the content of this technical presentation. The technical presentation does not necessarily reflect the official position of the Council of Educators in Landscape Architecture (CELA), and its printing and distribution does not constitute an endorsement of views which may be expressed. Citation of this work should state that it is from a CELA conference paper. EXAMPLE: Author's Last Name, Initials. 2019. Title of Paper. Sacramento, California: CELA. For information about securing permission to reprint or reproduce this paper, please contact CELA at [email protected] Trends in Technology and Materials Columns in Landscape Architecture Magazine: 1978-2017 Fox, Kris University of Calgary, [email protected] 1 ABSTRACT (250 words for this paper) This study examines the development and evolution of the landscape construction column as a component of Landscape Architecture Magazine (LAM) from 1978 to 2017. It is the first longitudinal study of technical columns focused on materials, technologies and construction methodologies and their contributions to trends with within the profession. Several questions will be addressed: How have the columns changed and evolved? Has their content paralleled the value systems of the profession and/or predicted future trends? Has their frequency and content related to the “materials explosion” that has swept through the building industries over the last two decades? Finally, how has LAM documented this evolution to help establish the values associated with these new materials and technologies? To answer these questions, column runs have been grouped into “eras” based on such factors as subject matter (materials, construction or technology / software), and approach (traditional vs. sustainable materials and/or construction methods). The ‘eras’ and their time-frames are “Traditional Materials and Construction” (1978 – 1991); “Traditional Materials and Explosion” (1992 – 1995); “Non-Material” (1996 – 1998); “Sustainably Influenced Materials Explosion” (1999 – 2004); “Ecology & Sustainability” (2005 – 2010); and “Assumed Knowledge” (2011 – 2017). The study concludes with a summary of the impact of the technology columns. Perhaps, most importantly, this article will offer a critique on how Landscape Architecture Magazine can look to its past to address how it should position itself moving forward with the coverage of landscape materials. 1.1 Keywords Landscape Architecture Magazine, landscape construction materials, sustainable materials, sustainable construction, landscape architecture profession CELA 2019 | UC Davis 259
-
Upload
khangminh22 -
Category
Documents
-
view
0 -
download
0
Transcript of Trends in Technology and Materials Columns in Landscape ...

The authors are solely responsible for the content of this technical presentation. The technical presentation does not necessarily reflect the official position of the Council of Educators in Landscape Architecture (CELA), and its printing and distribution does not constitute an endorsement of views which may be expressed. Citation of this work should state that it is from a CELA conference paper. EXAMPLE: Author's Last Name, Initials. 2019. Title of Paper. Sacramento, California: CELA. For information about securing permission to reprint or reproduce this paper, please contact CELA at [email protected]
Trends in Technology and Materials Columns in Landscape Architecture Magazine: 1978-2017
Fox, Kris University of Calgary, [email protected] 1 ABSTRACT (250 words for this paper)
This study examines the development and evolution of the landscape construction column as a component of Landscape Architecture Magazine (LAM) from 1978 to 2017. It is the first longitudinal study of technical columns focused on materials, technologies and construction methodologies and their contributions to trends with within the profession. Several questions will be addressed: How have the columns changed and evolved? Has their content paralleled the value systems of the profession and/or predicted future trends? Has their frequency and content related to the “materials explosion” that has swept through the building industries over the last two decades? Finally, how has LAM documented this evolution to help establish the values associated with these new materials and technologies? To answer these questions, column runs have been grouped into “eras” based on such factors as subject matter (materials, construction or technology / software), and approach (traditional vs. sustainable materials and/or construction methods). The ‘eras’ and their time-frames are “Traditional Materials and Construction” (1978 – 1991); “Traditional Materials and Explosion” (1992 – 1995); “Non-Material” (1996 – 1998); “Sustainably Influenced Materials Explosion” (1999 – 2004); “Ecology & Sustainability” (2005 – 2010); and “Assumed Knowledge” (2011 – 2017). The study concludes with a summary of the impact of the technology columns. Perhaps, most importantly, this article will offer a critique on how Landscape Architecture Magazine can look to its past to address how it should position itself moving forward with the coverage of landscape materials.
1.1 Keywords
Landscape Architecture Magazine, landscape construction materials, sustainable materials, sustainable construction, landscape architecture profession
CELA 2019 | UC Davis 259
2 INTRODUCTION
For over one hundred years, Landscape Architecture Magazine (LAM) has been the most widely circulated trade magazine in our profession, during which time it has served as a conduit for current events, trends and values within the profession. It is “the oldest, largest, and most continuous repository of landscape architectural practice, research, philosophy, and teaching anywhere.” (Ferguson, 1999, 86) Until the late 1970s, the magazine consisted mainly of feature articles, letters to the editor and book reviews. As the level of complexity of our profession increased, the magazine developed technically themed columns, the first of which was “Technik” debuting in January 1978. This was followed by the more widely known “Construction” in November 1980 under the editorship of Linda Jewell. In the years since “Construction” numerous technical column titles have come and gone. Articles on materials and construction evolved over the years. Several sustainable elements were mentioned for the first time in column articles and have become parts of our lexicon, such as green roofs, bioswales, constructed wetlands, landfill restoration and stream restoration. This paper analyzes LAM’s contribution to the evolution and introduction of new construction materials and new technologies that have impacted the profession since the late 1970s.
This paper documents the evolution of landscape construction columns as components of the magazine and, with this information, evaluates whether the content of the materials columns paralleled the value systems of the profession, accounted for the “materials explosion”, and has Landscape Architecture Magazine documented this evolution to help establish the values associated with these new materials and technologies? By answering these questions, the technology column runs will be redefined through the focus of the content into ‘eras’, illustrating the true impacts and trends of construction materials and how the coverage of these materials played out in LAM over the 40 year period: 1978 to 2017. 2.1 Significance
As a practitioner in a small firm in the early 2000s, it was difficult to keep up with the sheer number of new materials being introduced and frequently just as difficult to convince clients to use materials with little to no track record. Part of why I transitioned to academia was to work more closely with materials and to better understand the opportunities that were being brought to landscape architecture by the proliferation of new products. This explosion in materials was one of three major factors that have reshaped the profession in that last 15-20 years; the others being advances in computer technology and the sustainability movement.
The 2000s saw a proliferation of publications on new construction materials and methods, espousing the importance to designers of working within this new environment. Addressing this point, in the introduction to Transmaterial, Blaine Brownell states that “One simple view is that while materials science has existed since the stone age, it is simply advancing at an accelerated pace like other technologies, and this pace has finally become conspicuous.” (Brownell, 2005, 7) This is especially true within architecture, which produced numerous titles over the course of the decade including the Transmaterial Series (Brownell ), Materials For Design (Ballard and Rand), Refabricating Architecture (Kieran and Timberlake), Prefab Prototypes (Anderson and Anderson) and many more. At the same time, publications focused on landscape architectural materials emerged, such as Materials for Sustainable Sites (Calkins), The Sustainable Sites Handbook (Calkins) and Living Systems (Margolis and Robinson). However, within the covers of LAM, the number of articles covering materials decreased over the past decade, almost disappearing in the mid 2000s through early 2010s. In the past few years there has been a slight upward trend, with the number of articles doubling in 2017. In an era where there doesn’t appear to be anything stopping the trend of materials development in the construction industries, is this recent uptick in technology articles a move to keep pace?
During the peak of materials coverage in LAM, which ran from 1999-2004, technical articles provided vital information on what was becoming available within our field. The varying quantities of technology articles shows that LAM hasn’t always accurately reflected this trend of the ever expanding materials explosion, though other published resources (some of which are listed above) in landscape architecture, architecture and industrial design have begun to show that tracking this has become a
CELA 2019 | UC Davis 260

subject in and of itself Moving forward, can Landscape Architecture Magazine be the place where practitioners can go to educate themselves on the trends in this more technologically demanding environment of landscape architecture? 2.2 Historical Overview of Technology Columns
Figure 1. Column runs in Landscape Architecture Magazine over time with editorship periods (2018). Diagram by author.
While many practitioners and educators in landscape architecture remember “Construction” as the first materials column, it was preceded by “Technik”, which first appeared in January 1978. Though it only appeared twelve times, it laid the ground rules for the level of detail in technology columns that were to follow. But, it was in November 1980 when the technical column really took off.
That month, Grady Clay, the Editor of Landscape Architecture Magazine, incorporated subject-based columns into the magazine. Amongst these columns was “Construction”, which revolved around materials, detailing and construction. It served to teach us about new materials and construction techniques as well as to remind practitioners of materials which spoke to the legacy of our profession. Under the leadership of column editor Linda Jewell, “Construction” became a staple of the magazine for nearly a decade appearing on a regular basis, though not in every volume, until July/August 1987, (and twice under “Technique & Practice” in Dec 1988 and May 1989).
The late 1980s saw LAM’s ambitious expansion from six volumes per year in 1987, to eight in 1988, ten in 1989 and finally monthly in 1990. This period, primarily under Editor-In-Chief James Truelove, also witnessed a major reformatting of LAM. Beginning in Dec 1988, a new section entitled “Technique & Practice” was created. It served as an umbrella under which a variety of topics related to materials, construction, computers and the practice of landscape architecture were housed. In addition, a smaller one-page column on new landscape materials and products called “Product News” was started. These columns ran until Editor Truelove stepped down in January 1996.
Spearheaded by Editor-In-Chief Anne Elizabeth Powell, LAM underwent a content reformat in February 1996. One of the changes was the increase in the number of columns, dubbed ‘departments’ that appeared monthly. Unlike the single “Technique & Practice” column, there were now separate columns. This incarnation of LAM transitioned to Editor Steadman in 1999 and then to J. William Thompson in 2000. The majority of columns that focused on materials occurred in “Technology”, “Details” and “Ecology”. Over forty column headings were created during the 14-year run of this format to cover a diversity of topics. In the back of the volumes, “New Products”, which ran from Jan 1999 to Feb 2001, and “Product Profiles”, which ran from March 2001 to Dec 2010, picked up where Product News left
CELA 2019 | UC Davis 261

off in October 1995. After serving as editor for nearly a decade, J. William Thompson stepped down in October 2009.
The most recent major reformat, and current version of LAM, began in January 2011 under Editor-In-Chief Bradford McKee. Several new departments were created to reflect the changing nature of the discipline. The majority of materials-based columns occurred in “Close-Up”, “Materials”, “Green Roofs” and “Water”. Finally, “Goods” became the fourth iteration of a column revolving around new landscape materials and products. 3 METHODS
To track the evolution of materials focused technology column articles in Landscape Architecture Magazine, an inventory of the articles from the first appearance of “Technik” in January 1978 to June 2017 was created. For this study, a column is defined as any article that appeared under a subject category heading, occurred on a monthly or semi-regular basis and was not a ‘feature article’. A ‘material’ is defined as any landscape construction material that’s used for site construction or infrastructure. This is self-evident with hard landscape construction materials, but can include vegetation such as sedums, if they are described as the insulation layer to the sandwich assembly of a roof garden. From that, a ‘materials’ column article has been defined as those articles where the main focus is to provide a description, outline potential uses for and illustrate construction processes with a particular material, such as colored concrete, or assembled landscape elements, such as septic systems. Several readings of the column articles were required to isolate those with a significant amount of information on materials.
The period from February 1996 to December 2010 was the most complicated to sort through as over forty column titles were created, which LAM referred to as “departments”. For this study, the number of columns was narrowed down to the three with the highest proportion of articles on materials: “Ecology”, “Technology” and “Details”. Though not in significant numbers, articles focused on materials occasionally appeared in other columns, such as Landscapes of Home, Landscapes of Escape, an “Education” column from February 2009.
The articles were divided into two categories, “In-Depth” and “Product”. The criteria were based on similarities of formatting, content, and the level of descriptive detail. The In-Depth columns always listed an author, many of whom were frequent contributors, making these columns more impactful when present in a volume. They are as follows: “Technik”, “Construction”, “Technique & Practice”, “Technology”, “Ecology”, “Details”, “Close-Up”, “Materials”, “Green Roofs” and “Water”. Articles that provided brief profiles of landscape construction products were put into the ‘Product’ category. They are as follows: “Product News”, “New Products”, “Product Profiles” and “Goods”. The column runs and types are summarized in Figure 1.
The final step was to categorize the articles by how LAM presented the data: “traditional” or “sustainable”. Four variables were used as follows:
1. Traditional Materials 2. Sustainable Materials 3. Traditional construction process 4. Sustainable construction process
If a material or a construction process was referred to as “sustainable”, it was defined as such;
otherwise it was defined as “traditional”. Both traditional and sustainable materials are capable of illustrating advances in technology over time. A traditional material or construction process can be environmentally sensitive and have less impact than alternative materials or construction processes, but in order to be considered sustainable, they must speak to the ethos of sustainability.
The definition of sustainability that was used comes from the definition of sustainability presented by J. William Thompson and Kim Sorvig in Sustainable Landscape Construction. The authors pointed out that sustainability is difficult to define, which is emphasized by the fact that in the second edition of their
CELA 2019 | UC Davis 262

book the definition was changed to the article published by CELA in 1988, which defines sustainable landscapes as those which
“contribute to human well-being and at the same time are in harmony with the natural environment. They do not deplete or damage other ecosystem. While human activity will have altered native patterns, a sustainable landscape will work with native conditions in its structure and functions. Valuable resources – water, nutrients, soil et cetera – and energy will be conserved, diversity of species will be maintained or increased” (CELA, 1988).
4 FINDINGS
The findings for the ‘Product’ and ‘In-Depth’ columns will be addressed separately as there are major differences between them. The most notable is that virtually all ‘Product’ columns feature materials and have a more consistent month-to-month presence than the ‘In-Depth’ columns. As such all proportional calculations and comparisons were separated by these categories. For overall numbers, each category was counted separately and the two categories were combined to show the overall trend in the presence of materials column articles over the past 40 years. 4.1 “In-Depth” Columns: Detailed Descriptions
In January of 1978, Grady Clay introduced “Technik”, the first technology column. Only twelve articles appeared between January 1978 and March/April 1984. They provided a general heading under which a variety of technical articles could appear. Under this umbrella, articles ranged from bus shelter design to computer software to site engineering. The majority of articles were on such topics as slope stabilization, erosion control, and re-vegetation.
The next technology column to appear was entitled “Construction”, edited by Linda Jewell. The column and its editor were formally introduced in the “People” section of the November 1980 issue. Jewell authored 26 of the 36 articles written during the column’s run. Subject matter revolved around what today would be considered “traditional” landscape materials and construction, which, when grouped together, are similar to introductory texts on the subject. Overall, “Construction” featured the highest proportion of materials articles of any column run.
“Construction” articles were typically three to four pages in length and covered a single material such as granite curbing or integral color for concrete paving. In a sense, these articles were short crash courses on the material profiled. The articles gave a brief introduction to the material covering its available options, its qualitative and quantitative properties, best applications, and potential costs. Construction details and detailed sketches were common, photographs were not.
Of the 36 articles, 21 focused on landscape materials, nine focused on construction processes, and six focused on other topics, including a historical retrospective on A. D. Taylor who penned numerous articles on materials and construction from 1922-1936. Examples of Construction column articles that focused on a material were Bluestone and Slate Flagging from Nov 1981, Colored Concrete Paving from January/February 1984 and Ornamental Metal – Wrought Iron from March/April 1987. Examples of Construction column articles that focused on a construction process were Perforated Brick Walls from May/June 1983 and Wood Crib Retaining Walls from November/December 1984.
The next column to feature a large proportion of materials articles was “Technique and Practice”, which ran from December 1988 – January 1996. Similar to “Technik”, this column was set up as a section to capture a diverse range of articles that impacted the profession, in effect combining “Construction”, “Computers” and “Technik” from previous volumes of the magazine. Roughly 50% of articles focused on materials, but topics were as diverse as digital technologies, insurance, restoration, practice and education. Occasionally materials were discussed within these, but if they were, it was from a design perspective rather than a material perspective. The use of photographs, and to a lesser extent sketches was similar to the earlier “Construction” articles.
CELA 2019 | UC Davis 263
Notable examples of “Technique and Practice” column articles that focused on traditional materials were Green Walls, about vegetating highway barriers in August 1991, Brave New Materials, about new and emerging construction material in July 1992, Selecting Erosion Control Fabrics in September 1993, Colored Concrete in January 1994 and Plastic Lumber in January 1995. Examples of column articles that focused on traditional construction processes were Playground Surfaces in May 1994 and Earth-Building in Landscape Architecture in February 1995. Articles that focused on sustainable materials and construction processes had only a small presence. Examples were Wood Wise, in January 1992 and Comparing Grass Pavers in May 1995.
The columns to follow were entitled “Technology”, “Ecology”, and “Details”. These ran from February 1996 to December 2010 and from January 1999 to December 2010, respectively. Though 1996 to 1998 was a relatively quiet period, the change in editors brought about a resurgent period of materials column articles from 1999 to 2004. However, there was a steep decline in materials articles between 2005 and 2010.
A typical material-focused “Technology” article profiled a single material or construction process, such as salvaged wood or straw-bale construction. Many of these articles are similar to the material profile articles in “Construction”; however, they are more qualitative and are more likely to tie the subject to a site or sites. “Other articles contained information on digital technology for mapping and representation. Software-based columns rarely related to materials. Typical and notable examples of “Technology” column articles that focused on traditional materials were Back to Brick from December 1996, Tile Tales from February 1997, Grass Roofs Movement, which explained what green roofs are, from May 1998, Meadows Above, which further defined green roofs, from September 2000, and Problem Solving in Stormwater Bioretention Systems from May 2006. Examples of column articles that focused on traditional construction processes were Stone Veneer Site Walls in Feb 2001 and The Makings of a Skatepark in April 2004.
Typical material-focused “Ecology” articles look at how a common material or element can be made more sustainable through new specifications or alternatives. In general, these articles are very technical and provide a large number of quantitative and qualitative specifications, particularly in articles by Meg Calkins and Kim Sorvig. They typically introduce a material, describe the contemporary condition and its pros and cons and then spend the majority of the article looking at how to build or specify it in a more sustainable way. Notable examples of “Ecology” column articles are Soils Under Pressure, about structural soils, in June 2001, Light on Their Feet, about low-impact metal piering systems over water, in November 2001, and Cooling the Blacktop, in February 2007.
A typical “Details” article examined a single element from an existing project and either profiled the element or discusses how it was detailed. The subject could be a lighting product used in a project or an element, such as a wall. Typically these descriptions were qualitative, although some specifications may be included. Interviews with designers involved with the project are common. The number of material focused articles decreased during the lifespan of the column with the majority of the material-focused articles appearing in the first half of its tenure. Examples of “Details” column articles are Specifying a Greener Concrete in February 2000, A New Twist on Trellis Design in June 2000, and Conspicuous Reconsumption, about recycled concrete, in April 2004.
“Green Roofs” was introduced as a column in October 2008. Typically its articles consisted of a case study of one or more green roofs. Usually the studies touched on the decision making process that led to the installation, the plants used, soil depth and mix, issues, and lessons for future projects. Some articles only described the project, but others included technical information and construction details. Notable examples are A Spot of Green in Steel City in September 2008, and The Tipping Point in January 2010.
The current incarnation of LAM began in January 2011 with it three new columns, “Materials”, “Close-Up” and “Water”; “Green Roofs” has continued. However, from January 2011 to June 2014, there were only seven articles focused on materials distributed among these four columns. With such small sample sizes, it is not possible to isolate a “typical” materials focused article. “Materials” has only
CELA 2019 | UC Davis 264

appeared three times., Two of the articles focused on a specific class of product and provided a reasons why landscape architects are now interested in the product. Photos of these products were included and pros and cons of different product types were described broadly. “Close-Up” also has only two materials-focused articles; both of which are on either the detailing or construction process behind a project or product. Both provide photos of the finished work and some quantitative details through CAD drawings and text. To date, “Water” has only one materials-focused article, which spoke to new standard storm water plans for developments in the Los Angeles area. 4.2 Trends With ‘In-Depth’ Column Articles
During the past 40 years, several columns have featured materials as the focus of an individual article whether it was on a specific material or a construction technique. Some columns, like “Construction”, focused almost exclusively on the subject of materials (30 of 36 total articles), while others varied from 7-50%, such as “Technique and Practice” (52 of 107 articles), “Details” (31 of 84 articles), and “Ecology” (10 of 140 articles). The column articles were then separated into two groups based on their specific focus; a materials study vs. construction processes, with materials being the main subject. These two groups were then subdivided based on presentation, ‘traditional’ versus ‘sustainable’.
Based on the increase in of landscape construction materials becoming available over time, one might expect to see an upward trend over time in the number of articles per year that focus on materials. Instead, there are two distinct peaks, one in 1994 and the other in 2000. Since that time, there has been a decline in the frequency of column articles that focus on materials. As Todd Steadman’s editorship period is quite short and mimics that of the first portion of Thompson’s editorship, the two are being combined into the overall period of 1999-2010. The most curious decline is within the Steadman / Thompson editorship period which can be broken up into two parts, one with heavy coverage of landscape materials from 1999-2004, which averaged 9.0 articles per year, and the second being a period of minimal coverage from 2005-2010, which averaged 2.0 articles per year. Though most of the patterns in coverage can be attributed to editorship periods, one can also see the continuity of materials coverage that was maintained in the transition from Steadman to Thompson from 1999 to 2000. The number of total articles and articles per year was the lowest under the current editor, Bradford McKee, during the period 2011 – mid-2014. Since that time, there has been some indication that this pattern might be changing as the average number of articles between mid-2014 and 2016 was 3.3, with six articles published during 2017.
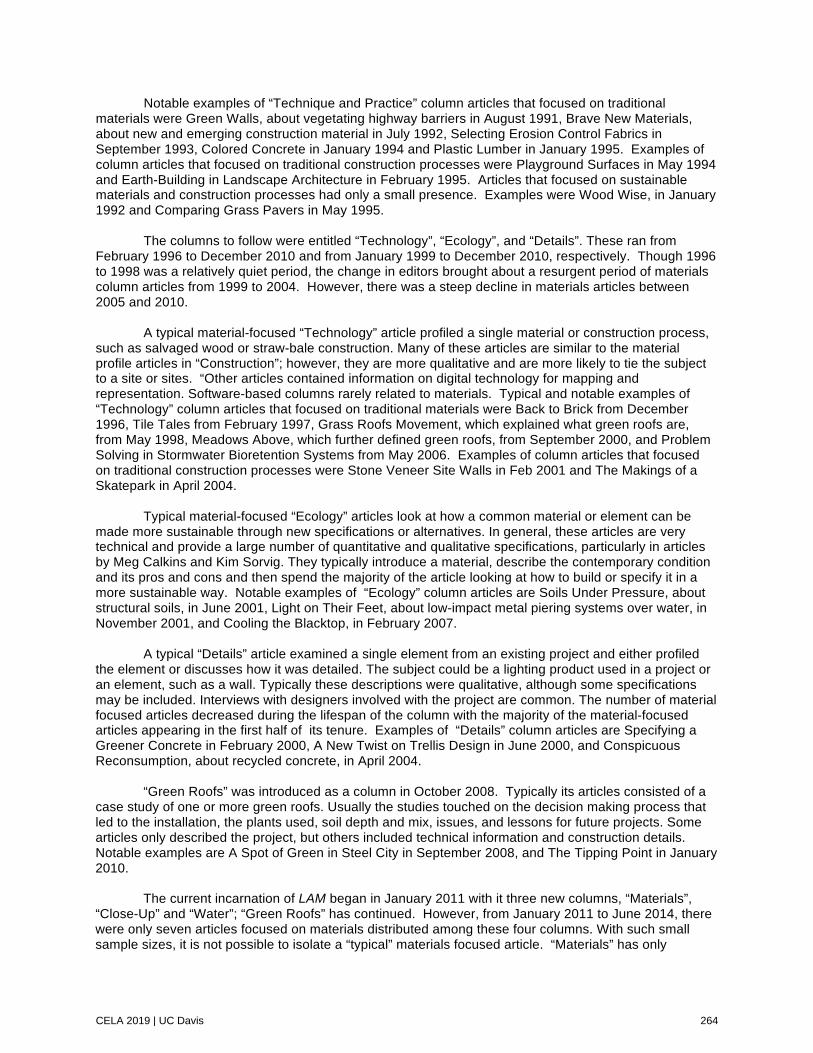
Figure 2. Total quantities of all ‘In-Depth’ column articles that focused on materials over time by subject matter (2018). Diagram by author. 4.3 Materials Versus Digital Technology Coverage in ‘In-Depth’ Columns.
From 1988-2010, articles that focused on digital technology appeared in the same columns as articles on materials. The columns were “Technique & Practice” (1988-1995) and “Technology” (1996-2010). Before December 1988, digital technology was covered in the column “Computers”, and starting in January 2011 digital technology is covered in “Workstation”. Between 50-80% of the column articles
CELA 2019 | UC Davis 265

during the periods from 1996-1998 and 2005-2009 were on digital technologies. In retrospect, these periods can be labeled as more ‘digitally focused eras’. In light of computer advances in both hardware and the increasing utilization of digital tools in landscape architecture, one can see how this subject matter could take precedence over coverage of landscape construction materials. 4.4 ‘Product’ Columns: Detailed Descriptions
Throughout the years, the ‘Product’ columns have had the same function and have exhibited similar formatting and levels of detail. Therefore, all ‘Product’ columns have been viewed as a single column type that changed names with changes in editorship.
The first of these, “Product News”, ran from 1988 to 1995, and initially reported on a variety of products that were not necessarily related to one another on a single page. For example, April 1990 covers a variety of landscape construction products; pavers, concrete stamps, site furnishing and modular trellises. September 1992 featured seeded turf fabric, site furnishings, site lighting, umbrellas and modular face brick. In January 1994, the “Product News” columns began to organize products via a unifying theme, and in October 1994, a subtitle named a theme for the page. This first officially themed ‘Product’ column is titled “Fair Game: New Playground Furniture and Surfacing”. The last “Product News” column appeared in October 1995, becoming the last ‘Product’ column to appear in LAM until January 1999 when the first “New Products” column appeared under Publisher Todd Steadman (J. William Thompson Managing Editor).
“New Products”, which ran from January 1999 to February 2001 featured a variety of products in a one to two page spread and used the ‘grab bag’ approach of its predecessor. Occasionally it would feature one to two new materials, such as A-Jacks concrete streambank stabilization units in February 2000, or ornamental metal work and bike racks in September 2000.
In March 2001, “New Products” was renamed “Product Profiles”, which themed the products each month. The theme was announced via a subheading and went further than the earlier themed “Product News” by including a few sentences on the theme. Some representative examples over the column run are as follows: June 2001 featured landscape ornamentation and furniture, April 2004 featured site furnishings for historic restorations, May 2006 featured a selection of green roof products, February 2009 featured stormwater management products and October 2010 featured site ‘style enhancers’. It should be noted that many of the Product Profiles columns from 2010 were given a sustainable theme, which is evidenced by the spike in articles that year. Another notable sustainably themed Product Profiles was Going Green from Jan 2001, which listed the top 10 green building products from the GreenSpec Directory.
The current Product column is “Goods”, which started in January 2011, and is the only one that credits an author, Lisa Speckhardt, in the article. Each article presents a set of products, all centered on a single theme, such as fencing or ground materials. The articles typically provide a photo and brief description of each product and the manufacturer’s website. 4.5 Trends With ‘Product’ Column Articles
The ‘Product’ columns have, in a sense, the purest focus on materials. While they may only offer short descriptions of a material or commercial product, 96% of the articles described a landscape construction material. The 4% that spoke to software exclusively were excluded from the calculation of traditional versus sustainable materials. Of the 96% of articles that mentioned a product, ‘traditional’ materials were present in 81% versus 19% for ‘sustainable’ materials for the period 1988-2017.
CELA 2019 | UC Davis 266

Figure 3. ‘Product’ column content by subject matter to the left; ‘Product’ columns by material category to the right (2018). Diagram by author.
From December 1988 to October 1995, ‘Product’ column articles were present in about half of the volumes in any given year and were focused almost exclusively on traditional materials. From November 1995 to December 1998, ‘Product columns’ did not appear.. However, since January 1999, the ‘Product’ column articles have generally been present throughout each year with the exception of some ASLA Awards issues. Two distinct trends have occurred since January 1999. The first is the upward trend in the frequency of sustainable material articles from 1999-2010 (the average jumped from 2.0 to 8.0 articles per year), and the second is the severe drop in the frequency of such articles since the beginning of “Goods” in January of 2011 (where it dropped from ten articles in 2010 to one in 2011). 4.6 Reframing Technology Columns: the Different Content Eras of Landscape Architecture Magazine
When looking at the trends presented by the various technology columns that focused on landscape materials and construction processes over the past 40 years, one can begin to map out the values of the magazine. From the rise and fall of traditional materials and construction to the resurgence of materials coupled with sustainability to the decline of materials altogether, each significant period of development within LAM can be given a name.
Figure 4. ‘In-Depth’ column articles per year by ‘Era’ (2018). Diagram by author.
CELA 2019 | UC Davis 267

Traditional Materials and Construction, 1978 – 1991: This era is defined via the coverage of a diverse spectrum of materials, from refinements of such age old materials as stone to such new composites as plastic lumber. Every volume of LAM contained an article to familiarize the reader about a new material or construction method. Over the course of this period, the materials and construction processes in column articles fell mostly into the ‘traditional materials’ category. Traditional Materials and Explosion Era, 1992 – 1995: The highest representation of materials articles appeared between 1992-1995, with the largest spike in in 1994, per Figure 2. The Non-Material Era, 1996 – 1998: during this period, the magazine turned its attention to digital technology and other subject matter. Feature articles contained fewer mentions of new materials within the technology columns.. Sustainably Influenced Materials Explosion Era, 1999 – 2004: With the reintroduction of a landscape architect at the helm of the magazine, materials and construction processes surged back into the consciousness of the profession. J. William Thompson also brought an emphasis on materials that espoused a sustainability ethos, which was echoed in Sustainable Landscape Construction that he authored with Kim Sorvig. The other hallmark of this era was that it was balanced between sustainable and traditional materials. Ecology and Sustainability Era, 2005 – 2010: Many of the materials and construction processes introduced in the previous era were maturing, with articles adding new dimensions such as monitoring performance and regional specifics. This trend is easiest to follow with green roofs, which is the hot button materials topic of this era. But, the overall trend was that concerns about materials and construction processes, sustainable or otherwise, were now on the decline. Similar to the Non-Materials Era, the focus of technology columns turned to digital technologies and other issues. Assumed Knowledge Era, 2011 – 2017: Column articles related to materials dwindled during the first few years under the current editorship. During this period the magazine underwent a major formatting transformation, placing emphasis on developing other aspects of the magazine. Toward the end of this ‘era’ the article count began to slowly rise to three articles per year from 2014-2016 and ending with six articles in 2017, the most in a single year since 2004. 5 CONCLUSION
All told, Landscape Architecture Magazine has created a substantial legacy of technology columns. Since their inception in January 1978, technology columns focusing on materials and construction have been one of the largest regular contributors to the discourse of these subjects to the professional and academic landscape architecture communities. Reviewing and reflecting upon the content of the largest publication in our profession is necessary if the discourse within landscape architecture is to evolve. Through such reflections we can look at what have we gained and what have we lost with regards to the coverage of landscape construction materials and construction processes and how this subject matter is to be covered by LAM moving forward. 5.1 Trends in Materials Coverage Within LAM.
The issue raised by this paper is whether or not LAM has reflected the proliferation of available construction materials within its column articles. With the exception of two distinct spikes, the average number of column articles per year in LAM has not always correlated directly with the general explosion of available construction materials. However, the spikes in the quantities of ‘In-Depth’ materials columns from 1992-1995 and form 1999-2004, suggest that there has been interest in this subject matter. The recent upward trend in 2017 may suggest that the future is once again bright, perhaps spurred on by the interest in landscape performance.
CELA 2019 | UC Davis 268

Figure 5. Graphic approximation of the trend in the quantity of available landscape construction materials versus coverage of materials in LAM over the past 40 years (2018). Diagram by author. 5.2 Landscape Architecture Magazine versus Online Resources.
If materials are not being covered by LAM, a question is: where do practitioners and students go to learn about materials in landscape architecture? Perhaps most materials research is being done online. Further research surveying practitioners and academics will be necessary to document where people go to research materials and if those sources are meeting their needs in terms of depth of coverage. The recent online platform for performative landscapes by the Landscape Architecture Foundation could help with the development of an online column that could highlight materials that help with aspects of landscape performance.
In looking at the directions LAM can go with its coverage of materials in column articles, perhaps the answer lies as much in its past as it does in its future. As Bruce Ferguson stated in his article chronicling the history of the magazine, “each successive generation tends to believe that it is starting the world anew without precedent or hindrance. But full professional competence requires respect for how much work has preceded ours, the mistakes landscape architects have made, and how far we have come.” (Ferguson, 1999, 113) As the sustainable movement matures and the materials explosion continues, the hope is that Landscape Architecture Magazine can present a holistic approach to materials, detail design and construction processes that speak to the technical legacy of the magazine and accurately reflect the trends of the present. If performance, maintenance and cost become the ‘values’ driving the future of the profession, dedicating more time to the knowledge of materials, methods and construction may be the key to helping us navigate this future.
CELA 2019 | UC Davis 269

6 REFERENCES Anderson, Mark, and Peter Anderson. 2007. Prefab Prototypes: Site-Specific Design for Offsite
Construction. New York: Princeton Architectural Press. Bell, Victoria Ballard and Patrick Rand. 2006. Materials for Design. New York: Princeton Architectural
Press. Brownell, Blaine. 2006. Transmaterial: A Catalog of Materials That Redefine Our Physical Environment.
New York: Princeton Architectural Press. Calkins, Meg. 2009. Materials for Sustainable Sites: A Complete Guide to the Evaluation, Selection, and
Use of Sustainable Construction Materials. Hoboken, New Jersey: John Wiley & Sons, Inc. Calkins, Meg. 2012. The Sustainable Sites Handbook: A Complete Guide to Principles, Strategies, and
Best Practices for Sustainable Landscapes. Hoboken, New Jersey: John Wiley & Sons, Inc. Council of Educators in Landscape Architecture (CELA). 1988. “Sustainable Landscapes – Call For
Papers”. Pomona: Department of Landscape Architecture, California State Polytechnic University.
Ferguson, Bruce. 1999. “The History of Landscape Architecture Magazine”, Landscape Architecture. Volume 89, Number 11. Washington DC.
Kieran, Stephen, and James Timberlake. 2004. Refabricating Architecture: How Manufacturing Methodologies Are Poised to Transform Building Construction. New York: McGraw-Hill.
Landscape Architecture. January 1978 – December 2017. Volume 68, Number 1 – Volume 107, Number 12. Washington DC.
Landscape Architecture: You’re Only 100 Once, Our Centennial Issue. October 2010. “Tools & Materials”. Volume 100, Number 10. Washington DC.
Margolis, Liat and Alexander Robinson. 2007. Living Systems: Innovative Materials and Technologies for Landscape Architecture. Basel: Birkhauser.
Thayer, Robert L. 1989. “The Experience of Sustainable Landscapes”, Landscape Journal. Volume 8, Number 2, Fall 1989. The University of Wisconsin Press.
Thompson, J. William, and Kim Sorvig. 2000. Sustainable Landscape Construction: A Guide to Green Building Outdoors. Washington, D.C.: Island Press.
Thompson, J. William, and Kim Sorvig. 2008. Sustainable Landscape Construction: A Guide to Green Building Outdoors. Second Edition. Washington, D.C.: Island Press.
Thompson, J. William, and Kim Sorvig. 2018. Sustainable Landscape Construction: A Guide to Green Building Outdoors. Third Edition. Washington, D.C.: Island Press.
Winterbottom, Daniel. 2000. Wood in the Landscape: A Practical Guide to Specification and Design. Hoboken, New Jersey: John Wiley & Sons, Inc.
CELA 2019 | UC Davis 270

The authors are solely responsible for the content of this technical presentation. The technical presentation does not necessarily reflect the official position of the Council of Educators in Landscape Architecture (CELA), and its printing and distribution does not constitute an endorsement of views which may be expressed. Citation of this work should state that it is from a CELA conference paper. EXAMPLE: Author's Last Name, Initials. 2019. Title of Paper. Sacramento, CA: CELA. For information about securing permission to reprint or reproduce this paper, please contact CELA at [email protected]
THE GAMBACORTA OR TOWN MARSH IN NEW CASTLE, DELAWARE: HARNESSING AND TRANSFORMING A NATURAL RESOURCE
Wik, Anna University of Delaware [email protected]
1 ABSTRACT
This project explores the shifting relationship of humans to marshland over time in Delaware. It links the development of the city of New Castle, Delaware to the Gambacorta/ Town Marsh, which includes the urban, industrial site of the historic Tasker Iron Works and neighborhood of Dobbinsville. Proximity and access to marshland have profoundly influenced settlement and land use patterns in New Castle, and human development and attitudes towards nature have in turn affected the marsh. While current attitudes recognize that, as a functional ecological system, tidal marshland provides a myriad of ecosystem services, such as habitat provision, storm surge protection, and carbon sequestration, humans have not always looked so favorably upon the marsh. By its very nature, marshland acts as a barrier, and does not lend itself to ease of development; humans are required to put in significant effort to manage this landscape and marshland has dictated land use patterns. Through interdependent relationships, based on input and extraction, and diking, banking or filling, agricultural and industrial practices in Delaware have harnessed and transformed this abundant natural resource. Historical research using the scholarship of vernacular architecture guides this investigation. As a historical repository for industrial waste, the marsh represents environmental injustice and segregates neighborhoods of the town. While methods of management and notions of stewardship have reformed over time, the current trend of marsh restoration and environmental sensitivity, especially in the face of resiliency concerns, supports this study and its applicability to future approaches to conservation and development.
1.1 Keywords
Marsh; Coastal Resilience; Vernacular; Environmental Justice; Townscape
CELA 2019 | UC Davis 271

2 INTRODUCTION 2.1 Themes A marsh is “an area of low-lying land that is flooded in wet seasons or at high tide, and typically remains waterlogged at all times” (Oxford Dictionary). Proximity and access to marshland have profoundly influenced settlement and land use patterns in the over 350 year old city of New Castle, Delaware and human development and attitudes towards nature have in turn affected the marsh. The field of vernacular architecture studies provides several methodologies or themes that guide this investigation, which examines the evolving relationship between people and a marsh. First, a broad understanding of shifting construction and management methods helps establish a typology of marsh treatments. Accounts over the years provide insight into several different methods humans have used to control and manage the Gambacorta marsh. Secondly, the themes of agriculture and industry have played an important role in the early development and subsequent transformations of the Gambacorta Marsh. Third, the lens of class provides another view, as the marsh functionally segregates distinct areas of the town of New Castle from one another. As a historical repository for industrial waste, the marsh represents issues of environmental injustice. Finally, the overriding theme of landscape and townscape coalesces all of these investigations into a clear picture of how the town of New Castle shaped and was shaped by the Gambacorta Marsh.
My interest in exploring the Gambacorta Marsh comes out of a growing necessity to understand the changing nature of the tidal wetlands in the state of Delaware, which buffer intensifying storms, provide ecological patches for wildlife, and inhibit mass development, as well as offer recreational and aesthetic value to our communities. Methods, including examination and comparison of primary resources, such historic maps, as well as review of secondary source materials such as HABS and National Register Nominations, provide insight into elements of the built environment surrounding and within the marsh that are no longer extant. Comparison of aerials documents the transformation of this landscape. Oral history in the form of interviews with town elders helps unearth previous research. Ultimately, the goal of this project is to lay historical groundwork to understand more fully the socio-cultural impacts of the marsh and the implications of these for modern efforts to establish coastal resilience.
Humans are drawn to the marsh and will continue to be. As we develop new technologies for protecting our coastlines, how do we interpret this important functional ecosystem and tell of its continuous impact on the community? My individual interests include development patterns related to industry and agriculture, environmental justice concerns, and coastal resilience. Assessing the marsh in the context of these specific lines of inquiry provides insight into historical impacts to the marsh and their future implications.
How does this landscape take on meaning? What makes it more than the individual materials that comprises it? This project uncovers an underlying connection between the meaning, lineage, and sociocultural aspects associated with the development of the marsh. It aims to understand this distinct cultural landscape and associated built environment less from the standpoint of how this collection of objects in space came together physically, or with what materials. Instead the focus is on uncovering the why of this place, space, and collection of objects, whih is considered common, ordinary, widespread but not mundane.
2.2 Chronology By way of orientation, the changing role of the marsh can be viewed in chronological order. In the
historical view, from pre-European settlement of New Castle by the Lenape to roughly 1800, the marsh was a provider, giving access to resources such as salt hay, forage for animals, and pelts. It was during this early period that the marsh was first documented to require ‘taming,’ as without intervention it proved unruly and non-compliant with the agricultural needs of humans. By the mid-19th century, the marsh was viewed as undesirable, leftover, or remnant land, and an ideal site for industrial development and the residual debris of the manufacturing process. In the 1930’s changing notions of the city of New Castle opened up the riverfront to recreation, but only within the last thirty to fifty years, since the development of the ecology movement in the 1970’s, has the marsh been recognized as a site to be protected and enjoyed. Even more recently, issues of resilience in the face of climate change and sea level rise have
CELA 2019 | UC Davis 272

revitalized the interest in and desire for understanding of the numerous functions healthy marsh ecosystems can provide. 3 METHODS 3.1 Vernacular Architecture, Defined
This investigation uses the field of vernacular architecture studies to delve into the various aspects that define the Gambacorta Marsh. Vernacular architecture is a hybrid area of scholarship, which resides at the junction of architectural history, cultural geography, anthropology, archaeology, historic preservation, folklore scholarship, and material culture. Vernacular architecture can refer to both a method of study and an object of study (Wells, 1986, p. 4), in the case of this marsh, the assemblage of entities and patterns that comprise the built (or human impacted) environment. Like the field of material culture, vernacular architecture studies have shifted (or waver) from the ‘object focused,’ in which the documentation, classification, and deconstruction of these elements are the outcome, to the ‘object driven’ mode of research, which posits that the built environment can only be understood in relation to the people that make and use it. The notion that the exploration of the physical form or other source material can allow researchers to understand a culture’s intangible values and beliefs is attractive. However, without the application of objective methodologies in the form of rigorous scientific thinking (Wells, 1986, p. 3) there is the danger of applying romantic theories, ‘filling in the blanks,’ or aestheticizing the object (Upton, 2007, p. 9). This is of concern as many of these objects have ‘complicated histories’ that deserve to be examined, as they can provide researchers important clues to our past and how human settlement patterns and building styles may affect the future.
Landscape architecture scholars and practitioners describe the act of ‘reading the landscape,’ by which they mean to analyze a given site in a holistic manner, taking into account the cultural, physical, geological, hydrological, vegetative, and other systems which can act on a landscape. However, as cultural landscape scholar D.W. Meinig describes in his essay The Beholding Eye: Ten Versions of the Same Scene, “such facts (can) take on meaning only by association… We are concerned not with the elements but with the essence; with the organizing ideas we use to make sense out of what we see” (Meinig, 1979, 34). Vernacular architecture studies are an attempt to tease out the less obvious, but sometimes more provocative, hidden histories found in the built environment, investigated by researchers who are concerned with using varying methodologies to come closer to a tangible expression of what the ‘essence’ of a site or object might be. The variability of the method of investigation is, in itself, one of the strengths of this field of study, in that it invests individual researchers with the agency to determine what is of utmost importance in their analysis. This individual approach requires scholars to bring their own experiences and interests to the research question, which leads to richer and more varied lines of research. 3.2 Historical Context
With over 98,800 acres, marshland is an abundant resource along the Delaware River (Fisher, 1993, p. 7), and historically, residents of New Castle, just like many of the other towns on the Delaware Estuary, made ample use of this fertile land. In Figure 1, an early map of Delaware River Valley settlement (Morden, 1688), a dark smudge along the west side of river indicates the imposing presence of the marsh. This graphic not only depicts the location of the marsh, but the prominence it played in the life and success of early settlers in the region. The small town of New Castle is clearly marked on the map, but the size of lettering of the town name is almost as large as Philadelphia, implying that this town is a prominent location in the colonies. This map shows the Delaware Estuary or South river, differentiated from the northern Delaware by its brackish condition and tidal influence (Fisher, 1993, p. 5). The riverbanks directly south of New Castle jut out to form a natural cove. The sedimentation that naturally occurs in the tidal deposits of the river would have made this a natural place to settle, and Dutch and Swedish colonists vied for control of this region.
CELA 2019 | UC Davis 273

Figure 1. 1688 Map of Delaware River Valley Settlement with Enlargement, A New Map of New Jarsey and Pensilvania, Robert Morden, Image reproduced by permission of the
Delaware Public Archives. The marsh played a prominent role in the town’s early development. Europeans settled this area in the 1600’s. According to Barbara Benson and Carol Hoffecker, “the main attraction of the Delaware River region to both colonial nations was… the lucrative fur trade with the native people”(Benson & Hoffecker, 2011, p. 2-3). The marshland was extensive in this area and the fur trade with the original Lenape inhabitants influenced the naming of the streets in the early settlement, such as Mink (Minquas), Beaver, and Otter), which were first laid out in the late 1600s by the original City founders. The Dutch who gained control of New Castle would have been well versed in draining marshland and building dikes to hold back the tidal river. They built four dikes in and around the city of New Castle to manage wetlands, including Buttonwood Dike, Broad Dike, Gambacorta Marsh Dike, and Army Creek Dike (The Resilient Community Partnership with the City of New Castle, n.d.).
Seasonality dictated the interdependent relationship of early settlers to the marsh. From March to October, tasks would include the controlled burning of marsh, the opening of dikes to allow seasonal flooding, the banking, or shoring up, of meadows, and harvesting and curing of hay. In October and November, traps for animals would be dyed and waxed. The marketing of harvested and cured hay occurred between October and late February, almost simultaneously with the trapping season for muskrats (Hufford, 1986, p. 117). This cyclical connection with the marsh would have figured prominently in day-to-day affairs of the town and health and success of its inhabitants.
The marsh significantly impacted the early appearance of the town of New Castle, and this is the town the surveyor Benjamin Henry Latrobe found in 1804 and 1805, when he was contracted to develop a survey and grading plan to guide the development of the city of New Castle. When he came to the town, the landscape was a combination of rolling hills and marsh, and his recommendations in the plan by Latrobe, Strickland, and Mills meant that, “in subsequent years hills were leveled and the dirt deposited in marshland to provide new spaces for building and better health for residents” (Benson & Hoffecker, 2011, p. 23). Paving and grading ensured that the historic core of the town became exceedingly flat, ostensibly to promote development and trade.
As the town grew, so did the stature of the inhabitants. Early town fathers, such as George Read I, who signed the Declaration of Independence, represented Delaware as delegate at the Constitutional Convention in 1787, and served as Chief Justice of Delaware, and Kensey Johns, Senior, who also served as Chief Justice of Delaware, played a significant role in the fledgling establishment of the United States. (Ibid, p.84) Both practiced law and built imposing homes in the core of New Castle, as well as
CELA 2019 | UC Davis 274

maintained farms to the west of city limits, to the north of the Delaware River. George Read’s ‘Stonum,’ built around 1730 and sold by Read around 1769, “commanded a fine view of the Delaware [river]”(Post. R, 1973, p.2). It is not clear from research whether the Stonum property was a country house or a tenant farm, but correspondence from his contemporaries indicates that it kept Read quite busy regardless. Mr. S. Wharton chides in a 1766 letter “I fear that attention to your meadows will be an injury to your health, as I am persuaded that the exhalations of such grounds are not healthy to the most athletic constitutions” (Read, 1870, p. 31-32). Read’s grandson went on to note in his 1870 collection of correspondence that ‘Stonum’:
Runs up nearly to the southwestern boundary of New Castle. This marsh fronts on the Delaware, there nearly three miles wide, and expanding into a reach [a continuous stretch of river between two bends] below it, and is much exposed to storms from the northeast, but especially those from the southeast. The embankment of this marsh was twice broken and repaired, at great expense by Mr. Read while he held it… after the second breach of the embankment (in 1789), he sold ‘Stonum’ and counseled his sons never to buy marsh. If he did not suffer in health as Mr. Wharton feared, he certainly did in purse. Twenty thousand dollars has lately been paid for ‘Stonum,’ its embankment being now much protected by accumulations of sand, and marsh is less valuable than when Mr. Read owned this farm, in consequence of upland having been made available for grazing by the introduction of clover. (p. 32)
These descriptions indicate prevalent views of the time, namely the 18th century opinion that marsh and meadowland could produce ‘injurious airs’ that could harm one’s health. It also supports the notion that by this point, marshes were something that must be controlled and tamed to suit the needs of farmers. Over a hundred years after his grandfather sold the Stonum property, William Thompson Read’s description of the value of marsh land indicates the changing attitudes of farmers and townspeople to the marsh. By the second half of the 19th century, it was no longer a necessity to provide salt hay as forage for livestock as new methods of cultivating cover crops such as clover were established.
Another gentleman farmer, Kensey Johns also held a large amount of land in the outskirts of New Castle, specified as 2303 acres in the 1798 census. Johns’ interest in marshland was publicly exposed in ‘The Monitor’ in October 1801, where he advertised a petition to the legislature to better maintain two prominent marshes in the area, St. Georges and Red Hook [maybe Red Lion?] (Riordan, 1798). In 1849, John’s name is shown on the Rea and Price map as an owner of considerable land, which was bisected by the new New Castle and Frenchtown Railroad in 1832 (Rea & Price, 1849). Although by the time of the creation of the Rea and Price map, this land probably belonged to his son, Kensey Johns, Junior, as Johns, Senior died in 1848, the juxtaposition of land ownership and the railroad predict a massive transformation for the town of New Castle.
Little by little, the nature of this town transformed from being the home of gentleman farmers to a town built on industry. In the first half of the 19th century, the relationship of the town to the riverfront changed drastically. In 1832, the New Castle and Frenchtown Railroad was the first rail line to appear in New Castle, and in rapid succession, a number of additional railroad spurs appeared, built for the purpose of carrying raw materials and finished goods from the burgeoning industrial sector west of town to the banks and wharves along the Delaware River. According to Benson and Hoffecker (2011, p. 37), in 1857, 200 acres of Johns’ land was sold to James G. Shaw, who “planned to develop it as an industrial residential addition to New Castle” and “in 1860 established the Triton Spinning Mill.” This speculative and industrial change to the landscape foreshadowed significant alterations to occur throughout the second half of the 19th century.
This land eventually was known as Shawtown, and Mr. Shaw provided worker housing for many of the industries that appeared northwest of the historic core of New Castle prior to 1900, such as the Triton Cotton Mill, a Flour Mill, Deemer Steel, as well as an umbrella factory (Meek, 2015, p. 3). Separated from the town by multiple railroad lines, the siting of this housing, predominantly settled by Italian immigrants, raises issues of class and ethnicity in 19th century America, and set a precedent that was revisited less than twenty years later in the establishment of another industrial village, Dobbinsville.
In 1872, Thomas T. Tasker, Junior and Stephen P. Tasker relocated their father’s successful iron tubing company from Philadelphia, which barred the creation of a new rail spur, to 35 acres in New Castle, which was more amenable to this type of modification to the landscape. Their father, Thomas Tasker, Senior, already well known as an industrialist in New Castle, “founded the Gas Works … which
CELA 2019 | UC Davis 275

manufactured gas and delivered the gas for cooking, heating and lighting underground through pipes manufactured by his company to dwellings and businesses” (“Thomas T. Tasker”, 2014).
Tasker, Senior’s New Castle Gas Company, which supplied light and heat from 1857-1918, was sited directly to the west of town proper, in the area known as the Town Marsh on early maps. Access to the banks of the Delaware River allowed for ease of influx of the raw material, coal, which kept the gas lamps lit. Still visible in the marsh today, a remnant of this industrial use is the round ‘gasometer’, a contraption that, with a floating tank of gas and water pressure, was able to ensure equal pressure of water into the homes and businesses of the town. By-products from this industry included tar, methane, and carbon monoxide (Meek, 2015, p. 5).
The largescale ironworks of the Tasker brothers were incorporated as the Delaware Iron Company in 1876 and comprised of a series of brick buildings west of the New Castle Gas Company and directly on the banks of the Delaware. The operation included a rolling mill, a bending mill, a welding mill, and a finishing room. Approximately eight hundred men made eight hundred tons of iron and steel tubing per week (Scharf, 1888). Dividing the Town Marsh and the Delaware River, along the top of the dike, the Taskers constructed a railroad spur to take materials between industrial sites.
The marsh, by this point in time thought of as leftover, remnant, or undesirable space for residential development, seemed like a good place to site industries like the ironworks. Their toxic byproducts of heavy metals, the need for water access for raw materials transport, and smoke belching towers, made the marsh on the outskirts of town the ideal location to set up these massive factories. However, due to other qualities inherent to a river front site, this marsh did not always prove to be the perfect location it seemed. During the hurricane of October 21 to 24, 1878, the banks or dikes were breached the entire length of the Delaware riverfront, and workers at the ironworks were forced to abandon their positions (Ramsey& Riley, 2002, p. 32). The danger presented by the very site amenities that made the location so ideal is ironic and highlights the volatile relationship workers of this time-period in the Industrial Revolution would have had with nature.
Figure 2. 1893 Baist Atlas Plan of New Castle, G. William Baist, Plan of New Castle. [map]. Scale 400 feet to 1 inch. Philadelphia: G. Wm. Baist. Reproduced by permission of Special Collections, University of Delaware Library, Newark, Delaware.
A factory of such stature would need workers to staff it, and this fact was not lost on Richard J. Dobbins, a speculator and building contractor from Philadelphia. Dobbins purchased land directly to the north of the Tasker/ Delaware Ironworks site and built “sixty-two brick dwellings… comprising a settlement known as Dobbinsville” (Scharf, 1888) in 1872. While the sixty two homes in five rows are built in a typical one-third Georgian form, one room wide and two deep, as is typical for the Delaware Valley (Glassie, 1972, p. 403), Dobbins is known for other more high-style commissions in the city of Philadelphia, most
CELA 2019 | UC Davis 276

notably, Memorial Hall in the Centennial District (Tatman, n.d.). Figure 2, from the Baist Atlas of 1893, has dashed in a network of gridded streets surrounding Dobbinsville, indicating that there may have been intentions to further develop the surrounding area. While this never happened, the prediction of future development supports Dobbin’s decision to create a tiny urban village, where, in the manner of many urban streetscapes in Philadelphia, grander and larger buildings, with mansard roofs and corner entries, are sited on the ends of the blocks. These end units provided businesses to be frequented by the inhabitants of Dobbinsville (Benson & Hoffecker, 2011, p. 207). During the heyday of the Delaware Ironworks, workers would have had a short walk through the marsh, in view of the river, to their posts. However, Dobbinsville location was even further afield than that of Shawtown, and in addition to being separated by the industrial rail spurs, the inhabitants of the neighborhood were also separated from the core of New Castle by thirty or more acres of marsh.
In 1899, the National Tube Company bought out Delaware Ironworks. This company was a ‘trust’ designed to buy out and eliminate competition, and the industrial site was soon abandoned (Meek, 2015, p. 13). Still, industry of all sorts continued to be encouraged by the city of New Castle, as an advertisement called ‘inducements to manufacturer,’ from George A. Wolf’s book “Ideal New Castle in the State of Delaware as it Appears in 1899” lists: “Beautiful sites. Exemption from taxes for ten years. Free land. Ample wharfage with deep water. Cheap labor. Excellent transportation facilities, both by rail and water. Low tax rate… Pure water… Raw material near at hand.” However, this incentive was not enough, and the dashed in streets on the Baist Atlas never came to fruition. The families who comprised the population of the little three-street, five-row village of Dobbinsville were not able to support themselves without the presence of industry.
Figure 3. 1907 Sanborn Fire Insurance Map. New Castle, New Castle County, Delaware. October 1907. Reproduced by permission of Special Collections, University of Delaware Library, Newark, Delaware.
By 1907, the Sanborn Fire Insurance Map, Figure 3, indicates three of the five rows of houses in Dobbinsville were ‘dilapidated and vacant.’ In 1910, a newspaper article (“New Lease on Life in Dobbinsville”, 1910) detailed the life, death, and hoped for rebirth of the little village. This article gives insight into what living conditions may have been like for the inhabitants of Dobbinsville:
As soon as the homes were completed they were occupied by the iron workers, the greater number were taken by American workman and their families, but the Poles and other foriegners centered in Dobbins Street. Here it is said from five to ten families were sometimes crowded into a single little four roomed house. ( p.1)
While only 1.5 miles from the post office in the center of town, as shown in the 1907 fire insurance map from the Sanborn Map Company, the marsh and industrial sites would have created a distinct and palpable barrier. Decay set in, and images depict cows grazing in the backyards of the row homes. While the article states that Richard Dobbins was willing to sell the homes in Dobbinsville at a reduced rate, “no buyers appeared”, it proffered hope for the village, “due in large part to… New Castle’s four new steel
CELA 2019 | UC Davis 277

plants.” Curiously, the new development promised in this article did not come to pass, and on the 1923 Sanborn Map, Dobbinsville is still listed as vacant. It was not until the mid 1920’s that “a New Jersey real-estate development company purchased the row housing, renovated the units, and sold them on a rent-to-buy arrangement” (Benson&Hoffecker, 2011, p. 207).
In 1931, the relationship between New Castillians and the Delaware River changed yet again, with the decision by the Trustees of the Common to transform the industrial area along the riverfront into Battery Park (Benson & Hoffecker, 2011, p. 59). In the Colonial Revival movement popular in the era after the First and Second World Wars, the quaint town of New Castle represented an idealized American past, which did not align with an industrial riverfront. In addition, the ferry to New Jersey prompted intensified traffic through the town and Battery Park, the riverfront, and the town’s historic core became a place to pass the time for travelers waiting for New Jersey- Delaware ferry (Benson & Hoffecker, 2011, p. 183). After the construction of the Delaware Memorial Bridge in 1951, the ferry service to New Jersey stopped, but Battery Park and historic Old New Castle remain a destination to this day.
The New Castle Gas Company had closed, and the railroad spurs that connected the industrial sites along the dike disappeared. What remained linking the historic core of New Castle to its industrial past was the dike that passed through the old Town Marsh, which as time went by, became known as the Gambacorta Marsh. John (Giovanni) Gambacorta was an first generation Italian- American and a successful business man who owned several car dealerships on route 9 along the north side of the town marsh, between the historic core of New Castle and Dobbinsville (Delaware Community History and Archaology Program, n.d.). In the 1980’s, a dirt footpath traced the old railroad spur path across the top of the dike, providing a faint connection between Dobbinsville and New Castle. As walking, jogging, and other foot traffic became more and more popular, paving renovations and widening of the dike allowed for additional public use. Even into the present, industrial remnants such as pilings and rangelights dot the landscape, though considerable changes have been made to the path over the past 35 years. The paved path now extends south, beyond Dobbinsville, and large trees and vegetation have been removed and new rip rap installed. One sees many people enjoying the river on a daily basis.
3.3 Current Affairs As awareness grows regarding the environmental repercussions of the industrial past, and the
marsh ecosystem is once again perceived as a valuable resource, programs are being instated to rehabilitate the Gambacorta Marsh and Dike. In 2013, a brownfields assessment of the New Castle Gas Company Facility was completed. The analysis of this parcel, the site of the Brosius-Eliason lumber yard for many years, indicates a more conscientious attitude about the impacts of the industry of the past on the marsh ecosystem. For example, the report points out that “structures related to the coal gas plant were located in the boundaries of the Site in areas that are now inundated wetlands”(Ratsep, 2013, p. 3). Furthermore, the report states that “the wetland portion of the site was dry land in the 19th century and was the location of the New Castle Gas Company Facility. Coal gasification, as historically practiced in Delaware, usually resulted in the release of coal tar in the environment.” While the report acknowledged the presence of semi-volatile organic compounds at the site, it does not recommend further action at this time, though “DNREC may address ecological issues present, if any, in the Gambacorta Marsh as a whole as a separate Operable Unit, to be addressed in a separate proposed plan.” One industrial dumping area of the marsh, historically drained and used as a landfill, was capped to prevent leaching of toxic chemicals. On this superfund site, no trees may be planted in order to prevent puncturing of the membrane holding in the contaminated soil (Meek, interview, 2018).
In addition to the toxic chemicals that may be present due to the industrial past, another concern has come to the forefront in the last decade, in the threat of storm surges and extreme weather events, as well as predicted sea level rise (The Resilient Community Partnership with the City of New Castle, n.d.). As the ecosystem functionality of wetlands and tidal marshes is better understood, significant maintenance of, and alterations to, the existent dike system have occurred. In 2013, “settlement, erosion, revetment protection loss, overtopping, (and) seepage” were identified as points of concern for the four dikes in the city of New Castle (O’Brien & Gere, 2012, p.21). In order to proactively boost coastal resilience, O’Brien and Gere provide the following recommendations for all of the dikes: “Raise dikes to elevation 8.5 feet. Enlarge dike in portions (raising and broadening). Supplement/replace flood side rip rap. Remove trees and woody vegetation. Construct filters on seepage areas.” The resultant
CELA 2019 | UC Davis 278

infrastructure, installed in 2013 and hugging the banks of the river, seen in Figure 4, likely bears little resemblance to the dikes of early Dutch settlement, or the embankments of the gentleman farmers of the
19th century. However, it does provide a sense of safety and the perception of control of nature that would not have been lost on those whose goal was to tame the marsh in earlier periods.
Figure 4. 2016 Annotated Aerial. Diagram by author.
Dobbinsville is no longer vacant, but remains an insular community, set apart from its town. Collections of children’s’ play equipment cluster in common spaces, indicating a strong sense of shared responsibility for this small village. Efforts by Trustees of the Common to rehabilitate some of the homes, now close to 150 years old, have been met with resistance. So-called amenities, such as a pollinator meadow, installed with good intentions, are not welcome by some residents, as they take away open space previously used for recreation (J. Meek, Interview, May 3, 2018). Continued efforts for stakeholder input through community engagement should be developed and, through cultivation of mutual respect between the historic New Castle town core and the village of Dobbinsville, innovative, mutually beneficial, and cost effective resiliency strategies may yet develop. Shaped by its industrial past, the little village of Dobbinsville may remain marginalized by its anomalous siting in the landscape, but town planners and the Trustees of the Common can encourage community engagement to develop equitable design strategies and provide desirable amenities.
3.4 Conclusion The relationship of New Castle and its marsh continues to evolve. Current development of a large multi-use residential building along the north side of the marsh on route 9 will further impact the ecosystem, as the developer is keen to provide access to the existing Gambacorta Marsh Dike walking path via a wooden boardwalk through the marsh (J. Meek, interview, May 3, 2018). As predictions of sea level rise place much of the historic core of the city of New Castle underwater if there were to be even 0.5 meter of inundation at Mean Higher High Water (Meek, 2013), engineers, planners, and landscape architects look to the marsh as an even greater resource. Indeed the Gambacorta Marsh and other marshes surrounding the city of New Castle have the potential to expand and absorb more water, provide additional protection from storm surges, and capture more carbon (St. Laurent, 2017).
Humans have historically been drawn to the marsh and will continue to be. As new technologies develop for protecting vulnerable coastlines, it is imperative that designers and stakeholders fully interpret this important functional ecosystem and illuminate its continuous relationship with the community, from the original Lenape inhabitants, to the gentleman farmers of the Colonial era, to the
Brownfields site
capped
Rip rap installed 2012/13 (post Hurricane Sandy)
New Castle Gas Company/ Brosius Eliason Site
Delaware/ Tasker Iron Works Site Remnants of coal
gasification plant
New Castle, DE Cultural Landscape Map
CELA 2019 | UC Davis 279

working class, immigrant residents of early 20th century Dobbinsville, to the walkers and joggers of 2019. No matter how humans try to shape, contain, transform, and harness the marsh, it has been a key player in the spatial organization of the town of New Castle. Through exploring this underinvestigated landscape type, and how it affected and was impacted by development patterns related to industry and agriculture, environmental justice concerns, and coastal resilience, the evolving historical, cultural and social contexts of the marsh are exposed. In this case, I examined these thematic relationships with the marsh as a driver of the line of study, which helped qualitatively form an idea of shifting notions of stewardship to this resource. In addition, it provided insight into the intangible values and beliefs associated with the surrounding community over time.
4 REFERENCES Baist, G. W. (1893). Plan of New Castle. [map]. Scale 400 feet to 1 inch. Philadelphia: G. Wm. Baist.
Special Collections, University of Delaware Library, Newark, Delaware. Benson, B. E. & Hoffecker, C.E. (2011) New Castle, Delaware: A walk through time, New Castle: Oak
Knoll Press. Fisher, C.C. (1993). Marshland resources in the Delaware estuary 1830-1950+/-: A historic context,
Newark, DE: Center for Historic Architecture and Engineering. Glassie, H. (1986) Eighteenth Century Process in Delaware Valley Folk Building. In Common Places, (pp.
394-412.) Athens, GA: University of Georgia Press. Hufford, M. (1986) One Space Many Place: Folk Life and Land Use in New Jersey's Pinelands National
Reserve Report and Recommendations to the New Jersey Pinelands Commission for Cultural Conservation in the Pinelands National Reserve, Washington: Library of Congress American Folklife Center.
Meek, J. (2015). 12: Industry [Lecture], New Castle, Delaware Community History and Archaeology
Program retrieved from http://nc-chap.org/lectures/fall_2015/12%20industry.pdf. Meek, J. (2013). Areas at Risk of Flooding in Historic New Castle, retrieved from New Castle, Delaware
Community History and Archaeology Program. http://nc-chap.org/flood/. Meek, J. (2013). John (Giovanni) Gambacorta [Oral History]. Retrieved from New Castle, Delaware
Community History and Archaeology Program, http://www.nc-chap.org/oralhistory/gambacorta.php.
New Lease on Life in Dobbinsville: Delaware’s Deserted Village. The Sunday Morning Star. (1910).
Wilmington, DE. P. 1. Retrieved from New Castle, Delaware Community History and Archaeology Program, http://nc-chap.org/lectures/fall_2015/12%20industry.pdf.
Meinig, D.W. (1979). The Beholding Eye: 10 Versions of the Same Scene. in The Interpretation of
Ordinary Landscapes. New York: Oxford University Press. Morden, R. (1693) A New Map of New Jarsey and Pensilvania [map]. London. O’Brien & Gere, (2012). Delaware Bay Dikes Repair and Prevention Project: Preliminary Design for New
Castle Dikes. New Castle Conservation District and DNREC. Post, R. (1973). National Register # 73000524. National Register of Historic Places Inventory –
Nomination Form: Stonum (sometimes spelled Stoneham). New Castle County, Delaware.
CELA 2019 | UC Davis 280

Ramsey, K.J. and Reilly, M. (2002). Special Publication Number 22: The Hurricane of October 21-24, 1878. Newark: Delaware Geologic Survey.
Ratsep, T.T. (2013). Final Plan of Remedial Action: New Castle Gas Company Site, Delaware Department
of Natural Resources. Rea, S. & Price, J. (1859). Map of New Castle County, Delaware: from original surveys. Philadelphia:
Smith & Wistar. Read, W.T. (1870). Life and Correspondence of George Read, a Signer of the Declaration of
Independence, with Notices of Some of His Contemporaries, Philadelphia: J.B. Lippincott and Co. The Resilient Community Partnership with the City of New Castle. (n.d.) State of Delaware: Delaware
Department of Natural Resources and Environmental Control. Retrieved from http://www.dnrec.delaware.gov/coastal/Pages/CityofNewCastleRCP.aspx.
Riordan, L. (n.d.) 1798 Tax Information for the Town of New Castle, retrieved from New Castle, Delaware
Community History and Archaeology Program, http://nc-chap.org/census/riordan/tax1798.php. Sanborn Map Company, (1907). New Castle, New Castle County, Delaware. [map]. Scale 50 feet to 1
inch. Sheet 7. October, 1907. Special Collections, University of Delaware Library, Newark, Delaware.
Sanborn Map Company, (1923). New Castle,New Castle County, Delaware. [map]. Scale 50 feet to 1
inch. Sheet 1. August, 1923. Special Collections, University of Delaware Library, Newark, Delaware.
Scharf, J.T. (1888). History of Delaware, 1609-1888. Philadelphia: L.J. Richards & Co. St. Laurent, K. (2017). Blue Carbon – a benefit to protecting tidal wetlands, WMAP Blog: The Official Blog
of the Wetland Monitoring & Assessment Program. Retreived from https://wmap.blogs.delaware.gov/2017/09/19/blue-carbon-a-benefit-to-protecting-tidal-wetlands/
Thomas T. Tasker (1799-1892) – Engineer, Industrialist, Inventor, Millionaire, and Pastor. (2014). Friends
of Mount Moriah Cemetery. Retrieved from http://friendsofmountmoriahcemetery.org/thomas-t-tasker-1799-1892-engineer-industrialist-inventor-millionaire-and-pastor/
Tatman, S. (n.d.) Richard J. Dobbins, Contractor (c. 1833-1893). in American Architects and Buildings.
Retrieved from https://www.americanbuildings.org/pab/app/ar_display.cfm/33368. Upton, D. (2006). The VAF at 25: What Now? Perspectives in Vernacular Architecture, 13(2), 7-13.
Retrieved from http://www.jstor.org/stable/20355380 Wells, C. (1986). Old Claims and New Demands: Vernacular Architecture Studies Today. Perspectives in
Vernacular Architecture, 2, 1-10. doi:10.2307/3514311 Wolf, G. A. (1899). Ideal New Castle. New Castle, Delaware Community History and Archaeology
Program. Retrieved from http://nc-chap.org/lectures/fall_2015/12%20industry.pdf
CELA 2019 | UC Davis 281

The authors are solely responsible for the content of this technical presentation. The technical presentation does not necessarily reflect the official position of the Council of Educators in Landscape Architecture (CELA), and its printing and distribution does not constitute an endorsement of views which may be expressed. Citation of this work should state that it is from a CELA conference paper. EXAMPLE: Author's Last Name, Initials. 2019. Title of Paper. Sacramento, CA: CELA. For information about securing permission to reprint or reproduce this paper, please contact CELA at [email protected]
CODIFYING IAN MCHARG’S AESTHETICS
Zhang, Bo Oklahoma State University [email protected] ABSTRACT Though he was neither an aesthetician, nor a practitioner of landscape architecture in the traditional sense, Ian McHarg produced an inevitable impact on the aesthetics of landscape architecture. This contribution has never been systematically codified. By inductively examining McHarg’s rhetoric and practice from articles, books, drawings, project reports, and archive materials, and deductively constructing philosophical arguments, this article deciphers McHarg’s aesthetics into two major parts. The first part discusses three major theoretical discourses: 1) truth of ecology over beauty of landscape, 2) form-process theory, and 3) environmental sin. When McHarg was developing his ecological design approach, aesthetics were methodologically excluded from the landscape suitability method and intellectually deprioritized by environmental considerations. Also, the legitimacy and morality of aesthetics was challenged against the ecological design backdrop. In this section, his aesthetic ideologies and rationales are summarized, and controversies and dilemmas are revealed as well. The second part summarizes McHarg’s aesthetic literacy into the topics of descriptive ecology, recluse landscape, and Picturesque landscape. Design visions and design guidelines are summarized and project imageries are illustrated. These three aesthetics are also woven into the theoretical frameworks as constructed in the first part. Finally, McHarg was included in the discussion of the schools of Visual Impact Assessment and Ecological Aesthetics, where his lasting contributions and possible damage to aesthetics were reconciled. Keywords Ecological design, landscape suitability method, aesthetic principles, aesthetic literacy, ecological aesthetics
CELA 2019 | UC Davis 282

INTRODUCTION In 1990, U.S. President George H. W. Bush granted Professor Ian McHarg (1920-2001) the National Medal of Art in recognition for his exquisite contributions to ecological design. This was the first time a landscape architect – which McHarg is generally regarded as – was awarded this honor, which might be the highest honor ever received in the discipline. In his presentation speech, President Bush said, “It is my hope that the art of the twenty-first century will be devoted to restoring the earth” (See McHarg, 1997a, p.331). The ironic part about McHarg receiving the medal was its name: National Medal of Art. Art was a topic that McHarg ignored, despised, or attacked while he was constructing a novel ecological planning focus for forty years.
From the1960s, McHarg always regarded himself as a spokesman for ecological determinists (1966). Though President Bush was not necessarily an ecological design expert, his statement reflected the lay public’s expectation of the role landscape architects played in the environmentalism context, which finally concluded a lengthy confusion about aesthetics and ecology in recent landscape architecture history. Soon after he received the National Medal of Art, McHarg, for the first time, accepted the legitimacy of aesthetics during a 1992 ecological design symposium at Arizona State University (See Thompson & Steiner, 1997). Recognizing art as a dimension critical to ecology, he ultimately admitted that ecological design “will require a fusion of science and art” (McHarg, 1997a, p.331).
Though he was neither an aesthetician, nor a practitioner of landscape architecture in the traditional sense, Ian McHarg presented an inevitable impact on landscape architecture aesthetics since publication of his seminal book Design with Nature in 1969. A pioneering promoter of the landscape suitability method, an eloquent public speaker who endorsed ecological planning, and a tireless advocate for protecting and restoring the environment, McHarg was also recognized by his indifference for, and even his intent to subdue, aesthetics in the landscape design and planning field (Thayer 1976; Corner, 1997). The powerful leadership in ecological design combined with fiery verbal attacks on art (McHarg, 1966, 1970, 1971) overweighed the theories of other contemporary aestheticians, if not all, in directing landscape architects. Receiving the National Medal of Art and recognizing the legitimacy of art in ecological design late in his life barely changed McHarg’s image as a radical opponent of aesthetics.
McHarg’s antithesis towards aesthetics does not necessarily mean he was an outsider to aesthetic discussion in ecological design, nor that he himself had no aesthetics. Though not consistently outlined in his work, and never systematically examined by scholars, the aesthetic values, logics, and tastes of McHarg were evident in his remarks and practices. This set of aesthetics not only represented the style of his fellow ecological planners, but also inculcated visions and principles to the landscape architect community. Today, few would regard McHarg as an all-purpose ecological “preacher.” However, McHarg’s impact on aesthetics has been fundamental and everlasting, a fact that should be reconciled but is frequently overlooked. While the landscape suitability method has involved broader scales and more complex elements incorporated into the consideration of practice, landscape architects have still sought consensus about preference, vision, composition, “style,” and taste, all associated with aesthetics (Nassauer, 1995, 1997; Gobster, 1999; Meyer, 2000).
This paper seeks to provide a fuller examination of McHarg’s aesthetics. Two approaches guided the exploration efforts. An inductive study was conducted to assess his books, articles, biographies, slides, and interviews from the bottom up. His actual landscape practices in the 1960s and 70s was also reviewed, with focus on the projects at Green Springs, Worthington, and Western Run Valleys (1963-64), the Princeton I-95 Highway (1965), Amelia Island (1971), Wilmington and Dover, Vermont (1972), Medford (1972-1974), and Woodlands (1971-77), to summarize his thoughts on aesthetics, beauty, and art. Simultaneously, a number of philosophical arguments were developed intellectually to construct the discussion framework (Deming & Swaffield, 2011). The efforts of both approaches converged into the discussion of three theoretical issues and three codified aesthetics. THREE THEORETICAL ISSUES Superiority: Truth of Ecology over Beauty of Landscape McHarg’s major contribution to landscape architecture and academia was the landscape suitability method. Many scholars later found embryonic forms of this method utilized prior to McHarg (Steinitz et al., 1976), which may invoke debates on the invention attributions. However, it is almost routinely acknowledged that McHarg was the most important figure who popularized the method and made it a
CELA 2019 | UC Davis 283

disciplinary norm in landscape architecture, planning, and beyond. This method prescribed a process of inventory, analysis, synthesis, interpretation, and planning decision making in order to generate environmentally friendly development schemes. Various natural processes (and later social and economic processes) were summarized into categories, inventoried on respective layers of same-scaled-maps like a layered cake, analyzed for their compatibilities, and finally synthesized into a single map as segmented parts of different suitability in order to inform land development. During the environmental movement of the 1960s and afterwards, this procedure provided an actionable means of converting understanding from various scientific disciplines to the perception of the biophysical health of land and suitability for future land uses. This revolutionized the subject and the process of landscape planning and design.
Through the landscape suitability method, McHarg inevitably influenced aesthetics in landscape design. The impacts were nothing like the style or trend changes previously practiced, but the legitimacy of aesthetics in landscape architecture was shaken. A deeply rooted triad of truth, goodness, and beauty in Western philosophy can explain this design priority change (Gardener, 2011). Historically, landscape architecture developed its theory and criticism as an alliance between goodness and beauty. In this reciprocal model, a landscape was rarely described as true or false since landscape beauty was created from metaphysical concepts rather than empirical data. Landscape architects designed by envisioning certain aesthetics, and landscape projects achieved goodness because of related symbolisms and metaphors. This type of beauty-goodness alignment evolved as design styles adapted to different chronological, cultural, social, climatic, and geographic changes. The principles of beauty were explored through design techniques such as proportion, scale, texture, and color, which did not address ecological necessities.
By redefining biophysical health as a critical good, the landscape suitability method deprioritized, if not excluded, aesthetics from the design objective. Compared with survival needs, the emphasis on landscape goodness led to an abdication of aesthetics. The new truth McHarg pursued was to recognize “the actual environment, the actual world” (2007, pp.23–24), in essence “the minimum requirement … for any attitude to man-nature is that it approximates reality” (1969, p.29). Learning from devastating environmental hazards of the 1950s and 1960s, McHarg realized that many hazards were derived from natural forces, especially those not understood and falsely deployed by humans. The opposite of good is not disorganized, but results in danger, survival risk, and inappropriate processes due to not following natural rules. Compared to learning artistic styles for design, McHarg suggested a more realistic task. “One can only understand what is in terms of evolutionary history – evolution of form and process” (McHarg, 1970, p.182). The contemporary scientific community provided tools to McHarg to reveal the actuality of the environment with great accuracy and comprehensiveness. In addition, mapping layer categories, such as relief, geology, hydrology, slope, soil, wood coverage, and land use were created to absorb systematic understandings from relevant disciplines. A robust structure of “truth-goodness” discourse elbowed out the “goodness-beauty” discourse. The landscape suitability method not only reset the major goal of design on land, but also created a methodological conquest of the traditional domination of aesthetics. This could be understood from following aspects.
First, the analytical quality of landscape suitability outweighed the experiential quality of aesthetics. McHarg named this logical rationale “ecological determinism” (1966). The rigid landscape suitability process, from inventory, analysis, synthesis, interpretation, and planning decisions, indicated a clear causality, initiated by different biological quality evaluations and ending with the biophysical synthesis that summarized development suitability. In this closed construct, McHarg aimed to change the “random, inconsequential, or indeed malevolent” design method used in landscape architecture. Instead, he suggested that the discipline should “follow medicine and espouse science, biology, perhaps ecology and anthropology, and justify a more central and consequential role” (1997b, p.188).
Ecological determinism is a projection of science that is central to environmental studies. System theory by von Bertalanffy (1968) inspired the landscape suitability method which suggests that all design activities have clear reasons, using a rational and analytical or even repeatable process. This finally leads to predictable outcomes.
In McHarg’s viewpoint, the application of aesthetics seemed shabby and random compared with the logic of ecological determinism. Aesthetics not only lacked a formative structure that seemed analytical, but they also required a defined information deduction process to be logical. Application of aesthetics lacked the robustness of analytic quality and its intuitive nature resisted repetition. Aesthetics, therefore, had to make concessions to the logical consistency of landscape suitability.
CELA 2019 | UC Davis 284

Secondly, the landscape suitability process does not compliment aesthetics. Scientific data from various disciplines dismantles the wholeness of human experience into components – the process can lose the gestalt. As shown in Figure 1, the approach categorized lands into different segments according to different ranges of certain biophysical features. Each range was coded with a uniform color. No matter whether in process drawings or in conclusive synthesis drawings, the representation of land was summative rather than representative, because all the land information closely related to users’ experiences, such as that of space, pattern, form, texture, and color, were removed. Many of McHarg’s projects were presented with a bird-eye view perspective, which presents higher comprehensibility to viewers. While the pattern of land was still comprehensively depicted, the singular site experience was still not utilized.
Third, during a landscape suitability process, data richness and comprehensiveness overwhelms aesthetics. Previously, landscape understanding was based on experiences of individual designers. Due to the time and energy limits, these experiences were often spontaneous, scattered, and segmented. The generated insights could be shallow, isolated, or even over-representative. The introduction of data from various scientific disciplines offered a viable amount of information better “approximat(ing) reality” (1969, p.29). By inventorying information on the flat map with defined scale and resolution, the analysis of every map inch created a continuous quality of accuracy. Moreover, quantitative data were imposed into layers, which offered the measurability and refinement of understanding (McHarg & Sutton, 1975). With support from an overwhelming number of scientific discoveries “provid(ing) the best evidence” (1969, p.29) about water resource protection, hazard prevention, biodiversity, brown field remediation, and other processes, the quantity, extent, and depth of understanding from the landscape suitability model was advanced and revealed important survival issues unaware of from individual experiences. By comparison, aesthetics revealed thinness and superficiality.
Figure 1. Analysis of life zones. Wallace, McHarg, Roberts, and Todd (WMRT). (1972). WMRT:
Philadelphia, PA. p.12.Fourth, the invisible nature of information incorporated in the landscape suitability model posed
another threat to aesthetics. For thousands of years, land had been seen and understood according to its visible features, such as plant coverage, topography, form, color, texture, spatial enclosure, and others. More recently, proposed natural and societal factors, such as permeability, usage, connection, and interaction, were originally insensitive to visual sense. The multidisciplinary approach that engaged scientific disciplines provided a possibility of penetrating through the visible land surface and presenting the information underneath. Geological, soil, and hydrological conditions, as shown in Figure 1, were presented by collaborating with other disciplines. This change demonstrated the limits of sense of sight, which aesthetics used to fully rely on.
Fifth, for the visible data categories, the working scale of landscape architecture expanded remarkably, which exceeded the conventional scope of aesthetics. McHarg suggested the significance of the viewing angle of astronauts, first acquired in 1972, coincided with his view of looking at the environment. “Man, far out in space, looks back to the distant earth, a celestial orb, blue-green oceans, green of verdant land, a celestial fruit” (McHarg, 1963, p.1). This distant and comprehensive view lifted humans from the “surrounding” environment, and enabled them to look at the environment through the
CELA 2019 | UC Davis 285

view of “other.” The experiential view of “ours” was diminished because of changes in both scale and angle. In many of McHarg’s projects, broad-scale satellite images are used as the base medium for each layer of analysis. As a result, in this presentation, singular human experience disappeared. The patterns collectively reflecting the land uses were clear, such as different plant communities, human habitats, structures, facilities, waters, and mountains. When the synthesis was presented, the clues of singular tangible space and place were still missing. McHarg suggested using the scale of the landscape suitability method, which “reveals the megaform of natural process at the national level, the mezoform of the region, the microform at the city” (1966, p.46). The design at site scale seemed to be relinquished.
In sum, the landscape suitability process not only reset the goal of landscape design from ideal aesthetic vision to biophysical health as a survival need, but also methodically estranged aesthetics. The powerful analytic logic, the abundance and depth of data incorporated, the invisible nature of data, all challenged the intuitive, synthetic-based, superficial aesthetics. The broad scope and data flattening alienated individual experiences by embracing the design of “a structure system” (1966, p.45).
Form-Process Theory In addition to the actionable landscape suitability process, McHarg also developed a form-process theory. This theory reinforced the ecological deterministic rationale, and simultaneously offered clues about how landscape forms should be derived under an ecological backdrop. “Form and process,” McHarg suggested, “are indivisible aspects of a single phenomenon” (1970, p.182). Form should be a sole outcome of natural process; otherwise, it is faulty. “Every form reflects processes engaged in the business of creative adapt[at]ion toward the end of survival; form is only the superficial expression of the process” (McHarg, 1970, p.182). Hence, any “capricious” form that has no practical meaning related to biophysical process should be denied.
In constructing the form-process theory, McHarg explicitly elaborated a set of concepts, such as fitness, suitability, and creativity. He borrowed the concept of fitness from Charles Darwin’s The Origin of Species (1859) and Lawrence Henderson’s The Fitness of the Environment (1913) to describe biosphere health “both for natural objects and creatures and for artifices” (1969, p.163). McHarg defined fitness as “the degree to which meaning can be perceived [as] a function of the ability of the observer to the meaning which is intrinsic” (McHarg, 1970, p.182). More specifically, the functionality of fitness was accessed by its relevance to environmental survival of organisms (McHarg, 2007, p.23). In terms of ecological significance, design disciplines, such as “architecture should not be called architecture; it should be called fitting” (1970, p.181) or “adaptation for survival” (1970, p.181). The concepts associated with visual vocabulary, such as art, beauty, aesthetics, were tenaciously excluded from this theory, and instead, the word “form” was used. Terms such as meaning and value were used. However, they were deprived of their social implications. When McHarg proclaimed “all form is meaningful” (McHarg, 1970, p.182), the meaning of landscape form was rigorously confirmed as “fitness” or “suitability” of the biosphere.
By redefining the concept of creativity, McHarg endowed nature with a personality. A term always used to describe the innovation of human beings, creativity, was redefined by McHarg as the fantastic fitting effects of biosphere, which “has nothing to do with previous art” (1970, p.179). Ecological design and planning, therefore, could be redefined as “creative fitting revealed in intrinsic and expressive form” (1997a, p.332). It was suggested that nature, being creative by itself, was capable of generating appropriate landscape forms. A landscape's form had been decided, even predetermined, by impersonal forces of nature beyond human control. In other words, nature should be the sole driving force that pushes forward the form generation process.
Since nature is creative enough, the “form follows…” structure was no longer needed despite inspiring generations of designers. Unlike the slogan “design with nature,” which suggested that designers could be inspired by nature, the form-process model suggested that all forms were designed by nature. The personality of God was borrowed to interpret nature’s creativity and expel aesthetics created by human. McHarg explained that “the view of the Reformation that beauty is a vanity,” was expanded upon by this statement “that any intent to create beauty by man is assumption of God’s role, is a vanity, and is sacrilegious” (McHarg, 1963, p.8). Hence, a designer should maintain an impersonal tone and a disinterested point of view in the design process, while any free will generated by aesthetics should be eliminated.
McHarg cited non-human habitats such as beehives, coral, and the chambered nautilus to interpret the form-process (1963; 1964; 1969; 1990). The examples possessed “great beauty” “in human
CELA 2019 | UC Davis 286

eyes” (1966, p.32) and “survived periods of evolutionary time vastly longer than human span” (1964, p.21). These forms are in the “richest biotic environment,” which are “benign, bountiful, and orderly,” “dynamic,” and “natural” (1990, p.187). McHarg emphasized the slow, even sluggish half-billion-year generation process by nature. There is little doubt that this should be respected. Yet, the question pertinent to landscape architects is whether this process should be considered the only source for form and space creation.
In sum, the form-process theory suggested a laissez-faire mechanism in which landscape form is generated. Treib suggested that McHarg implied that if designers followed the landscape suitability process, the final landscape form would automatically be beautiful (Treib, 1999). This mechanism plainly did not offer landscape architects a handy design tool (Eckbo & Porterfield, 1970; Laurie, 1971). The process of design and construction involves human programming, material composition, components alternation, and implementation destined to be different from natural processes, which were not distinguished in the form-process theory. The form-process theory, largely derived from describing natural processes, cannot automatically provide a perfect landscape form that suits the prospective human program (Thayer, 1976; 1989). Neither can a design process solely directed by landscape suitability analysis generate an adequate landscape form, as this imploded approach lacks attention on the site scale. The non-human habitats cited by McHarg associated with such different chronological and geographical scales hardly demonstrate any conclusion relevant to daily landscape practice.
Morality: Aesthetics as Environmental Sin The landscape suitability process suggested a NIMBY (“Not in my back yard”) attitude towards aesthetics, while the form-process theory indicated a laissez-faire (“It will work out itself”) view regarding aesthetics during a design process. McHarg’s further criticism of human society and design professionals rendered aesthetics a more malicious status, as an environmental sin, not only insignificant, but also unclean.
To McHarg, environmental degradation had an exterior cause as well as an internal cause. While the intense and massive human power and technology were behind the exterior cause, the internal cause was the notion of human’s “presumption of superiority, dominion and licensure to subdue the earth” (McHarg, 1963, p.12). He suggested a moral stand for treating the environment equally and cast off the notion that nature could be freely exploited. A dichotomy between nature and humanity was commonly seen in his rhetoric, which revolted against the human dominance rationale. Instead of treating nature as “a storehouse existing for his delectation” (1996, p.210), nature should be regarded “as a source of life, milieu, teacher, sanctum, challenge, and, most of all, of rediscovering nature’s corollary of the unknown in the self, the source of meaning” (1969, p.19).
Although the landscape suitability process provided a handy tool for identifying sensitive areas, McHarg always felt the necessity of accusing humans from an internal angle for their corporeal avarice and environmental idiocy, as a human being "plunders, rapes, poisons, and kills this living system, the biosphere, in ignorance of its workings and its fundamental value" (1996, p.210). Regarding humanity’s broad and intense disruptive power in diminishing the physical environment, McHarg called this species “the land rapist, the befouler of air and water, the uglifier, and the gratified bulldozer” (1969, p.51). By contrast, nature was pristine, innocent, vulnerable, and therefore beautiful. It was the greedy and arrogant human who made it risky, chaotic, and ugly. The proposition of “Man as Planetary Disease" (1971) culminated in the contemplation of human dominion and unrestrained power. He traced the notion of the origin of human dominance further back to the Judeo-Christian traditions, where the Bible says that man is to have dominion over the earth. McHarg suggested that the Scriptures could only be treated as an allegory rather than as a literal truth for the sake of the survival of humanity and earth. Later in his life, McHarg corrected his bold statement about humanity as a disease. He stated, “I looked about me at friends, faculty, students; were they pathogens, agents of diseases, epidemics? Surely not.” His accusations were instead made towards “institutions and men whose fulfillment threatened the humans and all life” (1996, p.237). However, the branding of humans as a Planetary Disease was not easy to erase.
While the moral ground of humanity was shaken, the morality of aesthetics was redefined. In scrutinizing the human-environment relationship, aesthetics involuntarily became an ethical scapegoat, as they embodied human activities and justified pertinent tastes. Since human activities were harmful and devastating, aesthetics, a largely human possession, was wicked. It was implied that the monumental vision of development drove ruthless exploitation with ignorance about the sensitivity of nature. The imposition of already justified and ideally preset aesthetics was not only unnecessary but also immoral, as
CELA 2019 | UC Davis 287

it fostered greedy and ruthless environmental alternation. Therefore, McHarg called upon his fellow environmental designers to reject this 2,000-year-old tradition of aesthetics and art, and “replace it with … the ecological view” (1970, p.185).
Landscape architects bore the greatest pressure when the ecological realm was constructed, while the ethical and aesthetic issues were not resolved. Landscape architectural practice was where environmental sin and humanity as a planetary disease converged. As McHarg once stated, “Almost all the architects, planners, and landscape architects should be handcuffed and their licenses taken away until they learn the way the world works” (1970, p.179). While McHarg’s rhetoric sent designers to the moral judgment desk, landscape architects considered taking more environmental stewardships, and began to question their societal status., As a part of human society and as a group of professionals serving human society, landscape architects confronted inevitable pressures. Was landscape architecture a destructive profession because it planned and designed projects altering the pristine land? Should landscape architects be held responsible for all the environmental degradation, even for projects programmed and commissioned by clients? If landscape architects were responsible for all these procedures, should they sacrifice aesthetics for a better natural process (if there was better practice)? Moreover, McHarg’s form-process theory challenged the professional status of landscape architects. Given that Nature itself was creative enough in manipulating a generative process that could lead to a fitting landscape, the landscape architecture profession seemed superfluous. Did we still need landscape architects to arrange and design land? This vital question concerned the fate of the landscape architectural discipline.
Landscape architects still deal with aesthetic issues on a daily base, such as the composition of a plaza plan, the spatial enclosure of a garden, and the scene from a viewing deck. Due to McHarg’s theories, anxieties prevailed in this most traditional territory of landscape architecture. Since aesthetics were methodically trivialized, the necessity and morality questioned, the specific actionable design strategies were left at loose ends. After comprehensive analysis and planning were implemented, the design literacy vacuum at a site might retard the design process. Were any of the conventional aesthetics in landscape design still considered valid? How could they guarantee that each sketch stroke represented an ecologically integral effect rather than disturbing ones? Could any new aesthetics be derived when the landscape suitability process was applied? Moreover, should there be stylistic landscape aesthetics that echoed ecological considerations? While preaching ecological design, McHarg did not suggest any solutions for these questions.
AESTHETICS IN SPECIFICS Aesthetics are unavoidable in landscape architecture. This was true for the ideals of McHarg. When we review his practice and read his autobiography (1996), beauty was the major motivation for many projects, such as the Green Springs, Worthington, and Western Run Valleys project (1963-64), Princeton I-95 Highway (1965), and Medford (1972-1974), as well as the publicly recognized result for others, such as Amelia Island (1971) and Woodlands (1971-1977).In his rhetoric, comments on form and beauty appeared in some unavoidable circumstances, or came across accidentally. He used images in project reports and books to illustrate ideal visions as well as to describe undesirable disturbances. The design documents and well as the realized projects constitute the major sources required to understand McHarg’s aesthetics (or more colloquially put, his tastes) as these were never codified. The codification in this paper shows a preliminary effort to construct design literacy from McHarg, while testing his theories and inference about aesthetics as well. Pristine Nature and Descriptive Ecology McHarg asserted that “the only beauty is natural beauty” (1963, p.8), a theory he spent a life-time trying to protect. However, nature is polysemantic. If asked what natural beauty is, the answers could vary greatly among landscape architects, other professionals, and the public. According to the Merriam-Webster website, Nature can be the “external world in its entirety.” All elements acquired from the external world, such as rock, water, soil, and most notably, plants, are natural. On the other hand, natural can refer to the occurrence of conformity within the ordinary course of nature, free of human intervention (Merriam-Webster, 2016). For landscape design, one may argue that natural beauty is associated with the amount of natural elements utilized (for example, the plants), or associated with the degree of the original status retained for the land. Asserting that “wild nature” should be exemplified, McHarg’s natural beauty has dual
CELA 2019 | UC Davis 288

meanings, as the visible “natural” elements and as the original status of land should be kept “naturally” untouched.
The pristine nature aesthetic vision, or at least the components of pristine nature under a comprehensive scenario, was also an analytical result of applying the landscape suitability process, which McHarg named “descriptive ecology” (1966, p.34). The landscape’s biophysical structure is the major source that outlines the compositional framework for future landscape designs. A series of prohibitions and permissiveness regarding limiting factors for future development were enacted to define the sensitive landscape elements/areas as preservation lands (McHarg, 1970). The intrinsic carrying capacity related to the long-term health of the land was therefore calculated.
Because the method was originally developed to defend natural land from the development encroachment, it was no surprise that preservation was always recommended as a suitable landscape program. In the analytic process, the original morphology of the sensitive lands should be retained as the spinal structure. Considering that “nature is the gardener’s best designer,” McHarg wrote, “the meadow was the single artifice, the remaining components were natural expressions, their dramatic and experiential qualities exploited” (1966, p.33). Original plants, including trees, shrubs, and ground covers, which were kept for their indispensable ecological service, constituted another major component of McHargian aesthetics. Because of the interdependence of geology, soil, topography, hydrology, and vegetation, McHarg always denounced the idea of deforestation, even for light human use, such as agriculture. The beauty of primitive nature was unconsciously used by McHarg as a medium to communicate environmentalism. To him, the primitive landform was the true representation of ecological fitness, “deriving in the first place from that observed in nature” (1966, p.33). Compared to previous preservationists, such as John Muir (1918) and Aldo Leopold (1949), McHarg’s vision of natural beauty presented a very similar appearance. Yet, the McHargian method offered a clearer underlying mechanism for ecological service, a more convincing planning process, and a guideline for more delicate protection and development.
Primitive nature may also include more imageries than the “total greenery” suggested by previous conversationalists. In Design with Nature (1969), a variety of natural landscape types other than “greenery” were presented, such as sand dunes, permeable soil, and swamps. Multiple versions of the Woodlands project reports showed scenes of messy ponds and muddy grounds (Figure 2). These landscape components are not as revelatory as those primarily composed of plants but they were crucial to biophysical health. Yet, none simply abides with conventional aesthetic principles, such as balance, outlines, texture, depth, and spatial enclosure, nor can they be appreciated easily according to a formalized design style. McHarg might imply that descriptive ecology could justify the instinctive beauty of these unconventional “natural” imageries. They are equally respectful and beautiful as those conventionally visual pleasing natural elements – at least their images didn’t need to be hidden from sight. Hence, the beauty of all the landscape elements of biophysical functionality can be legitimized. This rationale, partly echoing McHarg’s laissez-faire view of aesthetics in an ecological design process, awaits visual reception from the landscape architects and the public.
CELA 2019 | UC Davis 289

Figure 2. Images showing unconventional “natural” imageries. Wallace, McHarg, Roberts, and Todd (WMRT). (1973). WMRT: Philadelphia, PA. p.24.
` The form-process theory that glorifies the lengthy formation process lends a divine sense to the
aesthetics of pristine nature. At the same time, it is worth noting that the aesthetics of pristine nature (sand dune and marshes included) is the outcome of an analytic process rather than a formulaic style, though which “descriptive ecology” presents only those of biophysical significance. Rather than the time of their formations, the selectively retained wilderness resulted from the purposeful evaluation of ecological functionality. This analytic process was not the same process as in the form-process theory. Human designers, including landscape architects, played a vital role in preserving the pristine beauty, and were motivated by the pristine beauty itself.
Recluse Landscape While McHarg tirelessly promoted primitive beauty preservation and yearned for the “natural, nonhuman process” (1964), he clearly knew that “there can be no conception of a completely ‘natural’ environment. Wild nature, save a few exceptions, is not a satisfactory environment” (1964, p.21). Meanwhile, almost all the projects that he was involved in presented conflicts between the inevitability of development and the urgent necessity for preservation. Compromises had to be made, which gave rise to another aesthetic, the beauty of a recluse landscape.
Recluse landscape suggests an austere and self-sufficient aesthetic for humans. The appearance of necessary structures and facilities to support human living should adhere to their functionality, and the alternation of land should be minimized. The cover image of the Wilmington and Dover, Vermont Project visualizes this aesthetic (Figure 3). Natural structures (such as topography and hydrological patterns) and natural elements (such as trees, bushes, and groundcovers) constitute the major images. A scarcity of built elements was supposed to visually complement rather than detract from “natural beauty.” An appropriate level of human care was demonstrated, in which nature was respected rather than exploited. McHarg admired the lovely blending of humble and useful human elements into the land: “Expensive horses and cattle gaze in the pastures defined by white rail fences, handsome stone houses sit barely visible among the trees, rural roads fold over the gently undulating landscape” (1996, p.177). In contrast, McHarg did not hide his aversion towards the arrogant stand-out of designed elements, as “these representations are illusory when applied to nature” (1990, p.187).
Figure 3. Cover image showing recluse landscape. Wallace, McHarg, Roberts, and Todd (WMRT). (1972). WMRT: Philadelphia, PA. p.66.
In practice, the land itself serves the criteria of determining construction intensity, which should neither be manipulated for a “formal” look, nor rely heavily on constant fiscal input and regular maintenance. McHarg’s comments about his colleague, Sir Peter Shepheard, perfectly convey his own aesthetics, that the beauty of the designed landscape “eschews bombast and virtuosity,” and “selects modesty, simplicity, appropriate materials and form” (1996, p.136). In commenting on nonhuman habitat, McHarg suggested that designed landscapes should “take inert materials and dispose them to create a physical environment” (McHarg, 1963, p.14), and be “constructed with great economy of means” (1964, p.21).
The recluse landscape was not only a compromised vision of McHarg’s beloved nature and reluctant human use, but also could be a vision of new development. While the intrinsic appropriateness derived from suitability analysis suggested the sensitive areas that required preservation, it also
CELA 2019 | UC Davis 290

suggested areas suitable for moderate development. In McHarg’s words, the suitability analysis “provide(s) form in a most dramatic way from the level of the house on the shore to the form of metropolis” (McHarg, 1966, p.45). The primitive land was no longer a holistic untouchable piece, but could be broken down into its appropriate uses. In the Valleys Project, the housing development in the wooded areas are suggested to be one unit per acre, and even one unit per three acres on wooded slopes (1966, p.42),with scarce structures surrounded by a lush forest. Even for higher density projects, such as the Woodlands Development, McHarg also envisioned trees encompassing, if not purely hiding, human residences (Figure 4). Human life was embedded in the pervasive greenery, part of a preserved area and part newly planted, rendering a tranquil ambience. This aesthetic recalls an appealing reclusive moment in history, as living in the country was a remedy for city syndromes, much as an Italian villa that was built away from the city. Another example was the Chinese ancient retreat that was described as an escape from the “dusty world.” Compared with these precedents, McHarg’s recluse aesthetics seemed looser and resisted formality.
Figure 4. Illustrations showing housing environment. Wallace, McHarg, Roberts, and Todd
(WMRT). (1973). WMRT: Philadelphia, PA. p.69. McHarg also practiced the recluse aesthetic in his own residences. After his second marriage in
1977, the McHarg family moved to Marshallton, Chester County, to achieve seclusion from Philadelphia. The family lived a self-sufficient life on his fifty-five-acre Old Mill Farm, where not only dogs and cats multiplied, but the professor’s family also raised pigs, hens, ducks, pheasants, bulls, cows, horses, and sheep. Also, using only a wheelbarrow, pitchfork, and shovel, McHarg and his wife kept a vegetable garden and orchard where they grew red and black cherries, red and yellow apples, peaches, pears, nectarines, plums, apricots, currants, blueberries, gooseberries, and raspberries. The appreciation for the land cultivated by the living experiences, McHarg described as “emotional and physiological” (1996, p.310), and he found them very rewarding.
When a housing development adjacent to Old Mill Farm was built, McHarg felt that their recluse life was threatened, and moved to the thirty-five-acre King Ranch in Chester County, Pennsylvania. The planning, design, and construction process for the new house further illustrated a recluse aesthetic. Biophysical determinants, especially geology, soil, and existing plants understood, the family house was sited at the old farmhouse site on the rock pile, which minimized the disturbance to existing vegetation. By being built below the high point and shielded by the wood lot, the residence achieved visual seclusion. Inside, “there would be short views of the woodlot and long views of the horizon in all directions” (1996, p.313). The existing land features experienced nominal debasement. The only non-meadow area in the property was a gravel parking lot. The horticulture growth were all put “in the pots on decks and porches” (1996, p.315). Austere materiality and constructability of the house added to the beauty and modesty of the residence. White oak, hemlock, and chestnut floorboards were used to recall nature. Instead of using quarried stones, weather-worn stones were field collected and mortared using a “cheek masonry” technique, in which mortar was concealed (McHarg, 1996).
CELA 2019 | UC Davis 291

English Picturesque Compared to McHarg’s fascination with pristine and reclusive landscapes, his remarks on formalized landscape styles revealed more design specifics. Noticeably, McHarg constructed a dualism between English Picturesque landscape and French garden design. He regarded the former as “the finest accomplishment of art in the western tradition” (1997b, pp.189-190) and described the latter by saying it “constitutes the worst possible admonition to those explorers who were then about to discover and colonize the earth” (1997b, p.189). His obsession with English landscape suggests a clearer vision of naturalness instead of a vague totality of pristineness, or greenery as the best. English Picturesque landscape arranged natural materials in layers and scattered them in balance in order to compose a pastoral-looking image. In almost all his project reports and the Design with Nature book, pastoral-type images were included. And in the French Garden, the compositional vegetative elements, such as trees, shrubs, flowers, and ground covers were organized by rigid geometrical ordering principles to form geometric shapes or perspective lines.
McHarg’s opinion towards French and English Picturesque was more metaphorical than biophysical. McHarg regarded the French Garden’s rigid symmetrical pattern as being “imposed relentlessly upon a reluctant landscape” (1963, p.8), which represented “an image of flexed muscles” (1963, p.11). This view of aesthetics as an “imprint of humanist thoughts” (1963, p.8), symbolized “anthropomorphism, dominion, and subjugation” (1997b, p.189). Since McHarg was always on guard for the potential disruptive power of humans in the landscape, he depicted these aesthetics as more “suited to suicide, genocide than survival and success” (1997b, p.189). In contrast, the Picturesque style resembles an unexploited scene, recalls a nostalgia for pastoral scenery, and suggests a high ecological integrity. Yet, when McHarg cited English picturesque as a perfect aesthetic, this landscape tradition was not examined for its ecologically stabilizing effects, nor was a landscape suitability analysis conducted. A serious examination of the Picturesque landscape may challenge its ecological stability. The Red Book, by the Picturesque master Humphry Repton, clearly demonstrated magnificent changes exempted in order to achieve dramatic pastoral aesthetics. The original topography and vegetation were greatly altered. Compositional elements, such as water, vegetation, structure, and paths, were manipulated to accomplish a balanced and layered scenery. This did not affect McHarg, who regarded Repton as a precursor of ecological design (1966). Bedsides, Meyer (2008) suggested that the pesticide and herbicide used to retain this pastoral scenery proved ruinous to the biosphere of the environment.
McHarg’s English Picturesque obsession suggested a cultural need to visualize the abstractive ecology, which conveyed a vivid vision of design with nature. The image of Picturesque fits human culture as an ideal representation of the biophysical world, which was emphatically accepted by many landscape users, viewers, and designers. More metaphorically, McHarg regarded the Picturesque landscape as an “occult balance” (1966, p.33). The rich contrast and the mystical depth created by layers symbolized the complexity and diversity, as “evidence of higher evolutionary forms” (1968, p.57). A hierarchy of aesthetics resulted that prioritized the well-composed natural landscapes over the randomly preserved ones. This intent was illustrated in a number of photographs in the Woodlands Project reports, which captured undeveloped scenes according to Picturesque compositions, with a degree of roughness tolerated (Figure 5). This suggested that, although artificial manipulation of land should never be encouraged, a curation of natural elements towards Picturesque was preferred.
CELA 2019 | UC Davis 292

Figure 5. An images capturing undeveloped scenes according to Picturesque compositions. Wallace, McHarg, Roberts, and Todd (WMRT). (1973). WMRT: Philadelphia, PA. p.66.
McHarg’s depreciation of the French garden prescribed design interdictions, such as “nature abhors a straight line” (1966, p.33). Rigid geometry should be banned, because that “simplicity and uniformity reveal a primitive stage, while complexity and diversity are evidence of higher evolutionary forms” (1968, p.57). Even though this reasoning could not be used against biological effects, these claims against geometry (of course, Euclidian geometry) and grandness were coherent within the modest recluse landscape, and potentially extrapolatable into the design of urbanity.
The designed landscape appearance can help disseminate environmentalist values partially legitimizing the theory of aesthetics in ecological design. Knowing that English Picturesque “clearly did not exist in the raddled landscape of eighteenth-century England” and “it had to be created” (1966, p.33), McHarg implied that a degree of modification could be tolerated to achieve an ideal-appearing nature. Hence, the need for designed landscape could be validated to some degree. Following this rationale, it is not difficult to understand McHarg’s comment on Japanese gardens as a “valid tradition” (1969, p.29). This intuitive acknowledgement of visual beauty was vulnerable to the examination of its “natural process” and ecological performance. Also, this valid tradition does not necessarily align with the process and outcome of the ecological analysis. McHarg visited Japan in 1973, where his suggestion to the Japanese government to conduct a comprehensive ecological study was politely but ironically turned down (McHarg, 1996).
RECOGNITION AND RAMIFICATION McHarg’s thoughts about aesthetics were rich and diverse, but at the same time incomplete and non-systematical. He regarded wild nature as the ideal vision for landscape design, a model which resisted any preset design styles. A compromising but more applicable aesthetic was the recluse aesthetic, which suggests an austere and potentially self-sufficient beauty in tranquil and vast greenery. This type of aesthetic seemed the bottom line for McHarg, one which would allow for many human programs but which he could still regard as beautiful. The English Picturesque landscape was promoted as a materialized ideal vision of nature, the compositional principles of which could better “curate” and preserve natural landscapes. These three types of aesthetics, pristine nature, recluse landscape, and the English Picturesque, bearing some differences, unanimously embrace “total” greenery. They all use predominantly natural elements as the major scenery components, as we can see in the Valleys, Vermont, Woodlands, and other projects. The landscape suitability process acts as a gatekeeper for these aesthetics, meaning that while visual quality is held, landscapes for specific sites need to have their ecological characters evaluated in the analytic process to be valid and beautiful. The active consciousness of designers is always needed in driving the analytic landscape suitability process, sometimes influenced by unconsciously held aesthetic basis and biases. Even though we are certain that McHarg’s design syntax prioritized irregular forms and multilevel layer composition over rigid geometry, uniform lines, and prodigious aesthetics, few clues could be drawn about designing with hardscapes and/or under urbanized settings.
Acknowledging in the 1992 ASU Symposium that art and ecology should overlap, McHarg did not show any intent to establish a theoretical framework to address the ecology-aesthetic merger, such as how to generate appropriate forms and how to evaluate the potential new aesthetics. This spectrum is still being painted by interactive works of theoreticians and practitioners of next generations (Thayer, 1976; 1998; Howett, 1987; Spirn, 1988; Nassauer, 1995, 1997; Corner, 1997; Monzingo, 1997; Kaplan, Kaplan, and Ryan, 1998; Gobster, 1999; Meyer, 2000). Meanwhile, though McHarg expressed his discontent about the slow progress of “ecological and beautiful” practice in landscape architecture (McHarg, 1997a), he apparently did not recall his role as the lead ecological determinist assaulting aesthetics in the 1960s and 1970s. His radical criticism and ecological determinism rationale, we may argue, created more influential impacts on aesthetics than any other practitioner or theorist. Though it is debatable that McHarg’s suppression of aesthetics could be regarded as a bit of overkill after the environmental crisis of the 1960s and 1970s, the confusion and even the debacle of aesthetics in landscape architecture was real.
The development of aesthetics in landscape architecture, by any means, was different after McHarg. Greater depth and complexity of the McHargian method was studied (Spirn, 2000; Herrington, 2010). In addition, McHarg’s suitability method has been proven still a viable and actionable method in understanding and planning a landscape (Schnadelbach, 2001; Yang, 2016). Moreover, McHarg has so
CELA 2019 | UC Davis 293

far branded landscape aesthetics with the mark of ecology. Today, nobody can talk about beauty for beauty’s sake, without including the biosphere, energy, material, water, soil, and pollution as well (Dunstan, 1983; Rolston, 1995). While envisioning aesthetics for a project, landscape architects have been developing the consciousness to self-evaluate the environmental impacts. After nearly half a century, “environmental impact assessment, new community development, coastal zone management, brownfields restoration, zoo design, river corridor planning, and ideas about sustainability and regenerative design,” Steiner suggests, “all display the influence of Design with Nature" (2004, p.142). Clearly, we can see that such projects also demonstrated the McHargian qualities of pristine nature, of cleanness, greenness, austerity, developed with limited cultural elements, and well-curated pastoral imagery. These aesthetics not only visually represent the validity of ecological aspects, but they also incorporate the values of environmentalism.
The alarms sounded by McHarg are not outdated. They still stimulate, inspire, and attend to aesthetics in their own ways. When the practice of merging ecology and aesthetics entered into a level of greater complexity and richness, new dilemmas emerged. Scholars noticed energy and material consumption occurred in the projects that artistically expressed ecological considerations, and competing ecological considerations in one project may confound a readable landscape image (Thayer, 1994; 1998). While many codifications of ecological aesthetic vocabulary have been published (Koh, 1988; Strewlow et al,. 2004; Meyer, 2008), the lines between environmental rights and human needs, between ecological expression and material abusing, between nature and culture, have yet to be desirably defined. If we turn to McHarg’s remarks about the potential environmental risk of art, human greed, and the invisible ecological process, some may still be valid. In this sense, McHarg and his aesthetics are still alive, and connected to all the efforts, frustrations, and resolutions of the aesthetic realm against an ecological backdrop. McHarg represents not only a stone of ecology thrown in the pond of aesthetics, he is also a controversial, lasting, and beautiful ripple himself.
REFERENCES Corner, J. (1997). Ecology and landscape as agents of creativity. In G.F. Thompson & F.R. Steiner (Ed.),
Ecological design and planning (pp. 80-108). New York, NY: John Wiley. Darwin, C. (2003). The origin of species. New York, NY: Barnes & Noble Classics. Deming, M. E., & Swaffield, S. (2011). Landscape architectural research: inquiry, strategy, design.
Chicago, IL: John Wiley & Sons. Dunstan, J. (1983). Design with nature: 14 years later. Landscape Architecture, 73(1), 59-61. Eckbo, G. & Porterfield, N (1970). An Eckbo-Porterfield ecological exchange. Landscape Architecture,
60(3), 200-202. Gardner, H. (2011). Truth, beauty, and goodness reframed: Educating for the virtues in the age of
truthiness and twitter. New York, NY: Basic Books. Gobster, P. H. (1999). An ecological aesthetic for forest landscape management. Landscape Journal,
18(1), 54-64. Henderson, L. (1913). The fitness of the environment. New York, NY: Macmillan. Herrington, S. (2010). The nature of Ian McHarg's science. Landscape Journal, 29(1), 1-20. Howett, C. (1987). Systems, signs, sensibilities: Sources for a new landscape aesthetic. Landscape
Journal, 6(1), 1-12. Kaplan, R., Kaplan, S., & Ryan, R. (1998). With people in mind: Design and management of everyday
nature. Washington, DC: Island Press. Koh, J. (1988). An ecological aesthetic. Landscape Journal, 7(2), 177-191. Laurie, M. (1971). Scoring McHarg: Low on methods, high on values. Landscape Architecture, 61(3), 206-
248. Leopold, A. (1949). A Sand County Almanac. New York, NY: Oxford. McHarg, I. L. (1963). Man and Environment. In F.R. Steiner (Ed.), The essential Ian McHarg. Writing on
design and nature (pp.1-14). Washington, DC: Island Press. McHarg, I. L. (1964). The Place of Nature in the City of Man. In F.R. Steiner (Ed.), The essential Ian
McHarg. Writing on design and nature (pp.15-29). Washington, DC: Island Press. McHarg, I. L. (1966). Ecological Determinism. In F.R. Steiner (Ed.), The essential Ian McHarg. Writing on
design and nature (pp.30-46). Washington, DC: Island Press. McHarg, I. L. (1969). Design with nature. New York, NY: Garden City, Published for the American
Museum of Natural History [by] the Natural History Press.
CELA 2019 | UC Davis 294

McHarg, I. L. (1970). Architecture in an ecological view of the world. In F.R. Steiner (Ed.), In To heal the earth: Selected writings of Ian L. McHarg (pp.175-185). Washington, DC: Island Press.
McHarg, I. L. (1971). Man: planetary disease (The 1971 B. Y. Morrison Memorial Lecture). Washington, DC: Agricultural Research Service (DOA).
McHarg, I. L. (1990). Nature is more than a garden. In F.R. Steiner (Ed.), In To heal the earth: Selected writings of Ian L. McHarg (pp.186-187). Washington, DC: Island Press.
McHarg, I. L. (1996). A quest for life: An autobiography. New York, NY: John Wiley & Sons. McHarg, I. L. (1997a). Ecology and design, In G.F. Thompson & F.R. Steiner (Ed.), Ecological design and
planning (pp. 321-332). New York, NY: John Wiley. McHarg, I. L. (1997b). Landscape Architecture, In To heal the earth: Selected writings of Ian L. McHarg
(pp.188-193). Washington, DC: Island Press. McHarg, I. L. (2007). L. Margulis, J. Corner, & B. Hawthorne. (Ed.) Conversations with students: dwelling
in nature. New York, NY: Princeton Architectural Press. McHarg, I. L., & Sutton, J. (1975). Ecological plumbing for the Texas coastal plain: the Woodlands new
town experiment. Landscape Architecture, 65(1), 78-89. Merriam-Webster. (2016). Nature. Merriam-Webster.com. Retrieved May 8, 2016. Meyer, E. K. (2000). Post-earth Day conundrum: Translating environmental values into landscape design.
In M. Conan (Ed.), Environmentalism in Landscape Architecture (pp.187-244). Washington, DC: Dumbarton Oaks Research Library and Collection.
Meyer, E. K. (2008). Sustaining beauty: The performance of appearance. Journal of Landscape Architecture, 6-23.
Mozingo, L. A. (1997). The aesthetics of ecological design: Seeing science as culture. Landscape Journal, 16(1), 46-59.
Muir, J. (1918). Parsons, M. (Ed.) The Writings of John Muir: Steep Trails. Boston: Houghton Mifflin. Nassauer, J. I. (1995). Messy ecosystems, orderly frames. Landscape journal, 14(2), 161-170. Nassauer, J. I. (1997). Cultural sustainability: aligning aesthetics and ecology. Washington, D.C.: Island
Press. Repton, H. (1803). Observations on the theory and practice of landscape gardening
London, England: T. Bensley for J. Taylor. Rolston, H. (1995). Does aesthetic appreciation of landscapes need to be science-based? The British
Journal of Aesthetics, 35(4), 374-86. Schnadelbach, R. T. (2001). Ian McHarg. In J. A. Palmer, D. E. Cooper, & D. Cooper (Ed.), Fifty key
thinkers on the environment (pp.228-241). London, England: Routledge. Spirn, A. W. (1988). The poetics of city and nature: Towards a new aesthetic for urban design. Landscape
Journal, 7(2), 108-126. Spirn, A. W. (2000). Ian McHarg, Landscape architecture, and environmentalism: ideas and methods in
context. In M. Conan (Ed.), Environmentalism in landscape architecture (pp.97 -114). Washington, DC: Dumbarton Oaks Research Library and Collection.
Steiner, F. (2004). Commentary. Philosophy & Geography, 7(1), 141-149. Steinitz, C., Parker, P., & Jordan, L. (1976). Hand drawn overlays: Their history and prospective uses.
Landscape Architecture, 9, 444-455. Strewlow, H., Prigann, H., & David, V. (2004). Ecological aesthetics: Art in environmental design: theory
and practice. Basel: Birkhäuser Architecture. Thayer, R.L. Jr., (1976). Visual ecology: Revitalizing the aesthetic of landscape architecture. Landscape,
20(2), 37-43. Thayer, R.L. Jr. (1989). The experience of sustainable landscapes. Landscape Journal, 8(2), 101-110. Thayer, R.L. Jr. (1994). Gray world, Green heart: Technology, Nature, and Sustainable Landscape. New
York, NY: Wiley. Thayer, R.L. Jr., (1998). Landscape as an Ecologically Revealing Language. Landscape Journal, 17
(Special Issue), 118-129. Thompson, G. F., & Steiner, F. R. (1997). Ecological design and planning. New York, NY: John Wiley. Treib, M. (1999). Nature recalled. In J. Corner (Ed.), Recovering Landscape, Essays in Contemporary
Landscape Architecture (pp.29-44). New York, NY: Princeton Architectural Press. von Bertalanffy, L. (1968). General system theory: foundations, development, applications. New York, NY:
G. Braziller.
CELA 2019 | UC Davis 295

Yang, B., & Li, Shujuan. (2016). Design with nature: Ian mcharg’s ecological wisdom as actionable and practical knowledge. Landscape and Urban Planning, 155, 21–32.
CELA 2019 | UC Davis 296

The authors are solely responsible for the content of this technical presentation. The technical presentation does not necessarily reflect the official position of the Council of Educators in Landscape Architecture (CELA), and its printing and distribution does not constitute an endorsement of views which may be expressed. Citation of this work should state that it is from a CELA conference paper. EXAMPLE: Author's Last Name, Initials. 2019. Title of Paper. Sacramento, CA: CELA. For information about securing permission to reprint or reproduce this paper, please contact CELA at [email protected]
Postmodern Monument Design: Iconoclasm, Anti-Monumentalism, and Contemporary Design
Lorentzen, Chad University of Idaho, [email protected] Cronan, Daniel University of Idaho, [email protected] 1 ABSTRACT
Monuments stand as sentinels of the past. They commemorate the best of humanity, and occasionally the worst. These historic forms scatter the globe and show the fundamental human desire for spaces that commemorate the conspicuous nouns of the past. However, many monuments have an inherent narrative flaw: they propose a myopic worldview of the people or events they commemorate. Additionally, the original context of the monument rarely translates to future contexts and users. These static monuments can lead to many implicit and explicit biases– political, economic, cultural, and ethnic to name a few– through the arrangement, materials, and uses of the space.
Confederate monuments pose acute design challenges that illustrate both the limitations of traditional monumental spaces and the narrative power of revision. These static forms exclusively, and often problematically, suggest the communal values of the place and can fail to adapt to social dynamics. When these monuments’ controversial narratives come to light (through transitional moments like Charlottesville’s white nationalist rally) the public reclaims ownership of the space and authorship of the narrative. However, the decision to retain, cover, or topple the contentious monuments of the past creates a new exclusionary narrative that redefines the area's physical and cultural landscapes as well as its collective memory.
To avoid the contentious, exclusionary narratives written by retaining, covering, or toppling confederate monuments, designers should consider the lessons of Krzysztof Wodiczko. His public art projections, installed throughout the world, reanimate public spaces with minimal editorializing to acknowledge the past and stimulate meaningful, progressive discussion. As a result, these monuments can become instructional and allow users to define their own heroes and villains.
1.1 Keywords:
Confederate Monuments, Krzysztof Wodiczko, Anti-Monumentalism
CELA 2019 | UC Davis 297

2 INTRODUCTION While monuments are a fundamental feature of human identity aimed at commemorating the conspicuous nouns of the past, these public forms, and the spaces they occupy, have a long and contentious history. They are borne in a specific context, with certain values that often fail to adapt to future users’ needs.
This paper begins with a brief exploration of the history and psychology of monumental deconstruction and iconoclasm. It continues with contemporary case studies establishing the challenges faced by contemporary municipalities in the era of Confederate monument deconstruction throughout the southeastern United States. As many of these contemporary issues are founded in static, monolithic design decisions, care is taken to explore alternatives. Case studies demonstrating more adaptable monument design include the works of Michael Arad, Peter Walker, Lawrence Halprin, and Krzysztof Wodiczko,
3.1 A HISTORY OF ICONOCLASM
Distrust of the monolithic shadows monuments cast is not a contemporary idea. Iconoclasm, as defined by Joseph Leo Koerner, comes from asserting one’s agency and has ancient roots in texts like the Old Testament. Functionally, an iconoclast “instead of ignoring or adoring a thing, instead of moving or modifying it […] destroys it–and for no reason other than it exists” (Koerner, 2016, p. 5). This destructive act not only topples the monument, but also rewrites the monument’s public narrative to serve new contexts and users. For example, Paris’ Vendome Column, Budapest’s Stalin monument, and Baghdad’s Saddam Hussein statue all yielded to the public’s indignant hands and taught ropes (Koerner, 2016). In each circumstance, striking monumental forms fell and revised narratives filled the empty space. 3.1 Deconstruction of Confederate monuments
Another significant example of twenty-first century monument deconstruction has challenged Confederate vestiges across the southern United States. Some argue “Civil War era symbols are physical reminders that African Americans remain systematically disadvantaged in many ways” and that the public placement of these monuments, around courthouses for example, suggests that “unfair treatment awaits inside” (Wahlers, 2016, p. 2176). Others advocate for these monuments’ enduring and didactic significance. Recently North Carolina, which has five times as many Civil War monuments as World War One monuments spread across over half of its counties, established legislation to preserve Confederate monuments in response to recent public outcry (Wahlers, 2016, p. 2176). North Carolina’s Heritage Protection Act offers thinly-veiled protection to Confederate monuments by forbidding “the removal, relocation, or alteration of any monument […] located on public property” (Wahlers, 2016, p. 2176). In effect, North Carolina’s legislative resistance to iconoclasm has imposed a narrative on contemporary users and emboldened explicit and implicit biases. Charlottesville, Virginia’s Confederate monuments to Robert E. Lee and Stonewall Jackson show the hazards of editing monumental narratives. In August 2017 a white nationalist rally, purportedly a public demonstration against the City Council’s decision to remove Lee’s statue, ended in a second-degree murder charge against James Allen Fields for his alleged vehicular attack on counter protesters. In many ways the exclusive narratives of the monument’s imposing form and the proposed deconstruction of the monument heightened this tension. Both narratives are exclusionary and divisive, regardless of their respective moral grounding. In an effort to relieve tension exacerbated by President Trump’s ill-formed public remarks after the attack, the city covered the monuments with tarps for “a period of mourning” (Haag, 2018). However, judge Richard E. Moore of the Charlottesville Circuit Court ruled that the tarps must be removed because “the harm to defendants from removing the tarps and not being able to shield them until the matter goes to trial is outweighed by the harm to plaintiffs and the general public in not being able to view or enjoy them” (Haag). Judge Moore’s words imply several significant details about monuments’ ability to shape public consciousness. In a legal sense, Moore argues that simply viewing the monument allows it to author a narrative that could influence the trial and future legal proceedings. Additionally, Moore’s comments reveal that the public may interpret the monument’s physical presence,
CELA 2019 | UC Davis 298

even if under a tarp, as a political or cultural endorsement or condemnation. However, this fails to recognize the narrative authored by the tarp itself. The tarp is a profound, albeit temporary, record of public consciousness. It shows the desire to interact with the hegemonic structures of the past that have emboldened violence. Covering the monument becomes a very public statement of its narrative power. Moreover, the process of removing the tarp provides yet another moment for reshaping the narrative. The design solution may involve allowing both the monument and the tarp to speak. Deconstructing monuments, even those that memorialize controversial or disgraced figures and events, creates new psychosocial challenges. By allowing (or not condemning) the deconstruction of public monuments, officials encourage another narrative to be created with its own unique and potentially divisive biases. Even Freudian psychology applies to razing monuments. Freud’s lecture at Clark University in Worcester, Massachusetts introduces the dichotomy of monuments’ historical and contemporary contexts. While Freud’s discussion centers on clinical neuroses, its reference to London’s monument to the Great Fire of 1666 and a hypothetical citizen’s reaction to the monument is particularly instructive. Freud’s speech presents a “Londoner” who weeps at seeing the monument to the Great Fire of 1666 and “cannot get free of the past” to see “what is real and immediate” in the vibrancy of reconstructed London (Koerner, 2016, p. 13). In other words, Freud suggests that the neurotic citizen’s narrow interpretation of the memorial fails to account for its contemporary context. In this sense, Confederate monuments could become stimuli of social reflection for the general population and facilitate conversation to assess the relative progress (or lack thereof) from the monument’s original context. 4 ALTERNATIVES FOR DESIGNING ADAPTABLE MONUMENTS New York City’s Ground Zero memorial space and the related reconstruction of One World Trade Center embody many of the psychosocial dynamics of public monuments. The original terror attacks sadistically targeted not only the end users of the World Trade Center’s Twin Towers, but also the narrative portrayed by their monumental form. By deconstructing these monuments terrorists encouraged a new narrative of the space, one written with the fanaticism of desperate men and the resilience of a wounded nation. Reconstruction of the space involved significant public debate, but its contemporary form designed by Michael Arad and Peter Walker, includes “dark, sunken, or empty forms” to evoke “painful emotions such as sadness, defeat, grief and guilt” (Stevens and Franck, 2016, p. 48). Activating the empty foundations with symbolically regenerative water features revises the destructive narrative authored on September 11, 2001 to one of recovery. Additionally, visitors can discretely note the symbolic juxtaposition of the void of the memorial space with the surrounding constructed areas because “architectonic forms [are] commonly associated with heroism and victory” (Stevens and Franck, 2016, p. 48). The space becomes both a relic of cruel iconoclasm and an affective, ever-transforming testament to regeneration that requires users to view both the static historic context and dynamic contemporary context of the place. 4.1 Franklin Delano Roosevelt monument Other contemporary monuments, like Lawrence Halprin’s revisions to the Franklin Delano Roosevelt monument in Washington, DC, address the challenges of designing public monuments by creating specific, instructive spaces that avoid editorializing the subject through imposing scale or interpretative signage. Halprin claimed the memorial should be an “experiential history lesson that people could grasp on their own as they walked through the site” (Stevens and Franck, 2016, p. 48). The space becomes a historical space that places the user inside the history it tells. Four areas of the monument represent Roosevelt’s four terms in office and bronze statuary is scaled to allow public participation, including inclusive spaces for the disabled, in the historical eras portrayed. Speech excerpts, which are historical facts with only selection bias, are placed on various symbolic surfaces including tumbled granite. In effect Halprin’s monument becomes a static space that is only realized by dynamic, participatory user interaction and interpretation. 5 CREATING DIALOGIC MONUMENTS
CELA 2019 | UC Davis 299

The work of Krzysztof Wodiczko represents another approach to modernizing the narratives posed by monumental structures and offering a voice to those in monuments’ shadows. In essence, Wodiczko’s work is physically constructive while metaphorically deconstructive. He is best known for large-scale performances, technological projections and animations that challenge the icons of the past. The temporary tarp solution of Charlottesville would benefit from Wodiczko’s “process of uncovering needs and responding to them in hope that by the process of responding to them, and articulating them in public, we may contribute to conditions (of the social consciousness) that will render those needs obsolete” (Wodiczko and Nolan, 2005, p. 85). These projections allow personal and collective growth as a “silent person animating the monument must animate herself or himself in the first place” while public spaces and structures invoke “the inconvenient experiences that one doesn’t want to hear, that are strangely familiar and might actually provoke inconvenient thoughts about oneself, various hidden and repressed experiences” (Wodiczko and Nolan, 2005, p. 81). Wodiczko creates a democratic polyphony that voices “open secrets about the failings of society” and places the monument’s original form and context next to its present-day form and context (Kim, 2016, p. 174). Wodiczko’s site-specific projections and temporary installations in Madrid and Hiroshima reanimate the areas’ silent monumental forms. Madrid’s Arco de la Victoria was originally constructed as a war monument commemorating Francisco Franco’s victory in the Battle of Cuidad Universitaria. As Spain entered into the Persian Gulf War, the militaristic narrative quietly posed by the arch came under question. Wodiczko saw this tension and attempted to “link historical aggressions to Spain’s continuing participation in wars” (Kim, 2016, p. 177). The Arco de la Victoria projection (1991) featured haunting, skeletal hands grasping a gas pump handle and a weapon of war with the provocative question “¿CUANTOS?,” beckoning the viewer to count the cost of war. A similar haunting synecdoche of human form defined Wodiczko’s Hiroshima projection (1999). The projection included audio recordings of fifteen survivors of the Hiroshima atomic bomb with video recordings of their gesticulating hands appearing on the eviscerated Genbaku Dome. In this sense, the monument’s historical survivorship paralleled the sectioned human survivors and Wodiczko encouraged both “articular voices, monumental and human, to stand up once again and speak in public spaces” (Wodiczko, 2005, p. 34). While the performative spectacle of Wodiczko’s projections allows for conversation, it also encourages healing through the creative process leading to the final design. In the 2001 projection in Tijuana, Wodiczko allowed Mexican laborers to voice the quiet exploitation that defined the city’s factories. Female laborers’ stories were projected on El Centro Cultural’s “huge globe-like form” with a real-time audio-video projection (Wodiczko, 2005, p. 48). These women spoke of their experience and breathed life onto “the external body of the monument, transforming its faceless, silent mass into a manifestation of their presence” (Wodiczko, 2005, p. 48). While the projection’s performance was poignant and cathartic, the process of reciting and revising the words allowed “a great step forward psychologically and ethically” for the oppressed laborers (Wodiczko, 2005, p. 48). In effect, these women became actors reciting for a performative memoir; this recital, backed by social therapeutic strategies developed by Fred Newman in the 1970s, enabled these women to find their words before they spoke. 6 CONCLUSION
As monuments blend into the collective memory of physical and cultural landscapes, their narratives paradoxically become less evident and more powerful. Citizens essentially move among the monuments and accept them (and their symbolic values) as part of the social fabric of a place. However, static forms that exclusively monumentalize public spaces fail to adapt to social dynamics. When monuments’ controversial narratives come to light (through transitional moments like Saddam Hussein’s regime ending or Charlottesville’s white nationalist rally) the public aims to reclaim hegemonic balance. Iconoclasm is not the answer, as it defers transformative conversation and writes another divisive narrative through the resulting empty space. Newly commissioned public spaces would benefit from the successful tenets of Halprin’s FDR monument including human-scaling, interactive design, and minimal editorializing. Perhaps the most promising solution for existing monuments is targeted, reanimation of public narratives (like Wodiczko’s projections) that allows multiple narratives to be offered and users to define their own heroes and villains.
CELA 2019 | UC Davis 300

7 REFERENCES Haag, M. (2018) "Judge orders tarps removed from Confederate statues in Charlottesville." The New York
Times. Kaplan, M. (2015). "D.C. by wheelchair: putting ADA to the test." USA Today. Kim, J. (2016). "Encounters with the material: Krzysztof Wodiczko and site-specific media art." Discourse.
38(2), 173-192. Koerner, J.L. (2016). "On monuments." RES: Anthropology and Ethics 67-68, 5-20. Stevens, Q. & Franck, K.A. (2016). Memorial as spaces of engagement: design, use and meaning. New
York: Routledge. Van Toor, B. & Ronnes, H. (2015). "Reflecting absence, or how Ground Zero was purged of its material
history (2001-2010)." International Journal of Cultural Property. 22, 85-110. Wahlers, K.E. (2016). "North Carolina's Heritage Protection Act: cementing Confederate monuments in
North Carolina's landscape." North Carolina Law Review. 94(6), 2176-2189. Wodiczko, K. "Instruments, projections, monuments." AA Files. 43, 30-51. Wodiczko, K. & Nolan, G. (2005). “Disruptive agency: a conversation with Krzysztof Wodiczko.”
Thresholds. 29, 81-85.
CELA 2019 | UC Davis 301

The authors are solely responsible for the content of this technical presentation. The technical presentation does not necessarily reflect the official position of the Council of Educators in Landscape Architecture (CELA), and its printing and distribution does not constitute an endorsement of views which may be expressed. Citation of this work should state that it is from a CELA conference paper. EXAMPLE: Author's Last Name, Initials. 2019. Title of Paper. Sacramento, CA: CELA. For information about securing permission to reprint or reproduce this paper, please contact CELA at [email protected]
QUALITY OVER QUANTITY: ASSESSING TREE HEALTH FOR HIGHER
PERFORMANCE IN DESERT PARKING LOTS
ZAWARUS, PHILLIP University of Nevada Las Vegas, [email protected] 1 ABSTRACT
Extensive tree benefits for the built environment necessitate proper planting and maintenance standards in order to ensure mature tree growth. The compounding ecosystem services trees provide such as clean air, runoff reduction, outdoor comfort, and cost-savings can only be maximized if the tree has a life expectance longer than the average standard urban tree life of fifteen years. The lifespan of urban trees is often predicated on planter size, soil health, and routine maintenance but these factors are marginalized by current county planter codes for parking lots of Southern Nevada leading to poor tree health and frequent tree removal and replacement practices. Surface parking lots in Southern Nevada are also exposed to high summer temperatures and flooding due to codes not specifying placement of trees within parking lots, resulting in perimeter planting and no interior planters. By looking at strategies to implement proper tree planting strategies, optimizing parking lot layouts for tree planting, and diverse tree species based on their range of environmental, social, and economic benefits, parking lots in the desert can be transformed into multifunctional and comfortable outdoor spaces. The challenge of these strategies is the balance of maintaining parking stall count with an adequate tree count and plant communities that provide an extensive variety of benefits due to their prolonged lifespan from proper planting techniques.
1.1 Keywords
Tree Benefits, Parking Lots, Arid Performance, Stormwater Management, Green Infrastructure
CELA 2019 | UC Davis 302

2 INTRODUCTION Planting more trees in the urban environment of Las Vegas does not provide cooler outdoor spaces, stormwater runoff reduction, or wildlife habitat because the current Clark County codes for parking lots and planters does not provide adequate space or conditions for trees to thrive and reach maturity. The challenge is not planting more trees but to design for healthy tree growth in the city. Urban trees have an estimated average lifespan between seven (Moll, 1989) and thirteen years (Moll & Skiera, 1992) due to improper tree selection, planter design, planting techniques, and maintenance practices (Appleton, Horsley, & Harris, 2002). Tree species for parking lots should be low-water use, emit low biogenic volatile organic compounds, fast growing, and tolerant of reflect heat (Southern, 2012). The design of the planters should be adequately sized to promote root growth using a variety of planter strips and fingers, pervious surfaces such as permeable pavers, and structured soil. The planting of trees in the planters can also have a negative impact on the tree health if it planted too deep or on loose soil so that over time the tree will settle and sink deeper than its initial depth. If the tree flare is below the surface or covered with loose soil, then the tree will suffocate from a lack of access to oxygen. Not only should the soil be amended regularly but also irrigation maintenance should be scheduled to adjust emitter placement to be within close proximity to the root lines. Improper maintenance of tree irrigation in these planters is another cause of poor tree health and high tree mortality if the emitters stay within their initial location when the tree is first planted. The existing Clark County planter codes for parking lots do little to mitigate these issues as the planter sizes do not provide adequate soil volume for their suggested tree sizes. Within the six-hundred-page document of county codes, there is one section that states the use of permeable pavers can be used within the parking stalls to expand the soil volume for root growth, however, those guidelines or specifications are not included with the planter design guidelines. The lack of promotion or advocacy of these practices within the municipal codes undermines the significance of suggesting sustainable practices within the document. Another limitation within the codes is the placement of trees in relation to the parking stalls. It is stated within the codes that one large tree must be planted for every six parking stalls but because there are no specifications of where the tree must be planted for those six spaces the trees are often set to the perimeter of the parking lot leaving the asphalt surface parking lot exposed for thermal heat gain and an uncomfortable outdoor space. These current planting discrepancies not only impact trees in parking lots within Las Vegas, but also have had a negative impact nationally as evident in the documentation and evaluation of tree health through city tree planting campaigns such as the Million tree initiatives (Roman, 2014). The purpose of these initiatives was to demonstrate and provide a range of environmental and socioeconomic services to their respective city, supported by the monetary benefits that were estimated in the billions of dollars. The modeled projections of the tree benefits had a range in value for low and high tree mortality rate, but the estimations did not consider the trees life expectancy till maturity, where the benefits would be most substantial as a compounding investment. According to Laura Roman in her research How Many Trees Are Enough? Tree Death And The Urban Canopy (Roman, 2014) she states:
“In the study about Los Angeles’ million tree program, a low mortality scenario projected that 17% of planted trees would be dead after 35 years, and a high mortality scenario projected 56% mortality” (p. 2).
Although field data has not been recorded from Los Angeles yet, these modeled scenarios can be compared to New York City and Sacramento demonstrating the discrepancy of tree benefits in relation to survival rate:
“For street trees in New York City, eight to nine years after planting, 26.2% were dead. For a yard tree give-away program in Sacramento, five years after planting, 29.1% had died, on top of 15.1% that were never planted by residents” (p. 2).
For these tree planting initiatives and urban forest assessments to have positive impact with ecosystem services, Roman argues that the addition of long-term monitoring and tree mortality data should be incorporated into future planting strategies for more accurate evaluations of tree health and mortality rates in urban environments. 2.1 Research Background Through sponsored funding from the Nevada Division of Forestry and landscape architecture student studies, design strategies have been developed for transforming the performance and perspective
CELA 2019 | UC Davis 303

of parking lots in an arid urban environment. Las Vegas, located in the driest U.S. desert (Pariona, 2017), is experiencing high tree mortality rates due to poor planting strategies, harsh climatic conditions, abundance of impervious surfaces, and poor storm water management practices. Most evident in parking lots, tree health is hindered due to improper designs enforced by regulatory codes. Through an inventory and analysis of parking lots on the University of Nevada Las Vegas campus, advocacy workshops and partnerships, and volunteer training and community engagement this research will collaboratively identify best practices for trees in parking lots that will benefit local communities and establish healthy working forests. The Environmental Planning Agency (EPA) has identified numerous techniques to address the issues of water quality and management, heat island effect, habitat and ecology disruption, reduction in green space, urban sprawl, and infrastructure costs in surface parking lots (Environmental, 2008). Responding to these parking lot conditions requires planning, on-site stormwater management, surface material selection, and plant communities that enhance the environmental, social, and economic performance of a surface lot. According to studies from the service consultant JACOBS for the Regional Transportation Commission of Southern Nevada and Clark County Department of Comprehensive Planning the occupancy of parking lot spaces in relation to the mandated county code requirement were between 57% and 35% for large and medium shopping centers (JACOBS, 2015). The study also found that developers often over supplied the parking lots with additional spaces above the code requirements, reducing the occupancy of parking spaces even further. This study by JACOBS was performed in two phases with both receiving similar results parking space occupancy, which begins a case for reducing the number of stalls in a parking lot to potentially reallocate that space for landscape or other beneficial purposes. Another strategy suggested by the EPA is to reduce the size of the stalls. That idea combined with angled parking and one-way aisles can drastically reduce the asphalt surface in parking lots and repurpose that space for enlarged planters as demonstrated by student work samples. As stated previously, existing Clark County codes inhibit trees from growing to a mature state, reducing potential ecosystem service output, through inadequate soil volume limited by the planter size and unarticulated use of permeable pavers with structured soils in the document. When comparing the soil volume suggested by the Southern Nevada Regional Planning Coalition (Southern, 2012) for different tree sizes (Table 1) with the mandated planter sizes by Clark County (Figure 1) it is evident that trees will struggle to reach maturity or be of good health due to the equated soil space and volume for root growth. The county codes provide an extensive list of tree planting strategies with planters; however, they do not suggest necessary soil volume for different tree sizes. Because this information is not available within the document and there is little to no emphasis on the use of permeable pavers and structured soils, developers are reliant on only the planter size as a provision to specifying tree plantings. These county constraints provided a framework to use the University of Nevada Las Vegas campus, situated in Clark County, as a test site for best management practices from EPA’s documentation and student innovation and collaboration with allied professions to create healthy urban forests in parking lots for the arid environment of the Mojave Desert.
Table 1. Recommended minimum soil volumes for different tree size categories.
UNLV is a commuter campus of over thirty thousand students (UNLV, n.d.) and another four thousand employees (UNLV, n.d.) with almost twenty asphalt surface parking lots that range from half an acre to nearly thirty acres lined with trees in poor health. The acreage of land dedicated to this under-utilized infrastructure leads to undesirable conditions of flooding during rain events and strain on health when traversing the exposed asphalt during warmer temperatures at distances of a quarter of a mile. There is little to no ecosystem services that can be provided from these spaces since trees are in poor health and cannot substantially sequester carbon dioxide from the air, intercept stormwater runoff, or
CELA 2019 | UC Davis 304

shelter wildlife. This range of ecosystem services were the focus for delivering environmental benefits along with the social benefits of cooling the air or surface temperatures for outdoor comfort and wellbeing, and economic benefits of infrastructure cost savings and tree lifecycle cost savings. With most of these parking lots being at the perimeter of the campus, it was also an opportunity to treat the parking lot transformation as way to serve as the gateway into campus and add curb appeal to the surrounding community since it is the mission of the university to be accessible and inclusive of it’s residential and business neighbors. The many facets included in the design scope of work required partnerships with the university services and colleagues, local practitioners, and non-profit organizations to consult best practices and critical feedback to the design process. The partnership with The Nature Conservancy’s (TNC) national and state chapter representatives was invaluable to the assessment of existing tree health and inclusion of wildlife habitat for permanent and migratory bird species. Workshops and field work demonstrated necessary considerations for ensuring healthy mature tree growth that could be situated in dense plantings to promote bird habitat as a place of shelter, food source, nesting, and perching.
Figure 1. Comparison of planter volume according to Clark County codes. Drawing by the author
2.2 Research Purposes The inventorying of urban tree canopies within the University of Nevada Las Vegas parking lots
will serve the assessment of tree health, benefits, and performance of space beyond the standard utility of parking lots. UNLV students, faculty, and the surrounding community will benefit from this study by incorporating urban forestry in contrast to the existing exposed surface lots. Proposing adequate planting space, alternative program use, and performance function within parking lots, supported by the foundation of healthy mature tree canopies, will aleviate the prominent issues of flooding and the heat island effect, in
CELA 2019 | UC Davis 305

addition to the fragmented wildlife habitats, tree purchasing and removal costs, and strain on health, safety and wellbing for the campus community.
The positive effects of working urban forests in desert environments have been well documented by Greg McPherson’s Desert Southwest Community Tree Guide (McPherson, Simpson, Peper, Maco, Xiao, & Mulrean, 2004) and the Davey Resource Group’s Urban Forest Resource Analysis of Inventoried Public Trees (Davey, 2013). Urban tree canopies are particularly influential in harsh desert landscapes that lack surrounding forests to mitigate the effects of air pollution, urban heat islands, and monsoonal storm water events. The existing municipal codes mandate a tree density in parking lots, however, the overall tree vitality and public health benefit has become an evident issue due to lack of soil volumes necessary to sustain the trees, the impervious surfaces hindering rainfall capture, the lack of canopy area to absorb carbon emissions, and the negative human comfort experience. To establish and conserve working forests and promote the public benefit of trees throughout the Las Vegas metropolitan area, design codes must consider the environmental benefits of healthy urban trees. By starting with parking lots on the UNLV campus as a case, this research aims to influence and impact future development with the implementation of proper tree establishment in the urbanized Mojave Desert.
3 METHODS Qualitative and quantitative methods were both used in the assessment of existing tree health in the parking lots during the analysis phase along with determining appropriate tree species and plant communities during the design phase for the proposed parking lot planters using specific criteria for environmental, social, and economic benefits. Through the workshops with TNC, a rating criteria using the United States Forest Service Forest Ecologist Rich Hallett’s Tree Health Metrics (Hallet, 2018), students were able to assess tree health by documenting the tree’s crown health and measuring the trunk diameter at breast height (DBH) of forty eight different tree species. TNC’s Nevada Chapter also provided bird habitat workshops led by Leonard Warren to assist with the necessary plant communities and planting densities appropriate for sixteen bird species using criteria of nesting, diet, migration, and shelter from The Cornell Lab of Ornithology’s All About Birds online resource and field work examining different habitats. Methods used for determining environmental and economic benefits from individual trees came from the online calculators i-Tree Design (2017) and the National Tree Benefit Calculator (Casey, n.d.). These calculators were able to provide the quantitative measurement of stormwater runoff interception and carbon dioxide sequestration along with the cost savings associated with these elements and others for annual and lifespan performance. Other qualitative methods used for appropriate plant selection utilized the work of Stephen Kaplan’s theory of Attention Restoration (Ackerman) in workshops for understanding the aesthetic and ephemeral qualities of different plant characteristics to alleviate stress and promote a sense of well being in parking lots. 3.1 Existing Tree Health Assessment The Nature Conservancy’s coordinator of the Healthy Trees, Healthy Cities (HTHC) urban tree health monitoring national initiative, Rachel Holmes, lead the tree health assessment and early pest detection for all the trees within the nineteen inventoried campus lots. This workshop included demonstrations and training of student volunteers in the process of documenting and measuring of tree health using the Healthy Trees, Healthy Cities mobile application; which incorporates Hallett’s Tree Health Metrics into a digital interface. The training included measuring the tree DBH using either a dedicated DBH tape measurer or standard sewing tape for different tree types and planting conditions involving multi-stem trees, trunk irregularities, leaning trunk, and trees on a slope. Another component to the tree health assessment was observing and documenting the tree crown health using the HTHC app criteria and photographs of the tree crown characteristics. When documenting the tree crown, volunteers were instructed to rate the fine twig dieback, leaf discoloration, leaf defoliation, crown light exposure, vigor or combination of the previous criteria and large broken or dead branches, and finally crown transparency (Hallet, 2018). Through this training, the students were able to access the tree of nearly five hundred individual trees within the UNLV parking lots. The data recorded for each individual tree was also georeferenced using a coordinate system to place the tree with its health rating within a three-meter range of its approximate location on campus. After all the trees had been assessed and georeferenced onto a site plan, students determined priority parking lots for further analysis and design proposals reducing the previous parking lot count from nineteen to nine.
CELA 2019 | UC Davis 306

3.2 Environmental Benefits Assessing the stormwater runoff of the nine different sites was one of the primary drivers in improving the environmental performance of a parking lot. Analysis of the parking lot surface and the impact individual tree species have for runoff interception were the two procedures used to inform responsive design solutions. The Green Values National Stormwater Calculator was used to measure the potential runoff from the existing site during a 0.25” 0.50” rain event, two common rain intensities during the wet season of Las Vegas (Data, n.d.). The benefit of using this calculator is the ability to include pre-development or a natural state of the examined site and incorporate green improvements or green infrastructure into future proposals using the same variables from the existing conditions. By having runoff values calculated from a pre-development, existing, and green proposal, a relative comparison can be made to evaluate the stormwater performance of the design. The i-Tree Design software was also used to measure the potential runoff interception and carbon dioxide sequestration of specific individual tree species over a 100-year time span to evaluate the impact tree health and growth rate have on these potential environmental values as shown in Figure 2. The data chart shown in Figure 2 was created by inputting the annual tree growth change (DBH) into the i-Tree Design calculator in annual interval changes for the first ten years, then in increments of five and fifteen years as shown in Table 2. The table measures the annual and compounding benefits for a health and poor tree specimen, while adjusting for poor tree health removal and replacement every fifteen years as suggested from the previous stated research on tree mortality. By adjusting the projected values from both a healthy and poor tree specimen, the environmental tree benefit model can project the lifespan benefits from a flourishing mature tree that has been properly planted and maintained versus the existing planter design from the Clark County codes. This model becomes valuable in assessing the impact tree quality has on ecosystem services and the need to ensure trees reach a mature state and full lifespan.
CELA 2019 | UC Davis 307

Table 2. Charted annual environmental values from a healthy and poor health Honey Mesquite.
3.3 Lifecycle Benefits Determining the lifecycle benefits and cost savings followed similar procedures as the environmental methods by using the Green Values National Stormwater Calculator, the i-Tree Design
Figure 2. Environmental tree benefits from a Honey Mesquite tree. Drawing by the author
CELA 2019 | UC Davis 308

software, and the National Tree Benefit Calculator to measure annual and lifecycle values from individual tree species and existing parking lot conditions in relation to pre-development and proposed green improvements. The Green Values National Stormwater Calculator also calculates the associated construction, maintenance, and lifecycle costs of individual materials and green improvements. The significance of these values is that a comparison can be made between initial costs and long-term costs and savings depending on the improvements made to an existing parking lot over a 100-year lifespan, keeping the same time consistency generated from the i-Tree Design calculations mentioned previously in the Environmental Benefits section. The i-Tree Design software and National Tree Benefit Calculator were used in combination using the same tree growth rate and health criteria used in the Environmental Benefits section to calculate the property value and savings in electricity, natural gas, air quality, carbon dioxide, and stormwater runoff. The model for these tree savings also includes the cost associated with tree removal and new tree purchasing costs to emphasize the impact properly maintained and planted trees have as a long-term investment opportunity as shown in Table 3.
Table 3. Charted annual cost savings from a healthy and poor health Honey Mesquite.
3.4 Tree Benefit Matrix By providing environmental, social, and economic measurements and performance of Mojave native and appropriate tree species an output of 152 unique tree benefits was created as a matrix for selecting tree species during the design development of each student’s selected parking lot as shown in Figure 3. The significance of the tree benefit matrix is the correlation between tree size, characteristics, and performance for making decisions that satisfies the needs of the site in an evidence-based design strategy. The mapping of values as they change of time intervals of months and years gives a dynamic understanding of the changing tree qualities and the impact and affect it can have over the lifespan of a project.
4 STUDENT DESIGN IMPLEMENTATION The first phase of the student design implementation was conceptualizing a transformed parking lot found suitable for the arid environment of Las Vegas that performed environmental, social, and economic benefits. Part of the initial concept objectives was to reconfigure the parking lot layout and structure by suggesting different parking stall angles and aisle widths, new circulation routes, and additional program use beyond parking a car. The immediate challenge in this process was to maintain the existing stall count while providing more planting space for the growth and longevity of mature trees within a predominately fixed site boundary, although some of the UNLV parking lots had opportunities to expanding the site boundary in order to accommodate the range of additional site amenities. The first step in addressing this challenge was to negotiate alternative stall angles, widths, and surface material when
CELA 2019 | UC Davis 309

appropriate to necessitate larger planter areas. This included implementing one-way aisles and new vehicular and pedestrian circulation to address traffic calming and safety, decreasing potential conflict between the two groups. The goal of the transformed parking lots was to go beyond adding larger planters and more trees by re-programing how a parking lot may function for the needs of students, faculty, and the surrounding community when occupying these spaces on campus.
4.1 Site Analysis Students inventoried their respective site’s surface materials, traffic volume and routes, pedestrian preferences, and other unique characteristics to inform their analytical studies and methods and critically address the intentions of their conceptual ideas. The information found during this process served as a foundation for their evidenced-based and responsive design solutions by evaluating the impact of these existing conditions through both observation and analytical methods that include photographs, videos, the Green Values National Stormwater Calculator, i-Tree Design, the National Tree Benefit Calculator and conventions from James LaGro’s Site Analysis (LaGro, 2013). The site analysis was refined to center around the student’s performative goals of environmental improvement, safety and comfort, and feasibility. Environmental improvements included stormwater management, drainage, and filtration of different rain events that provide on-site mitigation practices. Analyzing the existing vehicular and pedestrian circulation to determine points of conflict and exposure to the elements informed strategic placement of trees for shade and designated pathways for safe passage through the space. The construction, maintenance, and lifecycle costs of the existing conditions were recorded to serve as a baseline target to either match or reduce with their proposals. The different components inventoried during this process were analyzed as a symbiotic network to demonstrate the impact one system may or may not have on another system, such as the significance surface material may have in not only restricting root growth but also contributing to the urban heat island affect and cost associated to maintain and replace over its lifespan.
4.2 Transforming a Parking Lot The evidence-based response to the analysis and tree benefit matrix demonstrates specific strategies that transform a parking lot beyond it singular use by reducing stormwater runoff, creating wildlife habitat, providing outdoor comfort for pedestrians and outdoor classrooms or other activities, along with being a feasible long-term investment. Surface materials such as permeable pavers were deliberately chosen to address multiple parameters such as runoff infiltration, high albedo, and feasible cost savings. The selection of specific tree species was also carefully considered depending on their preferred performance environmental, social, or economic impact within the parking lot. Comprehensive strategies were developed by several students that demonstrated an ability to maintain or increase parking stall count while providing substantial plant sizes and use of alternative surface materials to expand root growth for mature healthy trees. These examples shown in Figure 4 and Figure 5 transformed the parking lot and found innovative solutions that highlight the extensive level of benefits native Mojave Desert trees can provide within a parking lot and the overall identity of the UNLV campus if maintained within refined parking lot standards.
CELA 2019 | UC Davis 310

Figure 4. Site plan of UNLV parking lot showing the new layout, tree canopy, and economic
benefits. Drawing by Angelo Carvalho. Permission for reproduction and use provided.
Figure 5. Site plan of UNLV parking lot showing the new layout, tree canopy, and economic
benefits. Drawing by Nancy Villeda. Permission for reproduction and use provided.
CELA 2019 | UC Davis 311

5 CONCLUSIONS Parking lots are an extremely undervalued and underappreciated piece of the urban fabric lined with opportunities to reduce the environmental, social, and economic constraints they have on the principles of ecological design in arid environments. These expansive components of the urban infrastructure can be re-programmed to contribute ecosystem services from healthy trees and green infrastructure instead of hindering or diminishing their contribution to the health and wellbeing of those occupying them. Although parking lots were the case study of this research, the overall goal was to demonstrate the value mature trees can provide to the built environment if municipal codes could be amended to promote healthy tree growth that reach their natural lifespan. Tree planting initiatives can continue to advocate for more trees in cities but additionally their needs to be long-term monitoring efforts and changes to policies that enable those efforts to reach their ideal output of ecosystem services. The main takeaways from this study are to (1) incorporate recommended soil volume into the planning and design process of tree planters within municipal codes, (2) encourage alternative pervious surface materials to promote root growth and reduce potential runoff volume, (3) consider parking lots to be multifunctional, comfortable, and safe outdoor spaces that contribute to the surround context as a positive image, and (4) plan for the ecosystem services of the trees and parking lot performance to be a long-term investment and cost effective strategy. Although surface parking lots are beginning to lose demand as ride-share programs, autonomous vehicles, and more online services reduce the need to drive individual vehicles to large retail shopping center, the principles of this research still serve as a foundation when considering alternative design approaches to streets, plazas, and other outdoor spaces that reside within the urban fabric. It is still critical to implement policies that prioritize the health and longevity of trees regardless of their context. Planting, monitoring, and maintaining trees in the city will be needed to counteract the other conventional practices that diminish the health of our environment.
6 REFERENCES Ackerman, C. (2018, November 13). What is Kaplan’s Attention Restoration Theory (ART)? Benefits Criticisms. Retrieved November 30, 2018, from https://positivepsychologyprogram.com/attention- restoration-theory/. Appleton, B., Horsley, J., & Harris, V. (2002). Trees for Parking Lots and Paved Areas (G. Eaton, L. Fox, J. Orband, & C. Hoysa, Eds.). Trees for Problem Landscape Sites,430(28). Retrieved August 08, 2018, from http://www.fao.org/uploads/media/Trees_for_parking_lots_and_paved_areas.pdf. Casey Trees and Davey Tree Expert Co. (n.d.) National Tree Benefit Calculator.Retrieved 06, October 2018, from http://www.treebenefits.com/calculator/. Data, U. C. (n.d.). Temperature - Precipitation - Sunshine - Snowfall. Retrieved October 03, 2018, from https://www.usclimatedata.com/climate/las-vegas/nevada/united-states/usnv0049. Davey Resource Group. (2013, June). Urban Forest Resource Analysis of Inventoried Public Trees. Retrieved August 02, 2018, from http://forestry.nv.gov/wp- content/uploads/2013/09/LasVegas_ResourceAnalysis_20130802.pdf?forcedefault=true. Environmental Protection Agency: Office of Solid Waste and Emergenc Response. (2008, February). Green Parking Lot Resource Guide. Retrieved July 26, 2018, from https://nepis.epa.gov/EPA/html/DLwait.htm?url=/Exe/ZyPDF.cgi/P100D97A.PDF?Dockey=P100D9 7A.PDF. Hallett, Rich. (2018, August). Tree Health Metrics: One Page Guides. The Nature Conservancy. JACOBS. (2015, June). Clark County Parking Study. Retrieved August 13, 2018, from
http://www.rtcsnv.com/wp-content/uploads/2012/06/UPWP1710-CC-Parking-Study_-Report- _Final.pdf?forcedefault=true.
LaGro, J. A. (2013). Site analysis informing context-sensitive and sustainable site planning and design. Hoboken (N.J.): Wiley. McPherson, G., Simpson, J. R., Peper, P. J., Maco, S. E., Xiao, Q., & Mulrean, E. (2004). Desert Southwest Community Tree Guide: Benefits, Costs, and Strategic Planting. Arizona State Land Deparment Natural Resources Division, Urban & Community Forestry Section & Arizona Community Tree Council, Inc.Retrieved July 11, 2018, from https://www.fs.fed.us/psw/publications/mcpherson/psw_2004_mcpherson002.pdf?forcedefault=true.
CELA 2019 | UC Davis 312

Moll, G. (1989). The State of Our Urban Forest. American Forests,95(11), 12th ser., 61-64. Retrieved August 01, 2018, from https://www.questia.com/magazine/1G1-8175643/the-state-of-our-urban- forest. Moll, G., & Skiera, B. (1992). The Sad State of City Trees. American Forests, 98(3), 4th ser., 61-64. Retrieved August 01, 2018, from https://www.questia.com/magazine/1G1-12109868/the-sad-state- of-city-trees. Pariona, A. (2017, April 19). The Major Deserts Of The United States. Retrieved January 14, 2019, from https://www.worldatlas.com/articles/the-major-deserts-of-the-united-states.html Roman, L. (2014). How Many Trees Are Enough? Tree Death AndThe Urban Canopy. Scenario 04: Building the Urban Forest. Retrieved August 07, 2018, from https://www.fs.fed.us/nrs/pubs/jrnl/2014/nrs_2014_roman_001.pdf?forcedefault=true. Southern Nevada Regional Planning Coalition. (2012, January 24). Recommended Best Practices For
Urban Trees in Southern Nevada. Retrieved from: https://www.clarkcountynv.gov/comprehensive- planning/eco-county/Documents/BestPractices_forUrbanTreesSoNV.pdf.
UNLV. (n.d.). Retrieved August 12, 2018, from https://www.unlv.edu/hr/employee-info/employee-counts. UNLV. (n.d.). Retrieved August 12, 2018, from https://www.unlv.edu/about/facts-stats. USDA Forest Service. (2017). I-Tree design user’s manual. Retrieved October 06, 2017, from http://www.itreetools.org/applications.php.
CELA 2019 | UC Davis 313

The authors are solely responsible for the content of this technical presentation. The technical presentation does not necessarily reflect the official position of the Council of Educators in Landscape Architecture (CELA), and its printing and distribution does not constitute an endorsement of views which may be expressed. Citation of this work should state that it is from a CELA conference paper. EXAMPLE: Author's Last Name, Initials. 2019. Title of Paper. Sacramento, CA: CELA. For information about securing permission to reprint or reproduce this paper, please contact CELA at [email protected]
THE SOCIAL BASELINE
LOPRESTO, HANNAH University of Nebraska—Lincoln, Lincoln, NE, [email protected] DE ALMEIDA, CATHERINE University of Nebraska—Lincoln, Lincoln, NE, [email protected] 1 ABSTRACT
Participating in the Landscape Architecture Foundation’s Case Study Investigation, the University of Nebraska-Lincoln research team partnered with two world-renowned landscape architecture offices to conduct post-occupancy analysis of two projects that reclaimed underutilized sites with high performing landscapes in the Great Plains—Tom Hanafan River’s Edge Park in Council Bluffs, IA and P Street Corridor in Lincoln, NE. The research team documented, measured, and evaluated social, environmental, and economic benefits at each site to capture the transformative aspects of landscape architecture. Due to the reclamation aspects of these projects, the research team became interested in how user perceptions of the sites had changed in light of these recently constructed projects. While collecting social benefit data on-site, unanticipated opportunities and constraints arose during the user surveying process. This paper highlights the methodologies used to document social benefits, and explores the unexpected outcomes between each site’s survey results when documenting user perception, safety, ease of access, and increased levels of activity. With minimal social baseline data present for either site, survey questions directed to users with pre-existing site knowledge (aka “baseliners”) was of utmost importance to capture comparative perceptions of before and after conditions. Upon analysis of the survey results, patterns were discovered corresponding to differences in the surveying environment such as level of foot traffic and visitor demographics—making it clear that these differences can have unanticipated impacts to both the surveying process and results.
1.1 Keywords
landscape performance, landscape architecture, social benefits, baseline data, user survey methodology
CELA 2019 | UC Davis 314

2 INTRODUCTION Each year, the Landscape Architecture Foundation partners with university students, faculty, and
world-renowned landscape architecture firms to complete a Case Study Investigation as part of their Landscape Performance Series. These case studies measure social, environmental, and economic benefits of high performing, exemplary landscapes around the globe. Firm partners team up with university faculty and student researchers to develop a case study and methods document centered on landscape performance benefits for the featured project.
The University of Nebraska-Lincoln research team participated in the 2018 Case Study Investigation, collaborating with Design Workshop on P Street Corridor and Sasaki Associates on Tom Hanafan River’s Edge Park. The team collected on-site data and documented their methodology for evaluating social, environmental, and economic benefits at each site.
P Street Corridor, a six-block streetscape in downtown Lincoln, Nebraska, is a retrofit of preexisting street conditions—lacking in efficient on-street parking and safe pedestrian experiences (Figure 1). Located only two blocks from the University of Nebraska-Lincoln’s city campus, P Street is frequented by business professionals, local families, and many university students. Promoting multimodal safety for pedestrians, bikers, and motorists, the corridor renovation reduced each vehicular lane width by four feet, and implemented curb extensions at intersections to increase on-street parking, planting areas for stormwater retention, and pedestrian safety (De Almeida, et. al., 2018).
Figure 1. P Street Corridor, Phase 1 Before (left) & After (right). Image on the left provided by Design Workshop, Inc. Image on the right provided by D.A. Horchner / Design Workshop, Inc.
Tom Hanafan River’s Edge Park, a public park and event space in Council Bluffs, Iowa, is sited
along the Missouri River in its floodplain. Previously an inaccessible wooded area of unplanned uses, the location was severely impacted by the 2011 flood of the Missouri River. Designed to be resilient to future flood events, the park features an open event lawn, amphitheater, established meadow, and connection to regional trail networks (Figure 2) (De Almeida, et. al., 2018).
CELA 2019 | UC Davis 315

Figure 2. Tom Hanafan River’s Edge Park, Phase 1 Before (left) & After (right). Image on the left provided by Pottawatomie County GIS Office. Image on the right ©Kessler Photography, Courtesy
of Sasaki.
3 METHODS FOR MEASURING SOCIAL PERFORMANCE
While environmental and economic benefits rely on easily quantifiable values such as carbon sequestration or property value, social benefits can be more challenging to quantify. Historically difficult to measure, social benefits often fall in the grey area between qualitative and quantitative assessments. While the perception of a space may be qualitative, measuring the change in perception from pre to post project conditions can create a qualitative social benefit. The measure perceptual changes, the team administered surveys at both P Street Corridor and Tom Hanafan River’s Edge Park. 3.1 Measuring social performance with surveys
Survey distribution is a common method for measuring social performance. Typical best practices for surveying include two survey types: questionnaires and interviews. Questionnaires allow respondents to complete questions at their own convenience, often independently at a location of their choosing, which can lead to an increased level of honesty in the responses. Interviews offer face to face interaction where the respondent can ask for clarification and interact more closely with the survey distributor (Sendich, 2006).
Within the standard survey, questions are either asked in closed or open-ended formats. Close-ended questions are often variations of a Rating Scale, Likert Scale, or Numerical Scale (Sendich, 2006). The Rating Scale measures the respondents’ position between two opposing word pairs such as hot-cold or noisy-quiet (Sendich, 2006). The Likert Scale asks the extent at which the respondent agrees with a statement. For example, at Park Lane, a Landscape Architecture Foundation streetscape Case Study project similar to P Street’s conditions, the Likert Scale was incorporated into a survey to measure the site’s level of perceived safety, favorability, ADA access, and sense of identity, among others (Ozdil et. al., 2017). The Numerical Scale correlates a respondent’s positions with a numerical value. At Yanxiu Park, a Landscape Architecture Foundation waterfront Case Study similar to Tom Hanafan’s conditions, the administered survey measured overall park satisfaction by asking users to choose from 1=extremely unsatisfied to 5=extremely satisfied (Wu et. al., 2017).
The survey’s objective should dictate which of the various administration methods to use. Modes of distribution include face to face, posted mail, telephone, email, web, and a combination of them. Yanxiu Park’s surveys were available both online via mobile app as well as on-site. However, Yanxiu Park’s research team found that less respondents were comfortable to completing the survey online due to identity theft concerns (Wu et. al., 2017). This illustrates that it is important to consider that the number of distributed surveys will need to be adjusted based upon the response rate (Sendich, 2006).
CELA 2019 | UC Davis 316

At both P Street and Tom Hanafan River’s Edge Park, the research team used a mixed-methods approach by making the surveys remotely available to complete online or in-person. The advantage for in-person distribution allowed for the research team to directly answer any questions the respondents had. These options provided respondents with the flexibility to take the survey privately at home or on-site while conversing with the survey distributor. Within the surveys for each location, standard questions were asked based upon on the Likert and Numerical scales, but diverged from convention in the pursuit of baseline data. 3.2 Defining the “Baseliner”
Most landscape architecture firms are not consistently proactive about measuring landscape performance benefits, and therefore typically do not collect baseline data; having baseline social data is the rare exception rather than the rule. While it would generally be easier to compare pre and post project data if a pre-project survey was distributed, there are methods to quantify social benefits without access to pre-project data. These methods depend upon “baseliners”—users that can provide knowledge of preexisting site conditions during a post-project survey. Baseliners are essential participants that enable research teams to collect quantitative data by assessing qualitative knowledge from user perceptions.
For the research team, the user surveying process revealed the challenges with and importance of establishing baseline data for preexisting conditions. Throughout their investigation of social benefits for both P Street and Tom Hanafan River’s Edge Park, baseliners played a critical role in establishing baseline data for the measurement of landscape performance benefits, especially for such reclaimed sites. Asking these users specific questions to document and record their knowledge of pre-existing conditions, while also documenting their perceptions of site changes from a new project, became a critical additional assessment tool for measuring social benefits.
In the 2013 Landscape Research Record, Jessica Canfield and Bo Yang explain, “The validity of performance benefit statements largely depends on the quality and reliability of data sources. First-hand, verified data is most desirable for performance analyses, though it was not always feasible to obtain due to geographical limitations, cost implications, and/or the short duration of the CSI program” (Canfield and Yang, 2013, 4). First hand data, whether it be collected by a firm or measured on-site, is ideal for measuring social benefits such as the reduced crossing times on P Street. However, while baseline data collected by a firm is “first-hand,” it may not always be the most reliable data source option when identifying social benefits centered around perception. Baseliners could potentially be a more reliable source to identify change in perception from pre to post project conditions, illustrating the change in perception for the same individual rather than a completely different set. On the P Street survey, baseliners were able to provide benefits such as increased user perception without the presence of pre-project data collection.
In order to identify baseliners and archive their baseline data, the research team developed question sets, created as variations of the Likert and Numerical Scale, which were used to separate them from other survey participants (Table 1).
Table 1. Baseliner question sets for P Street and Tom Hanafan River’s Edge Park Surveys
____________________________________________________________________________________ P Street Scale Are you familiar with what P Street looked like None (Yes/No) before the 2014 renovation? Do you find walking on P Street easier or Numerical more difficult after the reconstruction? Do you find biking on P Street easier or more Numerical difficult after the reconstruction?
CELA 2019 | UC Davis 317

Do you find driving on P Street easier or more Numerical difficult after the reconstruction? I feel safer and more comfortable using P Street Likert as a pedestrian after the reconstruction. I feel safer and more comfortable using P Street Likert as a biker after the reconstruction. I feel safer and more comfortable using P Street Likert as a driver after the reconstruction. ____________________________________________________________________________________ Tom Hanafan River’s Edge Park Scale Are you familiar with what Tom Hanafan River’s None (Yes/No) Edge Park looked like before it became a public park? Do you find access to the Missouri river from Tom Numerical Hanafan River’s Edge Park easier or more difficult after the reconstruction? How much easier or more difficult? Do you feel safer and more comfortable using Tom Numerical Hanafan River’s Edge Park at all times of day after the reconstruction? How much safer and more comfortable?
3.3 All Inclusive Surveying
Developing a surveying methodology to be all-inclusive was a primary goal for the research team to gather as many responses as possible from baseliners. The initial surveys created for both P Street and Tom Hanafan River’s Edge Park were nearly identical. The surveys included the same general format, many of the same questions, and were distributed during similar times of day. With each site having its own summer event series (Jazz in June near P Street (Figure 3, left) and Hanafan’s Loessfest), surveys were distributed at both event and non-event days to gather a broader sampling of age ranges, locals, visitors, levels of education, and abilities. While distributing surveys at Tom Hanafan River’s Edge Park, fishermen agreed to complete the survey, but were unable to read. One student researcher from the team read the questions to them aloud, and completed the surveys using an interview-like method (Figure 3, right). Having fished along the Missouri river on site for years before the project was constructed, the fishermen provided valuable baseline data of the site’s previous fishing popularity and levels of accessibility on self-made trails.
CELA 2019 | UC Davis 318

Figure 3. Surveying environments at P Street Corridor and River’s Edge Park. Image on the left is a University of Nebraska-Lincoln file photo. Image on the right by Catherine De Almeida.
4 UNEXPECTED OBSERVATIONS, CHALLENGES, AND OPPORTUNITIES Although the surveys followed a very similar format, the research team observed unexpected
differences in each site’s surveying environment. P Street’s daily foot traffic density was much higher than Tom Hanafan’s, whether or not an event was taking place, making survey distribution and collection faster. Locals were also much easier to encounter on P Street due to the corridor being part of a daily commute or destination for workers or University students. At Tom Hanafan River’s Edge Park, daily foot traffic density was much lower, making it more difficult to collect surveys on non-event days. These on-site observations led the research team to adjust their survey completion expectations—resulting in 100 completed surveys on P Street while only 50 completed surveys from Tom Hanafan River’s Edge Park. However, on P Street, 52% of surveyed users had baseline knowledge (Figure 4, Table 2) while on Tom Hanafan River’s Edge Park, 65% of surveyed users had baseline knowledge (Figure 5, Table 3). The research team speculates that this is due to the transient university population for P Street. While locals were easier to come by on P Street, many have not lived there long enough to have pre-existing site knowledge. The research team encountered some challenges while attempting to filter out baseliners from other survey respondents. Errors began to present themselves in survey results when it became apparent that a) some non-baseliners had answered baseline questions or b) baseliners failed to indicate they had pre-existing site knowledge on the appropriate question.
After formulating social performance benefits from both firm baseline data and baseliners, the research team advocates for sensitivity in the type of collected baseline data. Certain social performance benefits, such as increased park space, are best suited for firm baseline data but specific social benefits focused on more perceptual aspects of landscape changes may be more accurate if collected post-project from baseliners. This ensures that perceptual shifts are captured by the same person, increasing data accuracy, rather than comparing data provided by different users at different times. An ideal scenario would be to have the same participants complete questionnaires during pre- and post-project conditions, since users are referencing memory rather than real-time experiences in their completion of a survey during post-occupancy analysis. However, this method becomes increasingly complicated and lengthy due the long time frame and high possibility of participants moving away within 5-10 years of the projects’ pre-construction inventory.
CELA 2019 | UC Davis 319

Figure 4. P Street Corridor Baseliner Survey Question. Source: SurveyMonkey
Figure 5. Tom Hanafan River’s Edge Park Baseliner Survey Question. Source: SurveyMonkey
Table 2. P Street’s social benefits
Surveys Distributed: 100
CELA 2019 | UC Davis 320

Reported Baseliners: 51 ____________________________________________________________________________________ Social Benefit (De Almeida et al., 2018) Baseline Data Obtained From… Improves perception of pedestrian safety and comfort baseliner survey question for 67% of 63 surveyed users who had visited the corridor before reconstruction1 Reduced street crossing time for pedestrians from an on-site measurements average of 11.5 seconds to 6.9 seconds per crossing, a 40% reduction. Improved user perception of the appearance of P Street, firm’s pre-project survey results with 80% of 100 surveyed visitors rating the street’s appearance as “good” or “very good” as compared to 23% before the redesign2 1 These results indicate 63 / 100 surveyed users on P Street were baseliners, but only 51 users reported having knowledge of pre-existing conditions. This indicates that either a) non-baseliners answered baseline questions or b) Baseliners failed to indicate they had baseline knowledge on the appropriate survey question. 2 This benefit was calculated by comparing the design firm’s baseline data to the research team’s collected survey data post-project.
Table 3. Tom Hanafan River’s Edge Park social benefits
Surveys Distributed: 50 Reported Baseliners: 32 ____________________________________________________________________________________ Social Benefit (De Almeida et al., 2018) Baseline Data Obtained From… Increased ease of access to the Missouri River baseliner survey question according to 89% of 35 surveyed users. Creates a safe public park space according to baseliner survey question 84% of 37 surveyed users who said that they perceive the park as safer than before the reconstruction. Increases levels of outdoor activity for 68% of none required 47 surveyed users. Provides new community event opportunities none required to 65% of 49 surveyed users.
5 CONCLUSIONS As a common method for measuring social performance, survey distribution became the key provider of social baseline data for the University of Nebraska-Lincoln research team. Incorporating a
CELA 2019 | UC Davis 321

mixed-methods approach for both P Street Corridor and Tom Hanafan River’s Edge Park, the surveys were available online as well as on-site with the survey distributor available for questions. Within the surveys for each location, standard questions were asked based upon on the Likert and Numerical scales, but varied from convention in the pursuit of missing baseline data in order to evaluate changes in landscape perception. Baseliners are an immensely valuable resource for obtaining missing baseline data. In their book Landscape Architecture Research: Inquiry, Strategy, Design, M. Elen Deming and Simon Swaffield explain, “Evidence-based design demands increasingly rigorous measurements that “prove” (or at least promise) the likelihood of adequate long-term performance and value of capital investments, especially when compared to the environmental services and other resource values that may be lost in development” (Deming et. al., 2011, 187-188). Baseliners are a key to providing social performance data in order to back investments of high performing landscapes. To find baseliners, full inclusivity of all people in the survey process should be a primary objective to ensure a diverse user audience is captured. To achieve this, research teams must be flexible and able to adapt to unexpected factors in the surveying environment such as foot traffic density and visitor demographics. As a professional practice, it is becoming increasingly important for landscape architects to implement baseline data collection in order to test whether their design goals are being met as part of a feedback loop, learning process. This is especially true for social benefits because they are difficult to quantify without baseliners. Unless firms are proactive about measuring landscape performance benefits, post project analysis is difficult. Baseline data collection is essential to giving performance value to the designed landscape, especially when it comes to projects that are transforming underutilized, marginal landscapes. Baseliners play a critical role in understanding how perceptual shifts of these redesigned landscapes can inform future practice. Through a more sensitive approach to social baseline data collection, firms and researchers can identify which benefits correspond most appropriately to either pre-project data collection, post-project surveys, or a mix of both. Understanding that each social benefit must be treated uniquely in order to most accurately be quantified, future practice has the opportunity to perform individually crafted methodologies to collect more reliable data sets to better inform the profession. 6 REFERENCES Canfield, Jessica and Bo Yang. 2013. “Reflections on Developing Landscape Performance Case Studies,” Landscape Research Record, No. 1.
http://thecela.org/wp-content/uploads/REFLECTIONS-ON-DEVELOPING-LANDSCAPE-PERFORMANCE-CASE-STUDIES.pdf
De Almeida, Catherine, Hannah LoPresto, and Brandon Zambrano. 2018. “P Street Corridor, Phase 1.” Landscape Performance Series. Landscape Architecture Foundation. https://doi.org/10.31353/cs1340
De Almeida, Catherine, Hannah LoPresto, and Brandon Zambrano. 2018. “Tom Hanafan River’s Edge Park, Phase 1.” Landscape Performance Series. Landscape Architecture Foundation. https://doi.org/10.31353/cs1350
Deming, Elen .M. 2015. “Social & cultural metrics: Measuring the intangible benefits of designed landscapes,” Landscape Architecture, 1, 99–109. Deming, Elen M. and Simon Swaffield. 2011. Landscape architectural research: Inquiry, strategy, design. New York: John Wiley & Sons. Ellis, C., Kweon, B.-S., Alward, S., & Burke, R.L. 2015. “Landscape performance: Measurement and assessment of multifunctional landscapes,” Landscape Architecture, 1, 32–39. Ozdil, Taner R., Ali Khoshkar, Ravija Munshi, and Riza Pradhan. 2017. “The Shops at Park Lane.”
Landscape Performance Series. Landscape Architecture Foundation. https://doi.org/10.31353/cs1280 Preiser, W.F., Rabinowitz, H.Z., & White, E.T. 1988. Post-occupancy evaluation. New York: Van Nostrand Reinhold. Sendich, Emina, ed. 2006. “Planning and Urban Design Standards,” American Planning Association.
Hoboken: John Wiley & Sons, Inc,.
CELA 2019 | UC Davis 322

Wu, Hong and Clarissa Ferreira Albrecht da Silviera. 2017. “Yanxiu Park.” Landscape Performance Series. Landscape Architecture Foundation.
https://doi.org/10.31353/cs1310 Yang, Bo and Shujuan Li. 2015. “A research frontier in landscape architecture: landscape performance and assessment of social benefits,” Landscape Research, Issue 3. https://www.tandfonline.com/doi/full/10.1080/01426397.2015.1077944
CELA 2019 | UC Davis 323

CELA MEDIA STATEMENT (Optional)
Dear CELA Authors: Please consider include in this space a research summery in 100 words or less that would best describe your topic, its principal results and/or impacts, written in clear language that would be of interest to public media outlets. In addition to the research summary, you may provide an optional graphic abstract that further explains the topic. Title of Paper or Research: The Social Baseline Author: Hannah LoPresto and Catherine De Almeida Institution or Professional Affiliation: Student (LoPresto) and Professor (De Almeida) of Landscape Architecture, University of Nebraska—Lincoln Authors please select one of the following: I DO__X___ DO NOT_____want to prepare a media statement for general release from the 2018 CELA Conference. (If you choose DO NOT, you do not need to prepare a media statement). Media Statement (100 words max.): Participating in the Landscape Architecture Foundation’s Case Study Investigation, the University of Nebraska-Lincoln research team partnered with two world-renowned landscape architecture offices to conduct post-occupancy analysis of Tom Hanafan River’s Edge Park in Council Bluffs, IA and P Street Corridor in Lincoln, NE. While collecting social benefit data from user surveys, the team discovered that establishing baseline data of pre-existing conditions would be the greatest challenge. Referring to users with pre-existing site knowledge as “baseliners,” the research team identifies the critical role that baseliners play in establishing baseline data for the measurement of landscape performance benefits. (Optional) Graphic Abstract: please insert the illustration below. Authors: please seek copyright permission if copyrighted materials are used.
CELA 2019 | UC Davis 324

The authors are solely responsible for the content of this technical presentation. The technical presentation does not necessarily reflect the official position of the Council of Educators in Landscape Architecture (CELA), and its printing and distribution does not constitute an endorsement of views which may be expressed. Citation of this work should state that it is from a CELA conference paper. EXAMPLE: Author's Last Name, Initials. 2019. Title of Paper. Sacramento, CA: CELA. For information about securing permission to reprint or reproduce this paper, please contact CELA at [email protected]
DYNAMICS OF HEAT ISLANDS FOR DRYLAND CITIES AND IMPLICATIONS FOR MITIGATION
WHEELER, STEPHEN M. Department of Human Ecology University of California at Davis [email protected] DIALESANDRO, JOHN Geography Graduate Group University of California at Davis [email protected] ABUNNASR, YASER Department of Landscape Design and Ecosystem Management American University of Beirut [email protected]
1 ABSTRACT
Urban heat island dynamics and mitigation strategies for dryland cities are more complex than for temperate cities. Whereas temperate cities typically form daytime urban heat islands (UHIs), deserts surrounding arid cities frequently heat up more rapidly than urban landscapes during daytimes, leading to an “urban cool island” effect. In this study, we analyze how urban heat island effects vary across 10 dryland urban regions worldwide and potential implications for UHI mitigation strategies. We use GIS to assemble daytime and nighttime satellite imagery for these regions. We then calculate land surface temperature and Normalized Difference Vegetation Index (NDVI) data for all regions, and identify typical neighborhood-scale examples of six land cover types for each region. Finally, we relate temperature and land cover data using standard statistical methods. The 10 dryland metropolitan areas showed a large variation in UHI effects. We found a strong daytime UHI in only one region. Nighttime heat islands were stronger. At a regional scale, vegetation correlated with lower urban temperature within only 4 of the 10 regions. However, at the neighborhood scale sample urban forests cooled local temperatures an average of 5.6° C compared to the metro mean. Turf-and-tree landscapes had a lesser cooling effect. Xeriscaped landscapes contributed to daytime heating rather than cooling. Multistory buildings appeared to have a small but substantial daytime cooling effect. These findings suggest that the most effective cooling strategies for arid cities may be a combination of urban forestry and shade-maximizing built form using high-albedo surface materials.
1.1 KEYWORDS
Urban Heat Island, Dryland Cities, Land Surface Temperature, Vegetative Cooling, Urban Forest
CELA 2019 | UC Davis 325

2. INTRODUCTION
Within temperate climates, cities typically form urban heat islands (UHIs) as buildings and paved surfaces absorb and slowly release solar radiation (Schatz and Kucharik 2014). Vegetated rural landscapes around cities are typically cooler (Chow et al. 2011). However, heat island dynamics for dryland cities are more complicated (Ferwati et al. 2018). Surrounding deserts may heat up more rapidly during the day, leading to an “urban cool island” effect (Rasul, Baltzer, and Smith 2015). Then they may cool more rapidly at night, leading to nighttime UHIs. Degrees of aridness, extent of vegetation, elevation, latitude, humidity, and typical building types also influence dryland urban heat island dynamics.
UHI’s have many negative effects and impacts on the natural environment and ecosystem services. In addition, UHI’s can also lead to heat related mortality (Anderson and Bell 2009), and exacerbate air quality issues (Akbari et al. 2001). Not all areas of a city are created equal when t comes to the intensity of urban heat islands. Thermal inequity exists between demographics (Mitchell and Chakraborty 2015). This oftentimes results in vulnerable population such as lower income, lower education levels , minority status and elderly facing higher temperatures and cooling costs with less resources to pay for it (Byrne et al. 2016; Ueijo et al. 2015; Gronland et al. 2015).
Little comparative information is available about dryland UHIs, especially considering nighttime as well as daytime effects. A better understanding of dryland city dynamics is important since many cities are considering urban greening strategies to reduce heating and improve human comfort for climate adaptation purposes. It is well known that green spaces such as lawns, parks, street tree canopies, green roofs, green facades, and rain gardens can provide cooling relief through evapotranspirative cooling as well as shade (Rchid 2012). However, water resources to maintain such green spaces are often minimal in dryland environments (Wang et al. 2016). Should extensively irrigated greenspaces be planted anyway for their cooling benefits? Will water-conserving xeriscaped landscapes produce similar effects? Can built form play a significant role in reducing UHIs? Understanding dryland UHI dynamics is important in order to be able to answer such questions.
This study analyzes how urban heat island effects vary across 10 dryland urban regions selected to represent a range of geographical environments worldwide. We correlate day and nighttime temperatures derived from satellite imagery with different land covers, built forms, and geographical factors. To assess the impact that certain built forms have on the surface temperature pattern within dryland cities, we selected six land covers--urban forest, irrigated turf and tree, xeriscape, hardscape, urban multistory and barren undeveloped rangeland--to see how temperature varies between land cover mean, regional urban mean, and surrounding territories. These methods, described further below, allow us to draw conclusions related to ways that vegetation, built form, and urban temperatures vary across a range of dryland urban regions, and potentially how urban heating can be mitigated through landscape planning. 2.2 Background
In urban regions, three layers of urban heat islands exist; the boundary, and canopy level urban heat island also known as the atmospheric urban heat island and measured in situ by weather stations, and the surface urban heat island temperatures of different surfaces (ie impervious, grass) and measured by remote sensing processes (Yuan and Bauer 2007). Urban heat islands are the net result of several physical processes which involve built form, materials, and vegetation within built up areas. These processes include the absorption of sunlight and re-radiation of heat by dark surfaces such as pavements and roofs; trees and buildings shading other surfaces which remain cooler; and evapotranspiration from plants, which cools the surrounding air. The configuration of land covers within the urban environment influences these dynamics (Zhou, Huang, and Cadenasso 2011; Song and Wang. 2015; Guhathakurta and Gober 2010; Middel et al. 2014). Starting in the 1970s researchers showed that urban impervious surfaces tend to produce higher ambient air and surface temperatures than surrounding natural surfaces (Oke 1973). In contrast green spaces have been found to produce lower ambient air and surface temperatures (Spronken-Smith and Oke 1998; Onishi et al. 2010; Chow et al. 2011). Temperature differences between natural and anthropogenic land covers can vary up to 5° C in adjacent sites and up to 9° C between urban core and rural areas far away from urban cores (Imoff et al. 2010).
CELA 2019 | UC Davis 326

Urban heat islands in most climates are especially prominent at night as urban surfaces experience a much slower nocturnal cooling rate than natural surfaces (Connors, Galletti, and Chow 2013). Seasonal impacts also play a role in the degree of intensity of an urban heat island. A study conducted on urban environments within the Pearl River Delta in China (Chen et al. 2006), found that the temperature difference between urban and non-urban areas varied by almost 1.5° C depending on the season. The urban spaces were nearly 2° C warmer than adjacent vegetative areas in summer, compared to only 0.34° warmer in spring. A study in the South African province of Ethekwini found that urban green spaces were much closer in temperature to densely built up areas during the leaf-off winter, compared to the three other seasons (Odindi, Bangamwabo, and Mutanga 2015).
The built landscape plays a role in the formation and intensity of urban heat islands (Bowler et al 2010; Balling and Brazel 1988). High-density urban parcels and an urban topography of buildings that create shade can lead to lower temperatures (Emmanuel and Fernando 2007; Norton et al. 2015). Light-colored roof and paving surfaces may potentially have a cooling effect as well. Street width, tree canopy level, and building height can all drive intensity and duration of UHIs (Coseo and Larsen et al. 2014). Nassar et al. (2016, 2017) found that increased building height, density, and shade are all correlated with lower urban temperatures in Dubai, although the reduced sky view associated with urban density also leads to greater heat retention at night.
In temperate latitudes the strong contrast in thermal performance between urban materials and surrounding rural vegetation produces UHIs for most cities. However, heat island dynamics for dryland cities are more complicated. Surrounding deserts with sparse xeric vegetation, grasses, and dry soils may heat up more rapidly than cities during daytime, leading to an “urban cool island” effect (Buyantuyev and Wu, 2010; 2010; Cao et al 2010; Du et al 2017). Deserts may then cool more rapidly at night, leading to an opposite UHI effect. Other factors come into play, including degrees of aridness, extent of vegetation, elevation, latitude, humidity, and typical building types (Heinl et al. 2015; Zhou et al. 2014). For example, arid cities with high humidity (perhaps because of proximity to an ocean) may cool relatively slowly (Sailor, 1998; Zhao et al. 2014). Conversely, [it could be hypothesized that] high elevation dryland cities may heat and cool rapidly because thin air and low humidity let heat radiate into space quickly (Ganbat 2013).
Urban heat islands for dryland cities have been researched less than those for temperate urban environments. The literature that does exist suggests a lack of daytime urban heat islands for dryland cities. Imhoff et al. (2010) found temperatures in urban areas of the Las Vegas, Phoenix, and Albuquerque metropolitan regions slightly cooler than in surrounding rural lands. García-Cueto et al. (2007) discovered that the city of Mexicali in Baja California behaved like a cool island in all seasons except autumn. Another study in Mexico City found that during the dry season the impact vegetation had was far stronger, up to 10° C compared to the wet season (Cui and De Foy 2012). Comparing humid, temperate Baltimore with arid Phoenix, Brazel et. al (2000) found a strong heat island for the former but a cool island for the latter. Lazzarinni et al. (2013) determined desert areas surrounding Abu Dhabi 5-8° K to be hotter in the daytime than the urban center. Haashemi et al. (2016) found average monthly daytime temperatures of bare soils outside Tehran up to 4° K hotter than those of the urban area, but average nighttime desert temperatures up to 4° K cooler. A study in Tabriz, Iran found that areas that went through urbanization over a time period experienced an average increase of 0.27° F (Amiri et al 2009).
Vegetated spaces in dryland regions are often aggregated along waterways (Kafafy 2010) or in irrigated parkland and golf courses. Residential areas only feature vegetation if consistently irrigated (Wu, Xiao, and McPherson 2008). Climate-adapted plant species are frequently slow-growing and highly specialized for specific locations. Without human intervention, vegetation in these arid communities may play a smaller role in mitigating temperatures than within temperate cities, where dense vegetation naturally grows within parks and private yards (Jenerette et al. 2013).
Water conservation is particularly important in times of climate change when arid regions may become even drier (Demuzere 2014). With limited irrigation potential in water-stressed urban regions, turf-and-tree landscapes which offer cooling potential from shading and evaporative cooling may be unsustainable (Yang and Wang 2017). In Phoenix private irrigation for landscapes accounts for nearly a third of the city's water use (Wang et al 2016). Xeric landscapes using native and/or drought tolerant species use less water, but may have less cooling effect since xeric species typically minimize evapotranspiration (Connors, Galletti, and Chow 2013). Akbari (1997) argues that xeriscaping can still
CELA 2019 | UC Davis 327

lead to significant cooling if the species chosen provide shade. However, many xeric trees have relatively thin canopies, and the world’s most arid regions have no large, native broadleaf trees. A detailed understanding of UHI dynamics in dryland cities and specific types of vegetation and built form that can mitigate heating effects is thus important for future efforts to improve human comfort and reduce cooling energy use in these communities.
3. METHODS
The methods comprises two level of analysis: the metropolitan and neighborhood scale. The objective of the metropolitan analysis was to determine the extent of UHI in each city and the neighborhood analysis was to determine the extent of contribution of each selected land cover type to the urban climate of each city. We selected 10 large global dryland cities that reflect a diversity of dryness, seasonality, urban growth, elevation, and built form. Over 80 dryland cities throughout the globe were considered initially. The selection and elimination process took into account the desire to have a diverse a sample as possible. For example Riyadh, Saudi Arabia and Mecca, Saudi Arabia were both similar in climate, and built practices to Dubai and may have given redundancy in our samples. Likewise Las Vegas, Nevada and Phoenix both had similar characteristics and thus only one was chosen. The climates of the cities include hyper-arid, arid, Mediterranean, monsoonal, and dry high-altitude, but all have an overall water deficit throughout the year and long annual periods with no rain. Eight are located in the northern hemisphere, and two in the southern. We defined urban boundaries for each metropolitan area using city boundaries from Open Street Map©. Around the resulting urban polygon we established a 20-kilometer-wide rural buffer for comparison purposes. To enhance uniformity, we removed water bodies, areas within 5 km of marine influences, and elevations exceeding 500 feet of the regional mean.
We acquired Landsat 8 OLI and ASTER data for daytime and nighttime hot-season dates for the 10 urban areas, and derived both LST and NDVI from these sources. The dates of the imagery were typical dry summer season images. For areas with monsoonal influences, images as close to the beginning of the monsoons were taken. At the urban metropolitan scale we then extracted the mean temperatures of the entire area, and the mean temperature of the upper and lower quintiles. We also extracted the mean temperature of the surrounding rural areas.The UHI for day and nighttime is the difference between urban metro mean and rural mean. For the NDVI and LST correlation analysis, we selected a stratified sample of 10,000 points for both the urban and rural polygon raster areas using ArcGIS tools. We extracted daytime and nighttime land surface temperature as well as NDVI values at these sample points, and tested the resulting values for correlation.
To analyze neighborhood-scale effects of different types of land cover within the 10 regions, we used Google Earth Engine to visually identify typical examples exceeding one square kilometer in size of six different land cover types (see Figure 1). These land covers were:
● urban multistory: urban neighborhoods with closely spaced buildings of three stories or more, able to cast substantial amounts of shade
● irrigated turf and tree: large areas of turfgrass with scattered trees (less than 25% tree canopy), including parks, golf courses, playing fields, and residential neighborhoods with sizable yards
● xeriscape: developed areas with sparse, native and/or drought-tolerant vegetation, typically also including substantial amounts of bare dirt
● hardscape: low-rise urban environments with extensive impermeable surfaces such as streets, parking lots, and rooftops
● urban forest: areas with dense tree canopies (>70%), typically found along waterways or in densely vegetated parks
● unbuilt: undeveloped land areas within or external to the urban area To assess spillover temperature effects, we also formed one-kilometer buffers around these built
landscape samples, and analyzed average temperature differences from both the six land cover types and surrounding buffer areas compared with the urban mean.
CELA 2019 | UC Davis 328
Figure 1: Six neighborhood scale land cover types
4. RESULTS 4.1 Metropolitan Scale
At the metropolitan scale, we found that only one of the ten regions (Mexico City) had average daytime surface temperatures substantially higher (>2º C) than the surrounding rural mean, in the
CELA 2019 | UC Davis 329
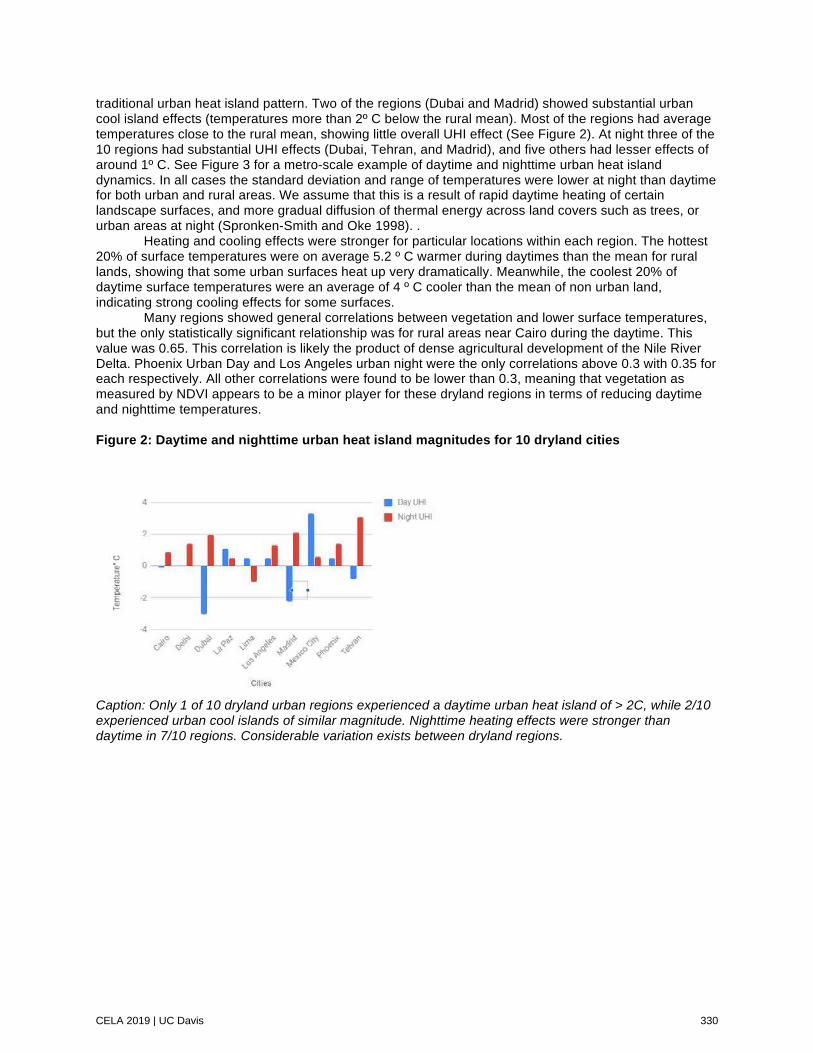
traditional urban heat island pattern. Two of the regions (Dubai and Madrid) showed substantial urban cool island effects (temperatures more than 2º C below the rural mean). Most of the regions had average temperatures close to the rural mean, showing little overall UHI effect (See Figure 2). At night three of the 10 regions had substantial UHI effects (Dubai, Tehran, and Madrid), and five others had lesser effects of around 1º C. See Figure 3 for a metro-scale example of daytime and nighttime urban heat island dynamics. In all cases the standard deviation and range of temperatures were lower at night than daytime for both urban and rural areas. We assume that this is a result of rapid daytime heating of certain landscape surfaces, and more gradual diffusion of thermal energy across land covers such as trees, or urban areas at night (Spronken-Smith and Oke 1998). .
Heating and cooling effects were stronger for particular locations within each region. The hottest 20% of surface temperatures were on average 5.2 º C warmer during daytimes than the mean for rural lands, showing that some urban surfaces heat up very dramatically. Meanwhile, the coolest 20% of daytime surface temperatures were an average of 4 º C cooler than the mean of non urban land, indicating strong cooling effects for some surfaces.
Many regions showed general correlations between vegetation and lower surface temperatures, but the only statistically significant relationship was for rural areas near Cairo during the daytime. This value was 0.65. This correlation is likely the product of dense agricultural development of the Nile River Delta. Phoenix Urban Day and Los Angeles urban night were the only correlations above 0.3 with 0.35 for each respectively. All other correlations were found to be lower than 0.3, meaning that vegetation as measured by NDVI appears to be a minor player for these dryland regions in terms of reducing daytime and nighttime temperatures.
Figure 2: Daytime and nighttime urban heat island magnitudes for 10 dryland cities
Caption: Only 1 of 10 dryland urban regions experienced a daytime urban heat island of > 2C, while 2/10 experienced urban cool islands of similar magnitude. Nighttime heating effects were stronger than daytime in 7/10 regions. Considerable variation exists between dryland regions.
CELA 2019 | UC Davis 330

Figure 3 about here: Sample daytime and nighttime urban heat island maps (Madrid)
Caption: Thinly vegetated dry land outside Madrid warms up more strongly during the day than urban landscapes. At night the latter strongly retain heat.
The literature discussed previously indicates that the considerable variation in thermal effects that we observed in these 10 dryland regions can most likely be explained by factors such as degree of aridity, extent of vegetation, elevation, humidity, latitude, and typical building types. However, interactions between these factors are likely complex. At a metro scale it is difficult to identify individual variables responsible for these differences. As Table 4 below shows, no single factor stands out strongly. Those regions with the strongest daytime or nighttime UHIs (Mexico City, Madrid, Dubai, and Tehran) have markedly different climates, elevations, densities, and average humidities. The same holds true for cities with the strongest urban cool islands.
Table 1: Ten Dryland Urban Regions Compared
Urban Region
Climate (koppen)
Prec. (mm)
Elev. (m)
Pop. (mil)
Pop. Density (per/km2)
Ave. hottest month humid.
Ave. daytime temp diff urban/ rural
Ave. nighttime temp diff urban/rural
Cairo Hot Desert (BWh)
24.7 25 20.4 38,636 58% -0.1ºC 0.9ºC
Delhi Warm Steppe (BSh)
800 230 26.5 17,857 33% 0.0 1.4
Dubai Hot Desert (BWh)
201 10 5.6 1,363 56% -3.0 2.0
La Paz Subtropical Highland (CWc)
564 3,640 2.7 5,720 43% 1.1 0.5
Lima Mild Desert 16 0- 12.1 15,125 85% 0.5 -1.0
CELA 2019 | UC Davis 331

(BWn) 1,550
Los Angeles
Mediterranean (Csb)
384 80 18.7 14,363 73% 0.5 1.3
Madrid Mediterranean (Csa)
436 730 6.7 11,093 35% -2.2 2.1
Mexico City
Subtropical Highland (Cwb)
820 2,450 20.9 14,074 43% 3.3 0.6
Phoenix Hot Desert (BWH)
200 300 4.7 3,500 32% 0.5 1.4
Tehran Cool Semiarid (BSK)
220 1,650 8.7 11,918 31% -0.8 3.1
Gray = Temperature differences over 2ºC Caption: Ten cities used in global urban heat island analysis 4.2 Neighborhood Scale
At the neighborhood scale, different types of land cover appear to vary strongly in surface temperature compared to the mean for these dryland urban regions. Our sample urban forest land covers produced the greatest daytime temperature reduction, an average decrease of 5.6º C. In Phoenix, Arizona, the urban forest sample was 16.5º C cooler than the metro mean during daytime. A surrounding one-kilometer buffer area around each urban forest sample also experienced spillover cooling effects, with an average temperature reduction of 1.7º C. These cooling effects of urban forest land covers relative to the regional mean disappeared at night.
Our irrigated turf and tree sample land covers also produced daytime cooling effects in all cities, an average temperature reduction of 2.0º C from the mean. The spillover cooling impact was weaker than for urban forests, and nighttime temperature differences from the urban mean were negligible.
Urban multistory land cover samples were cooler than the daytime mean in 7 of the 10 metro regions, with an average temperature reduction of 1.0º C. The strongest cooling effects were found in Dubai, Cairo, and Lima. Cooling effects disappeared for multistory samples in most regions at night. For Dubai and La Paz, urban multistory samples had substantially warmer nighttime temperatures than the urban average. However, these may have risen for contextual reasons: Dubai’s downtown is relatively near of the Persian Gulf, which likely moderates temperatures, and La Paz is at very high elevation, which likely leads to very rapid cooling of unbuilt areas and a low mean regional nighttime temperature.
Xeriscape/Bare Soil land cover samples were generally warmer than the average daytime metro temperature--an average of 1.8º C. In five of the 10 regions, the sample of this land cover type was more than 2.4º C above the metro mean. However, there were few spillover effects on surrounding areas. At night the xeriscape/bare soil samples showed no distinct pattern of difference from regional average temperatures.
Samples of unbuilt areas within the metro regions were typically warmer than the mean for these 10 dryland urban areas--an average of 1.4º C. At night these samples were cooler than the metro mean--an average of 0.5º C. These findings are to be expected, as these samples mirror rural arid landscapes with rapid daytime heating and nighttime cooling. We found the unbuilt sample for Mexico City to be much cooler than in the other regions during the daytime, which may be due to more extensive vegetation or topography.
CELA 2019 | UC Davis 332

Table 2: Daytime urban forest surface temperature compared to metro mean Region Metro mean
temp. Urban forest vs. mean
<1 km from veg. vs. mean
Cairo 38.8°C -5.5° -0.6° Delhi 38.4° -1.8° -2.0° Dubai 46.4° -5.2° 0° La Paz 32.0° -3.6° -1.3° Lima 26.8° -2.4° -1.9° Los Angeles 37.1° -4.2° -0.9° Madrid 39.5° -6.0° -0.2° Mexico City 32.3° -3.6° +0.5° Phoenix 44.3° -16.5° -8.7° Tehran 39.8° -7.0° -2.2° AVERAGE 37.5° -5.6° -1.7° Caption: Urban forests are > 2C cooler (dark gray) than the urban average for 9/10 dryland regions studied, with cooling extending 1km beyond borders of vegetated space in some cities. Table 3: Nighttime urban forest temperature compared to metro mean Region Metro mean
temp. Urban forest vs. mean
< 1 km from veg. vs. mean
Cairo 26.5° C -0.8° -0.5° Delhi 25.6° -0.6° 0.5° Dubai 26.2° -0.7° -1.9° La Paz 3.0° 1.0° 0.8° Lima 14.6° 0.1° 0.1° Los Angeles 17.7° -0.7° 0.8° Madrid 23.4° 1.4° 1.5° Mexico City 16.9° 1.4° 1.8° Phoenix 25.8° -0.1° -0.6° Tehran 22.6° 0.2° 0.1° AVERAGE 20.2° 0.1° 0.3° Caption: Nighttime urban forest temperatures were little different than the urban mean. Table 4: Temperatures by Land Surface Type within Dryland Urban Regions (Daytime) Region Metro
mean temp.
Urban Forest vs. mean
Irrigated turf & tree vs. mean
Urban multistory vs. mean
Hard- scape vs. mean
Xeriscape/dirt vs. mean
Unbuilt vs. mean
Rural
Cairo 38.8°C -5.5° -3.3°C -3.0° 1.4° -0.1° 0° 38.9° Delhi 38.4° -1.8° -2.4° -0.6° 2.2° 0.2 0.8° 38.4° Dubai 46.4° -5.2° -3.6° -4.3° 3.0° 0.4° 2.0° 49.4° La Paz 32° -3.6° 4.2° -0.4° 1.4° 4.2° 0.5° 30.9° Lima 26.8° -2.4° -2.9° -2.3° -0.2° -0.3° 1.3° 26.3° L.A. 37.1° -4.2° -3.6° -0.5° -2.1° 2.4° 0.3° 36.6° Madrid 39.5° -6.0° -3.4° 0.7° -0.2° 2.7° 2.6° 41.7° Mexico City
32.3° -3.6° -1.9° -0.4° 0.6° 2.9° -4.3° 28.9°
Phoenix 44.3° -16.5° -0.5° 2.9° 1.5° 2.9° 5.0° 43.8° Tehran 39.8° -7.0° -4.9° -1.9° 2.4° 1.6° 5.6° 40.6° AVERAGE 37.5° -5.6° -2.2° -1.0 1.0° 1.8° 1.4°
CELA 2019 | UC Davis 333

Caption: Urban forests, many irrigated turf & tree landscapes, and some multistory built landscapes are more than 2 C cooler (light gray) than the mean during daytime for the sampled land covers. Hardscaped, xeriscaped, and unbuilt landscapes are often substantially hotter (dark gray) than the mean. Table 5: Temperatures by Land Surface Type within Dryland Urban Regions (Nighttime) Region Metro
mean temp.
Urban Forest vs. mean
Irrigated turf & tree vs. mean
Urban multistory vs. mean
Hard- scape vs. mean
Xeriscape/dirt vs. mean
Unbuilt vs. mean
Rural
Cairo 26.5° C
-0.8° 0.5° 1.2 1.4° 0.3° -0.2° 25.6°
Delhi 25.6° -0.6° 0.5° 2.1° 2.2° 2.0° -1.1° 24.2° Dubai 26.2° -0.7° -0.2° 3.5° 3.0° -0.3° -2.2° 24.2° La Paz 3.0° 1.0° -0.1° 4.0° 1.4° -0.6° 3.8° 2.5° Lima 14.6° 0.1° -0.2° 0° -0.2° -0.3° -0.1° 15.6° Los Angeles
17.7° -0.7° -0.4° 0.8° -2.1° -0.3° -0.6° 16.4°
Madrid 23.4° 1.4° -1.5° 1.5° -0.2° -0.4° -3.4° 21.3° Mexico City
16.9° 1.4° 0.7° 1.1° 0.6° 0.8° 0.1 16.3°
Phoenix 25.8° -0.1° -0.1 -1.8° 1.5° -0.8° 1.0° 24.4° Tehran 22.6° 0.2° 1.2° -0.4° 2.4° 1.4° -2.7° 19.5° AVERAGE 20.2° 0.1° 0.0° 1.2° 1.0° 0.2° -0.5 Caption: Differences are not as pronounced at night. In some regions urban buildings and pavement retain substantial heat at night (dark gray). Although frequently hotter during the day in arid regions, unbuilt lands are often cooler at night (light gray) than the regional mean temperature. 5. DISCUSSION
Our analysis confirms that dryland urban regions have substantially different urban heat island dynamics than temperate regions. Daytime urban cooling compared to surrounding rural landscapes is likely, given the rapid heating characteristics of undeveloped, lightly vegetated arid terrain. But cooling is far from universal. Nighttime urban heat islands are likely, since rural arid landscapes cool more rapidly than urban ones. In terms of human impact, nighttime heating is particularly a concern for disadvantaged individuals whose homes may not have access to air conditioning, and who may thus be exposed to high temperatures for long continuous periods. Climate justice strategies to alleviate this impact potentially include initiating low-income home insulation and HVAC retrofit programs, and making 24-hour cool shelters available for elderly, ill, or otherwise disadvantaged individuals.
On a regional basis, the dryland metro areas studied here show relatively small cooling effects from vegetated green spaces. However, the overall amounts of vegetation (especially tree canopy) are low in most of these arid regions, and it is possible that with higher levels of vegetation greater correlations would be found. When we examined sample neighborhood-scale patches of urban forest, we found relatively large cooling effects. One implication is that ambitious region wide urban forestry programs might indeed help cool metro areas during daytimes. However, such urban forestry programs would have to take water consumption for irrigation into account. Potentially, low-water tree species could be found that would yield significant cooling when planted citywide without unsustainable water consumption. More investigation into low-water, shade-producing planting palettes as well as optimal configuration of green spaces for cooling would be desirable.
The sample irrigated turf & tree landscapes we examined had somewhat smaller but still sizable reductions in daytime surface temperature compared to metro means. Again, use of this landscape strategy will need to be balanced with water consumption. Turfgrass landscapes and water-intensive broadleaf trees are also known to increase local humidity. Such humidity can have multiple effects,
CELA 2019 | UC Davis 334

cooling the local landscape but also trapping heat at night. More research could help determine the exact mix of effects.
Xeriscaped landscapes showed little ability to cool urban regions, and the samples we examined were in fact hotter than the daytime metro mean in most regions. Although these landscapes may be desirable for other reasons such as habitat value, aesthetic value, and water conservation, they will probably not be able to help reduce urban heat islands.
Shade-producing built form shows potential to reduce daytime urban heating while improving micro-scale human comfort by providing shaded walkways, sidewalks, and courtyards. The samples of this land cover that we examined were 1° C cooler than metro means, even though their building types and surface materials were usually conventional in nature. Architects, urban designers, and engineers seeking to maximize the shade cast by structures as well as light-colored roof and paving materials might be able to achieve stronger daytime cooling effects from urban multistory development.
Our study does have a number of limitations that should be mentioned. The spatial resolution of Landsat and ASTER thermal imagery is relatively coarse, yielding 900 m2 pixels. Unfortunately higher spatial resolution for a macroscale metro regional analysis is not available for thermal imagery. Also, although we attempted to remove noise in the data caused by water bodies, elevation changes, proximity to coasts, and the like, we were not able to do this completely. Even removing a 5 km buffer next to shorelines from analysis in places such as Dubai, Lima, and Los Angeles, urban temperatures were undoubtedly influenced to some extent by nearby oceans.
Within the neighborhood-scale analysis some challenges arose with consistencies between on-the-ground practices across the ten metro regions. Xeriscape landscape design, for example, is not an active practice in many of the cities. For those lacking good examples, we chose neighborhoods with a mix of low-water vegetation and bare soil that seemed likely to be closest in performance to xeriscape. The La Paz and Lima regions are lacking in urban forests, and for the urban forest analysis we by necessity chose vegetated riparian canyons on the urban periphery. Shade-producing multistory built form is more common in Mediterranean cities, where narrow streets, arcades, courtyards, and related urban form elements have been used for millennia to enhance thermal comfort. Multistory buildings in Phoenix, by contrast, tend to stand alone among wider streets and extensive surface parking, and so are unlikely to produce the same cooling effect.
6. CONCLUSION In the era of anthropogenic climate change, keeping cities cool is a growing priority for human health, energy conservation, and greenhouse gas (GHG) mitigation reasons. (Higher cooling energy use is likely to lead to higher GHG emissions.) Arid urban regions face different challenges than cities in temperate climates. This study confirms the absence of daytime urban heat islands for many dryland cities, and, conversely, their strong presence at night. Our findings also suggest limited correlations between vegetation and cooling for dryland cities at the metropolitan scale, but stronger correlations tree canopy and cooler temperatures at the neighborhood scale. Based on our results it appears that within dryland regions with overall water resource deficit, it may be advantageous to focus mitigation efforts on the neighborhood scale versus an entire metropolitan area. We found lesser correlations between turf-and-tree and urban multistory landscapes and urban cooling. Meanwhile, xeriscape land covers do not appear to have substantial cooling benefit. A main takeaway is that a mix of drought-tolerant urban forestry and shade-maximizing multistory built form may be the most effective and sustainable way to cool arid cities, given water limitations. Additional studies of other dryland urban regions, along with more detailed study of shade-maximizing built forms and low-water urban forest species, can shed further light on potential cooling strategies. 7. REFERENCES Akbari, H., Pomerantz, M., & Taha, H. (2001). Cool surfaces and shade trees to reduce energy use and
improve air quality in urban areas. Solar Energy, 70(3), 295-310. Akbari, H. 2009. Cooling our communities. A guidebook on tree planting and light-colored surfacing.
Lawrence Berkeley National Laboratory.
CELA 2019 | UC Davis 335

Amiri, R., Q. Weng, A. Alimohammadi, and S. K. Alavipanah. 2009. Spatial–temporal dynamics of land surface temperature in relation to fractional vegetation cover and land use/cover in the Tabriz urban area, Iran. Remote Sensing of Environment 113 (12), 2606-2617.
Anderson, B. G., and M. L. Bell. 2009. Weather-related mortality: how heat, cold, and heat waves affect mortality in the United States. Epidemiology (Cambridge, Mass.) 20 (2): 205.
Balling Jr, R. C., and S. W. Brazel. 1988. High-resolution surface temperature patterns in a complex urban terrain. Photogram. Eng. Remote Sens. 54 (9), 1289-1293.
Bowler, D. E., Buyung-Ali, L., Knight, T. M., & Pullin, A. S. (2010). Urban greening to cool towns and cities: A systematic review of the empirical evidence. Landscape and urban planning, 97(3), 147-155.
Buyantuyev, A., and J. Wu. 2010. Urban heat islands and landscape heterogeneity: linking spatiotemporal variations in surface temperatures to land-cover and socioeconomic patterns. Landscape ecology 25 (1), 17-33.
Byrne, J., Ambrey, C., Portanger, C., Lo, A., Matthews, T., Baker, D., & Davison, A. (2016). Could urban greening mitigate suburban thermal inequity?: the role of residents’ dispositions and household practices. Environmental Research Letters, 11(9), 095014.
Cao, X., A. Onishi, J. Chen, and H. Imura. 2010. Quantifying the cool island intensity of urban parks using ASTER and IKONOS data. Landscape and Urban Planning 96 (4): 224-231
Chen, X.-L., H.-M. Zhao, P.-X. Li, and Z.-Y. Yin. 2006. Remote sensing image-based analysis of the relationship between urban heat island and land use/cover changes. Remote Sensing of Environment 104 (2), 133-146.
Coseo, P., & Larsen, L. (2014). How factors of land use/land cover, building configuration, and adjacent heat sources and sinks explain Urban Heat Islands in Chicago. Landscape and Urban Planning, 125, 117-129.
Connors, J. P., C. S. Galletti, and W. T. Chow. 2013. Landscape configuration and urban heat island effects: assessing the relationship between landscape characteristics and land surface temperature in Phoenix, Arizona. Landscape ecology 28 (2): 271-283.
Cui, Y. Y., and B. De Foy. 2012. Seasonal variations of the urban heat island at the surface and the near-surface and reductions due to urban vegetation in Mexico City. Journal of Applied Meteorology and Climatology 51 (5): 855-868.
Demuzere, M., Orru, K., Heidrich, O., Olazabal, E., Geneletti, D., Orru, H…, & Faehnle, M. (2014). Mitigating and adapting to climate change: Multi-functional and multi-scale assessment of green urban infrastructure. Journal of Environmental Management, 146, 107-115.
Du, H., Cai, W., Xu, Y., Wang, Z., Wang, Y., & Cai, Y. (2017). Quantifying the cool island effects of urban green spaces using remote sensing data. Urban Forestry & Urban Greening, 27, 24-31.
Emmanuel, R., and H. Fernando. 2007. Urban heat islands in humid and arid climates: role of urban form and thermal properties in Colombo, Sri Lanka and Phoenix, USA. Climate Research 34 (3): 241.
Ferwati, S., Skelhorn, C., Shandas, V., Voelkel, J., Shawish, A., & Ghanim, M. (2018). Analysis of urban heat in a corridor environment–The case of Doha, Qatar. Urban climate, 24, 692-702.
Ganbat, G., Han, J. Y., Ryu, Y. H., & Baik, J. J. (2013). Characteristics of the urban heat island in a high-altitude metropolitan city, Ulaanbaatar, Mongolia. Asia-Pacific Journal of Atmospheric Sciences, 49(4), 535-541.
Gronlund, C. J., Berrocal, V. J., White-Newsome, J. L., Conlon, K. C., & O’Neill, M. S. (2015). Vulnerability to extreme heat by socio-demographic characteristics and area green space among the elderly in Michigan, 1990–2007. Environmental research, 136, 449-461.
Haashemi, S., Weng, Q., Darvishi, A., & Alavipanah, S. K. (2016). Seasonal variations of the surface urban heat island in a semi-arid city. Remote Sensing, 8(4), 352.
Heinl, M., Hammerle, A., Tappeiner, U., & Leitinger, G. (2015). Determinants of urban–rural land surface temperature differences–A landscape scale perspective. Landscape and Urban Planning, 134, 33-42.
Huang G, Zhou W, Cadenasso ML (2011) Is everyone hot in the city? spatial pattern of land surface temperatures, land cover and neighborhood socioeconomic characteristics in Baltimore City, MD. J Environ Manag 92(7), 1753–1759
CELA 2019 | UC Davis 336

Huang, G., & Cadenasso, M. L. (2016). People, landscape, and urban heat island: dynamics among neighborhood social conditions, land cover and surface temperatures. Landscape ecology, 31(10), 2507-2515.
Imhoff, M. L., Zhang, P., Wolfe, R. E., & Bounoua, L. (2010). Remote sensing of the urban heat island effect across biomes in the continental USA. Remote sensing of environment, 114(3), 504-513.
Jenerette, G. D., Miller, G., Buyantuev, A., Pataki, D. E., Gillespie, T. W., & Pincetl, S. (2013). Urban vegetation and income segregation in drylands: a synthesis of seven metropolitan regions in the southwestern United States. Environmental Research Letters, 8(4), 044001.
Kafafy, N. A. A. (2010). Dynamics of urban green space in an arid city: The case of Cairo-Egypt. Cardiff University (United Kingdom).
Lazzarini, M., Marpu, P. R., & Ghedira, H. (2013). Temperature-land cover interactions: The inversion of urban heat island phenomenon in desert city areas. Remote Sensing of Environment, 130, 136-152.
Middel, A., Häb, K., Brazel, A. J., Martin, C. A., & Guhathakurta, S. (2014). Impact of urban form and design on mid-afternoon microclimate in Phoenix Local Climate Zones. Landscape and Urban Planning, 122, 16-28.
Mitchell, B. C., & Chakraborty, J. (2015). Landscapes of thermal inequity: disproportionate exposure to urban heat in the three largest US cities. Environmental Research Letters, 10(11), 115005.
Nassar, A. K., Blackburn, G. A., & Whyatt, J. D. (2016). Dynamics and controls of urban heat sink and island phenomena in a desert city: Development of a local climate zone scheme using remotely-sensed inputs. International journal of applied earth observation and geoinformation, 51, 76-90.
Nassar, A. K., Blackburn, G. A., & Whyatt, J. D. (2017). What controls the magnitude of the daytime heat sink in a desert city?. Applied geography, 80, 1-14.
Norton, B. A., Coutts, A. M., Livesley, S. J., Harris, R. J., Hunter, A. M., & Williams, N. S. (2015). Planning for cooler cities: A framework to prioritise green infrastructure to mitigate high temperatures in urban landscapes. Landscape and Urban Planning, 134, 127-138.
Odindi, J. O., Bangamwabo, V., & Mutanga, O. (2015). Assessing theValue ofUrbanGreen Spaces inMitigatingMulti-SeasonalUrban Heat usingMODISLand Surface Temperature (LST) and Landsat 8 data. International Journal of Environmental Research, 9(1), 9-18.
Oke, Tim R. "City size and the urban heat island." Atmospheric Environment (1967) 7.8 (1973): 769-779. Onishi, A., Cao, X., Ito, T., Shi, F., & Imura, H. (2010). Evaluating the potential for urban heat-island
mitigation by greening parking lots. Urban forestry & Urban greening, 9(4), 323-332. Rasul, A., Balzter, H., & Smith, C. (2015). Spatial variation of the daytime surface urban cool island during
the dry season in Erbil, Iraqi Kurdistan, from Landsat 8. Urban climate, 14, 176-186. Sailor, D. J. (1998). Simulations of annual degree day impacts of urban vegetative augmentation.
Atmospheric Environment, 32(1), 43-52. Uejio, C. K., Wilhelmi, O. V., Golden, J. S., Mills, D. M., Gulino, S. P., & Samenow, J. P. (2011). Intra-
urban societal vulnerability to extreme heat: the role of heat exposure and the built environment, socioeconomics, and neighborhood stability. Health & Place, 17(2), 498-507.
Salisbury, J. W., & D'Aria, D. M. (1992). Emissivity of terrestrial materials in the 8–14 µm atmospheric window. Remote sensing of Environment, 42(2), 83-106.
Schatz, J., & Kucharik, C. J. (2014). Seasonality of the urban heat island effect in Madison, Wisconsin. Journal of Applied Meteorology and Climatology, 53(10), 2371-2386.
Shashua‐Bar, L., Pearlmutter, D., & Erell, E. (2011). The influence of trees and grass on outdoor thermal comfort in a hot‐arid environment. International Journal of Climatology, 31(10), 1498-1506.
Song, J., & Wang, Z. H. (2015). Impacts of mesic and xeric urban vegetation on outdoor thermal comfort and microclimate in Phoenix, AZ. Building and Environment, 94, 558-568.
Spronken-Smith, R. A., & Oke, T. R. (1998). The thermal regime of urban parks in two cities with different summer climates. International journal of remote sensing, 19(11), 2085-2104.
Stabler, L. B., Martin, C. A., & Brazel, A. J. (2005). Microclimates in a desert city were related to land use and vegetation index. Urban Forestry & Urban Greening, 3(3-4), 137-147.
Wang, Z. H., Zhao, X., Yang, J., & Song, J. (2016). Cooling and energy saving potentials of shade trees and urban lawns in a desert city. Applied Energy, 161, 437-444.
CELA 2019 | UC Davis 337

Wu, C., Xiao, Q., & McPherson, E. G. (2008). A method for locating potential tree-planting sites in urban areas: A case study of Los Angeles, USA. Urban Forestry & Urban Greening, 7(2), 65-76.
Yang, J., & Wang, Z. H. (2017). Planning for a sustainable desert city: The potential water buffering capacity of urban green infrastructure. Landscape and Urban Planning, 167, 339-347.
Yuan, F., & Bauer, M. E. (2007). Comparison of impervious surface area and normalized difference vegetation index as indicators of surface urban heat island effects in Landsat imagery. Remote Sensing of environment, 106(3), 375-386.
Zhang, Y., Murray, A. T., & Turner, B. L. (2017). Optimizing green space locations to reduce daytime and nighttime urban heat island effects in Phoenix, Arizona. Landscape and Urban Planning, 165, 162-171.
Zhao, L., Lee, X., Smith, R.B., & Oleson, K. (2014). Strong contributions of local background climate to urban heat islands. Nature. 511, 216-219.
Zhou, D., Zhao, S., Liu, S., Zhang, L., & Zhu, C. (2014). Surface urban heat island in China's 32 major cities: Spatial patterns and drivers. Remote Sensing of Environment, 152, 51-61.
CELA 2019 | UC Davis 338

The authors are solely responsible for the content of this technical presentation. The technical presentation does not necessarily reflect the official position of the Council of Educators in Landscape Architecture (CELA), and its printing and distribution does not constitute an endorsement of views which may be expressed. Citation of this work should state that it is from a CELA conference paper. EXAMPLE: Author's Last Name, Initials. 2019. Title of Paper. Sacramento, CA: CELA. For information about securing permission to reprint or reproduce this paper, please contact CELA at [email protected]
DESIGNING A SUSTAINABLE CONSTRUCTED WETLAND TO TREAT WASTEWATER FOR THE CITY OF JULIAETTA, IDAHO
TOMPKINS, ALISON University of Idaho Landscape Architecture Graduate Program Nez Perce County Planner and Floodplain Coordinator [email protected] AUSTIN, GARY University of Idaho Professor of Landscape Architecture [email protected] 1 ABSTRACT
Small communities have a small tax base, limited funding, limited staffing, and must meet federal and state requirements for wastewater treatment. Many small communities in the United States are now facing the difficulty of how to replace aging rural infrastructure like wastewater treatment systems with limited resources. This is compounded by increasingly stringent water quality standards for treated effluent. Literature reveals that constructed wetlands have been used around the world to treat wastewater, even in cold climates. Case studies demonstrate that constructed wetlands provide a cost-effective solution for wastewater treatment that can be applied to small communities in cold climates. Constructed wetlands can remove nutrients and solids from wastewater and provide sustainable benefits that traditional engineered systems cannot, such as wildlife habitat, energy savings, irrigation water, and recreation area. Design and construction methods are presented for a constructed wetland to treat wastewater from the City of Juliaetta (population 609) in northern Idaho. The system must meet federal and state discharge permit requirements and water quality standards, be maintained by two staff employed by the city, be affordable to construct and maintain, and be sustained by the community for the lifetime of the system. The treatment wetland provides secondary benefits including wildlife habitat, irrigation water, and recreation area. Cost, effectiveness, and benefits of a wastewater treatment wetland are compared to traditional systems to demonstrate the value and feasibility of wetland systems. Constructed wetlands, as a built and natural environment, provide the opportunity to apply stewardship, planning, and design to treat wastewater.
1.1 Keywords
Cold climate, constructed wetland, rural infrastructure, wastewater treatment
CELA 2019 | UC Davis 339

2 INTRODUCTION
Small communities across the United States have aging wastewater infrastructure that can no longer meet federal or state water quality standards. Replacement of wastewater treatment infrastructure is costly and project costs can run in the millions of dollars. Small towns do not have a large tax base to support infrastructure costs or multimillion-dollar levies to upgrade or replace a wastewater treatment system. Most cities (large and small) rely on grant money and/or federal loans together with a local match to fund replacement or renovation of wastewater treatment systems. Small communities also face other difficulties like staffing, and often only have one or two staff members to operate and maintain the wastewater system at all times. It can be difficult for small towns and cities to attract and retain staff with the skills, experience, and/or certifications to run and maintain a wastewater treatment system, so they often rely on on-the-job training. The purpose of this project is to address the need of these small communities to replace aging wastewater treatment systems with the limited funding and staff that is typical of small towns. Constructed wetlands have successfully been used all over the world to treat wastewater, even in cold climates like the Pacific Northwest, but they still are not common in the United States and none exist in Idaho. When properly constructed, wetlands can effectively remove excess nutrients and solids from wastewater. Furthermore, constructed wetlands can contribute ancillary benefits that traditional engineered systems cannot, such as recreation area, aesthetic appeal, and habitat for wildlife.
2.1 Juliaetta, Idaho
The City of Juliaetta, Idaho, is a small town with a population of 609 in 2018 that has remained stable for more than 20 years (City-Data.com, 2018; US EPA, 2018a). For the purpose of planning for future growth and ensuring functional capacity over the lifetime of the treatment system, population growth was projected for 20 years at a modest growth rate of two percent/year, yielding a population projection of 905 in 2038. The climate in Juliaetta is temperate with an average temperature of 28˚ Fahrenheit (F) in winter and 88˚ F in summer. It is located 1155 feet above sea level (City-Data.com, 2018). Winter is generally wet with occasional snow accumulation. The average annual precipitation in Juliaetta is 18 inches per year (Sperling’s Best Places, n.d.), most of which occurs from fall to spring. This results in high peak flows of the Potlatch River in early spring and extremely low flows in late summer (Idaho Department of Environmental Quality, 2008). The U.S. Department of Agriculture (USDA) cold hardiness zone is 7a (PlantMaps, 2018) and the American Horticultural Society (AHS) heat zone is 3 (PlantMaps, n.d.).
Juliaetta utilizes a centralized wastewater treatment system that was completed in 1977 and still uses much of the original equipment from that time. Replacement parts for a system this age are becoming more difficult to obtain and based upon current performance levels it is unlikely that it will be able to meet 2018 discharge permit requirements (Keller Associates Inc., 2018). The system receives wastewater from 590 connections consisting of residential and light commercial uses and is operated and maintained by a staff of two system operators-in-training. It is located at the southern (downstream) end of town and discharges treated effluent to a wetland basin adjacent to the Potlatch River under a National Pollutant Discharge Elimination System (NPDES) permit that was approved in 2018 (US EPA, 2018b).
2.2 Site Characteristics and Analysis
The Potlach River watershed encompasses approximately 380,400 acres (594 square miles) and drains into the Clearwater River. Land uses within the watershed include forestry, livestock, agriculture, rural residential, commercial, and industrial areas, and undeveloped hillsides (Idaho Department of Environmental Quality, 2008). Designated beneficial uses of the Potlatch River include cold water aquatic life, salmonid spawning, primary contact recreation, and domestic water supply (Idaho Department of Environmental Quality, 2008). Pollutants identified in the 2008 Potlatch Watershed Total Maximum Daily Load (TMDL) report for the portion of the watershed from Big Bear Creek (at Kendrick) to the mouth at the confluence with the Clearwater River include bacteria, dissolved oxygen, ammonia, nutrients, oil and grease, organics, pesticides, sediment, and temperature. Salmon species, especially Chinook salmon, are prone to disease, injury and stress when water temperatures exceed 60°F. This was illustrated in July 2015 when water temperatures in the Willamette River, in Oregon rose above 70˚F and caused the death
CELA 2019 | UC Davis 340

of hundreds of fish (Friesen, 2015). The Environmental Protection Agency (EPA) has determined that Juliaetta cannot currently meet water temperature limits (<21.3 °C/70.34˚F) based on the updated 2018 Draft Potlatch River TMDL and has proposed a 13-year compliance schedule in the 2018 NPDES permit (US EPA, 2018a). Effluent temperature standards pose a significant challenge during summer months, when low flows of the Potlatch River can drop below 2 cubic feet per second. The previous NPDES permit did not include standards for water temperature, and this is a significant change with substantial design implications for the treatment system (US EPA, 2018a).
The existing wastewater treatment plant is located between State Highway 3 and the Potlatch River, which run parallel to one another in a north-south direction. The Juliaetta Volunteer Fire Station is located nearby, on the north side of a large gravel parking area that is more than adequate for current parking needs and materials storage. The treatment plant is adjacent to the 100-year floodplain of the Potlatch River according to the Federal Emergency Management Agency’s (FEMA) Flood Insurance Rate Map (FIRM). In order to minimize flood risk to Juliaetta’s wastewater treatment infrastructure and avoid unnecessary costs, property below the base flood elevation will not be considered for the constructed wetland (CW). Soil of the site is characterized as aquic xerofluvents of 0-3% slopes (USDA Natural Resources Conservation Service, n.d.) with a frost depth of 24 inches. This soil type occurs in floodplains and stream terraces and consists of gravelly loam from 0-7 inches, with stratified sand to very cobbly sandy loam from 7-60 inches deep. It is prone to flooding and depth to the water table is approximately 18-24 inches (USDA Natural Resources Conservation Service, n.d.), indicating that a wetland liner will be necessary to prevent untreated wastewater from leaching or mixing with groundwater.
The region is experiencing a growing wine industry with the approval of the Lewis-Clark Valley American Viticultural Area in recent years. Hillsides downriver from Juliaetta are now flourishing with vineyards which require irrigation during summer months, for which surface water is drawn from the Potlatch River. If vineyards are established nearer to Juliaetta, reuse of partially treated wastewater for vineyard irrigation may become an advantageous undertaking, as the water still retains plant available nitrogen. This would reduce the demand for surface water from the Potlatch River, which in turn preserves higher stream flows and helps maintain lower water temperature for endangered salmonid species. A city park and ballfields are located nearby but upstream of the existing wastewater treatment facility, with an additional gravel parking/equipment storage lot located in between. Reuse of treated effluent to irrigate the park would certainly be beneficial, but may not justify the cost of pumping the water uphill from the treatment facility. The park is connected to the wastewater treatment site by an abandoned railroad bed running parallel to State Highway 3, though paving stops short of connecting the two sites. The railroad bed presents an opportunity to extend recreational use south of the city park and ballfields.
Property lines were reviewed using property information available online through the Latah County Assessor’s Office (Latah County GIS, n.d.). It appears that the wastewater outfall is not actually owned by the City of Juliaetta, but due to variable accuracy of aerial imagery a survey is necessary to precisely locate property lines. Aerial imagery shows that the parcel in which the outfall lies consists of approximately 5.6 acres under ownership of a local business, Browning Cutstock. In a telephone interview with the Assessor’s Office, property such as this is valued for tax purposes at $300-1000/acre; probably nearer the lower value due to its location near/in a floodplain and without an approach to State Highway 3 for access. Based upon this information, the property may have an assessed value of $1680-$5,600. Since the property is not used by Browning Cutstock for regular business operations, it would be beneficial for Juliaetta to explore a mutually beneficial land acquisition in which Juliaetta owns and controls the existing wastewater outfall, infiltration channel, and adjacent area for future needs, and Browning Cutstock reduces its taxable landholdings without any negative impact to current operations.
3 METHODS 3.1 Literature Review
An assessment of recent (last 10 years) literature about constructed wetlands for wastewater treatment reveals five primary topics of study: 1) Types and general function, 2) Aeration, hydraulic loading rate (HLR) and hydraulic retention time (HRT), 3) Plants, 4) Substrate, and 5) Temperature. In addition to researching scientific literature, federal, state, and local government sources were reviewed to evaluate regulatory standards, permitting, and funding options available to rural communities like Juliaetta.
CELA 2019 | UC Davis 341

CW are treatment systems that use natural processes involving wetland vegetation, filter media, and their associated microbial assemblages to improve water quality (US EPA, n.d.). CW have become a popular method of wastewater treatment for small communities and remote locations around the world due to their low energy needs and fewer operational requirements compared to conventional wastewater treatment systems (Wu, Zhang, et al., 2015). They can produce high quality effluent and at lower power requirements than conventional activated sludge systems (Redmond, 2012). CW offer several benefits compared to traditional centralized treatment systems: lower energy demand, lower maintenance, lower cost, recreation area, resource conservation, habitat for wildlife and aquatic life, and attractive aesthetics (Wu, Fan, et al., 2015).
CWs generally fall into two categories based upon hydrology: 1) Free water surface wetlands, and 2) Subsurface flow wetlands. Free water surface (FWS) wetlands are similar in form and appearance to natural wetlands. They consist of a shallow depth of water over a substrate that is saturated by water in the wetland (Wu, Zhang, et al., 2015). Subsurface flow (SSF) wetlands are different in that wastewater flows horizontally or vertically through the substrate. SSF wetlands can be further categorized based upon this flow direction as horizontal SSF (HSSF), vertical SSF (VSSF), or a hybrid SSF system, which includes at least two treatment cells where at least one cell features horizontal flow and at least one features vertical flow (Wu, Zhang, et al., 2015) and takes advantage of the benefits that each system has to offer. SSF wetlands have some advantages over FWS wetlands, such as lack of odors, mosquitos, and minimal risk of human contact with contaminants (US EPA, 1993).
The French reed bed is a VSSF system that is unique in that it receives raw wastewater without the use of a septic or Imhoff tank for primary treatment, reducing the cost associated with those components. Pretreatment consists of grit removal followed by an equalization tank which traps oil and floatables and ensures consistent distribution to the wetland reed beds (Anacleto Rizzo, Riccardo Bresciani, 2018). Raw effluent is then intermittently distributed on the surface of the first stage reed bed for a period of 3-4 days followed by a resting period of about one week (Masi, Bresciani, Martinuzzi, Cigarini, & Rizzo, 2017). During the resting period, effluent is alternately distributed to one or more additional first stage reed beds with similar hydraulic loading and resting periods, preserving aerobic conditions and preventing odors (Anacleto Rizzo, Riccardo Bresciani, 2018). Sludge slowly accumulates on the top layer of the reed bed (1-2 cm/year) and is removed after 10 or more years. Effluent from first stage reed beds is sent to a pumping station that feeds second stage reed beds in a manner similar to the first stage (Masi et al., 2017). Subsequent stages vary depending upon the level of treatment desired and may include FWS CW, chlorination, or other tertiary treatment methods, see Figure 1.
CELA 2019 | UC Davis 342

Figure 1. French reed bed schematic (2018). Diagram by Alison Tompkins.
Aeration is commonly used in the secondary treatment of wastewater in traditional wastewater
treatment plants. It is an important component in the removal and aerobic digestion of organic matter by microorganisms. In both conventional and biological wastewater treatment, these beneficial bacteria utilize oxygen to digest organic matter found in wastewater. This process results in the reduction of organic matter (biodegradation) and the transformation of organic nitrogen into ammonia (ammonification), then nitrite, and nitrate (nitrification) and finally nitrogen gas (denitrification) as shown in Figure 2. Denitrification is conducted by anaerobic bacteria that convert nitrate to nitrogen gas. Removal of a particular pollutant is typically associated with specific microbial functional groups, which have aerobic and anaerobic populations. Aerobic zones increase the overall rate of nitrification while anaerobic zones facilitate denitrification and the reduction of sulphate (Jennifer L. Faulwetter et al., 2009). Flow rate and depth of water through the constructed wetland – hydraulic loading – affects the efficiency of contaminant removal by increasing or decreasing the contact time with media that are colonized with microbes. It also determines the type of plant materials used. An ideal hydraulic loading scheme allows the formation of a proper sludge layer on top of the French reed bed system and an increase in loading rates, improving efficiency over time (Masi et al., 2017). Studies show that nutrient removal is higher using a longer (8 hour) hydraulic retention time than controls with a shorter (4 hours or less) retention time (Marchand, 2008). A lower HLR will result in more complete treatment, but this must be balanced with HRT to maximize both aerobic and anaerobic conditions for nitrification and denitrification, respectively.
CELA 2019 | UC Davis 343

Figure 2. The nitrogen cycle (2018). Illustration by Alison Tompkins.
Substrate, or filter media, selection is critical to establishing the wetland and sustaining
performance. It provides the growing medium to support plant materials and microbial life and provides surface area for colonization by bacterial biofilms while still allowing water to flood through (Collison, 2010). Substrates vary in hydraulic permeability and pollutant-adsorbing capacity. Mixed substrates have reactive surfaces for microbial attachments and high hydraulic conductivity which allows water to move easily through pore spaces. Specific substrates can be selected to target the removal of pollutants such as phosphorous and nitrogen.
Selection of plant material is also critical to establishing the wetland and sustaining performance (Wu, Zhang, et al., 2015). In fact, the relationship between vegetation, substrate, and living organisms is a major mechanism of pollutant removal in CWs (Valipour & Ahn, 2016). The presence of plants distinguishes constructed wetlands from unplanted soil filters or lagoons (Vymazal, 2011) and greatly improves aesthetics compared to a traditional mechanical facility. Vegetation provides thermal protection against ice formations and plays an important role in the connections between oxygen and the density and activity of the microbial community in the rhizosphere - the region of soil in the vicinity of plant roots in which the chemistry and microbiology is influenced by plant growth, respiration, and nutrient exchange, see Figure 3 (Wang et al., 2017). Plant roots are an important location for microbial biodiversity (Jennifer Lyn Faulwetter, 2010), and optimizing conditions in support of the microbial community should be a priority for the effective design of wastewater treatment systems (Jennifer L. Faulwetter, Burr, Parker, Stein, & Camper, 2012). The use of vegetative polyculture and cold-hardy vegetation further improve pollutant removal (Zhou, Zhu, Bañuelos, & Yan, 2017; Yates, Varickanickal, Cousins, & Wootton, 2016). In summary, a polyculture of evergreen or deciduous cold-hardy plants with well-developed roots and rhizomes will provide insulation against cold temperatures, support microbial life, and provide oxygenation, all of which improve treatment efficiency and effectiveness. Native plants with these characteristics are preferred to support native wildlife and discourage the spread of invasive introduced species.
Cold climate areas have specific challenges to overcome due to a reduction in treatment performance under cold conditions. A number of processes are slowed as a result of cold temperature: microbial activities (nitrification/organic matter removal, denitrification), plant metabolism rate, chemical precipitation, and adsorption (Yan & Xu, 2014). Wang et al., 2017, found that temperature has a significant effect on ammonium nitrogen and total nitrogen removal efficiencies. Cold climate does not have a significant effect on the removal of total phosphorous, total suspended solids (TSS), biological
CELA 2019 | UC Davis 344

oxygen demand (BOD), and chemical oxygen demand (COD) (Vymazal & Březinová, 2014). Despite the challenges noted above, studies have shown that cold climate wetlands can provide treatment performance comparable to tropical regions (Vymazal & Březinová, 2014). For example, a French reed bed effectively treats wastewater from a portion of the city of Orhei, Moldova (population equivalent 20,000), despite winter air temperatures below -20°C and basins covered by ice and snow for several weeks (Masi et al., 2017). Several common-sense rules can also be applied to reduce temperature losses: site the system with southern aspect to increase exposure to direct sunlight, bury filter-feeding pipework and valves, and alternate filters twice a week to minimize filter freeze up (because the warmth of the wastewater causes the filter to warm up, but it cools during rest periods) (Prost-Boucle, Garcia, & Molle, 2015).
Figure 3. The relationship between vegetation, substrate, and living organisms (2018). Illustration
by Alison Tompkins. While it is not readily apparent when discussing cold-climate regions, reducing the temperature of
treated effluent prior to discharge is a significant challenge during summer months. The heat generated by decomposition of organic matter in wastewater combined with high ambient temperatures and low seasonal stream flows often results in water temperatures that are detrimental to cold water aquatic species such as salmonids. A pilot study conducted in Moscow, Idaho, proved that FWS CWs effectively reduce water temperature. The study reports that performance could be improved by modifying flow rate, water depth, and vegetation (JUB Engineers Inc., 2015). Additional suggestions for improvement include the use of berms and shade trees to reduce solar heat gains during daytime and the addition of, or conversion to, a SSF system to capitalize on subsurface temperature moderation. Comparatively, traditional mechanical methods of cooling water require high energy inputs to operate specialized equipment such as chillers and evaporative cooling towers.
CELA 2019 | UC Davis 345

3.2 Case Studies The following case studies demonstrate how constructed wetlands can be utilized for the effective
treatment of wastewater from communities of various sizes. While constructed wastewater treatment wetlands have been used in Europe for more than 40 years, the practice has been slow to gain popularity in the US. All case studies below are located in the US in order to demonstrate the ability to permit CW in accordance with state and US federal regulations. Climate plays a critical role in the proper design of constructed wetlands to achieve water quality standards for effluent. Case studies were selected in part for their location in cold winter climates, because Juliaetta also experiences extended periods of below freezing conditions in winter months. Systems were evaluated according to several characteristics: population served, capacity/volume of wastewater treated, land area required for constructed wetlands, type of constructed wetland, benefits specific to the constructed wetland that would not exist in a traditional mechanical treatment system, and challenges specific to the constructed wetland and methods used to mitigate or overcome them.
The Prinsburg, Minnesota, Wastewater Treatment Facility serves a population of 497 (207 households) (LakesnWoods.com, n.d.) and is sized to accommodate 545 people (20% population growth) by 2020 and treat 54,500 gallons per day (GPD) (Environmental Quality Board, 2003). It is located on land previously used for agricultural cropland located between the city and Chetomba Creek (44°56'29.53" N 95°11'41.54" W). The city’s wastewater is collected by a gravity sewer system network connecting a 4” service line from each home or business to the main sewer line. Treatment begins when the wastewater is pumped from these lines by two lift stations to four (4) 20,000-gallon septic tanks for primary treatment/removal of solids. Over time, sludge accumulates in the septic tanks and requires annual pumping to remove it. Annual septic sludge accumulation from 545 people is estimated at 25,600 gallons per year. From the septic tanks, wastewater is discharged into a metering manhole, which splits the flow evenly into four HSSF constructed wetlands with forced bed aeration to increase bacterial oxidation of organic matter. Each wetland cell is 17,100 ft2 in size (0.39 acres each; Total = 1.57 acres). Water then flows from the wetlands to two 15,000 gallon dosing tanks which pump the water to two sand filters. The sand filters are a VSSF system used for secondary treatment. The system uses chlorine disinfection and dechlorination prior to discharging treated effluent to nearby Chetomba Creek.
The October 2004 treatment facility as-bid costs were $1,281,762.32, and the collection system as-bid construction costs were $1,128,000.00. Legal, Administrative, Engineering, Interim Interest, and Contingencies Costs brought the as-bid project costs to a total of $3,300,400. System costs include the construction of city sewer lines because residents previously discharged to a centralized, underground, unpermitted wastewater collection system. The project was primarily funded by the USDA – Rural Development program, together with a mix of funding from Minnesota and the City of Prinsburg. The city pays $30,000/year for contracted services for system monitoring, maintenance, and operation. Additionally, the city employs a public works manager and pays for sludge cleanout on an annual basis. Project challenges include a shallow depth (15 feet) to groundwater and poorly drained, impermeable soils. Therefore, a PVC liner was used underneath the constructed wetlands to prevent any seepage of wastewater into the groundwater supply. Rodents are discouraged from the site to avoid potential damage to the wetland liner and underground piping by burrowing activity. System benefits include minimal odors due to the subsurface nature of the system, and aesthetics of a naturalistic site. Wildlife frequenting the adjacent fields and creek areas include deer, raccoon, fox, skunk, rabbits, moles, gophers, mice, waterfowl, songbirds, birds of prey, snakes, frogs, toads and turtles. Minnesota is well-prepared to permit CW for wastewater treatment, and has permitted 24 of these systems as of this writing.
The Minot, North Dakota, Wastewater Treatment Facility serves a population of 50,000 (North Dakota Department of Health, 2011) and treats 7.5 million GPD. It was constructed in 1991 and is permitted as a lagoon facility with wastewater stabilization ponds (i.e. FWS constructed wetlands) providing secondary treatment. The system was constructed to upgrade Minot’s previous method of treatment which consisted of a five-cell lagoon arrangement. The lagoon system suffered odor problems and the upgrades were intended to improve this system and meet permitting parameters for NH3 (ammonia) (Mander & Jenssen, 2002). The current system begins with two 8-acre aeration basins which receive all of Minot’s wastewater. The effluent then enters 5 lagoon cells (~140 acres each) for further treatment and retention, after which it enters the constructed wetland system for advanced treatment. There are four constructed FWS wetland cells consisting of 126.5 total acres, although the total wetland portion of the system occupies 160 acres. Final treatment occurs in a modified, 2.5 mile-long drainage
CELA 2019 | UC Davis 346

way that discharges to the Souris River (North Dakota Department of Health, 2011). Minot’s wastewater system discharges continually to the Souris River from May through December. It represents most of the Souris River flow during summer months, and therefore low NH3 parameters are included in the discharge permit (Mander & Jenssen, 2002). The system was designed to equally distribute flow to all four wetland cells, but initially all flow was directed to the fourth cell in order to allow vegetation to establish in other cells (Mander & Jenssen, 2002).
Each wetland cell was constructed with five marsh-pond zones to serve specific purposes. Zone A has a 6-inch operating depth planted with cattails (Typha latifolia) for reduction of biochemical oxygen demand and total suspended solids. Zone B is a pond designed to facilitate nitrification and has an operating depth of 23.5 inches planted with Sago pondweed (Potamogeton pectinatus) and wild celery/eelgrass (Vallisneria americana). Zone C is a marsh designed to facilitate both nitrification, denitrification and nutrient removal. It has an operating depth of 12 inches and is planted with soft-stemmed bulrush (Scirpus validus) and duckweed (Lemna). Zone D is a pond which also facilitates nitrification, denitrification, and nutrient removal. It is designed with the same depth and plant species as Zone B (23.5”, Sago pondweed and wild celery). The final wetland cell, Zone E, is a marsh which facilitates denitrification and removal of TSS and fecal coliform bacteria. It is designed with the same depth and plant species as Zone A (6”, cattails) (Mander & Jenssen, 2002). The system has aesthetic benefits similar to Prinsburg, though at a much larger scale, and also provides pond zones and small islands for wildlife nesting and loafing.
In a personal telephone interview (2018), City of Minot wastewater staff discussed the need to increase system capacity in order to meet the demand generated by population growth in recent years due to an oil boom. Staff indicated that increasing water quality standards, particularly minimum standards for the removal of NH3, combined with the increase in wastewater connections due to growth have resulted in a need to increase system capacity and improve the level of wastewater treatment. The Minot system is one of the largest cold-climate constructed wetlands treating municipal wastewater. Treatment efficiency of both the aerated lagoons and wetlands declines with water temperature during winter months. The system compensates for this by providing sufficient storage capacity for wastewater generated during the cold season. Adequate removal of NH3 is the primary challenge this system faces. Because NH3 is removed through nitrification by bacterial oxidation, the aerated lagoons achieve good NH3 removal under warm weather conditions. The constructed wetlands also achieve good TSS and BOD under warm weather conditions, but only receive low levels of effluent during this time because aerated lagoons are operated to maximize NH3 removal. Effluent to the wetlands is increased during cold weather, but wetlands do not function as well at low temperatures (Mander & Jenssen, 2002). The entire system is therefore limited at the front end (aerated lagoons) because the wetlands are not used at capacity during the most effective time of the year. Increasing the effectiveness or expansion of the aerated lagoons would facilitate higher hydraulic loading of the wetlands and improve system efficiency.
The Boston Mills Historic District is located in the Cuyahoga Valley National Park in Ohio. The population served is unknown but the system is designed to provide wastewater treatment for six structures within the Boston Mills Historic District: the Hines Hill Complex with Main House, Conference Center and Tenant House, the Boston Store Complex with Visitor Center, public restrooms, and offices, and four 3-bedroom, 2-bathroom residential properties. Average daily water usage was calculated for the structures based on records of water usage over a 5-month period from October 2003 through February 2004. A 50% increase in water was added to account for summer usage, and preliminary sizing was based on estimated design flow of 4,999 GPD (URS Corporation, 2006). Total cost of installation was $132,507 for initial construction.
The system combines the use of septic tanks with a FWS wetland and a SSF wetland. Wastewater receives primary treatment through use of a septic tank, which removes settling and floating solids to prevent clogging of the entry zone into the wetland. Secondary treatment occurs in the SSF wetland, where BOD and very small suspended solids are removed through aerobic and anaerobic processes. The final phase of treatment occurs in the FWS wetland, where effluent receives further biological treatment and is disposed through infiltration and evapotranspiration. An NPDES permit is not required because effluent is not discharged to a water body. This is a major benefit as it reduces the amount of permitting and regulatory oversight needed to operate the treatment system. Site challenges included lack of access to power and close proximity to the 100-year floodplain, which required delineation to determine if a floodplain development permit was needed. The floodplain was avoided and therefore the permit was not necessary. The system provides significant aesthetic benefits because it is
CELA 2019 | UC Davis 347

located adjacent to the Cuyahoga River and between two highways in the Cuyahoga National Park. The naturalistic look of the treatment facility blends well with the surrounding natural environment. Further, a feasibility study was conducted to compare the cost of a CW treatment system to sub-surface drip irrigation (re-use), and the advantages of a CW system were greater, including water conservation, low maintenance and cost, zero discharge, and no electricity needed because solar power was used.
3.3 Permitting
There are three phases to obtaining a permit to discharge wastewater in Idaho: 1) Planning, 2) Engineering, and 3) Permitting. First a Facility Plan is developed by a licensed engineer or engineering firm. As of this writing, the contract engineer for the City of Juliaetta is in the process of completing an updated facility plan for the city’s wastewater treatment system. A facility plan is a planning document and engineering report that contains a comprehensive assessment of operational needs and system requirements. It includes information the Idaho Department of Environmental Quality (IDEQ) requires for permitting and to be eligible for state grant and/or loan funding for design and construction. The facility plan is reviewed and approved by the IDEQ.
This is followed by the second phase of the permitting process, the preliminary engineering report. The preliminary engineering report is completed by the community’s engineer and includes plans and specifications for the proposed treatment system. This must also be reviewed and approved by engineers at the IDEQ. For the third and final phase, the community may request modification of an existing disposal permit or re-apply for a new permit. Depending on the location and proximity to surface water, this might be an Idaho Pollutant Discharge and Elimination System (IPDES) permit and/or reuse permit. Disposal to surface water requires an IPDES permit and must be approved by IDEQ prior to implementation of a wastewater treatment system. If no hydraulic connectivity to surface water exists, it may be possible to permit CWs as a reuse system. These would be very similar to rapid infiltration basins that eventually discharge to ground water. Two major advantages of CWs is cooling of water through subsurface seepage and streambank recharge.
Ultimately, in order for a CW to be permitted the system must first be included in a city’s facility plan. A CW may be included in the facility plan at the request of the community or at the discretion of the engineer serving the community. If a CW is not included in the facility plan at the beginning of this three-phase process, it cannot be approved for engineering or permitted for construction.
Permitting standards are not typically written to accommodate seasonal variations in natural systems like wetlands, despite ecological and social benefits of a wetland system over a mechanical system. Surface water discharge permits generally have a concentration and a load limit with maximum daily, average weekly, and average monthly effluent limitations and varying requirements for sampling frequency. These requirements are usually static throughout the year, which is at odds with the seasonal variability of a wetland system, whether natural or man-made. There are exceptions, such as water temperature and ammonia, which may sometimes have seasonal limitations in a permit.
Opportunities exist to provide incentives to engineers and permitting agencies in regard to constructed wastewater treatment wetlands. From a regulatory standpoint, constructed wetlands can provide all five beneficial uses of water identified in IDAPA 58.01.02.100; they can directly support aquatic life, provide recreation area, maintain a sustainable water supply, provide wildlife habitat, and improve aesthetics. Although they technically do not qualify as “beneficial uses” while the water is retained in a private treatment system, the benefits are acknowledged by regulatory agencies. In reality, the benefits are felt in the local community and passed on to receiving waters such as the Potlatch River. Endangered salmonids and other aquatic life inhabiting the Potlatch River also benefit from improved water quality and lower water temperature. It is important to promote awareness of these benefits at a local level to encourage community support for constructed wetlands and include them in facility plans for treatment systems. Mechanical systems simply cannot provide all of these benefits.
From the perspective of communities and engineers, the ability to obtain permitting/approval and funding for a cost-effective treatment system is a huge incentive. Engineers and communities also depend upon the regulatory agency to facilitate a permitting process that is timely in its review of constructed wetland technology, despite the fact that it has yet to be implemented in Idaho for wastewater treatment. The IDEQ, with its dual role as permitting agency and potential funding source, is ideally positioned to incentivize CW systems by prioritizing CW projects with demonstrable benefits over mechanical systems.
CELA 2019 | UC Davis 348

3.4 Cost and Funding Total cost of any treatment system includes materials, capital costs for labor and site work, and
operation, maintenance, and depreciation over the life of the system. Size and complexity of the system will also affect the overall cost. Selection of a preliminary system design should consider long-term maintenance needs in addition to start-up costs for construction/installation. Low maintenance needs can translate into large cost savings over the lifetime of the treatment system. Once a preliminary design schematic is selected, project costs can be estimated using local cost figures for materials and labor and current cost figures for monitoring and basic maintenance activities.
Costs of a French reed bed system for 500-1000 population equivalent (PE) in Italy was studied from 2014-2016 and provides an excellent example of costs for a community the size of Juliaetta. In this case study, cost of new construction was 364 Euros ($417 US) per PE, translating to $417,000 US for a system with treatment capacity of 1000 PE. The study also demonstrates that the primary operation and maintenance (O&M) costs of these systems is for energy, personnel for inspections, reed harvesting, and water quality samples (monitoring), with an average annual O&M cost of 5,531 Euros/year ($6340 US). It concludes that construction costs of French reed beds are in line with activated sludge systems in the Italian context, with lower O&M costs compared to classical CW (Anacleto Rizzo, Riccardo Bresciani, 2018) primarily due to reduced sludge management.
Comparatively, the cost for new construction or renovation of existing mechanical and/or lagoon treatment systems will normally range in the millions of dollars. In a review of IDEQ construction loans issued from 2015-2018 for cities with a population of less than 6,000, loans ranged from $1.09 to $30 million US.
There are several funding options available for the design and/or construction of wastewater treatment systems, see Table 1. United States Department of Agriculture (USDA), IDEQ, and Community Development Block Grant funding sources can be leveraged together to provide the required percentage of community matching funds. For example, a community can apply for IDEQ and USDA funding simultaneously, citing a 50% community match by using the funding requested/obtained from the other agency (i.e. a $60,000 project can be fully funded with $30,000 from IDEQ and $30,000 from USDA). Grants are very competitive, and a community that demonstrates commitment to completing a project by providing a portion of its own matching dollars may receive a higher priority ranking for funding than a community that does not.
Table 1. Funding programs for wastewater systems.
Agency Program Purpose Eligibility Grantor/Community Match
Idaho Department of Commerce
Community Development Block Grant
Public facilities construction and improvements –
sewer, water, etc.
> or = 51% Low-moderate income
communities
Minimum 50/50 to be competitive
Idaho Department of Environmental
Quality
Wastewater Planning Grant; State Revolving
Fund Low Interest Construction Loan
Wastewater facility planning and construction
Public entities and non-profits
50/50 planning; 100% construction
National Rural Water Association
Rural Water Loan Fund
Water/wastewater project pre-
development and small capital
projects
Public entities and non-profits, rural
communities up to 10,000
Maximum $100,000 or 75% of
total project cost
U.S. Army Corps of Engineers
Section 595 Program -
Environmental Infrastructure
Rural water/wastewater
improvements
Nevada, Montana, Idaho; <10,000
population preferred
75/25
U.S. Department of Agriculture –
Rural
Technical Assistance &
Training (TAT) -
Broad: construction,
improvements,
Rural communities up to 10,000 population
Grant - none; Loan - 45/55
CELA 2019 | UC Davis 349

Development Water & Waste Direct Loans &
Grants
relocation, connections, land
acquisition Juliaetta is already utilizing funding from the IDEQ and USDA for wastewater planning. With a
population of 609 people, the small town should also qualify for funding from the National Rural Water Association and the U.S. Army Corps of Engineers. It may also be eligible for funding from the Idaho Department of Commerce Community Development Block Grant, if it is demonstrated that greater than or equal to 51% of the population has a low to moderate income. Together, these additional funding sources could be leveraged to finance new construction and/or system upgrades. 4 DESIGN AND CONCLUSIONS 4.1 Design
The research methods of Section 3 yield concepts and techniques that guide the design toward proven techniques and away from unanticipated problems or design failures. This forms the basis of design principles that can be applied to conditions faced by the City of Juliaetta. The research verifies that constructed wetlands provide a cost-effective solution for wastewater treatment that can be applied to small communities in cold climates. CW can remove nutrients and solids from wastewater and provide sustainable benefits that traditional engineered systems cannot, such as wildlife habitat, energy savings, irrigation water, and recreation area. Currently, the only advantage of traditional mechanical systems over CW for wastewater treatment in small communities are the reduced land area needed for treatment and the acceptance/familiarity of permitting agencies with mechanical systems, which can ease the permitting process. This is particularly true in Idaho, where a single CW for wastewater treatment has yet to be permitted, and less of an issue in states like Minnesota that are well-versed in the review, monitoring, and permitting of CW. With any treatment system, the burden of proof lies with the community and its engineer(s) to demonstrate that water quality standards can be met and public health, safety, and welfare are not put at risk.
Juliaetta’s wastewater treatment system must meet federal and state discharge permit requirements and water quality standards, be maintained by two staff employed by the city (dedicated to wastewater management only part time), be affordable to construct and maintain, and be sustained by the community for the lifetime of the system. The treatment wetland should also provide secondary benefits that traditional mechanical systems cannot, such as wildlife habitat, irrigation water, and recreation area. As discussed, federal and state water quality standards and permits require engineering by a licensed engineer and are beyond the scope of this study, though numerous studies and sources are referenced as a means to that end. Literature and case studies demonstrate that compared to mechanical systems, CW provide a low energy, low maintenance, cost efficient means of wastewater treatment when adequate land area is available.
In summary, the French reed bed system is well-suited for the treatment of Juliaetta’s wastewater for its reduced cost and maintenance over other CW designs. As a VSSF system, it also requires less area per capita (2 m2/person) than HSSF or FWS CW systems. French reed beds can further reduce construction and maintenance costs by reducing sludge management over the lifetime of the system, requiring removal of accumulated sludge every 10 years or more. While this system will not allow direct contact recreation due to pathogens, it can be incorporated into a landscape design with recreational pathways, benches, and wildlife viewing that connect to the city park and ballfields as shown in Figure 4. Existing gravel parking areas appear mostly vacant and are located above flood elevation, providing an opportunity to maximize efficiency of developed land. This provides an ideal location for new construction while preserving the existing wastewater treatment system until the new CW treatment system is operational. Once the new CW system is operational, the original mechanical system can be decommissioned and storage constructed for water recirculation or reuse. The integration of additional storage for water reuse (irrigation of the city park or vineyards) increases flexibility for future uses. Alternatively, storage of treated water provides a convenient supply for the adjacent fire station, should the need arise.
Additional design recommendations include planting large tree species and woody shrubs. Large deciduous trees strategically located south of the CW will provide shade during hot summer months, a critical component for reducing water temperature and supporting cold water aquatic life. After leaf fall
CELA 2019 | UC Davis 350

when temperatures have dropped, sun will reach the wetland and aid in heat retention, supporting biological processes that slow in cold temperatures. Planting native woody shrubs provide shade, cover, and food sources for wildlife, not to mention aesthetic appeal for a site that is highly visible from the adjacent highway. Opportunities for infiltration of treated wastewater should also be investigated at the facility planning stage as a means of further cooling water temperature, providing streambank recharge, and permitting as a reuse facility.
CELA 2019 | UC Davis 351

Figure 4. Conceptual site design and schematic of a French reed bed system for the treatment of
Juliaetta’s wastewater (2018). Preliminary sizing based upon 2m2 per capita and treatment capacity of 905 population. Illustration by Alison Tompkins.
CELA 2019 | UC Davis 352

5 REFERENCES 1. Anacleto Rizzo, Riccardo Bresciani, N. M. and F. M. (2018). French Reed Bed as a Solution to
Minimize the Operational and Maintenance Costs of Wastewater Treatment from a Small Settlement : An. Water, 10(156), 13. https://doi.org/10.3390/w10020156
2. City-Data.com. (2018). Juliaetta, Idaho (ID 83535) profile: population, maps, real estate, averages, homes, statistics, relocation, travel, jobs, hospitals, schools, crime, moving, houses, news, sex offenders. Retrieved November 4, 2018, from http://www.city-data.com/city/Juliaetta-Idaho.html
3. Collison, R. S. (2010). Effects of porous media and plants in the performance of sub surface flow treatment wetlands. ProQuest Dissertations and Theses. Retrieved from http://sfx.scholarsportal.info/guelph/docview/763147065?accountid=11233%5Cnhttp://sfx.scholarsportal.info/guelph?url_ver=Z39.88-2004&rft_val_fmt=info:ofi/fmt:kev:mtx:dissertation&genre=dissertations+&+theses&sid=ProQ:ProQuest+Dissertations+&+Theses+A&I
4. Environmental Quality Board, B. L. (2003). Prinsburg Wastewater Treatment Facility Environmental Assessment Worksheet. Retrieved from https://www.pca.state.mn.us/sites/default/files/prinsburg-eaw.pdf
5. Faulwetter, J. L. (2010). Analysis of microbial biofilm community composition within constructed wetlands.
6. Faulwetter, J. L., Burr, M. D., Parker, A. E., Stein, O. R., & Camper, A. K. (2012). Influence of Season and Plant Species on the Abundance and Diversity of Sulfate Reducing Bacteria and Ammonia Oxidizing Bacteria in Constructed Wetland Microcosms. Microbial Ecology, 65(1), 111–127. https://doi.org/10.1007/s00248-012-0114-y
7. Faulwetter, J. L., Gagnon, V., Sundberg, C., Chazarenc, F., Burr, M. D., Brisson, J., … Stein, O. R. (2009). Microbial processes influencing performance of treatment wetlands: A review. Ecological Engineering, 35(6), 987–1004. https://doi.org/10.1016/j.ecoleng.2008.12.030
8. Friesen, T. “Higher Water Temperatures Primary Cause of Early Spring Chinook Mortality,”Oregon Department of Fish and Wildlife, 18 June 2015. [Online]. Available: www.dfw.state.or.us/news/2015/june/061815.asp. [Accessed: 10 August 2015].Idaho Department of Environmental Quality. (2008). Potlatch River Subbasin Assessment and TMDLs. Retrieved from https://www.deq.idaho.gov/media/464337-potlatch_river_entire.pdf
9. JUB Engineers Inc. (2015). City of Moscow Wastewater Treatment Evaluation: Constructed Wetlands and Cooling Tower Temperature Reduction Pilot Study.
10. Keller Associates Inc. (2018). Idaho Department of Environmental Quality Wastewater Planning Grant Letter of Interest.
11. LakesnWoods.com. (n.d.). Guide to Prinsburg Minnesota. Retrieved April 7, 2018, from http://www.lakesnwoods.com/Prinsburg.htm
12. Latah County GIS. (n.d.). Latah County. Retrieved December 24, 2018, from http://gis.latah.id.us/ParcelViewer/ParcelViewer.html
13. Mander, U. (Ülo), & Jenssen, P. D. (2002). Natural wetlands for wastewater treatment in cold climates. WIT Press.
14. Marchand, P. V. C. K. F. D. E. A. (2008). Behavior of Pilot-Scale Constructed Wetlands in Removing Nutrients and Sediments Under Varying Environmental Conditions.
15. Masi, F., Bresciani, R., Martinuzzi, N., Cigarini, G., & Rizzo, A. (2017). Large scale application of French reed beds: Municipal wastewater treatment for a 20,000 inhabitant’s town in Moldova. Water Science and Technology, 76(1), 134–146. https://doi.org/10.2166/wst.2017.188
16. North Dakota Department of Health. (2011). Minot, ND NPDES Fact Sheet. 17. PlantMaps. (n.d.). Interactive Idaho Heat Zone Map - Average Days the Temperature Exceeds 86°F.
Retrieved November 6, 2018, from https://www.plantmaps.com/interactive-idaho-heat-zones-map.php 18. PlantMaps. (2018). Juliaetta, Idaho Hardiness Zones. Retrieved November 6, 2018, from
https://www.plantmaps.com/hardiness-zones-for-juliaetta-idaho 19. Prost-Boucle, S., Garcia, O., & Molle, P. (2015). French vertical-flow constructed wetlands in
mountain areas: How do cold temperatures impact performances? Water Science and Technology, 71(8), 1219–1228. https://doi.org/10.2166/wst.2015.074
20. Redmond, E. (2012). NITROGEN REMOVAL FROM WASTEWATER BY AN AERATED
CELA 2019 | UC Davis 353

SUBSURFACE FLOW CONSTRUCTED WETLAND by Eric Redmond A thesis submitted in partial fulfillment of the requirements for the Master of Science degree in Civil and Environmental Engineering in the Graduate College.
21. Sperling’s Best Places. (n.d.). Juliaetta, Idaho Climate. Retrieved November 4, 2018, from https://www.bestplaces.net/climate/city/idaho/juliaetta
22. URS Corporation. (2006). FEASIBILITY STUDY BOSTON MILLS HISTORIC DISTRICT. 23. US EPA. (n.d.). Constructed Wetlands. Retrieved March 17, 2018, from
https://www.epa.gov/wetlands/constructed-wetlands 24. US EPA. (1993). Subsurface Flow Constructed Wetlands For WasteWater Treatment A Technology
Assessment. 25. US EPA. (2018a). Fact Sheet for the Draft NPDES Permit for the City of Juliaetta. 26. US EPA. (2018b). NPDES Permit for the City of Juliaetta. 27. USDA Natural Resources Conservation Service. (n.d.). Web Soil Survey. Retrieved December 24,
2018, from https://websoilsurvey.sc.egov.usda.gov/App/WebSoilSurvey.aspx 28. Valipour, A., & Ahn, Y. H. (2016). Constructed wetlands as sustainable ecotechnologies in
decentralization practices: a review. Environmental Science and Pollution Research, 23(1), 180–197. https://doi.org/10.1007/s11356-015-5713-y
29. Vymazal, J. (2011). Plants used in constructed wetlands with horizontal subsurface flow : a review, 133–156. https://doi.org/10.1007/s10750-011-0738-9
30. Vymazal, J., & Březinová, T. (2014). Long term treatment performance of constructed wetlands for wastewater treatment in mountain areas: Four case studies from the Czech Republic. Ecological Engineering, 71, 578–583. https://doi.org/10.1016/j.ecoleng.2014.07.075
31. Wang, M., Zhang, D. Q., Dong, J. W., & Tan, S. K. (2017). Constructed wetlands for wastewater treatment in cold climate — A review. Journal of Environmental Sciences (China), 57, 293–311. https://doi.org/10.1016/j.jes.2016.12.019
32. Wu, H., Fan, J., Zhang, J., Ngo, H. H., Guo, W., Liang, S., … Liu, H. (2015). Strategies and techniques to enhance constructed wetland performance for sustainable wastewater treatment. Environmental Science and Pollution Research, 22(19), 14637–14650. https://doi.org/10.1007/s11356-015-5151-x
33. Wu, H., Zhang, J., Ngo, H. H., Guo, W., Hu, Z., Liang, S., … Liu, H. (2015). A review on the sustainability of constructed wetlands for wastewater treatment: Design and operation. Bioresource Technology, 175, 594–601. https://doi.org/10.1016/j.biortech.2014.10.068
34. Yan, Y., & Xu, J. (2014). Improving winter performance of constructed wetlands for wastewater treatment in northern china: A Review. Wetlands, 34(2), 243–253. https://doi.org/10.1007/s13157-013-0444-7
35. Yates, C. N., Varickanickal, J., Cousins, S., & Wootto n, B. (2016). Testing the ability to enhance nitrogen removal at cold temperatures with C. aquatilis in a horizontal subsurface flow wetland system. Ecological Engineering, 94, 344–351. https://doi.org/10.1016/j.ecoleng.2016.05.064
CELA 2019 | UC Davis 354

CELA MEDIA STATEMENT Title of Paper or Research: Designing a Sustainable Constructed Wetland to Treat Wastewater for the City of Juliaetta, Idaho Authors: Alison Tompkins, Gary Austin Institution or Professional Affiliation: University of Idaho Authors please select one of the following: I DO__X___ DO NOT_____want to prepare a media statement for general release from the 2018 CELA Conference. (If you choose DO NOT, you do not need to prepare a media statement). Media Statement (100 words max.): Small communities have a small tax base, limited funding, limited staffing, and must meet federal and state requirements for wastewater treatment. Small communities in the United States are now facing the difficulty of replacing aging rural infrastructure like wastewater treatment systems with limited resources. Constructed wetlands provide a cost-effective solution for wastewater treatment that can be applied to small communities in cold climates. Design and construction methods are presented for a constructed wetland to treat wastewater from the City of Juliaetta (population 582) in northern Idaho. Constructed wetlands provide the opportunity to apply stewardship, planning, and design to treat wastewater. (Optional) Graphic Abstract: please insert the illustration below. Authors: please seek copyright permission if copyrighted materials are used.
CELA 2019 | UC Davis 355

CELA 2019 | UC Davis 356

CELA 2019 | UC Davis 357

The authors are solely responsible for the content of this technical presentation. The technical presentation does not necessarily reflect the official position of the Council of Educators in Landscape Architecture (CELA), and its printing and distribution does not constitute an endorsement of views which may be expressed. Citation of this work should state that it is from a CELA conference paper. EXAMPLE: Author's Last Name, Initials. 2019. Title of Paper. Sacramento, CA: CELA. For information about securing permission to reprint or reproduce this paper, please contact CELA at [email protected]
A Simulation Study on the Effect of the Road Greenbelt
Planning on PM2.5 Reduction Based on ENVI-met
Xiaohua GUO School of Architecture and Urban Planning, Huazhong University of Science and Technology, [email protected] Fei DAI School of Architecture and Urban Planning, Huazhong University of Science and Technology, [email protected] Shibo Bi School of Architecture and Urban Planning, Huazhong University of Science and Technology, [email protected] 1 ABSTRACT Urban road green space is an important part of urban green space system, the road greenbelt undertakes the important function of the ecological environment improving, the road green belt of the cross section layout is the core content of road green space planning and design. By using the urban microclimate simulation software ENVI-met, the typical daily meteorological parameters of Wuhan city were selected, and the numerical simulation of the particulate matter was carried out on several kinds of green forms that were common in urban main roads. The results show that 1) the green type of road cross section has significant influence on the distribution of particulate matter. The road greening results in the increase of particulate concentration of motor vehicles and the decrease of the concentration of non-motorized driveway and pavement. 2) Road greening can significantly reduce the PM2.5 concentration of pavement. In terms of the reduction area of PM2.5, there are four-plate & five greenbelt > two-plate & three greenbelt > one-plate & two greenbelt> three-plate & four greenbelt. From the extent of the reduction of PM2.5, two-plate & three greenbelt > four-plate & five greenbelt > one-plate & two greenbelt> three-plate & four greenbelt. 3) The best effect of the two-plate & three-greenbelt and four-plate & five-greenbelt greening reduction was achieved, with the maximum rate of sidewalk reduction increased by 18%. 1.1 Keywords ENVI-met, roadgreenbelt,planninganddesign,particulatematter2.5,reductionrate,simulation
CELA 2019 | UC Davis 358

2 INTRODUCTION In recent years, air pollution, especially the "haze weather" caused by particulate matter
pollution, has attracted widespread attention. Of the two, fine particulate matter (PM2.5) is the main cause of air pollution today. According to the United Nations environment program (UNEP), air pollution has caused more than one million premature deaths and one million stillbirths worldwide each year[1]. Studies have shown that green infrastructure is one of the effective methods to reduce urban particulate matter [2,3]. A significant negative correlation was found between block size green coverage rate and particle concentration. Every 10% increase in green coverage rate could reduce PM10, PM2.5 concentration by 13.83% and 7.58%, respectively [4]. However, the effect of plants on the reduction of particulate matter in road space has been controversial [5]. In summary, previous studies have shown that tall trees have a negative effect on plants in street canyon space, while low hedges can reduce plants to some extent. In the open road space, vegetation plays a positive role in particle reduction [6]. However, specific conditions vary with the complex pollution reduction principles of plants. The characteristics of vegetation, such as deposition rate, leaf area density, height, tree canopy, configuration mode, leaf characteristics (hairy, waxy), and seasonal changes, are all related to the effect of particle reduction [7].
At present, domestic and foreign studies on the reduction effect of road greening and particulate matter mostly focus on the micro scale, focusing on the reduction effect of greening plant types and types, plant configuration forms, green belt width and other factors on particulate matter [8-11]. However, the layout form of green belt section is not involved in the planning and design. Urban road green space is an important part of urban green space system. They form the whole urban green space into a whole in the form of network and line, forming a good urban ecosystem. The form of section of urban road green belt is the core content of road green belt planning and design, which is closely connected with urban planning, the key point of urban road green belt management and control, and the premise of urban road green belt design. The common form of road green space section in China is one board with two belts, two boards with three belts, three boards with four belts, and four boards with five belts [12]. Under the background of the increasing shortage of urban land, it is of great theoretical and practical significance to maximize the ecological benefits of the green belt through reasonable spatial planning and prospective layout of the section of the green belt under the premise of limited green road rate.
At present, urban block scale microclimate research methods include field measurement, wind tunnel test and numerical simulation. At present, the research results are mainly measured, but the measured method consumes energy and time, and is limited by geographical and climatic conditions, so it is impossible to exclude the interference of other environmental conditions, and it is difficult to deduce the universal conclusion. Wind tunnel test, high cost, difficult to promote; Numerical simulation method, which USES computer to simulate microclimate, is convenient for parameter adjustment and has strong controllability, and has gradually been widely valued by scholars [13]. The commonly used block scale air pollutant diffusion models are ENVI -met, FLUENT, MISKAM and OSPM[14]. Among them, ENVI -met is the simulation software with the most complete microclimate index and the most complete vegetation module, which is most suitable for the simulation research of microclimate in landscape architecture.
CELA 2019 | UC Davis 359

At present, the domestic use of landscape architecture microclimate ENVI - met research results in the initial stage, the theme of "ENVI - met" by CNKI and "greenfield" greening "landscape architecture", "planning" cross retrieval, with 28 references, research mainly focused on the microclimate indexes such as temperature, humidity, wind environment, thermal comfort [15-17], for the pollutant diffusion, only Zhang wei in the residential area green space layout of micro climate influence [18] PM10 concentration are discussed. From the Web of Science retrieval of " ENVI -met" AND "particulate matter, air pollution, PM", it can be seen that some foreign research results have been accumulated on the simulation of road greening AND particulate matter reduction by ENVI -met, which is mainly used to study the influence of different street width ratio AND plant configuration on the diffusion AND deposition of particulate matter. For example, Wania simulated the influence of different aspect ratios and plant configurations on street ventilation and particle diffusion, and the results showed that the greater aspect ratio was, the greater plant density was, and the lower wind speed was in street canyons, which was not conducive to particle diffusion [1]. Vos compared the effects of 19 plant configurations on pollutant concentration, and the results showed that trees in streets were not conducive to pollutant diffusion [5]. Morakinyo, city university of Hong Kong, combined with the "diffusion-sedimentation method" to simulate the effect of plant barrier on particle reduction, and proposed indicators such as the appropriate distance between plant barrier and particle source [19,20]. Nikolova simulated the dispersion and settlement of particles in real streets, and believed that ventilation was the main factor affecting the distribution of particles in street canyons [21,22]. In addition, some scholars also verified the envi-met model, indicating that the field measurement method and the biomagnetism monitoring method were consistent with the calculation results of the model, further confirming the effectiveness of the application of envi-met in particle diffusion [23-25].
his study will ENVI - met for the first time applied to urban road cross-section greenbelt planning simulation, a quantitative study of urban road green belt cross-section layout of PM2.5 reduction effect, for the urban planning and landscape design decision makers provide scientific quantitative basis, the research content specific reflected in the following aspects: 1) different types of road green belts, have any impact on the overall distribution of PM2.5 spread? 2) what is the reduction effect of different types of road greenbelts on PM2.5? 3) to what extent can the sectional forms of various types of road greenbelts reduce the PM2.5 concentration of sidewalks? 3 METHODS 3.1 Research plan 3.1.1 research overview
Wuhan is located in the middle and lower reaches of the Yangtze river, the eastern Jianghan plain, a subtropical monsoon humid climate zone. According to the statistics of the national environmental protection department in 2016, the annual average concentration of particulate matter in 338 regions and above cities [26], Wuhan ranks the 12th, which is not far from the PM2.5 pollution of the following cities, and can represent the pollution level of typical large and medium-sized cities in China. Wuhan, with a total area of 8 494.41 square kilometers and a permanent resident population of 10.914 million in 2017, has typical road traffic characteristics in large cities. Indentation must be ½ inch in width and the paragraphs
CELA 2019 | UC Davis 360

must run into one another smoothly (no extra spacing between the end of a paragraph and the beginning of a new one).
Each article must be divided into sections marked out by one numeral and paragraphs marked out by two numerals separated by a point. A third-level subdivision must be avoided. Within the text the reader must be referred to a section or a paragraph via abbreviations in parenthesis such as (Section 2).
3.1.2 road red line and green area rate The study focused on the reduction effect of the form of road green belt section on PM2.5, so the same road width and green area rate were set. According to the planning index of all kinds of urban roads in the code of urban road traffic planning and design, the width of the main road in big cities is 45~55m, and the secondary road 40~50m. According to the urban road greening planning and design specification, "the greening rate of landscape roads shall not be less than 40%" [28]. In order to ensure the reduction effect of road green space on particulate matter, the greening rate of the case design is 40%. Four groups are set according to the layout of road green belt section: one plate with two belts, two plates with three belts, three plates with
four belts, and four plates with five belts. Compare the road without green belt (CK), and the specific parameters are shown in figure 1. 3.2 Grid Settings and parameter Settings
The grid number is set as 60×80×30, and the spatial accuracy is 1×1×2m. The z-axis is equidistant, i.e. Add 5 nested grids. Since particle simulation is a steady-state calculation, the model operation time is designed as 6h, the first 5h is the preheating stage, and the last 1h is the discussion time of the results.
The model selects typical summer days in August 2017. The weather parameters (initial temperature, relative humidity) refer to the average weather of that month. The wind speed is set at 1m/s (static wind condition), and the wind direction is perpendicular to the road wind direction and inclined wind direction. According to the information of Wuhan traffic bureau, the traffic flow of Wuhan main road was selected and the PM2.5 emission rate was calculated as 12.7 g/s/m. Considering the road width and two-way lanes, the two pollution sources were set as 0.3m, and the emission rate was 6.35 g/s/m[19].
The research focus is to discuss the influence of the form of road greening section on PM2.5 reduction, so as to unify the types of plant allocation in the road green belt. According to previous studies, the optimal allocation mode for particle reduction is Joe + irrigation + grass
Fig.1 Profileofroadgreenbelt
CELA 2019 | UC Davis 361

[8], and shrub 0-2m height plays a key role in particle purification [11]. Abhijith also summarizes and recommends 2m as the optimal height of green belt in the review [6]. Therefore, shrub height 2m was designed. From the envi-met 3D database, wuhan city metasaurus was selected, with a height of 15m, a crown width of 7m, and a plant spacing of 8m. Data parameters in the database are modified or added by referring to relevant data according to the actual situation in Wuhan [29]. Specific parameters are shown in table 1.
3.3 Reduction rate and degree 3.3.1PM2.5concentrationdifferencediagram
The "LEONARDO" module was used to visualize the simulation results and obtain the plane and section distribution map of PM2.5 concentration in 3d road space. By superimposing and comparing the section forms of each green belt with the PM2.5 concentration distribution diagram of CK roads, the difference diagram of the action of the section forms of each green belt on the change of PM2.5 concentration can be obtained to discuss the reduction degree of the section forms of the green belt on PM2.5 concentration. In the plan, Z=1.5m pedestrian breathing height was selected; In the profile, inclined wind direction Y=60m and vertical wind direction Y=40m are selected to represent the region with stable diffusion under various wind directions. 3.3.2reductionrate
Previous studies have shown that the space most seriously affected by road pollution is the air in the low-altitude area within 50m and 1.7m of the traffic trunk road and its two sides [30], and this area is the pedestrian space. Therefore, this study focused on the changes of particles at the height of 1.5m in pavement under different road green belt conditions. Monitoring points (FIG. 3) were set at the edge of vehicle lane (0m) and pavement in a cross-section, with longitudinal interval of 10m. A total of 12 points were set for each road, and
Tab.1 MainparameterrequiredtoENVI-met
Types Projects Mainparameters
Numberofgrids 60�80�30
Gridprecision 1�1�2
Nestedgrid 5
Modelsetting
Nested grid soildefinition
Defaults
The initialtemperature
26�
Relativehumidity 69%
Windspeed 1m/s
Winddirection(10mheight)
225,270
Relative humidity2500m
7g/kg
Atmosphericconditions
Roughnessparameter
0.01
Particlediameter 2.5um
Typesof ���0.3m�
Sourceofpollution
Releaserate 6.35mg/(s*m)
3DPlant �/���15/7mPlantsSimpleplant �2m�LAD=2
CELA 2019 | UC Davis 362
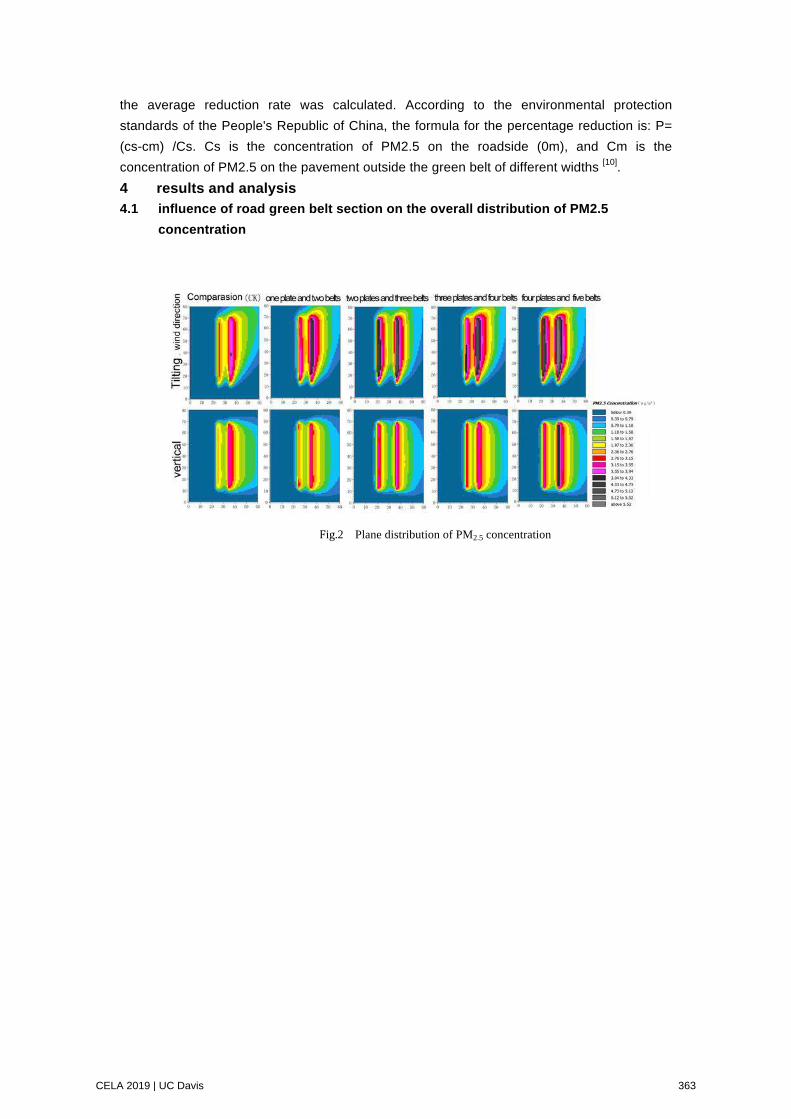
the average reduction rate was calculated. According to the environmental protection standards of the People's Republic of China, the formula for the percentage reduction is: P= (cs-cm) /Cs. Cs is the concentration of PM2.5 on the roadside (0m), and Cm is the concentration of PM2.5 on the pavement outside the green belt of different widths [10]. 4 results and analysis 4.1 influence of road green belt section on the overall distribution of PM2.5
concentration
Fig.2 Plane distribution of PM2.5 concentration
CELA 2019 | UC Davis 363

Because the discussion of the research results focuses on the reduction effect of the form
of road green belt section on PM2.5, the difference of background concentration value is omitted from the envi-met model, and the calculation results are expressed by relative concentration value [5], which is uniformly expressed as PM2.5 concentration in the paper. As shown in FIG. 2 and 3, the plane and profile distributions of PM2.5 concentration in road space converge as a whole. The concentration of PM2.5 increases gradually from the blue area to the black area in the figure. The area with the highest concentration in the road space is mainly at the source of the motor vehicle lane, which shows a trend of wind spreading towards the fan. Vertical wind is more conducive to the diffusion of particles than inclined wind, and the concentration of downwind particles is generally higher than upwind, and the diffusion height is within 10m.
Different greening types of road sections have significant influence on the distribution of fine particle concentration. As shown in the plan (FIG. 2), compared with CK's non-greening roads, the PM2.5 diffusion area of all types of roads converges after greening, the concentration of pollutants in motor vehicle lanes significantly increases, and the concentration of particles in non-motor vehicle lanes and sidewalks slightly decreases. According to the profile cloud map and the relative concentration line graph of 1.5m height (figure 3), the diffusion range of CK road with a concentration of 1.44-2.22 g/m3(light blue) is around 52m on the x axis. After the road greening, the cloud map of this concentration region shorted by 1-4m to varying degrees, indicating that the green belt significantly affected the diffusion of particle
Fig.3 Profile distribution of PM2.5 concentration and relative concentration polyline chart at 1.5m height
CELA 2019 | UC Davis 364

concentration. As can be seen from the broken line graph of 1.5m relative concentration, PM2.5 concentration of all green roads began to decline relative to non-green roads (CK) around 47m on the X-axis, indicating that the green belt can reduce PM2.5 concentration of sidewalks to a certain extent. Taking the X-axis 55m at the edge of the red line of the road as an example, assuming that the PM2.5 concentration of the actual greenless road is 100 g/m3, the concentration of one plate with two belts is 80 g/m3 under the inclined wind direction, the concentration of two plates with three belts is 74 g/m3, the three plates with four belts is 85 g/m3, and the four plates with five belts is 76 g/m3. Vertical wind direction, one plate two belt type concentration is 77 g/m3, two plate three belt type 73 g/m3, three plate four belt type 84 g/m3, four plate five belt type 79 g/m3. In addition, in the two-plate three-belt road space and four-plate five-belt road space, the concentration of vehicles in up-down wind direction tends to be similar, while the concentration in the central sub-belt area presents an obvious drop "trough", indicating that the distribution of PM2.5 concentration in the road space is affected by the separation of the central sub-belt between the up-down driving lanes. 4.2 the reduction degree of PM2.5 in the form of road green belt section
By comparing PM2.5 concentration values of all types of road greening sections with those of CK roads, the plane difference distribution diagram (figure 4) was obtained. Legend from blue to red area, the difference value from negative to positive. A positive area (red) indicates an increase in PM2.5 concentration after road greening, and a negative area (blue) indicates a decrease in PM2.5 concentration after road greening. As can be seen from figure 4, due to the effect of greening, the concentration of particulate matter in motor vehicle lane area increases to varying degrees, while the concentration of particulate matter in non-motor vehicle lane and sidewalk decreases. The areas with the highest concentration increase are generally found in upwind motor vehicle lanes. Among them, the concentration of two plates and three belts increases most obviously, reaching 4.27 g/m3 in inclined wind direction and 3.16 g/m3 in vertical wind direction. It is followed by four plates and five belts, reaching 4.23 g/m3 in inclined wind direction and 3.15 g/m3 in vertical wind direction. The area with the largest concentration drop appeared in the non-motorized lanes and sidewalks on both sides. The concentration drop was the most obvious in the two-plate and three-belt type. The road decreased by -1.82 g/m3 in the inclined wind direction and -1.08 g/m3 in the vertical wind direction. It is followed by four plates and five belts, with a decrease of -1.00 g/m3 in inclined wind direction and -0.28 g/m3 in vertical wind direction. In addition, there was also a significant decrease in the concentration of particulate matter between the upstream and downstream motor vehicle lanes, reflecting the reduction effect of the central green belt.
CELA 2019 | UC Davis 365

By comparing the section of each greening type road with the control road, the concentration difference of each section is obtained (figure 5). It can be seen from the figure that in the vertical space, under the form of section of each road green belt, the concentration value of the motor vehicle lane increases, and the airflow rises and deflects and diffuses toward the downwind, forming an obvious high-concentration diffusion zone with an influence height of about 15m. The 15m is the height of the arbor designed by the case, which reflects that the tree has a certain retarding effect on the diffusion of particulate matter. The maximum area of concentration drop appears below the high concentration diffusion area at the sidewalk side downwind, forming a "shelter area" with a minimum influence height of 2m(difference chart of three plates and four belts in vertical wind direction). 2m is the height of the hedgerow designed for the case, which can reflect the isolation effect of the hedgerow on PM2.5 diffusion.
Fig.4Plane distribution of PM2.5 difference concentration
CELA 2019 | UC Davis 366

In general, from the point of view of PM2.5 reduction area, four boards and five belts >,
two boards and three belts >, one board and two belts >, three boards and four belts >. In terms of the reduction degree of PM2.5, two-board three-belt >, four-board five-belt >, one-board two-belt >, three-board four-belt >. Two plates and three belts have the highest degree of reduction, reaching 4.42 g/m3 in vertical wind direction. The third board and four belts have the worst degree of reduction, only 0.23 g/m3 in inclined wind direction. 4.3 the PM2.5 reduction rate of pavement in the form of green belt section
In order to further know each road section greening on the reduction rate of the pavement, respectively along the lanes and sidewalks, 10 m set monitoring intervals, at 1.5 m height value, according to the pavement particles cut rate formula, the plate tilt average particle rate cuts the wind conditions, CK road of 54%, a plate two belts, two three zones 72% 62%, three board four take 67%, four board WuDai 72%; Each green board type cut rate raised respectively 8%, 18%, 13%, 18%. Under vertical wind direction, CK roads are 48%, one board two belts 54%, two board three belts 62%, three board four belts 53%, four board five belts 60%, each green board type increased by 6%, 14%, 5%, 12%. The best cutting rate is two boards with three belts and four boards with five belts. The best cutting rate is two boards with three belts under inclined wind condition, and the sidewalk cutting rate is increased by 18%. 5 Conclusion and discussion 5.1 the type of section of road green belt has a significant impact on the distribution
of particles The greenbelt can obviously change the distribution of PM2.5 concentration in the road
space. Different degrees of greening can lead to an increase in PM2.5 concentration in motor vehicle lanes and a decrease in PM2.5 concentration in non-motor vehicle lanes and sidewalks.
The mechanism of plant action on particle reduction is mainly divided into two aspects:
Fig.5 Profile distribution of PM2.5 difference concentration
CELA 2019 | UC Davis 367

diffusion and dust retention. This study shows that the distribution of pollutants in different road Spaces presents a trend of fan diffusion with the wind, which is consistent with the previous studies that diffusion plays a dominant role. Different greenbelt layouts affect the distribution of PM2.5 concentration. The greenbelt on both sides blocks the diffusion of PM2.5. PM2.5 continues to rise with the airflow and deflect downwind, again forming a diffusion zone of concentration difference. Thus, the sidewalk space under this diffusion area is blocked by the green belt and forms a low-concentration "shelter area". The green belt in the center blocks the diffusion of the upstream and downstream motor vehicle lanes, making the density values of the two motor vehicle lanes approximate. At the same time, due to the dust retention effect of the central car green belt, a concentration "trough" is formed. Therefore, in road space, plant diffusion plays a leading role in PM2.5 distribution, followed by dust retention. 5.2 road greening can significantly reduce the concentration of particulate matter in
sidewalks The research focused on pedestrian space. Through the simulation and analysis of the
plane and vertical distribution of PM2.5 in road space, it was found that although road greening increased the concentration of PM2.5 in motor vehicle lanes, it could significantly improve PM2.5 in non-motor vehicle lanes and sidewalks. Non-motor vehicles and sidewalks are exposed to the air and suffer the most, and they are the main audiences of road environment improvement.
It can be seen that road greening is an important measure to reduce sidewalk PM2.5 pollution. Previous road greening emphasized the beautification and cooling effect of plants, but did not pay attention to the reduction of particulate matter in green space, and even raised doubts [5]. However, previous studies mainly discussed street space as a whole, and concluded that plants affect the diffusion of particulate matter and produce poor effects [1]. This study shows that different types of road green belts can reduce the PM2.5 concentration of sidewalks to different degrees, and can effectively improve the pedestrian air environment. Moreover, the configuration type of plants is also closely related to the increase or decrease of PM2.5 concentration, and the diffusion height of PM2.5 concentration is basically the same as that of plants. Therefore, in the planning and design of road green belt, dense plant green barriers should be set as far as possible on the premise of safe visual range at the height of near-pedestrian space to prevent the diffusion of particles in the motor vehicle lane. Dense trees also play a certain role in blocking and isolating the diffusion of PM2.5 concentration in vehicle lanes, which is conducive to the reduction of PM2.5 concentration in pavement space. 5.3 two boards with three belts and four boards with five belts have the best cutting
effect Through comparative analysis, it is concluded that in terms of PM2.5 reduction area,
four-board five-belt >, two-board three-belt >, one-board two-belt >, three-board four-belt >. From the perspective of PM2.5 reduction degree, two-plate & three-belt > four- plate & five-belt > one- plate& two-belt > three- plate& four-belt >; From the point of view of cutting and improving rate, the green types of two boards, three belts and four boards and five belts have the best cutting effect on sidewalk space.
In the planning and design of road green space, the layout of two plates and three belts and four plates and five belts should be selected as far as possible. If the road space is dominated by pedestrians, or the land beyond the red line of the road is still other leisure
CELA 2019 | UC Davis 368

space, the area with the largest concentration of particulate matters should be given priority to, and the layout of four plates and five belts should be selected. If the road is dominated by vehicles and there is little activity space around, the green space design should be based on the maximum reduction of particulate matter, and the three- plate and four-belt layout has the best effect. 5.4 research prospect
In this paper, the simulation research method is used to exclude the influence of other factors to a certain extent through variable control, focusing only on the reduction effect of road green belt on PM2.5. However, in addition to reducing the concentration of particulate matter, the road green belt also undertakes a variety of important functions, such as shading, cooling, moisture and so on. ENVI -met simulation calculation of microclimate indicators also includes temperature, humidity, wind environment, etc. Subsequent research will expand the microclimate dimension, take into account a variety of environmental factors, and combine with field measurement, starting from solving specific problems to make the research results more accurate. At the same time, this paper focuses on the layout of plants in the cross-section, but the vertical layout of plants in the street space is also an important factor affecting the concentration of particulate matter, and how to reasonably design the spacing and length of green belts is also the direction of future research, in order to provide more detailed guidance and basis for road greening design.
Note: the graphs and tables are drawn by the author.
References:[1] WANIA A,BRUSE M,BLOND N,et al. Analysing the Influence of Different Street Vegetation on
Traffic-Induced Particle Dispersion Using Microscale Simulations[J]. Journal of Environmental Management,
2012,94: 91-101.
[2]DU Chunlan. Thinking about Ways to Reduce PM2.5 in Green Infrastructure[J].Landscape Architecture,
2013(2):147.
[3]ZHU Xiangming. PM2.5 and Green Infrastructure[J].Landscape Architecture,2013(2):151.
[4] DAI Fei, CHEN Ming, ZHU Shenwei. Effects of Different Green Coverage in Block Scale on PM10 and
PM2.5 Removal—A Case Study of the Main City of Wuhan[J]. Chinese Landscape Architecture,2018,34(3):
105-110.
[5] VOS PE,MAIHEU B,VANKERKO J,et al. Improving Local Air Quality in Cities: To Tree or not to Tree?
[J]. Environmental Pollution,2013,183: 113-122.
[6] ABHIJITH K.V. , KUMAR P , GALLAGHER J,et al.Air Pollution Abatement Performances of Green
Infrastructure in Open Road and Built-up Street Canyon Environments - A review[J]. Atmospheric Environment,
2017, 162:71-86.
[7] JANHALL S. Review on Urban Vegetation and Particle Air Pollution Deposition and Dispersion[J].
Atmospheric Environment, 2015, 105:130-137.
[8] XU Huan,ZHAO Jingjing,LI Hong. Influence of Urban Road Green Space on the Distribution and Reduction
of PM2.5 Concentration[J]. Northern Horticulture , 2016, (24): 65-69.
[9] ZHANG Lingyi. Research on Dust-Retention Effect of Urban Road Greenbelts[D].Chongqing:Southwest
University,2015.�
[10] MOU Hao. Research on Reduction Efficiency of Roadside Greenbelt Width on Air Pollutants[D].Wuhan:
Huazhong Agricultural University,2013.
CELA 2019 | UC Davis 369

[11] CHEN Xiaoping. Research on the Particle Attenuation Effect and Optimizing Strategy of Roadside
Greenbelt of Urban Major Road in Wuhan[D].Wuhan: Huazhong Agricultural University,2017.
[12] LIU Jun. Urban Green Space System Planning and Design [M]. China building industry press, 2004.
[13] GUO Linlin, LI Baofeng, CHEN Hong. A Review of Urban Micro-climate Research on Block Scale in
China[J]. Urban Development Studies,2017,24(1):75-81.
[14] ZHOU Shuwen, TANG Rongli, ZHANG Yuxin. A Review of Air Pollutant Diffusion Models for Urban
Street [J]. Chinese Journal of Applied Ecology, 2017, 28(3): 1039-1048.
[15] SUN Changfeng. Using ENVI-met to Simulation the Impact of Green Spaces on the Thermal Environment in
the Summer[D]. Nanjing:Nanjing University,2014.
[16] MA Xiaoyang. Greening’s Effects on Outdoor Thermal Environment of Residential Area by Numerical
Simulation [D]. Harbin:Harbin Institute of Technology, 2014.
[17] YANG Xiaoshan, ZHAO Lihua. Acomparison of Wind Field Simulations Between ENVI-met and
MISKAM[J]. Environmental Science & Technology ,2016,39(8):16-21. Building Energy Consumption.
[18] ZHAN Wei. Numercial Study of the Impact of Green Space Layout on Microclimate in Residential
District[D]. Nanjing:Nanjing University,2014.
[19 ]MORAKINYO TE,LAM YF.Simulation Study of Dispersion and Removal of Particulate Matter from
Traffic by Road-side Vegetation Barrier[J].Environmental Science and Pollution Research,2016,23: 6709-6722
[20] MORAKINYO TE,LAM YF, SONG H. Evaluating the Role of Green Infrastructures on Near-road Pollutant
Dispersion and Removal: Modelling and Measurement[J]. Journal of Environmental Management,
2016,182:595-605.
[21] NIKOLOVA I,JANSSEN S,VOS P,et al.Dispersion Modelling of Traffic Induced Ultrafine Particles in
a Street Canyon in Antwerp,Belgium and Comparison with Observations[J]. Science of the Total Environment,
2011,412: 336-343.
[22] NIKOLOVA I,JANSSEN S,VOS P ,et al. Modelling the Mixing of Size Resolved Traffic Induced and
Background Ultrafine Particles from an Urban Street Canyon to Adjacent Backyards[J].Aerosol and Air Quality
Research,2014,14:145-155.
[23] HOFMAN J,STOKKAERr I,SNAUWAERT L,et al. Spatial Distribution Assessment of Particulate Matter
in an Urban Street Canyon Using Biomagnetic Leaf Monitoring of Tree crown Deposited
Particles[J].Environmental Pollution, 2013,183: 123-132.
[24] HOFMAN J,WUYTS K, et al.On the link between Biomagnetic Monitoring and Leaf-depositeddust Load of
Urban Trees: Relationships and Spatial Variability of Different Particle Size Fractions[J]. Environmental
Pollution,2014,189: 63-72.
[25] HOFMAN J,BARTHOLOMEUS H,et al. On the Relation between Tree Crown Morphology and Particulate
Matter Deposition on Urban Tree Leaves: A ground-based LiDAR approach[J].Atmospheric Environment,2014,
99:130-139.
[26] Ministry of environmental protection of the People's Republic of China.2016 China Environmental Status
Bulletin [R].2016.
[27] Gb50220-95. Urban Road Traffic Planning and Design Specifications [S].1995.
[28]CJJ 75-97. Urban Road Greening Planning and Design Specifications [S].1997.
[29] ZHANG Li, ZHAN Qingming, et al. Effects of the Tree Distribution and Species on Outdoor Environment
Conditions in a Hot Summer and Cold Winter Zone: A case study in Wuhan residential quarters[J]. Building and
Environment,2018,130:27-39.
[30]KAUR S, NIEUWENHUIJSEN M J, COLVILE R N. Pedestrian Exposure to Air Pollution along a Major
Road in Central London, UK[J]. Atmospheric Environment, 2005, 39(38): 7307-7320.
CELA 2019 | UC Davis 370

CELA 2019 | UC Davis 371

The authors are solely responsible for the content of this technical presentation. The technical presentation does not necessarily reflect the official position of the Council of Educators in Landscape Architecture (CELA), and its printing and distribution does not constitute an endorsement of views which may be expressed. Citation of this work should state that it is from a CELA conference paper. EXAMPLE: Author's Last Name, Initials. 2019. Title of Paper. Sacramento, CA: CELA. For information about securing permission to reprint or reproduce this paper, please contact CELA at [email protected]
Taking a Plan of Heritage Corridor near Ancient Great Wall in Datong City as example: Construction Strategy of Scenic Forest in Heritage
Corridor
Shui, Jialing Beijing Forestry University,[email protected] Xiao,Feng Beijing Forestry University,[email protected] 1 ABSTRACT
Due to the particularity of the ancient Great Wall cultural heritage corridor along Datong, its vegetation construction has higher requirements in maintaining ecological stability, creating characteristic landscapes and inheriting historical culture. Therefore, the construction method of scenic forests is introduced. Different with traditional approach, the investigation is multidisciplinary collaborative that combines geographic information system (GIS), forestry, landscape architecture and historic preservation�and studies the landscape forest construction strategy based on the principles of landscape protection, ecological restoration, landscape construction and economic revitalization . First, we evaluate the heritage resources along the ancient Great Wall and delimit the boundaries of heritage corridor. Then, we identify the ecological problems in the study area and used the method of forest land suitability evaluation to select the suitable land, and then classify afforestation classes according to different site types.Finally, we use the method of plant landscape planning and design to carry out tree species selection and community layout planning and corresponding to the planning sub-class.This paper is beneficial for the future construction of heritage corridors which is able to conducted in a systematic, ecological, regional and aesthetic manner. In this work, a heritage corridor construction method is proposed which is more systematic as well as better integrates regional culture and forest aesthetics. The results demonstrate our proposal.
1.1 Keywords
the ancient great wall, heritage corridor, scenic forest, suitability evaluation, plant community layout
CELA 2019 | UC Davis 372

2 INTRODUCTION Heritage corridor has its rise from the American heritage protection which combines green
corridors and heritage protection. It emphasizes the linear regional heritage protection methods undertaking self-ecosystem restoration, historical and cultural protection, socio-economic development and cultural tourism development concurrently. In the spatial pattern, it comprises of ecological corridor system, eco-trail system, heritage resource system, and the interpretation system. As an important component of heritage corridor, the key factor in the construction of the ecological corridor system is vegetation. In many areas, vegetation degeneration due to natural or artificial causes renders the habitat collapse or about to collapse. Once heritage corridor involves such a zone, the restoration of the vegetation system becomes the priority.
Scenic forest is an artificial or natural community having ornamental, recreational and tourist functions under the premise of ecological stability. Such forest community effectively restores biotope, builds habitats, establishes diversity of species, inherits landscape characteristics of regional vegetation, and achieves the balanced development of natural ecology and cultural landscape. The scenic forest in cultural heritage corridor relies on the special cultural heritages and connects multiple independent cultural and natural resources. Different from traditional afforestation, its construction has higher demands on culture, ecology, aesthetics and economy. Therefore, the study of construction strategy in the scenic forest of heritage corridor is of particular importance. 3 OVERVIEW OF ANCIENT GREAT WALL CULTURAL HERITAGE CORRIDOR IN
DATONG In 2017, along with the economic strategic transformation of Shanxi Province, the new situation of
“all-for-one tourism” was developed. Datong Municipal Government proposed the conception of building the “Belt and Road”, namely: to construct a 250km-long tourist road along the ancient Great Wall. Further by relying on the tourist road and based on the reconstruction and construction of forest ecological landscape along the Great Wall, it integrates the cultural and natural heritage along the Great Wall. In this way, a green corridor 250km long and 1km wide on average is created so that a cultural heritage corridor relying on the ancient Great Wall is formed. The project involves five districts and counties of Zuoyun County, Xinrong District, Nanjiao District, Yanggao County and Tianzhen County in Datong City.
This area is Locate in the northeastern margin of Loess Plateau which is a transitional zone between semi-humid and semi-arid, monsoon and non-monsoon regions. As an ecotone of forests and grasslands, oases and deserts, the soil is arid with sparse vegetations, facing natural disasters such as drought, sandstorms and mountain torrents caused by storms. With the construction of the hillside Great Wall, the large-scale frequent moorburn, reclamation of steep slopes, unreasonable development of animal husbandry and mining in history, and disorderly tourism development in modern times, land desertification has aggravated, and vegetation has decreased drastically. Due to the lack of protection by natural vegetation, the Great Wall relics have been exposed without protection perennially and the wind and water erosion are serious. The surrounding cultural relics and historical sites in segmented distribution are also damaged to varying degrees and accompanied by the retarded regional tourism industry and people’s poverty. Therefore, it is extremely urgent to restore the vegetation system along the ancient Great Wall. 4 PRINCIPLES AND CONCEPTION OF TECHNICAL ROUTES OF THE SCENIC
FOREST CONSTRUCTION FOR CULTURAL HERITAGE CORRIDOR The particularity of the cultural heritage corridor determines that the construction of scenic forest
is different from the traditional ecological restoration and afforestation. It should be guided by a full respect of the regional culture and protection of heritage resources. Meanwhile, a full consideration from the macroscopic spatial structure layout and microscopic elemental organization of the scenic forest is given to its ecological, economic benefits and artistic appreciation value. According to the specific situation of Datong, it is held in this study that there are four principles in the construction of scenic forest in the region:
(1) From landscape protection, the construction of scenic forest along the Great Wall in Datong should protect the current authenticity of cultural and natural heritage. It requires not only to delimit the protection scope to ensure the protection of the existing vegetation, but also to clearly limit the scope of
CELA 2019 | UC Davis 373
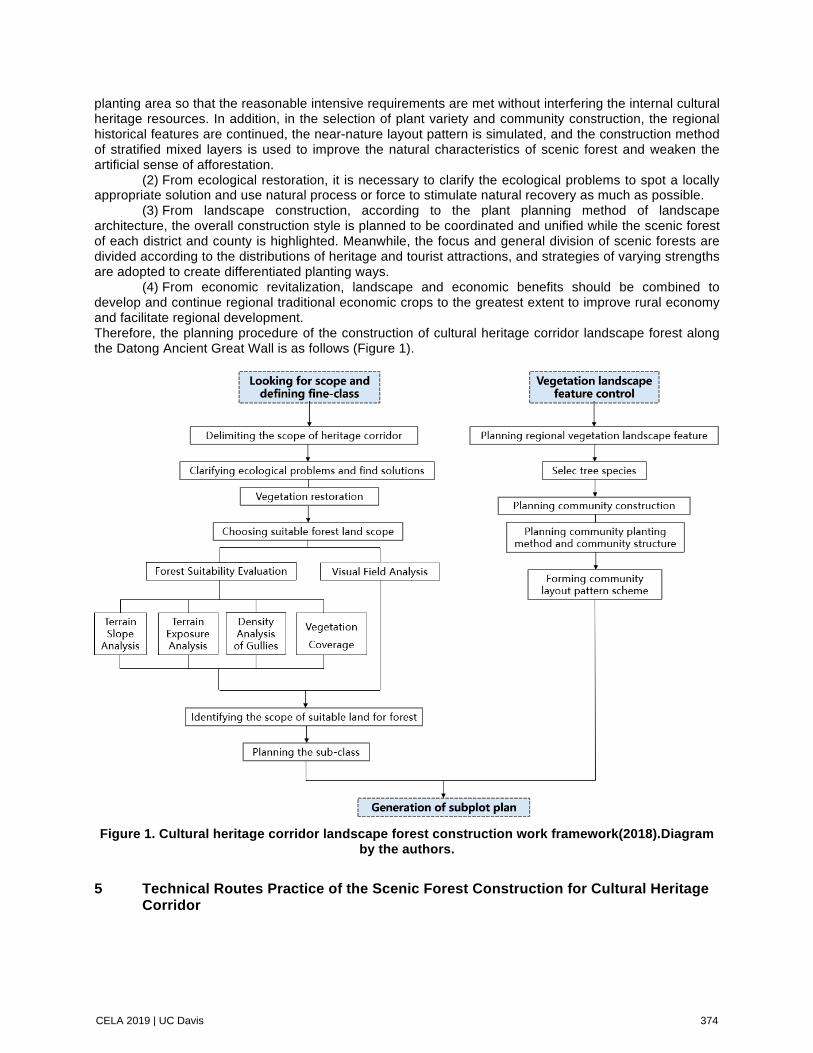
planting area so that the reasonable intensive requirements are met without interfering the internal cultural heritage resources. In addition, in the selection of plant variety and community construction, the regional historical features are continued, the near-nature layout pattern is simulated, and the construction method of stratified mixed layers is used to improve the natural characteristics of scenic forest and weaken the artificial sense of afforestation.
(2) From ecological restoration, it is necessary to clarify the ecological problems to spot a locally appropriate solution and use natural process or force to stimulate natural recovery as much as possible.
(3) From landscape construction, according to the plant planning method of landscape architecture, the overall construction style is planned to be coordinated and unified while the scenic forest of each district and county is highlighted. Meanwhile, the focus and general division of scenic forests are divided according to the distributions of heritage and tourist attractions, and strategies of varying strengths are adopted to create differentiated planting ways.
(4) From economic revitalization, landscape and economic benefits should be combined to develop and continue regional traditional economic crops to the greatest extent to improve rural economy and facilitate regional development. Therefore, the planning procedure of the construction of cultural heritage corridor landscape forest along the Datong Ancient Great Wall is as follows (Figure 1).
Figure 1. Cultural heritage corridor landscape forest construction work framework(2018).Diagram
by the authors.
5 Technical Routes Practice of the Scenic Forest Construction for Cultural Heritage
Corridor
CELA 2019 | UC Davis 374

5.1 Delimiting the scope of heritage corridor To obtain the intensive and efficient scenic forest construction area, the spatial distribution
pattern, the superiorities and inferiorities of the present environment and cultural value of the cultural heritage clusters along the Great Wall are evaluated. Datong ancient Great Wall is taken as the baseline with a width of 1.5km for the afforestation area (if the tourist road exceeds the 1.5km range of the Great Wall, 500 meters on both sides of the road will be taken as the area). However, most of the afforestation areas on the north of the Great Wall are within Inner Mongolia and beyond the sight range of the tourist road. Therefore, the first ridge line of the Great Wall within the sight range on the north of the road is defined as the northern limit of afforestation. In addition, in accordance with Law of the People’s Republic of China on the Protection of Cultural Relics and Rules on Great Wall Protection, the buffer zone of 50 meters on both sides of the ancient Great Wall is delimited not for the purpose of construction of scenic forests; plants damaging the Great Wall are removed, after an overall consideration of various factors is taken, such as the water and soil environment, vegetation conditions and the protection scope of cultural sites and others.
5.2 Clarifying ecological problems, choosing suitable forest land scope
The survey area is located in Loess Plateau where the mountain areas are faced with problems such as soil moisture loss and water soil erosion. The plain areas are exposed to problems such as soil fertility decline and low vegetation coverage. The gully regions have such problems as large gully density, steep slope and soil erosion. River area is faced with problems such as decreased water quantity and sharp decline in biodiversity; unused land is faced with problems such as soil erosion and a large amount of engineering wounds. However, vegetation restoration is the most effective means to solve these ecological problems.
To select effective vegetation restoration area, the study refers to the criteria and methods of forest suitability evaluation. According to the specific conditions in the survey area and land classification, other forests except for forest land (open forest land, shrubland, afforest land, unstocked land), cultivated land larger than 25°, and unused land (sandy land, bare land, bare land, and wild grassland) and gullies within the scope of afforestation base are selected as suitable forest land evaluation objects. According to the suitability degree of land for forest in the survey area, the suitable land for forest is divided into four grades, namely the highly suitable land for forest (S1), moderately suitable land for forest (S2), critically suitable land for forest (S3) and unsuitable land for forest (N).
Identifying the study factors is the primary and critical step to the evaluation of forestry suitability of land resources. Based on field investigations in the survey area and extensive literature reading, key factors restricting the plant growth were selected and studied. The solar radiation, spatial and temporal distribution of rainfalls, soil water content, vegetation type and other factors that affect the forest tree growth in the survey area are all influenced by topography. Therefore, the forest land suitability evaluation factors are mainly composed of topographic factors (Terrain slop, Terrain exposure, Density of gullies) and current vegetation (Vegetation coverage).
Above all, the GIS analysis functions were used to perform single-factor evaluation: (1)Terrain slope analysis The gullies in the survey area are criss-cross, which are indicative of the water soil loss in the
main catchment area of Loess Plateau. The stronger the development degree, the higher the ecological sensitivity. The density of the valley is divided into four grades: mild 0°-5°, moderate 6°-15°, strong 16°-25°, and intense 25°.
(2)Terrain exposure analysis The perennial precipitation in the survey area is scarce, and the evaporation capacity on the
sunny slope is greater than that on the shady slope, and the survival rate of trees is lower. To improve the ecological benefits of seedlings, the afforestation scope was marked out on the sunny slope. The slope of the survey area is divided into four grades: shady slope, half-shady slope, sunny slope and half-sunny slope.
(3)Density analysis of gullies The gullies in the survey area are criss-cross, which are indicative of the water soil loss in the
main catchment area of Loess Plateau. The stronger the development degree, the higher the ecological
CELA 2019 | UC Davis 375

sensitivity. The density of the valley is divided into four grades: mild 0-0.2, moderate 0.2-0.4, strong 0.4-0.6, and intense >0.6.
(4)Vegetation coverage Vegetation coverage is a significant factor reflecting the stand structure and forest growth as well
as an important condition for determining whether the natural conditions of soil and water in a certain area are suitable for forest plantation. The vegetation coverage of the survey area is divided into four levels: high coverage >0.7, medium coverage 0.4-0.7, low coverage 0.1-0.4, and bare land <0.1.
Delphi Descriptive lnventorles was used to determine the weight ratio of each factor. The factors were divided into four grades corresponding to the evaluation levels(Table 1). According to the single-factor evaluation model and the evaluation index system, the composite operation of fuzzy matrix was carried out, and the forestry suitability evaluation results in the survey area were obtained. Finally, to select a more intensive afforestation area, the tourist road contour was taken as the observation point, and visual line analysis was performed to select visible terrain coverage area as the suitable land for forest. The visual field analysis was carried out using GIS, and the forestry suitability evaluation analysis results and visual field analysis results were superimposed and analyzed to obtain the scope of suitable land for forest (Figure 2).
Table 1. Evaluation factor grading standard.
Ranking Evaluation Evaluation Factor S1 S2 S3 N
Weight
Terrain slope 0°-5° 5°-15° 15°-25° >25° 0.406 Terrain exposure shady slope half-shady slope sunny slope half-sunny slope 0.312 Density of gullies 0-0.2 0.2-0.4 0.4-0.6 >0.6 0.167
Vegetation coverage >0.7 0.7-0.4 0.4-0.1 <0.1 0.115
Figure 2. Operation process of selecting land area suitable for forest (2018) .Diagram by the
authors.
5.3 Sub-class planning
Ultimately, according to the distribution characteristics of land suitable for forest in the evaluation results, and the general map of ecological management patches and site type distribution diagrams in each district and county, the land is divided into eight types for subplot planning. It mainly includes mountain shady slopes, gullies, river wetlands, hill and land suitable for afforestation, immature forest land, cultivated land, sand dune and others.
5.4 Regional vegetation landscape feature planning
The construction of heritage corridor scenic forest imposes higher requirements on landscape planning and artistic conception compared with traditional afforestation. According to the status quo of the survey area, the featured demonstrations of the current situation in each district and county are obvious.
CELA 2019 | UC Davis 376

Therefore, the featured zoning of scenic forests is divided by districts and counties. In accordance with the landforms and water and soil characteristics, five sub-areas were planned.
Zuoyun section is characterized by the Great Wall of plains and piedmont Great Wall that creates a vegetation featuring plains and mountains as the green barrier of the ancient Great Wall, highlighting the humanistic style of the Great Wall. Xinrong section is dominated by plain and hilly landforms, spanning across Yinma River and surrounded by beach wetland, creating featured plain hills and wetland vegetation, stressing natural wild interest. Nanjiao section is surrounded by hilly landforms, adjacent to Zhaojiayao Reservoir, forming the colorful and fragrant vegetation landscape fronting water with hills on the back. Yanggao and Tianzhen sections are dominated by the piedmont Great Wall with basic landforms surrounding mountain land and hills, and the criss-cross gullies, presenting the near-natural vegetation featuring mountain forests and gullies.
5.5 Selection of tree species and community construction for scenic forest
According to the historical records of the vegetation landscape in the survey area, the current investigation and suggestions of local experts, relying on the existing featured tree species and regional culture, tree species selection was carried out from four aspects of stress resistance, ecological function, landscape aesthetics and economic benefit(Table 2).
CELA 2019 | UC Davis 377

Table 2. Evaluation factor grading standard.
Species Plant Lists
Evergreen coniferous arbors
Chinese pine (Pinus tabuliformis Carrière), Pinus sylvestris(Pinus sylvestris var. mongolica Litv.), Meyer's spruce(Picea meyeri Rehd. et Wils.),Platycladus orientalis(Platycladus orientalis (L.) Franco)
Arbor
Deciduous broadleaf
arbors
Dryland willow (Salix matsudana Koidz), Zhanghe willow (Salix chaenomeloides Krimura), Weeping willow (Salix babylonica), Locust (Robinia pseudoacacia L), Popularis (Populus ‘Popularis’), Populusopera (Cooperation ‘Popularis’), Elm(Ulmus pumila L.),Aspen (Populus davidiana),Trident maple (Acer buergerianum Miq.),White birch (Betula platyphylla Suk.), Gold leaf yu (Ulmus pumila'Jinye'), Larch (Larix gmelinii (Rupr.) Kuzen.), Gold leaf ash (Fraxinus chinensis Roxb.), Acer negundo (Acer negundo‘Aurea’)
Evergreen shrubs Needle juniper (Juniperus rigida S. et Z.), Sabina vulgalis (Sabina vulgaris)
Shrub
Broadleaf shrub
Winged spindle tree (Euonymus alatus (Thunb.) Sieb), Drunk fish wood (Buddleja ahernifolia Maxim), Daphne lilac (Syringa microphylla Diels), Liaodong clove (Syringa wolfii Schneid.), Beijing clove (Syringa pekinensis Rupr.), Flowering plum (Amygdalus triloba) ,Caragana (Caragana korshinskii), Dense branch red leaf plum (Prunuscerasifera var.atropurpurea 'Russia'), Fructus forsythiae (Forsythia suspensa), Baoma clove (Syringa reticulata (Blume) H. Hara var. amurensis (Rupr.) J. S. Pringle), Amur maple (Acer ginnala Maxim.), Prunus wilsonii (Padus virginiana ‘Canada Red’), Lespedeza (Lespedeza bicolor Turcz.), Caragana microphylla (Caragana microphylla Lam)
Hydrophyte /
Reed (Phragmites communis)、Willow herb (Lythrum salicaria L.), Fleur-de-lis(Iris tectorum Maxim.)
Cover
/
Lilium pumilum (Lilium pumilum DC.), Pink (Dianthus chinensis L.), Marestail (Equisetum arvense L.), Monochoria korsakowii (Monochoria korsakowii Regel & Maack), Red-spotted stonecrop(Hylotelephium erythrostictum (Miq.) H.Ohba [Sedum erythrostictum Miq.]), Orychophragmus violaceus(Orychophragmus violaceus (L.) O. E. Schulz)
Commercial
Crop
/
Ansu apricot (Armeniaca sibirica(L.) Lam), Mountain peach (Amygdalus davidiana (Carrière) de Vos ex Henry), Plum tree (Prunus L)、Sea-buckthorn (Hippophae rhamnoides Linn.), Big fruit sea-buckthorn(Fructus Hippophae), Medlar (Lycium chinenseMill.), Dahurian Rose Fruit (Rosa davurica), Marina Chinese pear-leaved crab-apple (Malus asiatica Nakai), Clover (Medicago sativa), Scutellaria (Scutellaria baicalensis Georgi), Chinese thorowax root (Bupleurum chinense), Flax (Sesamum indicum), Potato (Solanum tuberosum L.), Buckwheat (Fagopyrum esculentum Moench.), Rush (Juncus effusus L.)
On the basis of plant list, according to the subplot planning results combined with the distribution of site types, plant varieties were rationally combined, and 15 categories and 51 types of community combinations were formed.
(1) In the gully area, by planting featured tree species and shrubs on the side of ditch and gentle slope, not only can the richness of vertical layers be increased, but also the surface runoff formed by rainstorms be utilized to flush the seeds of waterborne plants to the gully downstream. This way can make
CELA 2019 | UC Davis 378

this area forming vegetation coverage gradually so use the combined plantation pattern of arbor and shrub. However, some of the gully slopes are too steep, which is not suitable for planting arbors while planting shrubs in large scale is conducive to conservation of water and soil.
(2) In the shady slope area of the mountain land, the evergreen species favoring light with high tolerance and strong resistance are planted in the areas below altitude of 1500m, and different operation areas are used to create the forest landscape with natural density; a pattern of random mixed grouping of evergreen and deciduous species is adopted in areas at the altitude of 1500m and above to enrich the color background of the ancient Great Wall. Although the sunny slope is mapped out of the scope of land suitable for forest, the shady slope of the survey area is affected by the southwest monsoon in summer with abundant rainfall. By planting anemochory species in the piedmont plain, the plant seeds are sown on the low-sloped mountainous areas by the prevailing wind. Seedlings with strong vitality will come into mountain land vegetation gradually.
(3) In the barren mountain and wasteland area of land suitable for forest, to create the forest landscape with rich texture and obvious seasonal color changes that reflects local characteristics, the evergreen and fruit bushes are mixed and planted. The soil with a slope ranging from 10° to 20° has a low soil moisture content, thus the mixed pattern of scale planting of drought-resistant and thin-grained small colorful arbors and random mixed grouping planting of large arbors is adopted. Areas with slope below 10° have enough moisture, adopting the planting pattern of large-scale shrubs and random mixed grouping of large and small arbors and resulting in the changes in vegetation layers in such areas of land suitable for forest.
(4) In the immature forest area, according to the opposite relationship with the Great Wall, the local community should adopt the three-community layout of random mixed grouping of arbors and large-scale planting of shrubs, random mixed grouping planting of arbors, and large-scale planting of shrubs to create the versatile spatial environment. The local area currently has Caragana korshinskii with a density of 2m*3m, using the planting mode of caragana korshinskii crown cutting flat insertion and random mixed grouping with arbors, breaking the rigidity of row planting.
(5) In the cultivated land area, the scale economic forestry and fruit industry is developed. For the convenience of planting and picking, a large area of row planting mode is adopted.
(6) In the sand dune area, caragana korshinskii with a strong root system and sand-fixing capacity is adopted. Sand dunes are vulnerable to wind erosion whereas excessively dense caragana korshinskii can cause soil moisture deficit. Too thin caragana korshinskii cannot resist wind erosion. Therefore, the 2m*3m plant spacing is used for planting, which is convenient for final-period management.
(7) In the river wetland area, the waterlogging-resistant arbors are selected on the river bank with the method of random mixed grouping of arbors; on the other hand, the large-scale planting method of aquatic plants is employed in the river channels and wetland areas.
(8) For other land areas, emphasis should be laid on the shaping of terrain as a whole, the underlaying relationship with the Great Wall and the creation of spatial changes, while the random mixed grouping combination of arbors in various operation areas enhances the abundance of overall vegetation landscape and create the scenic forest with local specialties. 5.6 Construction of scenic forest based on landscape garden plant planning method
Traditional afforestation community planting methods are typically distributed in criss-cross or staggered forms. Even if the density of planting points varies, the final resulting effect will appear artificial. Therefore, the scenic forest construction in the survey area abandoned the traditional planting method for afforestation community, combined with the planning and design method for landscape garden plant and the specific construction conditions. This way using 70% regular planting method plus 30% free distribution of planting points (Figure 3). In terms of community structure and form, in addition to the use of regular planting methods in economic forest planting areas and sand dune planting areas, a multi-layered mixed mode of mass type is used to highlight the natural attributes and improve biodiversity (Figure 4). Key plots and general plots are also differentiated, where large-scale high-density planting methods are adopted in tourist attractions while small-scale low-density planting methods used in other areas. On such basis, a total of 51 types of community combination patterns are formed to present the final community layout.
CELA 2019 | UC Davis 379

Figure 3. Comparison of traditional afforestation and the community planting pattern in this study
(2019) .Diagram by the authors.
Figure 4. Structure scheme of mass-type mixed cross-planting(2018) .Photo by Feng Xiao.
5.7 Generation of subplot plan
In line with the formed 51 types of community layout patterns, the study corresponds to the subplot planning results of the site types within the scope of land suitable for forest, and finally the scenic forest construction plan is generated.
CELA 2019 | UC Davis 380

6 Conclusion
The study approach has guided the construction of cultural heritage corridor scenic forest with a length of 250km, involving an area of 186km², and completed the afforestation of 120 million plants in 58 varieties, achieving outstanding effect. In this manner, we have realized the important role of cultural heritage corridor scenic forest in heritage protection, ecological restoration, landscape promotion and economic revitalization, laying a favorable green foundation for Datong’s cultural heritage corridor. However, the development status and ecological benefits of its long-term vegetation community still call for further studied (Figure 5). It is required to increase the planting of herbage in the late management and maintenance of some plants with single species and simple species configuration, and add ornamental plants in some places with poor landscape effect.
Figure 5. Typical vegetation features(2018) . Photo by Zhao Keji.
7 REFERENCES 1. Searns R M. (1995).The evolution of greenways as an adaptive urban landscape form. Landscape
& Urban Planning, 33(1–3), 65-80. 2. Buhyoff G J, Leuschner W A. (1978). Estimating psychological disutility from damaged forest
stands. Forest Science, 24(3), 424-432. 3. Deng S, Yan J, Guan Q. (2013). Short-term effects of thinning intensity on scenic beauty values of
different stands. Journal of Forest Research, 18(3), 209-219. 4. Pereira J C, LucienDuckstein. (1993). A multiple criteria decision-making approach to GIS-based
land suitability evaluation. International Journal of Geographical Information Systems, 7(5), 407-424.
5. A Research on Plant Landscape Planning and Design[J]. Chinese Landscape Architecture, 2012. 6. Wang Zhifang, Sun Peng. (2001). Heritage corridor - a relatively new method of heritage
conservation. Chinese Landscape Architecture, 17(5), 85-88. 7. Zhou Rongwu, An Yutao, Ma Runguo. (2013). Concept of landscape forest and its research status.
Scientia Silvae, Sincae, 49(8),117-125. 8. Ma Hao, Zhou Zhixiang, Wu Changguang. (2011). Study on the suitability evaluation and tree
species structure adjustment of xishui county forestland under GIS support. Soil and Water Conservation in China, 1(3), 44-47.
9. Wang Zhiming. (2012). Gis-based study on site factor analysis and type division of loess region in west Shanxi Province. Beijing forestry University.
10. Li Chunjiao, Jia Peiyi,Dong Li. (2014). Procedures and methods of plant landscape planning and design in landscape architecture. Chinese Landscape Architecture, (1), 93-99.
Title of Paper or Research: Taking a Plan of Heritage Corridor near Ancient Great Wall in Datong City as example: Construction Strategy of Scenic Forest in Heritage Corridor
Author: Shui Jialing, Feng Xiao
CELA 2019 | UC Davis 381

Institution or Professional Affiliation: Beijing Forestry University Authors please select one of the following: I DO_____ DO NOT___√__want to prepare a media statement for general release from the 2018 CELA Conference. (If you choose DO NOT, you do not need to prepare a media statement).
CELA 2019 | UC Davis 382

The authors are solely responsible for the content of this technical presentation. The technical presentation does not necessarily reflect the official position of the Council of Educators in Landscape Architecture (CELA), and its printing and distribution does not constitute an endorsement of views which may be expressed. Citation of this work should state that it is from a CELA conference paper. EXAMPLE: Author's Last Name, Initials. 2019. Title of Paper. Sacramento, CA: CELA. For information about securing permission to reprint or reproduce this paper, please contact CELA at [email protected]
A NEW PERSPECTIVE FOR FLOATING GREEN SPACES
BORELLI, TARYN Kansas State University [email protected] GOHAR, AMIR Kansas State University [email protected] 1 ABSTRACT An artificial floating island (AFI) is a man-made, floating planter installed with aquatic or terrestrial plants. AFIs float by a constructed, buoyant frame or substrate mat, and can be anchored in place via cables or piers. AFIs float on the surface of water, allowing plant roots to be constantly submerged in the water column. Through rhizofiltration, AFIs filter excess nutrients and pollutants from the water. For centuries, AFIs have been used for ecological purposes and have supported agriculture and human habitation. Recently, AFIs have been growing in usage and popularity for their ecological benefits, and some contemporary AFI designs incorporate spaces for social and recreational activities. Although these AFI designs successfully address their primary environmental goals, they may not fully accommodate the social and recreational uses of public open spaces. This research focuses on how AFIs can support social and recreational activities while maintaining their existing ecological services and contextual appropriateness. Through a series of precedent studies, expert interviews, and projective design, the research will inform new guidelines for the design of social and recreational AFIs, and ultimately help develop a new type of public green space. 1.1 Keywords AFI, artificial floating islands, landscape guidelines, urban riverfronts, public open space
CELA 2019 | UC Davis 383

2 INTRODUCTION
Floating islands, both artificial and natural, have been used by different populations of humans for centuries. In recent decades, artificial floating islands (AFIs) have been developed and implemented for their ecological benefits and are becoming more widely used as a strategy for ecological restoration. AFIs have also been, and are still being used, by humans for the provision of food and shelter. In Bangladesh, landless, impoverished farmers use AFIs to cultivate crops, especially during monsoon season when field crops would usually be damaged by floods (Andrews et al., 2013; Irfanullah, Azad, Kamruzzaman, & Wahed, 2011; “Floating Gardens in Bangladesh,” 2017; Li, 2013). And, in Peru, the Uros people of Lake Titicaca have built entire villages on AFIs constructed from living reeds (Andrews et al., 2013; Li, 2013; Masters, 2012) (Section 2.2).
AFI design is expanding to incorporate social and recreational activities and serve as public open spaces. For example, in Singapore’s Punggol Reservoir, a series of AFIs have been implemented both as an ecological remediation strategy and a community space (Andrews et al., 2013; CPG Consultants, 2018). AFIs have also been implemented on Rotterdam’s Nieuwe Maas River: The Recycled Park Foundation has recycled plastic litter found on the river to fabricate twenty-eight hexagonal AFIs, creating a “floating park” (Neelis, 2018). These AFI designs successfully fulfill their primary environmental goals: Recycled Park aims to reduce litter in the Nieuwe Maas River (Neelis, 2018; Waste 360, 2018) and the Punggol Reservoir AFI focuses on wetland restoration and community education (Andrews et al., 2013, CPG Consultants, 2018). Though these AFIs include spaces for social and recreational activities, it is not their primary goal, and might not be fully accommodated. This research will answer the question, “How can artificial floating islands (AFIs) along urban waterfronts support human social and recreational activities while maintaining their existing ecological services and contextual appropriateness?” and will look at creating guidelines for AFI design as public space along urban waterfronts. 2.1 Terminology
To begin, it is important to address and understand the many terms used to describe artificial floating islands (AFIs). The terms “floating island” and “floating wetland” are used to refer to the natural phenomenon of a mass of plants growing on the surface of water (Headley & Tanner, 2006); Hoeger, 1988). “Floating wetland”, along with “floating treatment wetland” (FTW), can also be used to refer to a constructed mat on which plants are installed for ecological purposes (Andrews et al., 2013; Headley & Tanner, 2006; Kennen & Kirkwood, 2015; MacDonald, 2016; Streb, 2013). “Floating garden” is used to describe constructed floating islands in Bangladesh used for crop cultivation (Irfanullah, Azad, Kamruzzaman, & Wahed, 2011; “Floating Gardens in Bangladesh,” 2017). The term “bairas” is also used to describe the floating crop technique that has been used in Bangladesh, Myanmar, and China for centuries (Andrews et al., 2013.; Li, 2013).
Throughout the research, the term “artificial floating island” or “AFI” will refer to a man-made floating planter that allows plants’ roots to be in constant contact with the water column. In addition, the term “social AFI” will refer to an artificial floating island that supports social and recreational activities. Social activities are events that “bring members of the community together” (Nugent, 2013) and recreational activities are ones that people choose to partake in their leisure time “to refresh their bodies and minds” (Khasnabis et al., 2010). These interactions enrich communities as well as personal growth.
The term “ecosystem services” will also be used throughout this research. In his article from Britannica Academic (2016), Johnston defines “ecosystem services” as ecological conditions that are directly or indirectly linked to the benefit or profit of human beneficiaries. Johnston (2016) uses the example that an increase in fish in a human-populated area can increase recreational and commercial fishing, which promotes the welfare of humans. The terms “ecological purposes” and “ecological benefits” will be used throughout this paper and refer to the ecosystem services that benefit humans.
2.2 History of Artificial Floating Islands (AFIs)
Human use of AFIs has occurred throughout history in different areas around the world. In between the Tigris and Euphrates Rivers lies the ancient Mesopotamian Marshlands, a place surmised to have been the “Garden of Eden” (Andrews et al., 2013). Native Marsh Arabs, the Ma’dan, have built their villages there for thousands of years (Arraf, 2016; Andrews et al., 2013). Floating islands made of reeds,
CELA 2019 | UC Davis 384
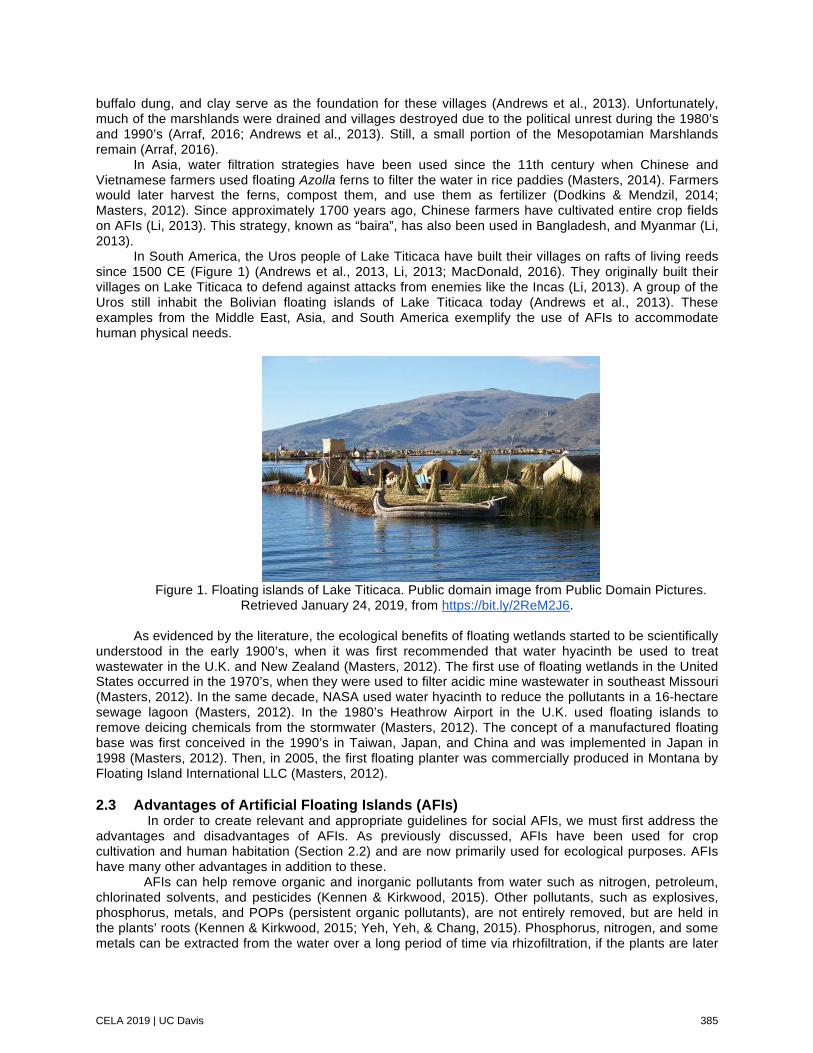
buffalo dung, and clay serve as the foundation for these villages (Andrews et al., 2013). Unfortunately, much of the marshlands were drained and villages destroyed due to the political unrest during the 1980’s and 1990’s (Arraf, 2016; Andrews et al., 2013). Still, a small portion of the Mesopotamian Marshlands remain (Arraf, 2016). In Asia, water filtration strategies have been used since the 11th century when Chinese and Vietnamese farmers used floating Azolla ferns to filter the water in rice paddies (Masters, 2014). Farmers would later harvest the ferns, compost them, and use them as fertilizer (Dodkins & Mendzil, 2014; Masters, 2012). Since approximately 1700 years ago, Chinese farmers have cultivated entire crop fields on AFIs (Li, 2013). This strategy, known as “baira”, has also been used in Bangladesh, and Myanmar (Li, 2013). In South America, the Uros people of Lake Titicaca have built their villages on rafts of living reeds since 1500 CE (Figure 1) (Andrews et al., 2013, Li, 2013; MacDonald, 2016). They originally built their villages on Lake Titicaca to defend against attacks from enemies like the Incas (Li, 2013). A group of the Uros still inhabit the Bolivian floating islands of Lake Titicaca today (Andrews et al., 2013). These examples from the Middle East, Asia, and South America exemplify the use of AFIs to accommodate human physical needs.
Figure 1. Floating islands of Lake Titicaca. Public domain image from Public Domain Pictures.
Retrieved January 24, 2019, from https://bit.ly/2ReM2J6.
As evidenced by the literature, the ecological benefits of floating wetlands started to be scientifically understood in the early 1900’s, when it was first recommended that water hyacinth be used to treat wastewater in the U.K. and New Zealand (Masters, 2012). The first use of floating wetlands in the United States occurred in the 1970’s, when they were used to filter acidic mine wastewater in southeast Missouri (Masters, 2012). In the same decade, NASA used water hyacinth to reduce the pollutants in a 16-hectare sewage lagoon (Masters, 2012). In the 1980’s Heathrow Airport in the U.K. used floating islands to remove deicing chemicals from the stormwater (Masters, 2012). The concept of a manufactured floating base was first conceived in the 1990’s in Taiwan, Japan, and China and was implemented in Japan in 1998 (Masters, 2012). Then, in 2005, the first floating planter was commercially produced in Montana by Floating Island International LLC (Masters, 2012).
2.3 Advantages of Artificial Floating Islands (AFIs)
In order to create relevant and appropriate guidelines for social AFIs, we must first address the advantages and disadvantages of AFIs. As previously discussed, AFIs have been used for crop cultivation and human habitation (Section 2.2) and are now primarily used for ecological purposes. AFIs have many other advantages in addition to these.
AFIs can help remove organic and inorganic pollutants from water such as nitrogen, petroleum, chlorinated solvents, and pesticides (Kennen & Kirkwood, 2015). Other pollutants, such as explosives, phosphorus, metals, and POPs (persistent organic pollutants), are not entirely removed, but are held in the plants’ roots (Kennen & Kirkwood, 2015; Yeh, Yeh, & Chang, 2015). Phosphorus, nitrogen, and some metals can be extracted from the water over a long period of time via rhizofiltration, if the plants are later
CELA 2019 | UC Davis 385

harvested (Kennen & Kirkwood, 2015; Yeh, Yeh, & Chang, 2015). The process of AFI rhizofiltration starts when microorganisms attach to the plants’ roots. The microorganisms digest excess phosphorus and nitrogen from the water and transfer the nutrients directly to the root system. The plants then use these excess nutrients to produce biomass that can be fully removed from the system once harvested (Li, 2013). The harvested biomass can then be used for fertilizer, animal feed, and food for humans (Li, 2013; Zhang, Li, Yu, Wu, & Cheng, 2015). AFIs can also control algae and phytoplankton levels in the water (Li, 2013). The plants’ roots absorb excess nutrients from the water column faster than algae can, thus starving the algae (Li, 2013). To reduce phytoplankton, AFIs create a shadowing effect in the water, which prevents phytoplankton from receiving adequate sunlight (Li, 2013). At the same time, shadowing from AFIs lowers the water temperature, which is healthier for fish and other aquatic species (Andrews et al., 2013). In addition, the plants’ roots provide protection and spawning materials for vulnerable fish (Andrews et al., 2013; Dodkins & Mendzil, 2014; Hoeger, 1988; Li, 2013). AFIs also serve as habitat and protection against terrestrial predators for waterfowl, insects, amphibians, reptiles, aquatic mammals, and invertebrates (Andrews et al., 2013; Hoeger, 1988; Li, 2013).
The presence of native plants and wildlife can attract ecotourism on floating islands with activities such as birdwatching (Dodkins & Mendzil, 2014). The presence of flora and fauna also creates opportunities for ecological education (Andrews et al., 2013; Dodkins & Mendzil, 2014). The Sengkang Floating Wetland in Singapore and the artificial floating islands along the Chicago Riverwalk both use floating spaces, native plantings, and informational signage to educate the public about the local ecosystem. (Andrews et al., 2013; Sasaki, 2017; CPG Consultants, 2018). This ecological education lends to a stronger local identity and even ecotourism. AFIs can also affect the well-being of a population. In his book “Biophilia” (1986), Edward O. Wilson describes his theory: humans have an innate desire to interact with other living things. And, in “Handbook of Biophilic City Planning & Design,” Beatley (2017, 3) defines a biophilic city as one that supports green spaces and biodiversity. He goes into detail about the impact that nature has on urban areas and argues that biophilic cities are more resilient when it comes to poverty, affordable housing, employment, and sustaining the local economy. In other words, it pays to have a green city. As green spaces, AFIs can help make cities more biophilic and create more enjoyable environments for city-dwellers and visitors. Today, 54% of the global population lives in urban areas and this number continues to grow with increasing urbanization (Beatley, 2017, 3). Impervious surfaces that accompany urbanization lead to more abundant and polluted stormwater runoff (MacDonald, 2016). In urban areas, where filtration of stormwater is vital, natural filtration systems, such as wetlands and other green spaces, are limited (MacDonald, 2016). Urbanization transforms desirable real-estate along urban waterfronts from soft, permeable edges, to hard and impermeable (MacDonald, 2016). Without permeable surfaces, polluted stormwater runs unobstructed to water bodies without natural filtration and inhibits the health of the environment (MacDonald, 2016). To mitigate this, AFIs are being implemented in stormwater retention ponds and other urban water bodies to strengthen natural filtration and remediate local ecologies (MacDonald, 2016; Wang & Sample, 2014). While AFIs improve conditions under the surface of water, they can also protect the shore by abating bank erosion (Hoeger, 1988; Li, 2013). AFIs can act as wave breaks by absorbing the shock of waves, retarding the gradual process of erosion and, thus, protecting aquatic edges (Hoeger, 1988; Li, 2013). Like other greenspaces, AFIs reduce the heat-island effect in urban areas. In his book, “Handbook of Biophilic City Planning & Design,” Beatley (2017, 42) explains the heat-island effect, a phenomenon where urban areas are significantly hotter than rural areas due to less heat-absorbent surfaces. The rise in urban temperature can be mitigated with several strategies, the most common being the implementation of more green space. As green space, AFIs can slightly reduce the heat-island effect and help control the immediate microclimate, making the space more enjoyable for visitors. Artificial floating islands are also beneficial to cities because they are relatively cost and space effective (Andrews et al., 2013; Olguín, Sánchez-Galván, Melo, Hernández, & González-Portela, 2017). AFIs do not typically require land acquisition (Wang & Sample, 2014) and, therefore, can be exempt from land taxes. Because AFIs require little to no land, they are also a space-effective strategy (Andrews et al., 2013; Olguín, Sánchez-Galván, Melo, Hernández, & González-Portela, 2017). The cost of an AFI can be further reduced by using recycled materials (Wang & Sample, 2014). For example, plastic bottles are often used to construct the buoyant bases AFIs. Some AFIs such as Spiral Island in Mexico, Pier 53 on the Delaware River in Philadelphia, and Lake Rotorua Floating Island in New Zealand use as many as
CELA 2019 | UC Davis 386

400,000 empty plastic bottles secured in netting to support the floating islands (Andrews et al., 2013). In addition, AFIs require a limited amount of labor (Wang & Sample, 2014; Headley & Tanner, 2006; Hoeger, 1988, 304) and Headley and Tanner (2006, 80) agree that that artificial floating islands are “virtually maintenance free” (Hoeger, 1988, 304) besides occasional inspections. AFIs can simply be pulled to shore and can support the weight of a person for maintenance (Headley & Tanner, 2006). Of course, Hoeger, Headly, and Tanner were describing the maintenance of highly naturalized AFIs used solely for water filtration and waterfowl habitat. Still, it can be deduced that the amount of labor needed for the construction, installation, and maintenance of an AFI is equal to - if not less - than a terrestrial green space. 2.4 Limitations of Artificial Floating Islands (AFIs)
Although AFIs have many benefits, there are other elements that must be addressed. First, the active ecosystem services of an AFI depend on its context. One of the most well-known ecosystem services of AFIs is water filtration. However, AFIs have varying effects on the water quality depending on the area, depth, and flow rate (m3/s) of a body of water (Headley & Tanner, 2006). AFIs only treat the volume of the water column that the roots come in contact with (Headley & Tanner, 2006). Thus, though they are still beneficial to the environment, AFIs have minimal impact on the water quality in larger bodies of water or those with higher flow rates. AFIs have the most impact on the water quality of small, freshwater water bodies with low flow rates (Headley & Tanner, 2006).
Another aspect to consider is that AFIs may require special maintenance. Sediment accumulation on AFIs is common, so dredging may be necessary every several years. The sediment that accumulates on AFIs tend to be high in metals and contaminants and must be handled appropriately as to not agitate and remobilize the pollutants. Maintenance may also require access by boat and may become more difficult in climate extremes (Andrews et al., 2013). For example, AFIs may need special attention or need to be removed during a freeze (Andrews et al., 2013).
Lastly, the balance of an AFI’s size and weight must be considered. Andrews et al. (2013) provide many examples of large AFIs. Rotorua Floating Island measures 68,775 sqft, Sengkang Floating Wetland is roughly 28,800 sqft, and Spiral Island measured 3,564 sqft. Rotorua Floating Island and Sengkang Floating Wetland are made up of multiple AFIs secured together, but Spiral Island was a large, singular AFI. Although these large precedents are and have been successful, AFI size and weight are generally limited by their context, purpose, and construction. Headley and Tanner (2006, 76) admit that the size of an ecological-effective AFI cannot be fully determined due to the absence of AFI design guidelines. 2.5 Significance
Urban water bodies possess historical, cultural, and social significance that lends to local identities. However, some urban water bodies have become inaccessible to locals and tourists. In addition, their aquatic ecologies are becoming threatened due to urban development and pollution. AFIs are a way to ecologically restore waterfronts while allowing us to take advantage of them as social and cultural platforms. AFIs have supported ecological purposes and human physical needs. However, they have not been researched for their potential to serve as social and cultural spaces. The research aims to create guidelines for social AFI design in order to create a new design thinking for this type of sustainable urban green space.
3 EVALUATING FRAMEWORKS FOR GUIDELINE DEVELOPMENT
General design guidelines for social AFIs have hardly been researched, if at all. In order to create effective design guidelines, it is useful to look at other well-recognized frameworks.
3.1 Existing Frameworks
AFIs can be effectively evaluated through the lens of ecosystem services. Ecosystem services are divided into four categories: supporting, provisioning, regulating, and cultural services (Johnston, 2016). Supporting, provisioning, and regulating are all quantitative, have been thoroughly researched, and are well-understood. These categories include aspects such as photosynthesis, climate regulation, and provision of medicinal resources. Cultural, though, is a qualitative value and has hardly been researched, if at all, in terms of AFIs. This category includes the recreational, educational, spiritual, and
CELA 2019 | UC Davis 387

aesthetic value that ecosystems provide. The cultural portion encompasses the social and recreational use of AFIs, which is the focus of this research.
Project for Public Spaces (PPS) is a non-profit organization that has developed a framework outlining criteria for successful public spaces. “The Place Diagram” is divided into four quadrants representing key attributes of good public spaces: sociability, uses and activities, access and linkages, and comfort and image. Two layers radiate out from the key attributes. The inner ring identifies “intangibles,” while the outer ring identifies “measurements” (Project for Public Spaces, 2018). “Intangibles” represent intuitive qualities of a space such as “welcoming” and “walkable,” while “measurements,” include quantitative variables such as property values and crime statistics (Project for Public Spaces, 2018).
This diagram has given clarity to a topic that once seemed incomprehensible. It provides a clear, organized way to evaluate public open space and can help inform the structure of the proposed AFI design guidelines. This diagram covers many important variables that affect the quality of a space. However, it does not fully address two crucial attributes: economy and governance. These variables will be addressed in the proposed AFI design guidelines.
The framework for sustainable development provides the missing pieces of economy and governance. The framework for sustainable development illustrates that sustainability is achieved through a balance of ecology, equity, and economy. Ecology is intrinsic to AFIs and is addressed in the ecosystem services framework. Equity would ideally be achieved through social AFIs and is addressed through the Place Diagram. Lastly, economic support is essential to the success of any public open space, including social AFIs, and is addressed in the sustainable development framework. El Hour et al. (2016) argue that effective governance is inherent of sustainable development in addition to ecology, equity, and economy, making it an overarching principle of sustainable development and a necessary part of the proposed AFI design guidelines.
3.2 Developed Framework
This research will use the ecosystem services framework, the Place Diagram, and the sustainable development framework to develop an outline for the design guidelines of social AFIs (Figure 2). In summary, the ecosystem services framework focuses on the ecological systems of a green space that benefit humans, some of which are cultural. This reflects the research and nature of AFIs in that, even though they are used primarily for ecological reasons, they also provide an opportunity for cultural activities. The Place Diagram will also be included because it thoroughly covers which aspects make a good public space, with an emphasis on social qualities. Lastly, the sustainable development framework will be integrated because it is a well-known and respected framework that addresses the importance of governance and economy in sustainable development. Using these three frameworks, a fourth framework will be created to help form the guidelines for social AFI design. The six overarching categories of the proposed guidelines will include sociability, uses and activities, comfort and images, and access and linkages, governance, and economy.
CELA 2019 | UC Davis 388

Figure 2. Design guideline framework developed from the ecosystem services, the Place Diagram, and the sustainability framework (2018). Diagram by the authors. Adapted from Project for Public Space, “What
Makes a Great Place?” Retrieved October 29, 2018, from https://bit.ly/2JwyUg0. Copyright 1975-2018 by Project for Public Spaces. Reproduced by permission of Project for Public Spaces. And adapted from El Hour et al., “The Concept of Governance and Sustainable Development.” Retrieved December 4, 2018,
from https://bit.ly/2FNWBAU.
CELA 2019 | UC Davis 389

4 METHODS The primary question driving this research is, “How can artificial floating islands (AFIs) along
urban waterfronts support human social and recreational activities while maintaining their existing ecological services and contextual significance?” To answer this, the following sub-questions must be addressed as well:
● What social and recreational activities have AFI precedents supported? ● How have AFI precedents balanced ecological and recreational uses? ● What other frameworks can inform the guidelines for social AFIs? ● What other important elements must be addressed to make an AFI successful?
Through precedent studies and phone interviews with experts, a set of design guidelines will be developed to inform future social AFIs, create a new design thinking for AFIs, and ultimately help develop a new type of public green space. Their effectiveness will be demonstrated through the development of design guidelines and projective design. We hypothesize that AFI designs can be developed into a new type of public open space. If this hypothesis is disproved, then AFIs will be evaluated for their ineffectiveness as to perform as public open spaces. 4.1 Precedent Studies
This research will begin with a series of precedent studies. There is a significant research gap regarding the social and recreational uses of AFIs. Therefore, a wide net will be casted for the selection of precedents. Criteria for the selection of precedents are that they must address an ecological goal and have floating vegetation with an adjacent social/recreational space. The precedents are not restricted to a geological region in order to demonstrate the global relevance and applicability of social AFIs. Each precedent will be evaluated for its design, the goals or issues it addresses, the construction methods and materials used, the parties involved in the design and implementation, and the social, recreational and ecological uses present. These elements will then be compared across all the precedents through a series of matrices.
The AFIs that will be investigated are the Sengkang Floating Wetland in Singapore, Recycled Park in Rotterdam, Merchant Square on the Grand Union Canal in London, “Seeds of Change” in Bristol Harbor, “The Jetty” of the Chicago Riverwalk, Spruce Street Harbor Park in Philadelphia, and the urban municipal canal restorer in Fuzhou, China. These precedents all meet the same selection criteria listed above. However, they represent different perspectives regarding the use of AFIs. Some precedents focus more on the ecological use, while others focus more on cultural and social uses. Some precedents are balanced on a social-ecological spectrum, representing both aspects relatively equally. More information about each precedent is listed below including their description and why they are relevant to the research.
Sengkang Floating Wetland is located in the Punggol Reservoir in Singapore. The native plantings of the floating park provide ecological remediation, and the connected floating platforms create spaces for community gatherings and ecological education. The wetland was developed by CPG Consultants and Singapore National Water Agency as part of the Public Utilities Board’s (PUB) Active, Beautiful, Clean Waters Programme (ABC). This precedent will be valuable to the research because it includes ecological, educational, and recreational uses. (Andrews et al., 2013; CPG Consultants, 2018)
In Rotterdam, plastic debris from the Nieuwe Maas River is being recycled to help build AFIs for “Recycled Park”. The first batch of twenty-eight pods been have recently installed. Most of the pods are vegetated AFIs, but two are used for visitor seating. This effort was enacted by Recycled Island Foundation to reduce plastic litter in the Nieuwe Maas River, and the park was designed by WHIM Architecture. This precedent will benefit the research because it includes both ecological goals and recreational uses. (Neelis, 2018; Waste 360, 2018)
An AFI at Merchant Square serves as a floating park in London’s Grand Union Canal. This design is part of Greater London Authority’s green infrastructure initiative. The site includes a pavilion equipped with Wi-Fi, a lawn area, pathways, and places for seating and is meant to be an outdoor workplace and recreational space for the community. It includes plants, though their roots are not submerged in the water for rhizofiltration. Instead, the plantings are intended to serve as habitat for waterfowl and other wildlife. This precedent is beneficial to the research because it focuses on the social and recreational use of the space while also striving towards an ecological goal. (Jewell, 2017; Garden Club London, n.d.)
“Seeds of Change,” in Bristol Harbor, was a collaboration between designer Gitta Gschwendtner and artist Maria Thereza Alves. The pair worked with the University of Bristol Botanic Garden, Arnolfini, and Bristol City Council. In this design, non-native plants are installed on a disused floating barge, and
CELA 2019 | UC Davis 390

spaces for seating are included. The design was inspired by Alves’ research of barges. Alves learned that after barges completed their shipment, they would be loaded with soils and stones native to the area to weigh the barges down for their return journey. The ballast naturally contained plant seeds from the foreign areas and would be dumped into Bristol Harbor upon its return. Alves learned that if the seeds were excavated from the bottom of Bristol Harbor today, they could still be germinated. The possibility of growing these foreign plants from another era inspired the design. The floating garden includes vegetation and spaces for visitor seating and circulation, all on a floating platform, designating it an appropriate precedent for social AFIs. (Chalcraft, 2012)
The Chicago Riverwalk by Sasaki consists of five main spaces. One of these spaces, “The Jetty”, includes AFIs interspersed between protruding piers. The AFIs provide an opportunity for ecological education and wildlife habitat. The piers support social opportunities and are often used for photography and fishing. The piers and AFIs are not physically connected, and the AFIs cannot support human weight beyond maintenance purposes. However, the proximity of the AFIs to the piers and the social value they add to the space make it an appropriate precedent for social AFIs. (Sasaki, 2017)
Spruce Street Harbor Park is located at Penn’s Landing along the Delaware River in Philadelphia, Pennsylvania. It was commissioned by the Delaware River Waterfront Corporation and designed by Groundswell Design Group. One part of the design includes a floating plaza. Three barges create a U-shape against the shore, enclosing a portion of water in the center. Atop the barges are restaurants and seating areas. The portion of water enclosed by the barges includes a floating garden, consisting of several small AFIs. These AFIs cannot support substantial human weight, but their visual and physical proximity to floating social and recreational spaces make it an appropriate precedent for the research. (“Spruce Street Harbor Park,” 2017; Groundswell Design Group, 2017)
The urban municipal canal, called Baima, in Fuzhou, China was polluted with commercial waste and untreated domestic sewage, inhibiting the quality of life of the adjacent neighborhoods. In 2002, Ecological Design, in collaboration with Ocean Arks International, created and installed the canal restorer. The design is a floating bridge, flanked on both sides by floating native plants. At one end of the bridge is a water recycling treatment system which aerates the water. Since its installation, the canal restorer has significantly improved the quality of the water and quality of life in the surrounding neighborhoods. (Andrews et al., 2013; World Unwrapped, 2015) 4.2 Interviews
To supplement the precedent studies phone interviews or video conferences with the projects leads or precedent experts will be conducted. The interview subjects are from the U.S., Singapore, the U.K., and the Netherlands. If phone and video conference interviews are not possible due to certain limitations such as Wi-Fi access, conflicting time zones, and schedule coordination, emailed interview questions will be used instead. Through the interviews, the inspiration, goals and services of the design, the governance and maintenance of the site, and the overall success of the space will be addressed. The information gathered from the interviews will supplement the information found through the precedent studies and will help develop the guidelines.
4.3 Design Guidelines
Using the precedent studies and interview results, we will develop a set of design guidelines for social AFIs along urban waterfronts. The resulting AFIs will accommodate social and recreational activities, while maintaining ecological services and contextual appropriateness. The guidelines will also catalyze a new perspective on AFIs as public green space. The design guidelines are meant to be applied along urban waterfronts but may be applicable in other contexts if deemed appropriate by the guidelines and judgement of the designer. 4.4 Projective Design
After developing the design guidelines, they will be used to create a projective design along the Nieuwe Maas in downtown Rotterdam. Rotterdam is known for being a major European port, situated in the delta of three major rivers: the Maas, the Rotte, and the Schie. (Goossens, Guinée, & Oosterhoff, 1995). Rotterdam is also known for its traditional flood management systems and creative contemporary sea level rise solutions. One such example is the Rijnhaven’s floating pavilion, which is is made out of lightweight material and rises and falls with the water level (“Eco Architecture,” 2009). Rotterdam is also the setting for the research precedent, “Recycle Park,” located directly adjacent to the floating pavilion
CELA 2019 | UC Davis 391

Many other floating designs have been conceptualized for the Rotterdam area, aiming to fill the demand for flood-resilient urban expansion (Casanova & Hernández, 2014; Metz & van den Heuvel, 2012). Rotterdam also holds a high standard for its public spaces as demonstrated by their many public open space policy plans throughout the past three decades (Van Melik & Lawton, 2011). AFIs could help meet the demand for both flood-resilient spaces, and quality public green spaces. Using the developed guidelines, a social AFI design will be generated for the riverfront of the Nieuwe Maas in downtown Rotterdam. One of the anticipated categories of the developed guidelines is site selection. Thus, the developed guidelines will inform the specific site location of the social AFI as well as its design.
5 ANTICIPATED FINDINGS AND CONCLUSION Through the research, we have looked at artificial floating islands with a social/recreational lens,
providing insight into an aspect of AFIs that has hardly been researched before. To achieve this, we have looked to the literature and precedents to provide evidence of the possibility of AFIs becoming a new type of public green space. These green spaces have the potential to strengthen an urban waterway edge socially, recreationally, and ecologically. The research has opened the door to further exploration of the possible uses of AFIs in landscape architecture and planning in a time when it is most relevant due to sea level change, climate change, and increasing urbanization. The information and knowledge gathered on this subject will be further explored through in-depth precedent studies, interviews with experts in the field, design guidelines development, and projective design.
Through the analysis of the well-recognized ecosystem service framework, the Place Diagram, and the sustainable development framework, they have been presented in a new light and developed into six overarching categories for the projected design guidelines: sociability, uses and activities, comfort and images, access and linkages, governance, and economy. Under the umbrella of these categories, other issues such as maintenance, construction and materials, site selection, and integrity to the ecological uses will be addressed.
The future research will result in a set of design guidelines that will inform the design of social AFIs and, thus, develop a new type of green space and a new perspective for AFIs. Future research from others will also help pioneer AFIs as a type of public open space. Related future research includes:
● Post-implementation assessment of AFI designs as public green space. ● How AFIs perform socially in different contexts. ● To what extent humans can occupy AFIs without disrupting the ecological goals of AFIs.
CELA 2019 | UC Davis 392

6 REFERENCES
1. Andrews, L., Rottle, N., Belay, B., Cromwell, P., Dinthongsai, A., Gelino, K., … Tsai, W. (2013). Floating Wetlands Research (Academic Report No. 1) (pp. 1–58). Seattle, WA: University of Washington. Retrieved from https://bit.ly/2F5vZvF
2. Arraf, J. (2016). Iraq’s Marshlands, Nearly Destroyed Under Saddam, Are Coming Back. Retrieved
December 10, 2017, from https://bit.ly/2CSm231 3. Beatley, T. (2017). Handbook of Biophilic City Planning & Design. Washington, DC: Island Press. 4. Casanova, H., & Hernández, J. (2014). Public Space Accupuncture: Strategies and Interventions for
Activating City Life. New York, NY: Actar Publishers. 5. Chalcraft, E. (2012). Seeds of Change floating garden by Gitta Gschwendtner and Maria Thereza
Alves. Retrieved October 24, 2018, from https://bit.ly/2DcDMXI 6. CPG Consultants. (2018). Sengkang Floating Wetland. Retrieved October 24, 2018, from
https://bit.ly/2DceE3s
7. Dodkins, I., & Mendzil, A. (2014). Floating Treatment Wetlands (FTWs) in Water Treatment: Treatment Efficiency and Potential Benefits of Activated Carbon. Swansea University, Swansea, Wales.
8. Eco Architecture: Rotterdam’s Floating Pavilion Will Adjust to Climate Changes. (n.d.).
9. El Hour, S., Aouane, M., & Chaouch, A. (2016). The Impact of the Environmental Management
System on Development Sustainable: A Case of Lesieur & Cristal Factory. Environmental Science: An Indian Journal, 12(10). Retrieved from https://bit.ly/2FNWBAU
10. Floating Gardens in Bangladesh. (2017, September 6). Practical Action, The Schumacher Centre for
Technology and Development, and Food and Agriculture Organization of the United Nations. Retrieved from http://bit.ly/2wSgCQj
11. Garden Club London. (n.d.). Merchant Square. Retrieved October 24, 2018, from
https://bit.ly/2KNtfCr
12. Goossens, J., Guinée, A., & Oosterhoff, W. (1995). Public Space: Design, Layout and Management of Public Space in Rotterdam. Rotterdam, Netherlands: 010 Publishers.
13. Groundswell Design Group. (2017). Spruce Street Harbor Park. Retrieved October 30, 2018, from
https://bit.ly/2PtuaO4
14. Headley, T. R., & Tanner, C. C. (2006). Application of Floating Wetlands for Enhanced Stormwater Treatment (NIWA Client Report No. HAM2006-123). Hamilton, New Zealand: National Institute of Water & Atmospheric Research Ltd.
15. Hoeger, S. (1988). Schwimmkampen: Germany’s Artificial Floating Islands. Journal of Soil and Water
Conservation, 43(4), 304–306.
16. Irfanullah, H. M., Azad, M. A. K., Kamruzzaman, M., & Wahed, M. A. (2011). Floating Gardening in Bangladesh: A Means to Rebuild Lives After Devastating Flood. Indian Journal of Traditional Knowledge, 10(1), 31–38.
17. Jewell, N. (2017). London’s First Floating Park Slated to Open This Spring [Inhabitat]. Retrieved
October 30, 2018, from https://bit.ly/2OXY79j
CELA 2019 | UC Davis 393

18. Johnston, R. J. (2016). Ecosystem Services [Online Encyclopedia]. Retrieved from
https://bit.ly/2CzqYrD
19. Kennen, K., & Kirkwood, N. (2015). Phyto: Principles and Resources for Site Remediation and Landscape Design (1 edition). New York, NY: Routledge.
20. Khasnabis, C., Motsch, K. H., Achu, K., Jubah, K. A., Brodtkorb, S., Chervin, P., … Lander, T.
(2010). Recreation, leisure and sports. World Health Organization. Retrieved from https://bit.ly/2W97Iu7
21. Li, Z. (2013). Artificial floating islands: a technology for clean water and agricultural production in
rural China. International Journal of Environmental Protection, 3(1), 7–14.
22. MacDonald, M. B. (2016). Floating Wetlands in the Puget Lowlands: Design, Construction, and Viability (Master’s). University of Washington, United States -- Washington. Retrieved from http://bit.ly/2fbx9HF
23. Masters, B. (2012). The Ability of Vegetated Floating Islands to Improve Water Quality in Natural and
Constructed Wetlands: a review. Water Practice & Technology, 7(1), 9. https://doi.org/10.2166/wpt.2012.022
24. Metz, T., & van den Heuvel, M. (2012). Sweet & Salt: Water and the Dutch. Rotterdam, Netherlands:
NAi Publishers.
25. Neelis, K. (2018, July 30). This Dutch City Has Made a Floating Park Out of Plastic Waste. Retrieved September 9, 2018, from https://bit.ly/2DeILXG
26. Nugent, Pam M.S. (2013, April 13). What is SOCIAL ACTIVITY? definition of SOCIAL ACTIVITY
(Psychology Dictionary). Retrieved December 6, 2018, from https://bit.ly/2R7br7E 27. Olguín, E. J., Sánchez-Galván, G., Melo, F. J., Hernández, V. J., & González-Portela, R. E. (2017).
Long-Term Assessment at Field Scale of Floating Treatment Wetlands for Improvement of Water Quality and Provision of Ecosystem Services in a Eutrophic Urban Pond. Science of the Total Environment, 584–585, 561–571. https://doi.org/10.1016/j.scitotenv.2017.01.072
28. Project for Public Spaces. (2018). What Makes a Successful Place? Retrieved October 30, 2018,
from https://bit.ly/2JwyUg0 29. Sasaki. (2017, December 10). Chicago Riverwalk. Retrieved December 10, 2017, from
https://bit.ly/2aqiaXx
30. Spruce Street Harbor Park. (2017). Retrieved June 27, 2017, from http://vstphl.ly/2rXUmRV
31. Streb, C. (2013). Building Floating Wetlands to Restore Urban Waterfronts and Community Partnerships. National Wetlands Newsletter, 35(2), 24–27.
32. Van Melik, R., & Lawton, P. (2011). The Role of Public Space in Urban Renewal Strategies in
Rotterdam and Dublin. Planning Practice & Research, 26(5), 513–530. https://doi.org/10.1080/02697459.2011.626681
33. Wang, C.-Y., & Sample, D. J. (2014). Assessment of the nutrient removal effectiveness of floating
treatment wetlands applied to urban retention ponds. Journal of Environmental Management, 137, 23–35. https://doi.org/10.1016/j.jenvman.2014.02.008
CELA 2019 | UC Davis 394

34. Waste 360. (2018, July 17). The Only Plastic That Should be Allowed in Rivers. Waste360 (Online). Retrieved from https://bit.ly/2AycvMD
35. Wilson, E. O. (1986). Biophilia. Cambridge, United States: Harvard University Press. Retrieved from
https://bit.ly/2RlNKco
36. World Unwrapped. (2015, June 8). A Polluted Urban Waterway in China Becomes a Beautiful Garden. Retrieved September 4, 2018, from https://bit.ly/2Py48ZO
37. Yeh, N., Yeh, P., & Chang, Y.-H. (2015). Artificial floating islands for environmental improvement.
Renewable and Sustainable Energy Reviews, 47, 616–622. https://doi.org/10.1016/j.rser.2015.03.090
38. Zhang, L., Li, Z., Yu, X., Wu, J., & Cheng, S. (2015). The Efficiencies of Floating Treatment Wetland
on Water Quality Improvement for Loach (misgurnus Anguillicaudatus) Cultivation. Fresenius Environmental Bulletin, 24(4a), 1380–1385.
CELA 2019 | UC Davis 395

The authors are solely responsible for the content of this technical presentation. The technical presentation does not necessarily reflect the official position of the Council of Educators in Landscape Architecture (CELA), and its printing and distribution does not constitute an endorsement of views which may be expressed. Citation of this work should state that it is from a CELA conference paper. EXAMPLE: Author's Last Name, Initials. 2019. Title of Paper. Sacramento, California: CELA. For information about securing permission to reprint or reproduce this paper, please contact CELA at [email protected]
NEW TOOLS FOR LANDSCAPE CONSERVATION PLANNING:
LOCAL CONSERVATION PLANNING THAT COMPLEMENTS STATE AND FEDERAL CONSERVATION PLANS
GRECO, STEVEN E. University of California, Davis [email protected] 1 ABSTRACT
To achieve sustainable wildlife conservation across regional landscapes there is a great need for incorporating comprehensive systematic conservation planning at the local level in city and county general plans. In the USA land use is controlled at the local level and conservation lands need to be identified at the local level by addressing all natural communities and native species. Locally-based conservation planning is needed to complement federal Habitat Conservation Plans (HCPs) and state-level plans that focus conservation efforts only on a small set of special-status species. General plans for most municipalities typically lack modern systematic conservation strategies in the mandated “elements” for conservation or open space. These conservation strategies should be scientifically based using ecological principles. HCPs, as prescribed in the federal Endangered Species Act, typically employ these strategies, however, they focus on conserving threatened and endangered species and do not address any other species. The state of California’s Natural Community Conservation Planning (NCCP) Program partially addresses the need for more comprehensive conservation and is oftentimes integrated into an HCP planning process. A case study in Yolo County, California is used to explore these conservation planning issues. A novel planning process is described to create a voluntary, non-regulatory “local conservation plan” (LCP) to complement a federal HCP and a state NCCP. The LCP subsequently was integrated into a new conservation planning tool in California called a Regional Conservation Investment Strategy (RCIS) that facilitates advanced mitigation. This approach is critically important to prevent future endangered species and sustain existing wildlife populations.
1.1 Keywords
Habitat conservation plan, natural community conservation plan, regional conservation investment strategy, local conservation, general plans
CELA 2019 | UC Davis 396

2 INTRODUCTION A key objective of sustainable landscape conservation is the long-term maintenance of wildlife
populations and natural communities, and “virtually all conservation issues are ultimately land-use issues” (Wiens, 2003, p. 3). To achieve sustainable wildlife conservation across regional landscapes there is a great need for incorporating comprehensive systematic conservation planning into local planning processes and to coordinate among multiple spatial scales including the local and ecoregional scales to continental scales (Baldwin et al., 2018; Powell, 2010). In this context, “comprehensive” means conservation planning for more than only special status species. In particular, we need to incorporate comprehensive systematic conservation planning principles into city and county general plans and coordinate those plans with regional conservation plans. In the USA land use is controlled at the local level (Duerksen et al., 1997) and conservation lands need to be identified at the local level by addressing the needs of all natural communities and native species. Locally-based conservation planning is needed to complement federal Habitat Conservation Plans (HCPs) and state-level plans that focus conservation efforts only on a small set of special-status species, such as Natural Community Conservation Plans (NCCPs). Regional advanced mitigation planning (sensu Thorne et al., 2009) could also benefit from this approach.
2.1 What is systematic conservation planning? A seminal paper by Margules & Pressey (2000) describes a framework for systematic
conservation planning as a six-stage process. The process begins with an inventory as the first stage to compile data on the planning region. The second stage identifies conservation goals and objectives, including quantitative and qualitative targets and selection of focal species. The third and fourth stages involve reviewing existing reserves and selecting additional reserves through techniques such as conservation gap analysis and assessment of complementarity, irreplaceability, and vulnerability. The fifth stage is implementation of conservation actions which involves management decisions, assessing feasibility, and timing. Finally, the sixth stage is to maintain the conservation values through adaptive management techniques designed to monitor species and natural communities and potentially change management as new data informs future decisions. Two key aspects to systematic conservation planning are (1) creating a connected network of representative local ecosystems and the species that use them, and (2) long-term persistence of those populations and ecosystems through maintaining habitat (natural plant communities) and ecosystem processes. Critiques of this approach to systematic conservation planning identified a lack of social science in the planning process (e.g., stakeholder identification) and an update to this protocol was published by Sarkar & Illoldi-Rangel (2010) adding seven more stages and refining the planning process (for a total of 13 stages or planning components).
2.2 General plans and landscape conservation General plans for most municipalities typically lack modern systematic conservation planning
strategies in the mandated plan “elements” for conservation or open space. These conservation strategies should be scientifically based using ecological principles. Over the past three decades the development of the field of landscape ecology has been highly informative to the field of conservation biology and vice-versa.
John Wiens provides insight how the two fields intersect in a paper entitled “Landscape ecology as a foundation for sustainable conservation” (Wiens, 2009). In it he explains four themes from landscape ecological theory that inform conservation: (1) “context”—that functional habitats are largely dependent on spatial configuration of larger land cover mosaics; (2) “threats”—the surroundings of a reserve may produce negative edge effects from human land uses that can reduce the actual size of a reserve; (3) “scale”—an administrative area may not match the spatial needs of wildlife populations, disturbance regimes or ecosystem processes; and, (4) “sustainability”—human activities will require tradeoffs between land use and biodiversity values (Wiens, 2009).
The field of conservation biology has also produced a classic set of reserve design principles reviewed and presented by many in the field (Diamond, 1975; Noss et al., 1997, Primack, 2004). These design principles have also been adapted to be used in city and regional planning (Dramstad et al., 1996; Soule, 1991). The design guidelines were developed from observations stemming from island biogeography theory being applied to fragmented landscapes in terrestrial systems, however, most island
CELA 2019 | UC Davis 397

theory has largely been replaced by landscape ecological and metapopulation dynamics theory (Laurance, 2008).
2.3 HCPs: Threatened and endangered species conservation A HCP, as prescribed in the federal Endangered Species Act, is a type of biodiversity offset
program for threatened and endangered species designed for compensatory mitigation due to impacts from human land uses. HCPs typically employ modern conservation strategies, however, they focus only on conserving threatened and endangered species and do not address the conservation of any other species. Typically, HCPs require many years (>10) to complete and can cost millions of dollars for the planning process, depending on the area, its complexity, and the number of species involved. At its core, a HCP is an “incidental take permit” meaning listed species in the plan and their habitat can be destroyed in exchange for conservation elsewhere (Noss et al., 1997). The HCP has a time period over which the take permit is valid, generally ranging from 10-100 years and plan spatial extents can vary from a single property to entire counties or multiple counties. Since the amendment to the federal ESA in 1982 that created the HCP program it has become quite popular. There are now hundreds of HCPs that have been approved or are in development nationwide.
For municipalities that decide to invest in creating a HCP, an advantage to having one is streamlining the permitting process for human land use development. A developer simply needs to write a single check (permit fee) and no further negotiation or mitigation action is needed. Without an approved HCP a land developer would have to negotiate with the US Fish and Wildlife Service and mitigate on a project-by-project basis, resulting in potentially enormous legal fees, great uncertainty in approval, and long delays in starting a project. The resulting compensatory actions are also ad hoc and uncoordinated and can result in piecemeal mitigation that does not function as intended (McKenney & Kiesecker, 2010). An advantage to implementing a HCP is coordinated mitigation that can result in larger, more connected and more functional reserves.
2.4 Criticisms of HCPs There are numerous criticisms leveled against HCPs. Many criticisms center on the uncertainty of
the science and the assumptions of models used for planning while others are wary of a lack of scientific peer-review, a lack of required monitoring, a lack of context planning, a lack of assurances that species will survive (given the “no surprises” policy and “safe harbor” agreements), lack of an ecosystem approach, a lack of recovery plans with designated critical habitat identified, among others (Duerksen et al., 1997; Noss et al., 1997). A particularly worrisome criticism is that HCPs have a “jeopardy” standard for species’ populations rather than a “recovery” standard, meaning the population growth rate of a listed species in a HCP does not have to achieve positive levels and result in population size increases, but, rather, be maintained at current population levels (Stanford Environmental Law Society, 2001). Many, but not all, of these criticisms have been addressed in the California NCCP Act.
2.5 NCCPs: Natural community conservation planning in California The state of California’s Natural Community Conservation Planning (NCCP) Program partially
addresses the short-comings of HCPs and the need for more comprehensive conservation (Noss et al., 1997). In California a NCCP is optionally integrated into a HCP planning process. A significant feature of the NCCP planning process is that it allows species not officially listed as threatened or endangered to be included in the plan. This effectively elevates alternative “special status” species for plan consideration. The California Department of Fish and Wildlife (CDFW) has several special status species categories including one called “species of special concern” and another called “candidates” for the California Endangered Species Act (CESA)—species that are nearing endangerment status. The other significant feature of the NCCP planning process is the inclusion of a list of all the natural (plant) communities in the plan area that act as habitat for the plan’s covered animal and plant species. Conservation targets are developed for both.
Additional benefits of the NCCP process are (1) the requirement for an independent science review team to advise the Board and the Advisory Committee, and (2) a requirement for monitoring (with an endowment fund) to inform adaptive management to verify success or failure of the plan. NCCPs also require a recovery standard for listed species populations, exceeding the HCP jeopardy standard.
CELA 2019 | UC Davis 398

Despite the criticisms of HCPs discussed above, there is some evidence that a HCP combined with a NCCP can be effective an effective conservation tool. In a case study using San Diego County, California, Underwood (2010) compared a region of the county with an approved and implemented HCP/NCCP in one portion but not in another, and found the HCP/NCCP area “increased conservation for many rare species, often 5-10 times more than the comparison area” (Underwood, 2010, p. 121). Thus, for species and natural communities listed in the plan, the conservation plan appears highly effective, as opposed to having no plan.
2.6 New Tools: Local conservation plans (LCPs) and RCIS Comprehensive systematic conservation planning is missing from nearly all municipality general
plans. The logical place to put these planning concepts is in the “open space” or “conservation” elements that cover natural resources and management for any home rule jurisdiction (see OPR, 2017). Oftentimes the conservation element needs to cross-reference the land use element and/or the open space element, especially in regards to agricultural land and its potential role in conservation. In most current general plans the principles of systematic conservation planning are used in vague and general ways and are non-comprehensive in nature. If a species list is included it usually is a list of special status species (e.g., threatened or endangered species) which is inadequate for comprehensive conservation. Local conservation plans (LCPs) that include all the stages of systematic conservation planning and address all species and natural communities in the municipality should be incorporated into the open space and conservation elements of all general plans. Federal and state wildlife agencies should provide outreach and funding to assist in these efforts when general plan updates are scheduled for any municipality.
In 2016 a new law by the California legislature created the CDFW’s Regional Conservation Investment Strategy (RCIS) Program. This is a voluntary and non-regulatory program to encourage local jurisdictions and state agencies to collaborate on identifying future conservation needs, priorities, and actions for advanced mitigation purposes (CDFW, 2018). A RCIS plan would “increase options for project proponents, including public infrastructure agencies, to create compensatory mitigation that supports regional conservation priorities in advance of the impact” (CDFW, 2018, p. 1-1). There are three parts to this program: regional conservation assessments (RCAs), regional conservation investment strategy (RCIS), and mitigation credit agreements (MCAs). The RCA is an ecoregional assessment at a landscape scale that puts a locality within its in context; this is an important but optional planning process for developing RCISs and MCAs. However, a RCIS must be approved before an MCA can be developed. 3 RESEARCH OBJECTIVES
The research objectives for this article are to: (1) describe the general relationship between municipal general plans and conservation planning using a case study, (2) contrast two types of conservation planning, one at the federal level and one at a state level, (3) present two new concepts, or “tools,” in local conservation planning that complement the federal and state tools, and (4) discuss approaches for the future of sustainable landscape conservation. 4 METHODS
To explore the issues presented above, a case study approach is used to describe (1) the current General Plan in in Yolo County, California, (2) a process to develop a federal HCP and a state NCCP conservation plan, and (3) the creation of a voluntary, non-regulatory comprehensive local conservation plan (LCP) to complement the HCP/NCCP. The jurisdiction of Yolo County, in the Central Valley ecoregion of California, is used as an example (Figure 1). To begin the process of creating a LCP and the rationale for it, I co-authored a white paper for the Advisory Committee of the Yolo Habitat Conservancy (YHC) (formerly known as the Yolo Natural Heritage Program or “Yolo NHP”) to explain the need for it (see Greco et al., 2013). With extensive input and multiple revisions, I wrote a second white paper to articulate six biological and ecological goals and 32 sub-goals with five notes on prioritization for the Yolo County LCP (Greco, 2015).
With approximately $40,000 of “seed funding” allocated from a state wildlife planning grant, the YHC Board contracted with the Yolo HCP/NCCP plan consultant, ICF (Sacramento, CA), to prepare a first draft LCP in 2016. This draft was based on (1) the two white papers, (2) species accounts and data from the first administrative draft of the HCP/NCCP that were not used in the second administrative draft (the
CELA 2019 | UC Davis 399

dropped species, see Results section), and (3) conducting numerous meetings with the Biological Subcommittee of the YHC Advisory Board (including myself and four others) to refine the concepts and approach. In 2017 Yolo County was chosen as a pilot project for the new RCIS program. The draft LCP subsequently was integrated into the new RCIS conservation planning tool in California.
Figure 1. The location of Yolo County (black fill) and the Landscape Conservation
Cooperative (LCC) ecoregions in the state of California and Baja California. Map graphic by the author. Data obtained from Data Basin (https://databasin.org).
5 RESULTS
5.1 General Plan The Yolo County General Plan was updated in 2009 and contains a combined conservation and
open space element that lacks comprehensive systematic conservation planning methods. It contains a single species list with 38 special status species. The County of Yolo 2030 Countywide General Plan's implementation program for the Biological Resources portion of the Conservation and Open Space Element calls for adopting and implementing the Yolo HCP/NCCP developed through the Yolo Natural Heritage Program (the former name of the YHC) and integrating it into the general plan (see Action CO-A26; Yolo County, 2009).
CELA 2019 | UC Davis 400

5.2 HCP and NCCP A HCP and NCCP planning process was conducted from 2002-2018. The first administrative draft
was completed in 2013 and covered 32 special status species and 25 natural communities (including agricultural semi-natural types). The estimated cost of implementing the first administrative draft was determined to be too great and with the advice of the USFWS, the species and community lists were reduced in scope. The second administrative draft for the Yolo HCP/NCCP was completed in 2017 and covers 12 special status species and 19 natural communities (including agricultural semi-natural types) with a permit period of 50 years (YHC, 2017). The cost of developing the second administrative draft was $4.9 million. The implementing county agency is the Yolo Habitat Conservancy that consists of a joint powers authority (JPA) Board (membership consisting of an elected representative from each member agency: Yolo County, and the cities of Davis, Woodland, Winters and West Sacramento, and an ex-officio member from UC Davis) and an Advisory Committee. The YHC Advisory Committee that assisted in developing the plan consisted of an Executive Director and support staff along with three stakeholder groups (environmental, agricultural, and urban development) each having approximately 3-5 representatives for a total committee size of about 12-18 members at any one time.
Of the 12 special status species selected for the plan, two are federally endangered (one bird and one plant), four are federally threatened (one reptile, one bird, one invertebrate, and one amphibian), two are exclusively California state threatened (both birds), one is a CESA Candidate (a bird), one is California “fully protected” (under California Fish and Game Code) (a bird), and one is a California “species of special concern” (a reptile). It should be noted that there are no mammals on the Yolo HCP/NCCP covered species list.
5.3 LCP and RCIS From 2015-2018 a combined draft LCP/RCIS was developed as a conservation framework for the
species not covered in the Yolo HCP/NCCP (see ICF, 2018). An administrative draft was completed in 2018. The LCP/RCIS contains three focal species lists with 40 species for the RCIS and 71 species for the LCP.
As noted above there are no mammals on the official HCP/NCCP species list, however, as part of the NCCP process, an Independent Science Review Team recommended several wide ranging (non-special status) mammals that are designated as “planning species,” including mule deer and America badger, for habitat connectivity planning over the broader landscape (Spencer et al., 2006). 6 DISCUSSION
The future of landscape conservation requires both a bottom-up approach (e.g., city and county general plans, HCPs, NCCPs, LCPs, and RCISs) and a coordinated ecoregional top-down approach (with federal and state leadership) to achieve meaningful and sustainable conservation results (Baldwin et al., 2018). This multi-scalar approach integrating local and regional scales is critical to future success of landscape conservation planning because important local habitat resources can be omitted in regional planning analyses and local planning can myopically miss regional connectivity patterns (Huber et al., 2010).
A key challenge with HCPs and NCCPs is the sheer cost and length of time to needed to complete them. Frequently, an elected representative must take on the role of being the “champion” of the project and since the process can be complex and require a steep learning curve, losing a champion between election cycles can severely set back a plan’s progress leading to delays or abandonment. Also, attracting and retaining knowledgeable experts on the Advisory Committee over long time periods can be problematic. Some municipalities simply lack local experts or environmental advocacy groups exposing a lack of community capacity to even undertake a HCP/NCCP process.
An important aspect of the Yolo RCIS/LCP is its voluntary, non-regulatory approach. Local control is large issue in Yolo County and out-of-county mitigation is a local concern (i.e., that other nearby municipalities outside Yolo County will use Yolo County to mitigate their impacts—creating competition and thus creating higher prices for Yolo County project mitigation). This was a major concern for the HCP/NCCP planning process. For the RCIS/LCP the concern was additional costs associated with additional conservation and where the funds would come from. To get local political support it had to be deemed voluntary and non-regulatory. The RCIS component would receive funds from an agency that has
CELA 2019 | UC Davis 401

succeeded in establishing a MCA from an approved RCIS. The LCP is dependent on receiving funds from grants or philanthropy. The advantage for Yolo County is that by having a LCP this type of funding can be attracted more readily.
Federal and state wildlife conservation agencies need to fulfill a local leadership role by assisting local municipalities with data and expertise to develop LCPs as part of, or as an addendum to, general plan open space or conservation elements (similar to how university extension agents help local farmers). These larger agencies frequently develop regional plans but have no way to implement them because all land use planning is done at the local home-rule level. A good example of this type of planning is the “Essential Habitat Connectivity Project” by the CDFW in California (Spencer et al., 2010). In this statewide study key connected and intact habitats were identified to act as, or to preserve as, wildlife corridors, but there are few local plans to implement it. Federal and state agencies need to provide the leadership (and funding) to bring these plans to the local level from the regional analysis level.
6.1 Landscape Conservation Cooperatives (LCCs) In 2010 the US Fish and Wildlife Service created a program called Landscape Conservation
Cooperatives (LCCs). The objective of the program is to apply systematic conservation planning to large regional landscapes to develop ecoregion plans and account for climate change. The LCC program divides North America into 23 ecoregions (Figure 2) and each ecoregion is further subdivided into sub-ecoregions. As an example, the California ecoregion is divided into seven sub-ecoregions (Figure 1).
Figure 2. Landscape Conservation Cooperative (LCC) ecoregions in North America. The Pacific
Islands and Caribbean ecoregions are not shown. Map graphic by the author. Data obtained from Data Basin (https://databasin.org).
CELA 2019 | UC Davis 402

Importantly, the LCC ecoregions and sub-ecoregions could create the regional conservation areas (RCAs) needed to give RCISs the proper context for local planning as discussed above. RCAs could act as a framework for regional and continental conservation strategy.
Unfortunately, the current US administration has allocated nothing in its current budget for the LCC Program and its future is uncertain. What is certain, however, from the standpoint of the scientific community, is that the LCC program is on the right track towards creating a sustainable ecological network at a continental scale (Baldwin et al., 2018).
6.2 Engaged scholarship and landscape conservation Since 2015 I have participated in eight meetings of the California LCC (some were all-day
meetings) to develop a pilot landscape conservation plan using the sub-ecoregion boundary of the Central Valley in California (Figure 1). This project is attempting to use cutting edge science and systematic conservation planning to create a “climate smart” landscape conservation plan (sensu Groves et al., 2012; Stein et al., 2012; Stein et al., 2014) using a suite of focal species and natural communities. I was invited to these meetings because I have much expertise with several threatened and endangered species in the Central Valley, as well as the habitat types and natural communities.
The most significant outreach project I have participated in over the past decade is serving as an Advisory Committee member for the Yolo Habitat Conservancy (YHC) since 2010. I was nominated and appointed to be an environmental stakeholder (by a Davis City Council member), since that is my professional expertise. Since 2012 I participated in 38 Advisory Committee meetings in Woodland, CA, and 30 ancillary meetings related to the work of the Advisory Committee, such as subcommittee meetings. Occasionally I was asked to chair some of the Advisory Committee meetings. All of these stakeholder meetings were at least 2-hours in length. In addition to these meetings, I participated in 29 meetings of the Yolo Habitat Conservancy Board (the Joint Powers Authority that oversees the Advisory Committee). I frequently gave testimony and advice to the Board, as well as reporting progress of the Advisory Committee. Advisory committee members frequently worked with personnel from the environmental consulting firm ICF to review and edit the conservation plan(s) chapters. Final approval of the Yolo HCP/NCCP from the federal, state, and local officials occurred in the summer of 2018 and this was a major accomplishment.
The service work described above relates directly to my teaching and research programs at UC Davis. My research program with the Agricultural Experiment Station is entitled “Landscape Conservation Planning and Design: Enhancing ecological function through reconciliation of cultural and natural systems.” My teaching program includes an undergraduate course called “Site Ecology” (LDA 050) where I teach introductory landscape conservation concepts and a graduate seminar called “Landscape Conservation” (LDA 280) where more advanced research is explored and discussed. This seminar focuses on theory and application of landscape ecology to conservation planning, design, and management techniques for natural resources. It examines ecological theory, methods, policy, and case studies as it relates to the establishment and management of conservation areas. Climate change and reserve design are recurrent themes in the course.
The learning objectives for the graduate course are presented below (Table 1). My outreach work feeds back directly to my research and my teaching and vice-versa. I bring to the classroom what I learn in research and what I learn in my “real world” service projects, and I bring what I learn in doing research and teaching to my service projects. The profession of landscape architecture needs to embrace not just the field of ecology, but the field of conservation planning and design—the strategic application of ecological principles. This is a landscape architecture pedagogical imperative.
Table 1. Learning objectives of the graduate course Landscape Conservation (LDA 280)
Learning Objectives 1. To articulate the principles of landscape ecology, biological conservation, and
systematic conservation planning 2. Be able to explain the following concepts: patch-matrix model, patch
CELA 2019 | UC Davis 403

dynamics, succession, disturbance, habitat analysis, ecological networks 3. Learn conservation policy: federal Endangered Species Act, California Natural
Communities Conservation Planning (NCCP) Act 4. Understand basic components of habitat conservation plans (HCP) and NCCP
plans 5. Explore systematic conservation planning methods, such as conservation gap
analysis, focal species, wildlife-habitat relationship modeling 6. Analyze the human dimension of conservation planning & the role of
environmental ethics 7. Explore case studies
7 CONCLUSIONS
It is essential to integrate systematic conservation planning into municipal general plans at the local level. This approach promotes comprehensive conservation and focuses beyond special status species. This is critically important to prevent future endangered species and to sustain existing wildlife populations. However, HCPs and NCCPs are both optional planning processes and most municipalities will not engage in those processes due to time, expense, politics, and lack of local experts (i.e., inadequate community capacity). Therefore, federal and state wildlife conservation agencies need to develop outreach programs to proactively assist local governments in developing comprehensive systematic conservation plans for their respective open space or conservation elements within their general plans. This type of effort will result in greater sustainability of local wildlife and plant communities for future generations. As Lister (2017, p. 31) states in the New Landscape Declaration, “we must (re)weave the tapestry of the wild back into the landscape of the future. … To lose the wild is to lose that which makes us most human.” 8 ACKNOWLEDGEMENTS
This work was supported by the USDA National Institute of Food and Agriculture, Hatch Project 1011533. I wish to thank the Yolo Habitat Conservancy Board and Advisory Committee members and others with whom I collaborated on the development of the Local Conservation Plan for Yolo County, including C. Roberts, J. Hopkins, and G. Holstein, ICF consultant E. Berryman, YHC Executive Director P. Marchand, and YHC staff S. Garbini and C. Alford, for their professional advice, guidance, and support.
9 REFERENCES 1. Baldwin, R. F., Trombulak, S. C., Leonard, P. B., Noss, R. F., Hilty, J. A., Possingham, H. P., Scarlett,
L., & Anderson, M. G. (2018). The Future of Landscape Conservation. BioScience, 68(2), 60-63. 2. California Department of Fish and Wildlife (CDFW). (2018). Regional Conservation Investment
Strategies Program Guidelines. California Department of Fish and Wildlife, Sacramento, CA. Retrieved from: https://nrm.dfg.ca.gov/FileHandler.ashx?DocumentID=161193&inline
3. Diamond, J. M. (1975). The island dilemma: lessons of modern biogeographic studies for the design of natural reserves. Biological Conservation 7, 129-146.
4. Dramstad, W.E., Olson, J.D. & Forman, R.T.T. (1996). Landscape Ecology Principles in Landscape Architecture and Land-Use Planning. Washington D.C.: Harvard University Graduate School of Design, Island Press, and American Society of Landscape Architects.
5. Duerksen, C. J., Elliott, D. L., Hobbs, N. T., Johnson, E., & Miller, J. R. (1997). Habitat Protection Planning: Where the Wild Things Are. American Planning Association, Planning Advisory Service, Report Number 470/471, Chicago, IL.
6. Groves, C. R., Game, E. T., Anderson, M. G., Cross, M., Enquist, C., Ferdana, Z., Girvetz, G., Gondor, A., Hall, K. R., Higgins, J., Marshall, R., Popper, K., Schill, S., & Shafer, S. L. (2012). Incorporating climate change into systematic conservation planning. Biological Conservation 21, 1651-1671.
7. Greco, S. E. (2015). Yolo County Local Conservation Plan (LCP): Biological and Ecological Goals. Yolo Habitat Conservancy, Yolo County Joint Powers Authority, Woodland, CA.
CELA 2019 | UC Davis 404

8. Greco, S.E., Roberts, C., Hopkins, J., & Holstein, G. (2013). Yolo County NHP Species of Local Concern Issue Paper. Yolo Natural Heritage Program, Joint Powers Authority, Yolo County, Woodland, CA.
9. Huber, P. R., Greco, S. E., & Thorne, J. H. (2010). Spatial Scale Effects on Conservation Network Design: Trade-offs and Omissions in Regional Versus Local Scale Planning. Landscape Ecology 25, 683-695.
10. ICF. (2018). Yolo Regional Conservation Investment Strategy/Local Conservation Plan. Draft. March. (ICF 00723.16.) Sacramento, CA. Administrative Draft. Prepared for Yolo Habitat Conservancy, Woodland, CA. Retrieved from: https://nrm.dfg.ca.gov/FileHandler.ashx?DocumentID=157451&inline
11. Laurance, W. F. (2008). Theory meets reality: How habitat fragmentation research has transcended island biogeographic theory. Biological Conservation 141, 1731-1744.
12. Lister, N.-M. (2017). Of Wilderness, Wild-ness, and Wild Things. In Berens, G. (Ed.), The New Landscape Declaration (pp. 29-32). Los Angeles, CA: Landscape Architecture Foundation and Rare Bird Books.
13. Margules, C. R., & Pressey, R. L. (2000). Systematic Conservation Planning. Nature 405, 242-253. 14. McKenney, B. A, & Kiesecker, J. M. (2010). Policy development for biodiversity offsets: A review of
offset frameworks. Environmental Management 45, 165-176. 15. Noss, R. F., O’Connell, M. A., & Murphy, D. D. (1997). The Science of Conservation Planning: Habitat
Conservation under the Endangered Species Act. Covelo, CA: Island Press. 16. Office of Planning and Research (OPR). (2017). State of California General Plan Guidelines,
Governor's Office of Planning and Research, Sacramento, CA. Retrieved from: http://opr.ca.gov/docs/OPR_COMPLETE_7.31.17.pdf
17. Powell, R. (2010). Developing Institutions to Overcome Governance Barriers to Ecoregional Conservation. In Trombulak, S. C., and R. F. Baldwin (Eds.), Landscape-scale Conservation Planning (pp. 53-66). New York, NY: Springer.
18. Primack, R. B. (2004). A Primer on Conservation Biology. Third Edition. Sunderland, MA: Sinauer Associates.
19. Sarkar, S., & Illoldi-Rangel, P. (2010). Systematic Conservation Planning: An Updated Protocol. Natureaz & Conservacao 8(1), 19-26.
20. Soule, M. E. (1991). Land use planning and Wildlife Maintenance: Guidelines for conserving wildlife in an urban landscape. Journal of the American Planning Association 57(3), 313-323.
21. Spencer, W.D., Beier, P., Penrod, K., Winters, K., Paulman, C., Rustigian-Romsos, H., Strittholt, J., Parisi, M., and Pettler, A. (2010). California Essential Habitat Connectivity Project: A Strategy for Conserving a Connected California. Prepared for California Department of Transportation, California Department of Fish and Game, and Federal Highways Administration. Retrieved from: https://www.wildlife.ca.gov/conservation/planning/connectivity/CEHC
22. Spencer, W., Noss, R., Marty, J., Schwartz, M., Soderstrom, E., Bloom, P., & Wylie, G. (2004). Report of Independent Science Advisors for Yolo County Natural Community Conservation Plan/Habitat Conservation Plan (NCCP/HCP). Report prepared for Yolo County Joint Powers Agency by the Conservation Biology Institute. Retrieved from: https://nrm.dfg.ca.gov/FileHandler.ashx?DocumentID=6407
23. Stanford Environmental Law Society. (2001). The Endangered Species Act: A Stanford Environmental Law Society Handbook. Stanford, CA: Stanford University Press.
24. Stein, B.A., Glick, P., Edelson, N., & Staudt, A. (Eds.). (2014). Climate-Smart Conservation: Putting Adaptation Principles into Practice. Washington, D.C.: National Wildlife Federation.
25. Stein, B.A., Staudt, A., Cross, M.S., Dubois, N.S., Enquist, C., Griffis, R., Hansen, L.J., Hellman, J.J., Lawler, J.J., Nelson, E.J., & Pairis, A. (2012). Preparing for and managing change: climate adaptation for biodiversity and ecosystems. Frontiers in Ecology and the Environment 11(9), 502-510.
26. Thorne, J. T., Huber, P. R., Girvetz, E. H., Quinn, J., & McCoy, M. C. (2009). Integration of Regional Mitigation Assessment and Conservation Planning. Ecology and Society 14(1), 47.
27. Underwood, J. G. (2011). Combining Landscape-Level Conservation Planning and Biodiversity Offset Programs: A Case Study. Environmental Management 47, 121-127.
CELA 2019 | UC Davis 405

28. Wiens, J. A. (2002). Chapter 1: Central Concepts and Issues of Landscape Ecology. In Gutzwiller, K. J. (Ed.), Applying Landscape Ecology in Biological Conservation (pp. 3-21). New York, NY: Springer-Verlag.
29. Wiens, J. A. (2009). Landscape ecology as a foundation for sustainable conservation. Landscape Ecology 24(8), 1053-1065.
30. Yolo Habitat Conservancy (YHC) (2017). Yolo Final Habitat Conservation Plan/Natural Community Conservation Plan. Prepared by ICF for the Yolo Habitat Conservancy, Woodland, CA. Retrieved from: https://www.yolohabitatconservancy.org/documents
31. Yolo County. (2009). Adopted 2030 Countywide General Plan. Resolution No. 09-189. Yolo County Planning and Public Works Department, Woodland, CA. Retrieved from: https://www.yolocounty.org/general-government/general-government-departments/county-administrator/general-plan-update/adopted-general-plan
CELA 2019 | UC Davis 406

CELA MEDIA STATEMENT (Optional)
Dear CELA Authors: Please consider include in this space a research summery in 100 words or less that would best describe your topic, its principal results and/or impacts, written in clear language that would be of interest to public media outlets. In addition to the research summary, you may provide an optional graphic abstract that further explains the topic. Title of Paper or Research: --- Author: Steven E. Greco Institution or Professional Affiliation: University of California, Davis Authors please select one of the following: I DO_____ DO NOT__X___want to prepare a media statement for general release from the 2018 CELA Conference. (If you choose DO NOT, you do not need to prepare a media statement). Media Statement (100 words max.): (Optional) Graphic Abstract: please insert the illustration below. Authors: please seek copyright permission if copyrighted materials are used.
CELA 2019 | UC Davis 407

The authors are solely responsible for the content of this technical presentation. The technical presentation does not necessarily reflect the official position of the Council of Educators in Landscape Architecture (CELA), and its printing and distribution does not constitute an endorsement of views which may be expressed. Citation of this work should state that it is from a CELA conference paper. EXAMPLE: Author's Last Name, Initials. 2019. Title of Paper. Sacramento, CA: CELA. For information about securing permission to reprint or reproduce this paper, please contact CELA at [email protected]
IDENTIFYING OIL SPILL HAZARDS IN NORTH DAKOTA, THROUGH
HYDRAULIC MODELING AND CONSERVATION PLANNING
SONG,YANG North Dakota State University, [email protected] DAVIS-KOLLMAN, MORGAN North Dakota State University, [email protected] 1 ABSTRACT
North Dakota is the second largest in oil production in the United States with 85 paramount oil spills within the last 20 years. In 2006, a broken pipeline burst more than a million gallons of brine wastewater into Charbonneau Creek in Northwestern North Dakota, altering ecosystem services and the residents who relied on the land and surrounding water bodies. The massive die-off of fish, plants and the tainting of productive soil and drinkable water sources especially for Native Americans who are most reliant on environmental healthy and stability. Oil spills are extremely unpredictable, with little available information of when, where and how they occur. Beyond the unforeseeable, there are few remediation or planning strategies to be executed when spills transpire. While most literature focuses on the reporting protocol and response actions, this study will propose an analytical strategy to estimate the environmental threat of oil spills to water resources through environmental planning. Geospatial and hydraulic modeling tools will be introduced using USGS StreamStats for watershed-based drainage delineations, basin characteristic visualization, and streamflow estimation. Impacted landuses will be examined and analyzed to inform environmental intervention. The result will present an efficient framework for hazard identification, vulnerability analysis and ecological planning for an endangered watershed area on Fort Berthold Reservation. The goal is to produce new perspectives on possibilities of creating a more resilient and sustainable tribal community.
1.1 Keywords
Geographic Information System, Hazard identification, Oil Spill, Conservation Planning
CELA 2019 | UC Davis 408

2 INTRODUCTION North Dakota state is ranked number two in US in oil production, just behind the state of Texas,
producing 1.3 million barrels of oil per day (Crude oil production, 2017). Approximately 1.4 million crude oil with regulated hazardous liquid run with pipelines across the state, with loose regulations on oil spill reporting (David, 2016; Oil Transportation Table, 2018). However, the state does not require that the public be notified in the event of an oil spill, making it a closed-door industry. Research in many regions throughout the nation have shown that contamination from fracking has been fairly sporadic and inconsistent; in North Dakota it is widespread and persistent, with evidence of direct water contamination from fracking (Daniel, 2016). A recent analysis from 2013-2017 found that 42% of oil and 57% of brine spilled was uncontained, spewing nearly 37,000 barrels of oil and over 169,000 barrels of toxic saltwater. Lack of regulation and expansion of industry has enabled an average of 4.4 spills a day across the state since 2013(Springer,2016).
2.1 Environmental hazard within the pipeline oil spill
Pipeline spills are releasing toxins into soils and waterways at alarming rates, exceeding the nation’s water quality standards (Scientists Say Oilfield, 2016). One gallon of wastewater or oil can make nearly a million gallons of freshwater undrinkable (Office of Research and Development, 2016). This improper disposal of these contaminants percolate and infect the groundwater, damage surface soil, water resources and inhabitants of the affected area. With increased implementation of wells and pipelines, the number of spills and leaks have followed. In the United States on average, from 1986-2013, one significant oil or gas pipeline incident occurred every thirty hours (Daniel, 2016). Spills and pipeline failures transpire in a variety of ways such as mechanical failure, human error and/or subfreezing temperatures which cause ruptures within the system (Pipeline Risks, 2017). The implementation of metals into water sources inhibits carbon, sulfur and phosphorus mineralization and nitrogen transformations, hindering photosynthesis and reproduction cycles. Due to the rise in spills, corruption of natural resources has multiplied. Only about 20% of oil compounds degrade within water, revealing 35x the level of ammonium and selenium in sampled water that the United States Environmental Protection Agency considers safe for freshwater aquatic life and use (Office of Research and Development, 2016).
2.2 Fort Berthold reservation
The increase of oil rigs and pipeline development across the Western part of North Dakota have led to detrimental impacts within Native American reservations. Most of them do not benefit from oil discovery and extraction financially and many times suffer environmentally which influence their vital farming and ranching practices. Fort Berthold is one reservation within the Bakken, with tribal land being owned by Native American as individual allotments or communally by the tribe (Three Affiliated, 2016). As of March 2016, 15,013 registered tribe members were reported (Demographics | North, 2016). This tribal land is subjected to serious threats from oil industry since North Dakota Department of Health revealed more than 8,000 spills [both pipeline and rigs] were recorded from 2008 to 2015 in the region (Cozzarelli et al, 2017). Due to the economic downward spiral, the unemployment rate has reached an alarming 26.5 percent, leaving approximately 750 workers to support 6,000 tribal residents. Centuries of treaties have resulted in the confiscation of large portions of land from the reservation and lack of economic stimulation. The implementation of the oil industry since the Bakken Boom has caused further hardship on surrounding Native American communities and their daily environment (Thompson, G, 2016).
2.3 Oil spill contingency planning and environmental planning
Most of the current effort on oil spills are based around the containment and recovery, focusing on the techniques after the oil spill event. Typical strategies include the use of booms, skimmers, sorbents or in-situ burning and other specifics (Oil Program Center, 1999, p9-18). The Environmental Protection Agency (EPA) has also specified a contingency plan for preparing oil spills events which consist of hazard identification, vulnerability analysis, risk assessment the use and response action. However, this contingency plan does not provide environmental planning guidance but “like a ‘game plan,’ or a set of instructions that outlines the steps that should be taken before, during, and after an emergency” (Oil Program Center, 1999, p27).
CELA 2019 | UC Davis 409

Environmental planners perform duties lie (March 2010, p24) hazard assessment which specifically aim for identifying vulnerable areas in environments where an industrial use exists and would risk damage to occur. Risk Management involves building strategies dealing with hazards and providing emergency relief services. Both Hazard Assessment and Risk Management planning started gaining serious attention to issues such as storm surge, riverain flooding, earthquake, and wildfire (p.24), while oil spills are rarely investigated in the field of environmental planning.
2.4 Hydrological analysis
Water is the key component in environmental planning problems (Dunne, T., & Leopold, L. B., 1978). Planners and landscape architects use hydrological analysis to understand the movement of water over and under land surface, as well as the geomorphic, geochemical and biologic processes of water flow. Specifically, the estimate of the rate and amount of runoff as overflow is extremely important. The runoff is currently calculated using runoff models such as rational methods, Unit Hydrograph, SWAT, HSPF, HEC-HMS, etc., (Sitterson et al, 2017) which involve extensive data collection such as rainfall record, land use, slope and topography, soil properties, runoff coefficients table, etc. Resulting parameters like 10-year peak flow and annual runoff could help planners specify areas with intense hydrological processes to inform actions, goals, and developments for resilient communities.
In this paper, we investigate the environmental hazard and vulnerable environments around Fort Berthold Reservation in North Dakota by implementing USGS StreamStats, a web based analytical service. The goal is to present a form of analytical framework for environmental planning issues around pipeline oil spills.
3 METHODS 3.1 Watershed and flow network
This study uses Lake Sakakawea basin as the main study area for 4,940,539.18 Acres (6-digit HUC 101101) where the Fort Berthold Reservation is located at the south end downstream of the basin (Figure 1). Based on 2011 National Landcover data, the basin has roughly 36% of land as Herbaceous, 44% Cultivated Crops, 3.1% Development, 2.4% wetland, 1.8% deciduous forest, 1.3% shrub/scrub. 8.5% is Open Water where Lake Sakakawea is a 307,000-acre man-made reservoir created by Garrison Dam.
Since most oils are lighter than water, they flow on top of the water. Many oil spill incidents reach and damage lakes, rivers and wetlands through the surface flow network (Oil Program Center, 1999, p5-8). In January 2015, a pipeline burst contributed to a spill of over 3 million gallons of oil and wastewater into nearby Blacktail Creek and traveled 27 miles to reach the Missouri River (Cozzarelli et al, 2017). GIS data on flow network from NHDPlus Dataset by EPA was collected to the creeks, rivers, streams, canals, lakes, ponds etc. in the study area. This will help us locate the likely hazardous and vulnerable areas after oil spill incidents occur.
CELA 2019 | UC Davis 410

Figure 1. Study Watershed Basin and Fort Berthold Reservation
3.2 Hydrological analysis through StreamStats Developed by the U.S. Geological Survey (USGS), StreamStats is a web application that provides
hydrological modeling functionalities for water resources planning and management, and engineering purposes (Kernell G et al, 2008). This study will focus on two tasks using StreamStats:
3.2.1 Drainage basin delineation: As the sample StreamStats report shows in Figure 2, the USGS StreamStats provides web
services to delineate the drainage basin for a stream point (SP) of interest by integrating multiple datasets, such as the National Hydrography Dataset (NHD), the Watershed Boundary Dataset, and the 3D Elevation Program. In this study, we collected 101 points of interests where the streams enter the land boundary of Fort Berthold Reservation and then ran all the drainage basins for these points of interests. The resulting drainage basins will show all the areas where surface runoff flows into Fort Berthold Reservation to help identify the impacted watershed by potential Oil Pipeline Spills.
3.2.2 Streamflow modeling The other key function by StreamStats is the automatic estimation of Streamflow Statistics for
each drainage basin delineated (Figure 2). With large amounts of data from more than 25,000 Gaging Stations around the United States (USGS Gage Locations, 2018), the USGS has developed many regression equations that can be used to estimate various streamflow statistics for locations on ungauged streams throughout the nation. As an example, the equation for estimating the 100-year flood for ungauged sites of Northern Idaho is:
Q100=5.39*DA*0.0874*(E/1000)-1.13*P*1.18 (Berenbrock, 2002) Where: Q100 is the peak flow that occurs, on average, once in 100 years (1-percent chance of
occurrence in any year), in cubic feet per second; DA is the drainage area, in square miles; E is the mean basin elevation, in feet; and P is the mean annual precipitation, in inches.
CELA 2019 | UC Davis 411

StreamStats will automatically detect the correct equation for the drainage basin of interests and generate corresponding flow statistics. There are also API and batch services available for requests with multiple basins (only 200 requests are allowed each time). In this study, we developed a customized StreamStats requesting script using Python to fetch all the drainage basins and their corresponding 10-year peak flow rate in GeoJson format. All results will then be aggregated into a shapefile for further analysis.
Figure 2. StreamStats Report
3.3 Hazard Indexing After the hydrological analysis using StreamStats, we are able to estimate how much stormwater
runoff will flow through each stream point (SP) on the reservation boundary at a 10-year event. We then estimated the overall runoff ratio of each cubic feet of rainfall at a 10-year event use (similar concept with Rational Method) the following equation:
R10-YEAR=3600*12*Q10-YEAR/(1.8*A) (1)
Where R10-YEAR is the runoff ratio of each cubic feet of rainfall at the 10-year event in the area; Q10-
YEAR is the 10-year peak flow of the drainage basin calculated from StreamStats, in cubic ft per second; 1.8 is the 10-year rainfall intensity of the study area in inch per hour (Hershfield, D. M., 1961)); A is the area of the drainage basin, in square ft;
We then estimate the level of oil spill hazard by calculating a Hazard Index that using three assumptions:
1.Oil spills flow with the storm runoff, the R10-YEAR equals the runoff rate of each cubic feet of oil spill at the 10-year event in the area.
2.The probability (P) of oil spill per mile pipeline is equal and independent. 3.The estimated damage of a pipeline oil spill event is a constant X, there is no difference in terms
of damage between multiple leaking spot simultaneously and one leaking spot. Therefore, the Hazard Index (HI) for one drainage basin is calculated as:
CELA 2019 | UC Davis 412

HI=R10-YEAR(1-(1-P)L)X (2) We use an estimated ratio of P=0.1% from an analysis between 1982 and 1991 (Hovey, D. J., &
Farmer, E. J, 1993); L is the total mileage of the pipeline in the drainage basin. 1-(1-P)L is the probability of at least one leakage of the total L mile pipeline in the drainage basin; the damage constant X=1000;
3.4 Vulnerability analysis The Hazard Index (HI) can help compare and rank the damage level of the pipeline oil spill inflows
at each stream point (SP). We then traced the downstream flow network for all stream points (SP) to identify the streams that will flow into reservation land. The Hazard Index will be aggregated to the downstream flow network to evaluate the vulnerability of the pipeline oil spill hazard for the reservation. Finally, we conducted an overlay analysis and descriptive statistics in ArcGIS for the ecosystem types being affected in the reservation.
4 RESULTS
Hydrological analysis started with the watershed delineation which provides a thorough understanding of drainage basins that flow into the reservation. As Figure 3 showed, all drainage basin delineations are generated from StreamStats and illustrated with 101 blue polygons in ArcGIS, with sizes ranging from 0.03 square miles to 221 square miles. 14 drainage basins (orange polygons) that have oil pipelines installed are identified as impacted basins in which most are from the west side of the reservation due to intense oil extracting and transporting activities.
Data gathered from StreamStats for Table 1 include all the basic characteristics of the impacted drainage basins such as mean slopes, length of longest flow path, average agriculture land percentage, mean basin elevation, total stream length, drainage area, average soil permeability and average percentage of impervious area, as well as the ten year peak flow rate, with the Basin ID in a clockwise order. The topography is relatively hilly with the median slope of 8.31 percent, especially at the west side of the reservation. Most impacted drainage basins are well-drained with a median average soil permeability of 1.57 inches per hour except the two at the north side where main agricultural lands are located. Overall, these basins consist of 573.61 miles of total streams, 363 square miles of drainage area, and a total of 6762.9 cubic feet per second 10-Year Peak Flow.
Table 1. Basic Characteristics of the Impacted Drainage Basins.
Basin Id
Mean Basin Slope from 10m DEM
Length of
Longest Flow Path (mile)
Ag Land Percentage
Mean Basin
Elevation
Stream Length Total (Mile)
Drainage Area
(Square Mile)
Average Soil Permeability (Inches Per
Hour)
Average Percentage
of Impervious Landcover from NLCD
2011
10-Year Peak Flow
Rate (Cubic
Feet per Second)
1 11.21 22.99 14.29 2326.30 105.20 48.76 1.54 0.23 1085.43 2 8.26 16.43 32.78 2327.61 45.08 22.27 1.93 0.34 736.87 3 9.21 12.60 24.90 2301.87 63.31 24.34 1.92 0.45 1100.85 4 4.69 0.60 39.89 2306.45 0.26 0.13 0.94 0.68 20.70 5 6.47 2.28 17.75 2297.24 2.61 1.31 1.15 0.25 111.66 6 7.64 1.10 0.00 2317.39 0.73 0.38 0.97 0.00 53.20 7 8.37 0.86 0.00 2341.88 0.52 0.21 1.04 0.33 44.34 8 9.71 1.91 0.00 2331.75 3.73 1.00 1.18 0.10 147.19 9 17.79 4.71 0.82 2340.38 16.71 5.79 1.92 0.08 592.88
10 11.03 8.18 20.46 2349.33 21.47 8.84 1.96 0.35 561.69 11 9.59 3.51 26.37 2282.33 3.14 1.69 1.60 0.60 178.26 12 8.07 9.44 38.83 2286.95 30.22 13.69 1.46 0.37 490.11 13 5.21 12.52 45.14 2204.57 36.55 23.30 3.26 0.44 679.85 14 4.01 42.97 57.56 2121.63 244.07 211.44 3.64 0.26 959.88
CELA 2019 | UC Davis 413

Median 8.31 6.45 22.68 2311.92 19.09 7.32 1.57 0.33 525.90
Figure 3 . Drainage Basins in the Study Area
As the color-coded polygons in Figure 4 have shown, the Hazard Index provides quantifiable
criteria to measure the expected impacts of each impacted drainage basin on the environmental safety of the reservation. The basins at the west side of the reservation have higher pipeline oil spill hazard than the two basins (ID 13&14) at the north. This is due to a densely located pipeline layout and higher 10-year runoff ratios (Table 2). Basin ID 1, 2 and 3 are the three most hazardous areas with multiple large-scale oil operation facilities between Mandaree, ND and Johnsons Corner, ND. Basin 4, 6, 7 and 8 are smaller basins with smaller Hazard Index but higher 10-year runoff ratios.
CELA 2019 | UC Davis 414
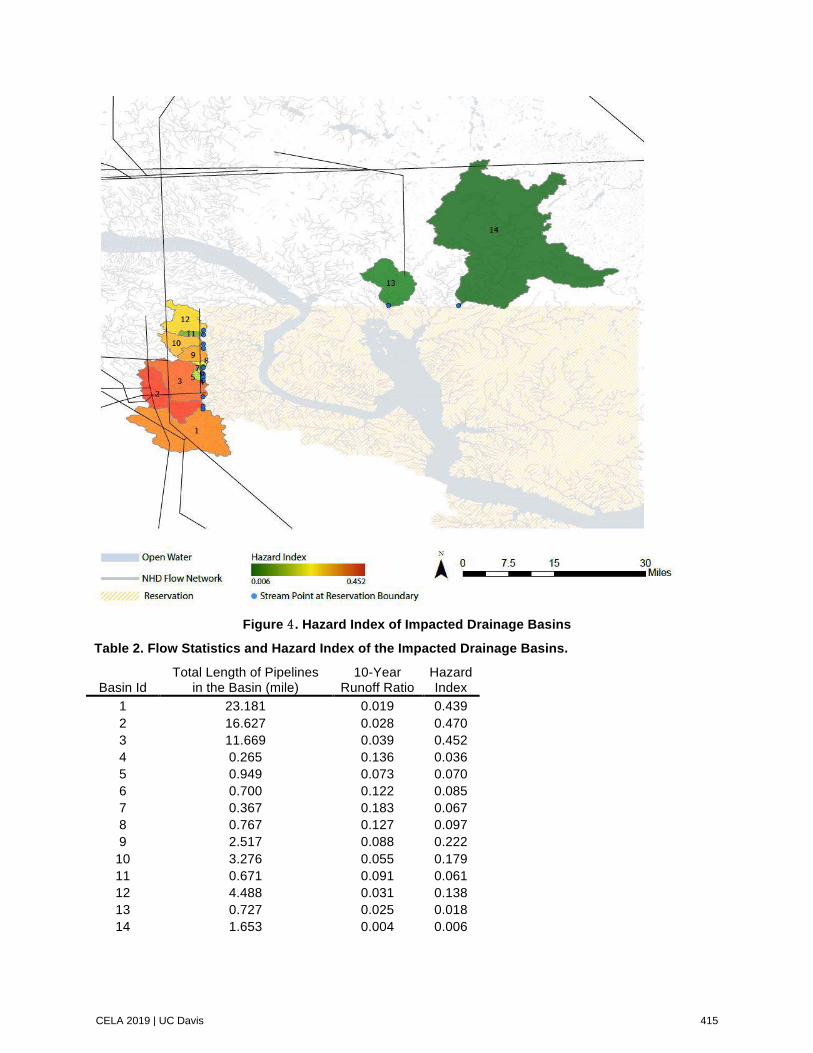
Figure 4 . Hazard Index of Impacted Drainage Basins
Table 2. Flow Statistics and Hazard Index of the Impacted Drainage Basins.
Basin Id Total Length of Pipelines
in the Basin (mile) 10-Year
Runoff Ratio Hazard Index
1 23.181 0.019 0.439 2 16.627 0.028 0.470 3 11.669 0.039 0.452 4 0.265 0.136 0.036 5 0.949 0.073 0.070 6 0.700 0.122 0.085 7 0.367 0.183 0.067 8 0.767 0.127 0.097 9 2.517 0.088 0.222
10 3.276 0.055 0.179 11 0.671 0.091 0.061 12 4.488 0.031 0.138 13 0.727 0.025 0.018 14 1.653 0.004 0.006
CELA 2019 | UC Davis 415

Downstream tracings based on the direction information of the NHD flow network for the stream
points (SP) at the reservation boundary of the impacted drainage basins. 71.56 miles of NHD flow networks were identified as vulnerable streams for ecological conservation and hazard management in the future. As Figure 5 shows, all the pipeline oil spill hazards will flow through four different creeks in which three are named as Bear Den Creek, Clarks Creek, and Shell Creek. We coded and aggregated each drainage basin Hazard Index value to all the corresponding streams based on their flow order. Therefore, the hierarchies of each stream segments can be evaluated as the color-coded polylines in Figure 5. Bear Den Creek, Clarks Creek, and their tributaries in the western part of the reservation are the most vulnerable areas, flowing into the Missouri River and Lake Sakakawea.
Figure 5 . Vulnerable Streams
Finally, to give us a clear understanding on the impacted ecosystems typology, the Land Cover
Data from the USGS National GAP Analysis Project was analyzed in the 1-mile buffer zone of the impacted streams (Figure 5). The Northwestern Great Plains Foothill and Piedmont Grassland are the
CELA 2019 | UC Davis 416

most dominating ecosystems at 52.66% of the reservation, followed by Western Great Plains Wooded Draw and Ravine (10.86%), Cultivated Cropland (8.46%), and Open Water (7%). Table 3 lists all the ecosystems in percentage.
Table 3. Ecosystems in the Vulnerable Streams.
Ecosystems in GAP Analysis Percentage
Northwestern Great Plains Shrubland 1.92 Western Great Plains Dry Bur Oak Forest and Woodland 2.22 Western Great Plains Wooded Draw and Ravine 10.86 Northwestern Great Plains Foothill and Piedmont Grassland 52.66
Western Great Plains Tallgrass Prairie 0.36 Western Great Plains Sandhill Steppe 5.12 Western Great Plains Depressional Wetland Systems 4.30 Inter-Mountain Basins Big Sagebrush Steppe 0.08 Western Great Plains Badland 1.46 Cultivated Cropland 8.46 Pasture/Hay 3.65 Modified/Managed Southern Tall Grassland 0.47 Open Water (Fresh) 7.00 Developed, Open Space 0.38 Developed, Low Intensity 0.14 Developed, High Intensity 0.91 Total 100
5 DISCUSSION This study presents a method of identifying potential hazards for the Pipeline Oil Spills in North
Dakota. By introducing NHDPlus flow network and USGS StreamStats, we were able to conduct Hydrological analysis (Figure 2) without sacrificing accuracy and reliability. Making requests from the StreamStats’ large hydrology datasets, our drainage basin delineation and streamflow modeling tasks didn’t have to include tedious data collection process such as land cover, precipitation, time of concentration, etc. We developed a customized Python Script to automate the estimation of peak flow runoff using StreamStats Web Service which utilizes regression techniques from large amounts of data from more than 25,000 Gauging Stations around the United States (USGS Gauge Locations, 2018). The processing time for the 101 points of interests cost approximately 2 hours. The results (Table 1 and 2) such as drainage area, soil permeability, and 10-year peak flow rate can help understand the hydrological characteristics of the region and inform environmental hazards of pipeline oil spills. With little modification, this hydrological analysis approach could also be used in many other regional planning objectives such as flood control, ecological restoration, and water resource management.
Additionally, we demonstrated the process of using StreamStats’ 10-year peak flow results to estimate Pipeline Oil Spill Hazards for each drainage basin by developing a customized Hazard Index. Through this, it concluded that the drainage basins (Figure 4, Table 2) at the west side of the reservation between Mandaree, ND and Johnsons Corner, ND pose the most significant threats to Fort Berthold Reservation. This area has large amounts of oil industry operations present and should gain extra attention from land policymakers. Stricter hazard assessment and environmental monitoring actions are desperately needed before further water and soil contamination occurs. Ecological restoration investments
CELA 2019 | UC Davis 417

should be made for lands currently suffering from sustaining environmental pollutions within the reservation.
Regarding the vulnerability analysis (Figure 5), we identified the vulnerable streams by down tracing the NHD flow network to assess the vulnerability level by aggregating the Hazard Index (HI) of corresponding upstream Stream Point (SP). Bear Den Creek and Clarks Creek are identified as high-risk areas in a pipeline oil spill event. Major impacted ecosystems are Northwestern Great Plains Foothill and Piedmont Grassland with large areas of mixed grass species such as Bluestem Grass and Needlegrass. The appearance of oil spill pollutants could harm the health of one or more species in the local food chain, which may lead to damage for food and water resources to human beings (Oil Program Center, 1999, p7). Tribal administration should prioritize these areas for conservation purpose, and if necessary, State and Federal agencies could also provide fiscal and policy incentives to facilitate projects that establish new natural communities for protecting potential threats.
This study focuses on pipelines as the major source of oil spill hazard. Other forms of oil spills from tankers, drilling rigs, wells, and refinery facilities are not considered. To gain a more holistic understanding of the environmental issues around Fort Berthold Reservation, more investigations are needed in the future.
6 REFERENCE Berenbrock, C. (2002). Estimating the magnitude of peak flows at selected recurrence intervals for
streams in Idaho. U.S Geological Survey Water-Resources Investigations Report 02-4170, 59 p. Cozzarelli, I. M., Skalak, K. J., Kent, D. B., Engle, M. A., Benthem, A., Mumford, A. C., … Jolly, G. D.
(2017). Environmental signatures and effects of an oil and gas wastewater spill in the Williston Basin, North Dakota. Science of The Total Environment, 579, 1781–1793.
Crude oil production in the United States in 2017, by state(2017). Statista. Retrieved from https://www.statista.com/statistics/714376/crude-oil-production-by-us-state/
Daniel, K. (2016). Soil, Water Contamination In North Dakota From Fracking Spills. Environmental Monitor. Retrieved from https://www.fondriest.com/news/soil-water-contamination-north-dakota-fracking-spills.htm
Demographics | North Dakota Studies (August 1, 2016). Retrieved from ndstudies.gov. Dunne, T., & Leopold, L. B. (1978). Water in environmental planning. W.H. Freeman. Hersperger, A. M., Langhamer, D., & Dalang, T. (2012). Inventorying human-made objects - A step
towards better understanding land use for multifunctional planning in a periurban Swiss landscape. Landscape and Urban Planning, 105(3), 307-314.
Hershfield, D. M. (1961). Rainfall Frequency Atlas Of The United States For Durations From 30 Minutes To 24 Hours And Return Periods From I To 100 Years. Washington, D.C. Retrieved from http://www.nws.noaa.gov/oh/hdsc/PF_documents/TechnicalPaper_No40.pdf
Hovey, D. J., & Farmer, E. J. (1993). Pipeline Accident, Failure Probability Determined From Historical Data - Oil & Gas Journal. Retrieved December 12, 2018, from https://www.ogj.com/articles/print/volume-91/issue-28/in-this-issue/pipeline/pipeline-accident-failure-probability-determined-from-historical-data.html
Kernell G. Ries, Guthrie, J. G., Rea, A. H., Steeves, P. A., & Stewart, D. W. (2008).StreamStats: A water resources web application. Fact Sheet. https://doi.org/10.3133/FS20083067
Kirby, D. (2016). North Dakota’s Oil Spill Record: 85 Pipeline Accidents in 20 Years. TakePart, . Retrieved from http://www.takepart.com/article/2016/12/08/north-dakotas-oil-spill-record-86-pipeline-accidents-20-years
Marsh, W. M. (2010). Landscape planning�: environmental applications. Hoboken, NJ: Wiley. Office of Research and Development. (2016). Hydraulic Fracturing for Oil and Gas:Impacts from the
Hydraulic Fracturing Water Cycle on Drinking Water Resources in the United States. U.S. Environmental Protection Agency
Oil Program Center. (1999). Understanding Oil Spills And Oil Spill Response. U.S. Environmental Protection Agency
Oil Transportation Table(2018). Nd Pipeline Authority. Retrieved from https://northdakotapipelines.com/oil-transportation-table/
CELA 2019 | UC Davis 418

Pipeline Risks(2017), Watershed Council, Retrieved from https://www.watershedcouncil.org/pipeline-risks.html
Scientists say oilfield wastewater spills release toxins (2016). CBSnews. Retrieved from https://www.cbsnews.com/news/scientists-say-oilfield-wastewater-spills-release-toxins/
Sitterson, J., Knightes, C., Parmar, R., Wolfe, K., Muche, M., & Avant, B. (2017). An Overview of Rainfall-Runoff Model Types. U.S. Environmental Protection Agency
Springer, P. (2016). 80 percent of ND oil spills wouldn't have been reported under new law. Grand Forks Herald. Retrieved from https://www.grandforksherald.com/news/government-and-politics/4426763-80-percent-nd-oil-spills-wouldnt-have-been-reported-under-new
Thompson, G (2016). The Double-Edged Sword of Sovereignty by the Barrel: How Native Nations Can Wield Environmental Justice in the Fight Against the Harms of Fracking. UCLA Law Review
Three Affiliated - Demographics - Land Base and Land Status (August 1, 2016). Retrieved from ww.ndstudies.org.
USGS Gage Locations - WorldMap. (December 9, 2018.).Retrieved from http://worldmap.harvard.edu/data/
CELA 2019 | UC Davis 419

The authors are solely responsible for the content of this technical presentation. The technical presentation does not necessarily reflect the official position of the Council of Educators in Landscape Architecture (CELA), and its printing and distribution does not constitute an endorsement of views which may be expressed. Citation of this work should state that it is from a CELA conference paper. EXAMPLE: Author's Last Name, Initials. 2019. Title of Paper. Sacramento, CA: CELA. For information about securing permission to reprint or reproduce this paper, please contact CELA at [email protected]
THE ROLE OF LANDSCAPE ARCHITECTURE IN COGNITIVE MAPPING
Goeden, Joshua South Dakota State University, [email protected] Burger, Don South Dakota State University, [email protected] 1 ABSTRACT
The Image of the City (Lynch, 1960) provides a theory of how people perceive the built environment through cognitive mapping. According to Lynch, five major feature classes help to construct these mental maps: paths, edges, districts, nodes, and landmarks. The mind organizes city features into these classes to simplify the encoding process. However, the role of parks and public spaces within this theory is largely undefined. This paper aims to identify this role. Initial research conducted by landscape architecture students at South Dakota State University showed that landscape features were largely absent from participants’ cognitive maps of the university campus (Burger, 2018). This paper changes the scale of the SDSU study to examine whether this holds true for the cognitive maps of residents in Brookings, South Dakota. Participants were interviewed using a similar method to Lynch’s study consisting of a mapping exercise, an oral description of their daily commute, an inquiry on their favorite place in Brookings, and follow-up demographic questions. The data was analyzed to indicate how many times parks were mentioned on individual surveys as compared to other mapped features. A content analysis of this data revealed that parks are fairly prevalent in cognitive perception, but the role they play within Lynch’s theory varies greatly depending on the method of recall. Our hope is that the results of this study will open a discussion on the role of parks with regards to city perception and promote further research on the relationship between cognitive mapping and park design.
1.1 Keywords
Cognitive Mapping, Lynch, Parks, Wayfinding, People-Environment Relationships
CELA 2019 | UC Davis 420

CELA 2019 | UC Davis 421

2 INTRODUCTION The human brain is constantly at work. Even in the most relaxed of times, the mind is ceaselessly laboring to collect, encode, and store data about our environment in an attempt to make sense of the world around us. The study of how the brain organizes this spatial data is dubbed cognitive mapping. Psychologists have long had their hands on this topic, but perhaps its most direct application came from an urban planner named Kevin Lynch. In 1960, Lynch published The Image of the City in which he details his findings from a hands-on cognitive mapping study he led in three major US cities. In that study, participants drew, from memory, a map of their local neighborhood in an attempt to simplify the complex fabric of the urban environment into a standard set of repeated elements. In the end, Lynch defined the city using five distinct elements- paths, edges, districts, nodes, and landmarks (Lynch, 1960). Any feature within the urban environment could be classified as one or more of these elements. Today, his work has become key to our understanding of the urban environment and how it is perceived by the people living in it. Following in Lynch’s footsteps, many other studies have been aimed at understanding the complexities of cognitive mapping. In 1981, Jerry Weisman published Evaluating Architectural Legibility: Way-finding in the Built Environment. In his paper, he attempted to determine how cognitive mapping influences navigation within an architectural setting. In the end, he came to the conclusion that in both architectural settings and the large-scale environment, the brain is not able to store the entirety of what is perceived. Rather, the brain focuses on the relationships between specific locations in the environment (Weisman, 1981). This solidified the concept of environmental legibility- the degree of difficulty the brain has in encoding a feature into the cognitive map. Other studies have built on this work, looking both at the psychology behind cognitive mapping and wayfinding (Tversky, 1993) as well as the attributes that contribute to the architectural legibility of a feature in the urban environment (Chan et al., 2012). Overall, these studies have provided a guide that can help urban planners design cities to be more legible and navigable for those interacting with these environments. As the field of landscape architecture continues to grow in scale, urban design has now become a common realm of practice of many landscape architects. Thus, the foundation left by Lynch and the others has had an increasing presence in the profession. However, the specific role that traditional landscape architecture projects - parks, plazas, gardens, and other public spaces - have had on cognitive mapping is largely unknown. Some studies have looked at features related to landscape architecture, such as the impacts of green space or recreational trails (Lui et al., 2016), but few have looked at the impact of the spaces themselves. Therefore, the major goal of this paper is to determine the role these spaces play in the mental image of the city. Over the past seven years, students at South Dakota State University have worked on a cognitive mapping exercise focusing on how SDSU students generally perceive the university campus. By and large, campus green spaces and other landscape features were absent from participants’ cognitive maps (Burger, 2018). These spaces were left as unlabeled voids between the footprints of the campus buildings, parking lots, and roads. This led to the question- does this hold true at the city scale? To answer this question, the research team decided to repeat the previous exercise at the scale of the city of Brookings, the home of SDSU. Brookings has a population of around 24,000. It was mainly selected due to its accessibility from the college, and also presented the opportunity to compare the cognitive maps of a similar sample set at a larger but familiar scale. However, its size is significantly smaller than the larger cities used in Lynch’s study. Brookings also has a much different layout and demographic makeup than these larger urban centers. Thus, it is unclear how the findings of this study will translate to that even larger scale. Therefore the aim of this paper is to start discussion on what the role of parks and public spaces should be in terms of cognitive mapping and open up further research on the relationship between cognitive mapping, park usage, and park design in cities of all scales. 3 METHODS An individually-administered survey modeled after Kevin Lynch’s original methodology was used to collect the data for this study. It began with a mapping exercise in which participants were asked to draw from memory a quick map of the city of Brookings and to detail and label the features they deemed necessary. Participants were given roughly 10 minutes to complete this mapping exercise. The process and strategy the participants used while drawing the map was observed and noted by the survey administrator, paying particular attention to the order in which features were drawn, the scale and page
CELA 2019 | UC Davis 422

orientation of the maps, the symbology used on the maps, and the overall strategy the participants employed. After completing the mapping exercise, the participants were then given a second sheet with a set of further questions to answer. First, the participants were asked to identify north on their completed maps. Then they were asked to draw a star to indicate where they lived within the community. Next, they were asked their occupation and to provide a verbal description of the route they take to get to work, including their mode of transportation, key places and features along the way, and directional aids they use. This question tested how they recalled the city without an evolving drawing to prompt them, and aimed to uncover any differences between the visual and verbal processes. Following the verbal process, participants were asked to name their favorite place in Brookings. Finally, participants were asked their age and how long they had lived in Brookings in order to facilitate demographic comparison. After the survey concluded, participants were briefed on the purpose of the survey and were given the opportunity to ask further questions. The sample for this survey was composed of thirty randomly selected individuals from the community, including participants from the university. The surveys were conducted over a six-week time period in the fall of 2018.
4 RESULTS The following data was collected from the 30 survey responses. For our study, we focused on the presence of parks in the maps and responses, as parks are the only major public spaces in the City of Brookings. These parks were verified using the information on the city’s parks and recreation website (City of Brookings, 2019). The survey information was sorted using two different methods that allowed for various comparisons. The first sorted the results of each individual survey into a chart to allow for comparison between demographic and park mention data as well as give an overview of the sample set. It was categorized by survey number, age, years lived in Brookings, number of parks mapped, and inclusion of parks in route recall. These results are included in the demographic analysis, individual park data, and park correlation to major paths. The second method was a comprehensive summary of all of the included map and response features. These features were sorted into 11 distinct land use categories, and the data was again categorized by inclusion on the drawn map, inclusion in the route recall, and inclusion as a favorite place. This chart was used to produce the results included under the land use comparison, land use impact factors, and feature prevalence. 4.1 Demographic Analysis
The demographic categories our study focused on were participant age and the number of years participants lived in Brookings. This allowed for a better understanding of our sample set and provided data that could be applied to other comparisons. The ages of the survey participants ranged from 19 to 67 with an average age of 34.2. Of the 30 participants, 10 were college students at South Dakota State University, 15 were residents not attending college, and 5 currently lived outside of Brookings. The average number of years lived in Brookings was 8.6, ranging from 0 to 27 years.
The 30-40 age group had the greatest number of parks mapped with an average of 5.5 parks per map. The 50-60 age group had the least with an average of 1.4 parks per map. However, as seen in Table 1, the number of parks mapped by age group does not reveal any obvious trend. This was also true regarding the most commonly mapped park by age group. McCrory Gardens was a top response by each age group. Hillcrest Park was more common between the ages of 23 and 50. However, there was no definitive trend regarding the relationship between age and parks in the cognitive map. There was also no obvious trend linking number of years lived in Brookings with the number of parks mapped, as shown in Table 2. The highest average came from those living in Brookings 10-14 years at 6, and the lowest from participants residing outside of Brookings at an average of 1.33 parks per map. This is unsurprising, as those living outside of Brookings are less likely to experience the parks and other public amenities in town on a typical workday.
CELA 2019 | UC Davis 423

4.2 Individual Park Data
The individual park data includes information on the parks that were mentioned during any part of the survey process, including the occurrences on the maps, in route recall, and as favorite places. It also looks at the breakdown of park inclusion on each individual survey and provides averages for each of the categories mentioned above. In total, 13 different parks showed up across the surveys. These included Hillcrest Park, Rotary Park, Larson Park, Dakota Nature Park, Sexauer Park, McCrory Gardens, Pioneer Park, Southbrook Softball Complex, Fishback Soccer Complex, Edgebrook Golf Course, Veterans Memorial Park, Dwiggins-Medary Park, and the Pump Park bike track. The locations of these parks are shown on Figure 1. Overall, these parks represent 52% of the total number of parks in the City of Brookings. The most commonly mapped parks, in order, were McCrory Gardens (mapped 18 times), Hillcrest Park (13), Dakota Nature Park (8), and Larson Park (7).
The number of parks included on individual maps ranged from 0 to 6, with an average of 2.2 parks per map. Parks were mentioned during the verbal route recall by only 5 participants (16.7%), with Larson Park being the most commonly mentioned. Parks were mentioned as participants’ favorite place in Brookings by 13 participants (43.3%), with McCrory Gardens having 5 mentions and the Dakota Nature Park having 4. Three of the participants who mentioned a park in their verbal route recall also included that park on their map, while two only had the park in the verbal recall. Ten participants mentioned a park as their favorite place and included it on their map, while three had a park as their favorite place without showing it on their map. The overall data for each park is shown in Table 3.
Table 1. Park mapping data by age group.
Table 2. Park mapping data by by years lived in Brookings.
CELA 2019 | UC Davis 424

4.3 Park Correlation to Major Paths An interesting trend in the data was the correlation between parks and major path features on the maps. The major streets in Brookings are 6th Street/Highway 14 (east/west connector) and 22nd Avenue (north-south connector), and a majority of the parks mentioned during the survey are located along these two routes. Only two (Fishback Soccer Complex and Dwiggins-Medary Park) are not located along these major streets. Breaking this down further, the majority of the park mentions occurred on 22nd Avenue, and seven of the thirteen parks mentioned in the survey are located along this street: McCrory Gardens, Larson Park, Rotary Park, Southbrook Softball Complex, Pump Park, Dakota Nature Park, and Edgebrook Golf Course. In total, 24 (80%) of the maps included at least one park along 22nd Avenue compared to only 16 (53%) containing a park not located on 22nd Avenue. In the responses, the parks on 22nd
Figure 1. Locations of parks in Brookings.
Table 3. Overall data for individual parks (2019). Map by the author.
CELA 2019 | UC Davis 425

Avenue were mentioned a total of 13 times (43.3%) compared to 2 times (6.7%) for all other parks. Table 4 shows the cumulative results for this data.
4.4 Land Use Comparison Some of the most interesting data came from breaking down all features identified during the
visual mapping process into land use categories. These features were divided into 11 categories, including: agricultural, commercial, dining, education, entertainment, industrial, institutional, parkland, non-park recreational, residential, and other (all features not fitting into an aforementioned land use). Looking at the number of mentions of each land use provides information on which types of features are more prevalent in the cognitive map. The land use data was again categorized by inclusion on the map, inclusion in route recall, and inclusion as a favorite place.
In total, there were 161 distinct features included on the maps. The top three categories were commercial with 43 individual features, dining with 33, and institutional with 22. Parkland came in 5th with 13 features. For mapping, commercial had the most total features mapped at 100, or 3.33 features per participant (fpp). Dining came in second at 81 (2.70 fpp) and parkland third at 66 (2.20 fpp). During the verbal route recall exercise, commercial had the most mentions at 16 (53% of participants) followed by education at 12 (40% of participants) and other at 11 (37% of participants). Parkland was tied for 6th with 5 (17% of participants). For favorites, parkland had the most total mentions at 13 (43% of participants), and commercial, residential, and other tied for next closest at 5 each (17% of participants). For total verbal responses (route recall and favorite place), commercial had the most mentions at 21 (70% of participants) with parkland in second at 18 (60% of participants). For overall total responses, commercial had the highest mentions at 121 (4.03 mentions per participant) followed by dining at 92 (3.07 mentions per participant) and parkland at 84 (2.8 mentions per participant).
4.5 Land Use Impact Factors The land use comparison data is used to show the overall cognitive prevalence of each land use,
showing the likelihood of a feature from a given land use category to be included by a participant. However, in order to better understand the cognitive prevalence of any individual feature within each land use category, the number of time a feature is mentioned is given as a ratio to the number of features within the category. This helps to give a more accurate comparison of the cognitive impact of each feature in a land use category rather than the overall prevalence of the land use categories. For this study, this ratio is referred to as the impact factor and is derived by dividing the number of times any
Table 4. Cumulative results for parks on 22nd Avenue.
CELA 2019 | UC Davis 426

features from a given land use category was mentioned (total mentions) by the number of features in that category. It is displayed as a value rounded to two decimal places. The impact factors compare as standard linear data, such that an impact factor of 2 has twice the impact of a factor of 1. As with the overall land use comparison, the impact factor was used to compare data for map inclusion, route recall inclusion, favorite place inclusion, and overall mentions. Figure 2 shows the comparison between the total mentions and total impact factors for each land use.
For the mapping category, education had the greatest impact factor at 6.00 (54 mentions/9 features in the category) followed by parkland at 5.08. Commercial, which had the most total mapped inclusions, only had an impact factor of 2.33. For route recall, agricultural had the greatest impact factor at 2.00 followed by education at 1.33. Parkland was 6th in this category with an impact factor of 0.38. In the favorite place category, parkland had the greatest impact factor at 1.00 followed by residential at 0.83. For total verbal responses (route recall and favorites), agricultural had the greatest impact factor at 2.00 followed by education at 1.56 and parkland at 1.38. For overall total responses (mapping, route recall, and favorite place), education had the greatest impact factor at 7.56 followed by parkland at 6.46.
4.6 Feature Prevalence The impact factor shows the impact of the average individual feature within a land use category,
but many features stood out much more than others regardless of land use. These features can be seen as the major icons of Brookings. Many of these stand out due to their size and usage, as well as their location along major paths and circulation nodes within the city. They were common among all of the participants and provide focal points within the cognitive map that led to the recall of adjacent features. This will be discussed more in the analysis.
The most commonly mapped feature was the SDSU Campus, showing up in 29 of the 30 maps and having 39 total mentions. Walmart was the next most commonly mapped at 20 (24 total mentions), followed by McCrory Gardens at 18 (24 total mentions). The Downtown was the next most commonly mapped at 16, followed by Hyvee at 14. These both had 20 mentions apiece. Out of the top ten features, four were parks and three were commercial. During the verbal route recall, the SDSU Campus was mentioned eight times, Hyvee six times, and Walmart four times. McCrory Gardens was five participants’ favorite place, while four identified Dakota Nature Park, and three said Downtown. Overall, the SDSU Campus was verbally identified ten times, while both Hyvee and McCrory Gardens were mentioned six times. Table 5 shows the overall data for the ten most prevalent features.
Figure 2. Comparison of total mentions versus total impact factors (2019). Charts by the author.
CELA 2019 | UC Davis 427
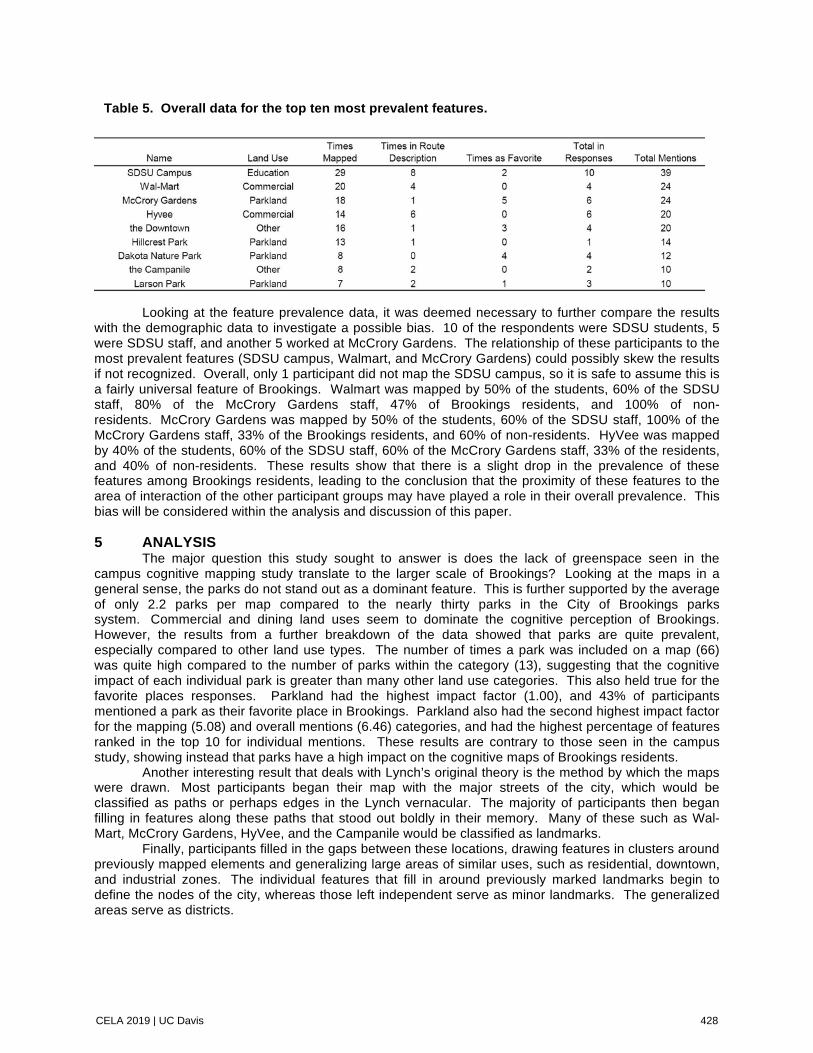
Looking at the feature prevalence data, it was deemed necessary to further compare the results
with the demographic data to investigate a possible bias. 10 of the respondents were SDSU students, 5 were SDSU staff, and another 5 worked at McCrory Gardens. The relationship of these participants to the most prevalent features (SDSU campus, Walmart, and McCrory Gardens) could possibly skew the results if not recognized. Overall, only 1 participant did not map the SDSU campus, so it is safe to assume this is a fairly universal feature of Brookings. Walmart was mapped by 50% of the students, 60% of the SDSU staff, 80% of the McCrory Gardens staff, 47% of Brookings residents, and 100% of non-residents. McCrory Gardens was mapped by 50% of the students, 60% of the SDSU staff, 100% of the McCrory Gardens staff, 33% of the Brookings residents, and 60% of non-residents. HyVee was mapped by 40% of the students, 60% of the SDSU staff, 60% of the McCrory Gardens staff, 33% of the residents, and 40% of non-residents. These results show that there is a slight drop in the prevalence of these features among Brookings residents, leading to the conclusion that the proximity of these features to the area of interaction of the other participant groups may have played a role in their overall prevalence. This bias will be considered within the analysis and discussion of this paper.
5 ANALYSIS The major question this study sought to answer is does the lack of greenspace seen in the
campus cognitive mapping study translate to the larger scale of Brookings? Looking at the maps in a general sense, the parks do not stand out as a dominant feature. This is further supported by the average of only 2.2 parks per map compared to the nearly thirty parks in the City of Brookings parks system. Commercial and dining land uses seem to dominate the cognitive perception of Brookings. However, the results from a further breakdown of the data showed that parks are quite prevalent, especially compared to other land use types. The number of times a park was included on a map (66) was quite high compared to the number of parks within the category (13), suggesting that the cognitive impact of each individual park is greater than many other land use categories. This also held true for the favorite places responses. Parkland had the highest impact factor (1.00), and 43% of participants mentioned a park as their favorite place in Brookings. Parkland also had the second highest impact factor for the mapping (5.08) and overall mentions (6.46) categories, and had the highest percentage of features ranked in the top 10 for individual mentions. These results are contrary to those seen in the campus study, showing instead that parks have a high impact on the cognitive maps of Brookings residents.
Another interesting result that deals with Lynch’s original theory is the method by which the maps were drawn. Most participants began their map with the major streets of the city, which would be classified as paths or perhaps edges in the Lynch vernacular. The majority of participants then began filling in features along these paths that stood out boldly in their memory. Many of these such as Wal-Mart, McCrory Gardens, HyVee, and the Campanile would be classified as landmarks.
Finally, participants filled in the gaps between these locations, drawing features in clusters around previously mapped elements and generalizing large areas of similar uses, such as residential, downtown, and industrial zones. The individual features that fill in around previously marked landmarks begin to define the nodes of the city, whereas those left independent serve as minor landmarks. The generalized areas serve as districts.
Table 5. Overall data for the top ten most prevalent features.
CELA 2019 | UC Davis 428

This mapping strategy suggests that paths and edges are the most prevalent elements in our cognitive maps as they form the framework for every other included feature. Landmarks hold the second most weight as they stand out in the mind without much effort. Finally, nodes and districts are the least present in the cognitive map, as they are filled in only after the reference points are set with paths and landmarks.
However, this only looks at these features from a navigational standpoint. When drawing out a cognitive map, the participant is mainly focused on laying features out in a logical way consistent with how they perceive the city from the air, as if looking at a street map. This can explain why parks are not as directly evident on most maps. In terms of wayfinding, parks are not as useful. This has to do with the difference between perception and encoding of environmental information.
According to the study C-Image: city cognitive mapping through geo-tagged photos, “green perception” was the most dominant city feature (Liu et al., 2016). This data matches the results of our study, as the highest percentage of participants’ favorite places were parks. However, the Liu study was based on a photographic representation of the city, so the data is based largely on our attraction to natural scenery. In contrast, in terms of wayfinding, landmarks or “environmental cues” are key. Parks offer fewer of these cues and thus require a sequence of memorized images to be useful in wayfinding.
Comparatively, landmarks reduce the need for this memorization by offering a single defining feature that can be readily used when making a navigational decision (Strickrodt et al., 2015). The perception of parks as navigation aids is further impaired by the vehicular culture in Brookings. Driving is a cognitively-passive mode of travel compared to walking or biking and thus less information is recorded along the route except for at decision points such as intersections and turns (Mondschein et al., 2013). Though Brookings has average overall walkability, research has shown that walking behavior is still limited (Schmunk and Spinney, 2018). Thus the standard transportation mode is driving, which limits the number of features encoded.
Park features tend to blend in with the surrounding streetscape at higher speeds of travel as well, thus further reducing their legibility. This is evident in the results of the route recall, where parks scored far lower than other land uses. Instead, destinations and decision points become the major recalled features. In mapping, some parks are seen as popular destinations due to usage, so these were more likely to show up in the cognitive map. Also, larger parks take up more land in plan view and are remembered as participants begin filling in districts and nodes. In summary, parks were most prevalent as favorite places due to their aesthetics and usage, but in terms of wayfinding they were far less prevalent.
This leads us to ask the question why parks were more prevalent in this study than green spaces were during the campus studies? The potential answer has to do with how these spaces function within Lynch’s theory. The simple answer to this is that parks and greenspaces do not fit into any one category. Rather, their status changes depending on the park type, location, size, and functionality. This applies to other land uses as well.
For example, Walmart is very prevalent in participants’ cognitive maps of Brookings. This is largely due to its size, which in some senses could make it a district. This is further supported by the ways in which participants mapped other features in the vicinity of Walmart. Walmart is often the only labeled building in the area, with a number of smaller buildings drawn in but not labeled. Thus, this could be seen as a commercial district identified by the presence of Walmart.
However, with this information Walmart could also be seen as a landmark, as it was often drawn on the map as a reference point and served to guide the cognitive perception of the area around it. Locationally, it is on a node at the intersection of the two major streets in Brookings: 6th Street/Highway 14 and 22nd Avenue. Functionally, it could also be seen as a node as it is the most popular destination in its location. Therefore, its classification varies greatly depending on how people interact with it.
Comparing this to the representation of campus green spaces versus city parkland helps to explain the differences between the SDSU study and the Brookings study. On campus, green spaces are generally very large compared to the surrounding buildings. Functionally, they are rarely seen as a destination but are rather the space one moves through to reach other destinations. Therefore, these spaces could be classified as districts, putting them near the bottom of general cognitive perception. Also, with the majority of campus circulation taking place on sidewalks which crisscross these green spaces, it is common for the paths to take precedence and the green spaces to be overlooked.
CELA 2019 | UC Davis 429

In the City of Brookings, on the other hand, parks can fall into a number of different categories and thus many are more prevalent in cognitive maps. Most parks still showed up as districts, although with more definition than residential neighborhoods. However, some maps did show parks as landmarks. These were represented using different shapes, mirroring the strategy used for many of the other landmarks on the maps. Many were also defined by their use rather than the actual park name, suggesting that parks with unique uses were more prominent in the cognitive map. Examples of these representations are shown in Image 1. Overall, each park had a different value to each participant, but they were all seen as an important part of the city. Therefore, they had more prominence within the cognitive map than the less-defined green spaces on campus.
A
nother interesting result was the definition decay that occurred with increased distance from major landmarks. The features that stood out as the major landmarks on nearly every map included the SDSU campus, Walmart, McCrory Gardens, HyVee, the Downtown, and Hillcrest Park. Many of these features, though able to be classified under multiple categories in Lynch’s theory, serve as landmarks within Brookings: they are located along major intersections and have functions that support use by a large portion of the population.
Looking at many of the maps, these landmarks serve as anchor points for cognitive recall and lead to the recall of other nearby features (Foxall and Hackett, 1994). As one moves away from these features, the quantity of the features decreases, and the level of generalization increases. Examples of this are shown in Image 2. This evidence helps to further
Image 1. Examples of park representations on maps (2018). Image by the author.
Image 2. Examples of distance decay on maps (2018). Image by the author.
CELA 2019 | UC Davis 430

solidify the hierarchy of features mentioned previously and also leads to more questions about the role of landmarks in a community.
Landmarks can be seen as more than just navigational aids; rather, they are pivotal locations in the community that lead to increased activity for their “satellite” buildings. This relates to the idea of first, second, and third place theory and how it contributes to cognitive perception (Low and Altman, 1992). A person’s first place is generally their home. The location of home is different for each participant, but in general the area surrounding home is well defined in cognitive maps and is highly detailed. Second place is generally a place of work, which was hinted at in the route recall exercise. Often, the cognitive mapping along this route as well as in the vicinity of the place of work is fairly well-defined. Third place varies for many people, but can include grocery stores, the library, a church, or even places for recreation such as parks or fitness centers. Since these are the most commonly visited places by each person, they will be more familiar to them and show up more defined in the cognitive map.
Though the 1st, 2nd, and 3rd place varies from person to person, commonalities can be had as the specificity of the function of the place broadens. This trend was hinted at in the results of the demographic breakdown of the park data. There were no conclusive correlations between the number of times a feature was mentioned and participants’ age or time lived in Brookings. The parks that were included did not vary much by these groups as well. This leads to the conclusion that parks are shown more by personal preference. The most prevalent parks, McCrory Gardens and Hillcrest Park, both offer more variety in their uses. McCrory is a common destination for social events, meetings, and weddings, while Hillcrest is adjacent to an elementary school and contains the city pool. The broad variety of activities allows these two park facilities to be utilized by a more diverse population and thus become more prevalent across the board. This also applies to other map features such as retail stores, as they begin to show up as they are used by a large portion of the community.
6 DISCUSSION After analyzing the results of this study, it becomes clear that the role of parks on the cognitive
map is still inconclusive. There are many variables that impact the way people perceive any feature of a city, and thus the role is dependent on the method employed. This study revealed that park location, size, type, and usage can all change how a park fits within Lynch’s cognitive mapping theory. However, this is not an exhaustive list, and further research could reveal more variables that could further define how parks are encoded in cognitive mapping.
For the sake of this study, perhaps a better approach is looking at the general role of parks within the community. A park is a public green area within a city used for recreation. This definition fits well with the usage definition from this study. Many parks were included based on their recreational opportunities with many being labeled by the activities they offer and many others being mentioned as favorite places. As discussed in the analysis, the associated activities with these parks create a mental link that lends them greater prevalence in the cognitive map.
Usage is a key component of the role of parks within Brookings, but not all of the parks present (or those missing) in the study can be explained by this approach. First, many of the parks not present on the maps offer just as many recreational opportunities and are used by many residents. Their absence could possibly be explained by the park type breakdown. Most of the parks included on the maps were community parks- large and easily accessible by everyone. Many of the missing parks were residential parks, mainly used by the surrounding neighborhood. This disparity could potentially be explained by a bias in the home locations of the participants, as a majority were taken near the SDSU campus and far from the residential districts.
However, there is still the question of why these residential parks do not show up along the major pathways where they would have a greater chance of being noticed. This would require more directed research to answer properly, but one reason could be the prominence of these parks. This would be based less on usage and park type and more on size, location, and visibility. Using these indicators would help to solidify why the community parks are much more likely to be mapped. They often have a greater presence based on size, are located along major circulation paths, and are much more visible to the average person.
A good example of this in Brookings would be the differences between Larson Park and Lions Park. Both are located along major streets in Brookings (Larson Park on 22nd Ave and Lions Park on Medary Ave), but Lions Park was never mentioned in the survey. One major difference is size, as Larson
CELA 2019 | UC Davis 431

Park is much larger. However, the major difference is in the visibility. As seen in Image 3, Larson Park is set level with the road and has a clear viewshed from the street to the park. Lions Park is set lower than the road and is obscured by the treeline from the road. Thus, it could be argued that Larson Park is much more prominent and could explain why it shows up more commonly in the cognitive perception of Brookings. Further research would be needed to support this claim, but it could offer an answer as to how park design impacts how parks are seen in Lynch’s theory and in cognitive presence in general.
The topic of prominence also leads the question of a parks role in wayfinding. The results of this study showed that parks do not play a major role in wayfinding for Brookings residents. Though other factors impact wayfinding potential (discussed in the analysis), park prominence plays a major role in its cognitive presence and thus its ability to be encoded in our cognitive maps. Thus, it could be assumed that the design of a park could play a key role in its perception not only for recreational purposes but also for wayfinding.
Designing parks to serve as landmark locations in terms of wayfinding could help define not only the parks as important city features but, much like with Walmart, also increase the perception of other businesses and locations around the park. This could be especially true along major streets where increased density of features could lead to legibility issues. The results of this study showed a strong correlation between major streets and cognitive recall of city features, and this was especially true for parks. Strengthening the connection of park features adjacent to major streets, framing impactful viewsheds into the park, and creating a change of density from the surrounding urban fabric are all design solutions that could increase the overall prominence of a park. These changes, combined with the already diverse selection of activities within parks, could potentially lead to greater park usage and make these parks more prevalent in the cognitive maps of the residents.
Amongst all of these inquiries, there is one overarching question: should the practice of park design change to accommodate these conditions? The easy answer is that there is still a lot to be considered both on the side of designers and city governments. There are many benefits that could come from an increased emphasis on park prominence within cities, but there are also other issues that need further research before any changes are made.
The first is whether or not parks should be planned and located along major streets. Though this study shows that parks have a much higher cognitive presence when located along these paths, the same could be true of other land uses. Thus, there is a question as to what land uses should take precedence in these locations. Due to zoning regulations, some land uses (such as large retail stores) are required to be in these locations whereas parks can be more versatile in their placement. Safety also becomes an issue with parks located along major streets. Thus, it is more of a decision based on a city’s needs rather than park design in this case.
Another consideration is whether all parks should be located in prominent locations. Though community parks provide many benefits to a community, the smaller residential parks also have a place. Thus, solely designing parks based on prominence may not be the best solution for all situations. Not all parks are meant to be highly visible- many are meant to be private retreats for the surrounding neighborhood. Park types and locations are generally fairly strategic within a city master plan, and the
Image 3. Street views of Larson Park (top) and Lions Park (bottom) (2015). Copyright
2019 by Google.
CELA 2019 | UC Davis 432
balance of community and residential parks is key to creating a healthy city environment. With that, this same strategic planning can be used to determine which parks would benefit from more prominent designs. By working to increase the cognitive perception of key parks, a community can ensure more efficient use of funding for these design changes and get the maximum benefit. As mentioned above, these design changes could lead to cognitive perception of these key parks and result in greater park usage, increased cognition of nearby city features, and an overall increase in city legibility through perception and wayfinding.
7 CONCLUSION The role of parks within both communities and the cognitive maps of the people living in these
communities largely depends upon the context in which they are presented. In terms of Lynch’s theory, parks were potentially seen as landmarks, districts, or nodes based on their location, size, type, and sub-features. These criteria, along with the design of the park relate to its prominence and determine its ability to be encoded into the cognitive map. Though feature prominence plays an important role in city legibility and wayfinding, it is important to remember that not all parks are meant to meet these objectives. Thus, it takes the cooperation of city governments and designers to determine the best course of action when analyzing the parkland environment of a city.
Since Brookings is not a perfect representation of all cities of the world, it is important to keep in mind the limitations of this study. There is still further research to be done to determine how these results change at different scales and areas with different societal habits and values, and related studies would need to be conducted to determine the role of other landscape features such as plazas or streetscapes. Further investigation into these topics would help to validate the role of landscape architecture within Lynch’s theory and the other context areas mentioned in this paper. It is our hope that this study will help to set a precedence for these future studies and will open up broader discussion on the relationship between landscape architecture and cognitive mapping. By continuing the work that was started by Lynch, we will be able to get a better understanding of the purpose of public spaces within the urban environment and find even more applications for these spaces for both landscape architects, city governments, and the general public. 8 REFERENCES Brookings, C. o. (2019). Facilities. Retrieved from https://cityofbrookings.org/facilities. Burger, D. (2018). Cognitive Mapping Exercies. In. South Dakota State University. Chan, E., Baumann, O., & Mattingley, J. B. (2012). From objects to landmarks: the function of visual
location information in spatial navigation. Frontiers in Psychology, 3, 11. Crooks, A., Croitoru, A., Lu, X., Wise, S., Irvine, J. M., & Stefanidis, A. (2015). Walk This Way: Improving
Pedestrian Agent-Based Models through Scene Activity Analysis. Geo-Information, 4, 30. Hackett, P. M. W., & Foxall, G. R. (1994). Consumers' perceptions of micro-retail locations: wayfinding
and cognitive mapping in planned and organic shopping environments. The Service Industries Journal, 14(3), 12.
Kaplan, R., & Kaplan, S. (1989). The Experience of Nature- A Psychological Perspective. New York, NY: Cambridge University Press.
Kara, B. (2013). Landscape Design and Cognitive Psychology. Procedia- Social and Behavioral Sciences, 82, 4.
Liu, L., Zhou, B., Zhao, J., & Ryan, B. D. (2016). C-IMAGE: city cognitive mapping through geo-tagged photos. GeoJournal, 81.
Low, S. M., & Altman, E. (1992). Place Attachment: A Conceptual Inquiry. New York, NY: Plenum Press. Lynch, K. (1960). The Image of the City. Cambridge, MA: MIT Press. Marquez, D. X., Hunter, R. H., Griffith, M. H., Bryant, L. L., Janicek, S. J., & Antherly, A. J. (2017). Older
Adult Strategies for Community Wayfinding. Journal of Applied Gerontology, 36, 20. Mondschein, A., Blumenberg, E., & Taylor, B. D. (2013). Going Mental: Everyday Travel and the Cognitive
Map. Access, 43(Fall 2013), 6. Schmunk, J., & Spinney, J. (2018). Walkability versus Walking Behavior: A Case Study in Brookings, SD.
In. Stefanidis, A. (2005). Mental mapping, Viewing the urban landscapes of the mind. In (pp. 5).
CELA 2019 | UC Davis 433

Strickrodt, M., O'Malley, M., & Wiener, J. M. (2015). This Place Looks Familiar- How Navigators Distinguish Places with Ambiguous Landmark Objects When Learning Novel Routes. Frontiers in Psychology, 6(December 2015), 12.
Tversky, B. (1993). Cognitive Maps, Cognitive Collages, and Spatial Mental Models. In (pp. 10): Department of Psychology, Standford University.
Weisman, J. (1981). Evaluating Architectural Legibility: Way-Finding in the Built Environment. Environment and Behavior, 13(March 1981), 15.
CELA 2019 | UC Davis 434

The authors are solely responsible for the content of this technical presentation. The technical presentation does not necessarily reflect the official position of the Council of Educators in Landscape Architecture (CELA), and its printing and distribution does not constitute an endorsement of views which may be expressed. Citation of this work should state that it is from a CELA conference paper. EXAMPLE: Author's Last Name, Initials. 2019. Title of Paper. Sacramento, CA: CELA. For information about securing permission to reprint or reproduce this paper, please contact CELA at [email protected]
Research on Design Concepts of Commemorative Landscapes Based on Adolescents’ Cognitive Characteristics in Contemporary China: A
Case Study of Mashan Martyrs’ Cemetery
Li, Zhe E-mail: [email protected] Alternate Contact: (+86)13776670359 Zhao, Kaiyu E-mail: [email protected] Chen, Feifei E-mail: [email protected] Han, Xiao E-mail: [email protected] 1 ABSTRACT
Under the strong influence of contemporary non-mainstream cultures such as pop, electronic and consumerism culture, the psychological and cognitive characteristics of current Chinese adolescents change significantly. Traditional design patterns of commemorative landscapes have been unable to adapt to adolescents’ psychological changes in China, and failed to gain broad and deep sympathy from them. Based on the relevant research about adolescent psychology and sociology, this paper analyzes the psychological characteristics such as independence, sociality, extensiveness and implicitness of contemporary Chinese youth. With the landscape design of Mashan Martyrs’ Cemetery as the research object, the paper gives the priority to the space construction of commemorative environment in high Chinese cultural context. After the discussion in five aspects, the paper delves deeply into the concepts and methods of commemorative landscape design, trying to promote the interaction and lead the adolescents’ landscape cognition to a positive direction. In these five aspects, culture organization emphasizes the highly composite use of cultural landscape languages to produce a strong commemorative historical atmosphere, and collective memories at a subconscious level. Event awakening means using typical events to create a experiential atmosphere, thus awakening deep memories of historical events. Besides, axis deduction relies on the spatial axis to organize the tour route and guides the gradual changes in adolescent emotion, while element resonance uses commemorative elements to express typical cultural connotations and guides the explosive changes in adolescent emotion. Finally, place experience can promote the generation of psychological belonging and identity of adolescents, achieving the purpose of spiritual landscape construction.
1.1 Keywords
Design concept; Commemorative landscape; Adolescent; Cognitive characteristic; Mashan Martyrs’ Cemetery.
CELA 2019 | UC Davis 435

Research on Design Concepts of Commemorative Landscapes Based on Adolescents’ Cognitive Characteristics in Contemporary China: A
Case Study of Mashan Martyrs’ Cemetery
1 ABSTRACT
Under the strong influence of contemporary non-mainstream cultures such as pop, electronic and consumerism culture, the psychological and cognitive characteristics of current Chinese adolescents change significantly. Traditional design patterns of commemorative landscapes have been unable to adapt to adolescents’ psychological changes in China, and failed to gain broad and deep sympathy from them. Based on the relevant research about adolescent psychology and sociology, this paper analyzes the psychological characteristics such as independence, sociality, extensiveness and implicitness of contemporary Chinese youth. With the landscape design of Mashan Martyrs’ Cemetery as the research object, the paper gives the priority to the space construction of commemorative environment in high Chinese cultural context. After the discussion in five aspects, the paper delves deeply into the concepts and methods of commemorative landscape design, trying to promote the interaction and lead the adolescents’ landscape cognition to a positive direction. In these five aspects, culture organization emphasizes the highly composite use of cultural landscape languages to produce a strong commemorative historical atmosphere, and collective memories at a subconscious level. Event awakening means using typical events to create a experiential atmosphere, thus awakening deep memories of historical events. Besides, axis deduction relies on the spatial axis to organize the tour route and guides the gradual changes in adolescent emotion, while element resonance uses commemorative elements to express typical cultural connotations and guides the explosive changes in adolescent emotion. Finally, place experience can promote the generation of psychological belonging and identity of adolescents, achieving the purpose of spiritual landscape construction.
1.1 Keywords
Design concept; Commemorative landscape; Adolescent; Cognitive characteristic; Mashan Martyrs’ Cemetery.
CELA 2019 | UC Davis 436

2 INTRODUCTION A commemorative landscape is a material or abstract landscape built to commemorate a special
event or person and to alert future generations. With the help of the external landscape form, the commemorative significance of an event embodied in the landscape entity triggers human groups’ association and memories of the event. Commemorative landscapes provide commemorative “education” to the people in the contemporary society by describing and recalling history and revealing “truth, goodness and beauty”, so that people can feel the spirit conveyed behind the landscapes and find their own existence value in comparison with the real world. Commemoration is bound to have both material and spiritual attributes, and commemorative landscapes are an intermediary carrier of the group’s indirect memories of commemorative events. However, it mainly depends on the cognitive characteristics of recipients and the material expression ability of landscapes whether commemorative landscapes can evoke people’s memories of events or people and highlight the cultural spirit of events (Yao, et al., 2017).
The analysis of cognitive characteristics of contemporary adolescents is aimed at analyzing the characteristics of their cognitive abilities. Cognitive abilities refer to the human ability to store, process and extract information in the brain, and to master the composition and attributes of an object, its internal relationship with other objects, and the motive force and basic laws of development. Cognitive abilities, the key to determining whether people can smoothly identify the essence and connotations of objects, are closely related to people’s age, environment, society, era and other factors. In contemporary China, the cognitive characteristics of adolescents tend to change suddenly with time going on. Influenced by today’s economic globalization and cultural pluralism, especially prevalent non-mainstream cultures such as pop culture, electronic culture and money worship culture, adolescents have inevitably gone through an identity crisis toward commemorative culture and even traditional culture (Liu, 2017). As a result, the expression forms of commemorative landscapes created in a specific era have failed to effectively adapt to the changes in psychological characteristics of contemporary adolescents, and it has become difficult for adolescents to smoothly accept the values carried by landscapes, to resonate and to gain inspiration.
Commemorative landscape has always been one of the theoretical research topics in the field of landscape architecture. Most studies focus on commemorative landscapes and architectural examples, exploring the internal relationship between commemorative landscapes and related influencing factors such as economic development, politics, death and religion, analyzing and summarizing the design concepts of commemorative landscapes under the effect of these influencing factors, and highlighting the design concepts and methods with humanistic values (Kristina, et al., 2017). For example, the influence of factional differences on the manifestation of commemorative landscapes (Guy, et al., 2016); the emotional changes in memories of historical wars and related landscape design techniques (Roger, et al., 2014); the impact of special commemorative activities on regional commemorative landscapes (John, et al., 2016); and the presentation of nationalism in commemorative landscapes (Cadey, et al., 2016).
Commemorative landscapes undertake the responsibility of public education in society, and they will play an important role in the growth and development of adolescents if public commemorative landscapes are reasonably regarded as the educational environment for adolescents (Kathryn, et al., 2018). While discussing the design methods of commemorative landscapes (Raheleh, et al., 2016) and the changes in their values around the characteristics of social groups (Jiang, et al., 2018), contemporary studies pay more attention to the psychological perception and behavioral characteristics of adults during their visit to commemorative landscapes (Sara, et al., 2017), or the role of commemorative landscapes in human social interaction (Amir, et al., 2018). However, the research on adolescents’ psychological and cognitive characteristics in commemorative landscape scenes is obviously insufficient.
Based on the above analysis and starting from the psychological and cognitive characteristics of contemporary Chinese adolescents, this paper intends to interpret the characteristics of adolescents’ psychological recognition of commemorative events in the context of informatization and pluralism. Taking the landscape design of Mashan Martyrs’ Cemetery as an example, this paper explores the adaptable changes in concepts and methods of commemorative landscape design and makes the commemorative landscape design adapt to the changing world and the learning modes and cognitive characteristics of contemporary adolescents, thereby allowing true resonation between commemorative landscapes and adolescents, as well as dissemination of commemorative landscapes’ culture and spirit by means of communication and infiltration.
CELA 2019 | UC Davis 437

3 APHASIA AND PERCEPTION Aphasia, originally a medical concept, refers to the impairment of speech communication caused
by lesions of language functional area in cerebral cortex while with a clear mind, normal consciousness, and unobstructed pronunciation and articulation ability. In this paper, it stands for the adolescents’ indifference to traditional commemorative landscapes and their neglect of the conveyed cultural spirits against the backdrop of changing cognitive cultural environment. Perception, on the other hand, indicates people’s interpretation of and reflection on a particular thing or experience. Therefore, aphasia and perception are undoubtedly two contradictory cognitive states in the cultural context of commemorative landscapes, and both of them are typical features of cognitive activities, thus requiring further analysis. 3.1 Changes in Cultural Context
If commemorative landscapes serve as the external catalyst for adolescents’ cognitive activities, and psychological characteristics as the dominant factor of cognition, then cultural context is the background of cognitive activities. Concerning the cultural context, American anthropologist Edward Twitchell Hall proposed the concepts of “high-context culture” and “low-context culture”. The former, emphasizing the implicit and restrained language expression, is massively influenced by tradition and history, marked by great stability once formed. In contrast, the latter stresses the outspoken expression and praises the power of language itself, relatively less affected by language environment. China is a typical representative of high-context countries, with a high homogeneity shared by its people. High-context information is accumulated mostly in culture, and thus cognitive ability and cultural background exert great influence on the access to abstract information. Meanwhile, adolescents’ growth stages indicate their easier acceptance of low-context culture, while the interpretation of high-context culture requires longer educational experience and deeper rational reflection.
Given the close relationship between material life and ideology, the high-context culture in contemporary China inevitably suffers from the impact of Western low-context culture, and undergoes gradual transformation and variation. Correspondingly, people’s collective habits in language, behavior and psychology tend to shift from introversion to extroversion. Other changes involve relatively independent interpersonal relationships as well as increasingly pluralistic life styles, thinking patterns and values (Yan, et al., 2012). The pop culture, electronic culture, money worship culture and other sub-cultures rapidly formed among adolescents have obviously impacted the traditional culture and Marxist culture, and to a certain extent led to the ambiguous collective memories of the traditional Chinese revolutionary spirits and the weak perception of cultural connotations (Yu, et al., 2016). Consequently, the values (lofty spirits including ideals and beliefs, arduous struggle, and bold dedication) embodied in commemorative landscapes have become difficult to win care and concern among people.
Cultural context is closely connected to adolescents’ psychological cognition of commemorative landscapes. Against the background of varying cultural context, contemporary commemorative landscape design should not cling to tradition but instead take into consideration the characteristics of contemporary adolescents’ cognitive model for design innovations. The content of commemorative information contained in the design should be increased, and so should the proportion of low-context landscape environment to the overall high-context landscape by considering the age as well as cognitive characteristics of contemporary adolescents. Appropriate design concepts and conducts are supposed to enable adolescents to return to the cultural context of commemorative landscapes and awaken their collective memories of the commemorative events and the spiritual implications. 3.2 Contemporary Characteristics of Adolescent Cognition
Adolescents’ effective recognition and interpretation of commemorative landscapes is closely related to their age and background. As a special growth period, adolescence is between childhood and adulthood. During this period, teenagers experience “qualitative transitions” in the physical, physiological, psychological and social aspects. Their self-awareness also enhances dramatically, and they begin to think about their existence value. Logical thinking gradually dominates their ways of thinking, shifting from simple logical thinking to dialectical thinking. Adolescents start to reflect on life issues and try to solve their own contradictions through independent thinking. However, due to their poor discrimination capability, confusion and anxiety often accompany them (Xu, et al., 2004).
CELA 2019 | UC Davis 438

The psychological characteristics of adolescents growing up under the background of contemporary Chinese culture mainly comprise independence, sociality, extensiveness and implicitness (Table 1). To go into detail, independence is manifested in the continuous development of their independent consciousness and their willingness to judge and examine the environment. Sociality is marked by their concern and curiosity about current social events and their subjective utilitarian criticisms regarding moral matters. Extensiveness lies in their extensive interests and hobbies, as well as their curiosity about certain vulgar things. Implicitness consists in their cautiousness and cognitive confusion about the complexity of their inner world (Chen, et al., 2015). The characteristics of the new era determine the transition of learning modes about commemorative landscapes from indoctrination to infiltration. Likewise, commemorative landscape design should be in line with the cognitive characteristics of adolescents by means of symbolism, analogy and other methods. In addition, the cognitive media and psychological and emotional communication channels ought to be increased for the purpose of cultivating adolescents’ positive cognition of commemorative events (Zhang, et al., 2018). Table 1. Cognitive characteristics of adolescents in contemporary China.
3.3 Commemorative Landscapes in Contemporary China
Commemorative landscapes in China are marked by long history and abundant types (royal mausoleums, Confucian temples, ancestral halls, temples, heritage sites and so on) (Li, 2018). Specifically, a unique cultural type with Chinese characteristics called red culture has been cultivated during the revolutionary wartime, which contains rich revolutionary spirit and profound historical significance. Therefore, New Chinese commemorative landscapes are designed to inherit the red culture and carry forward the red spirit, aiming at commemorating the fighting history of China on the revolutionary road and the heroes who sacrificed tremendously during the fight. At the meanwhile, the corresponding mature planning model and design concept have been formed over the past 70 years (Yao, 2006).
Martyrs’ cemetery is an important type of commemorative landscapes. The Chinese martyrs’ cemetery, as a landscape site with patriotic education significance, plays an indispensable role in advocating patriotism and promoting revolutionary spirit, as well as spreading the red culture (Table 2). However, with the changes in cultural context and adolescents’ cognitive characteristics, contemporary Chinese adolescents generally lack the sympathy for traditional martyrs’ cemeteries and feel strange or even alienated from the red culture transmitted therein. This is largely attributed to the remote history embodied in the red landscapes and the wide gap between the past tough struggling environment and the present prosperous life.
Table 2. Statistics on revolutionary martyrs’ cemeteries in China.
Furthermore, traditional martyrs’ cemeteries possess simple function, single spatial effect, huge
commemorative buildings and sculptures, regular vegetation, and symmetrical yet rigid architecture. All these features provide a striking contrast to the richness of contemporary landscapes (Li, 2005), failing to stimulate the psychological resonance from adolescents (Figures 1-3). According to the investigation and analysis of adolescents’ tourist cognition of martyrs’ cemeteries, the most common problem is the lack of
Characteristic Independence Sociality Extensiveness Implicitness
Manifestation Self-judgment Personality change
Concern for current affairs
Utilitarian morality
Extensive interests Pluralistic values
Cautiousness Cognitive confusion
Type National-level Provincial-level
Municipal-level
County-level Army-level and others
Number 181 419 351 2811 389
CELA 2019 | UC Davis 439

participation and experiential activities during tourism. Consequently, in contemporary China where adolescents’ cognitive characteristics have changed, commemorative landscapes must pay attention to adolescents’ identity, and the design concepts need to be effectively altered and improved in accordance with their psychological and cognitive features.
Figure 1. Traditional huge cemetery sculpture (2016). Photo by the author.
Figure 2. Traditional single cemetery vegetation (2016). Photo by the author.
Figure 3. Traditional (2016). Photo by the author.
CELA 2019 | UC Davis 440

4 CONSTRUCTION AND EXPLORATION Contemporary commemorative landscape design should optimally integrate the functions of
patriotism education, red tourism, cultural inheritance, ecological protection and industry services, form a multi-functional complex system consisting of humanistic mourning, red education and ecological landscapes, strengthen the cognitive characteristics of commemorative landscapes, and enhance the public’s (especially adolescents’) sense of identity and participation (Liu, et al., 2007). This paper, with Mashan Martyrs’ Cemetery as the research object, explores the commemorative landscape design from five perspectives: cultural organization, event awakening, axis deduction, element resonance and place experience, and explains and explores the concepts and modes of commemorative landscape design that conform to the characteristics of contemporary Chinese adolescents.
Mashan Martyrs’ Cemetery is located in Xuancheng City, Anhui Province. It is a famous patriotic education base in Anhui Province. The original cemetery was located in the main urban area. Because of the expansion of urban construction, it needs to be redesigned and constructed in a different place (Figure 4). In addition to martyrs’ cemetery zone, the new design also includes five other zones: patriotic education exhibition zone, revolutionary war exhibition zone, anti-Japanese war exhibition zone, liberation war exhibition zone and new China exhibition zone to commemorate the Xuancheng Revolutionaries who sacrificed for the country in different periods.
Figure 4. Construction site of Mashan (2016). Photo by the author. 4.1 Culture Organization
Cultural organization emphasizes the highly complex use of cultural landscape design techniques. By the careful organization of design axis layer by layer and progressive layout that coincides with commemorative events, a strong commemorative historical and cultural atmosphere will be created, thus promoting adolescents’ multi-dimensional logical thinking and triggering their subconscious collective memories. As part of the design content of Mashan Martyrs’ Cemetery, the red landscape should help adolescents realize visual impact and spiritual palpitation, display patriotic scenes, and achieve the educational function of revolutionary culture.
In the design layout of Mashan Martyrs’ Cemetery, the concept of axis is emphasized. With the serial organization of linear space as the cultural carrier, points function as the core of the structure, axis functions as the visual corridor, the related supporting functions are extended to the two wings, and finally an axial layout pattern is formed (Figure 5), including the main axis, red ribbons, three cores and six zones. The main axis is varying in content, the two wings have porches and commemorative buildings formed by red steel plates, and three core spaces are generated through the free change of ribbons. This spatial organization relies on the organization technique of cultural sequence, which results in six zones: image exhibition area, patriotic education exhibition area, revolutionary war exhibition area, anti-Japanese war exhibition area, liberation war exhibition area and new China exhibition area. The multi-dimensional logical thinking promotes the optimization of spatial form and quality. The strong atmosphere of red culture is gradually formed in the progressive axis. The visual impact of landscape form triggers the adolescents’ subconscious collective memories, and builds a bridge of dialogue between design and heart.
CELA 2019 | UC Davis 441

Figure 5. Overall airscape of Mashan Martyrs’ Cemetery design (2016). Photo by the author.
4.2 Event Awakening
Event awakening refers to the creation of a spatial atmosphere by virtue of typical commemorative events to guide adolescents’ immersion experience and awaken their deep memories of historical events. One of the most important points in the design intention of Mashan Martyrs’ Cemetery is to create a spatial context through a novel expression pattern, thus achieving the role of event awakening. Instead of emphasizing the cruelty of war and the solemnity of history, Mashan Martyrs’ Cemetery emphasizes the “experience” of revolutionary history by means of formal innovation and coordination with the environment (Li., et al., 2018). In other words, adolescents can immerse themselves in experiential reading in a novel spatial context, and stimulate their experience and understanding of the revolutionary war.
Nowadays, Chinese adolescents have different and sluggish attitudes to and understandings of red landscapes. In order to solve this problem, Mashan Martyrs’ Cemetery uses the formal language of “red ribbons” in the overall form design (Figure 6) to strengthen the spatial context, trigger the adolescents’ collective memories, and seek the agreement between their attitude and understanding depth. The “ribbons” in the design can best reflect the revolutionary history of Xuancheng and remind visitors of Mao Zedong’s famous poetry. Since the overall height of ribbons is below that of the surrounding trees, ribbons are hidden in the trees, which is consistent with the low-key dedication spirit of martyrs. The simplicity of the design form leaves certain “space”, which symbolizes the blood of revolutionary martyrs that once dyed the earth red as well as heroic courage, and creates a spatial atmosphere for remembrance.
CELA 2019 | UC Davis 442

Figure 6. Planar graph of Mashan Martyrs’ Cemetery based on the mian axis (2016). Photo by the author.
4.3 Axis Deduction Storytelling streamline organization can arouse adolescents’ related emotions. This design uses
the axis to organize traffic flow lines, fully considers the influence of people as information terminals, and guides their emotional gradual changes in order to achieve the interaction between people and the landscape on site.
The starting point of the axis of Mashan Martyrs’ Cemetery is the square as the image exhibition zone. The square is pleasant in scale and has many exhibition venues to show the martyrs’ deeds to visitors from the very beginning. The contrast between the arch slope of the entrance, the modern flower sea and the revolution flags in the distance symbolizes the hard-won happy life of today, emphasizes the scene contrasting effect of the axis, and guides visitors to be quickly immersed in the atmosphere of the cemetery. When visitors step into the gate, they are isolated from the outside world and enter a quiet and solemn cemetery area. Their emotions and thoughts fall into a depressed state. In the process of vertical lifting of the axis, the martyr sculptures on both sides of the lawn seem to walk with visitors, and the sense of distance is invisibly eliminated. Space continues to advance along the time axis of wars, the cruel war scenes and solemn martyrs’ images affect the nerves of visitors, and the development of history becomes vivid. In the evolution from the old China to the new China, people’s emotions change from depression to excitement, and reach a climax in the new China exhibition zone. The magnificent and modern central sculpture enables visitors to be emotionally moved and spiritually lifted. On the way back, visitors’ mood gradually calms down. While visitors slowly walk down the steps, the martyr sculptures never look back. The scene of soldiers rushing to the battlefield seems to emerge in front of visitors. With the departure of visitors, the distance between the living and the deceased is gradually widening. The huge behavioral contrast makes adolescents realize the martyrs’ great sacrifice spirit and spontaneously form their inner reflection. In a word, the cemetery axis comparatively describes the visitors’ mood through plot deduction (Figure 7).
Figure 7. Place effect picture based on the main axis (on both sides of green land are full-length sculptures of martyrs) (2016). Photo by the author.
4.4 Element Resonance
Design elements are the medium of expressing cultural connotations and can lead adolescents to experience emotional burst-out changes. The cultural attributes of experiential landscapes are triggered by cognitive resonance of landscape elements. Mashan Martyrs’ Cemetery fully applies the expression
CELA 2019 | UC Davis 443

forms of landscape elements and divides them into basic elements and variable elements for design organization (Figure 8).
(1) Basic elements are tangible elements that can directly carry cultural connotations, including buildings, sculptures, water, plants and so on. In the design, the main body of buildings consists of floating slabs. The free form is dynamic and symbolic, while the symmetrical form meets the needs of the cemetery function but is not restrained. The continuity of the design makes the nodes in the site integrated and unified, and strengthens the commemorative significance. The same-sized martyr sculptures on the axis are displayed in front of adolescents in a forward-facing manner, conveying their spirit to proceed without hesitation. The central sculpture at the end of the axis consists of 175 steel tubes, symbolizing 175 martyrs who died in Xuancheng. The steel tubes are laid out in the shape of a pentagonal star on the plane, which symbolizes the red revolution in China. Besides, the black stele symbolizes the cornerstone of the revolution. The symbolic use of digitals unifies meaning and form and has a strong centrality. The still water reflects the pentagonal star sculpture, which sets off a solemn atmosphere. Visitors naturally fall into the reminiscence of the revolution.
(2) Variable elements can diversify the basic elements, mainly including colors and materials. After the form of basic elements is determined, the appropriate selection of materials and colors of variable elements can achieve the effect of instantaneous mobilization of visitors’ emotions. From the viewpoint of color, the most prominent element in the design is the red “ribbon”. Apart from working as the shelter from the wind and rain, the bright red makes the vision extended and extremely shocking. The colors of plants are rich. To be specific, magnolias with white flowers represent purity, orchids with blue flowers represent eternity and camellias with red flowers represent dedication, all telling history poetically (Zhang X.L.. 2018). From the viewpoint of material, with steel plates as the rooftop, the sound of rain drops hitting steel plates is like a hymn dedicated to the heroes in the rainy days of early April. The steel tubes used in the central sculpture are far from flamboyant as a heroic character individually, but symbolizes the power of revolution after assembling together into a huge pentagonal star.
Figure 8. Element organization of main axis landscape (2016). Photo by the author. 4.5 Place Experience
Christian Norberg-Schulz (1926-2000) mentioned in Genius Loci, Towards a Phenomenology of Architecture (1980) that “protecting and preserving the spirit of place means concretizing the essence of place in a new historical context”. Mashan Martyrs’ Cemetery pays attention to the behavior and psychological activities of “people” in the landscape environment, shapes the spatial form with novel ideas, and presents adolescents with cultural connotations through axis deduction and element
CELA 2019 | UC Davis 444

resonance. The presentation of cultural connotations depends on the spatial atmosphere. When adolescents immerse themselves in the atmosphere of the venue, combine their own thoughts, moral concepts and aesthetic concepts together, gradually understand where they are, and have a sense of belonging and identity in the venue, they gradually clarify the relationship between themselves and the venue, and truly reflect on themselves. Accordingly, confusion is eliminated, spatial images are experienced, the red culture can be continued, and the purpose of commemorative places can be realized.
In the traditional commemorative landscapes, the static structures themselves are the carriers of commemorative content, such as a large number of text exhibitions, symmetrical buildings and giant stone carvings. Their one-way messages are both concrete and vague. In contrast, dynamic place experience can foster a spatial atmosphere and fully stimulate the essence of place (Li, 2008). The design tries to break the barriers of time and space through space transformation, contrast between light and shade and combination of reality and fiction on the main axis, so that adolescents can experience the ambition and pride of revolutionary martyrs and have a sense of identity with the environment. Adolescents gradually transform visual shock into psychological cognition and emotion, and sublimate their understanding of life, death and revolution. Mashan Martyrs’ Cemetery design builds a brand-new cognitive experience with brand-new place relationship. Place spatial experience abstracts information into emotional expression and impresses adolescents by its dynamic and clear manner. 5 THOUGHTS AND PROSPECTS
The continuation and transformation of Chinese commemorative landscape design concepts can be attributed to the driving force of cultural changes under the development of the era (Zhang, et al., 2010). Judging from the social level, it is the opening of culture and the progress of civilization that promote the sustainable development of lifestyle and ideas of contemporary Chinese adolescents. The phenomena are always objective, and the answers are always inevitable. Against such a background, commemorative landscapes must change their ways of inheritance and show a positive response to social changes so as to convey their spiritual content.
The traditional expression of commemorative landscapes is based on interpretation, namely narrating commemorative stories through various text descriptions. The cognitive relationship between external form and internal experience is monotonous. Therefore, the enlightenment to the contemporary era is that the development of commemorative landscapes should abandon the shackles of form, pay attention to place innovation and spiritual growth, and construct emotional ties between two different times.
As regards exploring the external image, we should create a sense of place in a simple and abstract, concise and novel form to realize the multiplicity of experience and imagination in spatial organization and arouse adolescents’ interest and identity. At the same time, how to balance the relationship between appearance and spirit deserves our deep thinking. Adolescents are in the primary stage of value formation, thus vulnerable to the influence of the external environment. Although formal innovation is infectious, it might also make adolescents ignore the value of commemorative landscapes and regard them as recreational places. In a well-structured place, the cultural characteristics carried by a landscape space are expressed by form and conveyed to the audience. In this process, wrong symbolization may occur in the interpretation of form, resulting in deviated value orientation and impossibility in interpreting cultural information. Therefore, the expression form of commemorative landscape design should be carefully deliberated to balance the relationship between form and spirit, and ultimately between cultural values and adolescents’ cognitive characteristics.
The commemorative landscape design based on the cognitive characteristics of contemporary adolescents can trigger the natural expression of emotions. In such design, the commemorative revolutionary deeds and spirits are displayed in a spatialized and scenario-based manner, thereby immersing visitors in experiential reading and in the remembrance of history. The application of this design method to new China commemorative landscapes is not only to commemorate historical events in a certain region or at a certain time. More importantly, in so doing, Chinese offspring’s concern for revolution and history can be aroused, and thus a deeper sympathy can be further promoted. In a conclusion, this design method will not only inherit the history, but also guide the adolescents to go beyond the history and create a new future for China.
CELA 2019 | UC Davis 445

6 ACKNOWLEDGMENTS We thank Bo Yang, Yuning Cheng, BaiHui Zhuo, Juan Wu, Shuang Song and Yukun He for their
indispensable help with this research, we also thank for the data support from the Digital Landscape Laboratory of Southeast University and Jiangsu Digital Landscape and Environment Engineering Center. The authors are grateful to the reviewers and the editor for the time and effort they put into their detailed comments that helped improve this paper.
This research is supported by the National Natural Science Foundation of China (NSFC No. 51778127).
The authors declare that there is no conflict of interest regarding the publication of this article.
7 REFERENCES 1. Journal article, non-English source - Yao D.Q., Cai J.. Analysis of Affective Factors in Commemor
ative Landscape[J]. South China Agriculture, 2017, 48(14): 11+26. 2. Journal article, non-English source - Liu R.Y.. On the Psychological Characteristics and Education
of Teenagers under the New Situation[J]. Popular Science, 2017(01): 49-50. 3. Journal article - Ilic K., Alempijevic N.S.. Cultures of Memory, Landscapes of Forgetting: the Case
Study of the Partisanmemorial Cemetery in Mostar[J]. Stud.ethnol.Croat, 2017, 29(1): 73 - 101. 4. Journal article - Guy P.. “Who Was Park Chung-hee?” The Memorial Landscape and National Identi
ty Politics in South Korea[J]. East Asia, 2016, (33): 271-288. DOI 10.1007/s12140-016-9261-y. 5. Journal article - Frie R.. From Memorials to Bomb Shelters: Navigating the Emotional Landscape of
German Memory[J]. PSYCHOANALYTIC INQUIRY, 2014, 34(7): 649-662. DOI: 10.1080/07351690.2014.944829.
6. Journal article - John G.E., Carlson K.M.. 'Making Change' in the Memorial Landscape to the Dakot
a-US War of 1862: Remembrance, Healing and Justice Through Affective Participation in the Dakota Commemorative March (DCM)[J]. SOCIAL & CULTURAL GEOGRAPHY , 2016, 17(8):987-1016. DOI: 10.1080/14649365.2016.1147062.
7. Journal article - Korson C.. Nationalism and Reconciliation in Memorial Landscapes: the Commemo
ration of Jean-Marie Tjibaou in Kanaky/ New Caledonia[J]. JOURNAL OF HISTORICAL GEOGRAPHY, 2016, 52:84-99. DOI: 10.1016/j.jhg.2016.02.007.
8. Journal article - Hannum K.L., Rhodes M.A.. Public Art as Public Pedagogy: Memorial Landscapes
of the Cambodian Genocide[J]. JOURNAL OF CULTURAL GEOGRAPHY, 2018, 35(3): 334-361. DOI: 10.1080/08873631.2018.1430935.
9. Journal article - Rostami R., Lamit H., Khoshnava S.M., Rostami R.. Successful Public Places: A Ca
se Study of Historical Persian Gardens[J]. Urban Forestry & Urban Greening, 2016,(15): 211-224. DOI: 10.1016/j.ufug.2015.08.011.
10. Journal article - Jiang B.Y., Liu Y.C.. Historical and Cultural Values of the Modern Historic Parks i
n Tianjin - the British Concession[J]. JOURNAL OF ASIAN ARCHITECTURE AND BUILDING ENGINEERING, 2018, 17(2): 221-228. DOI: 10.3130/jaabe.17.221.
11. Journal article - Azma S., Katanchi R.. The Effect of Landscaping and Building Facades on Percept
ual-Behavioral Features of Citizens[J]. Journal of History Culture and Art Research, 2017,6(3): 264-281. DOI: 10.7596/taksad.v6i3.890.
CELA 2019 | UC Davis 446

12. Journal article - Azeri A., Sosari Z., Mozhdehi A.. Reviewing the Role of Spatial Factors in Promoting Social Interactions with the Purpose of Designing a Cinematic-Cultural Complex[J]. Civil Engineering Journal, 2018,4(4):857-871. DOI: 10.28991/cej-0309139.
13. Journal article, non-English source - Yan C.P., Li G.Q., et al.. Cognitive Closure and Its Influencin
g Factors in Adolescent Students[J]. Chinese Journal of Clinical Psychology, 2012, 20(04): 574-576. 14. Journal article, non-English source - Yu G.L., Li T.R.. Exploration on the Structure and Characteris
tics of Adolescents' Mental Health in Social Transformation[J]. Journal of Southwest University for Nationalities (Humanities and Social Science), 2016, 37(08): 191-196.
15. Journal article, non-English source - Xu S.S.. On the Characteristics and Education of Current Yo
uth's Psychological Development[J]. Youth and Adolescence Studies, 2004(03): 6-8. 16. Journal article, non-English source - Chen B.S.. The Psychological Characteristics of Teenagers i
n The New Era and Its Countermeasures[J]. Journal of Tianzhong, 2015(01): 119-123. 17. Journal article - Zhang Y.C., Chen C.P., et al.. Children's Landscape Environment Creation Based o
n Brain Plasticity and Cognition[J]. NeuroQuantology, 2018, 16(4): 80-85. 18. Journal article - Zhe Li, YuNing Cheng, Rong Xiao. Electroencephalogram Experiment Based Analy
sis of Aesthetic Fatigue on Chinese Traditional Garden. NeuroQuantology. 2018. Vol.16, No5. 356-362. DOI: 10.14704/nq.2018.16.5.1296
19. Journal article, non-English source - Yao Z.. Cultural Interpretation of Evolutive Human Landscape
[D]. Nanjing:Southeast University, 2006. 20. Journal article, non-English source - Li Y.J.. Design Concept and Idea of Commemorative Landsc
ape: On the Planing Design of the Memorial Cemetery to the Martyrs in Huangma Uprising and in Hubei, Henan, Anhui Revolutionary Base[J]. Planners, 2005, (9):39-42.
21. Journal article, non-English source - Liu J.P.,Cao X.W.. Landscape Design Perspective on the Re
d-Cultural Heritage Protection[J]. Ecological Economy. 2007, (10): 419-421+430. 22. Journal article - Zhe Li, YuNing Cheng, YangYang Yuan. Research on the Application of Virtual Rea
lity Technology in Landscape Design Teaching. EDUCATIONAL SCIENCES-THEORY & PRACTICE. 2018. Vol 16, No 5. 1400-1410. DOI: 10.12738/estp.2018.5.037
23. Journal article - XueLing Zhang. Practice Teaching of Landscape Survey Course Based on eCogniti
on Remote Sensing Image Interpretation Technology. EDUCATIONAL SCIENCES-THEORY & PRACTICE. 2018. Vol 16, No 5. 14110-1423. DOI: 10.12738/estp.2018.5.038
24. Journal article, non-English source - Li K.R.. The Significance and Connotation of Memorial Lands
cape[J]. Chinese Landscape Architecture, 2008, (4): 46-51. 25. Journal article, non-English source - Zhang H.W., Wang X.R.. Review of Modern Memorial Landsc
ape Design[J]. Chinese Landscape Architecture, 2010, (9): 38-42.
CELA 2019 | UC Davis 447

CELA MEDIA STATEMENT Title of Paper or Research: Research on Design Concepts of Commemorative Landscapes Based on Adolescents’ Cognitive Characteristics in Contemporary China: A Case Study of Mashan Martyrs’ Cemetery. Author: Li Zhe*, Zhao Kaiyu, Chen Feifei, Han Xiao. Institution or Professional Affiliation: Southeast University Authors please select one of the following: I DO want to prepare a media statement for general release from the 2019 CELA Conference. Media Statement: Under the strong influence of contemporary non-mainstream cultures such as pop, electronic and consumerism culture, the psychological and cognitive characteristics of current Chinese adolescents change significantly. Traditional design patterns of commemorative landscapes have been unable to adapt to adolescents’ psychological changes in China, and failed to gain broad and deep sympathy from them. Based on the relevant research about adolescent psychology and sociology, this paper analyzes the psychological characteristics such as independence, sociality, extensiveness and implicitness of contemporary Chinese youth. With the landscape design of Mashan Martyrs’ Cemetery as the research object, the paper gives the priority to the space construction of commemorative environment in high Chinese cultural context. After the discussion in five aspects, the paper delves deeply into the concepts and methods of commemorative landscape design, trying to promote the interaction and lead the adolescents’ landscape cognition to a positive direction.
CELA 2019 | UC Davis 448

The authors are solely responsible for the content of this technical presentation. The technical presentation does not necessarily reflect the official position of the Council of Educators in Landscape Architecture (CELA), and its printing and distribution does not constitute an endorsement of views which may be expressed. Citation of this work should state that it is from a CELA conference paper. EXAMPLE: Author's Last Name, Initials. 2019. Title of Paper. Sacramento, CA: CELA. For information about securing permission to reprint or reproduce this paper, please contact CELA at [email protected]
Quantitative Study on the Vegetation Landscape Characters of Chinese Buddhist Mountain Environments Based on eCognition
Image Interpretation Technology: A Case Study of Jizu Mountain, Yunnan Province
Zhang,Xueling E-mail: [email protected] Alternate Contact: (+86)18310808533 Li,Shuhua Corresponding author E-mail:[email protected] 1 ABSTRACT
Chinese Buddhist mountains have become the symbols of large-scale Chinese traditional scenic spots and taken on striking diversiform landscape characters, and natural vegetation coexisting with artificial vegetation. As a newly-emerging smart image analysis technique, eCognition can help us to conduct research on and analysis of the vegetation landscape characters and realize the instant output of the drawings and the corresponding vector data. The paper is about the quantitative analysis of and experiment conducted on the images of the vegetation landscape of the scenic area of Jizu Mountain on the basis of the multi-spectral remote-sensing image data of China Resources (ZY-3) satellite. In the analysis and experiment, the eCognition object-oriented classification method is employed. With the spectral heterogeneity, multi-scale segmentation function and normalized vegetation index as the standards for image analysis, the mathematical algorithm suitable for the research on landscape is obtained by the membership function, with the characters of six kinds of vegetation landscapes extracted, such as the coniferous forest, broad-leaved forest, bamboo forest, sparse forest land, gardens, and orchards. The distribution of the vegetation landscape in Jizu Mountain is scientifically presented, with the algorithm description and drawing generation of vegetation landscape characteristics realized. Evaluated with the error matrix, the classification accuracy is great. The study provides a quantitative survey and analysis method for a highly spatial analysis of contemporary landscapes and analysis and design of urban green space;it also provides valuable and promising remote sensing interpretation platforms and special technologies for scientific research on human settlements such as urban and rural planning and architecture.
1.1 Keywords
Chinese Buddhist mountain landscape; vegetation landscape character; eCognition; image interpretation technology; Jizu Mountain.
CELA 2019 | UC Davis 449

Quantitative Study on the Vegetation Landscape Characters of Chinese Buddhist Mountain Environments Based on eCognition
Image Interpretation Technology: A Case Study of Jizu Mountain, Yunnan Province
1 ABSTRACT
Chinese Buddhist mountains have become the symbols of large-scale Chinese traditional scenic spots and taken on striking diversiform landscape characters, and natural vegetation coexisting with artificial vegetation. As a newly-emerging smart image analysis technique, eCognition can help us to conduct research on and analysis of the vegetation landscape characters and realize the instant output of the drawings and the corresponding vector data. The paper is about the quantitative analysis of and experiment conducted on the images of the vegetation landscape of the scenic area of Jizu Mountain on the basis of the multi-spectral remote-sensing image data of China Resources (ZY-3) satellite. In the analysis and experiment, the eCognition object-oriented classification method is employed. With the spectral heterogeneity, multi-scale segmentation function and normalized vegetation index as the standards for image analysis, the mathematical algorithm suitable for the research on landscape is obtained by the membership function, with the characters of six kinds of vegetation landscapes extracted, such as the coniferous forest, broad-leaved forest, bamboo forest, sparse forest land, gardens, and orchards. The distribution of the vegetation landscape in Jizu Mountain is scientifically presented, with the algorithm description and drawing generation of vegetation landscape characteristics realized. Evaluated with the error matrix, the classification accuracy is great. The study provides a quantitative survey and analysis method for a highly spatial analysis of contemporary landscapes and analysis and design of urban green space;it also provides valuable and promising remote sensing interpretation platforms and special technologies for scientific research on human settlements such as urban and rural planning and architecture.
1.1 Keywords
Chinese Buddhist mountain landscape; vegetation landscape character; eCognition; image interpretation technology; Jizu Mountain.
CELA 2019 | UC Davis 450

2 INTRODUCTION As the coordination of rational thinking, analytic logic and advanced technology is increasingly
valued in landscape architecture, quantitative analysis has become a critical basis for description of landscape science (Khwanruthai, et al. 2011) (Zhe Li, et al. 2018), and digital technology has played a key role in landscape character investigation, analysis and performance (Carrera, et al. 2017). Recently, Remote Sensing (RS), Geography Information Systems (GIS) and Global Positioning Systems (GPS) have been further applied in landscape architecture research (Zhang Xueling. 2018). As a result, the digital analysis of traditional landscape environment has high level, large spatial scope, strong comprehensiveness and scientific significance (Liu, et al. 2017).
Chinese Buddhist mountains represent an important part of China’s traditional landscape, a masterpiece by nature and human. Since ancient times, natural landscape and Buddhist mountain have interdepended for development. Affected by nature, history, religion, aesthetics, spatial understanding and planing and building techniques, they have formed landscape compounds with typical vegetation as the main body, and “continuous perceptual groups” (Susanne K.Langer, 1953) of landscape as spatial organization mechanism. Such landscape compounds, a combination of natural and cultural landscape (Li, et al. 2018), is featured by specific vegetation and spatial patterns. It not only presents multiple geology and platform, profound humanistic connotation and rich religious characteristics, but also highlights the beauty of vegetation (Yao, et al. 2014). For example, Chinese Buddhist mountain landscape of the West Mountain, Fragrant Hills, Wengshan Hill in Beijing developed since the Ming Dynasty keep abundant vegetation types. It has distinctive forest forms and aspection, with natural landscape being its iconic feature. The eight outlying temples of Chengde, Tiantai Mountain in Zhejiang Province and Jizu Mountain are also home to Chinese Buddhist mountain landscape. Based on religious landscape, numerous plants have been grown and maintained there, so zonal vegetation landscapes are distinctive.
Landscape character is one of the important propositions of modern landscape architecture research. As it can be sensed by people, landscape is characterized by natural factors, human factors, or both (Martin Belen, et al. 2018). Landscape character is a unique, identifiable and continuous landscape “texture” formed by the landscape elements under the influence of natural environment, historical development and regional culture. It is an organic representation of a scientific model, with uniqueness, complexity, multiple scale and continuity (Morrison, et al. 2018). The study of vegetation landscape character emphasizes the use of rational and logical thinking, so as to analyze its natural landscape components and its process of generation and development in a scientific and strict way and to fully present the composition model, deep decoding and seedling evolution mechanism of landscape space, thus establishing the corresponding relations between changes in the landscape system and the development of landscape environment (Cetin, et al. 2018). It provides a scientific and effective research approach for modern landscape construction, and promotes scientific research on and sustainable development of scenic spots including Chinese Buddhist mountain.
Can vegetation landscape characters be quantified? Can the landscape environment, as a integration, be decomposed into more accurate and measurable character elements for digital analysis? Faced with such problems, eCognition based on contemporary digital landscape theory and remote sensing technology has given a relatively systematic and clear solution (Nagabhatla, et al. 2016). As an emerging intelligent image analysis software. eCognition adopts the fuzzy classification algorithm supported by the decision expert system. It breaks through the limitations of traditional commercial remote sensing software such as GIS based on spectral information, and proposes a revolutionary classification technology, the object-oriented classification method. The method greatly improves the automatic recognition accuracy of spatial resolution data, satisfies the needs of scientific research and engineering applications, and provides a new quantitative analysis technology for the study of vegetation landscape character of Chinese Buddhist mountains (Chmielewski, et al. 2014). Through eCognition's remote sensing image analysis, we can carry out information collection and character analysis of vegetation landscape based on satellite remote sensing map (Frauenfelder, et al. 2015). Taking spectral heterogeneity and NDVI as vegetation image classification characters, through the membership function algorithm, we can effectively extract the information of typical vegetation landscape character elements, scientifically improve the classification accuracy of landscape character, and present the distribution of vegetation landscape character by vectors. While promoting the research of the traditional Chinese Buddhist mountain landscape characters, it is of significance in improving landscape survey and analysis technology.
CELA 2019 | UC Davis 451

3 STUDY AREA
Jizu Mountain is located in the Erhai Lake area of Dali Bai Autonomous Prefecture, east of Cangshan Mountain and Erhai Lake, and south of Jinsha River. It is part of Dali national scenic area. The main parts of the mountain range are from Jiegou Village in Tapan Hill in the east to Tianzhu Mountain in the west, and from the Shazhijie River to the south to the northern slope of Jiuchong Cliff in the north. It covers a total area of 2,822 hectares (see Figure 1). Jizu Mountain is located in the transitional part between subtropical and temperate zones. It has obvious three-dimensional climate, complex topography and landforms, abundant animal and plant resources, and excellent ecological environment. Rich terrain changes and vegetation resources have shaped vivid and diverse surface landscape environment.
The Jizu Mountain scenic area currently has a large number of temple landscapes, which is highly integrated with surrounding vegetation. Vegetation such as coniferous forest, broad-leaved forest, bamboo forest, sparse forest, tea gardens and orchards presents regular distribution, and plant landscape is an integral part of landscape environment. The spatial relationship between sequence and contrast, inwardness and outwardness, penetration and hierarchy, and guidance and suggestion needs to be further explored and analyzed.
Figure 1. Remote sensing image of the core landscape area of Jizu Mountain(2018) . Photo by the author.
4 DATA ACQUISITION AND PREPROCESSING
The ZY-3 satellite is China's first independent civilian high-resolution stereo mapping satellite. Through stereoscopic observation, it can make 1:50,000 scale topographic maps, serving land resources, agriculture, and forestry fields. The satellite can seamlessly cover areas within 84 degrees of the north and south latitudes of the earth, with a regression period of 59 days and a revisit period of 5 days.
The ZY-3 high spatial resolution remote sensing image of Jizu Mountain scenic area was acquired on January 23, 2018, and the spatial resolution was 5.8m. The spectral bands include blue band (450~520nm), green band (520~600nm), red band (630~690nm) and near-infrared band (760~890nm). No cloud was in image field, with good atmospheric environment and 11° tilt angle. The processing steps for the remote sensing image were as follows:
(1) Perform FLAASH atmospheric correction on the original image data. It is to eliminate the influence of refraction and scattering on ground objects, and improve the accuracy of the ground object extraction.
(2) Perform orthorectification with the 1:10,000 map of Jizu Mountain area as a reference. The quadratic polynomial correction method, the characteristics of the ZY-3 satellite and the WGS84 coordinate system were used.
(3) According to the research needs, an appropriate image range was intercepted for the subsequent secondary image correction and eCognition analysis.
CELA 2019 | UC Davis 452

5 TECHNOLOGY ROADMAP (1) Multi-scale hierarchical segmentation of eCognition images of Jizu Mountain was used to
obtain basic analysis images and corresponding data at different levels. The difficulty lies in setting the segmentation conditions of each level according to spectral characters, geometric shapes and topological characters of the plant landscape elements, so as to accurately segment the spatial and shape characters of the Jizu Mountain vegetation.
(2) The segmented basic images were used to select training sample plots (hereinafter referred to as sample plots) for statistical analysis, and the classification characters were determined according to the differences of various plant landscape characters in Jizu Mountain, in preparation for classification and analysis of plant landscape characters.
(3) The vegetation landscape character description based on the Normalized Difference Vegetation Index (NDVI) was used to analyze the images in depth with the membership fuzzy classification method. The membership function was applied for inter-class classification through landscape character setting. Object characters and inter-class characters were used to accurately define the classification criteria of objects.
(4) Based on the steps above, the remote sensing images of Jizu Mountain core landscape area and its radiation area were analyzed, the vegetation landscape characters were classified and analyzed, and technical drawings and related vector data were obtained.
(5) The sample plots were sampled again for accuracy analysis, and the classification accuracy of the study was obtained through field investigation. A technical summary was conducted and the following research options were explored.
The technology roadmap is shown in Figure 2.
Figure 2. Technology roadmap of Jizu Mountain remote sensing image analysis(2018) . Photo by the author.
6 METHODS AND RESULTS 6.1 Image segmentation
According to field research samples of Jizu Mountain, the fractal net evolution algorithm was used for segmentation on the eCognition platform. Within the segmentation scale of different surface vegetation
CELA 2019 | UC Davis 453

landscape characters, large-scale and small-scale image objects exist simultaneously after segmentation, forming a four-level network of multi-scale remote sensing image objects. It is necessary to consider the difference and identity of the spectral, shape and spatial characters of vegetation communities under different surface conditions in remote sensing images, and follow the principle of minimum heterogeneity to optimize the algorithm formula (Vaz, et al. 2015). After repeated comparison and debugging, the formula of the heterogeneity metric criterion in this study is:
𝐹=𝑤1×𝑐1+1−𝑤1×𝑐2(1)
c2=𝑤2×𝑐3+(1−𝑤2)×𝑐4(2)
Where 𝐹 represents the heterogeneity criterion, 𝑤1represents the weight of the shape, and 𝑐1 and 𝑐2represent the color difference metric and the shape difference metric. 𝑐2includes smoothness 𝑐3and compactness 𝑐4, and 𝑤2indicates the weight of smoothness and compactness. Smoothness refers to the smoothness level of the boundary of the merged region, and compactness is to ensure that the merged region is more compact. Both of the smoothness and compactness have a weight, which form shape difference metrics. It can be seen that the multi-scale hierarchical segmentation can not only divide the different objects for different scales, but also more accurately segment objects based on their spatial and shape characters. Besides, it can optimize the segmentation accuracy according to the logical topological relations of the upper and lower levels in the classification.
6.2 Segmentation parameter setting
According to the typical landform of the Jizu Mountain area, the segmentation scale function was tested and selected. The segmentation function generally includes the scale, the number of levels, the color factor, the shape factor, the smoothness and the compactness (Arsanjani, et al. 2013). In this study, the images were segmented based on landscape vegetation spectral characters, geometric shape and topological characters. Through the eCognition multi-resolution segmentation function, a object level network of multi-scale remote sensing image with a, b, c and d levels is formed.
Among them, Level a was used for segmentation of forest land and non-forest land. The segmentation scale should not be too large, for fear that the ground objects are fragmented. Considering that the high degree of interleasing between forest land and non-forest land in Jizu Mountain, it is advisable to divide the forest land from the non-forest land with a large scale, and explore the classification of the interlaced zone at the bottom level. And the segmentation scale was determined to be 100 by commissioning. Level b was used to distinguish coniferous forest, broad-leaved forest, sparse forest land and construction land. On the basis of segmentation of Level a and the shape characters of natural elements of tea garden, orchards and sparse forest under manual intervention, the natural elements can be separated by setting the scale to 50. Level c was used to distinguish sparse forest, bamboo forest, tea gardens, and orchards. By comparing samples, the spectrum, shape, compactness and smoothness characters of various vegetation were analyzed, and vegetation landscape information elements were effectively extracted. Level d was used to further improve extraction accuracy of vegetation landscape characters, and to improve the indexing of structure, gap, shadow and naked area. Figure 3 and Table 1 show the scale parameters and drawings for each level of segmentation.
Table 1. Hierarchical segmentation scale and discrimination parameters.
Object hierarchy
Segmentation scale
Color weight
Shape weight
Smoothness
Compactness Classification level
Level a 100 0.9 0.4 0.5 0.5 Forest land, non-forest land
Level b 50 0.5 0.5 0.5 0.3 Coniferous forest, broad-leaved
forest, sparse forest land, construction land
Level c 30 0.9 0.1 0.5 0.2 Bamboo forest, tea gardens and orchards
Level d 10 0.8 0.3 0.5 0.1 Structure
CELA 2019 | UC Davis 454

Figure 3. Hierarchical segmentation remote sensing image of Jizu Mountain core scenic spot (2018) . Photo by the author.
6.3 Object character extraction
Based on the segmentation images and sample survey data, statistical analysis was performed, and the classification characters were determined according to the character differences of various images (Tang, et al. 2007). According to visual analysis processing of the four spectral bands of multi-spectral remote sensing images of the Jizu Mountain core landscape area, the eCognition nearest neighbor classifier was used to select sample plots for classification test. Practice shows that a few sample characters for each type of vegetation landscape was selected at first, and the classification results can be optimized and the classification accuracy can be improved by continuously setting the undivided and misclassified objects as samples. The separability between various types of sample plots was observed by the distribution maps of the vegetation landscape character spectra.
6.3.1 Vegetation character indexes
The vegetation character index is a concise and rational metric of surface vegetation. More than 40 vegetation character indexes have been defined and widely used in remote sensing analysis of global and regional land coverage, vegetation classification and environmental change (Durieux , et al. 2008). The Normalized Difference Vegetation Index (NDVI) is used to determine the integration of vegetation community types, growth status, and vegetation coverage. It has been verified by the expert group of the Institute of Geographical Sciences and Natural Resources Research of the Chinese Academy of Sciences and field data (2012). Its spatial consistency is good. In the analysis of vegetation landscape characters, NDVI enhanced the difference between the scattering of green leaves in the near-infrared range and the absorption of chlorophyll in the red-band range, which is the best indicator for the species and growth status of the vegetation community. Figure 15 shows analytical map of NDVI of the Jizu Mountain core landscape area.
The vegetation character indexes are calculated as follows: 𝐼NDVI=𝑝𝑛𝑖𝑟−𝑝𝑟𝑒𝑑/(𝑝𝑛𝑖𝑟+𝑝𝑟𝑒𝑑) Where 𝑝𝑛𝑖𝑟 indicates the reflectance in the near-infrared band; 𝑝𝑟𝑒𝑑 indicates the reflectance in
the red band.
CELA 2019 | UC Davis 455

6.3.2Spectralheterogeneityindexes
In the classification, due to similarity of the spectral information of coniferous forest, broad-leaved forest and bamboo forest, there is a certain degree of misclassification, so the texture information was added into spectral information (Cleve, et al. 2008). The grey level co-occurrence matrix (GLCM) reflects the comprehensive information of the gray level change of the images, as well as the arrangement law and partial patterns of the analyzed images. Homogeneity is one of the main characters of GLCM, indicating the homogeneity of a region. The higher the homogeneity, the greater the value. According to the above statistical analysis method, the classification indexes used are shown in Table 2, and the analytical map is shown in Figure 4.
Table 2. Hierarchical classification indexes. Level Category Classification characters
Level a Vegetation, non-vegetation NDVI
Level b Construction land, tea garden, orchards, sparse forest land NDVI, compactness, mean
Level c Coniferous forest, broad-leaved forest, bamboo forest NDVI, compactness, smoothness
Level d Building, shadow, gap Normalized Difference Built-Up Index, compactness, brightness
Figure 4. Analytical map of gray level co-occurrence matrix (GLCM) in the Jizu Mountain core scenic area(2018) . Photo by the author.
6.4 Analysis of vegetation landscape characters
The classification for vegetation landscape object characters is a fuzzy logic function classification based on class hierarchy. eCognition offers two common classification methods: Nearest Neighbor and Membership Functions. The membership function is a simple method of expressing any character range with the same range (0-1), available to edit and adjust each character; it provides a transparent membership function for relations between the character value and the class membership, and precisely define the criteria of a class for an object using object characters and related inter-class characters (Lopez, et al. 2001). According to different conditions in the extraction of vegetation information of Jizu Mountain, the spectral heterogeneity and NDVI were used as image classification characters to analyze the membership of vegetation landscape characters. The analytical results are shown in Figure 5.
CELA 2019 | UC Davis 456

Figure 5. Analytical map of vegetation landscape characters in the Jizu Mountain core scenic area
(2018) . Photo by the author. 6.5 Accuracy evaluation
Accuracy evaluation is important for extraction of vegetation landscape characters, because the accuracy of a extraction classification image of vegetation landscape characters directly affects the accuracy of data analysis and the rationality of scientific evaluation (Ahadnejad, et al. 2009). It is advisable to compare the consistency between each pixel of the two images in accuracy evaluation. In this study, field artificial survey data was taken as reference data. Together with remote sensing analysis results, the reference data was used to establish an error matrix in units of pixels for calculation of accuracy evaluation.
In most cases, it is difficult to obtain the complete reference data, so the whole image was replaced with partial pixels or categories to evaluate the accuracy of the image. The error matrix, also known as the confusion matrix, is a standard format representing accuracy evaluation. In this study, four accuracy evaluation indexes of producer accuracy (PA), user accuracy (UA), overall accuracy (OA) and Kappa coefficient were used to quantitatively evaluate the influence of the segmentation scale on the classification accuracy, which was used as the accuracy verification standard. Its formula is as follows:
The sample plot data mainly includes 332 samples of surveyed vegetation landscape character
formation, vegetation landscape character distribution, landscape character structure and morphological structure. Through artificial interpretation, the objects are used as statistical objects, and the error matrix and overall accuracy were used to express the accuracy evaluation results. The classification accuracy and error matrix of the Jizu Mountain core landscape area are shown in Table 3. The overall accuracy is 78.92%.
Table3. Classification accuracy and confusion matrix of the Jizu Mountain core landscape area.
category Structure Tea Sparse Coniferous Broad- bamboo Total User
CELA 2019 | UC Davis 457

gardens, orchards
forest land
forest leaved forest
forest samples accuracy
Structure 45 2 3 2 1 6 59 76.272 Tea gardens,
orchards 1 38 2 3 2 4 50 76
Sparse forest land 0 1 50 4 2 0 57 87.72 Coniferous forest 1 3 6 43 2 3 58 74.14
Broad-leaved forest 1 5 3 3 44 0 56 78.57 Bamboo forest 1 3 2 3 1 42 52 80.77 Total samples 49 52 66 58 52 55 332 User accuracy 91.84 73.08 75.76 74.14 84.62 76.36
Overall accuracy 78.92% �KAPPA=0.7469�
7 DISCUSSIONS In this paper, the optimal segmentation scale is obtained by multi-segmentation and classification
analysis of remote sensing images of the Jizu Mountain scenic area. Based on the extracted spectral information of the vegetation objects in sample plots, the texture information and geometric information, the object-oriented classification method is used to interpret the images. Spectral heterogeneity and NDVI are used as image classification features. Through membership function algorithm, six types of vegetation landscape character information such as coniferous forest, broad-leaved forest, bamboo forest, sparse forest land, tea gardens and orchards are extracted effectively. The classification accuracy reaches 78.92%, scientifically presenting the distribution of vegetation landscape characters in Jizu Mountain.
The analysis results show that the object-oriented hierarchic segmentation membership function classification method has an high accuracy, which can effectively distinguish the overall landscape characters of vegetation communities around Chinese Buddhist mountains, and is suitable for the quantitative analysis of the vegetation elements of Chinese Buddhist mountains. Based on the eCognition remote sensing image analysis of the vegetation landscape elements in Jizu Mountain, this study analyzes and validates a complete set of remote sensing analysis technologies suitable for scenic spots. With the support of higher accuracy remote sensing images, the set of technologies can accurately identify typical surface landscapes such as mountains, rivers, springs and ancient trees, providing more scientific and reliable digital technologies for the analysis of vegetation landscape in the Jizu Mountain scenic area.
Compared with similar remote sensing image analysis technologies, eCognition remote sensing image analysis technology features diverse segmentation scales, advanced classification methods, and rich image characters and algorithms, and it can meet the needs of landscape architecture and urban and rural planning resources surveys. The acquired classification accuracy can conduct the characteristic data collection and graphical expression of the vegetation landscape in the landscape environment, providing reliable basic data and accurate basic drawings for subsequent large-scale analysis, judgment, transformation and new construction. What is worthy of attention in the follow-up study is that, because of the great similarity between broad-leaved forest, tea gardens and bamboo forest, there are still some misclassifications in results; if ZY-3 remote sensing stereo information and full color spectrum fusion remote sensing images are combined, and the digital elevation model (DEM) is developed, the classification accuracy will be further improved.
The quantitative analysis of landscape characters based on eCognition remote sensing image interpretation technology is a new method and technology for landscape character and resource survey, and it occurs with the development of contemporary landscape architecture science, computer and related remote sensing technology. The related research provides a quantitative research method characterized by objective quantitative analysis and multi-dimensional visual presentation for the study of large-scale landscape environment characters, and provides advanced remote sensing analysis basis and approach for spatial analysis, auxiliary analysis and planning design of scenic spots. On the basis, human vision is being rapidly replaced by the satellite vision, which is significant in technological progress. Besides, it provides a valuable and promising remote sensing interpretation platform and special technology for scientific research on human settlements such as urban and rural planning and architecture.
CELA 2019 | UC Davis 458

8 ACKNOWLEDGMENTS I thank YanFeng Li, YuKun He, Hao Wen, Ming Zhao, ChongXian Chen and my parents for their
indispensable help with this research, I also thank for the RS data support from Beijing Satlmage Information Technology Co., Ltd. The author is grateful to the reviewers and the editors for the time and effort they put into their detailed comments that helped improve this paper.
The authors declare that the research was conducted in the absence of any commercial or financial relationships that could be construed as a potential conflict of interest. This research is supported by the Post-doctoral Science Foundation Project of China (No. 2018M641363).
9 REFERENCES 1. Journal article - Khwanruthai B., Yuji M.. (2011).Site Suitability Evaluation for Ecotourism Using GIS
& AHP: A Case Study of Surat Thani Province, Thailand. Procedia Social and Behavioral Sciences. 21, 269-278. DOI:10.1016/j.sbspro.2011.07.024.
2. Journal article - Zhe Li, YuNing Cheng, YangYang Yuan. (2018). Research on the Application of Virt
ual Reality Technology in Landscape Design Teaching. EDUCATIONAL SCIENCES-THEORY & PRACTICE. Vol 16, No 5. 1400-1410. DOI: 10.12738/estp.2018.5.037.
3. Journal article - Carrera C.C., Asensio LAB.. (2017).Augmented Reality as A Digital Teaching Envir
onment to Develop Spatial Thinking. CARTOGRAPHY AND GEOGRAPHIC INFORMATION SCIENCE.44(3):259-207.DOI: 10.1080/15230406.2016.1145556.
4. Journal article - Zhang Xueling. (2018). Practice Teaching of Landscape Survey Course Based on e
Cognition Remote Sensing Image Interpretation Technology. EDUCATIONAL SCIENCES-THEORY & PRACTICE. Vol 18, No 5. 1411-1423. DOI: 10.12738/estp.2018.5.038.
5. Journal article - Liu M.H., Shao Y., Yao J., You Y.C.. (2017).Research on Teaching System Constru
ction of Applied Surveying Engineering Specialty with "3S" as the Core. PROCEEDINGS OF THE 2017 INTERNATIONAL CONFERENCE ON EDUCATION SCIENCE AND ECONOMIC MANAGEMENT (ICESEM 2017).106. 407-410.
6. Journal article - Zhe Li, YuNing Cheng, Rong Xiao.(2018). Electroencephalogram Experiment Base
d Analysis of Aesthetic Fatigue on Chinese Traditional Garden. NeuroQuantology. 16(5). 356-362. DOI: 10.14704/nq.2018.16.5.1296.
7. Journal article - Chengli Yao. (2014).Research on the Cultural Pattern of the Chinese Traditional Ga
rden Plant's Composition. 2014 2ND INTERNATIONAL CONFERENCE ON ECONOMIC, BUSINESS MANAGEMENT AND EDUCATION INNOVATION (EBMEI 2014). 41. 20-23.
8. Journal article - Martin B., Ortega E., Martino P., Otero I.. (2018). Inferring landscape change from d
ifferences in landscape character between the current and a reference situation. ECOLOGICAL INDICATORS. 99. 584-593. DOI:10.1016/j.ecolind.2018.03.065.
9. Journal article - Morrision B., Barker A., Handley J.. (2018). Systems, habitats or places: evaluating
the potential role of landscape character assessment in operationalising the ecosystem approach. LANDSCAPE RESEARCH. 43(7): 1000-1012. DOI:10.1080/01426397.2017.1415314.
10. Journal article - Cetin M., Sevik H., Yigit N.. (2018). Climate type-related changes in the leaf microm
orphological characters of certain landscapeplants. ENVIRONMENTAL MONITORING AND ASSESSMENT. 190(7): 404. DOI:10.1007/s10661-018-6783-3.
11. Journal article - Chmielewski S., et al.. (2014). Land cover and landscape diversity analysis in the West Polesie Biosphere Reserve. INTERNATIONAL AGROPHYSICS. 28(2): 153-162. DOI:10.2478/ intag-2014-0003.
CELA 2019 | UC Davis 459

12. Journal article - Nagabhatla N., Kuhle P.. (2016). Tropical Agrarian Landscape Classification using
high-resolution GeoEYE data and segmentationbased approach. EUROPEAN JOURNAL OF REMOTE SENSING. 49. 623-642. DOI:10.5721/EuJRS20164933.
13. Journal article - Frauenfelder R., Lato MJ., Biskupic M.. (2015). USING ECOGNITION TO AUTOMA
TICALLY DETECT AND MAP AVALANCHE DEPOSITS FROM THE SPRING 2009 AVALANCHE CYCLE IN THE TATRA MTS, SLOVAKIA. 36TH INTERNATIONAL SYMPOSIUM ON REMOTE SENSING OF ENVIRONMENT. 47(w3). 791-795. DOI:10.5194/isprsarchives-XL-7-W3-791-2015.
14. Journal article - E. Vaz,J. Arsanjani. (2015). Predicting urban growth of the Greater Toronto Area-
Coupling a Markov cellular automata with document meta-analysis. Journal of Environmental Informatics. 25(2). 71-80. DOI: 10.3808/jei.201500299.
15. Journal article - J. Arsanjani, M. Helbich, J. Mousivan. (2013). A morphological approach to predicti
ng urban expansion. Transactions in GIS. 18(2). 219-233. DOI: 10.1111/tgis.12031.
16. Journal article - J. Tang, L. Wang, Z. Yao. (2007). Spatio-temporal urban landscape change analysis using the Markov chain model and a modified genetic algorithm. International Journal of Remote Sensing. 28. 3255-3271. DOI: 10.1080/01431160600962749.
17. Journal article - L. Durieux, E. Lagabrielle, A. Nelson. (2008). A method for monitoring building cons
truction in urban sprawl areas using object-based analysis of Spot 5 images and existing GIS data. Journal of Photogrammetry & Remote Sensing. 63. 399–408. DOI: 10.1016/j.isprsjprs.2008.01.005.
18. Journal article - C. Cleve, M. Kelly, R. Kearns, M. Moritz. (2007). Classification of the wildland-urban
interface: A comparison of pixel- and object-based classifications using high-resolution aerial photography. Computers, Environment and Urban System. 32. 317-326. DOI: 10.1016/j.compenvurbsys.2007.10.001.
19. Journal article - E. Lopez, G. Bocco, M. Mendoza, E. Duhau. (2001). Prediction land-cover and lan
d-use change in the urban fringe: a case in Morelia City, Mexico. Landscape and Urban Planning. 55. 271-285. DOI: 10.1016/S0169-2046(01)00160-8.
20. Journal article - M. Ahadnejad, Y. Maruyama, F. Yamazaki. (2009). Evaluation and forecast of huma
n impacts based on land use changes using multi-temporal satellite imagery and GIS: A case study on Zanjan, Iran. JOURNAL OF THE INDIAN SOCIETY OF REMOTE SENSING. 37. 561-571. DOI: 10.1007/s12524-009-0054-2.
CELA 2019 | UC Davis 460

CELA MEDIA STATEMENT Title of Paper or Research: Quantitative Study on the Vegetation Landscape Characters of Chinese Buddhist Mountain Environments Based on eCognition Image Interpretation Technology: A Case Study of Jizu Mountain, Yunnan Province. Author: Zhang Xueling; Li Shuhua*. Institution or Professional Affiliation: Tsinghua University Authors please select one of the following: I DO want to prepare a media statement for general release from the 2019 CELA Conference. Media Statement: Chinese Buddhist mountains have become the symbols of large-scale Chinese traditional scenic spots and taken on striking diversiform landscape characters, and natural vegetation coexisting with artificial vegetation. The paper uses a newly-emerging smart image analysis technique, that eCognition, which can help us to conduct research on and analysis of the vegetation landscape characters and realize the instant output of the drawings and the corresponding vector data. On the basis of the multi-spectral remote-sensing image data of China Resources (ZY-3) satellite of Jizu Mountain, through analysis and experiment,extracts the characters of six kinds of vegetation landscapes, such as the coniferous forest, broad-leaved forest, bamboo forest, sparse forest land, gardens, and orchards.
CELA 2019 | UC Davis 461

The authors are solely responsible for the content of this technical presentation. The technical presentation does not necessarily reflect the official position of the Council of Educators in Landscape Architecture (CELA), and its printing and distribution does not constitute an endorsement of views which may be expressed. Citation of this work should state that it is from a CELA conference paper. EXAMPLE: Author's Last Name, Initials. 2019. Title of Paper. Sacramento, CA: CELA. For information about securing permission to reprint or reproduce this paper, please contact CELA at [email protected]
Low Impact Development of Green Space in Hillside Area--Based on
Stormwater Balance
Wang, Sijie Beijing Forestry University [email protected] Li, Xiong Beijing Forestry University [email protected] This study was supported by National Natural Science Foundation of China (Grant No.31670704). 1 ABSTRACT The development of hillside area in urban regions is a global issue. As a transitional zone connected urban and nature, hillside area is significant in the preservation of ecological environment. The study is based on a particular site which is planned to build as a country park with the conception of nature preservation, according to the superior planning of local government. The site is located at the eastside area of West Mount in Shijiazhuang, the capital of Heibei Province, which is a typical region in the North China Plain with the shortage of water resource and uneven distribution of annual precipitation. Considering the low-impact development, the study proposes an overall planning conception of stormwater balance. A strategy is proposed through the calculation of precipitation runoff and the water demand for vegetations, based on the existing natural conditions in this region and the analysis from data of current topography, geomorphology, relevant superior planning and field research. The research achieves the objective of the ecological and water-saving green space planning in hillside areas by the result of using the method of quantitative balance to calculate the stormwater recycling in the area, irrigation water demand of vegetations and then divide the proportion of irrigation and non-irrigation vegetations in vegetation planning. The study introduces a theoretical support for low-impact, low-interference and low-maintenance planning practices in typical hillside areas in the North China Plain and analogous regions around the world. 1.1 Keywords Hillside area, green space, low impact development, water balance, water demand of vegetation
CELA 2019 | UC Davis 462

Low Impact Development of Green Space in Hillside Area--Based on
Stormwater Balance
1 ABSTRACT
The development of hillside area in urban regions is a global issue. As a transitional zone connected urban and nature, hillside area is significant in the preservation of ecological environment. The study is based on a particular site which is planned to build as a country park with the conception of nature preservation, according to the superior planning of local government. The site is located at the eastside area of West Mount in Shijiazhuang, the capital of Heibei Province, which is a typical region in the North China Plain with the shortage of water resource and uneven distribution of annual precipitation. Considering the low-impact development, the study proposes an overall planning conception of stormwater balance. A strategy is proposed through the calculation of precipitation runoff and the water demand for vegetations, based on the existing natural conditions in this region and the analysis from data of current topography, geomorphology, relevant superior planning and field research. The research achieves the objective of the ecological and water-saving green space planning in hillside areas by the result of using the method of quantitative balance to calculate the stormwater recycling in the area, irrigation water demand of vegetations and then divide the proportion of irrigation and non-irrigation vegetations in vegetation planning. The study introduces a theoretical support for low-impact, low-interference and low-maintenance planning practices in typical hillside areas in the North China Plain and analogous regions around the world.
1.1 Keywords Hillside area, green space, low impact development, water balance, water demand of vegetation
CELA 2019 | UC Davis 463

2 INTRODUCTION
2.1 Backgrounds Hillside area refers to area located in the transition zone between deep mountains and plains,
including low mountains, hills, platforms, gullies and other topographic features with altitude below 300 meters or those with local elevation ranges in 300 meters. As the interlaced part between mountain ecosystem and plain ecosystem, hillside area is significant in the preservation and protection of ecological environment. In addition, it is the most significant water source conservation area and groundwater recharge area in the piedmont plain. However, with the rapid urbanization process around the world, more and more hillside areas are being constructed for habitancy or recreation because of the population aggregation and the shortage of land resources in cities. Therefore, the development of hillside area is an urgent global issue of the people-environment relationships.
In a narrow sense, Low-impact development (LID) is a term used in Canada and the United States to describe a land planning and engineering design approach to manage stormwater runoff as part of green infrastructure [1]. It’s an ecologically-based stormwater management approach favoring soft engineering to manage rainfall on site through a vegetated treatment network [2]. Learning from the successful experience of the international low-impact development and considering the requirements of Chinese relevant policies and regulation, a stormwater management approach called the Construction of Sponge City in China was proposed in recent years, which implies that the green infrastructure in stormwater management can absorb and release water like a sponge. Broadly equivalent terms used elsewhere include water-sensitive urban design (WSUD) in Australia and Sustainable drainage systems (SuDS) in the United Kingdom. The Construction of Sponge City has good resilience in adapting to environmental changes and responding to natural disasters. it absorbs water, accumulates water, seeps water, cleans water in rainstorm, and it "releases" the stored water for use when needed [3]. Besides using technologies and methods of Low-impact development, the study integrates the characteristics of different theories in stormwater management to expand the understanding of Low-impact development by the study of a typical hillside area in the North China Plain region.
The North China Plain region is located in the middle of the eastern edge of the second largest geomorphic step in eastern China. Although the North China Plain region is much less mountainous than the typical mountainous region in southwest China, the terrain features are diverse and the types of landforms including mountain, hills, plateaus and plains are complete [4]. Located in the mid-latitude zone, the North China Plain region belongs to the temperate continental monsoon climate. On the other hand, the annual precipitation is extremely uneven in spatial and temporal distribution because of the position of the subtropical ridge in this region. The rainstorm mainly concentrates in the deluge season which is usually July and August, and the volume of rainfall in the deluge season accounts for 45%-65% of the whole year’s precipitation [5]. The climate causes large shortage of water resources in the North China Plain region not only by less annual rainfall but also by a large number of abandoned stormwater in deluge season [6-7]. In addition, the expansion of urban space is extending from plains to the surrounded hillside areas with the rapid development of urbanization these years. Therefore, besides the pressure of seasonal drought and water shortage, on the other hand, these cities are also facing the pressure of deluges from the surrounding hillside areas, which increases more serious drainage pressures and urban waterlogging problems inside the city [8-9].
The study is based on an actual project located in Shijiazhuang city, the capital of Hebei province, which is facing this typical contradiction problem from the pressure of precipitation in the hillside area of the North China Plain region. According to the superior planning of local government, the site of this actual project is use to build a country park which is considered as a transition area for both nature preservation and urban recreation. Therefore, the study of low-Impact development planning of green space in the country park, based on the spatial and temporal stormwater balance is proposed.
2.2 Objective and significance Presupposed by the principle that no any stormwater inside the site area is drained out and no
any urban water is supplied into the site area, the objective of this study is to provide spatial planning for
CELA 2019 | UC Davis 464

water systems and plant communities in country parks, which is based on the Low-Impact Development methods and the quantitative analysis of the annual stormwater balance.
The significance of this study is attempt to propose a new mode to resolve the contradiction between seasonal water shortage and waterlogging in the deluge season, based on the spatial and temporal stormwater balance. Meanwhile, the study provides a new mode used the specific methods and generalized theories of the Low-impact development, which not only provides experience for other cities in the North China Plain region, but also recommends reference for worldwide regions with the similar spatial and temporal distribution of precipitation.
2.3 Framework
Figure 1. Framework of This Study (by Author)
3 METHODS
3.1 subject investigated
3.1.1 Environment Condition The average annual precipitation in Shijiazhuang City is 538.3 mm and the spatial and temporal
distribution of precipitation is uneven. Temporally, the amount of precipitation in summer accounts for about 65% of the annual precipitation, and the precipitation in deluge season accounts for more than 75% of the annual precipitation. spatially, the rainfall in the western mountainous area is 628.4-752.0 mm while in other areas it is 401.1-595.9 mm annually. The amount of city's average water resources is 2.16 billion m³ per year, and the city's per capita water resources is 208 m3, which equivalents to only 10 percent of the Chinese national average per capita water resources of 2040 m3 [10].
The country park is sited in the western hillside area of Shijiazhuang City, with a total area of 13.1 km2. The overall site’s topographic trend is high in the West and low in the east, with an elevation range from 102m to 630m. The west side of the site is the West hillside of Shijiazhuang with a height difference in about 450m, and the east side is the plain with a slope of about 2%. The existing vegetation in this hillside area is dominated by shrubs and grasses and secondary forests with the type of temperate deciduous broad-leaved forest system.
3.1.2 Field research Through the field research of the present situation, several stable east-west gullies in site are
observed and three of them have clear spatial form and high spatial enclosure. The current surface water
CELA 2019 | UC Davis 465

types mainly include natural pools formed with seasonal runoff accumulation, artificial water ponds and irrigation canals. Groundwater level in site is so low that local residents have to dig deep wells to get groundwater.
There are a few kinds of native vegetation species such as Populus tomentosa, Robinia pseudoacacia and Sabina chinensis with single vertical stratification and monotonous community diversity. In esthetics, there is low seasonal aspect and ornamental characters because of the shortage of blossom-viewing, color-leafed and evergreen floras generally.
3.2 Quantitative analysis
3.2.1 Runoff calculation The first step of runoff calculation is to divide the site area into different basin by using Arcgis
platform (Figure 2), based on the elevation data of the site area.
Figure 2. Basin Division (by Author)
Secondly, the runoff volume of each basin(L) is calculated separately by the equation below (Eq. 1), which considers the indexes including runoff area(S), the average annual precipitation in Shijiazhuang City(D) and the runoff coefficient(α), which depends on different type of ground surface.
L=S×D×α (1)
Thirdly, the amount of runoff volume in the site area is summarized with the runoff volume of each basin.
According to the approach of runoff calculation, the runoff volume of each basin and the amount of runoff volume in the site area are listed below.
BasinA is166711.7m³, BasinB is 443384.3m³, BasinC is 323551.1m³, BasinD is 21933.5m³, BasinE is 80823.1m3 and the amount is 1036403.7m³.
3.2.2 Pool water Calculation The amount of stormwater runoff is proposed to distribute into the pool water of waterscape and
the irrigation water for the growth of vegetation, considering the country park’s characteristic of the nature landscape and recreation requirement. Therefore, the key method of the study is the balanced distribution of the collected stormwater runoff. Guiding by the Low-impact development to the current landform situation, the waterscape system should be constructed based on the current natural low land and
CELA 2019 | UC Davis 466

seasonal pools sited on the streamlines of runoff and the stable gullies. Therefore, the method is proposed that the volume of water storage in pools that reform from the natural low land or current seasonal pools are calculated in priority. Then the rest of stormwater runoff is used for irrigating vegetation.
The amount of pool water (Lp) is accumulated by each pool’s area (Si) and depth (Hi) (Eq. 2). Based on the concept of Low-impact development, the area of water pool depends on the area of current natural low land and seasonal pool.
𝐿𝑝=𝑖=𝑚𝑛𝑆𝑖·𝐻𝑖 (2)
Considering the multiple functions of low impact development facilities, which includes groundwater supplement, peak flow reduction, stormwater purification and runoff pollution control, the depth of each water pool depends on the different type of Low-impact development facility, such as stormwater wetland, regulating pond, wet pond, reservoir and seasonal floodplain. The amount of pool water is 442464.65 m³.
3.2.3 Irrigation Water Calculation Under natural conditions, vegetations don’t need to be irrigated when the rainfall is sufficient to
maintain their normal growth. Therefore, it is significant to judge whether it is necessary to replenish irrigation water according to the water demand of vegetations when facing the change of seasonal drought [11]. The study judges whether plants need irrigation based on effective rainfall, which is the amount of rainfall that can actually be used by plants during the irrigation season [12]. The vegetations that don’t need to be irrigated are called self-sufficiency vegetations in the study, when the water it need for growth is less than the effective rainfall. On the contrary, those are called irrigation vegetation. The calculation of effective rainfall is based on Monthly Effective Rainfall(Re) ,Historical Rainfall(Rh) and Effective Rainfall Coefficient(Rf) in Shijiazhuang area (Eq. 3). The boundary line of effective rainfall between self-sufficiency vegetation and irrigation vegetation is 310.93mm [aam].
Re=Rh×𝑅𝑓100 (3)
The area of irrigated plants is calculated by the water requirement of vegetation per unit area (Eq. 4), including the area of Irrigation Vegetation(Si), Reference Crop Evapotranspiration(ET0), Factor of Vegetation Species(Ks), Factor of Vegetation Density(Kd) and Factor of Vegetation Microclimate(Kmc). (see Table 1)
Si=𝐿𝑖𝐸𝑇0·𝐾𝑠·𝐾𝑑·𝐾𝑚𝑐 (4)
Table 1. Annual water demand calculation of vegetation.
Month
Historical Rainfall Rh (
mm/ month)
Effective Rainfall Coefficient RF
Monthly Effective Rainfall Re (
mm/ month)
Plant Water Require- -ment PWR (
mm/d)
Plant Water Require- -ment PWR (
mm/ month)
Plant Water Require- -ment net PWRnet (
mm/month)
Plant Water Require- -ment PWR (
mm/year)
1 5 0.59 2.95 1.016 30.48 27.53 2 7 0.59 4.13 1.016 30.48 26.35 3 12 0.59 7.08 1.016 30.48 23.4 4 23 0.59 13.57 1.016 30.48 16.91
164.78
CELA 2019 | UC Davis 467

5 38 0.59 22.42 1.016 30.48 8.06 6 55 0.59 32.45 1.016 30.48 -1.97 7 136 0.59 80.24 1.016 30.48 -49.76 8 148 0.59 87.32 1.016 30.48 -56.84 9 54 0.59 31.86 1.016 30.48 -1.38 10 29 0.59 17.11 1.016 30.48 13.37 11 15 0.59 8.85 1.016 30.48 21.63 12 5 0.59 2.95 1.016 30.48 27.53
According to the water requirement of vegetations per unit area, the area of irrigated vegetations is 2311920.1m2.
4 Result
4.1.1 Planning of Pool System The current water pool potential water storage areas form different waterscape types based on
different low-impact development facilities transformation strategies. The current lowland gathers and enlarges the runoff to create a point like waterscape through a small adjustment pond facility. The existing deep pool creates seasonal dynamic landscape through wet pond facility. The existing shallow water surface creates a wetland band through the stormwater wetland facility.
Based on the current terrain condition and technology of low-impact development, the study combines and reconstructs the existing and potential water system. A “Xishan Blue Necklace” overall waterscape system (Figure 1) is formed by seasonal gully strips and scattered water pools.
Figure 2. “Xishan Blue Necklace” overall waterscape system (by Author)
4.1.2 Planning of Vegetation Based on local native vegetation, the self-sufficient vegetation area constructs most of the
vegetation area as the landscape background. With the strategy of reducing human intervention, these non-irrigation area relys on the natural reproduction of surrounding wild herbs to form the natural ground cover, so that the succession of pioneer community can be accomplished naturally without disturbing.
As for the irrigation vegetation area, through the calculation of the irrigation amount of plants in each district divided by the catchment area, the amount of vegetation type and planting area in each catchment is 231.193 hectares. Combined with the planning structure, the limited irrigation vegetations focus on the significant landscape nodes and corridors in the planning to form a rich and colorful plant landscape system (Figure 3).
CELA 2019 | UC Davis 468

Figure 3. Distribution of different kind of vegetation (by Author)
5 REFERENCES 1. Last edited on 3 October 2018 from:
https://en.wikipedia.org/wiki/Lowimpact_development_(U.S._and_Canada) 2. University of Arkansas Community Design Center. (2010). LID Low Impact Development a design
manual for urban areas. Fayetteville: Arkansas 3. The Ministry of Housing and Urban-Rural Development of China. (2014). Technical Guidelines for
Sponge City Construction-Construction of Rainwater System for Low Impact Development. Beijing 4. Wu Chen. Landform Environment and Its Formation in North China[M]. Beijing: Science Press,
2008: 116. 5. MA X B. Climate characteristics of water resources in North China [J]. Plateau Meteorology, 1999,
18(4): 520—524.
CELA 2019 | UC Davis 469

6. LIN Y M. Water resources and utilization in North China [J]. Impact of Science On Society, 1995( 1) : 36-43.
7. Yang Jinhu, Jiang Zhihong, Wang Pengxiang, et al. Temporal and spatial characteristic of extreme precipitation event in China [J]. Climatic and Environmental Research, 2008, 13(1): 75 - 83.
8. Bian Tao,Wang Lirong,Li Guocui,et al. Climatic characteristics and change rule of rain-storm in Shijiazhuang of Hebei province[J]. Arid Meteorology, 2009, 27( 1) : 18 - 22.
9. GHIMIRE S K, HIGAKI D, BHATTARAI T P. Estimation of soil erosion rates and eroded sediment in a degraded catchment of the Siwalik Hills, Nepal [J]. Land, 2013, 2( 3):370-391.
10. HAO Lin, ZHOU Hui, YANG Xiaoqing. “Three Red Lines” Deal with Water Storage Situation of Shijiazhuang City[J]. Water Science and Engineering Technology,2012,(S1):9-11.
11. CAI Wei. the Mode Research of the Plant View for the Country Park [D].Shanghai Jiaotong University,2009.
12. LI Fang, LI Yangmin. Current Situation of Water-saving Garden Greenbelt Construction in Beijing [J]. Water Saving Irrigation,2009,(02):17-19.
CELA 2019 | UC Davis 470

The authors are solely responsible for the content of this technical presentation. The technical presentation does not necessarily reflect the official position of the Council of Educators in Landscape Architecture (CELA), and its printing and distribution does not constitute an endorsement of views which may be expressed. Citation of this work should state that it is from a CELA conference paper. EXAMPLE: Author's Last Name, Initials. 2019. Title of Paper. Sacramento, CA: CELA. For information about securing permission to reprint or reproduce this paper, please contact CELA at [email protected]
BUILDING THE OUTSIDE-IN CLASSROOM McCullough, Michael ProjectSustainability,[email protected], Michael IowaStateUniversity,DepartmentofLandscapeArchitecture,[email protected] Sajady, Mollika UniversityofMinnesota,[email protected]
1 ABSTRACT This paper describes a primary school curriculum proposal that engages students in a project-based learning module. The module includes environmental education as well as design, installation and maintenance for a “green wall” system constructed within the students’ classroom, an effort that includes the active participation of the students. The proposal is grounded in pedagogical research that indicates educational benefits from learning environments that incorporate components of the outdoors; as well as research that supports active learning and project-based curricular strategies. Our premise: contemporary (and relatively inexpensive) modular green wall technologies create opportunities for the transformation of classrooms as learning environments, while affording instructors and students the opportunity to be directly and continuously involved in that transformation.
1.1 Keywords
Outside-inclassroom,Livingwallsinschools,LivingwallsandSTEAM,EnvironmentalEducationintheClassroom,Project-basedlearningusinglivingwalls
CELA 2019 | UC Davis 471

2 GREEN WALLS AND CLASSROOMS For the purposes of this paper, a green wall, or living wall, is defined as a vertical garden attached to an interior wall that includes living greenery, a growing medium substrate, some sort of armature that provides structure for the plants, and often times an integrated water delivery system. The green wall can be affixed to a pre-existing wall or be built as a free-standing structure; its advantage over typical interior plantscapes (plants in pots or planters) is that green walls do not significantly reduce floor space. Interior plantscapes of any sort provide environmental health benefits for individuals in institutional settings (Claudio, 2011). This flexibility-of-floorspace attribute of green walls is a significant advantage within multipurpose interior settings such as classrooms, where floor plans might be modified on an intermittent basis (through rearrangement of furniture) to suit the needs of different learning activities conducted for different subjects or courses (Figure 1).
Figure 1. Green walls provide individuals in institutional settings a direct connection a living interior garden without intruding into floorspace. Written permission for the publication of this figure was obtained from students’ parents. Photo by Michael McCullough.
Assuming comparable installation and maintenance costs, the environmental health benefits together with space-efficiency benefits make green wall systems the best option for classrooms. And yet there are two additional considerations that favor green walls for these environments. First, there are other effects from the mere presence of green walls. Studies in applied pedagogical design have shown
CELA 2019 | UC Davis 472
that, at all educational levels, direct exposure to the natural environment can enhance learning by improving student attention and behaviors (Kaplan, 1995; Taylor et al., 2002; Li and Sullivan, 2016; McCormick, 2017). Directed Attention Fatigue (DAF), for example, is "a neuro-psychological phenomenon that results from overuse of the brain’s inhibitory attention mechanisms, which handle incoming distractions while maintaining focus on a specific task" (Itti, Rees, et.al, 2005). DAF is a common phenomenon for primary school students, because of the constant “tasking” and need for focus throughout the school day. Exposure to outdoor “nature” is one proven strategy for ameliorating DAF; it is possible that exposure to nature brought indoors has related effects. Second, the green wall itself is potentially an experiential teaching and learning tool. The wall system—its design, construction, and maintenance—can afford an opportunity for hands-on "project-based” learning; and active-mode project-based learning is a pedagogical strategy that has proved to be effective for enhanced cognitive development across the spectrum of educational levels and subject areas (Lieberman and Hoody, 1998; Chawla et al., 2014). Design and construction of a simple modular green wall system has the potential to inspire critical thinking through a combination of project-based learning strategies and environmental education. The authors have outlined a curriculum involving the implementation of an indoor living wall system within a classroom-learning environment, incorporating project-based learning modules that interact with the wall. This sort of project-based curriculum model can connect students interactively with indoor nature and has the potential to inspire real-world thinking related to science, technology, engineering, art, and mathematics fields within the indoor learning environment. Through a combination of these passive and interactive experiential learning modes, students are connected through the green wall to nature in the indoor environment, regardless of weather conditions outdoors.
3 THE GREEN WALL CURRICULUM: OUTDOOR-IN NATURE AND PROJECT-BASED
LEARNING The model curriculum has been designed to incorporate a simple and inexpensive modular green-
wall prototype as a means to create an enhancement of passive “indoor nature” within the classroom. This model simultaneously creates an interactive learning workshop, which engages students in the conceptual basis, design, and construction of a green wall. The workshop touches on aspects of “STEAM” (Science, Technology, Engineering, Art, and Math) disciplines. This workshop has been “road tested” by running it as a prototype program in two schools.
The curriculum begins with lessons on the efficacy of green walls and their recent appearance as components of interior architecture. They are presented as a healthy interior enhancement and as useful passive infrastructure for any human-occupied buildings, but particularly for institutional settings such as their own school building atrium or library, places intermittently occupied during the course of the day. Students learn that green walls can conceivably be placed anywhere within the learning spaces inside a school. However, green walls are presented as especially valuable within intensive-use environments such as classrooms, because of more continuous passive exposure, as well as enhanced opportunities for interactions with the plantings.
4 GREEN WALL WORKSHOP The green wall workshop is the hands-on, intensively interactive approach that engages students directly in a design-build experience, all the way through installation of the green wall. Since the workshop incorporates aspects of art and science, it could be positioned as a learning module within almost any single course or even within a suite of courses that one set of students share. This workshop is intended to work as a form of “project-based learning,” a pedagogical strategy in the “active learning” mode that has its roots in the work of psychologist and educational reformer John Dewey (McDermott, 1981). "Active learning”, is learning by doing or learning while doing. It contrasts with passive learning modes such as participation in lectures or completing reading assignments. Students receive information in the passive mode; students must seek out and synthesize information in an active mode. Project-based learning is a type of active learning that encourages the student to apply new ideas and research information in purposeful fashion in order to complete a directed project. For project-based learning within a science course, for example, students might “investigate questions, propose hypotheses and
CELA 2019 | UC Davis 473

explanations, discuss their ideas, challenge the ideas of others, and try out new ideas” (Krajcik and Blumenfeld, 2006). However, this strategy can be utilized by educators in any discipline as a pedagogical device. Design educators have relied on project-based learning as long as there have been design schools (Erdman et al., 2002). In a successful project-based learning experience, the student constructs meaning and knowledge based on direct experience with some aspect of their environment. 4.1 Workshop part 1: living walls, human connection to nature, and plants Part one of the workshop provides an overview of both traditional and contemporary methods for utilizing plants as components of interior design, along with information about the recent discoveries of the physiological, psychological, and education tonal benefits provided by indoor nature. Students also learn that the green wall component is not necessarily generic, and in fact can be “customized” for individual users and for particular settings. This introductory presentation leads to hands-on learning through experimentation and one-on-one conversations with the consulting "green wall specialist” (if present) or with a school staff member who understands the process that constitutes the workshop. The objective of the specialist or staff leader is to introduce and promote the green wall concept, but also to inspire the students’ interest in future education tracks or even career possibilities within the STEAM disciplines that underlie the concept and design of green walls. Students then learn about some of the physical attributes of interior plants, including characteristics such as appropriate plant varieties, overall form, growth habit, foliage color and texture, and scale (Figure 2).
Figure 2. Students study texture, color, form, and structure of individual plants to learn how the unique characteristics can inspire a planting plan. Written permission for the publication of this figure was obtained from students’ parents. Photo by the Delta School.
CELA 2019 | UC Davis 474

Students work with some of these variations in characteristics by designing individual small-scale multimedia collages utilizing construction paper as design media (in colors similar to the plants), drawing utensils (added in order to simulate foliage textures), and adhesive. The objective is for students to understand that individual plants feature unique characteristics, and that those variations allow students to create larger patterns and contrasts within the vertical garden “parterre” of their green wall preliminary design. During this design process, students also are engaged in continuing discussions that link the concept of the green wall back to STEAM-related issues: what are the benefits of green walls? How is interior nature alike/different from outdoor nature, and how can outdoor nature experiences and qualities influence green wall design? What sort of natural and mechanical systems are at work within green walls and their environments? By integrating concepts with designing in this manner, students better understand the essential relationship between their project and the STEAM disciplines that in some way connect with or support it. 4.2 Workshop part II: designing of a planting plan Students then break into groups to develop alternative planting plans. In cases where more than a single green wall will be built, groups may be constituted or orchestrated based on the number of installations. In cases with just one green wall, the students participate in a consensus-based design competition. In developing planting plans, team members are encouraged to consider the characteristics of plants, to consider and employ a range of possible mathematical and geometrical concepts for pattern-making, and to collaborate in the creative process throughout all stages of the project. The initial planning stage is still conceptual, and not yet orthographic. What overall formal concepts might be employed, and for what reasons? Teams must generate a unique design concept or theme that they can abstract in the pattern of the planting plan (themes might include, for example, a natural process such as the movement of water, or a static form of an object such as the shape of a leaf). After achieving a team consensus on the concept, the next step is to reconcile that theme within the limitations of the modular grid pattern that the green wall incorporates, utilizing colored paper sheets on a wall-mounted grid that is a reduced-scale version of the entire green wall (figure 3). This scale-model “mock-up” of the wall is meant to be adjustable and manipulable, allowing team members to rearrange the paper as needed to achieve a consensus scheme that most successfully abstracts the team’s original concept theme. This stage of the exercise employs three essential aspects of the collaborative design process that is intrinsic to work in STEAM disciplines: the translation of abstract concept to physical pattern, collaborative decision-making at the team or whole-class level, and engagement in “iterative" design, a cyclical process during which the students consider a series of alternative solutions. The take-away for students is to understand that this same general design process can be employed to accomplish projects in other STEAM-based scenarios.
CELA 2019 | UC Davis 475

Figure 3. Students collaborate through a design-thinking exercise to develop their own planting plan. For this exercise, two plants were chosen and abstracted using colored paper respective to the plant’s color. Written permission for the publication of this figure was obtained from students’ parents. Photo by Michael McCullough. 4.3 Workshop part III: fabrication of green walls Fabrication includes construction and installation phases of the green wall, including the armature or modular structure as well as the substrate/soil medium and the plants themselves. Typically the wall is constructed on a backing board that lies flat; the finished wall is relocated to its final position after most of the construction is complete. It should be noted that student manual-skill level (including wielding of basic hand tools) will vary with the age and experiences of students. While some student groups will be fully capable of accomplishing fabrication with appropriate supervision, younger groups or students without tool experience may require a greater degree of involvement by adults (consultants, school staff members, older students, or even adult volunteers). The adults could even pre-fabricate the student-designed system, leaving only plant installation to the students. When students are capable, they may be engaged with any or all construction stages, from fastening the frame to the backing board to installing the planters as per the design pattern determined during Part II. Also, depending on the number of students, it may be desirable to organize teams who accomplish particular construction stages. The construction work is a further stage of collaborative problem-solving (figure 4)
CELA 2019 | UC Davis 476

Figure 4. Students install the planters onto the prefabricated frame. Written permission for the publication of this figure was obtained from students’ parents . Photo by The Delta School. The design template from Part II serves as the basis for the construction of the planter modules. Once the frames and planters are in place, students begin the installation of plants (figure 5). This phase requires attention to construction “detailing” that ensures the viability of the living system, including proper substrate depth and proper plant stabilization within planter modules. During this construction process, students are encouraged to routinely monitor the design as it “comes to life” at actual scale and in three dimensions, and to consider whether any adjustments to the pattern might be in order so that the constructed assemblage reflects the design intent as originally conceived. This step is crucial as a further-along component of iterative design; it is also an excellent lesson in the shortcomings of visualization and representation of imagined three-dimensional constructions initially in only two dimensions. Once the plant installation is complete, students assist with the clean up and preparation for the green wall (or walls) to be installed in their respective permanent location(s).
CELA 2019 | UC Davis 477
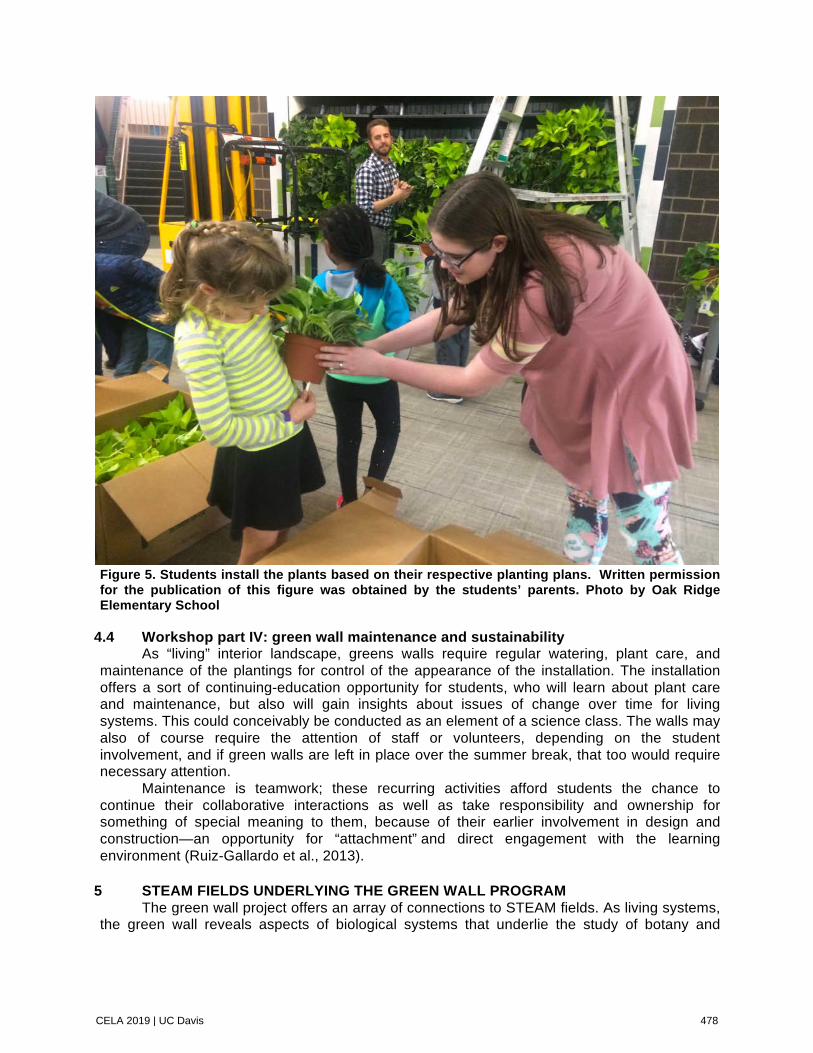
Figure 5. Students install the plants based on their respective planting plans. Written permission for the publication of this figure was obtained by the students’ parents. Photo by Oak Ridge Elementary School 4.4 Workshop part IV: green wall maintenance and sustainability As “living” interior landscape, greens walls require regular watering, plant care, and maintenance of the plantings for control of the appearance of the installation. The installation offers a sort of continuing-education opportunity for students, who will learn about plant care and maintenance, but also will gain insights about issues of change over time for living systems. This could conceivably be conducted as an element of a science class. The walls may also of course require the attention of staff or volunteers, depending on the student involvement, and if green walls are left in place over the summer break, that too would require necessary attention. Maintenance is teamwork; these recurring activities afford students the chance to continue their collaborative interactions as well as take responsibility and ownership for something of special meaning to them, because of their earlier involvement in design and construction—an opportunity for “attachment” and direct engagement with the learning environment (Ruiz-Gallardo et al., 2013).
5 STEAM FIELDS UNDERLYING THE GREEN WALL PROGRAM The green wall project offers an array of connections to STEAM fields. As living systems, the green wall reveals aspects of biological systems that underlie the study of botany and
CELA 2019 | UC Davis 478

horticulture. The green wall as interior design and architecture represents an aspect of environmental design, even to the point of connecting with architectural concepts concerning the relationship of indoor and outdoor environments. The environmental psychological benefits of green walls also connects to social science issues that concern disciplines such as sociology, psychology, and behavioral sciences. The modular system that the green wall employs derives from processes that involve digital technologies such as computer-aided drafting and 3-D printing, technologies that are fundamental to contemporary environmental design and engineering professions. Even mathematical and geometrical concepts are essential for green wall pattern design and for estimation of the quantities of plants, the dimensional capacity of each panel, and the number of planters required for the panels. Green walls even offer a connection with agriculture; typically the level of available light in classrooms inhibits growing edible plants, but classrooms with good solar access or the utilization of artificial lighting can overcome this limitation. Finally, beyond technical considerations, creative/artistic process itself is an essential aspect. Students begin with abstract concepts that ultimately become real-world, living, functioning artifacts.
6 ENSURING A SUSTAINABLE INSTALLATION As noted, the green wall will require ongoing maintenance throughout the year, so there must be some sort of routine maintenance regimen established for their support. If the green walls are considered part of the school infrastructure, this can fall under the supervision of staff just as outdoor landscape maintenance does. Most green walls that are built within commercial or institutional settings are maintained by outsourced companies that specialize in interior landscape maintenance. Considering limits on school budgets, it make sense for schools to either engage volunteer community members for this purpose (such as a volunteer or service organization “adopting” a green wall or school), or even fundraising and grant-seeking to attract outside financial support. Strategies such as those were employed by the three schools that participated in the pilot projects conducted by the authors.
7 CONCLUSION AND FUTURE DIRECTIONS Utilizing STEAM-related concepts to effectuate project-based learning, this curriculum provides students with interactive and passive exposure to indoor nature. This classroom-based green wall affords students the opportunity to gain awareness of environmental technologies, build upon their cooperative social skills, and develop design-process abilities when they translate abstract concepts into built form. As a pedagogical strategy, the project is accomplished through directed, active-mode, project-based-learning. This active approach to learning has been associated with improved academic achievement within STEAM fields (Freeman et al., 2014). The students’ introduction to these technologies and processes at the elementary school level could potentially lead to their subsequent involvement in more sophisticated applications of green technologies, or even inspire their interest in educational specialization within academic STEAM programs beyond the secondary education level. Economical modular green wall systems are a recent innovation. Ongoing research and development of these systems will provide additional opportunities for incorporation of these technologies within classrooms, as both environmental enhancement and as educational opportunity for other project-based learning models. Further experimentation with pilot or prototype programs, along with further innovations in the green wall systems themselves, will lead to greater understanding of the potential for building sustainable and dynamic “outdoor-in” classroom environments. Also, future research is needed to better understand and measure the effectiveness of project-based green wall programs on student learning and environmental well-being, with projects conducted at various educational levels.
CELA 2019 | UC Davis 479

8 REFERENCES
1 Chawla, L., Keena, K., Pevec, I., and Stanley, E. (2014). Green schoolyards as havens from stress and resources for resilience in childhood and adolescence. Health Place 28, 1–13.
2 Claudio, Luz. (2011) Planting Healthier Indoor Air. Environmental Health Perspectives, 119(10): a426–a427
3 Erdman, Jori, Robert Weddle, Thomas Mical, Jeffery S. Poss, Kevin Hinders, Ken McCown and Chris Taylor. 2002. “Designing/Building/Learning”. Journal of Architectural Education, vol. 55, issue 3.
4 Itti, Laurent; Rees, Geraint; Tsotsos, John K., eds. (2005). Neurobiology of Attention. Boston: Elsevier Academic Press.
5 Kaplan, S. (1995). The restorative benefits of nature: toward an integrative framework. Journal of Environmental Psychology. 15, 169–182.
6 Krajcik, Joseph S. and Phyllis C. Blumenfeld. “Project-based Learning”, in The Cambridge Handbook of the Learning Sciences, 2006. R. Keith Sawyer (ed). Cambridge University Press.
7 Li, D., and Sullivan, W. C. (2016). Impact of views to school landscapes on recovery from stress and mental fatigue. Landscape Urban Planning 148, 149–158.
8 Lieberman, G. A., and Hoody, L. L. (1998). Closing the Achievement Gap. Using the Environment as an Integrating Context for Learning. State Education and Environment Roundtable Report. San Diego, CA: Science Wizards.
9 McCormick, R. (2017). Does access to green space impact the mental well-being of children: a systematic review. Journal of Pediatric Nursing 37, 3–7.
10 McDermott, John J. (ed.), 1981. The Philosophy of John Dewey. University of Chicago Press.
11 Ruiz-Gallardo, José-Reyes, Alonso Verde, and Arturo Valdés. 2013. “Garden-Based Learning: An Experience With ‘At Risk’ Secondary Education Students.” The Journal of Environmental Education 44 (4): 252–70. doi:10.1080/00958964.2013.786669.
12 Taylor, A. F., Kuo, F. E., and Sullivan, W. C. (2002). Views of nature and self-discipline: evidence from inner city children. Journal of Environmental Psychology 22, 49–63.
CELA 2019 | UC Davis 480

The authors are solely responsible for the content of this technical presentation. The technical presentation does not necessarily reflect the official position of the Council of Educators in Landscape Architecture (CELA), and its printing and distribution does not constitute an endorsement of views which may be expressed. Citation of this work should state that it is from a CELA conference paper. EXAMPLE: Author's Last Name, Initials. 2019. Title of Paper. Sacramento, CA: CELA. For information about securing permission to reprint or reproduce this paper, please contact CELA at [email protected]
LANDSCAPE AND EQUAL PLAY IN NATURE:
EQUITABLE CONNECTIONS TO CHILDREN’S PLAY SPACES IN SYRACUSE, NEW YORK
KHAYAT, FARZANEH State University of New York, College of Environmental Science and Forestry (ESF), Syracuse, NY. [email protected] BRYANT, M. MARGARET State University of New York, College of Environmental Science and Forestry (ESF), Syracuse, NY. [email protected]
1. ABSTRACT: Opportunities for children and youth to connect directly with nature in outdoor environments has declined in recent decades. Disconnection from nature causes different physical and mental health issues for children (Mustapa et al., 2015). Playing outdoors is an essential component of a child’s life. Outdoor play spaces are a main source of physical activity, which is associated with decreased obesity and improved temperament in children (Herrington & Brussoni, 2015). Early childhood is an important developmental period involving cognitive learning, intellectual growth, and establishment of social connections and learned behaviors. Design of high quality play spaces based on children’s needs and integration of natural elements is critically important for children’s health and wellbeing. This study addresses environmental justice in vulnerable neighborhoods in the city of Syracuse, New York by focusing on equitable access to high quality, nature-integrated play spaces. Syracuse is a medium-sized city with a high rate of concentrated poverty, especially among Blacks and Hispanics. More than 50% of children under 18 live in poverty, and the average rate of economically disadvantaged students in Syracuse elementary schools is 79%. More than half of the households with a child aged 0-5 were below the poverty level based on American Community Survey 5-Year estimates, 2009 to 2013. A collaboration between a local nonprofit, Atlantic States Legal Foundation, a national play nonprofit, KaBoom!, and students and faculty in the Department of Landscape Architecture at SUNY ESF led to this research study. Using geospatial analysis, a detailed assessment of equitable access to play areas was conducted for three neighborhoods in Syracuse and compared to Syracuse as a whole. Options for decentralized play environments were explored, and approaches for integration of green elements (e.g., urban forest and green stormwater management) were developed. The study results identify best practices for integration of decentralized play spaces with access to nature in the context of neighborhoods with high levels of concentrated poverty.
1.1 Key words: Children, Outdoor play spaces, Environmental justice
CELA 2019 | UC Davis 481

2. INTRODUCTION:
Opportunities for children and youth to connect directly with nature in outdoor environments havedeclined in recent decades. Disconnection from nature causes different physical and mental healthissues for children (Mustapa et al., 2015). A thorough anthropological study of the decrease inchildren’s chances for free play over the past half century in the USA unequivocally connected thisdecline to a parallel growth inmental health issues (Gray, P., 2011). In this period of time: anxiety,depression, feelings of helplessness and suicide, has risen greatly in children, adolescents, and youngadults.Changesintechnologyhaveplayedacriticalroleinthereductionofkids'outsideplayespeciallybecauseoftheincreasedusageofvideogamesandtelevision.
Clements’sstudyin2004arguedthedegreetowhichchildrenintheUSAtodaytakeaninterestinactive,outsideplay,contrastedtothepastgenerations.Thesamplesizewaseighthundredandthirtymothers andperformednationwide. Mothers referred to TV viewing and computer play as reasonswhytheirchildrenplayedoutsidesorarelyaccountingfor85percentand81percentoftheresponsesrespectively. 82 percent stated that they confined their youngster’s outdoor play due to safety andcrimeconcerns.
It can be reasoned that not finding safe, equipped and attractive play spaces aswell as, nothavingothergroupsofchildrentoplaywithareamongthereasonsofspendingsomuchtimeplayingwiththemselvesindoors(Gray,P.,2011).
However,playwithotherchildrenandreconnectingwithnatureinchildren’sdailylifeservesarange of developmental functions, all of which improve children’s mental health. In one currentinternational survey, 54 percentage ofmothers said that, “Playing outside at a playground or park,”rankedamongtheactivitiesthatmadetheirchildrenhappiest(DorothyG.,etal2009).
Furthermore, play promotesmental health by which children, “(1) develop intrinsic interestsandcompetencies,(2)learnhowtomakedecisions,solveproblems,exertself-control,andfollowrules,(3)learntoregulatetheiremotions,(4)makefriendsandlearntogetalongwithothersasequals;and,(5) experience joy.” (Gray, P. 2011, p. 443). Early childhood is an important developmental periodinvolving cognitive learning, intellectual growth, and establishment of social connections and learnedbehaviors. Thevalueofplay for children is sometimes considered trivial. It isof vital importance thatthereisalinkageamongdeclineofplayandtheincreaseofpsychopathologyinyoungpeople.
A study performed on Norwegian preschoolers tested their long-term relations with thetimechildrenattending daycare spendoutdoorsand their cognitive and behavioralimprovementallthroughoutpreschool and first grade. Itindicatesthatoutdoortime in preschoolmight also helpchildren’s developmentofattentionskills andprotectionin opposition toinattention hyperactivitysymptoms. Highpublicitytooutdoorenvironmentswould possiblybe a cheap,reachable andenvironmentally pleasant way of supporting and improving children's self-regulatory capacities andcognitivedevelopment(Ulset,V.,etal,2017).Needless to say, playing outdoors is an essential component of a child’s life. Although reduction ofchildren’s obesity remains to be an issue globally, outdoor play spaces are amain source of physicalactivityandareassociatedwithdecreasedobesityandimprovedtemperamentinchildren(Herrington,S.&Brussoni,M,2015).
Outdoorplaynotonlyimprovesphysicalactivitybutalso,avoidsriskfactorslikehypertension,anddyslipidemia.Forinstance,theDirectoroftheObesityCenterattheU.S.CentersforDiseaseControlmentioned play as the only requisite for encouraging physical activity (Herrington, S. & Brussoni,M,2015).
CELA 2019 | UC Davis 482

Designing quality natural play spaces for children and equal distribution of them among allneighborhoods in the cities are essential for the future of urban planning as well. It is proven thatnaturalplayspacescanprovidemorevariousformsofplayforchildrenwithdifferentagesandabilities.This is vital since sedentary children may not be as active as other children in play spaces which isdesignedspecificallyforphysicalactivity.
Whilefreetimeusehasincrediblychangedamongthepastfewgenerations(RodwayC.,2016),today’s younger generations are spending less time playing outdoors compare to past ones. Thisreductionischallengingsinceplaying inoutdoorspaces iscriticallyimportantforchildren’shealthandwellbeing.Lackofplayfulchildrentoobtainthesocial,emotionalskillsandchildren’snaturalplayfulnessiscrucialforhealthyphysicalandmentalgrowth(Gray,P.,2011).
Inurbanenvironments,localparksandplaygroundsarethemeansofchildrenandteenagerstoaccessnatureandplayoutdoor.DisparitiesinprovisionofgreenspacesandparkshavebeenpartofawiderinequalityamongpeopleofcolorandvulnerablecommunitiesintheUnitedStatesand“proximityto environmental hazards and access to housing, employment, and education “(Boone et al., 2009;Wolch,Wilson,&Fehrenbach,2005).
Inequalitiesinhealthproblemsamongwhite,racialandethnicalminoritypopulationintheU.S.demonstratesthat low-incomecommunitiesofcoloroften livedclosertoSuperfundsitessuchaspower plants and landfills compared to whites. This was the start of the environmental justicemovementintheU.S.duringthe1980’swhiletodayunequalgeographicdistributionofpublicservicesandequalaccesstogreenspacesamongminoritiesisthematterofEJtoo.
Vulnerableneighborhoods in thecityofSyracuse,NewYorkaresuffering fromenvironmentalinjustice because of inequitable access to high quality, nature-integrated play spaces. Syracuse is amedium-sized city with a high rate of concentrated poverty, especially among Blacks and Hispanics.Morethan50%ofchildrenunder18liveinpoverty,andtheaveragerateofeconomicallydisadvantagedstudentsinSyracuseelementaryschoolsis79%.Morethanhalfofthehouseholdswithachildaged0-5werebelowthepovertylevelbasedontheAmericanCommunitySurvey5-Yearestimatesfrom2009to2013.(AlperinS.,etal,.2015).
ConcentratedpovertyamongthosedisadvantagedurbanenvironmentsinSyracusecityimposesmanyproblemstotheseresidents.Generally,disadvantagedneighborhoodshavelesslevelsofphysicalactivityandhigherratesofobesity.Thereasonscanbesafetyissueslikehighlevelofcrimebecauseofpoorly lighted streets, improper built environment and green infrastructure such as parks andplaygrounds,lackofwalkablepathwaysinthecommunitiesandaccesstohealthyfood(Kimbro,R.T,etal,2011).
The rich families are leaving the cities to dwell in suburbs for the sake of safety and privacy.They live in houseswith two car garageswhich are often larger and better than ruined shelters of afamily house in theWestside or Southside of a city like Syracuse or in a slum in amega city.Whileaffluent families can provide their children private playgrounds in their huge backyards, children ofdisadvantagecommunitiesmaynothaveaccesstopreschoolprogramsortohousingwithitsownplayfacilities.Ontheotherhand,thesechildrenhavemoreunstructuredtimetospendandfewerfacilitiestouse.Forexample,34%ofWestsidehousinghavenocarsavailablewhichmayincreasetheirdemandtospendmoretimeinlocalparksandfacilities.
These are all indicators of necessitation of quality green spaces and playground for thesesocioeconomicandethniccommunitiesespeciallyinacitylikeSyracusewithhighratesofconcentratedpoverty among minorities. There are a high percentage of vacant lots in Syracuse especially invulnerablecommunitiesliketheWestsideandSouthside(6%and7%)(AlperinS.,etal,.2015).Itcanbea good opportunity for building playgrounds in combination with green infrastructure projects.Furthermore,itcanincreasepropertyvaluesandinvestmentintheirhousinginfrastructure.Thereisno
CELA 2019 | UC Davis 483

doubtthatreconnectionofchildrenandyouthwithnatureintheirdailyenvironmentisthekeyindicatoroftheirphysicalandmentalhealth.
3. METHODS:
Urbanplannersanddesignersshouldidentifythegapsinparkprovisionsandplaygroundsforyouthandchildren.Developmentofstrategiestoaddressequalaccesstoqualitygreenspaceandwalkablecommunitiesisneeded.Itisthematterofenvironmentalandsocialjusticetoletchildrenandyouthenjoyplayingatplaygroundsandparksandhaveapositiveexperienceofenteringpubliclifeinacity.
Indoingso,usinggeospatialanalysis,adetailedassessmentofequitableaccesstoplayareascanbeconductedfordisadvantagedneighborhoodsinSyracuseandcomparedtoothercitiesasawhole.Optionsfordecentralizedplayenvironmentscanbeexplored,andapproachesforintegrationofgreenelements(e.g.,urbanforestandgreenstormwatermanagement)shouldbedeveloped.Weneedtoidentifybestpracticesforintegrationofdecentralizedplayspaceswithaccesstonatureinthecontextofneighborhoodswithhighlevelsofconcentratedpoverty.
4. REFERENCES:
Alperin,Scott,etal.BelowtheLine:AnAnalysisofConcentratedPovertyinSyracuse.MaxwellCommunityBenchmarksProgram(2015).Boone,C.G.,Buckley,G.L.,Grove,J.M.,&Sister,C.(2009).Parksandpeople:AnenvironmentaljusticeinquiryinBaltimore,Maryland.AnnalsoftheAssociationofAmericanGeographers,99(4),767–787.http://dx.doi.org/10.1080/00045600903102949.Clemens,R.(2004).Aninvestigationofthestatusofoutdoorplay.ContemporaryIssuesinEarlyChildhood,5(1),68–80.http://dx.doi.org/10.2304/ciec.2004.5.1.10.DorothyG.Singer,JeromeL.Singer,HeidiD’Agostino,andRaekaDeLong,“Children’sPastimesandPlayinSixteenNations:IsFree-PlayDeclining?”AmericanJournalofPlay1(2009):283–312.GrayP.Thedeclineofplayandtheriseofpsychopathology.AmJPlay2011;3:443–63.Herrington,S.,&Brussoni,M.(2015).BeyondPhysicalActivity:TheImportanceofPlayandNature-BasedPlaySpacesforChildren’sHealthandDevelopment.CurrentObesityReports,4(4),477–483.https://doi.org/10.1007/s13679-015-0179-2Kimbro,R.T.,Brooks-Gunn,J.,&McLanahan,S.(2011).Youngchildreninurbanareas:Linksamongneighborhoodcharacteristics,weightstatus,outdoorplay,andtelevisionwatching.SocialScience&Medicine,72(5),668–676.https://doi.org/10.1016/j.socscimed.2010.12.015NorDiyanaMustapa,NorZarifahMaliki,AswatiHamzah,2015.RepositioningChildren’sDevelopmentalNeedsinSpacePlanning:Areviewofconnectiontonature.SocialandBehavioralSciences,p.330–339.RhondaClements,“AnInvestigationoftheStatusofOutdoorPlay,”ContemporaryIssuesinEarlyChildhood5(2004):68–80.
CELA 2019 | UC Davis 484

Rodway,C.,ThamSG,IbrahimS,.SuicideinchildrenandyoungpeopleinEngland:aconsecutivecaseseries.LancetPsychiatry,2016;3:751–59.Ulset,V.,Vitaro,F.,Brendgen,M.,Bekkhus,M.,&Borge,A.I.H.(2017).Timespentoutdoorsduringpreschool:Linkswithchildren’scognitiveandbehavioraldevelopment.JournalofEnvironmentalPsychology,52,69–80.https://doi.org/10.1016/j.jenvp.2017.05.007Wolch,J.R.,Wilson,J.P.,&Fehrenbach,J.(2005).ParksandparkfundinginLosAngeles:Anequity-mappinganalysis.UrbanGeography,26(1),4–35.http://dx.doi.org/10.2747/0272-3638.26.1.4
CELA 2019 | UC Davis 485
The authors are solely responsible for the content of this technical presentation. The technical presentation does not necessarily reflect the official position of the Council of Educators in Landscape Architecture (CELA), and its printing and distribution does not constitute an endorsement of views which may be expressed. Citation of this work should state that it is from a CELA conference paper. EXAMPLE: Author's Last Name, Initials. 2019. Title of Paper. Sacramento, CA: CELA. For information about securing permission to reprint or reproduce this paper, please contact CELA at [email protected]
Predicting the Geography of Behavior
Smilovsky, Nikolas Arizona State University, [email protected] 1 ABSTRACT
Defining the geography of people’s behavior has been of great interest for many decades. With the proliferation of Geographic Information Systems (GIS), researchers from varying disciplines have begun to study the human spatial-behavioral phenomena with new innovative tools and modern methodologies. Researchers have been particularly interested in understanding why people behave the way they do and where they go in urban environments, in relation to other influencing factors such as socioeconomic status, culture, and the environment. This study focused on determining the extent to which variables associated with social capital building and civic engagement could predict people’s personal activity spaces. By understanding people’s behavior, future stakeholders have a greater ability to make informative decisions that will positively influece these individuals. The specific variables gender, ethnicity, educational achievement, income level, voter registration status, and neighborhood perceptions of safety/trust were leveraged to forecast activity space. The study used an archival data set, focusing on a sample of adults living in communities in Chicago, Miami, and Phoenix for analysis. The results from the study are threefold: 1) the variables of ethnicity and environmental perception of safety/trust (quantified spatially) can significantly predict an individual’s activity space, 2) on average non-Hispanics have larger activity spaces than Hispanics, and 3) people that perceive their neighborhoods as safe and trustworthy have larger associated activity spaces than people who poorly perceive their neighborhood’s safety and trustworthiness. This research was conducted as part of a Doctoral dissertation.
1.1 Keywords
Behavioral Geography, Activity Space, Environmental Perception, Mind Mapping, Geographic Information Systems.
CELA 2019 | UC Davis 486

2 INTRODUCTION Understanding people’s behavior is a critical component all designers, architects, urban planners, and engineers must consider to comprehensively meet the needs of their individual stakeholders. Throughout history, understanding and studying people’s behaviors has been the focus of many scholars and a point of much debate and contention (Simon, 1992). This study helped shed light on the subject by specifically analyzing how certain variables associated with social capital building (Putnam, 2000) and civic engagement, could influence and potentially predict individual’s spatial behaviors. The variables leveraged in this study to predict these spatial behaviors were gender, ethnicity, educational achievement, income level, voter registration status, and neighborhood environmental perception (Lynch, 1960) of safety/trust. Further, spatial behavior in this study was defined as an individual’s urban activity space. Activity space (Curtis, 2016; Mennis, Mason, & Cao, 2013; Perchoux et al., 2016) is anywhere that individuals travel on a daily basis including locations that Oldenburg (1997) described as first places or areas where people live, second places or where people work, and third places or where people gather with others. Utilizing techniques including mind mapping / cognitive mapping (Downs & Stea, 1973; Kitchin & Freundschuh, 2000; Tolman, 1948) and geographic information systems, this study took a unique approach at attempting to help define why and how people spatially behave in the way that they do.
Please note that the following text pertains to research conducted for a doctoral dissertation project. The doctoral study presented in this text was originally researched and its results published under the title Predicting Human Spatial Behavior Based on Social Capital Building and Civic Engagement Variables (Smilovsky, 2019). Additionally this research utilized archival data from a previous research study conducted by Price, P. L., Lukinbeal, C., Gioioso, R. N., Arreola, D. D., Fernández, D. J., Ready, T., & de los, A. T. (2011) with funding from National Science Foundation, Grant Award No. SES-0433947. 2.1 Research Statement and Questions
The following research was conducted based on the subsequent research statement: It is not known if or to what degree an individual’s gender, ethnicity, educational achievement, income level, voter registration status, and neighborhood perception of safety/trust can predict their personal urban activity space. To attempt to answer this statement, two specific research questions were postulated. The research questions were:
RQ1: To what extent do all the research variables mentioned, in conjunction, significantly predict the geography of a person’s behavior? RQ2: To what extent do any of the research variables mentioned significantly predict the geography of a person’s behavior?
These two research questions were specifically formulated to be as inclusive and flexible as possible. The first question comprehensively included all of the variables selected to see if they influenced spatial behavior together. The second question did the opposite and looked to see if any of the individual variables specifically influenced spatial behavior. 2.2 Background of the Study and Literature Review
Many factors influence and contribute to a person’s spatial behavior (Simon, 1992). Understanding these behaviors are importance for many facets of society that designers, architects, urban planners and engineers commonly engage with. To help better understand behavior the following theories were researched and implemented in this study social capital theory (Putnam, 2000), spatial theory (Olsson & Gale, 1968; Tobler, 1970), the theory of environmental perception (Lynch, 1960), and cognitive mapping (Tolman, 1948). The following section will review each of these concepts and why they are important factors to consider when studying spatial behavior. Following a brief outline of the associated theories civic engagment, activity space, and geographic information systems are briefly discussed.
Social capital theory (Putnam, 2000) refers to the societal norms, social networks, and the trust
individuals have that empower people to act communally and have a sense of collective-efficacy within
CELA 2019 | UC Davis 487

their communities. Positive social capital building correlates with specific socio-demographic variables, civic engagement, and spatial activities (Price et al., 2011; Putnam, 2000). Spatial theory or what is commonly referred to as Tobler’s first law of geography, put special emphasis on the importance of spatial dimensions (Klippel, A., Hardisty, F., & Li, R., 2011). These measurements and dimensions are specifically related to the items they are describing. They are defining their spatial proximity. The closer an object is in space to another object, the more those objects are related (Tobler, 1970). Thus, space can play an important role in defining many things, including behavior such as activity space. Environmental Perception is the results of a process between an individual and their environment, where specific pieces of environmental information is analyzed, stored, and then leveraged for behavioral decision-making (Lynch, 1960). This study used mind mapping (Curtis, 2016) or what Tolman (1948) coined as cognitive maps to quantify people’s environmental perception. This will be explain in detail in the methodology section.
Civic engagement is the amount of civic related activity that people participate in their individual
communities. Civic activities include volunteering, voting, citizenship status, or any type of activity that intends to better the community in which the individual identifies with (Price et al., 2011; Scandahl, 2013). Activity space as described earlier is where people travel in their daily lives. In this archival study, activity space is the quantification of first, second, and third spaces (Oldenburg, 1997). These spatial quantifications were performed in the geographic information system. A geographic information system or “GIS” is a software program that collects, stores, analyzes, and displays geographic data. In this study GIS was used to geocode activity space on a custom map and to digitize the cognitive maps collected by the participants. By entering in spatial data to the GIS, the computer can quickly calculate the quantitative characteristics of the individual set of data. GIS has the ability to help researchers think in innovative ways about applying new analysis methods to traditional datasets (Boschmann & Cubbon, 2014). 3 METHODS Before reviewing the actual methodology of this research, it is important to mention that this study relied on a previously existing data set created by Price et al. (2011). Because this research utilized an archival dataset, certain limitations were present such as the survey instrument having been already defined, the location of the study sites being predetermined, and sample size being already demarcated. However, the pros of using these data outweigh any negative limitations. Because the data had already been collected, there was no time or cost to use it. Please note that approval was obtained from the original research team to utilize these data in this new research. The original team was glad that the data were being used and that a further geospatial component was being introduced to the original research. The following section will first review the population of interest, sample, and location of the original study. Next, the research instrument and specific variables used in this research are outlined. Last, the data analysis methodology is presented for review.
3.1 Population of Interest, Sample, and Location
The original study by Price et al. (2011) used a complex random sampling strategy to collect survey questionnaire and cognitive map data from individuals living in three urban cities across the United States. These locations where the community neighborhoods of Garfield (Phoenix, Arizona), Pilsen (Chicago, IL), and Little Havana (Miami, Florida). Map figures 1, 2 and 3 below give more information on the individual neighborhoods.
CELA 2019 | UC Davis 488

Figure 1. Garfield, Phoenix Neighborhood Map
Figure 2. Pilsen, Chicago Neighborhood Map
CELA 2019 | UC Davis 489

Figure 3. Little Havana, Miami Neighborhood Map
More specifically the Price et al. (2011) team leveraged a stratified area probability, multistage
cluster sampling method to collect the data. By employing a strategy like this, the original research team confidently collected a spatially authoritative, random sample of data. Using Yamane’s (1967) formula for proportions the research team calculated the needed sample sizes in each neighborhood to obtain a confidence interval of 95% for the entire population being study. Further, they compared their results to the Saguaro Seminar (2000) to determine if they were in line with national standards. Specifically the population of interest in this and the original study were the adults living in these neighborhoods. Table 1 below shows the breakdown in surveys and cognitive maps collected. Note that the original team only collected a 10% subset of cognitive maps from their participants.
Table 1. Population and Sample Size
Location Total Population 18 and Over
Confidence Interval
Surveys Completed
Survey Size with 5% Level of Precision
Mind Maps Collected
Garfield 6,219 95.087% 388 376 39 Pilsen 23,621 95.052% 402 394 41 Little Havana 42,695 95.025% 400 396 40
Note. Data from Price et al. (2011)
In this research because the cognitive maps were an essential component and had to be included, only a sub-sample of adults could be studied. This sub-sample included all participants that completed both the survey questionnaire and the mind mapping exercise. In the end, after removing entries with no cognitive maps and removing other data points that were deemed in appropriate, the final sub-sample size was
CELA 2019 | UC Davis 490

107. Luckily, the multiple linear regression used in this study only needed 98 data points to be able to confidently predict activity space. 3.2 Research Instrument and Variables
The research instrument used in this study was composed of two parts including a survey questionnaire and a cognitive map exercise. The survey had 56 hand-crafted survey questions based on better understanding social capital and civic/place engagement in urban neighborhoods. From these 56 questions, 11 questions were utilized for this study. These questions were either categorically redefined for analysis purposes or were geocoded into the GIS to calculate individual activity spaces. Following Shareck, Krestens, and Gauvin (2013) example in which they utilized convex hulls to examine the spatial congruence between spatially obtained data from questionnaires, this study similarly leveraged convex hulls to calculate people’s activity spaces. A convex hull is a mathematical envelope that circumnavigates a set of points on a Euclidean plane, which are defined as the smallest convex polygons. Convex hulls are indicators of the spatial extent and spatial dispersions of an activity (Shareck, Kestens, & Gauvin, 2013). Based on spatial theory and the importance of a participant’s spatial behavior (Klippel et al., 2011), activity space was calculated from aggregating the spatial locations from survey questions. These questions asked where participants spend recreational time, where they go to be outside, where their children go to school, where they get their hair done, where they go out to eat, and where they shop for groceries.
Next the cognitive map data were georeference into the GIS and digitzed. Pariticpants were asked to draw on a basemap of their neighborhood where they specifically lived, where they thought safe/trustworthy areas were, and finally where unsafe/untrustworthy locations were. Figure 4 below is an example of one of the basemaps used in the study with the participant’s delineated environmental perceptions. Please note that no sensitive are shown in this example, that nothing can be traced back to the actual particiapnts, and that the data being displayed were collected publically over ten years ago.
Figure 4. Garfield, Cognitive Base Map Example
Once the cognitive map data were georeferenced in the GIS, the delineated areas of environmental perception were individually digitized. Because the data were digitized or “traced” specific area measurements were calculated for each of the participants. The GIS permitted the analyzing of how much space each person perceived to be safe and trustworthy in their individual community. Once all the variables were adapted and ready, the data analysis was performed.
CELA 2019 | UC Davis 491

3.3 Data Analysis After completing the background research and literature review, this study decided on a methodological approach similar to several of the research articles reviewed. Specifically Bauwens and Defourny (2017), Campos-Matos and Kawachi (2015), and Hawthorne, Solis, Terry, Price, and Atchison’s (2015) were three such studies leveraged to help design the research procedures in this study. To answer the two developed research questions both descriptive statistics and the statistical analysis method multiple linear regression was leveraged. In terms of the descriptive findings, everything appeared to be normally distributed as predicted. Once the descriptive statistic were deemed appripriate it was time to perform the linear regression. Figure 5 below is a graphical representation of how the six individual predictor variables were used to determine whether they could confidently predict the outcome variable activity space.
Figure 5. Methodology Flow Chart
Using IBM’s SPSS software the multiple linear regression (MLR) analysis was performed on the data. Following strict statistical guidelines from Statistic Solutions (2018) and Laerd (Laerd Statistics, 2015) eight assumptions were tested to make sure the MLR was an appropriate statistical measure to predict activity space. These included:
A1: You have a continuous dependent variable (outcome variable). A2: You have two or more independent variables (predictor variables) which are either
continuous (interval or ratio) or categorical (ordinal or nominal). A3: You should have independence of observations. A4: There needs to be a linear relationship between the dependent variable and all the
independent variables. A5: The data needs to show homoscedasticity of residuals. A6: The data must not show multicollinearity of independent variables. A7: There should be no significant outliers in the data. A8: The residuals (errors) are approximately normally distributed.
After rigorously reviewing these assumptions, it was determined that the MLR was an appropriate analysis tool to see if variables associated with social capital and civic engagement could significantly predict an individual’s activity space.
CELA 2019 | UC Davis 492

4 RESULTS This section is broken into three subsections including results related to research question #1,
results related to research question #2, and a brief discussion on the findings. Each of the research questions are fully explored by applying the results of the statistical analysis. Each question is presented and its results reviewed for significance. The text concludes with a discussion acknowledging other potential limitations of the study, while making suggestions for future studies pertaining to the geography of behavior.
4.1 Research Question #1 Results
Research question #1 asked, to what extent do all the research variables mentioned in this study, in conjunction, significantly predict the geography of a person’s behavior? The results from this study support the null hypothesis for this question. The null hypothesis stated that all predictor variables in conjunction did not significantly predict activity space. After analyzing the eight assumptions needing to be met for the multiple linear regression, the final model was produced. The final model used to test this research question was ActivitySpace = β0+ β1(Ethnicity)+ β2(Gender) + β3(Education)+ β4(Voter Registration) + β5(Income)+ β6(Safety/Trust). Based on the results from the statistical testing an individual’s gender, ethnicity, educational achievement, income level, voter registration status, and neighborhood perceptions of safety/trust do not all significantly predict a person’s activity space. This was due to the predictor variables not all being significantly related to the dependent variable activity space. Only the variable environmental perception of safety/trust was significantly related.
4.2 Research Question #2 Results
Research question #2 posed, to what extent did any of the research variables included in this study significantly predict the geography of a person’s behavior? The results from this study rejected the null hypothesis for this research question. The null hypothesis stated that none of the predictor variables would significantly predict a person’s activity space. This hypothesis was incorrect because both the variables of environmental perception of safety/trust and ethnicity were found to be significant predictors for the outcome variable activity space in the final model. The final model which represented this relationship was log(ActivitySpace) = β0+ β1(Ethnicity)+ βz*log(Safety/Trust).
4.3 Discussion The final multiple linear regression model produced significantly predicted an individual’s activity space based on two of the six variables selected in this study. The final model’s mathematical equation was log(ActivitySpace) = β0+ β1(Ethnicity)+ βz*log(Safety/Trust). By plugging in different values for the ethnicity and safety/trust variables, the equation was able to predict a person’s activity space. For example, if you assume the variable of environmental perception of safety/trust equals one square mile and the variable ethnicity equals one (non-Hispanic), then:
Log10 (ActivitySpace) = 1.07+ 0.502 log10 (1) - 0.508 * (1) Log10 (ActivitySpace) = 1.07 + 0 - 0.508 = 0.57 ActivitySpace = 10^0.57 = 3.72 square miles Activity Space is 3.72 square miles
Now if we assume the variable safety equals one square mile and ethnicity equals two (Hispanic), then:
Log10 (ActivitySpace) = 1.07+ 0.502 log10 (1) + 0.508 * (2) Log10 (ActivitySpace) = 1.07 + 0 - 1 = 0.07 ActivitySpace = 10^0.07 = 1.17 square miles Activity Space is 1.17 square miles
This example from the dissertation (Smilovsky, 2019) shows that the activity spaces of non-Hispanics (1) are higher than Hispanics (2) when the environmental perception of safety variable stays constant. This interpretation was supported by analyzing the median value of activity space for ethnicity, where the median value of non-Hispanics was higher than Hispanics. Another profound result from the
CELA 2019 | UC Davis 493

final model is when you assume the variable of environmental perception of safety/trust equals two square miles and the variable ethnicity equals one (non-Hispanic), then:
Log10 (ActivitySpace) = 1.07+ 0.5(.301) - .508 = .713 ActivitySpace = 10^.713 = 5.164 square miles Activity Space is 5.164 square miles
This demonstrated that non-Hispanic’s activity space was spatially larger when they had a higher environmental perception of safety/trust in their neighborhood. This was shown when the variable of environmental perception of safety/trust was set to one square mile, compared to two square miles, and when ethnicity was set to one (non-Hispanic). In this example the calculated activity space was 3.72 square miles, which was less than the 5.164 square miles reported previously. Finally, this same trend was seen with Hispanics. When the variable environmental perception of safety was set to two square miles and ethnicity was set to two (Hispanic), then:
Log10 (ActivitySpace) = 1.07+ 0.5(.301) – 1 = 1.07 + .151 – 1 = .221 ActivitySpace = 10^.221 = 1.93 square miles Activity Space is 1.93 square miles
This depicts that Hispanics similarly have larger activity spaces when they perceive their neighborhoods to be safer and more trustworthy. The results of this study indicate that there are specific variables associated with social capital building that have significant relationships with a person’s activity space (spatial behavior). By measuring behavior spatially and by applying spatial theory (Olsson & Gale, 1968; Tobler, 1970) as the foundation of the measurement, further importance is given to people’s behaviors in the context of social capital building and civic engagement. The variables that were significantly related to activity space are ethnicity and people’s environmental perception of safety and trust. It appropriate to mention that a few other limitations were identified in this research. The first was that workplace was not one of the locations asked in the original questionnaire by Price et al. (2011). This was only determined after analyzing the data. Second, that only a small sub-sample of 107 people were used to test the relationships between specific variables and urban behavior. Having a small sample has inherent issues. Third that the study focused on highly populated, urban centers. Having only teste one type of location also potentially could limit the reliability of the results from the study.
Positive social capital building and civic engagement are important for society because they help create collective efficacy in the community (Putnam, 2000) and because they are a vehicle for positive change (Scandahl, 2013). People’s behaviors have been the focus of much study since the conception of psychology yet studying behavior in conjunction to social capital building and civic engagement is new. The impact people’s behaviors have been extremely profound. They influence both the individuals and the community surrounding the individuals. This is nothing new, yet therefore any insight on people’s behaviors are theoretically important. However, while the results show theoretical promise, more research is needed to the vet these relationships further. For future studies it is recommended that the researchers broaden the geographic layout of the study, while increasing the sample size. Also to include more locations as part of the activity space calculation. Last, while this study showed positive relationships exist between these variavles, this study does not being to explain why these relationships exist. It only shows that they do. Using this information has the potential to help future designers, architects, urban planners, and engineers make decisions about the projects they are engaging. Understanding that people’s spatial behaviors are predicated on things such as environmental perception of safety/trustworthiness may lead these stakeholders to say, make specific decisions that help promote perceptions of safety.
CELA 2019 | UC Davis 494

5 REFERENCES 1. Bauwens, T., & Defourny, J. (2017). Social capital and mutual versus public benefit: The case of
renewable energy cooperatives. Annals of Public and Cooperative Economics, 88(2), 203-232. 2. Campos-Matos, I., & Kawachi, I. (2015). Social mobility and health in european countries: Does
welfare regime type matter? Social Science & Medicine, 142, 241-248. doi:10.1016/j.socscimed.2015.08.035.
3. Curtis, J. W. (2016). Transcribing from the mind to the map: Tracing the evolution of a concept. Geographical Review, 106(3), 338-359.
4. Downs, R. M., & Stea, D. (1973). Image and environment: Cognitive mapping and spatial behavior Transaction Publishers.
5. Hawthorne, T. L., Solís, P., Terry, B., Price, M., & Atchison, C. L. (2015). Critical reflection mapping as a hybrid methodology for examining sociospatial perceptions of new research sites. Annals of the Association of American Geographers, 105(1), 22-47. doi:10.1080/00045608.2014.960041.
6. Kitchin, R., & Freundschuh, S. (2000). Cognitive mapping: Past, present, and future Psychology Press.
7. Klippel, A., Hardisty, F., & Li, R. (2011). Interpreting spatial patterns: An inquiry into formal and cognitive aspects of tobler's first law of geography. Annals of the Association of American Geographers, 101(5), 1011-1031. doi:10.1080/00045608.2011.577364.
8. Laerd Statistics (2015). Multiple regression using SPSS Statistics. Statistical tutorials and software guides. Retrieved from https://stastitics.laerd.com/.
9. Lynch, K. (1960). The image of the city MIT press. 10. Mennis, J., Mason, M. J., & Cao, Y. (2013). Qualitative GIS and the visualization of narrative activity
space data. International Journal of Geographical Information Science, 27(2), 267-291. doi:DOI: 10.1080/13658816.2012.678362.
11. Oldenburg, R. (1997). Our vanishing third places. Planning Commissioners Journal, 25(4), 6-10. 12. Olsson, G., & Gale, S. (1968). Spatial theory and human behavior. Paper presented at the Papers of
the Regional Science Association, , 21(1) 229-242. 13. Perchoux, C., Chaix, B., Brondeel, R., & Kestens, Y. (2016). Residential buffer, perceived
neighborhood, and individual activity space: New refinements in the definition of exposure areas – the RECORD cohort study. Health and Place, 40, 116-122. doi:10.1016/j.healthplace.2016.05.004.
14. Price, P. L., Lukinbeal, C., Gioioso, R. N., Arreola, D. D., Fernández, D. J., Ready, T., & de los, A. T. (2011). Placing latino civic engagement. Urban Geography, 32(2), 179-207. doi:10.2747/0272-3638.32.2.179.
15. Putnam, R. D. (2000). Bowling alone: America’s declining social capital. Culture and politics (pp. 223-234) Springer.
16. Scandahl, J. (2013). Being engaged and knowledgeable: Social science thinking concepts and students’ civic engagement in teaching on globalisation. Nordidactica, (1), 158.
17. Seminar, S. (2010). Civic engagement in america, a project of the john F. kennedy school of government at harvard university, 2000. Social Capital Community Benchmark Survey.
18. Shareck, M., Kestens, Y., & Gauvin, L. (2013). Examining the spatial congruence between data obtained with a novel activity location questionnaire, continuous GPS tracking, and prompted recall surveys. International Journal of Health Geographics, 12(1), 1-10. 10.1186/1476-072X-12-40.
19. Simon, H. A. (1992). What is an "explanation" of behavior? Psychological Science (Sage Publications Inc.),3(3), 150-161.
20. Smilovsky, N. (2019). Predicting Human Spatial Behavior Based on Social Captial Building and Civic Engagement Variables.
21. Statistic Solutions (2018). Complete Dissertation. Assumptions of Multiple Linear Regression. 22. Tolman, E. C. (1948). Cognitive maps in rats and men. Psychological Review, 55(4), 189-208.
doi:10.1037/h0061626. 23. Yamane, T. (1967). Statistics: An introductory analysis. New York: Academic Press.
CELA 2019 | UC Davis 495

CELA MEDIA STATEMENT (Optional)
Title of Paper or Research: Author: Nikolas Smilovsky Institution or Professional Affiliation: Arizona State University Authors please select one of the following: I DO__X__ DO NOT_____want to prepare a media statement for general release from the 2018 CELA Conference. (If you choose DO NOT, you do not need to prepare a media statement). Media Statement (100 words max.): The geography of behavior matters. By studying variables associated with social capital building and civic engagement this research was able to determine that specific variables can significantly predict a person’s urban activity space. Understanding the why and how behind people’s spatial behaviors is a critical compontent to include in any comprehensive design being formulated by landscape architects, structural architects, urban planners, and engineers. This paper exempliefies the importance of these types of relationships.
CELA 2019 | UC Davis 496

The authors are solely responsible for the content of this technical presentation. The technical presentation does not
necessarily reflect the official position of the Council of Educators in Landscape Architecture (CELA), and its printing and distribution does not constitute an endorsement of views which may be expressed. Citation of this work should state that it is from a CELA conference paper. EXAMPLE: Author's Last Name, Initials. 2019. Title of Paper. Sacramento, CA: CELA. For information about securing permission to reprint or reproduce this paper, please contact CELA at [email protected]
SUSTAINABLE SOLUTIONS FOR VISITOR ACCESS AT YELLOWSTONE NATIONAL PARK: EXPLORING TRANSIT AND
TRAIL OPTIONS FOR THE PARK’S MOST POPULAR DESTINATIONS
ROBERTS, MANDI MLA Candidate, University of Idaho, [email protected]
SCOTT, ELIZABETH University of Idaho, Department of Landscape Architecture, Urban Design Center,
1 ABSTRACT Yellowstone National Park is experiencing unprecedented congestion levels, particularly in the
heavily-visited Geyser Basin from West Yellowstone to Old Faithful. Congestion threatens unique geothermal features, rivers, natural vegetation, and habitat due to off-trail foot traffic and parking outside designated areas. Park visitor surveys indicate congestion levels are detrimentally effecting the quality of the visitor experience. Because vehicle volumes are frequently above the capacity of parking areas in the Geyser Basin in summer, this study investigates the potential to introduce a shuttle system to this area. Research methods include case studies of shuttle systems at other national parks, secondary analysis of visitor surveys and studies of visitor impacts in the Geyser Basin, and interviews with National Park Service (NPS) experts who plan and manage shuttle systems at other parks. The case studies examine visitation levels, system capacity, scheduling, parking, and operations. Research findings suggest that capping private vehicle use to existing parking lot capacities and delivering additional visitors via shuttle could be a more sustainable means for access to the park. Key findings include: shuttle systems should connect heavily visited areas, rather than serving the entire park; convenient, attractive park-and-rides are critical for encouraging ridership; and opportunities to promote bicycling and sight-seeing with the shuttle program can enhance visitor experience. A conceptual transit system plan proposes three services between West Yellowstone and Old Faithful (Express, Explorer, and Trekker) with synchronized timetables.This plan could remove up to approximately 45 percent of private vehicles from the congested corridor during summer peak months.
1.1 Keywords
• National parks shuttle • Parks overcrowding • Visitor use management • Carrying capacity • Sustainable visitor access
CELA 2019 | UC Davis 497

2 INTRODUCTION
2.1 Problem Statement America’s national parks continue to experience increasing levels of visitation as our nation’s
population grows, and as international tourism levels continue to spike across the western United States. Yellowstone National Park (Yellowstone NP) is one of the most visited places in the world. Increasing levels of visitation are difficult to manage given limitations on funding and staffing. Increased visitation can affect the National Park Service (NPS) mission to protect natural and cultural resources and provide a positive visitor experience.
With increasing visitation, private automobile use is also reaching levels never seen before at Yellowstone NP. Roads and parking areas are highly congested, particularly in the Geyser Basin corridor from West Yellowstone to Old Faithful. Traffic congestion and high levels of private vehicle use bring increases in greenhouse gas emissions and air pollution, as well as degradation of resources and impacts to wildlife. Potential effects on visitor experience continue to be studied, but a 2016 survey of visitors by the NPS found that: • Over half the visitors think there are too many people in the park. • Two thirds of visitors think that parking is a problem and over half think that the amount of roadway
traffic and congestion are problems. • Many visitors would like to see these challenges addressed through voluntary public transportation
and expansion of parking options. • 67 percent stated “finding a parking space” was a problem (highest ranking of all problems). • Most visitors coming through West and South gates are going to see Old Faithful. (NPS, 2017c,
2017d). Investigation of options for introducing transit to Yellowstone NP began with discussions with Park
staff who identified the need to explore the options for managing the park’s traffic and high visitation levels during peak summer months. This project grew out of these discussions, and the work presented here reflects worksessions with NPS staff and stakeholders, as well as a thorough review of NPS data, reports and other literature regarding the use of transit in National Parks and other visitor use management strategies. Integrating the results of the literature review, park-based information, interviews, meetings, and workshops, as well as the case studies have informed the development of a specific program of solutions, as well as analysis and preparation of design concepts. This paper focuses on results of the case studies, and proposed shuttle route options for Yellowstone NP. Further work exploring design options, implementation guidelines, operational frameworks, and funding and financing options is not included here.
2.2 The Use of Transit in National Parks
Interviews with NPS transportation experts stationed at the Denver Service Center, Intermountain Region, the Washington Support Office, and at various national parks provided insights into the challenges and opportunities related to transit systems in national parks, as well as best management practices. Transit systems in parks vary widely in many aspects, including the types of vehicles used, service timeframes, length of routes, operational approaches, and level of visitor facilities and improvements in place to serve the public. (E. Cole, personal communication, April 17, 2018). Transit systems in parks often are designed to have a different purpose and carrying capacity than transit systems in urban areas. For example, city transit systems are often designed to carry as many people as efficiently as possible, but in national parks, it may be necessary to design the system to deliver a specifically defined number of visitors within a certain timetable aligned with the park’s carrying capacity or the estimated people at one time that a resource area can serve. (R. Collins, personal communication, March 21, 2018). With the Zion Canyon shuttle system, the NPS found that pulsing of shuttle visitor loads led to the unintended consequences of overcrowding at bus stops and trailheads. Zion National Park (Zion NP) had to adjust the service and improve certain areas to address these concerns. (J. Burns, personal communication, April 17, 2018).
CELA 2019 | UC Davis 498

Some park shuttle systems are designed to provide access to special experiences, while others are provided for general transportation and delivery of visitors. A more remote example is the Going-to-the-Sun Road shuttle at Glacier National Park, which is a free hop on, hop off system that delivers visitors to key sight-seeing destinations and visitor centers. It offers an alternative to driving that reduces congestion in this sensitive area of the park. The shuttle vehicles are air conditioned and have large windows for sight-seeing en route. The Zion Canyon system includes an audio tour that provides interpretive information and key stewardship messages to visitors. Systems at Yosemite National Park and Rocky Mountain National Park (Rocky Mountain NP) are designed for efficient delivery of visitors to heavily used areas of the parks (E. Cole, personal communication, May 3, 2018).
Partnerships are often crucial to successful implementation of park shuttle programs. At Acadia National Park (Acadia NP), the shuttle system provides service over longer distances to and from multiple gateway communities and is supported through partnerships between the NPS, L.L. Bean, Friends of Acadia, and private donations from local supporters (R. Collins, personal communication March 21, 2018). The National Mall Circulator system was planned through a partnership between the NPS, District of Columbia, and the Washington Metropolitan Area Transit Authority. The NPS is a formal partner that provides staffing at national sites served by system, but the shuttle is operated by other agencies. The NPS also provides Segways, bikeshare stations, and special tours that are interconnected to the Circulator shuttle that serves more than five million visitors each year (E. Cole, personal communication, May 3, 2018).
Because of the high capital costs in starting a shuttle system and ongoing operations costs, the NPS carefully studies each system opportunity, generally conducting a detailed feasibility study followed by a two- to three-year pilot program. Ongoing operations can be funded through various methods such as a portion of entrance fees allocated to transportation. In some cases, the NPS owns and operates shuttles in parks, while in other locations it may manage concession or service contracts to operate the systems (Begley, 2012). Feasibility studies often involve cost/benefit analysis and examining the potential advantages a shuttle system may offer in enhancing the visitor experience, minimizing congestion and crowding, and reducing potential detrimental effects to natural and cultural resources.
“Sustainable transportation in national parks makes good, common sense” according to the authors of Sustainable Transportation in the National Parks: from Acadia to Zion (Manning, 2014). Manning and co-authors explored the history of transportation in national parks and identified best management practices in place throughout the NPS related to transportation that can help guide planning and management of sustainable transportation systems. Table 1 summarizes some of these key best practices and identifies the advantages they may offer related to park operations, visitor experience, and resource protection.
Table 1. Best Management Practices for Sustainable Transportation in National Parks. Adapted from Manning, Lawson, Newman, Hallo, and Monz, (2014).
Best Management Practices (BMPs) Advantages of BMPs Operations Visitor
Experience Resource Protection
Transportation in national parks can have important experiential implications.
X
Transportation can be an effective management tool in national parks.
X X
Transportation can be an important form of recreation. X
Transportation offers important opportunities to deliver information, education, and interpretation to park visitors.
X X X
Transportation management in the national parks should be based on partnerships with important stakeholders.
X
CELA 2019 | UC Davis 499

Transportation management in the national parks needs strong leadership.
X
There is growing use and support for alternative transportation systems in the national parks.
X X X
3 METHODS A complex descriptive strategy used for investigating the potential to introduce transit to the
Geyser Basin corridor consisted of case studies of shuttle system use at Zion, Rocky Mountain, Yosemite, and Acadia National Parks, NPS staff interviews, review of internal NPS reports, and review of visitor data collected at Yellowstone NP beginning in 2016. The case studies evaluate how other national parks have implemented transportation demand management techniques, shuttling systems, trail access, and other actions to help manage visitor congestion and improve visitor experience. These were developed as part of a larger effort to understand NPS staff ideas, concerns, and perceived challenges in implementing some form of transit at Yellowstone NP. Key concerns and other information gathered from interviews and workshops with NPS staff are discussed in Section 2.2 above. In addition, visitor demographics and visitation statistics gathered by the NPS at Yellowstone NP (NPS, 2017a, 2017c) were reviewed to better understand visitor use patterns and demand. Key ideas from this data are presented in Section 5, Geyser Basin Analysis. Case studies of shuttle systems at Zion, Rocky Mountain, Yosemite, and Acadia National Parks posed the following questions: • How have alternative transportation systems been successfully designed and implemented in other
national parks? What features contribute to their sustainability? • What components do the case study systems include? • In what ways do the case study systems enhance the visitor experience (such as by reducing traffic
congestion) and protect natural and cultural resources (such as by reducing air pollution and traffic noise)?
• Do the system design features fit well within the park context and what are the specific design features that support context sensitive design?
This paper focuses on the Zion Canyon shuttle system at Zion NP to best represent operational and visitor experience characteristics of the four shuttle systems studied as part of this work. The other case study systems are briefly summarized in Table 2, Summary of National Park Shuttle System Characteristics, and discussed in Section 4.2.
Ongoing project work includes interviews, stakeholder meetings, and design workshops to inform the project recommendations and design approaches. Park leadership and staff, as well as partners of Yellowstone NP and stakeholders in the gateway community of West Yellowstone have been fully engaged in the process.
4 National Park Shuttle System Case Studies Alternative transportation systems in national parks have different operational and user
considerations than those operating in urban environments. Primary among these is the need to protect the park’s natural and cultural resources while providing a high-quality visitor experience. Other considerations include locations for parking visitors’ vehicles, provision of visitor amenities, provision of interpretive information, and connections with trails and/or other park facilities that are common destinations for the visitors. A further consideration is the design of supporting facilities in a way that blends sensitively with the park’s setting and environment. In short, the shuttle systems must support the overall mission of the Park Service to preserve “unimpaired the natural and cultural resources and values of the national park system for the enjoyment, education, and inspiration of this and future generations” (NPS, 2016).
4.1 Zion Canyon Shuttle at Zion National Park Zion National Park, near Springdale, UT, introduced its shuttle system in 2000, after visitation
topped 2.4 million visitors in 1999. At that time, on an average day during the peak season, more than 5000 cars and tour buses were using the scenic drive with only 400 parking spots available (J. Burns,
CELA 2019 | UC Davis 500

personal communication, April 17, 2018). The congestion led to erosion and destruction of vegetation in the sensitive Virgin River Canyon, as well as frustration among park visitors. A range of alternatives to protect resources in the canyon while also continuing to provide visitor access and enhance visitor experience was explored through a public and internal review process before deciding to implement a mandatory shuttle system to Zion Canyon destinations during the peak tourist season (J. Burns, personal communication, April 17, 2018). The free shuttle system was subsequently developed. It includes two loops—the park loop, which is 6.5 miles in length and the town loop, which operates in the gateway community of Springdale. The Springdale loop stops at nine locations in town, and the Zion Canyon shuttle loop stops at nine locations in the park including the Zion Human History Museum and the Zion Lodge (Upper Lodge). A transfer point between loops occurs at the Zion Canyon Visitor Center inside the park. The shuttle provides convenient, frequent access to hiking trails, scenic points, picnicking, horseback riding, and the Upper Lodge.
The system was planned and funded through cooperative efforts between Zion NP, the Town of Springdale, the National Park Service’s Denver Service Center, the Utah Department of Transportation, the Federal Highway Administration, the Zion National History Association (ZNHA), and other organizations. The park purchased the shuttle buses and received funding for capital construction of the shuttle maintenance barn and storage area in the park. Federal transportation funding helped cover the cost of shuttle stop improvements in Springdale, supported by matching funds from the town and ZNHA. The shuttle system is operated and maintained by a private contractor through a service contract between the contractor and the National Park Service that is renewed every five to ten. Annual operating costs for the shuttle service average approximately $2.5 million per year for transit operations not including vehicle replacement and infrastructure maintenance (NPS, 2009).
To support operation costs, the park charges a transportation fee that is part of the park entrance fees. Entrance fees were formerly $10 per vehicle or group of visitors, of which the park kept 80 percent and sent 20 percent to the National Park Service in Washington, D.C. Special legislation (public law 102.03) allowed the Park to add a $10 transportation fee on top of the $10 entrance fee, and allowed the park to keep 100 percent of the transportation fee to pay for the shuttle. The park could thus keep $18 for every $20 paid by visitors. This would have been enough to cover the annual operating costs of the system. However, in the same year that Zion Canyon Shuttle service started, the National Park Foundation started offering the National Parks Pass, which allowed visitors entrance to any national park in the system for a year for a fee of $50 (currently the pass costs $85/year). Because Zion NP is close to several other parks, many visitors started appearing with the National Parks Pass, and as such, these funds were dispersed throughout the system and not directly to Zion NP. Because of this, the transportation account started to fall short by approximately $800,000 per year, and additional funding sources had to be identified to support the shuttle operations.
Pulsing patterns of visitors deboarding the shuttle at trailhead stops in the canyon was closely monitored, and while the park had carefully designed most shuttle stops and trailheads to accommodate the full capacity of the vehicles, some locations had to be improved to handle a greater number of visitors after the shuttle system was in operation. Design also integrated features such as low walls and curbs to contain visitor traffic and protect adjacent resources as visitors travel to the trails and other park destinations. The shuttle stops are constructed of natural materials including timber and quarried rock from local sources. The bus stop shelters are simple structures with timber posts and beams and peaked roofs designed in materials and colors that blend well with the park setting. The color palette includes earth tones from various red rock sandstone colors to neutral gray and dark brown colors. Shuttle buses are also designed and branded with an attractive graphic template that blends with the park scenery and enhance the visual connectivity between the shuttle system and the park experience.
The shuttle system operates from April through October or November (park loop only). During the summer months, visitors may not drive their private vehicles on the scenic drive in upper Zion Canyon unless they are guests at the Upper Lodge. Buses run at six-minute intervals during the middle of the day, so visitors do not need to worry about hurrying to catch the bus. Shuttles generally operate from 6:30 a.m. to 11:00 p.m. daily during the summer months, allowing visitors a variety of time options during the day, and a variety of visit durations.
The shuttle system includes the vehicles, shuttle stops with shelters, seating areas and other amenities (in the park and in Springdale), an in-park maintenance and storage area, and a wayfinding/signing system that helps visitors determine where to park and ride the shuttle either from
CELA 2019 | UC Davis 501

locations in Springdale or by accessing the visitor center and parking there to catch the shuttle. The system operates with 30 propane-powered buses. Inside the park, passenger-carrying trailers are connected to the buses to increase visitor capacity along the route. When combined with the trailer, the double length shuttle has the capacity for 66 passengers.
The park has documented that resource conditions have improved and that visitors report a high level of satisfaction with the shuttle system. One double length shuttle carrying 66 passengers replaces approximately 25 private vehicles that without the shuttle system would be competing for parking and adding to congestion in the upper canyon. The vehicles have excellent ventilation with a top-opening window system, so no air conditioning is required (reducing energy use). They also have large windows so visitors have excellent views of the park scenery during their trip.
The park conveys a robust system of communications to visitors related to the shuttle. This includes website information, information in the park visitors guide and brochure (printed materials), information posted on signs in Springdale and at the visitor center, and other methods. Visitors are made aware through multiple sources that they may drive their vehicles through the park year-round, but during the summer season, the Zion Canyon Scenic Drive is accessible by shuttle only. The park helps visitors understand how and where to find parking to access the shuttle system, and important information about the buses. Visitors can refer to exhibits at the visitor center and bus stops that help them in planning their visit based on the duration of time they will be in the park for sightseeing, hiking, and other activities. Itineraries for visits of less than 3 hours and visits of more than 3 hours are provided on the outdoor, self-guided exhibits.
The Zion Canyon shuttle system has been effective in reducing traffic congestion in the upper canyon portion of the park and studies have documented that the visitor experience is enhanced by the shuttle system, which provides onboard interpretation and excellent scenic viewing opportunities. The park reports that evidence from visitor surveys shows a positive relationship between the shuttle and overall park experience. A greater degree of solitude and tranquility were reported by visitors in the canyon after the shuttle system was implemented compared to the years preceding the shuttle, and noise readings taken by park staff confirm these perceptions. In addition, park studies of natural resources in the canyon including vegetation, wildlife habitat, water quality, and other elements show that conditions improved with implementation of the shuttle system. Even though the shuttle has been successful in helping to protect natural resources in the canyon and enhancing visitor experience, ongoing operation of the system encounters periodic challenges. The visitor center where visitors can board the shuttle becomes crowded on peak visitation days and at times, visitors have to wait in line for the shuttle. The lack of available space for parking in town becomes a concern during peak visitation as well. Merchants and property owners in town have been known to complain about visitors parking illegally in private parking lots. Financial constraints have been reported related to the park’s ownership of the bus vehicles, which are due for major repairs and some replacements as they approach 20 years in service. These issues aside, the Zion Canyon shuttle system is known throughout the National Park Service as a highly effective and successful example of an alternative transportation system that has been effective in helping the park manage congestion and protect sensitive resources while also improving and enhancing visitor experience.
4.2 Case Studies Summary A review of alternative transportation systems at other national parks shows that a wide variety of
approaches and systems are in place in national parks across the country. Each system is tailored to the context, and there are varying structures of funding and operations. Table 2 summarizes key characteristics of shuttle systems in operation at Zion, Rocky Mountain, Yosemite, and Acadia National Parks. A variety of operational and implementation challenges arise with shuttle systems in national parks, including: • Initial capital costs associated with improvements, such as the need to create a bus maintenance and
staging/storage facility; purchase of the rolling stock; improvements for park and ride and bus stop locations.
• Funding of ongoing operational and maintenance costs, including development of maintenance facilities, and replacement of vehicles.
CELA 2019 | UC Davis 502

• For seasonal systems, it is often difficult to find enough qualified/trained employees to operate the system.
• A wide range of options for covering costs of shuttle systems, including allocating a portion of park fees, working with partners such as private corporations and non-profit groups, obtaining grants and donations, and leveraging services through regional and local transit agencies.
A critical factor in each of the shuttle systems studied for this project is the presence of gateway communities that provides a good base of operations for the shuttles. In the above cases, these gateway communities vary in size from a few hundred people (Springdale, UT) to a few thousand people (Estes Park, CO, Bar Harbor, ME). Yosemite NP’s YART regional bus system is a public transportation system that connects with Yosemite’s NPS-operated shuttle, and has major intermodal connections in the cities of Merced and Fresno, CA. The system regularly serves destinations in three counties, with expanded service during peak summer months. Despite differences in population, demographics, climate,
Table 2. Summary of National Park Shuttle System Characteristics.
Zion Rocky Mountain Yosemite Acadia
Annual Visitation (2017): Compared to Yellowstone NP at 4,116,524
4.5 million 4.4 million 4.3 million 3.3 million
Size of Shuttle Fleet:
39 power units and 23 trailers (18 doubles in park; singles in Springdale)
23 shuttle buses replaced on a rotating cycle
28 valley shuttle buses; replaced on a rotating cycle; other vehicles
17 buses for up to 28 passengers; up to 5 bikes/bus; replaced on rotating cycle
Operated By: Commercial Service Agreement/Contract
Commercial Service Agreement/Contract
Concession Contract; buses owned by NPS
Concession Contract; buses owned by NPS
Strategic Approach:
Originally created to reduce environmental impacts in Zion Canyon
Shuttle created around visitors’ needs and experiences; improved backcountry access
Provides alternative Yosemite Valley sight- seeing opportunities
Private sector and non-profit partner supported system
Other Notes: Frequently cited as a model for other parks High level of visitor satisfaction Management of visitor pulsing at stops
Careful consideration of stop locations Park transit different from urban transit Hiking trailheads as focus
Connect to regional transit and work with regional partners Give transit priority on the park roads
Good connectivity to gateway communities regionally Successful air quality improvement outcomes
employment and other characteristics, each gateway community provides a range of partnerships that prove essential to the successful operation of the shuttle systems. They typically also are home to many of the Parks’ full-time and seasonal employees. Just as the parks themselves contribute greatly to the local economy, the Parks’ shuttle systems play important roles in their communities.
At Acadia NP, a concessionaire operates the shuttle system (Downeast Transportation, Inc.), which is supported by multiple partners including the National Park Service, US Department of Transportation, Maine Department of Transportation, Friends of Acadia, six municipalities surrounding the
CELA 2019 | UC Davis 503

park, and private corporations and businesses including L.L. Bean. Park entrance fees support the system, along with contributions from these partners. Similarly, Rocky Mountain NP’s shuttle system is supported in part by the town of Estes Park, Colorado Department of Transportaion, and other sources. This shuttle leaves from Estes Park, CO, allowing visitors to leave their vehicles outside of the park, and to take advantage of the services and other tourism opportunities in town when they return.
Funding for ongoing maintenance and operations is a primary consideration for the NPS when considering system implementation. The systems rely on some combination of park entrance fees, federal, state and/or regional transportation funding, and grants or donations. Whether operated under a commercial service agreement or by a concessionaire, challenges in maintaining adequate levels of funding persist. Acadia NP’s partnership with L.L. Bean and non-profit supporters suggests that private-public partnerships may be the most sustainable way to achieve stable long-term funding.
Each of the parks studied for this project implemented a shuttle system to reduce congestion from personal vehicle use and to prevent degradation to natural and cultural resources because of overuse and/or undesirable visitor behavior within the park. It has been common for social trails and parking outside of designated areas to lead to erosion and runoff impacting waterways and aquatic life (Zion, Yosemite, Rocky Mountain) or cultural resources (Zion, Yosemite, Acadia), for unrestricted personal vehicle access to impact wildlife and vegetation (Zion, Yosemite, Acadia), and for air quality to suffer from congestion (Zion, Rocky Mountain, Acadia). In each case, environmental benefits have been observed following the implementation of the shuttle systems. Acadia NP has seen air quality improvements since implementing the Island Explorer shuttle in the late 1990s, in part because the system also encourages greater bicycle use. Zion NP has restored previously degraded habitat in Zion Canyon, and has restricted visitors from feeding wildlife such as deer, squirrels, and birds using educational information, and in some cases, fines. Rocky Mountain NP can now control parking in areas where visitors used to park haphazardly when lots were full.
Yellowstone NP faces all these types of impacts (picture tourists stopping along the highway to feed the bears) as well as degradation to its unique geothermal resources. Transit solutions aimed at reducing congestion and other impacts from personal vehicle use need to be multi-faceted, such as shuttling scenarios coupled with trails and paths that connect key features, and/or shuttling coupled with metering of traffic at key gates into the park that could have nearby park-and-ride facilities developed for visitor use once traffic reaches a certain level. There is much interest in and support for this work, including Yellowstone NP staff, as well as staff at the NPS Intermountain Region and the NPS Denver Service Center. Partners to Yellowstone NP are also interested and engaged. Ongoing work on this project has built in time for engagement and workshops with these stakeholders to help guide the development of the proposed system.
5 GEYSER BASIN CORRIDOR ANALYSIS
As visitation to Yellowstone NP continues to surpass record numbers, concerns intensify regarding how to provide public access while maintaining a positive visitor experience and preserving Yellowstone’s iconic natural and cultural resources. Figure 1 shows a wildlife jam in the Geyser Basin, a common occurrence that is one of visitors’ biggest complaints. The primary issues with intensifying visitation are:
• Visitor Experience — congestion and overcrowding at entrances, roads, parking areas, trailheads,
trails, attraction sites, visitor centers, restrooms, and other facilities. • Environmental — air pollution, noise pollution, light pollution, wildlife impacts, damage to resources,
including critical natural and cultural features, especially the iconic geothermal features.
CELA 2019 | UC Davis 504

Figure 1. Traffic congestion approaching Midway Geyser Basin (2018). Photo by Jacob W. Frank, NPS. Used with permission.
In determining potential shuttle routes in Yellowstone NP, it was evident from visitor statistics and survey information collected by the park staff beginning in 2016 (NPS, 2017a, 2017c, 2017d) that the Geyser Basin corridor between the west park entrance at West Yellowstone, MT and Old Faithful (Figure 1) was the principal route that could contribute the greatest benefits in terms of reducing vehicle congestion and managing visitor impacts to the park’s resources. Most visitors arriving through the west and south entrances are coming to see Old Faithful. Traffic volumes from the west entrance are roughly 30 percent higher than roads and parking lots are designed for and can safely handle.
5.1 Key Visitor Sites and Attractions and Congestion Hot Spots Figure 2 shows the main features in the park and the location and types of conflicts that have
been observed by NPS staff and visitors. The Geyser Basin stands out as the most congested area, with a high concentration of geothermal features including Old Faithful, the Grand Prismatic Spring, and other popular geothermal features. There is also a high concentration of “wildlife jams” along the Yellowstone River, that is, traffic jams caused by visitors stopping to view and photograph wildlife. Wildlife jams are also concentrated along the Madison River near the intersection of Highway 20 and Highway 89 at Madison. These types of traffic jams also occur along Highway 89 between the south entrance and Geyser Basin, as well as along other roads throughout the park.
CELA 2019 | UC Davis 505

Figure 2. Map of congested areas throughout Yellowstone National Park (2018). Diagram by authors.
The concentration of geothermal features in the Geyser Basin is clearly a major reason for visitors
to come to Yellowstone NP. Figure 3 is a bird’s-eye view of the Grand Prismatic Spring, one of the park’s most iconic features. The other-worldly beauty of Grand Prismatic and so many of the other geothermal features is the reason that the road between West Yellowstone and Old Faithful has the highest level of congestion in the park.
Given the sensitive nature and accessibility of these features, it is also one of the areas of greatest concern. Over the decades, the NPS has introduced new facilities and interpretive information intended to educate visitors and promote conservation of these resources. Yet overcrowding creates conflicts that give rise to undesirable visitor behavior. A study of summer visitor use patterns at major attractions in Yellowstone NP identified several hot spots of undesirable visitor behavior (Mills and Bramblett, 2017). Behaviors observed by Mills and Bramblett included parking outside of designated areas, creation of social trails, trash in geothermal pools and terraces, people stepping off boardwalks, and destruction of fragile geologic resources. There were high concentrations of unwanted behavior around parking areas, trails and boardwalks at Old Faithful and Midway Geyser Basin, including the Grand Prismatic Spring and Fairy Falls. Figure 4 shows visitors at the Old Faithful area during the peak summer season. It is clear that the high concentration of visitors creates an environment that can easily give rise to these unwanted behaviors. The Mills and Bramblett study also identifies problems affecting the otherwise pristine streams and rivers that are prime habitat for rare species such as the Yellowstone cutthroat trout.
Active visitor use management in this corridor is essential for visitor safety and to maintain a high-quality experience. Existing data provided by the NPS and others suggests that careful consideration of the level of visitation combined with design interventions at specific locations could go a long way to reduce the negative impacts of the high levels of congestion experienced in summer months.
CELA 2019 | UC Davis 506

Figure 3. Aerial view of the Grand Prismatic Spring (2018). Photo by Jacob W. Frank, NPS. Used with permission.
Figure 4. Crowds at Old Faithful (2015). Photo by Neil Herbert, NPS. Used with permission.
6 SUSTAINABLE ACCESS SOLUTIONS — PROPOSED SHUTTLE SYSTEM
6.1 Assessing Shuttle System Viability Understanding visitor use patterns is a critical aspect in developing a plan for implementing a
shuttle system. However, it is also necessary to consider the quality of the visitor experience that a shuttle system could provide, particularly as compared to the diminished experience that is common during the summer months when overcrowding can lead to long wait times, extreme traffic conditions, and inability to park and/or access popular features. Therefore, a key question for the system is: How many visitors should be delivered by a shuttle system? To answer this, a range of scenarios was developed, predicated on: • Desired visitor experiences • Routing options • Stops, access to trailheads and other features • Timetables • Vehicle types • Capacity analysis • Trip itineraries • Operating hours and distance
Information from the case studies was used to understand operational considerations, such as vehicle types and capacity, typical route times including stops and layovers at destinations, facilities and amenities needed at stops, location options for personal vehicle parking prior to boarding the shuttle, and communication of timetables and route options. One of the principal lessons from Zion NP’s shuttle system is that the system must operate on a frequent enough timetable that visitors can catch the shuttle with minimal wait times. Additional facilities such as comfortable stops, wayfinding information at stops, and interpretive information provided both along the route and at stops heighten the overall experience. Based on these and other lessons from the case studies, a range of scenarios was developed to evaluate potential to provide convenient access to destinations throughout the Geyser Basin, as well as an improved visitor experience.
6.2 Shuttle Routing Options, Stops, and Related Visitor Experiences An overall system design based on evaluation of these scenarios focuses on three route options
between West Yellowstone and Old Faithful. These route options would operate on a synchronized timetable, traveling the same route, but providing a variety of options for stops and length of stay. These options are the Old Faithful Express, the Geyser Basin Explorer, and the Westside Trekker. Figure 5 is a map showing the routes and stops for each route option. A summary of key features of each route option is provided in Table 3.
CELA 2019 | UC Davis 507

Figure 5. Route options for proposed shuttle system (2018). Figure by authors.
CELA 2019 | UC Davis 508

In the proposed system, visitors would be given three options for visiting features in the Geyser
Basin. The fastest and most direct option, the Old Faithful Express, would provide non-stop service from the west entrance at West Yellowstone to the Old Faithful Education Center. A detailed description and evaluation of this route is given below. The second option, the Geyser Basin Explorer, provides opportunities to stop at many of the most frequently visited Geyser Basin destinations. This route option is intended for visitors that want to spend some time at the features, perhaps take short hikes, or picnic and relax for a few hours, but spend about a half a day overall. The third option, the Westside Trekker, is intended for visitors who want to spend a longer time in the Geyser Basin. This option accommodates cyclists and backpackers who can access trails and other roads, and who may be staying for multiple days. It also accommodates visitors who will spend a long day visiting the Geyser Basin features.
Table 3. Shuttle Service Scenarios for the Geyser Basin Corridor.
Shuttle Service Scenarios
Old Faithful Express Geyser Basin Explorer Westside Trekker
Visitor Experience: Visitor Experience: Visitor Experience: Round-trip from West Yellowstone
to Old Faithful in the quickest possible time
Sight-seeing and photography in the Geyser Basin
Sight-seeing and photography in the Geyser Basin
Walking trail loops
Walking trail loops/hiking
Picnicking / Day use
Bike loops on low-speed roads
Picnicking / Day use
3 – 4 hours / Half day 4 – 6 hours / Short day 8 – 10 hours / Long day
Stops: West Yellowstone, Old Faithful
Stops: West Yellowstone, Madison River Wayside, Madison Junction, Fountain Paint Pot, Midway Basin /
Fairy Falls, and Old Faithful
Stops: West Yellowstone, Two Ribbons Trailhead, Madison River,
Madison Junction, Firehole, Fountain Paint Pot, Midway
Basin/Fairy Falls, Biscuit Basin, Black Sand Basin, and Old Faithful
An operational evaluation of the three shuttle service scenarios, Old Faithful Express, Geyser
Basin Explorer, and Westside Trekker, was completed to gain better understanding of the service requirements, capacity of visitors that could be served, and the potential benefits of implementing the proposed shuttle system, such as the number of private vehicles that could be replaced by shuttle service capacity, thereby reducing demand on parking spaces. Table 4 summarizes the results of this analysis, assuming a 12-hour period of service each day from 7:00 am to 7:00 pm.
The analysis estimates that the Express service, which has no intermediate stops, would arrive at Old Faithful in one hour; Geyser Basin Explorer with four intermediate stops/six stops total would arrive at Old Faithful in 90 minutes; and Westside Trekker with eight intermediate stops/ten stops total would arrive at Old Faithful in two hours. The model assumes 30-minute layovers at Old Faithful and upon return to West Yellowstone to provide adequate breaks for drivers. This means that there would be two to three shuttles present at the destinations at any given time requiring layover space at the termini.
Each service would require a different number of buses given the changes in travel times and both 10-minute and 20-minute headways were analyzed (with shuttles leaving West Yellowstone every 10 minutes/10-minute frequency of service at all stops or every 20 minutes/20-minute frequency of service at all stops), Express requires an estimated fleet size of 22 for 10-minute service and 11 for 20-minute service. Explorer requires an estimated fleet size of 30 for 10-minute service and 15 for 20-minute service. Trekker, with the most stops requires an estimated fleet size of 36 for 10 minute-service and 18 for 20-minute service.
CELA 2019 | UC Davis 509

The model also estimates a shuttle capacity of 30 per vehicle and assumes annual service days of 153 from Mid-May through Mid-October. Running at full capacity (100 percent), the 10-minute frequency model for all services could carry 2,190 round-trip passengers per day or 335,070 visitors per year maximum. Assuming 80 percent capacity (a more realistic average of ridership), 1,752 round-trip passengers/visitors could be carried in shuttles at 10-minute headways and 888 round-trip passengers/visitors at 20-minute headways.
All three shuttle scenarios would have the same carrying capacity given the same service durations for each. Implementation of the shuttle system would reduce demand for parking. The analysis found that the 10-minute service could reduce the number of private vehicles by 38 to 45 percent during the peak summer months, removing 674 vehicles from the corridor, and the 20-minute service could reduce private vehicle use by 19 to 23 percent, removing 342 vehicles from the corridor (assuming the park’s average persons per vehicle ratio of 2.6).
Table 4. Shuttle Service Operational Analysis.
Shuttle Service Operational Analysis Old Faithful Express Geyser Basin Explorer Westside Trekker
Number of Shuttle Stops 2 6 10
Trip Duration One Hour One Way 90 Minutes One Way Two Hours One Way
Number of Shuttle Vehicles in Operation
18 @ 10-Minute Headways 9 @ 20-Minute Headways
24 @ 10-Minute Headways 12 @ 20-Minute Headways
30 @ 10-Minute Headways 15 @ 20-Minute Headways
Estimated Full Fleet Size Needed
22 @10-Minute Headways 11@ 20-Minute Headways
30 @ 10-Minute Headways 15 @ 20-Minute Headways
36 @ 10-Minute Headways 18 @ 20-Minute Headways
Total Passengers Carried per Day at 80
Percent Capacity
1,752 @ 10-Minute Headways
888 @ 20-Minute Headways
1,752 @ 10-Minute Headways
888 @ 20-Minute Headways
1,752 @ 10-Minute Headways
888 @ 20-Minute Headways
Estimated Number of Private Vehicles that Could be Replaced
with Shuttle Use at 80 Percent in Peak
Summer Months of June, July, August
674 38 to 45 Percent @ 10
Minute Headways
342 19 to 23 Percent @ 20-Min
Headways
674 38 to 45 Percent @ 10
Minute Headways
342 19 to 23 Percent @ 20-Min
Headways
674 38 to 45 Percent @ 10
Minute Headways
342 19 to 23 Percent @ 20-Min
Headways
7 CONCLUSIONS 7.1 Summary of Findings Analysis completed for the Sustainable Solutions for Visitor Access project indicates that the
shuttle system would provide a variety of beneficial outcomes. The three types of services—Express, Explorer, and Trekker—could operate in tandem, providing visitors with a variety of choices to access sites in the Geyser Basin. Riding the shuttle would give visitors the opportunity to avoid the hassles of traffic congestion and overcrowded parking areas. The shuttle system would reduce the number of private vehicles in the congested corridor by up to 45 percent on peak summer days assuming a 10-minute frequency of service. The shuttles could provide onboard visitor interpretation and be designed to deliver visitors to a variety of recreational experiences and sight-seeing attractions on the Geyser Basin, including some areas that may not be accessible to private vehicles. Not only would the shuttle system enhance visitor experience, but parking areas would be able to operate at the capacities they were originally designed to accommodate. In addition, implementation could help to manage the number of people at one time at attractions, reducing crowding on boardwalks and trails, as well as undesirable off trail foot-traffic. Overall, shuttle system operations could significantly reduce the number of vehicles and
CELA 2019 | UC Davis 510

traffic congestion on roads and in parking areas. This also would result in less pollution and reduced greenhouse gas emissions. The shuttle system would need to be designed with adequate facilities such as staging and layover areas at the West Yellowstone and Old Faithful route termini and with a maintenance and storage headquarters area in West Yellowstone. Attractive and convenient stops and facilities would need to be carefully designed to fit the context of the park setting.
7.2 Limitiations of Study There is a difference between the amount of visitors a shuttle system could accommodate and the
amount of visitors the system should accommodate given limitations on park resources, space, operations capacity, and other factors. To achieve the outcomes summarized in 7.1, visitor use management in the Geyser Basin corridor would need be needed to monitor, meter and manage to the ideal capacity that parking lots can accommodate while simultaneously offering shuttle service as an alternative vehicle access option. This study does not address the visitor capacity of specific sites in the corridor. Analysis of the maximum number of people at one time that each site can accommodate is needed to determine how many visitors the shuttle system should deliver on an ongoing basis. The study also does not fully address financial and operational feasibility, such as how the system would be contracted or operated, who would own and maintain the vehicles, and how the system would be funded. While the study outlines potential options based on other national park models, additional analysis is needed to determine the best approach for Yellowstone NP and to identify potential partners who could support implementation.
7.3 Recommended Next Steps Ongoing work on the project will examine various visitor itineraries and potential adjustments to
the timetable to optimize service efficiencies. Concepts for enhancing visitor experience and integrating improvements and amenities as part of implementing the shuttle system also will be explored. Specific recommendations for repairing and preventing future damages to resources from visitor crowding and congestion in the corridor will be developed. After completion of this study, the NPS will need to proceed with a more detailed alternative transportation feasibility analysis, and this may include implementing and testing a shuttle pilot program in the corridor. In summary, this project shows that implementing a shuttle program in the West Yellowstone to Old Faithful corridor could result in a variety of positive outcomes. However, more detailed analysis is needed to determine specific operational and financial models that might be feasible and how these would be implemented.
8 REFERENCES Begley, Justin and Joslin, Ann. (2014). Alternative Transportation Systems Business Models Decision
Support Tool, Technical Assistance Research Final Report. Prepared by the Center for Urban Transportation Research, University of South Florida, and the Paul S. Sarbanes Transit in Parks Technical Assistance Center for the Federal Transit Administration.
Begley, Justin and Joslin, Ann. (2012). Alternative Transportation Systems Business Models Evaluation, Technical Assistance Research Final Report. Prepared by the Center for Urban Transportation Research, University of South Florida, and the Paul S. Sarbanes Transit in Parks Technical Assistance Center for the Federal Transit Administration.
Collum, Kourtney Kristen. (2012). From Automobiles to Alternatives: Applying Attitude Theory and Information Technologies to Increase Shuttle Use at Rocky Mountain National Park. Unpublished bachelor’s thesis. Western Michigan University, Kalamazoo, MI.
Dunning, Anne E. (2004). Transit for National Parks and Gateway Communities: Impacts and Guidance. Transport Research International Documentation - TRID, 30 Nov. 2004. Available from: http://trid.trb.org/view/854620.
Finnessey, Lauren. (2012). The Negative Effects of Tourism on National Parks in the United States. Unpublished master’s thesis. Johnson & Wales University, Providence, RI.
Haas, G., & Social Science Program. (2001). Visitor capacity in the National Park System (Social science research review ; v. 2, no. 1). Washington, D.C.]: U.S. Dept. of the Interior, National Park Service [Social Science Program].
Manning, R., Lawson, S., Newman, P., Hallo, J., and Monz, C. (2014). Sustainable Transportation in the National Parks: from Acadia to Zion. University Press of New England: Lebanon, NH.
CELA 2019 | UC Davis 511

National Park Service, US Department of the Interior and US Department of Transportation. (2003). Partnering for Transportation Success at Acadia National Park—A Case Study of the Island Explorer Shuttle Bus System at Mount Desert Island and Acadia National Park. John A. Volpe National Transportation Systems Center. Washington, D.C.
National Park Service, US Department of Interior. (2009). Zion Canyon Transportation System Technical Analysis. Prepared by OTAK under National Park Service IDIQ for Transportation Services Contract No. C2000070500. Available from: http://www.nps.gov/zion/learn/management/man-agement.htm
National Park Service, US Department of the Interior. (March 11, 2016). NPS Entering the 21st Century. Retrieved from: http://www.nps.gov/articles/npshistory-entering-21st-century.htm
National Park Service, US Department of the Interior. (2017a). Visitor Use Statistics. Retrieved from: http://irma.nps.gov/Stats/
National Park Service, US Department of the Interior. (May 3, 2017b). US Department of the Interior Federal Lands Transportation Program. Retrieved from http://www.nps.gov/acad/learn/news/
tourism-to-acadia-national-park-in-2016-created-333-million-in-total-economic-benefits.htm National Park Service, US Department of the Interior. (2017c). Yellowstone National Park Transportation
and Mobility Study, Data Collection and Analysis National Park Service, US Department of the Interior. (2017d). Yellowstone National Park Visitor Use
Study, Summer 2016 National Park Service, US Department of the Interior. (October 29, 2018). Transportation. Retrieved from:
http://www.nps.gov/transportation/busses_shuttles.html National Park Service, US Department of the Interior. (n.d.). Visitor Carrying Capacity Requirements.
Retrieved from: http://www.nps.gov/policy/mp/chapter8.htm Public Employees for Environmental Responsibility. (2016). Review of Current Carrying Capacities of
National Parks. Retrieved from: www.peer.org White, D., Aquino, J., Budruk, M., and Golub, A. (2011). Visitor’s Experiences of Traditional and
Alternative Transportation in Yosemite National Park. Journal of Park and Recreation Administration, 29(1), 38-57
White, D. and Aquino, J.F. (2008). Transportation Issues in National Parks, Report prepared by Arizona State University School of Resources and Development for Yosemite National Park. Chapter 7, p.75-81.
CELA 2019 | UC Davis 512

The authors are solely responsible for the content of this technical presentation. The technical presentation does not necessarily reflect the official position of the Council of Educators in Landscape Architecture (CELA), and its printing and distribution does not constitute an endorsement of views which may be expressed. Citation of this work should state that it is from a CELA conference paper. EXAMPLE: Author's Last Name, Initials. 2019. Title of Paper. Sacramento, CA: CELA. For information about securing permission to reprint or reproduce this paper, please contact CELA at [email protected]
REDEFINING INDIGENOUS LANDSCAPES FOR AUTHENTIC
REPRESENTATION
Shotyk, Olivia Pennsylvania State University, [email protected] Aeschbacher, Peter Pennsylvania State University, [email protected] 1 ABSTRACT
There are few examples of contemporary Indigenous landscape architecture in North America, despite the great number of rich cultures and their strong relationships with the land. A possible reason for this gap in representation includes the impact of colonization on Indigenous design principles and precedent examples, with communities having been deprived of opportunities to evolve culturally. Therefore, sites pre-dating colonization must be used as precedents of possible Indigenous design. Unfortunately, proper classification of these types of sites does not currently exist in North America. Despite the World Heritage Committee adopting the term ‘cultural landscape’ in 1992, little progress has been made to broaden the range of heritage sites to include those that hold cultural significance. This research examines numerous pre-colonial sites of significance to North American Aboriginal communities that should be recategorized as cultural landscapes: examples such as these could stimulate contemporary Indigenous landscape design. By studying literature that centers around the relationship between culture and environmental design, reading the landscape for cultural cues, and understanding Indigenous design, the delineation of this new classification of heritage site becomes apparent. Furthermore, using a semiotic square model to analyze what are currently classified as natural sites across North America, tangible cultural connections can be distinguished from intangible ones, and intentional versus unintentional alterations, to establish a new category of cultural landscape that can be identified as vernacular design. To decolonize Indigenous design, it must first be determined what the authentic foundation may be, by looking at vernacular landscapes that pre-date European arrival.
1.1 Keywords
Indigenous, architecture, landscape, culture, Aboriginal
CELA 2019 | UC Davis 513

2 INTRODUCTION
The release of the Report of the Truth and Reconciliation Commission in 2016 brought with it a list of calls to action directed at the Canadian government. These were intended to help move forward with reconciling the concerns of First Nations, Métis and Inuit inhabitants with the non-Indigenous population (Truth and Reconciliation Commission, n.d.). One of these calls to action specifically referred to protecting Indigenous historic sites and monuments. Indigenous cultural landscapes are common across North America, but often not identified, officially protected, or recognized for their cultural importance. These landscapes could contribute to a greater understanding of the historical and cultural context of the periods before European settlement. While this recognition would be important no matter what the landscape holds, some have even more significance as they are the remnants of pre-colonization examples of landscape design. Due to the interruption caused by colonization, residential and boarding schools, and the routine placement of Indigenous children in non-Indigenous foster families, Indigenous cultures have been prevented from developing as Western cultures have over the past two centuries. As landscape architecture, as a profession, begins to tackle social justice, stewardship and equality issues, it seems clear that the next injustice to address is representation of Indigenous cultures in public space design. This is especially true in Canada where the majority of the Indigenous population lives in urban areas with little to no connection to their cultural and ethnic identity. Some landscape architects in North America have begun to venture into this territory, but until North American landscape architecture schools begin to teach alternatives to the design processes and principles that evolved in Europe, and begin to allow for appropriate cultural accommodations, we cannot create authentic Indigenous spaces. Here, cultural landscapes pre-dating colonization are used to provide a glimpse into the past, not only to describe what was there, but also to predict what might have evolved if the opportunity had been given. Using UNESCO World Heritage Site designations as a framework to analyze the categorization of cultural landscapes in North America, New Zealand and Australia, this paper argues that we are missing a critical classification that would provide an authentic foundation for contemporary Indigenous landscape architecture. 2.1 Positionality
The limitations of this research lie primarily in the relationship between me as an outsider, non-Indigenous person to the research topic. I state here for context of the following paper, that I, as a Caucasian, middle-class person from southern Ontario, have an academic insight of Indigenous cultures, beliefs and traditions, as well as a humble and incomplete understanding through communications and friendships within the Anishinaabe community. Moving forward in my research, I aim to work collaboratively with Indigenous cultural experts and Indigenous designers to increase the value of this work.
2.2 Research Questions Did Indigenous communities pre-colonization manipulate the land in a way that we can argue they are designed? Is our definition of designed landscapes too narrow to encompass Indigenous vernacular designed landscapes? 3 LITERATURE REVIEW 3.1 Western versus Indigenous
In his 2005 book, Culture, architecture, and design, Amos Rapoport lays groundwork on the important connection between culture and built form. He stages important questions to his readers in the introduction, including “What biosocial, psychological, and cultural characteristics of human beings (as members of a species, as individuals, and as members of various groups) influence (and in design, should influence) which characteristics of the built environment?” (Rapoport, 2005, p. 6). This question is imperative in this research as it suggests by beginning to understand Indigenous cultural landscapes, we
CELA 2019 | UC Davis 514

can uncover more about the cultural and social context that these communities existed in. Rapoport also stresses that to understand foreign environments, it is necessary to approach them emically, that is from inside the culture, valuing what that culture values, rather than etically, as an outsider. This point allows us to consider how the Western perspective may prioritize certain senses or experiences over others.
Malnar and Vodvarka make this exact argument in their book, New Architecture on Indigenous Lands (2013). They argue that the Western perspective is reductionist, prioritizing visual experiences over other spatial experiences which may not be the case for other cultures. They also make an interesting point that typically vernacular architecture is influenced by high style architecture and that in the case of Indigenous design, the reverse would be necessary (Malnar & Vodvarka, 2013). Indigenous architecture will require high style architecture to learn from the symbolic and sensory nature of vernacular design to succeed (Malnar & Vodvarka, 2013). This is what we hope to accomplish in the near future: determine what those symbolic and sensory elements are to inform high style Indigenous landscape architecture moving forward. To begin to frame these symbolic and sensory elements, we turn to a book co-written in 1991 by Douglas Cardinal, the celebrated Métis architect and Jeanette Armstrong, an Okanagan writer and artist, in which they discuss the Native Creative Process. When analyzing some of these Indigenous cultural landscapes, Cardinal and Armstrong’s principles come to mind. They discuss the inter-connectedness of all things, like a spider’s web, as well as the cooperation and commitment required to create something truthful and powerful. Words hold power but they are even more powerful when turned into actions, and therefore before acting, one must consider the impact of one’s actions on the future (Armstrong & Cardinal, 1991). Designers in Aotearoa New Zealand have been facing the same dilemma on how to articulate values at the core of a culture, or a number of cultures, as is often the case when discussing a group of Indigenous communities. In 2001, Maori designers came together to form Nga Aho, an organization of architects, engineers, landscape architects, and planners supporting one another while serving the Maori community (Nga Aho, n.d.). One of their initiatives was organizing a set of Maori design principles in partnership with the city of Auckland to guide future public projects. This document is called “Te Aranga” and is made up of a set of core values, instructions on how to implement them in the built environment in the form of principles and actions, and case studies where the principles were used. The Te Aranga core values include self-determination, conserving the enviornment as part of a reciprocal relationship, hospitality, a spiritual connection between people and their environment, unity and cohesion, working together to create a sense of belonging, and knowledge and understanding (Te Aranga Principles, n.d.). The significance of the Te Aranga principles, in the context of this paper, is to demonstrate that a non-Western, specifically Indigenous, perspective of design professions and design principles exist. If the Maori community can put this together, can the Anishinaabe community or Salish community do something similar?
3.2 Reading the Landscape
In order to unravel which Indigenous cultural landscapes may have been intentionally manipulated for a design purpose, it is imperative to understand how to read the landscape for cultural cues. Peirce Lewis discusses some of his main principles in his 1976 paper, “Axioms for Reading the Landscape.” His very first axiom explains that any culture is inadvertently reflected in its everyday vernacular landscapes. This is the basis for this research: that the vernacular landscape we study, will reveal authentic truths about those cultures. Another interesting point he makes, is the corollary of convergence, that is the more two areas come to look alike, the more their cultures are converging (Lewis, 1976). This could be interesting to analyze; determining if there is a relationship between proximity and cultural similarity of Indigenous cultural landscapes. Tying into this point is the corollary of diffusion, that suggests that landscapes may be changed as a result of imitating another cultural group (Lewis, 1976). If there is evidence that two or more cultures participated in trade, there could similarities in their cultural landscapes. Lewis also points out that it is necessary to form an understanding of the landscape and the people who built it, in the context of their time period and environment, not ours (Lewis, 1976). Thirty years later, Don Mitchell came along and wrote a follow-up, “New Axioms for Reading the Landscape: Paying Attention to Political Economy and Social Justice,” (2008). Mitchell argues that not only does the landscape hold cultural meaning, but ideological meaning. While Mitchell uses this point to
CELA 2019 | UC Davis 515

explain how the built environment depicts power structures of a culture and can hold social justice, the ideological meaning uncovered in Indigenous cultural landscapes is often a spiritual one (Mitchell, 2008). While we agree that any landscape is an expression of power, there are so many thicker and more imperative layers of ideological meaning to pull back from Indigenous cultural landscapes.
4 METHODS
While organizations such as UNESCO World Heritage Sites and The Cultural Landscape Foundation have established their own classification of cultural landscapes, this paper argues they have missed a critical category: vernacular designed landscapes.
The World Heritage Committee amended their Operational Guidelines for the Implementation of the World Heritage Convention in December 1992 to include cultural landscapes. At that time, they also determined a subset of cultural landscape categories: associative landscapes, clearly defined landscapes, and organically evolved landscapes (Australia ICOMOS, 1995). At the 1995 Asia-Pacific Regional Workshop on Associative Cultural Landscapes, held by the Australian division of ICOMOS (International Council on Monuments and Sites), they began to take advantage of these categories by nominating sites that hold cultural and spiritual significance to Aboriginal communities to the associative cultural landscape category. Associative cultural landscapes refer to sites that do not necessarily hold tangible evidence of a culture, but rather have intangible attributes including acoustics, olfactory and kinetic elements. They are landscapes that are, “embedded in a people’s spirituality, cultural tradition and practice,” (Australia ICOMOS, 1995).
However, the North American sectors of UNESCO and ICOMOS have not applied these sub-categories. This demonstrates that UNESCO already identified, over 20 years ago, that there was a gap in the World Heritage Site classifications which, while they amended, was not implemented worldwide. This research proves that this gap is even a bit larger, the classifications not having accommodated a landscape architect or designer’s perspective on cultural landscapes. To begin to determine what this missing classification is, we organized all World Heritage Sites in Canada, the United States, Australia and New Zealand, in order of the level of human-caused manipulation, as seen in figure 1.
CELA 2019 | UC Davis 516

Figure 1. World Heritage Sites organized by degree of manipulation. Diagram by the author. The result is a category falling between second nature landscapes, such as agricultural sites and other working landscapes, and landscapes that feature historic artifacts, such as cave paintings. Next all World Heritage Sites were organized as a scatterplot along axes of cultural tangibility and self-consciousness of the site manipulation, as seen in figure 2. In order for a designed object to be considered vernacular, it must be intended as a landscape typical of that place and time, contextually, which is where the level of self-consciousness becomes significant.
Figure 2. World Heritage Sites organized by cultural tangibility and by self-consciousness of
manipulation. Diagram by the author. 4.1 Semiotic Square
To further determine where this missing category fits, a semiotic square model was implemented. Semiotic squares are used to visualize oppositions and contradictions, highlighting less apparent meanings or themes (Corso, 2014). Here the goal was to find the missing link between artifact and architecture, nature and design. Like Rosalind Krauss argued in her paper, “Sculpture in the Expanded Field,” that sculpture was “not-landscape” and “not-architecture,” our semiotic square model argues that vernacular landscapes are, “not-artifact” and “not-architecture,” (Krauss, 1979). Similar to Krauss’ use of the semiotic square, we chose this method to combine exclusions. As it was difficult to determine what this new category could be, the easiest approach was to rule out what it is not. It is not agriculture, it is not natural, it is not buildings, cultural artifacts or organically evolved landscapes. It is not landscape architecture as these landscapes were constructed centuries before the term was coined. However, something about these sites was intentional, manipulated, experiential and represents cultural values.
CELA 2019 | UC Davis 517

5 RESULTS What came out of the reclassification of UNESCO World Heritage Sites was a category of
vernacular designed landscapes, including sites in Australia, Canada and the United States. One such site is the Gondwana Rainforests of Australia. Originally inhabited by the Yugambeh, Yugarabul/Jagera, Gidabul and Wakka Waka, the site is home to a series or circuit of ceremonial spaces connected by travel routes, collectively known as the sacred triangle of Bundalung (McIntyre-Tamwoy, 2008). Another site in Australia, the Wet Tropics of Queensland, home to the Rainforest Aboriginal communities, consists of culturally significant sites connected by a complex network of walking tracks that delineated boundaries between clans (Wet Tropics Cultural Landscape, n.d.).
In Canada, the Haida in British Columbia lived in SGang Gwaay for thousands of years, with the remnant of their village another World Heritage Site. They have left behind evidence of a whole settlement complete with 32 mortuary poles and ten longhouses (Herrmann, Heinämäki, Morin, 1970). The stories the mortuary poles depict are that of high-ranking Haidas. Other poles in the village marked houses and memorials but they have been removed and relocated to museums (Duff & Kew, 1958; MacDonald, 1983; Swanton, 1909). Another Canadian site is Pimachiowin Aki, the ancestral home of the Anishinaabeg Poplar River, Bloodvein River, Pauingassi and Little Grand Rapids First Nations (Parks Canada, 2018). This heritage site is composed of petroforms, pictographs, Anishinaabeg travel routes, over 600 cabins and campsites, ceremonial and sacred sites (Pimachiowin Aki, 2019).
The United States is also home to vernacular designed landscapes: the Monumental Earthworks of Poverty Point and Everglades National Park. Poverty Point was part of a trading network that extended across North America 3,000 years ago (National Park Service, n.d.b). Consisting of a 72-foot tall mound, a series of concentric semi-elliptical ridges, residential and ceremonial spaces, a central plaza, and a large space that is thought to have been used for astronomical observation, this site has been abandoned for thousands of years (History & Artifacts of Poverty Point, n.d.; Poverty Point World Heritage Site, n.d.). The Everglades were formerly home to the Calusa, Tequesta, Jega and Ais communities. Evidence of the Calusa’s presence in the park remains in the form of shell works, that is, piling earth on top of shells to create ridges, mounds, canals, courtyards and platforms (National Park Service, n.d.a). Shell mounds were also used to organize spaces such as separating gathering places from sacred places (National Park Service, n.d.a).
The aim of this research is to extend beyond reclassifying UNESCO World Heritage Sites and seek out other Indigenous landscapes that should be recognized as vernacular design and are either only preserved on a national level, or are not designated as sites for preservation. 6 DISCUSSION
Reclassifying UNESCO World Heritage Sites is just the beginning of the intention of this research. In order to deem these sites as useful for future contemporary Indigenous design, we have to determine what the design principles are that guide the spatial arrangements. Western landscape architecture has evolved over centuries from a solid European base. Indigenous cultures have not been given the same luxury. To move forward and develop a set of prinicples and action items as the Nga Aho have in Aotearoa New Zealand, we need to peel apart these sites in their geographical and cultural context, reading the landscape for design clues. Speaking with Indigenous experts is the next step to verify if any of the themes and narratives we pull out from these sites show up in contemporary Indigenous design, or if the culture has been modifed so dramatically due to colonization that no similarities appear.
What is also important to identify is how North American design schools define designed landscapes and how limiting this definition is to cultures that do not adhere to the same belief system. While other fields begin to recognize two eyed seeing, a term referring to incorporating Western science with Indigenous ways of knowing, the landscape architecture field has not yet begun this conversation. The reason this is significant in the context of identifying designed landscapes, is that many Indigenous groups believe in cosmological forces shaping the Earth and therefore value what we perceive as natural landscapes, as sacred sites relating to creation stories or other important narratives. Many of the sites previously mentioned also have a significant spiritual connection to the local communities. If we begin to
CELA 2019 | UC Davis 518

understand cultural landscapes from a two eyed seeing perspective, we might have to add many more sites to our list of vernacular design. Perhaps our definition of designed landscapes is currently too narrow to encompass Indigenous perspectives. Perhaps our perspective of landscapes is too narrow to encompass Indigenous ways of knowing the land.
7 CONCLUSION As landscape architects take on a larger role in advancing society by tackling spatial injustices, we as a profession need to take a better look at how Indigenous communities are represented in public spaces. Most will find that there is very little authentic representation outside of architectural examples. By finding a source of designed landscapes, before the interference of colonization, we can distinguish potential design principles or narratives that guide the spatial arrangement of the site, that can perhaps guide Indigenous designs in a contemporary context. Moving forward, it is necessary to discuss any of these potential common threads with Indigenous cultural experts and Indigenous designers ot authenticate the plausibility that any design principles established could be applied in a modern context and is appropriate for a modern Indigenous audience. Future research should also focus on one cultural group at a time to determine in-depth cultural distinctions between neighboring Indigenous groups, as well as comparing the difference in narratives and oral histories, with the local design expressions. Justifying that we need to include Indigenous cultural landscapes in our landscape design conversation is just the first step. 8 REFERENCES Armstrong, J.C., & Cardinal, D. (1991). The Native Creative Process: A Collaborative Discourse.
Penticton, B.C.: Theytus Books.
Australia ICOMOS (1995). Asia-Pacific Workshop on Associative Cultural Landscapes. Sydney, NSW: ICOMOS/World Heritage. Retrieved from https://whc.unesco.org/archive/cullan95.htm
Buggey, S. (1999). An Approach to Aboriginal Cultural Landscapes (Canada, Historic Sites and Monuments Board of Canada). Retrieved November 20, 2016, from http://www.pc.gc.ca/docs/r/pca-acl/images/Aboriginal_Cultural_Landscapes_e.pdf
Corso, J. J. (2014). What Does Greimas’s Semiotic Square Really Do? Mosaic: A Journal for the Interdisciplinary Study of Literature, 47(1), 69-89. doi:10.1353/mos.2014.0006
Duff, W. & Kew, M. (1958). Monumental Art of SGang Gwaay. Retrieved from https://www.sfu.ca/brc/virtual_village/haida/sgang-gwaay--ninstints-/monumental-art-of-sgang-gwaay.html
Herrmann, T., Heinämäki, L., Morin, C. (2017). Protecting sacred sites, maintaining cultural heritage, and sharing power: Co-management of the SGang Gwaay UNESCO World Heritage site in Canada. In L. Elenius, C. Sandström & C. Allard (Ed.), Indigenous rights in modern landscapes: Nordic conservation regimes in global context. London: Routledge.
History & Artifacts of Poverty Point. (n.d.). Retrieved from https://www.louisianatravel.com/history-artifacts
Krauss, R. (1979). Sculpture in the Expanded Field. October, 8, 30-44. doi:10.2307/778224
Lewis, P. K. (1976). Axioms for Reading the Landscape. Journal of Architectural Education, 30(1), 6-18. doi:10.1080/10464883.1976.10758067
CELA 2019 | UC Davis 519

MacDonald, G. F. (1983). Monumental Art of SGang Gwaay. Retrieved from https://www.sfu.ca/brc/virtual_village/haida/sgang-gwaay--ninstints-/monumental-art-of-sgang-gwaay.html
Malnar, J. M. & Vodvarka, F. (2013). New Architecture on Indigenous Lands. Minneapolis: University of Minnesota Press.
McIntyre-Tamwoy, S. (2008). Archaeological sites & Indigenous values: The Gondwana Rainforests of Australia World Heritage Area. Archaeological Heritage, 1(1), 42-49. Retrieved from https://researchonline.jcu.edu.au/2070/1/McIntyreTamwoy.pdf.
Mitchell, D. (2008). New Axioms for Reading the Landscape: Paying Attention to Political Economy and Social Justice. In Political Economies of Landscape Change (pp. 29-50). Springer Netherlands.
National Parks Service. (n.d.a). Everglades National Park. Retrieved from https://www.nps.gov/nr/travel/cultural_diversity/everglades_national_park.html
National Parks Service. (n.d.b). Poverty Point. Retrieved from https://www.nps.gov/popo/index.htm
Nga Aho. (n.d.). Retrieved from http://www.ngaaho.maori.nz/page.php?m=8
Parks Canada. (2018). Gwaii Haanas National Park Reserve, National Marine Conservation Area Reserve, and Haida Heritage Site. Retrieved from https://www.pc.gc.ca/en/pn-np/bc/gwaiihaanas/activ/experiences/villages-village
Parks Canada. (2019). Pimachiowin Aki, Manitoba and Ontario. Retrieved from https://www.pc.gc.ca/en/culture/spm-whs/sites-canada/sec02s
Pimachiowin Aki, World Heritage Site. (n.d.). Retrieved from https://pimaki.ca/
Poverty Point World Heritage Site. (n.d.). Retrieved from http://www.povertypoint.us/
Rapoport, A. (2005). Culture, architecture, and design. Chicago: Locke Science Publishing Company.
Swanton, J. R. (1909). Monumental Art of SGang Gwaay. Retrieved from https://www.sfu.ca/brc/virtual_village/haida/sgang-gwaay--ninstints-/monumental-art-of-sgang-gwaay.html
Te Aranga Principles. (n.d.). Retrieved from http://www.aucklanddesignmanual.co.nz/design-subjects/maori-design/te_aranga_principles
Truth and Reconciliation Commission of Canada. (n.d.). Retrieved November 10, 2016, from http://www.trc.ca/websites/trcinstitution/index.php?p=4
U.S. Department of the Interior. (1994). Protecting Cultural Landscapes: Planning, Treatment and Management of Historic Landscapes. Washington, DC: C.A. Birnbaum.
Wet Tropics Cultural Landscape. (n.d.). Retrieved from https://www.wettropics.gov.au/wet-tropics-cultural-landscapes
CELA 2019 | UC Davis 520

CELA 2019 | UC Davis 521