Page 1 of 11 Ciprofloxacin (sip”row flox' a sin) Tablets USP for ...
Upload
independentCategory
view
0download
0
RESEARCH
*Central Punicable Dis‡IMS-HEA
Trends in Fluoroquinolone (Ciprofloxacin) Resistance in
Enterobacteriaceae from Bacteremias, England and
Wales, 1990–1999David M. Livermore,* Dorothy James,* Mark Reacher,† Catriona Graham,*
Thomas Nichols,* Peter Stephens,‡ Alan P. Johnson,* and Robert C. George*
The Public Health Laboratory Service receives antibiotic susceptibility data for bacteria from bloodstreaminfections from most hospitals in England and Wales. These data were used to ascertain resistance trendsto ciprofloxacin from 1990 through 1999 for the most prevalent gram-negative agents: Escherichia coli,Klebsiella spp., Enterobacter spp., and Proteus mirabilis. Significant increases in resistance wereobserved for all four species groups. For E. coli, ciprofloxacin resistance rose from 0.8% in 1990 to 3.7% in1999 and became widely scattered among reporting hospitals. The prevalence of resistance in Klebsiellaspp. rose from 3.5% in 1990, to 9.5% in 1996 and 7.1% in 1999, while that in Enterobacter spp. rose from2.1% in 1990 to 10.5% in 1996 and 10.9% in 1999. For both Klebsiella and Enterobacter spp., most resis-tance was localized in a few centers. Resistance was infrequent and scattered in P. mirabilis, but reacheda prevalence of 3.3% in 1999.
luoroquinolone antimicrobial drugs were a major thera-peutic advance of the 1980s because they have 100-fold
greater activity than their parent compound, nalidixic acid (1).Unlike nalidixic acid, which is used only for urinary infectionsand occasionally shigellosis, the fluoroquinolones have abroad range of therapeutic indications and are given as pro-phylaxis, e.g., for neutropenic patients. In veterinary medicinefluoroquinolones are used as treatment and metaphylaxis butnot as growth promoters. Early researchers thought that fluoro-quinolone resistance was unlikely to evolve, largely becauseresistant Escherichia coli mutants are exceptionally difficult toselect in vitro (2) and because plasmid-mediated quinoloneresistance remained unknown even after 30 years of nalidixicacid usage. Nevertheless, mutational fluoroquinolone resis-tance emerged readily in staphylococci and pseudomonads,which are inherently less susceptible than E. coli. Morerecently, fluoroquinolone resistance has emerged in E. coli andother Enterobacteriaceae, contingent on multiple mutationsthat diminish the affinity of its topoisomerase II and IV targetsin various ways, reduce permeability, and upregulate efflux(3). Plasmid-mediated quinolone resistance has been reported,but it is exceptional (4).
We report here resistance trends to ciprofloxacin, the mostwidely used fluoroquinolone in the United Kingdom, in theprevalent Enterobacteriaceae species from bacteremias inEngland and Wales during the 1990s.
F
Emerging Infectious Diseas
blic Health Laboratory, London, United Kingdom; †Commu-ease Surveillance Centre, London, United Kingdom; and
LTH UK, Pinner, Middlesex, United Kingdom
Data Sources
Data CollectionThe surveillance, described previously, depends on the
voluntary reporting of bloodstream isolates by hospital labora-tories in England and Wales (5). The number of laboratoriesreporting data has grown steadily: by 1998, 208 (91%) of the229 establishments in England and Wales listed by the Associ-ation of Medical Microbiologists were participating. Participa-tion by laboratories in Scotland and Northern Ireland islimited, and their data were excluded from our analysis. Mostlaboratories used variants of Stokes’ disc method (6) for sus-ceptibility tests in the period reviewed, but a minority usedbreakpoint tests. Results reported as intermediate werecounted as resistant. Quality control was provided by the labo-ratories’ participation in the National External Quality Assur-ance Scheme and by comparison to results for the smallernumbers of E. coli isolates from bloodstream infections testedat the Central Public Health Laboratory (7).
Prescribing Data for FluoroquinolonesPrescribing data for fluoroquinolones, as defined daily
doses (8), were estimated for retail pharmacies by using IMSHEALTH’s British Pharmaceutical Index (BPI) and for hospi-tals by using Medicare Audit’s Hospital Pharmacy Audit(HPA). The BPI records pharmaceutical sales to retail pharma-cies and dispensing doctors in the United Kingdom, ChannelIslands, and the Isle of Man. Approximately 97% of whole-saler sales to retail and physician outlets and >80% of directsales by manufacturers are recorded; other sales are estimatedfrom a sample of approximately 600 pharmacies. The number
es • Vol. 8, No. 5, May 2002 473

RESEARCH
of pharmacies represented in the BPI remained constant duringthe study period.
The HPA provides information on pharmaceutical con-sumption by National Health Service hospitals, which accountfor >95% of hospital care in the United Kingdom. Most hospi-tals participate: approximately 93% of beds are currently cov-ered. Since 1995, HPA data have been collected monthly fromthe stock control systems of participating hospitals. Most dataare supplied electronically, which minimizes reporting errors.Data include usage of pharmaceuticals among in- and outpa-tient departments and for private patients in NHS hospitals butnot for private patients in designated private hospitals. Before1995, HPA data were collected from wholesalers, manufactur-ers, and a panel of hospitals: approximately 90% of indirectsales to hospitals were received from wholesalers and approxi-mately 40% of direct sales from manufacturers. The panel ofhospitals covered approximately 80% of beds in 1990 and84.5% in 1995.
Statistical AnalysesPoisson regression was performed by using the log (total
number of isolates with resistance information) as an offset todetermine if the proportion of ciprofloxacin-resistant isolateswas changing with any type of pattern over time. S-Plus(Mathsoft Inc., Seattle, WA) was used for calculation.
Results
Species Prevalence and Reporting PatternsDuring the 1990s, the Public Health Laboratory Service
received nearly 392,551 reports of bacteremia in England andWales, including 132,311 that indicated E. coli, klebsiellae,Enterobacter spp., and P. mirabilis as the pathogens isolated.These four species groups thus accounted for 32% to 36% ofall bacteremia results in each year and for 71% to 72% of thoseconcerning gram-negative bacteria (Table 1). E. coli was themost frequently reported pathogen, causing 22% to 25% of allbacteremias in each year, whereas Klebsiella, Proteus, andEnterobacter spp. were among the 10 most frequent isolates.The number of bacteremia reports rose each year (Table 1),reflecting improved reporting rather than an increased inci-dence of disease. A fall in the proportion of reports with sus-ceptibility data in 1997 reflected early problems after a switchto electronic reporting and was not exclusive to ciprofloxacin.
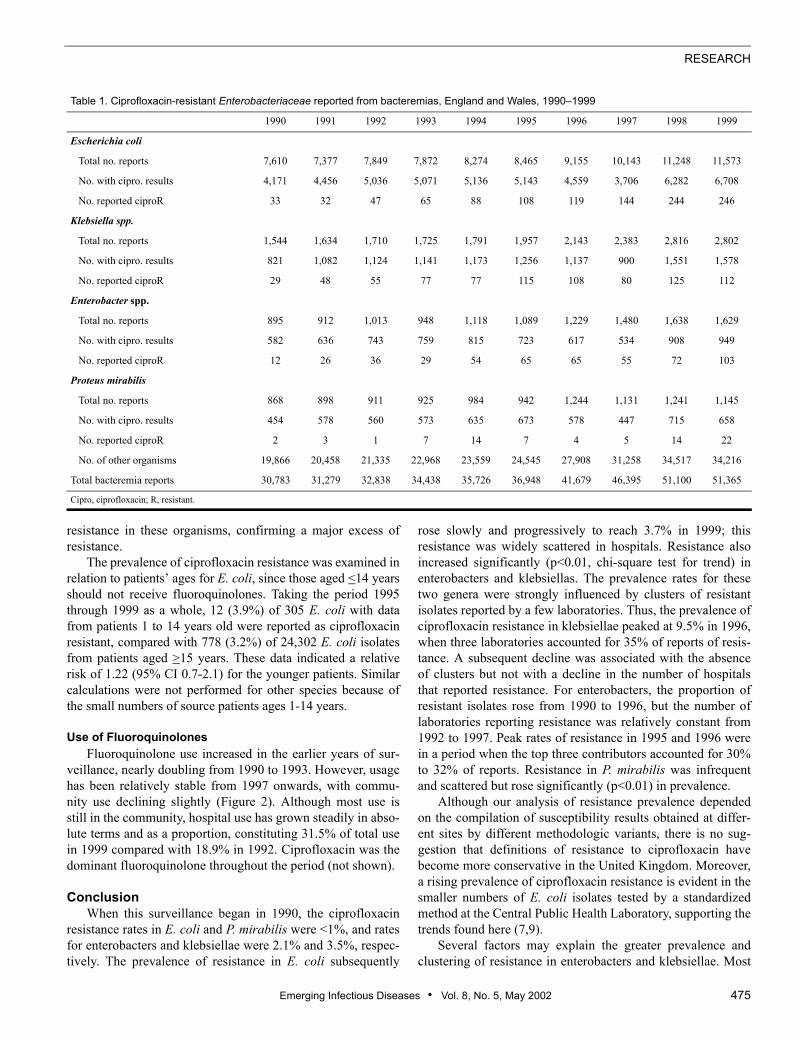
Resistance Trends for Ciprofloxacin Among the reports for E. coli, klebsiellae, Enterobacter
spp., and P. mirabilis, 75,168 (56.8%) had susceptibility datafor ciprofloxacin, confirming widespread testing. Ciprofloxa-cin resistance was extremely rare when surveillance began butsubsequently increased for all four organisms (Figure 1). Theproportion of E. coli isolates reported as resistant rose slowlybut steadily, from 0.8% in 1990 to 3.7% in 1999. For Kleb-siella spp., the resistance rate rose from 3.5% of reports in1990 to 9.5% in 1996, before declining to 7.1% by 1999.
474 Emerging Infectious Diseas
Enterobacter spp. showed a similar pattern to klebsiellae: theprevalence of resistance rose from 2.1% in 1990 to 10.5% in1996, then dipped to 7.9% in 1998 before rising to 10.9% in1999. Only a few P. mirabilis isolates were reported resistantin any year before 1999. Poisson regression showed strongevidence of a trend to increasing resistance for all four organ-isms and suggested that these increases had a nonlinear com-ponent for E. coli, enterobacters, and klebsiellae. If the trendsnevertheless were approximated to be linear, the averageannual increases in the proportion of resistant isolates were asfollows: E. coli, 21.54% (95% confidence intervals [CI] 18.86-24.30); Klebsiella spp., 6.97% (CI 4.41-9.59); Enterobacterspp. 13.97% (CI 10.46-17.58); and P. mirabilis, 21.31% (CI11.38-32.13).
Distribution of ResistanceTo assess the distribution of resistance, we counted, for
each organism in each year: 1) the number of laboratoriesreporting resistant isolates, 2) any laboratories contributing>10% of all reports of resistance, and 3) the proportion ofreports of resistance from the top three contributors (Table 2).The last two criteria were applied only when >30 resistant iso-lates of a species were reported in a year, so that a hospitalwould not appear as a “major contributor” on the basis of threeor fewer resistant isolates.
The number of laboratories reporting resistant E. coli rosefrom 25 in 1990 to 89 in 1999, and no single laboratory evercontributed >10% of all reports of resistance in a year for thisspecies. Laboratories reporting five or more resistant E. coli inyears before 1998 mostly served major teaching hospitals, butmany district general hospitals reported five or more resistantE. coli isolates in 1998 and 1999. Resistance was more local-ized and more prevalent in Klebsiella and Enterobacter spp.than in E. coli. The number of laboratories reporting resistantklebsiellae fluctuated from 36 to 57 after 1992, without obvi-ous trend. During a peak in resistance prevalence, from 1995to 1997, one or two laboratories each contributed >10% of allreports of resistant klebsiellae, and the top three contributorsaccounted for 32% to 39% of reports of resistance. For Entero-bacter spp., laboratories reporting resistance increased from10 in 1990 to 36 in 1992, then fluctuated with little trend until1997, before rising to 40 in 1998 and 58 in 1999. In the peak ofresistance in 1995 and 1996, two laboratories each accountedfor >10% of all reports of resistant enterobacters, and 30% to32% of reports of resistance came from the top three contribu-tors. Resistance was uncommon in P. mirabilis, and clusterswere not evident.
In a further analysis, we identified eight laboratories thatfrequently reported large numbers of resistant E. coli, Kleb-siella spp., and Enterobacter spp. during the entire surveil-lance period. These were in major metropolitan areas andserved teaching hospitals. These laboratories accounted for7.7%, 11.2%, and 10.3% of reports with ciprofloxacin data forE. coli, Klebsiella, and Enterobacter spp. respectively, but for18.2%, 30.9%, and 22.4%, respectively, of reports of
es • Vol. 8, No. 5, May 2002
RESEARCH
resistance in these organisms, confirming a major excess ofresistance.
The prevalence of ciprofloxacin resistance was examined inrelation to patients’ ages for E. coli, since those aged <14 yearsshould not receive fluoroquinolones. Taking the period 1995through 1999 as a whole, 12 (3.9%) of 305 E. coli with datafrom patients 1 to 14 years old were reported as ciprofloxacinresistant, compared with 778 (3.2%) of 24,302 E. coli isolatesfrom patients aged >15 years. These data indicated a relativerisk of 1.22 (95% CI 0.7-2.1) for the younger patients. Similarcalculations were not performed for other species because ofthe small numbers of source patients ages 1-14 years.
Use of FluoroquinolonesFluoroquinolone use increased in the earlier years of sur-
veillance, nearly doubling from 1990 to 1993. However, usagehas been relatively stable from 1997 onwards, with commu-nity use declining slightly (Figure 2). Although most use isstill in the community, hospital use has grown steadily in abso-lute terms and as a proportion, constituting 31.5% of total usein 1999 compared with 18.9% in 1992. Ciprofloxacin was thedominant fluoroquinolone throughout the period (not shown).
ConclusionWhen this surveillance began in 1990, the ciprofloxacin
resistance rates in E. coli and P. mirabilis were <1%, and ratesfor enterobacters and klebsiellae were 2.1% and 3.5%, respec-tively. The prevalence of resistance in E. coli subsequently
Table 1. Ciprofloxacin-resistant Enterobacteriaceae reported from bactere
1990 1991 1992
Escherichia coli
Total no. reports 7,610 7,377 7,849
No. with cipro. results 4,171 4,456 5,036
No. reported ciproR 33 32 47
Klebsiella spp.
Total no. reports 1,544 1,634 1,710
No. with cipro. results 821 1,082 1,124
No. reported ciproR 29 48 55
Enterobacter spp.
Total no. reports 895 912 1,013
No. with cipro. results 582 636 743
No. reported ciproR 12 26 36
Proteus mirabilis
Total no. reports 868 898 911
No. with cipro. results 454 578 560
No. reported ciproR 2 3 1
No. of other organisms 19,866 20,458 21,335 2
Total bacteremia reports 30,783 31,279 32,838 3
Cipro, ciprofloxacin; R, resistant.
Emerging Infectious Diseas
rose slowly and progressively to reach 3.7% in 1999; thisresistance was widely scattered in hospitals. Resistance alsoincreased significantly (p<0.01, chi-square test for trend) inenterobacters and klebsiellas. The prevalence rates for thesetwo genera were strongly influenced by clusters of resistantisolates reported by a few laboratories. Thus, the prevalence ofciprofloxacin resistance in klebsiellae peaked at 9.5% in 1996,when three laboratories accounted for 35% of reports of resis-tance. A subsequent decline was associated with the absenceof clusters but not with a decline in the number of hospitalsthat reported resistance. For enterobacters, the proportion ofresistant isolates rose from 1990 to 1996, but the number oflaboratories reporting resistance was relatively constant from1992 to 1997. Peak rates of resistance in 1995 and 1996 werein a period when the top three contributors accounted for 30%to 32% of reports. Resistance in P. mirabilis was infrequentand scattered but rose significantly (p<0.01) in prevalence.
Although our analysis of resistance prevalence dependedon the compilation of susceptibility results obtained at differ-ent sites by different methodologic variants, there is no sug-gestion that definitions of resistance to ciprofloxacin havebecome more conservative in the United Kingdom. Moreover,a rising prevalence of ciprofloxacin resistance is evident in thesmaller numbers of E. coli isolates tested by a standardizedmethod at the Central Public Health Laboratory, supporting thetrends found here (7,9).
Several factors may explain the greater prevalence andclustering of resistance in enterobacters and klebsiellae. Most
mias, England and Wales, 1990–1999
1993 1994 1995 1996 1997 1998 1999
7,872 8,274 8,465 9,155 10,143 11,248 11,573
5,071 5,136 5,143 4,559 3,706 6,282 6,708
65 88 108 119 144 244 246
1,725 1,791 1,957 2,143 2,383 2,816 2,802
1,141 1,173 1,256 1,137 900 1,551 1,578
77 77 115 108 80 125 112
948 1,118 1,089 1,229 1,480 1,638 1,629
759 815 723 617 534 908 949
29 54 65 65 55 72 103
925 984 942 1,244 1,131 1,241 1,145
573 635 673 578 447 715 658
7 14 7 4 5 14 22
2,968 23,559 24,545 27,908 31,258 34,517 34,216
4,438 35,726 36,948 41,679 46,395 51,100 51,365
es • Vol. 8, No. 5, May 2002 475

RESEARCH
Figure 1. Resistance trends inEscherichia coli, Klebsiella spp.,Enterobacter spp., and Proteusmirabilis, England and Wales,1990–1999.*
*Bars indicate 95% confidenceintervals.
importantly, Enterobacter and Klebsiella spp. are primarilyhospital pathogens, whereas E. coli bacteremias are more oftencommunity acquired. Thus, E. coli accounted for 22.8% of allbacteremias in this surveillance, which included both hospital-and community-acquired infections, but only 12.5% of hospi-tal-acquired bacteremias, as recorded by the NosocomialInfection National Surveillance Scheme (10). Although mostfluoroquinolone use is in the community (Figure 2), the mostintensive use and therefore the greatest selection pressure rela-tive to numbers and concentration of patients is in hospitals.
Table 2. Distribution of reports of ciprofloxacin resistance for Enterobacte
1990 1991 19
Escherichia coli
No. labs reporting ciproR isolates 25 29 3
Labs contributing >10% of ciproR total (n)a 1 0 0
% of all ciproR reports from top three contributorsa 33 19 1
Klebsiella spp.
No. labs reporting ciproR isolates 23 48 3
Labs contributing >10% of ciproR total (n)a - 0 1
% of all ciproR reports from top three contributorsa - 17 2
Enterobacter spp.
No. labs reporting ciproR isolates 10 19 3
Labs contributing >10% of ciproR total (n)a - - 0
% of all ciproR reports from top three contributorsa - - 2
Proteus mirabilis
No. labs reporting ciproR isolates 2 2 1
Labs contributing >10% of ciproR total (n) a - - % of all ciproR reports from top three contributorsa - -aNot calculated if <30 resistant isolates.Cipro, ciprofloxacin; R, resistant; labs, laboratories.
476 Emerging Infectious Diseas
Moreover Klebsiella and Enterobacter infections are moreoften clonal than those involving E. coli; single strains, per-haps resistant, spread to numerous patients (11). Clonal out-breaks seem the likely explanation when small numbers ofhospitals contributed substantially to resistance totals—as wasoften the case for Enterobacter and Klebsiella spp. (Table 2)—but cannot be proved without retained isolates. Bacteremiascaused by quinolone-resistant E. coli may or may not beclonal, even when multiple cases occur in a unit (12,13). Thelaboratories reporting clusters of resistant Enterobacter and
riaceae from bacteremia in hospitals, England and Wales, 1990–1999
92 1993 1994 1995 1996 1997 1998 1999
9 40 57 52 58 68 94 89
0 0 0 0 0 0 0
7 20 13 19 26 17 11 12
8 42 42 47 42 36 57 50
0 0 1 2 2 1 0
9 15 21 32 35 39 23 21
6 27 37 30 35 33 39 58
- 0 2 2 0 0 0
8 - 22 32 30 22 22 16
6 12 6 3 6 12 20
- - - - - - - -
- - - - - - - -
es • Vol. 8, No. 5, May 2002

RESEARCH
Klebsiella spp. mostly served major teaching hospitals, wherefluoroquinolone prophylaxis by hematology departments hasbeen associated with a reduced incidence of bacteremias inneutropenic patients (14) but with more bacteremias beingcaused by fluoroquinolone-resistant strains (15,16).
We did not attempt to comprehensively relate resistanceand prescribing, but three general points can be made. First,the recent decline in community prescribing of fluoroquino-lones (Figure 2) has not affected the upward resistance trend inE. coli, although most E. coli bacteremia is believed to involvenon-nosocomial strains. Second, the rising hospital use of flu-oroquinolones has not been mirrored by an acceleration inupward trend of resistance in Klebsiella and Enterobacter spp.Third, the prevalence of resistant E. coli from bacteremias inpatients 1-14 years old was similar to or higher than that inolder patients, although the younger patients should notreceive fluoroquinolones. These observations imply complexrelationships between use and resistance, demanding prospec-tive investigation.
Except for P. mirabilis, the resistance prevalence ratesfound here resemble those for bacteremias in the UnitedStates, a country with much heavier fluoroquinolone use thanthe United Kingdom. The Surveillance Network database(http://www.mrlworld.com) shows resistance trends (withintermediate counted as resistant) in bloodstream isolates from250 U.S. hospitals as follows: E. coli, 1.8% in 1996 and 4.3%in 1999; Klebsiella spp., 7.1% in 1996 and 6.7% in 1999;Enterobacter spp., 6.6% in 1996 and 6.5% in 1999; and P.mirabilis, 5.7% in 1996 and 12.7% in 1999. Much higher ratesare reported from Barcelona, Spain, where 17% of E. coli iso-lates from community infections were ciprofloxacin resistant(17), and India, where up to 50% of hospital E. coli arereported resistant (18). High rates in E. coli may reflect con-tamination via the food chain: the Spanish study found qui-nolone-resistant E. coli in 90% of chicken feces and notedsimilar fecal carriage rates of resistant E. coli in children and
Figure 2. Fluoroquinolones dispensed by retail (grey) and hospital(black) pharmacies, United Kingdom, 1990–1999.
Emerging Infectious Diseas
adults. Acquisition of resistant E. coli via the food chain mayalso explain why, in our study, resistant E. coli were reportedfrom age groups who should not receive fluoroquinolone ther-apy and its contingent selection pressure.
Ciprofloxacin remains a potent antibiotic; but the slowaccumulation of resistant Enterobacteriaceae is disturbing, notleast because resistance is a class effect, affecting all fluoro-quinolones. Ultimately, this resistance may be partly overcomeby inhibiting the efflux pumps that contribute to the resistance(19), but this strategy is still several years from fruition. In theinterim, the best approach lies in the prudent use of fluoroqui-nolones in humans and animals, coupled with an emphasis onpreventing patient-to-patient spread of resistant strains.
AcknowledgmentsWe are indebted to the hospitals that contributed data. We are
grateful to MRL Inc. of Reston, VA, USA, for permission to cite TheSurveillance Network (TSN) data for the USA.
Dr. Livermore is director of the national reference laboratory forantibiotic resistance for England and Wales. His interests center onthe prevalence trends and biochemical mechanisms of antimicrobialresistance.
References 1. Bauernfeind A, Petermuller C. In vitro activity of ciprofloxacin, norfloxa-
cin and nalidixic acid. Eur J Clin Microbiol 1983;2:111-5. 2. Smith JT. The mode of action of 4-quinolones and possible mechanisms
of resistance. J Antimicrob Chemother 1986;18 Suppl D:21-9. 3. Everett MJ, Jin YF, Ricci V, Piddock LJ. Contributions of individual
mechanisms to fluoroquinolone resistance in 36 Escherichia coli strainsisolated from humans and animals. Antimicrob Agents Chemother1996;40:2380-6.
4. Martinez-Martinez L, Pascual A, Jacoby GA. Quinolone resistance froma transferable plasmid. Lancet 1998;351:797-9.
5. Reacher MH, Shah A, Livermore DM, Wale MC, Graham C, Johnson AP,et al. Bacteremia and antibiotic resistance of its pathogens reported inEngland and Wales between 1990 and 1998: trend analysis. BMJ2000;320:213-16.
6. Report of the Working Party on Sensitivity Testing of the British Societyfor Antimicrobial Chemotherapy. A guide to sensitive testing. J Antimi-crob Chemother 1991;27(Suppl D):1-50.
7. Livermore DM, Threlfall EJ, Reacher MH, Johnson AP, James D,Cheasty T, et al. Are routine sensitivity test data suitable for the surveil-lance of resistance? Resistance rates amongst Escherichia coli from bloodand CSF from 1991-1997, as assessed by routine and centralized testing. JAntimicrob Chemother 2000;45:205-11.
8. WHO Collaborating Centre for Drug Statistics Methodology. ATC Indexwith DDDs 2000. Oslo, Norway.
9. Threlfall EJ, Cheasty T, Graham A, Rowe B. Antibiotic resistance inEscherichia coli isolated from blood and cerebrospinal fluid: a 6-yearstudy of isolates from patients in England and Wales. Int J AntimicrobAgents 1997;9:201-5.
10. Public Health Laboratory Service. Surveillance of hospital acquired bac-teremia in English hospitals 1997-1999. London: the Service; 2000.
11. Dennesen PJ, Bonten MJ, Weinstein RA. Multiresistant bacteria as a hos-pital epidemic problem. Ann Med 1998;30:176-85.
12. Oethinger M, Jellen-Ritter AS, Conrad S, Marre R, Kern WV. Coloniza-tion and infection with fluoroquinolone-resistant Escherichia coli amongcancer patients. Infection 1998;26:379-84.
es • Vol. 8, No. 5, May 2002 477

RESEARCH
13. Yoo JH, Huh DH, Choi JH, Shin WS, Kang MW, Kim CC, et al. Molecu-lar epidemiological analysis of quinolone-resistant Escherichia coli caus-ing bacteremia in neutropenic patients with leukemia in Korea. ClinInfect Dis 1997;25:1385-91.
14. Maschmeyer G. Use of the quinolones for the prophylaxis and therapy ofinfections in immunocompromised hosts. Drugs 1993;45 Suppl 3:73-80.
15. Kern WV, Andriof E, Oethinger M, Kern P, Hacker J, et al. Emergence offluoroquinolone-resistant Escherichia coli at a cancer center. AntimicrobAgents Chemother 1994;38:681-7.
16. Zinner SH. Changing epidemiology of infections in patients with neutro-penia and cancer: emphasis on gram-positive and resistant bacteria. ClinInfect Dis 1999;29:490-4.
478 Emerging Infectious Diseas
InternationaEmerging Infe
2002 Earn Continuin
Most sessions from the InInfectious Diseases, held March able online in webcast format. Ysions or presentations of interest
17. Garau J, Xercavins M, Rodriguez-Carballeira M, Gomez-Vera JR, Coll I,Vidal D, et al. Emergence and dissemination of quinolone-resistantEscherichia coli in the community. Antimicrob Agents Chemother1999;43:2736-41.
18. Nema S, Premchandani P, Asolkar MV, Chitnis DS. Emerging bacterialdrug resistance in hospital practice. Indian J Med Sci 1997;51:275-80.
19. Renau TE, Leger R, Flamme EM, Sangalang J, She MW, Yen R, et al.Inhibitors of efflux pumps in Pseudomonas aeruginosa potentiate theactivity of the fluoroquinolone antibacterial levofloxacin. J Med Chem1999;42:4928-31.
Address for correspondence: David M. Livermore, Antibiotic ResistanceMonitoring & Reference Laboratory, Central Public Health Laboratory, 61Colindale Avenue, London NW9 5HT, United Kingdom; fax: 44-020-8358-3292; e-mail: [email protected]
es • Vol. 8, No. 5, May 2002
l Conference on ctious Diseases, Webcastg Education Creditsternational Conference on Emerging24–27, 2002, in Atlanta, GA, are avail-ou can earn CE credits by viewing ses- to you. http://www.cdc.gov/iceid.
Copyright © 2022 FDOKUMEN