Ciprofloxacin Polymers Derived from Diallyltin and Divinyltin Dihalides
Upload
independentCategory
view
0download
0
Dynamic Article LinksC<Analyst
Cite this: Analyst, 2011, 136, 4119
www.rsc.org/analyst TUTORIAL REVIEW
Dow
nloa
ded
by U
NIV
ER
SID
AD
SA
O P
AU
LO
on
30 S
epte
mbe
r 20
11Pu
blis
hed
on 3
1 A
ugus
t 201
1 on
http
://pu
bs.r
sc.o
rg |
doi:1
0.10
39/C
1AN
1551
3JView Online
Two-dimensional difference gel electrophoresis applied for analyticalproteomics: fundamentals and applications to the study of plant proteomics
Sandra Cristina Capaldi Arruda,a Herbert de Sousa Barbosa,bc Ricardo Antunes Azevedoa
and Marco Aur�elio Zezzi Arruda*bc
Received 21st June 2011, Accepted 28th July 2011
DOI: 10.1039/c1an15513j
The present review reports the principles, fundamentals and some applications of two-dimensional
difference gel electrophoresis for analytical proteomics based on plant proteome analysis, also
emphasizing some advantages of 2-D DIGE over 2-D PAGE techniques. Some fluorescent protein
labeling reagents, methods of protein labeling, models of 2-D DIGE experiments, and some limitations
of this technique are presented and discussed in terms of 2-D DIGE plant proteomes. Finally, some
practical applications of this technique are pointed out, emphasizing its potentialities in plant
proteomics.
aLaboratory of Genetics and Biochemistry of Plants, Department ofGenetics, Escola Superior de Agricultura Luiz de Queiroz, ESALQ,USP, 13400-970 Piracicaba, SP, BrazilbSpectrometry, Sample Preparation and Mechanization Group-GEPAM,Institute of Chemistry, University of Campinas – UNICAMP, P.O. Box6154, 13083-970 Campinas, SP, BrazilcNational Institute of Science and Technology for Bioanalytics, Institute ofChemistry, University of Campinas – UNICAMP, P.O. Box 6154, 13083-970 Campinas, SP, Brazil
Sandra Cristina Capaldi Arruda
Dr Sandra Arruda received her
degree in Forestry from the
Univesity of Sao Paulo
(ESALQ/USP) in 1996. In the
period between 1993 and 1995
made part of undergraduate
reserach at the Botanical
Garden (C�ordoba, Spain). In
2000 she received the MSc
degree in Sciences from
ESALQ/USP, and the PhD in
Sciences (2004) at Center for
Nuclear Energy in Agriculture
(CENA/USP). Currently she is
developing a Post-Doctoral
program in plant proteomics and enzymology at the Laboratory of
Genetics and Biochemistry of Plants (ESALQ/USP).
This journal is ª The Royal Society of Chemistry 2011
1. Introduction
The word proteomics was coined in 1996 by Wilkins et al.1 and is
defined as the study of the overall protein composition of an
organism, cell or organelle. In this context, one of the main
targets of studies of proteomics is to establish possible
biomarkers in biological systems.2 In this way, studies of protein
changes in biological organisms are frequently carried out
through polyacrylamide gels by evaluation of their images,
providing relevant information for comparative proteomic
studies3 as well as using appropriate mass spectrometric tech-
niques for evaluating the identity of the studied proteins.4,5
Herbert de Sousa Barbosa
Dr Herbert Barbosa received his
degree in Chemistry from
Federal University of Piau�ı
(2004), Master in Analytical
Chemistry, Federal University
of Piau�ı (2007) and Ph.D. in
Analytical Chemistry by the
University of Campinas (Uni-
camp). He has experience in
Analytical Chemistry, with
emphasis on Bioanalytics, acting
on the following topics: electro-
phoresis gels, mass spectrometry
molecular types (MALDI-MS
and ESI-MS) and atomic (ICP-
MS) and proteomics and met-
allomics comparatives. Currently developing a Post-Doctoral
project at the Spectrometry, Sample Preparation and Mechani-
zation Group – GEPAM in Department of Analytical Chemistry,
Institute of Chemistry, UNICAMP-SP.
Analyst, 2011, 136, 4119–4126 | 4119
Dow
nloa
ded
by U
NIV
ER
SID
AD
SA
O P
AU
LO
on
30 S
epte
mbe
r 20
11Pu
blis
hed
on 3
1 A
ugus
t 201
1 on
http
://pu
bs.r
sc.o
rg |
doi:1
0.10
39/C
1AN
1551
3JView Online
Within this scenario, analytical proteomics is an area of
utmost importance within the analytical context.6 For compar-
ative proteomic studies, two-dimensional polyacrylamide gel
electrophoretic (2-D PAGE) separations are the most used
platform, due to their high resolution, allowing either high effi-
ciency protein separation or the identification of potential
protein spots with differences in concentration or expression in
the gels evaluated.2,6–8 The earliest applications of 2-D PAGE
were attempted ca. 30 years ago.9,10
However, comparison between different separations on these
gels, which is made by analyzing their digitized images, requires
constant attention by the analyst, due to the personalized inter-
pretationof thedataobtained.3Another issue involved inproteomic
studies that use comparative 2-D PAGE analysis of gels images lies
in the large variation that exists between gels, resulting in poor
reproducibility as well as in the difficulty in making accurate
measurementsof the proteins resolved in thegels.11These variations
can be attributed to the sample preparation method employed,
natural variations when considering biological samples, and varia-
tions related to the electrophoretic system used, among others.3,12,13
In this context, a promising alternative to these limitations is
two-dimensional difference gel electrophoresis (2-D DIGE),
which is detailed in this text. This technique,14 which is based on
fluorescent cyanine dyes, allows comparisons between two exact
quantitative proteomic samples, which are resolved on the same
gel, minimizing the problems mentioned above.15 Moreover,
there is the advantage of the high sensitivity of these dyes (ca.
1 fmol of protein), which enables the detection of low abundance
proteins when compared to other dyes used in the detection of
protein spots, such as Coomassie Brilliant Blue (CBB) and silver
staining.16 Even though excellent results can be achieved when
2-D DIGE is used, the necessity of protein identification through
mass spectrometric techniques is imperative for making sense of
these proteomics studies.17,18
Thus, by describing the potentialities of 2-D DIGE, using
a few studies involving this technique in plant proteomics, this
Ricardo Antunes Azevedo
Dr Ricardo Azevedo receives the
degree in Biological Sciences
from the Catholic University of
Campinas (1983), Master in
Plant Genetics from the
University of Campinas (1988)
and Ph.D. (1992) and post-
doctoral (1997) in Plant
Biochemistry from the Univer-
sity of Lancaster, England.
Since March 2001 he works as
Research Fellow at the Univer-
sity of Lancaster, England. He
is Professor at the University of
Sao Paulo since 1993, and Full
Professor since 2009. The main
research lines in Physiological and Biochemical Genetics of Plants
with an emphasis in Botany (Plant Physiology) refers to amino
acids and nitrogen metabolism, and oxidative stress by heavy
metals.
4120 | Analyst, 2011, 136, 4119–4126
review emphasizes the fundamentals of 2-D DIGE in order to
present some of its characteristics to the readers, as well as some
applications in plant proteomics, also emphasizing the impor-
tance of analytical procedures within the context of proteomics.
2. Fundamentals of the 2-D DIGE technique
In 1997, €Unlu et al.14 first described a modification of two-
dimensional (2-D) polyacrylamide gel electrophoresis, showing
that in a single gel reproducible differences between two protein
samples are detected. The system was accomplished by the
fluorescent tagging of two samples with two distinct dyes. These
samples were then run on the same 2-D gel, with post-run fluo-
rescence imaging of the gel into the two images. The images were
superimposed. The authors introduced the amine reactive dyes in
order to insure that the same relative mobility could be achieved
for common proteins for both samples, regardless of the dye
used. This technique was named difference gel electrophoresis
(DIGE) and Drosophila embryo extracts were used as samples.
The authors indicated that DIGE was reproducible and sensitive
at the nanogram level.
The principle involved in the DIGE technique is that different
dyes provide different fluorescence wavelengths for detection,
allowing two or more differentially labeled samples to be
combined before IEF as well as to be resolved using the same 2-D
gel. Frequently, three samples are labeled in 2-D DIGE: two of
them are experimental samples whereas the third sample is
composed of a mixture of equal amounts of all experimental
samples (i.e., a pooled internal standard). This creates a standard
for each protein during analysis. The protein samples are then
visualized using fluorescence imaging, which enables the detec-
tion of differences between protein abundances in the samples.
Therefore, the image processing software divides corresponding
pixels into separate images after background subtraction and
normalization. The resulting image ratio enables the visualiza-
tion of the differences between the two samples.16 As well as
Marco Aur�elio Zezzi Arruda
Dr Marco Arruda received his
degree in Industrial Chemistry
from the Methodist University
of Piracicaba (1987), Master in
Nuclear Energy in Agriculture
by the Center for Nuclear
Energy in Agriculture (1990),
Ph.D. in Analytical Chemistry
from the University of Cordoba
(1995) and post-doctoral fellow
at the Center for Nuclear
Energy in Agriculture by the
Center for Nuclear Energy in
Agriculture (1995–1996). He is
currently Full Professor at the
University of Campinas. He has
experience in Analytical Chemistry, acting on the following topics:
Bioanalytics, sample preparation, mass and atomic spectrometry
and mechanization.
This journal is ª The Royal Society of Chemistry 2011
Dow
nloa
ded
by U
NIV
ER
SID
AD
SA
O P
AU
LO
on
30 S
epte
mbe
r 20
11Pu
blis
hed
on 3
1 A
ugus
t 201
1 on
http
://pu
bs.r
sc.o
rg |
doi:1
0.10
39/C
1AN
1551
3JView Online
reducing the number of gels that need to be run, the differentially
labeled samples are subjected to the same handling procedures.15
Consequently, variation in spot intensities due to gel-specific
experimental factors, for example, protein loss during sample
insertion into the IPG strip, will be the same for each sample
within a single DIGE gel. In this sense, the relative amount of
a protein in a gel in one sample compared to another one will be
unaffected, raising the confidence to which protein changes can
be detected and quantified.15,19
This system may analyze up to 0.25 mg of proteins per sample
and two samples are compared in each gel at the same time.
When detectivity is required, fluorescence scanning may provide
better detection than silver staining, making detectional proteins
with <2-fold expression differences possible.
Comparing the advantages of DIGE over traditional 2-D
PAGE, some interesting characteristics can be pointed out:
� Multiplexing: the labeled samples are mixed and then
separated on the same 2-D PAGE gel. Thus, for samples on the
same DIGE gel, gel-to-gel variation is completely eliminated and
the number of gels needed for one experiment can be decreased
by 2–3-fold.
� Gel-to-gel comparison: as already mentioned, one of the
three samples labeled on a DIGE gel can be a mixture of equal
amounts of all experimental samples, creating a standard for
each protein during analysis. Therefore, comparisons across
different samples can be made with a high degree of confidence.
� User-friendly manipulation: large format gels are cumber-
some to handle. Since proteins in DIGE are pre-labeled, no
DIGE gel manipulation after electrophoresis is necessary.
Additionally, the scanner used for imaging accepts gel-sand-
wiches, including the glass plates, with a further reduction of the
variation between gels as well as the risk of them being damaged.
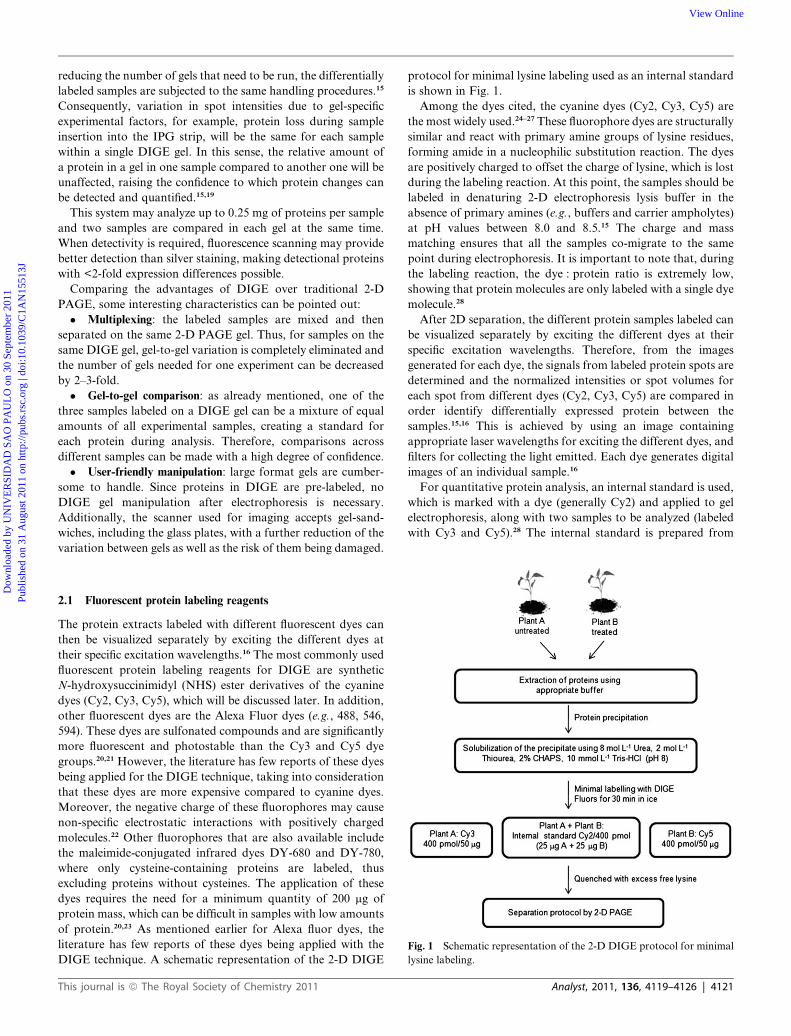
Fig. 1 Schematic representation of the 2-D DIGE protocol for minimal
lysine labeling.
2.1 Fluorescent protein labeling reagents
The protein extracts labeled with different fluorescent dyes can
then be visualized separately by exciting the different dyes at
their specific excitation wavelengths.16 The most commonly used
fluorescent protein labeling reagents for DIGE are synthetic
N-hydroxysuccinimidyl (NHS) ester derivatives of the cyanine
dyes (Cy2, Cy3, Cy5), which will be discussed later. In addition,
other fluorescent dyes are the Alexa Fluor dyes (e.g., 488, 546,
594). These dyes are sulfonated compounds and are significantly
more fluorescent and photostable than the Cy3 and Cy5 dye
groups.20,21 However, the literature has few reports of these dyes
being applied for the DIGE technique, taking into consideration
that these dyes are more expensive compared to cyanine dyes.
Moreover, the negative charge of these fluorophores may cause
non-specific electrostatic interactions with positively charged
molecules.22 Other fluorophores that are also available include
the maleimide-conjugated infrared dyes DY-680 and DY-780,
where only cysteine-containing proteins are labeled, thus
excluding proteins without cysteines. The application of these
dyes requires the need for a minimum quantity of 200 mg of
protein mass, which can be difficult in samples with low amounts
of protein.20,23 As mentioned earlier for Alexa fluor dyes, the
literature has few reports of these dyes being applied with the
DIGE technique. A schematic representation of the 2-D DIGE
This journal is ª The Royal Society of Chemistry 2011
protocol for minimal lysine labeling used as an internal standard
is shown in Fig. 1.
Among the dyes cited, the cyanine dyes (Cy2, Cy3, Cy5) are
the most widely used.24–27 These fluorophore dyes are structurally
similar and react with primary amine groups of lysine residues,
forming amide in a nucleophilic substitution reaction. The dyes
are positively charged to offset the charge of lysine, which is lost
during the labeling reaction. At this point, the samples should be
labeled in denaturing 2-D electrophoresis lysis buffer in the
absence of primary amines (e.g., buffers and carrier ampholytes)
at pH values between 8.0 and 8.5.15 The charge and mass
matching ensures that all the samples co-migrate to the same
point during electrophoresis. It is important to note that, during
the labeling reaction, the dye : protein ratio is extremely low,
showing that protein molecules are only labeled with a single dye
molecule.28
After 2D separation, the different protein samples labeled can
be visualized separately by exciting the different dyes at their
specific excitation wavelengths. Therefore, from the images
generated for each dye, the signals from labeled protein spots are
determined and the normalized intensities or spot volumes for
each spot from different dyes (Cy2, Cy3, Cy5) are compared in
order identify differentially expressed protein between the
samples.15,16 This is achieved by using an image containing
appropriate laser wavelengths for exciting the different dyes, and
filters for collecting the light emitted. Each dye generates digital
images of an individual sample.16
For quantitative protein analysis, an internal standard is used,
which is marked with a dye (generally Cy2) and applied to gel
electrophoresis, along with two samples to be analyzed (labeled
with Cy3 and Cy5).28 The internal standard is prepared from
Analyst, 2011, 136, 4119–4126 | 4121
Dow
nloa
ded
by U
NIV
ER
SID
AD
SA
O P
AU
LO
on
30 S
epte
mbe
r 20
11Pu
blis
hed
on 3
1 A
ugus
t 201
1 on
http
://pu
bs.r
sc.o
rg |
doi:1
0.10
39/C
1AN
1551
3JView Online
a mixture of equal amounts of proteins from two samples and
therefore contains all proteins that are present in each
sample.15,28 Thus, each protein has a single signal in the internal
standard, which is used for a direct quantitative comparison
within each gel and for normalizing the abundance values for
each protein when comparing different gels. As a consequence,
the abundance of each protein spot in a biological sample can be
measured as a ratio (not a volume) to its corresponding spot
present in the internal standard. In this way, as each sample spot
map is co-detected with a standard spot map, all of the spots are
compared in the gel to the same pooled standard. This enables
accurate quantification and accurate spot statistics between gels
and, most importantly, separation of experimental gel-to-gel
variation from biological variation in studying protein spot
abundance. Each sample will contain an image with a similar
spot pattern, simplifying and improving the confidence of inter-
gel spot matching. This is not possible with conventional 2-D
PAGE because of the high level of variation associated with all
samples running on individual gels.16,28
A study of the effect of the internal standard on experimental
variation was carried out by Alban et al.28 In this work, the
authors show that the coefficient of variation was larger for the
non-standardized abundance spot (spot volumes) than the
standardized abundance spot (spot volume ratios). In conclu-
sion, the authors say that comparisons of in-gel spot volume
ratio measurements from different gels results in less experi-
mental variation than when comparing spot volumes from
different gels, showing that the inclusion of the pooled standard
in the experimental design does greatly reduce experimental
variation.
Kieffer et al.27 showed an example of the use of the internal
standard in which 2-D DIGE and mass spectrometry (MALDI-
QTOF) were used to investigate the effects of Cd exposure in
a hydroponic culture of young poplar leaves, due to the delete-
rious effects of this metal on the growth and development of
plants. The control and Cd-treated samples were labeled with
Cy3 and Cy5 dyes, respectively. The internal standard, formed by
pooling equal quantities of the two samples, was labeled with
Cy2. The results pointed out that 125 spots were identified with
an absolute variation of at least 1.5-fold between control and
treated samples.
Regarding the process of labeling proteins, two alternative
concepts are involved: minimum labeling by attaching the dye to
the amino group of lysine residues and saturation labeling of all
cysteine residues. The main commercial reagents are produced by
GE Healthcare and named CyDye DIGE fluor minimal (Cy2,
Cy3 and Cy5) and CyDye DIGE fluor saturation dyes (Cy3 and
Cy5 maleimide derivatives). These methods of protein labeling
are discussed below.
2.2 Minimal and saturation labeling
The choice of the dye for protein labeling takes into account the
mass of protein available for labeling, where the minimal dyes are
suitable for detecting differences between protein abundance
when 50 mg of protein is used, since the saturation dyes are
suitable for detecting protein abundance when only 5 mg of
protein is used.16,29 These two DIGE labeling options, com-
mented upon above, provide rapid methods for preparing
4122 | Analyst, 2011, 136, 4119–4126
differentially labeled samples for comparative proteomics studies
based on fluorescence.30
The minimal labeling of lysine residues due to the very low
ratio between dye and protein, where the only protein molecules
visualized on the gel, are those labeled with a single dye molecule.
Only 3–5% of the total protein present in the sample is labeled
using these dyes, where the minimal dyes add ca. 500 Da to the
labeled protein. This shows that the increase in protein mass
makes a negligible impact on the apparent molecular mass of
proteins.30 It is important to note that because the Cy2, Cy3 and
Cy5 dyes are matched in terms of charge and molar mass, the
same protein labeled with any of these dyes will migrate to the
same position on a 2-D gel.16 In this sense, this labeling method is
applied in most studies reported in the literature.
An experimental procedure for minimal labeling using Cy2,
Cy3 and Cy5 dyes uses 400 pmol of each dye to be added to 50 mg
of protein of each sample and the pooled standard, this ratio
being recommended by the manufacturer.29 Considering the high
cost of these dyes, another option would be the reduction of the
amount of dye applied to the sample, increasing the number of
samples that can be analyzed. For example, Di Carli et al.26 used
this strategy for comparing the leaf proteome of transgenic plants
expressing antiviral antibodies, where about 2000 spots were
detected on gels. Thus, when a sample has a relatively large
amount of proteins, a decrease of the amount of dye applied to
the sample is possible, without loss of protein visualization in the
gel.
The saturation dyes label all available cysteine groups in each
protein, where the reagents for saturation labeling dyes comprise
Cy3 and Cy5 maleimide derivatives,31 which are designed to form
a covalent bond with the thiol group of cysteine residues in
a protein via a thioether linkage.16 This is based on the principle
that, generally, there are fewer cysteines residues per protein, so
that higher stoichiometric labeling of protein cysteines can be
achieved without compromising sample solubility.15 These dyes
are suitable for saturation labeling of all cysteine residues,
allowing an improvement in detectivity for protein detection and
enabling successful 2-D DIGE analysis of samples with low
protein concentrations.16,30 However, due to the relative low
prevalence of cysteine residues in proteins, high amounts of dye
are necessary for this labeling strategy.
The literature reports these dyes are being used for labeling
samples with low protein contents, such as infected ticks32 and
tissues samples isolated by laser micro-dissection.33–35 Further-
more, a study to identify cysteine modifications in proteins has
also been reported.36 Curiously, so far there are no studies in the
literature reporting the application of these dyes in plant
samples, considering that this type of sample has relatively high
amounts of proteins.
2.3 Models of 2-D DIGE experiments
The great interest in the field of analytical proteomics has
enabled scientists to obtain a large amount of information from
different samples. The 2-D DIGE technique allows the identifi-
cation of protein expression changes in proteomes of biological
samples with higher accuracy. The introduction of an internal
standard led to an increase in accuracy, and multiplexing of
This journal is ª The Royal Society of Chemistry 2011
Dow
nloa
ded
by U
NIV
ER
SID
AD
SA
O P
AU
LO
on
30 S
epte
mbe
r 20
11Pu
blis
hed
on 3
1 A
ugus
t 201
1 on
http
://pu
bs.r
sc.o
rg |
doi:1
0.10
39/C
1AN
1551
3JView Online
samples using different fluorescent dyes reduces systematic
variation.14,28,30
In addition, 2-D DIGE also enables the use of experimental
designs that would not be possible using conventional 2-D
PAGE to enable an accurate statistical analysis of protein
expression, taking into account the biological variations that are
expected between experiments. This is possible, because the
pooled control sample labeled with Cy2, and run on each gel, acts
as an internal standard to ensure that each protein in the samples
should appear in the entire quantity of the gels. The Cy3 or Cy5
labeled sample is then compared to the same internal standard
and measurements are taken relative to the internal Cy2 stan-
dard, reducing gel-to-gel variation and increasing statistical
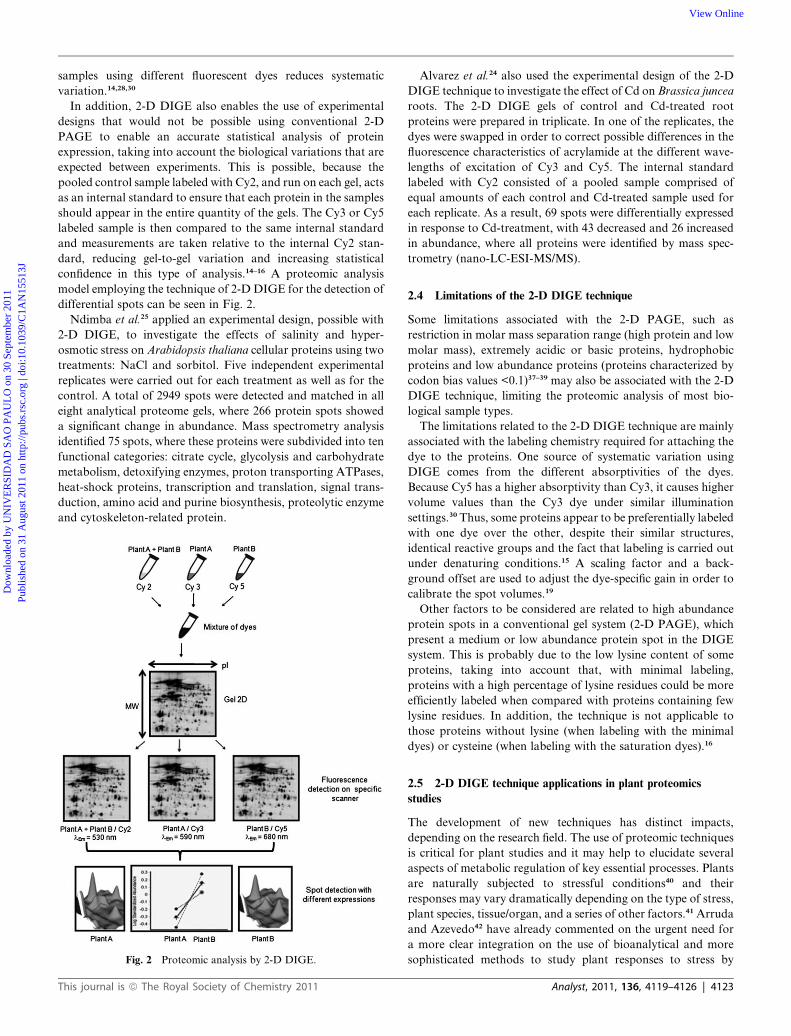
confidence in this type of analysis.14–16 A proteomic analysis
model employing the technique of 2-D DIGE for the detection of
differential spots can be seen in Fig. 2.
Ndimba et al.25 applied an experimental design, possible with
2-D DIGE, to investigate the effects of salinity and hyper-
osmotic stress on Arabidopsis thaliana cellular proteins using two
treatments: NaCl and sorbitol. Five independent experimental
replicates were carried out for each treatment as well as for the
control. A total of 2949 spots were detected and matched in all
eight analytical proteome gels, where 266 protein spots showed
a significant change in abundance. Mass spectrometry analysis
identified 75 spots, where these proteins were subdivided into ten
functional categories: citrate cycle, glycolysis and carbohydrate
metabolism, detoxifying enzymes, proton transporting ATPases,
heat-shock proteins, transcription and translation, signal trans-
duction, amino acid and purine biosynthesis, proteolytic enzyme
and cytoskeleton-related protein.
Fig. 2 Proteomic analysis by 2-D DIGE.
This journal is ª The Royal Society of Chemistry 2011
Alvarez et al.24 also used the experimental design of the 2-D
DIGE technique to investigate the effect of Cd on Brassica juncea
roots. The 2-D DIGE gels of control and Cd-treated root
proteins were prepared in triplicate. In one of the replicates, the
dyes were swapped in order to correct possible differences in the
fluorescence characteristics of acrylamide at the different wave-
lengths of excitation of Cy3 and Cy5. The internal standard
labeled with Cy2 consisted of a pooled sample comprised of
equal amounts of each control and Cd-treated sample used for
each replicate. As a result, 69 spots were differentially expressed
in response to Cd-treatment, with 43 decreased and 26 increased
in abundance, where all proteins were identified by mass spec-
trometry (nano-LC-ESI-MS/MS).
2.4 Limitations of the 2-D DIGE technique
Some limitations associated with the 2-D PAGE, such as
restriction in molar mass separation range (high protein and low
molar mass), extremely acidic or basic proteins, hydrophobic
proteins and low abundance proteins (proteins characterized by
codon bias values <0.1)37–39 may also be associated with the 2-D
DIGE technique, limiting the proteomic analysis of most bio-
logical sample types.
The limitations related to the 2-D DIGE technique are mainly
associated with the labeling chemistry required for attaching the
dye to the proteins. One source of systematic variation using
DIGE comes from the different absorptivities of the dyes.
Because Cy5 has a higher absorptivity than Cy3, it causes higher
volume values than the Cy3 dye under similar illumination
settings.30Thus, some proteins appear to be preferentially labeled
with one dye over the other, despite their similar structures,
identical reactive groups and the fact that labeling is carried out
under denaturing conditions.15 A scaling factor and a back-
ground offset are used to adjust the dye-specific gain in order to
calibrate the spot volumes.19
Other factors to be considered are related to high abundance
protein spots in a conventional gel system (2-D PAGE), which
present a medium or low abundance protein spot in the DIGE
system. This is probably due to the low lysine content of some
proteins, taking into account that, with minimal labeling,
proteins with a high percentage of lysine residues could be more
efficiently labeled when compared with proteins containing few
lysine residues. In addition, the technique is not applicable to
those proteins without lysine (when labeling with the minimal
dyes) or cysteine (when labeling with the saturation dyes).16
2.5 2-D DIGE technique applications in plant proteomics
studies
The development of new techniques has distinct impacts,
depending on the research field. The use of proteomic techniques
is critical for plant studies and it may help to elucidate several
aspects of metabolic regulation of key essential processes. Plants
are naturally subjected to stressful conditions40 and their
responses may vary dramatically depending on the type of stress,
plant species, tissue/organ, and a series of other factors.41 Arruda
and Azevedo42 have already commented on the urgent need for
a more clear integration on the use of bioanalytical and more
sophisticated methods to study plant responses to stress by
Analyst, 2011, 136, 4119–4126 | 4123
Dow
nloa
ded
by U
NIV
ER
SID
AD
SA
O P
AU
LO
on
30 S
epte
mbe
r 20
11Pu
blis
hed
on 3
1 A
ugus
t 201
1 on
http
://pu
bs.r
sc.o
rg |
doi:1
0.10
39/C
1AN
1551
3JView Online
metals. The proteomic approach using 2-D DIGE is a major step
forward so that new advances in terms of gathering information
are achieved.
An increase in 2-D DIGE applications is achieved in the recent
literature as a supporting proteomic method in expression
profiling. This technique has been widely used to assess proteome
changes as well as to find biomarkers in a wide variety of situa-
tions, such as cancer and clinical proteomics studies.43–46 Due to
development in plant physiological, proteomic and biochemical
areas, as well as in order to contribute to increasing progress
obtained in plant proteomics and genomics studies, an overview
is provided in this section related to the uses and benefits of 2-D
DIGE methodology in plant proteomics.
The majority of the examples follow a similar pattern in terms
of 2-D DIGE analysis, in accordance with the manufacturer’s
indication, and the samples are treated as in the 2-D PAGE
technique. In order to make the text more amenable to the
readers, the discussion will focus on the objective and on the
results obtained, which can include, or not, the use of the 2-D
DIGE with other techniques such as: differential isotope tagging
strategies coupled to non-gel-based LC-MS, MS-MS analysis,
MALDI-TOF, mLC-ESI-IT-MS-MS, ESI-MS-MS analysis, and
RNA isolation followed by RT-PCR, among others.
Marouga et al.16 commented about the development of 2-D
DIGE and pointed out the advantage of this technique over the
traditional 2-D PAGE. According to these authors, the great
advantage is related to the ability of 2-D DIGE to deal with
complex lysates and to simultaneously visualize large parts of the
interested proteome. Because of this, the authors commented
that the development and the use of new techniques continue to
complement rather than replace 2-D DIGE.
In order to emphasize the use of 2-DDIGE in proteomic studies,
particularly for those related to cell organelles, Lilley andDupree47
discussed some methods for quantitative proteomics analysis in
plant organelle characterization in a review paper. Among all the
discussed topics, they concluded that, due to the necessity of
knowing the subcellular localization of proteins, 2-DDIGE as well
as differential isotope tagging strategies coupled to non-gel-based
LC-MS were proven to be useful in this area of research.
For berries, an important culture for the economy of many
countries, changes in the metabolome during the maturation
process have been well documented, but the biological events
which occur at the protein level have yet to be fully investigated.
According to Di Carli et al.,48 in order to gain new insights into
the post-harvest withering process, they studied the protein
expression profiles of grape (Corvina variety) development,
focusing on withering. The authors decided, using 2-D DIGE
and to avoid artifacts due to preferential labeling and to ensure
statistical significance, to apply a random design with a dye-swap
approach. A total of 12 gels were run, 11 analytical gels repre-
senting 3–4 biological replicates according to the experimental
design. One preparative gel was used for transgenic plant and
protein interaction studies. According to the authors, the
detection of 90 proteins differentially expressed was possible by
using the 2-D DIGE during grape ripening/withering. From
these 90 proteins, 72 were identified by MS-MS analysis. These
results represent an important insight into the withering process
in terms of both Vitis germplasm characterization and
knowledge.
4124 | Analyst, 2011, 136, 4119–4126
In another example in which the 2-D DIGE technique was
successfully employed, Di Carli et al.26 investigated whether the
expression in plants of recombinant antibodies directed against
viral proteins may influence the host leaf proteome. The authors
utilized two transgenic plant models, Lycopersicon esculentum cv.
MicroTom and Nicotiana benthamiana. Results revealed that,
among the 2000 spots, about 10 were differentially expressed in
both transgenic models. The spots were identified by MALDI-
TOF PMF and mLC- ESI-IT-MS-MS procedures. The results
presented by the authors suggest that the expression of
recombinant antibodies in both evaluated transgenic systems
does not significantly alter the leaf proteomic profile expressing
antiviral antibodies. As a special aid, the authors emphasize that
this work represents the first demonstration, based on proteome
analysis, that engineered plants expressing low levels of anti-
bodies can be safely and effectively used to obtain protection
against viruses. Moreover, the authors referred to other trans-
genic systems as a ‘new model of study’ since they pointed out
that ‘every new genetically modified plant has to be considered as
unique and, therefore, analyzed as a result of an independent
DNA integration event’.
Amme et al.49 applied 2-D DIGE in order to evaluate the
proteome analysis of cold stress response in Arabidopsis thaliana.
In this report, protein labelling was performed using the CyDyes
DIGE Fluors according to the manufacturer’s recommended
protocol. The results revealed that many of the proteins analyzed
were previously reported in cold-stress response studies, indi-
cating that the employed methodology was valid. As a conclu-
sion, authors emphasized the capacity of proteome approaches
to analyze cellular mechanisms at the protein level, which can
contribute to understanding the complexity of plant defense
responses.
Delaplace et al.,50 working on the post-harvest ageing of
potato (Solanum tuberosum L.) tubers stored under realistic
agronomical conditions (270 days, 4 �C), applied 2-D DIGE for
proteomic analyses. The authors observed during ageing that the
differentially expressed proteins were involved mainly in starch
catabolism, control of protein conformation, protein recycling,
and stress response. Moreover, 14 breakdown products of
patatin increased during ageing, indicating enhanced patatin
proteolysis. They concluded that all the changes observed during
ageing appeared to allow the potato tubers to maintain their
radical scavenging activity until the end of the storage period, as
no increase of oxidative damage was observed. Besides this, the
authors commented that the all data are interpreted considering
the impact of reactive oxygen species (ROS) on the development
and the behavior of other plant systems undergoing ageing or
senescence processes. The results showed that using 2-D DIGE,
five spots were found to vary in intensity during the post-harvest
ripening process and that it was possible to identify two proteins,
that are related to Ca2+-calmodulin-dependent kinases. The
authors commented that these proteins are good candidates for
future studies in post-harvest ripening.
In order to better understand the early development of
Cunninghamia lanceolata [(Lamb.) Hook] seed embryos from
a proteomic point of view, Shi et al.51 carried out a proteomic
analysis of Cunninghamia seeds in six developmental stages
during early embryogenesis. Results revealed 136 spots that
differed in kinetics of appearance. A posterior analysis by liquid
This journal is ª The Royal Society of Chemistry 2011
Dow
nloa
ded
by U
NIV
ER
SID
AD
SA
O P
AU
LO
on
30 S
epte
mbe
r 20
11Pu
blis
hed
on 3
1 A
ugus
t 201
1 on
http
://pu
bs.r
sc.o
rg |
doi:1
0.10
39/C
1AN
1551
3JView Online
chromatography coupled to tandem mass spectrometry and
MALDI-TOF mass spectrometry identified proteins represented
by 71 of the spots. According to the data, these proteins are
involved in programmed cell death and chromatin modification.
The authors commented that the proteins may play a central role
in determining the number of zygotic embryos generated and
controlling embryo patterning and shape remodeling. These
results could provide important information for plant cloning
procedures and for the establishment of platforms for research
into plant development/regulation and in vitro transgenic studies
as well as to better understand the somatic embryogenesis
process.
Two ongoing projects in our laboratories are using 2-DDIGE:
one to study plant–pathogen interactions using sugarcane
Leifsonia xyli subsp. xyli, and the second to evaluate possible
alterations in the proteome map in transgenic and non-trans-
genic soybean (Glycine max L. Merril) seeds, leaves and roots,
and its correlation with oxidative stress. Studies of metal-induced
stress signaling in plants can also dramatically benefit from these
refined techniques.
As a matter of fact, the results reported in the papers cited in
this section are just a few examples that confirm how important
the systems biology approach is, an interdisciplinary study field
that focuses on complex interactions in biological systems.
3. Conclusions
This review points out the importance of the 2-D DIGE tech-
nique in order to contribute to improving analytical proteomics
research in plant proteomics. When considering the totality of
2-D DIGE applications in the literature (from Web of Science),
only 3.7% of the published manuscripts refer to plant proteo-
mics. This is a curious situation, since different models frequently
used in human and clinical studies are taken from ones based on
plant studies.
Additionally, it is important to mention that 2-D DIGE
studies show the necessity of transdisciplinary work, since not
only biochemical, physiological and biological concepts are
important, but also those based on analytical ones, again sup-
porting the idea of systems biology. Only with a well optimized
method, which involves good sample preparation, well-defined 2-
D DIGE parameters, skilled analysts for obtaining good
labeling, among others, can results be accurately obtained, thus
making sense in terms of proteomic analysis.
Acknowledgements
The authors thank the Fundacao de Amparo �a Pesquisa do
Estado de Sao Paulo (FAPESP, Brazil), the Conselho Nacional
de Desenvolvimento Cient�ıfico e Tecnol�ogico (CNPq, Brazil),
the Coordenacao de Aperfeicoamento de Pessoal de N�ıvel
Superior (CAPES, Brazil), and the Financiadora de Estudos e
Projetos (FINEP, Brazil) for financial support and fellowships.
References
1 M. R. Wilkins, J. C. Sanchez, K. L. Williams and D. F. Hochstrasser,Electrophoresis, 1996, 17, 830–838.
This journal is ª The Royal Society of Chemistry 2011
2 J. E. Bandow, J. D. Baker, M. Berth, C. Painter, O. J. Sepulveda,K. A. Clark, I. Kilty and R. A. VanBogelen, Proteomics, 2008, 8,3030–3041.
3 M. Berth, F. M. Moser, M. Kolbe and J. Bernhardt, Appl. Microbiol.Biotechnol., 2007, 76, 1223–1243.
4 B. Domon and R. Aebersold, Science, 2006, 312, 212–217.5 R. Aebersold and M. Mann, Nature, 2003, 422, 198–207.6 M. A. O. da Silva, J. S. Garcia, G. H. M. F. Souza, M. N. Eberlin,F. C. Gozzo and M. A. Z. Arruda, Talanta, 2010, 80, 1545–1551.
7 C. Ruiz-Romero, V. Calamia, V. Carreira, J. Mateos, P. Fern�andezand F. J. Blanco, Talanta, 2010, 80, 1552–1560.
8 A. W. Dowsey, M. J. Dunn and G. Z. Yang, Proteomics, 2003, 3,1567–1596.
9 J. Klose, Humangenetik, 1975, 26, 231–243.10 G. A. Scheele, J. Biol. Chem., 1975, 250, 5375–5385.11 J. Heinemeyer, B. Scheibe, U. K. Schmitz and H. P. Braun, J.
Proteomics, 2009, 72, 539–544.12 M. Eravci, S. Fuxius, O. Broedel, S. E. Weist, U. Mansmann,
H. Schluter, J. Tiemann and A. Baumgartner, Proteomics, 2007, 7,513–523.
13 P. Cutler, G. Heald, I. R. White and J. Ruan, Proteomics, 2003, 3,392–401.
14 M. €Unlu, M. E. Morgan and J. S. Minden, Electrophoresis, 1997, 18,2071–2077.
15 J. F. Timms and R. Cramer, Proteomics, 2008, 8, 4886–4897.16 R. Marouga, S. David and E. Hawkins, Anal. Bioanal. Chem., 2005,
382, 669–678.17 M. H. Elliott, D. S. Smith, C. E. Parker and C. Borchers, J. Mass
Spectrom., 2009, 44, 1637–1660.18 S. Komatsu, X. Zang and N. Tanaka, J. Proteome Res., 2005, 5, 270–
276.19 N. A. Karp, D. P. Krell and K. S. Lilley, Proteomics, 2004, 4, 1421–
1432.20 B. M. Riederer, J. Proteomics, 2008, 71, 231–244.21 J. A. M. Rasmussen and A. Hermetter, Prog. Lipid Res., 2008, 47,
436–460.22 N. Panchuk-Voloshina, R. P. Haugland, J. Bishop-Stewart,
M. K. Bhalgat, P. J. Millard, F. Mao, W. Y. Leung andR. P. Haugland, J. Histochem. Cytochem., 1999, 47, 1179–1188.
23 I. M. Riederer and B. M. Riederer, Proteomics, 2007, 7, 1753–1756.24 S. Alvarez, B. M. Berla, J. Sheffield, R. E. Cahoon, J. M. Jez and
L. M. Hicks, Proteomics, 2009, 9, 2419–2431.25 B. K. Ndimba, S. Chivasa, W. J. Simon and A. R. Slabas, Proteomics,
2005, 5, 4185–4196.26 M. Di Carli, M. E. Villani, G. Renzone, L. Nardi, A. Pasquo,
R. Franconi, A. Scaloni, E. Benvenuto and A. Desiderio, J.Proteome Res., 2009, 8, 838–848.
27 P. Kieffer, J. Dommes, L. Hoffmann, J. F. Hausman and J. Renaut,Proteomics, 2005, 8, 2514–2530.
28 A. Alban, S. O. David, L. Bjorkesten, C. Andersson, E. Sloge,S. Lewis and I. Currie, Proteomics, 2003, 3, 36–44.
29 R. Westermeier and R. Marouga, Biosci. Rep., 2005, 25, 19–32.30 J. S. Minden, S. R. Dowd, H. E. Meyer and K. St€uhler,
Electrophoresis, 2009, 30, 156–161.31 J. Shaw, R. Rowlinson, J. Nickson, T. Stone, A. Sweet, K. Williams
and R. Tonge, Proteomics, 2003, 3, 1181–1195.32 M. Villar, A. Torina, Y. Nunez, Z. Zivkovic, A. Marina, A. Alongi,
S. Scimena, G. La Barbera, S. Caracappa, J. Vasquez and J. De LaFuente, Proteome Sci., 2010, 8, 1–14.
33 F. De la Cuesta, G. Alvarez-Llamas, A. S. Maroto, A. Donado,R. Juarez-Tosina, L. Rodriguez-Padial, A. G. Pinto,M. G. Barderas and F. Vivanco, Proteomics Clin. Appl, 2009, 3,1174–1184.
34 S. Sawhney, R. Stubbs and K. Hood, Proteomics, 2009, 9, 4087–4092.35 O. Greengauz-Roberts, H. Stoppler, S. Nomura, H. Yamaguchi,
J. R. Goldenring, R. H. Podolsky, J. R. Lee and W. S. Dynan,Proteomics, 2005, 5, 1746–1757.
36 I. M. Riederer, R. M. Herrero, G. Leuba and B. M. Riederer, J.Proteomics, 2008, 71, 222–230.
37 T. Rabillouda, M. Chevalletb, S. Lucheb and C. Lelongb, J.Proteomics, 2010, 73, 2064–2077.
38 B.Wittmann-Liebold, H. R. Graack and T. Pohl,Proteomics, 2006, 6,4688–4703.
39 S. P. Gygi, G. L. Corthals, Y. Zhang, Yvan Rochon andR. Aebersold, Proc. Natl. Acad. Sci. U. S. A., 2000, 97, 9390–9395.
Analyst, 2011, 136, 4119–4126 | 4125
Dow
nloa
ded
by U
NIV
ER
SID
AD
SA
O P
AU
LO
on
30 S
epte
mbe
r 20
11Pu
blis
hed
on 3
1 A
ugus
t 201
1 on
http
://pu
bs.r
sc.o
rg |
doi:1
0.10
39/C
1AN
1551
3JView Online
40 P. L. Gratao, C. C. Monteiro, A. M. Antunes, L. E. P. Peres andR. A. Azevedo, Ann. Appl. Biol., 2008, 153, 321–333.
41 P. L. Gratao, A. Polle, P. J. Lea and R. A. Azevedo, Funct. PlantBiol., 2005, 32, 481–494.
42 M. A. Z. Arruda and R. A. Azevedo,Ann. Appl. Biol., 2009, 155, 301–307.
43 A. Sussulini, H. Dihazi, C. E. M. Banzato, M. A. Z. Arruda,W. St€ulmer, H. Ehrenreich, O. Jahn and H. D. Kratzin, Proteomics,2011, 11, 261–269.
44 Y. Fan, T. B. Murphy, J. C. Byrne, L. Brennan, J. M. Fitzpatrick andR. W. G. Watson, J. Proteome Res., 2011, 10, 1361–1373.
45 Y. Suehara, N. Tochigi, D. kubota, K. Kikuta, R. Nakayama,K. Seki, A. Yoshida, H. Ichikawa, T. Hasegawa, K. Kaneko,
4126 | Analyst, 2011, 136, 4119–4126
H. Chuman, Y. Beppu, A. Kawai and T. Kondo, J. Proteomics,2011, 74, 829–842.
46 L. M. Albuquerque, M. R. O. Trugilho, A. Chapeaurouge,P. B. Jurgilas, P. T. Bozza, F. A. Bozza, J. Perales andG. C. Neves-Ferreira, J. Proteome Res., 2009, 8, 5431–5441.
47 K. S. Lilley and P. Dupree, J. Exp. Bot., 2006, 57, 1493–1499.48 M. Di Carli, A. Zamboni, M. E. P�e, M. Pezzotti, K. S. Lilley,
E. Benvenuto and A. Desiderio, J. Proteome Res., 2011, 10, 429–446.49 S. Amme, A. Matros, B. Schlesier and H. P. Mock, J. Exp. Bot., 2006,
57, 1537–1546.50 P. Delaplace, M. L. Fauconnier, K. Sergeant, J. F. Dierick, M. Oufir,
F. Van der Wal, A. H. America, J. Renaut, J. F. Hausman and P. duJardin, J. Exp. Bot., 2009, 60, 1273–1288.
51 J. Shi, Y. Zhen and R. H. Zheng, J. Exp. Bot., 2010, 61, 2367–2381.
This journal is ª The Royal Society of Chemistry 2011
Copyright © 2022 FDOKUMEN