TREE RISK ASSESSMENT - Seattle.gov
126
Don Cox Tree Solutions, Inc. 2009 1 TREE RISK ASSESSMENT And Hazard Abatement Living on the California central coast or in other forested areas often brings special concerns for potential tree related risks for life and property. Homes and businesses are situated along the coast and in the forested areas of the coastal mountain range where trees get big and storms can be intense. Many areas in the Santa Cruz Mountains have a dense population of large native trees which can reach heights of over 150 feet, and have trunk diameters in excess of four feet. Coast redwoods and Douglas firs can grow to a height of 200 feet or more. A serious concern for property owners living in a forest like this is the potential risk for life and property from falling trees and tree parts. The size of some trees and proximity to adjacent homes creates a potential for property damage and/or personal injury from: Limb or top breakage, often associated with heavy winds during storm conditions. An entire tree toppling due to up-rooting or decay and structural failure, high winds and wet soil. Heavy creek water flow and washing out of the soil around the root system. Water saturation of the soil and mud slides carrying the trees with it. Much of tree risk assessment is common sense observation, spotting of something that doesn’t look right. Property owners and managers should do regular inspections of their trees and note irregularities and suspected problem situations. Call an arborist for confirmation and management suggestions and, if needed, tree service contractor selection. There is no way to 100% accurately predict or prevent limbs, tops or trees coming down, or where they will land when they do come down; even healthy trees can break or fall under extreme storm conditions. Tree risk assessment is not an exact science, the determination of hazard potential is based on the professional opinion and judgment of the arborist from LARGE GROWING TREES OF THE SANTA CRUZ MOUNTAINS Coast redwood (Sequoia sempervirens) Coast live oak (Quercus agrifolia) Tanbark oak (Lithocarpus densiflora), Douglas fir (Pseudotsuga menziesii) California bay laurel (Umbellularia californica) Big leaf maple (Acer macrophyllum). Some coastal zone areas have stands of: Monterey pine (Pinus radiata) Monterey cypress (Cupressus macrocarpa) Ponderosa pine (Pinus ponderosa) And the non-native Blue gum (Eucalyptus globulus).
-
Upload
khangminh22 -
Category
Documents
-
view
3 -
download
0
Transcript of TREE RISK ASSESSMENT - Seattle.gov

Don Cox Tree Solutions, Inc. 2009 1
TREE RISK ASSESSMENT And Hazard Abatement
Living on the California central coast or in other forested areas often brings special concerns for
potential tree related risks for life and property. Homes and businesses are situated along the coast
and in the forested areas of the coastal mountain range where trees get big and storms can be
intense.
Many areas in the Santa Cruz Mountains have a dense population of large native trees which can
reach heights of over 150 feet, and have trunk diameters in excess of four feet. Coast redwoods and
Douglas firs can grow to a height of 200 feet or more.
A serious concern for property owners living in a forest like this is the potential risk for life and
property from falling trees and tree parts. The size of some trees and proximity to adjacent homes
creates a potential for property damage and/or personal injury from:
Limb or top breakage, often associated with
heavy winds during storm conditions.
An entire tree toppling due to up-rooting or
decay and structural failure, high winds and wet soil.
Heavy creek water flow and washing out of
the soil around the root system.
Water saturation of the soil and mud slides
carrying the trees with it.
Much of tree risk assessment is common sense
observation, spotting of something that doesn’t look
right. Property owners and managers should do
regular
inspections of their trees and note irregularities and
suspected problem situations.
Call an arborist for confirmation and management
suggestions and, if needed, tree service contractor
selection.
There is no way to 100% accurately predict or prevent
limbs, tops or trees coming down, or where they will
land when they do come down; even healthy trees can
break or fall under extreme storm conditions.
Tree risk assessment is not an exact science, the
determination of hazard potential is based on the
professional opinion and judgment of the arborist from
LARGE GROWING TREES OF THE SANTA CRUZ MOUNTAINS
Coast redwood (Sequoia sempervirens)
Coast live oak (Quercus agrifolia)
Tanbark oak (Lithocarpus densiflora),
Douglas fir (Pseudotsuga menziesii)
California bay laurel (Umbellularia californica)
Big leaf maple (Acer macrophyllum).
Some coastal zone areas have stands of:
Monterey pine (Pinus radiata) Monterey cypress (Cupressus
macrocarpa)
Ponderosa pine (Pinus ponderosa) And the non-native
Blue gum (Eucalyptus globulus).

TREE RISK ASSESSMENT www.treesolutions.com
Don Cox, certified arborist Tree Solutions, Inc. 2009 Page 2
years of experience, knowledge of tree species, structural
and environmental factors.
A certain degree of risk must be accepted wherever there
are trees and targets; final decision of acceptable or
unacceptable risk is up to the property owner.
RISK INSPECTIONS
Initial technical inspections are based on visual tree and site
assessment, sounding (tapping on trunk and scaffold limbs
to detect sound variations), probing for decay pockets and
root placement, and evaluation of potential targets in
relation to the tree in question.
Initial inspections can be used to determine obvious
hazards and potential problems, or to identify need for
further examination.
To assist in evaluation and rating of risk according to
professional standards, ISA certified arborists use the
checklist and rating system of the
Tree Hazard Evaluation Form from the publication
“A Photographic Guide to the Evaluation of Hazard Trees in Urban Areas” by Methany and
Clark.
More thorough technical examination can include:
Excavating around the base of a tree to expose the root collar and major structural roots
where decay is often present but unobservable without exposure.
Climbing of the tree to examine potential structural defects of limbs, stem and top.
Examination with modern instruments for decay detection and stress assessment: resistance
drill, acoustic tomography, radar, and wind load analysis.
Determining property lines and responsibility for liabilities.
Measuring heights and distances and calculating possible worst-case scenarios.
RATING AND MANAGEMENT OF HAZARDS
When Tree Solutions arborists inspect and evaluate trees for risk, we put the hazard potential into
certain categories of urgency. Following the determination of risk, recommendations for
management of that risk are presented:
The most immediate hazards to identify are trees in the process of uprooting, splitting apart, or with
breakage of limbs or stem, representing imminent structural failure.
“Tree risk assessment is the
systematic process of assessing the
potential for a tree or one of its
parts to fail and, in so doing, injure
people or damage property. All
trees have the potential to fail. The
degree of risk will vary with the size
of the tree, type and location of the
defect, tree species, and the nature
of the target. Tree risk assessment
involves three components:
1. A tree with the potential to
fail,
2. An environment that may
contribute to that failure,
and
3. A person or object that
would be injured or
damaged (i.e. the target)”
Nelda Methany and James R. Clark

TREE RISK ASSESSMENT www.treesolutions.com
Don Cox, certified arborist Tree Solutions, Inc. 2009 Page 3
1. Imminent Hazard- Tree structural failure in progress with a target within range:
Uprooting with noticeable soil fissures, heaving of the root plate, structural root fractures.
Tree trunk or large limb breakage, often associated with overburdened weight distribution or
leaning.
Advanced decay weakening the structural integrity of the tree.
Tree parts broken and hanging.
Any of the above factors combined with near proximity to a home or business
structure, power lines, road or driveway would indicate a dire emergency. Get a tree
crew out now for emergency removal, on overtime if necessary.
2. Urgent Hazard- Compromised structural integrity, but not as immediate as above, no observed
failure in progress:
A tree leaning toward a house, overburdened limbs or top over a house, patio or
driveway.
Big trees in a potential mudslide area above a house.
Construction activity or other damage of the trunk, large limbs or structural support
roots.
Schedule removal or safety pruning as soon as possible, before the next storm.
3. Potential Hazard- Condition unclear from initial inspection. Root collar exam or other further
inspection needed to determine degree of risk:
Tree leaning toward house could become dangerous if allowed to continue growth in
that direction.
Shallow topsoil on rock base creating shallow rooting and vulnerability to toppling.
Structural defects- co-dominant stems, or suspected decay conditions that could weaken
tree structure if allowed to advance.
Dead or declining foliar top or other tree health issues that should be addressed or tree
may weaken or die and become dangerous.
Schedule further inspection, pest/disease control or tree pruning sometime in the near
future.
4. Preventive Maintenance- Known risk factors are identified that could become an issue if
allowed to develop:
Schedule crown cleaning and thinning and/or crown reduction pruning.
Remove selected overcrowded trees to allow light and space for remaining trees to grow
with balanced weight distribution.
Initiate pest and disease management program.

TREE RISK ASSESSMENT www.treesolutions.com
Don Cox, certified arborist Tree Solutions, Inc. 2009 Page 4
TREE RISK ABATEMENT
If a particular tree or group of trees is determined to have hazard potential, specific means of
abatement can be recommended.
Pruning can be specified to reduce overall tree height, density or canopy spread. Designated limbs
can be relieved of excess weight or length. The direction of growth can be re-directed by selective
pruning. Defective structural components can sometimes be removed.
Installation of cables and other forms of bracing, through-bolts and props, can be used to reinforce
a structural weakness.
Target removal or re-location if possible should be considered as an alternative to tree removal.
Tree removal is a last resort when all other forms of abatement have been ruled out.
Topping (heavy crown reduction or stubbing) is usually not recommended, but can be a short term,
cost effective alternative to removal when immediate safety and not tree care is the priority.
Topping can be ugly and create future problems and risk due to possible rapid re-growth and the
nature of the weak structural attachments that form as a result. If a tree is topped, it necessitates
follow-up with an annual inspection and maintenance program or a plan for progressive
removal of the tree.
Moderate crown reduction by selective pruning is preferred when height reduction is indicated.

TREE RISK ASSESSMENT www.treesolutions.com
Don Cox, certified arborist Tree Solutions, Inc. 2009 Page 5
Pest and Disease Factors: Wood rot fungus infection is the primary disease issue in relation to
tree structural failure. It exists in varying stages in many trees and is to be expected in a forest
environment. Advanced stages of decay in roots, stems or branches can contribute to structural
failure. Pest infestations can create or hasten decline in health and structural defects.
Many of the trees in this geographical area are re-sprouts from old cut stumps due to logging and
land clearing. This presents a potential problem in that advanced decay of the parent stump and
roots (which may be below ground and not visible in a superficial inspection) could create a
compromise to the structural integrity of the standing tree.
Some structural defects (clockwise from top left): 1. Imbalanced weight distribution, leaning.
2. Co-dominant stems splitting apart. 3. Large deadwood. 4. Large wound at critical location.

TREE RISK ASSESSMENT www.treesolutions.com
Don Cox, certified arborist Tree Solutions, Inc. 2009 Page 6
Forest fires are another major concern with need for preventive maintenance. Regarding fire
prevention, fire departments recommend clearing all trees and brush within a 30 - 100 foot distance
of the structures to create a “defensible space”. Obviously the more distance the better, and some
trees and shrubs are more flammable and therefore more important to clear than others. Even
beyond this defensible range, clearing of deadwood and lower limbs can prevent fire transferring
from grasses and shrubbery to the tree canopies and roofs of structures.
If you have trees near your home it is better to be safe than sorry. Have a Tree Solutions arborist
inspect the trees, discuss findings with you and make recommendations, or write a report with
detailed observations and specifications for management of risk.
The cost of prevention is usually much less than the cost of loss and inconvenience of damage.

Second Wednesdays | 1:00 – 2:15 pm ETwww.fs.fed.us/research/urban-webinars
USDA is an equal opportunity provider and employer.

Andrew KoeserAssistant Professor
University of Florida Gulf Coast
Research & Education Center
Gregory DahleAssistant Professor
West Virginia University
Mark DuntemannOwner & Urban Forestry
Consultant
Natural Path Urban Forestry

Tree Risk Assessment
Greg Dahle
West Virginia University

Tree Risk Assessment
• ANSI A300 Part 9
• BMP
• TRAQ
– Tree Risk Assessment Qualification
• 2 day educational course + ½ assessment
– Re-qualify every 5 years
• 1 day refresher + 3 hour exam

Three Levels of Tree Risk
Assessment
Level 1 - Limited visual (survey)
Level 2 – Basic (visual exam)
Level 3 - Advanced
All looking at factors that affect the likelihood and consequences of tree failure.
Many of these slides were adapted from a presentation by Dr. Tom Smiley with the Bartlett Tree Research Lab

Likelihood of Failure and Impact (Table 1)
Risk Rating Matrix (Table 2)

Categorizing the Likelihood of a
Failure Within the Specified Time Frame:
• Improbable - the tree is not likely to fail even in
severe weather conditions.
• Possible- failure could occur, but it is unlikely
during normal weather. High wind failure.
• Probable –failure is expected under normal
weather conditions.
• Imminent –failure has started or is most likely to
occur in the near future, even if there is no wind
or increased load.

Categorizing the Likelihood of
Impacting a Target
Very Low- The chance of impacting a target is
remote.
Low – It is not likely that the target will be
impacted.
Medium – The target may or may not be
impacted.
High - The target is likely to be impacted

Likelihood
Failure=Imminent
Impact=Medium

Likelihood of Failure and
Impact (Table 1)
Likelihood
of FailureLikelihood of Impacting Target
Very Low Low Medium High
Imminent Unlikely Somewhat
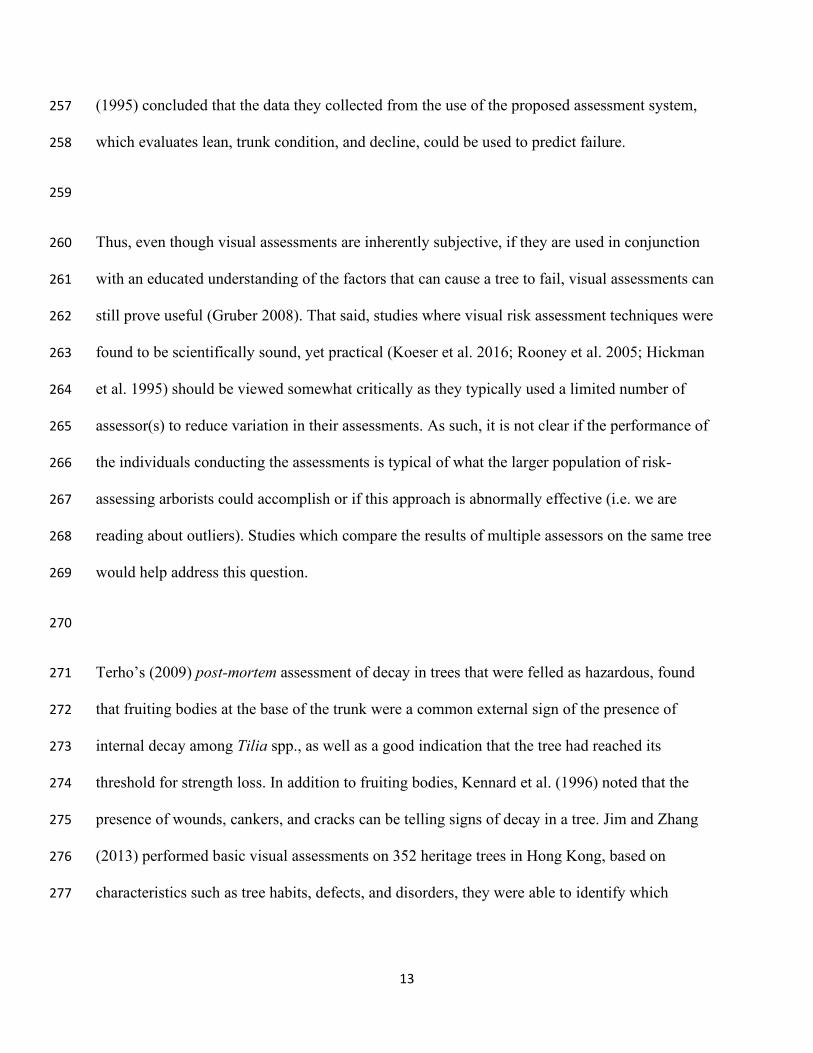
likelyLikely Very likely
Probable Unlikely Unlikely Somewhat
likelyLikely
Possible Unlikely Unlikely Unlikely Somewhat
likely
Improbable Unlikely Unlikely Unlikely Unlikely

• Negligible- low value property damage.
Personal injury is unlikely.
• Minor – low to moderate value property
damage. Personal injury is unlikely
• Significant –moderate to high value property
damage. People could be injured.
• Severe - High value property damage. One
or more people could be injured or killed.
Consequences are the effects or
outcome of a tree failure.

Consequences of failure
= Severe

Risk Rating Matrix (Table 2)Likelihood
of Failure
and Impact
Consequences of Failure
Negligible Minor Significant Severe
Very Likely Low Moderate High Extreme
Likely Low Moderate High High
Somewhat
Likely
Low Low Moderate Moderate
Unlikely Low Low Low Low

Digital Image
Correlation• Stereophotogemetry
• 3D strain maps
• Strain = deformation

Static Load Tests
Ken Beezley,
M.S. 2016
Rob Eckenrode,
M.S. 2017

Mean Strain
(A)
(B)
(A)
• Windward and leeward
were the same
• Tangential was lower
‒ Looking at torsion
• Prevailing wind important

The Lateral Branch Attachment
Aspect ratio varied from 0.5 to 1.0
Aspect ratio = branch diameter / stem diameter

Strain moved further into stem in co-dominant
Aspect ratio = 0.6
ball & socket failure
Aspect ratio 0.8,
imbedded failure

Mapping strain and likelihood of
failure
• Appears co-dominant begins around
aspect ratio 0.8 (mechanical and
hydraulic)
• Loads are transferred equally in line with wind
direction
– Yet torsion might be important

Second Wednesdays | 1:00 – 2:15 pm ETwww.fs.fed.us/research/urban-webinars
USDA is an equal opportunity provider and employer.

Andrew KoeserAssistant Professor
University of Florida Gulf Coast
Research & Education Center
Gregory DahleAssistant Professor
West Virginia University
Mark DuntemannOwner & Urban Forestry
Consultant
Natural Path Urban Forestry
Risk Assessment in Urban Settings
The Confluence of Risk Assessment and Risk Management
Mark DuntemannNatural Path Urban Forestry
US Forest ServiceUrban Forestry WebinarMay 10, 2017

Risk Assessment is the technical process for:
• Evaluating what unexpected things could happen,
• How likely they are to occur, and
• The consequences if they were to occur.
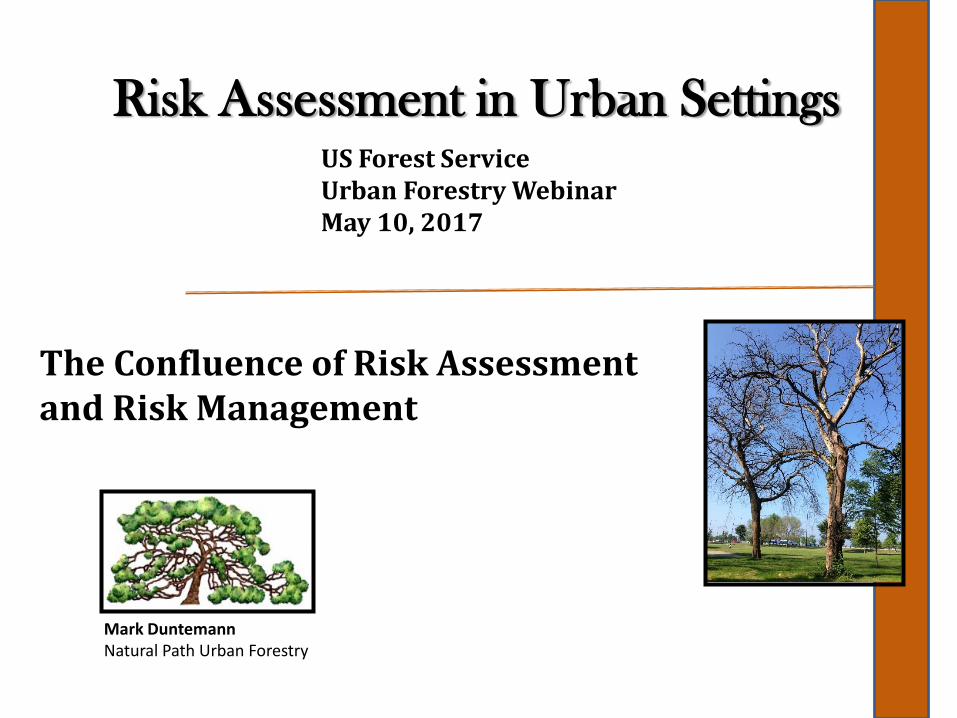
The Confluence of Risk Assessment and Risk Management
1. An overall risk rating for the subject tree.
2. Mitigation options to address the risk identified.
A Tree Risk Assessment should result in the following outcomes:
The Confluence of Risk Assessment and Risk Management

Risk Management is the process by which an agency or company assesses and monitors its risks and selects and implements measures to address those risks.
The Confluence of Risk Assessment and Risk Management

Risk Management is about making choices at the system level in the
presence of uncertainty.
The Confluence of Risk Assessment and Risk Management

Risk
AssessmentRisk
Management
Risk
CharacterizationTarget
Site
Environment
Structural
Issues
Species
Profile
Budget
Prioritization
Community
Values
Consequences
Consequences
History of
Events
Scale
Capacity
Mission
The Confluence of Risk Assessment and Risk Management

Risk Associated with Trees
Depends on the likelihood of two events typically happening at almost concurrent moments:
• The likelihood of a tree part failure (1) within a given time frame (2).
• If the part fails, the likelihood of striking a target (3).
ConsequencesIf the part fails and if a target is struck what are the potential consequences (4).

1. A tree is viewed as a hazard in absolute
terms. In other words, the subject tree was
a hazard or not a hazard.
The risk associated with a tree is
complex. Every single tree part
has some potential to fail.
The Confluence of Assessment and Management in Litigation

2. The context of the non-subject trees are minimized.
The subject tree is not managed in a vacuum. Choices are made as part of a larger system. (Assessor vs Manager)
The Confluence of Assessment and Management in Litigation

3. A high inspection and maintenance rigor is assigned to the subject tree.
The resources required to achieve this level of rigor is, at times, unreasonable and impractical.
The Confluence of Assessment and Management in Litigation

As Low as Reasonably Practical

Second Wednesdays | 1:00 – 2:15 pm ETwww.fs.fed.us/research/urban-webinars
USDA is an equal opportunity provider and employer.

Andrew KoeserAssistant Professor
University of Florida Gulf Coast
Research & Education Center
Gregory DahleAssistant Professor
West Virginia University
Mark DuntemannOwner & Urban Forestry
Consultant
Natural Path Urban Forestry

http://www.louisdallaraphotography.com
Tree Risk Assessment – Perceptions, Reality, and Reliability
Andrew Koeser, BCMA, Ph.D.University of Florida IFAS – Gulf Coast REC

Tree Risk Assessment
Tree risk is ultimately
governed by:
• The likelihood a target will
be impacted
• The potential of a tree or
tree part to fail
• The consequences should
a tree/tree part strike the
target
ww
w.s
ptim
es.c
om
ww
w.r
ockym
tnre
fl.c
om

Tree Risk Assessment
Tree risk is ultimately
governed by:
• The likelihood a target will
be impacted
• The potential of a tree or
tree part to fail
• The consequences should
a tree/tree part strike the
target
new
s.g
ard
ento
olb
ox.c
o.u
kauto
nopedia
.org

Tree Risk Assessment
Tree risk is ultimately
governed by:
• The likelihood a target will
be impacted
• The potential of a tree or
tree part to fail
• The consequences should
a tree/tree part strike the
target
htt
p:/
/ww
w.k
om
onew
s.c
om
ww
w.d
aily
mail.
co.u
k

Tree Risk Assessment
3 inputs (target – likelihood of failure – consequences) are shared
by all common assessment methods

All currently accepted methods of risk assessment share a
common concern…
How do we limit the impact of assessor bias and risk
perception to make risk assessments more robust and
repeatable?

Impact of Arborist on Risk Assessments
296 Arborists assessed
three trees each.
Compared sources of
variation among
ratings/inputs

Impact of Arborist on Risk Assessments
296 Arborists assessed
three trees each.
Compared sources of
variation among
ratings/inputsPerson
Inspecting is
4xs more
important than
the tree being
looked at!

Why are things so variable?

Failure Potential
“Accurately assessing the probability that a tree or branch
will fail is highly dependent on the skill and experience of
the assessor.”

What drives risk perception?

What drives risk perception?

What drives risk perception?

So, we focus on failure potential…
Next logical question: How well can we
assess it?

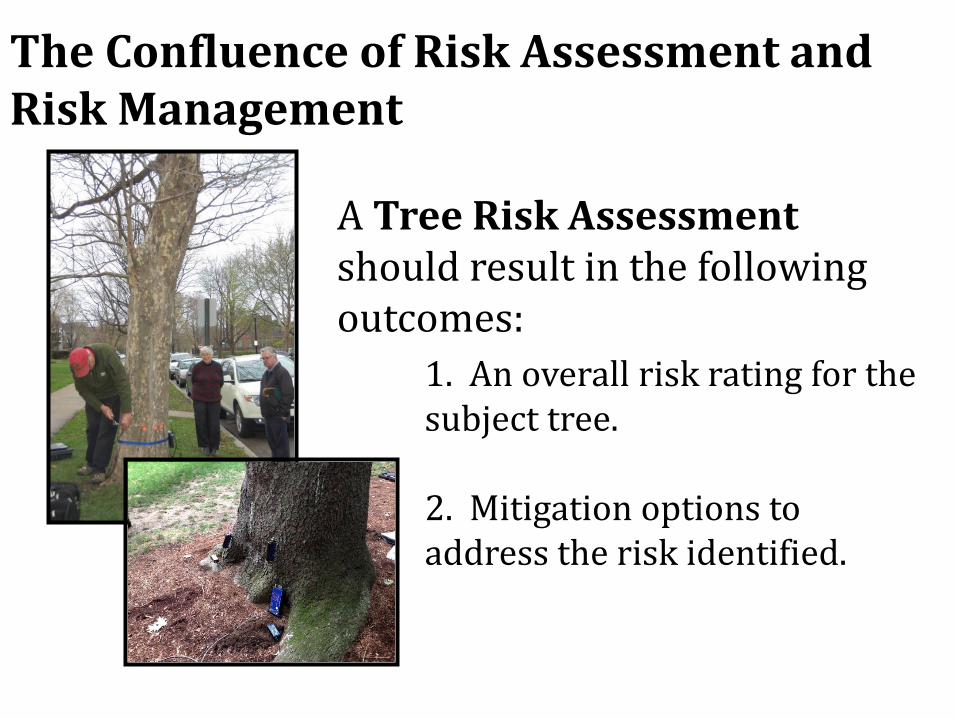
Detecting Decay With Visual Indicators
153 Quercus virginiana(Southern live oak)
86 Quercus laurifolia(laurel oak)


Next Logical Questions…
• How much more does advanced assessment add?
• Was this just one arborist getting lucky? What happens when multiple arborist perform a similar experiment?

Assessment of Likelihood of Failure Using Limited Visual, Basic, and Advanced
Assessment Techniques

Three Levels of Risk Assessment
• Level 1 – Limited
Visual (Walk- or
Drive-by)
• Level 2 – Basic
Assessment
• Level 3 – Advanced
Assessment

Impact of Level of Assessment on Failure Potential Rating
• 70 Arborists assessed 5 trees going from LV to AA
• At what point did the added info cease to impact rating?

Improbable
Possible
Probable
Imminent

Improbable
Possible
Probable
Imminent

Improbable
Possible
Probable
Imminent

What about reproducibility?

Improbable
Possible
Probable
Imminent

Improbable
Possible
Probable
Imminent

Remember this study? The plot thickens…
296 Arborists assessed
three trees each.
Compared sources of
variation among
ratings/inputs

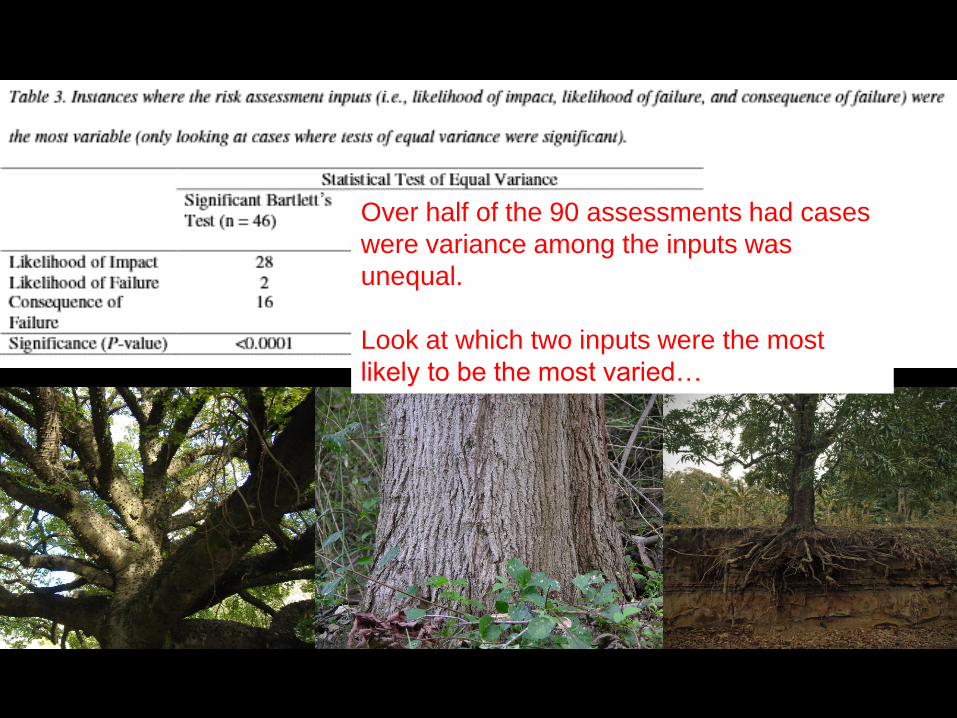
Over half of the 90 assessments had cases
were variance among the inputs was
unequal.
Look at which two inputs were the most
likely to be the most varied…

The risk ratings from this
study were gut-level.
Proper risk assessment
forces us to think beyond
our comfort zone (tree
defects).
An Explanation…

Target Occupancy
• “…target value is the most significant and most easily
quantified element of the [risk] assessment”
• Echoed by in ISA TRAQ Training…now multiple targets
can be listed

Perceived vs Real Target Occupancy

Actual vs real target occupancy
http://www.trafx.net/
www.southeastroads.com
4 sites shown 3 times each
Video clips varied by:
• Time Filmed (peak
hours vs off hours)
• Time of year (classes
in/out of session)
4 video stills with traffic
data shown after clips


Conclusions
North American arborists have long focused
solely on tree defects. This played out in
several studies.
We should take heart in knowing our basic
assessments can be quite consistent with
regard to failure potential.

Conclusions
• Advanced equipment can give precise estimates of decay and occupancy
• However, without defendable thresholds or decision rules, risk assessments will remain variable (if not more variable).

Conclusions
For ISA TRAQ, LoI and CoF are low-hanging
fruit which, if addressed, could greatly
increase reproducibility.
Scientifically sound and unbiased research
will improve risk assessment.

1
A Review of Tree Risk Assessment and Risk Perception Literature Relating to 1 Arboriculture and Urban Forestry 2
3
Ryan W. Kleina†, Andrew K. Koeserb, Richard J. Hauerc, Gail Hansend, and Francisco J. 4 Escobedoe 5
6
aDepartment of Environmental Horticulture, CLCE, IFAS, University of Florida, 100A Mehrhof 7 Hall, Gainesville, FL 32611, United States 8
bDepartment of Environmental Horticulture, CLCE, IFAS, University of Florida – Gulf Coast 9 Research and Education Center, 14625 County Road 672, Wimauma, FL 33598, United States 10
cCollege of Natural Resources, University of Wisconsin-Stevens Point, 800 Reserve Street, 11 Stevens Point, WI 54481, United States 12
dDepartment of Environmental Horticulture, CLCE, IFAS, University of Florida, Building 550 13 Room 101, Gainesville, FL 32611, United States 14
eFaculty of Natural Sciences and Mathematics, Universidad del Rosario, Bogotá, Cundinamarca, 15 Colombia 16
†Corresponding Author: [email protected] 17

2
A Review of Tree Risk Assessment and Risk Perception Literature Relating to 18
Arboriculture and Urban Forestry 19
Abstract: 20
Urban tree failures can have significant consequences to public health and safety, and result in 21
property damage. Standardized risk assessment methods are often applied to guide decisions 22
regarding the safety of urban trees and to mitigate the potential impacts of full or partial failure. 23
Worldwide, several qualitative methods are currently being used for performing tree risk 24
assessment. Comparing these methods with regard to consistency and soundness, and ultimately 25
understanding how risk perception can influence assessment of risk, may help reduce 26
preventable tree failures and unnecessary removals. This review offers an introduction to the 27
concept of risk, examines and contrasts the most commonly referenced tree risk assessment 28
methods, and highlights environmental psychology research on public risk perception of trees 29
and greenspaces in urban areas. General themes are summarized and gaps in the available 30
literature are noted as a means of identifying areas of future research. 31
32
Key Words: 33
Decision Making; Hazard Tree; Mitigation; Public Health; Public Safety; Perception of Risks 34
from Trees; Risk; Risk Perception; Qualitative Risk Assessment; Quantitative Risk Assessment 35
Methods; Urban Forest. 36
37
Introduction: 38

3
Trees can provide a wide variety of benefits, as well as potential risks. While a significant body 39
of research has been conducted on the former topic (Dwyer et al. 1992; Clark et al. 1997; Lohr et 40
al. 2004; McPherson et al. 2005; Tyrväinen et al. 2005; Nowak and Dwyer 2007; Roy et al. 41
2012), there is still much that is unknown about the true risks posed by trees, with and without 42
defects, or of the effectiveness of existing tree risk assessment methods (Matheny and Clark 43
1994; Mattheck and Breloer 1994; Hickman et al. 1995; Pokorny 2003; Matheny and Clark 44
2009; Smiley et al. 2011; Dunster et al 2013). Furthermore, little attention has been given to the 45
role professional and public risk perception plays in influencing tree care and management in 46
urban settings. Past research and case studies have shown that there can be significant variability 47
in the final determinations made by risk assessors in general (Ball and Watt, 2013a) and by tree 48
risk assessors using common risk assessment methods (Norris 2007; Stewart et al. 2013). These 49
inconsistencies among assessors were largely attributed to personal bias (Norris 2007), though 50
more research is needed to determine if there is indeed a significant interaction between the 51
method of assessment and the risk perceived by those conducting the assessment. 52
53
Interest surrounding tree risk has grown in recent years, and several international research 54
summits have focused on assessment as a whole or on the biomechanics of trees as related to tree 55
failure potential (Koeser 2009; NTSG 2011; Dahle et al. 2014). The research highlighted at the 56
latter event (and in the greater body of biomechanics literature) has often focused on specific 57
techniques or technologies for gauging failure potential. These include, among other things, 58
devices and procedures for testing the presence of decay (Rinn et al. 1996; Costello and Quarles 59
1999; Gilbert, and Smiley 2004; Johnstone et al. 2007; Wang and Allison 2008; Johnstone et al. 60
2010a; Johnstone et al. 2010b; Arciniegas et al. 2014), measuring the strength of different branch 61

4
attachments or the lean of the trees (Lilly and Sydnor 1995; Kane and Clouston 2008), modeling 62
wind load dynamics (James et al. 2006; James and Kane 2008), and performing comparative 63
assessments of mechanical stability of root systems (Smiley 2008; Bartens et al. 2010; Gilman 64
and Masters 2010; Ow et al. 2010; Gilman and Grabosky 2011; Gilman and Wiese 2012; Gilman 65
et al. 2013). 66
67
The aim of this literature review is to highlight past and current research on tree risk assessment 68
and risk perception. Specifically, the paper addresses the relationship between actual risk, risk 69
assessment, and risk perception surrounding trees. The summarization and synthesis that follows 70
can be used as a starting point for future research intended to improve the effectiveness of tree 71
risk assessment methods in urban areas. Additionally, it is worth pointing out that there are 72
several gaps in the current available literature. Some of the questions that remain to be 73
unanswered include: what is the impact of timeframe (i.e., 1, 3, 5, years etc.) on the variability of 74
assessments, do any of the existing risk assessment methods inherently bias results, do any of the 75
existing risk assessment methods lead to more consistent results, do any of the existing risk 76
assessment methods bias the mitigation methods prescribed, do advanced training and credentials 77
impact risk assessment outcomes and consistency, and are their low-tech/no tech ways of 78
accurately assessing target occupancy? Future research on the subject matter could help to fill in 79
some of the deficiencies in our present understanding. 80
81
Methods: 82

5
For this literature review, Arboriculture & Urban Forestry, Journal of Arboriculture, and Urban 83
Forestry & Urban Greening were searched in their entirety for publications related to tree risk 84
and the perceived risk from trees and greenspaces. Furthermore, the literature review on the topic 85
that was compiled by Matheny and Clark (2009) was referenced. Additionally, we performed 86
keyword searches in several electronic databases including: Google Scholar, JSTOR, Web of 87
Science, Science Direct, and the University of Florida George A. Smathers Library collections 88
database. The following English Language terms were used to conduct the search: urban forest 89
risk assessment; tree risk assessment; tree failure; risk perception; perception of trees; perception 90
of natural spaces; environmental psychology. Articles in the search were not limited to any 91
particular time frame. Throughout the search of electronic databases, articles were first assessed 92
by their title, filtering out those that were unrelated. After this initial screening of roughly 1,000 93
articles, the abstracts of the remaining article were read, and again those articles that did not 94
pertain to the scope of the review were eliminated, leaving 150 relevant articles. Finally, the 150 95
articles that remained were read and qualitatively analyzed for inclusion in the literature review. 96
97
Risk, Risk Assessment, and Risk Perception: 98
Ball (2007) defined risk as the probability of some specified adverse event occurring within a 99
specified time interval. In their tree risk assessment guidebook, Dunster et al. (2013) defined risk 100
as the combination of the likelihood of an event occurring and the severity of its potential 101
consequences. Risk assessment is a formalized method of identifying, analyzing, and evaluating 102
risk (Dunster et al. 2013). In assessing trees, all commonly used risk assessment methods 103
consider: 1.) the likelihood that all or part of the tree will fail (i.e., failure potential), 2.) the 104

6
likelihood of the target being present/struck (i.e., target occupancy), and 3.) the consequences of 105
failure (i.e., personal injury, damage to property, or disruption of services/activities) (Matheny 106
and Clark 1994; Mattheck and Breloer 1994; Pokorny 2003; Ellison 2005a; Smiley et al. 2011; 107
Dunster et al. 2013). These three components of risk are often assessed by careful consideration 108
of environmental factors (soil, precipitation, pests, etc.) that might incite failure, species-specific 109
failure profiles, and site history (Matheny and Clark 1994). 110
111
While it is possible to measure some factors that directly influence tree risk (i.e., target 112
occupancy or the size of the tree/tree part of concern), in practice many of these inputs are left to 113
the judgment of the assessor (Pokorny 2003; Ellison 2005a). Recommendations based on the 114
assessment are then passed on to the person or persons who ultimately make the final decisions – 115
typically a homeowner, property manager, or urban forester (Dunster et al. 2013). Both the 116
assessor’s and the decision maker’s perceptions and tolerances of risk affect what, if any, 117
mitigation efforts are taken to reduce potential harm to people and property (Pokorny 2003). 118
119
Risk perception is a social construct influenced by memories and personal experiences (Spangler 120
1984; Gavin 2001; Botterill and Mazur 2004). It is used as a means to rationalize and deal with 121
one’s personal perils and worries (Slovic 1999; Botterill and Mazur 2004). Likewise, Scherer 122
and Cho (2003) found that social networks within communities tend to share similar perceptions 123
of risk. Depending on an individual’s background, their perception of risk may or may not 124
correspond with the reality of the situation (Renn 2004). Risk reality, the arborist’s assessment of 125

7
that risk, and the property manager’s or homeowner’s perception of risk are all interconnected 126
and ultimately influence which risk management strategy is adopted. 127
128
In a study on tree risk management and arboriculture in Australia, Davison and Kirkpatrick 129
(2014) explained that several of the arborists they interviewed indicated their aggravation with 130
the great number of individuals that have an illogical fear of trees. Furthermore, they point out 131
that these perceptions of risk can potentially negatively affect their efforts to maximize the 132
benefits trees provide, as well as minimizing the related risks. In extreme cases, the disconnect 133
between risk reality and risk perception can lead to unnecessary tree removal or ill-advised tree 134
retention (Smiley et al. 2011). Accounting for these differences may ultimately make risk 135
assessments and management strategies less variable, potentially limiting cases where 136
practitioners suggest mitigation options that appear at odds with one another (Stewart et al. 137
2013). Though all of the current and commonly used risk assessment methods consider similar 138
components (the likelihood that all or part of the tree will fail, the likelihood of the target being 139
present/struck, and the consequences of failure), there is a great deal of variability that can arise 140
between assessors and among individual assessments. None the less, the use of these components 141
is a crucial part of the assessment and, if used properly, can add to the accuracy and legitimacy 142
of a tree risk assessment. 143
144
Components of Tree Failure: Likelihood of Impact, Failure Potential, and Consequences of 145
Failure: 146

8
LIKELIHOOD OF IMPACT AND TARGET OCCUPANCY. The presence or absence of a 147
target is considered to be the most important factor in a risk assessment (Ellison 2005a). When 148
no target is present, there is no risk (Ellison 2005a; Smiley et al. 2011; Dunster et al. 2013). That 149
said, most urban sites have multiple targets present at any given time (Dunster et al. 2013). When 150
evaluating tree risk, it is important to assess a particular target’s level of occupation, as well as 151
the factors that might affect occupancy (Hayes 2002; Ellison 2005a; Sreetheran et al. 2011). For 152
instance, the presence of pedestrian targets in a park varies greatly depending on the time of day. 153
Similarly, a park bench may attract people to a site and prolong their occupation of an area. 154
155
In a study on the tree risk assessment used for the management of amenity trees, Ellison (2005a) 156
evaluated the occupancy of vehicular targets based on Great Britain’s 1996 transportation 157
statistics. In one example, Ellison calculated vehicular occupancy for a point a motorway 158
(comparable to U.S. highways and freeways) was 27.5 hours per day (on average; 2005a) This 159
was in part due to the intense magnitude of traffic that frequents this particular road 160
classification. While values for occupancy in high traffic areas can exceed 24 hour a day, they 161
simply represent constant occupancy. This means that the probability of a tree failure impacting 162
a vehicle or a vehicle impacting a fallen tree was 1/1. 163
164
In calculating vehicular occupancy, Ellison (2005a) considered the minimum stopping distance 165
plus average vehicle length (D), divided by the average vehicle speeds (S), which renders the 166
time a vehicle occupies the space needed to come to a stop (T). T was then multiplied by the 167
average number of vehicles per day (V) to get the total number of hours per day a point on the 168

9
road is occupied (H). The equation used by Ellison (2005a) to calculate vehicular occupation and 169
the probability of impact (P) was D3600 ÷ S1000 = T; TV = H3600; H ÷ 24 = P. This particular 170
study showed just how important the presence of a target can be when assessing the risk posed 171
by a given tree. 172
173
Ellison (2005a) also noted that target occupancy can be easily quantified with the use of traffic 174
counters. Traffic counters allow the assessor to quantify occupancy rates over time, potentially 175
allowing for greater accuracy than visual occupancy assessments that are based solely on a short 176
visit to the site (i.e. the time it takes to perform a visual assessment) and professional judgment. 177
In assessing two trees in the United Kingdom, Papastavrou et al. (2010) found estimates of 178
traffic occupancy derived from 5 minute surveys were up to three orders of magnitude less than 179
those derived from the professional judgement of a trained tree assessor. Since elevated levels of 180
risk are so closely tied to human activity, mitigation plans in areas with greater property values 181
and higher levels of human traffic must be devised to help lower any unacceptable threats caused 182
by trees (Pokorny 2003). Despite the potential benefits of traffic counters, many arborists rely on 183
a quick visual assessment of site occupancy. These subjective assessments likely lead to less 184
accurate and more variable estimates of target occupation (Klein et al., 2016). 185
186
FAILURE POTENTIAL. Tree failure is defined as the breaking of any root, branch, or stem, or 187
the loss of mechanical support in the roots (Dunster et al. 2013). All trees have some level of 188
failure potential (Brakken 1995; Hayes 2002; Pokorny 2003; James et al., 2006), however, this 189
varies by species and the presence or absence of various growth and structural characteristics 190

10
(Hauer et al., 1993; Meilleur 2006; Kane 2008; Jim and Zhang 2013). Factors that increase 191
failure potential include tree health (Hickman et al. 1995), species (Hauer et al. 1993), growth 192
habit (Hayes 2002), branch attachments (Lily and Syndor 1995; Gilman 2003; Meilleur 2006; 193
Kane et al. 2008; Miesbauer et al. 2014), condition of roots (Brakken, 1995; Smiley et al. 2000; 194
Gilman and Masters 2010), presence of decay (Smiley and Fraedrich 1992; Kane et al. 2001; 195
Lonsdale 2007; Smiley 2008), maintenance history (Zhang et al., 2007), adverse weather 196
conditions (Duryea et al. 1996; Duryea and Kampf 2007), and changes to a site (Jim and Zhang, 197
2013). The two most common types of tree failures are tipping (i.e., whole tree failures caused 198
by decayed or severed roots, or defects at the root soil interface) and fractures (i.e., decay and 199
hollows that cause breaking of branches and stems) (Mattheck and Breloer 1999; Wassenaer and 200
Richardson 2009). Terho and Hallaksela (2005) assessed the potentially hazardous 201
characteristics of Tilia, Betula, and Acer in downtown Helsinki City, Finland, and found that 202
roughly 50-70% of potential failure points in park trees that had been removed were isolated to 203
the lower portion of the tree (roots, root flare, trunk). In a separate study, Terho (2009) examined 204
three species of felled trees from Helsinki, Finland and found that roughly 65% of the trees had 205
decay in the roots and trunk. 206
207
It is difficult to accurately predict tree failure, but controlled and observational studies have been 208
conducted to help provide guidance on the tree and environmental factors that lead to 209
overturning or stem breakage (Wessolly 1995; Kane 2008; Kane and Clouston, 2008). The 210
available body of related scientific research can be used to compliment the past observations and 211
experiences of arborists and urban forester in identifying the factors that elevate a tree to a higher 212
potential for failure (Kane et al. 2001). 213

11
214
Following an ice storm in the Northeastern United States and Eastern Canada where 84% of the 215
trees that failed had pre-existing defects, it was suggested that most of the defects contributing to 216
tree or branch failure could be identified and mitigated with appropriate tree planting and 217
maintenance practices (Johnson 1999). They believed that the majority of defects could have 218
been easily identified. Likewise, following both hurricane Andrew in 1992 and the 2004-2005 219
hurricane seasons in Florida, trees that had been properly pruned properly (open and evenly 220
dispersed crowns that had not been topped) withstood the hurricanes better than trees that had 221
been improperly pruned or not pruned at all (Duryea et al. 1996; Duryea and Kampf 2007). 222
Additionally, the study makes mention that trees with poor structural forms and or defects, such 223
as codominant stems, are more susceptible to the damaging effects of a hurricane. Similarly, 224
Hickman et al. (1995) evaluated 695 native oak trees in a California recreational area that had 225
previously been assessed for failure potential. They found that, of the original 695 trees, 60 226
(8.7%) had failed within 7 years of the original study. Of the tree defects assessed (decline, soil, 227
wind, butt, trunk, root, limb, irrigation frequency, lean), decline, trunk condition, and lean were 228
identified as being the key factors in predicting entire tree failure. 229
230
CONSEQUENCES OF FAILURE. When assessing the potential for a tree to fail, it is important 231
to consider the resulting consequences in the event of that failure. Consequences to infrastructure 232
can be minimal, such as damages that result in minor repairs (e.g., fixing a small fence or 233
disruption to landscape lighting) or they can be much more severe with regards to public safety 234
(e.g., injuries that lead to hospitalization/death; Smiley et al. 2011). When Schmidlin (2009) 235

12
looked at wind related tree failures in the United States that resulted in the loss of human life, he 236
found that from 1995-2007 there were 407 deaths at an average of 31deaths per year. Ellison 237
(2007) cited a study (ANON 2006) which estimated the likelihood of being killed by a tree in the 238
United Kingdom was 1 in 5 million. Similarly, Fay (2007) pointed out that the Health and Safety 239
Executive (HSE) Sector Information Minute (SIM) equates the likelihood of being killed by a 240
tree in a public space to be 1 in 20 million. This was then compared to the likelihood of being 241
struck by lightning (1 in 18.7 million; Health and Safety Executive 2007) and the likelihood of 242
being killed in an automobile accident (1 in 16,800; 243
http://www.hse.gov.uk/education/statistics.htm). Ball and Watt (2013b) explain that in the UK, 244
deaths and serious injuries resulting from tree failures are extremely rare and that it is unlikely 245
that the number of these incidents could be reduced without instituting strict measures that might 246
pose adverse effects to both the labor force and the environment. 247
248
Tree Risk Assessment: 249
Basic visual assessments may not catch defects which cannot be seen externally on the tree, such 250
as internal or incipient decay (Dolwin et al. 1999; Guglielmo et al. 2007). However, there is 251
some evidence which indicates an experienced arborist may be able to assess the likelihood of 252
tree failure based on an external evaluation with some level of accuracy (Koeser et al. 2016). 253
Hickman et al. (1995) conducted visual tree assessments on 695 oak trees in 1987. Upon 254
returning to the site in 1994, the researchers found that the assessments proved accurate 83% of 255
the time for standing living trees and 78% of the time for trees that had failed. Hickman et al. 256
13
(1995) concluded that the data they collected from the use of the proposed assessment system, 257
which evaluates lean, trunk condition, and decline, could be used to predict failure. 258
259
Thus, even though visual assessments are inherently subjective, if they are used in conjunction 260
with an educated understanding of the factors that can cause a tree to fail, visual assessments can 261
still prove useful (Gruber 2008). That said, studies where visual risk assessment techniques were 262
found to be scientifically sound, yet practical (Koeser et al. 2016; Rooney et al. 2005; Hickman 263
et al. 1995) should be viewed somewhat critically as they typically used a limited number of 264
assessor(s) to reduce variation in their assessments. As such, it is not clear if the performance of 265
the individuals conducting the assessments is typical of what the larger population of risk-266
assessing arborists could accomplish or if this approach is abnormally effective (i.e. we are 267
reading about outliers). Studies which compare the results of multiple assessors on the same tree 268
would help address this question. 269
270
Terho’s (2009) post-mortem assessment of decay in trees that were felled as hazardous, found 271
that fruiting bodies at the base of the trunk were a common external sign of the presence of 272
internal decay among Tilia spp., as well as a good indication that the tree had reached its 273
threshold for strength loss. In addition to fruiting bodies, Kennard et al. (1996) noted that the 274
presence of wounds, cankers, and cracks can be telling signs of decay in a tree. Jim and Zhang 275
(2013) performed basic visual assessments on 352 heritage trees in Hong Kong, based on 276
characteristics such as tree habits, defects, and disorders, they were able to identify which 277

14
species performed best in the urban environment and which species posed the greatest hazards to 278
the public. 279
Researchers have criticized the validity of basic visual assessments when attempting to predict 280
tree failure in the extreme winds associated with hurricanes and strong storms (Gruber 2008) or 281
even in the absence of such events (Stewart et al. 2013). In response to the former criticism, Fink 282
(2009) explained that there are no assessment methods that can predict the storm threshold of a 283
sound tree (i.e., we do not know how strong is strong enough in extreme conditions). However, 284
basic visual assessments have been accepted as being an efficient and dependable means of 285
identifying compromised trees, as compared to other trees (Kennard et al. 1996; Pokorny 2003; 286
Fink 2009; Dunster et al. 2013). 287
288
Basic visual assessments can be done from the base of a tree, by an assessor on foot (allowing 289
the assessor a 360-degree view in some cases) or from the perspective of a street view when an 290
assessor performs a limited visual inspection, such as a walk-by or drive-by assessment (ANSI 291
2011, Smiley et al. 2011). Rooney et al. (2005) compared these two levels of visual tree 292
assessments and contrasted ratings from windshield surveys to those derived from traditional 293
walking inspections. The study concluded that, despite the limited vantage point and time frame 294
associated with the limited visual (i.e. windshield) assessments, they were able to accurately 295
identify trees which posed the greatest risk (Rooney et al. 2005). In an urban forest management 296
scenario, managers are often unable to address all the issues they see during an inspection and 297
focus their mitigation efforts on the trees that pose the greatest threat to potential targets 298
(Pokorny et al. 2013). In a study of drive-by assessments, Rooney et al. (2005) point out that 299

15
limited visual surveys can be an inexpensive and efficient means of assessing large populations 300
of trees, especially for urban forest management or utility vegetation management. 301
302
Environmental Psychology and Risk Perception: 303
As explained above, the risk associated with a tree is related to its potential influence on the 304
health and safety of the public, damage to property, and disruption of any human activities. 305
Sjoberg et al. (2004) defined risk perception as “the subjective assessment of the probability of a 306
specified type of accident happening and how concerned we are with the consequences.” Smiley 307
et al. (2011) noted that the perception of risk and threats to personal safety can vary from person 308
to person. When acting to address this perceived risk, individuals make decisions based on their 309
own risk tolerance (Bechtel and Churchman 2003; Dunster et al. 2013). A tolerable level of risk 310
to one person might be unacceptable to another. As such, when an arborist assesses the potential 311
risk of a tree, a property manager or home owner may opt for mitigation measures that do not 312
reflect the actual risk posed by the tree (e.g. removing a large, but sound tree overhanging their 313
home or retaining a severely compromised tree). 314
315
Like risk, many of the costs and benefits of trees used to justify tree retention are framed from a 316
human perspective (e.g., impact on property value, ability to reduce summer cooling bills, 317
providing a sense of place). As such, mitigation decisions are a balance of often competing 318
human needs. The pressing concern of risk, coupled with maintaining an equilibrium between 319
costs and benefits and other aspects of the human relationship with the environment has been 320
explored in detail within the field of environmental psychology (Starr 1969; Fischhoff et al. 321

16
1978; DeYoung 1999; Finucane et al. 2000). Developed in the late 1960’s, environmental 322
psychology emerged as a field focused on the relationship between human behavior and physical 323
settings, which prior to this had been essentially overlooked (Gifford 2007). 324
325
Early risk perception work was conducted in the 1960s, as researchers looked to understand 326
public opposition to policies surrounding nuclear technology (Sowby 1965). Starr (1969) looked 327
at how people justified the use of automobiles and airplanes by weighing the benefits to quality 328
of life against a voluntarily accepted level of risk. In the 1970s, psychologists investigating how 329
people respond towards decision making with respects to risk, continued to look at this idea of 330
“how safe is safe enough”, they went a step further and concluded that not only is a person’s risk 331
acceptance based of the perception of benefits, but also on things such as control, catastrophic 332
potential, familiarity, and uncertainty related to the level of risk being posed (Sjoberg et al. 333
2004). Starting in the 1980s (Slovic et al. 1982; Slovic 1987), Sjoberg et al. (2004) explained that 334
some experts believe risk perception can be seen as a deterrent to rational decision making; 335
people have a tendency to see risk in a given situation where, in reality, none actually exists. 336
Botterill and Mazur (2004) noted that expert and public perceptions differ; the public tends to be 337
more alarmed and their perception of risk arises from uncertainty surrounding risky activities. 338
Additionally, they explained that consequences are often seen as extremely negative, even if the 339
probability is low. Lastly, it was pointed out that the public has a tendency to focus in on the 340
issues that experts do not understand fully and are unable to agree on. 341
342

17
Sometimes a person’s perception of safety and the associated risks that they are willing to accept 343
have more bearing on a decision than the actual reality of the risk. Pokorny (2003) suggested 344
avoiding decisions based on emotions, perceptions, and local politics, and moving towards a 345
more objective science-based assessment of potential risk. Having a better understanding of 346
where reality is removed from the context of the decision making process and a person’s 347
perceptions takes over is key to the consistency of any assessment method, no matter the 348
validity. If a person perceives that a situation poses a high level of risk, then it is likely that their 349
decisions regarding said situation will reflect their possible perception of the situation harboring 350
a great deal of risk. Moore (2014) illustrated that much of the time requests for tree removals are 351
based on unsubstantiated fear; the removal of healthy trees has unexpected consequences and 352
costs associated with it. Moore (2014) suggests that arborists and managers should attempt to 353
make logical decisions based on supported data, consider the long-term consequences associated 354
with such tree removals, and should perform a cost benefit analysis to justify their decision. 355
Smiley et al. (2011) explained that decisions to remove trees are not solely based on the 356
perception of reality; safety, historical and environmental significance, budget, aesthetics, and 357
many other issues may influence the decision. 358
359
Tree Risk Assessment in the Urban Forest: 360
The history of tree risk assessment is still relatively short. Most sources cite Wagener’s work 361
with recreational sites in California (1963) as being the first to touch on the idea of trees being 362
hazards to both people and property (Pokorny, 2003; Kane et al. 2001; Norris, 2007). Others cite 363
later work by Paine (1971), who also worked to assess the risk associated with trees in 364

18
recreational areas (Pokorny 2003; Ellison 2005a; Norris 2007). Tree risk assessment was largely 365
limited to recreation areas through the 1970s and much of the 1980s (Johnson and James 1978; 366
Johnson 1981; Mills and Russell 1981). Helliwell (1990) proposed the need for a quantified risk 367
assessment of trees in his article Acceptable levels of risk associated with trees; this idea of 368
quantifying tree risk assessments was further addressed by Ellison (2005a) in his work on the 369
management of risk from amenity trees. 370
371
Matheny and Clark (1991) released A Photographic Guide to the Evaluation of Hazard Trees in 372
Urban Areas; the book was later revised in 1994. This publication is generally cited as the first 373
comprehensive guide for tree risk assessment (Pokorny 2003; Kane et al. 2001; Hayes 2002; 374
Ellison 2005b; Norris 2007; Wassenaer and Richardson 2009). The system that they proposed 375
focused on three key components to determine the hazard level of a tree: failure potential, size of 376
the part likely to fail, and the target rating (Ellison 2005a). Many others have since contributed 377
similar efforts to the field and some of the most current and commonly used methods are: 378
International Society of Arboriculture (ISA) Tree Hazard Evaluation (Matheny and Clark 1994), 379
visual tree assessment (VTA) (Mattheck and Breloer 1994), United States Department of 380
Agriculture (USDA) Forest Services community Tree Risk Evaluation Method (Pokorny 2003), 381
Quantified Tree Risk Assessment (QTRA) (Ellison 2005a), ISA Tree Risk Assessment Best 382
Management Practice (BMP) Method (Smiley et al. 2011; Table 1). The methods detailed in 383
Table 1 are not a comprehensive list, rather they represent some of the more well received 384
methods in the tree care industry today. 385
386

19
The International Society of Arboriculture (ISA) Tree Hazard Evaluation (Matheny and Clark 387
1991), based on Matheny and Clark’s (1994) A Photographic Guide to the Evaluation of Hazard 388
Trees in Urban Areas, was devised to help locate and manage the risks associated with trees in an 389
urban area. The method is centered on three main components: 1) the potential failure of a tree, 390
2) environmental aspects that are conducive to failure, and 3) the potential injuries of people and 391
damages to property. A numerical value from 1-4 is given to each component, then all three 392
components are added together to achieve the trees hazard rating. The assessment method 393
focuses on tree characteristics and health; past and present site conditions; recognizing and 394
assessing structural defects in the root crown, trunk, scaffolds, and branches; evaluating the most 395
probable failure; assessing the targets significance; and developing a hazard rating (Matheny and 396
Clark 1994). 397
398
United States Department of Agriculture (USDA) Forest Services Community Tree Risk 399
Evaluation Method presents options for two different survey types, the walk-by inspection and 400
the drive-by inspection. Pokorny (2003) explained that both risk assessment methods are 401
designed to identify the defects of trees within proximity of a target, gauge the severity of the 402
defects, and to make recommendations for mediation prior to failure. There are three risk rating 403
systems for these methods, ranging from low (where no mitigation is needed), to moderate 404
(currently defects do not meet the failure threshold), to high (where corrective action is needed 405
immediately). The risk rating system has three components: probability of failure (1-4 points), 406
size of the defect (1-3 points), and the probability of target impact (1-3). Added together, these 407
factors result in a numerical risk ranking ranging from 3-10 (Pokorny 2003). Pokorny (2003) 408
mentions an additional judgment rating of 0-2 points, and suggests use in situations where the 409

20
risk should be increased; for example, points might be added to the risk rating for a species that 410
is more prone to failure. The evaluation is based on noticeable defects, surrounding targets, and 411
site conditions, and is useful for all trees within proximity of hitting a target (Pokorny, 2003). 412
413
The ISA Tree Risk Assessment Best Management Practice (BMP) method (Smiley et al. 2011) 414
was developed to specifically aid tree care professionals with tree risk assessment, providing the 415
most up to date information on the related science and technology, for the purpose of evaluating 416
risk and recommending mitigation while avoiding issues pertaining to tree risk management 417
(Smiley et al. 2011). The BMP method was designed to allow the user to select from a wide 418
array of assessment techniques, depending on the needs of the assessor, available resources, 419
existing information and data, and the level of expertise required; focusing more on qualitative 420
aspects, but not excluding the use of a quantitative approach (Smiley et al. 2011). The method 421
focuses on two main components, the likelihood of failure (ranging from improbable, possible, 422
probable, to imminent) and the likelihood of impacting a target (ranging from very low, low, 423
medium, to high). These are assessed individually and then collectively using qualitative terms 424
(ranging from unlikely, somewhat likely, likely, very likely) on a table to estimate risk potential. 425
The assessor then categorizes (ranging from negligible, minor, significant, to severe) the 426
consequences of failure based on the value of the target and the damage that is likely to occur. 427
428
The Visual Tree Assessment (VTA) (Mattheck and Breloer 1994) method evaluates the tree 429
structure based on the presence of stressors through the use of a three step process. First the tree 430
is visually inspected for any noticeable defects, as well as examining the overall vitality of the 431

21
tree. The next step is to thoroughly examine any of the defects that had been observed. Finally, 432
the defects are measured and analyzed to assess the general strength of the tree. 433
434
The Quantitative Tree Risk Assessment (QTRA) (Ellison 2005a) method is based on the three 435
assessment components suggested by Matheny and Clarks (1994). The most recent version of 436
the QTRA (2015) method adds a fourth component, known as the QTRA Risk Advisory 437
Threshold, which takes into consideration the concepts of ‘As Low As Reasonably Practicable’ 438
(ALARP) (HSE 2001) and the ‘Tolerability of Risk framework’ (ToR) (HSE 2001). The addition 439
of this fourth component is to help the assessor customize the assessment and associated 440
management of a tree to meet the preferences of the homeowner or tree manager, and as a means 441
of balancing the costs and benefits associated with the management of a given tree. Once 442
determined, the first three components (target, size, probability of failure) are assigned 443
independent probabilities, combined to determine Risk of Harm. The Risk of Harm is then 444
compared to the fourth component (risk advisory threshold) and assigned an associated action 445
that the arborist can recommend to the homeowner or tree manager. Ellison (2005a) explained 446
that the depth of the inspection for a given tree will depend on the available access in a given 447
area; a high level of access would allow for a more detailed inspection and a low level of access 448
might only permit a general inspection. Although this method is labeled as quantitative, it is 449
worth pointing out that, currently, are no true quantitative approaches, all require personal 450
judgement to some extent. Still, advances are being made to correct this with the use of target 451
occupancy. For example, Klein et al. (2016) used traffic counters to quantify the target 452
occupancy portion, which is commonly used in most current risk assessment methods. The 453
results suggest that there is a possible relationship between an arborist who are ISA certificated 454

22
and a more accurate understanding of actual occupancy data and that these arborists can apply 455
ratings that mirror such interpretations. 456
Standardized urban forestry risk assessment methods offer a consistent process for inspecting 457
and documenting potential issues of concern (Hayes 2002). The need for such assessment 458
methods stem from the effects of tree failure on public health and safety legislation (Forbes-459
Laird 2009), fears of liability and litigation (Ellison 2007), and a recognition of the ecological 460
benefits of trees (Ellison 2005a; Wassenaer and Richardson 2009). 461
462
463
Assessment Method Main Components Rating Formula
The International Society of Arboriculture (ISA) Tree Hazard Evaluation (Matheny and Clark, 1994)
The potential Failure of a tree, Environmental aspects that are conducive to failure, and Impacts to people and property
A numerical value from 1-4 is given to each component, then all three components are added together to get the trees hazard rating
United States Department of Agriculture (USDA) Forest Services community Tree Risk Evaluation Method (Pokorny, 2003)
Defects of trees within proximity to a target, gauge the severity of the defects, and makes recommendations for mediation
The three components are added together to render the risk rating, an additional judgment rating of 0-2 points is suggested in situations where the risk should be increased Probability of failure (1-4 points) Size of the defect (1-3 points) Probability of target impact (1-3) Rating system ranges from low (no mitigation is needed) to high (corrective action is needed immediately)
The ISA Tree Risk Assessment Best Management Practice (BMP) Method (Smiley et al., 2011)
Likelihood of failure, the likelihood of impacting a target, and the potential consequences
Three main components are assessed through the use of two matrices' and qualitative terms Matrix 1 combines the likelihood of failure and the likelihood of impacting a target (unlikely, somewhat likely, likely, very likely)

23
Likelihood of failure (improbable, possible, probable, imminent) Likelihood of impacting a target (very low, low, medium, high) The assessor then categorizes the consequences of failure (negligible, minor, significant, severe) based on the value of the target and the damage that is likely to occur Matrix 2 combines the likelihood of failure and impact with the potential consequences to render the level of risk (low, moderate, high, extreme)
The Visual Tree Assessment (VTA) (Mattheck and Breloer, 1994)
Visually inspected for any noticeable defects/overall vitality of the tree, defects are examined closely, and then the defects are measured and analyzed to assess the general strength of the tree
The Quantitative Tree Risk Assessment (QTRA) (Ellison, 2005)
Probability of failure, impact potential, and target value
The three main components are assessed through the use of a range of probabilities (e.g., 1/1 to 1/19 and 1/20 to 1/100) which are then further assessed using the developed QTRA field calculator to render the level of risk
464
465
466
Despite some notable differences, the most commonly referenced and employed risk assessment 467
methods use a framework with a great number of similarities (Table1). At its core, tree risk 468
assessment includes: an assessments of the tree structure, defects, and subsequent evaluation tree 469
failure probability, an assessment of targets, and an appraisal of the potential damage caused 470
should a target be struck (Matheny and Clark, 1994; Mattheck and Breloer 1994; Ellison 2005a; 471
Meilleur 2006; Matheny and Clark 2009; Wassenaer and Richardson 2009). 472

24
473
Beyond these similarities, methods vary in how they weight each underlying risk factor, how 474
different defects are rated, and how the various components are combined into a final, 475
comprehensive risk determination (Norris 2007; Matheny and Clark 2009). Ratings systems for 476
each of the risk assessment methods assign different numbers to work towards the same results 477
and associated recommendations. For example, the International Society of Arboriculture (ISA) 478
Tree Hazard Evaluation (Matheny and Clark 1991) uses a rating system that goes up to 10 points 479
with 4 points going to failure potential, whereas, the United States Department of Agriculture 480
(USDA) Forest Services Community Tree Risk Evaluation Method (Pokorny 2003) goes up to 481
12 points and all three inputs have 4 possible points. Matheny and Clark (2009) noted that there 482
are no studies that test and evaluate different risk assessment methods. They also note that there 483
is still uncertainty among professionals about the importance and accuracy of assessment 484
methods (Matheny and Clark 2009). Norris (2007) compared a number of risk assessment 485
methods in a series of controlled experiments. The author used two different sets of trees with a 486
multitude of targets, failures, and consequences, which were assessed by 12 experienced 487
arborists, each using 8 methods of assessment. This work highlighted inconsistencies in current 488
assessment methods and different assessor’s perceptions of risk. Norris (2007) concluded that 489
risk assessment methods can yield a wide range of output values when used on the same tree, in 490
the same situation, and that the validity, completeness, robustness, repeatability, base 491
assumptions, and underlying modelling of any risk assessment method must be assessed if it is to 492
be widely adopted. Finally, the study found that the evaluations of arborists varied greatly and it 493
is assumed that this is due to each arborist’s individual inherent attitudes towards risk. 494
495

25
Some studies have highlighted how risk rating systems can be inherently flawed and can present 496
a misinterpretation of posed risk. For example, Cox et al. (2005) explains that, though qualitative 497
risk rating systems are increasingly the basis for real-world risk rating throughout many different 498
fields, these systems can assign higher risk ratings to situations that realistically present a low 499
level of risk (reversed rankings). These systems have a tendency of labeling situations where 500
there is a low level of quantitative risk with extreme qualitative descriptors, such as ‘High’ 501
(uninformative ratings). Additionally, it is a frequent occurrence that these same ratings are also 502
assigned to various situations where the actual present risk can vary many magnitudes apart from 503
another risk that is assigned a similar rating. Beyond raising concerns over qualitative methods in 504
general, Cox (2008) suggests that matrix-based risk systems have additional limitations, 505
including poor resolution in relation to selected hazards, assigning the same risk rating to two 506
unequal risks, assigning higher qualitative ratings to risks that pose lower levels of quantitative 507
risk which can lead to erroneous decision making, allocation of resources to mitigate a risk that 508
are unequal to the actual risk, and that decisions based on rick matrix outputs are the result of 509
subjective inputs. Depending on the user, such risk matrices can render completely different 510
ratings of risk and that these systems should be used with caution. 511
512
Few studies exist which independently test the validity and consistency of risk assessment 513
methods (Matheny and Clark 2009). Beyond the thesis work by Norris (2007), no research has 514
offered a comparison of competing risk assessment methods. To date, there has been no outside 515
assessment of the new ISA BMP risk assessment method (Smiley et al. 2011). Most of the 516
reviewed studies either support (Ellison 2005a; Fink 2009; Bond 2010) or dispute (Gruber 2008) 517
the underlying logic and assumptions associated with a given risk assessment method. 518

26
519
Matheny and Clark (1994) appears in several risk related articles (Kane et al. 2001; Hayes 2002; 520
Ellison 2005a; Wang and Allison 2008), as does Mattheck and Breloer (1994) (Manning et al. 521
2002; Kane 2004; Wang, 2008; Fink 2009; Wassenaer 2009). Overall, we found that the United 522
States Department of Agriculture (USDA) Forest Services Community Tree Risk Evaluation 523
method (Pokorny 2003), the ISA Tree Risk Assessment Best Management Practice (BMP) 524
method (Smiley et al. 2011), and the Quantified Tree Risk Assessment (QTRA) (Ellison 2005a), 525
which are discussed here, very rarely show up in any of the tree risk literature. 526
527
Public Perceptions of Trees and Open Spaces in an Urban Area: 528
When looking at risk perception research related to arboriculture and urban forestry, the bulk of 529
the available research shared a similar approach to assessing the public’s perceptions for 530
groupings of urban vegetation, not individual trees (Roovers et al. 2006; Zheng et al. 2011). 531
Most studies used photographs and surveys (Schroeder 1982, 1983; Talbot and Kaplan 1984; 532
Smardon 1988; Jorgensen et al. 2002; Roovers et al. 2006; Jorgensen and Anthopoulou 2007) to 533
better understand how people view such areas. Schroeder et al. (2006) explained that research 534
has consistently shown that urban residents have positive perceptions of trees and that their 535
benefits outweigh their annoyances. 536
537
It is well accepted by environmental psychologists that contact with nature is fundamental to 538
human health and the well-being of people in urban areas (Rohde and Kendle 1994; Kuo et al. 539
1998; Ozguner and Kendle 2006). It is therefore rational that people have many positive 540

27
associations with urban vegetation and natural spaces. In a telephone survey of Charleston, South 541
Carolina following the destruction resulting from hurricane Hugo in 1989, Hull (1992) found that 542
over 30% of the respondents mentioned some component of the urban forest as one of the most 543
important physical feature destroyed by the hurricane. Similarly, Wyman et al. (2012) conducted 544
a study where they assessed and compared the perceptions of tree related risk among community 545
leaders from Hillsborough and Broward Counties, in Florida. They found that even though these 546
areas are highly susceptible to hurricanes and the resulting damage caused by trees, 57% of the 547
respondents from both counties were in agreement with regard to increasing the size of their 548
urban forests. 549
550
Many studies have found that people find urban parks and greenspaces to be relaxing, peaceful, 551
educational, and scenic (Schroeder 1982; Smardon, 1988; Jorgensen and Anthopoulou 2007). 552
Schoeder (1982) illustrated that the urban forest is important because it allows for recreational 553
activities; for those living in metropolitan areas, this might be their only contact with nature. 554
When reading through the related literature, it became apparent that there was a common theme 555
related to how people perceive trees and natural spaces in urban areas. The idea of preference 556
(Schroeder 1982; Talbot and Kaplan 1984; Jorgensen et al. 2002; Zheng et al. 2011) 557
continuously played into people’s perception of various natural settings. In their study on 558
preferences and perceptions of natural and designed landscapes in the city of Sheffield (UK), 559
Ozguner and Kendle (2006) found that even when respondents perceived two sites to both be 560
natural, it was their preferences of how they thought the natural area should look that ultimately 561
dictated their perceptions of security. For example, they explained that when the vegetation was 562

28
unmaintained and more natural in appearance, this resulted in some people having a lower 563
perception of security for a particular natural space. 564
565
The perception of safety was a reoccurring issue among most of the research that was examined 566
for this review. Many studies (Schroeder and Anderson 1984; Shaffer and Anderson 1985; 567
Bjerke et al. 2006) mentioned that the perception of safety decreased as visibility decreased due 568
to increased vegetation density and that areas that were better maintained where perceived as 569
being safer. Jansson et al. (2013) elucidated that these commonalities, such as landscape design, 570
feelings of being in control, vegetation density, and vegetation maintenance as they relate to 571
personal safety in woodland vegetation, can be further investigated and applied to studies 572
focusing on urban forests. Linked to this view of personal safety is the perception that green 573
spaces in urban areas are associated with harboring criminal activities (Jansson et al. 2013). 574
Similarly, Jorgensen et al. (2002) commented that some people do not enjoy the benefits of 575
urban parks due to their perceptions of fear. It has also been pointed out that people’s perceptions 576
of these areas are affected by their preference between a natural landscape and that of a designed 577
landscape (Ozguner and Kendle 2006; Zheng et al. 2011). The perception of safety is vital to the 578
likelihood of an urban forest being used and appreciated (Schroeder 1990; Pokorny 2003). To 579
reiterate, the majority of these studies were conducted using photographic surveys, Ozguner and 580
Kendle (2006) concluded that how people view settings in photos is different than how they see 581
those same places in person. Therefore, it might be of value to conduct future surveys on site 582
rather than through the use of photographs, as a comparison to test the variances in perception 583
between the two methods. 584
585

29
Conclusion: 586
Overall, this review shows that there is scarce literature that focuses specifically on the 587
perceptions of risk as related to the failure from an individual tree (Koeser et al. 2015). The bulk 588
of the research addresses the perception of benefits, personal preference, and the safety concerns 589
for urban parks and green spaces. Though the current available literature related to risk 590
perception provides insight into the differing perceptions between gender, age groups, education, 591
and cultural backgrounds, there is still a gap in the understanding of how property owners 592
perceive and accept the risk of trees. 593
594
Given the global importance of our urban forests and the impact that they have on the bulk of the 595
world’s population, there is a need for greater focus on the potential risks and the perceptions of 596
those risks. In a similar vein, there is a need to survey arborists, urban forest managers, and other 597
tree care professionals to understand how they perceive and communicate risk regarding an 598
urban forest. This information could be useful in future design planning, risk assessment, and 599
risk mitigation. 600
601
Currently, there is no one tree risk assessment method that is accepted as the standard in the 602
industry. Standardizing a method would allow for consistency among assessments, potential 603
lowering liability, but also better equipping the managers and home owners who make decisions 604
that change the face of our urban forests. Current models of tree risk assessment serve their 605
purpose, but could be improved in many ways; assessing existing methods for effectiveness, 606
biases, and sensitivities could promote the rise of a more efficient method of assessment. In a 607
30
study that evaluated the impact of assessor training and the related tree care industry credentials 608
of 296 arborist, Koeser and Smiley (Submitted) found that those individuals that had both were 609
more likely to assign a tree a lower risk rating, which resulted in professional recommendations 610
that leaned on the side of less aggressive mitigation (e.g. avoiding tree removal). Additionally, 611
they found there to be a great deal of variability among risk ratings for the various components 612
of the risk assessment (likelihood of impact, consequences of failure) and that this was due to the 613
assessments of the individual assessor. 614
615
Future research must continue to tease out biases inherent to a given risk assessment system, 616
inputs that are overly sensitive to assessor judgments (leading to excessive variability). 617
Additionally, research should look at how factors like the time frame of the assessment (e.g., 1, 618
3, or 5 or more years) impact the reproducibility of risk assessments. Moving towards a more 619
quantitative risk assessment approach will help to advance our understanding of risks from tree 620
failure. When the trees in question are on private property, it is ultimately the home owner that 621
makes the final decision as to the mitigation. This decision is likely based on their own 622
perceptions of risk and also the assessment of the consulting arborist. In the case of a 623
municipality, the decision falls on the local management. Again, it is the perception of risk and 624
the method of assessment that will ultimately lead to the final verdict. Given the importance of 625
both risk perception and a standardized assessment method, future research has the potential to 626
offer a great deal of insight that will further the understanding of the discipline. 627
628
Literature Cited 629

31
630
ANON., 2006. Population Estimates. UK Statistics Directive, Office for National Statistics, 631
Fareham. 632
ANSI., 2011. Tree, shrub, and other woody plant management -standard practices. Tree risk 633
assessment. a. Tree structure assessment. ANSI A300 (Part 9) - 2011. ANSI, Washington, DC. 634
14 pp. 635
Arciniegas, A., Prieto, F., Brancheriau, L., Lasaygues, P. 2014. Literature review of acoustic and 636
ultrasound tomography in standing trees. Trees 28: 1559-1567. 637
Ball, D.J., 2007. The evolution of risk assessment and risk management: a background to the 638
development of risk philosophy. Arboricultural Journal 30: 105-112. 639
Ball, D.J. and J. Watt. 2013a. further thoughts on the utility of risk matrices. Risk Analysis 640
33(11):2068-78 641
Ball, D.J. and Watt, J., 2013b. The risk to the public of tree fall. Journal of Risk Research, 16(2), 642
pp.261-269. 643
Bartens, J., Wiseman, P.E., Smiley, E.T., 2010. Stability of landscape trees in engineered and 644
conventional urban soil mixes. Urban Forestry & Urban Greening 9: 333-338. 645
Bechtel, R.B. and Churchman, A. eds., 2003. Handbook of environmental psychology. John 646
Wiley & Sons. 647
Bixler, R.D., Floyd, M.F., 1997. Nature is scary, disgusting and uncomfortable. Environmental 648
Behavior 29: 443–467. 649

32
Bjerke, T., Ostdahl, T., Thrane, C., Strumse, E., 2006. Vegetation density of urban parks and 650
perceived appropriateness for recreation. Urban Forestry and Urban Greening 5: 35-44. 651
Bond, J., 2010. Tree condition: health. Arborist News 19(1): 34-38. 652
Botterill, L., Mazur, N., 2004. Risk and perception: a literature review. Australian Government: 653
Rural Industries Research and Development Corporation 1-22. 654
Brakken, S.R., 1995. Group-tree hazard analysis. Journal of Arboriculture 21(3): 150-155. 655
Clark, J.R., Matheney, N.P., Cross, G., Wake, V., 1997. A model of urban forest sustainability. 656
Journal of Arboriculture 23(1): 17-30. 657
Costello, L.R., Quarles, S.L., 1999. Detection of wood decay in blue gum and elm: An 658
evaluation of the Resistograph® and the portable drill. Journal of Arboriculture 25(6): 311-318. 659
Cox, L. A. T., Babayev, D., & Huber, W., 2005. Some limitations of qualitative risk rating 660
systems. Risk Analysis, 25(3), 651-662. 661
Cox, L. A. T., 2008. What's wrong with risk matrices?. Risk analysis 28(2), 497-512. 662
Cullen, S., 2002. Trees and wind: a bibliography for tree care professionals. Journal of 663
Arboriculture 28: 1. 664
Dahle, G., J. Grabosky, B. Kane, J. Miesbauer, W. Peterson, F.W. Telewski, A.K. Koeser, and 665
G.W. Watson., 2014. Tree Biomechanics: A White Paper from the 2012 International Meeting 666
and Research Summit at The Morton Arboretum (Lisle, Illinois, US). Arboriculture & Urban 667
Forestry 40(6):309-318. 668
33
Davison, A., & Kirkpatrick, J. B., 2014. Risk and the Arborist in the Remaking of the Australian 669
Urban Forest. Geographical Research 52(2): 115-122. 670
DeYoung, R.K., 1999. Environmental psychology. Environmental Geology: Encyclopedia of 671
Earth Science 223-224. 672
Dolwin, J. A., Lonsdale, D., & Barnett, J., 1999. Detection of decay in trees. Arboricultural 673
Journal 23(2): 139-149. 674
Duryea, M.L., G.M. Blakeslee, W.G. Hubbard, and R.A. Vasquez., 1996. Wind and trees: A 675
survey of homeowners after Hurricane Andrew. Journal of Arboriculture 22(1): 44-50. 676
Duryea, M. L., & Kampf, E., 2007. Wind and Trees: Lessons Learned from Hurricanes. 677
University of Florida, IFAS Extension. 678
Dunster, J.A., Smiley, E.T., Matheny, N., Lilly, S., 2013. Tree risk assessment manual. 679
International Society of Arboriculture. Champaign, Illinois, U.S. 680
Dwyer, J.F., Schroeder, H.W., Gobster, P.H., 1991. The significance of urban trees and forests: 681
toward a deeper understanding of values. Journal of Arboriculture 17(10): 276-284. 682
Dwyer, J.F., McPherson, E.G., Schroeder, H.W., Rowntree, R.A., 1992. Accessing the benefits 683
and the costs of the urban forest. Journal of Arboriculture 18(5): 227-234. 684
Ellison, M.J., 2005a. Quantified tree risk assessment used in the management of amenity trees. 685
Journal of Arboriculture 31(2): 57-65. 686
Ellison, M. J., 2005b. Quantified Tree Risk Assessment User Manual. Quantified Tree Risk 687
Assessment Ltd. 688

34
Ellison, M. J., 2007. Moving the focus from tree defects to rational risk management—A 689
paradigm shift for tree managers. Arboricultural Journal 30: 137-142. 690
Fay, N., 2007. Towards reasonable tree risk decision-making. Arboriculture Journal 30: 143-161. 691
Fink, S., 2009. Hazard tree identification by visual tree assessment (VTA): Scientifically solid 692
and practically approved. Arboricultural Journal 32: 139-155. 693
Finucane, M.L., Alhakami, A., Slovic, P. and Johnson, S.M., 2000. The affect heuristic in 694
judgments of risks and benefits. Journal of Behavioral Decision Making 13(1): 1-17. 695
Fischhoff, B., Slovic, P., Lichtenstein, S., Read, S., & Combs, B., 1978. How safe is safe 696
enough? A psychometric study of attitudes towards technological risks and benefits. Policy 697
sciences 9(2): 127-152. 698
Forbes-Laird, J., 2009. Liability for death or injury caused by falling trees or branches: A review 699
of the present position under English law in relation to tree safety inspection. Arboricultural 700
Journal 32: 233-241. 701
Gifford, R., 2007. Environmental psychology: Principles and practice. Colville, WA: Optimal 702
books. 703
Gilbert, E.A., Smiley, E.T., 2004. Picus sonic tomography for the quantification of decay in 704
white oak (Quercus alba) and hickory (Carya spp.). Journal of Arboriculture 30(5): 277-281. 705
Gilman, E. F. 2003. Branch-to-stem diameter ratio affects strength of attachment. Journal of 706
Arboriculture 29(5): 291-294. 707

35
Gilman, E.F., Masters, F.J., 2010. Effect of tree size, root pruning, and production method on 708
root growth and lateral stability of Quercus virginiana. Arboriculture & Urban Forestry 36(6): 709
281-291. 710
Gilman, E.F., Grabosky, J., 2011. Quercus virginiana root attributes and lateral stability after 711
planting at different depths. Urban Forestry & Urban Greening 10: 3-9. 712
Gilman, E.F., Wiese, C., 2012. Root pruning at planting and planting depth in the nursery impact 713
root system morphology and anchorage. Arboriculture and Urban Forestry 38(5): 229-236. 714
Gilman, E.F., Miesbauer, J., Harchick, C., Beeson, R.C., 2013. Impact of tree size and container 715
volume at planting, mulch, and irrigation on Acer rubrum L. growth and anchorage. 716
Arboriculture & Urban Forestry 39(4): 173-181. 717
Gruber, F., 2008. Reply to the response of Claus Mattheck and Klaus Bethge to my criticisms on 718
untenable vta-failure criteria, who is right and who is wrong? Arboriculture Journal 31(4): 277–719
296. 720
Guglielmo, F., Bergemann, S. E., Gonthier, P., Nicolotti, G., & Garbelotto, M., 2007. A 721
multiplex PCR‐based method for the detection and early identification of wood rotting fungi in 722
standing trees. Journal of Applied Microbiology 103(5): 1490-1507. 723
Hauer, Richard J., Weishen Wang, and Jeffrey O. Dawson., 1993. Ice storm damage to urban 724
trees. Journal of Arboriculture 19(4): 184-194. 725
Hayes, E., 2002. Tree risk assessment & tree mechanics. Arborist News 33-37. 726
Helliwell, D.R., 1990. Acceptable level of risk associated with trees. Arboriculture Journal 14(2): 727
159–162. 728

36
Hickman, G.W., Perry, E., Evans, R., 1995. Validation of a tree failure evaluation system. 729
Journal of Arboriculture 21(5): 233-234. 730
Health and Safety Executive., 2007. Management for risk from falling tree Sector Information 731
Minute, SIM 01/2007/05, HSE Field Operations Directorate, Sudbury. 732
Health and Safety Executive. Accessed on 5/12/15. 733
<http://www.hse.gov.uk/education/statistics.htm> 734
Hull IV, R.B., 1992. How the public values urban forests. Journal of Arboriculture 18(2): 98-735
101. 736
Jansson, M., Fors, H., Lindgren, T., Wistrom, B., 2013. Perceived personal safety in relation to 737
urban woodland vegetation – A review. Urban Forestry and Urban Greening 12: 127-133. 738
Jim, C.Y., Zhang, H., 2013. Defect-disorder and risk assessment of heritage trees in urban Hong 739
Kong. Urban Forestry and Urban Greening 12: 585–596. 740
Johnson, D. James, R., 1978. Tree hazards: Recognition and reduction in recreation sites. Tech. 741
Rep. R2-1. Lakewood, CO: U. S. Department of Agriculture, Forest Service, Rocky Mountain 742
Region. 18pp. 743
Johnson, D., 1981. Tree hazards: Recognition and reduction in recreation sites. Tech. Rep. R2-1. 744
Lakewood, CO: U. S. Department of Agriculture, Forest Service, Rocky Mountain Region. 17pp. 745
Johnson, J.R., 1999. Storms over Minnesota. Minnesota Shade Tree Advocate 2(1):1-12. 746

37
Johnstone, D. Ades, P.K., Moore, G.M., Smith, I.W., 2007. Predicting wood decay in eucalypts 747
using an expert system and the IML-Resistograph drill. Arboriculture & Urban Forestry 33(2): 748
76-82. 749
Johnstone, D., Moore, G., Tausz, T., and Nicolas, M., 2010a. The measurement of wood decay in 750
landscape trees. Arboriculture & Urban Forestry 36: 121-127. 751
Johnstone, D. Tausz, M., Moore, G. and Nicolas, M., 2010b. Quantifying wood decay in Sydney 752
bluegum (Eucalyptus salinga) trees. Arboriculture & Urban Forestry 36(6): 243-253. 753
Jorgensen, A., Hitchmough, J., Calvert, T., 2002. Woodland spaces and edges: their impact on 754
perception of safety and preference. Landscape and Urban Planning 60: 135-150. 755
Jorgensen, A., Anthopoulou, A., 2007. Enjoyment and fear in urban woodlands – does age make 756
a difference? Urban Forestry and Urban Greening 6: 267-278. 757
Kane, B., Ryan, D., Bloniarz, D.V., 2001. Comparing formulae that assess strength loss due to 758
decay in trees. Journal of Arboriculture 27(2): 78-87. 759
Kane, B., 2008. Tree failure following a windstorm in Brewster, Massachusetts, USA. Urban 760
Forestry and Urban Greening 7: 15–23. 761
Kane, B., Clouston, P., 2008. Tree pulling tests of large shade trees in the genus Acer. 762
Arboriculture & Urban Forestry 34(2): 101-109. 763
Kane, B., Farrell, R., Zedaker, S. M., Lofersky, J. R., & Smith, D. W., 2008. Failure mode and 764
prediction of the strength of branch attachments. Arboriculture and Urban Forestry 34(5): 308-765
316. 766
Kennard, D.K., Putz, F.E., Niederhofer, M., 1996. The predictability of tree decay based on 767
visual assessments. Journal of Arboriculture 22(6): 249-254. 768

38
Klein, R.W., Koeser, A.K., Hauer, R.J., Hansen, G., Escobedo, F., 2016. Relationship between 769
perceived and actual occupancy rates in urban settings. Urban Forestry & Urban Greening 770
19:194-201. 771
Koeser, A.K., 2009. Trees & Risk Researcher Summit White Paper. Accessed on 2/2/15. 772
www.isaarbor.com/publications/resources/litReview/Trees_and_Risk_White_Paper_EGM.pdf 773
Koeser, A.K., R.W. Klein, G. Hasing, R.J. Northrop., 2015. Factors driving professional and 774
public urban tree risk perception. Urban Forestry & Urban Greening 14(4):968-974. 775
Koeser, A.K., D.C. Mclean, G. Hasing, and R.B. Allison., 2016. Frequency, Severity, and 776
Detectability of Internal Trunk Decay of Street Tree Quercus spp. in Tampa, Florida, U.S. 777
Arboriculture & Urban Forestry 42(4):217-225. 778
Koeser, A.K., Smiley, E.T. (Submitted). Impact of Tree Care Industry Credentials and Training 779
on Urban Tree Risk Assessment Ratings and Prescribed Mitigation Measures. Journal of Risk 780
Research. 781
Kuo, F. E., Bacaicoa, M., & Sullivan, W. C., 1998. Transforming inner-city landscapes trees, 782
sense of safety, and preference. Environment and behavior 30(1): 28-59. 783
Lilly, S., Sydnor, T.D., 1995. Comparison of branch failure during static loading of silver and 784
Norway maples. Journal of Arboriculture 21(6): 302-305. 785
Lohr, V.I., Pearson-Mims, C.H., Tarnai, J., Dillman, D.A., 2004. How Urban Residents Rate 786
Tree Benefits and Problems. Journal of Arboriculture 30(1): 28-35. 787
Lonsdale, D., 2007. Current issues in arboricultural risk assessment and management. 788
Arboricultural Journal 30(2): 163-174. 789

39
Manning, T., Bradford, P., White, C., Rowe, D., Densmore, N., Guy, S., 2002. British 790
Columbia’s dangerous tree assessment process. USDA Forest Service Gen. Tech. Rep. PSW-791
GTR-181: 863-868. 792
Matheny, N., Clark, J., 1994. A photographic guide to the evaluation of hazard trees in urban 793
areas. Champaign, IL: International Society of Arboriculture. 794
Matheny, N., Clark, J., 2009. Tree risk assessment: what we know (and what we don’t know). 795
Arborist News 18(1): 28-33. 796
Mattheck, C., Breloer, H., 1994 Field guide for visual tree assessment (VTA). Arboricultural 797
Journal 18(1): 1–23. 798
Mattheck, C., Breloer, H., 1999. The Body Language of Trees: A Handbook for Failure 799
Analysis. TSO. 800
McPherson, G., Simpson, J.R., Peper, P.J., Maco, S.E., Xiao, Q., 2005. Municipal forest Benefits 801
and costs in five US cities. Journal of Forestry 103(8): 411-416. 802
Meilleur, G., 2006. Basic tree risk assessment. Arborist News 15 (5): 12–17. 803
Miesbauer, J. W., Gilman, E. F., Masters, F. J., Nitesh, S., 2014. Impact of branch reorientation 804
on breaking stress in Liriodendron tulipifera L. Urban Forestry & Urban Greening 13(3): 526-805
533. 806
Mills, L. Russell, K., 1981. Detection and correction of hazard trees in Washington’s recreation 807
areas. Report 42. Olympia, WA: Washington Department of Natural Resources. 37 pp. 808
40
Moore, G.M., 2014. Defending and expanding the urban forest: opposing unnecessary tree 809
removal requests. The 15th National Street Tree Symposium. 70-76. 810
National Tree Safety Group (NTSG). 2011. Common Sense risk management of trees. 811
Edinburgh, United Kingdom: The Forestry Commission 102 pp. 812
Norris, M., 2007. Tree Risk Assessments – What Works – What Does Not – Can We Tell? A 813
review of a range of existing tree risk assessment methods. ISAAC Conference Perth 2007. 1-31. 814
Nowak. D.J., Dwyer, J.F., 2007. Understanding the benefits and costs of an urban forest 815
ecosystem. Urban and Community Forestry in the Northeast. Dordrecht: Springer. 816
Ow, L.F., Harnas, F.R., Indrawan, I.G.B., Sahadewa, A., Sim, E.K., Rahardjo, H. Leong, E.C., 817
Fong, Y.K., Tan, P.Y., 2010. Tree-pulling experiment: An analysis into the mechanical stability 818
of rain trees. Trees 24: 1007-1015. 819
Ozguner, H., Kendle, A.D., 2006. Public attitudes towards naturalistic versus designed 820
landscapes in the city of Sheffield (UK). Landscape and Urban Planning 74: 139-157. 821
Paine, L., 1971. Accident hazard: Evaluation and control decisions on forested recreation sites. 822
Res. Pap. PSW-68. Berkeley, CA: U. S. Department of Agriculture, Forest Service, Pacific 823
Southwest Forest and Range Experiment Station. 1-10. 824
Papastavrou, V., R. Leaper, and R. Prytherch., 2010. Determining pedestrian usage and parked 825
vehicle monetary values for inputs into quantified tree risk assessments – two case studies from 826
urban parks in Great Britain. Arboricultural Journal 33: 43-60. 827
Pokorny, J.D., 2003. Urban tree risk management, a community guide to program design and 828
implementation, USDA Forest Service Northeastern Area State and Private Forestry. 829

41
Quantified Tree Risk Assessment Ltd. 2015. Quantified Tree Risk Assessment Practice Note 830
Version 5. V5.1.5 (US) 2016-03. 831
Renn, O., 2004. Perception of risks. Toxicology letters 149(1): 405-413. 832
Rinn, F., Schweingruber, F.H., Schär, E., 1996. Resistograph and X-ray density charts of wood 833
comparative evaluation of drill resistance profiles and X-ray density charts of different wood 834
species. Holzforschung 50: 303-311. 835
Rohde, C.L.E., Kendle, A.D., 1994. Human Well Being, Natural Landscapes and Wildlife in 836
Urban Areas. English Nature Science No: 22. English Nature, Peterborough. 837
Rooney, C., Ryan, H., Bloniarz, D., Kane, B., 2005. The reliability of a windshield survey to 838
locate hazards in roadside trees. Journal of Arboriculture 31: 89-94. 839
Roovers, R., Dumont, B., Gulinck, H., Hermy, M., 2006. Recreationists’ perceived obstruction 840
of field and shrub layer vegetation. Urban Forestry and Urban Greening 4: 47-53. 841
Roy, S., Byrne, J., Pickering, C., 2012. A systematic quantitative review of urban tree benefits, 842
costs, and assessment methods across cities in different climatic zones. Urban Forestry & Urban 843
Greening 11(4): 351–363. 844
Scherer, C. W., & Cho, H., 2003. A social network contagion theory of risk perception. Risk 845
analysis 23(2): 261-267. 846
Schmidlin, T. W., 2009: Human fatalities from wind-related tree failures in the United States, 847
1995–2007. Nat. Hazards 50: 13–25. 848

42
Schroeder, H., 1982. Preferred features of urban parks and forests. Journal of Arboriculture 849
8(12): 317-322. 850
Schroeder, H., 1983. Variations in the perception of urban forest recreation sites. Leisure Science 851
5(3): 221-230. 852
Schroeder, H., Anderson, L.M., 1984. Perception of personal safety in urban recreation sites. 853
Journal of Leisure Research 16(2): 178-194. 854
Schroeder, H., Flannigan, J., Coles, R., 2006. Residents’ attitudes toward street trees in the UK 855
and U.S. communities. Arboriculture and Urban Forestry 32(5): 236-246. 856
Shaffer, G., Anderson, L.M., 1985. Perceptions of the security and attractiveness of urban 857
parking lots. Journal of Environmental Psychology 5: 311-323. 858
Sjöberg, L., Moen, B. E., Rundmo, T., 2004. Explaining risk perception. An evaluation of the 859
psychometric paradigm in risk perception research. Trondheim 1-33. 860
Slovic, P., Fischhoff, B., Lichtenstein, S., 1982. Why study risk perception?. Risk Analysis 2(2): 861
83-93. 862
Slovic, P., 1987. Perception of risk. Science 236: 280-290. 863
Slovic, P., 1999. Trust, emotion, sex, politics, and science: Surveying the risk-assessment 864
battlefield. Risk Analysis 19(4): 689-701 865
Smardon, R.C., 1988. Perceptions and aesthetics of the urban environment: review of the role of 866
vegetation. Landscape and Urban Planning 15: 85-106. 867

43
Smiley, E. T., & Fraedrich, B., (1992). Determining strength loss from decay. Journal of 868
Arboriculture 18(4): 201-204. 869
Smiley, E. T., Key, A., Greco, C., (2000). Root barriers and windthrow potential. Journal of 870
Arboriculture 26(4): 213-217. 871
Smiley, E.T., Fraedrich, B.R., Hendrickson, N., 2002. Tree risk management. Bartlett Tree 872
Research Laboratories. 873
Smiley, E.T., 2008. Root pruning and stability of young willow oak. Arboriculture & Urban 874
Forestry 34(2): 123-128. 875
Smiley, E.T., Matheny, N., Lilly, S., 2011. Best management practices. Tree risk assessment. 876
International Society of Arboriculture, Champaign, Illinois, U.S. 877
Sowby, F. D., 1965. Radiation and other risks. Health Physics 11: 879-887. 878
Spangler, M.B., 1984. Policy issues related to worst case risk analyses and the establishment of 879
acceptable standards of de minimis risk. Pp 1-26 in V.T. Covello, L.B. Lave, A. Moghissi and 880
V.R.R. Uppuluri (Eds), Uncertainty in Risk Assessment, Risk Management, and Decision 881
Making, Plenum Press: New York. 882
Sreetheran, M., Adnan, M., Khairil Azuar, A. K., 2011. Street tree inventory and tree risk 883
assessment of selected major roads in Kuala Lumpur, Malaysia. Arboriculture and Urban 884
Forestry 37(5): 226. 885
Starr, C., 1969. Social benefit versus technological risk. Science 165: 1232-1238. 886

44
Stewart, M.G., D. O’Callaghan, and M. Hartley., 2013. Review of QTRA and risk-based cost-887
benefit assessment of tree management. Arboriculture & Urban Forestry 39(4): 165-172. 888
Talbot, J.F., Kaplan, R., 1984. Needs and fears: the response to trees and nature in the inner city. 889
Journal of Arboriculture 10(8): 222-228. 890
Terho, M., Hallaksela, A., 2005. Potential hazard characteristics of Tilia, Betula, and Acer trees 891
removed in the Helsinki city area during 2001-2003. Urban Forestry and Urban Greening 3: 113-892
120. 893
Terho, M., 2009. An assessment of decay among urban Tilia, Betula, and Acer trees felled as 894
hazardous. Urban Forestry and Urban Greening 8: 77-85. 895
Tyrväinen, L., Pauleit, S., Seeland, K., Vries, S.D., 2005. Benefits and uses of urban forests and 896
trees. In: Konijnendijk, C., Nilsson, K., Randrup, T., Schipperijn, J. (Eds.), Urban Forests and 897
Trees in Europe: A Reference Book. Springer Verlag pp. 81–114. 898
Wagener, W.W., 1963 Judging hazard from native trees in California recreational areas: a guide 899
for professional foresters, Berkeley, CA: USDA Forest Service, Pacific Southwest Forest and 900
Range Experiment Station 1-29. 901
Wang, X. Allison, B.R. 2008. Decay detection in red oak trees using a combination of visual 902
inspection, acoustic testing, and resistance microdrilling. Arboriculture & Urban Forestry 34(1): 903
1-4. 904
Wassenaer, P.V., Richardson, M., 2009. A review of tree risk assessment using minimally 905
invasive technologies and two case studies. Arboriculture Journal 32: 275-292. 906

45
Wessolly, L., 1995. Fracture diagnosis of trees—Part 1: Statics–integrated methods—907
Measurement with tension test. Stadt Grün 6: 416–422. 908
Wyman, M., Escobedo, F., Stein, T., Orfanedes, M., & Northrop, R., 2012. Community leader 909
perceptions and attitudes toward coastal urban forests and hurricanes in Florida. Southern 910
Journal of Applied Forestry 36(3): 152-158. 911
Zhang, Y., Hussain, A., Deng, J., Letson, L., 2007. Public Attitudes Toward Urban Trees and 912
Supporting Urban Tree Programs. Environment and Behavior 39(6): 797-814. 913
Zheng, B., Zhang, Y., Chen, J., 2011. Preference to home landscape: wildness or neatness? 914
Landscape and Urban Planning 99, 1-8. 915