Using decision tree analysis to identify risk factors for relapse to smoking
31
Using decision tree analysis to identify risk factors for relapse to smoking Megan E. Piper, Ph.D., Center for Tobacco Research and Intervention, University of Wisconsin School of Medicine and Public Health, Madison, WI Wei-Yin Loh, Ph.D., Department of Statistics, University of Wisconsin, Madison, WI Stevens S. Smith, Ph.D., Center for Tobacco Research and Intervention and Department of Medicine, University of Wisconsin School of Medicine and Public Health, Madison, WI Sandra J. Japuntich, Ph.D., and Mongan Institute for Health Policy, Tobacco Research and Treatment Center, Massachusetts General Hospital, Harvard University Medical School Timothy B. Baker, Ph.D. Center for Tobacco Research and Intervention and Department of Medicine, University of Wisconsin School of Medicine and Public Health, Madison, WI Abstract This research used classification tree analysis and logistic regression models to identify risk factors related to short- and long-term abstinence. Baseline and cessation outcome data from two smoking cessation trials, conducted from 2001 to 2002, in two Midwestern urban areas, were analyzed. There were 928 participants (53.1% women, 81.8% white) with complete data. Both analyses suggest that relapse risk is produced by interactions of risk factors and that early and late cessation outcomes reflect different vulnerability factors. The results illustrate the dynamic nature of relapse risk and suggest the importance of efficient modeling of interactions in relapse prediction. Keywords Relapse; prediction; classification tree; regression; smoking Introduction Relapse or cessation failure is the modal outcome of smoking cessation attempts (Fiore, Jaen, Baker, Bailey, Benowitz, Curry, et al., 2008). Despite the frequency of cessation failure, the accurate prediction of cessation success might yield important benefits. First, accurate identification of high-risk individuals might permit the allocation of intensive Corresponding Author: Megan E. Piper, Center for Tobacco Research and Intervention, 1930 Monroe St., Suite 200, Madison, WI, 53711. Telephone: (608) 265-5472. Fax: (608) 265-3102. [email protected]. Megan E. Piper, Wei-Yin Loh, Stevens S. Smith and Sandra J. Japuntich have no potential conflicts of interest to disclose. Timothy B. Baker has served as an investigator on research projects sponsored by pharmaceutical companies including Pfizer, Glaxo Wellcome, Sanofi, and Nabi. NIH Public Access Author Manuscript Subst Use Misuse. Author manuscript; available in PMC 2012 January 1. Published in final edited form as: Subst Use Misuse. 2011 ; 46(4): 492–510. doi:10.3109/10826081003682222. NIH-PA Author Manuscript NIH-PA Author Manuscript NIH-PA Author Manuscript
Transcript of Using decision tree analysis to identify risk factors for relapse to smoking

Using decision tree analysis to identify risk factors for relapse tosmoking
Megan E. Piper, Ph.D.,Center for Tobacco Research and Intervention, University of Wisconsin School of Medicine andPublic Health, Madison, WI
Wei-Yin Loh, Ph.D.,Department of Statistics, University of Wisconsin, Madison, WI
Stevens S. Smith, Ph.D.,Center for Tobacco Research and Intervention and Department of Medicine, University ofWisconsin School of Medicine and Public Health, Madison, WI
Sandra J. Japuntich, Ph.D., andMongan Institute for Health Policy, Tobacco Research and Treatment Center, MassachusettsGeneral Hospital, Harvard University Medical School
Timothy B. Baker, Ph.D.Center for Tobacco Research and Intervention and Department of Medicine, University ofWisconsin School of Medicine and Public Health, Madison, WI
AbstractThis research used classification tree analysis and logistic regression models to identify riskfactors related to short- and long-term abstinence. Baseline and cessation outcome data from twosmoking cessation trials, conducted from 2001 to 2002, in two Midwestern urban areas, wereanalyzed. There were 928 participants (53.1% women, 81.8% white) with complete data. Bothanalyses suggest that relapse risk is produced by interactions of risk factors and that early and latecessation outcomes reflect different vulnerability factors. The results illustrate the dynamic natureof relapse risk and suggest the importance of efficient modeling of interactions in relapseprediction.
KeywordsRelapse; prediction; classification tree; regression; smoking
IntroductionRelapse or cessation failure is the modal outcome of smoking cessation attempts (Fiore,Jaen, Baker, Bailey, Benowitz, Curry, et al., 2008). Despite the frequency of cessationfailure, the accurate prediction of cessation success might yield important benefits. First,accurate identification of high-risk individuals might permit the allocation of intensive
Corresponding Author: Megan E. Piper, Center for Tobacco Research and Intervention, 1930 Monroe St., Suite 200, Madison, WI,53711. Telephone: (608) 265-5472. Fax: (608) 265-3102. [email protected] E. Piper, Wei-Yin Loh, Stevens S. Smith and Sandra J. Japuntich have no potential conflicts of interest to disclose. Timothy B.Baker has served as an investigator on research projects sponsored by pharmaceutical companies including Pfizer, Glaxo Wellcome,Sanofi, and Nabi.
NIH Public AccessAuthor ManuscriptSubst Use Misuse. Author manuscript; available in PMC 2012 January 1.
Published in final edited form as:Subst Use Misuse. 2011 ; 46(4): 492–510. doi:10.3109/10826081003682222.
NIH
-PA Author Manuscript
NIH
-PA Author Manuscript
NIH
-PA Author Manuscript

treatment on an empirically sound basis. Second, if we can identify those factors orsituations that precipitate cessation failure or relapse, treatments might be designed orapplied to mitigate such risk factors. Finally, knowing who is at risk, and the factors thatindex risk, could provide insight into mechanisms of dependence. Towards these goals, thisresearch used a classification tree modeling approach to efficiently screen large numbers ofvariables to detect ordered relations that provide easily interpretable and accurate predictionsof cessation outcomes. In other words, using variables from several diverse domains thathave been theoretically linked to relapse (e.g., treatment/cessation methods, demographic,life-context, and dependence variables), this research identified subgroups of individuals athigher risk for early and late relapse and specific variables that index this risk.
Theoretical and empirical work has implicated baseline person factors, environmentalfeatures, dependence and smoking history variables in increasing risk for relapse. Suchvariables include: gender (Perkins, 2001; Wetter, Kenford, Smith, Fiore, Jorenby, & Baker,1999); living with a smoker (Derby, Lasater, Vass, Gonzalez, & Carleton, 1994; Garvey,Kinnunen, Nordstrom, Utman, Doherty, Rosner, et al., 2000; Homish & Leonard, 2005;Osler & Prescott, 1998); smokers in the environment (Lu, Tong, & Oldenburg, 2001;Mermelstein, Cohen, Lichtenstein, Baer, & Kamarck, 1986; Morgan, Ashenberg, & Fisher,1988); tobacco dependence (Alterman, Gariti, Cook, & Cnaan, 1999; Campbell, Prescott, &Tjeder-Burton, 1996; Harris, Okuyemi, Catley, Mayo, Ge, & Ahluwalia, 2004; Hurt, Wolter,Rigotti, Hays, Niaura, Durcan, et al., 2002; Killen, Fortmann, Kraemer, Varady, & Newman,1992; Patten, Martin, Calfas, Lento, & Wolter, 2001; Westman, Behm, Simel, & Rose,1997); see also (Fagerstrom & Schneider, 1989); length of abstinence in previous quitattempts (Garvey, Bliss, Hitchcock, Heinold, & Rosner, 1992; Ockene, Emmons,Mermelstein, Perkins, Bonollo, Voorhees, et al., 2000); alcohol consumption (Garvey et al.,1992; Hyland, Li, Bauer, Giovino, Steger, & Cummings, et al., 2004; McClure, Wetter, deMoor, Cinciripini, & Gritz, 2002; McKee, Maciejewski, Falba, & Mazure, 2003); age(Harris et al., 2004; Hurt et al., 2002; Miller, Ratner, & Johnson, 2003; Nides, Rakos,Gonzales, Murray, Tashkin, & Bjornson-Benson, et al., 1995; Osler & Prescott, 1998);marital status (Derby et al., 1994); and educational attainment/socioeconomic status(Barbeau, Krieger, & Soobader, 2004; Eisinger, 1971; Fernandez, Schiaffino, Borrell,Benach, Ariza, Ramon, et al., 2006; Hyland et al., 2004; Hymowitz, Cummings, Hyland,Lynn, Pechacek, & Hartwell, 1997; Hymowitz, Sexton, Ockene, & Grandits, 1991; Levy,Romano, & Mumford, 2005; Miller et al., 2003; Nollen, Mayo, Sanderson, Okuyemi, Choi,Kaur, et al., 2006; Osler, Prescott, Godtfredsen, Hein, & Schnohr, 1999; Shields, 2005;Siahpush, Heller, & Singh, 2005; Wetter, Cofta-Gunn, Irvin, Fouladi, Wright, Daza, et al.,2005). These studies identified a number of main effect predictors, suggesting that mostpredictors apply to all subjects. However, few studied interactions so there is littleinformation about whether the above variables interact with one another to producemultiplicative patterns of risk or identify subgroups of smokers who might be at higher riskfor relapse.
The majority of these studies relied on linear or logistic regression techniques to link riskfactors with cessation outcome. This use of multivariate regression permits researchers toidentify those variables that both individually and collectively predict outcomes across agroup of smokers. With regards to a dichotomous outcome such as abstinence status, there isconsiderable evidence that logistic regression yields very good solutions when used as a“black box” (Lim, Loh, & Shih, 2000; Perlich, Provost, & Simonoff, 2003). However,regression approaches may have intrinsic biases that may affect the sorts of predictors thatare identified. First, regression analysis is somewhat insensitive to variables that permitaccurate prediction for a relatively small subgroup of smokers. It tests predictors on theirability to predict outcomes across an entire sample, and, therefore, may identify variablesthat weakly predict outcomes for many individuals vs. identifying variables that strongly
Piper et al. Page 2
Subst Use Misuse. Author manuscript; available in PMC 2012 January 1.
NIH
-PA Author Manuscript
NIH
-PA Author Manuscript
NIH
-PA Author Manuscript

predict outcomes for subgroups of individuals. Second, a regression model can be difficultto interpret, especially if it contains many predictor variables. The interpretation ofinteraction effects or cross-products can be complicated, made even more so by the jointeffect of more than one cross-product in a model. In addition, it is very difficult to testinteraction effects in a manner that is both comprehensive and methodologically principledbecause the number of interaction terms grows precipitously with increases in the number ofpredictors1. For example, if there are 70 predictors in a model, then there are (70*69)/2 =2,415 two-factor interaction terms associated with the 70 linear terms. In order to test for allinteractions, one would need more than 2,485 observations. Although researchers usuallyonly test a much smaller number of theoretically predicted interactions, this limitsresearchers’ ability to explore the data completely. Finally, coefficients in a regressionmodel measure only the residual effect of that variable, after all the other variables in themodel are accounted for. This has two disadvantages. First, the values of the coefficientsoften change if other variables are added or deleted from the model. Thus, each coefficient isconditional on other variables in a given model and cannot be evaluated on its merit alone.Second, if interaction terms are not thoroughly screened in a regression model, then maineffect coefficients may be misleading because they may not apply to subjects in a uniformmanner. There are no easy solutions to these challenges. For instance, stepwise variableaddition and deletion, a strategy that restricts the size of regression models, exaggerates thestatistical significance of the coefficient estimates (Miller, 2002; Zhang, 1992). Testing onlya priori models may result in model misspecification. As a result of these factors, limitationsin analytic strategies have limited our ability to identify which of the many candidatevariables are the most important measures of risk.
Classification tree analysis is a complementary approach to logistic regression. Aclassification tree is a statistical model for predicting an outcome variable from the values ofone or more predictor variables. The goal of a classification tree is to optimize prediction byiteratively dividing individuals into high- and low-risk groups. It is similar to polytomouslogistic regression, in that the outcome variable takes a small number of values (e.g.,smoking vs. non-smoking). But unlike logistic regression, which models the log odds as alinear function of the predictor variables, a classification tree recursively partitions a datasetinto two or more subgroups such that the observations within a subgroup are morehomogeneous than those across subgroups. Each partition is based on one predictor at a timewith different classification trees using different algorithms to partition the data at each step.When numerous variables are tested at each recursive step, a classification tree selects thevariable that most efficiently divides subjects on the basis of outcome likelihood. Thisallows researchers to examine potential interactions of a variable on one group vs. another(e.g., treatment effects on men vs. women). Therefore, a classification tree model is readilyinterpretable. In other words, decision trees offer a new way to look at complex data sets.They are not meant to replace traditional methods.
Classification or decision trees and logistic regression analyses are complementaryapproaches. In some situations, one approach is better than the other; see Perlich et al.(2003) for a study that shows decision trees having superior prediction accuracy comparedto logistic regression when the sample size is large. Classification trees can offer advantages
1This comparison of regression and classification tree models with regards to interaction effects should not be taken to mean thatsubnode branching within classification tree models is mathematically equivalent to multiplicative interactions in regression models.The classification tree model illustrates interactions by showing that a variable predicts the dependent variable only among individualswho meet a certain threshold on a different variable. For instance, Figure 1 shows that treatment condition is related to abstinencestatus only if individuals smoke within 30 minutes of waking (FTND1). Thus, we can say that there is an interaction between FTND1and treatment condition. Note that the interaction effect involves identifying the interaction variables (FTND1 and treatmentcondition) and identifying a threshold value for FTND1. Traditional regression approaches model interactions only through cross-product terms. However, both models indicate a predictive relation that differs as a function of another variable in the model.
Piper et al. Page 3
Subst Use Misuse. Author manuscript; available in PMC 2012 January 1.
NIH
-PA Author Manuscript
NIH
-PA Author Manuscript
NIH
-PA Author Manuscript

over logistic regression in that they capture optimal, sequential decision rules that maypossess clinical utility or theoretical significance as they apply to specific subgroups ofindividuals. Classification tree analysis is more likely to detect variables that powerfullypredict outcomes for just a subgroup of individuals. In essence, regression analysis relativelyweights pervasiveness, while classification tree analysis relatively weights specificity.
Swan and his colleagues (2003, 2004, 2008) have written that decision tree models are nowwidely accepted as providing a good complement to traditional methods. Swan andcolleagues (Swan, Javitz, Jack, Curry, & McAfee, 2004) were the first to use suchclassification trees in the field of tobacco research. They used Classification and RegressionTrees (CART; Breiman, Friedman, Olshen, & Stone, 1984) to explore gender differences in12-month cessation outcome from a bupropion smoking cessation trial. The results revealedsix subgroups for women based on: longest-quit attempt, body-mass index (BMI),education, family history of depression, and number of previous quit attempts. Sixsubgroups were also found for men and these were based on: the Fagerström Test ofNicotine Dependence (FTND) score, longest quit attempt, previous use of NRT, depressionhistory, and years smoked. These findings differed from logistic regression findingspreviously reported by the same research group using the same sample (Swan, Jack, Curry,Chorost, Javitz, McAfee, et al., 2003). This supports the premise that there are predictorsthat are particularly relevant to subgroups of smokers and that regression analysis may notidentify them. These researchers have also used CART to identify subgroups of at-risksmokers in two different treatment conditions (Swan, Jack, Javitz, McAffe & McClure,2008).
In addition to illustrating the different results produced by a logistic regression versus aclassification approach, the Swan et al. (2004) CART results are interesting in that theyshow that patterns of risk factors differ across the sexes and that outcomes were not stronglyrelated to treatment or traditional measures of nicotine dependence. This raises importantquestions regarding the relative importance of nicotine dependence vs. variables that reflectperson factors such as socioeconomic status (e.g., education), mental or physical health, orsituational/contextual factors.
Swan et al. (2004) produced important and intriguing findings, but there are several reasonsto conduct additional classification tree research relevant to cessation outcome. First, Swanand colleagues forced an initial sex-based subgroup separation based on their findings ofgender differences in outcome. Further decision tree analyses are needed that use gender as apredictor variable, rather than creating different trees for the two genders. In this way thestatus of sex as a predictor can be contrasted with other variables. Thus, we would be able todetermine if sex, relative to other variables, is effective at identifying subgroups of smokerswho differ meaningfully in cessation outcome. It might be the case that if all factors are usedin the classification models, sex would not provide a basis for classification because itspredictive validity would be accounted for by other variables that are correlated with sex. Inaddition, in Swan et al. (2008) different trees were created for the different treatment groups,which did not allow the researchers to analyze the role of treatment in predicting risk forrelapse in the sample when all of the other relapse prediction variables were included.
A second reason to conduct additional decision tree analyses is that the Swan et al. (2004,2008) research used only a single follow-up time point, 12-months post-quit, as an outcomevariable. It is possible that very different solutions would result if models were built usingoutcomes at different time points (e.g., as has been found in multivariate logistic regressionapproaches; Garvey et al., 1992; Hurt et al., 2002). For instance, Swan et al. found thattreatment did not predict outcome at 12 months post-quit. However, it may be that treatmentexerts its effects on outcome at earlier time points (e.g., shortly after the end of treatment).
Piper et al. Page 4
Subst Use Misuse. Author manuscript; available in PMC 2012 January 1.
NIH
-PA Author Manuscript
NIH
-PA Author Manuscript
NIH
-PA Author Manuscript

Other predictors may differ in their ability to organize data as a function of follow-uplatency. For instance, dependence might be more highly determinant of outcomes early (vs.late) in the post-cessation period, as it might influence the severity of the withdrawalsyndrome. However, factors such as the presence of smoking cues, living with a smoker, orsocial support might exert stronger effects over longer time periods (e.g., Mermelstein et al.,1986).
Finally, it is important to develop classification models with decision tree analytic methodsother than CART. CART is biased toward choosing predictors with many values (e.g., BMIor years smoked) over predictors with few values (e.g., binary variables such as male vs.female or treatment vs. placebo), because the former predictors allow more chances todivide the data into homogeneous subgroups (Loh & Shih, 1997). Other decision treemethods, including the GUIDE method we will be using in this research have been shown toimprove upon the average prediction accuracy of CART (Loh, 2002; 2010).
The goals of this research are two-fold: 1) to shed new light on relapse predictors; and 2) toillustrate the value of a classification approach to relapse prediction and analysis. Toaccomplish these goals we identified predictors of cessation success among smokers at bothearly and late time points post-quit (1 week, 8 weeks/end-of-treatment and 6 months) usingbaseline variables assessed pre-quit. Second we compared results yielded by classificationtree analyses with those produced by a logistic regression algorithm to obtaincomplementary evidence on important predictors of cessation success. The two analyticprocedures can be compared on the basis of overlap in predictors and the size andinterpretability of the prediction models they yield.
MethodsData presented here were collected from two randomized placebo-controlled smokingcessation trials. Trial methods are discussed in more detail in Piper et al. (Piper, Federman,McCarthy, Bolt, Smith, Fiore, et al., 2007) and McCarthy et al. (McCarthy, Bolt, & Baker,2007). In Study 1 (N = 608: Piper et al., 2007) participants were randomly assigned to one ofthe three treatment groups: active bupropion + active 4-mg nicotine gum (AA, n = 228);active bupropion SR + placebo nicotine gum (AP, n = 224); or placebo bupropion SR +placebo gum (PP, n = 156). All participants also received three brief (10-minute) counselingsessions (one week pre-quit, on the quit day, and one week post-quit) designed to providethe most effective elements recommended by the 2000 Public Health Service Guideline:intra-treatment social support, information and problem-solving, and aid in seeking extra-treatment social support (Fiore, Bailey, & Cohen, 2000). In Study 2 (N = 463: McCarthy etal., 2007) participants were randomly assigned to receive active bupropion + counseling(AC, n = 113), active bupropion + no counseling (ANc, n = 116), placebo + counseling (PC,n = 121) or placebo + no counseling (PNc, n = 113) in a 2 (active bupropion SR vs. placebo)× 2 (counseling vs. no counseling) factorial design. Counseling comprised eight sessions ofbrief (10-minute) individual cessation counseling.
ParticipantsIn both studies, participants were recruited through TV, radio and newspaper advertisementsand community flyers in Madison and Milwaukee, WI. Participants were eligible toparticipate if they smoked 10 or more cigarettes per day, were motivated to quit smoking,did not have any physical or mental health issues that would prevent them from participatingin or completing the study, and were not pregnant or breast-feeding and took steps toprevent pregnancy during treatment.
Piper et al. Page 5
Subst Use Misuse. Author manuscript; available in PMC 2012 January 1.
NIH
-PA Author Manuscript
NIH
-PA Author Manuscript
NIH
-PA Author Manuscript

ProcedureIn both studies, eligible participants were invited to an Orientation Session at which theylearned about the study, provided written informed consent, demographic and smokinghistory information, including a carbon monoxide breath test (participants were excluded ifexhaled carbon monoxide was < 10 ppm). Participants also completed health-screeningquestionnaires (i.e., Michigan Alcoholism Screening Test [MAST], Selzer, Vinokur, & vanRooijen, 1975; Primary Care Evaluation of Mental Disorders [PRIME-MD], Spitzer,Williams, Kroenke, Linzer, deGruy, Hahn, et al., 1994; Center for Epidemiologic StudiesDepression Scale [CES-D], Radloff, 1977) to assess for medical or psychological exclusioncriteria, in addition to the multiple tobacco dependence measures listed below. At 6-monthspost-quit, all participants who reported abstinence for the previous 7 days were scheduled toreturn to the clinic to provide a breath sample for CO analysis.
PredictorsCarbon Monoxide Assessment—Participants provided a breath sample to permitalveolar carbon monoxide (CO) analysis to verify their smoking status and estimate theirsmoking heaviness. A Bedfont Smokerlyzer was used to measure the CO in the breathsamples. Results were recorded as parts per million of carbon monoxide.
Demographics and Smoking History—A demographics questionnaire assessedcharacteristics such as gender, ethnicity, age, marital status, education level, andemployment. The Smoking History Questionnaire included items such as the number ofcigarettes smoked per day, age of smoking initiation, smoking status (e.g., daily smoker,occasional smoker, etc.), number of quit attempts, longest time abstinent, and other smokersin the household. The Smoking History Questionnaire yielded a total of 25 variables.
Direct Assay of Dependence Criteria—The Direct Assay of Dependence Criteria(DADC) comprises 14 items designed to assess 3 dependence-related constructs: relapselikelihood, withdrawal symptoms, and self-administration. Each item is answered on a 7-point Likert scale. This measure was developed by the study authors for use in the clinicaltrials described above.
Fagerström Test of Nicotine Dependence—The Fagerström Test of NicotineDependence (FTND; Heatherton, Kozlowski, Frecker, & Fagerstrom, 1991) is a 6-item scaledesigned to measure tobacco dependence. Each item has its own individual response scalethat varies by item. Previous research indicates that it has fair internal consistency (α = .61;Heatherton, et al., 1991).
Nicotine Dependence Syndrome Scale—The Nicotine Dependence Syndrome Scale(NDSS; Shiffman, Waters, & Hickcox, 2004) is a 19-item self-report measure, comprisingfive theoretically derived subscales: Drive, Priority, Tolerance, Continuity and Stereotypy.Each item is rated on a 5-point Likert scale from 1 = “Not at all true” to 5 = “Extremelytrue”.
Tobacco Dependence Screener—The Tobacco Dependence Screener (TDS;Kawakami, Takatsuka, Inaba, & Shimizu, 1999) is a self-report measure designed to assess10 of the DSM-IV (American Psychiatric Association, 1994) criteria for tobaccodependence, each on a dichotomous scale with 0 indicating lack of the symptom and 1indicating endorsement of the symptom. Research has shown that the TDS has good internalconsistency (α ranging from .76 to .81 across three studies; Kawakami, et al., 1999).
Piper et al. Page 6
Subst Use Misuse. Author manuscript; available in PMC 2012 January 1.
NIH
-PA Author Manuscript
NIH
-PA Author Manuscript
NIH
-PA Author Manuscript

Wisconsin Inventory of Smoking Dependence Motives—The Wisconsin Inventoryof Smoking Dependence Motives (WISDM; Piper, Piasecki, Federman, Bolt, Smith, Fiore,et al., 2004) comprises 68 items designed to assess 13 different theoretically-derivedmotivational domains: Affiliative Attachment, Automaticity, Behavioral Choice/Melioration, Cognitive Enhancement, Craving, Cue Exposure/Associative Processes, Lossof Control, Negative Reinforcement, Positive Reinforcement, Social and EnvironmentalGoads, Taste and Sensory Properties, Tolerance, and Weight Control. Each item is answeredon a 7-point Likert scale ranging from 1 = “Not true of me at all” to 7 = “Extremely true ofme.” Subscales are scored by taking the average of all of the answers relevant to thatsubscale.
OutcomesSeven-day point-prevalent abstinence was assessed at each study visit. For this research, theimportant outcomes were smoking at 1-week post-quit (early cessation failure), end-of-treatment (8 weeks post-quit) and 6 months post-quit. We also examined early (end-of-treatment) and late (6 months post-quit) relapse by removing individuals who were smokingin the first week (cessation failures) from the analyses. Smoking status was verified usingCO ratings (CO < 10 = abstinent). Using the intent-to-treat principle, individuals who couldnot be reached for a specific follow-up were considered to be smoking at that follow-up.
Analytic strategyUsing a listwise deletion procedure, we identified 928 participants who had complete datafor the 70 baseline variables of interest (see Appendix A). We deliberately included onlyparticipants with complete data so that type of analysis would not be confounded byapproach to missing data. The predictor variables were selected based on previous researchand theory as to their relations with relapse. The variables were analyzed as predictors of 1-week, end-of-treatment and 6-month post-quit abstinence using the Generalized, UnbiasedInteraction Detection and Estimation (GUIDE; Loh, 2002; Loh, 2010;www.stat.wisc.edu/~loh/guide.html) classification tree program and using a stepwise logisticregression algorithm. The GUIDE method, which does not have the selection bias of theCART method, uses chi-square tests to measure the degree of association between thedependent variable and each predictor variable (the range of each continuous predictorvariable is divided into four groups at its sample quartiles for this purpose). The mostsignificant predictor variable is selected to form the partition. If the selected variable X iscontinuous, the method searches for a split of the form, “X < c”, with c chosen to make bothof the resulting data subsets as homogeneous as possible. If X is categorical (e.g., maritalstatus), the best split of the form, “X in S”, is found, where S is a subset of the values takenby X. This step is applied recursively to each partition and the whole process can bedescribed by a tree structure. Partitioning stops when the sample size is less than 20. Sincethe resulting tree model probably over-fits the data, a sequence of smaller tree models isobtained by sequentially pruning the tree structure until only one node is left, using the sameinternal-validation method as CART. Finally, the tree model with the lowest estimate ofprediction error is chosen. In sum, the GUIDE classification tree program analyzes pairs ofvariables recursively and because it examines variable effects in subgroups determined byprior variable cut-scores, it is able to accommodate interactions when choosing the bestvariable to split the sample (its subsequent cuts account for the levels of previously enteredvariables).
The stepwise logistic regression algorithm was conducted using R and the AkaikeInformation Criterion (AIC). The AIC algorithm is designed to include as many terms asneeded to minimize the AIC criterion function and may include terms that are notstatistically significant. As such, the AIC model is known to overfit the data (Simonoff,
Piper et al. Page 7
Subst Use Misuse. Author manuscript; available in PMC 2012 January 1.
NIH
-PA Author Manuscript
NIH
-PA Author Manuscript
NIH
-PA Author Manuscript

2003). We did not use a usual stepwise procedure based on p-values because it isinapplicable when the number of potential terms (main effects plus all possible interactions)exceeds the sample size. Some of the regression models included interactions while othersincluded only main effect terms.
ResultsParticipant Characteristics
The combined sample from Study 1 and Study 2 comprised 1,071 smokers, 928 of whomhad complete data for the 70 predictor variables used in the analyses. See Table 1 fordemographic information. While the two study samples were comparable, there werestatistically significant differences in the number of women (χ2 (1, N=928) = 5.01, p = .03),racial composition (χ2 (1, N= 928) = 39.21, p < .01), educational attainment (χ2 (1, N= 928)= 23.37, p < .01), and age (t (926) = −5.12, p < .01), although some of these differenceswere relatively modest.
1 week post-quitAt the end of the first week post-quit, approximately 46% of participants reported nosmoking after their quit day. Figure 1 shows a pruned classification tree model for predictingabstinence at the end of the first week of treatment. The first variable chosen by GUIDE tosplit the data was FTND Item 1, “How soon after you wake do you smoke your firstcigarette?” Participants who reported smoking their first cigarette at least 30 minutes afterwaking went to the left node while those who smoked their first cigarette within 30 minuteswent to the right node. There are four leaf nodes, and hence, four subgroups. The subgroupconsisting of the participants who waited at least 30 minutes to smoke their first cigarette (n= 222) had the highest abstinence rate of 61%. Participants who smoked within 30 minutesafter waking and received placebo medication had the lowest abstinence rates (n = 246;30%). Of those individuals who smoked within 30 minutes of waking and received activemedication, those who were married or living with a partner had higher abstinence rates (n =264; 54%) than those who were not married or living with a partner (n = 196; 36%).
End of treatmentAt the end of treatment (8 weeks post-quit), 29.7% of the sample reported 7-day point-prevalence abstinence. The classification tree identified one predictor consistent with the 1-week tree: treatment condition, and two new predictors: income and self-reported healthstatus (Figure 2). Individuals who received placebo medication had the lowest abstinencerates (n = 335; 20%). However, abstinence rate was similar to that of individuals whoreceived active medication but reported a household income of less than $35,000 and thattheir health was good/fair/poor/don’t know (n = 172; 21%). Individuals with the highestabstinence rates at the end of treatment were those who received active medication and had ahousehold income of $35,000 or greater (n = 327; 43%), and those who received activemedication, had a household income of less than $35,000 but had excellent/very good health(n = 94; 36%).
The data were then re-analyzed excluding individuals who were smoking in the first weekpost-quit (i.e., cessation failures) to assess predictors of ability to establish and maintainabstinence through treatment. The average end-of-treatment abstinence rate among smokerswho were able to quit during the first week was 54.7%. Marital status, gender and age whenthe individual began daily smoking were the significant predictors of being able to establishand maintain abstinence through treatment (Figure 3). Results indicate that men who aremarried or living with a partner and individuals who started daily smoking after age 16 andwere not married or living with a partner were the most likely to be abstinent at the end of
Piper et al. Page 8
Subst Use Misuse. Author manuscript; available in PMC 2012 January 1.
NIH
-PA Author Manuscript
NIH
-PA Author Manuscript
NIH
-PA Author Manuscript

treatment (n = 141; 68% and n = 81; 60%, respectively), if they were able to achieve initialabstinence in the first week post-quit. Approximately half of the women who were marriedor living with a partner (n = 112) maintained abstinence through the end of treatment. Onlyone-third of individuals who were not married or living with a partner and started smokingdaily by age 16 (n = 90) were able to maintain abstinence through the end of treatment.
6 months post-quitThe overall abstinence rate at 6 months post-quit was 18.5%. The classification tree modelhad only two predictors – health status and longest previous quit attempt (see Figure 4).Individuals who were in good, fair or poor health but had a history of being able to quit formore than 5 months had the highest abstinence rates (n = 282; 25%). Individuals whoreported very good or excellent health had the next highest abstinence rates (n = 109; 20%).Individuals in good, fair or poor health who had been unable to quit for more than 5 monthshad the lowest abstinence rates at 6 months post-quit (n = 537; 15%).
The GUIDE model predicting abstinence only among individuals who were abstinent at oneweek post-quit was completely different from the model predicting abstinence using theentire sample (see Figure 5). The average abstinence rate at 6 months post-quit for thosewho achieved initial abstinence during the first week was 32.5%. Among this group, self-reported feelings of dependence and marital status predicted abstinence at 6 months post-quit. Individuals who reported that they’d never felt dependent on tobacco had the highestabstinence rates (n = 21; 57%). However, it should be noted that only 21 of the 424individuals in the sample reported never having felt dependent. Of those who reported thatthey had ever felt dependent on tobacco, individuals who were married or living with apartner had higher abstinence rates (n = 242; 36%) than did individuals who were notmarried or living with a partner (n = 161; 24%).
Logistic Regression AnalysesThe results for the AIC stepwise logistic regression analyses predicting 6-month abstinenceare presented in Tables 2–5. When all smokers and only main effects were included in theanalysis, the AIC regression yielded 14 predictors, 7 of which were statistically significant(p < .05) and one of which was also included in the GUIDE model – Longest previous quitattempt (see Table 2). When data from all smokers were used and main effects and allpossible interactions were analyzed, the regression yielded 52 predictors: 18 main effects (8statistically significant) and 36 interaction effects (23 statistically significant; see Table 3).Both of the GUIDE predictors, health status and longest previous quit attempt, wereincluded in this AIC model. When the analyses were done using only individuals whoachieved initial abstinence and only main effects were analyzed, the AIC model had 11predictors, 6 of which were statistically significant (see Table 4). Both of the GUIDEpredictors, marital status and ever felt dependent on tobacco, were included in this AICmodel. When the dataset was restricted to those who achieved initial abstinence and maineffects and interactions were included in the model there were 21 predictors: 12 main effects(5 statistically significant) and 9 interaction effects (4 statistically significant; see Table 5).As with the main effects only model, both the GUIDE predictors were included in this AICmodel.
DiscussionThe first goal of this paper was to use a somewhat novel methodology, the GUIDE decisiontree method, to provide insight into the factors that predict abstinence following a quitattempt and how these factors might interact to reveal predictors for specific subgroups ofsmokers. In addition, this study was designed to examine whether different predictors are
Piper et al. Page 9
Subst Use Misuse. Author manuscript; available in PMC 2012 January 1.
NIH
-PA Author Manuscript
NIH
-PA Author Manuscript
NIH
-PA Author Manuscript

relevant at different points during the quit attempt (e.g., does treatment predict late as wellas early success?).
Results of the GUIDE analyses revealed that individuals who delay smoking their firstcigarette of the day by 30 minutes or more have the greatest likelihood of achieving initialabstinence in a quit attempt. But for those who smoke their first cigarette within 30 minutesafter waking, which is a sign of strong nicotine dependence, receiving pharmacotherapy andbeing married/living with a partner predict initial success. These results also demonstrate theimportance of providing pharmacotherapy to individuals who smoke their first cigarettewithin 30 minutes of waking.
While treatment continues to be an important predictor of cessation success at the end oftreatment, income and health status are also important. Individuals with household incomesof at least $35,000 were more likely to be able to quit. If an individual had a householdincome of less than $35,000, then health status was a significant predictor of abstinence. Itmay be that good/fair/poor health predicts cessation failure because only highly relapse-vulnerable individuals have continued to smoke in the face of significant health risk. Whenthe analyses of end-of-treatment abstinence focused on those who had achieved initialabstinence, marital status was once again a significant predictor. It may be that beingmarried or living with a partner provides an extra motivation or extra support in dealing withthe challenges of quitting. Or, this variable may be a more general indicant of socialfunctioning. Interestingly, marital/partner status prognosticated greater success for malesthan females. Thus, this finding adds to findings by Swan and colleagues’ (2004) showingdifferential abstinence prediction as a function of gender. Results also showed that for thosewho did not live with a partner, age of initiating daily smoking was an important predictor.These findings resonate with the recent genetics findings that individuals with a certaingenetic loading are more likely to develop strong nicotine dependence if they begin dailysmoking prior to age 17 (Weiss, Baker, Cannon, von Niederhausern, Dunn, Matsunami, etal., 2008).2
At 6 months post-quit, health status and longest previous quit attempt are the most importantpredictors of cessation success. Good/fair/poor health and an inability to quit for more than 5months in the past combined to produce the lowest abstinence rates. As in the end-of-treatment analyses, the impact of health status may be an index of motivation (e.g., wantingto quit because of negative health) but may also index dependence as those who have triedto quit before due to health problems but have been unsuccessful, possibly due to strongnicotine dependence, may continue to have difficulty quitting. When the results focused onsmokers’ who achieved initial abstinence in the first week of the quit attempt, outcome waspredicted by self-reported dependence for a small number of participants (only 21 of the 424reported that they had never felt dependent). However, marital status predicted outcome forthe majority of the individuals.
It is also important to keep in mind that, as is the case with all approaches to prediction,variables may reflect the effects of correlated variables. It is unknown, therefore, whyindividuals who are married or living with a domestic partner are less likely to relapse thanare other individuals. It may be, for instance, that the social support that occurs in marriagehelps smokers maintain abstinence. Or, marital status might index a variety of person factorssuch as neuroticism, social skills, socioeconomic status, intelligence, and so on, andcessation medication is most helpful in persons with these factors. With respect to householdincome being predictive of outcome, research has shown that socioeconomic status is relatedto many factors that may affect cessation success, including: availability for treatment
2It should be noted that the data presented here were used in the Weiss et al. (2008) analyses.
Piper et al. Page 10
Subst Use Misuse. Author manuscript; available in PMC 2012 January 1.
NIH
-PA Author Manuscript
NIH
-PA Author Manuscript
NIH
-PA Author Manuscript

scheduling (Macken, Wilder, Mersy, & Madlon-Kay, 1991), financial and other stress (DeVogli & Santinello, 2005; McKee et al., 2003; Siahpush et al., 2005), living with smokers orhaving a partner who smokes (Chandola, Head, & Bartley, 2004; Graham, Francis, Inskip, &Harman, 2006; Honjo, Tsutsumi, Kawachi, & Kawakami, 2006), presence of smoking atwork and in one’s peer group, (Honjo et al., 2006), and having a blue collar job (Sorensen,Gupta, & Pednekar, 2005). These factors suggest that a low-income smoker might havemore stress, less support for quitting and may live in a more smoking-cue rich environment.Household income may also implicate mental illness as a mechanism of relapse, sincesevere mental illness is associated with lower employment status (McIntyre, Wilkins,Gilmour, Soczynska, Konarksi, Miranda, et al., 2008; Ridgeway & Rapp, 1998). Futureresearch should explore the mechanisms via which life-context variables are related toabstinence outcomes. This is especially true for such variables as marital status and income,which appear to be especially prognostic of outcome. It is possible that their influence ismediated by factors that can be affected by intervention (e.g., social and material resources,knowledge).
Another important facet of the GUIDE algorithm is its ability to determine cut scores. If thepredictor variable selected to split a node in the tree takes ordered values (e.g., age), GUIDEfinds the cut score on that variable that makes the observations in the resulting subnodes ashomogeneous as possible in terms of the binomial variance of the outcome variable. If thepredictor variable takes unordered values (e.g., marital status), GUIDE finds the bestgrouping of values to minimize the binomial variances in the subnodes. However, it shouldbe noted that the cut scores, and indeed the overall predictions, will be highly affected by thepopulations involved, item response scales, and the other items submitted to analysis.
In sum, at all three time points (1 week, end-of-treatment and 6 months post-quit), bothtobacco-related factors (e.g., treatment, dependence) as well as life-context factors (e.g.,health status, marital status, income) are important in determining likelihood of cessationsuccess, including ability to achieve and maintain abstinence. These data reinforce thenotion that only a portion of the variation in relapse is related to dependence and thatcovariates should be used to distill the portion of relapse that is reflective of dependence(Piper, McCarthy, & Baker, 2006; Uhl, Liu, Drgon, Johnson, Walther, & Rose, et al., 2007).However, it is important to note that the predictive power of the specific tobacco or life-context variable appears to change based on the time period being predicted, althoughmarital status did predict outcome at all three time periods. Marital status appears to be theonly variable that predicted not only the ability to establish initial abstinence, but maintain itover time. The results agree with theoretical models that hold that the determinants ofrelapse change with time (Piasecki, Fiore, McCarthy, & Baker, 2002; Shiffman, 1993).
These results share some similarity with those reported by Swan and colleagues (Swan et al.,2004). These researchers found that for women, longest previous quit attempt, education,number of previous quit attempts, BMI and family history of depression were significantpredictors of 12 month abstinence. For men FTND total score, longest previous quit attempt,previous use of NRT, depression history, and years smoked were the significant predictors.There is consistency in both analyses regarding the ability of past behavior (longest previousquit attempt) to predict future abstinence. In addition, both sets of analyses reveal theimportance of dependence variables as well as life-context/demographic variables inpredicting cessation success. The predictive validity of contextual/demographic variables(e.g., marital status, income, education) may have important clinical implications.Uncovering reasons that these variables predict treatment failure may suggest newinterventions designed to buffer their mechanisms of risk (Shiffman, 1993).
Piper et al. Page 11
Subst Use Misuse. Author manuscript; available in PMC 2012 January 1.
NIH
-PA Author Manuscript
NIH
-PA Author Manuscript
NIH
-PA Author Manuscript

The second goal of this study was to compare the more traditional regression approach withthe classification tree approach. The former contrasts variables on the basis of predictionacross a whole population. The latter recursively partitions individuals on the basis of theinformation value of predictors in providing optimal classification of subgroups ofindividuals. The current results illustrate the very different results that can be obtained fromthe two different methods, despite the fact that they both used the same subjects, the sameindependent variables, and the same dependent variables. As such, regression andclassification tree approaches should be viewed as complementary analytic approaches, andresearchers can gain additional perspective on a phenomenon by using both approaches.3
Consistent with previous research, the AIC regression models identified: gender (Perkins,2001; Wetter et al., 1999); tobacco dependence (Alterman et al., 1999; Campbell et al.,1996; Harris et al., 2004; Hurt et al., 2002; Killen et al., 1992; Patten et al., 2001; Westmanet al., 1997); length of abstinence in previous quit attempts (Garvey et al., 1992; Ockene etal., 2000); marital status (Derby et al., 1994); and educational attainment/socioeconomicstatus (Barbeau et al., 2004; Eisinger, 1971; Fernandez et al., 2006; Hyland et al., 2004;Hymowitz et al., 1997; Hymowitz et al., 1991; Levy et al., 2005; Miller et al., 2003; Nollenet al., 2006; Osler et al., 1999; Shields, 2005; Siahpush et al., 2005; Wetter et al., 2005) aspredictors of outcome. It did not identify alcohol use or age as being related to outcome.
However, the use of the AIC regressions illustrated several complications that arise whenusing a logistic regression approach to sift and winnow through a multitude of predictors.First, we were unable to use a more traditional p-value-based logistic regression because thenumber of predictors, including both main effects and all possible two-way interactions,exceeded the sample size. In exploratory analyses, when all possible predictors andcombinations need to be assessed, logistic regression approaches may not be suitable unlessthere are a priori predictions or interactions that are intrinsically interesting or theoreticallyrelevant and the model building is designed to test these. This strategy, though, can result inmodel misspecification if the a priori model does not include important predictors. Thedecision tree methodology is specifically designed to handle a large number of predictors,perhaps making it better suited to large exploratory analyses, relative to the logisticregression analyses.
Second, when there are numerous predictors, the AIC regression model will overfit the data,producing rather large models. Compared to the GUIDE models that included only two orthree predictors, the AIC model that included 52 predictors seems somewhat excessive. Itshould be noted that using the model with only main effects is not sufficient in that themodels with the interactions included revealed that the interaction terms were the bestpredictors. However, with large models like this, interpretation becomes an importantconcern. Even if the number of predictors is narrowed to only those demonstrating statisticalsignificance, interpretation becomes a substantial problem. One of the AIC models had 8significant main effects and 23 interaction effects. Interpreting interactions or cross-productsis challenging enough; but when there are several interactions in a single model forming anunderstanding of the joint interpretation of all of the interactions becomes even morecomplex. Comparatively, the GUIDE model produces a parsimonious solution that is readilyinterpretable in terms of dividing the sample into groups that are at higher or lower risk forrelapse. The GUIDE results also provide information on which variables are the mostimportant or best predictors, based on which variables are chosen at the initial nodes as wellas information on the order in which the interactions become operative.
3It should be noted that we conducted analyses using RPART (Atkinson and Therneau 2000), an R implementation of CART. TheCART trees were much bigger than the GUIDE trees.
Piper et al. Page 12
Subst Use Misuse. Author manuscript; available in PMC 2012 January 1.
NIH
-PA Author Manuscript
NIH
-PA Author Manuscript
NIH
-PA Author Manuscript

While much previous research on relapse prediction has not focused on interaction terms,the present results suggest that interactions may be highly informative. This suggests that wemay be able to predict the fate of smokers better, and identify who needs more or differenttreatments if we take interactions into account. However, we must replicate these findingssince interaction effects can be highly affected by sampling error. The use of numeroushighly correlated variables in prediction models increases the likelihood that differentsolutions will be obtained across samples. This is one of the limitations of classification treeanalyses. By design, a classification tree model gives a stepwise description of a data set. Ateach step, the most predictive explanatory variable is selected to split a node of the tree.After splitting on the variable, its explanatory power is depleted, and other variables may beselected in subsequent steps. If two or more highly correlated explanatory variables areequally predictive, however, at most one is selected. Thus the main limitation of such amodel is that the variables in the model may not be the only important ones. Of course,multicollinearity affects other statistical methods too, including logistic regression where itmakes the estimated regression coefficients more difficult to interpret and increases theirvariability. One way to see if multicollinearity is a serious concern in a classification treemodel is to reconstruct it without the selected variables and see which other variables areselected in their place.
These results suggest a potential use for decision tree approaches; i.e., to identify potentiallyimportant interactions that might be replicated in validation samples. In turn, theclassification tree approach can identify specific subpopulations for whom a specifictreatment is especially important. Therefore it may be useful for creating treatmentalgorithms. For instance, the decision tree results showed that treatment predicted outcomeonly among individuals who smoke their first cigarette within 30 minutes of waking (thehighly dependent; Figure 1). This suggests that it is particularly important for moredependent smokers to receive bupropion pharmacotherapy, compared to less dependentsmokers. However, it is important to note that treatment might have benefited all smokerssomewhat, while still producing effects that differed greatly for one type of smoker vs.another (the more and less dependent smoker). Similarly, Figure 2 might suggest that it doesnot make sense to give pharmacotherapy to persons who are in good/fair/poor health, andwho have a household income of less than $35,000. This is because when these individualsare given active medication they are no more successful than placebo controls. However, itis the case that such individuals might have done worse than placebo controls had they notbeen given medication (although they could not have done much worse). In short, decisiontree results may suggest a treatment algorithm, but they by themselves cannot validate suchan algorithm.
Finally, several measures from the GUIDE models might serve as important measures in thedevelopment of new relapse risk instruments, and such measures might be administered viaadaptive testing strategies. That is, predictors might be administered as a function of therespondents’ status on previously administered variables (dependence level, marital status,and so on). This might result in efficient earmarking of risk as it manifests in subgroups ofsmokers, e.g., subgroups based upon life-context or treatment factors, rather than acrosssmokers as a whole.
LimitationsSome design and analysis factors limit the interpretation of this research. First, while theseresults are based on two separate clinical trials, these findings have not been replicated. Itmay be that the identified predictors might not be selected in models in which there areother, similar predictors that better account for the variance in a specific population. Inaddition, while different predictors were identified at different time points, we did not
Piper et al. Page 13
Subst Use Misuse. Author manuscript; available in PMC 2012 January 1.
NIH
-PA Author Manuscript
NIH
-PA Author Manuscript
NIH
-PA Author Manuscript

formally test interactions between predictors and time. Therefore, we cannot conclude that aspecific predictor becomes less important over time, just that it no longer is the optimalpredictor in a specific model. A second limitation is that both clinical trials were conductedin the Midwest and there was little representation of any racial/ethnic group beyond whiteand African-American smokers. This may limit the generalizability of these results to otherracial/ethnic populations. One analysis factor that limits the generalizability of thesefindings is that other decision tree models may produce different optimal selection variables.Another limitation is that this research uses the same samples as previous research(Transdisciplinary Tobacco Use Research Center [TTURC] Tobacco DependencePhenotype Workgroup, 2007; Weiss et al., 2008). While the use of point-prevalenceoutcome is accepted and quite common (Fiore et al., 2008), the Society for Research onNicotine and Tobacco workgroup recommended prolonged abstinence be used as theprimary outcome for cessation trials (Hughes, Keely, Niaura, Ossip-Klein, Richmond &Swan, 2003). However, use of the dichotomous point-prevalence abstinence outcome ismore appropriate for use with classification tree analysis. Finally, while we have shown thatthe classification tree analyses yielded different prediction models than did the regressionanalyses, we did not demonstrate that they produce more accurate predictions. This isbecause accuracy measures gain meaning only with cross-validation, otherwise relativeaccuracy largely reflects the extent to which the models are over-fit4.
ConclusionsIn summary, the GUIDE classification tree analyses were able to provide efficiently anordered summary of variables that predict smoking cessation at 1-week, end-of-treatmentand 6-months post-quit. These results, in concert with the stepwise logistic regressionalgorithm, revealed that both tobacco-related and context-related variables are important inpredicting initial cessation, as well as long-term cessation and maintenance of abstinence.These results also highlight the complementary nature of decision tree and traditionalregression approaches in informing researchers about prediction for small subgroups as wellas prediction for the overall population, respectively.
AcknowledgmentsThis research was conducted at the University of Wisconsin-Madison and was supported by a TransdisciplinaryTobacco Use Research Center Award (TBB) P50DA19706 from the National Institutes on Drug Abuse. Dr Smithwas partially supported by grant 1R03CA126406 from the National Cancer Institute. Dr. Piper was supported by anInstitutional Clinical and Translational Science Award (UW-Madison; KL2 Grant # 1KL2RR025012-01). Dr. Lohwas partially supported by the U.S. Army Research Office under grants W911NF-05-1-0047 andW911NF-09-1-0205. Dr. Baker was partially supported by grant 1K05CA139871 from the National CancerInstitute.
ReferencesAlterman AI, Gariti P, Cook TG, Cnaan A. Nicodermal patch adherence and its correlates. Drug and
Alcohol Dependence 1999;53(2):159–165. [PubMed: 10080041]American Psychiatric Association. Diagnostice and statistical manual of mental disorders. 4.
Washington, D.C: American Psychiatric Association; 1994.Atkinson, EJ.; Therneau, TM. Technical report. Mayo Foundation; 2000. An introduction to recursive
partitioning using the RPART routines.
4While acknowledging the limitations of accuracy determination in derivation samples, it is of interest to note that in the currentresearch the smaller classification tree models were similar in accuracy to the larger regression models. This is consistent with otherresearch suggesting the comparable accuracy of the two approaches (Lim et al., 2000;Perlich et al., 2004).
Piper et al. Page 14
Subst Use Misuse. Author manuscript; available in PMC 2012 January 1.
NIH
-PA Author Manuscript
NIH
-PA Author Manuscript
NIH
-PA Author Manuscript

Barbeau EM, Krieger N, Soobader MJ. Working class matters: socioeconomic disadvantage, race/ethnicity, gender, and smoking in NHIS 2000. American Journal of Public Health 2004;94(2):269–278. [PubMed: 14759942]
Breiman, L.; Friedman, J.; Olshen, R.; Stone, C. Classification and regression trees. Pacific Groce,CA: Wadsworth; 1984.
Campbell IA, Prescott RJ, Tjeder-Burton SM. Transdermal nicotine plus support in patients attendinghospital with smoking-related diseases: A placebo-controlled study. Respiratory Medicine1996;90(1):47–51. [PubMed: 8857326]
Chandola T, Head J, Bartley M. Socio-demographic predictors of quitting smoking: how important arehousehold factors? Addiction 2004;99(6):770–777. [PubMed: 15139875]
De Vogli R, Santinello M. Unemployment and smoking: does psychosocial stress matter? TobaccoControl 2005;14(6):389–395. [PubMed: 16319362]
Derby CA, Lasater TM, Vass K, Gonzalez S, Carleton RA. Characteristics of smokers who attempt toquit and of those who recently succeeded. American Journal of Preventive Medicine 1994;10(6):327–334. [PubMed: 7880551]
Eisinger RA. Psychosocial predictors of smoking recidivism. Journal of Health and Social Behavior1971;12(4):355–362. [PubMed: 5130038]
Fagerstrom KO, Schneider NG. Measuring nicotine dependence: a review of the Fagerstrom ToleranceQuestionnaire. Journal of Behavioral Medicine 1989;12(2):159–182. [PubMed: 2668531]
Fernandez E, Schiaffino A, Borrell C, Benach J, Ariza C, Ramon JM, et al. Social class, education, andsmoking cessation: Long-term follow-up of patients treated at a smoking cessation unit. Nicotine& Tobacco Research 2006;8(1):29–36. [PubMed: 16497597]
Fiore, MC.; Bailey, WC.; Cohen, SJ. Treating tobacco use and dependence: Clinical PracticeGuideline. Rockville, MD: U.S. Department of Health and Human Services, U.S. Public HealthService; 2000.
Fiore, MC.; Jaen, CR.; Baker, TB.; Bailey, WC.; Benowitz, N.; Curry, SJ., et al. Treating tobacco useand dependence: 2008 update. Rockville, MD: U.S. Department of Health and Human Services,U.S. Public Health Service; 2008.
Garvey AJ, Bliss RE, Hitchcock JL, Heinold JW, Rosner B. Predictors of smoking relapse among self-quitters: A report from the Normative Aging Study. Addictive Behaviors 1992;17(4):367–377.[PubMed: 1502970]
Garvey AJ, Kinnunen T, Nordstrom BL, Utman CH, Doherty K, Rosner B, et al. Effects of nicotinegum dose by level of nicotine dependence. Nicotine & Tobacco Research 2000;2(1):53–63.[PubMed: 11072441]
Graham H, Francis B, Inskip HM, Harman J. Socioeconomic lifecourse influences on women’ssmoking status in early adulthood. Journal of Epidemiology and Community Health 2006;60(3):228–233. [PubMed: 16476753]
Harris KJ, Okuyemi KS, Catley D, Mayo MS, Ge B, Ahluwalia JS. Predictors of smoking cessationamong African-Americans enrolled in a randomized controlled trial of bupropion. PreventiveMedicine 2004;38(4):498–502. [PubMed: 15020185]
Heatherton TF, Kozlowski LT, Frecker RC, Fagerstrom KO. The Fagerstrom Test for NicotineDependence: a revision of the Fagerstrom Tolerance Questionnaire. British Journal of Addiction1991;86(9):1119–1127. [PubMed: 1932883]
Homish GG, Leonard KE. Spousal influence on smoking behaviors in a US community sample ofnewly married couples. Social Science & Medicine 2005;61(12):2557–2567. [PubMed: 15978712]
Honjo K, Tsutsumi A, Kawachi I, Kawakami N. What accounts for the relationship between socialclass and smoking cessation? Results of a path analysis. Social Science & Medicine 2006;62(2):317–328. [PubMed: 16039765]
Hughes JR, Keely JP, Niaura RS, Ossip-Klein DJ, Richmond RL, Swan GE. Measures of abstinence inclinical trials: issues and recommendations. Nicotine & Tobacco Research 2003;5:13–25.[PubMed: 12745503]
Hurt RD, Wolter TD, Rigotti N, Hays JT, Niaura R, Durcan MJ, et al. Bupropion for pharmacologicrelapse prevention to smoking: predictors of outcome. Addictive Behaviors 2002;27(4):493–507.[PubMed: 12188588]
Piper et al. Page 15
Subst Use Misuse. Author manuscript; available in PMC 2012 January 1.
NIH
-PA Author Manuscript
NIH
-PA Author Manuscript
NIH
-PA Author Manuscript

Hyland A, Li Q, Bauer JE, Giovino GA, Steger C, Cummings KM. Predictors of cessation in a cohortof current and former smokers followed over 13 years. Nicotine & Tobacco Research, 6 Suppl2004;3:S363–369.
Hymowitz N, Cummings KM, Hyland A, Lynn WR, Pechacek TF, Hartwell TD. Predictors ofsmoking cessation in a cohort of adult smokers followed for five years. Tobacco Control1997;6(Suppl 2):S57–62. [PubMed: 9583654]
Hymowitz N, Sexton M, Ockene J, Grandits G. Baseline factors associated with smoking cessation andrelapse. MRFIT Research Group. Preventive Medicine 1991;20(5):590–601. [PubMed: 1758840]
Kawakami N, Takatsuka N, Inaba S, Shimizu H. Development of a screening questionnaire fortobacco/nicotine dependence according to ICD-10, DSM-III-R, and DSM-IV. Addictive Behaviors1999;24(2):155–166. [PubMed: 10336098]
Killen JD, Fortmann SP, Kraemer HC, Varady A, Newman B. Who will relapse? Symptoms ofnicotine dependence predict long-term relapse after smoking cessation. Journal of Consulting andClinical Psychology 1992;60(5):797–801. [PubMed: 1401396]
Levy DT, Romano E, Mumford E. The relationship of smoking cessation to sociodemographiccharacteristics, smoking intensity, and tobacco control policies. Nicotine & Tobacco Research2005;7(3):387–396. [PubMed: 16085506]
Lim TS, Loh WY, Shih YS. A comparison of prediction accuracy, complexity, and training time ofthirty-three old and new classification algorithms. Machine Learning Journal 2000;40:203–228.
Loh W-Y. Improving the precision of classification trees. Annals of Applied Statistics. 2010 In press.Loh WY. Regression trees with unbiased variable selection and interaction detection. Statistica Sinica
2002;12:361–386.Loh WY, Shih YS. Split selection methods for classification trees. Statistica Sinica 1997;7:815–840.Lu Y, Tong S, Oldenburg B. Determinants of smoking and cessation during and after pregnancy.
Health Promotion International 2001;16(4):355–365. [PubMed: 11733454]Macken KM, Wilder D, Mersy DJ, Madlon-Kay DJ. Smoking patterns in a low-income urban
population. A challenge to smoking cessation efforts. Journal of Family Practice 1991;32(1):93,95–96. [PubMed: 1985141]
McCarthy, DE.; Bolt, DM.; Baker, TB. The importance of how: A call for mechanistic research intobacco dependence treatment studies. In: Treat, T.; Bootzin, RI.; Baker, TB., editors.Psychological clinical science: recent advances in theory and practicer. Integrative perspectives inhonor of Richard M. McFall. New York: Lawrence Erlbaum Associates; 2007.
McClure JB, Wetter DW, de Moor C, Cinciripini PM, Gritz ER. The relation between alcoholconsumption and smoking abstinence: Results from the Working Well Trial. Addictive Behaviors2002;27(3):367–379. [PubMed: 12125663]
McIntyre RS, Wilkins K, Gilmour H, Soczynska JK, Konarksi JZ, Miranda A, et al. The effect ofbipolar I disorder and major depressive disorder on workforce function. Chronic Diseases Canada2008;28(3):84–91.
McKee SA, Maciejewski PK, Falba T, Mazure CM. Sex differences in the effects of stressful lifeevents on changes in smoking status. Addiction 2003;98(6):847–855. [PubMed: 12780373]
Mermelstein R, Cohen S, Lichtenstein E, Baer JS, Kamarck T. Social support and smoking cessationand maintenance. Journal of Consulting & Clinical Psychology 1986;54(4):447–453. [PubMed:3745596]
Miller, A. Subset selection in regression. 2. Boca Raton, FL: 2002.Miller CE, Ratner PA, Johnson JL. Reducing cardiovascular risk: identifying predictors of smoking
relapse. Canadian Journal of Cardiovascular Nursing 2003;13(3):7–12. [PubMed: 14508913]Morgan GD, Ashenberg ZS, Fisher EB Jr. Abstinence from smoking and the social environment.
Journal of Consulting and Clinical Psychology 1988;56(2):298–301. [PubMed: 3372839]Nides MA, Rakos RF, Gonzales D, Murray RP, Tashkin DP, Bjornson-Benson WM. Predictors of
initial smoking cessation and relapse through the first 2 years of the Lung Health Study. Journal ofConsulting and Clinical Psychology 1995;63(1):60–69. [PubMed: 7896992]
Nollen NL, Mayo MS, Sanderson Cox L, Okuyemi KS, Choi WS, Kaur H, et al. Predictors of quittingamong African American light smokers enrolled in a randomized, placebo-controlled trial. Journalof General Internal Medicine 2006;21(6):590–595. [PubMed: 16808741]
Piper et al. Page 16
Subst Use Misuse. Author manuscript; available in PMC 2012 January 1.
NIH
-PA Author Manuscript
NIH
-PA Author Manuscript
NIH
-PA Author Manuscript

Ockene JK, Emmons KM, Mermelstein RJ, Perkins KA, Bonollo DS, Voorhees CC, et al. Relapse andmaintenance issues for smoking cessation. Health Psychology 2000;19(1 Suppl):17–31. [PubMed:10709945]
Osler M, Prescott E. Psychosocial, behavioural, and health determinants of successful smokingcessation: a longitudinal study of Danish adults. Tobacco Control 1998;7(3):262–267. [PubMed:9825421]
Osler M, Prescott E, Godtfredsen N, Hein HO, Schnohr P. Gender and determinants of smokingcessation: a longitudinal study. Preventive Medicine 1999;29(1):57–62. [PubMed: 10419801]
Patten CA, Martin JE, Calfas KJ, Lento J, Wolter TD. Behavioral treatment for smokers with a historyof alcoholism: predictors of successful outcome. Journal of Consulting and Clinical Psychology2001;69(5):796–801. [PubMed: 11680556]
Perkins KA. Smoking cessation in women. Special considerations. CNS Drugs 2001;15(5):391–411.[PubMed: 11475944]
Perlich C, Provost F, Simonoff JS. Tree induction vs. logistic regression: A learning curve analysis.Journal of Machine Learning Research 2003;4:211–255.
Piasecki TM, Fiore MC, McCarthy DE, Baker TB. Have we lost our way? The need for dynamicformulations of smoking relapse proneness. Addiction 2002;97(9):1093–1108. [PubMed:12199822]
Piper ME, Piasecki TM, Federman EB, Bolt DM, Smith SS, Fiore MC, et al. A multiple motivesapproach to tobacco dependence: The Wisconsin Inventory of Smoking Dependence Motives(WISDM-68). Journal of Consulting and Clinical Psychology 2004;72(2):139–154. [PubMed:15065950]
Piper ME, Federman EB, McCarthy DE, Bolt DM, Smith SS, Fiore MC, et al. Efficacy of bupropionalone and in combination with nicotine gum. Nicotine & Tobacco Research 2007;9(9):947–954.[PubMed: 17763111]
Piper ME, McCarthy DE, Baker TB. Assessing tobacco dependence: a guide to measure evaluationand selection. Nicotine & Tobacco Research 2006;8(3):339–351. [PubMed: 16801292]
Radloff LS. The CES-D scale: A self-report depression scale for research in the general population.Applied Psychological Measurement 1977;1:385–401.
Ridgeway, P.; Rapp, C. The active ingredients in achieving competitive employment for people withpsychiatric disabilities: A research synthesis. Lawrence, KS: Commission on Mental Health andDevelopmental Disabilities; 1998.
Selzer ML, Vinokur A, van Rooijen L. A self-administered Short Michigan Alcoholism Screening Test(SMAST). Journal of Studies on Alcohol 1975;36(1):117–126. [PubMed: 238068]
Shields M. The journey to quitting smoking. Health Reports 2005;16(3):19–36. [PubMed: 15971513]Shiffman S. Smoking cessation treatment: any progress? Journal of Consulting and Clinical
Psychology 1993;61(5):718–722. [PubMed: 8245269]Shiffman S, Waters A, Hickcox M. The Nicotine Dependence Syndrome scale: A multidimensional
measure of nicotine dependence. Nicotine & Tobacco Research 2004;6(2):327–348. [PubMed:15203807]
Siahpush M, Heller G, Singh G. Lower levels of occupation, income and education are stronglyassociated with a longer smoking duration: multivariate results from the 2001 Australian NationalDrug Strategy Survey. Public Health 2005;119(12):1105–1110. [PubMed: 16085150]
Simonoff, JS. Analyzing categorical data. New York: Springer; 2003.Sorensen G, Gupta PC, Pednekar MS. Social disparities in tobacco use in Mumbai, India: the roles of
occupation, education, and gender. American Journal of Public Health 2005;95(6):1003–1008.[PubMed: 15914825]
Spitzer RL, Williams JB, Kroenke K, Linzer M, deGruy FV 3rd, Hahn SR, et al. Utility of a newprocedure for diagnosing mental disorders in primary care. The PRIME-MD 1000 study. Journalof the American Medical Association 1994;272(22):1749–1756. [PubMed: 7966923]
Swan GE, Jack LM, Curry S, Chorost M, Javitz H, McAfee T, et al. Bupropion SR and counseling forsmoking cessation in actual practice: Predictors of outcome. Nicotine & Tobacco Research2003;6:911–921. [PubMed: 14668075]
Piper et al. Page 17
Subst Use Misuse. Author manuscript; available in PMC 2012 January 1.
NIH
-PA Author Manuscript
NIH
-PA Author Manuscript
NIH
-PA Author Manuscript

Swan GE, Jack LM, Javitz HS, McAfee T, McClure JB. Predictors of 12-month outcome in smokerswho received bupropion sustained-release for smoking cessation. CNS Drugs 2008;22:239–256.[PubMed: 18278978]
Swan GE, Javitz HS, Jack LM, Curry SJ, McAfee T. Heterogeneity in 12-month outcome amongfemale and male smokers. Addiction 2004;99(2):237–250. [PubMed: 14756716]
Uhl GR, Liu QR, Drgon T, Johnson C, Walther D, Rose JE. Molecular genetics of nicotinedependence and abstinence: whole genome association using 520,000 SNPs. BMC Genetics2007;8:10. [PubMed: 17407593]
Weiss RB, Baker TB, Cannon DS, von Niederhausern A, Dunn DM, Matsunami N, et al. A candidategene approach identifies the CHRNA5- A3-B4 region as a risk factor for age-dependent nicotineaddiction. PLoS Genetics 2008;4(7):e1000125. [PubMed: 18618000]
Westman EC, Behm FM, Simel DL, Rose JE. Smoking behavior on the first day of a quit attemptpredicts long-term abstinence. Archives of Internal Medicine 1997;157(3):333–340.
Wetter DW, Cofta-Gunn L, Irvin JE, Fouladi RT, Wright K, Daza P, et al. What accounts for theassociation of education and smoking cessation? Preventive Medicine 2005;40(4):452–460.[PubMed: 15530598]
Wetter DW, Kenford SL, Smith SS, Fiore MC, Jorenby DE, Baker TB. Gender differences in smokingcessation. Journal of Consulting and Clinical Psychology 1999;67(4):555–562. [PubMed:10450626]
Zhang P. Inference after variable selection in linear regression models. Biometrica 1992;79:741–746.
Appendix A. All items considered in the prediction analyses1. How old were you the first time you smoked a cigarette, even one or two puffs?
2. How old were you when you first started smoking daily/every day?
3. What is the total number of years you have smoked daily? Do not include any timeyou stayed off cigarettes for at least 6 months or longer.
4. Do you currently live with a spouse or partner who smokes cigarettes?
5. Do any of the other people that you currently live with, other than a partner, orspouse, smoke cigarettes?
6. How many of your friends smoke or use tobacco?
7. If someone in your household wants to smoke, does he/she have to leave in order tosmoke?
8. Which of these statements best describes your place of work’s smoking policy forwork areas?
9. How you ever tried to quit smoking?
10. How many times have you tried to quit smoking?
11. How long has it been since you last tried to quit smoking?
12. After you started smoking regularly, what is the longest time you ever went withoutsmoking?
13. If you try to quit smoking within the next 30 days, how likely is it that you will besuccessful?
14. During the past 30 days, did you have at least 1 drink of any alcoholic beverages?
15. During the past 30 days, on how many different days did you drink at least 1 drinkof any alcoholic beverage?
16. On the days when you drank, about how many drinks did you drink on average?
Piper et al. Page 18
Subst Use Misuse. Author manuscript; available in PMC 2012 January 1.
NIH
-PA Author Manuscript
NIH
-PA Author Manuscript
NIH
-PA Author Manuscript

17. Considering all types of alcoholic beverages, on how many different days duringthe past 30 days did you drink at least 5 drinks?
18. Have you ever been diagnosed with alcoholism, treated for alcoholism, or hadsignificant problems with alcohol?
19. Have you ever been diagnosed with a drug use disorder, treated for drug use, or hadsignificant problems related to your drug use?
20. Gender
21. Are you Hispanic/Latino/Latina?
22. Race (white, non-white)
23. Marital status (married/living with a partner, not married)
24. Education
25. Employment
26. What is your annual household income from all sources?
27. Would you say that in general your health is...?
28. Have you ever been diagnosed with depression, treated for depression, or hadsignificant problems with depression?
29. FTND (6 items)
30. TDS (10 items)
31. CES-D Total
32. DADC Relapse Subscale
33. DADC Withdrawal Subscale
34. DADC Self-Administration Subscale
35. Meets DSM criteria for alcohol abuse
36. Body-mass index
37. Active vs. placebo bupropion
38. Negative Affect Scale - PANAS
39. Positive Affect Scale - PANAS
40. Total MAST Score
41. WISDM Affiliative Attachment Subscale (Mean)
42. WISDM Automaticity Subscale (Mean)
43. WISDM Control Subscale (Mean)
44. WISDM Behavioral Choice/Melioration Subscale (Mean)
45. WISDM Cognitive Enhancement Subscale (Mean)
46. WISDM Craving Subscale (Mean)
47. WISDM Cue Exposure/Associative Processes Subscale (Mean)
48. WISDM Negative Reinforcement Subscale (Mean)
49. WISDM Positive Reinforcement Subscale (Mean)
Piper et al. Page 19
Subst Use Misuse. Author manuscript; available in PMC 2012 January 1.
NIH
-PA Author Manuscript
NIH
-PA Author Manuscript
NIH
-PA Author Manuscript

50. WISDM Social/Environmental Goads Subscale (Mean)
51. WISDM Taste/Sensory Properties Subscale (Mean)
52. WISDM Tolerance Subscale (Mean)
53. WISDM Weight Control Subscale (Mean)
54. WISDM Total (Sum of Means)
55. Study (Bupropion-Gum vs. Electronic Diary)
Piper et al. Page 20
Subst Use Misuse. Author manuscript; available in PMC 2012 January 1.
NIH
-PA Author Manuscript
NIH
-PA Author Manuscript
NIH
-PA Author Manuscript

Figure 1.GUIDE decision tree predicting abstinence at 1 week post-quit (N = 928; average abstinentrate = 45.7%)
Piper et al. Page 21
Subst Use Misuse. Author manuscript; available in PMC 2012 January 1.
NIH
-PA Author Manuscript
NIH
-PA Author Manuscript
NIH
-PA Author Manuscript

Figure 2.GUIDE decision tree predicting abstinence at the end of treatment (N = 928; averageabstinent rate = 29.7%)
Piper et al. Page 22
Subst Use Misuse. Author manuscript; available in PMC 2012 January 1.
NIH
-PA Author Manuscript
NIH
-PA Author Manuscript
NIH
-PA Author Manuscript

Figure 3.GUIDE decision tree predicting abstinence at the end of treatment excluding individualswho relapsed in the first week (N = 424; average abstinent rate = 54.3%)
Piper et al. Page 23
Subst Use Misuse. Author manuscript; available in PMC 2012 January 1.
NIH
-PA Author Manuscript
NIH
-PA Author Manuscript
NIH
-PA Author Manuscript
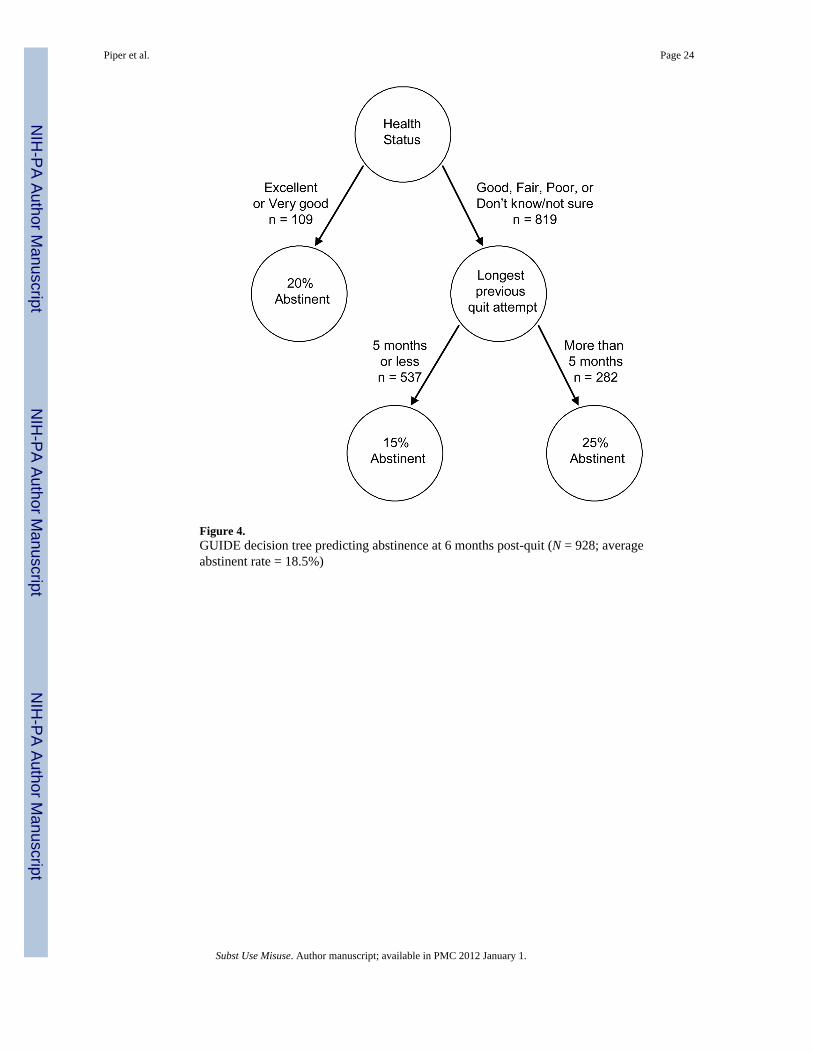
Figure 4.GUIDE decision tree predicting abstinence at 6 months post-quit (N = 928; averageabstinent rate = 18.5%)
Piper et al. Page 24
Subst Use Misuse. Author manuscript; available in PMC 2012 January 1.
NIH
-PA Author Manuscript
NIH
-PA Author Manuscript
NIH
-PA Author Manuscript

Figure 5.GUIDE decision tree predicting abstinence at 6 months post-quit excluding individuals whorelapsed in the first week (N = 424; average abstinent rate = 32.5%)
Piper et al. Page 25
Subst Use Misuse. Author manuscript; available in PMC 2012 January 1.
NIH
-PA Author Manuscript
NIH
-PA Author Manuscript
NIH
-PA Author Manuscript

NIH
-PA Author Manuscript
NIH
-PA Author Manuscript
NIH
-PA Author Manuscript
Piper et al. Page 26
Table 1
Demographics
Combination of Study 1 + Study 2 (N=928) Study 1 (N=554) Study 2 (N=374)
% Women* 53.1 56.1 48.7
% White* 81.8 75.3 91.4
% high school or greater education* 92.7 91.0 95.2
% Married or living with a partner 54.8 56.9 51.9
Age (SD)* 40.32 (11.68) 41.93 (11.37) 37.98 (11.74)
Mean cigarettes per day (SD) 22.22 (9.91) 22.64 (9.87) 21.60 (9.94)
Baseline CO in ppm (SD) (n = 896) 25.12 (11.29) 25.70 (11.13) 24.28 (11.49)
*Statistically significant differences between the Study 1 and Study 2.
Subst Use Misuse. Author manuscript; available in PMC 2012 January 1.

NIH
-PA Author Manuscript
NIH
-PA Author Manuscript
NIH
-PA Author Manuscript
Piper et al. Page 27
Table 2
Predicting abstinence at 6 months post-quit using the AIC logistic regression model without interactions
Variable Estimate SE p-value
Intercept −2.50 .84 .003
Income .13 .06 .04
Time to first cigarette in the morning (FTND1) −.28 .11 .01
Treatment condition .57 .20 .003
Longest previous quit attempt† .07 .04 .07
BMI .03 .01 .04
Age first smoked a cigarette .05 .02 .02
Positive affect (PPANAS) −.02 .01 .07
Gender −.55 .20 .01
WISDM Weight Control .10 .06 .08
Number of years smoked daily .01 .01 .14
Number of cigarettes smoked per day (FTND4) −.26 .13 .04
Race −.45 .27 .09
Household smoking restriction −.32 .20 .10
Marital status −.30 .21 .16
†Variable present in the GUIDE model.
Subst Use Misuse. Author manuscript; available in PMC 2012 January 1.

NIH
-PA Author Manuscript
NIH
-PA Author Manuscript
NIH
-PA Author Manuscript
Piper et al. Page 28
Table 3
Predicting abstinence at 6 months post-quit using the AIC logistic regression model including all interactions
Variable Estimate SE p-value
Intercept 2.81 3.43 .41
Income −.84 .42 .04
Time to first cigarette in the morning (FTND1) −.34 .64 .59
Treatment condition −.65 .93 .49
Longest previous quit attempt† .14 .29 .63
BMI −.07 .05 .16
Age first smoked a cigarette .12 .08 .13
Positive affect (PPANAS) −.01 .06 .90
Gender 1.10 1.66 .51
WISDM Behavioral Choice/Melioration 1.47 .46 .002
WISDM Positive Reinforcement −.90 .46 .05
Number of cigarettes smoked per day (FTND4) −1.47 .75 .05
Ever given up work or social activities to use tobacco −7.17 2.30 .002
Household smoking restriction −1.64 .85 .05
Race .16 .78 .84
WISDM Automaticity .38 .24 .11
WISDM Weight Control −.59 .25 .02
Time since previous quit attempt −.29 .28 .30
Health status† −1.64 .49 .001
Longest previous quit attempt X Positive affect −.01 .006 .03
Time to first cigarette X Positive affect −.03 .02 .07
BMI X WISDM Positive Reinforcement .04 .01 .001
Gender X Ever given up work or social activities to use tobacco −2.02 .69 .004
Number of cigarettes smoked per day X Ever given up work or social activities to use tobacco 1.12 .40 .005
Positive affect X Number of cigarettes smoked per day −.26 .11 .02
Time to first cigarette X Treatment condition .55 .26 .03
BMI X Gender −.08 .03 .02
Income X Gender −.29 .13 .03
Ever given up work or social activities to use tobacco X Race −18.99 651.66 .98
Longest previous quit attempt X Race −.36 .13 .004
Positive affect X Ever given up work or social activities to use tobacco .12 .05 .02
Longest previous quit attempt X Gender .25 .09 .01
Household smoking restriction X WISDM Automaticity .26 .14 .05
WISDM Positive Reinforcement X WISDM Automaticity −.11 .06 .04
Treatment condition X WISDM Automaticity −.37 .15 .01
Race X WISDM Weight Control .52 .18 .004
Number of cigarettes smoked per day X WISDM Weight Control .16 .08 .05
Positive affect X Gender .06 .03 .06
WISDM Positive Reinforcement X WISDM Weight Control .10 .05 .03
Subst Use Misuse. Author manuscript; available in PMC 2012 January 1.

NIH
-PA Author Manuscript
NIH
-PA Author Manuscript
NIH
-PA Author Manuscript
Piper et al. Page 29
Variable Estimate SE p-value
Age first smoked a cigarette X WISDM Behavioral Choice/Melioration −.05 .02 .03
Age first smoked a cigarette X Cigarettes smoked per day .06 .04 .08
Time to first cigarette X Cigarettes smoked per day .33 .16 .04
WISDM Behavioral Choice/Melioration X Ever given up work or social activities to use tobacco .46 .25 .07
Household smoking restriction X Time since previous quit attempt −.46 .14 .002
WISDM Positive Reinforcement X Time since previous quit attempt .12 .05 .01
Gender X Time since previous quit attempt −.25 .15 .08
Gender X Race −1.07 .64 .09
Time to first cigarette X Household smoking restriction .47 .24 .06
Treatment condition X Health status .78 .28 .01
Income X Health status .18 .07 .01
Income X Positive Affect .02 .01 .06
Longest previous quit attempt X Health status .10 .06 .08
Longest previous quit attempt X Household smoking restriction .15 .09 .09
WISDM Behavioral Choice/Melioration X WISDM Positive Reinforcement −.10 .07 .14
Income X Time since previous quit attempt .06 .04 .14
†Variable present in the GUIDE model.
Subst Use Misuse. Author manuscript; available in PMC 2012 January 1.

NIH
-PA Author Manuscript
NIH
-PA Author Manuscript
NIH
-PA Author Manuscript
Piper et al. Page 30
Table 4
Predicting abstinence at 6 months post-quit using the AIC logistic regression model without interactions,excluding 1-week relapsers
Variable Estimate SE p-value
Intercept −.80 .89 .37
Ever felt dependent on tobacco† −1.26 .49 .01
Marital status† −.55 .23 .02
Ever diagnosed with or treated for a drug use disorder −1.19 .66 .08
Health status .30 .14 .03
Time since last quit attempt .15 .08 .06
Age first smoked a cigarette .05 .03 .05
Negative affect (NPANAS) −.04 .02 .05
Time to first cigarette (FTND1) −.47 .18 .01
Household smoking restriction −.38 .23 .10
WISDM Tolerance .18 .12 .14
Number of years smoked daily .02 .01 .15
†Variable present in the GUIDE model.
Subst Use Misuse. Author manuscript; available in PMC 2012 January 1.

NIH
-PA Author Manuscript
NIH
-PA Author Manuscript
NIH
-PA Author Manuscript
Piper et al. Page 31
Table 5
Predicting abstinence at 6 months post-quit using the AIC logistic regression model including all interactions,excluding 1-week relapsers
Variable Estimate SE p-value
Intercept −.91 5.37 .86
Ever felt dependent on tobacco† 2.68 5.16 .60
Marital status† .64 .25 .01
Ever diagnosed with or treated for a drug use disorder −35.93 14.97 .02
Health status 4.67 2.81 .10
Time since last quit attempt −.21 .28 .46
Age first smoked a cigarette .09 .10 .38
Negative affect (NPANAS) −.21 .08 .01
Number of years smoked daily −.14 .08 .07
Time to first cigarette (FTND1) −2.31 1.16 .05
Household smoking restriction 1.71 .74 .02
WISDM Tolerance .21 .13 .09
Use tobacco despite mental problems .91 .56 .10
Ever diagnosed with or treated for a drug use disorder X Negative affect 1.19 .53 .03
Ever felt dependent on tobacco X Health status −4.97 2.80 .08
Ever felt dependent on tobacco X Number of years smoked daily .17 .08 .03
Ever diagnosed with or treated for a drug use disorder X Number of years smoked daily .39 .17 .03
Age first smoked a cigarette X Negative affect .01 .01 .12
Ever felt dependent on tobacco X Time to first cigarette 1.96 1.15 .09
Negative affect X Household smoking restriction .08 .04 .08
Time to first cigarette X Use tobacco despite mental problems −.79 .30 .01
Health status X Time since last quit attempt .15 .11 .16
†Variable present in the GUIDE model.
Subst Use Misuse. Author manuscript; available in PMC 2012 January 1.