Transient and steady-state relative permeabilities from two-phase flow experiments in planar pore...
12
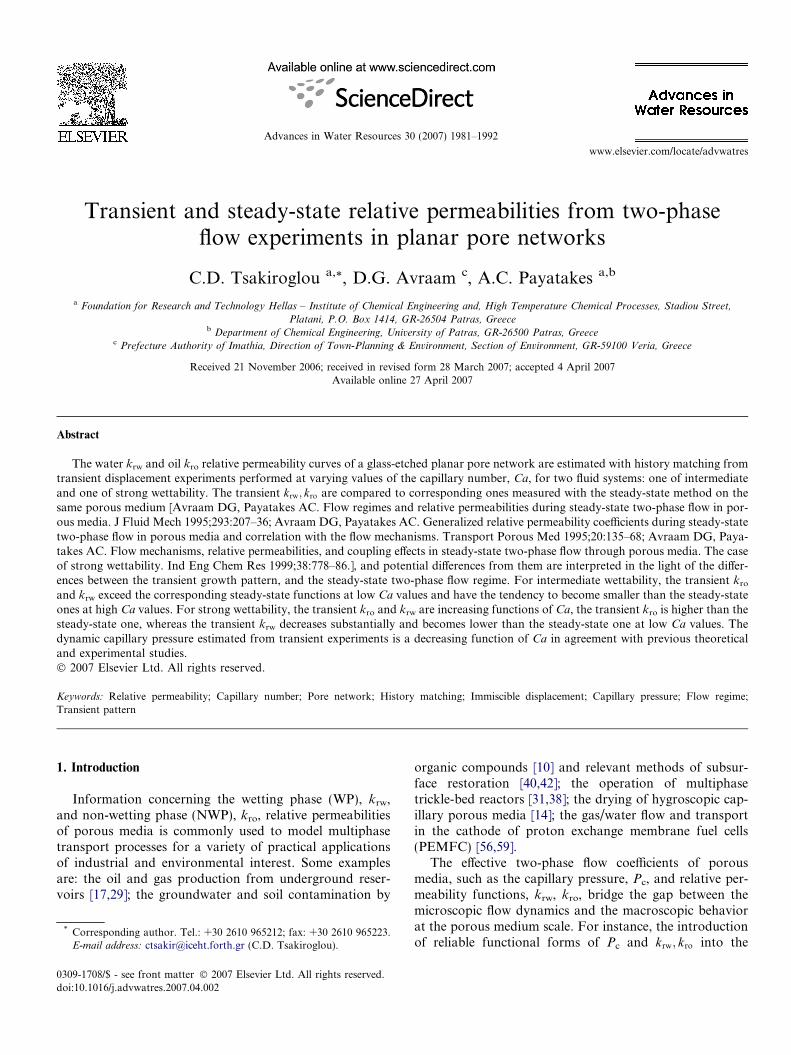
Transient and steady-state relative permeabilities from two-phase flow experiments in planar pore networks C.D. Tsakiroglou a, * , D.G. Avraam c , A.C. Payatakes a,b a Foundation for Research and Technology Hellas – Institute of Chemical Engineering and, High Temperature Chemical Processes, Stadiou Street, Platani, P.O. Box 1414, GR-26504 Patras, Greece b Department of Chemical Engineering, University of Patras, GR-26500 Patras, Greece c Prefecture Authority of Imathia, Direction of Town-Planning & Environment, Section of Environment, GR-59100 Veria, Greece Received 21 November 2006; received in revised form 28 March 2007; accepted 4 April 2007 Available online 27 April 2007 Abstract The water k rw and oil k ro relative permeability curves of a glass-etched planar pore network are estimated with history matching from transient displacement experiments performed at varying values of the capillary number, Ca, for two fluid systems: one of intermediate and one of strong wettability. The transient k rw ; k ro are compared to corresponding ones measured with the steady-state method on the same porous medium [Avraam DG, Payatakes AC. Flow regimes and relative permeabilities during steady-state two-phase flow in por- ous media. J Fluid Mech 1995;293:207–36; Avraam DG, Payatakes AC. Generalized relative permeability coefficients during steady-state two-phase flow in porous media and correlation with the flow mechanisms. Transport Porous Med 1995;20:135–68; Avraam DG, Paya- takes AC. Flow mechanisms, relative permeabilities, and coupling effects in steady-state two-phase flow through porous media. The case of strong wettability. Ind Eng Chem Res 1999;38:778–86.], and potential differences from them are interpreted in the light of the differ- ences between the transient growth pattern, and the steady-state two-phase flow regime. For intermediate wettability, the transient k ro and k rw exceed the corresponding steady-state functions at low Ca values and have the tendency to become smaller than the steady-state ones at high Ca values. For strong wettability, the transient k ro and k rw are increasing functions of Ca, the transient k ro is higher than the steady-state one, whereas the transient k rw decreases substantially and becomes lower than the steady-state one at low Ca values. The dynamic capillary pressure estimated from transient experiments is a decreasing function of Ca in agreement with previous theoretical and experimental studies. Ó 2007 Elsevier Ltd. All rights reserved. Keywords: Relative permeability; Capillary number; Pore network; History matching; Immiscible displacement; Capillary pressure; Flow regime; Transient pattern 1. Introduction Information concerning the wetting phase (WP), k rw , and non-wetting phase (NWP), k ro , relative permeabilities of porous media is commonly used to model multiphase transport processes for a variety of practical applications of industrial and environmental interest. Some examples are: the oil and gas production from underground reser- voirs [17,29]; the groundwater and soil contamination by organic compounds [10] and relevant methods of subsur- face restoration [40,42]; the operation of multiphase trickle-bed reactors [31,38]; the drying of hygroscopic cap- illary porous media [14]; the gas/water flow and transport in the cathode of proton exchange membrane fuel cells (PEMFC) [56,59]. The effective two-phase flow coefficients of porous media, such as the capillary pressure, P c , and relative per- meability functions, k rw , k ro , bridge the gap between the microscopic flow dynamics and the macroscopic behavior at the porous medium scale. For instance, the introduction of reliable functional forms of P c and k rw ; k ro into the 0309-1708/$ - see front matter Ó 2007 Elsevier Ltd. All rights reserved. doi:10.1016/j.advwatres.2007.04.002 * Corresponding author. Tel.: +30 2610 965212; fax: +30 2610 965223. E-mail address: [email protected] (C.D. Tsakiroglou). www.elsevier.com/locate/advwatres Advances in Water Resources 30 (2007) 1981–1992
Transcript of Transient and steady-state relative permeabilities from two-phase flow experiments in planar pore...
www.elsevier.com/locate/advwatres
Advances in Water Resources 30 (2007) 1981–1992
Transient and steady-state relative permeabilities from two-phaseflow experiments in planar pore networks
C.D. Tsakiroglou a,*, D.G. Avraam c, A.C. Payatakes a,b
a Foundation for Research and Technology Hellas – Institute of Chemical Engineering and, High Temperature Chemical Processes, Stadiou Street,
Platani, P.O. Box 1414, GR-26504 Patras, Greeceb Department of Chemical Engineering, University of Patras, GR-26500 Patras, Greece
c Prefecture Authority of Imathia, Direction of Town-Planning & Environment, Section of Environment, GR-59100 Veria, Greece
Received 21 November 2006; received in revised form 28 March 2007; accepted 4 April 2007Available online 27 April 2007
Abstract
The water krw and oil kro relative permeability curves of a glass-etched planar pore network are estimated with history matching fromtransient displacement experiments performed at varying values of the capillary number, Ca, for two fluid systems: one of intermediateand one of strong wettability. The transient krw; kro are compared to corresponding ones measured with the steady-state method on thesame porous medium [Avraam DG, Payatakes AC. Flow regimes and relative permeabilities during steady-state two-phase flow in por-ous media. J Fluid Mech 1995;293:207–36; Avraam DG, Payatakes AC. Generalized relative permeability coefficients during steady-statetwo-phase flow in porous media and correlation with the flow mechanisms. Transport Porous Med 1995;20:135–68; Avraam DG, Paya-takes AC. Flow mechanisms, relative permeabilities, and coupling effects in steady-state two-phase flow through porous media. The caseof strong wettability. Ind Eng Chem Res 1999;38:778–86.], and potential differences from them are interpreted in the light of the differ-ences between the transient growth pattern, and the steady-state two-phase flow regime. For intermediate wettability, the transient kro
and krw exceed the corresponding steady-state functions at low Ca values and have the tendency to become smaller than the steady-stateones at high Ca values. For strong wettability, the transient kro and krw are increasing functions of Ca, the transient kro is higher than thesteady-state one, whereas the transient krw decreases substantially and becomes lower than the steady-state one at low Ca values. Thedynamic capillary pressure estimated from transient experiments is a decreasing function of Ca in agreement with previous theoreticaland experimental studies.� 2007 Elsevier Ltd. All rights reserved.
Keywords: Relative permeability; Capillary number; Pore network; History matching; Immiscible displacement; Capillary pressure; Flow regime;Transient pattern
1. Introduction
Information concerning the wetting phase (WP), krw,and non-wetting phase (NWP), kro, relative permeabilitiesof porous media is commonly used to model multiphasetransport processes for a variety of practical applicationsof industrial and environmental interest. Some examplesare: the oil and gas production from underground reser-voirs [17,29]; the groundwater and soil contamination by
0309-1708/$ - see front matter � 2007 Elsevier Ltd. All rights reserved.
doi:10.1016/j.advwatres.2007.04.002
* Corresponding author. Tel.: +30 2610 965212; fax: +30 2610 965223.E-mail address: [email protected] (C.D. Tsakiroglou).
organic compounds [10] and relevant methods of subsur-face restoration [40,42]; the operation of multiphasetrickle-bed reactors [31,38]; the drying of hygroscopic cap-illary porous media [14]; the gas/water flow and transportin the cathode of proton exchange membrane fuel cells(PEMFC) [56,59].
The effective two-phase flow coefficients of porousmedia, such as the capillary pressure, Pc, and relative per-meability functions, krw, kro, bridge the gap between themicroscopic flow dynamics and the macroscopic behaviorat the porous medium scale. For instance, the introductionof reliable functional forms of Pc and krw; kro into the
1982 C.D. Tsakiroglou et al. / Advances in Water Resources 30 (2007) 1981–1992
macroscopic ‘‘black’’ oil simulators is of key importancefor the quality of the numerical results that commonlyare used to forecast the long-term reservoir production.Earlier experimental [32,53,55] and theoretical[1,2,9,11,21,27,32,44] studies have revealed that the tran-sient growth pattern of the displacement of a non-wettingfluid by a wetting one (imbibition), and vice-versa (drain-age), depends on a variety of factors such as the pore spacemorphology, the capillary number, Ca, the viscosity ratio,j, and wettability, as it is expressed by the equilibrium con-tact angle, he. Data of unsteady displacement experiments,such as the transient responses of the (i) fluid volumes pro-duced, (ii) pressure drop across the porous medium, and(iii) axial distribution of the fluid saturation are fitted eitherexplicitly [28] or implicitly [30,35,43,45,47–49] (historymatching) to the macroscopic two-phase flow equations[41,57] to estimate the Pc and krw; kro. There is strong evi-dence that the so-estimated relative permeability and capil-lary pressure curves are correlated strongly with thecapillary number and viscosity ratio [6,9,23–25,27,45,48,49]. Such correlations have occasionally beenattributed to the interactive effects of the various localforces (e.g. capillary, viscous, gravity, etc.) on the displace-ment growth pattern at the pore network scale[2,11,13,25,27,39,49]. Moreover, numerical studies haveshown that the fluid distribution, capillary pressure and rel-ative permeability curves depend strongly on micro-hetero-geneities, and as the intensity of heterogeneity of the porespace increases, the dynamic effects on the capillary pres-sure strengthen [16,36].
In addition to the transient techniques, steady-state flowtests are often employed to determine the P c; krw; kro [3–6,15,18,19,37]. A systematic parametric analysis of theexperiments of the simultaneous flow of two phasesthrough glass-etched planar [3–5] and non-planar [6] porenetworks of well-characterized topology and geometry,allowed the identification of several two-phase flow regimesdominating over different ranges of the parameter spaceðSw;Ca; j; heÞ: small-ganglion dynamics (SGD); large-gan-glion dynamics (LGD); drop-traffic flow (DTF); connectedpathway flow (CPF). Accordingly, the steady-state relativepermeability functions were found to change strongly withCa; j; he [3–6] whereas the existence of non-linear viscouscoupling effects on krw; kro suggested the use of the general-ized rather than conventional relative permeabilities [3,4] inagreement with analogous studies on 3-D sandpacks[8,18,34]. In the non-planar porous medium the ganglia sizedistribution widens, the mean ganglion size is larger andthe stranded ganglia are fewer than those in the planar,under the same flow conditions [6]. The experimentallyobserved ganglion population dynamics (intrinsicallyunsteady but giving a time averaged steady-state), alongwith the measured steady-state relative permeability curveswere reproduced satisfactorily by dynamic pore networksimulators which were applicable to 3-D and 2-D pore net-works [12,22]. The simulation of the co-current flow of twophases through a sphere-pack with the aid of a Lattice
Boltzman model [33] revealed that the viscous couplingcoefficients are significant, the interfacial area is of keyimportance for multiphase flow, whereas the correlationsof the relative permeability curves with Ca; j; he are quali-tatively consistent with the experimental results reportedin [3–5]. A full theoretical explanation of the conditionsunder which ganglion motion plays a significant part inthe two-phase flow in 3-D porous media as well as the cri-terion for ganglion mobilization has been reported in [54].For a long time, it has been recognized that the mobiliza-tion of trapped ganglia of oil depends on the interplay ofcapillary, viscous and buoyancy forces [20,58]. However,no systematic visualization study of the steady simulta-neous flow of two-phases on real 3-D porous media hasever been done to examine the range of parameter spaceover which the ganglion population dynamics is prevalent,and confirm the predictions of 3-D pore network simula-tors [12,22,33]. Such an investigation may be not too diffi-cult any more, with the high resolution X-ray CT-scannersdeveloped during the last decade.
In spite of the knowledge that has been accumulatedfrom earlier studies, there is still an ambiguity concerningthe adequacy of P c; krw; kro which are fed as input paramet-ric equations into the simulators of the transient immiscibledisplacement of two fluids in porous media. Unavoidably,some fundamental questions of reservoir engineering arestill unanswered: (a) how dependable are the results weget by using steady-state krw; kro curves in transient numer-ical simulators? (b) how large an error is introduced in themacroscopic numerical predictions, if the dependence ofP c; krw; kro on the flow rates and viscosity ratio is ignored?(c) which is the most efficient strategy for the determinationof the P c; krw; kro functions for a macro-scale simulator?
In the present work, transient imbibition experimentsare performed, at varying Ca values, on the porous med-ium model used in steady-state studies [3–5] by using twofluid systems, one of intermediate and one of strong wetta-bility. The post-breakthrough transient responses of thetotal wetting phase saturation and pressure drop acrossthe porous medium are measured and introduced into a1-D history matching algorithm to estimate simultaneouslythe Pc(Sw) and krwðSwÞ; kroðSwÞ as functions of Ca. The esti-mated krwðSwÞ; kroðSwÞ are compared to the correspondingsteady-state results, and potential differences are inter-preted in the light of the mechanisms governing the two-phase flow at the pore scale.
2. Methods and materials
2.1. Experimental setup
The porous medium model is a chamber-and-throat pla-nar network (Fig. 1a) that was fabricated by a photo-etching technique [3,55], and is identical to that used insteady-state two-phase flow experiments [3–5]. Each endof the pore network is extended with triangular segmentswhich serve as flow distributors and eliminate the end
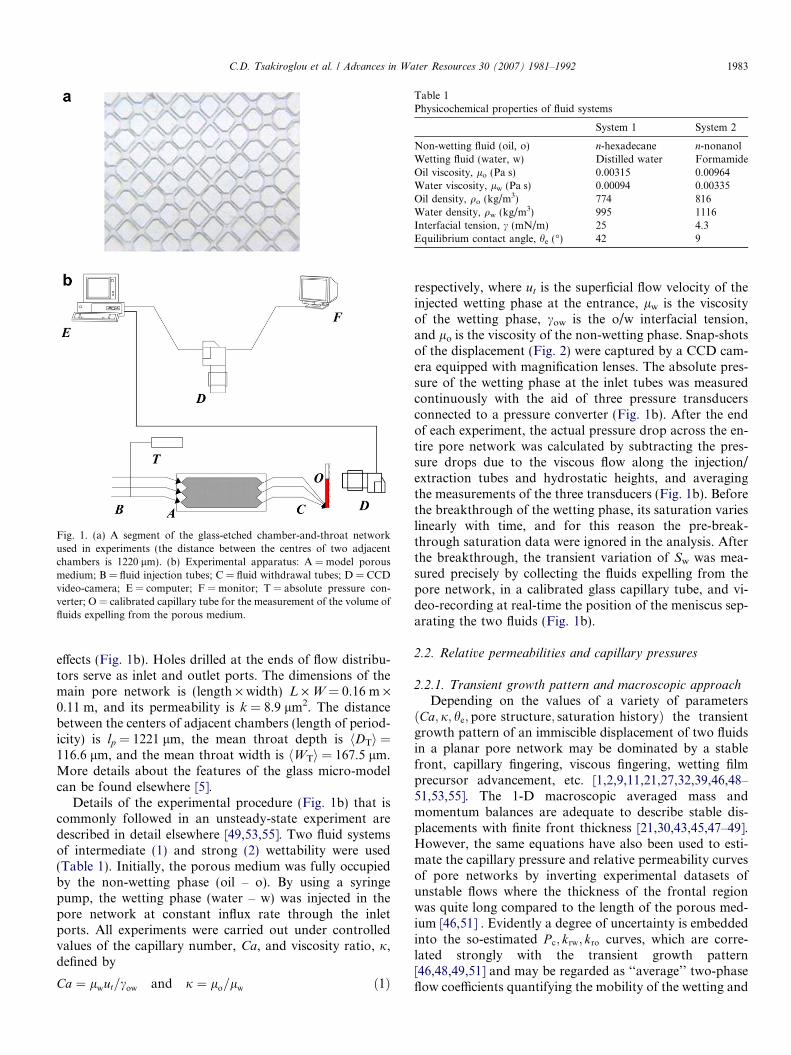
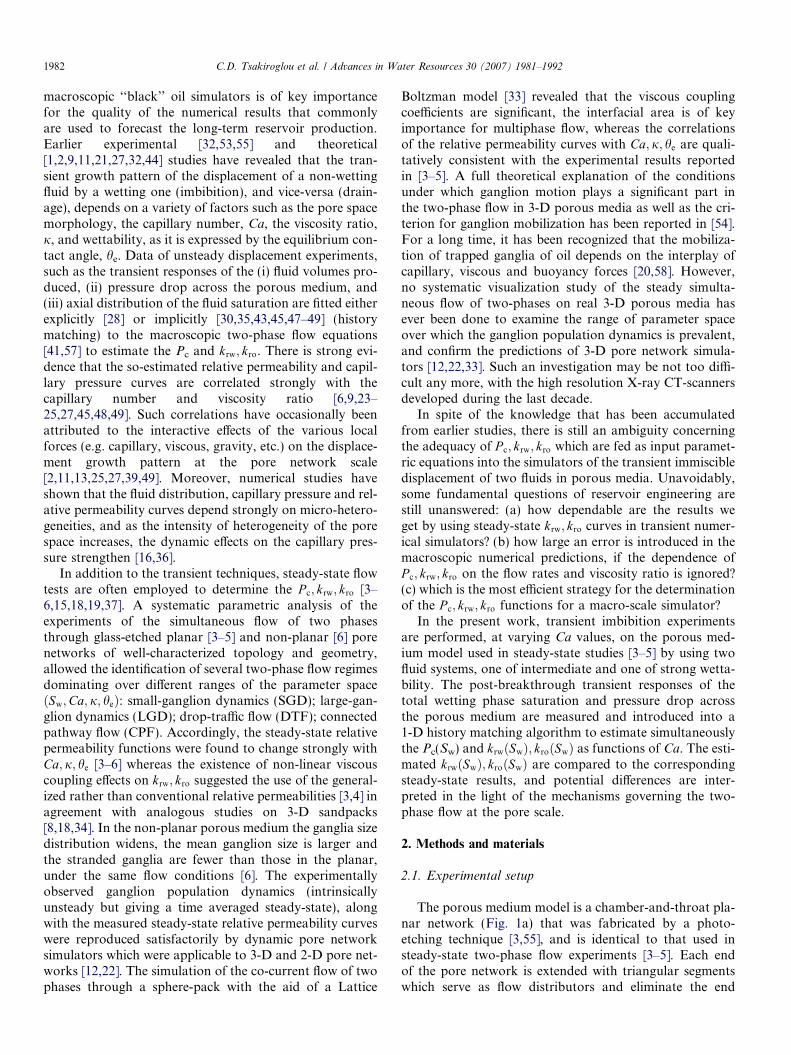
Fig. 1. (a) A segment of the glass-etched chamber-and-throat networkused in experiments (the distance between the centres of two adjacentchambers is 1220 lm). (b) Experimental apparatus: A = model porousmedium; B = fluid injection tubes; C = fluid withdrawal tubes; D = CCDvideo-camera; E = computer; F = monitor; T = absolute pressure con-verter; O = calibrated capillary tube for the measurement of the volume offluids expelling from the porous medium.
Table 1Physicochemical properties of fluid systems
System 1 System 2
Non-wetting fluid (oil, o) n-hexadecane n-nonanolWetting fluid (water, w) Distilled water FormamideOil viscosity, lo (Pa s) 0.00315 0.00964Water viscosity, lw (Pa s) 0.00094 0.00335Oil density, qo (kg/m3) 774 816Water density, qw (kg/m3) 995 1116Interfacial tension, c (mN/m) 25 4.3Equilibrium contact angle, he (�) 42 9
C.D. Tsakiroglou et al. / Advances in Water Resources 30 (2007) 1981–1992 1983
effects (Fig. 1b). Holes drilled at the ends of flow distribu-tors serve as inlet and outlet ports. The dimensions of themain pore network is (length · width) L · W = 0.16 m ·0.11 m, and its permeability is k = 8.9 lm2. The distancebetween the centers of adjacent chambers (length of period-icity) is lp = 1221 lm, the mean throat depth is hDTi =116.6 lm, and the mean throat width is hWTi = 167.5 lm.More details about the features of the glass micro-modelcan be found elsewhere [5].
Details of the experimental procedure (Fig. 1b) that iscommonly followed in an unsteady-state experiment aredescribed in detail elsewhere [49,53,55]. Two fluid systemsof intermediate (1) and strong (2) wettability were used(Table 1). Initially, the porous medium was fully occupiedby the non-wetting phase (oil – o). By using a syringepump, the wetting phase (water – w) was injected in thepore network at constant influx rate through the inletports. All experiments were carried out under controlledvalues of the capillary number, Ca, and viscosity ratio, j,defined by
Ca ¼ lwut=cow and j ¼ lo=lw ð1Þ
respectively, where ut is the superficial flow velocity of theinjected wetting phase at the entrance, lw is the viscosityof the wetting phase, cow is the o/w interfacial tension,and lo is the viscosity of the non-wetting phase. Snap-shotsof the displacement (Fig. 2) were captured by a CCD cam-era equipped with magnification lenses. The absolute pres-sure of the wetting phase at the inlet tubes was measuredcontinuously with the aid of three pressure transducersconnected to a pressure converter (Fig. 1b). After the endof each experiment, the actual pressure drop across the en-tire pore network was calculated by subtracting the pres-sure drops due to the viscous flow along the injection/extraction tubes and hydrostatic heights, and averagingthe measurements of the three transducers (Fig. 1b). Beforethe breakthrough of the wetting phase, its saturation varieslinearly with time, and for this reason the pre-break-through saturation data were ignored in the analysis. Afterthe breakthrough, the transient variation of Sw was mea-sured precisely by collecting the fluids expelling from thepore network, in a calibrated glass capillary tube, and vi-deo-recording at real-time the position of the meniscus sep-arating the two fluids (Fig. 1b).
2.2. Relative permeabilities and capillary pressures
2.2.1. Transient growth pattern and macroscopic approach
Depending on the values of a variety of parametersðCa; j; he; pore structure; saturation historyÞ the transientgrowth pattern of an immiscible displacement of two fluidsin a planar pore network may be dominated by a stablefront, capillary fingering, viscous fingering, wetting filmprecursor advancement, etc. [1,2,9,11,21,27,32,39,46,48–51,53,55]. The 1-D macroscopic averaged mass andmomentum balances are adequate to describe stable dis-placements with finite front thickness [21,30,43,45,47–49].However, the same equations have also been used to esti-mate the capillary pressure and relative permeability curvesof pore networks by inverting experimental datasets ofunstable flows where the thickness of the frontal regionwas quite long compared to the length of the porous med-ium [46,51] . Evidently a degree of uncertainty is embeddedinto the so-estimated P c; krw; kro curves, which are corre-lated strongly with the transient growth pattern[46,48,49,51] and may be regarded as ‘‘average’’ two-phaseflow coefficients quantifying the mobility of the wetting and
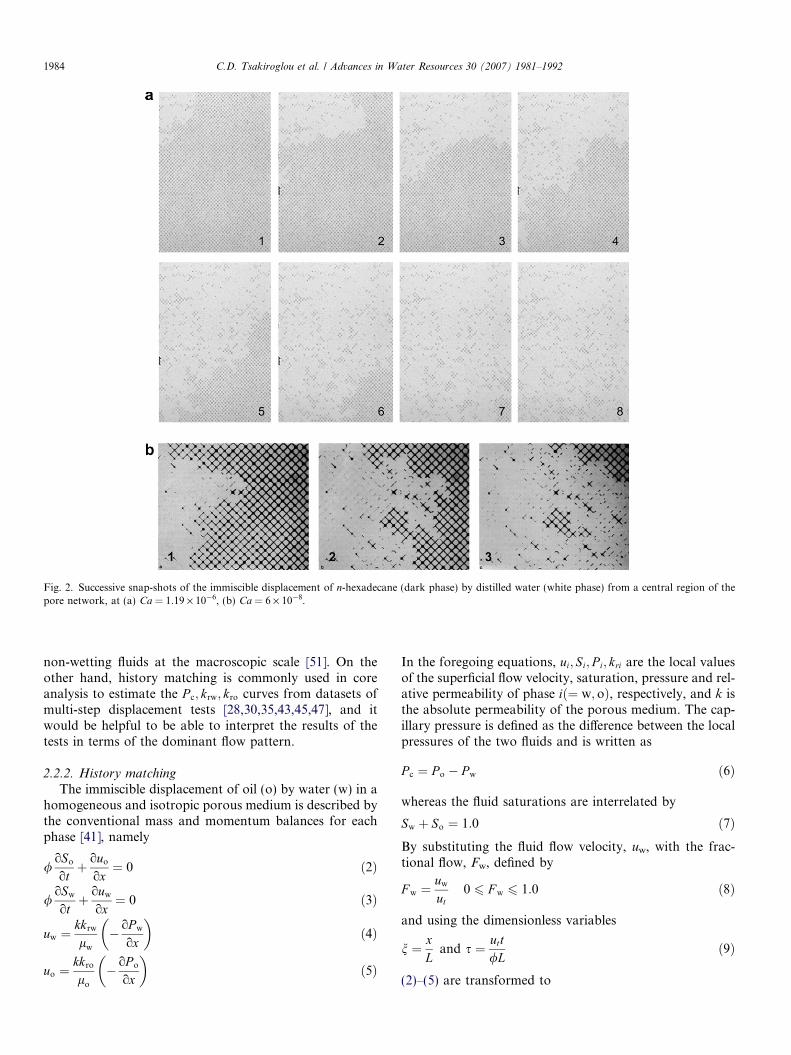
Fig. 2. Successive snap-shots of the immiscible displacement of n-hexadecane (dark phase) by distilled water (white phase) from a central region of thepore network, at (a) Ca = 1.19 · 10�6, (b) Ca = 6 · 10�8.
1984 C.D. Tsakiroglou et al. / Advances in Water Resources 30 (2007) 1981–1992
non-wetting fluids at the macroscopic scale [51]. On theother hand, history matching is commonly used in coreanalysis to estimate the P c; krw; kro curves from datasets ofmulti-step displacement tests [28,30,35,43,45,47], and itwould be helpful to be able to interpret the results of thetests in terms of the dominant flow pattern.
2.2.2. History matching
The immiscible displacement of oil (o) by water (w) in ahomogeneous and isotropic porous medium is described bythe conventional mass and momentum balances for eachphase [41], namely
/oSo
otþ ouo
ox¼ 0 ð2Þ
/oSw
otþ ouw
ox¼ 0 ð3Þ
uw ¼kkrw
lw
� oP w
ox
� �ð4Þ
uo ¼kkro
lo
� oP o
ox
� �ð5Þ
In the foregoing equations, ui; Si; P i; kri are the local valuesof the superficial flow velocity, saturation, pressure and rel-ative permeability of phase ið¼ w; oÞ, respectively, and k isthe absolute permeability of the porous medium. The cap-illary pressure is defined as the difference between the localpressures of the two fluids and is written as
P c ¼ P o � P w ð6Þ
whereas the fluid saturations are interrelated by
Sw þ So ¼ 1:0 ð7ÞBy substituting the fluid flow velocity, uw, with the frac-tional flow, Fw, defined by
F w ¼uw
ut0 6 F w 6 1:0 ð8Þ
and using the dimensionless variables
n ¼ xL
and s ¼ utt/L
ð9Þ
(2)–(5) are transformed to
C.D. Tsakiroglou et al. / Advances in Water Resources 30 (2007) 1981–1992 1985
oSw
osþ oF w
on¼ 0 ð10Þ
F w ¼ 1� kro
kro þ jkrw
1� uc
utkrw
oP �coSw
oSw
on
� �ð11Þ
� oP �won
� �¼ j
kro þ jkrw
ut
uc
þ kro
joP �coSw
oSw
on
� �ð12Þ
where the dimensionless variables P �c and P �w are defined by
P �c ¼P c
DP 0w
P �w ¼P w
DP 0w
ð13Þ
the characteristic velocity uc is given by
uc ¼kDP 0
w
lwLð14Þ
and DP 0w is the steady-state pressure drop across the porous
medium. By regarding the pore network (0 6 n 6 1) as apart of a semi-infinite porous medium, and ignoring capil-lary end effects [26,30,35,45] on the outlet ports, Eqs. (10)and (11) are subject to the initial condition
Swð0; nÞ ¼ 0 ð15Þleft boundary condition
Swðn ¼ 0Þ ¼ 1� Sor ð16Þand right boundary condition
oSw
on
� �n¼n0
¼ 0 ð17Þ
where n0� 1. The pressure gradient ð�oP �w=onÞ is an expli-cit function of Sw and is post-calculated from the numericalsolution of the PDE [49,51]. With respect to the dimension-less saturation
S�w ¼Sw
1� Sor
ð18Þ
the capillary pressure and relative permeability curves maybe given by the following functional forms [43,51]
P c ¼ P 0cðS�w þ hcÞ�mc ð19Þ
krw ¼ k0rw
ðS�w þ hwÞmw þ awS�wð1þ hwÞmw þ aw
ð20Þ
kro ¼ k0ro
ð1� S�w þ hoÞmo þ aoð1� S�wÞð1þ hoÞmo þ ao
ð21Þ
Simple Corey type models were selected, Eqs. (19)–(21), asthey reproduce satisfactorily the capillary pressure and rel-ative permeability curves of glass-etched pore networks[46,48,49,51] which are characterized by an almost uniformpore depth, and small variability of the equivalent capillarydiameter distribution [52]. The parameters P 0
c ; k0rw;mc;mw;
mo; aw; ao are estimated with history matching, while it isassumed that k0
ro ¼ 1. The parameters hc, hw and ho wereintroduced into the foregoing relationships in order toavoid numerical instabilities arising as Pc!1, or kro! 0.The hc is associated with the maximum P cðS�w ¼ 0Þ, andwas included in the list of the estimated parameters,
whereas hw and ho were kept constant and equal to 10�4.The residual oil saturation, Sor, was set equal to its exper-imentally measured value. The history matching algorithmwas developed in the environment of the commercial soft-ware package ATHENA by using finite differences andmethod of lines to integrate the PDE, and Bayesian estima-tion to fit the numerical results to the experimentally mea-sured transient responses of the total water saturation,Swt(s), and total pressure drop across the wetting fluid,DPwt(s) [49]. It is worth noting that only after-break-through datasets were used in the parameter estimationprocedure. The numerically calculated values of Sw(s,n)and ð�oP �w=onÞjs;n were integrated along the entire lengthof the porous medium for the determination of Swt(s),and DPwt(s).
2.2.3. Steady-state relative permeability functions
In earlier papers [3,5], the steady-state relative perme-ability functions have been determined during the simulta-neous flow of both fluids through the porous medium(Fig. 1a) by measuring the time averaged pressure dropacross each phase, and the average water saturation, bothin a central area of the pore network. Depending on theflow parameters, Ca, j, he, and water saturation, Sw, fourfundamental steady-state two-phase flow regimes wereidentified at the pore network scale (Fig. 3) [3,5]. For thedetermination of krw, kro the measured pressure drops wereintroduced into the multiphase Darcy law. Therefore thesteady-state krw; kro can be regarded as overall (average)properties of the porous medium (length scale � L) andrelate explicitly to the corresponding flow regime. On theother hand, the transient krw; kro, resulting from the historymatching of an immiscible displacement experiment arelocal properties (length scale� L) and relate implicitly tothe corresponding displacement growth pattern [46].
Supposing that the end values krwðSw ¼ 0Þ ¼ 0;kr0ðSw ¼ 1� SorÞ ¼ 0; kr0ðSw ¼ 0Þ ¼ 1, the conventionalsteady-state relative permeability curves were fitted(Fig. 4, Table 2) with 3-parameter sigmoid functions ofthe form
krw ¼ bw exp½� expð�gwðSw � ScwÞÞ� � bw exp½� expðgwScwÞ�ð22Þ
kro ¼ bo exp½� expð�goð1� Sw � ScoÞÞ� þ ASw þ B ð23Þ
where
B ¼ 1� bo exp½� expð�goð1� ScoÞÞ� ð24ÞA ¼ f�bo exp½� expð�goðSor � ScoÞÞ� � Bg=ð1� SorÞ ð25Þ
The foregoing fitting functions enable us to (i) extrapolatethe measured steady-state krw; kro to high and low Sw values(Fig. 4, Table 2), (ii) simplify their comparison with thecorresponding transient relative permeabilities, and (iii)introduce the steady-state krw; kro as input parameters intomacroscopic numerical simulators.
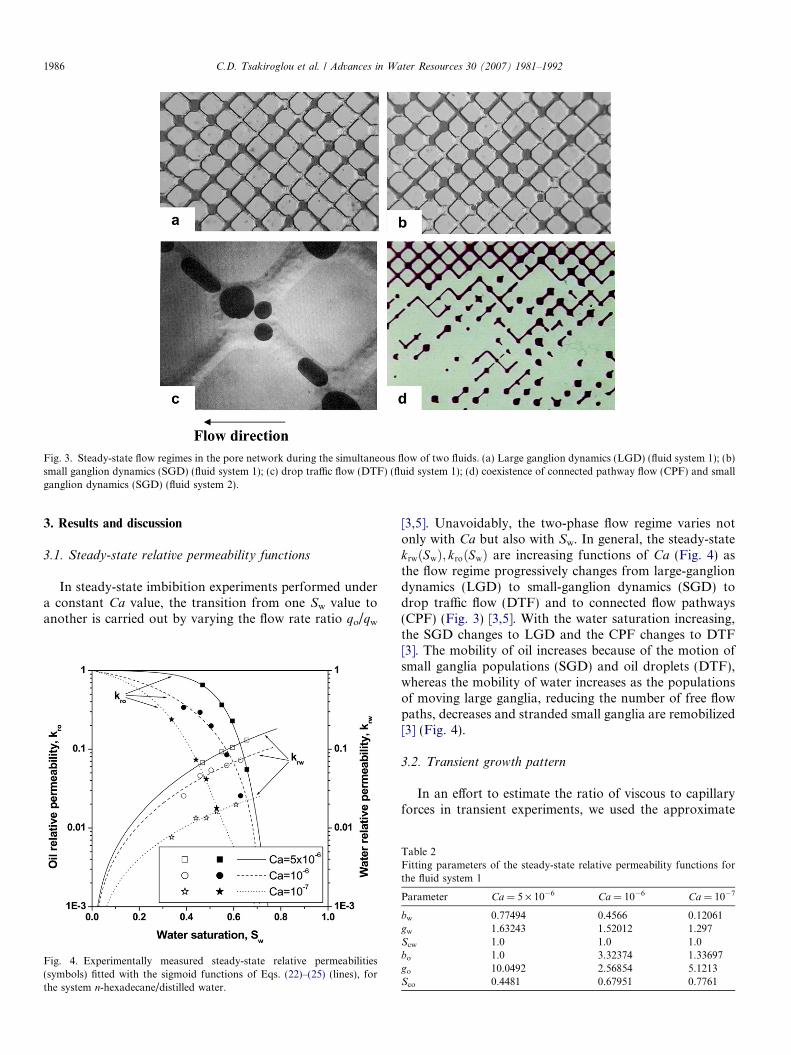
Fig. 3. Steady-state flow regimes in the pore network during the simultaneous flow of two fluids. (a) Large ganglion dynamics (LGD) (fluid system 1); (b)small ganglion dynamics (SGD) (fluid system 1); (c) drop traffic flow (DTF) (fluid system 1); (d) coexistence of connected pathway flow (CPF) and smallganglion dynamics (SGD) (fluid system 2).
1986 C.D. Tsakiroglou et al. / Advances in Water Resources 30 (2007) 1981–1992
3. Results and discussion
3.1. Steady-state relative permeability functions
In steady-state imbibition experiments performed undera constant Ca value, the transition from one Sw value toanother is carried out by varying the flow rate ratio qo/qw
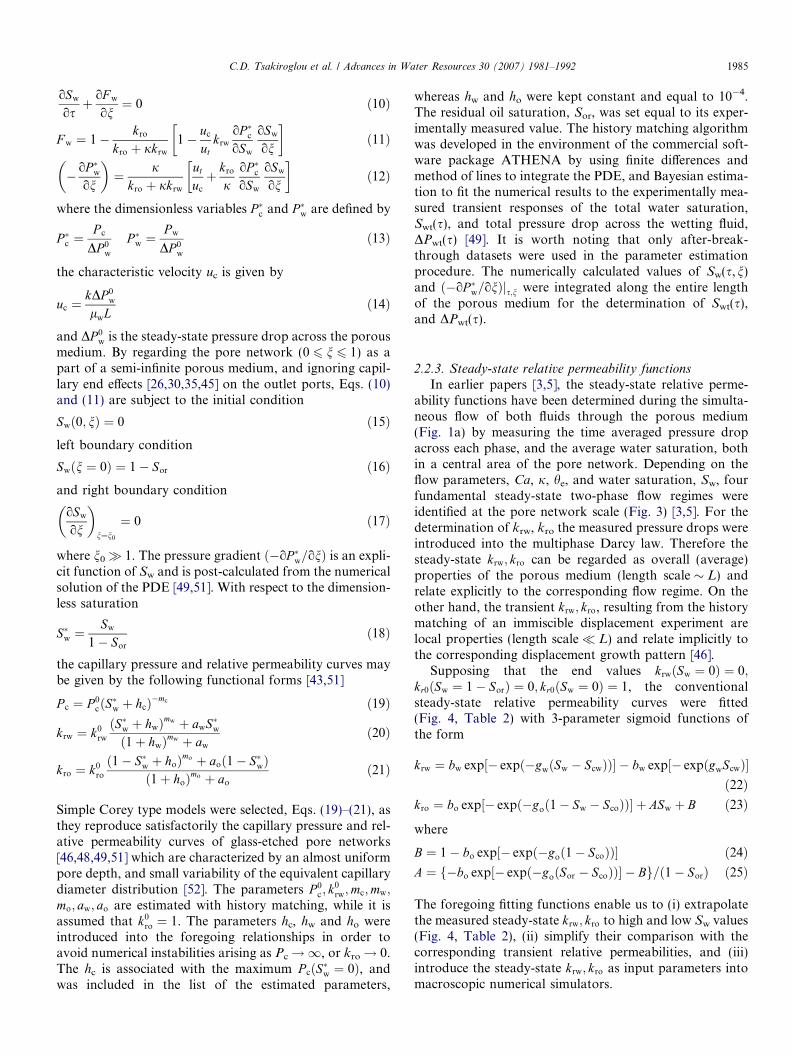
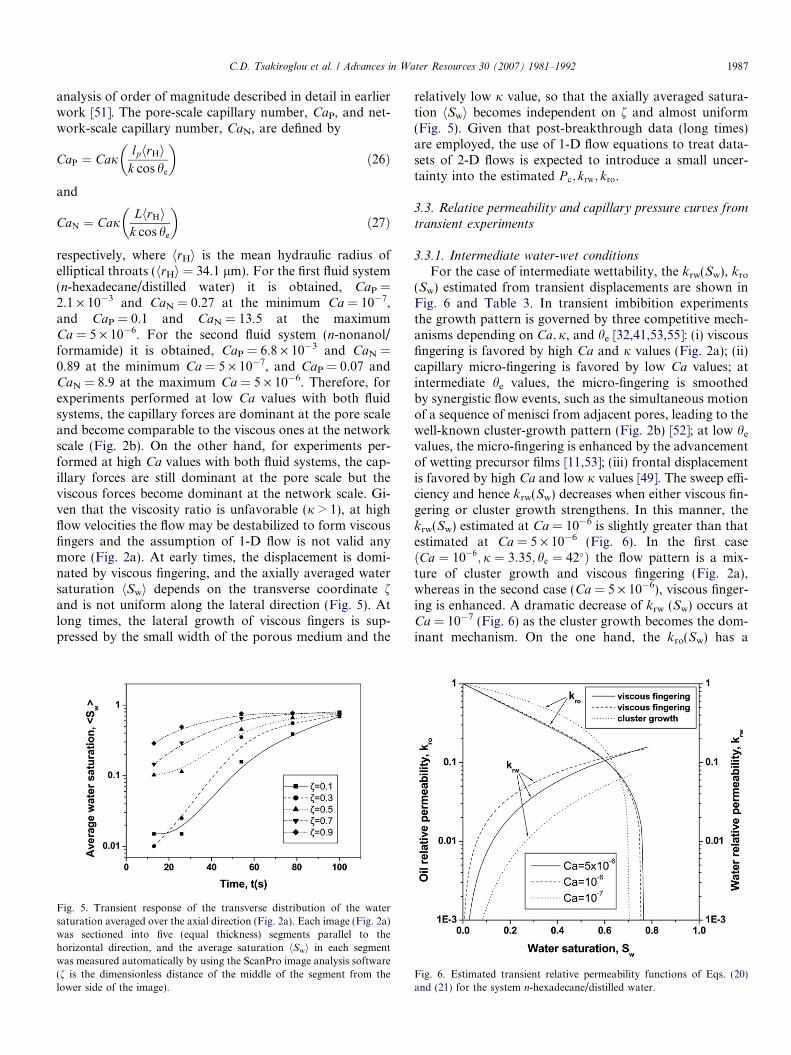
Fig. 4. Experimentally measured steady-state relative permeabilities(symbols) fitted with the sigmoid functions of Eqs. (22)–(25) (lines), forthe system n-hexadecane/distilled water.
[3,5]. Unavoidably, the two-phase flow regime varies notonly with Ca but also with Sw. In general, the steady-statekrwðSwÞ; kroðSwÞ are increasing functions of Ca (Fig. 4) asthe flow regime progressively changes from large-gangliondynamics (LGD) to small-ganglion dynamics (SGD) todrop traffic flow (DTF) and to connected flow pathways(CPF) (Fig. 3) [3,5]. With the water saturation increasing,the SGD changes to LGD and the CPF changes to DTF[3]. The mobility of oil increases because of the motion ofsmall ganglia populations (SGD) and oil droplets (DTF),whereas the mobility of water increases as the populationsof moving large ganglia, reducing the number of free flowpaths, decreases and stranded small ganglia are remobilized[3] (Fig. 4).
3.2. Transient growth pattern
In an effort to estimate the ratio of viscous to capillaryforces in transient experiments, we used the approximate
Table 2Fitting parameters of the steady-state relative permeability functions forthe fluid system 1
Parameter Ca = 5 · 10�6 Ca = 10�6 Ca = 10�7
bw 0.77494 0.4566 0.12061gw 1.63243 1.52012 1.297Scw 1.0 1.0 1.0bo 1.0 3.32374 1.33697go 10.0492 2.56854 5.1213Sco 0.4481 0.67951 0.7761
C.D. Tsakiroglou et al. / Advances in Water Resources 30 (2007) 1981–1992 1987
analysis of order of magnitude described in detail in earlierwork [51]. The pore-scale capillary number, CaP, and net-work-scale capillary number, CaN, are defined by
CaP ¼ CajlphrHi
k cos he
� �ð26Þ
and
CaN ¼ CajLhrHi
k cos he
� �ð27Þ
respectively, where hrHi is the mean hydraulic radius ofelliptical throats (hrHi = 34.1 lm). For the first fluid system(n-hexadecane/distilled water) it is obtained, CaP =2.1 · 10�3 and CaN = 0.27 at the minimum Ca = 10�7,and CaP = 0.1 and CaN = 13.5 at the maximumCa = 5 · 10�6. For the second fluid system (n-nonanol/formamide) it is obtained, CaP = 6.8 · 10�3 and CaN =0.89 at the minimum Ca = 5 · 10�7, and CaP = 0.07 andCaN = 8.9 at the maximum Ca = 5 · 10�6. Therefore, forexperiments performed at low Ca values with both fluidsystems, the capillary forces are dominant at the pore scaleand become comparable to the viscous ones at the networkscale (Fig. 2b). On the other hand, for experiments per-formed at high Ca values with both fluid systems, the cap-illary forces are still dominant at the pore scale but theviscous forces become dominant at the network scale. Gi-ven that the viscosity ratio is unfavorable (j > 1), at highflow velocities the flow may be destabilized to form viscousfingers and the assumption of 1-D flow is not valid anymore (Fig. 2a). At early times, the displacement is domi-nated by viscous fingering, and the axially averaged watersaturation hSwi depends on the transverse coordinate fand is not uniform along the lateral direction (Fig. 5). Atlong times, the lateral growth of viscous fingers is sup-pressed by the small width of the porous medium and the
Fig. 5. Transient response of the transverse distribution of the watersaturation averaged over the axial direction (Fig. 2a). Each image (Fig. 2a)was sectioned into five (equal thickness) segments parallel to thehorizontal direction, and the average saturation hSwi in each segmentwas measured automatically by using the ScanPro image analysis software(f is the dimensionless distance of the middle of the segment from thelower side of the image).
relatively low j value, so that the axially averaged satura-tion hSwi becomes independent on f and almost uniform(Fig. 5). Given that post-breakthrough data (long times)are employed, the use of 1-D flow equations to treat data-sets of 2-D flows is expected to introduce a small uncer-tainty into the estimated P c; krw; kro.
3.3. Relative permeability and capillary pressure curves from
transient experiments
3.3.1. Intermediate water-wet conditions
For the case of intermediate wettability, the krw(Sw), kro
(Sw) estimated from transient displacements are shown inFig. 6 and Table 3. In transient imbibition experimentsthe growth pattern is governed by three competitive mech-anisms depending on Ca; j, and he [32,41,53,55]: (i) viscousfingering is favored by high Ca and j values (Fig. 2a); (ii)capillary micro-fingering is favored by low Ca values; atintermediate he values, the micro-fingering is smoothedby synergistic flow events, such as the simultaneous motionof a sequence of menisci from adjacent pores, leading to thewell-known cluster-growth pattern (Fig. 2b) [52]; at low he
values, the micro-fingering is enhanced by the advancementof wetting precursor films [11,53]; (iii) frontal displacementis favored by high Ca and low j values [49]. The sweep effi-ciency and hence krw(Sw) decreases when either viscous fin-gering or cluster growth strengthens. In this manner, thekrw(Sw) estimated at Ca = 10�6 is slightly greater than thatestimated at Ca = 5 · 10�6 (Fig. 6). In the first caseðCa ¼ 10�6; j ¼ 3:35; he ¼ 42�Þ the flow pattern is a mix-ture of cluster growth and viscous fingering (Fig. 2a),whereas in the second case (Ca = 5 · 10�6), viscous finger-ing is enhanced. A dramatic decrease of krw (Sw) occurs atCa = 10�7 (Fig. 6) as the cluster growth becomes the dom-inant mechanism. On the one hand, the kro(Sw) has a
Fig. 6. Estimated transient relative permeability functions of Eqs. (20)and (21) for the system n-hexadecane/distilled water.
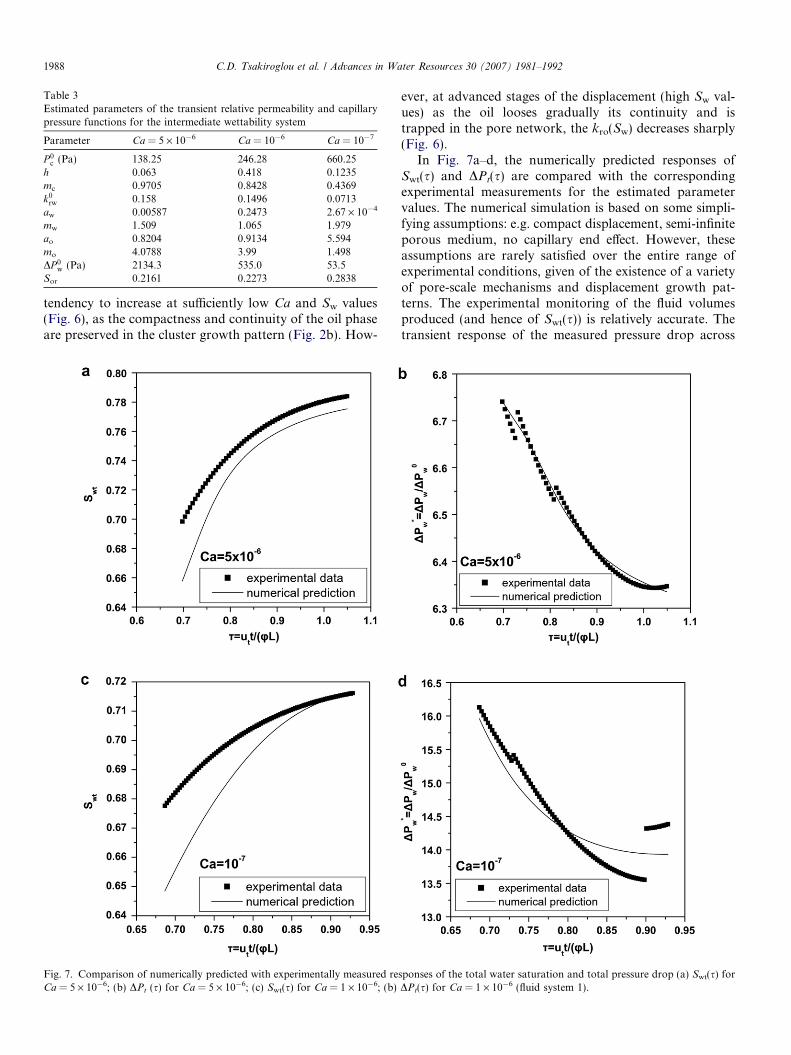
Table 3Estimated parameters of the transient relative permeability and capillarypressure functions for the intermediate wettability system
Parameter Ca = 5 · 10�6 Ca = 10�6 Ca = 10�7
P 0c (Pa) 138.25 246.28 660.25
h 0.063 0.418 0.1235mc 0.9705 0.8428 0.4369k0
rw 0.158 0.1496 0.0713aw 0.00587 0.2473 2.67 · 10�4
mw 1.509 1.065 1.979ao 0.8204 0.9134 5.594mo 4.0788 3.99 1.498DP 0
w (Pa) 2134.3 535.0 53.5Sor 0.2161 0.2273 0.2838
1988 C.D. Tsakiroglou et al. / Advances in Water Resources 30 (2007) 1981–1992
tendency to increase at sufficiently low Ca and Sw values(Fig. 6), as the compactness and continuity of the oil phaseare preserved in the cluster growth pattern (Fig. 2b). How-
Fig. 7. Comparison of numerically predicted with experimentally measured reCa = 5 · 10�6; (b) DPt (s) for Ca = 5 · 10�6; (c) Swt(s) for Ca = 1 · 10�6; (b)
ever, at advanced stages of the displacement (high Sw val-ues) as the oil looses gradually its continuity and istrapped in the pore network, the kro(Sw) decreases sharply(Fig. 6).
In Fig. 7a–d, the numerically predicted responses ofSwt(s) and DPt(s) are compared with the correspondingexperimental measurements for the estimated parametervalues. The numerical simulation is based on some simpli-fying assumptions: e.g. compact displacement, semi-infiniteporous medium, no capillary end effect. However, theseassumptions are rarely satisfied over the entire range ofexperimental conditions, given of the existence of a varietyof pore-scale mechanisms and displacement growth pat-terns. The experimental monitoring of the fluid volumesproduced (and hence of Swt(s)) is relatively accurate. Thetransient response of the measured pressure drop across
sponses of the total water saturation and total pressure drop (a) Swt(s) forDPt(s) for Ca = 1 · 10�6 (fluid system 1).
C.D. Tsakiroglou et al. / Advances in Water Resources 30 (2007) 1981–1992 1989
the porous medium is predicted satisfactorily by thenumerical solution of the two-phase flow equations at theestimated parameter values (Fig. 7b and d). The displace-ment is faster than that predicted by numerical simulation(Fig. 7a and c) because flow instabilities (viscous fingering,capillary fingering, cluster growth) observed in experimentare not accounted for the 1-D flow equations. The averagewater saturation measured is always greater than that pre-dicted, since the experimental two-phase flow is 2-D atearly times (Fig. 2a and b), whereas 1-D two-phase flowequations are used in simulations.
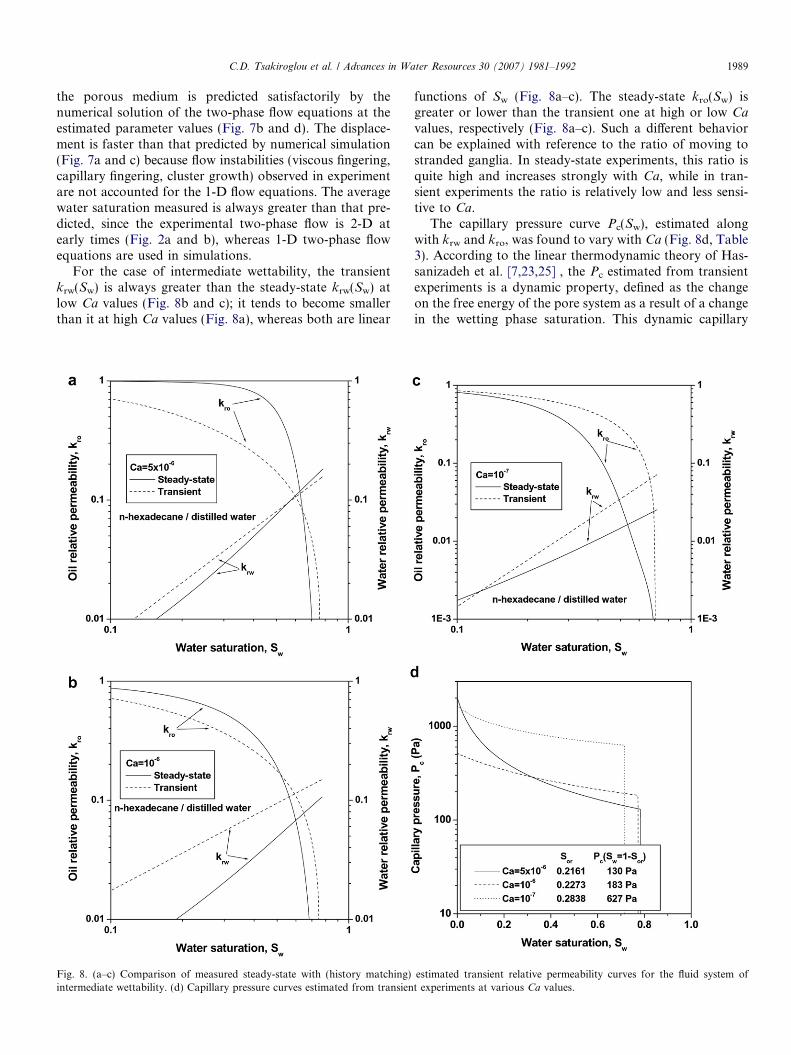
For the case of intermediate wettability, the transientkrw(Sw) is always greater than the steady-state krw(Sw) atlow Ca values (Fig. 8b and c); it tends to become smallerthan it at high Ca values (Fig. 8a), whereas both are linear
Fig. 8. (a–c) Comparison of measured steady-state with (history matching)intermediate wettability. (d) Capillary pressure curves estimated from transien
functions of Sw (Fig. 8a–c). The steady-state kro(Sw) isgreater or lower than the transient one at high or low Ca
values, respectively (Fig. 8a–c). Such a different behaviorcan be explained with reference to the ratio of moving tostranded ganglia. In steady-state experiments, this ratio isquite high and increases strongly with Ca, while in tran-sient experiments the ratio is relatively low and less sensi-tive to Ca.
The capillary pressure curve Pc(Sw), estimated alongwith krw and kro, was found to vary with Ca (Fig. 8d, Table3). According to the linear thermodynamic theory of Has-sanizadeh et al. [7,23,25] , the Pc estimated from transientexperiments is a dynamic property, defined as the changeon the free energy of the pore system as a result of a changein the wetting phase saturation. This dynamic capillary
estimated transient relative permeability curves for the fluid system oft experiments at various Ca values.
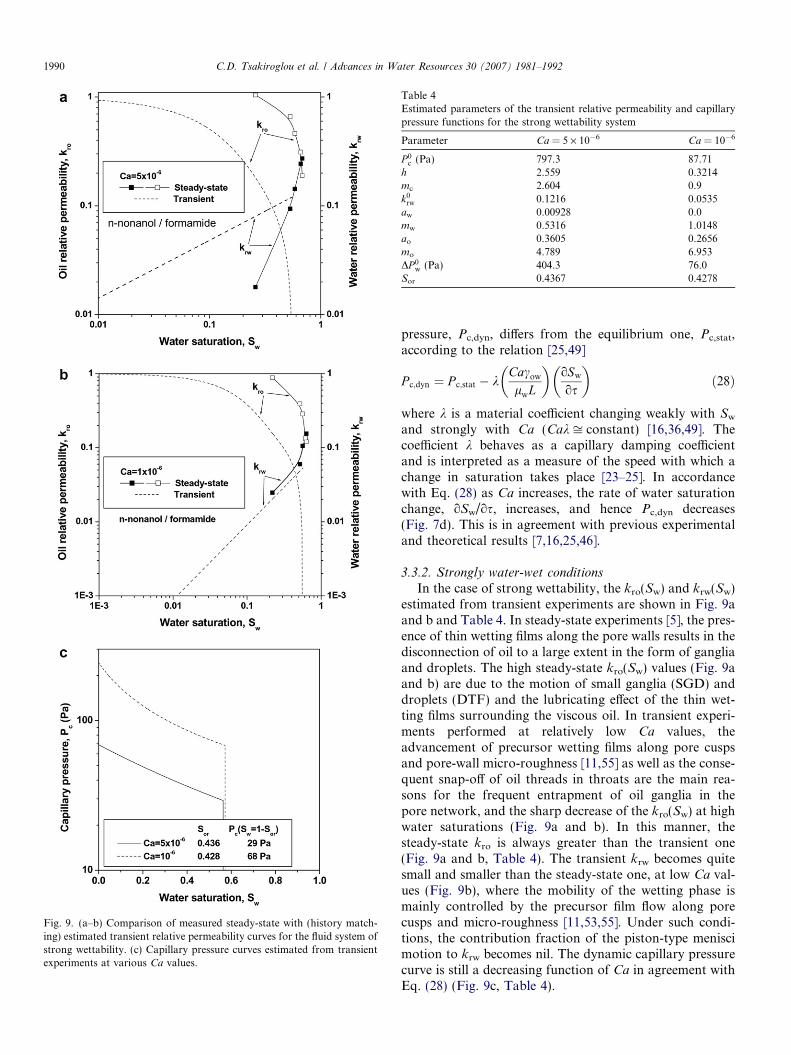
Fig. 9. (a–b) Comparison of measured steady-state with (history match-ing) estimated transient relative permeability curves for the fluid system ofstrong wettability. (c) Capillary pressure curves estimated from transientexperiments at various Ca values.
Table 4Estimated parameters of the transient relative permeability and capillarypressure functions for the strong wettability system
Parameter Ca = 5 · 10�6 Ca = 10�6
P 0c (Pa) 797.3 87.71
h 2.559 0.3214mc 2.604 0.9k0
rw 0.1216 0.0535aw 0.00928 0.0mw 0.5316 1.0148ao 0.3605 0.2656mo 4.789 6.953DP 0
w (Pa) 404.3 76.0Sor 0.4367 0.4278
1990 C.D. Tsakiroglou et al. / Advances in Water Resources 30 (2007) 1981–1992
pressure, Pc,dyn, differs from the equilibrium one, Pc,stat,according to the relation [25,49]
P c;dyn ¼ P c;stat � kCacow
lwL
� �oSw
os
� �ð28Þ
where k is a material coefficient changing weakly with Sw
and strongly with Ca (Cak ffi constant) [16,36,49]. Thecoefficient k behaves as a capillary damping coefficientand is interpreted as a measure of the speed with which achange in saturation takes place [23–25]. In accordancewith Eq. (28) as Ca increases, the rate of water saturationchange, oSw/os, increases, and hence Pc,dyn decreases(Fig. 7d). This is in agreement with previous experimentaland theoretical results [7,16,25,46].
3.3.2. Strongly water-wet conditions
In the case of strong wettability, the kro(Sw) and krw(Sw)estimated from transient experiments are shown in Fig. 9aand b and Table 4. In steady-state experiments [5], the pres-ence of thin wetting films along the pore walls results in thedisconnection of oil to a large extent in the form of gangliaand droplets. The high steady-state kro(Sw) values (Fig. 9aand b) are due to the motion of small ganglia (SGD) anddroplets (DTF) and the lubricating effect of the thin wet-ting films surrounding the viscous oil. In transient experi-ments performed at relatively low Ca values, theadvancement of precursor wetting films along pore cuspsand pore-wall micro-roughness [11,55] as well as the conse-quent snap-off of oil threads in throats are the main rea-sons for the frequent entrapment of oil ganglia in thepore network, and the sharp decrease of the kro(Sw) at highwater saturations (Fig. 9a and b). In this manner, thesteady-state kro is always greater than the transient one(Fig. 9a and b, Table 4). The transient krw becomes quitesmall and smaller than the steady-state one, at low Ca val-ues (Fig. 9b), where the mobility of the wetting phase ismainly controlled by the precursor film flow along porecusps and micro-roughness [11,53,55]. Under such condi-tions, the contribution fraction of the piston-type meniscimotion to krw becomes nil. The dynamic capillary pressurecurve is still a decreasing function of Ca in agreement withEq. (28) (Fig. 9c, Table 4).
C.D. Tsakiroglou et al. / Advances in Water Resources 30 (2007) 1981–1992 1991
4. Conclusions
The wetting krw and non-wetting kro phase relative per-meabilities of a glass-etched model pore network are esti-mated with history matching of transient imbibitionexperiments for two fluid systems: one of intermediate,and one of strong wettability. The variation of krw andkro with capillary number, Ca, as well as their potential dif-ferences from the corresponding steady-state functionsmeasured on the same porous medium [3–5] are interpretedin the terms of the dominant displacement growth patternand steady-state two-phase flow regime which have beendescribed in detail in earlier work. The most importantconclusions are outlined below
• For the case of intermediate wettability, the transient kro
is a decreasing function of Ca whereas krw is a decreas-ing or increasing function Ca at high or low Ca values,respectively, as the flow pattern changes from viscousfingering to cluster growth. The transient kro is loweror higher than the steady-state kro at high or low Ca val-ues, respectively. The transient krw exceeds the steady-state one over the entire range of Ca values, havingthe tendency to become smaller than it at sufficientlyhigh Ca values.
• For the case of strong wettability, the transient kro andkrw are clearly increasing functions of Ca. The transientkro is higher than the steady-state one, whereas the tran-sient krw decreases substantially and becomes lower thanthe steady-state one at low Ca and high Sw values.
• The dynamic capillary pressure estimated from transientimbibition experiments is a decreasing function of Ca inagreement with the linear thermodynamic theory ofHassanizadeh and Gray [23,24] and previous experimen-tal and theoretical results [16,25,46].
The differences between the steady-state and transientkrw; kro can be attributed to the different two-phase flowstructures (transient growth pattern and steady-state flowregime) developed within a pore network and associatedwith the sensitivity of their mobility to viscous and capil-lary forces. Conclusions concerning the relative positionsof steady-state and transient krw; kro are restricted to thespecific category of porous media used (homogeneousand planar or non-planar chamber-and-throat networkswith small variability of equivalent capillary diameters)and cannot be generalized directly to any porous medium.On the other hand, the present analysis reveals that theresults of core analysis tests should be interpreted closelywith the type of test (steady-state, transient) and experi-mental conditions imposed.
In real 3-D porous media, where pore structure proper-ties are of key importance, the visualized behavior (steadyflow regimes and transient flow patterns) along with thesensitivity of krw; kro to Ca may be valid over a differentrange of the parameter space. However there is a lack ofany systematic study that could allow us to formulate rules
about the dependence of transient and steady-state relativepermeabilities on capillary number or any other parameterfor 3-D real porous media.
References
[1] Aker E, Maloy KJ. Simulating temporal evolution of pressure in two-phase flow in porous media. Phys Rev E 1998;58:2217–26.
[2] Aker E, Maloy KJ, Hansen A, Batrouni GG. A two-dimensionalnetwork simulator for two-phase flow in porous media. TransportPorous Med 1998;32:163–86.
[3] Avraam DG, Payatakes AC. Flow regimes and relative permeabilitiesduring steady-state two-phase flow in porous media. J Fluid Mech1995;293:207–36.
[4] Avraam DG, Payatakes AC. Generalized relative permeability coef-ficients during steady-state two-phase flow in porous media andcorrelation with the flow mechanisms. Transport Porous Med 1995;20:135–68.
[5] Avraam DG, Payatakes AC. Flow mechanisms, relative permeabil-ities, and coupling effects in steady-state two-phase flow throughporous media. The case of strong wettability. Ind Eng Chem Res1999;38:778–86.
[6] Avraam DG, Kolonis GB, Roumeliotis TC, Constantinides GN,Payatakes AC. Steady-state two-phase flow through planar andnonplanar model porous media. Transport Porous Med 1994;16:75–101.
[7] Beliaev AY, Hassanizadeh SM. A theoretical model of hysteresis anddynamic effects in the capillary relation for two-phase flow in porousmedia. Transport Porous Med 2001;43:487–510.
[8] Bentsen RG, Manai AA. On the use of conventional cocurrent andcountercurrent effective permeabilities to estimate the four general-ized permeability coefficients which arise in coupled two-phase flow.Transport Porous Med 1993;11:243–62.
[9] Blunt M, King P. Relative permeabilities from two- and three-dimensional pore-scale network modeling. Transport Porous Med1991;6:407–33.
[10] Bradford SA, Abriola LM, Rathfelder KM. Flow and entrapment ofdense nonaqueous phase liquids in physically and chemically heter-ogeneous aquifer formations. Adv Water Resour 1998;22:117–32.
[11] Constantinides GN, Payatakes AC. Effects of precursor wetting filmsin immiscible displacement through porous media. Transport PorousMed 2000;38:291–317.
[12] Constantinides GN, Payatakes AC. Network simulation of steady-state two-phase flow in consolidated porous media. AIChE J1996;42:369–82.
[13] Constantinides GN, Payatakes AC. Determination of the effects ofcapillary number, viscosity ratio and wettability on the capillarypressure–saturation relation using an advanced pore network simu-lator. SPE Paper No. 78518, 10th ADIPEC, Abu-Dhabi; 2002.
[14] Couture F, Jomaa W, Puiggali JR. Relative permeability relations: akey factor for a drying model. Transport Porous Med 1996;23:303–35.
[15] Dana E, Skoczylas F. Experimental study of two-phase flow in threesandstones. I. Measuring relative permeabilities during two-phasesteady-state experiments. Int J Multiphase Flow 2002;28:1719–36.
[16] Das DB, Mirzaei M, Widdows N. Non-uniqueness in capillarypressure–saturation-relative permeability relationships for two-phaseflow in porous media: interplay between intensity and distribution ofrandom micro-heterogeneities. Chem Eng Sci 2006;61:6786–803.
[17] Delshad M, Lenhard RJ, Oostrom M, Pope GA. A mixed-wethysteretic relative permeability and capillary pressure model forreservoir simulations. SPE Res Eval Eng 2003;6:328–34.
[18] Dullien FAL, Dong M. Experimental determination of the flowtransport coefficients in the coupled equations of two-phase flow inporous media. Transport Porous Med 1996;25:97–120.
[19] Fourar M, Bories S, Lenormand R, Persoff P. Two-phase flow insmooth and rough fractures: measurement and correlation by

1992 C.D. Tsakiroglou et al. / Advances in Water Resources 30 (2007) 1981–1992
porous-medium and pipe flow models. Water Resour Res 1993;29:3699–708.
[20] Gioia F, Alfani G, Andreutti S, Murena F. Oil mobility in a saturatedwater-wetted bed of glass beads. J Hazardous Mat B 2003;97:315–27.
[21] Goode PA, Ramakrishnan TS. Momentum transfer across fluid–fluidinterfaces in porous media: a network model. AIChE J1993;39:1124–34.
[22] Hashemi M, Dabir B, Sahimi M. Dynamics of two-phase flow inporous media: simultaneous invasion of two-fluids. AIChE J1999;45:1365–82.
[23] Hassanizadeh SM, Gray WG. Thermodynamic basis of capillarypressure in porous media. Water Resour Res 1993;29:3389–405.
[24] Hassanizadeh SM, Gray WG. Toward an improved description of thephysics of two-phase flow. Adv Water Resour 1993;16:53–67.
[25] Hassanissadeh SM, Celia MA, Dahle HK. Dynamic effect in thecapillary pressure–saturation relationship and its impacts on unsat-urated flow. Vadoze Zone J 2002;1:38–57.
[26] Huang DD, Honarpour MM. Capillary end effects in corefloodcalculations. J Pet Sci Eng 1998;19:103–17.
[27] Hughes RG, Blunt MJ. Pore scale modeling of rate effects inimbibition. Transport Porous Med 2000;40:295–322.
[28] Johnson EF, Bossler DP, Naumann VO. Calculation of relativepermeability from displacement experiments. J Pet Tech1959:61–3.
[29] Kalaydjian FJM, Moulu JC, Vizika O, Munkerud PK. Three-phasein water-wet porous media: gas/oil relative permeabilities for variousspreading conditions. J Pet Sci Eng 1997;17:275–90.
[30] Kulkarni R, Watson R, Norttvedt JE, Sylte A. Two-phase flow inporous media: property identification and model validation. AIChE J1998;44:2337–50.
[31] Latifi MA, Naderifar A, Midoux N. Experimental investigation of theliquid/solid mass transfer at the wall of a trickle-bed reactor—influence of Schmidt number. Chem Eng Sci 1997;52:4005–11.
[32] Lenormand R, Touboul E, Zarcone C. Numerical models andexperiments on immiscible displacement in porous media. J FluidMech 1988;189:165–87.
[33] Li H, Pan C, Miller CT. Pore-scale investigation of viscous couplingeffects for two-phase flow in porous media. Phys Rev E2005;72:026705.
[34] Liang Q, Lohrenz J. Dynamic method of measuring couplingcoefficients of transport equations of two-phase flow in porousmedia. Transport Porous Med 1994;15:71–9.
[35] Mejia GM, Mohanty KK, Watson AT. Use of in situ saturation datain estimation of two-phase flow functions in porous media. J Pet SciEng 1995;12:233–45.
[36] Mirzaei M, Das DB. Dynamic effects in capillary pressure–satura-tions relationships for two-phase flow in 3D porous media: implica-tions of micro-heterogeneities. Chem Eng Sci 2007;62:1927–47.
[37] Mitlin VS, McLennan JD, Green SG. Simultaneous determination oftwo-phase relative permeability and capillary pressure of porousrocks from steady-state flow experiments: accounting for gravita-tional forces and fluid compressibility. J Colloid Interf Sci1998;204:205–13.
[38] Nemec D, Bercic G, Levec J. The hydrodynamics of trickling flow inpacked beds operating at high pressures. The relative permeabilityconcept. Chem Eng Sci 2001;56:5955–62.
[39] Nguyen VH, Sheppard AP, Knackstedt MA, Pinczewski WV. Theeffect of displacement rate on imbibition relative permeability andresidual saturation. J Pet Sci Eng 2006;52:54–70.
[40] Rathfelder KM, Abriola LM, Singletary MA, Pennell KD. Influenceof surfactant-facilitated interfacial tension reduction on chlorinated
solvent migration in porous media: observations and numericalsimulation. J Contam Hydrol 2003;64:227–52.
[41] Sahimi M. Flow and transport in porous media and fractured rock:from classical methods to modern approaches. Weinheim, Ger-many: VCH; 1995.
[42] Schmidt R, Gudbjerg J, Sonnenborg TO, Jensen KH. Removal ofNAPL from the unsaturated zone using steam: prevention ofdownward migration by injecting mixtures of steam and air. JContam Hydrol 2002;55:233–60.
[43] Sigmund P, McCaffery F. An improved unsteady-state procedure fordetermining the relative permeability characteristics of heterogeneousmedia. SPE J 1979;169:15–28.
[44] Singh M, Mohanty KK. Dynamic modelling of drainage throughthree-dimensional porous materials. Chem Eng Sci 2003;58:1–18.
[45] Singh M, Mani V, Honarpour MM, Mohanty KK. Comparison ofviscous and gravity dominated gas–oil relative permeabilities. J PetSci Eng 2001;30:67–81.
[46] Theodoropoulou MA, Sygouni V, Karoutsos V, Tsakiroglou CD.Relative permeability and capillary pressure functions of porousmedia as related to the displacement growth pattern. Int J MultiphaseFlow 2005;31:1155–80.
[47] Toth J, Bodi T, Szucs P, Civan F. Convenient formulae fordetermination of relative permeability from unsteady-state fluiddisplacements in core plugs. J Pet Sci Eng 2002;36:33–44.
[48] Tsakiroglou CD. Correlation of the two-phase flow coefficients ofporous media with the rheology of shear-thinning fluids. J Non-Newtonian Fluid Mech 2004;117:1–23.
[49] Tsakiroglou CD, Theodoropoulou M, Karoutsos V. Non-equilibriumcapillary pressure and relative permeability curves of porous media.AIChE J 2003;49:2472–86.
[50] Tsakiroglou CD, Theodoropoulou M, Karoutsos V, Papanicolaou D,Sygouni V. Experimental study of the immiscible displacement ofshear-thinning fluids in pore networks. J Colloid Interf Sci2003;267:217–32.
[51] Tsakiroglou CD, Theodoropoulou MA, Karoutsos V, PapanicolaouD. Determination of the effective transport coefficients of porenetworks from transient immiscible and miscible displacementexperiments. Water Resour Res 2005;41:W02014.
[52] Tsakiroglou CD, Payatakes AC. Mercury intrusion and retraction inmodel porous media. Adv Colloid Interf Sci 1998;75:215–53.
[53] Tzimas GC, Matsuura T, Avraam DG, van der Brugghen W,Constantinides GN, Payatakes AC. The combined effect of theviscosity ratio and the wettability during forced imbibition throughnonplanar porous media. J Colloid Interf Sci 1997;189:27–36.
[54] Valavanides MS, Payatakes AC. True-to-mechanism model ofsteady-state two-phase flow in porous media, using decompositioninto prototype flows. Adv Water Res 2001;24:385–407.
[55] Vizika O, Avraam DG, Payatakes AC. On the role of the viscosityratio during low-capillary number forced imbibition in porous media.J Colloid Interf Sci 1994;165:386–401.
[56] Wang ZH, Wang CY, Chen KS. Two-phase flow and transport in theair cathode of proton exchange membrane fuel cells. J Power Sources2000;94:40–50.
[57] Whitaker S. Flow in porous media II: The governing equations forimmiscible, two-phase flow. Transport Porous Med 1986;1:105–25.
[58] Wilson CS, Hall JL, Miller CT, Imhoff PT. Factors affecting bankformation during surfactant-enhanced mobilization of residualNAPL. Environ Sci Technol 1999;33:2440–6.
[59] You Y, Liu H. A two-phase flow and transport model for thecathode of PEM fuel cells. Int J Heat Mass Transfer 2002;45:2277–87.