
Tandem reactions initiated by copper-catalyzed cross-coupling
Transfusion independence and HMGA2 activation after genetherapy of human β-thalassaemia
Marina Cavazzana-Calvo1,2,*, Emmanuel Payen3,4,5,*, Olivier Negre3,4,5,6, Gary Wang7,Kathleen Hehir8, Floriane Fusil3,4,5, Julian Down8, Maria Denaro8, Troy Brady7, KarenWesterman8,9, Resy Cavallesco9, Beatrix Gillet-Legrand6, Laure Caccavelli1,2, RiccardoSgarra10, Leila Maouche-Chrétien3,4, Françoise Bernaudin11, Robert Girot12, RonaldDorazio8, Geert-Jan Mulder8, Axel Polack8, Arthur Bank13, Jean Soulier5, JérômeLarghero5, Nabil Kabbara5, Bruno Dalle5, Bernard Gourmel5, Gérard Socie5, StanyChrétien3,4,9, Nathalie Cartier14, Patrick Aubourg14, Alain Fischer1,2, Kenneth Cornetta15,Frédéric Galacteros16, Yves Beuzard3,4,5, Eliane Gluckman5, Frederick Bushman7, SalimaHacein-Bey-Abina1,2,*, and Philippe Leboulch3,4,9,*
1Clinical Investigation Center in Biotherapy, Groupe Hospitalier Universitaire Ouest, Inserm/Assistance Publique–Hôpitaux de Paris, Paris 75015, France.2University Paris-Descartes, Paris 75005, France.3CEA, Institute of Emerging Diseases and Innovative Therapies (iMETI), Fontenay-aux-Roses92265, France.4Inserm U962 and University Paris XI, CEA-iMETI, Fontenay-aux-Roses 92265, France.5Departments of Hematology, Bone Marrow Transplantation and Biochemistry, University ParisVII, Institute of Hematology, Hôpital Saint-Louis, AP-HP, Paris 75010, France.6Genetix-France, CEA-iMETI, Fontenay-aux-Roses 92265, France.7Department of Microbiology, University of Pennsylvania School of Medicine, Philadelphia,Pennsylvania 19104, USA.8Genetix Pharmaceuticals, Cambridge, Massachusetts 02139, USA.9Genetics Division, Brigham & Women's Hospital and Harvard Medical School, Boston,Massachusetts 02115, USA.10University of Trieste, Department of Life Sciences, Trieste 34127, Italy.11Centre Hospitalier Intercommunal de Créteil, Créteil 94000, France.12Department of Biology, Hôpital Tenon, Paris 75020, France.
©2010 Macmillan Publishers Limited. All rights reserved
Correspondence and requests for materials should be addressed to P.L. ([email protected])..*These authors contributed equally to this work.
Author Contributions P.L. is the scientific director of the overall project, conceived the strategy and supervised the studies. M.C.-C.and E.G. are the principal clinical investigators. F.Be., R.G., G.S. and E.G. conducted clinical work. E.P., K.W., R.C., Y.B. and P.L.initiated the studies. M.C.-C., E.P., O.N.,G.W.,K.H., F.F.,J.D., M.D., T.B., B.G.-L., L.C., R.S., L.M.-C., J.S., J.L., N.K., B.G., K.C.,Y.B., F.Bu., S.H.-B.-A. and P.L. designed or performed experiments. E.P., O.N., G.W., K.H., J.D., M.D., B.D., F.Bu. and P.L.analysed the data. All authors discussed results and conclusions. P.L. wrote the paper.
Supplementary Information is linked to the online version of the paper at www.nature.com/nature.
Author Information Reprints and permissions information is available at www.nature.com/reprints. The authors declare competingfinancial interests: details accompany the full-text HTML version of the paper at www.nature.com/nature. Readers are welcome tocomment on the online version of this article at www.nature.com/nature.
NIH Public AccessAuthor ManuscriptNature. Author manuscript; available in PMC 2012 May 18.
Published in final edited form as:Nature. 2010 September 16; 467(7313): 318–322. doi:10.1038/nature09328.
NIH
-PA Author Manuscript
NIH
-PA Author Manuscript
NIH
-PA Author Manuscript
13Department of Medicine and Department of Genetics and Development, Columbia UniversityCollege of Physicians and Surgeons, New York, New York 10032, USA.14Inserm UMR745, University Paris-Descartes, Paris 75005, France.15Department of Medical and Molecular Genetics, Indiana University, Indianapolis, Indiana 46202,USA.16Hopital Henri Mondor, AP-HP, Créteil 94000, France.
AbstractThe β-haemoglobinopathies are the most prevalent inherited disorders worldwide. Gene therapy ofβ-thalassaemia is particularly challenging given the requirement for massive haemoglobinproduction in a lineage-specific manner and the lack of selective advantage for correctedhaematopoietic stem cells. Compound βE/β0-thalassaemia is the most common form of severethalassaemia in southeast Asian countries and their diasporas1,2. The βE-globin allele bears a pointmutation that causes alternative splicing. The abnormally spliced form is non-coding, whereas thecorrectly spliced messenger RNA expresses a mutated βE-globin with partial instability1,2. Whenthis is compounded with a non-functional β0 allele, a profound decrease in β-globin synthesisresults, and approximately half of βE/β0-thalassaemia patients are transfusion-dependent1,2. Theonly available curative therapy is allogeneic haematopoietic stem cell transplantation, althoughmost patients do not have a human-leukocyte-antigen-matched, geno-identical donor, and thosewho do still risk rejection or graft-versus-host disease. Here we show that, 33 months afterlentiviral β-globin gene transfer, an adult patient with severe βE/β0-thalassaemia dependent onmonthly transfusions since early childhood has become trans-fusion independent for the past 21months. Blood haemoglobin is maintained between 9 and 10 g dl–1, of which one-third containsvector-encoded β-globin. Most of the therapeutic benefit results from a dominant, myeloid-biasedcell clone, in which the integrated vector causes transcriptional activation of HMGA2 in erythroidcells with further increased expression of a truncated HMGA2 mRNA insensitive to degradationby let-7 microRNAs. The clonal dominance that accompanies therapeutic efficacy may becoincidental and stochasticor resultfrom a hithertobenign cellexpansion caused by dysregulation ofthe HMGA2 gene in stem/progenitor cells.
The design of integrative vectors for human β-globin gene transfer has been difficult.Thegenetic elements required for high and erythroid-specific expression are complex: the β-globin gene with its introns, promoter and β-locus control region (β-LCR)3,4. Lentiviralvectors have proven capable of transferring these elaborate structures with fidelity and hightitres5,6. Hence, several mouse models of the β-haemoglobinopathies have been corrected,long-term, by ex vivo transduction of haematopoietic stem cells (HSCs) with β-globinlentiviral vectors5–10. These advances have prompted the prudent initiation of a humanclinical trial (Supplementary Note 1).
The general structure of the β-globin-expressing lentiviral vector has been previouslydescribed6,8 (Supplementary Fig. 1). It is a self-inactivating vector with two copies of the250-base-pair (bp) core of the cHS4 chromatin insulator11 implanted in the U3 region. Itencodes a mutated adult β-globin (βA(T87Q)) with anti-sickling properties6 that can bedistinguished from normal adult β-globin (βA) by high-performance liquid chromatography(HPLC) analysis in individuals receiving red blood cell transfusions and/or β1-thalassaemiapatients.
This report focuses on the first treated patient (P2) who did not receive back-up cells: amale, aged 18 years at the time of treatment, with severe βE/β0-thalassaemia. A previouspatient (P1) failed to engraft because the HSCs had been compromised by the technical
Cavazzana-Calvo et al. Page 2
Nature. Author manuscript; available in PMC 2012 May 18.
NIH
-PA Author Manuscript
NIH
-PA Author Manuscript
NIH
-PA Author Manuscript
handling of the cells without relation to the gene therapy vector. P1 failed to engraft after 5weeks and was thus given back-up cells (Supplementary Note 2). P2 was first transfused atage three because of poorly tolerated anaemia (6.7 g dl–1 despite residual fetal haemoglobin(HbF)) and major hepatosplenomegaly. Transfusion requirements rapidly increased to oncea month (2–3 red blood cell packs each time; 157 ml of red blood cells per kg the yearbefore transplant). He was splenectomized at age 6. In spite of this, Hb levels decreasedseveral times to as low as 4 g dl–1, and hydroxurea therapy was ineffective. Iron chelationwas initiated at age 8 by parenteral deferoxamine overnight, 5 times a week. The patient didnot have a related human-leukocyte-antigen-matched donor and was thus enrolled in thistrial after informed consent.
The ex vivo transduction efficiency of bulk bonemarrow CD341 cells was 0.6 vector per cellafter 1 week in culture after gene transfer. The patient was conditioned by intravenousBusulfex (3.2 mg kg–1 day–1 for 4 days) without the addition of cyclophosphamide, beforetransplantation with autologous gene-modified and cryopreserved cells (3.9 × 10⁶ CD34+
cells per kg). Haematopoietic reconstitution was uneventful (Supplementary Fig. 2b).
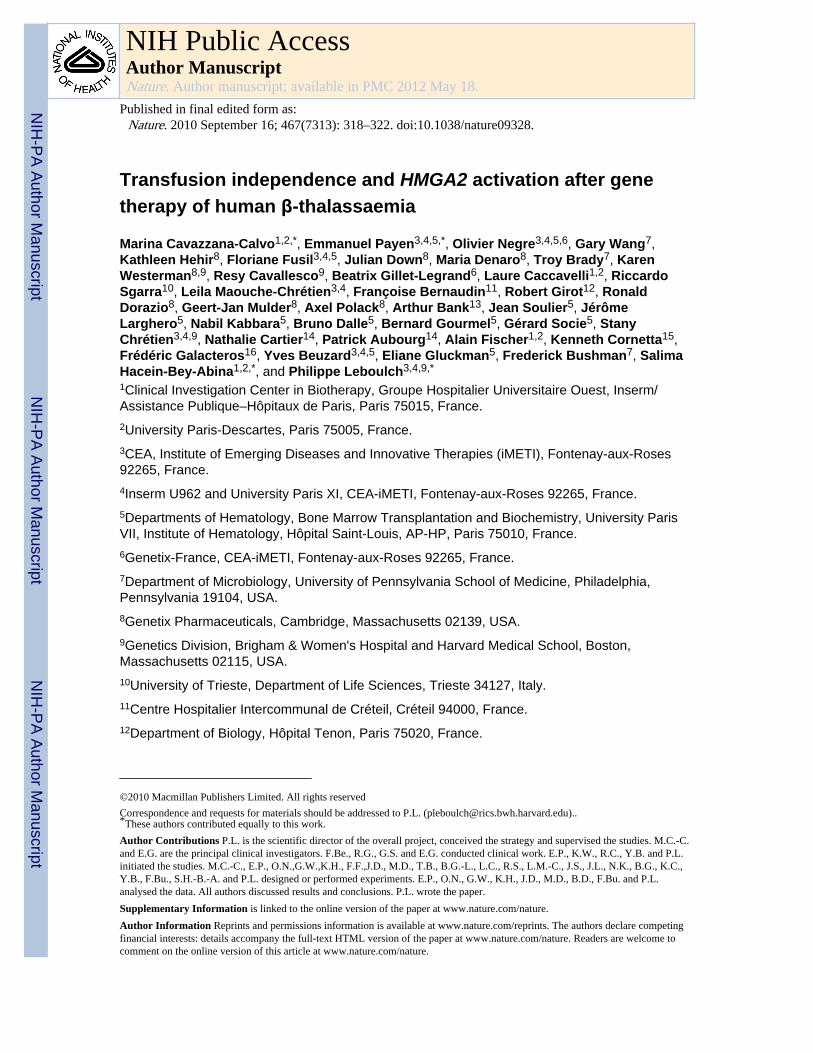
Patient P2 was transplanted on 7 June 2007. At present, approximately 3 years post-transplantation, the biological and clinical evolution is remarkable, and the patient's qualityof life is good. The patient was last transfused on 6 June 2008 (Fig. 1a, c) and has stable Hblevels between 9 and 10 g dl–1 (Fig. 1a), of which approximately one-third is comprised ofeach of the therapeutic Hb-βA(T87Q) (αβ(T87Q) Hb dimer), HbE (αβE Hb dimer) and HbF(αγ Hb dimer) (Fig. 1b, c and Supplementary Fig. 3a), with HbA2 (αδ Hb dimer) beingnegligible. No trace of transfused HbA (αβA Hb dimer) has been detected in the blood forthe past 17 months (Fig. 1c). The ratios of γ/βE-globin chains remain similar, 33 monthspost-transplantation, when compared to levels at the time of transplantation, following atransient supplemental rise in γ-globin expression shortly after cell engraftment(Supplementary Fig. 3b). These observations indicate that the concurrent increase in γ- andβE-globin blood concentration is the consequence of the discontinuation of bloodtransfusions, which exerted a global suppressive effect on endogenous globin geneexpression, together with the downstream selection for red blood cells with the highest Hb-βA(T87Q), HbE and HbF combined content. Although there is partial correction of theanaemia with concurrent decrease in blood reticulocyte and erythroblast counts(Supplementary Fig. 2c, d), the hypererythroid state remains (Supplementary Note 3).Consistent with previous studies in mice12, it is likely that sufficiently corrected β-thalassaemic red blood cells are selected in the blood due to their prolonged lifespan. Asexpected from the vector design that confers erythroid-specific expression, βA(T87Q)-globinwas undetectable in purified blood CD15+ cells (granulocytes-monocytes) (data not shown).Because the patient had poor tolerance to oral iron chelation (deferasirox), deferiprone wassubstituted and phlebotomies were performed during the past 6 months to withdraw 200 mlof blood each month (Fig.1a). Notably, blood Hb levels havebeen maintained in spite of acumulated blood withdrawal of 1.2 l.
Twenty-one months after the last transfusion, the mean corpuscular haemoglobin (MCH) ofthe last 6 months averaged 28.7 pg, which is within the normal range (27–32 pg; mean 29.5pg) and contrasts with the low values averaging at 19 pg found in non-transfused βE/β0-thalassaemia patients1. Because 36.2% of all the β-like globin chains produced during thelast 6 months is βA(T87Q)-globin, the contribution of βA(T87Q)-globin to the measured MCHwas 28.7 × 0.362 5 10.4 pg. The ratio of βA(T87Q)-globin output to the mean normalendogenous βA-globin output on a per-gene basis is thus 10.4/(29.5/2) 5 70.5%. Because itis unlikely that all of the circulating red blood cells derive from vector-bearing progenitorsdespite peripheral selection for corrected red blood cells, one can surmise that βA(T87Q)-
Cavazzana-Calvo et al. Page 3
Nature. Author manuscript; available in PMC 2012 May 18.
NIH
-PA Author Manuscript
NIH
-PA Author Manuscript
NIH
-PA Author Manuscript
globin expression assessed from red blood cells is anywhere between 70.5% and 100% ofnormal value on a per-gene basis.
The percentage of vector-bearing nucleated blood cells (NBCs) increased progressively aftertransplant and stabilized at ~11% (Table 1 and Supplementary Fig. 2a). Among bloodsubsets, 18.7% and 9.3% of granulocytes-monocytes (CD151) and B lymphocytes (CD191),respectively, contain an integrated vector at 33 months post-transplantation (Table 1). Thelower level of gene marking for erythroblasts (CD45–/CD71+) of blood (~2.9%) versus bonemarrow origin (9.8% at 24 months post-transplantation) (Table 1) is in agreement with thecontention that genetically corrected erythroblasts appear less frequently in the blood thanuncorrected erythroblasts, as the former are capable of differentiating further within the bonemarrow compartment into reticulocytes and red blood cells. The low level of T-cell (CD3+)gene marking (~1.7%) (Table 1) is probably due to the omission of cyclophosphamide fromthe conditioning regimen. Ten to twenty per cent of bone marrow burst-forming units-erythroid (BFU-Es) and colony-forming units-granulocyte/ monocyte (CFU-GMs) werevector positive by polymerase chain reaction (PCR) (Table 1). At 24 months post-transplantation, the proportion of long-term culture-initiating cells (LTC-ICs) (~1/1,000CD34+ cells) bearing an integrated vector was 11.1% (Table 1).
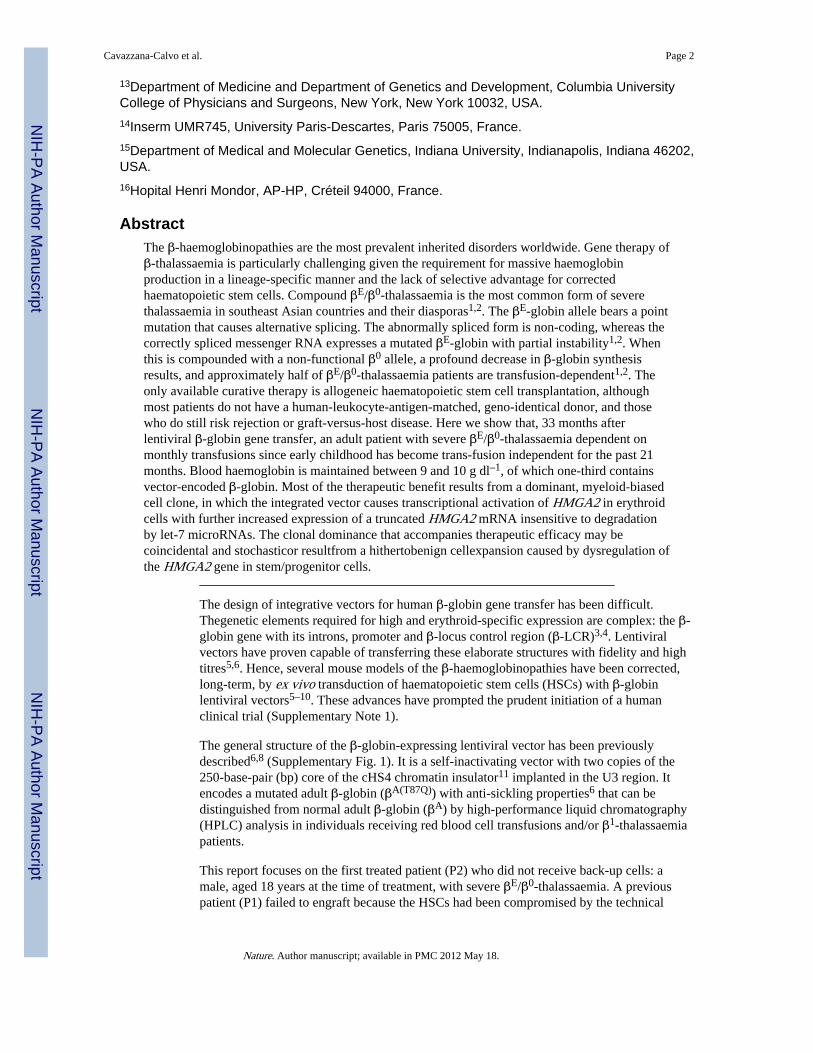
Chromosomal integration sites (IS) of the βA(T87Q)-globin vector in NBCs were analysed byDNA pyrosequencing of ligation-mediated (LM)-PCR products (Fig. 2a) and subsetsthereof. Twenty-four of them were found in both lymphoid and myeloid lineages. Cross-contamination was excluded by real-time quantitative (q)PCR to detect specific provirus/flanking DNA junctions in highly purified NBC subsets. Two of the most abundant andstable multilineage IS (lymphoid and myeloid) lay within the RFX3 and ZZEF1 genes. Theircontribution, as monitored by qPCR, remained below 0.5% and 1% for RFX3 and ZZEF1,respectively (not shown).
Importantly, there was dominance over time of an IS at the high mobility group AT-hook 2(HMGA2)13 locus in both granulocytes-monocytes and erythroblasts (Fig. 2). However, theHMGA2 IS was undetectable by qPCR in fresh or expanded B or T lymphocytes. Inmyeloid cells, DNA sequence analysis showed that a single vector had integrated in theforward orientation within the ~113-kb third intron of the HMGA2 gene (Fig. 3d). Theintegrated vector was intact, except for the presence of only one of the two 250-bp cHS4insulator cores at each end (Supplementary Fig. 1). The qPCR-mediated analysis of theHMGA2/provirus junction showed that ~45% (plateau) of vector-bearing NBCs werepositive for the HMGA2 IS (Fig. 2b). However, untransduced cells continued topredominate so that only approximately 3%, 8% and 2% of circulating NBCs, granulocytes-monocytes and erythroblasts, respectively, were HMGA2 IS positive 28 months post-transplantation (Fig. 2b, c). For BFU-Es and CFU-GMs, 8.2% and 8.7%, respectively, areHMGA2 IS positive 24 months post-transplantation (Fig. 2d); this accounts for 67% and78% of vector-bearing CFU-GMs and BFU-Es, respectively. Notably, the frequency ofLTC-ICs positive for HMGA2 IS was 5.6% (Fig. 2d), thus accounting for ~50% of vector-bearing LTC-ICs (Table 1). The mean number of colonies produced by LTC-ICs, orproliferative potential, was not increased when the HMGA2 IS was present (2.6 beforetransplantation versus 1.5 at 24 months post-transplantation); neither was the mean size ofBFU-E colonies (not shown).
Expression of HMGA2 in NBCs was increased by ~10,000-fold, 16 months post-transplantation, as compared to pre-transplant levels (Fig. 3a). However, HMGA2 was onlyexpressed in erythroblasts, consistent with β-LCR erythroid specificity. HMGA2 mRNAwas undetectable in granulocytes-monocytes (not shown) despite a greater frequency ofHMGA2 IS in granulocytes-monocytes versus erythro-blasts (Fig. 2c). Consistent with the
Cavazzana-Calvo et al. Page 4
Nature. Author manuscript; available in PMC 2012 May 18.
NIH
-PA Author Manuscript
NIH
-PA Author Manuscript
NIH
-PA Author Manuscript

asymptotic saturation of HMGA2 IS representation in NBCs at the DNA level, RT-qPCRanalysis revealed that HMGA2 mRNA expression has also stabilized (Fig. 3b).
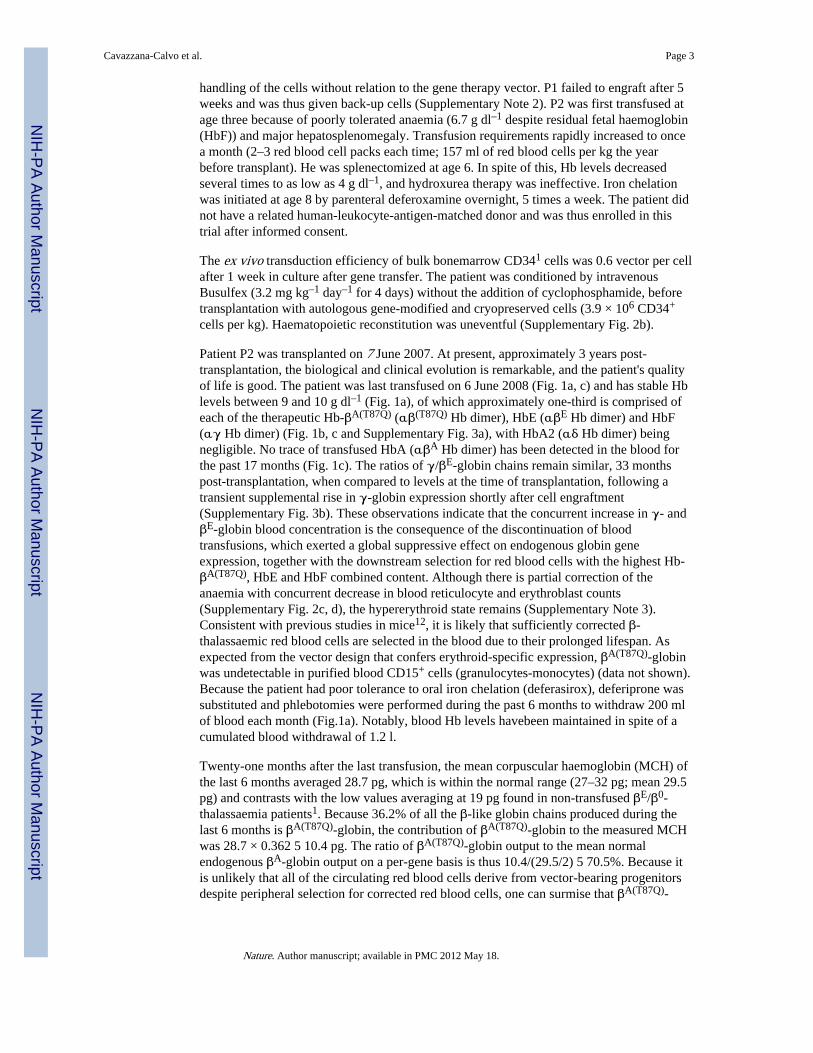
In certain benign tumours, HMGA2 is activated by chromosomal rearrangement within thelong third intron, thereby deleting the two distal exons (IV and V)13. The missing distalportion of the mRNA contains multiple binding sites for let-7 microRNAs, which triggerphysiological HMGA2 RNA degradation13. Staggered RT-qPCR reactions specific for eachexon junction showed that only exons I to III were present in most of the HMGA2transcripts in patient P2's NBCs (Fig. 3a). The predominant HMGA2 mRNA speciesexpressed in the patient's cells was sequenced. It is truncated by alternative splicing of thethird intron with a cryptic 3' splice signal (GTAT(C)6AG) located within the cHS4 insulatorcore and cleavage/polyadenylation within the adjacent R region of the left long-terminal-repeat (Fig. 3d). Western blot analysis with a polyclonal antibody against human HMGA2revealed a reactive protein in the vicinity of the expected size of 135 amino acids, whichcomprises the 83 amino acids encoded by the first three HMGA2 exons fused, in-frame, to52 amino acids corresponding to the residual downstream open reading frame of theabnormally spliced transcript (Fig. 3e). In an effort to estimate the respective contributionsof β-LCR-mediated enhancer effect versus post-transcriptional mRNA stabilization by lossof let-7 microRNA target sites, we quantified the ratio of spliced mRNA versus unsplicedpre-mRNA HMGA2 by RT-qPCR with differential primers and probes, on the basis of thefact that let-7 miRNAs are only functional in the cytoplasm and are thus only capable ofdegrading cytoplasmic HMGA2 mRNAs and not the nuclear pre-mRNA14. This assayindicated that there was a 36-fold excess of patient P2's truncated HMGA2 mRNA over pre-mRNA compared to the ratio observed in human embryonic stem cells, which express largeamounts of full-length HMGA2 mRNA (Fig. 3c). With ~10,000-fold excess of HMGA2RNA, the β-LCR thus accounted for a calculated 278-fold enhancer effect in erythroid cells.
We then asked whether dominance of the HMGA2 IS is associated with a breach ofhaematopoietic homeostasis. As seen above, HMGA2 mRNA expression has asymptoticallystabilized for the past 15 months (Fig. 3b) in parallel to the observed stabilization of thepresence of the clone (Fig. 2b, c). Bone marrow cytology and immunotyping were normal,except for bone marrow erythroid hyperplasia as seen in β-thalassaemia (SupplementaryNote 3). Karyotype analysis of bone marrow cells was normal as was high-resolution array-comparative-genomic-hybridization (CGH) analysis of chromosomes. LTC-IC frequencywas within the normal range (1 per 1,000 CD34+ cells), and no decrease in cytokinerequirement was observed in clonogenic assays.
We also investigated whether vector integration at the HMGA2 IS was associated withaltered globin gene expression with respect to cand βA(T87Q)-globin levels. As seen above,there was no increase in γ/βE-globin ratios in the blood after restoration of steady-statehaematopoiesis (Supplementary Fig. 3b). In addition, we compared HbF/HbE ratios insingle blood-derived BFU-E colonies during the first 6 months post-transplantation—at atime when HMGA2 IS was not yet detectable in erythroid progenitors (n = 8)—to BFU-Esharvested during a recent 12–28 months post-transplantation period when 50–80% of BFU-Es were modified at the HMGA2 IS (n = 64). HbF/HbE ratios remained constant betweenuntransduced (n = 16) and transduced BFU-E colonies, whether the HMGA2 IS was absentor vastly predominant (Supplementary Fig. 3c).
We finally asked whether βA(T87Q)-globin expression was especially high at the HMGA2 IScompared to other IS. At 4 months post-transplantation, at a time when the HMGA2 IS copynumber was too low to be quantified by qPCR (<0.06%), βA(T87Q)-globin expression incirculating red blood cells was at least 13% of the sum of all the endogenous β-like-globins(Fig. 1c), although patient P2 was still undergoing blood transfusions and accumulation of
Cavazzana-Calvo et al. Page 5
Nature. Author manuscript; available in PMC 2012 May 18.
NIH
-PA Author Manuscript
NIH
-PA Author Manuscript
NIH
-PA Author Manuscript

corrected red blood cells was far from complete. Furthermore, HPLC analysis performed onindividual BFU-E colonies showed that the median Hb βA(T87Q)-globin concentration percolony was significantly greater when HMGA2 IS was undetectable (n = 8) than during theperiod of HMGA2 IS dominance (n = 64) (Supplementary Fig. 3c), thus indicating that theHMGA2 IS was not especially favourable for high expression of the transferred βA(T87Q)-globin gene.
Since the discovery of the β-LCR over 20 years ago3,4, gene therapy for the β-haemoglobinopathies in humans has been long awaited. Here we have shown that a patientwith severe βE/β0-thalassaemia and lifelong transfusion requirement has converted tosustained transfusion independence for the past 21 months. The increase in steady-state Hbprovided by βA(T87Q)-globin alone was up to 3.7 g dl–1, which compares favourably to thehighest levels reported in mouse models with any β-globin lentiviral vector even at highcopy number15. This amount is expected to provide therapeutic benefit in patients with βE/β0-thalassaemia2, where the mean spontaneous blood Hb levels between severe, transfusion-dependent, βE/β0-thalassaemia and better tolerated cases are separated by less than 2 g dl–1
(ref. 2), although the long-term prognosis remains unknown.
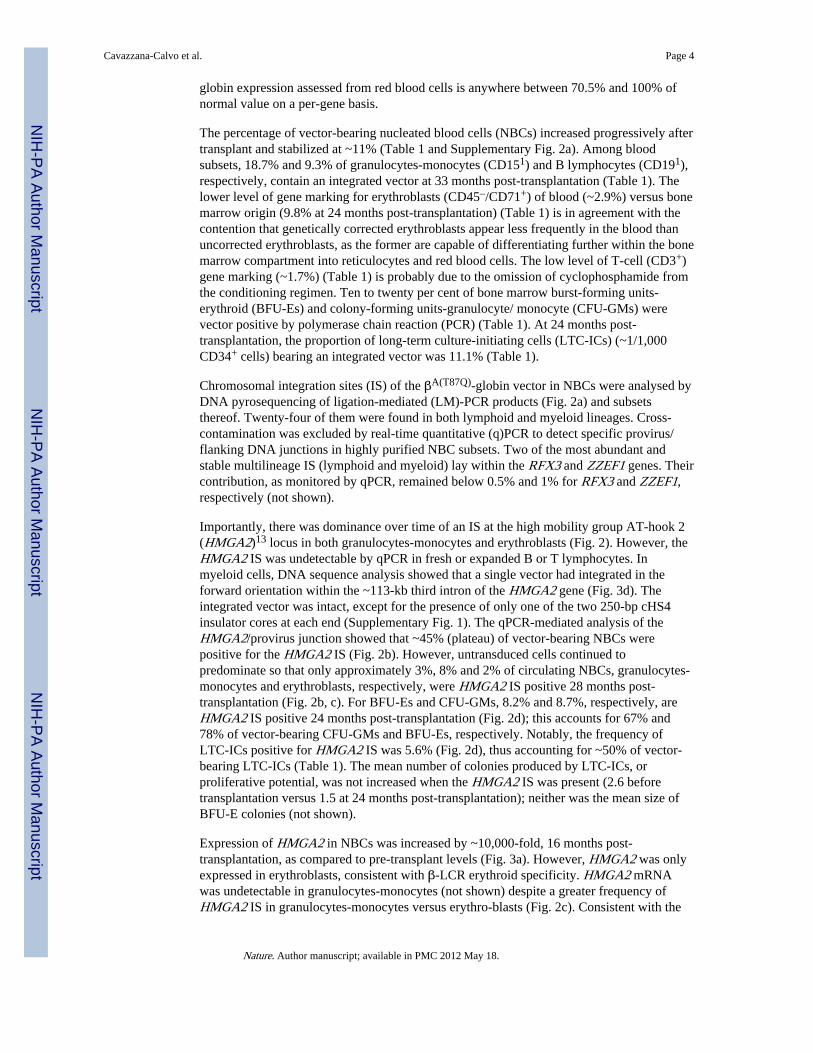
The emergence of a partially dominant cell clone requires careful consideration. High,erythroid-specific expression of truncated fusion HMGA2 mRNA and corresponding proteinwas found to be confined to erythroid cells by a β-LCR-mediated effect—predicted bycertain genotoxicity studies16 but not others17—and upon increased stability of the truncatedmRNA. Although a single cHS4 insulator 250-bp core has been found to be effective inlentiviral vectors18, the loss of one element in the intended cHS4 doublet may havecontributed to insulator failure. The presence of the HMGA2 IS in similar proportion amongerythroblasts, granulocytes-monocytes and LTC-IC subsets, but not in lymphocytes, leads usto propose that haematopoiesis deriving from the transduced clone initiating cell is myeloid-biased19,20 in this patient. The considerable departure from polyclonal distribution exhibitedby the HMGA2 IS clone (~50% of all IS in myeloid cells, including LTC-ICs) can either bethe consequence of a stochastic event in the context of a low initial number of transducedHSCs–1, with strictly erythroid-specific HMGA2 expression, or explained by differentialexpansion/production of myeloid-biased haematopoiesis triggered by dysregulatedexpression of HMGA2 in upstream progenitors. The truncated HMGA2 mRNA may thus betransiently expressed at abnormally high levels upon β-LCR lineage priming22, before the β-LCR enhancing capacity becomes subsequently restricted to the erythroid lineage. Althoughthe lack of sufficient numbers of patient P2's bone marrow cells available for analysisprecluded the investigation of vector-derived HMGA2 in the rare common myeloidprogenitor, the latter hypothesis may have resulted in myeloid-biased cell expansion (Fig. 4).Similarly, the respective roles in HMGA2 activation of the β-LCR versus the loss of let-7miRNA targets are not directly quantifiable in the rare upstream progenitors and stem cellsthat cannot be isolated to sufficient numbers and degree of purity. Notably, very highcompared with undetectable levels of HMGA2 mRNA in erythroblasts versus granulocyte-monocyte cells, respectively, did not result in a substantial further expansion of erythroidcells.
The clone may remain homeostatic or be a prelude to multistep leukaemogenesis23,24; cloneexhaustion or substitution may also occur. A reassuring fact is that overexpression of atruncated HMGA2 mRNA is correlated with benign tumour phenotypes (for example,lipomas)13. In addition, the findings in this gene therapy patient bear certain similarities withparoxysmal nocturnal haemoglobinuria (PNH), a clonal yet benign haematopoieticexpansion without increased risk of secondary leukaemia25. Paroxysmal nocturnalhaemoglobinuria is occasionally associated with multilineage overexpression of a truncatedHMGA2 mRNA together with an inactivated PIGA gene25. A paroxysmal nocturnal
Cavazzana-Calvo et al. Page 6
Nature. Author manuscript; available in PMC 2012 May 18.
NIH
-PA Author Manuscript
NIH
-PA Author Manuscript
NIH
-PA Author Manuscript
haemoglobinuria patient with almost complete HMGA2 clonal dominance has beenobserved for 17 years without leukaemic progression (T. Kinoshita, personalcommunication). This contrasts with overexpression of the full-length HMGA2 mRNAfound in several malignancies, presumably because the primary event is the loss of let-7microRNAs, which control the degradation of multiple oncogeneic mRNAs that includeMYC and RAS26.
The frequent occurrence of homeostatic, clonal haematopoiesis initiated by retroviralactivation of proto-oncogenes has been documented in mice27, whereas polyclonalhaematopoietic reconstitution with clinical efficacy after lentiviral transfer has been recentlyreported in a human clinical trial28. Because perturbations of gene expression triggered byintegrated vectors have been detected in human gene therapy trials without apparent illeffects29, our understanding of observed cases of polyclonality after integrative gene transferwould benefit from in-depth genome-wide expression studies. Interestingly, we have nowidentified occurrences of vector integration within the HMGA2 gene, in the absence ofleukaemic progression, in several patients of the retroviral gene therapy trial for X-SCID30.
As with any other therapeutic approach, patient treatment decisions should ultimately rest onthe ethical evaluation of risk/benefit ratios that would be provided by a larger series ofpatients with severe β-thalassaemia.
METHODS SUMMARYBlood and marrow cells of patient P2 were purified by magnetic cell sorting with specificantibodies. Vector-positive progenitors were scored by PCR. Vector copy numbers andspecific insertion sites were quantified by qPCR, RNA expression levels by RT-qPCR, andglobin chains and Hb species by HPLC. Integration site analysis was performed by LM-PCRand DNA pyrosequencing. Bone marrow analysis included cytology, immunophenotyping,clonogenic assays, karyotype and high-resolution array-CGH.
Full Methods and any associated references are available in the online version of the paperat www.nature.com/nature.
METHODSPost-transplant cell purification
Cell fractions were purified by several rounds of enrichment or depletion using specificantibodies against CD15, CD19, CD3, CD71 or CD45 included in whole-blood purificationmicrobeads and column kits (Miltenyi Biotec). High purity of resulting cell fractions wasverified by FACS analysis (>98%). To achieve maximum purity for lymphocytes, purifiedlymphocytes were grown for 1 week in RPMI medium supplemented with 10% humanserum (Institut national de transfusion sanguine) containing phytohaemagglutinin (0.5 μgml–1; Sigma) and IL-2 (40 U ml–1; Chiron Proleukin) for CD3+ cells and CD40L (500 ngml–1; Alexis Biochemicals) and IL-4 (100 U ml–1; Peprotech) for CD19+ cells followed bycell sorting with a Becton Dickinson FACS Aria cell sorter (99.9% purity).
qPCR analysesGenomic DNA was prepared using NucleoSpin blood kits (Macherey Nagel). Averagevector copy numbers were determined by qPCR with primers amplifying the packagingsignal Ω1 gag after normalization for endogenous β-actin genes (Supplementary Table 1).Results were compared with those obtained after serial dilutions of genomic DNA from acell line containing one copy of the integrated globin lentiviral (LentiGlobin, LG) vector perhaploid genome. Estimation of the mean vector copy number per transduced cell was
Cavazzana-Calvo et al. Page 7
Nature. Author manuscript; available in PMC 2012 May 18.
NIH
-PA Author Manuscript
NIH
-PA Author Manuscript
NIH
-PA Author Manuscript
obtained by qPCR performed on pooled in vitro colony forming cell (CFC) obtained fromthe blood. The number of individual CFC colonies (used to generate the qPCR-tested pool)positive for the presence of a vector provirus was scored (Supplementary Table 2). Themean vector copy number per transduced cell was thus obtained by dividing the averagevector copy number by this value. The per cent of HMGA2-specific provirus relative to totalprovirus was determined by comparative CT method (ΔΔCT) using the delta value derivedfrom a LG/HMGA2 junction plasmid (containing an equimolar amount of the gag andvector/HMGA2 junction targets) as the standard. The primers for the HMGA2 TaqManassay are listed (Supplementary Table 1). For qPCR of the LG–RFX3 and LG–ZZEF1junctions, the same principle was applied with specific primers and probe (SupplementaryTable 1).
RT-qPCR analysisAfter total RNA extraction with the Purelink micro to midi total RNA purification system(Invitrogen) and cDNA synthesis using the Superscript III first strand synthesis super mix(Invitrogen), the HMGA2 and GAPDH cDNAs were quantified using TaqMan geneexpression assays (Supplementary Table 1). The comparative CT method (ΔΔCT) was usedto compare HMGA2 production levels between cell types. qPCR analysis of spliced versusunspliced HMGA2 transcripts were performed with specific primers (Supplementary Table1) as described in Fig. 3. Control samples from which the reverse transcriptase or the samplehad been omitted were included. All qPCR assays were performed with the 7300 ABI PrismDetection system and the TaqMan gene expression master mix containing ROX fromApplied Biosystems. To demonstrate that only one integrated vector provirus was present incells with the HMGA2 IS, three qPCR experiments were simultaneously performed on thesame genomic DNA preparation with primers specific for either (1) a ‘HIV gag packagingsignal’ DNA sequence (common to all vector provirus regardless of IS); (2) the HS3–HS4junction of the β-LCR cassette included in the vector (also common to all vector provirusregardless of IS); and (3) the HMGA2 IS–vector provirus junction (with the left LTR).Quantitative controls included plasmid DNA constructs that reconstituted a full-lengthvector provirus either with or without the flanking HMGA2 IS junction, mixed in differentproportions. Results in triplicates unambiguously indicate that only one integrant at theHMGA2 IS is present in these cells. Furthermore, a Mu transposon-based method developedby the F.B. laboratory (paper submitted) to cleave DNA with minimal bias showed that noother co-dominant IS was present in HMGA2 IS positive cells.
Western blot analysisFive million myeloid cells were extracted from methylcellulose-containing erythroidcolonies generated from patient P2's blood sample 27 months post-transplantation. Myeloidcolonies obtained from the blood of a non-treated β-thalassaemic patient were used as anegative control. One-fifth of the protein volumes was separated on SDS–PAGE, transferredonto nitrocellulose and visualized by Ponceau staining for loading comparison. Thechimaeric HMGA2 protein was detected by means of a rabbit polyclonal anti-humanHMGA2 antibody31 revealed by the enhanced chemiluminescence (ECL) or ECL advancewestern blot detection systems (Amersham).
Haematopoietic colonies and PCR amplificationOne million peripheral blood mononuclear cells or 7,500 CD34+ bone marrow cells werecultured over 14 days in α-MEM (PAA) based methylcellulose medium (Methocult H4230,StemCell Technologies) supplemented with 2 mM L-glutamine, antibiotics, hEpo (3 U ml–1;Assay design), hIL3 (10 ng ml–1; Peprotech) and hSCF (50 ng ml–1; Peprotech) at 3 × 10⁵
and 2,500 per ml, respectively. The colonies were scored and collected after 14 daysincubation at 37 °C and 5% CO2. Colonies were washed with PBS and kept frozen for
Cavazzana-Calvo et al. Page 8
Nature. Author manuscript; available in PMC 2012 May 18.
NIH
-PA Author Manuscript
NIH
-PA Author Manuscript
NIH
-PA Author Manuscript
subsequent analysis. DNA wasobtained upon proteinase K lysis and purified using the QiaexII gel extraction beads (Qiagen). Detection of the LG vector was carried out by PCR withprimers amplifying the vector (Supplementary Table 2). The presence of DNA wasmonitored using primers amplifying the human erythropoietin gene (Supplementary Table2). Progenitors carrying a vector at the HMGA2 IS were identified with primers amplifyingboth the LG vector and the LG–HMGA2 junction (Supplementary Table 2). The PCRreactions were carried out at 94 °C, 60 °C and 72 °C for 30, 30 and 50 s, respectively, andproceeded in the Mastercycler gradient system (Eppendorf) for 35 cycles. Amplified DNAwas analysed by gel electrophoresis. For evaluation of vector copy number per HMGA2modified progenitor, genomic DNA of colonies in which the vector is inserted at theHMGA2 IS was submitted to qPCR analyses as described in the previous section.
LTC-IC assaysLTC-IC assays were performed in StemSpan SFEM medium (Stemcell technologies) onirradiated MS5 monolayers at several dilutions of CD34+ cells (2,000 to 16 per well) in 96-well plates with 12–24 replicate wells per concentration. After 5 weeks with weekly changeof one half medium volume, all cells were transferred in α-MEM based methylcellulosemedium (GF H4434, Stemcell technologies) to determine the total clonogenic cell content ofeach LTC. The frequency of LTC-IC was determined using L-Calc software (StemCellTechnologies).The meannumber of colonies produced by LTC-IC, or proliferative potential,was calculated by dividing the total number of LTC-ICs by the total number of CFCs. Toassess the percentage of vector-modified LTC-ICs during the readout phase of the assay, amaximum of one clonogenic colony per well was submitted to PCR-based scoring to ensurethat only independent LTC-ICs were analysed.
HPLC analysisHPLC analyses were performed with a Prominence chromatograph (Shimadzu) and its LCSolution software. Globin chains from whole blood, pooled erythroid colonies andreticulocytes were separated by reverse-phase HPLC using a 4 × 250 mm Nucleosil 300-5C4 column (Macherey-Nagel). Samples were eluted with a gradient mixture of solution A(water/acetonitrile/trifluoroacetic acid/heptafluorobutyric acid, 700:300:0.7:0.1) and solutionB (water/acetonitrile/trifluoroacetic acid/heptafluorobutyric acid, 450:550:0.5:0.1). Theabsorbance was measured at 220 nm. Haemoglobins from individual erythroid colonies wereseparated by ion-exchange HPLC on a PolyCAT A column (PolyLC Inc.). Elution wasachieved with a linear gradient mixture of buffer C (Tris 40 mM, KCN 3 mM; pHadjustedat6.5 withacetic acid)and bufferD (Tris 40 mM, KCN 3 mM, NaCl 200 mM; pH adjusted at6.5 with acetic acid) of different ionic strength. The detection wavelength was 418 nm.
Bone marrow karyotype and high-resolution array-CGH analysisTotal bone marrow cells were cultured for 17, 24 and 48 h. Metaphases were treated forReverse Heat and Giemsa (RHG) banding, and 30 mitoses were fully analysed following therecommendations of the International System for Human Cytogenetic Nomenclature.Genomic copy number analysis was performed using high-density CGH array technology aspreviously described. Five-hundred nanograms of genomic DNA was labelled and co-hybridized with control DNA on the 244K Human Genome CGH Microarray (AgilentTechnologies). Scanned data were processed using Feature Extraction and DNA Analyticssoftware (Agilent Technologies). The analysis tools ADM1, ADM2 and visual inspectionwere used to search for copy number abnormalities.
Cavazzana-Calvo et al. Page 9
Nature. Author manuscript; available in PMC 2012 May 18.
NIH
-PA Author Manuscript
NIH
-PA Author Manuscript
NIH
-PA Author Manuscript
Integration site analysis (LM-PCR and DNA pyrosequencing)Aliquots of genomic DNA extracted from patient samples were digested using two differentrestriction enzymes (MseI or NlaIII). The digested samples were ligated to DNA linkers,then digested using ApoI to cleave the internal fragments derived from the vector, andamplified by nested PCR as previously described32. Each second-round LTR specific primercontains a unique 8-nucleotide barcode which indexes the amplification products32. ThePCR products were gel purified, pooled and sequenced using the 454/Roche GS FLXplatform. Pyrosequencing reads were decoded, trimmed to remove LTR and linkersequences, then mapped to the human genome (hg18) to yield integration sites using criteriaas previously described32.
Supplementary MaterialRefer to Web version on PubMed Central for supplementary material.
AcknowledgmentsWe thank S. Cross, C. Ballas and L. Duffy for cGMP vector manufacturing and QC testing; T. Andrieux, D. Bachir,C. Courne, A. Henri, A. Janin, A. Moindrot, M.-E. Noguera and F. Pinto for their experimental or medicalcontributions; F. Calvo, C. Eaves, K. Humphries, G. Manfioletti, R. Nagel, K. Sii Felice and A. Slanetz fordiscussions; and C. Berry for statistical analysis. This work was supported by NIH grants HL090921 to P.L. andAI52845 and AI082020 to F.B., and l'Association française contre les myopathies.
References1. Fucharoen S, Winichagoon P. Clinical and hematologic aspects of hemoglobin E β-thalassemia.
Curr. Opin. Hematol. 2000; 7:106–112. [PubMed: 10698297]
2. Olivieri NF, et al. Studies in haemoglobin E β-thalassaemia. Br. J. Haematol. 2008; 141:388–397.[PubMed: 18410572]
3. Grosveld F, van Assendelft GB, Greaves DR, Kollias G. Position-independent, high-levelexpression of the human β-globin gene in transgenic mice. Cell. 1987; 51:975–985. [PubMed:3690667]
4. Tuan D, London IM. Mapping of DNase I-hypersensitive sites in the upstream DNA of humanembryonic ε-globin gene in K562 leukemia cells. Proc. Natl Acad. Sci. USA. 1984; 81:2718–2722.[PubMed: 6232614]
5. May C, et al. Therapeutic haemoglobin synthesis in β-thalassaemic mice expressing lentivirus-encoded human β-globin. Nature. 2000; 406:82–86. [PubMed: 10894546]
6. Pawliuk R, et al. Correction of sickle cell disease in transgenic mouse models by gene therapy.Science. 2001; 294:2368–2371. [PubMed: 11743206]
7. Hanawa H, et al. Extended β-globin locus control region elements promote consistent therapeuticexpression of a γ-globin lentiviral vector in murine β-thalassemia. Blood. 2004; 104:2281–2290.[PubMed: 15198957]
8. Imren S, et al. Permanent and panerythroid correction of murine β thalassemia by multiple lentiviralintegration in hematopoietic stem cells. Proc. Natl Acad. Sci. USA. 2002; 99:14380–14385.[PubMed: 12391330]
9. Levasseur DN, Ryan TM, Pawlik KM, Townes TM. Correction of a mouse model of sickle celldisease: lentiviral/antisickling β-globin gene transduction of unmobilized, purified hematopoieticstem cells. Blood. 2003; 102:4312–4319. [PubMed: 12933581]
10. Malik P, Arumugam PI, Yee JK, Puthenveetil G. Successful correction of the human Cooley'sanemia β-thalassemia major phenotype using a lentiviral vector flanked by the chickenhypersensitive site 4 chromatin insulator. Ann. NY Acad. Sci. 2005; 1054:238–249. [PubMed:16339671]
Cavazzana-Calvo et al. Page 10
Nature. Author manuscript; available in PMC 2012 May 18.
NIH
-PA Author Manuscript
NIH
-PA Author Manuscript
NIH
-PA Author Manuscript

11. Chung JH, Whiteley M, Felsenfeld G. A 5’ element of the chicken β-globin domain serves as aninsulator in human erythroid cells and protects against position effect in Drosophila. Cell. 1993;74:505–514. [PubMed: 8348617]
12. Miccio A, et al. In vivo selection of genetically modified erythroblastic progenitors leads to long-term correction of β-thalassemia. Proc. Natl Acad. Sci. USA. 2008; 105:10547–10552. [PubMed:18650378]
13. Cleynen I, Van de Ven WJ. The HMGA proteins: a myriad of functions. Int. J. Oncol. 2008;32:289–305. [PubMed: 18202751]
14. Lee Y, Jeon K, Lee JT, Kim S, Kim VN. MicroRNA maturation: stepwise processing andsubcellular localization. EMBO J. 2002; 21:4663–4670. [PubMed: 12198168]
15. Sadelain M. Recent advances in globin gene transfer for the treatment of β-thalassemia and sicklecell anemia. Curr. Opin. Hematol. 2006; 13:142–148. [PubMed: 16567956]
16. Hargrove PW, et al. Globin lentiviral vector insertions can perturb the expression of endogenousgenes in β-thalassemic hematopoietic cells. Mol. Ther. 2008; 16:525–533. [PubMed: 18195719]
17. Arumugam PI, et al. Genotoxic potential of lineage-specific lentivirus vectors carrying the β-globin locus control region. Mol. Ther. 2009; 17:1929–1937. [PubMed: 19707188]
18. Hanawa H, Yamamoto M, Zhao H, Shimada T, Persons DA. Optimized lentiviral vector designimproves titer and transgene expression of vectors containing the chicken β-globin locus HS4insulator element. Mol. Ther. 2009; 17:667–674. [PubMed: 19223867]
19. Sieburg HB, et al. The hematopoietic stem compartment consists of a limited number of discretestem cell subsets. Blood. 2006; 107:2311–2316. [PubMed: 16291588]
20. Dykstra B, et al. Long-term propagation of distinct hematopoietic differentiation programs in vivo.Cell Stem Cell. 2007; 1:218–229. [PubMed: 18371352]
21. Abkowitz JL, Catlin SN, Guttorp P. Evidence that hematopoiesis may be a stochastic process invivo. Nature Med. 1996; 2:190–197. [PubMed: 8574964]
22. Bottardi S, et al. Lineage-specific transcription factors in multipotent hematopoietic progenitors: alittle bit goes a long way. Cell Cycle. 2007; 6:1035–1039. [PubMed: 17457053]
23. Ott MG, et al. Correction of X-linked chronic granulomatous disease by gene therapy, augmentedby insertional activation of MDS1–EVI1, PRDM16 or SETBP1. Nature Med. 2006; 12:401–409.[PubMed: 16582916]
24. Hacein-Bey-Abina S, et al. Insertional oncogenesis in 4 patients after retrovirus-mediated genetherapy of SCID-X1. J. Clin. Invest. 2008; 118:3132–3142. [PubMed: 18688285]
25. Inoue N, et al. Molecular basis of clonal expansion of hematopoiesis in 2 patients with paroxysmalnocturnal hemoglobinuria (PNH). Blood. 2006; 108:4232–4236. [PubMed: 16940417]
26. Viswanathan SR, et al. Lin28 promotes transformation and is associated with advanced humanmalignancies. Nature Genet. 2009; 41:843–848. [PubMed: 19483683]
27. Kustikova OS, et al. Retroviral vector insertion sites associated with dominant hematopoieticclones mark “stemness” pathways. Blood. 2007; 109:1897–1907. [PubMed: 17119121]
28. Cartier N, et al. Hematopoietic stem cell gene therapy with a lentiviral vector in X-linkedadrenoleukodystrophy. Science. 2009; 326:818–823. [PubMed: 19892975]
29. Cassani B, et al. Integration of retroviral vectors induces minor changes in the transcriptionalactivity of T cells from ADA-SCID patients treated with gene therapy. Blood. 2009; 114:3546–3556. [PubMed: 19652199]
30. Wang GP, et al. Dynamics of gene-modified progenitor cells analyzed by tracking retroviralintegration sites in a human SCID-X1 gene therapy trial. Blood. 2010; 115:4356–4366. [PubMed:20228274]
31. Cattaruzzi G, et al. The second AT-hook of the architectural transcription factor HMGA2 isdeterminant for nuclear localization and function. Nucleic Acids Res. 2007; 35:1751–1760.[PubMed: 17324944]
32. Wang GP, et al. DNA bar coding and pyrosequencing to analyze adverse events in therapeuticgene transfer. Nucleic Acids Res. 2008; 36:e49. [PubMed: 18411205]
Cavazzana-Calvo et al. Page 11
Nature. Author manuscript; available in PMC 2012 May 18.
NIH
-PA Author Manuscript
NIH
-PA Author Manuscript
NIH
-PA Author Manuscript

Figure 1. Conversion to transfusion independencea, Total Hb concentrations in whole blood. Red dots, transfusion time points; black verticalarrow, the last time the patient was transfused; red arrows, phlebotomies (200 ml each) toremove excess iron. b, HPLC blood globin chain profiles. Note that βA only derives fromblood transfusions. c, Contribution of each Hb species, quantified by HPLC, to total bloodHb concentrations (in g dl–1). Actual numbers for each Hb species are indicated above thechart.
Cavazzana-Calvo et al. Page 12
Nature. Author manuscript; available in PMC 2012 May 18.
NIH
-PA Author Manuscript
NIH
-PA Author Manuscript
NIH
-PA Author Manuscript
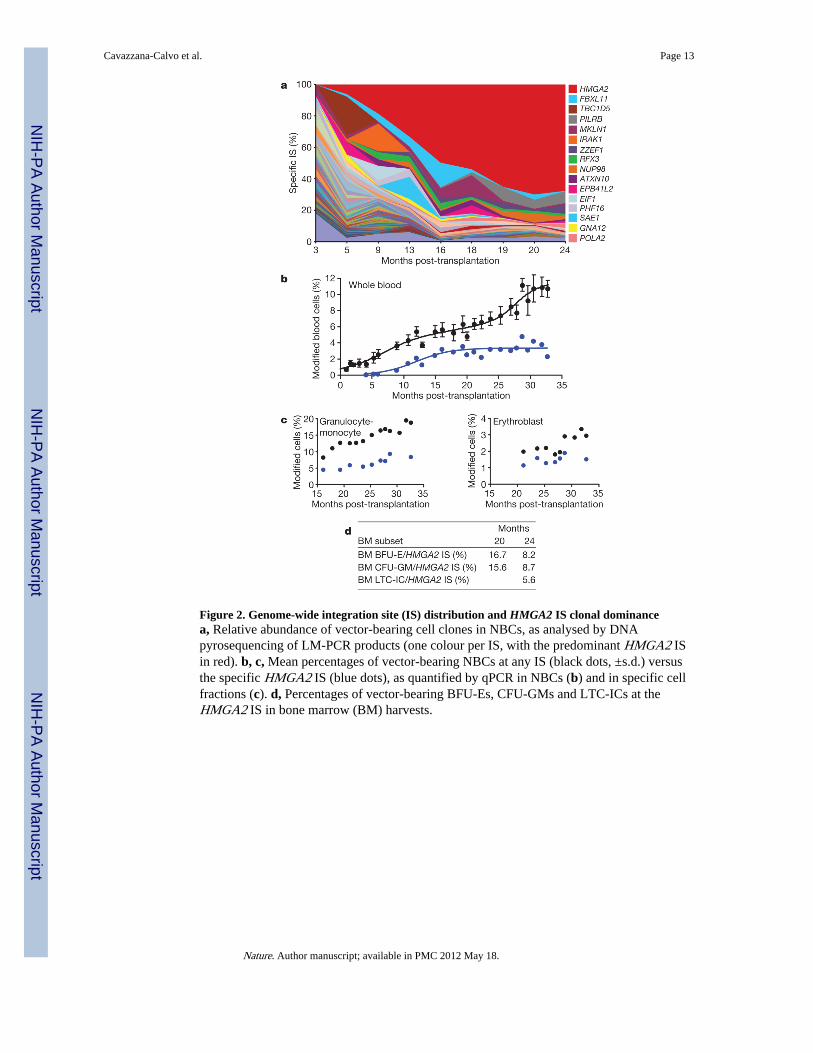
Figure 2. Genome-wide integration site (IS) distribution and HMGA2 IS clonal dominancea, Relative abundance of vector-bearing cell clones in NBCs, as analysed by DNApyrosequencing of LM-PCR products (one colour per IS, with the predominant HMGA2 ISin red). b, c, Mean percentages of vector-bearing NBCs at any IS (black dots, ±s.d.) versusthe specific HMGA2 IS (blue dots), as quantified by qPCR in NBCs (b) and in specific cellfractions (c). d, Percentages of vector-bearing BFU-Es, CFU-GMs and LTC-ICs at theHMGA2 IS in bone marrow (BM) harvests.
Cavazzana-Calvo et al. Page 13
Nature. Author manuscript; available in PMC 2012 May 18.
NIH
-PA Author Manuscript
NIH
-PA Author Manuscript
NIH
-PA Author Manuscript
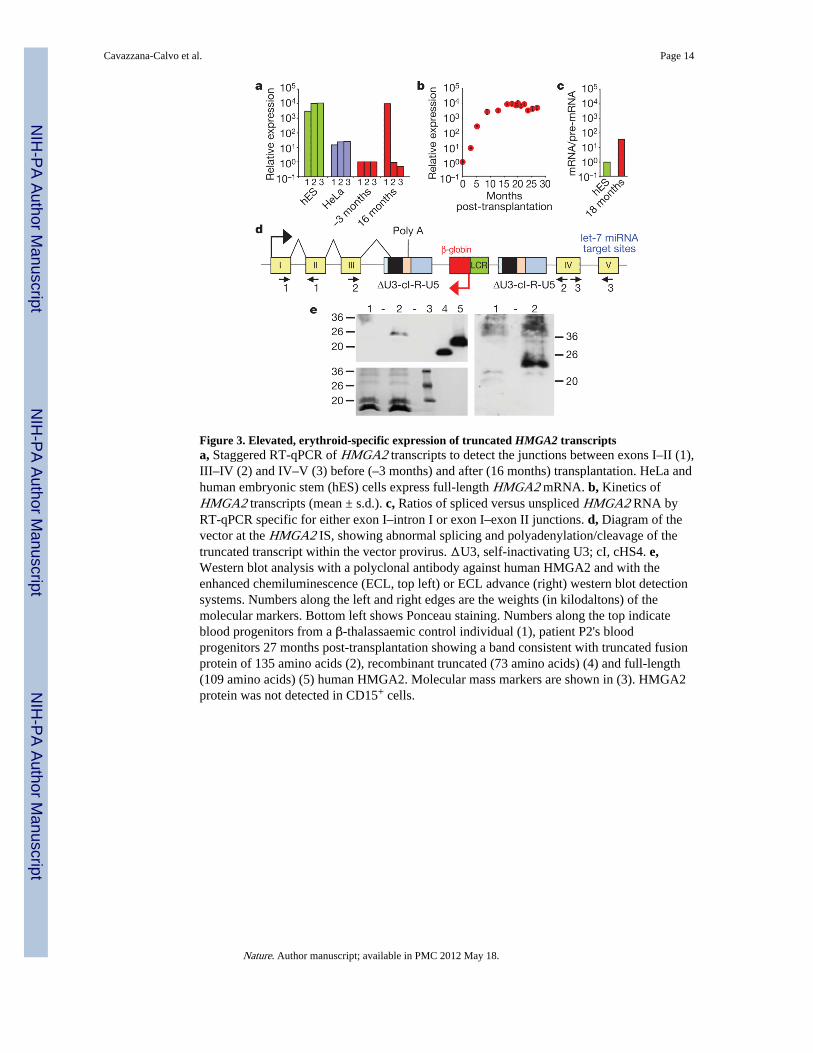
Figure 3. Elevated, erythroid-specific expression of truncated HMGA2 transcriptsa, Staggered RT-qPCR of HMGA2 transcripts to detect the junctions between exons I–II (1),III–IV (2) and IV–V (3) before (–3 months) and after (16 months) transplantation. HeLa andhuman embryonic stem (hES) cells express full-length HMGA2 mRNA. b, Kinetics ofHMGA2 transcripts (mean ± s.d.). c, Ratios of spliced versus unspliced HMGA2 RNA byRT-qPCR specific for either exon I–intron I or exon I–exon II junctions. d, Diagram of thevector at the HMGA2 IS, showing abnormal splicing and polyadenylation/cleavage of thetruncated transcript within the vector provirus. ΔU3, self-inactivating U3; cI, cHS4. e,Western blot analysis with a polyclonal antibody against human HMGA2 and with theenhanced chemiluminescence (ECL, top left) or ECL advance (right) western blot detectionsystems. Numbers along the left and right edges are the weights (in kilodaltons) of themolecular markers. Bottom left shows Ponceau staining. Numbers along the top indicateblood progenitors from a β-thalassaemic control individual (1), patient P2's bloodprogenitors 27 months post-transplantation showing a band consistent with truncated fusionprotein of 135 amino acids (2), recombinant truncated (73 amino acids) (4) and full-length(109 amino acids) (5) human HMGA2. Molecular mass markers are shown in (3). HMGA2protein was not detected in CD15+ cells.
Cavazzana-Calvo et al. Page 14
Nature. Author manuscript; available in PMC 2012 May 18.
NIH
-PA Author Manuscript
NIH
-PA Author Manuscript
NIH
-PA Author Manuscript
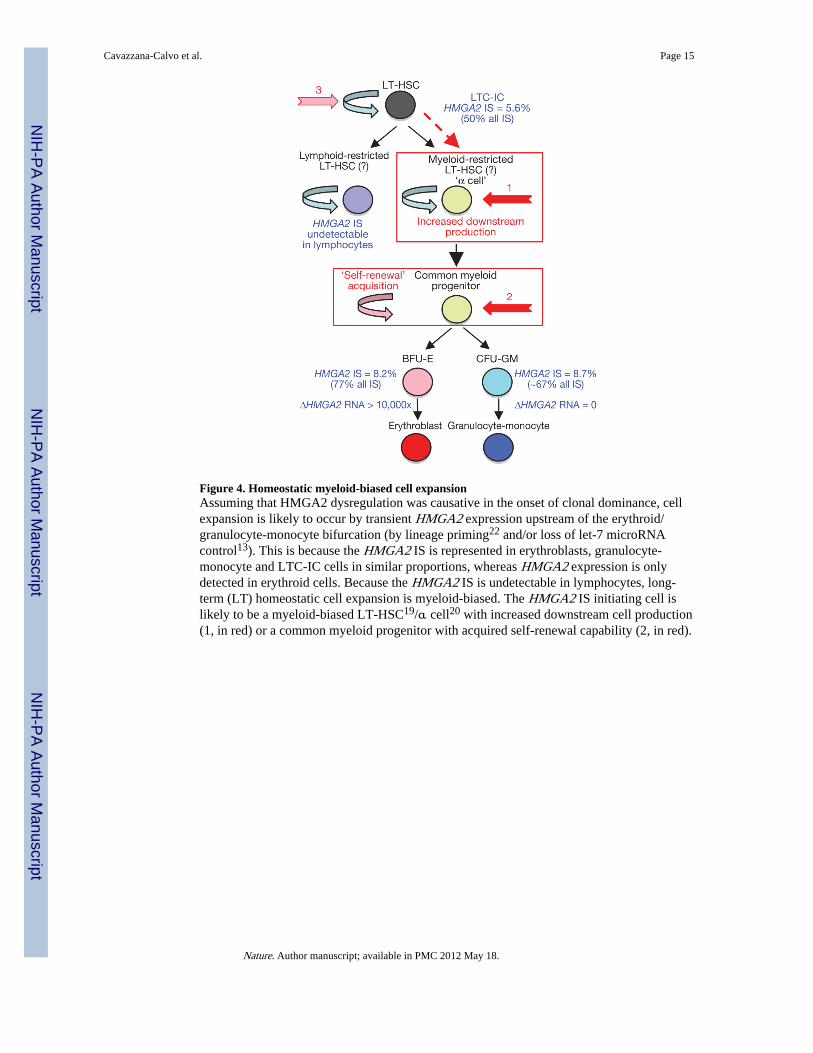
Figure 4. Homeostatic myeloid-biased cell expansionAssuming that HMGA2 dysregulation was causative in the onset of clonal dominance, cellexpansion is likely to occur by transient HMGA2 expression upstream of the erythroid/granulocyte-monocyte bifurcation (by lineage priming22 and/or loss of let-7 microRNAcontrol13). This is because the HMGA2 IS is represented in erythroblasts, granulocyte-monocyte and LTC-IC cells in similar proportions, whereas HMGA2 expression is onlydetected in erythroid cells. Because the HMGA2 IS is undetectable in lymphocytes, long-term (LT) homeostatic cell expansion is myeloid-biased. The HMGA2 IS initiating cell islikely to be a myeloid-biased LT-HSC19/α cell20 with increased downstream cell production(1, in red) or a common myeloid progenitor with acquired self-renewal capability (2, in red).
Cavazzana-Calvo et al. Page 15
Nature. Author manuscript; available in PMC 2012 May 18.
NIH
-PA Author Manuscript
NIH
-PA Author Manuscript
NIH
-PA Author Manuscript

NIH
-PA Author Manuscript
NIH
-PA Author Manuscript
NIH
-PA Author Manuscript
Cavazzana-Calvo et al. Page 16
Tabl
e 1
Perc
enta
ges
of v
ecto
r-be
arin
g ce
lls in
blo
od a
nd b
one
mar
row
cel
ls
Cel
l fra
ctio
nM
onth
s
2124
2527
30.5
3233
Blo
od
W
hole
blo
od (
%)
6.3
7.0
7.4
8.5
10.7
10.9
10.8
T
lym
phoc
ytes
(%
)0.
90.
71.
11.
31.
71.
71.
7
B
lym
phoc
ytes
(%
)5.
35.
76.
69.
313
.59.
59.
3
G
ranu
locy
tes-
mon
ocyt
es (
%)
12.3
13.1
14.9
16.2
15.6
19.3
18.7
E
ryth
robl
asts
(%
)1.
92.
12.
21.
82.
83.
32.
9
Bon
e m
arro
w
W
hole
bon
e m
arro
w (
%)
11.5
13.5
––
––
–
B
FU-E
(%
)20
.010
.6–
––
––
C
FU-G
M (
%)
18.2
13.0
––
––
–
E
ryth
robl
asts
(%
)–
9.8
––
––
–
L
TC
-IC
s (%
)–
11.1
––
––
–
Nature. Author manuscript; available in PMC 2012 May 18.
Copyright © 2022 FDOKUMEN