Supporting the Perpetuation and Reproducibility of Numerical Method Publications

Journal of CardiovascularMagnetic Resonance
Volume 11 Suppl 1, 2009
Meeting abstracts
Abstracts of the 12th Annual SCMR Scientific Sessions – 2009Orlando, FL, USA
29 January–1 February 2009
Published: 28 January 2009These abstracts are available online at http://jcmr-online.com/supplements/11/S1
ORAL PRESENTATIONS
O1Contrast enhanced cardiovascular magneticresonance imaging prior to prophylacticimplantation of a cardioverter/defibrillatoridentifies patients with increased risk forventricular arrhythmiasPhilipp Boyé, Hassan Abdel-Aty, Udo Zacharzowsky,Alexander Schirdewan, Rainer Dietz andJeanette Schulz-MengerFranz-Volhard Clinic, Charite Campus Buch, Berlin, Germany
Journal of Cardiovascular Magnetic Resonance 2009, 11(Suppl 1):O1
Introduction: Prophylactic implantation of a cardioverter/
defibrillator (ICD) has been shown to reduce mortality in
patients with chronic myocardial infarction (CMI) and an
increased risk for life threatening ventricular arrhythmia (VA).
The use of ICDs in this large patient population is still limited by
high costs and possible adverse events including inappropriate
discharges and progression of heart failure. VA is related to
infarct size and seems to be related to infarct morphology.
Contrast enhanced cardiovascular magnetic resonance imaging
(ceCMR) can detect and quantify myocardial fibrosis in the
setting of CMI and might therefore be a valuable tool for a more
accurate risk stratification in this setting.
Hypothesis: ceCMR can identify the subgroup developing VA
in patients with prophylactic ICD implantation following MADIT
criteria.
Methods: We prospectively enrolled 52 patients (49 males, age
69 ± 10 years) with CMI and clinical indication for ICD therapy
following MADIT criteria. Prior to implantation (36 ± 78 days)
patients were investigated on a 1.5 T clinical scanner (Siemens
Avanto©, Germany) to assess left ventricular function (LVEF), LV
end-diastolic volume (LVEDV) and LV mass (sequence para-
meters: GRE SSFP, matrix 256 × 192, short axis stack; full LV
coverage, no gap; slice thickness 6 mm). For quantitative
assessment of infarct morphology late gadolinium enhancement
(LGE) was performed including measurement of total and
relative infarct mass (related to LV mass) and the degree of
transmurality (DT) as defined by the percentage of transmurality
in each scar. (sequence parameters: inversion recovery gradient
echo; matrix 256 × 148, imaging 10 min after 0.2 mg/kggadolinium DTPA; slice orientation equal to SSFP). MRI images
were analysed using dedicated software (MASS©, Medis,
Netherlands). LGE was defined as myocardial areas with signal
intensity above the average plus 5 SD of the remote myocardium.
After implantation, patients were followed up including ICD
readout after 3 and than every 6 months for a mean of 945 ± 344
days. ICD data were evaluated by an experienced electrophysiol-
ogist. Primary endpoint was the occurrence of an appropriate
discharge (DC), antitachycard pacing (ATP) or death from cardiac
cause.
Results: The endpoint occurred in 10 patients (3 DC, 6 ATP, 1
death). These patients had a higher relative infarct mass (28 ± 7%
vs. 22 ± 11%, p = 0.03) as well as high degree of transmurality
(64 ± 22% vs. 44 ± 25%, p = 0.05). Their LVEF (29 ± 8% vs.
30 ± 4%, p = 0.75), LV mass (148 ± 29 g vs. 154 ± 42 g,
p = 0.60), LVEDV (270 ± 133 ml vs. 275 ± 83 ml, p = 0.90) or
total infarct mass (43 ± 19 g vs. 37 ± 21 g, p = 0.43) were
however not significant from the group with no events. In a cox
proportional hazards regression model including LVEF, LVEDV, LV
mass, DT and age, only degree of transmurality and relative
infarct mass emerged as independent predictors of the primary
end point (p = 0.009).
Conclusion: In CMI-patients fulfilling MADIT criteria ceCMR
could show that the extent and transmurality of myocardial
scarring are independent predictors for life threatening ventri-
cular arrhythmia or death. This additional information could lead
to more precise risk stratification and might reduce adverse
events and cost of ICD therapy in this patient population. Larger
trials are needed to confirm this finding.
O2Cardiac T2* magnetic resonance for prediction ofcardiac complications in thalassemia majorPaul Kirk1, Michael Roughton1, John B Porter2,John M Walker2, Mark A Tanner1, Junaid Patel1,Dianne Wu1, Jane Taylor1, Mark A Westwood1,Lisa J Anderson1 and Dudley J Pennel11Royal Brompton Hospital, London, UK2University College Hospital London, London, UK
Journal of Cardiovascular Magnetic Resonance 2009, 11(Suppl 1):O2
Background: Myocardial siderosis is the main cause of
morbidity and mortality in thalassaemia major. In the United
Kingdom approximately 50% of patients die before reaching
35 years. The cardiomyopathy is reversible if chelation is
commenced early but diagnosis is often delayed due to the late
onset of symptoms. T2* CMR can now assess cardiac iron
BioMed Central
Page 1 of 316(page number not for citation purposes)
directly and this has profound implications for clinical manage-
ment of iron overload and the assessment of chelation regimes.
Left ventricular ejection fraction falls with increasing myocardial
iron (reduced myocardial T2*; normal value >20 ms), and
accordingly iron overloaded patients with symptomatic heart
failure have a low T2*. Although data is available on the level of
T2* in patients developing heart failure there is no published data
on the incidence of heart failure and arrhythmia in patients
during follow-up according to baseline myocardial T2*. The aim
of this study therefore was to establish the risk of cardiac
complications in patients with cardiac siderosis as measured by
T2*.
Methods: A prospective database containing clinical data and
T2* values on 652 thalassaemia major patients (1442 scans) was
maintained over a 6 year period with 1,285 patient years of
prospective follow-up. Of these patients, 319 were male and 333
female with a mean age at time of first scan of 27.1 ± 9.6 years.
The mean number of blood units transfused per year per patient
was 32.6 ± 11.5.
Results: At 1 year of follow-up, there were 84 episodes of
heart failure and 100 episodes of arrhythmia. There were
4 deaths, with 3 patients dying from sepsis following bone
marrow transplant and 1 patient dying following an episode of
ventricular tachycardia.
Heart failure: For the 84 heart failure episodes, 64 presented
in New York Heart Association (NYHA) class two, 16 were
NYHA class three, and 4 were NYHA class four. The mean
ejection fraction of these patients was 43.1 ± 7.2%. In these
heart failure patients, the preceding cardiac T2* was 6.7 ± 1.8
ms, the liver T2* 3.9 ± 3.7 ms and ferritin 2,713 ± 1,686 mg/L. Incomparison with cardiac T2* values >20 ms, there was a
significantly increased risk of heart failure associated with cardiac
T2* values < 10 ms (Relative Risk 159, P < 0.001) and T2*<6
(RR 268, P < 0.001). Serum ferritin using the conventional
threshold was a significant but weaker predictor of heart failure
(ferritin >2500 mg/L, RR 0.56, P = 0.021). Liver T2* < 0.96 ms
(equivalent to the conventional threshold of >15 mg/g/dw iron)
was not a significant predictor of heart failure (liver T2* < 0.96
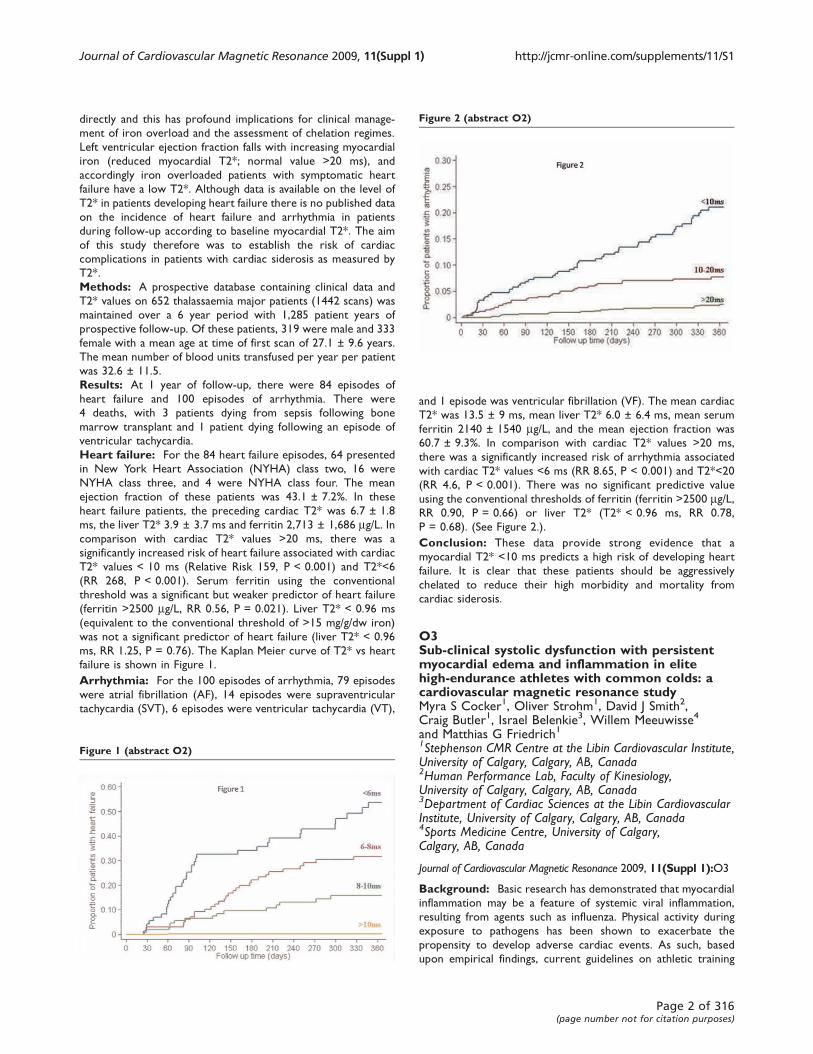
ms, RR 1.25, P = 0.76). The Kaplan Meier curve of T2* vs heart
failure is shown in Figure 1.
Arrhythmia: For the 100 episodes of arrhythmia, 79 episodes
were atrial fibrillation (AF), 14 episodes were supraventricular
tachycardia (SVT), 6 episodes were ventricular tachycardia (VT),
and 1 episode was ventricular fibrillation (VF). The mean cardiac
T2* was 13.5 ± 9 ms, mean liver T2* 6.0 ± 6.4 ms, mean serum
ferritin 2140 ± 1540 mg/L, and the mean ejection fraction was
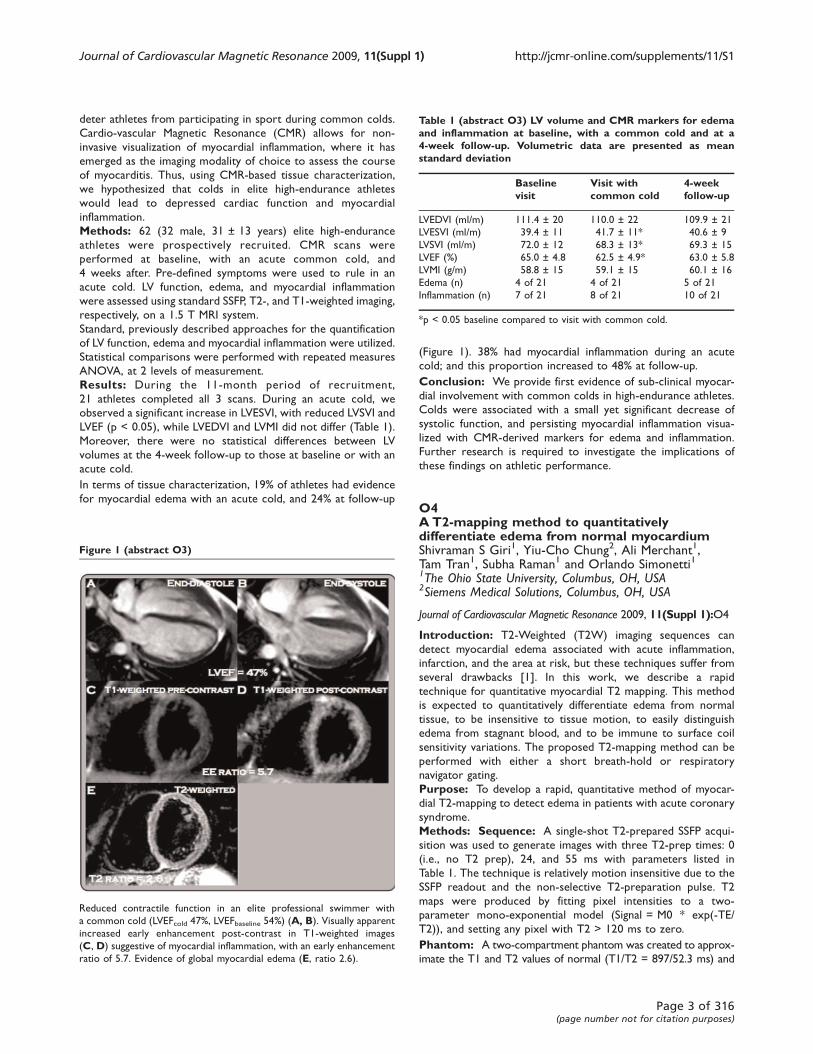
60.7 ± 9.3%. In comparison with cardiac T2* values >20 ms,
there was a significantly increased risk of arrhythmia associated
with cardiac T2* values <6 ms (RR 8.65, P < 0.001) and T2*<20
(RR 4.6, P < 0.001). There was no significant predictive value
using the conventional thresholds of ferritin (ferritin >2500 mg/L,RR 0.90, P = 0.66) or liver T2* (T2* < 0.96 ms, RR 0.78,
P = 0.68). (See Figure 2.).
Conclusion: These data provide strong evidence that a
myocardial T2* <10 ms predicts a high risk of developing heart
failure. It is clear that these patients should be aggressively
chelated to reduce their high morbidity and mortality from
cardiac siderosis.
O3Sub-clinical systolic dysfunction with persistentmyocardial edema and inflammation in elitehigh-endurance athletes with common colds: acardiovascular magnetic resonance studyMyra S Cocker1, Oliver Strohm1, David J Smith2,Craig Butler1, Israel Belenkie3, Willem Meeuwisse4
and Matthias G Friedrich11Stephenson CMR Centre at the Libin Cardiovascular Institute,University of Calgary, Calgary, AB, Canada2Human Performance Lab, Faculty of Kinesiology,University of Calgary, Calgary, AB, Canada3Department of Cardiac Sciences at the Libin CardiovascularInstitute, University of Calgary, Calgary, AB, Canada4Sports Medicine Centre, University of Calgary,Calgary, AB, Canada
Journal of Cardiovascular Magnetic Resonance 2009, 11(Suppl 1):O3
Background: Basic research has demonstrated that myocardial
inflammation may be a feature of systemic viral inflammation,
resulting from agents such as influenza. Physical activity during
exposure to pathogens has been shown to exacerbate the
propensity to develop adverse cardiac events. As such, based
upon empirical findings, current guidelines on athletic training
Figure 1 (abstract O2)
Figure 2 (abstract O2)
Journal of Cardiovascular Magnetic Resonance 2009, 11(Suppl 1) http://jcmr-online.com/supplements/11/S1
Page 2 of 316(page number not for citation purposes)
deter athletes from participating in sport during common colds.
Cardio-vascular Magnetic Resonance (CMR) allows for non-
invasive visualization of myocardial inflammation, where it has
emerged as the imaging modality of choice to assess the course
of myocarditis. Thus, using CMR-based tissue characterization,
we hypothesized that colds in elite high-endurance athletes
would lead to depressed cardiac function and myocardial
inflammation.
Methods: 62 (32 male, 31 ± 13 years) elite high-endurance
athletes were prospectively recruited. CMR scans were
performed at baseline, with an acute common cold, and
4 weeks after. Pre-defined symptoms were used to rule in an
acute cold. LV function, edema, and myocardial inflammation
were assessed using standard SSFP, T2-, and T1-weighted imaging,
respectively, on a 1.5 T MRI system.
Standard, previously described approaches for the quantification
of LV function, edema and myocardial inflammation were utilized.
Statistical comparisons were performed with repeated measures
ANOVA, at 2 levels of measurement.
Results: During the 11-month period of recruitment,
21 athletes completed all 3 scans. During an acute cold, we
observed a significant increase in LVESVI, with reduced LVSVI and
LVEF (p < 0.05), while LVEDVI and LVMI did not differ (Table 1).
Moreover, there were no statistical differences between LV
volumes at the 4-week follow-up to those at baseline or with an
acute cold.
In terms of tissue characterization, 19% of athletes had evidence
for myocardial edema with an acute cold, and 24% at follow-up
(Figure 1). 38% had myocardial inflammation during an acute
cold; and this proportion increased to 48% at follow-up.
Conclusion: We provide first evidence of sub-clinical myocar-
dial involvement with common colds in high-endurance athletes.
Colds were associated with a small yet significant decrease of
systolic function, and persisting myocardial inflammation visua-
lized with CMR-derived markers for edema and inflammation.
Further research is required to investigate the implications of
these findings on athletic performance.
O4A T2-mapping method to quantitativelydifferentiate edema from normal myocardiumShivraman S Giri1, Yiu-Cho Chung2, Ali Merchant1,Tam Tran1, Subha Raman1 and Orlando Simonetti11The Ohio State University, Columbus, OH, USA2Siemens Medical Solutions, Columbus, OH, USA
Journal of Cardiovascular Magnetic Resonance 2009, 11(Suppl 1):O4
Introduction: T2-Weighted (T2W) imaging sequences can
detect myocardial edema associated with acute inflammation,
infarction, and the area at risk, but these techniques suffer from
several drawbacks [1]. In this work, we describe a rapid
technique for quantitative myocardial T2 mapping. This method
is expected to quantitatively differentiate edema from normal
tissue, to be insensitive to tissue motion, to easily distinguish
edema from stagnant blood, and to be immune to surface coil
sensitivity variations. The proposed T2-mapping method can be
performed with either a short breath-hold or respiratory
navigator gating.
Purpose: To develop a rapid, quantitative method of myocar-
dial T2-mapping to detect edema in patients with acute coronary
syndrome.
Methods: Sequence: A single-shot T2-prepared SSFP acqui-
sition was used to generate images with three T2-prep times: 0
(i.e., no T2 prep), 24, and 55 ms with parameters listed in
Table 1. The technique is relatively motion insensitive due to the
SSFP readout and the non-selective T2-preparation pulse. T2
maps were produced by fitting pixel intensities to a two-
parameter mono-exponential model (Signal = M0 * exp(-TE/
T2)), and setting any pixel with T2 > 120 ms to zero.
Phantom: A two-compartment phantom was created to approx-
imate the T1 and T2 values of normal (T1/T2 = 897/52.3 ms) and
Table 1 (abstract O3) LV volume and CMR markers for edemaand inflammation at baseline, with a common cold and at a4-week follow-up. Volumetric data are presented as meanstandard deviation
Baselinevisit
Visit withcommon cold
4-weekfollow-up
LVEDVI (ml/m) 111.4 ± 20 110.0 ± 22 109.9 ± 21
LVESVI (ml/m) 39.4 ± 11 41.7 ± 11* 40.6 ± 9
LVSVI (ml/m) 72.0 ± 12 68.3 ± 13* 69.3 ± 15
LVEF (%) 65.0 ± 4.8 62.5 ± 4.9* 63.0 ± 5.8
LVMI (g/m) 58.8 ± 15 59.1 ± 15 60.1 ± 16
Edema (n) 4 of 21 4 of 21 5 of 21
Inflammation (n) 7 of 21 8 of 21 10 of 21
*p < 0.05 baseline compared to visit with common cold.
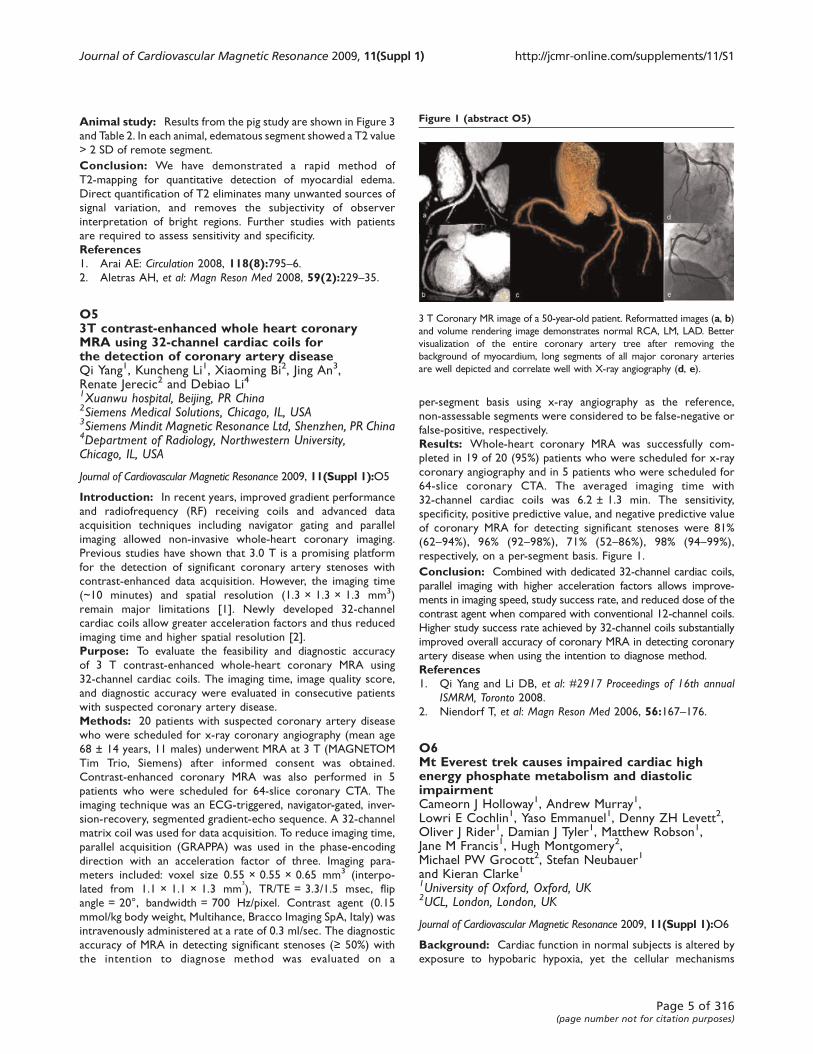
Figure 1 (abstract O3)
Reduced contractile function in an elite professional swimmer with
a common cold (LVEFcold 47%, LVEFbaseline 54%) (A, B). Visually apparentincreased early enhancement post-contrast in T1-weighted images
(C, D) suggestive of myocardial inflammation, with an early enhancement
ratio of 5.7. Evidence of global myocardial edema (E, ratio 2.6).
Journal of Cardiovascular Magnetic Resonance 2009, 11(Suppl 1) http://jcmr-online.com/supplements/11/S1
Page 3 of 316(page number not for citation purposes)

edematous myocardium (T1/T2 = 1119/101.8 ms) [2]. Phantom T1
and T2 values were verified using a standard spin echo sequence.
In-vivo: T2 Maps were acquired in 9 healthy subjects to
determine the normal range of T2 values. Three short-axis and
two long-axis views were imaged during breath hold (duration ~5
HB) and in free breathing using navigator gating. In 5 subjects, four
averages were acquired with navigator gating to test the benefits of
increased SNR. Average T2 values were calculated in 16 myocardial
segments using both methods and compared. Measurements were
pooled to obtain global mean and standard deviation to investigate
inter-subject and inter-segment variability.
Signal intensity variability: In six healthy subjects, T2W
images using conventional dark-blood STIR turbo spin echo (DB-
STIR-TSE) were acquired and compared to the T2 maps
generated using the proposed method. Only anterior coil
elements were used to investigate signal variability due to surface
coil intensity variation, as well as motion induced signal loss.
Parameters are listed in Table 1. In each subject, average signal
was computed and normalized to the maximum segment. The
standard deviation (SD) of this normalized mean was used as a
measure of variability.
Animal studies: Three pigs underwent 90 minute LAD
occlusion and were imaged with breath-hold within six hours
of reperfusion.
Results: Phantom: T2 values were slightly overestimated
(107.9 ms vs. 101.8 ms, and 60.7 ms vs. 52.3 ms) in the two
phantom compartments.
In-vivo: T2 values did not show significant variation among the
16 segments (p = 0.277, ANOVA) or between breathhold and
free breathing techniques (p = 0.76, paired t-test). The mean T2
and standard deviation were 51.54+3.5 ms (range: 49.6 to
53 ms). Figure 1 demonstrates the discrimination of static apical
blood from myocardium in the T2 map.
Signal intensity variability: Signal in T2W DB-STIR-TSE
showed high variability (36.7%) while T2 maps showed no such
variation (3%) as seen in Figure 2.
Figure 1 (abstract O4)
T2 Weighted image (DB-STIR-TSE) (I) showing high signal intensity due
to stagnant blood in the apical regions. The corresponding T2 Map clearly
distinguishes myocardium from stagnant blood.
Figure 2 (abstract O4)
T2W image (left) shows a lot of signal variability due to surface coil
sensitivity variations and motion as compared to the corresponding
T2 Map (right). Similar color map used in both images for comparison.
Figure 3 (abstract O4)
T2 Maps from a pig showing enhanced T2 in anterior segment (arrow). In
this pig, T2 in anterior segment was 83.5 + 11 ms vs. 58.6 + 4.5 ms in
inferior segment.
Table 2 (abstract O4) Results from pig studies.
Animal # Infarcted segment Remote normal segment
1 83.5,11 58.6,4.5
2 80.4,6.8 51.1,5.6
3 83.6,10 58.4,7.2
The values are mean, SD of T2 (ms) in mid ventricular SAX slice.
Table 1 (abstract O4) Imaging parameters
Parameter T2Prep SSFP DB-TSE
TE (ms) 0, 24, 55 62
TR 2 × RR 2 × RR
Avg. FOV 350 × 400 350 × 400
Image Matrix 128 × 160 144 × 192
Flip angle 40 90
Journal of Cardiovascular Magnetic Resonance 2009, 11(Suppl 1) http://jcmr-online.com/supplements/11/S1
Page 4 of 316(page number not for citation purposes)
Animal study: Results from the pig study are shown in Figure 3
and Table 2. In each animal, edematous segment showed a T2 value
> 2 SD of remote segment.
Conclusion: We have demonstrated a rapid method of
T2-mapping for quantitative detection of myocardial edema.
Direct quantification of T2 eliminates many unwanted sources of
signal variation, and removes the subjectivity of observer
interpretation of bright regions. Further studies with patients
are required to assess sensitivity and specificity.
References1. Arai AE: Circulation 2008, 118(8):795–6.2. Aletras AH, et al: Magn Reson Med 2008, 59(2):229–35.
O53T contrast-enhanced whole heart coronaryMRA using 32-channel cardiac coils forthe detection of coronary artery diseaseQi Yang1, Kuncheng Li1, Xiaoming Bi2, Jing An3,Renate Jerecic2 and Debiao Li41Xuanwu hospital, Beijing, PR China2Siemens Medical Solutions, Chicago, IL, USA3Siemens Mindit Magnetic Resonance Ltd, Shenzhen, PR China4Department of Radiology, Northwestern University,Chicago, IL, USA
Journal of Cardiovascular Magnetic Resonance 2009, 11(Suppl 1):O5
Introduction: In recent years, improved gradient performance
and radiofrequency (RF) receiving coils and advanced data
acquisition techniques including navigator gating and parallel
imaging allowed non-invasive whole-heart coronary imaging.
Previous studies have shown that 3.0 T is a promising platform
for the detection of significant coronary artery stenoses with
contrast-enhanced data acquisition. However, the imaging time
(~10 minutes) and spatial resolution (1.3 × 1.3 × 1.3 mm3)
remain major limitations [1]. Newly developed 32-channel
cardiac coils allow greater acceleration factors and thus reduced
imaging time and higher spatial resolution [2].
Purpose: To evaluate the feasibility and diagnostic accuracy
of 3 T contrast-enhanced whole-heart coronary MRA using
32-channel cardiac coils. The imaging time, image quality score,
and diagnostic accuracy were evaluated in consecutive patients
with suspected coronary artery disease.
Methods: 20 patients with suspected coronary artery disease
who were scheduled for x-ray coronary angiography (mean age
68 ± 14 years, 11 males) underwent MRA at 3 T (MAGNETOM
Tim Trio, Siemens) after informed consent was obtained.
Contrast-enhanced coronary MRA was also performed in 5
patients who were scheduled for 64-slice coronary CTA. The
imaging technique was an ECG-triggered, navigator-gated, inver-
sion-recovery, segmented gradient-echo sequence. A 32-channel
matrix coil was used for data acquisition. To reduce imaging time,
parallel acquisition (GRAPPA) was used in the phase-encoding
direction with an acceleration factor of three. Imaging para-
meters included: voxel size 0.55 × 0.55 × 0.65 mm3 (interpo-
lated from 1.1 × 1.1 × 1.3 mm3
), TR/TE = 3.3/1.5 msec, flip
angle = 20°, bandwidth = 700 Hz/pixel. Contrast agent (0.15
mmol/kg body weight, Multihance, Bracco Imaging SpA, Italy) was
intravenously administered at a rate of 0.3 ml/sec. The diagnostic
accuracy of MRA in detecting significant stenoses (≥ 50%) with
the intention to diagnose method was evaluated on a
per-segment basis using x-ray angiography as the reference,
non-assessable segments were considered to be false-negative or
false-positive, respectively.
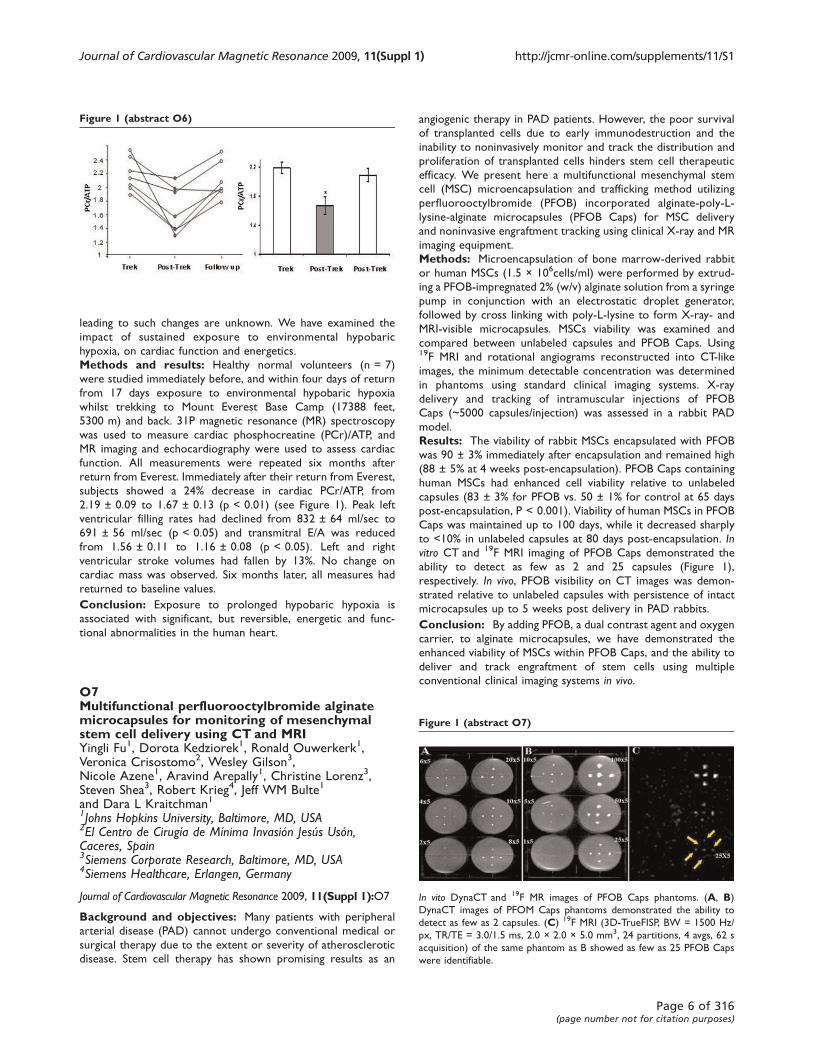
Results: Whole-heart coronary MRA was successfully com-
pleted in 19 of 20 (95%) patients who were scheduled for x-ray
coronary angiography and in 5 patients who were scheduled for
64-slice coronary CTA. The averaged imaging time with
32-channel cardiac coils was 6.2 ± 1.3 min. The sensitivity,
specificity, positive predictive value, and negative predictive value
of coronary MRA for detecting significant stenoses were 81%
(62–94%), 96% (92–98%), 71% (52–86%), 98% (94–99%),respectively, on a per-segment basis. Figure 1.
Conclusion: Combined with dedicated 32-channel cardiac coils,
parallel imaging with higher acceleration factors allows improve-
ments in imaging speed, study success rate, and reduced dose of the
contrast agent when compared with conventional 12-channel coils.
Higher study success rate achieved by 32-channel coils substantially
improved overall accuracy of coronary MRA in detecting coronary
artery disease when using the intention to diagnose method.
References1. Qi Yang and Li DB, et al: #2917 Proceedings of 16th annual
ISMRM, Toronto 2008.
2. Niendorf T, et al: Magn Reson Med 2006, 56:167–176.
O6Mt Everest trek causes impaired cardiac highenergy phosphate metabolism and diastolicimpairmentCameorn J Holloway1, Andrew Murray1,Lowri E Cochlin1, Yaso Emmanuel1, Denny ZH Levett2,Oliver J Rider1, Damian J Tyler1, Matthew Robson1,Jane M Francis1, Hugh Montgomery2,Michael PW Grocott2, Stefan Neubauer1
and Kieran Clarke11University of Oxford, Oxford, UK2UCL, London, London, UK
Journal of Cardiovascular Magnetic Resonance 2009, 11(Suppl 1):O6
Background: Cardiac function in normal subjects is altered by
exposure to hypobaric hypoxia, yet the cellular mechanisms
Figure 1 (abstract O5)
3 T Coronary MR image of a 50-year-old patient. Reformatted images (a, b)and volume rendering image demonstrates normal RCA, LM, LAD. Better
visualization of the entire coronary artery tree after removing the
background of myocardium, long segments of all major coronary arteries
are well depicted and correlate well with X-ray angiography (d, e).
Journal of Cardiovascular Magnetic Resonance 2009, 11(Suppl 1) http://jcmr-online.com/supplements/11/S1
Page 5 of 316(page number not for citation purposes)
leading to such changes are unknown. We have examined the
impact of sustained exposure to environmental hypobaric
hypoxia, on cardiac function and energetics.
Methods and results: Healthy normal volunteers (n = 7)
were studied immediately before, and within four days of return
from 17 days exposure to environmental hypobaric hypoxia
whilst trekking to Mount Everest Base Camp (17388 feet,
5300 m) and back. 31P magnetic resonance (MR) spectroscopy
was used to measure cardiac phosphocreatine (PCr)/ATP, and
MR imaging and echocardiography were used to assess cardiac
function. All measurements were repeated six months after
return from Everest. Immediately after their return from Everest,
subjects showed a 24% decrease in cardiac PCr/ATP, from
2.19 ± 0.09 to 1.67 ± 0.13 (p < 0.01) (see Figure 1). Peak left
ventricular filling rates had declined from 832 ± 64 ml/sec to
691 ± 56 ml/sec (p < 0.05) and transmitral E/A was reduced
from 1.56 ± 0.11 to 1.16 ± 0.08 (p < 0.05). Left and right
ventricular stroke volumes had fallen by 13%. No change on
cardiac mass was observed. Six months later, all measures had
returned to baseline values.
Conclusion: Exposure to prolonged hypobaric hypoxia is
associated with significant, but reversible, energetic and func-
tional abnormalities in the human heart.
O7Multifunctional perfluorooctylbromide alginatemicrocapsules for monitoring of mesenchymalstem cell delivery using CT and MRIYingli Fu1, Dorota Kedziorek1, Ronald Ouwerkerk1,Veronica Crisostomo2, Wesley Gilson3,Nicole Azene1, Aravind Arepally1, Christine Lorenz3,Steven Shea3, Robert Krieg4, Jeff WM Bulte1
and Dara L Kraitchman11Johns Hopkins University, Baltimore, MD, USA2El Centro de Cirugía de Mínima Invasión Jesús Usón,Caceres, Spain3Siemens Corporate Research, Baltimore, MD, USA4Siemens Healthcare, Erlangen, Germany
Journal of Cardiovascular Magnetic Resonance 2009, 11(Suppl 1):O7
Background and objectives: Many patients with peripheral
arterial disease (PAD) cannot undergo conventional medical or
surgical therapy due to the extent or severity of atherosclerotic
disease. Stem cell therapy has shown promising results as an
angiogenic therapy in PAD patients. However, the poor survival
of transplanted cells due to early immunodestruction and the
inability to noninvasively monitor and track the distribution and
proliferation of transplanted cells hinders stem cell therapeutic
efficacy. We present here a multifunctional mesenchymal stem
cell (MSC) microencapsulation and trafficking method utilizing
perfluorooctylbromide (PFOB) incorporated alginate-poly-L-
lysine-alginate microcapsules (PFOB Caps) for MSC delivery
and noninvasive engraftment tracking using clinical X-ray and MR
imaging equipment.
Methods: Microencapsulation of bone marrow-derived rabbit
or human MSCs (1.5 × 10⁶cells/ml) were performed by extrud-
ing a PFOB-impregnated 2% (w/v) alginate solution from a syringe
pump in conjunction with an electrostatic droplet generator,
followed by cross linking with poly-L-lysine to form X-ray- and
MRI-visible microcapsules. MSCs viability was examined and
compared between unlabeled capsules and PFOB Caps. Using19F MRI and rotational angiograms reconstructed into CT-like
images, the minimum detectable concentration was determined
in phantoms using standard clinical imaging systems. X-ray
delivery and tracking of intramuscular injections of PFOB
Caps (~5000 capsules/injection) was assessed in a rabbit PAD
model.
Results: The viability of rabbit MSCs encapsulated with PFOB
was 90 ± 3% immediately after encapsulation and remained high
(88 ± 5% at 4 weeks post-encapsulation). PFOB Caps containing
human MSCs had enhanced cell viability relative to unlabeled
capsules (83 ± 3% for PFOB vs. 50 ± 1% for control at 65 days
post-encapsulation, P < 0.001). Viability of human MSCs in PFOB
Caps was maintained up to 100 days, while it decreased sharply
to <10% in unlabeled capsules at 80 days post-encapsulation. Invitro CT and 19F MRI imaging of PFOB Caps demonstrated the
ability to detect as few as 2 and 25 capsules (Figure 1),
respectively. In vivo, PFOB visibility on CT images was demon-
strated relative to unlabeled capsules with persistence of intact
microcapsules up to 5 weeks post delivery in PAD rabbits.
Conclusion: By adding PFOB, a dual contrast agent and oxygen
carrier, to alginate microcapsules, we have demonstrated the
enhanced viability of MSCs within PFOB Caps, and the ability to
deliver and track engraftment of stem cells using multiple
conventional clinical imaging systems in vivo.
Figure 1 (abstract O6)
Figure 1 (abstract O7)
In vito DynaCT and 19F MR images of PFOB Caps phantoms. (A, B)DynaCT images of PFOM Caps phantoms demonstrated the ability to
detect as few as 2 capsules. (C) 19F MRI (3D-TrueFISP, BW = 1500 Hz/
px, TR/TE = 3.0/1.5 ms, 2.0 × 2.0 × 5.0 mm3, 24 partitions, 4 avgs, 62 s
acquisition) of the same phantom as B showed as few as 25 PFOB Caps
were identifiable.
Journal of Cardiovascular Magnetic Resonance 2009, 11(Suppl 1) http://jcmr-online.com/supplements/11/S1
Page 6 of 316(page number not for citation purposes)

O8Cardiac magnetic resonance of targetedannexin-iron oxide labeling detects cardiac cell deathin vivo after doxorubicin and myocardial infarctionRajesh Dash1, Trevor Chan2, Mayumi Yamada2,Marietta Paningbatan2, Bat-Erdene Myagmar1,Philip Swigart1, Paul C SimpsonJr1 and Phillip C Yang21San Francisco Veterans Affairs Hospital, San Francisco, CA,USA2Stanford University, Stanford, CA, USA
Journal of Cardiovascular Magnetic Resonance 2009, 11(Suppl 1):O8
Background: Heart failure from myocardial infarction (MI) or
doxorubicin (DOX), used in cancer therapy, is preceded by
significant cell apoptosis. Real-time, non-invasive detection of
early cardiac apoptosis might impact patient treatment and
outcomes. Early apoptosis is detected by Annexin V protein
(ANX) binding to externalized membrane phosphatidylserine. To
this end, we previously conjugated ANX to superparamagnetic
iron oxide (ANX-SPIO). This conjugate specifically binds to early
apoptotic cardiac cells in culture and is detectable by in vitromagnetic resonance imaging (MRI).
Hypothesis: We tested whether ANX-SPIO could detect
cardiac apoptosis, in vivo, via MRI (3 Tesla, GE Excite, WI) after
ischemic or oxidative injury.
Methods: Mice underwent LAD ligation or intraperitoneal,
cardiotoxic DOX (25 mg/kg) injection. After 24–48 hours,
ANX-SPIO was given by tail vein, and mice were imaged by
T2-weighted cardiac MRI (3 Tesla, GE Excite).
Results: After MI and DOX, myocardial T2 MRI signal was
detectable within 30 minutes of ANX-SPIO delivery, exhibiting
either a focal (MI) or diffuse (DOX) signal distribution (see Figure 1).
Peak signal was evident 24 hours after ANX-SPIO delivery, and
decreased over the next 2 weeks.
Conclusion: Cardiac MRI using ANX-SPIO can accurately
detect myocardial apoptosis in vivo. Distinct MRI signal
distributions were noted following ischemic (MI) versus oxidative
(DOX) injury. This molecular imaging strategy may help identify
‘at risk’ cardiac cell populations.
O9Integrated analysis of diastolic, systolic andpulmonary vascular function using MRI guidedcatheterizationBoris Schmitt1, Paul Steendjik2, Karsten Lunze1,Stanislav Ovrouski1, Jan Falkenberg1,Pedram Rahmanzadeh1, Nizar Maarouf1, Peter Ewert1,Felix Berger1 and Titus Kuehne11Unit of Cardiovascular Imaging – Congenital Heart Diseases,Deutsches Herzzentrum Berlin, Berlin, Germany2Cardiology, Medical University Leiden, The Netherlands,Leiden, Netherlands
Journal of Cardiovascular Magnetic Resonance 2009, 11(Suppl 1):O9
Indroduction and purpose: An integrated approach for
assessing ventricular pump function, diastolic compliance
(EDPVR), myocontractility and pulmonary vascular resistance
would be of clinical interest. In addition to pump function, MRI
guided catheterization was demonstrated to accurately measure
myocontractility and vascular resistance. We now extended this
method for acquisition of the EDPVR. Subsequently, this
approach was applied in patients with Fontan hemodynamic in
which abnormalities in pulmonary vascular, myocontractile and
diastolic properties are debated.
Methods: The EDPVR was determined by synchronizing invasive
ventricular pressures with cine and real-timeMRI derived ventricular
volumes and pulmonary/aortic blood flow measurements.
Validation part: In 7 pigs the MRI and conductance-catheter
method (gold standard) were compared for measuring the
EDPVR at rest and during dobutamine.
Clinical part: Parameters of global function, myocontractility
(ESPVR), vascular resistance and EDPVR were measured with MRI
at rest and under dobutamine in 14 patients with Fontan circulation.
Results: Bland-Altman test showed agreement between the
conductance-catheter and MRI method. In the pigs, there was in
both ventricles during dobutamine a right/bottom shift of the
EDPVR, the stiffness co efficient decreased slightly (p < 0.051). In
the patients during dobutamine we noted failure to increase
stroke volumes despite increased contractility and evidenced
diastolic dysfunction. Active relaxation was inconspicuous but
the EDPVR shifted towards the left/top, the stiffness constant
remained unchanged. Pulmonary resistance decreased slightly
(p = 0.058) and thus showed adequate response to augmented
cardiac outputs.
Conclusion: This novel MRI method provides differential
information about diastolic, systolic and vascular function. The
method evidenced that in Fontan patients diastolic dysfunction is
an important pathophysiologic cause of heart failure.
O10Diffusion-prepared dark blood delayedenhancement imaging for improveddetection of subendocardial infarctsMichael Salerno, Frederick H Epsteinand Christopher M KramerUniversity of Virginia, Charlottesville, VA, USA
Journal of Cardiovascular Magnetic Resonance 2009, 11(Suppl 1):O10
Introduction: Delayed enhancement MRI enables detection of
non-viable myocardium with high spatial resolution and has
Figure 1 (abstract O8)
ECG- and respiratory-gated T2-weighted cardiac MRI of mice post-MI
(A, 2-chamber view) and post-DOX (B, short axis view), 30 minutes
after tail vein infection of 100 ml ANX-SPIO. Note focal T2 signal void
(white arrows) of ANX-SPIO in antero-apex of post-MI heart, and diffuseseptal, anterior and inferior T2 signal void in post-DOX heart (LA, left
atrium; LV, left ventricle; RV, right ventricle; AW, anterior wall; IW,
inferior wall).
Journal of Cardiovascular Magnetic Resonance 2009, 11(Suppl 1) http://jcmr-online.com/supplements/11/S1
Page 7 of 316(page number not for citation purposes)
become the gold standard for imaging myocardial infarction.
However, subendocardial infarcts are sometimes difficult to
detect as they may demonstrate similar image intensity as the
ventricular cavity. A double inversion dark-blood pulse sequence
to create black blood delayed enhancement images of myocardial
infarction has been previously described [1, 2, 3]. The sequence
relies on precise timing of non-selective and selective inversion
pulses, and it is sensitive to incomplete exchange of blood and
changes in T1 relaxation of the blood and myocardium. The
technique significantly improves blood-infarct contrast at the
expense of some reduction in SNR and infarct-myocardial
contrast. Diffusion preparation-gradients have been used to
create dark-blood vessel wall images [4], but have never been
applied post-contrast for infarct imaging.
Purpose: To develop a dark-blood delayed enhancement pulse
sequence based on diffusion preparation which would not rely on
complete blood exchange and would be relatively insensitive to
changes in relaxation times.
Methods: A diffusion-prepared inversion recovery (IR) pulse
sequence was developed by adding a driven equilibrium module
using a BIR-4 0 degree radiofrequency pulse with motion
sensitization gradients between its components prior to a
segmented FLASH readout. The timing of this preparation was
optimized to minimize the effects of strain-induced signal loss.
The technique was tested in a canine model of chronic infarction
using a 1.5 T MR scanner (Magnetom Avanto, Siemens Medical
Solutions). Images were obtained 5–10 minutes after injection of
0.15 mg/kg of Magnevist. Sequence parameters included field of
view 300 mm, matrix 192 × 114, TE 2.7 ms, spatial resolution
1.6 × 2.3 × 10 mm, lines per segment 12, bandwidth 400 Hz/
pixel, acquisition duration 16 heartbeats, effective b-value 0.25 s/
mm2.
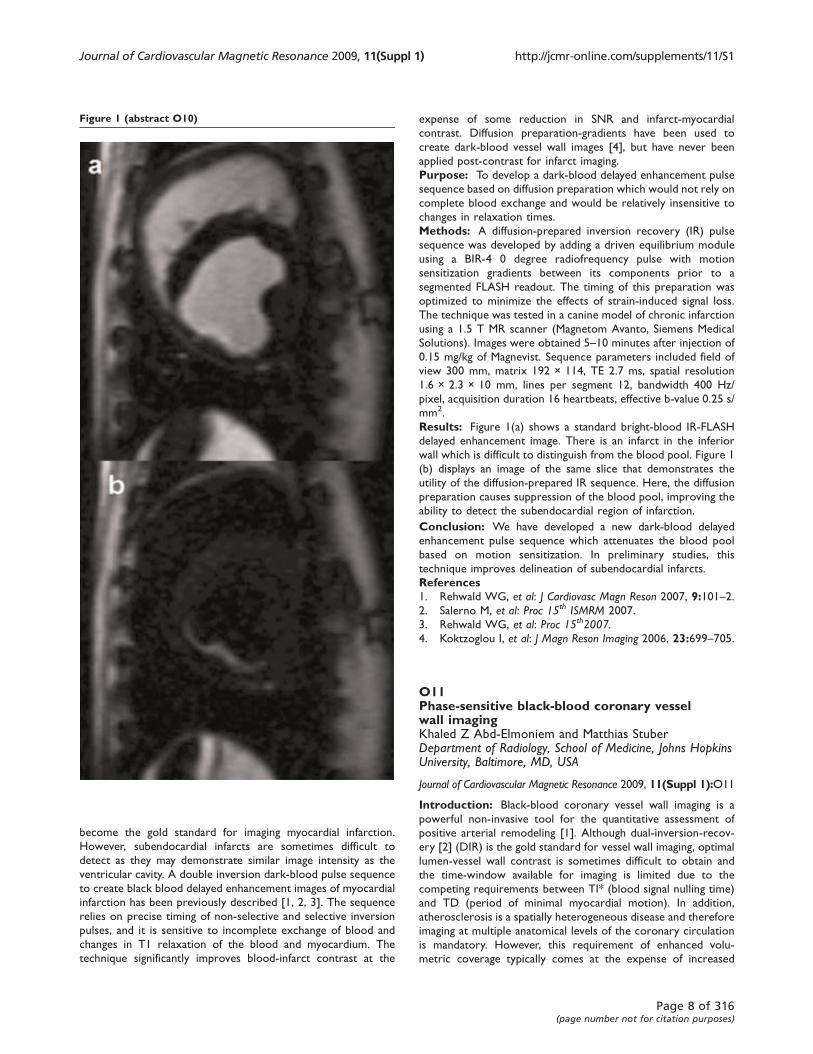
Results: Figure 1(a) shows a standard bright-blood IR-FLASH
delayed enhancement image. There is an infarct in the inferior
wall which is difficult to distinguish from the blood pool. Figure 1
(b) displays an image of the same slice that demonstrates the
utility of the diffusion-prepared IR sequence. Here, the diffusion
preparation causes suppression of the blood pool, improving the
ability to detect the subendocardial region of infarction.
Conclusion: We have developed a new dark-blood delayed
enhancement pulse sequence which attenuates the blood pool
based on motion sensitization. In preliminary studies, this
technique improves delineation of subendocardial infarcts.
References1. Rehwald WG, et al: J Cardiovasc Magn Reson 2007, 9:101–2.2. Salerno M, et al: Proc 15th ISMRM 2007.
3. Rehwald WG, et al: Proc 15th2007.4. Koktzoglou I, et al: J Magn Reson Imaging 2006, 23:699–705.
O11Phase-sensitive black-blood coronary vesselwall imagingKhaled Z Abd-Elmoniem and Matthias StuberDepartment of Radiology, School of Medicine, Johns HopkinsUniversity, Baltimore, MD, USA
Journal of Cardiovascular Magnetic Resonance 2009, 11(Suppl 1):O11
Introduction: Black-blood coronary vessel wall imaging is a
powerful non-invasive tool for the quantitative assessment of
positive arterial remodeling [1]. Although dual-inversion-recov-
ery [2] (DIR) is the gold standard for vessel wall imaging, optimal
lumen-vessel wall contrast is sometimes difficult to obtain and
the time-window available for imaging is limited due to the
competing requirements between TI* (blood signal nulling time)
and TD (period of minimal myocardial motion). In addition,
atherosclerosis is a spatially heterogeneous disease and therefore
imaging at multiple anatomical levels of the coronary circulation
is mandatory. However, this requirement of enhanced volu-
metric coverage typically comes at the expense of increased
Figure 1 (abstract O10)
Journal of Cardiovascular Magnetic Resonance 2009, 11(Suppl 1) http://jcmr-online.com/supplements/11/S1
Page 8 of 316(page number not for citation purposes)
scanning time. Phase-sensitive IR [3, 4, 5] (PS-IR) has shown to
be valuable for enhancing tissue-tissue contrast and for
making IR imaging less sensitive to TI*. This work extends
PS-IR to PS-DIR and combined with spiral-imaging, multi-slice
black-blood coronary vessel wall imaging is enabled in a single
breath-hold.
Purpose: To develop, and test a phase-sensitive DIR (PS-DIR)
single-breath-hold multi-slice spiral black-blood coronary vessel
wall imaging method.
Methods: Concept: After DIR (Fig. 1), the inversion time TI*
allows for signal-nulling of the in-flowing blood-pool at the
anatomical level of interest. Blood-tissue contrast therefore
depends on the accurate determination of TI*. Although the MR
signal is complex (magnitude and phase), DIR images only show
the magnitude of the signal with a suboptimal blood-tissue
contrast if TI does not equal TI*. However, by additionally using
the MR signal phase, a signed (positive/negative) black-blood
image can be acquired at TI less than TI* and reconstructed with
a blood-tissue contrast higher than that obtained at TI*.
Simultaneously, competing constraints related to TI* and TD
are avoided (Fig. 1). Consequently, single-breath-hold multi-
slice black-blood coronary vessel wall imaging is enabled using
PS-DIR.
Reconstruction: A local region-growing reconstruction algo-
rithm was developed and is summarized in Fig. 2. Pixels with high
signal near the cross-sectional coronary artery are selected as
seed points. The phase values of these points are used to
estimate the local signal phase inhomogeneity which is needed
for local signed-magnitude image reconstruction [4].
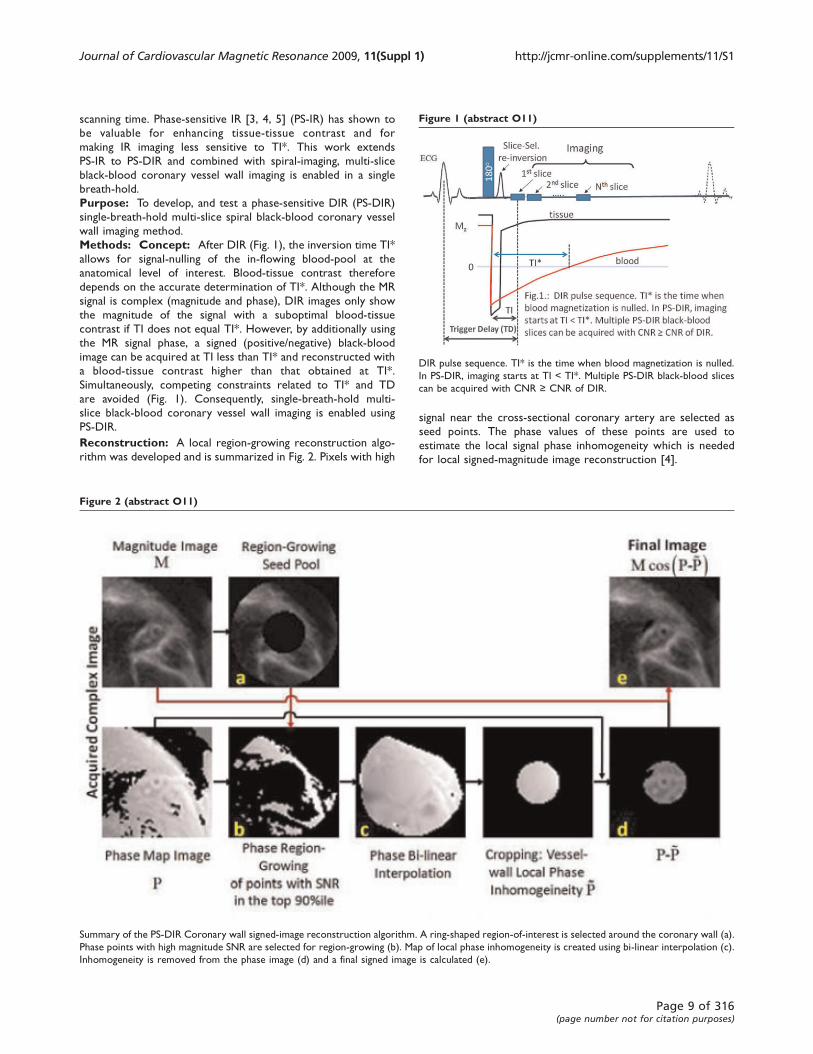
Figure 1 (abstract O11)
DIR pulse sequence. TI* is the time when blood magnetization is nulled.
In PS-DIR, imaging starts at TI < TI*. Multiple PS-DIR black-blood slices
can be acquired with CNR ≥ CNR of DIR.
Figure 2 (abstract O11)
Summary of the PS-DIR Coronary wall signed-image reconstruction algorithm. A ring-shaped region-of-interest is selected around the coronary wall (a).
Phase points with high magnitude SNR are selected for region-growing (b). Map of local phase inhomogeneity is created using bi-linear interpolation (c).
Inhomogeneity is removed from the phase image (d) and a final signed image is calculated (e).
Journal of Cardiovascular Magnetic Resonance 2009, 11(Suppl 1) http://jcmr-online.com/supplements/11/S1
Page 9 of 316(page number not for citation purposes)
Implementation: A single breathhold DIR sequence was
implemented (Fig. 1) on a clinical 3 T Philips-Achieva MRI-
system. Data were acquired using a segmented k-space spiral
acquisition with spectral spatial excitation [6]. Image processing
was performed off-line on a personal computer.
Experiments: Anatomical slices perpendicular to the proximal
part of the right coronary artery (RCA) at end-systole were
planned similar to a previously published methodology [7]. First,
serial single-slice multi-phase PS-DIR images were acquired with
incremental TI ranging from 50 ms–500 ms in 15 healthy adult
subjects (slice-thickness = 8 mm, FOV = 190 × 190 mm,
matrix = 320 × 320, interleaves = 20, acq.window = 18 ms/
interleaf). CNR was calculated on the signed-magnitude images
reconstructed with the above algorithm. Mean vessel wall
thickness was measured manually on the images obtained with
incremental TI and was compared to that from TI*. Finally, a dual-
slice rather than a multi-phase version of the sequence (Fig. 1)
was tested in four subjects.
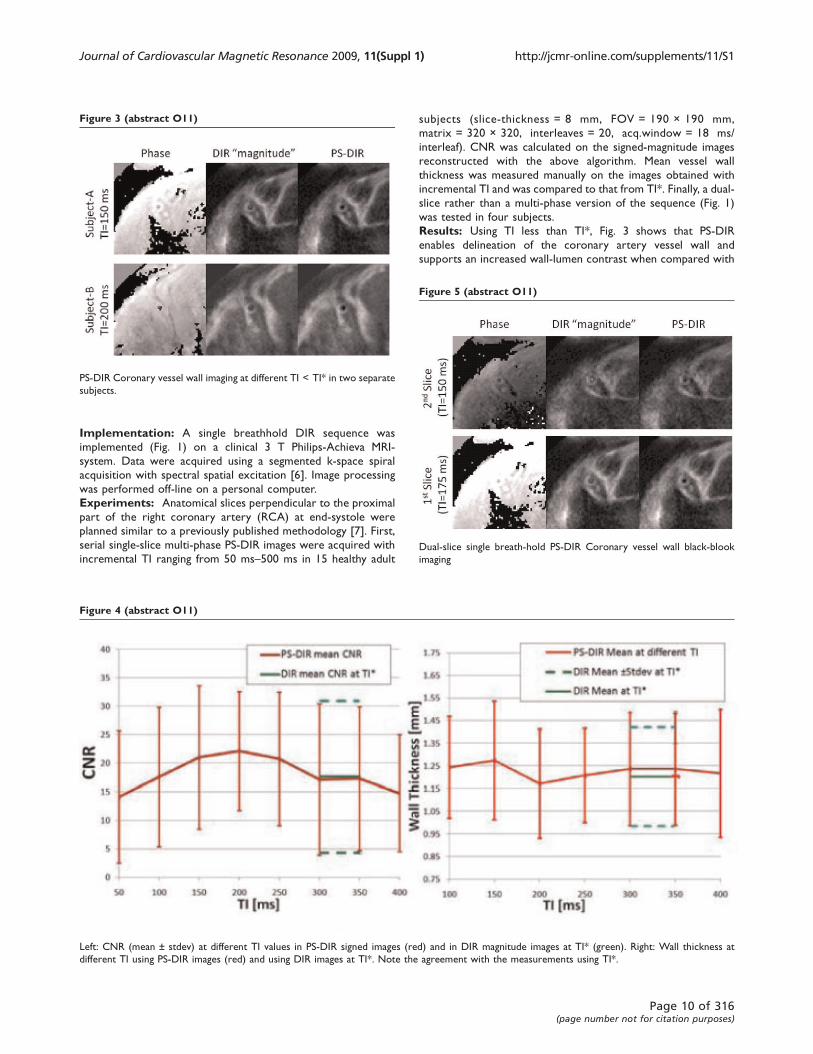
Results: Using TI less than TI*, Fig. 3 shows that PS-DIR
enables delineation of the coronary artery vessel wall and
supports an increased wall-lumen contrast when compared with
Figure 3 (abstract O11)
PS-DIR Coronary vessel wall imaging at different TI < TI* in two separate
subjects.
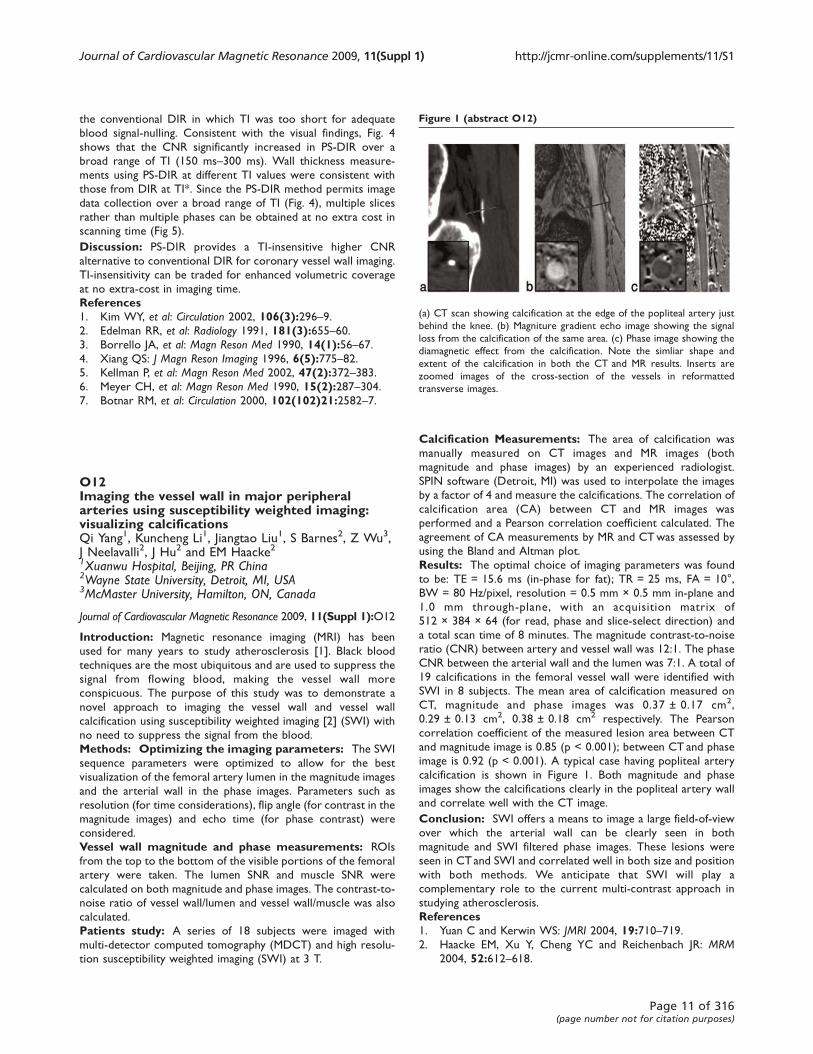
Figure 4 (abstract O11)
Left: CNR (mean ± stdev) at different TI values in PS-DIR signed images (red) and in DIR magnitude images at TI* (green). Right: Wall thickness at
different TI using PS-DIR images (red) and using DIR images at TI*. Note the agreement with the measurements using TI*.
Figure 5 (abstract O11)
Dual-slice single breath-hold PS-DIR Coronary vessel wall black-blook
imaging
Journal of Cardiovascular Magnetic Resonance 2009, 11(Suppl 1) http://jcmr-online.com/supplements/11/S1
Page 10 of 316(page number not for citation purposes)
the conventional DIR in which TI was too short for adequate
blood signal-nulling. Consistent with the visual findings, Fig. 4
shows that the CNR significantly increased in PS-DIR over a
broad range of TI (150 ms–300 ms). Wall thickness measure-
ments using PS-DIR at different TI values were consistent with
those from DIR at TI*. Since the PS-DIR method permits image
data collection over a broad range of TI (Fig. 4), multiple slices
rather than multiple phases can be obtained at no extra cost in
scanning time (Fig 5).
Discussion: PS-DIR provides a TI-insensitive higher CNR
alternative to conventional DIR for coronary vessel wall imaging.
TI-insensitivity can be traded for enhanced volumetric coverage
at no extra-cost in imaging time.
References1. Kim WY, et al: Circulation 2002, 106(3):296–9.2. Edelman RR, et al: Radiology 1991, 181(3):655–60.3. Borrello JA, et al: Magn Reson Med 1990, 14(1):56–67.4. Xiang QS: J Magn Reson Imaging 1996, 6(5):775–82.5. Kellman P, et al: Magn Reson Med 2002, 47(2):372–383.6. Meyer CH, et al: Magn Reson Med 1990, 15(2):287–304.7. Botnar RM, et al: Circulation 2000, 102(102)21:2582–7.
O12Imaging the vessel wall in major peripheralarteries using susceptibility weighted imaging:visualizing calcificationsQi Yang1, Kuncheng Li1, Jiangtao Liu1, S Barnes2, Z Wu3,J Neelavalli2, J Hu2 and EM Haacke21Xuanwu Hospital, Beijing, PR China2Wayne State University, Detroit, MI, USA3McMaster University, Hamilton, ON, Canada
Journal of Cardiovascular Magnetic Resonance 2009, 11(Suppl 1):O12
Introduction: Magnetic resonance imaging (MRI) has been
used for many years to study atherosclerosis [1]. Black blood
techniques are the most ubiquitous and are used to suppress the
signal from flowing blood, making the vessel wall more
conspicuous. The purpose of this study was to demonstrate a
novel approach to imaging the vessel wall and vessel wall
calcification using susceptibility weighted imaging [2] (SWI) with
no need to suppress the signal from the blood.
Methods: Optimizing the imaging parameters: The SWI
sequence parameters were optimized to allow for the best
visualization of the femoral artery lumen in the magnitude images
and the arterial wall in the phase images. Parameters such as
resolution (for time considerations), flip angle (for contrast in the
magnitude images) and echo time (for phase contrast) were
considered.
Vessel wall magnitude and phase measurements: ROIs
from the top to the bottom of the visible portions of the femoral
artery were taken. The lumen SNR and muscle SNR were
calculated on both magnitude and phase images. The contrast-to-
noise ratio of vessel wall/lumen and vessel wall/muscle was also
calculated.
Patients study: A series of 18 subjects were imaged with
multi-detector computed tomography (MDCT) and high resolu-
tion susceptibility weighted imaging (SWI) at 3 T.
Calcification Measurements: The area of calcification was
manually measured on CT images and MR images (both
magnitude and phase images) by an experienced radiologist.
SPIN software (Detroit, MI) was used to interpolate the images
by a factor of 4 and measure the calcifications. The correlation of
calcification area (CA) between CT and MR images was
performed and a Pearson correlation coefficient calculated. The
agreement of CA measurements by MR and CTwas assessed by
using the Bland and Altman plot.
Results: The optimal choice of imaging parameters was found
to be: TE = 15.6 ms (in-phase for fat); TR = 25 ms, FA = 10°,
BW = 80 Hz/pixel, resolution = 0.5 mm × 0.5 mm in-plane and
1.0 mm through-plane, with an acquisition matrix of
512 × 384 × 64 (for read, phase and slice-select direction) and
a total scan time of 8 minutes. The magnitude contrast-to-noise
ratio (CNR) between artery and vessel wall was 12:1. The phase
CNR between the arterial wall and the lumen was 7:1. A total of
19 calcifications in the femoral vessel wall were identified with
SWI in 8 subjects. The mean area of calcification measured on
CT, magnitude and phase images was 0.37 ± 0.17 cm2,
0.29 ± 0.13 cm2, 0.38 ± 0.18 cm2 respectively. The Pearson
correlation coefficient of the measured lesion area between CT
and magnitude image is 0.85 (p < 0.001); between CT and phase
image is 0.92 (p < 0.001). A typical case having popliteal artery
calcification is shown in Figure 1. Both magnitude and phase
images show the calcifications clearly in the popliteal artery wall
and correlate well with the CT image.
Conclusion: SWI offers a means to image a large field-of-view
over which the arterial wall can be clearly seen in both
magnitude and SWI filtered phase images. These lesions were
seen in CT and SWI and correlated well in both size and position
with both methods. We anticipate that SWI will play a
complementary role to the current multi-contrast approach in
studying atherosclerosis.
References1. Yuan C and Kerwin WS: JMRI 2004, 19:710–719.2. Haacke EM, Xu Y, Cheng YC and Reichenbach JR: MRM
2004, 52:612–618.
Figure 1 (abstract O12)
(a) CT scan showing calcification at the edge of the popliteal artery just
behind the knee. (b) Magniture gradient echo image showing the signal
loss from the calcification of the same area. (c) Phase image showing the
diamagnetic effect from the calcification. Note the simliar shape and
extent of the calcification in both the CT and MR results. Inserts are
zoomed images of the cross-section of the vessels in reformatted
transverse images.
Journal of Cardiovascular Magnetic Resonance 2009, 11(Suppl 1) http://jcmr-online.com/supplements/11/S1
Page 11 of 316(page number not for citation purposes)

O13European cardiovascular magnetic resonance(EUROCMR) registry – preliminary resultsof the German pilot phaseOliver Bruder1, Steffen Schneider2, Detlev Nothnagel3,Thorsten Dill4, Eike Nagel5, Massimo Lombardi6,Albert C van Rossum7, Anja Wagner8, Juerg Schwitter9,Jochen Senges2, Georg V Sabin1, Udo Sechtem10
and Heiko Mahrholdt101Department of Cardiology and Angiology, Elisabeth Hospital,Essen, Germany2Institut für Herzinfarktforschung, Ludwigshafen, Germany3Department of Cardiology, Klinikum Ludwigsburg,Ludwigsburg, Germany4Department of Cardiology, Kerkhoff-Klinik, Bad Nauheim,Germany5Division of Imaging Sciences, King’s College, London, UK6Clinical Physiology Institute, CNR National Research Council,Pisa, Italy7Department of Cardiology, VU Medical Center, Amsterdam,Netherlands8Duke Cardiovascular Magnetic Resonance Center, DukeUniversity Medical Center, Durham, NC, USA9Clinic of Cardiology and Cardiac MR Center, University ofZurich, Zurich, Switzerland10Department of Cardiology, Robert Bosch Medical Center,Stuttgart, Germany
Journal of Cardiovascular Magnetic Resonance 2009, 11(Suppl 1):O13
Background: Cardiovascular magnetic resonance (CMR) has a
broad range of clinical applications and is increasingly used in
daily clinical practice in many European countries.
During its German pilot phase the EUROCMR Registry sought to
evaluate indications, image quality, safety and impact on patient
management of CMR imaging in clinical routine in a large number
of cases.
Methods: Multicenter registry with consecutive enrolment of
patients scanned in 29 German CMR centers using web based
online case record forms.
Results: 6530 consecutive patients were enrolled from April
2007 to September 2008 (66% male, median age 61 years
[quartiles 49–70]). Ninety-three percent of patients received a
gadolinium based contrast agent. Twenty percent of patients
underwent adenosine perfusion, and 13% high-dose dobutamine
stress CMR. The indications for CMR can be viewed in Figure 1.
Case reading and reporting was mostly done by cardiologists
(70%), or a team of cardiologists and radiologists (26%). Image
quality was found to be good or excellent in 91%, moderate in
8%, and inadequate in 1% of cases.Severe complications occurred in a minority of patients (0.07%) and
were all associated with stress testing. We reported NSVT (n = 1),
VF (n = 1) during dobutamine infusion, as well as overt heart failure
(n = 2) and unstable angina (n = 1) related to adenosine stress
CMR. No patient died during or due to the CMR procedure.
In nearly half the patients included (48%), CMR findings resulted
in a change of patient management. Importantly, in 16% of cases
the final diagnosis based on CMR was different to the diagnosis
before CMR, leading to a complete change in patient manage-
ment. In more than 70% of cases CMR was capable of satisfying
all imaging needs so that no further imaging procedure was
required after completion of CMR.
Conclusion: CMR is a frequently performed in German clinical
practice. The most important indications are risk stratification in
suspected CAD/Ischemia, workup of heart failure, and assess-
ment of myocardial viability. CMR imaging is a safe procedure, has
diagnostic image quality in 99% of cases, and its results have
strong impact on patient management.
O14Sudden cardiac death with normal coronaries:cardiac MRI in the differential diagnosis ofunderlying disease in survivorsPeter Hunold1, Thomas Schlosser2, Kai Nassenstein2,Oliver Bruder3, Holger Eggebrecht4, Peter W Radke1
and Jörg Barkhausen11University Hospital Schleswig-Holstein, Campus Lübeck,Lübeck, Germany2University Hospital Essen, University of Duisburg-Essen,Essen, Germany3Elisabeth Hospital, Essen, Germany4West German Heart Center, University of Duisburg-Essen,Essen, Germany
Journal of Cardiovascular Magnetic Resonance 2009, 11(Suppl 1):O14
Introduction: Sudden cardiac death (SCD) is most commonly
caused by acute myocardial infarction as a correlate of coronary
artery disease. Therefore, survivors of SCD undergo cardiac
catheter to treat or rule out CAD. However, in cases with
normal coronary arteries SCD often remains unexplained.
Diagnostic work-up in this collective is important to adjust and
optimize therapy.
Purpose: Aim of this study was to evaluate the use of contrast-
enhanced cardiac MRI (CMR) in defining the underlying
pathology of survived SCD in patients without coronary artery
occlusion.
Methods: More than 6.000 contrast-enhanced CMR studies
from 3 different hospitals were reviewed for cases of survived
SCD with angiographic rule out of obstructive coronary artery
disease. The CMR protocol (1.5 T) consisted of a functional left
ventricular study using a segmented SSFP sequence (TrueFISP,
balancedFFE) in long and short axes. Data sets for late gadolinium
enhancement detection were acquired 8–15 min after 0.2 mmol/
kg BW of Gd-based contrast material using a segmented
inversion-recovery TurboFLASH/FGRE sequence (TI, 200–260 ms;
Figure 1 (abstract O13)
Initial indications for CMR (n = 6530).
Journal of Cardiovascular Magnetic Resonance 2009, 11(Suppl 1) http://jcmr-online.com/supplements/11/S1
Page 12 of 316(page number not for citation purposes)

slice thickness, 8 mm, 2D or 3D). All cases of non-coronary
SCD were reviewed and the different underlying pathologies as
defined by MRI were collected.
Results: In total, 18 cases of unclear SCD were identified. In
14 patients thereof, MRI could state the diagnosis based on the
typical imaging features of myocardial disease: Primary cardio-
myopathy was found in 7 patients (arrhythmogenic right
ventricular cardiomyopathy, 2; dilated cardiomyopathy, 3; hyper-
trophic cardiomyopathy, 1; isolated left ventricular non-compac-
tion, 1). Acute myocarditis and acute cardiac sarcoidosis were
found in 3 patients each. Chronic aneurysm of the anterior wall
most probably due to cardiac contusion was found in 1 patient. In
4 patients, CMR could clarify the etiology of SCD.
Conclusion: Contrast-enhanced CMR has unique features in
detecting and differentiating myocardial disease with possibly
fatal outcome. It has proven to be an utmost valuable tool for
the diagnostic work-up of survivors of unclear SCD. This
underlines the role of CMR as the first-line technique in
myocardial disease.
O15Predictors of subclinical diastolic dysfunctionmeasured by MRI: multi-ethnic study ofatherosclerosis (MESA)Sadia Qadir1, Wendy S Post2, Gregory W Hundley3,Gregory DN Pearson4, Shantanu Sinha5, Joao Lima2
and David A Bluemke61Massachusetts General Hospital, Boston, MA, USA2Johns Hopkins Hospital, Baltimore, MD, USA3Wake Forest University School of Medicine, Winston-Salem,NC, USA4Columbia University, New York, NY, USA5UCLA School of Medicine, Los Angeles, CA, USA6National Institute of Health, Bethesda, MD, USA
Journal of Cardiovascular Magnetic Resonance 2009, 11(Suppl 1):O15
Introduction: Diastolic dysfunction, often preclinical with no
recognized CHF diagnosis, is associated with marked increases in
all-cause mortality. Current data on diastolic dysfunction have
limitations due to retrospective study designs and/or exclusive
reliance on echocardiography.
Purpose: The purpose of this study was to analyze the
predictors of diastolic dysfunction in the MESA population
using cardiac MRI.
Methods: We studied peak filling rate (PFR ml/s) and time to
peak filling (TPFR msec) in a subclinical population (n = 4465,
males 47%, mean age 62 ± 10 years). Mean (SD), correlation
coefficients and multivariable regression coefficients were
determined.
Results: Table 1 illustrates associations between risk factors
with diastolic LV function. End diastolic volume (EDV) modified
the relationship of gender and PFR. Mean PFR was therefore
analyzed across quintiles of EDV and was found to be higher in
females 386.35, [95%CI 382.53 to 390.17] compared to males
359.11 ml/s [95%CI 355.05 to 363.17] (Fig 1). Comapred to non-
smokers smokers had lower peak filling rates. Compared to
Whites, Hispanics were at a higher risk for diastolic dysfunction,
Chinese ethnicity showed a relative protective effect after
adjusting for all other risk factors.
Table 1 (abstract O15) Multivariable regressions analysis of predictors of diastolic LV dysfunction
Independent Predictors Peak Filling Rate (ml/s) Time to Peak Filling (msec)
RegressionCoefficient
95% CI P-Value RegressionCoefficient
95% CI P-Value
Age (years) -1.70 -1.20 to -1.40 <0.001 1.94 1.53 to 2.36 <0.001
DBP (mmHg) -0.42 -0.78 to -0.05 0.02 0.48 0.14 to 0.82 0.005
HTN meds -5.92 -11.18 to -0.62 0.03 8.86 3.01 to 14.71 0.003
BMI (kg/m2) -0.67 -1.32 to -0.05 0.04 1.37 0.62 to 2.11 <0.001
Former Smokers -6.52 -12.30 to 0.65 0.03 1.00 -4.56 60 6.58 NS
Impaired Fasting Glucose 2.63 -2.74 to 8.01 NS 9.06 3.21 to 17.38 0.03
Chinese 8.14 -0.25 to 16.53 NS -8.19 -14.27 to -1.87 0.01
Hispanics 8.33 1.88 to 14.88 0.006 4.67 -1.76 to 11.1 NS
Figure 1 (abstract O15)
Journal of Cardiovascular Magnetic Resonance 2009, 11(Suppl 1) http://jcmr-online.com/supplements/11/S1
Page 13 of 316(page number not for citation purposes)
Conclusion: Impaired LV relaxation is associated with increas-
ing age, male gender, obesity, diastolic hypertension, smoking,
and varied by ethnicity.
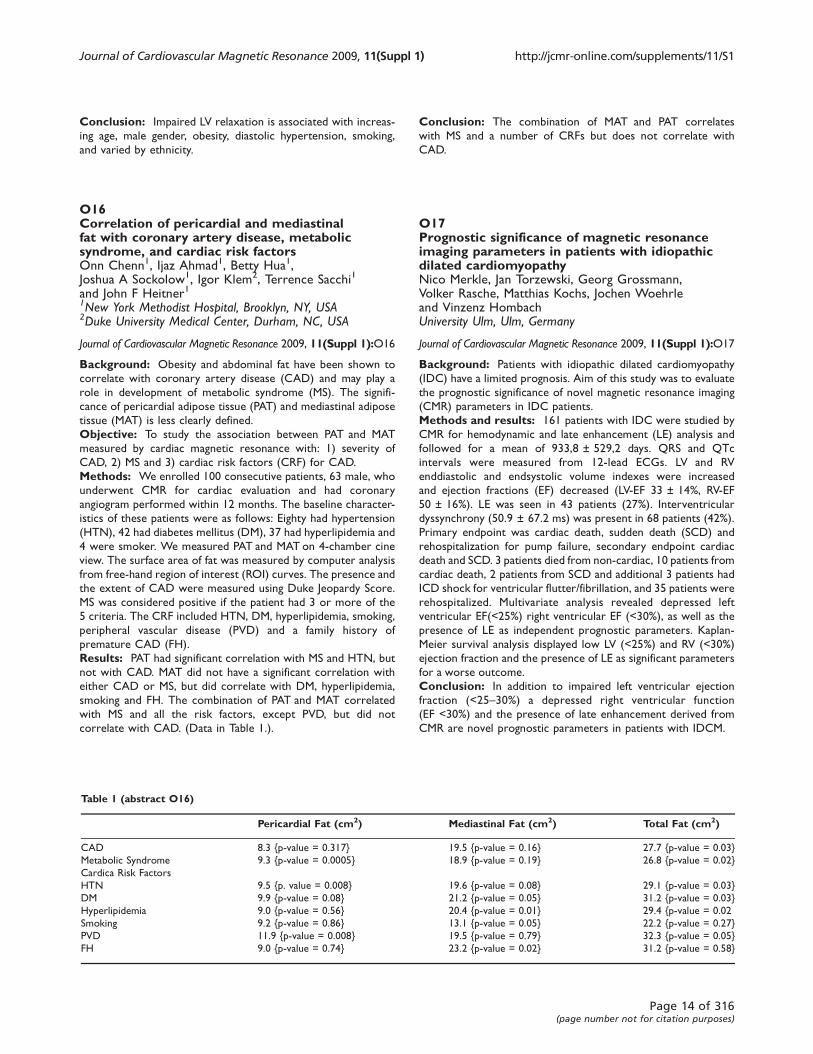
O16Correlation of pericardial and mediastinalfat with coronary artery disease, metabolicsyndrome, and cardiac risk factorsOnn Chenn1, Ijaz Ahmad1, Betty Hua1,Joshua A Sockolow1, Igor Klem2, Terrence Sacchi1
and John F Heitner11New York Methodist Hospital, Brooklyn, NY, USA2Duke University Medical Center, Durham, NC, USA
Journal of Cardiovascular Magnetic Resonance 2009, 11(Suppl 1):O16
Background: Obesity and abdominal fat have been shown to
correlate with coronary artery disease (CAD) and may play a
role in development of metabolic syndrome (MS). The signifi-
cance of pericardial adipose tissue (PAT) and mediastinal adipose
tissue (MAT) is less clearly defined.
Objective: To study the association between PAT and MAT
measured by cardiac magnetic resonance with: 1) severity of
CAD, 2) MS and 3) cardiac risk factors (CRF) for CAD.
Methods: We enrolled 100 consecutive patients, 63 male, who
underwent CMR for cardiac evaluation and had coronary
angiogram performed within 12 months. The baseline character-
istics of these patients were as follows: Eighty had hypertension
(HTN), 42 had diabetes mellitus (DM), 37 had hyperlipidemia and
4 were smoker. We measured PAT and MAT on 4-chamber cine
view. The surface area of fat was measured by computer analysis
from free-hand region of interest (ROI) curves. The presence and
the extent of CAD were measured using Duke Jeopardy Score.
MS was considered positive if the patient had 3 or more of the
5 criteria. The CRF included HTN, DM, hyperlipidemia, smoking,
peripheral vascular disease (PVD) and a family history of
premature CAD (FH).
Results: PAT had significant correlation with MS and HTN, but
not with CAD. MAT did not have a significant correlation with
either CAD or MS, but did correlate with DM, hyperlipidemia,
smoking and FH. The combination of PAT and MAT correlated
with MS and all the risk factors, except PVD, but did not
correlate with CAD. (Data in Table 1.).
Conclusion: The combination of MAT and PAT correlates
with MS and a number of CRFs but does not correlate with
CAD.
O17Prognostic significance of magnetic resonanceimaging parameters in patients with idiopathicdilated cardiomyopathyNico Merkle, Jan Torzewski, Georg Grossmann,Volker Rasche, Matthias Kochs, Jochen Woehrleand Vinzenz HombachUniversity Ulm, Ulm, Germany
Journal of Cardiovascular Magnetic Resonance 2009, 11(Suppl 1):O17
Background: Patients with idiopathic dilated cardiomyopathy
(IDC) have a limited prognosis. Aim of this study was to evaluate
the prognostic significance of novel magnetic resonance imaging
(CMR) parameters in IDC patients.
Methods and results: 161 patients with IDC were studied by
CMR for hemodynamic and late enhancement (LE) analysis and
followed for a mean of 933,8 ± 529,2 days. QRS and QTc
intervals were measured from 12-lead ECGs. LV and RV
enddiastolic and endsystolic volume indexes were increased
and ejection fractions (EF) decreased (LV-EF 33 ± 14%, RV-EF
50 ± 16%). LE was seen in 43 patients (27%). Interventricular
dyssynchrony (50.9 ± 67.2 ms) was present in 68 patients (42%).
Primary endpoint was cardiac death, sudden death (SCD) and
rehospitalization for pump failure, secondary endpoint cardiac
death and SCD. 3 patients died from non-cardiac, 10 patients from
cardiac death, 2 patients from SCD and additional 3 patients had
ICD shock for ventricular flutter/fibrillation, and 35 patients were
rehospitalized. Multivariate analysis revealed depressed left
ventricular EF(<25%) right ventricular EF (<30%), as well as the
presence of LE as independent prognostic parameters. Kaplan-
Meier survival analysis displayed low LV (<25%) and RV (<30%)
ejection fraction and the presence of LE as significant parameters
for a worse outcome.
Conclusion: In addition to impaired left ventricular ejection
fraction (<25–30%) a depressed right ventricular function
(EF <30%) and the presence of late enhancement derived from
CMR are novel prognostic parameters in patients with IDCM.
Table 1 (abstract O16)
Pericardial Fat (cm2) Mediastinal Fat (cm2) Total Fat (cm2)
CAD 8.3 {p-value = 0.317} 19.5 {p-value = 0.16} 27.7 {p-value = 0.03}
Metabolic Syndrome 9.3 {p-value = 0.0005} 18.9 {p-value = 0.19} 26.8 {p-value = 0.02}
Cardica Risk Factors
HTN 9.5 {p. value = 0.008} 19.6 {p-value = 0.08} 29.1 {p-value = 0.03}
DM 9.9 {p-value = 0.08} 21.2 {p-value = 0.05} 31.2 {p-value = 0.03}
Hyperlipidemia 9.0 {p-value = 0.56} 20.4 {p-value = 0.01} 29.4 {p-value = 0.02
Smoking 9.2 {p-value = 0.86} 13.1 {p-value = 0.05} 22.2 {p-value = 0.27}
PVD 11.9 {p-value = 0.008} 19.5 {p-value = 0.79} 32.3 {p-value = 0.05}
FH 9.0 {p-value = 0.74} 23.2 {p-value = 0.02} 31.2 {p-value = 0.58}
Journal of Cardiovascular Magnetic Resonance 2009, 11(Suppl 1) http://jcmr-online.com/supplements/11/S1
Page 14 of 316(page number not for citation purposes)
O18Complementary prognostic values of stressmyocardial perfusion and late gadoliniumenhancement imaging by cardiac magneticresonance in patients with suspectedmyocardial ischemiaKevin Steel1, Ryan Broderick2, Vijay Gandla2,Eric Larose3, Frederick Resnic2,Michael Jerosch-Herold2, Kenneth Brown4
and Raymond Y Kwong21Wilford Hall Medical Center, San Antonio, TX, USA2Brigham and Women’s Hospital, Boston, MA, USA3Quebec Heart Institute, Quebec City, QC, Canada4University of Vermont College of Medicine,Burlington, VT, USA
Journal of Cardiovascular Magnetic Resonance 2009, 11(Suppl 1):O18
Background: Recent studies have demonstrated the prognos-
tic implication of CMR myocardial perfusion imaging (CMRMPI)
in a clinical setting. Apart from detecting reversible perfusion
defect from flow-limiting coronary stenosis, CMR late enhance-
ment imaging (LGE) is currently the most sensitive method in
detecting clinically unrecognized subendocardial infarction (UMI)
from prior ischemic injury. We therefore tested the hypothesis
that, characterization of these 2 processes from coronary artery
disease (CAD) by CMR can provide complementary patient
prognostic values.
Methods and Results: We performed CMR on 254 patients
referred with symptoms suspicious of myocardial ischemia. Rest
and vasodilator (adenosine or dipyridamole) stress first-pass
CMRMPI images were obtained and followed by LGE imaging. All
CMRMPI images were interpreted for reversible perfusion
defects (RevPD) using the 16-segment nomenclature and graded
segmental LGE in a separate session. The readers were blinded
to any clinical outcome in either session. At a median follow up
of 15 months, 13 cardiac deaths and 26 nonfatal events occurred.
RevPD was the strongest multivariable predictor to MACE,
demonstrating a > 8-fold hazard increase to MACE (P < 0.0001)
Figure 1 (abstract O18)
Kaplan-Meier curves illustrating. A) the prognostic implications of UMI alone and B) the complementary prediction of MACE by RevPD and UMI,
in patients without any history of MI.
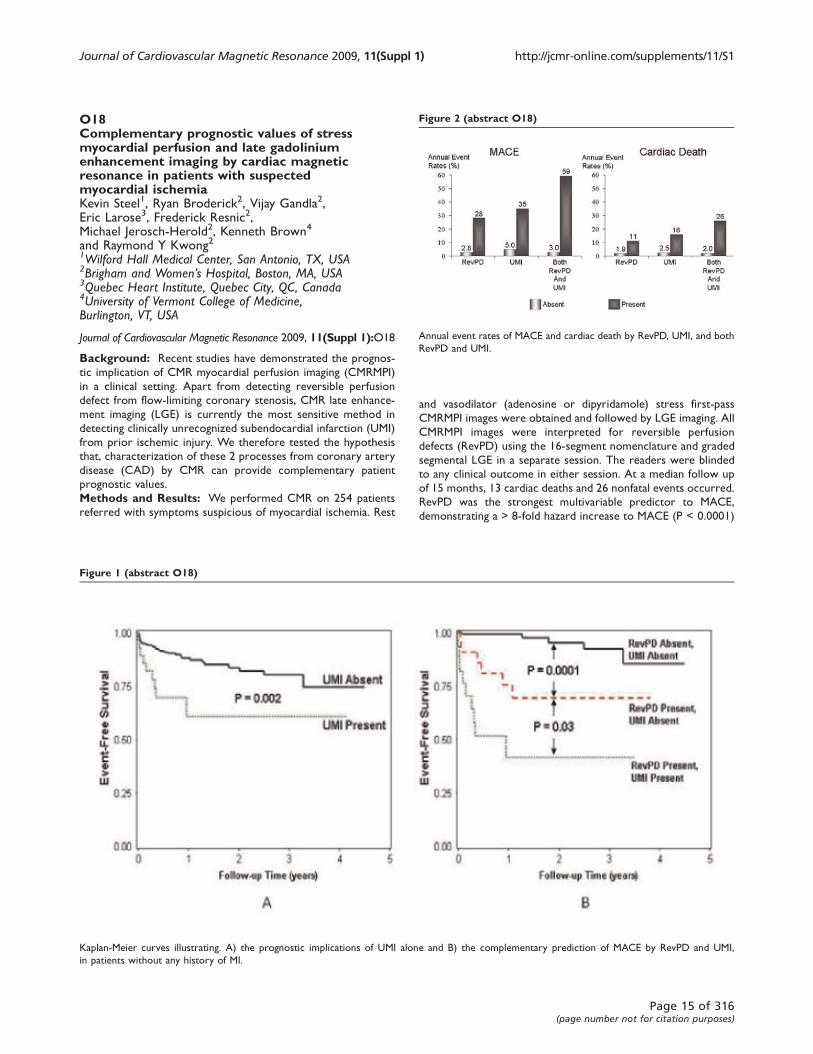
Figure 2 (abstract O18)
Annual event rates of MACE and cardiac death by RevPD, UMI, and both
RevPD and UMI.
Journal of Cardiovascular Magnetic Resonance 2009, 11(Suppl 1) http://jcmr-online.com/supplements/11/S1
Page 15 of 316(page number not for citation purposes)
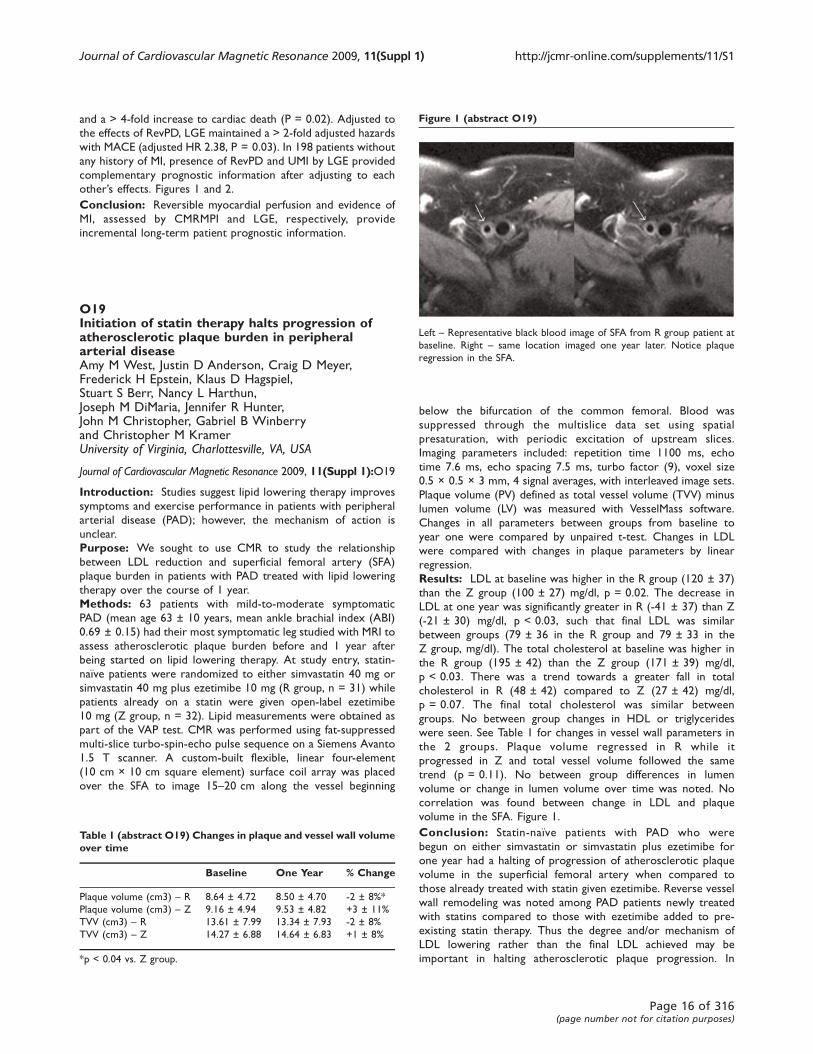
and a > 4-fold increase to cardiac death (P = 0.02). Adjusted to
the effects of RevPD, LGE maintained a > 2-fold adjusted hazards
with MACE (adjusted HR 2.38, P = 0.03). In 198 patients without
any history of MI, presence of RevPD and UMI by LGE provided
complementary prognostic information after adjusting to each
other’s effects. Figures 1 and 2.
Conclusion: Reversible myocardial perfusion and evidence of
MI, assessed by CMRMPI and LGE, respectively, provide
incremental long-term patient prognostic information.
O19Initiation of statin therapy halts progression ofatherosclerotic plaque burden in peripheralarterial diseaseAmy M West, Justin D Anderson, Craig D Meyer,Frederick H Epstein, Klaus D Hagspiel,Stuart S Berr, Nancy L Harthun,Joseph M DiMaria, Jennifer R Hunter,John M Christopher, Gabriel B Winberryand Christopher M KramerUniversity of Virginia, Charlottesville, VA, USA
Journal of Cardiovascular Magnetic Resonance 2009, 11(Suppl 1):O19
Introduction: Studies suggest lipid lowering therapy improves
symptoms and exercise performance in patients with peripheral
arterial disease (PAD); however, the mechanism of action is
unclear.
Purpose: We sought to use CMR to study the relationship
between LDL reduction and superficial femoral artery (SFA)
plaque burden in patients with PAD treated with lipid lowering
therapy over the course of 1 year.
Methods: 63 patients with mild-to-moderate symptomatic
PAD (mean age 63 ± 10 years, mean ankle brachial index (ABI)
0.69 ± 0.15) had their most symptomatic leg studied with MRI to
assess atherosclerotic plaque burden before and 1 year after
being started on lipid lowering therapy. At study entry, statin-
naïve patients were randomized to either simvastatin 40 mg or
simvastatin 40 mg plus ezetimibe 10 mg (R group, n = 31) while
patients already on a statin were given open-label ezetimibe
10 mg (Z group, n = 32). Lipid measurements were obtained as
part of the VAP test. CMR was performed using fat-suppressed
multi-slice turbo-spin-echo pulse sequence on a Siemens Avanto
1.5 T scanner. A custom-built flexible, linear four-element
(10 cm × 10 cm square element) surface coil array was placed
over the SFA to image 15–20 cm along the vessel beginning
below the bifurcation of the common femoral. Blood was
suppressed through the multislice data set using spatial
presaturation, with periodic excitation of upstream slices.
Imaging parameters included: repetition time 1100 ms, echo
time 7.6 ms, echo spacing 7.5 ms, turbo factor (9), voxel size
0.5 × 0.5 × 3 mm, 4 signal averages, with interleaved image sets.
Plaque volume (PV) defined as total vessel volume (TVV) minus
lumen volume (LV) was measured with VesselMass software.
Changes in all parameters between groups from baseline to
year one were compared by unpaired t-test. Changes in LDL
were compared with changes in plaque parameters by linear
regression.
Results: LDL at baseline was higher in the R group (120 ± 37)
than the Z group (100 ± 27) mg/dl, p = 0.02. The decrease in
LDL at one year was significantly greater in R (-41 ± 37) than Z
(-21 ± 30) mg/dl, p < 0.03, such that final LDL was similar
between groups (79 ± 36 in the R group and 79 ± 33 in the
Z group, mg/dl). The total cholesterol at baseline was higher in
the R group (195 ± 42) than the Z group (171 ± 39) mg/dl,
p < 0.03. There was a trend towards a greater fall in total
cholesterol in R (48 ± 42) compared to Z (27 ± 42) mg/dl,
p = 0.07. The final total cholesterol was similar between
groups. No between group changes in HDL or triglycerides
were seen. See Table 1 for changes in vessel wall parameters in
the 2 groups. Plaque volume regressed in R while it
progressed in Z and total vessel volume followed the same
trend (p = 0.11). No between group differences in lumen
volume or change in lumen volume over time was noted. No
correlation was found between change in LDL and plaque
volume in the SFA. Figure 1.
Conclusion: Statin-naïve patients with PAD who were
begun on either simvastatin or simvastatin plus ezetimibe for
one year had a halting of progression of atherosclerotic plaque
volume in the superficial femoral artery when compared to
those already treated with statin given ezetimibe. Reverse vessel
wall remodeling was noted among PAD patients newly treated
with statins compared to those with ezetimibe added to pre-
existing statin therapy. Thus the degree and/or mechanism of
LDL lowering rather than the final LDL achieved may be
important in halting atherosclerotic plaque progression. In
Table 1 (abstract O19) Changes in plaque and vessel wall volumeover time
Baseline One Year % Change
Plaque volume (cm3) – R 8.64 ± 4.72 8.50 ± 4.70 -2 ± 8%*
Plaque volume (cm3) – Z 9.16 ± 4.94 9.53 ± 4.82 +3 ± 11%
TVV (cm3) – R 13.61 ± 7.99 13.34 ± 7.93 -2 ± 8%
TVV (cm3) – Z 14.27 ± 6.88 14.64 ± 6.83 +1 ± 8%
*p < 0.04 vs. Z group.
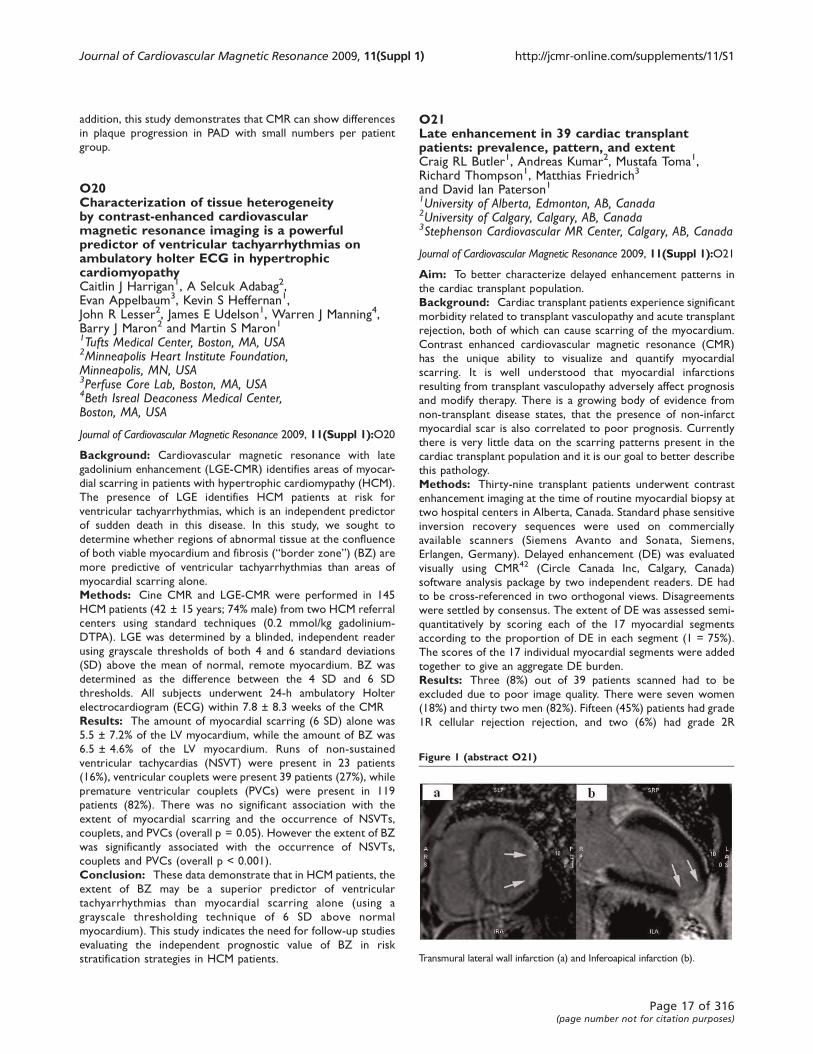
Figure 1 (abstract O19)
Left – Representative black blood image of SFA from R group patient at
baseline. Right – same location imaged one year later. Notice plaque
regression in the SFA.
Journal of Cardiovascular Magnetic Resonance 2009, 11(Suppl 1) http://jcmr-online.com/supplements/11/S1
Page 16 of 316(page number not for citation purposes)
addition, this study demonstrates that CMR can show differences
in plaque progression in PAD with small numbers per patient
group.
O20Characterization of tissue heterogeneityby contrast-enhanced cardiovascularmagnetic resonance imaging is a powerfulpredictor of ventricular tachyarrhythmias onambulatory holter ECG in hypertrophiccardiomyopathyCaitlin J Harrigan1, A Selcuk Adabag2,Evan Appelbaum3, Kevin S Heffernan1,John R Lesser2, James E Udelson1, Warren J Manning4,Barry J Maron2 and Martin S Maron11Tufts Medical Center, Boston, MA, USA2Minneapolis Heart Institute Foundation,Minneapolis, MN, USA3Perfuse Core Lab, Boston, MA, USA4Beth Isreal Deaconess Medical Center,Boston, MA, USA
Journal of Cardiovascular Magnetic Resonance 2009, 11(Suppl 1):O20
Background: Cardiovascular magnetic resonance with late
gadolinium enhancement (LGE-CMR) identifies areas of myocar-
dial scarring in patients with hypertrophic cardiomypathy (HCM).
The presence of LGE identifies HCM patients at risk for
ventricular tachyarrhythmias, which is an independent predictor
of sudden death in this disease. In this study, we sought to
determine whether regions of abnormal tissue at the confluence
of both viable myocardium and fibrosis (“border zone”) (BZ) aremore predictive of ventricular tachyarrhythmias than areas of
myocardial scarring alone.
Methods: Cine CMR and LGE-CMR were performed in 145
HCM patients (42 ± 15 years; 74% male) from two HCM referral
centers using standard techniques (0.2 mmol/kg gadolinium-
DTPA). LGE was determined by a blinded, independent reader
using grayscale thresholds of both 4 and 6 standard deviations
(SD) above the mean of normal, remote myocardium. BZ was
determined as the difference between the 4 SD and 6 SD
thresholds. All subjects underwent 24-h ambulatory Holter
electrocardiogram (ECG) within 7.8 ± 8.3 weeks of the CMR
Results: The amount of myocardial scarring (6 SD) alone was
5.5 ± 7.2% of the LV myocardium, while the amount of BZ was
6.5 ± 4.6% of the LV myocardium. Runs of non-sustained
ventricular tachycardias (NSVT) were present in 23 patients
(16%), ventricular couplets were present 39 patients (27%), while
premature ventricular couplets (PVCs) were present in 119
patients (82%). There was no significant association with the
extent of myocardial scarring and the occurrence of NSVTs,
couplets, and PVCs (overall p = 0.05). However the extent of BZ
was significantly associated with the occurrence of NSVTs,
couplets and PVCs (overall p < 0.001).
Conclusion: These data demonstrate that in HCM patients, the
extent of BZ may be a superior predictor of ventricular
tachyarrhythmias than myocardial scarring alone (using a
grayscale thresholding technique of 6 SD above normal
myocardium). This study indicates the need for follow-up studies
evaluating the independent prognostic value of BZ in risk
stratification strategies in HCM patients.
O21Late enhancement in 39 cardiac transplantpatients: prevalence, pattern, and extentCraig RL Butler1, Andreas Kumar2, Mustafa Toma1,Richard Thompson1, Matthias Friedrich3
and David Ian Paterson11University of Alberta, Edmonton, AB, Canada2University of Calgary, Calgary, AB, Canada3Stephenson Cardiovascular MR Center, Calgary, AB, Canada
Journal of Cardiovascular Magnetic Resonance 2009, 11(Suppl 1):O21
Aim: To better characterize delayed enhancement patterns in
the cardiac transplant population.
Background: Cardiac transplant patients experience significant
morbidity related to transplant vasculopathy and acute transplant
rejection, both of which can cause scarring of the myocardium.
Contrast enhanced cardiovascular magnetic resonance (CMR)
has the unique ability to visualize and quantify myocardial
scarring. It is well understood that myocardial infarctions
resulting from transplant vasculopathy adversely affect prognosis
and modify therapy. There is a growing body of evidence from
non-transplant disease states, that the presence of non-infarct
myocardial scar is also correlated to poor prognosis. Currently
there is very little data on the scarring patterns present in the
cardiac transplant population and it is our goal to better describe
this pathology.
Methods: Thirty-nine transplant patients underwent contrast
enhancement imaging at the time of routine myocardial biopsy at
two hospital centers in Alberta, Canada. Standard phase sensitive
inversion recovery sequences were used on commercially
available scanners (Siemens Avanto and Sonata, Siemens,
Erlangen, Germany). Delayed enhancement (DE) was evaluated
visually using CMR42 (Circle Canada Inc, Calgary, Canada)
software analysis package by two independent readers. DE had
to be cross-referenced in two orthogonal views. Disagreements
were settled by consensus. The extent of DE was assessed semi-
quantitatively by scoring each of the 17 myocardial segments
according to the proportion of DE in each segment (1 = 75%).
The scores of the 17 individual myocardial segments were added
together to give an aggregate DE burden.
Results: Three (8%) out of 39 patients scanned had to be
excluded due to poor image quality. There were seven women
(18%) and thirty two men (82%). Fifteen (45%) patients had grade
1R cellular rejection rejection, and two (6%) had grade 2R
Figure 1 (abstract O21)
Transmural lateral wall infarction (a) and Inferoapical infarction (b).
Journal of Cardiovascular Magnetic Resonance 2009, 11(Suppl 1) http://jcmr-online.com/supplements/11/S1
Page 17 of 316(page number not for citation purposes)
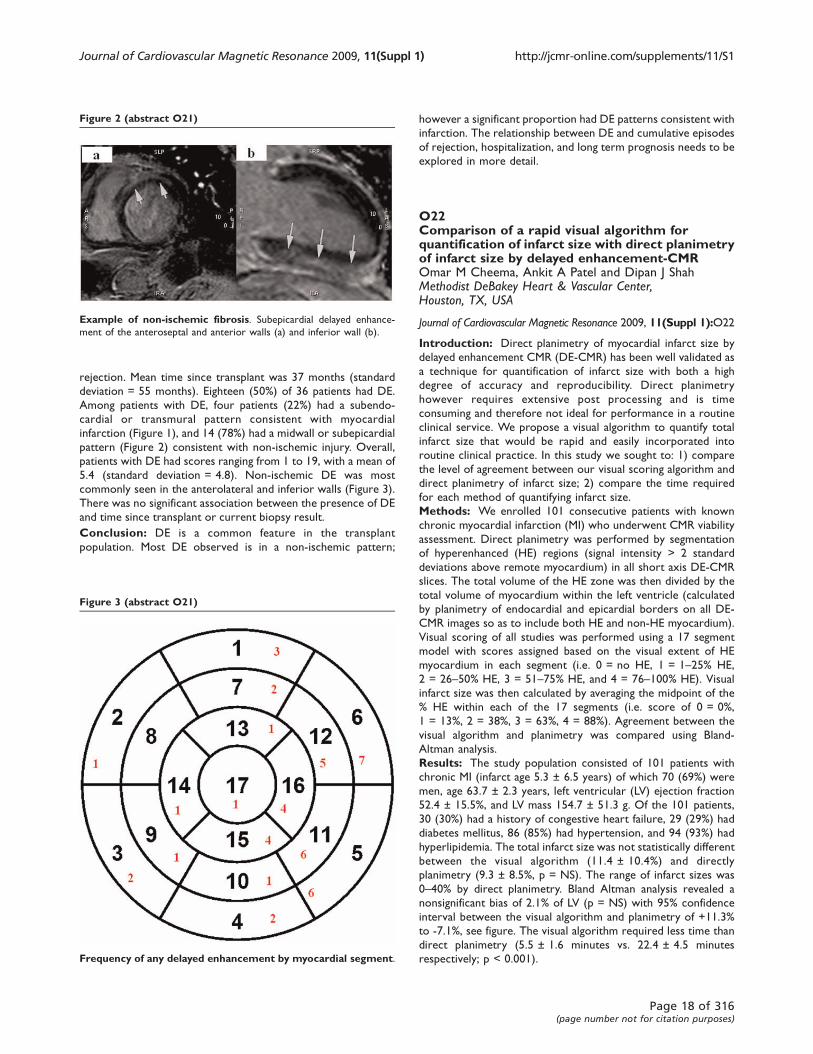
rejection. Mean time since transplant was 37 months (standard
deviation = 55 months). Eighteen (50%) of 36 patients had DE.
Among patients with DE, four patients (22%) had a subendo-
cardial or transmural pattern consistent with myocardial
infarction (Figure 1), and 14 (78%) had a midwall or subepicardial
pattern (Figure 2) consistent with non-ischemic injury. Overall,
patients with DE had scores ranging from 1 to 19, with a mean of
5.4 (standard deviation = 4.8). Non-ischemic DE was most
commonly seen in the anterolateral and inferior walls (Figure 3).
There was no significant association between the presence of DE
and time since transplant or current biopsy result.
Conclusion: DE is a common feature in the transplant
population. Most DE observed is in a non-ischemic pattern;
however a significant proportion had DE patterns consistent with
infarction. The relationship between DE and cumulative episodes
of rejection, hospitalization, and long term prognosis needs to be
explored in more detail.
O22Comparison of a rapid visual algorithm forquantification of infarct size with direct planimetryof infarct size by delayed enhancement-CMROmar M Cheema, Ankit A Patel and Dipan J ShahMethodist DeBakey Heart & Vascular Center,Houston, TX, USA
Journal of Cardiovascular Magnetic Resonance 2009, 11(Suppl 1):O22
Introduction: Direct planimetry of myocardial infarct size by
delayed enhancement CMR (DE-CMR) has been well validated as
a technique for quantification of infarct size with both a high
degree of accuracy and reproducibility. Direct planimetry
however requires extensive post processing and is time
consuming and therefore not ideal for performance in a routine
clinical service. We propose a visual algorithm to quantify total
infarct size that would be rapid and easily incorporated into
routine clinical practice. In this study we sought to: 1) compare
the level of agreement between our visual scoring algorithm and
direct planimetry of infarct size; 2) compare the time required
for each method of quantifying infarct size.
Methods: We enrolled 101 consecutive patients with known
chronic myocardial infarction (MI) who underwent CMR viability
assessment. Direct planimetry was performed by segmentation
of hyperenhanced (HE) regions (signal intensity > 2 standard
deviations above remote myocardium) in all short axis DE-CMR
slices. The total volume of the HE zone was then divided by the
total volume of myocardium within the left ventricle (calculated
by planimetry of endocardial and epicardial borders on all DE-
CMR images so as to include both HE and non-HE myocardium).
Visual scoring of all studies was performed using a 17 segment
model with scores assigned based on the visual extent of HE
myocardium in each segment (i.e. 0 = no HE, 1 = 1–25% HE,
2 = 26–50% HE, 3 = 51–75% HE, and 4 = 76–100% HE). Visual
infarct size was then calculated by averaging the midpoint of the
% HE within each of the 17 segments (i.e. score of 0 = 0%,
1 = 13%, 2 = 38%, 3 = 63%, 4 = 88%). Agreement between the
visual algorithm and planimetry was compared using Bland-
Altman analysis.
Results: The study population consisted of 101 patients with
chronic MI (infarct age 5.3 ± 6.5 years) of which 70 (69%) were
men, age 63.7 ± 2.3 years, left ventricular (LV) ejection fraction
52.4 ± 15.5%, and LV mass 154.7 ± 51.3 g. Of the 101 patients,
30 (30%) had a history of congestive heart failure, 29 (29%) had
diabetes mellitus, 86 (85%) had hypertension, and 94 (93%) had
hyperlipidemia. The total infarct size was not statistically different
between the visual algorithm (11.4 ± 10.4%) and directly
planimetry (9.3 ± 8.5%, p = NS). The range of infarct sizes was
0–40% by direct planimetry. Bland Altman analysis revealed a
nonsignificant bias of 2.1% of LV (p = NS) with 95% confidence
interval between the visual algorithm and planimetry of +11.3%
to -7.1%, see figure. The visual algorithm required less time than
direct planimetry (5.5 ± 1.6 minutes vs. 22.4 ± 4.5 minutes
respectively; p < 0.001).
Figure 2 (abstract O21)
Example of non-ischemic fibrosis. Subepicardial delayed enhance-
ment of the anteroseptal and anterior walls (a) and inferior wall (b).
Figure 3 (abstract O21)
Frequency of any delayed enhancement by myocardial segment.
Journal of Cardiovascular Magnetic Resonance 2009, 11(Suppl 1) http://jcmr-online.com/supplements/11/S1
Page 18 of 316(page number not for citation purposes)
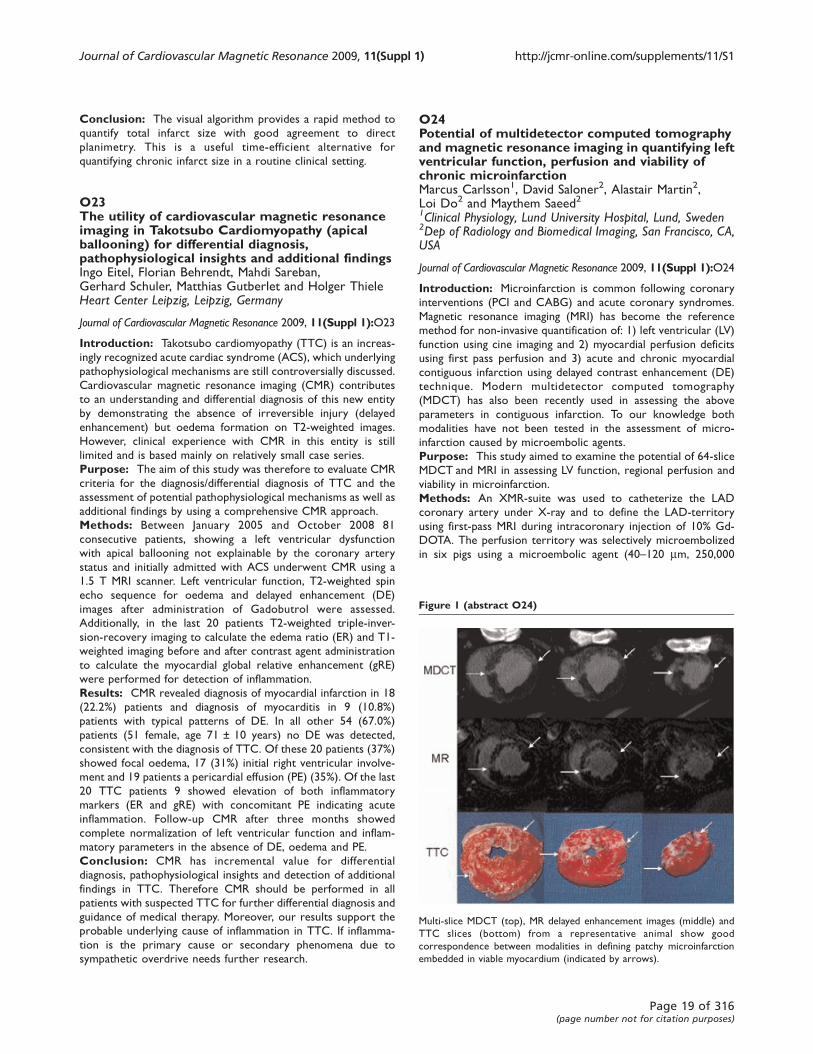
Conclusion: The visual algorithm provides a rapid method to
quantify total infarct size with good agreement to direct
planimetry. This is a useful time-efficient alternative for
quantifying chronic infarct size in a routine clinical setting.
O23The utility of cardiovascular magnetic resonanceimaging in Takotsubo Cardiomyopathy (apicalballooning) for differential diagnosis,pathophysiological insights and additional findingsIngo Eitel, Florian Behrendt, Mahdi Sareban,Gerhard Schuler, Matthias Gutberlet and Holger ThieleHeart Center Leipzig, Leipzig, Germany
Journal of Cardiovascular Magnetic Resonance 2009, 11(Suppl 1):O23
Introduction: Takotsubo cardiomyopathy (TTC) is an increas-
ingly recognized acute cardiac syndrome (ACS), which underlying
pathophysiological mechanisms are still controversially discussed.
Cardiovascular magnetic resonance imaging (CMR) contributes
to an understanding and differential diagnosis of this new entity
by demonstrating the absence of irreversible injury (delayed
enhancement) but oedema formation on T2-weighted images.
However, clinical experience with CMR in this entity is still
limited and is based mainly on relatively small case series.
Purpose: The aim of this study was therefore to evaluate CMR
criteria for the diagnosis/differential diagnosis of TTC and the
assessment of potential pathophysiological mechanisms as well as
additional findings by using a comprehensive CMR approach.
Methods: Between January 2005 and October 2008 81
consecutive patients, showing a left ventricular dysfunction
with apical ballooning not explainable by the coronary artery
status and initially admitted with ACS underwent CMR using a
1.5 T MRI scanner. Left ventricular function, T2-weighted spin
echo sequence for oedema and delayed enhancement (DE)
images after administration of Gadobutrol were assessed.
Additionally, in the last 20 patients T2-weighted triple-inver-
sion-recovery imaging to calculate the edema ratio (ER) and T1-
weighted imaging before and after contrast agent administration
to calculate the myocardial global relative enhancement (gRE)
were performed for detection of inflammation.
Results: CMR revealed diagnosis of myocardial infarction in 18
(22.2%) patients and diagnosis of myocarditis in 9 (10.8%)
patients with typical patterns of DE. In all other 54 (67.0%)
patients (51 female, age 71 ± 10 years) no DE was detected,
consistent with the diagnosis of TTC. Of these 20 patients (37%)
showed focal oedema, 17 (31%) initial right ventricular involve-
ment and 19 patients a pericardial effusion (PE) (35%). Of the last
20 TTC patients 9 showed elevation of both inflammatory
markers (ER and gRE) with concomitant PE indicating acute
inflammation. Follow-up CMR after three months showed
complete normalization of left ventricular function and inflam-
matory parameters in the absence of DE, oedema and PE.
Conclusion: CMR has incremental value for differential
diagnosis, pathophysiological insights and detection of additional
findings in TTC. Therefore CMR should be performed in all
patients with suspected TTC for further differential diagnosis and
guidance of medical therapy. Moreover, our results support the
probable underlying cause of inflammation in TTC. If inflamma-
tion is the primary cause or secondary phenomena due to
sympathetic overdrive needs further research.
O24Potential of multidetector computed tomographyand magnetic resonance imaging in quantifying leftventricular function, perfusion and viability ofchronic microinfarctionMarcus Carlsson1, David Saloner2, Alastair Martin2,Loi Do2 and Maythem Saeed21Clinical Physiology, Lund University Hospital, Lund, Sweden2Dep of Radiology and Biomedical Imaging, San Francisco, CA,USA
Journal of Cardiovascular Magnetic Resonance 2009, 11(Suppl 1):O24
Introduction: Microinfarction is common following coronary
interventions (PCI and CABG) and acute coronary syndromes.
Magnetic resonance imaging (MRI) has become the reference
method for non-invasive quantification of: 1) left ventricular (LV)
function using cine imaging and 2) myocardial perfusion deficits
using first pass perfusion and 3) acute and chronic myocardial
contiguous infarction using delayed contrast enhancement (DE)
technique. Modern multidetector computed tomography
(MDCT) has also been recently used in assessing the above
parameters in contiguous infarction. To our knowledge both
modalities have not been tested in the assessment of micro-
infarction caused by microembolic agents.
Purpose: This study aimed to examine the potential of 64-slice
MDCT and MRI in assessing LV function, regional perfusion and
viability in microinfarction.
Methods: An XMR-suite was used to catheterize the LAD
coronary artery under X-ray and to define the LAD-territory
using first-pass MRI during intracoronary injection of 10% Gd-
DOTA. The perfusion territory was selectively microembolized
in six pigs using a microembolic agent (40–120 mm, 250,000
Figure 1 (abstract O24)
Multi-slice MDCT (top), MR delayed enhancement images (middle) and
TTC slices (bottom) from a representative animal show good
correspondence between modalities in defining patchy microinfarction
embedded in viable myocardium (indicated by arrows).
Journal of Cardiovascular Magnetic Resonance 2009, 11(Suppl 1) http://jcmr-online.com/supplements/11/S1
Page 19 of 316(page number not for citation purposes)

count). LV function (cine imaging), perfusion (first-pass imaging)
and viability (DE imaging) were determined 7–8 weeks after
microembolization using MRI followed by MDCT (5 days later).
Histochemical staining (TTC) was used as golden standard for
quantification of microinfarction. Figure 1.
Results: The LAD-territory was 32.4 ± 3.8% of the LV mass.
There was no significant difference between MR and MDCT
measurements of systolic wall thickening. Global LV function did
not differ between MRI (end diastolic volume: 92 ± 8 ml, end-
systolic volume 48 ± 5 ml and ejection fraction: 47 ± 3%) and
MDCT (96 ± 8 ml, 49 ± 3 ml, 49 ± 2%, respectively). Both MRI
and MDCT showed a decrease in function in the microembolized
territory and an increased contractility in remote myocardium.
There was no difference in the quantification of systolic wall
thickening (radial strain) between the methods (P = ns for all
segments, bias 0.3 ± 21.9%). MRI, but not MDCT, detected a
perfusion deficit in the microembolized territory (significant
decrease in max upslope and maximum signal intensity).
Microinfarction size did not differ between MDCT (6.3 ± 0.8%
LV), MRI (6.6 ± 0.5%LV) or TTC (7.0 ± 0.6%LV). Bias (Bland-
Altman test) for quantifying microinfarction on MDCT was -
0.6 ± 1.9%LV compared to TTC and for MRI -0.4 ± 1.3%LV
compared to TTC.
Conclusion: Modern MDCT and MRI techniques have the
sensitivity to: 1) visualize and quantify chronic microinfarction
and 2) demonstrate regional LV dysfunction. MRI, but not MDCT,
has the sensitivity for detecting small changes in regional
perfusion of chronic microinfarction. Close agreements were
found between MDCT and MRI in measuring regional and global
LV function. The results of this study suggest that MDCTand MRI
can be used for detecting the consequences of microinfarction
following coronary interventions and evaluating the efficacy of
new therapies and devices designed to prevent microemboliza-
tion.
AcknowledgementsThis study was supported by grant RO1HL07295 from NIH.
O25Co-localization of areas of delayed mechanicalactivation and areas of myocardial scarJana G Delfino1, Brandon K Fornwalt1, Calvin R Kurz2,Jack A Talsma1 and John N Oshinski31Emory University, Atlanta, GA, USA2Georgia Institute of Technology, Atlanta, GA, USA3Emory University/Georgia Institute of Technology, Atlanta,GA, USA
Journal of Cardiovascular Magnetic Resonance 2009, 11(Suppl 1):O25
Objective: To determine the overlap between the regions of
delayed mechanical activation and regions of myocardial scar
tissue.
Introduction: The greatest benefit from Cardiac Resynchro-
nization Therapy (CRT) is likely achieved when the LV pacing lead
is placed in the area with the greatest mechanical activation delay
[1]. However, in patients with ischemic heart failure, the region
with the greatest mechanical activation delay may correspond to
an area of myocardial scar. Placing the pacing leads in areas of
scar tissue will result in nonresponse to CRT[2]. The co-
localization of areas of delayed mechanical activation and
myocardial scar in patients with previous MI is not known.
Methods: 16 patients with a prior history of myocardial
infarction (MI) were studied six-months post infarct. Cine SSFP
images were obtained in the 2-chamber, 4-chamber, and short
axis orientations. Following a double-dose injection (0.2 mmol/
kg) of Gd-DPTA, delayed contrast enhancement (DCE) images
were obtained at the same locations as the cine SSFP images.
Mechanical activation delays were calculated from the cine SSFP
images. Radial displacement curves showing movement of the
endocardial border toward the LV center of mass were
calculated for 360 chords around each short axis slice.
Displacement curves were averaged throughout the entire
myocardium to generate a global displacement curve. Cross
correlation analysis between the global curve and the curve for
each chord was done to determine the mechanical activation
delay. A cross correlation delay of 31 msec was used as the
threshold to determine mechanical activation delay[3]. Mechan-
ical activation delay information for the entire myocardium was
mapped onto the standardized AHA Bullseye model.
Endocardial and epicardial borders were traced on the short axis
DCE images. A separate region of interest was drawn around the
area of infarct. Each slice of the myocardium was resampled at
360 chords around the heart, and each chord was assigned a
value between 0 and 1 depending on the scar burden at that
Figure 1 (abstract O25)
An example patient showing regions of >50% scar tissue, regional
mechanical activation delay, and regions of overlap. In this example, 32%
of the region of delayed mechanical activation was also a region of >50%
scar tissue.
Journal of Cardiovascular Magnetic Resonance 2009, 11(Suppl 1) http://jcmr-online.com/supplements/11/S1
Page 20 of 316(page number not for citation purposes)
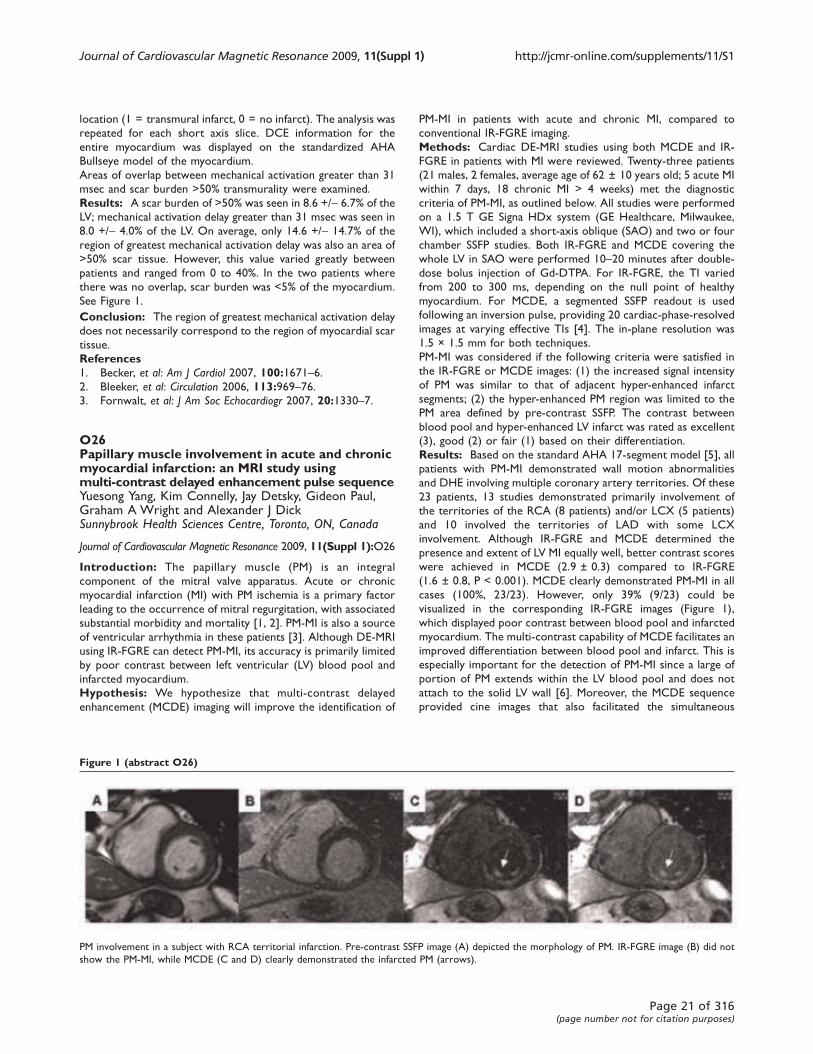
location (1 = transmural infarct, 0 = no infarct). The analysis was
repeated for each short axis slice. DCE information for the
entire myocardium was displayed on the standardized AHA
Bullseye model of the myocardium.
Areas of overlap between mechanical activation greater than 31
msec and scar burden >50% transmurality were examined.
Results: A scar burden of >50% was seen in 8.6 +/- 6.7% of the
LV; mechanical activation delay greater than 31 msec was seen in
8.0 +/- 4.0% of the LV. On average, only 14.6 +/- 14.7% of the
region of greatest mechanical activation delay was also an area of
>50% scar tissue. However, this value varied greatly between
patients and ranged from 0 to 40%. In the two patients where
there was no overlap, scar burden was <5% of the myocardium.
See Figure 1.
Conclusion: The region of greatest mechanical activation delay
does not necessarily correspond to the region of myocardial scar
tissue.
References1. Becker, et al: Am J Cardiol 2007, 100:1671–6.2. Bleeker, et al: Circulation 2006, 113:969–76.3. Fornwalt, et al: J Am Soc Echocardiogr 2007, 20:1330–7.
O26Papillary muscle involvement in acute and chronicmyocardial infarction: an MRI study usingmulti-contrast delayed enhancement pulse sequenceYuesong Yang, Kim Connelly, Jay Detsky, Gideon Paul,Graham A Wright and Alexander J DickSunnybrook Health Sciences Centre, Toronto, ON, Canada
Journal of Cardiovascular Magnetic Resonance 2009, 11(Suppl 1):O26
Introduction: The papillary muscle (PM) is an integral
component of the mitral valve apparatus. Acute or chronic
myocardial infarction (MI) with PM ischemia is a primary factor
leading to the occurrence of mitral regurgitation, with associated
substantial morbidity and mortality [1, 2]. PM-MI is also a source
of ventricular arrhythmia in these patients [3]. Although DE-MRI
using IR-FGRE can detect PM-MI, its accuracy is primarily limited
by poor contrast between left ventricular (LV) blood pool and
infarcted myocardium.
Hypothesis: We hypothesize that multi-contrast delayed
enhancement (MCDE) imaging will improve the identification of
PM-MI in patients with acute and chronic MI, compared to
conventional IR-FGRE imaging.
Methods: Cardiac DE-MRI studies using both MCDE and IR-
FGRE in patients with MI were reviewed. Twenty-three patients
(21 males, 2 females, average age of 62 ± 10 years old; 5 acute MI
within 7 days, 18 chronic MI > 4 weeks) met the diagnostic
criteria of PM-MI, as outlined below. All studies were performed
on a 1.5 T GE Signa HDx system (GE Healthcare, Milwaukee,
WI), which included a short-axis oblique (SAO) and two or four
chamber SSFP studies. Both IR-FGRE and MCDE covering the
whole LV in SAO were performed 10–20 minutes after double-
dose bolus injection of Gd-DTPA. For IR-FGRE, the TI varied
from 200 to 300 ms, depending on the null point of healthy
myocardium. For MCDE, a segmented SSFP readout is used
following an inversion pulse, providing 20 cardiac-phase-resolved
images at varying effective TIs [4]. The in-plane resolution was
1.5 × 1.5 mm for both techniques.
PM-MI was considered if the following criteria were satisfied in
the IR-FGRE or MCDE images: (1) the increased signal intensity
of PM was similar to that of adjacent hyper-enhanced infarct
segments; (2) the hyper-enhanced PM region was limited to the
PM area defined by pre-contrast SSFP. The contrast between
blood pool and hyper-enhanced LV infarct was rated as excellent
(3), good (2) or fair (1) based on their differentiation.
Results: Based on the standard AHA 17-segment model [5], all
patients with PM-MI demonstrated wall motion abnormalities
and DHE involving multiple coronary artery territories. Of these
23 patients, 13 studies demonstrated primarily involvement of
the territories of the RCA (8 patients) and/or LCX (5 patients)
and 10 involved the territories of LAD with some LCX
involvement. Although IR-FGRE and MCDE determined the
presence and extent of LV MI equally well, better contrast scores
were achieved in MCDE (2.9 ± 0.3) compared to IR-FGRE
(1.6 ± 0.8, P < 0.001). MCDE clearly demonstrated PM-MI in all
cases (100%, 23/23). However, only 39% (9/23) could be
visualized in the corresponding IR-FGRE images (Figure 1),
which displayed poor contrast between blood pool and infarcted
myocardium. The multi-contrast capability of MCDE facilitates an
improved differentiation between blood pool and infarct. This is
especially important for the detection of PM-MI since a large of
portion of PM extends within the LV blood pool and does not
attach to the solid LV wall [6]. Moreover, the MCDE sequence
provided cine images that also facilitated the simultaneous
Figure 1 (abstract O26)
PM involvement in a subject with RCA territorial infarction. Pre-contrast SSFP image (A) depicted the morphology of PM. IR-FGRE image (B) did not
show the PM-MI, while MCDE (C and D) clearly demonstrated the infarcted PM (arrows).
Journal of Cardiovascular Magnetic Resonance 2009, 11(Suppl 1) http://jcmr-online.com/supplements/11/S1
Page 21 of 316(page number not for citation purposes)
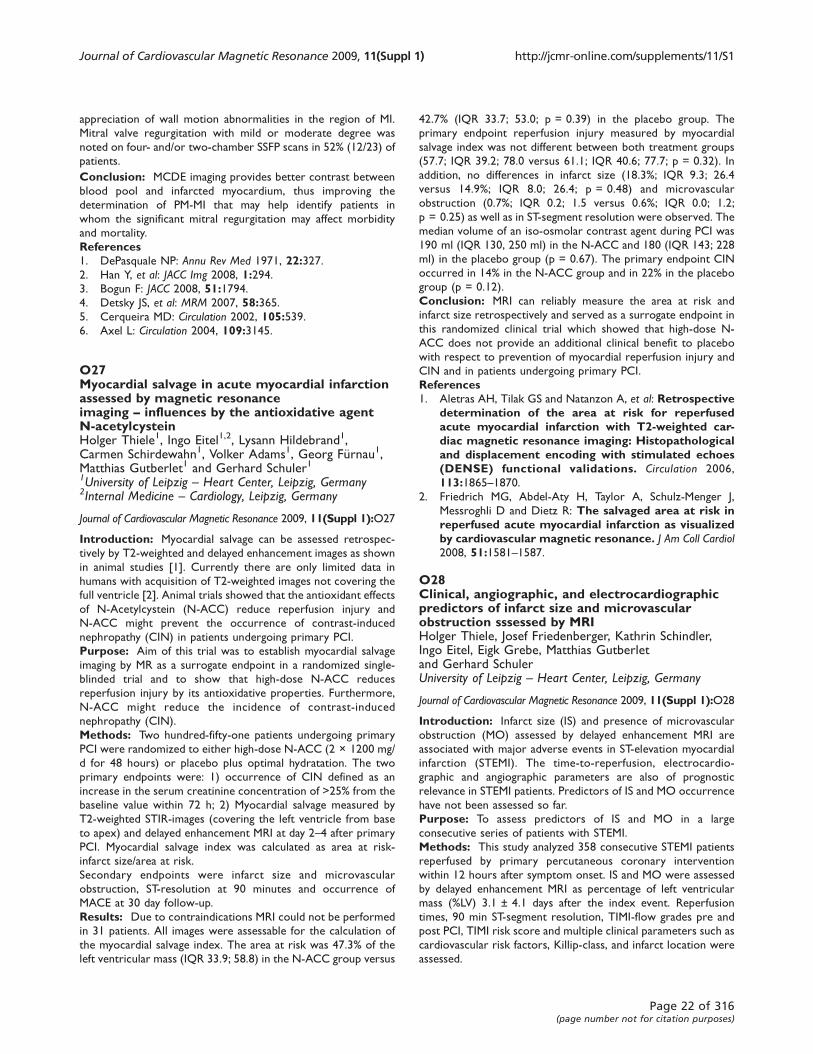
appreciation of wall motion abnormalities in the region of MI.
Mitral valve regurgitation with mild or moderate degree was
noted on four- and/or two-chamber SSFP scans in 52% (12/23) of
patients.
Conclusion: MCDE imaging provides better contrast between
blood pool and infarcted myocardium, thus improving the
determination of PM-MI that may help identify patients in
whom the significant mitral regurgitation may affect morbidity
and mortality.
References1. DePasquale NP: Annu Rev Med 1971, 22:327.
2. Han Y, et al: JACC Img 2008, 1:294.3. Bogun F: JACC 2008, 51:1794.4. Detsky JS, et al: MRM 2007, 58:365.
5. Cerqueira MD: Circulation 2002, 105:539.6. Axel L: Circulation 2004, 109:3145.
O27Myocardial salvage in acute myocardial infarctionassessed by magnetic resonanceimaging – influences by the antioxidative agentN-acetylcysteinHolger Thiele1, Ingo Eitel1,2, Lysann Hildebrand1,Carmen Schirdewahn1, Volker Adams1, Georg Fürnau1,Matthias Gutberlet1 and Gerhard Schuler11University of Leipzig – Heart Center, Leipzig, Germany2Internal Medicine – Cardiology, Leipzig, Germany
Journal of Cardiovascular Magnetic Resonance 2009, 11(Suppl 1):O27
Introduction: Myocardial salvage can be assessed retrospec-
tively by T2-weighted and delayed enhancement images as shown
in animal studies [1]. Currently there are only limited data in
humans with acquisition of T2-weighted images not covering the
full ventricle [2]. Animal trials showed that the antioxidant effects
of N-Acetylcystein (N-ACC) reduce reperfusion injury and
N-ACC might prevent the occurrence of contrast-induced
nephropathy (CIN) in patients undergoing primary PCI.
Purpose: Aim of this trial was to establish myocardial salvage
imaging by MR as a surrogate endpoint in a randomized single-
blinded trial and to show that high-dose N-ACC reduces
reperfusion injury by its antioxidative properties. Furthermore,
N-ACC might reduce the incidence of contrast-induced
nephropathy (CIN).
Methods: Two hundred-fifty-one patients undergoing primary
PCI were randomized to either high-dose N-ACC (2 × 1200 mg/
d for 48 hours) or placebo plus optimal hydratation. The two
primary endpoints were: 1) occurrence of CIN defined as an
increase in the serum creatinine concentration of >25% from the
baseline value within 72 h; 2) Myocardial salvage measured by
T2-weighted STIR-images (covering the left ventricle from base
to apex) and delayed enhancement MRI at day 2–4 after primary
PCI. Myocardial salvage index was calculated as area at risk-
infarct size/area at risk.
Secondary endpoints were infarct size and microvascular
obstruction, ST-resolution at 90 minutes and occurrence of
MACE at 30 day follow-up.
Results: Due to contraindications MRI could not be performed
in 31 patients. All images were assessable for the calculation of
the myocardial salvage index. The area at risk was 47.3% of the
left ventricular mass (IQR 33.9; 58.8) in the N-ACC group versus
42.7% (IQR 33.7; 53.0; p = 0.39) in the placebo group. The
primary endpoint reperfusion injury measured by myocardial
salvage index was not different between both treatment groups
(57.7; IQR 39.2; 78.0 versus 61.1; IQR 40.6; 77.7; p = 0.32). In
addition, no differences in infarct size (18.3%; IQR 9.3; 26.4
versus 14.9%; IQR 8.0; 26.4; p = 0.48) and microvascular
obstruction (0.7%; IQR 0.2; 1.5 versus 0.6%; IQR 0.0; 1.2;
p = 0.25) as well as in ST-segment resolution were observed. The
median volume of an iso-osmolar contrast agent during PCI was
190 ml (IQR 130, 250 ml) in the N-ACC and 180 (IQR 143; 228
ml) in the placebo group (p = 0.67). The primary endpoint CIN
occurred in 14% in the N-ACC group and in 22% in the placebo
group (p = 0.12).
Conclusion: MRI can reliably measure the area at risk and
infarct size retrospectively and served as a surrogate endpoint in
this randomized clinical trial which showed that high-dose N-
ACC does not provide an additional clinical benefit to placebo
with respect to prevention of myocardial reperfusion injury and
CIN and in patients undergoing primary PCI.
References1. Aletras AH, Tilak GS and Natanzon A, et al: Retrospective
determination of the area at risk for reperfusedacute myocardial infarction with T2-weighted car-diac magnetic resonance imaging: Histopathologicaland displacement encoding with stimulated echoes(DENSE) functional validations. Circulation 2006,
113:1865–1870.2. Friedrich MG, Abdel-Aty H, Taylor A, Schulz-Menger J,
Messroghli D and Dietz R: The salvaged area at risk inreperfused acute myocardial infarction as visualizedby cardiovascular magnetic resonance. J Am Coll Cardiol2008, 51:1581–1587.
O28Clinical, angiographic, and electrocardiographicpredictors of infarct size and microvascularobstruction sssessed by MRIHolger Thiele, Josef Friedenberger, Kathrin Schindler,Ingo Eitel, Eigk Grebe, Matthias Gutberletand Gerhard SchulerUniversity of Leipzig – Heart Center, Leipzig, Germany
Journal of Cardiovascular Magnetic Resonance 2009, 11(Suppl 1):O28
Introduction: Infarct size (IS) and presence of microvascular
obstruction (MO) assessed by delayed enhancement MRI are
associated with major adverse events in ST-elevation myocardial
infarction (STEMI). The time-to-reperfusion, electrocardio-
graphic and angiographic parameters are also of prognostic
relevance in STEMI patients. Predictors of IS and MO occurrence
have not been assessed so far.
Purpose: To assess predictors of IS and MO in a large
consecutive series of patients with STEMI.
Methods: This study analyzed 358 consecutive STEMI patients
reperfused by primary percutaneous coronary intervention
within 12 hours after symptom onset. IS and MO were assessed
by delayed enhancement MRI as percentage of left ventricular
mass (%LV) 3.1 ± 4.1 days after the index event. Reperfusion
times, 90 min ST-segment resolution, TIMI-flow grades pre and
post PCI, TIMI risk score and multiple clinical parameters such as
cardiovascular risk factors, Killip-class, and infarct location were
assessed.
Journal of Cardiovascular Magnetic Resonance 2009, 11(Suppl 1) http://jcmr-online.com/supplements/11/S1
Page 22 of 316(page number not for citation purposes)

Results: In patients with pre PCI TIMI flow 0–1 IS was
significantly higher with 24 ± 14% versus 15 ± 14% in TIMI-
flow 2–3 (p < 0.001). Similarly, the extent of MO occurrence
was affected by the pre PCI TIMI flow. The post PCI TIMI flow
had no significant effect on final IS and MO occurrence. In
patients with TIMI flow <3 IS was 28 ± 11% versus 20 ± 12% in
TIMI-flow = 3 (p = 0.05). The ST-segment resolution correlated
inversely with final IS and presence of MO (IS r = -0.34,
p = 0.003; MO r = -0.31, p = 0.004). Anterior MI IS was
25 ± 16% (MO 7.8 ± 9.8%) versus 17 ± 12% (MO 3.8 ± 4.7%)
in inferior MI (p = 0.002 IS; p = 0.003 MO). According to sixtiles
of time-to-reperfusion, there was no interaction between time-
to-reperfusion and IS and extent of MO even when restricted to
patients with pre PCI TIMI flow 0–1. In a multivariable model the
strongest predictors of IS and MO were pre-PCI TIMI-flow,
infarct location, Killip class, and 90 minute ST-segment resolution
(p < 0.05 for all).
Conclusion: The pre-PCI TIMI flow, infarct location, Killip
class and ST-segment resolution are the strongest predictors of IS
and extent of MO. This may explain why these clinical,
angiographic and electrocardiographic measures are associated
with survival. In contrast to other studies the time-to-reperfu-
sion did not affect IS and MO, which might be a selection bias, as
patients with larger infarctions will be treated earlier.
O29Myocardium at risk and myocardial salvage afteracute infarction in humans; quantification bymagnetic resonance imagingMarcus Carlsson1, Joey Ubachs1, Einar Heiberg1,Erik Hedstrom1, Stefan Jovinge2 and Hakan Arheden11Clinical Physiology, Lund University Hospital, Lund, Sweden2Cardiology, Lund University Hospital, Lund, Sweden
Journal of Cardiovascular Magnetic Resonance 2009, 11(Suppl 1):O29
Introduction: To assess reperfusion therapy, it is necessary to
determine how much myocardium is salvaged by measuring the
final infarct size in relation to the initial myocardium at risk (MaR)
of the left ventricle (LV). T2 weighted MRI has recently been
shown to be able to identify MaR but has not been validated
against an independent method in humans.
Purpose: To validate myocardium at risk by T2 weighted MRI
(T2-STIR) over time, compared to perfusion SPECT in patients
with ST-elevation myocardial infarction (STEMI), and, to assess
the amount of salvaged myocardium after 1 week.
Methods: Sixteen patients with first-time STEMI received99mTc tetrofosmin prior to primary percutaneous coronary
intervention and SPECTwas performed within 4 hours to identify
MaR. MRI was performed on a 1.5 T Siemens Vision (5 patients)
or Philips Intera. T2-STIR was at 1 day, 1 week, 6 weeks and
6 months. Image parameters for T2-STIR were: TE, 43 ms
(Siemens), or 100 ms (Philips); TR, 2 heart beats; NEX, 2; image
resolution, 1.5 × 1.5 mm; slice thickness, 10 mm (Siemens) or 8
mm with a slice gap of 2 mm (Philips). At 1 week, patients were
injected with a gadolinium-based contrast agent for quantification
of infarct size on delayed contrast enhanced (DE) MRI. T2-STIR
and DE MR images were acquired in the short-axis view, covering
the left ventricle from the base to apex.
Results: MaR at occlusion on SPECT was 33 ± 10% of the LV.
MaR on T2-STIR did not differ from SPECT, at day 1 (29 ± 7%,
p = 0.74), or week 1 (31 ± 6%, p = 0.23) but declined at week 6
(10 ± 12%, p = 0.03 vs. 1 week) and month 6 (4 ± 11%, p = 0.02
vs. 1 week). The difference between SPECT and T2-STIR at
1 week was -2.3 ± 5.7%. Both modalities identified MaR in the
same perfusion territory and in concordance with coronary
angiography. Final infarct size was 8 ± 7% and salvage was
75 ± 19% of MaR. Figure 1.
Conclusion: This is the first study to validate T2-STIR for
quantification of MaR against an independent method (SPECT) in
patients with acute ST-elevation myocardial infarction after
reperfusion therapy. The results demonstrate that T2-STIR
performed up to one week after reperfusion can accurately
determine myocardium at risk as it was before opening of the
occluded artery. The result of reperfusion therapy can therefore
be assessed clinically by calculating myocardial salvage as the
difference between myocardium at risk and final infarct size using
MR imaging.
O30Impact of myocardial hemorrhage on leftventricular function and remodeling in patientswith reperfused acute myocardial infarctionJavier Ganame, Giancarlo Messalli, Steven Dymarkowski,Frank E Rademakers, Walter Desmet, Frans Van de Werfand Jan BogaertUniversity Hospitals Leuven, Leuven, Belgium
Journal of Cardiovascular Magnetic Resonance 2009, 11(Suppl 1):O30
Background: Myocardial hemorrhage is a common complica-
tion following reperfusion of ST-segment-elevation acute myo-
cardial infarction (MI). Although its presence is clearly related to
infarct size, at present it is unknown whether post-reperfusion
hemorrhage affects left ventricular (LV) remodeling. Magnetic
resonance imaging (MRI) can be used to identify myocardial
infarction, myocardial hemorrhage and microvascular obstruc-
tion (MVO), as well as measure LV volumes, function and mass.
Methods and results: Ninety-eight patients (14 females,
84 males, mean age: 57.7 years) with MI reperfused with
percutaneous coronary intervention (PCI) were studied in the
first week and at 4 months after the event. T2-weighted MRI was
used to differentiate between hemorrhagic (i.e., hypo-intense
core) and non-hemorrhagic infarcts (i.e., hyper-intense core).
MVO and infarct size were determined on contrast-enhanced
MRI, while cine MRI was used to quantify LV volumes, mass and
function. Twenty-four patients (25%) presented with a hemor-
rhagic MI. In the acute phase, presence of myocardial hemor-
rhage was related to larger LV end-diastolic and end-systolic
volumes and infarct transmurality, lower LV ejection fraction as
Figure 1 (abstract O29)
Journal of Cardiovascular Magnetic Resonance 2009, 11(Suppl 1) http://jcmr-online.com/supplements/11/S1
Page 23 of 316(page number not for citation purposes)

well as lower systolic wall thickening in the infarcted myocardium
(all p-values < 0.001). Infarct size, size of area at risk and size of
MVO were significantly larger in patients with hermorrhagic MI.
At 4 months, a significant improvement in LV ejection fraction
in patients with non-hemorrhagic MI was seen (baseline:
49.3 ± 7.9% vs. 4 months: 52.9 ± 8.1%; p < 0.01). LV ejection
fraction did, however, not improve in patients with hemorrhagic
MI (baseline: 42.8 ± 6.5% vs. 4 months: 41.9 ± 8.5%; p = 0.68).
Multivariate analysis showed myocardial hemorrhage to be an
independent predictor of adverse LV remodeling at 4 months
(defined as an increase in LV end-systolic volume). This pattern
was independent of initial infarct size (See Table 1).
Conclusion: Myocardial hemorrhage, the presence of which
can easily be detected with T2-weighted MRI, is a frequent
complication after successful myocardial reperfusion, and an
independent predictor of adverse LV remodeling regardless of
initial infarct size.
O31Strain-encoded imaging for prediction offunctional recovery in patients after acutemyocardial infarctionMirja Neizel1, Grigorios Korosoglou2, Tim Schaeufele2,Dirk Lossnitzer2, Harald P Kuehl1, Evangelos Giannitsis2,Malte Kelm1, Hugo A Katus2, Nael F Osman3
and Henning Steen21University Hospital Aachen, Aachen, Germany2University Hospital Heidelberg, Heidelberg, Germany3Johns Hopkins University, Baltimore, MD, USA
Journal of Cardiovascular Magnetic Resonance 2009, 11(Suppl 1):O31
Introduction: Evaluation of reversible dysfunction after acute
myocardial infarction (AMI) has important therapeutic and
prognostic implications. The role of impaired systolic function
for evaluation of functional recovery has been extensively
investigated. However, whether impaired regional diastolic
function after AMI also has predictive implications has not
been investigated so far in humans using magnetic resonance
imaging (MRI). Recently, Strain-Encoded (SENC) Imaging was
introduced as a new MR-technique to evaluate myocardial strain
and strain rate. SENC, compared to MR tagging, is a method that
does not suffer that much from diastolic fading. Therefore, SENC
is an ideal MR-method to determine not only regional systolic but
also regional diastolic function.
Purpose: To evaluate the predictive value of regional systolic
and diastolic function for improvement of regional myocardial
function in patients after AMI.
Methods: MRI (1.5 T, Achieva, Philips, the Netherlands) was
performed to 23 consecutive patients (mean age 57 ± 10) 3 ± 1
days after successfully reperfused ST-elevation-myocardial infarc-
tion and at a follow-up of 6 ± 2 month. 10 age-matched
volunteers served as controls. True cine sequences of 3 long-
axis views (2-,3- and 4-chamber) and a short-axis (SA) view
covering the ventricle from apex to basis were acquired using a
Steady State Free Precession (SSFP) sequence. After that, SENC
cine images were acquired on the same long-axis planes to
measure circumferential strains. Finally, using the same plane
Table 1 (abstract O30) Results of multiple linear regression ofleft ventricular remodeling
Predictors of end point 95% CI R2 F value p value
Hemorrhagic MI 0.15–0.31 0.17 20.19 <0.001
Infarct size at baseline 20.8–27.7 0.16 18.11 0.001
Microvascular obstruction 5.0–9.3 0.12 13.13 0.001
Maximum troponin I 91.9–142.6 0.10 10.75 0.001
Size of area at risk 37.0–46.5 0.09 9.12 0.003
LV mass at baseline 118.6–131.4 0.02 2.31 0.132
Percent MI transmurality 78.6–87.2 0.03 3.39 0.068
Infarct location 0.37–0.58 <0.01 0.41 0.892
Time to PCI 241.1–305.6 <0.01 0.02 0.874
Figure 1 (abstract O31)
Colour coded SENC-image of a patient with transmural myocardial
infarction with corresponding strain-curve.
Figure 2 (abstract O31)
Receiver-operating characteristic (ROC) curve demonstrates that
diastolic strain rate assessed with Strain-Encoded Imaging is more
sensitive than peak systolic strain for prediction of functional recovery
(diastolic strain rate AUC 0.77 (0.67–0.86); peak systolic strain AUC 0.64
(0.53–0.74); p < 0.05).
Journal of Cardiovascular Magnetic Resonance 2009, 11(Suppl 1) http://jcmr-online.com/supplements/11/S1
Page 24 of 316(page number not for citation purposes)
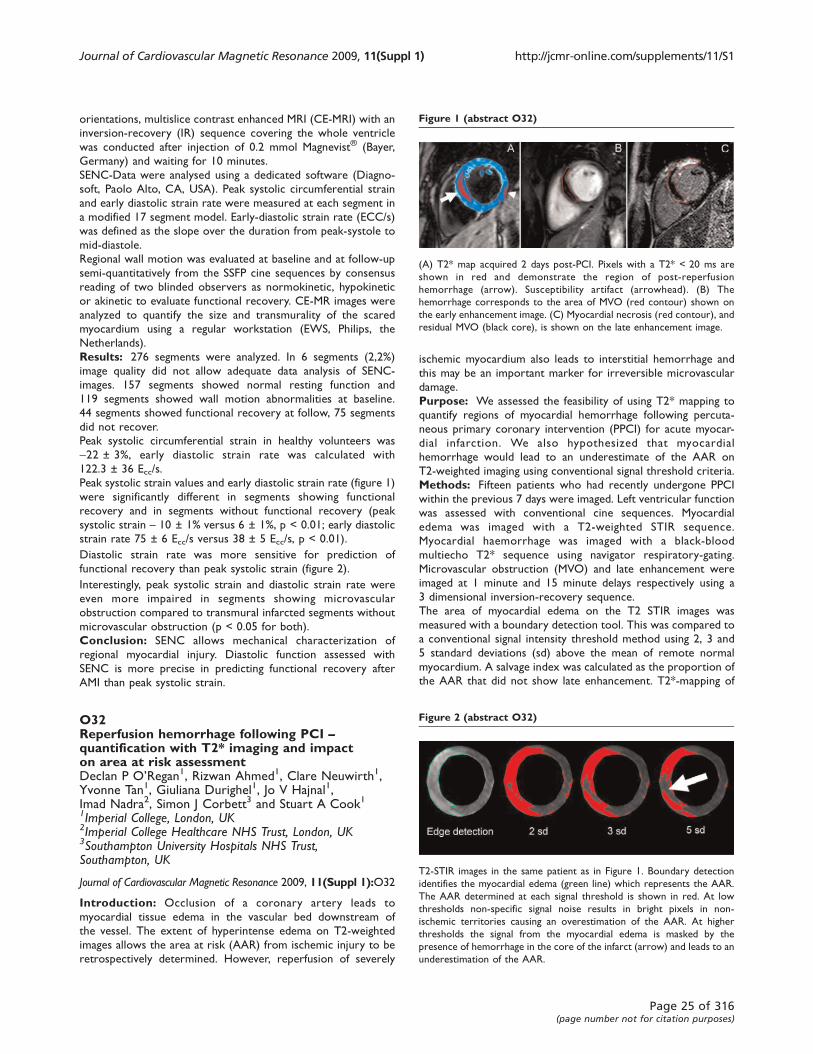
orientations, multislice contrast enhanced MRI (CE-MRI) with an
inversion-recovery (IR) sequence covering the whole ventricle
was conducted after injection of 0.2 mmol Magnevist® (Bayer,
Germany) and waiting for 10 minutes.
SENC-Data were analysed using a dedicated software (Diagno-
soft, Paolo Alto, CA, USA). Peak systolic circumferential strain
and early diastolic strain rate were measured at each segment in
a modified 17 segment model. Early-diastolic strain rate (ECC/s)
was defined as the slope over the duration from peak-systole to
mid-diastole.
Regional wall motion was evaluated at baseline and at follow-up
semi-quantitatively from the SSFP cine sequences by consensus
reading of two blinded observers as normokinetic, hypokinetic
or akinetic to evaluate functional recovery. CE-MR images were
analyzed to quantify the size and transmurality of the scared
myocardium using a regular workstation (EWS, Philips, the
Netherlands).
Results: 276 segments were analyzed. In 6 segments (2,2%)
image quality did not allow adequate data analysis of SENC-
images. 157 segments showed normal resting function and
119 segments showed wall motion abnormalities at baseline.
44 segments showed functional recovery at follow, 75 segments
did not recover.
Peak systolic circumferential strain in healthy volunteers was
-22 ± 3%, early diastolic strain rate was calculated with
122.3 ± 36 Ecc/s.
Peak systolic strain values and early diastolic strain rate (figure 1)
were significantly different in segments showing functional
recovery and in segments without functional recovery (peak
systolic strain – 10 ± 1% versus 6 ± 1%, p < 0.01; early diastolic
strain rate 75 ± 6 Ecc/s versus 38 ± 5 Ecc/s, p < 0.01).
Diastolic strain rate was more sensitive for prediction of
functional recovery than peak systolic strain (figure 2).
Interestingly, peak systolic strain and diastolic strain rate were
even more impaired in segments showing microvascular
obstruction compared to transmural infarcted segments without
microvascular obstruction (p < 0.05 for both).
Conclusion: SENC allows mechanical characterization of
regional myocardial injury. Diastolic function assessed with
SENC is more precise in predicting functional recovery after
AMI than peak systolic strain.
O32Reperfusion hemorrhage following PCI –quantification with T2* imaging and impacton area at risk assessmentDeclan P O’Regan1, Rizwan Ahmed1, Clare Neuwirth1,Yvonne Tan1, Giuliana Durighel1, Jo V Hajnal1,Imad Nadra2, Simon J Corbett3 and Stuart A Cook11Imperial College, London, UK2Imperial College Healthcare NHS Trust, London, UK3Southampton University Hospitals NHS Trust,Southampton, UK
Journal of Cardiovascular Magnetic Resonance 2009, 11(Suppl 1):O32
Introduction: Occlusion of a coronary artery leads to
myocardial tissue edema in the vascular bed downstream of
the vessel. The extent of hyperintense edema on T2-weighted
images allows the area at risk (AAR) from ischemic injury to be
retrospectively determined. However, reperfusion of severely
ischemic myocardium also leads to interstitial hemorrhage and
this may be an important marker for irreversible microvascular
damage.
Purpose: We assessed the feasibility of using T2* mapping to
quantify regions of myocardial hemorrhage following percuta-
neous primary coronary intervention (PPCI) for acute myocar-
dial infarction. We also hypothesized that myocardial
hemorrhage would lead to an underestimate of the AAR on
T2-weighted imaging using conventional signal threshold criteria.
Methods: Fifteen patients who had recently undergone PPCI
within the previous 7 days were imaged. Left ventricular function
was assessed with conventional cine sequences. Myocardial
edema was imaged with a T2-weighted STIR sequence.
Myocardial haemorrhage was imaged with a black-blood
multiecho T2* sequence using navigator respiratory-gating.
Microvascular obstruction (MVO) and late enhancement were
imaged at 1 minute and 15 minute delays respectively using a
3 dimensional inversion-recovery sequence.
The area of myocardial edema on the T2 STIR images was
measured with a boundary detection tool. This was compared to
a conventional signal intensity threshold method using 2, 3 and
5 standard deviations (sd) above the mean of remote normal
myocardium. A salvage index was calculated as the proportion of
the AAR that did not show late enhancement. T2*-mapping of
Figure 1 (abstract O32)
(A) T2* map acquired 2 days post-PCI. Pixels with a T2* < 20 ms are
shown in red and demonstrate the region of post-reperfusion
hemorrhage (arrow). Susceptibility artifact (arrowhead). (B) The
hemorrhage corresponds to the area of MVO (red contour) shown on
the early enhancement image. (C) Myocardial necrosis (red contour), and
residual MVO (black core), is shown on the late enhancement image.
Figure 2 (abstract O32)
T2-STIR images in the same patient as in Figure 1. Boundary detection
identifies the myocardial edema (green line) which represents the AAR.
The AAR determined at each signal threshold is shown in red. At low
thresholds non-specific signal noise results in bright pixels in non-
ischemic territories causing an overestimation of the AAR. At higher
thresholds the signal from the myocardial edema is masked by the
presence of hemorrhage in the core of the infarct (arrow) and leads to an
underestimation of the AAR.
Journal of Cardiovascular Magnetic Resonance 2009, 11(Suppl 1) http://jcmr-online.com/supplements/11/S1
Page 25 of 316(page number not for citation purposes)
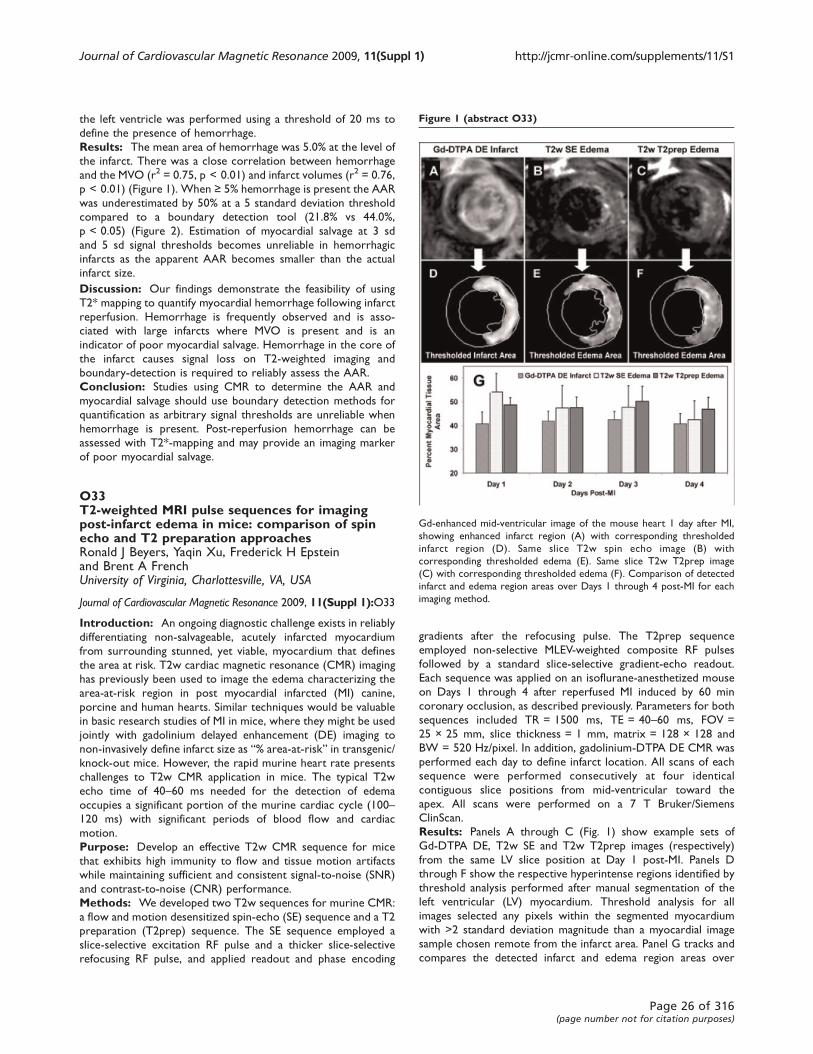
the left ventricle was performed using a threshold of 20 ms to
define the presence of hemorrhage.
Results: The mean area of hemorrhage was 5.0% at the level of
the infarct. There was a close correlation between hemorrhage
and the MVO (r2 = 0.75, p < 0.01) and infarct volumes (r2 = 0.76,
p < 0.01) (Figure 1). When ≥ 5% hemorrhage is present the AAR
was underestimated by 50% at a 5 standard deviation threshold
compared to a boundary detection tool (21.8% vs 44.0%,
p < 0.05) (Figure 2). Estimation of myocardial salvage at 3 sd
and 5 sd signal thresholds becomes unreliable in hemorrhagic
infarcts as the apparent AAR becomes smaller than the actual
infarct size.
Discussion: Our findings demonstrate the feasibility of using
T2* mapping to quantify myocardial hemorrhage following infarct
reperfusion. Hemorrhage is frequently observed and is asso-
ciated with large infarcts where MVO is present and is an
indicator of poor myocardial salvage. Hemorrhage in the core of
the infarct causes signal loss on T2-weighted imaging and
boundary-detection is required to reliably assess the AAR.
Conclusion: Studies using CMR to determine the AAR and
myocardial salvage should use boundary detection methods for
quantification as arbitrary signal thresholds are unreliable when
hemorrhage is present. Post-reperfusion hemorrhage can be
assessed with T2*-mapping and may provide an imaging marker
of poor myocardial salvage.
O33T2-weighted MRI pulse sequences for imagingpost-infarct edema in mice: comparison of spinecho and T2 preparation approachesRonald J Beyers, Yaqin Xu, Frederick H Epsteinand Brent A FrenchUniversity of Virginia, Charlottesville, VA, USA
Journal of Cardiovascular Magnetic Resonance 2009, 11(Suppl 1):O33
Introduction: An ongoing diagnostic challenge exists in reliably
differentiating non-salvageable, acutely infarcted myocardium
from surrounding stunned, yet viable, myocardium that defines
the area at risk. T2w cardiac magnetic resonance (CMR) imaging
has previously been used to image the edema characterizing the
area-at-risk region in post myocardial infarcted (MI) canine,
porcine and human hearts. Similar techniques would be valuable
in basic research studies of MI in mice, where they might be used
jointly with gadolinium delayed enhancement (DE) imaging to
non-invasively define infarct size as “% area-at-risk” in transgenic/
knock-out mice. However, the rapid murine heart rate presents
challenges to T2w CMR application in mice. The typical T2w
echo time of 40–60 ms needed for the detection of edema
occupies a significant portion of the murine cardiac cycle (100–120 ms) with significant periods of blood flow and cardiac
motion.
Purpose: Develop an effective T2w CMR sequence for mice
that exhibits high immunity to flow and tissue motion artifacts
while maintaining sufficient and consistent signal-to-noise (SNR)
and contrast-to-noise (CNR) performance.
Methods: We developed two T2w sequences for murine CMR:
a flow and motion desensitized spin-echo (SE) sequence and a T2
preparation (T2prep) sequence. The SE sequence employed a
slice-selective excitation RF pulse and a thicker slice-selective
refocusing RF pulse, and applied readout and phase encoding
gradients after the refocusing pulse. The T2prep sequence
employed non-selective MLEV-weighted composite RF pulses
followed by a standard slice-selective gradient-echo readout.
Each sequence was applied on an isoflurane-anesthetized mouse
on Days 1 through 4 after reperfused MI induced by 60 min
coronary occlusion, as described previously. Parameters for both
sequences included TR = 1500 ms, TE = 40–60 ms, FOV =
25 × 25 mm, slice thickness = 1 mm, matrix = 128 × 128 and
BW = 520 Hz/pixel. In addition, gadolinium-DTPA DE CMR was
performed each day to define infarct location. All scans of each
sequence were performed consecutively at four identical
contiguous slice positions from mid-ventricular toward the
apex. All scans were performed on a 7 T Bruker/Siemens
ClinScan.
Results: Panels A through C (Fig. 1) show example sets of
Gd-DTPA DE, T2w SE and T2w T2prep images (respectively)
from the same LV slice position at Day 1 post-MI. Panels D
through F show the respective hyperintense regions identified by
threshold analysis performed after manual segmentation of the
left ventricular (LV) myocardium. Threshold analysis for all
images selected any pixels within the segmented myocardium
with >2 standard deviation magnitude than a myocardial image
sample chosen remote from the infarct area. Panel G tracks and
compares the detected infarct and edema region areas over
Figure 1 (abstract O33)
Gd-enhanced mid-ventricular image of the mouse heart 1 day after MI,
showing enhanced infarct region (A) with corresponding thresholded
infarct region (D). Same slice T2w spin echo image (B) with
corresponding thresholded edema (E). Same slice T2w T2prep image
(C) with corresponding thresholded edema (F). Comparison of detected
infarct and edema region areas over Days 1 through 4 post-MI for each
imaging method.
Journal of Cardiovascular Magnetic Resonance 2009, 11(Suppl 1) http://jcmr-online.com/supplements/11/S1
Page 26 of 316(page number not for citation purposes)
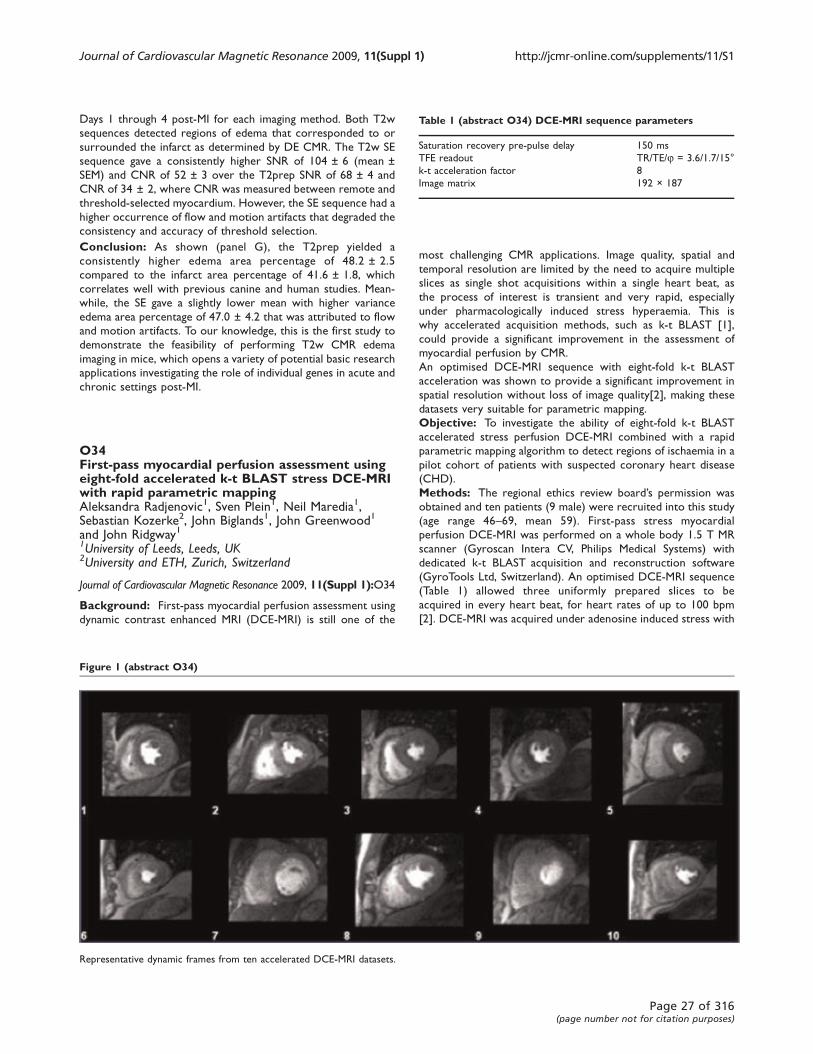
Days 1 through 4 post-MI for each imaging method. Both T2w
sequences detected regions of edema that corresponded to or
surrounded the infarct as determined by DE CMR. The T2w SE
sequence gave a consistently higher SNR of 104 ± 6 (mean ±
SEM) and CNR of 52 ± 3 over the T2prep SNR of 68 ± 4 and
CNR of 34 ± 2, where CNR was measured between remote and
threshold-selected myocardium. However, the SE sequence had a
higher occurrence of flow and motion artifacts that degraded the
consistency and accuracy of threshold selection.
Conclusion: As shown (panel G), the T2prep yielded a
consistently higher edema area percentage of 48.2 ± 2.5
compared to the infarct area percentage of 41.6 ± 1.8, which
correlates well with previous canine and human studies. Mean-
while, the SE gave a slightly lower mean with higher variance
edema area percentage of 47.0 ± 4.2 that was attributed to flow
and motion artifacts. To our knowledge, this is the first study to
demonstrate the feasibility of performing T2w CMR edema
imaging in mice, which opens a variety of potential basic research
applications investigating the role of individual genes in acute and
chronic settings post-MI.
O34First-pass myocardial perfusion assessment usingeight-fold accelerated k-t BLAST stress DCE-MRIwith rapid parametric mappingAleksandra Radjenovic1, Sven Plein1, Neil Maredia1,Sebastian Kozerke2, John Biglands1, John Greenwood1
and John Ridgway11University of Leeds, Leeds, UK2University and ETH, Zurich, Switzerland
Journal of Cardiovascular Magnetic Resonance 2009, 11(Suppl 1):O34
Background: First-pass myocardial perfusion assessment using
dynamic contrast enhanced MRI (DCE-MRI) is still one of the
most challenging CMR applications. Image quality, spatial and
temporal resolution are limited by the need to acquire multiple
slices as single shot acquisitions within a single heart beat, as
the process of interest is transient and very rapid, especially
under pharmacologically induced stress hyperaemia. This is
why accelerated acquisition methods, such as k-t BLAST [1],
could provide a significant improvement in the assessment of
myocardial perfusion by CMR.
An optimised DCE-MRI sequence with eight-fold k-t BLAST
acceleration was shown to provide a significant improvement in
spatial resolution without loss of image quality[2], making these
datasets very suitable for parametric mapping.
Objective: To investigate the ability of eight-fold k-t BLAST
accelerated stress perfusion DCE-MRI combined with a rapid
parametric mapping algorithm to detect regions of ischaemia in a
pilot cohort of patients with suspected coronary heart disease
(CHD).
Methods: The regional ethics review board’s permission was
obtained and ten patients (9 male) were recruited into this study
(age range 46–69, mean 59). First-pass stress myocardial
perfusion DCE-MRI was performed on a whole body 1.5 T MR
scanner (Gyroscan Intera CV, Philips Medical Systems) with
dedicated k-t BLAST acquisition and reconstruction software
(GyroTools Ltd, Switzerland). An optimised DCE-MRI sequence
(Table 1) allowed three uniformly prepared slices to be
acquired in every heart beat, for heart rates of up to 100 bpm
[2]. DCE-MRI was acquired under adenosine induced stress with
Figure 1 (abstract O34)
Representative dynamic frames from ten accelerated DCE-MRI datasets.
Table 1 (abstract O34) DCE-MRI sequence parameters
Saturation recovery pre-pulse delay 150 ms
TFE readout TR/TE/j = 3.6/1.7/15°
k-t acceleration factor 8
Image matrix 192 × 187
Journal of Cardiovascular Magnetic Resonance 2009, 11(Suppl 1) http://jcmr-online.com/supplements/11/S1
Page 27 of 316(page number not for citation purposes)

peripheral venous administration of 0.1 mmol/kg Gd-DTPA. The
algorithm for quantitative analysis and parametric mapping
comprised the following steps: 1) automated detection of the
target post-contrast frame 2) endocardial border detection in
the target post-contrast frame using automated region-growing
algorithm and a single spline fitting to define epicardial border 3)
automated registration of pre- and post-contrast frames using
incremental rigid translation 4) computation of percentage
enhancement ratios (ER) on voxel-by-voxel basis 5) histogram
analysis of the ER datasets and creation of percentile-based
colour maps.
Results: On coronary X-ray angiography, 8/10 patients had
coronary stenosis ≥ 70%, while two had no significant lesions
(Table 2). Representative dynamic frames from all ten DCE-MRI
studies are shown in Figure 1. Example parametric maps of ER
are presented in Figure 2. Global enhancement ratios were
computed as a median percentage change over baseline (Table 2).
Motion correction was not required in three datasets, and 1–2voxel displacement was applied in seven datasets. In patients with
no significant coronary stenoses, the average ratio was 71.2%
(n = 2), in single-vessel disease it was 66.0% (n = 4). In a patient
with two-vessel disease ER was 33.1% and in a patient with three-
vessel disease ER was 19.1%.
Discussion: The results of this pilot study suggest that the
proposed methods for acquisition and analysis of first-pass
myocardial perfusion are robust and ready for use in clinical
studies, where its diagnostic utility needs to be assessed formally
in a larger patient cohort. The methods allow the assessment of
regional differences in perfusion, as well as global changes in
perfusion. There is scope for further improvement, notably in
increasing resistance to motion artefact and reducing signal
inhomogeneity, which can lead to the appearance of false positive
lesions.
References1. Tsao, Boesinger and Preussman : Magn Reson Med. 1042,
50:1031–2003.2. Radjenovic, et al: J Cardiovasc Magn Reson. 2007, 9(2):213–
214.
O35k-t SENSE accelerated stress myocardialperfusion MRI at 3 TeslaShingo Kato, Hajime Sakuma, Motonori Nagata,Nanaka Ishida, Kakuya Kitagawa, Masaki Ishida,Hiroshi Nakajima, Katsuya Onishi, Masaaki Itoand Kan TakedaMie University Hosiptal, Tsu, Mie, Japan
Journal of Cardiovascular Magnetic Resonance 2009, 11(Suppl 1):O35
Objective: The purpose of this study was to evaluate the
feasibility and diagnostic accuracy of high spatial resolution stress
myocardial perfusion MRI acquired at every heartbeat by using
k-t SENSE and 3 Tesla MR imager.
Background: High spatial and temporal resolutions are
required for the accurate assessment of myocardial ischemia
using stress perfusion MRI.
Methods: Thirty-three patients with suspected coronary artery
disease were studied. High spatial resolution (<2 mm) first-pass
contrast enhanced MR images were obtained at rest and during
stress by using a 3.0 T MR imager (Achieva) and k-t SENSE
acceleration factor of 5. Saturation recovery TFE images were
acquired with TR/TE of 2.9 ms/1.5 ms, FOV = 40 × 30 cm,
matrix = 256 × 192, slice thickness = 8 mm. Three short-axis
sections of the left ventricle were imaged at every heart beat. Two
observers determined the image quality score (1:poor – 4:excellent)and recorded the presence or absence of respiratory artifacts and
endocardial dark rim artifacts using a 16-segment model.
Results: All studies were successfully completed, with the
averaged image quality score of 3.8 ± 0.4. Endocardial dark rim
artifacts were observed in 17 (3.2%) of 528 segments, but there
Table 2 (abstract O34) Median Enhancement Ratios (ER%)
Patient 1 2 3 4 5 6 7 8 9 10
Coronary artery X-ray (number of affected territories) 1 1 1 1 0 2 1 0 1 3
Median Enhancement Ratio% 61.4 133 64.6 38.3 77.2 33.1 58.0 65.2 40.6 19.1
Figure 2 (abstract O34)
Examples of parametric maps of enhancement ratios in single-vessel
disease (corresponding to images 2, 4 and 7 in Figure 1). Dark coloured
voxels belong to the lowest part of the individual study's frequency
distribution.
Figure 1 (abstract O35)
Rest perfusion MRI acquired with 3 T MR imager, 32 channel cardiac coils
and k-t SENSE in a patient with triple vessel disease. Rest perfusion MRI is
normal and no endocardial banding artifact is observed.
Journal of Cardiovascular Magnetic Resonance 2009, 11(Suppl 1) http://jcmr-online.com/supplements/11/S1
Page 28 of 316(page number not for citation purposes)
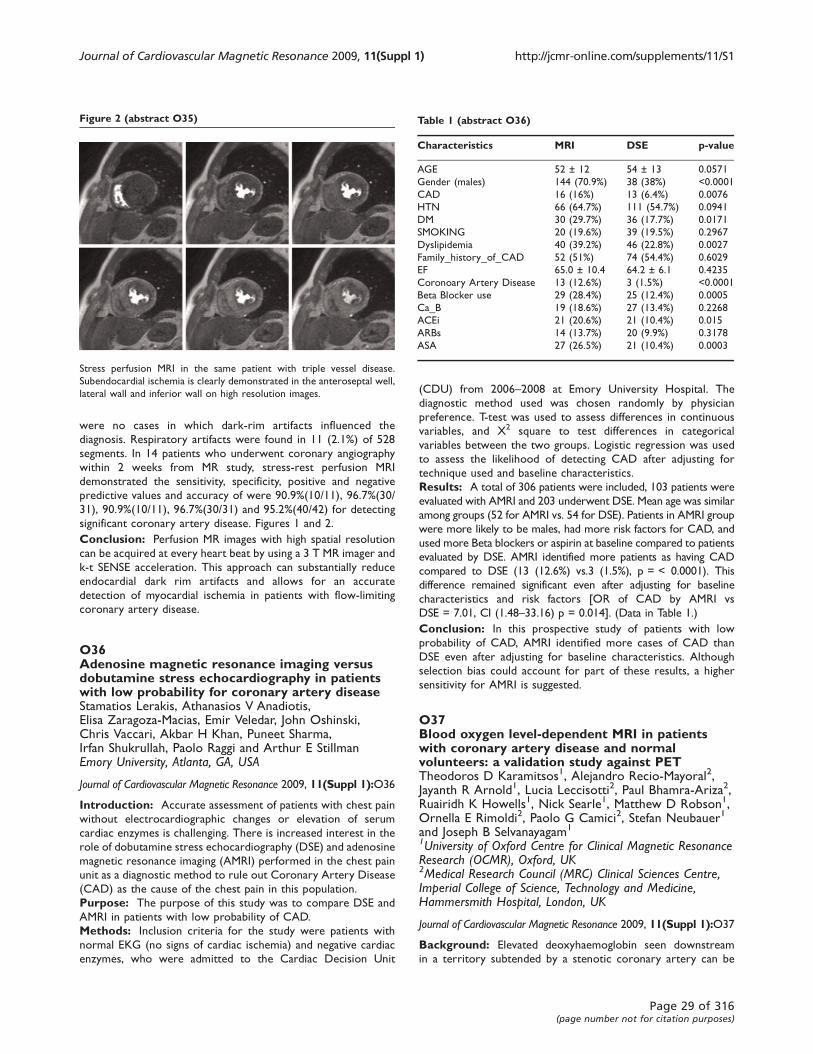
were no cases in which dark-rim artifacts influenced the
diagnosis. Respiratory artifacts were found in 11 (2.1%) of 528
segments. In 14 patients who underwent coronary angiography
within 2 weeks from MR study, stress-rest perfusion MRI
demonstrated the sensitivity, specificity, positive and negative
predictive values and accuracy of were 90.9%(10/11), 96.7%(30/
31), 90.9%(10/11), 96.7%(30/31) and 95.2%(40/42) for detecting
significant coronary artery disease. Figures 1 and 2.
Conclusion: Perfusion MR images with high spatial resolution
can be acquired at every heart beat by using a 3 T MR imager and
k-t SENSE acceleration. This approach can substantially reduce
endocardial dark rim artifacts and allows for an accurate
detection of myocardial ischemia in patients with flow-limiting
coronary artery disease.
O36Adenosine magnetic resonance imaging versusdobutamine stress echocardiography in patientswith low probability for coronary artery diseaseStamatios Lerakis, Athanasios V Anadiotis,Elisa Zaragoza-Macias, Emir Veledar, John Oshinski,Chris Vaccari, Akbar H Khan, Puneet Sharma,Irfan Shukrullah, Paolo Raggi and Arthur E StillmanEmory University, Atlanta, GA, USA
Journal of Cardiovascular Magnetic Resonance 2009, 11(Suppl 1):O36
Introduction: Accurate assessment of patients with chest pain
without electrocardiographic changes or elevation of serum
cardiac enzymes is challenging. There is increased interest in the
role of dobutamine stress echocardiography (DSE) and adenosine
magnetic resonance imaging (AMRI) performed in the chest pain
unit as a diagnostic method to rule out Coronary Artery Disease
(CAD) as the cause of the chest pain in this population.
Purpose: The purpose of this study was to compare DSE and
AMRI in patients with low probability of CAD.
Methods: Inclusion criteria for the study were patients with
normal EKG (no signs of cardiac ischemia) and negative cardiac
enzymes, who were admitted to the Cardiac Decision Unit
(CDU) from 2006–2008 at Emory University Hospital. The
diagnostic method used was chosen randomly by physician
preference. T-test was used to assess differences in continuous
variables, and X2 square to test differences in categorical
variables between the two groups. Logistic regression was used
to assess the likelihood of detecting CAD after adjusting for
technique used and baseline characteristics.
Results: A total of 306 patients were included, 103 patients were
evaluated with AMRI and 203 underwent DSE. Mean age was similar
among groups (52 for AMRI vs. 54 for DSE). Patients in AMRI group
were more likely to be males, had more risk factors for CAD, and
used more Beta blockers or aspirin at baseline compared to patients
evaluated by DSE. AMRI identified more patients as having CAD
compared to DSE (13 (12.6%) vs.3 (1.5%), p = < 0.0001). This
difference remained significant even after adjusting for baseline
characteristics and risk factors [OR of CAD by AMRI vs
DSE = 7.01, CI (1.48–33.16) p = 0.014]. (Data in Table 1.)
Conclusion: In this prospective study of patients with low
probability of CAD, AMRI identified more cases of CAD than
DSE even after adjusting for baseline characteristics. Although
selection bias could account for part of these results, a higher
sensitivity for AMRI is suggested.
O37Blood oxygen level-dependent MRI in patientswith coronary artery disease and normalvolunteers: a validation study against PETTheodoros D Karamitsos1, Alejandro Recio-Mayoral2,Jayanth R Arnold1, Lucia Leccisotti2, Paul Bhamra-Ariza2,Ruairidh K Howells1, Nick Searle1, Matthew D Robson1,Ornella E Rimoldi2, Paolo G Camici2, Stefan Neubauer1
and Joseph B Selvanayagam1
1University of Oxford Centre for Clinical Magnetic ResonanceResearch (OCMR), Oxford, UK2Medical Research Council (MRC) Clinical Sciences Centre,Imperial College of Science, Technology and Medicine,Hammersmith Hospital, London, UK
Journal of Cardiovascular Magnetic Resonance 2009, 11(Suppl 1):O37
Background: Elevated deoxyhaemoglobin seen downstream
in a territory subtended by a stenotic coronary artery can be
Figure 2 (abstract O35)
Stress perfusion MRI in the same patient with triple vessel disease.
Subendocardial ischemia is clearly demonstrated in the anteroseptal well,
lateral wall and inferior wall on high resolution images.
Table 1 (abstract O36)
Characteristics MRI DSE p-value
AGE 52 ± 12 54 ± 13 0.0571
Gender (males) 144 (70.9%) 38 (38%) <0.0001
CAD 16 (16%) 13 (6.4%) 0.0076
HTN 66 (64.7%) 111 (54.7%) 0.0941
DM 30 (29.7%) 36 (17.7%) 0.0171
SMOKING 20 (19.6%) 39 (19.5%) 0.2967
Dyslipidemia 40 (39.2%) 46 (22.8%) 0.0027
Family_history_of_CAD 52 (51%) 74 (54.4%) 0.6029
EF 65.0 ± 10.4 64.2 ± 6.1 0.4235
Coronoary Artery Disease 13 (12.6%) 3 (1.5%) <0.0001
Beta Blocker use 29 (28.4%) 25 (12.4%) 0.0005
Ca_B 19 (18.6%) 27 (13.4%) 0.2268
ACEi 21 (20.6%) 21 (10.4%) 0.015
ARBs 14 (13.7%) 20 (9.9%) 0.3178
ASA 27 (26.5%) 21 (10.4%) 0.0003
Journal of Cardiovascular Magnetic Resonance 2009, 11(Suppl 1) http://jcmr-online.com/supplements/11/S1
Page 29 of 316(page number not for citation purposes)
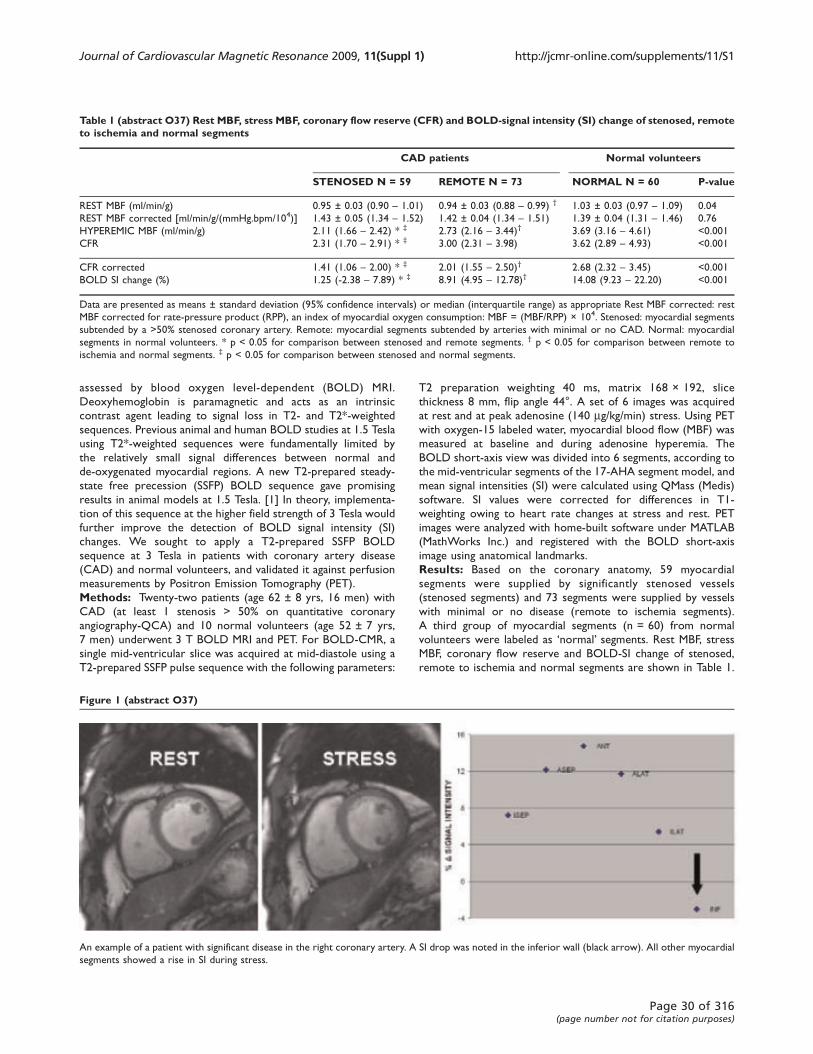
assessed by blood oxygen level-dependent (BOLD) MRI.
Deoxyhemoglobin is paramagnetic and acts as an intrinsic
contrast agent leading to signal loss in T2- and T2*-weighted
sequences. Previous animal and human BOLD studies at 1.5 Tesla
using T2*-weighted sequences were fundamentally limited by
the relatively small signal differences between normal and
de-oxygenated myocardial regions. A new T2-prepared steady-
state free precession (SSFP) BOLD sequence gave promising
results in animal models at 1.5 Tesla. [1] In theory, implementa-
tion of this sequence at the higher field strength of 3 Tesla would
further improve the detection of BOLD signal intensity (SI)
changes. We sought to apply a T2-prepared SSFP BOLD
sequence at 3 Tesla in patients with coronary artery disease
(CAD) and normal volunteers, and validated it against perfusion
measurements by Positron Emission Tomography (PET).
Methods: Twenty-two patients (age 62 ± 8 yrs, 16 men) with
CAD (at least 1 stenosis > 50% on quantitative coronary
angiography-QCA) and 10 normal volunteers (age 52 ± 7 yrs,
7 men) underwent 3 T BOLD MRI and PET. For BOLD-CMR, a
single mid-ventricular slice was acquired at mid-diastole using a
T2-prepared SSFP pulse sequence with the following parameters:
T2 preparation weighting 40 ms, matrix 168 × 192, slice
thickness 8 mm, flip angle 44°. A set of 6 images was acquired
at rest and at peak adenosine (140 mg/kg/min) stress. Using PET
with oxygen-15 labeled water, myocardial blood flow (MBF) was
measured at baseline and during adenosine hyperemia. The
BOLD short-axis view was divided into 6 segments, according to
the mid-ventricular segments of the 17-AHA segment model, and
mean signal intensities (SI) were calculated using QMass (Medis)
software. SI values were corrected for differences in T1-
weighting owing to heart rate changes at stress and rest. PET
images were analyzed with home-built software under MATLAB
(MathWorks Inc.) and registered with the BOLD short-axis
image using anatomical landmarks.
Results: Based on the coronary anatomy, 59 myocardial
segments were supplied by significantly stenosed vessels
(stenosed segments) and 73 segments were supplied by vessels
with minimal or no disease (remote to ischemia segments).
A third group of myocardial segments (n = 60) from normal
volunteers were labeled as ‘normal’ segments. Rest MBF, stress
MBF, coronary flow reserve and BOLD-SI change of stenosed,
remote to ischemia and normal segments are shown in Table 1.
Table 1 (abstract O37) Rest MBF, stress MBF, coronary flow reserve (CFR) and BOLD-signal intensity (SI) change of stenosed, remoteto ischemia and normal segments
CAD patients Normal volunteers
STENOSED N = 59 REMOTE N = 73 NORMAL N = 60 P-value
REST MBF (ml/min/g) 0.95 ± 0.03 (0.90 – 1.01) 0.94 ± 0.03 (0.88 – 0.99) † 1.03 ± 0.03 (0.97 – 1.09) 0.04
REST MBF corrected [ml/min/g/(mmHg.bpm/104)] 1.43 ± 0.05 (1.34 – 1.52) 1.42 ± 0.04 (1.34 – 1.51) 1.39 ± 0.04 (1.31 – 1.46) 0.76
HYPEREMIC MBF (ml/min/g) 2.11 (1.66 – 2.42) * ‡ 2.73 (2.16 – 3.44)† 3.69 (3.16 – 4.61) <0.001
CFR 2.31 (1.70 – 2.91) * ‡ 3.00 (2.31 – 3.98) 3.62 (2.89 – 4.93) <0.001
CFR corrected 1.41 (1.06 – 2.00) * ‡ 2.01 (1.55 – 2.50)† 2.68 (2.32 – 3.45) <0.001
BOLD SI change (%) 1.25 (-2.38 – 7.89) * ‡ 8.91 (4.95 – 12.78)† 14.08 (9.23 – 22.20) <0.001
Data are presented as means ± standard deviation (95% confidence intervals) or median (interquartile range) as appropriate Rest MBF corrected: rest
MBF corrected for rate-pressure product (RPP), an index of myocardial oxygen consumption: MBF = (MBF/RPP) × 104. Stenosed: myocardial segments
subtended by a >50% stenosed coronary artery. Remote: myocardial segments subtended by arteries with minimal or no CAD. Normal: myocardial
segments in normal volunteers. * p < 0.05 for comparison between stenosed and remote segments. † p < 0.05 for comparison between remote to
ischemia and normal segments. ‡ p < 0.05 for comparison between stenosed and normal segments.
Figure 1 (abstract O37)
An example of a patient with significant disease in the right coronary artery. A SI drop was noted in the inferior wall (black arrow). All other myocardial
segments showed a rise in SI during stress.
Journal of Cardiovascular Magnetic Resonance 2009, 11(Suppl 1) http://jcmr-online.com/supplements/11/S1
Page 30 of 316(page number not for citation purposes)

Taking QCA as the gold standard, cut-off values for stress MBF
(≤ 2.45 ml/min/g – AUC 0.83) and BOLD SI change (≤ 3.74% –AUC 0.78) were determined to define ischemic segments. BOLD
MRI and PETagreed on the presence or absence of ischemia in 18
of the 22 patients (82%), and in all normal subjects. With regards
to per segment analysis: taking PET as the gold standard and by
applying the cut-off values for stress MBF and BOLD SI, BOLD
MRI had moderate sensitivity (63%) but very good specificity
(88%) for the identification of ischemia. Minor off-resonance
artifacts were found in 9 subjects (7 CAD patients and 2 normal
volunteers). Figure 1 shows an example of a patient with
significant disease in the right coronary artery.
Conclusion: T2-prepared SSFP 3 T BOLD imaging is feasible in
the clinical setting and has good agreement with PET perfusion
measurements for the detection of myocardial ischemia.
Reference1. Fieno DS, et al: Circulation 2004, 110:1284–1290.
O38Assessment of stess and rest perfusion in patientsearly after first anterior STEMI patients treatedsuccessfully with pPCIDorota Piotrowska-Kownacka, Lukasz Kownacki,Grzegorz Opolski, Leszek Krolicki and Olgierd RowinskiMedical University of Warsaw, Warsaw, Poland
Journal of Cardiovascular Magnetic Resonance 2009, 11(Suppl 1):O38
Introduction: Restoration of normal epicardial coronary flow
in acute ST segment elevation myocardial infarction does not
ensure adequate perfusion at the myocardial tissue level. In the
era of primary PCI, patients with acute myocardial infarction
treated successfully with PCI are discharged mostly within first
week. There are no studies available regarding blood flow at the
tissue level in these patients during effort.
Purpose: Assessment of stess and rest perfusion defects early
after STEMI successfully treated with pPCI.
Methods: 61 patients with first anterior STEMI (57 ± 10 yrs.
52 M) who underwent successful pPCI have been included into
the study. CMR was performed on 1.5 T scanner between 5 and
10 days after pPCI. Myocardial perfusion was assessed at rest and
in stress condition during infusion of adenosine (140 mg/kg b.w./min., 3 minutes infusion) during first-pass perfusion imaging.
Microvascular obstruction regions (MVO) were assessed on early
enhancement images acquired 1–2-minutes after stress perfu-
sion. Delayed enhancement (DE) images were acquiered 15
minutes after Gd-DTPA. Transmurality of myocardial perfusion
defecits at rest and in stress condition, MVO were evaluated
using 5 point scale in 16 segments. DE was also evaluated in
segment 17. The sum of scores were calculated for each variable.
Scar size and MVO were additionally quantitatively analyzed using
MASS software. The results were given in ml and in % of LV
volume.
Results: Only in 2 patients there was no evidence of at least
subendocardial stress perfusion deficit. Stress perfusion sum of
scores discriminated patients with normal EF (mean 59 ± 1%)
and LV dysfunction (mean EF = 38 ± 9,7). Median stress perfu-
sion sum of scores was 15 points (ranged 0 to 37). Median rest
perfusion scores was significantly lower (3 points; ranged 0–27).Median MVO and DE sum of scores were 3 points (ranged 0–33)and 25 (3–42) respectively. DE measured as a % of LV volume has
discriminated patients with severe (mean EF 31,7 ± 8,7) vs
moderate LV dysfunction (mean EF 41,9 ± 9,5; p = 0,001) with a
cut of point 40%. Regression model revealed that only DE and
stress perfusion sum of scores have significantly contributed to
the LV EF model at discharge.
Conclusion: Despite TIMI 3 flow in coronary artery myocar-
dial perfusion defects at the tissue level are very frequent. Only
in patients with preserved LV function pharmacological stress
have not induced or intensed perfusion deficits. All patients with
STEMI anterior successfully treated with pPCI, even with mild LV
dysfunction should avoid effort which could induce ischemia. The
pathogenesis remains unknown. Further studies are needed.
O39Evaluation of contrast wash-in and peakenhancement in adenosine first pass perfusion inpatients post bypass surgeryChristoph Klein1, Eike Nagel2, Kristof Graf1,Stephan Dreysse1, Bernhard Schnackenburg3
and Eckart Fleck11German Heart Institute Berlin, Berlin, Germany2King’s College London, London, UK3Philips Medical Systems, Hamburg, Germany
Journal of Cardiovascular Magnetic Resonance 2009, 11(Suppl 1):O39
Introduction: CMR adenosine first pass perfusion yields
excellent results for the detection of significant coronary artery
disease. As in patients after coronary artery bypass grafts
(CABG) myocardial perfusion is more complex and additionally
the kinetic of a first pass bolus may by altered due to different
distances through the bypasses and/or native vessels, this patient
group has been excluded from most published studies.
Parameters like speed of contrast wash-in (upslope, time to
50% or peak enhancement) and peak enhancement are indirectly
used for visual analysis and may be altered post CABG imitating
perfusion defects without significant stenosis. In this case,
adenosine perfusion would be an inadequate diagnostic test.
Purpose: Aim of the study was to evaluate semiquantitative
perfusion parameters in patients after CABG in order to evaluate
Table 1 (abstract O39) Semiquantitative parameters in native vessels and grafts
Nativevessel
CABG p (nativevs. CABG)
Correlation(native vs. CABG)
p (CABGvs. CABG)
Correlation(CABG vs. CABG)
Upslope 17.7 ± 7.8 17.3 ± 7.0 >0.05 0.92 >0.05 0.89
Time to 50% 8.2 ± 1.8 8.1 ± 1.8 >0.05 0.94 >0.05 0.90
Time to peak 13.7 ± 3.1 13.7 ± 3.1 >0.05 0.97 >0.05 0.92
Relative peak enhancement 22.9 ± 9.2 22.0 ± 8.7 >0.05 0.91 >0.05 0.86
Journal of Cardiovascular Magnetic Resonance 2009, 11(Suppl 1) http://jcmr-online.com/supplements/11/S1
Page 31 of 316(page number not for citation purposes)
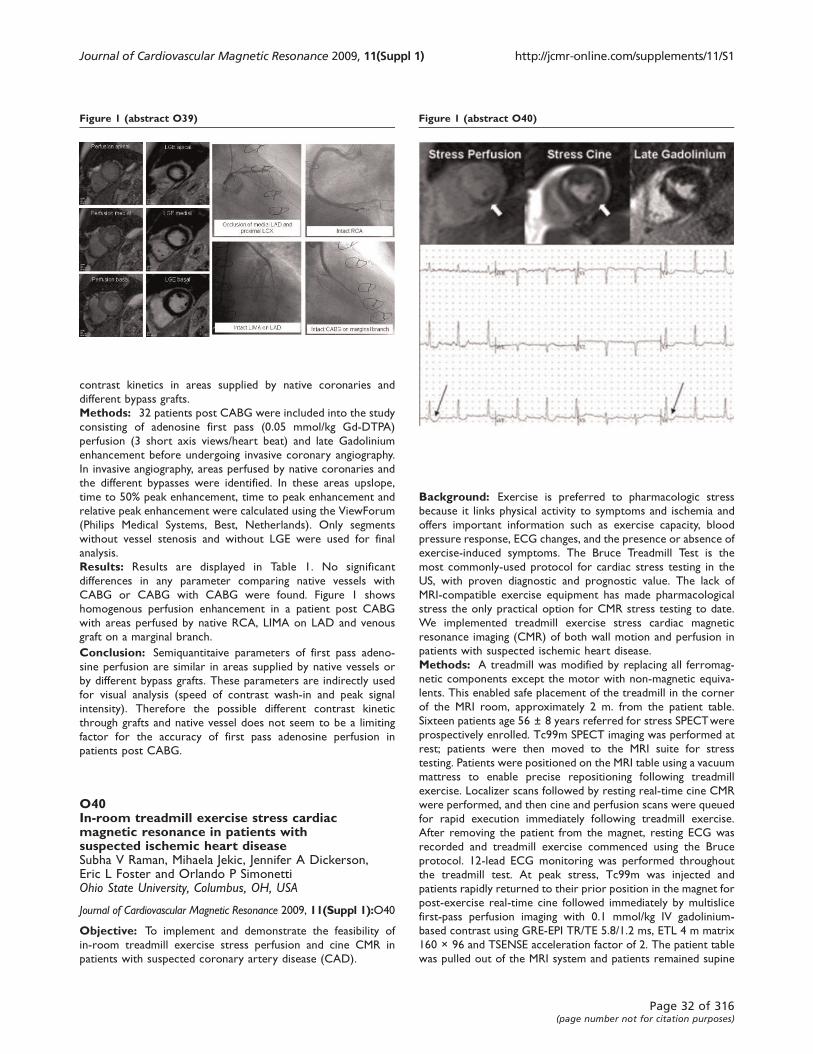
contrast kinetics in areas supplied by native coronaries and
different bypass grafts.
Methods: 32 patients post CABG were included into the study
consisting of adenosine first pass (0.05 mmol/kg Gd-DTPA)
perfusion (3 short axis views/heart beat) and late Gadolinium
enhancement before undergoing invasive coronary angiography.
In invasive angiography, areas perfused by native coronaries and
the different bypasses were identified. In these areas upslope,
time to 50% peak enhancement, time to peak enhancement and
relative peak enhancement were calculated using the ViewForum
(Philips Medical Systems, Best, Netherlands). Only segments
without vessel stenosis and without LGE were used for final
analysis.
Results: Results are displayed in Table 1. No significant
differences in any parameter comparing native vessels with
CABG or CABG with CABG were found. Figure 1 shows
homogenous perfusion enhancement in a patient post CABG
with areas perfused by native RCA, LIMA on LAD and venous
graft on a marginal branch.
Conclusion: Semiquantitaive parameters of first pass adeno-
sine perfusion are similar in areas supplied by native vessels or
by different bypass grafts. These parameters are indirectly used
for visual analysis (speed of contrast wash-in and peak signal
intensity). Therefore the possible different contrast kinetic
through grafts and native vessel does not seem to be a limiting
factor for the accuracy of first pass adenosine perfusion in
patients post CABG.
O40In-room treadmill exercise stress cardiacmagnetic resonance in patients withsuspected ischemic heart diseaseSubha V Raman, Mihaela Jekic, Jennifer A Dickerson,Eric L Foster and Orlando P SimonettiOhio State University, Columbus, OH, USA
Journal of Cardiovascular Magnetic Resonance 2009, 11(Suppl 1):O40
Objective: To implement and demonstrate the feasibility of
in-room treadmill exercise stress perfusion and cine CMR in
patients with suspected coronary artery disease (CAD).
Background: Exercise is preferred to pharmacologic stress
because it links physical activity to symptoms and ischemia and
offers important information such as exercise capacity, blood
pressure response, ECG changes, and the presence or absence of
exercise-induced symptoms. The Bruce Treadmill Test is the
most commonly-used protocol for cardiac stress testing in the
US, with proven diagnostic and prognostic value. The lack of
MRI-compatible exercise equipment has made pharmacological
stress the only practical option for CMR stress testing to date.
We implemented treadmill exercise stress cardiac magnetic
resonance imaging (CMR) of both wall motion and perfusion in
patients with suspected ischemic heart disease.
Methods: A treadmill was modified by replacing all ferromag-
netic components except the motor with non-magnetic equiva-
lents. This enabled safe placement of the treadmill in the corner
of the MRI room, approximately 2 m. from the patient table.
Sixteen patients age 56 ± 8 years referred for stress SPECTwere
prospectively enrolled. Tc99m SPECT imaging was performed at
rest; patients were then moved to the MRI suite for stress
testing. Patients were positioned on the MRI table using a vacuum
mattress to enable precise repositioning following treadmill
exercise. Localizer scans followed by resting real-time cine CMR
were performed, and then cine and perfusion scans were queued
for rapid execution immediately following treadmill exercise.
After removing the patient from the magnet, resting ECG was
recorded and treadmill exercise commenced using the Bruce
protocol. 12-lead ECG monitoring was performed throughout
the treadmill test. At peak stress, Tc99m was injected and
patients rapidly returned to their prior position in the magnet for
post-exercise real-time cine followed immediately by multislice
first-pass perfusion imaging with 0.1 mmol/kg IV gadolinium-
based contrast using GRE-EPI TR/TE 5.8/1.2 ms, ETL 4 m matrix
160 × 96 and TSENSE acceleration factor of 2. The patient table
was pulled out of the MRI system and patients remained supine
Figure 1 (abstract O39) Figure 1 (abstract O40)
Journal of Cardiovascular Magnetic Resonance 2009, 11(Suppl 1) http://jcmr-online.com/supplements/11/S1
Page 32 of 316(page number not for citation purposes)
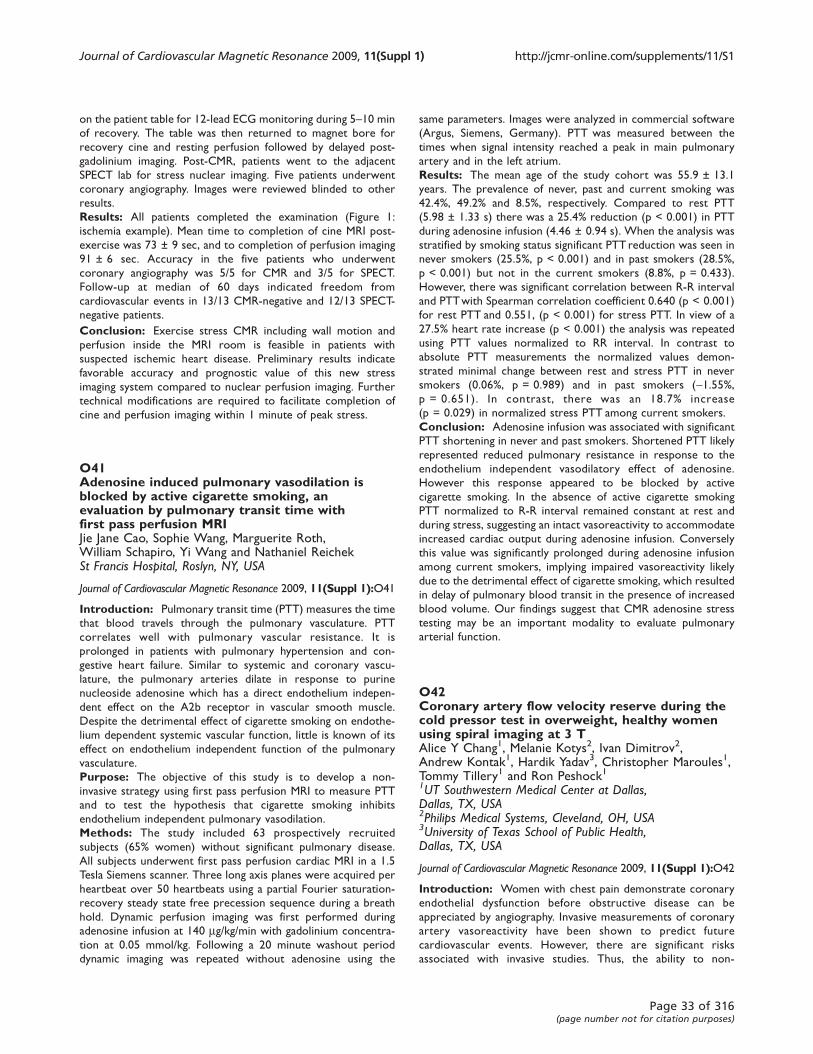
on the patient table for 12-lead ECG monitoring during 5–10 min
of recovery. The table was then returned to magnet bore for
recovery cine and resting perfusion followed by delayed post-
gadolinium imaging. Post-CMR, patients went to the adjacent
SPECT lab for stress nuclear imaging. Five patients underwent
coronary angiography. Images were reviewed blinded to other
results.
Results: All patients completed the examination (Figure 1:
ischemia example). Mean time to completion of cine MRI post-
exercise was 73 ± 9 sec, and to completion of perfusion imaging
91 ± 6 sec. Accuracy in the five patients who underwent
coronary angiography was 5/5 for CMR and 3/5 for SPECT.
Follow-up at median of 60 days indicated freedom from
cardiovascular events in 13/13 CMR-negative and 12/13 SPECT-
negative patients.
Conclusion: Exercise stress CMR including wall motion and
perfusion inside the MRI room is feasible in patients with
suspected ischemic heart disease. Preliminary results indicate
favorable accuracy and prognostic value of this new stress
imaging system compared to nuclear perfusion imaging. Further
technical modifications are required to facilitate completion of
cine and perfusion imaging within 1 minute of peak stress.
O41Adenosine induced pulmonary vasodilation isblocked by active cigarette smoking, anevaluation by pulmonary transit time withfirst pass perfusion MRIJie Jane Cao, Sophie Wang, Marguerite Roth,William Schapiro, Yi Wang and Nathaniel ReichekSt Francis Hospital, Roslyn, NY, USA
Journal of Cardiovascular Magnetic Resonance 2009, 11(Suppl 1):O41
Introduction: Pulmonary transit time (PTT) measures the time
that blood travels through the pulmonary vasculature. PTT
correlates well with pulmonary vascular resistance. It is
prolonged in patients with pulmonary hypertension and con-
gestive heart failure. Similar to systemic and coronary vascu-
lature, the pulmonary arteries dilate in response to purine
nucleoside adenosine which has a direct endothelium indepen-
dent effect on the A2b receptor in vascular smooth muscle.
Despite the detrimental effect of cigarette smoking on endothe-
lium dependent systemic vascular function, little is known of its
effect on endothelium independent function of the pulmonary
vasculature.
Purpose: The objective of this study is to develop a non-
invasive strategy using first pass perfusion MRI to measure PTT
and to test the hypothesis that cigarette smoking inhibits
endothelium independent pulmonary vasodilation.
Methods: The study included 63 prospectively recruited
subjects (65% women) without significant pulmonary disease.
All subjects underwent first pass perfusion cardiac MRI in a 1.5
Tesla Siemens scanner. Three long axis planes were acquired per
heartbeat over 50 heartbeats using a partial Fourier saturation-
recovery steady state free precession sequence during a breath
hold. Dynamic perfusion imaging was first performed during
adenosine infusion at 140 mg/kg/min with gadolinium concentra-
tion at 0.05 mmol/kg. Following a 20 minute washout period
dynamic imaging was repeated without adenosine using the
same parameters. Images were analyzed in commercial software
(Argus, Siemens, Germany). PTT was measured between the
times when signal intensity reached a peak in main pulmonary
artery and in the left atrium.
Results: The mean age of the study cohort was 55.9 ± 13.1
years. The prevalence of never, past and current smoking was
42.4%, 49.2% and 8.5%, respectively. Compared to rest PTT
(5.98 ± 1.33 s) there was a 25.4% reduction (p < 0.001) in PTT
during adenosine infusion (4.46 ± 0.94 s). When the analysis was
stratified by smoking status significant PTT reduction was seen in
never smokers (25.5%, p < 0.001) and in past smokers (28.5%,
p < 0.001) but not in the current smokers (8.8%, p = 0.433).
However, there was significant correlation between R-R interval
and PTTwith Spearman correlation coefficient 0.640 (p < 0.001)
for rest PTT and 0.551, (p < 0.001) for stress PTT. In view of a
27.5% heart rate increase (p < 0.001) the analysis was repeated
using PTT values normalized to RR interval. In contrast to
absolute PTT measurements the normalized values demon-
strated minimal change between rest and stress PTT in never
smokers (0.06%, p = 0.989) and in past smokers (-1.55%,p = 0.651). In contrast, there was an 18.7% increase
(p = 0.029) in normalized stress PTT among current smokers.
Conclusion: Adenosine infusion was associated with significant
PTT shortening in never and past smokers. Shortened PTT likely
represented reduced pulmonary resistance in response to the
endothelium independent vasodilatory effect of adenosine.
However this response appeared to be blocked by active
cigarette smoking. In the absence of active cigarette smoking
PTT normalized to R-R interval remained constant at rest and
during stress, suggesting an intact vasoreactivity to accommodate
increased cardiac output during adenosine infusion. Conversely
this value was significantly prolonged during adenosine infusion
among current smokers, implying impaired vasoreactivity likely
due to the detrimental effect of cigarette smoking, which resulted
in delay of pulmonary blood transit in the presence of increased
blood volume. Our findings suggest that CMR adenosine stress
testing may be an important modality to evaluate pulmonary
arterial function.
O42Coronary artery flow velocity reserve during thecold pressor test in overweight, healthy womenusing spiral imaging at 3 TAlice Y Chang1, Melanie Kotys2, Ivan Dimitrov2,Andrew Kontak1, Hardik Yadav3, Christopher Maroules1,Tommy Tillery1 and Ron Peshock11UT Southwestern Medical Center at Dallas,Dallas, TX, USA2Philips Medical Systems, Cleveland, OH, USA3University of Texas School of Public Health,Dallas, TX, USA
Journal of Cardiovascular Magnetic Resonance 2009, 11(Suppl 1):O42
Introduction: Women with chest pain demonstrate coronary
endothelial dysfunction before obstructive disease can be
appreciated by angiography. Invasive measurements of coronary
artery vasoreactivity have been shown to predict future
cardiovascular events. However, there are significant risks
associated with invasive studies. Thus, the ability to non-
Journal of Cardiovascular Magnetic Resonance 2009, 11(Suppl 1) http://jcmr-online.com/supplements/11/S1
Page 33 of 316(page number not for citation purposes)
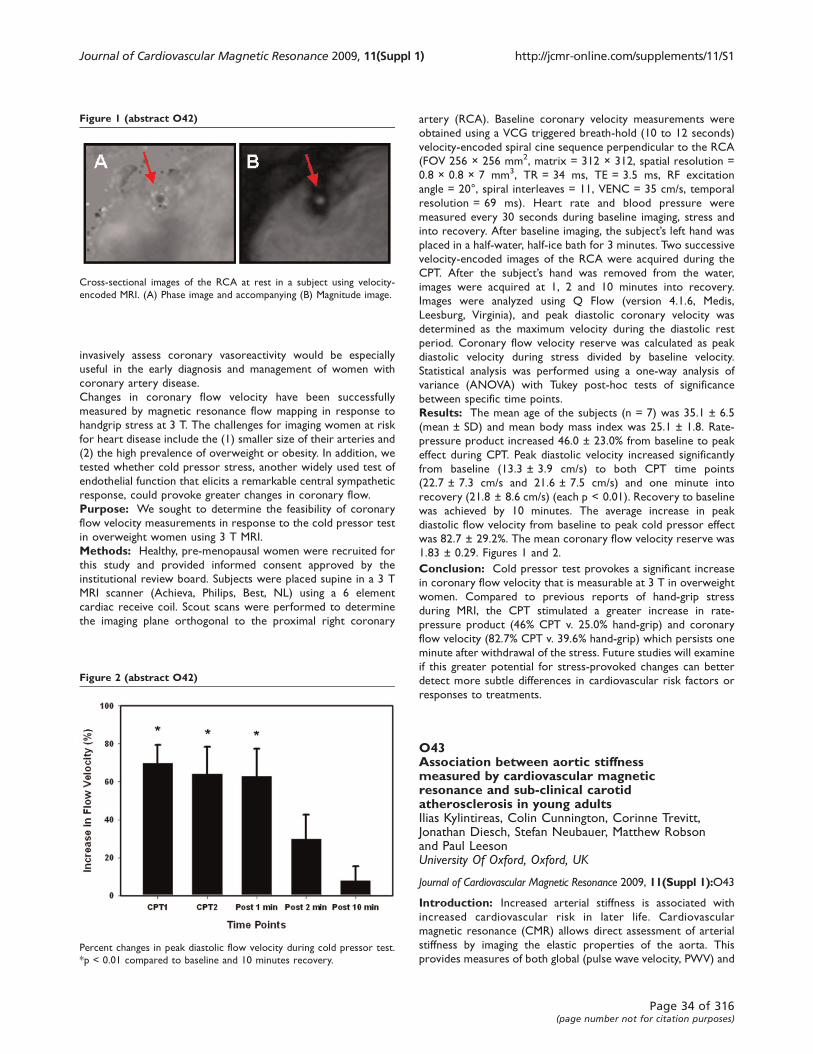
invasively assess coronary vasoreactivity would be especially
useful in the early diagnosis and management of women with
coronary artery disease.
Changes in coronary flow velocity have been successfully
measured by magnetic resonance flow mapping in response to
handgrip stress at 3 T. The challenges for imaging women at risk
for heart disease include the (1) smaller size of their arteries and
(2) the high prevalence of overweight or obesity. In addition, we
tested whether cold pressor stress, another widely used test of
endothelial function that elicits a remarkable central sympathetic
response, could provoke greater changes in coronary flow.
Purpose: We sought to determine the feasibility of coronary
flow velocity measurements in response to the cold pressor test
in overweight women using 3 T MRI.
Methods: Healthy, pre-menopausal women were recruited for
this study and provided informed consent approved by the
institutional review board. Subjects were placed supine in a 3 T
MRI scanner (Achieva, Philips, Best, NL) using a 6 element
cardiac receive coil. Scout scans were performed to determine
the imaging plane orthogonal to the proximal right coronary
artery (RCA). Baseline coronary velocity measurements were
obtained using a VCG triggered breath-hold (10 to 12 seconds)
velocity-encoded spiral cine sequence perpendicular to the RCA
(FOV 256 × 256 mm2, matrix = 312 × 312, spatial resolution =
0.8 × 0.8 × 7 mm3, TR = 34 ms, TE = 3.5 ms, RF excitation
angle = 20°, spiral interleaves = 11, VENC = 35 cm/s, temporal
resolution = 69 ms). Heart rate and blood pressure were
measured every 30 seconds during baseline imaging, stress and
into recovery. After baseline imaging, the subject’s left hand was
placed in a half-water, half-ice bath for 3 minutes. Two successive
velocity-encoded images of the RCA were acquired during the
CPT. After the subject’s hand was removed from the water,
images were acquired at 1, 2 and 10 minutes into recovery.
Images were analyzed using Q Flow (version 4.1.6, Medis,
Leesburg, Virginia), and peak diastolic coronary velocity was
determined as the maximum velocity during the diastolic rest
period. Coronary flow velocity reserve was calculated as peak
diastolic velocity during stress divided by baseline velocity.
Statistical analysis was performed using a one-way analysis of
variance (ANOVA) with Tukey post-hoc tests of significance
between specific time points.
Results: The mean age of the subjects (n = 7) was 35.1 ± 6.5
(mean ± SD) and mean body mass index was 25.1 ± 1.8. Rate-
pressure product increased 46.0 ± 23.0% from baseline to peak
effect during CPT. Peak diastolic velocity increased significantly
from baseline (13.3 ± 3.9 cm/s) to both CPT time points
(22.7 ± 7.3 cm/s and 21.6 ± 7.5 cm/s) and one minute into
recovery (21.8 ± 8.6 cm/s) (each p < 0.01). Recovery to baseline
was achieved by 10 minutes. The average increase in peak
diastolic flow velocity from baseline to peak cold pressor effect
was 82.7 ± 29.2%. The mean coronary flow velocity reserve was
1.83 ± 0.29. Figures 1 and 2.
Conclusion: Cold pressor test provokes a significant increase
in coronary flow velocity that is measurable at 3 T in overweight
women. Compared to previous reports of hand-grip stress
during MRI, the CPT stimulated a greater increase in rate-
pressure product (46% CPT v. 25.0% hand-grip) and coronary
flow velocity (82.7% CPT v. 39.6% hand-grip) which persists one
minute after withdrawal of the stress. Future studies will examine
if this greater potential for stress-provoked changes can better
detect more subtle differences in cardiovascular risk factors or
responses to treatments.
O43Association between aortic stiffnessmeasured by cardiovascular magneticresonance and sub-clinical carotidatherosclerosis in young adultsIlias Kylintireas, Colin Cunnington, Corinne Trevitt,Jonathan Diesch, Stefan Neubauer, Matthew Robsonand Paul LeesonUniversity Of Oxford, Oxford, UK
Journal of Cardiovascular Magnetic Resonance 2009, 11(Suppl 1):O43
Introduction: Increased arterial stiffness is associated with
increased cardiovascular risk in later life. Cardiovascular
magnetic resonance (CMR) allows direct assessment of arterial
stiffness by imaging the elastic properties of the aorta. This
provides measures of both global (pulse wave velocity, PWV) and
Figure 1 (abstract O42)
Cross-sectional images of the RCA at rest in a subject using velocity-
encoded MRI. (A) Phase image and accompanying (B) Magnitude image.
Figure 2 (abstract O42)
Percent changes in peak diastolic flow velocity during cold pressor test.
*p < 0.01 compared to baseline and 10 minutes recovery.
Journal of Cardiovascular Magnetic Resonance 2009, 11(Suppl 1) http://jcmr-online.com/supplements/11/S1
Page 34 of 316(page number not for citation purposes)
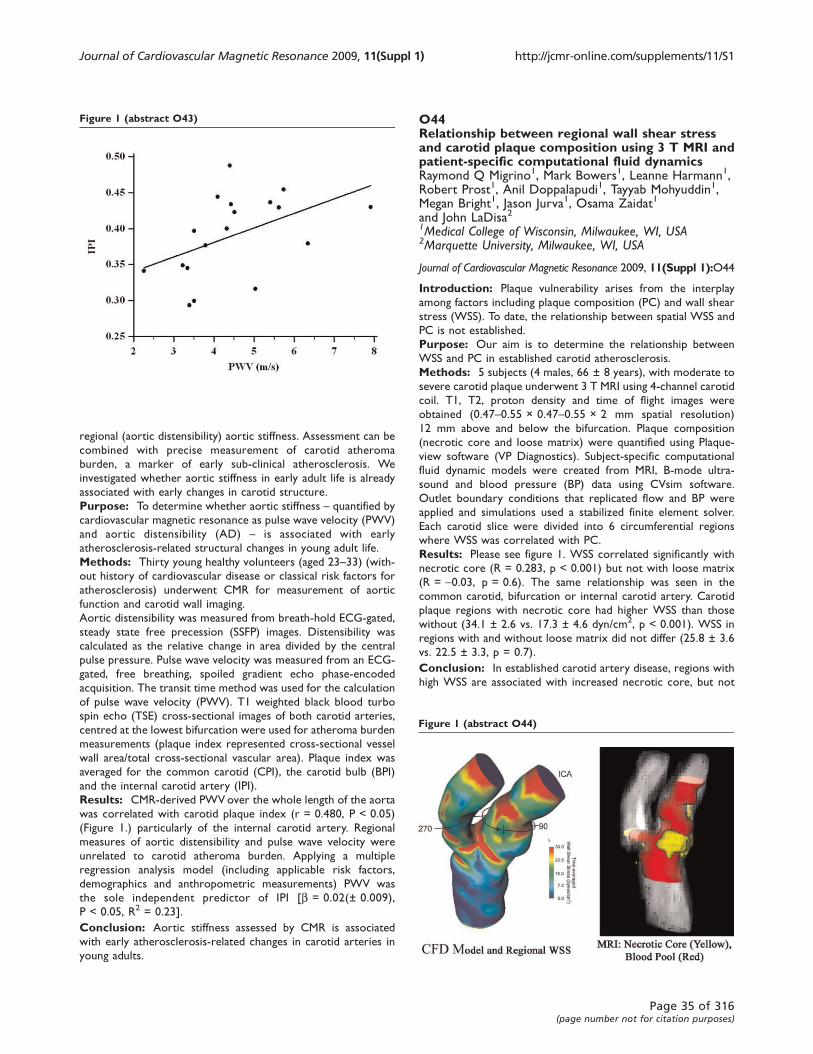
regional (aortic distensibility) aortic stiffness. Assessment can be
combined with precise measurement of carotid atheroma
burden, a marker of early sub-clinical atherosclerosis. We
investigated whether aortic stiffness in early adult life is already
associated with early changes in carotid structure.
Purpose: To determine whether aortic stiffness – quantified by
cardiovascular magnetic resonance as pulse wave velocity (PWV)
and aortic distensibility (AD) – is associated with early
atherosclerosis-related structural changes in young adult life.
Methods: Thirty young healthy volunteers (aged 23–33) (with-out history of cardiovascular disease or classical risk factors for
atherosclerosis) underwent CMR for measurement of aortic
function and carotid wall imaging.
Aortic distensibility was measured from breath-hold ECG-gated,
steady state free precession (SSFP) images. Distensibility was
calculated as the relative change in area divided by the central
pulse pressure. Pulse wave velocity was measured from an ECG-
gated, free breathing, spoiled gradient echo phase-encoded
acquisition. The transit time method was used for the calculation
of pulse wave velocity (PWV). T1 weighted black blood turbo
spin echo (TSE) cross-sectional images of both carotid arteries,
centred at the lowest bifurcation were used for atheroma burden
measurements (plaque index represented cross-sectional vessel
wall area/total cross-sectional vascular area). Plaque index was
averaged for the common carotid (CPI), the carotid bulb (BPI)
and the internal carotid artery (IPI).
Results: CMR-derived PWV over the whole length of the aorta
was correlated with carotid plaque index (r = 0.480, P < 0.05)
(Figure 1.) particularly of the internal carotid artery. Regional
measures of aortic distensibility and pulse wave velocity were
unrelated to carotid atheroma burden. Applying a multiple
regression analysis model (including applicable risk factors,
demographics and anthropometric measurements) PWV was
the sole independent predictor of IPI [b = 0.02(± 0.009),
P < 0.05, R2 = 0.23].
Conclusion: Aortic stiffness assessed by CMR is associated
with early atherosclerosis-related changes in carotid arteries in
young adults.
O44Relationship between regional wall shear stressand carotid plaque composition using 3 T MRI andpatient-specific computational fluid dynamicsRaymond Q Migrino1, Mark Bowers1, Leanne Harmann1,Robert Prost1, Anil Doppalapudi1, Tayyab Mohyuddin1,Megan Bright1, Jason Jurva1, Osama Zaidat1
and John LaDisa21Medical College of Wisconsin, Milwaukee, WI, USA2Marquette University, Milwaukee, WI, USA
Journal of Cardiovascular Magnetic Resonance 2009, 11(Suppl 1):O44
Introduction: Plaque vulnerability arises from the interplay
among factors including plaque composition (PC) and wall shear
stress (WSS). To date, the relationship between spatial WSS and
PC is not established.
Purpose: Our aim is to determine the relationship between
WSS and PC in established carotid atherosclerosis.
Methods: 5 subjects (4 males, 66 ± 8 years), with moderate to
severe carotid plaque underwent 3 T MRI using 4-channel carotid
coil. T1, T2, proton density and time of flight images were
obtained (0.47–0.55 × 0.47–0.55 × 2 mm spatial resolution)
12 mm above and below the bifurcation. Plaque composition
(necrotic core and loose matrix) were quantified using Plaque-
view software (VP Diagnostics). Subject-specific computational
fluid dynamic models were created from MRI, B-mode ultra-
sound and blood pressure (BP) data using CVsim software.
Outlet boundary conditions that replicated flow and BP were
applied and simulations used a stabilized finite element solver.
Each carotid slice were divided into 6 circumferential regions
where WSS was correlated with PC.
Results: Please see figure 1. WSS correlated significantly with
necrotic core (R = 0.283, p < 0.001) but not with loose matrix
(R = -0.03, p = 0.6). The same relationship was seen in the
common carotid, bifurcation or internal carotid artery. Carotid
plaque regions with necrotic core had higher WSS than those
without (34.1 ± 2.6 vs. 17.3 ± 4.6 dyn/cm2, p < 0.001). WSS in
regions with and without loose matrix did not differ (25.8 ± 3.6
vs. 22.5 ± 3.3, p = 0.7).
Conclusion: In established carotid artery disease, regions with
high WSS are associated with increased necrotic core, but not
Figure 1 (abstract O43)
Figure 1 (abstract O44)
Journal of Cardiovascular Magnetic Resonance 2009, 11(Suppl 1) http://jcmr-online.com/supplements/11/S1
Page 35 of 316(page number not for citation purposes)
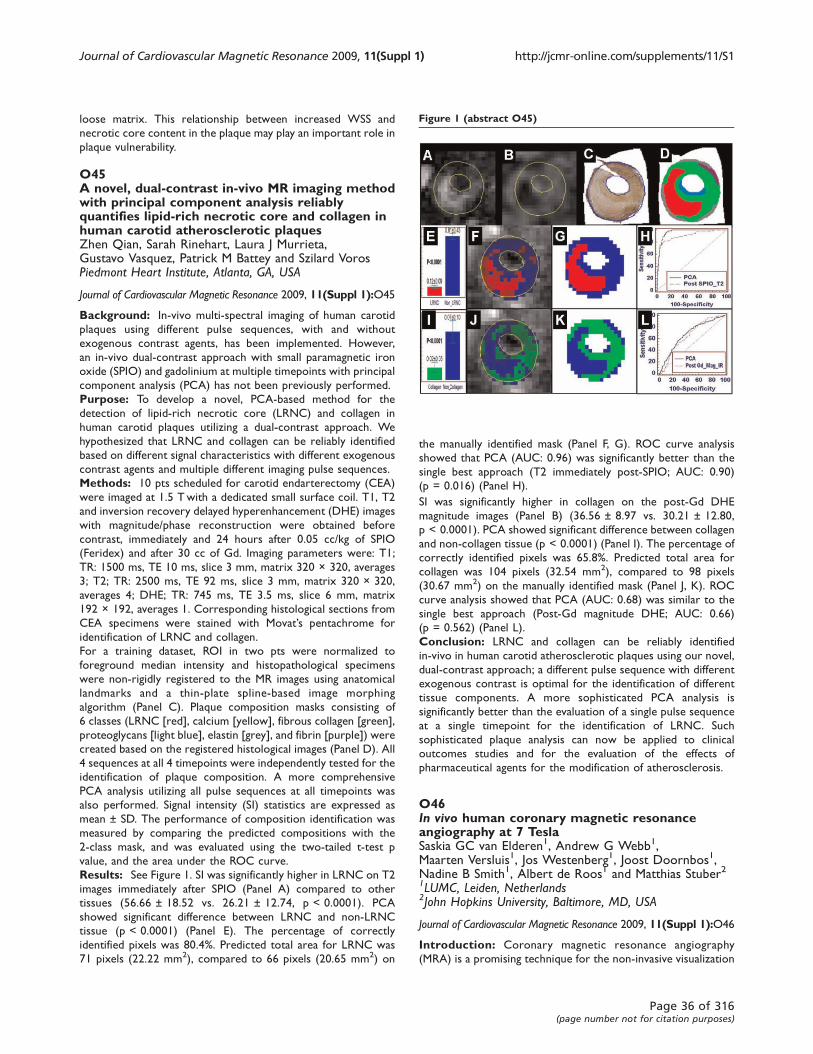
loose matrix. This relationship between increased WSS and
necrotic core content in the plaque may play an important role in
plaque vulnerability.
O45A novel, dual-contrast in-vivo MR imaging methodwith principal component analysis reliablyquantifies lipid-rich necrotic core and collagen inhuman carotid atherosclerotic plaquesZhen Qian, Sarah Rinehart, Laura J Murrieta,Gustavo Vasquez, Patrick M Battey and Szilard VorosPiedmont Heart Institute, Atlanta, GA, USA
Journal of Cardiovascular Magnetic Resonance 2009, 11(Suppl 1):O45
Background: In-vivo multi-spectral imaging of human carotid
plaques using different pulse sequences, with and without
exogenous contrast agents, has been implemented. However,
an in-vivo dual-contrast approach with small paramagnetic iron
oxide (SPIO) and gadolinium at multiple timepoints with principal
component analysis (PCA) has not been previously performed.
Purpose: To develop a novel, PCA-based method for the
detection of lipid-rich necrotic core (LRNC) and collagen in
human carotid plaques utilizing a dual-contrast approach. We
hypothesized that LRNC and collagen can be reliably identified
based on different signal characteristics with different exogenous
contrast agents and multiple different imaging pulse sequences.
Methods: 10 pts scheduled for carotid endarterectomy (CEA)
were imaged at 1.5 T with a dedicated small surface coil. T1, T2
and inversion recovery delayed hyperenhancement (DHE) images
with magnitude/phase reconstruction were obtained before
contrast, immediately and 24 hours after 0.05 cc/kg of SPIO
(Feridex) and after 30 cc of Gd. Imaging parameters were: T1;
TR: 1500 ms, TE 10 ms, slice 3 mm, matrix 320 × 320, averages
3; T2; TR: 2500 ms, TE 92 ms, slice 3 mm, matrix 320 × 320,
averages 4; DHE; TR: 745 ms, TE 3.5 ms, slice 6 mm, matrix
192 × 192, averages 1. Corresponding histological sections from
CEA specimens were stained with Movat’s pentachrome for
identification of LRNC and collagen.
For a training dataset, ROI in two pts were normalized to
foreground median intensity and histopathological specimens
were non-rigidly registered to the MR images using anatomical
landmarks and a thin-plate spline-based image morphing
algorithm (Panel C). Plaque composition masks consisting of
6 classes (LRNC [red], calcium [yellow], fibrous collagen [green],
proteoglycans [light blue], elastin [grey], and fibrin [purple]) were
created based on the registered histological images (Panel D). All
4 sequences at all 4 timepoints were independently tested for the
identification of plaque composition. A more comprehensive
PCA analysis utilizing all pulse sequences at all timepoints was
also performed. Signal intensity (SI) statistics are expressed as
mean ± SD. The performance of composition identification was
measured by comparing the predicted compositions with the
2-class mask, and was evaluated using the two-tailed t-test p
value, and the area under the ROC curve.
Results: See Figure 1. SI was significantly higher in LRNC on T2
images immediately after SPIO (Panel A) compared to other
tissues (56.66 ± 18.52 vs. 26.21 ± 12.74, p < 0.0001). PCA
showed significant difference between LRNC and non-LRNC
tissue (p < 0.0001) (Panel E). The percentage of correctly
identified pixels was 80.4%. Predicted total area for LRNC was
71 pixels (22.22 mm2), compared to 66 pixels (20.65 mm2) on
the manually identified mask (Panel F, G). ROC curve analysis
showed that PCA (AUC: 0.96) was significantly better than the
single best approach (T2 immediately post-SPIO; AUC: 0.90)
(p = 0.016) (Panel H).
SI was significantly higher in collagen on the post-Gd DHE
magnitude images (Panel B) (36.56 ± 8.97 vs. 30.21 ± 12.80,
p < 0.0001). PCA showed significant difference between collagen
and non-collagen tissue (p < 0.0001) (Panel I). The percentage of
correctly identified pixels was 65.8%. Predicted total area for
collagen was 104 pixels (32.54 mm2), compared to 98 pixels
(30.67 mm2) on the manually identified mask (Panel J, K). ROC
curve analysis showed that PCA (AUC: 0.68) was similar to the
single best approach (Post-Gd magnitude DHE; AUC: 0.66)
(p = 0.562) (Panel L).
Conclusion: LRNC and collagen can be reliably identified
in-vivo in human carotid atherosclerotic plaques using our novel,
dual-contrast approach; a different pulse sequence with different
exogenous contrast is optimal for the identification of different
tissue components. A more sophisticated PCA analysis is
significantly better than the evaluation of a single pulse sequence
at a single timepoint for the identification of LRNC. Such
sophisticated plaque analysis can now be applied to clinical
outcomes studies and for the evaluation of the effects of
pharmaceutical agents for the modification of atherosclerosis.
O46In vivo human coronary magnetic resonanceangiography at 7 TeslaSaskia GC van Elderen1, Andrew G Webb1,Maarten Versluis1, Jos Westenberg1, Joost Doornbos1,Nadine B Smith1, Albert de Roos1 and Matthias Stuber21LUMC, Leiden, Netherlands2John Hopkins University, Baltimore, MD, USA
Journal of Cardiovascular Magnetic Resonance 2009, 11(Suppl 1):O46
Introduction: Coronary magnetic resonance angiography
(MRA) is a promising technique for the non-invasive visualization
Figure 1 (abstract O45)
Journal of Cardiovascular Magnetic Resonance 2009, 11(Suppl 1) http://jcmr-online.com/supplements/11/S1
Page 36 of 316(page number not for citation purposes)
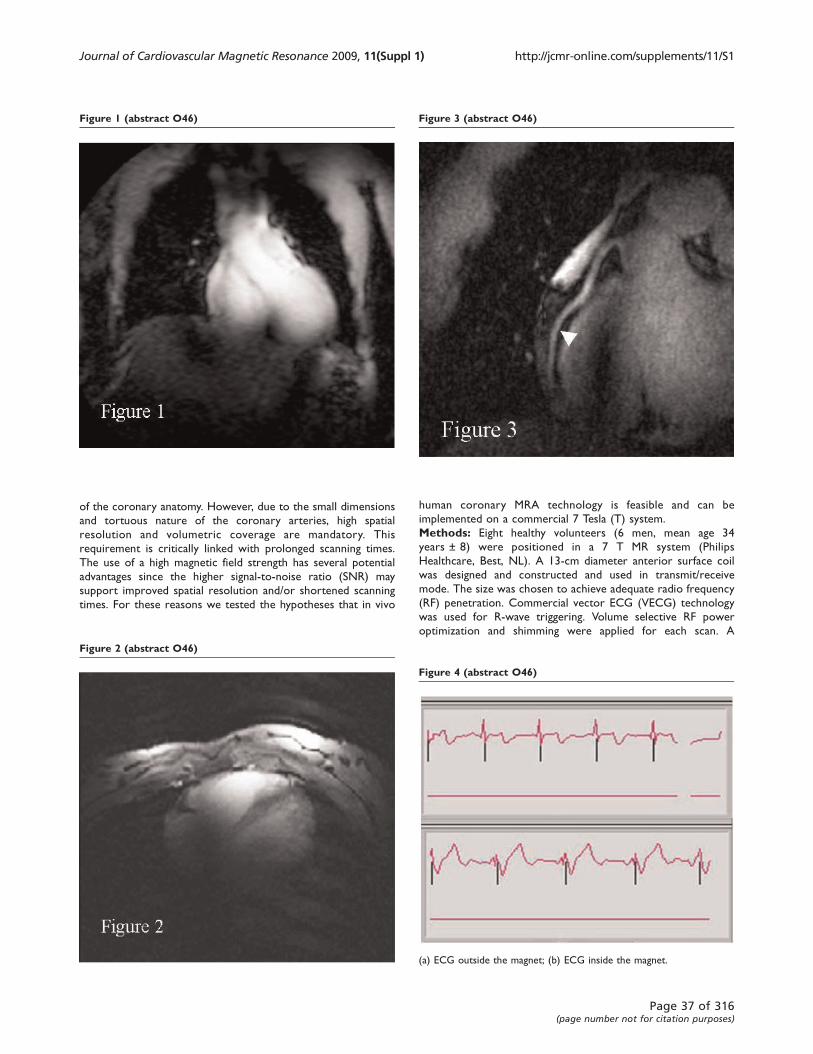
of the coronary anatomy. However, due to the small dimensions
and tortuous nature of the coronary arteries, high spatial
resolution and volumetric coverage are mandatory. This
requirement is critically linked with prolonged scanning times.
The use of a high magnetic field strength has several potential
advantages since the higher signal-to-noise ratio (SNR) may
support improved spatial resolution and/or shortened scanning
times. For these reasons we tested the hypotheses that in vivo
human coronary MRA technology is feasible and can be
implemented on a commercial 7 Tesla (T) system.
Methods: Eight healthy volunteers (6 men, mean age 34
years ± 8) were positioned in a 7 T MR system (Philips
Healthcare, Best, NL). A 13-cm diameter anterior surface coil
was designed and constructed and used in transmit/receive
mode. The size was chosen to achieve adequate radio frequency
(RF) penetration. Commercial vector ECG (VECG) technology
was used for R-wave triggering. Volume selective RF power
optimization and shimming were applied for each scan. A
Figure 1 (abstract O46)
Figure 2 (abstract O46)
Figure 3 (abstract O46)
Figure 4 (abstract O46)
(a) ECG outside the magnet; (b) ECG inside the magnet.
Journal of Cardiovascular Magnetic Resonance 2009, 11(Suppl 1) http://jcmr-online.com/supplements/11/S1
Page 37 of 316(page number not for citation purposes)
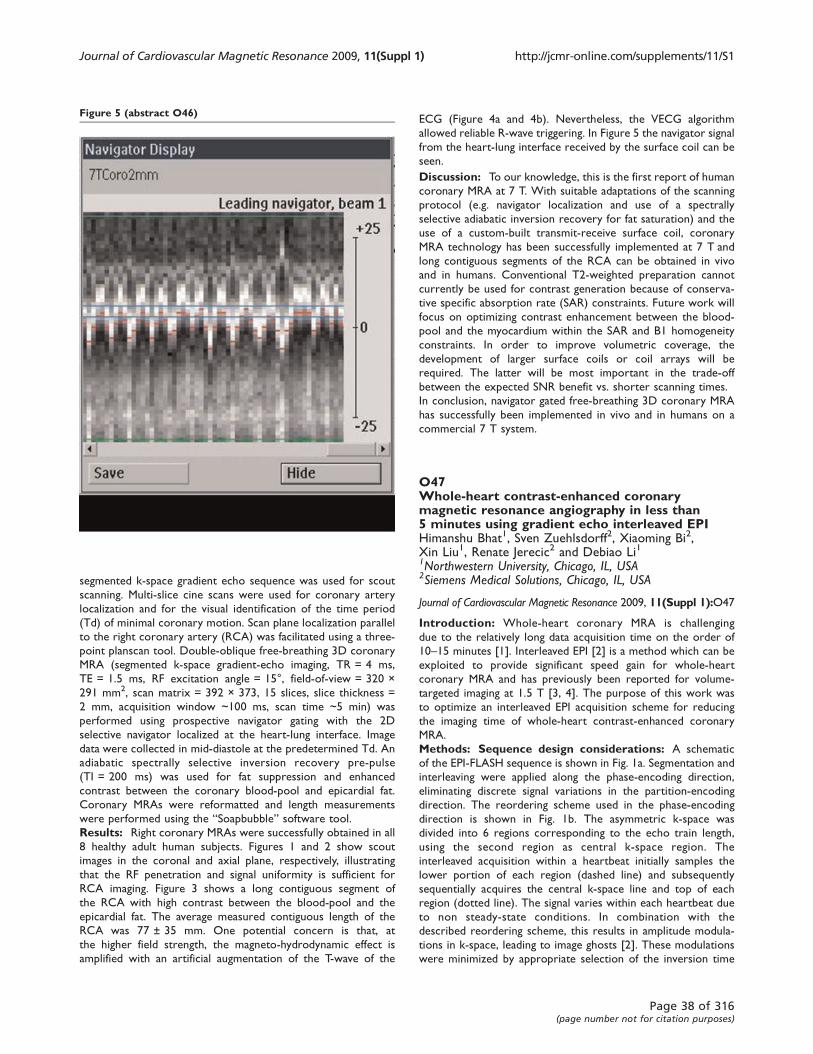
segmented k-space gradient echo sequence was used for scout
scanning. Multi-slice cine scans were used for coronary artery
localization and for the visual identification of the time period
(Td) of minimal coronary motion. Scan plane localization parallel
to the right coronary artery (RCA) was facilitated using a three-
point planscan tool. Double-oblique free-breathing 3D coronary
MRA (segmented k-space gradient-echo imaging, TR = 4 ms,
TE = 1.5 ms, RF excitation angle = 15°, field-of-view = 320 ×
291 mm2, scan matrix = 392 × 373, 15 slices, slice thickness =
2 mm, acquisition window ~100 ms, scan time ~5 min) was
performed using prospective navigator gating with the 2D
selective navigator localized at the heart-lung interface. Image
data were collected in mid-diastole at the predetermined Td. An
adiabatic spectrally selective inversion recovery pre-pulse
(TI = 200 ms) was used for fat suppression and enhanced
contrast between the coronary blood-pool and epicardial fat.
Coronary MRAs were reformatted and length measurements
were performed using the “Soapbubble” software tool.
Results: Right coronary MRAs were successfully obtained in all
8 healthy adult human subjects. Figures 1 and 2 show scout
images in the coronal and axial plane, respectively, illustrating
that the RF penetration and signal uniformity is sufficient for
RCA imaging. Figure 3 shows a long contiguous segment of
the RCA with high contrast between the blood-pool and the
epicardial fat. The average measured contiguous length of the
RCA was 77 ± 35 mm. One potential concern is that, at
the higher field strength, the magneto-hydrodynamic effect is
amplified with an artificial augmentation of the T-wave of the
ECG (Figure 4a and 4b). Nevertheless, the VECG algorithm
allowed reliable R-wave triggering. In Figure 5 the navigator signal
from the heart-lung interface received by the surface coil can be
seen.
Discussion: To our knowledge, this is the first report of human
coronary MRA at 7 T. With suitable adaptations of the scanning
protocol (e.g. navigator localization and use of a spectrally
selective adiabatic inversion recovery for fat saturation) and the
use of a custom-built transmit-receive surface coil, coronary
MRA technology has been successfully implemented at 7 T and
long contiguous segments of the RCA can be obtained in vivo
and in humans. Conventional T2-weighted preparation cannot
currently be used for contrast generation because of conserva-
tive specific absorption rate (SAR) constraints. Future work will
focus on optimizing contrast enhancement between the blood-
pool and the myocardium within the SAR and B1 homogeneity
constraints. In order to improve volumetric coverage, the
development of larger surface coils or coil arrays will be
required. The latter will be most important in the trade-off
between the expected SNR benefit vs. shorter scanning times.
In conclusion, navigator gated free-breathing 3D coronary MRA
has successfully been implemented in vivo and in humans on a
commercial 7 T system.
O47Whole-heart contrast-enhanced coronarymagnetic resonance angiography in less than5 minutes using gradient echo interleaved EPIHimanshu Bhat1, Sven Zuehlsdorff2, Xiaoming Bi2,Xin Liu1, Renate Jerecic2 and Debiao Li11Northwestern University, Chicago, IL, USA2Siemens Medical Solutions, Chicago, IL, USA
Journal of Cardiovascular Magnetic Resonance 2009, 11(Suppl 1):O47
Introduction: Whole-heart coronary MRA is challenging
due to the relatively long data acquisition time on the order of
10–15 minutes [1]. Interleaved EPI [2] is a method which can be
exploited to provide significant speed gain for whole-heart
coronary MRA and has previously been reported for volume-
targeted imaging at 1.5 T [3, 4]. The purpose of this work was
to optimize an interleaved EPI acquisition scheme for reducing
the imaging time of whole-heart contrast-enhanced coronary
MRA.
Methods: Sequence design considerations: A schematic
of the EPI-FLASH sequence is shown in Fig. 1a. Segmentation and
interleaving were applied along the phase-encoding direction,
eliminating discrete signal variations in the partition-encoding
direction. The reordering scheme used in the phase-encoding
direction is shown in Fig. 1b. The asymmetric k-space was
divided into 6 regions corresponding to the echo train length,
using the second region as central k-space region. The
interleaved acquisition within a heartbeat initially samples the
lower portion of each region (dashed line) and subsequently
sequentially acquires the central k-space line and top of each
region (dotted line). The signal varies within each heartbeat due
to non steady-state conditions. In combination with the
described reordering scheme, this results in amplitude modula-
tions in k-space, leading to image ghosts [2]. These modulations
were minimized by appropriate selection of the inversion time
Figure 5 (abstract O46)
Journal of Cardiovascular Magnetic Resonance 2009, 11(Suppl 1) http://jcmr-online.com/supplements/11/S1
Page 38 of 316(page number not for citation purposes)
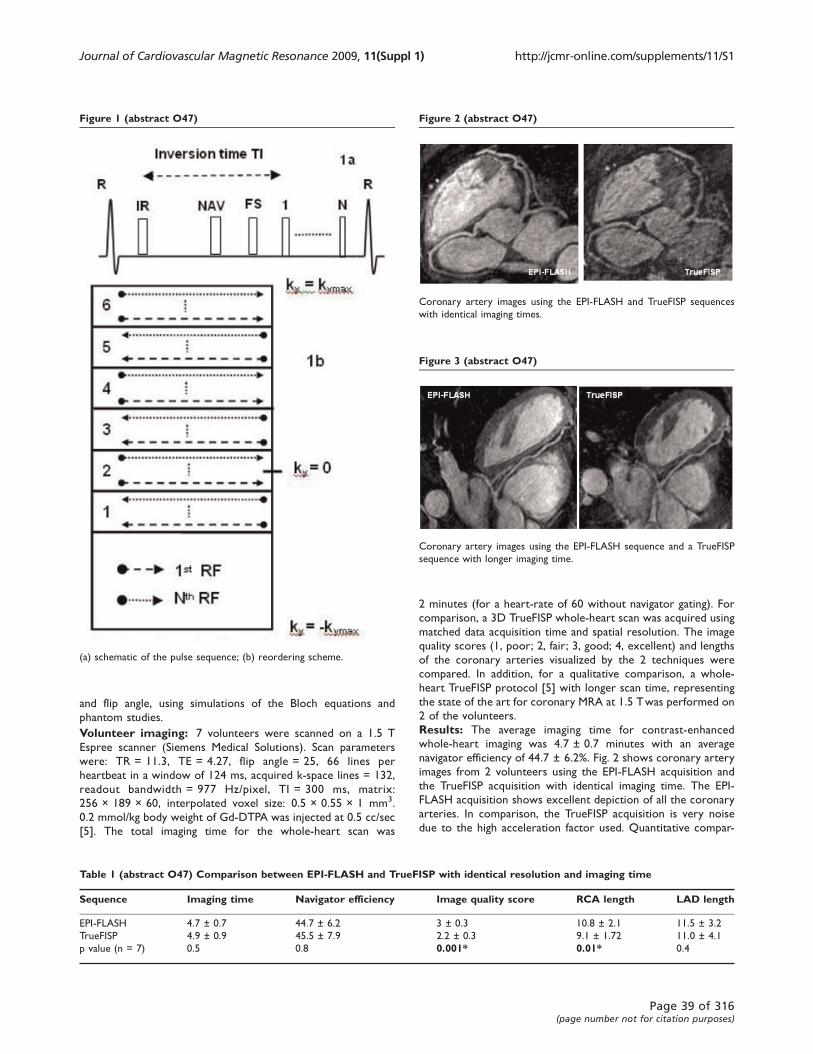
and flip angle, using simulations of the Bloch equations and
phantom studies.
Volunteer imaging: 7 volunteers were scanned on a 1.5 T
Espree scanner (Siemens Medical Solutions). Scan parameters
were: TR = 11.3, TE = 4.27, flip angle = 25, 66 lines per
heartbeat in a window of 124 ms, acquired k-space lines = 132,
readout bandwidth = 977 Hz/pixel, TI = 300 ms, matrix:
256 × 189 × 60, interpolated voxel size: 0.5 × 0.55 × 1 mm3.
0.2 mmol/kg body weight of Gd-DTPA was injected at 0.5 cc/sec
[5]. The total imaging time for the whole-heart scan was
2 minutes (for a heart-rate of 60 without navigator gating). For
comparison, a 3D TrueFISP whole-heart scan was acquired using
matched data acquisition time and spatial resolution. The image
quality scores (1, poor; 2, fair; 3, good; 4, excellent) and lengths
of the coronary arteries visualized by the 2 techniques were
compared. In addition, for a qualitative comparison, a whole-
heart TrueFISP protocol [5] with longer scan time, representing
the state of the art for coronary MRA at 1.5 Twas performed on
2 of the volunteers.
Results: The average imaging time for contrast-enhanced
whole-heart imaging was 4.7 ± 0.7 minutes with an average
navigator efficiency of 44.7 ± 6.2%. Fig. 2 shows coronary artery
images from 2 volunteers using the EPI-FLASH acquisition and
the TrueFISP acquisition with identical imaging time. The EPI-
FLASH acquisition shows excellent depiction of all the coronary
arteries. In comparison, the TrueFISP acquisition is very noise
due to the high acceleration factor used. Quantitative compar-
Figure 2 (abstract O47)
Coronary artery images using the EPI-FLASH and TrueFISP sequences
with identical imaging times.
Figure 1 (abstract O47)
(a) schematic of the pulse sequence; (b) reordering scheme.
Table 1 (abstract O47) Comparison between EPI-FLASH and TrueFISP with identical resolution and imaging time
Sequence Imaging time Navigator efficiency Image quality score RCA length LAD length
EPI-FLASH 4.7 ± 0.7 44.7 ± 6.2 3 ± 0.3 10.8 ± 2.1 11.5 ± 3.2
TrueFISP 4.9 ± 0.9 45.5 ± 7.9 2.2 ± 0.3 9.1 ± 1.72 11.0 ± 4.1
p value (n = 7) 0.5 0.8 0.001* 0.01* 0.4
Figure 3 (abstract O47)
Coronary artery images using the EPI-FLASH sequence and a TrueFISP
sequence with longer imaging time.
Journal of Cardiovascular Magnetic Resonance 2009, 11(Suppl 1) http://jcmr-online.com/supplements/11/S1
Page 39 of 316(page number not for citation purposes)
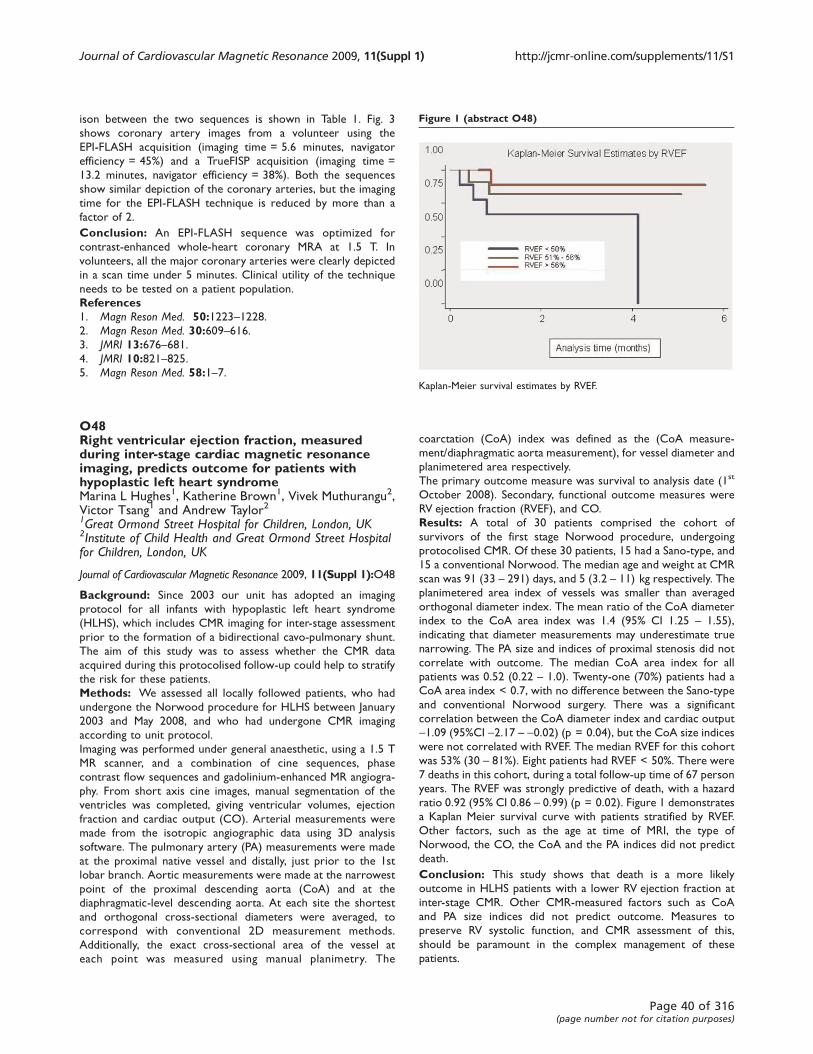
ison between the two sequences is shown in Table 1. Fig. 3
shows coronary artery images from a volunteer using the
EPI-FLASH acquisition (imaging time = 5.6 minutes, navigator
efficiency = 45%) and a TrueFISP acquisition (imaging time =
13.2 minutes, navigator efficiency = 38%). Both the sequences
show similar depiction of the coronary arteries, but the imaging
time for the EPI-FLASH technique is reduced by more than a
factor of 2.
Conclusion: An EPI-FLASH sequence was optimized for
contrast-enhanced whole-heart coronary MRA at 1.5 T. In
volunteers, all the major coronary arteries were clearly depicted
in a scan time under 5 minutes. Clinical utility of the technique
needs to be tested on a patient population.
References1. Magn Reson Med. 50:1223–1228.2. Magn Reson Med. 30:609–616.3. JMRI 13:676–681.4. JMRI 10:821–825.5. Magn Reson Med. 58:1–7.
O48Right ventricular ejection fraction, measuredduring inter-stage cardiac magnetic resonanceimaging, predicts outcome for patients withhypoplastic left heart syndromeMarina L Hughes1, Katherine Brown1, Vivek Muthurangu2,Victor Tsang1 and Andrew Taylor21Great Ormond Street Hospital for Children, London, UK2Institute of Child Health and Great Ormond Street Hospitalfor Children, London, UK
Journal of Cardiovascular Magnetic Resonance 2009, 11(Suppl 1):O48
Background: Since 2003 our unit has adopted an imaging
protocol for all infants with hypoplastic left heart syndrome
(HLHS), which includes CMR imaging for inter-stage assessment
prior to the formation of a bidirectional cavo-pulmonary shunt.
The aim of this study was to assess whether the CMR data
acquired during this protocolised follow-up could help to stratify
the risk for these patients.
Methods: We assessed all locally followed patients, who had
undergone the Norwood procedure for HLHS between January
2003 and May 2008, and who had undergone CMR imaging
according to unit protocol.
Imaging was performed under general anaesthetic, using a 1.5 T
MR scanner, and a combination of cine sequences, phase
contrast flow sequences and gadolinium-enhanced MR angiogra-
phy. From short axis cine images, manual segmentation of the
ventricles was completed, giving ventricular volumes, ejection
fraction and cardiac output (CO). Arterial measurements were
made from the isotropic angiographic data using 3D analysis
software. The pulmonary artery (PA) measurements were made
at the proximal native vessel and distally, just prior to the 1st
lobar branch. Aortic measurements were made at the narrowest
point of the proximal descending aorta (CoA) and at the
diaphragmatic-level descending aorta. At each site the shortest
and orthogonal cross-sectional diameters were averaged, to
correspond with conventional 2D measurement methods.
Additionally, the exact cross-sectional area of the vessel at
each point was measured using manual planimetry. The
coarctation (CoA) index was defined as the (CoA measure-
ment/diaphragmatic aorta measurement), for vessel diameter and
planimetered area respectively.
The primary outcome measure was survival to analysis date (1st
October 2008). Secondary, functional outcome measures were
RV ejection fraction (RVEF), and CO.
Results: A total of 30 patients comprised the cohort of
survivors of the first stage Norwood procedure, undergoing
protocolised CMR. Of these 30 patients, 15 had a Sano-type, and
15 a conventional Norwood. The median age and weight at CMR
scan was 91 (33 – 291) days, and 5 (3.2 – 11) kg respectively. The
planimetered area index of vessels was smaller than averaged
orthogonal diameter index. The mean ratio of the CoA diameter
index to the CoA area index was 1.4 (95% CI 1.25 – 1.55),
indicating that diameter measurements may underestimate true
narrowing. The PA size and indices of proximal stenosis did not
correlate with outcome. The median CoA area index for all
patients was 0.52 (0.22 – 1.0). Twenty-one (70%) patients had a
CoA area index < 0.7, with no difference between the Sano-type
and conventional Norwood surgery. There was a significant
correlation between the CoA diameter index and cardiac output
-1.09 (95%CI -2.17 – -0.02) (p = 0.04), but the CoA size indices
were not correlated with RVEF. The median RVEF for this cohort
was 53% (30 – 81%). Eight patients had RVEF < 50%. There were
7 deaths in this cohort, during a total follow-up time of 67 person
years. The RVEF was strongly predictive of death, with a hazard
ratio 0.92 (95% CI 0.86 – 0.99) (p = 0.02). Figure 1 demonstrates
a Kaplan Meier survival curve with patients stratified by RVEF.
Other factors, such as the age at time of MRI, the type of
Norwood, the CO, the CoA and the PA indices did not predict
death.
Conclusion: This study shows that death is a more likely
outcome in HLHS patients with a lower RV ejection fraction at
inter-stage CMR. Other CMR-measured factors such as CoA
and PA size indices did not predict outcome. Measures to
preserve RV systolic function, and CMR assessment of this,
should be paramount in the complex management of these
patients.
Figure 1 (abstract O48)
Kaplan-Meier survival estimates by RVEF.
Journal of Cardiovascular Magnetic Resonance 2009, 11(Suppl 1) http://jcmr-online.com/supplements/11/S1
Page 40 of 316(page number not for citation purposes)
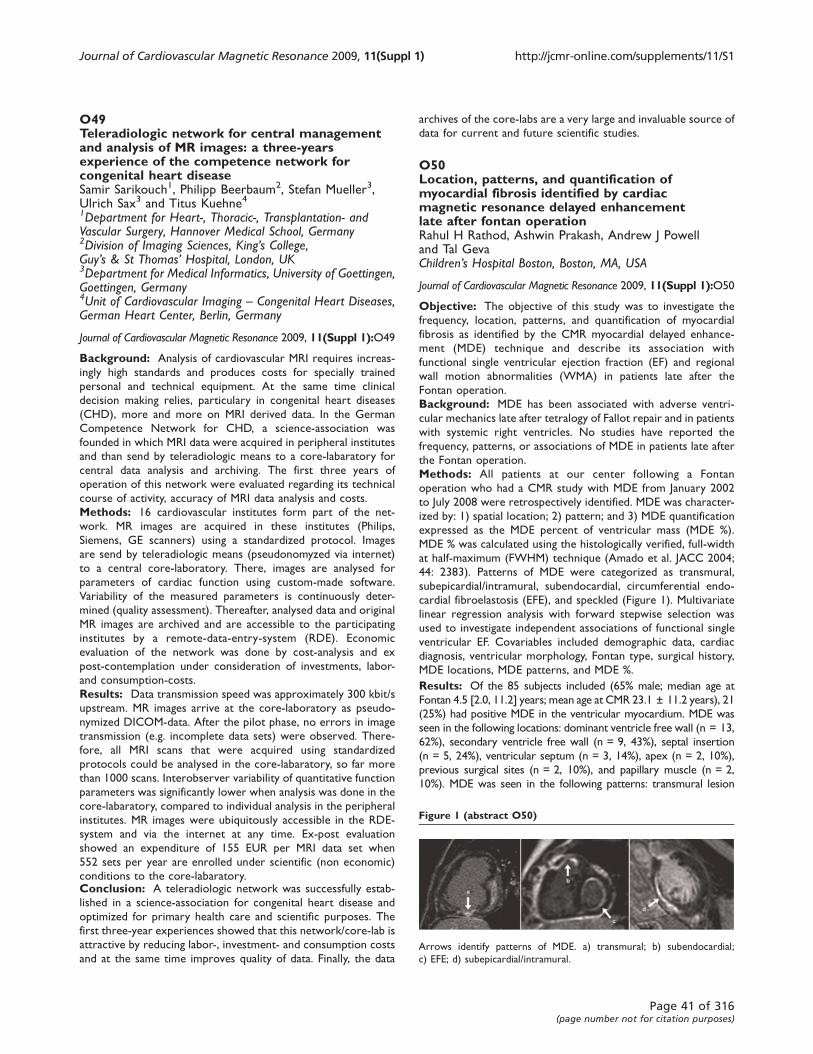
O49Teleradiologic network for central managementand analysis of MR images: a three-yearsexperience of the competence network forcongenital heart diseaseSamir Sarikouch1, Philipp Beerbaum2, Stefan Mueller3,Ulrich Sax3 and Titus Kuehne41Department for Heart-, Thoracic-, Transplantation- andVascular Surgery, Hannover Medical School, Germany2Division of Imaging Sciences, King’s College,Guy’s & St Thomas’ Hospital, London, UK3Department for Medical Informatics, University of Goettingen,Goettingen, Germany4Unit of Cardiovascular Imaging – Congenital Heart Diseases,German Heart Center, Berlin, Germany
Journal of Cardiovascular Magnetic Resonance 2009, 11(Suppl 1):O49
Background: Analysis of cardiovascular MRI requires increas-
ingly high standards and produces costs for specially trained
personal and technical equipment. At the same time clinical
decision making relies, particulary in congenital heart diseases
(CHD), more and more on MRI derived data. In the German
Competence Network for CHD, a science-association was
founded in which MRI data were acquired in peripheral institutes
and than send by teleradiologic means to a core-labaratory for
central data analysis and archiving. The first three years of
operation of this network were evaluated regarding its technical
course of activity, accuracy of MRI data analysis and costs.
Methods: 16 cardiovascular institutes form part of the net-
work. MR images are acquired in these institutes (Philips,
Siemens, GE scanners) using a standardized protocol. Images
are send by teleradiologic means (pseudonomyzed via internet)
to a central core-laboratory. There, images are analysed for
parameters of cardiac function using custom-made software.
Variability of the measured parameters is continuously deter-
mined (quality assessment). Thereafter, analysed data and original
MR images are archived and are accessible to the participating
institutes by a remote-data-entry-system (RDE). Economic
evaluation of the network was done by cost-analysis and ex
post-contemplation under consideration of investments, labor-
and consumption-costs.
Results: Data transmission speed was approximately 300 kbit/s
upstream. MR images arrive at the core-laboratory as pseudo-
nymized DICOM-data. After the pilot phase, no errors in image
transmission (e.g. incomplete data sets) were observed. There-
fore, all MRI scans that were acquired using standardized
protocols could be analysed in the core-labaratory, so far more
than 1000 scans. Interobserver variability of quantitative function
parameters was significantly lower when analysis was done in the
core-labaratory, compared to individual analysis in the peripheral
institutes. MR images were ubiquitously accessible in the RDE-
system and via the internet at any time. Ex-post evaluation
showed an expenditure of 155 EUR per MRI data set when
552 sets per year are enrolled under scientific (non economic)
conditions to the core-labaratory.Conclusion: A teleradiologic network was successfully estab-
lished in a science-association for congenital heart disease and
optimized for primary health care and scientific purposes. The
first three-year experiences showed that this network/core-lab is
attractive by reducing labor-, investment- and consumption costs
and at the same time improves quality of data. Finally, the data
archives of the core-labs are a very large and invaluable source of
data for current and future scientific studies.
O50Location, patterns, and quantification ofmyocardial fibrosis identified by cardiacmagnetic resonance delayed enhancementlate after fontan operationRahul H Rathod, Ashwin Prakash, Andrew J Powelland Tal GevaChildren’s Hospital Boston, Boston, MA, USA
Journal of Cardiovascular Magnetic Resonance 2009, 11(Suppl 1):O50
Objective: The objective of this study was to investigate the
frequency, location, patterns, and quantification of myocardial
fibrosis as identified by the CMR myocardial delayed enhance-
ment (MDE) technique and describe its association with
functional single ventricular ejection fraction (EF) and regional
wall motion abnormalities (WMA) in patients late after the
Fontan operation.
Background: MDE has been associated with adverse ventri-
cular mechanics late after tetralogy of Fallot repair and in patients
with systemic right ventricles. No studies have reported the
frequency, patterns, or associations of MDE in patients late after
the Fontan operation.
Methods: All patients at our center following a Fontan
operation who had a CMR study with MDE from January 2002
to July 2008 were retrospectively identified. MDE was character-
ized by: 1) spatial location; 2) pattern; and 3) MDE quantification
expressed as the MDE percent of ventricular mass (MDE %).
MDE % was calculated using the histologically verified, full-width
at half-maximum (FWHM) technique (Amado et al. JACC 2004;
44: 2383). Patterns of MDE were categorized as transmural,
subepicardial/intramural, subendocardial, circumferential endo-
cardial fibroelastosis (EFE), and speckled (Figure 1). Multivariate
linear regression analysis with forward stepwise selection was
used to investigate independent associations of functional single
ventricular EF. Covariables included demographic data, cardiac
diagnosis, ventricular morphology, Fontan type, surgical history,
MDE locations, MDE patterns, and MDE %.
Results: Of the 85 subjects included (65% male; median age at
Fontan 4.5 [2.0, 11.2] years; mean age at CMR 23.1 ± 11.2 years), 21
(25%) had positive MDE in the ventricular myocardium. MDE was
seen in the following locations: dominant ventricle free wall (n = 13,
62%), secondary ventricle free wall (n = 9, 43%), septal insertion
(n = 5, 24%), ventricular septum (n = 3, 14%), apex (n = 2, 10%),
previous surgical sites (n = 2, 10%), and papillary muscle (n = 2,
10%). MDE was seen in the following patterns: transmural lesion
Figure 1 (abstract O50)
Arrows identify patterns of MDE. a) transmural; b) subendocardial;
c) EFE; d) subepicardial/intramural.
Journal of Cardiovascular Magnetic Resonance 2009, 11(Suppl 1) http://jcmr-online.com/supplements/11/S1
Page 41 of 316(page number not for citation purposes)
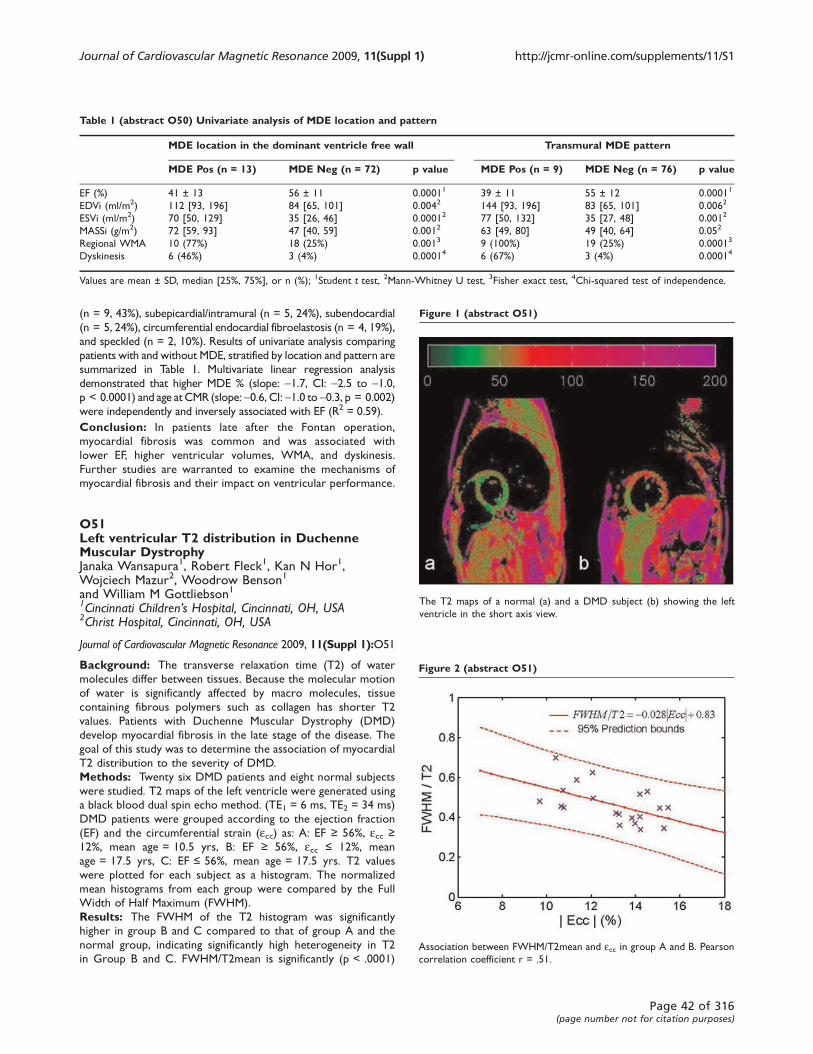
(n = 9, 43%), subepicardial/intramural (n = 5, 24%), subendocardial
(n = 5, 24%), circumferential endocardial fibroelastosis (n = 4, 19%),
and speckled (n = 2, 10%). Results of univariate analysis comparing
patients with and without MDE, stratified by location and pattern are
summarized in Table 1. Multivariate linear regression analysis
demonstrated that higher MDE % (slope: -1.7, CI: -2.5 to -1.0,p < 0.0001) and age at CMR (slope: -0.6, CI: -1.0 to -0.3, p = 0.002)
were independently and inversely associated with EF (R2 = 0.59).
Conclusion: In patients late after the Fontan operation,
myocardial fibrosis was common and was associated with
lower EF, higher ventricular volumes, WMA, and dyskinesis.
Further studies are warranted to examine the mechanisms of
myocardial fibrosis and their impact on ventricular performance.
O51Left ventricular T2 distribution in DuchenneMuscular DystrophyJanaka Wansapura1, Robert Fleck1, Kan N Hor1,Wojciech Mazur2, Woodrow Benson1
and William M Gottliebson11Cincinnati Children’s Hospital, Cincinnati, OH, USA2Christ Hospital, Cincinnati, OH, USA
Journal of Cardiovascular Magnetic Resonance 2009, 11(Suppl 1):O51
Background: The transverse relaxation time (T2) of water
molecules differ between tissues. Because the molecular motion
of water is significantly affected by macro molecules, tissue
containing fibrous polymers such as collagen has shorter T2
values. Patients with Duchenne Muscular Dystrophy (DMD)
develop myocardial fibrosis in the late stage of the disease. The
goal of this study was to determine the association of myocardial
T2 distribution to the severity of DMD.
Methods: Twenty six DMD patients and eight normal subjects
were studied. T2 maps of the left ventricle were generated using
a black blood dual spin echo method. (TE1 = 6 ms, TE2 = 34 ms)
DMD patients were grouped according to the ejection fraction
(EF) and the circumferential strain (ecc) as: A: EF ≥ 56%, ecc ≥12%, mean age = 10.5 yrs, B: EF ≥ 56%, ecc ≤ 12%, mean
age = 17.5 yrs, C: EF ≤ 56%, mean age = 17.5 yrs. T2 values
were plotted for each subject as a histogram. The normalized
mean histograms from each group were compared by the Full
Width of Half Maximum (FWHM).
Results: The FWHM of the T2 histogram was significantly
higher in group B and C compared to that of group A and the
normal group, indicating significantly high heterogeneity in T2
in Group B and C. FWHM/T2mean is significantly (p < .0001)
Table 1 (abstract O50) Univariate analysis of MDE location and pattern
MDE location in the dominant ventricle free wall Transmural MDE pattern
MDE Pos (n = 13) MDE Neg (n = 72) p value MDE Pos (n = 9) MDE Neg (n = 76) p value
EF (%) 41 ± 13 56 ± 11 0.00011 39 ± 11 55 ± 12 0.00011
EDVi (ml/m2) 112 [93, 196] 84 [65, 101] 0.0042 144 [93, 196] 83 [65, 101] 0.0062
ESVi (ml/m2) 70 [50, 129] 35 [26, 46] 0.00012 77 [50, 132] 35 [27, 48] 0.0012
MASSi (g/m2) 72 [59, 93] 47 [40, 59] 0.0012 63 [49, 80] 49 [40, 64] 0.052
Regional WMA 10 (77%) 18 (25%) 0.0013 9 (100%) 19 (25%) 0.00013
Dyskinesis 6 (46%) 3 (4%) 0.00014 6 (67%) 3 (4%) 0.00014
Values are mean ± SD, median [25%, 75%], or n (%); 1Student t test, 2Mann-Whitney U test, 3Fisher exact test, 4Chi-squared test of independence.
Figure 1 (abstract O51)
The T2 maps of a normal (a) and a DMD subject (b) showing the left
ventricle in the short axis view.
Figure 2 (abstract O51)
Association between FWHM/T2mean and ecc in group A and B. Pearson
correlation coefficient r = .51.
Journal of Cardiovascular Magnetic Resonance 2009, 11(Suppl 1) http://jcmr-online.com/supplements/11/S1
Page 42 of 316(page number not for citation purposes)
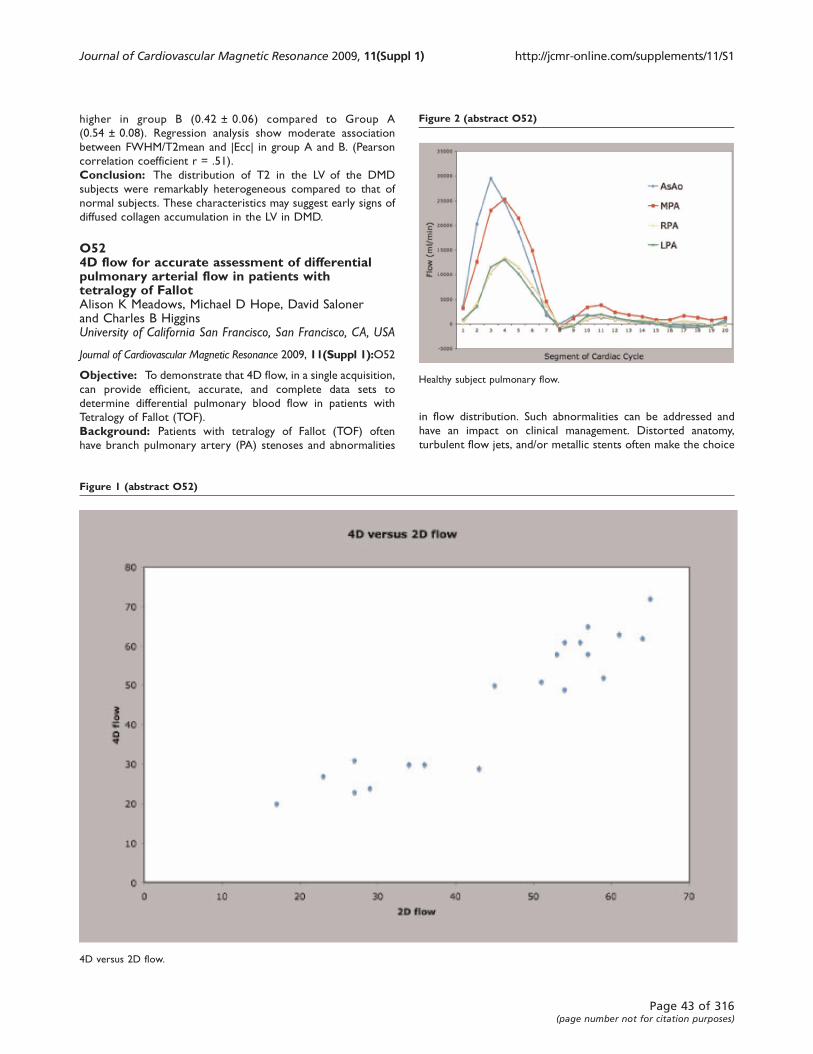
higher in group B (0.42 ± 0.06) compared to Group A
(0.54 ± 0.08). Regression analysis show moderate association
between FWHM/T2mean and |Ecc| in group A and B. (Pearson
correlation coefficient r = .51).
Conclusion: The distribution of T2 in the LV of the DMD
subjects were remarkably heterogeneous compared to that of
normal subjects. These characteristics may suggest early signs of
diffused collagen accumulation in the LV in DMD.
O524D flow for accurate assessment of differentialpulmonary arterial flow in patients withtetralogy of FallotAlison K Meadows, Michael D Hope, David Salonerand Charles B HigginsUniversity of California San Francisco, San Francisco, CA, USA
Journal of Cardiovascular Magnetic Resonance 2009, 11(Suppl 1):O52
Objective: To demonstrate that 4D flow, in a single acquisition,
can provide efficient, accurate, and complete data sets to
determine differential pulmonary blood flow in patients with
Tetralogy of Fallot (TOF).
Background: Patients with tetralogy of Fallot (TOF) often
have branch pulmonary artery (PA) stenoses and abnormalities
in flow distribution. Such abnormalities can be addressed and
have an impact on clinical management. Distorted anatomy,
turbulent flow jets, and/or metallic stents often make the choice
Figure 1 (abstract O52)
4D versus 2D flow.
Figure 2 (abstract O52)
Healthy subject pulmonary flow.
Journal of Cardiovascular Magnetic Resonance 2009, 11(Suppl 1) http://jcmr-online.com/supplements/11/S1
Page 43 of 316(page number not for citation purposes)
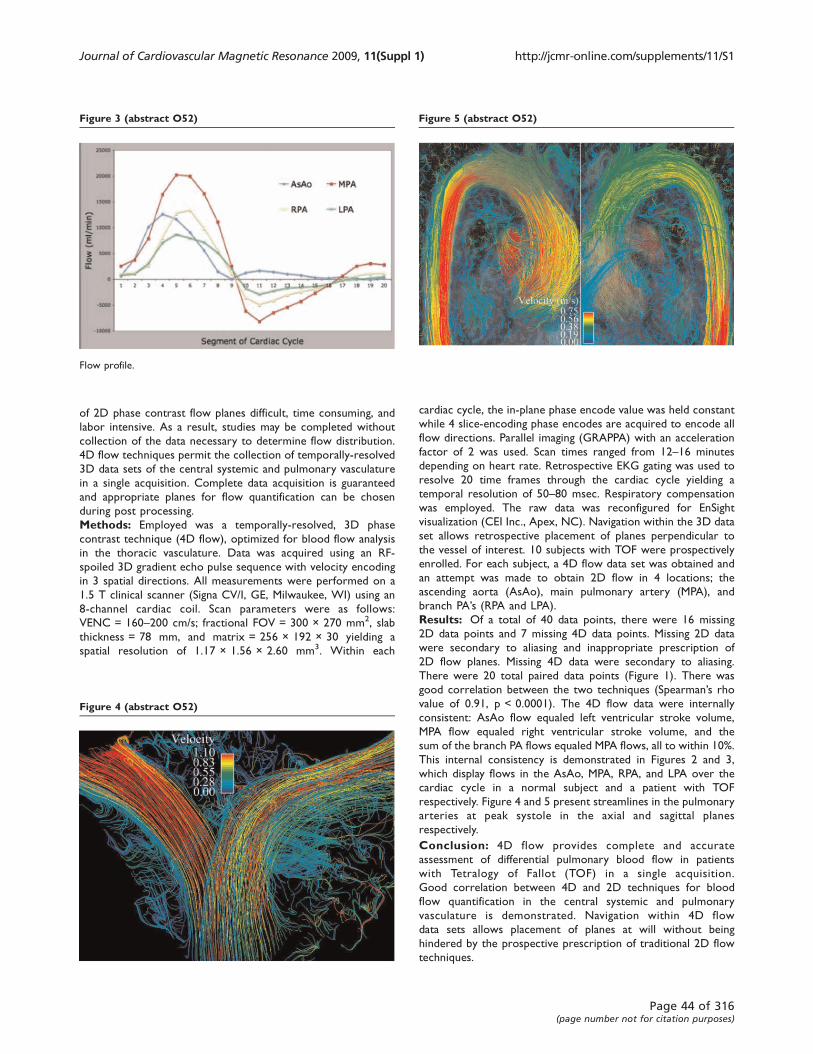
of 2D phase contrast flow planes difficult, time consuming, and
labor intensive. As a result, studies may be completed without
collection of the data necessary to determine flow distribution.
4D flow techniques permit the collection of temporally-resolved
3D data sets of the central systemic and pulmonary vasculature
in a single acquisition. Complete data acquisition is guaranteed
and appropriate planes for flow quantification can be chosen
during post processing.
Methods: Employed was a temporally-resolved, 3D phase
contrast technique (4D flow), optimized for blood flow analysis
in the thoracic vasculature. Data was acquired using an RF-
spoiled 3D gradient echo pulse sequence with velocity encoding
in 3 spatial directions. All measurements were performed on a
1.5 T clinical scanner (Signa CV/I, GE, Milwaukee, WI) using an
8-channel cardiac coil. Scan parameters were as follows:
VENC = 160–200 cm/s; fractional FOV = 300 × 270 mm2, slab
thickness = 78 mm, and matrix = 256 × 192 × 30 yielding a
spatial resolution of 1.17 × 1.56 × 2.60 mm3. Within each
cardiac cycle, the in-plane phase encode value was held constant
while 4 slice-encoding phase encodes are acquired to encode all
flow directions. Parallel imaging (GRAPPA) with an acceleration
factor of 2 was used. Scan times ranged from 12–16 minutes
depending on heart rate. Retrospective EKG gating was used to
resolve 20 time frames through the cardiac cycle yielding a
temporal resolution of 50–80 msec. Respiratory compensation
was employed. The raw data was reconfigured for EnSight
visualization (CEI Inc., Apex, NC). Navigation within the 3D data
set allows retrospective placement of planes perpendicular to
the vessel of interest. 10 subjects with TOF were prospectively
enrolled. For each subject, a 4D flow data set was obtained and
an attempt was made to obtain 2D flow in 4 locations; the
ascending aorta (AsAo), main pulmonary artery (MPA), and
branch PA’s (RPA and LPA).
Results: Of a total of 40 data points, there were 16 missing
2D data points and 7 missing 4D data points. Missing 2D data
were secondary to aliasing and inappropriate prescription of
2D flow planes. Missing 4D data were secondary to aliasing.
There were 20 total paired data points (Figure 1). There was
good correlation between the two techniques (Spearman’s rho
value of 0.91, p < 0.0001). The 4D flow data were internally
consistent: AsAo flow equaled left ventricular stroke volume,
MPA flow equaled right ventricular stroke volume, and the
sum of the branch PA flows equaled MPA flows, all to within 10%.
This internal consistency is demonstrated in Figures 2 and 3,
which display flows in the AsAo, MPA, RPA, and LPA over the
cardiac cycle in a normal subject and a patient with TOF
respectively. Figure 4 and 5 present streamlines in the pulmonary
arteries at peak systole in the axial and sagittal planes
respectively.
Conclusion: 4D flow provides complete and accurate
assessment of differential pulmonary blood flow in patients
with Tetralogy of Fallot (TOF) in a single acquisition.
Good correlation between 4D and 2D techniques for blood
flow quantification in the central systemic and pulmonary
vasculature is demonstrated. Navigation within 4D flow
data sets allows placement of planes at will without being
hindered by the prospective prescription of traditional 2D flow
techniques.
Figure 3 (abstract O52)
Flow profile.
Figure 4 (abstract O52)
Figure 5 (abstract O52)
Journal of Cardiovascular Magnetic Resonance 2009, 11(Suppl 1) http://jcmr-online.com/supplements/11/S1
Page 44 of 316(page number not for citation purposes)
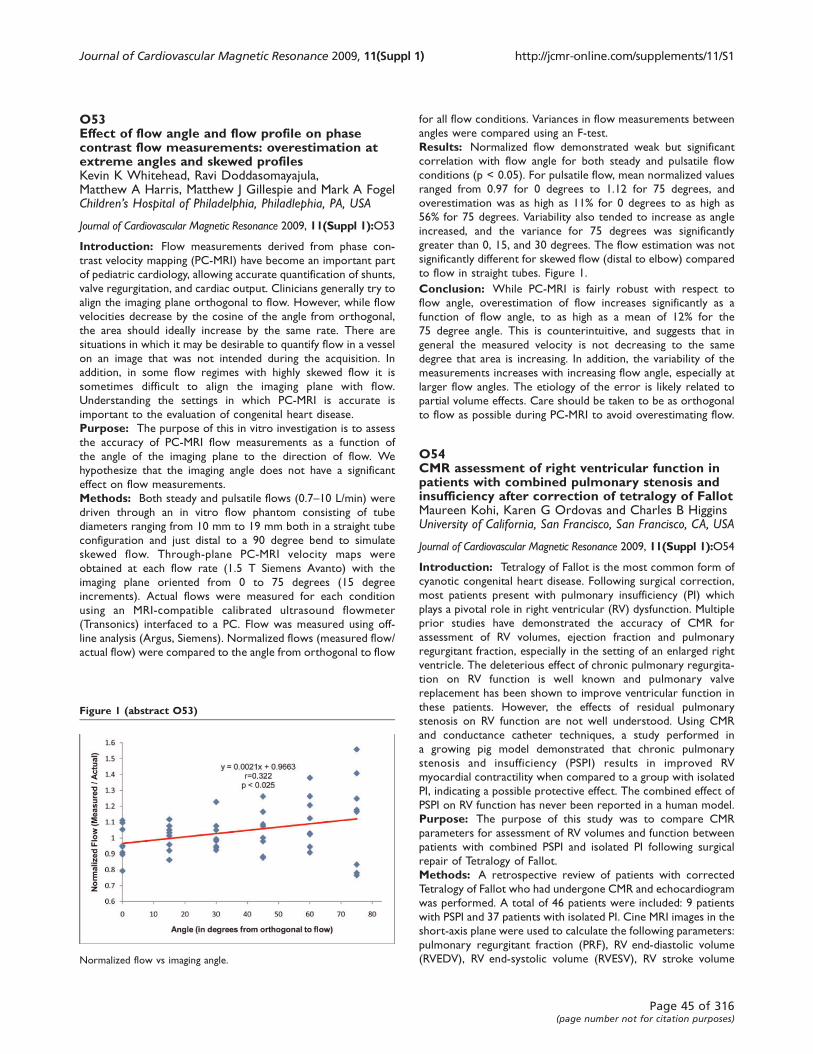
O53Effect of flow angle and flow profile on phasecontrast flow measurements: overestimation atextreme angles and skewed profilesKevin K Whitehead, Ravi Doddasomayajula,Matthew A Harris, Matthew J Gillespie and Mark A FogelChildren’s Hospital of Philadelphia, Philadlephia, PA, USA
Journal of Cardiovascular Magnetic Resonance 2009, 11(Suppl 1):O53
Introduction: Flow measurements derived from phase con-
trast velocity mapping (PC-MRI) have become an important part
of pediatric cardiology, allowing accurate quantification of shunts,
valve regurgitation, and cardiac output. Clinicians generally try to
align the imaging plane orthogonal to flow. However, while flow
velocities decrease by the cosine of the angle from orthogonal,
the area should ideally increase by the same rate. There are
situations in which it may be desirable to quantify flow in a vessel
on an image that was not intended during the acquisition. In
addition, in some flow regimes with highly skewed flow it is
sometimes difficult to align the imaging plane with flow.
Understanding the settings in which PC-MRI is accurate is
important to the evaluation of congenital heart disease.
Purpose: The purpose of this in vitro investigation is to assess
the accuracy of PC-MRI flow measurements as a function of
the angle of the imaging plane to the direction of flow. We
hypothesize that the imaging angle does not have a significant
effect on flow measurements.
Methods: Both steady and pulsatile flows (0.7–10 L/min) were
driven through an in vitro flow phantom consisting of tube
diameters ranging from 10 mm to 19 mm both in a straight tube
configuration and just distal to a 90 degree bend to simulate
skewed flow. Through-plane PC-MRI velocity maps were
obtained at each flow rate (1.5 T Siemens Avanto) with the
imaging plane oriented from 0 to 75 degrees (15 degree
increments). Actual flows were measured for each condition
using an MRI-compatible calibrated ultrasound flowmeter
(Transonics) interfaced to a PC. Flow was measured using off-
line analysis (Argus, Siemens). Normalized flows (measured flow/
actual flow) were compared to the angle from orthogonal to flow
for all flow conditions. Variances in flow measurements between
angles were compared using an F-test.
Results: Normalized flow demonstrated weak but significant
correlation with flow angle for both steady and pulsatile flow
conditions (p < 0.05). For pulsatile flow, mean normalized values
ranged from 0.97 for 0 degrees to 1.12 for 75 degrees, and
overestimation was as high as 11% for 0 degrees to as high as
56% for 75 degrees. Variability also tended to increase as angle
increased, and the variance for 75 degrees was significantly
greater than 0, 15, and 30 degrees. The flow estimation was not
significantly different for skewed flow (distal to elbow) compared
to flow in straight tubes. Figure 1.
Conclusion: While PC-MRI is fairly robust with respect to
flow angle, overestimation of flow increases significantly as a
function of flow angle, to as high as a mean of 12% for the
75 degree angle. This is counterintuitive, and suggests that in
general the measured velocity is not decreasing to the same
degree that area is increasing. In addition, the variability of the
measurements increases with increasing flow angle, especially at
larger flow angles. The etiology of the error is likely related to
partial volume effects. Care should be taken to be as orthogonal
to flow as possible during PC-MRI to avoid overestimating flow.
O54CMR assessment of right ventricular function inpatients with combined pulmonary stenosis andinsufficiency after correction of tetralogy of FallotMaureen Kohi, Karen G Ordovas and Charles B HigginsUniversity of California, San Francisco, San Francisco, CA, USA
Journal of Cardiovascular Magnetic Resonance 2009, 11(Suppl 1):O54
Introduction: Tetralogy of Fallot is the most common form of
cyanotic congenital heart disease. Following surgical correction,
most patients present with pulmonary insufficiency (PI) which
plays a pivotal role in right ventricular (RV) dysfunction. Multiple
prior studies have demonstrated the accuracy of CMR for
assessment of RV volumes, ejection fraction and pulmonary
regurgitant fraction, especially in the setting of an enlarged right
ventricle. The deleterious effect of chronic pulmonary regurgita-
tion on RV function is well known and pulmonary valve
replacement has been shown to improve ventricular function in
these patients. However, the effects of residual pulmonary
stenosis on RV function are not well understood. Using CMR
and conductance catheter techniques, a study performed in
a growing pig model demonstrated that chronic pulmonary
stenosis and insufficiency (PSPI) results in improved RV
myocardial contractility when compared to a group with isolated
PI, indicating a possible protective effect. The combined effect of
PSPI on RV function has never been reported in a human model.
Purpose: The purpose of this study was to compare CMR
parameters for assessment of RV volumes and function between
patients with combined PSPI and isolated PI following surgical
repair of Tetralogy of Fallot.
Methods: A retrospective review of patients with corrected
Tetralogy of Fallot who had undergone CMR and echocardiogram
was performed. A total of 46 patients were included: 9 patients
with PSPI and 37 patients with isolated PI. Cine MRI images in the
short-axis plane were used to calculate the following parameters:
pulmonary regurgitant fraction (PRF), RV end-diastolic volume
(RVEDV), RV end-systolic volume (RVESV), RV stroke volume
Figure 1 (abstract O53)
Normalized flow vs imaging angle.
Journal of Cardiovascular Magnetic Resonance 2009, 11(Suppl 1) http://jcmr-online.com/supplements/11/S1
Page 45 of 316(page number not for citation purposes)
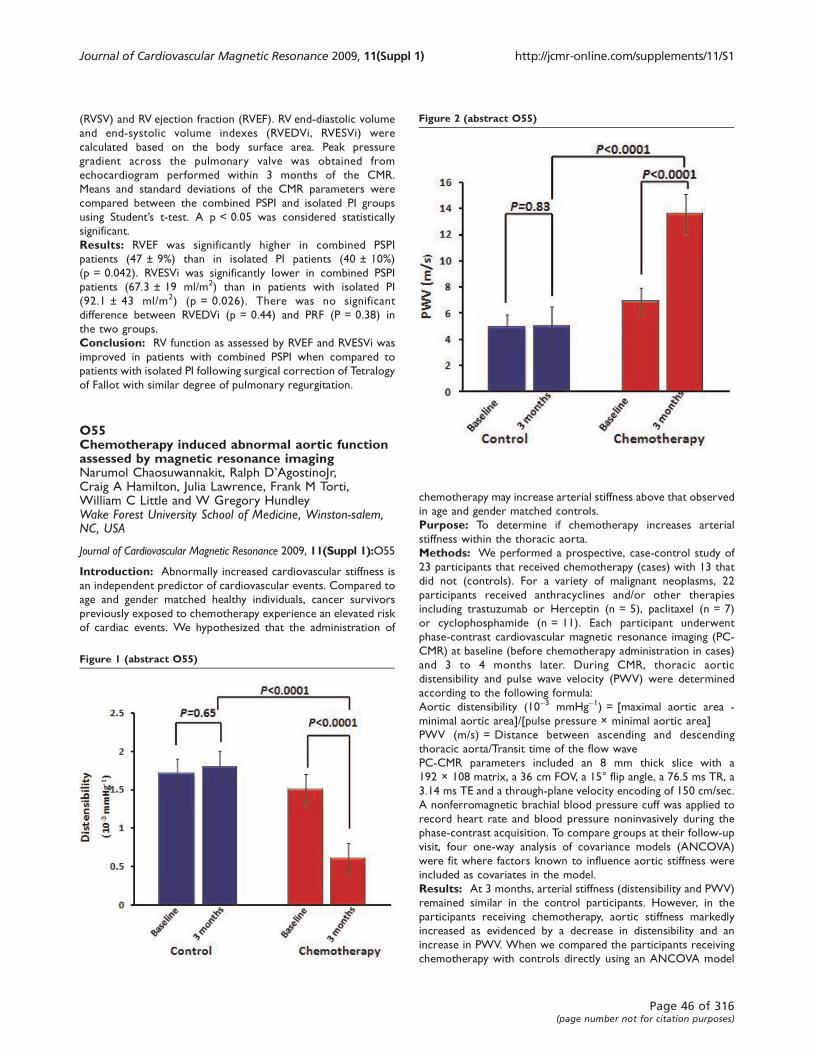
(RVSV) and RV ejection fraction (RVEF). RV end-diastolic volume
and end-systolic volume indexes (RVEDVi, RVESVi) were
calculated based on the body surface area. Peak pressure
gradient across the pulmonary valve was obtained from
echocardiogram performed within 3 months of the CMR.
Means and standard deviations of the CMR parameters were
compared between the combined PSPI and isolated PI groups
using Student’s t-test. A p < 0.05 was considered statistically
significant.
Results: RVEF was significantly higher in combined PSPI
patients (47 ± 9%) than in isolated PI patients (40 ± 10%)
(p = 0.042). RVESVi was significantly lower in combined PSPI
patients (67.3 ± 19 ml/m2) than in patients with isolated PI
(92.1 ± 43 ml/m2) (p = 0.026). There was no significant
difference between RVEDVi (p = 0.44) and PRF (P = 0.38) in
the two groups.
Conclusion: RV function as assessed by RVEF and RVESVi was
improved in patients with combined PSPI when compared to
patients with isolated PI following surgical correction of Tetralogy
of Fallot with similar degree of pulmonary regurgitation.
O55Chemotherapy induced abnormal aortic functionassessed by magnetic resonance imagingNarumol Chaosuwannakit, Ralph D’AgostinoJr,Craig A Hamilton, Julia Lawrence, Frank M Torti,William C Little and W Gregory HundleyWake Forest University School of Medicine, Winston-salem,NC, USA
Journal of Cardiovascular Magnetic Resonance 2009, 11(Suppl 1):O55
Introduction: Abnormally increased cardiovascular stiffness is
an independent predictor of cardiovascular events. Compared to
age and gender matched healthy individuals, cancer survivors
previously exposed to chemotherapy experience an elevated risk
of cardiac events. We hypothesized that the administration of
chemotherapy may increase arterial stiffness above that observed
in age and gender matched controls.
Purpose: To determine if chemotherapy increases arterial
stiffness within the thoracic aorta.
Methods: We performed a prospective, case-control study of
23 participants that received chemotherapy (cases) with 13 that
did not (controls). For a variety of malignant neoplasms, 22
participants received anthracyclines and/or other therapies
including trastuzumab or Herceptin (n = 5), paclitaxel (n = 7)
or cyclophosphamide (n = 11). Each participant underwent
phase-contrast cardiovascular magnetic resonance imaging (PC-
CMR) at baseline (before chemotherapy administration in cases)
and 3 to 4 months later. During CMR, thoracic aortic
distensibility and pulse wave velocity (PWV) were determined
according to the following formula:
Aortic distensibility (10-3 mmHg-1) = [maximal aortic area -
minimal aortic area]/[pulse pressure × minimal aortic area]
PWV (m/s) = Distance between ascending and descending
thoracic aorta/Transit time of the flow wave
PC-CMR parameters included an 8 mm thick slice with a
192 × 108 matrix, a 36 cm FOV, a 15° flip angle, a 76.5 ms TR, a
3.14 ms TE and a through-plane velocity encoding of 150 cm/sec.
A nonferromagnetic brachial blood pressure cuff was applied to
record heart rate and blood pressure noninvasively during the
phase-contrast acquisition. To compare groups at their follow-up
visit, four one-way analysis of covariance models (ANCOVA)
were fit where factors known to influence aortic stiffness were
included as covariates in the model.
Results: At 3 months, arterial stiffness (distensibility and PWV)
remained similar in the control participants. However, in the
participants receiving chemotherapy, aortic stiffness markedly
increased as evidenced by a decrease in distensibility and an
increase in PWV. When we compared the participants receiving
chemotherapy with controls directly using an ANCOVA model
Figure 1 (abstract O55)
Figure 2 (abstract O55)
Journal of Cardiovascular Magnetic Resonance 2009, 11(Suppl 1) http://jcmr-online.com/supplements/11/S1
Page 46 of 316(page number not for citation purposes)

that adjusted for baseline aortic stiffness, age, gender, body mass
index, systolic blood pressure, heart rate, pulse pressure,
medication use, and the presence of hypertension, diabetes and
hyperlipidemia, distensibility and PWV were significantly different
between controls and chemotherapy recipients (p < 0.0001;
Figures 1 and 2).
Conclusion: Patients receiving relatively short courses of
chemotherapy (3 months) experience a significant increase in
vascular stiffness (manifest as both reduced aortic distensibility
and increased PWV) compared to healthy controls. These results
indicate that previously regarded cardiotoxic chemotherapy
adversely increases cardiovascular stiffness, a known indepen-
dent predictor of cardiovascular events.
O56Marfan’s cardiomyopathy is associated with aorticannular and root dilatation in the absence ofsignificant valvular regurgitationJoyce Wong, Francisco Alpendurada, Elizabeth Burmanand Raad MohiaddinRoyal Brompton Hospital, London, UK
Journal of Cardiovascular Magnetic Resonance 2009, 11(Suppl 1):O56
Introduction: Marfan syndrome is the commonest inherited
disorder of connective tissue affecting multiple organ systems,
caused by heterozygous mutations in the gene (FBN1) that
encodes the extracellular matrix protein fibrillin-1. Limited
evidence is available that Marfan syndrome is associated with a
primary cardiomyopathy. Cardiovascular Magnetic Resonance
(CMR) plays an important role in the identification and evaluation
of cardiovascular disease in this population, the major source of
morbidity and mortality. CMR was used to assess the prevalence
and predictors of primary cardiomyopathy, in a Marfan popula-
tion without evidence of significant valvular regurgitation or
aortic disease.
Methods: 120 Marfan patients were consecutively referred to
our centre for cardiovascular assessment with CMR between
January 2003 and June 2007 (diagnosis based on Ghent criteria).
Our study population consisted of 66 of these patients who had
no significant valvular regurgitation, and no previous aortic or
cardiac disease warranting surgery. This included 38 males
(57.8%) and 28 females (42.1%), with a mean age of 33,2 years.
Thoracic aortic dimensions were evaluated. Left ventricular (LV)
volumes, ejection fraction, and mass were evaluated using semi-
automated analysis software (CMRtools, Cardiovascular Imaging
Solutions, London, UK). The volumes and mass were then
indexed to the body surface area. Aortic (AV) and mitral valves
(MV) anatomy and function were assessed, and thoracic
musculoskeletal deformities identified. The final values were
compared with previously published normal values with values
being considered abnormal if they were outside the 95%
confidence interval. We similarly compared our population to
an age and sex matched cohort of normal individuals when
assessing aortic dimensions.
Results: A significant proportion of this population demon-
strated reductions in LV ejection fraction (27%). LV indexed
volumes were also significantly different. Annular and aortic root
dimensions were increased in the population with reduced LV
ejection fraction when compared with population with normal
ejection fraction (r of 0.33 and 0.26 respectively, p < 0.05 for
both values, Pearson’s coefficient). There was no significant
difference in global aortopathy indices or incidence of muscu-
loskeletal deformities between the two groups.
Conclusion: We confirm that Marfan syndrome is associated
with a primary cardiomyopathy in a population without
significant valvular disease. Moreover, annular and root dimen-
sions are increased in patients with LV dysfunction when
compared with patients with preserved LV systolic function,
suggesting that aortopathy and cardiomyopathy could be related
in this multi-systemic disorder. Recent advances in the molecular
pathogenesis of Marfan syndrome suggest that modulation of
abnormal fibrillin-1-TGF beta signalling by angiotensin-II receptor
blockade in Marfan patients may reverse aortopathy. It remains to
be determined whether angiotensin-II receptor blockade may
reverse aortopathy and associated cardiomyopathy.
O57Prevalence and imaging features of nephrogenicsystemic fibrosis at two large medical centersMartin R Prince1, Honglei Zhang1, Michael F Morris2,Jennifer L MacGregor2, Yang Zhang1, Marc E Grossman2,Jeffrey Silberzweig1, Robert L DeLapaz2, Henry J Lee1,Cynthia M Magro1, Anthony M Valeri2, David N Silvers2
and Joan C Prowda21Weill Medical College of Cornell University,New York, NY, USA2Columbia University, New York, NY, USA
Journal of Cardiovascular Magnetic Resonance 2009, 11(Suppl 1):O57
Introduction: Nephrogenic Systemic Fibrosis (NSF) is a rare
disease, seen in patients with severe renal impairment, that has
garnered increased interest among radiologists due to reports of
its association with gadolinium based contrast agents (GBCA).
Purpose: To determine the prevalence and illustrate the
spectrum of imaging findings with photographic and histopatho-
logic correlation of nephrogenic systemic fibrosis (NSF) in
patients undergoing gadolinium based contrast agent (GBCA)
enhanced MRI and associated risk factors.
Methods: With Institutional Review Board approval (informed
consent not required) medical records from two hospitals were
retrospectively reviewed to identify all cases of biopsy-confirmed
NSF and all patients receiving GBCA administration from 1/1/
1997 to 6/30/2007. Prevalence of NSF was calculated for patients
receiving standard dose GBCA, high dose GBCA as well as in
subgroups of patients with renal impairment. Imaging studies of
these patients were reviewed to correlate with photographic and
histopathologic findings.
Results: Fifteen patients had NSF following GBCA enhanced
MR. All had an estimated glomerular filtration rate (eGFR) < 30
m L/min and 11 had acute renal failure or acute deterioration of
chronic renal failure. NSF prevalence following GBCA without
screening for renal function was 0/74124 for standard dose and
15/8997 (0.17%) for high dose (p < 0.001). The high dose
prevalence increased to 0.4% for chronic hemodialysis patients
and 8.8% for patients with eGFR < 15 mL/min but not on dialysis
(p < 0.001). NSF prevalence in patients with acute renal failure
given high dose GBCA during rising serum creatinine was 19%
(11/58) when dialysis was delayed by > 2 days. More NSF patients
Journal of Cardiovascular Magnetic Resonance 2009, 11(Suppl 1) http://jcmr-online.com/supplements/11/S1
Page 47 of 316(page number not for citation purposes)
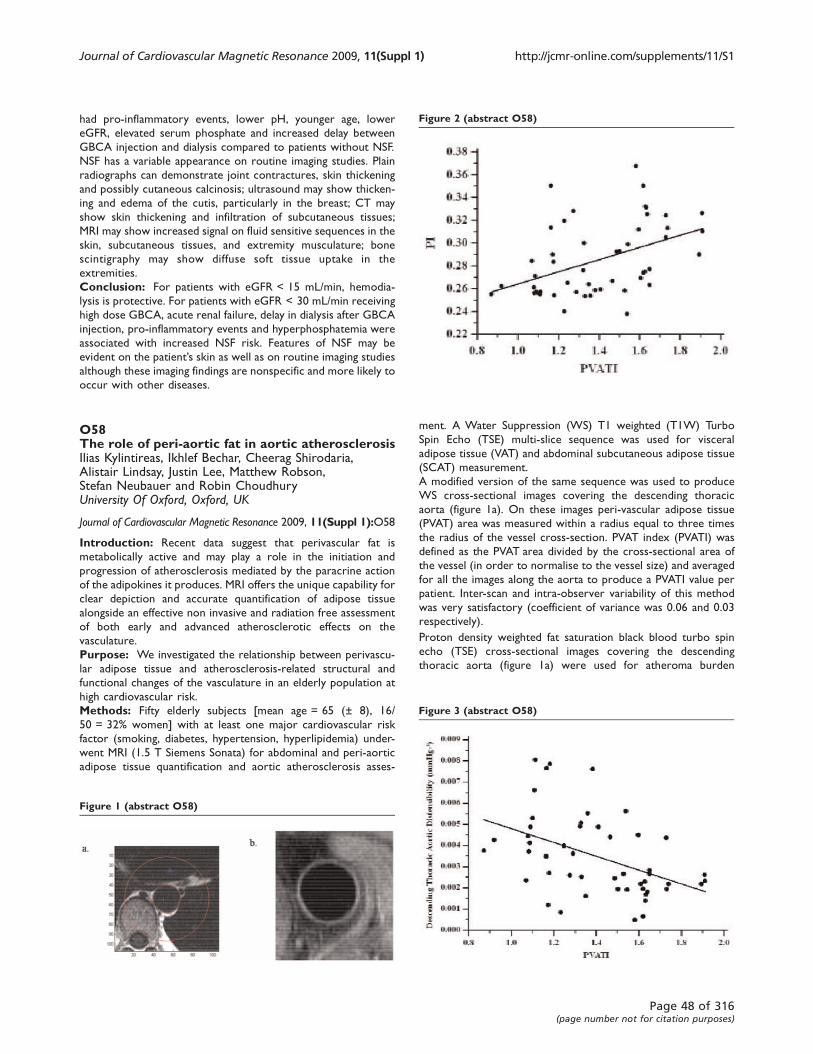
had pro-inflammatory events, lower pH, younger age, lower
eGFR, elevated serum phosphate and increased delay between
GBCA injection and dialysis compared to patients without NSF.
NSF has a variable appearance on routine imaging studies. Plain
radiographs can demonstrate joint contractures, skin thickening
and possibly cutaneous calcinosis; ultrasound may show thicken-
ing and edema of the cutis, particularly in the breast; CT may
show skin thickening and infiltration of subcutaneous tissues;
MRI may show increased signal on fluid sensitive sequences in the
skin, subcutaneous tissues, and extremity musculature; bone
scintigraphy may show diffuse soft tissue uptake in the
extremities.
Conclusion: For patients with eGFR < 15 mL/min, hemodia-
lysis is protective. For patients with eGFR < 30 mL/min receiving
high dose GBCA, acute renal failure, delay in dialysis after GBCA
injection, pro-inflammatory events and hyperphosphatemia were
associated with increased NSF risk. Features of NSF may be
evident on the patient’s skin as well as on routine imaging studies
although these imaging findings are nonspecific and more likely to
occur with other diseases.
O58The role of peri-aortic fat in aortic atherosclerosisIlias Kylintireas, Ikhlef Bechar, Cheerag Shirodaria,Alistair Lindsay, Justin Lee, Matthew Robson,Stefan Neubauer and Robin ChoudhuryUniversity Of Oxford, Oxford, UK
Journal of Cardiovascular Magnetic Resonance 2009, 11(Suppl 1):O58
Introduction: Recent data suggest that perivascular fat is
metabolically active and may play a role in the initiation and
progression of atherosclerosis mediated by the paracrine action
of the adipokines it produces. MRI offers the unique capability for
clear depiction and accurate quantification of adipose tissue
alongside an effective non invasive and radiation free assessment
of both early and advanced atherosclerotic effects on the
vasculature.
Purpose: We investigated the relationship between perivascu-
lar adipose tissue and atherosclerosis-related structural and
functional changes of the vasculature in an elderly population at
high cardiovascular risk.
Methods: Fifty elderly subjects [mean age = 65 (± 8), 16/
50 = 32% women] with at least one major cardiovascular risk
factor (smoking, diabetes, hypertension, hyperlipidemia) under-
went MRI (1.5 T Siemens Sonata) for abdominal and peri-aortic
adipose tissue quantification and aortic atherosclerosis asses-
ment. A Water Suppression (WS) T1 weighted (T1W) Turbo
Spin Echo (TSE) multi-slice sequence was used for visceral
adipose tissue (VAT) and abdominal subcutaneous adipose tissue
(SCAT) measurement.
A modified version of the same sequence was used to produce
WS cross-sectional images covering the descending thoracic
aorta (figure 1a). On these images peri-vascular adipose tissue
(PVAT) area was measured within a radius equal to three times
the radius of the vessel cross-section. PVAT index (PVATI) was
defined as the PVAT area divided by the cross-sectional area of
the vessel (in order to normalise to the vessel size) and averaged
for all the images along the aorta to produce a PVATI value per
patient. Inter-scan and intra-observer variability of this method
was very satisfactory (coefficient of variance was 0.06 and 0.03
respectively).
Proton density weighted fat saturation black blood turbo spin
echo (TSE) cross-sectional images covering the descending
thoracic aorta (figure 1a) were used for atheroma burden
Figure 1 (abstract O58)
Figure 2 (abstract O58)
Figure 3 (abstract O58)
Journal of Cardiovascular Magnetic Resonance 2009, 11(Suppl 1) http://jcmr-online.com/supplements/11/S1
Page 48 of 316(page number not for citation purposes)
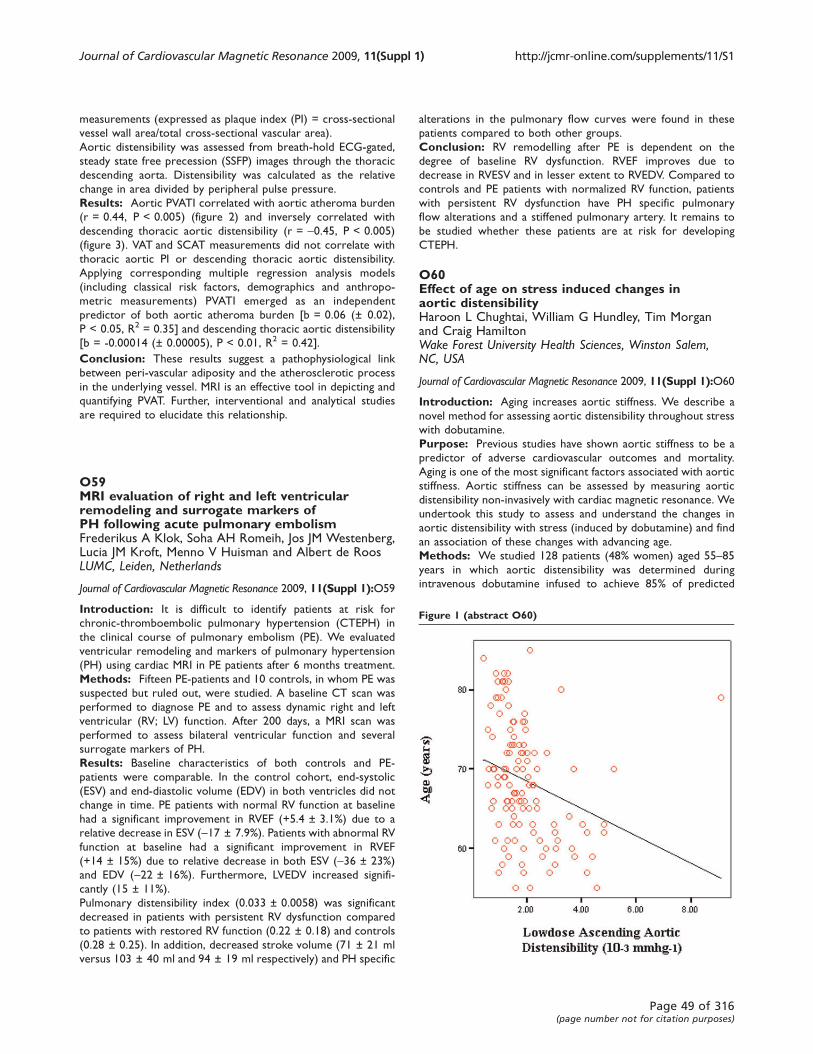
measurements (expressed as plaque index (PI) = cross-sectional
vessel wall area/total cross-sectional vascular area).
Aortic distensibility was assessed from breath-hold ECG-gated,
steady state free precession (SSFP) images through the thoracic
descending aorta. Distensibility was calculated as the relative
change in area divided by peripheral pulse pressure.
Results: Aortic PVATI correlated with aortic atheroma burden
(r = 0.44, P < 0.005) (figure 2) and inversely correlated with
descending thoracic aortic distensibility (r = -0.45, P < 0.005)
(figure 3). VAT and SCAT measurements did not correlate with
thoracic aortic PI or descending thoracic aortic distensibility.
Applying corresponding multiple regression analysis models
(including classical risk factors, demographics and anthropo-
metric measurements) PVATI emerged as an independent
predictor of both aortic atheroma burden [b = 0.06 (± 0.02),
P < 0.05, R2 = 0.35] and descending thoracic aortic distensibility
[b = -0.00014 (± 0.00005), P < 0.01, R2 = 0.42].
Conclusion: These results suggest a pathophysiological link
between peri-vascular adiposity and the atherosclerotic process
in the underlying vessel. MRI is an effective tool in depicting and
quantifying PVAT. Further, interventional and analytical studies
are required to elucidate this relationship.
O59MRI evaluation of right and left ventricularremodeling and surrogate markers ofPH following acute pulmonary embolismFrederikus A Klok, Soha AH Romeih, Jos JM Westenberg,Lucia JM Kroft, Menno V Huisman and Albert de RoosLUMC, Leiden, Netherlands
Journal of Cardiovascular Magnetic Resonance 2009, 11(Suppl 1):O59
Introduction: It is difficult to identify patients at risk for
chronic-thromboembolic pulmonary hypertension (CTEPH) in
the clinical course of pulmonary embolism (PE). We evaluated
ventricular remodeling and markers of pulmonary hypertension
(PH) using cardiac MRI in PE patients after 6 months treatment.
Methods: Fifteen PE-patients and 10 controls, in whom PE was
suspected but ruled out, were studied. A baseline CT scan was
performed to diagnose PE and to assess dynamic right and left
ventricular (RV; LV) function. After 200 days, a MRI scan was
performed to assess bilateral ventricular function and several
surrogate markers of PH.
Results: Baseline characteristics of both controls and PE-
patients were comparable. In the control cohort, end-systolic
(ESV) and end-diastolic volume (EDV) in both ventricles did not
change in time. PE patients with normal RV function at baseline
had a significant improvement in RVEF (+5.4 ± 3.1%) due to a
relative decrease in ESV (-17 ± 7.9%). Patients with abnormal RV
function at baseline had a significant improvement in RVEF
(+14 ± 15%) due to relative decrease in both ESV (-36 ± 23%)
and EDV (-22 ± 16%). Furthermore, LVEDV increased signifi-
cantly (15 ± 11%).
Pulmonary distensibility index (0.033 ± 0.0058) was significant
decreased in patients with persistent RV dysfunction compared
to patients with restored RV function (0.22 ± 0.18) and controls
(0.28 ± 0.25). In addition, decreased stroke volume (71 ± 21 ml
versus 103 ± 40 ml and 94 ± 19 ml respectively) and PH specific
alterations in the pulmonary flow curves were found in these
patients compared to both other groups.
Conclusion: RV remodelling after PE is dependent on the
degree of baseline RV dysfunction. RVEF improves due to
decrease in RVESV and in lesser extent to RVEDV. Compared to
controls and PE patients with normalized RV function, patients
with persistent RV dysfunction have PH specific pulmonary
flow alterations and a stiffened pulmonary artery. It remains to
be studied whether these patients are at risk for developing
CTEPH.
O60Effect of age on stress induced changes inaortic distensibilityHaroon L Chughtai, William G Hundley, Tim Morganand Craig HamiltonWake Forest University Health Sciences, Winston Salem,NC, USA
Journal of Cardiovascular Magnetic Resonance 2009, 11(Suppl 1):O60
Introduction: Aging increases aortic stiffness. We describe a
novel method for assessing aortic distensibility throughout stress
with dobutamine.
Purpose: Previous studies have shown aortic stiffness to be a
predictor of adverse cardiovascular outcomes and mortality.
Aging is one of the most significant factors associated with aortic
stiffness. Aortic stiffness can be assessed by measuring aortic
distensibility non-invasively with cardiac magnetic resonance. We
undertook this study to assess and understand the changes in
aortic distensibility with stress (induced by dobutamine) and find
an association of these changes with advancing age.
Methods: We studied 128 patients (48% women) aged 55–85years in which aortic distensibility was determined during
intravenous dobutamine infused to achieve 85% of predicted
Figure 1 (abstract O60)
Journal of Cardiovascular Magnetic Resonance 2009, 11(Suppl 1) http://jcmr-online.com/supplements/11/S1
Page 49 of 316(page number not for citation purposes)
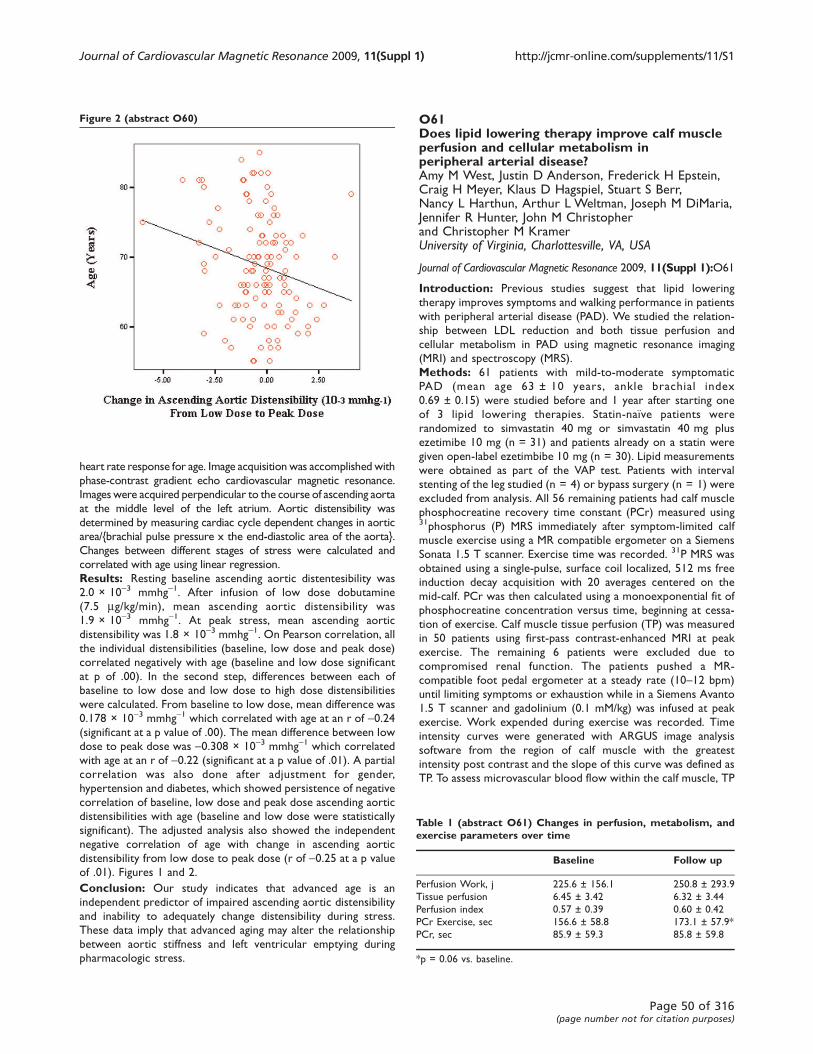
heart rate response for age. Image acquisition was accomplished with
phase-contrast gradient echo cardiovascular magnetic resonance.
Images were acquired perpendicular to the course of ascending aorta
at the middle level of the left atrium. Aortic distensibility was
determined by measuring cardiac cycle dependent changes in aortic
area/{brachial pulse pressure x the end-diastolic area of the aorta}.
Changes between different stages of stress were calculated and
correlated with age using linear regression.
Results: Resting baseline ascending aortic distentesibility was
2.0 × 10⁻³ mmhg-1. After infusion of low dose dobutamine
(7.5 mg/kg/min), mean ascending aortic distensibility was
1.9 × 10⁻³ mmhg-1. At peak stress, mean ascending aortic
distensibility was 1.8 × 10⁻³ mmhg-1. On Pearson correlation, all
the individual distensibilities (baseline, low dose and peak dose)
correlated negatively with age (baseline and low dose significant
at p of .00). In the second step, differences between each of
baseline to low dose and low dose to high dose distensibilities
were calculated. From baseline to low dose, mean difference was
0.178 × 10⁻³ mmhg-1 which correlated with age at an r of -0.24(significant at a p value of .00). The mean difference between low
dose to peak dose was -0.308 × 10⁻³ mmhg-1 which correlated
with age at an r of -0.22 (significant at a p value of .01). A partial
correlation was also done after adjustment for gender,
hypertension and diabetes, which showed persistence of negative
correlation of baseline, low dose and peak dose ascending aortic
distensibilities with age (baseline and low dose were statistically
significant). The adjusted analysis also showed the independent
negative correlation of age with change in ascending aortic
distensibility from low dose to peak dose (r of -0.25 at a p value
of .01). Figures 1 and 2.
Conclusion: Our study indicates that advanced age is an
independent predictor of impaired ascending aortic distensibility
and inability to adequately change distensibility during stress.
These data imply that advanced aging may alter the relationship
between aortic stiffness and left ventricular emptying during
pharmacologic stress.
O61Does lipid lowering therapy improve calf muscleperfusion and cellular metabolism inperipheral arterial disease?Amy M West, Justin D Anderson, Frederick H Epstein,Craig H Meyer, Klaus D Hagspiel, Stuart S Berr,Nancy L Harthun, Arthur L Weltman, Joseph M DiMaria,Jennifer R Hunter, John M Christopherand Christopher M KramerUniversity of Virginia, Charlottesville, VA, USA
Journal of Cardiovascular Magnetic Resonance 2009, 11(Suppl 1):O61
Introduction: Previous studies suggest that lipid lowering
therapy improves symptoms and walking performance in patients
with peripheral arterial disease (PAD). We studied the relation-
ship between LDL reduction and both tissue perfusion and
cellular metabolism in PAD using magnetic resonance imaging
(MRI) and spectroscopy (MRS).
Methods: 61 patients with mild-to-moderate symptomatic
PAD (mean age 63 ± 10 years, ankle brachial index
0.69 ± 0.15) were studied before and 1 year after starting one
of 3 lipid lowering therapies. Statin-naïve patients were
randomized to simvastatin 40 mg or simvastatin 40 mg plus
ezetimibe 10 mg (n = 31) and patients already on a statin were
given open-label ezetimbibe 10 mg (n = 30). Lipid measurements
were obtained as part of the VAP test. Patients with interval
stenting of the leg studied (n = 4) or bypass surgery (n = 1) were
excluded from analysis. All 56 remaining patients had calf muscle
phosphocreatine recovery time constant (PCr) measured using31phosphorus (P) MRS immediately after symptom-limited calf
muscle exercise using a MR compatible ergometer on a Siemens
Sonata 1.5 T scanner. Exercise time was recorded. 31P MRS was
obtained using a single-pulse, surface coil localized, 512 ms free
induction decay acquisition with 20 averages centered on the
mid-calf. PCr was then calculated using a monoexponential fit of
phosphocreatine concentration versus time, beginning at cessa-
tion of exercise. Calf muscle tissue perfusion (TP) was measured
in 50 patients using first-pass contrast-enhanced MRI at peak
exercise. The remaining 6 patients were excluded due to
compromised renal function. The patients pushed a MR-
compatible foot pedal ergometer at a steady rate (10–12 bpm)
until limiting symptoms or exhaustion while in a Siemens Avanto
1.5 T scanner and gadolinium (0.1 mM/kg) was infused at peak
exercise. Work expended during exercise was recorded. Time
intensity curves were generated with ARGUS image analysis
software from the region of calf muscle with the greatest
intensity post contrast and the slope of this curve was defined as
TP. To assess microvascular blood flow within the calf muscle, TP
Figure 2 (abstract O60)
Table 1 (abstract O61) Changes in perfusion, metabolism, andexercise parameters over time
Baseline Follow up
Perfusion Work, j 225.6 ± 156.1 250.8 ± 293.9
Tissue perfusion 6.45 ± 3.42 6.32 ± 3.44
Perfusion index 0.57 ± 0.39 0.60 ± 0.42
PCr Exercise, sec 156.6 ± 58.8 173.1 ± 57.9*
PCr, sec 85.9 ± 59.3 85.8 ± 59.8
*p = 0.06 vs. baseline.
Journal of Cardiovascular Magnetic Resonance 2009, 11(Suppl 1) http://jcmr-online.com/supplements/11/S1
Page 50 of 316(page number not for citation purposes)
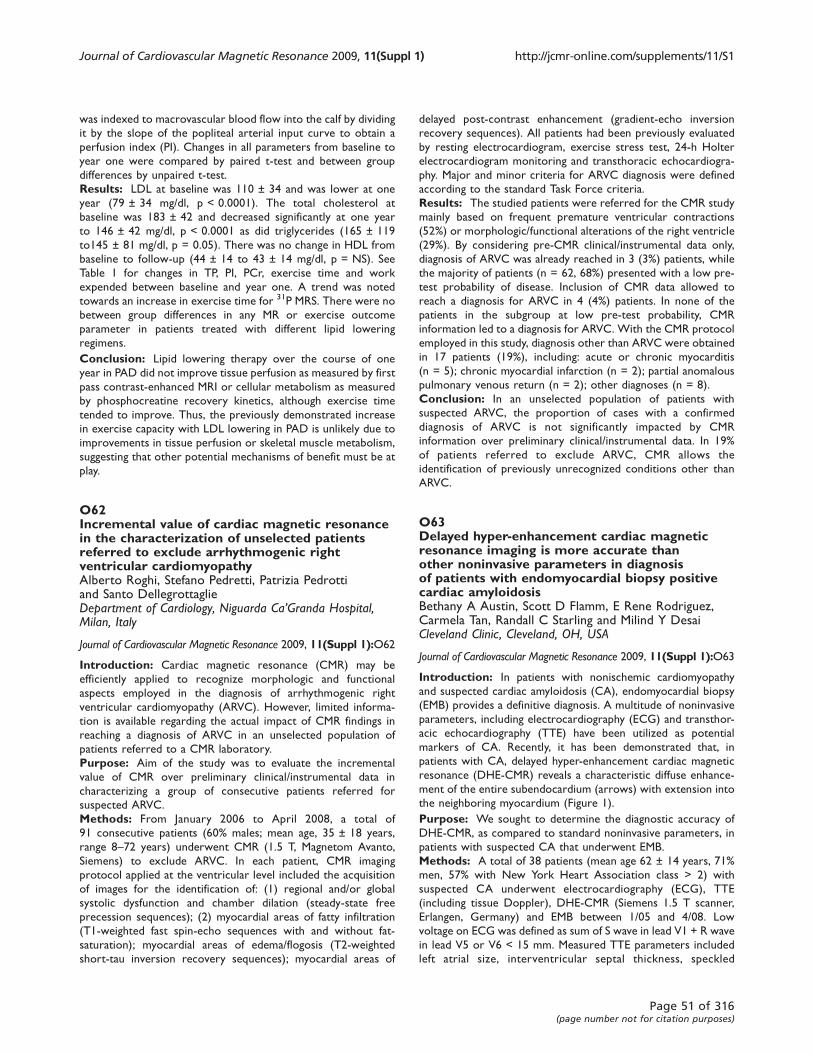
was indexed to macrovascular blood flow into the calf by dividing
it by the slope of the popliteal arterial input curve to obtain a
perfusion index (PI). Changes in all parameters from baseline to
year one were compared by paired t-test and between group
differences by unpaired t-test.
Results: LDL at baseline was 110 ± 34 and was lower at one
year (79 ± 34 mg/dl, p < 0.0001). The total cholesterol at
baseline was 183 ± 42 and decreased significantly at one year
to 146 ± 42 mg/dl, p < 0.0001 as did triglycerides (165 ± 119
to145 ± 81 mg/dl, p = 0.05). There was no change in HDL from
baseline to follow-up (44 ± 14 to 43 ± 14 mg/dl, p = NS). See
Table 1 for changes in TP, PI, PCr, exercise time and work
expended between baseline and year one. A trend was noted
towards an increase in exercise time for 31P MRS. There were no
between group differences in any MR or exercise outcome
parameter in patients treated with different lipid lowering
regimens.
Conclusion: Lipid lowering therapy over the course of one
year in PAD did not improve tissue perfusion as measured by first
pass contrast-enhanced MRI or cellular metabolism as measured
by phosphocreatine recovery kinetics, although exercise time
tended to improve. Thus, the previously demonstrated increase
in exercise capacity with LDL lowering in PAD is unlikely due to
improvements in tissue perfusion or skeletal muscle metabolism,
suggesting that other potential mechanisms of benefit must be at
play.
O62Incremental value of cardiac magnetic resonancein the characterization of unselected patientsreferred to exclude arrhythmogenic rightventricular cardiomyopathyAlberto Roghi, Stefano Pedretti, Patrizia Pedrottiand Santo DellegrottaglieDepartment of Cardiology, Niguarda Ca’Granda Hospital,Milan, Italy
Journal of Cardiovascular Magnetic Resonance 2009, 11(Suppl 1):O62
Introduction: Cardiac magnetic resonance (CMR) may be
efficiently applied to recognize morphologic and functional
aspects employed in the diagnosis of arrhythmogenic right
ventricular cardiomyopathy (ARVC). However, limited informa-
tion is available regarding the actual impact of CMR findings in
reaching a diagnosis of ARVC in an unselected population of
patients referred to a CMR laboratory.
Purpose: Aim of the study was to evaluate the incremental
value of CMR over preliminary clinical/instrumental data in
characterizing a group of consecutive patients referred for
suspected ARVC.
Methods: From January 2006 to April 2008, a total of
91 consecutive patients (60% males; mean age, 35 ± 18 years,
range 8–72 years) underwent CMR (1.5 T, Magnetom Avanto,
Siemens) to exclude ARVC. In each patient, CMR imaging
protocol applied at the ventricular level included the acquisition
of images for the identification of: (1) regional and/or global
systolic dysfunction and chamber dilation (steady-state free
precession sequences); (2) myocardial areas of fatty infiltration
(T1-weighted fast spin-echo sequences with and without fat-
saturation); myocardial areas of edema/flogosis (T2-weighted
short-tau inversion recovery sequences); myocardial areas of
delayed post-contrast enhancement (gradient-echo inversion
recovery sequences). All patients had been previously evaluated
by resting electrocardiogram, exercise stress test, 24-h Holter
electrocardiogram monitoring and transthoracic echocardiogra-
phy. Major and minor criteria for ARVC diagnosis were defined
according to the standard Task Force criteria.
Results: The studied patients were referred for the CMR study
mainly based on frequent premature ventricular contractions
(52%) or morphologic/functional alterations of the right ventricle
(29%). By considering pre-CMR clinical/instrumental data only,
diagnosis of ARVC was already reached in 3 (3%) patients, while
the majority of patients (n = 62, 68%) presented with a low pre-
test probability of disease. Inclusion of CMR data allowed to
reach a diagnosis for ARVC in 4 (4%) patients. In none of the
patients in the subgroup at low pre-test probability, CMR
information led to a diagnosis for ARVC. With the CMR protocol
employed in this study, diagnosis other than ARVC were obtained
in 17 patients (19%), including: acute or chronic myocarditis
(n = 5); chronic myocardial infarction (n = 2); partial anomalous
pulmonary venous return (n = 2); other diagnoses (n = 8).
Conclusion: In an unselected population of patients with
suspected ARVC, the proportion of cases with a confirmed
diagnosis of ARVC is not significantly impacted by CMR
information over preliminary clinical/instrumental data. In 19%
of patients referred to exclude ARVC, CMR allows the
identification of previously unrecognized conditions other than
ARVC.
O63Delayed hyper-enhancement cardiac magneticresonance imaging is more accurate thanother noninvasive parameters in diagnosisof patients with endomyocardial biopsy positivecardiac amyloidosisBethany A Austin, Scott D Flamm, E Rene Rodriguez,Carmela Tan, Randall C Starling and Milind Y DesaiCleveland Clinic, Cleveland, OH, USA
Journal of Cardiovascular Magnetic Resonance 2009, 11(Suppl 1):O63
Introduction: In patients with nonischemic cardiomyopathy
and suspected cardiac amyloidosis (CA), endomyocardial biopsy
(EMB) provides a definitive diagnosis. A multitude of noninvasive
parameters, including electrocardiography (ECG) and transthor-
acic echocardiography (TTE) have been utilized as potential
markers of CA. Recently, it has been demonstrated that, in
patients with CA, delayed hyper-enhancement cardiac magnetic
resonance (DHE-CMR) reveals a characteristic diffuse enhance-
ment of the entire subendocardium (arrows) with extension into
the neighboring myocardium (Figure 1).
Purpose: We sought to determine the diagnostic accuracy of
DHE-CMR, as compared to standard noninvasive parameters, in
patients with suspected CA that underwent EMB.
Methods: A total of 38 patients (mean age 62 ± 14 years, 71%
men, 57% with New York Heart Association class > 2) with
suspected CA underwent electrocardiography (ECG), TTE
(including tissue Doppler), DHE-CMR (Siemens 1.5 T scanner,
Erlangen, Germany) and EMB between 1/05 and 4/08. Low
voltage on ECG was defined as sum of S wave in lead V1 + R wave
in lead V5 or V6 < 15 mm. Measured TTE parameters included
left atrial size, interventricular septal thickness, speckled
Journal of Cardiovascular Magnetic Resonance 2009, 11(Suppl 1) http://jcmr-online.com/supplements/11/S1
Page 51 of 316(page number not for citation purposes)
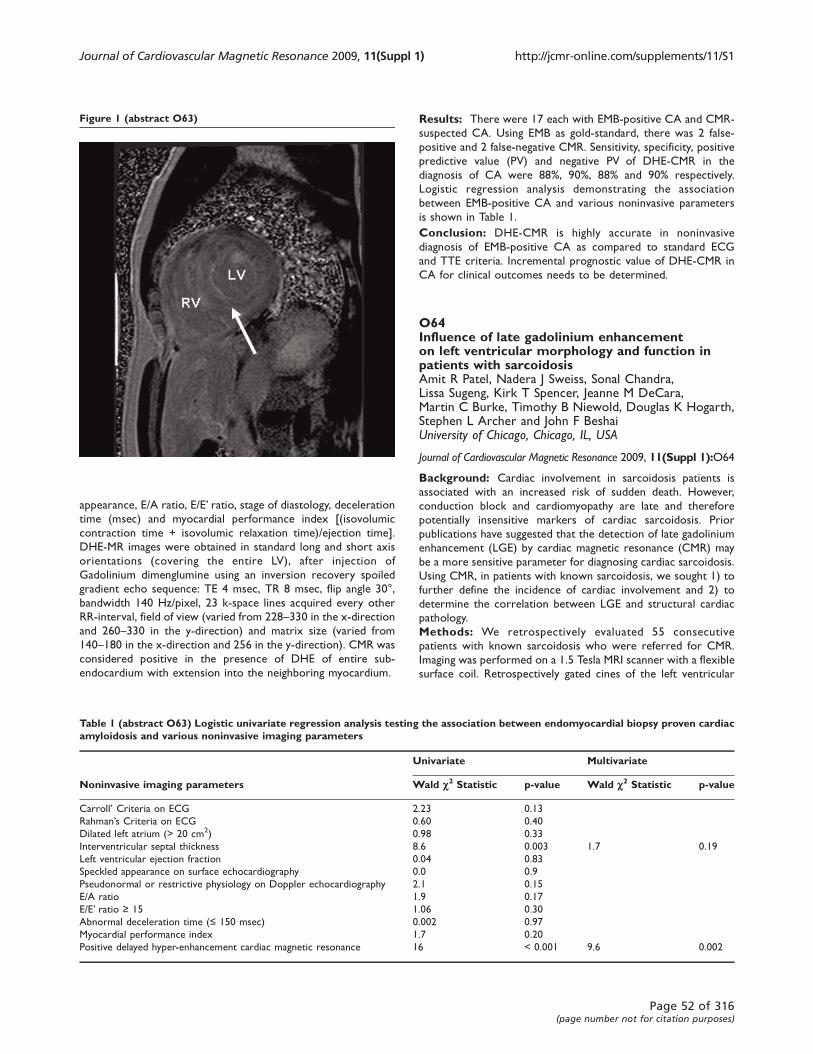
appearance, E/A ratio, E/E’ ratio, stage of diastology, deceleration
time (msec) and myocardial performance index [(isovolumic
contraction time + isovolumic relaxation time)/ejection time].
DHE-MR images were obtained in standard long and short axis
orientations (covering the entire LV), after injection of
Gadolinium dimenglumine using an inversion recovery spoiled
gradient echo sequence: TE 4 msec, TR 8 msec, flip angle 30°,
bandwidth 140 Hz/pixel, 23 k-space lines acquired every other
RR-interval, field of view (varied from 228–330 in the x-direction
and 260–330 in the y-direction) and matrix size (varied from
140–180 in the x-direction and 256 in the y-direction). CMR was
considered positive in the presence of DHE of entire sub-
endocardium with extension into the neighboring myocardium.
Results: There were 17 each with EMB-positive CA and CMR-
suspected CA. Using EMB as gold-standard, there was 2 false-
positive and 2 false-negative CMR. Sensitivity, specificity, positive
predictive value (PV) and negative PV of DHE-CMR in the
diagnosis of CA were 88%, 90%, 88% and 90% respectively.
Logistic regression analysis demonstrating the association
between EMB-positive CA and various noninvasive parameters
is shown in Table 1.
Conclusion: DHE-CMR is highly accurate in noninvasive
diagnosis of EMB-positive CA as compared to standard ECG
and TTE criteria. Incremental prognostic value of DHE-CMR in
CA for clinical outcomes needs to be determined.
O64Influence of late gadolinium enhancementon left ventricular morphology and function inpatients with sarcoidosisAmit R Patel, Nadera J Sweiss, Sonal Chandra,Lissa Sugeng, Kirk T Spencer, Jeanne M DeCara,Martin C Burke, Timothy B Niewold, Douglas K Hogarth,Stephen L Archer and John F BeshaiUniversity of Chicago, Chicago, IL, USA
Journal of Cardiovascular Magnetic Resonance 2009, 11(Suppl 1):O64
Background: Cardiac involvement in sarcoidosis patients is
associated with an increased risk of sudden death. However,
conduction block and cardiomyopathy are late and therefore
potentially insensitive markers of cardiac sarcoidosis. Prior
publications have suggested that the detection of late gadolinium
enhancement (LGE) by cardiac magnetic resonance (CMR) may
be a more sensitive parameter for diagnosing cardiac sarcoidosis.
Using CMR, in patients with known sarcoidosis, we sought 1) to
further define the incidence of cardiac involvement and 2) to
determine the correlation between LGE and structural cardiac
pathology.
Methods: We retrospectively evaluated 55 consecutive
patients with known sarcoidosis who were referred for CMR.
Imaging was performed on a 1.5 Tesla MRI scanner with a flexible
surface coil. Retrospectively gated cines of the left ventricular
Figure 1 (abstract O63)
Table 1 (abstract O63) Logistic univariate regression analysis testing the association between endomyocardial biopsy proven cardiacamyloidosis and various noninvasive imaging parameters
Univariate Multivariate
Noninvasive imaging parameters Wald c2 Statistic p-value Wald c2 Statistic p-value
Carroll’ Criteria on ECG 2.23 0.13
Rahman’s Criteria on ECG 0.60 0.40
Dilated left atrium (> 20 cm2) 0.98 0.33
Interventricular septal thickness 8.6 0.003 1.7 0.19
Left ventricular ejection fraction 0.04 0.83
Speckled appearance on surface echocardiography 0.0 0.9
Pseudonormal or restrictive physiology on Doppler echocardiography 2.1 0.15
E/A ratio 1.9 0.17
E/E’ ratio ≥ 15 1.06 0.30
Abnormal deceleration time (≤ 150 msec) 0.002 0.97
Myocardial performance index 1.7 0.20
Positive delayed hyper-enhancement cardiac magnetic resonance 16 < 0.001 9.6 0.002
Journal of Cardiovascular Magnetic Resonance 2009, 11(Suppl 1) http://jcmr-online.com/supplements/11/S1
Page 52 of 316(page number not for citation purposes)
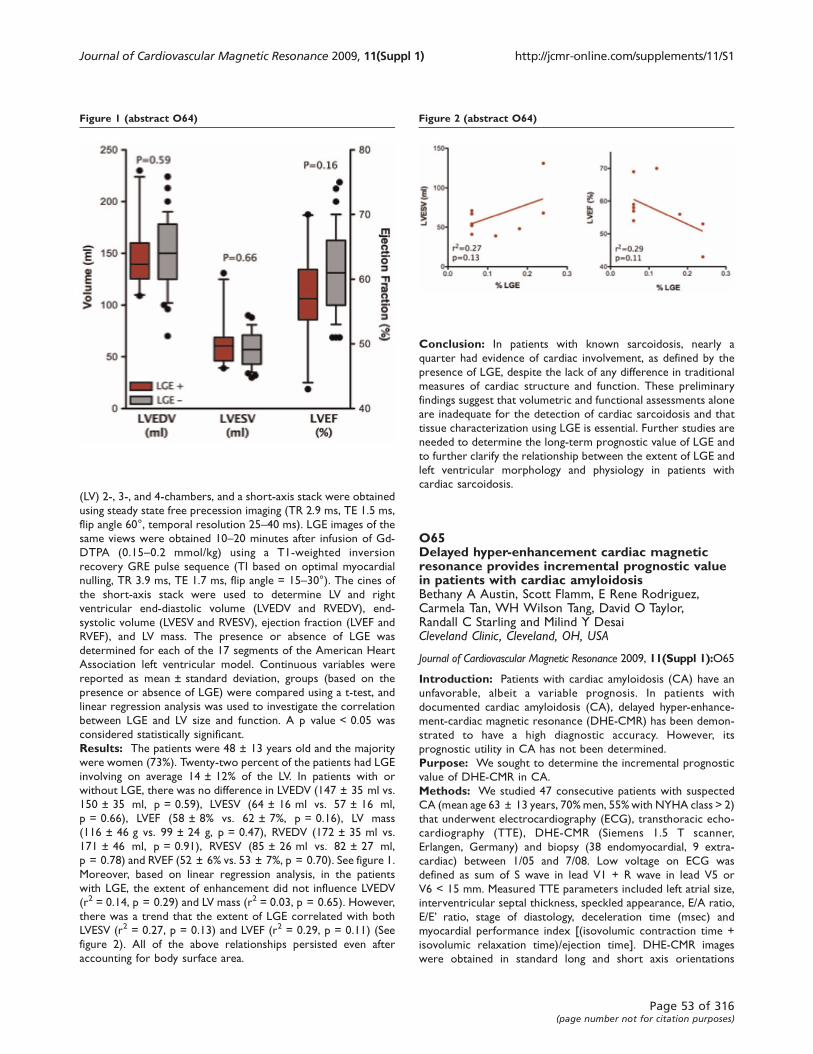
(LV) 2-, 3-, and 4-chambers, and a short-axis stack were obtained
using steady state free precession imaging (TR 2.9 ms, TE 1.5 ms,
flip angle 60°, temporal resolution 25–40 ms). LGE images of the
same views were obtained 10–20 minutes after infusion of Gd-
DTPA (0.15–0.2 mmol/kg) using a T1-weighted inversion
recovery GRE pulse sequence (TI based on optimal myocardial
nulling, TR 3.9 ms, TE 1.7 ms, flip angle = 15–30°). The cines of
the short-axis stack were used to determine LV and right
ventricular end-diastolic volume (LVEDV and RVEDV), end-
systolic volume (LVESV and RVESV), ejection fraction (LVEF and
RVEF), and LV mass. The presence or absence of LGE was
determined for each of the 17 segments of the American Heart
Association left ventricular model. Continuous variables were
reported as mean ± standard deviation, groups (based on the
presence or absence of LGE) were compared using a t-test, and
linear regression analysis was used to investigate the correlation
between LGE and LV size and function. A p value < 0.05 was
considered statistically significant.
Results: The patients were 48 ± 13 years old and the majority
were women (73%). Twenty-two percent of the patients had LGE
involving on average 14 ± 12% of the LV. In patients with or
without LGE, there was no difference in LVEDV (147 ± 35 ml vs.
150 ± 35 ml, p = 0.59), LVESV (64 ± 16 ml vs. 57 ± 16 ml,
p = 0.66), LVEF (58 ± 8% vs. 62 ± 7%, p = 0.16), LV mass
(116 ± 46 g vs. 99 ± 24 g, p = 0.47), RVEDV (172 ± 35 ml vs.
171 ± 46 ml, p = 0.91), RVESV (85 ± 26 ml vs. 82 ± 27 ml,
p = 0.78) and RVEF (52 ± 6% vs. 53 ± 7%, p = 0.70). See figure 1.
Moreover, based on linear regression analysis, in the patients
with LGE, the extent of enhancement did not influence LVEDV
(r2 = 0.14, p = 0.29) and LV mass (r2 = 0.03, p = 0.65). However,
there was a trend that the extent of LGE correlated with both
LVESV (r2 = 0.27, p = 0.13) and LVEF (r2 = 0.29, p = 0.11) (See
figure 2). All of the above relationships persisted even after
accounting for body surface area.
Conclusion: In patients with known sarcoidosis, nearly a
quarter had evidence of cardiac involvement, as defined by the
presence of LGE, despite the lack of any difference in traditional
measures of cardiac structure and function. These preliminary
findings suggest that volumetric and functional assessments alone
are inadequate for the detection of cardiac sarcoidosis and that
tissue characterization using LGE is essential. Further studies are
needed to determine the long-term prognostic value of LGE and
to further clarify the relationship between the extent of LGE and
left ventricular morphology and physiology in patients with
cardiac sarcoidosis.
O65Delayed hyper-enhancement cardiac magneticresonance provides incremental prognostic valuein patients with cardiac amyloidosisBethany A Austin, Scott Flamm, E Rene Rodriguez,Carmela Tan, WH Wilson Tang, David O Taylor,Randall C Starling and Milind Y DesaiCleveland Clinic, Cleveland, OH, USA
Journal of Cardiovascular Magnetic Resonance 2009, 11(Suppl 1):O65
Introduction: Patients with cardiac amyloidosis (CA) have an
unfavorable, albeit a variable prognosis. In patients with
documented cardiac amyloidosis (CA), delayed hyper-enhance-
ment-cardiac magnetic resonance (DHE-CMR) has been demon-
strated to have a high diagnostic accuracy. However, its
prognostic utility in CA has not been determined.
Purpose: We sought to determine the incremental prognostic
value of DHE-CMR in CA.
Methods: We studied 47 consecutive patients with suspected
CA (mean age 63 ± 13 years, 70% men, 55% with NYHA class > 2)
that underwent electrocardiography (ECG), transthoracic echo-
cardiography (TTE), DHE-CMR (Siemens 1.5 T scanner,
Erlangen, Germany) and biopsy (38 endomyocardial, 9 extra-
cardiac) between 1/05 and 7/08. Low voltage on ECG was
defined as sum of S wave in lead V1 + R wave in lead V5 or
V6 < 15 mm. Measured TTE parameters included left atrial size,
interventricular septal thickness, speckled appearance, E/A ratio,
E/E’ ratio, stage of diastology, deceleration time (msec) and
myocardial performance index [(isovolumic contraction time +
isovolumic relaxation time)/ejection time]. DHE-CMR images
were obtained in standard long and short axis orientations
Figure 1 (abstract O64) Figure 2 (abstract O64)
Journal of Cardiovascular Magnetic Resonance 2009, 11(Suppl 1) http://jcmr-online.com/supplements/11/S1
Page 53 of 316(page number not for citation purposes)

(covering the entire LV), after injection of Gadolinium
dimenglumine using an inversion recovery spoiled gradient
echo sequence: TE 4 msec, TR 8 msec, flip angle 30°, bandwidth
140 Hz/pixel, 23 k-space lines acquired every other RR-interval,
field of view (varied from 228–330 in the x-direction and 260–330 in the y-direction) and matrix size (varied from 140–180 in
the x-direction and 256 in the y-direction). CMR was
considered positive in the presence of DHE of entire
subendocardium with extension into the neighboring myocar-
dium. All-cause mortality was ascertained.
Results: At baseline, 59% patients had low voltage on ECG,
while 67% had deceleration time < 150 msec and 53% had E/E’ >15 (both on Doppler echocardiography). Mean MPI, left
ventricular ejection fraction and interventricular septal thickness
were 0.51 ± 0.3, 51% ± 13 and 1.5 cm ± 0.5, respectively. At up
to 1-year after biopsy, there were 9 (19%) deaths. Results of Cox
Proportional Hazard survival analysis are shown in Table 1. On
univariate Kaplan-Meier survival analysis, presence of DHE on
CMR was associated with worse 1-year survival (log rank statistic
p-value = 0.03, Figure 1).
Conclusion: Presence of DHE on CMR is associated with
worse 1-year survival in CA. Along with a high diagnostic
accuracy; DHE-CMR adds incremental prognostic value in CA,
independent of other variables.
O66Delayed-enhanced magnetic resonanceimaging for identifying the ventriculararrhythmia substrate in non-ischemiccardiomyopathyBenoit Desjardins1, Fred Morady2 and Frank Bogun21University of Pennsylvania, Philadelphia, PA, USA2University of Michigan, Ann Arbor, MI, USA
Journal of Cardiovascular Magnetic Resonance 2009, 11(Suppl 1):O66
Introduction: Scar tissue is often noted in the myocardium of
patients with non-ischemic cardiomyopathy. Delayed-enhanced
magnetic resonance imaging (DE-MRI) can precisely define the
extension and distribution of this scar tissue. Such scar tissue can
act as arrhythmogenic substrate and lead to ventricular
arrhythmia. Patients with non-ischemic cardiomyopathy who
present with ventricular arrhythmia can undergo ablation therapy
to eliminate these arrhythmia.
Purpose: The purpose of the study is to determine if DE-MRI is
useful to guide mapping of ventricular arrhythmias in patients
with non-ischemic cardiomyopathy.
Methods: DE-MRI was performed in 28 consecutive patients
(mean age 50 ± 15 years) with non-ischemic cardiomyopathy
(mean ejection fraction 38 ± 9%) referred for catheter ablation
of ventricular tachycardia (VT) or premature ventricular
complexes (PVCs). If scar tissue was found on the DE-MRI, the
myocardial contours and scar distribution was semi-automatically
extracted, in order to generate 3-D maps of scar distribution.
These maps were then integrated into the electroanatomic map
using the CARTO Merge function (Figure 1). This integration
involved initial matching of fiducial markers (LV apex, center of
mitral valve, aortic outflow tract) in both modalities, and then a
Table 1 (abstract O65) Cox proportional hazard analysis of various clinical and noninvasive imaging predictors of long-term mortalityin patients with biopsy proven cardiac amyloidosis
Univariate Analysis Multivariate Analysis
Variable c2 p value p value
Age 3.8 0.05 0.10
Gender 0.15 0.69
New York Heart Association Class 3.3 0.07 0.16
Low voltage on electrocardiogram 0.67 0.41
Left atrial size > 20 cm2 0.76 0.39
Left ventricular ejection fraction 2.21 0.14
Interventricular septal thickness 1.7 0.19
E/E' > 15 on Doppler echocardiography 1.12 0.29
Deceleration time on Doppler echocardiography ≤ 150 msec 1.41 0.23
Myocardial performance index 2.10 0.15
Diastology grade 0.35 0.55
Delayed hyperenhancement on cardiac magnetic resonance 4.91 0.03 0.02
Chi-square for multivariate model = 12.27, p-value = 0.007.
Figure 1 (abstract O65)
Journal of Cardiovascular Magnetic Resonance 2009, 11(Suppl 1) http://jcmr-online.com/supplements/11/S1
Page 54 of 316(page number not for citation purposes)
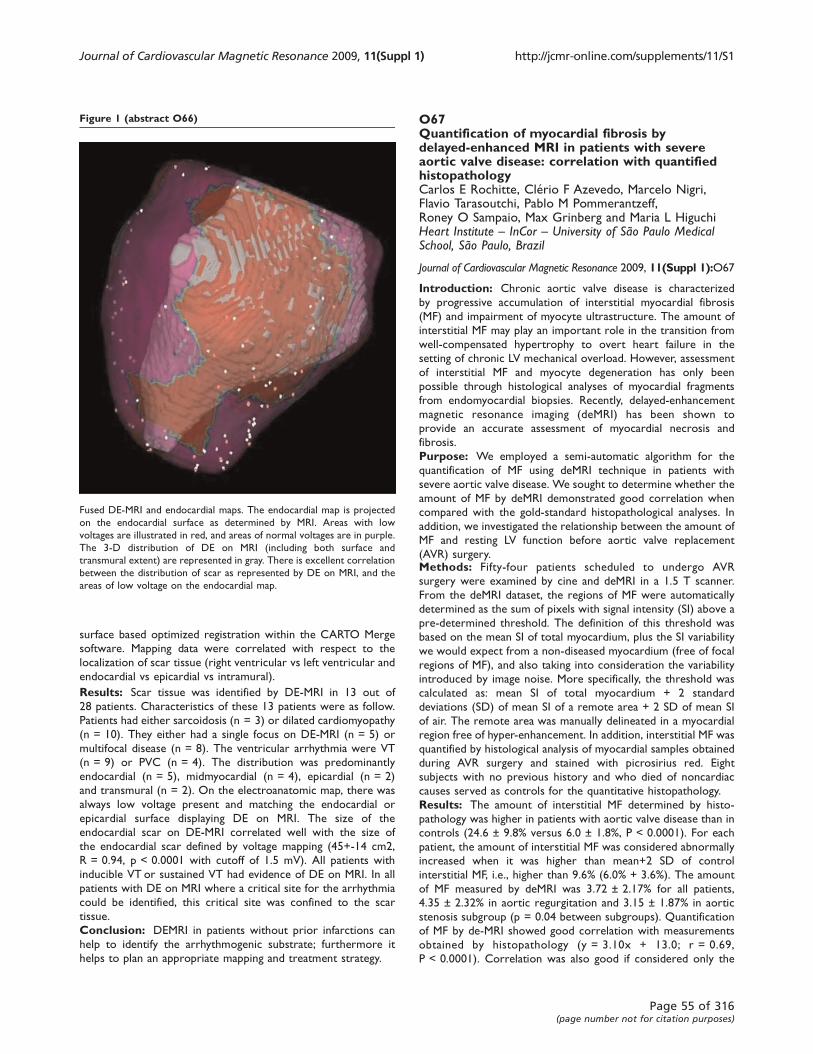
surface based optimized registration within the CARTO Merge
software. Mapping data were correlated with respect to the
localization of scar tissue (right ventricular vs left ventricular and
endocardial vs epicardial vs intramural).
Results: Scar tissue was identified by DE-MRI in 13 out of
28 patients. Characteristics of these 13 patients were as follow.
Patients had either sarcoidosis (n = 3) or dilated cardiomyopathy
(n = 10). They either had a single focus on DE-MRI (n = 5) or
multifocal disease (n = 8). The ventricular arrhythmia were VT
(n = 9) or PVC (n = 4). The distribution was predominantly
endocardial (n = 5), midmyocardial (n = 4), epicardial (n = 2)
and transmural (n = 2). On the electroanatomic map, there was
always low voltage present and matching the endocardial or
epicardial surface displaying DE on MRI. The size of the
endocardial scar on DE-MRI correlated well with the size of
the endocardial scar defined by voltage mapping (45+-14 cm2,
R = 0.94, p < 0.0001 with cutoff of 1.5 mV). All patients with
inducible VT or sustained VT had evidence of DE on MRI. In all
patients with DE on MRI where a critical site for the arrhythmia
could be identified, this critical site was confined to the scar
tissue.
Conclusion: DEMRI in patients without prior infarctions can
help to identify the arrhythmogenic substrate; furthermore it
helps to plan an appropriate mapping and treatment strategy.
O67Quantification of myocardial fibrosis bydelayed-enhanced MRI in patients with severeaortic valve disease: correlation with quantifiedhistopathologyCarlos E Rochitte, Clério F Azevedo, Marcelo Nigri,Flavio Tarasoutchi, Pablo M Pommerantzeff,Roney O Sampaio, Max Grinberg and Maria L HiguchiHeart Institute – InCor – University of São Paulo MedicalSchool, São Paulo, Brazil
Journal of Cardiovascular Magnetic Resonance 2009, 11(Suppl 1):O67
Introduction: Chronic aortic valve disease is characterized
by progressive accumulation of interstitial myocardial fibrosis
(MF) and impairment of myocyte ultrastructure. The amount of
interstitial MF may play an important role in the transition from
well-compensated hypertrophy to overt heart failure in the
setting of chronic LV mechanical overload. However, assessment
of interstitial MF and myocyte degeneration has only been
possible through histological analyses of myocardial fragments
from endomyocardial biopsies. Recently, delayed-enhancement
magnetic resonance imaging (deMRI) has been shown to
provide an accurate assessment of myocardial necrosis and
fibrosis.
Purpose: We employed a semi-automatic algorithm for the
quantification of MF using deMRI technique in patients with
severe aortic valve disease. We sought to determine whether the
amount of MF by deMRI demonstrated good correlation when
compared with the gold-standard histopathological analyses. In
addition, we investigated the relationship between the amount of
MF and resting LV function before aortic valve replacement
(AVR) surgery.Methods: Fifty-four patients scheduled to undergo AVR
surgery were examined by cine and deMRI in a 1.5 T scanner.
From the deMRI dataset, the regions of MF were automatically
determined as the sum of pixels with signal intensity (SI) above a
pre-determined threshold. The definition of this threshold was
based on the mean SI of total myocardium, plus the SI variability
we would expect from a non-diseased myocardium (free of focal
regions of MF), and also taking into consideration the variability
introduced by image noise. More specifically, the threshold was
calculated as: mean SI of total myocardium + 2 standard
deviations (SD) of mean SI of a remote area + 2 SD of mean SI
of air. The remote area was manually delineated in a myocardial
region free of hyper-enhancement. In addition, interstitial MF was
quantified by histological analysis of myocardial samples obtained
during AVR surgery and stained with picrosirius red. Eight
subjects with no previous history and who died of noncardiac
causes served as controls for the quantitative histopathology.
Results: The amount of interstitial MF determined by histo-
pathology was higher in patients with aortic valve disease than in
controls (24.6 ± 9.8% versus 6.0 ± 1.8%, P < 0.0001). For each
patient, the amount of interstitial MF was considered abnormally
increased when it was higher than mean+2 SD of control
interstitial MF, i.e., higher than 9.6% (6.0% + 3.6%). The amount
of MF measured by deMRI was 3.72 ± 2.17% for all patients,
4.35 ± 2.32% in aortic regurgitation and 3.15 ± 1.87% in aortic
stenosis subgroup (p = 0.04 between subgroups). Quantification
of MF by de-MRI showed good correlation with measurements
obtained by histopathology (y = 3.10x + 13.0; r = 0.69,
P < 0.0001). Correlation was also good if considered only the
Figure 1 (abstract O66)
Fused DE-MRI and endocardial maps. The endocardial map is projected
on the endocardial surface as determined by MRI. Areas with low
voltages are illustrated in red, and areas of normal voltages are in purple.
The 3-D distribution of DE on MRI (including both surface and
transmural extent) are represented in gray. There is excellent correlation
between the distribution of scar as represented by DE on MRI, and the
areas of low voltage on the endocardial map.
Journal of Cardiovascular Magnetic Resonance 2009, 11(Suppl 1) http://jcmr-online.com/supplements/11/S1
Page 55 of 316(page number not for citation purposes)

subgroup of patients with aortic regurgitation (y = 3.09x + 12.3;
r = 0.70, P < 0.0001) or aortic stenosis (y = 3.34x + 12.9;
r = 0.67, P = 0.0001). Considering histopathology as the method
of reference, ROC analysis revealed a good accuracy of deMRI in
identifying patients with increased degrees of MF accumulation
(area under the curve = 0.92; 95% CI 0.81 to 1.00). In addition,
the amount of MF by deMRI showed an inverse correlation with
LV EF (r = -0.67; p < 0.0001) and direct correlations with LV
EDV (r = 0.46; p = 0.0005), LV ESV (r = 0.62; p < 0.0001) and
LV mass (r = 0.46; p = 0.0005) before AVR surgery.
Conclusion: Delayed-enhanced MRI allows for the non-
invasive quantification of MF with good accuracy when compared
with histopathology in patients with severe aortic valve disease.
In addition, the amount of MF by deMRI is associated with worse
LV morphological and functional parameters before AVR surgery
in this population.
O68Myocardial fibrosis is a prevalent findingin elite high-endurance athletesMyra S Cocker1, Oliver Strohm1, David J Smith2,Craig Butler1, Israel Belenkie3, Willem Meeuwisse4
and Matthias G Friedrich11Stephenson CMR Centre at the Libin Cardiovascular Institute,University of Calgary, Calgary, AB, Canada2Human Performance Lab, Faculty of Kinesiology, Universityof Calgary, Calgary, AB, Canada3Department of Cardiac Sciences at the Libin CardiovascularInstitute, University of Calgary, Calgary, AB, Canada4Sports Medicine Centre, University of Calgary, Calgary,AB, Canada
Journal of Cardiovascular Magnetic Resonance 2009, 11(Suppl 1):O68
Background: Autopsies in athletes have shown that athletes have
diffuse myocardial fibrosis, and epidemiological findings place
athletes at a greater relative risk of sudden death due to
cardiovascular causes. Electrocardiography abnormalities are well
documented in athletes, where it is widely accepted that these are
characteristic of the ‘athlete’s heart’. Furthermore, biochemical
markers of collagen breakdown and myocardial fibrosis are elevated
in athletes. As such, using CMR late Gadolinium enhancement (LE)
imaging, we hypothesized that fibrosis is a feature of the athlete’sheart and is associated with reduced cardiac function.
Methods: 48 elite athletes (25 male, age 32 ± 13 years), and a
control group of 8 healthy individuals (4 male, 31 ± 9 years)
were prospectively recruited. On a 1.5 T MRI system, standard
protocols for assessment for LV function and T1-weighted LE
were performed.
Two experienced observers assessed LE images visually for the
presence of fibrosis. The extent of fibrosis was assessed
quantitatively, using semi-automated detection where regions
that had signal enhancement above a threshold of 5 standard
deviations from the mean signal of healthy myocardium, were
considered to represent fibrosis. Areas that had a lack of contrast
enhancement were used to define healthy myocardium.
Abbreviations utilized: LVEDVI – LV end-diastolic volume indexed-
to-height; LVESVI – LVend-systolic volume indexed-to-height; LVSVI –LV stroke volume indexed-to-height; LVEF – LV ejection fraction
Results: 37 of 48 (77%) athletes had non-ischemic diffuse LE,
compared with 1 of 8 (13%) of controls. The extent of myocardial
fibrosis in athletes who had visual evidence for LE was 10.7 ± 3.3%.
Athletes with fibrosis had increased LVEDVI (117 ± 19 vs.
98 ± 15 ml/m, p < 0.05), LVESVI (44 ± 11 vs. 34 ± 10 ml/m,
p < 0.05), and LVSVI (73 ± 11 vs. 64 ± 7 ml/m, p < 0.05), while
LVEF (63 ± 5 vs. 66 ± 6%, p > 0.05) did not differ, when compared
to those who did not have fibrosis. Figure 1.
Conclusion: This is the first evidence of myocardial fibrosis
being a prevalent finding in elite athletes, and its relation to
cardiac morphology with depressed cardiac function. Long-term
follow-up is required to assess the impact of fibrosis on outcome
and prognosis in the ‘athlete’s heart’.
O69Non-rheumatic streptococcal myocarditismimicking acute ST-segment elevationmyocardial infarction: characterizationby cardiac magnetic resonanceRasoul Mokabberi, Jamshid Shirani,Afsaneh Haftbaradaran Mohammadiand William SchiavoneGeisinger Medical Center, Danville, PA, USA
Journal of Cardiovascular Magnetic Resonance 2009, 11(Suppl 1):O69
Introduction: Acute myocarditis may mimic acute ST-segment
elevation myocardial infarction (STEMI) and result in unnecessary
invasive coronary angiography. Cardiac magnetic resonance
Figure 1 (abstract O68)
T1-weighted late gadolinium enhancement images. Left panels: Evidence ofsubepicardial non-ischemic myocardial fibrosis in athletes 1 and 2
(arrows), with none in healthy control. Right panels: Quantification of
myocardial fibrosis by manually tracing a region of interest in health
remote myocardium (blue outline). Automated computer thresholding
set at 5 standard deviations above the mean signal intensity of remote
myocardium detects fibrosis (red overlay). The detected extent of fibrosis
for athlete 1 is 14.12%, 11.30% for athlete 2 and 0.20% for control.
Journal of Cardiovascular Magnetic Resonance 2009, 11(Suppl 1) http://jcmr-online.com/supplements/11/S1
Page 56 of 316(page number not for citation purposes)
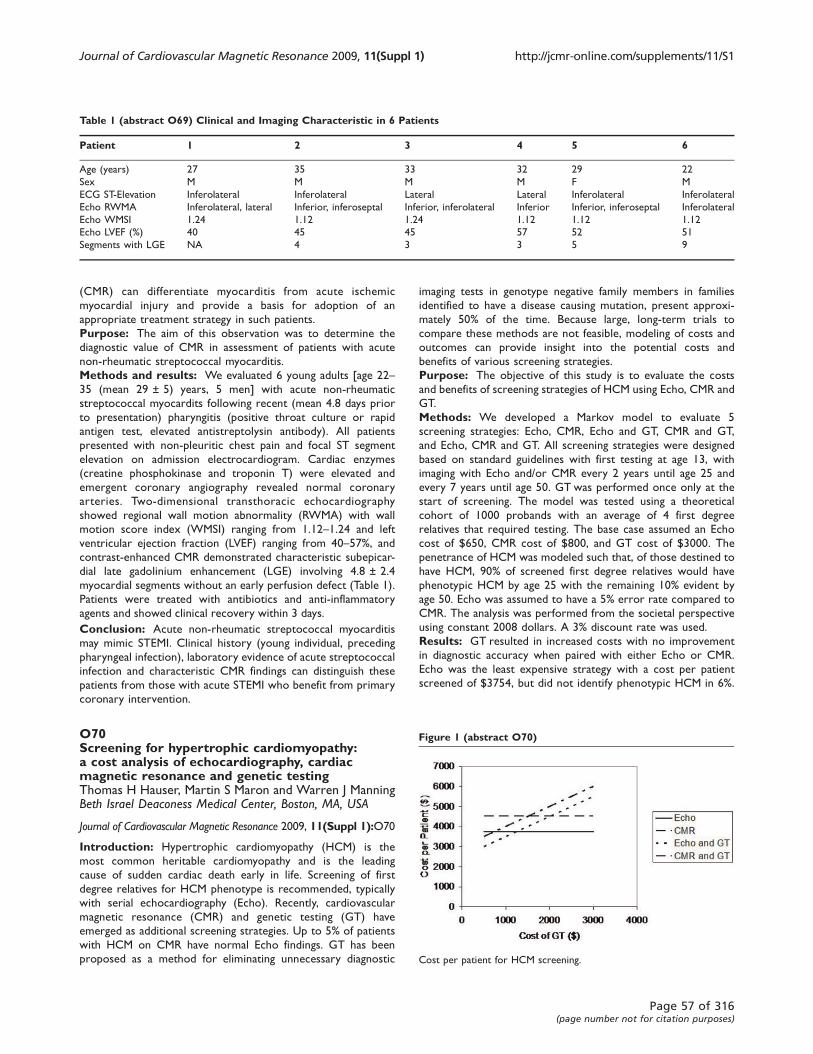
(CMR) can differentiate myocarditis from acute ischemic
myocardial injury and provide a basis for adoption of an
appropriate treatment strategy in such patients.
Purpose: The aim of this observation was to determine the
diagnostic value of CMR in assessment of patients with acute
non-rheumatic streptococcal myocarditis.
Methods and results: We evaluated 6 young adults [age 22–35 (mean 29 ± 5) years, 5 men] with acute non-rheumatic
streptococcal myocardits following recent (mean 4.8 days prior
to presentation) pharyngitis (positive throat culture or rapid
antigen test, elevated antistreptolysin antibody). All patients
presented with non-pleuritic chest pain and focal ST segment
elevation on admission electrocardiogram. Cardiac enzymes
(creatine phosphokinase and troponin T) were elevated and
emergent coronary angiography revealed normal coronary
arteries. Two-dimensional transthoracic echocardiography
showed regional wall motion abnormality (RWMA) with wall
motion score index (WMSI) ranging from 1.12–1.24 and left
ventricular ejection fraction (LVEF) ranging from 40–57%, andcontrast-enhanced CMR demonstrated characteristic subepicar-
dial late gadolinium enhancement (LGE) involving 4.8 ± 2.4
myocardial segments without an early perfusion defect (Table 1).
Patients were treated with antibiotics and anti-inflammatory
agents and showed clinical recovery within 3 days.
Conclusion: Acute non-rheumatic streptococcal myocarditis
may mimic STEMI. Clinical history (young individual, preceding
pharyngeal infection), laboratory evidence of acute streptococcal
infection and characteristic CMR findings can distinguish these
patients from those with acute STEMI who benefit from primary
coronary intervention.
O70Screening for hypertrophic cardiomyopathy:a cost analysis of echocardiography, cardiacmagnetic resonance and genetic testingThomas H Hauser, Martin S Maron and Warren J ManningBeth Israel Deaconess Medical Center, Boston, MA, USA
Journal of Cardiovascular Magnetic Resonance 2009, 11(Suppl 1):O70
Introduction: Hypertrophic cardiomyopathy (HCM) is the
most common heritable cardiomyopathy and is the leading
cause of sudden cardiac death early in life. Screening of first
degree relatives for HCM phenotype is recommended, typically
with serial echocardiography (Echo). Recently, cardiovascular
magnetic resonance (CMR) and genetic testing (GT) have
emerged as additional screening strategies. Up to 5% of patients
with HCM on CMR have normal Echo findings. GT has been
proposed as a method for eliminating unnecessary diagnostic
imaging tests in genotype negative family members in families
identified to have a disease causing mutation, present approxi-
mately 50% of the time. Because large, long-term trials to
compare these methods are not feasible, modeling of costs and
outcomes can provide insight into the potential costs and
benefits of various screening strategies.
Purpose: The objective of this study is to evaluate the costs
and benefits of screening strategies of HCM using Echo, CMR and
GT.
Methods: We developed a Markov model to evaluate 5
screening strategies: Echo, CMR, Echo and GT, CMR and GT,
and Echo, CMR and GT. All screening strategies were designed
based on standard guidelines with first testing at age 13, with
imaging with Echo and/or CMR every 2 years until age 25 and
every 7 years until age 50. GT was performed once only at the
start of screening. The model was tested using a theoretical
cohort of 1000 probands with an average of 4 first degree
relatives that required testing. The base case assumed an Echo
cost of $650, CMR cost of $800, and GT cost of $3000. The
penetrance of HCM was modeled such that, of those destined to
have HCM, 90% of screened first degree relatives would have
phenotypic HCM by age 25 with the remaining 10% evident by
age 50. Echo was assumed to have a 5% error rate compared to
CMR. The analysis was performed from the societal perspective
using constant 2008 dollars. A 3% discount rate was used.
Results: GT resulted in increased costs with no improvement
in diagnostic accuracy when paired with either Echo or CMR.
Echo was the least expensive strategy with a cost per patient
screened of $3754, but did not identify phenotypic HCM in 6%.
Table 1 (abstract O69) Clinical and Imaging Characteristic in 6 Patients
Patient 1 2 3 4 5 6
Age (years) 27 35 33 32 29 22
Sex M M M M F M
ECG ST-Elevation Inferolateral Inferolateral Lateral Lateral Inferolateral Inferolateral
Echo RWMA Inferolateral, lateral Inferior, inferoseptal Inferior, inferolateral Inferior Inferior, inferoseptal Inferolateral
Echo WMSI 1.24 1.12 1.24 1.12 1.12 1.12
Echo LVEF (%) 40 45 45 57 52 51
Segments with LGE NA 4 3 3 5 9
Figure 1 (abstract O70)
Cost per patient for HCM screening.
Journal of Cardiovascular Magnetic Resonance 2009, 11(Suppl 1) http://jcmr-online.com/supplements/11/S1
Page 57 of 316(page number not for citation purposes)
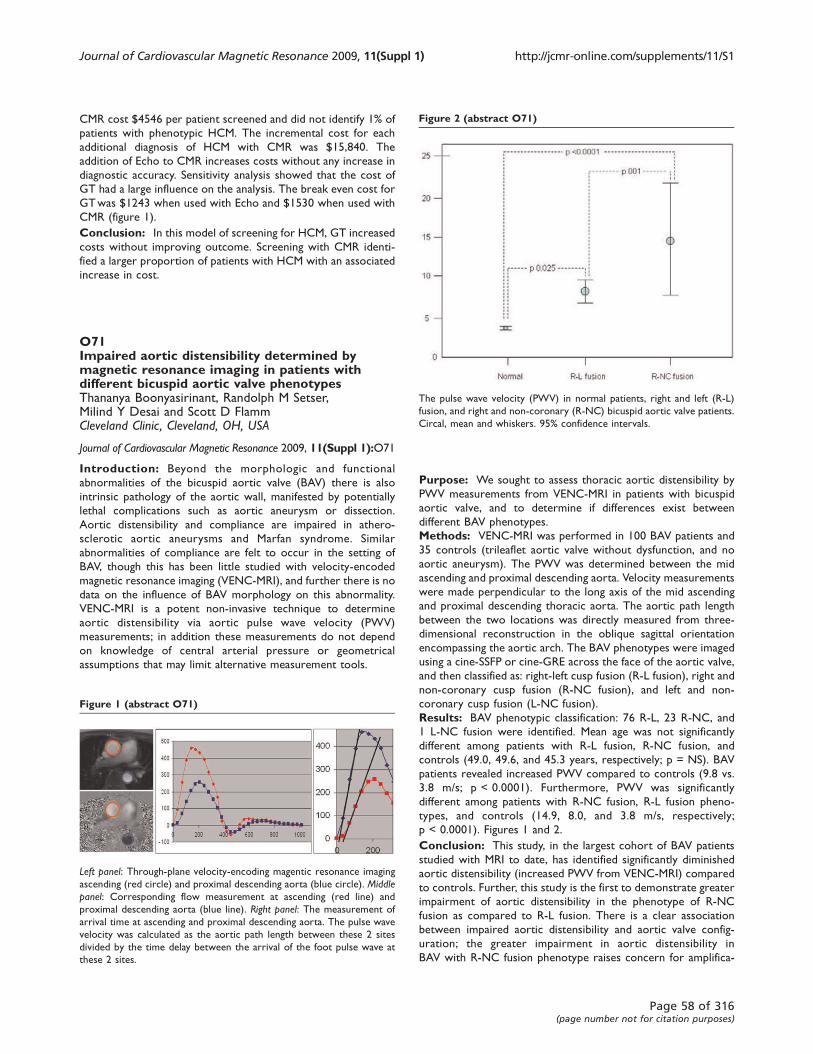
CMR cost $4546 per patient screened and did not identify 1% of
patients with phenotypic HCM. The incremental cost for each
additional diagnosis of HCM with CMR was $15,840. The
addition of Echo to CMR increases costs without any increase in
diagnostic accuracy. Sensitivity analysis showed that the cost of
GT had a large influence on the analysis. The break even cost for
GTwas $1243 when used with Echo and $1530 when used with
CMR (figure 1).
Conclusion: In this model of screening for HCM, GT increased
costs without improving outcome. Screening with CMR identi-
fied a larger proportion of patients with HCM with an associated
increase in cost.
O71Impaired aortic distensibility determined bymagnetic resonance imaging in patients withdifferent bicuspid aortic valve phenotypesThananya Boonyasirinant, Randolph M Setser,Milind Y Desai and Scott D FlammCleveland Clinic, Cleveland, OH, USA
Journal of Cardiovascular Magnetic Resonance 2009, 11(Suppl 1):O71
Introduction: Beyond the morphologic and functional
abnormalities of the bicuspid aortic valve (BAV) there is also
intrinsic pathology of the aortic wall, manifested by potentially
lethal complications such as aortic aneurysm or dissection.
Aortic distensibility and compliance are impaired in athero-
sclerotic aortic aneurysms and Marfan syndrome. Similar
abnormalities of compliance are felt to occur in the setting of
BAV, though this has been little studied with velocity-encoded
magnetic resonance imaging (VENC-MRI), and further there is no
data on the influence of BAV morphology on this abnormality.
VENC-MRI is a potent non-invasive technique to determine
aortic distensibility via aortic pulse wave velocity (PWV)
measurements; in addition these measurements do not depend
on knowledge of central arterial pressure or geometrical
assumptions that may limit alternative measurement tools.
Purpose: We sought to assess thoracic aortic distensibility by
PWV measurements from VENC-MRI in patients with bicuspid
aortic valve, and to determine if differences exist between
different BAV phenotypes.
Methods: VENC-MRI was performed in 100 BAV patients and
35 controls (trileaflet aortic valve without dysfunction, and no
aortic aneurysm). The PWV was determined between the mid
ascending and proximal descending aorta. Velocity measurements
were made perpendicular to the long axis of the mid ascending
and proximal descending thoracic aorta. The aortic path length
between the two locations was directly measured from three-
dimensional reconstruction in the oblique sagittal orientation
encompassing the aortic arch. The BAV phenotypes were imaged
using a cine-SSFP or cine-GRE across the face of the aortic valve,
and then classified as: right-left cusp fusion (R-L fusion), right and
non-coronary cusp fusion (R-NC fusion), and left and non-
coronary cusp fusion (L-NC fusion).
Results: BAV phenotypic classification: 76 R-L, 23 R-NC, and
1 L-NC fusion were identified. Mean age was not significantly
different among patients with R-L fusion, R-NC fusion, and
controls (49.0, 49.6, and 45.3 years, respectively; p = NS). BAV
patients revealed increased PWV compared to controls (9.8 vs.
3.8 m/s; p < 0.0001). Furthermore, PWV was significantly
different among patients with R-NC fusion, R-L fusion pheno-
types, and controls (14.9, 8.0, and 3.8 m/s, respectively;
p < 0.0001). Figures 1 and 2.
Conclusion: This study, in the largest cohort of BAV patients
studied with MRI to date, has identified significantly diminished
aortic distensibility (increased PWV from VENC-MRI) compared
to controls. Further, this study is the first to demonstrate greater
impairment of aortic distensibility in the phenotype of R-NC
fusion as compared to R-L fusion. There is a clear association
between impaired aortic distensibility and aortic valve config-
uration; the greater impairment in aortic distensibility in
BAV with R-NC fusion phenotype raises concern for amplifica-
Figure 1 (abstract O71)
Left panel: Through-plane velocity-encoding magentic resonance imaging
ascending (red circle) and proximal descending aorta (blue circle). Middlepanel: Corresponding flow measurement at ascending (red line) and
proximal descending aorta (blue line). Right panel: The measurement of
arrival time at ascending and proximal descending aorta. The pulse wave
velocity was calculated as the aortic path length between these 2 sites
divided by the time delay between the arrival of the foot pulse wave at
these 2 sites.
Figure 2 (abstract O71)
The pulse wave velocity (PWV) in normal patients, right and left (R-L)
fusion, and right and non-coronary (R-NC) bicuspid aortic valve patients.
Circal, mean and whiskers. 95% confidence intervals.
Journal of Cardiovascular Magnetic Resonance 2009, 11(Suppl 1) http://jcmr-online.com/supplements/11/S1
Page 58 of 316(page number not for citation purposes)
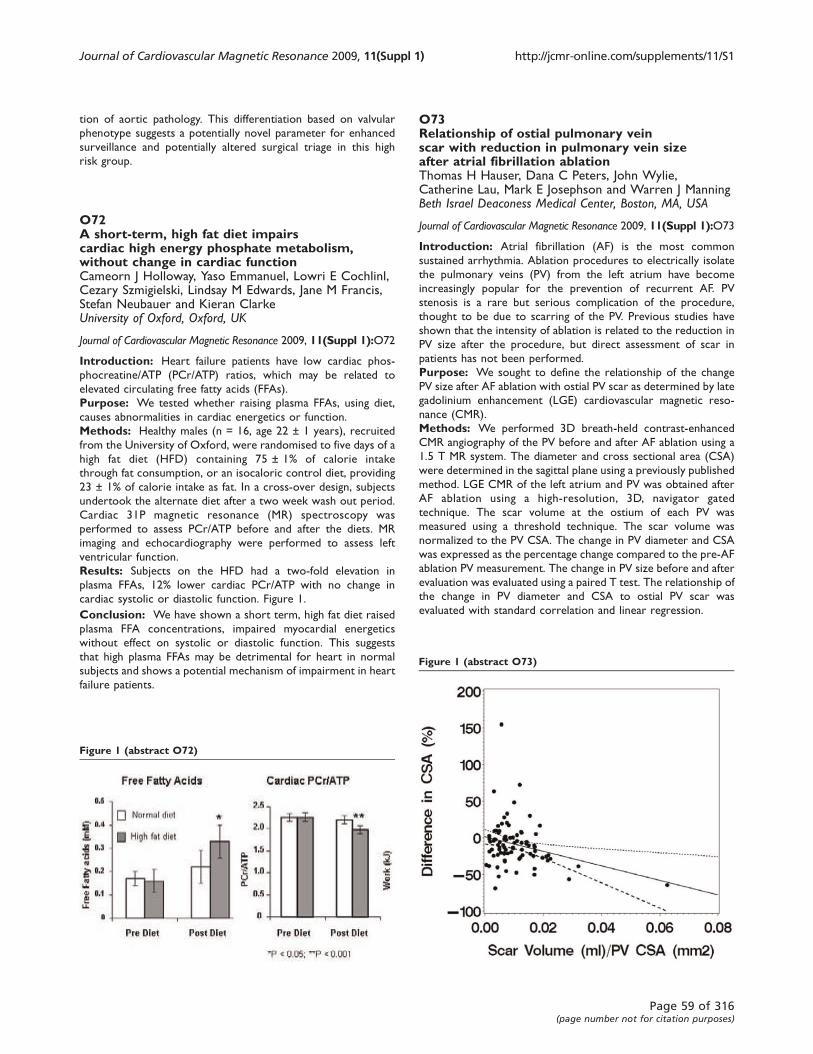
tion of aortic pathology. This differentiation based on valvular
phenotype suggests a potentially novel parameter for enhanced
surveillance and potentially altered surgical triage in this high
risk group.
O72A short-term, high fat diet impairscardiac high energy phosphate metabolism,without change in cardiac functionCameorn J Holloway, Yaso Emmanuel, Lowri E Cochlinl,Cezary Szmigielski, Lindsay M Edwards, Jane M Francis,Stefan Neubauer and Kieran ClarkeUniversity of Oxford, Oxford, UK
Journal of Cardiovascular Magnetic Resonance 2009, 11(Suppl 1):O72
Introduction: Heart failure patients have low cardiac phos-
phocreatine/ATP (PCr/ATP) ratios, which may be related to
elevated circulating free fatty acids (FFAs).
Purpose: We tested whether raising plasma FFAs, using diet,
causes abnormalities in cardiac energetics or function.
Methods: Healthy males (n = 16, age 22 ± 1 years), recruited
from the University of Oxford, were randomised to five days of a
high fat diet (HFD) containing 75 ± 1% of calorie intake
through fat consumption, or an isocaloric control diet, providing
23 ± 1% of calorie intake as fat. In a cross-over design, subjects
undertook the alternate diet after a two week wash out period.
Cardiac 31P magnetic resonance (MR) spectroscopy was
performed to assess PCr/ATP before and after the diets. MR
imaging and echocardiography were performed to assess left
ventricular function.
Results: Subjects on the HFD had a two-fold elevation in
plasma FFAs, 12% lower cardiac PCr/ATP with no change in
cardiac systolic or diastolic function. Figure 1.
Conclusion: We have shown a short term, high fat diet raised
plasma FFA concentrations, impaired myocardial energetics
without effect on systolic or diastolic function. This suggests
that high plasma FFAs may be detrimental for heart in normal
subjects and shows a potential mechanism of impairment in heart
failure patients.
O73Relationship of ostial pulmonary veinscar with reduction in pulmonary vein sizeafter atrial fibrillation ablationThomas H Hauser, Dana C Peters, John Wylie,Catherine Lau, Mark E Josephson and Warren J ManningBeth Israel Deaconess Medical Center, Boston, MA, USA
Journal of Cardiovascular Magnetic Resonance 2009, 11(Suppl 1):O73
Introduction: Atrial fibrillation (AF) is the most common
sustained arrhythmia. Ablation procedures to electrically isolate
the pulmonary veins (PV) from the left atrium have become
increasingly popular for the prevention of recurrent AF. PV
stenosis is a rare but serious complication of the procedure,
thought to be due to scarring of the PV. Previous studies have
shown that the intensity of ablation is related to the reduction in
PV size after the procedure, but direct assessment of scar in
patients has not been performed.
Purpose: We sought to define the relationship of the change
PV size after AF ablation with ostial PV scar as determined by late
gadolinium enhancement (LGE) cardiovascular magnetic reso-
nance (CMR).
Methods: We performed 3D breath-held contrast-enhanced
CMR angiography of the PV before and after AF ablation using a
1.5 T MR system. The diameter and cross sectional area (CSA)
were determined in the sagittal plane using a previously published
method. LGE CMR of the left atrium and PV was obtained after
AF ablation using a high-resolution, 3D, navigator gated
technique. The scar volume at the ostium of each PV was
measured using a threshold technique. The scar volume was
normalized to the PV CSA. The change in PV diameter and CSA
was expressed as the percentage change compared to the pre-AF
ablation PV measurement. The change in PV size before and after
evaluation was evaluated using a paired T test. The relationship of
the change in PV diameter and CSA to ostial PV scar was
evaluated with standard correlation and linear regression.
Figure 1 (abstract O72)
Figure 1 (abstract O73)
Journal of Cardiovascular Magnetic Resonance 2009, 11(Suppl 1) http://jcmr-online.com/supplements/11/S1
Page 59 of 316(page number not for citation purposes)
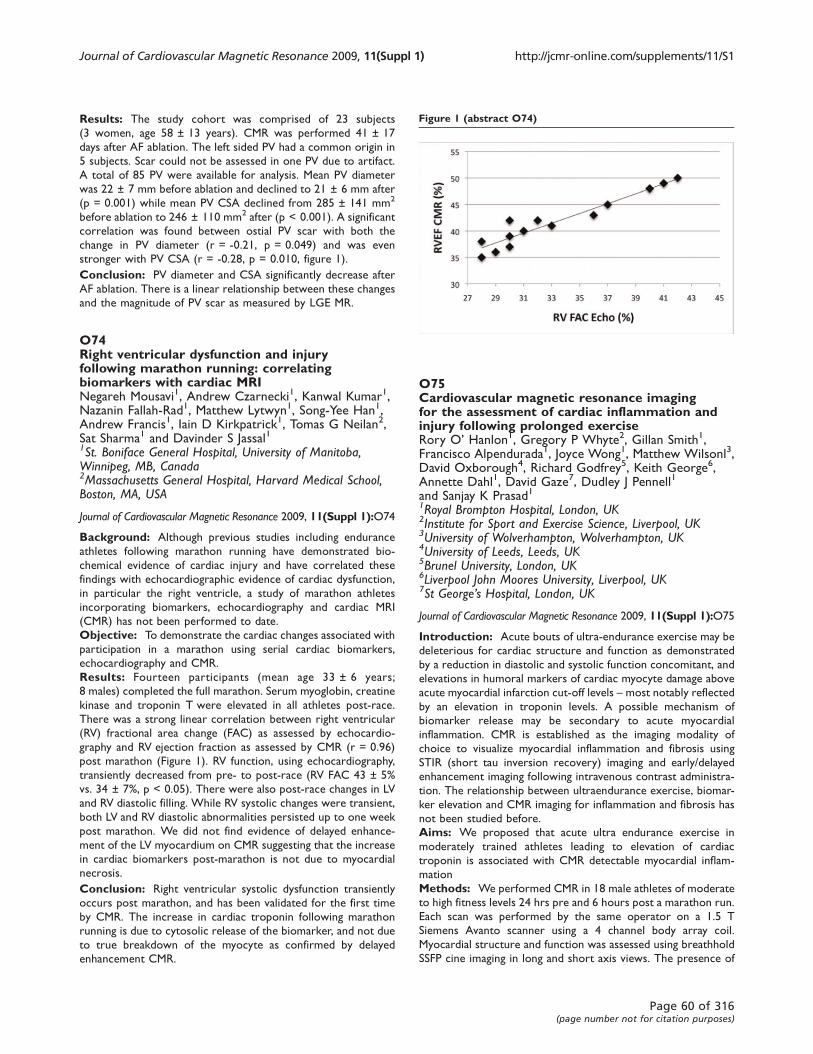
Results: The study cohort was comprised of 23 subjects
(3 women, age 58 ± 13 years). CMR was performed 41 ± 17
days after AF ablation. The left sided PV had a common origin in
5 subjects. Scar could not be assessed in one PV due to artifact.
A total of 85 PV were available for analysis. Mean PV diameter
was 22 ± 7 mm before ablation and declined to 21 ± 6 mm after
(p = 0.001) while mean PV CSA declined from 285 ± 141 mm2
before ablation to 246 ± 110 mm2 after (p < 0.001). A significant
correlation was found between ostial PV scar with both the
change in PV diameter (r = -0.21, p = 0.049) and was even
stronger with PV CSA (r = -0.28, p = 0.010, figure 1).
Conclusion: PV diameter and CSA significantly decrease after
AF ablation. There is a linear relationship between these changes
and the magnitude of PV scar as measured by LGE MR.
O74Right ventricular dysfunction and injuryfollowing marathon running: correlatingbiomarkers with cardiac MRINegareh Mousavi1, Andrew Czarnecki1, Kanwal Kumar1,Nazanin Fallah-Rad1, Matthew Lytwyn1, Song-Yee Han1,Andrew Francis1, Iain D Kirkpatrick1, Tomas G Neilan2,Sat Sharma1 and Davinder S Jassal11St. Boniface General Hospital, University of Manitoba,Winnipeg, MB, Canada2Massachusetts General Hospital, Harvard Medical School,Boston, MA, USA
Journal of Cardiovascular Magnetic Resonance 2009, 11(Suppl 1):O74
Background: Although previous studies including endurance
athletes following marathon running have demonstrated bio-
chemical evidence of cardiac injury and have correlated these
findings with echocardiographic evidence of cardiac dysfunction,
in particular the right ventricle, a study of marathon athletes
incorporating biomarkers, echocardiography and cardiac MRI
(CMR) has not been performed to date.
Objective: To demonstrate the cardiac changes associated with
participation in a marathon using serial cardiac biomarkers,
echocardiography and CMR.
Results: Fourteen participants (mean age 33 ± 6 years;
8 males) completed the full marathon. Serum myoglobin, creatine
kinase and troponin T were elevated in all athletes post-race.
There was a strong linear correlation between right ventricular
(RV) fractional area change (FAC) as assessed by echocardio-
graphy and RV ejection fraction as assessed by CMR (r = 0.96)
post marathon (Figure 1). RV function, using echocardiography,
transiently decreased from pre- to post-race (RV FAC 43 ± 5%
vs. 34 ± 7%, p < 0.05). There were also post-race changes in LV
and RV diastolic filling. While RV systolic changes were transient,
both LV and RV diastolic abnormalities persisted up to one week
post marathon. We did not find evidence of delayed enhance-
ment of the LV myocardium on CMR suggesting that the increase
in cardiac biomarkers post-marathon is not due to myocardial
necrosis.
Conclusion: Right ventricular systolic dysfunction transiently
occurs post marathon, and has been validated for the first time
by CMR. The increase in cardiac troponin following marathon
running is due to cytosolic release of the biomarker, and not due
to true breakdown of the myocyte as confirmed by delayed
enhancement CMR.
O75Cardiovascular magnetic resonance imagingfor the assessment of cardiac inflammation andinjury following prolonged exerciseRory O’ Hanlon1, Gregory P Whyte2, Gillan Smith1,Francisco Alpendurada1, Joyce Wong1, Matthew Wilsonl3,David Oxborough4, Richard Godfrey5, Keith George6,Annette Dahl1, David Gaze7, Dudley J Pennell1
and Sanjay K Prasad11Royal Brompton Hospital, London, UK2Institute for Sport and Exercise Science, Liverpool, UK3University of Wolverhampton, Wolverhampton, UK4University of Leeds, Leeds, UK5Brunel University, London, UK6Liverpool John Moores University, Liverpool, UK7St George’s Hospital, London, UK
Journal of Cardiovascular Magnetic Resonance 2009, 11(Suppl 1):O75
Introduction: Acute bouts of ultra-endurance exercise may be
deleterious for cardiac structure and function as demonstrated
by a reduction in diastolic and systolic function concomitant, and
elevations in humoral markers of cardiac myocyte damage above
acute myocardial infarction cut-off levels – most notably reflected
by an elevation in troponin levels. A possible mechanism of
biomarker release may be secondary to acute myocardial
inflammation. CMR is established as the imaging modality of
choice to visualize myocardial inflammation and fibrosis using
STIR (short tau inversion recovery) imaging and early/delayed
enhancement imaging following intravenous contrast administra-
tion. The relationship between ultraendurance exercise, biomar-
ker elevation and CMR imaging for inflammation and fibrosis has
not been studied before.
Aims: We proposed that acute ultra endurance exercise in
moderately trained athletes leading to elevation of cardiac
troponin is associated with CMR detectable myocardial inflam-
mation
Methods: We performed CMR in 18 male athletes of moderate
to high fitness levels 24 hrs pre and 6 hours post a marathon run.
Each scan was performed by the same operator on a 1.5 T
Siemens Avanto scanner using a 4 channel body array coil.
Myocardial structure and function was assessed using breathhold
SSFP cine imaging in long and short axis views. The presence of
Figure 1 (abstract O74)
Journal of Cardiovascular Magnetic Resonance 2009, 11(Suppl 1) http://jcmr-online.com/supplements/11/S1
Page 60 of 316(page number not for citation purposes)
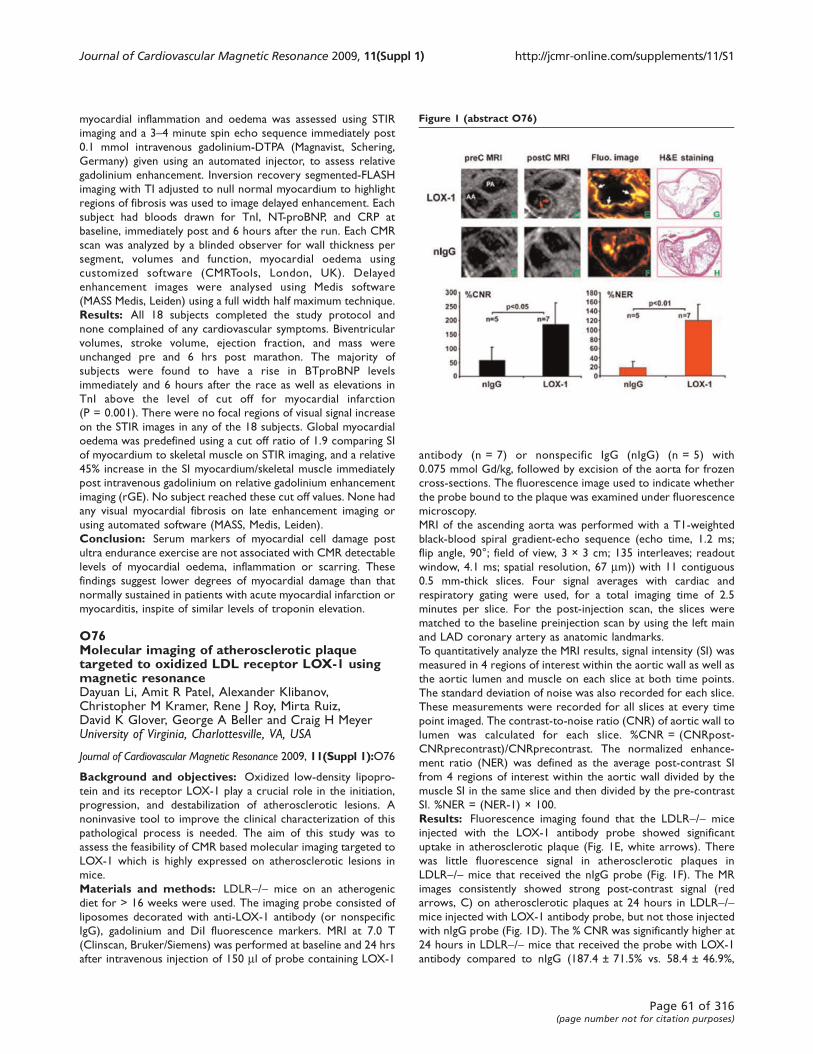
myocardial inflammation and oedema was assessed using STIR
imaging and a 3–4 minute spin echo sequence immediately post
0.1 mmol intravenous gadolinium-DTPA (Magnavist, Schering,
Germany) given using an automated injector, to assess relative
gadolinium enhancement. Inversion recovery segmented-FLASH
imaging with TI adjusted to null normal myocardium to highlight
regions of fibrosis was used to image delayed enhancement. Each
subject had bloods drawn for TnI, NT-proBNP, and CRP at
baseline, immediately post and 6 hours after the run. Each CMR
scan was analyzed by a blinded observer for wall thickness per
segment, volumes and function, myocardial oedema using
customized software (CMRTools, London, UK). Delayed
enhancement images were analysed using Medis software
(MASS Medis, Leiden) using a full width half maximum technique.
Results: All 18 subjects completed the study protocol and
none complained of any cardiovascular symptoms. Biventricular
volumes, stroke volume, ejection fraction, and mass were
unchanged pre and 6 hrs post marathon. The majority of
subjects were found to have a rise in BTproBNP levels
immediately and 6 hours after the race as well as elevations in
TnI above the level of cut off for myocardial infarction
(P = 0.001). There were no focal regions of visual signal increase
on the STIR images in any of the 18 subjects. Global myocardial
oedema was predefined using a cut off ratio of 1.9 comparing SI
of myocardium to skeletal muscle on STIR imaging, and a relative
45% increase in the SI myocardium/skeletal muscle immediately
post intravenous gadolinium on relative gadolinium enhancement
imaging (rGE). No subject reached these cut off values. None had
any visual myocardial fibrosis on late enhancement imaging or
using automated software (MASS, Medis, Leiden).
Conclusion: Serum markers of myocardial cell damage post
ultra endurance exercise are not associated with CMR detectable
levels of myocardial oedema, inflammation or scarring. These
findings suggest lower degrees of myocardial damage than that
normally sustained in patients with acute myocardial infarction or
myocarditis, inspite of similar levels of troponin elevation.
O76Molecular imaging of atherosclerotic plaquetargeted to oxidized LDL receptor LOX-1 usingmagnetic resonanceDayuan Li, Amit R Patel, Alexander Klibanov,Christopher M Kramer, Rene J Roy, Mirta Ruiz,David K Glover, George A Beller and Craig H MeyerUniversity of Virginia, Charlottesville, VA, USA
Journal of Cardiovascular Magnetic Resonance 2009, 11(Suppl 1):O76
Background and objectives: Oxidized low-density lipopro-
tein and its receptor LOX-1 play a crucial role in the initiation,
progression, and destabilization of atherosclerotic lesions. A
noninvasive tool to improve the clinical characterization of this
pathological process is needed. The aim of this study was to
assess the feasibility of CMR based molecular imaging targeted to
LOX-1 which is highly expressed on atherosclerotic lesions in
mice.
Materials and methods: LDLR-/- mice on an atherogenic
diet for > 16 weeks were used. The imaging probe consisted of
liposomes decorated with anti-LOX-1 antibody (or nonspecific
IgG), gadolinium and DiI fluorescence markers. MRI at 7.0 T
(Clinscan, Bruker/Siemens) was performed at baseline and 24 hrs
after intravenous injection of 150 ml of probe containing LOX-1
antibody (n = 7) or nonspecific IgG (nIgG) (n = 5) with
0.075 mmol Gd/kg, followed by excision of the aorta for frozen
cross-sections. The fluorescence image used to indicate whether
the probe bound to the plaque was examined under fluorescence
microscopy.
MRI of the ascending aorta was performed with a T1-weighted
black-blood spiral gradient-echo sequence (echo time, 1.2 ms;
flip angle, 90°; field of view, 3 × 3 cm; 135 interleaves; readout
window, 4.1 ms; spatial resolution, 67 mm)) with 11 contiguous
0.5 mm-thick slices. Four signal averages with cardiac and
respiratory gating were used, for a total imaging time of 2.5
minutes per slice. For the post-injection scan, the slices were
matched to the baseline preinjection scan by using the left main
and LAD coronary artery as anatomic landmarks.
To quantitatively analyze the MRI results, signal intensity (SI) was
measured in 4 regions of interest within the aortic wall as well as
the aortic lumen and muscle on each slice at both time points.
The standard deviation of noise was also recorded for each slice.
These measurements were recorded for all slices at every time
point imaged. The contrast-to-noise ratio (CNR) of aortic wall to
lumen was calculated for each slice. %CNR = (CNRpost-
CNRprecontrast)/CNRprecontrast. The normalized enhance-
ment ratio (NER) was defined as the average post-contrast SI
from 4 regions of interest within the aortic wall divided by the
muscle SI in the same slice and then divided by the pre-contrast
SI. %NER = (NER-1) × 100.
Results: Fluorescence imaging found that the LDLR-/- mice
injected with the LOX-1 antibody probe showed significant
uptake in atherosclerotic plaque (Fig. 1E, white arrows). There
was little fluorescence signal in atherosclerotic plaques in
LDLR-/- mice that received the nIgG probe (Fig. 1F). The MR
images consistently showed strong post-contrast signal (red
arrows, C) on atherosclerotic plaques at 24 hours in LDLR-/-mice injected with LOX-1 antibody probe, but not those injected
with nIgG probe (Fig. 1D). The % CNR was significantly higher at
24 hours in LDLR-/- mice that received the probe with LOX-1
antibody compared to nIgG (187.4 ± 71.5% vs. 58.4 ± 46.9%,
Figure 1 (abstract O76)
Journal of Cardiovascular Magnetic Resonance 2009, 11(Suppl 1) http://jcmr-online.com/supplements/11/S1
Page 61 of 316(page number not for citation purposes)
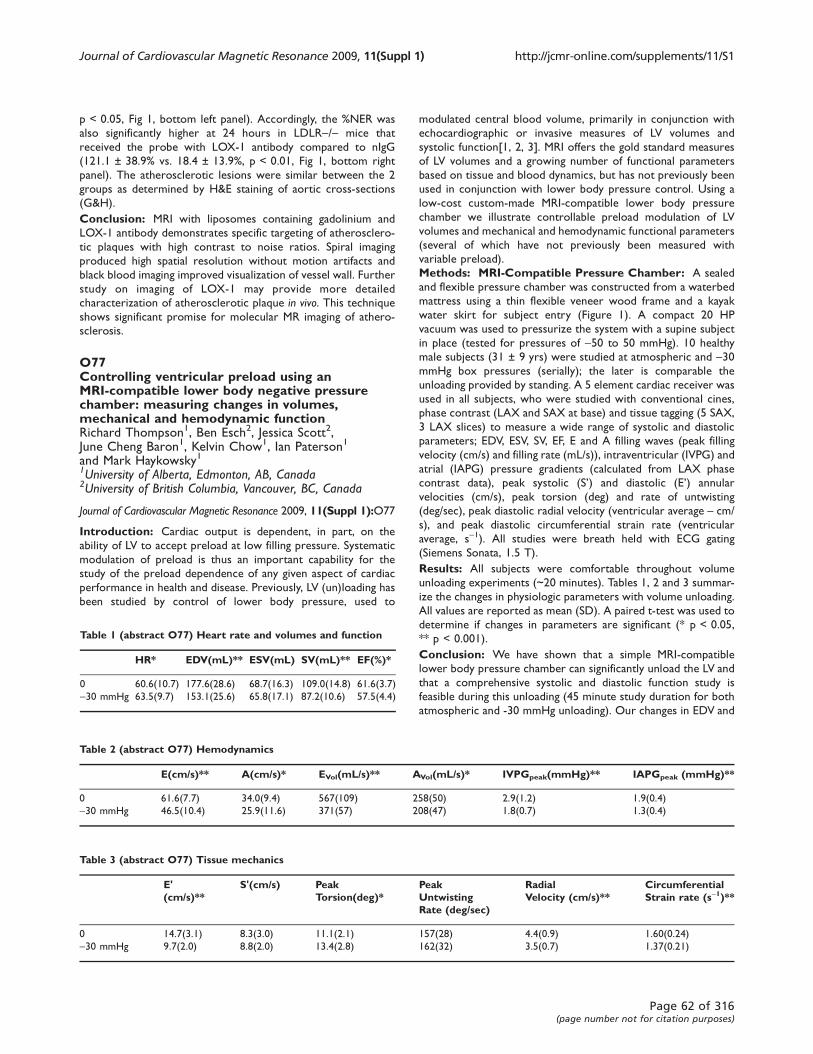
p < 0.05, Fig 1, bottom left panel). Accordingly, the %NER was
also significantly higher at 24 hours in LDLR-/- mice that
received the probe with LOX-1 antibody compared to nIgG
(121.1 ± 38.9% vs. 18.4 ± 13.9%, p < 0.01, Fig 1, bottom right
panel). The atherosclerotic lesions were similar between the 2
groups as determined by H&E staining of aortic cross-sections
(G&H).
Conclusion: MRI with liposomes containing gadolinium and
LOX-1 antibody demonstrates specific targeting of atherosclero-
tic plaques with high contrast to noise ratios. Spiral imaging
produced high spatial resolution without motion artifacts and
black blood imaging improved visualization of vessel wall. Further
study on imaging of LOX-1 may provide more detailed
characterization of atherosclerotic plaque in vivo. This techniqueshows significant promise for molecular MR imaging of athero-
sclerosis.
O77Controlling ventricular preload using anMRI-compatible lower body negative pressurechamber: measuring changes in volumes,mechanical and hemodynamic functionRichard Thompson1, Ben Esch2, Jessica Scott2,June Cheng Baron1, Kelvin Chow1, Ian Paterson1
and Mark Haykowsky11University of Alberta, Edmonton, AB, Canada2University of British Columbia, Vancouver, BC, Canada
Journal of Cardiovascular Magnetic Resonance 2009, 11(Suppl 1):O77
Introduction: Cardiac output is dependent, in part, on the
ability of LV to accept preload at low filling pressure. Systematic
modulation of preload is thus an important capability for the
study of the preload dependence of any given aspect of cardiac
performance in health and disease. Previously, LV (un)loading has
been studied by control of lower body pressure, used to
modulated central blood volume, primarily in conjunction with
echocardiographic or invasive measures of LV volumes and
systolic function[1, 2, 3]. MRI offers the gold standard measures
of LV volumes and a growing number of functional parameters
based on tissue and blood dynamics, but has not previously been
used in conjunction with lower body pressure control. Using a
low-cost custom-made MRI-compatible lower body pressure
chamber we illustrate controllable preload modulation of LV
volumes and mechanical and hemodynamic functional parameters
(several of which have not previously been measured with
variable preload).
Methods: MRI-Compatible Pressure Chamber: A sealed
and flexible pressure chamber was constructed from a waterbed
mattress using a thin flexible veneer wood frame and a kayak
water skirt for subject entry (Figure 1). A compact 20 HP
vacuum was used to pressurize the system with a supine subject
in place (tested for pressures of -50 to 50 mmHg). 10 healthy
male subjects (31 ± 9 yrs) were studied at atmospheric and -30mmHg box pressures (serially); the later is comparable the
unloading provided by standing. A 5 element cardiac receiver was
used in all subjects, who were studied with conventional cines,
phase contrast (LAX and SAX at base) and tissue tagging (5 SAX,
3 LAX slices) to measure a wide range of systolic and diastolic
parameters; EDV, ESV, SV, EF, E and A filling waves (peak filling
velocity (cm/s) and filling rate (mL/s)), intraventricular (IVPG) and
atrial (IAPG) pressure gradients (calculated from LAX phase
contrast data), peak systolic (S’) and diastolic (E’) annular
velocities (cm/s), peak torsion (deg) and rate of untwisting
(deg/sec), peak diastolic radial velocity (ventricular average – cm/
s), and peak diastolic circumferential strain rate (ventricular
average, s-1). All studies were breath held with ECG gating
(Siemens Sonata, 1.5 T).
Results: All subjects were comfortable throughout volume
unloading experiments (~20 minutes). Tables 1, 2 and 3 summar-
ize the changes in physiologic parameters with volume unloading.
All values are reported as mean (SD). A paired t-test was used to
determine if changes in parameters are significant (* p < 0.05,
** p < 0.001).
Conclusion: We have shown that a simple MRI-compatible
lower body pressure chamber can significantly unload the LV and
that a comprehensive systolic and diastolic function study is
feasible during this unloading (45 minute study duration for both
atmospheric and -30 mmHg unloading). Our changes in EDV and
Table 1 (abstract O77) Heart rate and volumes and function
HR* EDV(mL)** ESV(mL) SV(mL)** EF(%)*
0 60.6(10.7) 177.6(28.6) 68.7(16.3) 109.0(14.8) 61.6(3.7)
-30 mmHg 63.5(9.7) 153.1(25.6) 65.8(17.1) 87.2(10.6) 57.5(4.4)
Table 2 (abstract O77) Hemodynamics
E(cm/s)** A(cm/s)* EVol(mL/s)** AVol(mL/s)* IVPGpeak(mmHg)** IAPGpeak (mmHg)**
0 61.6(7.7) 34.0(9.4) 567(109) 258(50) 2.9(1.2) 1.9(0.4)
-30 mmHg 46.5(10.4) 25.9(11.6) 371(57) 208(47) 1.8(0.7) 1.3(0.4)
Table 3 (abstract O77) Tissue mechanics
E'(cm/s)**
S'(cm/s) PeakTorsion(deg)*
PeakUntwistingRate (deg/sec)
RadialVelocity (cm/s)**
CircumferentialStrain rate (s-1)**
0 14.7(3.1) 8.3(3.0) 11.1(2.1) 157(28) 4.4(0.9) 1.60(0.24)
-30 mmHg 9.7(2.0) 8.8(2.0) 13.4(2.8) 162(32) 3.5(0.7) 1.37(0.21)
Journal of Cardiovascular Magnetic Resonance 2009, 11(Suppl 1) http://jcmr-online.com/supplements/11/S1
Page 62 of 316(page number not for citation purposes)
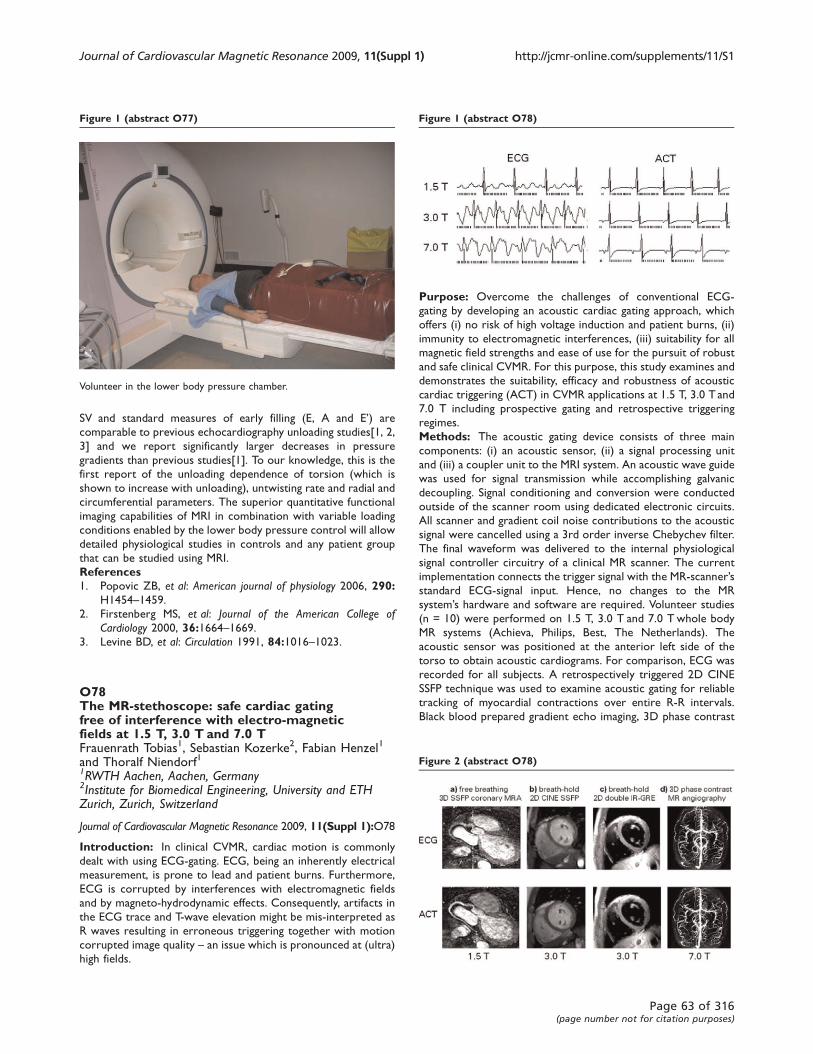
SV and standard measures of early filling (E, A and E’) are
comparable to previous echocardiography unloading studies[1, 2,
3] and we report significantly larger decreases in pressure
gradients than previous studies[1]. To our knowledge, this is the
first report of the unloading dependence of torsion (which is
shown to increase with unloading), untwisting rate and radial and
circumferential parameters. The superior quantitative functional
imaging capabilities of MRI in combination with variable loading
conditions enabled by the lower body pressure control will allow
detailed physiological studies in controls and any patient group
that can be studied using MRI.
References1. Popovic ZB, et al: American journal of physiology 2006, 290:
H1454–1459.2. Firstenberg MS, et al: Journal of the American College of
Cardiology 2000, 36:1664–1669.3. Levine BD, et al: Circulation 1991, 84:1016–1023.
O78The MR-stethoscope: safe cardiac gatingfree of interference with electro-magneticfields at 1.5 T, 3.0 T and 7.0 TFrauenrath Tobias1, Sebastian Kozerke2, Fabian Henzel1
and Thoralf Niendorf11RWTH Aachen, Aachen, Germany2Institute for Biomedical Engineering, University and ETHZurich, Zurich, Switzerland
Journal of Cardiovascular Magnetic Resonance 2009, 11(Suppl 1):O78
Introduction: In clinical CVMR, cardiac motion is commonly
dealt with using ECG-gating. ECG, being an inherently electrical
measurement, is prone to lead and patient burns. Furthermore,
ECG is corrupted by interferences with electromagnetic fields
and by magneto-hydrodynamic effects. Consequently, artifacts in
the ECG trace and T-wave elevation might be mis-interpreted as
R waves resulting in erroneous triggering together with motion
corrupted image quality – an issue which is pronounced at (ultra)
high fields.
Purpose: Overcome the challenges of conventional ECG-
gating by developing an acoustic cardiac gating approach, which
offers (i) no risk of high voltage induction and patient burns, (ii)
immunity to electromagnetic interferences, (iii) suitability for all
magnetic field strengths and ease of use for the pursuit of robust
and safe clinical CVMR. For this purpose, this study examines and
demonstrates the suitability, efficacy and robustness of acoustic
cardiac triggering (ACT) in CVMR applications at 1.5 T, 3.0 T and
7.0 T including prospective gating and retrospective triggering
regimes.
Methods: The acoustic gating device consists of three main
components: (i) an acoustic sensor, (ii) a signal processing unit
and (iii) a coupler unit to the MRI system. An acoustic wave guide
was used for signal transmission while accomplishing galvanic
decoupling. Signal conditioning and conversion were conducted
outside of the scanner room using dedicated electronic circuits.
All scanner and gradient coil noise contributions to the acoustic
signal were cancelled using a 3rd order inverse Chebychev filter.
The final waveform was delivered to the internal physiological
signal controller circuitry of a clinical MR scanner. The current
implementation connects the trigger signal with the MR-scanner’sstandard ECG-signal input. Hence, no changes to the MR
system’s hardware and software are required. Volunteer studies
(n = 10) were performed on 1.5 T, 3.0 T and 7.0 T whole body
MR systems (Achieva, Philips, Best, The Netherlands). The
acoustic sensor was positioned at the anterior left side of the
torso to obtain acoustic cardiograms. For comparison, ECG was
recorded for all subjects. A retrospectively triggered 2D CINE
SSFP technique was used to examine acoustic gating for reliable
tracking of myocardial contractions over entire R-R intervals.
Black blood prepared gradient echo imaging, 3D phase contrast
Figure 1 (abstract O77)
Volunteer in the lower body pressure chamber.
Figure 1 (abstract O78)
Figure 2 (abstract O78)
Journal of Cardiovascular Magnetic Resonance 2009, 11(Suppl 1) http://jcmr-online.com/supplements/11/S1
Page 63 of 316(page number not for citation purposes)
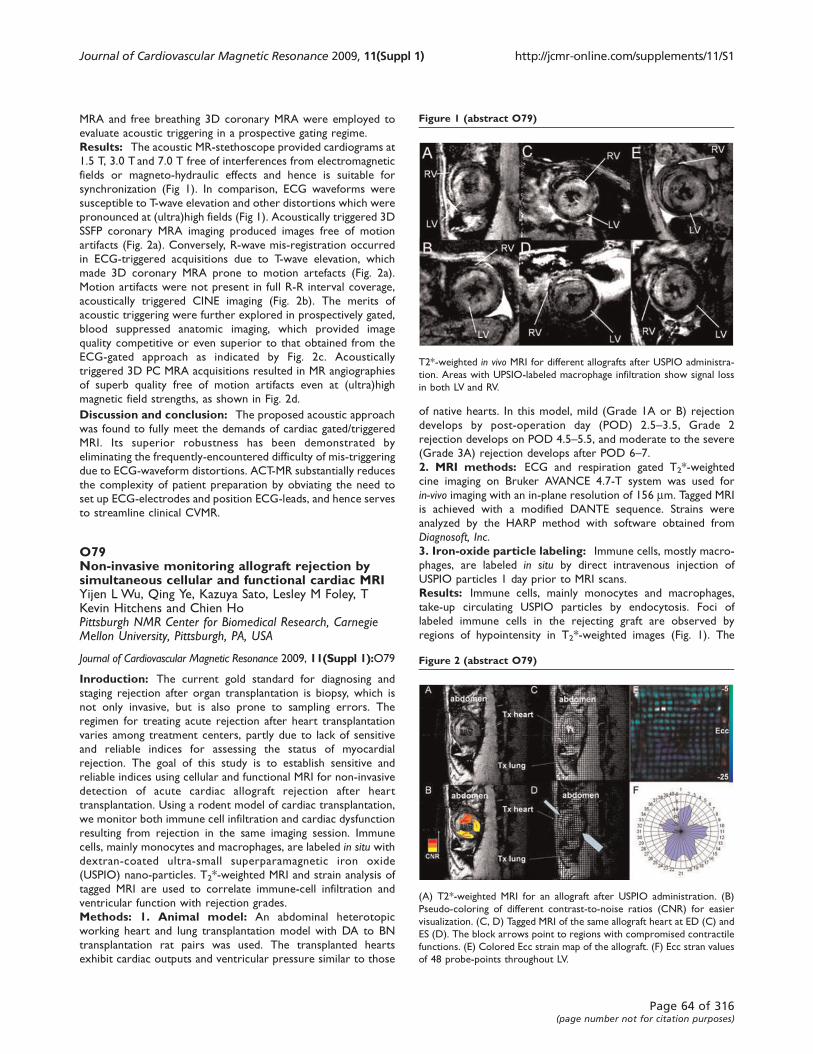
MRA and free breathing 3D coronary MRA were employed to
evaluate acoustic triggering in a prospective gating regime.
Results: The acoustic MR-stethoscope provided cardiograms at
1.5 T, 3.0 T and 7.0 T free of interferences from electromagnetic
fields or magneto-hydraulic effects and hence is suitable for
synchronization (Fig 1). In comparison, ECG waveforms were
susceptible to T-wave elevation and other distortions which were
pronounced at (ultra)high fields (Fig 1). Acoustically triggered 3D
SSFP coronary MRA imaging produced images free of motion
artifacts (Fig. 2a). Conversely, R-wave mis-registration occurred
in ECG-triggered acquisitions due to T-wave elevation, which
made 3D coronary MRA prone to motion artefacts (Fig. 2a).
Motion artifacts were not present in full R-R interval coverage,
acoustically triggered CINE imaging (Fig. 2b). The merits of
acoustic triggering were further explored in prospectively gated,
blood suppressed anatomic imaging, which provided image
quality competitive or even superior to that obtained from the
ECG-gated approach as indicated by Fig. 2c. Acoustically
triggered 3D PC MRA acquisitions resulted in MR angiographies
of superb quality free of motion artifacts even at (ultra)high
magnetic field strengths, as shown in Fig. 2d.
Discussion and conclusion: The proposed acoustic approach
was found to fully meet the demands of cardiac gated/triggered
MRI. Its superior robustness has been demonstrated by
eliminating the frequently-encountered difficulty of mis-triggering
due to ECG-waveform distortions. ACT-MR substantially reduces
the complexity of patient preparation by obviating the need to
set up ECG-electrodes and position ECG-leads, and hence serves
to streamline clinical CVMR.
O79Non-invasive monitoring allograft rejection bysimultaneous cellular and functional cardiac MRIYijen L Wu, Qing Ye, Kazuya Sato, Lesley M Foley, TKevin Hitchens and Chien HoPittsburgh NMR Center for Biomedical Research, CarnegieMellon University, Pittsburgh, PA, USA
Journal of Cardiovascular Magnetic Resonance 2009, 11(Suppl 1):O79
Inroduction: The current gold standard for diagnosing and
staging rejection after organ transplantation is biopsy, which is
not only invasive, but is also prone to sampling errors. The
regimen for treating acute rejection after heart transplantation
varies among treatment centers, partly due to lack of sensitive
and reliable indices for assessing the status of myocardial
rejection. The goal of this study is to establish sensitive and
reliable indices using cellular and functional MRI for non-invasive
detection of acute cardiac allograft rejection after heart
transplantation. Using a rodent model of cardiac transplantation,
we monitor both immune cell infiltration and cardiac dysfunction
resulting from rejection in the same imaging session. Immune
cells, mainly monocytes and macrophages, are labeled in situ withdextran-coated ultra-small superparamagnetic iron oxide
(USPIO) nano-particles. T2*-weighted MRI and strain analysis of
tagged MRI are used to correlate immune-cell infiltration and
ventricular function with rejection grades.
Methods: 1. Animal model: An abdominal heterotopic
working heart and lung transplantation model with DA to BN
transplantation rat pairs was used. The transplanted hearts
exhibit cardiac outputs and ventricular pressure similar to those
of native hearts. In this model, mild (Grade 1A or B) rejection
develops by post-operation day (POD) 2.5–3.5, Grade 2
rejection develops on POD 4.5–5.5, and moderate to the severe
(Grade 3A) rejection develops after POD 6–7.2. MRI methods: ECG and respiration gated T2*-weighted
cine imaging on Bruker AVANCE 4.7-T system was used for
in-vivo imaging with an in-plane resolution of 156 mm. Tagged MRI
is achieved with a modified DANTE sequence. Strains were
analyzed by the HARP method with software obtained from
Diagnosoft, Inc.3. Iron-oxide particle labeling: Immune cells, mostly macro-
phages, are labeled in situ by direct intravenous injection of
USPIO particles 1 day prior to MRI scans.
Results: Immune cells, mainly monocytes and macrophages,
take-up circulating USPIO particles by endocytosis. Foci of
labeled immune cells in the rejecting graft are observed by
regions of hypointensity in T2*-weighted images (Fig. 1). The
Figure 1 (abstract O79)
T2*-weighted in vivo MRI for different allografts after USPIO administra-
tion. Areas with UPSIO-labeled macrophage infiltration show signal loss
in both LV and RV.
Figure 2 (abstract O79)
(A) T2*-weighted MRI for an allograft after USPIO administration. (B)
Pseudo-coloring of different contrast-to-noise ratios (CNR) for easier
visualization. (C, D) Tagged MRI of the same allograft heart at ED (C) and
ES (D). The block arrows point to regions with compromised contractile
functions. (E) Colored Ecc strain map of the allograft. (F) Ecc stran values
of 48 probe-points throughout LV.
Journal of Cardiovascular Magnetic Resonance 2009, 11(Suppl 1) http://jcmr-online.com/supplements/11/S1
Page 64 of 316(page number not for citation purposes)
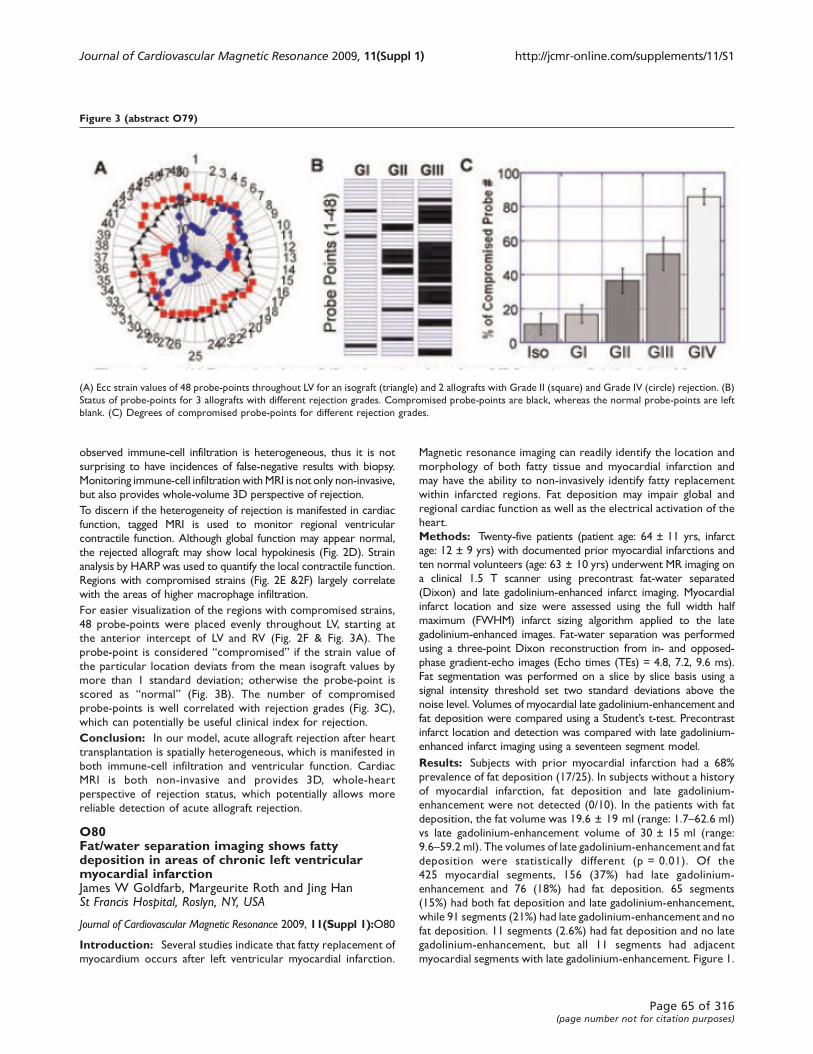
observed immune-cell infiltration is heterogeneous, thus it is not
surprising to have incidences of false-negative results with biopsy.
Monitoring immune-cell infiltrationwithMRI is not only non-invasive,
but also provides whole-volume 3D perspective of rejection.
To discern if the heterogeneity of rejection is manifested in cardiac
function, tagged MRI is used to monitor regional ventricular
contractile function. Although global function may appear normal,
the rejected allograft may show local hypokinesis (Fig. 2D). Strain
analysis by HARP was used to quantify the local contractile function.
Regions with compromised strains (Fig. 2E &2F) largely correlate
with the areas of higher macrophage infiltration.
For easier visualization of the regions with compromised strains,
48 probe-points were placed evenly throughout LV, starting at
the anterior intercept of LV and RV (Fig. 2F & Fig. 3A). The
probe-point is considered “compromised” if the strain value of
the particular location deviats from the mean isograft values by
more than 1 standard deviation; otherwise the probe-point is
scored as “normal” (Fig. 3B). The number of compromised
probe-points is well correlated with rejection grades (Fig. 3C),
which can potentially be useful clinical index for rejection.
Conclusion: In our model, acute allograft rejection after heart
transplantation is spatially heterogeneous, which is manifested in
both immune-cell infiltration and ventricular function. Cardiac
MRI is both non-invasive and provides 3D, whole-heart
perspective of rejection status, which potentially allows more
reliable detection of acute allograft rejection.
O80Fat/water separation imaging shows fattydeposition in areas of chronic left ventricularmyocardial infarctionJames W Goldfarb, Margeurite Roth and Jing HanSt Francis Hospital, Roslyn, NY, USA
Journal of Cardiovascular Magnetic Resonance 2009, 11(Suppl 1):O80
Introduction: Several studies indicate that fatty replacement of
myocardium occurs after left ventricular myocardial infarction.
Magnetic resonance imaging can readily identify the location and
morphology of both fatty tissue and myocardial infarction and
may have the ability to non-invasively identify fatty replacement
within infarcted regions. Fat deposition may impair global and
regional cardiac function as well as the electrical activation of the
heart.
Methods: Twenty-five patients (patient age: 64 ± 11 yrs, infarct
age: 12 ± 9 yrs) with documented prior myocardial infarctions and
ten normal volunteers (age: 63 ± 10 yrs) underwent MR imaging on
a clinical 1.5 T scanner using precontrast fat-water separated
(Dixon) and late gadolinium-enhanced infarct imaging. Myocardial
infarct location and size were assessed using the full width half
maximum (FWHM) infarct sizing algorithm applied to the late
gadolinium-enhanced images. Fat-water separation was performed
using a three-point Dixon reconstruction from in- and opposed-
phase gradient-echo images (Echo times (TEs) = 4.8, 7.2, 9.6 ms).
Fat segmentation was performed on a slice by slice basis using a
signal intensity threshold set two standard deviations above the
noise level. Volumes of myocardial late gadolinium-enhancement and
fat deposition were compared using a Student’s t-test. Precontrastinfarct location and detection was compared with late gadolinium-
enhanced infarct imaging using a seventeen segment model.
Results: Subjects with prior myocardial infarction had a 68%
prevalence of fat deposition (17/25). In subjects without a history
of myocardial infarction, fat deposition and late gadolinium-
enhancement were not detected (0/10). In the patients with fat
deposition, the fat volume was 19.6 ± 19 ml (range: 1.7–62.6 ml)
vs late gadolinium-enhancement volume of 30 ± 15 ml (range:
9.6–59.2 ml). The volumes of late gadolinium-enhancement and fat
deposition were statistically different (p = 0.01). Of the
425 myocardial segments, 156 (37%) had late gadolinium-
enhancement and 76 (18%) had fat deposition. 65 segments
(15%) had both fat deposition and late gadolinium-enhancement,
while 91 segments (21%) had late gadolinium-enhancement and no
fat deposition. 11 segments (2.6%) had fat deposition and no late
gadolinium-enhancement, but all 11 segments had adjacent
myocardial segments with late gadolinium-enhancement. Figure 1.
Figure 3 (abstract O79)
(A) Ecc strain values of 48 probe-points throughout LV for an isograft (triangle) and 2 allografts with Grade II (square) and Grade IV (circle) rejection. (B)
Status of probe-points for 3 allografts with different rejection grades. Compromised probe-points are black, whereas the normal probe-points are left
blank. (C) Degrees of compromised probe-points for different rejection grades.
Journal of Cardiovascular Magnetic Resonance 2009, 11(Suppl 1) http://jcmr-online.com/supplements/11/S1
Page 65 of 316(page number not for citation purposes)
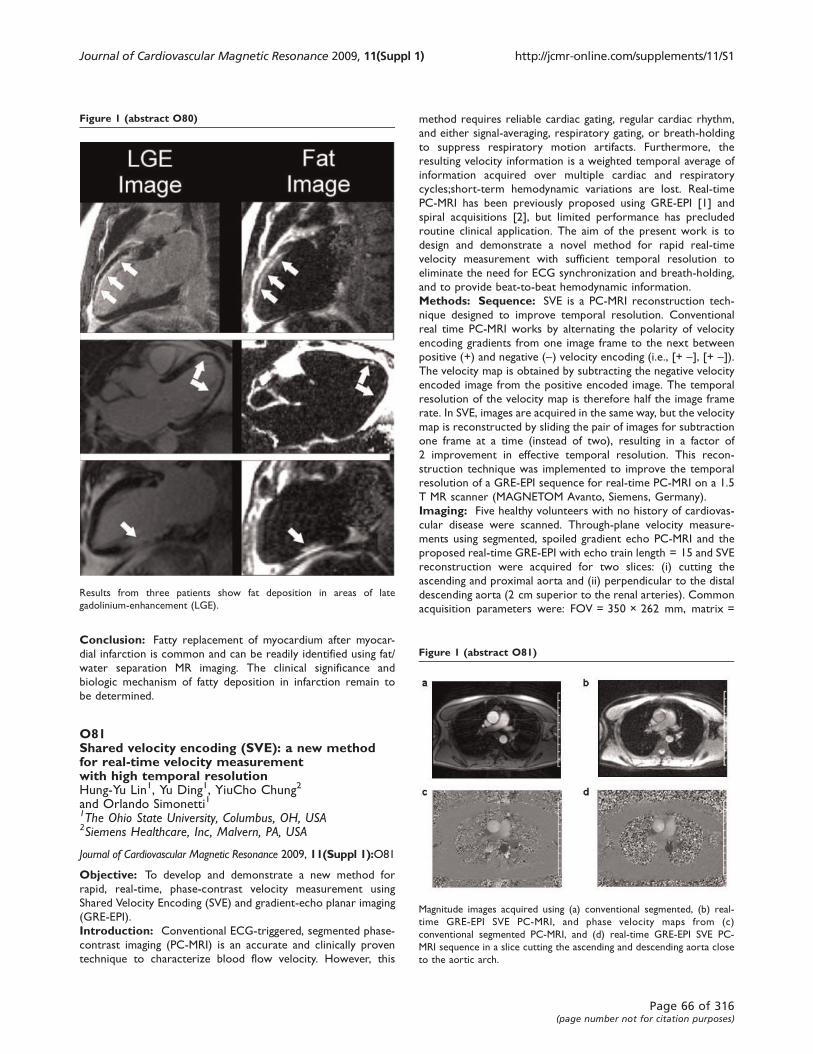
Conclusion: Fatty replacement of myocardium after myocar-
dial infarction is common and can be readily identified using fat/
water separation MR imaging. The clinical significance and
biologic mechanism of fatty deposition in infarction remain to
be determined.
O81Shared velocity encoding (SVE): a new methodfor real-time velocity measurementwith high temporal resolutionHung-Yu Lin1, Yu Ding1, YiuCho Chung2
and Orlando Simonetti11The Ohio State University, Columbus, OH, USA2Siemens Healthcare, Inc, Malvern, PA, USA
Journal of Cardiovascular Magnetic Resonance 2009, 11(Suppl 1):O81
Objective: To develop and demonstrate a new method for
rapid, real-time, phase-contrast velocity measurement using
Shared Velocity Encoding (SVE) and gradient-echo planar imaging
(GRE-EPI).
Introduction: Conventional ECG-triggered, segmented phase-
contrast imaging (PC-MRI) is an accurate and clinically proven
technique to characterize blood flow velocity. However, this
method requires reliable cardiac gating, regular cardiac rhythm,
and either signal-averaging, respiratory gating, or breath-holding
to suppress respiratory motion artifacts. Furthermore, the
resulting velocity information is a weighted temporal average of
information acquired over multiple cardiac and respiratory
cycles;short-term hemodynamic variations are lost. Real-time
PC-MRI has been previously proposed using GRE-EPI [1] and
spiral acquisitions [2], but limited performance has precluded
routine clinical application. The aim of the present work is to
design and demonstrate a novel method for rapid real-time
velocity measurement with sufficient temporal resolution to
eliminate the need for ECG synchronization and breath-holding,
and to provide beat-to-beat hemodynamic information.
Methods: Sequence: SVE is a PC-MRI reconstruction tech-
nique designed to improve temporal resolution. Conventional
real time PC-MRI works by alternating the polarity of velocity
encoding gradients from one image frame to the next between
positive (+) and negative (-) velocity encoding (i.e., [+ -], [+ -]).The velocity map is obtained by subtracting the negative velocity
encoded image from the positive encoded image. The temporal
resolution of the velocity map is therefore half the image frame
rate. In SVE, images are acquired in the same way, but the velocity
map is reconstructed by sliding the pair of images for subtraction
one frame at a time (instead of two), resulting in a factor of
2 improvement in effective temporal resolution. This recon-
struction technique was implemented to improve the temporal
resolution of a GRE-EPI sequence for real-time PC-MRI on a 1.5
T MR scanner (MAGNETOM Avanto, Siemens, Germany).
Imaging: Five healthy volunteers with no history of cardiovas-
cular disease were scanned. Through-plane velocity measure-
ments using segmented, spoiled gradient echo PC-MRI and the
proposed real-time GRE-EPI with echo train length = 15 and SVE
reconstruction were acquired for two slices: (i) cutting the
ascending and proximal aorta and (ii) perpendicular to the distal
descending aorta (2 cm superior to the renal arteries). Common
acquisition parameters were: FOV = 350 × 262 mm, matrix =
Figure 1 (abstract O80)
Results from three patients show fat deposition in areas of late
gadolinium-enhancement (LGE).
Figure 1 (abstract O81)
Magnitude images acquired using (a) conventional segmented, (b) real-
time GRE-EPI SVE PC-MRI, and phase velocity maps from (c)
conventional segmented PC-MRI, and (d) real-time GRE-EPI SVE PC-
MRI sequence in a slice cutting the ascending and descending aorta close
to the aortic arch.
Journal of Cardiovascular Magnetic Resonance 2009, 11(Suppl 1) http://jcmr-online.com/supplements/11/S1
Page 66 of 316(page number not for citation purposes)

160 × 120, flip angle = 25°, spatial resolution = 2.18 ×
2.18 mm2, GRAPPA acceleration rate = 2, and Venc = 150 cm/s.
The TE/TR/temporal resolution of the conventional gradient-echo
and real-time GRE-EPI sequences were 3.5/7.0/42.0 ms and
2.9/14.6/58.4 ms, respectively.
Analysis: Peak velocity measurements were compared, and
Root-Mean-Square Error (RMSE) was calculated between
velocity curves obtained using the real-time SVE and the
conventional sequence. Linear interpolation was used prior to
RMSE calculation to compare curve values at exactly the same
time points.
Results: In vivo images from one volunteer are shown in Figure
1. Magnitude images clearly show vascular anatomy in both the
segmented (Figure 1a) and real-time sequences (Figure 1b). In
Table 1, peak aortic velocity measurements show good agree-
ment between conventional segmented PC-MRI and real-time
PC-MRI with SVE reconstruction (r = 0.93, p < 0.05). Insignificant
RMS errors (Table 1) were obtained in all regions-of-interest
showing good agreement between velocity curves generated by
conventional and real-time SVE techniques.
Conclusion: We have demonstrated the new SVE method that
results in a factor of 2 improvement in effective temporal
resolution in PC-MRI without sacrificing spatial resolution. With
SVE reconstruction, real-time velocity measurement becomes
practical with temporal resolution approaching that of conven-
tional segmented PC-MRI.
References1. Debatin JF, et al: J Magn Reson Imaging 1995, 5(6):656–662.2. Park JB, et al: Magn Reson Med 2003, 49(2):322–328.
O82On the sensitivity of steady-state free precessionmyocardial blood-oxygen-level-dependentMRI at 1.5 T: theory and experimentXiangzhi Zhou1, Richard Tang2, Rachel Klein1,Debiao Li1 and Rohan Dharmakumar11Department of Radiology, Northwestern University, Chicago,IL, USA2Northwestern University, Chicago, IL, USA
Journal of Cardiovascular Magnetic Resonance 2009, 11(Suppl 1):O82
Introduction: Through theoretical simulations and experi-
mental studies, it has been shown in whole blood and in skeletal
muscle that SSFP-based BOLD contrast is strongly dependent on
repetition time(TR) and flip angle(FA). While these studies
accounted for spin exchange effects between intra-(IV) and
extra-vascular(EV) spaces, they have largely ignored the diffusion
effects, particularly in the EV space. Since most of the blood
present in the microvasculature of the heart is in the capillaries,
we hypothesize that diffusion-mediated effects is an important
mechanism allowing for the detection of oxygenation changes
with SSFP-based myocardial BOLD imaging.
Purpose: To investigate the effect of TR and FA on SSFP-based
myocardial BOLD sensitivity through a theoretical model
accounting for diffusion effects and validate it using a controlled
canine model.
Methods: Monte-Carlo simulations(MCS): Approximat-
ing capillaries as an infinite cylinder, the magnetic field variation
(DBz) outside the capillary vessel was computed as B0Dc(R/r)2
cos(2j)sin2q/2 (EV) and B0Dc(cos2q-1/3)/2 (IV), where R is the
vessel radius, r the distance from vessel axis, q the angle between
the main magnetic field (B0) and the vessel axis, and j the angle
between r and the projection of the main magnetic field onto the
plane orthogonal to the vessel axis. The susceptibility difference
Dc between IV and EV space is: Dc = Hct(1-Y)DX, where
DX = 3.39 ppm is the susceptibility difference between fully
oxygenated and deoxygenated hemoglobin, Hct is hematocrit
(0.4), and Y is oxygen saturation(20% and 80%). Spin diffusion
was modeled as 3D Brownian motion of 5000 spins inside a cubic
box with time steps of 50 ms and diffusion coefficient of
Table 1 (abstract O81) Peak velocities and RMSE) of the real-time SVE technique with respect to conventional PC-MRI
ROI Peak Velocity (Segmented) Peak Velocity (Real-time SVE) RMSE
Proximal Ascending Aorta 83.7 ± 4.23 cm/s 87.4 ± 5.43 cm/s 3.6153 cm/s
Proximal Descending Aorta 24.4 ± 5.61 cm/s 23.7 ± 5.39 cm/s 1.1573 cm/s
Distal Descending Aorta 20.4 ± 4.97 cm/s 20.4 ± 4.77 cm/s 1.0744 cm/s
Figure 1 (abstract O82)
2D late diastole cine SSFP BOLD images of a dog with severe LCX
stenosis and adenosine infusion obtained at different TR and FA:
TR/FA = 3.5 ms, 30° (A); 3.5 ms, 70° (B); 6.0 ms, 30° (C); and 6.0 ms,
70° (D). LCX territories are the shorter arcs subtended by arrows.
Journal of Cardiovascular Magnetic Resonance 2009, 11(Suppl 1) http://jcmr-online.com/supplements/11/S1
Page 67 of 316(page number not for citation purposes)

1.5 × 10⁻⁹m2/s. Other parameters were: R = 6 × 10⁻⁶m, blood
volume fractions = 9%, number pulses to reach steady-state =
2000; TR = 3.5, 4.7, 6.0 ms; and FA= 30°, 50°, 70°.
Experimental studies: An external hydraulic occluder was
placed around the left circumflex coronary(LCX) for the
purpose of inducing reversible stenosis in 4 dogs. Following
recovery(1 week), animals were sedated, ventilated and placed in
the scanner (1.5 T Siemens Espree). ECG-gated and multiple
breath-held 2D-Cine SSFP sequences were prescribed under
pharmacological stress with and without LCX stenosis over the
LV. Three short-axis images with centre slice located on mid-LV
were acquired for each study. Scan parameters: in-plane
resolution = 1.2 × 1.2 mm2, slice thickness = 5 mm, TR/
TE = 6.0 ms/3.0 ms, 4.7 ms/2.35 ms, 3.5 ms/1.75 ms, flip
angle = 70°, 50°, 30°, segments/cardiac phase were adjusted to
achieve an optimal temporal resolution(10 ms–20 ms) that
minimize motion/flow artifacts.
Data analysis: Regional SSFP BOLD signal contrast, [ILAD-
ILCX]/ILAD, was used to evaluated the SSFP BOLD sensitivity,
where ILAD and ILCX are average SSFP signal intensities measured
within LAD and LCX territories.
Results: Figure 1 shows a typical set of 2D late diastole short-
axis cardiac images from SSFP cine scans of a dog with severe
stenosis and adenosine infusion for different TR and FA. Note
that the global and regional signal intensities are strongly
dependent on imaging parameters. Figure 2 shows the SSFP
BOLD signal contrast obtained from MCS and experimental
studies. The regional BOLD signal contrast between LAD and
LCX supplying regions match well with the MCS.
Discussion: MCS and experimental studies showed that TR
and FA play a significant role in determining SSFP-based
myocardial BOLD contrast. In particular, both MCS and
experiments showed that increasing the FA or TR gave a
concomitant increase in SSFP-based myocardial BOLD contrast.
We found that a combination of TR/FA = 6.0 ms/70° gave the
highest oxygen contrast among all the parameter sets studied,
although more artifacts were observed in certain cardiac phases
as TR was increased from 3.5 ms. In order to enable the entire
cine image set to provide reliable regional BOLD contrast at
large TRs, robust artifact correction methods need to be
developed.
O83Acute and chronic cardiac radio frequencyablation lesion visualisation using magneticresonance imagingBenjamin R Knowles1, Dennis Caulfield1,Michael Cooklin2, Aldo Rinaldi2, Reza Razavi1,Tobias Schaeffter1 and Kawal S Rhode11King’s College London, London, UK2Guy’s and St Thomas’ NHS Foundation Trust, London, UK
Journal of Cardiovascular Magnetic Resonance 2009, 11(Suppl 1):O83
Introduction: The use of electro-anatomical mapping
systems (EAMS) for catheter guidance and ablation point
recording is widespread for the treatment of atrial
arrhythmias using radio frequency ablation (RFA). Also, the
evolution of RFA lesions over time may be an important factor in
the reoccurrence of arrhythmias. In this study, we use late
enhancement (LE) magnetic resonance imaging (MRI) as a tool to
measure RFA lesions and present a novel visualisation method to
represent this information in an intuitive way. This allows the
validation of the in-vivo accuracy of EAMS and the examination of
the evolution of RFA lesions from the acute to the chronic
timescales.
Methods: Six patients with either atrial fibrillation (AF, 5 cases)
or flutter (AFL, 1 case) underwent RFA. Prior to the procedure,
each patient underwent a MRI examination that included
administration of a double dose of Gd-DTPA contrast agent
followed by MR angiography (MRA) and a T2-prepared balanced-
SSFP (bSSFP) sequence. Approximately 20 minutes after contrast
administration, a free-breathing, cardiac triggered, 3D LE scan
was performed. The scan was inversion recovery-prepared with
a resolution of 1.3 × 1.3 × 2 mm3 and TR/TE/á of 6.2 ms/3.0 ms/
30°. Signal was acquired using Turbo Field Echo (TFE) with a
100 ms window and a low-high K-space ordering. Inversion time
was determined from a Look-Locker scan. All scans were
performed using a 1.5 T Philips Achieva MR scanner. During the
procedure, ablation points from various EAMS (NavX, CARTO,
XMR-EAMS [1]) were recorded. Post ablation, the patient
returned to the MR scanner for a further examination including
the bSSFP and LE scans. Approximately 6 weeks later, the patient
returned for follow-up MR imaging. Offline, an atrial surface
model was generated from the MRA scan, and was transformed
into the coordinate system of each of the LE images. Integration of
the LE image along the normal vector at each of the surface
vertices was performed. This integral was used to colour code the
surface model. Areas of LE were defined by integral values higher
Figure 2 (abstract O82)
SSFP-baseed Myocardial BOLD contrast obtained from MCS and
experimental studies with the same parameters (TR = 3.5 ms, 4.7 ms,
6.0 ms; Flip angle = 30°, 50°, 70°). For a given FA and TR, MCS oxygen
contrasts were computed assuming myocardial oxygenation in the
territory supplied by a stenotic vessl is 20%, while that supplied by a
healthy vessel is 80% under pharmacological stress, assuming myocardial
blood volume fraction of 9%.
Journal of Cardiovascular Magnetic Resonance 2009, 11(Suppl 1) http://jcmr-online.com/supplements/11/S1
Page 68 of 316(page number not for citation purposes)
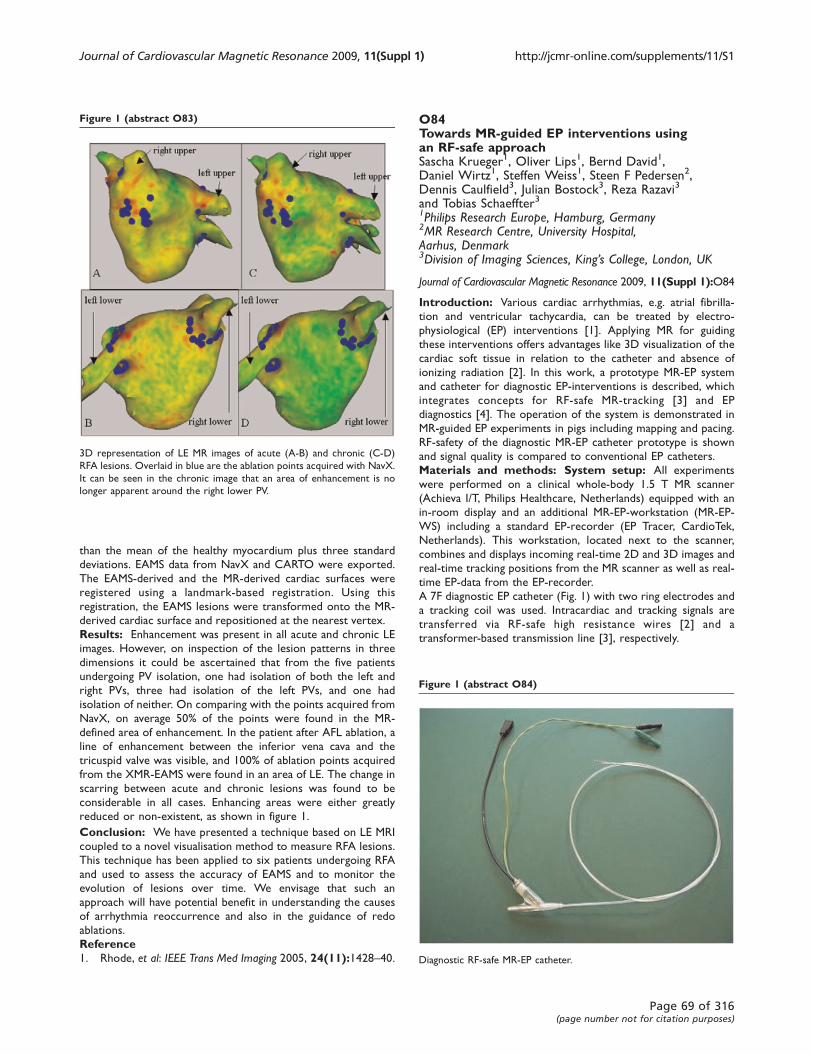
than the mean of the healthy myocardium plus three standard
deviations. EAMS data from NavX and CARTO were exported.
The EAMS-derived and the MR-derived cardiac surfaces were
registered using a landmark-based registration. Using this
registration, the EAMS lesions were transformed onto the MR-
derived cardiac surface and repositioned at the nearest vertex.
Results: Enhancement was present in all acute and chronic LE
images. However, on inspection of the lesion patterns in three
dimensions it could be ascertained that from the five patients
undergoing PV isolation, one had isolation of both the left and
right PVs, three had isolation of the left PVs, and one had
isolation of neither. On comparing with the points acquired from
NavX, on average 50% of the points were found in the MR-
defined area of enhancement. In the patient after AFL ablation, a
line of enhancement between the inferior vena cava and the
tricuspid valve was visible, and 100% of ablation points acquired
from the XMR-EAMS were found in an area of LE. The change in
scarring between acute and chronic lesions was found to be
considerable in all cases. Enhancing areas were either greatly
reduced or non-existent, as shown in figure 1.
Conclusion: We have presented a technique based on LE MRI
coupled to a novel visualisation method to measure RFA lesions.
This technique has been applied to six patients undergoing RFA
and used to assess the accuracy of EAMS and to monitor the
evolution of lesions over time. We envisage that such an
approach will have potential benefit in understanding the causes
of arrhythmia reoccurrence and also in the guidance of redo
ablations.
Reference1. Rhode, et al: IEEE Trans Med Imaging 2005, 24(11):1428–40.
O84Towards MR-guided EP interventions usingan RF-safe approachSascha Krueger1, Oliver Lips1, Bernd David1,Daniel Wirtz1, Steffen Weiss1, Steen F Pedersen2,Dennis Caulfield3, Julian Bostock3, Reza Razavi3
and Tobias Schaeffter31Philips Research Europe, Hamburg, Germany2MR Research Centre, University Hospital,Aarhus, Denmark3Division of Imaging Sciences, King’s College, London, UK
Journal of Cardiovascular Magnetic Resonance 2009, 11(Suppl 1):O84
Introduction: Various cardiac arrhythmias, e.g. atrial fibrilla-
tion and ventricular tachycardia, can be treated by electro-
physiological (EP) interventions [1]. Applying MR for guiding
these interventions offers advantages like 3D visualization of the
cardiac soft tissue in relation to the catheter and absence of
ionizing radiation [2]. In this work, a prototype MR-EP system
and catheter for diagnostic EP-interventions is described, which
integrates concepts for RF-safe MR-tracking [3] and EP
diagnostics [4]. The operation of the system is demonstrated in
MR-guided EP experiments in pigs including mapping and pacing.
RF-safety of the diagnostic MR-EP catheter prototype is shown
and signal quality is compared to conventional EP catheters.
Materials and methods: System setup: All experiments
were performed on a clinical whole-body 1.5 T MR scanner
(Achieva I/T, Philips Healthcare, Netherlands) equipped with an
in-room display and an additional MR-EP-workstation (MR-EP-
WS) including a standard EP-recorder (EP Tracer, CardioTek,
Netherlands). This workstation, located next to the scanner,
combines and displays incoming real-time 2D and 3D images and
real-time tracking positions from the MR scanner as well as real-
time EP-data from the EP-recorder.
A 7F diagnostic EP catheter (Fig. 1) with two ring electrodes and
a tracking coil was used. Intracardiac and tracking signals are
transferred via RF-safe high resistance wires [2] and a
transformer-based transmission line [3], respectively.
Figure 1 (abstract O83)
3D representation of LE MR images of acute (A-B) and chronic (C-D)
RFA lesions. Overlaid in blue are the ablation points acquired with NavX.
It can be seen in the chronic image that an area of enhancement is no
longer apparent around the right lower PV.
Figure 1 (abstract O84)
Diagnostic RF-safe MR-EP catheter.
Journal of Cardiovascular Magnetic Resonance 2009, 11(Suppl 1) http://jcmr-online.com/supplements/11/S1
Page 69 of 316(page number not for citation purposes)
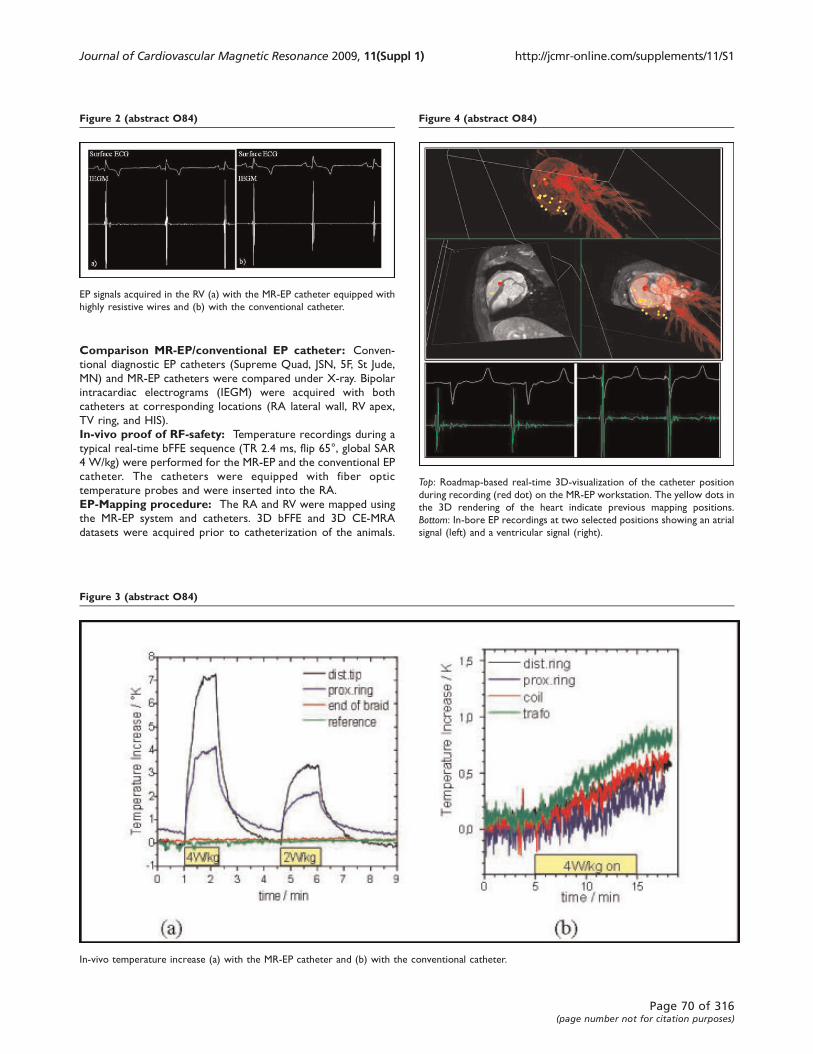
Comparison MR-EP/conventional EP catheter: Conven-
tional diagnostic EP catheters (Supreme Quad, JSN, 5F, St Jude,
MN) and MR-EP catheters were compared under X-ray. Bipolar
intracardiac electrograms (IEGM) were acquired with both
catheters at corresponding locations (RA lateral wall, RV apex,
TV ring, and HIS).
In-vivo proof of RF-safety: Temperature recordings during a
typical real-time bFFE sequence (TR 2.4 ms, flip 65°, global SAR
4 W/kg) were performed for the MR-EP and the conventional EP
catheter. The catheters were equipped with fiber optic
temperature probes and were inserted into the RA.
EP-Mapping procedure: The RA and RV were mapped using
the MR-EP system and catheters. 3D bFFE and 3D CE-MRA
datasets were acquired prior to catheterization of the animals.
Figure 2 (abstract O84)
EP signals acquired in the RV (a) with the MR-EP catheter equipped with
highly resistive wires and (b) with the conventional catheter.
Figure 4 (abstract O84)
Top: Roadmap-based real-time 3D-visualization of the catheter position
during recording (red dot) on the MR-EP workstation. The yellow dots in
the 3D rendering of the heart indicate previous mapping positions.
Bottom: In-bore EP recordings at two selected positions showing an atrial
signal (left) and a ventricular signal (right).
Figure 3 (abstract O84)
In-vivo temperature increase (a) with the MR-EP catheter and (b) with the conventional catheter.
Journal of Cardiovascular Magnetic Resonance 2009, 11(Suppl 1) http://jcmr-online.com/supplements/11/S1
Page 70 of 316(page number not for citation purposes)
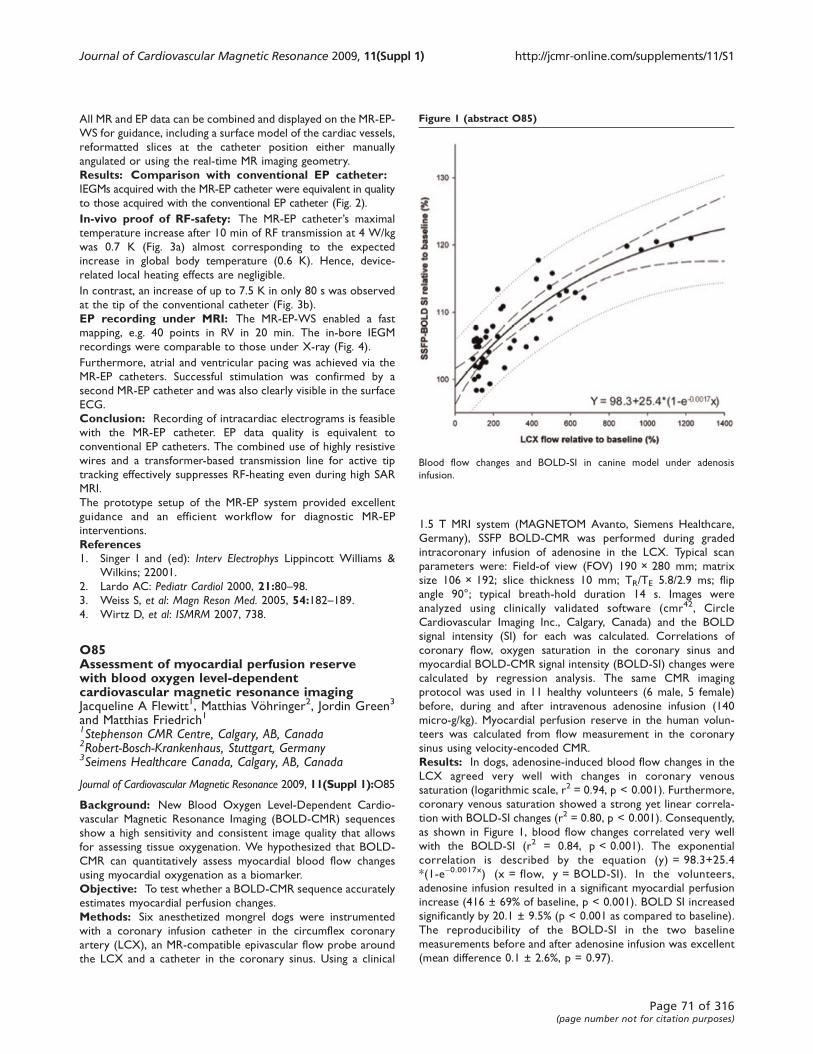
All MR and EP data can be combined and displayed on the MR-EP-
WS for guidance, including a surface model of the cardiac vessels,
reformatted slices at the catheter position either manually
angulated or using the real-time MR imaging geometry.
Results: Comparison with conventional EP catheter:IEGMs acquired with the MR-EP catheter were equivalent in quality
to those acquired with the conventional EP catheter (Fig. 2).
In-vivo proof of RF-safety: The MR-EP catheter’s maximal
temperature increase after 10 min of RF transmission at 4 W/kg
was 0.7 K (Fig. 3a) almost corresponding to the expected
increase in global body temperature (0.6 K). Hence, device-
related local heating effects are negligible.
In contrast, an increase of up to 7.5 K in only 80 s was observed
at the tip of the conventional catheter (Fig. 3b).
EP recording under MRI: The MR-EP-WS enabled a fast
mapping, e.g. 40 points in RV in 20 min. The in-bore IEGM
recordings were comparable to those under X-ray (Fig. 4).
Furthermore, atrial and ventricular pacing was achieved via the
MR-EP catheters. Successful stimulation was confirmed by a
second MR-EP catheter and was also clearly visible in the surface
ECG.
Conclusion: Recording of intracardiac electrograms is feasible
with the MR-EP catheter. EP data quality is equivalent to
conventional EP catheters. The combined use of highly resistive
wires and a transformer-based transmission line for active tip
tracking effectively suppresses RF-heating even during high SAR
MRI.
The prototype setup of the MR-EP system provided excellent
guidance and an efficient workflow for diagnostic MR-EP
interventions.
References1. Singer I and (ed): Interv Electrophys Lippincott Williams &
Wilkins; 22001.
2. Lardo AC: Pediatr Cardiol 2000, 21:80–98.3. Weiss S, et al: Magn Reson Med. 2005, 54:182–189.4. Wirtz D, et al: ISMRM 2007, 738.
O85Assessment of myocardial perfusion reservewith blood oxygen level-dependentcardiovascular magnetic resonance imagingJacqueline A Flewitt1, Matthias Vöhringer2, Jordin Green3
and Matthias Friedrich11Stephenson CMR Centre, Calgary, AB, Canada2Robert-Bosch-Krankenhaus, Stuttgart, Germany3Seimens Healthcare Canada, Calgary, AB, Canada
Journal of Cardiovascular Magnetic Resonance 2009, 11(Suppl 1):O85
Background: New Blood Oxygen Level-Dependent Cardio-
vascular Magnetic Resonance Imaging (BOLD-CMR) sequences
show a high sensitivity and consistent image quality that allows
for assessing tissue oxygenation. We hypothesized that BOLD-
CMR can quantitatively assess myocardial blood flow changes
using myocardial oxygenation as a biomarker.
Objective: To test whether a BOLD-CMR sequence accurately
estimates myocardial perfusion changes.
Methods: Six anesthetized mongrel dogs were instrumented
with a coronary infusion catheter in the circumflex coronary
artery (LCX), an MR-compatible epivascular flow probe around
the LCX and a catheter in the coronary sinus. Using a clinical
1.5 T MRI system (MAGNETOM Avanto, Siemens Healthcare,
Germany), SSFP BOLD-CMR was performed during graded
intracoronary infusion of adenosine in the LCX. Typical scan
parameters were: Field-of view (FOV) 190 × 280 mm; matrix
size 106 × 192; slice thickness 10 mm; TR/TE 5.8/2.9 ms; flip
angle 90°; typical breath-hold duration 14 s. Images were
analyzed using clinically validated software (cmr42, Circle
Cardiovascular Imaging Inc., Calgary, Canada) and the BOLD
signal intensity (SI) for each was calculated. Correlations of
coronary flow, oxygen saturation in the coronary sinus and
myocardial BOLD-CMR signal intensity (BOLD-SI) changes were
calculated by regression analysis. The same CMR imaging
protocol was used in 11 healthy volunteers (6 male, 5 female)
before, during and after intravenous adenosine infusion (140
micro-g/kg). Myocardial perfusion reserve in the human volun-
teers was calculated from flow measurement in the coronary
sinus using velocity-encoded CMR.
Results: In dogs, adenosine-induced blood flow changes in the
LCX agreed very well with changes in coronary venous
saturation (logarithmic scale, r2 = 0.94, p < 0.001). Furthermore,
coronary venous saturation showed a strong yet linear correla-
tion with BOLD-SI changes (r2 = 0.80, p < 0.001). Consequently,
as shown in Figure 1, blood flow changes correlated very well
with the BOLD-SI (r2 = 0.84, p < 0.001). The exponential
correlation is described by the equation (y) = 98.3+25.4
*(1-e-0.0017x) (x = flow, y = BOLD-SI). In the volunteers,
adenosine infusion resulted in a significant myocardial perfusion
increase (416 ± 69% of baseline, p < 0.001). BOLD SI increased
significantly by 20.1 ± 9.5% (p < 0.001 as compared to baseline).
The reproducibility of the BOLD-SI in the two baseline
measurements before and after adenosine infusion was excellent
(mean difference 0.1 ± 2.6%, p = 0.97).
Figure 1 (abstract O85)
Blood flow changes and BOLD-SI in canine model under adenosis
infusion.
Journal of Cardiovascular Magnetic Resonance 2009, 11(Suppl 1) http://jcmr-online.com/supplements/11/S1
Page 71 of 316(page number not for citation purposes)
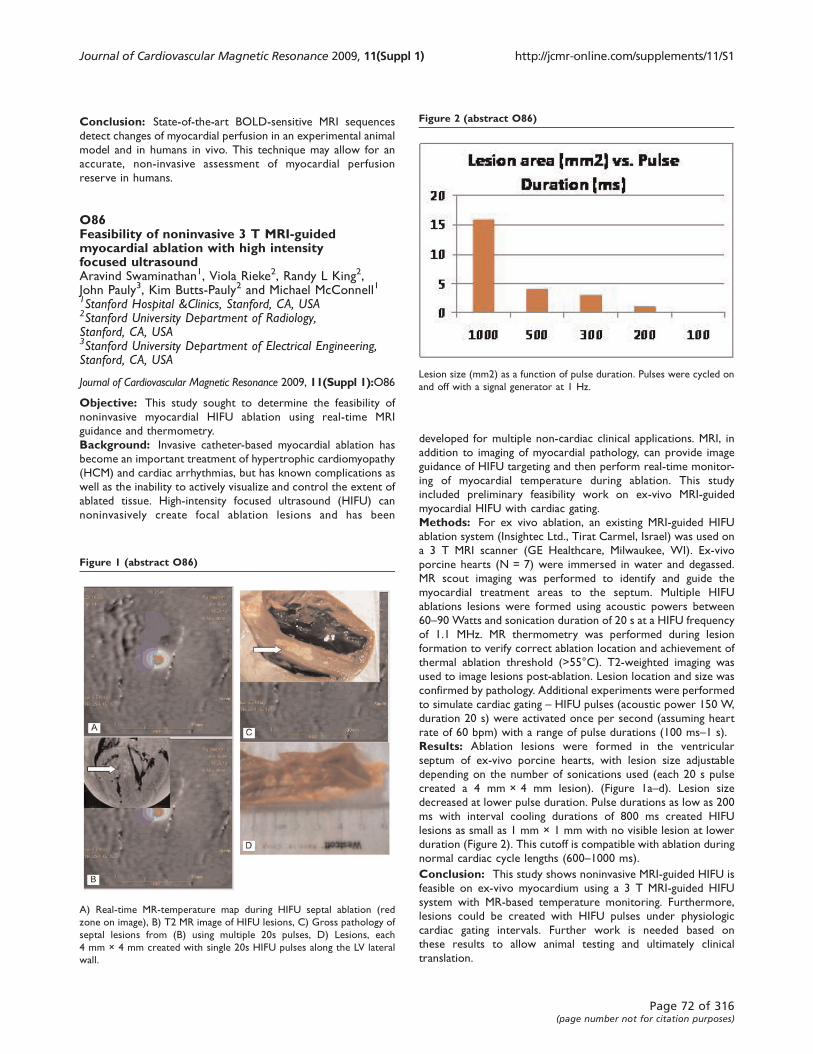
Conclusion: State-of-the-art BOLD-sensitive MRI sequences
detect changes of myocardial perfusion in an experimental animal
model and in humans in vivo. This technique may allow for an
accurate, non-invasive assessment of myocardial perfusion
reserve in humans.
O86Feasibility of noninvasive 3 T MRI-guidedmyocardial ablation with high intensityfocused ultrasoundAravind Swaminathan1, Viola Rieke2, Randy L King2,John Pauly3, Kim Butts-Pauly2 and Michael McConnell11Stanford Hospital &Clinics, Stanford, CA, USA2Stanford University Department of Radiology,Stanford, CA, USA3Stanford University Department of Electrical Engineering,Stanford, CA, USA
Journal of Cardiovascular Magnetic Resonance 2009, 11(Suppl 1):O86
Objective: This study sought to determine the feasibility of
noninvasive myocardial HIFU ablation using real-time MRI
guidance and thermometry.
Background: Invasive catheter-based myocardial ablation has
become an important treatment of hypertrophic cardiomyopathy
(HCM) and cardiac arrhythmias, but has known complications as
well as the inability to actively visualize and control the extent of
ablated tissue. High-intensity focused ultrasound (HIFU) can
noninvasively create focal ablation lesions and has been
developed for multiple non-cardiac clinical applications. MRI, in
addition to imaging of myocardial pathology, can provide image
guidance of HIFU targeting and then perform real-time monitor-
ing of myocardial temperature during ablation. This study
included preliminary feasibility work on ex-vivo MRI-guided
myocardial HIFU with cardiac gating.
Methods: For ex vivo ablation, an existing MRI-guided HIFU
ablation system (Insightec Ltd., Tirat Carmel, Israel) was used on
a 3 T MRI scanner (GE Healthcare, Milwaukee, WI). Ex-vivo
porcine hearts (N = 7) were immersed in water and degassed.
MR scout imaging was performed to identify and guide the
myocardial treatment areas to the septum. Multiple HIFU
ablations lesions were formed using acoustic powers between
60–90 Watts and sonication duration of 20 s at a HIFU frequency
of 1.1 MHz. MR thermometry was performed during lesion
formation to verify correct ablation location and achievement of
thermal ablation threshold (>55°C). T2-weighted imaging was
used to image lesions post-ablation. Lesion location and size was
confirmed by pathology. Additional experiments were performed
to simulate cardiac gating – HIFU pulses (acoustic power 150 W,
duration 20 s) were activated once per second (assuming heart
rate of 60 bpm) with a range of pulse durations (100 ms–1 s).
Results: Ablation lesions were formed in the ventricular
septum of ex-vivo porcine hearts, with lesion size adjustable
depending on the number of sonications used (each 20 s pulse
created a 4 mm × 4 mm lesion). (Figure 1a–d). Lesion size
decreased at lower pulse duration. Pulse durations as low as 200
ms with interval cooling durations of 800 ms created HIFU
lesions as small as 1 mm × 1 mm with no visible lesion at lower
duration (Figure 2). This cutoff is compatible with ablation during
normal cardiac cycle lengths (600–1000 ms).
Conclusion: This study shows noninvasive MRI-guided HIFU is
feasible on ex-vivo myocardium using a 3 T MRI-guided HIFU
system with MR-based temperature monitoring. Furthermore,
lesions could be created with HIFU pulses under physiologic
cardiac gating intervals. Further work is needed based on
these results to allow animal testing and ultimately clinical
translation.
Figure 1 (abstract O86)
A) Real-time MR-temperature map during HIFU septal ablation (red
zone on image), B) T2 MR image of HIFU lesions, C) Gross pathology of
septal lesions from (B) using multiple 20s pulses, D) Lesions, each
4 mm × 4 mm created with single 20s HIFU pulses along the LV lateral
wall.
Figure 2 (abstract O86)
Lesion size (mm2) as a function of pulse duration. Pulses were cycled on
and off with a signal generator at 1 Hz.
Journal of Cardiovascular Magnetic Resonance 2009, 11(Suppl 1) http://jcmr-online.com/supplements/11/S1
Page 72 of 316(page number not for citation purposes)
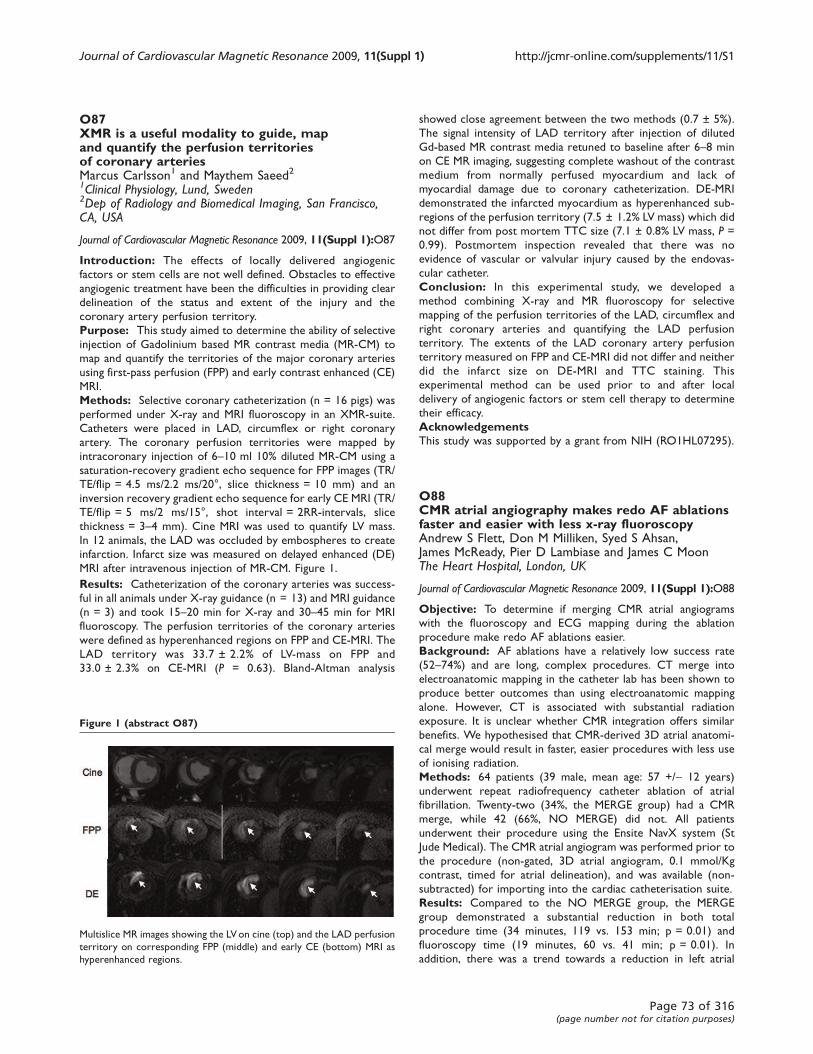
O87XMR is a useful modality to guide, mapand quantify the perfusion territoriesof coronary arteriesMarcus Carlsson1 and Maythem Saeed21Clinical Physiology, Lund, Sweden2Dep of Radiology and Biomedical Imaging, San Francisco,CA, USA
Journal of Cardiovascular Magnetic Resonance 2009, 11(Suppl 1):O87
Introduction: The effects of locally delivered angiogenic
factors or stem cells are not well defined. Obstacles to effective
angiogenic treatment have been the difficulties in providing clear
delineation of the status and extent of the injury and the
coronary artery perfusion territory.
Purpose: This study aimed to determine the ability of selective
injection of Gadolinium based MR contrast media (MR-CM) to
map and quantify the territories of the major coronary arteries
using first-pass perfusion (FPP) and early contrast enhanced (CE)
MRI.
Methods: Selective coronary catheterization (n = 16 pigs) was
performed under X-ray and MRI fluoroscopy in an XMR-suite.
Catheters were placed in LAD, circumflex or right coronary
artery. The coronary perfusion territories were mapped by
intracoronary injection of 6–10 ml 10% diluted MR-CM using a
saturation-recovery gradient echo sequence for FPP images (TR/
TE/flip = 4.5 ms/2.2 ms/20°, slice thickness = 10 mm) and an
inversion recovery gradient echo sequence for early CE MRI (TR/
TE/flip = 5 ms/2 ms/15°, shot interval = 2RR-intervals, slice
thickness = 3–4 mm). Cine MRI was used to quantify LV mass.
In 12 animals, the LAD was occluded by embospheres to create
infarction. Infarct size was measured on delayed enhanced (DE)
MRI after intravenous injection of MR-CM. Figure 1.
Results: Catheterization of the coronary arteries was success-
ful in all animals under X-ray guidance (n = 13) and MRI guidance
(n = 3) and took 15–20 min for X-ray and 30–45 min for MRI
fluoroscopy. The perfusion territories of the coronary arteries
were defined as hyperenhanced regions on FPP and CE-MRI. The
LAD territory was 33.7 ± 2.2% of LV-mass on FPP and
33.0 ± 2.3% on CE-MRI (P = 0.63). Bland-Altman analysis
showed close agreement between the two methods (0.7 ± 5%).
The signal intensity of LAD territory after injection of diluted
Gd-based MR contrast media retuned to baseline after 6–8 min
on CE MR imaging, suggesting complete washout of the contrast
medium from normally perfused myocardium and lack of
myocardial damage due to coronary catheterization. DE-MRI
demonstrated the infarcted myocardium as hyperenhanced sub-
regions of the perfusion territory (7.5 ± 1.2% LV mass) which did
not differ from post mortem TTC size (7.1 ± 0.8% LV mass, P =
0.99). Postmortem inspection revealed that there was no
evidence of vascular or valvular injury caused by the endovas-
cular catheter.
Conclusion: In this experimental study, we developed a
method combining X-ray and MR fluoroscopy for selective
mapping of the perfusion territories of the LAD, circumflex and
right coronary arteries and quantifying the LAD perfusion
territory. The extents of the LAD coronary artery perfusion
territory measured on FPP and CE-MRI did not differ and neither
did the infarct size on DE-MRI and TTC staining. This
experimental method can be used prior to and after local
delivery of angiogenic factors or stem cell therapy to determine
their efficacy.
AcknowledgementsThis study was supported by a grant from NIH (RO1HL07295).
O88CMR atrial angiography makes redo AF ablationsfaster and easier with less x-ray fluoroscopyAndrew S Flett, Don M Milliken, Syed S Ahsan,James McReady, Pier D Lambiase and James C MoonThe Heart Hospital, London, UK
Journal of Cardiovascular Magnetic Resonance 2009, 11(Suppl 1):O88
Objective: To determine if merging CMR atrial angiograms
with the fluoroscopy and ECG mapping during the ablation
procedure make redo AF ablations easier.
Background: AF ablations have a relatively low success rate
(52–74%) and are long, complex procedures. CT merge into
electroanatomic mapping in the catheter lab has been shown to
produce better outcomes than using electroanatomic mapping
alone. However, CT is associated with substantial radiation
exposure. It is unclear whether CMR integration offers similar
benefits. We hypothesised that CMR-derived 3D atrial anatomi-
cal merge would result in faster, easier procedures with less use
of ionising radiation.
Methods: 64 patients (39 male, mean age: 57 +/- 12 years)
underwent repeat radiofrequency catheter ablation of atrial
fibrillation. Twenty-two (34%, the MERGE group) had a CMR
merge, while 42 (66%, NO MERGE) did not. All patients
underwent their procedure using the Ensite NavX system (St
Jude Medical). The CMR atrial angiogram was performed prior to
the procedure (non-gated, 3D atrial angiogram, 0.1 mmol/Kg
contrast, timed for atrial delineation), and was available (non-
subtracted) for importing into the cardiac catheterisation suite.
Results: Compared to the NO MERGE group, the MERGE
group demonstrated a substantial reduction in both total
procedure time (34 minutes, 119 vs. 153 min; p = 0.01) and
fluoroscopy time (19 minutes, 60 vs. 41 min; p = 0.01). In
addition, there was a trend towards a reduction in left atrial
Figure 1 (abstract O87)
Multislice MR images showing the LV on cine (top) and the LAD perfusion
territory on corresponding FPP (middle) and early CE (bottom) MRI as
hyperenhanced regions.
Journal of Cardiovascular Magnetic Resonance 2009, 11(Suppl 1) http://jcmr-online.com/supplements/11/S1
Page 73 of 316(page number not for citation purposes)
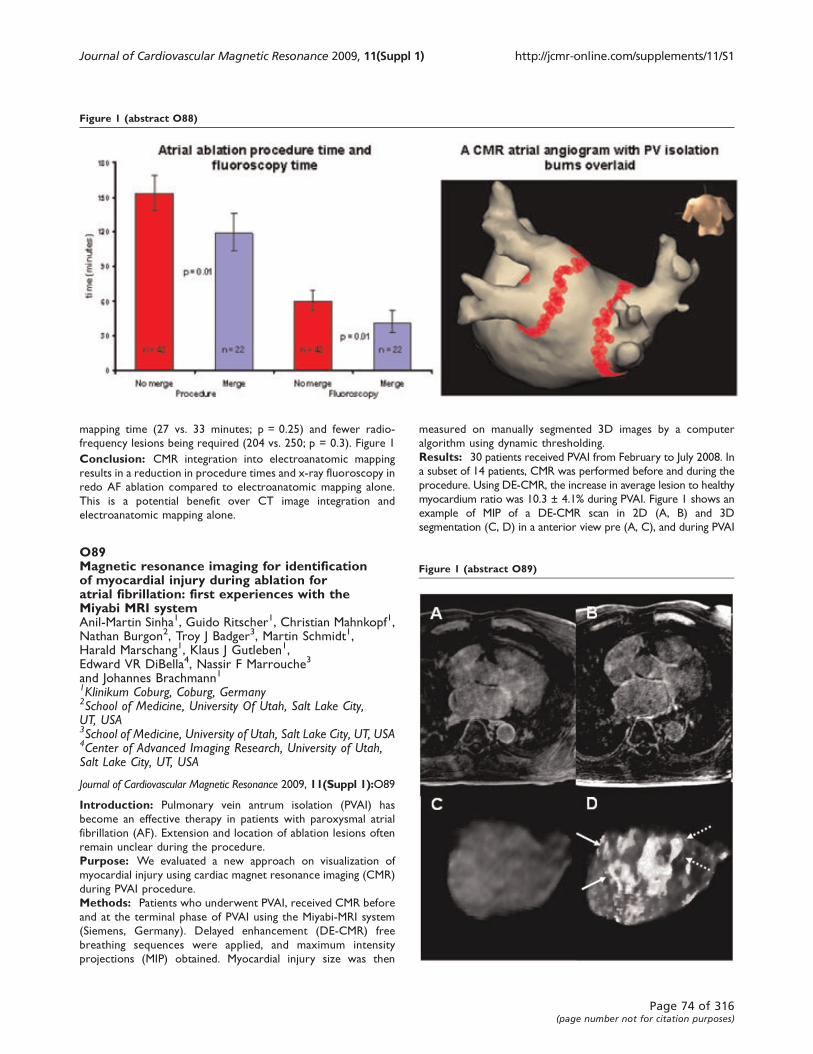
mapping time (27 vs. 33 minutes; p = 0.25) and fewer radio-
frequency lesions being required (204 vs. 250; p = 0.3). Figure 1
Conclusion: CMR integration into electroanatomic mapping
results in a reduction in procedure times and x-ray fluoroscopy in
redo AF ablation compared to electroanatomic mapping alone.
This is a potential benefit over CT image integration and
electroanatomic mapping alone.
O89Magnetic resonance imaging for identificationof myocardial injury during ablation foratrial fibrillation: first experiences with theMiyabi MRI systemAnil-Martin Sinha1, Guido Ritscher1, Christian Mahnkopf1,Nathan Burgon2, Troy J Badger3, Martin Schmidt1,Harald Marschang1, Klaus J Gutleben1,Edward VR DiBella4, Nassir F Marrouche3
and Johannes Brachmann11Klinikum Coburg, Coburg, Germany2School of Medicine, University Of Utah, Salt Lake City,UT, USA3School of Medicine, University of Utah, Salt Lake City, UT, USA4Center of Advanced Imaging Research, University of Utah,Salt Lake City, UT, USA
Journal of Cardiovascular Magnetic Resonance 2009, 11(Suppl 1):O89
Introduction: Pulmonary vein antrum isolation (PVAI) has
become an effective therapy in patients with paroxysmal atrial
fibrillation (AF). Extension and location of ablation lesions often
remain unclear during the procedure.
Purpose: We evaluated a new approach on visualization of
myocardial injury using cardiac magnet resonance imaging (CMR)
during PVAI procedure.
Methods: Patients who underwent PVAI, received CMR before
and at the terminal phase of PVAI using the Miyabi-MRI system
(Siemens, Germany). Delayed enhancement (DE-CMR) free
breathing sequences were applied, and maximum intensity
projections (MIP) obtained. Myocardial injury size was then
measured on manually segmented 3D images by a computer
algorithm using dynamic thresholding.
Results: 30 patients received PVAI from February to July 2008. In
a subset of 14 patients, CMR was performed before and during the
procedure. Using DE-CMR, the increase in average lesion to healthy
myocardium ratio was 10.3 ± 4.1% during PVAI. Figure 1 shows an
example of MIP of a DE-CMR scan in 2D (A, B) and 3D
segmentation (C, D) in a anterior view pre (A, C), and during PVAI
Figure 1 (abstract O88)
Figure 1 (abstract O89)
Journal of Cardiovascular Magnetic Resonance 2009, 11(Suppl 1) http://jcmr-online.com/supplements/11/S1
Page 74 of 316(page number not for citation purposes)
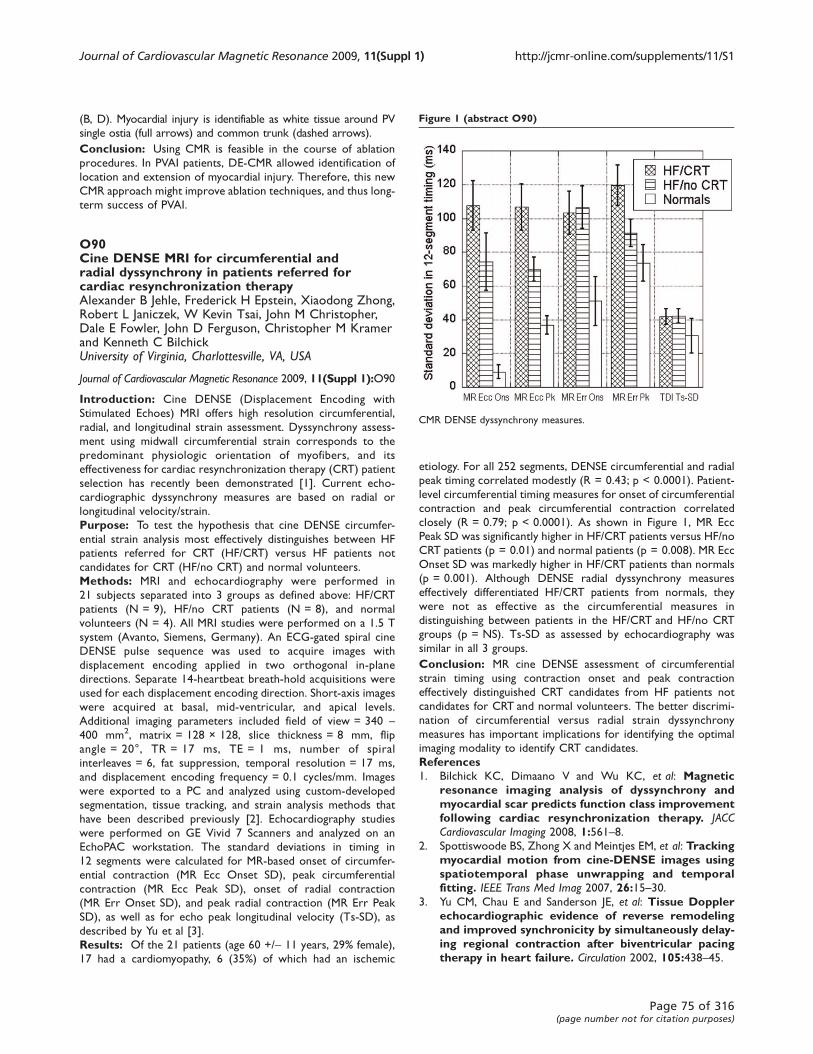
(B, D). Myocardial injury is identifiable as white tissue around PV
single ostia (full arrows) and common trunk (dashed arrows).
Conclusion: Using CMR is feasible in the course of ablation
procedures. In PVAI patients, DE-CMR allowed identification of
location and extension of myocardial injury. Therefore, this new
CMR approach might improve ablation techniques, and thus long-
term success of PVAI.
O90Cine DENSE MRI for circumferential andradial dyssynchrony in patients referred forcardiac resynchronization therapyAlexander B Jehle, Frederick H Epstein, Xiaodong Zhong,Robert L Janiczek, W Kevin Tsai, John M Christopher,Dale E Fowler, John D Ferguson, Christopher M Kramerand Kenneth C BilchickUniversity of Virginia, Charlottesville, VA, USA
Journal of Cardiovascular Magnetic Resonance 2009, 11(Suppl 1):O90
Introduction: Cine DENSE (Displacement Encoding with
Stimulated Echoes) MRI offers high resolution circumferential,
radial, and longitudinal strain assessment. Dyssynchrony assess-
ment using midwall circumferential strain corresponds to the
predominant physiologic orientation of myofibers, and its
effectiveness for cardiac resynchronization therapy (CRT) patient
selection has recently been demonstrated [1]. Current echo-
cardiographic dyssynchrony measures are based on radial or
longitudinal velocity/strain.
Purpose: To test the hypothesis that cine DENSE circumfer-
ential strain analysis most effectively distinguishes between HF
patients referred for CRT (HF/CRT) versus HF patients not
candidates for CRT (HF/no CRT) and normal volunteers.
Methods: MRI and echocardiography were performed in
21 subjects separated into 3 groups as defined above: HF/CRT
patients (N = 9), HF/no CRT patients (N = 8), and normal
volunteers (N = 4). All MRI studies were performed on a 1.5 T
system (Avanto, Siemens, Germany). An ECG-gated spiral cine
DENSE pulse sequence was used to acquire images with
displacement encoding applied in two orthogonal in-plane
directions. Separate 14-heartbeat breath-hold acquisitions were
used for each displacement encoding direction. Short-axis images
were acquired at basal, mid-ventricular, and apical levels.
Additional imaging parameters included field of view = 340 –400 mm2, matrix = 128 × 128, slice thickness = 8 mm, flip
angle = 20°, TR = 17 ms, TE = 1 ms, number of spiral
interleaves = 6, fat suppression, temporal resolution = 17 ms,
and displacement encoding frequency = 0.1 cycles/mm. Images
were exported to a PC and analyzed using custom-developed
segmentation, tissue tracking, and strain analysis methods that
have been described previously [2]. Echocardiography studies
were performed on GE Vivid 7 Scanners and analyzed on an
EchoPAC workstation. The standard deviations in timing in
12 segments were calculated for MR-based onset of circumfer-
ential contraction (MR Ecc Onset SD), peak circumferential
contraction (MR Ecc Peak SD), onset of radial contraction
(MR Err Onset SD), and peak radial contraction (MR Err Peak
SD), as well as for echo peak longitudinal velocity (Ts-SD), as
described by Yu et al [3].
Results: Of the 21 patients (age 60 +/- 11 years, 29% female),
17 had a cardiomyopathy, 6 (35%) of which had an ischemic
etiology. For all 252 segments, DENSE circumferential and radial
peak timing correlated modestly (R = 0.43; p < 0.0001). Patient-
level circumferential timing measures for onset of circumferential
contraction and peak circumferential contraction correlated
closely (R = 0.79; p < 0.0001). As shown in Figure 1, MR Ecc
Peak SD was significantly higher in HF/CRT patients versus HF/no
CRT patients (p = 0.01) and normal patients (p = 0.008). MR Ecc
Onset SD was markedly higher in HF/CRT patients than normals
(p = 0.001). Although DENSE radial dyssynchrony measures
effectively differentiated HF/CRT patients from normals, they
were not as effective as the circumferential measures in
distinguishing between patients in the HF/CRT and HF/no CRT
groups (p = NS). Ts-SD as assessed by echocardiography was
similar in all 3 groups.
Conclusion: MR cine DENSE assessment of circumferential
strain timing using contraction onset and peak contraction
effectively distinguished CRT candidates from HF patients not
candidates for CRT and normal volunteers. The better discrimi-
nation of circumferential versus radial strain dyssynchrony
measures has important implications for identifying the optimal
imaging modality to identify CRT candidates.
References1. Bilchick KC, Dimaano V and Wu KC, et al: Magnetic
resonance imaging analysis of dyssynchrony andmyocardial scar predicts function class improvementfollowing cardiac resynchronization therapy. JACCCardiovascular Imaging 2008, 1:561–8.
2. Spottiswoode BS, Zhong X and Meintjes EM, et al: Trackingmyocardial motion from cine-DENSE images usingspatiotemporal phase unwrapping and temporalfitting. IEEE Trans Med Imag 2007, 26:15–30.
3. Yu CM, Chau E and Sanderson JE, et al: Tissue Dopplerechocardiographic evidence of reverse remodelingand improved synchronicity by simultaneously delay-ing regional contraction after biventricular pacingtherapy in heart failure. Circulation 2002, 105:438–45.
Figure 1 (abstract O90)
CMR DENSE dyssynchrony measures.
Journal of Cardiovascular Magnetic Resonance 2009, 11(Suppl 1) http://jcmr-online.com/supplements/11/S1
Page 75 of 316(page number not for citation purposes)
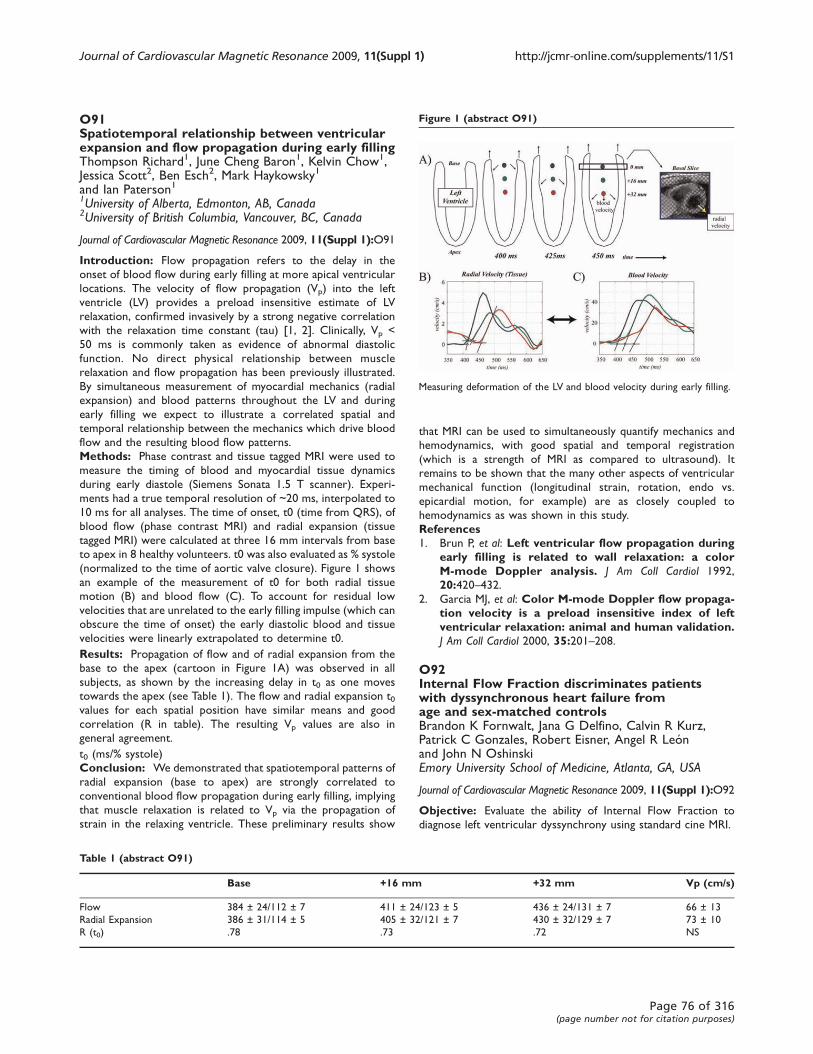
O91Spatiotemporal relationship between ventricularexpansion and flow propagation during early fillingThompson Richard1, June Cheng Baron1, Kelvin Chow1,Jessica Scott2, Ben Esch2, Mark Haykowsky1
and Ian Paterson11University of Alberta, Edmonton, AB, Canada2University of British Columbia, Vancouver, BC, Canada
Journal of Cardiovascular Magnetic Resonance 2009, 11(Suppl 1):O91
Introduction: Flow propagation refers to the delay in the
onset of blood flow during early filling at more apical ventricular
locations. The velocity of flow propagation (Vp) into the left
ventricle (LV) provides a preload insensitive estimate of LV
relaxation, confirmed invasively by a strong negative correlation
with the relaxation time constant (tau) [1, 2]. Clinically, Vp <
50 ms is commonly taken as evidence of abnormal diastolic
function. No direct physical relationship between muscle
relaxation and flow propagation has been previously illustrated.
By simultaneous measurement of myocardial mechanics (radial
expansion) and blood patterns throughout the LV and during
early filling we expect to illustrate a correlated spatial and
temporal relationship between the mechanics which drive blood
flow and the resulting blood flow patterns.
Methods: Phase contrast and tissue tagged MRI were used to
measure the timing of blood and myocardial tissue dynamics
during early diastole (Siemens Sonata 1.5 T scanner). Experi-
ments had a true temporal resolution of ~20 ms, interpolated to
10 ms for all analyses. The time of onset, t0 (time from QRS), of
blood flow (phase contrast MRI) and radial expansion (tissue
tagged MRI) were calculated at three 16 mm intervals from base
to apex in 8 healthy volunteers. t0 was also evaluated as % systole
(normalized to the time of aortic valve closure). Figure 1 shows
an example of the measurement of t0 for both radial tissue
motion (B) and blood flow (C). To account for residual low
velocities that are unrelated to the early filling impulse (which can
obscure the time of onset) the early diastolic blood and tissue
velocities were linearly extrapolated to determine t0.
Results: Propagation of flow and of radial expansion from the
base to the apex (cartoon in Figure 1A) was observed in all
subjects, as shown by the increasing delay in t0 as one moves
towards the apex (see Table 1). The flow and radial expansion t0values for each spatial position have similar means and good
correlation (R in table). The resulting Vp values are also in
general agreement.
t0 (ms/% systole)
Conclusion: We demonstrated that spatiotemporal patterns of
radial expansion (base to apex) are strongly correlated to
conventional blood flow propagation during early filling, implying
that muscle relaxation is related to Vp via the propagation of
strain in the relaxing ventricle. These preliminary results show
that MRI can be used to simultaneously quantify mechanics and
hemodynamics, with good spatial and temporal registration
(which is a strength of MRI as compared to ultrasound). It
remains to be shown that the many other aspects of ventricular
mechanical function (longitudinal strain, rotation, endo vs.
epicardial motion, for example) are as closely coupled to
hemodynamics as was shown in this study.
References1. Brun P, et al: Left ventricular flow propagation during
early filling is related to wall relaxation: a colorM-mode Doppler analysis. J Am Coll Cardiol 1992,
20:420–432.2. Garcia MJ, et al: Color M-mode Doppler flow propaga-
tion velocity is a preload insensitive index of leftventricular relaxation: animal and human validation.J Am Coll Cardiol 2000, 35:201–208.
O92Internal Flow Fraction discriminates patientswith dyssynchronous heart failure fromage and sex-matched controlsBrandon K Fornwalt, Jana G Delfino, Calvin R Kurz,Patrick C Gonzales, Robert Eisner, Angel R Leónand John N OshinskiEmory University School of Medicine, Atlanta, GA, USA
Journal of Cardiovascular Magnetic Resonance 2009, 11(Suppl 1):O92
Objective: Evaluate the ability of Internal Flow Fraction to
diagnose left ventricular dyssynchrony using standard cine MRI.
Table 1 (abstract O91)
Base +16 mm +32 mm Vp (cm/s)
Flow 384 ± 24/112 ± 7 411 ± 24/123 ± 5 436 ± 24/131 ± 7 66 ± 13
Radial Expansion 386 ± 31/114 ± 5 405 ± 32/121 ± 7 430 ± 32/129 ± 7 73 ± 10
R (t0) .78 .73 .72 NS
Figure 1 (abstract O91)
Measuring deformation of the LV and blood velocity during early filling.
Journal of Cardiovascular Magnetic Resonance 2009, 11(Suppl 1) http://jcmr-online.com/supplements/11/S1
Page 76 of 316(page number not for citation purposes)
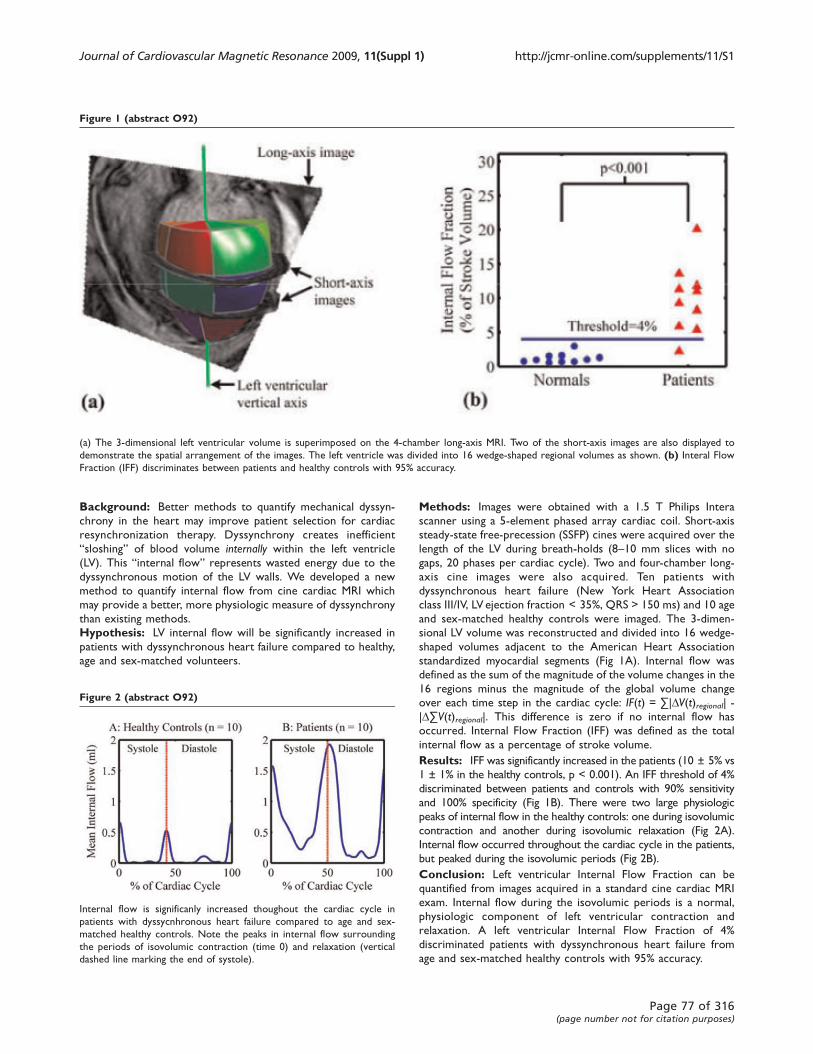
Background: Better methods to quantify mechanical dyssyn-
chrony in the heart may improve patient selection for cardiac
resynchronization therapy. Dyssynchrony creates inefficient
“sloshing” of blood volume internally within the left ventricle
(LV). This “internal flow” represents wasted energy due to the
dyssynchronous motion of the LV walls. We developed a new
method to quantify internal flow from cine cardiac MRI which
may provide a better, more physiologic measure of dyssynchrony
than existing methods.
Hypothesis: LV internal flow will be significantly increased in
patients with dyssynchronous heart failure compared to healthy,
age and sex-matched volunteers.
Methods: Images were obtained with a 1.5 T Philips Intera
scanner using a 5-element phased array cardiac coil. Short-axis
steady-state free-precession (SSFP) cines were acquired over the
length of the LV during breath-holds (8–10 mm slices with no
gaps, 20 phases per cardiac cycle). Two and four-chamber long-
axis cine images were also acquired. Ten patients with
dyssynchronous heart failure (New York Heart Association
class III/IV, LV ejection fraction < 35%, QRS > 150 ms) and 10 age
and sex-matched healthy controls were imaged. The 3-dimen-
sional LV volume was reconstructed and divided into 16 wedge-
shaped volumes adjacent to the American Heart Association
standardized myocardial segments (Fig 1A). Internal flow was
defined as the sum of the magnitude of the volume changes in the
16 regions minus the magnitude of the global volume change
over each time step in the cardiac cycle: IF(t) = ∑|DV(t)regional| -|D∑V(t)regional|. This difference is zero if no internal flow has
occurred. Internal Flow Fraction (IFF) was defined as the total
internal flow as a percentage of stroke volume.
Results: IFF was significantly increased in the patients (10 ± 5% vs
1 ± 1% in the healthy controls, p < 0.001). An IFF threshold of 4%
discriminated between patients and controls with 90% sensitivity
and 100% specificity (Fig 1B). There were two large physiologic
peaks of internal flow in the healthy controls: one during isovolumic
contraction and another during isovolumic relaxation (Fig 2A).
Internal flow occurred throughout the cardiac cycle in the patients,
but peaked during the isovolumic periods (Fig 2B).
Conclusion: Left ventricular Internal Flow Fraction can be
quantified from images acquired in a standard cine cardiac MRI
exam. Internal flow during the isovolumic periods is a normal,
physiologic component of left ventricular contraction and
relaxation. A left ventricular Internal Flow Fraction of 4%
discriminated patients with dyssynchronous heart failure from
age and sex-matched healthy controls with 95% accuracy.
Figure 1 (abstract O92)
(a) The 3-dimensional left ventricular volume is superimposed on the 4-chamber long-axis MRI. Two of the short-axis images are also displayed to
demonstrate the spatial arrangement of the images. The left ventricle was divided into 16 wedge-shaped regional volumes as shown. (b) Interal FlowFraction (IFF) discriminates between patients and healthy controls with 95% accuracy.
Figure 2 (abstract O92)
Internal flow is significanly increased thoughout the cardiac cycle in
patients with dyssycnhronous heart failure compared to age and sex-
matched healthy controls. Note the peaks in internal flow surrounding
the periods of isovolumic contraction (time 0) and relaxation (vertical
dashed line marking the end of systole).
Journal of Cardiovascular Magnetic Resonance 2009, 11(Suppl 1) http://jcmr-online.com/supplements/11/S1
Page 77 of 316(page number not for citation purposes)

O93Accurate quantification of heart valveregurgitation in all four heart valvessimultaneously using 3D velocity-encoded MRIwith retrospective valve trackingJos JM Westenberg, Stijntje D Roes,Rob J van der Geest, Sebastiaan Hammer,Nina Ajmone Marsan, Jeroen J Bax, Albert de Roosand Johan HC ReiberLeiden University Medical Center, Leiden, Netherlands
Journal of Cardiovascular Magnetic Resonance 2009, 11(Suppl 1):O93
Introduction: In regurgitant heart valves, surgical decision-
making is based on the severity of the regurgitation through the
particular valve. Conventional two-dimensional (2D) one-direc-
tional velocity-encoded (VE) MRI is routinely used for flow
assessment, but this technique has been shown to be inaccurate
and correlation between the net flow volumes through the valves
is weak, even in the absence of regurgitation. 2D one-directional
VE MRI is limited because the position and angulation of the
acquisition plane cannot be adapted to the valve motion and the
direction of the inflow and regurgitant jet.
Figure 1 (abstract O93)
3D 3-directional velocity-encoded MRI is performed at the basal level of the
heart. In offline analysis, retrospective valve tracking for each of the heart
valves can be performed, resulting in flow at the mitral valve (MV), tricuspid
valve (TV), aortic valve (AV) and pulmonary valve (PV).
Figure 2 (abstract O93)
Net flow volumes for mitral valve (MV) vs. aortic valve (AV), tricuspid valve (TV) vs. MV and TV vs. pulmonary valve (PV) in 23 patients with valve
regurgitation.
Journal of Cardiovascular Magnetic Resonance 2009, 11(Suppl 1) http://jcmr-online.com/supplements/11/S1
Page 78 of 316(page number not for citation purposes)

Purpose: Three-dimensional (3D) 3-directional VE MRI
with retrospective valve tracking during offline analysis is
introduced for flow assessment through all heart valves
simultaneously. This technique is validated in phantoms and
applied in 14 volunteers without and 23 patients with valve
regurgitation.
Methods: MRI was performed on a 1.5 T Gyroscan ACS/NT15
MRI (Philips, Best, the Netherlands). A 3D 3-directional VE
MRI sequence was designed (3D volume scan with slab thickness
48 mm, acquisition voxel size 2.9 × 3.8 × 4.0 mm3, three-
directional velocity sensitivity 150 cm/s, with 30 phases
reconstructed during one average cardiac cycle, Echo Planar
Imaging factor 5, with free-breathing in vivo) and tested in
stationary flow phantoms and in a phantom simulating
harmonic left ventricular filling. From the 3D velocity-data,
through-plane velocity was reformatted offline for each valve
plane using two orthogonal reformat-guides per plane (i.e., for
mitral valve (MV): 2- and 4-chamber of the left ventricle (LV);
tricuspid valve (TV): 2- and 4-chamber of the right ventricle (RV);
aortic valve (AV): two orthogonal views of LV outflow tract;
pulmonary valve (PV): two orthogonal views of the RV outflow
tract) (Figure 1).
In 14 volunteers without regurgitation and in 23 patients with
single or multiple valve regurgitation proven on echocardiogra-
phy, trans-valvular flow was assessed at all four valves using 3D 3-
directional VE MRI. Regurgitation was quantified. Correlation
between the net flow volumes per valve was examined and
differences were studied.
Results: Validation in phantoms showed less than 5% error in
flow. In vivo, mean scan time = 4.2 ± 0.8 min at a mean heart
rate of 67 ± 12 beats per minute. In volunteers, comparison of
the net flow volumes through the four valves showed strong
correlation with a only small differences between AV and MV and
between PV and TV (statistically significant but clinically non-
significant) and with small confidence intervals (Table 1). In
patients, also strong correlation between the net flow volumes
per valve were found (Figure 2), with no significant biases. Mean
regurgitant fraction for MV = 12 ± 8% (range: 4–29%), TV =
10 ± 7% (range: 2–25%), AV = 2 ± 2% (range: 0–5%) and
PV = 3 ± 3% (range: 0–10%).
Conclusion: 3D VE MRI provides the true trans-valvular
flow for all four heart valves from a single acquisition in less
than 5 minutes scan time. Regurgitation can be quantified
accurately, providing essential information for surgical decision-
making.
O94Navigator-gated 3D cine DENSE: developmentand initial evaluationXiaodong Zhong1, Bruce S Spottiswoode2,Craig H Meyer1, Christopher M Kramer1
and Frederick H Epstein11University of Virginia, Charlottesville, VA, USA2University of Stellenbosch, Tygerberg, South Africa
Journal of Cardiovascular Magnetic Resonance 2009, 11(Suppl 1):O94
Introduction: Ideally, imaging of cardiac function should cover
the entire heart and completely quantify myocardial deformation
in three dimensions.
Purpose: To (a) develop a free-breathing navigator-gated 3D
cine DENSE (Displacement-encoding with Stimulated Echoes)
pulse sequence to acquire such data and (b) implement post-
processing methods to quantify 3D myocardial strain throughout
the left ventricle (LV).
Methods: An ECG-gated segmented 3D spiral cine DENSE pulse
sequence with navigator gating and online image reconstruction was
implemented on a 1.5 T MRI scanner (Siemens Avanto, Erlangen,
Germany). A 3D stack of spirals k-space trajectory was employed
for rapid data acquisition. Three-point phase cycling was used for
artifact suppression, a balanced four-point method was used for
optimal displacement encoding, and field map acquisition and online
spiral deblurring were employed. A navigator echo was placed at
the end of the cardiac cycle, so as not to interfere with imaging of
the onset of myocardial contraction. The navigator echo was used
to accept or reject the DENSE data acquired in the subsequent
heart beat. Five normal volunteers provided informed consent and
were studied in accordance with protocols approved by our
institutional review board. Imaging parameters included voxel
size = 2.8 × 2.8 × 5.0 mm3, flip angle = 20°, TR = 16 ms,
TE = 1.3 ms, number of spiral interleaves = 6, temporal resolu-
tion = 32 ms, and cardiac phases = 22. A double-oblique 3D
volume was aligned with the short and long axes of the LV. Fourteen
k-space partitions were acquired and then zero-padded to
reconstruct 28 slices. A 3 mm navigator acceptance window was
placed at the end-expiration position. For displacement and strain
analysis, images were exported to a PC and manually segmented.
Tissue tracking and strain analysis were performed using 3D
extensions of 2D methods that were described previously. To
validate the 3D measurements, separate 2D cine DENSE MRI was
also performed in multiple short- and long-axis planes. Non-
navigator-gated 3D data were also acquired in some volunteers.
Table 1 (abstract O93) Statistical results
MV-AV MV-TV TV-PV
Volunteers (n = 14) Pearson correlation 0.96 0.97 0.96
p-value t-test 0.01 0.31 0.01
Mean difference 6 ± 7 ml -2 ± 5 ml 6 ± 6 ml
Confidence interval -7 – 19 ml -12 – 9 ml -6 – 17 ml
Patients (n = 23) Pearson correlation 0.95 0.98 0.88
p-value t-test 0.07 0.75 0.30
Mean difference 3 ± 6 ml 0.3 ± 4 ml 2 ± 10 ml
Confidence interval -10 – 16 ml -8 – 9 ml -17 – 22 ml
Journal of Cardiovascular Magnetic Resonance 2009, 11(Suppl 1) http://jcmr-online.com/supplements/11/S1
Page 79 of 316(page number not for citation purposes)
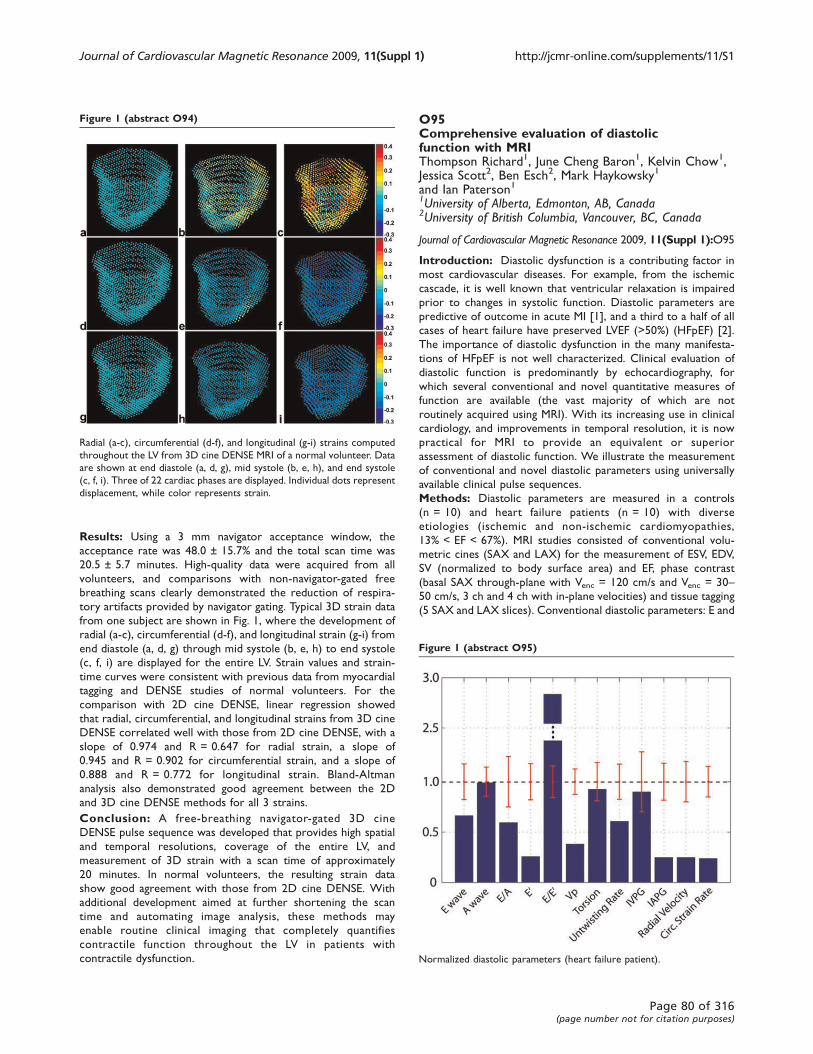
Results: Using a 3 mm navigator acceptance window, the
acceptance rate was 48.0 ± 15.7% and the total scan time was
20.5 ± 5.7 minutes. High-quality data were acquired from all
volunteers, and comparisons with non-navigator-gated free
breathing scans clearly demonstrated the reduction of respira-
tory artifacts provided by navigator gating. Typical 3D strain data
from one subject are shown in Fig. 1, where the development of
radial (a-c), circumferential (d-f), and longitudinal strain (g-i) from
end diastole (a, d, g) through mid systole (b, e, h) to end systole
(c, f, i) are displayed for the entire LV. Strain values and strain-
time curves were consistent with previous data from myocardial
tagging and DENSE studies of normal volunteers. For the
comparison with 2D cine DENSE, linear regression showed
that radial, circumferential, and longitudinal strains from 3D cine
DENSE correlated well with those from 2D cine DENSE, with a
slope of 0.974 and R = 0.647 for radial strain, a slope of
0.945 and R = 0.902 for circumferential strain, and a slope of
0.888 and R = 0.772 for longitudinal strain. Bland-Altman
analysis also demonstrated good agreement between the 2D
and 3D cine DENSE methods for all 3 strains.
Conclusion: A free-breathing navigator-gated 3D cine
DENSE pulse sequence was developed that provides high spatial
and temporal resolutions, coverage of the entire LV, and
measurement of 3D strain with a scan time of approximately
20 minutes. In normal volunteers, the resulting strain data
show good agreement with those from 2D cine DENSE. With
additional development aimed at further shortening the scan
time and automating image analysis, these methods may
enable routine clinical imaging that completely quantifies
contractile function throughout the LV in patients with
contractile dysfunction.
O95Comprehensive evaluation of diastolicfunction with MRIThompson Richard1, June Cheng Baron1, Kelvin Chow1,Jessica Scott2, Ben Esch2, Mark Haykowsky1
and Ian Paterson11University of Alberta, Edmonton, AB, Canada2University of British Columbia, Vancouver, BC, Canada
Journal of Cardiovascular Magnetic Resonance 2009, 11(Suppl 1):O95
Introduction: Diastolic dysfunction is a contributing factor in
most cardiovascular diseases. For example, from the ischemic
cascade, it is well known that ventricular relaxation is impaired
prior to changes in systolic function. Diastolic parameters are
predictive of outcome in acute MI [1], and a third to a half of all
cases of heart failure have preserved LVEF (>50%) (HFpEF) [2].
The importance of diastolic dysfunction in the many manifesta-
tions of HFpEF is not well characterized. Clinical evaluation of
diastolic function is predominantly by echocardiography, for
which several conventional and novel quantitative measures of
function are available (the vast majority of which are not
routinely acquired using MRI). With its increasing use in clinical
cardiology, and improvements in temporal resolution, it is now
practical for MRI to provide an equivalent or superior
assessment of diastolic function. We illustrate the measurement
of conventional and novel diastolic parameters using universally
available clinical pulse sequences.
Methods: Diastolic parameters are measured in a controls
(n = 10) and heart failure patients (n = 10) with diverse
etiologies (ischemic and non-ischemic cardiomyopathies,
13% < EF < 67%). MRI studies consisted of conventional volu-
metric cines (SAX and LAX) for the measurement of ESV, EDV,
SV (normalized to body surface area) and EF, phase contrast
(basal SAX through-plane with Venc = 120 cm/s and Venc = 30–50 cm/s, 3 ch and 4 ch with in-plane velocities) and tissue tagging
(5 SAX and LAX slices). Conventional diastolic parameters: E and
Figure 1 (abstract O94)
Radial (a-c), circumferential (d-f), and longitudinal (g-i) strains computed
throughout the LV from 3D cine DENSE MRI of a normal volunteer. Data
are shown at end diastole (a, d, g), mid systole (b, e, h), and end systole
(c, f, i). Three of 22 cardiac phases are displayed. Individual dots represent
displacement, while color represents strain.
Figure 1 (abstract O95)
Normalized diastolic parameters (heart failure patient).
Journal of Cardiovascular Magnetic Resonance 2009, 11(Suppl 1) http://jcmr-online.com/supplements/11/S1
Page 80 of 316(page number not for citation purposes)
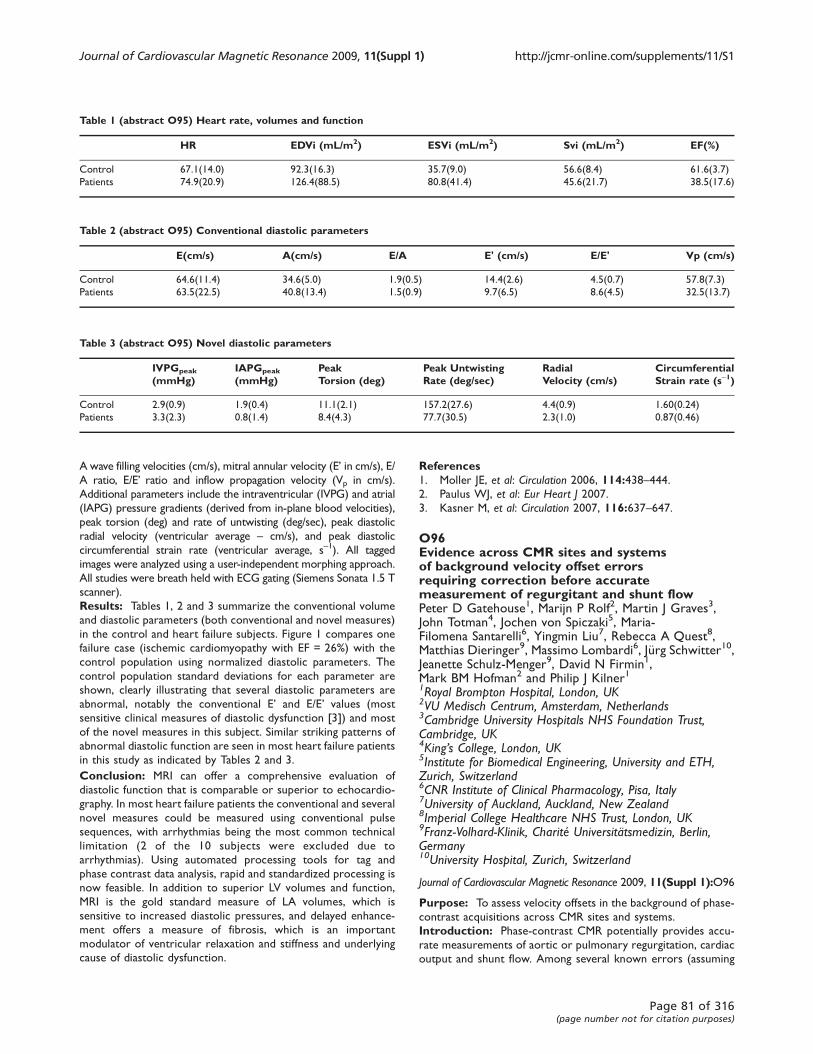
A wave filling velocities (cm/s), mitral annular velocity (E’ in cm/s), E/
A ratio, E/E’ ratio and inflow propagation velocity (Vp in cm/s).
Additional parameters include the intraventricular (IVPG) and atrial
(IAPG) pressure gradients (derived from in-plane blood velocities),
peak torsion (deg) and rate of untwisting (deg/sec), peak diastolic
radial velocity (ventricular average – cm/s), and peak diastolic
circumferential strain rate (ventricular average, s-1). All tagged
images were analyzed using a user-independent morphing approach.
All studies were breath held with ECG gating (Siemens Sonata 1.5 T
scanner).
Results: Tables 1, 2 and 3 summarize the conventional volume
and diastolic parameters (both conventional and novel measures)
in the control and heart failure subjects. Figure 1 compares one
failure case (ischemic cardiomyopathy with EF = 26%) with the
control population using normalized diastolic parameters. The
control population standard deviations for each parameter are
shown, clearly illustrating that several diastolic parameters are
abnormal, notably the conventional E’ and E/E’ values (most
sensitive clinical measures of diastolic dysfunction [3]) and most
of the novel measures in this subject. Similar striking patterns of
abnormal diastolic function are seen in most heart failure patients
in this study as indicated by Tables 2 and 3.
Conclusion: MRI can offer a comprehensive evaluation of
diastolic function that is comparable or superior to echocardio-
graphy. In most heart failure patients the conventional and several
novel measures could be measured using conventional pulse
sequences, with arrhythmias being the most common technical
limitation (2 of the 10 subjects were excluded due to
arrhythmias). Using automated processing tools for tag and
phase contrast data analysis, rapid and standardized processing is
now feasible. In addition to superior LV volumes and function,
MRI is the gold standard measure of LA volumes, which is
sensitive to increased diastolic pressures, and delayed enhance-
ment offers a measure of fibrosis, which is an important
modulator of ventricular relaxation and stiffness and underlying
cause of diastolic dysfunction.
References1. Moller JE, et al: Circulation 2006, 114:438–444.2. Paulus WJ, et al: Eur Heart J 2007.3. Kasner M, et al: Circulation 2007, 116:637–647.
O96Evidence across CMR sites and systemsof background velocity offset errorsrequiring correction before accuratemeasurement of regurgitant and shunt flowPeter D Gatehouse1, Marijn P Rolf2, Martin J Graves3,John Totman4, Jochen von Spiczaki5, Maria-Filomena Santarelli6, Yingmin Liu7, Rebecca A Quest8,Matthias Dieringer9, Massimo Lombardi6, Jürg Schwitter10,Jeanette Schulz-Menger9, David N Firmin1,Mark BM Hofman2 and Philip J Kilner11Royal Brompton Hospital, London, UK2VU Medisch Centrum, Amsterdam, Netherlands3Cambridge University Hospitals NHS Foundation Trust,Cambridge, UK4King’s College, London, UK5Institute for Biomedical Engineering, University and ETH,Zurich, Switzerland6CNR Institute of Clinical Pharmacology, Pisa, Italy7University of Auckland, Auckland, New Zealand8Imperial College Healthcare NHS Trust, London, UK9Franz-Volhard-Klinik, Charité Universitätsmedizin, Berlin,Germany10University Hospital, Zurich, Switzerland
Journal of Cardiovascular Magnetic Resonance 2009, 11(Suppl 1):O96
Purpose: To assess velocity offsets in the background of phase-
contrast acquisitions across CMR sites and systems.
Introduction: Phase-contrast CMR potentially provides accu-
rate measurements of aortic or pulmonary regurgitation, cardiac
output and shunt flow. Among several known errors (assuming
Table 3 (abstract O95) Novel diastolic parameters
IVPGpeak
(mmHg)IAPGpeak
(mmHg)PeakTorsion (deg)
Peak UntwistingRate (deg/sec)
RadialVelocity (cm/s)
CircumferentialStrain rate (s-1)
Control 2.9(0.9) 1.9(0.4) 11.1(2.1) 157.2(27.6) 4.4(0.9) 1.60(0.24)
Patients 3.3(2.3) 0.8(1.4) 8.4(4.3) 77.7(30.5) 2.3(1.0) 0.87(0.46)
Table 1 (abstract O95) Heart rate, volumes and function
HR EDVi (mL/m2) ESVi (mL/m2) Svi (mL/m2) EF(%)
Control 67.1(14.0) 92.3(16.3) 35.7(9.0) 56.6(8.4) 61.6(3.7)
Patients 74.9(20.9) 126.4(88.5) 80.8(41.4) 45.6(21.7) 38.5(17.6)
Table 2 (abstract O95) Conventional diastolic parameters
E(cm/s) A(cm/s) E/A E' (cm/s) E/E' Vp (cm/s)
Control 64.6(11.4) 34.6(5.0) 1.9(0.5) 14.4(2.6) 4.5(0.7) 57.8(7.3)
Patients 63.5(22.5) 40.8(13.4) 1.5(0.9) 9.7(6.5) 8.6(4.5) 32.5(13.7)
Journal of Cardiovascular Magnetic Resonance 2009, 11(Suppl 1) http://jcmr-online.com/supplements/11/S1
Page 81 of 316(page number not for citation purposes)

concomitant gradient correction [1]) we examined one: a 2 cm/s
velocity offset (i.e. around 1% of a typical VENC) can cause >20%
error in cardiac output [2, 3] with larger consequences for
regurgitation and shunt flow, particularly in dilated vessels.
As a collaborative group, we measured velocity offsets across
sites and scanner types, an initiative backed by the European
Society of Cardiology CMR Working Group.
Methods: To eliminate slow flow, 10–15 litre uniform gelatine
phantoms were used, containing 5 millimoles/litre Gd-DTPA for
SNR. We used similar phase-contrast sequence parameters at
each site, measuring 45° oblique ‘aortic’ (Ao) and ‘main
pulmonary artery’ (MPA) planes (Figure 1). Constant sequence
parameters were: retro-gated cine at 1000 ms RR-interval,
through-plane Venc = 150 cm/s, SLT = 6 mm, TE = 2.8–3.0 ms,
FOV = 320 mm square, uninterpolated pixels 1.25 mm(FE) by
2.5 mm(PE), bandwidth 355 Hz/pixel, 6 rawdata lines per
cardiac cycle, no cine data-sharing or parallel imaging.
Unless stated, velocity encoding was asymmetric (i.e. phase-
subtraction of compensated and velocity-encoded). The gradi-
ent-echo was asymmetric (early for short TE); Philips
applied partial-echo sampling which may explain its shorter TR.
Slower machines were excluded because fast gradient perfor-
mance was necessary. Three 1.5 T scanner types were compared,
and the sequences were reproduced exactly among the 4 sites
of each scanner type by protocol file transfer (except 1 site
below):
GE (4 sites) Signa Excite 14M5. Symmetric velocity-encoding
(compulsory), flow analysis on, flow optimization off, TR5.9–6.0 ms, TE2.9–3.0 ms (image orientation dependent) (1 site on
12M5 TR5.7–5.8 ms TE2.9 ms)
Philips (4 sites) Achieva R2.53. TR5.5 ms, TE2.8 ms, asymmetric
RF pulse (late centre), phase correction off.
Siemens (4 sites) Avanto VB15 TR6.6 ms, TE2.8 ms.
Velocity images were reconstructed without offset correction
(which performed unrealistically well in this large uniform
phantom). Within 50 mm of isocentre, the largest offset in cm/
s averaged over 300 mm2 circular ROI was recorded for each
plane. All images were measured independently by two sites;
total error was estimated between these, also from noise and
cine frame variations.
Results: Please see data in Table 1.
Discussion and conclusion: The results are believed reliable
for 3 reasons: 1) cine images were stable without ghosting, 2)
similar results occurred in nearby parallel slices, 3) image analysis
was repeated independently. Comparison of hardware is
prevented by remaining differences between sequences; we
emphasise that small sequence changes may alter these results.
An offset of 1% of Venc (π/100) is impressive engineering,
representing a residual gradient of ~0.02% (for approx. TE/2,
50 mm from isocentre) of typical velocity-encoding gradients.
This extreme sensitivity to adjustments such as pre-emphasis
could explain variations between nominally identical sites.
Various automatic offset corrections are routinely installed.
However, this study intentionally omitted them; their usefulness
may depend on applications. Offset correction uses stationary
tissue pixels which can be identified automatically based on their
smaller temporal variation [2]), or identified by users during
postprocessing. This approach is sometimes limited by insuffi-
cient stationary tissue, its low SNR in flow images, and possible
spatial non-linearity. A more time-consuming approach repeats
identical flow acquisitions on a static phantom, subtracting the
corresponding apparent phantom velocities from the clinical
acquisition [2].
We conclude that most systems require velocity offset correc-
tion of flow images for the most sensitive clinical applications.
There is a general need for optimization of acquisition protocols
or (if possible) system engineering and correction methods to
minimise velocity offsets.
Table 1 (abstract O96) Largest ROI mean offset (cm/s) within50 mm of Isocentre, for aortic slice, MPA slice (HF phase-encoding) and MPA slice (LR phase-encoding). The four rows perslice are from the four sites using each scanner type. Thecolumn order is not specified, i.e. scanner types are notidentified. (< ± 0.3 cm/s stdev total error as described above)
cm/s Site Scannertype 1
Scannertype 2
Scannertype 3
Aorta 1 2.5 1.4 1.7
2 0.7 2.5 0.9
3 0.9 2.9 1.4
4 1.9 1.6 0.7
MPA (HF phase-enc) 1 0.8 3.9 1.0
2 1.1 3.4 1.3
3 0.8 4.9 1.2
4 1.0 3.9 0.8
MPA (LR phase-enc) 1 1.2 3.3 1.5
2 1.0 5.3 1.6
3 0.8 5.0 1.8
4 0.4 3.6 0.6
Maximum per site 1 2.5 3.9 1.7
2 1.1 5.3 1.6
3 0.9 5.0 1.8
4 1.9 3.9 0.8
Figure 1 (abstract O96)
The planes used for veolicity offset acquisitions at all sites. The aortic
(AO) plane at 45 degress between transaxial and sagittal used antero-
posterior phase-encode. The main pulmonary artery (MPA) plane at
45 degrees between transaxial and coronal was repeated with head-foot
and left-right phase-encoding. The grey bloc represents the gelatin
phantom.
Journal of Cardiovascular Magnetic Resonance 2009, 11(Suppl 1) http://jcmr-online.com/supplements/11/S1
Page 82 of 316(page number not for citation purposes)
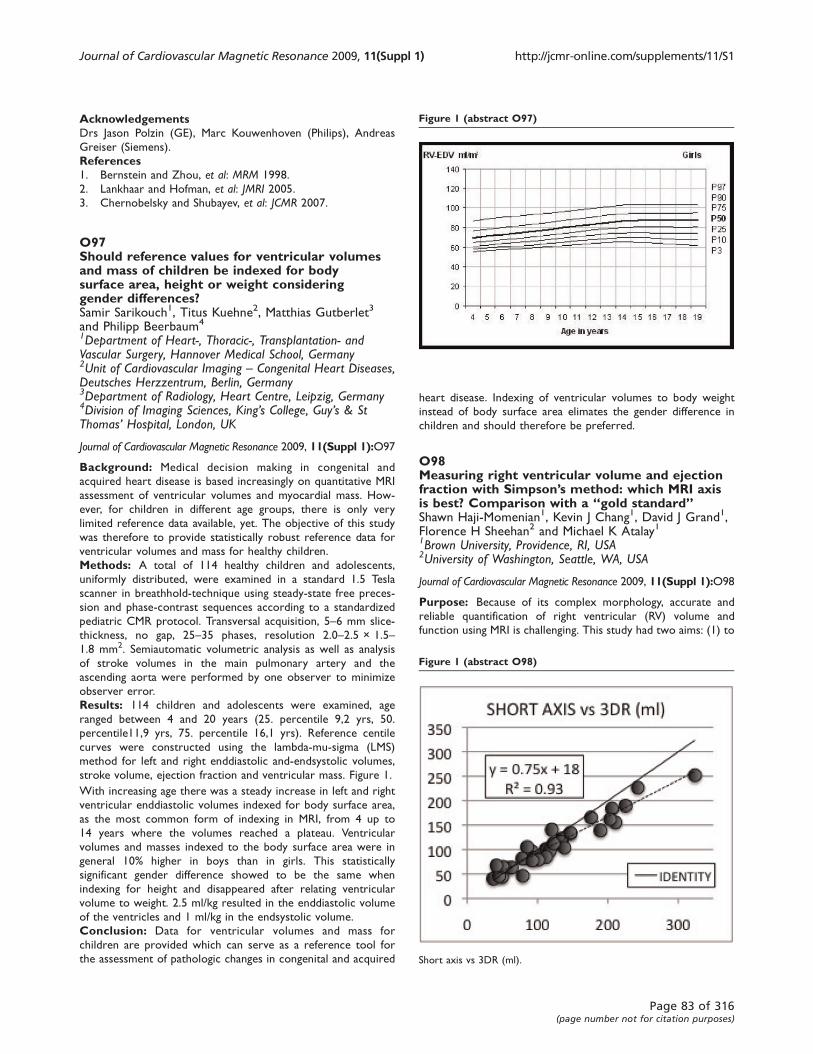
AcknowledgementsDrs Jason Polzin (GE), Marc Kouwenhoven (Philips), Andreas
Greiser (Siemens).
References1. Bernstein and Zhou, et al: MRM 1998.
2. Lankhaar and Hofman, et al: JMRI 2005.3. Chernobelsky and Shubayev, et al: JCMR 2007.
O97Should reference values for ventricular volumesand mass of children be indexed for bodysurface area, height or weight consideringgender differences?Samir Sarikouch1, Titus Kuehne2, Matthias Gutberlet3
and Philipp Beerbaum4
1Department of Heart-, Thoracic-, Transplantation- andVascular Surgery, Hannover Medical School, Germany2Unit of Cardiovascular Imaging – Congenital Heart Diseases,Deutsches Herzzentrum, Berlin, Germany3Department of Radiology, Heart Centre, Leipzig, Germany4Division of Imaging Sciences, King’s College, Guy’s & StThomas’ Hospital, London, UK
Journal of Cardiovascular Magnetic Resonance 2009, 11(Suppl 1):O97
Background: Medical decision making in congenital and
acquired heart disease is based increasingly on quantitative MRI
assessment of ventricular volumes and myocardial mass. How-
ever, for children in different age groups, there is only very
limited reference data available, yet. The objective of this study
was therefore to provide statistically robust reference data for
ventricular volumes and mass for healthy children.
Methods: A total of 114 healthy children and adolescents,
uniformly distributed, were examined in a standard 1.5 Tesla
scanner in breathhold-technique using steady-state free preces-
sion and phase-contrast sequences according to a standardized
pediatric CMR protocol. Transversal acquisition, 5–6 mm slice-
thickness, no gap, 25–35 phases, resolution 2.0–2.5 × 1.5–1.8 mm2. Semiautomatic volumetric analysis as well as analysis
of stroke volumes in the main pulmonary artery and the
ascending aorta were performed by one observer to minimize
observer error.
Results: 114 children and adolescents were examined, age
ranged between 4 and 20 years (25. percentile 9,2 yrs, 50.
percentile11,9 yrs, 75. percentile 16,1 yrs). Reference centile
curves were constructed using the lambda-mu-sigma (LMS)
method for left and right enddiastolic and-endsystolic volumes,
stroke volume, ejection fraction and ventricular mass. Figure 1.
With increasing age there was a steady increase in left and right
ventricular enddiastolic volumes indexed for body surface area,
as the most common form of indexing in MRI, from 4 up to
14 years where the volumes reached a plateau. Ventricular
volumes and masses indexed to the body surface area were in
general 10% higher in boys than in girls. This statistically
significant gender difference showed to be the same when
indexing for height and disappeared after relating ventricular
volume to weight. 2.5 ml/kg resulted in the enddiastolic volume
of the ventricles and 1 ml/kg in the endsystolic volume.
Conclusion: Data for ventricular volumes and mass for
children are provided which can serve as a reference tool for
the assessment of pathologic changes in congenital and acquired
heart disease. Indexing of ventricular volumes to body weight
instead of body surface area elimates the gender difference in
children and should therefore be preferred.
O98Measuring right ventricular volume and ejectionfraction with Simpson’s method: which MRI axisis best? Comparison with a “gold standard”Shawn Haji-Momenian1, Kevin J Chang1, David J Grand1,Florence H Sheehan2 and Michael K Atalay11Brown University, Providence, RI, USA2University of Washington, Seattle, WA, USA
Journal of Cardiovascular Magnetic Resonance 2009, 11(Suppl 1):O98
Purpose: Because of its complex morphology, accurate and
reliable quantification of right ventricular (RV) volume and
function using MRI is challenging. This study had two aims: (1) to
Figure 1 (abstract O97)
Figure 1 (abstract O98)
Short axis vs 3DR (ml).
Journal of Cardiovascular Magnetic Resonance 2009, 11(Suppl 1) http://jcmr-online.com/supplements/11/S1
Page 83 of 316(page number not for citation purposes)
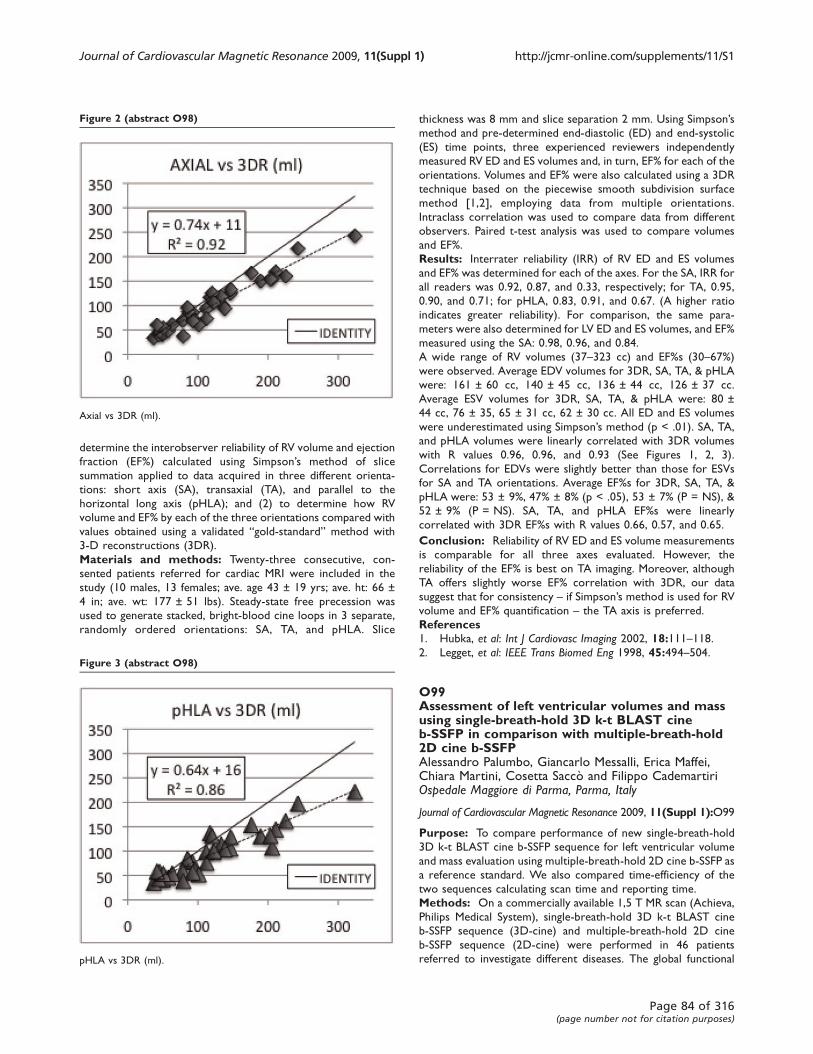
determine the interobserver reliability of RV volume and ejection
fraction (EF%) calculated using Simpson’s method of slice
summation applied to data acquired in three different orienta-
tions: short axis (SA), transaxial (TA), and parallel to the
horizontal long axis (pHLA); and (2) to determine how RV
volume and EF% by each of the three orientations compared with
values obtained using a validated “gold-standard” method with
3-D reconstructions (3DR).
Materials and methods: Twenty-three consecutive, con-
sented patients referred for cardiac MRI were included in the
study (10 males, 13 females; ave. age 43 ± 19 yrs; ave. ht: 66 ±
4 in; ave. wt: 177 ± 51 lbs). Steady-state free precession was
used to generate stacked, bright-blood cine loops in 3 separate,
randomly ordered orientations: SA, TA, and pHLA. Slice
thickness was 8 mm and slice separation 2 mm. Using Simpson’smethod and pre-determined end-diastolic (ED) and end-systolic
(ES) time points, three experienced reviewers independently
measured RV ED and ES volumes and, in turn, EF% for each of the
orientations. Volumes and EF% were also calculated using a 3DR
technique based on the piecewise smooth subdivision surface
method [1,2], employing data from multiple orientations.
Intraclass correlation was used to compare data from different
observers. Paired t-test analysis was used to compare volumes
and EF%.
Results: Interrater reliability (IRR) of RV ED and ES volumes
and EF% was determined for each of the axes. For the SA, IRR for
all readers was 0.92, 0.87, and 0.33, respectively; for TA, 0.95,
0.90, and 0.71; for pHLA, 0.83, 0.91, and 0.67. (A higher ratio
indicates greater reliability). For comparison, the same para-
meters were also determined for LV ED and ES volumes, and EF%
measured using the SA: 0.98, 0.96, and 0.84.
A wide range of RV volumes (37–323 cc) and EF%s (30–67%)were observed. Average EDV volumes for 3DR, SA, TA, & pHLA
were: 161 ± 60 cc, 140 ± 45 cc, 136 ± 44 cc, 126 ± 37 cc.
Average ESV volumes for 3DR, SA, TA, & pHLA were: 80 ±
44 cc, 76 ± 35, 65 ± 31 cc, 62 ± 30 cc. All ED and ES volumes
were underestimated using Simpson’s method (p < .01). SA, TA,
and pHLA volumes were linearly correlated with 3DR volumes
with R values 0.96, 0.96, and 0.93 (See Figures 1, 2, 3).
Correlations for EDVs were slightly better than those for ESVs
for SA and TA orientations. Average EF%s for 3DR, SA, TA, &
pHLA were: 53 ± 9%, 47% ± 8% (p < .05), 53 ± 7% (P = NS), &
52 ± 9% (P = NS). SA, TA, and pHLA EF%s were linearly
correlated with 3DR EF%s with R values 0.66, 0.57, and 0.65.
Conclusion: Reliability of RV ED and ES volume measurements
is comparable for all three axes evaluated. However, the
reliability of the EF% is best on TA imaging. Moreover, although
TA offers slightly worse EF% correlation with 3DR, our data
suggest that for consistency – if Simpson’s method is used for RV
volume and EF% quantification – the TA axis is preferred.
References1. Hubka, et al: Int J Cardiovasc Imaging 2002, 18:111–118.2. Legget, et al: IEEE Trans Biomed Eng 1998, 45:494–504.
O99Assessment of left ventricular volumes and massusing single-breath-hold 3D k-t BLAST cineb-SSFP in comparison with multiple-breath-hold2D cine b-SSFPAlessandro Palumbo, Giancarlo Messalli, Erica Maffei,Chiara Martini, Cosetta Saccò and Filippo CademartiriOspedale Maggiore di Parma, Parma, Italy
Journal of Cardiovascular Magnetic Resonance 2009, 11(Suppl 1):O99
Purpose: To compare performance of new single-breath-hold
3D k-t BLAST cine b-SSFP sequence for left ventricular volume
and mass evaluation using multiple-breath-hold 2D cine b-SSFP as
a reference standard. We also compared time-efficiency of the
two sequences calculating scan time and reporting time.
Methods: On a commercially available 1,5 T MR scan (Achieva,
Philips Medical System), single-breath-hold 3D k-t BLAST cine
b-SSFP sequence (3D-cine) and multiple-breath-hold 2D cine
b-SSFP sequence (2D-cine) were performed in 46 patients
referred to investigate different diseases. The global functional
Figure 2 (abstract O98)
Axial vs 3DR (ml).
Figure 3 (abstract O98)
pHLA vs 3DR (ml).
Journal of Cardiovascular Magnetic Resonance 2009, 11(Suppl 1) http://jcmr-online.com/supplements/11/S1
Page 84 of 316(page number not for citation purposes)

parameters, LV mass, scan time and report time were evaluated
in each patient for both sequences. Differences between
functional parameters and LV mass were made with a paired
Student’s T test; correlation between parameters was assessed
with Pearson’s correlation coefficient. A Bland-Altman analysis
was used to investigate the limits of agreement between the
measurements. Differences between time-efficiency related
parameters were made with a paired Student’s T test.
Results: Functional parameters and mass were significantly
different in the two sequences (p < 0.05) but a strong correlation
was found for LVejection fraction (r = 0.96) and good correlation for
other functional parameters (r between 0.83 and 0.93). Scan time
was significantly lower for 3D sequence, report timewas significantly
higher for 3D sequence.
Conclusion: 3D k-t BLAST sequence can be used to assess EF
in patients who have poor compliance in performing multiple
apnoeas and in patients who are not able to remain in the
scanner for a long time. Conversely report time is significantly
higher for 3D sequence.
O100CMR T2* technique for segmental and globalquantification of myocardial iron: multi-centretransfereability and healtcare impact evalautionVincenzo Positano1, Anna Ramazzotti1, Antonella Meloni1,Alessia Pepe1, Giuseppe Rossi1, Cristina Salvatori1,Paolo Marcheschi1, Maurizio Mangione1, Luigi Natale2,Eliana Cracolici3, Gennaro Restaino4, Gianluca Valeri5,Antongiulio Luciani6, Calogera Gerardi7
and Massimo Lombardi11“G Monasterio” Foundation and Institute of ClinicalPhysiology, CNR, Pisa, Italy2Policlinico “Gemelli”, Roma, Italy3Policlinico “Paolo Giaccone”, Palermo, Italy
4Università Cattolica del Sacro Cuore, Campobasso, Italy5Ospedali Riuniti di Ancona, Ancona, Italy6Az. Osp. “Garibaldi”, Catania, Italy7Ospedali Civili Riuniti, Sciacca (AG), Italy
Journal of Cardiovascular Magnetic Resonance 2009, 11(Suppl 1):O100
Introduction: Iron induced cardiomiopathy is the main cause
of mortality in thalassemic population. Thus, the improvement of
chelation regimens, to reduce cardiac disease, has the highest
priority. Efficient evaluation of cardiac iron status and careful
epidemiologic assessment of thalassemic patients play an
important role in this matter. T2* cardiac magnetic resonance
imaging (CMR) is a unique technique to quantify myocardial iron
overload and useful to tailor the chelation therapy. In particular,
effective and reproducible assessment of myocardial iron loading
using the multislice multiecho T2* approach for segmental and
global myocardial iron distribution has been demonstrated within
a single CMR site. Thalassemia major (TM) patients require
lifelong myocardial iron load monitoring to assess the effective-
ness of chelation therapies. Hence, it is highly desirable that CMR
be performed near the patients’ locations, and that the patients
be able to safely move between different CMR centers.
Purpose: Aim of this work is to build a reliable network of
haematological and paediatric centers specializing in thalassemia
care and MRI sites able to perform feasible and reproducible
heart iron overload assessments for a consistent number of
thalassemia patients in a standardized and robust manner.
Materials and methods: In order to assess the transferability
of the multislice multiecho T2* technique, heart multislice
multiecho T2* sequence was installed on 1.5 T MRI scanners (GE
Healthcare) at six different sites. Five healthy subjects at each site
(n = 30) were scanned to verify the homogeneity of normal
ranges (T2* lover limit of normal 20 ms). Then, five TM patients
were scanned at the reference site and were rescanned locally
Figure 1 (abstract O100)
Journal of Cardiovascular Magnetic Resonance 2009, 11(Suppl 1) http://jcmr-online.com/supplements/11/S1
Page 85 of 316(page number not for citation purposes)
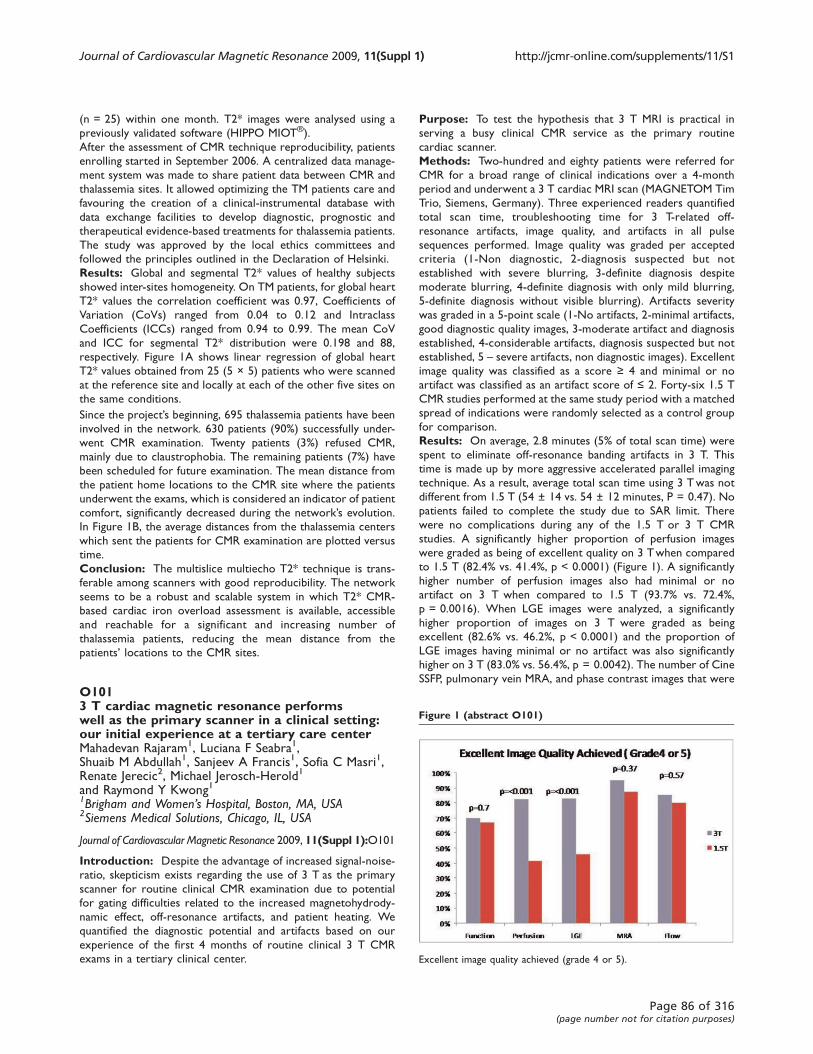
(n = 25) within one month. T2* images were analysed using a
previously validated software (HIPPO MIOT®).
After the assessment of CMR technique reproducibility, patients
enrolling started in September 2006. A centralized data manage-
ment system was made to share patient data between CMR and
thalassemia sites. It allowed optimizing the TM patients care and
favouring the creation of a clinical-instrumental database with
data exchange facilities to develop diagnostic, prognostic and
therapeutical evidence-based treatments for thalassemia patients.
The study was approved by the local ethics committees and
followed the principles outlined in the Declaration of Helsinki.
Results: Global and segmental T2* values of healthy subjects
showed inter-sites homogeneity. On TM patients, for global heart
T2* values the correlation coefficient was 0.97, Coefficients of
Variation (CoVs) ranged from 0.04 to 0.12 and Intraclass
Coefficients (ICCs) ranged from 0.94 to 0.99. The mean CoV
and ICC for segmental T2* distribution were 0.198 and 88,
respectively. Figure 1A shows linear regression of global heart
T2* values obtained from 25 (5 × 5) patients who were scanned
at the reference site and locally at each of the other five sites on
the same conditions.
Since the project’s beginning, 695 thalassemia patients have been
involved in the network. 630 patients (90%) successfully under-
went CMR examination. Twenty patients (3%) refused CMR,
mainly due to claustrophobia. The remaining patients (7%) have
been scheduled for future examination. The mean distance from
the patient home locations to the CMR site where the patients
underwent the exams, which is considered an indicator of patient
comfort, significantly decreased during the network’s evolution.In Figure 1B, the average distances from the thalassemia centers
which sent the patients for CMR examination are plotted versus
time.
Conclusion: The multislice multiecho T2* technique is trans-
ferable among scanners with good reproducibility. The network
seems to be a robust and scalable system in which T2* CMR-
based cardiac iron overload assessment is available, accessible
and reachable for a significant and increasing number of
thalassemia patients, reducing the mean distance from the
patients’ locations to the CMR sites.
O1013 T cardiac magnetic resonance performswell as the primary scanner in a clinical setting:our initial experience at a tertiary care centerMahadevan Rajaram1, Luciana F Seabra1,Shuaib M Abdullah1, Sanjeev A Francis1, Sofia C Masri1,Renate Jerecic2, Michael Jerosch-Herold1
and Raymond Y Kwong11Brigham and Women’s Hospital, Boston, MA, USA2Siemens Medical Solutions, Chicago, IL, USA
Journal of Cardiovascular Magnetic Resonance 2009, 11(Suppl 1):O101
Introduction: Despite the advantage of increased signal-noise-
ratio, skepticism exists regarding the use of 3 T as the primary
scanner for routine clinical CMR examination due to potential
for gating difficulties related to the increased magnetohydrody-
namic effect, off-resonance artifacts, and patient heating. We
quantified the diagnostic potential and artifacts based on our
experience of the first 4 months of routine clinical 3 T CMR
exams in a tertiary clinical center.
Purpose: To test the hypothesis that 3 T MRI is practical in
serving a busy clinical CMR service as the primary routine
cardiac scanner.
Methods: Two-hundred and eighty patients were referred for
CMR for a broad range of clinical indications over a 4-month
period and underwent a 3 T cardiac MRI scan (MAGNETOM Tim
Trio, Siemens, Germany). Three experienced readers quantified
total scan time, troubleshooting time for 3 T-related off-
resonance artifacts, image quality, and artifacts in all pulse
sequences performed. Image quality was graded per accepted
criteria (1-Non diagnostic, 2-diagnosis suspected but not
established with severe blurring, 3-definite diagnosis despite
moderate blurring, 4-definite diagnosis with only mild blurring,
5-definite diagnosis without visible blurring). Artifacts severity
was graded in a 5-point scale (1-No artifacts, 2-minimal artifacts,
good diagnostic quality images, 3-moderate artifact and diagnosis
established, 4-considerable artifacts, diagnosis suspected but not
established, 5 – severe artifacts, non diagnostic images). Excellent
image quality was classified as a score ≥ 4 and minimal or no
artifact was classified as an artifact score of ≤ 2. Forty-six 1.5 T
CMR studies performed at the same study period with a matched
spread of indications were randomly selected as a control group
for comparison.
Results: On average, 2.8 minutes (5% of total scan time) were
spent to eliminate off-resonance banding artifacts in 3 T. This
time is made up by more aggressive accelerated parallel imaging
technique. As a result, average total scan time using 3 Twas not
different from 1.5 T (54 ± 14 vs. 54 ± 12 minutes, P = 0.47). No
patients failed to complete the study due to SAR limit. There
were no complications during any of the 1.5 T or 3 T CMR
studies. A significantly higher proportion of perfusion images
were graded as being of excellent quality on 3 Twhen compared
to 1.5 T (82.4% vs. 41.4%, p < 0.0001) (Figure 1). A significantly
higher number of perfusion images also had minimal or no
artifact on 3 T when compared to 1.5 T (93.7% vs. 72.4%,
p = 0.0016). When LGE images were analyzed, a significantly
higher proportion of images on 3 T were graded as being
excellent (82.6% vs. 46.2%, p < 0.0001) and the proportion of
LGE images having minimal or no artifact was also significantly
higher on 3 T (83.0% vs. 56.4%, p = 0.0042). The number of Cine
SSFP, pulmonary vein MRA, and phase contrast images that were
Figure 1 (abstract O101)
Excellent image quality achieved (grade 4 or 5).
Journal of Cardiovascular Magnetic Resonance 2009, 11(Suppl 1) http://jcmr-online.com/supplements/11/S1
Page 86 of 316(page number not for citation purposes)

graded as being of excellent quality or with no or minimal artifact
did not differ between 3 T and 1.5 T.
Conclusion: 3 T cardiac MRI performs well serving as the
primary scanner in a busy CMR service with comparable scan
times to 1.5 T cardiac MRI. 3 T has improved image quality and
fewer artifacts especially for applications like perfusion and LGE
which benefit from the increase in T1 times at 3 T. The high SNR
leaves additional room to also decrease the overall scan time in
the future using higher acceleration factors for parallel imaging
techniques without sacrificing diagnostic image quality.
O102Three-dimensional measurement of LV andRV dimensions using prospective self-gatingfor simultaneous compensation of cardiacand respiratory motionRobert Manka1, Peter Boesiger2, Martin Buehrer2
and Sebastian Kozerke21German Heart Institute Berlin, Berlin, Germany2Institute for Biomedical Engineering, Zürich, Switzerland
Journal of Cardiovascular Magnetic Resonance 2009, 11(Suppl 1):O102
Purpose: To compare three-dimensional (3D) balanced steady-
state free precession (SSFP), prospective self-gating technique [1]
without ECG triggering and breath-holding for the assessment of
left ventricular (LV) and right ventricular (RV) function in the
heart in comparison to standard 2D, multiple breath-hold SSFP
cine imaging.
Methods: Data were acquired in 15 subjects (10 volunteers,
5 patients) using a 1.5 T system with a five element cardiac array
coil. In each subject a standard multi-slice, multi-breathhold 2D
cine SSFP sequence was performed with complete ventricular
coverage. Additionally, a three-dimensional cine sequence with
prospective self-gating [1] with complete ventricular coverage
was acquired during free breathing. LV and RV end-systolic
volume (ESV) and end-diastolic volume (EDV) and LV mass were
calculated for each method. With both imaging techniques, a
patient-based analysis of image quality was performed with
grading on a four-point scale, referring to the visibility of the
endocardial border (excellent (4), good (3), moderate (2) and
nondiagnostic (1)).
Results: Good agreement between LVEDV, LVESV, LV mass,
LVEF, RVEDV, RVESV, and RVEF calculated for the standard 2D
and the 3D prospective self-gating method (concordance
coefficients 0.99, 0.99, 0.99, 0.90, 0.95, 0.95 and 0.91,
respectively). The mean bias (95% confidence interval (CI) for
each parameter was; LVEDV: -0.3% (-5.2 to 4.6), LVESV: 0.3%
(-5.4 to 6.0), LV mass: -0.8% (-8.3 to 6.8), LVEF: -0.2% (-2.7 to
2.4), RVEDV: 4.5% (-9.6 to 18.6), RVESV: 3.8% (-11.2 to 18.7),
RVEF: 1.0% (-4.7 to 6.7). The overall image quality score for
prospective self-gating (2.7 ± 0.8) was lower when compared to
standard SSFP (3.9 ± 0.4; p < 0.01). Figure 1 shows representa-
tive images from one patient.
Discussion: Three-dimensional, free-breathing, prospective
self-gating MRI enabled accurate assessment of LV and RV
quantitative parameters when compared to standard multi-slice,
multi-breathhold SSFP cine imaging. Image quality with prospec-
tive self-gating was rated lower relative to the reference ECG
triggered, multiple breathhold scans due to lower image contrast
between blood and myocardium and residual motion artefacts.
Reference1. Buehrer M, et al: Magn Reson Med 2008, 60(3):683–690.
O103Randomized comparison of observation unit plusstress cardiac MRI and hospital admissionChadwick D Miller, Wenke Hwang, James W Hoekstra,Cedric Lefebvre, Doug Case and W Gregory HundleyWake Forest University School of Medicine, Winston-Salem,NC, USA
Journal of Cardiovascular Magnetic Resonance 2009, 11(Suppl 1):O103
Introduction: Adoption of an observation unit (OU) strategy
in patients with chest pain at intermediate-risk for ACS has been
hampered by limitations of traditional cardiac testing. As a result,
most intermediate risk patients are admitted to the hospital for
their evaluation. CMR demonstrates superior accuracy com-
pared to other testing modalities. Additionally, CMR is with
highly sensitive to recent or ongoing infarction which may allow
stress imaging to be performed without waiting for the results of
serial cardiac markers. These advantages of CMR make it well
suited for use in OUs. An OU-CMR strategy may be resource
saving compared to hospital admission.
Purpose: To compare resource consumption between an
observation unit stress cardiac MRI (OU-CMR) strategy and
hospital admission when used to evaluate emergency department
(ED) patients with chest pain at intermediate risk for acute
coronary syndrome (ACS).
Methods: Patients meeting intermediate risk criteria (TIMI risk
score ≥ 2 or clinical impression of intermediate risk) underwent
stratified blocked randomization to OU-CMR or hospital
admission. OU-CMR participants underwent cardiac markers at
0, 4, and 8 hours with adenosine or dobutamine CMR imaging
performed at the first available time after the return of the first
two cardiac marker results. CMR imaging included resting wall
motion, T2 weighted imaging, and perfusion, stress wall motion
and perfusion, and delayed enhancement. Hospital admission
participants underwent evaluations as determined by their
treating physician. Participants were contacted at 30 days to
determine events occurring after hospital discharge. Primary
outcomes included direct cost of the index hospitalization and
length of stay. Cost was calculated using cost:charge ratios and
physician work-RVUs. The results of the first 50 participants are
reported in this interim analysis.
Figure 1 (abstract O102)
End-diastolic (ED) frame of the left and right ventricle (mid-ventricular
slice in short-axis orientation); left: multi-breath-hold, standard SSFP,
right: free breathing prospective self-gating.
Journal of Cardiovascular Magnetic Resonance 2009, 11(Suppl 1) http://jcmr-online.com/supplements/11/S1
Page 87 of 316(page number not for citation purposes)

Results: Participants had a mean age of 56 years, a median TIMI
risk score of 2 (Q1 = 2, Q3 = 3), 25 (50%) were female, and 10
(20%) reported prior coronary disease. Participants were equally
randomized with 25 participants in each treatment group.
Protocol adherence was high among both groups (24/25 [96%]
OU-CMR, 23/25 [92%] standard care remained until hospital
discharge). Stress CMR imaging was obtained in 24/25 (96%) OU-
CMR participants during the index visit; 11/25 (44%) received
imaging the same day as presentation. In the OU-CMR group, 20/
25 (80%) of participants were discharged from the OU without
admission. Five participants were admitted from the OU and
underwent continued monitoring (n = 1) or cardiac catheteriza-
tion (n = 4). Of the 4 undergoing cardiac catheterization, 1 was
diagnosed with a non-ischemic emergent cardiac condition and 3
were not found to have an emergent cause of chest pain. There
were no complications related to CMR testing. Among standard
care participants, all patients were admitted, 21/25 (84%) had
cardiac imaging with 14 undergoing stress echocardiography, 3
stress cardiac MRI, 3 cardiac catheterizations, and 1 resting echo
exam.
ACS criteria were met in 3/50 (6%) participants due to
revascularization (n = 2) and myocardial infarction (n = 1), all
in the hospital admission arm during the index hospitalization.
Two participants had repeat hospitalizations for chest pain within
30 days, both in the hospital admission arm, and neither met ACS
criteria. The OU-CMR group had a trend towards same day
discharge more frequently than standard care participants (7/25
(28%) vs 3/25 (12%), p = 0.29). Cost of index hospitalization
demonstrated a near significant trend towards favoring OU-CMR
before adjustment (mean $2823 vs $4342, p = 0.12) and after
adjustment for covariates ($1537 difference, p = 0.10). Length of
stay demonstrated a trend towards favoring OU-CMR before
(mean 27.5 h vs 31.4 h, p = 0.38) and after adjustment (5.5 h
difference, p = 0.24).
Conclusion: An OU-CMR approach among ED patients with
chest pain at intermediate risk for ACS is feasible. OU-CMR
decreases hospital admissions and has demonstrated a strong
near-significant trend towards decreasing index hospitalization
cost.
POSTER PRESENTATIONS
P1Ventricular function and volume assessmentin children, adolescents and young adultswith thalassemia major withoutmyocardial iron overloadJuliano L Fernandes1, Matheus Avelar1,2,Monica Verissimo3 and Otavio Coelho11University of Campinas (Unicamp), Campinas, Brazil2Instituto Boldrini, Campinas, Brazil3Centro Infantil Boldrini, Campinas, Brazil
Journal of Cardiovascular Magnetic Resonance 2009, 11(Suppl 1):P1
Introduction: Reference ranges for normal ventricular func-
tion and volumes in patients with thalassemia major without
myocardial iron overload have been established before in
European countries. However, these values might not be directly
applicable to patients in most other countries where they tend to
be younger and start chelation therapy later in life.
Purpose: To study children, adolescents and young adults with
thalassemia major with normal T2* values and compare the
results to matched normal volunteers as well as patients with
high ferritin levels, normal myocardial iron and chronic anemia
due to other etiologies.
Methods: We selected 25 patients (52% male) with thalassemia
major (TM) and normal myocardial iron concentrations (T2* >
20 msec) and compared them to 17 age- and gender-matched
normal (NL) volunteers (41% male) and 24 gender-matched (58%
male) patients with high ferritin levels from other etiologies
(NT). All patients underwent a cardiovascular magnetic reso-
nance (CMR) function study using a steady-state free precession
sequence. Normalized data to body surface area was compared
among the three groups.
Results: The mean age of TM patients was 18.8 ± 2.3 years
(range 7–31) with no significant differences from NL volunteers
(16.2 ± 2.8 years, range 5–34, P = NS), but younger than NT
patients (39.5 ± 2.4 years, range 11–69, P < 0.001). T2* in
patients with TM were somewhat lower than NT patients
(27.5 ± 4.3 versus 31.7 ± 6.8, P = 0.06) but still within the
normal range. Body surface area was similar in the three study
groups (TM, 1.51 ± 0.32 m2; NL, 1.45 ± 0.37 m2; NT,
1.61 ± 0.33 m2; P = NS). Left ventricular ejection fraction was
not different when comparing TM and NL patients [65.2 ± 6.0%
(95% CI 62.7–67.7), versus 65.4 ± 5.6% (95% CI 62.6–68.3),P = NS], with both values non significantly lower than NT
patients [68.5 ± 6.9% (95% CI 65.6–71.4), P = 0.15]. Despite
that, normalized diastolic and systolic volumes were higher in
patients with TM compared to NL volunteers (78.5 ± 15.8 ×
27.4 ± 8.3 ml/m2 versus 63.8 ± 10.4 × 21.8 ± 4.6 ml/m2,
P = 0.007 and P = 0.05 respectively) with no significant differ-
ences compared to NT patients (75.6 ± 16.3 × 24.8 ± 8.2 ml/
m2, P = NS). Normalized mass also showed similar character-
istics with higher values in TM patients compared to NL
(56.9 ± 10.6 g/m2 versus 37.9 ± 7.9 g/m2, P < 0.001) and no
differences compared to NT individuals (62.9 ± 14.2 g/m2,
P = NS). Male and female comparisons showed similar results
although no differences were found in normalized volumes when
looking only in female patients.
Conclusion: Younger patients with TM do not present
different left ventricular function values compared to normal
controls despite having increase ventricular volumes and mass.
The parameters presented by these patients are similar to older
individuals with comparable degrees of chronic anemia. Pre-
viously published reference ranges for TM may not be applicable
to younger patients with different clinical settings.
P2Phenotyping of tako tsubocardiomyopathy – structural comparisonto acute myocardial infarctionAndreas Rolf, Guido Conradi, Johannes Rixe,Holger Steiger, Holger Nef, Helge Möllmann,Katharina Beiring, Christian Hamm and Thorsten DillKerckhoff-Heart-Center, Bad Nauheim, Germany
Journal of Cardiovascular Magnetic Resonance 2009, 11(Suppl 1):P2
Objective: The tako tsubo cardiomyopathy (TTC) is charac-
terized by a transient contractile dysfunction after severe
physical or emotional stress. Relevant coronary artery disease
is absent. Clinically it mimics acute myocardial infarction (AMI).
Journal of Cardiovascular Magnetic Resonance 2009, 11(Suppl 1) http://jcmr-online.com/supplements/11/S1
Page 88 of 316(page number not for citation purposes)
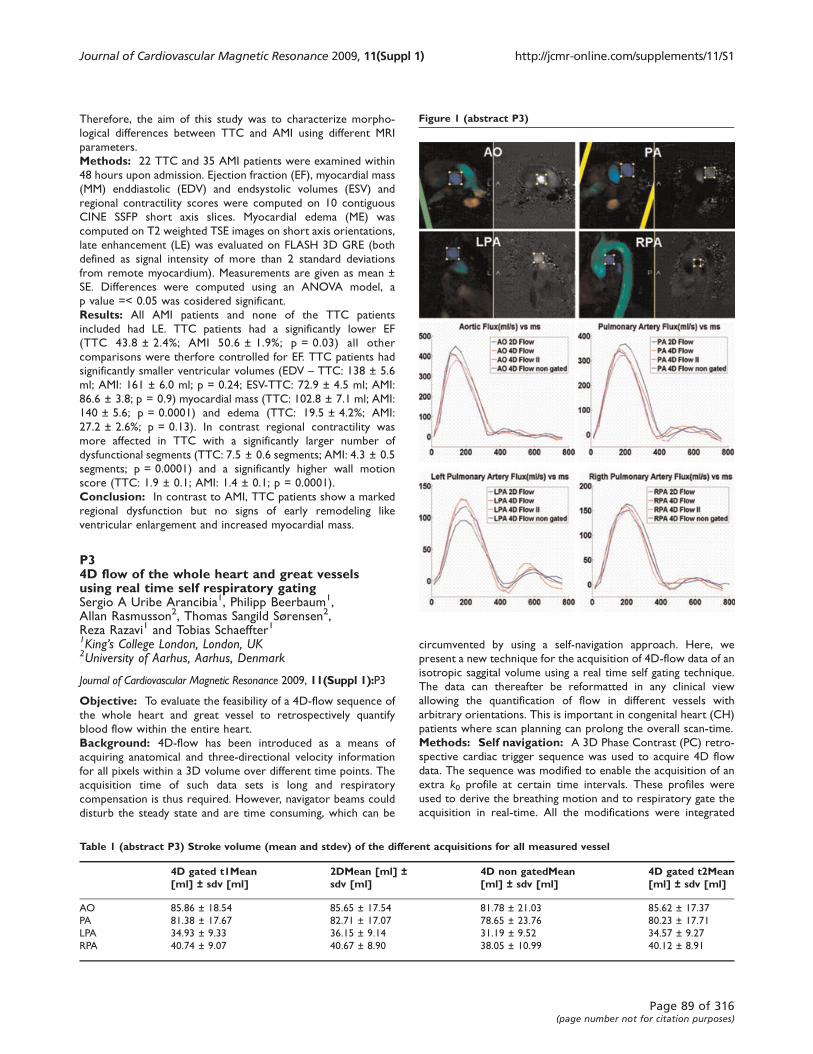
Therefore, the aim of this study was to characterize morpho-
logical differences between TTC and AMI using different MRI
parameters.
Methods: 22 TTC and 35 AMI patients were examined within
48 hours upon admission. Ejection fraction (EF), myocardial mass
(MM) enddiastolic (EDV) and endsystolic volumes (ESV) and
regional contractility scores were computed on 10 contiguous
CINE SSFP short axis slices. Myocardial edema (ME) was
computed on T2 weighted TSE images on short axis orientations,
late enhancement (LE) was evaluated on FLASH 3D GRE (both
defined as signal intensity of more than 2 standard deviations
from remote myocardium). Measurements are given as mean ±
SE. Differences were computed using an ANOVA model, a
p value =< 0.05 was cosidered significant.
Results: All AMI patients and none of the TTC patients
included had LE. TTC patients had a significantly lower EF
(TTC 43.8 ± 2.4%; AMI 50.6 ± 1.9%; p = 0.03) all other
comparisons were therfore controlled for EF. TTC patients had
significantly smaller ventricular volumes (EDV – TTC: 138 ± 5.6
ml; AMI: 161 ± 6.0 ml; p = 0.24; ESV-TTC: 72.9 ± 4.5 ml; AMI:
86.6 ± 3.8; p = 0.9) myocardial mass (TTC: 102.8 ± 7.1 ml; AMI:
140 ± 5.6; p = 0.0001) and edema (TTC: 19.5 ± 4.2%; AMI:
27.2 ± 2.6%; p = 0.13). In contrast regional contractility was
more affected in TTC with a significantly larger number of
dysfunctional segments (TTC: 7.5 ± 0.6 segments; AMI: 4.3 ± 0.5
segments; p = 0.0001) and a significantly higher wall motion
score (TTC: 1.9 ± 0.1; AMI: 1.4 ± 0.1; p = 0.0001).
Conclusion: In contrast to AMI, TTC patients show a marked
regional dysfunction but no signs of early remodeling like
ventricular enlargement and increased myocardial mass.
P34D flow of the whole heart and great vesselsusing real time self respiratory gatingSergio A Uribe Arancibia1, Philipp Beerbaum1,Allan Rasmusson2, Thomas Sangild Sørensen2,Reza Razavi1 and Tobias Schaeffter11King’s College London, London, UK2University of Aarhus, Aarhus, Denmark
Journal of Cardiovascular Magnetic Resonance 2009, 11(Suppl 1):P3
Objective: To evaluate the feasibility of a 4D-flow sequence of
the whole heart and great vessel to retrospectively quantify
blood flow within the entire heart.
Background: 4D-flow has been introduced as a means of
acquiring anatomical and three-directional velocity information
for all pixels within a 3D volume over different time points. The
acquisition time of such data sets is long and respiratory
compensation is thus required. However, navigator beams could
disturb the steady state and are time consuming, which can be
circumvented by using a self-navigation approach. Here, we
present a new technique for the acquisition of 4D-flow data of an
isotropic saggital volume using a real time self gating technique.
The data can thereafter be reformatted in any clinical view
allowing the quantification of flow in different vessels with
arbitrary orientations. This is important in congenital heart (CH)
patients where scan planning can prolong the overall scan-time.
Methods: Self navigation: A 3D Phase Contrast (PC) retro-
spective cardiac trigger sequence was used to acquire 4D flow
data. The sequence was modified to enable the acquisition of an
extra k0 profile at certain time intervals. These profiles were
used to derive the breathing motion and to respiratory gate the
acquisition in real-time. All the modifications were integrated
Figure 1 (abstract P3)
Table 1 (abstract P3) Stroke volume (mean and stdev) of the different acquisitions for all measured vessel
4D gated t1Mean[ml] ± sdv [ml]
2DMean [ml] ±sdv [ml]
4D non gatedMean[ml] ± sdv [ml]
4D gated t2Mean[ml] ± sdv [ml]
AO 85.86 ± 18.54 85.65 ± 17.54 81.78 ± 21.03 85.62 ± 17.37
PA 81.38 ± 17.67 82.71 ± 17.07 78.65 ± 23.76 80.23 ± 17.71
LPA 34.93 ± 9.33 36.15 ± 9.14 31.19 ± 9.52 34.57 ± 9.27
RPA 40.74 ± 9.07 40.67 ± 8.90 38.05 ± 10.99 40.12 ± 8.91
Journal of Cardiovascular Magnetic Resonance 2009, 11(Suppl 1) http://jcmr-online.com/supplements/11/S1
Page 89 of 316(page number not for citation purposes)
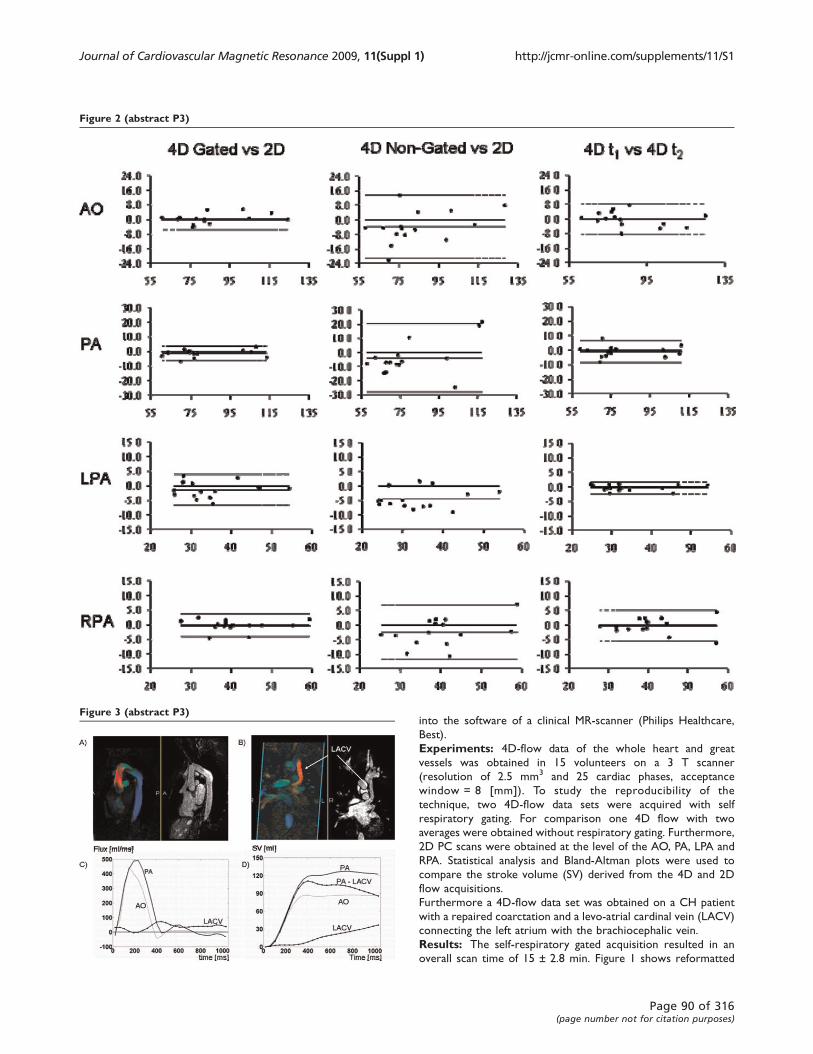
into the software of a clinical MR-scanner (Philips Healthcare,
Best).
Experiments: 4D-flow data of the whole heart and great
vessels was obtained in 15 volunteers on a 3 T scanner
(resolution of 2.5 mm3 and 25 cardiac phases, acceptance
window = 8 [mm]). To study the reproducibility of the
technique, two 4D-flow data sets were acquired with self
respiratory gating. For comparison one 4D flow with two
averages were obtained without respiratory gating. Furthermore,
2D PC scans were obtained at the level of the AO, PA, LPA and
RPA. Statistical analysis and Bland-Altman plots were used to
compare the stroke volume (SV) derived from the 4D and 2D
flow acquisitions.
Furthermore a 4D-flow data set was obtained on a CH patient
with a repaired coarctation and a levo-atrial cardinal vein (LACV)
connecting the left atrium with the brachiocephalic vein.
Results: The self-respiratory gated acquisition resulted in an
overall scan time of 15 ± 2.8 min. Figure 1 shows reformatted
Figure 2 (abstract P3)
Figure 3 (abstract P3)
Journal of Cardiovascular Magnetic Resonance 2009, 11(Suppl 1) http://jcmr-online.com/supplements/11/S1
Page 90 of 316(page number not for citation purposes)
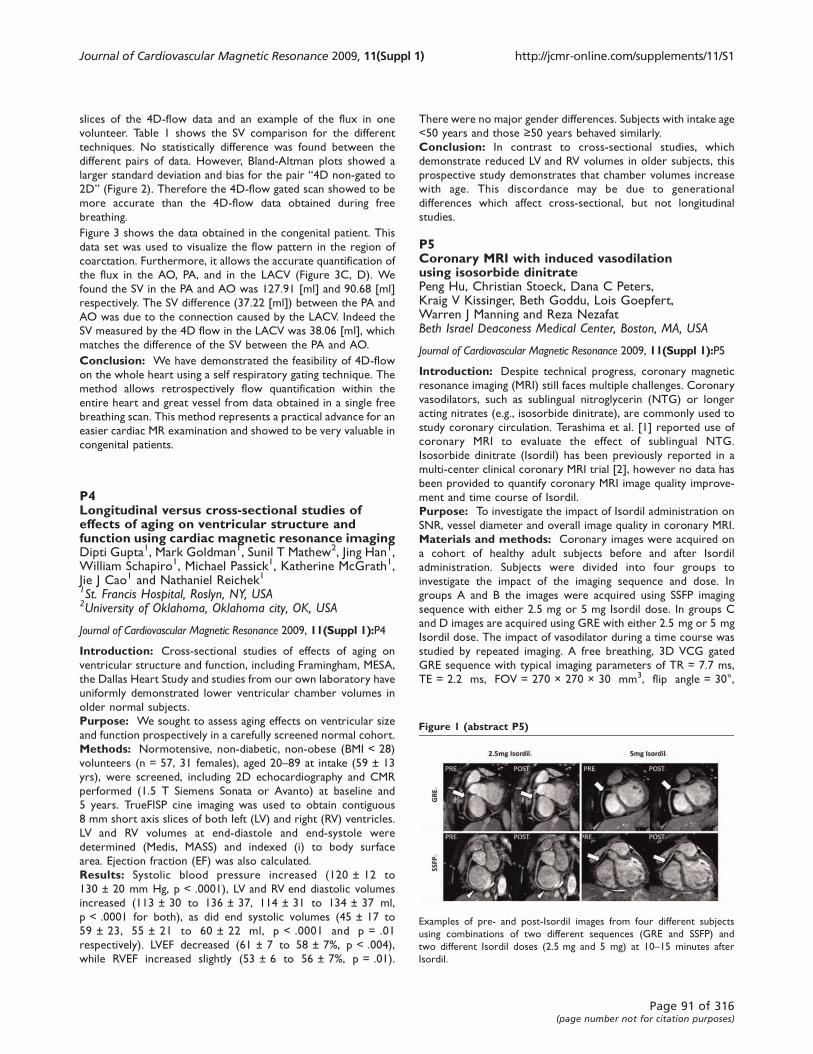
slices of the 4D-flow data and an example of the flux in one
volunteer. Table 1 shows the SV comparison for the different
techniques. No statistically difference was found between the
different pairs of data. However, Bland-Altman plots showed a
larger standard deviation and bias for the pair “4D non-gated to
2D” (Figure 2). Therefore the 4D-flow gated scan showed to be
more accurate than the 4D-flow data obtained during free
breathing.
Figure 3 shows the data obtained in the congenital patient. This
data set was used to visualize the flow pattern in the region of
coarctation. Furthermore, it allows the accurate quantification of
the flux in the AO, PA, and in the LACV (Figure 3C, D). We
found the SV in the PA and AO was 127.91 [ml] and 90.68 [ml]
respectively. The SV difference (37.22 [ml]) between the PA and
AO was due to the connection caused by the LACV. Indeed the
SV measured by the 4D flow in the LACV was 38.06 [ml], which
matches the difference of the SV between the PA and AO.
Conclusion: We have demonstrated the feasibility of 4D-flow
on the whole heart using a self respiratory gating technique. The
method allows retrospectively flow quantification within the
entire heart and great vessel from data obtained in a single free
breathing scan. This method represents a practical advance for an
easier cardiac MR examination and showed to be very valuable in
congenital patients.
P4Longitudinal versus cross-sectional studies ofeffects of aging on ventricular structure andfunction using cardiac magnetic resonance imagingDipti Gupta1, Mark Goldman1, Sunil T Mathew2, Jing Han1,William Schapiro1, Michael Passick1, Katherine McGrath1,Jie J Cao1 and Nathaniel Reichek11St. Francis Hospital, Roslyn, NY, USA2University of Oklahoma, Oklahoma city, OK, USA
Journal of Cardiovascular Magnetic Resonance 2009, 11(Suppl 1):P4
Introduction: Cross-sectional studies of effects of aging on
ventricular structure and function, including Framingham, MESA,
the Dallas Heart Study and studies from our own laboratory have
uniformly demonstrated lower ventricular chamber volumes in
older normal subjects.
Purpose: We sought to assess aging effects on ventricular size
and function prospectively in a carefully screened normal cohort.
Methods: Normotensive, non-diabetic, non-obese (BMI < 28)
volunteers (n = 57, 31 females), aged 20–89 at intake (59 ± 13
yrs), were screened, including 2D echocardiography and CMR
performed (1.5 T Siemens Sonata or Avanto) at baseline and
5 years. TrueFISP cine imaging was used to obtain contiguous
8 mm short axis slices of both left (LV) and right (RV) ventricles.
LV and RV volumes at end-diastole and end-systole were
determined (Medis, MASS) and indexed (i) to body surface
area. Ejection fraction (EF) was also calculated.
Results: Systolic blood pressure increased (120 ± 12 to
130 ± 20 mm Hg, p < .0001), LV and RV end diastolic volumes
increased (113 ± 30 to 136 ± 37, 114 ± 31 to 134 ± 37 ml,
p < .0001 for both), as did end systolic volumes (45 ± 17 to
59 ± 23, 55 ± 21 to 60 ± 22 ml, p < .0001 and p = .01
respectively). LVEF decreased (61 ± 7 to 58 ± 7%, p < .004),
while RVEF increased slightly (53 ± 6 to 56 ± 7%, p = .01).
There were no major gender differences. Subjects with intake age
<50 years and those ≥50 years behaved similarly.
Conclusion: In contrast to cross-sectional studies, which
demonstrate reduced LV and RV volumes in older subjects, this
prospective study demonstrates that chamber volumes increase
with age. This discordance may be due to generational
differences which affect cross-sectional, but not longitudinal
studies.
P5Coronary MRI with induced vasodilationusing isosorbide dinitratePeng Hu, Christian Stoeck, Dana C Peters,Kraig V Kissinger, Beth Goddu, Lois Goepfert,Warren J Manning and Reza NezafatBeth Israel Deaconess Medical Center, Boston, MA, USA
Journal of Cardiovascular Magnetic Resonance 2009, 11(Suppl 1):P5
Introduction: Despite technical progress, coronary magnetic
resonance imaging (MRI) still faces multiple challenges. Coronary
vasodilators, such as sublingual nitroglycerin (NTG) or longer
acting nitrates (e.g., isosorbide dinitrate), are commonly used to
study coronary circulation. Terashima et al. [1] reported use of
coronary MRI to evaluate the effect of sublingual NTG.
Isosorbide dinitrate (Isordil) has been previously reported in a
multi-center clinical coronary MRI trial [2], however no data has
been provided to quantify coronary MRI image quality improve-
ment and time course of Isordil.
Purpose: To investigate the impact of Isordil administration on
SNR, vessel diameter and overall image quality in coronary MRI.
Materials and methods: Coronary images were acquired on
a cohort of healthy adult subjects before and after Isordil
administration. Subjects were divided into four groups to
investigate the impact of the imaging sequence and dose. In
groups A and B the images were acquired using SSFP imaging
sequence with either 2.5 mg or 5 mg Isordil dose. In groups C
and D images are acquired using GRE with either 2.5 mg or 5 mg
Isordil dose. The impact of vasodilator during a time course was
studied by repeated imaging. A free breathing, 3D VCG gated
GRE sequence with typical imaging parameters of TR = 7.7 ms,
TE = 2.2 ms, FOV = 270 × 270 × 30 mm3, flip angle = 30°,
Figure 1 (abstract P5)
Examples of pre- and post-Isordil images from four different subjects
using combinations of two different sequences (GRE and SSFP) and
two different Isordil doses (2.5 mg and 5 mg) at 10–15 minutes after
Isordil.
Journal of Cardiovascular Magnetic Resonance 2009, 11(Suppl 1) http://jcmr-online.com/supplements/11/S1
Page 91 of 316(page number not for citation purposes)
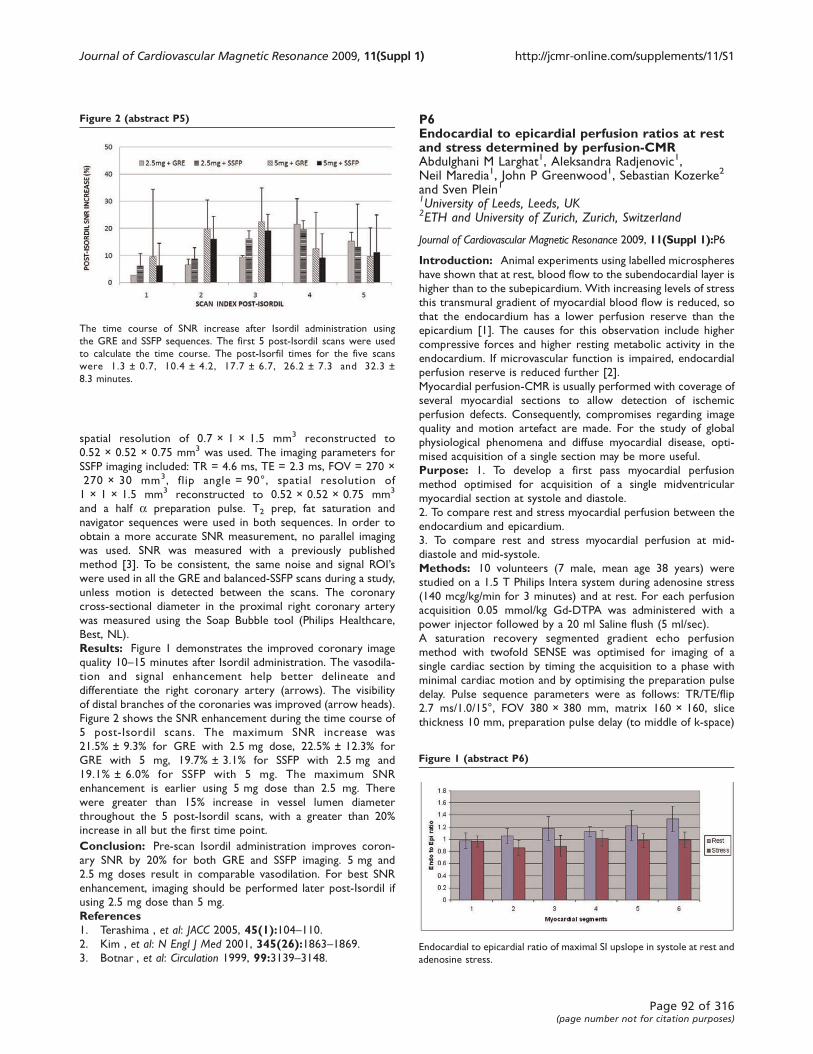
spatial resolution of 0.7 × 1 × 1.5 mm3 reconstructed to
0.52 × 0.52 × 0.75 mm3 was used. The imaging parameters for
SSFP imaging included: TR = 4.6 ms, TE = 2.3 ms, FOV = 270 ×
270 × 30 mm3, flip angle = 90°, spatial resolution of
1 × 1 × 1.5 mm3 reconstructed to 0.52 × 0.52 × 0.75 mm3
and a half a preparation pulse. T2 prep, fat saturation and
navigator sequences were used in both sequences. In order to
obtain a more accurate SNR measurement, no parallel imaging
was used. SNR was measured with a previously published
method [3]. To be consistent, the same noise and signal ROI’swere used in all the GRE and balanced-SSFP scans during a study,
unless motion is detected between the scans. The coronary
cross-sectional diameter in the proximal right coronary artery
was measured using the Soap Bubble tool (Philips Healthcare,
Best, NL).
Results: Figure 1 demonstrates the improved coronary image
quality 10–15 minutes after Isordil administration. The vasodila-
tion and signal enhancement help better delineate and
differentiate the right coronary artery (arrows). The visibility
of distal branches of the coronaries was improved (arrow heads).
Figure 2 shows the SNR enhancement during the time course of
5 post-Isordil scans. The maximum SNR increase was
21.5% ± 9.3% for GRE with 2.5 mg dose, 22.5% ± 12.3% for
GRE with 5 mg, 19.7% ± 3.1% for SSFP with 2.5 mg and
19.1% ± 6.0% for SSFP with 5 mg. The maximum SNR
enhancement is earlier using 5 mg dose than 2.5 mg. There
were greater than 15% increase in vessel lumen diameter
throughout the 5 post-Isordil scans, with a greater than 20%
increase in all but the first time point.
Conclusion: Pre-scan Isordil administration improves coron-
ary SNR by 20% for both GRE and SSFP imaging. 5 mg and
2.5 mg doses result in comparable vasodilation. For best SNR
enhancement, imaging should be performed later post-Isordil if
using 2.5 mg dose than 5 mg.
References1. Terashima , et al: JACC 2005, 45(1):104–110.2. Kim , et al: N Engl J Med 2001, 345(26):1863–1869.3. Botnar , et al: Circulation 1999, 99:3139–3148.
P6Endocardial to epicardial perfusion ratios at restand stress determined by perfusion-CMRAbdulghani M Larghat1, Aleksandra Radjenovic1,Neil Maredia1, John P Greenwood1, Sebastian Kozerke2
and Sven Plein11University of Leeds, Leeds, UK2ETH and University of Zurich, Zurich, Switzerland
Journal of Cardiovascular Magnetic Resonance 2009, 11(Suppl 1):P6
Introduction: Animal experiments using labelled microspheres
have shown that at rest, blood flow to the subendocardial layer is
higher than to the subepicardium. With increasing levels of stress
this transmural gradient of myocardial blood flow is reduced, so
that the endocardium has a lower perfusion reserve than the
epicardium [1]. The causes for this observation include higher
compressive forces and higher resting metabolic activity in the
endocardium. If microvascular function is impaired, endocardial
perfusion reserve is reduced further [2].
Myocardial perfusion-CMR is usually performed with coverage of
several myocardial sections to allow detection of ischemic
perfusion defects. Consequently, compromises regarding image
quality and motion artefact are made. For the study of global
physiological phenomena and diffuse myocardial disease, opti-
mised acquisition of a single section may be more useful.
Purpose: 1. To develop a first pass myocardial perfusion
method optimised for acquisition of a single midventricular
myocardial section at systole and diastole.
2. To compare rest and stress myocardial perfusion between the
endocardium and epicardium.
3. To compare rest and stress myocardial perfusion at mid-
diastole and mid-systole.
Methods: 10 volunteers (7 male, mean age 38 years) were
studied on a 1.5 T Philips Intera system during adenosine stress
(140 mcg/kg/min for 3 minutes) and at rest. For each perfusion
acquisition 0.05 mmol/kg Gd-DTPA was administered with a
power injector followed by a 20 ml Saline flush (5 ml/sec).
A saturation recovery segmented gradient echo perfusion
method with twofold SENSE was optimised for imaging of a
single cardiac section by timing the acquisition to a phase with
minimal cardiac motion and by optimising the preparation pulse
delay. Pulse sequence parameters were as follows: TR/TE/flip
2.7 ms/1.0/15°, FOV 380 × 380 mm, matrix 160 × 160, slice
thickness 10 mm, preparation pulse delay (to middle of k-space)
Figure 2 (abstract P5)
The time course of SNR increase after Isordil administration using
the GRE and SSFP sequences. The first 5 post-Isordil scans were used
to calculate the time course. The post-Isorfil times for the five scans
were 1.3 ± 0.7, 10.4 ± 4.2, 17.7 ± 6.7, 26.2 ± 7.3 and 32.3 ±
8.3 minutes.
Figure 1 (abstract P6)
Endocardial to epicardial ratio of maximal SI upslope in systole at rest and
adenosine stress.
Journal of Cardiovascular Magnetic Resonance 2009, 11(Suppl 1) http://jcmr-online.com/supplements/11/S1
Page 92 of 316(page number not for citation purposes)
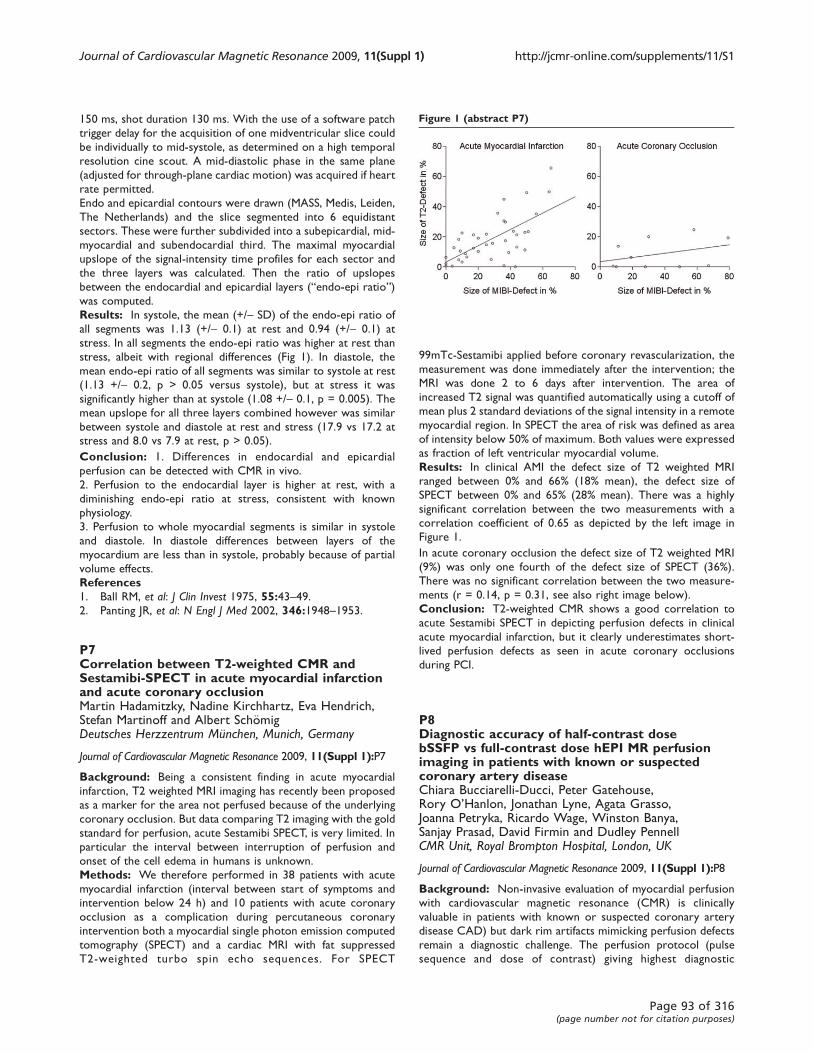
150 ms, shot duration 130 ms. With the use of a software patch
trigger delay for the acquisition of one midventricular slice could
be individually to mid-systole, as determined on a high temporal
resolution cine scout. A mid-diastolic phase in the same plane
(adjusted for through-plane cardiac motion) was acquired if heart
rate permitted.
Endo and epicardial contours were drawn (MASS, Medis, Leiden,
The Netherlands) and the slice segmented into 6 equidistant
sectors. These were further subdivided into a subepicardial, mid-
myocardial and subendocardial third. The maximal myocardial
upslope of the signal-intensity time profiles for each sector and
the three layers was calculated. Then the ratio of upslopes
between the endocardial and epicardial layers (“endo-epi ratio”)was computed.
Results: In systole, the mean (+/- SD) of the endo-epi ratio of
all segments was 1.13 (+/- 0.1) at rest and 0.94 (+/- 0.1) at
stress. In all segments the endo-epi ratio was higher at rest than
stress, albeit with regional differences (Fig 1). In diastole, the
mean endo-epi ratio of all segments was similar to systole at rest
(1.13 +/- 0.2, p > 0.05 versus systole), but at stress it was
significantly higher than at systole (1.08 +/- 0.1, p = 0.005). The
mean upslope for all three layers combined however was similar
between systole and diastole at rest and stress (17.9 vs 17.2 at
stress and 8.0 vs 7.9 at rest, p > 0.05).
Conclusion: 1. Differences in endocardial and epicardial
perfusion can be detected with CMR in vivo.
2. Perfusion to the endocardial layer is higher at rest, with a
diminishing endo-epi ratio at stress, consistent with known
physiology.
3. Perfusion to whole myocardial segments is similar in systole
and diastole. In diastole differences between layers of the
myocardium are less than in systole, probably because of partial
volume effects.
References1. Ball RM, et al: J Clin Invest 1975, 55:43–49.2. Panting JR, et al: N Engl J Med 2002, 346:1948–1953.
P7Correlation between T2-weighted CMR andSestamibi-SPECT in acute myocardial infarctionand acute coronary occlusionMartin Hadamitzky, Nadine Kirchhartz, Eva Hendrich,Stefan Martinoff and Albert SchömigDeutsches Herzzentrum München, Munich, Germany
Journal of Cardiovascular Magnetic Resonance 2009, 11(Suppl 1):P7
Background: Being a consistent finding in acute myocardial
infarction, T2 weighted MRI imaging has recently been proposed
as a marker for the area not perfused because of the underlying
coronary occlusion. But data comparing T2 imaging with the gold
standard for perfusion, acute Sestamibi SPECT, is very limited. In
particular the interval between interruption of perfusion and
onset of the cell edema in humans is unknown.
Methods: We therefore performed in 38 patients with acute
myocardial infarction (interval between start of symptoms and
intervention below 24 h) and 10 patients with acute coronary
occlusion as a complication during percutaneous coronary
intervention both a myocardial single photon emission computed
tomography (SPECT) and a cardiac MRI with fat suppressed
T2-weighted turbo spin echo sequences. For SPECT
99mTc-Sestamibi applied before coronary revascularization, the
measurement was done immediately after the intervention; the
MRI was done 2 to 6 days after intervention. The area of
increased T2 signal was quantified automatically using a cutoff of
mean plus 2 standard deviations of the signal intensity in a remote
myocardial region. In SPECT the area of risk was defined as area
of intensity below 50% of maximum. Both values were expressed
as fraction of left ventricular myocardial volume.
Results: In clinical AMI the defect size of T2 weighted MRI
ranged between 0% and 66% (18% mean), the defect size of
SPECT between 0% and 65% (28% mean). There was a highly
significant correlation between the two measurements with a
correlation coefficient of 0.65 as depicted by the left image in
Figure 1.
In acute coronary occlusion the defect size of T2 weighted MRI
(9%) was only one fourth of the defect size of SPECT (36%).
There was no significant correlation between the two measure-
ments (r = 0.14, p = 0.31, see also right image below).
Conclusion: T2-weighted CMR shows a good correlation to
acute Sestamibi SPECT in depicting perfusion defects in clinical
acute myocardial infarction, but it clearly underestimates short-
lived perfusion defects as seen in acute coronary occlusions
during PCI.
P8Diagnostic accuracy of half-contrast dosebSSFP vs full-contrast dose hEPI MR perfusionimaging in patients with known or suspectedcoronary artery diseaseChiara Bucciarelli-Ducci, Peter Gatehouse,Rory O’Hanlon, Jonathan Lyne, Agata Grasso,Joanna Petryka, Ricardo Wage, Winston Banya,Sanjay Prasad, David Firmin and Dudley PennellCMR Unit, Royal Brompton Hospital, London, UK
Journal of Cardiovascular Magnetic Resonance 2009, 11(Suppl 1):P8
Background: Non-invasive evaluation of myocardial perfusion
with cardiovascular magnetic resonance (CMR) is clinically
valuable in patients with known or suspected coronary artery
disease CAD) but dark rim artifacts mimicking perfusion defects
remain a diagnostic challenge. The perfusion protocol (pulse
sequence and dose of contrast) giving highest diagnostic
Figure 1 (abstract P7)
Journal of Cardiovascular Magnetic Resonance 2009, 11(Suppl 1) http://jcmr-online.com/supplements/11/S1
Page 93 of 316(page number not for citation purposes)

confidence is not yet standardised. Hybrid EPI (hEPI) is a
fast sequence reducing motion artifact by its short imaging
time, but with low SNR. Balanced SSFP (bSSFP) has greater SNR
but previously has been reported as more prone to dark
subendocardial rim artifacts: field distortion by the high-dose
bolus is one suspected reason, and this distortion could
potentially be reduced by using a half contrast dose, making
use of bSSFP’s abundant SNR. We therefore compared these
2 sequences.
Methods: Seventeen patients were scanned at 1.5 T (Siemens,
Avanto) with both protocols. All patients underwent coronary
angiography (CA) and significant CAD (>50% stenosis) was
detected in 6/17 patients (35%).
The dose of gadolinium contrast agent was 0.1 mmol/kg for the hEPI
sequence and 0.05 mmol/kg for bSSFP, with 15 ml flush at 7 ml/s.
Centre-out hEPI (TR 5.8 ms, 30°, ETL 4, 1860 Hz/pixel) acquired
2.8 × 2.8 × 8 mm voxels over typically 360 × 270 mm FOV
(adapted per patient) at TI = 110–160 ms for each of 3 fat-
suppressed slices per cycle, using TSENSE (R2), typical image
time 75 ms (i.e. excluding prepulses). Linear-ordered bSSFP (TR
2.6 ms, 70°, 930 Hz/pixel) acquired the same voxel size at the
same TI for central of k-space for each of 3 fat-suppressed slices
per cycle, using TSENSE (R2), typical image time 125 ms. The
slice acquisition order was the same in hEPI and bSSFP, resulting
in approximately similar image timings through the cardiac cycle
in both. Slice positions in the heart were reproduced by viewing
the first study while piloting the second.
The randomised scans were scored by 2 blinded experienced
observers based on the 16-segment model. Perfusion scan
myocardial SNR and diagnostic confidence were assessed
subjectively (score from 0 = unusable to 4 = excellent). Severity
of perfusion defects was graded based on its transmurality
(0 = none, 1 = <25% 2 = 25–50%, 3 = 51–75%, 4 = >76%, and
A = dark rim artefact). A total of 272 segments were analyzed.
Sensitivity and specificity of both sequences were calculated and
comparison of agreement between observers and scan methods
was assessed by kappa coefficients.
Results: The agreement between bSSFP and hEPI scans on the
presence of normal perfusion, artefacts or genuine perfusion
defects was 65% (k = 0.25, 95% CI: 0.17–0.33, p < 0.0001) for
observer 1 and 53% (k = 0.15, 95% CI: 0.09–0.21, p < 0.0001)
for observer 2.
The agreement between observer 1 and 2 on the presence of
normal perfusion, artefacts or genuine perfusion defects was 83%
(k = 0.51, 95% CI: 0.41–0.61, p < 0.0001) for hEPI scans and 53%
(k = 0.15, 95% CI: 0.10–0.26, p < 0.0001) for the bSSFP scans.
True artefacts (compared against CA) occurred more frequently
with bSSFP (59 segments, 22%) than with hEPI (14 segments, 5%)
(X2, p < 0.001).
Using CA as gold-standard, sensitivity and specificity of bSSFP
scans was 17% and 88% (observer 1), 25% and 72% (observer 2).
Conversely, sensitivity and specificity of hEPI scans was 42% and
87% (observer 1), 33% and 84% (observer 2).
Observer 1 noted a significant lower diagnostic confidence for
bSSFP vs hEPI scans (p < 0.03). Both observers reported a
similar diagnostic confidence for hEPI scans. The SNR of the
bSSFP and hEPI were similar for both observers.
Conclusion: Overall, bSSFP demonstrated lower diagnostic
accuracy compared to hEPI. Dark-rim artifacts occurred more
frequently in the bSSFP than hEPI, even when the half-contrast
dose was used. Although two experienced observers were
usually able to correctly identify dark-rim artefacts, using bSSFP
in clinical practise in less experienced centers may not be ideal
because of reduced diagnostic confidence.
P9A 3D evaluation of dyssynchrony may offer anadvantage over a 2D approach; a cardiovascularMRI method for dyssynchrony quantificationRobert WW Biederman1, Frank Grothues2,Helmut Klein2, Ronald B Williams1, June A Yamrozik1,Geetha Rayarao1, Diane A Vido1, Christof Huth2
and Mark Doyle11Allegheny General Hospital, The Gerald McGinnisCardiovascular Institute, Pittsburgh, PA, USA2University Hospital Magdeburg, Magdeburg, Germany
Journal of Cardiovascular Magnetic Resonance 2009, 11(Suppl 1):P9
Introduction: Detection of dyssynchrony is primarily per-
formed by EKG and/or tissue Doppler echocardiography,
sampling the heart in selected basal segments. Limited
approaches for dyssynchrony have been performed by cardio-
vascular MRI (CMR).
Hypothesis: We hypothesize that 3D global assessment of
dyssynchrony may be more sensitive than conventional regional 2D
analysis.
Methods: At baseline, 8 patients (47 ± 9 yrs) with mean
NYHA Class 2.3 ± 0.5 on optimal medical therapy (maintained
throughout the study) underwent 3D CMR (1.5 T GE) to assess
LV function. Using Medis Mass software (Leiden, The Nether-
lands), endo and epicardial boundaries were outlined in multiple
contiguous short-axis slices. For each slice the myocardium was
circumferentially divided into 16 equally spaced segments. End-
systolic (ES) time was automatically identified as time of maximal
wall thickening and the dyssynchrony index taken as the
dispersion of ES times. Patients underwent HeartNetTM
(Paracor Medical Inc, Sunnyvale, CA) placement. A follow-up
CMR was performed at 6 months. In total >800 data points were
generated for each heart (as compared to 6 by standard
echocardiography). The dispersion of the ES time was analyzed
for pre to post treatment effect for the basal region separately
using all measured points and for 4, 6, or 8 equally spaced
circumferential regions, each set starting at several offset values,
resulting in 11 regional data sets.
Results: All patients survived HeartNet™ placement and were
available for 6 month follow-up. When using all segments to
describe the dispersion of ES time pre to post, a statistically
significant change in the dyssynchrony index was observed (254
vs. 220 ms, p < 0.001). When assessed using the separate 2D
analysis, a pre-post change in dyssynchrony was only detected in
3 out of 11 data series (36%).
Conclusion: By its nature, dyssynchrony is a heterogeneous
phenomenon. When assessed using a 3D CMR approach, a pre
to post treatment effect was detectable. However, when
restricting measurements to 4, 6, or 8 equally spaced regions
(analagous to a 2D echocardiographic approach), the chance of
detecting the change in dyssynchrony substantially dropped,
indicating that the phenomenon of Dyssynchrony should be
assessed using a global 3D as opposed to regional 2D approach,
irrespective of assessment modality.
Journal of Cardiovascular Magnetic Resonance 2009, 11(Suppl 1) http://jcmr-online.com/supplements/11/S1
Page 94 of 316(page number not for citation purposes)
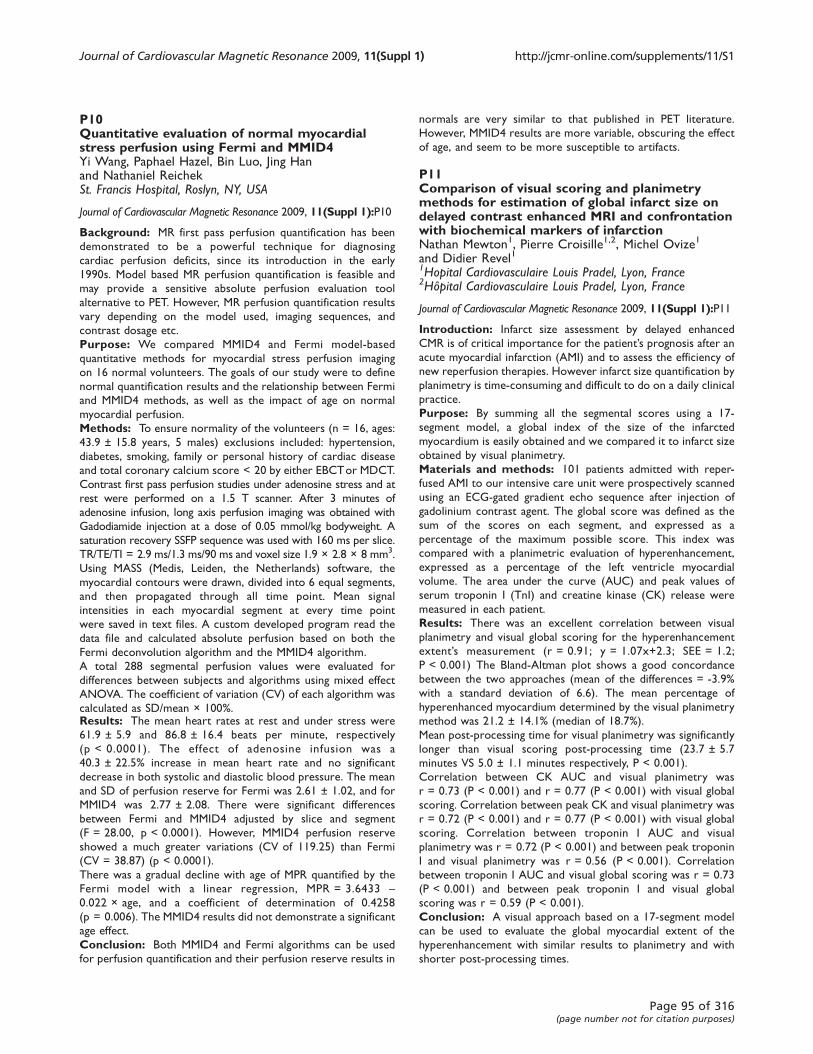
P10Quantitative evaluation of normal myocardialstress perfusion using Fermi and MMID4Yi Wang, Paphael Hazel, Bin Luo, Jing Hanand Nathaniel ReichekSt. Francis Hospital, Roslyn, NY, USA
Journal of Cardiovascular Magnetic Resonance 2009, 11(Suppl 1):P10
Background: MR first pass perfusion quantification has been
demonstrated to be a powerful technique for diagnosing
cardiac perfusion deficits, since its introduction in the early
1990s. Model based MR perfusion quantification is feasible and
may provide a sensitive absolute perfusion evaluation tool
alternative to PET. However, MR perfusion quantification results
vary depending on the model used, imaging sequences, and
contrast dosage etc.
Purpose: We compared MMID4 and Fermi model-based
quantitative methods for myocardial stress perfusion imaging
on 16 normal volunteers. The goals of our study were to define
normal quantification results and the relationship between Fermi
and MMID4 methods, as well as the impact of age on normal
myocardial perfusion.
Methods: To ensure normality of the volunteers (n = 16, ages:
43.9 ± 15.8 years, 5 males) exclusions included: hypertension,
diabetes, smoking, family or personal history of cardiac disease
and total coronary calcium score < 20 by either EBCTor MDCT.
Contrast first pass perfusion studies under adenosine stress and at
rest were performed on a 1.5 T scanner. After 3 minutes of
adenosine infusion, long axis perfusion imaging was obtained with
Gadodiamide injection at a dose of 0.05 mmol/kg bodyweight. A
saturation recovery SSFP sequence was used with 160 ms per slice.
TR/TE/TI = 2.9 ms/1.3 ms/90 ms and voxel size 1.9 × 2.8 × 8 mm3.
Using MASS (Medis, Leiden, the Netherlands) software, the
myocardial contours were drawn, divided into 6 equal segments,
and then propagated through all time point. Mean signal
intensities in each myocardial segment at every time point
were saved in text files. A custom developed program read the
data file and calculated absolute perfusion based on both the
Fermi deconvolution algorithm and the MMID4 algorithm.
A total 288 segmental perfusion values were evaluated for
differences between subjects and algorithms using mixed effect
ANOVA. The coefficient of variation (CV) of each algorithm was
calculated as SD/mean × 100%.Results: The mean heart rates at rest and under stress were
61.9 ± 5.9 and 86.8 ± 16.4 beats per minute, respectively
(p < 0.0001). The effect of adenosine infusion was a
40.3 ± 22.5% increase in mean heart rate and no significant
decrease in both systolic and diastolic blood pressure. The mean
and SD of perfusion reserve for Fermi was 2.61 ± 1.02, and for
MMID4 was 2.77 ± 2.08. There were significant differences
between Fermi and MMID4 adjusted by slice and segment
(F = 28.00, p < 0.0001). However, MMID4 perfusion reserve
showed a much greater variations (CV of 119.25) than Fermi
(CV = 38.87) (p < 0.0001).
There was a gradual decline with age of MPR quantified by the
Fermi model with a linear regression, MPR = 3.6433 –0.022 × age, and a coefficient of determination of 0.4258
(p = 0.006). The MMID4 results did not demonstrate a significant
age effect.
Conclusion: Both MMID4 and Fermi algorithms can be used
for perfusion quantification and their perfusion reserve results in
normals are very similar to that published in PET literature.
However, MMID4 results are more variable, obscuring the effect
of age, and seem to be more susceptible to artifacts.
P11Comparison of visual scoring and planimetrymethods for estimation of global infarct size ondelayed contrast enhanced MRI and confrontationwith biochemical markers of infarctionNathan Mewton1, Pierre Croisille1,2, Michel Ovize1
and Didier Revel11Hopital Cardiovasculaire Louis Pradel, Lyon, France2Hôpital Cardiovasculaire Louis Pradel, Lyon, France
Journal of Cardiovascular Magnetic Resonance 2009, 11(Suppl 1):P11
Introduction: Infarct size assessment by delayed enhanced
CMR is of critical importance for the patient’s prognosis after anacute myocardial infarction (AMI) and to assess the efficiency of
new reperfusion therapies. However infarct size quantification by
planimetry is time-consuming and difficult to do on a daily clinical
practice.
Purpose: By summing all the segmental scores using a 17-
segment model, a global index of the size of the infarcted
myocardium is easily obtained and we compared it to infarct size
obtained by visual planimetry.
Materials and methods: 101 patients admitted with reper-
fused AMI to our intensive care unit were prospectively scanned
using an ECG-gated gradient echo sequence after injection of
gadolinium contrast agent. The global score was defined as the
sum of the scores on each segment, and expressed as a
percentage of the maximum possible score. This index was
compared with a planimetric evaluation of hyperenhancement,
expressed as a percentage of the left ventricle myocardial
volume. The area under the curve (AUC) and peak values of
serum troponin I (TnI) and creatine kinase (CK) release were
measured in each patient.
Results: There was an excellent correlation between visual
planimetry and visual global scoring for the hyperenhancement
extent’s measurement (r = 0.91; y = 1.07x+2.3; SEE = 1.2;
P < 0.001) The Bland-Altman plot shows a good concordance
between the two approaches (mean of the differences = -3.9%
with a standard deviation of 6.6). The mean percentage of
hyperenhanced myocardium determined by the visual planimetry
method was 21.2 ± 14.1% (median of 18.7%).
Mean post-processing time for visual planimetry was significantly
longer than visual scoring post-processing time (23.7 ± 5.7
minutes VS 5.0 ± 1.1 minutes respectively, P < 0.001).
Correlation between CK AUC and visual planimetry was
r = 0.73 (P < 0.001) and r = 0.77 (P < 0.001) with visual global
scoring. Correlation between peak CK and visual planimetry was
r = 0.72 (P < 0.001) and r = 0.77 (P < 0.001) with visual global
scoring. Correlation between troponin I AUC and visual
planimetry was r = 0.72 (P < 0.001) and between peak troponin
I and visual planimetry was r = 0.56 (P < 0.001). Correlation
between troponin I AUC and visual global scoring was r = 0.73
(P < 0.001) and between peak troponin I and visual global
scoring was r = 0.59 (P < 0.001).
Conclusion: A visual approach based on a 17-segment model
can be used to evaluate the global myocardial extent of the
hyperenhancement with similar results to planimetry and with
shorter post-processing times.
Journal of Cardiovascular Magnetic Resonance 2009, 11(Suppl 1) http://jcmr-online.com/supplements/11/S1
Page 95 of 316(page number not for citation purposes)

P12Increased susceptibility of the left lateralfree wall to myocardial delayed enhancement inDuchenne Muscular Dystrophy: progressivesystolic dysfunction demonstrable byCMR regional strain analysisNarayan Kissoon1, Kan N Hor2, Janaka P Wansapura2,Wojciech Mazur3, Robert J Fleck2, Micheal D Puchalski4,D Woodrow Benson2 and William M Gottliebson21University of Minnesota, Minneapolis, MN, USA2Cincinnati Childrens Hospital Medical Center, Cincinnati,OH, USA3Christ Hospital Medical Center, Cincinnati, OH, USA4Primary Childrens Hospital, Salt Lake City, UT, USA
Journal of Cardiovascular Magnetic Resonance 2009, 11(Suppl 1):P12
Background: Cardiac magnetic resonance imaging (CMR) has
demonstrated reductions in peak LV myocardial circumferential
strain (ecc) despite normal ejection fraction (EF) in Duchenne
Muscular Dystrophy (DMD) patients. We hypothesized that the
increased initial contractility of the lateral LV free wall makes that
region more susceptible to myocardial injury with subsequent
fibrosis than the septum in DMD patients.
Methods: We analyzed regional ecc from myocardial tagged
CMR images on the mid-papillary level LV slice (using HARP™
software) from 14 DMD males with global cardiac dysfunction
(LV EF < 55%) and myocardial delayed enhancement (MDE, a
marker of myocardial fibrosis), as well as from 13 age-matched
control males with normal cardiac function. Regions were
assigned based on standard coronary perfusion regions. Regional
Decc was computed as the difference between normal and DMD
subject ecc per region.
Results: In controls, the lateral free wall regions had a greater
baseline ecc than the septal regions. In DMD patients, Decc wasconsistently greater in magnitude in the lateral free wall regions
when compared to the Decc of the septal regions (Figure 1). MDE
was consistently detected in these same lateral free wall regions.
Conclusion: Changes in ecc show that the regions with
greatest contractility in control subjects (the lateral free wall)
are the most susceptible to injury in DMD patients, as
exemplified both by the greatest reduction in regional ecc and
the development of MDE in those regions.
P13Pulse wave velocity in the aortic arch is thestrongest predictor of left ventricularconcentric remodeling in subjects withdifferent levels of cardiovascular riskAlban Redheuil1, Wen Chung Yu1, Raymond T Yan1,Elie Mousseaux2, Alain De Cesare2, David A Bluemke3
and Joao AC Lima11Johns Hopkins University, Baltimore, MD, USA2INSERM U678, Paris, France3NIH, Bethesda, MD, USA
Journal of Cardiovascular Magnetic Resonance 2009, 11(Suppl 1):P13
Introduction: Increased systolic blood pressure (SBP), pulse
pressure (PP) and left ventricular (LV) concentric remodeling are
associated with aging and increased cardiovascular risk. The
aortic arch accounts for most of the vascular buffering function
and is primarily involved in arterial stiffening and complications.
Mechanisms of heart failure during aging and the role of aortic-
ventricular stiffening and interaction need clarification. In
particular, the importance of the aortic arch on central arterial
stiffness remains unclear.
Purpose: In this study, we evaluated the contribution of aortic
arch stiffness to LV concentric remodeling
Methods: We studied 52 subjects: 28 men; mean age: 41 yrs
[20–79], 40 without and 12 with risk factors (hypertension in all
and diabetes in 6) and normal LV ejection fraction. Global aortic
stiffness was determined from carotid-femoral pulse wave
velocity (cfPWV) using tonometry and transit surface distances.
Aortic stiffness in the aortic arch was determined by MRI from as
regional pulse wave velocity (PWV): ratio of aortic length to
flow transit time. Augmentation index was calculated from
tonometry as the ratio of the pressure above the inflection point
and PP. SBP, MBP and PP were averages of 6 brachial
measurements. End diastolic LV mass was measured on cine
MRI. LV mass to volume ratio (M/V) was calculated as end
diastolic volume over mass. Correlations are given and multi-
variate regression was used to study the determinants of
concentric LV remodeling (M/V)
Results: M/V ratio increased with age: r = 0.35 (p = 0.01);
mean M/V in subjects <50 years is 0.97 vs. 1.18 in subjects >=
50 years (p = 0.006). Aortic arch PWV increased with age:
r = 0.77 (p < 0.001), SBP: r = 0.62 (p < 0.001), PP: r = 0.69
(p < 0.001) and was well correlated with cfPWV: r = 0.83
(p < 0.001). However, PWV in the aortic arch was a stronger
determinant of M/V ratio than global cfPWV in subjects >50
years. Moreover, in multivariate analysis using age, BMI, SBP, PP,
augmentation index and cfPWV, PWV in the aortic arch was the
Figure 1 (abstract P12)
Regional distribution of MDE and corresponding Decc.
Journal of Cardiovascular Magnetic Resonance 2009, 11(Suppl 1) http://jcmr-online.com/supplements/11/S1
Page 96 of 316(page number not for citation purposes)
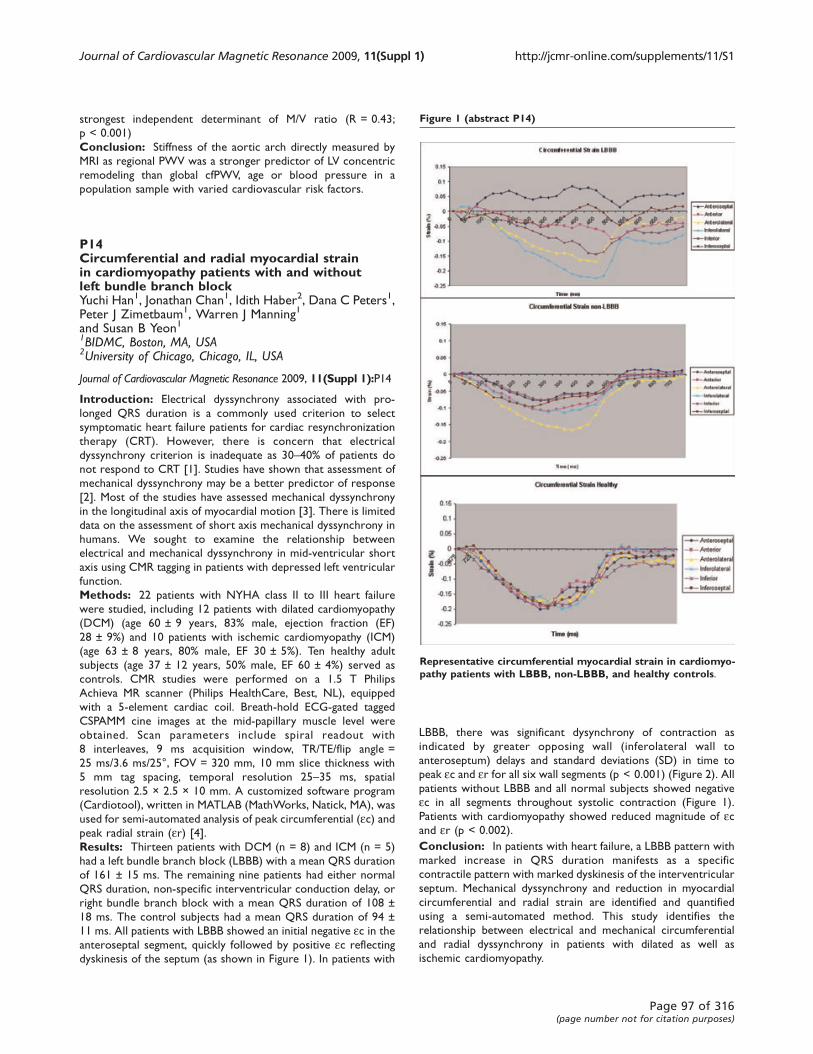
strongest independent determinant of M/V ratio (R = 0.43;
p < 0.001)
Conclusion: Stiffness of the aortic arch directly measured by
MRI as regional PWV was a stronger predictor of LV concentric
remodeling than global cfPWV, age or blood pressure in a
population sample with varied cardiovascular risk factors.
P14Circumferential and radial myocardial strainin cardiomyopathy patients with and withoutleft bundle branch blockYuchi Han1, Jonathan Chan1, Idith Haber2, Dana C Peters1,Peter J Zimetbaum1, Warren J Manning1
and Susan B Yeon11BIDMC, Boston, MA, USA2University of Chicago, Chicago, IL, USA
Journal of Cardiovascular Magnetic Resonance 2009, 11(Suppl 1):P14
Introduction: Electrical dyssynchrony associated with pro-
longed QRS duration is a commonly used criterion to select
symptomatic heart failure patients for cardiac resynchronization
therapy (CRT). However, there is concern that electrical
dyssynchrony criterion is inadequate as 30–40% of patients do
not respond to CRT [1]. Studies have shown that assessment of
mechanical dyssynchrony may be a better predictor of response
[2]. Most of the studies have assessed mechanical dyssynchrony
in the longitudinal axis of myocardial motion [3]. There is limited
data on the assessment of short axis mechanical dyssynchrony in
humans. We sought to examine the relationship between
electrical and mechanical dyssynchrony in mid-ventricular short
axis using CMR tagging in patients with depressed left ventricular
function.
Methods: 22 patients with NYHA class II to III heart failure
were studied, including 12 patients with dilated cardiomyopathy
(DCM) (age 60 ± 9 years, 83% male, ejection fraction (EF)
28 ± 9%) and 10 patients with ischemic cardiomyopathy (ICM)
(age 63 ± 8 years, 80% male, EF 30 ± 5%). Ten healthy adult
subjects (age 37 ± 12 years, 50% male, EF 60 ± 4%) served as
controls. CMR studies were performed on a 1.5 T Philips
Achieva MR scanner (Philips HealthCare, Best, NL), equipped
with a 5-element cardiac coil. Breath-hold ECG-gated tagged
CSPAMM cine images at the mid-papillary muscle level were
obtained. Scan parameters include spiral readout with
8 interleaves, 9 ms acquisition window, TR/TE/flip angle =
25 ms/3.6 ms/25°, FOV = 320 mm, 10 mm slice thickness with
5 mm tag spacing, temporal resolution 25–35 ms, spatial
resolution 2.5 × 2.5 × 10 mm. A customized software program
(Cardiotool), written in MATLAB (MathWorks, Natick, MA), was
used for semi-automated analysis of peak circumferential (ec) andpeak radial strain (er) [4].Results: Thirteen patients with DCM (n = 8) and ICM (n = 5)
had a left bundle branch block (LBBB) with a mean QRS duration
of 161 ± 15 ms. The remaining nine patients had either normal
QRS duration, non-specific interventricular conduction delay, or
right bundle branch block with a mean QRS duration of 108 ±
18 ms. The control subjects had a mean QRS duration of 94 ±
11 ms. All patients with LBBB showed an initial negative ec in the
anteroseptal segment, quickly followed by positive ec reflecting
dyskinesis of the septum (as shown in Figure 1). In patients with
LBBB, there was significant dysynchrony of contraction as
indicated by greater opposing wall (inferolateral wall to
anteroseptum) delays and standard deviations (SD) in time to
peak ec and er for all six wall segments (p < 0.001) (Figure 2). All
patients without LBBB and all normal subjects showed negative
ec in all segments throughout systolic contraction (Figure 1).
Patients with cardiomyopathy showed reduced magnitude of ecand er (p < 0.002).
Conclusion: In patients with heart failure, a LBBB pattern with
marked increase in QRS duration manifests as a specific
contractile pattern with marked dyskinesis of the interventricular
septum. Mechanical dyssynchrony and reduction in myocardial
circumferential and radial strain are identified and quantified
using a semi-automated method. This study identifies the
relationship between electrical and mechanical circumferential
and radial dyssynchrony in patients with dilated as well as
ischemic cardiomyopathy.
Figure 1 (abstract P14)
Representative circumferential myocardial strain in cardiomyo-pathy patients with LBBB, non-LBBB, and healthy controls.
Journal of Cardiovascular Magnetic Resonance 2009, 11(Suppl 1) http://jcmr-online.com/supplements/11/S1
Page 97 of 316(page number not for citation purposes)
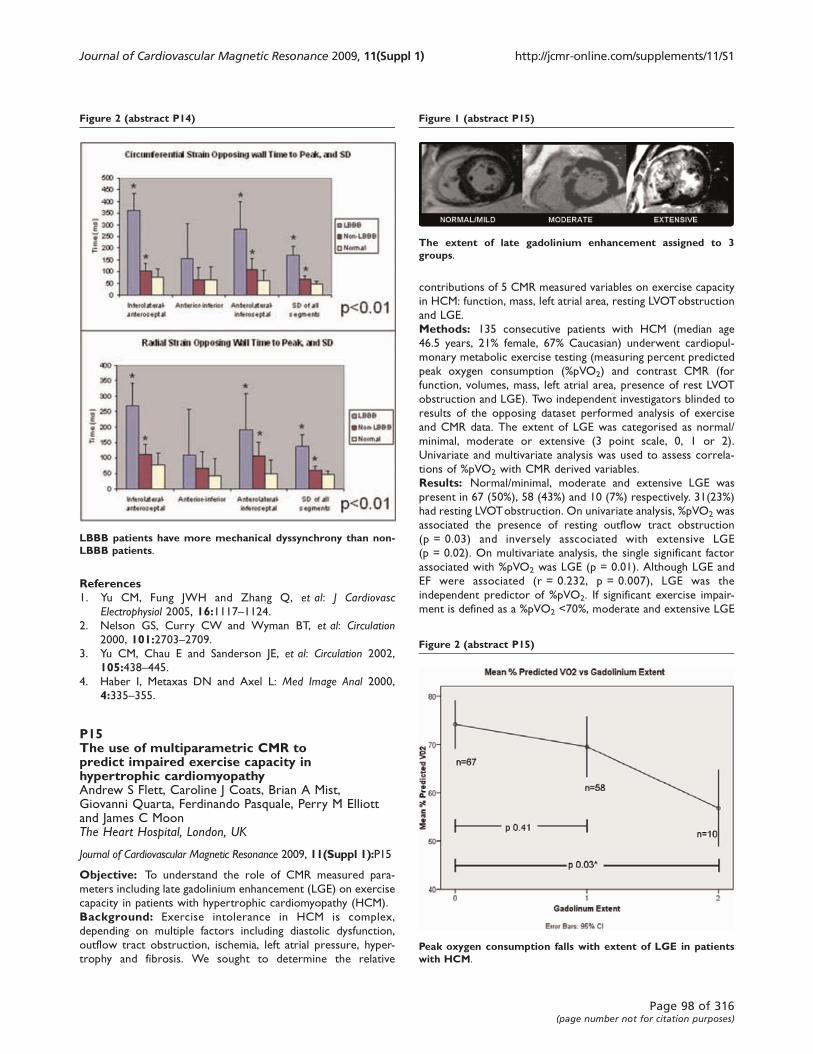
References1. Yu CM, Fung JWH and Zhang Q, et al: J Cardiovasc
Electrophysiol 2005, 16:1117–1124.2. Nelson GS, Curry CW and Wyman BT, et al: Circulation
2000, 101:2703–2709.3. Yu CM, Chau E and Sanderson JE, et al: Circulation 2002,
105:438–445.4. Haber I, Metaxas DN and Axel L: Med Image Anal 2000,
4:335–355.
P15The use of multiparametric CMR topredict impaired exercise capacity inhypertrophic cardiomyopathyAndrew S Flett, Caroline J Coats, Brian A Mist,Giovanni Quarta, Ferdinando Pasquale, Perry M Elliottand James C MoonThe Heart Hospital, London, UK
Journal of Cardiovascular Magnetic Resonance 2009, 11(Suppl 1):P15
Objective: To understand the role of CMR measured para-
meters including late gadolinium enhancement (LGE) on exercise
capacity in patients with hypertrophic cardiomyopathy (HCM).
Background: Exercise intolerance in HCM is complex,
depending on multiple factors including diastolic dysfunction,
outflow tract obstruction, ischemia, left atrial pressure, hyper-
trophy and fibrosis. We sought to determine the relative
contributions of 5 CMR measured variables on exercise capacity
in HCM: function, mass, left atrial area, resting LVOTobstruction
and LGE.
Methods: 135 consecutive patients with HCM (median age
46.5 years, 21% female, 67% Caucasian) underwent cardiopul-
monary metabolic exercise testing (measuring percent predicted
peak oxygen consumption (%pVO2) and contrast CMR (for
function, volumes, mass, left atrial area, presence of rest LVOT
obstruction and LGE). Two independent investigators blinded to
results of the opposing dataset performed analysis of exercise
and CMR data. The extent of LGE was categorised as normal/
minimal, moderate or extensive (3 point scale, 0, 1 or 2).
Univariate and multivariate analysis was used to assess correla-
tions of %pVO2 with CMR derived variables.
Results: Normal/minimal, moderate and extensive LGE was
present in 67 (50%), 58 (43%) and 10 (7%) respectively. 31(23%)
had resting LVOTobstruction. On univariate analysis, %pVO2 was
associated the presence of resting outflow tract obstruction
(p = 0.03) and inversely asscociated with extensive LGE
(p = 0.02). On multivariate analysis, the single significant factor
associated with %pVO2 was LGE (p = 0.01). Although LGE and
EF were associated (r = 0.232, p = 0.007), LGE was the
independent predictor of %pVO2. If significant exercise impair-
ment is defined as a %pVO2 <70%, moderate and extensive LGE
Figure 2 (abstract P14)
LBBB patients have more mechanical dyssynchrony than non-LBBB patients.
Figure 1 (abstract P15)
The extent of late gadolinium enhancement assigned to 3groups.
Figure 2 (abstract P15)
Peak oxygen consumption falls with extent of LGE in patientswith HCM.
Journal of Cardiovascular Magnetic Resonance 2009, 11(Suppl 1) http://jcmr-online.com/supplements/11/S1
Page 98 of 316(page number not for citation purposes)

independently predicts it with odds ratios of 2.2 (95% CI 1.0,
4.5 p = 0.04) and 18.9 (95% CI 1.9, 188.2, p = 0.01) respectively.
Extensive LGE has low sensitivity (13%) but high specificity (98%)
for predicting poor exercise capacity. Figures 1 and 2
Conclusion: The main determinant of significant exercise
limitation measured by multiparametric CMR in HCM is the
presence of extensive LGE. Lesser amounts of LGE do not
predict exercise capacity, highlighting the mulitfactorial nature of
functional limitation in this condition.
P16Cardiac magnetic resonance findings inasymptomatic patients with Brugada syndromeChristoph J Jensen1, Holger C Eberle1,2, Dinh Q Nguyen1,Thomas Schlosser3, Jan Hluchy1, Christoph K Naber1,Georg V Sabin1 and Oliver Bruder11Elisabeth Hospital Essen, Essen, Germany2Elisabeth Hospital, Department of Cardiology and Angiology,Essen, Germany3University Hospital Essen, Essen, Germany
Journal of Cardiovascular Magnetic Resonance 2009, 11(Suppl 1):P16
Introduction: The Brugada syndrome (BS) is characterized by
distinctive ST-segment abnormalities, malignant ventricular
arrhythmias, and sudden cardiac death and is attributed to a
sodium channelopathy. Additionally, right ventricular wall motion
abnormalities have been described by previous studies.
Purpose: To evaluate cardiac magnetic resonance (CMR)
findings in asymptomatic patients with Brugada syndrome
compared to matched controls.
Methods: CMR was performed in 24 asymptomatic patients
(13 males; mean age 42. ± 7 years) with proven Brugada
syndrome on a 1.5 Tesla MR System. The imaging protocol
included steady-state free precession (SSFP) cine sequences
(TrueFISP, TR 3 ms, TE 1.5 ms, FA 60°, slice thickness 5 mm) in
long axis views and contiguous short-axis views covering the
entire left (LV) and right ventricle (RV) including the right
ventricular outflow tract (RVOT). Additionally, T1 weighted
turbo spin-echo sequences with and without fat suppression (TR
700 ms, TE 14 ms, FA 180°, slice thickness 5 mm) were acquired,
and delayed enhancement imaging was performed following
gadolinium contrast administration using segmented 2D inver-
sion-recovery fast low angle shot sequences (TR 8 ms, TE 4 ms,
FA 25°, slice thickness 5 mm) in corresponding slice orientation.
Functional analysis and the area of the RVOT were calculated
offline by semi-automatic post-processing software. CMR para-
meters were compared by Mann-Whitney test to age and sex
matched controls (n = 24).
Results: Patients with BS had statistically significant larger RV
end-diastolic (167 ± 43 ml vs. 119 ± 24 ml, p < 0.001) and end-
systolic volumes (87 ± 33 ml vs. 51 ± 16 ml, p < 0.001), lower
RV ejection fraction (49 ± 8% vs. 58 ± 4%, p < 0.001) and dilated
RVOT (11 ± 2 cm2 vs. 8 ± 1 cm2, p < 0.001) compared to
controls. There was no statistically significant difference in LV
volumes and function between patients and controls. Local RV
myocardial signal enhancement in the T1 weighted turbo spin-
echo images was observed in three (12.5%) patients and RV
delayed enhancement in four (17%) of the 24 patients, as
compared to no patient in the control group. Five (21%) patients
showed localised right ventricular wall motion abnormalities,
whereof in 2 patients no delayed enhancement or intramyocar-
dial T1 signal suggesting fat deposits was present. Figure 1.
Conclusion: Patients with proven Brugada syndrome have
larger right ventricular volumes, impaired RV function and dilated
RVOT compared to matched controls. Right ventricular wall
motion abnormalities, localized fat deposits and delayed
enhancement can be found in some of the Brugada syndrome
patients indicating subtle structural heart disease.
P17Focal myocardial fibrosis detected with magneticresonance late Gadolinium enhancementimaging and diffuse interstitial fibrosisdetermined with histological staining ofendomyocardial biopsy specimens in patientswith non-ischemic left ventricular systolicdysfunction: two distinct entities?Simon Schalla, Sebastiaan Bekkers, Robert Dennert,Robert J van Suylen, Johannes Waltenberger, Tim Leinerand Stephane HeymansUniversity Hospital Maastricht, Maastricht, Netherlands
Journal of Cardiovascular Magnetic Resonance 2009, 11(Suppl 1):P17
Introduction: Focal myocardial fibrosis detected with mag-
netic resonance late gadolinium enhancement imaging (LGE) as
well as diffuse interstitial fibrosis seen on endomyocardial biopsy
specimens are associated with an adverse prognosis in patients
with non-ischemic left ventricular dysfunction.
Purpose: We tested the hypothesis if these two forms of
fibrosis are linked to each other and whether focal fibrosis
becomes visible if a certain amount of diffuse fibrosis is present.
Figure 1 (abstract P16)
Journal of Cardiovascular Magnetic Resonance 2009, 11(Suppl 1) http://jcmr-online.com/supplements/11/S1
Page 99 of 316(page number not for citation purposes)
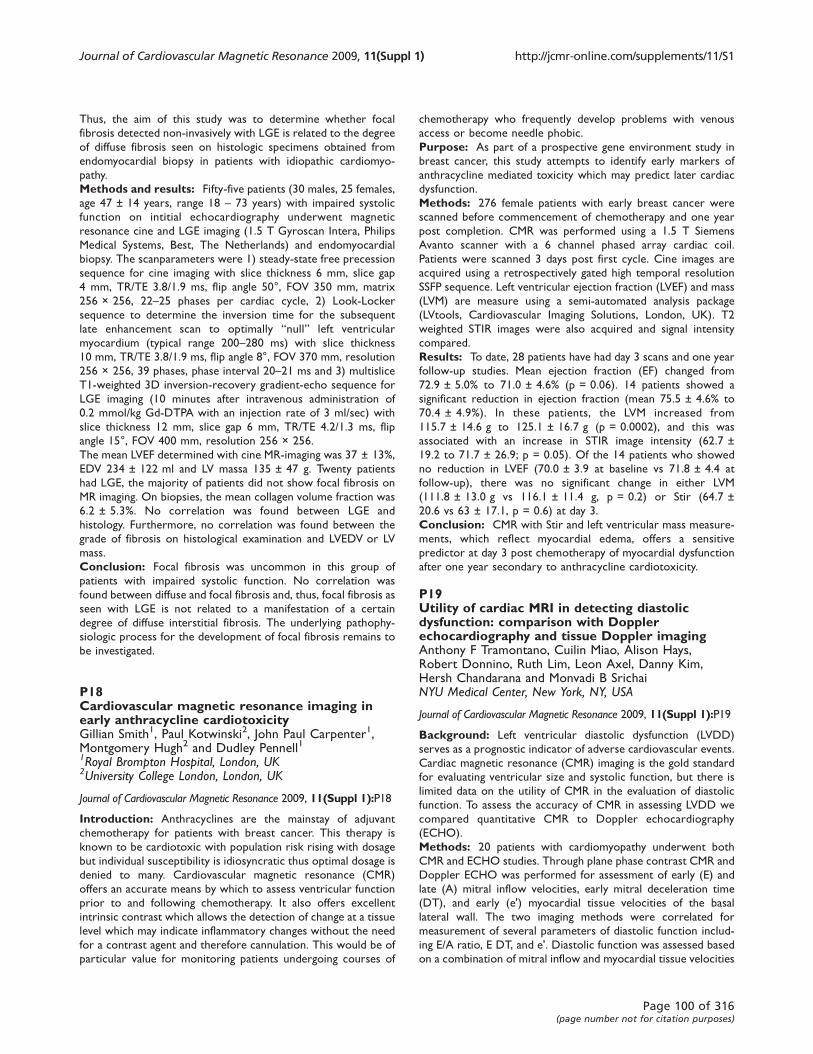
Thus, the aim of this study was to determine whether focal
fibrosis detected non-invasively with LGE is related to the degree
of diffuse fibrosis seen on histologic specimens obtained from
endomyocardial biopsy in patients with idiopathic cardiomyo-
pathy.
Methods and results: Fifty-five patients (30 males, 25 females,
age 47 ± 14 years, range 18 – 73 years) with impaired systolic
function on intitial echocardiography underwent magnetic
resonance cine and LGE imaging (1.5 T Gyroscan Intera, Philips
Medical Systems, Best, The Netherlands) and endomyocardial
biopsy. The scanparameters were 1) steady-state free precession
sequence for cine imaging with slice thickness 6 mm, slice gap
4 mm, TR/TE 3.8/1.9 ms, flip angle 50°, FOV 350 mm, matrix
256 × 256, 22–25 phases per cardiac cycle, 2) Look-Locker
sequence to determine the inversion time for the subsequent
late enhancement scan to optimally “null” left ventricular
myocardium (typical range 200–280 ms) with slice thickness
10 mm, TR/TE 3.8/1.9 ms, flip angle 8°, FOV 370 mm, resolution
256 × 256, 39 phases, phase interval 20–21 ms and 3) multislice
T1-weighted 3D inversion-recovery gradient-echo sequence for
LGE imaging (10 minutes after intravenous administration of
0.2 mmol/kg Gd-DTPA with an injection rate of 3 ml/sec) with
slice thickness 12 mm, slice gap 6 mm, TR/TE 4.2/1.3 ms, flip
angle 15°, FOV 400 mm, resolution 256 × 256.
The mean LVEF determined with cine MR-imaging was 37 ± 13%,
EDV 234 ± 122 ml and LV massa 135 ± 47 g. Twenty patients
had LGE, the majority of patients did not show focal fibrosis on
MR imaging. On biopsies, the mean collagen volume fraction was
6.2 ± 5.3%. No correlation was found between LGE and
histology. Furthermore, no correlation was found between the
grade of fibrosis on histological examination and LVEDV or LV
mass.
Conclusion: Focal fibrosis was uncommon in this group of
patients with impaired systolic function. No correlation was
found between diffuse and focal fibrosis and, thus, focal fibrosis as
seen with LGE is not related to a manifestation of a certain
degree of diffuse interstitial fibrosis. The underlying pathophy-
siologic process for the development of focal fibrosis remains to
be investigated.
P18Cardiovascular magnetic resonance imaging inearly anthracycline cardiotoxicityGillian Smith1, Paul Kotwinski2, John Paul Carpenter1,Montgomery Hugh2 and Dudley Pennell11Royal Brompton Hospital, London, UK2University College London, London, UK
Journal of Cardiovascular Magnetic Resonance 2009, 11(Suppl 1):P18
Introduction: Anthracyclines are the mainstay of adjuvant
chemotherapy for patients with breast cancer. This therapy is
known to be cardiotoxic with population risk rising with dosage
but individual susceptibility is idiosyncratic thus optimal dosage is
denied to many. Cardiovascular magnetic resonance (CMR)
offers an accurate means by which to assess ventricular function
prior to and following chemotherapy. It also offers excellent
intrinsic contrast which allows the detection of change at a tissue
level which may indicate inflammatory changes without the need
for a contrast agent and therefore cannulation. This would be of
particular value for monitoring patients undergoing courses of
chemotherapy who frequently develop problems with venous
access or become needle phobic.
Purpose: As part of a prospective gene environment study in
breast cancer, this study attempts to identify early markers of
anthracycline mediated toxicity which may predict later cardiac
dysfunction.
Methods: 276 female patients with early breast cancer were
scanned before commencement of chemotherapy and one year
post completion. CMR was performed using a 1.5 T Siemens
Avanto scanner with a 6 channel phased array cardiac coil.
Patients were scanned 3 days post first cycle. Cine images are
acquired using a retrospectively gated high temporal resolution
SSFP sequence. Left ventricular ejection fraction (LVEF) and mass
(LVM) are measure using a semi-automated analysis package
(LVtools, Cardiovascular Imaging Solutions, London, UK). T2
weighted STIR images were also acquired and signal intensity
compared.
Results: To date, 28 patients have had day 3 scans and one year
follow-up studies. Mean ejection fraction (EF) changed from
72.9 ± 5.0% to 71.0 ± 4.6% (p = 0.06). 14 patients showed a
significant reduction in ejection fraction (mean 75.5 ± 4.6% to
70.4 ± 4.9%). In these patients, the LVM increased from
115.7 ± 14.6 g to 125.1 ± 16.7 g (p = 0.0002), and this was
associated with an increase in STIR image intensity (62.7 ±
19.2 to 71.7 ± 26.9; p = 0.05). Of the 14 patients who showed
no reduction in LVEF (70.0 ± 3.9 at baseline vs 71.8 ± 4.4 at
follow-up), there was no significant change in either LVM
(111.8 ± 13.0 g vs 116.1 ± 11.4 g, p = 0.2) or Stir (64.7 ±
20.6 vs 63 ± 17.1, p = 0.6) at day 3.
Conclusion: CMR with Stir and left ventricular mass measure-
ments, which reflect myocardial edema, offers a sensitive
predictor at day 3 post chemotherapy of myocardial dysfunction
after one year secondary to anthracycline cardiotoxicity.
P19Utility of cardiac MRI in detecting diastolicdysfunction: comparison with Dopplerechocardiography and tissue Doppler imagingAnthony F Tramontano, Cuilin Miao, Alison Hays,Robert Donnino, Ruth Lim, Leon Axel, Danny Kim,Hersh Chandarana and Monvadi B SrichaiNYU Medical Center, New York, NY, USA
Journal of Cardiovascular Magnetic Resonance 2009, 11(Suppl 1):P19
Background: Left ventricular diastolic dysfunction (LVDD)
serves as a prognostic indicator of adverse cardiovascular events.
Cardiac magnetic resonance (CMR) imaging is the gold standard
for evaluating ventricular size and systolic function, but there is
limited data on the utility of CMR in the evaluation of diastolic
function. To assess the accuracy of CMR in assessing LVDD we
compared quantitative CMR to Doppler echocardiography
(ECHO).
Methods: 20 patients with cardiomyopathy underwent both
CMR and ECHO studies. Through plane phase contrast CMR and
Doppler ECHO was performed for assessment of early (E) and
late (A) mitral inflow velocities, early mitral deceleration time
(DT), and early (e') myocardial tissue velocities of the basal
lateral wall. The two imaging methods were correlated for
measurement of several parameters of diastolic function includ-
ing E/A ratio, E DT, and e'. Diastolic function was assessed based
on a combination of mitral inflow and myocardial tissue velocities
Journal of Cardiovascular Magnetic Resonance 2009, 11(Suppl 1) http://jcmr-online.com/supplements/11/S1
Page 100 of 316(page number not for citation purposes)
and was classified as normal, abnormal relaxation, pseudo-
normal or restrictive.
Results: There was a statistically significant correlation for
measurement of E/A ratio with both techniques (r = 0.827,
p < 0.05), but not for any of the other parameters evaluated
(E DT, e', E/e’ ratio). Patients were classified by ECHO into
diastolic functional grades as: 4 (20%) normal, 7 (35%) abnormal
relaxation, 4 (20%) pseudo-normal, and 5 (25%) restrictive.
Diastolic function grade was identical in 10 (50%) patients,
differed by 1 grade in 5 (25%), differed by 2 grades in 3 (15%), and
differed by 3 grades in 2 (10%). CMR tended to underestimate
the degree of diastolic dysfunction in 70% of patients compared
to ECHO, and there were 3 patients (15%) who were classified as
normal by CMR, but who demonstrated some evidence of
diastolic dysfunction on ECHO.
Conclusion: CMR can detect the presence of LVDD with
reasonable accuracy, although it tends to underestimate the
degree when compared with Doppler ECHO.
P20Contrast enhanced delayed myocardialenhancement in patients with end stage livercirrhosis – further evidence for cirrhoticcardiomyopathyDirk Lossnitzer, Daniel Gotthardt, Stephanie Lehrke,Grigorios Korosoglou, Henning Steen, Peter Sauer,Evangelos Giannitsis and Hugo A KatusUniversity of Heidelberg, Heidelberg, Germany
Journal of Cardiovascular Magnetic Resonance 2009, 11(Suppl 1):P20
Introduction: Cirrhotic cardiomyopathy was first described in
1969 by Regan TJ et al. and was found in all kinds of liver cirrhosis
since 1990. Nevertheless the disease is still not well understood
due to the hyperdynamic LV function, the lack of reliable
diagnostic tools as well as multimorbidity of patients with end
stage liver disease. However there is evidence for a reduced
cardiac response to stress factors, QT-prolongation as well as
myocardial fibrosis, subendocardial edema and vacuolization of
myocytes.
Purpose: The aim of this study was to further investigate the
evidence of cirrhotic cardiomyopathy in patients with end stage
liver disease by cardiac MRI.
Methods: We examined 20 patients (8 females, age 54 ± 9)
who are/were listed for liver transplantation (MELD score
15 ± 6, CHILD score 8.7 ± 2) because of alcoholic liver cirrhosis
on a 1.5 T Philips Achieva scanner using a 5-element phased array
cardiac synergy coil in 2007. Multiple short axes (SAX) cine
images using a SSFP sequence with parallel imaging were acquired
for the assessment of left ventricular ejection fraction (LVEF %)
followed by a standardized high-dose dobutamine stress protocol
up to 40 mg per kilogram of body weight per minute. A 3D FFE
SAX multi-slice inversion recovery sequence 10 minutes post-Gd
(Gd = 0.2 mmol/kg of gadopentetate dimeglumine (Schering,
Berlin, Germany)) was employed for the measurement of LE.
TNT and NT-proBNP were measured according to clinical
routine procedures (Roche Diagnostics, Penzberg, Germany).
Results: All patients showed normal to hyperdynamic LVEF at
rest (71,3 ± 8%) as described before with other imaging methods
and no wall motion abnormalities at rest or during dobutamine
stress. However relevant LE (27,4 ± 17,4% of myocardial mass
(see figure 1), was detected in all patients. NTproBNP levels
were increased (846 ± 1042 pg/ml), but there was no correlation
between the amount of LE and the NTproBNP levels (r = -0.04).
TNT levels were within normal range (0,0225 ± 0,008 ng/ml). 8
patients underwent liver transplantation and 5 patients (3 of
them after liver transplantation) died during the study period.
Conclusion: This is the first description of myocardial delayed
contrast enhancement in patients with end stage liver disease.
We assume that these findings might be of diagnostic and
prognostic value and might be helpful to detect patients at risk
for cardiac complications on the waiting list for liver transplanta-
tion. However further studies with bigger sample sizes have to be
done to fortify our results.
P21MRI signs of carotid plaque inflammation inpatients with unstable angina: a possiblesign of widespread plaque activityCarlo Liguori1, Luigi Natale1, Agostino Meduri1,Antonio Bernardini2, Antonella Lombardo1
and Lorenzo Bonomo11Università Cattolica del Sacro Cuore – Policlinico A. Gemelli,Rome, Italy2“G. Mazzini” Hospital – ASL Teramo, Teramo, Italy
Journal of Cardiovascular Magnetic Resonance 2009, 11(Suppl 1):P21
Purpose: Inflammation may contribute to destabilize vulner-
able plaques in acute coronary syndromes by promoting rupture
and erosion; systemic inflammatory factors could be related with
widespread plaque activity in many vascular districts.
The purpose of this study was to evaluate with contrast
enhanced-MRI(CE-MRI) plaque inflammation signs in carotid
arteries of pts with unstable angina (UA) and to relate them to
serum levels of C-reactive protein (CRP), a marker of systemic
inflammation.
Methods: 27 pts with carotid plaques, 16 with UA and 11 with
stable angina(SA) underwent carotid arteries MRI with SE, FSE
and bb-FSE sequences, before and after Gd iv. administration
(0.2 mmol/Kg). We considered 3 markers: 1) wall thickening,
index of arterial wall edema or infiltration; 2) increased T2 or
FSE-STIR signal intensity (SI), index of arterial wall or plaque
edema; 3) arterial wall or plaque enhancement, index of
increased capillary permeability. Totally 37 plaques were
evaluated (17 patients with monolateral and 10 with bilateral
stenosis). CRP levels were determined with ELISA essay.
Results: 19 plaques showed wall thickening and/or increased
T2 and/or FSE-STIR SI and Gd enhancement, 5 plaques showed
only contrast enhancement, whereas 13 plaques had no
inflammation signs. CRP levels of patients with enhanced plaques
were significantly higher than those of patients without
enhancement (median values: 12.5 vs 3.3, p < 0.05).
Conclusion: Pts with UA showed plaque inflammation signs
more frequently than controls; patients with UA and inflamma-
tion signs showed higher CRP levels than pts with UA and no
inflammation signs. These results suggest a widespread plaque
activity, possibly mediated by systemic inflammation, in acute
coronary syndromes.
Journal of Cardiovascular Magnetic Resonance 2009, 11(Suppl 1) http://jcmr-online.com/supplements/11/S1
Page 101 of 316(page number not for citation purposes)
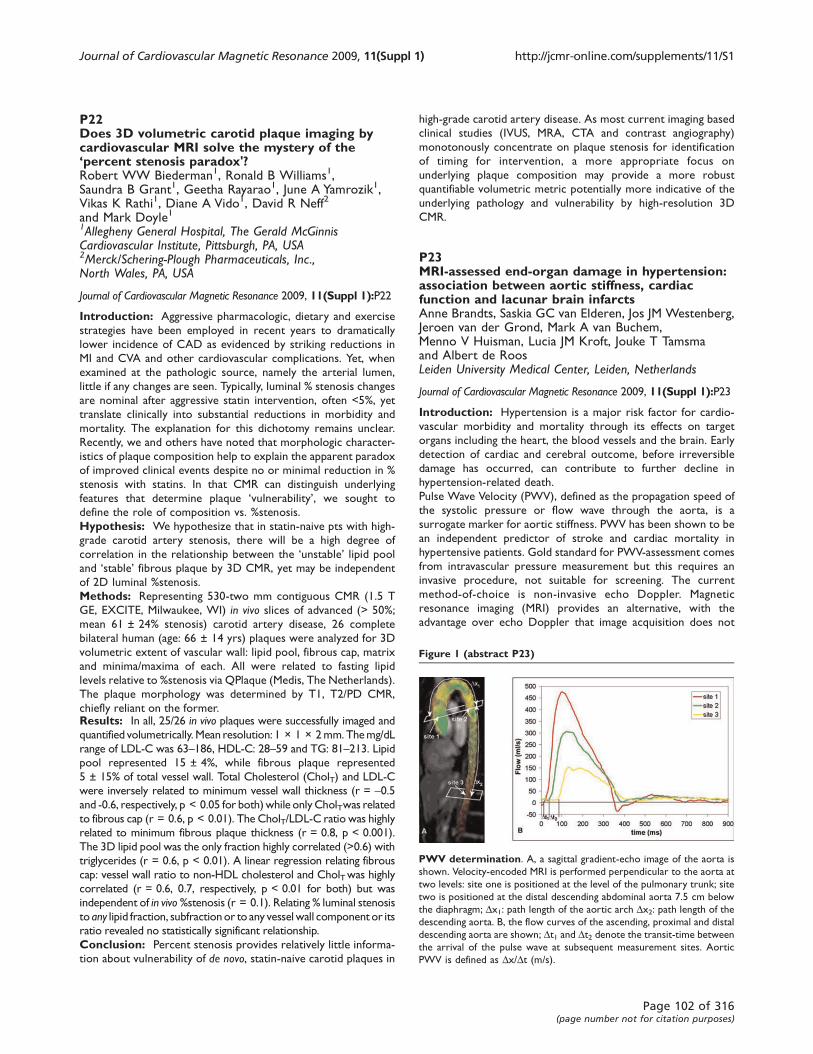
P22Does 3D volumetric carotid plaque imaging bycardiovascular MRI solve the mystery of the‘percent stenosis paradox'?Robert WW Biederman1, Ronald B Williams1,Saundra B Grant1, Geetha Rayarao1, June A Yamrozik1,Vikas K Rathi1, Diane A Vido1, David R Neff2
and Mark Doyle11Allegheny General Hospital, The Gerald McGinnisCardiovascular Institute, Pittsburgh, PA, USA2Merck/Schering-Plough Pharmaceuticals, Inc.,North Wales, PA, USA
Journal of Cardiovascular Magnetic Resonance 2009, 11(Suppl 1):P22
Introduction: Aggressive pharmacologic, dietary and exercise
strategies have been employed in recent years to dramatically
lower incidence of CAD as evidenced by striking reductions in
MI and CVA and other cardiovascular complications. Yet, when
examined at the pathologic source, namely the arterial lumen,
little if any changes are seen. Typically, luminal % stenosis changes
are nominal after aggressive statin intervention, often <5%, yet
translate clinically into substantial reductions in morbidity and
mortality. The explanation for this dichotomy remains unclear.
Recently, we and others have noted that morphologic character-
istics of plaque composition help to explain the apparent paradox
of improved clinical events despite no or minimal reduction in %
stenosis with statins. In that CMR can distinguish underlying
features that determine plaque ‘vulnerability’, we sought to
define the role of composition vs. %stenosis.
Hypothesis: We hypothesize that in statin-naive pts with high-
grade carotid artery stenosis, there will be a high degree of
correlation in the relationship between the ‘unstable’ lipid pool
and ‘stable’ fibrous plaque by 3D CMR, yet may be independent
of 2D luminal %stenosis.
Methods: Representing 530-two mm contiguous CMR (1.5 T
GE, EXCITE, Milwaukee, WI) in vivo slices of advanced (> 50%;
mean 61 ± 24% stenosis) carotid artery disease, 26 complete
bilateral human (age: 66 ± 14 yrs) plaques were analyzed for 3D
volumetric extent of vascular wall: lipid pool, fibrous cap, matrix
and minima/maxima of each. All were related to fasting lipid
levels relative to %stenosis via QPlaque (Medis, The Netherlands).
The plaque morphology was determined by T1, T2/PD CMR,
chiefly reliant on the former.Results: In all, 25/26 in vivo plaques were successfully imaged and
quantified volumetrically.Mean resolution: 1 × 1 × 2mm.Themg/dL
range of LDL-C was 63–186, HDL-C: 28–59 and TG: 81–213. Lipidpool represented 15 ± 4%, while fibrous plaque represented
5 ± 15% of total vessel wall. Total Cholesterol (CholT) and LDL-C
were inversely related to minimum vessel wall thickness (r = -0.5and -0.6, respectively, p < 0.05 for both)while onlyCholTwas related
to fibrous cap (r = 0.6, p < 0.01). The CholT/LDL-C ratio was highly
related to minimum fibrous plaque thickness (r = 0.8, p < 0.001).
The 3D lipid pool was the only fraction highly correlated (>0.6) with
triglycerides (r = 0.6, p < 0.01). A linear regression relating fibrous
cap: vessel wall ratio to non-HDL cholesterol and CholTwas highly
correlated (r = 0.6, 0.7, respectively, p < 0.01 for both) but was
independent of in vivo %stenosis (r = 0.1). Relating % luminal stenosis
to any lipid fraction, subfractionor to any vesselwall component or its
ratio revealed no statistically significant relationship.
Conclusion: Percent stenosis provides relatively little informa-
tion about vulnerability of de novo, statin-naive carotid plaques in
high-grade carotid artery disease. As most current imaging based
clinical studies (IVUS, MRA, CTA and contrast angiography)
monotonously concentrate on plaque stenosis for identification
of timing for intervention, a more appropriate focus on
underlying plaque composition may provide a more robust
quantifiable volumetric metric potentially more indicative of the
underlying pathology and vulnerability by high-resolution 3D
CMR.
P23MRI-assessed end-organ damage in hypertension:association between aortic stiffness, cardiacfunction and lacunar brain infarctsAnne Brandts, Saskia GC van Elderen, Jos JM Westenberg,Jeroen van der Grond, Mark A van Buchem,Menno V Huisman, Lucia JM Kroft, Jouke T Tamsmaand Albert de RoosLeiden University Medical Center, Leiden, Netherlands
Journal of Cardiovascular Magnetic Resonance 2009, 11(Suppl 1):P23
Introduction: Hypertension is a major risk factor for cardio-
vascular morbidity and mortality through its effects on target
organs including the heart, the blood vessels and the brain. Early
detection of cardiac and cerebral outcome, before irreversible
damage has occurred, can contribute to further decline in
hypertension-related death.
Pulse Wave Velocity (PWV), defined as the propagation speed of
the systolic pressure or flow wave through the aorta, is a
surrogate marker for aortic stiffness. PWV has been shown to be
an independent predictor of stroke and cardiac mortality in
hypertensive patients. Gold standard for PWV-assessment comes
from intravascular pressure measurement but this requires an
invasive procedure, not suitable for screening. The current
method-of-choice is non-invasive echo Doppler. Magnetic
resonance imaging (MRI) provides an alternative, with the
advantage over echo Doppler that image acquisition does not
Figure 1 (abstract P23)
PWV determination. A, a sagittal gradient-echo image of the aorta is
shown. Velocity-encoded MRI is performed perpendicular to the aorta at
two levels: site one is positioned at the level of the pulmonary trunk; site
two is positioned at the distal descending abdominal aorta 7.5 cm below
the diaphragm; Dx1: path length of the aortic arch Dx2: path length of the
descending aorta. B, the flow curves of the ascending, proximal and distal
descending aorta are shown; Dt1 and Dt2 denote the transit-time between
the arrival of the pulse wave at subsequent measurement sites. Aortic
PWV is defined as Dx/Dt (m/s).
Journal of Cardiovascular Magnetic Resonance 2009, 11(Suppl 1) http://jcmr-online.com/supplements/11/S1
Page 102 of 316(page number not for citation purposes)

have a limited acoustic window and the aorta can be visualized
along its full length, allowing for more accurate assessment of the
path lengths of pulse waves. Also, MRI is the gold standard for
assessment of cardiac left ventricular (LV) function and mass and
cerebral lacunar infarcts and white matter hyperintensities
(WMHs). An integrated MRI-approach for the assessment of
aortic stiffness, cardiac function and brain examination is
performed in hypertensive patients. Our hypothesis is that
early end-organ damage (i.e. increased aortic stiffness, decreased
cardiac function and cerebral lacunar infarcts and WMHs) are
interrelated in hypertensive patients.
Purpose: To assess the association between aortic PWV,
cardiac LV function and mass as well as cerebral lacunar infarcts
and WMHs in hypertensive patients using MRI.
Methods: MRI of the aorta, heart and brain was performed in
50 consecutive hypertensive patients (19 male, 31 female; mean
age 49 ± 12 years). Aortic PWV was determined from one-
directional through-plane velocity-encoded (VE) MRI at the
ascending aorta, proximal and distal descending aorta (Figure 1).
From VE MRI, flow graphs were obtained. High temporal
resolution (6–10 ms) allows for accurate assessment of the
transit-time between the arrival of the pulse wave at subsequent
measurement sites. A value for PWV was obtained for the aortic
arch and the descending aorta.
Short-axis MRI using steady-state free precession was used to
measure LV systolic function and mass. An ECG-gated gradient-
echo sequence with VE was performed to measure blood flow
across the mitral valve to determine LV diastolic function. For
detection of lacunar infarcts and WMHs, patients underwent T2
and Fluid Attenuated Inversion Recovery (FLAIR) acquisitions.
The association between aortic PWV, cardiac and cerebral
parameters was calculated using univariate and multivariate linear
and logistic regression analyses.
Results: Mean systolic BP was 152 ± 22 mmHg, mean diastolic
BP 88 ± 13 mmHg. Mean aortic arch PWV was 7.3 ± 2.5 m/s,
mean descending aorta PWV 6.9 ± 2.7 m/s.
After adjustment for age, gender and hypertension duration,
aortic PWV was shown to be independently associated with LV
mass (r = 0.41, p = 0.03) and lacunar brain infarcts (OR = 1.8,
95% CI 1.0–3.0, p = 0.02) and not with LV function and WMHs.
Conclusion: Aortic PWV is independently associated with LV
mass and lacunar brain infarcts, both indicators of early end-
organ damage of hypertension.
P24Initial validation of a multi-stationnon-contrast dark blood approach forthe diagnosis of peripheral arterial diseaseGeorgeta Mihai1, YiuCho Chung2, Mbabazi Kariisa1,Orlando P Simonetti1 and Sanjay Rajagopalan11The Ohio State University, Columbus, OH, USA2Siemens Healthcare USA, Inc, Columbus, OH, USA
Journal of Cardiovascular Magnetic Resonance 2009, 11(Suppl 1):P24
Introduction: Current magnetic resonance angiographic
(MRA) diagnosis of peripheral arterial disease (PAD) is based
on contrast-enhanced angiography (ce-MRA), a luminographic
technique lacking information on atherosclerotic plaque burden.
Moreover, the recent links between nephrogenic systemic
fibrosis disease and gadolinium based contrasts limits use of
this technique in PAD patients with impaired renal function.
Purpose: This study aims to evaluate the feasibility and
accuracy of a multistationT1w-SPACE [1] dark blood MRA
sequence to assess disease in the aorto-iliac and superficial
femoral artery (SFA) (inflow vessels) by comparing it to a
multistation ce-MRA protocol with identical spatial resolution.
Methods: Sequences: T1w-SPACE [1] is a highly efficient 3D
TSE technique due to its long echo train and very short echo
spacing. Blood signal is suppressed in T1w-SPACE by dephasing
due to flow in the readout direction. Both T1w-SPACE and ce-
MRA were acquired with isotropic 1 mm resolution. Imaging
parameters are listed in Table 1.
Imaging: The study was approved by the Institutional Review
Board. Two normal volunteers and six patients (with normal
kidney function) diagnosed with PAD and symptoms of
intermittent claudication were included in the study. Imaging
was performed on a 1.5 T system (MAGNETOM Avanto,
Figure 1 (abstract P24)
T1w-SPACE (left) and ce-MRA (right) images of segments ofabdominal aorta (left group) and SFA (right group) showing thedark and bright lumen, as well as the arterosclerotic plaque inT1w-Space (left middle group).
Figure 2 (abstract P24)
Graph showing the strong correlation between T1w-SPACE and ce-MRA
lumen area, and strong inter-observer agreement.
Journal of Cardiovascular Magnetic Resonance 2009, 11(Suppl 1) http://jcmr-online.com/supplements/11/S1
Page 103 of 316(page number not for citation purposes)
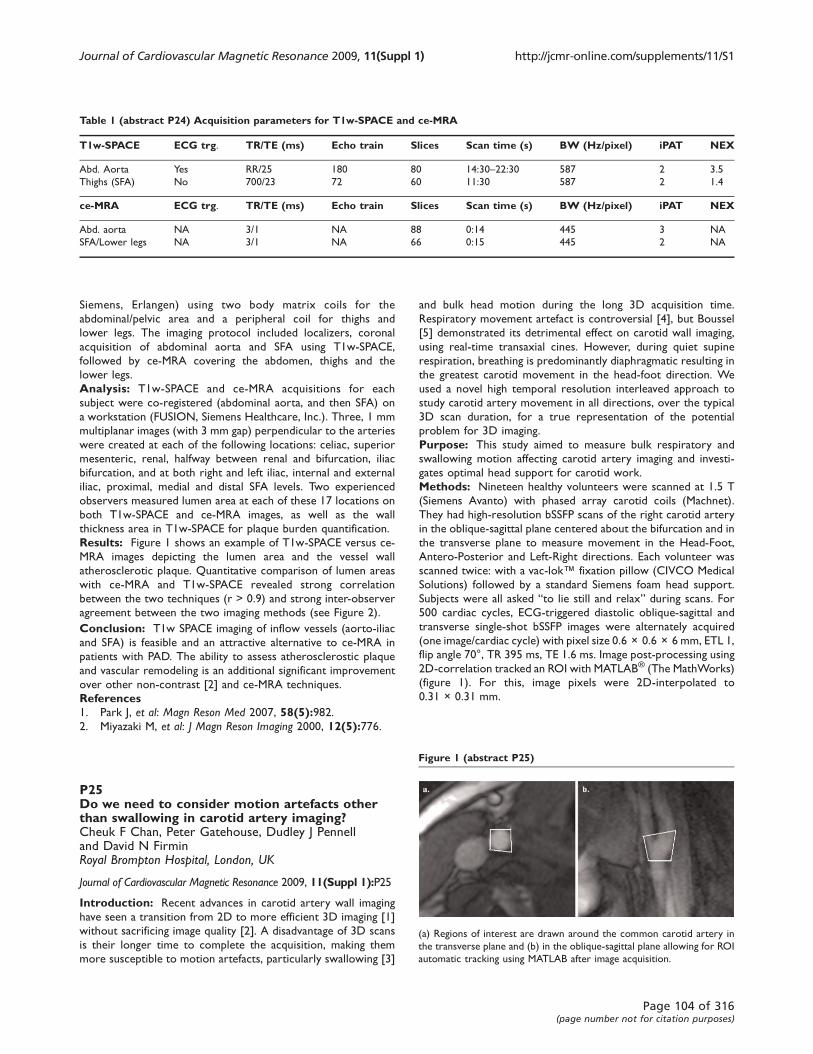
Siemens, Erlangen) using two body matrix coils for the
abdominal/pelvic area and a peripheral coil for thighs and
lower legs. The imaging protocol included localizers, coronal
acquisition of abdominal aorta and SFA using T1w-SPACE,
followed by ce-MRA covering the abdomen, thighs and the
lower legs.
Analysis: T1w-SPACE and ce-MRA acquisitions for each
subject were co-registered (abdominal aorta, and then SFA) on
a workstation (FUSION, Siemens Healthcare, Inc.). Three, 1 mm
multiplanar images (with 3 mm gap) perpendicular to the arteries
were created at each of the following locations: celiac, superior
mesenteric, renal, halfway between renal and bifurcation, iliac
bifurcation, and at both right and left iliac, internal and external
iliac, proximal, medial and distal SFA levels. Two experienced
observers measured lumen area at each of these 17 locations on
both T1w-SPACE and ce-MRA images, as well as the wall
thickness area in T1w-SPACE for plaque burden quantification.
Results: Figure 1 shows an example of T1w-SPACE versus ce-
MRA images depicting the lumen area and the vessel wall
atherosclerotic plaque. Quantitative comparison of lumen areas
with ce-MRA and T1w-SPACE revealed strong correlation
between the two techniques (r > 0.9) and strong inter-observer
agreement between the two imaging methods (see Figure 2).
Conclusion: T1w SPACE imaging of inflow vessels (aorto-iliac
and SFA) is feasible and an attractive alternative to ce-MRA in
patients with PAD. The ability to assess atherosclerostic plaque
and vascular remodeling is an additional significant improvement
over other non-contrast [2] and ce-MRA techniques.
References1. Park J, et al: Magn Reson Med 2007, 58(5):982.
2. Miyazaki M, et al: J Magn Reson Imaging 2000, 12(5):776.
P25Do we need to consider motion artefacts otherthan swallowing in carotid artery imaging?Cheuk F Chan, Peter Gatehouse, Dudley J Pennelland David N FirminRoyal Brompton Hospital, London, UK
Journal of Cardiovascular Magnetic Resonance 2009, 11(Suppl 1):P25
Introduction: Recent advances in carotid artery wall imaging
have seen a transition from 2D to more efficient 3D imaging [1]
without sacrificing image quality [2]. A disadvantage of 3D scans
is their longer time to complete the acquisition, making them
more susceptible to motion artefacts, particularly swallowing [3]
and bulk head motion during the long 3D acquisition time.
Respiratory movement artefact is controversial [4], but Boussel
[5] demonstrated its detrimental effect on carotid wall imaging,
using real-time transaxial cines. However, during quiet supine
respiration, breathing is predominantly diaphragmatic resulting in
the greatest carotid movement in the head-foot direction. We
used a novel high temporal resolution interleaved approach to
study carotid artery movement in all directions, over the typical
3D scan duration, for a true representation of the potential
problem for 3D imaging.
Purpose: This study aimed to measure bulk respiratory and
swallowing motion affecting carotid artery imaging and investi-
gates optimal head support for carotid work.
Methods: Nineteen healthy volunteers were scanned at 1.5 T
(Siemens Avanto) with phased array carotid coils (Machnet).
They had high-resolution bSSFP scans of the right carotid artery
in the oblique-sagittal plane centered about the bifurcation and in
the transverse plane to measure movement in the Head-Foot,
Antero-Posterior and Left-Right directions. Each volunteer was
scanned twice: with a vac-lok™ fixation pillow (CIVCO Medical
Solutions) followed by a standard Siemens foam head support.
Subjects were all asked “to lie still and relax” during scans. For
500 cardiac cycles, ECG-triggered diastolic oblique-sagittal and
transverse single-shot bSSFP images were alternately acquired
(one image/cardiac cycle) with pixel size 0.6 × 0.6 × 6 mm, ETL 1,
flip angle 70°, TR 395 ms, TE 1.6 ms. Image post-processing using
2D-correlation tracked an ROI with MATLAB® (The MathWorks)
(figure 1). For this, image pixels were 2D-interpolated to
0.31 × 0.31 mm.
Table 1 (abstract P24) Acquisition parameters for T1w-SPACE and ce-MRA
T1w-SPACE ECG trg. TR/TE (ms) Echo train Slices Scan time (s) BW (Hz/pixel) iPAT NEX
Abd. Aorta Yes RR/25 180 80 14:30–22:30 587 2 3.5
Thighs (SFA) No 700/23 72 60 11:30 587 2 1.4
ce-MRA ECG trg. TR/TE (ms) Echo train Slices Scan time (s) BW (Hz/pixel) iPAT NEX
Abd. aorta NA 3/1 NA 88 0:14 445 3 NA
SFA/Lower legs NA 3/1 NA 66 0:15 445 2 NA
Figure 1 (abstract P25)
(a) Regions of interest are drawn around the common carotid artery in
the transverse plane and (b) in the oblique-sagittal plane allowing for ROI
automatic tracking using MATLAB after image acquisition.
Journal of Cardiovascular Magnetic Resonance 2009, 11(Suppl 1) http://jcmr-online.com/supplements/11/S1
Page 104 of 316(page number not for citation purposes)

Results: There was no obvious bulk head motion during scans
with either pillow. In 30/38 scans, there was “drift” of the carotidartery compared to the baseline reference image with no clear
pattern. “Drift” was seen in all three directions with both types
of head support (figure 2).
During a swallow event, there was variable movement of carotid
artery in all 3 directions. To measure swallowing motion the
position measurements were compared between smoothed
(20-cycle running average, swallows filtered out) and
unsmoothed motion traces. Examining all the scans, the greatest
movement was predominantly in the head-foot direction with
average movement of 3.5 mm (SD 1.8, range 1.6–6.2 mm). Left-
Right movement was greater in comparison to Antero-Posterior,
2.8 mm (SD 1.4, range 0.9–6.2 mm) and 1.7 mm (SD 1.5, range
0.6–5.1 mm), respectively.
The amount of movement during quiet respiration was calculated
between smoothed and unsmoothed traces excluding swallow
events. The largest average movement was in the head-foot
direction 1.4 mm (SD 0.6, range 0.6–3.2 mm), with substantially
less movement in the LR 0.9 mm (SD 0.5, range 0.3–2.4 mm) and
AP 0.5 mm (SD 0.3, range 0.1–1.1 mm).
Although no obvious difference in head motion was measured
between the different head supports, individuals reported that
the vac-lok™ pillow was more comfortable and offered greater
neck support.
Conclusion: We have shown that respiratory motion pre-
viously regarded as insignificant may be large enough to
contribute to blurring and ghosting of 3D carotid images.
Involuntary head motion even in motivated volunteers during 3D
imaging times is clearly an issue for 3D imaging reliability, as is
swallowing motion in some subjects. These motion artefacts can
corrupt the entire 3D sequence and affect wall imaging and
plaque characterisation.
References1. Fayad ZA: Magn Reson Med. 2001, 89(4):305–316.2. Chung YC: Proc ISMRM683.3. Chan CF: Proceedings ISMRM 2008.
4. Aoki S: AJNR 2000, 21:381–385.5. Boussel L: JMRI 2006, 23:413–415.
P26Aortic pulse wave velocity in obesityas assessed by magnetic resonance imagingOliver J Rider1, Upasana Tayal1, Jane M Francis1,Monique Robinson1, James P Byrne2, Kieran Clarke1
and Stefan Neubauer11University of Oxford, Oxford, UK2Southampton General Hospital, Southampton, UK
Journal of Cardiovascular Magnetic Resonance 2009, 11(Suppl 1):P26
Objective: Our aim was to investigate the effects of obesity
and weight loss on aortic Pulse Wave Velocity as assessed by
vascular magnetic resonance imaging.
Introduction: Obesity is an escalating global health problem
associated with both an increased risk of death and an increased
risk of cardiovascular events. The various mechanisms by which
obesity mediates cardiovascular risk are not well understood but
may be related to aortic stiffness, both present in obesity and
linked to increased mortality. Our goal was to determine the
effect of obesity, in the absence of the traditional cardiovascular
risk factors on aortic pulse wave velocity (PWV) as assessed by
vascular magnetic resonance imaging, a reliable, reproducible and
accurate clinical measure of aortic stiffness.
Methods: Fifty obese (BMI 38.3 ± 6.8 kg/m2) and eighteen
normal weight controls (BMI 22.0 ± 1.7 kg/m2) with no
identifiable cardiovascular risk factors underwent vascular
magnetic resonance imaging at 1.5 T to assess of PWV at three
points, the ascending (Ao) and proximal descending aorta (PDA)
at the level of the pulmonary artery and the abdominal aorta
(AA) 12 cm below the pulmonary artery. Aortic flow/time
curves, at these three points, were used to calculate the arrival
times of aortic pulse waveform. The time of arrival of the pulse
wave (Dt (ms)) was determined to be the intercept of the tangent
to the curve at the half maximal point of flow. The distance over
which the pulse wave had travelled (Dx) was measured from
oblique sagittal aortic images. PWV was then calculated as Dx/Dt.28 subjects underwent repeat imaging after weight loss, 16 obese
subjects underwent a supervised low glycaemic index diet, while
twelve underwent bariatric surgery.
Figure 2 (abstract P25)
(a) Demonstrates the “drift” phenomenon in all three perpendicular directions with both types of head support after smoothing. The“drift” appears to increase as the scan progresses but then seems to decrease towards the end. This could be due to the individual falling asleep during
the scan but becoming more alert towards the end. Whereas, in (b), there is a gradual “drift” away from baseline until the end of the scan. In this
example, the phenomenon may be explained by increased muscle tension at the start; individuals are generally tense and anxious prior to the scan but
once the scan has commenced, they start to relax and so muscle tension decreases resulting in the observed “drift”.
Journal of Cardiovascular Magnetic Resonance 2009, 11(Suppl 1) http://jcmr-online.com/supplements/11/S1
Page 105 of 316(page number not for citation purposes)
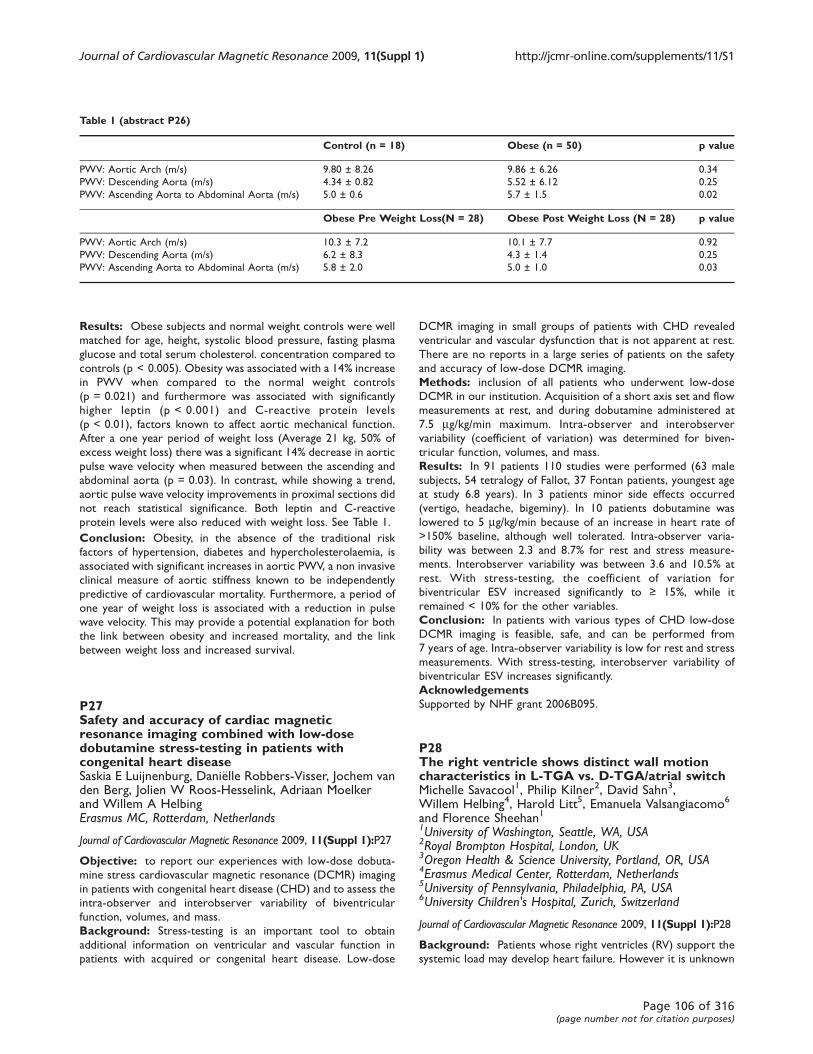
Results: Obese subjects and normal weight controls were well
matched for age, height, systolic blood pressure, fasting plasma
glucose and total serum cholesterol. concentration compared to
controls (p < 0.005). Obesity was associated with a 14% increase
in PWV when compared to the normal weight controls
(p = 0.021) and furthermore was associated with significantly
higher leptin (p < 0.001) and C-reactive protein levels
(p < 0.01), factors known to affect aortic mechanical function.
After a one year period of weight loss (Average 21 kg, 50% of
excess weight loss) there was a significant 14% decrease in aortic
pulse wave velocity when measured between the ascending and
abdominal aorta (p = 0.03). In contrast, while showing a trend,
aortic pulse wave velocity improvements in proximal sections did
not reach statistical significance. Both leptin and C-reactive
protein levels were also reduced with weight loss. See Table 1.
Conclusion: Obesity, in the absence of the traditional risk
factors of hypertension, diabetes and hypercholesterolaemia, is
associated with significant increases in aortic PWV, a non invasive
clinical measure of aortic stiffness known to be independently
predictive of cardiovascular mortality. Furthermore, a period of
one year of weight loss is associated with a reduction in pulse
wave velocity. This may provide a potential explanation for both
the link between obesity and increased mortality, and the link
between weight loss and increased survival.
P27Safety and accuracy of cardiac magneticresonance imaging combined with low-dosedobutamine stress-testing in patients withcongenital heart diseaseSaskia E Luijnenburg, Daniëlle Robbers-Visser, Jochem vanden Berg, Jolien W Roos-Hesselink, Adriaan Moelkerand Willem A HelbingErasmus MC, Rotterdam, Netherlands
Journal of Cardiovascular Magnetic Resonance 2009, 11(Suppl 1):P27
Objective: to report our experiences with low-dose dobuta-
mine stress cardiovascular magnetic resonance (DCMR) imaging
in patients with congenital heart disease (CHD) and to assess the
intra-observer and interobserver variability of biventricular
function, volumes, and mass.
Background: Stress-testing is an important tool to obtain
additional information on ventricular and vascular function in
patients with acquired or congenital heart disease. Low-dose
DCMR imaging in small groups of patients with CHD revealed
ventricular and vascular dysfunction that is not apparent at rest.
There are no reports in a large series of patients on the safety
and accuracy of low-dose DCMR imaging.
Methods: inclusion of all patients who underwent low-dose
DCMR in our institution. Acquisition of a short axis set and flow
measurements at rest, and during dobutamine administered at
7.5 mg/kg/min maximum. Intra-observer and interobserver
variability (coefficient of variation) was determined for biven-
tricular function, volumes, and mass.
Results: In 91 patients 110 studies were performed (63 male
subjects, 54 tetralogy of Fallot, 37 Fontan patients, youngest age
at study 6.8 years). In 3 patients minor side effects occurred
(vertigo, headache, bigeminy). In 10 patients dobutamine was
lowered to 5 mg/kg/min because of an increase in heart rate of
>150% baseline, although well tolerated. Intra-observer varia-
bility was between 2.3 and 8.7% for rest and stress measure-
ments. Interobserver variability was between 3.6 and 10.5% at
rest. With stress-testing, the coefficient of variation for
biventricular ESV increased significantly to ≥ 15%, while it
remained < 10% for the other variables.
Conclusion: In patients with various types of CHD low-dose
DCMR imaging is feasible, safe, and can be performed from
7 years of age. Intra-observer variability is low for rest and stress
measurements. With stress-testing, interobserver variability of
biventricular ESV increases significantly.
AcknowledgementsSupported by NHF grant 2006B095.
P28The right ventricle shows distinct wall motioncharacteristics in L-TGA vs. D-TGA/atrial switchMichelle Savacool1, Philip Kilner2, David Sahn3,Willem Helbing4, Harold Litt5, Emanuela Valsangiacomo6
and Florence Sheehan11University of Washington, Seattle, WA, USA2Royal Brompton Hospital, London, UK3Oregon Health & Science University, Portland, OR, USA4Erasmus Medical Center, Rotterdam, Netherlands5University of Pennsylvania, Philadelphia, PA, USA6University Children's Hospital, Zurich, Switzerland
Journal of Cardiovascular Magnetic Resonance 2009, 11(Suppl 1):P28
Background: Patients whose right ventricles (RV) support the
systemic load may develop heart failure. However it is unknown
Table 1 (abstract P26)
Control (n = 18) Obese (n = 50) p value
PWV: Aortic Arch (m/s) 9.80 ± 8.26 9.86 ± 6.26 0.34
PWV: Descending Aorta (m/s) 4.34 ± 0.82 5.52 ± 6.12 0.25
PWV: Ascending Aorta to Abdominal Aorta (m/s) 5.0 ± 0.6 5.7 ± 1.5 0.02
Obese Pre Weight Loss(N = 28) Obese Post Weight Loss (N = 28) p value
PWV: Aortic Arch (m/s) 10.3 ± 7.2 10.1 ± 7.7 0.92
PWV: Descending Aorta (m/s) 6.2 ± 8.3 4.3 ± 1.4 0.25
PWV: Ascending Aorta to Abdominal Aorta (m/s) 5.8 ± 2.0 5.0 ± 1.0 0.03
Journal of Cardiovascular Magnetic Resonance 2009, 11(Suppl 1) http://jcmr-online.com/supplements/11/S1
Page 106 of 316(page number not for citation purposes)

whether the RV remodels similarly in different etiologies of
systemic RV.
Methods: RV wall motion and shape were measured from 3D
reconstructions generated from magnetic resonance images in 25
patients with transposition of the great arteries after atrial switch
(D-TGA), 17 patients with L-TGA and 9 normal subjects. Wall
motion was measured in 11 regions of the RV free wall and
septum and normalized by dividing by the square root of body
surface area. Regional RV Shape was measured as eccentricity
(range from 0 for a line to 1 for a circle) in 20 short-axis slices of
the RV.
Results: Systemic RV patients had severe RV dilatation
(end diastolic volume index 137 ± 37 vs. 84 ± 22 ml/m2 in
normals, p < .001), poor RV function (ejection fraction (EF)
32 ± 7 vs. 55 ± 5%, p < .001), and more circular cross sections
(eccentricity .83 to .93 vs. below .66 for normals, p < .001 for
all slices). L-TGA patients had better RV function than D-
TGA patients (EF 35 ± 7 vs. 30 ± 7%, p < .05). Both groups
had significantly depressed wall motion in most regions
compared to normal. However L-TGA had better wall motion
at the base than D-TGA but contracted more poorly at the apex.
Figure 1.
Conclusion: Systemic RVs are dilated, spherical, and poorly
functioning. L-TGA and D-TGA systemic RVs have distinctive
wall motion and remodeling patterns. The functional and
morphological response to systemic pressure in the RV may
differ depending on the anomaly.
P29Does a selective non-peptide angiotensin II type 2receptor agonist reduce post-infarction leftventricular remodeling?Alexander B Jehle, Yaqin Xu, Joseph D DiMaria,Frederick H Epstein, Brent A French, R Jack Roy,Robert M Carey and Christopher M KramerUniversity of Virginia, Charlottesville, VA, USA
Journal of Cardiovascular Magnetic Resonance 2009, 11(Suppl 1):P29
Purpose: Cardiac overexpression of the angiotensin II
type 2 receptor (AT2-R) attenuates left ventricular (LV)
remodeling following myocardial infarction (MI). We hypothe-
sized that the use of a novel non-peptide AT2-R agonist
Compound 21 (C21) would significantly reduce adverse
post-MI remodeling in mice as measured by cardiac magnetic
resonance imaging (CMR). Such a compound could offer
significant translational potential.
Methods: Forty nine C57/BL6 mice underwent 60-minute
occlusion of the left anterior descending artery, followed by
reperfusion. Nine died early post-MI, leaving 40 for further study.
Twenty three received 0.3 mg/Kg/day C21 SQ by Alzet
minipump and 17 were untreated. CMR images were obtained
at baseline and post-infarct (days 1 and 28) using a Clinscan 7 T
MRI system (Siemens/Bruker). Using cine gradient echo black
blood imaging, six to 8 continuous short-axis slices were
acquired, each 1 mm thick, from the apex to the base. Images
were both electrocardiographic and respiratory gated, with echo
time of 1.9 ms, 15 degree flip angle and field of view 25.6 mm,
giving a spatial resolution of 200 × 200 × 1000 mm3. The TR was
adjusted continuously to obtain 16 equally spaced phases during
each cardiac cycle. Three signal averages were used, resulting in
an acquisition time of approximately 4 minutes per slice and total
imaging time of 30 to 45 minutes per mouse. For infarct sizing on
day 1 post-MI, late gadolinium enhancement was performed using
an inversion recovery sequence with an initial 180 degree
inversion pulse, TR of 5.4, TE of 0.67 ms, TI 500 ms, 20 degree
flip angle and three averages. The FOV was 25.6 mm, with a
spatial resolution of 200 × 200 × 1000 mm3. The ARGUS
(Siemens Medical Systems) image analysis program was used to
define LV end-diastolic (LVEDV) and systolic volumes (LVESV),
stroke volume (SV), ejection fraction (LVEF) and LV mass at
baseline and day 28 post-MI as well as infarct size on day 1 post-
MI as % of total LV mass.
Results: At baseline, LV end-systolic volume, mass and EF were
similar between groups. Baseline LV end-diastolic volume in the
treated group was larger (mean ± S.D., 48.6 ± 12.8 vs.
39.9 ± 10.6, p < 0.05). Infarct size was similar between groups
(41 ± 9 vs. 38 ± 13%, p = 0.32). By CMR at day 28 post-MI, end-
diastolic volume, end-systolic volume, stroke volume, and LV
Figure 1 (abstract P28)
Regional wall motion (cm).
Table 1 (abstract P29) Post-MI day 28 LV parameters
LVEF (%) LVEDV (ml) LVESV (ml) SV (ml) MASS (mg)
Control (n = 17) 27.5 ± 10.5 74.1 ± 26.7 54.8 ± 24.8 19.2 ± 6.4 47.5 ± 13.9
C21 (n = 23) 27.3 ± 11.8 91.6 ± 23.8 66.9 ± 21.5 24.7 ± 13.3 56.7 ± 15.2
p value 0.98 <0.01 <0.05 <0.05 <0.05
Journal of Cardiovascular Magnetic Resonance 2009, 11(Suppl 1) http://jcmr-online.com/supplements/11/S1
Page 107 of 316(page number not for citation purposes)
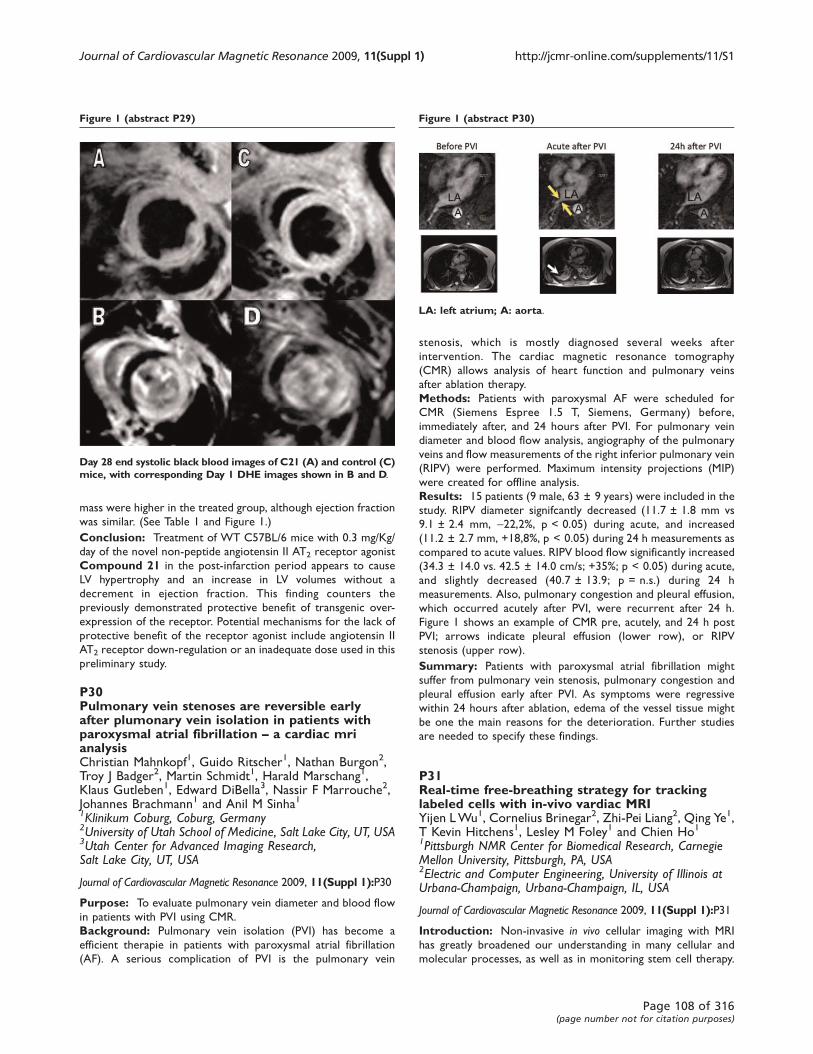
mass were higher in the treated group, although ejection fraction
was similar. (See Table 1 and Figure 1.)
Conclusion: Treatment of WT C57BL/6 mice with 0.3 mg/Kg/
day of the novel non-peptide angiotensin II AT2 receptor agonist
Compound 21 in the post-infarction period appears to cause
LV hypertrophy and an increase in LV volumes without a
decrement in ejection fraction. This finding counters the
previously demonstrated protective benefit of transgenic over-
expression of the receptor. Potential mechanisms for the lack of
protective benefit of the receptor agonist include angiotensin II
AT2 receptor down-regulation or an inadequate dose used in this
preliminary study.
P30Pulmonary vein stenoses are reversible earlyafter plumonary vein isolation in patients withparoxysmal atrial fibrillation – a cardiac mrianalysisChristian Mahnkopf1, Guido Ritscher1, Nathan Burgon2,Troy J Badger2, Martin Schmidt1, Harald Marschang1,Klaus Gutleben1, Edward DiBella3, Nassir F Marrouche2,Johannes Brachmann1 and Anil M Sinha11Klinikum Coburg, Coburg, Germany2University of Utah School of Medicine, Salt Lake City, UT, USA3Utah Center for Advanced Imaging Research,Salt Lake City, UT, USA
Journal of Cardiovascular Magnetic Resonance 2009, 11(Suppl 1):P30
Purpose: To evaluate pulmonary vein diameter and blood flow
in patients with PVI using CMR.
Background: Pulmonary vein isolation (PVI) has become a
efficient therapie in patients with paroxysmal atrial fibrillation
(AF). A serious complication of PVI is the pulmonary vein
stenosis, which is mostly diagnosed several weeks after
intervention. The cardiac magnetic resonance tomography
(CMR) allows analysis of heart function and pulmonary veins
after ablation therapy.
Methods: Patients with paroxysmal AF were scheduled for
CMR (Siemens Espree 1.5 T, Siemens, Germany) before,
immediately after, and 24 hours after PVI. For pulmonary vein
diameter and blood flow analysis, angiography of the pulmonary
veins and flow measurements of the right inferior pulmonary vein
(RIPV) were performed. Maximum intensity projections (MIP)
were created for offline analysis.
Results: 15 patients (9 male, 63 ± 9 years) were included in the
study. RIPV diameter signifcantly decreased (11.7 ± 1.8 mm vs
9.1 ± 2.4 mm, -22,2%, p < 0.05) during acute, and increased
(11.2 ± 2.7 mm, +18,8%, p < 0.05) during 24 h measurements as
compared to acute values. RIPV blood flow significantly increased
(34.3 ± 14.0 vs. 42.5 ± 14.0 cm/s; +35%; p < 0.05) during acute,
and slightly decreased (40.7 ± 13.9; p = n.s.) during 24 h
measurements. Also, pulmonary congestion and pleural effusion,
which occurred acutely after PVI, were recurrent after 24 h.
Figure 1 shows an example of CMR pre, acutely, and 24 h post
PVI; arrows indicate pleural effusion (lower row), or RIPV
stenosis (upper row).
Summary: Patients with paroxysmal atrial fibrillation might
suffer from pulmonary vein stenosis, pulmonary congestion and
pleural effusion early after PVI. As symptoms were regressive
within 24 hours after ablation, edema of the vessel tissue might
be one the main reasons for the deterioration. Further studies
are needed to specify these findings.
P31Real-time free-breathing strategy for trackinglabeled cells with in-vivo vardiac MRIYijen LWu1, Cornelius Brinegar2, Zhi-Pei Liang2, Qing Ye1,T Kevin Hitchens1, Lesley M Foley1 and Chien Ho11Pittsburgh NMR Center for Biomedical Research, CarnegieMellon University, Pittsburgh, PA, USA2Electric and Computer Engineering, University of Illinois atUrbana-Champaign, Urbana-Champaign, IL, USA
Journal of Cardiovascular Magnetic Resonance 2009, 11(Suppl 1):P31
Introduction: Non-invasive in vivo cellular imaging with MRI
has greatly broadened our understanding in many cellular and
molecular processes, as well as in monitoring stem cell therapy.
Figure 1 (abstract P29)
Day 28 end systolic black blood images of C21 (A) and control (C)mice, with corresponding Day 1 DHE images shown in B and D.
Figure 1 (abstract P30)
LA: left atrium; A: aorta.
Journal of Cardiovascular Magnetic Resonance 2009, 11(Suppl 1) http://jcmr-online.com/supplements/11/S1
Page 108 of 316(page number not for citation purposes)
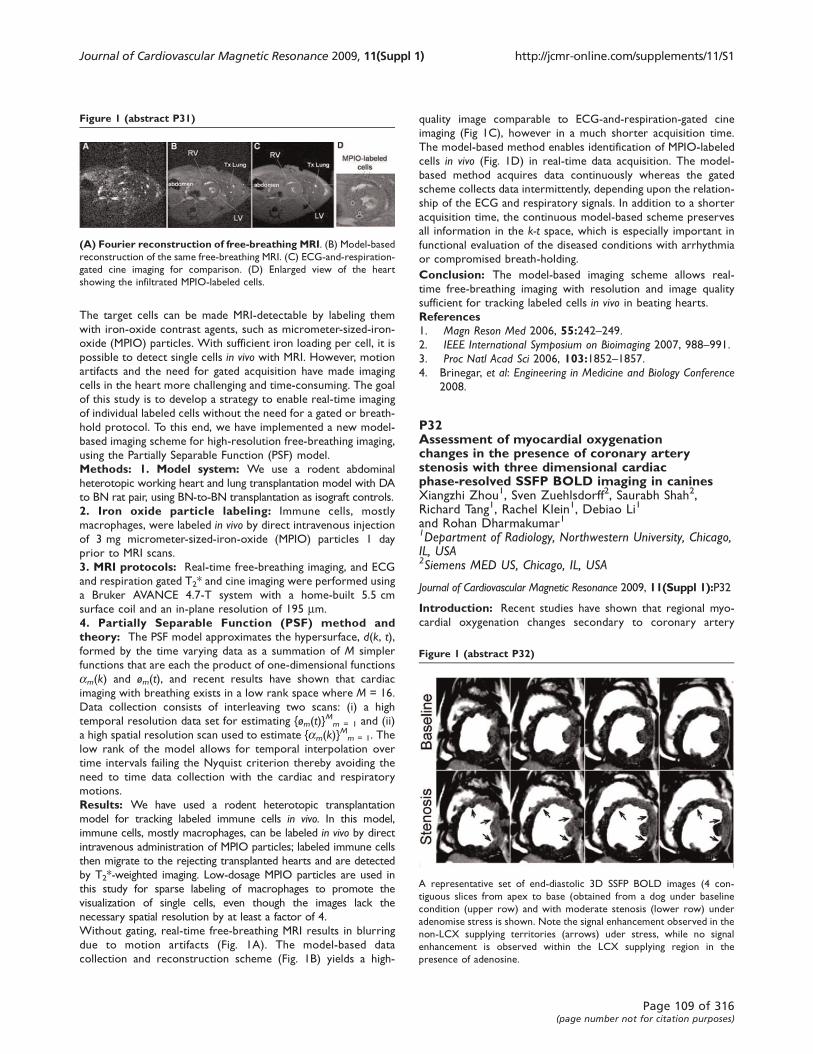
The target cells can be made MRI-detectable by labeling them
with iron-oxide contrast agents, such as micrometer-sized-iron-
oxide (MPIO) particles. With sufficient iron loading per cell, it is
possible to detect single cells in vivo with MRI. However, motion
artifacts and the need for gated acquisition have made imaging
cells in the heart more challenging and time-consuming. The goal
of this study is to develop a strategy to enable real-time imaging
of individual labeled cells without the need for a gated or breath-
hold protocol. To this end, we have implemented a new model-
based imaging scheme for high-resolution free-breathing imaging,
using the Partially Separable Function (PSF) model.
Methods: 1. Model system: We use a rodent abdominal
heterotopic working heart and lung transplantation model with DA
to BN rat pair, using BN-to-BN transplantation as isograft controls.
2. Iron oxide particle labeling: Immune cells, mostly
macrophages, were labeled in vivo by direct intravenous injectionof 3 mg micrometer-sized-iron-oxide (MPIO) particles 1 day
prior to MRI scans.
3. MRI protocols: Real-time free-breathing imaging, and ECG
and respiration gated T2* and cine imaging were performed using
a Bruker AVANCE 4.7-T system with a home-built 5.5 cm
surface coil and an in-plane resolution of 195 mm.
4. Partially Separable Function (PSF) method andtheory: The PSF model approximates the hypersurface, d(k, t),formed by the time varying data as a summation of M simpler
functions that are each the product of one-dimensional functions
am(k) and øm(t), and recent results have shown that cardiac
imaging with breathing exists in a low rank space where M = 16.
Data collection consists of interleaving two scans: (i) a high
temporal resolution data set for estimating {øm(t)}Mm = 1 and (ii)
a high spatial resolution scan used to estimate {am(k)}Mm = 1. The
low rank of the model allows for temporal interpolation over
time intervals failing the Nyquist criterion thereby avoiding the
need to time data collection with the cardiac and respiratory
motions.
Results: We have used a rodent heterotopic transplantation
model for tracking labeled immune cells in vivo. In this model,
immune cells, mostly macrophages, can be labeled in vivo by direct
intravenous administration of MPIO particles; labeled immune cells
then migrate to the rejecting transplanted hearts and are detected
by T2*-weighted imaging. Low-dosage MPIO particles are used in
this study for sparse labeling of macrophages to promote the
visualization of single cells, even though the images lack the
necessary spatial resolution by at least a factor of 4.
Without gating, real-time free-breathing MRI results in blurring
due to motion artifacts (Fig. 1A). The model-based data
collection and reconstruction scheme (Fig. 1B) yields a high-
quality image comparable to ECG-and-respiration-gated cine
imaging (Fig 1C), however in a much shorter acquisition time.
The model-based method enables identification of MPIO-labeled
cells in vivo (Fig. 1D) in real-time data acquisition. The model-
based method acquires data continuously whereas the gated
scheme collects data intermittently, depending upon the relation-
ship of the ECG and respiratory signals. In addition to a shorter
acquisition time, the continuous model-based scheme preserves
all information in the k-t space, which is especially important in
functional evaluation of the diseased conditions with arrhythmia
or compromised breath-holding.
Conclusion: The model-based imaging scheme allows real-
time free-breathing imaging with resolution and image quality
sufficient for tracking labeled cells in vivo in beating hearts.
References1. Magn Reson Med 2006, 55:242–249.2. IEEE International Symposium on Bioimaging 2007, 988–991.3. Proc Natl Acad Sci 2006, 103:1852–1857.4. Brinegar, et al: Engineering in Medicine and Biology Conference
2008.
P32Assessment of myocardial oxygenationchanges in the presence of coronary arterystenosis with three dimensional cardiacphase-resolved SSFP BOLD imaging in caninesXiangzhi Zhou1, Sven Zuehlsdorff2, Saurabh Shah2,Richard Tang1, Rachel Klein1, Debiao Li1
and Rohan Dharmakumar11Department of Radiology, Northwestern University, Chicago,IL, USA2Siemens MED US, Chicago, IL, USA
Journal of Cardiovascular Magnetic Resonance 2009, 11(Suppl 1):P32
Introduction: Recent studies have shown that regional myo-
cardial oxygenation changes secondary to coronary artery
Figure 1 (abstract P31)
(A) Fourier reconstruction of free-breathing MRI. (B) Model-based
reconstruction of the same free-breathing MRI. (C) ECG-and-respiration-
gated cine imaging for comparison. (D) Enlarged view of the heart
showing the infiltrated MPIO-labeled cells.
Figure 1 (abstract P32)
A representative set of end-diastolic 3D SSFP BOLD images (4 con-
tiguous slices from apex to base (obtained from a dog under baseline
condition (upper row) and with moderate stenosis (lower row) under
adenomise stress is shown. Note the signal enhancement observed in the
non-LCX supplying territories (arrows) uder stress, while no signal
enhancement is observed within the LCX supplying region in the
presence of adenosine.
Journal of Cardiovascular Magnetic Resonance 2009, 11(Suppl 1) http://jcmr-online.com/supplements/11/S1
Page 109 of 316(page number not for citation purposes)
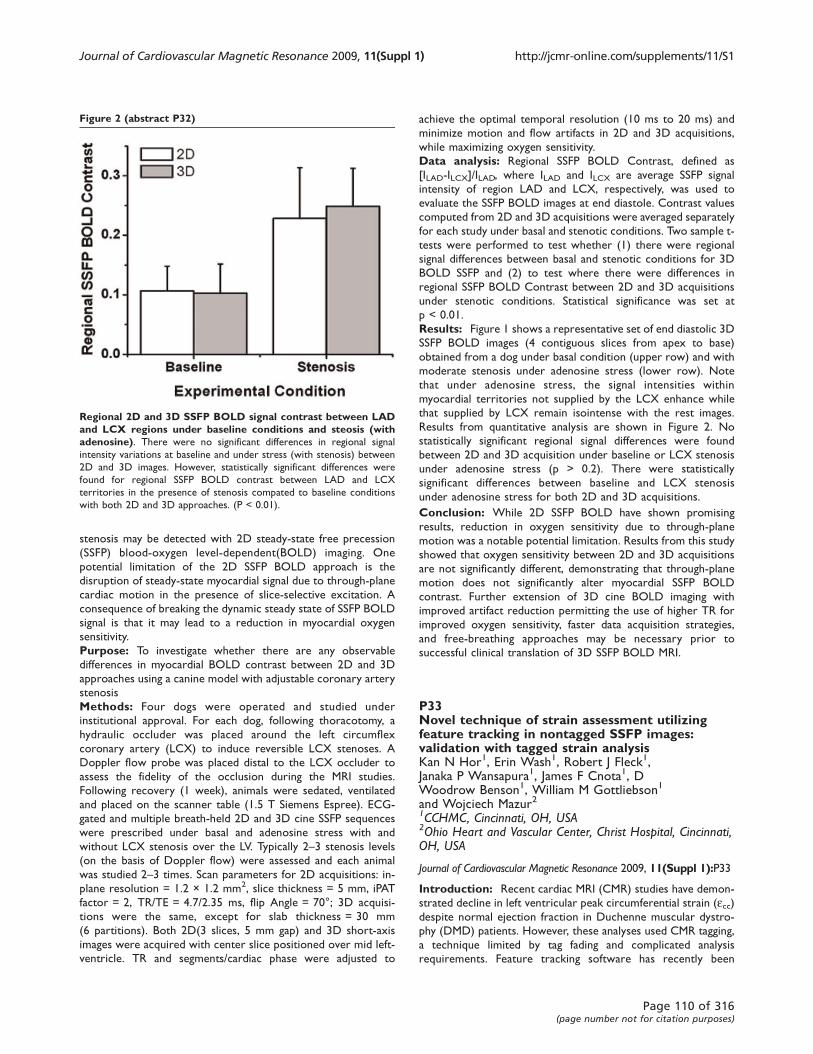
stenosis may be detected with 2D steady-state free precession
(SSFP) blood-oxygen level-dependent(BOLD) imaging. One
potential limitation of the 2D SSFP BOLD approach is the
disruption of steady-state myocardial signal due to through-plane
cardiac motion in the presence of slice-selective excitation. A
consequence of breaking the dynamic steady state of SSFP BOLD
signal is that it may lead to a reduction in myocardial oxygen
sensitivity.
Purpose: To investigate whether there are any observable
differences in myocardial BOLD contrast between 2D and 3D
approaches using a canine model with adjustable coronary artery
stenosis
Methods: Four dogs were operated and studied under
institutional approval. For each dog, following thoracotomy, a
hydraulic occluder was placed around the left circumflex
coronary artery (LCX) to induce reversible LCX stenoses. A
Doppler flow probe was placed distal to the LCX occluder to
assess the fidelity of the occlusion during the MRI studies.
Following recovery (1 week), animals were sedated, ventilated
and placed on the scanner table (1.5 T Siemens Espree). ECG-
gated and multiple breath-held 2D and 3D cine SSFP sequences
were prescribed under basal and adenosine stress with and
without LCX stenosis over the LV. Typically 2–3 stenosis levels
(on the basis of Doppler flow) were assessed and each animal
was studied 2–3 times. Scan parameters for 2D acquisitions: in-
plane resolution = 1.2 × 1.2 mm2, slice thickness = 5 mm, iPAT
factor = 2, TR/TE = 4.7/2.35 ms, flip Angle = 70°; 3D acquisi-
tions were the same, except for slab thickness = 30 mm
(6 partitions). Both 2D(3 slices, 5 mm gap) and 3D short-axis
images were acquired with center slice positioned over mid left-
ventricle. TR and segments/cardiac phase were adjusted to
achieve the optimal temporal resolution (10 ms to 20 ms) and
minimize motion and flow artifacts in 2D and 3D acquisitions,
while maximizing oxygen sensitivity.
Data analysis: Regional SSFP BOLD Contrast, defined as
[ILAD-ILCX]/ILAD, where ILAD and ILCX are average SSFP signal
intensity of region LAD and LCX, respectively, was used to
evaluate the SSFP BOLD images at end diastole. Contrast values
computed from 2D and 3D acquisitions were averaged separately
for each study under basal and stenotic conditions. Two sample t-
tests were performed to test whether (1) there were regional
signal differences between basal and stenotic conditions for 3D
BOLD SSFP and (2) to test where there were differences in
regional SSFP BOLD Contrast between 2D and 3D acquisitions
under stenotic conditions. Statistical significance was set at
p < 0.01.
Results: Figure 1 shows a representative set of end diastolic 3D
SSFP BOLD images (4 contiguous slices from apex to base)
obtained from a dog under basal condition (upper row) and with
moderate stenosis under adenosine stress (lower row). Note
that under adenosine stress, the signal intensities within
myocardial territories not supplied by the LCX enhance while
that supplied by LCX remain isointense with the rest images.
Results from quantitative analysis are shown in Figure 2. No
statistically significant regional signal differences were found
between 2D and 3D acquisition under baseline or LCX stenosis
under adenosine stress (p > 0.2). There were statistically
significant differences between baseline and LCX stenosis
under adenosine stress for both 2D and 3D acquisitions.
Conclusion: While 2D SSFP BOLD have shown promising
results, reduction in oxygen sensitivity due to through-plane
motion was a notable potential limitation. Results from this study
showed that oxygen sensitivity between 2D and 3D acquisitions
are not significantly different, demonstrating that through-plane
motion does not significantly alter myocardial SSFP BOLD
contrast. Further extension of 3D cine BOLD imaging with
improved artifact reduction permitting the use of higher TR for
improved oxygen sensitivity, faster data acquisition strategies,
and free-breathing approaches may be necessary prior to
successful clinical translation of 3D SSFP BOLD MRI.
P33Novel technique of strain assessment utilizingfeature tracking in nontagged SSFP images:validation with tagged strain analysisKan N Hor1, Erin Wash1, Robert J Fleck1,Janaka P Wansapura1, James F Cnota1, DWoodrow Benson1, William M Gottliebson1
and Wojciech Mazur21CCHMC, Cincinnati, OH, USA2Ohio Heart and Vascular Center, Christ Hospital, Cincinnati,OH, USA
Journal of Cardiovascular Magnetic Resonance 2009, 11(Suppl 1):P33
Introduction: Recent cardiac MRI (CMR) studies have demon-
strated decline in left ventricular peak circumferential strain (ecc)despite normal ejection fraction in Duchenne muscular dystro-
phy (DMD) patients. However, these analyses used CMR tagging,
a technique limited by tag fading and complicated analysis
requirements. Feature tracking software has recently been
Figure 2 (abstract P32)
Regional 2D and 3D SSFP BOLD signal contrast between LADand LCX regions under baseline conditions and steosis (withadenosine). There were no significant differences in regional signal
intensity variations at baseline and under stress (with stenosis) between
2D and 3D images. However, statistically significant differences were
found for regional SSFP BOLD contrast between LAD and LCX
territories in the presence of stenosis compated to baseline conditions
with both 2D and 3D approaches. (P < 0.01).
Journal of Cardiovascular Magnetic Resonance 2009, 11(Suppl 1) http://jcmr-online.com/supplements/11/S1
Page 110 of 316(page number not for citation purposes)
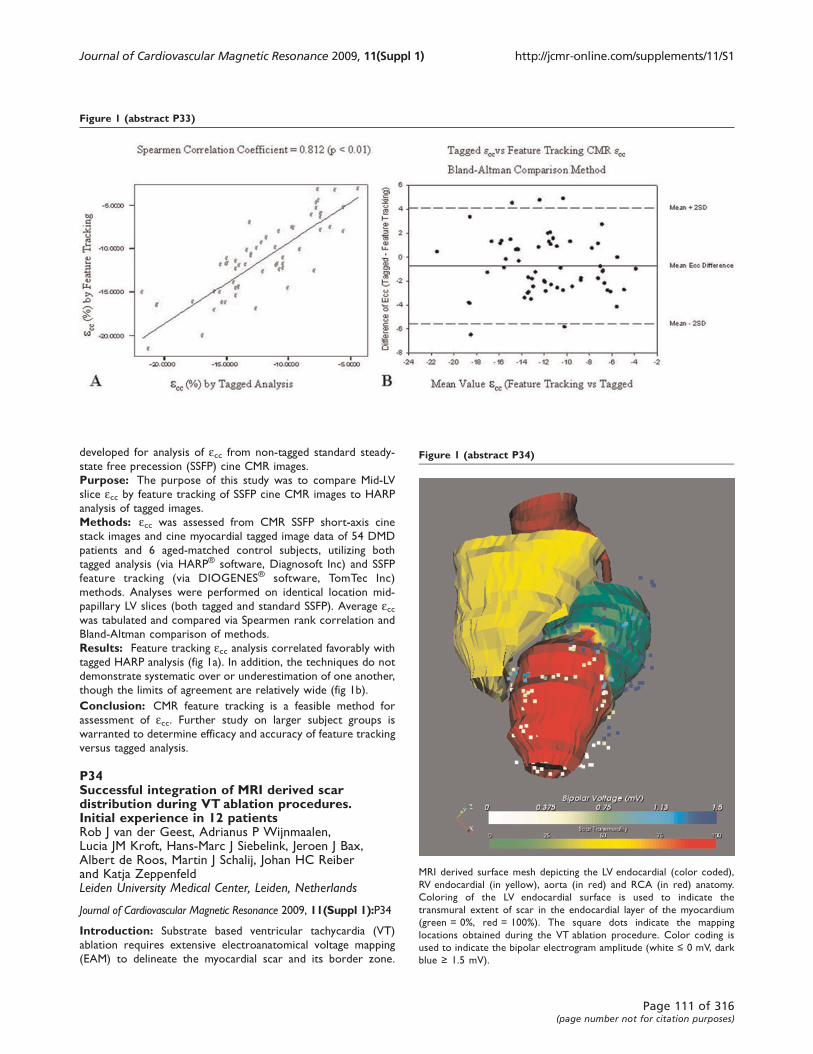
developed for analysis of ecc from non-tagged standard steady-
state free precession (SSFP) cine CMR images.
Purpose: The purpose of this study was to compare Mid-LV
slice ecc by feature tracking of SSFP cine CMR images to HARP
analysis of tagged images.
Methods: ecc was assessed from CMR SSFP short-axis cine
stack images and cine myocardial tagged image data of 54 DMD
patients and 6 aged-matched control subjects, utilizing both
tagged analysis (via HARP® software, Diagnosoft Inc) and SSFP
feature tracking (via DIOGENES® software, TomTec Inc)
methods. Analyses were performed on identical location mid-
papillary LV slices (both tagged and standard SSFP). Average eccwas tabulated and compared via Spearmen rank correlation and
Bland-Altman comparison of methods.
Results: Feature tracking ecc analysis correlated favorably with
tagged HARP analysis (fig 1a). In addition, the techniques do not
demonstrate systematic over or underestimation of one another,
though the limits of agreement are relatively wide (fig 1b).
Conclusion: CMR feature tracking is a feasible method for
assessment of ecc. Further study on larger subject groups is
warranted to determine efficacy and accuracy of feature tracking
versus tagged analysis.
P34Successful integration of MRI derived scardistribution during VT ablation procedures.Initial experience in 12 patientsRob J van der Geest, Adrianus P Wijnmaalen,Lucia JM Kroft, Hans-Marc J Siebelink, Jeroen J Bax,Albert de Roos, Martin J Schalij, Johan HC Reiberand Katja ZeppenfeldLeiden University Medical Center, Leiden, Netherlands
Journal of Cardiovascular Magnetic Resonance 2009, 11(Suppl 1):P34
Introduction: Substrate based ventricular tachycardia (VT)
ablation requires extensive electroanatomical voltage mapping
(EAM) to delineate the myocardial scar and its border zone.
Figure 1 (abstract P33)
Figure 1 (abstract P34)
MRI derived surface mesh depicting the LV endocardial (color coded),
RV endocardial (in yellow), aorta (in red) and RCA (in red) anatomy.
Coloring of the LV endocardial surface is used to indicate the
transmural extent of scar in the endocardial layer of the myocardium
(green = 0%, red = 100%). The square dots indicate the mapping
locations obtained during the VT ablation procedure. Color coding is
used to indicate the bipolar electrogram amplitude (white ≤ 0 mV, dark
blue ≥ 1.5 mV).
Journal of Cardiovascular Magnetic Resonance 2009, 11(Suppl 1) http://jcmr-online.com/supplements/11/S1
Page 111 of 316(page number not for citation purposes)

Integration of three-dimensional (3D) information from late
enhancement (LE) MRI may be feasible and may provide
additional information on VT substrate mapping. This study
was conducted to test the feasibility of merging 3D MR derived
scar information during the VT ablation procedure.
Methods: In 12 patients (all men; age 64 ± 10) referred for
catheter ablation of VT late after myocardial infarction CMR was
performed 2–3 days prior to VT ablation. LE MR was performed in
multiple slices covering the complete LV in short-axis (slice
thickness 10 mm, 5 mm overlap) and long-axis views (two-chamber,
four-chamber views, slice thickness 12 mm, 6 mm overlap). In
addition, a black-blood imaging sequence was used to image the
proximal aorta and the origin of the left main (LM) and right
coronary artery (RCA). In the short-axis LE scan, endocardial and
epicardial boundaries were derived semi-automatically. The myo-
cardium was divided in an endocardial and epicardial layer and for
each layer, at each location, the extent of scar was computed.
Subsequently, 3D endocardial and epicardial surface meshes were
constructed. Mesh points were color coded based on the extent of
scar at the respective myocardial location and layer. In addition, 3D
meshes were constructed of the ascending aorta and origin of the
LM and RCA.
Prior to VT ablation the generated meshes were imported into
the 3D mapping system (CARTO, research version). Based on
the 3D catheter tracking capabilities of this system, the MRI
derived meshes were registered with the endocardial EAM using
the LM position and the endocardial surface as landmarks. After
the procedure, 3D mapping point positions and the correspond-
ing bipolar electrogram voltages were saved and superimposed
on the original LE MRI data for comparison. Presence of scar
from EAM was based on a cut off value of 1.5 mV.
Results: Average LV EF was 43 ± 10%; average MRI derived
scar size was 11 ± 11% of the LV myocardium. Integration of MRI
derived scar information with EAM was successful in all cases.
The average number of endocardial mapping points was
264 ± 37. The mean registration error between the MRI derived
endocardial surface and EAM was 4.4 ± 3.0 mm. In all patients,
regions with transmural scar as seen on MRI, were also identified
by EAM (bipolar electrogram amplitude <1.5 mV). In the majority
of regions without scar, bipolar voltages were >1.5 mV. However,
in regions with non-transmural scar as derived by MRI, EAM
derived bipolar voltages were either <1.5 mVor >1.5 mV. Figures 1
and 2.
Conclusion: It was demonstrated that integration of MRI
derived scar information into a 3D mapping system is feasible.
The observed registration errors are small compared to the
expected amount of cardiac and respiratory motion and the slice
thickness of the LE MRI acquisition. The additional information
provided by MRI, especially in regions of non-transmural scar,
may be helpful to assess the anatomical substrate of VT and to
improve the efficiency and outcome of VT ablation procedures.
P35Comparison of coronary endothelial functionand brachial flow mediated vasodilatation usingcardiac magnetic resonance imagingDipti Gupta, Lynette Duncanson, Danielle Janosevic,William Schapiro, Jing Han, Katherine McGrathand Nathaniel ReichekSt. Francis Hospital, Roslyn, NY, USA
Journal of Cardiovascular Magnetic Resonance 2009, 11(Suppl 1):P35
Introduction: Brachial artery flow-mediated dilatation (FMD)
is used as a surrogate for invasive assessment of coronary artery
endothelial function, concordance with invasive assessment of
coronary endothelial function is controversial.
Purpose: We assessed both brachial FMD and coronary CPT
noninvasively at the same sitting using cardiac MRI (CMR) and
compared the two in a population with and without coronary
risk factors.
Methods: Endothelium-dependent vasodilator function was
assessed in the brachial and coronary arteries in 39 subjects.
Using a Siemens 1.5 T scanner, the left anterior descending
(LAD) coronary artery was localized using a navigator angio-
graphic sequence and a proximal cross-section imaged using
TrueFISP bright blood imaging and T2 weighted turbo spin echo
imaging. Images were obtained at rest and during cold pressor
testing(CPT) and evaluated in ARGUS (Siemens). The % change
in lumen cross-sectional area in mid diastole was determined.
FMD was assessed by inflating a blood pressure cuff to a reading
50 mmHg higher than the subject's resting systolic pressure, and
deflating after 1 min. Imaging was done using TrueFISP cine bright
blood imaging at rest, inflation and at 5 sequential time points
during deflation. Images were evaluated in ARGUS (Siemens).
The % change in lumen cross-sectional area pre and post inflation
was determined.
Results: Of 39 subjects, 16 were females and the mean age was
52 ± 8 yrs. Coronary risk factors (hypertension, hyperlipidemia,
smoking, diabetes) were present in 19 while 20 had no risk
factors.
The mean brachial FMD of the pooled cohort was 13% and the
mean coronary response to CPT was 16%. There was no
significant relationship between the brachial FMD and coronary
CPT response (r = 0.03, P = 0.8).
Conclusion: When determined with similar noninvasive meth-
ods at the same sitting, brachial FMD does not correlate closely
with coronary endothelial response to CPT in a population with
and without coronary risk factors. Use of brachial FMD as a
surrogate for coronary endothelial function should be recon-
sidered.
Figure 2 (abstract P34)
Late enhancement MRI of the same patient showing transmural scar in
the septal-apical region with results of EAM superimposed. Bipolar
voltages are low (<1.5 mV) in the scar region and normal (>1.5 mV) in
the healthy myocardium.
Journal of Cardiovascular Magnetic Resonance 2009, 11(Suppl 1) http://jcmr-online.com/supplements/11/S1
Page 112 of 316(page number not for citation purposes)

P36The evaluation of right and left ventricularmorphology by CMR with comparison to recipientheart after heart transplant: a surgical perspectiveNicholas Farber, Mark Doyle, Ronald B Williams,June A Yamrozik, Perry Bruno, George J Magovern,James A Magovern, Srinivas Muraliand Robert WW BiedermanAllegheny General Hospital, The Gerald McGinnisCardiovascular Institute, Pittsburgh, PA, USA
Journal of Cardiovascular Magnetic Resonance 2009, 11(Suppl 1):P36
Introduction: Cardiovascular MRI (CMR) is considered the
“gold standard” for non-invasive left and right ventricular mass
quantitation. To our knowledge, this information is only based on
animal and phantom data and has never been prospectively or
retrospectively validated in humans undermining the credibility of
the ‘gold standard'. This issue is particularly important for the
right ventricle having complex geometry ill suited for mathema-
tical modeling, placing increased importance on accurate mass
quantitation. The surest way to validate the accuracy and thus the
true gold standard of CMR derived mass is through autopsy.
Purpose: To establish a correlation between CMR derived
ventricular mass and autopsy mass of ex vivo hearts from heart
transplants.Methods: Over a 10-week period, five ex vivo hearts donor
hearts were obtained immediately upon orthotopic heart
transplantation from the operating room. They were quickly
cleaned and suspended in a saline-filled container and scanned
using a steady state free precession (SSFP) sequence and 2D
short-axis slices to measure the CMR defined weight (g), (GE 1.5
T, Excite. Milwaukee, WI). Semiautomated endocardial and
epicardial contouring was performed via Mass Plus, Medis (The
Leiden, The Netherlands). The donor hearts were then dissected
to shave the atria off at the atrioventricular plane and ventricles
separated at the interventricular septum. The actual weight of
the LV and RV was measured via high-fidelity scale giving the true
mass of each ventricle for comparison with the weighed mass.
Results: The CMR measured LV mass (mean = 329.2 g,
SD = 78.9 g) significantly predicted the actual measured
LV mass (mean = 329.4 g, SD = 83.7 g), p = NS. The Pearson
product-moment correlation for this sample was 0.94 (p = 0.02).
The CMR measured RV mass (mean = 151.0 g , SD = 50.5 g)
significantly predicted the actual measured RV mass (mean =
126.8 g, SD = 44.6 g). The Pearson product-moment correlation
for this sample was 0.92 (p = 0.03). The CMR measured LV + RV
mass (mean = 240.1 g, SD = 112.8 g) significantly predicted the
actual measured LV + RV mass (mean = 228.1 g, SD = 124.1 g).
The Pearson product-moment correlation for this sample was
0.98 (p < 0.001).
Conclusion: CMR accurately determined both left and right
ventricular masses as compared to weighed explanted hearts,
despite variable surgical removal of instrumentation (LVAD/
RVAD and AICD's) in the majority and the complexities of the
right ventricle in all. To our knowledge, albeit a small sample size,
it represents a ‘first’ in human CMR vs. autopsy comparison,
similar to the intrepid days of the initial validation of
echocardiography vs. autopsy report by Reichek and Devereux
in 1976. Future work will include sampling of additional ex vivohearts and a correlation between in vivo CMR derived cardiac
mass pre-heart transplant and following explantation.
P37Correlation between velocity encoded cinemagnetic resonance imaging and Dopplerechocardiography for the evaluation of diastolicdysfunctionIjaz Ahmad1, Mitra Sahebazamai1, Lesan Banko1,Joshua A Sockolow1, Igor Klem2, Terrence Sacchi1
and John F Heitner11New York Methodist Hospital, Brooklyn, NY, USA2Duke University Medical Center, Durham, NC, USA
Journal of Cardiovascular Magnetic Resonance 2009, 11(Suppl 1):P37
Background: Doppler echocardiographic (Echo) measure-
ments of the mitral and pulmonary venous flow have been
used to assess diastolic dysfunction (DD). Velocity-encoded
cardiac magnetic resonance (Ve-CMR) can measure similar
parameters and may potentially be used for the assessment of
DD.
Objective: To assess the correlation of Ve-CMR with Echo in
assessing mitral inflow E/A ratio, left atrial (LA) size, and
pulmonary vein (PV) flow.
Methods: We prospectively enrolled 22 outpatients with a
mitral inflow pattern by Echo that was normal (8), impaired
relaxation (7), pseudo-normal (2), or restrictive (5). The mean
left ventricular ejection fraction (LVEF) was 60.8 and two patients
had left ventricular hypertrophy on echo. Ve-CMR was
performed within 2 hours of the Echo. The following indices
were measured: LA size, mitral inflow E-velocity (E), A-velocity
(A), E/A ratio, PV waves (S, D and A).
Results: The mean age of the patients was 51 years. The
average Echo mitral inflow absolute velocities were close to
double the Ve-CMR {Echo E-velocity = 85.8 cm/sec vs. Ve-CMR
E velocity = 41.4 cm/sec, Echo A-velocity 70 cm/sec vs. Ve-CMR
Figure 1 (abstract P37)
Correlation between Ve-CMR and Doppler echo derived values was
tested using Spearman's rank correlation coefficients. There was
significant correlation between left atrial size and E/A ratio. A: LA size
(R = 0.9, p-value < 0.05), B: E/A ratio (R = 0.88, p-value < 0.05), but not
C: (R = 0.12, p = 0.58). LA; left atrium, PV, pulmonary vein.
Journal of Cardiovascular Magnetic Resonance 2009, 11(Suppl 1) http://jcmr-online.com/supplements/11/S1
Page 113 of 316(page number not for citation purposes)
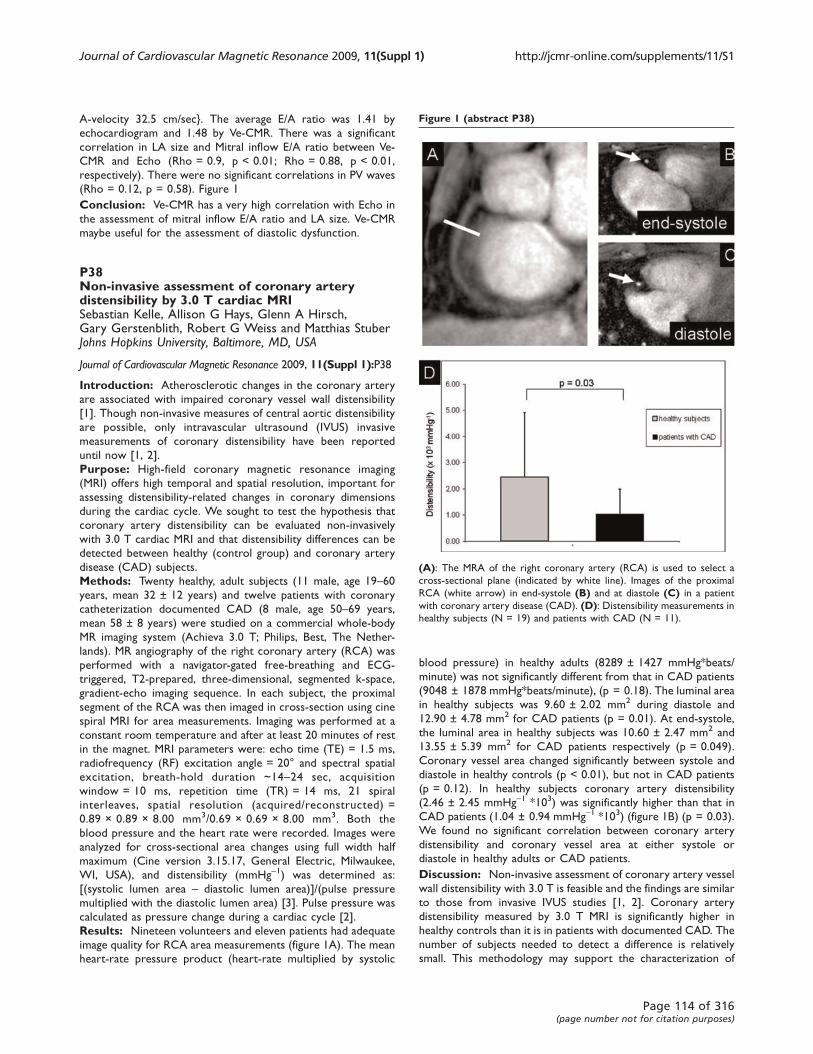
A-velocity 32.5 cm/sec}. The average E/A ratio was 1.41 by
echocardiogram and 1.48 by Ve-CMR. There was a significant
correlation in LA size and Mitral inflow E/A ratio between Ve-
CMR and Echo (Rho = 0.9, p < 0.01; Rho = 0.88, p < 0.01,
respectively). There were no significant correlations in PV waves
(Rho = 0.12, p = 0.58). Figure 1
Conclusion: Ve-CMR has a very high correlation with Echo in
the assessment of mitral inflow E/A ratio and LA size. Ve-CMR
maybe useful for the assessment of diastolic dysfunction.
P38Non-invasive assessment of coronary arterydistensibility by 3.0 T cardiac MRISebastian Kelle, Allison G Hays, Glenn A Hirsch,Gary Gerstenblith, Robert G Weiss and Matthias StuberJohns Hopkins University, Baltimore, MD, USA
Journal of Cardiovascular Magnetic Resonance 2009, 11(Suppl 1):P38
Introduction: Atherosclerotic changes in the coronary artery
are associated with impaired coronary vessel wall distensibility
[1]. Though non-invasive measures of central aortic distensibility
are possible, only intravascular ultrasound (IVUS) invasive
measurements of coronary distensibility have been reported
until now [1, 2].
Purpose: High-field coronary magnetic resonance imaging
(MRI) offers high temporal and spatial resolution, important for
assessing distensibility-related changes in coronary dimensions
during the cardiac cycle. We sought to test the hypothesis that
coronary artery distensibility can be evaluated non-invasively
with 3.0 T cardiac MRI and that distensibility differences can be
detected between healthy (control group) and coronary artery
disease (CAD) subjects.
Methods: Twenty healthy, adult subjects (11 male, age 19–60years, mean 32 ± 12 years) and twelve patients with coronary
catheterization documented CAD (8 male, age 50–69 years,
mean 58 ± 8 years) were studied on a commercial whole-body
MR imaging system (Achieva 3.0 T; Philips, Best, The Nether-
lands). MR angiography of the right coronary artery (RCA) was
performed with a navigator-gated free-breathing and ECG-
triggered, T2-prepared, three-dimensional, segmented k-space,
gradient-echo imaging sequence. In each subject, the proximal
segment of the RCA was then imaged in cross-section using cine
spiral MRI for area measurements. Imaging was performed at a
constant room temperature and after at least 20 minutes of rest
in the magnet. MRI parameters were: echo time (TE) = 1.5 ms,
radiofrequency (RF) excitation angle = 20° and spectral spatial
excitation, breath-hold duration ~14–24 sec, acquisition
window = 10 ms, repetition time (TR) = 14 ms, 21 spiral
interleaves, spatial resolution (acquired/reconstructed) =
0.89 × 0.89 × 8.00 mm3/0.69 × 0.69 × 8.00 mm3. Both the
blood pressure and the heart rate were recorded. Images were
analyzed for cross-sectional area changes using full width half
maximum (Cine version 3.15.17, General Electric, Milwaukee,
WI, USA), and distensibility (mmHg-1) was determined as:
[(systolic lumen area – diastolic lumen area)]/(pulse pressure
multiplied with the diastolic lumen area) [3]. Pulse pressure was
calculated as pressure change during a cardiac cycle [2].
Results: Nineteen volunteers and eleven patients had adequate
image quality for RCA area measurements (figure 1A). The mean
heart-rate pressure product (heart-rate multiplied by systolic
blood pressure) in healthy adults (8289 ± 1427 mmHg*beats/
minute) was not significantly different from that in CAD patients
(9048 ± 1878 mmHg*beats/minute), (p = 0.18). The luminal area
in healthy subjects was 9.60 ± 2.02 mm2 during diastole and
12.90 ± 4.78 mm2 for CAD patients (p = 0.01). At end-systole,
the luminal area in healthy subjects was 10.60 ± 2.47 mm2 and
13.55 ± 5.39 mm2 for CAD patients respectively (p = 0.049).
Coronary vessel area changed significantly between systole and
diastole in healthy controls (p < 0.01), but not in CAD patients
(p = 0.12). In healthy subjects coronary artery distensibility
(2.46 ± 2.45 mmHg-1 *103) was significantly higher than that in
CAD patients (1.04 ± 0.94 mmHg-1 *103) (figure 1B) (p = 0.03).
We found no significant correlation between coronary artery
distensibility and coronary vessel area at either systole or
diastole in healthy adults or CAD patients.
Discussion: Non-invasive assessment of coronary artery vessel
wall distensibility with 3.0 T is feasible and the findings are similar
to those from invasive IVUS studies [1, 2]. Coronary artery
distensibility measured by 3.0 T MRI is significantly higher in
healthy controls than it is in patients with documented CAD. The
number of subjects needed to detect a difference is relatively
small. This methodology may support the characterization of
Figure 1 (abstract P38)
(A): The MRA of the right coronary artery (RCA) is used to select a
cross-sectional plane (indicated by white line). Images of the proximal
RCA (white arrow) in end-systole (B) and at diastole (C) in a patient
with coronary artery disease (CAD). (D): Distensibility measurements in
healthy subjects (N = 19) and patients with CAD (N = 11).
Journal of Cardiovascular Magnetic Resonance 2009, 11(Suppl 1) http://jcmr-online.com/supplements/11/S1
Page 114 of 316(page number not for citation purposes)
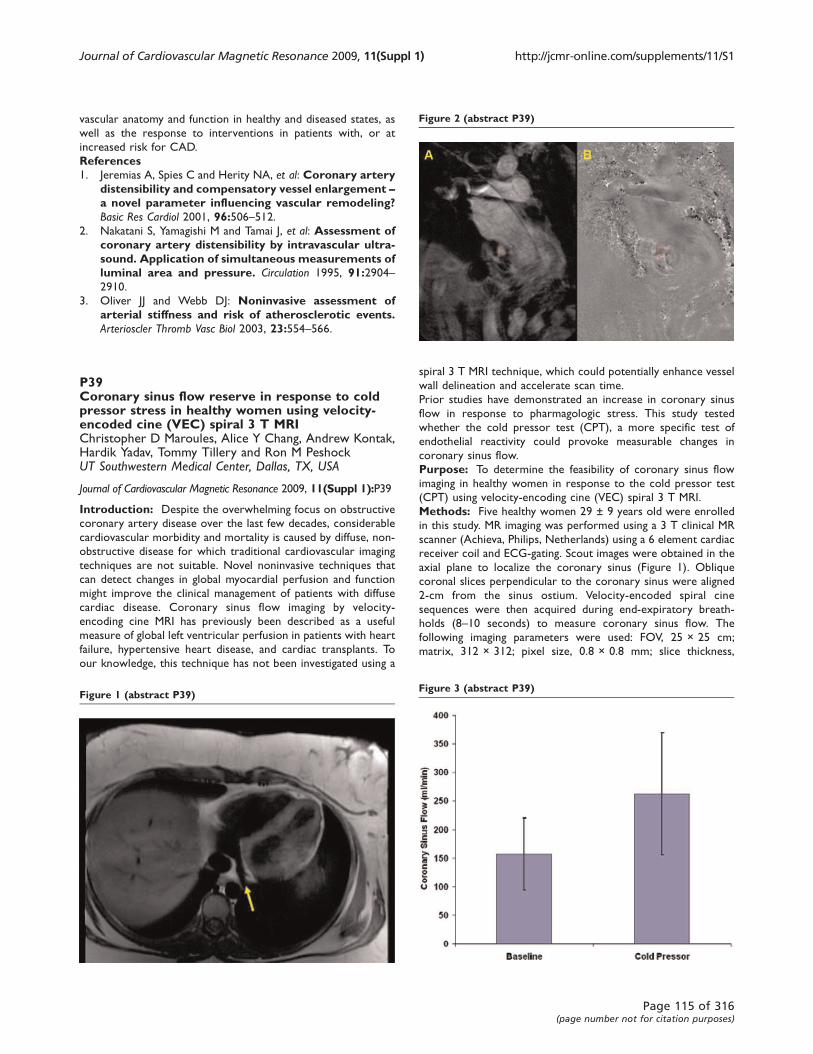
vascular anatomy and function in healthy and diseased states, as
well as the response to interventions in patients with, or at
increased risk for CAD.
References1. Jeremias A, Spies C and Herity NA, et al: Coronary artery
distensibility and compensatory vessel enlargement –a novel parameter influencing vascular remodeling?Basic Res Cardiol 2001, 96:506–512.
2. Nakatani S, Yamagishi M and Tamai J, et al: Assessment ofcoronary artery distensibility by intravascular ultra-sound. Application of simultaneous measurements ofluminal area and pressure. Circulation 1995, 91:2904–2910.
3. Oliver JJ and Webb DJ: Noninvasive assessment ofarterial stiffness and risk of atherosclerotic events.Arterioscler Thromb Vasc Biol 2003, 23:554–566.
P39Coronary sinus flow reserve in response to coldpressor stress in healthy women using velocity-encoded cine (VEC) spiral 3 T MRIChristopher D Maroules, Alice Y Chang, Andrew Kontak,Hardik Yadav, Tommy Tillery and Ron M PeshockUT Southwestern Medical Center, Dallas, TX, USA
Journal of Cardiovascular Magnetic Resonance 2009, 11(Suppl 1):P39
Introduction: Despite the overwhelming focus on obstructive
coronary artery disease over the last few decades, considerable
cardiovascular morbidity and mortality is caused by diffuse, non-
obstructive disease for which traditional cardiovascular imaging
techniques are not suitable. Novel noninvasive techniques that
can detect changes in global myocardial perfusion and function
might improve the clinical management of patients with diffuse
cardiac disease. Coronary sinus flow imaging by velocity-
encoding cine MRI has previously been described as a useful
measure of global left ventricular perfusion in patients with heart
failure, hypertensive heart disease, and cardiac transplants. To
our knowledge, this technique has not been investigated using a
spiral 3 T MRI technique, which could potentially enhance vessel
wall delineation and accelerate scan time.
Prior studies have demonstrated an increase in coronary sinus
flow in response to pharmagologic stress. This study tested
whether the cold pressor test (CPT), a more specific test of
endothelial reactivity could provoke measurable changes in
coronary sinus flow.
Purpose: To determine the feasibility of coronary sinus flow
imaging in healthy women in response to the cold pressor test
(CPT) using velocity-encoding cine (VEC) spiral 3 T MRI.
Methods: Five healthy women 29 ± 9 years old were enrolled
in this study. MR imaging was performed using a 3 T clinical MR
scanner (Achieva, Philips, Netherlands) using a 6 element cardiac
receiver coil and ECG-gating. Scout images were obtained in the
axial plane to localize the coronary sinus (Figure 1). Oblique
coronal slices perpendicular to the coronary sinus were aligned
2-cm from the sinus ostium. Velocity-encoded spiral cine
sequences were then acquired during end-expiratory breath-
holds (8–10 seconds) to measure coronary sinus flow. The
following imaging parameters were used: FOV, 25 × 25 cm;
matrix, 312 × 312; pixel size, 0.8 × 0.8 mm; slice thickness,
Figure 1 (abstract P39)
Figure 2 (abstract P39)
Figure 3 (abstract P39)
Journal of Cardiovascular Magnetic Resonance 2009, 11(Suppl 1) http://jcmr-online.com/supplements/11/S1
Page 115 of 316(page number not for citation purposes)

7 mm; TR, 34 msec; TE, 3.5 msec; flip angle 20°; temporal
resolution, 69 msec; spiral interleaves, 11; VENC, 80 cm/sec.
Heart rate and blood pressure were measured every 30 seconds.
After baseline flow data acquisition, the participant's left hand
was placed in an ice water bath (50% ice, 50% water) for 3
minutes. Repeat flow images were acquired 1-minute following
CPT, and again at 2-minutes and 10-minutes. Images were
transferred to a remote workstation and analyzed using QFlow
(v. 4.1.6, Medis, Leesburg). The contour of the coronary sinus
was manually traced on each magnitude image. Identical tracings
were applied to the corresponding phase images so coronary
sinus flow velocity and volume flow could be calculated.
Coronary sinus flow was determined by integrating phasic flow
over time. Coronary sinus flow velocity was determined by
averaging flow velocity across all cardiac phases. Statistical
significance was determined using the paired t-test assuming an
a-error of 0.05.Results: Coronary sinus flow was successfully measured in
each subject throughout the cardiac cycle (Figure 2). All subjects
tolerated the CPT. Rate-pressure product increased
41.2 ± 15.8% from baseline to peak effect during CPT. Similarly,
coronary sinus flow increased from 157 ± 63 ml/minute at
baseline to 262 ± 107 ml/minute at peak effect during CPT,
representing a 67% increase (P < 0.05, Figure 3). Coronary sinus
flow velocity increased from 7.9 ± 3.4 cm/second at baseline to
12.6 ± 6.3 cm/second at peak effect during CPT, representing a
61% increase (P < 0.05).
Conclusion: Velocity-encoding cine spiral 3 T MRI is a
promising tool for evaluating coronary sinus flow reserve. The
CPT provokes a significant increase in myocardial blood flow
which can be used to specifically evaluate endothelial function.
Future studies will examine the ability of this technique to detect
meaningful changes in myocardial flow reserve.
P40Comparison of two novel methods of measuringthe blood velocity in the deep veins of the lower legusing phase contrast MR imagingIain Pierce, Peter D Gatehouse, Xiao Yun Xu,Jenny Keegan, Andrew D Scott and David N FirminImperial College London, London, UK
Journal of Cardiovascular Magnetic Resonance 2009, 11(Suppl 1):P40
Aim: To compare the effectiveness of two novel methods
developed to measure the velocity of the blood in the deep veins
in the lower leg.
Background: To investigate the causes and treatment of deep
vein thrombosis, there is a need for blood flow measurements in
the lower limb veins. The work of Downie et al into the effects of
compression stockings on geometry [1] and wall shear stress [2]
concludes that MR imaging should be utilised for continued
research of the haemodynamics of the lower limb venous system
as it can supply structural and velocity data from the same
acquisition. Venous velocity is low and more dependent on the
respiratory than cardiac cycle, requiring new methods. Also the
muscle pump can cause large spikes in the velocity requiring real-
time measurement.
Methods: Two sequences have been developed using Phase-
Contrast velocity mapping: gated SEGmented GRadient Echo
(SEG-GRE) sequence and an Interleaved SPiral (ISPLASH)
sequence. Both use VElocity ENCoding (VENC) of 10 cm/s,
arterial flow saturation upstream, slice thickness of 7 mm and
pixel size of 1 × 1 mm.
Seven normal volunteers were asked to lie prone (1.5 T Siemens
Avanto) with left leg raised 10 – 15 cm, resting the ankle on a
foam support, with a pair of carotid surface coils (Machnet)
placed around the calf. The volunteers were asked to breathe
deeply, in time with an LED driven by a 7 second/cycle square
wave input [3]. The logfiles for the subject's respiratory belt
sensor were recorded for each spiral scan.
SEG-GRE: Triggered by the square wave input with 7 seconds
cine acquisition window (23 respiratory-cine frames) covering
one respiratory cycle, acquiring 11 rawdata lines per cine frame
per cycle. The velocity encoding gradients are applied every
other excitation (REF – VENC) within each cine frame. The
number of averages was 2, acquisition time 2.5 minutes, time per
frame 285 ms.
Figure 1 (abstract P40)
SEG-GRE magnitude image at peak mean velocity (a) and corresponding
PC image (b). ISPLASH magnitude image at peak mean velocity (c) and
corresponding PC image.
Figure 2 (abstract P40)
Mean velocity measured from SEG-GRE and the averaged mean velocity,
4 respiratory cycles, from ISPLASH.
Journal of Cardiovascular Magnetic Resonance 2009, 11(Suppl 1) http://jcmr-online.com/supplements/11/S1
Page 116 of 316(page number not for citation purposes)
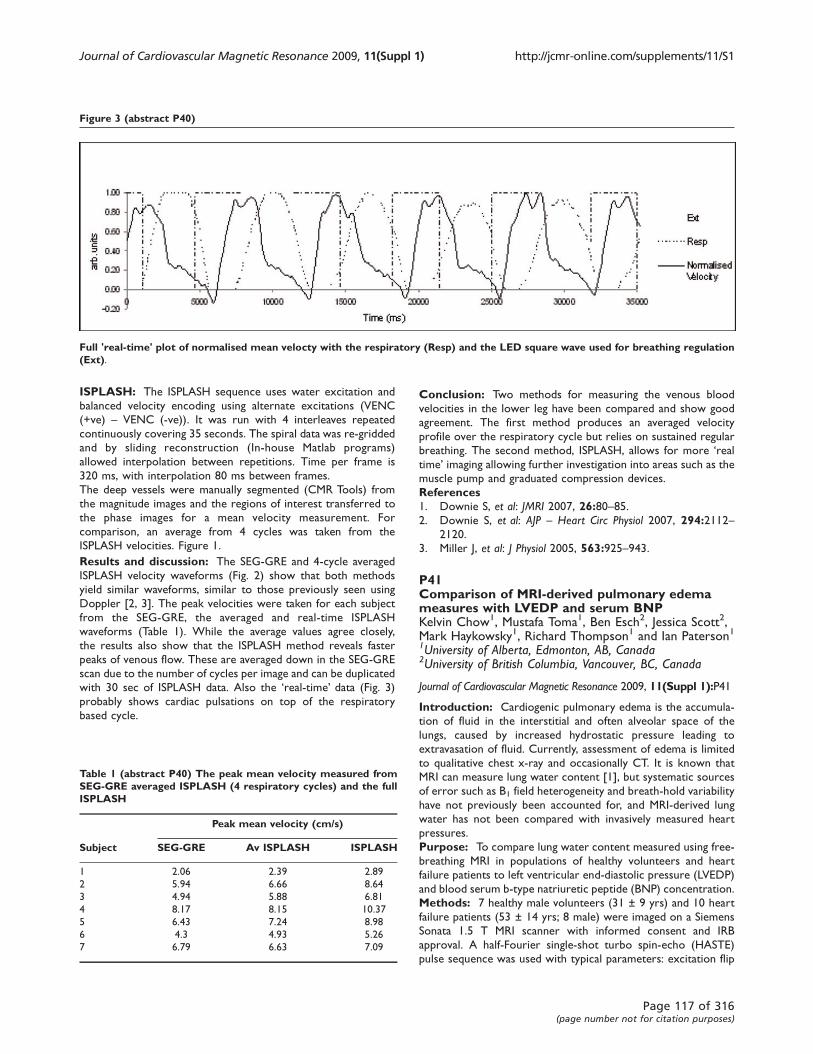
ISPLASH: The ISPLASH sequence uses water excitation and
balanced velocity encoding using alternate excitations (VENC
(+ve) – VENC (-ve)). It was run with 4 interleaves repeated
continuously covering 35 seconds. The spiral data was re-gridded
and by sliding reconstruction (In-house Matlab programs)
allowed interpolation between repetitions. Time per frame is
320 ms, with interpolation 80 ms between frames.
The deep vessels were manually segmented (CMR Tools) from
the magnitude images and the regions of interest transferred to
the phase images for a mean velocity measurement. For
comparison, an average from 4 cycles was taken from the
ISPLASH velocities. Figure 1.
Results and discussion: The SEG-GRE and 4-cycle averaged
ISPLASH velocity waveforms (Fig. 2) show that both methods
yield similar waveforms, similar to those previously seen using
Doppler [2, 3]. The peak velocities were taken for each subject
from the SEG-GRE, the averaged and real-time ISPLASH
waveforms (Table 1). While the average values agree closely,
the results also show that the ISPLASH method reveals faster
peaks of venous flow. These are averaged down in the SEG-GRE
scan due to the number of cycles per image and can be duplicated
with 30 sec of ISPLASH data. Also the ‘real-time’ data (Fig. 3)
probably shows cardiac pulsations on top of the respiratory
based cycle.
Conclusion: Two methods for measuring the venous blood
velocities in the lower leg have been compared and show good
agreement. The first method produces an averaged velocity
profile over the respiratory cycle but relies on sustained regular
breathing. The second method, ISPLASH, allows for more ‘realtime’ imaging allowing further investigation into areas such as the
muscle pump and graduated compression devices.
References1. Downie S, et al: JMRI 2007, 26:80–85.2. Downie S, et al: AJP – Heart Circ Physiol 2007, 294:2112–
2120.
3. Miller J, et al: J Physiol 2005, 563:925–943.
P41Comparison of MRI-derived pulmonary edemameasures with LVEDP and serum BNPKelvin Chow1, Mustafa Toma1, Ben Esch2, Jessica Scott2,Mark Haykowsky1, Richard Thompson1 and Ian Paterson11University of Alberta, Edmonton, AB, Canada2University of British Columbia, Vancouver, BC, Canada
Journal of Cardiovascular Magnetic Resonance 2009, 11(Suppl 1):P41
Introduction: Cardiogenic pulmonary edema is the accumula-
tion of fluid in the interstitial and often alveolar space of the
lungs, caused by increased hydrostatic pressure leading to
extravasation of fluid. Currently, assessment of edema is limited
to qualitative chest x-ray and occasionally CT. It is known that
MRI can measure lung water content [1], but systematic sources
of error such as B1 field heterogeneity and breath-hold variability
have not previously been accounted for, and MRI-derived lung
water has not been compared with invasively measured heart
pressures.
Purpose: To compare lung water content measured using free-
breathing MRI in populations of healthy volunteers and heart
failure patients to left ventricular end-diastolic pressure (LVEDP)
and blood serum b-type natriuretic peptide (BNP) concentration.
Methods: 7 healthy male volunteers (31 ± 9 yrs) and 10 heart
failure patients (53 ± 14 yrs; 8 male) were imaged on a Siemens
Sonata 1.5 T MRI scanner with informed consent and IRB
approval. A half-Fourier single-shot turbo spin-echo (HASTE)
pulse sequence was used with typical parameters: excitation flip
Figure 3 (abstract P40)
Full 'real-time' plot of normalised mean velocty with the respiratory (Resp) and the LED square wave used for breathing regulation(Ext).
Table 1 (abstract P40) The peak mean velocity measured fromSEG-GRE averaged ISPLASH (4 respiratory cycles) and the fullISPLASH
Peak mean velocity (cm/s)
Subject SEG-GRE Av ISPLASH ISPLASH
1 2.06 2.39 2.89
2 5.94 6.66 8.64
3 4.94 5.88 6.81
4 8.17 8.15 10.37
5 6.43 7.24 8.98
6 4.3 4.93 5.26
7 6.79 6.63 7.09
Journal of Cardiovascular Magnetic Resonance 2009, 11(Suppl 1) http://jcmr-online.com/supplements/11/S1
Page 117 of 316(page number not for citation purposes)
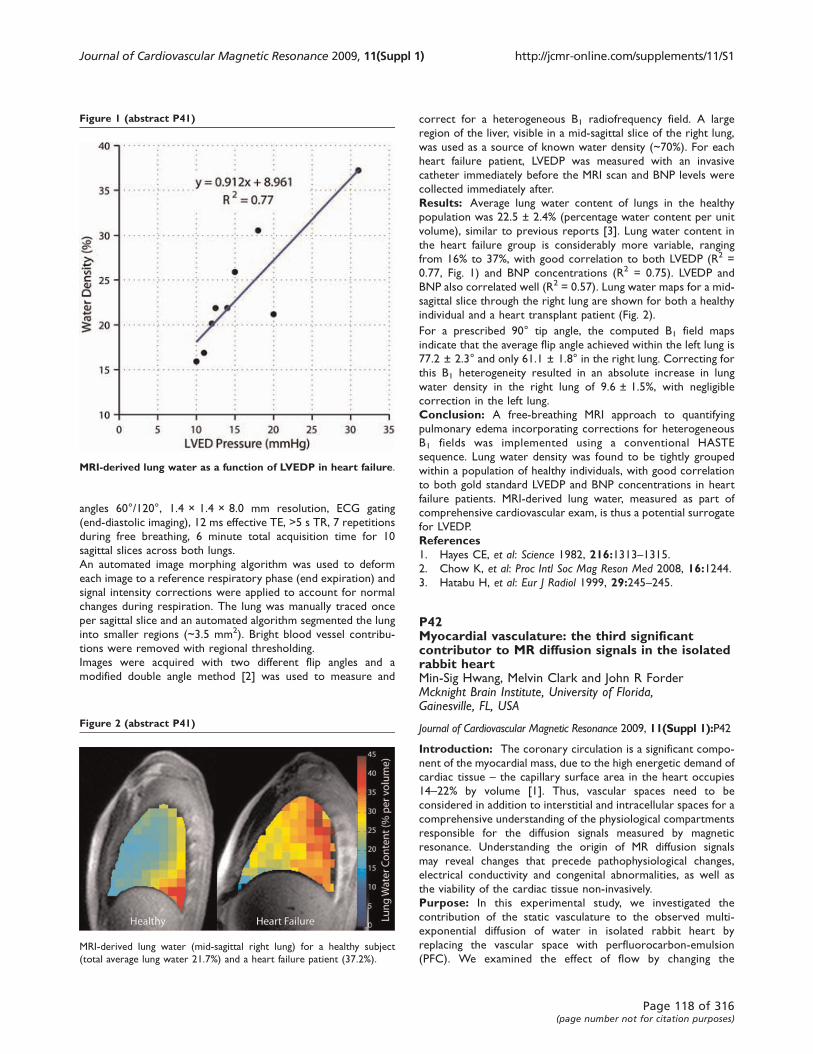
angles 60°/120°, 1.4 × 1.4 × 8.0 mm resolution, ECG gating
(end-diastolic imaging), 12 ms effective TE, >5 s TR, 7 repetitions
during free breathing, 6 minute total acquisition time for 10
sagittal slices across both lungs.
An automated image morphing algorithm was used to deform
each image to a reference respiratory phase (end expiration) and
signal intensity corrections were applied to account for normal
changes during respiration. The lung was manually traced once
per sagittal slice and an automated algorithm segmented the lung
into smaller regions (~3.5 mm2). Bright blood vessel contribu-
tions were removed with regional thresholding.
Images were acquired with two different flip angles and a
modified double angle method [2] was used to measure and
correct for a heterogeneous B1 radiofrequency field. A large
region of the liver, visible in a mid-sagittal slice of the right lung,
was used as a source of known water density (~70%). For each
heart failure patient, LVEDP was measured with an invasive
catheter immediately before the MRI scan and BNP levels were
collected immediately after.
Results: Average lung water content of lungs in the healthy
population was 22.5 ± 2.4% (percentage water content per unit
volume), similar to previous reports [3]. Lung water content in
the heart failure group is considerably more variable, ranging
from 16% to 37%, with good correlation to both LVEDP (R2 =
0.77, Fig. 1) and BNP concentrations (R2 = 0.75). LVEDP and
BNP also correlated well (R2 = 0.57). Lung water maps for a mid-
sagittal slice through the right lung are shown for both a healthy
individual and a heart transplant patient (Fig. 2).
For a prescribed 90° tip angle, the computed B1 field maps
indicate that the average flip angle achieved within the left lung is
77.2 ± 2.3° and only 61.1 ± 1.8° in the right lung. Correcting for
this B1 heterogeneity resulted in an absolute increase in lung
water density in the right lung of 9.6 ± 1.5%, with negligible
correction in the left lung.
Conclusion: A free-breathing MRI approach to quantifying
pulmonary edema incorporating corrections for heterogeneous
B1 fields was implemented using a conventional HASTE
sequence. Lung water density was found to be tightly grouped
within a population of healthy individuals, with good correlation
to both gold standard LVEDP and BNP concentrations in heart
failure patients. MRI-derived lung water, measured as part of
comprehensive cardiovascular exam, is thus a potential surrogate
for LVEDP.
References1. Hayes CE, et al: Science 1982, 216:1313–1315.2. Chow K, et al: Proc Intl Soc Mag Reson Med 2008, 16:1244.
3. Hatabu H, et al: Eur J Radiol 1999, 29:245–245.
P42Myocardial vasculature: the third significantcontributor to MR diffusion signals in the isolatedrabbit heartMin-Sig Hwang, Melvin Clark and John R ForderMcknight Brain Institute, University of Florida,Gainesville, FL, USA
Journal of Cardiovascular Magnetic Resonance 2009, 11(Suppl 1):P42
Introduction: The coronary circulation is a significant compo-
nent of the myocardial mass, due to the high energetic demand of
cardiac tissue – the capillary surface area in the heart occupies
14–22% by volume [1]. Thus, vascular spaces need to be
considered in addition to interstitial and intracellular spaces for a
comprehensive understanding of the physiological compartments
responsible for the diffusion signals measured by magnetic
resonance. Understanding the origin of MR diffusion signals
may reveal changes that precede pathophysiological changes,
electrical conductivity and congenital abnormalities, as well as
the viability of the cardiac tissue non-invasively.
Purpose: In this experimental study, we investigated the
contribution of the static vasculature to the observed multi-
exponential diffusion of water in isolated rabbit heart by
replacing the vascular space with perfluorocarbon-emulsion
(PFC). We examined the effect of flow by changing the
Figure 1 (abstract P41)
MRI-derived lung water as a function of LVEDP in heart failure.
Figure 2 (abstract P41)
MRI-derived lung water (mid-sagittal right lung) for a healthy subject
(total average lung water 21.7%) and a heart failure patient (37.2%).
Journal of Cardiovascular Magnetic Resonance 2009, 11(Suppl 1) http://jcmr-online.com/supplements/11/S1
Page 118 of 316(page number not for citation purposes)
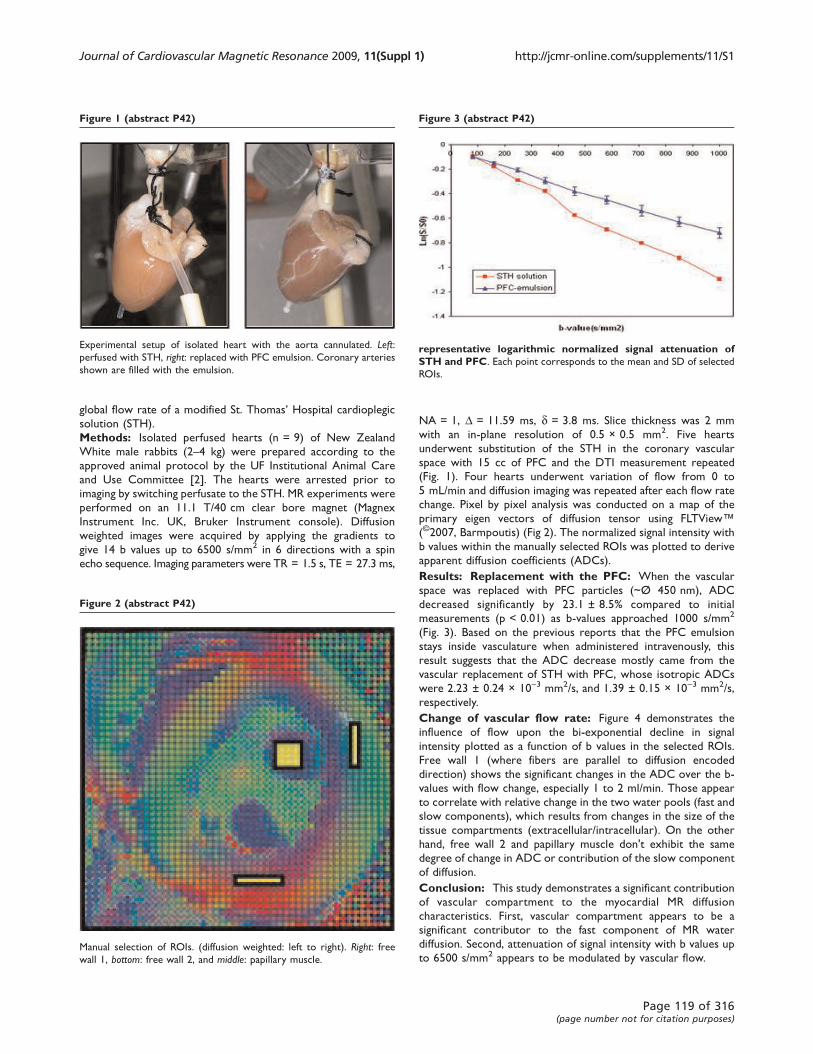
global flow rate of a modified St. Thomas’ Hospital cardioplegicsolution (STH).
Methods: Isolated perfused hearts (n = 9) of New Zealand
White male rabbits (2–4 kg) were prepared according to the
approved animal protocol by the UF Institutional Animal Care
and Use Committee [2]. The hearts were arrested prior to
imaging by switching perfusate to the STH. MR experiments were
performed on an 11.1 T/40 cm clear bore magnet (Magnex
Instrument Inc. UK, Bruker Instrument console). Diffusion
weighted images were acquired by applying the gradients to
give 14 b values up to 6500 s/mm2 in 6 directions with a spin
echo sequence. Imaging parameters were TR = 1.5 s, TE = 27.3 ms,
NA = 1, D = 11.59 ms, d = 3.8 ms. Slice thickness was 2 mm
with an in-plane resolution of 0.5 × 0.5 mm2. Five hearts
underwent substitution of the STH in the coronary vascular
space with 15 cc of PFC and the DTI measurement repeated
(Fig. 1). Four hearts underwent variation of flow from 0 to
5 mL/min and diffusion imaging was repeated after each flow rate
change. Pixel by pixel analysis was conducted on a map of the
primary eigen vectors of diffusion tensor using FLTView™
(©2007, Barmpoutis) (Fig 2). The normalized signal intensity with
b values within the manually selected ROIs was plotted to derive
apparent diffusion coefficients (ADCs).
Results: Replacement with the PFC: When the vascular
space was replaced with PFC particles (~Ø 450 nm), ADC
decreased significantly by 23.1 ± 8.5% compared to initial
measurements (p < 0.01) as b-values approached 1000 s/mm2
(Fig. 3). Based on the previous reports that the PFC emulsion
stays inside vasculature when administered intravenously, this
result suggests that the ADC decrease mostly came from the
vascular replacement of STH with PFC, whose isotropic ADCs
were 2.23 ± 0.24 × 10⁻³ mm2/s, and 1.39 ± 0.15 × 10⁻³ mm2/s,
respectively.
Change of vascular flow rate: Figure 4 demonstrates the
influence of flow upon the bi-exponential decline in signal
intensity plotted as a function of b values in the selected ROIs.
Free wall 1 (where fibers are parallel to diffusion encoded
direction) shows the significant changes in the ADC over the b-
values with flow change, especially 1 to 2 ml/min. Those appear
to correlate with relative change in the two water pools (fast and
slow components), which results from changes in the size of the
tissue compartments (extracellular/intracellular). On the other
hand, free wall 2 and papillary muscle don't exhibit the same
degree of change in ADC or contribution of the slow component
of diffusion.
Conclusion: This study demonstrates a significant contribution
of vascular compartment to the myocardial MR diffusion
characteristics. First, vascular compartment appears to be a
significant contributor to the fast component of MR water
diffusion. Second, attenuation of signal intensity with b values up
to 6500 s/mm2 appears to be modulated by vascular flow.
Figure 1 (abstract P42)
Experimental setup of isolated heart with the aorta cannulated. Left:perfused with STH, right: replaced with PFC emulsion. Coronary arteries
shown are filled with the emulsion.
Figure 3 (abstract P42)
representative logarithmic normalized signal attenuation ofSTH and PFC. Each point corresponds to the mean and SD of selected
ROIs.
Figure 2 (abstract P42)
Manual selection of ROIs. (diffusion weighted: left to right). Right: freewall 1, bottom: free wall 2, and middle: papillary muscle.
Journal of Cardiovascular Magnetic Resonance 2009, 11(Suppl 1) http://jcmr-online.com/supplements/11/S1
Page 119 of 316(page number not for citation purposes)
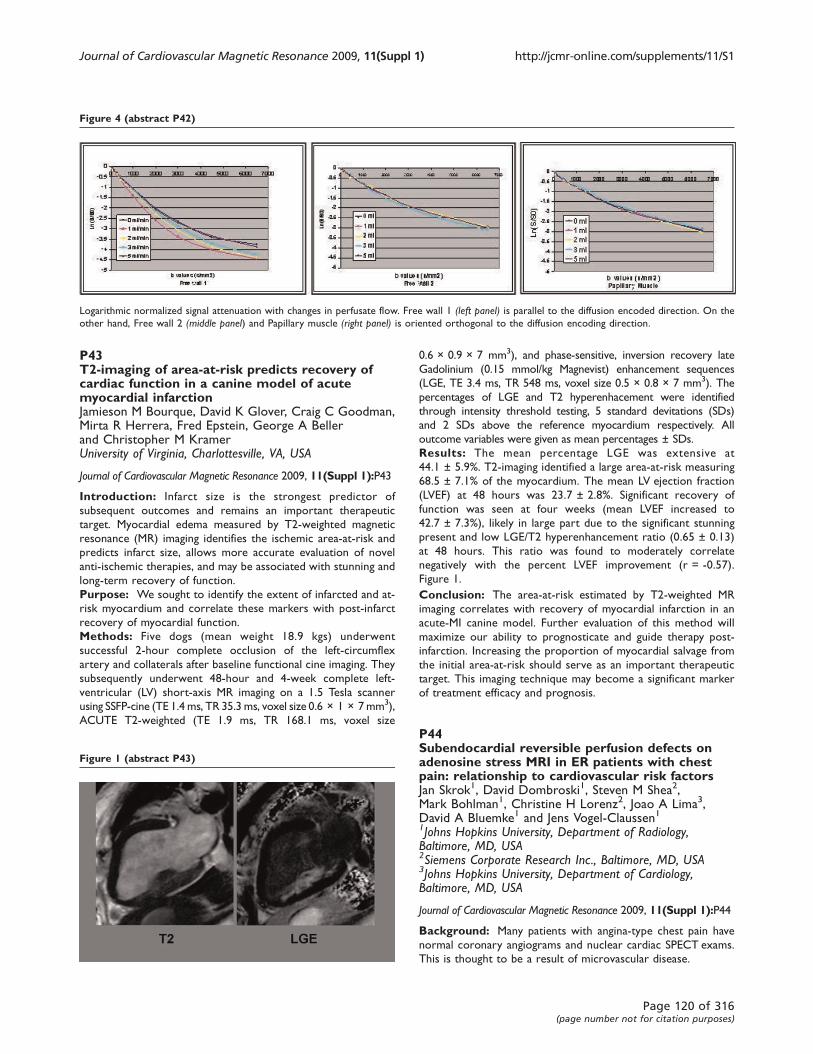
P43T2-imaging of area-at-risk predicts recovery ofcardiac function in a canine model of acutemyocardial infarctionJamieson M Bourque, David K Glover, Craig C Goodman,Mirta R Herrera, Fred Epstein, George A Bellerand Christopher M KramerUniversity of Virginia, Charlottesville, VA, USA
Journal of Cardiovascular Magnetic Resonance 2009, 11(Suppl 1):P43
Introduction: Infarct size is the strongest predictor of
subsequent outcomes and remains an important therapeutic
target. Myocardial edema measured by T2-weighted magnetic
resonance (MR) imaging identifies the ischemic area-at-risk and
predicts infarct size, allows more accurate evaluation of novel
anti-ischemic therapies, and may be associated with stunning and
long-term recovery of function.
Purpose: We sought to identify the extent of infarcted and at-
risk myocardium and correlate these markers with post-infarct
recovery of myocardial function.
Methods: Five dogs (mean weight 18.9 kgs) underwent
successful 2-hour complete occlusion of the left-circumflex
artery and collaterals after baseline functional cine imaging. They
subsequently underwent 48-hour and 4-week complete left-
ventricular (LV) short-axis MR imaging on a 1.5 Tesla scanner
using SSFP-cine (TE 1.4 ms, TR 35.3 ms, voxel size 0.6 × 1 × 7mm3),
ACUTE T2-weighted (TE 1.9 ms, TR 168.1 ms, voxel size
0.6 × 0.9 × 7 mm3), and phase-sensitive, inversion recovery late
Gadolinium (0.15 mmol/kg Magnevist) enhancement sequences
(LGE, TE 3.4 ms, TR 548 ms, voxel size 0.5 × 0.8 × 7 mm3). The
percentages of LGE and T2 hyperenhacement were identified
through intensity threshold testing, 5 standard devitations (SDs)
and 2 SDs above the reference myocardium respectively. All
outcome variables were given as mean percentages ± SDs.
Results: The mean percentage LGE was extensive at
44.1 ± 5.9%. T2-imaging identified a large area-at-risk measuring
68.5 ± 7.1% of the myocardium. The mean LV ejection fraction
(LVEF) at 48 hours was 23.7 ± 2.8%. Significant recovery of
function was seen at four weeks (mean LVEF increased to
42.7 ± 7.3%), likely in large part due to the significant stunning
present and low LGE/T2 hyperenhancement ratio (0.65 ± 0.13)
at 48 hours. This ratio was found to moderately correlate
negatively with the percent LVEF improvement (r = -0.57).
Figure 1.
Conclusion: The area-at-risk estimated by T2-weighted MR
imaging correlates with recovery of myocardial infarction in an
acute-MI canine model. Further evaluation of this method will
maximize our ability to prognosticate and guide therapy post-
infarction. Increasing the proportion of myocardial salvage from
the initial area-at-risk should serve as an important therapeutic
target. This imaging technique may become a significant marker
of treatment efficacy and prognosis.
P44Subendocardial reversible perfusion defects onadenosine stress MRI in ER patients with chestpain: relationship to cardiovascular risk factorsJan Skrok1, David Dombroski1, Steven M Shea2,Mark Bohlman1, Christine H Lorenz2, Joao A Lima3,David A Bluemke1 and Jens Vogel-Claussen11Johns Hopkins University, Department of Radiology,Baltimore, MD, USA2Siemens Corporate Research Inc., Baltimore, MD, USA3Johns Hopkins University, Department of Cardiology,Baltimore, MD, USA
Journal of Cardiovascular Magnetic Resonance 2009, 11(Suppl 1):P44
Background: Many patients with angina-type chest pain have
normal coronary angiograms and nuclear cardiac SPECT exams.
This is thought to be a result of microvascular disease.
Figure 4 (abstract P42)
Logarithmic normalized signal attenuation with changes in perfusate flow. Free wall 1 (left panel) is parallel to the diffusion encoded direction. On the
other hand, Free wall 2 (middle panel) and Papillary muscle (right panel) is oriented orthogonal to the diffusion encoding direction.
Figure 1 (abstract P43)
Journal of Cardiovascular Magnetic Resonance 2009, 11(Suppl 1) http://jcmr-online.com/supplements/11/S1
Page 120 of 316(page number not for citation purposes)
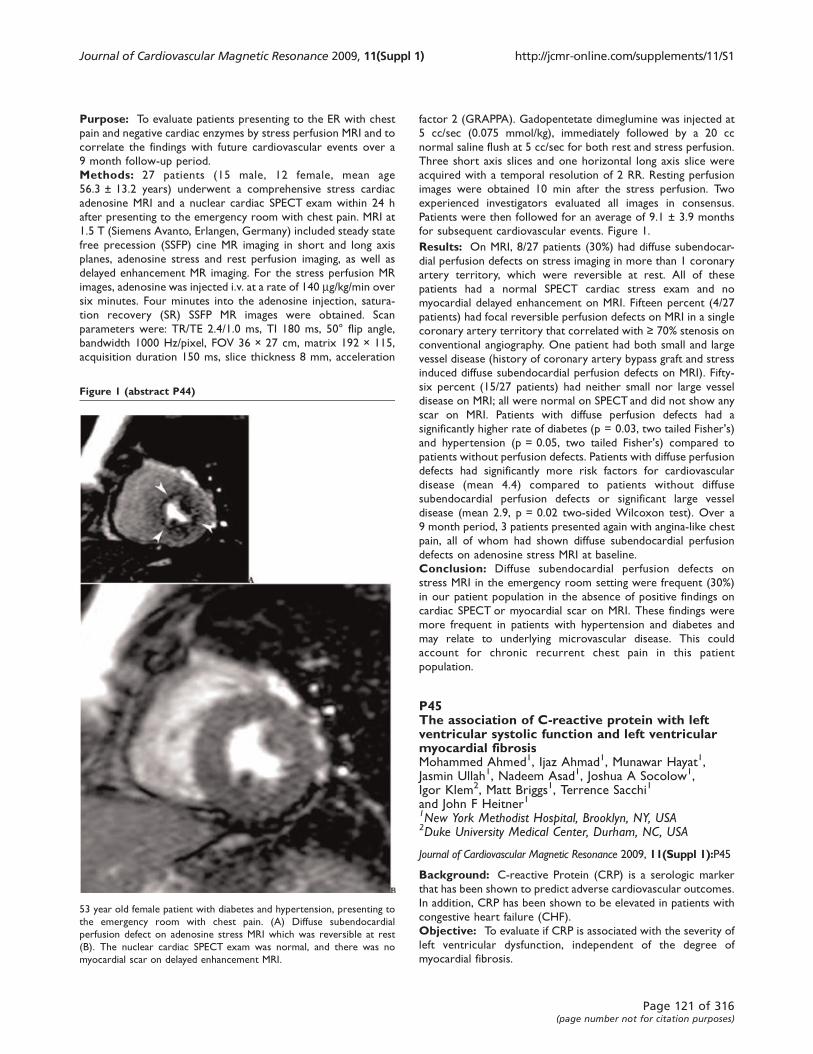
Purpose: To evaluate patients presenting to the ER with chest
pain and negative cardiac enzymes by stress perfusion MRI and to
correlate the findings with future cardiovascular events over a
9 month follow-up period.
Methods: 27 patients (15 male, 12 female, mean age
56.3 ± 13.2 years) underwent a comprehensive stress cardiac
adenosine MRI and a nuclear cardiac SPECT exam within 24 h
after presenting to the emergency room with chest pain. MRI at
1.5 T (Siemens Avanto, Erlangen, Germany) included steady state
free precession (SSFP) cine MR imaging in short and long axis
planes, adenosine stress and rest perfusion imaging, as well as
delayed enhancement MR imaging. For the stress perfusion MR
images, adenosine was injected i.v. at a rate of 140 mg/kg/min over
six minutes. Four minutes into the adenosine injection, satura-
tion recovery (SR) SSFP MR images were obtained. Scan
parameters were: TR/TE 2.4/1.0 ms, TI 180 ms, 50° flip angle,
bandwidth 1000 Hz/pixel, FOV 36 × 27 cm, matrix 192 × 115,
acquisition duration 150 ms, slice thickness 8 mm, acceleration
factor 2 (GRAPPA). Gadopentetate dimeglumine was injected at
5 cc/sec (0.075 mmol/kg), immediately followed by a 20 cc
normal saline flush at 5 cc/sec for both rest and stress perfusion.
Three short axis slices and one horizontal long axis slice were
acquired with a temporal resolution of 2 RR. Resting perfusion
images were obtained 10 min after the stress perfusion. Two
experienced investigators evaluated all images in consensus.
Patients were then followed for an average of 9.1 ± 3.9 months
for subsequent cardiovascular events. Figure 1.
Results: On MRI, 8/27 patients (30%) had diffuse subendocar-
dial perfusion defects on stress imaging in more than 1 coronary
artery territory, which were reversible at rest. All of these
patients had a normal SPECT cardiac stress exam and no
myocardial delayed enhancement on MRI. Fifteen percent (4/27
patients) had focal reversible perfusion defects on MRI in a single
coronary artery territory that correlated with ≥ 70% stenosis on
conventional angiography. One patient had both small and large
vessel disease (history of coronary artery bypass graft and stress
induced diffuse subendocardial perfusion defects on MRI). Fifty-
six percent (15/27 patients) had neither small nor large vessel
disease on MRI; all were normal on SPECT and did not show any
scar on MRI. Patients with diffuse perfusion defects had a
significantly higher rate of diabetes (p = 0.03, two tailed Fisher's)
and hypertension (p = 0.05, two tailed Fisher's) compared to
patients without perfusion defects. Patients with diffuse perfusion
defects had significantly more risk factors for cardiovascular
disease (mean 4.4) compared to patients without diffuse
subendocardial perfusion defects or significant large vessel
disease (mean 2.9, p = 0.02 two-sided Wilcoxon test). Over a
9 month period, 3 patients presented again with angina-like chest
pain, all of whom had shown diffuse subendocardial perfusion
defects on adenosine stress MRI at baseline.
Conclusion: Diffuse subendocardial perfusion defects on
stress MRI in the emergency room setting were frequent (30%)
in our patient population in the absence of positive findings on
cardiac SPECT or myocardial scar on MRI. These findings were
more frequent in patients with hypertension and diabetes and
may relate to underlying microvascular disease. This could
account for chronic recurrent chest pain in this patient
population.
P45The association of C-reactive protein with leftventricular systolic function and left ventricularmyocardial fibrosisMohammed Ahmed1, Ijaz Ahmad1, Munawar Hayat1,Jasmin Ullah1, Nadeem Asad1, Joshua A Socolow1,Igor Klem2, Matt Briggs1, Terrence Sacchi1
and John F Heitner11New York Methodist Hospital, Brooklyn, NY, USA2Duke University Medical Center, Durham, NC, USA
Journal of Cardiovascular Magnetic Resonance 2009, 11(Suppl 1):P45
Background: C-reactive Protein (CRP) is a serologic marker
that has been shown to predict adverse cardiovascular outcomes.
In addition, CRP has been shown to be elevated in patients with
congestive heart failure (CHF).
Objective: To evaluate if CRP is associated with the severity of
left ventricular dysfunction, independent of the degree of
myocardial fibrosis.
Figure 1 (abstract P44)
53 year old female patient with diabetes and hypertension, presenting to
the emergency room with chest pain. (A) Diffuse subendocardial
perfusion defect on adenosine stress MRI which was reversible at rest
(B). The nuclear cardiac SPECT exam was normal, and there was no
myocardial scar on delayed enhancement MRI.
Journal of Cardiovascular Magnetic Resonance 2009, 11(Suppl 1) http://jcmr-online.com/supplements/11/S1
Page 121 of 316(page number not for citation purposes)
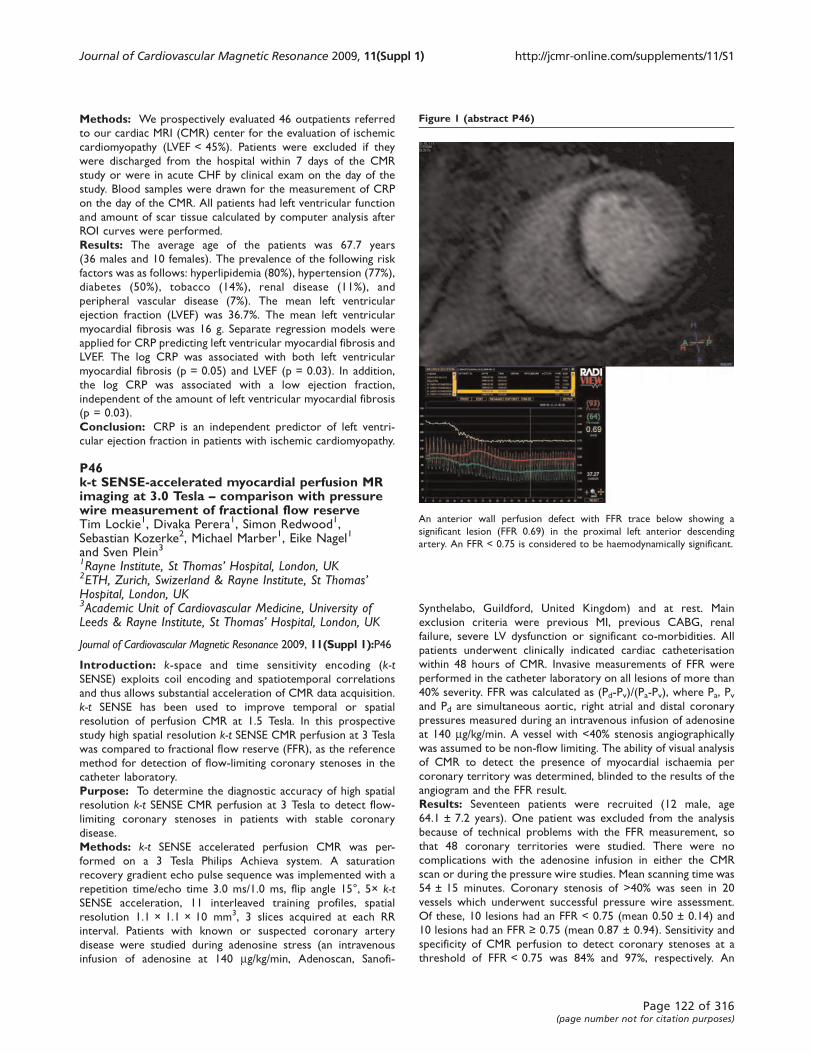
Methods: We prospectively evaluated 46 outpatients referred
to our cardiac MRI (CMR) center for the evaluation of ischemic
cardiomyopathy (LVEF < 45%). Patients were excluded if they
were discharged from the hospital within 7 days of the CMR
study or were in acute CHF by clinical exam on the day of the
study. Blood samples were drawn for the measurement of CRP
on the day of the CMR. All patients had left ventricular function
and amount of scar tissue calculated by computer analysis after
ROI curves were performed.
Results: The average age of the patients was 67.7 years
(36 males and 10 females). The prevalence of the following risk
factors was as follows: hyperlipidemia (80%), hypertension (77%),
diabetes (50%), tobacco (14%), renal disease (11%), and
peripheral vascular disease (7%). The mean left ventricular
ejection fraction (LVEF) was 36.7%. The mean left ventricular
myocardial fibrosis was 16 g. Separate regression models were
applied for CRP predicting left ventricular myocardial fibrosis and
LVEF. The log CRP was associated with both left ventricular
myocardial fibrosis (p = 0.05) and LVEF (p = 0.03). In addition,
the log CRP was associated with a low ejection fraction,
independent of the amount of left ventricular myocardial fibrosis
(p = 0.03).
Conclusion: CRP is an independent predictor of left ventri-
cular ejection fraction in patients with ischemic cardiomyopathy.
P46k-t SENSE-accelerated myocardial perfusion MRimaging at 3.0 Tesla – comparison with pressurewire measurement of fractional flow reserveTim Lockie1, Divaka Perera1, Simon Redwood1,Sebastian Kozerke2, Michael Marber1, Eike Nagel1
and Sven Plein31Rayne Institute, St Thomas’ Hospital, London, UK2ETH, Zurich, Swizerland & Rayne Institute, St Thomas’Hospital, London, UK3Academic Unit of Cardiovascular Medicine, University ofLeeds & Rayne Institute, St Thomas’ Hospital, London, UK
Journal of Cardiovascular Magnetic Resonance 2009, 11(Suppl 1):P46
Introduction: k-space and time sensitivity encoding (k-tSENSE) exploits coil encoding and spatiotemporal correlations
and thus allows substantial acceleration of CMR data acquisition.
k-t SENSE has been used to improve temporal or spatial
resolution of perfusion CMR at 1.5 Tesla. In this prospective
study high spatial resolution k-t SENSE CMR perfusion at 3 Tesla
was compared to fractional flow reserve (FFR), as the reference
method for detection of flow-limiting coronary stenoses in the
catheter laboratory.
Purpose: To determine the diagnostic accuracy of high spatial
resolution k-t SENSE CMR perfusion at 3 Tesla to detect flow-
limiting coronary stenoses in patients with stable coronary
disease.
Methods: k-t SENSE accelerated perfusion CMR was per-
formed on a 3 Tesla Philips Achieva system. A saturation
recovery gradient echo pulse sequence was implemented with a
repetition time/echo time 3.0 ms/1.0 ms, flip angle 15°, 5× k-tSENSE acceleration, 11 interleaved training profiles, spatial
resolution 1.1 × 1.1 × 10 mm3, 3 slices acquired at each RR
interval. Patients with known or suspected coronary artery
disease were studied during adenosine stress (an intravenous
infusion of adenosine at 140 mg/kg/min, Adenoscan, Sanofi-
Synthelabo, Guildford, United Kingdom) and at rest. Main
exclusion criteria were previous MI, previous CABG, renal
failure, severe LV dysfunction or significant co-morbidities. All
patients underwent clinically indicated cardiac catheterisation
within 48 hours of CMR. Invasive measurements of FFR were
performed in the catheter laboratory on all lesions of more than
40% severity. FFR was calculated as (Pd-Pv)/(Pa-Pv), where Pa, Pvand Pd are simultaneous aortic, right atrial and distal coronary
pressures measured during an intravenous infusion of adenosine
at 140 mg/kg/min. A vessel with <40% stenosis angiographically
was assumed to be non-flow limiting. The ability of visual analysis
of CMR to detect the presence of myocardial ischaemia per
coronary territory was determined, blinded to the results of the
angiogram and the FFR result.
Results: Seventeen patients were recruited (12 male, age
64.1 ± 7.2 years). One patient was excluded from the analysis
because of technical problems with the FFR measurement, so
that 48 coronary territories were studied. There were no
complications with the adenosine infusion in either the CMR
scan or during the pressure wire studies. Mean scanning time was
54 ± 15 minutes. Coronary stenosis of >40% was seen in 20
vessels which underwent successful pressure wire assessment.
Of these, 10 lesions had an FFR < 0.75 (mean 0.50 ± 0.14) and
10 lesions had an FFR ≥ 0.75 (mean 0.87 ± 0.94). Sensitivity and
specificity of CMR perfusion to detect coronary stenoses at a
threshold of FFR < 0.75 was 84% and 97%, respectively. An
Figure 1 (abstract P46)
An anterior wall perfusion defect with FFR trace below showing a
significant lesion (FFR 0.69) in the proximal left anterior descending
artery. An FFR < 0.75 is considered to be haemodynamically significant.
Journal of Cardiovascular Magnetic Resonance 2009, 11(Suppl 1) http://jcmr-online.com/supplements/11/S1
Page 122 of 316(page number not for citation purposes)
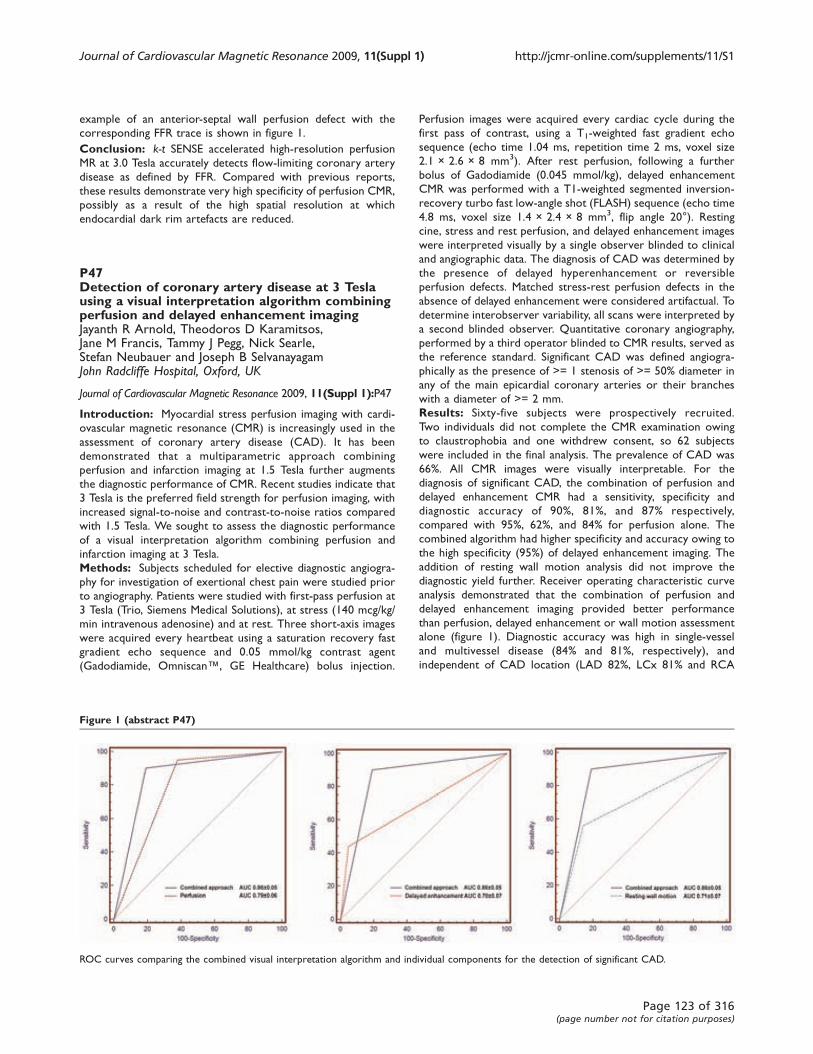
example of an anterior-septal wall perfusion defect with the
corresponding FFR trace is shown in figure 1.
Conclusion: k-t SENSE accelerated high-resolution perfusion
MR at 3.0 Tesla accurately detects flow-limiting coronary artery
disease as defined by FFR. Compared with previous reports,
these results demonstrate very high specificity of perfusion CMR,
possibly as a result of the high spatial resolution at which
endocardial dark rim artefacts are reduced.
P47Detection of coronary artery disease at 3 Teslausing a visual interpretation algorithm combiningperfusion and delayed enhancement imagingJayanth R Arnold, Theodoros D Karamitsos,Jane M Francis, Tammy J Pegg, Nick Searle,Stefan Neubauer and Joseph B SelvanayagamJohn Radcliffe Hospital, Oxford, UK
Journal of Cardiovascular Magnetic Resonance 2009, 11(Suppl 1):P47
Introduction: Myocardial stress perfusion imaging with cardi-
ovascular magnetic resonance (CMR) is increasingly used in the
assessment of coronary artery disease (CAD). It has been
demonstrated that a multiparametric approach combining
perfusion and infarction imaging at 1.5 Tesla further augments
the diagnostic performance of CMR. Recent studies indicate that
3 Tesla is the preferred field strength for perfusion imaging, with
increased signal-to-noise and contrast-to-noise ratios compared
with 1.5 Tesla. We sought to assess the diagnostic performance
of a visual interpretation algorithm combining perfusion and
infarction imaging at 3 Tesla.
Methods: Subjects scheduled for elective diagnostic angiogra-
phy for investigation of exertional chest pain were studied prior
to angiography. Patients were studied with first-pass perfusion at
3 Tesla (Trio, Siemens Medical Solutions), at stress (140 mcg/kg/
min intravenous adenosine) and at rest. Three short-axis images
were acquired every heartbeat using a saturation recovery fast
gradient echo sequence and 0.05 mmol/kg contrast agent
(Gadodiamide, Omniscan™, GE Healthcare) bolus injection.
Perfusion images were acquired every cardiac cycle during the
first pass of contrast, using a T1-weighted fast gradient echo
sequence (echo time 1.04 ms, repetition time 2 ms, voxel size
2.1 × 2.6 × 8 mm3). After rest perfusion, following a further
bolus of Gadodiamide (0.045 mmol/kg), delayed enhancement
CMR was performed with a T1-weighted segmented inversion-
recovery turbo fast low-angle shot (FLASH) sequence (echo time
4.8 ms, voxel size 1.4 × 2.4 × 8 mm3, flip angle 20°). Resting
cine, stress and rest perfusion, and delayed enhancement images
were interpreted visually by a single observer blinded to clinical
and angiographic data. The diagnosis of CAD was determined by
the presence of delayed hyperenhancement or reversible
perfusion defects. Matched stress-rest perfusion defects in the
absence of delayed enhancement were considered artifactual. To
determine interobserver variability, all scans were interpreted by
a second blinded observer. Quantitative coronary angiography,
performed by a third operator blinded to CMR results, served as
the reference standard. Significant CAD was defined angiogra-
phically as the presence of >= 1 stenosis of >= 50% diameter in
any of the main epicardial coronary arteries or their branches
with a diameter of >= 2 mm.
Results: Sixty-five subjects were prospectively recruited.
Two individuals did not complete the CMR examination owing
to claustrophobia and one withdrew consent, so 62 subjects
were included in the final analysis. The prevalence of CAD was
66%. All CMR images were visually interpretable. For the
diagnosis of significant CAD, the combination of perfusion and
delayed enhancement CMR had a sensitivity, specificity and
diagnostic accuracy of 90%, 81%, and 87% respectively,
compared with 95%, 62%, and 84% for perfusion alone. The
combined algorithm had higher specificity and accuracy owing to
the high specificity (95%) of delayed enhancement imaging. The
addition of resting wall motion analysis did not improve the
diagnostic yield further. Receiver operating characteristic curve
analysis demonstrated that the combination of perfusion and
delayed enhancement imaging provided better performance
than perfusion, delayed enhancement or wall motion assessment
alone (figure 1). Diagnostic accuracy was high in single-vessel
and multivessel disease (84% and 81%, respectively), and
independent of CAD location (LAD 82%, LCx 81% and RCA
Figure 1 (abstract P47)
ROC curves comparing the combined visual interpretation algorithm and individual components for the detection of significant CAD.
Journal of Cardiovascular Magnetic Resonance 2009, 11(Suppl 1) http://jcmr-online.com/supplements/11/S1
Page 123 of 316(page number not for citation purposes)
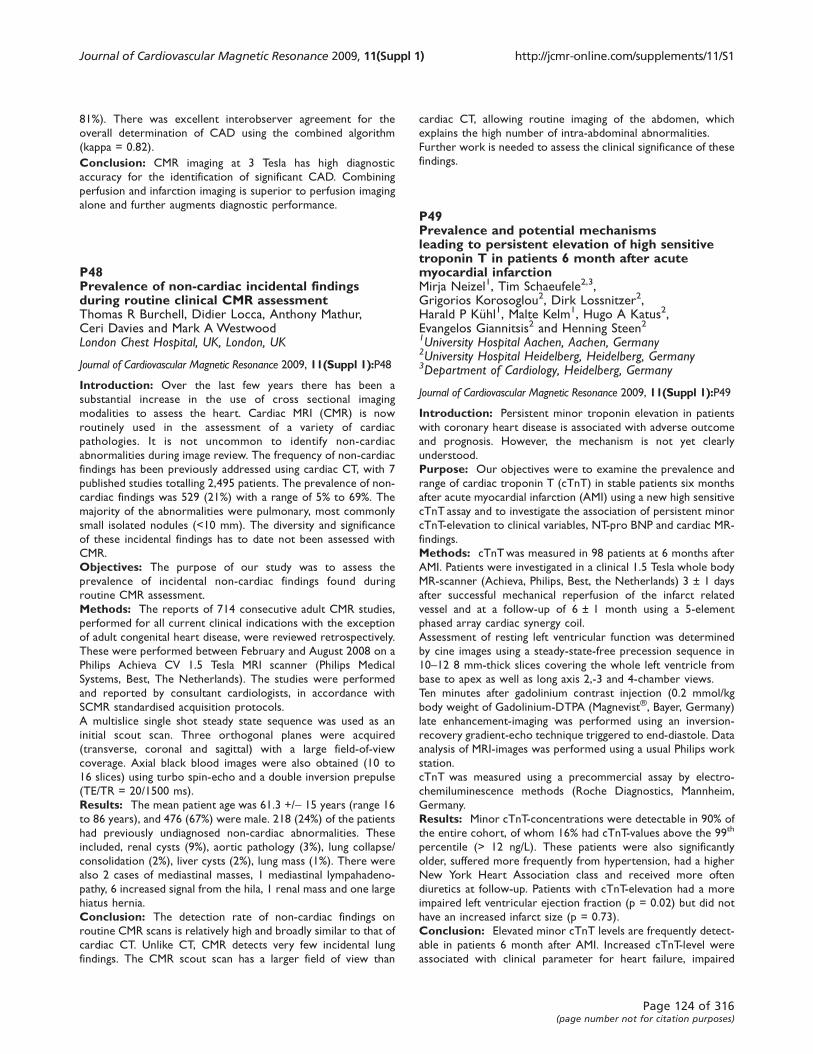
81%). There was excellent interobserver agreement for the
overall determination of CAD using the combined algorithm
(kappa = 0.82).
Conclusion: CMR imaging at 3 Tesla has high diagnostic
accuracy for the identification of significant CAD. Combining
perfusion and infarction imaging is superior to perfusion imaging
alone and further augments diagnostic performance.
P48Prevalence of non-cardiac incidental findingsduring routine clinical CMR assessmentThomas R Burchell, Didier Locca, Anthony Mathur,Ceri Davies and Mark A WestwoodLondon Chest Hospital, UK, London, UK
Journal of Cardiovascular Magnetic Resonance 2009, 11(Suppl 1):P48
Introduction: Over the last few years there has been a
substantial increase in the use of cross sectional imaging
modalities to assess the heart. Cardiac MRI (CMR) is now
routinely used in the assessment of a variety of cardiac
pathologies. It is not uncommon to identify non-cardiac
abnormalities during image review. The frequency of non-cardiac
findings has been previously addressed using cardiac CT, with 7
published studies totalling 2,495 patients. The prevalence of non-
cardiac findings was 529 (21%) with a range of 5% to 69%. The
majority of the abnormalities were pulmonary, most commonly
small isolated nodules (<10 mm). The diversity and significance
of these incidental findings has to date not been assessed with
CMR.
Objectives: The purpose of our study was to assess the
prevalence of incidental non-cardiac findings found during
routine CMR assessment.
Methods: The reports of 714 consecutive adult CMR studies,
performed for all current clinical indications with the exception
of adult congenital heart disease, were reviewed retrospectively.
These were performed between February and August 2008 on a
Philips Achieva CV 1.5 Tesla MRI scanner (Philips Medical
Systems, Best, The Netherlands). The studies were performed
and reported by consultant cardiologists, in accordance with
SCMR standardised acquisition protocols.
A multislice single shot steady state sequence was used as an
initial scout scan. Three orthogonal planes were acquired
(transverse, coronal and sagittal) with a large field-of-view
coverage. Axial black blood images were also obtained (10 to
16 slices) using turbo spin-echo and a double inversion prepulse
(TE/TR = 20/1500 ms).
Results: The mean patient age was 61.3 +/- 15 years (range 16
to 86 years), and 476 (67%) were male. 218 (24%) of the patients
had previously undiagnosed non-cardiac abnormalities. These
included, renal cysts (9%), aortic pathology (3%), lung collapse/
consolidation (2%), liver cysts (2%), lung mass (1%). There were
also 2 cases of mediastinal masses, 1 mediastinal lympahadeno-
pathy, 6 increased signal from the hila, 1 renal mass and one large
hiatus hernia.
Conclusion: The detection rate of non-cardiac findings on
routine CMR scans is relatively high and broadly similar to that of
cardiac CT. Unlike CT, CMR detects very few incidental lung
findings. The CMR scout scan has a larger field of view than
cardiac CT, allowing routine imaging of the abdomen, which
explains the high number of intra-abdominal abnormalities.
Further work is needed to assess the clinical significance of these
findings.
P49Prevalence and potential mechanismsleading to persistent elevation of high sensitivetroponin T in patients 6 month after acutemyocardial infarctionMirja Neizel1, Tim Schaeufele2,3,Grigorios Korosoglou2, Dirk Lossnitzer2,Harald P Kühl1, Malte Kelm1, Hugo A Katus2,Evangelos Giannitsis2 and Henning Steen21University Hospital Aachen, Aachen, Germany2University Hospital Heidelberg, Heidelberg, Germany3Department of Cardiology, Heidelberg, Germany
Journal of Cardiovascular Magnetic Resonance 2009, 11(Suppl 1):P49
Introduction: Persistent minor troponin elevation in patients
with coronary heart disease is associated with adverse outcome
and prognosis. However, the mechanism is not yet clearly
understood.
Purpose: Our objectives were to examine the prevalence and
range of cardiac troponin T (cTnT) in stable patients six months
after acute myocardial infarction (AMI) using a new high sensitive
cTnT assay and to investigate the association of persistent minor
cTnT-elevation to clinical variables, NT-pro BNP and cardiac MR-
findings.
Methods: cTnTwas measured in 98 patients at 6 months after
AMI. Patients were investigated in a clinical 1.5 Tesla whole body
MR-scanner (Achieva, Philips, Best, the Netherlands) 3 ± 1 days
after successful mechanical reperfusion of the infarct related
vessel and at a follow-up of 6 ± 1 month using a 5-element
phased array cardiac synergy coil.
Assessment of resting left ventricular function was determined
by cine images using a steady-state-free precession sequence in
10–12 8 mm-thick slices covering the whole left ventricle from
base to apex as well as long axis 2,-3 and 4-chamber views.
Ten minutes after gadolinium contrast injection (0.2 mmol/kg
body weight of Gadolinium-DTPA (Magnevist®, Bayer, Germany)
late enhancement-imaging was performed using an inversion-
recovery gradient-echo technique triggered to end-diastole. Data
analysis of MRI-images was performed using a usual Philips work
station.
cTnT was measured using a precommercial assay by electro-
chemiluminescence methods (Roche Diagnostics, Mannheim,
Germany.
Results: Minor cTnT-concentrations were detectable in 90% of
the entire cohort, of whom 16% had cTnT-values above the 99th
percentile (> 12 ng/L). These patients were also significantly
older, suffered more frequently from hypertension, had a higher
New York Heart Association class and received more often
diuretics at follow-up. Patients with cTnT-elevation had a more
impaired left ventricular ejection fraction (p = 0.02) but did not
have an increased infarct size (p = 0.73).
Conclusion: Elevated minor cTnT levels are frequently detect-
able in patients 6 month after AMI. Increased cTnT-level were
associated with clinical parameter for heart failure, impaired
Journal of Cardiovascular Magnetic Resonance 2009, 11(Suppl 1) http://jcmr-online.com/supplements/11/S1
Page 124 of 316(page number not for citation purposes)
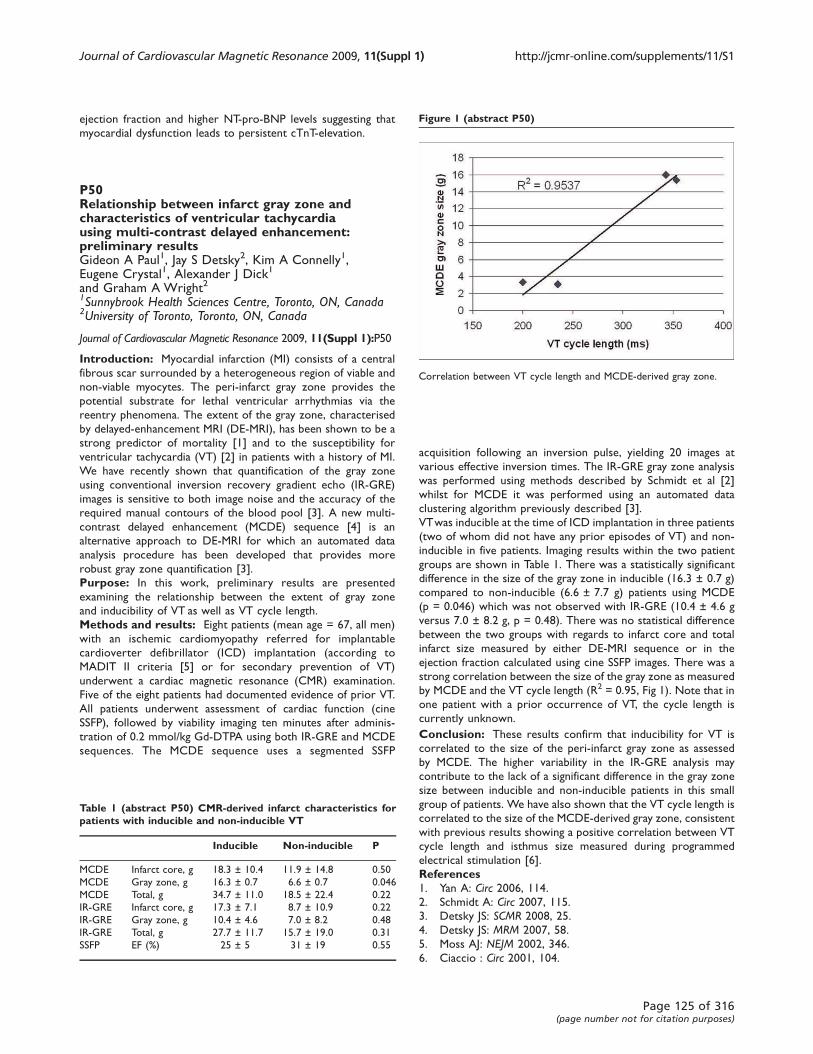
ejection fraction and higher NT-pro-BNP levels suggesting that
myocardial dysfunction leads to persistent cTnT-elevation.
P50Relationship between infarct gray zone andcharacteristics of ventricular tachycardiausing multi-contrast delayed enhancement:preliminary resultsGideon A Paul1, Jay S Detsky2, Kim A Connelly1,Eugene Crystal1, Alexander J Dick1
and Graham A Wright21Sunnybrook Health Sciences Centre, Toronto, ON, Canada2University of Toronto, Toronto, ON, Canada
Journal of Cardiovascular Magnetic Resonance 2009, 11(Suppl 1):P50
Introduction: Myocardial infarction (MI) consists of a central
fibrous scar surrounded by a heterogeneous region of viable and
non-viable myocytes. The peri-infarct gray zone provides the
potential substrate for lethal ventricular arrhythmias via the
reentry phenomena. The extent of the gray zone, characterised
by delayed-enhancement MRI (DE-MRI), has been shown to be a
strong predictor of mortality [1] and to the susceptibility for
ventricular tachycardia (VT) [2] in patients with a history of MI.
We have recently shown that quantification of the gray zone
using conventional inversion recovery gradient echo (IR-GRE)
images is sensitive to both image noise and the accuracy of the
required manual contours of the blood pool [3]. A new multi-
contrast delayed enhancement (MCDE) sequence [4] is an
alternative approach to DE-MRI for which an automated data
analysis procedure has been developed that provides more
robust gray zone quantification [3].
Purpose: In this work, preliminary results are presented
examining the relationship between the extent of gray zone
and inducibility of VT as well as VT cycle length.
Methods and results: Eight patients (mean age = 67, all men)
with an ischemic cardiomyopathy referred for implantable
cardioverter defibrillator (ICD) implantation (according to
MADIT II criteria [5] or for secondary prevention of VT)
underwent a cardiac magnetic resonance (CMR) examination.
Five of the eight patients had documented evidence of prior VT.
All patients underwent assessment of cardiac function (cine
SSFP), followed by viability imaging ten minutes after adminis-
tration of 0.2 mmol/kg Gd-DTPA using both IR-GRE and MCDE
sequences. The MCDE sequence uses a segmented SSFP
acquisition following an inversion pulse, yielding 20 images at
various effective inversion times. The IR-GRE gray zone analysis
was performed using methods described by Schmidt et al [2]
whilst for MCDE it was performed using an automated data
clustering algorithm previously described [3].
VTwas inducible at the time of ICD implantation in three patients
(two of whom did not have any prior episodes of VT) and non-
inducible in five patients. Imaging results within the two patient
groups are shown in Table 1. There was a statistically significant
difference in the size of the gray zone in inducible (16.3 ± 0.7 g)
compared to non-inducible (6.6 ± 7.7 g) patients using MCDE
(p = 0.046) which was not observed with IR-GRE (10.4 ± 4.6 g
versus 7.0 ± 8.2 g, p = 0.48). There was no statistical difference
between the two groups with regards to infarct core and total
infarct size measured by either DE-MRI sequence or in the
ejection fraction calculated using cine SSFP images. There was a
strong correlation between the size of the gray zone as measured
by MCDE and the VT cycle length (R2 = 0.95, Fig 1). Note that in
one patient with a prior occurrence of VT, the cycle length is
currently unknown.
Conclusion: These results confirm that inducibility for VT is
correlated to the size of the peri-infarct gray zone as assessed
by MCDE. The higher variability in the IR-GRE analysis may
contribute to the lack of a significant difference in the gray zone
size between inducible and non-inducible patients in this small
group of patients. We have also shown that the VT cycle length is
correlated to the size of the MCDE-derived gray zone, consistent
with previous results showing a positive correlation between VT
cycle length and isthmus size measured during programmed
electrical stimulation [6].
References1. Yan A: Circ 2006, 114.2. Schmidt A: Circ 2007, 115.3. Detsky JS: SCMR 2008, 25.
4. Detsky JS: MRM 2007, 58.
5. Moss AJ: NEJM 2002, 346.
6. Ciaccio : Circ 2001, 104.
Table 1 (abstract P50) CMR-derived infarct characteristics forpatients with inducible and non-inducible VT
Inducible Non-inducible P
MCDE Infarct core, g 18.3 ± 10.4 11.9 ± 14.8 0.50
MCDE Gray zone, g 16.3 ± 0.7 6.6 ± 0.7 0.046
MCDE Total, g 34.7 ± 11.0 18.5 ± 22.4 0.22
IR-GRE Infarct core, g 17.3 ± 7.1 8.7 ± 10.9 0.22
IR-GRE Gray zone, g 10.4 ± 4.6 7.0 ± 8.2 0.48
IR-GRE Total, g 27.7 ± 11.7 15.7 ± 19.0 0.31
SSFP EF (%) 25 ± 5 31 ± 19 0.55
Figure 1 (abstract P50)
Correlation between VT cycle length and MCDE-derived gray zone.
Journal of Cardiovascular Magnetic Resonance 2009, 11(Suppl 1) http://jcmr-online.com/supplements/11/S1
Page 125 of 316(page number not for citation purposes)
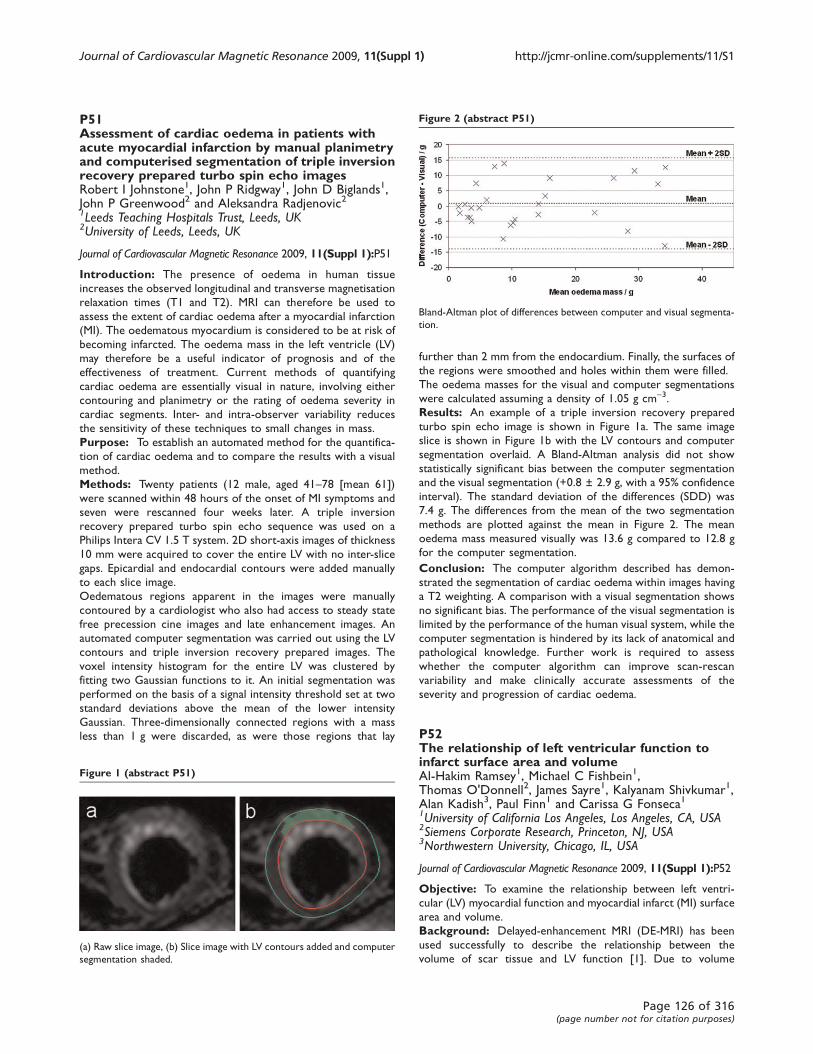
P51Assessment of cardiac oedema in patients withacute myocardial infarction by manual planimetryand computerised segmentation of triple inversionrecovery prepared turbo spin echo imagesRobert I Johnstone1, John P Ridgway1, John D Biglands1,John P Greenwood2 and Aleksandra Radjenovic21Leeds Teaching Hospitals Trust, Leeds, UK2University of Leeds, Leeds, UK
Journal of Cardiovascular Magnetic Resonance 2009, 11(Suppl 1):P51
Introduction: The presence of oedema in human tissue
increases the observed longitudinal and transverse magnetisation
relaxation times (T1 and T2). MRI can therefore be used to
assess the extent of cardiac oedema after a myocardial infarction
(MI). The oedematous myocardium is considered to be at risk of
becoming infarcted. The oedema mass in the left ventricle (LV)
may therefore be a useful indicator of prognosis and of the
effectiveness of treatment. Current methods of quantifying
cardiac oedema are essentially visual in nature, involving either
contouring and planimetry or the rating of oedema severity in
cardiac segments. Inter- and intra-observer variability reduces
the sensitivity of these techniques to small changes in mass.
Purpose: To establish an automated method for the quantifica-
tion of cardiac oedema and to compare the results with a visual
method.
Methods: Twenty patients (12 male, aged 41–78 [mean 61])
were scanned within 48 hours of the onset of MI symptoms and
seven were rescanned four weeks later. A triple inversion
recovery prepared turbo spin echo sequence was used on a
Philips Intera CV 1.5 T system. 2D short-axis images of thickness
10 mm were acquired to cover the entire LV with no inter-slice
gaps. Epicardial and endocardial contours were added manually
to each slice image.
Oedematous regions apparent in the images were manually
contoured by a cardiologist who also had access to steady state
free precession cine images and late enhancement images. An
automated computer segmentation was carried out using the LV
contours and triple inversion recovery prepared images. The
voxel intensity histogram for the entire LV was clustered by
fitting two Gaussian functions to it. An initial segmentation was
performed on the basis of a signal intensity threshold set at two
standard deviations above the mean of the lower intensity
Gaussian. Three-dimensionally connected regions with a mass
less than 1 g were discarded, as were those regions that lay
further than 2 mm from the endocardium. Finally, the surfaces of
the regions were smoothed and holes within them were filled.
The oedema masses for the visual and computer segmentations
were calculated assuming a density of 1.05 g cm-3.
Results: An example of a triple inversion recovery prepared
turbo spin echo image is shown in Figure 1a. The same image
slice is shown in Figure 1b with the LV contours and computer
segmentation overlaid. A Bland-Altman analysis did not show
statistically significant bias between the computer segmentation
and the visual segmentation (+0.8 ± 2.9 g, with a 95% confidence
interval). The standard deviation of the differences (SDD) was
7.4 g. The differences from the mean of the two segmentation
methods are plotted against the mean in Figure 2. The mean
oedema mass measured visually was 13.6 g compared to 12.8 g
for the computer segmentation.
Conclusion: The computer algorithm described has demon-
strated the segmentation of cardiac oedema within images having
a T2 weighting. A comparison with a visual segmentation shows
no significant bias. The performance of the visual segmentation is
limited by the performance of the human visual system, while the
computer segmentation is hindered by its lack of anatomical and
pathological knowledge. Further work is required to assess
whether the computer algorithm can improve scan-rescan
variability and make clinically accurate assessments of the
severity and progression of cardiac oedema.
P52The relationship of left ventricular function toinfarct surface area and volumeAl-Hakim Ramsey1, Michael C Fishbein1,Thomas O'Donnell2, James Sayre1, Kalyanam Shivkumar1,Alan Kadish3, Paul Finn1 and Carissa G Fonseca11University of California Los Angeles, Los Angeles, CA, USA2Siemens Corporate Research, Princeton, NJ, USA3Northwestern University, Chicago, IL, USA
Journal of Cardiovascular Magnetic Resonance 2009, 11(Suppl 1):P52
Objective: To examine the relationship between left ventri-
cular (LV) myocardial function and myocardial infarct (MI) surface
area and volume.
Background: Delayed-enhancement MRI (DE-MRI) has been
used successfully to describe the relationship between the
volume of scar tissue and LV function [1]. Due to volume
Figure 1 (abstract P51)
(a) Raw slice image, (b) Slice image with LV contours added and computer
segmentation shaded.
Figure 2 (abstract P51)
Bland-Altman plot of differences between computer and visual segmenta-
tion.
Journal of Cardiovascular Magnetic Resonance 2009, 11(Suppl 1) http://jcmr-online.com/supplements/11/S1
Page 126 of 316(page number not for citation purposes)

shrinkage of hyperenhanced tissue over time, DE-MRI derived
infarct surface area (iSA) and the iSA to infarct volume ratio (iSA/
V) may provide more stable indices of the extent of infarction
than does scar volume and may better predict LV functional
impairment.
Figure 1 (abstract P52)
3D rendering of LV and infarct (infarct mass: 14.1 g, iSA: 52.9 cm2, iSA/V:
3.9 cm2/ml) superimposed on a basal LV short-axis DE-MR image.
Figure 2 (abstract P52)
Relationshop of LV volumetric measurements to infarct surface area.
Figure 3 (abstract P52)
Decrease in LV wall thickening in relation to infarct surface area to volume (iSA/V) ratio and relative infarct mass.
Journal of Cardiovascular Magnetic Resonance 2009, 11(Suppl 1) http://jcmr-online.com/supplements/11/S1
Page 127 of 316(page number not for citation purposes)

Methods: Segmented SSFP cardiac cine and multi-shot inver-
sion recovery spoiled gradient echo DE-MR images were
obtained at 1.5 T, in 13 patients (11 M, 2 F; aged 40–82 years,
mean 60.3 ± 12.3 years) with documented myocardial infarction
from the Defibrillators To Reduce Risk by Magnetic Resonance
Imaging Evaluation (DETERMINE) study. Cine and DE images
were acquired in corresponding short-axis planes (spatial
resolution ≤ 2.5 × 2.0 × 10.0 mm; slice gap ≤ 2 mm) from the
base of the heart to the apex. 3DSlicer v2.6, free open source
image analysis software (slicer.org), was used to manually
segment and create a three-dimensional model of the infarct
from which volume and iSA were derived (Fig 1).
LV function was assessed using CIM software [2], which provided
the following global measurements: LV mass, LVEF, LV end-
diastolic volume (EDV), and LV end-systolic volume (ESV). CIM
also provided segmental data based on a 16 segment LV model:
myocardial thickening (peak thickness – minimum thickness),
EDV, ESV, and EF. Infarct and LV mass were calculated from their
respective volumes assuming a constant density of 1.04 g/ml. Mid-
ventricular segments that visually contained greater than 50%
hyper-enhancement on DE-MRI were considered infarcted.
Segments which were non-infarcted and not adjacent to infarcted
segments were considered remote. Statistical comparisons
between infarct and remote regions were made using a paired,
two-tailed student's t-test. For linear relationship comparisons,
the standard error of the estimate was calculated to examine
goodness-of-fit.
Results: Infarct mass correlated with iSA (r = 0.958). EDV and
ESV both increased with iSA (r = 0.875 and 0.937 respectively;
Fig 2). ESV correlated more strongly with iSA than with relative
infarct mass (100*infarct mass/LV mass; r = 0.499; p < 0.05).
LVEF decreased with relative infarct mass (r = -0.526) and
showed a higher correlation with iSA (r = -0.768, p < 0.01).
Relative infarct mass correlated with iSA/V (r = -0.845). A
relationship was not observed between iSA/V and LVEF
(r = 0.298).
Thickening of the infarcted region was reduced compared with the
remote region (3.47 mm ± 1.95 vs. 9.79 mm ± 2.47, p < 0.001).
The percent reduction in thickening of infarcted myocardium
showed a negative correlation with iSA/V (r = -0.758) and a positive
correlation with relative infarct mass (r = 0.573; Fig 3), the
correlation with iSA/V being stronger (P < 0.0001).
Conclusion: Impaired LV function is strongly related to infarct
surface area. Relative infarct mass may underestimate the extent
of damage post-MI because of thinning of infarcted myocardium
during remodeling. Infarct surface area is less affected by volume
shrinkage, and may be more stable over time than infarct mass in
measuring the loss of functioning myocardium.
A greater decrease in LV wall thickening is associated with a
larger relative infarct mass and surface area but a smaller iSA/V. A
transmural increase in infarct size may increase infarct volume
with little change in iSA. Infarct transmurality greater than 50% is
associated with severe loss of myocardial function and mortality
[3]. Thus, iSA/V can provide an objective quantitative index of
transmurality, superior to relative infarct mass for predicting
decrease in myocardial function.
References1. Kolipaka A, Charzimavroudis GP, White RD, Lieber ML and
Setser RM: Relationship between the extent of non-viable myocardium and regional left ventricular
function in chronic ischemic heart disease. J CardiovascMagn Reson 2005, 7:573–579.
2. Chan J, Khafagi F, Young AA, Cowan BR, Thompson C and
Marwick TH: Impact of coronary revascularization andtransmural extent of scar on regional left ventricularremodelling. Eur Heart J 2008, 29:1608–1617.
3. Roes SD, Kelle S, Kaandorp TA, Kokocinski T, Poldermans D,
Lamb HJ, Boersma E, van der Wall EE, Fleck E, de Roos A,
Nagel E and Bax JJ: Comparison of myocardial infarctsize assessed with contrast-enhanced magnetic reso-nance imaging and left ventricular function andvolumes to predict mortality in patients with withhealed myocardial infarction. Am J Cardiol 2007,
100:930–936.
P53Contribution of the base of the heart to MRmeasures of left ventricular mass, volumes andscar in patients with myocardial infarctionCarissa G Fonseca, Tariq Balawi,James Sayre and Paul FinnUCLA, Los Angeles, CA, USA
Journal of Cardiovascular Magnetic Resonance 2009, 11(Suppl 1):P53
Introduction: In planimetric measurement of left ventricular
(LV) mass and volumes, selection of the most basal short-axis
cine MR image plane is generally not standardized and may affect
calculation of relative infarct size in post-myocardial infarct (MI)
patients.
Purpose: To study the effect of LV base-plane selection on MR
measures of LV mass, volumes, ejection fraction (EF) and relative
infarct size in post-MI patients.
Methods: SSFP cardiac cine and multi-shot inversion recovery
spoiled gradient echo delayed enhancement (DE) images were
acquired in 14 patients with documented MI (3 F; mean age
59.6 ± 10.4 years), at 1.5 T. Cine and DE images were acquired in
corresponding short-axis planes (voxel size ≤ 2.5 × 2.0 × 10.0
mm; slice gap ≤ 2 mm) from LV base (mitral valve plane) to apex.
An expert observer used Argus software (Siemens Medical
Solutions) to manually outline LV epi- and endomyocardial
contours on cine images at end-diastole (ED) and end-systole
(ES) using each of 3 methods for choosing the most basal LV slice:
#1 base-plane showing 100% of myocardium at ED and
corresponding ES plane, #2 base-plane selected separately for
ED and ES, with 100% of myocardium visible at both phases, #3
base-plane showing 100% of myocardium at ES and correspond-
ing ED plane. LV mass was averaged over ED and ES for each
method. EF, and ED and ES-volumes were also calculated. Infarct
borders were manually outlined on DE images. Infarct size
(Infarct%) was expressed as a percentage of LV mass measured
on the cines (in each method). Comparisons were made using
repeated measures ANOVA, with Bonferroni-corrected post-
hoc P-values.
Results: LV mass was largest in method #1 and smallest in #3
(138.5 ± 31.2 vs. 133.0 ± 29.3 vs. 124.8 ± 27.3 g, P < 0.01 for all
comparisons). Method #2 produced a larger EF (51.3 ± 8.9%) vs.
#1 (43.8 ± 9.4%) or #3 (43.9 ± 10.8%); P < 0.01. Infarct% was
smallest in method #1 and differed significantly between all
methods (9.7 ± 4.9 vs. 10.2 ± 5.3 vs. 10.9 ± 6.0%, P < 0.05). ED
Journal of Cardiovascular Magnetic Resonance 2009, 11(Suppl 1) http://jcmr-online.com/supplements/11/S1
Page 128 of 316(page number not for citation purposes)

volume was lower in #3 than in #1 or #2 (P < 0.01) and ES
volume was higher in #1 than in #2 or #3 (P < 0.01).
Conclusion: Selecting the base-plane based on the anatomy
visible in only one phase, will lead to miscalculation of MRI
measures of LV mass, volumes and relative infarct size, due
to through-plane motion of the heart over the cycle. To
standardize measurements and to ensure that the same tissue
is being measured at both phases, the most basal slice should be
selected independently for ED and ES based on the visible
anatomy.
P54Comparison of right ventricularinvolvement in AL and transthyretin-typecardiac amyloidosis by cardiovascularmagnetic resonanceEvan Appelbaum1, Caitlin Harrigan1,Leah Biller1, Warren J Manning1,Frederick L Ruberg2, Kenneth Tripp3, Jeff Packman3
and Donna Grogan31PERFUSE CMR Core Lab, Beth Israel Deaconess MedicalCenter, Boston, MA, USA2Amyloid Treatment and Research Programand Section of Cardiology, Department of Medicine,Boston University School of Medicine, Boston, MA, USA3FoldRx Pharmaceuticals, Inc, Cambridge, MA, USA
Journal of Cardiovascular Magnetic Resonance 2009, 11(Suppl 1):P54
Background: Increased right ventricular (RV) wall thickness
and RV dysfunction are adverse prognostic signs in primary (AL)
cardiac amyloidosis and suggest more extensive disease. RV
involvement in other forms of cardiac amyloidosis remains
poorly understood. We sought to determine differences in RV
involvement for those with transthyretin (TTR) type and light-
chain (AL) type cardiac amyloidosis using cardiovascular magnetic
resonance (CMR).
Methods: We assessed a multi-center cohort of subjects with
proven cardiac amyloidosis due to AL (n = 21, 14 M, age 61 +/-11.5 yr) and TTR (n = 14 12 M, age 73 +/- 4.8 yr) using
conventional cine SSFP CMR. RV thickening was defined as a wall
thickness = 6 mm. Volumetric assessments of RV free wall mass,
volumes and ejection fraction (EF) were measured by an
independent core lab blinded to patient data.
Results: The prevalence of RVH was greater in the TTR group
(71% vs. 48% AL group, p = 0.01). Similarly, RV free wall mass
was increased in the TTR subjects (55.4 ± 20.6 g vs 37.3 ± 15.4 g;
p < 0.01). In addition, RVend-diastolic volume was greater in TTR
amyloidosis (190 ± 39 g vs 138 ± 48 g; p < 0.01) while RVEF was
lower in the TTR subjects (37 ± 11% vs 53 ± 13%; p < 0.001).
There were no differences in the degree of heart failure symptoms
in the TTR and AL groups: NHYA Class I: 4 vs 5; Class II/III: 10 vs
15; Class IV: 0 vs 1, respectively (p = 0.69).
Conclusion: These data suggest that, while similar in clinical
heart failure symptoms, TTR amyloidosis appears to have more
prevalent and extensive RV involvement than AL. The clinical
impact of RV involvement in TTR amyloidosis remains to be
determined.
P55Abnormal myocardial perfusion inhypertrophic cardiomyopathy:preliminary findings of a cardiovascularMRI studyJames A White1, Sarah Armstrong2,Mohammed Al-Admawi2, Sherryn Rambihar2,Gerald Wisenberg2, Ivonna Verschuur1,Anna MacDonald2, Cyndi Harper-Little3,Aaron So3, Ting-Yim Lee4, Frank Prato4
and Terry Thomspon41Dept. of Medicine and Lawson HealthResearch Institute and Robarts Research Institute,University of Western Ontario, London, ON,Canada2Dept. of Medicine, University of Western Ontario, London,ON, Canada3Robarts Research Institute, University of Western Ontario,London, ON, Canada4Lawson Health Research Institute, University of WesternOntario, London, ON, Canada
Journal of Cardiovascular Magnetic Resonance 2009, 11(Suppl 1):P55
Background: Reduced myocardial perfusion has been specu-
lated as a potential mechanism for the development and/or
propagation of myocardial fibrosis in hypertrophic cardiomyo-
pathy (HCM). This study aims to evaluate the prevalence,
distribution and extent of stress-induced perfusion abnormalities
and their relationship to underlying fibrosis in patients with HCM
using magnetic resonance imaging.
Methods: 15 patients with echocardiographically diagnosed
HCM have been enrolled. Cine imaging, first-pass stress
perfusion imaging using vasodilator stress (Dipyridamole), and
delayed gadolinium enhancement imaging were performed. Stress
hypoperfusion and delayed enhancement images were assessed
both quantitatively and visually using a 16-segment model.
Conversion of segmental visual scoring to % of LV by volume
was achieved for both hypoperfusion (HP) and late enhancement
(LE) using a standardized scoring system. For quantitative
assessment prospectively defined cut-offs for LE and HP were
used.
Results: Maximal wall thickness ranged from 13 to 22 mm
(mean 17 ± 2.6 mm). Non-ischemic pattern LE was present in
70% of patients. Perfusion abnormalities were identified on
stress perfusion images in 80% of patients using visual analysis
and 87% of patients using quantitative analysis. Perfusion
abnormalities were predominantly subendocardial, and were
regionally associated with segments containing LE (p < 0.01).
Mean percent HP and mean percent LE were 17 ± 8.4%
and 10 ± 9.3%, respectively by visual estimation and 20.0 ±
12.1% and 14.0 ± 7.4%, respectively by quantitative assessment.
Figure 1.
Conclusion: These preliminary results suggest that patients
with HCM have a high prevalence of stress-induced myocardial
hypoperfusion as represented by reduced first-pass gadolinium
enhancement during vasodilator stress. This hypoperfusion
appears to extend beyond regions of established LE
suggesting a potential contribution of ischemia in the develop-
ment and/or propagation of myocardial fibrosis in patients with
HCM.
Journal of Cardiovascular Magnetic Resonance 2009, 11(Suppl 1) http://jcmr-online.com/supplements/11/S1
Page 129 of 316(page number not for citation purposes)
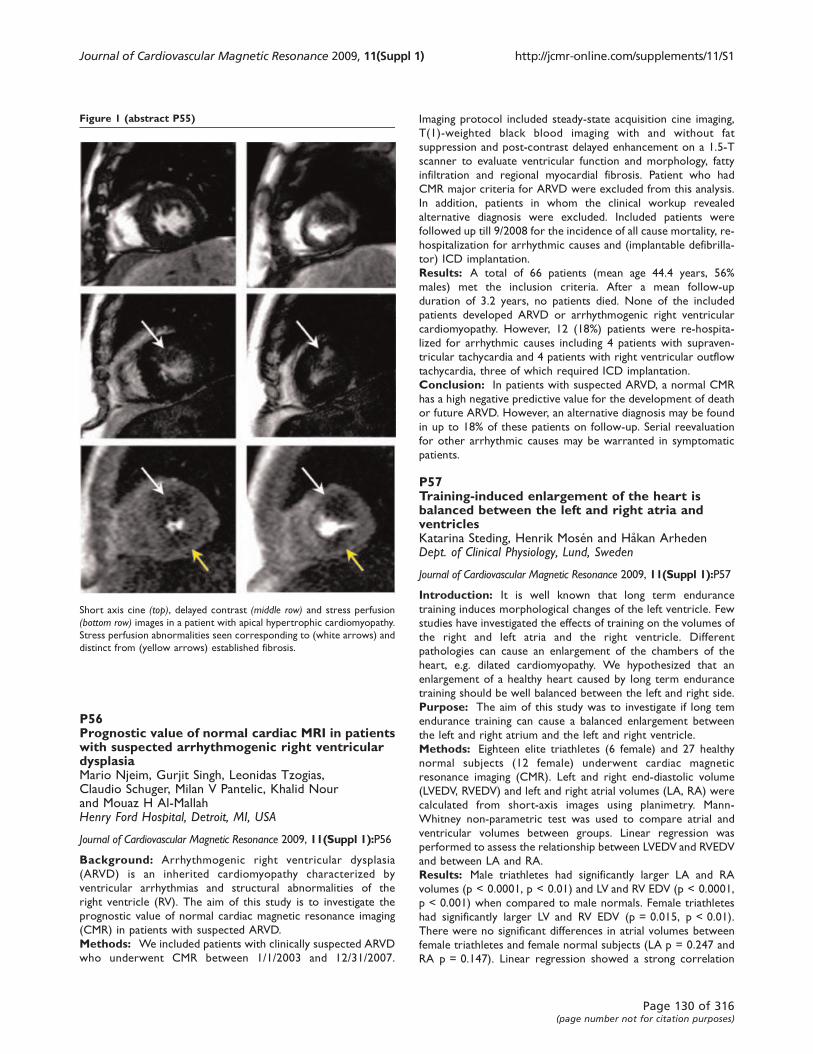
P56Prognostic value of normal cardiac MRI in patientswith suspected arrhythmogenic right ventriculardysplasiaMario Njeim, Gurjit Singh, Leonidas Tzogias,Claudio Schuger, Milan V Pantelic, Khalid Nourand Mouaz H Al-MallahHenry Ford Hospital, Detroit, MI, USA
Journal of Cardiovascular Magnetic Resonance 2009, 11(Suppl 1):P56
Background: Arrhythmogenic right ventricular dysplasia
(ARVD) is an inherited cardiomyopathy characterized by
ventricular arrhythmias and structural abnormalities of the
right ventricle (RV). The aim of this study is to investigate the
prognostic value of normal cardiac magnetic resonance imaging
(CMR) in patients with suspected ARVD.
Methods: We included patients with clinically suspected ARVD
who underwent CMR between 1/1/2003 and 12/31/2007.
Imaging protocol included steady-state acquisition cine imaging,
T(1)-weighted black blood imaging with and without fat
suppression and post-contrast delayed enhancement on a 1.5-T
scanner to evaluate ventricular function and morphology, fatty
infiltration and regional myocardial fibrosis. Patient who had
CMR major criteria for ARVD were excluded from this analysis.
In addition, patients in whom the clinical workup revealed
alternative diagnosis were excluded. Included patients were
followed up till 9/2008 for the incidence of all cause mortality, re-
hospitalization for arrhythmic causes and (implantable defibrilla-
tor) ICD implantation.
Results: A total of 66 patients (mean age 44.4 years, 56%
males) met the inclusion criteria. After a mean follow-up
duration of 3.2 years, no patients died. None of the included
patients developed ARVD or arrhythmogenic right ventricular
cardiomyopathy. However, 12 (18%) patients were re-hospita-
lized for arrhythmic causes including 4 patients with supraven-
tricular tachycardia and 4 patients with right ventricular outflow
tachycardia, three of which required ICD implantation.
Conclusion: In patients with suspected ARVD, a normal CMR
has a high negative predictive value for the development of death
or future ARVD. However, an alternative diagnosis may be found
in up to 18% of these patients on follow-up. Serial reevaluation
for other arrhythmic causes may be warranted in symptomatic
patients.
P57Training-induced enlargement of the heart isbalanced between the left and right atria andventriclesKatarina Steding, Henrik Mosén and Håkan ArhedenDept. of Clinical Physiology, Lund, Sweden
Journal of Cardiovascular Magnetic Resonance 2009, 11(Suppl 1):P57
Introduction: It is well known that long term endurance
training induces morphological changes of the left ventricle. Few
studies have investigated the effects of training on the volumes of
the right and left atria and the right ventricle. Different
pathologies can cause an enlargement of the chambers of the
heart, e.g. dilated cardiomyopathy. We hypothesized that an
enlargement of a healthy heart caused by long term endurance
training should be well balanced between the left and right side.
Purpose: The aim of this study was to investigate if long tem
endurance training can cause a balanced enlargement between
the left and right atrium and the left and right ventricle.
Methods: Eighteen elite triathletes (6 female) and 27 healthy
normal subjects (12 female) underwent cardiac magnetic
resonance imaging (CMR). Left and right end-diastolic volume
(LVEDV, RVEDV) and left and right atrial volumes (LA, RA) were
calculated from short-axis images using planimetry. Mann-
Whitney non-parametric test was used to compare atrial and
ventricular volumes between groups. Linear regression was
performed to assess the relationship between LVEDV and RVEDV
and between LA and RA.
Results: Male triathletes had significantly larger LA and RA
volumes (p < 0.0001, p < 0.01) and LV and RV EDV (p < 0.0001,
p < 0.001) when compared to male normals. Female triathletes
had significantly larger LV and RV EDV (p = 0.015, p < 0.01).
There were no significant differences in atrial volumes between
female triathletes and female normal subjects (LA p = 0.247 and
RA p = 0.147). Linear regression showed a strong correlation
Figure 1 (abstract P55)
Short axis cine (top), delayed contrast (middle row) and stress perfusion
(bottom row) images in a patient with apical hypertrophic cardiomyopathy.
Stress perfusion abnormalities seen corresponding to (white arrows) and
distinct from (yellow arrows) established fibrosis.
Journal of Cardiovascular Magnetic Resonance 2009, 11(Suppl 1) http://jcmr-online.com/supplements/11/S1
Page 130 of 316(page number not for citation purposes)
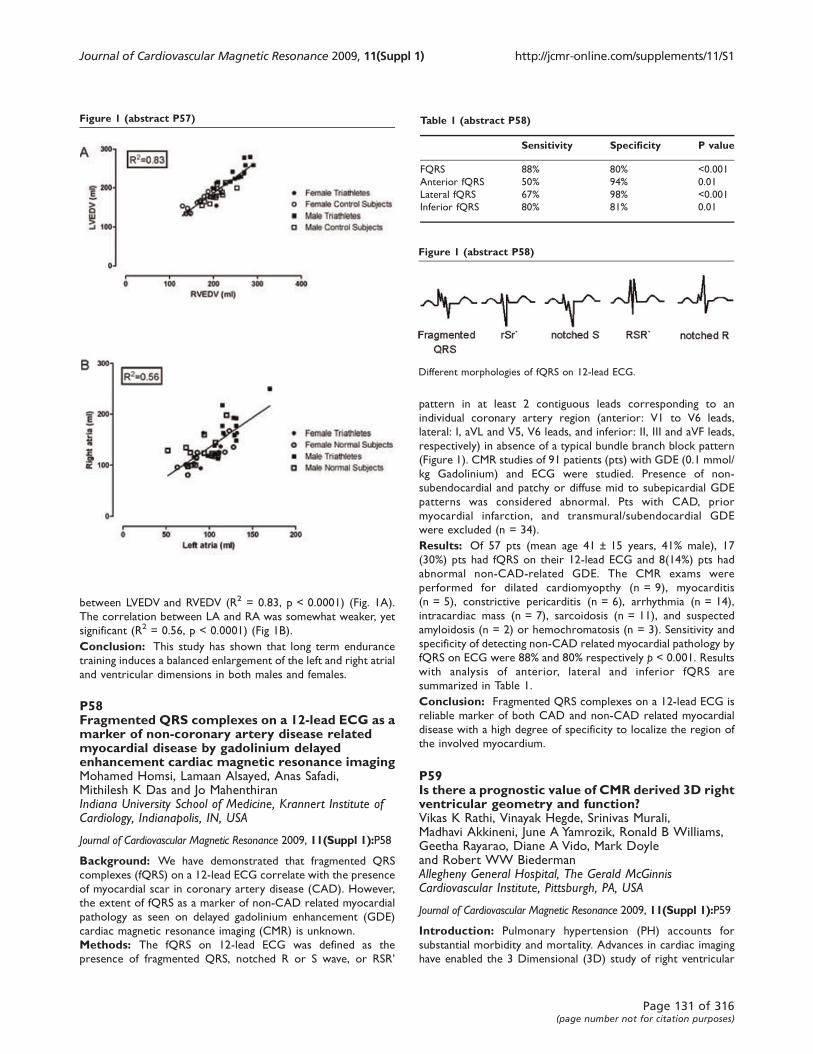
between LVEDV and RVEDV (R2 = 0.83, p < 0.0001) (Fig. 1A).
The correlation between LA and RA was somewhat weaker, yet
significant (R2 = 0.56, p < 0.0001) (Fig 1B).
Conclusion: This study has shown that long term endurance
training induces a balanced enlargement of the left and right atrial
and ventricular dimensions in both males and females.
P58Fragmented QRS complexes on a 12-lead ECG as amarker of non-coronary artery disease relatedmyocardial disease by gadolinium delayedenhancement cardiac magnetic resonance imagingMohamed Homsi, Lamaan Alsayed, Anas Safadi,Mithilesh K Das and Jo MahenthiranIndiana University School of Medicine, Krannert Institute ofCardiology, Indianapolis, IN, USA
Journal of Cardiovascular Magnetic Resonance 2009, 11(Suppl 1):P58
Background: We have demonstrated that fragmented QRS
complexes (fQRS) on a 12-lead ECG correlate with the presence
of myocardial scar in coronary artery disease (CAD). However,
the extent of fQRS as a marker of non-CAD related myocardial
pathology as seen on delayed gadolinium enhancement (GDE)
cardiac magnetic resonance imaging (CMR) is unknown.
Methods: The fQRS on 12-lead ECG was defined as the
presence of fragmented QRS, notched R or S wave, or RSR’
pattern in at least 2 contiguous leads corresponding to an
individual coronary artery region (anterior: V1 to V6 leads,
lateral: I, aVL and V5, V6 leads, and inferior: II, III and aVF leads,
respectively) in absence of a typical bundle branch block pattern
(Figure 1). CMR studies of 91 patients (pts) with GDE (0.1 mmol/
kg Gadolinium) and ECG were studied. Presence of non-
subendocardial and patchy or diffuse mid to subepicardial GDE
patterns was considered abnormal. Pts with CAD, prior
myocardial infarction, and transmural/subendocardial GDE
were excluded (n = 34).
Results: Of 57 pts (mean age 41 ± 15 years, 41% male), 17
(30%) pts had fQRS on their 12-lead ECG and 8(14%) pts had
abnormal non-CAD-related GDE. The CMR exams were
performed for dilated cardiomyopthy (n = 9), myocarditis
(n = 5), constrictive pericarditis (n = 6), arrhythmia (n = 14),
intracardiac mass (n = 7), sarcoidosis (n = 11), and suspected
amyloidosis (n = 2) or hemochromatosis (n = 3). Sensitivity and
specificity of detecting non-CAD related myocardial pathology by
fQRS on ECG were 88% and 80% respectively p < 0.001. Results
with analysis of anterior, lateral and inferior fQRS are
summarized in Table 1.
Conclusion: Fragmented QRS complexes on a 12-lead ECG is
reliable marker of both CAD and non-CAD related myocardial
disease with a high degree of specificity to localize the region of
the involved myocardium.
P59Is there a prognostic value of CMR derived 3D rightventricular geometry and function?Vikas K Rathi, Vinayak Hegde, Srinivas Murali,Madhavi Akkineni, June A Yamrozik, Ronald B Williams,Geetha Rayarao, Diane A Vido, Mark Doyleand Robert WW BiedermanAllegheny General Hospital, The Gerald McGinnisCardiovascular Institute, Pittsburgh, PA, USA
Journal of Cardiovascular Magnetic Resonance 2009, 11(Suppl 1):P59
Introduction: Pulmonary hypertension (PH) accounts for
substantial morbidity and mortality. Advances in cardiac imaging
have enabled the 3 Dimensional (3D) study of right ventricular
Figure 1 (abstract P57) Table 1 (abstract P58)
Sensitivity Specificity P value
FQRS 88% 80% <0.001
Anterior fQRS 50% 94% 0.01
Lateral fQRS 67% 98% <0.001
Inferior fQRS 80% 81% 0.01
Figure 1 (abstract P58)
Different morphologies of fQRS on 12-lead ECG.
Journal of Cardiovascular Magnetic Resonance 2009, 11(Suppl 1) http://jcmr-online.com/supplements/11/S1
Page 131 of 316(page number not for citation purposes)
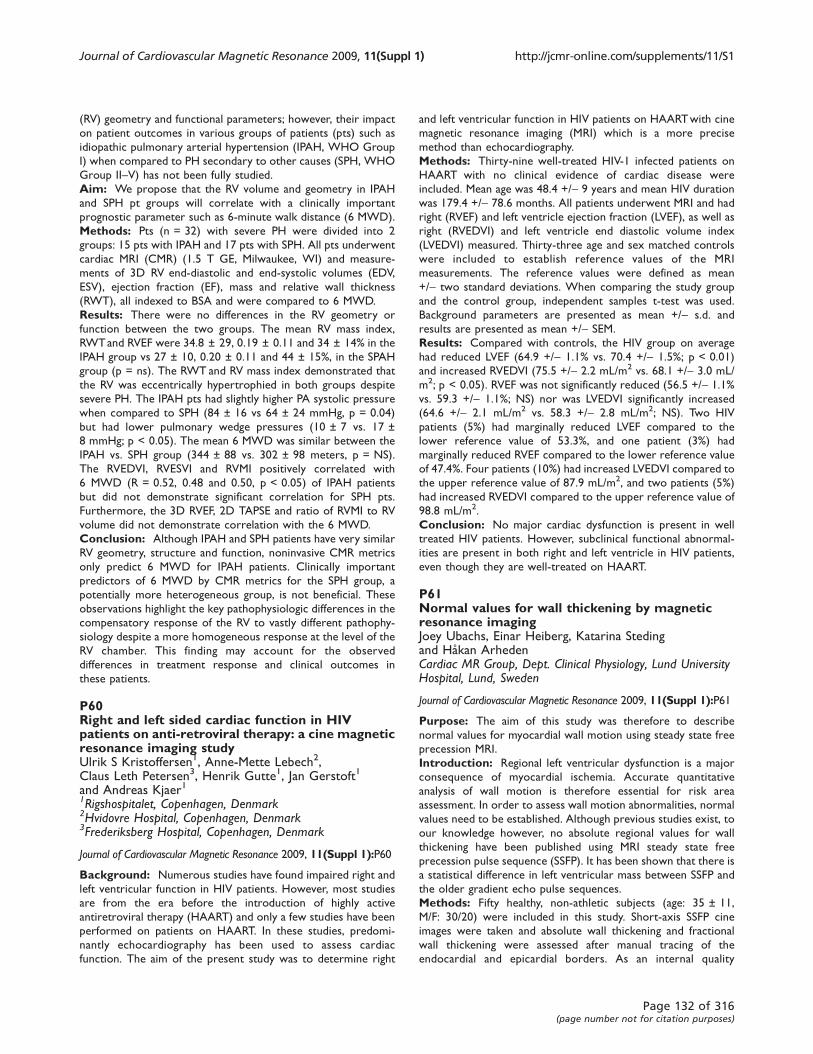
(RV) geometry and functional parameters; however, their impact
on patient outcomes in various groups of patients (pts) such as
idiopathic pulmonary arterial hypertension (IPAH, WHO Group
I) when compared to PH secondary to other causes (SPH, WHO
Group II–V) has not been fully studied.
Aim: We propose that the RV volume and geometry in IPAH
and SPH pt groups will correlate with a clinically important
prognostic parameter such as 6-minute walk distance (6 MWD).
Methods: Pts (n = 32) with severe PH were divided into 2
groups: 15 pts with IPAH and 17 pts with SPH. All pts underwent
cardiac MRI (CMR) (1.5 T GE, Milwaukee, WI) and measure-
ments of 3D RV end-diastolic and end-systolic volumes (EDV,
ESV), ejection fraction (EF), mass and relative wall thickness
(RWT), all indexed to BSA and were compared to 6 MWD.
Results: There were no differences in the RV geometry or
function between the two groups. The mean RV mass index,
RWTand RVEF were 34.8 ± 29, 0.19 ± 0.11 and 34 ± 14% in the
IPAH group vs 27 ± 10, 0.20 ± 0.11 and 44 ± 15%, in the SPAH
group (p = ns). The RWT and RV mass index demonstrated that
the RV was eccentrically hypertrophied in both groups despite
severe PH. The IPAH pts had slightly higher PA systolic pressure
when compared to SPH (84 ± 16 vs 64 ± 24 mmHg, p = 0.04)
but had lower pulmonary wedge pressures (10 ± 7 vs. 17 ±
8 mmHg; p < 0.05). The mean 6 MWD was similar between the
IPAH vs. SPH group (344 ± 88 vs. 302 ± 98 meters, p = NS).
The RVEDVI, RVESVI and RVMI positively correlated with
6 MWD (R = 0.52, 0.48 and 0.50, p < 0.05) of IPAH patients
but did not demonstrate significant correlation for SPH pts.
Furthermore, the 3D RVEF, 2D TAPSE and ratio of RVMI to RV
volume did not demonstrate correlation with the 6 MWD.
Conclusion: Although IPAH and SPH patients have very similar
RV geometry, structure and function, noninvasive CMR metrics
only predict 6 MWD for IPAH patients. Clinically important
predictors of 6 MWD by CMR metrics for the SPH group, a
potentially more heterogeneous group, is not beneficial. These
observations highlight the key pathophysiologic differences in the
compensatory response of the RV to vastly different pathophy-
siology despite a more homogeneous response at the level of the
RV chamber. This finding may account for the observed
differences in treatment response and clinical outcomes in
these patients.
P60Right and left sided cardiac function in HIVpatients on anti-retroviral therapy: a cine magneticresonance imaging studyUlrik S Kristoffersen1, Anne-Mette Lebech2,Claus Leth Petersen3, Henrik Gutte1, Jan Gerstoft1
and Andreas Kjaer11Rigshospitalet, Copenhagen, Denmark2Hvidovre Hospital, Copenhagen, Denmark3Frederiksberg Hospital, Copenhagen, Denmark
Journal of Cardiovascular Magnetic Resonance 2009, 11(Suppl 1):P60
Background: Numerous studies have found impaired right and
left ventricular function in HIV patients. However, most studies
are from the era before the introduction of highly active
antiretroviral therapy (HAART) and only a few studies have been
performed on patients on HAART. In these studies, predomi-
nantly echocardiography has been used to assess cardiac
function. The aim of the present study was to determine right
and left ventricular function in HIV patients on HAARTwith cine
magnetic resonance imaging (MRI) which is a more precise
method than echocardiography.
Methods: Thirty-nine well-treated HIV-1 infected patients on
HAART with no clinical evidence of cardiac disease were
included. Mean age was 48.4 +/- 9 years and mean HIV duration
was 179.4 +/- 78.6 months. All patients underwent MRI and had
right (RVEF) and left ventricle ejection fraction (LVEF), as well as
right (RVEDVI) and left ventricle end diastolic volume index
(LVEDVI) measured. Thirty-three age and sex matched controls
were included to establish reference values of the MRI
measurements. The reference values were defined as mean
+/- two standard deviations. When comparing the study group
and the control group, independent samples t-test was used.
Background parameters are presented as mean +/- s.d. and
results are presented as mean +/- SEM.
Results: Compared with controls, the HIV group on average
had reduced LVEF (64.9 +/- 1.1% vs. 70.4 +/- 1.5%; p < 0.01)
and increased RVEDVI (75.5 +/- 2.2 mL/m2 vs. 68.1 +/- 3.0 mL/
m2; p < 0.05). RVEF was not significantly reduced (56.5 +/- 1.1%
vs. 59.3 +/- 1.1%; NS) nor was LVEDVI significantly increased
(64.6 +/- 2.1 mL/m2 vs. 58.3 +/- 2.8 mL/m2; NS). Two HIV
patients (5%) had marginally reduced LVEF compared to the
lower reference value of 53.3%, and one patient (3%) had
marginally reduced RVEF compared to the lower reference value
of 47.4%. Four patients (10%) had increased LVEDVI compared to
the upper reference value of 87.9 mL/m2, and two patients (5%)
had increased RVEDVI compared to the upper reference value of
98.8 mL/m2.
Conclusion: No major cardiac dysfunction is present in well
treated HIV patients. However, subclinical functional abnormal-
ities are present in both right and left ventricle in HIV patients,
even though they are well-treated on HAART.
P61Normal values for wall thickening by magneticresonance imagingJoey Ubachs, Einar Heiberg, Katarina Stedingand Håkan ArhedenCardiac MR Group, Dept. Clinical Physiology, Lund UniversityHospital, Lund, Sweden
Journal of Cardiovascular Magnetic Resonance 2009, 11(Suppl 1):P61
Purpose: The aim of this study was therefore to describe
normal values for myocardial wall motion using steady state free
precession MRI.
Introduction: Regional left ventricular dysfunction is a major
consequence of myocardial ischemia. Accurate quantitative
analysis of wall motion is therefore essential for risk area
assessment. In order to assess wall motion abnormalities, normal
values need to be established. Although previous studies exist, to
our knowledge however, no absolute regional values for wall
thickening have been published using MRI steady state free
precession pulse sequence (SSFP). It has been shown that there is
a statistical difference in left ventricular mass between SSFP and
the older gradient echo pulse sequences.
Methods: Fifty healthy, non-athletic subjects (age: 35 ± 11,
M/F: 30/20) were included in this study. Short-axis SSFP cine
images were taken and absolute wall thickening and fractional
wall thickening were assessed after manual tracing of the
endocardial and epicardial borders. As an internal quality
Journal of Cardiovascular Magnetic Resonance 2009, 11(Suppl 1) http://jcmr-online.com/supplements/11/S1
Page 132 of 316(page number not for citation purposes)
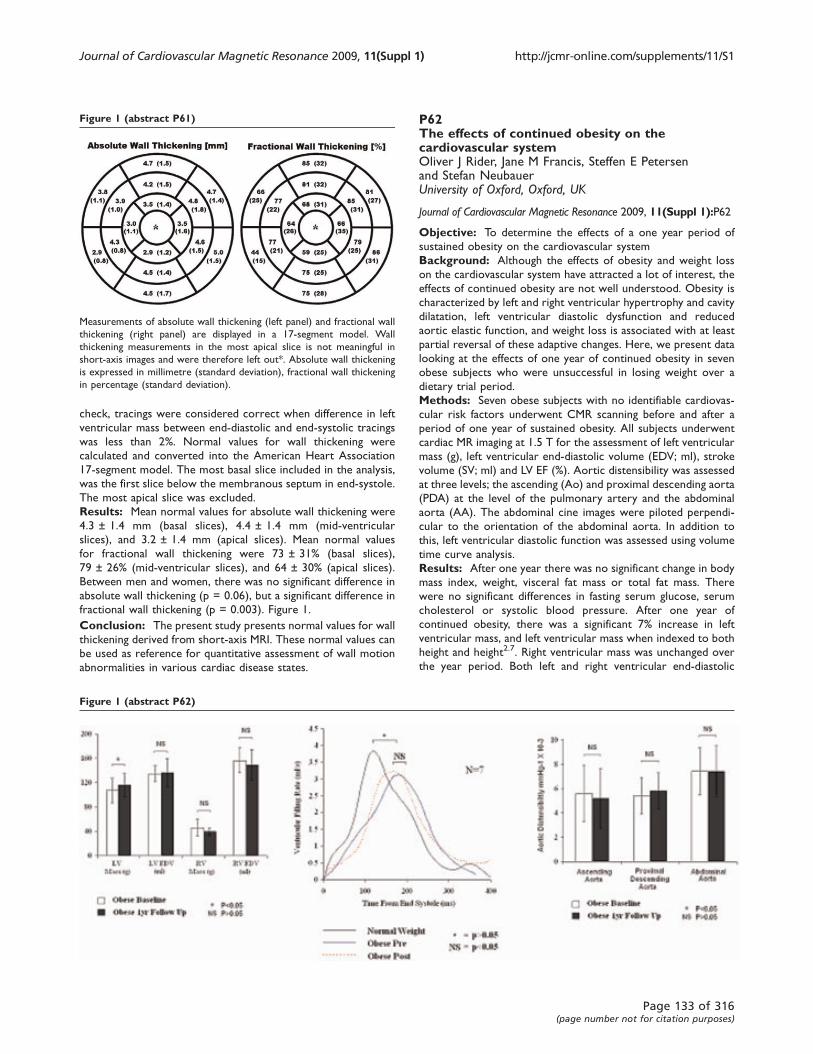
check, tracings were considered correct when difference in left
ventricular mass between end-diastolic and end-systolic tracings
was less than 2%. Normal values for wall thickening were
calculated and converted into the American Heart Association
17-segment model. The most basal slice included in the analysis,
was the first slice below the membranous septum in end-systole.
The most apical slice was excluded.
Results: Mean normal values for absolute wall thickening were
4.3 ± 1.4 mm (basal slices), 4.4 ± 1.4 mm (mid-ventricular
slices), and 3.2 ± 1.4 mm (apical slices). Mean normal values
for fractional wall thickening were 73 ± 31% (basal slices),
79 ± 26% (mid-ventricular slices), and 64 ± 30% (apical slices).
Between men and women, there was no significant difference in
absolute wall thickening (p = 0.06), but a significant difference in
fractional wall thickening (p = 0.003). Figure 1.
Conclusion: The present study presents normal values for wall
thickening derived from short-axis MRI. These normal values can
be used as reference for quantitative assessment of wall motion
abnormalities in various cardiac disease states.
P62The effects of continued obesity on thecardiovascular systemOliver J Rider, Jane M Francis, Steffen E Petersenand Stefan NeubauerUniversity of Oxford, Oxford, UK
Journal of Cardiovascular Magnetic Resonance 2009, 11(Suppl 1):P62
Objective: To determine the effects of a one year period of
sustained obesity on the cardiovascular system
Background: Although the effects of obesity and weight loss
on the cardiovascular system have attracted a lot of interest, the
effects of continued obesity are not well understood. Obesity is
characterized by left and right ventricular hypertrophy and cavity
dilatation, left ventricular diastolic dysfunction and reduced
aortic elastic function, and weight loss is associated with at least
partial reversal of these adaptive changes. Here, we present data
looking at the effects of one year of continued obesity in seven
obese subjects who were unsuccessful in losing weight over a
dietary trial period.
Methods: Seven obese subjects with no identifiable cardiovas-
cular risk factors underwent CMR scanning before and after a
period of one year of sustained obesity. All subjects underwent
cardiac MR imaging at 1.5 T for the assessment of left ventricular
mass (g), left ventricular end-diastolic volume (EDV; ml), stroke
volume (SV; ml) and LV EF (%). Aortic distensibility was assessed
at three levels; the ascending (Ao) and proximal descending aorta
(PDA) at the level of the pulmonary artery and the abdominal
aorta (AA). The abdominal cine images were piloted perpendi-
cular to the orientation of the abdominal aorta. In addition to
this, left ventricular diastolic function was assessed using volume
time curve analysis.
Results: After one year there was no significant change in body
mass index, weight, visceral fat mass or total fat mass. There
were no significant differences in fasting serum glucose, serum
cholesterol or systolic blood pressure. After one year of
continued obesity, there was a significant 7% increase in left
ventricular mass, and left ventricular mass when indexed to both
height and height2.7. Right ventricular mass was unchanged over
the year period. Both left and right ventricular end-diastolic
Figure 1 (abstract P61)
Measurements of absolute wall thickening (left panel) and fractional wall
thickening (right panel) are displayed in a 17-segment model. Wall
thickening measurements in the most apical slice is not meaningful in
short-axis images and were therefore left out*. Absolute wall thickening
is expressed in millimetre (standard deviation), fractional wall thickening
in percentage (standard deviation).
Figure 1 (abstract P62)
Journal of Cardiovascular Magnetic Resonance 2009, 11(Suppl 1) http://jcmr-online.com/supplements/11/S1
Page 133 of 316(page number not for citation purposes)
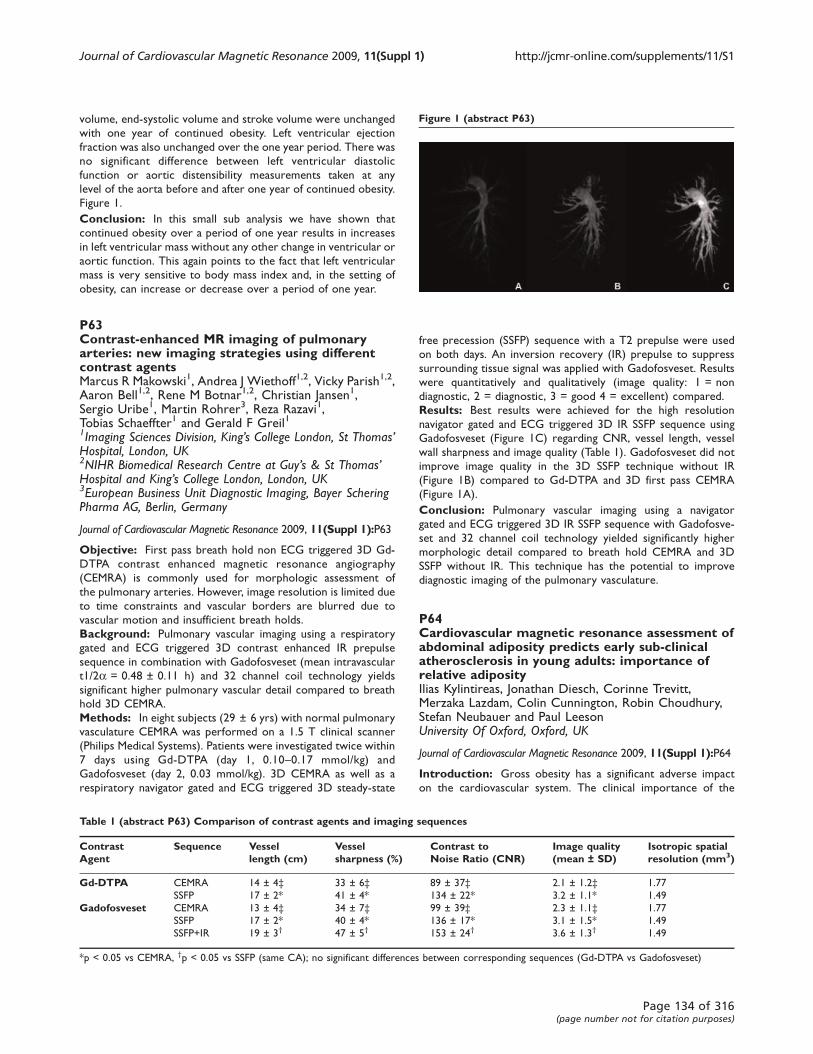
volume, end-systolic volume and stroke volume were unchanged
with one year of continued obesity. Left ventricular ejection
fraction was also unchanged over the one year period. There was
no significant difference between left ventricular diastolic
function or aortic distensibility measurements taken at any
level of the aorta before and after one year of continued obesity.
Figure 1.
Conclusion: In this small sub analysis we have shown that
continued obesity over a period of one year results in increases
in left ventricular mass without any other change in ventricular or
aortic function. This again points to the fact that left ventricular
mass is very sensitive to body mass index and, in the setting of
obesity, can increase or decrease over a period of one year.
P63Contrast-enhanced MR imaging of pulmonaryarteries: new imaging strategies using differentcontrast agentsMarcus R Makowski1, Andrea J Wiethoff1,2, Vicky Parish1,2,Aaron Bell1,2, Rene M Botnar1,2, Christian Jansen1,Sergio Uribe1, Martin Rohrer3, Reza Razavi1,Tobias Schaeffter1 and Gerald F Greil11Imaging Sciences Division, King’s College London, St Thomas’Hospital, London, UK2NIHR Biomedical Research Centre at Guy’s & St Thomas’Hospital and King’s College London, London, UK3European Business Unit Diagnostic Imaging, Bayer ScheringPharma AG, Berlin, Germany
Journal of Cardiovascular Magnetic Resonance 2009, 11(Suppl 1):P63
Objective: First pass breath hold non ECG triggered 3D Gd-
DTPA contrast enhanced magnetic resonance angiography
(CEMRA) is commonly used for morphologic assessment of
the pulmonary arteries. However, image resolution is limited due
to time constraints and vascular borders are blurred due to
vascular motion and insufficient breath holds.
Background: Pulmonary vascular imaging using a respiratory
gated and ECG triggered 3D contrast enhanced IR prepulse
sequence in combination with Gadofosveset (mean intravascular
t1/2a = 0.48 ± 0.11 h) and 32 channel coil technology yields
significant higher pulmonary vascular detail compared to breath
hold 3D CEMRA.
Methods: In eight subjects (29 ± 6 yrs) with normal pulmonary
vasculature CEMRA was performed on a 1.5 T clinical scanner
(Philips Medical Systems). Patients were investigated twice within
7 days using Gd-DTPA (day 1, 0.10–0.17 mmol/kg) and
Gadofosveset (day 2, 0.03 mmol/kg). 3D CEMRA as well as a
respiratory navigator gated and ECG triggered 3D steady-state
free precession (SSFP) sequence with a T2 prepulse were used
on both days. An inversion recovery (IR) prepulse to suppress
surrounding tissue signal was applied with Gadofosveset. Results
were quantitatively and qualitatively (image quality: 1 = non
diagnostic, 2 = diagnostic, 3 = good 4 = excellent) compared.
Results: Best results were achieved for the high resolution
navigator gated and ECG triggered 3D IR SSFP sequence using
Gadofosveset (Figure 1C) regarding CNR, vessel length, vessel
wall sharpness and image quality (Table 1). Gadofosveset did not
improve image quality in the 3D SSFP technique without IR
(Figure 1B) compared to Gd-DTPA and 3D first pass CEMRA
(Figure 1A).
Conclusion: Pulmonary vascular imaging using a navigator
gated and ECG triggered 3D IR SSFP sequence with Gadofosve-
set and 32 channel coil technology yielded significantly higher
morphologic detail compared to breath hold CEMRA and 3D
SSFP without IR. This technique has the potential to improve
diagnostic imaging of the pulmonary vasculature.
P64Cardiovascular magnetic resonance assessment ofabdominal adiposity predicts early sub-clinicalatherosclerosis in young adults: importance ofrelative adiposityIlias Kylintireas, Jonathan Diesch, Corinne Trevitt,Merzaka Lazdam, Colin Cunnington, Robin Choudhury,Stefan Neubauer and Paul LeesonUniversity Of Oxford, Oxford, UK
Journal of Cardiovascular Magnetic Resonance 2009, 11(Suppl 1):P64
Introduction: Gross obesity has a significant adverse impact
on the cardiovascular system. The clinical importance of the
Table 1 (abstract P63) Comparison of contrast agents and imaging sequences
ContrastAgent
Sequence Vessellength (cm)
Vesselsharpness (%)
Contrast toNoise Ratio (CNR)
Image quality(mean ± SD)
Isotropic spatialresolution (mm3)
Gd-DTPA CEMRA 14 ± 4‡ 33 ± 6‡ 89 ± 37‡ 2.1 ± 1.2‡ 1.77
SSFP 17 ± 2* 41 ± 4* 134 ± 22* 3.2 ± 1.1* 1.49
Gadofosveset CEMRA 13 ± 4‡ 34 ± 7‡ 99 ± 39‡ 2.3 ± 1.1‡ 1.77
SSFP 17 ± 2* 40 ± 4* 136 ± 17* 3.1 ± 1.5* 1.49
SSFP+IR 19 ± 3† 47 ± 5† 153 ± 24† 3.6 ± 1.3† 1.49
*p < 0.05 vs CEMRA, †p < 0.05 vs SSFP (same CA); no significant differences between corresponding sequences (Gd-DTPA vs Gadofosveset)
Figure 1 (abstract P63)
Journal of Cardiovascular Magnetic Resonance 2009, 11(Suppl 1) http://jcmr-online.com/supplements/11/S1
Page 134 of 316(page number not for citation purposes)
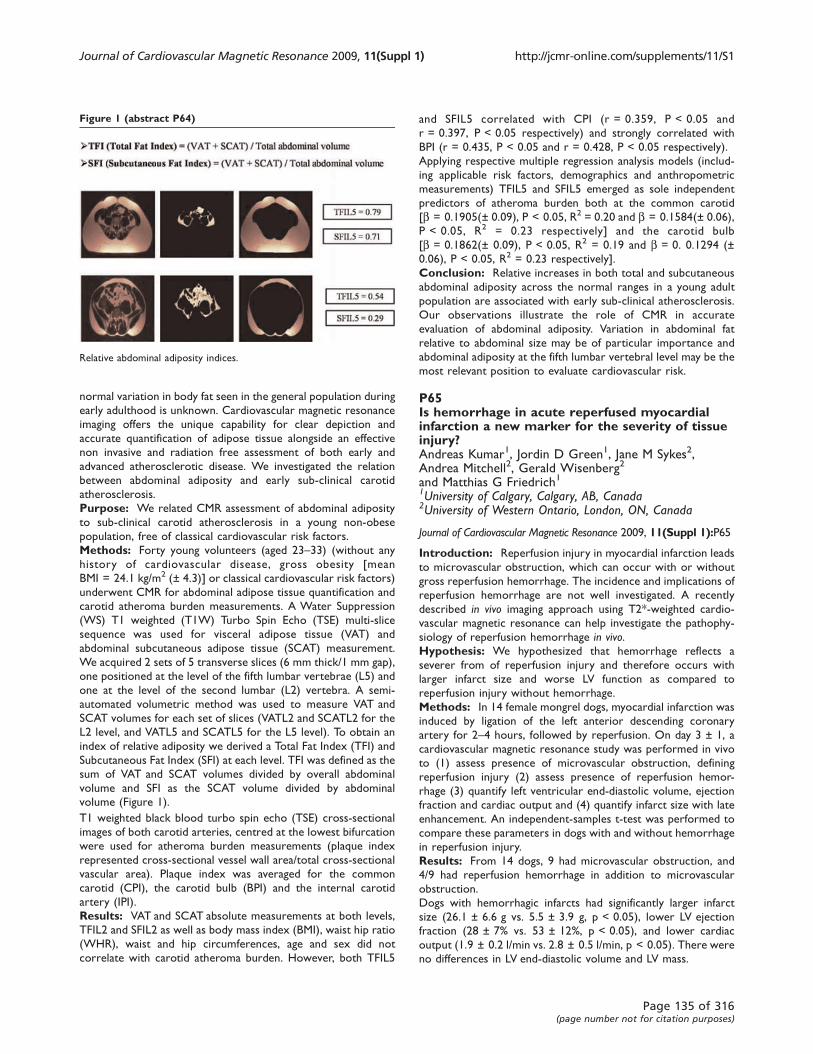
normal variation in body fat seen in the general population during
early adulthood is unknown. Cardiovascular magnetic resonance
imaging offers the unique capability for clear depiction and
accurate quantification of adipose tissue alongside an effective
non invasive and radiation free assessment of both early and
advanced atherosclerotic disease. We investigated the relation
between abdominal adiposity and early sub-clinical carotid
atherosclerosis.
Purpose: We related CMR assessment of abdominal adiposity
to sub-clinical carotid atherosclerosis in a young non-obese
population, free of classical cardiovascular risk factors.
Methods: Forty young volunteers (aged 23–33) (without any
history of cardiovascular disease, gross obesity [mean
BMI = 24.1 kg/m2 (± 4.3)] or classical cardiovascular risk factors)
underwent CMR for abdominal adipose tissue quantification and
carotid atheroma burden measurements. A Water Suppression
(WS) T1 weighted (T1W) Turbo Spin Echo (TSE) multi-slice
sequence was used for visceral adipose tissue (VAT) and
abdominal subcutaneous adipose tissue (SCAT) measurement.
We acquired 2 sets of 5 transverse slices (6 mm thick/1 mm gap),
one positioned at the level of the fifth lumbar vertebrae (L5) and
one at the level of the second lumbar (L2) vertebra. A semi-
automated volumetric method was used to measure VAT and
SCAT volumes for each set of slices (VATL2 and SCATL2 for the
L2 level, and VATL5 and SCATL5 for the L5 level). To obtain an
index of relative adiposity we derived a Total Fat Index (TFI) and
Subcutaneous Fat Index (SFI) at each level. TFI was defined as the
sum of VAT and SCAT volumes divided by overall abdominal
volume and SFI as the SCAT volume divided by abdominal
volume (Figure 1).
T1 weighted black blood turbo spin echo (TSE) cross-sectional
images of both carotid arteries, centred at the lowest bifurcation
were used for atheroma burden measurements (plaque index
represented cross-sectional vessel wall area/total cross-sectional
vascular area). Plaque index was averaged for the common
carotid (CPI), the carotid bulb (BPI) and the internal carotid
artery (IPI).
Results: VAT and SCAT absolute measurements at both levels,
TFIL2 and SFIL2 as well as body mass index (BMI), waist hip ratio
(WHR), waist and hip circumferences, age and sex did not
correlate with carotid atheroma burden. However, both TFIL5
and SFIL5 correlated with CPI (r = 0.359, P < 0.05 and
r = 0.397, P < 0.05 respectively) and strongly correlated with
BPI (r = 0.435, P < 0.05 and r = 0.428, P < 0.05 respectively).
Applying respective multiple regression analysis models (includ-
ing applicable risk factors, demographics and anthropometric
measurements) TFIL5 and SFIL5 emerged as sole independent
predictors of atheroma burden both at the common carotid
[b = 0.1905(± 0.09), P < 0.05, R2 = 0.20 and b = 0.1584(± 0.06),
P < 0.05, R2 = 0.23 respectively] and the carotid bulb
[b = 0.1862(± 0.09), P < 0.05, R2 = 0.19 and b = 0. 0.1294 (±
0.06), P < 0.05, R2 = 0.23 respectively].
Conclusion: Relative increases in both total and subcutaneous
abdominal adiposity across the normal ranges in a young adult
population are associated with early sub-clinical atherosclerosis.
Our observations illustrate the role of CMR in accurate
evaluation of abdominal adiposity. Variation in abdominal fat
relative to abdominal size may be of particular importance and
abdominal adiposity at the fifth lumbar vertebral level may be the
most relevant position to evaluate cardiovascular risk.
P65Is hemorrhage in acute reperfused myocardialinfarction a new marker for the severity of tissueinjury?Andreas Kumar1, Jordin D Green1, Jane M Sykes2,Andrea Mitchell2, Gerald Wisenberg2
and Matthias G Friedrich11University of Calgary, Calgary, AB, Canada2University of Western Ontario, London, ON, Canada
Journal of Cardiovascular Magnetic Resonance 2009, 11(Suppl 1):P65
Introduction: Reperfusion injury in myocardial infarction leads
to microvascular obstruction, which can occur with or without
gross reperfusion hemorrhage. The incidence and implications of
reperfusion hemorrhage are not well investigated. A recently
described in vivo imaging approach using T2*-weighted cardio-
vascular magnetic resonance can help investigate the pathophy-
siology of reperfusion hemorrhage in vivo.Hypothesis: We hypothesized that hemorrhage reflects a
severer from of reperfusion injury and therefore occurs with
larger infarct size and worse LV function as compared to
reperfusion injury without hemorrhage.
Methods: In 14 female mongrel dogs, myocardial infarction was
induced by ligation of the left anterior descending coronary
artery for 2–4 hours, followed by reperfusion. On day 3 ± 1, a
cardiovascular magnetic resonance study was performed in vivo
to (1) assess presence of microvascular obstruction, defining
reperfusion injury (2) assess presence of reperfusion hemor-
rhage (3) quantify left ventricular end-diastolic volume, ejection
fraction and cardiac output and (4) quantify infarct size with late
enhancement. An independent-samples t-test was performed to
compare these parameters in dogs with and without hemorrhage
in reperfusion injury.
Results: From 14 dogs, 9 had microvascular obstruction, and
4/9 had reperfusion hemorrhage in addition to microvascular
obstruction.
Dogs with hemorrhagic infarcts had significantly larger infarct
size (26.1 ± 6.6 g vs. 5.5 ± 3.9 g, p < 0.05), lower LV ejection
fraction (28 ± 7% vs. 53 ± 12%, p < 0.05), and lower cardiac
output (1.9 ± 0.2 l/min vs. 2.8 ± 0.5 l/min, p < 0.05). There were
no differences in LV end-diastolic volume and LV mass.
Figure 1 (abstract P64)
Relative abdominal adiposity indices.
Journal of Cardiovascular Magnetic Resonance 2009, 11(Suppl 1) http://jcmr-online.com/supplements/11/S1
Page 135 of 316(page number not for citation purposes)

Discussion and conclusion: In this dog model of ischemia/
reperfusion injury, gross hemorrhage was associated with
significantly larger infarct size and worse LV functional para-
meters. This supports the hypothesis that hemorrhage may occur
with advanced, severe ischemic tissue injury only.
P66Early diastolic leftward septal motion in Tetrologyof Fallot at MRI: analysis and comparison topatients with constrictive/restrictive physiologyJeremy D Collins, Karen Ordovas, Allison Meadows,Maureen Kohi, Brett Elicker, WR Webband Charlie HigginsUCSF, San Francisco, CA, USA
Journal of Cardiovascular Magnetic Resonance 2009, 11(Suppl 1):P66
Background/purpose: Early diastolic leftward septal motion
(EDSM) is a nonspecific finding at diagnostic cardiac imaging.
Although touted as a sensitive marker for constrictive or
restrictive physiology, EDSM can also be seen in volume overload
and rhythm disturbances. The purpose of this study was to
retrospectively evaluate early leftward diastolic septal motion in
patients with Tetrology of Fallot (TOF) and right ventricular
enlargement.
Methods: The UCSF Committee on Human Research
approved this study. Medical records and cardiac MR images
from 116 consecutive patients with suspected constrictive/
restrictive physiology (64 pts, mean age 49 yrs, 34 men), history
of surgical repair of TOF with pulmonary insufficiency (PI)
(31 pts, mean age 27 yrs, 18 men) or both PI and stenosis (PS)
(21 pts, mean age 32 yrs, 10 men) referred for cardiac MRI
between January 1997 and September 2008 were reviewed.
Images from 9 volunteers (4 men, mean age 29 yrs) were also
included in the analysis.
Cinegraphic cardiac MRI images were reviewed for the presence
of EDSM, defined as > 2 mm leftward deviation on two
consecutive short axis images immediately following isovolu-
metric relaxation. Ventricular chamber volumes were obtained
from contoured short axis images and adjusted to body surface
area. The extent of pulmonary insufficiency was assessed with
velocity encoding sequences orthogonal to the right ventricular
outflow tract. Images were reviewed for pericardial thickening,
enhancement, effusions, and coupling of the parietal and visceral
pericardial layers as well as evidence for impaired diastolic filling.
QRS complex duration, pulmonary valve gradient, and systemic
venous and pulmonary wedge pressures were obtained from the
medical record, when available. An analysis of variance (ANOVA)
was performed on TOF patients with p > 0.05 considered
statistically significant. Results from pathology, right heart
catheterization, echocardiography and surgical procedures pro-
vided the reference standard for analysis.
Results: EDSM was identified in 58% (18 of 31) TOF patients
with PI and 48% (10 of 21) patients with PI and PS. Grouping all
TOF patients with PI for ANOVA, right ventricular end diastolic
volume index was strongly associated with EDSM (p = 0.001);
QRS complex duration (p = 0.18), pulmonary regurgitant
fraction (p = 0.61), and left ventricular end diastolic volume
index (LVEDVI) (p = 0.32) demonstrated weaker associations.
Right atrial and pulmonary wedge pressures were available in 16
TOF patients, precluding evaluation with ANOVA. See Table 1.
EDSM was identified in 18 of 21 patients (86%) with suspected (5
patients) or proven (16 patients) constrictive pericarditis and in 6
of 12 patients (50%) with suspected (3 patients) or proven
restrictive cardiomyopathy (9 patients). Eight individuals out of
39 (30 patients, 9 volunteers) without MR or corroborative
evidence of constrictive pericarditis or myocardial pathology
demonstrated EDSM; 7 patients were subsequently diagnosed
with a volume overload state.
Conclusion: A substantial proportion of patients with TOF and
enlarged right ventricular volumes demonstrated EDSM at CINE
cardiac MRI, controlling for effects from QRS complex duration,
LVEDVI and pulmonary regurgitation. This finding, although
somewhat less prevalent in our TOF sample population than in
constrictive pericarditis, suggests that progressive enlargement of
the right ventricle may lead to an appearance mimicking
constrictive physiology. We hypothesize that in TOF patients,
development of EDSM is due to reduced compliance of the
stretched pericardium. Careful prospective assessment of
volume status in TOF patients will be necessary to validate
these findings and enable correlation of EDSM with development
of clinical symptoms.
P67Evaluation of complex congenital heart disease andassociated complications in newborns, infants andsmall children using multi-detector CTJoachim G Eichhorn1, Sebastian Ley2, Christian Fink3,John Cheatham4, Wim Helbing5 and Frederick Long61University Children’s Hospital, Pediatric Cardiology,Heidelberg, Germany2University Children’s Hospital, Pediatric Radiology, Heidelberg,Germany3German Cancer Research Center (DKFZ), Radiology,Heidelberg, Germany4Nationwide Children’s Hospital, Pediatric Cardiology,Columbus, OH, USA5Erasmus MC, Sophia University Children’s Hospital, PediatricCardiology, Rotterdam, Netherlands6Nationwide Children’s Hospital, Pediatric Radiology,Columbus, OH, USA
Journal of Cardiovascular Magnetic Resonance 2009, 11(Suppl 1):P67
Introduction: Multi-detector CT (MDCT) with multiplanar
and three-dimensional (3D) reconstruction has become an
important first-line imaging tool in diagnosis of congenital
vascular anomalies (VA) and airway diseases in children.
Purpose: To assess the diagnostic value of MDCT for
evaluation of VA and associated complications in newborns and
infants.
Table 1 (abstract P66)
TOF Patients c EDSM
RV EDVI PI only PI and PS
Normal 0% (0 of 4) 0% (0 of 2)
Mildly Enlarged 63% (5 of 8) 30% (3 of 10)
Moderately Enlarged 63% (7 of 11) 66% (4 of 6)
Severely Enlarged 75% (6 of 8) 100% (3 of 3)
Journal of Cardiovascular Magnetic Resonance 2009, 11(Suppl 1) http://jcmr-online.com/supplements/11/S1
Page 136 of 316(page number not for citation purposes)

Methods: At 4 centers, 262 children (mean age: 7 ± 7 months,
range: 6 hours to 24 months) were examed. The diagnoses
included: suspected of having in-stent stenosis after stent
placement to treat vascular stenoses (n = 72), pulmonary atresia
(32) and stenosis (48) with collateral arteries, arterial rings and
slings (28), aortic arch anomalies (15), bronchoscopy revealed
stenosis(23), abnormal pulmonary venous return (15) and others
(29). The CT exams were performed on varying scanners (4 up
to 64 slices, collimation isotrope 0.4–1.25 mm; scan-time 2–20 s,
usage of low dose protocols: 80–120 kVp, 60–80 mA) under
controlled ventilation or free breathing, mostly without ECG-
gating to minimize radiation exposure. The image quality was
rated using a 5-point score. Image findings were correlated to
echocardiography, conventional digital catheter angiography
(DA), bronchoscopy, and intraoperativ findings. The effects of
dose on image quality were also evaluated, retrospectively.
Results: High quality MDCT data were almost free of cardiac
and respiratory motion. Images were scored for vascular
contrast and for delineation of the tracheobronchial tree in
>95% of all cases as excellent or good, showing a significant
improving with increasing number of detectors. Significant
differences between higher and lower radiation settings were
not found. The radiation exposure was mostly less than 2 mSv
(range 1.1–3.2). High radiation exposure settings did not improve
image quality. VA morphology and topography in relation to
adjacent structures, e.g. tracheal and esophageal compression
caused by an arterial ring or sling, could be assessed exactly and
allowed the final diagnosis. Even smallest vessels with a diameter
of less than 1 mm (see figure 1), could be identified and
excellently visualized. Eighty-two percent (215/262) of all
patients had benefited from MDCT: Digital angiography was
neither necessary to perform surgical or interventional planning
nor to exclude a VA, or radiation doses and sedation time due to
interventional procedures could be reduced markedly.
Conclusion: A 3D submillimeter evaluation of the heart and
great vessels can be achieved routinely in a matter of seconds
with little motion artifacts, without general anesthesia and with
much less radiation exposure than previously thought. Never-
theless, the optimal radiation dose settings for performing
cardiac CT in infants and pediatric patients are still being worked
out. The use of CT for screening may result in a net decrease in
overall radiation decreasing the number of diagnostic cardiac
catherizations. CT can now be regarded as the modality of choice
as a minimally invasive, robust, and accurate technique for the
diagnosis of complex VA even in the group of newborns and
infants or critically ill patients. Its accuracy for detecting VA
appears at least equivalent to catherizations while it is more
accurate in delineating potential life-threatening complications.
This advance should have the greatest impact in the smallest,
youngest, and most critically ill children with congenital heart
disease.
P68Coronary MR angiography in children duringsystole and diastole using a dual cardiac phase scanof the whole heartSergio A Uribe Arancibia1, Israel Valverde2,Philipp Beerbaum1, Aaron Bell1, Rene Botnar1,Reza Razavi1, Tobias Schaeffter1 and Gerald Greil11King’s College London, London, UK2Hospital Virgen del Rocio, Seville, Spain
Journal of Cardiovascular Magnetic Resonance 2009, 11(Suppl 1):P68
Objective: To investigate the feasibility of dual cardiac phase
whole heart MRI to obtain Coronary Magnetic Resonance
Angiography (CMRA) at end-systole and mid-diastole in children
with Congenital Heart Diseases (CHD).
Background: In children the visualization of the course of the
coronary arteries is highly desirable for surgical planning and for
follow up in CHD and Kawasaki disease. CMRA has been successful
applied in adults and recently has been demonstrated in young
children and infants. In children with CHD a whole heart CMR
approach is of great clinical advantage, since the anatomy of the heart
and the great vessels can be evaluated in addition to the coronary
arteries. Usually, a 3D volume is obtained either at end-systole or
mid-diastole. However, in children with high heart-rates and/or with
RR variability it is unclear which phase of the cardiac cycle results in
better image quality. Therefore, the simultaneous acquisition of the
Figure 1 (abstract P67)
Newborn (body weight 3 kg) with heterotaxia, tetralogy of Fallot with
pulmonary atresia and total anomalous pulmonary venous drainage to the
portal vein. 3D volume rendered images obtained on a 64 slice MDCT
scanner following hand injection of contrast in the umbilical venous
catheter. Images show the pulmonary veins (PV, diameter < 1 mm)
draining to a confluens which crosses the diaphragm supplying the hepar
veins (HV) in posteriorlateral and inferior projections. Aorta (Ao), right
atrium and ventricel (RA and RV), left and right pulmonary artery (LPA
and RPA).
Figure 1 (abstract P68)
Journal of Cardiovascular Magnetic Resonance 2009, 11(Suppl 1) http://jcmr-online.com/supplements/11/S1
Page 137 of 316(page number not for citation purposes)

end-systolic and mid-diastolic phase in conjunction with the whole
heart approach allows retrospectively selection of the best image
phase for coronary artery visualization without any scan time penalty.
Methods: Eight children (age = 6.38 ± 4.27, height = 116.57 ±
30.77, weight = 23.57 ± 14.25, Heart-rate = 85.02 ± 8.59) with
CHD were scanned under general anesthesia on a 1.5 T MR
system (Achieva, Philips Healthcare). The cardiac rest period for
end-systole and mid-diastole was determined from a 2D SSFP
cine scan with high temporal resolution (TR/TE = 3.1/1.6 ms, flip
angle 60°, slice thickness 6 mm, 60 to 80 cardiac phases).
A previously developed free-breathing navigator gated 3D SSFP
dual cardiac phase sequence [1] was then applied in sagittal
orientation for imaging of the whole heart including the coronary
arteries and great vessels (TR/TE = 3.4/1.7 ms, flip angle 90°,
60–120 slice, isotropic resolution of 1–1.5 mm3, temporal
resolution of 60 – 75 ms, Sense of 2 in AP direction). Data was
obtained during end-systole and mid-diastole and the acquisition
window of the 3D scan was adapted accordingly to the shortest
rest period. Images were then reformatted along the major axes
of the left and right coronary artery for both cardiac phases.
Vessel length, diameter and sharpness of the visualized coronary
arteries (RCA, LM, LAD, LCx) were measured using the
“SoapBubble” software. Image quality was assessed by two
independent observers. Statistical analysis and Bland Altman
plots were used to compare the different data sets.
Results: The dual cardiac phase whole heart scan was
applied successfully in all patients. An example of each coronary
segment is shown in figure 1. The vessel length, diameter,
sharpness and consensus score for each segment during systole
and diastole are shown in Table 1. Bland Altman plots of the
systolic versus diastolic data from each coronary segment are
shown in figure 2. No statistically difference was found
comparing vessel length, diameter, sharpness for all vessels
between systole and diastole. Moreover, no statistically differ-
ence was found in image quality. Although, there was no
difference for the mean vessel length, diameter, and sharpness,
it was found that on a patient level, those parameters and image
quality showed differences either favoring systolic or diastolic
image acquisition for different coronary segments within the
same patient.
Conclusion: A 3D SSFP dual cardiac phase scan of the whole
heart was capable of identifying the origin and proximal course of
the coronary arteries in children in two cardiac phases.
The ability to show the 3D relationship of the heart, great
vessels and coronary arteries, and also the possibility to
retrospectively select the heart phase with best coronary artery
visualization make this technique a clinically valuable tool for
surgical planning.
Reference1. Uribe, et al: Radiology 2008.
Figure 2 (abstract P68)
Table 1 (abstract P68) Mean ± SDV values for different parameters
RCA RCA LM LM LAD LAD LCx LCx
Systole Diastole Systole Diastole Systole Diastole Systole Diastole
Vessel Length 76.94 ± 24.15 75.54 ± 23.96 21.26 ± 31.06 20.93 ± 31.41 41.02 ± 018.44 43.36 ± 20.24 30.35 ± 12.8 28.21 ± 11.48
Vessel Diameter 2.78 ± 0.42 2.76 ± 0.47 2.34 ± 1.15 2.09 ± 1.02 2.58 ± 0.37 2.5 ± 0.64 2.61 ± 0.56 2.77 ± 0.4
Vessel Sharpness 0.52 ± 0.1 0.48 ± 0.09 0.37 ± 0.19 0.37 ± 0.19 0.46 ± 0.05 0.47 ± 0.07 0.47 ± 0.06 0.47 ± 0.07
Consensus Image
Quality Score (1 to 4)
3.88 ± 0.44 3.19 ± 0.75 3 ± 0.6 2.5 ± 0.53 3 ± 0.6 2.5 ± 0.53 3.14 ± 0.56 3 ± 1
Journal of Cardiovascular Magnetic Resonance 2009, 11(Suppl 1) http://jcmr-online.com/supplements/11/S1
Page 138 of 316(page number not for citation purposes)
P69Non-invasive quantification of myocardial fibrosisin diabetic mice using in-vivo high-resolution MRISok Sithikun1, Frank Kober1, Alexis Jacquier1,Jérôme Kalifa1, Francis Kopp2, Marie-France Bonzi2, Jean-Claude Deharo3, Patrick J Cozzone1
and Monique Bernard11CRMBM, Marseille, France2Laboratory of Histology, Marseille, France3Department of Cardiology, Arrhythmias unit, Marseille, France
Journal of Cardiovascular Magnetic Resonance 2009, 11(Suppl 1):P69
Introduction: There is an established role for magnetic
resonance imaging in the assessment of myocardial fibrosis, in
ischaemic and non-ischaemic cardiomyopathies. The amount of
fibrosis is of importance because of its prognostic value, in terms
of arrhythmias occurrence, and haemodynamic consequences.
T2 relaxation time directly depends on physico-chemical proper-
ties of each tissue. Thus, myocardial T2 time determination can
help in quantifying fibrosis. Diabetic cardiomyopathy is char-
acterized by myocardial structural modifications including
hypertrophy, microcirculation impairment and interstitial fibrosis.
Purpose: To describe a non-invasive MRI method using high-
resolution myocardial T2 time measurement to assess myocardial
fibrosis in a model of diabetic mice in vivo.
Methods: Two multi-slice spin-echo sequences were per-
formed for T2 time assessment respectively at 20 and 9 ms
echo time (resolution 85 × 85 mm2, slice thickness 1.0 mm,
imaging time 15 minutes), in ten 16-week old C57Bl/6J after 8
weeks of streptozotocin-induced diabetes, and ten control mice,
under isoflurane anesthesia using a 11.75 T vertical scanner
(Bruker, Rheinstetten, Germany). All images were acquired in
short-axis view. MRI measurements were then compared with
histological quantification of fibrosis using picrosirius red staining.
Results: T2 relaxation time was significantly lower in diabetic
mice (13.8 +/- 2.8 ms versus 18.9 +/- 2.3 ms in the control
group, p < 0.05). This was associated with a significant increase
of myocardial fibrosis as evaluated by picro-sirius red staining, in
diabetic mice.
Conclusion: We describe here a non-invasive and accurate
MRI method to quantify myocardial fibrosis in vivo in diabetic
mice, using T2 relaxation time measurement. This method can be
applied in many ischaemic or non-ischaemic cardiomyopathies in
which a fibrotic phenomenon is involved.
P70Cardiac MR for ventricular scar evaluation inpatients with implanted defibrillators: technicaland safety issues, and initial resultsHarold Litt and Francis MarchlinskiUniversity of Pennsylvania School of Medicine, Philadelphia, PA,USA
Journal of Cardiovascular Magnetic Resonance 2009, 11(Suppl 1):P70
Introduction: Catheter based RF ablation is becoming an
increasingly accepted treatment for refractory ventricular
arrhythmias and late enhancement MRI can assist by providing
anatomic maps of regions of scar which may form the basis for
the arrhythmia. Unfortunately, many patients with ventricular
arrhythmias have defibrillators (ICDs) implanted early in the
course of their disease, prior to MR imaging assessment of
cardiac structure, function, and scar burden. As ICDs are
generally considered a contraindication to MRI, and the presence
of a defibrillator may cause significant artifacts in the chest even if
a study is performed, the use and utility of cardiac MR has not
been studied in these patients.
Purpose: To evaluate the feasibility and safety of performing
cardiac MR in patients with ICDs and refractory ventricular
arrhythmias and provide an initial assessment of its utility for scar
mapping related to RF ablation procedures.
Methods: Six patients with ICDs suffering from refractory
ventricular tachyarrhythmias were imaged within several days of
catheter ablation procedures. All patients gave informed consent
for performing MRI in the presence of an ICD. The devices were
interrogated prior to and after the study; tachycardia detection
and therapies were turned off, and the pacemakers were set to
VVI mode at a rate of 40 bpm for the duration of the MRI.
All studies were performed at 1.5 T. When possible, low SAR
non-balanced gradient-echo cine and IR-prepped late-enhance-
ment sequences were used, however real-time SSFP sequences
were used in the presence of frequent ventricular ectopic beats.
Imaging parameters were adjusted to minimize artifacts from the
device.
Results: All studies were completed safely, no patients
reported any discomfort, and there were no episodes of
tachycardia requiring treatment. Post-procedure device para-
meters, including thresholds, lead impedances, and battery
voltage were unchanged in all patients, and all devices could be
reprogrammed to previous settings. Real time SSFP cine
sequences were needed in two patients with frequent ventricular
ectopic beats. As expected, spin echo sequences were less
affected by artifact from the ICD generator than gradient echo
sequences, with SSFP cine sequences showing greater artifact
than non-balanced gradient echo cine sequences. Late enhance-
ment images were particularly affected, with significant difficulties
encountered in nulling the myocardium in regions affected by
artifact. Increasing bandwidth, with resultant decrease in TE,
Figure 1 (abstract P70)
Journal of Cardiovascular Magnetic Resonance 2009, 11(Suppl 1) http://jcmr-online.com/supplements/11/S1
Page 139 of 316(page number not for citation purposes)

decreased the size of the device related artifact but also impacted
SNR. The degree to which cardiac evaluation was limited by
artifact was most influenced by the size of the patient and
distance from the generator to the left ventricle.
Two patients were diagnosed with right ventricular cardiomyo-
pathy with good visualization of RV structure, function, and scar.
One patient had hypertrophic cardiomyopathy, and three non-
specific LV cardiomyopathies, with variable limitations in
visualization of the LV antero-lateral wall and apex. All patients
did have evidence of focal myocardial scar in regions not affected
by artifact; imaging information was consistent with electro-
physiologic observations and was considered clinically valuable in
all cases. Figure 1 shows a large region of scar in the RV free wall
and RVOT (arrow) in a patient with RV cardiomyopathy; note
pacemaker/ICD leads (arrowheads) and artifact from generator
(star).
Conclusion: The results of this initial study suggest that cardiac
MR for scar mapping may be performed safely in patients with
ICDs under certain circumstances, giving clinically relevant
results in those with refractory ventricular arrhythmias having
RF ablation procedures.
P71Altered right ventricular papillary muscle positionand orientation in patients with dilated leftventriclesErin M Spinner1, Kartik Sundareswaran1,Lakshimi Prasad Dasi1, Vinod H Thourani2, John Oshinski2
and Ajit P Yoganathan11Georgia Institute of Technology, Atlanta, GA, USA2Emory University, Atlanta, GA, USA
Journal of Cardiovascular Magnetic Resonance 2009, 11(Suppl 1):P71
Introduction: Displacement of papillary muscle (PM) positions
in the right ventricle (RV) may be an important factor in inducing
tricuspid regurgitation (TR). We hypothesize that left ventricular
(LV) dilation is one possible mechanism for RV PM displacement;
given the adjacent and proximal relative positions of the two
ventricles.
Purpose: In this study, we identify and compare the position of
RV PMs in normal subjects and patients with LV dilation to
quantitatively establish RV PM positions and the influence of LV
dilation on RV PM displacement.
Methods: 7 congestive heart failure patients with mild to
severe mitral valve regurgitation and a dilated left ventricle
(LVEDV 234.7 ± 70.8 ml) were recruited at Emory University
Hospital. 6 normal subjects were used as a control in this study.
Scans were acquired on a Philips Intera CV 1.5 T system using a
cardiac coil. The MRI scan to assess PM position was a high
Table 1 (abstract P71) Numerical measurements of PMs for normal and dilated LV patients
NormalAverage
NormalStandard Error
Dilated LVAverage
Dilated LVStandard Error
T-TestP value(* p < 0.05)
Anterior PMX dist 0.61 0.09 0.38 0.04 0.06
Y dist 0.20 0.04 0.30 0.04 0.11
Z dist 0.20 0.05 0.15 0.03 0.44
Posterior PMX dist 0.00 0.07 0.03 0.06 0.76
Y dist -0.35 0.04 -0.33 0.06 0.83
Z dist 0.65 0.03 0.62 0.03 0.48
Septal PMX dist -0.61 0.08 -0.41 0.07 0.09
Y dist 0.14 0.03 0.03 0.04 0.03 *
Z dist 0.85 0.07 0.74 0.05 0.24
Dist Ant PMDist Post PM 0.690.76 0.080.04 0.490.65 0.060.10 0.070.32
Dist Sept PM 1.07 0.08 0.76 0.11 0.05*
Triangle Area 0.13 0.02 0.09 0.02 0.23
Sept – Ant PM dist 1.40 0.15 1.04 0.08 1.08
Sept – Post PM dist 0.84 0.10 0.63 0.11 0.19
Post – Ant PM dist 0.99 0.07 0.90 0.07 0.35
Figure 1 (abstract P71)
Journal of Cardiovascular Magnetic Resonance 2009, 11(Suppl 1) http://jcmr-online.com/supplements/11/S1
Page 140 of 316(page number not for citation purposes)
resolution, navigator-echo gated ‘whole heart’ sequence acquiredin the short axis orientation. Pixel size ranged from 0.53–0.70mm, slice thickness ranged from 1.5–2.0 mm, and echo time
ranged from 1.3–2.1 ms. Approximately 120 slices were acquired
at mid-diastole to cover the entire LV and RV. Papillary muscle tip
position was manually identified in the various images by
identifying the regions of low intensity (PM) among regions of
high intensity (blood) within the right ventricle (RV) (Fig 1a).
Coordinates were recorded for all three papillary muscles,
septal, posterior and anterior for all subjects. All images were
registered to the MRI coordinate system for the purpose of
position and orientation comparison. The centroid of the three
PM coordinates was used as the reference point (Fig 1b). All
distances were normalized by ascending aortic diameter to
minimize patient variability. Values for directional distances from
the centroid (x, y, z) where calculated for each PM as well as, area
of the triangle formed by the three PMs, distance of each triangle
side length, and distance from each PM to the centroid. Values for
normal subjects and dilated LV patients were then analyzed for
statistical significance using parametric unpaired t-test.
Results: Significant (p < 0.05) posterior displacement of XYZ
mm/aortic size of the septal PM from its normal position was
observed (Dilated 0.029 ± 0.04 mm/aortic diameter, Normal
0.144 ± 0.03 mm/aortic diameter). More specifically the septal
PM significantly displaced from the septal wall (Dilated
0.38 ± 0.04 mm/aortic diameter, Normal 0.61 ± 0.09 mm/aortic
diameter). The PM position in normal patients forms a symmetric
triangle with sides of similar lengths. For the first time, specific
location of all three RV PMs is reported for normal and dilated LV
patients (Table 1).
Conclusion: Dilatation of the LV has an impact on PMs in the
RV. This may have implications in the development of tricuspid
valve disease. This also demonstrates that diseases on the left
side of the heart also affect the right side of the heart.
P72Automatic delineation of myocardial contours inlate-enhancement long-axis cardiac MR imagesCybele Ciofolo1, Maxim Fradkin1, Gilion Hautvast2
and Marcel Breeuwer21Medisys Research Lab – Philips Healthcare, Suresnes Cedex,France2Philips Medical Systems Nederland B.V., Best, Netherlands
Journal of Cardiovascular Magnetic Resonance 2009, 11(Suppl 1):P72
Introduction: Viability assessment is essential for therapy
planning following a myocardial infarction. In particular, the
proportion of viable myocardium is a major factor in determining
whether a patient may benefit from revascularization [1]. In
addition to estimating the left ventricular myocardial thickness
and thickening with functional imaging, it is possible to visualize
normal and non-viable areas with high spatial resolution, using
late-enhancement cardiac MR imaging (LECMR). To locate and
quantify non-viable tissue, it is first necessary to delineate the
endo- and epicardial contours on every available view of the
LECMR acquisition. In particular long-axis (LA) views are useful
because they provide a visualization of the apical area, which is
often not well visible on or not covered well by short-axis slices.
While manual delineation is a tedious and time-consuming task,
its automation is challenging and, to our knowledge, not yet
addressed by any publication or commercial product. This is
mainly due to the non-homogeneous intensity of the myocardium
resulting from contrast agent accumulation in infarcted areas.
Purpose: We propose a novel method to delineate the endo-
and epicardial contours in late-enhancement long-axis cardiac
MR images with a minimal user-input in order to provide an
accurate quantitative viability assessment.
Methods: Before running the automatic segmentation process,
the user selects one enhancement type from four pre-defined
ones (no enhancement, diffuse/small enhancement, large/trans-
mural scar, sub-endocardial enhancement), depending on his own
observation of the LA view.
Then the delineation of the myocardial contours is performed by
alternating automatic deformation of a geometrical template and
computation of a binary map of the enhanced areas. The
template is ribbon-shaped with a variable width, its position is
updated depending on image gray values. The map is a 2D binary
image showing enhanced areas, it is updated by thresholding the
image gray values in a region of interest centered on the
endocardium, in order to include sub-endocardial scars. The
segmentation is performed as follows: (1) automatic delineation
of myocardial contours on short-axis LECMR slices [2],
Table 1 (abstract P72) Mean positioning error with respect to 3manual contours and inter-observer variability. DRefi is the meandistance to reference contour number i
Contour Unit DRef1 DRef2 DRef3 Inter-observervariability
Endocardium mm 2.4 ± 0.9 2.6 ± 0.9 2.3 ± 0.8 1.7 ± 0.7
pixels 1.6 ± 0.6 1.7 ± 0.6 1.5 ± 0.5 1.1 ± 0.5
Epicardium mm 2.3 ± 1.0 2.4 ± 0.9 2.4 ± 1.1 1.5 ± 0.9
pixels 1.5 ± 0.6 1.6 ± 0.6 1.6 ± 0.7 1.0 ± 0.6
Figure 1 (abstract P72)
Final myocardium contours on 4 different patients.
Journal of Cardiovascular Magnetic Resonance 2009, 11(Suppl 1) http://jcmr-online.com/supplements/11/S1
Page 141 of 316(page number not for citation purposes)
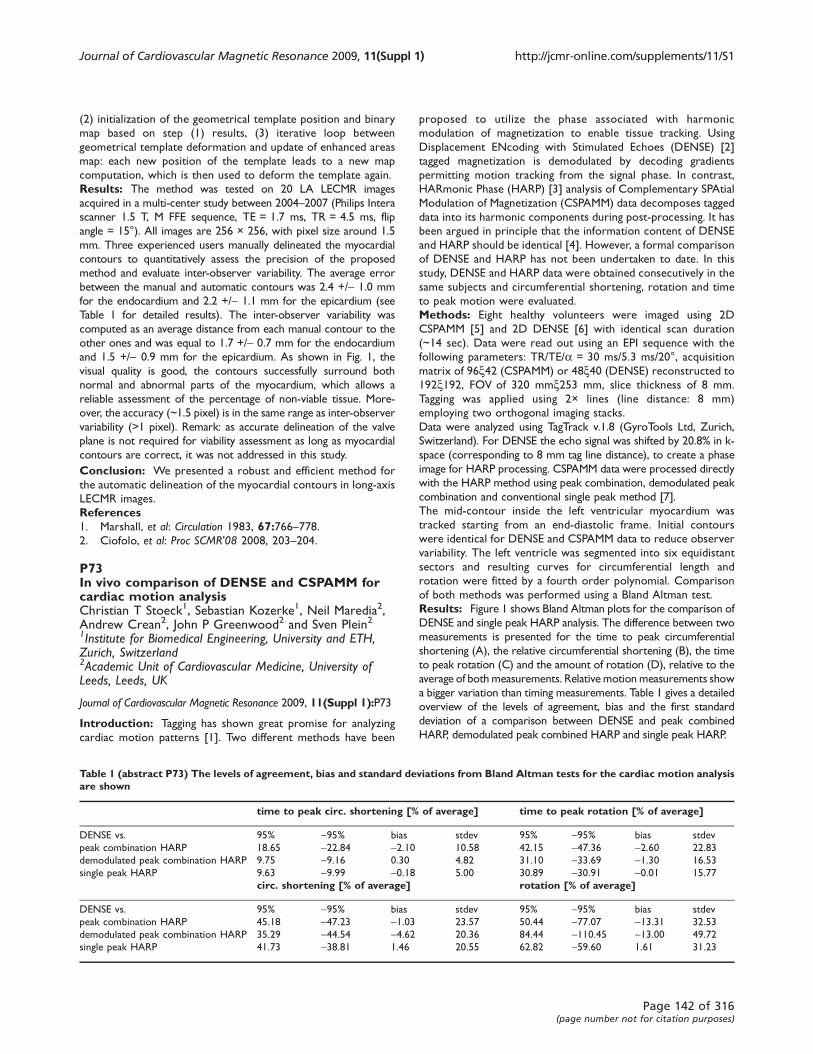
(2) initialization of the geometrical template position and binary
map based on step (1) results, (3) iterative loop between
geometrical template deformation and update of enhanced areas
map: each new position of the template leads to a new map
computation, which is then used to deform the template again.
Results: The method was tested on 20 LA LECMR images
acquired in a multi-center study between 2004–2007 (Philips Intera
scanner 1.5 T, M FFE sequence, TE = 1.7 ms, TR = 4.5 ms, flip
angle = 15°). All images are 256 × 256, with pixel size around 1.5
mm. Three experienced users manually delineated the myocardial
contours to quantitatively assess the precision of the proposed
method and evaluate inter-observer variability. The average error
between the manual and automatic contours was 2.4 +/- 1.0 mm
for the endocardium and 2.2 +/- 1.1 mm for the epicardium (see
Table 1 for detailed results). The inter-observer variability was
computed as an average distance from each manual contour to the
other ones and was equal to 1.7 +/- 0.7 mm for the endocardium
and 1.5 +/- 0.9 mm for the epicardium. As shown in Fig. 1, the
visual quality is good, the contours successfully surround both
normal and abnormal parts of the myocardium, which allows a
reliable assessment of the percentage of non-viable tissue. More-
over, the accuracy (~1.5 pixel) is in the same range as inter-observer
variability (>1 pixel). Remark: as accurate delineation of the valve
plane is not required for viability assessment as long as myocardial
contours are correct, it was not addressed in this study.
Conclusion: We presented a robust and efficient method for
the automatic delineation of the myocardial contours in long-axis
LECMR images.
References1. Marshall, et al: Circulation 1983, 67:766–778.2. Ciofolo, et al: Proc SCMR'08 2008, 203–204.
P73In vivo comparison of DENSE and CSPAMM forcardiac motion analysisChristian T Stoeck1, Sebastian Kozerke1, Neil Maredia2,Andrew Crean2, John P Greenwood2 and Sven Plein21Institute for Biomedical Engineering, University and ETH,Zurich, Switzerland2Academic Unit of Cardiovascular Medicine, University ofLeeds, Leeds, UK
Journal of Cardiovascular Magnetic Resonance 2009, 11(Suppl 1):P73
Introduction: Tagging has shown great promise for analyzing
cardiac motion patterns [1]. Two different methods have been
proposed to utilize the phase associated with harmonic
modulation of magnetization to enable tissue tracking. Using
Displacement ENcoding with Stimulated Echoes (DENSE) [2]
tagged magnetization is demodulated by decoding gradients
permitting motion tracking from the signal phase. In contrast,
HARmonic Phase (HARP) [3] analysis of Complementary SPAtial
Modulation of Magnetization (CSPAMM) data decomposes tagged
data into its harmonic components during post-processing. It has
been argued in principle that the information content of DENSE
and HARP should be identical [4]. However, a formal comparison
of DENSE and HARP has not been undertaken to date. In this
study, DENSE and HARP data were obtained consecutively in the
same subjects and circumferential shortening, rotation and time
to peak motion were evaluated.
Methods: Eight healthy volunteers were imaged using 2D
CSPAMM [5] and 2D DENSE [6] with identical scan duration
(~14 sec). Data were read out using an EPI sequence with the
following parameters: TR/TE/a = 30 ms/5.3 ms/20°, acquisition
matrix of 96x42 (CSPAMM) or 48x40 (DENSE) reconstructed to
192x192, FOV of 320 mmx253 mm, slice thickness of 8 mm.
Tagging was applied using 2× lines (line distance: 8 mm)
employing two orthogonal imaging stacks.
Data were analyzed using TagTrack v.1.8 (GyroTools Ltd, Zurich,
Switzerland). For DENSE the echo signal was shifted by 20.8% in k-
space (corresponding to 8 mm tag line distance), to create a phase
image for HARP processing. CSPAMM data were processed directly
with the HARP method using peak combination, demodulated peak
combination and conventional single peak method [7].
The mid-contour inside the left ventricular myocardium was
tracked starting from an end-diastolic frame. Initial contours
were identical for DENSE and CSPAMM data to reduce observer
variability. The left ventricle was segmented into six equidistant
sectors and resulting curves for circumferential length and
rotation were fitted by a fourth order polynomial. Comparison
of both methods was performed using a Bland Altman test.
Results: Figure 1 shows Bland Altman plots for the comparison of
DENSE and single peak HARP analysis. The difference between two
measurements is presented for the time to peak circumferential
shortening (A), the relative circumferential shortening (B), the time
to peak rotation (C) and the amount of rotation (D), relative to the
average of bothmeasurements. Relative motionmeasurements show
a bigger variation than timing measurements. Table 1 gives a detailed
overview of the levels of agreement, bias and the first standard
deviation of a comparison between DENSE and peak combined
HARP, demodulated peak combined HARP and single peak HARP.
Table 1 (abstract P73) The levels of agreement, bias and standard deviations from Bland Altman tests for the cardiac motion analysisare shown
time to peak circ. shortening [% of average] time to peak rotation [% of average]
DENSE vs. 95% -95% bias stdev 95% -95% bias stdev
peak combination HARP 18.65 -22.84 -2.10 10.58 42.15 -47.36 -2.60 22.83
demodulated peak combination HARP 9.75 -9.16 0.30 4.82 31.10 -33.69 -1.30 16.53
single peak HARP 9.63 -9.99 -0.18 5.00 30.89 -30.91 -0.01 15.77
circ. shortening [% of average] rotation [% of average]
DENSE vs. 95% -95% bias stdev 95% -95% bias stdev
peak combination HARP 45.18 -47.23 -1.03 23.57 50.44 -77.07 -13.31 32.53
demodulated peak combination HARP 35.29 -44.54 -4.62 20.36 84.44 -110.45 -13.00 49.72
single peak HARP 41.73 -38.81 1.46 20.55 62.82 -59.60 1.61 31.23
Journal of Cardiovascular Magnetic Resonance 2009, 11(Suppl 1) http://jcmr-online.com/supplements/11/S1
Page 142 of 316(page number not for citation purposes)
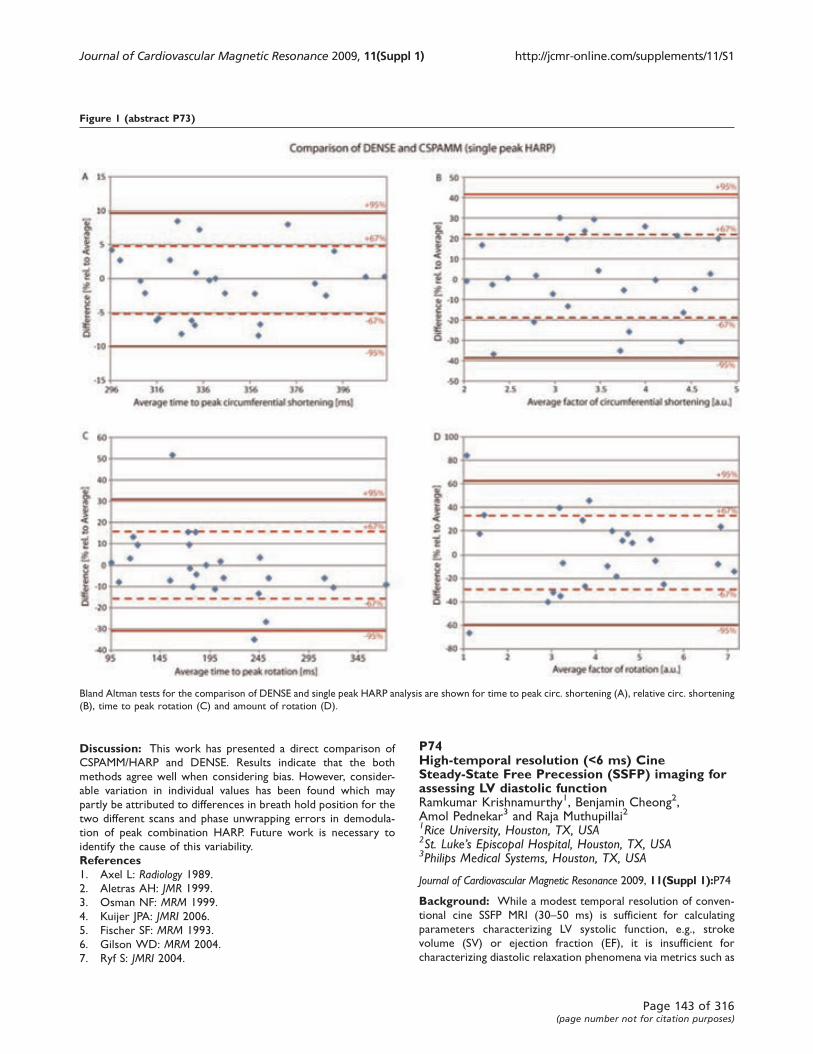
Discussion: This work has presented a direct comparison of
CSPAMM/HARP and DENSE. Results indicate that the both
methods agree well when considering bias. However, consider-
able variation in individual values has been found which may
partly be attributed to differences in breath hold position for the
two different scans and phase unwrapping errors in demodula-
tion of peak combination HARP. Future work is necessary to
identify the cause of this variability.
References1. Axel L: Radiology 1989.2. Aletras AH: JMR 1999.
3. Osman NF: MRM 1999.
4. Kuijer JPA: JMRI 2006.5. Fischer SF: MRM 1993.
6. Gilson WD: MRM 2004.
7. Ryf S: JMRI 2004.
P74High-temporal resolution (<6 ms) CineSteady-State Free Precession (SSFP) imaging forassessing LV diastolic functionRamkumar Krishnamurthy1, Benjamin Cheong2,Amol Pednekar3 and Raja Muthupillai21Rice University, Houston, TX, USA2St. Luke’s Episcopal Hospital, Houston, TX, USA3Philips Medical Systems, Houston, TX, USA
Journal of Cardiovascular Magnetic Resonance 2009, 11(Suppl 1):P74
Background: While a modest temporal resolution of conven-
tional cine SSFP MRI (30–50 ms) is sufficient for calculating
parameters characterizing LV systolic function, e.g., stroke
volume (SV) or ejection fraction (EF), it is insufficient for
characterizing diastolic relaxation phenomena via metrics such as
Figure 1 (abstract P73)
Bland Altman tests for the comparison of DENSE and single peak HARP analysis are shown for time to peak circ. shortening (A), relative circ. shortening
(B), time to peak rotation (C) and amount of rotation (D).
Journal of Cardiovascular Magnetic Resonance 2009, 11(Suppl 1) http://jcmr-online.com/supplements/11/S1
Page 143 of 316(page number not for citation purposes)
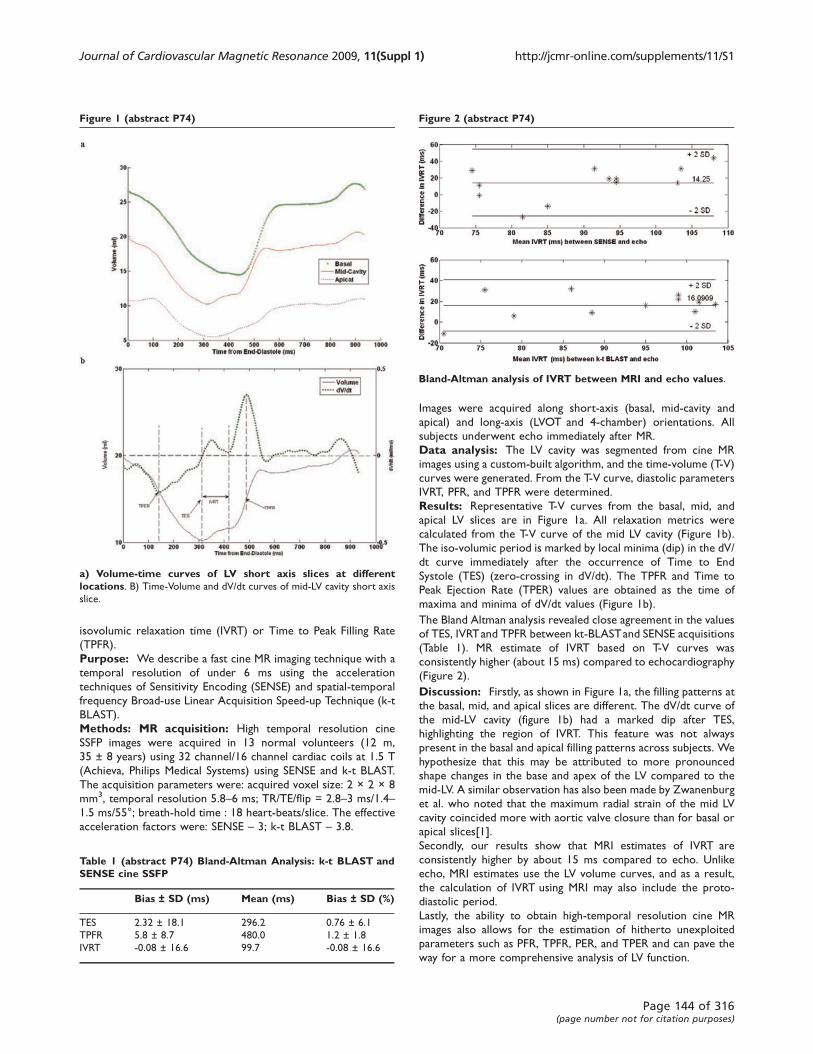
isovolumic relaxation time (IVRT) or Time to Peak Filling Rate
(TPFR).
Purpose: We describe a fast cine MR imaging technique with a
temporal resolution of under 6 ms using the acceleration
techniques of Sensitivity Encoding (SENSE) and spatial-temporal
frequency Broad-use Linear Acquisition Speed-up Technique (k-t
BLAST).
Methods: MR acquisition: High temporal resolution cine
SSFP images were acquired in 13 normal volunteers (12 m,
35 ± 8 years) using 32 channel/16 channel cardiac coils at 1.5 T
(Achieva, Philips Medical Systems) using SENSE and k-t BLAST.
The acquisition parameters were: acquired voxel size: 2 × 2 × 8
mm3, temporal resolution 5.8–6 ms; TR/TE/flip = 2.8–3 ms/1.4–1.5 ms/55°; breath-hold time : 18 heart-beats/slice. The effective
acceleration factors were: SENSE – 3; k-t BLAST – 3.8.
Images were acquired along short-axis (basal, mid-cavity and
apical) and long-axis (LVOT and 4-chamber) orientations. All
subjects underwent echo immediately after MR.
Data analysis: The LV cavity was segmented from cine MR
images using a custom-built algorithm, and the time-volume (T-V)
curves were generated. From the T-V curve, diastolic parameters
IVRT, PFR, and TPFR were determined.
Results: Representative T-V curves from the basal, mid, and
apical LV slices are in Figure 1a. All relaxation metrics were
calculated from the T-V curve of the mid LV cavity (Figure 1b).
The iso-volumic period is marked by local minima (dip) in the dV/
dt curve immediately after the occurrence of Time to End
Systole (TES) (zero-crossing in dV/dt). The TPFR and Time to
Peak Ejection Rate (TPER) values are obtained as the time of
maxima and minima of dV/dt values (Figure 1b).
The Bland Altman analysis revealed close agreement in the values
of TES, IVRTand TPFR between kt-BLASTand SENSE acquisitions
(Table 1). MR estimate of IVRT based on T-V curves was
consistently higher (about 15 ms) compared to echocardiography
(Figure 2).
Discussion: Firstly, as shown in Figure 1a, the filling patterns at
the basal, mid, and apical slices are different. The dV/dt curve of
the mid-LV cavity (figure 1b) had a marked dip after TES,
highlighting the region of IVRT. This feature was not always
present in the basal and apical filling patterns across subjects. We
hypothesize that this may be attributed to more pronounced
shape changes in the base and apex of the LV compared to the
mid-LV. A similar observation has also been made by Zwanenburg
et al. who noted that the maximum radial strain of the mid LV
cavity coincided more with aortic valve closure than for basal or
apical slices[1].
Secondly, our results show that MRI estimates of IVRT are
consistently higher by about 15 ms compared to echo. Unlike
echo, MRI estimates use the LV volume curves, and as a result,
the calculation of IVRT using MRI may also include the proto-
diastolic period.
Lastly, the ability to obtain high-temporal resolution cine MR
images also allows for the estimation of hitherto unexploited
parameters such as PFR, TPFR, PER, and TPER and can pave the
way for a more comprehensive analysis of LV function.
Figure 1 (abstract P74)
a) Volume-time curves of LV short axis slices at differentlocations. B) Time-Volume and dV/dt curves of mid-LV cavity short axis
slice.
Table 1 (abstract P74) Bland-Altman Analysis: k-t BLAST andSENSE cine SSFP
Bias ± SD (ms) Mean (ms) Bias ± SD (%)
TES 2.32 ± 18.1 296.2 0.76 ± 6.1
TPFR 5.8 ± 8.7 480.0 1.2 ± 1.8
IVRT -0.08 ± 16.6 99.7 -0.08 ± 16.6
Figure 2 (abstract P74)
Bland-Altman analysis of IVRT between MRI and echo values.
Journal of Cardiovascular Magnetic Resonance 2009, 11(Suppl 1) http://jcmr-online.com/supplements/11/S1
Page 144 of 316(page number not for citation purposes)
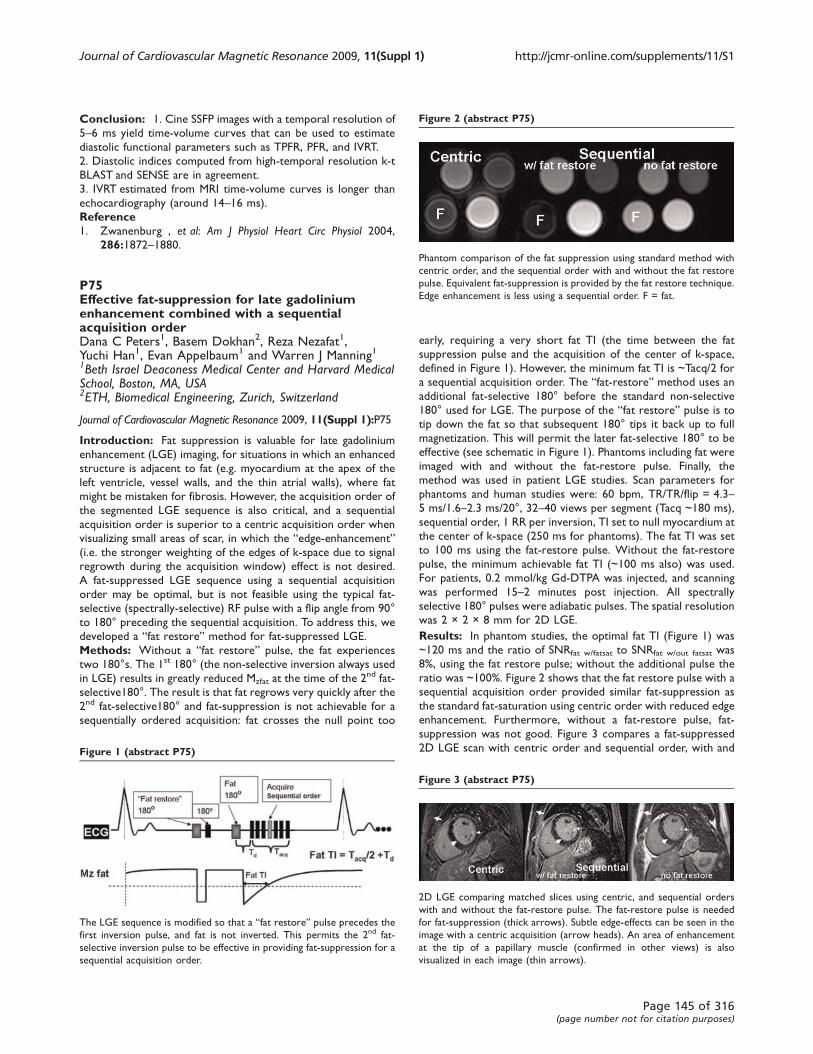
Conclusion: 1. Cine SSFP images with a temporal resolution of
5–6 ms yield time-volume curves that can be used to estimate
diastolic functional parameters such as TPFR, PFR, and IVRT.
2. Diastolic indices computed from high-temporal resolution k-t
BLAST and SENSE are in agreement.
3. IVRT estimated from MRI time-volume curves is longer than
echocardiography (around 14–16 ms).
Reference1. Zwanenburg , et al: Am J Physiol Heart Circ Physiol 2004,
286:1872–1880.
P75Effective fat-suppression for late gadoliniumenhancement combined with a sequentialacquisition orderDana C Peters1, Basem Dokhan2, Reza Nezafat1,Yuchi Han1, Evan Appelbaum1 and Warren J Manning11Beth Israel Deaconess Medical Center and Harvard MedicalSchool, Boston, MA, USA2ETH, Biomedical Engineering, Zurich, Switzerland
Journal of Cardiovascular Magnetic Resonance 2009, 11(Suppl 1):P75
Introduction: Fat suppression is valuable for late gadolinium
enhancement (LGE) imaging, for situations in which an enhanced
structure is adjacent to fat (e.g. myocardium at the apex of the
left ventricle, vessel walls, and the thin atrial walls), where fat
might be mistaken for fibrosis. However, the acquisition order of
the segmented LGE sequence is also critical, and a sequential
acquisition order is superior to a centric acquisition order when
visualizing small areas of scar, in which the “edge-enhancement”(i.e. the stronger weighting of the edges of k-space due to signal
regrowth during the acquisition window) effect is not desired.
A fat-suppressed LGE sequence using a sequential acquisition
order may be optimal, but is not feasible using the typical fat-
selective (spectrally-selective) RF pulse with a flip angle from 90°
to 180° preceding the sequential acquisition. To address this, we
developed a “fat restore” method for fat-suppressed LGE.
Methods: Without a “fat restore” pulse, the fat experiences
two 180°s. The 1st 180° (the non-selective inversion always used
in LGE) results in greatly reduced Mzfat at the time of the 2nd fat-
selective180°. The result is that fat regrows very quickly after the
2nd fat-selective180° and fat-suppression is not achievable for a
sequentially ordered acquisition: fat crosses the null point too
early, requiring a very short fat TI (the time between the fat
suppression pulse and the acquisition of the center of k-space,
defined in Figure 1). However, the minimum fat TI is ~Tacq/2 for
a sequential acquisition order. The “fat-restore” method uses an
additional fat-selective 180° before the standard non-selective
180° used for LGE. The purpose of the “fat restore” pulse is to
tip down the fat so that subsequent 180° tips it back up to full
magnetization. This will permit the later fat-selective 180° to be
effective (see schematic in Figure 1). Phantoms including fat were
imaged with and without the fat-restore pulse. Finally, the
method was used in patient LGE studies. Scan parameters for
phantoms and human studies were: 60 bpm, TR/TR/flip = 4.3–5 ms/1.6–2.3 ms/20°, 32–40 views per segment (Tacq ~180 ms),
sequential order, 1 RR per inversion, TI set to null myocardium at
the center of k-space (250 ms for phantoms). The fat TI was set
to 100 ms using the fat-restore pulse. Without the fat-restore
pulse, the minimum achievable fat TI (~100 ms also) was used.
For patients, 0.2 mmol/kg Gd-DTPA was injected, and scanning
was performed 15–2 minutes post injection. All spectrally
selective 180° pulses were adiabatic pulses. The spatial resolution
was 2 × 2 × 8 mm for 2D LGE.
Results: In phantom studies, the optimal fat TI (Figure 1) was
~120 ms and the ratio of SNRfat w/fatsat to SNRfat w/out fatsat was
8%, using the fat restore pulse; without the additional pulse the
ratio was ~100%. Figure 2 shows that the fat restore pulse with a
sequential acquisition order provided similar fat-suppression as
the standard fat-saturation using centric order with reduced edge
enhancement. Furthermore, without a fat-restore pulse, fat-
suppression was not good. Figure 3 compares a fat-suppressed
2D LGE scan with centric order and sequential order, with andFigure 1 (abstract P75)
The LGE sequence is modified so that a “fat restore” pulse precedes the
first inversion pulse, and fat is not inverted. This permits the 2nd fat-
selective inversion pulse to be effective in providing fat-suppression for a
sequential acquisition order.
Figure 2 (abstract P75)
Phantom comparison of the fat suppression using standard method with
centric order, and the sequential order with and without the fat restore
pulse. Equivalent fat-suppression is provided by the fat restore technique.
Edge enhancement is less using a sequential order. F = fat.
Figure 3 (abstract P75)
2D LGE comparing matched slices using centric, and sequential orders
with and without the fat-restore pulse. The fat-restore pulse is needed
for fat-suppression (thick arrows). Subtle edge-effects can be seen in the
image with a centric acquisition (arrow heads). An area of enhancement
at the tip of a papillary muscle (confirmed in other views) is also
visualized in each image (thin arrows).
Journal of Cardiovascular Magnetic Resonance 2009, 11(Suppl 1) http://jcmr-online.com/supplements/11/S1
Page 145 of 316(page number not for citation purposes)
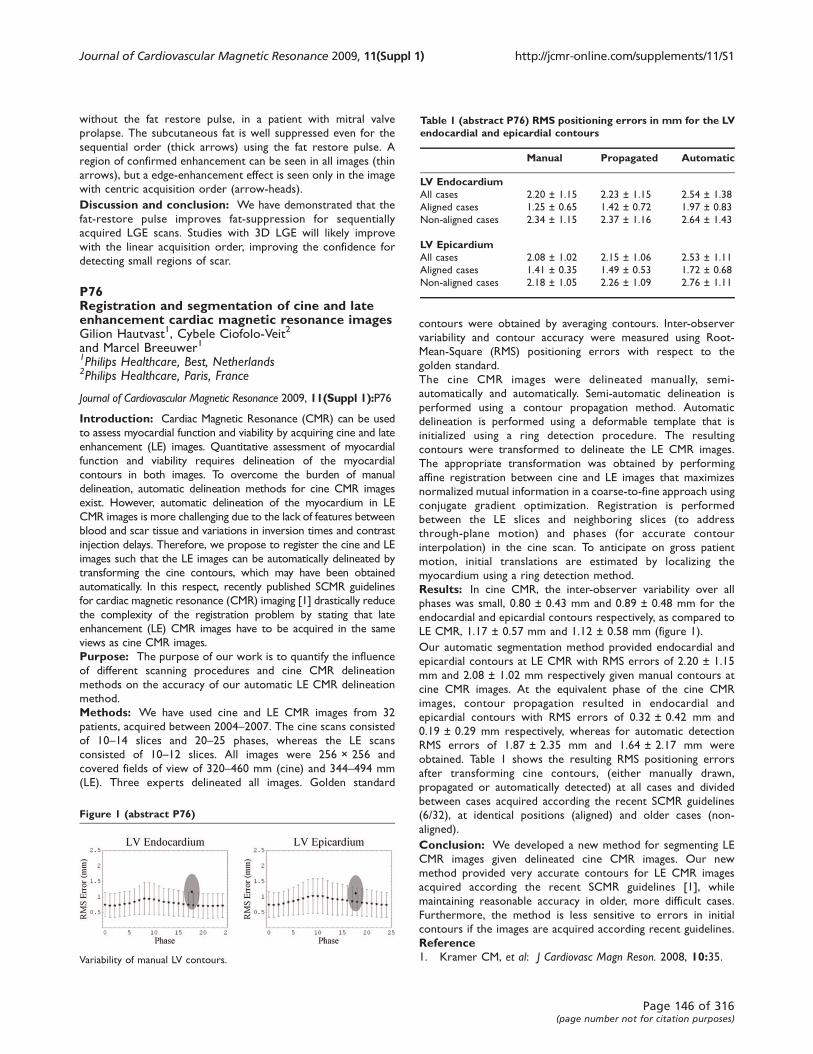
without the fat restore pulse, in a patient with mitral valve
prolapse. The subcutaneous fat is well suppressed even for the
sequential order (thick arrows) using the fat restore pulse. A
region of confirmed enhancement can be seen in all images (thin
arrows), but a edge-enhancement effect is seen only in the image
with centric acquisition order (arrow-heads).
Discussion and conclusion: We have demonstrated that the
fat-restore pulse improves fat-suppression for sequentially
acquired LGE scans. Studies with 3D LGE will likely improve
with the linear acquisition order, improving the confidence for
detecting small regions of scar.
P76Registration and segmentation of cine and lateenhancement cardiac magnetic resonance imagesGilion Hautvast1, Cybele Ciofolo-Veit2
and Marcel Breeuwer11Philips Healthcare, Best, Netherlands2Philips Healthcare, Paris, France
Journal of Cardiovascular Magnetic Resonance 2009, 11(Suppl 1):P76
Introduction: Cardiac Magnetic Resonance (CMR) can be used
to assess myocardial function and viability by acquiring cine and late
enhancement (LE) images. Quantitative assessment of myocardial
function and viability requires delineation of the myocardial
contours in both images. To overcome the burden of manual
delineation, automatic delineation methods for cine CMR images
exist. However, automatic delineation of the myocardium in LE
CMR images is more challenging due to the lack of features between
blood and scar tissue and variations in inversion times and contrast
injection delays. Therefore, we propose to register the cine and LE
images such that the LE images can be automatically delineated by
transforming the cine contours, which may have been obtained
automatically. In this respect, recently published SCMR guidelines
for cardiac magnetic resonance (CMR) imaging [1] drastically reduce
the complexity of the registration problem by stating that late
enhancement (LE) CMR images have to be acquired in the same
views as cine CMR images.
Purpose: The purpose of our work is to quantify the influence
of different scanning procedures and cine CMR delineation
methods on the accuracy of our automatic LE CMR delineation
method.
Methods: We have used cine and LE CMR images from 32
patients, acquired between 2004–2007. The cine scans consisted
of 10–14 slices and 20–25 phases, whereas the LE scans
consisted of 10–12 slices. All images were 256 × 256 and
covered fields of view of 320–460 mm (cine) and 344–494 mm
(LE). Three experts delineated all images. Golden standard
contours were obtained by averaging contours. Inter-observer
variability and contour accuracy were measured using Root-
Mean-Square (RMS) positioning errors with respect to the
golden standard.
The cine CMR images were delineated manually, semi-
automatically and automatically. Semi-automatic delineation is
performed using a contour propagation method. Automatic
delineation is performed using a deformable template that is
initialized using a ring detection procedure. The resulting
contours were transformed to delineate the LE CMR images.
The appropriate transformation was obtained by performing
affine registration between cine and LE images that maximizes
normalized mutual information in a coarse-to-fine approach using
conjugate gradient optimization. Registration is performed
between the LE slices and neighboring slices (to address
through-plane motion) and phases (for accurate contour
interpolation) in the cine scan. To anticipate on gross patient
motion, initial translations are estimated by localizing the
myocardium using a ring detection method.
Results: In cine CMR, the inter-observer variability over all
phases was small, 0.80 ± 0.43 mm and 0.89 ± 0.48 mm for the
endocardial and epicardial contours respectively, as compared to
LE CMR, 1.17 ± 0.57 mm and 1.12 ± 0.58 mm (figure 1).
Our automatic segmentation method provided endocardial and
epicardial contours at LE CMR with RMS errors of 2.20 ± 1.15
mm and 2.08 ± 1.02 mm respectively given manual contours at
cine CMR images. At the equivalent phase of the cine CMR
images, contour propagation resulted in endocardial and
epicardial contours with RMS errors of 0.32 ± 0.42 mm and
0.19 ± 0.29 mm respectively, whereas for automatic detection
RMS errors of 1.87 ± 2.35 mm and 1.64 ± 2.17 mm were
obtained. Table 1 shows the resulting RMS positioning errors
after transforming cine contours, (either manually drawn,
propagated or automatically detected) at all cases and divided
between cases acquired according the recent SCMR guidelines
(6/32), at identical positions (aligned) and older cases (non-
aligned).
Conclusion: We developed a new method for segmenting LE
CMR images given delineated cine CMR images. Our new
method provided very accurate contours for LE CMR images
acquired according the recent SCMR guidelines [1], while
maintaining reasonable accuracy in older, more difficult cases.
Furthermore, the method is less sensitive to errors in initial
contours if the images are acquired according recent guidelines.
Reference1. Kramer CM, et al: J Cardiovasc Magn Reson. 2008, 10:35.
Figure 1 (abstract P76)
Variability of manual LV contours.
Table 1 (abstract P76) RMS positioning errors in mm for the LVendocardial and epicardial contours
Manual Propagated Automatic
LV EndocardiumAll cases 2.20 ± 1.15 2.23 ± 1.15 2.54 ± 1.38
Aligned cases 1.25 ± 0.65 1.42 ± 0.72 1.97 ± 0.83
Non-aligned cases 2.34 ± 1.15 2.37 ± 1.16 2.64 ± 1.43
LV EpicardiumAll cases 2.08 ± 1.02 2.15 ± 1.06 2.53 ± 1.11
Aligned cases 1.41 ± 0.35 1.49 ± 0.53 1.72 ± 0.68
Non-aligned cases 2.18 ± 1.05 2.26 ± 1.09 2.76 ± 1.11
Journal of Cardiovascular Magnetic Resonance 2009, 11(Suppl 1) http://jcmr-online.com/supplements/11/S1
Page 146 of 316(page number not for citation purposes)
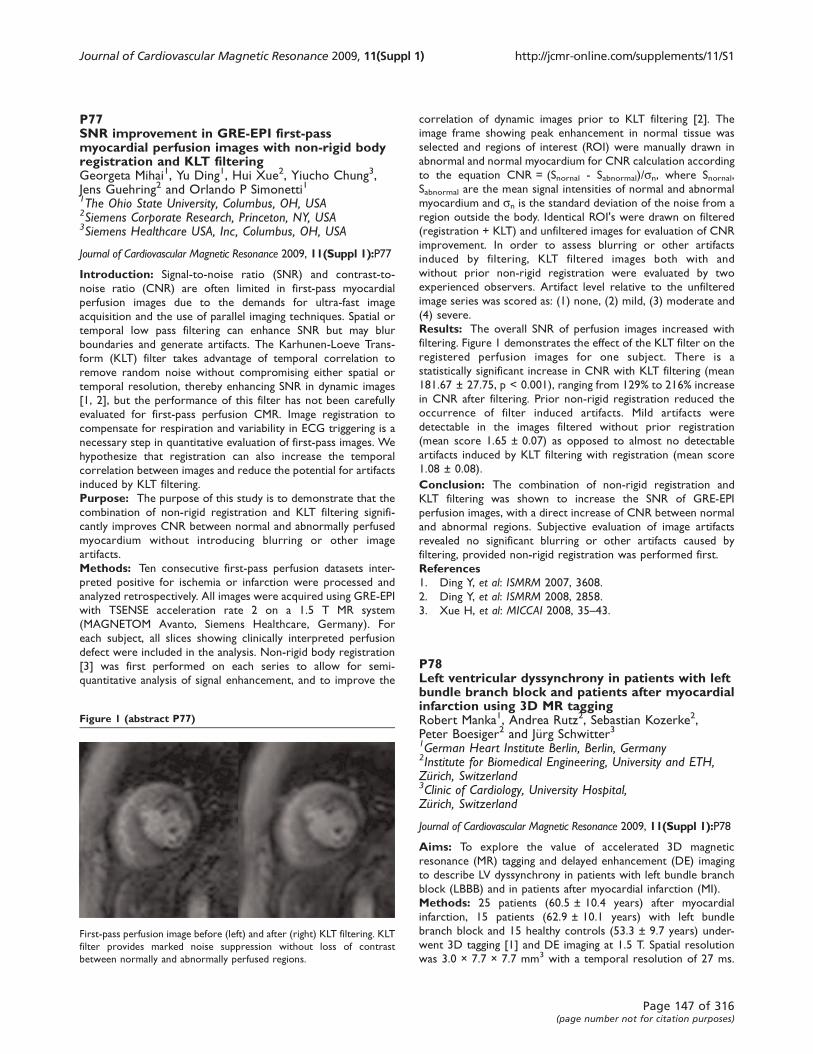
P77SNR improvement in GRE-EPI first-passmyocardial perfusion images with non-rigid bodyregistration and KLT filteringGeorgeta Mihai1, Yu Ding1, Hui Xue2, Yiucho Chung3,Jens Guehring2 and Orlando P Simonetti11The Ohio State University, Columbus, OH, USA2Siemens Corporate Research, Princeton, NY, USA3Siemens Healthcare USA, Inc, Columbus, OH, USA
Journal of Cardiovascular Magnetic Resonance 2009, 11(Suppl 1):P77
Introduction: Signal-to-noise ratio (SNR) and contrast-to-
noise ratio (CNR) are often limited in first-pass myocardial
perfusion images due to the demands for ultra-fast image
acquisition and the use of parallel imaging techniques. Spatial or
temporal low pass filtering can enhance SNR but may blur
boundaries and generate artifacts. The Karhunen-Loeve Trans-
form (KLT) filter takes advantage of temporal correlation to
remove random noise without compromising either spatial or
temporal resolution, thereby enhancing SNR in dynamic images
[1, 2], but the performance of this filter has not been carefully
evaluated for first-pass perfusion CMR. Image registration to
compensate for respiration and variability in ECG triggering is a
necessary step in quantitative evaluation of first-pass images. We
hypothesize that registration can also increase the temporal
correlation between images and reduce the potential for artifacts
induced by KLT filtering.
Purpose: The purpose of this study is to demonstrate that the
combination of non-rigid registration and KLT filtering signifi-
cantly improves CNR between normal and abnormally perfused
myocardium without introducing blurring or other image
artifacts.
Methods: Ten consecutive first-pass perfusion datasets inter-
preted positive for ischemia or infarction were processed and
analyzed retrospectively. All images were acquired using GRE-EPI
with TSENSE acceleration rate 2 on a 1.5 T MR system
(MAGNETOM Avanto, Siemens Healthcare, Germany). For
each subject, all slices showing clinically interpreted perfusion
defect were included in the analysis. Non-rigid body registration
[3] was first performed on each series to allow for semi-
quantitative analysis of signal enhancement, and to improve the
correlation of dynamic images prior to KLT filtering [2]. The
image frame showing peak enhancement in normal tissue was
selected and regions of interest (ROI) were manually drawn in
abnormal and normal myocardium for CNR calculation according
to the equation CNR = (Snornal - Sabnormal)/sn, where Snornal,
Sabnormal are the mean signal intensities of normal and abnormal
myocardium and sn is the standard deviation of the noise from a
region outside the body. Identical ROI's were drawn on filtered
(registration + KLT) and unfiltered images for evaluation of CNR
improvement. In order to assess blurring or other artifacts
induced by filtering, KLT filtered images both with and
without prior non-rigid registration were evaluated by two
experienced observers. Artifact level relative to the unfiltered
image series was scored as: (1) none, (2) mild, (3) moderate and
(4) severe.
Results: The overall SNR of perfusion images increased with
filtering. Figure 1 demonstrates the effect of the KLT filter on the
registered perfusion images for one subject. There is a
statistically significant increase in CNR with KLT filtering (mean
181.67 ± 27.75, p < 0.001), ranging from 129% to 216% increase
in CNR after filtering. Prior non-rigid registration reduced the
occurrence of filter induced artifacts. Mild artifacts were
detectable in the images filtered without prior registration
(mean score 1.65 ± 0.07) as opposed to almost no detectable
artifacts induced by KLT filtering with registration (mean score
1.08 ± 0.08).
Conclusion: The combination of non-rigid registration and
KLT filtering was shown to increase the SNR of GRE-EPI
perfusion images, with a direct increase of CNR between normal
and abnormal regions. Subjective evaluation of image artifacts
revealed no significant blurring or other artifacts caused by
filtering, provided non-rigid registration was performed first.
References1. Ding Y, et al: ISMRM 2007, 3608.
2. Ding Y, et al: ISMRM 2008, 2858.
3. Xue H, et al: MICCAI 2008, 35–43.
P78Left ventricular dyssynchrony in patients with leftbundle branch block and patients after myocardialinfarction using 3D MR taggingRobert Manka1, Andrea Rutz2, Sebastian Kozerke2,Peter Boesiger2 and Jürg Schwitter31German Heart Institute Berlin, Berlin, Germany2Institute for Biomedical Engineering, University and ETH,Zürich, Switzerland3Clinic of Cardiology, University Hospital,Zürich, Switzerland
Journal of Cardiovascular Magnetic Resonance 2009, 11(Suppl 1):P78
Aims: To explore the value of accelerated 3D magnetic
resonance (MR) tagging and delayed enhancement (DE) imaging
to describe LV dyssynchrony in patients with left bundle branch
block (LBBB) and in patients after myocardial infarction (MI).
Methods: 25 patients (60.5 ± 10.4 years) after myocardial
infarction, 15 patients (62.9 ± 10.1 years) with left bundle
branch block and 15 healthy controls (53.3 ± 9.7 years) under-
went 3D tagging [1] and DE imaging at 1.5 T. Spatial resolution
was 3.0 × 7.7 × 7.7 mm3 with a temporal resolution of 27 ms.
Figure 1 (abstract P77)
First-pass perfusion image before (left) and after (right) KLT filtering. KLT
filter provides marked noise suppression without loss of contrast
between normally and abnormally perfused regions.
Journal of Cardiovascular Magnetic Resonance 2009, 11(Suppl 1) http://jcmr-online.com/supplements/11/S1
Page 147 of 316(page number not for citation purposes)
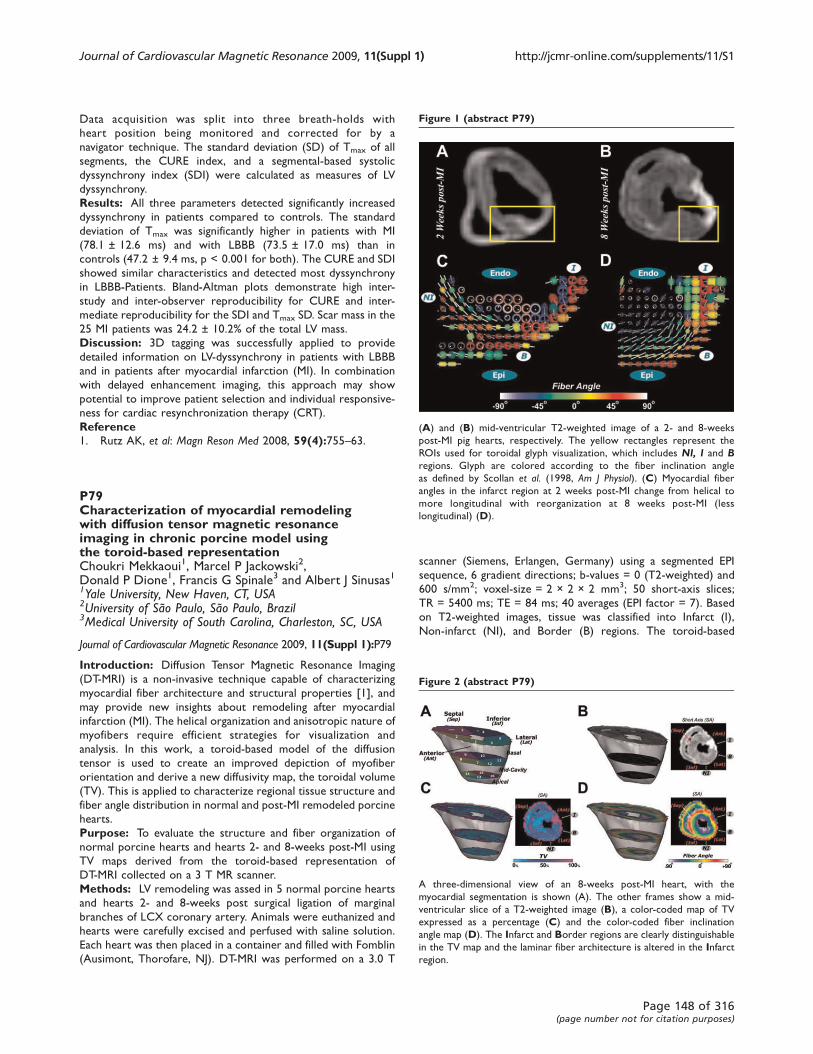
Data acquisition was split into three breath-holds with
heart position being monitored and corrected for by a
navigator technique. The standard deviation (SD) of Tmax of all
segments, the CURE index, and a segmental-based systolic
dyssynchrony index (SDI) were calculated as measures of LV
dyssynchrony.
Results: All three parameters detected significantly increased
dyssynchrony in patients compared to controls. The standard
deviation of Tmax was significantly higher in patients with MI
(78.1 ± 12.6 ms) and with LBBB (73.5 ± 17.0 ms) than in
controls (47.2 ± 9.4 ms, p < 0.001 for both). The CURE and SDI
showed similar characteristics and detected most dyssynchrony
in LBBB-Patients. Bland-Altman plots demonstrate high inter-
study and inter-observer reproducibility for CURE and inter-
mediate reproducibility for the SDI and Tmax SD. Scar mass in the
25 MI patients was 24.2 ± 10.2% of the total LV mass.
Discussion: 3D tagging was successfully applied to provide
detailed information on LV-dyssynchrony in patients with LBBB
and in patients after myocardial infarction (MI). In combination
with delayed enhancement imaging, this approach may show
potential to improve patient selection and individual responsive-
ness for cardiac resynchronization therapy (CRT).
Reference1. Rutz AK, et al: Magn Reson Med 2008, 59(4):755–63.
P79Characterization of myocardial remodelingwith diffusion tensor magnetic resonanceimaging in chronic porcine model usingthe toroid-based representationChoukri Mekkaoui1, Marcel P Jackowski2,Donald P Dione1, Francis G Spinale3 and Albert J Sinusas11Yale University, New Haven, CT, USA2University of São Paulo, São Paulo, Brazil3Medical University of South Carolina, Charleston, SC, USA
Journal of Cardiovascular Magnetic Resonance 2009, 11(Suppl 1):P79
Introduction: Diffusion Tensor Magnetic Resonance Imaging
(DT-MRI) is a non-invasive technique capable of characterizing
myocardial fiber architecture and structural properties [1], and
may provide new insights about remodeling after myocardial
infarction (MI). The helical organization and anisotropic nature of
myofibers require efficient strategies for visualization and
analysis. In this work, a toroid-based model of the diffusion
tensor is used to create an improved depiction of myofiber
orientation and derive a new diffusivity map, the toroidal volume
(TV). This is applied to characterize regional tissue structure and
fiber angle distribution in normal and post-MI remodeled porcine
hearts.
Purpose: To evaluate the structure and fiber organization of
normal porcine hearts and hearts 2- and 8-weeks post-MI using
TV maps derived from the toroid-based representation of
DT-MRI collected on a 3 T MR scanner.
Methods: LV remodeling was assed in 5 normal porcine hearts
and hearts 2- and 8-weeks post surgical ligation of marginal
branches of LCX coronary artery. Animals were euthanized and
hearts were carefully excised and perfused with saline solution.
Each heart was then placed in a container and filled with Fomblin
(Ausimont, Thorofare, NJ). DT-MRI was performed on a 3.0 T
scanner (Siemens, Erlangen, Germany) using a segmented EPI
sequence, 6 gradient directions; b-values = 0 (T2-weighted) and
600 s/mm2; voxel-size = 2 × 2 × 2 mm3; 50 short-axis slices;
TR = 5400 ms; TE = 84 ms; 40 averages (EPI factor = 7). Based
on T2-weighted images, tissue was classified into Infarct (I),
Non-infarct (NI), and Border (B) regions. The toroid-based
Figure 1 (abstract P79)
(A) and (B) mid-ventricular T2-weighted image of a 2- and 8-weeks
post-MI pig hearts, respectively. The yellow rectangles represent the
ROIs used for toroidal glyph visualization, which includes NI, I and Bregions. Glyph are colored according to the fiber inclination angle
as defined by Scollan et al. (1998, Am J Physiol). (C) Myocardial fiber
angles in the infarct region at 2 weeks post-MI change from helical to
more longitudinal with reorganization at 8 weeks post-MI (less
longitudinal) (D).
Figure 2 (abstract P79)
A three-dimensional view of an 8-weeks post-MI heart, with the
myocardial segmentation is shown (A). The other frames show a mid-
ventricular slice of a T2-weighted image (B), a color-coded map of TV
expressed as a percentage (C) and the color-coded fiber inclination
angle map (D). The Infarct and Border regions are clearly distinguishable
in the TV map and the laminar fiber architecture is altered in the Infarctregion.
Journal of Cardiovascular Magnetic Resonance 2009, 11(Suppl 1) http://jcmr-online.com/supplements/11/S1
Page 148 of 316(page number not for citation purposes)

representation of the DT is described by the modified parametric
equation of an elliptical torus and TV is the volume of the toroid.
Fiber angle variance (FAV) captures the degree of fiber angles
spreading over the volume of interest. TV (mm6/s3) and FAV
(deg.2) indices were then quantified for 16 segments of the
standard cardiac polar map.
Results: The toroidal representation revealed that myocardial
fiber angles in the infarct region at 2-weeks post-MI changed
from helical to more uniform longitudinal orientation, with
reorganization at 8-weeks post-MI (less longitudinal) (Figure 1).
This toroid-based approach exhibits the laminar architecture
with the changing orientation of fiber angles from epicardium to
endocardium and also reveals a change in the toroidal shape in
the infarct region. The structural change is reflected by a
substantial global increase in TV. Hence, the analysis of TV and
FAV maps allows for a structural and a geometrical quantification
of the myocardial remodeling (see Figure 2 for an example at
8-weeks post-MI). TV and FAV were uniform in normal hearts,
and significantly (p < 0.05) altered in the infarct regions at 2- and
8-weeks post-MI. TV and FAV were also altered (p < 0.05) in NI
and B regions at 2-weeks post-MI with normalization by 8-weeks
(Figure 3). These changes in TV and FAV are in agreement with
previously observed spatial and temporal changes in regional
activation of matrix metalloproteinase's [2].
Conclusion: Results suggest that the DT-MRI indices of TV and
FAV provide quantitative information that may enhance the
understanding of the underlying myocardial structure properties
and temporal changes involved in the post-MI remodeling
process.
References1. Helm PA, Younes L, Beg MF, Ennis DB, Leclercq C, Faris OP,
McVeigh E, Kass D, Miller MI and Winslow RL: Evidence ofstructural remodeling in the dyssynchronous failingheart. Circ Res 2006, 98:125–32.
2. Vanhoutte D, Schellings M, Pinto Y and Heymans S:
Relevance of matrix metalloproteinases and theirinhibitors after myocardial infarction: a temporaland spatial window. Cardiovasc Res 2006, 69(3):604–13.
P80Gadolinium enhanced magnetic resonancemean voxel signal intensity within the leftventricular myocardium changes prior toejection fraction drop after receipt ofcardiotoxic chemotherapyJimmy C Lightfoot, Ralph B D'Agostino Jr,Craig A Hamilton, William C Little, Frank M Torti,Nancy D Kock, Mike Robbins and W Gregory HundleyWake Forest University, Winston-Salem, NC, USA
Journal of Cardiovascular Magnetic Resonance 2009, 11(Suppl 1):P80
Objective: To determine if serial measures of gadolinium (GD)
signal intensity acquired with cardiac magnetic resonance (CMR)
during receipt of cardiotoxic doxorubicin (DOX) chemotherapy
are associated with left ventricular ejection fraction (LVEF).
Methods: 40 Sprague-Dawley rats were divided into 3 groups
receiving weekly doses of: normal saline [NS] (n = 7), 1.5 mg/kg
DOX (n = 19), or 2.5 mg/kg DOX (n = 14). 1.5 T CMR images of
LVEF and myocardial GD signal were acquired before and at 2
and 4 weeks after DOX treatment. LVEF was determined from a
multi-slice short axis cine acquisition; signal intensity was
obtained from an inversion recovery (IR) mid-LV slice. Analysis
of variance models were fit with group or LVEF drop status
(>10% drop in LVEF from baseline yes/no, or NS) as factors.
RESULTS: LVEF was similar among the 3 groups at baseline
(p = 0.27), and at 2 weeks, (73 + 5%, NS; 74 + 5%,1.5 mg/kg
DOX; 71 + 6%,2.5 mg/kg DOX). At 4 weeks, LVEF after NS was
unchanged (77 ± 7%, p = 0.93), but there was a >10% drop in
LVEF in 3/19 in the 1.5 mg/kg DOX, and 10/14 in the 2.5 mg/kg
DOX groups: LVEF was 77 ± 7% in non-dropped and 64 ± 8% in
dropped groups at 4 weeks (p < 0.001). LVEF remained ≥70% in
all animals at 2 weeks. In animals dropping their LVEF at 4 weeks,
the GD signal within the LV myocardium was elevated relative to
baseline at week 2 (2 weeks prior to LVEF drop – Figure 1); in
animals receiving NS or DOX without LVEF drop, GD was not
elevated at 2 weeks.
Conclusion: These data suggest gadolinium CMR may be useful
to monitor for doxorubicin chemotherapy cardiotoxicity: low
Figure 3 (abstract P79)
Mean TV (A) and fiber angle variance (B) computed from 16 regions of
the standard cardiac polar map for normal, 2- and 8-weeks post-MI
hearts. Myocardial regions were classified as NI, B or I based on the T2-
weighted image. TV and fiber angle variance for all categories is
significantly elevated at 2 weeks post-MI and remains elevated only in
the infarcted region at 8 weeks post-MI. These findings indicate the
progress of the remodelling process post-MI.
Figure 1 (abstract P80)
Journal of Cardiovascular Magnetic Resonance 2009, 11(Suppl 1) http://jcmr-online.com/supplements/11/S1
Page 149 of 316(page number not for citation purposes)
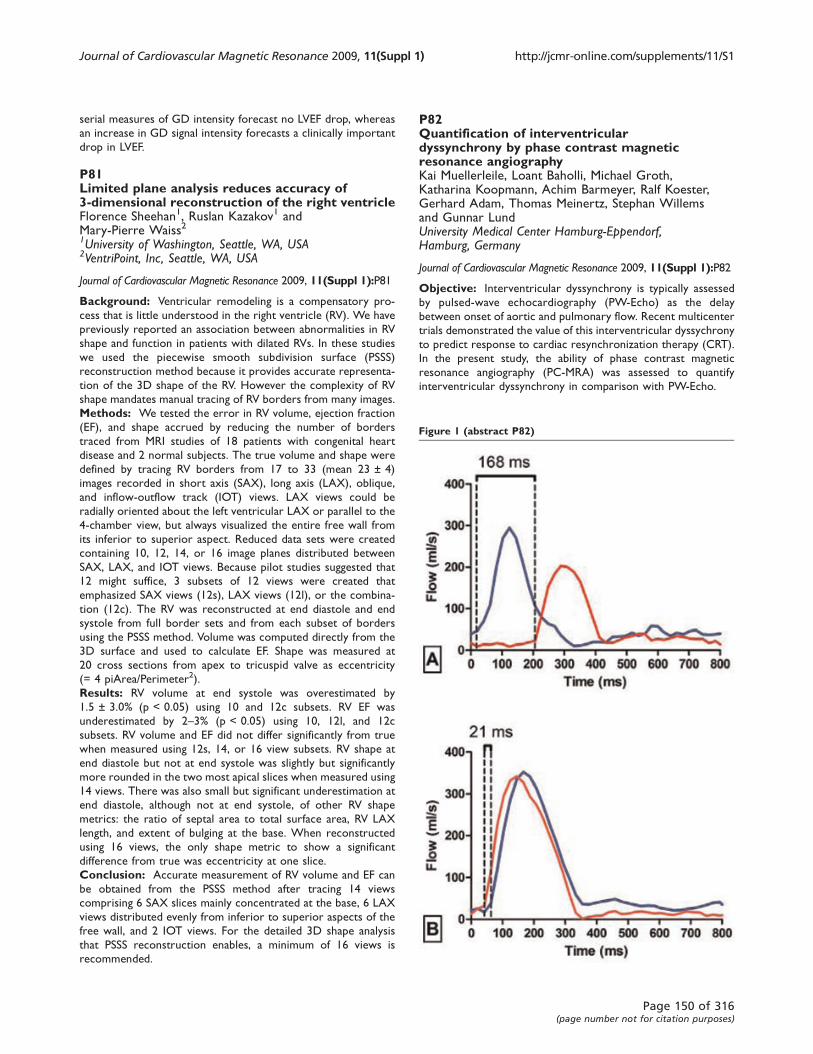
serial measures of GD intensity forecast no LVEF drop, whereas
an increase in GD signal intensity forecasts a clinically important
drop in LVEF.
P81Limited plane analysis reduces accuracy of3-dimensional reconstruction of the right ventricleFlorence Sheehan1, Ruslan Kazakov1 andMary-Pierre Waiss21University of Washington, Seattle, WA, USA2VentriPoint, Inc, Seattle, WA, USA
Journal of Cardiovascular Magnetic Resonance 2009, 11(Suppl 1):P81
Background: Ventricular remodeling is a compensatory pro-
cess that is little understood in the right ventricle (RV). We have
previously reported an association between abnormalities in RV
shape and function in patients with dilated RVs. In these studies
we used the piecewise smooth subdivision surface (PSSS)
reconstruction method because it provides accurate representa-
tion of the 3D shape of the RV. However the complexity of RV
shape mandates manual tracing of RV borders from many images.
Methods: We tested the error in RV volume, ejection fraction
(EF), and shape accrued by reducing the number of borders
traced from MRI studies of 18 patients with congenital heart
disease and 2 normal subjects. The true volume and shape were
defined by tracing RV borders from 17 to 33 (mean 23 ± 4)
images recorded in short axis (SAX), long axis (LAX), oblique,
and inflow-outflow track (IOT) views. LAX views could be
radially oriented about the left ventricular LAX or parallel to the
4-chamber view, but always visualized the entire free wall from
its inferior to superior aspect. Reduced data sets were created
containing 10, 12, 14, or 16 image planes distributed between
SAX, LAX, and IOT views. Because pilot studies suggested that
12 might suffice, 3 subsets of 12 views were created that
emphasized SAX views (12s), LAX views (12l), or the combina-
tion (12c). The RV was reconstructed at end diastole and end
systole from full border sets and from each subset of borders
using the PSSS method. Volume was computed directly from the
3D surface and used to calculate EF. Shape was measured at
20 cross sections from apex to tricuspid valve as eccentricity
(= 4 piArea/Perimeter2).
Results: RV volume at end systole was overestimated by
1.5 ± 3.0% (p < 0.05) using 10 and 12c subsets. RV EF was
underestimated by 2–3% (p < 0.05) using 10, 12l, and 12c
subsets. RV volume and EF did not differ significantly from true
when measured using 12s, 14, or 16 view subsets. RV shape at
end diastole but not at end systole was slightly but significantly
more rounded in the two most apical slices when measured using
14 views. There was also small but significant underestimation at
end diastole, although not at end systole, of other RV shape
metrics: the ratio of septal area to total surface area, RV LAX
length, and extent of bulging at the base. When reconstructed
using 16 views, the only shape metric to show a significant
difference from true was eccentricity at one slice.
Conclusion: Accurate measurement of RV volume and EF can
be obtained from the PSSS method after tracing 14 views
comprising 6 SAX slices mainly concentrated at the base, 6 LAX
views distributed evenly from inferior to superior aspects of the
free wall, and 2 IOT views. For the detailed 3D shape analysis
that PSSS reconstruction enables, a minimum of 16 views is
recommended.
P82Quantification of interventriculardyssynchrony by phase contrast magneticresonance angiographyKai Muellerleile, Loant Baholli, Michael Groth,Katharina Koopmann, Achim Barmeyer, Ralf Koester,Gerhard Adam, Thomas Meinertz, Stephan Willemsand Gunnar LundUniversity Medical Center Hamburg-Eppendorf,Hamburg, Germany
Journal of Cardiovascular Magnetic Resonance 2009, 11(Suppl 1):P82
Objective: Interventricular dyssynchrony is typically assessed
by pulsed-wave echocardiography (PW-Echo) as the delay
between onset of aortic and pulmonary flow. Recent multicenter
trials demonstrated the value of this interventricular dyssychrony
to predict response to cardiac resynchronization therapy (CRT).
In the present study, the ability of phase contrast magnetic
resonance angiography (PC-MRA) was assessed to quantify
interventricular dyssynchrony in comparison with PW-Echo.
Figure 1 (abstract P82)
Journal of Cardiovascular Magnetic Resonance 2009, 11(Suppl 1) http://jcmr-online.com/supplements/11/S1
Page 150 of 316(page number not for citation purposes)
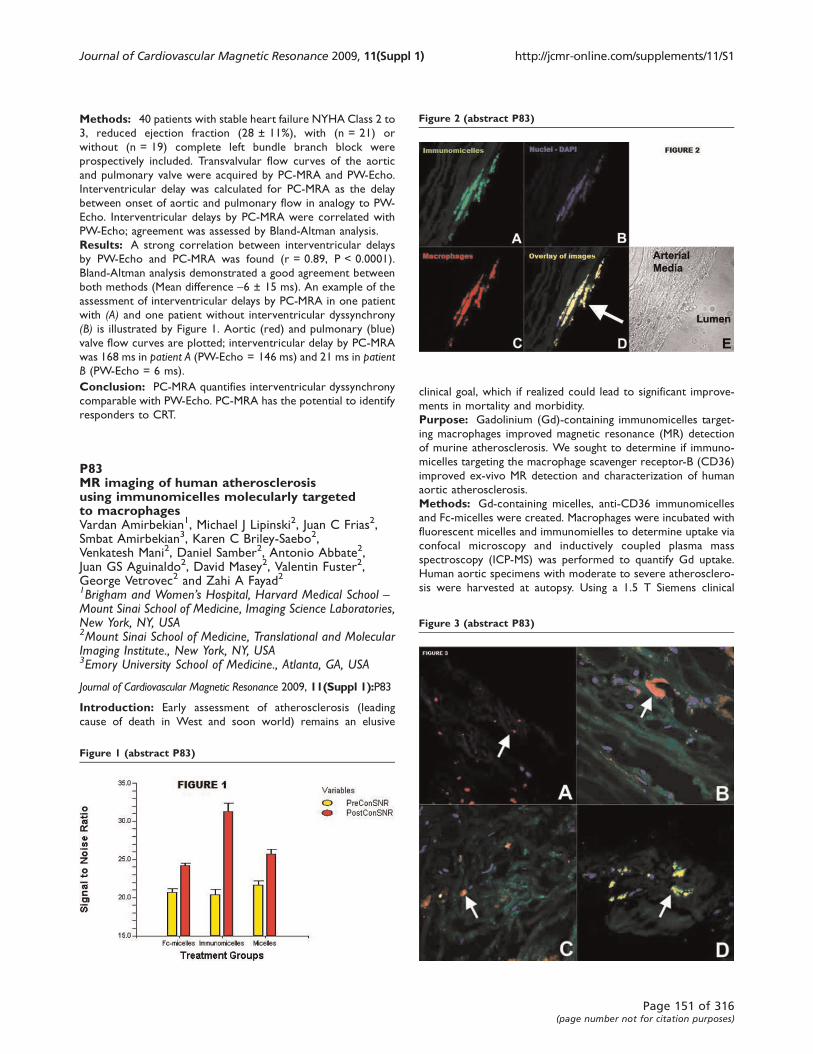
Methods: 40 patients with stable heart failure NYHA Class 2 to
3, reduced ejection fraction (28 ± 11%), with (n = 21) or
without (n = 19) complete left bundle branch block were
prospectively included. Transvalvular flow curves of the aortic
and pulmonary valve were acquired by PC-MRA and PW-Echo.
Interventricular delay was calculated for PC-MRA as the delay
between onset of aortic and pulmonary flow in analogy to PW-
Echo. Interventricular delays by PC-MRA were correlated with
PW-Echo; agreement was assessed by Bland-Altman analysis.
Results: A strong correlation between interventricular delays
by PW-Echo and PC-MRA was found (r = 0.89, P < 0.0001).
Bland-Altman analysis demonstrated a good agreement between
both methods (Mean difference -6 ± 15 ms). An example of the
assessment of interventricular delays by PC-MRA in one patient
with (A) and one patient without interventricular dyssynchrony
(B) is illustrated by Figure 1. Aortic (red) and pulmonary (blue)
valve flow curves are plotted; interventricular delay by PC-MRA
was 168 ms in patient A (PW-Echo = 146 ms) and 21 ms in patientB (PW-Echo = 6 ms).
Conclusion: PC-MRA quantifies interventricular dyssynchrony
comparable with PW-Echo. PC-MRA has the potential to identify
responders to CRT.
P83MR imaging of human atherosclerosisusing immunomicelles molecularly targetedto macrophagesVardan Amirbekian1, Michael J Lipinski2, Juan C Frias2,Smbat Amirbekian3, Karen C Briley-Saebo2,Venkatesh Mani2, Daniel Samber2, Antonio Abbate2,Juan GS Aguinaldo2, David Masey2, Valentin Fuster2,George Vetrovec2 and Zahi A Fayad21Brigham and Women’s Hospital, Harvard Medical School –Mount Sinai School of Medicine, Imaging Science Laboratories,New York, NY, USA2Mount Sinai School of Medicine, Translational and MolecularImaging Institute., New York, NY, USA3Emory University School of Medicine., Atlanta, GA, USA
Journal of Cardiovascular Magnetic Resonance 2009, 11(Suppl 1):P83
Introduction: Early assessment of atherosclerosis (leading
cause of death in West and soon world) remains an elusive
clinical goal, which if realized could lead to significant improve-
ments in mortality and morbidity.
Purpose: Gadolinium (Gd)-containing immunomicelles target-
ing macrophages improved magnetic resonance (MR) detection
of murine atherosclerosis. We sought to determine if immuno-
micelles targeting the macrophage scavenger receptor-B (CD36)
improved ex-vivo MR detection and characterization of human
aortic atherosclerosis.
Methods: Gd-containing micelles, anti-CD36 immunomicelles
and Fc-micelles were created. Macrophages were incubated with
fluorescent micelles and immunomielles to determine uptake via
confocal microscopy and inductively coupled plasma mass
spectroscopy (ICP-MS) was performed to quantify Gd uptake.
Human aortic specimens with moderate to severe atherosclero-
sis were harvested at autopsy. Using a 1.5 T Siemens clinical
Figure 1 (abstract P83)
Figure 2 (abstract P83)
Figure 3 (abstract P83)
Journal of Cardiovascular Magnetic Resonance 2009, 11(Suppl 1) http://jcmr-online.com/supplements/11/S1
Page 151 of 316(page number not for citation purposes)
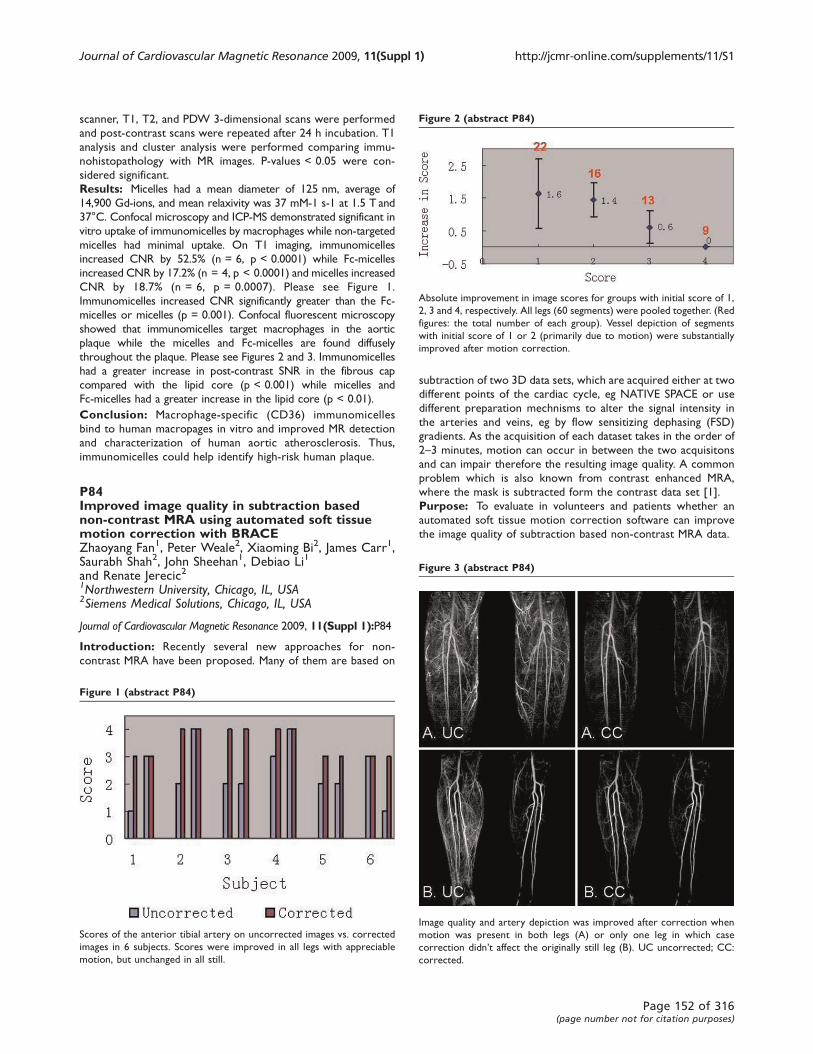
scanner, T1, T2, and PDW 3-dimensional scans were performed
and post-contrast scans were repeated after 24 h incubation. T1
analysis and cluster analysis were performed comparing immu-
nohistopathology with MR images. P-values < 0.05 were con-
sidered significant.
Results: Micelles had a mean diameter of 125 nm, average of
14,900 Gd-ions, and mean relaxivity was 37 mM-1 s-1 at 1.5 T and
37°C. Confocal microscopy and ICP-MS demonstrated significant in
vitro uptake of immunomicelles by macrophages while non-targeted
micelles had minimal uptake. On T1 imaging, immunomicelles
increased CNR by 52.5% (n = 6, p < 0.0001) while Fc-micelles
increased CNR by 17.2% (n = 4, p < 0.0001) and micelles increased
CNR by 18.7% (n = 6, p = 0.0007). Please see Figure 1.
Immunomicelles increased CNR significantly greater than the Fc-
micelles or micelles (p = 0.001). Confocal fluorescent microscopy
showed that immunomicelles target macrophages in the aortic
plaque while the micelles and Fc-micelles are found diffusely
throughout the plaque. Please see Figures 2 and 3. Immunomicelles
had a greater increase in post-contrast SNR in the fibrous cap
compared with the lipid core (p < 0.001) while micelles and
Fc-micelles had a greater increase in the lipid core (p < 0.01).
Conclusion: Macrophage-specific (CD36) immunomicelles
bind to human macropages in vitro and improved MR detection
and characterization of human aortic atherosclerosis. Thus,
immunomicelles could help identify high-risk human plaque.
P84Improved image quality in subtraction basednon-contrast MRA using automated soft tissuemotion correction with BRACEZhaoyang Fan1, Peter Weale2, Xiaoming Bi2, James Carr1,Saurabh Shah2, John Sheehan1, Debiao Li1
and Renate Jerecic21Northwestern University, Chicago, IL, USA2Siemens Medical Solutions, Chicago, IL, USA
Journal of Cardiovascular Magnetic Resonance 2009, 11(Suppl 1):P84
Introduction: Recently several new approaches for non-
contrast MRA have been proposed. Many of them are based on
subtraction of two 3D data sets, which are acquired either at two
different points of the cardiac cycle, eg NATIVE SPACE or use
different preparation mechnisms to alter the signal intensity in
the arteries and veins, eg by flow sensitizing dephasing (FSD)
gradients. As the acquisition of each dataset takes in the order of
2–3 minutes, motion can occur in between the two acquisitons
and can impair therefore the resulting image quality. A common
problem which is also known from contrast enhanced MRA,
where the mask is subtracted form the contrast data set [1].
Purpose: To evaluate in volunteers and patients whether an
automated soft tissue motion correction software can improve
the image quality of subtraction based non-contrast MRA data.
Figure 1 (abstract P84)
Scores of the anterior tibial artery on uncorrected images vs. corrected
images in 6 subjects. Scores were improved in all legs with appreciable
motion, but unchanged in all still.
Figure 2 (abstract P84)
Absolute improvement in image scores for groups with initial score of 1,
2, 3 and 4, respectively. All legs (60 segments) were pooled together. (Red
figures: the total number of each group). Vessel depiction of segments
with initial score of 1 or 2 (primarily due to motion) were substantially
improved after motion correction.
Figure 3 (abstract P84)
Image quality and artery depiction was improved after correction when
motion was present in both legs (A) or only one leg in which case
correction didn’t affect the originally still leg (B). UC uncorrected; CC:
corrected.
Journal of Cardiovascular Magnetic Resonance 2009, 11(Suppl 1) http://jcmr-online.com/supplements/11/S1
Page 152 of 316(page number not for citation purposes)

Methods: Non contrast peripheral MRA data sets of the lower
legs of 3 healthy volunteers and 3 patients where qualitatively
scored before and after motion correction by an experienced
radiologist. The commecially available software syngo BRACE
(Siemens Healthcare, Germany) was used [1] to perform the
automated motion correction of the two data sets.
Qualitative image quality was assed using a scale from 1 to 4
(1 being poor, 2 fair, 3 good, 4 excellent vessel conspicuity) The
conspicuity was scored for the popliteal, anterior tibial, posterior
tibial and the peroneal branch as well as for the side branches.
A score was given for each branch before and after motion
correction.
Results: The results are shown in Figure 1 on the example of
the anterior tibiaL branch assesment. The asessment of the other
branches was comparable. Figure 2 shows the overall improve-
ment based on the initial score before motion corredtion was
applied. Figure 3 shows two typical case examples before and
after BRACE was applied.
Conclusion: The motion correction software BRACE was able
to improve the image quality in subtraction based non contrast
MRA techniques when motion occued. Many cases showed that
motion often occurs in only one leg. In those cases BRACE did
not deteriorate the image quality of the leg without motion while
at the same time improving the result in the leg affected by
motion. No case was observed where the software did decrease
the image quality compared to the uncorrected image. BRACE
therefore provides a promising tool in the area of non contrast
MRA.
Reference1. Herrmann K-H, et al: Eur Radiol 2006.
P85Stress cardiac magnetic resonance imagingin an outpatient settingAmir-Ali Fassa1, Alain Naïmi2, Golmehr Ashrafpoor1,Yannick Magliano2, Béatrice Veragut Davies3
and Juan Sztajzel21Geneva University Hospitals, Geneva, Switzerland2Centre de Diagnostic Radiologique de Carouge, Geneva,Switzerland3Centre Cardio-Pulmonaire de la Clinique de Carouge, Geneva,Switzerland
Journal of Cardiovascular Magnetic Resonance 2009, 11(Suppl 1):P85
Introduction: Stress cardiac magnetic resonance (CMR) ima-
ging is a non-invasive modality which is increasingly used for
detection of myocardial ischemia, necrosis and viability.
Purpose: To assess the feasibility and safety of stress CMR in a
non-hospital outpatient setting.
Methods: We reviewed the data of all patients who were
referred for stress CMR (1.5 Tesla) from February 1st 2006 to
January 31st 2008 to the Centre de Diagnostic Radiologique de
Carouge, an outpatient imaging centre. Standard protocol
consisted of: 1) assessment of myocardial function at rest;
2) pharmacological stress induced either by dobutamine (proto-
col of 10, 20, 30, 40 mg/kg/min during 3 minutes with atropine if
necessary) until achieving submaximal heart rate ([220-
age] × 0.85), or by adenosine (protocol of 140 mg/kg/minute
during 3 minutes followed by a bolus of 10 ml of gadolinium at
4 ml/second “first pass”); 3) assessment of myocardial scar and/or
viability by delayed enhancement (DE) sequences.
Results: During the study period 472 patients were referred
for stress CMR. The test was performed in 452 patients (96%):
294 males (65%), mean age 62 ± 11 years, mean duration
55 ± 10 minutes, stress induction with dobutamine in
241 patients (53%) and adenosine in 211 patients (47%). The
test could not be carried out in 23 patients (5%) because of
claustrophobia (18 patients), excessive thoracic diameter
(4 patients) and excessive baseline arterial blood pressure
(1 patient). However, stress CMR could finally be performed
during a second appointment in 3 patients. The remainder either
underwent another non-invasive test (Thallium myocardial
scintigraphy in 14 patients), or did not undergo further functional
assessment at our centre (6 patients). No ischemia or infarction
was found in 306 patients (68%), while isolated ischemia was
found in 18 patients (4%) and ischemia in the presence of an
infarction in 30 patients (7%). Infarction without ischemia was
found in 95 patients (21%). DE was found 146 patients (33%),
which was subendocardial in 124 patients (28%, involving <50%
of wall thickness in 53 patients (12%) and >50% of wall thickness
in 71 patients (16%)). DE sparing the subendocardium was found
in 22 patients (5%). The following complications occurred during
17 tests (4%): supraventricular tachycardia or unsustained
ventricular tachycardia (7 patients), anxiety attack (3 patients),
chest pain (3 patients), suspected allergic reaction to gadolinium
(1 patient), dizziness (1 patient), vomiting during dobutamine
infusion (1 patient) and hypotension (1 patient). No other
complications occurred.
Conclusion: Stress CMR is a well tolerated non-invasive
assessment modality, which can be safely performed in a non-
hospital outpatient setting.
P86Evaluation of myocardial function after primarypercutaneous intervention by cardial MRI:5 years follow upTirza Springeling1, Sharon W Kirschbaum2, Timo Baks1,Yusuf Karamermer1, Gabriel K Krestin1, Pim J de Feyter1
and Robert-Jan M van Geuns11Erasmus MC, Rotterdam, Netherlands2Erasmus MC, Thoraxcenter, Rotterdam, Netherlands
Journal of Cardiovascular Magnetic Resonance 2009, 11(Suppl 1):P86
Background: We investigated the early and late effect of
primary percutaneous coronary interventions (PCI) for acute
myocardial infarction on recovery of left ventricular ejection
fraction (LVEF), end diastolic volume (EDV), end systolic volume
(ESV) and segmental wall thickening (SWT) using Cardiac MRI.
Methods: This abstract includes preliminary analysis of the first
12 patients. All patients underwent cardial MRI within 5 days, at
5 months and at 5 years after successful primary PCI. LVEF, EDV,
ESV and SWT quantified on cine-images, the transmural extent of
the infarction (TEI) was quantified on delayed-enhancement
images.
Results: EDV increased significantly between baseline and
5 months (from 193.5 ± 45.4 to 216.4 ± 61.5, p = .01), with a
trend for additional late remodelling at 5 years (from
216.4 ± 61.5 to 218.0 ± 82.1, p = .27). The same trend seems
to be visible in ESV although also not significant (resp.114,2 ±
33.9; 122.0 ± 51.8; 132.5 ± 73.4 p = 0.20). LVEF showed some
Journal of Cardiovascular Magnetic Resonance 2009, 11(Suppl 1) http://jcmr-online.com/supplements/11/S1
Page 153 of 316(page number not for citation purposes)
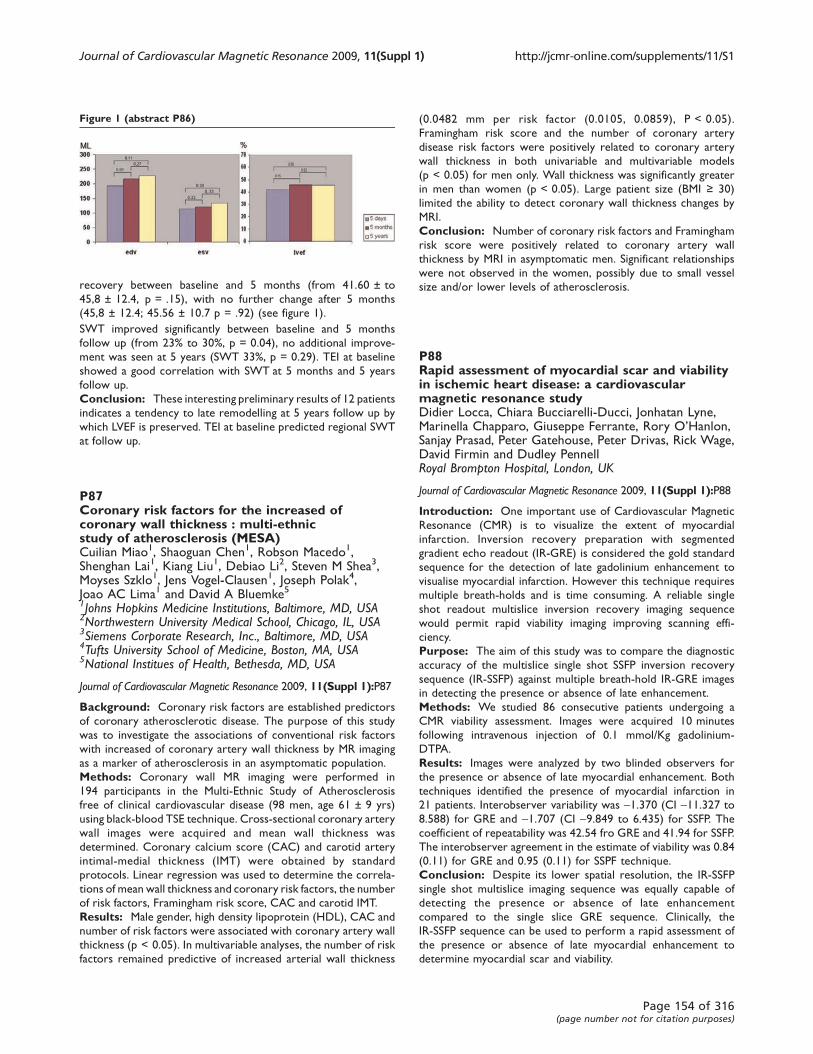
recovery between baseline and 5 months (from 41.60 ± to
45,8 ± 12.4, p = .15), with no further change after 5 months
(45,8 ± 12.4; 45.56 ± 10.7 p = .92) (see figure 1).
SWT improved significantly between baseline and 5 months
follow up (from 23% to 30%, p = 0.04), no additional improve-
ment was seen at 5 years (SWT 33%, p = 0.29). TEI at baseline
showed a good correlation with SWT at 5 months and 5 years
follow up.
Conclusion: These interesting preliminary results of 12 patients
indicates a tendency to late remodelling at 5 years follow up by
which LVEF is preserved. TEI at baseline predicted regional SWT
at follow up.
P87Coronary risk factors for the increased ofcoronary wall thickness : multi-ethnicstudy of atherosclerosis (MESA)Cuilian Miao1, Shaoguan Chen1, Robson Macedo1,Shenghan Lai1, Kiang Liu1, Debiao Li2, Steven M Shea3,Moyses Szklo1, Jens Vogel-Clausen1, Joseph Polak4,Joao AC Lima1 and David A Bluemke51Johns Hopkins Medicine Institutions, Baltimore, MD, USA2Northwestern University Medical School, Chicago, IL, USA3Siemens Corporate Research, Inc., Baltimore, MD, USA4Tufts University School of Medicine, Boston, MA, USA5National Institues of Health, Bethesda, MD, USA
Journal of Cardiovascular Magnetic Resonance 2009, 11(Suppl 1):P87
Background: Coronary risk factors are established predictors
of coronary atherosclerotic disease. The purpose of this study
was to investigate the associations of conventional risk factors
with increased of coronary artery wall thickness by MR imaging
as a marker of atherosclerosis in an asymptomatic population.
Methods: Coronary wall MR imaging were performed in
194 participants in the Multi-Ethnic Study of Atherosclerosis
free of clinical cardiovascular disease (98 men, age 61 ± 9 yrs)
using black-blood TSE technique. Cross-sectional coronary artery
wall images were acquired and mean wall thickness was
determined. Coronary calcium score (CAC) and carotid artery
intimal-medial thickness (IMT) were obtained by standard
protocols. Linear regression was used to determine the correla-
tions of mean wall thickness and coronary risk factors, the number
of risk factors, Framingham risk score, CAC and carotid IMT.
Results: Male gender, high density lipoprotein (HDL), CAC and
number of risk factors were associated with coronary artery wall
thickness (p < 0.05). In multivariable analyses, the number of risk
factors remained predictive of increased arterial wall thickness
(0.0482 mm per risk factor (0.0105, 0.0859), P < 0.05).
Framingham risk score and the number of coronary artery
disease risk factors were positively related to coronary artery
wall thickness in both univariable and multivariable models
(p < 0.05) for men only. Wall thickness was significantly greater
in men than women (p < 0.05). Large patient size (BMI ≥ 30)
limited the ability to detect coronary wall thickness changes by
MRI.
Conclusion: Number of coronary risk factors and Framingham
risk score were positively related to coronary artery wall
thickness by MRI in asymptomatic men. Significant relationships
were not observed in the women, possibly due to small vessel
size and/or lower levels of atherosclerosis.
P88Rapid assessment of myocardial scar and viabilityin ischemic heart disease: a cardiovascularmagnetic resonance studyDidier Locca, Chiara Bucciarelli-Ducci, Jonhatan Lyne,Marinella Chapparo, Giuseppe Ferrante, Rory O’Hanlon,Sanjay Prasad, Peter Gatehouse, Peter Drivas, Rick Wage,David Firmin and Dudley PennellRoyal Brompton Hospital, London, UK
Journal of Cardiovascular Magnetic Resonance 2009, 11(Suppl 1):P88
Introduction: One important use of Cardiovascular Magnetic
Resonance (CMR) is to visualize the extent of myocardial
infarction. Inversion recovery preparation with segmented
gradient echo readout (IR-GRE) is considered the gold standard
sequence for the detection of late gadolinium enhancement to
visualise myocardial infarction. However this technique requires
multiple breath-holds and is time consuming. A reliable single
shot readout multislice inversion recovery imaging sequence
would permit rapid viability imaging improving scanning effi-
ciency.
Purpose: The aim of this study was to compare the diagnostic
accuracy of the multislice single shot SSFP inversion recovery
sequence (IR-SSFP) against multiple breath-hold IR-GRE images
in detecting the presence or absence of late enhancement.
Methods: We studied 86 consecutive patients undergoing a
CMR viability assessment. Images were acquired 10 minutes
following intravenous injection of 0.1 mmol/Kg gadolinium-
DTPA.
Results: Images were analyzed by two blinded observers for
the presence or absence of late myocardial enhancement. Both
techniques identified the presence of myocardial infarction in
21 patients. Interobserver variability was -1.370 (CI -11.327 to
8.588) for GRE and -1.707 (CI -9.849 to 6.435) for SSFP. The
coefficient of repeatability was 42.54 fro GRE and 41.94 for SSFP.
The interobserver agreement in the estimate of viability was 0.84
(0.11) for GRE and 0.95 (0.11) for SSPF technique.
Conclusion: Despite its lower spatial resolution, the IR-SSFP
single shot multislice imaging sequence was equally capable of
detecting the presence or absence of late enhancement
compared to the single slice GRE sequence. Clinically, the
IR-SSFP sequence can be used to perform a rapid assessment of
the presence or absence of late myocardial enhancement to
determine myocardial scar and viability.
Figure 1 (abstract P86)
Journal of Cardiovascular Magnetic Resonance 2009, 11(Suppl 1) http://jcmr-online.com/supplements/11/S1
Page 154 of 316(page number not for citation purposes)
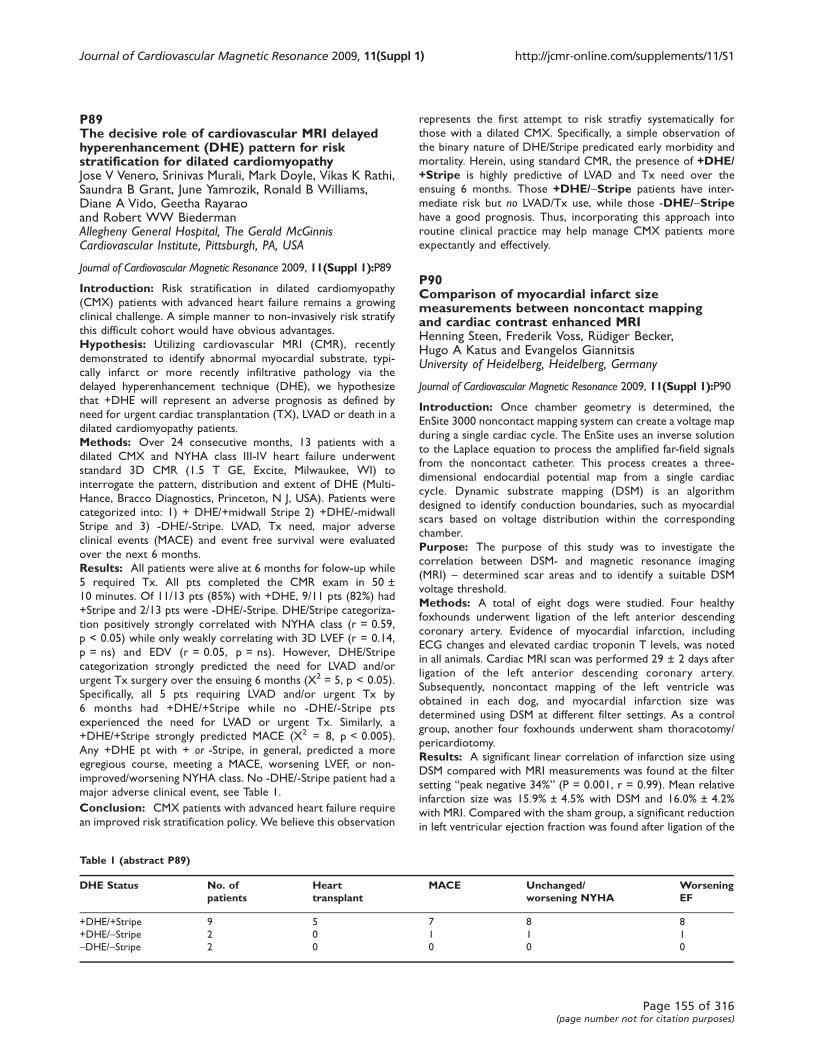
P89The decisive role of cardiovascular MRI delayedhyperenhancement (DHE) pattern for riskstratification for dilated cardiomyopathyJose V Venero, Srinivas Murali, Mark Doyle, Vikas K Rathi,Saundra B Grant, June Yamrozik, Ronald B Williams,Diane A Vido, Geetha Rayaraoand Robert WW BiedermanAllegheny General Hospital, The Gerald McGinnisCardiovascular Institute, Pittsburgh, PA, USA
Journal of Cardiovascular Magnetic Resonance 2009, 11(Suppl 1):P89
Introduction: Risk stratification in dilated cardiomyopathy
(CMX) patients with advanced heart failure remains a growing
clinical challenge. A simple manner to non-invasively risk stratify
this difficult cohort would have obvious advantages.
Hypothesis: Utilizing cardiovascular MRI (CMR), recently
demonstrated to identify abnormal myocardial substrate, typi-
cally infarct or more recently infiltrative pathology via the
delayed hyperenhancement technique (DHE), we hypothesize
that +DHE will represent an adverse prognosis as defined by
need for urgent cardiac transplantation (TX), LVAD or death in a
dilated cardiomyopathy patients.
Methods: Over 24 consecutive months, 13 patients with a
dilated CMX and NYHA class III-IV heart failure underwent
standard 3D CMR (1.5 T GE, Excite, Milwaukee, WI) to
interrogate the pattern, distribution and extent of DHE (Multi-
Hance, Bracco Diagnostics, Princeton, N J, USA). Patients were
categorized into: 1) + DHE/+midwall Stripe 2) +DHE/-midwall
Stripe and 3) -DHE/-Stripe. LVAD, Tx need, major adverse
clinical events (MACE) and event free survival were evaluated
over the next 6 months.
Results: All patients were alive at 6 months for folow-up while
5 required Tx. All pts completed the CMR exam in 50 ±
10 minutes. Of 11/13 pts (85%) with +DHE, 9/11 pts (82%) had
+Stripe and 2/13 pts were -DHE/-Stripe. DHE/Stripe categoriza-
tion positively strongly correlated with NYHA class (r = 0.59,
p < 0.05) while only weakly correlating with 3D LVEF (r = 0.14,
p = ns) and EDV (r = 0.05, p = ns). However, DHE/Stripe
categorization strongly predicted the need for LVAD and/or
urgent Tx surgery over the ensuing 6 months (X2 = 5, p < 0.05).
Specifically, all 5 pts requiring LVAD and/or urgent Tx by
6 months had +DHE/+Stripe while no -DHE/-Stripe pts
experienced the need for LVAD or urgent Tx. Similarly, a
+DHE/+Stripe strongly predicted MACE (X2 = 8, p < 0.005).
Any +DHE pt with + or -Stripe, in general, predicted a more
egregious course, meeting a MACE, worsening LVEF, or non-
improved/worsening NYHA class. No -DHE/-Stripe patient had a
major adverse clinical event, see Table 1.
Conclusion: CMX patients with advanced heart failure require
an improved risk stratification policy. We believe this observation
represents the first attempt to risk stratfiy systematically for
those with a dilated CMX. Specifically, a simple observation of
the binary nature of DHE/Stripe predicated early morbidity and
mortality. Herein, using standard CMR, the presence of +DHE/+Stripe is highly predictive of LVAD and Tx need over the
ensuing 6 months. Those +DHE/-Stripe patients have inter-
mediate risk but no LVAD/Tx use, while those -DHE/-Stripehave a good prognosis. Thus, incorporating this approach into
routine clinical practice may help manage CMX patients more
expectantly and effectively.
P90Comparison of myocardial infarct sizemeasurements between noncontact mappingand cardiac contrast enhanced MRIHenning Steen, Frederik Voss, Rüdiger Becker,Hugo A Katus and Evangelos GiannitsisUniversity of Heidelberg, Heidelberg, Germany
Journal of Cardiovascular Magnetic Resonance 2009, 11(Suppl 1):P90
Introduction: Once chamber geometry is determined, the
EnSite 3000 noncontact mapping system can create a voltage map
during a single cardiac cycle. The EnSite uses an inverse solution
to the Laplace equation to process the amplified far-field signals
from the noncontact catheter. This process creates a three-
dimensional endocardial potential map from a single cardiac
cycle. Dynamic substrate mapping (DSM) is an algorithm
designed to identify conduction boundaries, such as myocardial
scars based on voltage distribution within the corresponding
chamber.
Purpose: The purpose of this study was to investigate the
correlation between DSM- and magnetic resonance imaging
(MRI) – determined scar areas and to identify a suitable DSM
voltage threshold.
Methods: A total of eight dogs were studied. Four healthy
foxhounds underwent ligation of the left anterior descending
coronary artery. Evidence of myocardial infarction, including
ECG changes and elevated cardiac troponin T levels, was noted
in all animals. Cardiac MRI scan was performed 29 ± 2 days after
ligation of the left anterior descending coronary artery.
Subsequently, noncontact mapping of the left ventricle was
obtained in each dog, and myocardial infarction size was
determined using DSM at different filter settings. As a control
group, another four foxhounds underwent sham thoracotomy/
pericardiotomy.
Results: A significant linear correlation of infarction size using
DSM compared with MRI measurements was found at the filter
setting “peak negative 34%” (P = 0.001, r = 0.99). Mean relative
infarction size was 15.9% ± 4.5% with DSM and 16.0% ± 4.2%
with MRI. Compared with the sham group, a significant reduction
in left ventricular ejection fraction was found after ligation of the
Table 1 (abstract P89)
DHE Status No. ofpatients
Hearttransplant
MACE Unchanged/worsening NYHA
WorseningEF
+DHE/+Stripe 9 5 7 8 8
+DHE/-Stripe 2 0 1 1 1
-DHE/-Stripe 2 0 0 0 0
Journal of Cardiovascular Magnetic Resonance 2009, 11(Suppl 1) http://jcmr-online.com/supplements/11/S1
Page 155 of 316(page number not for citation purposes)
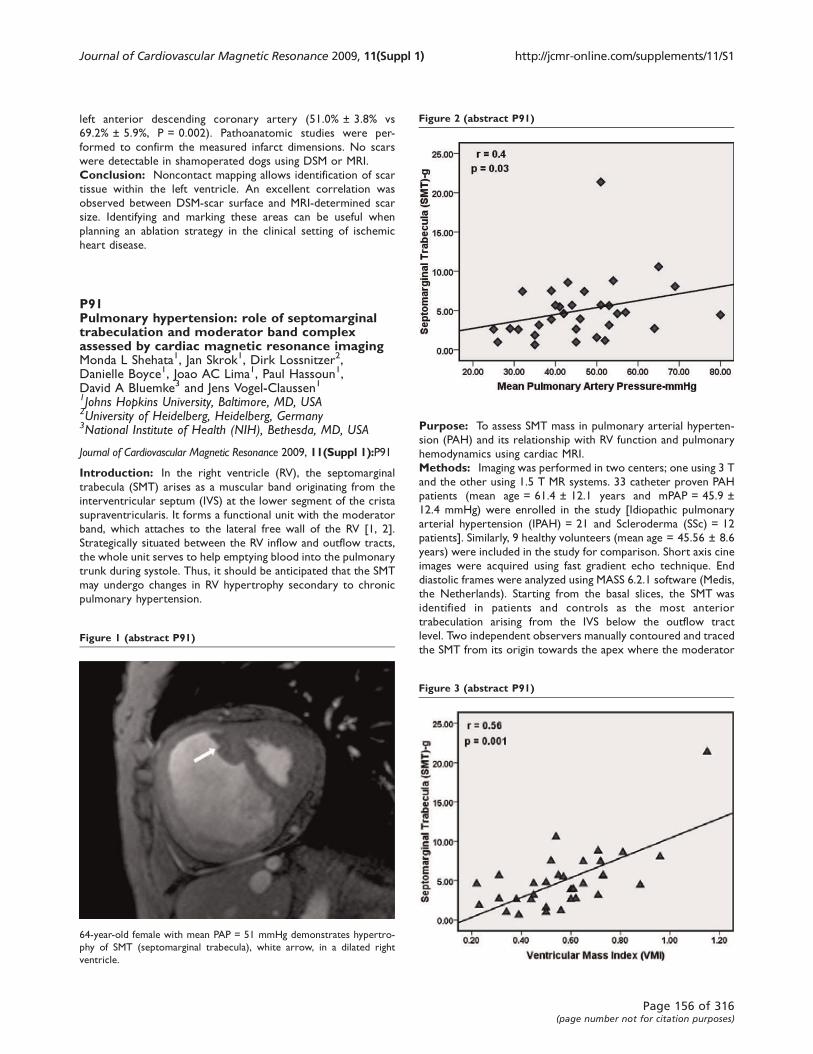
left anterior descending coronary artery (51.0% ± 3.8% vs
69.2% ± 5.9%, P = 0.002). Pathoanatomic studies were per-
formed to confirm the measured infarct dimensions. No scars
were detectable in shamoperated dogs using DSM or MRI.
Conclusion: Noncontact mapping allows identification of scar
tissue within the left ventricle. An excellent correlation was
observed between DSM-scar surface and MRI-determined scar
size. Identifying and marking these areas can be useful when
planning an ablation strategy in the clinical setting of ischemic
heart disease.
P91Pulmonary hypertension: role of septomarginaltrabeculation and moderator band complexassessed by cardiac magnetic resonance imagingMonda L Shehata1, Jan Skrok1, Dirk Lossnitzer2,Danielle Boyce1, Joao AC Lima1, Paul Hassoun1,David A Bluemke3 and Jens Vogel-Claussen11Johns Hopkins University, Baltimore, MD, USA2University of Heidelberg, Heidelberg, Germany3National Institute of Health (NIH), Bethesda, MD, USA
Journal of Cardiovascular Magnetic Resonance 2009, 11(Suppl 1):P91
Introduction: In the right ventricle (RV), the septomarginal
trabecula (SMT) arises as a muscular band originating from the
interventricular septum (IVS) at the lower segment of the crista
supraventricularis. It forms a functional unit with the moderator
band, which attaches to the lateral free wall of the RV [1, 2].
Strategically situated between the RV inflow and outflow tracts,
the whole unit serves to help emptying blood into the pulmonary
trunk during systole. Thus, it should be anticipated that the SMT
may undergo changes in RV hypertrophy secondary to chronic
pulmonary hypertension.
Purpose: To assess SMT mass in pulmonary arterial hyperten-
sion (PAH) and its relationship with RV function and pulmonary
hemodynamics using cardiac MRI.
Methods: Imaging was performed in two centers; one using 3 T
and the other using 1.5 T MR systems. 33 catheter proven PAH
patients (mean age = 61.4 ± 12.1 years and mPAP = 45.9 ±
12.4 mmHg) were enrolled in the study [Idiopathic pulmonary
arterial hypertension (IPAH) = 21 and Scleroderma (SSc) = 12
patients]. Similarly, 9 healthy volunteers (mean age = 45.56 ± 8.6
years) were included in the study for comparison. Short axis cine
images were acquired using fast gradient echo technique. End
diastolic frames were analyzed using MASS 6.2.1 software (Medis,
the Netherlands). Starting from the basal slices, the SMT was
identified in patients and controls as the most anterior
trabeculation arising from the IVS below the outflow tract
level. Two independent observers manually contoured and traced
the SMT from its origin towards the apex where the moderatorFigure 1 (abstract P91)
64-year-old female with mean PAP = 51 mmHg demonstrates hypertro-
phy of SMT (septomarginal trabecula), white arrow, in a dilated right
ventricle.
Figure 2 (abstract P91)
Figure 3 (abstract P91)
Journal of Cardiovascular Magnetic Resonance 2009, 11(Suppl 1) http://jcmr-online.com/supplements/11/S1
Page 156 of 316(page number not for citation purposes)
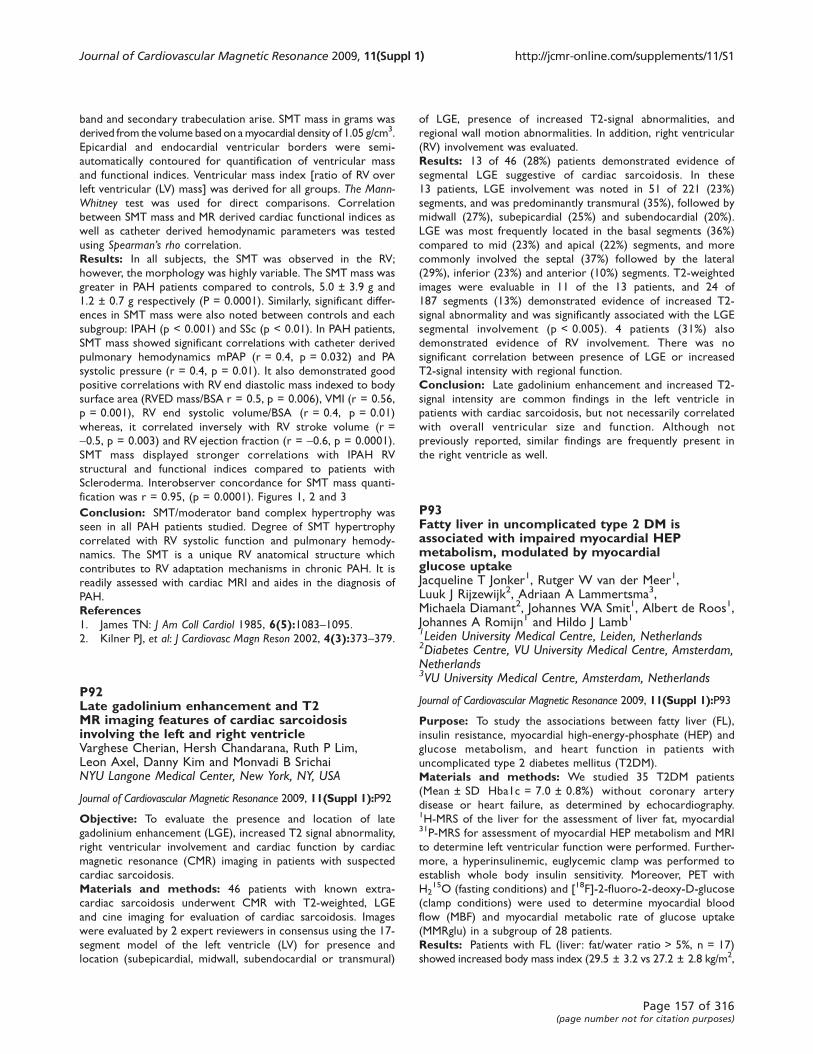
band and secondary trabeculation arise. SMT mass in grams was
derived from the volume based on amyocardial density of 1.05 g/cm3.
Epicardial and endocardial ventricular borders were semi-
automatically contoured for quantification of ventricular mass
and functional indices. Ventricular mass index [ratio of RV over
left ventricular (LV) mass] was derived for all groups. The Mann-Whitney test was used for direct comparisons. Correlation
between SMT mass and MR derived cardiac functional indices as
well as catheter derived hemodynamic parameters was tested
using Spearman’s rho correlation.
Results: In all subjects, the SMT was observed in the RV;
however, the morphology was highly variable. The SMT mass was
greater in PAH patients compared to controls, 5.0 ± 3.9 g and
1.2 ± 0.7 g respectively (P = 0.0001). Similarly, significant differ-
ences in SMT mass were also noted between controls and each
subgroup: IPAH (p < 0.001) and SSc (p < 0.01). In PAH patients,
SMT mass showed significant correlations with catheter derived
pulmonary hemodynamics mPAP (r = 0.4, p = 0.032) and PA
systolic pressure (r = 0.4, p = 0.01). It also demonstrated good
positive correlations with RV end diastolic mass indexed to body
surface area (RVED mass/BSA r = 0.5, p = 0.006), VMI (r = 0.56,
p = 0.001), RV end systolic volume/BSA (r = 0.4, p = 0.01)
whereas, it correlated inversely with RV stroke volume (r =
-0.5, p = 0.003) and RV ejection fraction (r = -0.6, p = 0.0001).
SMT mass displayed stronger correlations with IPAH RV
structural and functional indices compared to patients with
Scleroderma. Interobserver concordance for SMT mass quanti-
fication was r = 0.95, (p = 0.0001). Figures 1, 2 and 3
Conclusion: SMT/moderator band complex hypertrophy was
seen in all PAH patients studied. Degree of SMT hypertrophy
correlated with RV systolic function and pulmonary hemody-
namics. The SMT is a unique RV anatomical structure which
contributes to RV adaptation mechanisms in chronic PAH. It is
readily assessed with cardiac MRI and aides in the diagnosis of
PAH.
References1. James TN: J Am Coll Cardiol 1985, 6(5):1083–1095.2. Kilner PJ, et al: J Cardiovasc Magn Reson 2002, 4(3):373–379.
P92Late gadolinium enhancement and T2MR imaging features of cardiac sarcoidosisinvolving the left and right ventricleVarghese Cherian, Hersh Chandarana, Ruth P Lim,Leon Axel, Danny Kim and Monvadi B SrichaiNYU Langone Medical Center, New York, NY, USA
Journal of Cardiovascular Magnetic Resonance 2009, 11(Suppl 1):P92
Objective: To evaluate the presence and location of late
gadolinium enhancement (LGE), increased T2 signal abnormality,
right ventricular involvement and cardiac function by cardiac
magnetic resonance (CMR) imaging in patients with suspected
cardiac sarcoidosis.
Materials and methods: 46 patients with known extra-
cardiac sarcoidosis underwent CMR with T2-weighted, LGE
and cine imaging for evaluation of cardiac sarcoidosis. Images
were evaluated by 2 expert reviewers in consensus using the 17-
segment model of the left ventricle (LV) for presence and
location (subepicardial, midwall, subendocardial or transmural)
of LGE, presence of increased T2-signal abnormalities, and
regional wall motion abnormalities. In addition, right ventricular
(RV) involvement was evaluated.
Results: 13 of 46 (28%) patients demonstrated evidence of
segmental LGE suggestive of cardiac sarcoidosis. In these
13 patients, LGE involvement was noted in 51 of 221 (23%)
segments, and was predominantly transmural (35%), followed by
midwall (27%), subepicardial (25%) and subendocardial (20%).
LGE was most frequently located in the basal segments (36%)
compared to mid (23%) and apical (22%) segments, and more
commonly involved the septal (37%) followed by the lateral
(29%), inferior (23%) and anterior (10%) segments. T2-weighted
images were evaluable in 11 of the 13 patients, and 24 of
187 segments (13%) demonstrated evidence of increased T2-
signal abnormality and was significantly associated with the LGE
segmental involvement (p < 0.005). 4 patients (31%) also
demonstrated evidence of RV involvement. There was no
significant correlation between presence of LGE or increased
T2-signal intensity with regional function.
Conclusion: Late gadolinium enhancement and increased T2-
signal intensity are common findings in the left ventricle in
patients with cardiac sarcoidosis, but not necessarily correlated
with overall ventricular size and function. Although not
previously reported, similar findings are frequently present in
the right ventricle as well.
P93Fatty liver in uncomplicated type 2 DM isassociated with impaired myocardial HEPmetabolism, modulated by myocardialglucose uptakeJacqueline T Jonker1, Rutger W van der Meer1,Luuk J Rijzewijk2, Adriaan A Lammertsma3,Michaela Diamant2, Johannes WA Smit1, Albert de Roos1,Johannes A Romijn1 and Hildo J Lamb11Leiden University Medical Centre, Leiden, Netherlands2Diabetes Centre, VU University Medical Centre, Amsterdam,Netherlands3VU University Medical Centre, Amsterdam, Netherlands
Journal of Cardiovascular Magnetic Resonance 2009, 11(Suppl 1):P93
Purpose: To study the associations between fatty liver (FL),
insulin resistance, myocardial high-energy-phosphate (HEP) and
glucose metabolism, and heart function in patients with
uncomplicated type 2 diabetes mellitus (T2DM).
Materials and methods: We studied 35 T2DM patients
(Mean ± SD Hba1c = 7.0 ± 0.8%) without coronary artery
disease or heart failure, as determined by echocardiography.1H-MRS of the liver for the assessment of liver fat, myocardial31P-MRS for assessment of myocardial HEP metabolism and MRI
to determine left ventricular function were performed. Further-
more, a hyperinsulinemic, euglycemic clamp was performed to
establish whole body insulin sensitivity. Moreover, PET with
H215O (fasting conditions) and [18F]-2-fluoro-2-deoxy-D-glucose
(clamp conditions) were used to determine myocardial blood
flow (MBF) and myocardial metabolic rate of glucose uptake
(MMRglu) in a subgroup of 28 patients.
Results: Patients with FL (liver: fat/water ratio > 5%, n = 17)
showed increased body mass index (29.5 ± 3.2 vs 27.2 ± 2.8 kg/m2,
Journal of Cardiovascular Magnetic Resonance 2009, 11(Suppl 1) http://jcmr-online.com/supplements/11/S1
Page 157 of 316(page number not for citation purposes)

p < 0.05), reduced whole body insulin sensitivity (0.45 ± 0.48 vs
0.74 ± 0.44 (mg/kg·min)/(pmol/L), p < 0.05), and reduced
MMRglu (0.21 ± 0.13 vs 0.34 ± 0.14 mmol/mL/min, p < 0.05),
as compared with patients without FL, while MBF was not
different. The ratio of phosphocreatine over adenosine tripho-
sphate, a marker of myocardial HEP metabolism, was reduced in
patients with FL (1.90 ± 0.35 versus 2.27 ± 0.29; p < 0.05), also
after adjustment for BMI, and correlated to MMRglu (r = 0.43,
p < 0.05). LV systolic and diastolic function were not statistically
significantly different. Figure 1
Conclusion: Fatty liver in patients with uncomplicated T2DM
is associated with decreased myocardial HEP metabolism. In
addition myocardial HEP metabolism is modulated by myocardial
glucose uptake.
P94Incongruity of LVH regression withpersistent inopportune diastolic dysfunction;results following AVR for severe aortic stenosis.Sponsored by the American Heart AssociationRobert WW Biederman, Ronald B Williams,Saundra B Grant, Wadih Nadour, Vikas K Rathi,Diane A Vido, June Yamrozik, Geetha Rayarao,James A Magovern and Mark DoyleAllegheny General Hospital, The Gerald McGinnisCardiovascular Institute, Pittsburgh, PA, USA
Journal of Cardiovascular Magnetic Resonance 2009, 11(Suppl 1):P94
Background: Very elegant invasive animal and human studies
have demonstrated that in subjects with pressure overload due
to severe aortic stenosis (AS), following aortic valve replacement
(AVR), while myocyte regression is quite rapid, interstitial
collagen content regression lags.
We hypothesize that this discord manifests as a thwarted
improvement in diastolic function as related to LVH regression
after AVR for AS.
Methods: Ten patients with severe, but compensated AS
underwent 4 serial 3D cardiac MRIs (CMR) with 1.5 T EXCITE
(GE Milwaukee, WI) out to 4 years (40 time-points: baseline,
6 months, 1 year and up to 4 years). 3D LV volumetrics were
measured. LV diastolic function was assessed by a phase velocity
mapping slice placed at the tips of the mitral valve leaflets,
acquired in a through-plane manner with temporal resolution of
25 ± 5 ms. Interrogation of resultant time-velocity curves was
performed to resolve: 1) E:A ratio as mean and peak absolute and
relative velocities 2) deceleration time. Figure 1.
Results: All patients survived AVR and were available for serial
follow-up over 4 time periods (mean 3 ± 1) out to 4 years. E:A
ratios and/or morphology almost uniformly improved (9/10 pts)
from 0.9:1 to 1.7:1 (p < 0.005), including 4 patients improving
one complete grade. This was moderately well correlated with
LV mass index regression (r = 0.55, p = < 0.05). Deceleration
time also improved (233 vs. 192 ms, p < 0.005). While EF
improved (55 ± 22 to 65 ± 11%, p < 0.05), as did LV geometry
(1.07 ± 0.2 to 0.94 ± 0.24 g/m2, p < 0.05), neither were tightly
correlated with improvements in diastolic function. However,
using predictive modeling from historic controls, the improve-
ment seen in diastolic function was incomplete and tardy.
Specifically, while there were 4 patients that returned to normal
diastolic function as per morphologic criteria, even these patients
did not return to pre-morbid e:a ratios or deceleration times of
the normal historic cohort. It followed that the remaining
patients, except for one, improved only in arithmatic metrics.
Importantly, while the LVH regresssed quickly, most occured
within the first 6 months, there was a lag in diastolic function
improvement by >12 months.
Conclusion: Following AVR for severe AS, as expected,
marked improvements in LV mass regression occur; however,
improvements in diastolic physiology are incomplete and quite
tardy, not paralleling structural changes. Pathophysiologically, it is
likely that the interstitium, failing to be as heavily modulated by
relief of pressure overload as are the myocytes, contributes to a
paradoxical increase in diastolic stiffness. This interplay between
collagen content and myocyte results in a less than expected
improvement in myocardial diastolic properties following after-
load relief contributing to residual dyspnea.
Figure 1 (abstract P93)
Myocardial HEP metabolism in patients with DM2. PCr/ATP ratio = ratio
of phosphocreatine over adenosine triphosphate. *P < 0.05.
Figure 1 (abstract P94)
Journal of Cardiovascular Magnetic Resonance 2009, 11(Suppl 1) http://jcmr-online.com/supplements/11/S1
Page 158 of 316(page number not for citation purposes)
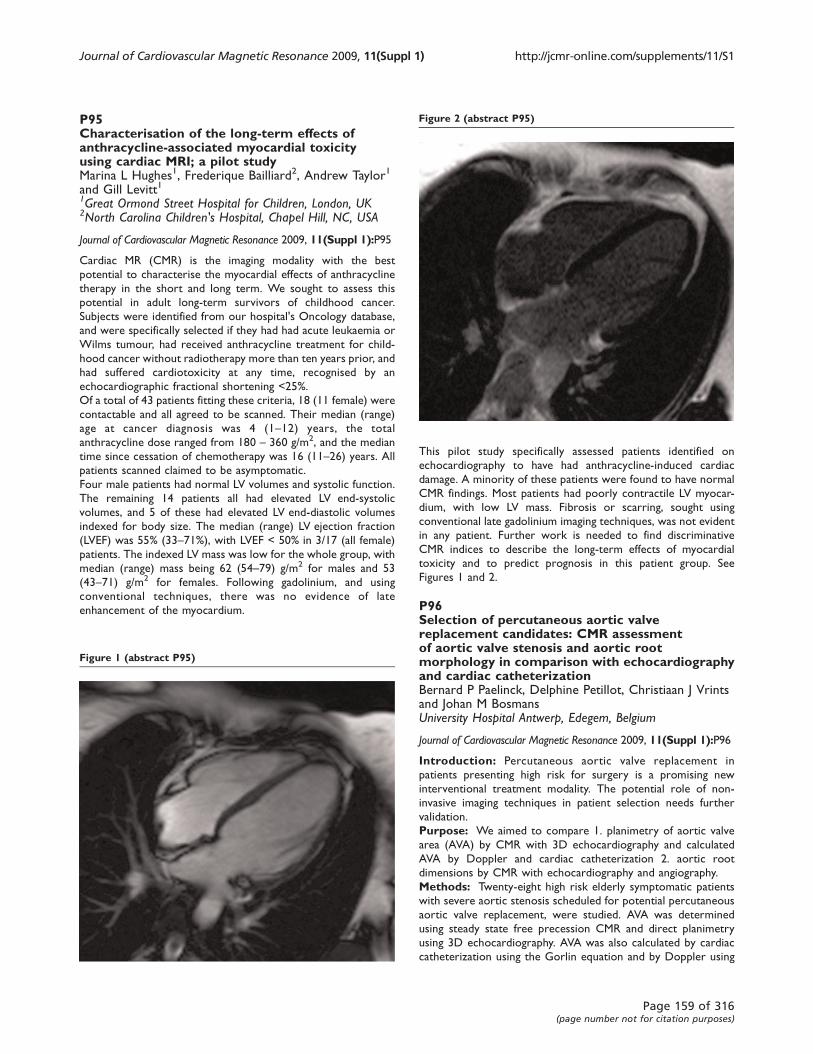
P95Characterisation of the long-term effects ofanthracycline-associated myocardial toxicityusing cardiac MRI; a pilot studyMarina L Hughes1, Frederique Bailliard2, Andrew Taylor1
and Gill Levitt11Great Ormond Street Hospital for Children, London, UK2North Carolina Children's Hospital, Chapel Hill, NC, USA
Journal of Cardiovascular Magnetic Resonance 2009, 11(Suppl 1):P95
Cardiac MR (CMR) is the imaging modality with the best
potential to characterise the myocardial effects of anthracycline
therapy in the short and long term. We sought to assess this
potential in adult long-term survivors of childhood cancer.
Subjects were identified from our hospital's Oncology database,
and were specifically selected if they had had acute leukaemia or
Wilms tumour, had received anthracycline treatment for child-
hood cancer without radiotherapy more than ten years prior, and
had suffered cardiotoxicity at any time, recognised by an
echocardiographic fractional shortening <25%.
Of a total of 43 patients fitting these criteria, 18 (11 female) were
contactable and all agreed to be scanned. Their median (range)
age at cancer diagnosis was 4 (1–12) years, the total
anthracycline dose ranged from 180 – 360 g/m2, and the median
time since cessation of chemotherapy was 16 (11–26) years. Allpatients scanned claimed to be asymptomatic.
Four male patients had normal LV volumes and systolic function.
The remaining 14 patients all had elevated LV end-systolic
volumes, and 5 of these had elevated LV end-diastolic volumes
indexed for body size. The median (range) LV ejection fraction
(LVEF) was 55% (33–71%), with LVEF < 50% in 3/17 (all female)
patients. The indexed LV mass was low for the whole group, with
median (range) mass being 62 (54–79) g/m2 for males and 53
(43–71) g/m2 for females. Following gadolinium, and using
conventional techniques, there was no evidence of late
enhancement of the myocardium.
This pilot study specifically assessed patients identified on
echocardiography to have had anthracycline-induced cardiac
damage. A minority of these patients were found to have normal
CMR findings. Most patients had poorly contractile LV myocar-
dium, with low LV mass. Fibrosis or scarring, sought using
conventional late gadolinium imaging techniques, was not evident
in any patient. Further work is needed to find discriminative
CMR indices to describe the long-term effects of myocardial
toxicity and to predict prognosis in this patient group. See
Figures 1 and 2.
P96Selection of percutaneous aortic valvereplacement candidates: CMR assessmentof aortic valve stenosis and aortic rootmorphology in comparison with echocardiographyand cardiac catheterizationBernard P Paelinck, Delphine Petillot, Christiaan J Vrintsand Johan M BosmansUniversity Hospital Antwerp, Edegem, Belgium
Journal of Cardiovascular Magnetic Resonance 2009, 11(Suppl 1):P96
Introduction: Percutaneous aortic valve replacement in
patients presenting high risk for surgery is a promising new
interventional treatment modality. The potential role of non-
invasive imaging techniques in patient selection needs further
validation.
Purpose: We aimed to compare 1. planimetry of aortic valve
area (AVA) by CMR with 3D echocardiography and calculated
AVA by Doppler and cardiac catheterization 2. aortic root
dimensions by CMR with echocardiography and angiography.
Methods: Twenty-eight high risk elderly symptomatic patients
with severe aortic stenosis scheduled for potential percutaneous
aortic valve replacement, were studied. AVA was determined
using steady state free precession CMR and direct planimetry
using 3D echocardiography. AVA was also calculated by cardiac
catheterization using the Gorlin equation and by Doppler using
Figure 1 (abstract P95)
Figure 2 (abstract P95)
Journal of Cardiovascular Magnetic Resonance 2009, 11(Suppl 1) http://jcmr-online.com/supplements/11/S1
Page 159 of 316(page number not for citation purposes)
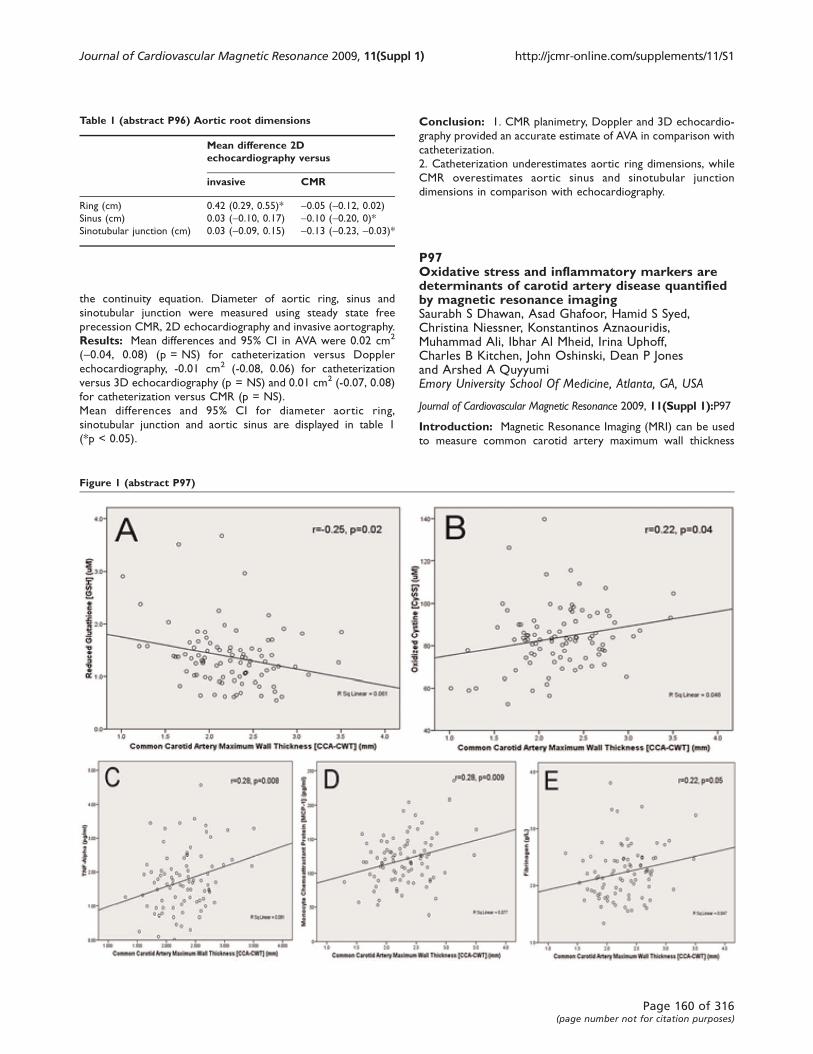
the continuity equation. Diameter of aortic ring, sinus and
sinotubular junction were measured using steady state free
precession CMR, 2D echocardiography and invasive aortography.
Results: Mean differences and 95% CI in AVA were 0.02 cm2
(-0.04, 0.08) (p = NS) for catheterization versus Doppler
echocardiography, -0.01 cm2 (-0.08, 0.06) for catheterization
versus 3D echocardiography (p = NS) and 0.01 cm2 (-0.07, 0.08)
for catheterization versus CMR (p = NS).
Mean differences and 95% CI for diameter aortic ring,
sinotubular junction and aortic sinus are displayed in table 1
(*p < 0.05).
Conclusion: 1. CMR planimetry, Doppler and 3D echocardio-
graphy provided an accurate estimate of AVA in comparison with
catheterization.
2. Catheterization underestimates aortic ring dimensions, while
CMR overestimates aortic sinus and sinotubular junction
dimensions in comparison with echocardiography.
P97Oxidative stress and inflammatory markers aredeterminants of carotid artery disease quantifiedby magnetic resonance imagingSaurabh S Dhawan, Asad Ghafoor, Hamid S Syed,Christina Niessner, Konstantinos Aznaouridis,Muhammad Ali, Ibhar Al Mheid, Irina Uphoff,Charles B Kitchen, John Oshinski, Dean P Jonesand Arshed A QuyyumiEmory University School Of Medicine, Atlanta, GA, USA
Journal of Cardiovascular Magnetic Resonance 2009, 11(Suppl 1):P97
Introduction: Magnetic Resonance Imaging (MRI) can be used
to measure common carotid artery maximum wall thickness
Table 1 (abstract P96) Aortic root dimensions
Mean difference 2Dechocardiography versus
invasive CMR
Ring (cm) 0.42 (0.29, 0.55)* -0.05 (-0.12, 0.02)Sinus (cm) 0.03 (-0.10, 0.17) -0.10 (-0.20, 0)*Sinotubular junction (cm) 0.03 (-0.09, 0.15) -0.13 (-0.23, -0.03)*
Figure 1 (abstract P97)
Journal of Cardiovascular Magnetic Resonance 2009, 11(Suppl 1) http://jcmr-online.com/supplements/11/S1
Page 160 of 316(page number not for citation purposes)
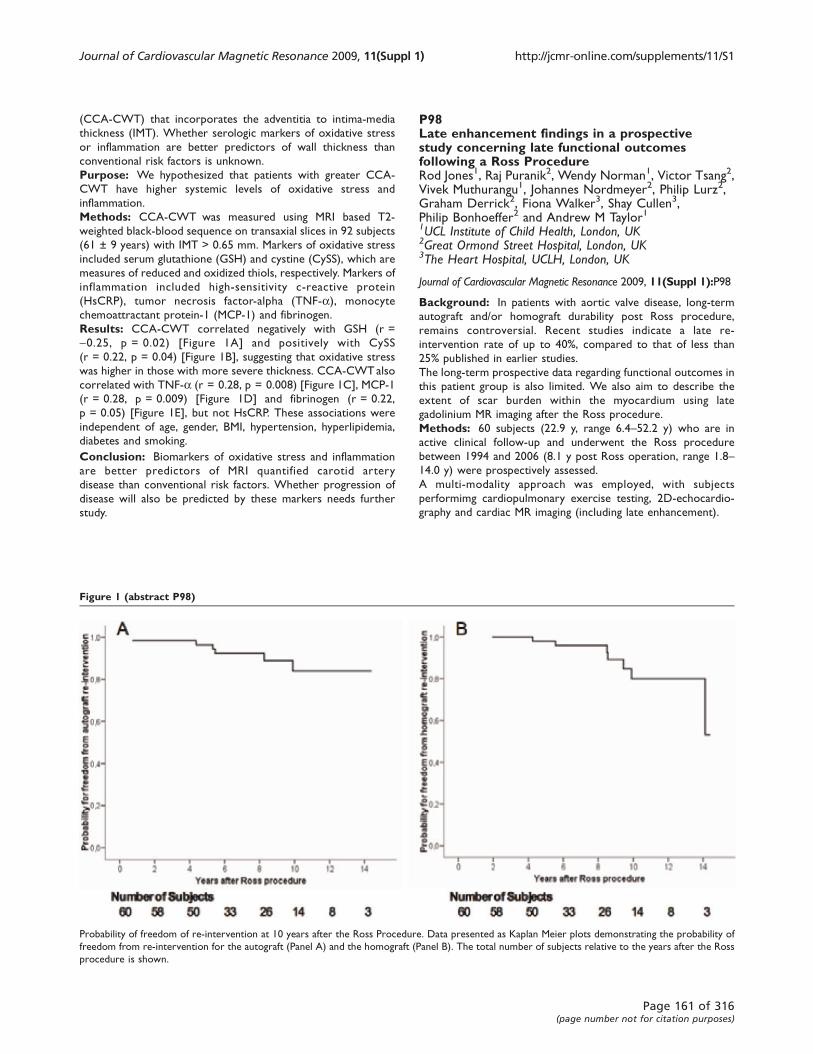
(CCA-CWT) that incorporates the adventitia to intima-media
thickness (IMT). Whether serologic markers of oxidative stress
or inflammation are better predictors of wall thickness than
conventional risk factors is unknown.
Purpose: We hypothesized that patients with greater CCA-
CWT have higher systemic levels of oxidative stress and
inflammation.
Methods: CCA-CWT was measured using MRI based T2-
weighted black-blood sequence on transaxial slices in 92 subjects
(61 ± 9 years) with IMT > 0.65 mm. Markers of oxidative stress
included serum glutathione (GSH) and cystine (CySS), which are
measures of reduced and oxidized thiols, respectively. Markers of
inflammation included high-sensitivity c-reactive protein
(HsCRP), tumor necrosis factor-alpha (TNF-a), monocyte
chemoattractant protein-1 (MCP-1) and fibrinogen.
Results: CCA-CWT correlated negatively with GSH (r =
-0.25, p = 0.02) [Figure 1A] and positively with CySS
(r = 0.22, p = 0.04) [Figure 1B], suggesting that oxidative stress
was higher in those with more severe thickness. CCA-CWTalso
correlated with TNF-a (r = 0.28, p = 0.008) [Figure 1C], MCP-1
(r = 0.28, p = 0.009) [Figure 1D] and fibrinogen (r = 0.22,
p = 0.05) [Figure 1E], but not HsCRP. These associations were
independent of age, gender, BMI, hypertension, hyperlipidemia,
diabetes and smoking.
Conclusion: Biomarkers of oxidative stress and inflammation
are better predictors of MRI quantified carotid artery
disease than conventional risk factors. Whether progression of
disease will also be predicted by these markers needs further
study.
P98Late enhancement findings in a prospectivestudy concerning late functional outcomesfollowing a Ross ProcedureRod Jones1, Raj Puranik2, Wendy Norman1, Victor Tsang2,Vivek Muthurangu1, Johannes Nordmeyer2, Philip Lurz2,Graham Derrick2, Fiona Walker3, Shay Cullen3,Philip Bonhoeffer2 and Andrew M Taylor11UCL Institute of Child Health, London, UK2Great Ormond Street Hospital, London, UK3The Heart Hospital, UCLH, London, UK
Journal of Cardiovascular Magnetic Resonance 2009, 11(Suppl 1):P98
Background: In patients with aortic valve disease, long-term
autograft and/or homograft durability post Ross procedure,
remains controversial. Recent studies indicate a late re-
intervention rate of up to 40%, compared to that of less than
25% published in earlier studies.
The long-term prospective data regarding functional outcomes in
this patient group is also limited. We also aim to describe the
extent of scar burden within the myocardium using late
gadolinium MR imaging after the Ross procedure.
Methods: 60 subjects (22.9 y, range 6.4–52.2 y) who are in
active clinical follow-up and underwent the Ross procedure
between 1994 and 2006 (8.1 y post Ross operation, range 1.8–14.0 y) were prospectively assessed.
A multi-modality approach was employed, with subjects
performimg cardiopulmonary exercise testing, 2D-echocardio-
graphy and cardiac MR imaging (including late enhancement).
Figure 1 (abstract P98)
Probability of freedom of re-intervention at 10 years after the Ross Procedure. Data presented as Kaplan Meier plots demonstrating the probability of
freedom from re-intervention for the autograft (Panel A) and the homograft (Panel B). The total number of subjects relative to the years after the Ross
procedure is shown.
Journal of Cardiovascular Magnetic Resonance 2009, 11(Suppl 1) http://jcmr-online.com/supplements/11/S1
Page 161 of 316(page number not for citation purposes)
Late enhancement scar imaging within the myocardium was
performed with segmented phase-sensitive inversion recovery
sequences (Image parameters – TR = 2 × RR interval; TE =
3.4 ms; flip angle = 25°; slice thickness = 10 mm; matrix =
144 × 256; field of view = 300–380 mm, acquired during a single
breath-hold) 10 minutes post administration of intravenous
contrast (0.1 mmol/kg of gadolinium pentatate, Magnevist).
Imaging included the entire short-axis and long axis planes.
A ‘Look-locker’ sequence was used to determine the inversion
time, which reflected the null point of the normal myocardium.
The volume of scar within the myocardium was expressed as a %
of the total LV volume.
Results: 80% of subjects had aortic stenosis as their original
diagnosis (43% biscuspid aortic valves). The probability of
freedom from re-intervention on the autograft and the homo-
graft at 10 years was 84% and 80% respectively (Figure 1). On
exercise testing, the mean exercise capacity achieved was
87 ± 23% of predicted. On 2D-echocardiography the peak
velocity across the autograft and homograft was 1.3 ± 0.4 m/sec
and 2.6 ± 0.6 m/sec respectively. Cardiac MR imaging identified
only trivial mean autograft and homograft regurgitation
(5.9 ± 7.6% and 6.4 ± 9.3% respectively). Biventricular systolic
function was normal (LV EF 63 ± 6% and RV EF 61 ± 7%).
55/60 subjects underwent delayed enhancement studies with
intravenous gadolinium. 18/55 subjects (33%) had evidence of
myocardial scar within the LV (Table 1). The mean scar volume
within the LV was 6.0 ± 5.0 cm3 and mean % of scar within the
left ventricle was 5.4 ± 8.5%. In 5/9 cases of septal wall scar the
surgeon had commented on bleeding at the time of autograft
harvest. There was no significant relationship between LV scar
and baseline ECG abnormalities (p = 1.0).
Conclusion: Results show, many years after the Ross proce-
dure, there is excellent autograft and homograft function,
translating into high functional capacity. Institution based
re-intervention rates of less than 20% are in agreement with
earlier published work.
We provide the first description of the extent of scar burden
within the LV myocardium using late gadolinium MR imaging after
the Ross procedure. The predominant distribution of LV scar was
identified within the LV septum (50% of cases). This is likely
mainly related to technical aspects surrounding the autograft
harvest, site’s proximity to septal coronary vessels.
Although in our study we found no association between LV scar
burden and ECG abnormalities, the prognostic significance of
these findings may only be truly deciphered after longer-term
follow-up.
P99Enlarged right ventricular size at 11 yearsfollow-up after closure of secundum type atrialseptal defect in childrenWilfred B de Koning, Saskia E Luijnenburg,Lennie M van Osch-Gevers, Derk Jan ADJ ten Harkel,Daniëlle Robbers-Visser, Ron T van Domburg,Ad JJC Bogers and Willem A HelbingErasmus MC, Rotterdam, Netherlands
Journal of Cardiovascular Magnetic Resonance 2009, 11(Suppl 1):P99
Objective: to assess ventricular dimensions, exercise capacity
and rhythm-status of patients operated for secundum type atrial
septal defect (ASD-II) and compare the results with those in
healthy references.
Background: Long-term prognosis of children operated for
ASD-II is excellent. It remains unclear whether right ventricular
(RV) dimensions completely normalize after surgery and whether
this may have implications for (timing of) treatment strategies.
Methods: Seventy-eight consecutive patients underwent surgi-
cal closure for ASD-II between 1990 and 1995. Forty-two
Table 1 (abstract P98)
Pts Gender Age Yearspost Ross
ScarVol (cm3)
Scan as % ofLV volume
Pattern within LV Surgical aspects
1 F 48.4 5.2 1.9 1.8 Apex (SE) N/A
2 M 52.1 8.8 9.1 9.9 Mid to distal septum (SE), Apex (SE) N/A
3 M 19.3 5.8 3.3 1.9 Basal septum (FT) Bleeding at autograft harvest
4 F 22.3 5.7 3.1 3.0 Basal septum (SE) N/A
5 M 16.7 8.2 1.9 1.4 Apex (FT) N/A
6 M 20.7 5.6 7.8 4.8 Basal septum (FT) Bleeding at autograft harvest
7 F 33.8 5.5 6.3 4.5 Basal septum (FT) and Apex (FT) N/A
8 F 32.8 8.7 2.9 1.4 Apex (FT) N/A
9 M 34.6 6.2 0.9 0.5 Mid septum (SE) Anomolous coronary anatomy, no
bleeding
10 M 6.4 5.8 17.3 37.6 Complete ring enhancement of LV SE Endocardial fibroelastosis
11 M 22.3 6.2 2.5 1.9 Basal lateral wall (FT) N/A
12 M 24.7 10.3 19.0 10.2 Antero-septal (FT) Small branch coronary vessel divided
at autograft harvest
13 M 26.7 12.2 6.9 3.9 Basal septum (FT) and Apex (SE) Bleeding at autograft harvest
14 M 27.1 13.4 1.9 1.1 Apex (SE) Minor bleeding at autograft harvest
15 M 25.2 13.0 4.0 2.8 Apex (SE) N/A
16 M 23.3 12.0 7.2 4.4 Antero-septal (FT) Small branch coronary vessel divided
at autograft harvest
17 M 38.5 13.9 4.9 3.1 Inferior-posterior (SE) N/A
18 M 24.7 13.9 6.7 3.5 Inferior (SE) N/A
SE = subendocardium, FT = full thickness.
Journal of Cardiovascular Magnetic Resonance 2009, 11(Suppl 1) http://jcmr-online.com/supplements/11/S1
Page 162 of 316(page number not for citation purposes)
patients were included in this study and underwent a cross-
sectional evaluation including echocardiography, cardiovascular
magnetic resonance (CMR) imaging, exercise testing, and
24-hours Holter monitoring. For comparison of the results,
ASD-II patients were matched with healthy controls for gender,
body surface area (BSA) and age.
Results: Mean age at surgery was 4.6 ± 2.8 years and mean age
at follow-up 16 ± 3 years. There were no residual intracardiac
lesions. Mean right ventricular end-systolic volume (RVESV) was
significantly larger in patients (142 ± 26 ml) than in references
(137 ± 28 ml) (p = 0.04). In 25% of the patients, RVESV was
larger than the 95th percentile for healthy controls. No relevant
arrhythmias were detected. Exercise testing did not reveal
differences between patients and healthy controls. Maximal
workload (Watt) was 169 ± 43 for patients vs. 172 ± 53 for
controls (p = 0.8), maximal oxygen uptake (ml/kg/min) was
38 ± 8 for patients vs. 41 ± 13 for controls (p = 0.1).
Conclusion: After surgical closure of ASD-II, RVESV is
increased. These findings have no impact on rhythm-status or
exercise capacity at this stage of follow-up, but may have
implications for the timing of surgery or the technique of closure
if confirmed in longer follow-up.
P100Intra-observer and interobserver variabilityof biventricular function, volumes and mass inpatients with congenital heart diseasemeasured by CMR imagingSaskia E Luijnenburg1, Daniëlle Robbers-Visser1,Adriaan Moelker1, Hubert W Vliegen2,Barbara JM Mulder3 and Willem A Helbing11Erasmus MC, Rotterdam, Netherlands2Leiden University Medical Center, Leiden, Netherlands3Amsterdam Medical Center, Amsterdam, Netherlands
Journal of Cardiovascular Magnetic Resonance 2009, 11(Suppl 1):P100
Objective: The aim of this study was to assess intra-observer
and interobserver variability of biventricular function, volumes
and mass in a heterogeneous group of patients with congenital
heart disease (CHD) using cardiovascular magnetic resonance
(CMR) imaging.
Background: CMR imaging provides highly accurate measure-
ments of biventricular volumes and mass and is frequently used in
the follow-up of patients with acquired and congenital heart
disease. Data on reproducibility are limited in patients with CHD,
while measurements should be reproducible, since CMR imaging
has a main contribution to decision making and timing of (re)
interventions.
Methods: Thirty-five patients with CHD (26 males, 9 females;
age range 7 – 62 years) were included in this study. A short axis
set of contiguous slices was acquired with CMR imaging using a
steady-state free precession (SSFP) pulse sequence. Intra-
observer and interobserver variability was assessed for left
ventricular (LV) and right ventricular (RV) volumes, function and
mass by calculating the coefficient of variability.
Results: Intra-observer variability was between 2.9% and 6.8%,
with the smallest variations in LV and RV end-diastolic volume
(EDV) and the highest variations in LV end-systolic volume (ESV)
and RV mass. Interobserver variability was between 3.9% and
10.2%, with the smallest variations in LV ejection fraction (EF)
and RV EDV and the highest variations in biventricular ESV and
mass.
Conclusion: Intra-observer and interobserver variability of
biventricular parameters assessed by CMR imaging is good for a
heterogeneous group of patients with CHD. CMR imaging is an
accurate and reliable method for follow-up of biventricular
function, volumes and mass and should allow adequate assess-
ment of changes in ventricular size and global ventricular
function.
Supported by NHF grant 2006B095
P101CMR tagging for measurement of the long axisfunction and deformation rate of the systemic rightventricular free wallSylvia SM Chen1, Jenny Keegan2,3, Andrew W Dowsey4,5,Rick Wage1,6, David N Firmin2,3 and Philip J Kilner21Royal Brompton Hospital, London, UK2Royal Brompton Hospital and Imperial College, London, UK3The Brompton Hospital and Imperial College London,London, UK4Imperial College, London, UK5Imperial College London, London, UK6The Brompton Hospital, London, UK
Journal of Cardiovascular Magnetic Resonance 2009, 11(Suppl 1):P101
Introduction: Although the systemic right ventricle (RV) in
transposition of the great arteries generally functions well
through childhood, it typically shows signs of failure later in
life. Ejection fraction has been used as a cardiac magnetic
resonance imaging (CMR) measurement of systemic RV function,
but it is not easy to measure reproducibly due to complex
geometry and prominent trabeculations, and may fail to detect
early changes. Early detection of dysfunction could be advanta-
geous, for example for trial and eventual implementation of a
prospective pharmacological therapy.
Purpose: We aimed to use CMR tagging of the free wall of the
RV, with semi-automated analysis, as a measurement of RV long
axis function, comparing findings with multislice CMR measure-
ments of ejection fraction, in patients with Mustard operation for
transposition of the great arteries (OTGA), or with unoperated
congenitally corrected transposition of the great arteries
(CCTGA).
Methods: A breath hold four chamber steady state free
precession cine dataset was acquired, followed by a breath
hold cine gradient-echo echo-planar tagged acquisition in the
same plane. Two pre-pulse labelled tag lines were applied
immediately after the R wave, one across the basal RV
myocardium and the other located 40 mm apical of the first.
Motion of the tagged myocardium was tracked automatically by
multi-resolution image registration so that the position of the
tags, and their individual and relative displacements, could be
derived throughout the cardiac cycle using semi-automated
software. The RV free wall deformation rate was calculated by
dividing the amount of deformation (the difference between the
displacements of the basal and apical tag) by the time to
maximum displacement of the basal tag (m/s).
Results: Twelve patients (6 OTGA, age 30 ± 7 years and
6 CCTGA, age 35 ± 12 years) were studied and compared to
6 control subjects (age 31 ± 9 years). Basal RV myocardial
displacements in both OTGA and CCTGA were reduced
Journal of Cardiovascular Magnetic Resonance 2009, 11(Suppl 1) http://jcmr-online.com/supplements/11/S1
Page 163 of 316(page number not for citation purposes)
compared to control subjects (12 ± 5 and 20 ± 4 vs 25 ± 2 mm,
p = 0.0003 and p = 0.03 respectively). Basal myocardial displace-
ment in OTGA was more impaired than CCTGA (p = 0.007).
The RV myocardial deformation rates in both OTGA and
CCTGA were slower than in control subjects (0.03 ± 0.02 and
0.03 ± 0.02 vs 0.07 ± 0.02 m/s, p = 0.03 and p = 0.02 respec-
tively). Ejection fractions did not differ significantly between
patients and controls: OTGA 52 ± 7% and CCTGA 63 ± 12% vs
control subjects 57 ± 4% (p = 0.2 and p = 0.5 respectively).
Conclusion: RV free wall tagging by CMR with semi-automated
analysis showed reduction of RV free wall motion and deforma-
tion rate in the patients relative to the controls in the absence of
significant differences of volumetric ejection fraction. The
reduction is likely to result from pressure loading in both patient
groups. Greater reduction in OTGA than CCTGA may be a
consequence of surgery in patients who had undergone atrial
switch repair. RV free wall tagging could provide a relatively quick
and simple method for longitudinal comparison of systemic RV
myocardial function.
P102Improved accuracy in flow mapping of congenitalheart disease using stationary phantom techniqueThomas A Miller and Adrian M MoranMaine Medical Center, Portland, ME, USA
Journal of Cardiovascular Magnetic Resonance 2009, 11(Suppl 1):P102
Objective: We aimed to define the differences between flow
mapping with and without baseline correction using a stationary
phantom when evaluating congenital heart disease (CHD).
Background: Flow mapping by cardiovascular magnetic reso-
nance (CMR) has become the gold standard for defining cardiac
output, shunt flow and regurgitation. Previous reports have
highlighted the presence of inherent errors in flow mapping by
CMR secondary to eddy currents and concomitant gradients.
The use of a stationary phantom to control for these errors can
improve predicted Qp/Qs ratios in normal volunteers. To our
knowledge, no one has investigated the effect of phantom
correction in CHD.
Methods: All patients were imaged using GE 1.5 T Signa HDX
systems. Phase velocity flow mapping by CMR was performed
when clinically indicated on 20 patients with repaired Tetrology
of Fallot (ToF), 7 patients with atrial level shunting (ASD/PAPVR),
and 13 patients with bicuspid aortic valves (BAV). Flow velocities
through the ascending aorta, main pulmonary artery (MPA) and
proximal branch pulmonary arteries (BPA) were calculated using
commercially available software (ReportCard) by placing a region
of interest (ROI) around the vessel lumen. Flow velocities were
then corrected by measuring baseline velocities in a ROI of the
same size and location on a corresponding stationary phantom
image. Comparison was then made between the uncorrected and
corrected flows, degree of shunting, and regurgitant fraction.
Qp/Qs was calculated as the ratio of net BPA flow to aortic flow.
Results: Marked variation in net flow was seen in all vessels
(Table 1). The variation in net flow was largest when analyzing the
MPA/RVOT with a range of 0.2 to 70 ml/min (0.3–107.5%difference). In repaired ToF patients, the average Qp:Qs ratio was
1.03 with phantom correction and 1.15 without. Based on
previously published criteria, 26% of the ToF group would have
been incorrectly classified as having a residual shunt without
performing phantom correction. In the ASD/PAPVR group 100%
had significant shunting with phantom correction, while only 71%
of uncorrected flows detected significant shunting. In the BAV
group, the differences in the regurgitant fraction ranged from
0 to 31%. 23% of the patients changed their classification
between mild, moderate and severe regurgitation when the
phantom was performed.
Conclusion: The impact of inherent errors in CMR flow
mapping should not be underestimated. The range of variation, in
common CHD, appears large and varied. Failure to correct for
such variation can lead to clinically significant misinterpretation
of flow data. The use of the stationary phantom correction
technique appears to improve flow accuracy in patients with
CHD. Further research is needed to elicit the causes and best
control of such errors.
P103Patient-specific coronary artery supply territoryAHA diagramsMaurice Termeer1, Javier Oliván Bescós2,Marcel Breeuwer2, Anna Vilanova3, Frans Gerritsen2,Eduard Gröller1 and Eike Nagel41Vienna University of Technology, Wien (Vienna), Austria2Philips Healthcare, Best, Netherlands3Eindhoven University of Technology, Eindhoven, Netherlands4King's College London, London, UK
Journal of Cardiovascular Magnetic Resonance 2009, 11(Suppl 1):P103
Introduction: The American Heart Association proposed a
17-segment model for the segmentation of the left ventricle
together with a mapping from each segment to a supplying
coronary artery. This proposal is based on population averages.
Several studies have confirmed the inaccuracy of this mapping
due to large anatomical variations of the coronary arteries
among individuals. Several proposals have been made for a
different mapping between the 17 segments and the coronary
arteries.
Purpose: Due to the large variation in coronary anatomy there
is a need for a patient-specific assignment of ventricular segments
to supplying coronary arteries. We propose to use a segmenta-
tion of the coronary arteries and the ventricular epicardium to
compute this patient-specific mapping.
Table 1 (abstract P102) Differences in net flows between corrected and uncorrected flow mapping
Aorta MPA/RVOT RPA LPA
Avg difference in net flow (ml/min) 12.1 16.8 3.4 6.6
Range of difference in net flow (ml/min) 0.0–68.4 0.2–70 0.1–8.3 0.1–23.1% Difference in net flow (diff/corrected net flow) 13% 25% 8% 20%
Range of %difference 0–62% 0.3–108% 0.3–24% 0.3–59%
Journal of Cardiovascular Magnetic Resonance 2009, 11(Suppl 1) http://jcmr-online.com/supplements/11/S1
Page 164 of 316(page number not for citation purposes)
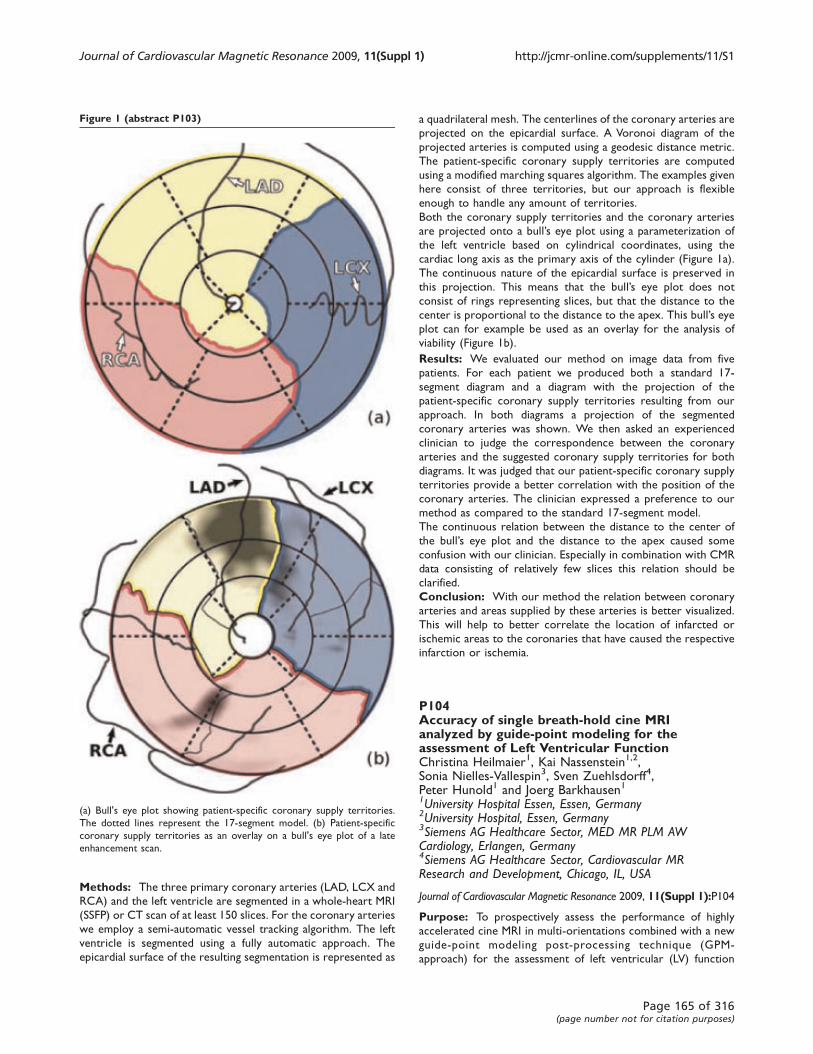
Methods: The three primary coronary arteries (LAD, LCX and
RCA) and the left ventricle are segmented in a whole-heart MRI
(SSFP) or CT scan of at least 150 slices. For the coronary arteries
we employ a semi-automatic vessel tracking algorithm. The left
ventricle is segmented using a fully automatic approach. The
epicardial surface of the resulting segmentation is represented as
a quadrilateral mesh. The centerlines of the coronary arteries are
projected on the epicardial surface. A Voronoi diagram of the
projected arteries is computed using a geodesic distance metric.
The patient-specific coronary supply territories are computed
using a modified marching squares algorithm. The examples given
here consist of three territories, but our approach is flexible
enough to handle any amount of territories.
Both the coronary supply territories and the coronary arteries
are projected onto a bull’s eye plot using a parameterization of
the left ventricle based on cylindrical coordinates, using the
cardiac long axis as the primary axis of the cylinder (Figure 1a).
The continuous nature of the epicardial surface is preserved in
this projection. This means that the bull’s eye plot does not
consist of rings representing slices, but that the distance to the
center is proportional to the distance to the apex. This bull’s eyeplot can for example be used as an overlay for the analysis of
viability (Figure 1b).
Results: We evaluated our method on image data from five
patients. For each patient we produced both a standard 17-
segment diagram and a diagram with the projection of the
patient-specific coronary supply territories resulting from our
approach. In both diagrams a projection of the segmented
coronary arteries was shown. We then asked an experienced
clinician to judge the correspondence between the coronary
arteries and the suggested coronary supply territories for both
diagrams. It was judged that our patient-specific coronary supply
territories provide a better correlation with the position of the
coronary arteries. The clinician expressed a preference to our
method as compared to the standard 17-segment model.
The continuous relation between the distance to the center of
the bull’s eye plot and the distance to the apex caused some
confusion with our clinician. Especially in combination with CMR
data consisting of relatively few slices this relation should be
clarified.
Conclusion: With our method the relation between coronary
arteries and areas supplied by these arteries is better visualized.
This will help to better correlate the location of infarcted or
ischemic areas to the coronaries that have caused the respective
infarction or ischemia.
P104Accuracy of single breath-hold cine MRIanalyzed by guide-point modeling for theassessment of Left Ventricular FunctionChristina Heilmaier1, Kai Nassenstein1,2,Sonia Nielles-Vallespin3, Sven Zuehlsdorff4,Peter Hunold1 and Joerg Barkhausen11University Hospital Essen, Essen, Germany2University Hospital, Essen, Germany3Siemens AG Healthcare Sector, MED MR PLM AWCardiology, Erlangen, Germany4Siemens AG Healthcare Sector, Cardiovascular MRResearch and Development, Chicago, IL, USA
Journal of Cardiovascular Magnetic Resonance 2009, 11(Suppl 1):P104
Purpose: To prospectively assess the performance of highly
accelerated cine MRI in multi-orientations combined with a new
guide-point modeling post-processing technique (GPM-
approach) for the assessment of left ventricular (LV) function
Figure 1 (abstract P103)
(a) Bull's eye plot showing patient-specific coronary supply territories.
The dotted lines represent the 17-segment model. (b) Patient-specific
coronary supply territories as an overlay on a bull's eye plot of a late
enhancement scan.
Journal of Cardiovascular Magnetic Resonance 2009, 11(Suppl 1) http://jcmr-online.com/supplements/11/S1
Page 165 of 316(page number not for citation purposes)
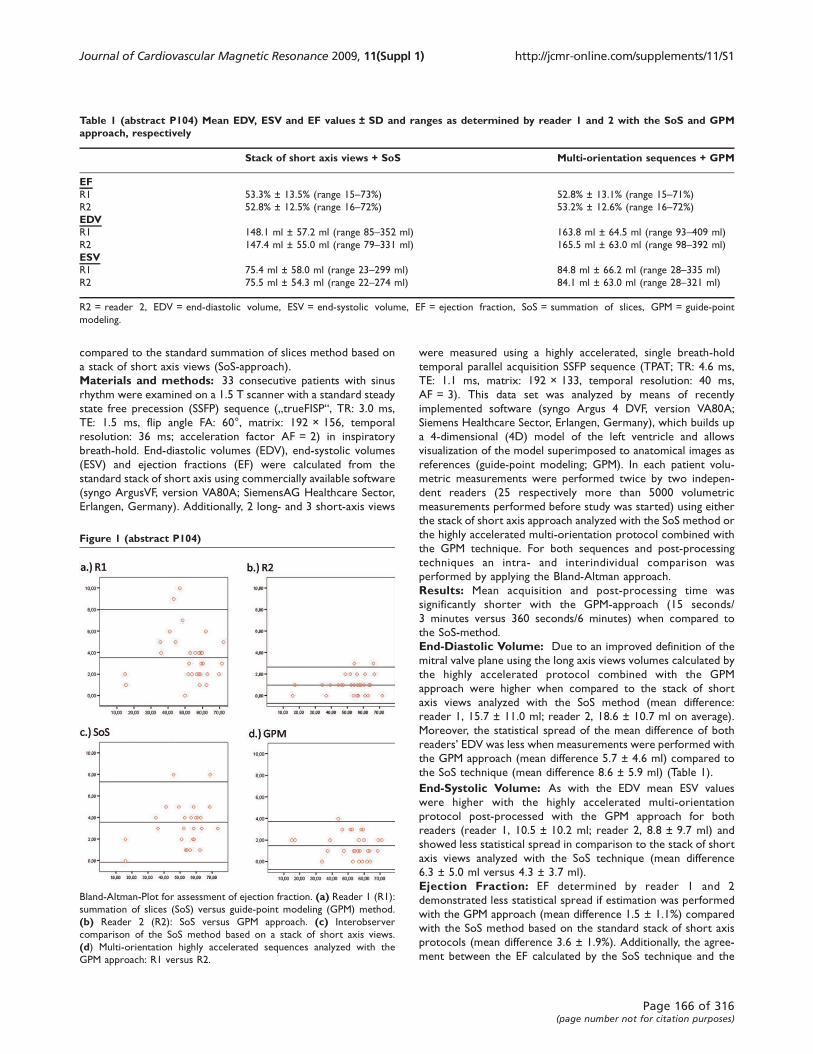
compared to the standard summation of slices method based on
a stack of short axis views (SoS-approach).
Materials and methods: 33 consecutive patients with sinus
rhythm were examined on a 1.5 T scanner with a standard steady
state free precession (SSFP) sequence („trueFISP“, TR: 3.0 ms,
TE: 1.5 ms, flip angle FA: 60°, matrix: 192 × 156, temporal
resolution: 36 ms; acceleration factor AF = 2) in inspiratory
breath-hold. End-diastolic volumes (EDV), end-systolic volumes
(ESV) and ejection fractions (EF) were calculated from the
standard stack of short axis using commercially available software
(syngo ArgusVF, version VA80A; SiemensAG Healthcare Sector,
Erlangen, Germany). Additionally, 2 long- and 3 short-axis views
were measured using a highly accelerated, single breath-hold
temporal parallel acquisition SSFP sequence (TPAT; TR: 4.6 ms,
TE: 1.1 ms, matrix: 192 × 133, temporal resolution: 40 ms,
AF = 3). This data set was analyzed by means of recently
implemented software (syngo Argus 4 DVF, version VA80A;
Siemens Healthcare Sector, Erlangen, Germany), which builds up
a 4-dimensional (4D) model of the left ventricle and allows
visualization of the model superimposed to anatomical images as
references (guide-point modeling; GPM). In each patient volu-
metric measurements were performed twice by two indepen-
dent readers (25 respectively more than 5000 volumetric
measurements performed before study was started) using either
the stack of short axis approach analyzed with the SoS method or
the highly accelerated multi-orientation protocol combined with
the GPM technique. For both sequences and post-processing
techniques an intra- and interindividual comparison was
performed by applying the Bland-Altman approach.
Results: Mean acquisition and post-processing time was
significantly shorter with the GPM-approach (15 seconds/
3 minutes versus 360 seconds/6 minutes) when compared to
the SoS-method.
End-Diastolic Volume: Due to an improved definition of the
mitral valve plane using the long axis views volumes calculated by
the highly accelerated protocol combined with the GPM
approach were higher when compared to the stack of short
axis views analyzed with the SoS method (mean difference:
reader 1, 15.7 ± 11.0 ml; reader 2, 18.6 ± 10.7 ml on average).
Moreover, the statistical spread of the mean difference of both
readers’ EDV was less when measurements were performed with
the GPM approach (mean difference 5.7 ± 4.6 ml) compared to
the SoS technique (mean difference 8.6 ± 5.9 ml) (Table 1).
End-Systolic Volume: As with the EDV mean ESV values
were higher with the highly accelerated multi-orientation
protocol post-processed with the GPM approach for both
readers (reader 1, 10.5 ± 10.2 ml; reader 2, 8.8 ± 9.7 ml) and
showed less statistical spread in comparison to the stack of short
axis views analyzed with the SoS technique (mean difference
6.3 ± 5.0 ml versus 4.3 ± 3.7 ml).
Ejection Fraction: EF determined by reader 1 and 2
demonstrated less statistical spread if estimation was performed
with the GPM approach (mean difference 1.5 ± 1.1%) compared
with the SoS method based on the standard stack of short axis
protocols (mean difference 3.6 ± 1.9%). Additionally, the agree-
ment between the EF calculated by the SoS technique and the
Table 1 (abstract P104) Mean EDV, ESV and EF values ± SD and ranges as determined by reader 1 and 2 with the SoS and GPMapproach, respectively
Stack of short axis views + SoS Multi-orientation sequences + GPM
EFR1 53.3% ± 13.5% (range 15–73%) 52.8% ± 13.1% (range 15–71%)R2 52.8% ± 12.5% (range 16–72%) 53.2% ± 12.6% (range 16–72%)EDVR1 148.1 ml ± 57.2 ml (range 85–352 ml) 163.8 ml ± 64.5 ml (range 93–409 ml)
R2 147.4 ml ± 55.0 ml (range 79–331 ml) 165.5 ml ± 63.0 ml (range 98–392 ml)
ESVR1 75.4 ml ± 58.0 ml (range 23–299 ml) 84.8 ml ± 66.2 ml (range 28–335 ml)
R2 75.5 ml ± 54.3 ml (range 22–274 ml) 84.1 ml ± 63.0 ml (range 28–321 ml)
R2 = reader 2, EDV = end-diastolic volume, ESV = end-systolic volume, EF = ejection fraction, SoS = summation of slices, GPM = guide-point
modeling.
Figure 1 (abstract P104)
Bland-Altman-Plot for assessment of ejection fraction. (a) Reader 1 (R1):
summation of slices (SoS) versus guide-point modeling (GPM) method.
(b) Reader 2 (R2): SoS versus GPM approach. (c) Interobserver
comparison of the SoS method based on a stack of short axis views.
(d) Multi-orientation highly accelerated sequences analyzed with the
GPM approach: R1 versus R2.
Journal of Cardiovascular Magnetic Resonance 2009, 11(Suppl 1) http://jcmr-online.com/supplements/11/S1
Page 166 of 316(page number not for citation purposes)

GPM method was excellent for reader 2 (more than 5000
volumetric measurements performed before study was started;
mean difference 1.0 ± 0.9%) and good for reader 1 (25 volumetric
measurements done before; mean difference 3.6 ± 2.2%)
(Figure 1).
P105Effective saturation pulse for the whole heart at 3 TKellyAnne McGorty and Daniel KimNew York University Langone Medical Center,New York, NY, USA
Journal of Cardiovascular Magnetic Resonance 2009, 11(Suppl 1):P105
Introduction: Cardiac MRI at 3 T is a promising modality to
increase the contrast-to-noise ratio (CNR) in first-pass cardiac
perfusion imaging. This CNR boost can improve the accuracy of
perfusion estimation from dynamic contrast-enhanced images.
However, radio-frequency (RF) field (B1) variations and dielectric
effects are comparatively higher at 3 T than at 1.5 T. These
challenging factors make it difficult to perform accurate T1-
weighting using a conventional rectangular saturation pulse.
Previous studies have shown improved saturation of magnetiza-
tion at 3 T using adiabatic B1-insensitive rotation (BIR-4) [1],
rectangular RF pulse train [1], and specific absorption rate (SAR)
constrained rectangular RF pulse train [2]. Unfortunately, these
pulses did not achieve effective saturation of magnetization,
which we shall define as residual magnetization after saturation
< 5% of equilibrium magnetization (M0), within the whole heart,
while remaining within clinically acceptable SAR limits. The
purpose of this study was to develop an adiabatic-rectangular
pulse train at 3 T that can achieve both of the aforementioned
objectives.
Methods: Pulse sequence: Figure 1 shows pulse sequence
diagrams of a conventional rectangular pulse and an adiabatic-
rectangular pulse train. This pulse train consists of a rectangular
130° pulse with 0.8 ms duration, a rectangular 85° pulse with
0.5 ms duration, and an adiabatic half-passage pulse with 1.5 ms
duration. Crusher gradients were played between successive RF
pulses to suppress stimulated echoes. The total pulse durations,
excluding the final spoiler gradients, for the rectangular and
adiabatic-rectangular pulse train were 1 ms and 8.8 ms,
respectively. These two saturation pulses were implemented on
a 3 Twhole-body MR scanner (Tim-Trio; Siemens) equipped with
an 12-channel phased array RF coil.
The residual longitudinal magnetization left behind by the
saturation pulse can be measured by performing a saturation-
no-recovery experiment using a TurboFLASH pulse sequence
with centric k-space reordering, as previously described [1].
Normalization of the saturation image by the proton density
weighted (PDW) image corrects for surface coil inhomogeneities
and M0. Relevant imaging parameters include: field of view =
320–400 × 255–324 mm, acquisition matrix = 64 × 52, slice
thickness = 8 mm, TE/TR = 1.1/2.3 ms, TD = 3 ms, image
Figure 1 (abstract P105)
Pulse sequence diagrams of rectangular pulse and adiabatic-rectangular
pulse train.
Figure 2 (abstract P105)
Representative normalized saturation images in six different views of the
heart: PDW (left), rectangular pulse (middle), and adiabatic-rectangular
pulse (right).
Journal of Cardiovascular Magnetic Resonance 2009, 11(Suppl 1) http://jcmr-online.com/supplements/11/S1
Page 167 of 316(page number not for citation purposes)
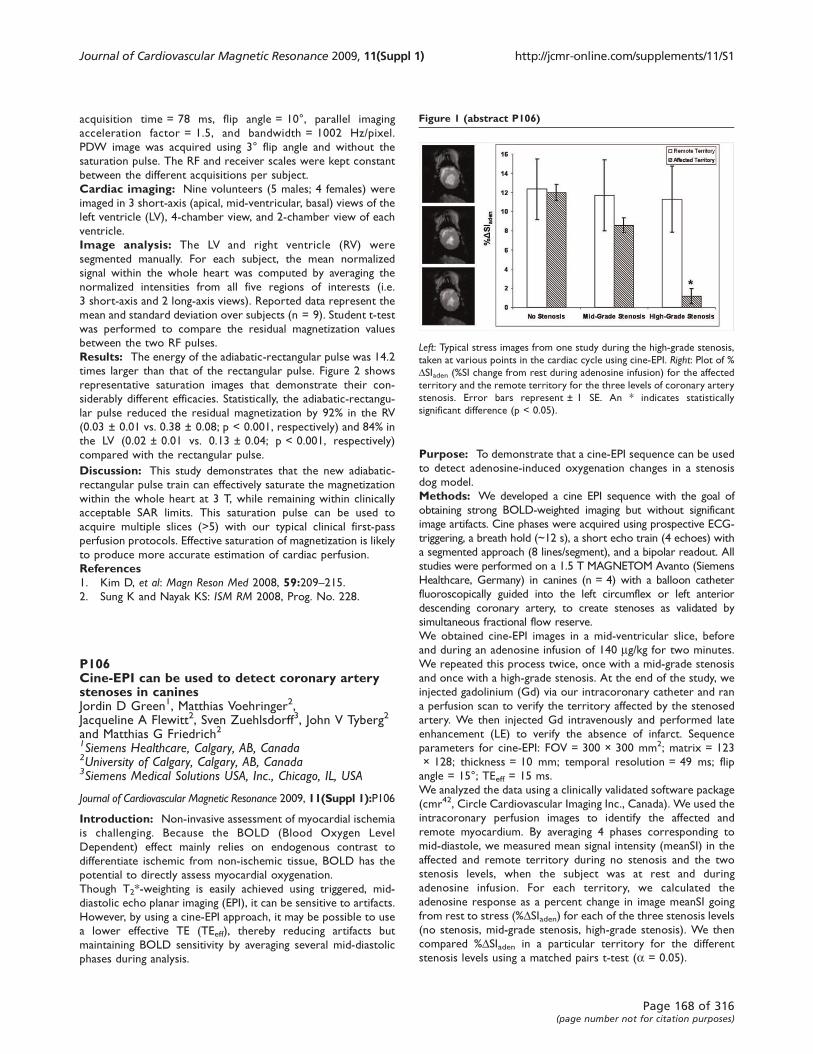
acquisition time = 78 ms, flip angle = 10°, parallel imaging
acceleration factor = 1.5, and bandwidth = 1002 Hz/pixel.
PDW image was acquired using 3° flip angle and without the
saturation pulse. The RF and receiver scales were kept constant
between the different acquisitions per subject.
Cardiac imaging: Nine volunteers (5 males; 4 females) were
imaged in 3 short-axis (apical, mid-ventricular, basal) views of the
left ventricle (LV), 4-chamber view, and 2-chamber view of each
ventricle.
Image analysis: The LV and right ventricle (RV) were
segmented manually. For each subject, the mean normalized
signal within the whole heart was computed by averaging the
normalized intensities from all five regions of interests (i.e.
3 short-axis and 2 long-axis views). Reported data represent the
mean and standard deviation over subjects (n = 9). Student t-test
was performed to compare the residual magnetization values
between the two RF pulses.
Results: The energy of the adiabatic-rectangular pulse was 14.2
times larger than that of the rectangular pulse. Figure 2 shows
representative saturation images that demonstrate their con-
siderably different efficacies. Statistically, the adiabatic-rectangu-
lar pulse reduced the residual magnetization by 92% in the RV
(0.03 ± 0.01 vs. 0.38 ± 0.08; p < 0.001, respectively) and 84% in
the LV (0.02 ± 0.01 vs. 0.13 ± 0.04; p < 0.001, respectively)
compared with the rectangular pulse.
Discussion: This study demonstrates that the new adiabatic-
rectangular pulse train can effectively saturate the magnetization
within the whole heart at 3 T, while remaining within clinically
acceptable SAR limits. This saturation pulse can be used to
acquire multiple slices (>5) with our typical clinical first-pass
perfusion protocols. Effective saturation of magnetization is likely
to produce more accurate estimation of cardiac perfusion.
References1. Kim D, et al: Magn Reson Med 2008, 59:209–215.2. Sung K and Nayak KS: ISM RM 2008, Prog. No. 228.
P106Cine-EPI can be used to detect coronary arterystenoses in caninesJordin D Green1, Matthias Voehringer2,Jacqueline A Flewitt2, Sven Zuehlsdorff3, John V Tyberg2
and Matthias G Friedrich21Siemens Healthcare, Calgary, AB, Canada2University of Calgary, Calgary, AB, Canada3Siemens Medical Solutions USA, Inc., Chicago, IL, USA
Journal of Cardiovascular Magnetic Resonance 2009, 11(Suppl 1):P106
Introduction: Non-invasive assessment of myocardial ischemia
is challenging. Because the BOLD (Blood Oxygen Level
Dependent) effect mainly relies on endogenous contrast to
differentiate ischemic from non-ischemic tissue, BOLD has the
potential to directly assess myocardial oxygenation.
Though T2*-weighting is easily achieved using triggered, mid-
diastolic echo planar imaging (EPI), it can be sensitive to artifacts.
However, by using a cine-EPI approach, it may be possible to use
a lower effective TE (TEeff), thereby reducing artifacts but
maintaining BOLD sensitivity by averaging several mid-diastolic
phases during analysis.
Purpose: To demonstrate that a cine-EPI sequence can be used
to detect adenosine-induced oxygenation changes in a stenosis
dog model.
Methods: We developed a cine EPI sequence with the goal of
obtaining strong BOLD-weighted imaging but without significant
image artifacts. Cine phases were acquired using prospective ECG-
triggering, a breath hold (~12 s), a short echo train (4 echoes) with
a segmented approach (8 lines/segment), and a bipolar readout. All
studies were performed on a 1.5 T MAGNETOM Avanto (Siemens
Healthcare, Germany) in canines (n = 4) with a balloon catheter
fluoroscopically guided into the left circumflex or left anterior
descending coronary artery, to create stenoses as validated by
simultaneous fractional flow reserve.
We obtained cine-EPI images in a mid-ventricular slice, before
and during an adenosine infusion of 140 mg/kg for two minutes.
We repeated this process twice, once with a mid-grade stenosis
and once with a high-grade stenosis. At the end of the study, we
injected gadolinium (Gd) via our intracoronary catheter and ran
a perfusion scan to verify the territory affected by the stenosed
artery. We then injected Gd intravenously and performed late
enhancement (LE) to verify the absence of infarct. Sequence
parameters for cine-EPI: FOV = 300 × 300 mm2; matrix = 123
× 128; thickness = 10 mm; temporal resolution = 49 ms; flip
angle = 15°; TEeff = 15 ms.
We analyzed the data using a clinically validated software package
(cmr42, Circle Cardiovascular Imaging Inc., Canada). We used the
intracoronary perfusion images to identify the affected and
remote myocardium. By averaging 4 phases corresponding to
mid-diastole, we measured mean signal intensity (meanSI) in the
affected and remote territory during no stenosis and the two
stenosis levels, when the subject was at rest and during
adenosine infusion. For each territory, we calculated the
adenosine response as a percent change in image meanSI going
from rest to stress (%DSIaden) for each of the three stenosis levels
(no stenosis, mid-grade stenosis, high-grade stenosis). We then
compared %DSIaden in a particular territory for the different
stenosis levels using a matched pairs t-test (a = 0.05).
Figure 1 (abstract P106)
Left: Typical stress images from one study during the high-grade stenosis,
taken at various points in the cardiac cycle using cine-EPI. Right: Plot of %DSIaden (%SI change from rest during adenosine infusion) for the affected
territory and the remote territory for the three levels of coronary artery
stenosis. Error bars represent ± 1 SE. An * indicates statistically
significant difference (p < 0.05).
Journal of Cardiovascular Magnetic Resonance 2009, 11(Suppl 1) http://jcmr-online.com/supplements/11/S1
Page 168 of 316(page number not for citation purposes)

Results: The results are summarized in the Figure 1. In the
remote territory, mean %DSIaden at no, mid-grade, and high-grade
stenosis (± standard error) was 12.3% ± 3%, 11.7% ± 4%, and
11.3% ± 3% respectively. In the affected territory, the same
measurements were 12.0% ± 1%, 8.6% ± 1%, and 1.2% ± 1%.
Looking at each stenosis level, there was only a statistically
significant difference between the two territories for the high-grade
stenosis. Looking at each territory, there was no statistically
significant difference between the %DSIaden observed for the
different stenosis levels in the remote territory. For the affected
myocardial territory, there was a statistically significant decrease in
%DSIaden going from baseline to either stenosis level, as well as going
from mid- to high-grade stenosis. No LE was observed.
Conclusion: We have shown that cine-EPI can accurately
detect changes in adenosine response in myocardium affected by
a high-grade stenosis. We could use a lower TEeff than previously
reported for EPI cardiac BOLD because we were able to signal
average over several cardiac phases, which in turn reduced image
artifacts. Cine-EPI shows promise for identifying regions of
ischemia in CMR, simultaneous to functional assessment.
P107Myocardial fat quantification using 2D Dixon MRI:feasibility studyChia-Ying Liu1, Alban Redheuil1, Ronald Ouwerkerk1,Joao Lima1 and David Bluemke21The Johns Hopkins Hospital, Baltimore, MD, USA2National Institutes of Health, Bethesda, MD, USA
Journal of Cardiovascular Magnetic Resonance 2009, 11(Suppl 1):P107
Introduction: The concept of fat contained within the
myocardium, has recently received attention because of its
potential role in diabetic myocardial disease, obesity, and human
immunodeficiency virus (HIV) infected individuals [1]. Measure-
ments of myocardial triglycerides in humans have been accessed
using proton MR spectroscopy (1H MRS) [2]. 1H MRS provides a
precise and reproducible tool for in-vivo quantification of
intracellular triglycerides within the sarcolemma. However, the
spatial distribution of the fat deposition cannot be accessed by
1H MRS due to its single voxel characteristics. We studied
whether the dual-echo Dixon MRI could quantify the fatty
content of the myocardium. The fraction of fat was also
quantified directly with 1H MRS as an independent method.
Methods: All MRI/MRS studies were performed using a 3.0 T
MR scanner (TrioTim Imager, Siemens) on seven healthy
individuals. Myocardial 1H MRS was obtained with a 6-ml voxel
positioned in the interventricular septum. Four chamber and
short-axis images were acquired by using a breath-hold dual-
echo spoiled gradient-recalled echo sequence with TR/TE (In,
Out) = 6.3/2.46, 3.69 ms, flip angle = 15° in late diastole. Fat (F)
and water (W) images were reconstructed using Matlab. The
short-axis water image was used as a reference to contour the
epi- and endo-myocardial borders using Mass, and epi-cardial fat
was carefully excluded. Contours were transposed to the fat
fraction images (defined as F/(F+W) [3]) to calculate the fat
fraction of different sectors of the myocardium. MRS was
performed with water suppressed ECG gated PRESS, TR/TE =
1 R-R/30 ms, with navigator across the liver-lung interface to
reduce of breathing effects. Fat content was quantified with
Amares/MRUI and related to water in unsuppressed spectra.
Results: Figure 1(a) and 1(b) demonstrate decomposed water
and fat fraction images from a healthy participant. The fat fractions
from six sectors of the myocardium are shown in Figure 1(c). Note
the 8% fat deposition on the inferior lateral wall (segment 3). Figure
2 shows the fat fraction based on the in- and out-phase images from
the septum (average of section 1 and section 2) of the five
volunteers and the comparison to those of 1H MRS.
Discussion: The dual echo technique showed consistently higher
estimates of fat fraction compared to the 1H MRS technique. To
accurately quantify the fat fraction, two major issues should be
addressed: the effect of tissue relaxation (T1 bias) and image noise.
T1 bias is small however for low fat fraction that we observed. Low
signal intensity/image noise may become the dominant source of
bias since the magnitude image was reconstructed. Future work will
focus on the noise reduction.
References1. Szczepaniak LS, et al: Circ Res 2007, 101:759–767.2. Meer van der RW, et al: Diabetes 2007, 56:2849–2853.3. Liu CY, et al: MRM 2007, 58:354–364.
P108Validation of left ventricular wall thickening inshort-axis cine magnetic resonance imaging bycorrection of basal-descent through-planemovementJyh-Wen Chai1, Wei-Hsun Chen1, Chih-Ming Chiang1
and Jachih Fu21Taichung Veterans General Hospital, Taichung, Taiwan2Department of Industrial Engineering and Management,National Yunlin University of Science and Technology, Yunlin,Taiwan
Journal of Cardiovascular Magnetic Resonance 2009, 11(Suppl 1):P108
Introduction: The problem of the basal descent through-plane
movement in quantitative measurement of regional left ventricular
Figure 1 (abstract P107)
(a) Decomposed water and (b) Fat fraction images (c) Fat fraction from
six segments (contoured on the water image). Fat deposition was
observed on the inferior lateral wall (segment 3).
Figure 2 (abstract P107)
The fat fraction comparisons shown on the MRI is greater than those of
MRS, likey due to noise bias contributing to the fat fraction calculation.
Journal of Cardiovascular Magnetic Resonance 2009, 11(Suppl 1) http://jcmr-online.com/supplements/11/S1
Page 169 of 316(page number not for citation purposes)
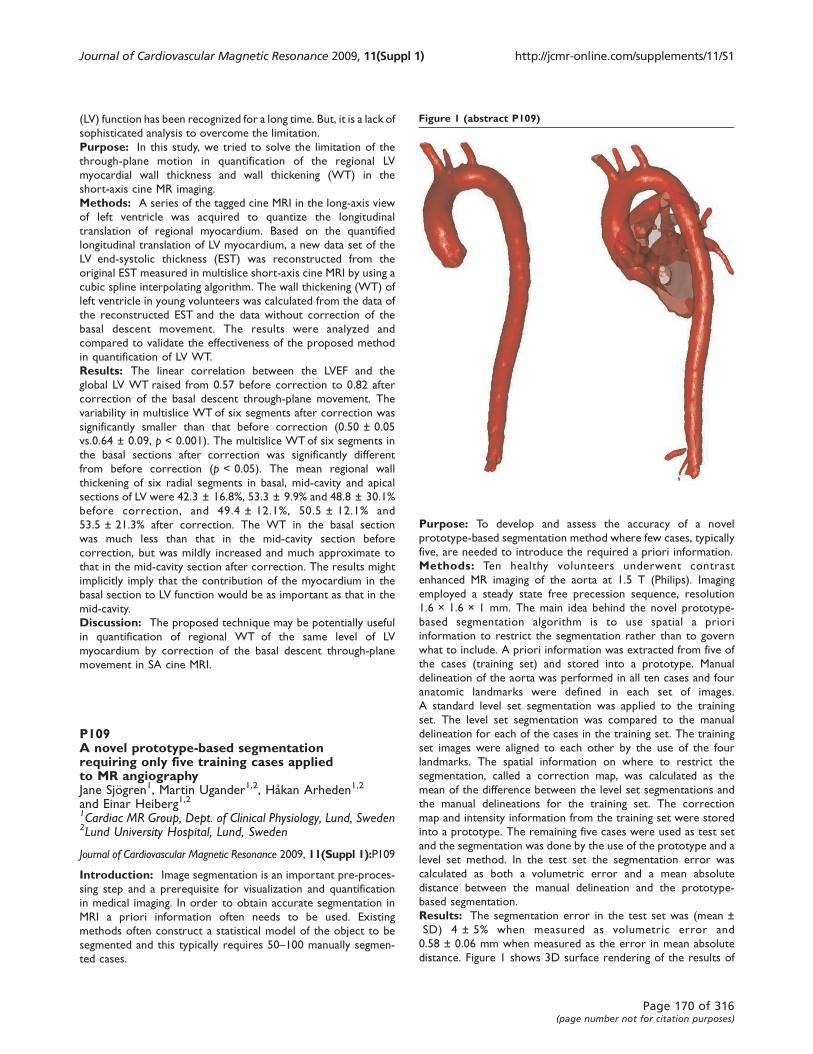
(LV) function has been recognized for a long time. But, it is a lack of
sophisticated analysis to overcome the limitation.
Purpose: In this study, we tried to solve the limitation of the
through-plane motion in quantification of the regional LV
myocardial wall thickness and wall thickening (WT) in the
short-axis cine MR imaging.
Methods: A series of the tagged cine MRI in the long-axis view
of left ventricle was acquired to quantize the longitudinal
translation of regional myocardium. Based on the quantified
longitudinal translation of LV myocardium, a new data set of the
LV end-systolic thickness (EST) was reconstructed from the
original EST measured in multislice short-axis cine MRI by using a
cubic spline interpolating algorithm. The wall thickening (WT) of
left ventricle in young volunteers was calculated from the data of
the reconstructed EST and the data without correction of the
basal descent movement. The results were analyzed and
compared to validate the effectiveness of the proposed method
in quantification of LV WT.
Results: The linear correlation between the LVEF and the
global LV WT raised from 0.57 before correction to 0.82 after
correction of the basal descent through-plane movement. The
variability in multislice WT of six segments after correction was
significantly smaller than that before correction (0.50 ± 0.05
vs.0.64 ± 0.09, p < 0.001). The multislice WTof six segments in
the basal sections after correction was significantly different
from before correction (p < 0.05). The mean regional wall
thickening of six radial segments in basal, mid-cavity and apical
sections of LV were 42.3 ± 16.8%, 53.3 ± 9.9% and 48.8 ± 30.1%
before correction, and 49.4 ± 12.1%, 50.5 ± 12.1% and
53.5 ± 21.3% after correction. The WT in the basal section
was much less than that in the mid-cavity section before
correction, but was mildly increased and much approximate to
that in the mid-cavity section after correction. The results might
implicitly imply that the contribution of the myocardium in the
basal section to LV function would be as important as that in the
mid-cavity.
Discussion: The proposed technique may be potentially useful
in quantification of regional WT of the same level of LV
myocardium by correction of the basal descent through-plane
movement in SA cine MRI.
P109A novel prototype-based segmentationrequiring only five training cases appliedto MR angiographyJane Sjögren1, Martin Ugander1,2, Håkan Arheden1,2
and Einar Heiberg1,21Cardiac MR Group, Dept. of Clinical Physiology, Lund, Sweden2Lund University Hospital, Lund, Sweden
Journal of Cardiovascular Magnetic Resonance 2009, 11(Suppl 1):P109
Introduction: Image segmentation is an important pre-proces-
sing step and a prerequisite for visualization and quantification
in medical imaging. In order to obtain accurate segmentation in
MRI a priori information often needs to be used. Existing
methods often construct a statistical model of the object to be
segmented and this typically requires 50–100 manually segmen-
ted cases.
Purpose: To develop and assess the accuracy of a novel
prototype-based segmentation method where few cases, typically
five, are needed to introduce the required a priori information.
Methods: Ten healthy volunteers underwent contrast
enhanced MR imaging of the aorta at 1.5 T (Philips). Imaging
employed a steady state free precession sequence, resolution
1.6 × 1.6 × 1 mm. The main idea behind the novel prototype-
based segmentation algorithm is to use spatial a priori
information to restrict the segmentation rather than to govern
what to include. A priori information was extracted from five of
the cases (training set) and stored into a prototype. Manual
delineation of the aorta was performed in all ten cases and four
anatomic landmarks were defined in each set of images.
A standard level set segmentation was applied to the training
set. The level set segmentation was compared to the manual
delineation for each of the cases in the training set. The training
set images were aligned to each other by the use of the four
landmarks. The spatial information on where to restrict the
segmentation, called a correction map, was calculated as the
mean of the difference between the level set segmentations and
the manual delineations for the training set. The correction
map and intensity information from the training set were stored
into a prototype. The remaining five cases were used as test set
and the segmentation was done by the use of the prototype and a
level set method. In the test set the segmentation error was
calculated as both a volumetric error and a mean absolute
distance between the manual delineation and the prototype-
based segmentation.
Results: The segmentation error in the test set was (mean ±
SD) 4 ± 5% when measured as volumetric error and
0.58 ± 0.06 mm when measured as the error in mean absolute
distance. Figure 1 shows 3D surface rendering of the results of
Figure 1 (abstract P109)
Journal of Cardiovascular Magnetic Resonance 2009, 11(Suppl 1) http://jcmr-online.com/supplements/11/S1
Page 170 of 316(page number not for citation purposes)
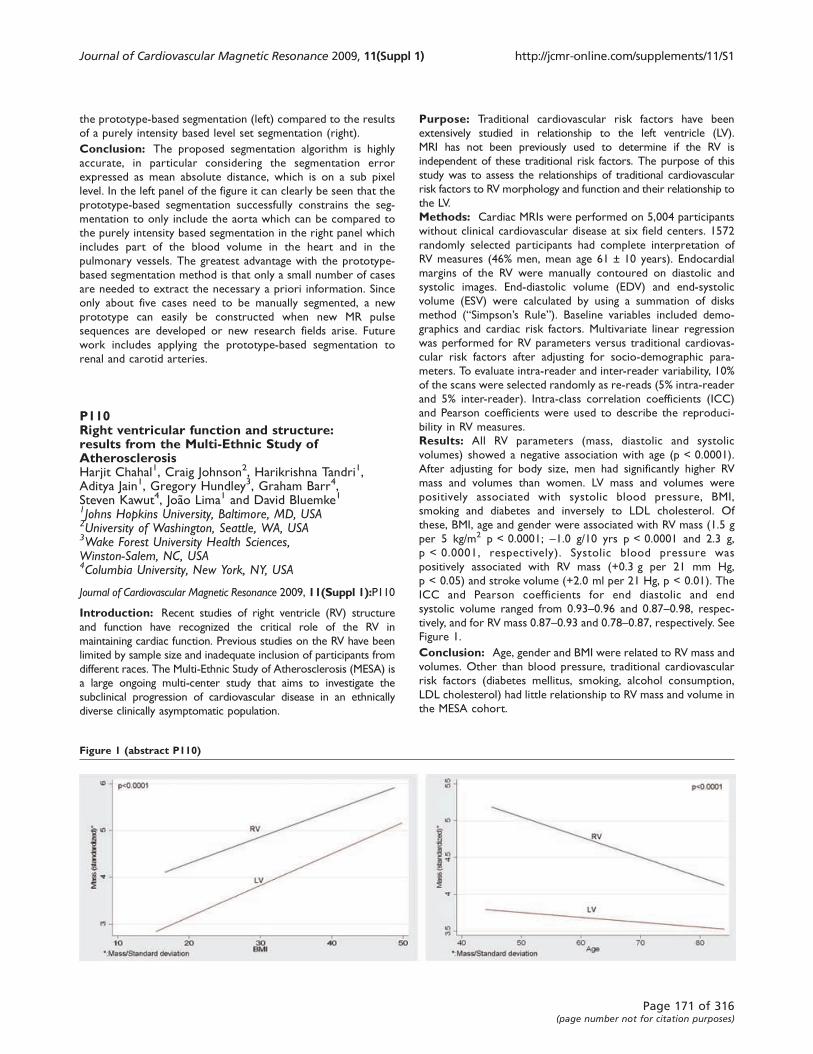
the prototype-based segmentation (left) compared to the results
of a purely intensity based level set segmentation (right).
Conclusion: The proposed segmentation algorithm is highly
accurate, in particular considering the segmentation error
expressed as mean absolute distance, which is on a sub pixel
level. In the left panel of the figure it can clearly be seen that the
prototype-based segmentation successfully constrains the seg-
mentation to only include the aorta which can be compared to
the purely intensity based segmentation in the right panel which
includes part of the blood volume in the heart and in the
pulmonary vessels. The greatest advantage with the prototype-
based segmentation method is that only a small number of cases
are needed to extract the necessary a priori information. Since
only about five cases need to be manually segmented, a new
prototype can easily be constructed when new MR pulse
sequences are developed or new research fields arise. Future
work includes applying the prototype-based segmentation to
renal and carotid arteries.
P110Right ventricular function and structure:results from the Multi-Ethnic Study ofAtherosclerosisHarjit Chahal1, Craig Johnson2, Harikrishna Tandri1,Aditya Jain1, Gregory Hundley3, Graham Barr4,Steven Kawut4, João Lima1 and David Bluemke11Johns Hopkins University, Baltimore, MD, USA2University of Washington, Seattle, WA, USA3Wake Forest University Health Sciences,Winston-Salem, NC, USA4Columbia University, New York, NY, USA
Journal of Cardiovascular Magnetic Resonance 2009, 11(Suppl 1):P110
Introduction: Recent studies of right ventricle (RV) structure
and function have recognized the critical role of the RV in
maintaining cardiac function. Previous studies on the RV have been
limited by sample size and inadequate inclusion of participants from
different races. The Multi-Ethnic Study of Atherosclerosis (MESA) is
a large ongoing multi-center study that aims to investigate the
subclinical progression of cardiovascular disease in an ethnically
diverse clinically asymptomatic population.
Purpose: Traditional cardiovascular risk factors have been
extensively studied in relationship to the left ventricle (LV).
MRI has not been previously used to determine if the RV is
independent of these traditional risk factors. The purpose of this
study was to assess the relationships of traditional cardiovascular
risk factors to RV morphology and function and their relationship to
the LV.
Methods: Cardiac MRIs were performed on 5,004 participants
without clinical cardiovascular disease at six field centers. 1572
randomly selected participants had complete interpretation of
RV measures (46% men, mean age 61 ± 10 years). Endocardial
margins of the RV were manually contoured on diastolic and
systolic images. End-diastolic volume (EDV) and end-systolic
volume (ESV) were calculated by using a summation of disks
method (“Simpson’s Rule”). Baseline variables included demo-
graphics and cardiac risk factors. Multivariate linear regression
was performed for RV parameters versus traditional cardiovas-
cular risk factors after adjusting for socio-demographic para-
meters. To evaluate intra-reader and inter-reader variability, 10%
of the scans were selected randomly as re-reads (5% intra-reader
and 5% inter-reader). Intra-class correlation coefficients (ICC)
and Pearson coefficients were used to describe the reproduci-
bility in RV measures.
Results: All RV parameters (mass, diastolic and systolic
volumes) showed a negative association with age (p < 0.0001).
After adjusting for body size, men had significantly higher RV
mass and volumes than women. LV mass and volumes were
positively associated with systolic blood pressure, BMI,
smoking and diabetes and inversely to LDL cholesterol. Of
these, BMI, age and gender were associated with RV mass (1.5 g
per 5 kg/m2 p < 0.0001; -1.0 g/10 yrs p < 0.0001 and 2.3 g,
p < 0.0001, respectively). Systolic blood pressure was
positively associated with RV mass (+0.3 g per 21 mm Hg,
p < 0.05) and stroke volume (+2.0 ml per 21 Hg, p < 0.01). The
ICC and Pearson coefficients for end diastolic and end
systolic volume ranged from 0.93–0.96 and 0.87–0.98, respec-tively, and for RV mass 0.87–0.93 and 0.78–0.87, respectively. SeeFigure 1.
Conclusion: Age, gender and BMI were related to RV mass and
volumes. Other than blood pressure, traditional cardiovascular
risk factors (diabetes mellitus, smoking, alcohol consumption,
LDL cholesterol) had little relationship to RV mass and volume in
the MESA cohort.
Figure 1 (abstract P110)
Journal of Cardiovascular Magnetic Resonance 2009, 11(Suppl 1) http://jcmr-online.com/supplements/11/S1
Page 171 of 316(page number not for citation purposes)
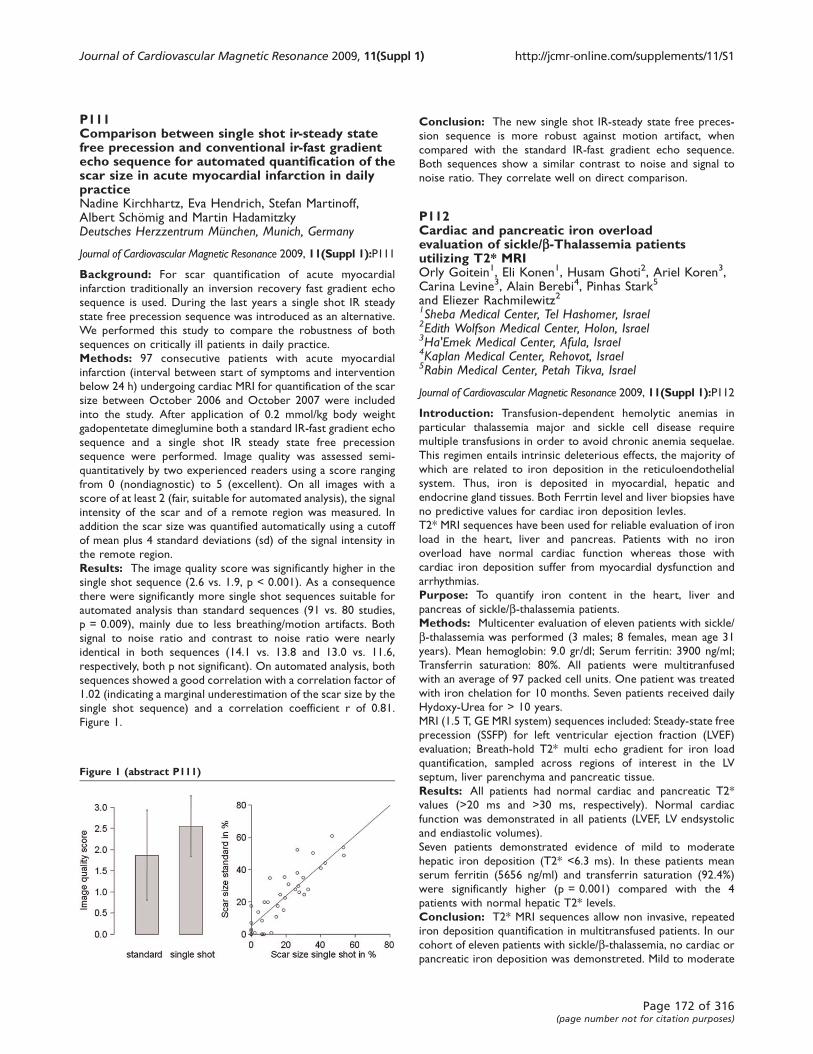
P111Comparison between single shot ir-steady statefree precession and conventional ir-fast gradientecho sequence for automated quantification of thescar size in acute myocardial infarction in dailypracticeNadine Kirchhartz, Eva Hendrich, Stefan Martinoff,Albert Schömig and Martin HadamitzkyDeutsches Herzzentrum München, Munich, Germany
Journal of Cardiovascular Magnetic Resonance 2009, 11(Suppl 1):P111
Background: For scar quantification of acute myocardial
infarction traditionally an inversion recovery fast gradient echo
sequence is used. During the last years a single shot IR steady
state free precession sequence was introduced as an alternative.
We performed this study to compare the robustness of both
sequences on critically ill patients in daily practice.
Methods: 97 consecutive patients with acute myocardial
infarction (interval between start of symptoms and intervention
below 24 h) undergoing cardiac MRI for quantification of the scar
size between October 2006 and October 2007 were included
into the study. After application of 0.2 mmol/kg body weight
gadopentetate dimeglumine both a standard IR-fast gradient echo
sequence and a single shot IR steady state free precession
sequence were performed. Image quality was assessed semi-
quantitatively by two experienced readers using a score ranging
from 0 (nondiagnostic) to 5 (excellent). On all images with a
score of at least 2 (fair, suitable for automated analysis), the signal
intensity of the scar and of a remote region was measured. In
addition the scar size was quantified automatically using a cutoff
of mean plus 4 standard deviations (sd) of the signal intensity in
the remote region.
Results: The image quality score was significantly higher in the
single shot sequence (2.6 vs. 1.9, p < 0.001). As a consequence
there were significantly more single shot sequences suitable for
automated analysis than standard sequences (91 vs. 80 studies,
p = 0.009), mainly due to less breathing/motion artifacts. Both
signal to noise ratio and contrast to noise ratio were nearly
identical in both sequences (14.1 vs. 13.8 and 13.0 vs. 11.6,
respectively, both p not significant). On automated analysis, both
sequences showed a good correlation with a correlation factor of
1.02 (indicating a marginal underestimation of the scar size by the
single shot sequence) and a correlation coefficient r of 0.81.
Figure 1.
Conclusion: The new single shot IR-steady state free preces-
sion sequence is more robust against motion artifact, when
compared with the standard IR-fast gradient echo sequence.
Both sequences show a similar contrast to noise and signal to
noise ratio. They correlate well on direct comparison.
P112Cardiac and pancreatic iron overloadevaluation of sickle/b-Thalassemia patientsutilizing T2* MRIOrly Goitein1, Eli Konen1, Husam Ghoti2, Ariel Koren3,Carina Levine3, Alain Berebi4, Pinhas Stark5
and Eliezer Rachmilewitz21Sheba Medical Center, Tel Hashomer, Israel2Edith Wolfson Medical Center, Holon, Israel3Ha'Emek Medical Center, Afula, Israel4Kaplan Medical Center, Rehovot, Israel5Rabin Medical Center, Petah Tikva, Israel
Journal of Cardiovascular Magnetic Resonance 2009, 11(Suppl 1):P112
Introduction: Transfusion-dependent hemolytic anemias in
particular thalassemia major and sickle cell disease require
multiple transfusions in order to avoid chronic anemia sequelae.
This regimen entails intrinsic deleterious effects, the majority of
which are related to iron deposition in the reticuloendothelial
system. Thus, iron is deposited in myocardial, hepatic and
endocrine gland tissues. Both Ferrtin level and liver biopsies have
no predictive values for cardiac iron deposition levles.
T2* MRI sequences have been used for reliable evaluation of iron
load in the heart, liver and pancreas. Patients with no iron
overload have normal cardiac function whereas those with
cardiac iron deposition suffer from myocardial dysfunction and
arrhythmias.
Purpose: To quantify iron content in the heart, liver and
pancreas of sickle/b-thalassemia patients.
Methods: Multicenter evaluation of eleven patients with sickle/
b-thalassemia was performed (3 males; 8 females, mean age 31
years). Mean hemoglobin: 9.0 gr/dl; Serum ferritin: 3900 ng/ml;
Transferrin saturation: 80%. All patients were multitranfused
with an average of 97 packed cell units. One patient was treated
with iron chelation for 10 months. Seven patients received daily
Hydoxy-Urea for > 10 years.
MRI (1.5 T, GE MRI system) sequences included: Steady-state free
precession (SSFP) for left ventricular ejection fraction (LVEF)
evaluation; Breath-hold T2* multi echo gradient for iron load
quantification, sampled across regions of interest in the LV
septum, liver parenchyma and pancreatic tissue.
Results: All patients had normal cardiac and pancreatic T2*
values (>20 ms and >30 ms, respectively). Normal cardiac
function was demonstrated in all patients (LVEF, LV endsystolic
and endiastolic volumes).
Seven patients demonstrated evidence of mild to moderate
hepatic iron deposition (T2* <6.3 ms). In these patients mean
serum ferritin (5656 ng/ml) and transferrin saturation (92.4%)
were significantly higher (p = 0.001) compared with the 4
patients with normal hepatic T2* levels.
Conclusion: T2* MRI sequences allow non invasive, repeated
iron deposition quantification in multitransfused patients. In our
cohort of eleven patients with sickle/b-thalassemia, no cardiac or
pancreatic iron deposition was demonstreted. Mild to moderate
Figure 1 (abstract P111)
Journal of Cardiovascular Magnetic Resonance 2009, 11(Suppl 1) http://jcmr-online.com/supplements/11/S1
Page 172 of 316(page number not for citation purposes)

iron liver deposition was found in 7 of these patients, in which
serum ferritin levels and transferrin saturation were significantly
higher.
With respect to iron deposition, multitransfused sickle/b-thalassemia are similar to patients with homozygous sickle cell
disease and not to patients with thalassemia major. The reasons
for this observation are still unclear. This similarity could be
related in part to the relativly low number of transfusions,
starting later in life, in these patients.
The liver is the dominant iron storage organ. Hepatic iron
concentration correlates closely with the total body iron
content. While iron uptake by hepatocytes is predominately
mediated via transferrin and correlates well with serum ferritin
levels, as confirmed in the present study, this is not the case in
cardiac and endocrine iron uptake regulation. These organs might
acquire the excess metal differently.
P113Pioglitazone alters fat distribution in patients withtype 2 diabetes mellitus, in contrast to metforminJacqueline T Jonker1, Rutger W van der Meer1,Luuk J Rijzewijk2, Lisa M Menting1, Michaela Diamant2,Johannes A Romijn1, Johannes WA Smit1, Albert de Roos1
and Hildo J Lamb11Leiden University Medical Centre, Leiden, Netherlands2Diabetes Centre, VU University Medical Centre, Amsterdam,Netherlands
Journal of Cardiovascular Magnetic Resonance 2009, 11(Suppl 1):P113
Introduction: Diabetes mellitus is associated with an increased
risk on cardiovascular disease and epicardial fat has been
proposed as an additional cardiovascular risk factor. Treatment
with pioglitazone leads to an improvement in glycemic control,
but also increases body weight.
Purpose: The primary aim was to evaluate the effect of
pioglitazone on weight and fat distribution in patients with type 2
diabetes mellitus (DM2). The secondary aim was to assess the
relationship of epicardial fat to anthropometric measurements
and fat distribution in these patients
Methods: Seventy-seven male patients with DM2 were
included in this study (mean ± SEM, age 56.5 ± 0.6 yr; HbA1c
7.1 ± 0.1%), without cardiac ischemia. Patients were randomly
assigned to pioglitazone (30 mg/day) or metformin (2000 mg/day)
and matching placebo during 24 weeks. Epicardial fat and
abdominal visceral and subcutaneous fat were measured by
magnetic resonance imaging. Myocardial and hepatic triglyceride
content (TG) were determined by 1H magnetic resonance
spectroscopy.
Results: Epicardial fat correlated with abdominal visceral fat
(r = 0.53, p < 0.001), BMI (r = 0.42, p < 0.001), abdominal
subcutaneous fat (r = 0.35, p = 0.002), myocardial TG
(r = 0.24, p = 0.04) and hepatic TG (r = 0.29, p = 0.01). Both
treatments improved glycemic control similarly. Patients treated
with pioglitazone had an increased body weight (p < 0.001). In
this group, epicardial fat increased by 9% (p = 0.01) and
abdominal subcutaneous fat by 18% (p < 0.001), whereas
metformin did not affect these fat compartments. In contrast,
hepatic TG content significantly decreased in the pioglitazone
group. Abdominal visceral fat did not change in both groups. See
figure 1.
Conclusion: In patients with DM2 there is a relation between
epicardial fat mass, BMI and visceral fat mass. Pioglitazone
increases body weight, epicardial fat and subcutaneous fat mass in
patients with DM2 treated with pioglitazone, whereas hepatic
triglyceride content decreases.
P114Right ventricular assessment with cardiacmagnetic resonance: usefulness in routine clinicalpractice compared to echocardiographyCovadonga Fernández-Golfín, José Zamorano Gómez,Cecilia Corros Vicente, Tibisay Sánchez, Joaquin Ferreiros,Leopoldo Pérez de Isla, Ana Bustos, Betariz Cabezaand Carlos MacayaHospital Universitario Clinico San Carlos, Madrid, Spain
Journal of Cardiovascular Magnetic Resonance 2009, 11(Suppl 1):P114
Introduction: Right ventricular (RV) morphology and function
is essential in the evaluation of different cardiac diseases. It has
prognosis significance and influence everyday clinical decision
making. Routine RV assessment is done by means of echocardio-
graphy. Visual estimation of RV morphology and function is
normally performed, using RV function echocardiographic
indexes only in selected populations. This approach may lead
to inaccurate RV assessment especially in cases with mild RV
dilatation/impairment. Cardiac magnetic resonance (CMR) has
emerged as the gold standard for biventricular volume and
function quantiphication.
Purpose: The aim of the study was to analyze in a clinical
setting, the utility of CMR in the evaluation of RV morphology
and function, comparing it to routine echocardiography exam-
inations reports.
Methods: 96 patients with RV volume and function assessed
with CRM were initially included. Reports form echocardiogra-
phy performed to these patients were reviewed. Patients in
whom the echocardiography was performed more than one year
from the CRM study were excluded, as well as patients in whom
specific echocardiography RV information was lacking. Study
population consisted of 72 patients, mean age 48 years, men 55,
Figure 1 (abstract P113)
Correlation between epicardial and visceral fat at baseline.
Journal of Cardiovascular Magnetic Resonance 2009, 11(Suppl 1) http://jcmr-online.com/supplements/11/S1
Page 173 of 316(page number not for citation purposes)
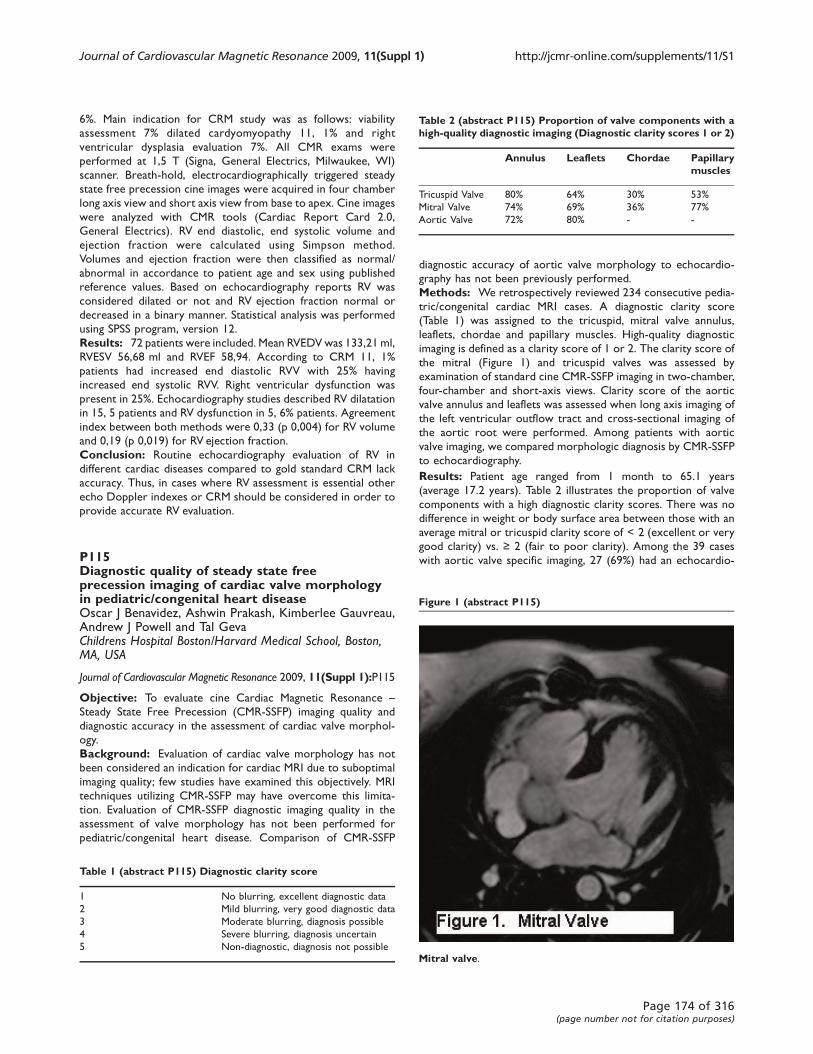
6%. Main indication for CRM study was as follows: viability
assessment 7% dilated cardyomyopathy 11, 1% and right
ventricular dysplasia evaluation 7%. All CMR exams were
performed at 1,5 T (Signa, General Electrics, Milwaukee, WI)
scanner. Breath-hold, electrocardiographically triggered steady
state free precession cine images were acquired in four chamber
long axis view and short axis view from base to apex. Cine images
were analyzed with CMR tools (Cardiac Report Card 2.0,
General Electrics). RV end diastolic, end systolic volume and
ejection fraction were calculated using Simpson method.
Volumes and ejection fraction were then classified as normal/
abnormal in accordance to patient age and sex using published
reference values. Based on echocardiography reports RV was
considered dilated or not and RV ejection fraction normal or
decreased in a binary manner. Statistical analysis was performed
using SPSS program, version 12.
Results: 72 patients were included. Mean RVEDV was 133,21 ml,
RVESV 56,68 ml and RVEF 58,94. According to CRM 11, 1%
patients had increased end diastolic RVV with 25% having
increased end systolic RVV. Right ventricular dysfunction was
present in 25%. Echocardiography studies described RV dilatation
in 15, 5 patients and RV dysfunction in 5, 6% patients. Agreement
index between both methods were 0,33 (p 0,004) for RV volume
and 0,19 (p 0,019) for RV ejection fraction.
Conclusion: Routine echocardiography evaluation of RV in
different cardiac diseases compared to gold standard CRM lack
accuracy. Thus, in cases where RV assessment is essential other
echo Doppler indexes or CRM should be considered in order to
provide accurate RV evaluation.
P115Diagnostic quality of steady state freeprecession imaging of cardiac valve morphologyin pediatric/congenital heart diseaseOscar J Benavidez, Ashwin Prakash, Kimberlee Gauvreau,Andrew J Powell and Tal GevaChildrens Hospital Boston/Harvard Medical School, Boston,MA, USA
Journal of Cardiovascular Magnetic Resonance 2009, 11(Suppl 1):P115
Objective: To evaluate cine Cardiac Magnetic Resonance –Steady State Free Precession (CMR-SSFP) imaging quality and
diagnostic accuracy in the assessment of cardiac valve morphol-
ogy.
Background: Evaluation of cardiac valve morphology has not
been considered an indication for cardiac MRI due to suboptimal
imaging quality; few studies have examined this objectively. MRI
techniques utilizing CMR-SSFP may have overcome this limita-
tion. Evaluation of CMR-SSFP diagnostic imaging quality in the
assessment of valve morphology has not been performed for
pediatric/congenital heart disease. Comparison of CMR-SSFP
diagnostic accuracy of aortic valve morphology to echocardio-
graphy has not been previously performed.
Methods: We retrospectively reviewed 234 consecutive pedia-
tric/congenital cardiac MRI cases. A diagnostic clarity score
(Table 1) was assigned to the tricuspid, mitral valve annulus,
leaflets, chordae and papillary muscles. High-quality diagnostic
imaging is defined as a clarity score of 1 or 2. The clarity score of
the mitral (Figure 1) and tricuspid valves was assessed by
examination of standard cine CMR-SSFP imaging in two-chamber,
four-chamber and short-axis views. Clarity score of the aortic
valve annulus and leaflets was assessed when long axis imaging of
the left ventricular outflow tract and cross-sectional imaging of
the aortic root were performed. Among patients with aortic
valve imaging, we compared morphologic diagnosis by CMR-SSFP
to echocardiography.
Results: Patient age ranged from 1 month to 65.1 years
(average 17.2 years). Table 2 illustrates the proportion of valve
components with a high diagnostic clarity scores. There was no
difference in weight or body surface area between those with an
average mitral or tricuspid clarity score of < 2 (excellent or very
good clarity) vs. ≥ 2 (fair to poor clarity). Among the 39 cases
with aortic valve specific imaging, 27 (69%) had an echocardio-
Table 1 (abstract P115) Diagnostic clarity score
1 No blurring, excellent diagnostic data
2 Mild blurring, very good diagnostic data
3 Moderate blurring, diagnosis possible
4 Severe blurring, diagnosis uncertain
5 Non-diagnostic, diagnosis not possible
Table 2 (abstract P115) Proportion of valve components with ahigh-quality diagnostic imaging (Diagnostic clarity scores 1 or 2)
Annulus Leaflets Chordae Papillarymuscles
Tricuspid Valve 80% 64% 30% 53%
Mitral Valve 74% 69% 36% 77%
Aortic Valve 72% 80% - -
Figure 1 (abstract P115)
Mitral valve.
Journal of Cardiovascular Magnetic Resonance 2009, 11(Suppl 1) http://jcmr-online.com/supplements/11/S1
Page 174 of 316(page number not for citation purposes)
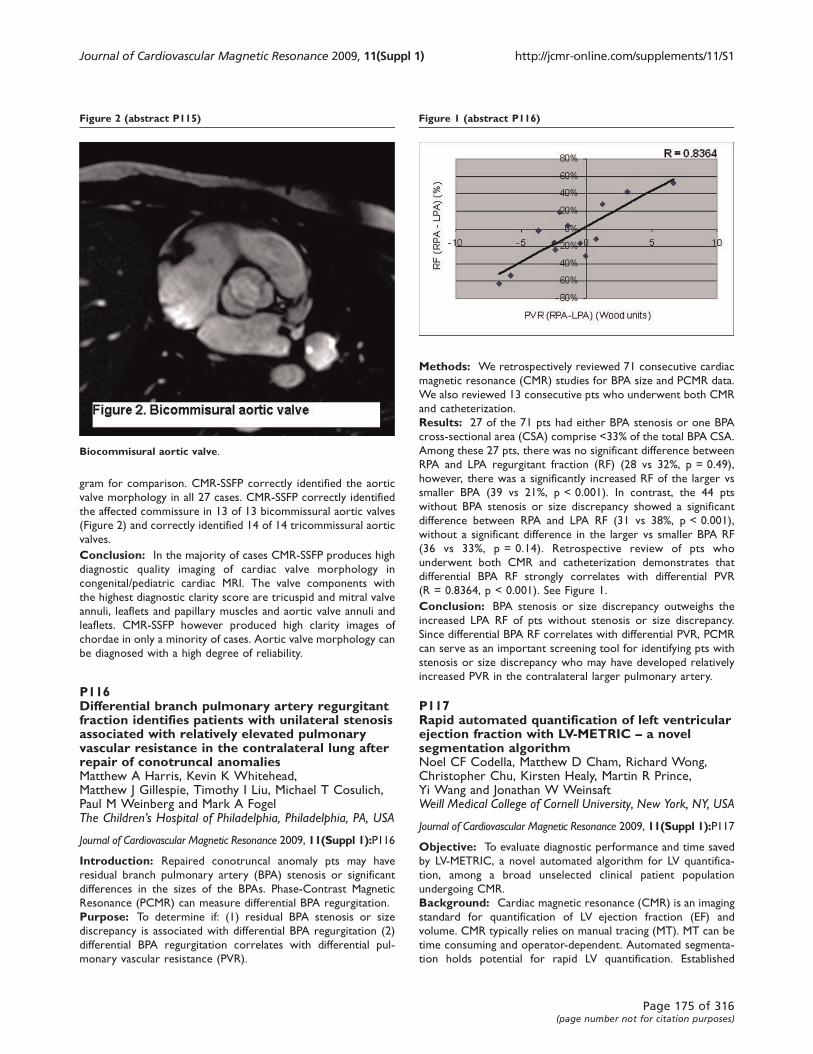
gram for comparison. CMR-SSFP correctly identified the aortic
valve morphology in all 27 cases. CMR-SSFP correctly identified
the affected commissure in 13 of 13 bicommissural aortic valves
(Figure 2) and correctly identified 14 of 14 tricommissural aortic
valves.
Conclusion: In the majority of cases CMR-SSFP produces high
diagnostic quality imaging of cardiac valve morphology in
congenital/pediatric cardiac MRI. The valve components with
the highest diagnostic clarity score are tricuspid and mitral valve
annuli, leaflets and papillary muscles and aortic valve annuli and
leaflets. CMR-SSFP however produced high clarity images of
chordae in only a minority of cases. Aortic valve morphology can
be diagnosed with a high degree of reliability.
P116Differential branch pulmonary artery regurgitantfraction identifies patients with unilateral stenosisassociated with relatively elevated pulmonaryvascular resistance in the contralateral lung afterrepair of conotruncal anomaliesMatthew A Harris, Kevin K Whitehead,Matthew J Gillespie, Timothy I Liu, Michael T Cosulich,Paul M Weinberg and Mark A FogelThe Children’s Hospital of Philadelphia, Philadelphia, PA, USA
Journal of Cardiovascular Magnetic Resonance 2009, 11(Suppl 1):P116
Introduction: Repaired conotruncal anomaly pts may have
residual branch pulmonary artery (BPA) stenosis or significant
differences in the sizes of the BPAs. Phase-Contrast Magnetic
Resonance (PCMR) can measure differential BPA regurgitation.
Purpose: To determine if: (1) residual BPA stenosis or size
discrepancy is associated with differential BPA regurgitation (2)
differential BPA regurgitation correlates with differential pul-
monary vascular resistance (PVR).
Methods: We retrospectively reviewed 71 consecutive cardiac
magnetic resonance (CMR) studies for BPA size and PCMR data.
We also reviewed 13 consecutive pts who underwent both CMR
and catheterization.
Results: 27 of the 71 pts had either BPA stenosis or one BPA
cross-sectional area (CSA) comprise <33% of the total BPA CSA.
Among these 27 pts, there was no significant difference between
RPA and LPA regurgitant fraction (RF) (28 vs 32%, p = 0.49),
however, there was a significantly increased RF of the larger vs
smaller BPA (39 vs 21%, p < 0.001). In contrast, the 44 pts
without BPA stenosis or size discrepancy showed a significant
difference between RPA and LPA RF (31 vs 38%, p < 0.001),
without a significant difference in the larger vs smaller BPA RF
(36 vs 33%, p = 0.14). Retrospective review of pts who
underwent both CMR and catheterization demonstrates that
differential BPA RF strongly correlates with differential PVR
(R = 0.8364, p < 0.001). See Figure 1.
Conclusion: BPA stenosis or size discrepancy outweighs the
increased LPA RF of pts without stenosis or size discrepancy.
Since differential BPA RF correlates with differential PVR, PCMR
can serve as an important screening tool for identifying pts with
stenosis or size discrepancy who may have developed relatively
increased PVR in the contralateral larger pulmonary artery.
P117Rapid automated quantification of left ventricularejection fraction with LV-METRIC – a novelsegmentation algorithmNoel CF Codella, Matthew D Cham, Richard Wong,Christopher Chu, Kirsten Healy, Martin R Prince,Yi Wang and Jonathan W WeinsaftWeill Medical College of Cornell University, New York, NY, USA
Journal of Cardiovascular Magnetic Resonance 2009, 11(Suppl 1):P117
Objective: To evaluate diagnostic performance and time saved
by LV-METRIC, a novel automated algorithm for LV quantifica-
tion, among a broad unselected clinical patient population
undergoing CMR.
Background: Cardiac magnetic resonance (CMR) is an imaging
standard for quantification of LV ejection fraction (EF) and
volume. CMR typically relies on manual tracing (MT). MT can be
time consuming and operator-dependent. Automated segmenta-
tion holds potential for rapid LV quantification. Established
Figure 2 (abstract P115)
Biocommisural aortic valve.
Figure 1 (abstract P116)
Journal of Cardiovascular Magnetic Resonance 2009, 11(Suppl 1) http://jcmr-online.com/supplements/11/S1
Page 175 of 316(page number not for citation purposes)

automated algorithms often fail or require extensive user
interface, possibly due to the fact that they employ assumptions
regarding cavity shape or regional propagation. We developed an
automated segmentation algorithm (LV-METRIC) that involves no
geometric assumptions and instead quantifies LV EF and volume
based on local per-pixel signal intensity while accounting for
partial voxel effects. The purpose of the current study was three-
fold; (1) to evaluate LV-METRIC performance vs. MT among a
broad unselected patient population; (2) to compare processing
time by LV-METRIC to MT, and (3) to compare LV-METRIC and
MT to an independent standard of LV flow quantification.
Methods: LV-METRIC and MT were independently applied for
quantification of LV EF and volumes on consecutive patients that
underwent CMR (1.5 T) between June-November, 2007.
Processing times were recorded. Quantification was based on
endocardial border delineation of consecutive short axis SSFP
images throughout the LV (slice thickness 6 mm, gap 4 mm,
typical spatial resolution 1.9 × 1.4 mm). Through-plane aortic
valve phase contrast imaging was performed on a subset (n = 65)
of patients for independent confirmation of LV stroke volume.
No patients were excluded based on clinical characteristics; the
only exclusion criteria were cardiac arrhythmias or image
artifacts that prohibited MT (6.7% patients).
Results: The study population was comprised of 151 patients
(54 ± 14 yo, HTN 40%, DM 23%, CAD 34%). LV-METRIC was
successful in all patients; average processing time was 22 seconds
for LV-METRIC and 4 minutes 59 seconds for MT (p < 0.001). An
example segmentation is shown in Figure 1, where MT is
depicted in Fig. 1a, and LV-METRIC in Fig. 1b. Voxel blood
content color labels for LV-METRIC are also illustrated. LV EF
based on LV-METRIC was, on average, within 2 percentage points
of MT irrespective of whether partial voxel (-2.0 ± 2.3%) or full
voxel (0.6 ± 2.3%) computation was used (Table 1). LV volumes
yielded by LV-METRIC were smaller than MT. Mean end-diastolic
and end-systolic volumes in LV-METRIC measurements with
partial voxel interpolation were 25.7 mL and 14.3 mL smaller
than MT measurements, respectively. Full voxel computation
yielded less drastic differences, with diastolic volumes smaller by
4 mL and systolic volumes larger by 1.4 mL. All EF and volumetric
differences between LV-METRIC and MT were significant
(p < 0.001). Correlations for cavity volumes, global stroke
volume, and ejection fraction were high (all R2 > .95). Both LV-
METRIC and MT similarly agreed with phase contrast (all
differences p < 0.05); Although volumetric stroke volume by
MT was, on average, similar to PC (D5.9 mL), there was
substantial variance between the two techniques (SD ±
13.4 mL). Similar differences were evident when comparing PC
and LV-METRIC with (6.2 ± 14.2 ml) or without (-3.9 ± 14.7 ml)
partial voxel interpolation.
Conclusion: Among a broad population of consecutive
patients, LV-METRIC, a novel automated CMR segmentation
algorithm, provides highly accurate quantification of LV ejection
fraction and volumes with a marked reduction in processing time
vs. MT. Both LV-METRIC and MT provide similar agreement with
an independent standard of phase contrast imaging.
P118Regional right ventricular wall motion in tetralogyof fallot: a three dimensional analysisMichael Morcos, Christopher S Kirk and Florence SheehanUniversity of Washington, Seattle, WA, USA
Journal of Cardiovascular Magnetic Resonance 2009, 11(Suppl 1):P118
Background: We previously reported an abnormal contrac-
tion pattern in the right ventricle (RV) in tetralogy of Fallot (TOF)
patients by measuring the regional contribution to global stroke
volume (rSV) at 20 cross sections. However the rSV method only
measures regions spanning the RV from apex to base. Therefore
we tested a second method that allows regions of interest to be
defined for RV function.
Purpose: We wanted to develop a method that enables
detailed regional RV wall motion analysis that is capable of
producing a wide variety of user-specific regional designation.
Methods: We reconstructed the RV in 3D from manually
traced borders in 20 repaired TOF patients and 9 normal (NL)
subjects from magnetic resonance images. Wall motion was
measured using the Centersurface (CS) method as the local
orthogonal distance between the RV endocardium at end diastole
and end systole in 10 regions on the RV free wall, the septum,
and the outflow track. The free wall was divided into apical,
middle, and basal levels; each level was further subdivided into
inferior, middle, and superior regions. Regional function by both
methods was compared between TOF and NL groups.
Results: Both methods showed that TOF patients have reduced
function at the base and increased function at the apex compared
Table 1 (abstract P117) Comparison of LV-METRIC to manual tracing
Manual tracing LV-METRIC(PV interpolation)
D LV-METRIC(no PV interpolation)
D
Ejection fraction 57.1 ± 17.0 59.1 ± 17.4 -2.0 ± 2.3 56.5 ± 16.7 0.6 ± 2.3
End-diastolic volume (ml) 157.8 ± 67.9 132.1 ± 60.5 25.7 ± 10.9 153.8 ± 65.9 4.0 ± 6.8
End-systolic volume (ml) 75.1 ± 62.7 60.9 ± 55 14.3 ± 9.6 73.7 ± 60 1.4 ± 5.5
Stroke volume (ml) 82.6 ± 26.8 71.2 ± 24.1 11.4 ± 6.6 80 ± 26.9 2.6 ± 5.3
Processing time (minutes) 5:18 ± 1:56 0:22 ± 0:13 4:37 ± 1:51
Figure 1 (abstract P117)
Journal of Cardiovascular Magnetic Resonance 2009, 11(Suppl 1) http://jcmr-online.com/supplements/11/S1
Page 176 of 316(page number not for citation purposes)
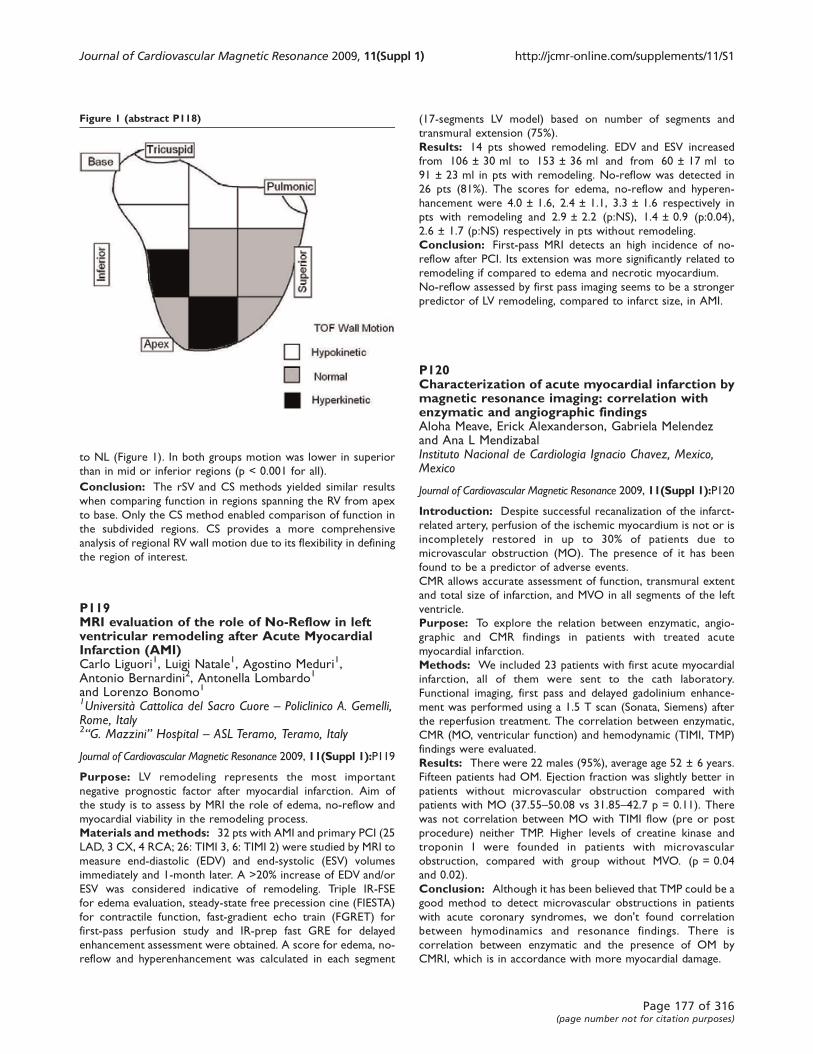
to NL (Figure 1). In both groups motion was lower in superior
than in mid or inferior regions (p < 0.001 for all).
Conclusion: The rSV and CS methods yielded similar results
when comparing function in regions spanning the RV from apex
to base. Only the CS method enabled comparison of function in
the subdivided regions. CS provides a more comprehensive
analysis of regional RV wall motion due to its flexibility in defining
the region of interest.
P119MRI evaluation of the role of No-Reflow in leftventricular remodeling after Acute MyocardialInfarction (AMI)Carlo Liguori1, Luigi Natale1, Agostino Meduri1,Antonio Bernardini2, Antonella Lombardo1
and Lorenzo Bonomo11Università Cattolica del Sacro Cuore – Policlinico A. Gemelli,Rome, Italy2“G. Mazzini” Hospital – ASL Teramo, Teramo, Italy
Journal of Cardiovascular Magnetic Resonance 2009, 11(Suppl 1):P119
Purpose: LV remodeling represents the most important
negative prognostic factor after myocardial infarction. Aim of
the study is to assess by MRI the role of edema, no-reflow and
myocardial viability in the remodeling process.
Materials and methods: 32 pts with AMI and primary PCI (25
LAD, 3 CX, 4 RCA; 26: TIMI 3, 6: TIMI 2) were studied by MRI to
measure end-diastolic (EDV) and end-systolic (ESV) volumes
immediately and 1-month later. A >20% increase of EDV and/or
ESV was considered indicative of remodeling. Triple IR-FSE
for edema evaluation, steady-state free precession cine (FIESTA)
for contractile function, fast-gradient echo train (FGRET) for
first-pass perfusion study and IR-prep fast GRE for delayed
enhancement assessment were obtained. A score for edema, no-
reflow and hyperenhancement was calculated in each segment
(17-segments LV model) based on number of segments and
transmural extension (75%).
Results: 14 pts showed remodeling. EDV and ESV increased
from 106 ± 30 ml to 153 ± 36 ml and from 60 ± 17 ml to
91 ± 23 ml in pts with remodeling. No-reflow was detected in
26 pts (81%). The scores for edema, no-reflow and hyperen-
hancement were 4.0 ± 1.6, 2.4 ± 1.1, 3.3 ± 1.6 respectively in
pts with remodeling and 2.9 ± 2.2 (p:NS), 1.4 ± 0.9 (p:0.04),
2.6 ± 1.7 (p:NS) respectively in pts without remodeling.
Conclusion: First-pass MRI detects an high incidence of no-
reflow after PCI. Its extension was more significantly related to
remodeling if compared to edema and necrotic myocardium.
No-reflow assessed by first pass imaging seems to be a stronger
predictor of LV remodeling, compared to infarct size, in AMI.
P120Characterization of acute myocardial infarction bymagnetic resonance imaging: correlation withenzymatic and angiographic findingsAloha Meave, Erick Alexanderson, Gabriela Melendezand Ana L MendizabalInstituto Nacional de Cardiologia Ignacio Chavez, Mexico,Mexico
Journal of Cardiovascular Magnetic Resonance 2009, 11(Suppl 1):P120
Introduction: Despite successful recanalization of the infarct-
related artery, perfusion of the ischemic myocardium is not or is
incompletely restored in up to 30% of patients due to
microvascular obstruction (MO). The presence of it has been
found to be a predictor of adverse events.
CMR allows accurate assessment of function, transmural extent
and total size of infarction, and MVO in all segments of the left
ventricle.
Purpose: To explore the relation between enzymatic, angio-
graphic and CMR findings in patients with treated acute
myocardial infarction.
Methods: We included 23 patients with first acute myocardial
infarction, all of them were sent to the cath laboratory.
Functional imaging, first pass and delayed gadolinium enhance-
ment was performed using a 1.5 T scan (Sonata, Siemens) after
the reperfusion treatment. The correlation between enzymatic,
CMR (MO, ventricular function) and hemodynamic (TIMI, TMP)
findings were evaluated.
Results: There were 22 males (95%), average age 52 ± 6 years.
Fifteen patients had OM. Ejection fraction was slightly better in
patients without microvascular obstruction compared with
patients with MO (37.55–50.08 vs 31.85–42.7 p = 0.11). There
was not correlation between MO with TIMI flow (pre or post
procedure) neither TMP. Higher levels of creatine kinase and
troponin I were founded in patients with microvascular
obstruction, compared with group without MVO. (p = 0.04
and 0.02).
Conclusion: Although it has been believed that TMP could be a
good method to detect microvascular obstructions in patients
with acute coronary syndromes, we don't found correlation
between hymodinamics and resonance findings. There is
correlation between enzymatic and the presence of OM by
CMRI, which is in accordance with more myocardial damage.
Figure 1 (abstract P118)
Journal of Cardiovascular Magnetic Resonance 2009, 11(Suppl 1) http://jcmr-online.com/supplements/11/S1
Page 177 of 316(page number not for citation purposes)
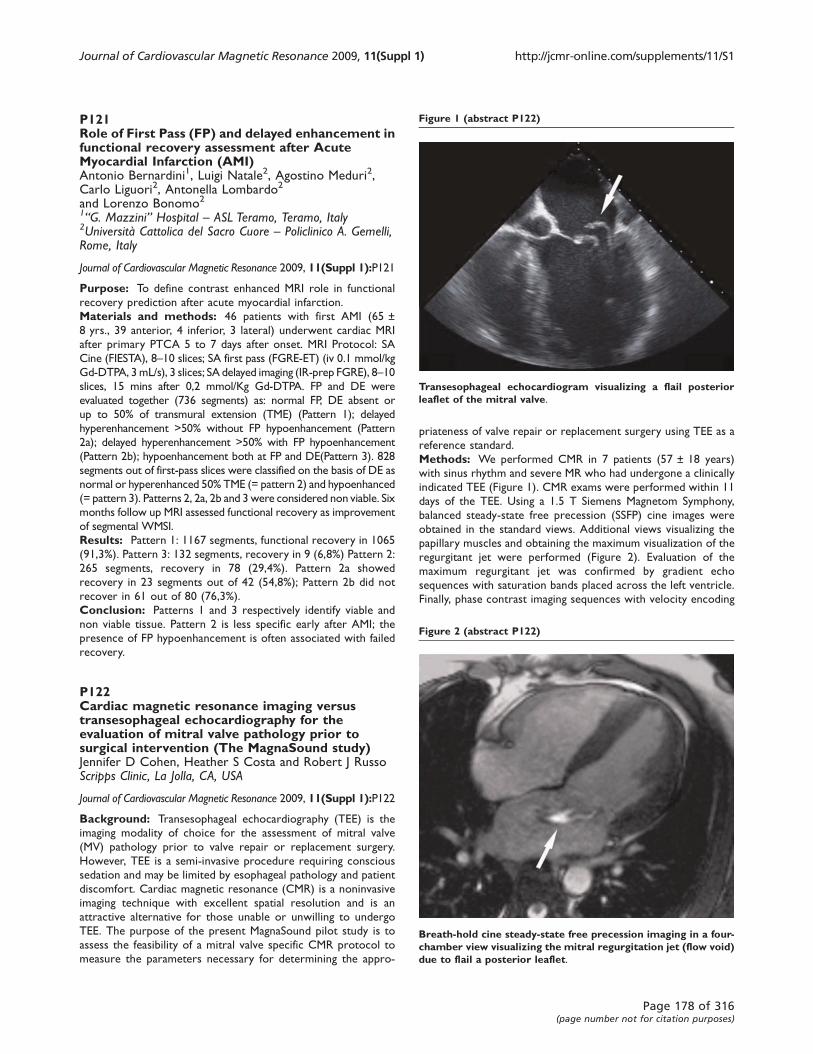
P121Role of First Pass (FP) and delayed enhancement infunctional recovery assessment after AcuteMyocardial Infarction (AMI)Antonio Bernardini1, Luigi Natale2, Agostino Meduri2,Carlo Liguori2, Antonella Lombardo2
and Lorenzo Bonomo21“G. Mazzini” Hospital – ASL Teramo, Teramo, Italy2Università Cattolica del Sacro Cuore – Policlinico A. Gemelli,Rome, Italy
Journal of Cardiovascular Magnetic Resonance 2009, 11(Suppl 1):P121
Purpose: To define contrast enhanced MRI role in functional
recovery prediction after acute myocardial infarction.
Materials and methods: 46 patients with first AMI (65 ±
8 yrs., 39 anterior, 4 inferior, 3 lateral) underwent cardiac MRI
after primary PTCA 5 to 7 days after onset. MRI Protocol: SA
Cine (FIESTA), 8–10 slices; SA first pass (FGRE-ET) (iv 0.1 mmol/kg
Gd-DTPA, 3mL/s), 3 slices; SA delayed imaging (IR-prep FGRE), 8–10slices, 15 mins after 0,2 mmol/Kg Gd-DTPA. FP and DE were
evaluated together (736 segments) as: normal FP, DE absent or
up to 50% of transmural extension (TME) (Pattern 1); delayed
hyperenhancement >50% without FP hypoenhancement (Pattern
2a); delayed hyperenhancement >50% with FP hypoenhancement
(Pattern 2b); hypoenhancement both at FP and DE(Pattern 3). 828
segments out of first-pass slices were classified on the basis of DE as
normal or hyperenhanced 50% TME (= pattern 2) and hypoenhanced
(= pattern 3). Patterns 2, 2a, 2b and 3 were considered non viable. Six
months follow up MRI assessed functional recovery as improvement
of segmental WMSI.
Results: Pattern 1: 1167 segments, functional recovery in 1065
(91,3%). Pattern 3: 132 segments, recovery in 9 (6,8%) Pattern 2:
265 segments, recovery in 78 (29,4%). Pattern 2a showed
recovery in 23 segments out of 42 (54,8%); Pattern 2b did not
recover in 61 out of 80 (76,3%).
Conclusion: Patterns 1 and 3 respectively identify viable and
non viable tissue. Pattern 2 is less specific early after AMI; the
presence of FP hypoenhancement is often associated with failed
recovery.
P122Cardiac magnetic resonance imaging versustransesophageal echocardiography for theevaluation of mitral valve pathology prior tosurgical intervention (The MagnaSound study)Jennifer D Cohen, Heather S Costa and Robert J RussoScripps Clinic, La Jolla, CA, USA
Journal of Cardiovascular Magnetic Resonance 2009, 11(Suppl 1):P122
Background: Transesophageal echocardiography (TEE) is the
imaging modality of choice for the assessment of mitral valve
(MV) pathology prior to valve repair or replacement surgery.
However, TEE is a semi-invasive procedure requiring conscious
sedation and may be limited by esophageal pathology and patient
discomfort. Cardiac magnetic resonance (CMR) is a noninvasive
imaging technique with excellent spatial resolution and is an
attractive alternative for those unable or unwilling to undergo
TEE. The purpose of the present MagnaSound pilot study is to
assess the feasibility of a mitral valve specific CMR protocol to
measure the parameters necessary for determining the appro-
priateness of valve repair or replacement surgery using TEE as a
reference standard.
Methods: We performed CMR in 7 patients (57 ± 18 years)
with sinus rhythm and severe MR who had undergone a clinically
indicated TEE (Figure 1). CMR exams were performed within 11
days of the TEE. Using a 1.5 T Siemens Magnetom Symphony,
balanced steady-state free precession (SSFP) cine images were
obtained in the standard views. Additional views visualizing the
papillary muscles and obtaining the maximum visualization of the
regurgitant jet were performed (Figure 2). Evaluation of the
maximum regurgitant jet was confirmed by gradient echo
sequences with saturation bands placed across the left ventricle.
Finally, phase contrast imaging sequences with velocity encoding
Figure 1 (abstract P122)
Transesophageal echocardiogram visualizing a flail posteriorleaflet of the mitral valve.
Figure 2 (abstract P122)
Breath-hold cine steady-state free precession imaging in a four-chamber view visualizing the mitral regurgitation jet (flow void)due to flail a posterior leaflet.
Journal of Cardiovascular Magnetic Resonance 2009, 11(Suppl 1) http://jcmr-online.com/supplements/11/S1
Page 178 of 316(page number not for citation purposes)
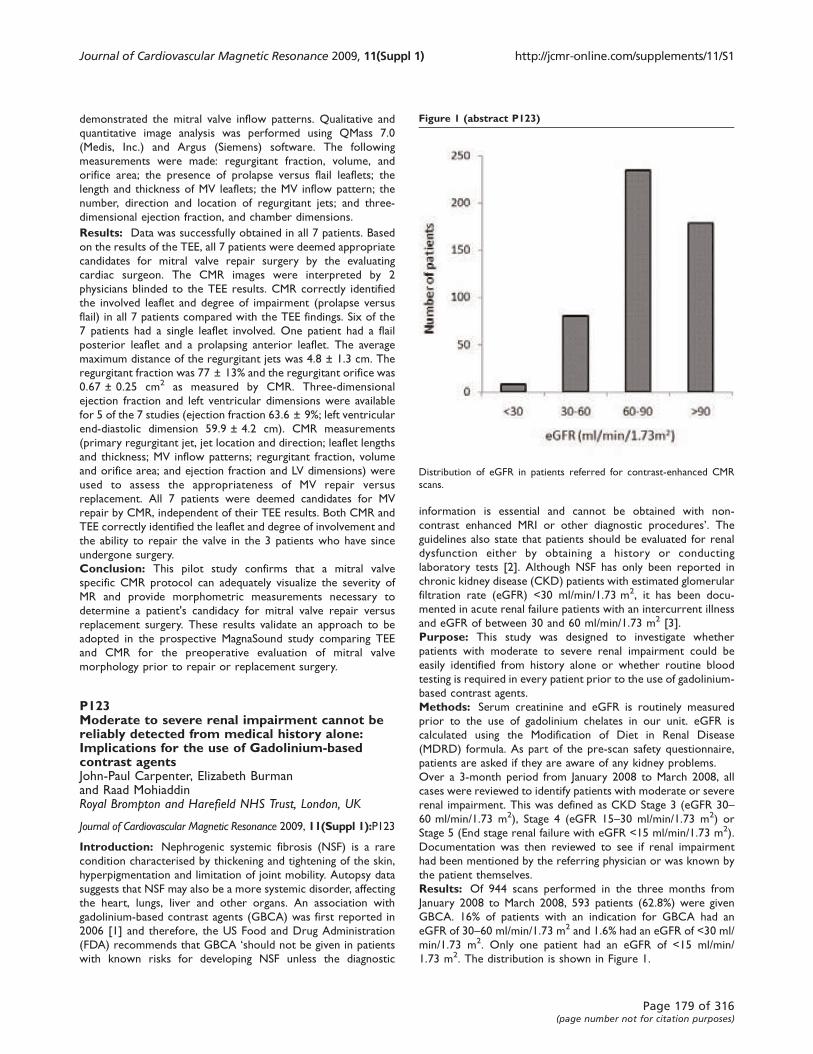
demonstrated the mitral valve inflow patterns. Qualitative and
quantitative image analysis was performed using QMass 7.0
(Medis, Inc.) and Argus (Siemens) software. The following
measurements were made: regurgitant fraction, volume, and
orifice area; the presence of prolapse versus flail leaflets; the
length and thickness of MV leaflets; the MV inflow pattern; the
number, direction and location of regurgitant jets; and three-
dimensional ejection fraction, and chamber dimensions.
Results: Data was successfully obtained in all 7 patients. Based
on the results of the TEE, all 7 patients were deemed appropriate
candidates for mitral valve repair surgery by the evaluating
cardiac surgeon. The CMR images were interpreted by 2
physicians blinded to the TEE results. CMR correctly identified
the involved leaflet and degree of impairment (prolapse versus
flail) in all 7 patients compared with the TEE findings. Six of the
7 patients had a single leaflet involved. One patient had a flail
posterior leaflet and a prolapsing anterior leaflet. The average
maximum distance of the regurgitant jets was 4.8 ± 1.3 cm. The
regurgitant fraction was 77 ± 13% and the regurgitant orifice was
0.67 ± 0.25 cm2 as measured by CMR. Three-dimensional
ejection fraction and left ventricular dimensions were available
for 5 of the 7 studies (ejection fraction 63.6 ± 9%; left ventricular
end-diastolic dimension 59.9 ± 4.2 cm). CMR measurements
(primary regurgitant jet, jet location and direction; leaflet lengths
and thickness; MV inflow patterns; regurgitant fraction, volume
and orifice area; and ejection fraction and LV dimensions) were
used to assess the appropriateness of MV repair versus
replacement. All 7 patients were deemed candidates for MV
repair by CMR, independent of their TEE results. Both CMR and
TEE correctly identified the leaflet and degree of involvement and
the ability to repair the valve in the 3 patients who have since
undergone surgery.
Conclusion: This pilot study confirms that a mitral valve
specific CMR protocol can adequately visualize the severity of
MR and provide morphometric measurements necessary to
determine a patient's candidacy for mitral valve repair versus
replacement surgery. These results validate an approach to be
adopted in the prospective MagnaSound study comparing TEE
and CMR for the preoperative evaluation of mitral valve
morphology prior to repair or replacement surgery.
P123Moderate to severe renal impairment cannot bereliably detected from medical history alone:Implications for the use of Gadolinium-basedcontrast agentsJohn-Paul Carpenter, Elizabeth Burmanand Raad MohiaddinRoyal Brompton and Harefield NHS Trust, London, UK
Journal of Cardiovascular Magnetic Resonance 2009, 11(Suppl 1):P123
Introduction: Nephrogenic systemic fibrosis (NSF) is a rare
condition characterised by thickening and tightening of the skin,
hyperpigmentation and limitation of joint mobility. Autopsy data
suggests that NSF may also be a more systemic disorder, affecting
the heart, lungs, liver and other organs. An association with
gadolinium-based contrast agents (GBCA) was first reported in
2006 [1] and therefore, the US Food and Drug Administration
(FDA) recommends that GBCA ‘should not be given in patients
with known risks for developing NSF unless the diagnostic
information is essential and cannot be obtained with non-
contrast enhanced MRI or other diagnostic procedures’. Theguidelines also state that patients should be evaluated for renal
dysfunction either by obtaining a history or conducting
laboratory tests [2]. Although NSF has only been reported in
chronic kidney disease (CKD) patients with estimated glomerular
filtration rate (eGFR) <30 ml/min/1.73 m2, it has been docu-
mented in acute renal failure patients with an intercurrent illness
and eGFR of between 30 and 60 ml/min/1.73 m2 [3].
Purpose: This study was designed to investigate whether
patients with moderate to severe renal impairment could be
easily identified from history alone or whether routine blood
testing is required in every patient prior to the use of gadolinium-
based contrast agents.
Methods: Serum creatinine and eGFR is routinely measured
prior to the use of gadolinium chelates in our unit. eGFR is
calculated using the Modification of Diet in Renal Disease
(MDRD) formula. As part of the pre-scan safety questionnaire,
patients are asked if they are aware of any kidney problems.
Over a 3-month period from January 2008 to March 2008, all
cases were reviewed to identify patients with moderate or severe
renal impairment. This was defined as CKD Stage 3 (eGFR 30–60 ml/min/1.73 m2), Stage 4 (eGFR 15–30 ml/min/1.73 m2) or
Stage 5 (End stage renal failure with eGFR <15 ml/min/1.73 m2).
Documentation was then reviewed to see if renal impairment
had been mentioned by the referring physician or was known by
the patient themselves.
Results: Of 944 scans performed in the three months from
January 2008 to March 2008, 593 patients (62.8%) were given
GBCA. 16% of patients with an indication for GBCA had an
eGFR of 30–60 ml/min/1.73 m2 and 1.6% had an eGFR of <30 ml/
min/1.73 m2. Only one patient had an eGFR of <15 ml/min/
1.73 m2. The distribution is shown in Figure 1.
Figure 1 (abstract P123)
Distribution of eGFR in patients referred for contrast-enhanced CMR
scans.
Journal of Cardiovascular Magnetic Resonance 2009, 11(Suppl 1) http://jcmr-online.com/supplements/11/S1
Page 179 of 316(page number not for citation purposes)
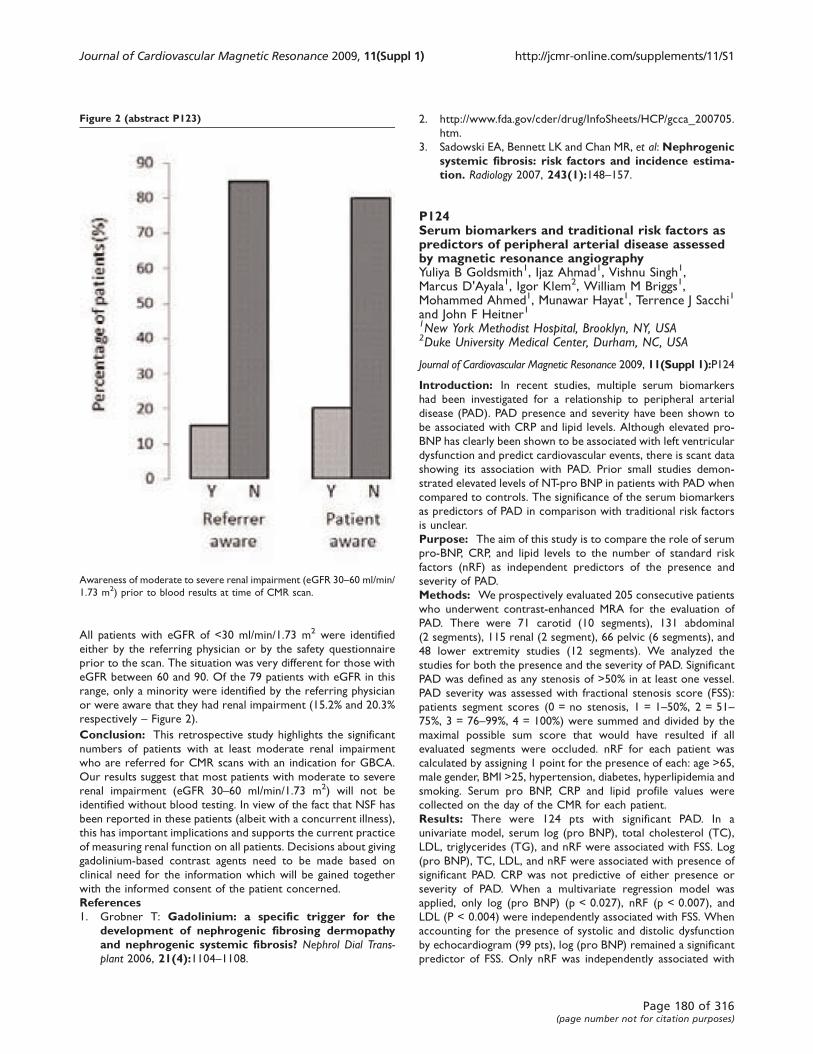
All patients with eGFR of <30 ml/min/1.73 m2 were identified
either by the referring physician or by the safety questionnaire
prior to the scan. The situation was very different for those with
eGFR between 60 and 90. Of the 79 patients with eGFR in this
range, only a minority were identified by the referring physician
or were aware that they had renal impairment (15.2% and 20.3%
respectively – Figure 2).
Conclusion: This retrospective study highlights the significant
numbers of patients with at least moderate renal impairment
who are referred for CMR scans with an indication for GBCA.
Our results suggest that most patients with moderate to severe
renal impairment (eGFR 30–60 ml/min/1.73 m2) will not be
identified without blood testing. In view of the fact that NSF has
been reported in these patients (albeit with a concurrent illness),
this has important implications and supports the current practice
of measuring renal function on all patients. Decisions about giving
gadolinium-based contrast agents need to be made based on
clinical need for the information which will be gained together
with the informed consent of the patient concerned.
References1. Grobner T: Gadolinium: a specific trigger for the
development of nephrogenic fibrosing dermopathyand nephrogenic systemic fibrosis? Nephrol Dial Trans-plant 2006, 21(4):1104–1108.
2. http://www.fda.gov/cder/drug/InfoSheets/HCP/gcca_200705.
htm.
3. Sadowski EA, Bennett LK and Chan MR, et al: Nephrogenicsystemic fibrosis: risk factors and incidence estima-tion. Radiology 2007, 243(1):148–157.
P124Serum biomarkers and traditional risk factors aspredictors of peripheral arterial disease assessedby magnetic resonance angiographyYuliya B Goldsmith1, Ijaz Ahmad1, Vishnu Singh1,Marcus D'Ayala1, Igor Klem2, William M Briggs1,Mohammed Ahmed1, Munawar Hayat1, Terrence J Sacchi1
and John F Heitner11New York Methodist Hospital, Brooklyn, NY, USA2Duke University Medical Center, Durham, NC, USA
Journal of Cardiovascular Magnetic Resonance 2009, 11(Suppl 1):P124
Introduction: In recent studies, multiple serum biomarkers
had been investigated for a relationship to peripheral arterial
disease (PAD). PAD presence and severity have been shown to
be associated with CRP and lipid levels. Although elevated pro-
BNP has clearly been shown to be associated with left ventricular
dysfunction and predict cardiovascular events, there is scant data
showing its association with PAD. Prior small studies demon-
strated elevated levels of NT-pro BNP in patients with PAD when
compared to controls. The significance of the serum biomarkers
as predictors of PAD in comparison with traditional risk factors
is unclear.
Purpose: The aim of this study is to compare the role of serum
pro-BNP, CRP, and lipid levels to the number of standard risk
factors (nRF) as independent predictors of the presence and
severity of PAD.
Methods: We prospectively evaluated 205 consecutive patients
who underwent contrast-enhanced MRA for the evaluation of
PAD. There were 71 carotid (10 segments), 131 abdominal
(2 segments), 115 renal (2 segment), 66 pelvic (6 segments), and
48 lower extremity studies (12 segments). We analyzed the
studies for both the presence and the severity of PAD. Significant
PAD was defined as any stenosis of >50% in at least one vessel.
PAD severity was assessed with fractional stenosis score (FSS):
patients segment scores (0 = no stenosis, 1 = 1–50%, 2 = 51–75%, 3 = 76–99%, 4 = 100%) were summed and divided by the
maximal possible sum score that would have resulted if all
evaluated segments were occluded. nRF for each patient was
calculated by assigning 1 point for the presence of each: age >65,
male gender, BMI >25, hypertension, diabetes, hyperlipidemia and
smoking. Serum pro BNP, CRP and lipid profile values were
collected on the day of the CMR for each patient.
Results: There were 124 pts with significant PAD. In a
univariate model, serum log (pro BNP), total cholesterol (TC),
LDL, triglycerides (TG), and nRF were associated with FSS. Log
(pro BNP), TC, LDL, and nRF were associated with presence of
significant PAD. CRP was not predictive of either presence or
severity of PAD. When a multivariate regression model was
applied, only log (pro BNP) (p < 0.027), nRF (p < 0.007), and
LDL (P < 0.004) were independently associated with FSS. When
accounting for the presence of systolic and distolic dysfunction
by echocardiogram (99 pts), log (pro BNP) remained a significant
predictor of FSS. Only nRF was independently associated with
Figure 2 (abstract P123)
Awareness of moderate to severe renal impairment (eGFR 30–60 ml/min/
1.73 m2) prior to blood results at time of CMR scan.
Journal of Cardiovascular Magnetic Resonance 2009, 11(Suppl 1) http://jcmr-online.com/supplements/11/S1
Page 180 of 316(page number not for citation purposes)
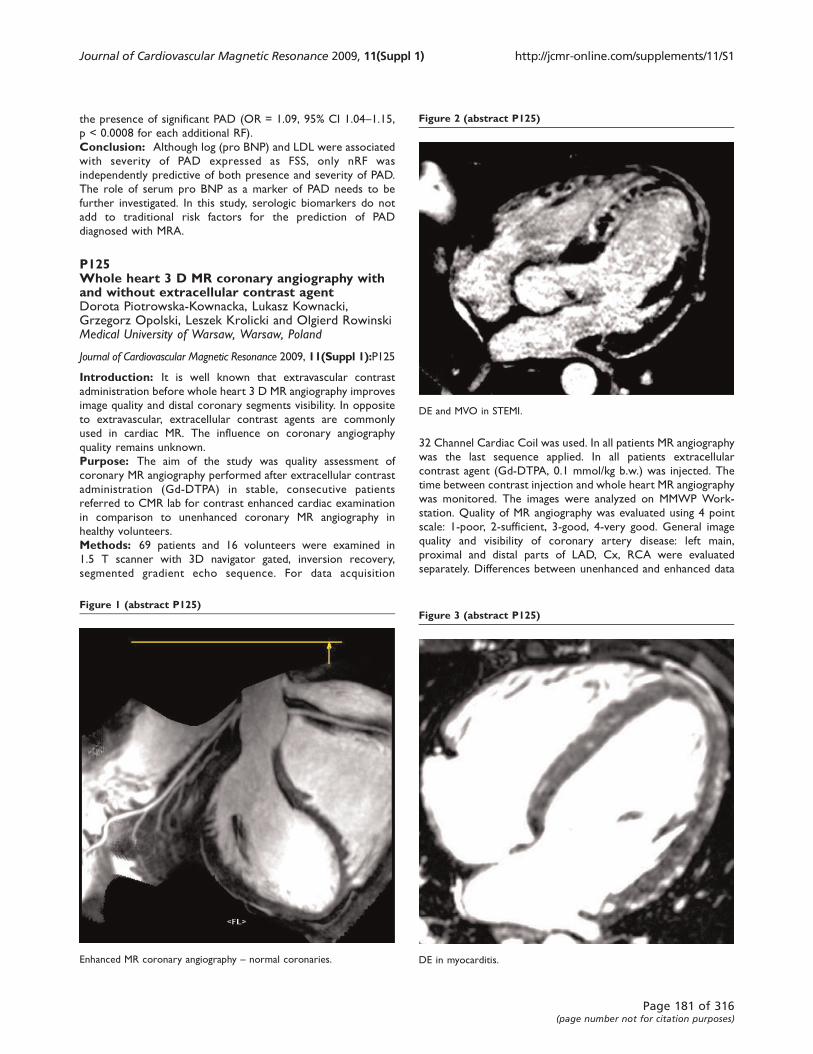
the presence of significant PAD (OR = 1.09, 95% CI 1.04–1.15,p < 0.0008 for each additional RF).
Conclusion: Although log (pro BNP) and LDL were associated
with severity of PAD expressed as FSS, only nRF was
independently predictive of both presence and severity of PAD.
The role of serum pro BNP as a marker of PAD needs to be
further investigated. In this study, serologic biomarkers do not
add to traditional risk factors for the prediction of PAD
diagnosed with MRA.
P125Whole heart 3 D MR coronary angiography withand without extracellular contrast agentDorota Piotrowska-Kownacka, Lukasz Kownacki,Grzegorz Opolski, Leszek Krolicki and Olgierd RowinskiMedical University of Warsaw, Warsaw, Poland
Journal of Cardiovascular Magnetic Resonance 2009, 11(Suppl 1):P125
Introduction: It is well known that extravascular contrast
administration before whole heart 3 D MR angiography improves
image quality and distal coronary segments visibility. In opposite
to extravascular, extracellular contrast agents are commonly
used in cardiac MR. The influence on coronary angiography
quality remains unknown.
Purpose: The aim of the study was quality assessment of
coronary MR angiography performed after extracellular contrast
administration (Gd-DTPA) in stable, consecutive patients
referred to CMR lab for contrast enhanced cardiac examination
in comparison to unenhanced coronary MR angiography in
healthy volunteers.
Methods: 69 patients and 16 volunteers were examined in
1.5 T scanner with 3D navigator gated, inversion recovery,
segmented gradient echo sequence. For data acquisition
32 Channel Cardiac Coil was used. In all patients MR angiography
was the last sequence applied. In all patients extracellular
contrast agent (Gd-DTPA, 0.1 mmol/kg b.w.) was injected. The
time between contrast injection and whole heart MR angiography
was monitored. The images were analyzed on MMWP Work-
station. Quality of MR angiography was evaluated using 4 point
scale: 1-poor, 2-sufficient, 3-good, 4-very good. General image
quality and visibility of coronary artery disease: left main,
proximal and distal parts of LAD, Cx, RCA were evaluated
separately. Differences between unenhanced and enhanced data
Figure 1 (abstract P125)
Enhanced MR coronary angiography – normal coronaries.
Figure 2 (abstract P125)
DE and MVO in STEMI.
Figure 3 (abstract P125)
DE in myocarditis.
Journal of Cardiovascular Magnetic Resonance 2009, 11(Suppl 1) http://jcmr-online.com/supplements/11/S1
Page 181 of 316(page number not for citation purposes)

were analyzed using Mann-Whitney test. P value of below 0,05
was considered statistically significant.
Results: Mean time between contrast injection and sequence
start was 12,8 ± 7,7 min. Mean acquisition time was 14 ± 5,9.
The median quality score was 3. General MR angiography quality
was good or very good in 76,6% of patient and 67,7% of
volunteers. There was significant improvement of general quality
as well as coronaries visibility in all evaluated arteries and parts
on enhanced images. No relation between contrast injection
time as well as acquisition time and image quality were found.
Enhanced images have given additional information regarding
viability in patients with acute myocarditis and viability/no-reflow
regions in patients early after myocardial infarction.
Conclusion: Extracellular contrast agents, which are com-
monly used in cardiac MR, significantly improves image quality of
the whole heart, navigator gated 3D MR coronary angiography.
Preliminary data suggests that this sequence could be used as
“one stop shop” alternative in patients in acute condition
uncapable of breath-hold. MR angiography, morphology as well as
viability and microvascular obstruction regions could be
imagined. Further studies are needed. Please refer to Figures 1,
2, and 3.
P126Analysis platform for hemodynamic function incongenital heart diseaseElizabeth J Nett, Kevin M Johnson, Christopher J Francoisand Oliver WiebenUniversity of Wisconsin, Madison, WI, USA
Journal of Cardiovascular Magnetic Resonance 2009, 11(Suppl 1):P126
Introduction: Advanced Phase Contrast MR acquisition tech-
niques such as PC VIPR [1] can simultaneously provide
anatomical images and cine velocity fields with volumetric
coverage. These data can be used for non-contrast enhanced
MR Angiography, velocity and flow measurements, and the
derivation of addition hemodynamic parameters such as trans-
stenotic pressure gradients and wall shear stress. While this
comprehensive information can be very valuable, particularly in
complex congenital heart disease, the large data volume with high
spatial and temporal information requires new approaches for
efficient visualization and extraction of clinically relevant
parameters.
Purpose: To develop a software platform that streamlines
hemodynamic analysis including flow measurements with auto-
matic alignment with respect to the vessel orientation and the
derivation of hemodynamic parameters such as wall shear stress
and pressure gradients.
Methods: Data were acquired with a dual-echo PC VIPR
trajectory with cardiac and respiratory gating on 1.5 T and 3 T
clinical systems (GE Healthcare) [2]. Typical scan parameters
were: (1.0–1.25 mm)3 isotropic spatial resolution in approxi-
mately 10 min scan time with 50% respiratory gating efficiency,
imaging volume: 32 × 32 × 16 cm3, VENC of 50–100 cm/s
(application specific). Figure 1 displays representative axial,
coronal, and sagittal reformats of the magnitude, three velocity
components, and the derived angiogram. These data sets contain
320 slices × 20 time frames × 5 volumes = 32,000 images.
We developed a software platform with a visual interface using
Matlab (MathWorks) in order to visualize the results, enable
quantitative measurements, and derive additional hemodynamic
parameters. First, the reconstructed PC VIPR data are loaded
into a segmentation tool in order to reduce the size of the data
set for more efficient processing. The knowledge of vessel
boundaries is also essential for the calculations of flow, wall shear
stress, and pressure gradients, which are available processing
tools. Next the data can be loaded into the analysis plug-ins to
measure and visualize flow, derive pressure maps [3], or calculate
wall shear stress [4] from the velocity fields with volumetric
coverage. For improved flow measurements, the analysis plane
can be automatically aligned perpendicular to the vessel path.
Flow measurements are derived by integration of the velocity
Figure 1 (abstract P126)
Time averaged complex difference, magnitude and velocity images in
three orthogonal directions in the axial, saggital and coronal slices from a
PC VIPR data set of a patient with pulmonary venolobar sydrome. The
large data volume requires a new, efficient approach to data processing
and visualization.
Figure 2 (abstract P126)
Matlab flow analysis software used on a PC VIPR data set of a patient with
Scimitar syndrome. An arrow points to the ROI box (grey) that can be
automatically centered and aligned with the vessel and the through plane
velocities. Based on the RIO selection, the flow through the cardiac cycle
and profile of the mean velocity can be derived.
Journal of Cardiovascular Magnetic Resonance 2009, 11(Suppl 1) http://jcmr-online.com/supplements/11/S1
Page 182 of 316(page number not for citation purposes)
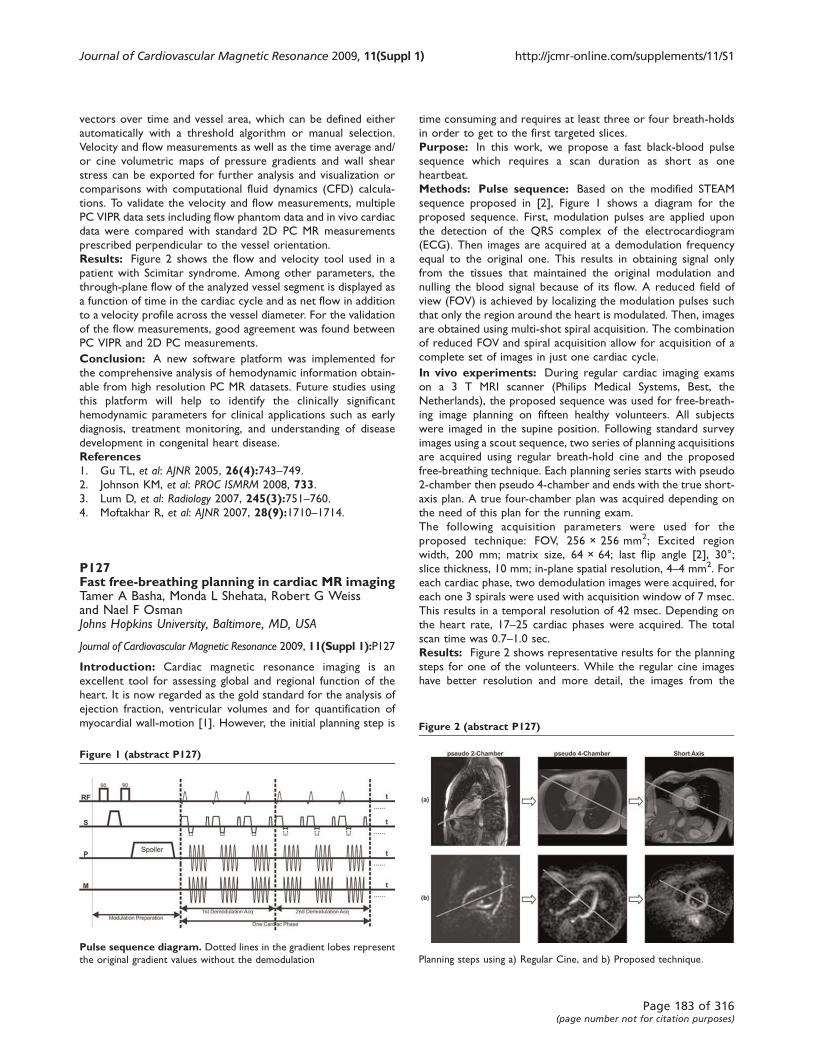
vectors over time and vessel area, which can be defined either
automatically with a threshold algorithm or manual selection.
Velocity and flow measurements as well as the time average and/
or cine volumetric maps of pressure gradients and wall shear
stress can be exported for further analysis and visualization or
comparisons with computational fluid dynamics (CFD) calcula-
tions. To validate the velocity and flow measurements, multiple
PC VIPR data sets including flow phantom data and in vivo cardiac
data were compared with standard 2D PC MR measurements
prescribed perpendicular to the vessel orientation.
Results: Figure 2 shows the flow and velocity tool used in a
patient with Scimitar syndrome. Among other parameters, the
through-plane flow of the analyzed vessel segment is displayed as
a function of time in the cardiac cycle and as net flow in addition
to a velocity profile across the vessel diameter. For the validation
of the flow measurements, good agreement was found between
PC VIPR and 2D PC measurements.
Conclusion: A new software platform was implemented for
the comprehensive analysis of hemodynamic information obtain-
able from high resolution PC MR datasets. Future studies using
this platform will help to identify the clinically significant
hemodynamic parameters for clinical applications such as early
diagnosis, treatment monitoring, and understanding of disease
development in congenital heart disease.
References1. Gu TL, et al: AJNR 2005, 26(4):743–749.2. Johnson KM, et al: PROC ISMRM 2008, 733.3. Lum D, et al: Radiology 2007, 245(3):751–760.4. Moftakhar R, et al: AJNR 2007, 28(9):1710–1714.
P127Fast free-breathing planning in cardiac MR imagingTamer A Basha, Monda L Shehata, Robert G Weissand Nael F OsmanJohns Hopkins University, Baltimore, MD, USA
Journal of Cardiovascular Magnetic Resonance 2009, 11(Suppl 1):P127
Introduction: Cardiac magnetic resonance imaging is an
excellent tool for assessing global and regional function of the
heart. It is now regarded as the gold standard for the analysis of
ejection fraction, ventricular volumes and for quantification of
myocardial wall-motion [1]. However, the initial planning step is
time consuming and requires at least three or four breath-holds
in order to get to the first targeted slices.
Purpose: In this work, we propose a fast black-blood pulse
sequence which requires a scan duration as short as one
heartbeat.
Methods: Pulse sequence: Based on the modified STEAM
sequence proposed in [2], Figure 1 shows a diagram for the
proposed sequence. First, modulation pulses are applied upon
the detection of the QRS complex of the electrocardiogram
(ECG). Then images are acquired at a demodulation frequency
equal to the original one. This results in obtaining signal only
from the tissues that maintained the original modulation and
nulling the blood signal because of its flow. A reduced field of
view (FOV) is achieved by localizing the modulation pulses such
that only the region around the heart is modulated. Then, images
are obtained using multi-shot spiral acquisition. The combination
of reduced FOV and spiral acquisition allow for acquisition of a
complete set of images in just one cardiac cycle.
In vivo experiments: During regular cardiac imaging exams
on a 3 T MRI scanner (Philips Medical Systems, Best, the
Netherlands), the proposed sequence was used for free-breath-
ing image planning on fifteen healthy volunteers. All subjects
were imaged in the supine position. Following standard survey
images using a scout sequence, two series of planning acquisitions
are acquired using regular breath-hold cine and the proposed
free-breathing technique. Each planning series starts with pseudo
2-chamber then pseudo 4-chamber and ends with the true short-
axis plan. A true four-chamber plan was acquired depending on
the need of this plan for the running exam.
The following acquisition parameters were used for the
proposed technique: FOV, 256 × 256 mm2; Excited region
width, 200 mm; matrix size, 64 × 64; last flip angle [2], 30°;
slice thickness, 10 mm; in-plane spatial resolution, 4–4 mm2. For
each cardiac phase, two demodulation images were acquired, for
each one 3 spirals were used with acquisition window of 7 msec.
This results in a temporal resolution of 42 msec. Depending on
the heart rate, 17–25 cardiac phases were acquired. The total
scan time was 0.7–1.0 sec.
Results: Figure 2 shows representative results for the planning
steps for one of the volunteers. While the regular cine images
have better resolution and more detail, the images from the
Figure 2 (abstract P127)
Planning steps using a) Regular Cine, and b) Proposed technique.
Figure 1 (abstract P127)
Pulse sequence diagram. Dotted lines in the gradient lobes represent
the original gradient values without the demodulation
Journal of Cardiovascular Magnetic Resonance 2009, 11(Suppl 1) http://jcmr-online.com/supplements/11/S1
Page 183 of 316(page number not for citation purposes)
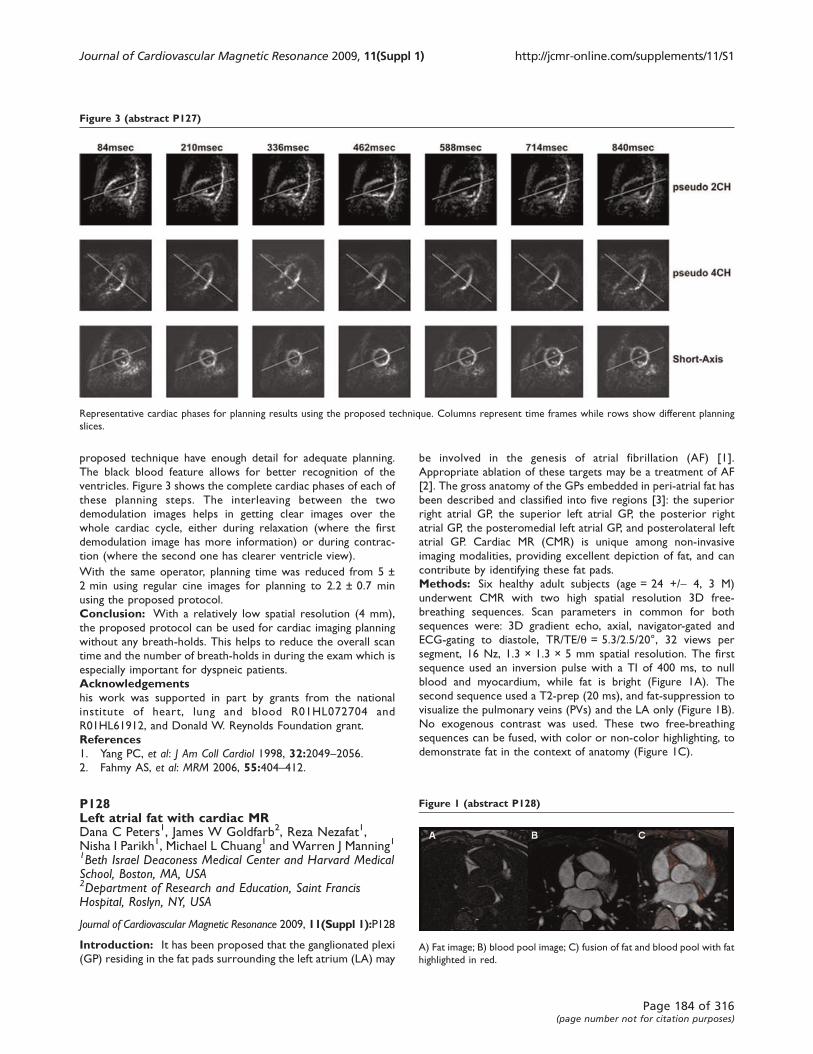
proposed technique have enough detail for adequate planning.
The black blood feature allows for better recognition of the
ventricles. Figure 3 shows the complete cardiac phases of each of
these planning steps. The interleaving between the two
demodulation images helps in getting clear images over the
whole cardiac cycle, either during relaxation (where the first
demodulation image has more information) or during contrac-
tion (where the second one has clearer ventricle view).
With the same operator, planning time was reduced from 5 ±
2 min using regular cine images for planning to 2.2 ± 0.7 min
using the proposed protocol.
Conclusion: With a relatively low spatial resolution (4 mm),
the proposed protocol can be used for cardiac imaging planning
without any breath-holds. This helps to reduce the overall scan
time and the number of breath-holds in during the exam which is
especially important for dyspneic patients.
Acknowledgementshis work was supported in part by grants from the national
institute of heart, lung and blood R01HL072704 and
R01HL61912, and Donald W. Reynolds Foundation grant.
References1. Yang PC, et al: J Am Coll Cardiol 1998, 32:2049–2056.2. Fahmy AS, et al: MRM 2006, 55:404–412.
P128Left atrial fat with cardiac MRDana C Peters1, James W Goldfarb2, Reza Nezafat1,Nisha I Parikh1, Michael L Chuang1 and Warren J Manning11Beth Israel Deaconess Medical Center and Harvard MedicalSchool, Boston, MA, USA2Department of Research and Education, Saint FrancisHospital, Roslyn, NY, USA
Journal of Cardiovascular Magnetic Resonance 2009, 11(Suppl 1):P128
Introduction: It has been proposed that the ganglionated plexi
(GP) residing in the fat pads surrounding the left atrium (LA) may
be involved in the genesis of atrial fibrillation (AF) [1].
Appropriate ablation of these targets may be a treatment of AF
[2]. The gross anatomy of the GPs embedded in peri-atrial fat has
been described and classified into five regions [3]: the superior
right atrial GP, the superior left atrial GP, the posterior right
atrial GP, the posteromedial left atrial GP, and posterolateral left
atrial GP. Cardiac MR (CMR) is unique among non-invasive
imaging modalities, providing excellent depiction of fat, and can
contribute by identifying these fat pads.
Methods: Six healthy adult subjects (age = 24 +/- 4, 3 M)
underwent CMR with two high spatial resolution 3D free-
breathing sequences. Scan parameters in common for both
sequences were: 3D gradient echo, axial, navigator-gated and
ECG-gating to diastole, TR/TE/q = 5.3/2.5/20°, 32 views per
segment, 16 Nz, 1.3 × 1.3 × 5 mm spatial resolution. The first
sequence used an inversion pulse with a TI of 400 ms, to null
blood and myocardium, while fat is bright (Figure 1A). The
second sequence used a T2-prep (20 ms), and fat-suppression to
visualize the pulmonary veins (PVs) and the LA only (Figure 1B).
No exogenous contrast was used. These two free-breathing
sequences can be fused, with color or non-color highlighting, to
demonstrate fat in the context of anatomy (Figure 1C).
Figure 3 (abstract P127)
Representative cardiac phases for planning results using the proposed technique. Columns represent time frames while rows show different planning
slices.
Figure 1 (abstract P128)
A) Fat image; B) blood pool image; C) fusion of fat and blood pool with fat
highlighted in red.
Journal of Cardiovascular Magnetic Resonance 2009, 11(Suppl 1) http://jcmr-online.com/supplements/11/S1
Page 184 of 316(page number not for citation purposes)
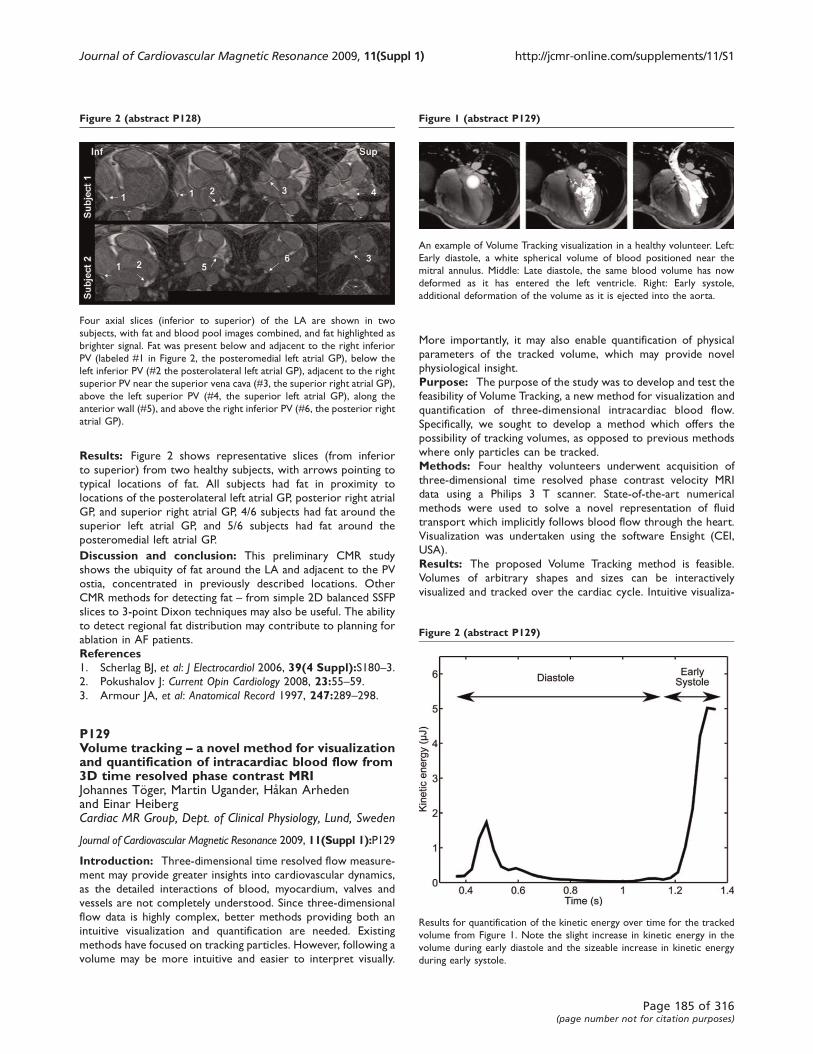
Results: Figure 2 shows representative slices (from inferior
to superior) from two healthy subjects, with arrows pointing to
typical locations of fat. All subjects had fat in proximity to
locations of the posterolateral left atrial GP, posterior right atrial
GP, and superior right atrial GP, 4/6 subjects had fat around the
superior left atrial GP, and 5/6 subjects had fat around the
posteromedial left atrial GP.
Discussion and conclusion: This preliminary CMR study
shows the ubiquity of fat around the LA and adjacent to the PV
ostia, concentrated in previously described locations. Other
CMR methods for detecting fat – from simple 2D balanced SSFP
slices to 3-point Dixon techniques may also be useful. The ability
to detect regional fat distribution may contribute to planning for
ablation in AF patients.
References1. Scherlag BJ, et al: J Electrocardiol 2006, 39(4 Suppl):S180–3.2. Pokushalov J: Current Opin Cardiology 2008, 23:55–59.3. Armour JA, et al: Anatomical Record 1997, 247:289–298.
P129Volume tracking – a novel method for visualizationand quantification of intracardiac blood flow from3D time resolved phase contrast MRIJohannes Töger, Martin Ugander, Håkan Arhedenand Einar HeibergCardiac MR Group, Dept. of Clinical Physiology, Lund, Sweden
Journal of Cardiovascular Magnetic Resonance 2009, 11(Suppl 1):P129
Introduction: Three-dimensional time resolved flow measure-
ment may provide greater insights into cardiovascular dynamics,
as the detailed interactions of blood, myocardium, valves and
vessels are not completely understood. Since three-dimensional
flow data is highly complex, better methods providing both an
intuitive visualization and quantification are needed. Existing
methods have focused on tracking particles. However, following a
volume may be more intuitive and easier to interpret visually.
More importantly, it may also enable quantification of physical
parameters of the tracked volume, which may provide novel
physiological insight.
Purpose: The purpose of the study was to develop and test the
feasibility of Volume Tracking, a new method for visualization and
quantification of three-dimensional intracardiac blood flow.
Specifically, we sought to develop a method which offers the
possibility of tracking volumes, as opposed to previous methods
where only particles can be tracked.
Methods: Four healthy volunteers underwent acquisition of
three-dimensional time resolved phase contrast velocity MRI
data using a Philips 3 T scanner. State-of-the-art numerical
methods were used to solve a novel representation of fluid
transport which implicitly follows blood flow through the heart.
Visualization was undertaken using the software Ensight (CEI,
USA).
Results: The proposed Volume Tracking method is feasible.
Volumes of arbitrary shapes and sizes can be interactively
visualized and tracked over the cardiac cycle. Intuitive visualiza-
Figure 2 (abstract P128)
Four axial slices (inferior to superior) of the LA are shown in two
subjects, with fat and blood pool images combined, and fat highlighted as
brighter signal. Fat was present below and adjacent to the right inferior
PV (labeled #1 in Figure 2, the posteromedial left atrial GP), below the
left inferior PV (#2 the posterolateral left atrial GP), adjacent to the right
superior PV near the superior vena cava (#3, the superior right atrial GP),
above the left superior PV (#4, the superior left atrial GP), along the
anterior wall (#5), and above the right inferior PV (#6, the posterior right
atrial GP).
Figure 1 (abstract P129)
An example of Volume Tracking visualization in a healthy volunteer. Left:
Early diastole, a white spherical volume of blood positioned near the
mitral annulus. Middle: Late diastole, the same blood volume has now
deformed as it has entered the left ventricle. Right: Early systole,
additional deformation of the volume as it is ejected into the aorta.
Figure 2 (abstract P129)
Results for quantification of the kinetic energy over time for the tracked
volume from Figure 1. Note the slight increase in kinetic energy in the
volume during early diastole and the sizeable increase in kinetic energy
during early systole.
Journal of Cardiovascular Magnetic Resonance 2009, 11(Suppl 1) http://jcmr-online.com/supplements/11/S1
Page 185 of 316(page number not for citation purposes)
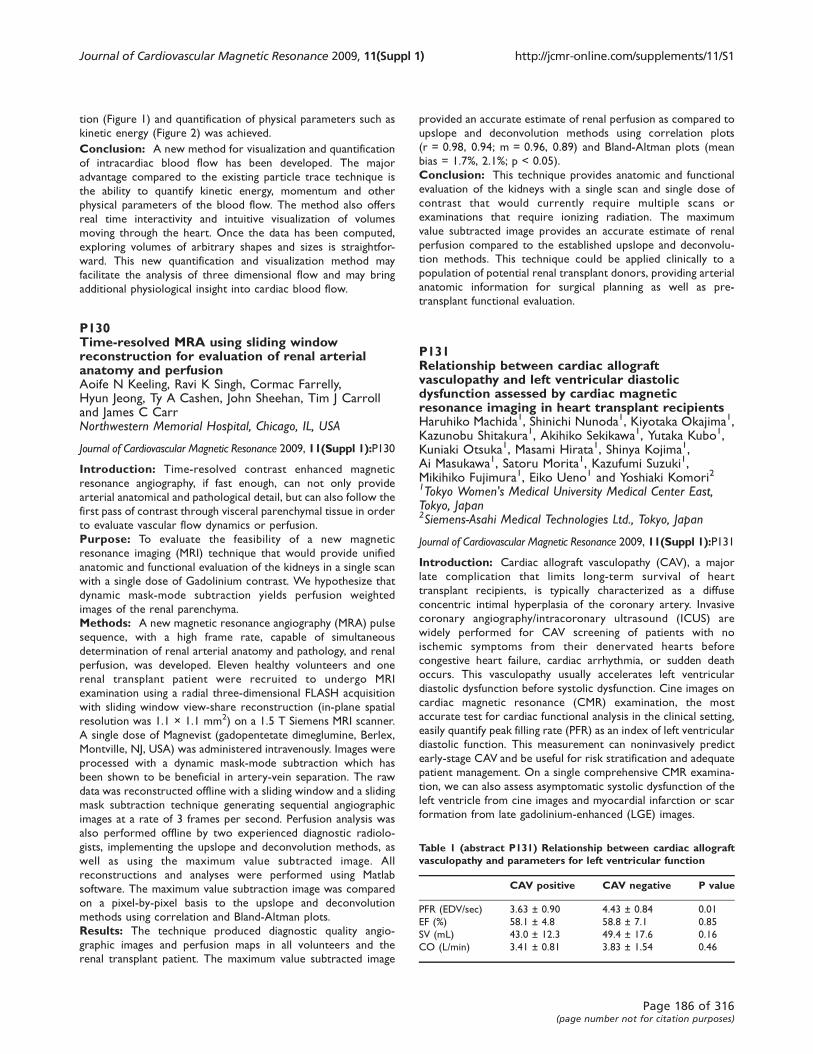
tion (Figure 1) and quantification of physical parameters such as
kinetic energy (Figure 2) was achieved.
Conclusion: A new method for visualization and quantification
of intracardiac blood flow has been developed. The major
advantage compared to the existing particle trace technique is
the ability to quantify kinetic energy, momentum and other
physical parameters of the blood flow. The method also offers
real time interactivity and intuitive visualization of volumes
moving through the heart. Once the data has been computed,
exploring volumes of arbitrary shapes and sizes is straightfor-
ward. This new quantification and visualization method may
facilitate the analysis of three dimensional flow and may bring
additional physiological insight into cardiac blood flow.
P130Time-resolved MRA using sliding windowreconstruction for evaluation of renal arterialanatomy and perfusionAoife N Keeling, Ravi K Singh, Cormac Farrelly,Hyun Jeong, Ty A Cashen, John Sheehan, Tim J Carrolland James C CarrNorthwestern Memorial Hospital, Chicago, IL, USA
Journal of Cardiovascular Magnetic Resonance 2009, 11(Suppl 1):P130
Introduction: Time-resolved contrast enhanced magnetic
resonance angiography, if fast enough, can not only provide
arterial anatomical and pathological detail, but can also follow the
first pass of contrast through visceral parenchymal tissue in order
to evaluate vascular flow dynamics or perfusion.
Purpose: To evaluate the feasibility of a new magnetic
resonance imaging (MRI) technique that would provide unified
anatomic and functional evaluation of the kidneys in a single scan
with a single dose of Gadolinium contrast. We hypothesize that
dynamic mask-mode subtraction yields perfusion weighted
images of the renal parenchyma.
Methods: A new magnetic resonance angiography (MRA) pulse
sequence, with a high frame rate, capable of simultaneous
determination of renal arterial anatomy and pathology, and renal
perfusion, was developed. Eleven healthy volunteers and one
renal transplant patient were recruited to undergo MRI
examination using a radial three-dimensional FLASH acquisition
with sliding window view-share reconstruction (in-plane spatial
resolution was 1.1 × 1.1 mm2) on a 1.5 T Siemens MRI scanner.
A single dose of Magnevist (gadopentetate dimeglumine, Berlex,
Montville, NJ, USA) was administered intravenously. Images were
processed with a dynamic mask-mode subtraction which has
been shown to be beneficial in artery-vein separation. The raw
data was reconstructed offline with a sliding window and a sliding
mask subtraction technique generating sequential angiographic
images at a rate of 3 frames per second. Perfusion analysis was
also performed offline by two experienced diagnostic radiolo-
gists, implementing the upslope and deconvolution methods, as
well as using the maximum value subtracted image. All
reconstructions and analyses were performed using Matlab
software. The maximum value subtraction image was compared
on a pixel-by-pixel basis to the upslope and deconvolution
methods using correlation and Bland-Altman plots.
Results: The technique produced diagnostic quality angio-
graphic images and perfusion maps in all volunteers and the
renal transplant patient. The maximum value subtracted image
provided an accurate estimate of renal perfusion as compared to
upslope and deconvolution methods using correlation plots
(r = 0.98, 0.94; m = 0.96, 0.89) and Bland-Altman plots (mean
bias = 1.7%, 2.1%; p < 0.05).
Conclusion: This technique provides anatomic and functional
evaluation of the kidneys with a single scan and single dose of
contrast that would currently require multiple scans or
examinations that require ionizing radiation. The maximum
value subtracted image provides an accurate estimate of renal
perfusion compared to the established upslope and deconvolu-
tion methods. This technique could be applied clinically to a
population of potential renal transplant donors, providing arterial
anatomic information for surgical planning as well as pre-
transplant functional evaluation.
P131Relationship between cardiac allograftvasculopathy and left ventricular diastolicdysfunction assessed by cardiac magneticresonance imaging in heart transplant recipientsHaruhiko Machida1, Shinichi Nunoda1, Kiyotaka Okajima1,Kazunobu Shitakura1, Akihiko Sekikawa1, Yutaka Kubo1,Kuniaki Otsuka1, Masami Hirata1, Shinya Kojima1,Ai Masukawa1, Satoru Morita1, Kazufumi Suzuki1,Mikihiko Fujimura1, Eiko Ueno1 and Yoshiaki Komori21Tokyo Women's Medical University Medical Center East,Tokyo, Japan2Siemens-Asahi Medical Technologies Ltd., Tokyo, Japan
Journal of Cardiovascular Magnetic Resonance 2009, 11(Suppl 1):P131
Introduction: Cardiac allograft vasculopathy (CAV), a major
late complication that limits long-term survival of heart
transplant recipients, is typically characterized as a diffuse
concentric intimal hyperplasia of the coronary artery. Invasive
coronary angiography/intracoronary ultrasound (ICUS) are
widely performed for CAV screening of patients with no
ischemic symptoms from their denervated hearts before
congestive heart failure, cardiac arrhythmia, or sudden death
occurs. This vasculopathy usually accelerates left ventricular
diastolic dysfunction before systolic dysfunction. Cine images on
cardiac magnetic resonance (CMR) examination, the most
accurate test for cardiac functional analysis in the clinical setting,
easily quantify peak filling rate (PFR) as an index of left ventricular
diastolic function. This measurement can noninvasively predict
early-stage CAV and be useful for risk stratification and adequate
patient management. On a single comprehensive CMR examina-
tion, we can also assess asymptomatic systolic dysfunction of the
left ventricle from cine images and myocardial infarction or scar
formation from late gadolinium-enhanced (LGE) images.
Table 1 (abstract P131) Relationship between cardiac allograftvasculopathy and parameters for left ventricular function
CAV positive CAV negative P value
PFR (EDV/sec) 3.63 ± 0.90 4.43 ± 0.84 0.01
EF (%) 58.1 ± 4.8 58.8 ± 7.1 0.85
SV (mL) 43.0 ± 12.3 49.4 ± 17.6 0.16
CO (L/min) 3.41 ± 0.81 3.83 ± 1.54 0.46
Journal of Cardiovascular Magnetic Resonance 2009, 11(Suppl 1) http://jcmr-online.com/supplements/11/S1
Page 186 of 316(page number not for citation purposes)

Purpose: We investigated the clinical feasibility of CMR imaging
for noninvasively screening for CAV in asymptomatic recipients
of heart transplants. Especially, we assessed the significance of left
ventricular PFR value as a marker of early-stage CAVover several
parameters of the systolic function and LGE by CMR imaging.
Methods: Between June 2006 and June 2008, 38 asymptomatic
recipients of heart transplants (25 men, 13 women, aged
37.2 ± 14.9 years) underwent both CMR and ICUS 8.5 ±
4.4 years after heart transplantation. We measured PFR normal-
ized to end-diastolic volume and several parameters for systolic
function of the left ventricle, including ejection fraction (EF),
stroke volume (SV), and cardiac output (CO), by steady-state
free precession cine CMR imaging with 20 sampling phases during
one cardiac cycle. We also evaluated intramyocardial LGE on the
CMR examinations. According to Stanford classification based on
intimal wall morphology assessed by ICUS [1], we classified
recipients of grade 0–2 as negative and grade 3–4 as positive for
CAV and compared the values of PFR, EF, SV, and CO between
the 2 groups using Mann-Whitney U test. P < 0.05 was
considered statistically significant. Furthermore, we calculated
receiver operating characteristic (ROC) curve in the relationship
between PFR value and CAV as defined by ICUS.
Results: Using ICUS, we classified 20 patients (53%) positive
and 18 (47%) negative for CAV. There was no significant
difference in the values for EF (58.1 ± 4.8% versus 58.8 ± 7.1%,
P = 0.85); SV (43.0 ± 12.3 mL versus 49.4 ± 17.6 mL, P = 0.16); and
CO (3.41 ± 0.81 L/min versus 3.83 ± 1.54 L/min, P = 0.46). No
patient revealed intramyocardial LGE.
In contrast, the PFR value was significantly lower in the positive
(3.63 ± 0.90 EDV/sec) than negative group (4.43 ± 0.84 EDV/
sec, P = 0.01). Area under the ROC curve was 0.759 (95%
confidence interval: 0.587 to 0.882). When PFR cut-off value was
3.65, CAV sensitivity was 58.2% and specificity, 79.8%. Table 1.
Conclusion: The presence of CAV significantly enhances
diastolic dysfunction of the left ventricle. For asymptomatic
recipients of heart transplants, PFR measurement with CMR
provides noninvasive prediction of CAV, which precedes systolic
dysfunction and myocardial infarction or scar formation, and PFR
is a feasible tool for decision-making in managing those patients.
Reference1. St Goar, et al: Circulation 1992, 85:979–987.
P132Local coronary endothelial dysfunction varies withthe extent of coronary disease: a 3 T MRI studyAllison Hays, Sebastian Kelle, Glenn A Hirsch,Gary Gerstenblith, Robert G Weiss and Matthias StuberJohns Hopkins, Baltimore, MD, USA
Journal of Cardiovascular Magnetic Resonance 2009, 11(Suppl 1):P132
Introduction: Endothelial-dependent coronary artery vasoreac-
tivity is an important indicator of vascular function and predicts
cardiovascular events [1]. Non-invasive measures of endothelial
dysfunction are typically obtained in the brachial arteries, which are
exposed to systemic risk factors but which rarely develop severe
atherosclerosis or plaque rupture. Endothelial injury plays a critical,
causal role in the development and progression of local athero-
sclerosis, a regionally heterogeneous process in the coronary
arteries. We therefore posit that local endothelial function varies
throughout the coronary tree in patients with disease and may
contribute to local atherosclerosis. By means of previously
described non-invasive 3 T MRI methods combined with isometric
handgrip to assess endothelial-dependent coronary vasoreactivity
[2], we therefore sought to test the hypothesis that local endothelial
function varies within the coronary vasculature and is more
deranged in regions with significant coronary atherosclerosis than in
those with mild disease.
Methods: Eleven patients (59 ± 6.2 years, mean ± SD,
3 women) with x-ray-defined coronary artery disease (CAD)
were recruited and imaged using a 3 T MRI scanner (Achieva,
Philips, Best, NL). In each patient, two arteries were imaged in
cross-section: one artery (LAD or RCA) with severe stenosis
(≥60%) and the contralateral artery with no significant stenosis
(<30%) by x-ray angiography. Baseline imaging at rest for cross-
sectional coronary artery area measurements was followed by
coronary flow velocity-encoded MRI for flow velocity measure-
ments. Alternating anatomical and velocity-encoded images were
collected at baseline, and during 4 minutes of continuous
isometric handgrip (at 30% of maximum grip strength). Three
patients additionally received 0.4 mg of sublingual nitroglycerin
and images were collected after five minutes. MRI parameters for
anatomical and flow imaging respectively were: echo time
(TE) = 1.5 ms/3.5 ms, radiofrequency (RF) excitation angle =
20° and spectral spatial excitation (both), breath-hold duration
~17–23 sec, acquisition window = 10 ms/27 ms, repetition time
(TR) = 14 ms/34 ms, 21/11 spiral interleaves/cine frame, spatial
resolution = 0.89 × 0.89 × 8.0 mm3/0.8 × 0.8 × 8 mm3 with
velocity encoding = 35 cm/second. Blood pressure and heart
rate were recorded at rest and during handgrip. Images were
analyzed for cross-sectional area changes (Cine version 3.15.17,
General Electric, Milwaukee, WI) and for peak diastolic coronary
flow velocity (FLOW Version3.0, Medis, NL). Coronary flow
(mL/min) was calculated as: coronary cross-sectional area ×
coronary artery peak diastolic velocity × 30 [3].
Results: Nine patients had adequate image quality in both
arteries for coronary area measurements and eight patients had
sufficient image quality for flow velocity measurements. The
Figure 1 (abstract P132)
Percent change (mean ± SD) from baseline in coronary artery area, peak
diastolic coronary flow velocity and flow during isometric handgrip stress
for arteries with mild vs. severe coronary disease. (*p = 0.007, †p = 0.02 mild vs. severe CAD)
Journal of Cardiovascular Magnetic Resonance 2009, 11(Suppl 1) http://jcmr-online.com/supplements/11/S1
Page 187 of 316(page number not for citation purposes)
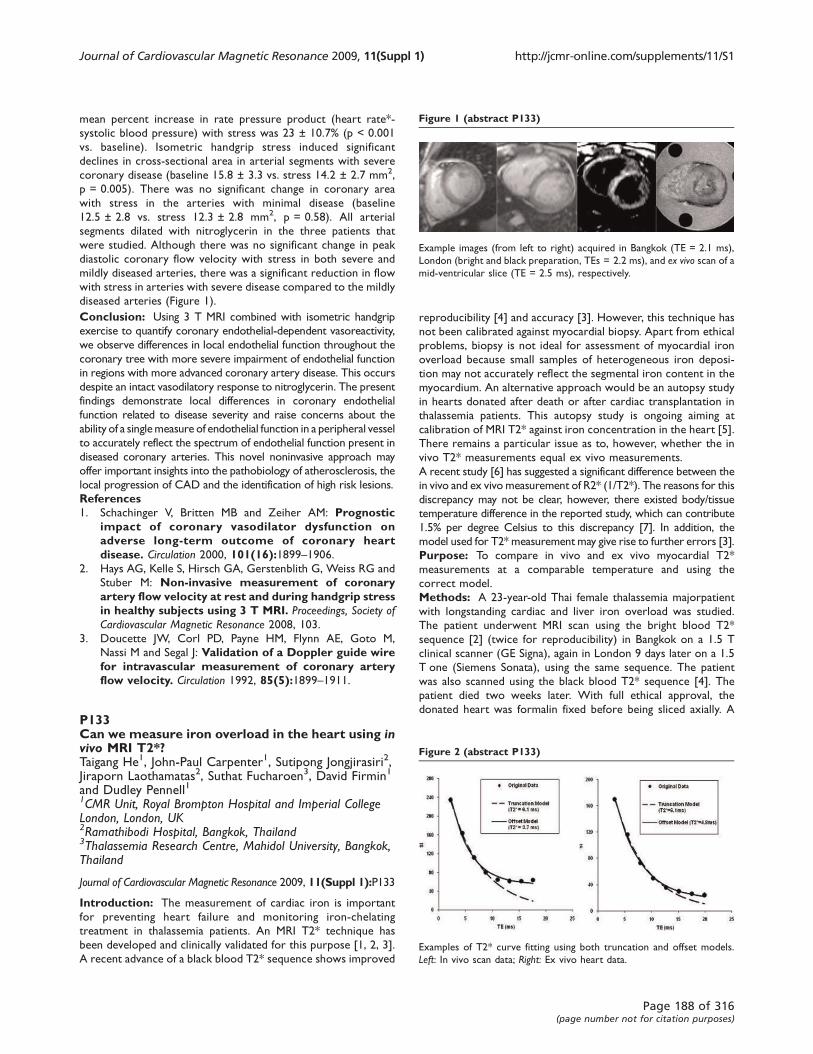
mean percent increase in rate pressure product (heart rate*-
systolic blood pressure) with stress was 23 ± 10.7% (p < 0.001
vs. baseline). Isometric handgrip stress induced significant
declines in cross-sectional area in arterial segments with severe
coronary disease (baseline 15.8 ± 3.3 vs. stress 14.2 ± 2.7 mm2,
p = 0.005). There was no significant change in coronary area
with stress in the arteries with minimal disease (baseline
12.5 ± 2.8 vs. stress 12.3 ± 2.8 mm2, p = 0.58). All arterial
segments dilated with nitroglycerin in the three patients that
were studied. Although there was no significant change in peak
diastolic coronary flow velocity with stress in both severe and
mildly diseased arteries, there was a significant reduction in flow
with stress in arteries with severe disease compared to the mildly
diseased arteries (Figure 1).
Conclusion: Using 3 T MRI combined with isometric handgrip
exercise to quantify coronary endothelial-dependent vasoreactivity,
we observe differences in local endothelial function throughout the
coronary tree with more severe impairment of endothelial function
in regions with more advanced coronary artery disease. This occurs
despite an intact vasodilatory response to nitroglycerin. The present
findings demonstrate local differences in coronary endothelial
function related to disease severity and raise concerns about the
ability of a singlemeasure of endothelial function in a peripheral vessel
to accurately reflect the spectrum of endothelial function present in
diseased coronary arteries. This novel noninvasive approach may
offer important insights into the pathobiology of atherosclerosis, the
local progression of CAD and the identification of high risk lesions.
References1. Schachinger V, Britten MB and Zeiher AM: Prognostic
impact of coronary vasodilator dysfunction onadverse long-term outcome of coronary heartdisease. Circulation 2000, 101(16):1899–1906.
2. Hays AG, Kelle S, Hirsch GA, Gerstenblith G, Weiss RG and
Stuber M: Non-invasive measurement of coronaryartery flow velocity at rest and during handgrip stressin healthy subjects using 3 T MRI. Proceedings, Society ofCardiovascular Magnetic Resonance 2008, 103.
3. Doucette JW, Corl PD, Payne HM, Flynn AE, Goto M,
Nassi M and Segal J: Validation of a Doppler guide wirefor intravascular measurement of coronary arteryflow velocity. Circulation 1992, 85(5):1899–1911.
P133Can we measure iron overload in the heart using invivo MRI T2*?Taigang He1, John-Paul Carpenter1, Sutipong Jongjirasiri2,Jiraporn Laothamatas2, Suthat Fucharoen3, David Firmin1
and Dudley Pennell11CMR Unit, Royal Brompton Hospital and Imperial CollegeLondon, London, UK2Ramathibodi Hospital, Bangkok, Thailand3Thalassemia Research Centre, Mahidol University, Bangkok,Thailand
Journal of Cardiovascular Magnetic Resonance 2009, 11(Suppl 1):P133
Introduction: The measurement of cardiac iron is important
for preventing heart failure and monitoring iron-chelating
treatment in thalassemia patients. An MRI T2* technique has
been developed and clinically validated for this purpose [1, 2, 3].
A recent advance of a black blood T2* sequence shows improved
reproducibility [4] and accuracy [3]. However, this technique has
not been calibrated against myocardial biopsy. Apart from ethical
problems, biopsy is not ideal for assessment of myocardial iron
overload because small samples of heterogeneous iron deposi-
tion may not accurately reflect the segmental iron content in the
myocardium. An alternative approach would be an autopsy study
in hearts donated after death or after cardiac transplantation in
thalassemia patients. This autopsy study is ongoing aiming at
calibration of MRI T2* against iron concentration in the heart [5].
There remains a particular issue as to, however, whether the in
vivo T2* measurements equal ex vivo measurements.
A recent study [6] has suggested a significant difference between the
in vivo and ex vivo measurement of R2* (1/T2*). The reasons for this
discrepancy may not be clear, however, there existed body/tissue
temperature difference in the reported study, which can contribute
1.5% per degree Celsius to this discrepancy [7]. In addition, the
model used for T2* measurement may give rise to further errors [3].
Purpose: To compare in vivo and ex vivo myocardial T2*
measurements at a comparable temperature and using the
correct model.
Methods: A 23-year-old Thai female thalassemia majorpatient
with longstanding cardiac and liver iron overload was studied.
The patient underwent MRI scan using the bright blood T2*
sequence [2] (twice for reproducibility) in Bangkok on a 1.5 T
clinical scanner (GE Signa), again in London 9 days later on a 1.5
T one (Siemens Sonata), using the same sequence. The patient
was also scanned using the black blood T2* sequence [4]. The
patient died two weeks later. With full ethical approval, the
donated heart was formalin fixed before being sliced axially. A
Figure 1 (abstract P133)
Example images (from left to right) acquired in Bangkok (TE = 2.1 ms),
London (bright and black preparation, TEs = 2.2 ms), and ex vivo scan of a
mid-ventricular slice (TE = 2.5 ms), respectively.
Figure 2 (abstract P133)
Examples of T2* curve fitting using both truncation and offset models.
Left: In vivo scan data; Right: Ex vivo heart data.
Journal of Cardiovascular Magnetic Resonance 2009, 11(Suppl 1) http://jcmr-online.com/supplements/11/S1
Page 188 of 316(page number not for citation purposes)

custom-made Perspex plinth was used to hold each of the slices
which were then scanned at 37°C. Main perameters [2] are TEs
from 2.47 ms–16.9 ms (increment 2.01 ms) and a resolution of
1.2 × 1.2 × 5 mm3.
Results: Figure 1 shows example images acquired at Bangkok
and London including the ex vivo scan. Figure 2 shows two curve
fitting examples demonstrating the discrepancy in T2* measure-
ment using both the truncation and the offset model. The in vivo
and ex vivo measurements, however, agree well using the
truncation model. Table 1 summaries all T2* measurements using
different models. The mean value and standard deviation are also
calculated.
Conclusion: This study has demonstrated the good reprodu-
cibility of the myocardial T2* measurement using the truncation
model, where an in vivo T2* measurement from the patient data
agrees with ex vivo one of the fixed heart. These data, along with
the calibration study [5], support the clinical use of myocardial
T2* in iron overload syndromes.
References1. Anderson1 LJ, et al: Eur Heart J 2001, 22:2171–2179.2. Westwood M, et al: J Magn Reson Imag 2003, 18:33–39.3. He T, et al: Magn Reson Med 2008 in press.
4. He T, et al: J Magn Reson Imaging 2007, 25:1205–1209.5. Carpenter JP, et al: Abstract in SCMR 2009.
6. Ghugre NR, et al: Magn Reson Med 2006, 56:681–686.7. He T, Smith GC, Carpenter J-P, Mohiaddin RH, Pennell DJ
and Firmin DN: A phantom study of temperature-dependent MRI T2* measurement. J Cardiovasc MagnReson 2009, 11(Suppl 1):P147.
P134T2* heterogeneity detected by CMR could berelated to myocardial iron distribution inThalassemia patientsVincenzo Positano1, Alessia Pepe1,Maria Filomena Santarelli1, Anna Ramazzotti1, Daniele DeMarchi1, Antonella Meloni1, Eliana Cracolici2,Domenico G D’Ascola3, Luigi Landini4
and Massimo Lombardi11“G Monasterio” Foundation and Institute of ClinicalPhysiology, CNR, Pisa, Italy2University of Palermo, Palermo, Italy3A.O. “Bianchi-Melacrino-Morelli”, Reggio Calabria, Italy4University of Pisa, Pisa, Italy
Journal of Cardiovascular Magnetic Resonance 2009, 11(Suppl 1):P134
Introduction: A large percentage of thalassemia major (TM)
patients shows a significant heterogeneity of segmental distribu-
Table 1 (abstract P133) Summary of T2* measurements using both truncation and offset models
T2* (ms) Bangkok Baseline Bangkok Repeat London Bright Blood London Black Blood ex vivo Mean STD
Truncation Model 6.0 6.1 6.1 6.0 6.1 6.1 0.1
Offset Model 4.6 6.1 3.7 4.6 4.8 4.8 0.9
Figure 1 (abstract P134)
Journal of Cardiovascular Magnetic Resonance 2009, 11(Suppl 1) http://jcmr-online.com/supplements/11/S1
Page 189 of 316(page number not for citation purposes)

tion of T2* values in myocardium, measured by multislice
multiecho T2* cardiac magnetic resonance (CMR). This finding is
in agreement with previous histological studies that have
detected heterogeneous iron deposition in hemochromatotic
hearts. However, it is not yet clear if that represented true
heterogeneous iron density or if it could have been generated by
geometric and susceptibility artefacts.
Purpose: The purpose of this study is to investigate myocardial
T2* heterogeneity in TM patients by CMR, and to determine if it
is related to inhomogeneous iron overload distribution.
Methods: 230 TM patients consecutively affered to our
laboratory were retrospectively studied. Three short-axis
views (basal, medium, and apical) of the left ventricle (LV) were
obtained by multislice multiecho T2* CMR. T2* segmental
distribution was mapped on a 16-segment LV model. The level of
heterogeneity of the T2* segmental distribution on each patient
was evaluated by the coefficient of variation. Measured hetero-
geneity was compared with that of a surrogate data set obtained
from measurements of subjects without iron overload, to
determine whether the inhomogeneous segmental distribution
of T2* could be generated only by susceptibility artefacts.
Results: In 45 (20%) TM patients, segmental T2* values were all
below the lower limit of normal (20 ms). In 104 (45%) patients,
T2* values were heterogeneous with respect to the normal
threshold. Of these patients, 74% showed a normal T2* global
value. Eighty-one (35%) patients had all normal segments (A). T2*
value heterogeneity assessed by the CoV in TM patients and in
the surrogate data is shown in Figure 1B. The white squares and
the black line represent single patient measurements and the
CoV average on all patients, respectively. The grey line represents
the mean CoV of the surrogate data with the mean ± 2 SD limits
(grey dotted lines). The mean and the normal lower limit of the
T2* global value assessed in the healthy subjects are shown as
well (vertical black arrows). T2* heterogeneity for patients
without iron overload was compatible with the hypothesis that
the heterogeneity was generated by susceptibility artefacts.
Below the lower limit of normal for global T2*, the heterogeneity
abruptly increased and could not be explained by artefactual
effects.
Conclusion: A true heterogeneity in iron overload distribution
may be present in TM patients. Heterogeneity seemingly appears
in the borderline myocardial iron and stabilizes for moderate to
severe iron burden.
P135Baseline correction of phase-contrast images incongenital Cardiac Magnetic Resonance ImagingBrian J Holland, Beth F Printz and Wyman W LaiChildren's Hospital of New York, New York, NY, USA
Journal of Cardiovascular Magnetic Resonance 2009, 11(Suppl 1):P135
Introduction: Phase-contrast flow measurements have been
shown to accurately quantify blood flow in subjects with
structurally normal hearts and those with congenital heart
disease (CHD). There are a number of potential sources of error,
however, in phase-contrast CMR flow measurements, including
phase offset errors due to local non-compensated eddy currents.
Wolff and colleagues recently reported on the clinical application
of phantom correction of phase offset errors in adult volunteers
with structurally normal hearts [1]. The effect of phantom
correction on phase-contrast flow measurements in patients
with known or suspected heart disease has not previously been
reported.
Purpose: To assess whether phantom correction significantly
changed flow measurements by phase-contrast imaging in
patients referred to a congenital CMR program.
Methods: The clinical congenital cardiac magnetic resonance
imaging database at a single institution was searched for patients
who had examinations performed with phase contrast images
using phantom correction. Examinations were performed on a
GE Signa HDx 1.5 T scanner using commercially available coils
(GE Healthcare, Milwaukee, Wisconsin). Phase-contrast images
were acquired perpendicular to the vessel of interest using
orthogonal long-axis views of the vessel. Breathe-through images
were obtained using the commercially resident FastCine PC
pulse sequence with the Venc determined by clinical parameters.
The phase-contrast sequences were each repeated on a
stationary fluid phantom with an ECG simulator to establish a
baseline of zero velocity. Based on the clinical protocol, phase-
contrast images of flow were obtained in the ascending aorta
(AAO), main pulmonary artery (MPA), right pulmonary artery
(RPA), and/or left pulmonary artery (LPA) and analyzed with and
without phantom correction using GE ReportCard software
version 3.6. The ratio of pulmonary to systemic flow (Qp/Qs),
percent flow to the RPA (QpR fraction), pulmonary regurgitation
fraction (PR), and aortic regurgitation (AR) fraction were also
calculated with and without phantom correction. Clinically
significant changes in flow measurements with phantom correc-
tion were defined prior to analysis: a change in MPA or AAo flow
≥ 0.5 L/min/m2, change in RPA or LPA flow ≥ 0.25 L/min/m2,
change in Qp/Qs ≥ 0.4, change in QpR fraction ≥ 10%, and
change in PR or AR fraction ≥ 10%. Marked changes in flow
measurements were defined as double the amount of clinically
significant change in each category – for example, a change in
MPA flow ≥ 1.0 L/min/m2 or PR fraction ≥ 20%.
Results: From May 2008 to September 2008, 89 patients
(median age 17.5 years, range 0.3 to 58.7 years) were identified
who had clinical CMR examinations using phase-contrast images
with phantom correction. The patients were referred with the
following diagnoses: 25 with tetralogy of Fallot (repaired),
17 miscellaneous, 12 other conotruncal diagnoses, 11 single
ventricle, 9 shunt lesions, 9 cardiomyopathy/myocarditis, and
6 aortic coarctation. The number and percent of patients with
clinically significant or marked changes in the phase-contrast
measurements are listed in Table 1.
Table 1 (abstract P135) Phantom correction of phase-contrastmeasurements
Variable N ClinicallySignificant Change
MarkedChange
MPA flow (L/min/m2) 67 29 (43%) 11 (16%)
AAO flow (L/min/m2) 85 32 (38%) 16 (19%)
RPA flow (L/min/m2) 38 9 (24%) 5 (13%)
LPA flow (L/min/m2) 33 17 (52%) 11 (33%)
Qp/Qs 64 12 (19%) 5 (8%)
PR fraction (%) 28 7 (25%) 0 (0%)
AR fraction (%) 8 3 (38%) 0 (0%)
QpR fraction (%) 30 8 (27%) 3 (10%)
Journal of Cardiovascular Magnetic Resonance 2009, 11(Suppl 1) http://jcmr-online.com/supplements/11/S1
Page 190 of 316(page number not for citation purposes)
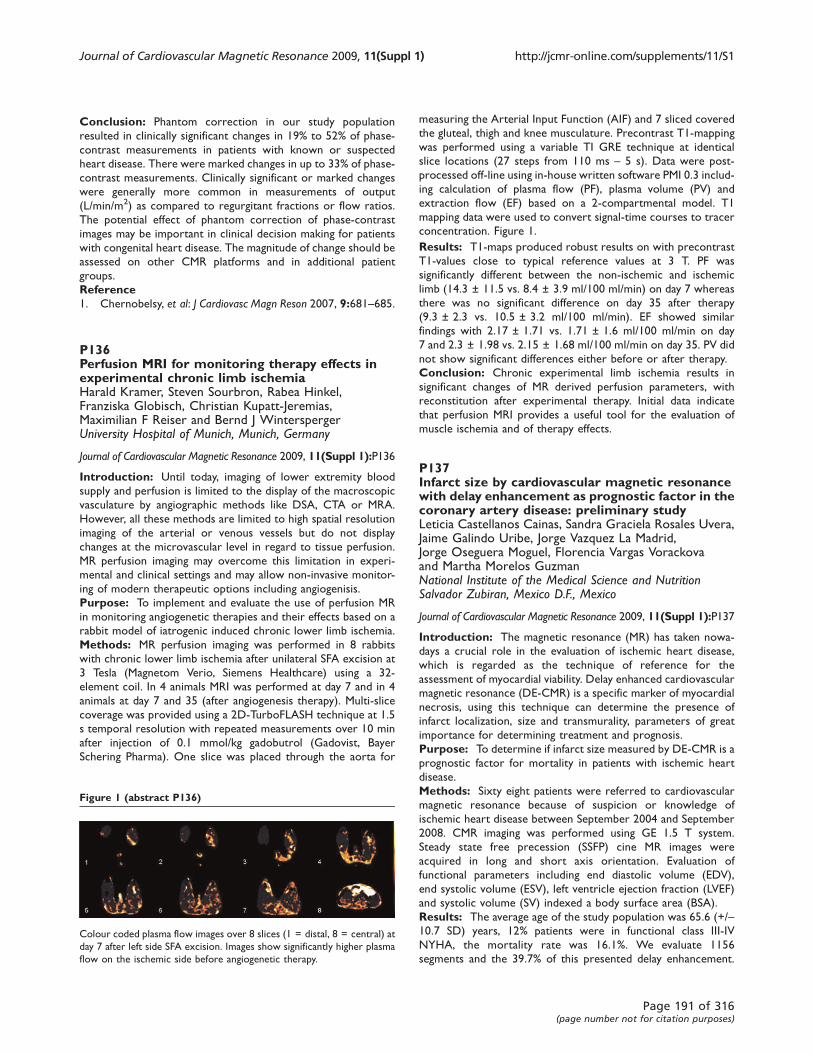
Conclusion: Phantom correction in our study population
resulted in clinically significant changes in 19% to 52% of phase-
contrast measurements in patients with known or suspected
heart disease. There were marked changes in up to 33% of phase-
contrast measurements. Clinically significant or marked changes
were generally more common in measurements of output
(L/min/m2) as compared to regurgitant fractions or flow ratios.
The potential effect of phantom correction of phase-contrast
images may be important in clinical decision making for patients
with congenital heart disease. The magnitude of change should be
assessed on other CMR platforms and in additional patient
groups.
Reference1. Chernobelsy, et al: J Cardiovasc Magn Reson 2007, 9:681–685.
P136Perfusion MRI for monitoring therapy effects inexperimental chronic limb ischemiaHarald Kramer, Steven Sourbron, Rabea Hinkel,Franziska Globisch, Christian Kupatt-Jeremias,Maximilian F Reiser and Bernd J WinterspergerUniversity Hospital of Munich, Munich, Germany
Journal of Cardiovascular Magnetic Resonance 2009, 11(Suppl 1):P136
Introduction: Until today, imaging of lower extremity blood
supply and perfusion is limited to the display of the macroscopic
vasculature by angiographic methods like DSA, CTA or MRA.
However, all these methods are limited to high spatial resolution
imaging of the arterial or venous vessels but do not display
changes at the microvascular level in regard to tissue perfusion.
MR perfusion imaging may overcome this limitation in experi-
mental and clinical settings and may allow non-invasive monitor-
ing of modern therapeutic options including angiogenisis.
Purpose: To implement and evaluate the use of perfusion MR
in monitoring angiogenetic therapies and their effects based on a
rabbit model of iatrogenic induced chronic lower limb ischemia.
Methods: MR perfusion imaging was performed in 8 rabbits
with chronic lower limb ischemia after unilateral SFA excision at
3 Tesla (Magnetom Verio, Siemens Healthcare) using a 32-
element coil. In 4 animals MRI was performed at day 7 and in 4
animals at day 7 and 35 (after angiogenesis therapy). Multi-slice
coverage was provided using a 2D-TurboFLASH technique at 1.5
s temporal resolution with repeated measurements over 10 min
after injection of 0.1 mmol/kg gadobutrol (Gadovist, Bayer
Schering Pharma). One slice was placed through the aorta for
measuring the Arterial Input Function (AIF) and 7 sliced covered
the gluteal, thigh and knee musculature. Precontrast T1-mapping
was performed using a variable TI GRE technique at identical
slice locations (27 steps from 110 ms – 5 s). Data were post-
processed off-line using in-house written software PMI 0.3 includ-
ing calculation of plasma flow (PF), plasma volume (PV) and
extraction flow (EF) based on a 2-compartmental model. T1
mapping data were used to convert signal-time courses to tracer
concentration. Figure 1.
Results: T1-maps produced robust results on with precontrast
T1-values close to typical reference values at 3 T. PF was
significantly different between the non-ischemic and ischemic
limb (14.3 ± 11.5 vs. 8.4 ± 3.9 ml/100 ml/min) on day 7 whereas
there was no significant difference on day 35 after therapy
(9.3 ± 2.3 vs. 10.5 ± 3.2 ml/100 ml/min). EF showed similar
findings with 2.17 ± 1.71 vs. 1.71 ± 1.6 ml/100 ml/min on day
7 and 2.3 ± 1.98 vs. 2.15 ± 1.68 ml/100 ml/min on day 35. PV did
not show significant differences either before or after therapy.
Conclusion: Chronic experimental limb ischemia results in
significant changes of MR derived perfusion parameters, with
reconstitution after experimental therapy. Initial data indicate
that perfusion MRI provides a useful tool for the evaluation of
muscle ischemia and of therapy effects.
P137Infarct size by cardiovascular magnetic resonancewith delay enhancement as prognostic factor in thecoronary artery disease: preliminary studyLeticia Castellanos Cainas, Sandra Graciela Rosales Uvera,Jaime Galindo Uribe, Jorge Vazquez La Madrid,Jorge Oseguera Moguel, Florencia Vargas Vorackovaand Martha Morelos GuzmanNational Institute of the Medical Science and NutritionSalvador Zubiran, Mexico D.F., Mexico
Journal of Cardiovascular Magnetic Resonance 2009, 11(Suppl 1):P137
Introduction: The magnetic resonance (MR) has taken nowa-
days a crucial role in the evaluation of ischemic heart disease,
which is regarded as the technique of reference for the
assessment of myocardial viability. Delay enhanced cardiovascular
magnetic resonance (DE-CMR) is a specific marker of myocardial
necrosis, using this technique can determine the presence of
infarct localization, size and transmurality, parameters of great
importance for determining treatment and prognosis.
Purpose: To determine if infarct size measured by DE-CMR is a
prognostic factor for mortality in patients with ischemic heart
disease.
Methods: Sixty eight patients were referred to cardiovascular
magnetic resonance because of suspicion or knowledge of
ischemic heart disease between September 2004 and September
2008. CMR imaging was performed using GE 1.5 T system.
Steady state free precession (SSFP) cine MR images were
acquired in long and short axis orientation. Evaluation of
functional parameters including end diastolic volume (EDV),
end systolic volume (ESV), left ventricle ejection fraction (LVEF)
and systolic volume (SV) indexed a body surface area (BSA).
Results: The average age of the study population was 65.6 (+/-10.7 SD) years, 12% patients were in functional class III-IV
NYHA, the mortality rate was 16.1%. We evaluate 1156
segments and the 39.7% of this presented delay enhancement.
Figure 1 (abstract P136)
Colour coded plasma flow images over 8 slices (1 = distal, 8 = central) at
day 7 after left side SFA excision. Images show significantly higher plasma
flow on the ischemic side before angiogenetic therapy.
Journal of Cardiovascular Magnetic Resonance 2009, 11(Suppl 1) http://jcmr-online.com/supplements/11/S1
Page 191 of 316(page number not for citation purposes)
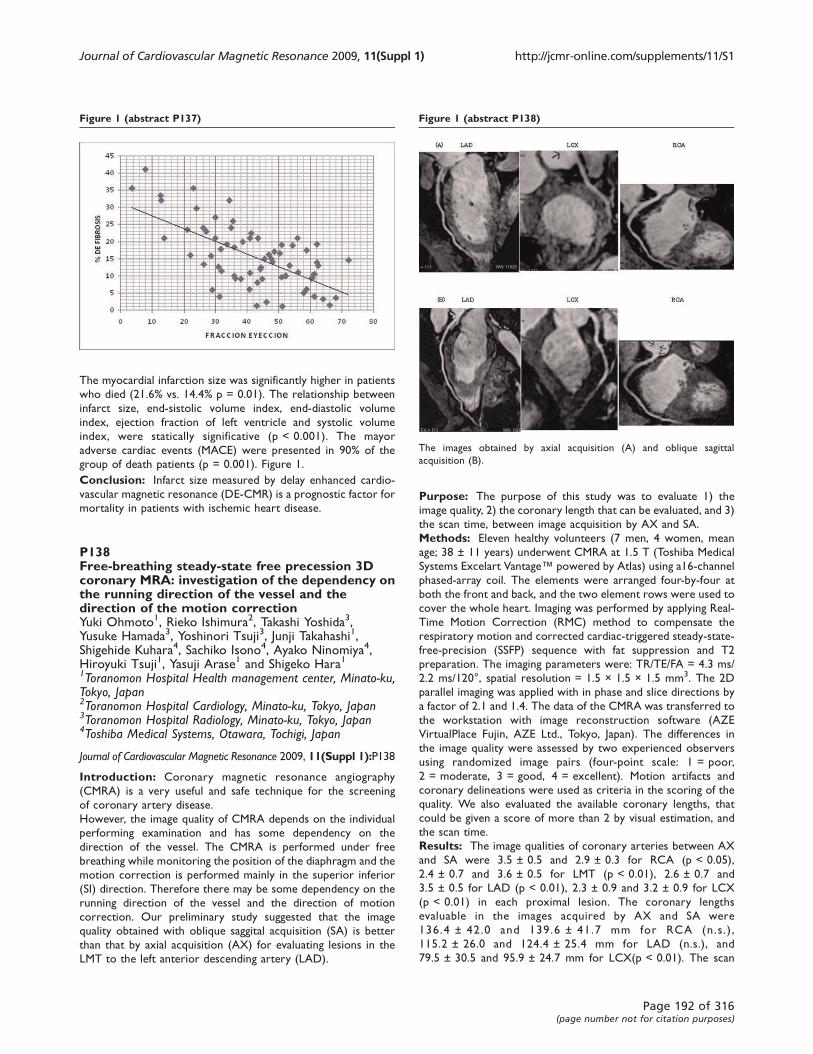
The myocardial infarction size was significantly higher in patients
who died (21.6% vs. 14.4% p = 0.01). The relationship between
infarct size, end-sistolic volume index, end-diastolic volume
index, ejection fraction of left ventricle and systolic volume
index, were statically significative (p < 0.001). The mayor
adverse cardiac events (MACE) were presented in 90% of the
group of death patients (p = 0.001). Figure 1.
Conclusion: Infarct size measured by delay enhanced cardio-
vascular magnetic resonance (DE-CMR) is a prognostic factor for
mortality in patients with ischemic heart disease.
P138Free-breathing steady-state free precession 3Dcoronary MRA: investigation of the dependency onthe running direction of the vessel and thedirection of the motion correctionYuki Ohmoto1, Rieko Ishimura2, Takashi Yoshida3,Yusuke Hamada3, Yoshinori Tsuji3, Junji Takahashi1,Shigehide Kuhara4, Sachiko Isono4, Ayako Ninomiya4,Hiroyuki Tsuji1, Yasuji Arase1 and Shigeko Hara11Toranomon Hospital Health management center, Minato-ku,Tokyo, Japan2Toranomon Hospital Cardiology, Minato-ku, Tokyo, Japan3Toranomon Hospital Radiology, Minato-ku, Tokyo, Japan4Toshiba Medical Systems, Otawara, Tochigi, Japan
Journal of Cardiovascular Magnetic Resonance 2009, 11(Suppl 1):P138
Introduction: Coronary magnetic resonance angiography
(CMRA) is a very useful and safe technique for the screening
of coronary artery disease.
However, the image quality of CMRA depends on the individual
performing examination and has some dependency on the
direction of the vessel. The CMRA is performed under free
breathing while monitoring the position of the diaphragm and the
motion correction is performed mainly in the superior inferior
(SI) direction. Therefore there may be some dependency on the
running direction of the vessel and the direction of motion
correction. Our preliminary study suggested that the image
quality obtained with oblique saggital acquisition (SA) is better
than that by axial acquisition (AX) for evaluating lesions in the
LMT to the left anterior descending artery (LAD).
Purpose: The purpose of this study was to evaluate 1) the
image quality, 2) the coronary length that can be evaluated, and 3)
the scan time, between image acquisition by AX and SA.
Methods: Eleven healthy volunteers (7 men, 4 women, mean
age; 38 ± 11 years) underwent CMRA at 1.5 T (Toshiba Medical
Systems Excelart Vantage™ powered by Atlas) using a16-channel
phased-array coil. The elements were arranged four-by-four at
both the front and back, and the two element rows were used to
cover the whole heart. Imaging was performed by applying Real-
Time Motion Correction (RMC) method to compensate the
respiratory motion and corrected cardiac-triggered steady-state-
free-precision (SSFP) sequence with fat suppression and T2
preparation. The imaging parameters were: TR/TE/FA = 4.3 ms/
2.2 ms/120°, spatial resolution = 1.5 × 1.5 × 1.5 mm3. The 2D
parallel imaging was applied with in phase and slice directions by
a factor of 2.1 and 1.4. The data of the CMRA was transferred to
the workstation with image reconstruction software (AZE
VirtualPlace Fujin, AZE Ltd., Tokyo, Japan). The differences in
the image quality were assessed by two experienced observers
using randomized image pairs (four-point scale: 1 = poor,
2 = moderate, 3 = good, 4 = excellent). Motion artifacts and
coronary delineations were used as criteria in the scoring of the
quality. We also evaluated the available coronary lengths, that
could be given a score of more than 2 by visual estimation, and
the scan time.
Results: The image qualities of coronary arteries between AX
and SA were 3.5 ± 0.5 and 2.9 ± 0.3 for RCA (p < 0.05),
2.4 ± 0.7 and 3.6 ± 0.5 for LMT (p < 0.01), 2.6 ± 0.7 and
3.5 ± 0.5 for LAD (p < 0.01), 2.3 ± 0.9 and 3.2 ± 0.9 for LCX
(p < 0.01) in each proximal lesion. The coronary lengths
evaluable in the images acquired by AX and SA were
136.4 ± 42.0 and 139.6 ± 41.7 mm for RCA (n.s .) ,
115.2 ± 26.0 and 124.4 ± 25.4 mm for LAD (n.s.), and
79.5 ± 30.5 and 95.9 ± 24.7 mm for LCX(p < 0.01). The scan
Figure 1 (abstract P137) Figure 1 (abstract P138)
The images obtained by axial acquisition (A) and oblique sagittal
acquisition (B).
Journal of Cardiovascular Magnetic Resonance 2009, 11(Suppl 1) http://jcmr-online.com/supplements/11/S1
Page 192 of 316(page number not for citation purposes)
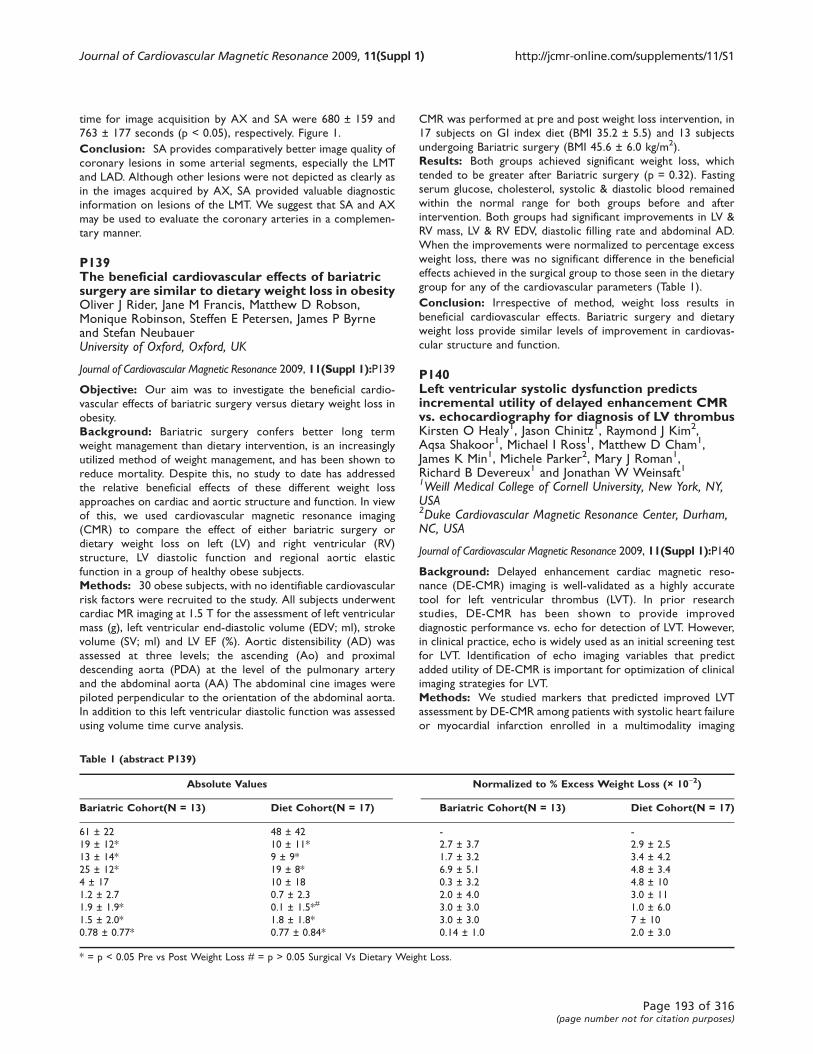
time for image acquisition by AX and SA were 680 ± 159 and
763 ± 177 seconds (p < 0.05), respectively. Figure 1.
Conclusion: SA provides comparatively better image quality of
coronary lesions in some arterial segments, especially the LMT
and LAD. Although other lesions were not depicted as clearly as
in the images acquired by AX, SA provided valuable diagnostic
information on lesions of the LMT. We suggest that SA and AX
may be used to evaluate the coronary arteries in a complemen-
tary manner.
P139The beneficial cardiovascular effects of bariatricsurgery are similar to dietary weight loss in obesityOliver J Rider, Jane M Francis, Matthew D Robson,Monique Robinson, Steffen E Petersen, James P Byrneand Stefan NeubauerUniversity of Oxford, Oxford, UK
Journal of Cardiovascular Magnetic Resonance 2009, 11(Suppl 1):P139
Objective: Our aim was to investigate the beneficial cardio-
vascular effects of bariatric surgery versus dietary weight loss in
obesity.
Background: Bariatric surgery confers better long term
weight management than dietary intervention, is an increasingly
utilized method of weight management, and has been shown to
reduce mortality. Despite this, no study to date has addressed
the relative beneficial effects of these different weight loss
approaches on cardiac and aortic structure and function. In view
of this, we used cardiovascular magnetic resonance imaging
(CMR) to compare the effect of either bariatric surgery or
dietary weight loss on left (LV) and right ventricular (RV)
structure, LV diastolic function and regional aortic elastic
function in a group of healthy obese subjects.
Methods: 30 obese subjects, with no identifiable cardiovascular
risk factors were recruited to the study. All subjects underwent
cardiac MR imaging at 1.5 T for the assessment of left ventricular
mass (g), left ventricular end-diastolic volume (EDV; ml), stroke
volume (SV; ml) and LV EF (%). Aortic distensibility (AD) was
assessed at three levels; the ascending (Ao) and proximal
descending aorta (PDA) at the level of the pulmonary artery
and the abdominal aorta (AA) The abdominal cine images were
piloted perpendicular to the orientation of the abdominal aorta.
In addition to this left ventricular diastolic function was assessed
using volume time curve analysis.
CMR was performed at pre and post weight loss intervention, in
17 subjects on GI index diet (BMI 35.2 ± 5.5) and 13 subjects
undergoing Bariatric surgery (BMI 45.6 ± 6.0 kg/m2).
Results: Both groups achieved significant weight loss, which
tended to be greater after Bariatric surgery (p = 0.32). Fasting
serum glucose, cholesterol, systolic & diastolic blood remained
within the normal range for both groups before and after
intervention. Both groups had significant improvements in LV &
RV mass, LV & RV EDV, diastolic filling rate and abdominal AD.
When the improvements were normalized to percentage excess
weight loss, there was no significant difference in the beneficial
effects achieved in the surgical group to those seen in the dietary
group for any of the cardiovascular parameters (Table 1).
Conclusion: Irrespective of method, weight loss results in
beneficial cardiovascular effects. Bariatric surgery and dietary
weight loss provide similar levels of improvement in cardiovas-
cular structure and function.
P140Left ventricular systolic dysfunction predictsincremental utility of delayed enhancement CMRvs. echocardiography for diagnosis of LV thrombusKirsten O Healy1, Jason Chinitz1, Raymond J Kim2,Aqsa Shakoor1, Michael I Ross1, Matthew D Cham1,James K Min1, Michele Parker2, Mary J Roman1,Richard B Devereux1 and Jonathan W Weinsaft11Weill Medical College of Cornell University, New York, NY,USA2Duke Cardiovascular Magnetic Resonance Center, Durham,NC, USA
Journal of Cardiovascular Magnetic Resonance 2009, 11(Suppl 1):P140
Background: Delayed enhancement cardiac magnetic reso-
nance (DE-CMR) imaging is well-validated as a highly accurate
tool for left ventricular thrombus (LVT). In prior research
studies, DE-CMR has been shown to provide improved
diagnostic performance vs. echo for detection of LVT. However,
in clinical practice, echo is widely used as an initial screening test
for LVT. Identification of echo imaging variables that predict
added utility of DE-CMR is important for optimization of clinical
imaging strategies for LVT.
Methods: We studied markers that predicted improved LVT
assessment by DE-CMR among patients with systolic heart failure
or myocardial infarction enrolled in a multimodality imaging
Table 1 (abstract P139)
Absolute Values Normalized to % Excess Weight Loss (× 10-2)
Bariatric Cohort(N = 13) Diet Cohort(N = 17) Bariatric Cohort(N = 13) Diet Cohort(N = 17)
61 ± 22 48 ± 42 - -
19 ± 12* 10 ± 11* 2.7 ± 3.7 2.9 ± 2.5
13 ± 14* 9 ± 9* 1.7 ± 3.2 3.4 ± 4.2
25 ± 12* 19 ± 8* 6.9 ± 5.1 4.8 ± 3.4
4 ± 17 10 ± 18 0.3 ± 3.2 4.8 ± 10
1.2 ± 2.7 0.7 ± 2.3 2.0 ± 4.0 3.0 ± 11
1.9 ± 1.9* 0.1 ± 1.5*# 3.0 ± 3.0 1.0 ± 6.0
1.5 ± 2.0* 1.8 ± 1.8* 3.0 ± 3.0 7 ± 10
0.78 ± 0.77* 0.77 ± 0.84* 0.14 ± 1.0 2.0 ± 3.0
* = p < 0.05 Pre vs Post Weight Loss # = p > 0.05 Surgical Vs Dietary Weight Loss.
Journal of Cardiovascular Magnetic Resonance 2009, 11(Suppl 1) http://jcmr-online.com/supplements/11/S1
Page 193 of 316(page number not for citation purposes)
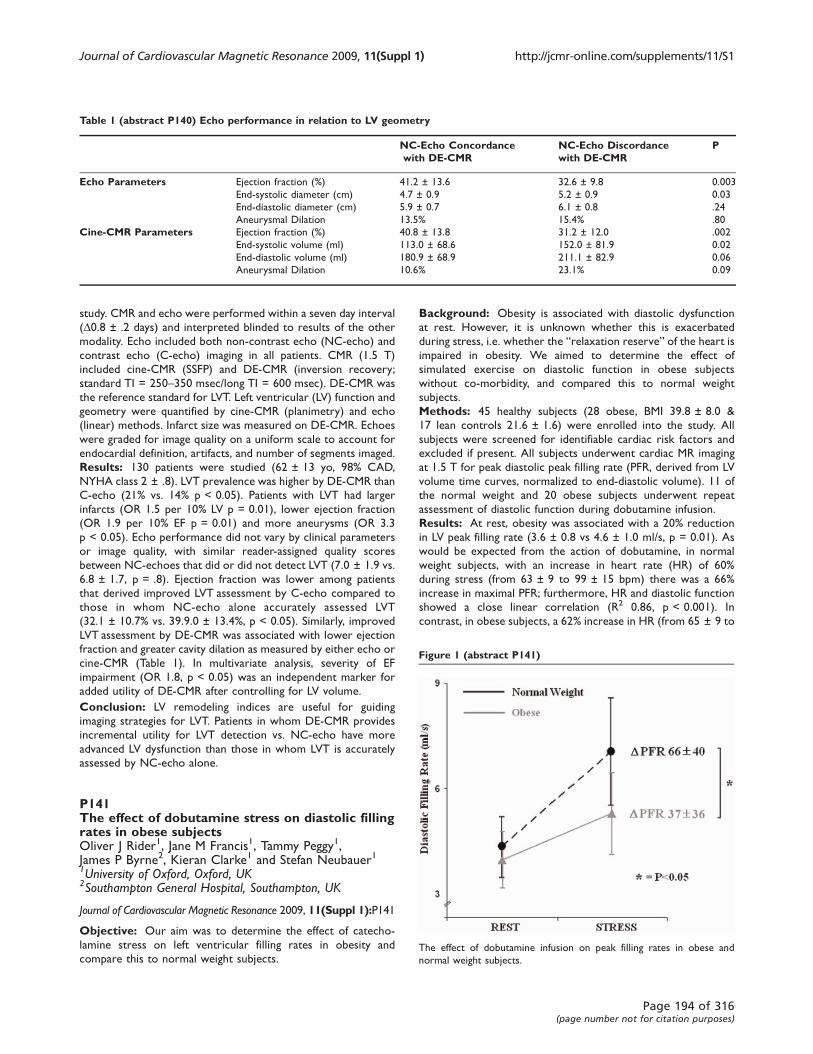
study. CMR and echo were performed within a seven day interval
(D0.8 ± .2 days) and interpreted blinded to results of the other
modality. Echo included both non-contrast echo (NC-echo) and
contrast echo (C-echo) imaging in all patients. CMR (1.5 T)
included cine-CMR (SSFP) and DE-CMR (inversion recovery;
standard TI = 250–350 msec/long TI = 600 msec). DE-CMR was
the reference standard for LVT. Left ventricular (LV) function and
geometry were quantified by cine-CMR (planimetry) and echo
(linear) methods. Infarct size was measured on DE-CMR. Echoes
were graded for image quality on a uniform scale to account for
endocardial definition, artifacts, and number of segments imaged.
Results: 130 patients were studied (62 ± 13 yo, 98% CAD,
NYHA class 2 ± .8). LVT prevalence was higher by DE-CMR than
C-echo (21% vs. 14% p < 0.05). Patients with LVT had larger
infarcts (OR 1.5 per 10% LV p = 0.01), lower ejection fraction
(OR 1.9 per 10% EF p = 0.01) and more aneurysms (OR 3.3
p < 0.05). Echo performance did not vary by clinical parameters
or image quality, with similar reader-assigned quality scores
between NC-echoes that did or did not detect LVT (7.0 ± 1.9 vs.
6.8 ± 1.7, p = .8). Ejection fraction was lower among patients
that derived improved LVT assessment by C-echo compared to
those in whom NC-echo alone accurately assessed LVT
(32.1 ± 10.7% vs. 39.9.0 ± 13.4%, p < 0.05). Similarly, improved
LVT assessment by DE-CMR was associated with lower ejection
fraction and greater cavity dilation as measured by either echo or
cine-CMR (Table 1). In multivariate analysis, severity of EF
impairment (OR 1.8, p < 0.05) was an independent marker for
added utility of DE-CMR after controlling for LV volume.
Conclusion: LV remodeling indices are useful for guiding
imaging strategies for LVT. Patients in whom DE-CMR provides
incremental utility for LVT detection vs. NC-echo have more
advanced LV dysfunction than those in whom LVT is accurately
assessed by NC-echo alone.
P141The effect of dobutamine stress on diastolic fillingrates in obese subjectsOliver J Rider1, Jane M Francis1, Tammy Peggy1,James P Byrne2, Kieran Clarke1 and Stefan Neubauer11University of Oxford, Oxford, UK2Southampton General Hospital, Southampton, UK
Journal of Cardiovascular Magnetic Resonance 2009, 11(Suppl 1):P141
Objective: Our aim was to determine the effect of catecho-
lamine stress on left ventricular filling rates in obesity and
compare this to normal weight subjects.
Background: Obesity is associated with diastolic dysfunction
at rest. However, it is unknown whether this is exacerbated
during stress, i.e. whether the “relaxation reserve” of the heart isimpaired in obesity. We aimed to determine the effect of
simulated exercise on diastolic function in obese subjects
without co-morbidity, and compared this to normal weight
subjects.
Methods: 45 healthy subjects (28 obese, BMI 39.8 ± 8.0 &
17 lean controls 21.6 ± 1.6) were enrolled into the study. All
subjects were screened for identifiable cardiac risk factors and
excluded if present. All subjects underwent cardiac MR imaging
at 1.5 T for peak diastolic peak filling rate (PFR, derived from LV
volume time curves, normalized to end-diastolic volume). 11 of
the normal weight and 20 obese subjects underwent repeat
assessment of diastolic function during dobutamine infusion.
Results: At rest, obesity was associated with a 20% reduction
in LV peak filling rate (3.6 ± 0.8 vs 4.6 ± 1.0 ml/s, p = 0.01). As
would be expected from the action of dobutamine, in normal
weight subjects, with an increase in heart rate (HR) of 60%
during stress (from 63 ± 9 to 99 ± 15 bpm) there was a 66%
increase in maximal PFR; furthermore, HR and diastolic function
showed a close linear correlation (R2 0.86, p < 0.001). In
contrast, in obese subjects, a 62% increase in HR (from 65 ± 9 to
Table 1 (abstract P140) Echo performance in relation to LV geometry
NC-Echo Concordancewith DE-CMR
NC-Echo Discordancewith DE-CMR
P
Echo Parameters Ejection fraction (%) 41.2 ± 13.6 32.6 ± 9.8 0.003
End-systolic diameter (cm) 4.7 ± 0.9 5.2 ± 0.9 0.03
End-diastolic diameter (cm) 5.9 ± 0.7 6.1 ± 0.8 .24
Aneurysmal Dilation 13.5% 15.4% .80
Cine-CMR Parameters Ejection fraction (%) 40.8 ± 13.8 31.2 ± 12.0 .002
End-systolic volume (ml) 113.0 ± 68.6 152.0 ± 81.9 0.02
End-diastolic volume (ml) 180.9 ± 68.9 211.1 ± 82.9 0.06
Aneurysmal Dilation 10.6% 23.1% 0.09
Figure 1 (abstract P141)
The effect of dobutamine infusion on peak filling rates in obese and
normal weight subjects.
Journal of Cardiovascular Magnetic Resonance 2009, 11(Suppl 1) http://jcmr-online.com/supplements/11/S1
Page 194 of 316(page number not for citation purposes)
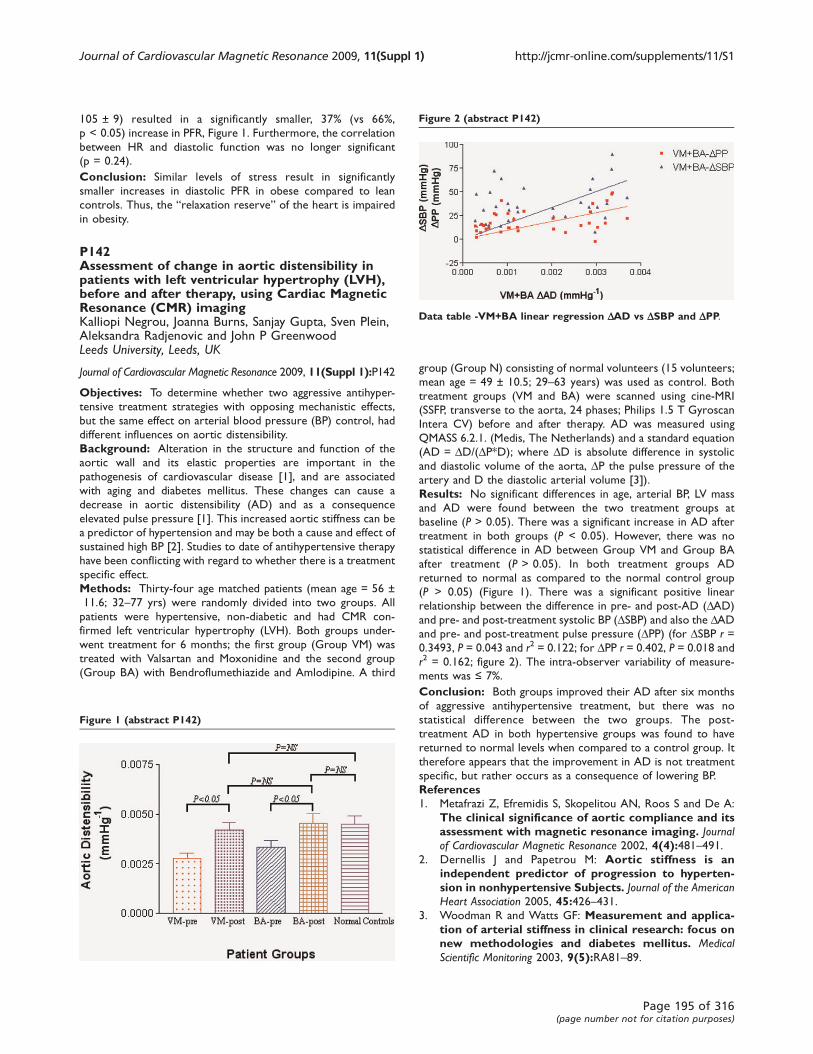
105 ± 9) resulted in a significantly smaller, 37% (vs 66%,
p < 0.05) increase in PFR, Figure 1. Furthermore, the correlation
between HR and diastolic function was no longer significant
(p = 0.24).
Conclusion: Similar levels of stress result in significantly
smaller increases in diastolic PFR in obese compared to lean
controls. Thus, the “relaxation reserve” of the heart is impaired
in obesity.
P142Assessment of change in aortic distensibility inpatients with left ventricular hypertrophy (LVH),before and after therapy, using Cardiac MagneticResonance (CMR) imagingKalliopi Negrou, Joanna Burns, Sanjay Gupta, Sven Plein,Aleksandra Radjenovic and John P GreenwoodLeeds University, Leeds, UK
Journal of Cardiovascular Magnetic Resonance 2009, 11(Suppl 1):P142
Objectives: To determine whether two aggressive antihyper-
tensive treatment strategies with opposing mechanistic effects,
but the same effect on arterial blood pressure (BP) control, had
different influences on aortic distensibility.
Background: Alteration in the structure and function of the
aortic wall and its elastic properties are important in the
pathogenesis of cardiovascular disease [1], and are associated
with aging and diabetes mellitus. These changes can cause a
decrease in aortic distensibility (AD) and as a consequence
elevated pulse pressure [1]. This increased aortic stiffness can be
a predictor of hypertension and may be both a cause and effect of
sustained high BP [2]. Studies to date of antihypertensive therapy
have been conflicting with regard to whether there is a treatment
specific effect.
Methods: Thirty-four age matched patients (mean age = 56 ±
11.6; 32–77 yrs) were randomly divided into two groups. All
patients were hypertensive, non-diabetic and had CMR con-
firmed left ventricular hypertrophy (LVH). Both groups under-
went treatment for 6 months; the first group (Group VM) was
treated with Valsartan and Moxonidine and the second group
(Group BA) with Bendroflumethiazide and Amlodipine. A third
group (Group N) consisting of normal volunteers (15 volunteers;
mean age = 49 ± 10.5; 29–63 years) was used as control. Both
treatment groups (VM and BA) were scanned using cine-MRI
(SSFP, transverse to the aorta, 24 phases; Philips 1.5 T Gyroscan
Intera CV) before and after therapy. AD was measured using
QMASS 6.2.1. (Medis, The Netherlands) and a standard equation
(AD = DD/(DP*D); where DD is absolute difference in systolic
and diastolic volume of the aorta, DP the pulse pressure of the
artery and D the diastolic arterial volume [3]).
Results: No significant differences in age, arterial BP, LV mass
and AD were found between the two treatment groups at
baseline (P > 0.05). There was a significant increase in AD after
treatment in both groups (P < 0.05). However, there was no
statistical difference in AD between Group VM and Group BA
after treatment (P > 0.05). In both treatment groups AD
returned to normal as compared to the normal control group
(P > 0.05) (Figure 1). There was a significant positive linear
relationship between the difference in pre- and post-AD (DAD)
and pre- and post-treatment systolic BP (DSBP) and also the DADand pre- and post-treatment pulse pressure (DPP) (for DSBP r =0.3493, P = 0.043 and r2 = 0.122; for DPP r = 0.402, P = 0.018 and
r2 = 0.162; figure 2). The intra-observer variability of measure-
ments was ≤ 7%.
Conclusion: Both groups improved their AD after six months
of aggressive antihypertensive treatment, but there was no
statistical difference between the two groups. The post-
treatment AD in both hypertensive groups was found to have
returned to normal levels when compared to a control group. It
therefore appears that the improvement in AD is not treatment
specific, but rather occurs as a consequence of lowering BP.
References1. Metafrazi Z, Efremidis S, Skopelitou AN, Roos S and De A:
The clinical significance of aortic compliance and itsassessment with magnetic resonance imaging. Journalof Cardiovascular Magnetic Resonance 2002, 4(4):481–491.
2. Dernellis J and Papetrou M: Aortic stiffness is anindependent predictor of progression to hyperten-sion in nonhypertensive Subjects. Journal of the AmericanHeart Association 2005, 45:426–431.
3. Woodman R and Watts GF: Measurement and applica-tion of arterial stiffness in clinical research: focus onnew methodologies and diabetes mellitus. MedicalScientific Monitoring 2003, 9(5):RA81–89.
Figure 1 (abstract P142)
Figure 2 (abstract P142)
Data table -VM+BA linear regression DAD vs DSBP and DPP.
Journal of Cardiovascular Magnetic Resonance 2009, 11(Suppl 1) http://jcmr-online.com/supplements/11/S1
Page 195 of 316(page number not for citation purposes)
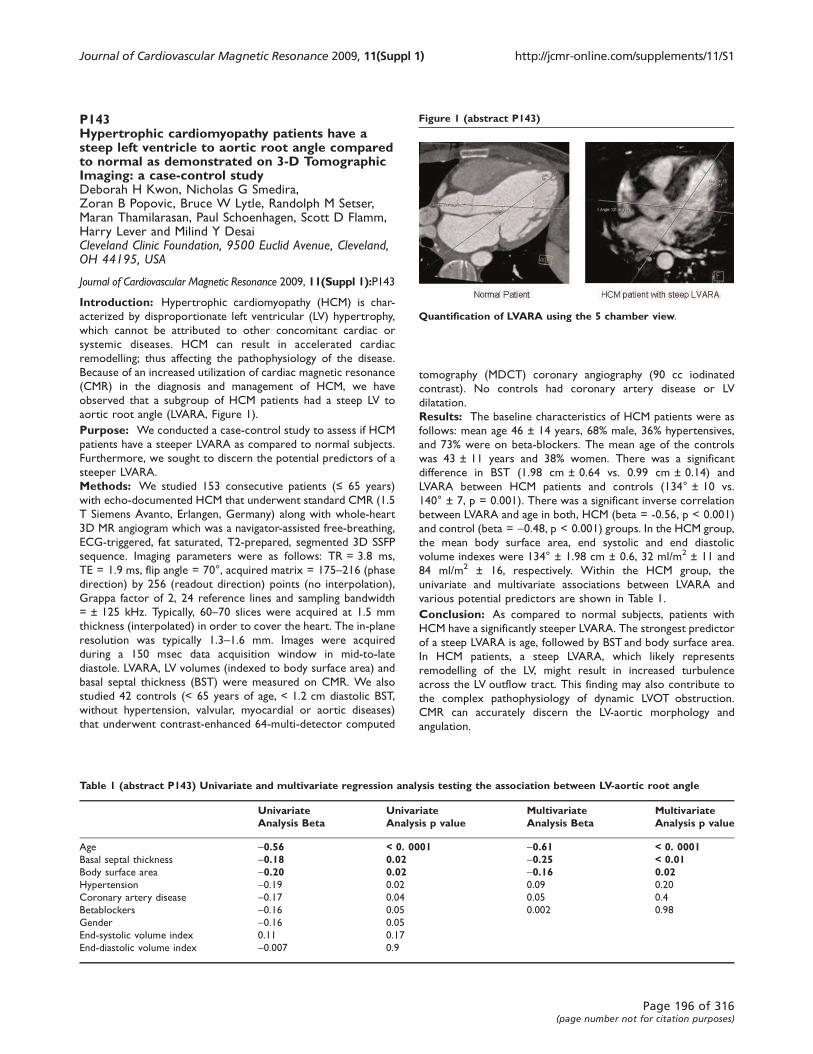
P143Hypertrophic cardiomyopathy patients have asteep left ventricle to aortic root angle comparedto normal as demonstrated on 3-D TomographicImaging: a case-control studyDeborah H Kwon, Nicholas G Smedira,Zoran B Popovic, Bruce W Lytle, Randolph M Setser,Maran Thamilarasan, Paul Schoenhagen, Scott D Flamm,Harry Lever and Milind Y DesaiCleveland Clinic Foundation, 9500 Euclid Avenue, Cleveland,OH 44195, USA
Journal of Cardiovascular Magnetic Resonance 2009, 11(Suppl 1):P143
Introduction: Hypertrophic cardiomyopathy (HCM) is char-
acterized by disproportionate left ventricular (LV) hypertrophy,
which cannot be attributed to other concomitant cardiac or
systemic diseases. HCM can result in accelerated cardiac
remodelling; thus affecting the pathophysiology of the disease.
Because of an increased utilization of cardiac magnetic resonance
(CMR) in the diagnosis and management of HCM, we have
observed that a subgroup of HCM patients had a steep LV to
aortic root angle (LVARA, Figure 1).
Purpose: We conducted a case-control study to assess if HCM
patients have a steeper LVARA as compared to normal subjects.
Furthermore, we sought to discern the potential predictors of a
steeper LVARA.
Methods: We studied 153 consecutive patients (≤ 65 years)
with echo-documented HCM that underwent standard CMR (1.5
T Siemens Avanto, Erlangen, Germany) along with whole-heart
3D MR angiogram which was a navigator-assisted free-breathing,
ECG-triggered, fat saturated, T2-prepared, segmented 3D SSFP
sequence. Imaging parameters were as follows: TR = 3.8 ms,
TE = 1.9 ms, flip angle = 70°, acquired matrix = 175–216 (phase
direction) by 256 (readout direction) points (no interpolation),
Grappa factor of 2, 24 reference lines and sampling bandwidth
= ± 125 kHz. Typically, 60–70 slices were acquired at 1.5 mm
thickness (interpolated) in order to cover the heart. The in-plane
resolution was typically 1.3–1.6 mm. Images were acquired
during a 150 msec data acquisition window in mid-to-late
diastole. LVARA, LV volumes (indexed to body surface area) and
basal septal thickness (BST) were measured on CMR. We also
studied 42 controls (< 65 years of age, < 1.2 cm diastolic BST,
without hypertension, valvular, myocardial or aortic diseases)
that underwent contrast-enhanced 64-multi-detector computed
tomography (MDCT) coronary angiography (90 cc iodinated
contrast). No controls had coronary artery disease or LV
dilatation.
Results: The baseline characteristics of HCM patients were as
follows: mean age 46 ± 14 years, 68% male, 36% hypertensives,
and 73% were on beta-blockers. The mean age of the controls
was 43 ± 11 years and 38% women. There was a significant
difference in BST (1.98 cm ± 0.64 vs. 0.99 cm ± 0.14) and
LVARA between HCM patients and controls (134° ± 10 vs.
140° ± 7, p = 0.001). There was a significant inverse correlation
between LVARA and age in both, HCM (beta = -0.56, p < 0.001)
and control (beta = -0.48, p < 0.001) groups. In the HCM group,
the mean body surface area, end systolic and end diastolic
volume indexes were 134° ± 1.98 cm ± 0.6, 32 ml/m2 ± 11 and
84 ml/m2 ± 16, respectively. Within the HCM group, the
univariate and multivariate associations between LVARA and
various potential predictors are shown in Table 1.
Conclusion: As compared to normal subjects, patients with
HCM have a significantly steeper LVARA. The strongest predictor
of a steep LVARA is age, followed by BST and body surface area.
In HCM patients, a steep LVARA, which likely represents
remodelling of the LV, might result in increased turbulence
across the LV outflow tract. This finding may also contribute to
the complex pathophysiology of dynamic LVOT obstruction.
CMR can accurately discern the LV-aortic morphology and
angulation.
Table 1 (abstract P143) Univariate and multivariate regression analysis testing the association between LV-aortic root angle
UnivariateAnalysis Beta
UnivariateAnalysis p value
MultivariateAnalysis Beta
MultivariateAnalysis p value
Age -0.56 < 0. 0001 -0.61 < 0. 0001Basal septal thickness -0.18 0.02 -0.25 < 0.01Body surface area -0.20 0.02 -0.16 0.02Hypertension -0.19 0.02 0.09 0.20
Coronary artery disease -0.17 0.04 0.05 0.4
Betablockers -0.16 0.05 0.002 0.98
Gender -0.16 0.05
End-systolic volume index 0.11 0.17
End-diastolic volume index -0.007 0.9
Figure 1 (abstract P143)
Quantification of LVARA using the 5 chamber view.
Journal of Cardiovascular Magnetic Resonance 2009, 11(Suppl 1) http://jcmr-online.com/supplements/11/S1
Page 196 of 316(page number not for citation purposes)

P144GEISIR: gadolinium exposure induced systemicinflammatory response in dialysis patientsHenning Steen, Constanze Merten, Dirk Lossnitzer,Stephanie Lehrke, Vedat Schwenger, Hugo A Katusand Evangelos GiannitsisUniversity of Heidelberg, Heidelberg, Germany
Journal of Cardiovascular Magnetic Resonance 2009, 11(Suppl 1):P144
Introduction and purpose: Several late sequelae of the
administration of gadolinium (Gd)-containing MRI contrast agents
have been described in patients with advanced renal failure. In an
observational series we found a remarkable frequency of peracute
reactions after administration of Gd-DTPA used for cardiovascular
evaluation before renal transplantation.
Methods: In a 26 months observational period 13 of 136
hemodialysed or CAPD patients exhibited onset of fever, chills
and nausea within hours after administration of Gd-DTPA
peracute. A minority showed persistent cessation of residual
diuresis. We performed blood cultures in most patients and
evaluated white blood cell counts (WBC), eosinophils, CRP,
heart rate and blood pressure.
Results: Within an average of 12 h (range 12–36 h) after Gd-
administration, the 13 patients (9 male, 4 female; median age 61
years, range 47 – 79) developed consistent symptomatology with
fever (median 39.0°C, range 37.5 – 39.5), chills, malaise,
hypotension, vomiting, dyspnea – initially raising suspicion of
septicaemia. Subsequent blood cultures on bacterial contamina-
tion of the injected product remained negative throughout;
bacterial or endotoxin contamination of the reagent was
excluded. Steroids were tried in the first two patients without
noticeable effect. In all subsequent patients symptoms were
attenuated during the first 5 h dialysis (F60HPS with 280 ml/min
blood flow) and disappeared within 72 h. CRP levels remained
markedly elevated up to 14 days. Lymphopenia was seen in all
patients and polymorphic neutrophils (PMN) remained normal.
Two polyuric patients developed persistent anuria. After a
median of 16 months none of these patients developed
nephrogenic systemic fibrosis.
Conclusion: This series with unusually severe acute phase
reactions was caused by one specific preparation. Such peracute
reactions may be relevant for the so far largely unresolved
pathogenesis of the skin reaction to some Gd products in end-
stage renal disease (ESRD) patients. It remains unresolved,
whether the reaction observed with Gd-DTPA do in principle
also occur with other Gd reagents.
P145Cardiovascular MRI derived mitral valve geometrypredicts the surgical treatment of mitralregurgitationAndre M Fernandes, Robert WW Biederman,Mark Doyle, June A Yamrozik, Ronald B Williams,Electra Markopoulos, George Magovern and Vikas K RathiAllegheny General Hospital, The Gerald McGinnisCardiovascular Institute, Pittsburgh, PA, USA
Journal of Cardiovascular Magnetic Resonance 2009, 11(Suppl 1):P145
Background: Mitral regurgitation (MR) is the most common
valvular heart disease worldwide with varying causes. The
ultimate treatment of mitral regurgitation is surgical. The surgical
decision making classically depends on the symptoms, severity of
MR, left ventricular dimension and function. Common mitral
apparatus descriptors now serve as a ‘road map’ to direct
surgical options.
Aim: Distinguish mitral valvar/apparati geometric patterns in
pts who undergo mitral valve (MV) surgery via cardiovascular
MRI (CMR).
Methods: Thirty-seven (37) pts underwent CMR (1.5 T GE).
The 3D MV and ventricular geometry was analyzed by multi-
planar SSFP imaging without contrast administration. The
following MV parameters were measured: tenting area, tenting
angle, tenting height, anterior leaflet (AL) and posterior leaflet
(PL) length and annulus diameter. Pts were divided into two
groups: MV surgery (MV+) and no MV surgery (MV-). The data
was statically analyzed by t-test, linear regression and ANOVA.
Results: Out of 37 pts, 18 had mild to moderate MR (1–2+)and 19 pts had moderate-severe MR (3–4+). Eight out of 37 pts
underwent surgery (6 of 8 had severe 4+ MR and two were
moderate 3–4+). As expected, MR severity correlated with
surgical treatment (r = 0.6, p < 0.001). The AL length most
strongly predicted the severity of MR (r = 0.7, p = 0.007).
Tenting area and annulus diameter were higher in MV+ than in
MV- (141 ± 92 vs. 106 ± 38 mm2, 34 ± 8 vs. 27 ± 4 mm,
p < 0.005). However, a composite of MR degree, annular
diameter and the ventricular length most strongly predicted
MV surgery (r = 0.8, p < 0.001). Interestingly, in contradiction to
current dogma, the tenting angle and tenting height did not
predict the severity of MR or need for MV surgery. More
importantly, the appearance and description of the MV on CMR
study correlated well with the surgeon's description of the mitral
apparatus at time of surgery (7/8 pts; 88% concordance). In 1 pt,
the surgeon's description of the MV was sparse.
Conclusion: While many criteria have been well established to
direct mitral valve surgical strategies, little has been defined by
non-echocardiographic methods. Herein, CMR is shown to be
concordant with the clinical need for MV surgery and
independently predictive of etiology of MR as confirmed at
surgery.
P146Exploring the promise land of 7 T for CMR withT-PAT accelerated imaging techniques – firstresults for real time cardiac function and tagging involunteersGregory Metzger1, Peter Weale2, Lance DelaBarre1,Patrick Bolan1, Sven Zuehlsdorff2, Sonia Nielles-Vallespin3,Pierre-Francois Van de Moortele1, Carl J Snyder1,Edward J Auerbach1, J Thomas Vaughan1, Kamil Ugurbil1
and Renate Jerecic21CMRR, Minneapolis, IL, USA2Siemens Medical Solutions, Chicago, IL, USA3Siemens Healthcare, Erlangen, Germany
Journal of Cardiovascular Magnetic Resonance 2009, 11(Suppl 1):P146
Introduction: CMR faces many challenges at 7 T, including
increased magnetic susceptibility, increased power deposition
and non-uniform B1 distribution. Particularly, non-uniformities in
B1 become a challenge beyond 3 Tesla, as the radio-frequency
wavelength becomes smaller than the size of the imaged object.
Journal of Cardiovascular Magnetic Resonance 2009, 11(Suppl 1) http://jcmr-online.com/supplements/11/S1
Page 197 of 316(page number not for citation purposes)
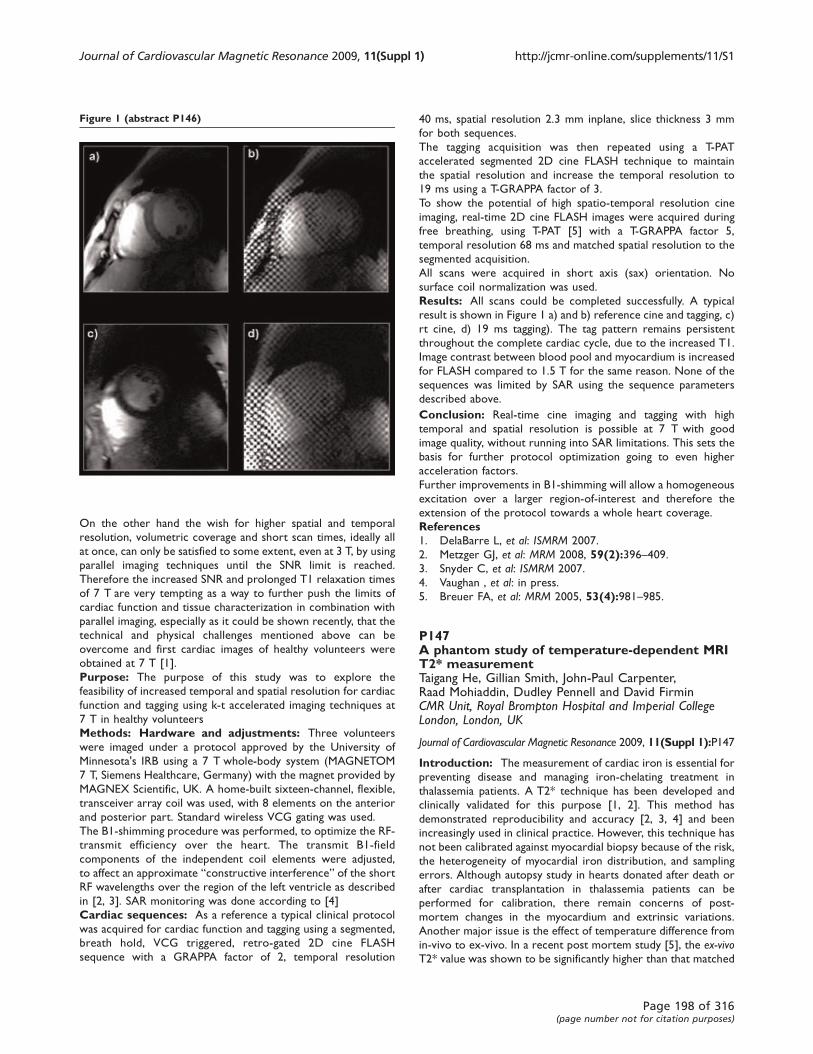
On the other hand the wish for higher spatial and temporal
resolution, volumetric coverage and short scan times, ideally all
at once, can only be satisfied to some extent, even at 3 T, by using
parallel imaging techniques until the SNR limit is reached.
Therefore the increased SNR and prolonged T1 relaxation times
of 7 T are very tempting as a way to further push the limits of
cardiac function and tissue characterization in combination with
parallel imaging, especially as it could be shown recently, that the
technical and physical challenges mentioned above can be
overcome and first cardiac images of healthy volunteers were
obtained at 7 T [1].
Purpose: The purpose of this study was to explore the
feasibility of increased temporal and spatial resolution for cardiac
function and tagging using k-t accelerated imaging techniques at
7 T in healthy volunteers
Methods: Hardware and adjustments: Three volunteers
were imaged under a protocol approved by the University of
Minnesota's IRB using a 7 T whole-body system (MAGNETOM
7 T, Siemens Healthcare, Germany) with the magnet provided by
MAGNEX Scientific, UK. A home-built sixteen-channel, flexible,
transceiver array coil was used, with 8 elements on the anterior
and posterior part. Standard wireless VCG gating was used.
The B1-shimming procedure was performed, to optimize the RF-
transmit efficiency over the heart. The transmit B1-field
components of the independent coil elements were adjusted,
to affect an approximate “constructive interference” of the shortRF wavelengths over the region of the left ventricle as described
in [2, 3]. SAR monitoring was done according to [4]
Cardiac sequences: As a reference a typical clinical protocol
was acquired for cardiac function and tagging using a segmented,
breath hold, VCG triggered, retro-gated 2D cine FLASH
sequence with a GRAPPA factor of 2, temporal resolution
40 ms, spatial resolution 2.3 mm inplane, slice thickness 3 mm
for both sequences.
The tagging acquisition was then repeated using a T-PAT
accelerated segmented 2D cine FLASH technique to maintain
the spatial resolution and increase the temporal resolution to
19 ms using a T-GRAPPA factor of 3.
To show the potential of high spatio-temporal resolution cine
imaging, real-time 2D cine FLASH images were acquired during
free breathing, using T-PAT [5] with a T-GRAPPA factor 5,
temporal resolution 68 ms and matched spatial resolution to the
segmented acquisition.
All scans were acquired in short axis (sax) orientation. No
surface coil normalization was used.
Results: All scans could be completed successfully. A typical
result is shown in Figure 1 a) and b) reference cine and tagging, c)
rt cine, d) 19 ms tagging). The tag pattern remains persistent
throughout the complete cardiac cycle, due to the increased T1.
Image contrast between blood pool and myocardium is increased
for FLASH compared to 1.5 T for the same reason. None of the
sequences was limited by SAR using the sequence parameters
described above.
Conclusion: Real-time cine imaging and tagging with high
temporal and spatial resolution is possible at 7 T with good
image quality, without running into SAR limitations. This sets the
basis for further protocol optimization going to even higher
acceleration factors.
Further improvements in B1-shimming will allow a homogeneous
excitation over a larger region-of-interest and therefore the
extension of the protocol towards a whole heart coverage.
References1. DelaBarre L, et al: ISMRM 2007.
2. Metzger GJ, et al: MRM 2008, 59(2):396–409.3. Snyder C, et al: ISMRM 2007.
4. Vaughan , et al: in press.
5. Breuer FA, et al: MRM 2005, 53(4):981–985.
P147A phantom study of temperature-dependent MRIT2* measurementTaigang He, Gillian Smith, John-Paul Carpenter,Raad Mohiaddin, Dudley Pennell and David FirminCMR Unit, Royal Brompton Hospital and Imperial CollegeLondon, London, UK
Journal of Cardiovascular Magnetic Resonance 2009, 11(Suppl 1):P147
Introduction: The measurement of cardiac iron is essential for
preventing disease and managing iron-chelating treatment in
thalassemia patients. A T2* technique has been developed and
clinically validated for this purpose [1, 2]. This method has
demonstrated reproducibility and accuracy [2, 3, 4] and been
increasingly used in clinical practice. However, this technique has
not been calibrated against myocardial biopsy because of the risk,
the heterogeneity of myocardial iron distribution, and sampling
errors. Although autopsy study in hearts donated after death or
after cardiac transplantation in thalassemia patients can be
performed for calibration, there remain concerns of post-
mortem changes in the myocardium and extrinsic variations.
Another major issue is the effect of temperature difference from
in-vivo to ex-vivo. In a recent post mortem study [5], the ex-vivoT2* value was shown to be significantly higher than that matched
Figure 1 (abstract P146)
Journal of Cardiovascular Magnetic Resonance 2009, 11(Suppl 1) http://jcmr-online.com/supplements/11/S1
Page 198 of 316(page number not for citation purposes)
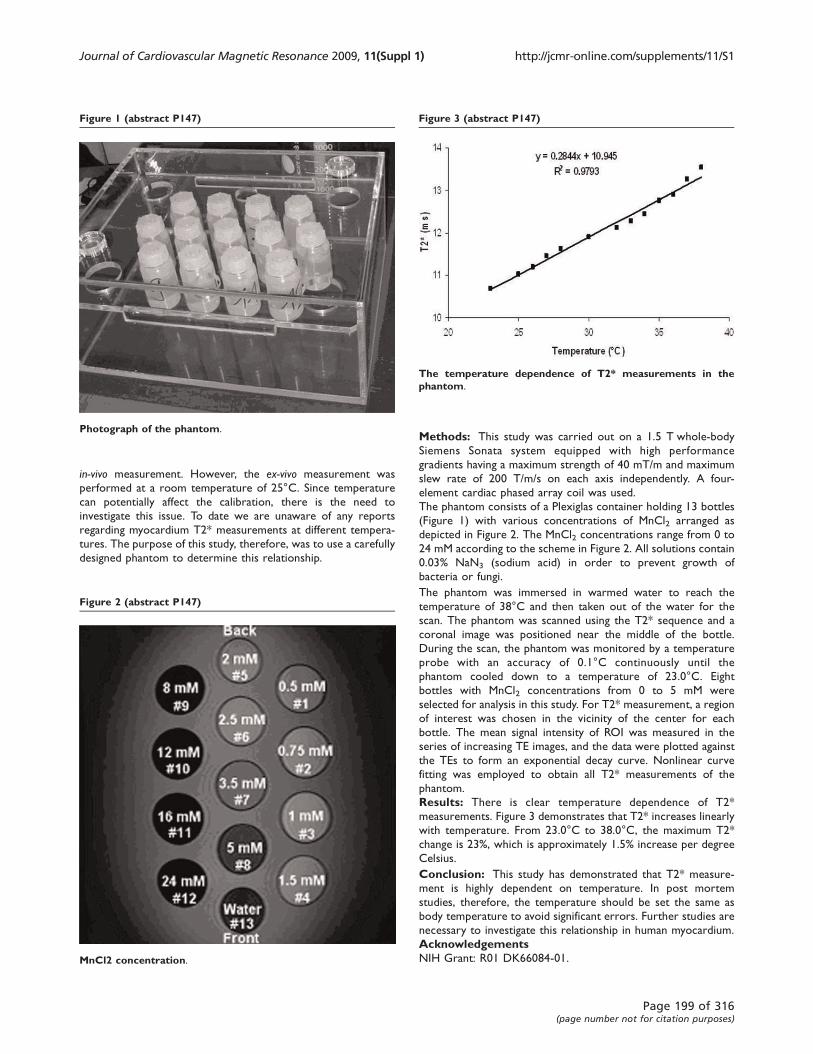
in-vivo measurement. However, the ex-vivo measurement was
performed at a room temperature of 25°C. Since temperature
can potentially affect the calibration, there is the need to
investigate this issue. To date we are unaware of any reports
regarding myocardium T2* measurements at different tempera-
tures. The purpose of this study, therefore, was to use a carefully
designed phantom to determine this relationship.
Methods: This study was carried out on a 1.5 T whole-body
Siemens Sonata system equipped with high performance
gradients having a maximum strength of 40 mT/m and maximum
slew rate of 200 T/m/s on each axis independently. A four-
element cardiac phased array coil was used.
The phantom consists of a Plexiglas container holding 13 bottles
(Figure 1) with various concentrations of MnCl2 arranged as
depicted in Figure 2. The MnCl2 concentrations range from 0 to
24 mM according to the scheme in Figure 2. All solutions contain
0.03% NaN3 (sodium acid) in order to prevent growth of
bacteria or fungi.
The phantom was immersed in warmed water to reach the
temperature of 38°C and then taken out of the water for the
scan. The phantom was scanned using the T2* sequence and a
coronal image was positioned near the middle of the bottle.
During the scan, the phantom was monitored by a temperature
probe with an accuracy of 0.1°C continuously until the
phantom cooled down to a temperature of 23.0°C. Eight
bottles with MnCl2 concentrations from 0 to 5 mM were
selected for analysis in this study. For T2* measurement, a region
of interest was chosen in the vicinity of the center for each
bottle. The mean signal intensity of ROI was measured in the
series of increasing TE images, and the data were plotted against
the TEs to form an exponential decay curve. Nonlinear curve
fitting was employed to obtain all T2* measurements of the
phantom.
Results: There is clear temperature dependence of T2*
measurements. Figure 3 demonstrates that T2* increases linearly
with temperature. From 23.0°C to 38.0°C, the maximum T2*
change is 23%, which is approximately 1.5% increase per degree
Celsius.
Conclusion: This study has demonstrated that T2* measure-
ment is highly dependent on temperature. In post mortem
studies, therefore, the temperature should be set the same as
body temperature to avoid significant errors. Further studies are
necessary to investigate this relationship in human myocardium.
AcknowledgementsNIH Grant: R01 DK66084-01.
Figure 1 (abstract P147)
Photograph of the phantom.
Figure 2 (abstract P147)
MnCl2 concentration.
Figure 3 (abstract P147)
The temperature dependence of T2* measurements in thephantom.
Journal of Cardiovascular Magnetic Resonance 2009, 11(Suppl 1) http://jcmr-online.com/supplements/11/S1
Page 199 of 316(page number not for citation purposes)
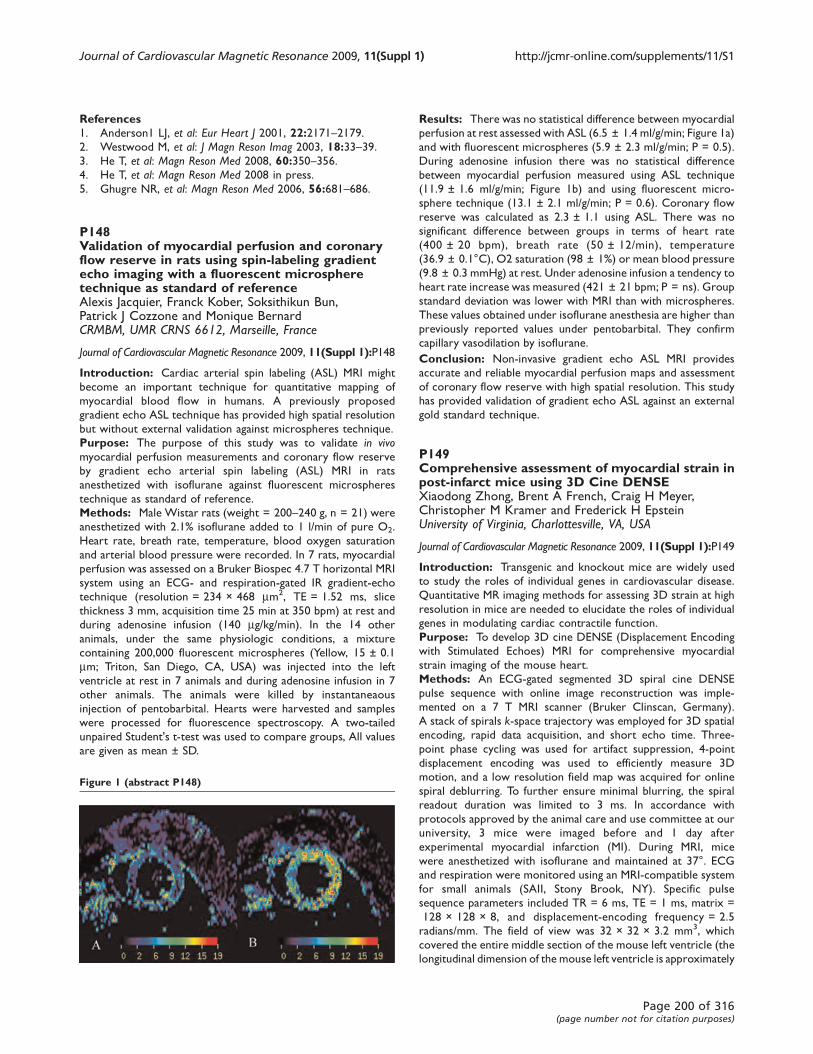
References1. Anderson1 LJ, et al: Eur Heart J 2001, 22:2171–2179.2. Westwood M, et al: J Magn Reson Imag 2003, 18:33–39.3. He T, et al: Magn Reson Med 2008, 60:350–356.4. He T, et al: Magn Reson Med 2008 in press.
5. Ghugre NR, et al: Magn Reson Med 2006, 56:681–686.
P148Validation of myocardial perfusion and coronaryflow reserve in rats using spin-labeling gradientecho imaging with a fluorescent microspheretechnique as standard of referenceAlexis Jacquier, Franck Kober, Soksithikun Bun,Patrick J Cozzone and Monique BernardCRMBM, UMR CRNS 6612, Marseille, France
Journal of Cardiovascular Magnetic Resonance 2009, 11(Suppl 1):P148
Introduction: Cardiac arterial spin labeling (ASL) MRI might
become an important technique for quantitative mapping of
myocardial blood flow in humans. A previously proposed
gradient echo ASL technique has provided high spatial resolution
but without external validation against microspheres technique.
Purpose: The purpose of this study was to validate in vivomyocardial perfusion measurements and coronary flow reserve
by gradient echo arterial spin labeling (ASL) MRI in rats
anesthetized with isoflurane against fluorescent microspheres
technique as standard of reference.
Methods: Male Wistar rats (weight = 200–240 g, n = 21) were
anesthetized with 2.1% isoflurane added to 1 l/min of pure O2.
Heart rate, breath rate, temperature, blood oxygen saturation
and arterial blood pressure were recorded. In 7 rats, myocardial
perfusion was assessed on a Bruker Biospec 4.7 T horizontal MRI
system using an ECG- and respiration-gated IR gradient-echo
technique (resolution = 234 × 468 mm2, TE = 1.52 ms, slice
thickness 3 mm, acquisition time 25 min at 350 bpm) at rest and
during adenosine infusion (140 mg/kg/min). In the 14 other
animals, under the same physiologic conditions, a mixture
containing 200,000 fluorescent microspheres (Yellow, 15 ± 0.1
mm; Triton, San Diego, CA, USA) was injected into the left
ventricle at rest in 7 animals and during adenosine infusion in 7
other animals. The animals were killed by instantaneaous
injection of pentobarbital. Hearts were harvested and samples
were processed for fluorescence spectroscopy. A two-tailed
unpaired Student's t-test was used to compare groups, All values
are given as mean ± SD.
Results: There was no statistical difference between myocardial
perfusion at rest assessed with ASL (6.5 ± 1.4 ml/g/min; Figure 1a)
and with fluorescent microspheres (5.9 ± 2.3 ml/g/min; P = 0.5).
During adenosine infusion there was no statistical difference
between myocardial perfusion measured using ASL technique
(11.9 ± 1.6 ml/g/min; Figure 1b) and using fluorescent micro-
sphere technique (13.1 ± 2.1 ml/g/min; P = 0.6). Coronary flow
reserve was calculated as 2.3 ± 1.1 using ASL. There was no
significant difference between groups in terms of heart rate
(400 ± 20 bpm), breath rate (50 ± 12/min), temperature
(36.9 ± 0.1°C), O2 saturation (98 ± 1%) or mean blood pressure
(9.8 ± 0.3 mmHg) at rest. Under adenosine infusion a tendency to
heart rate increase was measured (421 ± 21 bpm; P = ns). Group
standard deviation was lower with MRI than with microspheres.
These values obtained under isoflurane anesthesia are higher than
previously reported values under pentobarbital. They confirm
capillary vasodilation by isoflurane.
Conclusion: Non-invasive gradient echo ASL MRI provides
accurate and reliable myocardial perfusion maps and assessment
of coronary flow reserve with high spatial resolution. This study
has provided validation of gradient echo ASL against an external
gold standard technique.
P149Comprehensive assessment of myocardial strain inpost-infarct mice using 3D Cine DENSEXiaodong Zhong, Brent A French, Craig H Meyer,Christopher M Kramer and Frederick H EpsteinUniversity of Virginia, Charlottesville, VA, USA
Journal of Cardiovascular Magnetic Resonance 2009, 11(Suppl 1):P149
Introduction: Transgenic and knockout mice are widely used
to study the roles of individual genes in cardiovascular disease.
Quantitative MR imaging methods for assessing 3D strain at high
resolution in mice are needed to elucidate the roles of individual
genes in modulating cardiac contractile function.
Purpose: To develop 3D cine DENSE (Displacement Encoding
with Stimulated Echoes) MRI for comprehensive myocardial
strain imaging of the mouse heart.
Methods: An ECG-gated segmented 3D spiral cine DENSE
pulse sequence with online image reconstruction was imple-
mented on a 7 T MRI scanner (Bruker Clinscan, Germany).
A stack of spirals k-space trajectory was employed for 3D spatial
encoding, rapid data acquisition, and short echo time. Three-
point phase cycling was used for artifact suppression, 4-point
displacement encoding was used to efficiently measure 3D
motion, and a low resolution field map was acquired for online
spiral deblurring. To further ensure minimal blurring, the spiral
readout duration was limited to 3 ms. In accordance with
protocols approved by the animal care and use committee at our
university, 3 mice were imaged before and 1 day after
experimental myocardial infarction (MI). During MRI, mice
were anesthetized with isoflurane and maintained at 37°. ECG
and respiration were monitored using an MRI-compatible system
for small animals (SAII, Stony Brook, NY). Specific pulse
sequence parameters included TR = 6 ms, TE = 1 ms, matrix =
128 × 128 × 8, and displacement-encoding frequency = 2.5
radians/mm. The field of view was 32 × 32 × 3.2 mm3, which
covered the entire middle section of the mouse left ventricle (the
longitudinal dimension of the mouse left ventricle is approximately
Figure 1 (abstract P148)
Journal of Cardiovascular Magnetic Resonance 2009, 11(Suppl 1) http://jcmr-online.com/supplements/11/S1
Page 200 of 316(page number not for citation purposes)

6 mm). These parameters provided voxel size = 0.25 × 0.25 ×
0.4 mm3, temporal resolution = 6 ms, typically 18 cardiac phases
across the cardiac cycle, and a scan time of approximately
45 minutes, depending on heart and respiratory rates. Addition-
ally, on day-1 post-MI, delayed Gd-DTPA-enhanced inversion-
recovery MRI was performed to image the region of infarction.
For quantitative analysis of DENSE data, images were exported to
a PC and manually segmented. Tissue tracking and strain analysis
were performed using 3D extensions of 2D methods that were
described previously.
Results: Example images and strainmaps are shown inFigure1 for a
mouse 1 day after MI. Specifically, the Gd-enhanced image (Panel A)
defined the infarcted, adjacent (within 1mmof infarction) and remote
regions. Panels B –Dshowthe corresponding end-systolic radial (Err),
circumferential (Ecc) and longitudinal (Ell) strain maps for the same
slice. Abnormal strain generation is evident in the infarcted and
adjacent regions of each map. Panels E through G show strain-time
curves (mean ± SEM) from themid-ventricle for the infarct, adjacent,
and remote regions, where severely reduced strain was measured in
the infarct region, intermediate strain characterized the adjacent
region, andnearly normal strainwas found in the remote region. In the
day-1 post MI infarct region, the times to peak strain were also all
significantly delayed. In contrast to data from post-MI mice, baseline
data showed normal strains throughout the mid ventricle.
Conclusion: Cine DENSE methods were developed that provide
a quantitative assessment of 3D strain throughout the mid-section
of the mouse LV in a scan time of approximately 45 minutes. Using
the parameters provided here, DENSE images had high signal-to-
noise ratio and high temporal and spatial resolutions. The high-
quality displacement images lead to high resolution 3D strain data
that clearly distinguished differences in function between infarcted,
adjacent, and remote regions in post-infarct mice. When applied to
genetically-engineered mice, these accurate high resolution data
may help elucidate the roles of individual genes in modulating post-
infarct regional function and LV remodeling.
P150Myocardial fat quantification using navigator 1HMRS combined with MRI: myocardial fat fraction isinversely correlated with indexed left ventricularmass in healthy subjectsAlban Redheuil1, Ronald Ouwerkerk1, Chia-Ying Liu1,Joao AC Lima1 and David A Bluemke21Johns Hopkins University, Baltimore, MD, USA2NIH, Bethesda, MD, USA
Journal of Cardiovascular Magnetic Resonance 2009, 11(Suppl 1):P150
Introduction: Myocardial fat content has recently been shown
to be a potential indicator of myocardial involvement in diabetes or
obesity. Myocardial triglycerides (TG) can be quantified non-
invasively in humans with proton magnetic resonance spectroscopy
(1H MRS). In this study, we quantified myocardial TG with an ECG
and navigator gated 1H MRS sequence in combination with a cardiac
MRI measuring left ventricular (LV) volumes, mass and function.
Our aim was to study the feasibility of this protocol and the
relationship of myocardial fat to LV mass in healthy subjects.
Methods: All studies were performed on a 3.0 T MR scanner
(Trio Tim, Siemens) on 20 healthy subjects (12 men, mean age:
42 ± 18 years), Myocardial 1H MRS spectra were obtained with an
average 6-ml voxel positioned in the interventricular septum
prescribed on two chamber, four chamber and short-axis images
of the LV. Two MRS spectra were recorded with ECG gated PRESS,
TR/TE = 1 R-R/30 ms, with navigator across the liver-lung interface
to reduce of breathing effects. One spectrum (32 to 128 averages)
was recorded with WETwater suppression. Another spectrum (4
averages) was recorded without water suppression. Fat content was
quantified with Amares/MRUI and related to water in unsuppressed
spectra. LV volumes and mass were measured on short axis cine
MRI images using QMass (MEDIS). The correlation between left
ventricular parameters and myocardial fat fraction were studied
using Pearson's coefficients.
Figure 1 (abstract P149)
Journal of Cardiovascular Magnetic Resonance 2009, 11(Suppl 1) http://jcmr-online.com/supplements/11/S1
Page 201 of 316(page number not for citation purposes)
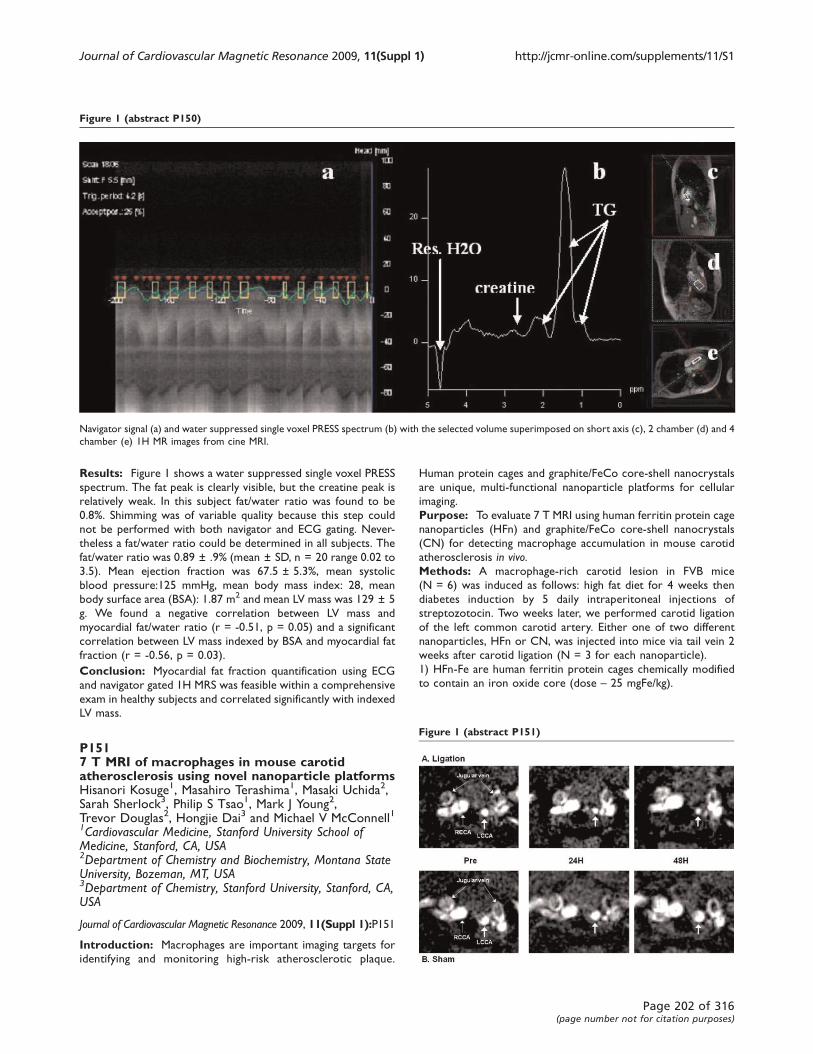
Results: Figure 1 shows a water suppressed single voxel PRESS
spectrum. The fat peak is clearly visible, but the creatine peak is
relatively weak. In this subject fat/water ratio was found to be
0.8%. Shimming was of variable quality because this step could
not be performed with both navigator and ECG gating. Never-
theless a fat/water ratio could be determined in all subjects. The
fat/water ratio was 0.89 ± .9% (mean ± SD, n = 20 range 0.02 to
3.5). Mean ejection fraction was 67.5 ± 5.3%, mean systolic
blood pressure:125 mmHg, mean body mass index: 28, mean
body surface area (BSA): 1.87 m2 and mean LV mass was 129 ± 5
g. We found a negative correlation between LV mass and
myocardial fat/water ratio (r = -0.51, p = 0.05) and a significant
correlation between LV mass indexed by BSA and myocardial fat
fraction (r = -0.56, p = 0.03).
Conclusion: Myocardial fat fraction quantification using ECG
and navigator gated 1H MRS was feasible within a comprehensive
exam in healthy subjects and correlated significantly with indexed
LV mass.
P1517 T MRI of macrophages in mouse carotidatherosclerosis using novel nanoparticle platformsHisanori Kosuge1, Masahiro Terashima1, Masaki Uchida2,Sarah Sherlock3, Philip S Tsao1, Mark J Young2,Trevor Douglas2, Hongjie Dai3 and Michael V McConnell11Cardiovascular Medicine, Stanford University School ofMedicine, Stanford, CA, USA2Department of Chemistry and Biochemistry, Montana StateUniversity, Bozeman, MT, USA3Department of Chemistry, Stanford University, Stanford, CA,USA
Journal of Cardiovascular Magnetic Resonance 2009, 11(Suppl 1):P151
Introduction: Macrophages are important imaging targets for
identifying and monitoring high-risk atherosclerotic plaque.
Human protein cages and graphite/FeCo core-shell nanocrystals
are unique, multi-functional nanoparticle platforms for cellular
imaging.
Purpose: To evaluate 7 T MRI using human ferritin protein cage
nanoparticles (HFn) and graphite/FeCo core-shell nanocrystals
(CN) for detecting macrophage accumulation in mouse carotid
atherosclerosis in vivo.Methods: A macrophage-rich carotid lesion in FVB mice
(N = 6) was induced as follows: high fat diet for 4 weeks then
diabetes induction by 5 daily intraperitoneal injections of
streptozotocin. Two weeks later, we performed carotid ligation
of the left common carotid artery. Either one of two different
nanoparticles, HFn or CN, was injected into mice via tail vein 2
weeks after carotid ligation (N = 3 for each nanoparticle).
1) HFn-Fe are human ferritin protein cages chemically modified
to contain an iron oxide core (dose – 25 mgFe/kg).
Figure 1 (abstract P150)
Navigator signal (a) and water suppressed single voxel PRESS spectrum (b) with the selected volume superimposed on short axis (c), 2 chamber (d) and 4
chamber (e) 1H MR images from cine MRI.
Figure 1 (abstract P151)
Journal of Cardiovascular Magnetic Resonance 2009, 11(Suppl 1) http://jcmr-online.com/supplements/11/S1
Page 202 of 316(page number not for citation purposes)
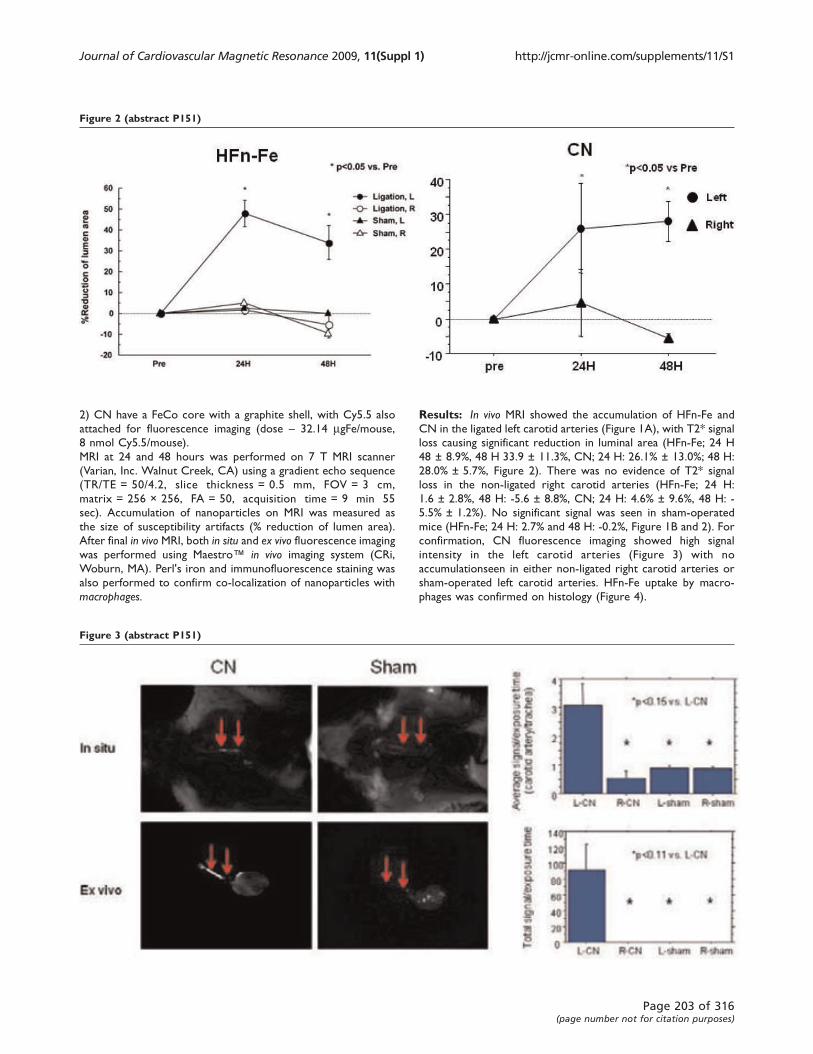
2) CN have a FeCo core with a graphite shell, with Cy5.5 also
attached for fluorescence imaging (dose – 32.14 mgFe/mouse,
8 nmol Cy5.5/mouse).
MRI at 24 and 48 hours was performed on 7 T MRI scanner
(Varian, Inc. Walnut Creek, CA) using a gradient echo sequence
(TR/TE = 50/4.2, slice thickness = 0.5 mm, FOV = 3 cm,
matrix = 256 × 256, FA = 50, acquisition time = 9 min 55
sec). Accumulation of nanoparticles on MRI was measured as
the size of susceptibility artifacts (% reduction of lumen area).
After final in vivo MRI, both in situ and ex vivo fluorescence imaging
was performed using Maestro™ in vivo imaging system (CRi,
Woburn, MA). Perl's iron and immunofluorescence staining was
also performed to confirm co-localization of nanoparticles with
macrophages.
Results: In vivo MRI showed the accumulation of HFn-Fe and
CN in the ligated left carotid arteries (Figure 1A), with T2* signal
loss causing significant reduction in luminal area (HFn-Fe; 24 H
48 ± 8.9%, 48 H 33.9 ± 11.3%, CN; 24 H: 26.1% ± 13.0%; 48 H:
28.0% ± 5.7%, Figure 2). There was no evidence of T2* signal
loss in the non-ligated right carotid arteries (HFn-Fe; 24 H:
1.6 ± 2.8%, 48 H: -5.6 ± 8.8%, CN; 24 H: 4.6% ± 9.6%, 48 H: -
5.5% ± 1.2%). No significant signal was seen in sham-operated
mice (HFn-Fe; 24 H: 2.7% and 48 H: -0.2%, Figure 1B and 2). For
confirmation, CN fluorescence imaging showed high signal
intensity in the left carotid arteries (Figure 3) with no
accumulationseen in either non-ligated right carotid arteries or
sham-operated left carotid arteries. HFn-Fe uptake by macro-
phages was confirmed on histology (Figure 4).
Figure 2 (abstract P151)
Figure 3 (abstract P151)
Journal of Cardiovascular Magnetic Resonance 2009, 11(Suppl 1) http://jcmr-online.com/supplements/11/S1
Page 203 of 316(page number not for citation purposes)
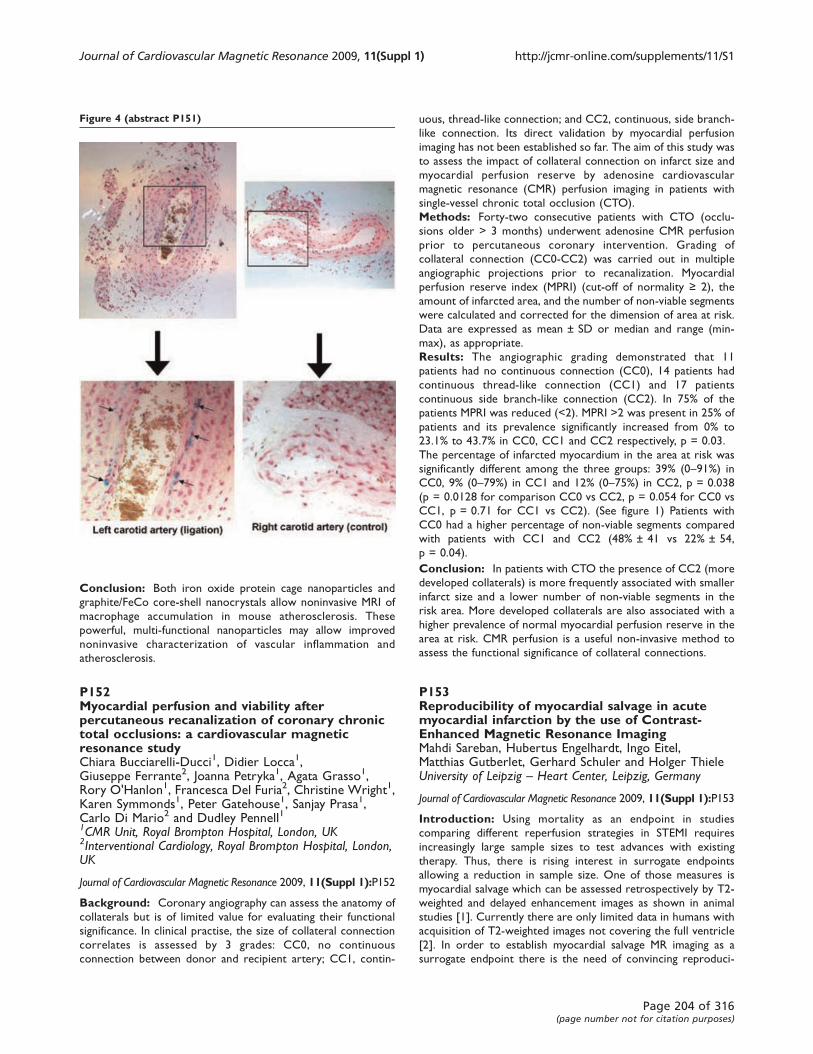
Conclusion: Both iron oxide protein cage nanoparticles and
graphite/FeCo core-shell nanocrystals allow noninvasive MRI of
macrophage accumulation in mouse atherosclerosis. These
powerful, multi-functional nanoparticles may allow improved
noninvasive characterization of vascular inflammation and
atherosclerosis.
P152Myocardial perfusion and viability afterpercutaneous recanalization of coronary chronictotal occlusions: a cardiovascular magneticresonance studyChiara Bucciarelli-Ducci1, Didier Locca1,Giuseppe Ferrante2, Joanna Petryka1, Agata Grasso1,Rory O'Hanlon1, Francesca Del Furia2, Christine Wright1,Karen Symmonds1, Peter Gatehouse1, Sanjay Prasa1,Carlo Di Mario2 and Dudley Pennell11CMR Unit, Royal Brompton Hospital, London, UK2Interventional Cardiology, Royal Brompton Hospital, London,UK
Journal of Cardiovascular Magnetic Resonance 2009, 11(Suppl 1):P152
Background: Coronary angiography can assess the anatomy of
collaterals but is of limited value for evaluating their functional
significance. In clinical practise, the size of collateral connection
correlates is assessed by 3 grades: CC0, no continuous
connection between donor and recipient artery; CC1, contin-
uous, thread-like connection; and CC2, continuous, side branch-
like connection. Its direct validation by myocardial perfusion
imaging has not been established so far. The aim of this study was
to assess the impact of collateral connection on infarct size and
myocardial perfusion reserve by adenosine cardiovascular
magnetic resonance (CMR) perfusion imaging in patients with
single-vessel chronic total occlusion (CTO).
Methods: Forty-two consecutive patients with CTO (occlu-
sions older > 3 months) underwent adenosine CMR perfusion
prior to percutaneous coronary intervention. Grading of
collateral connection (CC0-CC2) was carried out in multiple
angiographic projections prior to recanalization. Myocardial
perfusion reserve index (MPRI) (cut-off of normality ≥ 2), the
amount of infarcted area, and the number of non-viable segments
were calculated and corrected for the dimension of area at risk.
Data are expressed as mean ± SD or median and range (min-
max), as appropriate.
Results: The angiographic grading demonstrated that 11
patients had no continuous connection (CC0), 14 patients had
continuous thread-like connection (CC1) and 17 patients
continuous side branch-like connection (CC2). In 75% of the
patients MPRI was reduced (<2). MPRI >2 was present in 25% of
patients and its prevalence significantly increased from 0% to
23.1% to 43.7% in CC0, CC1 and CC2 respectively, p = 0.03.
The percentage of infarcted myocardium in the area at risk was
significantly different among the three groups: 39% (0–91%) inCC0, 9% (0–79%) in CC1 and 12% (0–75%) in CC2, p = 0.038
(p = 0.0128 for comparison CC0 vs CC2, p = 0.054 for CC0 vs
CC1, p = 0.71 for CC1 vs CC2). (See figure 1) Patients with
CC0 had a higher percentage of non-viable segments compared
with patients with CC1 and CC2 (48% ± 41 vs 22% ± 54,
p = 0.04).
Conclusion: In patients with CTO the presence of CC2 (more
developed collaterals) is more frequently associated with smaller
infarct size and a lower number of non-viable segments in the
risk area. More developed collaterals are also associated with a
higher prevalence of normal myocardial perfusion reserve in the
area at risk. CMR perfusion is a useful non-invasive method to
assess the functional significance of collateral connections.
P153Reproducibility of myocardial salvage in acutemyocardial infarction by the use of Contrast-Enhanced Magnetic Resonance ImagingMahdi Sareban, Hubertus Engelhardt, Ingo Eitel,Matthias Gutberlet, Gerhard Schuler and Holger ThieleUniversity of Leipzig – Heart Center, Leipzig, Germany
Journal of Cardiovascular Magnetic Resonance 2009, 11(Suppl 1):P153
Introduction: Using mortality as an endpoint in studies
comparing different reperfusion strategies in STEMI requires
increasingly large sample sizes to test advances with existing
therapy. Thus, there is rising interest in surrogate endpoints
allowing a reduction in sample size. One of those measures is
myocardial salvage which can be assessed retrospectively by T2-
weighted and delayed enhancement images as shown in animal
studies [1]. Currently there are only limited data in humans with
acquisition of T2-weighted images not covering the full ventricle
[2]. In order to establish myocardial salvage MR imaging as a
surrogate endpoint there is the need of convincing reproduci-
Figure 4 (abstract P151)
Journal of Cardiovascular Magnetic Resonance 2009, 11(Suppl 1) http://jcmr-online.com/supplements/11/S1
Page 204 of 316(page number not for citation purposes)
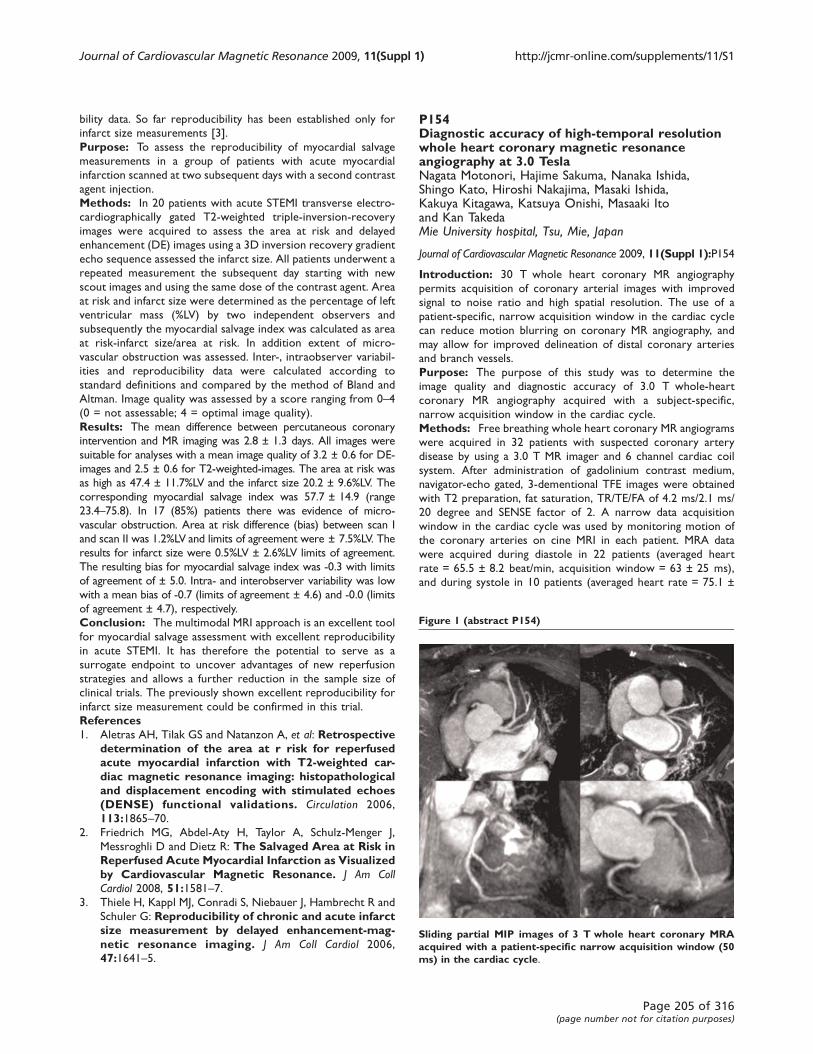
bility data. So far reproducibility has been established only for
infarct size measurements [3].
Purpose: To assess the reproducibility of myocardial salvage
measurements in a group of patients with acute myocardial
infarction scanned at two subsequent days with a second contrast
agent injection.
Methods: In 20 patients with acute STEMI transverse electro-
cardiographically gated T2-weighted triple-inversion-recovery
images were acquired to assess the area at risk and delayed
enhancement (DE) images using a 3D inversion recovery gradient
echo sequence assessed the infarct size. All patients underwent a
repeated measurement the subsequent day starting with new
scout images and using the same dose of the contrast agent. Area
at risk and infarct size were determined as the percentage of left
ventricular mass (%LV) by two independent observers and
subsequently the myocardial salvage index was calculated as area
at risk-infarct size/area at risk. In addition extent of micro-
vascular obstruction was assessed. Inter-, intraobserver variabil-
ities and reproducibility data were calculated according to
standard definitions and compared by the method of Bland and
Altman. Image quality was assessed by a score ranging from 0–4(0 = not assessable; 4 = optimal image quality).
Results: The mean difference between percutaneous coronary
intervention and MR imaging was 2.8 ± 1.3 days. All images were
suitable for analyses with a mean image quality of 3.2 ± 0.6 for DE-
images and 2.5 ± 0.6 for T2-weighted-images. The area at risk was
as high as 47.4 ± 11.7%LV and the infarct size 20.2 ± 9.6%LV. The
corresponding myocardial salvage index was 57.7 ± 14.9 (range
23.4–75.8). In 17 (85%) patients there was evidence of micro-
vascular obstruction. Area at risk difference (bias) between scan I
and scan II was 1.2%LV and limits of agreement were ± 7.5%LV. The
results for infarct size were 0.5%LV ± 2.6%LV limits of agreement.
The resulting bias for myocardial salvage index was -0.3 with limits
of agreement of ± 5.0. Intra- and interobserver variability was low
with a mean bias of -0.7 (limits of agreement ± 4.6) and -0.0 (limits
of agreement ± 4.7), respectively.
Conclusion: The multimodal MRI approach is an excellent tool
for myocardial salvage assessment with excellent reproducibility
in acute STEMI. It has therefore the potential to serve as a
surrogate endpoint to uncover advantages of new reperfusion
strategies and allows a further reduction in the sample size of
clinical trials. The previously shown excellent reproducibility for
infarct size measurement could be confirmed in this trial.
References1. Aletras AH, Tilak GS and Natanzon A, et al: Retrospective
determination of the area at r risk for reperfusedacute myocardial infarction with T2-weighted car-diac magnetic resonance imaging: histopathologicaland displacement encoding with stimulated echoes(DENSE) functional validations. Circulation 2006,
113:1865–70.2. Friedrich MG, Abdel-Aty H, Taylor A, Schulz-Menger J,
Messroghli D and Dietz R: The Salvaged Area at Risk inReperfused Acute Myocardial Infarction as Visualizedby Cardiovascular Magnetic Resonance. J Am CollCardiol 2008, 51:1581–7.
3. Thiele H, Kappl MJ, Conradi S, Niebauer J, Hambrecht R and
Schuler G: Reproducibility of chronic and acute infarctsize measurement by delayed enhancement-mag-netic resonance imaging. J Am Coll Cardiol 2006,
47:1641–5.
P154Diagnostic accuracy of high-temporal resolutionwhole heart coronary magnetic resonanceangiography at 3.0 TeslaNagata Motonori, Hajime Sakuma, Nanaka Ishida,Shingo Kato, Hiroshi Nakajima, Masaki Ishida,Kakuya Kitagawa, Katsuya Onishi, Masaaki Itoand Kan TakedaMie University hospital, Tsu, Mie, Japan
Journal of Cardiovascular Magnetic Resonance 2009, 11(Suppl 1):P154
Introduction: 30 T whole heart coronary MR angiography
permits acquisition of coronary arterial images with improved
signal to noise ratio and high spatial resolution. The use of a
patient-specific, narrow acquisition window in the cardiac cycle
can reduce motion blurring on coronary MR angiography, and
may allow for improved delineation of distal coronary arteries
and branch vessels.
Purpose: The purpose of this study was to determine the
image quality and diagnostic accuracy of 3.0 T whole-heart
coronary MR angiography acquired with a subject-specific,
narrow acquisition window in the cardiac cycle.
Methods: Free breathing whole heart coronary MR angiograms
were acquired in 32 patients with suspected coronary artery
disease by using a 3.0 T MR imager and 6 channel cardiac coil
system. After administration of gadolinium contrast medium,
navigator-echo gated, 3-dementional TFE images were obtained
with T2 preparation, fat saturation, TR/TE/FA of 4.2 ms/2.1 ms/
20 degree and SENSE factor of 2. A narrow data acquisition
window in the cardiac cycle was used by monitoring motion of
the coronary arteries on cine MRI in each patient. MRA data
were acquired during diastole in 22 patients (averaged heart
rate = 65.5 ± 8.2 beat/min, acquisition window = 63 ± 25 ms),
and during systole in 10 patients (averaged heart rate = 75.1 ±
Figure 1 (abstract P154)
Sliding partial MIP images of 3 T whole heart coronary MRAacquired with a patient-specific narrow acquisition window (50ms) in the cardiac cycle.
Journal of Cardiovascular Magnetic Resonance 2009, 11(Suppl 1) http://jcmr-online.com/supplements/11/S1
Page 205 of 316(page number not for citation purposes)

10.3 beats/min, acquisition window = 36.2 ± 6.2 ms). Image
quality was classified on a 4-point scale (1 = poor, 2 = moderate,
3 = good, 4 = excellent). X-ray coronary angiograms were
obtained in 11 patients within 2 weeks from MR study. Significant
coronary artery disease was defined as a diameter reduction of ≥50 % in coronary arteries with a reference of ≥ 2 mm on X-ray
coronary angiography. MRA images were interpreted by 2
independent observers by using a sliding multiplanar reformat
reconstruction method, and disagreement between 2 observers
was settled by a consensus reading.
Results: Acquisition of whole heart coronary MR angiography
was completed in all 32 patients with averaged imaging time of
11.4 ± 4.5 minutes. Excellent average image quality scores (≥ 3.8)
were observed in the proximal and mid portion of the arteries
(RCA #1–3, LMT#5, LAD #6–7, LCX #11) (Figure 1). In addition,
high image quality scores (≥ 3.0) were achieved in the distal
segments and branch vessels as well (RCA#4, LAD#8–9, LCX#12–13) (Figure 2). On a vessel-based analysis, the sensitivity, specificity,
positive and negative predictive value and accuracy of whole heart
coronary MR angiography for the detection of significant coronary
artery disease was 83% (95% confidence interval [CI] 36–99%), 96%(95%CI 79–100%), 83% (95%CI 36–99%), 96% (95%CI 79–100%),and 94% (95%CI 86–100%), respectively.
Conclusion: 30 T free-breathing whole heart coronary MR
angiography acquired with a subject-specific, narrow acquisition
window in the cardiac cycle permits improved visualization of
coronary arteries including distal segments and branch vessels. High
negative predictive value found in this study indicates the value of 3.0
T coronary MRA for screening significant coronary artery disease.
P155Myocardial hypoperfusion due to hypoplasticcoronary arteries: a cause for false-positive resultsduring adenosine stress Cardiac MagneticResonance ImagingGuenter Pilz, Maximilian Graw, Tobias Heer, Markus Klos,Eman Ali and Berthold HoeflingCardiac MRI, Clinic Agatharied, University of Munich,Hausham, Germany
Journal of Cardiovascular Magnetic Resonance 2009, 11(Suppl 1):P155
Background: Magnetic resonance myocardial perfusion ima-
ging (MRMPI) based on adenosine stress cardiac magnetic
resonance (CMR) is increasingly proposed for non-invasive
detection of relevant coronary artery disease (CAD). However,
little is known about the impact of the normal variability of
coronary anatomy and caliber on the diagnostic performance of
adenosine stress CMR.
Purpose: Aim of our study was to examine whether hypoplas-
tic coronary arteries found as normal variations in right-
dominant or left-dominant circulation may account for visualiza-
tion of hypoperfusion in the absence of coronary stenosis and
thus may result in false-positive (FP) results of MRMPI in the
assessment of CAD.
Methods: From 05/2007 until 01/2008, we enrolled 206
consecutive patients with suspected CAD undergoing MRMPI,
who were diagnosed as having myocardial ischemia during
adenosine-stress perfusion and subsequently underwent coron-
ary angiography (CA). Patients were examined in a 1.5 Twhole-
body scanner (GE Signa Excite). After three minutes of adenosine
infusion (140 mg/kg/min), myocardial first-pass sequence in 4–5continuous short-axis orientation using Gadolinium-based con-
trast agent was performed (0.1 mmol/kg, Omniscan, GE
Healthcare Buchler). Images were visually analyzed in compar-
ison to rest perfusion by two experienced investigators in
consensus. A perfusion deficit was regarded relevant if affecting
more than 1/3 of myocardial wall thickness in at least two
neighbouring myocardial segments and persisting for more than
five heart beats after maximal signal intensity in the LV cavity.
Significant CAD was defined as luminal narrowing of ≥70% in CA.
Figure 2 (abstract P154)
Averaged image quality score of 3 Twhole heart coronary MRAcompared with 1.5 MRA.
Table 1 (abstract P155)
CMR parameter FP results TP results P value
LV EF 65.8 % 65.6 % 0.86
LV EDV (ml) 126 129 0.58
LV mass (g) 130 137 0.20
LV wall stress 35.7 34.7 0.62
Transmural extent of ischemia 41.1 % 41.3 % 0.64
Temporal persistence of
ischemia (beats)
8.9 8.7 0.44
CMR – CA correlation:
Ischemia in area with
hypoplastic vessel
51.2 % 0.6 % <0.0001
Figure 1 (abstract P155)
Journal of Cardiovascular Magnetic Resonance 2009, 11(Suppl 1) http://jcmr-online.com/supplements/11/S1
Page 206 of 316(page number not for citation purposes)
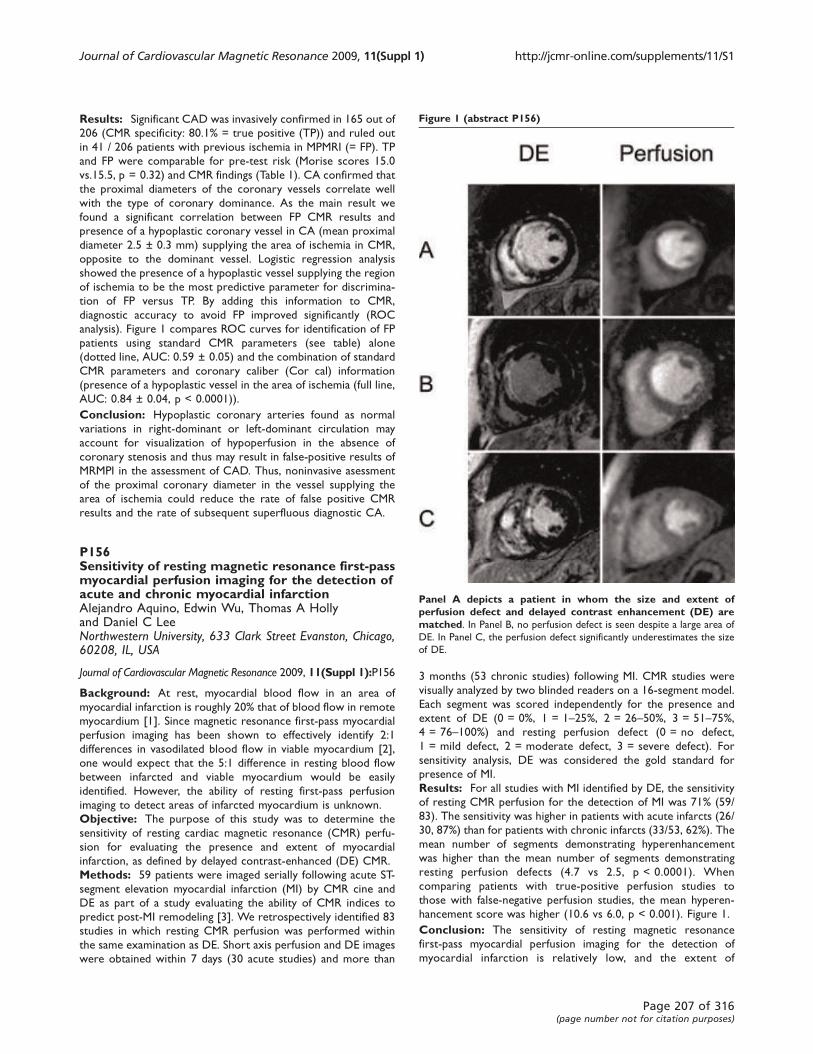
Results: Significant CAD was invasively confirmed in 165 out of
206 (CMR specificity: 80.1% = true positive (TP)) and ruled out
in 41 / 206 patients with previous ischemia in MPMRI (= FP). TP
and FP were comparable for pre-test risk (Morise scores 15.0
vs.15.5, p = 0.32) and CMR findings (Table 1). CA confirmed that
the proximal diameters of the coronary vessels correlate well
with the type of coronary dominance. As the main result we
found a significant correlation between FP CMR results and
presence of a hypoplastic coronary vessel in CA (mean proximal
diameter 2.5 ± 0.3 mm) supplying the area of ischemia in CMR,
opposite to the dominant vessel. Logistic regression analysis
showed the presence of a hypoplastic vessel supplying the region
of ischemia to be the most predictive parameter for discrimina-
tion of FP versus TP. By adding this information to CMR,
diagnostic accuracy to avoid FP improved significantly (ROC
analysis). Figure 1 compares ROC curves for identification of FP
patients using standard CMR parameters (see table) alone
(dotted line, AUC: 0.59 ± 0.05) and the combination of standard
CMR parameters and coronary caliber (Cor cal) information
(presence of a hypoplastic vessel in the area of ischemia (full line,
AUC: 0.84 ± 0.04, p < 0.0001)).
Conclusion: Hypoplastic coronary arteries found as normal
variations in right-dominant or left-dominant circulation may
account for visualization of hypoperfusion in the absence of
coronary stenosis and thus may result in false-positive results of
MRMPI in the assessment of CAD. Thus, noninvasive asessment
of the proximal coronary diameter in the vessel supplying the
area of ischemia could reduce the rate of false positive CMR
results and the rate of subsequent superfluous diagnostic CA.
P156Sensitivity of resting magnetic resonance first-passmyocardial perfusion imaging for the detection ofacute and chronic myocardial infarctionAlejandro Aquino, Edwin Wu, Thomas A Hollyand Daniel C LeeNorthwestern University, 633 Clark Street Evanston, Chicago,60208, IL, USA
Journal of Cardiovascular Magnetic Resonance 2009, 11(Suppl 1):P156
Background: At rest, myocardial blood flow in an area of
myocardial infarction is roughly 20% that of blood flow in remote
myocardium [1]. Since magnetic resonance first-pass myocardial
perfusion imaging has been shown to effectively identify 2:1
differences in vasodilated blood flow in viable myocardium [2],
one would expect that the 5:1 difference in resting blood flow
between infarcted and viable myocardium would be easily
identified. However, the ability of resting first-pass perfusion
imaging to detect areas of infarcted myocardium is unknown.
Objective: The purpose of this study was to determine the
sensitivity of resting cardiac magnetic resonance (CMR) perfu-
sion for evaluating the presence and extent of myocardial
infarction, as defined by delayed contrast-enhanced (DE) CMR.
Methods: 59 patients were imaged serially following acute ST-
segment elevation myocardial infarction (MI) by CMR cine and
DE as part of a study evaluating the ability of CMR indices to
predict post-MI remodeling [3]. We retrospectively identified 83
studies in which resting CMR perfusion was performed within
the same examination as DE. Short axis perfusion and DE images
were obtained within 7 days (30 acute studies) and more than
3 months (53 chronic studies) following MI. CMR studies were
visually analyzed by two blinded readers on a 16-segment model.
Each segment was scored independently for the presence and
extent of DE (0 = 0%, 1 = 1–25%, 2 = 26–50%, 3 = 51–75%,4 = 76–100%) and resting perfusion defect (0 = no defect,
1 = mild defect, 2 = moderate defect, 3 = severe defect). For
sensitivity analysis, DE was considered the gold standard for
presence of MI.
Results: For all studies with MI identified by DE, the sensitivity
of resting CMR perfusion for the detection of MI was 71% (59/
83). The sensitivity was higher in patients with acute infarcts (26/
30, 87%) than for patients with chronic infarcts (33/53, 62%). The
mean number of segments demonstrating hyperenhancement
was higher than the mean number of segments demonstrating
resting perfusion defects (4.7 vs 2.5, p < 0.0001). When
comparing patients with true-positive perfusion studies to
those with false-negative perfusion studies, the mean hyperen-
hancement score was higher (10.6 vs 6.0, p < 0.001). Figure 1.
Conclusion: The sensitivity of resting magnetic resonance
first-pass myocardial perfusion imaging for the detection of
myocardial infarction is relatively low, and the extent of
Figure 1 (abstract P156)
Panel A depicts a patient in whom the size and extent ofperfusion defect and delayed contrast enhancement (DE) arematched. In Panel B, no perfusion defect is seen despite a large area of
DE. In Panel C, the perfusion defect significantly underestimates the size
of DE.
Journal of Cardiovascular Magnetic Resonance 2009, 11(Suppl 1) http://jcmr-online.com/supplements/11/S1
Page 207 of 316(page number not for citation purposes)
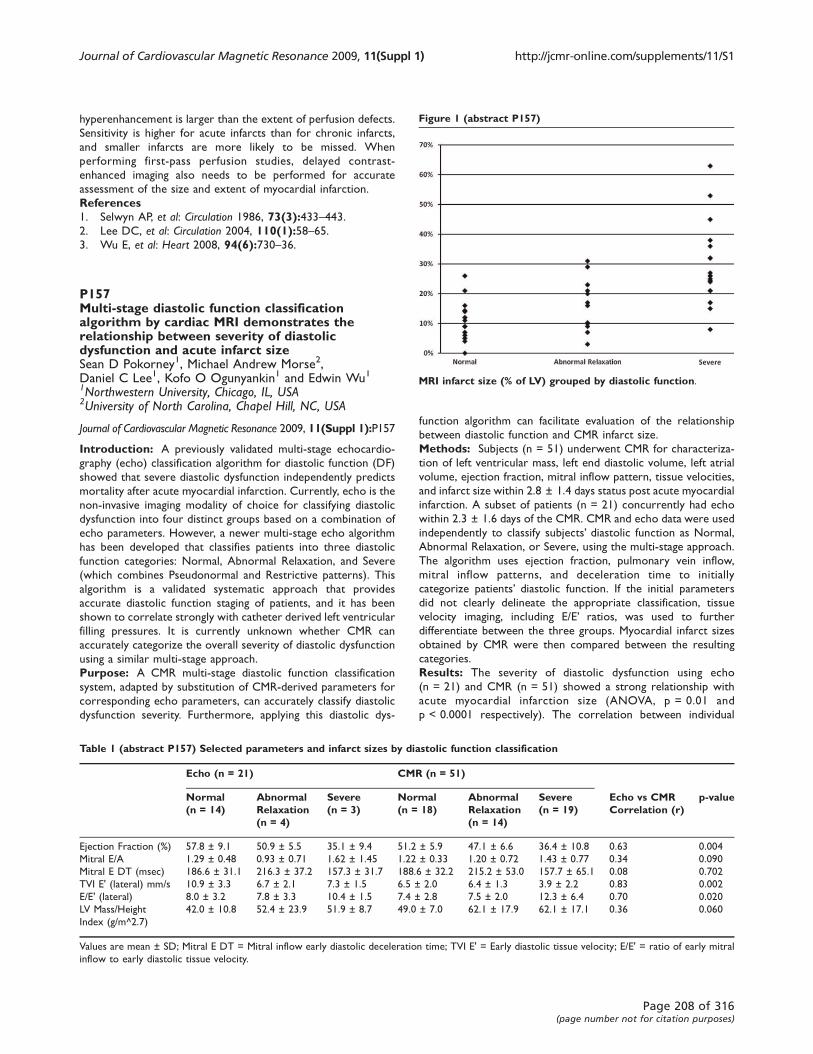
hyperenhancement is larger than the extent of perfusion defects.
Sensitivity is higher for acute infarcts than for chronic infarcts,
and smaller infarcts are more likely to be missed. When
performing first-pass perfusion studies, delayed contrast-
enhanced imaging also needs to be performed for accurate
assessment of the size and extent of myocardial infarction.
References1. Selwyn AP, et al: Circulation 1986, 73(3):433–443.2. Lee DC, et al: Circulation 2004, 110(1):58–65.3. Wu E, et al: Heart 2008, 94(6):730–36.
P157Multi-stage diastolic function classificationalgorithm by cardiac MRI demonstrates therelationship between severity of diastolicdysfunction and acute infarct sizeSean D Pokorney1, Michael Andrew Morse2,Daniel C Lee1, Kofo O Ogunyankin1 and Edwin Wu11Northwestern University, Chicago, IL, USA2University of North Carolina, Chapel Hill, NC, USA
Journal of Cardiovascular Magnetic Resonance 2009, 11(Suppl 1):P157
Introduction: A previously validated multi-stage echocardio-
graphy (echo) classification algorithm for diastolic function (DF)
showed that severe diastolic dysfunction independently predicts
mortality after acute myocardial infarction. Currently, echo is the
non-invasive imaging modality of choice for classifying diastolic
dysfunction into four distinct groups based on a combination of
echo parameters. However, a newer multi-stage echo algorithm
has been developed that classifies patients into three diastolic
function categories: Normal, Abnormal Relaxation, and Severe
(which combines Pseudonormal and Restrictive patterns). This
algorithm is a validated systematic approach that provides
accurate diastolic function staging of patients, and it has been
shown to correlate strongly with catheter derived left ventricular
filling pressures. It is currently unknown whether CMR can
accurately categorize the overall severity of diastolic dysfunction
using a similar multi-stage approach.
Purpose: A CMR multi-stage diastolic function classification
system, adapted by substitution of CMR-derived parameters for
corresponding echo parameters, can accurately classify diastolic
dysfunction severity. Furthermore, applying this diastolic dys-
function algorithm can facilitate evaluation of the relationship
between diastolic function and CMR infarct size.
Methods: Subjects (n = 51) underwent CMR for characteriza-
tion of left ventricular mass, left end diastolic volume, left atrial
volume, ejection fraction, mitral inflow pattern, tissue velocities,
and infarct size within 2.8 ± 1.4 days status post acute myocardial
infarction. A subset of patients (n = 21) concurrently had echo
within 2.3 ± 1.6 days of the CMR. CMR and echo data were used
independently to classify subjects’ diastolic function as Normal,
Abnormal Relaxation, or Severe, using the multi-stage approach.
The algorithm uses ejection fraction, pulmonary vein inflow,
mitral inflow patterns, and deceleration time to initially
categorize patients’ diastolic function. If the initial parameters
did not clearly delineate the appropriate classification, tissue
velocity imaging, including E/E’ ratios, was used to further
differentiate between the three groups. Myocardial infarct sizes
obtained by CMR were then compared between the resulting
categories.
Results: The severity of diastolic dysfunction using echo
(n = 21) and CMR (n = 51) showed a strong relationship with
acute myocardial infarction size (ANOVA, p = 0.01 and
p < 0.0001 respectively). The correlation between individual
Table 1 (abstract P157) Selected parameters and infarct sizes by diastolic function classification
Echo (n = 21) CMR (n = 51)
Normal(n = 14)
AbnormalRelaxation(n = 4)
Severe(n = 3)
Normal(n = 18)
AbnormalRelaxation(n = 14)
Severe(n = 19)
Echo vs CMRCorrelation (r)
p-value
Ejection Fraction (%) 57.8 ± 9.1 50.9 ± 5.5 35.1 ± 9.4 51.2 ± 5.9 47.1 ± 6.6 36.4 ± 10.8 0.63 0.004
Mitral E/A 1.29 ± 0.48 0.93 ± 0.71 1.62 ± 1.45 1.22 ± 0.33 1.20 ± 0.72 1.43 ± 0.77 0.34 0.090
Mitral E DT (msec) 186.6 ± 31.1 216.3 ± 37.2 157.3 ± 31.7 188.6 ± 32.2 215.2 ± 53.0 157.7 ± 65.1 0.08 0.702
TVI E' (lateral) mm/s 10.9 ± 3.3 6.7 ± 2.1 7.3 ± 1.5 6.5 ± 2.0 6.4 ± 1.3 3.9 ± 2.2 0.83 0.002
E/E' (lateral) 8.0 ± 3.2 7.8 ± 3.3 10.4 ± 1.5 7.4 ± 2.8 7.5 ± 2.0 12.3 ± 6.4 0.70 0.020
LV Mass/Height
Index (g/m^2.7)
42.0 ± 10.8 52.4 ± 23.9 51.9 ± 8.7 49.0 ± 7.0 62.1 ± 17.9 62.1 ± 17.1 0.36 0.060
Values are mean ± SD; Mitral E DT = Mitral inflow early diastolic deceleration time; TVI E' = Early diastolic tissue velocity; E/E' = ratio of early mitral
inflow to early diastolic tissue velocity.
Figure 1 (abstract P157)
MRI infarct size (% of LV) grouped by diastolic function.
Journal of Cardiovascular Magnetic Resonance 2009, 11(Suppl 1) http://jcmr-online.com/supplements/11/S1
Page 208 of 316(page number not for citation purposes)
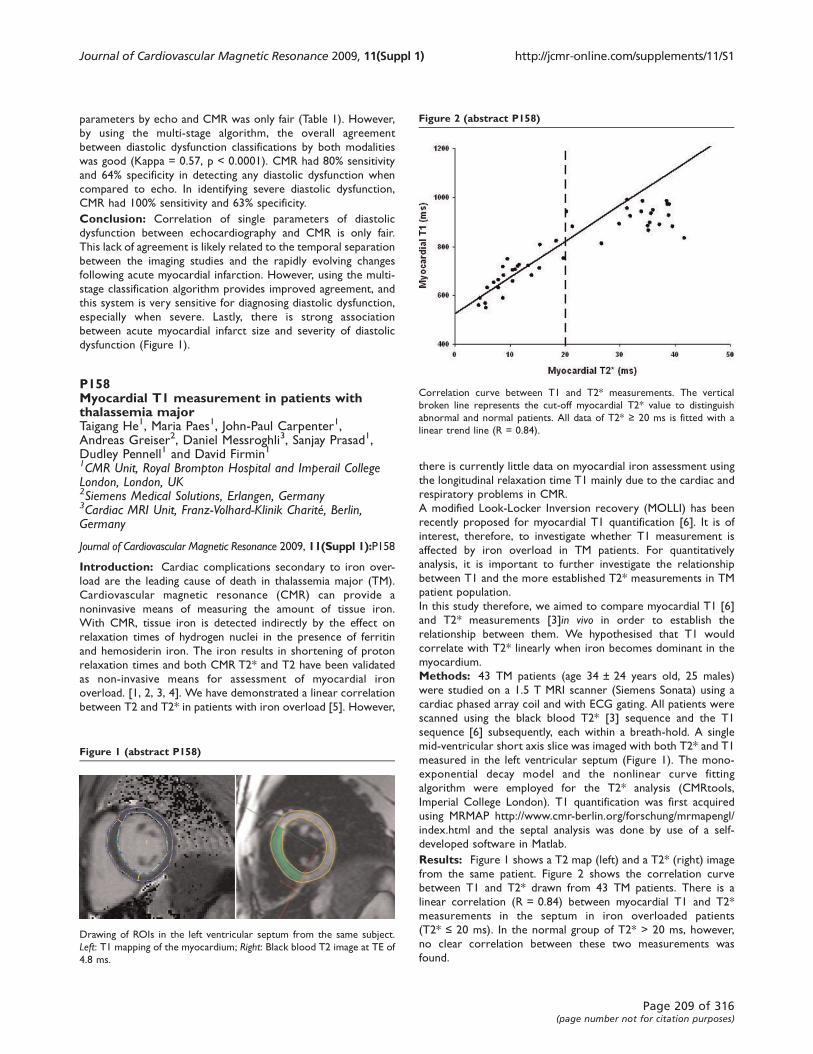
parameters by echo and CMR was only fair (Table 1). However,
by using the multi-stage algorithm, the overall agreement
between diastolic dysfunction classifications by both modalities
was good (Kappa = 0.57, p < 0.0001). CMR had 80% sensitivity
and 64% specificity in detecting any diastolic dysfunction when
compared to echo. In identifying severe diastolic dysfunction,
CMR had 100% sensitivity and 63% specificity.
Conclusion: Correlation of single parameters of diastolic
dysfunction between echocardiography and CMR is only fair.
This lack of agreement is likely related to the temporal separation
between the imaging studies and the rapidly evolving changes
following acute myocardial infarction. However, using the multi-
stage classification algorithm provides improved agreement, and
this system is very sensitive for diagnosing diastolic dysfunction,
especially when severe. Lastly, there is strong association
between acute myocardial infarct size and severity of diastolic
dysfunction (Figure 1).
P158Myocardial T1 measurement in patients withthalassemia majorTaigang He1, Maria Paes1, John-Paul Carpenter1,Andreas Greiser2, Daniel Messroghli3, Sanjay Prasad1,Dudley Pennell1 and David Firmin11CMR Unit, Royal Brompton Hospital and Imperail CollegeLondon, London, UK2Siemens Medical Solutions, Erlangen, Germany3Cardiac MRI Unit, Franz-Volhard-Klinik Charité, Berlin,Germany
Journal of Cardiovascular Magnetic Resonance 2009, 11(Suppl 1):P158
Introduction: Cardiac complications secondary to iron over-
load are the leading cause of death in thalassemia major (TM).
Cardiovascular magnetic resonance (CMR) can provide a
noninvasive means of measuring the amount of tissue iron.
With CMR, tissue iron is detected indirectly by the effect on
relaxation times of hydrogen nuclei in the presence of ferritin
and hemosiderin iron. The iron results in shortening of proton
relaxation times and both CMR T2* and T2 have been validated
as non-invasive means for assessment of myocardial iron
overload. [1, 2, 3, 4]. We have demonstrated a linear correlation
between T2 and T2* in patients with iron overload [5]. However,
there is currently little data on myocardial iron assessment using
the longitudinal relaxation time T1 mainly due to the cardiac and
respiratory problems in CMR.
A modified Look-Locker Inversion recovery (MOLLI) has been
recently proposed for myocardial T1 quantification [6]. It is of
interest, therefore, to investigate whether T1 measurement is
affected by iron overload in TM patients. For quantitatively
analysis, it is important to further investigate the relationship
between T1 and the more established T2* measurements in TM
patient population.
In this study therefore, we aimed to compare myocardial T1 [6]
and T2* measurements [3]in vivo in order to establish the
relationship between them. We hypothesised that T1 would
correlate with T2* linearly when iron becomes dominant in the
myocardium.
Methods: 43 TM patients (age 34 ± 24 years old, 25 males)
were studied on a 1.5 T MRI scanner (Siemens Sonata) using a
cardiac phased array coil and with ECG gating. All patients were
scanned using the black blood T2* [3] sequence and the T1
sequence [6] subsequently, each within a breath-hold. A single
mid-ventricular short axis slice was imaged with both T2* and T1
measured in the left ventricular septum (Figure 1). The mono-
exponential decay model and the nonlinear curve fitting
algorithm were employed for the T2* analysis (CMRtools,
Imperial College London). T1 quantification was first acquired
using MRMAP http://www.cmr-berlin.org/forschung/mrmapengl/
index.html and the septal analysis was done by use of a self-
developed software in Matlab.
Results: Figure 1 shows a T2 map (left) and a T2* (right) image
from the same patient. Figure 2 shows the correlation curve
between T1 and T2* drawn from 43 TM patients. There is a
linear correlation (R = 0.84) between myocardial T1 and T2*
measurements in the septum in iron overloaded patients
(T2* ≤ 20 ms). In the normal group of T2* > 20 ms, however,
no clear correlation between these two measurements was
found.
Figure 1 (abstract P158)
Drawing of ROIs in the left ventricular septum from the same subject.
Left: T1 mapping of the myocardium; Right: Black blood T2 image at TE of
4.8 ms.
Figure 2 (abstract P158)
Correlation curve between T1 and T2* measurements. The vertical
broken line represents the cut-off myocardial T2* value to distinguish
abnormal and normal patients. All data of T2* ≥ 20 ms is fitted with a
linear trend line (R = 0.84).
Journal of Cardiovascular Magnetic Resonance 2009, 11(Suppl 1) http://jcmr-online.com/supplements/11/S1
Page 209 of 316(page number not for citation purposes)

Conclusion: T2* of 20 ms is a useful indicator to identify
patient with cardiac iron. Myocardial T1 correlated linearly with
T2* in TM patients with cardiac iron overload, which is analogous
to our previous finding regarding the relationship between T2
and T2* [5]. This study suggests myocardial T1 may potentially be
used for assessing iron overload in the heart for TM and other
transfusion dependent patients.
References1. Westwood M, et al: J Magn Reson Imaging 2003, 18:33–9.2. Tanner MA, et al: Haematologica 2006, 91:1388–1391.3. He T, et al: J Magn Reson Imaging 2007, 25:1205–1209.4. He T, et al: J Magn Reson Imaging 2006, 24:580–585.5. He T, et al: Magn Reson Med 2008.
6. Messroghli DR, et al: Magn Reson Med 2004, 52:141–146.
P159Prognostic value of cardiovascular magneticresonance in patients with strong suspicion formyocarditisOtavio R Coelho-Filho, Michael Jerosch-Herold,Sanjeev A Francis and Raymond Y KwongBrigham and Women's Hospital, Boston, MA, USA
Journal of Cardiovascular Magnetic Resonance 2009, 11(Suppl 1):P159
Background: While late gadolinium enhancement (LGE)
imaging by Cardiovascular Magnetic Resonance (CMR) can
detect evidence of myocarditis, the prognostic implication of
this finding is still unknown.
Purpose: The objective of this study is to assess the prognostic
value of CMR in patients with suspected myocarditis.
Methods: We performed gadolinium-enhanced CMR in
76 patients (27 females, mean age 41 ± 14 years) with a strong
clinical suspicion of myocarditis referred for CMR assessment.
Patients were excluded if there was any clinical history of
myocardial infarction or prior evidence of coronary artery
disease. All enrolled patients had a recent normal coronary
angiogram (n = 41) and/or a negative noninvasive stress test
(n = 35). The CMR study was performed at a 1.5 Tesla scanner
(GE Signa CVi) and a 3.0 Tesla scanner (Siemens Trio) and
included short and long-axis function with cine SSFP imaging, and
T1-weighted inversion recovery fast GRE imaging 10–15 minutes
after a cumulative dose of 0.15 mmol/kg of gadolinium. In all
CMR studies, we assessed the global and regional left ventricular
function and presence of atypical (mid-wall or epicardial) LGE by
CMR. The LGE mass was measured with a validated software (Pie
Medical Imaging, CAAS, The Netherlands) using signal-intensity
threshold (>3 SDs above remote myocardium) (Figure 1). In all
patients, we obtained vital status and non-fatal MACE including
heart failure admissions, significant ventricular arrhythmias
requiring treatment, and recurrent myocarditis.
Results: After a median follow-up period of 1.3 years (range 6
months to 48 months), only 7 patients experienced adverse
events including 1 death, 2 heart failure admissions, 3 cases of
significant ventricular arrhythmias, and 1 recurrent episode of
acute myocarditis. Mean left ventricular ejection fraction of the
study cohort was 54 ± 14%. LGE was detected in 23 patients
(30.2%) and was not significantly associated with MACE by Cox
regression analysis. Presence of LGE in this study cohort was
associated with an elevated left ventricular mass (65 ± 17 vs.
75 ± 30 g/m2, p = 0.01), regional wall motion abnormalities
(OR = 22, p = 0.03), and with peak serum troponin (2.4 ± 6 vs.
12 ± 9, p = 0.05). The relationship between LGE and elevated
left ventricular mass persisted after adjusting for comorbidities
such as hypertension and diabetes. The LGE mass (mean
3.5 ± 6.7 g) was associated with CK levels (r = 0.02, p = 0.02),
with CK-MB levels (r = 0.41, p = 0.008) and with troponin levels
(r = 0.48, p = 0.002).
Conclusion: While a high proportion of patients were seen to
have evidence of small myocardial involvement by LGE imaging
consistent with acute myocarditis, overall patient prognosis of
this clinical cohort with small LGE myocardial extent and
preserved left ventricular ejection fraction is benign. CMR is
helpful in the diagnosis of acute myocarditis and provides
quantifiable parameters of the disease activity.
P160Cardiovascular magnetic resonance measures ofcoronary artery blood flow improve after receipt oforal conjugated estrogen and/or high doseatorvastatin in early post-menopausal womenwithout known coronary arteriosclerosisChirapa Puntawangkoon, Tim M Morgan,David M Herrington, Craig A Hamiltonand William G HundleyWakeforest University, Winston Salem, NC, USA
Journal of Cardiovascular Magnetic Resonance 2009, 11(Suppl 1):P160
Objectives: To determine the effect of oral hormone replace-
ment with conjugated equine estrogens (CEE, 0.625 mg po qd)
and/or high dose atorvastatin (ATORV, 80 mg po qd) on
submaximal exercise induced coronary artery blood flow
(CABF) in relatively early postmenopausal women without
documented coronary artery disease (CAD).
Background: Oral conjugated equine estrogens and HMG-
CoA reductase inhibitor (statin) therapy have been shown to
enhance arterial endothelial function, but the effect of these
agents on submaximal coronary artery blood flow is unknown.
Methods: We randomized 56 postmenopausal women aged
59 ± 3 years without evidence of coronary arteriosclerosis, into
a randomized double blinded, cross-over study in which women
were assigned to receive 8 weeks of oral CEE 0.625 mg or
placebo, with or without 80 mg per day of ATORV. Each
treatment period was separated by a 6 week “washout” period ofno treatment. Prior to receipt of any therapy, and after each
Figure 1 (abstract P159)
An example of mid-wall LGE present in the mid-inferior and lateral walls
(arrows) in a patient with a strong clinical suspicion of acute myocarditis
(A). The area confined represents the detected LGE (B).
Journal of Cardiovascular Magnetic Resonance 2009, 11(Suppl 1) http://jcmr-online.com/supplements/11/S1
Page 210 of 316(page number not for citation purposes)
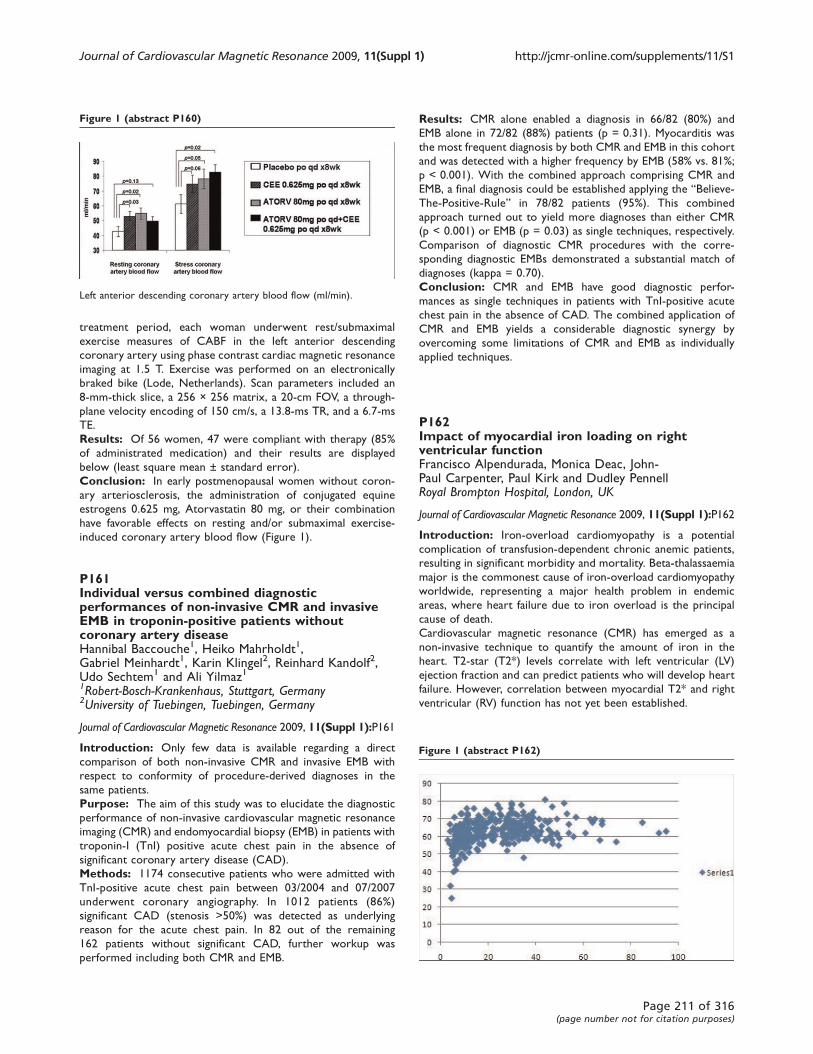
treatment period, each woman underwent rest/submaximal
exercise measures of CABF in the left anterior descending
coronary artery using phase contrast cardiac magnetic resonance
imaging at 1.5 T. Exercise was performed on an electronically
braked bike (Lode, Netherlands). Scan parameters included an
8-mm-thick slice, a 256 × 256 matrix, a 20-cm FOV, a through-
plane velocity encoding of 150 cm/s, a 13.8-ms TR, and a 6.7-ms
TE.
Results: Of 56 women, 47 were compliant with therapy (85%
of administrated medication) and their results are displayed
below (least square mean ± standard error).
Conclusion: In early postmenopausal women without coron-
ary arteriosclerosis, the administration of conjugated equine
estrogens 0.625 mg, Atorvastatin 80 mg, or their combination
have favorable effects on resting and/or submaximal exercise-
induced coronary artery blood flow (Figure 1).
P161Individual versus combined diagnosticperformances of non-invasive CMR and invasiveEMB in troponin-positive patients withoutcoronary artery diseaseHannibal Baccouche1, Heiko Mahrholdt1,Gabriel Meinhardt1, Karin Klingel2, Reinhard Kandolf2,Udo Sechtem1 and Ali Yilmaz11Robert-Bosch-Krankenhaus, Stuttgart, Germany2University of Tuebingen, Tuebingen, Germany
Journal of Cardiovascular Magnetic Resonance 2009, 11(Suppl 1):P161
Introduction: Only few data is available regarding a direct
comparison of both non-invasive CMR and invasive EMB with
respect to conformity of procedure-derived diagnoses in the
same patients.
Purpose: The aim of this study was to elucidate the diagnostic
performance of non-invasive cardiovascular magnetic resonance
imaging (CMR) and endomyocardial biopsy (EMB) in patients with
troponin-I (TnI) positive acute chest pain in the absence of
significant coronary artery disease (CAD).
Methods: 1174 consecutive patients who were admitted with
TnI-positive acute chest pain between 03/2004 and 07/2007
underwent coronary angiography. In 1012 patients (86%)
significant CAD (stenosis >50%) was detected as underlying
reason for the acute chest pain. In 82 out of the remaining
162 patients without significant CAD, further workup was
performed including both CMR and EMB.
Results: CMR alone enabled a diagnosis in 66/82 (80%) and
EMB alone in 72/82 (88%) patients (p = 0.31). Myocarditis was
the most frequent diagnosis by both CMR and EMB in this cohort
and was detected with a higher frequency by EMB (58% vs. 81%;
p < 0.001). With the combined approach comprising CMR and
EMB, a final diagnosis could be established applying the “Believe-The-Positive-Rule” in 78/82 patients (95%). This combined
approach turned out to yield more diagnoses than either CMR
(p < 0.001) or EMB (p = 0.03) as single techniques, respectively.
Comparison of diagnostic CMR procedures with the corre-
sponding diagnostic EMBs demonstrated a substantial match of
diagnoses (kappa = 0.70).
Conclusion: CMR and EMB have good diagnostic perfor-
mances as single techniques in patients with TnI-positive acute
chest pain in the absence of CAD. The combined application of
CMR and EMB yields a considerable diagnostic synergy by
overcoming some limitations of CMR and EMB as individually
applied techniques.
P162Impact of myocardial iron loading on rightventricular functionFrancisco Alpendurada, Monica Deac, John-Paul Carpenter, Paul Kirk and Dudley PennellRoyal Brompton Hospital, London, UK
Journal of Cardiovascular Magnetic Resonance 2009, 11(Suppl 1):P162
Introduction: Iron-overload cardiomyopathy is a potential
complication of transfusion-dependent chronic anemic patients,
resulting in significant morbidity and mortality. Beta-thalassaemia
major is the commonest cause of iron-overload cardiomyopathy
worldwide, representing a major health problem in endemic
areas, where heart failure due to iron overload is the principal
cause of death.
Cardiovascular magnetic resonance (CMR) has emerged as a
non-invasive technique to quantify the amount of iron in the
heart. T2-star (T2*) levels correlate with left ventricular (LV)
ejection fraction and can predict patients who will develop heart
failure. However, correlation between myocardial T2* and right
ventricular (RV) function has not yet been established.
Figure 1 (abstract P160)
Left anterior descending coronary artery blood flow (ml/min).
Figure 1 (abstract P162)
Journal of Cardiovascular Magnetic Resonance 2009, 11(Suppl 1) http://jcmr-online.com/supplements/11/S1
Page 211 of 316(page number not for citation purposes)
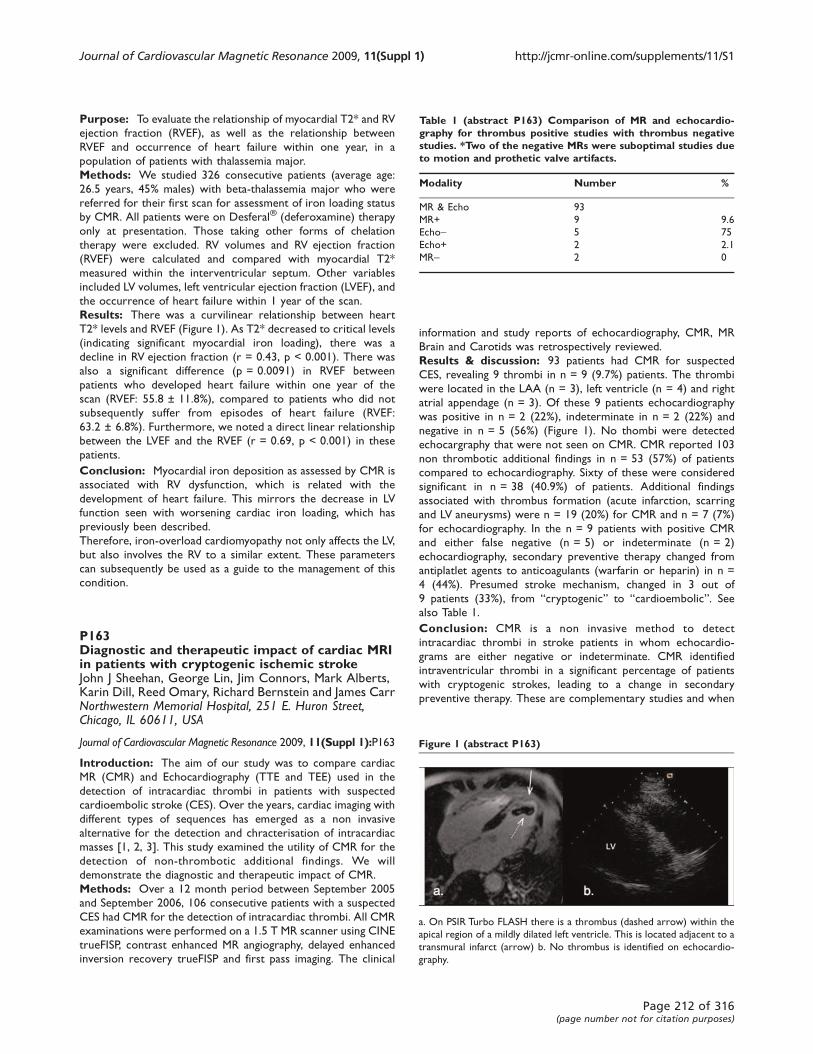
Purpose: To evaluate the relationship of myocardial T2* and RV
ejection fraction (RVEF), as well as the relationship between
RVEF and occurrence of heart failure within one year, in a
population of patients with thalassemia major.
Methods: We studied 326 consecutive patients (average age:
26.5 years, 45% males) with beta-thalassemia major who were
referred for their first scan for assessment of iron loading status
by CMR. All patients were on Desferal® (deferoxamine) therapy
only at presentation. Those taking other forms of chelation
therapy were excluded. RV volumes and RV ejection fraction
(RVEF) were calculated and compared with myocardial T2*
measured within the interventricular septum. Other variables
included LV volumes, left ventricular ejection fraction (LVEF), and
the occurrence of heart failure within 1 year of the scan.
Results: There was a curvilinear relationship between heart
T2* levels and RVEF (Figure 1). As T2* decreased to critical levels
(indicating significant myocardial iron loading), there was a
decline in RV ejection fraction (r = 0.43, p < 0.001). There was
also a significant difference (p = 0.0091) in RVEF between
patients who developed heart failure within one year of the
scan (RVEF: 55.8 ± 11.8%), compared to patients who did not
subsequently suffer from episodes of heart failure (RVEF:
63.2 ± 6.8%). Furthermore, we noted a direct linear relationship
between the LVEF and the RVEF (r = 0.69, p < 0.001) in these
patients.
Conclusion: Myocardial iron deposition as assessed by CMR is
associated with RV dysfunction, which is related with the
development of heart failure. This mirrors the decrease in LV
function seen with worsening cardiac iron loading, which has
previously been described.
Therefore, iron-overload cardiomyopathy not only affects the LV,
but also involves the RV to a similar extent. These parameters
can subsequently be used as a guide to the management of this
condition.
P163Diagnostic and therapeutic impact of cardiac MRIin patients with cryptogenic ischemic strokeJohn J Sheehan, George Lin, Jim Connors, Mark Alberts,Karin Dill, Reed Omary, Richard Bernstein and James CarrNorthwestern Memorial Hospital, 251 E. Huron Street,Chicago, IL 60611, USA
Journal of Cardiovascular Magnetic Resonance 2009, 11(Suppl 1):P163
Introduction: The aim of our study was to compare cardiac
MR (CMR) and Echocardiography (TTE and TEE) used in the
detection of intracardiac thrombi in patients with suspected
cardioembolic stroke (CES). Over the years, cardiac imaging with
different types of sequences has emerged as a non invasive
alternative for the detection and chracterisation of intracardiac
masses [1, 2, 3]. This study examined the utility of CMR for the
detection of non-thrombotic additional findings. We will
demonstrate the diagnostic and therapeutic impact of CMR.
Methods: Over a 12 month period between September 2005
and September 2006, 106 consecutive patients with a suspected
CES had CMR for the detection of intracardiac thrombi. All CMR
examinations were performed on a 1.5 T MR scanner using CINE
trueFISP, contrast enhanced MR angiography, delayed enhanced
inversion recovery trueFISP and first pass imaging. The clinical
information and study reports of echocardiography, CMR, MR
Brain and Carotids was retrospectively reviewed.
Results & discussion: 93 patients had CMR for suspected
CES, revealing 9 thrombi in n = 9 (9.7%) patients. The thrombi
were located in the LAA (n = 3), left ventricle (n = 4) and right
atrial appendage (n = 3). Of these 9 patients echocardiography
was positive in n = 2 (22%), indeterminate in n = 2 (22%) and
negative in n = 5 (56%) (Figure 1). No thombi were detected
echocargraphy that were not seen on CMR. CMR reported 103
non thrombotic additional findings in n = 53 (57%) of patients
compared to echocardiography. Sixty of these were considered
significant in n = 38 (40.9%) of patients. Additional findings
associated with thrombus formation (acute infarction, scarring
and LV aneurysms) were n = 19 (20%) for CMR and n = 7 (7%)
for echocardiography. In the n = 9 patients with positive CMR
and either false negative (n = 5) or indeterminate (n = 2)
echocardiography, secondary preventive therapy changed from
antiplatlet agents to anticoagulants (warfarin or heparin) in n =
4 (44%). Presumed stroke mechanism, changed in 3 out of
9 patients (33%), from “cryptogenic” to “cardioembolic”. Seealso Table 1.
Conclusion: CMR is a non invasive method to detect
intracardiac thrombi in stroke patients in whom echocardio-
grams are either negative or indeterminate. CMR identified
intraventricular thrombi in a significant percentage of patients
with cryptogenic strokes, leading to a change in secondary
preventive therapy. These are complementary studies and when
Table 1 (abstract P163) Comparison of MR and echocardio-graphy for thrombus positive studies with thrombus negativestudies. *Two of the negative MRs were suboptimal studies dueto motion and prothetic valve artifacts.
Modality Number %
MR & Echo 93
MR+ 9 9.6
Echo- 5 75
Echo+ 2 2.1
MR- 2 0
Figure 1 (abstract P163)
a. On PSIR Turbo FLASH there is a thrombus (dashed arrow) within the
apical region of a mildly dilated left ventricle. This is located adjacent to a
transmural infarct (arrow) b. No thrombus is identified on echocardio-
graphy.
Journal of Cardiovascular Magnetic Resonance 2009, 11(Suppl 1) http://jcmr-online.com/supplements/11/S1
Page 212 of 316(page number not for citation purposes)
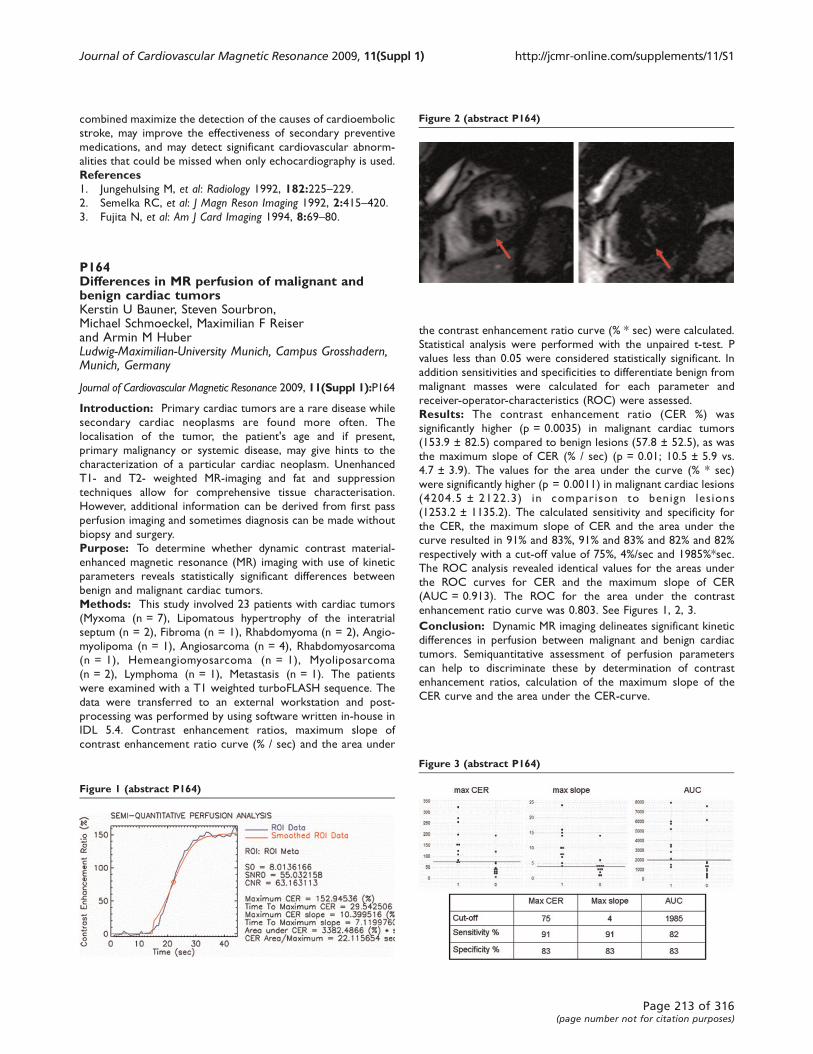
combined maximize the detection of the causes of cardioembolic
stroke, may improve the effectiveness of secondary preventive
medications, and may detect significant cardiovascular abnorm-
alities that could be missed when only echocardiography is used.
References1. Jungehulsing M, et al: Radiology 1992, 182:225–229.2. Semelka RC, et al: J Magn Reson Imaging 1992, 2:415–420.3. Fujita N, et al: Am J Card Imaging 1994, 8:69–80.
P164Differences in MR perfusion of malignant andbenign cardiac tumorsKerstin U Bauner, Steven Sourbron,Michael Schmoeckel, Maximilian F Reiserand Armin M HuberLudwig-Maximilian-University Munich, Campus Grosshadern,Munich, Germany
Journal of Cardiovascular Magnetic Resonance 2009, 11(Suppl 1):P164
Introduction: Primary cardiac tumors are a rare disease while
secondary cardiac neoplasms are found more often. The
localisation of the tumor, the patient's age and if present,
primary malignancy or systemic disease, may give hints to the
characterization of a particular cardiac neoplasm. Unenhanced
T1- and T2- weighted MR-imaging and fat and suppression
techniques allow for comprehensive tissue characterisation.
However, additional information can be derived from first pass
perfusion imaging and sometimes diagnosis can be made without
biopsy and surgery.
Purpose: To determine whether dynamic contrast material-
enhanced magnetic resonance (MR) imaging with use of kinetic
parameters reveals statistically significant differences between
benign and malignant cardiac tumors.
Methods: This study involved 23 patients with cardiac tumors
(Myxoma (n = 7), Lipomatous hypertrophy of the interatrial
septum (n = 2), Fibroma (n = 1), Rhabdomyoma (n = 2), Angio-
myolipoma (n = 1), Angiosarcoma (n = 4), Rhabdomyosarcoma
(n = 1), Hemeangiomyosarcoma (n = 1), Myoliposarcoma
(n = 2), Lymphoma (n = 1), Metastasis (n = 1). The patients
were examined with a T1 weighted turboFLASH sequence. The
data were transferred to an external workstation and post-
processing was performed by using software written in-house in
IDL 5.4. Contrast enhancement ratios, maximum slope of
contrast enhancement ratio curve (% / sec) and the area under
the contrast enhancement ratio curve (% * sec) were calculated.
Statistical analysis were performed with the unpaired t-test. P
values less than 0.05 were considered statistically significant. In
addition sensitivities and specificities to differentiate benign from
malignant masses were calculated for each parameter and
receiver-operator-characteristics (ROC) were assessed.
Results: The contrast enhancement ratio (CER %) was
significantly higher (p = 0.0035) in malignant cardiac tumors
(153.9 ± 82.5) compared to benign lesions (57.8 ± 52.5), as was
the maximum slope of CER (% / sec) (p = 0.01; 10.5 ± 5.9 vs.
4.7 ± 3.9). The values for the area under the curve (% * sec)
were significantly higher (p = 0.0011) in malignant cardiac lesions
(4204.5 ± 2122.3) in comparison to benign les ions
(1253.2 ± 1135.2). The calculated sensitivity and specificity for
the CER, the maximum slope of CER and the area under the
curve resulted in 91% and 83%, 91% and 83% and 82% and 82%
respectively with a cut-off value of 75%, 4%/sec and 1985%*sec.
The ROC analysis revealed identical values for the areas under
the ROC curves for CER and the maximum slope of CER
(AUC = 0.913). The ROC for the area under the contrast
enhancement ratio curve was 0.803. See Figures 1, 2, 3.
Conclusion: Dynamic MR imaging delineates significant kinetic
differences in perfusion between malignant and benign cardiac
tumors. Semiquantitative assessment of perfusion parameters
can help to discriminate these by determination of contrast
enhancement ratios, calculation of the maximum slope of the
CER curve and the area under the CER-curve.
Figure 1 (abstract P164)
Figure 2 (abstract P164)
Figure 3 (abstract P164)
Journal of Cardiovascular Magnetic Resonance 2009, 11(Suppl 1) http://jcmr-online.com/supplements/11/S1
Page 213 of 316(page number not for citation purposes)
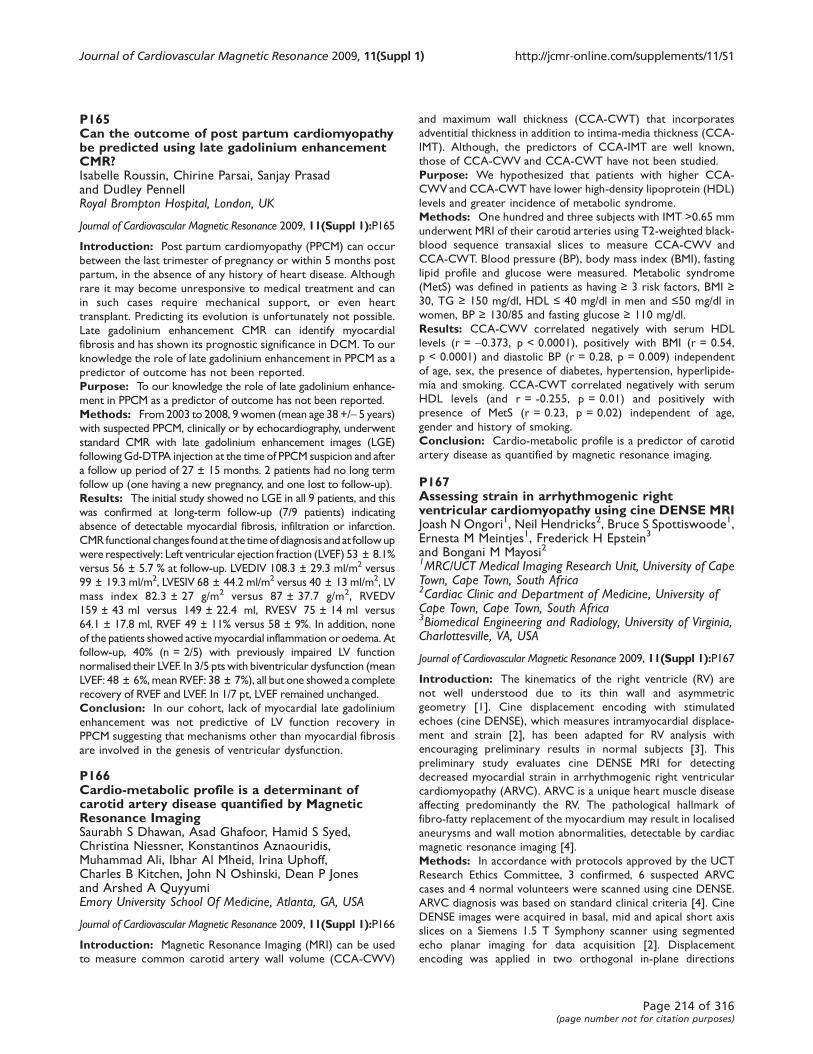
P165Can the outcome of post partum cardiomyopathybe predicted using late gadolinium enhancementCMR?Isabelle Roussin, Chirine Parsai, Sanjay Prasadand Dudley PennellRoyal Brompton Hospital, London, UK
Journal of Cardiovascular Magnetic Resonance 2009, 11(Suppl 1):P165
Introduction: Post partum cardiomyopathy (PPCM) can occur
between the last trimester of pregnancy or within 5 months post
partum, in the absence of any history of heart disease. Although
rare it may become unresponsive to medical treatment and can
in such cases require mechanical support, or even heart
transplant. Predicting its evolution is unfortunately not possible.
Late gadolinium enhancement CMR can identify myocardial
fibrosis and has shown its prognostic significance in DCM. To our
knowledge the role of late gadolinium enhancement in PPCM as a
predictor of outcome has not been reported.
Purpose: To our knowledge the role of late gadolinium enhance-
ment in PPCM as a predictor of outcome has not been reported.
Methods: From2003 to 2008, 9 women (mean age 38 +/- 5 years)with suspected PPCM, clinically or by echocardiography, underwent
standard CMR with late gadolinium enhancement images (LGE)
following Gd-DTPA injection at the time of PPCM suspicion and after
a follow up period of 27 ± 15 months. 2 patients had no long term
follow up (one having a new pregnancy, and one lost to follow-up).
Results: The initial study showed no LGE in all 9 patients, and this
was confirmed at long-term follow-up (7/9 patients) indicating
absence of detectable myocardial fibrosis, infiltration or infarction.
CMR functional changes found at the timeofdiagnosis and at followup
were respectively: Left ventricular ejection fraction (LVEF) 53 ± 8.1%
versus 56 ± 5.7 % at follow-up. LVEDIV 108.3 ± 29.3 ml/m2 versus
99 ± 19.3 ml/m2, LVESIV 68 ± 44.2 ml/m2 versus 40 ± 13 ml/m2, LV
mass index 82.3 ± 27 g/m2 versus 87 ± 37.7 g/m2, RVEDV
159 ± 43 ml versus 149 ± 22.4 ml, RVESV 75 ± 14 ml versus
64.1 ± 17.8 ml, RVEF 49 ± 11% versus 58 ± 9%. In addition, none
of the patients showed active myocardial inflammation oroedema. At
follow-up, 40% (n = 2/5) with previously impaired LV function
normalised their LVEF. In 3/5 pts with biventricular dysfunction (mean
LVEF: 48 ± 6%,mean RVEF: 38 ± 7%), all but one showed a complete
recovery of RVEF and LVEF. In 1/7 pt, LVEF remained unchanged.
Conclusion: In our cohort, lack of myocardial late gadolinium
enhancement was not predictive of LV function recovery in
PPCM suggesting that mechanisms other than myocardial fibrosis
are involved in the genesis of ventricular dysfunction.
P166Cardio-metabolic profile is a determinant ofcarotid artery disease quantified by MagneticResonance ImagingSaurabh S Dhawan, Asad Ghafoor, Hamid S Syed,Christina Niessner, Konstantinos Aznaouridis,Muhammad Ali, Ibhar Al Mheid, Irina Uphoff,Charles B Kitchen, John N Oshinski, Dean P Jonesand Arshed A QuyyumiEmory University School Of Medicine, Atlanta, GA, USA
Journal of Cardiovascular Magnetic Resonance 2009, 11(Suppl 1):P166
Introduction: Magnetic Resonance Imaging (MRI) can be used
to measure common carotid artery wall volume (CCA-CWV)
and maximum wall thickness (CCA-CWT) that incorporates
adventitial thickness in addition to intima-media thickness (CCA-
IMT). Although, the predictors of CCA-IMT are well known,
those of CCA-CWV and CCA-CWT have not been studied.
Purpose: We hypothesized that patients with higher CCA-
CWV and CCA-CWT have lower high-density lipoprotein (HDL)
levels and greater incidence of metabolic syndrome.
Methods: One hundred and three subjects with IMT >0.65 mm
underwent MRI of their carotid arteries using T2-weighted black-
blood sequence transaxial slices to measure CCA-CWV and
CCA-CWT. Blood pressure (BP), body mass index (BMI), fasting
lipid profile and glucose were measured. Metabolic syndrome
(MetS) was defined in patients as having ≥ 3 risk factors, BMI ≥30, TG ≥ 150 mg/dl, HDL ≤ 40 mg/dl in men and ≤50 mg/dl in
women, BP ≥ 130/85 and fasting glucose ≥ 110 mg/dl.
Results: CCA-CWV correlated negatively with serum HDL
levels (r = -0.373, p < 0.0001), positively with BMI (r = 0.54,
p < 0.0001) and diastolic BP (r = 0.28, p = 0.009) independent
of age, sex, the presence of diabetes, hypertension, hyperlipide-
mia and smoking. CCA-CWT correlated negatively with serum
HDL levels (and r = -0.255, p = 0.01) and positively with
presence of MetS (r = 0.23, p = 0.02) independent of age,
gender and history of smoking.
Conclusion: Cardio-metabolic profile is a predictor of carotid
artery disease as quantified by magnetic resonance imaging.
P167Assessing strain in arrhythmogenic rightventricular cardiomyopathy using cine DENSE MRIJoash N Ongori1, Neil Hendricks2, Bruce S Spottiswoode1,Ernesta M Meintjes1, Frederick H Epstein3
and Bongani M Mayosi21MRC/UCT Medical Imaging Research Unit, University of CapeTown, Cape Town, South Africa2Cardiac Clinic and Department of Medicine, University ofCape Town, Cape Town, South Africa3Biomedical Engineering and Radiology, University of Virginia,Charlottesville, VA, USA
Journal of Cardiovascular Magnetic Resonance 2009, 11(Suppl 1):P167
Introduction: The kinematics of the right ventricle (RV) are
not well understood due to its thin wall and asymmetric
geometry [1]. Cine displacement encoding with stimulated
echoes (cine DENSE), which measures intramyocardial displace-
ment and strain [2], has been adapted for RV analysis with
encouraging preliminary results in normal subjects [3]. This
preliminary study evaluates cine DENSE MRI for detecting
decreased myocardial strain in arrhythmogenic right ventricular
cardiomyopathy (ARVC). ARVC is a unique heart muscle disease
affecting predominantly the RV. The pathological hallmark of
fibro-fatty replacement of the myocardium may result in localised
aneurysms and wall motion abnormalities, detectable by cardiac
magnetic resonance imaging [4].
Methods: In accordance with protocols approved by the UCT
Research Ethics Committee, 3 confirmed, 6 suspected ARVC
cases and 4 normal volunteers were scanned using cine DENSE.
ARVC diagnosis was based on standard clinical criteria [4]. Cine
DENSE images were acquired in basal, mid and apical short axis
slices on a Siemens 1.5 T Symphony scanner using segmented
echo planar imaging for data acquisition [2]. Displacement
encoding was applied in two orthogonal in-plane directions
Journal of Cardiovascular Magnetic Resonance 2009, 11(Suppl 1) http://jcmr-online.com/supplements/11/S1
Page 214 of 316(page number not for citation purposes)
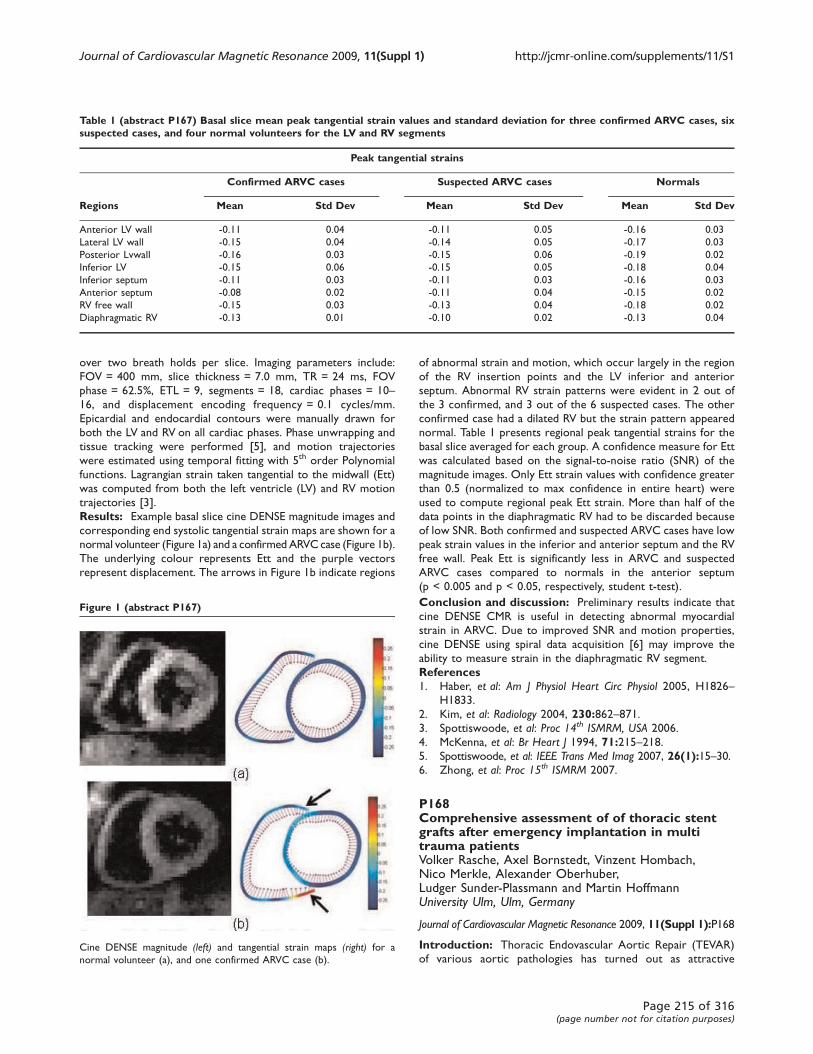
over two breath holds per slice. Imaging parameters include:
FOV = 400 mm, slice thickness = 7.0 mm, TR = 24 ms, FOV
phase = 62.5%, ETL = 9, segments = 18, cardiac phases = 10–16, and displacement encoding frequency = 0.1 cycles/mm.
Epicardial and endocardial contours were manually drawn for
both the LV and RV on all cardiac phases. Phase unwrapping and
tissue tracking were performed [5], and motion trajectories
were estimated using temporal fitting with 5th order Polynomial
functions. Lagrangian strain taken tangential to the midwall (Ett)
was computed from both the left ventricle (LV) and RV motion
trajectories [3].
Results: Example basal slice cine DENSE magnitude images and
corresponding end systolic tangential strain maps are shown for a
normal volunteer (Figure 1a) and a confirmed ARVC case (Figure 1b).
The underlying colour represents Ett and the purple vectors
represent displacement. The arrows in Figure 1b indicate regions
of abnormal strain and motion, which occur largely in the region
of the RV insertion points and the LV inferior and anterior
septum. Abnormal RV strain patterns were evident in 2 out of
the 3 confirmed, and 3 out of the 6 suspected cases. The other
confirmed case had a dilated RV but the strain pattern appeared
normal. Table 1 presents regional peak tangential strains for the
basal slice averaged for each group. A confidence measure for Ett
was calculated based on the signal-to-noise ratio (SNR) of the
magnitude images. Only Ett strain values with confidence greater
than 0.5 (normalized to max confidence in entire heart) were
used to compute regional peak Ett strain. More than half of the
data points in the diaphragmatic RV had to be discarded because
of low SNR. Both confirmed and suspected ARVC cases have low
peak strain values in the inferior and anterior septum and the RV
free wall. Peak Ett is significantly less in ARVC and suspected
ARVC cases compared to normals in the anterior septum
(p < 0.005 and p < 0.05, respectively, student t-test).
Conclusion and discussion: Preliminary results indicate that
cine DENSE CMR is useful in detecting abnormal myocardial
strain in ARVC. Due to improved SNR and motion properties,
cine DENSE using spiral data acquisition [6] may improve the
ability to measure strain in the diaphragmatic RV segment.
References1. Haber, et al: Am J Physiol Heart Circ Physiol 2005, H1826–
H1833.
2. Kim, et al: Radiology 2004, 230:862–871.3. Spottiswoode, et al: Proc 14th ISMRM, USA 2006.
4. McKenna, et al: Br Heart J 1994, 71:215–218.5. Spottiswoode, et al: IEEE Trans Med Imag 2007, 26(1):15–30.6. Zhong, et al: Proc 15th ISMRM 2007.
P168Comprehensive assessment of of thoracic stentgrafts after emergency implantation in multitrauma patientsVolker Rasche, Axel Bornstedt, Vinzent Hombach,Nico Merkle, Alexander Oberhuber,Ludger Sunder-Plassmann and Martin HoffmannUniversity Ulm, Ulm, Germany
Journal of Cardiovascular Magnetic Resonance 2009, 11(Suppl 1):P168
Introduction: Thoracic Endovascular Aortic Repair (TEVAR)
of various aortic pathologies has turned out as attractive
Table 1 (abstract P167) Basal slice mean peak tangential strain values and standard deviation for three confirmed ARVC cases, sixsuspected cases, and four normal volunteers for the LV and RV segments
Peak tangential strains
Confirmed ARVC cases Suspected ARVC cases Normals
Regions Mean Std Dev Mean Std Dev Mean Std Dev
Anterior LV wall -0.11 0.04 -0.11 0.05 -0.16 0.03
Lateral LV wall -0.15 0.04 -0.14 0.05 -0.17 0.03
Posterior Lvwall -0.16 0.03 -0.15 0.06 -0.19 0.02
Inferior LV -0.15 0.06 -0.15 0.05 -0.18 0.04
Inferior septum -0.11 0.03 -0.11 0.03 -0.16 0.03
Anterior septum -0.08 0.02 -0.11 0.04 -0.15 0.02
RV free wall -0.15 0.03 -0.13 0.04 -0.18 0.02
Diaphragmatic RV -0.13 0.01 -0.10 0.02 -0.13 0.04
Figure 1 (abstract P167)
Cine DENSE magnitude (left) and tangential strain maps (right) for a
normal volunteer (a), and one confirmed ARVC case (b).
Journal of Cardiovascular Magnetic Resonance 2009, 11(Suppl 1) http://jcmr-online.com/supplements/11/S1
Page 215 of 316(page number not for citation purposes)
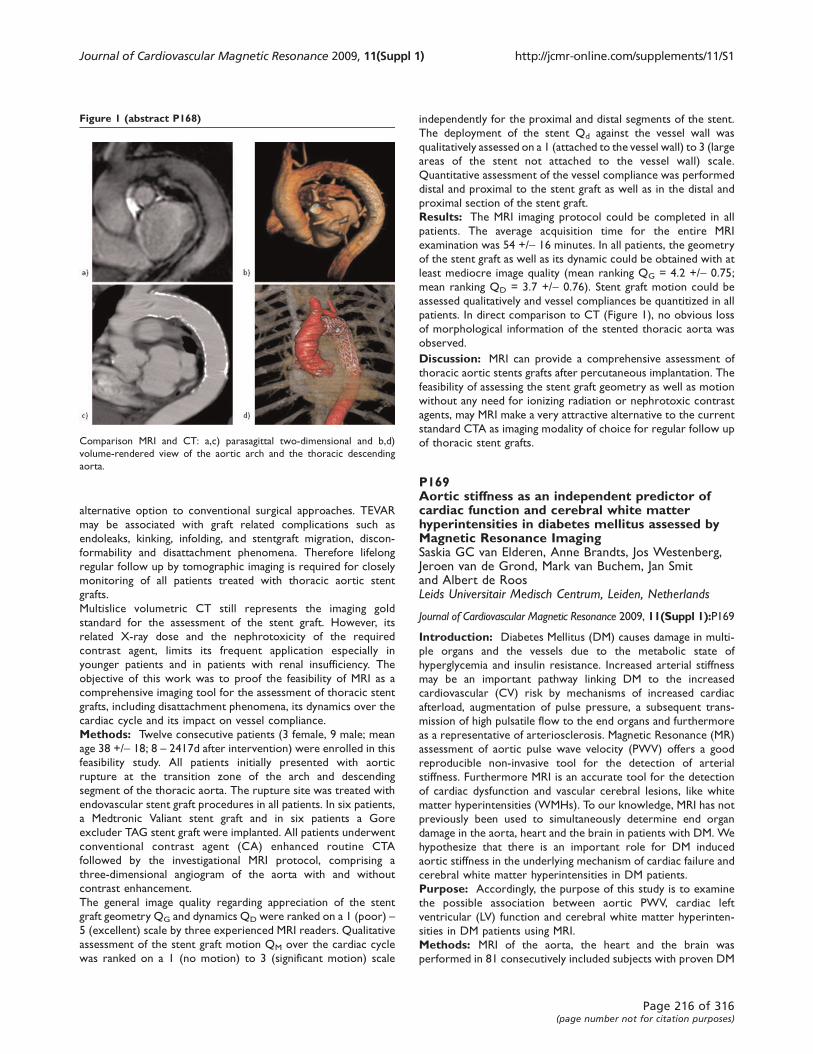
alternative option to conventional surgical approaches. TEVAR
may be associated with graft related complications such as
endoleaks, kinking, infolding, and stentgraft migration, discon-
formability and disattachment phenomena. Therefore lifelong
regular follow up by tomographic imaging is required for closely
monitoring of all patients treated with thoracic aortic stent
grafts.
Multislice volumetric CT still represents the imaging gold
standard for the assessment of the stent graft. However, its
related X-ray dose and the nephrotoxicity of the required
contrast agent, limits its frequent application especially in
younger patients and in patients with renal insufficiency. The
objective of this work was to proof the feasibility of MRI as a
comprehensive imaging tool for the assessment of thoracic stent
grafts, including disattachment phenomena, its dynamics over the
cardiac cycle and its impact on vessel compliance.
Methods: Twelve consecutive patients (3 female, 9 male; mean
age 38 +/- 18; 8 – 2417d after intervention) were enrolled in this
feasibility study. All patients initially presented with aortic
rupture at the transition zone of the arch and descending
segment of the thoracic aorta. The rupture site was treated with
endovascular stent graft procedures in all patients. In six patients,
a Medtronic Valiant stent graft and in six patients a Gore
excluder TAG stent graft were implanted. All patients underwent
conventional contrast agent (CA) enhanced routine CTA
followed by the investigational MRI protocol, comprising a
three-dimensional angiogram of the aorta with and without
contrast enhancement.
The general image quality regarding appreciation of the stent
graft geometry QG and dynamics QD were ranked on a 1 (poor) –5 (excellent) scale by three experienced MRI readers. Qualitative
assessment of the stent graft motion QM over the cardiac cycle
was ranked on a 1 (no motion) to 3 (significant motion) scale
independently for the proximal and distal segments of the stent.
The deployment of the stent Qd against the vessel wall was
qualitatively assessed on a 1 (attached to the vessel wall) to 3 (large
areas of the stent not attached to the vessel wall) scale.
Quantitative assessment of the vessel compliance was performed
distal and proximal to the stent graft as well as in the distal and
proximal section of the stent graft.
Results: The MRI imaging protocol could be completed in all
patients. The average acquisition time for the entire MRI
examination was 54 +/- 16 minutes. In all patients, the geometry
of the stent graft as well as its dynamic could be obtained with at
least mediocre image quality (mean ranking QG = 4.2 +/- 0.75;
mean ranking QD = 3.7 +/- 0.76). Stent graft motion could be
assessed qualitatively and vessel compliances be quantitized in all
patients. In direct comparison to CT (Figure 1), no obvious loss
of morphological information of the stented thoracic aorta was
observed.
Discussion: MRI can provide a comprehensive assessment of
thoracic aortic stents grafts after percutaneous implantation. The
feasibility of assessing the stent graft geometry as well as motion
without any need for ionizing radiation or nephrotoxic contrast
agents, may MRI make a very attractive alternative to the current
standard CTA as imaging modality of choice for regular follow up
of thoracic stent grafts.
P169Aortic stiffness as an independent predictor ofcardiac function and cerebral white matterhyperintensities in diabetes mellitus assessed byMagnetic Resonance ImagingSaskia GC van Elderen, Anne Brandts, Jos Westenberg,Jeroen van de Grond, Mark van Buchem, Jan Smitand Albert de RoosLeids Universitair Medisch Centrum, Leiden, Netherlands
Journal of Cardiovascular Magnetic Resonance 2009, 11(Suppl 1):P169
Introduction: Diabetes Mellitus (DM) causes damage in multi-
ple organs and the vessels due to the metabolic state of
hyperglycemia and insulin resistance. Increased arterial stiffness
may be an important pathway linking DM to the increased
cardiovascular (CV) risk by mechanisms of increased cardiac
afterload, augmentation of pulse pressure, a subsequent trans-
mission of high pulsatile flow to the end organs and furthermore
as a representative of arteriosclerosis. Magnetic Resonance (MR)
assessment of aortic pulse wave velocity (PWV) offers a good
reproducible non-invasive tool for the detection of arterial
stiffness. Furthermore MRI is an accurate tool for the detection
of cardiac dysfunction and vascular cerebral lesions, like white
matter hyperintensities (WMHs). To our knowledge, MRI has not
previously been used to simultaneously determine end organ
damage in the aorta, heart and the brain in patients with DM. We
hypothesize that there is an important role for DM induced
aortic stiffness in the underlying mechanism of cardiac failure and
cerebral white matter hyperintensities in DM patients.
Purpose: Accordingly, the purpose of this study is to examine
the possible association between aortic PWV, cardiac left
ventricular (LV) function and cerebral white matter hyperinten-
sities in DM patients using MRI.
Methods: MRI of the aorta, the heart and the brain was
performed in 81 consecutively included subjects with proven DM
Figure 1 (abstract P168)
Comparison MRI and CT: a,c) parasagittal two-dimensional and b,d)
volume-rendered view of the aortic arch and the thoracic descending
aorta.
Journal of Cardiovascular Magnetic Resonance 2009, 11(Suppl 1) http://jcmr-online.com/supplements/11/S1
Page 216 of 316(page number not for citation purposes)
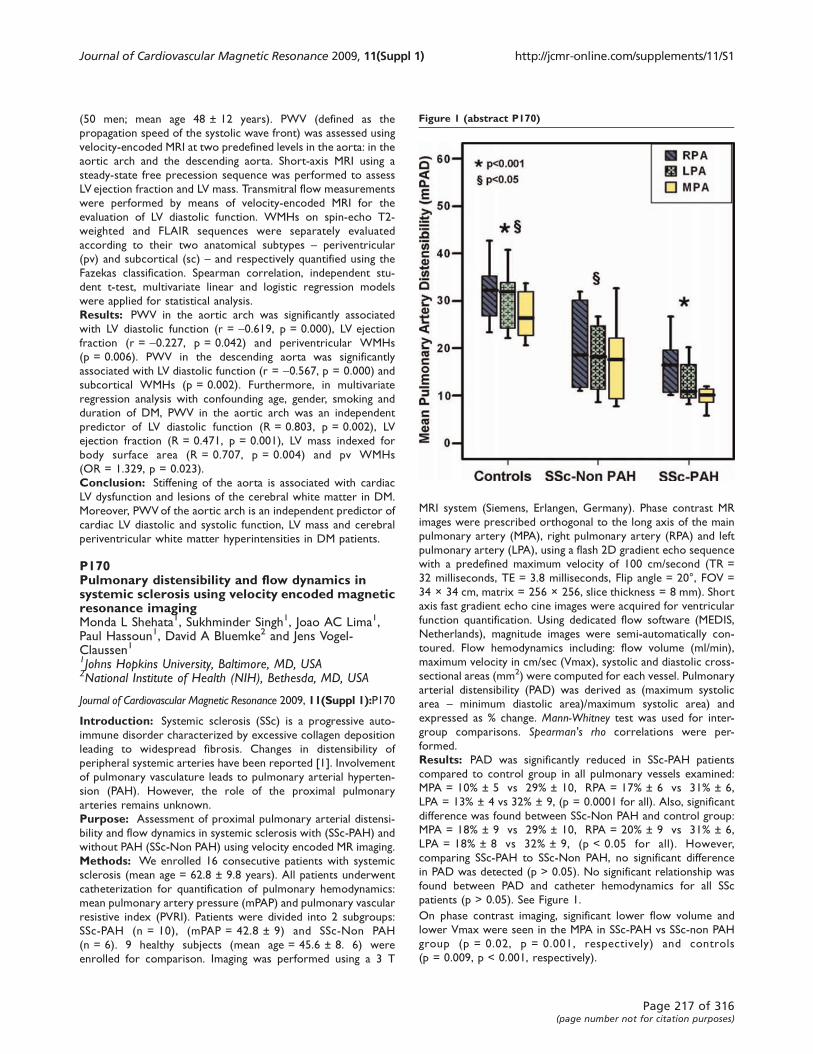
(50 men; mean age 48 ± 12 years). PWV (defined as the
propagation speed of the systolic wave front) was assessed using
velocity-encoded MRI at two predefined levels in the aorta: in the
aortic arch and the descending aorta. Short-axis MRI using a
steady-state free precession sequence was performed to assess
LV ejection fraction and LV mass. Transmitral flow measurements
were performed by means of velocity-encoded MRI for the
evaluation of LV diastolic function. WMHs on spin-echo T2-
weighted and FLAIR sequences were separately evaluated
according to their two anatomical subtypes – periventricular
(pv) and subcortical (sc) – and respectively quantified using the
Fazekas classification. Spearman correlation, independent stu-
dent t-test, multivariate linear and logistic regression models
were applied for statistical analysis.
Results: PWV in the aortic arch was significantly associated
with LV diastolic function (r = -0.619, p = 0.000), LV ejection
fraction (r = -0.227, p = 0.042) and periventricular WMHs
(p = 0.006). PWV in the descending aorta was significantly
associated with LV diastolic function (r = -0.567, p = 0.000) and
subcortical WMHs (p = 0.002). Furthermore, in multivariate
regression analysis with confounding age, gender, smoking and
duration of DM, PWV in the aortic arch was an independent
predictor of LV diastolic function (R = 0.803, p = 0.002), LV
ejection fraction (R = 0.471, p = 0.001), LV mass indexed for
body surface area (R = 0.707, p = 0.004) and pv WMHs
(OR = 1.329, p = 0.023).
Conclusion: Stiffening of the aorta is associated with cardiac
LV dysfunction and lesions of the cerebral white matter in DM.
Moreover, PWVof the aortic arch is an independent predictor of
cardiac LV diastolic and systolic function, LV mass and cerebral
periventricular white matter hyperintensities in DM patients.
P170Pulmonary distensibility and flow dynamics insystemic sclerosis using velocity encoded magneticresonance imagingMonda L Shehata1, Sukhminder Singh1, Joao AC Lima1,Paul Hassoun1, David A Bluemke2 and Jens Vogel-Claussen11Johns Hopkins University, Baltimore, MD, USA2National Institute of Health (NIH), Bethesda, MD, USA
Journal of Cardiovascular Magnetic Resonance 2009, 11(Suppl 1):P170
Introduction: Systemic sclerosis (SSc) is a progressive auto-
immune disorder characterized by excessive collagen deposition
leading to widespread fibrosis. Changes in distensibility of
peripheral systemic arteries have been reported [1]. Involvement
of pulmonary vasculature leads to pulmonary arterial hyperten-
sion (PAH). However, the role of the proximal pulmonary
arteries remains unknown.
Purpose: Assessment of proximal pulmonary arterial distensi-
bility and flow dynamics in systemic sclerosis with (SSc-PAH) and
without PAH (SSc-Non PAH) using velocity encoded MR imaging.
Methods: We enrolled 16 consecutive patients with systemic
sclerosis (mean age = 62.8 ± 9.8 years). All patients underwent
catheterization for quantification of pulmonary hemodynamics:
mean pulmonary artery pressure (mPAP) and pulmonary vascular
resistive index (PVRI). Patients were divided into 2 subgroups:
SSc-PAH (n = 10), (mPAP = 42.8 ± 9) and SSc-Non PAH
(n = 6). 9 healthy subjects (mean age = 45.6 ± 8. 6) were
enrolled for comparison. Imaging was performed using a 3 T
MRI system (Siemens, Erlangen, Germany). Phase contrast MR
images were prescribed orthogonal to the long axis of the main
pulmonary artery (MPA), right pulmonary artery (RPA) and left
pulmonary artery (LPA), using a flash 2D gradient echo sequence
with a predefined maximum velocity of 100 cm/second (TR =
32 milliseconds, TE = 3.8 milliseconds, Flip angle = 20°, FOV =
34 × 34 cm, matrix = 256 × 256, slice thickness = 8 mm). Short
axis fast gradient echo cine images were acquired for ventricular
function quantification. Using dedicated flow software (MEDIS,
Netherlands), magnitude images were semi-automatically con-
toured. Flow hemodynamics including: flow volume (ml/min),
maximum velocity in cm/sec (Vmax), systolic and diastolic cross-
sectional areas (mm2) were computed for each vessel. Pulmonary
arterial distensibility (PAD) was derived as (maximum systolic
area – minimum diastolic area)/maximum systolic area) and
expressed as % change. Mann-Whitney test was used for inter-
group comparisons. Spearman's rho correlations were per-
formed.
Results: PAD was significantly reduced in SSc-PAH patients
compared to control group in all pulmonary vessels examined:
MPA = 10% ± 5 vs 29% ± 10, RPA = 17% ± 6 vs 31% ± 6,
LPA = 13% ± 4 vs 32% ± 9, (p = 0.0001 for all). Also, significant
difference was found between SSc-Non PAH and control group:
MPA = 18% ± 9 vs 29% ± 10, RPA = 20% ± 9 vs 31% ± 6,
LPA = 18% ± 8 vs 32% ± 9, (p < 0.05 for all). However,
comparing SSc-PAH to SSc-Non PAH, no significant difference
in PAD was detected (p > 0.05). No significant relationship was
found between PAD and catheter hemodynamics for all SSc
patients (p > 0.05). See Figure 1.
On phase contrast imaging, significant lower flow volume and
lower Vmax were seen in the MPA in SSc-PAH vs SSc-non PAH
group (p = 0.02, p = 0.001, respectively) and controls
(p = 0.009, p < 0.001, respectively).
Figure 1 (abstract P170)
Journal of Cardiovascular Magnetic Resonance 2009, 11(Suppl 1) http://jcmr-online.com/supplements/11/S1
Page 217 of 316(page number not for citation purposes)

MPA flow volume showed good inverse correlation with mPAP
(r = -0.76, p = 0.001) and PVRI (r = -0.79, p < 0.001) for all
SSc patients, however, no correlation was found between MPA
flow volume and PAD (p > 0.05).
RV ejection fraction (EF) and stroke volume indexed to body
surface area were significantly reduced in SSc-PAH compared to
controls and SSc-Non PAH patients (p < 0.05). No significant
difference was found in RV function between SSc-Non PAH and
control groups.
Conclusion: SSc patients have significantly lower PAD in the
proximal pulmonary arteries, in presence or absence of PAH,
compared to normal controls, which is likely related to the
patho-physiologic vascular change in systemic sclerosis. Main
pulmonary artery flow volume, however, seems to be a better
correlate for increased mPAP than PAD.
Reference1. Moyssakis I, et al: Rheumatology (Oxford) 2005, 44(2):251–4.
P171Underestimation of carotid plaque by ultrasoundIMTand potential error in measurement of changein plaque burden: simultaneous comparison with3 T MRIMark Bowers1, Leanne Harmann1, Robert Prost1,Megan Bright1, Anil Doppalapudi1, Tayyab Mohyuddin1,John LaDisa2 and Raymond A Migrino11Medical College of Wisconsin, Milwaukee, WI, USA2Marquette University, Milwaukee, WI, USA
Journal of Cardiovascular Magnetic Resonance 2009, 11(Suppl 1):P171
Introduction: Both ultrasound (intima-media thickness, IMT)
and MRI are established methods of measuring carotid plaque
burden. The recent ENHANCE trial demonstrated that despite
greater reduction in LDL cholesterol with simvastatin-ezetimibe,
carotid IMT did not decrease and in fact trended towards
progression versus simvastatin control. This was a surprising
finding and called into question whether measuring the change in
posterior wall thickness by 2-dimensional IMT accurately reflects
the change in plaque burden especially since plaque can be
eccentric. Unlike IMT that by standard methodology quantifies
posterior wall thickness, MRI allows measurement of plaque
volume and is ideal for quantifying eccentric plaques.
Purpose: To compare carotid plaque volume calculated from
ultrasound IMT and lumen radius (IMT-vol) versus plaque volume
measured by MRI (MRI-vol) in patients with atherosclerotic
disease and to compare % change in IMT versus MRI-vol in
patients taking statins for 6 months.
Methods: 16 patients (67 ± 10 years, 3 females) with carotid
atherosclerotic disease underwent sequential B-mode ultrasound
and MRI of both carotid arteries at baseline, with 11 having
6-month follow up post-statin treatment. IMTof the right and left
common carotid (CC, starting 2–4 mm below flow divider and
10 mm length going inferiorly) and internal carotid (IC, starting
2 mm above flow divider and 10 mm length going superiorly)
arteries were measured from the posterior wall using standard
ENHANCE trial methods. IMT-vol was calculated using the
formula: [π(r+IMT)2-πr2]*10 mm where r is the lumen radius and
IMT is the mean posterior plaque thickness. MRI-vol was derived
from T2-weighted spin echo images using 3 T MRI (General
Electric) and 4 channel carotid coil (0.47 × 0.47 × 2 mm spatial
resolution, 256 × 256 matrix). Plaque volume in 10 mm length of
the corresponding CC and IC regions were derived using
Simpson's formula from sequential 2 mm slice thickness images.
IMT-vol and MRI-vol were compared in 61 evaluable carotid
segments and % change in volume was compared in subjects with
6 month follow-up.
Results: Carotid plaques often have eccentric distribution (see
Figure 1). IMT-vol has significant correlation with MRI-vol
(R = 0.5, p < 0.001). However, IMT-vol is significantly less than
MRI-vol (all, CC, IC: 227 ± 159 vs. 430 ± 159; 211 ± 63 vs.
507 ± 120; 232 ± 211 vs. 405 ± 164 mm3, all p < 0.001).
Following 6-month statin treatment, IMT increased by
2.1 ± 36%, IMT-volume increased by 15 ± 61% while MRI-vol
decreased by 9.4 ± 15%. The % change in MRI-vol did not
correlate with % change in IMT (R = 0.2, p = 0.3) or IMT-vol
(R = 0.1, p = 0.6). When % change is categorized into 3 groups
(greater than +5%, +5 to -5% or greater than -5%), IMT-vol was
concordant with MRI-vol change in only 8/21 (38%) of cases.
Conclusion: Carotid plaque burden derived from posterior
wall IMT systematically underestimates plaque volume as
measured by MRI, likely due to eccentric nature of carotid
atherosclerosis. The change in plaque volume measured by MRI is
discordant with change in IMTor IMT-vol suggesting non-uniform
change in regional plaque burden that may not be reflected by
simply measuring the posterior wall. This has important
implications in utilization of ultrasound in serial studies of plaque
burden and suggests need for 3-dimensional volumetric mea-
surement of plaque burden.
P1724D flow for accurate assessment of complex flowdistributionAlison K Meadows, Michael D Hope, David Salonerand Charles B HigginsUniversity of California San Francisco, San Francisco, CA, USA
Journal of Cardiovascular Magnetic Resonance 2009, 11(Suppl 1):P172
Objective: To demonstrate that 4D flow can provide fast,
accurate, and complete data sets to determine differential blood
flow in patients with complex distributions of flow.
Background: Patients with abnormal vasculature, particularly
those with congenital heart disease, often have complex
Figure 1 (abstract P171)
Journal of Cardiovascular Magnetic Resonance 2009, 11(Suppl 1) http://jcmr-online.com/supplements/11/S1
Page 218 of 316(page number not for citation purposes)
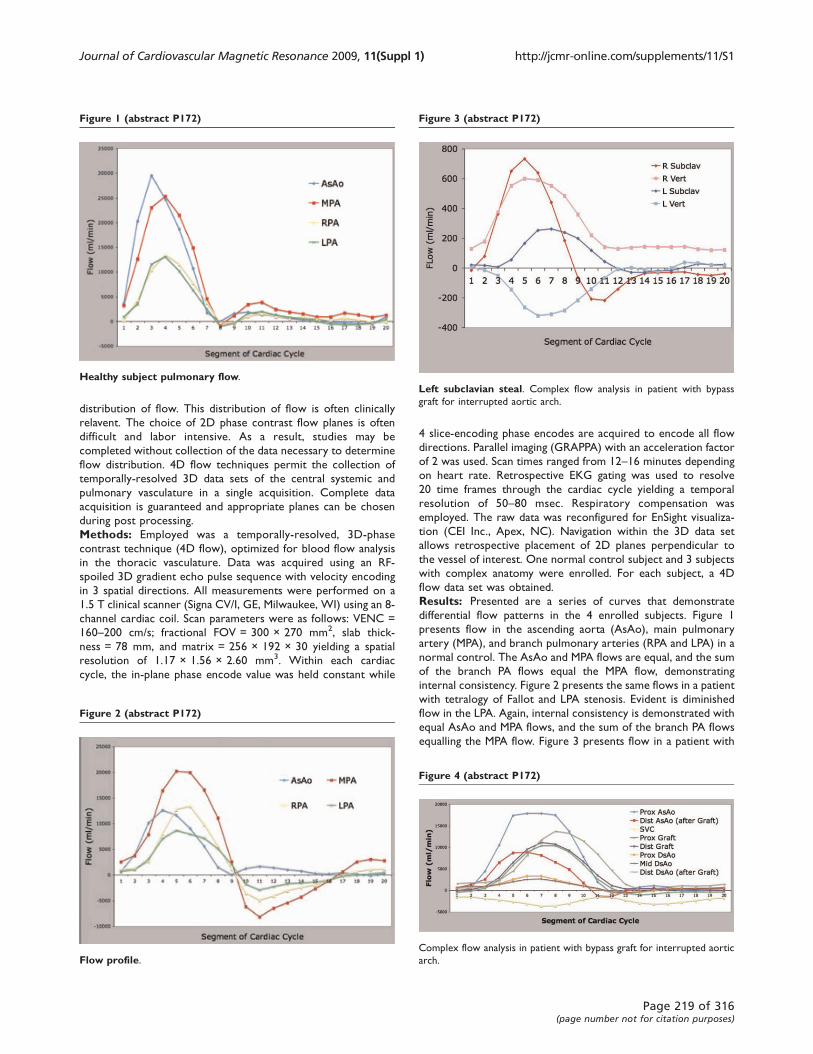
distribution of flow. This distribution of flow is often clinically
relavent. The choice of 2D phase contrast flow planes is often
difficult and labor intensive. As a result, studies may be
completed without collection of the data necessary to determine
flow distribution. 4D flow techniques permit the collection of
temporally-resolved 3D data sets of the central systemic and
pulmonary vasculature in a single acquisition. Complete data
acquisition is guaranteed and appropriate planes can be chosen
during post processing.
Methods: Employed was a temporally-resolved, 3D-phase
contrast technique (4D flow), optimized for blood flow analysis
in the thoracic vasculature. Data was acquired using an RF-
spoiled 3D gradient echo pulse sequence with velocity encoding
in 3 spatial directions. All measurements were performed on a
1.5 T clinical scanner (Signa CV/I, GE, Milwaukee, WI) using an 8-
channel cardiac coil. Scan parameters were as follows: VENC =
160–200 cm/s; fractional FOV = 300 × 270 mm2, slab thick-
ness = 78 mm, and matrix = 256 × 192 × 30 yielding a spatial
resolution of 1.17 × 1.56 × 2.60 mm3. Within each cardiac
cycle, the in-plane phase encode value was held constant while
4 slice-encoding phase encodes are acquired to encode all flow
directions. Parallel imaging (GRAPPA) with an acceleration factor
of 2 was used. Scan times ranged from 12–16 minutes depending
on heart rate. Retrospective EKG gating was used to resolve
20 time frames through the cardiac cycle yielding a temporal
resolution of 50–80 msec. Respiratory compensation was
employed. The raw data was reconfigured for EnSight visualiza-
tion (CEI Inc., Apex, NC). Navigation within the 3D data set
allows retrospective placement of 2D planes perpendicular to
the vessel of interest. One normal control subject and 3 subjects
with complex anatomy were enrolled. For each subject, a 4D
flow data set was obtained.
Results: Presented are a series of curves that demonstrate
differential flow patterns in the 4 enrolled subjects. Figure 1
presents flow in the ascending aorta (AsAo), main pulmonary
artery (MPA), and branch pulmonary arteries (RPA and LPA) in a
normal control. The AsAo and MPA flows are equal, and the sum
of the branch PA flows equal the MPA flow, demonstrating
internal consistency. Figure 2 presents the same flows in a patient
with tetralogy of Fallot and LPA stenosis. Evident is diminished
flow in the LPA. Again, internal consistency is demonstrated with
equal AsAo and MPA flows, and the sum of the branch PA flows
equalling the MPA flow. Figure 3 presents flow in a patient with
Figure 1 (abstract P172)
Healthy subject pulmonary flow.
Figure 2 (abstract P172)
Flow profile.
Figure 3 (abstract P172)
Left subclavian steal. Complex flow analysis in patient with bypass
graft for interrupted aortic arch.
Figure 4 (abstract P172)
Complex flow analysis in patient with bypass graft for interrupted aortic
arch.
Journal of Cardiovascular Magnetic Resonance 2009, 11(Suppl 1) http://jcmr-online.com/supplements/11/S1
Page 219 of 316(page number not for citation purposes)
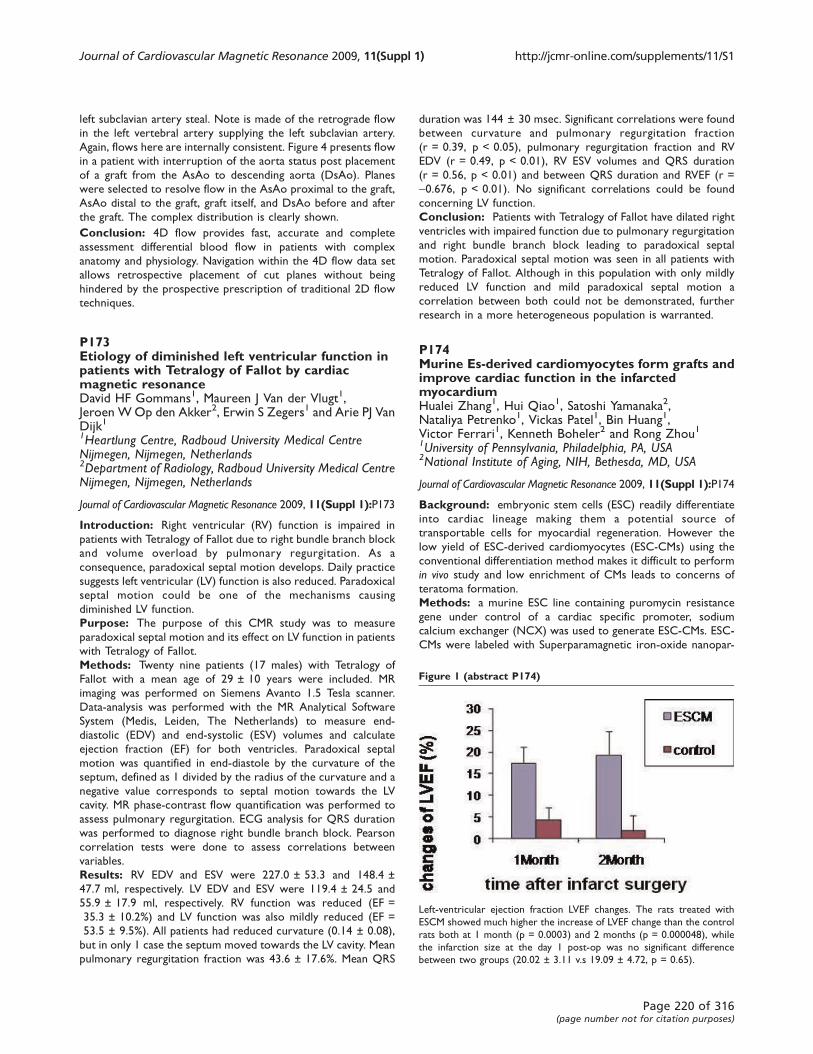
left subclavian artery steal. Note is made of the retrograde flow
in the left vertebral artery supplying the left subclavian artery.
Again, flows here are internally consistent. Figure 4 presents flow
in a patient with interruption of the aorta status post placement
of a graft from the AsAo to descending aorta (DsAo). Planes
were selected to resolve flow in the AsAo proximal to the graft,
AsAo distal to the graft, graft itself, and DsAo before and after
the graft. The complex distribution is clearly shown.
Conclusion: 4D flow provides fast, accurate and complete
assessment differential blood flow in patients with complex
anatomy and physiology. Navigation within the 4D flow data set
allows retrospective placement of cut planes without being
hindered by the prospective prescription of traditional 2D flow
techniques.
P173Etiology of diminished left ventricular function inpatients with Tetralogy of Fallot by cardiacmagnetic resonanceDavid HF Gommans1, Maureen J Van der Vlugt1,Jeroen WOp den Akker2, Erwin S Zegers1 and Arie PJ VanDijk11Heartlung Centre, Radboud University Medical CentreNijmegen, Nijmegen, Netherlands2Department of Radiology, Radboud University Medical CentreNijmegen, Nijmegen, Netherlands
Journal of Cardiovascular Magnetic Resonance 2009, 11(Suppl 1):P173
Introduction: Right ventricular (RV) function is impaired in
patients with Tetralogy of Fallot due to right bundle branch block
and volume overload by pulmonary regurgitation. As a
consequence, paradoxical septal motion develops. Daily practice
suggests left ventricular (LV) function is also reduced. Paradoxical
septal motion could be one of the mechanisms causing
diminished LV function.
Purpose: The purpose of this CMR study was to measure
paradoxical septal motion and its effect on LV function in patients
with Tetralogy of Fallot.
Methods: Twenty nine patients (17 males) with Tetralogy of
Fallot with a mean age of 29 ± 10 years were included. MR
imaging was performed on Siemens Avanto 1.5 Tesla scanner.
Data-analysis was performed with the MR Analytical Software
System (Medis, Leiden, The Netherlands) to measure end-
diastolic (EDV) and end-systolic (ESV) volumes and calculate
ejection fraction (EF) for both ventricles. Paradoxical septal
motion was quantified in end-diastole by the curvature of the
septum, defined as 1 divided by the radius of the curvature and a
negative value corresponds to septal motion towards the LV
cavity. MR phase-contrast flow quantification was performed to
assess pulmonary regurgitation. ECG analysis for QRS duration
was performed to diagnose right bundle branch block. Pearson
correlation tests were done to assess correlations between
variables.
Results: RV EDV and ESV were 227.0 ± 53.3 and 148.4 ±
47.7 ml, respectively. LV EDV and ESV were 119.4 ± 24.5 and
55.9 ± 17.9 ml, respectively. RV function was reduced (EF =
35.3 ± 10.2%) and LV function was also mildly reduced (EF =
53.5 ± 9.5%). All patients had reduced curvature (0.14 ± 0.08),
but in only 1 case the septum moved towards the LV cavity. Mean
pulmonary regurgitation fraction was 43.6 ± 17.6%. Mean QRS
duration was 144 ± 30 msec. Significant correlations were found
between curvature and pulmonary regurgitation fraction
(r = 0.39, p < 0.05), pulmonary regurgitation fraction and RV
EDV (r = 0.49, p < 0.01), RV ESV volumes and QRS duration
(r = 0.56, p < 0.01) and between QRS duration and RVEF (r =
-0.676, p < 0.01). No significant correlations could be found
concerning LV function.
Conclusion: Patients with Tetralogy of Fallot have dilated right
ventricles with impaired function due to pulmonary regurgitation
and right bundle branch block leading to paradoxical septal
motion. Paradoxical septal motion was seen in all patients with
Tetralogy of Fallot. Although in this population with only mildly
reduced LV function and mild paradoxical septal motion a
correlation between both could not be demonstrated, further
research in a more heterogeneous population is warranted.
P174Murine Es-derived cardiomyocytes form grafts andimprove cardiac function in the infarctedmyocardiumHualei Zhang1, Hui Qiao1, Satoshi Yamanaka2,Nataliya Petrenko1, Vickas Patel1, Bin Huang1,Victor Ferrari1, Kenneth Boheler2 and Rong Zhou11University of Pennsylvania, Philadelphia, PA, USA2National Institute of Aging, NIH, Bethesda, MD, USA
Journal of Cardiovascular Magnetic Resonance 2009, 11(Suppl 1):P174
Background: embryonic stem cells (ESC) readily differentiate
into cardiac lineage making them a potential source of
transportable cells for myocardial regeneration. However the
low yield of ESC-derived cardiomyocytes (ESC-CMs) using the
conventional differentiation method makes it difficult to perform
in vivo study and low enrichment of CMs leads to concerns of
teratoma formation.
Methods: a murine ESC line containing puromycin resistance
gene under control of a cardiac specific promoter, sodium
calcium exchanger (NCX) was used to generate ESC-CMs. ESC-
CMs were labeled with Superparamagnetic iron-oxide nanopar-
Figure 1 (abstract P174)
Left-ventricular ejection fraction LVEF changes. The rats treated with
ESCM showed much higher the increase of LVEF change than the control
rats both at 1 month (p = 0.0003) and 2 months (p = 0.000048), while
the infarction size at the day 1 post-op was no significant difference
between two groups (20.02 ± 3.11 v.s 19.09 ± 4.72, p = 0.65).
Journal of Cardiovascular Magnetic Resonance 2009, 11(Suppl 1) http://jcmr-online.com/supplements/11/S1
Page 220 of 316(page number not for citation purposes)

ticles (SPIO) for MRI detection. Reperfused myocardial infarction
was induced in athymic rats. Infarction size was estimated by MRI
post-op day1 to exclude animals with infarct size smaller than
10% or larger than 35%of the LV volume. At post-op day 7,
labeled ESC-CMs (5–10 millions) were injected into infarction
region. Control group was injected with vehicle. MRI scan was
performed at post-op day 8 to confirm successful CM cell
transplantation. Global cardiac function in ESC-CM and vehicle
treated animals was assessed by MRI for 2 months. Immunohis-
tology staining and electrophysiology were performed on
postmortem hearts and ESC-CMs, respectively.
Results: a high yield of ESC-CMs was achieved with positive
cardiac specific alpha-actinin in more than 90% of cells. The low
proliferative capacity of ESC-CMs allows them to retain SPIO for
serial MRI tracking. LV ejection fraction in ESC-CM treated rats at
1- and 2-month is significantly higher than that in the controls.
IHC demonstrated formation of grafts in the host myocardium
and gap junctions between grafted ESC-CMs and host CMs. See
Figure 1.
Conclusion: Large numbers of highly pure ESC-CMs were
obtained. Preliminary results suggest that ESC-CMs form grafts
and improve LV function in the infarcted hearts.
P175High-resolution diffusion tensor mr imaging for theevaluation of myocardial anisotropy and fibertracking at 3 T: effect of the numbers of diffusion-sensitizing gradient directionsSang Il Choi1, Joon-Won Kang1, Eun Ju Chun2,Seong Hoon Choi3 and Tae-Hwan Lim1
1Department of Radiology, Asan Medical Center, University ofUlsan College of Medicine, Seoul, Republic of Korea2Department of Radiology, Seoul National University BundangHospital, Seong-Nam, Republic of Korea3Department of Radiology, Ulsan University Hospital,University of Ulsan College of Medicine, Ulsan, Republic ofKorea
Journal of Cardiovascular Magnetic Resonance 2009, 11(Suppl 1):P175
Introduction: Diffusion tensor magnetic resonance imaging
(DT-MRI) has provided a means for rapid and noninvasive
evaluation of the cardiac geometry and three-dimensional fiber
structure. However, most cardiac DT-MRI studies have used low
diffusion resolution such as 6 directions in animal’s fixed heart. To
our knowledge, the effect of the numbers of diffusion-sensitizing
gradient directions has not been studied for image quality of
cardiac DT-MRI.
Purpose: To evaluate effect of numbers of diffusion-sensitizing
gradient direction on image quality for the evaluation of
myocardial anisotropy and fiber tracking by using ex vivo
diffusion tensor MR imaging (DT-MRI).
Methods: DT-MRI using a SENSE-based echo-planar imaging
technique was acquired by using a 3 T MR scanner from ten
excised heart. With a b-value of 800 s/mm2, the diffusion tensor
images were obtained for 6, 15, 32 diffusion-sensitizing gradient
directions at the midventricular level. For quantitative analysis,
the numbers of tracked fibers, fractional anisotropy (FA), and the
length of tracked fibers were measured. For qualitative analysis,
two radiologists assessed the image quality of fiber tractography.
Results: By increasing the numbers of diffusion-sensitizing
gradient directions from 6 to 15, and 32, FA and standard deviation
were significantly reduced (P = 0.001), and the numbers of tracked
fibers and the length of tracked fibers were significantly increased
(P = 0.001). The image quality of fiber tractography was significantly
increased as the increased numbers of diffusion-sensitizing gradient
directions (P < 0.001). See Figure 1.
Conclusion: Image quality of ex vivo DT-MRI is significantly
improved as the numbers of diffusion-sensitizing gradient
directions increased.
P176Three-dimensional changes in left atrial volumesand ejection fraction during dobutamine stressCardiovascular Magnetic ResonanceVinodh Jeevanantham, William Ntim, Craig Hamilton,Tim Morgan, John Hoyle and Gregory HundleyWake Forest University, Winston Salem, NC, USA
Journal of Cardiovascular Magnetic Resonance 2009, 11(Suppl 1):P176
Introduction: Left ventricular performance is routinely mea-
sured during dobutamine cardiovascular magnetic resonance
(DCMR) and the stress induced left ventricular changes have been
well described. Left atrial (LA) size and volume are associated with
increased risk of developing atrial fibrillation, stroke and congestive
heart failure; however changes in LA volume and LA ejection
fraction (LAEF) during DCMR have not been described.
Purpose: To determine LA volumes and LAEF in patients
undergoing DCMR.
Methods: We enrolled 128 consecutive participants referred
for DCMR. Using white blood CINE steady-state free precession
imaging, a 3 dimensional LA model (determined from a multi-
slice, multi-phase stack of LA short axis views) was obtained to
compute LA volumes and LAEF throughout dobutamine stress.
Baseline clinical cardiac risk factors such as diabetes mellitus,
hypertension, coronary artery disease (CAD), atrial fibrillation,
age and gender were collected. Dobutamine stress protocol
involved infusion of 7.5 mg/kg/min for low dose stage and 20 mg/kg/min ± atropine for peak dose stress stage. LA maximal
volume (LAV max) was defined as maximal LA volume before
the opening of mitral valves. LA minimal volume (LAV min) was
defined as minimal LA volume at closure of mitral valve. LAEF
Figure 1 (abstract P175)
Journal of Cardiovascular Magnetic Resonance 2009, 11(Suppl 1) http://jcmr-online.com/supplements/11/S1
Page 221 of 316(page number not for citation purposes)
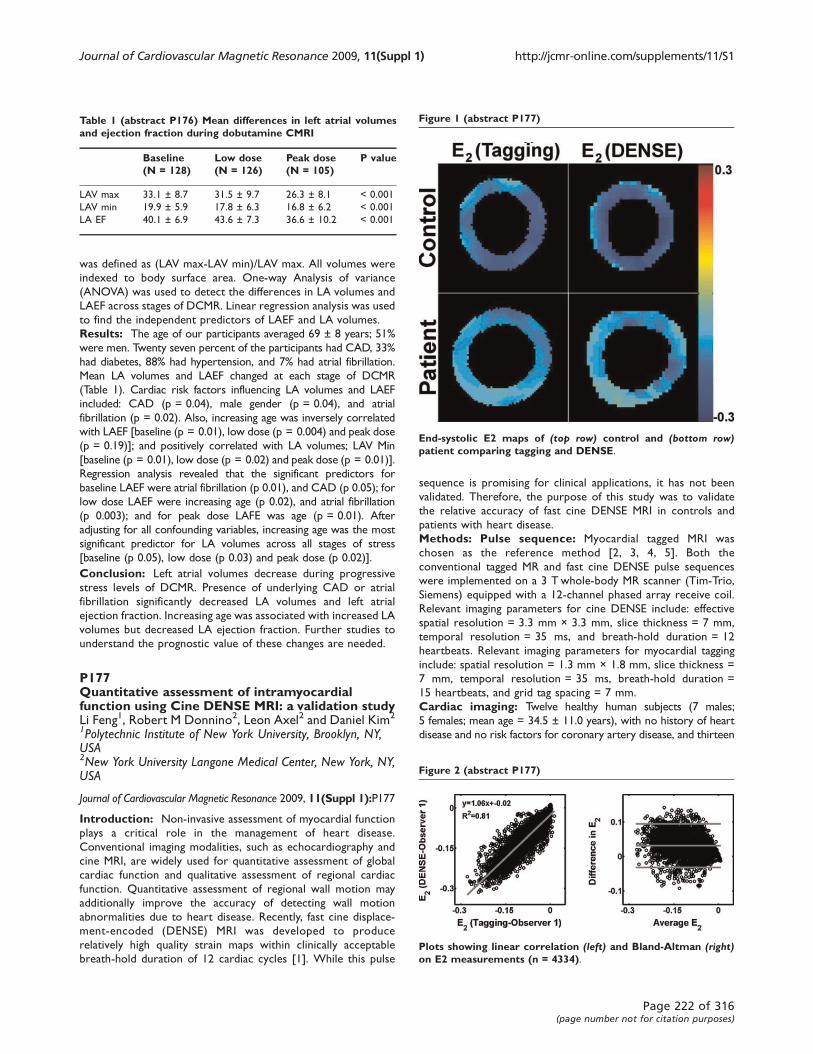
was defined as (LAV max-LAV min)/LAV max. All volumes were
indexed to body surface area. One-way Analysis of variance
(ANOVA) was used to detect the differences in LA volumes and
LAEF across stages of DCMR. Linear regression analysis was used
to find the independent predictors of LAEF and LA volumes.
Results: The age of our participants averaged 69 ± 8 years; 51%
were men. Twenty seven percent of the participants had CAD, 33%
had diabetes, 88% had hypertension, and 7% had atrial fibrillation.
Mean LA volumes and LAEF changed at each stage of DCMR
(Table 1). Cardiac risk factors influencing LA volumes and LAEF
included: CAD (p = 0.04), male gender (p = 0.04), and atrial
fibrillation (p = 0.02). Also, increasing age was inversely correlated
with LAEF [baseline (p = 0.01), low dose (p = 0.004) and peak dose
(p = 0.19)]; and positively correlated with LA volumes; LAV Min
[baseline (p = 0.01), low dose (p = 0.02) and peak dose (p = 0.01)].
Regression analysis revealed that the significant predictors for
baseline LAEF were atrial fibrillation (p 0.01), and CAD (p 0.05); for
low dose LAEF were increasing age (p 0.02), and atrial fibrillation
(p 0.003); and for peak dose LAFE was age (p = 0.01). After
adjusting for all confounding variables, increasing age was the most
significant predictor for LA volumes across all stages of stress
[baseline (p 0.05), low dose (p 0.03) and peak dose (p 0.02)].
Conclusion: Left atrial volumes decrease during progressive
stress levels of DCMR. Presence of underlying CAD or atrial
fibrillation significantly decreased LA volumes and left atrial
ejection fraction. Increasing age was associated with increased LA
volumes but decreased LA ejection fraction. Further studies to
understand the prognostic value of these changes are needed.
P177Quantitative assessment of intramyocardialfunction using Cine DENSE MRI: a validation studyLi Feng1, Robert M Donnino2, Leon Axel2 and Daniel Kim2
1Polytechnic Institute of New York University, Brooklyn, NY,USA2New York University Langone Medical Center, New York, NY,USA
Journal of Cardiovascular Magnetic Resonance 2009, 11(Suppl 1):P177
Introduction: Non-invasive assessment of myocardial function
plays a critical role in the management of heart disease.
Conventional imaging modalities, such as echocardiography and
cine MRI, are widely used for quantitative assessment of global
cardiac function and qualitative assessment of regional cardiac
function. Quantitative assessment of regional wall motion may
additionally improve the accuracy of detecting wall motion
abnormalities due to heart disease. Recently, fast cine displace-
ment-encoded (DENSE) MRI was developed to produce
relatively high quality strain maps within clinically acceptable
breath-hold duration of 12 cardiac cycles [1]. While this pulse
sequence is promising for clinical applications, it has not been
validated. Therefore, the purpose of this study was to validate
the relative accuracy of fast cine DENSE MRI in controls and
patients with heart disease.
Methods: Pulse sequence: Myocardial tagged MRI was
chosen as the reference method [2, 3, 4, 5]. Both the
conventional tagged MR and fast cine DENSE pulse sequences
were implemented on a 3 T whole-body MR scanner (Tim-Trio,
Siemens) equipped with a 12-channel phased array receive coil.
Relevant imaging parameters for cine DENSE include: effective
spatial resolution = 3.3 mm × 3.3 mm, slice thickness = 7 mm,
temporal resolution = 35 ms, and breath-hold duration = 12
heartbeats. Relevant imaging parameters for myocardial tagging
include: spatial resolution = 1.3 mm × 1.8 mm, slice thickness =
7 mm, temporal resolution = 35 ms, breath-hold duration =
15 heartbeats, and grid tag spacing = 7 mm.
Cardiac imaging: Twelve healthy human subjects (7 males;
5 females; mean age = 34.5 ± 11.0 years), with no history of heart
disease and no risk factors for coronary artery disease, and thirteen
Table 1 (abstract P176) Mean differences in left atrial volumesand ejection fraction during dobutamine CMRI
Baseline(N = 128)
Low dose(N = 126)
Peak dose(N = 105)
P value
LAV max 33.1 ± 8.7 31.5 ± 9.7 26.3 ± 8.1 < 0.001
LAV min 19.9 ± 5.9 17.8 ± 6.3 16.8 ± 6.2 < 0.001
LA EF 40.1 ± 6.9 43.6 ± 7.3 36.6 ± 10.2 < 0.001
Figure 1 (abstract P177)
End-systolic E2 maps of (top row) control and (bottom row)patient comparing tagging and DENSE.
Figure 2 (abstract P177)
Plots showing linear correlation (left) and Bland-Altman (right)on E2 measurements (n = 4334).
Journal of Cardiovascular Magnetic Resonance 2009, 11(Suppl 1) http://jcmr-online.com/supplements/11/S1
Page 222 of 316(page number not for citation purposes)
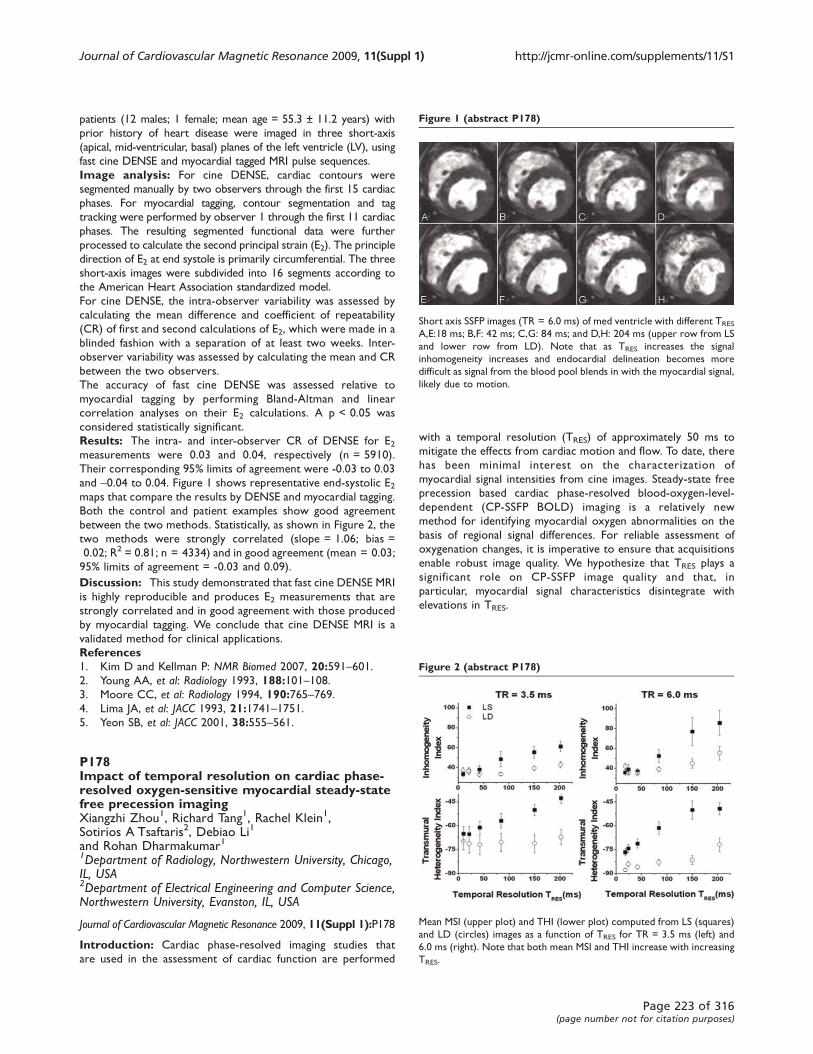
patients (12 males; 1 female; mean age = 55.3 ± 11.2 years) with
prior history of heart disease were imaged in three short-axis
(apical, mid-ventricular, basal) planes of the left ventricle (LV), using
fast cine DENSE and myocardial tagged MRI pulse sequences.
Image analysis: For cine DENSE, cardiac contours were
segmented manually by two observers through the first 15 cardiac
phases. For myocardial tagging, contour segmentation and tag
tracking were performed by observer 1 through the first 11 cardiac
phases. The resulting segmented functional data were further
processed to calculate the second principal strain (E2). The principle
direction of E2 at end systole is primarily circumferential. The three
short-axis images were subdivided into 16 segments according to
the American Heart Association standardized model.
For cine DENSE, the intra-observer variability was assessed by
calculating the mean difference and coefficient of repeatability
(CR) of first and second calculations of E2, which were made in a
blinded fashion with a separation of at least two weeks. Inter-
observer variability was assessed by calculating the mean and CR
between the two observers.
The accuracy of fast cine DENSE was assessed relative to
myocardial tagging by performing Bland-Altman and linear
correlation analyses on their E2 calculations. A p < 0.05 was
considered statistically significant.
Results: The intra- and inter-observer CR of DENSE for E2measurements were 0.03 and 0.04, respectively (n = 5910).
Their corresponding 95% limits of agreement were -0.03 to 0.03
and -0.04 to 0.04. Figure 1 shows representative end-systolic E2maps that compare the results by DENSE and myocardial tagging.
Both the control and patient examples show good agreement
between the two methods. Statistically, as shown in Figure 2, the
two methods were strongly correlated (slope = 1.06; bias =
0.02; R2 = 0.81; n = 4334) and in good agreement (mean = 0.03;
95% limits of agreement = -0.03 and 0.09).
Discussion: This study demonstrated that fast cine DENSE MRI
is highly reproducible and produces E2 measurements that are
strongly correlated and in good agreement with those produced
by myocardial tagging. We conclude that cine DENSE MRI is a
validated method for clinical applications.
References1. Kim D and Kellman P: NMR Biomed 2007, 20:591–601.2. Young AA, et al: Radiology 1993, 188:101–108.3. Moore CC, et al: Radiology 1994, 190:765–769.4. Lima JA, et al: JACC 1993, 21:1741–1751.5. Yeon SB, et al: JACC 2001, 38:555–561.
P178Impact of temporal resolution on cardiac phase-resolved oxygen-sensitive myocardial steady-statefree precession imagingXiangzhi Zhou1, Richard Tang1, Rachel Klein1,Sotirios A Tsaftaris2, Debiao Li1
and Rohan Dharmakumar11Department of Radiology, Northwestern University, Chicago,IL, USA2Department of Electrical Engineering and Computer Science,Northwestern University, Evanston, IL, USA
Journal of Cardiovascular Magnetic Resonance 2009, 11(Suppl 1):P178
Introduction: Cardiac phase-resolved imaging studies that
are used in the assessment of cardiac function are performed
with a temporal resolution (TRES) of approximately 50 ms to
mitigate the effects from cardiac motion and flow. To date, there
has been minimal interest on the characterization of
myocardial signal intensities from cine images. Steady-state free
precession based cardiac phase-resolved blood-oxygen-level-
dependent (CP-SSFP BOLD) imaging is a relatively new
method for identifying myocardial oxygen abnormalities on the
basis of regional signal differences. For reliable assessment of
oxygenation changes, it is imperative to ensure that acquisitions
enable robust image quality. We hypothesize that TRES plays a
significant role on CP-SSFP image quality and that, in
particular, myocardial signal characteristics disintegrate with
elevations in TRES.
Figure 1 (abstract P178)
Short axis SSFP images (TR = 6.0 ms) of med ventricle with different TRES
A,E:18 ms; B,F: 42 ms; C,G: 84 ms; and D,H: 204 ms (upper row from LS
and lower row from LD). Note that as TRES increases the signal
inhomogeneity increases and endocardial delineation becomes more
difficult as signal from the blood pool blends in with the myocardial signal,
likely due to motion.
Figure 2 (abstract P178)
Mean MSI (upper plot) and THI (lower plot) computed from LS (squares)
and LD (circles) images as a function of TRES for TR = 3.5 ms (left) and
6.0 ms (right). Note that both mean MSI and THI increase with increasing
TRES.
Journal of Cardiovascular Magnetic Resonance 2009, 11(Suppl 1) http://jcmr-online.com/supplements/11/S1
Page 223 of 316(page number not for citation purposes)
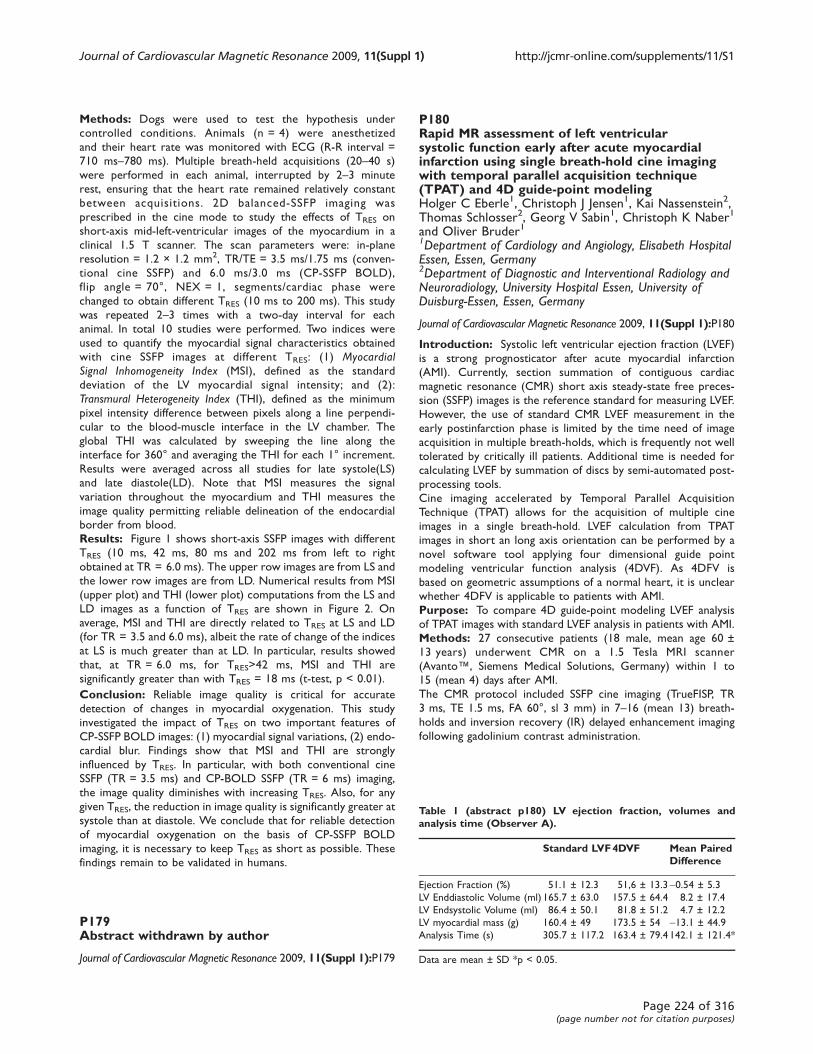
Methods: Dogs were used to test the hypothesis under
controlled conditions. Animals (n = 4) were anesthetized
and their heart rate was monitored with ECG (R-R interval =
710 ms–780 ms). Multiple breath-held acquisitions (20–40 s)
were performed in each animal, interrupted by 2–3 minute
rest, ensuring that the heart rate remained relatively constant
between acquisitions. 2D balanced-SSFP imaging was
prescribed in the cine mode to study the effects of TRES on
short-axis mid-left-ventricular images of the myocardium in a
clinical 1.5 T scanner. The scan parameters were: in-plane
resolution = 1.2 × 1.2 mm2, TR/TE = 3.5 ms/1.75 ms (conven-
tional cine SSFP) and 6.0 ms/3.0 ms (CP-SSFP BOLD),
flip angle = 70°, NEX = 1, segments/cardiac phase were
changed to obtain different TRES (10 ms to 200 ms). This study
was repeated 2–3 times with a two-day interval for each
animal. In total 10 studies were performed. Two indices were
used to quantify the myocardial signal characteristics obtained
with cine SSFP images at different TRES: (1) MyocardialSignal Inhomogeneity Index (MSI), defined as the standard
deviation of the LV myocardial signal intensity; and (2):
Transmural Heterogeneity Index (THI), defined as the minimum
pixel intensity difference between pixels along a line perpendi-
cular to the blood-muscle interface in the LV chamber. The
global THI was calculated by sweeping the line along the
interface for 360° and averaging the THI for each 1° increment.
Results were averaged across all studies for late systole(LS)
and late diastole(LD). Note that MSI measures the signal
variation throughout the myocardium and THI measures the
image quality permitting reliable delineation of the endocardial
border from blood.
Results: Figure 1 shows short-axis SSFP images with different
TRES (10 ms, 42 ms, 80 ms and 202 ms from left to right
obtained at TR = 6.0 ms). The upper row images are from LS and
the lower row images are from LD. Numerical results from MSI
(upper plot) and THI (lower plot) computations from the LS and
LD images as a function of TRES are shown in Figure 2. On
average, MSI and THI are directly related to TRES at LS and LD
(for TR = 3.5 and 6.0 ms), albeit the rate of change of the indices
at LS is much greater than at LD. In particular, results showed
that, at TR = 6.0 ms, for TRES>42 ms, MSI and THI are
significantly greater than with TRES = 18 ms (t-test, p < 0.01).
Conclusion: Reliable image quality is critical for accurate
detection of changes in myocardial oxygenation. This study
investigated the impact of TRES on two important features of
CP-SSFP BOLD images: (1) myocardial signal variations, (2) endo-
cardial blur. Findings show that MSI and THI are strongly
influenced by TRES. In particular, with both conventional cine
SSFP (TR = 3.5 ms) and CP-BOLD SSFP (TR = 6 ms) imaging,
the image quality diminishes with increasing TRES. Also, for any
given TRES, the reduction in image quality is significantly greater at
systole than at diastole. We conclude that for reliable detection
of myocardial oxygenation on the basis of CP-SSFP BOLD
imaging, it is necessary to keep TRES as short as possible. These
findings remain to be validated in humans.
P179Abstract withdrawn by author
Journal of Cardiovascular Magnetic Resonance 2009, 11(Suppl 1):P179
P180Rapid MR assessment of left ventricularsystolic function early after acute myocardialinfarction using single breath-hold cine imagingwith temporal parallel acquisition technique(TPAT) and 4D guide-point modelingHolger C Eberle1, Christoph J Jensen1, Kai Nassenstein2,Thomas Schlosser2, Georg V Sabin1, Christoph K Naber1
and Oliver Bruder11Department of Cardiology and Angiology, Elisabeth HospitalEssen, Essen, Germany2Department of Diagnostic and Interventional Radiology andNeuroradiology, University Hospital Essen, University ofDuisburg-Essen, Essen, Germany
Journal of Cardiovascular Magnetic Resonance 2009, 11(Suppl 1):P180
Introduction: Systolic left ventricular ejection fraction (LVEF)
is a strong prognosticator after acute myocardial infarction
(AMI). Currently, section summation of contiguous cardiac
magnetic resonance (CMR) short axis steady-state free preces-
sion (SSFP) images is the reference standard for measuring LVEF.
However, the use of standard CMR LVEF measurement in the
early postinfarction phase is limited by the time need of image
acquisition in multiple breath-holds, which is frequently not well
tolerated by critically ill patients. Additional time is needed for
calculating LVEF by summation of discs by semi-automated post-
processing tools.
Cine imaging accelerated by Temporal Parallel Acquisition
Technique (TPAT) allows for the acquisition of multiple cine
images in a single breath-hold. LVEF calculation from TPAT
images in short an long axis orientation can be performed by a
novel software tool applying four dimensional guide point
modeling ventricular function analysis (4DVF). As 4DFV is
based on geometric assumptions of a normal heart, it is unclear
whether 4DFV is applicable to patients with AMI.
Purpose: To compare 4D guide-point modeling LVEF analysis
of TPAT images with standard LVEF analysis in patients with AMI.
Methods: 27 consecutive patients (18 male, mean age 60 ±
13 years) underwent CMR on a 1.5 Tesla MRI scanner
(Avanto™, Siemens Medical Solutions, Germany) within 1 to
15 (mean 4) days after AMI.
The CMR protocol included SSFP cine imaging (TrueFISP, TR
3 ms, TE 1.5 ms, FA 60°, sl 3 mm) in 7–16 (mean 13) breath-
holds and inversion recovery (IR) delayed enhancement imaging
following gadolinium contrast administration.
Table 1 (abstract p180) LV ejection fraction, volumes andanalysis time (Observer A).
Standard LVF4DVF Mean PairedDifference
Ejection Fraction (%) 51.1 ± 12.3 51,6 ± 13.3-0.54 ± 5.3
LV Enddiastolic Volume (ml) 165.7 ± 63.0 157.5 ± 64.4 8.2 ± 17.4
LV Endsystolic Volume (ml) 86.4 ± 50.1 81.8 ± 51.2 4.7 ± 12.2
LV myocardial mass (g) 160.4 ± 49 173.5 ± 54 -13.1 ± 44.9
Analysis Time (s) 305.7 ± 117.2 163.4 ± 79.4 142.1 ± 121.4*
Data are mean ± SD *p < 0.05.
Journal of Cardiovascular Magnetic Resonance 2009, 11(Suppl 1) http://jcmr-online.com/supplements/11/S1
Page 224 of 316(page number not for citation purposes)
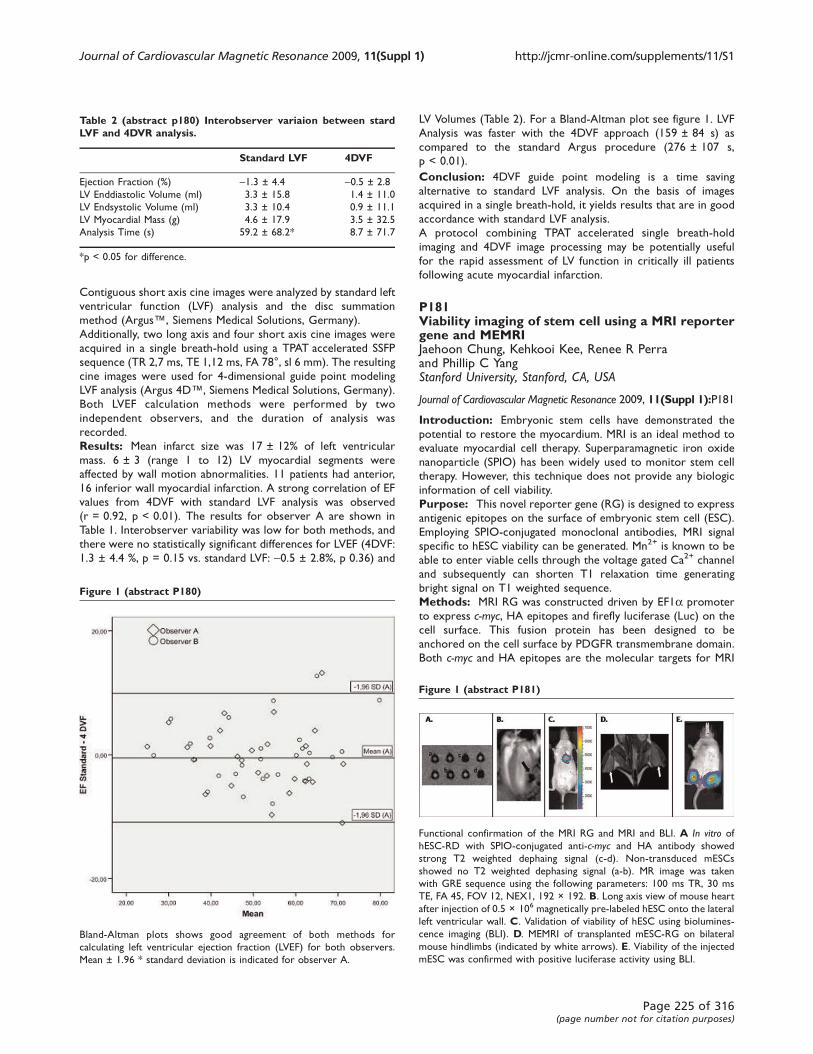
Contiguous short axis cine images were analyzed by standard left
ventricular function (LVF) analysis and the disc summation
method (Argus™, Siemens Medical Solutions, Germany).
Additionally, two long axis and four short axis cine images were
acquired in a single breath-hold using a TPAT accelerated SSFP
sequence (TR 2,7 ms, TE 1,12 ms, FA 78°, sl 6 mm). The resulting
cine images were used for 4-dimensional guide point modeling
LVF analysis (Argus 4D™, Siemens Medical Solutions, Germany).
Both LVEF calculation methods were performed by two
independent observers, and the duration of analysis was
recorded.
Results: Mean infarct size was 17 ± 12% of left ventricular
mass. 6 ± 3 (range 1 to 12) LV myocardial segments were
affected by wall motion abnormalities. 11 patients had anterior,
16 inferior wall myocardial infarction. A strong correlation of EF
values from 4DVF with standard LVF analysis was observed
(r = 0.92, p < 0.01). The results for observer A are shown in
Table 1. Interobserver variability was low for both methods, and
there were no statistically significant differences for LVEF (4DVF:
1.3 ± 4.4 %, p = 0.15 vs. standard LVF: -0.5 ± 2.8%, p 0.36) and
LV Volumes (Table 2). For a Bland-Altman plot see figure 1. LVF
Analysis was faster with the 4DVF approach (159 ± 84 s) as
compared to the standard Argus procedure (276 ± 107 s,
p < 0.01).
Conclusion: 4DVF guide point modeling is a time saving
alternative to standard LVF analysis. On the basis of images
acquired in a single breath-hold, it yields results that are in good
accordance with standard LVF analysis.
A protocol combining TPAT accelerated single breath-hold
imaging and 4DVF image processing may be potentially useful
for the rapid assessment of LV function in critically ill patients
following acute myocardial infarction.
P181Viability imaging of stem cell using a MRI reportergene and MEMRIJaehoon Chung, Kehkooi Kee, Renee R Perraand Phillip C YangStanford University, Stanford, CA, USA
Journal of Cardiovascular Magnetic Resonance 2009, 11(Suppl 1):P181
Introduction: Embryonic stem cells have demonstrated the
potential to restore the myocardium. MRI is an ideal method to
evaluate myocardial cell therapy. Superparamagnetic iron oxide
nanoparticle (SPIO) has been widely used to monitor stem cell
therapy. However, this technique does not provide any biologic
information of cell viability.
Purpose: This novel reporter gene (RG) is designed to express
antigenic epitopes on the surface of embryonic stem cell (ESC).
Employing SPIO-conjugated monoclonal antibodies, MRI signal
specific to hESC viability can be generated. Mn2+ is known to be
able to enter viable cells through the voltage gated Ca2+ channel
and subsequently can shorten T1 relaxation time generating
bright signal on T1 weighted sequence.
Methods: MRI RG was constructed driven by EF1a promoter
to express c-myc, HA epitopes and firefly luciferase (Luc) on the
cell surface. This fusion protein has been designed to be
anchored on the cell surface by PDGFR transmembrane domain.
Both c-myc and HA epitopes are the molecular targets for MRI
Table 2 (abstract p180) Interobserver variaion between stardLVF and 4DVR analysis.
Standard LVF 4DVF
Ejection Fraction (%) -1.3 ± 4.4 -0.5 ± 2.8
LV Enddiastolic Volume (ml) 3.3 ± 15.8 1.4 ± 11.0
LV Endsystolic Volume (ml) 3.3 ± 10.4 0.9 ± 11.1
LV Myocardial Mass (g) 4.6 ± 17.9 3.5 ± 32.5
Analysis Time (s) 59.2 ± 68.2* 8.7 ± 71.7
*p < 0.05 for difference.
Figure 1 (abstract P180)
Bland-Altman plots shows good agreement of both methods for
calculating left ventricular ejection fraction (LVEF) for both observers.
Mean ± 1.96 * standard deviation is indicated for observer A.
Figure 1 (abstract P181)
Functional confirmation of the MRI RG and MRI and BLI. A In vitro of
hESC-RD with SPIO-conjugated anti-c-myc and HA antibody showed
strong T2 weighted dephaing signal (c-d). Non-transduced mESCs
showed no T2 weighted dephasing signal (a-b). MR image was taken
with GRE sequence using the following parameters: 100 ms TR, 30 ms
TE, FA 45, FOV 12, NEX1, 192 × 192. B. Long axis view of mouse heart
after injection of 0.5 × 10⁶ magnetically pre-labeled hESC onto the lateral
left ventricular wall. C. Validation of viability of hESC using biolumines-
cence imaging (BLI). D. MEMRI of transplanted mESC-RG on bilateral
mouse hindlimbs (indicated by white arrows). E. Viability of the injected
mESC was confirmed with positive luciferase activity using BLI.
Journal of Cardiovascular Magnetic Resonance 2009, 11(Suppl 1) http://jcmr-online.com/supplements/11/S1
Page 225 of 316(page number not for citation purposes)
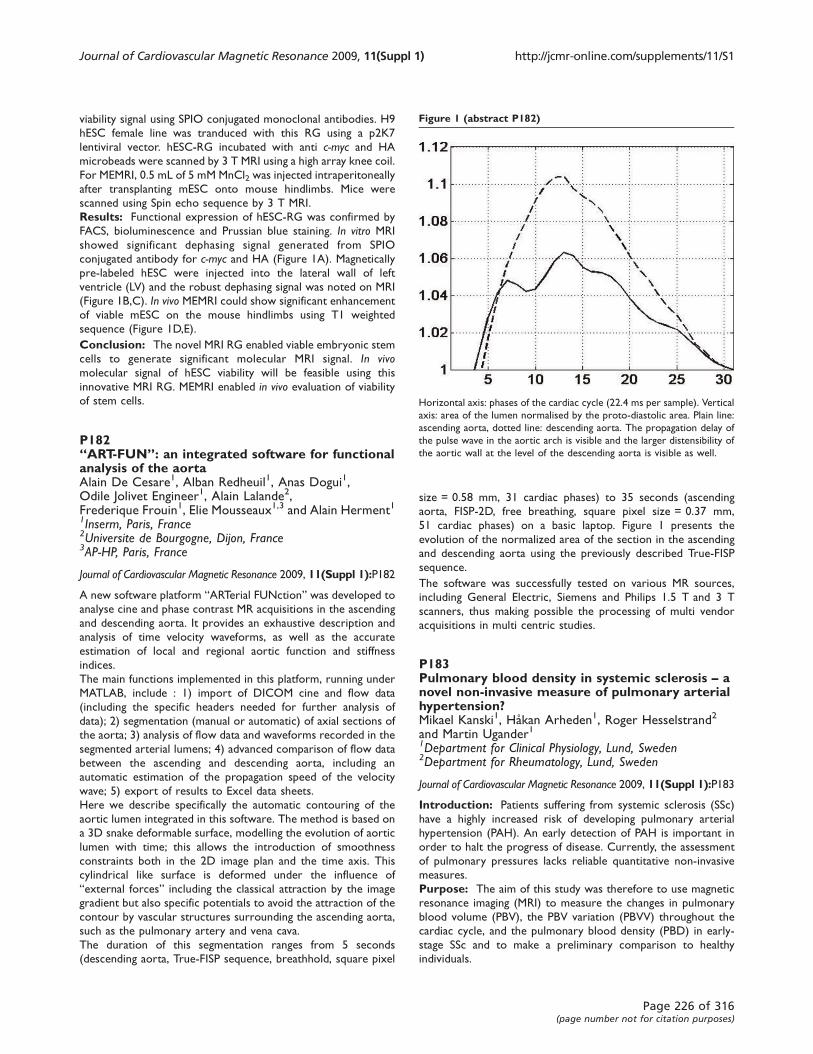
viability signal using SPIO conjugated monoclonal antibodies. H9
hESC female line was tranduced with this RG using a p2K7
lentiviral vector. hESC-RG incubated with anti c-myc and HA
microbeads were scanned by 3 T MRI using a high array knee coil.
For MEMRI, 0.5 mL of 5 mM MnCl2 was injected intraperitoneally
after transplanting mESC onto mouse hindlimbs. Mice were
scanned using Spin echo sequence by 3 T MRI.
Results: Functional expression of hESC-RG was confirmed by
FACS, bioluminescence and Prussian blue staining. In vitro MRI
showed significant dephasing signal generated from SPIO
conjugated antibody for c-myc and HA (Figure 1A). Magnetically
pre-labeled hESC were injected into the lateral wall of left
ventricle (LV) and the robust dephasing signal was noted on MRI
(Figure 1B,C). In vivo MEMRI could show significant enhancement
of viable mESC on the mouse hindlimbs using T1 weighted
sequence (Figure 1D,E).
Conclusion: The novel MRI RG enabled viable embryonic stem
cells to generate significant molecular MRI signal. In vivomolecular signal of hESC viability will be feasible using this
innovative MRI RG. MEMRI enabled in vivo evaluation of viability
of stem cells.
P182“ART-FUN”: an integrated software for functionalanalysis of the aortaAlain De Cesare1, Alban Redheuil1, Anas Dogui1,Odile Jolivet Engineer1, Alain Lalande2,Frederique Frouin1, Elie Mousseaux1,3 and Alain Herment11Inserm, Paris, France2Universite de Bourgogne, Dijon, France3AP-HP, Paris, France
Journal of Cardiovascular Magnetic Resonance 2009, 11(Suppl 1):P182
A new software platform “ARTerial FUNction” was developed to
analyse cine and phase contrast MR acquisitions in the ascending
and descending aorta. It provides an exhaustive description and
analysis of time velocity waveforms, as well as the accurate
estimation of local and regional aortic function and stiffness
indices.
The main functions implemented in this platform, running under
MATLAB, include : 1) import of DICOM cine and flow data
(including the specific headers needed for further analysis of
data); 2) segmentation (manual or automatic) of axial sections of
the aorta; 3) analysis of flow data and waveforms recorded in the
segmented arterial lumens; 4) advanced comparison of flow data
between the ascending and descending aorta, including an
automatic estimation of the propagation speed of the velocity
wave; 5) export of results to Excel data sheets.
Here we describe specifically the automatic contouring of the
aortic lumen integrated in this software. The method is based on
a 3D snake deformable surface, modelling the evolution of aortic
lumen with time; this allows the introduction of smoothness
constraints both in the 2D image plan and the time axis. This
cylindrical like surface is deformed under the influence of
“external forces” including the classical attraction by the image
gradient but also specific potentials to avoid the attraction of the
contour by vascular structures surrounding the ascending aorta,
such as the pulmonary artery and vena cava.
The duration of this segmentation ranges from 5 seconds
(descending aorta, True-FISP sequence, breathhold, square pixel
size = 0.58 mm, 31 cardiac phases) to 35 seconds (ascending
aorta, FISP-2D, free breathing, square pixel size = 0.37 mm,
51 cardiac phases) on a basic laptop. Figure 1 presents the
evolution of the normalized area of the section in the ascending
and descending aorta using the previously described True-FISP
sequence.
The software was successfully tested on various MR sources,
including General Electric, Siemens and Philips 1.5 T and 3 T
scanners, thus making possible the processing of multi vendor
acquisitions in multi centric studies.
P183Pulmonary blood density in systemic sclerosis – anovel non-invasive measure of pulmonary arterialhypertension?Mikael Kanski1, Håkan Arheden1, Roger Hesselstrand2
and Martin Ugander11Department for Clinical Physiology, Lund, Sweden2Department for Rheumatology, Lund, Sweden
Journal of Cardiovascular Magnetic Resonance 2009, 11(Suppl 1):P183
Introduction: Patients suffering from systemic sclerosis (SSc)
have a highly increased risk of developing pulmonary arterial
hypertension (PAH). An early detection of PAH is important in
order to halt the progress of disease. Currently, the assessment
of pulmonary pressures lacks reliable quantitative non-invasive
measures.
Purpose: The aim of this study was therefore to use magnetic
resonance imaging (MRI) to measure the changes in pulmonary
blood volume (PBV), the PBV variation (PBVV) throughout the
cardiac cycle, and the pulmonary blood density (PBD) in early-
stage SSc and to make a preliminary comparison to healthy
individuals.
Figure 1 (abstract P182)
Horizontal axis: phases of the cardiac cycle (22.4 ms per sample). Vertical
axis: area of the lumen normalised by the proto-diastolic area. Plain line:
ascending aorta, dotted line: descending aorta. The propagation delay of
the pulse wave in the aortic arch is visible and the larger distensibility of
the aortic wall at the level of the descending aorta is visible as well.
Journal of Cardiovascular Magnetic Resonance 2009, 11(Suppl 1) http://jcmr-online.com/supplements/11/S1
Page 226 of 316(page number not for citation purposes)

Methods: Thirty-nine SSc patients (25 women and 14 men,
31–81 years, mean 58 years) and healthy patients and healthy
volunteers (three women and 10 men, 21–45 years, mean 26)
underwent cardiac MRI. PBV was calculated as the product of
cardiac output determined by velocity encoded MRI, and the
pulmonary transit time (PTT) determined as the time for a 2 ml
intravenously administered contrast bolus to pass from the
pulmonary trunk to the left atrium. The lung volume was
determined by planimetry using transversal MR images covering
the lungs. The PBD was defined as the PBV divided by the lung
volume. Also, the blood flow in the pulmonary artery and the
pulmonary veins was measured using velocity encoded MRI. The
PBVV was calculated by integration of the difference in arterial
and venous pulmonary flow over the cardiac. PBV and PBD was
measured in three patients (all men, 24, 34, and 45 years,
respectively) who showed to be healthy. In 10 healthy volunteers
(three women and 7 men, 21–30 years, mean 24 years), the
PBVV was assessed. The SSc patients were then compared to the
healthy subjects considering PBV and PBD, and PBVV, respec-
tively.
Results: Stroke volume, PBV and PBD in 36 SSc patients and
three healthy subjects were respectively (mean ± SD)
77 ± 20 ml vs 94 ± 11 ml, 467 ± 111 ml vs 552 ± 99 ml, and
17 ± 5% vs 19 ± 6%. PBVV in 32 SSc patients and 10 healthy
individuals were respectively 31 ± 9 ml vs 45 ± 14 ml.
Conclusion: This study is the first to show the feasibility to
assess the PBD using MRI. Preliminary data shows no difference
between newly diagnosed SSc patients and healthy individuals
considering PBD. The PBD may be a useful prognostic non-
invasive measure of PAH and cardiac failure. Therefore, further
studies are needed to reveal the importance of the PBD in these
contexts.
P1844D flow evaluation of abnormal flow patterns withbicuspid aortic valveMichael D Hope1, Alison K Meadows1, Thomas A Hope1,Karen G Ordovas1, David Saloner1, Gautham P Reddy2,Marcus T Alley3 and Charles B Higgins11UCSF, San Francisco, CA, USA2University of Washington, Seattle, WA, USA3Stanford, Palo Alto, CA, USA
Journal of Cardiovascular Magnetic Resonance 2009, 11(Suppl 1):P184
Introduction: Bicuspid aortic valve (BAV) is the most common
congenital heart defect and may account for more morbidity and
mortality than all other congenital cardiac malformations
combined. Two theories are commonly discussed for the
elevated risk of aortic aneurysm and dissection in patients with
BAV: 1) an increased hemodynamic load placed on the proximal
aorta results in progressive dilatation and 2) a genetic or
developmental abnormality in the proximal aortic tissue leads to
weakness of the aortic wall.
Purpose: This study utilizes 4D Flow to collect multidirectional
blood flow velocity data in the thoracic aorta of patients with
BAV. The goal of the study is to characterize altered flow
patterns in these patients and uncover potential hemodynamic
contributors to aneurysm and dissection formation.
Methods: Time-resolved, 3D phase contrast MRI (4D Flow)
was employed to assess thoracic aortic blood flow in
12 individuals: 8 patients with bicuspid aortic valve and 4 healthy
subjects. The technique, which has been previously validated, was
performed with parallel imaging after the standard clinical MR
evaluation.
Results: 4D Flow evaluation of the ascending thoracic aorta
revealed markedly abnormal systolic helical flow in 6 of 8 patients
with bicuspid aortic valve. Five of these patients demonstrated an
eccentric right anterior systolic jet and right-handed helical flow;
at least two of these patients had fusion of the right and left
coronary cusps, and three had aneurysms of the ascending aorta
along with aortic stenosis and/or regurgitation. The other patient
Figure 1 (abstract P184)
Journal of Cardiovascular Magnetic Resonance 2009, 11(Suppl 1) http://jcmr-online.com/supplements/11/S1
Page 227 of 316(page number not for citation purposes)
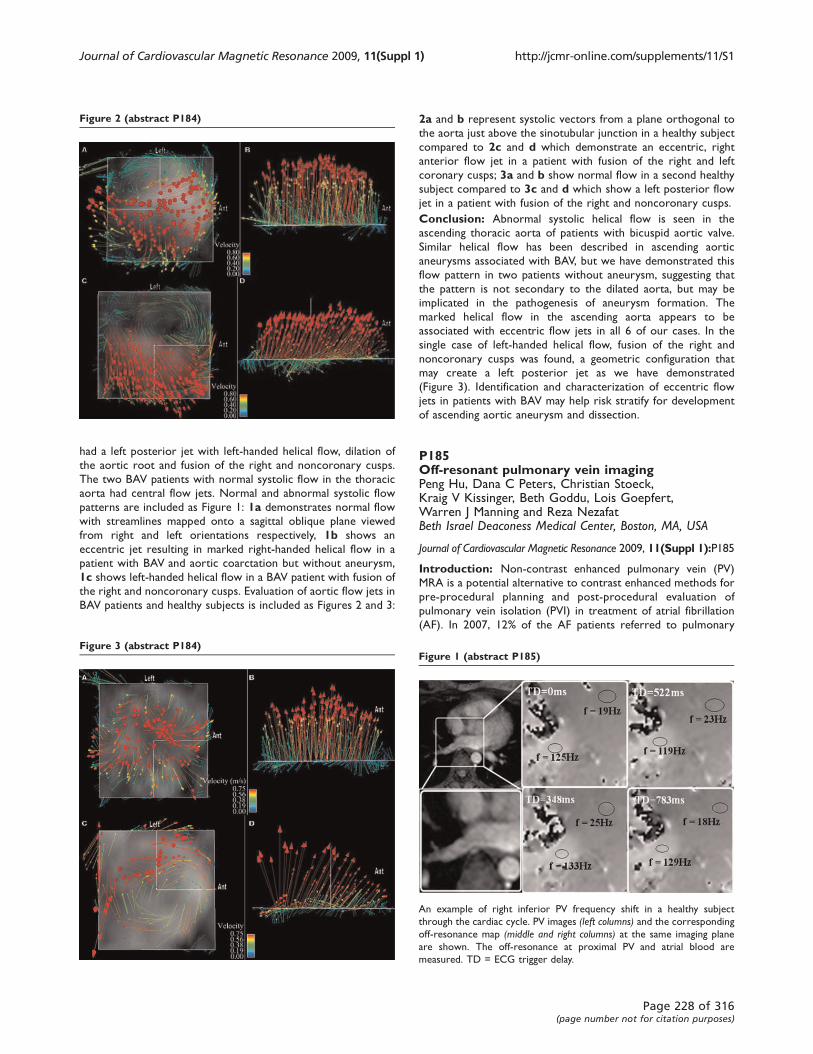
had a left posterior jet with left-handed helical flow, dilation of
the aortic root and fusion of the right and noncoronary cusps.
The two BAV patients with normal systolic flow in the thoracic
aorta had central flow jets. Normal and abnormal systolic flow
patterns are included as Figure 1: 1a demonstrates normal flow
with streamlines mapped onto a sagittal oblique plane viewed
from right and left orientations respectively, 1b shows an
eccentric jet resulting in marked right-handed helical flow in a
patient with BAV and aortic coarctation but without aneurysm,
1c shows left-handed helical flow in a BAV patient with fusion of
the right and noncoronary cusps. Evaluation of aortic flow jets in
BAV patients and healthy subjects is included as Figures 2 and 3:
2a and b represent systolic vectors from a plane orthogonal to
the aorta just above the sinotubular junction in a healthy subject
compared to 2c and d which demonstrate an eccentric, right
anterior flow jet in a patient with fusion of the right and left
coronary cusps; 3a and b show normal flow in a second healthy
subject compared to 3c and d which show a left posterior flow
jet in a patient with fusion of the right and noncoronary cusps.
Conclusion: Abnormal systolic helical flow is seen in the
ascending thoracic aorta of patients with bicuspid aortic valve.
Similar helical flow has been described in ascending aortic
aneurysms associated with BAV, but we have demonstrated this
flow pattern in two patients without aneurysm, suggesting that
the pattern is not secondary to the dilated aorta, but may be
implicated in the pathogenesis of aneurysm formation. The
marked helical flow in the ascending aorta appears to be
associated with eccentric flow jets in all 6 of our cases. In the
single case of left-handed helical flow, fusion of the right and
noncoronary cusps was found, a geometric configuration that
may create a left posterior jet as we have demonstrated
(Figure 3). Identification and characterization of eccentric flow
jets in patients with BAV may help risk stratify for development
of ascending aortic aneurysm and dissection.
P185Off-resonant pulmonary vein imagingPeng Hu, Dana C Peters, Christian Stoeck,Kraig V Kissinger, Beth Goddu, Lois Goepfert,Warren J Manning and Reza NezafatBeth Israel Deaconess Medical Center, Boston, MA, USA
Journal of Cardiovascular Magnetic Resonance 2009, 11(Suppl 1):P185
Introduction: Non-contrast enhanced pulmonary vein (PV)
MRA is a potential alternative to contrast enhanced methods for
pre-procedural planning and post-procedural evaluation of
pulmonary vein isolation (PVI) in treatment of atrial fibrillation
(AF). In 2007, 12% of the AF patients referred to pulmonary
Figure 2 (abstract P184)
Figure 3 (abstract P184)Figure 1 (abstract P185)
An example of right inferior PV frequency shift in a healthy subject
through the cardiac cycle. PV images (left columns) and the corresponding
off-resonance map (middle and right columns) at the same imaging plane
are shown. The off-resonance at proximal PV and atrial blood are
measured. TD = ECG trigger delay.
Journal of Cardiovascular Magnetic Resonance 2009, 11(Suppl 1) http://jcmr-online.com/supplements/11/S1
Page 228 of 316(page number not for citation purposes)
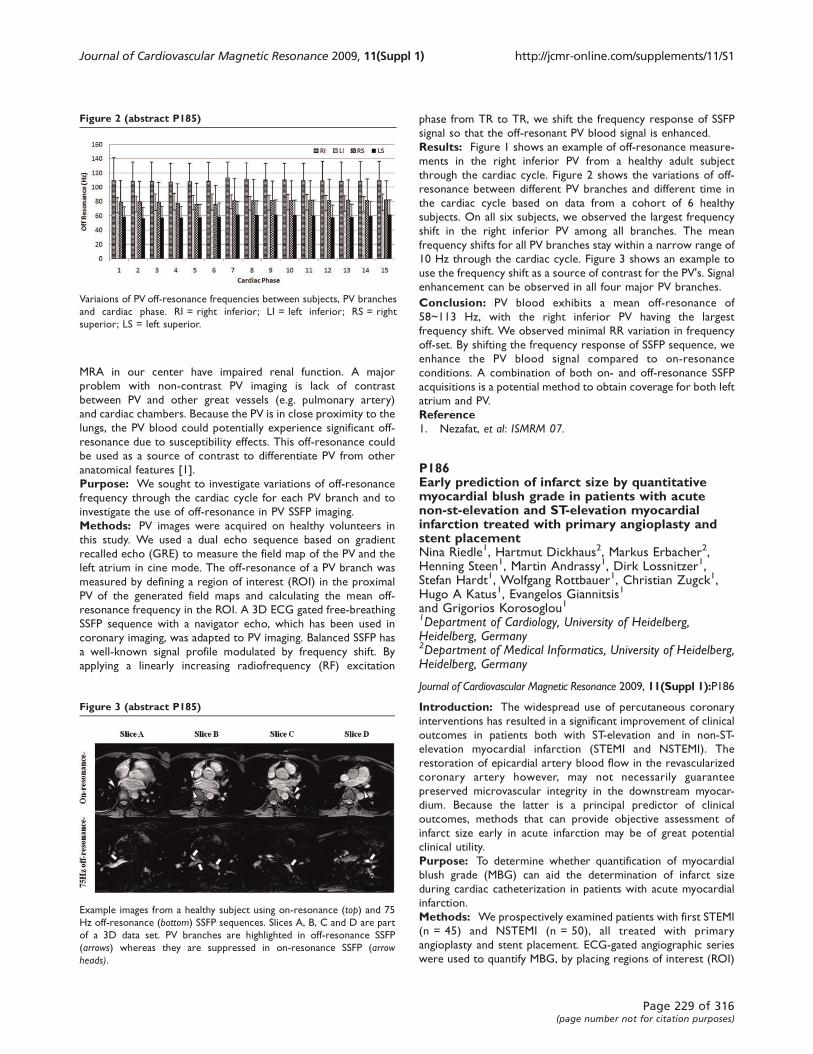
MRA in our center have impaired renal function. A major
problem with non-contrast PV imaging is lack of contrast
between PV and other great vessels (e.g. pulmonary artery)
and cardiac chambers. Because the PV is in close proximity to the
lungs, the PV blood could potentially experience significant off-
resonance due to susceptibility effects. This off-resonance could
be used as a source of contrast to differentiate PV from other
anatomical features [1].
Purpose: We sought to investigate variations of off-resonance
frequency through the cardiac cycle for each PV branch and to
investigate the use of off-resonance in PV SSFP imaging.
Methods: PV images were acquired on healthy volunteers in
this study. We used a dual echo sequence based on gradient
recalled echo (GRE) to measure the field map of the PV and the
left atrium in cine mode. The off-resonance of a PV branch was
measured by defining a region of interest (ROI) in the proximal
PV of the generated field maps and calculating the mean off-
resonance frequency in the ROI. A 3D ECG gated free-breathing
SSFP sequence with a navigator echo, which has been used in
coronary imaging, was adapted to PV imaging. Balanced SSFP has
a well-known signal profile modulated by frequency shift. By
applying a linearly increasing radiofrequency (RF) excitation
phase from TR to TR, we shift the frequency response of SSFP
signal so that the off-resonant PV blood signal is enhanced.
Results: Figure 1 shows an example of off-resonance measure-
ments in the right inferior PV from a healthy adult subject
through the cardiac cycle. Figure 2 shows the variations of off-
resonance between different PV branches and different time in
the cardiac cycle based on data from a cohort of 6 healthy
subjects. On all six subjects, we observed the largest frequency
shift in the right inferior PV among all branches. The mean
frequency shifts for all PV branches stay within a narrow range of
10 Hz through the cardiac cycle. Figure 3 shows an example to
use the frequency shift as a source of contrast for the PV's. Signal
enhancement can be observed in all four major PV branches.
Conclusion: PV blood exhibits a mean off-resonance of
58~113 Hz, with the right inferior PV having the largest
frequency shift. We observed minimal RR variation in frequency
off-set. By shifting the frequency response of SSFP sequence, we
enhance the PV blood signal compared to on-resonance
conditions. A combination of both on- and off-resonance SSFP
acquisitions is a potential method to obtain coverage for both left
atrium and PV.
Reference1. Nezafat, et al: ISMRM 07.
P186Early prediction of infarct size by quantitativemyocardial blush grade in patients with acutenon-st-elevation and ST-elevation myocardialinfarction treated with primary angioplasty andstent placementNina Riedle1, Hartmut Dickhaus2, Markus Erbacher2,Henning Steen1, Martin Andrassy1, Dirk Lossnitzer1,Stefan Hardt1, Wolfgang Rottbauer1, Christian Zugck1,Hugo A Katus1, Evangelos Giannitsis1
and Grigorios Korosoglou11Department of Cardiology, University of Heidelberg,Heidelberg, Germany2Department of Medical Informatics, University of Heidelberg,Heidelberg, Germany
Journal of Cardiovascular Magnetic Resonance 2009, 11(Suppl 1):P186
Introduction: The widespread use of percutaneous coronary
interventions has resulted in a significant improvement of clinical
outcomes in patients both with ST-elevation and in non-ST-
elevation myocardial infarction (STEMI and NSTEMI). The
restoration of epicardial artery blood flow in the revascularized
coronary artery however, may not necessarily guarantee
preserved microvascular integrity in the downstream myocar-
dium. Because the latter is a principal predictor of clinical
outcomes, methods that can provide objective assessment of
infarct size early in acute infarction may be of great potential
clinical utility.
Purpose: To determine whether quantification of myocardial
blush grade (MBG) can aid the determination of infarct size
during cardiac catheterization in patients with acute myocardial
infarction.
Methods: We prospectively examined patients with first STEMI
(n = 45) and NSTEMI (n = 50), all treated with primary
angioplasty and stent placement. ECG-gated angiographic series
were used to quantify MBG, by placing regions of interest (ROI)
Figure 2 (abstract P185)
Variaions of PV off-resonance frequencies between subjects, PV branches
and cardiac phase. RI = right inferior; LI = left inferior; RS = right
superior; LS = left superior.
Figure 3 (abstract P185)
Example images from a healthy subject using on-resonance (top) and 75
Hz off-resonance (bottom) SSFP sequences. Slices A, B, C and D are part
of a 3D data set. PV branches are highlighted in off-resonance SSFP
(arrows) whereas they are suppressed in on-resonance SSFP (arrowheads).
Journal of Cardiovascular Magnetic Resonance 2009, 11(Suppl 1) http://jcmr-online.com/supplements/11/S1
Page 229 of 316(page number not for citation purposes)
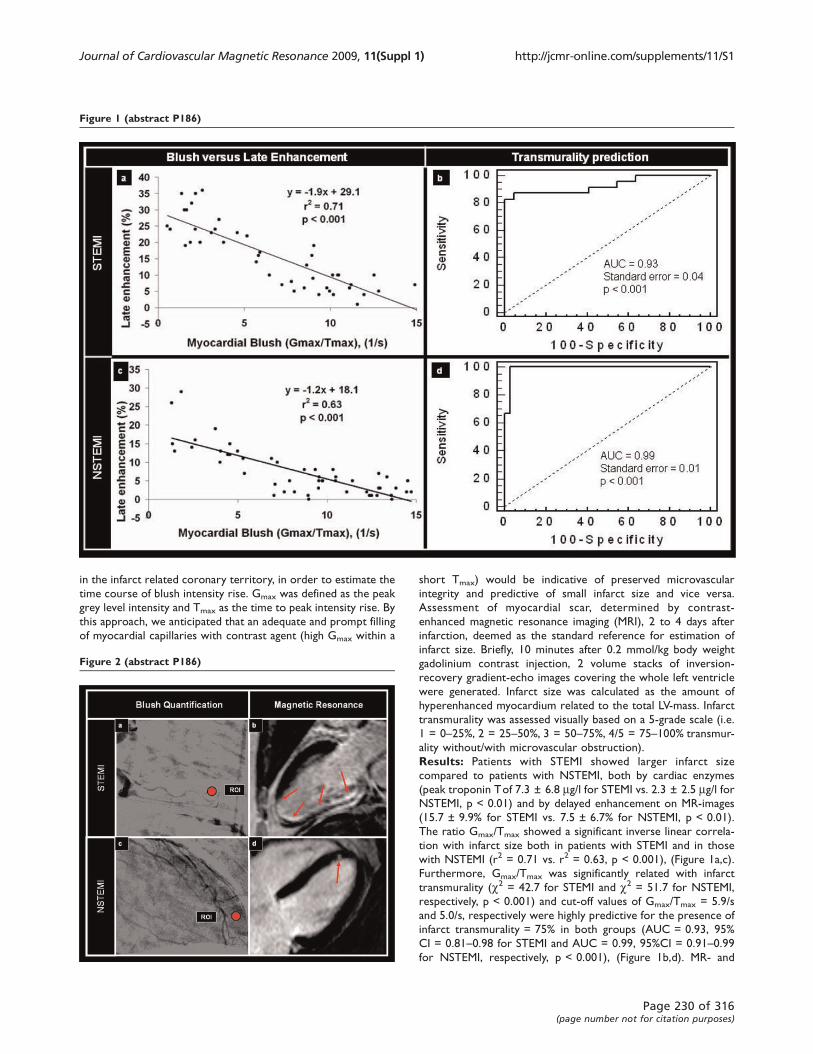
in the infarct related coronary territory, in order to estimate the
time course of blush intensity rise. Gmax was defined as the peak
grey level intensity and Tmax as the time to peak intensity rise. By
this approach, we anticipated that an adequate and prompt filling
of myocardial capillaries with contrast agent (high Gmax within a
short Tmax) would be indicative of preserved microvascular
integrity and predictive of small infarct size and vice versa.
Assessment of myocardial scar, determined by contrast-
enhanced magnetic resonance imaging (MRI), 2 to 4 days after
infarction, deemed as the standard reference for estimation of
infarct size. Briefly, 10 minutes after 0.2 mmol/kg body weight
gadolinium contrast injection, 2 volume stacks of inversion-
recovery gradient-echo images covering the whole left ventricle
were generated. Infarct size was calculated as the amount of
hyperenhanced myocardium related to the total LV-mass. Infarct
transmurality was assessed visually based on a 5-grade scale (i.e.
1 = 0–25%, 2 = 25–50%, 3 = 50–75%, 4/5 = 75–100% transmur-
ality without/with microvascular obstruction).
Results: Patients with STEMI showed larger infarct size
compared to patients with NSTEMI, both by cardiac enzymes
(peak troponin Tof 7.3 ± 6.8 mg/l for STEMI vs. 2.3 ± 2.5 mg/l forNSTEMI, p < 0.01) and by delayed enhancement on MR-images
(15.7 ± 9.9% for STEMI vs. 7.5 ± 6.7% for NSTEMI, p < 0.01).
The ratio Gmax/Tmax showed a significant inverse linear correla-
tion with infarct size both in patients with STEMI and in those
with NSTEMI (r2 = 0.71 vs. r2 = 0.63, p < 0.001), (Figure 1a,c).
Furthermore, Gmax/Tmax was significantly related with infarct
transmurality (c2 = 42.7 for STEMI and c2 = 51.7 for NSTEMI,
respectively, p < 0.001) and cut-off values of Gmax/Tmax = 5.9/s
and 5.0/s, respectively were highly predictive for the presence of
infarct transmurality = 75% in both groups (AUC = 0.93, 95%
CI = 0.81–0.98 for STEMI and AUC = 0.99, 95%CI = 0.91–0.99for NSTEMI, respectively, p < 0.001), (Figure 1b,d). MR- and
Figure 1 (abstract P186)
Figure 2 (abstract P186)
Journal of Cardiovascular Magnetic Resonance 2009, 11(Suppl 1) http://jcmr-online.com/supplements/11/S1
Page 230 of 316(page number not for citation purposes)
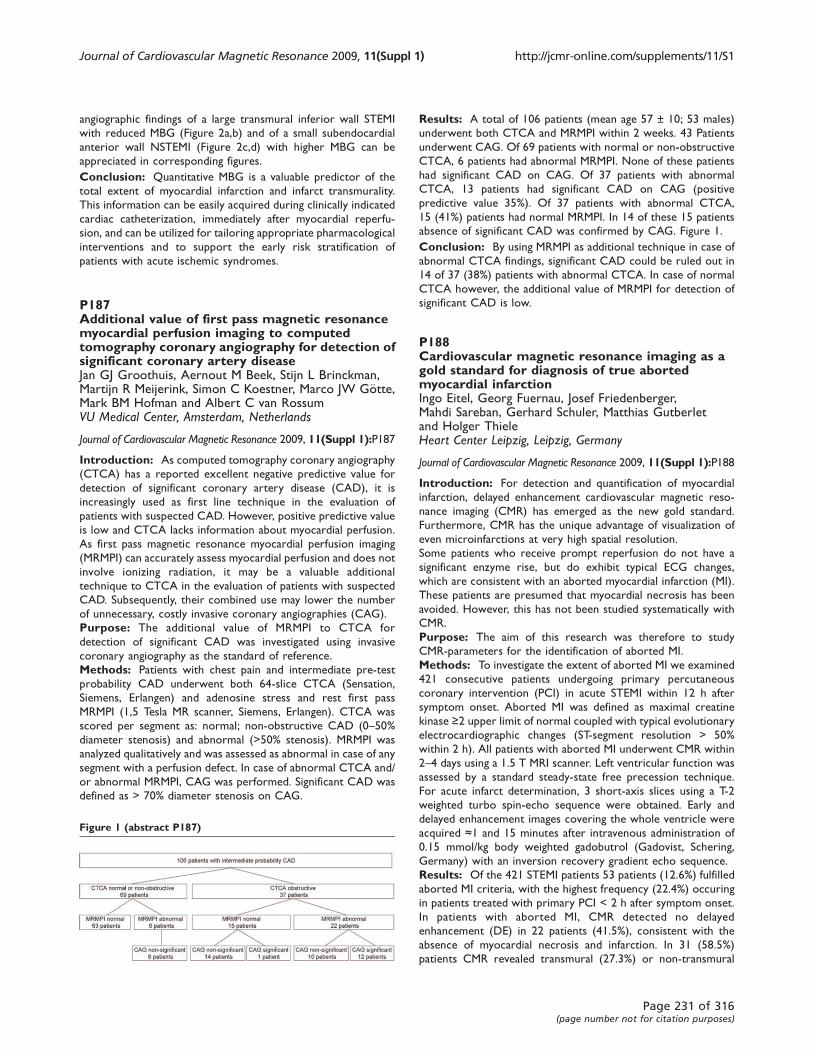
angiographic findings of a large transmural inferior wall STEMI
with reduced MBG (Figure 2a,b) and of a small subendocardial
anterior wall NSTEMI (Figure 2c,d) with higher MBG can be
appreciated in corresponding figures.
Conclusion: Quantitative MBG is a valuable predictor of the
total extent of myocardial infarction and infarct transmurality.
This information can be easily acquired during clinically indicated
cardiac catheterization, immediately after myocardial reperfu-
sion, and can be utilized for tailoring appropriate pharmacological
interventions and to support the early risk stratification of
patients with acute ischemic syndromes.
P187Additional value of first pass magnetic resonancemyocardial perfusion imaging to computedtomography coronary angiography for detection ofsignificant coronary artery diseaseJan GJ Groothuis, Aernout M Beek, Stijn L Brinckman,Martijn R Meijerink, Simon C Koestner, Marco JW Götte,Mark BM Hofman and Albert C van RossumVU Medical Center, Amsterdam, Netherlands
Journal of Cardiovascular Magnetic Resonance 2009, 11(Suppl 1):P187
Introduction: As computed tomography coronary angiography
(CTCA) has a reported excellent negative predictive value for
detection of significant coronary artery disease (CAD), it is
increasingly used as first line technique in the evaluation of
patients with suspected CAD. However, positive predictive value
is low and CTCA lacks information about myocardial perfusion.
As first pass magnetic resonance myocardial perfusion imaging
(MRMPI) can accurately assess myocardial perfusion and does not
involve ionizing radiation, it may be a valuable additional
technique to CTCA in the evaluation of patients with suspected
CAD. Subsequently, their combined use may lower the number
of unnecessary, costly invasive coronary angiographies (CAG).
Purpose: The additional value of MRMPI to CTCA for
detection of significant CAD was investigated using invasive
coronary angiography as the standard of reference.
Methods: Patients with chest pain and intermediate pre-test
probability CAD underwent both 64-slice CTCA (Sensation,
Siemens, Erlangen) and adenosine stress and rest first pass
MRMPI (1,5 Tesla MR scanner, Siemens, Erlangen). CTCA was
scored per segment as: normal; non-obstructive CAD (0–50%diameter stenosis) and abnormal (>50% stenosis). MRMPI was
analyzed qualitatively and was assessed as abnormal in case of any
segment with a perfusion defect. In case of abnormal CTCA and/
or abnormal MRMPI, CAG was performed. Significant CAD was
defined as > 70% diameter stenosis on CAG.
Results: A total of 106 patients (mean age 57 ± 10; 53 males)
underwent both CTCA and MRMPI within 2 weeks. 43 Patients
underwent CAG. Of 69 patients with normal or non-obstructive
CTCA, 6 patients had abnormal MRMPI. None of these patients
had significant CAD on CAG. Of 37 patients with abnormal
CTCA, 13 patients had significant CAD on CAG (positive
predictive value 35%). Of 37 patients with abnormal CTCA,
15 (41%) patients had normal MRMPI. In 14 of these 15 patients
absence of significant CAD was confirmed by CAG. Figure 1.
Conclusion: By using MRMPI as additional technique in case of
abnormal CTCA findings, significant CAD could be ruled out in
14 of 37 (38%) patients with abnormal CTCA. In case of normal
CTCA however, the additional value of MRMPI for detection of
significant CAD is low.
P188Cardiovascular magnetic resonance imaging as agold standard for diagnosis of true abortedmyocardial infarctionIngo Eitel, Georg Fuernau, Josef Friedenberger,Mahdi Sareban, Gerhard Schuler, Matthias Gutberletand Holger ThieleHeart Center Leipzig, Leipzig, Germany
Journal of Cardiovascular Magnetic Resonance 2009, 11(Suppl 1):P188
Introduction: For detection and quantification of myocardial
infarction, delayed enhancement cardiovascular magnetic reso-
nance imaging (CMR) has emerged as the new gold standard.
Furthermore, CMR has the unique advantage of visualization of
even microinfarctions at very high spatial resolution.
Some patients who receive prompt reperfusion do not have a
significant enzyme rise, but do exhibit typical ECG changes,
which are consistent with an aborted myocardial infarction (MI).
These patients are presumed that myocardial necrosis has been
avoided. However, this has not been studied systematically with
CMR.
Purpose: The aim of this research was therefore to study
CMR-parameters for the identification of aborted MI.
Methods: To investigate the extent of aborted MI we examined
421 consecutive patients undergoing primary percutaneous
coronary intervention (PCI) in acute STEMI within 12 h after
symptom onset. Aborted MI was defined as maximal creatine
kinase ≥2 upper limit of normal coupled with typical evolutionary
electrocardiographic changes (ST-segment resolution > 50%
within 2 h). All patients with aborted MI underwent CMR within
2–4 days using a 1.5 T MRI scanner. Left ventricular function was
assessed by a standard steady-state free precession technique.
For acute infarct determination, 3 short-axis slices using a T-2
weighted turbo spin-echo sequence were obtained. Early and
delayed enhancement images covering the whole ventricle were
acquired ≈1 and 15 minutes after intravenous administration of
0.15 mmol/kg body weighted gadobutrol (Gadovist, Schering,
Germany) with an inversion recovery gradient echo sequence.
Results: Of the 421 STEMI patients 53 patients (12.6%) fulfilled
aborted MI criteria, with the highest frequency (22.4%) occuring
in patients treated with primary PCI < 2 h after symptom onset.
In patients with aborted MI, CMR detected no delayed
enhancement (DE) in 22 patients (41.5%), consistent with the
absence of myocardial necrosis and infarction. In 31 (58.5%)
patients CMR revealed transmural (27.3%) or non-transmural
Figure 1 (abstract P187)
Journal of Cardiovascular Magnetic Resonance 2009, 11(Suppl 1) http://jcmr-online.com/supplements/11/S1
Page 231 of 316(page number not for citation purposes)

(31.2%) DE in the distribution of a coronary artery compatible
with MI. As compared with true MI patients, patients with
aborted MI had a significant lower infarct size (30.9 ± 19.6 ml vs.
8.5 ± 12.3 ml; 22.2 ± 12.7% vs. 5.9 ± 7.1%; p < 0.001 respec-
tively) shorter pain-to-balloon time and a significant better left
ventricular ejection fraction (46% vs. 60%, p < 0.001).
Conclusion: CMR can distinguish between patients with true
aborted MI with absence of myocardial scar and patients with
fulfilled criteria of aborted MI but detected scar formation.
Therefore CMR should be established as a diagnostic criteria for
true aborted MI.
P189TI nulling and contrast conditions with a0.15 mmol/kg dosage of MultiHance as comparedto the standard 0.2 mmol/kg gadoliniumdosage in patients with myocardial infarctsJune AYamrozik, Mark Doyle, Vikas K Rathi, Diane A Vido,Ronald B Williams, Geetha Rayaraoand Robert WW BiedermanAllegheny General Hospital, The Gerald McGinnisCardiovascular Institute, Pittsburgh, PA, USA
Journal of Cardiovascular Magnetic Resonance 2009, 11(Suppl 1):P189
Introduction: It is known that utilizing the proper inversion
time (TI) is essential when diagnosing myocardial infarction. Many
factors play a role in acquiring optimal nulling of the myocardium.
Recently, higher relaxivity contrast agents have been advocated
for use in infarct imaging. Specifically, MultiHance® (gadobenate
dimeglumine) has higher relaxivities (r1 and r2, 9.71 and 12.51)
compared to standard gadolinium (gadopentetate dimeglumine)
(r1 and r2, 4.91 and 6.31). Will this higher relaxivity allow a lower
dosage of contrast to be used to maintain a comparable TI null
time compared to the conventional gadolinium dosage and how
does it affect contrast?
Purpose: We hypothesize that a 0.15 mmol/kg dosage of
MultiHance with its higher relaxivity will produce a lower TI null
time in infarct patients compared to patients imaged with a
standard dosage of 0.2 mmol/kg of gadolinium at 10 and
20 minutes post-contrast.
Methods: A total of 52 patients with GFR > 60 mL/min/1.73 m2
were imaged.Twenty-six (26) patients (19 M, 6 F), age 42–81years, post-myocardial infarction underwent a standard cardiac
MRI (CMR), utilizing a total of 0.2 mmol/kg gadolinium dosage
(Magnevist-Berlex, New Jersey, USA). This was administered as a
0.5 mmol/kg for perfusion imaging, followed by an additional
0.15 mmol/kg for viability (DHE) imaging. Twenty-six (26)
patients (21 M, 5 F), age 43–83 years, post-myocardial infarction
underwent a standard cardiac MRI (CMR), utilizing a total of
0.15 mmol/kg MultiHance dosage (Bracco Diagnostics, Prince-
ton, N J, USA). This was administered as a 0.5 mmol /kg dosage
for perfusion imaging, followed by an additional 0.10 mmol/kg for
viability imaging. The scans were acquired on a GE CV/i Excite
Version 12, 1.5 T system (GE, Milwaukee, WI). The sequence
utilized for optimum myocardial nulling was a standard 2D
Gradient Echo IRP (FGR with inversion recovery prep). Manual
selection of TI was performed independent of contrast media.
Contrast of infarct to myocardium and blood pool was measured
in a subset of 14 patients (7 per group) with large infarcts. An
8-channel or 4-channel cardiac coil was used, again independent
of the contrast agent. The sequence parameters were as follows:
TE: min, FA: 20, NEX: 2 trigger delay: adjusted to onset of
diastole, 1 RR interval and TI adjusted to null the myocardium.
This sequence was performed at 10 and 20 minutes post-
contrast administration.
Results: All the patients successfully completed the CMR
examination without difficulty, or impairment in infarct detec-
tion. Particular attention was focused on the contrast medium
utilized, dosage and its effects on the TI at 10 and 20 minutes
post-contrast. At 10 minutes post-contrast, the inversion time
with Magnevist was 158.7 ± 17.2, which was not different from
that obtained with MultiHance (154.3 ± 13.6, p = 0.3). At
20 minutes post-contrast, the TI with Magnevist was 200.4 ±
28.8, and again was not different from that obtained with
MultiHance (193.0 ± 15.6, p = 0.3).
The signal intensity contrast between the infarct and myocardium
at 10 minutes is greatest with the MultiHance a ratio of
(7.6 ± 2.5) compared to (4.9 ± 1.2) with gadolinium.
Conclusion: While the relaxivity of MultiHance compared to
standard gadolinium is almost a factor of two higher, similar
contrast null times are achieved by using a 75% dosage of
MultiHance as compared to gadolinium. Relaxivity alone does not
predict arithmetic decreases in TI times. Despite this, Multi-
Hance administration at the lower dose did result in a higher
infarct-myocardium contrast. Further, the higher relaxivity agent
is potentially beneficial in those situations when additional
imaging might be necessary, since an additional 25% of contrast
is held in reserve for further administration.
P190Does DHE imaging shed insight into the inaccuracyof EKGs?Wadih Nadour and Robert W BiedermanAllegheny General Hospital, The Gerald McGinnisCardiovascular Institute, Pittsburgh, PA, USA
Journal of Cardiovascular Magnetic Resonance 2009, 11(Suppl 1):P190
Background: The presence of Q wave on EKG remains in
wide clinical use to identify people with prior myocardial infarct
(MI), in particular transmural infarct. We hypothesized that
standard assessment of infarct presence relying on EKG is both
insensitive and inaccurate, especially as compared to CMR DHE
assessment, regardless of the DHE pattern (ischemic versus non-
ischemic).
Objectives: The purpose of the study is to relate EKG defined
scar (Q waves) as compared to late gadolinium enhancement
(DHE) cardiovascular magnetic resonance (CMR) defined scar
independent of the underlying pathology.
Methods: We reviewed a total of 106 unselected, consecutive
patients who underwent CMR with DHE and had an EKG
performed within 1 day of CMR between 2006 and 2008 at our
institution. Non-ischemic, infiltrative and other cardiomyopathic
patients were not excluded. EKGs performed on the same day or
the day prior to the test were screened for the presence of a Q
wave and compared to those with a positive DHE regardless of
the myocardial post-gadolinium pattern. Then we divided the
patients into three subgroups: 1) one group with only positive
DHE (DHE+) pattern of ischemia 2) the other group with other
DHE (DHE+/-) patterns or 3) negative DHE (DHE-). Further-
more, we divided the ischemic group (DHE+) into transmural vs.
endocardial post-gadolinium patterns.
Journal of Cardiovascular Magnetic Resonance 2009, 11(Suppl 1) http://jcmr-online.com/supplements/11/S1
Page 232 of 316(page number not for citation purposes)

Results: While 58/106 (45%) patients were either DHE+orDHE+/-, Q waves were present in only 24/106 patients
(22%). However, of the DHE+ or DHE+/- patients, only 22
(20%) had an ischemic DHE pattern, representing little overlap
between presence of DHE+ and finding of Q waves on EKG. The
sensitivity and specificity of EKG to detect infarct were 63% and
90%, respectively. The positive predictive value was 73% and
negative predictive value was 85%. In the subgroup of patients
divided into transmural infarcts (15) and endocardial infarcts (7),
the sensitivity was 60% and 57%, respectively. However, of 10/24
(41%) patients with Q waves on EKG, 50% were either DHE- (5/
10) or DHE+/- (5/10). The latter group included 3 viral
cardiomyopathy, 1 infiltrative disease and 1 hypertrophic
cardiomyopathy.
Conclusion: EKG remains the most widely used method in
clinical practice to identify patients with prior infarcts based on
the presence of Q waves; however it has a low sensitivity
compared to CMR DHE defined scar. This sensitivity does not
appreciably change with the presence of transmural versus
subendocardial infarcts. Importantly, a significant number of Q
waves have no ischemic etiology, indicating a high percentage of
false positive results by EKG.
P191Evaluation by MRI of left ventricular remodelingand global functional recovery in patients treatedwith granulocyte-colony stimulating factor(G-CSF) after acute myocardial infarction (AMI)Antonio Bernardini1, Luigi Natale2, Agostino Meduri2,Carlo Liguori2, Antonio Maria Leone2
and Lorenzo Bonomo21“G. Mazzini” Hospital – ASL Teramo, Teramo, Italy2Università Cattolica del Sacro Cuore – Policlinico A. Gemelli,Rome, Italy
Journal of Cardiovascular Magnetic Resonance 2009, 11(Suppl 1):P191
Purpose: To evaluate by MRI the effect of G-CSF on ventricular
remodeling after AMI treated with PTCA.
Materials and methods: 14 patients with AMI (TIMI 3), 7
tretaed with G-CSF administration (5 mcg/kg sc for 5 days)
studied by MRI (GE 1.5 T) within 7 days and after 4–6 months to
evaluate end systolic (ESV) and end diastolic (EDV) volumes and
ejection ffraction (EF). B-SSFP sequences for functional study,
FGRET forFirst Pass study (FP) and IR-prep FGRE for Delayed
Enhancement (DE). 0,1 mmol/Kg of Gd-DTPA were administered
with a 3 ml/sec flow both for FP and DE (total dose 0,2 mmol/kg).
FP and DE were visually scored accounting for transmural and
circumferential extent.
FP and DE correlation with functional recovery and differences
between groups were evaluated by linear regression analysis and
covariance analysis (ANCOVA).
Results: A statistically significant correlation between DE and
functional recovery at follow up is present (for ESV p = 0,05; for
EF p = 0,03); there was no significant linear correlation with FP.
ANCOVA showed a positive trend for patients treated with G-
CSF, for any infarct size, especially for EDV and ESV (mean G-CSF
effect: EDV -29,4 ml, p = 0,045; ESV -28 ml p = 0,06).
Conclusion: MRI allows to correctly evaluate differences in
functional recovery between different groups of patients,
accounting for infarct size. We found a positive trend with
partial statistical significance regarding global functional recovery
in patients treated with G-CSF after AMI. These data need
however to be confirmed in larger series, as other studies
(REVIVAL2) did not show significant correlations.
P192Multi-contrast delayed enhancement imaging(MCDE): accuracy and reproducibility comparedto conventional SSFP and delayedhyperenhancement imagingKim A Connelly, Jay S Detsky, John J Graham, Gideon Paul,Ram Vijayaraghavan, Rhonda Walcarius, Graham AWrightand Alexander J DickSunnybrook HSC, Toronto, ON, Canada
Journal of Cardiovascular Magnetic Resonance 2009, 11(Suppl 1):P192
Introduction: Cardiac magnetic resonance (CMR) imaging is
an important tool in the assessment of cardiac function and
viability, with prognostic implications for patients with ischemic
heart disease [1]. Multi-contrast delayed enhancement imaging
(MCDE) allows myocardial viability and wall motion to be
assessed simultaneously by producing cardiac-phase-resolved
images at multiple inversion times [2].
Purpose: This study compared MCDE imaging to the conven-
tional wall motion and viability CMR imaging for the evaluation of
ejection fraction (EF), LV mass, LV end-diastolic volume (EDV)
and infarct mass.
Methods: Forty-one patients with suspected myocardial infarc-
tion were studied. All patients underwent assessment of cardiac
function (cine SSFP), followed by viability imaging ten minutes
after administration of 0.2 mmol/kg Gd-DTPA using the inversion
recovery gradient echo (IR-GRE) and MCDE sequences. The
MCDE sequence uses a segmented SSFP acquisition following an
inversion pulse; one inversion pulse is played out per heartbeat,
and twenty images each at a different effective inversion time and
cardiac phase are reconstructed. The position of the inversion
pulse was placed just prior to diastole to produce infarct-
Figure 1 (abstract P192)
A comparison between (a) IR-GRE delayed enhancement image, (b)
conventional SSFP end-systolic wall motion image, (c) conventional SSFP
end-diastolic wall motion image with (d) MCDE infarct-enhanced image,
(e) MCDE end-systolic image, and (f) MCDE end-diastolic image. Note
that (d-f) are three of the 20 MCDE images acquired during a single
breath-hold.
Journal of Cardiovascular Magnetic Resonance 2009, 11(Suppl 1) http://jcmr-online.com/supplements/11/S1
Page 233 of 316(page number not for citation purposes)
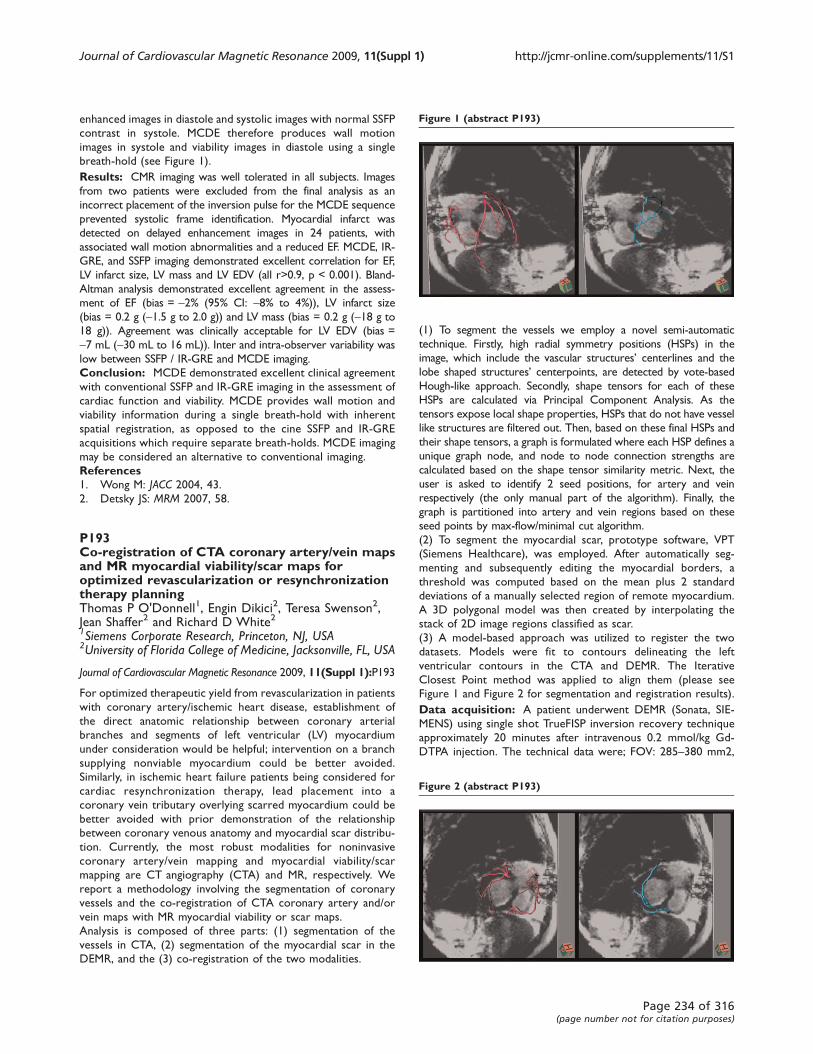
enhanced images in diastole and systolic images with normal SSFP
contrast in systole. MCDE therefore produces wall motion
images in systole and viability images in diastole using a single
breath-hold (see Figure 1).
Results: CMR imaging was well tolerated in all subjects. Images
from two patients were excluded from the final analysis as an
incorrect placement of the inversion pulse for the MCDE sequence
prevented systolic frame identification. Myocardial infarct was
detected on delayed enhancement images in 24 patients, with
associated wall motion abnormalities and a reduced EF. MCDE, IR-
GRE, and SSFP imaging demonstrated excellent correlation for EF,
LV infarct size, LV mass and LV EDV (all r>0.9, p < 0.001). Bland-
Altman analysis demonstrated excellent agreement in the assess-
ment of EF (bias = -2% (95% CI: -8% to 4%)), LV infarct size
(bias = 0.2 g (-1.5 g to 2.0 g)) and LV mass (bias = 0.2 g (-18 g to
18 g)). Agreement was clinically acceptable for LV EDV (bias =
-7 mL (-30 mL to 16 mL)). Inter and intra-observer variability was
low between SSFP / IR-GRE and MCDE imaging.
Conclusion: MCDE demonstrated excellent clinical agreement
with conventional SSFP and IR-GRE imaging in the assessment of
cardiac function and viability. MCDE provides wall motion and
viability information during a single breath-hold with inherent
spatial registration, as opposed to the cine SSFP and IR-GRE
acquisitions which require separate breath-holds. MCDE imaging
may be considered an alternative to conventional imaging.
References1. Wong M: JACC 2004, 43.
2. Detsky JS: MRM 2007, 58.
P193Co-registration of CTA coronary artery/vein mapsand MR myocardial viability/scar maps foroptimized revascularization or resynchronizationtherapy planningThomas P O'Donnell1, Engin Dikici2, Teresa Swenson2,Jean Shaffer2 and Richard D White21Siemens Corporate Research, Princeton, NJ, USA2University of Florida College of Medicine, Jacksonville, FL, USA
Journal of Cardiovascular Magnetic Resonance 2009, 11(Suppl 1):P193
For optimized therapeutic yield from revascularization in patients
with coronary artery/ischemic heart disease, establishment of
the direct anatomic relationship between coronary arterial
branches and segments of left ventricular (LV) myocardium
under consideration would be helpful; intervention on a branch
supplying nonviable myocardium could be better avoided.
Similarly, in ischemic heart failure patients being considered for
cardiac resynchronization therapy, lead placement into a
coronary vein tributary overlying scarred myocardium could be
better avoided with prior demonstration of the relationship
between coronary venous anatomy and myocardial scar distribu-
tion. Currently, the most robust modalities for noninvasive
coronary artery/vein mapping and myocardial viability/scar
mapping are CT angiography (CTA) and MR, respectively. We
report a methodology involving the segmentation of coronary
vessels and the co-registration of CTA coronary artery and/or
vein maps with MR myocardial viability or scar maps.
Analysis is composed of three parts: (1) segmentation of the
vessels in CTA, (2) segmentation of the myocardial scar in the
DEMR, and the (3) co-registration of the two modalities.
(1) To segment the vessels we employ a novel semi-automatic
technique. Firstly, high radial symmetry positions (HSPs) in the
image, which include the vascular structures’ centerlines and the
lobe shaped structures’ centerpoints, are detected by vote-based
Hough-like approach. Secondly, shape tensors for each of these
HSPs are calculated via Principal Component Analysis. As the
tensors expose local shape properties, HSPs that do not have vessel
like structures are filtered out. Then, based on these final HSPs and
their shape tensors, a graph is formulated where each HSP defines a
unique graph node, and node to node connection strengths are
calculated based on the shape tensor similarity metric. Next, the
user is asked to identify 2 seed positions, for artery and vein
respectively (the only manual part of the algorithm). Finally, the
graph is partitioned into artery and vein regions based on these
seed points by max-flow/minimal cut algorithm.
(2) To segment the myocardial scar, prototype software, VPT
(Siemens Healthcare), was employed. After automatically seg-
menting and subsequently editing the myocardial borders, a
threshold was computed based on the mean plus 2 standard
deviations of a manually selected region of remote myocardium.
A 3D polygonal model was then created by interpolating the
stack of 2D image regions classified as scar.
(3) A model-based approach was utilized to register the two
datasets. Models were fit to contours delineating the left
ventricular contours in the CTA and DEMR. The Iterative
Closest Point method was applied to align them (please see
Figure 1 and Figure 2 for segmentation and registration results).
Data acquisition: A patient underwent DEMR (Sonata, SIE-
MENS) using single shot TrueFISP inversion recovery technique
approximately 20 minutes after intravenous 0.2 mmol/kg Gd-
DTPA injection. The technical data were; FOV: 285–380 mm2,
Figure 1 (abstract P193)
Figure 2 (abstract P193)
Journal of Cardiovascular Magnetic Resonance 2009, 11(Suppl 1) http://jcmr-online.com/supplements/11/S1
Page 234 of 316(page number not for citation purposes)
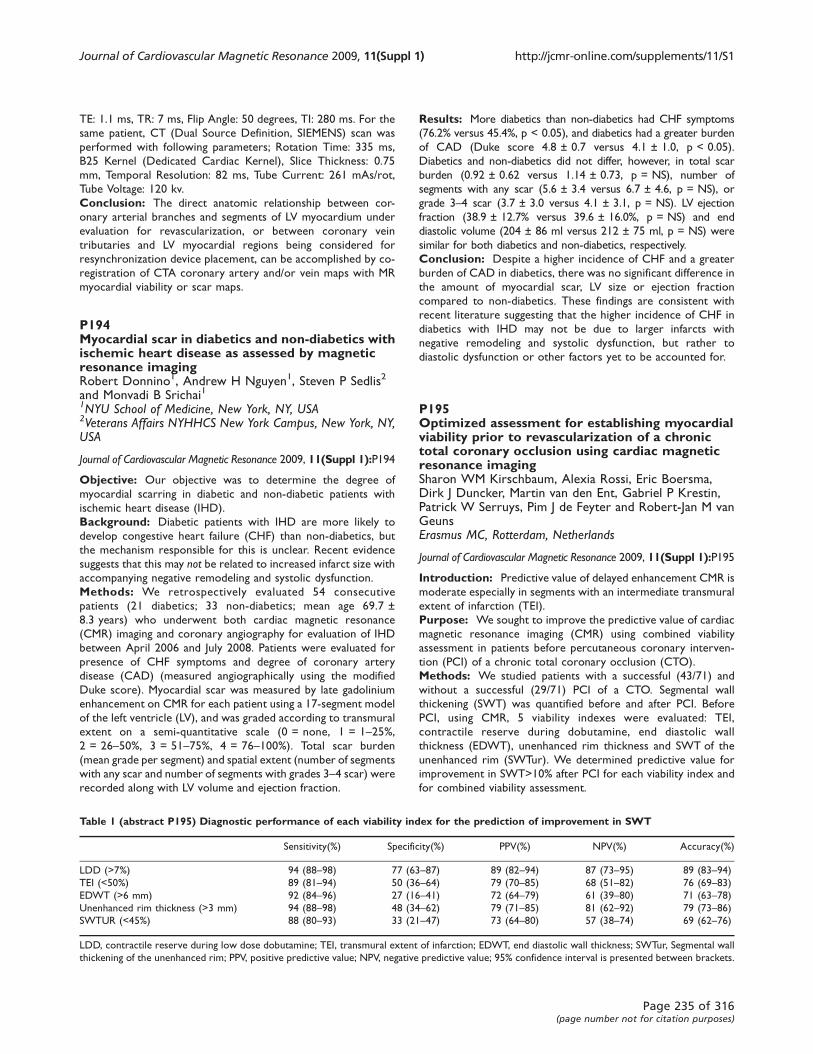
TE: 1.1 ms, TR: 7 ms, Flip Angle: 50 degrees, TI: 280 ms. For the
same patient, CT (Dual Source Definition, SIEMENS) scan was
performed with following parameters; Rotation Time: 335 ms,
B25 Kernel (Dedicated Cardiac Kernel), Slice Thickness: 0.75
mm, Temporal Resolution: 82 ms, Tube Current: 261 mAs/rot,
Tube Voltage: 120 kv.
Conclusion: The direct anatomic relationship between cor-
onary arterial branches and segments of LV myocardium under
evaluation for revascularization, or between coronary vein
tributaries and LV myocardial regions being considered for
resynchronization device placement, can be accomplished by co-
registration of CTA coronary artery and/or vein maps with MR
myocardial viability or scar maps.
P194Myocardial scar in diabetics and non-diabetics withischemic heart disease as assessed by magneticresonance imagingRobert Donnino1, Andrew H Nguyen1, Steven P Sedlis2
and Monvadi B Srichai11NYU School of Medicine, New York, NY, USA2Veterans Affairs NYHHCS New York Campus, New York, NY,USA
Journal of Cardiovascular Magnetic Resonance 2009, 11(Suppl 1):P194
Objective: Our objective was to determine the degree of
myocardial scarring in diabetic and non-diabetic patients with
ischemic heart disease (IHD).
Background: Diabetic patients with IHD are more likely to
develop congestive heart failure (CHF) than non-diabetics, but
the mechanism responsible for this is unclear. Recent evidence
suggests that this may not be related to increased infarct size with
accompanying negative remodeling and systolic dysfunction.
Methods: We retrospectively evaluated 54 consecutive
patients (21 diabetics; 33 non-diabetics; mean age 69.7 ±
8.3 years) who underwent both cardiac magnetic resonance
(CMR) imaging and coronary angiography for evaluation of IHD
between April 2006 and July 2008. Patients were evaluated for
presence of CHF symptoms and degree of coronary artery
disease (CAD) (measured angiographically using the modified
Duke score). Myocardial scar was measured by late gadolinium
enhancement on CMR for each patient using a 17-segment model
of the left ventricle (LV), and was graded according to transmural
extent on a semi-quantitative scale (0 = none, 1 = 1–25%,2 = 26–50%, 3 = 51–75%, 4 = 76–100%). Total scar burden
(mean grade per segment) and spatial extent (number of segments
with any scar and number of segments with grades 3–4 scar) wererecorded along with LV volume and ejection fraction.
Results: More diabetics than non-diabetics had CHF symptoms
(76.2% versus 45.4%, p < 0.05), and diabetics had a greater burden
of CAD (Duke score 4.8 ± 0.7 versus 4.1 ± 1.0, p < 0.05).
Diabetics and non-diabetics did not differ, however, in total scar
burden (0.92 ± 0.62 versus 1.14 ± 0.73, p = NS), number of
segments with any scar (5.6 ± 3.4 versus 6.7 ± 4.6, p = NS), or
grade 3–4 scar (3.7 ± 3.0 versus 4.1 ± 3.1, p = NS). LV ejection
fraction (38.9 ± 12.7% versus 39.6 ± 16.0%, p = NS) and end
diastolic volume (204 ± 86 ml versus 212 ± 75 ml, p = NS) were
similar for both diabetics and non-diabetics, respectively.
Conclusion: Despite a higher incidence of CHF and a greater
burden of CAD in diabetics, there was no significant difference in
the amount of myocardial scar, LV size or ejection fraction
compared to non-diabetics. These findings are consistent with
recent literature suggesting that the higher incidence of CHF in
diabetics with IHD may not be due to larger infarcts with
negative remodeling and systolic dysfunction, but rather to
diastolic dysfunction or other factors yet to be accounted for.
P195Optimized assessment for establishing myocardialviability prior to revascularization of a chronictotal coronary occlusion using cardiac magneticresonance imagingSharon WM Kirschbaum, Alexia Rossi, Eric Boersma,Dirk J Duncker, Martin van den Ent, Gabriel P Krestin,Patrick W Serruys, Pim J de Feyter and Robert-Jan M vanGeunsErasmus MC, Rotterdam, Netherlands
Journal of Cardiovascular Magnetic Resonance 2009, 11(Suppl 1):P195
Introduction: Predictive value of delayed enhancement CMR is
moderate especially in segments with an intermediate transmural
extent of infarction (TEI).
Purpose: We sought to improve the predictive value of cardiac
magnetic resonance imaging (CMR) using combined viability
assessment in patients before percutaneous coronary interven-
tion (PCI) of a chronic total coronary occlusion (CTO).
Methods: We studied patients with a successful (43/71) and
without a successful (29/71) PCI of a CTO. Segmental wall
thickening (SWT) was quantified before and after PCI. Before
PCI, using CMR, 5 viability indexes were evaluated: TEI,
contractile reserve during dobutamine, end diastolic wall
thickness (EDWT), unenhanced rim thickness and SWT of the
unenhanced rim (SWTur). We determined predictive value for
improvement in SWT>10% after PCI for each viability index and
for combined viability assessment.
Table 1 (abstract P195) Diagnostic performance of each viability index for the prediction of improvement in SWT
Sensitivity(%) Specificity(%) PPV(%) NPV(%) Accuracy(%)
LDD (>7%) 94 (88–98) 77 (63–87) 89 (82–94) 87 (73–95) 89 (83–94)TEI (<50%) 89 (81–94) 50 (36–64) 79 (70–85) 68 (51–82) 76 (69–83)EDWT (>6 mm) 92 (84–96) 27 (16–41) 72 (64–79) 61 (39–80) 71 (63–78)Unenhanced rim thickness (>3 mm) 94 (88–98) 48 (34–62) 79 (71–85) 81 (62–92) 79 (73–86)SWTUR (<45%) 88 (80–93) 33 (21–47) 73 (64–80) 57 (38–74) 69 (62–76)
LDD, contractile reserve during low dose dobutamine; TEI, transmural extent of infarction; EDWT, end diastolic wall thickness; SWTur, Segmental wall
thickening of the unenhanced rim; PPV, positive predictive value; NPV, negative predictive value; 95% confidence interval is presented between brackets.
Journal of Cardiovascular Magnetic Resonance 2009, 11(Suppl 1) http://jcmr-online.com/supplements/11/S1
Page 235 of 316(page number not for citation purposes)
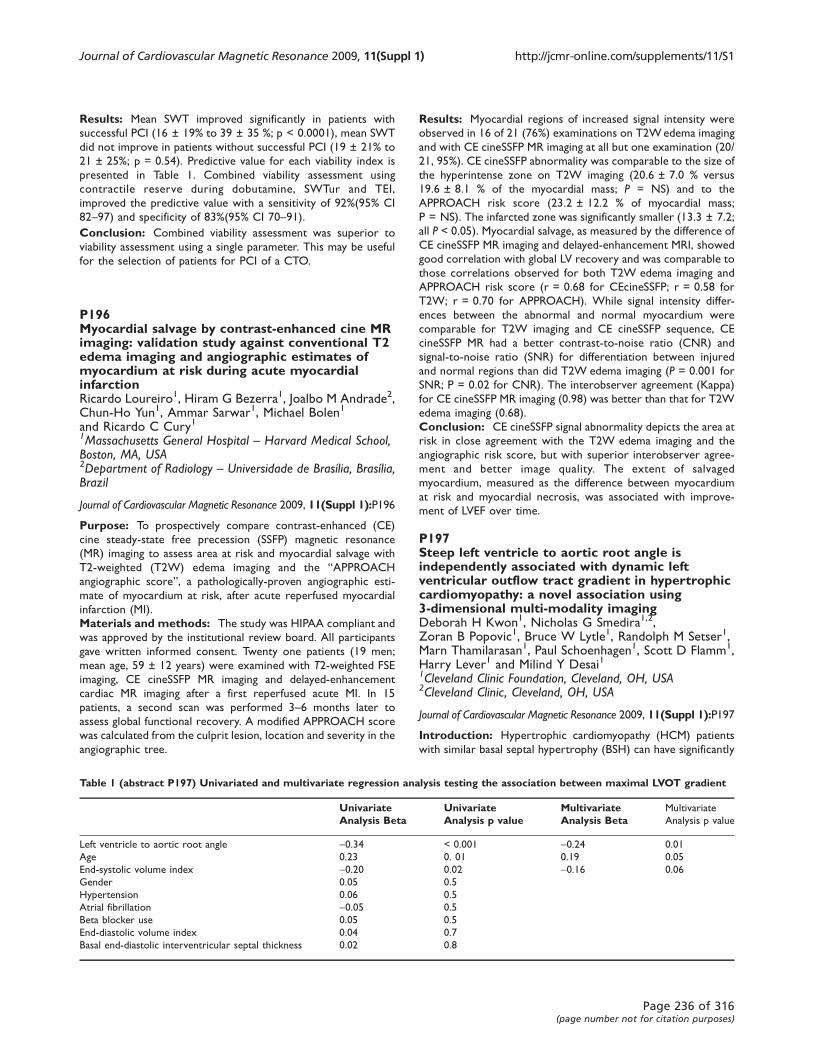
Results: Mean SWT improved significantly in patients with
successful PCI (16 ± 19% to 39 ± 35 %; p < 0.0001), mean SWT
did not improve in patients without successful PCI (19 ± 21% to
21 ± 25%; p = 0.54). Predictive value for each viability index is
presented in Table 1. Combined viability assessment using
contractile reserve during dobutamine, SWTur and TEI,
improved the predictive value with a sensitivity of 92%(95% CI
82–97) and specificity of 83%(95% CI 70–91).
Conclusion: Combined viability assessment was superior to
viability assessment using a single parameter. This may be useful
for the selection of patients for PCI of a CTO.
P196Myocardial salvage by contrast-enhanced cine MRimaging: validation study against conventional T2edema imaging and angiographic estimates ofmyocardium at risk during acute myocardialinfarctionRicardo Loureiro1, Hiram G Bezerra1, Joalbo M Andrade2,Chun-Ho Yun1, Ammar Sarwar1, Michael Bolen1
and Ricardo C Cury11Massachusetts General Hospital – Harvard Medical School,Boston, MA, USA2Department of Radiology – Universidade de Brasília, Brasília,Brazil
Journal of Cardiovascular Magnetic Resonance 2009, 11(Suppl 1):P196
Purpose: To prospectively compare contrast-enhanced (CE)
cine steady-state free precession (SSFP) magnetic resonance
(MR) imaging to assess area at risk and myocardial salvage with
T2-weighted (T2W) edema imaging and the “APPROACH
angiographic score”, a pathologically-proven angiographic esti-
mate of myocardium at risk, after acute reperfused myocardial
infarction (MI).
Materials and methods: The study was HIPAA compliant and
was approved by the institutional review board. All participants
gave written informed consent. Twenty one patients (19 men;
mean age, 59 ± 12 years) were examined with T2-weighted FSE
imaging, CE cineSSFP MR imaging and delayed-enhancement
cardiac MR imaging after a first reperfused acute MI. In 15
patients, a second scan was performed 3–6 months later to
assess global functional recovery. A modified APPROACH score
was calculated from the culprit lesion, location and severity in the
angiographic tree.
Results: Myocardial regions of increased signal intensity were
observed in 16 of 21 (76%) examinations on T2Wedema imaging
and with CE cineSSFP MR imaging at all but one examination (20/
21, 95%). CE cineSSFP abnormality was comparable to the size of
the hyperintense zone on T2W imaging (20.6 ± 7.0 % versus
19.6 ± 8.1 % of the myocardial mass; P = NS) and to the
APPROACH risk score (23.2 ± 12.2 % of myocardial mass;
P = NS). The infarcted zone was significantly smaller (13.3 ± 7.2;
all P < 0.05). Myocardial salvage, as measured by the difference of
CE cineSSFP MR imaging and delayed-enhancement MRI, showed
good correlation with global LV recovery and was comparable to
those correlations observed for both T2W edema imaging and
APPROACH risk score (r = 0.68 for CEcineSSFP; r = 0.58 for
T2W; r = 0.70 for APPROACH). While signal intensity differ-
ences between the abnormal and normal myocardium were
comparable for T2W imaging and CE cineSSFP sequence, CE
cineSSFP MR had a better contrast-to-noise ratio (CNR) and
signal-to-noise ratio (SNR) for differentiation between injured
and normal regions than did T2W edema imaging (P = 0.001 for
SNR; P = 0.02 for CNR). The interobserver agreement (Kappa)
for CE cineSSFP MR imaging (0.98) was better than that for T2W
edema imaging (0.68).
Conclusion: CE cineSSFP signal abnormality depicts the area at
risk in close agreement with the T2W edema imaging and the
angiographic risk score, but with superior interobserver agree-
ment and better image quality. The extent of salvaged
myocardium, measured as the difference between myocardium
at risk and myocardial necrosis, was associated with improve-
ment of LVEF over time.
P197Steep left ventricle to aortic root angle isindependently associated with dynamic leftventricular outflow tract gradient in hypertrophiccardiomyopathy: a novel association using3-dimensional multi-modality imagingDeborah H Kwon1, Nicholas G Smedira1,2,Zoran B Popovic1, Bruce W Lytle1, Randolph M Setser1,Marn Thamilarasan1, Paul Schoenhagen1, Scott D Flamm1,Harry Lever1 and Milind Y Desai11Cleveland Clinic Foundation, Cleveland, OH, USA2Cleveland Clinic, Cleveland, OH, USA
Journal of Cardiovascular Magnetic Resonance 2009, 11(Suppl 1):P197
Introduction: Hypertrophic cardiomyopathy (HCM) patients
with similar basal septal hypertrophy (BSH) can have significantly
Table 1 (abstract P197) Univariated and multivariate regression analysis testing the association between maximal LVOT gradient
UnivariateAnalysis Beta
UnivariateAnalysis p value
MultivariateAnalysis Beta
Multivariate
Analysis p value
Left ventricle to aortic root angle -0.34 < 0.001 -0.24 0.01
Age 0.23 0. 01 0.19 0.05
End-systolic volume index -0.20 0.02 -0.16 0.06
Gender 0.05 0.5
Hypertension 0.06 0.5
Atrial fibrillation -0.05 0.5
Beta blocker use 0.05 0.5
End-diastolic volume index 0.04 0.7
Basal end-diastolic interventricular septal thickness 0.02 0.8
Journal of Cardiovascular Magnetic Resonance 2009, 11(Suppl 1) http://jcmr-online.com/supplements/11/S1
Page 236 of 316(page number not for citation purposes)
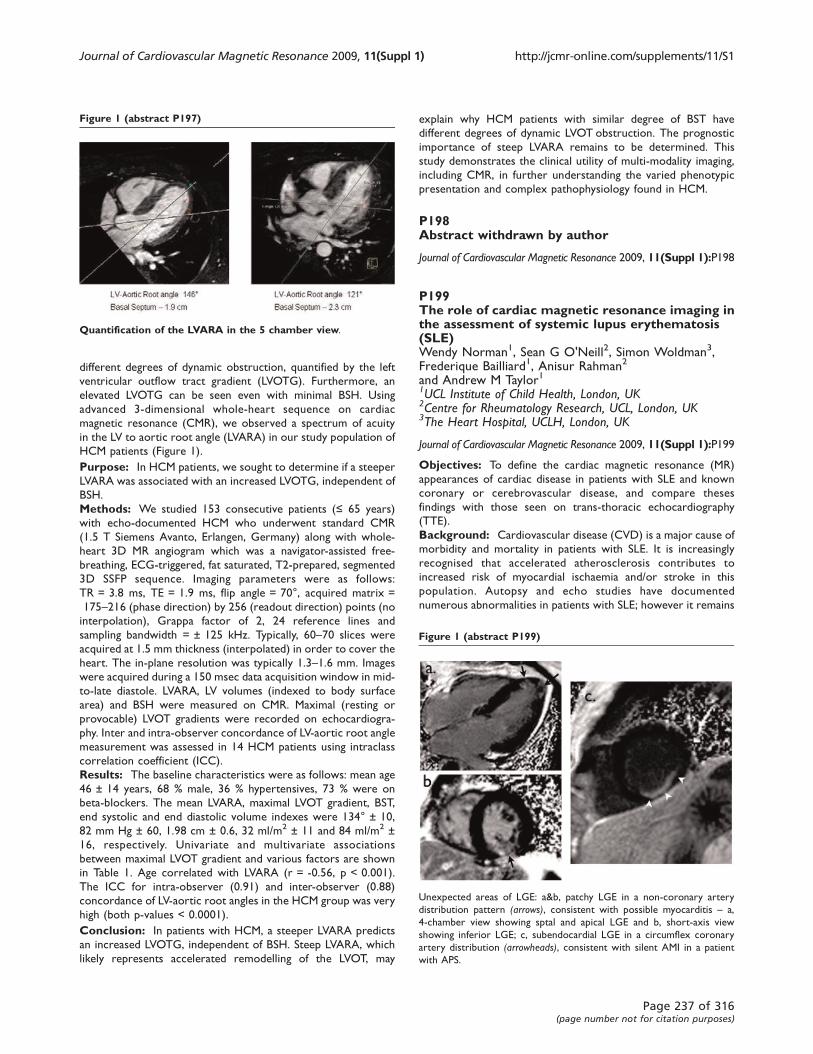
different degrees of dynamic obstruction, quantified by the left
ventricular outflow tract gradient (LVOTG). Furthermore, an
elevated LVOTG can be seen even with minimal BSH. Using
advanced 3-dimensional whole-heart sequence on cardiac
magnetic resonance (CMR), we observed a spectrum of acuity
in the LV to aortic root angle (LVARA) in our study population of
HCM patients (Figure 1).
Purpose: In HCM patients, we sought to determine if a steeper
LVARA was associated with an increased LVOTG, independent of
BSH.
Methods: We studied 153 consecutive patients (≤ 65 years)
with echo-documented HCM who underwent standard CMR
(1.5 T Siemens Avanto, Erlangen, Germany) along with whole-
heart 3D MR angiogram which was a navigator-assisted free-
breathing, ECG-triggered, fat saturated, T2-prepared, segmented
3D SSFP sequence. Imaging parameters were as follows:
TR = 3.8 ms, TE = 1.9 ms, flip angle = 70°, acquired matrix =
175–216 (phase direction) by 256 (readout direction) points (no
interpolation), Grappa factor of 2, 24 reference lines and
sampling bandwidth = ± 125 kHz. Typically, 60–70 slices were
acquired at 1.5 mm thickness (interpolated) in order to cover the
heart. The in-plane resolution was typically 1.3–1.6 mm. Images
were acquired during a 150 msec data acquisition window in mid-
to-late diastole. LVARA, LV volumes (indexed to body surface
area) and BSH were measured on CMR. Maximal (resting or
provocable) LVOT gradients were recorded on echocardiogra-
phy. Inter and intra-observer concordance of LV-aortic root angle
measurement was assessed in 14 HCM patients using intraclass
correlation coefficient (ICC).
Results: The baseline characteristics were as follows: mean age
46 ± 14 years, 68 % male, 36 % hypertensives, 73 % were on
beta-blockers. The mean LVARA, maximal LVOT gradient, BST,
end systolic and end diastolic volume indexes were 134° ± 10,
82 mm Hg ± 60, 1.98 cm ± 0.6, 32 ml/m2 ± 11 and 84 ml/m2 ±
16, respectively. Univariate and multivariate associations
between maximal LVOT gradient and various factors are shown
in Table 1. Age correlated with LVARA (r = -0.56, p < 0.001).
The ICC for intra-observer (0.91) and inter-observer (0.88)
concordance of LV-aortic root angles in the HCM group was very
high (both p-values < 0.0001).
Conclusion: In patients with HCM, a steeper LVARA predicts
an increased LVOTG, independent of BSH. Steep LVARA, which
likely represents accelerated remodelling of the LVOT, may
explain why HCM patients with similar degree of BST have
different degrees of dynamic LVOT obstruction. The prognostic
importance of steep LVARA remains to be determined. This
study demonstrates the clinical utility of multi-modality imaging,
including CMR, in further understanding the varied phenotypic
presentation and complex pathophysiology found in HCM.
P198Abstract withdrawn by author
Journal of Cardiovascular Magnetic Resonance 2009, 11(Suppl 1):P198
P199The role of cardiac magnetic resonance imaging inthe assessment of systemic lupus erythematosis(SLE)Wendy Norman1, Sean G O'Neill2, Simon Woldman3,Frederique Bailliard1, Anisur Rahman2
and Andrew M Taylor11UCL Institute of Child Health, London, UK2Centre for Rheumatology Research, UCL, London, UK3The Heart Hospital, UCLH, London, UK
Journal of Cardiovascular Magnetic Resonance 2009, 11(Suppl 1):P199
Objectives: To define the cardiac magnetic resonance (MR)
appearances of cardiac disease in patients with SLE and known
coronary or cerebrovascular disease, and compare theses
findings with those seen on trans-thoracic echocardiography
(TTE).
Background: Cardiovascular disease (CVD) is a major cause of
morbidity and mortality in patients with SLE. It is increasingly
recognised that accelerated atherosclerosis contributes to
increased risk of myocardial ischaemia and/or stroke in this
population. Autopsy and echo studies have documented
numerous abnormalities in patients with SLE; however it remains
Figure 1 (abstract P197)
Quantification of the LVARA in the 5 chamber view.
Figure 1 (abstract P199)
Unexpected areas of LGE: a&b, patchy LGE in a non-coronary artery
distribution pattern (arrows), consistent with possible myocarditis – a,
4-chamber view showing sptal and apical LGE and b, short-axis view
showing inferior LGE; c, subendocardial LGE in a circumflex coronary
artery distribution (arrowheads), consistent with silent AMI in a patient
with APS.
Journal of Cardiovascular Magnetic Resonance 2009, 11(Suppl 1) http://jcmr-online.com/supplements/11/S1
Page 237 of 316(page number not for citation purposes)

unclear whether these abnormalities are an important con-
tributor to mortality and morbidity, and whether they are related
to early development of coronary artery disease.
Methods: Cardiac MR assessment including late gadolinium
enhancement (LGE) was performed on 22 patients meeting 4 or
more of the revised ACR criteria for SLE. Imaging performed at
1.5 T (Avanto, Siemens, Erlangen, Germany). 11 patients had
previous CVD and were matched with 11 control patients with
no history of CVD. Control patients were matched for age,
gender, race and SLE disease duration. TTE was performed at the
same visit. The Research Ethics Committee approved the study
and all participants gave informed consent to take part.
Results: Of the subjects in the known CVD group, 5 had areas
of LGE on the MR images: 4 LGE patterns were consistent with
myocardial infarction, whilst in 1 patient (history of stroke) there
was patchy LGE in a non-coronary distribution (Figure 1a &1b).
One subject, with known antiphospholipid antibody syndrome
(APS) but no history of CVD, had LGE suggestive of a previous
infarct (Figure 1c). This was not evident on TTE. One patient
purported to have had a myocardial infarction had no LGE. TTE
myocardial abnormalities were detected on 4 of the 6 subjects
that had LGE.
Conclusion: In this small study, we demonstrate that cardiac
MR can detect changes in the myocardium of patients with SLE
that are not evident on TTE. The 2 imaging modalities were
carried out on the same day to avoid the possibility of new
abnormalities developing between the dates of the MR and TTE.
Three of the 22 patients we studied (14%) had diagnostic MR
scans that could potentially influence their long-term manage-
ment and prognosis. Two patients with no clinical history of
cardiac disease had areas of unexpected myocardial fibrosis, one
with a pattern suggestive of coronary artery disease, and one
with multiple areas of myocardial scarring, perhaps suggestive of
myocarditis. Both these patients had normal TTE. Conversely,
1 patient with a supposed acute myocardial infarction had no
evidence of myocardial fibrosis on MR scanning, placing this
patient in a good prognostic group for the future. Further studies
of cardiac MR in patients with SLE are warranted to investigate
these preliminary findings.
P200Three dimensional Phase Sensitive InversionRecovery (PSIR) turbo FLASH for evaluation of leftventricular myocardial lesions in infiltrative andnon-ischemic cardiac diseasesAya Kino1, Sven Zuehlsdorff2, Aoife Keeling1,Cormac Farrelly1, John Sheehan1, Randall Ramsay1,Renate Jerecic2 and James C Carr11Northwestern University, Chicago, IL, USA2Siemens Medical Solutions USA, Inc., Chicago, IL, USA
Journal of Cardiovascular Magnetic Resonance 2009, 11(Suppl 1):P200
Background: Delayed-enhanced MRI (DE-MRI) is typically
used to assess myocardial viability by depicting regions of
myocardial scarring caused by myocardial infarction. Infiltrative
myocardial disease and non-ischemic cardiomyopathy demon-
strate atypical patterns of enhancement on DE-MRI, producing
diffuse hyperenhanced lesions throughout the myocardium. Such
hyperenhanced lesions patterns may be missed by conventional
2D imaging due to non-contiguous slices and limited slice
coverage. 3D DE-MRI may be a more effective technique for
assessing hyperenhanced lesions due to the isotropic coverage of
left ventricle (LV).
Purpose: The purpose of this study was to compare a navigator
gated free breathing 3D Phase Sensitive Inversion Recovery (PSIR)
turboFLASH to an established 2D PSIR turboFLASH method for
detecting myocardial hyperenhanced lesions caused by infiltrative
myocardial disease and non-ischemic cardiomyopathy.
Materials and methods: Under an IRB approved protocol,
18 patients with suspected infiltrative myocardial heart disease
and cardiomyopathy [hypertrophic cardiomyopathy (HCM)
n = 9, sarcoidosis, n = 4, and myocarditis, n = 5] were examined
on a 1.5 T MR scanner (MAGNETOM Avanto, Siemens AG,
Erlangen, Germany) after the administration of gadopentetate
dimeglumine [0.2 mmol/kg Gadolinium-DTPA (Magnevist, Scher-
ing AG, Berlin, Germany)] using a segmented 2D PSIR
turboFLASH sequence and a navigator-gated 3D PSIR turbo-
FLASH sequence. Quantitative evaluation was carried out by
measuring the volume of hyperenhaced lesions for both
techniques using the VPT quantification software (Siemens AG)
that considered areas with 6 standard deviations above the
normal myocardial signal intensity as abnormal. Images were
assessed qualitatively by 2 reviewers using the AHA 17-segment
model. The presence and transmural extent of lesions were
evaluated and the number of lesion per segment was counted.
Image quality was scored using a four point Likert scale (0-poor,
non-diagnostic; 1-fair, diagnostic maybe be impaired; 2-good with
some artifacts and 3-excellent without artifacts).
Figure 1 (abstract P200)
(a) 2D PSIR images of the left ventricle of a 55-year-old male patient with
biopsy proven sarcoidosis showing multiple scattered hyper enhanced
lesions (red arrows) within the left ventricular myocardium in short axis, 2
and 3 chamber views. (b) 3D PSIR reformatted images from the same
patient demonstrate more numerous lesions in a subepicardial and mid
myocardial location (red arrows) compared to 2D PSIR.
Journal of Cardiovascular Magnetic Resonance 2009, 11(Suppl 1) http://jcmr-online.com/supplements/11/S1
Page 238 of 316(page number not for citation purposes)
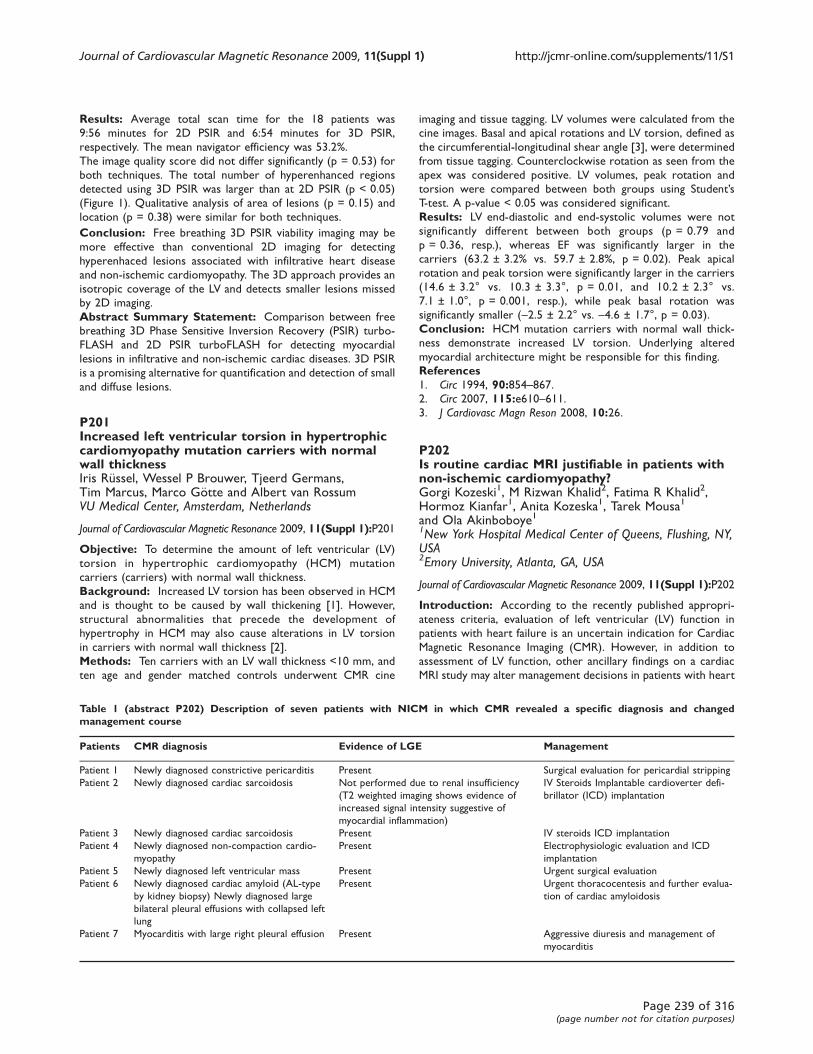
Results: Average total scan time for the 18 patients was
9:56 minutes for 2D PSIR and 6:54 minutes for 3D PSIR,
respectively. The mean navigator efficiency was 53.2%.
The image quality score did not differ significantly (p = 0.53) for
both techniques. The total number of hyperenhanced regions
detected using 3D PSIR was larger than at 2D PSIR (p < 0.05)
(Figure 1). Qualitative analysis of area of lesions (p = 0.15) and
location (p = 0.38) were similar for both techniques.
Conclusion: Free breathing 3D PSIR viability imaging may be
more effective than conventional 2D imaging for detecting
hyperenhaced lesions associated with infiltrative heart disease
and non-ischemic cardiomyopathy. The 3D approach provides an
isotropic coverage of the LV and detects smaller lesions missed
by 2D imaging.
Abstract Summary Statement: Comparison between free
breathing 3D Phase Sensitive Inversion Recovery (PSIR) turbo-
FLASH and 2D PSIR turboFLASH for detecting myocardial
lesions in infiltrative and non-ischemic cardiac diseases. 3D PSIR
is a promising alternative for quantification and detection of small
and diffuse lesions.
P201Increased left ventricular torsion in hypertrophiccardiomyopathy mutation carriers with normalwall thicknessIris Rüssel, Wessel P Brouwer, Tjeerd Germans,Tim Marcus, Marco Götte and Albert van RossumVU Medical Center, Amsterdam, Netherlands
Journal of Cardiovascular Magnetic Resonance 2009, 11(Suppl 1):P201
Objective: To determine the amount of left ventricular (LV)
torsion in hypertrophic cardiomyopathy (HCM) mutation
carriers (carriers) with normal wall thickness.
Background: Increased LV torsion has been observed in HCM
and is thought to be caused by wall thickening [1]. However,
structural abnormalities that precede the development of
hypertrophy in HCM may also cause alterations in LV torsion
in carriers with normal wall thickness [2].
Methods: Ten carriers with an LV wall thickness <10 mm, and
ten age and gender matched controls underwent CMR cine
imaging and tissue tagging. LV volumes were calculated from the
cine images. Basal and apical rotations and LV torsion, defined as
the circumferential-longitudinal shear angle [3], were determined
from tissue tagging. Counterclockwise rotation as seen from the
apex was considered positive. LV volumes, peak rotation and
torsion were compared between both groups using Student’sT-test. A p-value < 0.05 was considered significant.
Results: LV end-diastolic and end-systolic volumes were not
significantly different between both groups (p = 0.79 and
p = 0.36, resp.), whereas EF was significantly larger in the
carriers (63.2 ± 3.2% vs. 59.7 ± 2.8%, p = 0.02). Peak apical
rotation and peak torsion were significantly larger in the carriers
(14.6 ± 3.2° vs. 10.3 ± 3.3°, p = 0.01, and 10.2 ± 2.3° vs.
7.1 ± 1.0°, p = 0.001, resp.), while peak basal rotation was
significantly smaller (-2.5 ± 2.2° vs. -4.6 ± 1.7°, p = 0.03).
Conclusion: HCM mutation carriers with normal wall thick-
ness demonstrate increased LV torsion. Underlying altered
myocardial architecture might be responsible for this finding.
References1. Circ 1994, 90:854–867.2. Circ 2007, 115:e610–611.3. J Cardiovasc Magn Reson 2008, 10:26.
P202Is routine cardiac MRI justifiable in patients withnon-ischemic cardiomyopathy?Gorgi Kozeski1, M Rizwan Khalid2, Fatima R Khalid2,Hormoz Kianfar1, Anita Kozeska1, Tarek Mousa1
and Ola Akinboboye11New York Hospital Medical Center of Queens, Flushing, NY,USA2Emory University, Atlanta, GA, USA
Journal of Cardiovascular Magnetic Resonance 2009, 11(Suppl 1):P202
Introduction: According to the recently published appropri-
ateness criteria, evaluation of left ventricular (LV) function in
patients with heart failure is an uncertain indication for Cardiac
Magnetic Resonance Imaging (CMR). However, in addition to
assessment of LV function, other ancillary findings on a cardiac
MRI study may alter management decisions in patients with heart
Table 1 (abstract P202) Description of seven patients with NICM in which CMR revealed a specific diagnosis and changedmanagement course
Patients CMR diagnosis Evidence of LGE Management
Patient 1 Newly diagnosed constrictive pericarditis Present Surgical evaluation for pericardial stripping
Patient 2 Newly diagnosed cardiac sarcoidosis Not performed due to renal insufficiency
(T2 weighted imaging shows evidence of
increased signal intensity suggestive of
myocardial inflammation)
IV Steroids Implantable cardioverter defi-
brillator (ICD) implantation
Patient 3 Newly diagnosed cardiac sarcoidosis Present IV steroids ICD implantation
Patient 4 Newly diagnosed non-compaction cardio-
myopathy
Present Electrophysiologic evaluation and ICD
implantation
Patient 5 Newly diagnosed left ventricular mass Present Urgent surgical evaluation
Patient 6 Newly diagnosed cardiac amyloid (AL-type
by kidney biopsy) Newly diagnosed large
bilateral pleural effusions with collapsed left
lung
Present Urgent thoracocentesis and further evalua-
tion of cardiac amyloidosis
Patient 7 Myocarditis with large right pleural effusion Present Aggressive diuresis and management of
myocarditis
Journal of Cardiovascular Magnetic Resonance 2009, 11(Suppl 1) http://jcmr-online.com/supplements/11/S1
Page 239 of 316(page number not for citation purposes)
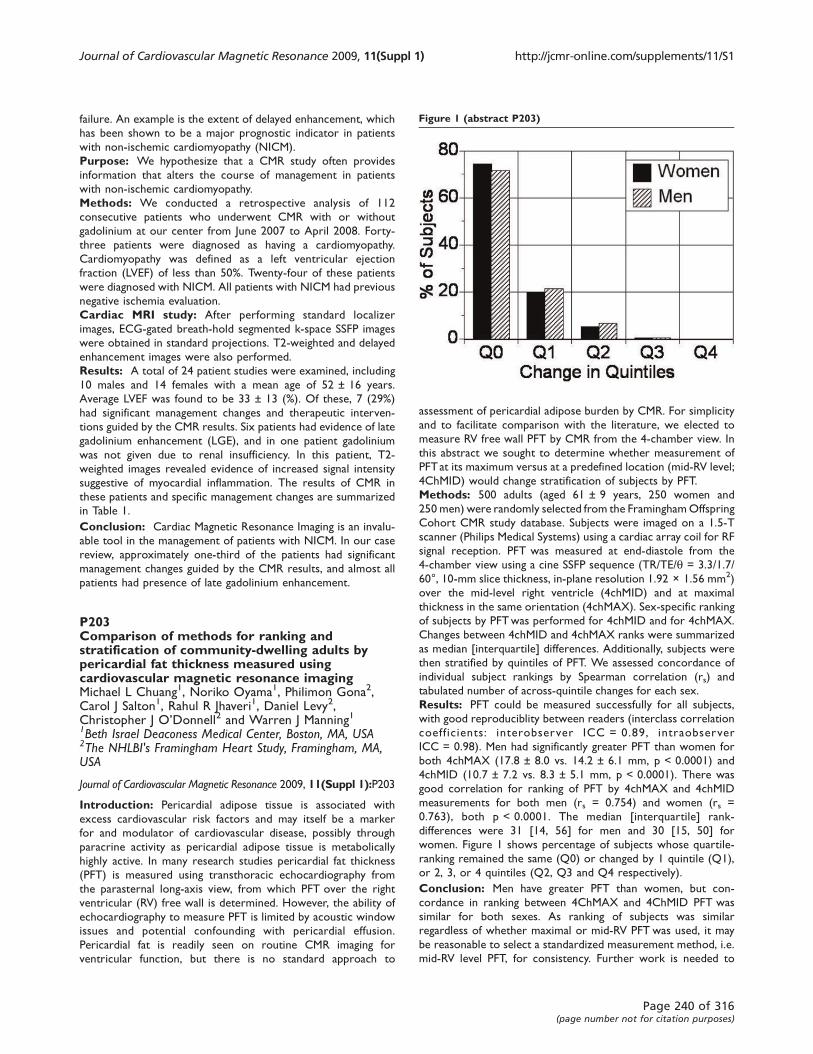
failure. An example is the extent of delayed enhancement, which
has been shown to be a major prognostic indicator in patients
with non-ischemic cardiomyopathy (NICM).
Purpose: We hypothesize that a CMR study often provides
information that alters the course of management in patients
with non-ischemic cardiomyopathy.
Methods: We conducted a retrospective analysis of 112
consecutive patients who underwent CMR with or without
gadolinium at our center from June 2007 to April 2008. Forty-
three patients were diagnosed as having a cardiomyopathy.
Cardiomyopathy was defined as a left ventricular ejection
fraction (LVEF) of less than 50%. Twenty-four of these patients
were diagnosed with NICM. All patients with NICM had previous
negative ischemia evaluation.
Cardiac MRI study: After performing standard localizer
images, ECG-gated breath-hold segmented k-space SSFP images
were obtained in standard projections. T2-weighted and delayed
enhancement images were also performed.
Results: A total of 24 patient studies were examined, including
10 males and 14 females with a mean age of 52 ± 16 years.
Average LVEF was found to be 33 ± 13 (%). Of these, 7 (29%)
had significant management changes and therapeutic interven-
tions guided by the CMR results. Six patients had evidence of late
gadolinium enhancement (LGE), and in one patient gadolinium
was not given due to renal insufficiency. In this patient, T2-
weighted images revealed evidence of increased signal intensity
suggestive of myocardial inflammation. The results of CMR in
these patients and specific management changes are summarized
in Table 1.
Conclusion: Cardiac Magnetic Resonance Imaging is an invalu-
able tool in the management of patients with NICM. In our case
review, approximately one-third of the patients had significant
management changes guided by the CMR results, and almost all
patients had presence of late gadolinium enhancement.
P203Comparison of methods for ranking andstratification of community-dwelling adults bypericardial fat thickness measured usingcardiovascular magnetic resonance imagingMichael L Chuang1, Noriko Oyama1, Philimon Gona2,Carol J Salton1, Rahul R Jhaveri1, Daniel Levy2,Christopher J O’Donnell2 and Warren J Manning11Beth Israel Deaconess Medical Center, Boston, MA, USA2The NHLBI's Framingham Heart Study, Framingham, MA,USA
Journal of Cardiovascular Magnetic Resonance 2009, 11(Suppl 1):P203
Introduction: Pericardial adipose tissue is associated with
excess cardiovascular risk factors and may itself be a marker
for and modulator of cardiovascular disease, possibly through
paracrine activity as pericardial adipose tissue is metabolically
highly active. In many research studies pericardial fat thickness
(PFT) is measured using transthoracic echocardiography from
the parasternal long-axis view, from which PFT over the right
ventricular (RV) free wall is determined. However, the ability of
echocardiography to measure PFT is limited by acoustic window
issues and potential confounding with pericardial effusion.
Pericardial fat is readily seen on routine CMR imaging for
ventricular function, but there is no standard approach to
assessment of pericardial adipose burden by CMR. For simplicity
and to facilitate comparison with the literature, we elected to
measure RV free wall PFT by CMR from the 4-chamber view. In
this abstract we sought to determine whether measurement of
PFTat its maximum versus at a predefined location (mid-RV level;
4ChMID) would change stratification of subjects by PFT.
Methods: 500 adults (aged 61 ± 9 years, 250 women and
250 men) were randomly selected from the FraminghamOffspring
Cohort CMR study database. Subjects were imaged on a 1.5-T
scanner (Philips Medical Systems) using a cardiac array coil for RF
signal reception. PFT was measured at end-diastole from the
4-chamber view using a cine SSFP sequence (TR/TE/q = 3.3/1.7/
60°, 10-mm slice thickness, in-plane resolution 1.92 × 1.56 mm2)
over the mid-level right ventricle (4chMID) and at maximal
thickness in the same orientation (4chMAX). Sex-specific ranking
of subjects by PFTwas performed for 4chMID and for 4chMAX.
Changes between 4chMID and 4chMAX ranks were summarized
as median [interquartile] differences. Additionally, subjects were
then stratified by quintiles of PFT. We assessed concordance of
individual subject rankings by Spearman correlation (rs) and
tabulated number of across-quintile changes for each sex.
Results: PFT could be measured successfully for all subjects,
with good reproduciblity between readers (interclass correlation
coeff icients: interobserver ICC = 0.89, intraobserver
ICC = 0.98). Men had significantly greater PFT than women for
both 4chMAX (17.8 ± 8.0 vs. 14.2 ± 6.1 mm, p < 0.0001) and
4chMID (10.7 ± 7.2 vs. 8.3 ± 5.1 mm, p < 0.0001). There was
good correlation for ranking of PFT by 4chMAX and 4chMID
measurements for both men (rs = 0.754) and women (rs =
0.763), both p < 0.0001. The median [interquartile] rank-
differences were 31 [14, 56] for men and 30 [15, 50] for
women. Figure 1 shows percentage of subjects whose quartile-
ranking remained the same (Q0) or changed by 1 quintile (Q1),
or 2, 3, or 4 quintiles (Q2, Q3 and Q4 respectively).
Conclusion: Men have greater PFT than women, but con-
cordance in ranking between 4ChMAX and 4ChMID PFT was
similar for both sexes. As ranking of subjects was similar
regardless of whether maximal or mid-RV PFT was used, it may
be reasonable to select a standardized measurement method, i.e.
mid-RV level PFT, for consistency. Further work is needed to
Figure 1 (abstract P203)
Journal of Cardiovascular Magnetic Resonance 2009, 11(Suppl 1) http://jcmr-online.com/supplements/11/S1
Page 240 of 316(page number not for citation purposes)

determine whether PFT measured by CMR has additional
prognostic value over standard clinical predictors of cardiovas-
cular risk, but PFT can be determined reliably and reproducibly
using routine SSFP sequences for assessment of ventricular
function, so that PFT can be determined without increasing
examination time in a standard clinical CMR examination.
P204Late gadolinium enhancement as an independentpredictor of atrial fibrillation in hypertrophiccardiomyopathy (HCM)Rory O'Hanlon, Agata Grasso, Chiara Bucciarelli-Ducci,Meghana Kulkarni, Susan Clark, Ricardo Wage,Jessica Webb, Michael Roughton, Leena Sulaibeekh,Dana Dawson, Dudley J Pennell and Sanjay K PrasadRoyal Brompton Hospital, London, UK
Journal of Cardiovascular Magnetic Resonance 2009, 11(Suppl 1):P204
Introduction: Atrial fibrillation (AF) is the most common
arrhythmia observed in HCM, developing in approximately 20%
of all cases, with an annual incidence of 1–3% per year. The risk of
AF developing is 4–6 fold greater in HCM than in the general
population. Its’ development is associated with an increased risk
of systemic thromoboembolism, heart failure and death.
Myocardial fibrosis is an important risk factor for the develop-
ment of atrial fibrillation as demonstrated in post mortem
studies. Cardiovascular magnetic resonance (CMR) is the gold
standard imaging tool to visualise replacement myocardial fibrosis
in vivo. The presence of fibrosis has been shown to be an
important predictor of cardiovascular morbidity and mortality in
both ischaemic and dilated cardiomyopathies, and more recently
an important predictor of arrhythmia as detected by Holter
monitoring in HCM.
Aims: We hypothesised that the presence of myocardial
fibrosis is an independent predictor of atrial fibrillation in
patients with HCM in a prospective cohort of patients.
Methods: Between 2001 and 2005, 126 patients with an
established diagnosis of HCM were scanned with gadolinium
late enhancement. Clinical data, cardiac events, and investigations
were collected prospectively to identify outcomes. Relevant data
including severity of mitral regurgitation, left atrial indexed
volumes, and ejection fraction were noted. The median duration
of follow up was 1076 days. CMR volumes, mass, and ejection
fraction were analysed using customised software (CMRTools,
London). Myocardial fibrosis was assessed using standard late
enhancement techniques with gadolinium-DTPA contrast agent
(ADD DOSE. The amount of fibrosis was_quantified from
sequential short axis slices (base to apex)apex using customised
software (MASS, Medis, Leiden). Myocardial epicardial and
endocardial contours were delineated. Regions of normal and
abnormal myocardium were identified and the total amount of
fibrosis was quantified on a per segment basis using the full width
half maximum technique. The total amount of fibrosis was
expressed as a percentage per segment, as a total in grams, and as
a percentage of the total left ventricular mass. A Cox
proportional hazard model was applied to correlate the
incidence of atrial fibrillation with the presence of myocardial
fibrosis.
Results: Of 126 patients studied, 87 (69%) had detectable
myocardial fibrosis. In those with myocardial fibrosis the
incidence of atrial fibrillation over the follow up period was
21% vs 5% for those without (p = 0.033). The presence of
myocardial fibrosis was associated with an 8 fold increased risk of
the development of atrial fibrillation (HR 8.45; CI 1.12–65.53;p = 0.038). Mutivariate analysis demonstrated that fibrosis
remained an independent predictor of AF regardless of mitral
regurgitant severity, ejection fraction, and LA indexed volumes.
Conclusion: The presence of LV myocardial fibrosis in HCM is
an independent predictor of the development of atrial fibrillation
over a median of approximately three years. This may have
important implications for risk stratification, decision to antic-
oagulate, and maintenance of sinus rhythm in this population.
A potential mechanism may relate to associated diastolic
dysfunction resulting in changes to atrial architecture. It is also
possible that LV changes reflect increased atrial fibrosis as part of
the disease spectrum but that is more difficult to detect with
present techniques.
P205CMR evaluation in patients with high gradeventricular arrhythmiasAntonio Bernardini1, Agostino Meduri2,3, Luigi Natale2,Carlo Liguori2, Riccardo Fenici2, Donatella Brisinda2
and Lorenzo Bonomo21“G. Mazzini” Hospital – ASL Teramo, Teramo, Italy2Università Cattolica del Sacro Cuore – Policlinico A. Gemelli,Rome, Italy3Università Cattolica del Sacro Cuore, Rome, Italy
Journal of Cardiovascular Magnetic Resonance 2009, 11(Suppl 1):P205
Purpose: To assess by cardiac-MR the prevalence of myocardial
alterations in arrhythmic patients.
Materials and methods: 43 patients with non ischemic
ventricular arrhythmias. Premature ventricular complexes had
left bundle branch block morphology (LBBB) in 29 cases, in 7 a
right bundle branch block contour (RBBB) and 7 had poly-
morphic patterns(PV). US was negative in 78.4% of patients,
while CMR was negative in only 13% of patients. Studies were
performed on a 1.5 MR scanner with Cine sequences (Fastcard
or FIESTA), bb-FSE and IR-prep FGRE 15 minutes after injection
of 0.2 mmol/Kg of Gd-DTPA.
Results: CMR found a high prevalence of morphological, signal
intensity and functional myocardial abnormalities. RV dilatation
was found in 85% of patients with PV arrhytmias, 48.3% of
patients with LBBB morphology, 12.5% of patients with RBBB
morphology. LV dilatation was present in 28.6%, 25% and 24.1%
of patients with LBBB, PV and RBBB type arrhytmias respectively.
RV wall motion abnormalities were identified in 50% and 36.7%
of patients with PV and LBBB pattern respectively while LV
motion abnormalities in 25% and 10.3%. Free wall RV signal/
thickness abnormalities were found in 23.3% of patients; LV signal
abnormalities were found in 11.6% of patients.
Seven patients underwent myocardial biopsy: 5 positive for
myocarditis, 1 positive for ARVD, one had a negative biopsy.
Conclusion: In patients with primary ventricular arrhythmias
MR documented high prevalence (87%) of morphological, signal
intensity and wall motion abnormalities even with negative
echocardiogram.
Journal of Cardiovascular Magnetic Resonance 2009, 11(Suppl 1) http://jcmr-online.com/supplements/11/S1
Page 241 of 316(page number not for citation purposes)

P206Association between wall metrics andidentification of lipid-rich necrotic core in theearly-stage atherosclerosis using magneticresonance imagingLi Dong, Xue-Qiao Zhao, Baocheng Chu,Hunter Underhill, Thomas S Hatsukami and Chun YuanUniverisity of Washington, Seattle, WA, USA
Journal of Cardiovascular Magnetic Resonance 2009, 11(Suppl 1):P206
Introduction: Detection of early-stage of carotid atherosclerosis
is important for stroke prevention. We sought to explore reliability
of wall metrics measurements by high resolution MRI in a
population of patients with early-stage carotid atherosclerosis.
Methods: Subjects (n = 106) recruited from an ongoing clinical
trial underwent carotid MRI scans (1.5 T GE scanner) using a
high-resolution multi-sequence protocol. Artery metrics mea-
surements, which include maximum wall thickness (MaxWT),
mean wall thickness (MWT), normalized wall index (NWI =
WA/[LA + WA]), and wall area (WA), were recorded after the
lumen and outer wall boundary were identified. Intraclass
coefficient (ICC) was used to assess intra- and inter-reader
agreements for measurement of the MaxWT, MWT, NWI, and
WA. The lipid-rich necrotic core (LRNC) was identified as non-
enhancing area on the contrast-enhanced T1-weighted images
with exclusion of calcification by multi-sequence images. A
spearman correlation coefficient was used to correlate Occur-
rence of LRNC with artery metrics measurements. Prevalence of
LRNC was categorized by NWI in quartiles.
Results: Intra-reader ICC's for the MaxWT, MWT, NWI, and
WA are 0.92, 0.94, 0.95, and 0.92 respectively. Inter-reader ICC’sfor measurement of the MaxWT, MWT, NWI, and WA are 0.83,
0.80, 0.85, and 0.80 respectively. The LRNC is found in
29 arteries out of a total of 106 arteries (27.4%). The mean
area of LRNC is 3.25 mm2 (SD, 2.64). There are significant
correlations between occurrence of LRNC and the MaxWT,
MWT, NWI, and WA (r = 0.71, 0.66, 0.64 and 0.42, respec-
tively). LRNC is not present in the first NWI quartile and 66.7%
of LRNC is present in the last NWI quartile (Table 1).
Discussion and conclusion: Small mean LRNC areas found in
this study indicate that this study population has early-stage of
carotid atherosclerosis. Excellent inter- and intra-reader ICC's
suggest that MRI is reliable tool for the evaluation of carotid
artery wall metrics. Good correlation between wall metrics
measurements and LRNC suggests wall metrics reflect the plaque
burden. In particular, NWI can be used to assess prevalence of
LRNC in subjects with early-stage carotid atherosclerosis.
P207Trajectory of the time course for LVH regressionand remodeling imparted by aortic valvereplacement for severe aortic stenosis;a cardiovascular MRI study sponsored by theAmerican Heart AssociationRobert WW Biederman, James A Magovern,Saundra B Grant, Ronald B Williams, June A Yamrozik,Diane A Vido, Vikas K Rathi and Mark DoyleAllegheny General Hospital, The Gerald McGinnisCardiovascular Institute, Pittsburgh, PA, USA
Journal of Cardiovascular Magnetic Resonance 2009, 11(Suppl 1):P207
Background: In patients with severe aortic stenosis (AS), long-
term data tracking surgically induced beneficial effects of
afterload reduction via aortic valve replacement (AVR) on
reverse LV remodeling are not available. Echocardiographic
data is available short-term, but in limited fashion beyond one
year. Cardiovascular MRI (CMR) offers the ability to track
discrete changes in LV metrics with small numbers but high
accuracy due to its inherent high spatial resolution and low
variability.
Hypothesis: We hypothesize that progressive changes follow-
ing AVR are detectable by CMR and changes in LV structure and
function, triggered by AVR, continue to favorably improve over
an extended period following AVR.
Methods: Ten pts (67 ± 12 yrs, 6 female) with severe, but
compensated, AS underwent CMR pre AVR and post AVR at
6 ± 2 months, 1 year ± 2 month, and up to 4 yearrs ± 5 month.
LV mass index (LVMI), LV geometry, volumetrics and EF were
measured (GE, EXCITE 1.5 T, Milwaukee, WI). A Kruskall-Wallis
one-way ANOVA was performed.
Results: Despite advanced but mostly compensated AS ((peak
and mean gradient by CMR (67 ± 21 and 43 ± 10 mmHg,
respectively) and by Echocardiography (72 ± 23 and 44 ± 11,
resepctively) (p = NS for all), all 10 pts survived AVR and
underwent CMR at up to a 4-year time point (40 time points).
LVMI markedly decreased at 6 months (157 ± 42 to 134 ±
32 g/m2, p < 0.005), continuing to gently trend downwards at
4 yrs (127 ± 32 g/m2). Similarly, EF increased pre to post AVR
(55 ± 22 to 65 ± 11%, (p < 0.05)) and continued trending
upward, remaining stable at years 1–4 (66 ± 11 vs. 65 ± 9%).
LVEDV index, initially high pre AVR, normalized post AVR
(83 ± 30 to 68 ± 11 ml/m2, p < 0.05), trending even lower by
year 4 (66 ± 10 ml/m2). LV stroke volume increased rapidly from
pre to post AVR (40 ± 11 to 44 ± 7 ml) continuing to gradually
Table 1 (abstract P206) Proportion of lipid-rich necrotic coreacross normalized wall index
NWI Number Proportion P value(comparingto the4th quartile)
1st quartile (≤ 0.36) 24 0/24 (0%) < 0.0001
2nd quartile (0.37–0.39) 23 2/23 (8.7%) 0.0001
3rd quartile (0.40–0.45) 32 9/32 (28.1%) 0.007
4th quartile (> 0.45) 23 18/27 (66.7%) -
Figure 1 (abstract P207)
Journal of Cardiovascular Magnetic Resonance 2009, 11(Suppl 1) http://jcmr-online.com/supplements/11/S1
Page 242 of 316(page number not for citation purposes)
increase at 4 yrs (49 ± 14 ml, p = 0.3). Most importantly, LVMI/
volume, a 3D measure of LV geometry, remained unchanged
initially but over 4 years markedly improved (1.07 ± 0.2 to
0.94 ± 0.24, p < 0.05), all paralleling improvements in NYHA
(3.2 ± 1.0 to 1.5 ± 1.1, p < 0.05). Figure 1.
Conclusion: After the initial beneficial effects imparted by AVR
in severe AS patients, there are, as expected, marked improve-
ments in LV reverse remodeling. We have shown, via CMR, that
surgically induced benefits to LV structure and function, including
favorable alterations in LV geometry, are durable and, unexpect-
edly, show continued improvement extending through 4 years
post-AVR concordant with sustained improved clinical status.
The pattern of this improvement is, however, previously
unrecognized. Namely, a steep trajectory of improvement early
in which fully 75% of the effect that was to be present by year 4 is
completed within the first 6 months. Afterwards, the slope of LV
remodeling is much less steep and appears to become
asymptotic.
P208Associations of plasma C-Reactive Protein andosteopontin levels with the severities of coronaryand aortic atherosclerosisYukihiko Momiyama1, Reiko Ohmori2, Zahi A Fayad3,Teruyoshi Kihara4, Ryuichi Kato2, Hiroaki Taniguchi2,Masayoshi Nagata4, Haruo Nakamura2
and Fumitaka Ohsuzu21National Hospital Organization Tokyo Medical Center, Tokyo,Japan2National Defense Medical College, Saitama, Japan3Mount Sinai School of Medicine, New York, NY, USA4Iruma Heart Hospital, Saitama, Japan
Journal of Cardiovascular Magnetic Resonance 2009, 11(Suppl 1):P208
Introduction: Limited correlations between biomarkers (e.g.
C-reactive protein (CRP) and osteopontin (OPN)) and the
severity of coronary artery disease (CAD) have been reported.
Recently, MRI became a useful tool for non-invasively evaluating
atherosclerotic plaques in both thoracic and abdominal aortas.
Using MRI, we investigated the associations of plasma CRP and
OPN levels with the severities of coronary and aortic athero-
sclerosis.
Methods: Aortic MRI was performed on Signa 1.5 T Cvi with a
phased-array body coil in 136 patients undergoing coronary
angiography. Transverse PDW and T2W images of thoracic
descending and abdominal aortas were obtained using an ECG-
gated, double-inversion-recovery FSE sequence. Imaging para-
meters were TR = 2 RR intervals, TE = 10 (PDW) and 60 ms
(T2W), 20-cm FOV, 4-mm slice thickness, 8-mm inter-slice gap,
256 × 256 acquisition matrix, and 32 echo-train. For each
patient, 9 slices of thoracic aorta and 9 slices of abdominal
aorta were obtained at 12-mm intervals, which each covered
about 10-cm portion of thoracic aorta below the arch and 10-cm
portion of abdominal aorta above the bifurcation of iliac artery.
Plaque was defined as a clearly identified luminal protrusion with
focal wall thickening, and plaque extent in each slice was scored
0 to 4 points by the percentage of luminal surface involved by
plaque. The severity of aortic atherosclerosis was represented as
the sum of scores (plaque score). On coronary angiograms, the
degree of stenosis in each segment was evaluated by 5 grades.
The severity of coronary atherosclerosis was represented as the
number of >50% stenotic vessels and the number of >25%
stenotic segments. Plasma OPN and high-sensitivity CRP levels
were measured by ELISA with a commercially available kit
(Human OPN assay kit, IBL) and by a BNII nephelometer (Dade
Behring), respectively. Any patients with acute coronary
syndromes were excluded from this study.
Results: Of the 136 patients, 53 (39%) were on statin
treatment, and 96 (71%) had CAD (>50% luminal diameter
stenosis) on angiograms. Thoracic and abdominal aortic plaques
were found in 88 (65%) and 124 (91%) patients, respectively.
Patients with CAD had higher OPN (562 ± 223 vs. 445 ±
234 ng/ml) and CRP (median 0.78 vs. 0.48 mg/l) levels than those
without CAD (P < 0.02). Plasma OPN levels did not correlate
with CRP levels. Stepwise increase in OPN levels was found
depending on the number of >50% stenotic coronary vessels:
445 ± 234 (0VD), 541 ± 239 (1VD), 556 ± 219 (2VD), and
604 ± 211 ng/ml (3VD) (P < 0.05). OPN levels correlated with
the number of >25% stenotic coronary segments (r = 0.23 by
Spearman’s rank correlation test, P < 0.01). Plasma CRP levels
also stepwise increased depending on the number of stenotic
vessels: 0.48, 0.70, 0.74, and 0.88 mg/l (P = NS). CRP levels
correlated with the number of stenotic segments (r = 0.21 by
Spearman’s rank correlation test, P < 0.02). Regarding aortic
atherosclerosis, the 136 patients were divided into quartiles by
plaque score. Stepwise increase in OPN levels was found
depending on the quartiles of aortic plaque score: 451 ± 165
(Q1), 471 ± 236 (Q2), 560 ± 232 (Q3), and 629 ± 252 ng/ml
(Q4) (P < 0.02). OPN levels correlated with aortic plaque score
(r = 0.26, P < 0.005). CRP levels also stepwise increased on the
quartiles: 0.40, 0.56, 1.08, and 1.10 mg/l (P < 0.001). CRP levels
correlated with plaque score (r = 0.38, P < 0.001). In multi-
variate analysis, aortic atherosclerosis was found to be an
independent factor associated with both OPN and CRP levels,
but coronary atherosclerosis was not.
Conclusion: Plasma OPN and CRP levels correlated with the
severities of both coronary and aortic atherosclerosis, but these
biomarkers are more likely to reflect the severity of aortic
atherosclerosis than coronary atherosclerosis. MRI was useful
for non-invasively evaluating atherosclerosis in thoracic and
abdominal aortas.
P209Does implantation of an Amplatzer septal occluder(ASO) device change ventricular contractionpattern? An MR tagging studyHeiko Stern and Sohrab FratzDeutsches Herzzentrum Munchen, München, Germany
Journal of Cardiovascular Magnetic Resonance 2009, 11(Suppl 1):P209
Amplatzer occluder devices are used throughout the world for
occlusion of atrial septal defects (ASD) or persistent foramen
ovale (PFO). This foreign body remains in place for life time and
could change the contraction pattern of the heart. The
contraction pattern should be analyzed by MR tagging. In order
to differentiate motion changes by unloading the right ventricle
(RV) from changes by the presence of the ASO itself both
patients with ASD and PFO were included, presuming that PFO
occluders did not change ventricular volumes.
Journal of Cardiovascular Magnetic Resonance 2009, 11(Suppl 1) http://jcmr-online.com/supplements/11/S1
Page 243 of 316(page number not for citation purposes)
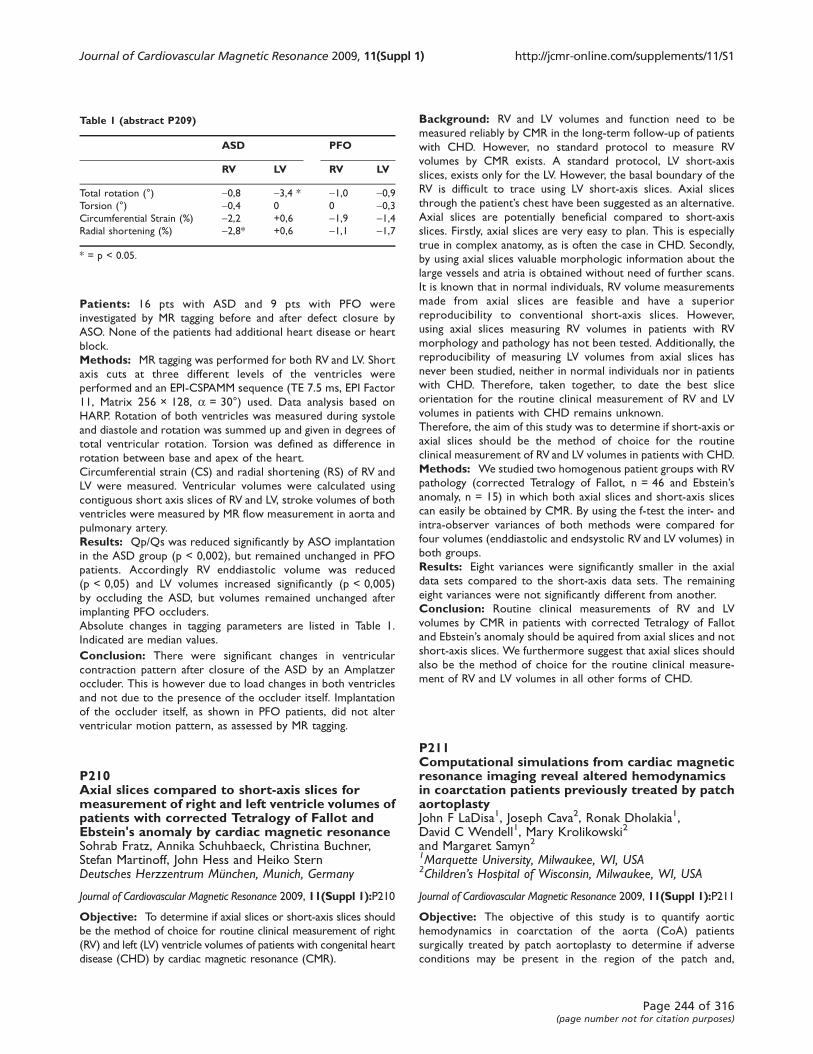
Patients: 16 pts with ASD and 9 pts with PFO were
investigated by MR tagging before and after defect closure by
ASO. None of the patients had additional heart disease or heart
block.
Methods: MR tagging was performed for both RV and LV. Short
axis cuts at three different levels of the ventricles were
performed and an EPI-CSPAMM sequence (TE 7.5 ms, EPI Factor
11, Matrix 256 × 128, a = 30°) used. Data analysis based on
HARP. Rotation of both ventricles was measured during systole
and diastole and rotation was summed up and given in degrees of
total ventricular rotation. Torsion was defined as difference in
rotation between base and apex of the heart.
Circumferential strain (CS) and radial shortening (RS) of RV and
LV were measured. Ventricular volumes were calculated using
contiguous short axis slices of RV and LV, stroke volumes of both
ventricles were measured by MR flow measurement in aorta and
pulmonary artery.
Results: Qp/Qs was reduced significantly by ASO implantation
in the ASD group (p < 0,002), but remained unchanged in PFO
patients. Accordingly RV enddiastolic volume was reduced
(p < 0,05) and LV volumes increased significantly (p < 0,005)
by occluding the ASD, but volumes remained unchanged after
implanting PFO occluders.
Absolute changes in tagging parameters are listed in Table 1.
Indicated are median values.
Conclusion: There were significant changes in ventricular
contraction pattern after closure of the ASD by an Amplatzer
occluder. This is however due to load changes in both ventricles
and not due to the presence of the occluder itself. Implantation
of the occluder itself, as shown in PFO patients, did not alter
ventricular motion pattern, as assessed by MR tagging.
P210Axial slices compared to short-axis slices formeasurement of right and left ventricle volumes ofpatients with corrected Tetralogy of Fallot andEbstein's anomaly by cardiac magnetic resonanceSohrab Fratz, Annika Schuhbaeck, Christina Buchner,Stefan Martinoff, John Hess and Heiko SternDeutsches Herzzentrum München, Munich, Germany
Journal of Cardiovascular Magnetic Resonance 2009, 11(Suppl 1):P210
Objective: To determine if axial slices or short-axis slices should
be the method of choice for routine clinical measurement of right
(RV) and left (LV) ventricle volumes of patients with congenital heart
disease (CHD) by cardiac magnetic resonance (CMR).
Background: RV and LV volumes and function need to be
measured reliably by CMR in the long-term follow-up of patients
with CHD. However, no standard protocol to measure RV
volumes by CMR exists. A standard protocol, LV short-axis
slices, exists only for the LV. However, the basal boundary of the
RV is difficult to trace using LV short-axis slices. Axial slices
through the patient’s chest have been suggested as an alternative.
Axial slices are potentially beneficial compared to short-axis
slices. Firstly, axial slices are very easy to plan. This is especially
true in complex anatomy, as is often the case in CHD. Secondly,
by using axial slices valuable morphologic information about the
large vessels and atria is obtained without need of further scans.
It is known that in normal individuals, RV volume measurements
made from axial slices are feasible and have a superior
reproducibility to conventional short-axis slices. However,
using axial slices measuring RV volumes in patients with RV
morphology and pathology has not been tested. Additionally, the
reproducibility of measuring LV volumes from axial slices has
never been studied, neither in normal individuals nor in patients
with CHD. Therefore, taken together, to date the best slice
orientation for the routine clinical measurement of RV and LV
volumes in patients with CHD remains unknown.
Therefore, the aim of this study was to determine if short-axis or
axial slices should be the method of choice for the routine
clinical measurement of RV and LV volumes in patients with CHD.
Methods: We studied two homogenous patient groups with RV
pathology (corrected Tetralogy of Fallot, n = 46 and Ebstein’sanomaly, n = 15) in which both axial slices and short-axis slices
can easily be obtained by CMR. By using the f-test the inter- and
intra-observer variances of both methods were compared for
four volumes (enddiastolic and endsystolic RV and LV volumes) in
both groups.
Results: Eight variances were significantly smaller in the axial
data sets compared to the short-axis data sets. The remaining
eight variances were not significantly different from another.
Conclusion: Routine clinical measurements of RV and LV
volumes by CMR in patients with corrected Tetralogy of Fallot
and Ebstein’s anomaly should be aquired from axial slices and not
short-axis slices. We furthermore suggest that axial slices should
also be the method of choice for the routine clinical measure-
ment of RV and LV volumes in all other forms of CHD.
P211Computational simulations from cardiac magneticresonance imaging reveal altered hemodynamicsin coarctation patients previously treated by patchaortoplastyJohn F LaDisa1, Joseph Cava2, Ronak Dholakia1,David C Wendell1, Mary Krolikowski2
and Margaret Samyn21Marquette University, Milwaukee, WI, USA2Children’s Hospital of Wisconsin, Milwaukee, WI, USA
Journal of Cardiovascular Magnetic Resonance 2009, 11(Suppl 1):P211
Objective: The objective of this study is to quantify aortic
hemodynamics in coarctation of the aorta (CoA) patients
surgically treated by patch aortoplasty to determine if adverse
conditions may be present in the region of the patch and,
Table 1 (abstract P209)
ASD PFO
RV LV RV LV
Total rotation (°) -0,8 -3,4 * -1,0 -0,9Torsion (°) -0,4 0 0 -0,3Circumferential Strain (%) -2,2 +0,6 -1,9 -1,4Radial shortening (%) -2,8* +0,6 -1,1 -1,7
* = p < 0.05.
Journal of Cardiovascular Magnetic Resonance 2009, 11(Suppl 1) http://jcmr-online.com/supplements/11/S1
Page 244 of 316(page number not for citation purposes)
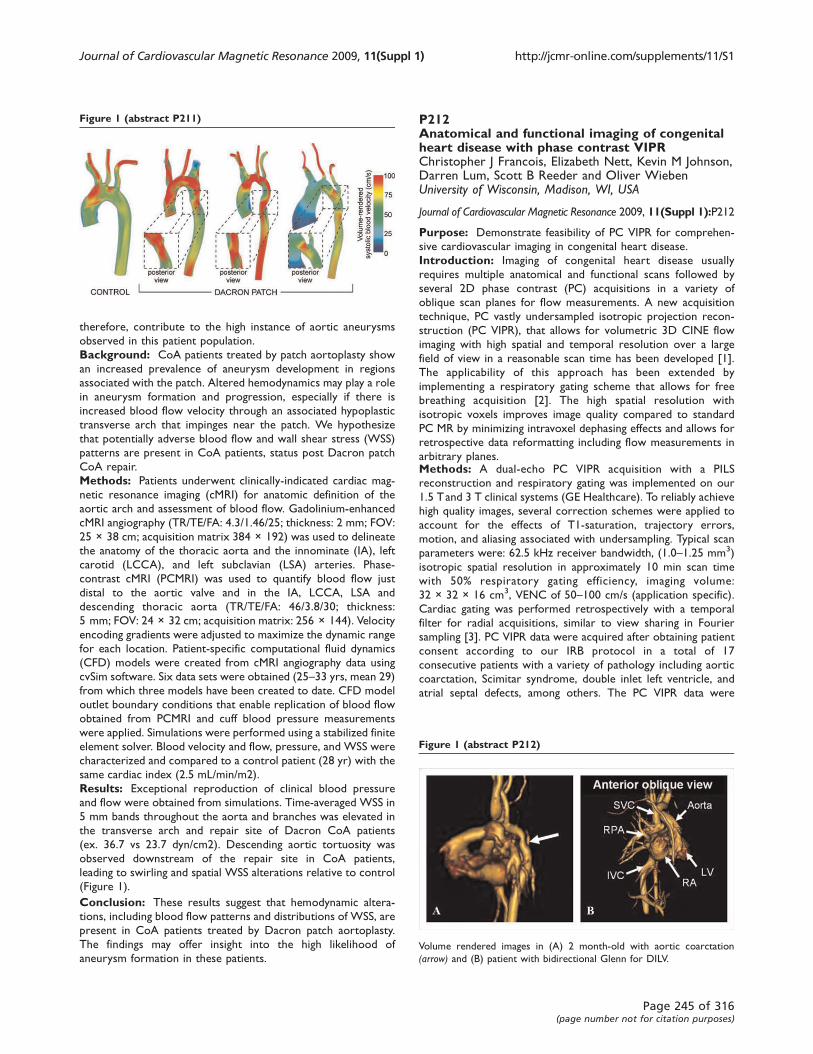
therefore, contribute to the high instance of aortic aneurysms
observed in this patient population.
Background: CoA patients treated by patch aortoplasty show
an increased prevalence of aneurysm development in regions
associated with the patch. Altered hemodynamics may play a role
in aneurysm formation and progression, especially if there is
increased blood flow velocity through an associated hypoplastic
transverse arch that impinges near the patch. We hypothesize
that potentially adverse blood flow and wall shear stress (WSS)
patterns are present in CoA patients, status post Dacron patch
CoA repair.
Methods: Patients underwent clinically-indicated cardiac mag-
netic resonance imaging (cMRI) for anatomic definition of the
aortic arch and assessment of blood flow. Gadolinium-enhanced
cMRI angiography (TR/TE/FA: 4.3/1.46/25; thickness: 2 mm; FOV:
25 × 38 cm; acquisition matrix 384 × 192) was used to delineate
the anatomy of the thoracic aorta and the innominate (IA), left
carotid (LCCA), and left subclavian (LSA) arteries. Phase-
contrast cMRI (PCMRI) was used to quantify blood flow just
distal to the aortic valve and in the IA, LCCA, LSA and
descending thoracic aorta (TR/TE/FA: 46/3.8/30; thickness:
5 mm; FOV: 24 × 32 cm; acquisition matrix: 256 × 144). Velocity
encoding gradients were adjusted to maximize the dynamic range
for each location. Patient-specific computational fluid dynamics
(CFD) models were created from cMRI angiography data using
cvSim software. Six data sets were obtained (25–33 yrs, mean 29)
from which three models have been created to date. CFD model
outlet boundary conditions that enable replication of blood flow
obtained from PCMRI and cuff blood pressure measurements
were applied. Simulations were performed using a stabilized finite
element solver. Blood velocity and flow, pressure, and WSS were
characterized and compared to a control patient (28 yr) with the
same cardiac index (2.5 mL/min/m2).
Results: Exceptional reproduction of clinical blood pressure
and flow were obtained from simulations. Time-averaged WSS in
5 mm bands throughout the aorta and branches was elevated in
the transverse arch and repair site of Dacron CoA patients
(ex. 36.7 vs 23.7 dyn/cm2). Descending aortic tortuosity was
observed downstream of the repair site in CoA patients,
leading to swirling and spatial WSS alterations relative to control
(Figure 1).
Conclusion: These results suggest that hemodynamic altera-
tions, including blood flow patterns and distributions of WSS, are
present in CoA patients treated by Dacron patch aortoplasty.
The findings may offer insight into the high likelihood of
aneurysm formation in these patients.
P212Anatomical and functional imaging of congenitalheart disease with phase contrast VIPRChristopher J Francois, Elizabeth Nett, Kevin M Johnson,Darren Lum, Scott B Reeder and Oliver WiebenUniversity of Wisconsin, Madison, WI, USA
Journal of Cardiovascular Magnetic Resonance 2009, 11(Suppl 1):P212
Purpose: Demonstrate feasibility of PC VIPR for comprehen-
sive cardiovascular imaging in congenital heart disease.
Introduction: Imaging of congenital heart disease usually
requires multiple anatomical and functional scans followed by
several 2D phase contrast (PC) acquisitions in a variety of
oblique scan planes for flow measurements. A new acquisition
technique, PC vastly undersampled isotropic projection recon-
struction (PC VIPR), that allows for volumetric 3D CINE flow
imaging with high spatial and temporal resolution over a large
field of view in a reasonable scan time has been developed [1].
The applicability of this approach has been extended by
implementing a respiratory gating scheme that allows for free
breathing acquisition [2]. The high spatial resolution with
isotropic voxels improves image quality compared to standard
PC MR by minimizing intravoxel dephasing effects and allows for
retrospective data reformatting including flow measurements in
arbitrary planes.Methods: A dual-echo PC VIPR acquisition with a PILS
reconstruction and respiratory gating was implemented on our
1.5 Tand 3 T clinical systems (GE Healthcare). To reliably achieve
high quality images, several correction schemes were applied to
account for the effects of T1-saturation, trajectory errors,
motion, and aliasing associated with undersampling. Typical scan
parameters were: 62.5 kHz receiver bandwidth, (1.0–1.25 mm3)
isotropic spatial resolution in approximately 10 min scan time
with 50% respiratory gating efficiency, imaging volume:
32 × 32 × 16 cm3, VENC of 50–100 cm/s (application specific).
Cardiac gating was performed retrospectively with a temporal
filter for radial acquisitions, similar to view sharing in Fourier
sampling [3]. PC VIPR data were acquired after obtaining patient
consent according to our IRB protocol in a total of 17
consecutive patients with a variety of pathology including aortic
coarctation, Scimitar syndrome, double inlet left ventricle, and
atrial septal defects, among others. The PC VIPR data were
Figure 1 (abstract P211)
Figure 1 (abstract P212)
Volume rendered images in (A) 2 month-old with aortic coarctation
(arrow) and (B) patient with bidirectional Glenn for DILV.
Journal of Cardiovascular Magnetic Resonance 2009, 11(Suppl 1) http://jcmr-online.com/supplements/11/S1
Page 245 of 316(page number not for citation purposes)
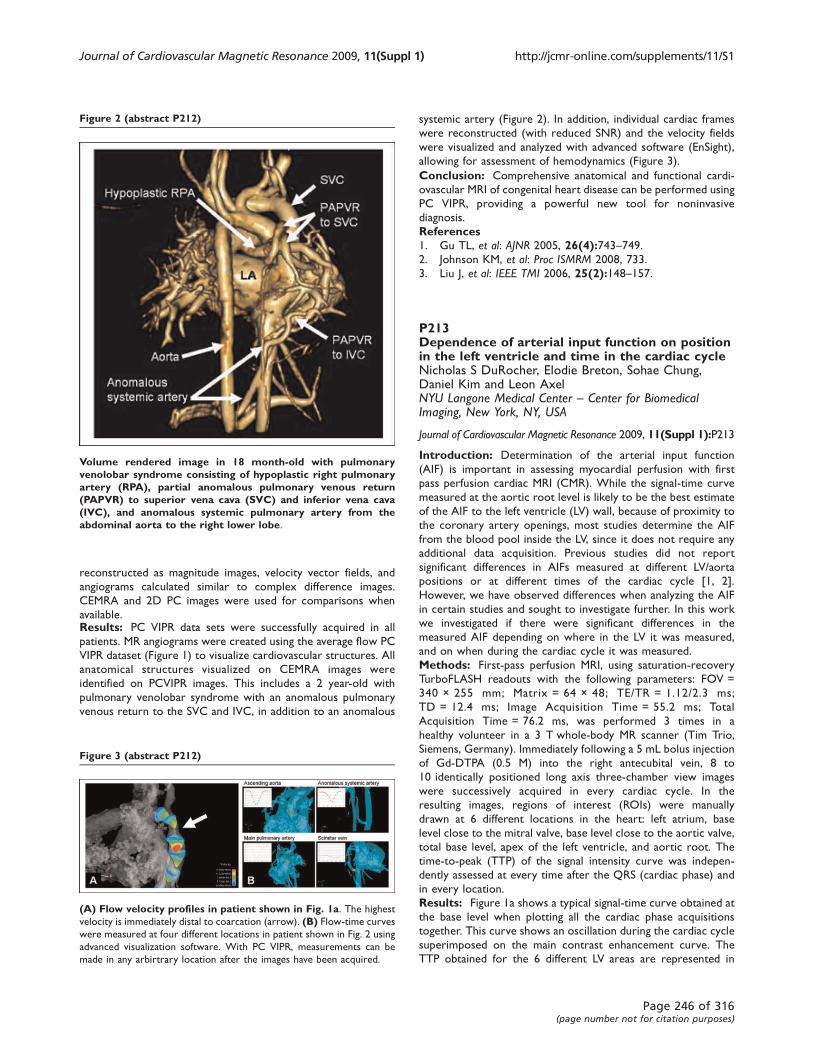
reconstructed as magnitude images, velocity vector fields, and
angiograms calculated similar to complex difference images.
CEMRA and 2D PC images were used for comparisons when
available.Results: PC VIPR data sets were successfully acquired in all
patients. MR angiograms were created using the average flow PC
VIPR dataset (Figure 1) to visualize cardiovascular structures. All
anatomical structures visualized on CEMRA images were
identified on PCVIPR images. This includes a 2 year-old with
pulmonary venolobar syndrome with an anomalous pulmonary
venous return to the SVC and IVC, in addition to an anomalous
systemic artery (Figure 2). In addition, individual cardiac frames
were reconstructed (with reduced SNR) and the velocity fields
were visualized and analyzed with advanced software (EnSight),
allowing for assessment of hemodynamics (Figure 3).
Conclusion: Comprehensive anatomical and functional cardi-
ovascular MRI of congenital heart disease can be performed using
PC VIPR, providing a powerful new tool for noninvasive
diagnosis.
References1. Gu TL, et al: AJNR 2005, 26(4):743–749.2. Johnson KM, et al: Proc ISMRM 2008, 733.
3. Liu J, et al: IEEE TMI 2006, 25(2):148–157.
P213Dependence of arterial input function on positionin the left ventricle and time in the cardiac cycleNicholas S DuRocher, Elodie Breton, Sohae Chung,Daniel Kim and Leon AxelNYU Langone Medical Center – Center for BiomedicalImaging, New York, NY, USA
Journal of Cardiovascular Magnetic Resonance 2009, 11(Suppl 1):P213
Introduction: Determination of the arterial input function
(AIF) is important in assessing myocardial perfusion with first
pass perfusion cardiac MRI (CMR). While the signal-time curve
measured at the aortic root level is likely to be the best estimate
of the AIF to the left ventricle (LV) wall, because of proximity to
the coronary artery openings, most studies determine the AIF
from the blood pool inside the LV, since it does not require any
additional data acquisition. Previous studies did not report
significant differences in AIFs measured at different LV/aorta
positions or at different times of the cardiac cycle [1, 2].
However, we have observed differences when analyzing the AIF
in certain studies and sought to investigate further. In this work
we investigated if there were significant differences in the
measured AIF depending on where in the LV it was measured,
and on when during the cardiac cycle it was measured.
Methods: First-pass perfusion MRI, using saturation-recovery
TurboFLASH readouts with the following parameters: FOV =
340 × 255 mm; Matrix = 64 × 48; TE/TR = 1.12/2.3 ms;
TD = 12.4 ms; Image Acquisition Time = 55.2 ms; Total
Acquisition Time = 76.2 ms, was performed 3 times in a
healthy volunteer in a 3 T whole-body MR scanner (Tim Trio,
Siemens, Germany). Immediately following a 5 mL bolus injection
of Gd-DTPA (0.5 M) into the right antecubital vein, 8 to
10 identically positioned long axis three-chamber view images
were successively acquired in every cardiac cycle. In the
resulting images, regions of interest (ROIs) were manually
drawn at 6 different locations in the heart: left atrium, base
level close to the mitral valve, base level close to the aortic valve,
total base level, apex of the left ventricle, and aortic root. The
time-to-peak (TTP) of the signal intensity curve was indepen-
dently assessed at every time after the QRS (cardiac phase) and
in every location.
Results: Figure 1a shows a typical signal-time curve obtained at
the base level when plotting all the cardiac phase acquisitions
together. This curve shows an oscillation during the cardiac cycle
superimposed on the main contrast enhancement curve. The
TTP obtained for the 6 different LV areas are represented in
Figure 2 (abstract P212)
Volume rendered image in 18 month-old with pulmonaryvenolobar syndrome consisting of hypoplastic right pulmonaryartery (RPA), partial anomalous pulmonary venous return(PAPVR) to superior vena cava (SVC) and inferior vena cava(IVC), and anomalous systemic pulmonary artery from theabdominal aorta to the right lower lobe.
Figure 3 (abstract P212)
(A) Flow velocity profiles in patient shown in Fig. 1a. The highest
velocity is immediately distal to coarcation (arrow). (B) Flow-time curves
were measured at four different locations in patient shown in Fig. 2 using
advanced visualization software. With PC VIPR, measurements can be
made in any arbirtrary location after the images have been acquired.
Journal of Cardiovascular Magnetic Resonance 2009, 11(Suppl 1) http://jcmr-online.com/supplements/11/S1
Page 246 of 316(page number not for citation purposes)
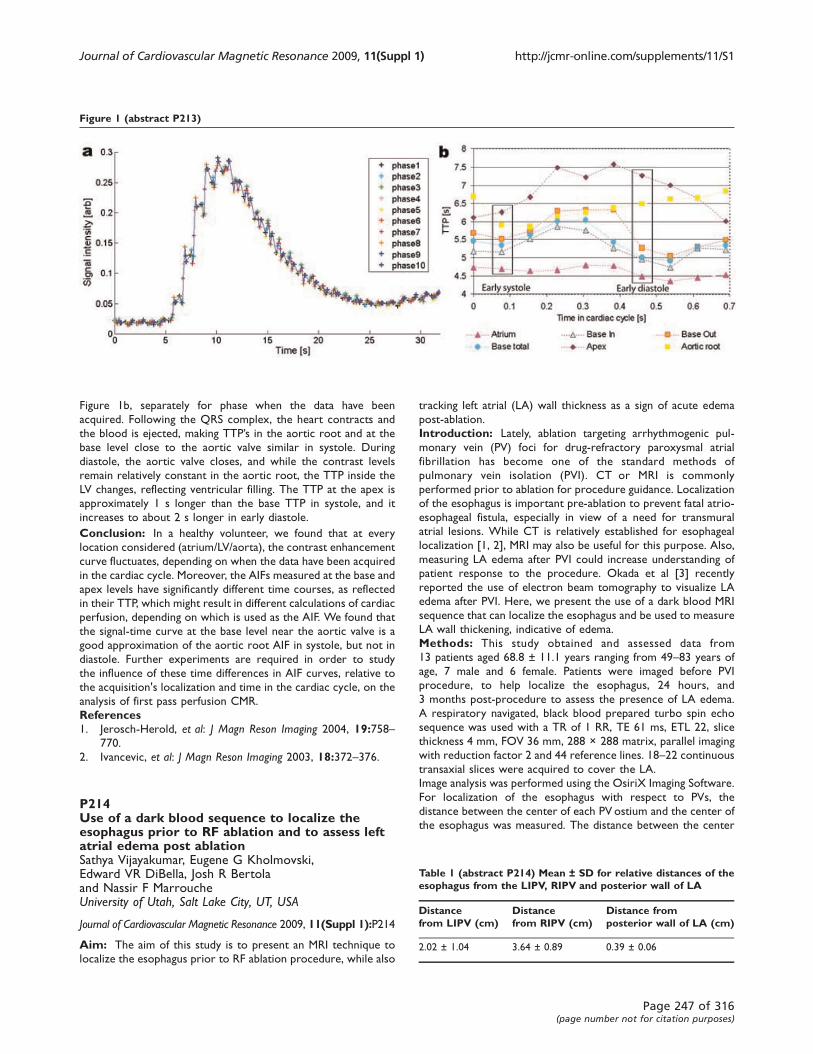
Figure 1b, separately for phase when the data have been
acquired. Following the QRS complex, the heart contracts and
the blood is ejected, making TTP’s in the aortic root and at the
base level close to the aortic valve similar in systole. During
diastole, the aortic valve closes, and while the contrast levels
remain relatively constant in the aortic root, the TTP inside the
LV changes, reflecting ventricular filling. The TTP at the apex is
approximately 1 s longer than the base TTP in systole, and it
increases to about 2 s longer in early diastole.
Conclusion: In a healthy volunteer, we found that at every
location considered (atrium/LV/aorta), the contrast enhancement
curve fluctuates, depending on when the data have been acquired
in the cardiac cycle. Moreover, the AIFs measured at the base and
apex levels have significantly different time courses, as reflected
in their TTP, which might result in different calculations of cardiac
perfusion, depending on which is used as the AIF. We found that
the signal-time curve at the base level near the aortic valve is a
good approximation of the aortic root AIF in systole, but not in
diastole. Further experiments are required in order to study
the influence of these time differences in AIF curves, relative to
the acquisition's localization and time in the cardiac cycle, on the
analysis of first pass perfusion CMR.
References1. Jerosch-Herold, et al: J Magn Reson Imaging 2004, 19:758–
770.
2. Ivancevic, et al: J Magn Reson Imaging 2003, 18:372–376.
P214Use of a dark blood sequence to localize theesophagus prior to RF ablation and to assess leftatrial edema post ablationSathya Vijayakumar, Eugene G Kholmovski,Edward VR DiBella, Josh R Bertolaand Nassir F MarroucheUniversity of Utah, Salt Lake City, UT, USA
Journal of Cardiovascular Magnetic Resonance 2009, 11(Suppl 1):P214
Aim: The aim of this study is to present an MRI technique to
localize the esophagus prior to RF ablation procedure, while also
tracking left atrial (LA) wall thickness as a sign of acute edema
post-ablation.
Introduction: Lately, ablation targeting arrhythmogenic pul-
monary vein (PV) foci for drug-refractory paroxysmal atrial
fibrillation has become one of the standard methods of
pulmonary vein isolation (PVI). CT or MRI is commonly
performed prior to ablation for procedure guidance. Localization
of the esophagus is important pre-ablation to prevent fatal atrio-
esophageal fistula, especially in view of a need for transmural
atrial lesions. While CT is relatively established for esophageal
localization [1, 2], MRI may also be useful for this purpose. Also,
measuring LA edema after PVI could increase understanding of
patient response to the procedure. Okada et al [3] recently
reported the use of electron beam tomography to visualize LA
edema after PVI. Here, we present the use of a dark blood MRI
sequence that can localize the esophagus and be used to measure
LA wall thickening, indicative of edema.
Methods: This study obtained and assessed data from
13 patients aged 68.8 ± 11.1 years ranging from 49–83 years of
age, 7 male and 6 female. Patients were imaged before PVI
procedure, to help localize the esophagus, 24 hours, and
3 months post-procedure to assess the presence of LA edema.
A respiratory navigated, black blood prepared turbo spin echo
sequence was used with a TR of 1 RR, TE 61 ms, ETL 22, slice
thickness 4 mm, FOV 36 mm, 288 × 288 matrix, parallel imaging
with reduction factor 2 and 44 reference lines. 18–22 continuous
transaxial slices were acquired to cover the LA.
Image analysis was performed using the OsiriX Imaging Software.
For localization of the esophagus with respect to PVs, the
distance between the center of each PV ostium and the center of
the esophagus was measured. The distance between the center
Figure 1 (abstract P213)
Table 1 (abstract P214) Mean ± SD for relative distances of theesophagus from the LIPV, RIPV and posterior wall of LA
Distancefrom LIPV (cm)
Distancefrom RIPV (cm)
Distance fromposterior wall of LA (cm)
2.02 ± 1.04 3.64 ± 0.89 0.39 ± 0.06
Journal of Cardiovascular Magnetic Resonance 2009, 11(Suppl 1) http://jcmr-online.com/supplements/11/S1
Page 247 of 316(page number not for citation purposes)
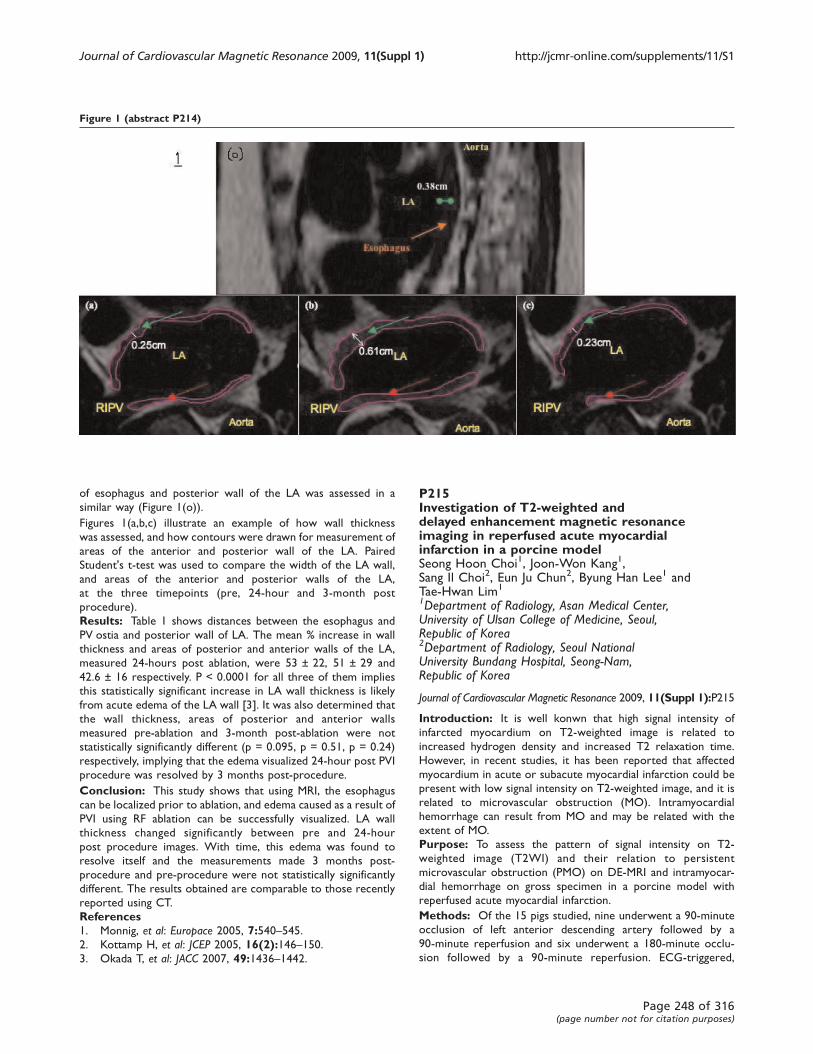
of esophagus and posterior wall of the LA was assessed in a
similar way (Figure 1(o)).
Figures 1(a,b,c) illustrate an example of how wall thickness
was assessed, and how contours were drawn for measurement of
areas of the anterior and posterior wall of the LA. Paired
Student's t-test was used to compare the width of the LA wall,
and areas of the anterior and posterior walls of the LA,
at the three timepoints (pre, 24-hour and 3-month post
procedure).
Results: Table 1 shows distances between the esophagus and
PV ostia and posterior wall of LA. The mean % increase in wall
thickness and areas of posterior and anterior walls of the LA,
measured 24-hours post ablation, were 53 ± 22, 51 ± 29 and
42.6 ± 16 respectively. P < 0.0001 for all three of them implies
this statistically significant increase in LA wall thickness is likely
from acute edema of the LA wall [3]. It was also determined that
the wall thickness, areas of posterior and anterior walls
measured pre-ablation and 3-month post-ablation were not
statistically significantly different (p = 0.095, p = 0.51, p = 0.24)
respectively, implying that the edema visualized 24-hour post PVI
procedure was resolved by 3 months post-procedure.
Conclusion: This study shows that using MRI, the esophagus
can be localized prior to ablation, and edema caused as a result of
PVI using RF ablation can be successfully visualized. LA wall
thickness changed significantly between pre and 24-hour
post procedure images. With time, this edema was found to
resolve itself and the measurements made 3 months post-
procedure and pre-procedure were not statistically significantly
different. The results obtained are comparable to those recently
reported using CT.
References1. Monnig, et al: Europace 2005, 7:540–545.2. Kottamp H, et al: JCEP 2005, 16(2):146–150.3. Okada T, et al: JACC 2007, 49:1436–1442.
P215Investigation of T2-weighted anddelayed enhancement magnetic resonanceimaging in reperfused acute myocardialinfarction in a porcine modelSeong Hoon Choi1, Joon-Won Kang1,Sang Il Choi2, Eun Ju Chun2, Byung Han Lee1 andTae-Hwan Lim1
1Department of Radiology, Asan Medical Center,University of Ulsan College of Medicine, Seoul,Republic of Korea2Department of Radiology, Seoul NationalUniversity Bundang Hospital, Seong-Nam,Republic of Korea
Journal of Cardiovascular Magnetic Resonance 2009, 11(Suppl 1):P215
Introduction: It is well konwn that high signal intensity of
infarcted myocardium on T2-weighted image is related to
increased hydrogen density and increased T2 relaxation time.
However, in recent studies, it has been reported that affected
myocardium in acute or subacute myocardial infarction could be
present with low signal intensity on T2-weighted image, and it is
related to microvascular obstruction (MO). Intramyocardial
hemorrhage can result from MO and may be related with the
extent of MO.
Purpose: To assess the pattern of signal intensity on T2-
weighted image (T2WI) and their relation to persistent
microvascular obstruction (PMO) on DE-MRI and intramyocar-
dial hemorrhage on gross specimen in a porcine model with
reperfused acute myocardial infarction.
Methods: Of the 15 pigs studied, nine underwent a 90-minute
occlusion of left anterior descending artery followed by a
90-minute reperfusion and six underwent a 180-minute occlu-
sion followed by a 90-minute reperfusion. ECG-triggered,
Figure 1 (abstract P214)
Journal of Cardiovascular Magnetic Resonance 2009, 11(Suppl 1) http://jcmr-online.com/supplements/11/S1
Page 248 of 316(page number not for citation purposes)
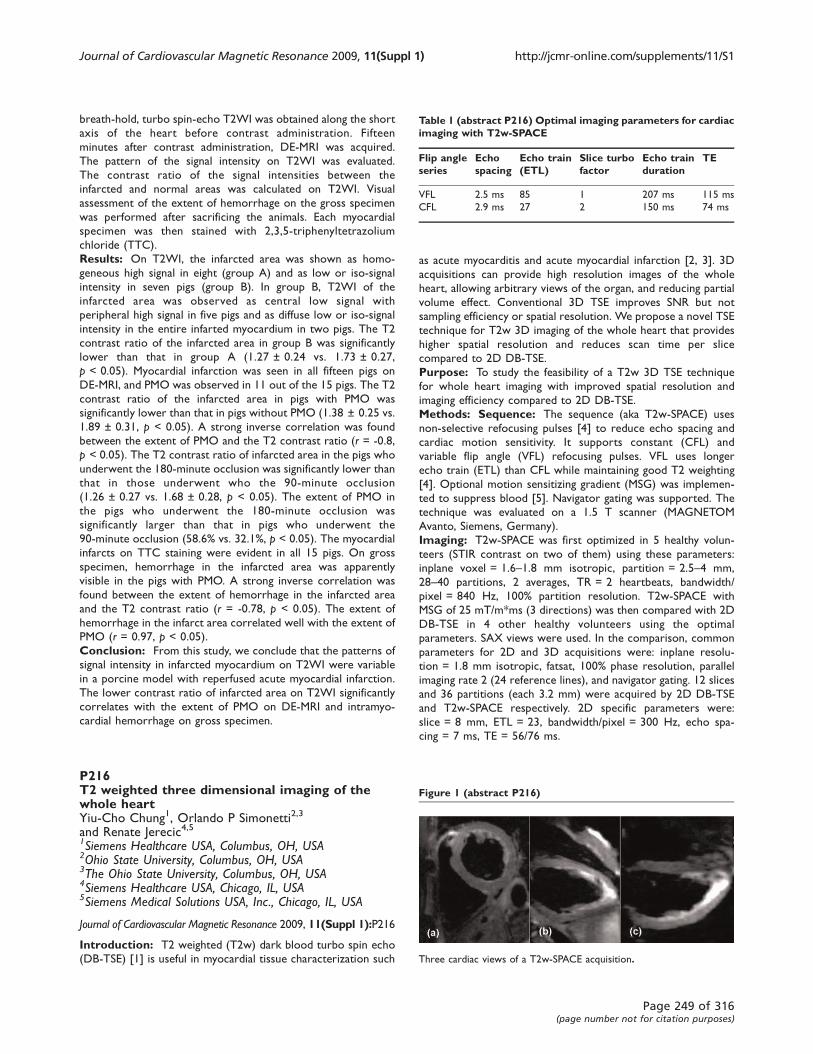
breath-hold, turbo spin-echo T2WI was obtained along the short
axis of the heart before contrast administration. Fifteen
minutes after contrast administration, DE-MRI was acquired.
The pattern of the signal intensity on T2WI was evaluated.
The contrast ratio of the signal intensities between the
infarcted and normal areas was calculated on T2WI. Visual
assessment of the extent of hemorrhage on the gross specimen
was performed after sacrificing the animals. Each myocardial
specimen was then stained with 2,3,5-triphenyltetrazolium
chloride (TTC).
Results: On T2WI, the infarcted area was shown as homo-
geneous high signal in eight (group A) and as low or iso-signal
intensity in seven pigs (group B). In group B, T2WI of the
infarcted area was observed as central low signal with
peripheral high signal in five pigs and as diffuse low or iso-signal
intensity in the entire infarted myocardium in two pigs. The T2
contrast ratio of the infarcted area in group B was significantly
lower than that in group A (1.27 ± 0.24 vs. 1.73 ± 0.27,
p < 0.05). Myocardial infarction was seen in all fifteen pigs on
DE-MRI, and PMO was observed in 11 out of the 15 pigs. The T2
contrast ratio of the infarcted area in pigs with PMO was
significantly lower than that in pigs without PMO (1.38 ± 0.25 vs.
1.89 ± 0.31, p < 0.05). A strong inverse correlation was found
between the extent of PMO and the T2 contrast ratio (r = -0.8,
p < 0.05). The T2 contrast ratio of infarcted area in the pigs who
underwent the 180-minute occlusion was significantly lower than
that in those underwent who the 90-minute occlusion
(1.26 ± 0.27 vs. 1.68 ± 0.28, p < 0.05). The extent of PMO in
the pigs who underwent the 180-minute occlusion was
significantly larger than that in pigs who underwent the
90-minute occlusion (58.6% vs. 32.1%, p < 0.05). The myocardial
infarcts on TTC staining were evident in all 15 pigs. On gross
specimen, hemorrhage in the infarcted area was apparently
visible in the pigs with PMO. A strong inverse correlation was
found between the extent of hemorrhage in the infarcted area
and the T2 contrast ratio (r = -0.78, p < 0.05). The extent of
hemorrhage in the infarct area correlated well with the extent of
PMO (r = 0.97, p < 0.05).
Conclusion: From this study, we conclude that the patterns of
signal intensity in infarcted myocardium on T2WI were variable
in a porcine model with reperfused acute myocardial infarction.
The lower contrast ratio of infarcted area on T2WI significantly
correlates with the extent of PMO on DE-MRI and intramyo-
cardial hemorrhage on gross specimen.
P216T2 weighted three dimensional imaging of thewhole heartYiu-Cho Chung1, Orlando P Simonetti2,3
and Renate Jerecic4,51Siemens Healthcare USA, Columbus, OH, USA2Ohio State University, Columbus, OH, USA3The Ohio State University, Columbus, OH, USA4Siemens Healthcare USA, Chicago, IL, USA5Siemens Medical Solutions USA, Inc., Chicago, IL, USA
Journal of Cardiovascular Magnetic Resonance 2009, 11(Suppl 1):P216
Introduction: T2 weighted (T2w) dark blood turbo spin echo
(DB-TSE) [1] is useful in myocardial tissue characterization such
as acute myocarditis and acute myocardial infarction [2, 3]. 3D
acquisitions can provide high resolution images of the whole
heart, allowing arbitrary views of the organ, and reducing partial
volume effect. Conventional 3D TSE improves SNR but not
sampling efficiency or spatial resolution. We propose a novel TSE
technique for T2w 3D imaging of the whole heart that provides
higher spatial resolution and reduces scan time per slice
compared to 2D DB-TSE.
Purpose: To study the feasibility of a T2w 3D TSE technique
for whole heart imaging with improved spatial resolution and
imaging efficiency compared to 2D DB-TSE.
Methods: Sequence: The sequence (aka T2w-SPACE) uses
non-selective refocusing pulses [4] to reduce echo spacing and
cardiac motion sensitivity. It supports constant (CFL) and
variable flip angle (VFL) refocusing pulses. VFL uses longer
echo train (ETL) than CFL while maintaining good T2 weighting
[4]. Optional motion sensitizing gradient (MSG) was implemen-
ted to suppress blood [5]. Navigator gating was supported. The
technique was evaluated on a 1.5 T scanner (MAGNETOM
Avanto, Siemens, Germany).
Imaging: T2w-SPACE was first optimized in 5 healthy volun-
teers (STIR contrast on two of them) using these parameters:
inplane voxel = 1.6–1.8 mm isotropic, partition = 2.5–4 mm,
28–40 partitions, 2 averages, TR = 2 heartbeats, bandwidth/
pixel = 840 Hz, 100% partition resolution. T2w-SPACE with
MSG of 25 mT/m*ms (3 directions) was then compared with 2D
DB-TSE in 4 other healthy volunteers using the optimal
parameters. SAX views were used. In the comparison, common
parameters for 2D and 3D acquisitions were: inplane resolu-
tion = 1.8 mm isotropic, fatsat, 100% phase resolution, parallel
imaging rate 2 (24 reference lines), and navigator gating. 12 slices
and 36 partitions (each 3.2 mm) were acquired by 2D DB-TSE
and T2w-SPACE respectively. 2D specific parameters were:
slice = 8 mm, ETL = 23, bandwidth/pixel = 300 Hz, echo spa-
cing = 7 ms, TE = 56/76 ms.
Table 1 (abstract P216) Optimal imaging parameters for cardiacimaging with T2w-SPACE
Flip angleseries
Echospacing
Echo train(ETL)
Slice turbofactor
Echo trainduration
TE
VFL 2.5 ms 85 1 207 ms 115 ms
CFL 2.9 ms 27 2 150 ms 74 ms
Figure 1 (abstract P216)
Three cardiac views of a T2w-SPACE acquisition.
Journal of Cardiovascular Magnetic Resonance 2009, 11(Suppl 1) http://jcmr-online.com/supplements/11/S1
Page 249 of 316(page number not for citation purposes)
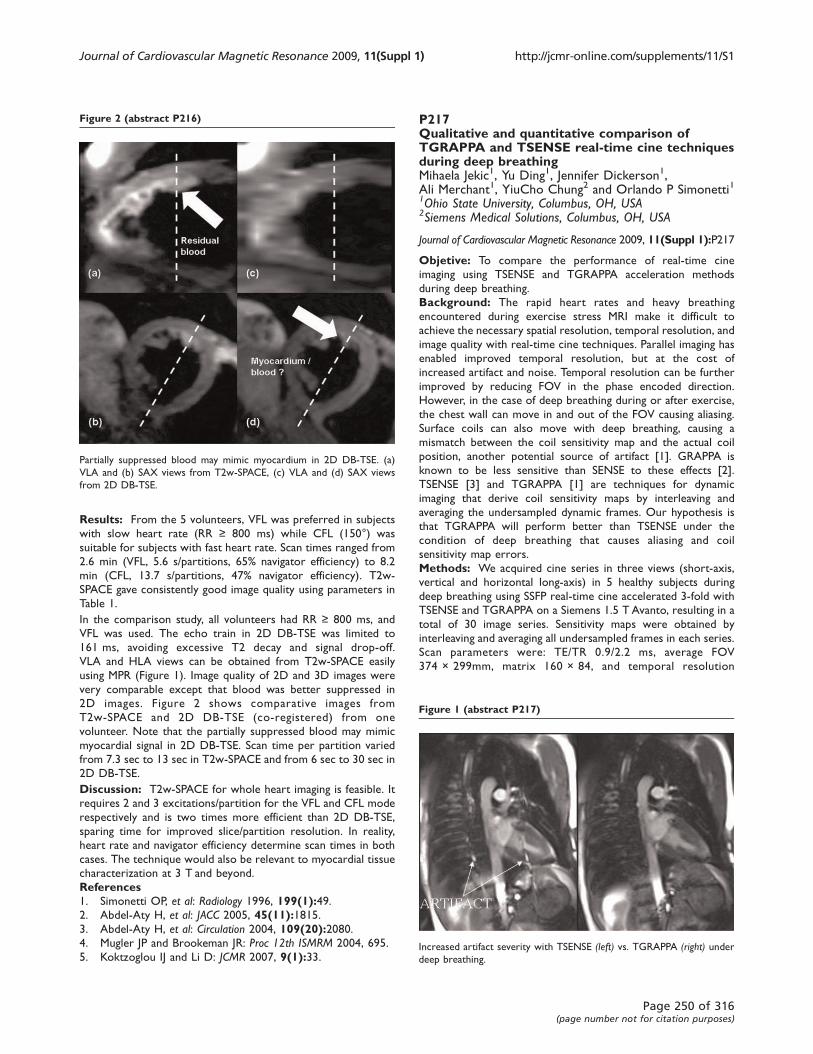
Results: From the 5 volunteers, VFL was preferred in subjects
with slow heart rate (RR ≥ 800 ms) while CFL (150°) was
suitable for subjects with fast heart rate. Scan times ranged from
2.6 min (VFL, 5.6 s/partitions, 65% navigator efficiency) to 8.2
min (CFL, 13.7 s/partitions, 47% navigator efficiency). T2w-
SPACE gave consistently good image quality using parameters in
Table 1.
In the comparison study, all volunteers had RR ≥ 800 ms, and
VFL was used. The echo train in 2D DB-TSE was limited to
161 ms, avoiding excessive T2 decay and signal drop-off.
VLA and HLA views can be obtained from T2w-SPACE easily
using MPR (Figure 1). Image quality of 2D and 3D images were
very comparable except that blood was better suppressed in
2D images. Figure 2 shows comparative images from
T2w-SPACE and 2D DB-TSE (co-registered) from one
volunteer. Note that the partially suppressed blood may mimic
myocardial signal in 2D DB-TSE. Scan time per partition varied
from 7.3 sec to 13 sec in T2w-SPACE and from 6 sec to 30 sec in
2D DB-TSE.
Discussion: T2w-SPACE for whole heart imaging is feasible. It
requires 2 and 3 excitations/partition for the VFL and CFL mode
respectively and is two times more efficient than 2D DB-TSE,
sparing time for improved slice/partition resolution. In reality,
heart rate and navigator efficiency determine scan times in both
cases. The technique would also be relevant to myocardial tissue
characterization at 3 T and beyond.
References1. Simonetti OP, et al: Radiology 1996, 199(1):49.2. Abdel-Aty H, et al: JACC 2005, 45(11):1815.
3. Abdel-Aty H, et al: Circulation 2004, 109(20):2080.4. Mugler JP and Brookeman JR: Proc 12th ISMRM 2004, 695.
5. Koktzoglou IJ and Li D: JCMR 2007, 9(1):33.
P217Qualitative and quantitative comparison ofTGRAPPA and TSENSE real-time cine techniquesduring deep breathingMihaela Jekic1, Yu Ding1, Jennifer Dickerson1,Ali Merchant1, YiuCho Chung2 and Orlando P Simonetti11Ohio State University, Columbus, OH, USA2Siemens Medical Solutions, Columbus, OH, USA
Journal of Cardiovascular Magnetic Resonance 2009, 11(Suppl 1):P217
Objetive: To compare the performance of real-time cine
imaging using TSENSE and TGRAPPA acceleration methods
during deep breathing.
Background: The rapid heart rates and heavy breathing
encountered during exercise stress MRI make it difficult to
achieve the necessary spatial resolution, temporal resolution, and
image quality with real-time cine techniques. Parallel imaging has
enabled improved temporal resolution, but at the cost of
increased artifact and noise. Temporal resolution can be further
improved by reducing FOV in the phase encoded direction.
However, in the case of deep breathing during or after exercise,
the chest wall can move in and out of the FOV causing aliasing.
Surface coils can also move with deep breathing, causing a
mismatch between the coil sensitivity map and the actual coil
position, another potential source of artifact [1]. GRAPPA is
known to be less sensitive than SENSE to these effects [2].
TSENSE [3] and TGRAPPA [1] are techniques for dynamic
imaging that derive coil sensitivity maps by interleaving and
averaging the undersampled dynamic frames. Our hypothesis is
that TGRAPPA will perform better than TSENSE under the
condition of deep breathing that causes aliasing and coil
sensitivity map errors.
Methods: We acquired cine series in three views (short-axis,
vertical and horizontal long-axis) in 5 healthy subjects during
deep breathing using SSFP real-time cine accelerated 3-fold with
TSENSE and TGRAPPA on a Siemens 1.5 T Avanto, resulting in a
total of 30 image series. Sensitivity maps were obtained by
interleaving and averaging all undersampled frames in each series.
Scan parameters were: TE/TR 0.9/2.2 ms, average FOV
374 × 299mm, matrix 160 × 84, and temporal resolution
Figure 2 (abstract P216)
Partially suppressed blood may mimic myocardium in 2D DB-TSE. (a)
VLA and (b) SAX views from T2w-SPACE, (c) VLA and (d) SAX views
from 2D DB-TSE.
Figure 1 (abstract P217)
Increased artifact severity with TSENSE (left) vs. TGRAPPA (right) underdeep breathing.
Journal of Cardiovascular Magnetic Resonance 2009, 11(Suppl 1) http://jcmr-online.com/supplements/11/S1
Page 250 of 316(page number not for citation purposes)

63.8 ± 1.6 ms. The FOV was specified immediately adjacent to
the chest wall in the view in which the body appears largest in the
phase encode direction (typically the VLA). Two experienced
readers blinded to the study assigned qualitative scores of artifact
severity: (1) none, (2) minor, (3) moderate, and (4) severe, and
overall image quality: (1) excellent, (2) good, (3) diagnosis may be
limited, and (4) poor, non-diagnostic. Artifacts were also
quantitatively analyzed by examining peaks in the image
autocorrelation function in the phase encode direction at shifts
of 1/3 and 2/3 FOV, the expected locations for parallel imaging
associated ghost artifacts at rate 3 acceleration. Within each
series, the highest 10% of autocorrelation coefficients at 1/3 FOV
were averaged to define an “artifact index”.Results: TGRAPPA scores were superior to TSENSE both in
terms of the physician-assessed image quality (1.6 ± 0.6 vs.
2.3 ± 0.7, p < .001) and artifact severity (1.7 ± 0.6 vs. 2.9 ± 0.8,
p < .001). The computed artifact index agreed with the
qualitative artifact score, with TGRAPPA showing less artifact
severity (0.058 ± 0.035 vs. 0.110 ± 0.052, p = .0036). Figure 1
illustrates the increased artifact level with TSENSE compared to
TGRAPPA.
Conclusion: In the presence of deep breathing, TGRAPPA
delivered superior image quality and artifact performance
compared to TSENSE independent of FOV and aliasing, and
exhibited less sensitivity to coil map errors. While SENSE
provides an optimal reconstruction under normal conditions of
breath-hold or quiet breathing, it is known to suffer from
artifacts when the FOV is smaller than the object or the coil map
is imperfect [2]. Our results indicate that TGRAPPA is preferred
over TSENSE under conditions such as exercise stress, deep
breathing, and patient motion.
References1. Breuer FA, et al: Dynamic autocalibrated parallel
imaging using temporal GRAPPA (TGRAPPA).Magn Reson Med 2005, 53:981–985.
2. Griswold MA, et al: Field-of-view limitations in parallelimaging. Magn Reson Med 2004, 52:1118–1126.
3. Kellman P, et al: Adaptive sensitivity encoding incor-porating temporal filtering (TSENSE). Magn ResonMed 2001, 45:846–852.
P218Myocardial T2* mapping free of distortion usingsusceptibility weighted spin-echo based imaging: afeasibility studyUwe Heinrichs1, Jane F Utting1, Fabian Hezel1,Gabriele A Krombach1, Sebastian Kozerke2
and Thoralf Niendorf11RWTH Aachen, Aachen, Germany2Institute for Biomedical Engineering, University and ETHZurich, Zuerich, Switzerland
Journal of Cardiovascular Magnetic Resonance 2009, 11(Suppl 1):P218
Introduction: Myocardial T2* mapping is of proven value for
the assessment of myocardial iron content and tissue oxygena-
tion [1, 2]. Conventionally, T2*-weighting is accomplished with
gradient echo based or echo planar imaging techniques.
However, the disadvantages of T1-related saturation effects,
artifacts due to ventricular blood flow and image distortion must
be addressed to pave the way for a broader clinical acceptance.
Hence, spin-echo based acquisition strategies which generate
T2* contrast free of distortion represent a valuable alternative.
Purpose: This study demonstrates the promise of navigator
gated, susceptibility weighted, fast spin-echo imaging in conjunc-
tion with ventricular black blood preparation, for anatomically
accurate T2* mapping of the heart.
Figure 1 (abstract P218)
Basic scheme of cardiac and navigator gated, black blood prepared,
susceptibility weighted UFLARE.
Figure 2 (abstract P218)
Geometrical fidelity of T2 *-weighted images overlaid on a contour plot of
the test object (red): UFLARE (yellow) and EPI (green).
Journal of Cardiovascular Magnetic Resonance 2009, 11(Suppl 1) http://jcmr-online.com/supplements/11/S1
Page 251 of 316(page number not for citation purposes)
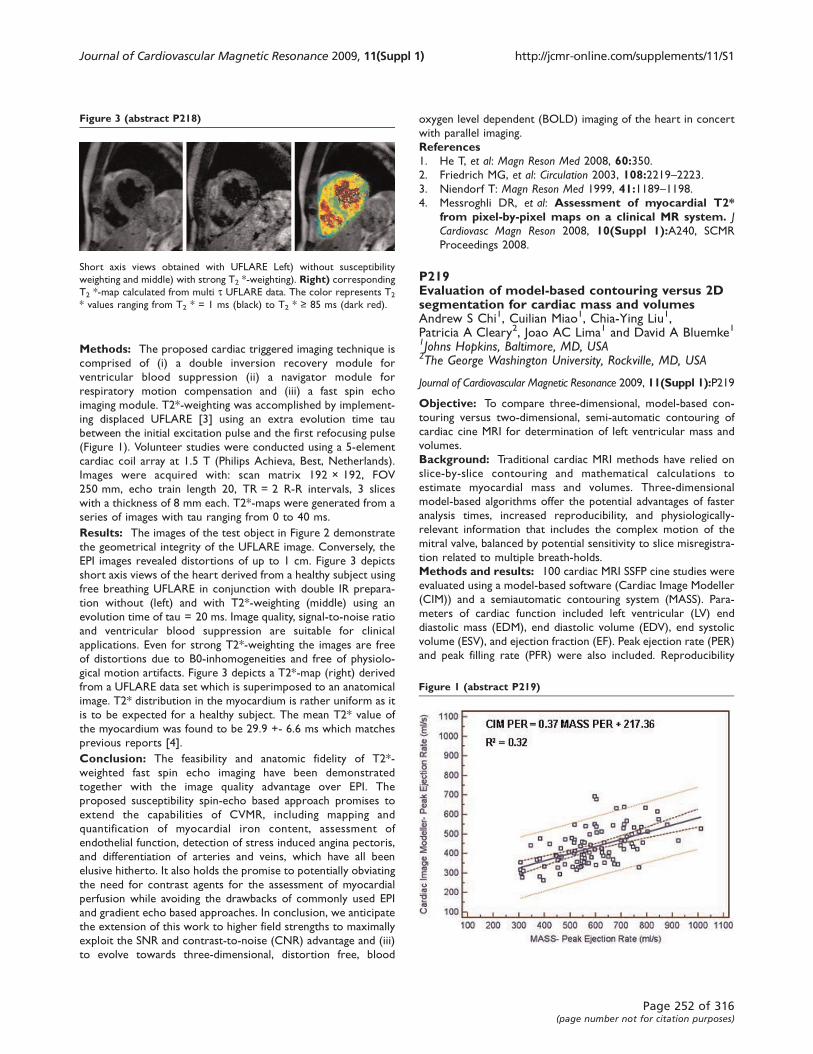
Methods: The proposed cardiac triggered imaging technique is
comprised of (i) a double inversion recovery module for
ventricular blood suppression (ii) a navigator module for
respiratory motion compensation and (iii) a fast spin echo
imaging module. T2*-weighting was accomplished by implement-
ing displaced UFLARE [3] using an extra evolution time tau
between the initial excitation pulse and the first refocusing pulse
(Figure 1). Volunteer studies were conducted using a 5-element
cardiac coil array at 1.5 T (Philips Achieva, Best, Netherlands).
Images were acquired with: scan matrix 192 × 192, FOV
250 mm, echo train length 20, TR = 2 R-R intervals, 3 slices
with a thickness of 8 mm each. T2*-maps were generated from a
series of images with tau ranging from 0 to 40 ms.
Results: The images of the test object in Figure 2 demonstrate
the geometrical integrity of the UFLARE image. Conversely, the
EPI images revealed distortions of up to 1 cm. Figure 3 depicts
short axis views of the heart derived from a healthy subject using
free breathing UFLARE in conjunction with double IR prepara-
tion without (left) and with T2*-weighting (middle) using an
evolution time of tau = 20 ms. Image quality, signal-to-noise ratio
and ventricular blood suppression are suitable for clinical
applications. Even for strong T2*-weighting the images are free
of distortions due to B0-inhomogeneities and free of physiolo-
gical motion artifacts. Figure 3 depicts a T2*-map (right) derived
from a UFLARE data set which is superimposed to an anatomical
image. T2* distribution in the myocardium is rather uniform as it
is to be expected for a healthy subject. The mean T2* value of
the myocardium was found to be 29.9 +- 6.6 ms which matches
previous reports [4].
Conclusion: The feasibility and anatomic fidelity of T2*-
weighted fast spin echo imaging have been demonstrated
together with the image quality advantage over EPI. The
proposed susceptibility spin-echo based approach promises to
extend the capabilities of CVMR, including mapping and
quantification of myocardial iron content, assessment of
endothelial function, detection of stress induced angina pectoris,
and differentiation of arteries and veins, which have all been
elusive hitherto. It also holds the promise to potentially obviating
the need for contrast agents for the assessment of myocardial
perfusion while avoiding the drawbacks of commonly used EPI
and gradient echo based approaches. In conclusion, we anticipate
the extension of this work to higher field strengths to maximally
exploit the SNR and contrast-to-noise (CNR) advantage and (iii)
to evolve towards three-dimensional, distortion free, blood
oxygen level dependent (BOLD) imaging of the heart in concert
with parallel imaging.
References1. He T, et al: Magn Reson Med 2008, 60:350.2. Friedrich MG, et al: Circulation 2003, 108:2219–2223.3. Niendorf T: Magn Reson Med 1999, 41:1189–1198.4. Messroghli DR, et al: Assessment of myocardial T2*
from pixel-by-pixel maps on a clinical MR system. JCardiovasc Magn Reson 2008, 10(Suppl 1):A240, SCMR
Proceedings 2008.
P219Evaluation of model-based contouring versus 2Dsegmentation for cardiac mass and volumesAndrew S Chi1, Cuilian Miao1, Chia-Ying Liu1,Patricia A Cleary2, Joao AC Lima1 and David A Bluemke11Johns Hopkins, Baltimore, MD, USA2The George Washington University, Rockville, MD, USA
Journal of Cardiovascular Magnetic Resonance 2009, 11(Suppl 1):P219
Objective: To compare three-dimensional, model-based con-
touring versus two-dimensional, semi-automatic contouring of
cardiac cine MRI for determination of left ventricular mass and
volumes.
Background: Traditional cardiac MRI methods have relied on
slice-by-slice contouring and mathematical calculations to
estimate myocardial mass and volumes. Three-dimensional
model-based algorithms offer the potential advantages of faster
analysis times, increased reproducibility, and physiologically-
relevant information that includes the complex motion of the
mitral valve, balanced by potential sensitivity to slice misregistra-
tion related to multiple breath-holds.
Methods and results: 100 cardiac MRI SSFP cine studies were
evaluated using a model-based software (Cardiac Image Modeller
(CIM)) and a semiautomatic contouring system (MASS). Para-
meters of cardiac function included left ventricular (LV) end
diastolic mass (EDM), end diastolic volume (EDV), end systolic
volume (ESV), and ejection fraction (EF). Peak ejection rate (PER)
and peak filling rate (PFR) were also included. Reproducibility
Figure 3 (abstract P218)
Short axis views obtained with UFLARE Left) without susceptibility
weighting and middle) with strong T2 *-weighting). Right) correspondingT2 *-map calculated from multi t UFLARE data. The color represents T2
* values ranging from T2 * = 1 ms (black) to T2 * ≥ 85 ms (dark red).
Figure 1 (abstract P219)
Journal of Cardiovascular Magnetic Resonance 2009, 11(Suppl 1) http://jcmr-online.com/supplements/11/S1
Page 252 of 316(page number not for citation purposes)

data for intra-observer variability was performed for
20 consecutive cases.
Results: Bland Altman analysis comparing CIM and MASS
software demonstrated a high degree of agreement for left
ventricular mass and volumes. Mean differences (± limits of
disagreement defined as ± 2 SD) were -0.2 g (-11.8–11.5 g) for
EDM, 0.1 ml (-8.5–8.6 ml) for EDV, -0.3 ml (-6.0–5.4 ml) for
ESV, and 0.3% (-3.6–4.2%) for EF. The relationship between CIM
and MASS was linear (Figure 1) and highly correlated for left
ventricular end diastolic mass (R2 = 0.96) and volumes (R2 =
0.98). Intra-observer mean differences (± 2 SD) using the CIM
software were -2.5 g (-13.2–8.2 g) for EDM, 3.2 ml (-10.4–16.7 ml) for EDV, 1.6 ml (-4.7–8.0 ml) for ESV and -0.4% (-5.4–4.6%) for EF. Intraclass correlation coefficients for left ventricular
EDM, EDV, ESV, and EF were 0.99 (0.988–0.998), 0.99 (0.97–0.99), 0.99 (0.98–1.0), and 0.96(0.90–0.99), respectively. For
filling and emptying rates (Figure 2), large variations between the
two methods were identified. Mean differences (± 2 SD) were
-155.2 ml/s (-388.5–78.1 ml/s) for PER and -109.7 ml/s (-357.9–138.4 ml/s) for PFR.
Conclusion: Compared to two-dimensional contouring tech-
niques for cardiac MRI analysis, model-based contouring provides
a reliable alternative for quantitative determination of myocardial
mass and volumes. Characterization of systolic emptying and
diastolic filling rates varies significantly between the two
methods; further study is needed to understand these differ-
ences.
P220Clinical evaluation of automatic whole-heart andcoronary-artery segmentationMarcel Breeuwer1, Pierre Ermes1 and Bernhard Gerber21Philips Healthcare, Best, Netherlands2Louvain University, St. Luc Hospital, Brussels, Belgium
Journal of Cardiovascular Magnetic Resonance 2009, 11(Suppl 1):P220
Introduction: With Steady-State Free-Precession (SSFP) MRI
the heart and surrounding arteries can be imaged. The resulting
image data can be used to inspect the patient-specific cardiac
anatomy and to quantify aspects such as left-ventricular volume
and wall mass. The data can furthermore be used to detect
stenosis in the proximal and middle coronary-artery segments
[1]. To simplify the visualization, quantification and stenosis
detection, we have developed an almost automatic whole-heart
and coronary-artery segmentation method.
Purpose: We describe the clinical evaluation of the perfor-
mance of our cardiac MR whole-heart and coronary-artery
segmentation method.
Methods: Our segmentation method was first developed for
Computed Tomography [2] and thereafter adapted to MR [3].
The method fully automatically segments the ventricles, atria, and
part of the aorta and pulmonary vessels by means of a shape-
constrained deformable model, which has been constructed from
a large set of representative trainings data. Manual corrections of
the segmentation are possible by single mouse clicks on the 3D
segmentation surface visualization. The points where the
coronary-arteries branch off the aorta (ostia) are also auto-
matically detected. The user has to manually indicate the
coronary-artery end points in the image data, these arteries
are thereafter automatically tracked [4]. Total time needed for
automatic segmentation/tracking is less than 2 min per data set
(Dell 670 PC, dual-processor 3 GHz, 3 Gbyte memory).
Our method was evaluated by an experienced clinical cardiol-
ogist (third author) on whole-heart MR acquisitions from
50 patients with coronary-artery disease or heart failure (Philips
Figure 1 (abstract P220)
Example of whole-heart and coronary-artery segmentation (surface
rendering with different colour per component).
Figure 2 (abstract P219)
Journal of Cardiovascular Magnetic Resonance 2009, 11(Suppl 1) http://jcmr-online.com/supplements/11/S1
Page 253 of 316(page number not for citation purposes)
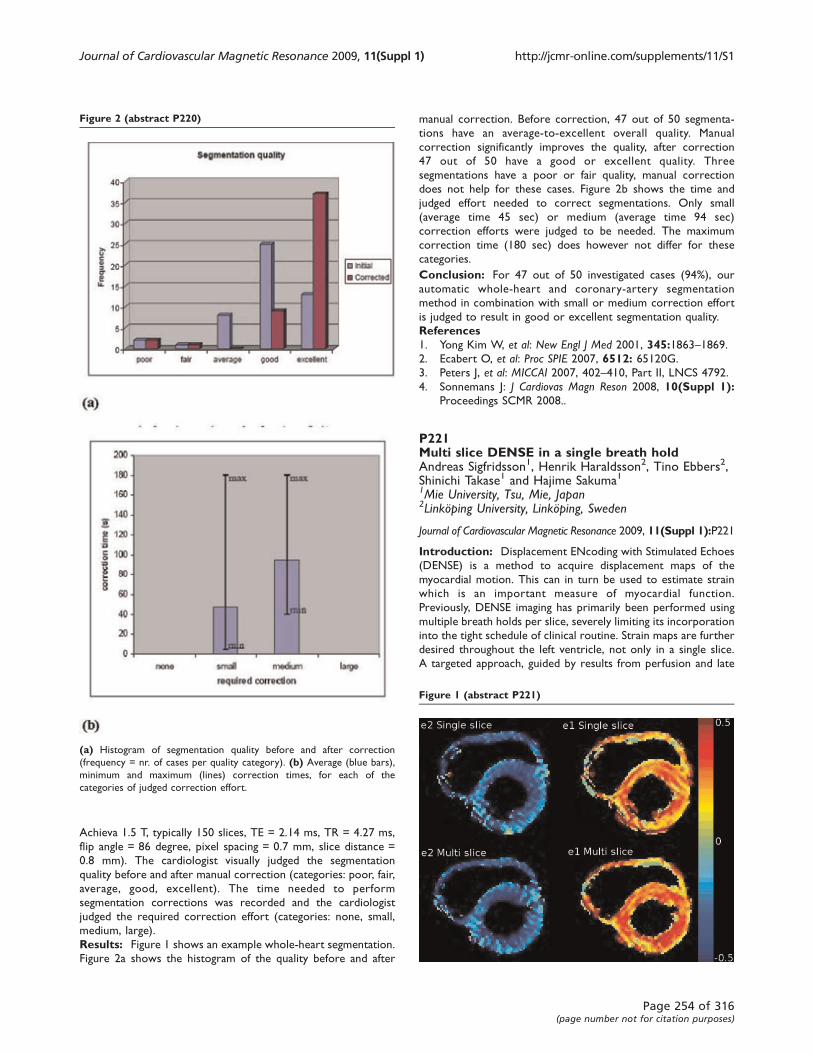
Achieva 1.5 T, typically 150 slices, TE = 2.14 ms, TR = 4.27 ms,
flip angle = 86 degree, pixel spacing = 0.7 mm, slice distance =
0.8 mm). The cardiologist visually judged the segmentation
quality before and after manual correction (categories: poor, fair,
average, good, excellent). The time needed to perform
segmentation corrections was recorded and the cardiologist
judged the required correction effort (categories: none, small,
medium, large).
Results: Figure 1 shows an example whole-heart segmentation.
Figure 2a shows the histogram of the quality before and after
manual correction. Before correction, 47 out of 50 segmenta-
tions have an average-to-excellent overall quality. Manual
correction significantly improves the quality, after correction
47 out of 50 have a good or excellent quality. Three
segmentations have a poor or fair quality, manual correction
does not help for these cases. Figure 2b shows the time and
judged effort needed to correct segmentations. Only small
(average time 45 sec) or medium (average time 94 sec)
correction efforts were judged to be needed. The maximum
correction time (180 sec) does however not differ for these
categories.
Conclusion: For 47 out of 50 investigated cases (94%), our
automatic whole-heart and coronary-artery segmentation
method in combination with small or medium correction effort
is judged to result in good or excellent segmentation quality.
References1. Yong Kim W, et al: New Engl J Med 2001, 345:1863–1869.2. Ecabert O, et al: Proc SPIE 2007, 6512: 65120G.3. Peters J, et al: MICCAI 2007, 402–410, Part II, LNCS 4792.
4. Sonnemans J: J Cardiovas Magn Reson 2008, 10(Suppl 1):Proceedings SCMR 2008..
P221Multi slice DENSE in a single breath holdAndreas Sigfridsson1, Henrik Haraldsson2, Tino Ebbers2,Shinichi Takase1 and Hajime Sakuma11Mie University, Tsu, Mie, Japan2Linköping University, Linköping, Sweden
Journal of Cardiovascular Magnetic Resonance 2009, 11(Suppl 1):P221
Introduction: Displacement ENcoding with Stimulated Echoes
(DENSE) is a method to acquire displacement maps of the
myocardial motion. This can in turn be used to estimate strain
which is an important measure of myocardial function.
Previously, DENSE imaging has primarily been performed using
multiple breath holds per slice, severely limiting its incorporation
into the tight schedule of clinical routine. Strain maps are further
desired throughout the left ventricle, not only in a single slice.
A targeted approach, guided by results from perfusion and late
Figure 2 (abstract P220)
(a) Histogram of segmentation quality before and after correction
(frequency = nr. of cases per quality category). (b) Average (blue bars),
minimum and maximum (lines) correction times, for each of the
categories of judged correction effort.
Figure 1 (abstract P221)
Journal of Cardiovascular Magnetic Resonance 2009, 11(Suppl 1) http://jcmr-online.com/supplements/11/S1
Page 254 of 316(page number not for citation purposes)

enhancement studies is tempting, but the presence of contrast
agent shortens the T1 relaxation, which hampers stimulated
echo acquisitions such as DENSE. We therefore propose a multi
slice acquisition for strain measurements in a single breath hold.
We compare this with conventional single slice DENSE acquired
in separate breath holds.
Methods: Ten healthy volunteers were imaged in a Philips
Achieva 1.5 T scanner, using the standard 5 channel cardiac coil.
Three slices were acquired at the basal, equatorial and apical
short axis levels in a single breath hold multi slice acquisition.
End systolic displacement was measured by encoding the position
at the R-wave using a SPAMM 1–1 sequence, and decoding at end
systole. The appropriate trigger delay time was determined using
a long axis cine imaging sequence. The three slices were excited
and read out after each other in the same cardiac cycle, with
25 ms separation.
Imaging parameters were: field of view 350 mm, slice thickness
8 mm, matrix 128 × 115, SENSE factor 2, TFE-factor 3, EPI-
factor 7, TR 8.9 ms, TE 4.2 ms. Displacement encoding strength
was 0.35 cycles per pixel. Flip angle was optimized to yield
highest constant signal strength [1].
Both in-plane displacement directions were measured using
displacement encoding in three oblique directions [2]. This
allows for the subtraction of background phase errors and
increases the displacement-to-noise ratio while maintaining
encoding strength, and thus signal dephasing. Complementary
encoding was used to suppress the T1 relaxation echo[3]. Each
direction was acquired in six heart beats, resulting in a total scan
time of 18 heart beats.
For comparison, the three slices were also acquired separately in
one 18 heart beat breath hold each. Apart from only acquiring a
single slice at a time, the scan parameters were identical. The
order of the single slice and multi slice acquisitions was
randomized.
Eulerian strain was analysed using custom software written in
MATLAB. Strain was evaluated in ROIs placed manually according
to the AHA 17-segment model with the apical segment excluded.
Results: Strain maps of eulerian strain eigenvalues e1 and e2,
corresponding to expansion and contraction, are shown in Figure
1 for single slice and multi slice acquisitions of one volunteer.
Regional strain values from all volunteers are plotted in Figure 2.
Error bars indicate the standard deviation within each ROI.
A Bland-Altman analysis is shown in Figure 3. For e2
(contraction), the bias is 0.004 and limits of agreement -0.11and 0.12. For e1 (expansion), the bias is 0.007 with limits of
agreement -0.06 and 0.07.
Discussion: A method for acquiring myocardial strain in the
whole left ventricle in a single breath hold has been presented. It
has been shown that acquiring three slices in the same breath
hold results in strain values that agree well with those acquired in
three separate breath holds. The small differences between the
methods indicate that the slight shift in acquisition timing
between the slices (25 ms) did not significantly influence the
strain values.
Eliminating the need for multiple breath holds, multi slice DENSE
extends the utility of DENSE for myocardial strain analysis.
References1. Stuber, et al: MAGMA 1999, 9:85–91.2. Lin, et al: MRM 2008, 60:8–13.3. Gilson, et al: MRM 2004, 51:744–752.
P222An automated method for left ventricularlocalization and identification of end-systolic andend-diastolic images from cine cardiac MRISotirios A Tsaftaris1, Xiangzhi Zhou2,3, Richard Tang2,Rachel Klein2 and Rohan Dharmakumar21Department of Electrical Engineering and Computer Science,Northwestern University, Evanston, IL, USA2Department of Radiology, Northwestern University, Chicago,IL, USA3Northwestern University, Chicago, IL, USA
Journal of Cardiovascular Magnetic Resonance 2009, 11(Suppl 1):P222
Introduction: A critical component in computing quantitative
diagnostic metrics, such as ejection fraction, as well as image
segmentation and registration is the accurate identification of the
end-systolic (ES) and end-diastolic (ED) frames in cine MRI.
Localization of the LV is also important, to assist further analysis
Figure 2 (abstract P221)
Figure 3 (abstract P221)
Journal of Cardiovascular Magnetic Resonance 2009, 11(Suppl 1) http://jcmr-online.com/supplements/11/S1
Page 255 of 316(page number not for citation purposes)
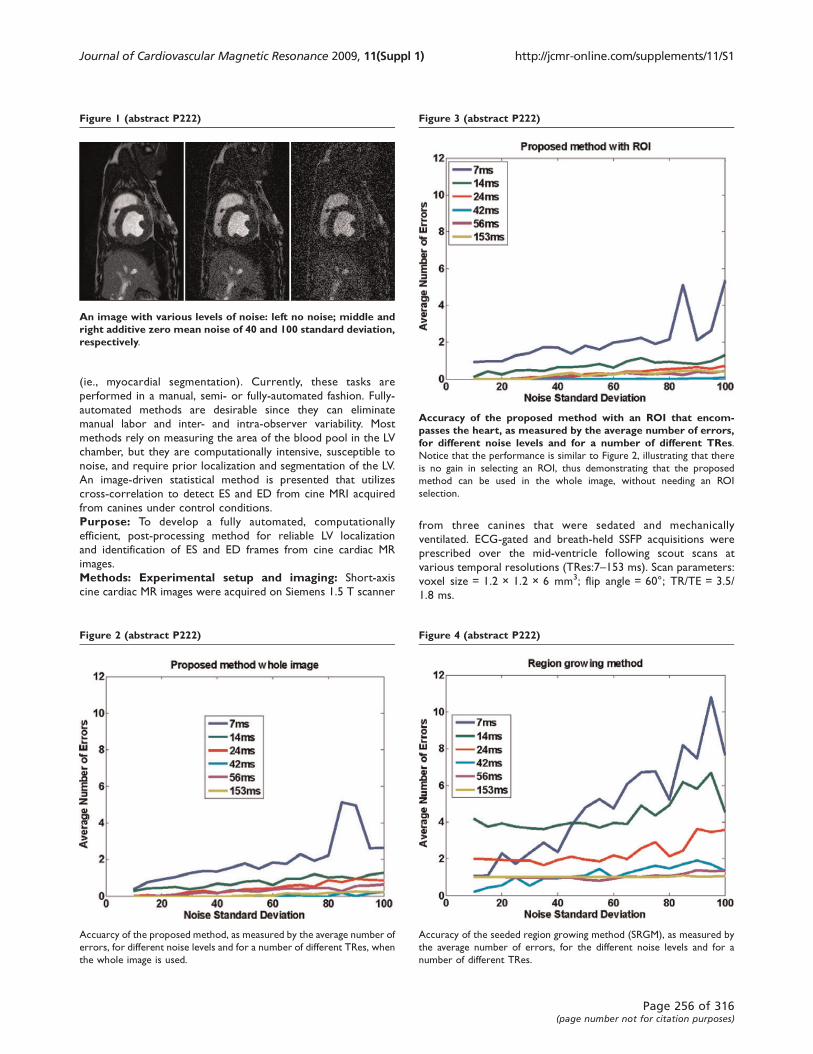
(ie., myocardial segmentation). Currently, these tasks are
performed in a manual, semi- or fully-automated fashion. Fully-
automated methods are desirable since they can eliminate
manual labor and inter- and intra-observer variability. Most
methods rely on measuring the area of the blood pool in the LV
chamber, but they are computationally intensive, susceptible to
noise, and require prior localization and segmentation of the LV.
An image-driven statistical method is presented that utilizes
cross-correlation to detect ES and ED from cine MRI acquired
from canines under control conditions.
Purpose: To develop a fully automated, computationally
efficient, post-processing method for reliable LV localization
and identification of ES and ED frames from cine cardiac MR
images.
Methods: Experimental setup and imaging: Short-axis
cine cardiac MR images were acquired on Siemens 1.5 T scanner
from three canines that were sedated and mechanically
ventilated. ECG-gated and breath-held SSFP acquisitions were
prescribed over the mid-ventricle following scout scans at
various temporal resolutions (TRes:7–153 ms). Scan parameters:
voxel size = 1.2 × 1.2 × 6 mm3; flip angle = 60°; TR/TE = 3.5/
1.8 ms.
Figure 1 (abstract P222)
An image with various levels of noise: left no noise; middle andright additive zero mean noise of 40 and 100 standard deviation,respectively.
Figure 2 (abstract P222)
Accuarcy of the proposed method, as measured by the average number of
errors, for different noise levels and for a number of different TRes, when
the whole image is used.
Figure 3 (abstract P222)
Accuracy of the proposed method with an ROI that encom-passes the heart, as measured by the average number of errors,for different noise levels and for a number of different TRes.Notice that the performance is similar to Figure 2, illustrating that there
is no gain in selecting an ROI, thus demonstrating that the proposed
method can be used in the whole image, without needing an ROI
selection.
Figure 4 (abstract P222)
Accuracy of the seeded region growing method (SRGM), as measured by
the average number of errors, for the different noise levels and for a
number of different TRes.
Journal of Cardiovascular Magnetic Resonance 2009, 11(Suppl 1) http://jcmr-online.com/supplements/11/S1
Page 256 of 316(page number not for citation purposes)
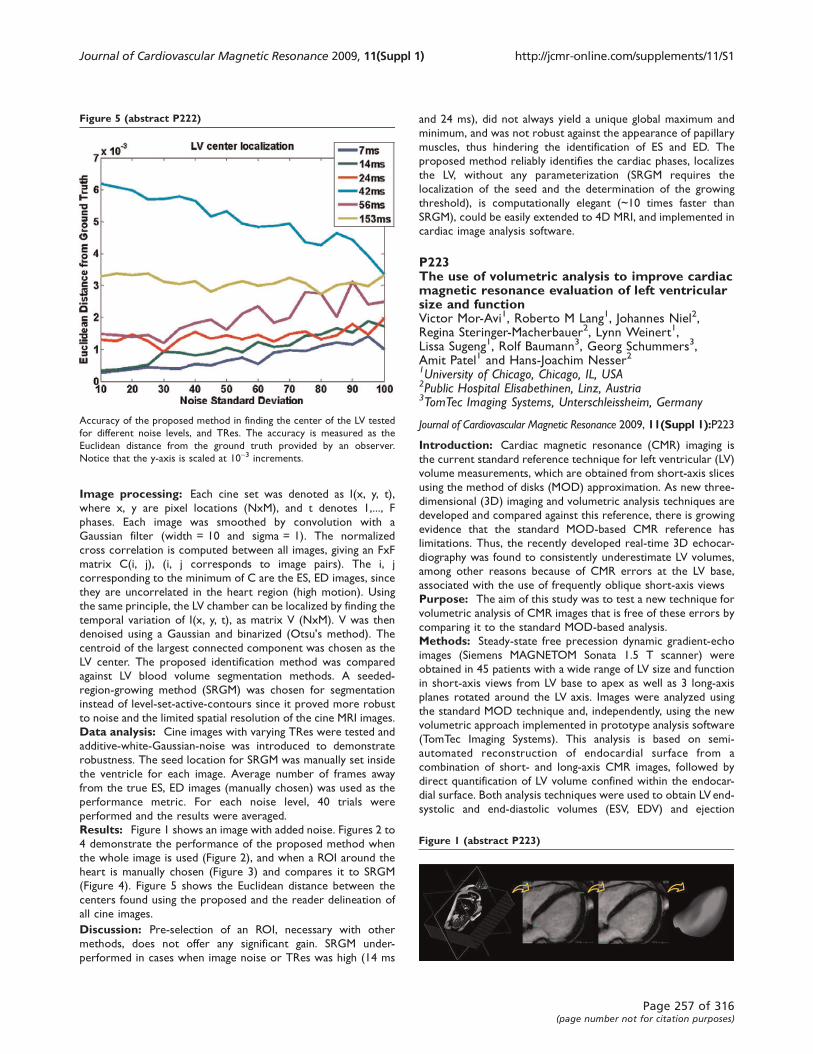
Image processing: Each cine set was denoted as I(x, y, t),
where x, y are pixel locations (NxM), and t denotes 1,..., F
phases. Each image was smoothed by convolution with a
Gaussian filter (width = 10 and sigma = 1). The normalized
cross correlation is computed between all images, giving an FxF
matrix C(i, j), (i, j corresponds to image pairs). The i, j
corresponding to the minimum of C are the ES, ED images, since
they are uncorrelated in the heart region (high motion). Using
the same principle, the LV chamber can be localized by finding the
temporal variation of I(x, y, t), as matrix V (NxM). V was then
denoised using a Gaussian and binarized (Otsu's method). The
centroid of the largest connected component was chosen as the
LV center. The proposed identification method was compared
against LV blood volume segmentation methods. A seeded-
region-growing method (SRGM) was chosen for segmentation
instead of level-set-active-contours since it proved more robust
to noise and the limited spatial resolution of the cine MRI images.
Data analysis: Cine images with varying TRes were tested and
additive-white-Gaussian-noise was introduced to demonstrate
robustness. The seed location for SRGM was manually set inside
the ventricle for each image. Average number of frames away
from the true ES, ED images (manually chosen) was used as the
performance metric. For each noise level, 40 trials were
performed and the results were averaged.
Results: Figure 1 shows an image with added noise. Figures 2 to
4 demonstrate the performance of the proposed method when
the whole image is used (Figure 2), and when a ROI around the
heart is manually chosen (Figure 3) and compares it to SRGM
(Figure 4). Figure 5 shows the Euclidean distance between the
centers found using the proposed and the reader delineation of
all cine images.
Discussion: Pre-selection of an ROI, necessary with other
methods, does not offer any significant gain. SRGM under-
performed in cases when image noise or TRes was high (14 ms
and 24 ms), did not always yield a unique global maximum and
minimum, and was not robust against the appearance of papillary
muscles, thus hindering the identification of ES and ED. The
proposed method reliably identifies the cardiac phases, localizes
the LV, without any parameterization (SRGM requires the
localization of the seed and the determination of the growing
threshold), is computationally elegant (~10 times faster than
SRGM), could be easily extended to 4D MRI, and implemented in
cardiac image analysis software.
P223The use of volumetric analysis to improve cardiacmagnetic resonance evaluation of left ventricularsize and functionVictor Mor-Avi1, Roberto M Lang1, Johannes Niel2,Regina Steringer-Macherbauer2, Lynn Weinert1,Lissa Sugeng1, Rolf Baumann3, Georg Schummers3,Amit Patel1 and Hans-Joachim Nesser21University of Chicago, Chicago, IL, USA2Public Hospital Elisabethinen, Linz, Austria3TomTec Imaging Systems, Unterschleissheim, Germany
Journal of Cardiovascular Magnetic Resonance 2009, 11(Suppl 1):P223
Introduction: Cardiac magnetic resonance (CMR) imaging is
the current standard reference technique for left ventricular (LV)
volume measurements, which are obtained from short-axis slices
using the method of disks (MOD) approximation. As new three-
dimensional (3D) imaging and volumetric analysis techniques are
developed and compared against this reference, there is growing
evidence that the standard MOD-based CMR reference has
limitations. Thus, the recently developed real-time 3D echocar-
diography was found to consistently underestimate LV volumes,
among other reasons because of CMR errors at the LV base,
associated with the use of frequently oblique short-axis views
Purpose: The aim of this study was to test a new technique for
volumetric analysis of CMR images that is free of these errors by
comparing it to the standard MOD-based analysis.
Methods: Steady-state free precession dynamic gradient-echo
images (Siemens MAGNETOM Sonata 1.5 T scanner) were
obtained in 45 patients with a wide range of LV size and function
in short-axis views from LV base to apex as well as 3 long-axis
planes rotated around the LV axis. Images were analyzed using
the standard MOD technique and, independently, using the new
volumetric approach implemented in prototype analysis software
(TomTec Imaging Systems). This analysis is based on semi-
automated reconstruction of endocardial surface from a
combination of short- and long-axis CMR images, followed by
direct quantification of LV volume confined within the endocar-
dial surface. Both analysis techniques were used to obtain LV end-
systolic and end-diastolic volumes (ESV, EDV) and ejection
Figure 5 (abstract P222)
Accuracy of the proposed method in finding the center of the LV tested
for different noise levels, and TRes. The accuracy is measured as the
Euclidean distance from the ground truth provided by an observer.
Notice that the y-axis is scaled at 10-3 increments.
Figure 1 (abstract P223)
Journal of Cardiovascular Magnetic Resonance 2009, 11(Suppl 1) http://jcmr-online.com/supplements/11/S1
Page 257 of 316(page number not for citation purposes)
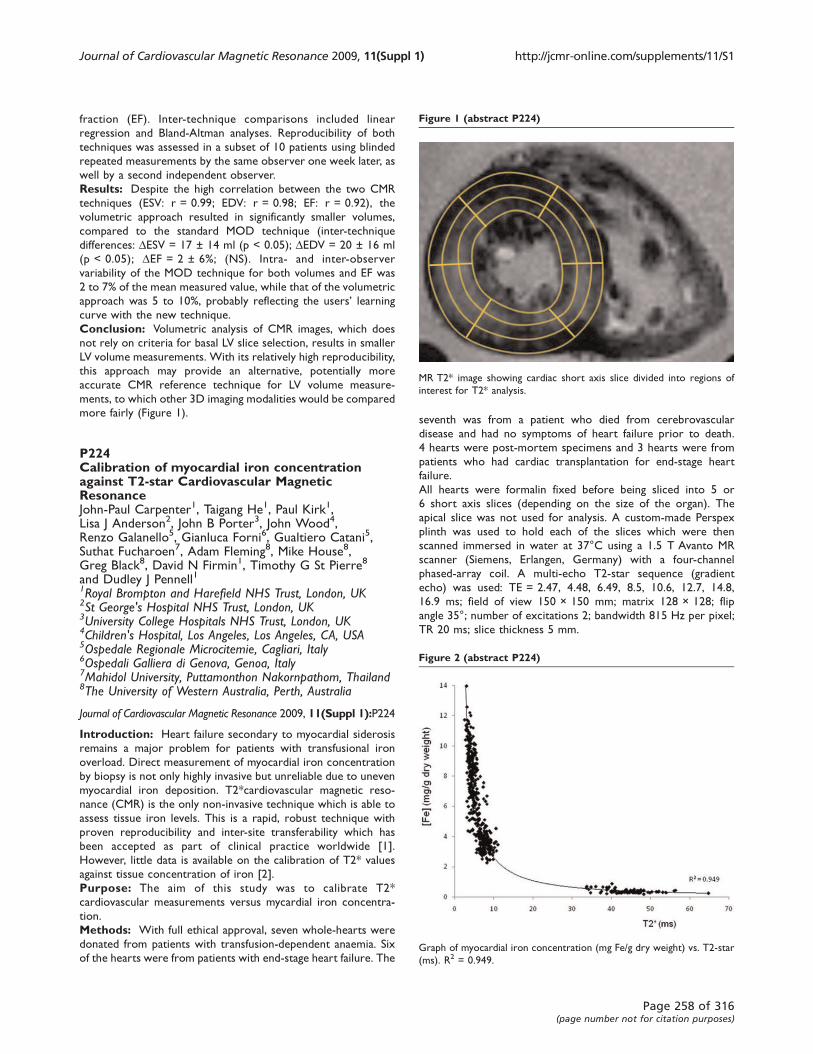
fraction (EF). Inter-technique comparisons included linear
regression and Bland-Altman analyses. Reproducibility of both
techniques was assessed in a subset of 10 patients using blinded
repeated measurements by the same observer one week later, as
well by a second independent observer.
Results: Despite the high correlation between the two CMR
techniques (ESV: r = 0.99; EDV: r = 0.98; EF: r = 0.92), the
volumetric approach resulted in significantly smaller volumes,
compared to the standard MOD technique (inter-technique
differences: DESV = 17 ± 14 ml (p < 0.05); DEDV = 20 ± 16 ml
(p < 0.05); DEF = 2 ± 6%; (NS). Intra- and inter-observer
variability of the MOD technique for both volumes and EF was
2 to 7% of the mean measured value, while that of the volumetric
approach was 5 to 10%, probably reflecting the users’ learningcurve with the new technique.
Conclusion: Volumetric analysis of CMR images, which does
not rely on criteria for basal LV slice selection, results in smaller
LV volume measurements. With its relatively high reproducibility,
this approach may provide an alternative, potentially more
accurate CMR reference technique for LV volume measure-
ments, to which other 3D imaging modalities would be compared
more fairly (Figure 1).
P224Calibration of myocardial iron concentrationagainst T2-star Cardiovascular MagneticResonanceJohn-Paul Carpenter1, Taigang He1, Paul Kirk1,Lisa J Anderson2, John B Porter3, John Wood4,Renzo Galanello5, Gianluca Forni6, Gualtiero Catani5,Suthat Fucharoen7, Adam Fleming8, Mike House8,Greg Black8, David N Firmin1, Timothy G St Pierre8
and Dudley J Pennell11Royal Brompton and Harefield NHS Trust, London, UK2St George's Hospital NHS Trust, London, UK3University College Hospitals NHS Trust, London, UK4Children's Hospital, Los Angeles, Los Angeles, CA, USA5Ospedale Regionale Microcitemie, Cagliari, Italy6Ospedali Galliera di Genova, Genoa, Italy7Mahidol University, Puttamonthon Nakornpathom, Thailand8The University of Western Australia, Perth, Australia
Journal of Cardiovascular Magnetic Resonance 2009, 11(Suppl 1):P224
Introduction: Heart failure secondary to myocardial siderosis
remains a major problem for patients with transfusional iron
overload. Direct measurement of myocardial iron concentration
by biopsy is not only highly invasive but unreliable due to uneven
myocardial iron deposition. T2*cardiovascular magnetic reso-
nance (CMR) is the only non-invasive technique which is able to
assess tissue iron levels. This is a rapid, robust technique with
proven reproducibility and inter-site transferability which has
been accepted as part of clinical practice worldwide [1].
However, little data is available on the calibration of T2* values
against tissue concentration of iron [2].
Purpose: The aim of this study was to calibrate T2*
cardiovascular measurements versus mycardial iron concentra-
tion.
Methods: With full ethical approval, seven whole-hearts were
donated from patients with transfusion-dependent anaemia. Six
of the hearts were from patients with end-stage heart failure. The
seventh was from a patient who died from cerebrovascular
disease and had no symptoms of heart failure prior to death.
4 hearts were post-mortem specimens and 3 hearts were from
patients who had cardiac transplantation for end-stage heart
failure.
All hearts were formalin fixed before being sliced into 5 or
6 short axis slices (depending on the size of the organ). The
apical slice was not used for analysis. A custom-made Perspex
plinth was used to hold each of the slices which were then
scanned immersed in water at 37°C using a 1.5 T Avanto MR
scanner (Siemens, Erlangen, Germany) with a four-channel
phased-array coil. A multi-echo T2-star sequence (gradient
echo) was used: TE = 2.47, 4.48, 6.49, 8.5, 10.6, 12.7, 14.8,
16.9 ms; field of view 150 × 150 mm; matrix 128 × 128; flip
angle 35°; number of excitations 2; bandwidth 815 Hz per pixel;
TR 20 ms; slice thickness 5 mm.
Figure 1 (abstract P224)
MR T2* image showing cardiac short axis slice divided into regions of
interest for T2* analysis.
Figure 2 (abstract P224)
Graph of myocardial iron concentration (mg Fe/g dry weight) vs. T2-star
(ms). R2 = 0.949.
Journal of Cardiovascular Magnetic Resonance 2009, 11(Suppl 1) http://jcmr-online.com/supplements/11/S1
Page 258 of 316(page number not for citation purposes)

Each of the slices was subsequently divided into 6 sectors, each
sector being subdivided into epicardial (outer), mesocardial (mid)
and endocardial (inner) myocardial layers. Two specimens were
taken from the right ventricular free wall. Analysis of myocardial
iron concentration was performed using inductively coupled
atomic emission spectrometry (after digestion in acid to avoid
sampling errors). T2* was measured using Thalassaemia tools (a
plug-in of CMRtools, Cardiovascular Imaging Solutions, London)
in the corresponding regions of myocardium (see Figure 1).
A truncation method was used for curve-fitting as previously
described [3].
Results: 31 short axis myocardial slices from the 7 hearts were
analysed. A total of 558 specimen blocks (mean mass +/-SD = 1001 +/- 620 mg) and the corresponding region of interest
(ROI) on CMR were included in the analysis. 21 (3.6%) of the
ROIs were excluded from the final analysis due to technical issues
(such as artefact affecting T2-star analysis). The mean wet (dry)
tissue iron concentration ranged from 0.07 (0.35) to 1.86
(8.08) mg Fe/g. T2-star values ranged from 2.54 to 64.7 ms. Iron
concentration was related to T2* and R2* (Figures 2 and 3).
Conclusion: There is a linear relationship between tissue iron
concentration and R2* and a non-linear relationship with T2*.
The results accord with published data on myocardial iron
concentration in non-iron loaded hearts, and a previous report in
a single iron loaded post-mortem heart [2, 4]. In vivo T2*
correlates well with that of ex-vivo formalin-fixed tissue, and
therefore these data form a calibration curve for myocardial iron
concentration over a wide range from normal to fatal levels [5].
References1. Tanner MA, He T and Westwood MA, et al: Haematologica
2006, 91:11388–1391.2. Ghugre NR, Enriquez CM and Gonzalez I, et al: Magn Reson
Med 2006, 56:681–686.3. He T, Gatehouse PD and Kirk P, et al: Magn Reson Med 2008,
60:350–356.4. Collins W and Taylor WH: Ann Clin Biochem 1987, 24:483–
387.
5. He T, Carpenter JP and Jongirasiri S, et al: Can we measureiron overload in the heart using in vivo T2* MRI?.Abstract SCMR 2008.
P225Accelerated real time 2D and segmented 3D cineimaging – whole heart approaches in a singlebreath holdYu-Po Chen1, Sven Zuehlsdorff2, Peter Weale2,John Sheehan1, Renate Jerecic2 and James C Carr11Northwestern University Feinberg School of Medicine,Chicago, IL, USA2Siemens Medical Solutions USA, Inc., Chicago, IL, USA
Journal of Cardiovascular Magnetic Resonance 2009, 11(Suppl 1):P225
Introduction: The clinically well-established technique used to
assess global functional cardiac parameters such as ejection
fraction (EF) is a 2D cine approach in which the left ventricle (LV)
is covered in multiple breath holds. The development of 32
channel receiver coils allows using high parallel acceleration
factors with and increased signal to noise ratio (SNR). In this
volunteer study, single breath-hold approaches have been used
and the derived functional parameters (ejection fraction EF, end
diastolic volume EDV, end systolic volume ESV, stroke volume SV,
and myocardial mass MM) have been compared to the clinical
standard technique. There is a good correlation between the
standard and the single breath-hold techniques. They can
Figure 3 (abstract P224)
Graph of myocardial iron concentration (mg Fe/g dry weight) vs R2* (Hz).
R2 = 0.825
Table 1 (abstract P225) Protocol parameters
2D Segmented (GRAPPA) 2D (GRAPPA) 2D (TGRAPPA) 3D (TGRAPPA)
TR/TE (ms) 2.84/1.2 2.4/1.04 2.3/1 2.9/1.44
Temporal Resolution (ms) 29.9 (interpolated) 45.8 46.6 51.84
FOV 340 × 276 340 × 289 340 × 288 380 × 306
Slice/Partition Thickness (mm) 8 8 7 6
Voxel Size (mm3) 2.5 × 1.8 × 8.0 2.3 × 2.1 × 8.0 3.6 × 2.4 × 7.0 3.1 × 2.6 × 6.0
Acceleration Factor GRAPPA 2 (Integrated
Reference Lines)
GRAPPA 4 (separate
reference lines and
shared phases)
TGRAPPA 2 × 2 TGRAPPA 2 × 2
(Non-isotropic)
Triggering Retrospective Prospective Prospective Prospective
Number of Breath holds 10 1 1 1
Journal of Cardiovascular Magnetic Resonance 2009, 11(Suppl 1) http://jcmr-online.com/supplements/11/S1
Page 259 of 316(page number not for citation purposes)
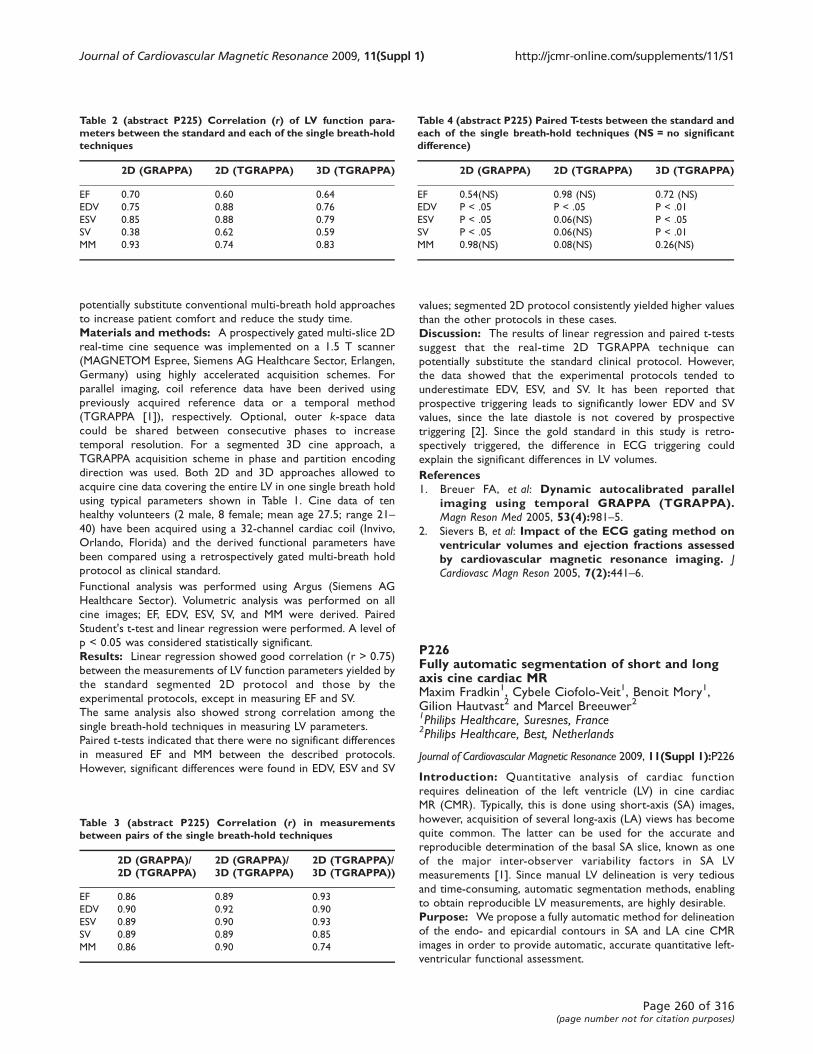
potentially substitute conventional multi-breath hold approaches
to increase patient comfort and reduce the study time.
Materials and methods: A prospectively gated multi-slice 2D
real-time cine sequence was implemented on a 1.5 T scanner
(MAGNETOM Espree, Siemens AG Healthcare Sector, Erlangen,
Germany) using highly accelerated acquisition schemes. For
parallel imaging, coil reference data have been derived using
previously acquired reference data or a temporal method
(TGRAPPA [1]), respectively. Optional, outer k-space data
could be shared between consecutive phases to increase
temporal resolution. For a segmented 3D cine approach, a
TGRAPPA acquisition scheme in phase and partition encoding
direction was used. Both 2D and 3D approaches allowed to
acquire cine data covering the entire LV in one single breath hold
using typical parameters shown in Table 1. Cine data of ten
healthy volunteers (2 male, 8 female; mean age 27.5; range 21–40) have been acquired using a 32-channel cardiac coil (Invivo,
Orlando, Florida) and the derived functional parameters have
been compared using a retrospectively gated multi-breath hold
protocol as clinical standard.
Functional analysis was performed using Argus (Siemens AG
Healthcare Sector). Volumetric analysis was performed on all
cine images; EF, EDV, ESV, SV, and MM were derived. Paired
Student's t-test and linear regression were performed. A level of
p < 0.05 was considered statistically significant.
Results: Linear regression showed good correlation (r > 0.75)
between the measurements of LV function parameters yielded by
the standard segmented 2D protocol and those by the
experimental protocols, except in measuring EF and SV.
The same analysis also showed strong correlation among the
single breath-hold techniques in measuring LV parameters.
Paired t-tests indicated that there were no significant differences
in measured EF and MM between the described protocols.
However, significant differences were found in EDV, ESV and SV
values; segmented 2D protocol consistently yielded higher values
than the other protocols in these cases.
Discussion: The results of linear regression and paired t-tests
suggest that the real-time 2D TGRAPPA technique can
potentially substitute the standard clinical protocol. However,
the data showed that the experimental protocols tended to
underestimate EDV, ESV, and SV. It has been reported that
prospective triggering leads to significantly lower EDV and SV
values, since the late diastole is not covered by prospective
triggering [2]. Since the gold standard in this study is retro-
spectively triggered, the difference in ECG triggering could
explain the significant differences in LV volumes.
References1. Breuer FA, et al: Dynamic autocalibrated parallel
imaging using temporal GRAPPA (TGRAPPA).Magn Reson Med 2005, 53(4):981–5.
2. Sievers B, et al: Impact of the ECG gating method onventricular volumes and ejection fractions assessedby cardiovascular magnetic resonance imaging. JCardiovasc Magn Reson 2005, 7(2):441–6.
P226Fully automatic segmentation of short and longaxis cine cardiac MRMaxim Fradkin1, Cybele Ciofolo-Veit1, Benoit Mory1,Gilion Hautvast2 and Marcel Breeuwer21Philips Healthcare, Suresnes, France2Philips Healthcare, Best, Netherlands
Journal of Cardiovascular Magnetic Resonance 2009, 11(Suppl 1):P226
Introduction: Quantitative analysis of cardiac function
requires delineation of the left ventricle (LV) in cine cardiac
MR (CMR). Typically, this is done using short-axis (SA) images,
however, acquisition of several long-axis (LA) views has become
quite common. The latter can be used for the accurate and
reproducible determination of the basal SA slice, known as one
of the major inter-observer variability factors in SA LV
measurements [1]. Since manual LV delineation is very tedious
and time-consuming, automatic segmentation methods, enabling
to obtain reproducible LV measurements, are highly desirable.
Purpose: We propose a fully automatic method for delineation
of the endo- and epicardial contours in SA and LA cine CMR
images in order to provide automatic, accurate quantitative left-
ventricular functional assessment.
Table 2 (abstract P225) Correlation (r) of LV function para-meters between the standard and each of the single breath-holdtechniques
2D (GRAPPA) 2D (TGRAPPA) 3D (TGRAPPA)
EF 0.70 0.60 0.64
EDV 0.75 0.88 0.76
ESV 0.85 0.88 0.79
SV 0.38 0.62 0.59
MM 0.93 0.74 0.83
Table 3 (abstract P225) Correlation (r) in measurementsbetween pairs of the single breath-hold techniques
2D (GRAPPA)/2D (TGRAPPA)
2D (GRAPPA)/3D (TGRAPPA)
2D (TGRAPPA)/3D (TGRAPPA))
EF 0.86 0.89 0.93
EDV 0.90 0.92 0.90
ESV 0.89 0.90 0.93
SV 0.89 0.89 0.85
MM 0.86 0.90 0.74
Table 4 (abstract P225) Paired T-tests between the standard andeach of the single breath-hold techniques (NS = no significantdifference)
2D (GRAPPA) 2D (TGRAPPA) 3D (TGRAPPA)
EF 0.54(NS) 0.98 (NS) 0.72 (NS)
EDV P < .05 P < .05 P < .01
ESV P < .05 0.06(NS) P < .05
SV P < .05 0.06(NS) P < .01
MM 0.98(NS) 0.08(NS) 0.26(NS)
Journal of Cardiovascular Magnetic Resonance 2009, 11(Suppl 1) http://jcmr-online.com/supplements/11/S1
Page 260 of 316(page number not for citation purposes)
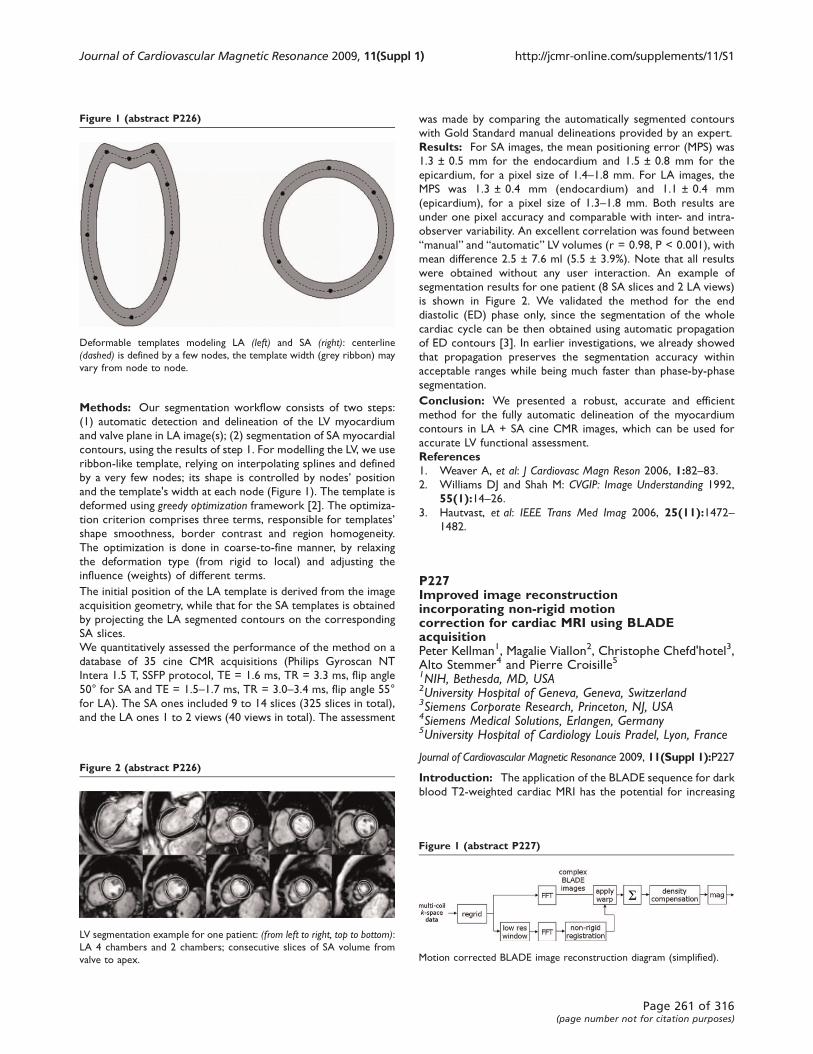
Methods: Our segmentation workflow consists of two steps:
(1) automatic detection and delineation of the LV myocardium
and valve plane in LA image(s); (2) segmentation of SA myocardial
contours, using the results of step 1. For modelling the LV, we use
ribbon-like template, relying on interpolating splines and defined
by a very few nodes; its shape is controlled by nodes’ positionand the template's width at each node (Figure 1). The template is
deformed using greedy optimization framework [2]. The optimiza-
tion criterion comprises three terms, responsible for templates’shape smoothness, border contrast and region homogeneity.
The optimization is done in coarse-to-fine manner, by relaxing
the deformation type (from rigid to local) and adjusting the
influence (weights) of different terms.
The initial position of the LA template is derived from the image
acquisition geometry, while that for the SA templates is obtained
by projecting the LA segmented contours on the corresponding
SA slices.
We quantitatively assessed the performance of the method on a
database of 35 cine CMR acquisitions (Philips Gyroscan NT
Intera 1.5 T, SSFP protocol, TE = 1.6 ms, TR = 3.3 ms, flip angle
50° for SA and TE = 1.5–1.7 ms, TR = 3.0–3.4 ms, flip angle 55°
for LA). The SA ones included 9 to 14 slices (325 slices in total),
and the LA ones 1 to 2 views (40 views in total). The assessment
was made by comparing the automatically segmented contours
with Gold Standard manual delineations provided by an expert.
Results: For SA images, the mean positioning error (MPS) was
1.3 ± 0.5 mm for the endocardium and 1.5 ± 0.8 mm for the
epicardium, for a pixel size of 1.4–1.8 mm. For LA images, the
MPS was 1.3 ± 0.4 mm (endocardium) and 1.1 ± 0.4 mm
(epicardium), for a pixel size of 1.3–1.8 mm. Both results are
under one pixel accuracy and comparable with inter- and intra-
observer variability. An excellent correlation was found between
“manual” and “automatic” LV volumes (r = 0.98, P < 0.001), with
mean difference 2.5 ± 7.6 ml (5.5 ± 3.9%). Note that all results
were obtained without any user interaction. An example of
segmentation results for one patient (8 SA slices and 2 LA views)
is shown in Figure 2. We validated the method for the end
diastolic (ED) phase only, since the segmentation of the whole
cardiac cycle can be then obtained using automatic propagation
of ED contours [3]. In earlier investigations, we already showed
that propagation preserves the segmentation accuracy within
acceptable ranges while being much faster than phase-by-phase
segmentation.
Conclusion: We presented a robust, accurate and efficient
method for the fully automatic delineation of the myocardium
contours in LA + SA cine CMR images, which can be used for
accurate LV functional assessment.
References1. Weaver A, et al: J Cardiovasc Magn Reson 2006, 1:82–83.2. Williams DJ and Shah M: CVGIP: Image Understanding 1992,
55(1):14–26.3. Hautvast, et al: IEEE Trans Med Imag 2006, 25(11):1472–
1482.
P227Improved image reconstructionincorporating non-rigid motioncorrection for cardiac MRI using BLADEacquisitionPeter Kellman1, Magalie Viallon2, Christophe Chefd'hotel3,Alto Stemmer4 and Pierre Croisille51NIH, Bethesda, MD, USA2University Hospital of Geneva, Geneva, Switzerland3Siemens Corporate Research, Princeton, NJ, USA4Siemens Medical Solutions, Erlangen, Germany5University Hospital of Cardiology Louis Pradel, Lyon, France
Journal of Cardiovascular Magnetic Resonance 2009, 11(Suppl 1):P227
Introduction: The application of the BLADE sequence for dark
blood T2-weighted cardiac MRI has the potential for increasing
Figure 1 (abstract P226)
Deformable templates modeling LA (left) and SA (right): centerline
(dashed) is defined by a few nodes, the template width (grey ribbon) may
vary from node to node.
Figure 2 (abstract P226)
LV segmentation example for one patient: (from left to right, top to bottom):LA 4 chambers and 2 chambers; consecutive slices of SA volume from
valve to apex.
Figure 1 (abstract P227)
Motion corrected BLADE image reconstruction diagram (simplified).
Journal of Cardiovascular Magnetic Resonance 2009, 11(Suppl 1) http://jcmr-online.com/supplements/11/S1
Page 261 of 316(page number not for citation purposes)
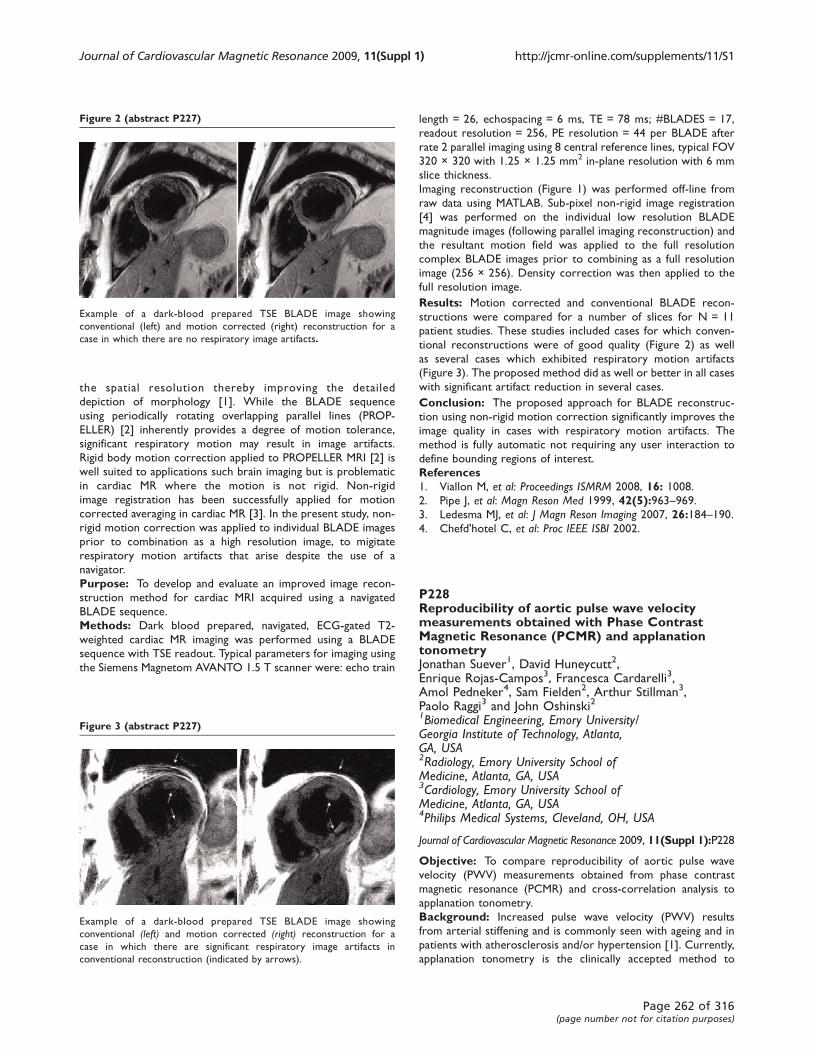
the spatial resolution thereby improving the detailed
depiction of morphology [1]. While the BLADE sequence
using periodically rotating overlapping parallel lines (PROP-
ELLER) [2] inherently provides a degree of motion tolerance,
significant respiratory motion may result in image artifacts.
Rigid body motion correction applied to PROPELLER MRI [2] is
well suited to applications such brain imaging but is problematic
in cardiac MR where the motion is not rigid. Non-rigid
image registration has been successfully applied for motion
corrected averaging in cardiac MR [3]. In the present study, non-
rigid motion correction was applied to individual BLADE images
prior to combination as a high resolution image, to migitate
respiratory motion artifacts that arise despite the use of a
navigator.
Purpose: To develop and evaluate an improved image recon-
struction method for cardiac MRI acquired using a navigated
BLADE sequence.
Methods: Dark blood prepared, navigated, ECG-gated T2-
weighted cardiac MR imaging was performed using a BLADE
sequence with TSE readout. Typical parameters for imaging using
the Siemens Magnetom AVANTO 1.5 T scanner were: echo train
length = 26, echospacing = 6 ms, TE = 78 ms; #BLADES = 17,
readout resolution = 256, PE resolution = 44 per BLADE after
rate 2 parallel imaging using 8 central reference lines, typical FOV
320 × 320 with 1.25 × 1.25 mm2 in-plane resolution with 6 mm
slice thickness.
Imaging reconstruction (Figure 1) was performed off-line from
raw data using MATLAB. Sub-pixel non-rigid image registration
[4] was performed on the individual low resolution BLADE
magnitude images (following parallel imaging reconstruction) and
the resultant motion field was applied to the full resolution
complex BLADE images prior to combining as a full resolution
image (256 × 256). Density correction was then applied to the
full resolution image.
Results: Motion corrected and conventional BLADE recon-
structions were compared for a number of slices for N = 11
patient studies. These studies included cases for which conven-
tional reconstructions were of good quality (Figure 2) as well
as several cases which exhibited respiratory motion artifacts
(Figure 3). The proposed method did as well or better in all cases
with significant artifact reduction in several cases.
Conclusion: The proposed approach for BLADE reconstruc-
tion using non-rigid motion correction significantly improves the
image quality in cases with respiratory motion artifacts. The
method is fully automatic not requiring any user interaction to
define bounding regions of interest.
References1. Viallon M, et al: Proceedings ISMRM 2008, 16: 1008.2. Pipe J, et al: Magn Reson Med 1999, 42(5):963–969.3. Ledesma MJ, et al: J Magn Reson Imaging 2007, 26:184–190.4. Chefd'hotel C, et al: Proc IEEE ISBI 2002.
P228Reproducibility of aortic pulse wave velocitymeasurements obtained with Phase ContrastMagnetic Resonance (PCMR) and applanationtonometryJonathan Suever1, David Huneycutt2,Enrique Rojas-Campos3, Francesca Cardarelli3,Amol Pedneker4, Sam Fielden2, Arthur Stillman3,Paolo Raggi3 and John Oshinski21Biomedical Engineering, Emory University/Georgia Institute of Technology, Atlanta,GA, USA2Radiology, Emory University School ofMedicine, Atlanta, GA, USA3Cardiology, Emory University School ofMedicine, Atlanta, GA, USA4Philips Medical Systems, Cleveland, OH, USA
Journal of Cardiovascular Magnetic Resonance 2009, 11(Suppl 1):P228
Objective: To compare reproducibility of aortic pulse wave
velocity (PWV) measurements obtained from phase contrast
magnetic resonance (PCMR) and cross-correlation analysis to
applanation tonometry.
Background: Increased pulse wave velocity (PWV) results
from arterial stiffening and is commonly seen with ageing and in
patients with atherosclerosis and/or hypertension [1]. Currently,
applanation tonometry is the clinically accepted method to
Figure 2 (abstract P227)
Example of a dark-blood prepared TSE BLADE image showing
conventional (left) and motion corrected (right) reconstruction for a
case in which there are no respiratory image artifacts.
Figure 3 (abstract P227)
Example of a dark-blood prepared TSE BLADE image showing
conventional (left) and motion corrected (right) reconstruction for a
case in which there are significant respiratory image artifacts in
conventional reconstruction (indicated by arrows).
Journal of Cardiovascular Magnetic Resonance 2009, 11(Suppl 1) http://jcmr-online.com/supplements/11/S1
Page 262 of 316(page number not for citation purposes)
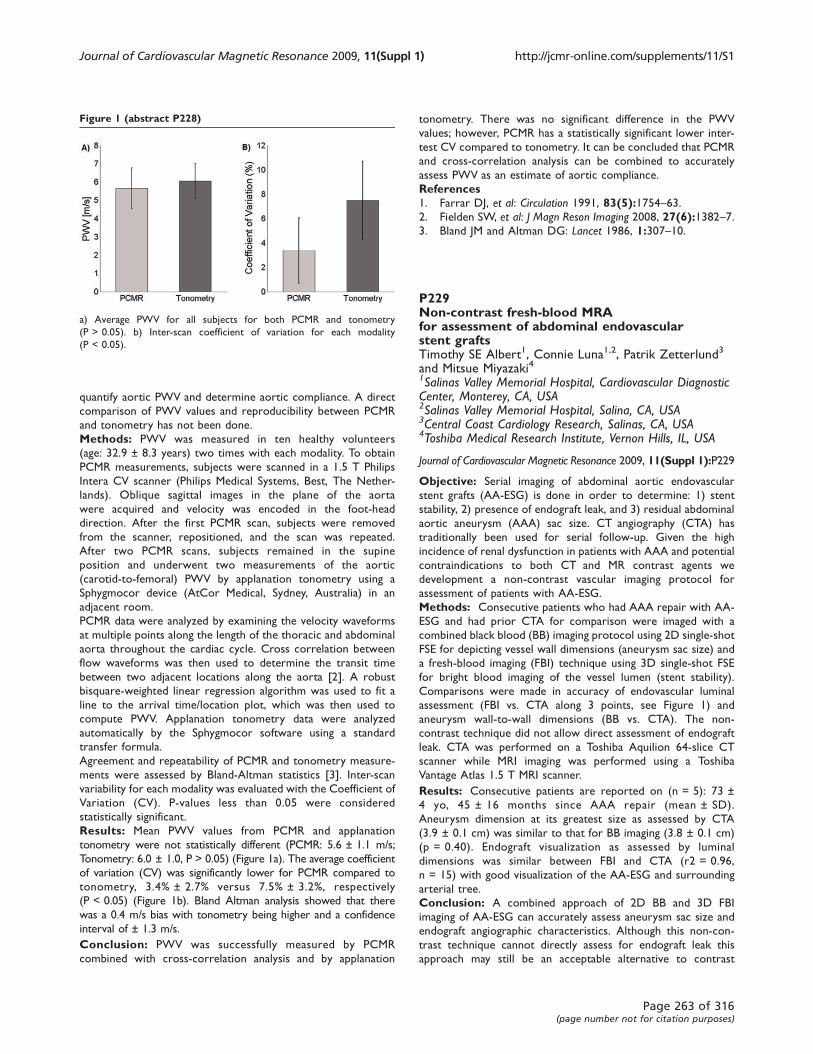
quantify aortic PWV and determine aortic compliance. A direct
comparison of PWV values and reproducibility between PCMR
and tonometry has not been done.
Methods: PWV was measured in ten healthy volunteers
(age: 32.9 ± 8.3 years) two times with each modality. To obtain
PCMR measurements, subjects were scanned in a 1.5 T Philips
Intera CV scanner (Philips Medical Systems, Best, The Nether-
lands). Oblique sagittal images in the plane of the aorta
were acquired and velocity was encoded in the foot-head
direction. After the first PCMR scan, subjects were removed
from the scanner, repositioned, and the scan was repeated.
After two PCMR scans, subjects remained in the supine
position and underwent two measurements of the aortic
(carotid-to-femoral) PWV by applanation tonometry using a
Sphygmocor device (AtCor Medical, Sydney, Australia) in an
adjacent room.
PCMR data were analyzed by examining the velocity waveforms
at multiple points along the length of the thoracic and abdominal
aorta throughout the cardiac cycle. Cross correlation between
flow waveforms was then used to determine the transit time
between two adjacent locations along the aorta [2]. A robust
bisquare-weighted linear regression algorithm was used to fit a
line to the arrival time/location plot, which was then used to
compute PWV. Applanation tonometry data were analyzed
automatically by the Sphygmocor software using a standard
transfer formula.
Agreement and repeatability of PCMR and tonometry measure-
ments were assessed by Bland-Altman statistics [3]. Inter-scan
variability for each modality was evaluated with the Coefficient of
Variation (CV). P-values less than 0.05 were considered
statistically significant.
Results: Mean PWV values from PCMR and applanation
tonometry were not statistically different (PCMR: 5.6 ± 1.1 m/s;
Tonometry: 6.0 ± 1.0, P > 0.05) (Figure 1a). The average coefficient
of variation (CV) was significantly lower for PCMR compared to
tonometry, 3.4% ± 2.7% versus 7.5% ± 3.2%, respectively
(P < 0.05) (Figure 1b). Bland Altman analysis showed that there
was a 0.4 m/s bias with tonometry being higher and a confidence
interval of ± 1.3 m/s.
Conclusion: PWV was successfully measured by PCMR
combined with cross-correlation analysis and by applanation
tonometry. There was no significant difference in the PWV
values; however, PCMR has a statistically significant lower inter-
test CV compared to tonometry. It can be concluded that PCMR
and cross-correlation analysis can be combined to accurately
assess PWV as an estimate of aortic compliance.
References1. Farrar DJ, et al: Circulation 1991, 83(5):1754–63.2. Fielden SW, et al: J Magn Reson Imaging 2008, 27(6):1382–7.3. Bland JM and Altman DG: Lancet 1986, 1:307–10.
P229Non-contrast fresh-blood MRAfor assessment of abdominal endovascularstent graftsTimothy SE Albert1, Connie Luna1,2, Patrik Zetterlund3
and Mitsue Miyazaki41Salinas Valley Memorial Hospital, Cardiovascular DiagnosticCenter, Monterey, CA, USA2Salinas Valley Memorial Hospital, Salina, CA, USA3Central Coast Cardiology Research, Salinas, CA, USA4Toshiba Medical Research Institute, Vernon Hills, IL, USA
Journal of Cardiovascular Magnetic Resonance 2009, 11(Suppl 1):P229
Objective: Serial imaging of abdominal aortic endovascular
stent grafts (AA-ESG) is done in order to determine: 1) stent
stability, 2) presence of endograft leak, and 3) residual abdominal
aortic aneurysm (AAA) sac size. CT angiography (CTA) has
traditionally been used for serial follow-up. Given the high
incidence of renal dysfunction in patients with AAA and potential
contraindications to both CT and MR contrast agents we
development a non-contrast vascular imaging protocol for
assessment of patients with AA-ESG.
Methods: Consecutive patients who had AAA repair with AA-
ESG and had prior CTA for comparison were imaged with a
combined black blood (BB) imaging protocol using 2D single-shot
FSE for depicting vessel wall dimensions (aneurysm sac size) and
a fresh-blood imaging (FBI) technique using 3D single-shot FSE
for bright blood imaging of the vessel lumen (stent stability).
Comparisons were made in accuracy of endovascular luminal
assessment (FBI vs. CTA along 3 points, see Figure 1) and
aneurysm wall-to-wall dimensions (BB vs. CTA). The non-
contrast technique did not allow direct assessment of endograft
leak. CTA was performed on a Toshiba Aquilion 64-slice CT
scanner while MRI imaging was performed using a Toshiba
Vantage Atlas 1.5 T MRI scanner.
Results: Consecutive patients are reported on (n = 5): 73 ±
4 yo, 45 ± 16 months since AAA repair (mean ± SD).
Aneurysm dimension at its greatest size as assessed by CTA
(3.9 ± 0.1 cm) was similar to that for BB imaging (3.8 ± 0.1 cm)
(p = 0.40). Endograft visualization as assessed by luminal
dimensions was similar between FBI and CTA (r2 = 0.96,
n = 15) with good visualization of the AA-ESG and surrounding
arterial tree.
Conclusion: A combined approach of 2D BB and 3D FBI
imaging of AA-ESG can accurately assess aneurysm sac size and
endograft angiographic characteristics. Although this non-con-
trast technique cannot directly assess for endograft leak this
approach may still be an acceptable alternative to contrast
Figure 1 (abstract P228)
a) Average PWV for all subjects for both PCMR and tonometry
(P > 0.05). b) Inter-scan coefficient of variation for each modality
(P < 0.05).
Journal of Cardiovascular Magnetic Resonance 2009, 11(Suppl 1) http://jcmr-online.com/supplements/11/S1
Page 263 of 316(page number not for citation purposes)

imaging for serial follow-up of patients with renal dysfunction.
Further validation of this novel technique will need to be done in
a larger cohort of patients.
P230Relationship of aortic stiffness measured bycardiovascular magnetic resonance to arterialstiffness estimates by tonometryIlias Kylintireas, Colin Cunnington,Malcolm Kohler, Jonathan Diesch,Corinne Trevitt, Robin Choudhury,Steffen Petersen, Stefan Neubauer, Matthew Robsonand Paul LeesonUniversity Of Oxford, Oxford, UK
Journal of Cardiovascular Magnetic Resonance 2009, 11(Suppl 1):P230
Introduction: Arterial stiffness assessed by arterial tonometry
– in particular pulse wave velocity and augmentation index – is
associated with increased cardiovascular risk. It is now possible
to use cardiovascular magnetic resonance imaging (CMR) for
direct imaging of aortic function. This provides a precise
assessment of the elastic properties of the aorta within distinct
regions of the aorta. We therefore studied what parameters of
aortic function are related to arterial tonometry-derived indices
of arterial stiffness.
Purpose: We compared aortic stiffness assessed by cardiovas-
cular magnetic resonance (CMR) pulse wave velocity (PWV)
based on flow, velocity or acceleration, and aortic distensibility
(AD)) to widely used arterial stiffness estimates provided by
arterial tonometry (pulse wave velocity (PWVS) and pulse wave
analysis (AI)).
Methods: Thirty young healthy volunteers (aged 23–33)underwent tonometry (Sphygmacor) for determination of
carotid to femoral PWVS and radial pulse wave analysis for AI
estimation. They then underwent CMR to assess aortic elastic
properties.
Aortic distensibility was assessed from breath-hold ECG-gated,
steady state free precession (SSFP) images (TR = 2.8 ms, echo
time, TE = 1.4, 2 mm × 2 mm, slice thickness 7 mm, temporal
resolution 40 ms) acquired at the level of the right pulmonary
artery through the ascending and proximal descending aorta and
through the distal aorta below the diaphragm to determine aortic
Figure 1 (abstract P229)
CTA (upper image) and FBI (lower image) of same patient after AA-ESG.
The diastolic-triggered FBI image clearly depicts the lumen of the
endovascular stent graft and its iliac sleeves in bright blood. The
abdominal veins and large renal cysts are also well visualized.
Figure 1 (abstract P230)
Journal of Cardiovascular Magnetic Resonance 2009, 11(Suppl 1) http://jcmr-online.com/supplements/11/S1
Page 264 of 316(page number not for citation purposes)
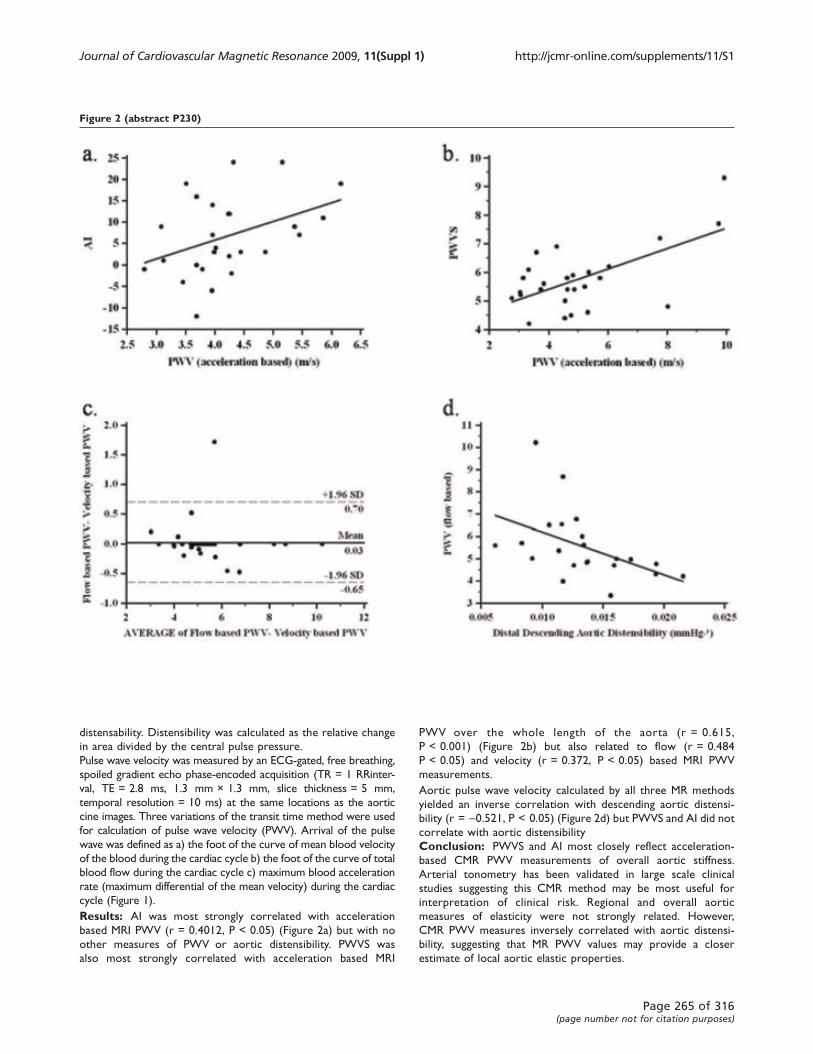
distensability. Distensibility was calculated as the relative change
in area divided by the central pulse pressure.
Pulse wave velocity was measured by an ECG-gated, free breathing,
spoiled gradient echo phase-encoded acquisition (TR = 1 RRinter-
val, TE = 2.8 ms, 1.3 mm × 1.3 mm, slice thickness = 5 mm,
temporal resolution = 10 ms) at the same locations as the aortic
cine images. Three variations of the transit time method were used
for calculation of pulse wave velocity (PWV). Arrival of the pulse
wave was defined as a) the foot of the curve of mean blood velocity
of the blood during the cardiac cycle b) the foot of the curve of total
blood flow during the cardiac cycle c) maximum blood acceleration
rate (maximum differential of the mean velocity) during the cardiac
cycle (Figure 1).
Results: AI was most strongly correlated with acceleration
based MRI PWV (r = 0.4012, P < 0.05) (Figure 2a) but with no
other measures of PWV or aortic distensibility. PWVS was
also most strongly correlated with acceleration based MRI
PWV over the whole length of the aorta (r = 0.615,
P < 0.001) (Figure 2b) but also related to flow (r = 0.484
P < 0.05) and velocity (r = 0.372, P < 0.05) based MRI PWV
measurements.
Aortic pulse wave velocity calculated by all three MR methods
yielded an inverse correlation with descending aortic distensi-
bility (r = -0.521, P < 0.05) (Figure 2d) but PWVS and AI did not
correlate with aortic distensibility
Conclusion: PWVS and AI most closely reflect acceleration-
based CMR PWV measurements of overall aortic stiffness.
Arterial tonometry has been validated in large scale clinical
studies suggesting this CMR method may be most useful for
interpretation of clinical risk. Regional and overall aortic
measures of elasticity were not strongly related. However,
CMR PWV measures inversely correlated with aortic distensi-
bility, suggesting that MR PWV values may provide a closer
estimate of local aortic elastic properties.
Figure 2 (abstract P230)
Journal of Cardiovascular Magnetic Resonance 2009, 11(Suppl 1) http://jcmr-online.com/supplements/11/S1
Page 265 of 316(page number not for citation purposes)
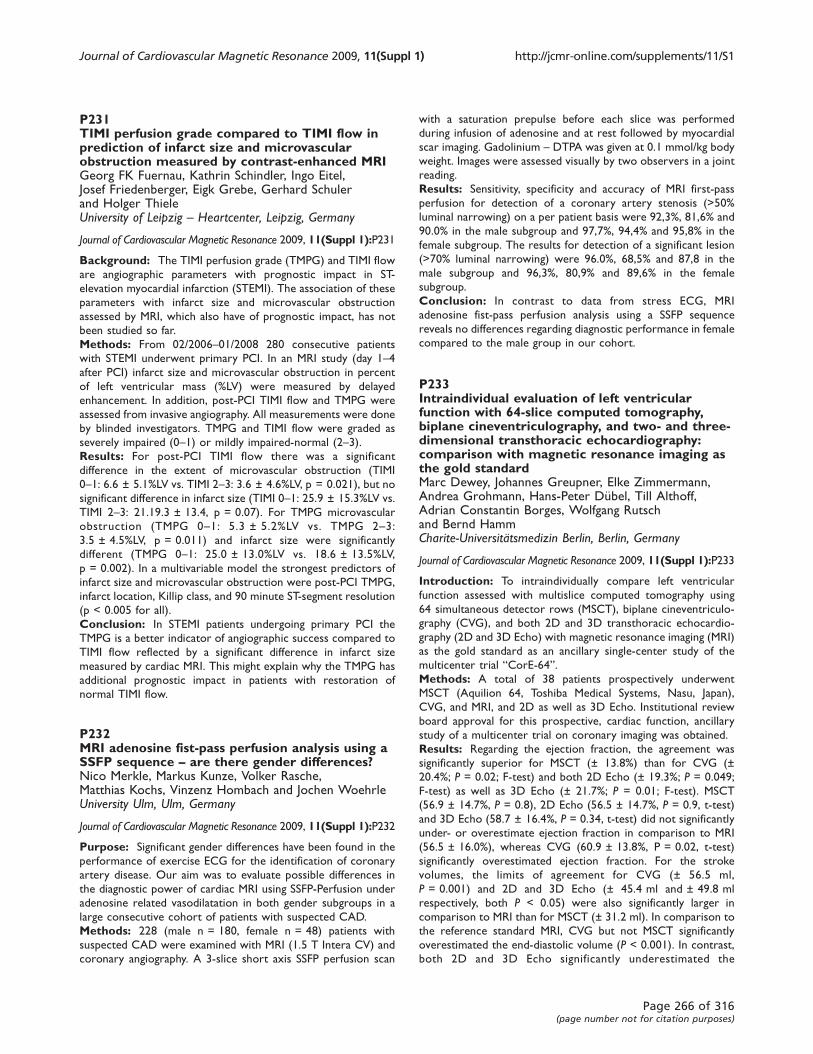
P231TIMI perfusion grade compared to TIMI flow inprediction of infarct size and microvascularobstruction measured by contrast-enhanced MRIGeorg FK Fuernau, Kathrin Schindler, Ingo Eitel,Josef Friedenberger, Eigk Grebe, Gerhard Schulerand Holger ThieleUniversity of Leipzig – Heartcenter, Leipzig, Germany
Journal of Cardiovascular Magnetic Resonance 2009, 11(Suppl 1):P231
Background: The TIMI perfusion grade (TMPG) and TIMI flow
are angiographic parameters with prognostic impact in ST-
elevation myocardial infarction (STEMI). The association of these
parameters with infarct size and microvascular obstruction
assessed by MRI, which also have of prognostic impact, has not
been studied so far.
Methods: From 02/2006–01/2008 280 consecutive patients
with STEMI underwent primary PCI. In an MRI study (day 1–4after PCI) infarct size and microvascular obstruction in percent
of left ventricular mass (%LV) were measured by delayed
enhancement. In addition, post-PCI TIMI flow and TMPG were
assessed from invasive angiography. All measurements were done
by blinded investigators. TMPG and TIMI flow were graded as
severely impaired (0–1) or mildly impaired-normal (2–3).Results: For post-PCI TIMI flow there was a significant
difference in the extent of microvascular obstruction (TIMI
0–1: 6.6 ± 5.1%LV vs. TIMI 2–3: 3.6 ± 4.6%LV, p = 0.021), but no
significant difference in infarct size (TIMI 0–1: 25.9 ± 15.3%LV vs.
TIMI 2–3: 21.19.3 ± 13.4, p = 0.07). For TMPG microvascular
obstruction (TMPG 0–1: 5.3 ± 5.2%LV vs. TMPG 2–3:3.5 ± 4.5%LV, p = 0.011) and infarct size were significantly
different (TMPG 0–1: 25.0 ± 13.0%LV vs. 18.6 ± 13.5%LV,
p = 0.002). In a multivariable model the strongest predictors of
infarct size and microvascular obstruction were post-PCI TMPG,
infarct location, Killip class, and 90 minute ST-segment resolution
(p < 0.005 for all).
Conclusion: In STEMI patients undergoing primary PCI the
TMPG is a better indicator of angiographic success compared to
TIMI flow reflected by a significant difference in infarct size
measured by cardiac MRI. This might explain why the TMPG has
additional prognostic impact in patients with restoration of
normal TIMI flow.
P232MRI adenosine fist-pass perfusion analysis using aSSFP sequence – are there gender differences?Nico Merkle, Markus Kunze, Volker Rasche,Matthias Kochs, Vinzenz Hombach and Jochen WoehrleUniversity Ulm, Ulm, Germany
Journal of Cardiovascular Magnetic Resonance 2009, 11(Suppl 1):P232
Purpose: Significant gender differences have been found in the
performance of exercise ECG for the identification of coronary
artery disease. Our aim was to evaluate possible differences in
the diagnostic power of cardiac MRI using SSFP-Perfusion under
adenosine related vasodilatation in both gender subgroups in a
large consecutive cohort of patients with suspected CAD.
Methods: 228 (male n = 180, female n = 48) patients with
suspected CAD were examined with MRI (1.5 T Intera CV) and
coronary angiography. A 3-slice short axis SSFP perfusion scan
with a saturation prepulse before each slice was performed
during infusion of adenosine and at rest followed by myocardial
scar imaging. Gadolinium – DTPA was given at 0.1 mmol/kg body
weight. Images were assessed visually by two observers in a joint
reading.
Results: Sensitivity, specificity and accuracy of MRI first-pass
perfusion for detection of a coronary artery stenosis (>50%
luminal narrowing) on a per patient basis were 92,3%, 81,6% and
90.0% in the male subgroup and 97,7%, 94,4% and 95,8% in the
female subgroup. The results for detection of a significant lesion
(>70% luminal narrowing) were 96.0%, 68,5% and 87,8 in the
male subgroup and 96,3%, 80,9% and 89,6% in the female
subgroup.
Conclusion: In contrast to data from stress ECG, MRI
adenosine fist-pass perfusion analysis using a SSFP sequence
reveals no differences regarding diagnostic performance in female
compared to the male group in our cohort.
P233Intraindividual evaluation of left ventricularfunction with 64-slice computed tomography,biplane cineventriculography, and two- and three-dimensional transthoracic echocardiography:comparison with magnetic resonance imaging asthe gold standardMarc Dewey, Johannes Greupner, Elke Zimmermann,Andrea Grohmann, Hans-Peter Dübel, Till Althoff,Adrian Constantin Borges, Wolfgang Rutschand Bernd HammCharite-Universitätsmedizin Berlin, Berlin, Germany
Journal of Cardiovascular Magnetic Resonance 2009, 11(Suppl 1):P233
Introduction: To intraindividually compare left ventricular
function assessed with multislice computed tomography using
64 simultaneous detector rows (MSCT), biplane cineventriculo-
graphy (CVG), and both 2D and 3D transthoracic echocardio-
graphy (2D and 3D Echo) with magnetic resonance imaging (MRI)
as the gold standard as an ancillary single-center study of the
multicenter trial “CorE-64”.Methods: A total of 38 patients prospectively underwent
MSCT (Aquilion 64, Toshiba Medical Systems, Nasu, Japan),
CVG, and MRI, and 2D as well as 3D Echo. Institutional review
board approval for this prospective, cardiac function, ancillary
study of a multicenter trial on coronary imaging was obtained.
Results: Regarding the ejection fraction, the agreement was
significantly superior for MSCT (± 13.8%) than for CVG (±
20.4%; P = 0.02; F-test) and both 2D Echo (± 19.3%; P = 0.049;
F-test) as well as 3D Echo (± 21.7%; P = 0.01; F-test). MSCT
(56.9 ± 14.7%, P = 0.8), 2D Echo (56.5 ± 14.7%, P = 0.9, t-test)
and 3D Echo (58.7 ± 16.4%, P = 0.34, t-test) did not significantly
under- or overestimate ejection fraction in comparison to MRI
(56.5 ± 16.0%), whereas CVG (60.9 ± 13.8%, P = 0.02, t-test)
significantly overestimated ejection fraction. For the stroke
volumes, the limits of agreement for CVG (± 56.5 ml,
P = 0.001) and 2D and 3D Echo (± 45.4 ml and ± 49.8 ml
respectively, both P < 0.05) were also significantly larger in
comparison to MRI than for MSCT (± 31.2 ml). In comparison to
the reference standard MRI, CVG but not MSCT significantly
overestimated the end-diastolic volume (P < 0.001). In contrast,
both 2D and 3D Echo significantly underestimated the
Journal of Cardiovascular Magnetic Resonance 2009, 11(Suppl 1) http://jcmr-online.com/supplements/11/S1
Page 266 of 316(page number not for citation purposes)
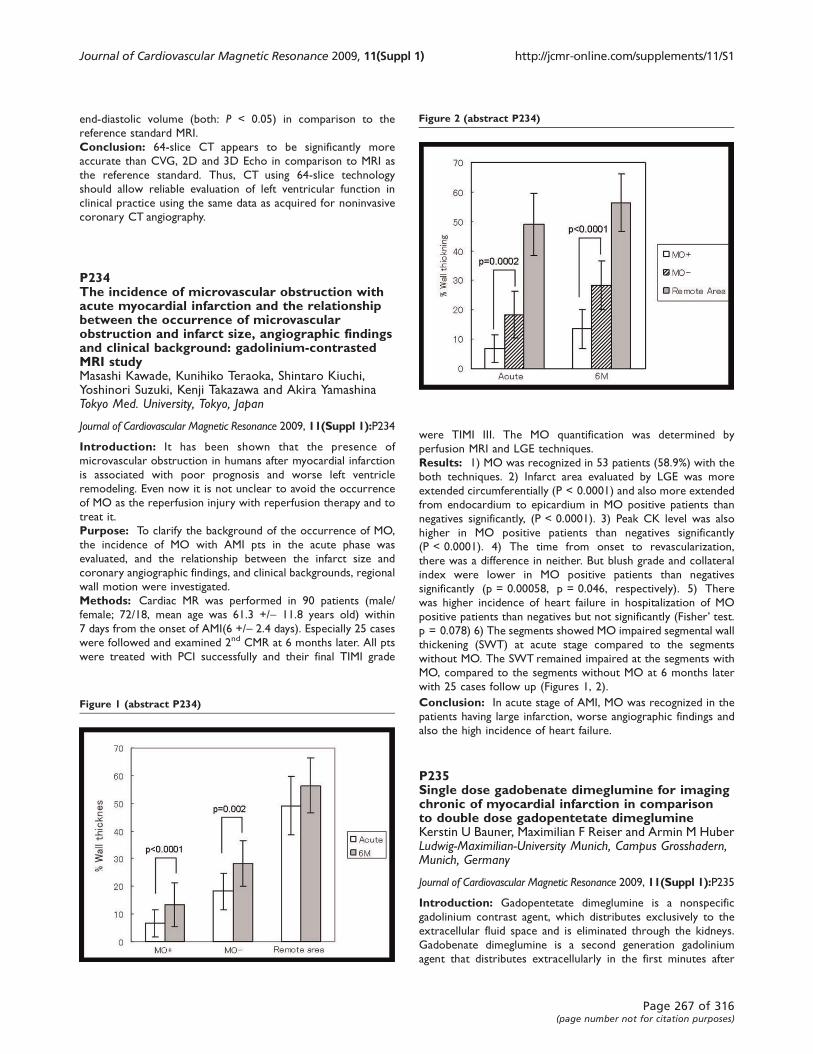
end-diastolic volume (both: P < 0.05) in comparison to the
reference standard MRI.
Conclusion: 64-slice CT appears to be significantly more
accurate than CVG, 2D and 3D Echo in comparison to MRI as
the reference standard. Thus, CT using 64-slice technology
should allow reliable evaluation of left ventricular function in
clinical practice using the same data as acquired for noninvasive
coronary CT angiography.
P234The incidence of microvascular obstruction withacute myocardial infarction and the relationshipbetween the occurrence of microvascularobstruction and infarct size, angiographic findingsand clinical background: gadolinium-contrastedMRI studyMasashi Kawade, Kunihiko Teraoka, Shintaro Kiuchi,Yoshinori Suzuki, Kenji Takazawa and Akira YamashinaTokyo Med. University, Tokyo, Japan
Journal of Cardiovascular Magnetic Resonance 2009, 11(Suppl 1):P234
Introduction: It has been shown that the presence of
microvascular obstruction in humans after myocardial infarction
is associated with poor prognosis and worse left ventricle
remodeling. Even now it is not unclear to avoid the occurrence
of MO as the reperfusion injury with reperfusion therapy and to
treat it.
Purpose: To clarify the background of the occurrence of MO,
the incidence of MO with AMI pts in the acute phase was
evaluated, and the relationship between the infarct size and
coronary angiographic findings, and clinical backgrounds, regional
wall motion were investigated.
Methods: Cardiac MR was performed in 90 patients (male/
female; 72/18, mean age was 61.3 +/- 11.8 years old) within
7 days from the onset of AMI(6 +/- 2.4 days). Especially 25 cases
were followed and examined 2nd CMR at 6 months later. All pts
were treated with PCI successfully and their final TIMI grade
were TIMI III. The MO quantification was determined by
perfusion MRI and LGE techniques.
Results: 1) MO was recognized in 53 patients (58.9%) with the
both techniques. 2) Infarct area evaluated by LGE was more
extended circumferentially (P < 0.0001) and also more extended
from endocardium to epicardium in MO positive patients than
negatives significantly, (P < 0.0001). 3) Peak CK level was also
higher in MO positive patients than negatives significantly
(P < 0.0001). 4) The time from onset to revascularization,
there was a difference in neither. But blush grade and collateral
index were lower in MO positive patients than negatives
significantly (p = 0.00058, p = 0.046, respectively). 5) There
was higher incidence of heart failure in hospitalization of MO
positive patients than negatives but not significantly (Fisher’ test.p = 0.078) 6) The segments showed MO impaired segmental wall
thickening (SWT) at acute stage compared to the segments
without MO. The SWT remained impaired at the segments with
MO, compared to the segments without MO at 6 months later
with 25 cases follow up (Figures 1, 2).
Conclusion: In acute stage of AMI, MO was recognized in the
patients having large infarction, worse angiographic findings and
also the high incidence of heart failure.
P235Single dose gadobenate dimeglumine for imagingchronic of myocardial infarction in comparisonto double dose gadopentetate dimeglumineKerstin U Bauner, Maximilian F Reiser and Armin M HuberLudwig-Maximilian-University Munich, Campus Grosshadern,Munich, Germany
Journal of Cardiovascular Magnetic Resonance 2009, 11(Suppl 1):P235
Introduction: Gadopentetate dimeglumine is a nonspecific
gadolinium contrast agent, which distributes exclusively to the
extracellular fluid space and is eliminated through the kidneys.
Gadobenate dimeglumine is a second generation gadolinium
agent that distributes extracellularly in the first minutes after
Figure 1 (abstract P234)
Figure 2 (abstract P234)
Journal of Cardiovascular Magnetic Resonance 2009, 11(Suppl 1) http://jcmr-online.com/supplements/11/S1
Page 267 of 316(page number not for citation purposes)
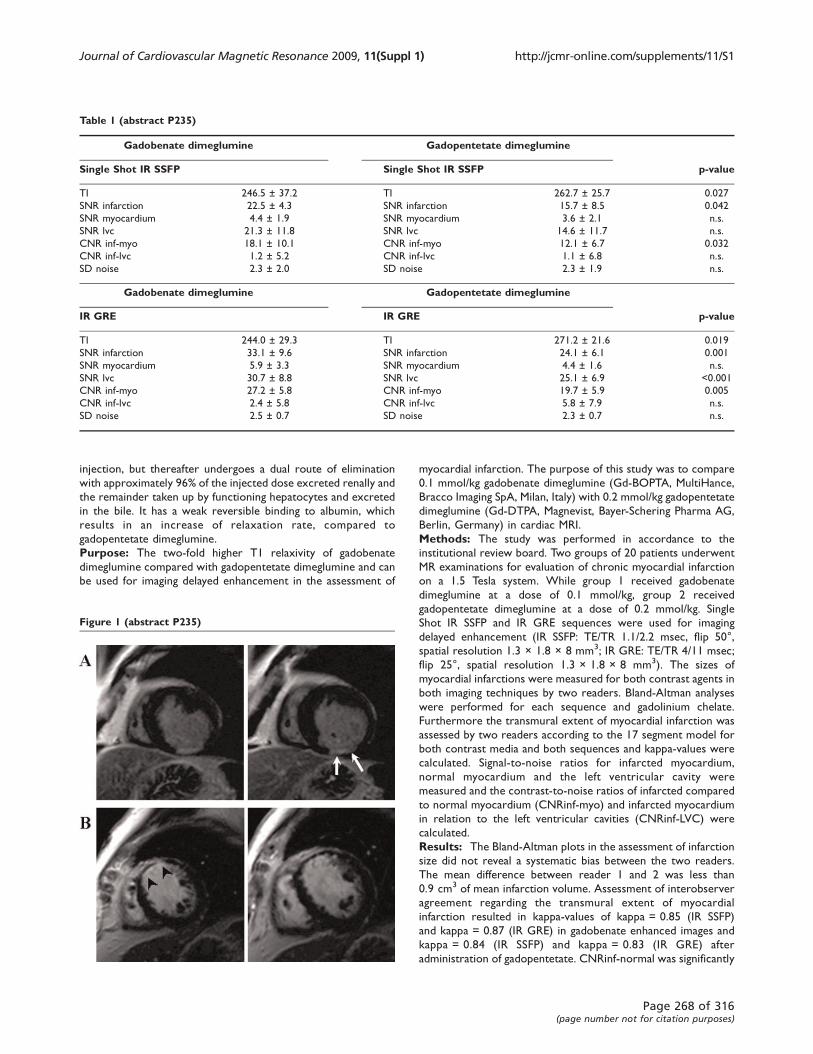
injection, but thereafter undergoes a dual route of elimination
with approximately 96% of the injected dose excreted renally and
the remainder taken up by functioning hepatocytes and excreted
in the bile. It has a weak reversible binding to albumin, which
results in an increase of relaxation rate, compared to
gadopentetate dimeglumine.
Purpose: The two-fold higher T1 relaxivity of gadobenate
dimeglumine compared with gadopentetate dimeglumine and can
be used for imaging delayed enhancement in the assessment of
myocardial infarction. The purpose of this study was to compare
0.1 mmol/kg gadobenate dimeglumine (Gd-BOPTA, MultiHance,
Bracco Imaging SpA, Milan, Italy) with 0.2 mmol/kg gadopentetate
dimeglumine (Gd-DTPA, Magnevist, Bayer-Schering Pharma AG,
Berlin, Germany) in cardiac MRI.
Methods: The study was performed in accordance to the
institutional review board. Two groups of 20 patients underwent
MR examinations for evaluation of chronic myocardial infarction
on a 1.5 Tesla system. While group 1 received gadobenate
dimeglumine at a dose of 0.1 mmol/kg, group 2 received
gadopentetate dimeglumine at a dose of 0.2 mmol/kg. Single
Shot IR SSFP and IR GRE sequences were used for imaging
delayed enhancement (IR SSFP: TE/TR 1.1/2.2 msec, flip 50°,
spatial resolution 1.3 × 1.8 × 8 mm3; IR GRE: TE/TR 4/11 msec;
flip 25°, spatial resolution 1.3 × 1.8 × 8 mm3). The sizes of
myocardial infarctions were measured for both contrast agents in
both imaging techniques by two readers. Bland-Altman analyses
were performed for each sequence and gadolinium chelate.
Furthermore the transmural extent of myocardial infarction was
assessed by two readers according to the 17 segment model for
both contrast media and both sequences and kappa-values were
calculated. Signal-to-noise ratios for infarcted myocardium,
normal myocardium and the left ventricular cavity were
measured and the contrast-to-noise ratios of infarcted compared
to normal myocardium (CNRinf-myo) and infarcted myocardium
in relation to the left ventricular cavities (CNRinf-LVC) were
calculated.
Results: The Bland-Altman plots in the assessment of infarction
size did not reveal a systematic bias between the two readers.
The mean difference between reader 1 and 2 was less than
0.9 cm3 of mean infarction volume. Assessment of interobserver
agreement regarding the transmural extent of myocardial
infarction resulted in kappa-values of kappa = 0.85 (IR SSFP)
and kappa = 0.87 (IR GRE) in gadobenate enhanced images and
kappa = 0.84 (IR SSFP) and kappa = 0.83 (IR GRE) after
administration of gadopentetate. CNRinf-normal was significantly
Figure 1 (abstract P235)
Table 1 (abstract P235)
Gadobenate dimeglumine Gadopentetate dimeglumine
Single Shot IR SSFP Single Shot IR SSFP p-value
TI 246.5 ± 37.2 TI 262.7 ± 25.7 0.027
SNR infarction 22.5 ± 4.3 SNR infarction 15.7 ± 8.5 0.042
SNR myocardium 4.4 ± 1.9 SNR myocardium 3.6 ± 2.1 n.s.
SNR lvc 21.3 ± 11.8 SNR lvc 14.6 ± 11.7 n.s.
CNR inf-myo 18.1 ± 10.1 CNR inf-myo 12.1 ± 6.7 0.032
CNR inf-lvc 1.2 ± 5.2 CNR inf-lvc 1.1 ± 6.8 n.s.
SD noise 2.3 ± 2.0 SD noise 2.3 ± 1.9 n.s.
Gadobenate dimeglumine Gadopentetate dimeglumine
IR GRE IR GRE p-value
TI 244.0 ± 29.3 TI 271.2 ± 21.6 0.019
SNR infarction 33.1 ± 9.6 SNR infarction 24.1 ± 6.1 0.001
SNR myocardium 5.9 ± 3.3 SNR myocardium 4.4 ± 1.6 n.s.
SNR lvc 30.7 ± 8.8 SNR lvc 25.1 ± 6.9 <0.001
CNR inf-myo 27.2 ± 5.8 CNR inf-myo 19.7 ± 5.9 0.005
CNR inf-lvc 2.4 ± 5.8 CNR inf-lvc 5.8 ± 7.9 n.s.
SD noise 2.5 ± 0.7 SD noise 2.3 ± 0.7 n.s.
Journal of Cardiovascular Magnetic Resonance 2009, 11(Suppl 1) http://jcmr-online.com/supplements/11/S1
Page 268 of 316(page number not for citation purposes)

higher on the images of group 1 (gadobenate) compared to group
2 (gadopentetate) in both sequences (Single Shot IR SSFP:
18.1 ± 10.1 vs. 12.1 ± 6.7; p = 0.032 and IR GRE: 27.2 ± 5.8 vs.
19.7 ± 5.9; p = 0.005) (Table 1). The mean value of CNRinf-LVC
for the group examined with gadobenate dimeglumine was lower,
though not significantly, compared to the group examined with
gadopentetate dimeglumien in IR GRE technique, while CNRinf-
LVC for IR SSFP resulted in equal values (single Shot IR SSFP:
1.2 ± 5.2 vs. 1.1 ± 6.8; p = n.s. and IR GRE 2.4 ± 5.8 vs.
5.8 ± 7.9; p = n.s.).
Conclusion: Low dose gadobenate dimeglumine resulted in
significantly higher CNRinf-myo compared to standard dose
gadopentetate dimeglumine in imaging of myocardial infarction
with IR SSFP and IR GRE sequences. Demarcation of infarcted
myocardium from the left ventricular cavity was equal in IR SSFP
technique and not significantly different in IR GRE technique. The
diagnostic value of a single dose gadobenate dimeglumine is
comparable or even superior compared to a double dose
gadopentetate dimeglumine for imaging myocardial infarction at
least for imaging myocardial infarction in Single Shot IR SSFP
technique (Figure 1).
P236Early infarct size prediction with two-dimensionalspeckle tracking echocardiography compared withlate gadolinium enhanced CMRCecile Roiron1, Nathan Mewton1, Marie Egan2,Cyril Bergerot1, Pierre Yves Leroux1, Pierre Croisille1,Michel Ovize1 and Genevieve Derumeaux11Hopital Cardiovasculaire Louis Pradel, Lyon, France2INSERM U 886: « Cardioprotection » Université ClaudeBernard – Lyon, Lyon, France
Journal of Cardiovascular Magnetic Resonance 2009, 11(Suppl 1):P236
Objective: Infarct size measurement is crucial since it predicts
both viability and left ventricular remodeling. A recent technique,
two dimensional speckle tracking echocardiography (STE) allows
accurate evaluation of myocardial deformation indices as
compared to sonomicrometry and magnetic resonance imaging
(MRI).
The aim of our study was to evaluate whether peak systolic
longitudinal strain (SL) measured by STE was able to quantify the
transmural extent of myocardial infarction (TEMI) as assessed by
late contrast enhancement MRI.
Materials and methods: 29 patients (55,4 ± 4,6 years, F 11/
M 18) with a first reperfused myocardial infarction (MI) were
included.
Echocardiography and MRI performed between day 2 and day 5
after infarction were analyzed with a 16 segment model.
Segmental and global (average of segmental SL) longitudinal
strain were measured by STE in apical views. Segments with MI
were classified as non-transmural (TEMI<25%, TEMI<50%,
TEMI<75%) and transmural MI (TEMI>75%) by late gadolinium
enhanced (LGE) MRI. Infarct mass was also assessed by
planimetry on LGE MRI.
Statistical analysis was performed using STATISTICA° software.
Results: 464 segments were analyzed by MRI. Evaluation of SL
by STE was feasible in 459/464 segments.
STE correctly identified segmental LV dysfunction induced by MI.
Mean value of LS in the transmural MI segments (-8,56 ± 1,22%)
was significantly lower compared to normal myocardium (-17,88 ±
0,8%) and to non-transmural MI segments (-16,43 ± 1,2% in
TEMI<25% vs -12,18 ± 1,6% in 25–50%TEMI vs -11,49 ± 2,1% in
50–75%TEMI) (p < 0,001).
A significant relationship was found between the global long-
itudinal strain and the infarct mass measured by MRI (r = 0.61,
p < 0,01). See Figure 1.
Conclusion: Early after MI, STE evaluates both the global
infarct mass by global longitudinal strain and can differentiate
transmural from non transmural MI segments by segmental
systolic longitudinal strain compared to LGE-MRI. This new
technique is promising for early infarct size prediction.
P237Is there an innate sex-based differencein the manner in which the left ventricleresponds to the pressure overloadof aortic stenosis?Saundra Grant, Diane A Vido, Vikas K Rathi,June A Yamrozik, Ronald B Williams, Geetha Rayarao,Mark Doyle and Robert WW BiedermanAllegheny General Hospital, The Gerald McGinnisCardiovascular Institute, Pittsburgh, PA, USA
Journal of Cardiovascular Magnetic Resonance 2009, 11(Suppl 1):P237
Introduction: Numerous investigators have suggested that
women are particularly prone to develop an exaggerated LV
hypertrophy (LVH) response to increased developed pressure as
compared to men. This has been best exemplified in both HTN
and aortic stenosis (AS) states and has been proposed
euphemistically as ‘exuberant hypertrophy'. This reference
implies that there is an inappropriate physiologic amplification
to the typical and necessary hypertrophic response for any given
blood pressure/afterload experienced by the LV. Furthermore, it
suggests that there is a divergent response at the gene level to
Figure 1 (abstract P236)
SL values plotted versus TEMI. A: normal myocardium, B: TEMI <25%, C:
TEMI 25–49%, D: TEMI 50–74%, E: TEMI ≥ 75%.
Journal of Cardiovascular Magnetic Resonance 2009, 11(Suppl 1) http://jcmr-online.com/supplements/11/S1
Page 269 of 316(page number not for citation purposes)
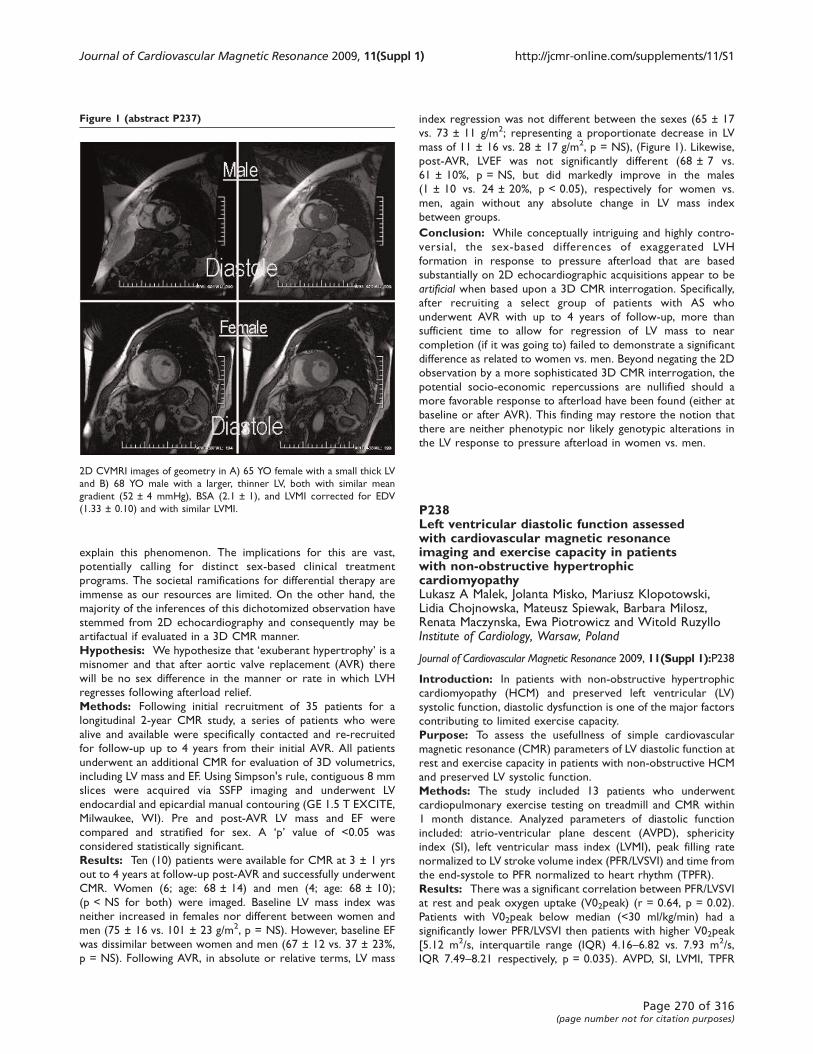
explain this phenomenon. The implications for this are vast,
potentially calling for distinct sex-based clinical treatment
programs. The societal ramifications for differential therapy are
immense as our resources are limited. On the other hand, the
majority of the inferences of this dichotomized observation have
stemmed from 2D echocardiography and consequently may be
artifactual if evaluated in a 3D CMR manner.
Hypothesis: We hypothesize that ‘exuberant hypertrophy’ is amisnomer and that after aortic valve replacement (AVR) there
will be no sex difference in the manner or rate in which LVH
regresses following afterload relief.
Methods: Following initial recruitment of 35 patients for a
longitudinal 2-year CMR study, a series of patients who were
alive and available were specifically contacted and re-recruited
for follow-up up to 4 years from their initial AVR. All patients
underwent an additional CMR for evaluation of 3D volumetrics,
including LV mass and EF. Using Simpson's rule, contiguous 8 mm
slices were acquired via SSFP imaging and underwent LV
endocardial and epicardial manual contouring (GE 1.5 T EXCITE,
Milwaukee, WI). Pre and post-AVR LV mass and EF were
compared and stratified for sex. A ‘p’ value of <0.05 was
considered statistically significant.
Results: Ten (10) patients were available for CMR at 3 ± 1 yrs
out to 4 years at follow-up post-AVR and successfully underwent
CMR. Women (6; age: 68 ± 14) and men (4; age: 68 ± 10);
(p < NS for both) were imaged. Baseline LV mass index was
neither increased in females nor different between women and
men (75 ± 16 vs. 101 ± 23 g/m2, p = NS). However, baseline EF
was dissimilar between women and men (67 ± 12 vs. 37 ± 23%,
p = NS). Following AVR, in absolute or relative terms, LV mass
index regression was not different between the sexes (65 ± 17
vs. 73 ± 11 g/m2; representing a proportionate decrease in LV
mass of 11 ± 16 vs. 28 ± 17 g/m2, p = NS), (Figure 1). Likewise,
post-AVR, LVEF was not significantly different (68 ± 7 vs.
61 ± 10%, p = NS, but did markedly improve in the males
(1 ± 10 vs. 24 ± 20%, p < 0.05), respectively for women vs.
men, again without any absolute change in LV mass index
between groups.
Conclusion: While conceptually intriguing and highly contro-
versial, the sex-based differences of exaggerated LVH
formation in response to pressure afterload that are based
substantially on 2D echocardiographic acquisitions appear to be
artificial when based upon a 3D CMR interrogation. Specifically,
after recruiting a select group of patients with AS who
underwent AVR with up to 4 years of follow-up, more than
sufficient time to allow for regression of LV mass to near
completion (if it was going to) failed to demonstrate a significant
difference as related to women vs. men. Beyond negating the 2D
observation by a more sophisticated 3D CMR interrogation, the
potential socio-economic repercussions are nullified should a
more favorable response to afterload have been found (either at
baseline or after AVR). This finding may restore the notion that
there are neither phenotypic nor likely genotypic alterations in
the LV response to pressure afterload in women vs. men.
P238Left ventricular diastolic function assessedwith cardiovascular magnetic resonanceimaging and exercise capacity in patientswith non-obstructive hypertrophiccardiomyopathyLukasz A Malek, Jolanta Misko, Mariusz Klopotowski,Lidia Chojnowska, Mateusz Spiewak, Barbara Milosz,Renata Maczynska, Ewa Piotrowicz and Witold RuzylloInstitute of Cardiology, Warsaw, Poland
Journal of Cardiovascular Magnetic Resonance 2009, 11(Suppl 1):P238
Introduction: In patients with non-obstructive hypertrophic
cardiomyopathy (HCM) and preserved left ventricular (LV)
systolic function, diastolic dysfunction is one of the major factors
contributing to limited exercise capacity.
Purpose: To assess the usefullness of simple cardiovascular
magnetic resonance (CMR) parameters of LV diastolic function at
rest and exercise capacity in patients with non-obstructive HCM
and preserved LV systolic function.
Methods: The study included 13 patients who underwent
cardiopulmonary exercise testing on treadmill and CMR within
1 month distance. Analyzed parameters of diastolic function
included: atrio-ventricular plane descent (AVPD), sphericity
index (SI), left ventricular mass index (LVMI), peak filling rate
normalized to LV stroke volume index (PFR/LVSVI) and time from
the end-systole to PFR normalized to heart rhythm (TPFR).
Results: There was a significant correlation between PFR/LVSVI
at rest and peak oxygen uptake (V02peak) (r = 0.64, p = 0.02).
Patients with V02peak below median (<30 ml/kg/min) had a
significantly lower PFR/LVSVI then patients with higher V02peak
[5.12 m2/s, interquartile range (IQR) 4.16–6.82 vs. 7.93 m2/s,
IQR 7.49–8.21 respectively, p = 0.035). AVPD, SI, LVMI, TPFR
Figure 1 (abstract P237)
2D CVMRI images of geometry in A) 65 YO female with a small thick LV
and B) 68 YO male with a larger, thinner LV, both with similar mean
gradient (52 ± 4 mmHg), BSA (2.1 ± 1), and LVMI corrected for EDV
(1.33 ± 0.10) and with similar LVMI.
Journal of Cardiovascular Magnetic Resonance 2009, 11(Suppl 1) http://jcmr-online.com/supplements/11/S1
Page 270 of 316(page number not for citation purposes)
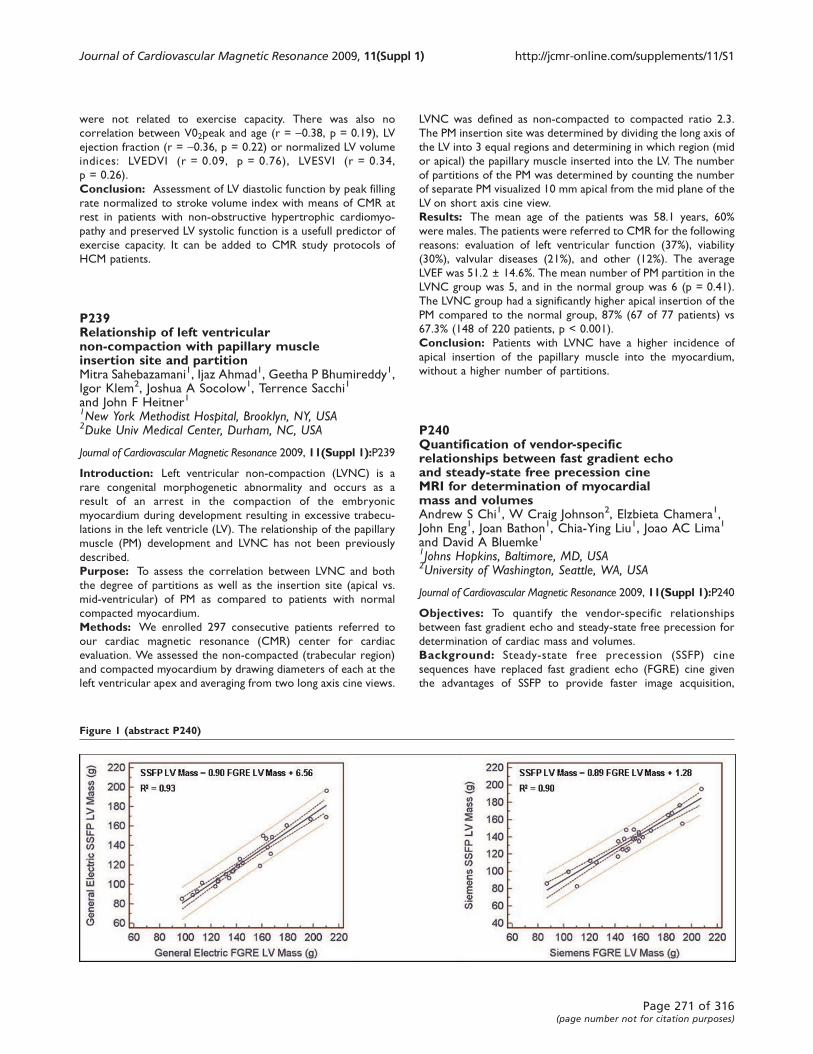
were not related to exercise capacity. There was also no
correlation between V02peak and age (r = -0.38, p = 0.19), LV
ejection fraction (r = -0.36, p = 0.22) or normalized LV volume
indices: LVEDVI (r = 0.09, p = 0.76), LVESVI (r = 0.34,
p = 0.26).
Conclusion: Assessment of LV diastolic function by peak filling
rate normalized to stroke volume index with means of CMR at
rest in patients with non-obstructive hypertrophic cardiomyo-
pathy and preserved LV systolic function is a usefull predictor of
exercise capacity. It can be added to CMR study protocols of
HCM patients.
P239Relationship of left ventricularnon-compaction with papillary muscleinsertion site and partitionMitra Sahebazamani1, Ijaz Ahmad1, Geetha P Bhumireddy1,Igor Klem2, Joshua A Socolow1, Terrence Sacchi1
and John F Heitner11New York Methodist Hospital, Brooklyn, NY, USA2Duke Univ Medical Center, Durham, NC, USA
Journal of Cardiovascular Magnetic Resonance 2009, 11(Suppl 1):P239
Introduction: Left ventricular non-compaction (LVNC) is a
rare congenital morphogenetic abnormality and occurs as a
result of an arrest in the compaction of the embryonic
myocardium during development resulting in excessive trabecu-
lations in the left ventricle (LV). The relationship of the papillary
muscle (PM) development and LVNC has not been previously
described.
Purpose: To assess the correlation between LVNC and both
the degree of partitions as well as the insertion site (apical vs.
mid-ventricular) of PM as compared to patients with normal
compacted myocardium.
Methods: We enrolled 297 consecutive patients referred to
our cardiac magnetic resonance (CMR) center for cardiac
evaluation. We assessed the non-compacted (trabecular region)
and compacted myocardium by drawing diameters of each at the
left ventricular apex and averaging from two long axis cine views.
LVNC was defined as non-compacted to compacted ratio 2.3.
The PM insertion site was determined by dividing the long axis of
the LV into 3 equal regions and determining in which region (mid
or apical) the papillary muscle inserted into the LV. The number
of partitions of the PM was determined by counting the number
of separate PM visualized 10 mm apical from the mid plane of the
LV on short axis cine view.
Results: The mean age of the patients was 58.1 years, 60%
were males. The patients were referred to CMR for the following
reasons: evaluation of left ventricular function (37%), viability
(30%), valvular diseases (21%), and other (12%). The average
LVEF was 51.2 ± 14.6%. The mean number of PM partition in the
LVNC group was 5, and in the normal group was 6 (p = 0.41).
The LVNC group had a significantly higher apical insertion of the
PM compared to the normal group, 87% (67 of 77 patients) vs
67.3% (148 of 220 patients, p < 0.001).
Conclusion: Patients with LVNC have a higher incidence of
apical insertion of the papillary muscle into the myocardium,
without a higher number of partitions.
P240Quantification of vendor-specificrelationships between fast gradient echoand steady-state free precession cineMRI for determination of myocardialmass and volumesAndrew S Chi1, W Craig Johnson2, Elzbieta Chamera1,John Eng1, Joan Bathon1, Chia-Ying Liu1, Joao AC Lima1
and David A Bluemke11Johns Hopkins, Baltimore, MD, USA2University of Washington, Seattle, WA, USA
Journal of Cardiovascular Magnetic Resonance 2009, 11(Suppl 1):P240
Objectives: To quantify the vendor-specific relationships
between fast gradient echo and steady-state free precession for
determination of cardiac mass and volumes.
Background: Steady-state free precession (SSFP) cine
sequences have replaced fast gradient echo (FGRE) cine given
the advantages of SSFP to provide faster image acquisition,
Figure 1 (abstract P240)
Journal of Cardiovascular Magnetic Resonance 2009, 11(Suppl 1) http://jcmr-online.com/supplements/11/S1
Page 271 of 316(page number not for citation purposes)
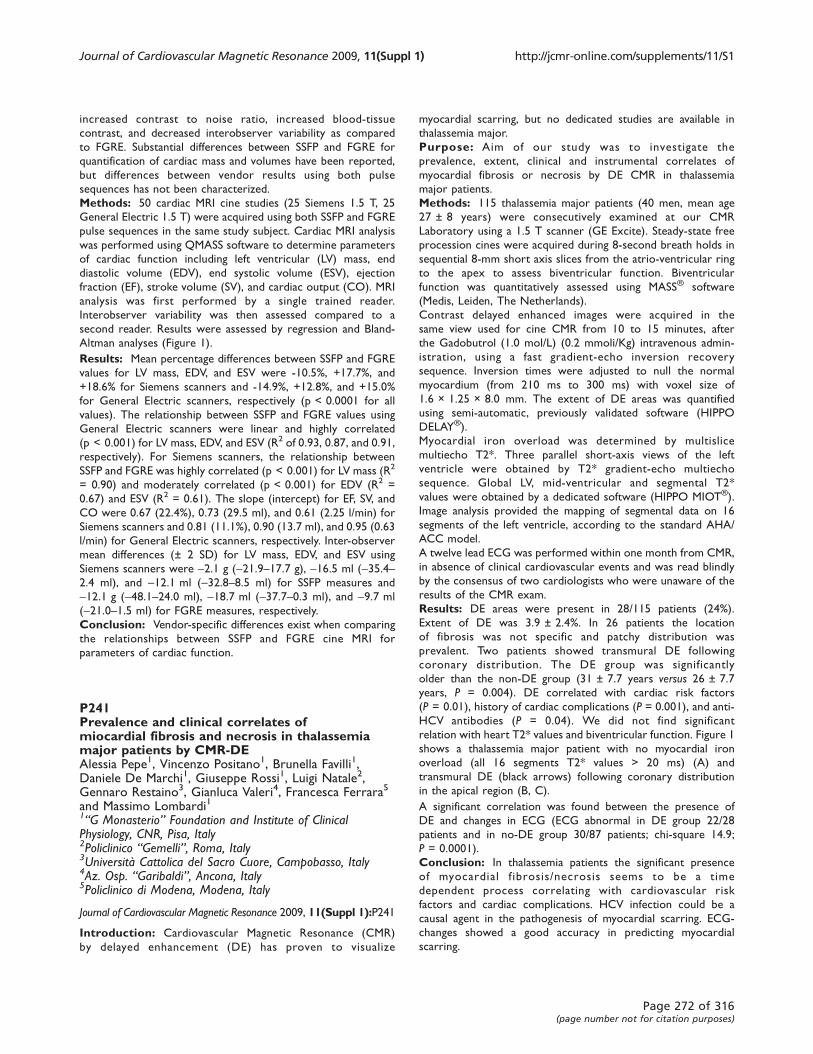
increased contrast to noise ratio, increased blood-tissue
contrast, and decreased interobserver variability as compared
to FGRE. Substantial differences between SSFP and FGRE for
quantification of cardiac mass and volumes have been reported,
but differences between vendor results using both pulse
sequences has not been characterized.
Methods: 50 cardiac MRI cine studies (25 Siemens 1.5 T, 25
General Electric 1.5 T) were acquired using both SSFP and FGRE
pulse sequences in the same study subject. Cardiac MRI analysis
was performed using QMASS software to determine parameters
of cardiac function including left ventricular (LV) mass, end
diastolic volume (EDV), end systolic volume (ESV), ejection
fraction (EF), stroke volume (SV), and cardiac output (CO). MRI
analysis was first performed by a single trained reader.
Interobserver variability was then assessed compared to a
second reader. Results were assessed by regression and Bland-
Altman analyses (Figure 1).
Results: Mean percentage differences between SSFP and FGRE
values for LV mass, EDV, and ESV were -10.5%, +17.7%, and
+18.6% for Siemens scanners and -14.9%, +12.8%, and +15.0%
for General Electric scanners, respectively (p < 0.0001 for all
values). The relationship between SSFP and FGRE values using
General Electric scanners were linear and highly correlated
(p < 0.001) for LV mass, EDV, and ESV (R2 of 0.93, 0.87, and 0.91,
respectively). For Siemens scanners, the relationship between
SSFP and FGRE was highly correlated (p < 0.001) for LV mass (R2
= 0.90) and moderately correlated (p < 0.001) for EDV (R2 =
0.67) and ESV (R2 = 0.61). The slope (intercept) for EF, SV, and
CO were 0.67 (22.4%), 0.73 (29.5 ml), and 0.61 (2.25 l/min) for
Siemens scanners and 0.81 (11.1%), 0.90 (13.7 ml), and 0.95 (0.63
l/min) for General Electric scanners, respectively. Inter-observer
mean differences (± 2 SD) for LV mass, EDV, and ESV using
Siemens scanners were -2.1 g (-21.9–17.7 g), -16.5 ml (-35.4–2.4 ml), and -12.1 ml (-32.8–8.5 ml) for SSFP measures and
-12.1 g (-48.1–24.0 ml), -18.7 ml (-37.7–0.3 ml), and -9.7 ml
(-21.0–1.5 ml) for FGRE measures, respectively.
Conclusion: Vendor-specific differences exist when comparing
the relationships between SSFP and FGRE cine MRI for
parameters of cardiac function.
P241Prevalence and clinical correlates ofmiocardial fibrosis and necrosis in thalassemiamajor patients by CMR-DEAlessia Pepe1, Vincenzo Positano1, Brunella Favilli1,Daniele De Marchi1, Giuseppe Rossi1, Luigi Natale2,Gennaro Restaino3, Gianluca Valeri4, Francesca Ferrara5
and Massimo Lombardi11“G Monasterio” Foundation and Institute of ClinicalPhysiology, CNR, Pisa, Italy2Policlinico “Gemelli”, Roma, Italy3Università Cattolica del Sacro Cuore, Campobasso, Italy4Az. Osp. “Garibaldi”, Ancona, Italy5Policlinico di Modena, Modena, Italy
Journal of Cardiovascular Magnetic Resonance 2009, 11(Suppl 1):P241
Introduction: Cardiovascular Magnetic Resonance (CMR)
by delayed enhancement (DE) has proven to visualize
myocardial scarring, but no dedicated studies are available in
thalassemia major.
Purpose: Aim of our study was to investigate the
prevalence, extent, clinical and instrumental correlates of
myocardial fibrosis or necrosis by DE CMR in thalassemia
major patients.
Methods: 115 thalassemia major patients (40 men, mean age
27 ± 8 years) were consecutively examined at our CMR
Laboratory using a 1.5 T scanner (GE Excite). Steady-state free
procession cines were acquired during 8-second breath holds in
sequential 8-mm short axis slices from the atrio-ventricular ring
to the apex to assess biventricular function. Biventricular
function was quantitatively assessed using MASS® software
(Medis, Leiden, The Netherlands).
Contrast delayed enhanced images were acquired in the
same view used for cine CMR from 10 to 15 minutes, after
the Gadobutrol (1.0 mol/L) (0.2 mmoli/Kg) intravenous admin-
istration, using a fast gradient-echo inversion recovery
sequence. Inversion times were adjusted to null the normal
myocardium (from 210 ms to 300 ms) with voxel size of
1.6 × 1.25 × 8.0 mm. The extent of DE areas was quantified
using semi-automatic, previously validated software (HIPPO
DELAY®).
Myocardial iron overload was determined by multislice
multiecho T2*. Three parallel short-axis views of the left
ventricle were obtained by T2* gradient-echo multiecho
sequence. Global LV, mid-ventricular and segmental T2*
values were obtained by a dedicated software (HIPPO MIOT®).
Image analysis provided the mapping of segmental data on 16
segments of the left ventricle, according to the standard AHA/
ACC model.
A twelve lead ECG was performed within one month from CMR,
in absence of clinical cardiovascular events and was read blindly
by the consensus of two cardiologists who were unaware of the
results of the CMR exam.
Results: DE areas were present in 28/115 patients (24%).
Extent of DE was 3.9 ± 2.4%. In 26 patients the location
of fibrosis was not specific and patchy distribution was
prevalent. Two patients showed transmural DE following
coronary distribution. The DE group was significantly
older than the non-DE group (31 ± 7.7 years versus 26 ± 7.7
years, P = 0.004). DE correlated with cardiac risk factors
(P = 0.01), history of cardiac complications (P = 0.001), and anti-
HCV antibodies (P = 0.04). We did not find significant
relation with heart T2* values and biventricular function. Figure 1
shows a thalassemia major patient with no myocardial iron
overload (all 16 segments T2* values > 20 ms) (A) and
transmural DE (black arrows) following coronary distribution
in the apical region (B, C).
A significant correlation was found between the presence of
DE and changes in ECG (ECG abnormal in DE group 22/28
patients and in no-DE group 30/87 patients; chi-square 14.9;
P = 0.0001).
Conclusion: In thalassemia patients the significant presence
of myocardial f ibrosis/necrosis seems to be a time
dependent process correlating with cardiovascular risk
factors and cardiac complications. HCV infection could be a
causal agent in the pathogenesis of myocardial scarring. ECG-
changes showed a good accuracy in predicting myocardial
scarring.
Journal of Cardiovascular Magnetic Resonance 2009, 11(Suppl 1) http://jcmr-online.com/supplements/11/S1
Page 272 of 316(page number not for citation purposes)
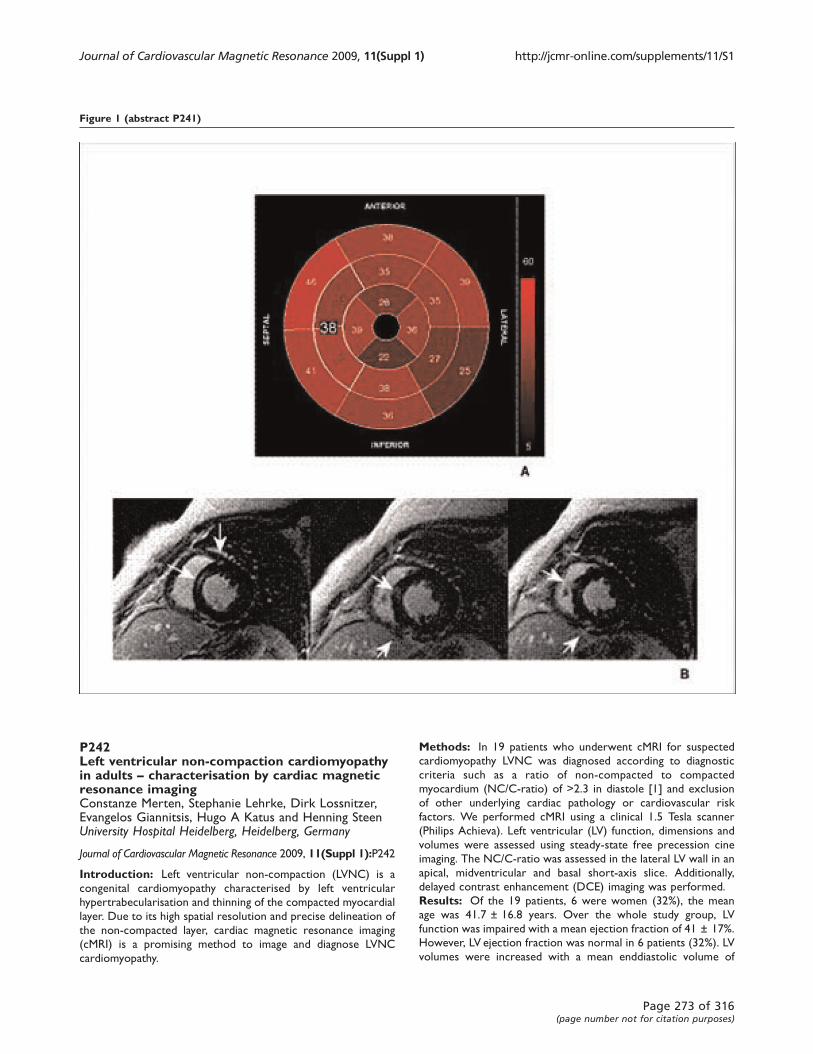
P242Left ventricular non-compaction cardiomyopathyin adults – characterisation by cardiac magneticresonance imagingConstanze Merten, Stephanie Lehrke, Dirk Lossnitzer,Evangelos Giannitsis, Hugo A Katus and Henning SteenUniversity Hospital Heidelberg, Heidelberg, Germany
Journal of Cardiovascular Magnetic Resonance 2009, 11(Suppl 1):P242
Introduction: Left ventricular non-compaction (LVNC) is a
congenital cardiomyopathy characterised by left ventricular
hypertrabecularisation and thinning of the compacted myocardial
layer. Due to its high spatial resolution and precise delineation of
the non-compacted layer, cardiac magnetic resonance imaging
(cMRI) is a promising method to image and diagnose LVNC
cardiomyopathy.
Methods: In 19 patients who underwent cMRI for suspected
cardiomyopathy LVNC was diagnosed according to diagnostic
criteria such as a ratio of non-compacted to compacted
myocardium (NC/C-ratio) of >2.3 in diastole [1] and exclusion
of other underlying cardiac pathology or cardiovascular risk
factors. We performed cMRI using a clinical 1.5 Tesla scanner
(Philips Achieva). Left ventricular (LV) function, dimensions and
volumes were assessed using steady-state free precession cine
imaging. The NC/C-ratio was assessed in the lateral LV wall in an
apical, midventricular and basal short-axis slice. Additionally,
delayed contrast enhancement (DCE) imaging was performed.
Results: Of the 19 patients, 6 were women (32%), the mean
age was 41.7 ± 16.8 years. Over the whole study group, LV
function was impaired with a mean ejection fraction of 41 ± 17%.
However, LV ejection fraction was normal in 6 patients (32%). LV
volumes were increased with a mean enddiastolic volume of
Figure 1 (abstract P241)
Journal of Cardiovascular Magnetic Resonance 2009, 11(Suppl 1) http://jcmr-online.com/supplements/11/S1
Page 273 of 316(page number not for citation purposes)
247 ± 100 ml and a mean endsystolic volume of 155 ± 99 ml,
resulting in mean stroke volume of 92 ± 31 ml. Using the 17-
segment model, we found a mean number of 11.8 ± 2.6 segments
to be affected by LVNC with the typical predomination of the
apical segments and the free lateral LV wall. The mean NC/C-
ratio was 5.0 ± 1.6 in the apical lateral wall, 3.3 ± 0.7 in the
midventricular lateral LV wall and 2.0 ± 1.1 in the basal lateral
wall; the basal septum was involved in none of the patients.
DCE was present in 7 patients (37%); in all patients non-ischemic
type DCE with an intramural or spotted enhancement pattern
and a predilection for the inferior right ventricular insertion zone
was observed.
Conclusion: We characterised 19 patients with LVNC cardi-
omyopathy by cMRI. We observed an impaired LV function in the
study cohort along with a dilatation of the left ventricle. The
mean number of affected segments was 12 of 17. Apical and
lateral segments were most frequently affected. Accordingly, the
NC/C-ratio decreased from the apical to the basal segments.
Non-ischemic type DCE was observed in 37% of patients.
Reference1. Petersen , et al: J Am Coll Cardiol 2005, 46:101–105.
P243Quantitative evaluation of the dark rim artifactin cardiac perfusion imagesRaphael D Hazel, Nathaniel Reichek and Yi WangSt Francis Hospital, Roslyn, NY, USA
Journal of Cardiovascular Magnetic Resonance 2009, 11(Suppl 1):P243
Introduction: The dark rim artifact (DRA) which appears in
cardiac first pass perfusion MRI compromises both visual
assessment and quantitative evaluation of ischemia. DRA signal
loss in the subendocardium may be mistaken for a perfusion
defect or it can overlap with a region showing a real perfusion
disorder, and make it impossible to obtain an accurate
assessment of myocardial blood flow. The quantitatively evalua-
tion of the artifact will allow for precise determination of its
origin, automated image assessment, and elimination of observer
error from the evaluation of cardiac perfusion images. We have
quantified the DRA in perfusion images from three separate
studies using SSFP, TFL and EPI imaging sequences to determine
the characteristics and origin of the artifact.
Methods: Retrospective quantitative analysis was done on
myocardial perfusion images from 32 normal volunteers. Images
from three separate studies approved by the institutional review
board were analyzed for artifacts. In the first study, images were
acquired in 14 normal volunteers (10 female) age 43.8 (s.d. 15.9)
years, using a saturation recovery SSFP pulse sequence and
gadodiamide (0.05 mM/kg), under adenosine (140 ug/kg/min)
stress followed by rest. The image parameters were as follows:
body coil, TR 160 ms, TE 1.03 ms, FA 50, matrix 192 × 108;
three long axis planes (HLA, VLA, and LVOT) of 8 mm slice
thickness were recorded. In the second study, using the same
imaging parameters, TFI images from 7 subjects which were
acquired at rest, under cold pressor stress, and after 0.4 mg
sublingual nitroglycerin were analyzed. In the third study, images
were acquired using the dual bolus approach with two doses of
gadodiamide (0.005 and 0.05 mM/kg) at rest from 11 normal
volunteers (5 female) using the TFI, TFL and EPI pulse sequences
in random order during a single session. Imaging parameters for
each sequence were as follows: TFI (TR 199 ms, TE 1.04 ms, FA
50, matrix 192 × 160) TFL (TR 163 ms, TE 1.27 ms, FA 10,
matrix 192 × 160) and EPI (TR 5.8 ms, TE 1.22 ms, FA 25, matrix
160 × 132) Three long axis and one short axis slice with
thicknesses of 10 mm were collected. Images were analyzed for
the presence of DRA using ImageJ to measure the intensity
profile across the myocardium. DRA was identified as signal loss
in the subendocardium occurring after the arrival of the CA in
the LV with a duration coincident with the passage of the bolus
through the LV.
Results: Heart motion: The signal loss per image appears to
be independent of heart rate within each study. In study #1 the
mean signal loss per image is 32.9% and 31.5% for rest and stress
respectively, and in study #2 the signal loss per image was 21.9%,
21.3% and 20.8% for rest, cold stress and nitroglycerine
respectively.
Concentration dependence: There were no artifacts in low
CA dose (0.005 mM/kg) images. Only the high CA dose
produced the DRA in TFI and TFL images.
Sequence dependence: DRA was found in TFI images from 8
of 11 volunteers (4% of all images) while only 3 sets of TFL (2%)
images contained the DRA. EPI images did not contain the DRA.
The severity of the DRA is similar for TFI and TFL images with a
mean signal loss of 31.6% and 33.1% respectively. The average
duration of the DRA is also similar for TFI and TFL with 11.8 and
10.5 frames out of 50 respectively.
Conclusion: The signal loss in the DRA is independent of heart
rate, but seems to depend on CA concentration for TFI and TFL
but not EPI images. Quantitative evaluation of the DRA is feasible
with first pass perfusion imaging.
P244Are there innate differences in 3D ejection fractionbetween the sexes detectable by CMR? A CMRstudy in ~4000 patientsRobert WW Biederman, Diane A Vido, Geetha Rayarao,June A Yamrozik, Ronald B Williams, Saundra B Grantand Mark DoyleAllegheny General Hospital, The Gerald McGinnisCardiovascular Institute, Pittsburgh, PA, USA
Journal of Cardiovascular Magnetic Resonance 2009, 11(Suppl 1):P244
Introduction: It has long been assumed that the standard
mechanical contraction parameter ejection fraction (EF) is the
same in male and female hearts. Until recently, the fidelity and
reproducibility of imaging techniques guaranteed virtual super-
imposition of EF, nullifying any gender differences were they to be
present. The influence of gender on normal thresholds for EF by
CV MRI is unknown.
Hypothesis: Using high resolution 3D CV MRI, we tested the
hypothesis that females will have lower EF compared to males.
Methods: A database composed of consecutive patients who
underwent CV MRI scanning (GE, EXCITE HD 1.5 T, Milwaukee,
WI) between Aug 2003 and May 2008 was interrogated to yield
all patients with EF >55% and no valvular heart disease >1+, no
evidence of CAD, HTN, or cardiomyopathy. EF was determined
primarily by standard FIESTA 3D methodology or 2D when
available. Patients were stratified only by gender and age. We
performed two-sample t tests to analyze the data and considered
differences significant at p < 0.05.
Journal of Cardiovascular Magnetic Resonance 2009, 11(Suppl 1) http://jcmr-online.com/supplements/11/S1
Page 274 of 316(page number not for citation purposes)
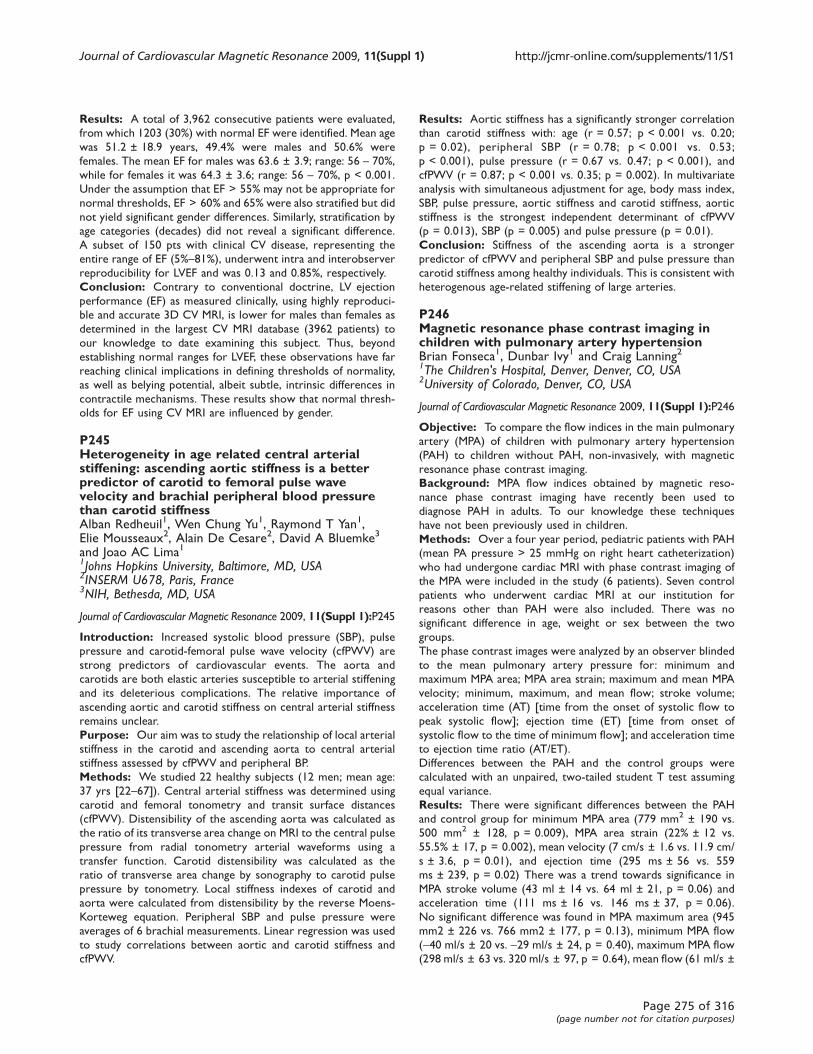
Results: A total of 3,962 consecutive patients were evaluated,
from which 1203 (30%) with normal EF were identified. Mean age
was 51.2 ± 18.9 years, 49.4% were males and 50.6% were
females. The mean EF for males was 63.6 ± 3.9; range: 56 – 70%,
while for females it was 64.3 ± 3.6; range: 56 – 70%, p < 0.001.
Under the assumption that EF > 55% may not be appropriate for
normal thresholds, EF > 60% and 65% were also stratified but did
not yield significant gender differences. Similarly, stratification by
age categories (decades) did not reveal a significant difference.
A subset of 150 pts with clinical CV disease, representing the
entire range of EF (5%–81%), underwent intra and interobserver
reproducibility for LVEF and was 0.13 and 0.85%, respectively.
Conclusion: Contrary to conventional doctrine, LV ejection
performance (EF) as measured clinically, using highly reproduci-
ble and accurate 3D CV MRI, is lower for males than females as
determined in the largest CV MRI database (3962 patients) to
our knowledge to date examining this subject. Thus, beyond
establishing normal ranges for LVEF, these observations have far
reaching clinical implications in defining thresholds of normality,
as well as belying potential, albeit subtle, intrinsic differences in
contractile mechanisms. These results show that normal thresh-
olds for EF using CV MRI are influenced by gender.
P245Heterogeneity in age related central arterialstiffening: ascending aortic stiffness is a betterpredictor of carotid to femoral pulse wavevelocity and brachial peripheral blood pressurethan carotid stiffnessAlban Redheuil1, Wen Chung Yu1, Raymond T Yan1,Elie Mousseaux2, Alain De Cesare2, David A Bluemke3
and Joao AC Lima11Johns Hopkins University, Baltimore, MD, USA2INSERM U678, Paris, France3NIH, Bethesda, MD, USA
Journal of Cardiovascular Magnetic Resonance 2009, 11(Suppl 1):P245
Introduction: Increased systolic blood pressure (SBP), pulse
pressure and carotid-femoral pulse wave velocity (cfPWV) are
strong predictors of cardiovascular events. The aorta and
carotids are both elastic arteries susceptible to arterial stiffening
and its deleterious complications. The relative importance of
ascending aortic and carotid stiffness on central arterial stiffness
remains unclear.
Purpose: Our aim was to study the relationship of local arterial
stiffness in the carotid and ascending aorta to central arterial
stiffness assessed by cfPWV and peripheral BP.
Methods: We studied 22 healthy subjects (12 men; mean age:
37 yrs [22–67]). Central arterial stiffness was determined using
carotid and femoral tonometry and transit surface distances
(cfPWV). Distensibility of the ascending aorta was calculated as
the ratio of its transverse area change on MRI to the central pulse
pressure from radial tonometry arterial waveforms using a
transfer function. Carotid distensibility was calculated as the
ratio of transverse area change by sonography to carotid pulse
pressure by tonometry. Local stiffness indexes of carotid and
aorta were calculated from distensibility by the reverse Moens-
Korteweg equation. Peripheral SBP and pulse pressure were
averages of 6 brachial measurements. Linear regression was used
to study correlations between aortic and carotid stiffness and
cfPWV.
Results: Aortic stiffness has a significantly stronger correlation
than carotid stiffness with: age (r = 0.57; p < 0.001 vs. 0.20;
p = 0.02), peripheral SBP (r = 0.78; p < 0.001 vs. 0.53;
p < 0.001), pulse pressure (r = 0.67 vs. 0.47; p < 0.001), and
cfPWV (r = 0.87; p < 0.001 vs. 0.35; p = 0.002). In multivariate
analysis with simultaneous adjustment for age, body mass index,
SBP, pulse pressure, aortic stiffness and carotid stiffness, aortic
stiffness is the strongest independent determinant of cfPWV
(p = 0.013), SBP (p = 0.005) and pulse pressure (p = 0.01).
Conclusion: Stiffness of the ascending aorta is a stronger
predictor of cfPWV and peripheral SBP and pulse pressure than
carotid stiffness among healthy individuals. This is consistent with
heterogenous age-related stiffening of large arteries.
P246Magnetic resonance phase contrast imaging inchildren with pulmonary artery hypertensionBrian Fonseca1, Dunbar Ivy1 and Craig Lanning21The Children's Hospital, Denver, Denver, CO, USA2University of Colorado, Denver, CO, USA
Journal of Cardiovascular Magnetic Resonance 2009, 11(Suppl 1):P246
Objective: To compare the flow indices in the main pulmonary
artery (MPA) of children with pulmonary artery hypertension
(PAH) to children without PAH, non-invasively, with magnetic
resonance phase contrast imaging.
Background: MPA flow indices obtained by magnetic reso-
nance phase contrast imaging have recently been used to
diagnose PAH in adults. To our knowledge these techniques
have not been previously used in children.
Methods: Over a four year period, pediatric patients with PAH
(mean PA pressure > 25 mmHg on right heart catheterization)
who had undergone cardiac MRI with phase contrast imaging of
the MPA were included in the study (6 patients). Seven control
patients who underwent cardiac MRI at our institution for
reasons other than PAH were also included. There was no
significant difference in age, weight or sex between the two
groups.
The phase contrast images were analyzed by an observer blinded
to the mean pulmonary artery pressure for: minimum and
maximum MPA area; MPA area strain; maximum and mean MPA
velocity; minimum, maximum, and mean flow; stroke volume;
acceleration time (AT) [time from the onset of systolic flow to
peak systolic flow]; ejection time (ET) [time from onset of
systolic flow to the time of minimum flow]; and acceleration time
to ejection time ratio (AT/ET).
Differences between the PAH and the control groups were
calculated with an unpaired, two-tailed student T test assuming
equal variance.
Results: There were significant differences between the PAH
and control group for minimum MPA area (779 mm2 ± 190 vs.
500 mm2 ± 128, p = 0.009), MPA area strain (22% ± 12 vs.
55.5% ± 17, p = 0.002), mean velocity (7 cm/s ± 1.6 vs. 11.9 cm/
s ± 3.6, p = 0.01), and ejection time (295 ms ± 56 vs. 559
ms ± 239, p = 0.02) There was a trend towards significance in
MPA stroke volume (43 ml ± 14 vs. 64 ml ± 21, p = 0.06) and
acceleration time (111 ms ± 16 vs. 146 ms ± 37, p = 0.06).
No significant difference was found in MPA maximum area (945
mm2 ± 226 vs. 766 mm2 ± 177, p = 0.13), minimum MPA flow
(-40 ml/s ± 20 vs. -29 ml/s ± 24, p = 0.40), maximum MPA flow
(298 ml/s ± 63 vs. 320 ml/s ± 97, p = 0.64), mean flow (61 ml/s ±
Journal of Cardiovascular Magnetic Resonance 2009, 11(Suppl 1) http://jcmr-online.com/supplements/11/S1
Page 275 of 316(page number not for citation purposes)
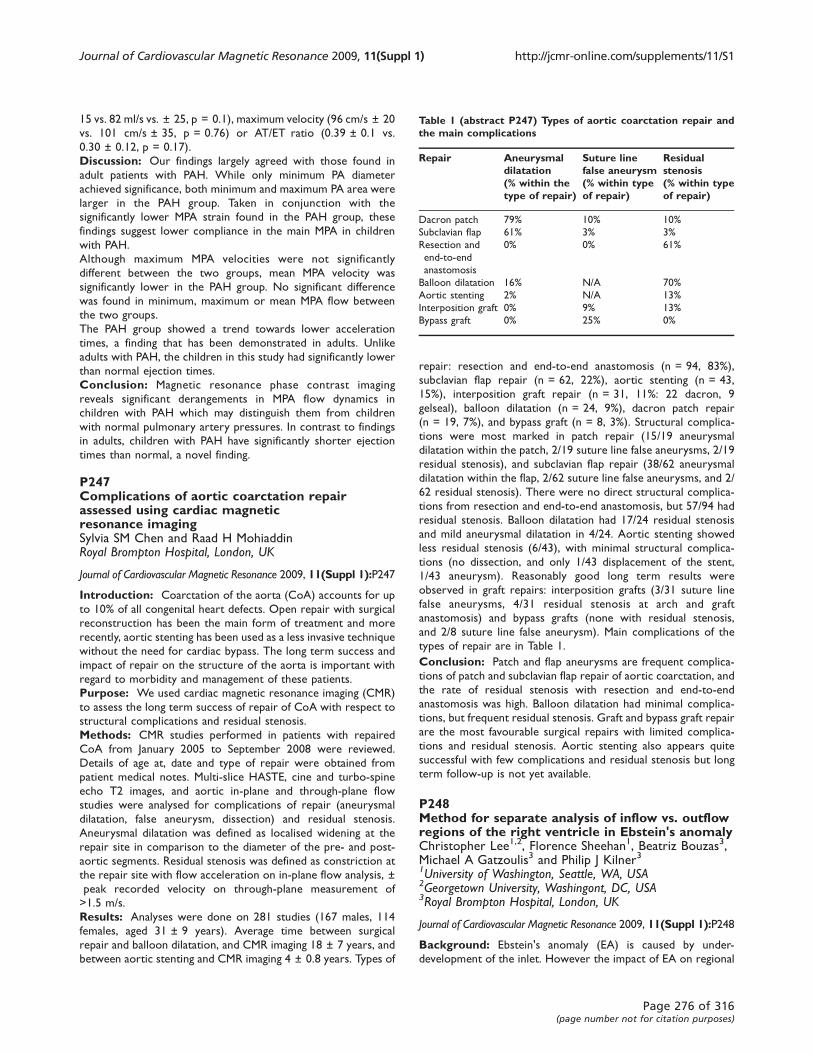
15 vs. 82 ml/s vs. ± 25, p = 0.1), maximum velocity (96 cm/s ± 20
vs. 101 cm/s ± 35, p = 0.76) or AT/ET ratio (0.39 ± 0.1 vs.
0.30 ± 0.12, p = 0.17).
Discussion: Our findings largely agreed with those found in
adult patients with PAH. While only minimum PA diameter
achieved significance, both minimum and maximum PA area were
larger in the PAH group. Taken in conjunction with the
significantly lower MPA strain found in the PAH group, these
findings suggest lower compliance in the main MPA in children
with PAH.
Although maximum MPA velocities were not significantly
different between the two groups, mean MPA velocity was
significantly lower in the PAH group. No significant difference
was found in minimum, maximum or mean MPA flow between
the two groups.
The PAH group showed a trend towards lower acceleration
times, a finding that has been demonstrated in adults. Unlike
adults with PAH, the children in this study had significantly lower
than normal ejection times.
Conclusion: Magnetic resonance phase contrast imaging
reveals significant derangements in MPA flow dynamics in
children with PAH which may distinguish them from children
with normal pulmonary artery pressures. In contrast to findings
in adults, children with PAH have significantly shorter ejection
times than normal, a novel finding.
P247Complications of aortic coarctation repairassessed using cardiac magneticresonance imagingSylvia SM Chen and Raad H MohiaddinRoyal Brompton Hospital, London, UK
Journal of Cardiovascular Magnetic Resonance 2009, 11(Suppl 1):P247
Introduction: Coarctation of the aorta (CoA) accounts for up
to 10% of all congenital heart defects. Open repair with surgical
reconstruction has been the main form of treatment and more
recently, aortic stenting has been used as a less invasive technique
without the need for cardiac bypass. The long term success and
impact of repair on the structure of the aorta is important with
regard to morbidity and management of these patients.
Purpose: We used cardiac magnetic resonance imaging (CMR)
to assess the long term success of repair of CoA with respect to
structural complications and residual stenosis.
Methods: CMR studies performed in patients with repaired
CoA from January 2005 to September 2008 were reviewed.
Details of age at, date and type of repair were obtained from
patient medical notes. Multi-slice HASTE, cine and turbo-spine
echo T2 images, and aortic in-plane and through-plane flow
studies were analysed for complications of repair (aneurysmal
dilatation, false aneurysm, dissection) and residual stenosis.
Aneurysmal dilatation was defined as localised widening at the
repair site in comparison to the diameter of the pre- and post-
aortic segments. Residual stenosis was defined as constriction at
the repair site with flow acceleration on in-plane flow analysis, ±
peak recorded velocity on through-plane measurement of
>1.5 m/s.
Results: Analyses were done on 281 studies (167 males, 114
females, aged 31 ± 9 years). Average time between surgical
repair and balloon dilatation, and CMR imaging 18 ± 7 years, and
between aortic stenting and CMR imaging 4 ± 0.8 years. Types of
repair: resection and end-to-end anastomosis (n = 94, 83%),
subclavian flap repair (n = 62, 22%), aortic stenting (n = 43,
15%), interposition graft repair (n = 31, 11%: 22 dacron, 9
gelseal), balloon dilatation (n = 24, 9%), dacron patch repair
(n = 19, 7%), and bypass graft (n = 8, 3%). Structural complica-
tions were most marked in patch repair (15/19 aneurysmal
dilatation within the patch, 2/19 suture line false aneurysms, 2/19
residual stenosis), and subclavian flap repair (38/62 aneurysmal
dilatation within the flap, 2/62 suture line false aneurysms, and 2/
62 residual stenosis). There were no direct structural complica-
tions from resection and end-to-end anastomosis, but 57/94 had
residual stenosis. Balloon dilatation had 17/24 residual stenosis
and mild aneurysmal dilatation in 4/24. Aortic stenting showed
less residual stenosis (6/43), with minimal structural complica-
tions (no dissection, and only 1/43 displacement of the stent,
1/43 aneurysm). Reasonably good long term results were
observed in graft repairs: interposition grafts (3/31 suture line
false aneurysms, 4/31 residual stenosis at arch and graft
anastomosis) and bypass grafts (none with residual stenosis,
and 2/8 suture line false aneurysm). Main complications of the
types of repair are in Table 1.
Conclusion: Patch and flap aneurysms are frequent complica-
tions of patch and subclavian flap repair of aortic coarctation, and
the rate of residual stenosis with resection and end-to-end
anastomosis was high. Balloon dilatation had minimal complica-
tions, but frequent residual stenosis. Graft and bypass graft repair
are the most favourable surgical repairs with limited complica-
tions and residual stenosis. Aortic stenting also appears quite
successful with few complications and residual stenosis but long
term follow-up is not yet available.
P248Method for separate analysis of inflow vs. outflowregions of the right ventricle in Ebstein's anomalyChristopher Lee1,2, Florence Sheehan1, Beatriz Bouzas3,Michael A Gatzoulis3 and Philip J Kilner31University of Washington, Seattle, WA, USA2Georgetown University, Washingont, DC, USA3Royal Brompton Hospital, London, UK
Journal of Cardiovascular Magnetic Resonance 2009, 11(Suppl 1):P248
Background: Ebstein's anomaly (EA) is caused by under-
development of the inlet. However the impact of EA on regional
Table 1 (abstract P247) Types of aortic coarctation repair andthe main complications
Repair Aneurysmaldilatation(% within thetype of repair)
Suture linefalse aneurysm(% within typeof repair)
Residualstenosis(% within typeof repair)
Dacron patch 79% 10% 10%
Subclavian flap 61% 3% 3%
Resection and
end-to-end
anastomosis
0% 0% 61%
Balloon dilatation 16% N/A 70%
Aortic stenting 2% N/A 13%
Interposition graft 0% 9% 13%
Bypass graft 0% 25% 0%
Journal of Cardiovascular Magnetic Resonance 2009, 11(Suppl 1) http://jcmr-online.com/supplements/11/S1
Page 276 of 316(page number not for citation purposes)

and global function in the underdeveloped inlet has been difficult
to assess quantitatively.
Methods: We measured the size and shape of the right
ventricle (RV) and its inlet and infundibulum (outflow) portions
in 30 patients with EA aged 16–64 yrs and 9 normal subjects
from MR images acquired in long and short axis and oblique
views. The RV was traced and reconstructed in 3D as a triangular
mesh using the piecewise smooth subdivision surface method. To
define the volumes of the inlet and infundibulum, points were
traced at the muscular ring separating the two portions, focusing
on the supraventricular crest and the parietal, septal, and
moderator bands. Care was taken to confirm the locations of
these anatomic landmarks in intersecting views. A plane was fit to
the points and used to cut the RV into inlet and infundibulum.
Wall motion was measured in 13 regions by the centersurface
method along chords drawn orthogonal to a surface constructed
midway between the end diastolic (ED) and end systolic (ES)
surfaces. The lengths of chords in each region were averaged and
then normalized by dividing by the square root of body surface
area. Tricuspid tilt was defined as the angle between the mitral
and tricuspid annular planes, and tricuspid descent was the
systolic excursion of the annulus centroid. See Figure 1.
Results: The global RV ejection fraction (EF) was mildly
depressed in EA patients (45 ± 8 vs. 55 ± 4% in normals,
p < 0.001). Their RV's were severely dilated (end diastolic
volume index 185 ± 78 vs. 82 ± 16 ml/m2, p < 0.001) and
rounded in apical and mid RV cross sections. The tricuspid
annulus was severely tilted (62 ± 26 vs. 19 ± 9° in normals,
p < 0.001). The infundibulum contained approximately 1/5th of
RV volume in both groups (20 ± 7 in normals vs. 21 ± 9% in EA,
p = NS). In EA patients inlet EF exceeded infundibulum EF
(46 ± 7 vs. 38 ± 13%, p < 0.02). However the function of both
inlet and infundibulum were depressed compared to normal
(p < 0.05 for both). The function of the inlet and infundibulum
differed less in normals (55 ± 6 vs. 49 ± 11%, p = NS). Regional
function was depressed compared to normal in all 9 inlet regions,
significantly so in 4 regions. Tricuspid descent was also depressed
compared to normal (13 ± 5 vs. 18 ± 3 mm, p < 0.005) but the
pattern of regional function was similar to normal with the
greatest contraction occurring in basal regions. The global EF
correlated with wall motion in the basal regions and inlet septum
(r between 0.43 and 0.58, p < 0.05) and with tricuspid annular
descent (r = 0.52, p < 0.005).
Conclusion: Despite underdevelopment of the inlet, patients
with EA have relatively preserved function in this portion of the
RV. Three dimensional surface reconstruction enables separate
analysis of the inlet and infundibulum portions of the RV as well as
detailed assessment of regional function and shape.
P249A prospective audit of paediatric cardiac MRIunder general anaesthesia; practise and problemsMarina L Hughes1, Emma Stockton1,2, Andrew Taylor1
and Angus McEwan11Great Ormond Street Hospital for Children, London, UK2Great Ormond Street Hospital, London, UK
Journal of Cardiovascular Magnetic Resonance 2009, 11(Suppl 1):P249
Background: Cardiac MRI (CMRI) is increasingly used to assist
with the surgical planning and follow up of children with
congenital heart disease. In small children general anaesthesia
(GA) is always required. We describe our experience of GA for
paediatric CMRI, using data collected prospectively over 3 years.
Methods and results: 120 patients presented for CMRI under
GA from November 2005 to May 2008. These patients were
aged 0 – 288 months (median 28 months), and weighed 2.8 –64 kg (median 11.7 kg).
This cohort of patients had a large range of diagnoses, but
principally comprised those with hypoplastic left heart syndrome
(HLHS) and other functionally univentricular hearts for inter-
stage imaging, patients with pulmonary atresia or Tetralogy of
Fallot for surgical planning, and patients with aortic arch
abnormalities.
The majority of patients (91.6%) were admitted as a day-case to
our hospital on the day of CMRI. Ten patients were imaged
during an inpatient stay, three of whom (2.5%) were inpatients on
the Cardiac Intensive Care Unit (CICU) prior to their MRI.
Ten percent of patients were classified as American Society of
Anaesthesiology (ASA) Class 2, 80% ASA Class 3 and 10% ASA
Class 4.
Fifty-seven children (47.5%) had a functionally single ventricle.
Fifty patients (42%) had normal oxygen saturations. Of the
cyanosed patients, pulmonary blood flow was supplied through
an aorto-pulmonary shunt in 33% of patients, and 13% had a
cavopulmonary shunt. Sixteen patients (13%) had a mixed
circulation.
Six patients (5%) had severely impaired systemic ventricular
function, 10 (8.3%) had moderately impaired function and 31
(25.8%) had mildly impaired function. 14 patients (11.6%) had at
least moderate systemic outflow tract obstruction.
A senior, cardiac anaesthetist was continuously present during
every case. Most patients (100/120, 83%) received an inhalational
induction with sevoflurane. Sixteen received an intravenous
induction with propofol. The anaesthetist remained in the
control room with the MRI technician and cardiologist during
scanning. Breath holding was achieved from within the control
room by breaking the circuit and occluding the inspiratory limb
of the circle system.
The majority of children (98/120, 81.6%) had an uneventful CMRI
under GA. Nineteen (15.8%) patients suffered minor adverse
events. One major adverse event occurred; a patient with
hypoplastic left heart syndrome (HLHS) became hypotensive and
had a cardiac arrest in the MRI scanner. This patient was
Figure 1 (abstract P248)
Journal of Cardiovascular Magnetic Resonance 2009, 11(Suppl 1) http://jcmr-online.com/supplements/11/S1
Page 277 of 316(page number not for citation purposes)
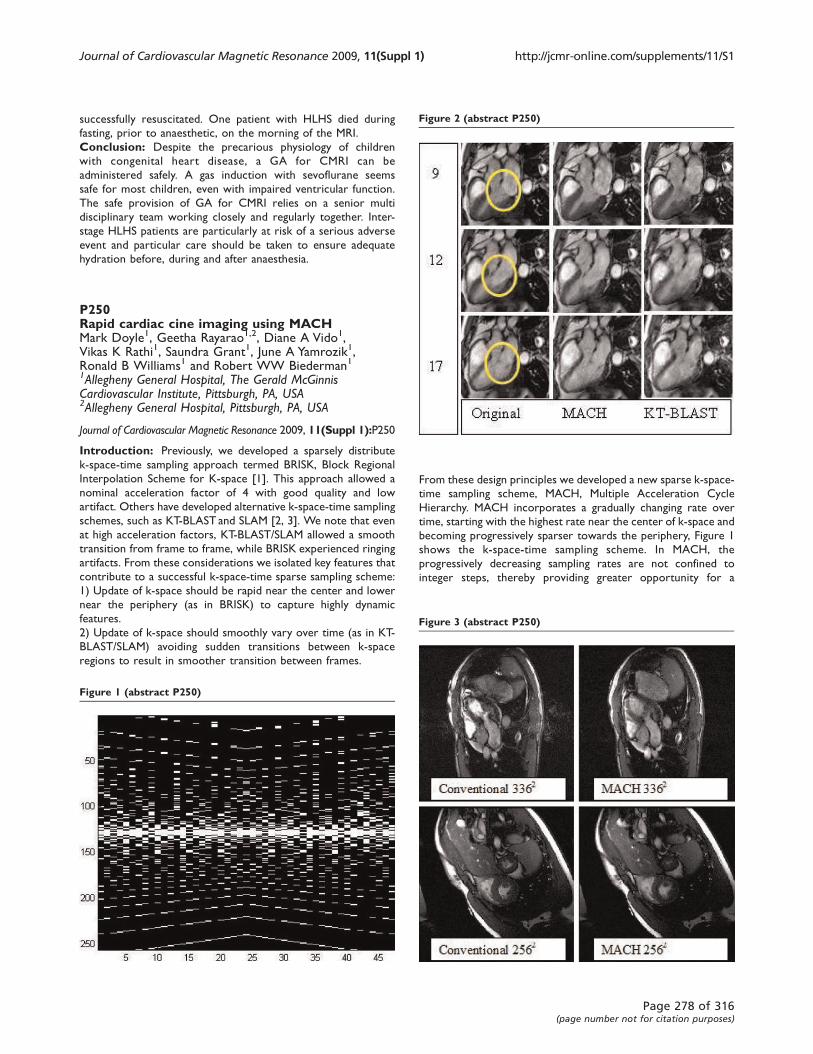
successfully resuscitated. One patient with HLHS died during
fasting, prior to anaesthetic, on the morning of the MRI.
Conclusion: Despite the precarious physiology of children
with congenital heart disease, a GA for CMRI can be
administered safely. A gas induction with sevoflurane seems
safe for most children, even with impaired ventricular function.
The safe provision of GA for CMRI relies on a senior multi
disciplinary team working closely and regularly together. Inter-
stage HLHS patients are particularly at risk of a serious adverse
event and particular care should be taken to ensure adequate
hydration before, during and after anaesthesia.
P250Rapid cardiac cine imaging using MACHMark Doyle1, Geetha Rayarao1,2, Diane A Vido1,Vikas K Rathi1, Saundra Grant1, June A Yamrozik1,Ronald B Williams1 and Robert WW Biederman11Allegheny General Hospital, The Gerald McGinnisCardiovascular Institute, Pittsburgh, PA, USA2Allegheny General Hospital, Pittsburgh, PA, USA
Journal of Cardiovascular Magnetic Resonance 2009, 11(Suppl 1):P250
Introduction: Previously, we developed a sparsely distribute
k-space-time sampling approach termed BRISK, Block Regional
Interpolation Scheme for K-space [1]. This approach allowed a
nominal acceleration factor of 4 with good quality and low
artifact. Others have developed alternative k-space-time sampling
schemes, such as KT-BLAST and SLAM [2, 3]. We note that even
at high acceleration factors, KT-BLAST/SLAM allowed a smooth
transition from frame to frame, while BRISK experienced ringing
artifacts. From these considerations we isolated key features that
contribute to a successful k-space-time sparse sampling scheme:
1) Update of k-space should be rapid near the center and lower
near the periphery (as in BRISK) to capture highly dynamic
features.
2) Update of k-space should smoothly vary over time (as in KT-
BLAST/SLAM) avoiding sudden transitions between k-space
regions to result in smoother transition between frames.
From these design principles we developed a new sparse k-space-
time sampling scheme, MACH, Multiple Acceleration Cycle
Hierarchy. MACH incorporates a gradually changing rate over
time, starting with the highest rate near the center of k-space and
becoming progressively sparser towards the periphery, Figure 1
shows the k-space-time sampling scheme. In MACH, the
progressively decreasing sampling rates are not confined to
integer steps, thereby providing greater opportunity for a
Figure 1 (abstract P250)
Figure 2 (abstract P250)
Figure 3 (abstract P250)
Journal of Cardiovascular Magnetic Resonance 2009, 11(Suppl 1) http://jcmr-online.com/supplements/11/S1
Page 278 of 316(page number not for citation purposes)
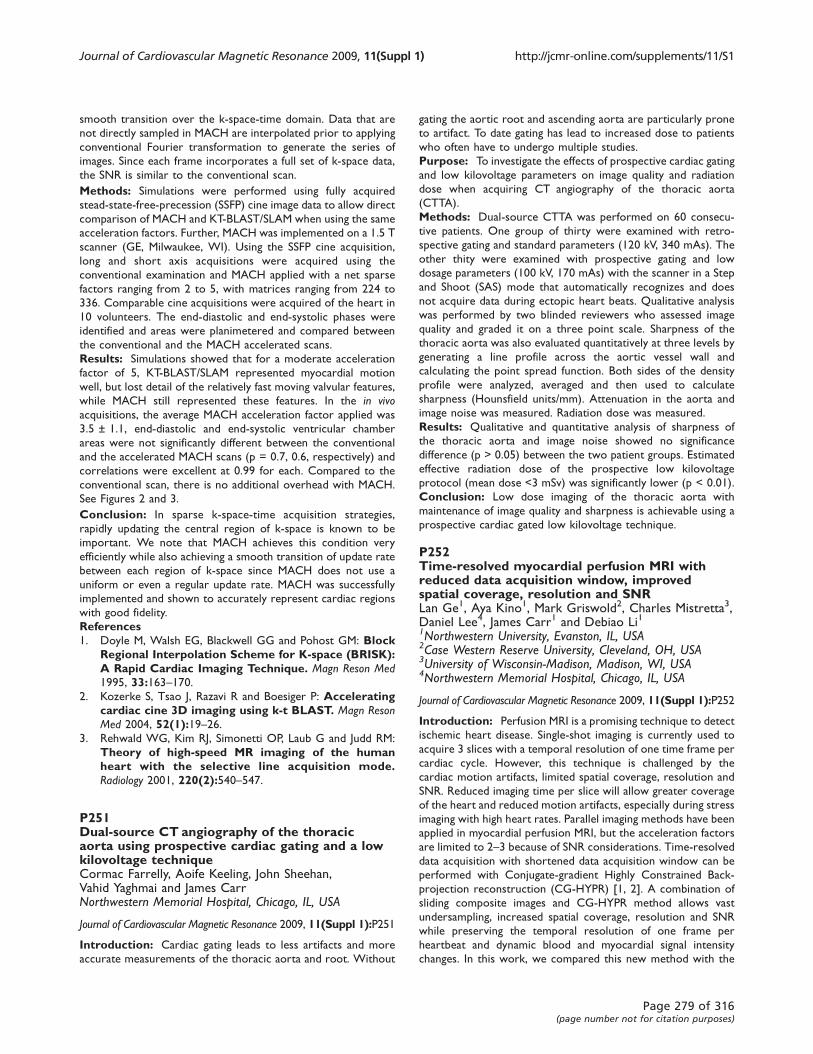
smooth transition over the k-space-time domain. Data that are
not directly sampled in MACH are interpolated prior to applying
conventional Fourier transformation to generate the series of
images. Since each frame incorporates a full set of k-space data,
the SNR is similar to the conventional scan.
Methods: Simulations were performed using fully acquired
stead-state-free-precession (SSFP) cine image data to allow direct
comparison of MACH and KT-BLAST/SLAM when using the same
acceleration factors. Further, MACH was implemented on a 1.5 T
scanner (GE, Milwaukee, WI). Using the SSFP cine acquisition,
long and short axis acquisitions were acquired using the
conventional examination and MACH applied with a net sparse
factors ranging from 2 to 5, with matrices ranging from 224 to
336. Comparable cine acquisitions were acquired of the heart in
10 volunteers. The end-diastolic and end-systolic phases were
identified and areas were planimetered and compared between
the conventional and the MACH accelerated scans.
Results: Simulations showed that for a moderate acceleration
factor of 5, KT-BLAST/SLAM represented myocardial motion
well, but lost detail of the relatively fast moving valvular features,
while MACH still represented these features. In the in vivoacquisitions, the average MACH acceleration factor applied was
3.5 ± 1.1, end-diastolic and end-systolic ventricular chamber
areas were not significantly different between the conventional
and the accelerated MACH scans (p = 0.7, 0.6, respectively) and
correlations were excellent at 0.99 for each. Compared to the
conventional scan, there is no additional overhead with MACH.
See Figures 2 and 3.
Conclusion: In sparse k-space-time acquisition strategies,
rapidly updating the central region of k-space is known to be
important. We note that MACH achieves this condition very
efficiently while also achieving a smooth transition of update rate
between each region of k-space since MACH does not use a
uniform or even a regular update rate. MACH was successfully
implemented and shown to accurately represent cardiac regions
with good fidelity.
References1. Doyle M, Walsh EG, Blackwell GG and Pohost GM: Block
Regional Interpolation Scheme for K-space (BRISK):A Rapid Cardiac Imaging Technique. Magn Reson Med1995, 33:163–170.
2. Kozerke S, Tsao J, Razavi R and Boesiger P: Acceleratingcardiac cine 3D imaging using k-t BLAST. Magn ResonMed 2004, 52(1):19–26.
3. Rehwald WG, Kim RJ, Simonetti OP, Laub G and Judd RM:
Theory of high-speed MR imaging of the humanheart with the selective line acquisition mode.Radiology 2001, 220(2):540–547.
P251Dual-source CT angiography of the thoracicaorta using prospective cardiac gating and a lowkilovoltage techniqueCormac Farrelly, Aoife Keeling, John Sheehan,Vahid Yaghmai and James CarrNorthwestern Memorial Hospital, Chicago, IL, USA
Journal of Cardiovascular Magnetic Resonance 2009, 11(Suppl 1):P251
Introduction: Cardiac gating leads to less artifacts and more
accurate measurements of the thoracic aorta and root. Without
gating the aortic root and ascending aorta are particularly prone
to artifact. To date gating has lead to increased dose to patients
who often have to undergo multiple studies.
Purpose: To investigate the effects of prospective cardiac gating
and low kilovoltage parameters on image quality and radiation
dose when acquiring CT angiography of the thoracic aorta
(CTTA).
Methods: Dual-source CTTA was performed on 60 consecu-
tive patients. One group of thirty were examined with retro-
spective gating and standard parameters (120 kV, 340 mAs). The
other thity were examined with prospective gating and low
dosage parameters (100 kV, 170 mAs) with the scanner in a Step
and Shoot (SAS) mode that automatically recognizes and does
not acquire data during ectopic heart beats. Qualitative analysis
was performed by two blinded reviewers who assessed image
quality and graded it on a three point scale. Sharpness of the
thoracic aorta was also evaluated quantitatively at three levels by
generating a line profile across the aortic vessel wall and
calculating the point spread function. Both sides of the density
profile were analyzed, averaged and then used to calculate
sharpness (Hounsfield units/mm). Attenuation in the aorta and
image noise was measured. Radiation dose was measured.
Results: Qualitative and quantitative analysis of sharpness of
the thoracic aorta and image noise showed no significance
difference (p > 0.05) between the two patient groups. Estimated
effective radiation dose of the prospective low kilovoltage
protocol (mean dose <3 mSv) was significantly lower (p < 0.01).
Conclusion: Low dose imaging of the thoracic aorta with
maintenance of image quality and sharpness is achievable using a
prospective cardiac gated low kilovoltage technique.
P252Time-resolved myocardial perfusion MRI withreduced data acquisition window, improvedspatial coverage, resolution and SNRLan Ge1, Aya Kino1, Mark Griswold2, Charles Mistretta3,Daniel Lee4, James Carr1 and Debiao Li11Northwestern University, Evanston, IL, USA2Case Western Reserve University, Cleveland, OH, USA3University of Wisconsin-Madison, Madison, WI, USA4Northwestern Memorial Hospital, Chicago, IL, USA
Journal of Cardiovascular Magnetic Resonance 2009, 11(Suppl 1):P252
Introduction: Perfusion MRI is a promising technique to detect
ischemic heart disease. Single-shot imaging is currently used to
acquire 3 slices with a temporal resolution of one time frame per
cardiac cycle. However, this technique is challenged by the
cardiac motion artifacts, limited spatial coverage, resolution and
SNR. Reduced imaging time per slice will allow greater coverage
of the heart and reduced motion artifacts, especially during stress
imaging with high heart rates. Parallel imaging methods have been
applied in myocardial perfusion MRI, but the acceleration factors
are limited to 2–3 because of SNR considerations. Time-resolved
data acquisition with shortened data acquisition window can be
performed with Conjugate-gradient Highly Constrained Back-
projection reconstruction (CG-HYPR) [1, 2]. A combination of
sliding composite images and CG-HYPR method allows vast
undersampling, increased spatial coverage, resolution and SNR
while preserving the temporal resolution of one frame per
heartbeat and dynamic blood and myocardial signal intensity
changes. In this work, we compared this new method with the
Journal of Cardiovascular Magnetic Resonance 2009, 11(Suppl 1) http://jcmr-online.com/supplements/11/S1
Page 279 of 316(page number not for citation purposes)
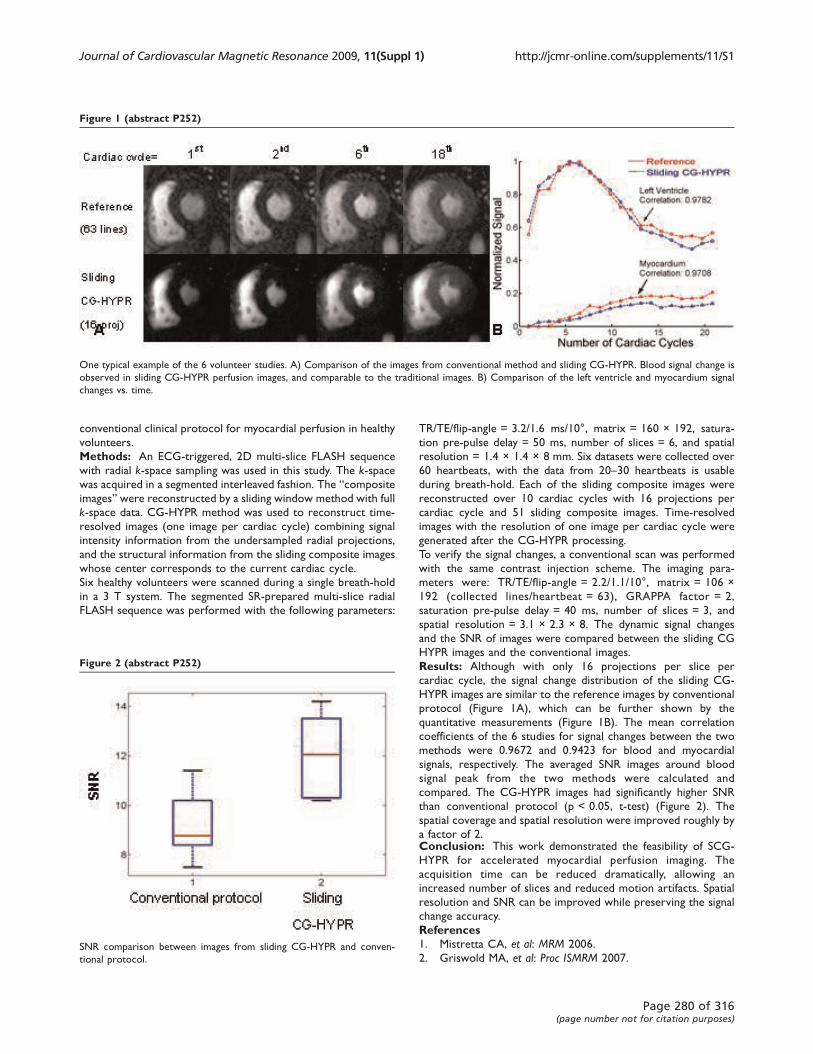
conventional clinical protocol for myocardial perfusion in healthy
volunteers.
Methods: An ECG-triggered, 2D multi-slice FLASH sequence
with radial k-space sampling was used in this study. The k-spacewas acquired in a segmented interleaved fashion. The “composite
images” were reconstructed by a sliding window method with full
k-space data. CG-HYPR method was used to reconstruct time-
resolved images (one image per cardiac cycle) combining signal
intensity information from the undersampled radial projections,
and the structural information from the sliding composite images
whose center corresponds to the current cardiac cycle.
Six healthy volunteers were scanned during a single breath-hold
in a 3 T system. The segmented SR-prepared multi-slice radial
FLASH sequence was performed with the following parameters:
TR/TE/flip-angle = 3.2/1.6 ms/10°, matrix = 160 × 192, satura-
tion pre-pulse delay = 50 ms, number of slices = 6, and spatial
resolution = 1.4 × 1.4 × 8 mm. Six datasets were collected over
60 heartbeats, with the data from 20–30 heartbeats is usable
during breath-hold. Each of the sliding composite images were
reconstructed over 10 cardiac cycles with 16 projections per
cardiac cycle and 51 sliding composite images. Time-resolved
images with the resolution of one image per cardiac cycle were
generated after the CG-HYPR processing.
To verify the signal changes, a conventional scan was performed
with the same contrast injection scheme. The imaging para-
meters were: TR/TE/flip-angle = 2.2/1.1/10°, matrix = 106 ×
192 (collected lines/heartbeat = 63), GRAPPA factor = 2,
saturation pre-pulse delay = 40 ms, number of slices = 3, and
spatial resolution = 3.1 × 2.3 × 8. The dynamic signal changes
and the SNR of images were compared between the sliding CG
HYPR images and the conventional images.
Results: Although with only 16 projections per slice per
cardiac cycle, the signal change distribution of the sliding CG-
HYPR images are similar to the reference images by conventional
protocol (Figure 1A), which can be further shown by the
quantitative measurements (Figure 1B). The mean correlation
coefficients of the 6 studies for signal changes between the two
methods were 0.9672 and 0.9423 for blood and myocardial
signals, respectively. The averaged SNR images around blood
signal peak from the two methods were calculated and
compared. The CG-HYPR images had significantly higher SNR
than conventional protocol (p < 0.05, t-test) (Figure 2). The
spatial coverage and spatial resolution were improved roughly by
a factor of 2.Conclusion: This work demonstrated the feasibility of SCG-
HYPR for accelerated myocardial perfusion imaging. The
acquisition time can be reduced dramatically, allowing an
increased number of slices and reduced motion artifacts. Spatial
resolution and SNR can be improved while preserving the signal
change accuracy.
References1. Mistretta CA, et al: MRM 2006.
2. Griswold MA, et al: Proc ISMRM 2007.
Figure 2 (abstract P252)
SNR comparison between images from sliding CG-HYPR and conven-
tional protocol.
Figure 1 (abstract P252)
One typical example of the 6 volunteer studies. A) Comparison of the images from conventional method and sliding CG-HYPR. Blood signal change is
observed in sliding CG-HYPR perfusion images, and comparable to the traditional images. B) Comparison of the left ventricle and myocardium signal
changes vs. time.
Journal of Cardiovascular Magnetic Resonance 2009, 11(Suppl 1) http://jcmr-online.com/supplements/11/S1
Page 280 of 316(page number not for citation purposes)
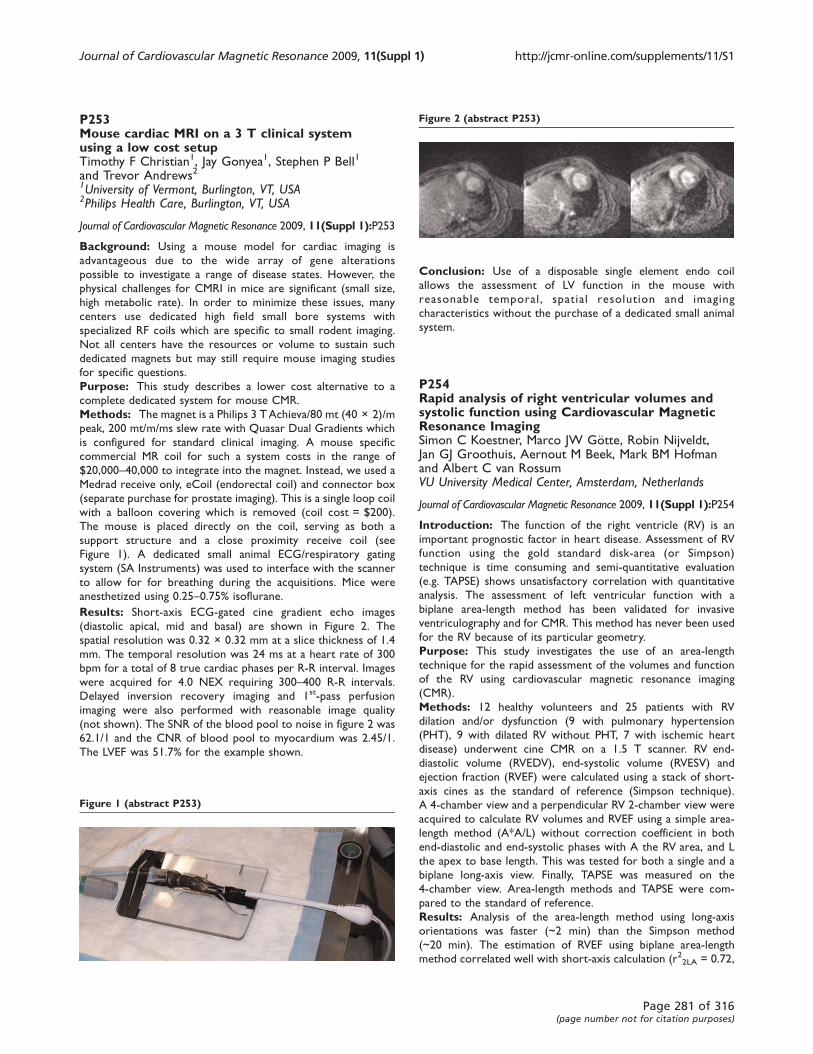
P253Mouse cardiac MRI on a 3 T clinical systemusing a low cost setupTimothy F Christian1, Jay Gonyea1, Stephen P Bell1
and Trevor Andrews21University of Vermont, Burlington, VT, USA2Philips Health Care, Burlington, VT, USA
Journal of Cardiovascular Magnetic Resonance 2009, 11(Suppl 1):P253
Background: Using a mouse model for cardiac imaging is
advantageous due to the wide array of gene alterations
possible to investigate a range of disease states. However, the
physical challenges for CMRI in mice are significant (small size,
high metabolic rate). In order to minimize these issues, many
centers use dedicated high field small bore systems with
specialized RF coils which are specific to small rodent imaging.
Not all centers have the resources or volume to sustain such
dedicated magnets but may still require mouse imaging studies
for specific questions.
Purpose: This study describes a lower cost alternative to a
complete dedicated system for mouse CMR.
Methods: The magnet is a Philips 3 TAchieva/80 mt (40 × 2)/m
peak, 200 mt/m/ms slew rate with Quasar Dual Gradients which
is configured for standard clinical imaging. A mouse specific
commercial MR coil for such a system costs in the range of
$20,000–40,000 to integrate into the magnet. Instead, we used a
Medrad receive only, eCoil (endorectal coil) and connector box
(separate purchase for prostate imaging). This is a single loop coil
with a balloon covering which is removed (coil cost = $200).
The mouse is placed directly on the coil, serving as both a
support structure and a close proximity receive coil (see
Figure 1). A dedicated small animal ECG/respiratory gating
system (SA Instruments) was used to interface with the scanner
to allow for for breathing during the acquisitions. Mice were
anesthetized using 0.25–0.75% isoflurane.
Results: Short-axis ECG-gated cine gradient echo images
(diastolic apical, mid and basal) are shown in Figure 2. The
spatial resolution was 0.32 × 0.32 mm at a slice thickness of 1.4
mm. The temporal resolution was 24 ms at a heart rate of 300
bpm for a total of 8 true cardiac phases per R-R interval. Images
were acquired for 4.0 NEX requiring 300–400 R-R intervals.
Delayed inversion recovery imaging and 1st-pass perfusion
imaging were also performed with reasonable image quality
(not shown). The SNR of the blood pool to noise in figure 2 was
62.1/1 and the CNR of blood pool to myocardium was 2.45/1.
The LVEF was 51.7% for the example shown.
Conclusion: Use of a disposable single element endo coil
allows the assessment of LV function in the mouse with
reasonable temporal , spatial resolution and imaging
characteristics without the purchase of a dedicated small animal
system.
P254Rapid analysis of right ventricular volumes andsystolic function using Cardiovascular MagneticResonance ImagingSimon C Koestner, Marco JW Götte, Robin Nijveldt,Jan GJ Groothuis, Aernout M Beek, Mark BM Hofmanand Albert C van RossumVU University Medical Center, Amsterdam, Netherlands
Journal of Cardiovascular Magnetic Resonance 2009, 11(Suppl 1):P254
Introduction: The function of the right ventricle (RV) is an
important prognostic factor in heart disease. Assessment of RV
function using the gold standard disk-area (or Simpson)
technique is time consuming and semi-quantitative evaluation
(e.g. TAPSE) shows unsatisfactory correlation with quantitative
analysis. The assessment of left ventricular function with a
biplane area-length method has been validated for invasive
ventriculography and for CMR. This method has never been used
for the RV because of its particular geometry.
Purpose: This study investigates the use of an area-length
technique for the rapid assessment of the volumes and function
of the RV using cardiovascular magnetic resonance imaging
(CMR).
Methods: 12 healthy volunteers and 25 patients with RV
dilation and/or dysfunction (9 with pulmonary hypertension
(PHT), 9 with dilated RV without PHT, 7 with ischemic heart
disease) underwent cine CMR on a 1.5 T scanner. RV end-
diastolic volume (RVEDV), end-systolic volume (RVESV) and
ejection fraction (RVEF) were calculated using a stack of short-
axis cines as the standard of reference (Simpson technique).
A 4-chamber view and a perpendicular RV 2-chamber view were
acquired to calculate RV volumes and RVEF using a simple area-
length method (A*A/L) without correction coefficient in both
end-diastolic and end-systolic phases with A the RV area, and L
the apex to base length. This was tested for both a single and a
biplane long-axis view. Finally, TAPSE was measured on the
4-chamber view. Area-length methods and TAPSE were com-
pared to the standard of reference.
Results: Analysis of the area-length method using long-axis
orientations was faster (~2 min) than the Simpson method
(~20 min). The estimation of RVEF using biplane area-length
method correlated well with short-axis calculation (r22LA = 0.72,
Figure 2 (abstract P253)
Figure 1 (abstract P253)
Journal of Cardiovascular Magnetic Resonance 2009, 11(Suppl 1) http://jcmr-online.com/supplements/11/S1
Page 281 of 316(page number not for citation purposes)
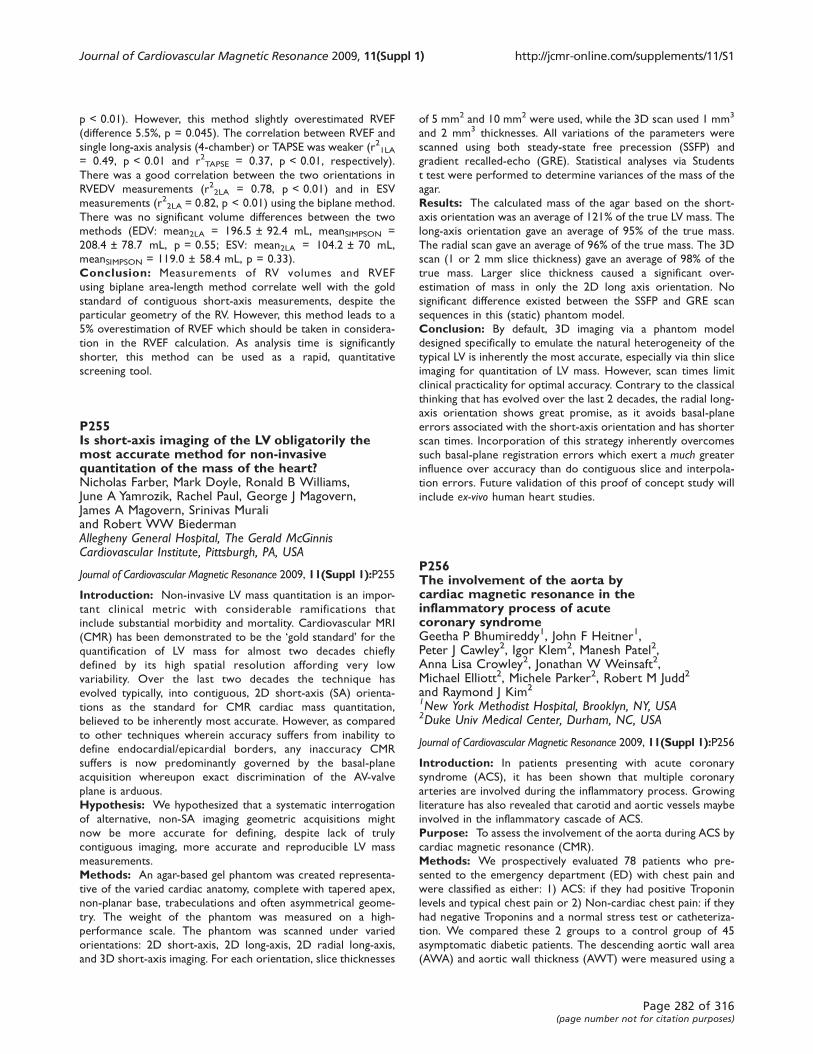
p < 0.01). However, this method slightly overestimated RVEF
(difference 5.5%, p = 0.045). The correlation between RVEF and
single long-axis analysis (4-chamber) or TAPSE was weaker (r21LA= 0.49, p < 0.01 and r2TAPSE = 0.37, p < 0.01, respectively).
There was a good correlation between the two orientations in
RVEDV measurements (r22LA = 0.78, p < 0.01) and in ESV
measurements (r22LA = 0.82, p < 0.01) using the biplane method.
There was no significant volume differences between the two
methods (EDV: mean2LA = 196.5 ± 92.4 mL, meanSIMPSON =
208.4 ± 78.7 mL, p = 0.55; ESV: mean2LA = 104.2 ± 70 mL,
meanSIMPSON = 119.0 ± 58.4 mL, p = 0.33).
Conclusion: Measurements of RV volumes and RVEF
using biplane area-length method correlate well with the gold
standard of contiguous short-axis measurements, despite the
particular geometry of the RV. However, this method leads to a
5% overestimation of RVEF which should be taken in considera-
tion in the RVEF calculation. As analysis time is significantly
shorter, this method can be used as a rapid, quantitative
screening tool.
P255Is short-axis imaging of the LV obligatorily themost accurate method for non-invasivequantitation of the mass of the heart?Nicholas Farber, Mark Doyle, Ronald B Williams,June A Yamrozik, Rachel Paul, George J Magovern,James A Magovern, Srinivas Muraliand Robert WW BiedermanAllegheny General Hospital, The Gerald McGinnisCardiovascular Institute, Pittsburgh, PA, USA
Journal of Cardiovascular Magnetic Resonance 2009, 11(Suppl 1):P255
Introduction: Non-invasive LV mass quantitation is an impor-
tant clinical metric with considerable ramifications that
include substantial morbidity and mortality. Cardiovascular MRI
(CMR) has been demonstrated to be the ‘gold standard’ for thequantification of LV mass for almost two decades chiefly
defined by its high spatial resolution affording very low
variability. Over the last two decades the technique has
evolved typically, into contiguous, 2D short-axis (SA) orienta-
tions as the standard for CMR cardiac mass quantitation,
believed to be inherently most accurate. However, as compared
to other techniques wherein accuracy suffers from inability to
define endocardial/epicardial borders, any inaccuracy CMR
suffers is now predominantly governed by the basal-plane
acquisition whereupon exact discrimination of the AV-valve
plane is arduous.
Hypothesis: We hypothesized that a systematic interrogation
of alternative, non-SA imaging geometric acquisitions might
now be more accurate for defining, despite lack of truly
contiguous imaging, more accurate and reproducible LV mass
measurements.
Methods: An agar-based gel phantom was created representa-
tive of the varied cardiac anatomy, complete with tapered apex,
non-planar base, trabeculations and often asymmetrical geome-
try. The weight of the phantom was measured on a high-
performance scale. The phantom was scanned under varied
orientations: 2D short-axis, 2D long-axis, 2D radial long-axis,
and 3D short-axis imaging. For each orientation, slice thicknesses
of 5 mm2 and 10 mm2 were used, while the 3D scan used 1 mm3
and 2 mm3 thicknesses. All variations of the parameters were
scanned using both steady-state free precession (SSFP) and
gradient recalled-echo (GRE). Statistical analyses via Students
t test were performed to determine variances of the mass of the
agar.
Results: The calculated mass of the agar based on the short-
axis orientation was an average of 121% of the true LV mass. The
long-axis orientation gave an average of 95% of the true mass.
The radial scan gave an average of 96% of the true mass. The 3D
scan (1 or 2 mm slice thickness) gave an average of 98% of the
true mass. Larger slice thickness caused a significant over-
estimation of mass in only the 2D long axis orientation. No
significant difference existed between the SSFP and GRE scan
sequences in this (static) phantom model.
Conclusion: By default, 3D imaging via a phantom model
designed specifically to emulate the natural heterogeneity of the
typical LV is inherently the most accurate, especially via thin slice
imaging for quantitation of LV mass. However, scan times limit
clinical practicality for optimal accuracy. Contrary to the classical
thinking that has evolved over the last 2 decades, the radial long-
axis orientation shows great promise, as it avoids basal-plane
errors associated with the short-axis orientation and has shorter
scan times. Incorporation of this strategy inherently overcomes
such basal-plane registration errors which exert a much greater
influence over accuracy than do contiguous slice and interpola-
tion errors. Future validation of this proof of concept study will
include ex-vivo human heart studies.
P256The involvement of the aorta bycardiac magnetic resonance in theinflammatory process of acutecoronary syndromeGeetha P Bhumireddy1, John F Heitner1,Peter J Cawley2, Igor Klem2, Manesh Patel2,Anna Lisa Crowley2, Jonathan W Weinsaft2,Michael Elliott2, Michele Parker2, Robert M Judd2
and Raymond J Kim2
1New York Methodist Hospital, Brooklyn, NY, USA2Duke Univ Medical Center, Durham, NC, USA
Journal of Cardiovascular Magnetic Resonance 2009, 11(Suppl 1):P256
Introduction: In patients presenting with acute coronary
syndrome (ACS), it has been shown that multiple coronary
arteries are involved during the inflammatory process. Growing
literature has also revealed that carotid and aortic vessels maybe
involved in the inflammatory cascade of ACS.
Purpose: To assess the involvement of the aorta during ACS by
cardiac magnetic resonance (CMR).
Methods: We prospectively evaluated 78 patients who pre-
sented to the emergency department (ED) with chest pain and
were classified as either: 1) ACS: if they had positive Troponin
levels and typical chest pain or 2) Non-cardiac chest pain: if they
had negative Troponins and a normal stress test or catheteriza-
tion. We compared these 2 groups to a control group of 45
asymptomatic diabetic patients. The descending aortic wall area
(AWA) and aortic wall thickness (AWT) were measured using a
Journal of Cardiovascular Magnetic Resonance 2009, 11(Suppl 1) http://jcmr-online.com/supplements/11/S1
Page 282 of 316(page number not for citation purposes)
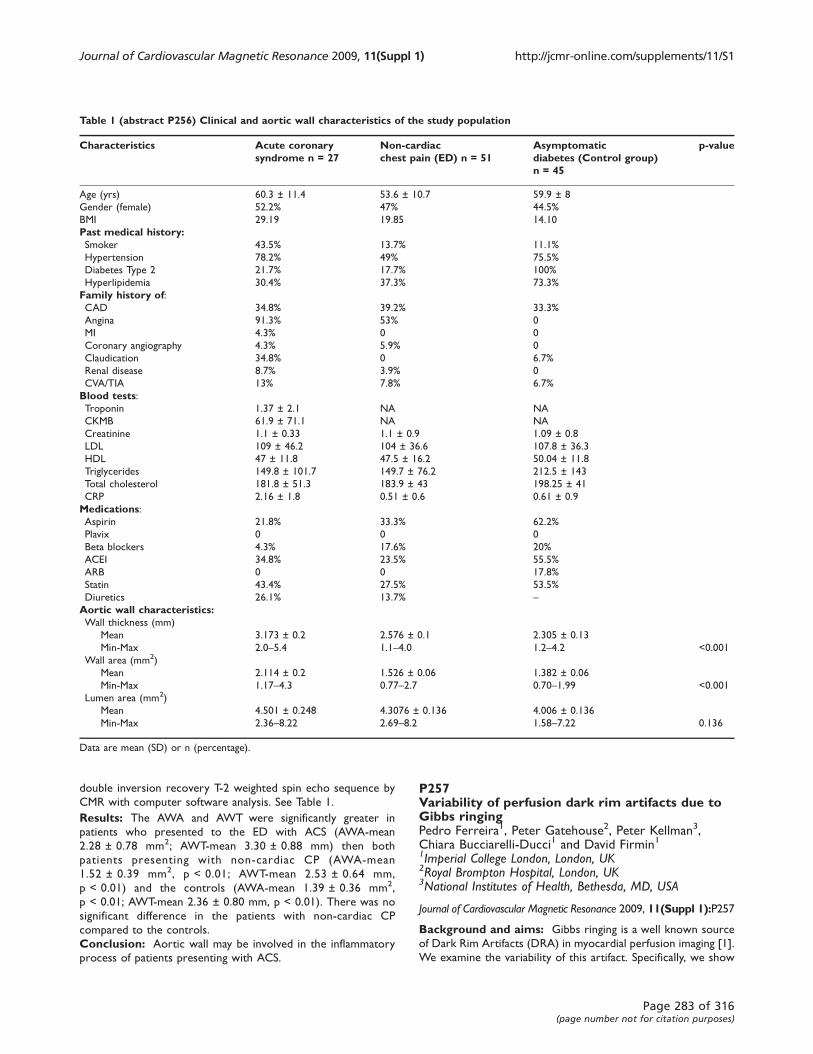
double inversion recovery T-2 weighted spin echo sequence by
CMR with computer software analysis. See Table 1.
Results: The AWA and AWT were significantly greater in
patients who presented to the ED with ACS (AWA-mean
2.28 ± 0.78 mm2; AWT-mean 3.30 ± 0.88 mm) then both
patients presenting with non-cardiac CP (AWA-mean
1.52 ± 0.39 mm2, p < 0.01; AWT-mean 2.53 ± 0.64 mm,
p < 0.01) and the controls (AWA-mean 1.39 ± 0.36 mm2,
p < 0.01; AWT-mean 2.36 ± 0.80 mm, p < 0.01). There was no
significant difference in the patients with non-cardiac CP
compared to the controls.
Conclusion: Aortic wall may be involved in the inflammatory
process of patients presenting with ACS.
P257Variability of perfusion dark rim artifacts due toGibbs ringingPedro Ferreira1, Peter Gatehouse2, Peter Kellman3,Chiara Bucciarelli-Ducci1 and David Firmin11Imperial College London, London, UK2Royal Brompton Hospital, London, UK3National Institutes of Health, Bethesda, MD, USA
Journal of Cardiovascular Magnetic Resonance 2009, 11(Suppl 1):P257
Background and aims: Gibbs ringing is a well known source
of Dark Rim Artifacts (DRA) in myocardial perfusion imaging [1].
We examine the variability of this artifact. Specifically, we show
Table 1 (abstract P256) Clinical and aortic wall characteristics of the study population
Characteristics Acute coronarysyndrome n = 27
Non-cardiacchest pain (ED) n = 51
Asymptomaticdiabetes (Control group)n = 45
p-value
Age (yrs) 60.3 ± 11.4 53.6 ± 10.7 59.9 ± 8
Gender (female) 52.2% 47% 44.5%
BMI 29.19 19.85 14.10
Past medical history:Smoker 43.5% 13.7% 11.1%
Hypertension 78.2% 49% 75.5%
Diabetes Type 2 21.7% 17.7% 100%
Hyperlipidemia 30.4% 37.3% 73.3%
Family history of:CAD 34.8% 39.2% 33.3%
Angina 91.3% 53% 0
MI 4.3% 0 0
Coronary angiography 4.3% 5.9% 0
Claudication 34.8% 0 6.7%
Renal disease 8.7% 3.9% 0
CVA/TIA 13% 7.8% 6.7%
Blood tests:Troponin 1.37 ± 2.1 NA NA
CKMB 61.9 ± 71.1 NA NA
Creatinine 1.1 ± 0.33 1.1 ± 0.9 1.09 ± 0.8
LDL 109 ± 46.2 104 ± 36.6 107.8 ± 36.3
HDL 47 ± 11.8 47.5 ± 16.2 50.04 ± 11.8
Triglycerides 149.8 ± 101.7 149.7 ± 76.2 212.5 ± 143
Total cholesterol 181.8 ± 51.3 183.9 ± 43 198.25 ± 41
CRP 2.16 ± 1.8 0.51 ± 0.6 0.61 ± 0.9
Medications:Aspirin 21.8% 33.3% 62.2%
Plavix 0 0 0
Beta blockers 4.3% 17.6% 20%
ACEI 34.8% 23.5% 55.5%
ARB 0 0 17.8%
Statin 43.4% 27.5% 53.5%
Diuretics 26.1% 13.7% –Aortic wall characteristics:Wall thickness (mm)
Mean 3.173 ± 0.2 2.576 ± 0.1 2.305 ± 0.13
Min-Max 2.0–5.4 1.1–4.0 1.2–4.2 <0.001
Wall area (mm2)
Mean 2.114 ± 0.2 1.526 ± 0.06 1.382 ± 0.06
Min-Max 1.17–4.3 0.77–2.7 0.70–1.99 <0.001
Lumen area (mm2)
Mean 4.501 ± 0.248 4.3076 ± 0.136 4.006 ± 0.136
Min-Max 2.36–8.22 2.69–8.2 1.58–7.22 0.136
Data are mean (SD) or n (percentage).
Journal of Cardiovascular Magnetic Resonance 2009, 11(Suppl 1) http://jcmr-online.com/supplements/11/S1
Page 283 of 316(page number not for citation purposes)
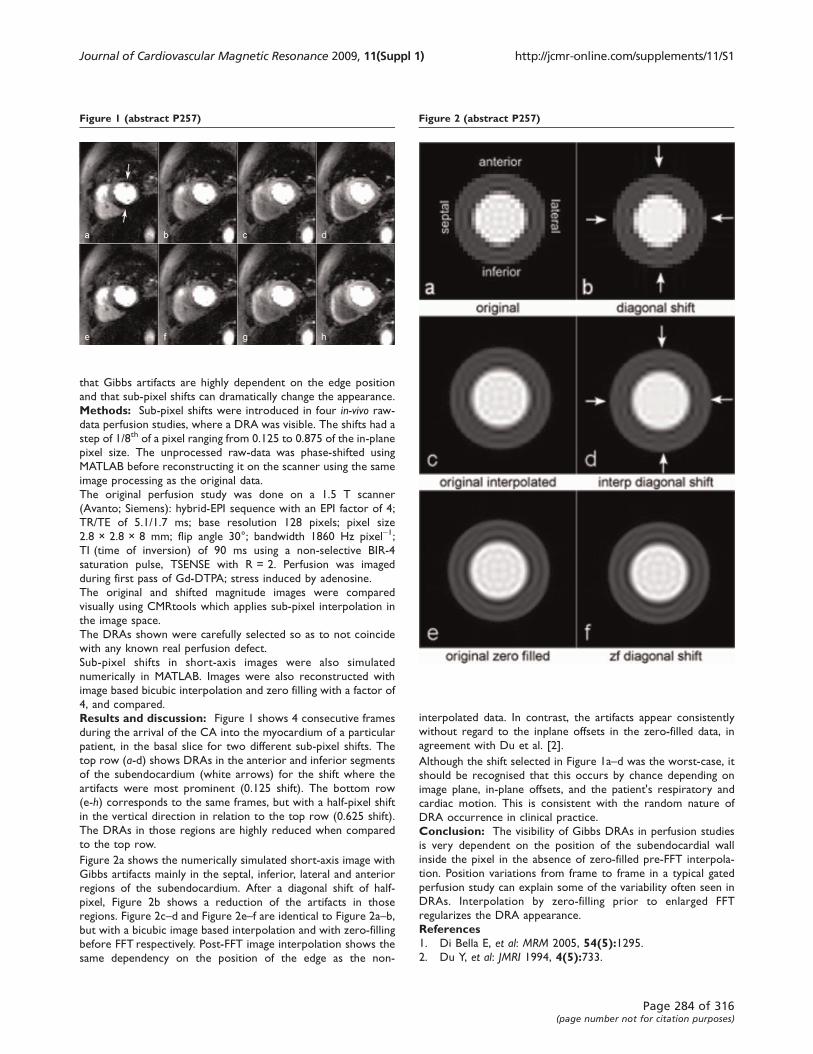
that Gibbs artifacts are highly dependent on the edge position
and that sub-pixel shifts can dramatically change the appearance.
Methods: Sub-pixel shifts were introduced in four in-vivo raw-
data perfusion studies, where a DRA was visible. The shifts had a
step of 1/8th of a pixel ranging from 0.125 to 0.875 of the in-plane
pixel size. The unprocessed raw-data was phase-shifted using
MATLAB before reconstructing it on the scanner using the same
image processing as the original data.
The original perfusion study was done on a 1.5 T scanner
(Avanto; Siemens): hybrid-EPI sequence with an EPI factor of 4;
TR/TE of 5.1/1.7 ms; base resolution 128 pixels; pixel size
2.8 × 2.8 × 8 mm; flip angle 30°; bandwidth 1860 Hz pixel-1;
TI (time of inversion) of 90 ms using a non-selective BIR-4
saturation pulse, TSENSE with R = 2. Perfusion was imaged
during first pass of Gd-DTPA; stress induced by adenosine.
The original and shifted magnitude images were compared
visually using CMRtools which applies sub-pixel interpolation in
the image space.
The DRAs shown were carefully selected so as to not coincide
with any known real perfusion defect.
Sub-pixel shifts in short-axis images were also simulated
numerically in MATLAB. Images were also reconstructed with
image based bicubic interpolation and zero filling with a factor of
4, and compared.
Results and discussion: Figure 1 shows 4 consecutive frames
during the arrival of the CA into the myocardium of a particular
patient, in the basal slice for two different sub-pixel shifts. The
top row (a-d) shows DRAs in the anterior and inferior segments
of the subendocardium (white arrows) for the shift where the
artifacts were most prominent (0.125 shift). The bottom row
(e-h) corresponds to the same frames, but with a half-pixel shift
in the vertical direction in relation to the top row (0.625 shift).
The DRAs in those regions are highly reduced when compared
to the top row.
Figure 2a shows the numerically simulated short-axis image with
Gibbs artifacts mainly in the septal, inferior, lateral and anterior
regions of the subendocardium. After a diagonal shift of half-
pixel, Figure 2b shows a reduction of the artifacts in those
regions. Figure 2c–d and Figure 2e–f are identical to Figure 2a–b,but with a bicubic image based interpolation and with zero-filling
before FFT respectively. Post-FFT image interpolation shows the
same dependency on the position of the edge as the non-
interpolated data. In contrast, the artifacts appear consistently
without regard to the inplane offsets in the zero-filled data, in
agreement with Du et al. [2].
Although the shift selected in Figure 1a–d was the worst-case, it
should be recognised that this occurs by chance depending on
image plane, in-plane offsets, and the patient's respiratory and
cardiac motion. This is consistent with the random nature of
DRA occurrence in clinical practice.
Conclusion: The visibility of Gibbs DRAs in perfusion studies
is very dependent on the position of the subendocardial wall
inside the pixel in the absence of zero-filled pre-FFT interpola-
tion. Position variations from frame to frame in a typical gated
perfusion study can explain some of the variability often seen in
DRAs. Interpolation by zero-filling prior to enlarged FFT
regularizes the DRA appearance.
References1. Di Bella E, et al: MRM 2005, 54(5):1295.2. Du Y, et al: JMRI 1994, 4(5):733.
Figure 2 (abstract P257)Figure 1 (abstract P257)
Journal of Cardiovascular Magnetic Resonance 2009, 11(Suppl 1) http://jcmr-online.com/supplements/11/S1
Page 284 of 316(page number not for citation purposes)
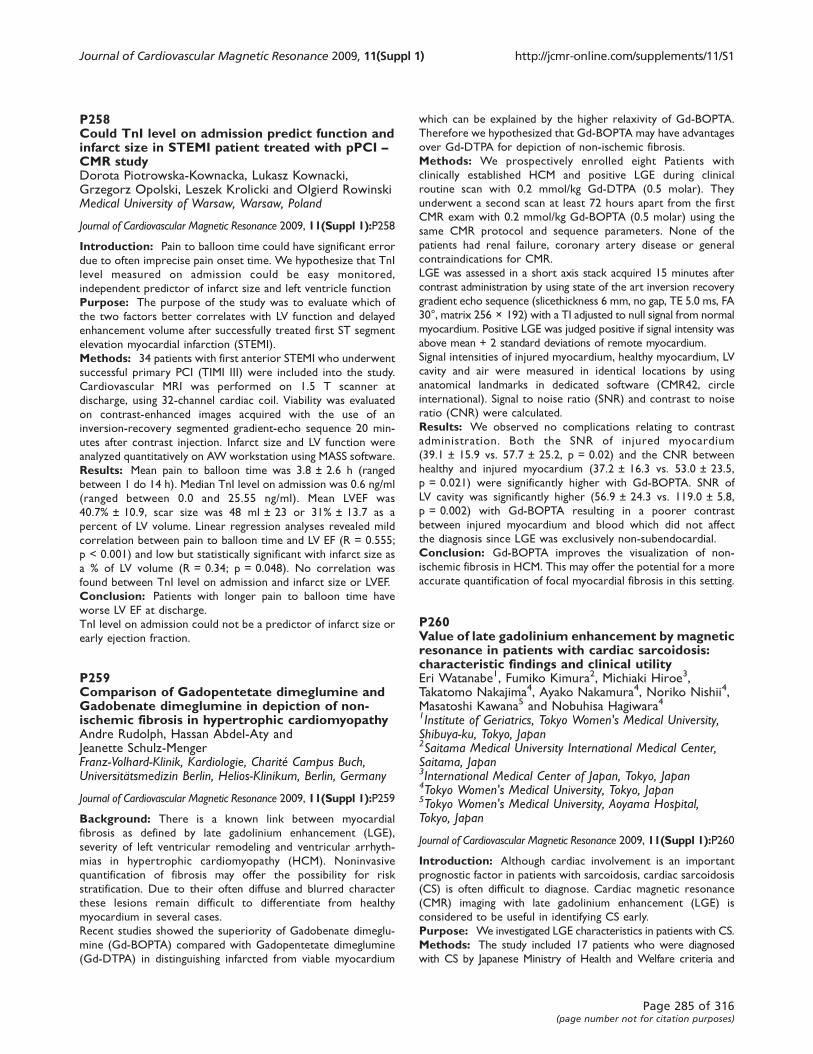
P258Could TnI level on admission predict function andinfarct size in STEMI patient treated with pPCI –CMR studyDorota Piotrowska-Kownacka, Lukasz Kownacki,Grzegorz Opolski, Leszek Krolicki and Olgierd RowinskiMedical University of Warsaw, Warsaw, Poland
Journal of Cardiovascular Magnetic Resonance 2009, 11(Suppl 1):P258
Introduction: Pain to balloon time could have significant error
due to often imprecise pain onset time. We hypothesize that TnI
level measured on admission could be easy monitored,
independent predictor of infarct size and left ventricle function
Purpose: The purpose of the study was to evaluate which of
the two factors better correlates with LV function and delayed
enhancement volume after successfully treated first ST segment
elevation myocardial infarction (STEMI).
Methods: 34 patients with first anterior STEMI who underwent
successful primary PCI (TIMI III) were included into the study.
Cardiovascular MRI was performed on 1.5 T scanner at
discharge, using 32-channel cardiac coil. Viability was evaluated
on contrast-enhanced images acquired with the use of an
inversion-recovery segmented gradient-echo sequence 20 min-
utes after contrast injection. Infarct size and LV function were
analyzed quantitatively on AW workstation using MASS software.
Results: Mean pain to balloon time was 3.8 ± 2.6 h (ranged
between 1 do 14 h). Median TnI level on admission was 0.6 ng/ml
(ranged between 0.0 and 25.55 ng/ml). Mean LVEF was
40.7% ± 10.9, scar size was 48 ml ± 23 or 31% ± 13.7 as a
percent of LV volume. Linear regression analyses revealed mild
correlation between pain to balloon time and LV EF (R = 0.555;
p < 0.001) and low but statistically significant with infarct size as
a % of LV volume (R = 0.34; p = 0.048). No correlation was
found between TnI level on admission and infarct size or LVEF.
Conclusion: Patients with longer pain to balloon time have
worse LV EF at discharge.
TnI level on admission could not be a predictor of infarct size or
early ejection fraction.
P259Comparison of Gadopentetate dimeglumine andGadobenate dimeglumine in depiction of non-ischemic fibrosis in hypertrophic cardiomyopathyAndre Rudolph, Hassan Abdel-Aty andJeanette Schulz-MengerFranz-Volhard-Klinik, Kardiologie, Charité Campus Buch,Universitätsmedizin Berlin, Helios-Klinikum, Berlin, Germany
Journal of Cardiovascular Magnetic Resonance 2009, 11(Suppl 1):P259
Background: There is a known link between myocardial
fibrosis as defined by late gadolinium enhancement (LGE),
severity of left ventricular remodeling and ventricular arrhyth-
mias in hypertrophic cardiomyopathy (HCM). Noninvasive
quantification of fibrosis may offer the possibility for risk
stratification. Due to their often diffuse and blurred character
these lesions remain difficult to differentiate from healthy
myocardium in several cases.
Recent studies showed the superiority of Gadobenate dimeglu-
mine (Gd-BOPTA) compared with Gadopentetate dimeglumine
(Gd-DTPA) in distinguishing infarcted from viable myocardium
which can be explained by the higher relaxivity of Gd-BOPTA.
Therefore we hypothesized that Gd-BOPTA may have advantages
over Gd-DTPA for depiction of non-ischemic fibrosis.
Methods: We prospectively enrolled eight Patients with
clinically established HCM and positive LGE during clinical
routine scan with 0.2 mmol/kg Gd-DTPA (0.5 molar). They
underwent a second scan at least 72 hours apart from the first
CMR exam with 0.2 mmol/kg Gd-BOPTA (0.5 molar) using the
same CMR protocol and sequence parameters. None of the
patients had renal failure, coronary artery disease or general
contraindications for CMR.
LGE was assessed in a short axis stack acquired 15 minutes after
contrast administration by using state of the art inversion recovery
gradient echo sequence (slicethickness 6 mm, no gap, TE 5.0 ms, FA
30°, matrix 256 × 192) with a TI adjusted to null signal from normal
myocardium. Positive LGE was judged positive if signal intensity was
above mean + 2 standard deviations of remote myocardium.
Signal intensities of injured myocardium, healthy myocardium, LV
cavity and air were measured in identical locations by using
anatomical landmarks in dedicated software (CMR42, circle
international). Signal to noise ratio (SNR) and contrast to noise
ratio (CNR) were calculated.
Results: We observed no complications relating to contrast
administration. Both the SNR of injured myocardium
(39.1 ± 15.9 vs. 57.7 ± 25.2, p = 0.02) and the CNR between
healthy and injured myocardium (37.2 ± 16.3 vs. 53.0 ± 23.5,
p = 0.021) were significantly higher with Gd-BOPTA. SNR of
LV cavity was significantly higher (56.9 ± 24.3 vs. 119.0 ± 5.8,
p = 0.002) with Gd-BOPTA resulting in a poorer contrast
between injured myocardium and blood which did not affect
the diagnosis since LGE was exclusively non-subendocardial.
Conclusion: Gd-BOPTA improves the visualization of non-
ischemic fibrosis in HCM. This may offer the potential for a more
accurate quantification of focal myocardial fibrosis in this setting.
P260Value of late gadolinium enhancement by magneticresonance in patients with cardiac sarcoidosis:characteristic findings and clinical utilityEri Watanabe1, Fumiko Kimura2, Michiaki Hiroe3,Takatomo Nakajima4, Ayako Nakamura4, Noriko Nishii4,Masatoshi Kawana5 and Nobuhisa Hagiwara41Institute of Geriatrics, Tokyo Women's Medical University,Shibuya-ku, Tokyo, Japan2Saitama Medical University International Medical Center,Saitama, Japan3International Medical Center of Japan, Tokyo, Japan4Tokyo Women's Medical University, Tokyo, Japan5Tokyo Women's Medical University, Aoyama Hospital,Tokyo, Japan
Journal of Cardiovascular Magnetic Resonance 2009, 11(Suppl 1):P260
Introduction: Although cardiac involvement is an important
prognostic factor in patients with sarcoidosis, cardiac sarcoidosis
(CS) is often difficult to diagnose. Cardiac magnetic resonance
(CMR) imaging with late gadolinium enhancement (LGE) is
considered to be useful in identifying CS early.
Purpose: We investigated LGE characteristics in patients with CS.
Methods: The study included 17 patients who were diagnosed
with CS by Japanese Ministry of Health and Welfare criteria and
Journal of Cardiovascular Magnetic Resonance 2009, 11(Suppl 1) http://jcmr-online.com/supplements/11/S1
Page 285 of 316(page number not for citation purposes)
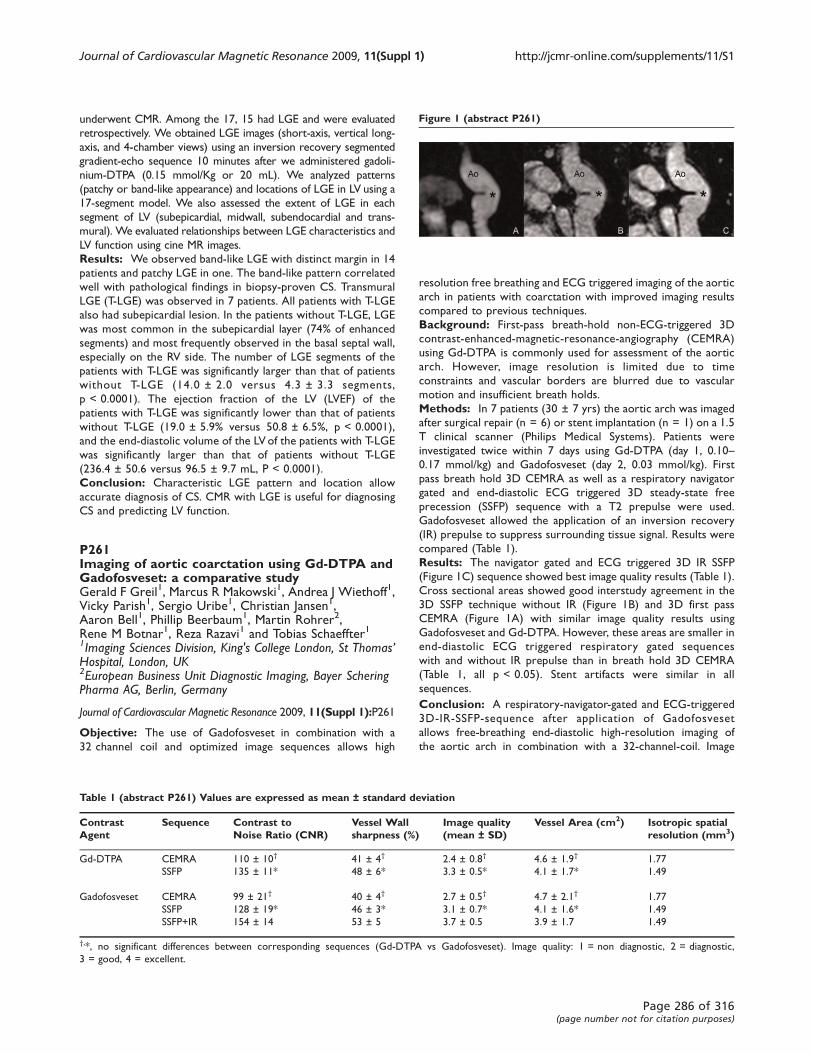
underwent CMR. Among the 17, 15 had LGE and were evaluated
retrospectively. We obtained LGE images (short-axis, vertical long-
axis, and 4-chamber views) using an inversion recovery segmented
gradient-echo sequence 10 minutes after we administered gadoli-
nium-DTPA (0.15 mmol/Kg or 20 mL). We analyzed patterns
(patchy or band-like appearance) and locations of LGE in LV using a
17-segment model. We also assessed the extent of LGE in each
segment of LV (subepicardial, midwall, subendocardial and trans-
mural). We evaluated relationships between LGE characteristics and
LV function using cine MR images.
Results: We observed band-like LGE with distinct margin in 14
patients and patchy LGE in one. The band-like pattern correlated
well with pathological findings in biopsy-proven CS. Transmural
LGE (T-LGE) was observed in 7 patients. All patients with T-LGE
also had subepicardial lesion. In the patients without T-LGE, LGE
was most common in the subepicardial layer (74% of enhanced
segments) and most frequently observed in the basal septal wall,
especially on the RV side. The number of LGE segments of the
patients with T-LGE was significantly larger than that of patients
without T-LGE (14.0 ± 2.0 versus 4.3 ± 3.3 segments,
p < 0.0001). The ejection fraction of the LV (LVEF) of the
patients with T-LGE was significantly lower than that of patients
without T-LGE (19.0 ± 5.9% versus 50.8 ± 6.5%, p < 0.0001),
and the end-diastolic volume of the LV of the patients with T-LGE
was significantly larger than that of patients without T-LGE
(236.4 ± 50.6 versus 96.5 ± 9.7 mL, P < 0.0001).
Conclusion: Characteristic LGE pattern and location allow
accurate diagnosis of CS. CMR with LGE is useful for diagnosing
CS and predicting LV function.
P261Imaging of aortic coarctation using Gd-DTPA andGadofosveset: a comparative studyGerald F Greil1, Marcus R Makowski1, Andrea J Wiethoff1,Vicky Parish1, Sergio Uribe1, Christian Jansen1,Aaron Bell1, Phillip Beerbaum1, Martin Rohrer2,Rene M Botnar1, Reza Razavi1 and Tobias Schaeffter11Imaging Sciences Division, King's College London, St Thomas’Hospital, London, UK2European Business Unit Diagnostic Imaging, Bayer ScheringPharma AG, Berlin, Germany
Journal of Cardiovascular Magnetic Resonance 2009, 11(Suppl 1):P261
Objective: The use of Gadofosveset in combination with a
32 channel coil and optimized image sequences allows high
resolution free breathing and ECG triggered imaging of the aortic
arch in patients with coarctation with improved imaging results
compared to previous techniques.
Background: First-pass breath-hold non-ECG-triggered 3D
contrast-enhanced-magnetic-resonance-angiography (CEMRA)
using Gd-DTPA is commonly used for assessment of the aortic
arch. However, image resolution is limited due to time
constraints and vascular borders are blurred due to vascular
motion and insufficient breath holds.
Methods: In 7 patients (30 ± 7 yrs) the aortic arch was imaged
after surgical repair (n = 6) or stent implantation (n = 1) on a 1.5
T clinical scanner (Philips Medical Systems). Patients were
investigated twice within 7 days using Gd-DTPA (day 1, 0.10–0.17 mmol/kg) and Gadofosveset (day 2, 0.03 mmol/kg). First
pass breath hold 3D CEMRA as well as a respiratory navigator
gated and end-diastolic ECG triggered 3D steady-state free
precession (SSFP) sequence with a T2 prepulse were used.
Gadofosveset allowed the application of an inversion recovery
(IR) prepulse to suppress surrounding tissue signal. Results were
compared (Table 1).
Results: The navigator gated and ECG triggered 3D IR SSFP
(Figure 1C) sequence showed best image quality results (Table 1).
Cross sectional areas showed good interstudy agreement in the
3D SSFP technique without IR (Figure 1B) and 3D first pass
CEMRA (Figure 1A) with similar image quality results using
Gadofosveset and Gd-DTPA. However, these areas are smaller in
end-diastolic ECG triggered respiratory gated sequences
with and without IR prepulse than in breath hold 3D CEMRA
(Table 1, all p < 0.05). Stent artifacts were similar in all
sequences.
Conclusion: A respiratory-navigator-gated and ECG-triggered
3D-IR-SSFP-sequence after application of Gadofosveset
allows free-breathing end-diastolic high-resolution imaging of
the aortic arch in combination with a 32-channel-coil. Image
Table 1 (abstract P261) Values are expressed as mean ± standard deviation
ContrastAgent
Sequence Contrast toNoise Ratio (CNR)
Vessel Wallsharpness (%)
Image quality(mean ± SD)
Vessel Area (cm2) Isotropic spatialresolution (mm3)
Gd-DTPA CEMRA 110 ± 10† 41 ± 4† 2.4 ± 0.8† 4.6 ± 1.9† 1.77
SSFP 135 ± 11* 48 ± 6* 3.3 ± 0.5* 4.1 ± 1.7* 1.49
Gadofosveset CEMRA 99 ± 21† 40 ± 4† 2.7 ± 0.5† 4.7 ± 2.1† 1.77
SSFP 128 ± 19* 46 ± 3* 3.1 ± 0.7* 4.1 ± 1.6* 1.49
SSFP+IR 154 ± 14 53 ± 5 3.7 ± 0.5 3.9 ± 1.7 1.49
†,*, no significant differences between corresponding sequences (Gd-DTPA vs Gadofosveset). Image quality: 1 = non diagnostic, 2 = diagnostic,
3 = good, 4 = excellent.
Figure 1 (abstract P261)
Journal of Cardiovascular Magnetic Resonance 2009, 11(Suppl 1) http://jcmr-online.com/supplements/11/S1
Page 286 of 316(page number not for citation purposes)
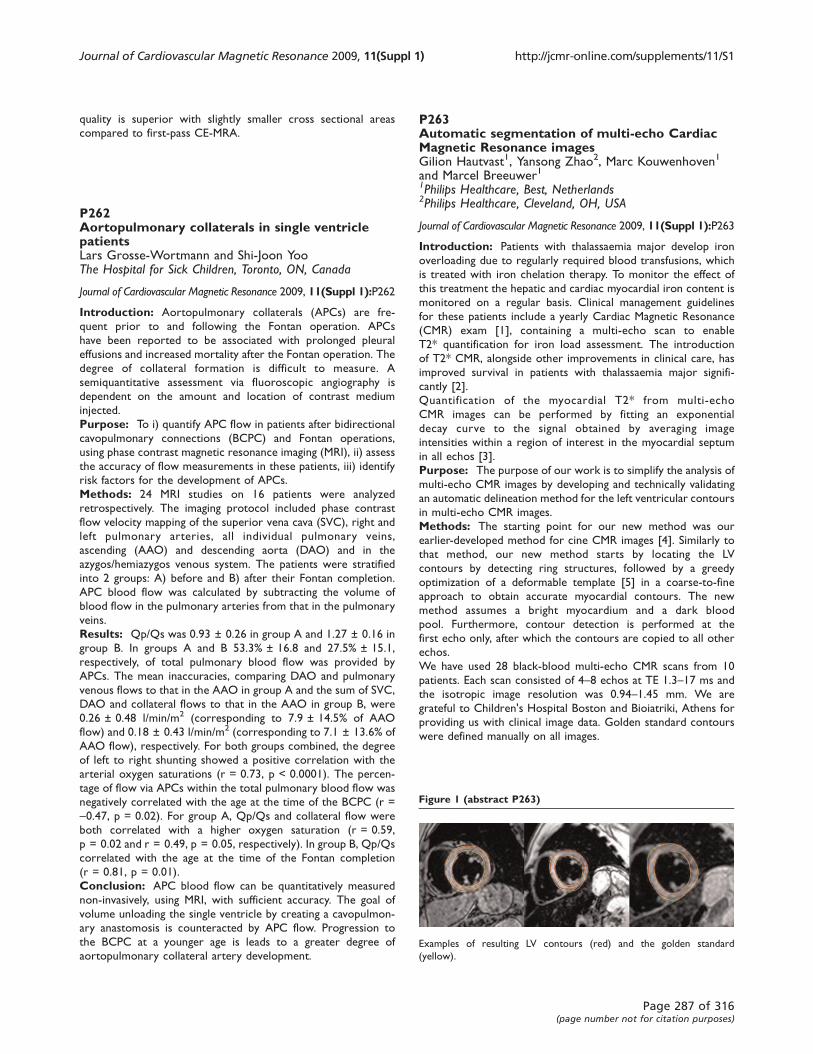
quality is superior with slightly smaller cross sectional areas
compared to first-pass CE-MRA.
P262Aortopulmonary collaterals in single ventriclepatientsLars Grosse-Wortmann and Shi-Joon YooThe Hospital for Sick Children, Toronto, ON, Canada
Journal of Cardiovascular Magnetic Resonance 2009, 11(Suppl 1):P262
Introduction: Aortopulmonary collaterals (APCs) are fre-
quent prior to and following the Fontan operation. APCs
have been reported to be associated with prolonged pleural
effusions and increased mortality after the Fontan operation. The
degree of collateral formation is difficult to measure. A
semiquantitative assessment via fluoroscopic angiography is
dependent on the amount and location of contrast medium
injected.
Purpose: To i) quantify APC flow in patients after bidirectional
cavopulmonary connections (BCPC) and Fontan operations,
using phase contrast magnetic resonance imaging (MRI), ii) assess
the accuracy of flow measurements in these patients, iii) identify
risk factors for the development of APCs.
Methods: 24 MRI studies on 16 patients were analyzed
retrospectively. The imaging protocol included phase contrast
flow velocity mapping of the superior vena cava (SVC), right and
left pulmonary arteries, all individual pulmonary veins,
ascending (AAO) and descending aorta (DAO) and in the
azygos/hemiazygos venous system. The patients were stratified
into 2 groups: A) before and B) after their Fontan completion.
APC blood flow was calculated by subtracting the volume of
blood flow in the pulmonary arteries from that in the pulmonary
veins.
Results: Qp/Qs was 0.93 ± 0.26 in group A and 1.27 ± 0.16 in
group B. In groups A and B 53.3% ± 16.8 and 27.5% ± 15.1,
respectively, of total pulmonary blood flow was provided by
APCs. The mean inaccuracies, comparing DAO and pulmonary
venous flows to that in the AAO in group A and the sum of SVC,
DAO and collateral flows to that in the AAO in group B, were
0.26 ± 0.48 l/min/m2 (corresponding to 7.9 ± 14.5% of AAO
flow) and 0.18 ± 0.43 l/min/m2 (corresponding to 7.1 ± 13.6% of
AAO flow), respectively. For both groups combined, the degree
of left to right shunting showed a positive correlation with the
arterial oxygen saturations (r = 0.73, p < 0.0001). The percen-
tage of flow via APCs within the total pulmonary blood flow was
negatively correlated with the age at the time of the BCPC (r =
-0.47, p = 0.02). For group A, Qp/Qs and collateral flow were
both correlated with a higher oxygen saturation (r = 0.59,
p = 0.02 and r = 0.49, p = 0.05, respectively). In group B, Qp/Qs
correlated with the age at the time of the Fontan completion
(r = 0.81, p = 0.01).
Conclusion: APC blood flow can be quantitatively measured
non-invasively, using MRI, with sufficient accuracy. The goal of
volume unloading the single ventricle by creating a cavopulmon-
ary anastomosis is counteracted by APC flow. Progression to
the BCPC at a younger age is leads to a greater degree of
aortopulmonary collateral artery development.
P263Automatic segmentation of multi-echo CardiacMagnetic Resonance imagesGilion Hautvast1, Yansong Zhao2, Marc Kouwenhoven1
and Marcel Breeuwer11Philips Healthcare, Best, Netherlands2Philips Healthcare, Cleveland, OH, USA
Journal of Cardiovascular Magnetic Resonance 2009, 11(Suppl 1):P263
Introduction: Patients with thalassaemia major develop iron
overloading due to regularly required blood transfusions, which
is treated with iron chelation therapy. To monitor the effect of
this treatment the hepatic and cardiac myocardial iron content is
monitored on a regular basis. Clinical management guidelines
for these patients include a yearly Cardiac Magnetic Resonance
(CMR) exam [1], containing a multi-echo scan to enable
T2* quantification for iron load assessment. The introduction
of T2* CMR, alongside other improvements in clinical care, has
improved survival in patients with thalassaemia major signifi-
cantly [2].
Quantification of the myocardial T2* from multi-echo
CMR images can be performed by fitting an exponential
decay curve to the signal obtained by averaging image
intensities within a region of interest in the myocardial septum
in all echos [3].
Purpose: The purpose of our work is to simplify the analysis of
multi-echo CMR images by developing and technically validating
an automatic delineation method for the left ventricular contours
in multi-echo CMR images.
Methods: The starting point for our new method was our
earlier-developed method for cine CMR images [4]. Similarly to
that method, our new method starts by locating the LV
contours by detecting ring structures, followed by a greedy
optimization of a deformable template [5] in a coarse-to-fine
approach to obtain accurate myocardial contours. The new
method assumes a bright myocardium and a dark blood
pool. Furthermore, contour detection is performed at the
first echo only, after which the contours are copied to all other
echos.
We have used 28 black-blood multi-echo CMR scans from 10
patients. Each scan consisted of 4–8 echos at TE 1.3–17 ms and
the isotropic image resolution was 0.94–1.45 mm. We are
grateful to Children's Hospital Boston and Bioiatriki, Athens for
providing us with clinical image data. Golden standard contours
were defined manually on all images.
Figure 1 (abstract P263)
Examples of resulting LV contours (red) and the golden standard
(yellow).
Journal of Cardiovascular Magnetic Resonance 2009, 11(Suppl 1) http://jcmr-online.com/supplements/11/S1
Page 287 of 316(page number not for citation purposes)
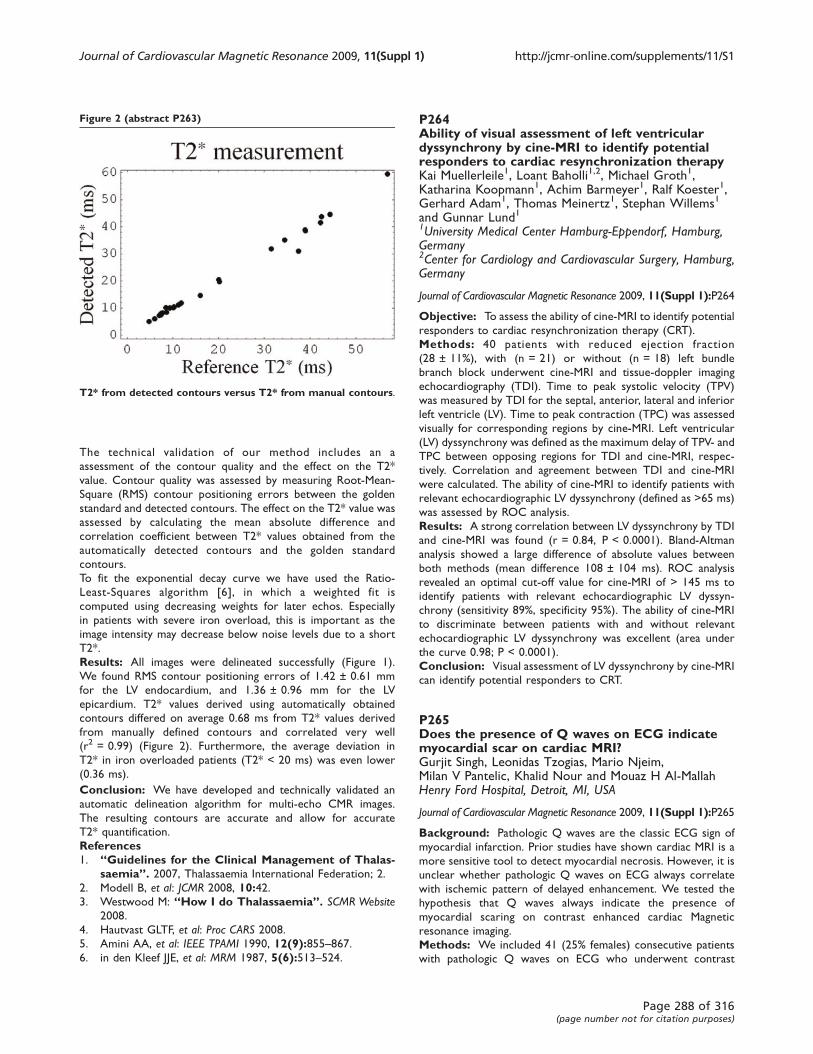
The technical validation of our method includes an a
assessment of the contour quality and the effect on the T2*
value. Contour quality was assessed by measuring Root-Mean-
Square (RMS) contour positioning errors between the golden
standard and detected contours. The effect on the T2* value was
assessed by calculating the mean absolute difference and
correlation coefficient between T2* values obtained from the
automatically detected contours and the golden standard
contours.
To fit the exponential decay curve we have used the Ratio-
Least-Squares algorithm [6], in which a weighted fit is
computed using decreasing weights for later echos. Especially
in patients with severe iron overload, this is important as the
image intensity may decrease below noise levels due to a short
T2*.
Results: All images were delineated successfully (Figure 1).
We found RMS contour positioning errors of 1.42 ± 0.61 mm
for the LV endocardium, and 1.36 ± 0.96 mm for the LV
epicardium. T2* values derived using automatically obtained
contours differed on average 0.68 ms from T2* values derived
from manually defined contours and correlated very well
(r2 = 0.99) (Figure 2). Furthermore, the average deviation in
T2* in iron overloaded patients (T2* < 20 ms) was even lower
(0.36 ms).
Conclusion: We have developed and technically validated an
automatic delineation algorithm for multi-echo CMR images.
The resulting contours are accurate and allow for accurate
T2* quantification.
References1. “Guidelines for the Clinical Management of Thalas-
saemia”. 2007, Thalassaemia International Federation; 2.
2. Modell B, et al: JCMR 2008, 10:42.3. Westwood M: “How I do Thalassaemia”. SCMR Website
2008.
4. Hautvast GLTF, et al: Proc CARS 2008.
5. Amini AA, et al: IEEE TPAMI 1990, 12(9):855–867.6. in den Kleef JJE, et al: MRM 1987, 5(6):513–524.
P264Ability of visual assessment of left ventriculardyssynchrony by cine-MRI to identify potentialresponders to cardiac resynchronization therapyKai Muellerleile1, Loant Baholli1,2, Michael Groth1,Katharina Koopmann1, Achim Barmeyer1, Ralf Koester1,Gerhard Adam1, Thomas Meinertz1, Stephan Willems1
and Gunnar Lund11University Medical Center Hamburg-Eppendorf, Hamburg,Germany2Center for Cardiology and Cardiovascular Surgery, Hamburg,Germany
Journal of Cardiovascular Magnetic Resonance 2009, 11(Suppl 1):P264
Objective: To assess the ability of cine-MRI to identify potential
responders to cardiac resynchronization therapy (CRT).
Methods: 40 patients with reduced ejection fraction
(28 ± 11%), with (n = 21) or without (n = 18) left bundle
branch block underwent cine-MRI and tissue-doppler imaging
echocardiography (TDI). Time to peak systolic velocity (TPV)
was measured by TDI for the septal, anterior, lateral and inferior
left ventricle (LV). Time to peak contraction (TPC) was assessed
visually for corresponding regions by cine-MRI. Left ventricular
(LV) dyssynchrony was defined as the maximum delay of TPV- and
TPC between opposing regions for TDI and cine-MRI, respec-
tively. Correlation and agreement between TDI and cine-MRI
were calculated. The ability of cine-MRI to identify patients with
relevant echocardiographic LV dyssynchrony (defined as >65 ms)
was assessed by ROC analysis.
Results: A strong correlation between LV dyssynchrony by TDI
and cine-MRI was found (r = 0.84, P < 0.0001). Bland-Altman
analysis showed a large difference of absolute values between
both methods (mean difference 108 ± 104 ms). ROC analysis
revealed an optimal cut-off value for cine-MRI of > 145 ms to
identify patients with relevant echocardiographic LV dyssyn-
chrony (sensitivity 89%, specificity 95%). The ability of cine-MRI
to discriminate between patients with and without relevant
echocardiographic LV dyssynchrony was excellent (area under
the curve 0.98; P < 0.0001).
Conclusion: Visual assessment of LV dyssynchrony by cine-MRI
can identify potential responders to CRT.
P265Does the presence of Q waves on ECG indicatemyocardial scar on cardiac MRI?Gurjit Singh, Leonidas Tzogias, Mario Njeim,Milan V Pantelic, Khalid Nour and Mouaz H Al-MallahHenry Ford Hospital, Detroit, MI, USA
Journal of Cardiovascular Magnetic Resonance 2009, 11(Suppl 1):P265
Background: Pathologic Q waves are the classic ECG sign of
myocardial infarction. Prior studies have shown cardiac MRI is a
more sensitive tool to detect myocardial necrosis. However, it is
unclear whether pathologic Q waves on ECG always correlate
with ischemic pattern of delayed enhancement. We tested the
hypothesis that Q waves always indicate the presence of
myocardial scaring on contrast enhanced cardiac Magnetic
resonance imaging.
Methods: We included 41 (25% females) consecutive patients
with pathologic Q waves on ECG who underwent contrast
Figure 2 (abstract P263)
T2* from detected contours versus T2* from manual contours.
Journal of Cardiovascular Magnetic Resonance 2009, 11(Suppl 1) http://jcmr-online.com/supplements/11/S1
Page 288 of 316(page number not for citation purposes)
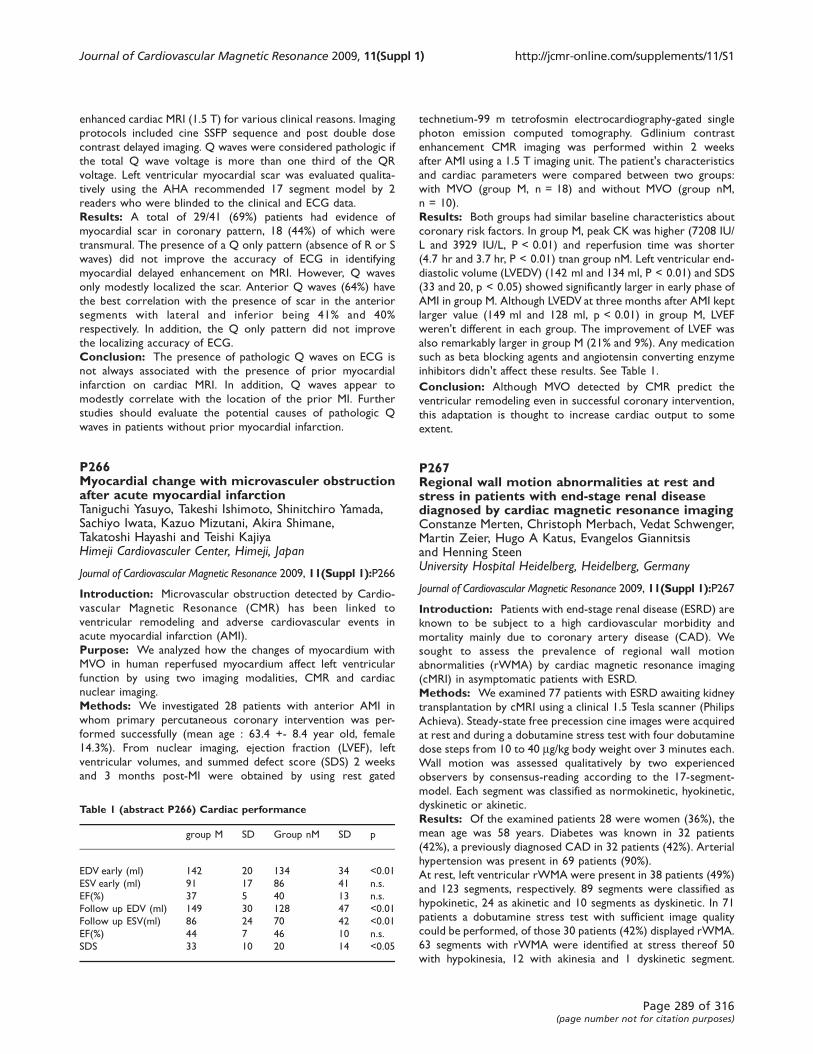
enhanced cardiac MRI (1.5 T) for various clinical reasons. Imaging
protocols included cine SSFP sequence and post double dose
contrast delayed imaging. Q waves were considered pathologic if
the total Q wave voltage is more than one third of the QR
voltage. Left ventricular myocardial scar was evaluated qualita-
tively using the AHA recommended 17 segment model by 2
readers who were blinded to the clinical and ECG data.
Results: A total of 29/41 (69%) patients had evidence of
myocardial scar in coronary pattern, 18 (44%) of which were
transmural. The presence of a Q only pattern (absence of R or S
waves) did not improve the accuracy of ECG in identifying
myocardial delayed enhancement on MRI. However, Q waves
only modestly localized the scar. Anterior Q waves (64%) have
the best correlation with the presence of scar in the anterior
segments with lateral and inferior being 41% and 40%
respectively. In addition, the Q only pattern did not improve
the localizing accuracy of ECG.
Conclusion: The presence of pathologic Q waves on ECG is
not always associated with the presence of prior myocardial
infarction on cardiac MRI. In addition, Q waves appear to
modestly correlate with the location of the prior MI. Further
studies should evaluate the potential causes of pathologic Q
waves in patients without prior myocardial infarction.
P266Myocardial change with microvasculer obstructionafter acute myocardial infarctionTaniguchi Yasuyo, Takeshi Ishimoto, Shinitchiro Yamada,Sachiyo Iwata, Kazuo Mizutani, Akira Shimane,Takatoshi Hayashi and Teishi KajiyaHimeji Cardiovasculer Center, Himeji, Japan
Journal of Cardiovascular Magnetic Resonance 2009, 11(Suppl 1):P266
Introduction: Microvascular obstruction detected by Cardio-
vascular Magnetic Resonance (CMR) has been linked to
ventricular remodeling and adverse cardiovascular events in
acute myocardial infarction (AMI).
Purpose: We analyzed how the changes of myocardium with
MVO in human reperfused myocardium affect left ventricular
function by using two imaging modalities, CMR and cardiac
nuclear imaging.
Methods: We investigated 28 patients with anterior AMI in
whom primary percutaneous coronary intervention was per-
formed successfully (mean age : 63.4 +- 8.4 year old, female
14.3%). From nuclear imaging, ejection fraction (LVEF), left
ventricular volumes, and summed defect score (SDS) 2 weeks
and 3 months post-MI were obtained by using rest gated
technetium-99 m tetrofosmin electrocardiography-gated single
photon emission computed tomography. Gdlinium contrast
enhancement CMR imaging was performed within 2 weeks
after AMI using a 1.5 T imaging unit. The patient's characteristics
and cardiac parameters were compared between two groups:
with MVO (group M, n = 18) and without MVO (group nM,
n = 10).
Results: Both groups had similar baseline characteristics about
coronary risk factors. In group M, peak CK was higher (7208 IU/
L and 3929 IU/L, P < 0.01) and reperfusion time was shorter
(4.7 hr and 3.7 hr, P < 0.01) tnan group nM. Left ventricular end-
diastolic volume (LVEDV) (142 ml and 134 ml, P < 0.01) and SDS
(33 and 20, p < 0.05) showed significantly larger in early phase of
AMI in group M. Although LVEDV at three months after AMI kept
larger value (149 ml and 128 ml, p < 0.01) in group M, LVEF
weren't different in each group. The improvement of LVEF was
also remarkably larger in group M (21% and 9%). Any medication
such as beta blocking agents and angiotensin converting enzyme
inhibitors didn't affect these results. See Table 1.
Conclusion: Although MVO detected by CMR predict the
ventricular remodeling even in successful coronary intervention,
this adaptation is thought to increase cardiac output to some
extent.
P267Regional wall motion abnormalities at rest andstress in patients with end-stage renal diseasediagnosed by cardiac magnetic resonance imagingConstanze Merten, Christoph Merbach, Vedat Schwenger,Martin Zeier, Hugo A Katus, Evangelos Giannitsisand Henning SteenUniversity Hospital Heidelberg, Heidelberg, Germany
Journal of Cardiovascular Magnetic Resonance 2009, 11(Suppl 1):P267
Introduction: Patients with end-stage renal disease (ESRD) are
known to be subject to a high cardiovascular morbidity and
mortality mainly due to coronary artery disease (CAD). We
sought to assess the prevalence of regional wall motion
abnormalities (rWMA) by cardiac magnetic resonance imaging
(cMRI) in asymptomatic patients with ESRD.
Methods: We examined 77 patients with ESRD awaiting kidney
transplantation by cMRI using a clinical 1.5 Tesla scanner (Philips
Achieva). Steady-state free precession cine images were acquired
at rest and during a dobutamine stress test with four dobutamine
dose steps from 10 to 40 mg/kg body weight over 3 minutes each.
Wall motion was assessed qualitatively by two experienced
observers by consensus-reading according to the 17-segment-
model. Each segment was classified as normokinetic, hyokinetic,
dyskinetic or akinetic.
Results: Of the examined patients 28 were women (36%), the
mean age was 58 years. Diabetes was known in 32 patients
(42%), a previously diagnosed CAD in 32 patients (42%). Arterial
hypertension was present in 69 patients (90%).
At rest, left ventricular rWMA were present in 38 patients (49%)
and 123 segments, respectively. 89 segments were classified as
hypokinetic, 24 as akinetic and 10 segments as dyskinetic. In 71
patients a dobutamine stress test with sufficient image quality
could be performed, of those 30 patients (42%) displayed rWMA.
63 segments with rWMA were identified at stress thereof 50
with hypokinesia, 12 with akinesia and 1 dyskinetic segment.
Table 1 (abstract P266) Cardiac performance
group M SD Group nM SD p
EDV early (ml) 142 20 134 34 <0.01
ESV early (ml) 91 17 86 41 n.s.
EF(%) 37 5 40 13 n.s.
Follow up EDV (ml) 149 30 128 47 <0.01
Follow up ESV(ml) 86 24 70 42 <0.01
EF(%) 44 7 46 10 n.s.
SDS 33 10 20 14 <0.05
Journal of Cardiovascular Magnetic Resonance 2009, 11(Suppl 1) http://jcmr-online.com/supplements/11/S1
Page 289 of 316(page number not for citation purposes)

Among patients with rWMA at rest, 12 showed a normalisation
of contractility at stress, in 18 patients WMA remained
unchanged during dobutamine stimulation, further 2 patients
had worsening WMA at stress. In the remaining 6 patients a
stress test could not be performed due to claustrophobic
reactions or resulted in insufficient image quality.
In 6 patients (8.5%) a positive stress test was observed. 4 of those
patients had normal contractility at rest, in 2 patients pre-existing
rWMA worsened under dobutamine stimulation. 3 patients with
a positive stress test were diabetic, 2 patients had previously
known CAD.
At rest and stress, the prevalence of rWMA was not different in
patients with and without diabetes mellitus (47 vs. 51%, p = NS
at rest and 45 vs. 40% at stress, p = NS). The presence of arterial
hypertension and the myocardial mass equally had no influence of
the prevalence of WMA. However, we observed significantly
more rWMA in patients with known CAD than in patients with a
history of CAD, as well at rest (66 vs. 38%, p = 0.016) as at
stress (59 vs. 31%, p = 0.02).
Conclusion: rWMA are e frequent finding in patients with
ESRD. Patients with a known CAD have a significantly higher
prevalence of rWMA. However, rWMA were also observed in
about a third of patients without a history of CAD. Risk factors
such as diabetes mellitus or arterial hypertension did not
influence the prevalence of rWMA.
cMRI is a useful and non-invasive method to identify patients with
cardiac morbidity in the high risk population of patients with
ESRD.
P268Evolution of left ventricular strain after a first timemyocardial infarction. A study using velocityencoded magnetic resonance imagingUlrika Pahlm-Webb, Einar Heiberg, Erik Hedströmand Hakan ArhedenDepartment of Clincial Physiology, Lund, Sweden
Journal of Cardiovascular Magnetic Resonance 2009, 11(Suppl 1):P268
Purpose: To compare the evolution of regional myocardial
strain in an area of myocardial infarction to remote myocardium
in patients with first time myocardial infarction.
Introduction: After a myocardial infarction there is loss of
function in the left ventricular region affected by ischemia. With
time and treatment the function could improve. How fast the
regional function improves is debated. Therefore we studied the
evolution of left ventricular strain measured with velocity
encoded MRI in the injured myocardium and compared it to
strain in remote myocardium.
Methods: Velocity-encoded magnetic resonance images (VE-
MRI) were acquired in 8 patients (median age: 69 years, range:
41–74) with acute myocardial infarction and were followed with
subsequent VE-MRI after 1 and 6 weeks, 6 and 12 months. The
myocardium was manually delineated in the first time-frame and
strain was automatically calculated using in house developed
software http://segment.heiberg.se. Delayed enhancement images
were used to determine the site of the myocardial injury. The
first MRI was used as an internal control for each patient to be
able to track change of regional strain over time. Strain in the
injured myocardium was compared to remote myocardium over
12 months. A student t-test was used to test for significant
change.
Results: Figure 1 shows change of strain over time at one day,
one week, six weeks, three months and one year, for injured and
remote myocardium, respectively. Regional strain in the injured
region increases over 12 month (p < 0.05) while strain in remote
myocardium decreases (p < 0.05).
Conclusion: Regional strain in the injured region increases
over 12 month while strain in remote myocardium decreases.
This study shows a statistical difference in the change of strain
12 months after the infarct.
P269Contrast-enhanced cine cardiac MR detectsimpairment of coronary microvascular perfusionin patients after acute myocardial infarctRicardo Loureiro1, Hiram G Bezerra1, Joalbo M Andrade2,Chun-Ho Yun1, Ammar Sarwar1, Michael Bolen1,Thomas J Brady1 and Ricardo C Cury11Massachusetts General Hospital – Harvard Medical School,Boston, MA, USA2Department of Radiology – Universidade de Brasília,Brasilia, Brazil
Journal of Cardiovascular Magnetic Resonance 2009, 11(Suppl 1):P269
Purpose: To prospectively compare contrast-enhanced (CE)
cine steady-state free precession (SSFP) magnetic resonance
imaging (MRI) to assess microvascular obstruction (MVO) with
delayed-enhancement (DE) MRI, and to evaluate the association
between MVO size and angiographic perfusion scores after
primary percutaneous coronary angioplasty.
Materials and methods: The study was HIPAA compliant and
was approved by the institutional review board. All participants
gave written informed consent. Twenty one patients (19 men;
mean age, 59 ± 12 years) were examined with contrast-
enhanced MRI after presentation and repeated at 6 months in
15 patients. TIMI Flow Grade (TFG), corrected TIMI Frame
Count (cTFC), TIMI Myocardial Perfusion grade (TMPG), MVO,
infarct size, and left ventricular ejection fraction (EF) were
assessed.
Figure 1 (abstract P268)
Change of strain over time at one day, one week, six weeks, three months
and one year, for injured and remote myocardium, respectively.
Journal of Cardiovascular Magnetic Resonance 2009, 11(Suppl 1) http://jcmr-online.com/supplements/11/S1
Page 290 of 316(page number not for citation purposes)

Results: MVO zones of decreased signal intensity were
observed in 18 of 21 (86%) examinations on CE cineSSFP MR
imaging and 17/21 (80%) examinations on DE MRI (P = NS). The
size of CE cineSSFP hypointense zone was comparable to the
MVO size measured by DE MRI (3.3 ± 3.1% versus 2.9 ± 3.0% of
the myocardial mass; P = NS). MVO size correlated well with
infarct size (r = 0.76 for CE cineSSFP and r = 0.83 for DE MRI)
and EF at follow-up (r = -0.64 for CE cineSSFP and r = -0.58 for
CE MRI). TFG 3 was present following percutaneous coronary
intervention (PCI) in 20/21 (95%) patients. Abnormal post-PCI
TMPG (0/1/2) was present in 11/21 (50%) of subjects and was
associated with MVO size on CE cineSSFP (3.6 ± 2.2% with
abnormal TMPG versus 0.8 ± 0.7% of the myocardial mass (LV)
with TMPG 3; P < 0.05) and DE MRI (4.4 ± 2.6% with abnormal
TMPG versus 1.3 ± 1.3% LV with TMPG 3; P < 0.05). There was
no association between abnormal post-PCI TFC (≥ 40) and MVO
size on CE cineSSFP (3.5 ± 2.5% with abnormal TFC versus
1.8 ± 2.3% LV with TFC < 40, P = 0.26) and DE MRI (2.9 ± 2.0%
with abnormal TFC versus 1.5 ± 2.3% LV with TFC < 40,
P = 0.29). Abnormal post-PCI TMPG was also associated with
greater relative infarct size (18.8% vs. 9.6%, P = 0.04). CEci-
neSSFP MR had a comparable contrast-to-noise ratio (CNR) to
DE MRI for depicting MVO zones (P = NS).
Conclusion: CE cineSSFP hypointense zone depicts the
microvascular obstruction region in close agreement with the
DE MRI approach, and correlates with infarct size and global LV
function at follow-up. TMPG seems to translate better the
microvascular integrity compared to cardiac MRI measures of
MVO.
P270Comparison of left ventricle ejection fraction byechocardiography and cardiac magnetic resonanceimaging in day to day clinical practiceMichael A Witcik1, Meghana Raghavendra1,Vicki L McHugh1, Jacob D Gundrum1, Kara J Kallies1,Tim T Tissue2, Marvin J Shear2 and Raju G Ailiani21Gundersen Lutheran Medical Foundation, La Crosse, WI, USA2Gundersen Lutheran Health System, La Crosse, WI, USA
Journal of Cardiovascular Magnetic Resonance 2009, 11(Suppl 1):P270
Introduction: Left ventricle ejection fraction (LVEF) is the
most commonly used marker of LV function. It generally does not
change over a short period of time in the absence of a major
cardiovascular event or medication change. Cardiac magnetic
resonance imaging (CMRI) is considered gold standard for LVEF
assessment, however echocardiography is more widely available
and most commonly used tool to assess LVEF.
Purpose: To evaluate the differences in clinically relevant
LVEF ranges as measured by echocardiography and CMRI and
to assess the reproducibility of CMRI LVEF calculations of
experienced CMRI physicians compared to minimally-trained
medical residents.
Methods: One hundred consecutive patients who underwent
both echocardiography and CMRI from 9/01/05 to 6/18/07 at a
community hospital were retrospectively reviewed. Echocardio-
graphy LVEF was derived by standard techniques. CMRI LVEF
measurements were derived by standard techniques, utilizing
short axis stack of TRUFISP cine images over the entire LV
volume with volumetric analysis on the ARGUS work station.
LVEF cutoffs for major clinical decision making were defined as
<30% (prophylactic ICD implantation) and <50% (diagnosis of
cardiomyopathy and discontinuation of cardiotoxic chemother-
apy agents), and were the basis for comparisons. Mean time
frame between the echocardiogram and CMRI was 15.8 days
(range 14–49 days). CMRI LVEF calculated by two internal
medicine residents blinded to patient information and original
CMRI was compared with experienced CMRI physician calcu-
lated LVEF. Residents received limited training in selecting
appropriate CMRI images and working with ARGUS workstation.
We compared physician read echocardiography and CMRI LVEF,
as well as physician read and resident read CMRI derived LVEF.
Results: Physician read echocardiography and CMRI LVEF
comparisons divided subjects into 4 groups. Group 1 had LVEF
<30% on echocardiography (n = 16). Of these, 8 (50%) had
corresponding LVEF by CMRI as >30% with differences of 5–10%in 1 subject (6%) and >10% in 7 subjects (44%). Group 2 had
LVEF <30% on CMRI (n = 9). Of these, 1 subject (5%) had
corresponding LVEF by echocardiography >30%, with a differ-
ence of >10%. Group 3 had LVEF ≥ 30 to <50% on
echocardiography (n = 22). Of these, 10 (45%) had correspond-
ing LVEF by CMRI as >50% with differences of 5–10% in 4
subjects (18%) and >10% in 6 subjects (27%). Group 4 had LVEF
≥ 30 to <50% on CMRI (n = 27). Of these, 5 subjects (18%) had
corresponding LVEF by echocardiography as > 50% with
differences of 0–10% in 2 subjects (7%) and >10% in 3 subjects
(11%). When LVEF was assessed as <30% by either tool, the
discordance was 36%; when assessed as ≥ 30 to <50% by either
tool, the discordance was 35%.
Physician read and resident read CMRI LVEF comparisons divided
subjects into 2 groups. Group A had physician calculated CMRI
LVEF <30% (n = 9). Of these, 8 (89%) had corresponding
LVEF by resident calculated CMRI as <30%. The one subject with
a divergent LVEF was over read by the resident by 10.4%. Group
B had LVEF ≥ 30 to <50% on CMRI (n = 27). Of these, 17 (63%)
had corresponding LVEF by resident read CMRI as ≥ 30%
to < 50% with differences of < 5% in 6 subjects (22%) and > 5%
in 4 subjects (15%). Overall discordance between physician and
resident calculated CMRI LVEF for <30% was 11%. When LVEF
was assessed as ≥ 30 to <50%, the discordance was 37% (22%
with a difference of <5%; 15% with a difference of >5%).
Conclusion: Prior to making major management decisions
based on echocardiography derived LVEF in clinically relevant
ranges, CMRI confirmation is strongly suggested, particularly in
patients with suboptimal images. These results also suggest that
the analysis of CMRI data to derive accurate LVEF can be
performed without extensive training and is reproducible.
P271Delay enhancement cardiac MR imaging forassesment of myocardial involvement in patientswith systemic lupus erythematosus and clinicalsuspect of myocarditisSandra Graciela Rosales Uvera, Leticia Castellanos Cainas,Jaime Galindo Uribe, Jorge Vazquez La Madrid,Jorge Oseguera Moguel and Martha Morelos GuzmanNational Institute of the Medical Science and NutritionSalvador Zubiran, Mexico D.F., Mexico
Journal of Cardiovascular Magnetic Resonance 2009, 11(Suppl 1):P271
Introduction: The systemic lupus erythematosus (SLE) is a
multiorgan inflammatory autoimmune disease mainly affecting
Journal of Cardiovascular Magnetic Resonance 2009, 11(Suppl 1) http://jcmr-online.com/supplements/11/S1
Page 291 of 316(page number not for citation purposes)

women and is associated with high cardiovascular motality;
myocarditis is a rare complication; however little knowledge
about cardiac damage by myocarditis in patients with SLE. The
cardiac magnetic resonance (CMR) is a useful tool for diagnosis
of myocarditis and evaluate progression or regression of cardiac
damage caused by SLE. See Figure 1.
Purpose: The purpose of this preliminary study is to evaluate
the structural and functional alterations in patients with SLE and
clinical suspect of myocarditis.
Methods: 9 SLE consecutive patients (mean age 40.5 years), 1
man and 8 woman. Diagnosis followed the criteria of American
Rheumatism Association; assessment of SLE activity was based
on the European Consensus Lupus Activity Mesurement
(ECLAM) Index. Underwent CMR on a GE 1.5 tesla magnet for
assessment of cardiac function, cine images used a balanced
steady state free precession (FIESTA) technique with retro-
spective ECG triggering (TE = 1.6 TR = 3.6, flip angle 45 =, slice
thickness = 8 mm) short and long axis images were performed,
matrix 224 × 224. Ten minutes after administration of 0.2 mmol/
kg of Gd-DTPA a k space segmented 2D inversion-recovery
gradient echo secuences (in-plane resolution 1.3 × 1.3 mm2,
slice thickeness 8 mm) with complete coverage of the left
ventricle (LV) myocardium in short axis slices and additional long
axis view. Images were analyzed based on 17 segment model to
evaluate segmental wall motions abnormalities.
Results: Mean LV end-diastolic volume 147 ml and mean LV
end-systolic volume 75 ml with LV dilated in 2 patients, mean LV
mass 109 gr, mean left ventricular ejection fraction was 51.8%,
77% have segmental wall motions abnormalities, 55% left and
right atrium enlargement. Aortic valve alterations in 55%, mitral
valve involvement 100%, pericardial effusion 66%. Delay
enhancement imaging revealed intramyocardial hyperenhancing
lesions in the LV myocardium in 4 patients (44%) without
relationship with coronary artery territory.
Conclusion: Preliminary data suggest delayed enhancement
CMR is avaible to detect cardiac damage caused by SLE
myocarditis, besides CMR can identify valvular damage, atrial
enlargement and pericardial alterations as early evolution of the
disease.
P272Atrial size and function post orthotopic hearttransplantation – CMR and ECHO studyNishant Kalra and Vincent L SorrellSarver Heart Center, University of Arizona, Tucson, AZ, USA
Journal of Cardiovascular Magnetic Resonance 2009, 11(Suppl 1):P272
Background: The conventional orthotopic heart transplanta-
tion (OHT) (biatrial) results in atrial enlargement. The variability
of atrial size and function in these patients has not been
previously reported.
Objectives: 1. Determine the variability in the post-OHT size
and function of left and right atria; 2. Analyze the relationship of
donor and native atria; 3. Compare cardiac MRI (CMR) with
transthoracic echocardiogram (TTE).
Methods: This is a retrospective observational study. Nine
patients who had undergone OHT via biatrial anastomosis
technique and had both CMR as well TTE within one month of
each other were selected. Using the optimized apical 4-chamber
views in both TTE and CMR cine images (SSFP), endocardial
borders of the native and donor, right atrial (RA) and left atrial
(LA) free wall and septum were traced from base to the valvular
annulus and areas were determined in late systole when atrial
volumes are maximal and late diastole when atrial volumes are
minimal. RA and LA function was assessed quantitatively using
percentage of change in cavity area or fractional area change
(FAC). FAC was defined using the formula ([end-systolic area] -
[end-diastolic area])/[end-systolic area] × 100). Native and
donor areas were also combined to calculate the total area of
the right and left atria. Comparison was made between the TTE
Figure 1 (abstract P271)
37 year old female with 3 year evolution of SLE and myocarditis, with
precordial pain and dispnea, left ventricle is dilated, low ejection
fraction and fibrosis with patchy pattern, other sings of damage were
mitral and aortic regurgitation, biatrial enlargement and pericardial
effusion.
Table 1 (abstract P272) Atrial Area (mean +/- SD) measured by CMR and TTE
CMR Systole CMR Diastole TTE Systole TTE Diastole
Total Left Atrial Area 30.6 +/- 13.3 27.7 +/- 13.8 30.5 +/- 12.6 22.2 +/- 11.1
Total Right Atrial Area 24.9 +/- 8.1 23.6 +/- 7.7 20.6 +/- 7.7 18.5 +/- 7.5
Donor Left Atrial Area 11.9 +/- 3.7 8.5 +/- 3.9 13.1 +/- 3.1 8.3 +/- 2.8
Donor Right Atrial Area 12.4 +/- 3.1 11.3 +/- 3.0 11.8 +/- 3.4 9.5 +/- 2.8
Native Left Atrial Area 18.7 +/- 10.1 19.2 +/- 10.4 17.4 +/- 9.8 13.9 +/- 8.3
Native Right Atrial Area 12.5 +/- 5.8 12.3 +/- 5.4 8.8 +/- 5.1 8.9+/4.8
Journal of Cardiovascular Magnetic Resonance 2009, 11(Suppl 1) http://jcmr-online.com/supplements/11/S1
Page 292 of 316(page number not for citation purposes)

and CMR values. Data for continuous variables are expressed as
mean value +/- SD.
Results: See Tables 1 and 2. TTE and CMR were performed
within 6 + 9 days of each other. The native atria (retained atrial
cuff) are usually larger than the donor atria on the left and almost
equal on right. The total LA area is usually > total RA area.
7 patients have LA total area > 24 cm2 and 4 of these patients
also have RA total area > 24 cm2. TTE showed a good correlation
with CMR, however within individual patients, there were both
over- and under-estimation of atrial areas and TTE consistently
underestimated native atrial areas. Native atrial function was
consistently worse than donor atrial function. Overall total LA
function was better than total RA function. TTE consistently
overestimated the FAC compared to CMR in all except the native
right atrial group.
Discussion: Left atrial volumes consistently predict outcome in
most patient groups studied. LA size is frequently severely
distorted after OHT and is dependent upon extent of retained
pulmonary vein cuffs or associated donor lung preparation,
individual cardiac surgeon preferences, and cardiac recipient
organ status. Knowing the variations in atrial sizes may provide a
new avenue for clinical investigation (Figure 1). A CMR atrial area
<24 cm2 is considered normal, but rarely present in this post-
OHT patient subgroup.
It appears that the retained native atrium does not contribute to
atrial contraction. This resulted in a negative total FAC% in 45%
(4/9) of our patients. Given the large retained native atria, and its
poor contribution to atrial contraction, this report suggests that
minimizing this atrial reservoir may be valuable and warrants
additional study. The underestimation of native atrial size
reported by TTE is most likely due to apical fore-shortening of
the true long-axis and the far field ultrasound imaging.
Conclusion: This observational study suggests that despite a
generally reasonable correlation between TTE and CMR
measures of OHT atria, significant differences exist. Further-
more, because of suspected intra-atrial (donor versus native)
mechanical dysynchrony, some patients surprisingly had a
negative FAC% suggesting that the native atria is larger during
donor atrial contraction – acting as a non-functioning reservoir.
The association of this to the clinical outcome has yet to be
determined.
P273Whole-body magnetic resonance angiographyfor the assessment of extent and severity ofextra-cardiac atherosclerosis in patients withnewly diagnosed coronary artery diseaseStephanie Lehrke, Benjamin Egenlauf, Henning Steen,Constanze Merten, Dirk Lossnitzer, Evangelos Giannitsisand Hugo A KatusMedizinische Universitätsklinik Heidelberg, Heidelberg,Germany
Journal of Cardiovascular Magnetic Resonance 2009, 11(Suppl 1):P273
Introduction: The presence of extra- cardiac atherosclerosis
is associated with an adverse prognosis in patients with coronary
artery disease (CAD).
Purpose: We hypothesized that whole body magnetic reso-
nance angiography (MRA) is a valuable tool for the non-invasive
assessment of the severity of systemic atherosclerosis in patients
(pts) with CAD. We further propose the use of an athero-
sclerosis score index as a novel marker for the severity of
systemic atherosclerotic burden.
Methods: Whole-body MRA was performed on a 1.5 T clinical
scanner equipped with a moving table top extender (Intera
Achieva®, Philips Medical Systems) in 31 pts scheduled to
undergo coronary angiography for suspected CAD. None of the
pts had known extra-cardiac arterial disease. The arterial tree
was divided into 40 segments from the carotid arteries to the
arteries of the lower leg which were graded with regard to their
luminal narrowing (≤10%, 11–25%, 26–50%, 51–75%, 76–90%,91–99%, occlusion). All segments received a score according to
the severity of stenosis, ranging from 1 for a normal vessel to 8
for a total occlusion. The atherosclerosis score index (ASI) for
each patient was calculated by dividing the sum of vessel scores
by the number of analysed segments.
Results: Whole-body MRA was obtained in good quality from
all pts and a total of 1088 arterial segments were analysed.
Coronary angiography revealed significant CAD in 19/31 pts.
These pts had a higher atherosclerosis score index (1.77 ± 0.11
Table 2 (abstract P272) Fractional Area Change (mean +/- SD)measured by CMR and TTE
CMR TTE
Total Left FAC 10.3 +/- 8.9 28.8+/12.2
Total Right FAC 4.9 +/- 8.9 10.6 +/- 7.8
Donor Left FAC 29.7 +/- 12.8 36.6 +/- 13.4
Donor Right FAC 8.4 +/- 13.1 17.6 +/- 16.4
Native Left FAC -3.9 +/- 13.0 20.9 +/- 18.0
Native Right FAC 0.6 +/- 10.1 -8.2 +/- 25.1
Figure 1 (abstract P272)
Journal of Cardiovascular Magnetic Resonance 2009, 11(Suppl 1) http://jcmr-online.com/supplements/11/S1
Page 293 of 316(page number not for citation purposes)
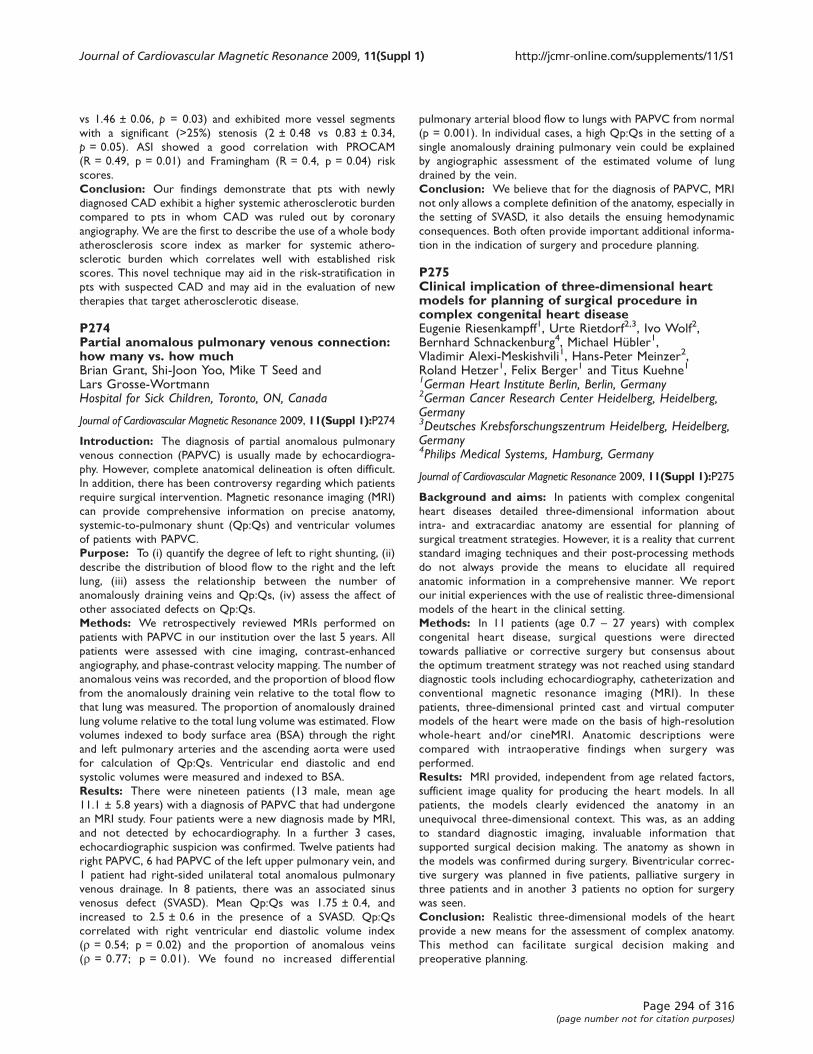
vs 1.46 ± 0.06, p = 0.03) and exhibited more vessel segments
with a significant (>25%) stenosis (2 ± 0.48 vs 0.83 ± 0.34,
p = 0.05). ASI showed a good correlation with PROCAM
(R = 0.49, p = 0.01) and Framingham (R = 0.4, p = 0.04) risk
scores.
Conclusion: Our findings demonstrate that pts with newly
diagnosed CAD exhibit a higher systemic atherosclerotic burden
compared to pts in whom CAD was ruled out by coronary
angiography. We are the first to describe the use of a whole body
atherosclerosis score index as marker for systemic athero-
sclerotic burden which correlates well with established risk
scores. This novel technique may aid in the risk-stratification in
pts with suspected CAD and may aid in the evaluation of new
therapies that target atherosclerotic disease.
P274Partial anomalous pulmonary venous connection:how many vs. how muchBrian Grant, Shi-Joon Yoo, Mike T Seed andLars Grosse-WortmannHospital for Sick Children, Toronto, ON, Canada
Journal of Cardiovascular Magnetic Resonance 2009, 11(Suppl 1):P274
Introduction: The diagnosis of partial anomalous pulmonary
venous connection (PAPVC) is usually made by echocardiogra-
phy. However, complete anatomical delineation is often difficult.
In addition, there has been controversy regarding which patients
require surgical intervention. Magnetic resonance imaging (MRI)
can provide comprehensive information on precise anatomy,
systemic-to-pulmonary shunt (Qp:Qs) and ventricular volumes
of patients with PAPVC.
Purpose: To (i) quantify the degree of left to right shunting, (ii)
describe the distribution of blood flow to the right and the left
lung, (iii) assess the relationship between the number of
anomalously draining veins and Qp:Qs, (iv) assess the affect of
other associated defects on Qp:Qs.
Methods: We retrospectively reviewed MRIs performed on
patients with PAPVC in our institution over the last 5 years. All
patients were assessed with cine imaging, contrast-enhanced
angiography, and phase-contrast velocity mapping. The number of
anomalous veins was recorded, and the proportion of blood flow
from the anomalously draining vein relative to the total flow to
that lung was measured. The proportion of anomalously drained
lung volume relative to the total lung volume was estimated. Flow
volumes indexed to body surface area (BSA) through the right
and left pulmonary arteries and the ascending aorta were used
for calculation of Qp:Qs. Ventricular end diastolic and end
systolic volumes were measured and indexed to BSA.
Results: There were nineteen patients (13 male, mean age
11.1 ± 5.8 years) with a diagnosis of PAPVC that had undergone
an MRI study. Four patients were a new diagnosis made by MRI,
and not detected by echocardiography. In a further 3 cases,
echocardiographic suspicion was confirmed. Twelve patients had
right PAPVC, 6 had PAPVC of the left upper pulmonary vein, and
1 patient had right-sided unilateral total anomalous pulmonary
venous drainage. In 8 patients, there was an associated sinus
venosus defect (SVASD). Mean Qp:Qs was 1.75 ± 0.4, and
increased to 2.5 ± 0.6 in the presence of a SVASD. Qp:Qs
correlated with right ventricular end diastolic volume index
(r = 0.54; p = 0.02) and the proportion of anomalous veins
(r = 0.77; p = 0.01). We found no increased differential
pulmonary arterial blood flow to lungs with PAPVC from normal
(p = 0.001). In individual cases, a high Qp:Qs in the setting of a
single anomalously draining pulmonary vein could be explained
by angiographic assessment of the estimated volume of lung
drained by the vein.
Conclusion: We believe that for the diagnosis of PAPVC, MRI
not only allows a complete definition of the anatomy, especially in
the setting of SVASD, it also details the ensuing hemodynamic
consequences. Both often provide important additional informa-
tion in the indication of surgery and procedure planning.
P275Clinical implication of three-dimensional heartmodels for planning of surgical procedure incomplex congenital heart diseaseEugenie Riesenkampff1, Urte Rietdorf2,3, Ivo Wolf2,Bernhard Schnackenburg4, Michael Hübler1,Vladimir Alexi-Meskishvili1, Hans-Peter Meinzer2,Roland Hetzer1, Felix Berger1 and Titus Kuehne11German Heart Institute Berlin, Berlin, Germany2German Cancer Research Center Heidelberg, Heidelberg,Germany3Deutsches Krebsforschungszentrum Heidelberg, Heidelberg,Germany4Philips Medical Systems, Hamburg, Germany
Journal of Cardiovascular Magnetic Resonance 2009, 11(Suppl 1):P275
Background and aims: In patients with complex congenital
heart diseases detailed three-dimensional information about
intra- and extracardiac anatomy are essential for planning of
surgical treatment strategies. However, it is a reality that current
standard imaging techniques and their post-processing methods
do not always provide the means to elucidate all required
anatomic information in a comprehensive manner. We report
our initial experiences with the use of realistic three-dimensional
models of the heart in the clinical setting.
Methods: In 11 patients (age 0.7 – 27 years) with complex
congenital heart disease, surgical questions were directed
towards palliative or corrective surgery but consensus about
the optimum treatment strategy was not reached using standard
diagnostic tools including echocardiography, catheterization and
conventional magnetic resonance imaging (MRI). In these
patients, three-dimensional printed cast and virtual computer
models of the heart were made on the basis of high-resolution
whole-heart and/or cineMRI. Anatomic descriptions were
compared with intraoperative findings when surgery was
performed.
Results: MRI provided, independent from age related factors,
sufficient image quality for producing the heart models. In all
patients, the models clearly evidenced the anatomy in an
unequivocal three-dimensional context. This was, as an adding
to standard diagnostic imaging, invaluable information that
supported surgical decision making. The anatomy as shown in
the models was confirmed during surgery. Biventricular correc-
tive surgery was planned in five patients, palliative surgery in
three patients and in another 3 patients no option for surgery
was seen.
Conclusion: Realistic three-dimensional models of the heart
provide a new means for the assessment of complex anatomy.
This method can facilitate surgical decision making and
preoperative planning.
Journal of Cardiovascular Magnetic Resonance 2009, 11(Suppl 1) http://jcmr-online.com/supplements/11/S1
Page 294 of 316(page number not for citation purposes)

P276Visualizing regional myocardial oxygenationchanges with statistically optimal colormapsSotirios A Tsaftaris1, Richard Tang2, Rachel Klein2,Debiao Li2 and Rohan Dharmakumar21Department of Electrical Engineering and Computer Science,Northwestern University, Evanston, IL, USA2Department of Radiology, Northwestern University,Chicago, IL, USA
Journal of Cardiovascular Magnetic Resonance 2009, 11(Suppl 1):P276
Introduction: Blood-oxygen-level dependent (BOLD) MRI
may be used for detecting myocardial oxygenation (MO) changes
secondary to coronary artery stenosis. Under pharmacological
stress, areas in the myocardium supplied by a stenotic coronary
artery are hypointense relative to healthy regions. Visualizing
these changes requires manual windowing. In this paper a
method for automatic visualization of myocardial signal changes
reflecting the regional variations in oxygenation is presented,
using images obtained from a canine study under controlled
conditions. The objective of this study is to overcome the rather
subjective step of windowing by establishing an optimal colormap
that permits visualization of statistical changes in signal intensities
between healthy and pathological cases.
Purpose: To facilitate the evaluation of myocardial BOLD
images by automating the detection of regional abnormalities in
MO under pharmacological stress in the presence of coronary
artery stenosis.
Methods: Data acquisition: Breath-held and ECG-gated
short-axis cardiac phase-resolved 2D SSFP-based myocardial
BOLD images were acquired in two dogs under pharmacological
stress with and without left-circumflex coronary artery stenosis
in a Siemens 1.5 T scanner. Scan parameters: voxel size = 1.2 ×
1.2 × 6 mm3; flip angle = 90°; TR/TE = 5.7/2.9 ms; 20 cardiac
phases.
Image processing algorithms: In order to have the
greatest myocardial surface available for analysis, only the end
systolic images of the two image series (adenosine without
stenosis (AD) and adenosine with severe stenosis (SS)) were
identified. A rectangular region of interest was chosen around
the heart and a segmentation algorithm was utilized to isolate and
segment the myocardium. The myocardial AD intensities (ADv)
were collected and a student-T distribution was fitted by
maximum likelihood estimation of its parameters (mean (m),
variance (s), and degrees-of-freedom). An optimal pixel colormap
was created by assigning red hues to signal values below the
threshold m-s and yellow hues to larger values. The color-coded
myocardial segments for both images were overlaid over the
grayscale original images. All operations were performed in
MATLAB.
Results: End-systolic AD and SS images from the two canine
studies are shown in Figure 1 with, and without, windowing. The
empirical distributions for (AD and SS) of the myocardial signal
intensities and the corresponding fitted student-T distributions
are shown in Figure 2. Figure 3 shows the color overlays utilizing
the optimized colormap.
Discussion and conclusion: As Figure 1 demonstrates, with-
out proper windowing the appreciation of MO differences is
cumbersome. It takes several minutes for a reader to window the
images. Moreover, windowing is subjective and has large intra-
Figure 1 (abstract P276)
End-systolic adenosine images without (AD) and with LCX stenosis (SS) from the two controlled canine studies are shown in panels (A) and (B),
respectively. The top row shows the AD and SS images without any windowing. The bottom row shows the same images but windowed the same to
increase the regional myocardial contrast corresponding to oxygenation changes. Red arrows on the windowed SS images illustrate the limits of the
affected myocardial segments corresponding to the LCX artery.
Journal of Cardiovascular Magnetic Resonance 2009, 11(Suppl 1) http://jcmr-online.com/supplements/11/S1
Page 295 of 316(page number not for citation purposes)
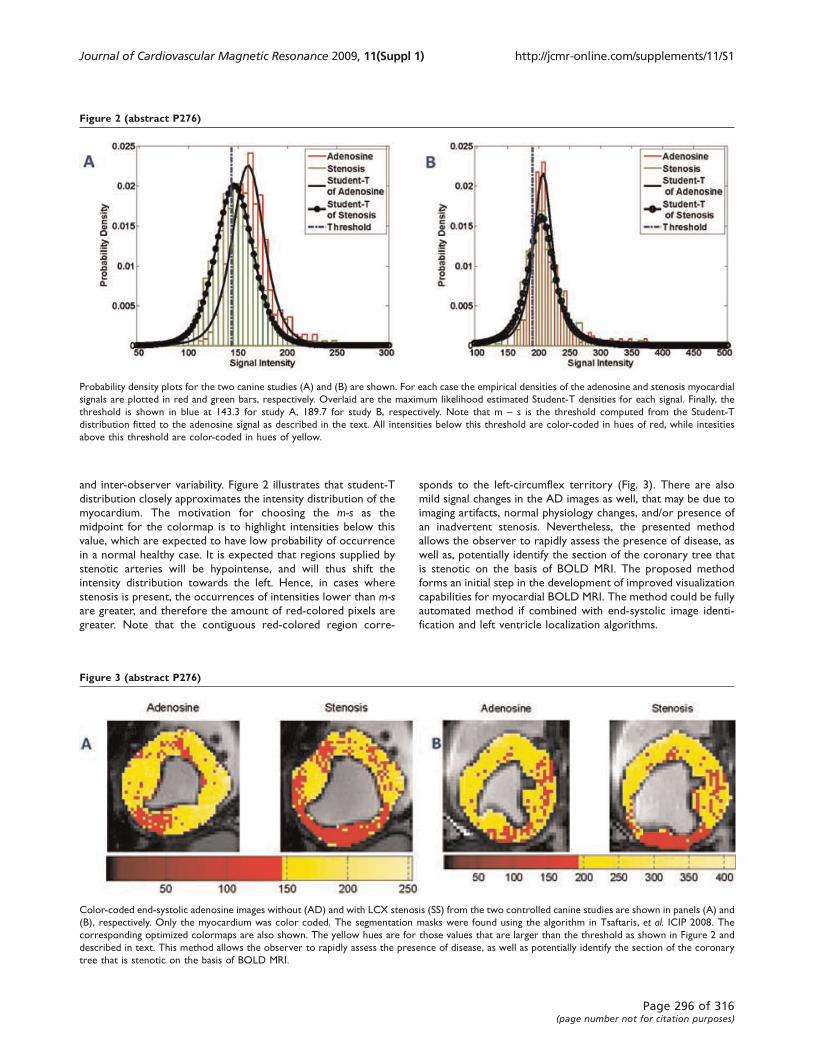
and inter-observer variability. Figure 2 illustrates that student-T
distribution closely approximates the intensity distribution of the
myocardium. The motivation for choosing the m-s as the
midpoint for the colormap is to highlight intensities below this
value, which are expected to have low probability of occurrence
in a normal healthy case. It is expected that regions supplied by
stenotic arteries will be hypointense, and will thus shift the
intensity distribution towards the left. Hence, in cases where
stenosis is present, the occurrences of intensities lower than m-sare greater, and therefore the amount of red-colored pixels are
greater. Note that the contiguous red-colored region corre-
sponds to the left-circumflex territory (Fig. 3). There are also
mild signal changes in the AD images as well, that may be due to
imaging artifacts, normal physiology changes, and/or presence of
an inadvertent stenosis. Nevertheless, the presented method
allows the observer to rapidly assess the presence of disease, as
well as, potentially identify the section of the coronary tree that
is stenotic on the basis of BOLD MRI. The proposed method
forms an initial step in the development of improved visualization
capabilities for myocardial BOLD MRI. The method could be fully
automated method if combined with end-systolic image identi-
fication and left ventricle localization algorithms.
Figure 3 (abstract P276)
Color-coded end-systolic adenosine images without (AD) and with LCX stenosis (SS) from the two controlled canine studies are shown in panels (A) and
(B), respectively. Only the myocardium was color coded. The segmentation masks were found using the algorithm in Tsaftaris, et al. ICIP 2008. The
corresponding optimized colormaps are also shown. The yellow hues are for those values that are larger than the threshold as shown in Figure 2 and
described in text. This method allows the observer to rapidly assess the presence of disease, as well as potentially identify the section of the coronary
tree that is stenotic on the basis of BOLD MRI.
Figure 2 (abstract P276)
Probability density plots for the two canine studies (A) and (B) are shown. For each case the empirical densities of the adenosine and stenosis myocardial
signals are plotted in red and green bars, respectively. Overlaid are the maximum likelihood estimated Student-T densities for each signal. Finally, the
threshold is shown in blue at 143.3 for study A, 189.7 for study B, respectively. Note that m – s is the threshold computed from the Student-T
distribution fitted to the adenosine signal as described in the text. All intensities below this threshold are color-coded in hues of red, while intesities
above this threshold are color-coded in hues of yellow.
Journal of Cardiovascular Magnetic Resonance 2009, 11(Suppl 1) http://jcmr-online.com/supplements/11/S1
Page 296 of 316(page number not for citation purposes)

P277System identification theory in myocardialperfusion modeling of dynamic contrast-enhancedMRIJean-Paul Vallée, Marko Ivancevic, Jean-Luc Daire,Dominique Didier and Michel KocherRadiology/Geneva University Hospital, Geneva-14, Switzerland
Journal of Cardiovascular Magnetic Resonance 2009, 11(Suppl 1):P277
Introduction: Tissue perfusion and blood volume can be
quantified by MRI after contrast media (CM) injection and a
one compartment model that yields K1, the blood to tissue
transfer constant (related to myocardial blood flow MBF) and Vd,
the CM distribution volume. Using system identification theory
and computer simulations, the confounding effects of volume and
rate of a contrast injection on the reliability of K1 estimation was
recently evaluated (Aerts MRM 2008; 59:1111). The simulations
predict that the K1 is most reliable with a high injection volume
administered in a single injection, where high rates only modestly
improve K1. However, the data used for the simulation were
taken from a model of rectal cancer. It is not known how these
simulations apply to myocardial perfusion at rest and at stress.
Therefore, the aim of this study was to apply system
identification theory on realistic data encountered in cardiac
patients.
Methods: To evaluate the effect of the bolus shape on the
model, two arterial input functions (AIF), were derived from real
data (narrow AIF with a small CM volume and fast injection rate
0.035 mmol/kg at 5 cc/sec and wide AIF with a larger CM volume
and slower injection rate 0.08 mmol/kg at 0.5 cc/sec as shown in
Figure 1) and used as input stimuli. Using constant rest and stress
values for K1 (0.6 ml/ming/g and 2.4 ml/min/g) and Vd (15%), time
transit curves (Cmyo) have been simulated by the discrete
transfer function of the one compartment model derived from
the Laplace transform (see Figure 1). The output error (OE)
method was used as a system identification method to estimate
K1 and Vd. Finally, estimated values of K1 and K2 are described
for different realistic noise indices (the standard deviation of a
zero mean Gaussian process varies from 0 to 10%) and different
under-sampling levels (from 1 to 4×). Bias (fitted value/true value)
in % and error (std dev/mean) in % of fitted K1 and Vd as well as
the Bode diagram were obtained for each cases.
Figure 1 (abstract P277)
Journal of Cardiovascular Magnetic Resonance 2009, 11(Suppl 1) http://jcmr-online.com/supplements/11/S1
Page 297 of 316(page number not for citation purposes)

Results: At rest, no significant difference in bias and standard
deviation were observed with the identification process between
the two shapes of the arterial input function (narrow and wide).
Under-sampled curves introduce an increase of standard
deviation of rest K1 and K2 but with no significant effect on
the bias (< 1% for noise up to 5%). At stress (see Figure 1), there
was no significant bias for both arterial input functions red and
green curves of Figure 1) as well as for the wide undersampled
function (black curve). However, almost 5× increase of bias was
observed in the undersampled narrow function (blue curve). The
standard deviation was increased by undersampling as well by a
slow injection rate. Regarding the distribution volume Vd,
accurate measurement was obtained for all the conditions
(bias < 1% for a noise of 0.05 and standard deviation < 4%).
The Bode diagram showed a similar pattern around the cut-off
frequency for the narrow and wide AIF at rest as well as for the
wide AIF at stress but not for the narrow undersampled AIF
explaining the lowest performance of this AIF. See also Figure 2.
Conclusion: At rest, both slow and fast injection rates as well
as undersampling up to 1 image/4 seconds yield accurate
measurements of the myocardium blood flow and distribution
volume. At stress the myocardium blood flow measurement is
less accurate in case of a fast injection of a small volume of CM.
The simulations indicated that MBF measurements at stress can
improved by slowing the injection rate for the same sampling
frequency.
P278Evaluation of 3-dimensional left ventricularvelocities with cardiac MR imaging usingnavigator gated high temporal resolutiontissue phase mappingIon Codreanu1, Cameron J Holloway1, Oliver J Rider1,Steffen E Petersen1, Matthew D Robson1, Bernd A Jung2,Stephen J Golding3, Stefan Neubauer1 and Kieran Clarke41University of Oxford Centre for Clinical Magnetic ResonanceResearch, Headington, Oxford, UK2Department of Diagnostic Radiology, Medical Physics,University Hospital, Freiburg, Germany3MRI Centre, Oxford Radcliffe Hospital, University of Oxford,Headington, Oxford, UK4Department of Physiology, Anatomy and Genetics,University of Oxford, Oxford, UK
Journal of Cardiovascular Magnetic Resonance 2009, 11(Suppl 1):P278
Introduction: Identification of regional myocardial dysfunction
with adequate temporal and spatial resolution is important for
diagnosis and management of cardiovascular disease. Assessment
of regional myocardial velocities allows 3-dimensional quantifica-
tion of left ventricular function and carries independent
prognostic information.
Purpose: The aim of this study was to use navigator gated
tissue phase mapping with high temporal resolution to obtain
accurate normative data of left ventricular velocities, to assess
normal patterns of left ventricular motion and to evaluate the
reproducibility of this technique.
Methods: Cardiac magnetic resonance examinations were
performed on a 1.5 Tesla MR clinical scanner (Sonata; Siemens
Medical Solutions, Erlangen, Germany). Cardiac gated, phase
contrast measurements using respiratory navigator with a
temporal resolution of 13.8 ms were obtained on two separate
occasions on 13 healthy male subjects (age 22 ± 3 years) three
weeks apart. Three short axis images were obtained for the left
ventricular base, mid-ventricle and apex. Each short axis
Figure 2 (abstract P277)
Journal of Cardiovascular Magnetic Resonance 2009, 11(Suppl 1) http://jcmr-online.com/supplements/11/S1
Page 298 of 316(page number not for citation purposes)
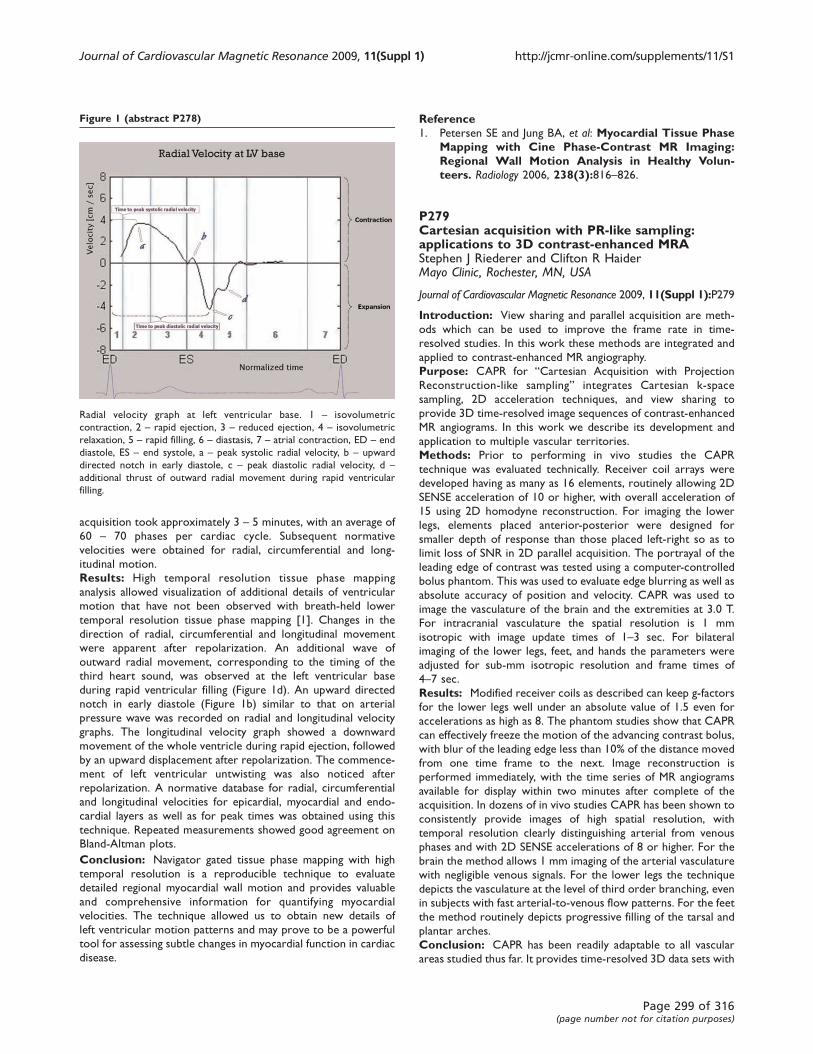
acquisition took approximately 3 – 5 minutes, with an average of
60 – 70 phases per cardiac cycle. Subsequent normative
velocities were obtained for radial, circumferential and long-
itudinal motion.
Results: High temporal resolution tissue phase mapping
analysis allowed visualization of additional details of ventricular
motion that have not been observed with breath-held lower
temporal resolution tissue phase mapping [1]. Changes in the
direction of radial, circumferential and longitudinal movement
were apparent after repolarization. An additional wave of
outward radial movement, corresponding to the timing of the
third heart sound, was observed at the left ventricular base
during rapid ventricular filling (Figure 1d). An upward directed
notch in early diastole (Figure 1b) similar to that on arterial
pressure wave was recorded on radial and longitudinal velocity
graphs. The longitudinal velocity graph showed a downward
movement of the whole ventricle during rapid ejection, followed
by an upward displacement after repolarization. The commence-
ment of left ventricular untwisting was also noticed after
repolarization. A normative database for radial, circumferential
and longitudinal velocities for epicardial, myocardial and endo-
cardial layers as well as for peak times was obtained using this
technique. Repeated measurements showed good agreement on
Bland-Altman plots.
Conclusion: Navigator gated tissue phase mapping with high
temporal resolution is a reproducible technique to evaluate
detailed regional myocardial wall motion and provides valuable
and comprehensive information for quantifying myocardial
velocities. The technique allowed us to obtain new details of
left ventricular motion patterns and may prove to be a powerful
tool for assessing subtle changes in myocardial function in cardiac
disease.
Reference1. Petersen SE and Jung BA, et al: Myocardial Tissue Phase
Mapping with Cine Phase-Contrast MR Imaging:Regional Wall Motion Analysis in Healthy Volun-teers. Radiology 2006, 238(3):816–826.
P279Cartesian acquisition with PR-like sampling:applications to 3D contrast-enhanced MRAStephen J Riederer and Clifton R HaiderMayo Clinic, Rochester, MN, USA
Journal of Cardiovascular Magnetic Resonance 2009, 11(Suppl 1):P279
Introduction: View sharing and parallel acquisition are meth-
ods which can be used to improve the frame rate in time-
resolved studies. In this work these methods are integrated and
applied to contrast-enhanced MR angiography.
Purpose: CAPR for “Cartesian Acquisition with Projection
Reconstruction-like sampling” integrates Cartesian k-space
sampling, 2D acceleration techniques, and view sharing to
provide 3D time-resolved image sequences of contrast-enhanced
MR angiograms. In this work we describe its development and
application to multiple vascular territories.
Methods: Prior to performing in vivo studies the CAPR
technique was evaluated technically. Receiver coil arrays were
developed having as many as 16 elements, routinely allowing 2D
SENSE acceleration of 10 or higher, with overall acceleration of
15 using 2D homodyne reconstruction. For imaging the lower
legs, elements placed anterior-posterior were designed for
smaller depth of response than those placed left-right so as to
limit loss of SNR in 2D parallel acquisition. The portrayal of the
leading edge of contrast was tested using a computer-controlled
bolus phantom. This was used to evaluate edge blurring as well as
absolute accuracy of position and velocity. CAPR was used to
image the vasculature of the brain and the extremities at 3.0 T.
For intracranial vasculature the spatial resolution is 1 mm
isotropic with image update times of 1–3 sec. For bilateral
imaging of the lower legs, feet, and hands the parameters were
adjusted for sub-mm isotropic resolution and frame times of
4–7 sec.
Results: Modified receiver coils as described can keep g-factors
for the lower legs well under an absolute value of 1.5 even for
accelerations as high as 8. The phantom studies show that CAPR
can effectively freeze the motion of the advancing contrast bolus,
with blur of the leading edge less than 10% of the distance moved
from one time frame to the next. Image reconstruction is
performed immediately, with the time series of MR angiograms
available for display within two minutes after complete of the
acquisition. In dozens of in vivo studies CAPR has been shown to
consistently provide images of high spatial resolution, with
temporal resolution clearly distinguishing arterial from venous
phases and with 2D SENSE accelerations of 8 or higher. For the
brain the method allows 1 mm imaging of the arterial vasculature
with negligible venous signals. For the lower legs the technique
depicts the vasculature at the level of third order branching, even
in subjects with fast arterial-to-venous flow patterns. For the feet
the method routinely depicts progressive filling of the tarsal and
plantar arches.
Conclusion: CAPR has been readily adaptable to all vascular
areas studied thus far. It provides time-resolved 3D data sets with
Figure 1 (abstract P278)
Radial velocity graph at left ventricular base. 1 – isovolumetric
contraction, 2 – rapid ejection, 3 – reduced ejection, 4 – isovolumetric
relaxation, 5 – rapid filling, 6 – diastasis, 7 – atrial contraction, ED – end
diastole, ES – end systole, a – peak systolic radial velocity, b – upward
directed notch in early diastole, c – peak diastolic radial velocity, d –additional thrust of outward radial movement during rapid ventricular
filling.
Journal of Cardiovascular Magnetic Resonance 2009, 11(Suppl 1) http://jcmr-online.com/supplements/11/S1
Page 299 of 316(page number not for citation purposes)

very high (1 mm isotropic) spatial resolution and which clearly
portray arterial and venous enhancement patterns.
P280Contrast enhanced MRI and MR coronaryangiography (MRCA) as one stop shop in patientswith untreated myocardial infarctionCarlo Liguori1, Luigi Natale1, Agostino Meduri1,Antonio Bernardini2, Riccardo Marano1
and Lorenzo Bonomo11Università Cattolica del Sacro Cuore – Policlinico A. Gemelli,Rome, Italy2“G. Mazzini” Hospital – ASL Teramo, Teramo, Italy
Journal of Cardiovascular Magnetic Resonance 2009, 11(Suppl 1):P280
Purpose: To define MRI role in patients with myocardial
infarction not treated by PCI.
Methods and materials: 24 pts (17 males, 7 females) with
myocardial infarction (7 anterior, 9 lateral, 8 inferior), untreated
by PCI, underwent MRI within three weeks after infarction. MRI
was performed on a 1.5 T scanner (GE Signa Excite) with this
protocol:
1) Triple-IR FSE sequence short axis for edema;
2) Fiesta sequences on short, horizontal and vertical long axes,
for regional and global systolic function;
3) FGR-ET short axis sequence for first pass;
4) IR-FGRE sequence on short, horizontal and vertical long axes,
for infarct size.
5) Before delayed imaging, MRCA with breath-hold 3D Fiesta
VCATS technique was obtained. MRCA was compared with the
gold standard conventional coronary angiography (CA), per-
formed within 24–48 h.
Results: MRCA was scored with a 3 points scale (0 = good,
1 = sufficient, 2 = poor) by 2 blinded readers; 3 exams were
excluded as pts could not hold their breath. MRCA showed 11
severe stenoses (>50%) and 9 occlusions, with 1 exam not
evaluable for poor quality; CA showed severe stenoses in 14 and
7 occlusions. Collaterals and retrograde filling were present in 2
occlusions at CA; in these 2 cases DE at MRI was ≤50%. DE and
FP defects distribution always showed correlation with the
diseased vessel. MRCA showed 100% sensitivity, 78.6% specifi-
city, 70% PPV, 100% NPV.
Conclusion: In pts not treated by primary or rescue PCI,
MRCA can rule out occlusion and/or significant stenosis; the
correlation with segmental distribution of DE is excellent.
P281Repeatability of global myocardial functionparameters post pacemaker implantationJana G Delfino1, Jack A Talsma1, Edward T Martin2,David A Sandler2 and John N Oshinski31Emory University, Atlanta, GA, USA2Oklahoma Heart Institute, Tulsa, OK, USA3Emory University/Georgia Institute of Technology,Atlanta, GA, USA
Journal of Cardiovascular Magnetic Resonance 2009, 11(Suppl 1):P281
Objective: To determine the reproducibility of global myocar-
dial function parameters in patients with implanted pacemakers.
Introduction: Quantitative measurement of patient response
to CRT includes reverse remodeling of the left ventricle. Usually
this is measured by a >15% reduction in end-systolic left
ventricular volume at 3 months post CRT. Two-dimensional
echocardiography has been the primary modality used for this
endpoint. There is an interest in using MRI to evaluate response
because of its superior image quality, resolution and reproduci-
bility compared to echo. However, the image quality and
reproducibility of CMR in patient with dual chamber pacemakers
is unknown.
Methods: Six patients with implanted pacemakers and clinical
indications for CMR were included in this study. All patients were
not pacemaker dependent and had dual chamber devices (50%
Medtronic Inc, 50% Guidant Inc). Clinical indications for CMR
included pericardial mass, pre-pulmonary vein ablation, pulmon-
ary vein stenosis, myocardial fibrosis and constrictive pericarditis.
MRI exams were performed on a 1.5 T GE Signa Excite MRI (GE
Medical Systems, Waukesha, WI). Following acquisition of scout
images, cine steady state free precession (SSFP) images were
acquired in the two chamber, four chamber, and short axis
orientations. Image acquisition parameters were as follows:
TR = 3 msec, TE = 1.2 msec, slice thickness = 8 mm,
FOV = 360–380 mm, pixel size 0.7–1.5 mm. Appropriate
precautions were taken regarding pacemaker-MRI interaction
including telemetry monitoring, voice and visual contact, and
device interrogation pre/post MRI.
Endocardial and epicardial borders were traced on short axis
cine SSFP images using MASS software (ARL, Lieden, The
Figure 1 (abstract P281)
Example CMR image from a patient with an implanted dual chamber
pacemaker. Although artifacts from both the pulse generator (top center)
and the RV pacing lead are visible (arrow), image quality is sufficient for
accurate analysis of myocardial function.
Journal of Cardiovascular Magnetic Resonance 2009, 11(Suppl 1) http://jcmr-online.com/supplements/11/S1
Page 300 of 316(page number not for citation purposes)
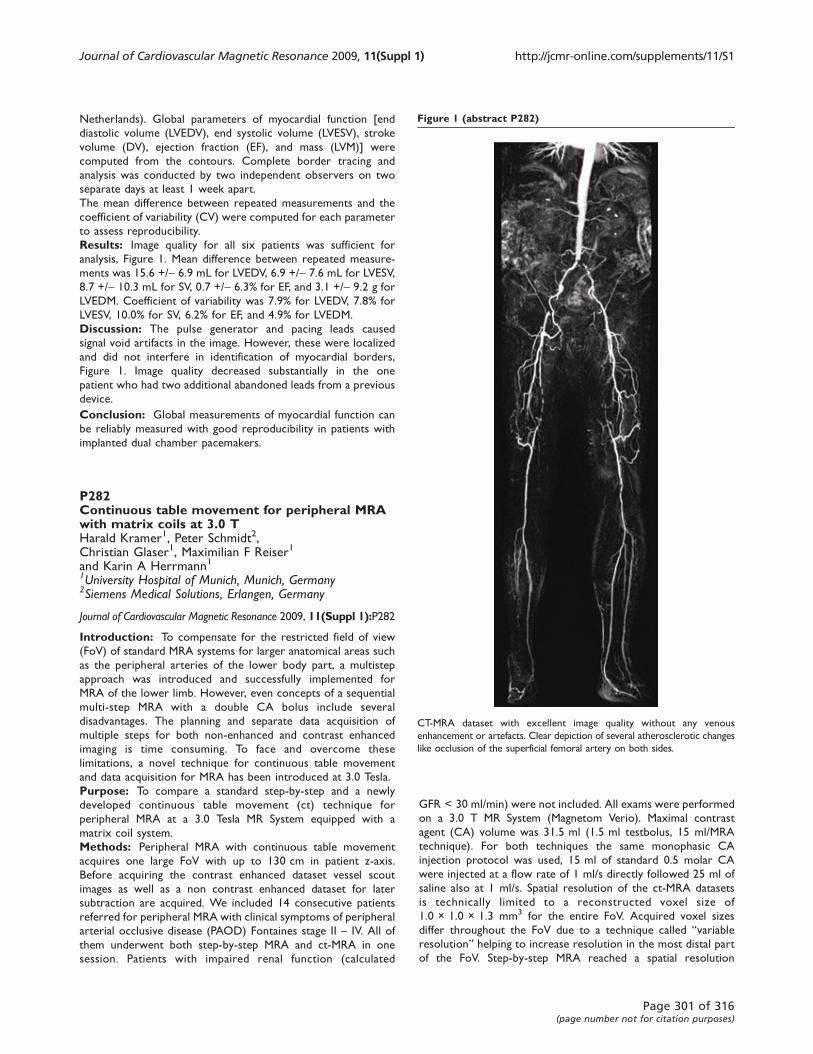
Netherlands). Global parameters of myocardial function [end
diastolic volume (LVEDV), end systolic volume (LVESV), stroke
volume (DV), ejection fraction (EF), and mass (LVM)] were
computed from the contours. Complete border tracing and
analysis was conducted by two independent observers on two
separate days at least 1 week apart.
The mean difference between repeated measurements and the
coefficient of variability (CV) were computed for each parameter
to assess reproducibility.
Results: Image quality for all six patients was sufficient for
analysis, Figure 1. Mean difference between repeated measure-
ments was 15.6 +/- 6.9 mL for LVEDV, 6.9 +/- 7.6 mL for LVESV,
8.7 +/- 10.3 mL for SV, 0.7 +/- 6.3% for EF, and 3.1 +/- 9.2 g for
LVEDM. Coefficient of variability was 7.9% for LVEDV, 7.8% for
LVESV, 10.0% for SV, 6.2% for EF, and 4.9% for LVEDM.
Discussion: The pulse generator and pacing leads caused
signal void artifacts in the image. However, these were localized
and did not interfere in identification of myocardial borders,
Figure 1. Image quality decreased substantially in the one
patient who had two additional abandoned leads from a previous
device.
Conclusion: Global measurements of myocardial function can
be reliably measured with good reproducibility in patients with
implanted dual chamber pacemakers.
P282Continuous table movement for peripheral MRAwith matrix coils at 3.0 THarald Kramer1, Peter Schmidt2,Christian Glaser1, Maximilian F Reiser1
and Karin A Herrmann11University Hospital of Munich, Munich, Germany2Siemens Medical Solutions, Erlangen, Germany
Journal of Cardiovascular Magnetic Resonance 2009, 11(Suppl 1):P282
Introduction: To compensate for the restricted field of view
(FoV) of standard MRA systems for larger anatomical areas such
as the peripheral arteries of the lower body part, a multistep
approach was introduced and successfully implemented for
MRA of the lower limb. However, even concepts of a sequential
multi-step MRA with a double CA bolus include several
disadvantages. The planning and separate data acquisition of
multiple steps for both non-enhanced and contrast enhanced
imaging is time consuming. To face and overcome these
limitations, a novel technique for continuous table movement
and data acquisition for MRA has been introduced at 3.0 Tesla.
Purpose: To compare a standard step-by-step and a newly
developed continuous table movement (ct) technique for
peripheral MRA at a 3.0 Tesla MR System equipped with a
matrix coil system.
Methods: Peripheral MRA with continuous table movement
acquires one large FoV with up to 130 cm in patient z-axis.
Before acquiring the contrast enhanced dataset vessel scout
images as well as a non contrast enhanced dataset for later
subtraction are acquired. We included 14 consecutive patients
referred for peripheral MRA with clinical symptoms of peripheral
arterial occlusive disease (PAOD) Fontaines stage II – IV. All of
them underwent both step-by-step MRA and ct-MRA in one
session. Patients with impaired renal function (calculated
GFR < 30 ml/min) were not included. All exams were performed
on a 3.0 T MR System (Magnetom Verio). Maximal contrast
agent (CA) volume was 31.5 ml (1.5 ml testbolus, 15 ml/MRA
technique). For both techniques the same monophasic CA
injection protocol was used, 15 ml of standard 0.5 molar CA
were injected at a flow rate of 1 ml/s directly followed 25 ml of
saline also at 1 ml/s. Spatial resolution of the ct-MRA datasets
is technically limited to a reconstructed voxel size of
1.0 × 1.0 × 1.3 mm3 for the entire FoV. Acquired voxel sizes
differ throughout the FoV due to a technique called “variableresolution” helping to increase resolution in the most distal part
of the FoV. Step-by-step MRA reached a spatial resolution
Figure 1 (abstract P282)
CT-MRA dataset with excellent image quality without any venous
enhancement or artefacts. Clear depiction of several atherosclerotic changes
like occlusion of the superficial femoral artery on both sides.
Journal of Cardiovascular Magnetic Resonance 2009, 11(Suppl 1) http://jcmr-online.com/supplements/11/S1
Page 301 of 316(page number not for citation purposes)
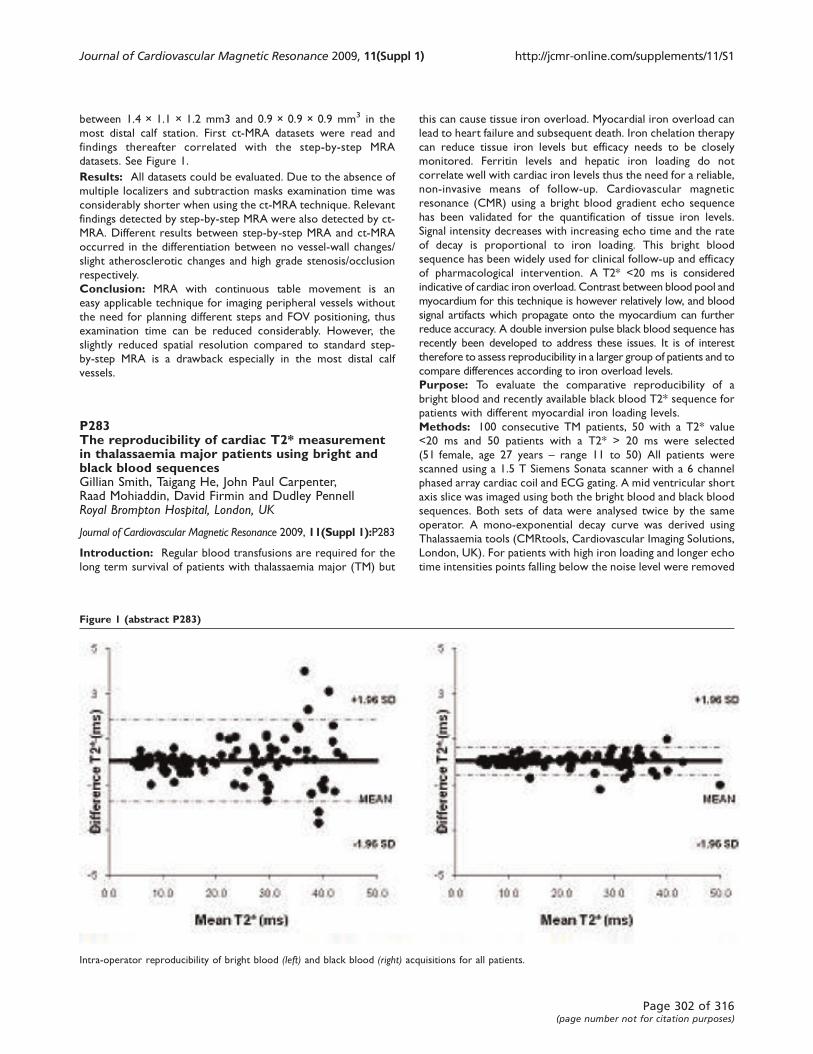
between 1.4 × 1.1 × 1.2 mm3 and 0.9 × 0.9 × 0.9 mm3 in the
most distal calf station. First ct-MRA datasets were read and
findings thereafter correlated with the step-by-step MRA
datasets. See Figure 1.
Results: All datasets could be evaluated. Due to the absence of
multiple localizers and subtraction masks examination time was
considerably shorter when using the ct-MRA technique. Relevant
findings detected by step-by-step MRA were also detected by ct-
MRA. Different results between step-by-step MRA and ct-MRA
occurred in the differentiation between no vessel-wall changes/
slight atherosclerotic changes and high grade stenosis/occlusion
respectively.
Conclusion: MRA with continuous table movement is an
easy applicable technique for imaging peripheral vessels without
the need for planning different steps and FOV positioning, thus
examination time can be reduced considerably. However, the
slightly reduced spatial resolution compared to standard step-
by-step MRA is a drawback especially in the most distal calf
vessels.
P283The reproducibility of cardiac T2* measurementin thalassaemia major patients using bright andblack blood sequencesGillian Smith, Taigang He, John Paul Carpenter,Raad Mohiaddin, David Firmin and Dudley PennellRoyal Brompton Hospital, London, UK
Journal of Cardiovascular Magnetic Resonance 2009, 11(Suppl 1):P283
Introduction: Regular blood transfusions are required for the
long term survival of patients with thalassaemia major (TM) but
this can cause tissue iron overload. Myocardial iron overload can
lead to heart failure and subsequent death. Iron chelation therapy
can reduce tissue iron levels but efficacy needs to be closely
monitored. Ferritin levels and hepatic iron loading do not
correlate well with cardiac iron levels thus the need for a reliable,
non-invasive means of follow-up. Cardiovascular magnetic
resonance (CMR) using a bright blood gradient echo sequence
has been validated for the quantification of tissue iron levels.
Signal intensity decreases with increasing echo time and the rate
of decay is proportional to iron loading. This bright blood
sequence has been widely used for clinical follow-up and efficacy
of pharmacological intervention. A T2* <20 ms is considered
indicative of cardiac iron overload. Contrast between blood pool and
myocardium for this technique is however relatively low, and blood
signal artifacts which propagate onto the myocardium can further
reduce accuracy. A double inversion pulse black blood sequence has
recently been developed to address these issues. It is of interest
therefore to assess reproducibility in a larger group of patients and to
compare differences according to iron overload levels.
Purpose: To evaluate the comparative reproducibility of a
bright blood and recently available black blood T2* sequence for
patients with different myocardial iron loading levels.
Methods: 100 consecutive TM patients, 50 with a T2* value
<20 ms and 50 patients with a T2* > 20 ms were selected
(51 female, age 27 years – range 11 to 50) All patients were
scanned using a 1.5 T Siemens Sonata scanner with a 6 channel
phased array cardiac coil and ECG gating. A mid ventricular short
axis slice was imaged using both the bright blood and black blood
sequences. Both sets of data were analysed twice by the same
operator. A mono-exponential decay curve was derived using
Thalassaemia tools (CMRtools, Cardiovascular Imaging Solutions,
London, UK). For patients with high iron loading and longer echo
time intensities points falling below the noise level were removed
Figure 1 (abstract P283)
Intra-operator reproducibility of bright blood (left) and black blood (right) acquisitions for all patients.
Journal of Cardiovascular Magnetic Resonance 2009, 11(Suppl 1) http://jcmr-online.com/supplements/11/S1
Page 302 of 316(page number not for citation purposes)
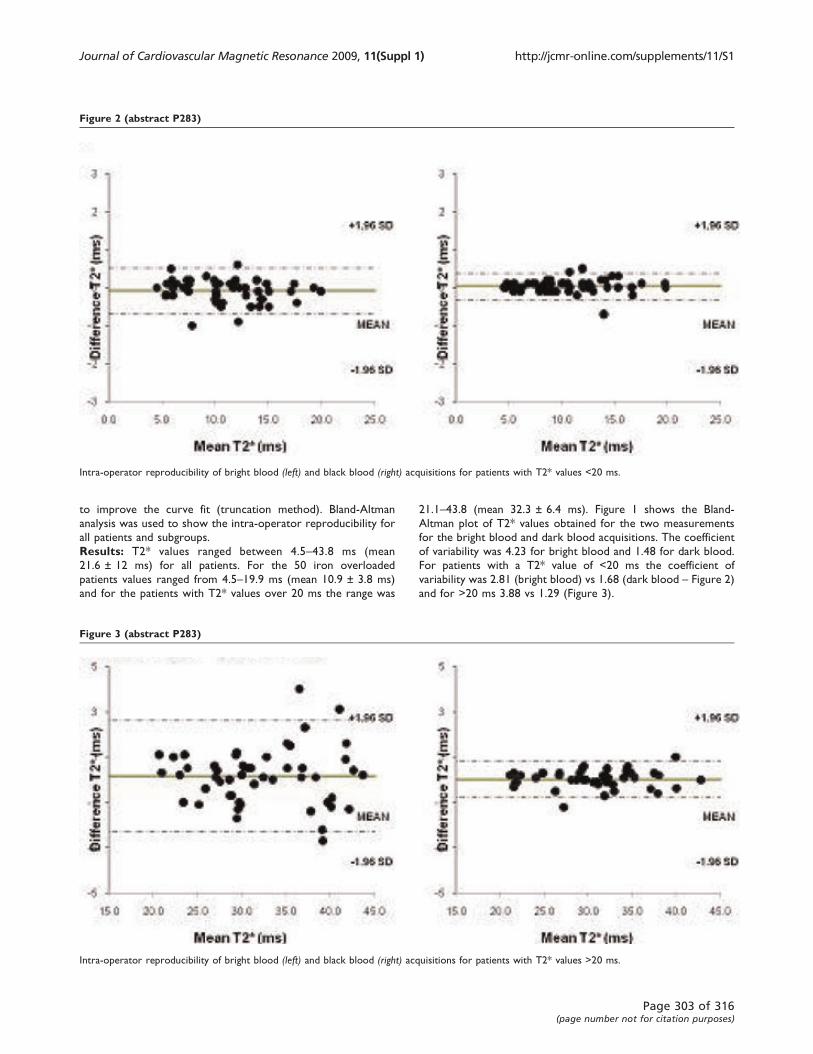
to improve the curve fit (truncation method). Bland-Altman
analysis was used to show the intra-operator reproducibility for
all patients and subgroups.
Results: T2* values ranged between 4.5–43.8 ms (mean
21.6 ± 12 ms) for all patients. For the 50 iron overloaded
patients values ranged from 4.5–19.9 ms (mean 10.9 ± 3.8 ms)
and for the patients with T2* values over 20 ms the range was
21.1–43.8 (mean 32.3 ± 6.4 ms). Figure 1 shows the Bland-
Altman plot of T2* values obtained for the two measurements
for the bright blood and dark blood acquisitions. The coefficient
of variability was 4.23 for bright blood and 1.48 for dark blood.
For patients with a T2* value of <20 ms the coefficient of
variability was 2.81 (bright blood) vs 1.68 (dark blood – Figure 2)
and for >20 ms 3.88 vs 1.29 (Figure 3).
Figure 2 (abstract P283)
Intra-operator reproducibility of bright blood (left) and black blood (right) acquisitions for patients with T2* values <20 ms.
Figure 3 (abstract P283)
Intra-operator reproducibility of bright blood (left) and black blood (right) acquisitions for patients with T2* values >20 ms.
Journal of Cardiovascular Magnetic Resonance 2009, 11(Suppl 1) http://jcmr-online.com/supplements/11/S1
Page 303 of 316(page number not for citation purposes)
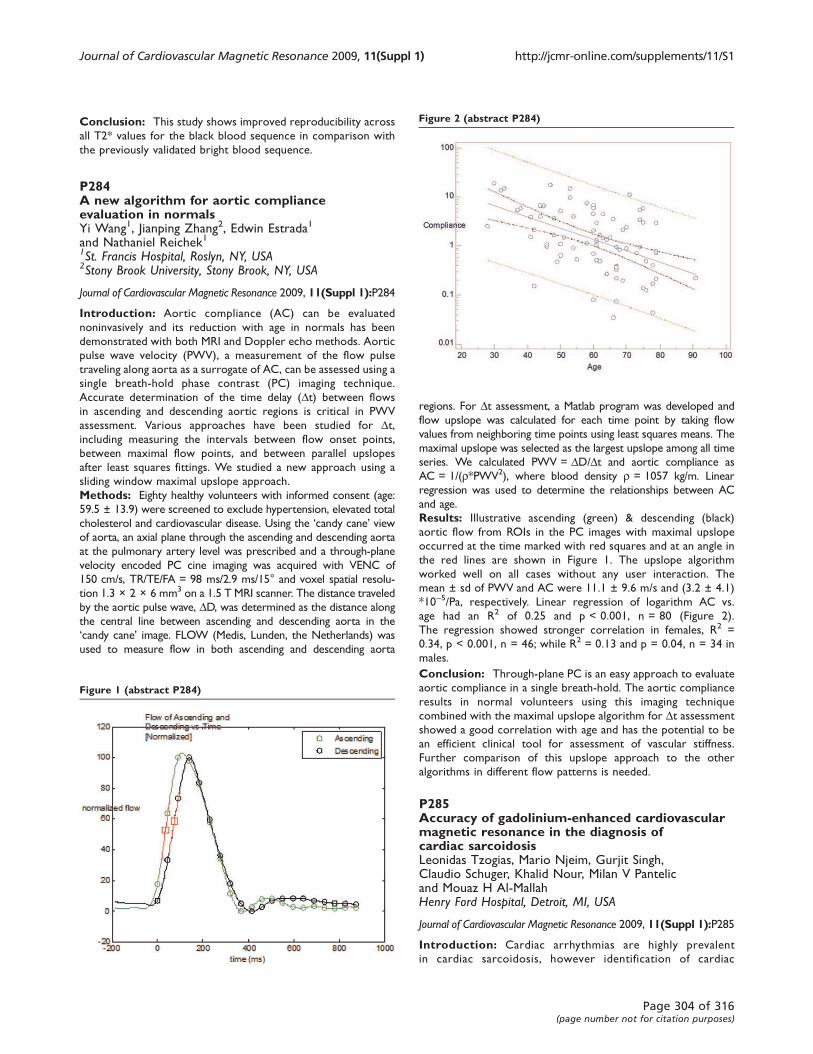
Conclusion: This study shows improved reproducibility across
all T2* values for the black blood sequence in comparison with
the previously validated bright blood sequence.
P284A new algorithm for aortic complianceevaluation in normalsYi Wang1, Jianping Zhang2, Edwin Estrada1
and Nathaniel Reichek11St. Francis Hospital, Roslyn, NY, USA2Stony Brook University, Stony Brook, NY, USA
Journal of Cardiovascular Magnetic Resonance 2009, 11(Suppl 1):P284
Introduction: Aortic compliance (AC) can be evaluated
noninvasively and its reduction with age in normals has been
demonstrated with both MRI and Doppler echo methods. Aortic
pulse wave velocity (PWV), a measurement of the flow pulse
traveling along aorta as a surrogate of AC, can be assessed using a
single breath-hold phase contrast (PC) imaging technique.
Accurate determination of the time delay (Dt) between flows
in ascending and descending aortic regions is critical in PWV
assessment. Various approaches have been studied for Dt,including measuring the intervals between flow onset points,
between maximal flow points, and between parallel upslopes
after least squares fittings. We studied a new approach using a
sliding window maximal upslope approach.
Methods: Eighty healthy volunteers with informed consent (age:
59.5 ± 13.9) were screened to exclude hypertension, elevated total
cholesterol and cardiovascular disease. Using the ‘candy cane’ viewof aorta, an axial plane through the ascending and descending aorta
at the pulmonary artery level was prescribed and a through-plane
velocity encoded PC cine imaging was acquired with VENC of
150 cm/s, TR/TE/FA = 98 ms/2.9 ms/15° and voxel spatial resolu-
tion 1.3 × 2 × 6 mm3 on a 1.5 T MRI scanner. The distance traveled
by the aortic pulse wave, DD, was determined as the distance along
the central line between ascending and descending aorta in the
‘candy cane’ image. FLOW (Medis, Lunden, the Netherlands) was
used to measure flow in both ascending and descending aorta
regions. For Dt assessment, a Matlab program was developed and
flow upslope was calculated for each time point by taking flow
values from neighboring time points using least squares means. The
maximal upslope was selected as the largest upslope among all time
series. We calculated PWV = DD/Dt and aortic compliance as
AC = 1/(r*PWV2), where blood density r = 1057 kg/m. Linear
regression was used to determine the relationships between AC
and age.
Results: Illustrative ascending (green) & descending (black)
aortic flow from ROIs in the PC images with maximal upslope
occurred at the time marked with red squares and at an angle in
the red lines are shown in Figure 1. The upslope algorithm
worked well on all cases without any user interaction. The
mean ± sd of PWV and AC were 11.1 ± 9.6 m/s and (3.2 ± 4.1)
*10-5/Pa, respectively. Linear regression of logarithm AC vs.
age had an R2 of 0.25 and p < 0.001, n = 80 (Figure 2).
The regression showed stronger correlation in females, R2 =
0.34, p < 0.001, n = 46; while R2 = 0.13 and p = 0.04, n = 34 in
males.
Conclusion: Through-plane PC is an easy approach to evaluate
aortic compliance in a single breath-hold. The aortic compliance
results in normal volunteers using this imaging technique
combined with the maximal upslope algorithm for Dt assessment
showed a good correlation with age and has the potential to be
an efficient clinical tool for assessment of vascular stiffness.
Further comparison of this upslope approach to the other
algorithms in different flow patterns is needed.
P285Accuracy of gadolinium-enhanced cardiovascularmagnetic resonance in the diagnosis ofcardiac sarcoidosisLeonidas Tzogias, Mario Njeim, Gurjit Singh,Claudio Schuger, Khalid Nour, Milan V Pantelicand Mouaz H Al-MallahHenry Ford Hospital, Detroit, MI, USA
Journal of Cardiovascular Magnetic Resonance 2009, 11(Suppl 1):P285
Introduction: Cardiac arrhythmias are highly prevalent
in cardiac sarcoidosis, however identification of cardiac
Figure 1 (abstract P284)
Figure 2 (abstract P284)
Journal of Cardiovascular Magnetic Resonance 2009, 11(Suppl 1) http://jcmr-online.com/supplements/11/S1
Page 304 of 316(page number not for citation purposes)
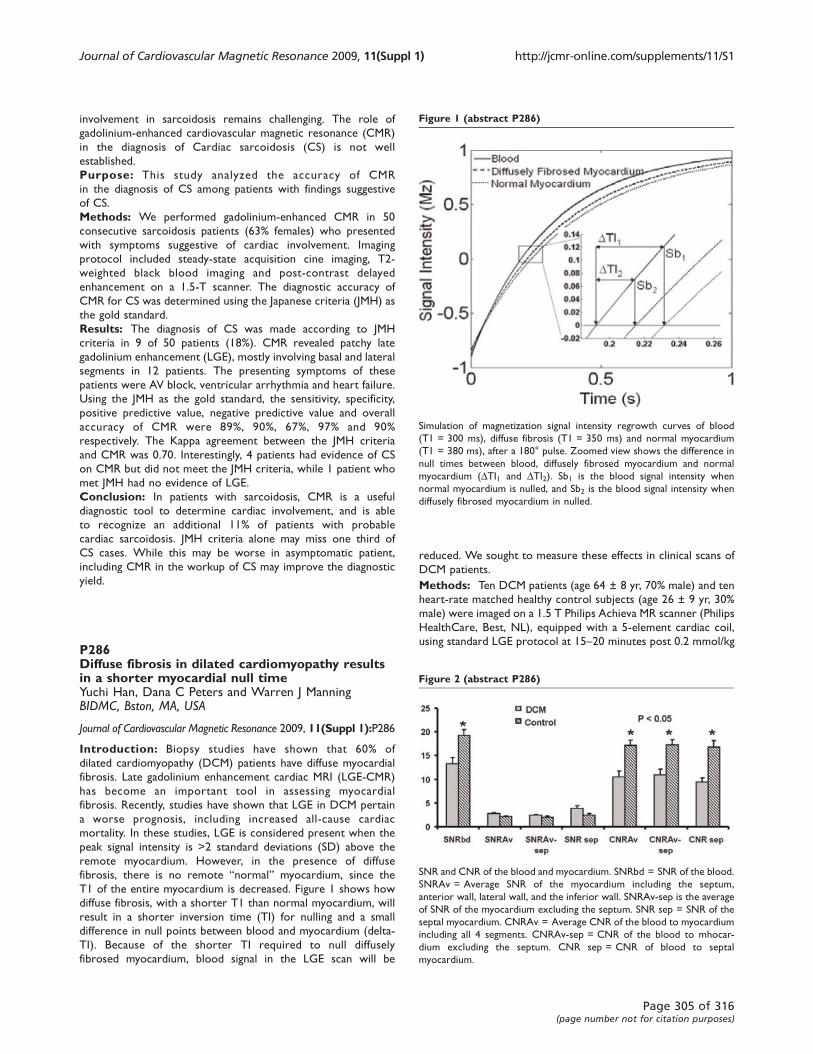
involvement in sarcoidosis remains challenging. The role of
gadolinium-enhanced cardiovascular magnetic resonance (CMR)
in the diagnosis of Cardiac sarcoidosis (CS) is not well
established.
Purpose: This study analyzed the accuracy of CMR
in the diagnosis of CS among patients with findings suggestive
of CS.
Methods: We performed gadolinium-enhanced CMR in 50
consecutive sarcoidosis patients (63% females) who presented
with symptoms suggestive of cardiac involvement. Imaging
protocol included steady-state acquisition cine imaging, T2-
weighted black blood imaging and post-contrast delayed
enhancement on a 1.5-T scanner. The diagnostic accuracy of
CMR for CS was determined using the Japanese criteria (JMH) as
the gold standard.
Results: The diagnosis of CS was made according to JMH
criteria in 9 of 50 patients (18%). CMR revealed patchy late
gadolinium enhancement (LGE), mostly involving basal and lateral
segments in 12 patients. The presenting symptoms of these
patients were AV block, ventricular arrhythmia and heart failure.
Using the JMH as the gold standard, the sensitivity, specificity,
positive predictive value, negative predictive value and overall
accuracy of CMR were 89%, 90%, 67%, 97% and 90%
respectively. The Kappa agreement between the JMH criteria
and CMR was 0.70. Interestingly, 4 patients had evidence of CS
on CMR but did not meet the JMH criteria, while 1 patient who
met JMH had no evidence of LGE.
Conclusion: In patients with sarcoidosis, CMR is a useful
diagnostic tool to determine cardiac involvement, and is able
to recognize an additional 11% of patients with probable
cardiac sarcoidosis. JMH criteria alone may miss one third of
CS cases. While this may be worse in asymptomatic patient,
including CMR in the workup of CS may improve the diagnostic
yield.
P286Diffuse fibrosis in dilated cardiomyopathy resultsin a shorter myocardial null timeYuchi Han, Dana C Peters and Warren J ManningBIDMC, Bston, MA, USA
Journal of Cardiovascular Magnetic Resonance 2009, 11(Suppl 1):P286
Introduction: Biopsy studies have shown that 60% of
dilated cardiomyopathy (DCM) patients have diffuse myocardial
fibrosis. Late gadolinium enhancement cardiac MRI (LGE-CMR)
has become an important tool in assessing myocardial
fibrosis. Recently, studies have shown that LGE in DCM pertain
a worse prognosis, including increased all-cause cardiac
mortality. In these studies, LGE is considered present when the
peak signal intensity is >2 standard deviations (SD) above the
remote myocardium. However, in the presence of diffuse
fibrosis, there is no remote “normal” myocardium, since the
T1 of the entire myocardium is decreased. Figure 1 shows how
diffuse fibrosis, with a shorter T1 than normal myocardium, will
result in a shorter inversion time (TI) for nulling and a small
difference in null points between blood and myocardium (delta-
TI). Because of the shorter TI required to null diffusely
fibrosed myocardium, blood signal in the LGE scan will be
reduced. We sought to measure these effects in clinical scans of
DCM patients.
Methods: Ten DCM patients (age 64 ± 8 yr, 70% male) and ten
heart-rate matched healthy control subjects (age 26 ± 9 yr, 30%
male) were imaged on a 1.5 T Philips Achieva MR scanner (Philips
HealthCare, Best, NL), equipped with a 5-element cardiac coil,
using standard LGE protocol at 15–20 minutes post 0.2 mmol/kg
Figure 1 (abstract P286)
Simulation of magnetization signal intensity regrowth curves of blood
(T1 = 300 ms), diffuse fibrosis (T1 = 350 ms) and normal myocardium
(T1 = 380 ms), after a 180° pulse. Zoomed view shows the difference in
null times between blood, diffusely fibrosed myocardium and normal
myocardium (DTI1 and DTI2). Sb1 is the blood signal intensity when
normal myocardium is nulled, and Sb2 is the blood signal intensity when
diffusely fibrosed myocardium in nulled.
Figure 2 (abstract P286)
SNR and CNR of the blood and myocardium. SNRbd = SNR of the blood.
SNRAv = Average SNR of the myocardium including the septum,
anterior wall, lateral wall, and the inferior wall. SNRAv-sep is the average
of SNR of the myocardium excluding the septum. SNR sep = SNR of the
septal myocardium. CNRAv = Average CNR of the blood to myocardium
including all 4 segments. CNRAv-sep = CNR of the blood to mhocar-
dium excluding the septum. CNR sep = CNR of blood to septal
myocardium.
Journal of Cardiovascular Magnetic Resonance 2009, 11(Suppl 1) http://jcmr-online.com/supplements/11/S1
Page 305 of 316(page number not for citation purposes)
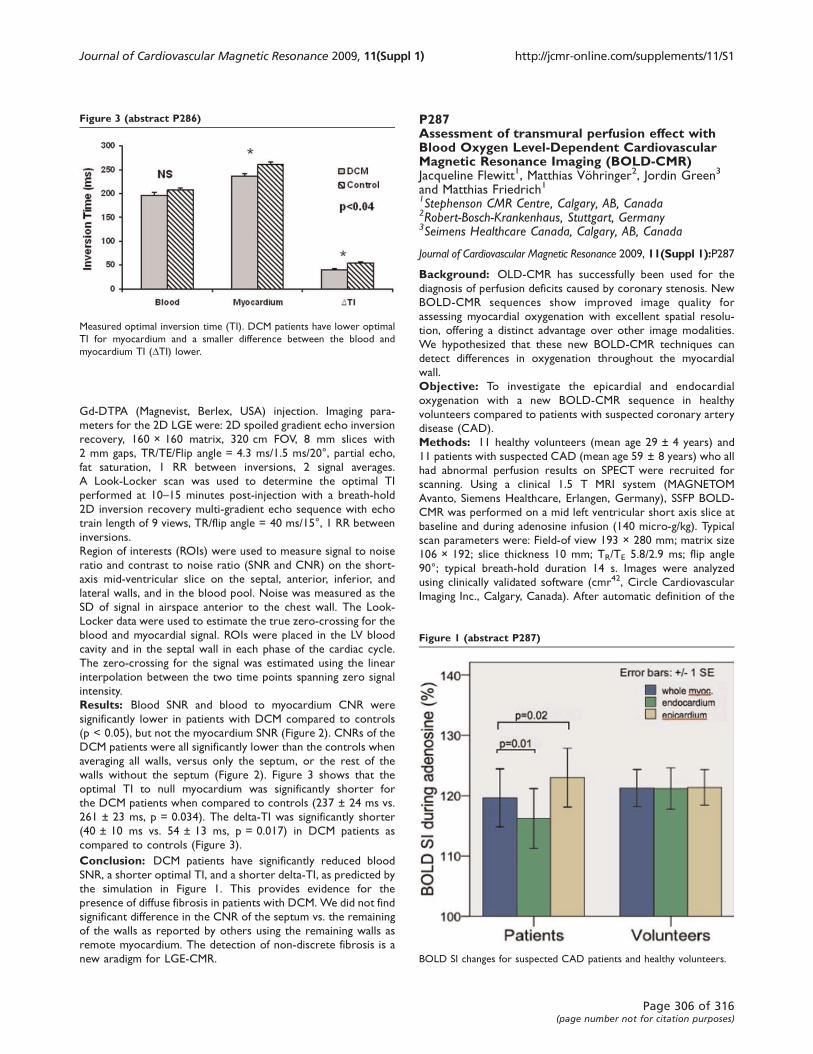
Gd-DTPA (Magnevist, Berlex, USA) injection. Imaging para-
meters for the 2D LGE were: 2D spoiled gradient echo inversion
recovery, 160 × 160 matrix, 320 cm FOV, 8 mm slices with
2 mm gaps, TR/TE/Flip angle = 4.3 ms/1.5 ms/20°, partial echo,
fat saturation, 1 RR between inversions, 2 signal averages.
A Look-Locker scan was used to determine the optimal TI
performed at 10–15 minutes post-injection with a breath-hold
2D inversion recovery multi-gradient echo sequence with echo
train length of 9 views, TR/flip angle = 40 ms/15°, 1 RR between
inversions.
Region of interests (ROIs) were used to measure signal to noise
ratio and contrast to noise ratio (SNR and CNR) on the short-
axis mid-ventricular slice on the septal, anterior, inferior, and
lateral walls, and in the blood pool. Noise was measured as the
SD of signal in airspace anterior to the chest wall. The Look-
Locker data were used to estimate the true zero-crossing for the
blood and myocardial signal. ROIs were placed in the LV blood
cavity and in the septal wall in each phase of the cardiac cycle.
The zero-crossing for the signal was estimated using the linear
interpolation between the two time points spanning zero signal
intensity.
Results: Blood SNR and blood to myocardium CNR were
significantly lower in patients with DCM compared to controls
(p < 0.05), but not the myocardium SNR (Figure 2). CNRs of the
DCM patients were all significantly lower than the controls when
averaging all walls, versus only the septum, or the rest of the
walls without the septum (Figure 2). Figure 3 shows that the
optimal TI to null myocardium was significantly shorter for
the DCM patients when compared to controls (237 ± 24 ms vs.
261 ± 23 ms, p = 0.034). The delta-TI was significantly shorter
(40 ± 10 ms vs. 54 ± 13 ms, p = 0.017) in DCM patients as
compared to controls (Figure 3).
Conclusion: DCM patients have significantly reduced blood
SNR, a shorter optimal TI, and a shorter delta-TI, as predicted by
the simulation in Figure 1. This provides evidence for the
presence of diffuse fibrosis in patients with DCM. We did not find
significant difference in the CNR of the septum vs. the remaining
of the walls as reported by others using the remaining walls as
remote myocardium. The detection of non-discrete fibrosis is a
new aradigm for LGE-CMR.
P287Assessment of transmural perfusion effect withBlood Oxygen Level-Dependent CardiovascularMagnetic Resonance Imaging (BOLD-CMR)Jacqueline Flewitt1, Matthias Vöhringer2, Jordin Green3
and Matthias Friedrich11Stephenson CMR Centre, Calgary, AB, Canada2Robert-Bosch-Krankenhaus, Stuttgart, Germany3Seimens Healthcare Canada, Calgary, AB, Canada
Journal of Cardiovascular Magnetic Resonance 2009, 11(Suppl 1):P287
Background: OLD-CMR has successfully been used for the
diagnosis of perfusion deficits caused by coronary stenosis. New
BOLD-CMR sequences show improved image quality for
assessing myocardial oxygenation with excellent spatial resolu-
tion, offering a distinct advantage over other image modalities.
We hypothesized that these new BOLD-CMR techniques can
detect differences in oxygenation throughout the myocardial
wall.
Objective: To investigate the epicardial and endocardial
oxygenation with a new BOLD-CMR sequence in healthy
volunteers compared to patients with suspected coronary artery
disease (CAD).
Methods: 11 healthy volunteers (mean age 29 ± 4 years) and
11 patients with suspected CAD (mean age 59 ± 8 years) who all
had abnormal perfusion results on SPECT were recruited for
scanning. Using a clinical 1.5 T MRI system (MAGNETOM
Avanto, Siemens Healthcare, Erlangen, Germany), SSFP BOLD-
CMR was performed on a mid left ventricular short axis slice at
baseline and during adenosine infusion (140 micro-g/kg). Typical
scan parameters were: Field-of view 193 × 280 mm; matrix size
106 × 192; slice thickness 10 mm; TR/TE 5.8/2.9 ms; flip angle
90°; typical breath-hold duration 14 s. Images were analyzed
using clinically validated software (cmr42, Circle Cardiovascular
Imaging Inc., Calgary, Canada). After automatic definition of the
Figure 3 (abstract P286)
Measured optimal inversion time (TI). DCM patients have lower optimal
TI for myocardium and a smaller difference between the blood and
myocardium TI (DTI) lower.
Figure 1 (abstract P287)
BOLD SI changes for suspected CAD patients and healthy volunteers.
Journal of Cardiovascular Magnetic Resonance 2009, 11(Suppl 1) http://jcmr-online.com/supplements/11/S1
Page 306 of 316(page number not for citation purposes)
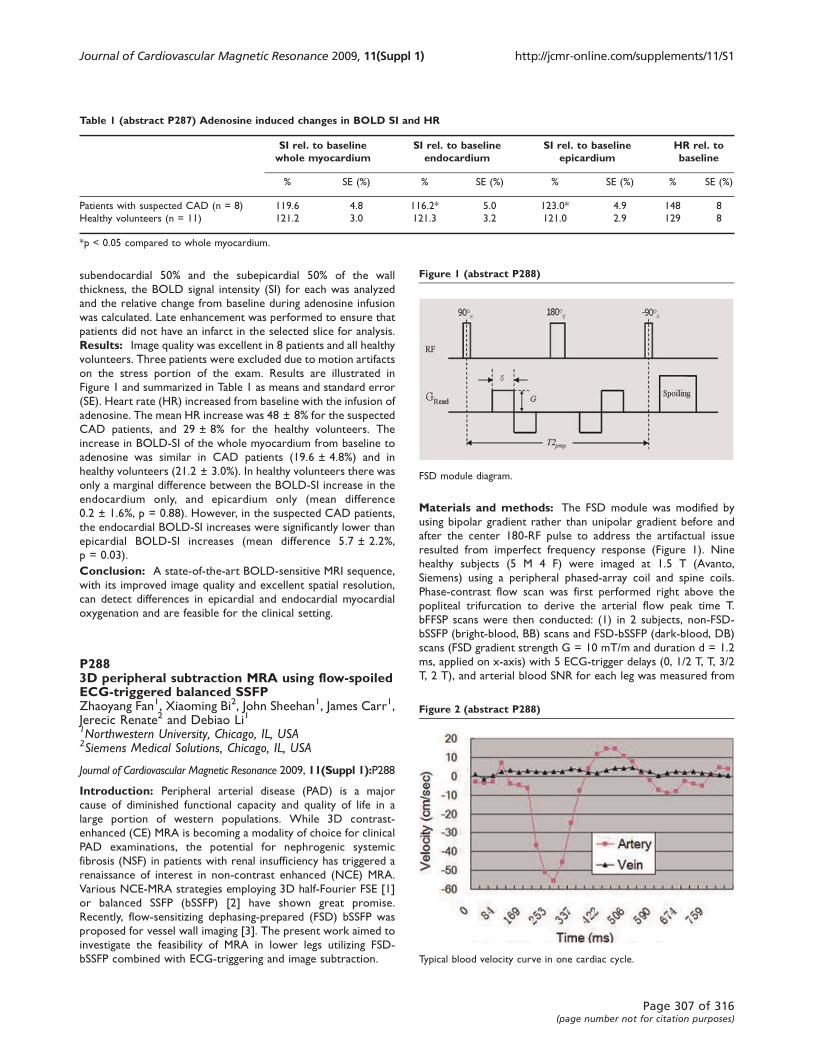
subendocardial 50% and the subepicardial 50% of the wall
thickness, the BOLD signal intensity (SI) for each was analyzed
and the relative change from baseline during adenosine infusion
was calculated. Late enhancement was performed to ensure that
patients did not have an infarct in the selected slice for analysis.
Results: Image quality was excellent in 8 patients and all healthy
volunteers. Three patients were excluded due to motion artifacts
on the stress portion of the exam. Results are illustrated in
Figure 1 and summarized in Table 1 as means and standard error
(SE). Heart rate (HR) increased from baseline with the infusion of
adenosine. The mean HR increase was 48 ± 8% for the suspected
CAD patients, and 29 ± 8% for the healthy volunteers. The
increase in BOLD-SI of the whole myocardium from baseline to
adenosine was similar in CAD patients (19.6 ± 4.8%) and in
healthy volunteers (21.2 ± 3.0%). In healthy volunteers there was
only a marginal difference between the BOLD-SI increase in the
endocardium only, and epicardium only (mean difference
0.2 ± 1.6%, p = 0.88). However, in the suspected CAD patients,
the endocardial BOLD-SI increases were significantly lower than
epicardial BOLD-SI increases (mean difference 5.7 ± 2.2%,
p = 0.03).
Conclusion: A state-of-the-art BOLD-sensitive MRI sequence,
with its improved image quality and excellent spatial resolution,
can detect differences in epicardial and endocardial myocardial
oxygenation and are feasible for the clinical setting.
P2883D peripheral subtraction MRA using flow-spoiledECG-triggered balanced SSFPZhaoyang Fan1, Xiaoming Bi2, John Sheehan1, James Carr1,Jerecic Renate2 and Debiao Li11Northwestern University, Chicago, IL, USA2Siemens Medical Solutions, Chicago, IL, USA
Journal of Cardiovascular Magnetic Resonance 2009, 11(Suppl 1):P288
Introduction: Peripheral arterial disease (PAD) is a major
cause of diminished functional capacity and quality of life in a
large portion of western populations. While 3D contrast-
enhanced (CE) MRA is becoming a modality of choice for clinical
PAD examinations, the potential for nephrogenic systemic
fibrosis (NSF) in patients with renal insufficiency has triggered a
renaissance of interest in non-contrast enhanced (NCE) MRA.
Various NCE-MRA strategies employing 3D half-Fourier FSE [1]
or balanced SSFP (bSSFP) [2] have shown great promise.
Recently, flow-sensitizing dephasing-prepared (FSD) bSSFP was
proposed for vessel wall imaging [3]. The present work aimed to
investigate the feasibility of MRA in lower legs utilizing FSD-
bSSFP combined with ECG-triggering and image subtraction.
Materials and methods: The FSD module was modified by
using bipolar gradient rather than unipolar gradient before and
after the center 180-RF pulse to address the artifactual issue
resulted from imperfect frequency response (Figure 1). Nine
healthy subjects (5 M 4 F) were imaged at 1.5 T (Avanto,
Siemens) using a peripheral phased-array coil and spine coils.
Phase-contrast flow scan was first performed right above the
popliteal trifurcation to derive the arterial flow peak time T.
bFFSP scans were then conducted: (1) in 2 subjects, non-FSD-
bSSFP (bright-blood, BB) scans and FSD-bSSFP (dark-blood, DB)
scans (FSD gradient strength G = 10 mT/m and duration d = 1.2
ms, applied on x-axis) with 5 ECG-trigger delays (0, 1/2 T, T, 3/2
T, 2 T), and arterial blood SNR for each leg was measured from
Figure 2 (abstract P288)
Typical blood velocity curve in one cardiac cycle.
Table 1 (abstract P287) Adenosine induced changes in BOLD SI and HR
SI rel. to baselinewhole myocardium
SI rel. to baselineendocardium
SI rel. to baselineepicardium
HR rel. tobaseline
% SE (%) % SE (%) % SE (%) % SE (%)
Patients with suspected CAD (n = 8) 119.6 4.8 116.2* 5.0 123.0* 4.9 148 8
Healthy volunteers (n = 11) 121.2 3.0 121.3 3.2 121.0 2.9 129 8
*p < 0.05 compared to whole myocardium.
Figure 1 (abstract P288)
FSD module diagram.
Journal of Cardiovascular Magnetic Resonance 2009, 11(Suppl 1) http://jcmr-online.com/supplements/11/S1
Page 307 of 316(page number not for citation purposes)
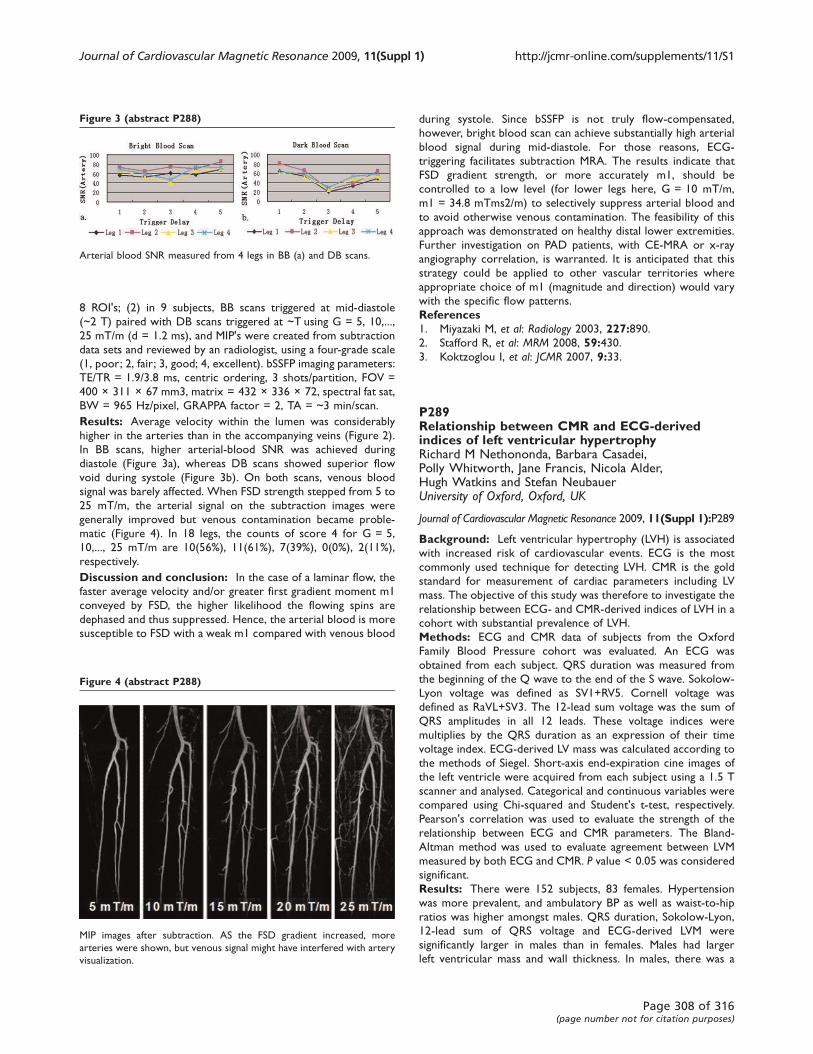
8 ROI's; (2) in 9 subjects, BB scans triggered at mid-diastole
(~2 T) paired with DB scans triggered at ~T using G = 5, 10,...,
25 mT/m (d = 1.2 ms), and MIP's were created from subtraction
data sets and reviewed by an radiologist, using a four-grade scale
(1, poor; 2, fair; 3, good; 4, excellent). bSSFP imaging parameters:
TE/TR = 1.9/3.8 ms, centric ordering, 3 shots/partition, FOV =
400 × 311 × 67 mm3, matrix = 432 × 336 × 72, spectral fat sat,
BW = 965 Hz/pixel, GRAPPA factor = 2, TA = ~3 min/scan.
Results: Average velocity within the lumen was considerably
higher in the arteries than in the accompanying veins (Figure 2).
In BB scans, higher arterial-blood SNR was achieved during
diastole (Figure 3a), whereas DB scans showed superior flow
void during systole (Figure 3b). On both scans, venous blood
signal was barely affected. When FSD strength stepped from 5 to
25 mT/m, the arterial signal on the subtraction images were
generally improved but venous contamination became proble-
matic (Figure 4). In 18 legs, the counts of score 4 for G = 5,
10,..., 25 mT/m are 10(56%), 11(61%), 7(39%), 0(0%), 2(11%),
respectively.
Discussion and conclusion: In the case of a laminar flow, the
faster average velocity and/or greater first gradient moment m1
conveyed by FSD, the higher likelihood the flowing spins are
dephased and thus suppressed. Hence, the arterial blood is more
susceptible to FSD with a weak m1 compared with venous blood
during systole. Since bSSFP is not truly flow-compensated,
however, bright blood scan can achieve substantially high arterial
blood signal during mid-diastole. For those reasons, ECG-
triggering facilitates subtraction MRA. The results indicate that
FSD gradient strength, or more accurately m1, should be
controlled to a low level (for lower legs here, G = 10 mT/m,
m1 = 34.8 mTms2/m) to selectively suppress arterial blood and
to avoid otherwise venous contamination. The feasibility of this
approach was demonstrated on healthy distal lower extremities.
Further investigation on PAD patients, with CE-MRA or x-ray
angiography correlation, is warranted. It is anticipated that this
strategy could be applied to other vascular territories where
appropriate choice of m1 (magnitude and direction) would vary
with the specific flow patterns.
References1. Miyazaki M, et al: Radiology 2003, 227:890.2. Stafford R, et al: MRM 2008, 59:430.
3. Koktzoglou I, et al: JCMR 2007, 9:33.
P289Relationship between CMR and ECG-derivedindices of left ventricular hypertrophyRichard M Nethononda, Barbara Casadei,Polly Whitworth, Jane Francis, Nicola Alder,Hugh Watkins and Stefan NeubauerUniversity of Oxford, Oxford, UK
Journal of Cardiovascular Magnetic Resonance 2009, 11(Suppl 1):P289
Background: Left ventricular hypertrophy (LVH) is associated
with increased risk of cardiovascular events. ECG is the most
commonly used technique for detecting LVH. CMR is the gold
standard for measurement of cardiac parameters including LV
mass. The objective of this study was therefore to investigate the
relationship between ECG- and CMR-derived indices of LVH in a
cohort with substantial prevalence of LVH.
Methods: ECG and CMR data of subjects from the Oxford
Family Blood Pressure cohort was evaluated. An ECG was
obtained from each subject. QRS duration was measured from
the beginning of the Q wave to the end of the S wave. Sokolow-
Lyon voltage was defined as SV1+RV5. Cornell voltage was
defined as RaVL+SV3. The 12-lead sum voltage was the sum of
QRS amplitudes in all 12 leads. These voltage indices were
multiplies by the QRS duration as an expression of their time
voltage index. ECG-derived LV mass was calculated according to
the methods of Siegel. Short-axis end-expiration cine images of
the left ventricle were acquired from each subject using a 1.5 T
scanner and analysed. Categorical and continuous variables were
compared using Chi-squared and Student's t-test, respectively.
Pearson's correlation was used to evaluate the strength of the
relationship between ECG and CMR parameters. The Bland-
Altman method was used to evaluate agreement between LVM
measured by both ECG and CMR. P value < 0.05 was considered
significant.
Results: There were 152 subjects, 83 females. Hypertension
was more prevalent, and ambulatory BP as well as waist-to-hip
ratios was higher amongst males. QRS duration, Sokolow-Lyon,
12-lead sum of QRS voltage and ECG-derived LVM were
significantly larger in males than in females. Males had larger
left ventricular mass and wall thickness. In males, there was a
Figure 3 (abstract P288)
Arterial blood SNR measured from 4 legs in BB (a) and DB scans.
Figure 4 (abstract P288)
MIP images after subtraction. AS the FSD gradient increased, more
arteries were shown, but venous signal might have interfered with artery
visualization.
Journal of Cardiovascular Magnetic Resonance 2009, 11(Suppl 1) http://jcmr-online.com/supplements/11/S1
Page 308 of 316(page number not for citation purposes)
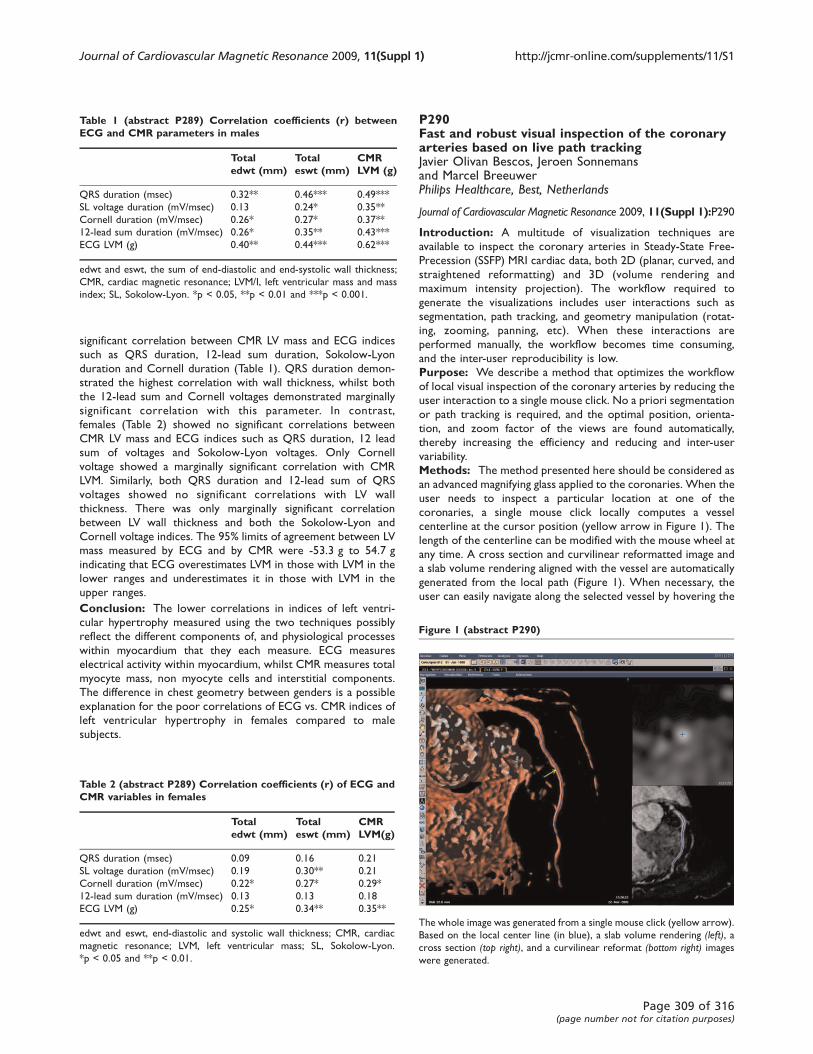
significant correlation between CMR LV mass and ECG indices
such as QRS duration, 12-lead sum duration, Sokolow-Lyon
duration and Cornell duration (Table 1). QRS duration demon-
strated the highest correlation with wall thickness, whilst both
the 12-lead sum and Cornell voltages demonstrated marginally
significant correlation with this parameter. In contrast,
females (Table 2) showed no significant correlations between
CMR LV mass and ECG indices such as QRS duration, 12 lead
sum of voltages and Sokolow-Lyon voltages. Only Cornell
voltage showed a marginally significant correlation with CMR
LVM. Similarly, both QRS duration and 12-lead sum of QRS
voltages showed no significant correlations with LV wall
thickness. There was only marginally significant correlation
between LV wall thickness and both the Sokolow-Lyon and
Cornell voltage indices. The 95% limits of agreement between LV
mass measured by ECG and by CMR were -53.3 g to 54.7 g
indicating that ECG overestimates LVM in those with LVM in the
lower ranges and underestimates it in those with LVM in the
upper ranges.
Conclusion: The lower correlations in indices of left ventri-
cular hypertrophy measured using the two techniques possibly
reflect the different components of, and physiological processes
within myocardium that they each measure. ECG measures
electrical activity within myocardium, whilst CMR measures total
myocyte mass, non myocyte cells and interstitial components.
The difference in chest geometry between genders is a possible
explanation for the poor correlations of ECG vs. CMR indices of
left ventricular hypertrophy in females compared to male
subjects.
P290Fast and robust visual inspection of the coronaryarteries based on live path trackingJavier Olivan Bescos, Jeroen Sonnemansand Marcel BreeuwerPhilips Healthcare, Best, Netherlands
Journal of Cardiovascular Magnetic Resonance 2009, 11(Suppl 1):P290
Introduction: A multitude of visualization techniques are
available to inspect the coronary arteries in Steady-State Free-
Precession (SSFP) MRI cardiac data, both 2D (planar, curved, and
straightened reformatting) and 3D (volume rendering and
maximum intensity projection). The workflow required to
generate the visualizations includes user interactions such as
segmentation, path tracking, and geometry manipulation (rotat-
ing, zooming, panning, etc). When these interactions are
performed manually, the workflow becomes time consuming,
and the inter-user reproducibility is low.
Purpose: We describe a method that optimizes the workflow
of local visual inspection of the coronary arteries by reducing the
user interaction to a single mouse click. No a priori segmentation
or path tracking is required, and the optimal position, orienta-
tion, and zoom factor of the views are found automatically,
thereby increasing the efficiency and reducing and inter-user
variability.
Methods: The method presented here should be considered as
an advanced magnifying glass applied to the coronaries. When the
user needs to inspect a particular location at one of the
coronaries, a single mouse click locally computes a vessel
centerline at the cursor position (yellow arrow in Figure 1). The
length of the centerline can be modified with the mouse wheel at
any time. A cross section and curvilinear reformatted image and
a slab volume rendering aligned with the vessel are automatically
generated from the local path (Figure 1). When necessary, the
user can easily navigate along the selected vessel by hovering the
Table 1 (abstract P289) Correlation coefficients (r) betweenECG and CMR parameters in males
Totaledwt (mm)
Totaleswt (mm)
CMRLVM (g)
QRS duration (msec) 0.32** 0.46*** 0.49***
SL voltage duration (mV/msec) 0.13 0.24* 0.35**
Cornell duration (mV/msec) 0.26* 0.27* 0.37**
12-lead sum duration (mV/msec) 0.26* 0.35** 0.43***
ECG LVM (g) 0.40** 0.44*** 0.62***
edwt and eswt, the sum of end-diastolic and end-systolic wall thickness;
CMR, cardiac magnetic resonance; LVM/I, left ventricular mass and mass
index; SL, Sokolow-Lyon. *p < 0.05, **p < 0.01 and ***p < 0.001.
Table 2 (abstract P289) Correlation coefficients (r) of ECG andCMR variables in females
Totaledwt (mm)
Totaleswt (mm)
CMRLVM(g)
QRS duration (msec) 0.09 0.16 0.21
SL voltage duration (mV/msec) 0.19 0.30** 0.21
Cornell duration (mV/msec) 0.22* 0.27* 0.29*
12-lead sum duration (mV/msec) 0.13 0.13 0.18
ECG LVM (g) 0.25* 0.34** 0.35**
edwt and eswt, end-diastolic and systolic wall thickness; CMR, cardiac
magnetic resonance; LVM, left ventricular mass; SL, Sokolow-Lyon.
*p < 0.05 and **p < 0.01.
Figure 1 (abstract P290)
The whole image was generated from a single mouse click (yellow arrow).
Based on the local center line (in blue), a slab volume rendering (left), across section (top right), and a curvilinear reformat (bottom right) images
were generated.
Journal of Cardiovascular Magnetic Resonance 2009, 11(Suppl 1) http://jcmr-online.com/supplements/11/S1
Page 309 of 316(page number not for citation purposes)
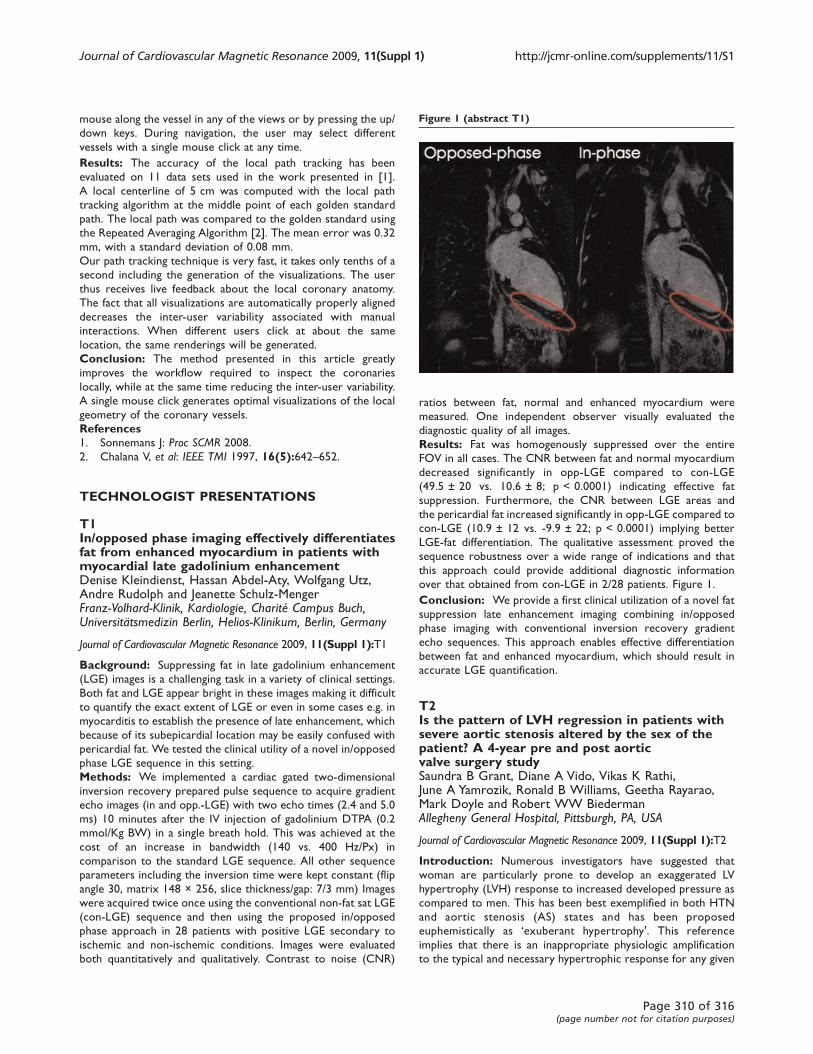
mouse along the vessel in any of the views or by pressing the up/
down keys. During navigation, the user may select different
vessels with a single mouse click at any time.
Results: The accuracy of the local path tracking has been
evaluated on 11 data sets used in the work presented in [1].
A local centerline of 5 cm was computed with the local path
tracking algorithm at the middle point of each golden standard
path. The local path was compared to the golden standard using
the Repeated Averaging Algorithm [2]. The mean error was 0.32
mm, with a standard deviation of 0.08 mm.
Our path tracking technique is very fast, it takes only tenths of a
second including the generation of the visualizations. The user
thus receives live feedback about the local coronary anatomy.
The fact that all visualizations are automatically properly aligned
decreases the inter-user variability associated with manual
interactions. When different users click at about the same
location, the same renderings will be generated.
Conclusion: The method presented in this article greatly
improves the workflow required to inspect the coronaries
locally, while at the same time reducing the inter-user variability.
A single mouse click generates optimal visualizations of the local
geometry of the coronary vessels.
References1. Sonnemans J: Proc SCMR 2008.
2. Chalana V, et al: IEEE TMI 1997, 16(5):642–652.
TECHNOLOGIST PRESENTATIONS
T1In/opposed phase imaging effectively differentiatesfat from enhanced myocardium in patients withmyocardial late gadolinium enhancementDenise Kleindienst, Hassan Abdel-Aty, Wolfgang Utz,Andre Rudolph and Jeanette Schulz-MengerFranz-Volhard-Klinik, Kardiologie, Charité Campus Buch,Universitätsmedizin Berlin, Helios-Klinikum, Berlin, Germany
Journal of Cardiovascular Magnetic Resonance 2009, 11(Suppl 1):T1
Background: Suppressing fat in late gadolinium enhancement
(LGE) images is a challenging task in a variety of clinical settings.
Both fat and LGE appear bright in these images making it difficult
to quantify the exact extent of LGE or even in some cases e.g. in
myocarditis to establish the presence of late enhancement, which
because of its subepicardial location may be easily confused with
pericardial fat. We tested the clinical utility of a novel in/opposed
phase LGE sequence in this setting.
Methods: We implemented a cardiac gated two-dimensional
inversion recovery prepared pulse sequence to acquire gradient
echo images (in and opp.-LGE) with two echo times (2.4 and 5.0
ms) 10 minutes after the IV injection of gadolinium DTPA (0.2
mmol/Kg BW) in a single breath hold. This was achieved at the
cost of an increase in bandwidth (140 vs. 400 Hz/Px) in
comparison to the standard LGE sequence. All other sequence
parameters including the inversion time were kept constant (flip
angle 30, matrix 148 × 256, slice thickness/gap: 7/3 mm) Images
were acquired twice once using the conventional non-fat sat LGE
(con-LGE) sequence and then using the proposed in/opposed
phase approach in 28 patients with positive LGE secondary to
ischemic and non-ischemic conditions. Images were evaluated
both quantitatively and qualitatively. Contrast to noise (CNR)
ratios between fat, normal and enhanced myocardium were
measured. One independent observer visually evaluated the
diagnostic quality of all images.
Results: Fat was homogenously suppressed over the entire
FOV in all cases. The CNR between fat and normal myocardium
decreased significantly in opp-LGE compared to con-LGE
(49.5 ± 20 vs. 10.6 ± 8; p < 0.0001) indicating effective fat
suppression. Furthermore, the CNR between LGE areas and
the pericardial fat increased significantly in opp-LGE compared to
con-LGE (10.9 ± 12 vs. -9.9 ± 22; p < 0.0001) implying better
LGE-fat differentiation. The qualitative assessment proved the
sequence robustness over a wide range of indications and that
this approach could provide additional diagnostic information
over that obtained from con-LGE in 2/28 patients. Figure 1.
Conclusion: We provide a first clinical utilization of a novel fat
suppression late enhancement imaging combining in/opposed
phase imaging with conventional inversion recovery gradient
echo sequences. This approach enables effective differentiation
between fat and enhanced myocardium, which should result in
accurate LGE quantification.
T2Is the pattern of LVH regression in patients withsevere aortic stenosis altered by the sex of thepatient? A 4-year pre and post aorticvalve surgery studySaundra B Grant, Diane A Vido, Vikas K Rathi,June A Yamrozik, Ronald B Williams, Geetha Rayarao,Mark Doyle and Robert WW BiedermanAllegheny General Hospital, Pittsburgh, PA, USA
Journal of Cardiovascular Magnetic Resonance 2009, 11(Suppl 1):T2
Introduction: Numerous investigators have suggested that
woman are particularly prone to develop an exaggerated LV
hypertrophy (LVH) response to increased developed pressure as
compared to men. This has been best exemplified in both HTN
and aortic stenosis (AS) states and has been proposed
euphemistically as ‘exuberant hypertrophy'. This reference
implies that there is an inappropriate physiologic amplification
to the typical and necessary hypertrophic response for any given
Figure 1 (abstract T1)
Journal of Cardiovascular Magnetic Resonance 2009, 11(Suppl 1) http://jcmr-online.com/supplements/11/S1
Page 310 of 316(page number not for citation purposes)
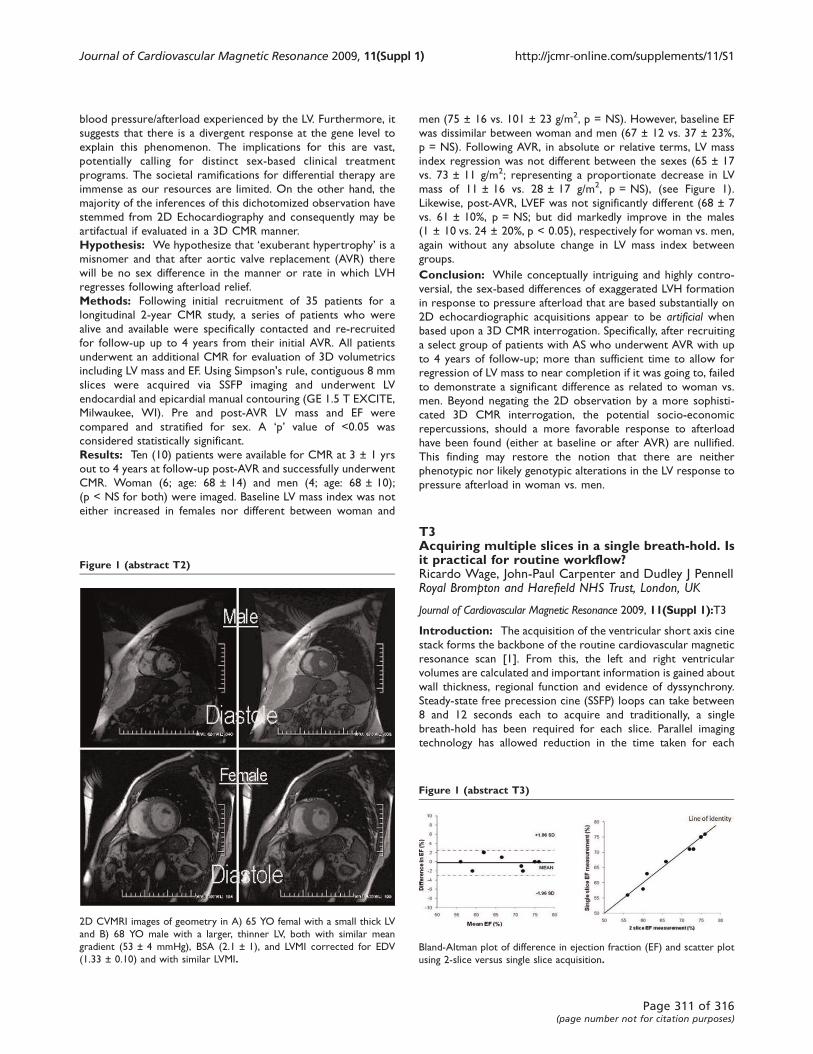
blood pressure/afterload experienced by the LV. Furthermore, it
suggests that there is a divergent response at the gene level to
explain this phenomenon. The implications for this are vast,
potentially calling for distinct sex-based clinical treatment
programs. The societal ramifications for differential therapy are
immense as our resources are limited. On the other hand, the
majority of the inferences of this dichotomized observation have
stemmed from 2D Echocardiography and consequently may be
artifactual if evaluated in a 3D CMR manner.
Hypothesis: We hypothesize that ‘exuberant hypertrophy’ is amisnomer and that after aortic valve replacement (AVR) there
will be no sex difference in the manner or rate in which LVH
regresses following afterload relief.
Methods: Following initial recruitment of 35 patients for a
longitudinal 2-year CMR study, a series of patients who were
alive and available were specifically contacted and re-recruited
for follow-up up to 4 years from their initial AVR. All patients
underwent an additional CMR for evaluation of 3D volumetrics
including LV mass and EF. Using Simpson's rule, contiguous 8 mm
slices were acquired via SSFP imaging and underwent LV
endocardial and epicardial manual contouring (GE 1.5 T EXCITE,
Milwaukee, WI). Pre and post-AVR LV mass and EF were
compared and stratified for sex. A ‘p’ value of <0.05 was
considered statistically significant.
Results: Ten (10) patients were available for CMR at 3 ± 1 yrs
out to 4 years at follow-up post-AVR and successfully underwent
CMR. Woman (6; age: 68 ± 14) and men (4; age: 68 ± 10);
(p < NS for both) were imaged. Baseline LV mass index was not
either increased in females nor different between woman and
men (75 ± 16 vs. 101 ± 23 g/m2, p = NS). However, baseline EF
was dissimilar between woman and men (67 ± 12 vs. 37 ± 23%,
p = NS). Following AVR, in absolute or relative terms, LV mass
index regression was not different between the sexes (65 ± 17
vs. 73 ± 11 g/m2; representing a proportionate decrease in LV
mass of 11 ± 16 vs. 28 ± 17 g/m2, p = NS), (see Figure 1).
Likewise, post-AVR, LVEF was not significantly different (68 ± 7
vs. 61 ± 10%, p = NS; but did markedly improve in the males
(1 ± 10 vs. 24 ± 20%, p < 0.05), respectively for woman vs. men,
again without any absolute change in LV mass index between
groups.
Conclusion: While conceptually intriguing and highly contro-
versial, the sex-based differences of exaggerated LVH formation
in response to pressure afterload that are based substantially on
2D echocardiographic acquisitions appear to be artificial whenbased upon a 3D CMR interrogation. Specifically, after recruiting
a select group of patients with AS who underwent AVR with up
to 4 years of follow-up; more than sufficient time to allow for
regression of LV mass to near completion if it was going to, failed
to demonstrate a significant difference as related to woman vs.
men. Beyond negating the 2D observation by a more sophisti-
cated 3D CMR interrogation, the potential socio-economic
repercussions, should a more favorable response to afterload
have been found (either at baseline or after AVR) are nullified.
This finding may restore the notion that there are neither
phenotypic nor likely genotypic alterations in the LV response to
pressure afterload in woman vs. men.
T3Acquiring multiple slices in a single breath-hold. Isit practical for routine workflow?Ricardo Wage, John-Paul Carpenter and Dudley J PennellRoyal Brompton and Harefield NHS Trust, London, UK
Journal of Cardiovascular Magnetic Resonance 2009, 11(Suppl 1):T3
Introduction: The acquisition of the ventricular short axis cine
stack forms the backbone of the routine cardiovascular magnetic
resonance scan [1]. From this, the left and right ventricular
volumes are calculated and important information is gained about
wall thickness, regional function and evidence of dyssynchrony.
Steady-state free precession cine (SSFP) loops can take between
8 and 12 seconds each to acquire and traditionally, a single
breath-hold has been required for each slice. Parallel imaging
technology has allowed reduction in the time taken for each
Figure 1 (abstract T2)
2D CVMRI images of geometry in A) 65 YO femal with a small thick LV
and B) 68 YO male with a larger, thinner LV, both with similar mean
gradient (53 ± 4 mmHg), BSA (2.1 ± 1), and LVMI corrected for EDV
(1.33 ± 0.10) and with similar LVMI.
Figure 1 (abstract T3)
Bland-Altman plot of difference in ejection fraction (EF) and scatter plot
using 2-slice versus single slice acquisition.
Journal of Cardiovascular Magnetic Resonance 2009, 11(Suppl 1) http://jcmr-online.com/supplements/11/S1
Page 311 of 316(page number not for citation purposes)
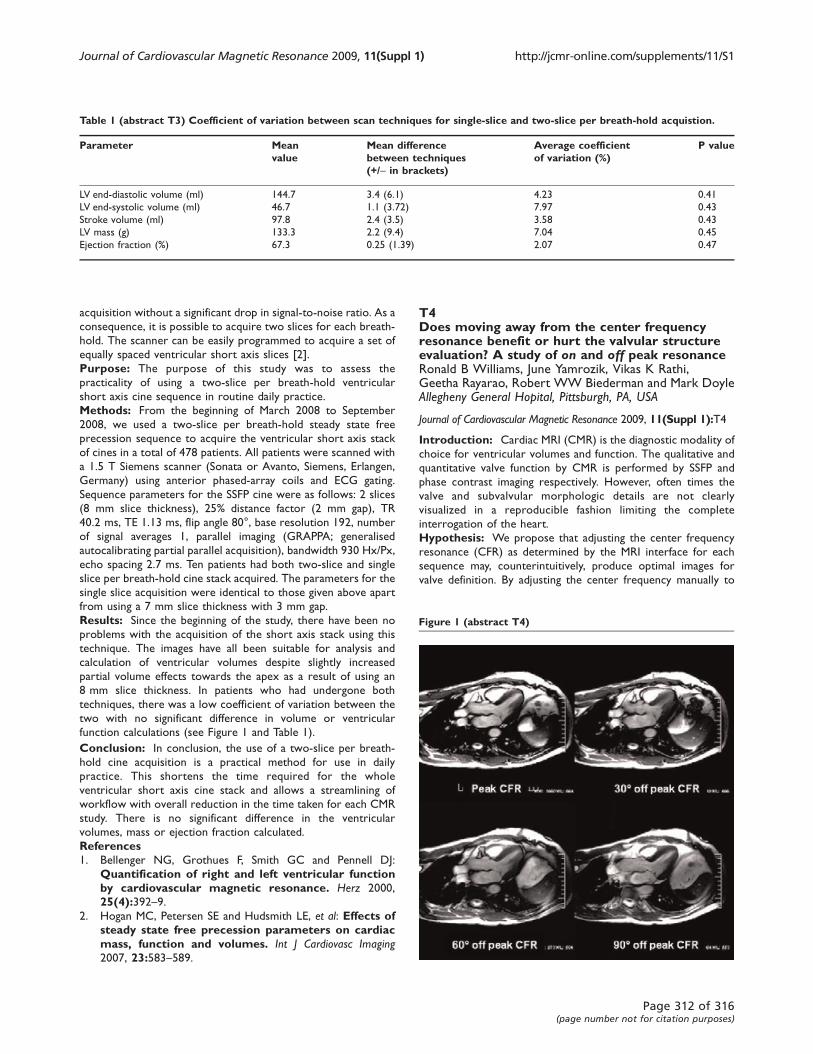
acquisition without a significant drop in signal-to-noise ratio. As a
consequence, it is possible to acquire two slices for each breath-
hold. The scanner can be easily programmed to acquire a set of
equally spaced ventricular short axis slices [2].
Purpose: The purpose of this study was to assess the
practicality of using a two-slice per breath-hold ventricular
short axis cine sequence in routine daily practice.
Methods: From the beginning of March 2008 to September
2008, we used a two-slice per breath-hold steady state free
precession sequence to acquire the ventricular short axis stack
of cines in a total of 478 patients. All patients were scanned with
a 1.5 T Siemens scanner (Sonata or Avanto, Siemens, Erlangen,
Germany) using anterior phased-array coils and ECG gating.
Sequence parameters for the SSFP cine were as follows: 2 slices
(8 mm slice thickness), 25% distance factor (2 mm gap), TR
40.2 ms, TE 1.13 ms, flip angle 80°, base resolution 192, number
of signal averages 1, parallel imaging (GRAPPA; generalised
autocalibrating partial parallel acquisition), bandwidth 930 Hx/Px,
echo spacing 2.7 ms. Ten patients had both two-slice and single
slice per breath-hold cine stack acquired. The parameters for the
single slice acquisition were identical to those given above apart
from using a 7 mm slice thickness with 3 mm gap.
Results: Since the beginning of the study, there have been no
problems with the acquisition of the short axis stack using this
technique. The images have all been suitable for analysis and
calculation of ventricular volumes despite slightly increased
partial volume effects towards the apex as a result of using an
8 mm slice thickness. In patients who had undergone both
techniques, there was a low coefficient of variation between the
two with no significant difference in volume or ventricular
function calculations (see Figure 1 and Table 1).
Conclusion: In conclusion, the use of a two-slice per breath-
hold cine acquisition is a practical method for use in daily
practice. This shortens the time required for the whole
ventricular short axis cine stack and allows a streamlining of
workflow with overall reduction in the time taken for each CMR
study. There is no significant difference in the ventricular
volumes, mass or ejection fraction calculated.
References1. Bellenger NG, Grothues F, Smith GC and Pennell DJ:
Quantification of right and left ventricular functionby cardiovascular magnetic resonance. Herz 2000,
25(4):392–9.2. Hogan MC, Petersen SE and Hudsmith LE, et al: Effects of
steady state free precession parameters on cardiacmass, function and volumes. Int J Cardiovasc Imaging2007, 23:583–589.
T4Does moving away from the center frequencyresonance benefit or hurt the valvular structureevaluation? A study of on and off peak resonanceRonald B Williams, June Yamrozik, Vikas K Rathi,Geetha Rayarao, Robert WW Biederman and Mark DoyleAllegheny General Hopital, Pittsburgh, PA, USA
Journal of Cardiovascular Magnetic Resonance 2009, 11(Suppl 1):T4
Introduction: Cardiac MRI (CMR) is the diagnostic modality of
choice for ventricular volumes and function. The qualitative and
quantitative valve function by CMR is performed by SSFP and
phase contrast imaging respectively. However, often times the
valve and subvalvular morphologic details are not clearly
visualized in a reproducible fashion limiting the complete
interrogation of the heart.
Hypothesis: We propose that adjusting the center frequency
resonance (CFR) as determined by the MRI interface for each
sequence may, counterintuitively, produce optimal images for
valve definition. By adjusting the center frequency manually to
Table 1 (abstract T3) Coefficient of variation between scan techniques for single-slice and two-slice per breath-hold acquistion.
Parameter Meanvalue
Mean differencebetween techniques(+/- in brackets)
Average coefficientof variation (%)
P value
LV end-diastolic volume (ml) 144.7 3.4 (6.1) 4.23 0.41
LV end-systolic volume (ml) 46.7 1.1 (3.72) 7.97 0.43
Stroke volume (ml) 97.8 2.4 (3.5) 3.58 0.43
LV mass (g) 133.3 2.2 (9.4) 7.04 0.45
Ejection fraction (%) 67.3 0.25 (1.39) 2.07 0.47
Figure 1 (abstract T4)
Journal of Cardiovascular Magnetic Resonance 2009, 11(Suppl 1) http://jcmr-online.com/supplements/11/S1
Page 312 of 316(page number not for citation purposes)
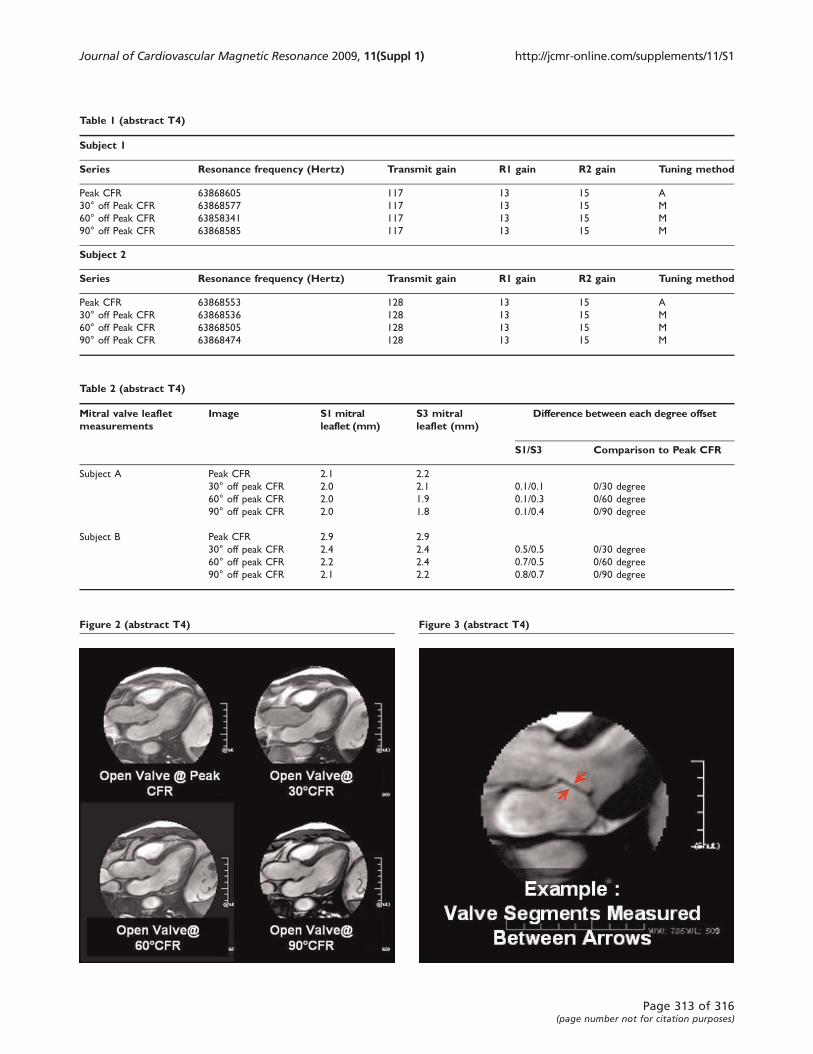
Table 1 (abstract T4)
Subject 1
Series Resonance frequency (Hertz) Transmit gain R1 gain R2 gain Tuning method
Peak CFR 63868605 117 13 15 A
30° off Peak CFR 63868577 117 13 15 M
60° off Peak CFR 63858341 117 13 15 M
90° off Peak CFR 63868585 117 13 15 M
Subject 2
Series Resonance frequency (Hertz) Transmit gain R1 gain R2 gain Tuning method
Peak CFR 63868553 128 13 15 A
30° off Peak CFR 63868536 128 13 15 M
60° off Peak CFR 63868505 128 13 15 M
90° off Peak CFR 63868474 128 13 15 M
Table 2 (abstract T4)
Mitral valve leafletmeasurements
Image S1 mitralleaflet (mm)
S3 mitralleaflet (mm)
Difference between each degree offset
S1/S3 Comparison to Peak CFR
Subject A Peak CFR 2.1 2.2
30° off peak CFR 2.0 2.1 0.1/0.1 0/30 degree
60° off peak CFR 2.0 1.9 0.1/0.3 0/60 degree
90° off peak CFR 2.0 1.8 0.1/0.4 0/90 degree
Subject B Peak CFR 2.9 2.9
30° off peak CFR 2.4 2.4 0.5/0.5 0/30 degree
60° off peak CFR 2.2 2.4 0.7/0.5 0/60 degree
90° off peak CFR 2.1 2.2 0.8/0.7 0/90 degree
Figure 2 (abstract T4) Figure 3 (abstract T4)
Journal of Cardiovascular Magnetic Resonance 2009, 11(Suppl 1) http://jcmr-online.com/supplements/11/S1
Page 313 of 316(page number not for citation purposes)
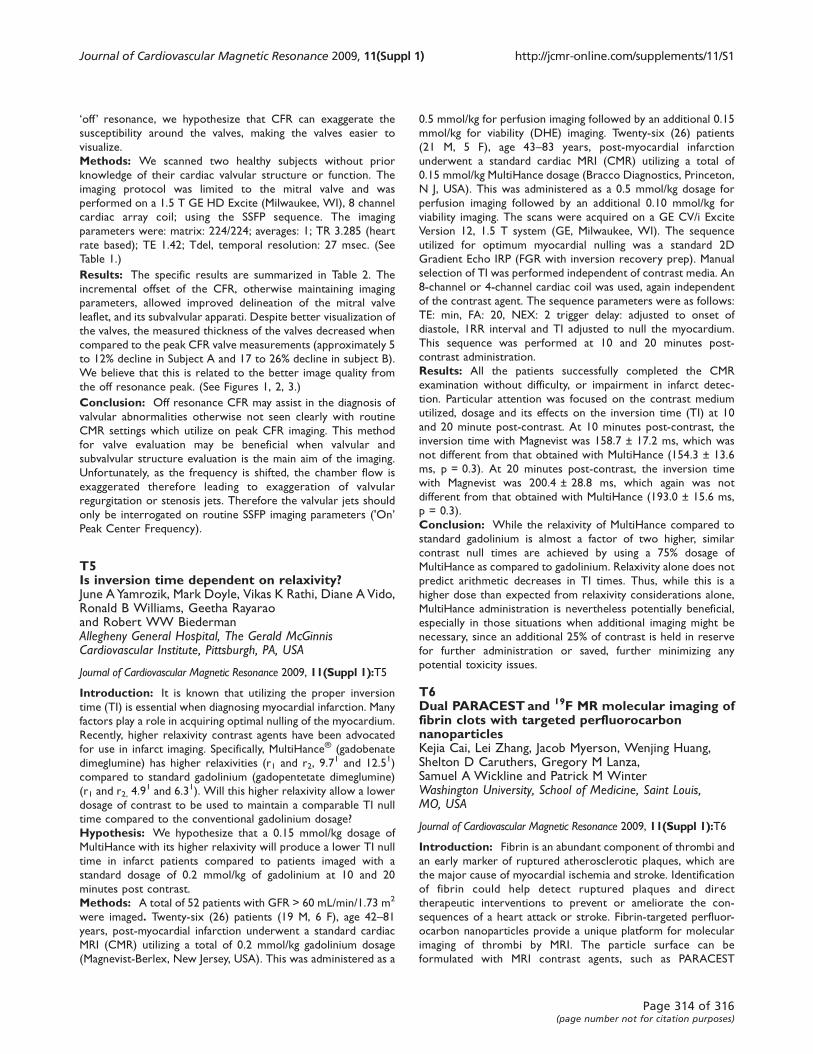
‘off ’ resonance, we hypothesize that CFR can exaggerate the
susceptibility around the valves, making the valves easier to
visualize.
Methods: We scanned two healthy subjects without prior
knowledge of their cardiac valvular structure or function. The
imaging protocol was limited to the mitral valve and was
performed on a 1.5 T GE HD Excite (Milwaukee, WI), 8 channel
cardiac array coil; using the SSFP sequence. The imaging
parameters were: matrix: 224/224; averages: 1; TR 3.285 (heart
rate based); TE 1.42; Tdel, temporal resolution: 27 msec. (See
Table 1.)
Results: The specific results are summarized in Table 2. The
incremental offset of the CFR, otherwise maintaining imaging
parameters, allowed improved delineation of the mitral valve
leaflet, and its subvalvular apparati. Despite better visualization of
the valves, the measured thickness of the valves decreased when
compared to the peak CFR valve measurements (approximately 5
to 12% decline in Subject A and 17 to 26% decline in subject B).
We believe that this is related to the better image quality from
the off resonance peak. (See Figures 1, 2, 3.)
Conclusion: Off resonance CFR may assist in the diagnosis of
valvular abnormalities otherwise not seen clearly with routine
CMR settings which utilize on peak CFR imaging. This method
for valve evaluation may be beneficial when valvular and
subvalvular structure evaluation is the main aim of the imaging.
Unfortunately, as the frequency is shifted, the chamber flow is
exaggerated therefore leading to exaggeration of valvular
regurgitation or stenosis jets. Therefore the valvular jets should
only be interrogated on routine SSFP imaging parameters ('On’Peak Center Frequency).
T5Is inversion time dependent on relaxivity?June AYamrozik, Mark Doyle, Vikas K Rathi, Diane A Vido,Ronald B Williams, Geetha Rayaraoand Robert WW BiedermanAllegheny General Hospital, The Gerald McGinnisCardiovascular Institute, Pittsburgh, PA, USA
Journal of Cardiovascular Magnetic Resonance 2009, 11(Suppl 1):T5
Introduction: It is known that utilizing the proper inversion
time (TI) is essential when diagnosing myocardial infarction. Many
factors play a role in acquiring optimal nulling of the myocardium.
Recently, higher relaxivity contrast agents have been advocated
for use in infarct imaging. Specifically, MultiHance® (gadobenate
dimeglumine) has higher relaxivities (r1 and r2, 9.71 and 12.51)
compared to standard gadolinium (gadopentetate dimeglumine)
(r1 and r2, 4.91 and 6.31). Will this higher relaxivity allow a lower
dosage of contrast to be used to maintain a comparable TI null
time compared to the conventional gadolinium dosage?
Hypothesis: We hypothesize that a 0.15 mmol/kg dosage of
MultiHance with its higher relaxivity will produce a lower TI null
time in infarct patients compared to patients imaged with a
standard dosage of 0.2 mmol/kg of gadolinium at 10 and 20
minutes post contrast.
Methods: A total of 52 patients with GFR > 60 mL/min/1.73 m2
were imaged. Twenty-six (26) patients (19 M, 6 F), age 42–81years, post-myocardial infarction underwent a standard cardiac
MRI (CMR) utilizing a total of 0.2 mmol/kg gadolinium dosage
(Magnevist-Berlex, New Jersey, USA). This was administered as a
0.5 mmol/kg for perfusion imaging followed by an additional 0.15
mmol/kg for viability (DHE) imaging. Twenty-six (26) patients
(21 M, 5 F), age 43–83 years, post-myocardial infarction
underwent a standard cardiac MRI (CMR) utilizing a total of
0.15 mmol/kg MultiHance dosage (Bracco Diagnostics, Princeton,
N J, USA). This was administered as a 0.5 mmol/kg dosage for
perfusion imaging followed by an additional 0.10 mmol/kg for
viability imaging. The scans were acquired on a GE CV/i Excite
Version 12, 1.5 T system (GE, Milwaukee, WI). The sequence
utilized for optimum myocardial nulling was a standard 2D
Gradient Echo IRP (FGR with inversion recovery prep). Manual
selection of TI was performed independent of contrast media. An
8-channel or 4-channel cardiac coil was used, again independent
of the contrast agent. The sequence parameters were as follows:
TE: min, FA: 20, NEX: 2 trigger delay: adjusted to onset of
diastole, 1RR interval and TI adjusted to null the myocardium.
This sequence was performed at 10 and 20 minutes post-
contrast administration.
Results: All the patients successfully completed the CMR
examination without difficulty, or impairment in infarct detec-
tion. Particular attention was focused on the contrast medium
utilized, dosage and its effects on the inversion time (TI) at 10
and 20 minute post-contrast. At 10 minutes post-contrast, the
inversion time with Magnevist was 158.7 ± 17.2 ms, which was
not different from that obtained with MultiHance (154.3 ± 13.6
ms, p = 0.3). At 20 minutes post-contrast, the inversion time
with Magnevist was 200.4 ± 28.8 ms, which again was not
different from that obtained with MultiHance (193.0 ± 15.6 ms,
p = 0.3).
Conclusion: While the relaxivity of MultiHance compared to
standard gadolinium is almost a factor of two higher, similar
contrast null times are achieved by using a 75% dosage of
MultiHance as compared to gadolinium. Relaxivity alone does not
predict arithmetic decreases in TI times. Thus, while this is a
higher dose than expected from relaxivity considerations alone,
MultiHance administration is nevertheless potentially beneficial,
especially in those situations when additional imaging might be
necessary, since an additional 25% of contrast is held in reserve
for further administration or saved, further minimizing any
potential toxicity issues.
T6Dual PARACEST and 19F MR molecular imaging offibrin clots with targeted perfluorocarbonnanoparticlesKejia Cai, Lei Zhang, Jacob Myerson, Wenjing Huang,Shelton D Caruthers, Gregory M Lanza,Samuel A Wickline and Patrick M WinterWashington University, School of Medicine, Saint Louis,MO, USA
Journal of Cardiovascular Magnetic Resonance 2009, 11(Suppl 1):T6
Introduction: Fibrin is an abundant component of thrombi and
an early marker of ruptured atherosclerotic plaques, which are
the major cause of myocardial ischemia and stroke. Identification
of fibrin could help detect ruptured plaques and direct
therapeutic interventions to prevent or ameliorate the con-
sequences of a heart attack or stroke. Fibrin-targeted perfluor-
ocarbon nanoparticles provide a unique platform for molecular
imaging of thrombi by MRI. The particle surface can be
formulated with MRI contrast agents, such as PARACEST
Journal of Cardiovascular Magnetic Resonance 2009, 11(Suppl 1) http://jcmr-online.com/supplements/11/S1
Page 314 of 316(page number not for citation purposes)
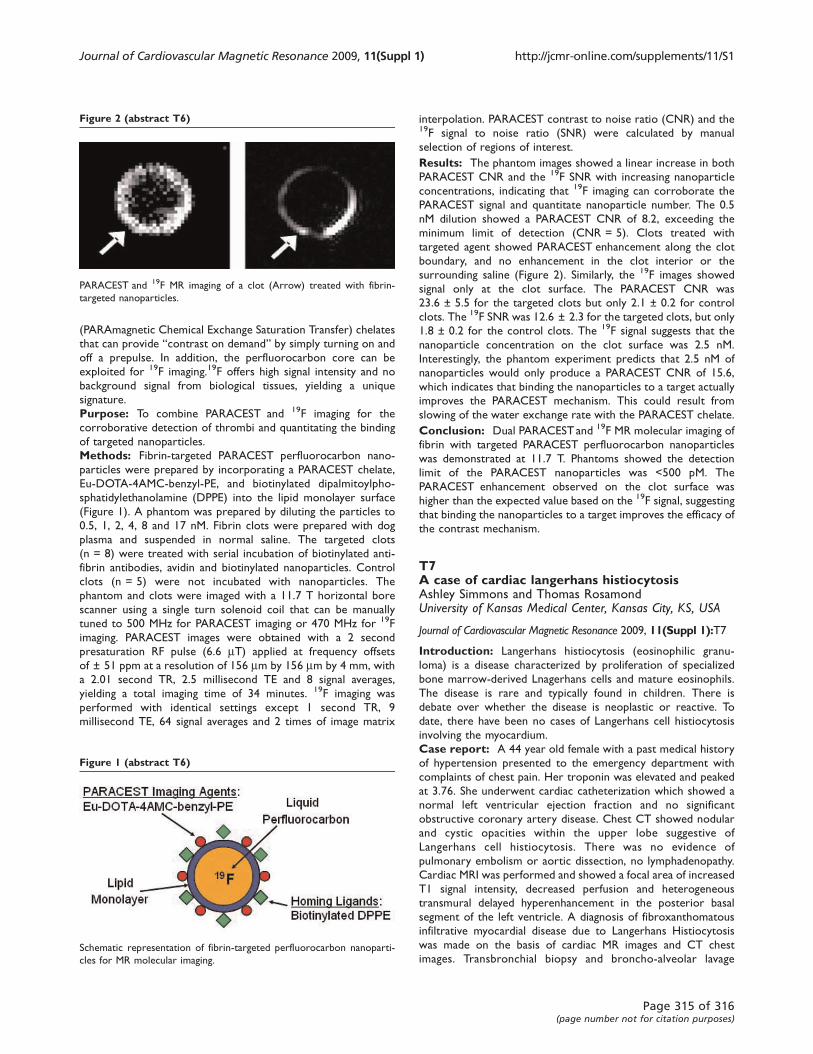
(PARAmagnetic Chemical Exchange Saturation Transfer) chelates
that can provide “contrast on demand” by simply turning on and
off a prepulse. In addition, the perfluorocarbon core can be
exploited for 19F imaging.19F offers high signal intensity and no
background signal from biological tissues, yielding a unique
signature.
Purpose: To combine PARACEST and 19F imaging for the
corroborative detection of thrombi and quantitating the binding
of targeted nanoparticles.
Methods: Fibrin-targeted PARACEST perfluorocarbon nano-
particles were prepared by incorporating a PARACEST chelate,
Eu-DOTA-4AMC-benzyl-PE, and biotinylated dipalmitoylpho-
sphatidylethanolamine (DPPE) into the lipid monolayer surface
(Figure 1). A phantom was prepared by diluting the particles to
0.5, 1, 2, 4, 8 and 17 nM. Fibrin clots were prepared with dog
plasma and suspended in normal saline. The targeted clots
(n = 8) were treated with serial incubation of biotinylated anti-
fibrin antibodies, avidin and biotinylated nanoparticles. Control
clots (n = 5) were not incubated with nanoparticles. The
phantom and clots were imaged with a 11.7 T horizontal bore
scanner using a single turn solenoid coil that can be manually
tuned to 500 MHz for PARACEST imaging or 470 MHz for 19F
imaging. PARACEST images were obtained with a 2 second
presaturation RF pulse (6.6 mT) applied at frequency offsets
of ± 51 ppm at a resolution of 156 mm by 156 mm by 4 mm, with
a 2.01 second TR, 2.5 millisecond TE and 8 signal averages,
yielding a total imaging time of 34 minutes. 19F imaging was
performed with identical settings except 1 second TR, 9
millisecond TE, 64 signal averages and 2 times of image matrix
interpolation. PARACEST contrast to noise ratio (CNR) and the19F signal to noise ratio (SNR) were calculated by manual
selection of regions of interest.
Results: The phantom images showed a linear increase in both
PARACEST CNR and the 19F SNR with increasing nanoparticle
concentrations, indicating that 19F imaging can corroborate the
PARACEST signal and quantitate nanoparticle number. The 0.5
nM dilution showed a PARACEST CNR of 8.2, exceeding the
minimum limit of detection (CNR = 5). Clots treated with
targeted agent showed PARACEST enhancement along the clot
boundary, and no enhancement in the clot interior or the
surrounding saline (Figure 2). Similarly, the 19F images showed
signal only at the clot surface. The PARACEST CNR was
23.6 ± 5.5 for the targeted clots but only 2.1 ± 0.2 for control
clots. The 19F SNR was 12.6 ± 2.3 for the targeted clots, but only
1.8 ± 0.2 for the control clots. The 19F signal suggests that the
nanoparticle concentration on the clot surface was 2.5 nM.
Interestingly, the phantom experiment predicts that 2.5 nM of
nanoparticles would only produce a PARACEST CNR of 15.6,
which indicates that binding the nanoparticles to a target actually
improves the PARACEST mechanism. This could result from
slowing of the water exchange rate with the PARACEST chelate.
Conclusion: Dual PARACEST and 19F MR molecular imaging of
fibrin with targeted PARACEST perfluorocarbon nanoparticles
was demonstrated at 11.7 T. Phantoms showed the detection
limit of the PARACEST nanoparticles was <500 pM. The
PARACEST enhancement observed on the clot surface was
higher than the expected value based on the 19F signal, suggesting
that binding the nanoparticles to a target improves the efficacy of
the contrast mechanism.
T7A case of cardiac langerhans histiocytosisAshley Simmons and Thomas RosamondUniversity of Kansas Medical Center, Kansas City, KS, USA
Journal of Cardiovascular Magnetic Resonance 2009, 11(Suppl 1):T7
Introduction: Langerhans histiocytosis (eosinophilic granu-
loma) is a disease characterized by proliferation of specialized
bone marrow-derived Lnagerhans cells and mature eosinophils.
The disease is rare and typically found in children. There is
debate over whether the disease is neoplastic or reactive. To
date, there have been no cases of Langerhans cell histiocytosis
involving the myocardium.
Case report: A 44 year old female with a past medical history
of hypertension presented to the emergency department with
complaints of chest pain. Her troponin was elevated and peaked
at 3.76. She underwent cardiac catheterization which showed a
normal left ventricular ejection fraction and no significant
obstructive coronary artery disease. Chest CT showed nodular
and cystic opacities within the upper lobe suggestive of
Langerhans cell histiocytosis. There was no evidence of
pulmonary embolism or aortic dissection, no lymphadenopathy.
Cardiac MRI was performed and showed a focal area of increased
T1 signal intensity, decreased perfusion and heterogeneous
transmural delayed hyperenhancement in the posterior basal
segment of the left ventricle. A diagnosis of fibroxanthomatous
infiltrative myocardial disease due to Langerhans Histiocytosis
was made on the basis of cardiac MR images and CT chest
images. Transbronchial biopsy and broncho-alveolar lavage
Figure 1 (abstract T6)
Schematic representation of fibrin-targeted perfluorocarbon nanoparti-
cles for MR molecular imaging.
Figure 2 (abstract T6)
PARACEST and 19F MR imaging of a clot (Arrow) treated with fibrin-
targeted nanoparticles.
Journal of Cardiovascular Magnetic Resonance 2009, 11(Suppl 1) http://jcmr-online.com/supplements/11/S1
Page 315 of 316(page number not for citation purposes)
showed no evidence of histiocytosis. The differential diagnosis
remains focal eosinophilic granuloma versus viral myocarditis.
Conclusion: Cardiac MRI can help with the differential
diagnosis of infiltrative myocardial diseases with delayed hyper-
enhancement techniques.
T8The role of CMR in the diagnosis of systemicvasculitis: a case studyPhillip AndrewsUniversity Hospital of North Staffordshire, Stoke-on-Trent, UK
Journal of Cardiovascular Magnetic Resonance 2009, 11(Suppl 1):T8
An 18 yr old caucasian man presented with neurological symptoms
and breathlessness. Echocardiography demonstrated a left ventri-
cular abnormality of unclear aetiology. The patient was referred
onwards to our unit for further assessment by cardiac magnetic
resonance. Imaging was performed on a 1.5 T Philips Intera Acheiva,
using a five element phased-array surface coil.
On steady state free precession (SSFP) cine images the
appearances were of marked left ventricular hypertrophy with
partial cavity obliteration. Left ventricular cavity volumes were
reduced and ejection fraction was 54%. Early post contrast
inversion recovery gradient echo (IRGE) images showed an area
of low signal within the LV cavity distinct from the myocardium.
The mass was markedly hypointense to both myocardium and the
blood pool. Delayed IRGE sequences 10 minutes following the
administration of contrast demonstrated widespread subendo-
cardial hyperenhancement in all myocardial segments sparing
only the basal septum. CMR was able to confidently establish the
diagnosis of endomyocardial fibrosis with a large left ventricular
thrombus burden.
The patient had no history of foreign travel or malnutrition,
making a vasculitis the most likely aetiology.
Baseline blood testing demonstrated a mild eosinophilia of 17%, a
C reactive protein of 27 mg/L (normal 0–5) and an erythrocyte
sedimentation rate of 27 mm/h (normal 0–20). Further imaging
demonstrated normal renal arteries on MR angiogram. However
CT thorax demonstrated pulmonary haemorrhage and MRI brain
demonstrated white matter abnormalities in the cerebral cortex.
These findings were in keeping with the clinical diagnosis of
vasculitis, Although autoantibodies were all normal, the most
likely process is a variant of Churg Strauss.
Cardiac MR was able to establish the diagnosis of endomyocardial
fibrosis which was pivotal in identifying the underlying vasculitic
disease process.
Journal of Cardiovascular Magnetic Resonance 2009, 11(Suppl 1) http://jcmr-online.com/supplements/11/S1
Page 316 of 316(page number not for citation purposes)
Copyright © 2022 FDOKUMEN