Transformed diffuse large B-cell lymphomas with gains of the discontinuous 12q12-14 amplicon display...
10
Transformed diffuse large B-cell lymphomas with gains of the discontinuous 12q12-14 amplicon display concurrent deregulation of CDK2, CDK4 and GADD153 genes Follicular lymphoma (FL) accounts for 20–25% of all non- Hodgkin lymphoma (NHL) (Harris et al, 1994; The Non- Hodgkin’s Lymphoma Classification Project, 1997). FL is characteristically associated with the chromosomal transloca- tion t(14;18)(q32;q21), which juxtaposes the BCL-2 gene on 18q21 to the actively transcribed IGH gene on 14q32. Consequently, the overproduction of BCL2 protein leads to the inhibition of apoptosis (Godon et al, 2003). Although FL is an indolent malignancy with a median survival of 7–8 years, it is currently incurable. In addition, FL may undergo high grade histological transformation to more aggressive malignancies, most commonly diffuse large B-cell lymphoma (DLBCL) with the frequency being highly variable (10–60%) (Bastion et al, 1997). Transformation is typically associated with the loss of follicular histological architecture and acceleration of the clinical course, with a loss of durable response to chemother- apy and radiotherapy and a median survival less than 1 year (Hubbard et al, 1982). DLBCL constitutes 31% of all NHL types and is therefore the most common (Harris et al, 1994; The Non-Hodgkin’s Lymphoma Classification Project, 1997). In addition to some of the cells retaining the t(14;18)(q32;q21) translocation characteristic of FL (Richardson et al, 1987), the transformed DLBCL cells also acquire multiple secondary genetic abnor- malities at the cytogenetic (Armitage et al, 1988; Elenitoba- Johnson et al, 1998; Cigudosa et al, 1999; Nanjangud et al, 2002) and molecular (Matolcsy et al, 1996; Pinyol et al, 1998; Pasqualucci et al, 2001; Elenitoba-Johnson et al, 2003; Osama Al-Assar, 1 Karen S. Rees- Unwin, 1 * Lia P. Menasce, 2 Rachael E. Hough, 3 John R. Goepel, 4 David W. Hammond 1 and Barry W. Hancock 5 1 Yorkshire Cancer Research Institute for Cancer Studies, Division of Genomic Medicine, University of Sheffield, Sheffield, 2 Department of Pathology, Christie Hospital, Manchester, 3 Department of Haematology, Sheffield Children’s Hospital, 4 Department of Pathology, Royal Hallamshire Hospital, and 5 Yorkshire Cancer Research Academic Unit of Clinical Oncology, Cancer Research Centre, Weston Park Hospital, Sheffield, UK Received 30 January 2006; accepted for publication 7 March 2006 Correspondence: Dr O. Al-Assar, Institute for Cancer Studies, Division of Genomic Medicine, University of Sheffield, Sheffield S10 2RX, UK. E-mail: o.al-assar@sheffield.ac.uk *Present address: Dr Karen S. Rees-Unwin, School of Life Sciences, The University of Manchester, Jackson’s Mill, PO Box 88, Manchester M13 OJH, UK. Summary Transformation of the indolent follicular lymphoma (FL) to the aggressive diffuse large B-cell lymphoma (DLBCL) results in resistance to therapy with shortened survival. It has been demonstrated that the 12q12-14 region was mainly amplified in DLBCL cases but not in their FL counterparts. Therefore, we examined the DNA copy number and protein expression profiles for CDK2, CDK4 and GADD153, three genes that map to 12q12-14, in a set of 44 paired FL/DLBCL samples from 22 patients. The concordant amplification of these genes occurred in seven of 22 (32%) of FL cases, compared with 15 of 22 (68%) of DLBCL cases. At the protein level, 15 of 22 of the DLBCL samples (68%) showed strong staining for the CDK2 protein, compared with five of 21 of FL samples (24%). The majority of the DLBCL samples (16/22, 72%) expressed the CDK4 protein, whereas the majority of the FL samples (12/21, 57%) showed no expression of this protein. Except for one DLBCL case, no expression of the GADD153 protein could be detected. The deregulation of the CDK2 and CDK4 genes at the genetic and protein levels suggest a functional role for these genes in the transformation process and could potentially provide targets for prognostic tests or therapeutic interventions. Keywords: diffuse large B-cell lymphoma, follicular lymphoma, deregula- tion, 12q12-14, genes. research paper ª 2006 The Authors doi:10.1111/j.1365-2141.2006.06093.x Journal Compilation ª 2006 Blackwell Publishing Ltd, British Journal of Haematology, 133, 612–621
-
Upload
independent -
Category
Documents
-
view
0 -
download
0
Transcript of Transformed diffuse large B-cell lymphomas with gains of the discontinuous 12q12-14 amplicon display...

Transformed diffuse large B-cell lymphomas with gains of thediscontinuous 12q12-14 amplicon display concurrentderegulation of CDK2, CDK4 and GADD153 genes
Follicular lymphoma (FL) accounts for 20–25% of all non-
Hodgkin lymphoma (NHL) (Harris et al, 1994; The Non-
Hodgkin’s Lymphoma Classification Project, 1997). FL is
characteristically associated with the chromosomal transloca-
tion t(14;18)(q32;q21), which juxtaposes the BCL-2 gene on
18q21 to the actively transcribed IGH gene on 14q32.
Consequently, the overproduction of BCL2 protein leads to
the inhibition of apoptosis (Godon et al, 2003). Although FL is
an indolent malignancy with a median survival of 7–8 years, it
is currently incurable. In addition, FL may undergo high grade
histological transformation to more aggressive malignancies,
most commonly diffuse large B-cell lymphoma (DLBCL) with
the frequency being highly variable (10–60%) (Bastion et al,
1997). Transformation is typically associated with the loss of
follicular histological architecture and acceleration of the
clinical course, with a loss of durable response to chemother-
apy and radiotherapy and a median survival less than 1 year
(Hubbard et al, 1982).
DLBCL constitutes 31% of all NHL types and is therefore
the most common (Harris et al, 1994; The Non-Hodgkin’s
Lymphoma Classification Project, 1997). In addition to some
of the cells retaining the t(14;18)(q32;q21) translocation
characteristic of FL (Richardson et al, 1987), the transformed
DLBCL cells also acquire multiple secondary genetic abnor-
malities at the cytogenetic (Armitage et al, 1988; Elenitoba-
Johnson et al, 1998; Cigudosa et al, 1999; Nanjangud et al,
2002) and molecular (Matolcsy et al, 1996; Pinyol et al, 1998;
Pasqualucci et al, 2001; Elenitoba-Johnson et al, 2003;
Osama Al-Assar,1 Karen S. Rees-
Unwin,1* Lia P. Menasce,2 Rachael
E. Hough,3 John R. Goepel,4 David
W. Hammond1 and Barry W. Hancock5
1Yorkshire Cancer Research Institute for Cancer
Studies, Division of Genomic Medicine, University
of Sheffield, Sheffield, 2Department of Pathology,
Christie Hospital, Manchester, 3Department of
Haematology, Sheffield Children’s Hospital,4Department of Pathology, Royal Hallamshire
Hospital, and 5Yorkshire Cancer Research
Academic Unit of Clinical Oncology, Cancer
Research Centre, Weston Park Hospital, Sheffield,
UK
Received 30 January 2006; accepted for
publication 7 March 2006
Correspondence: Dr O. Al-Assar, Institute for
Cancer Studies, Division of Genomic Medicine,
University of Sheffield, Sheffield S10 2RX, UK.
E-mail: [email protected]
*Present address: Dr Karen S. Rees-Unwin,
School of Life Sciences, The University of
Manchester, Jackson’s Mill, PO Box 88,
Manchester M13 OJH, UK.
Summary
Transformation of the indolent follicular lymphoma (FL) to the aggressive
diffuse large B-cell lymphoma (DLBCL) results in resistance to therapy with
shortened survival. It has been demonstrated that the 12q12-14 region was
mainly amplified in DLBCL cases but not in their FL counterparts. Therefore,
we examined the DNA copy number and protein expression profiles for
CDK2, CDK4 and GADD153, three genes that map to 12q12-14, in a set of
44 paired FL/DLBCL samples from 22 patients. The concordant amplification
of these genes occurred in seven of 22 (32%) of FL cases, compared with 15 of
22 (68%) of DLBCL cases. At the protein level, 15 of 22 of the DLBCL
samples (68%) showed strong staining for the CDK2 protein, compared with
five of 21 of FL samples (24%). The majority of the DLBCL samples (16/22,
72%) expressed the CDK4 protein, whereas the majority of the FL samples
(12/21, 57%) showed no expression of this protein. Except for one DLBCL
case, no expression of the GADD153 protein could be detected. The
deregulation of the CDK2 and CDK4 genes at the genetic and protein levels
suggest a functional role for these genes in the transformation process and
could potentially provide targets for prognostic tests or therapeutic
interventions.
Keywords: diffuse large B-cell lymphoma, follicular lymphoma, deregula-
tion, 12q12-14, genes.
research paper
ª 2006 The Authorsdoi:10.1111/j.1365-2141.2006.06093.x Journal Compilation ª 2006 Blackwell Publishing Ltd, British Journal of Haematology, 133, 612–621

Katzenberger et al, 2004) levels. These changes can involve
several genes but these do not appear to account for more than
a small number of cases (Lossos & Levy, 2003).
Previous work carried out by our group on a series of FL/
DLBCL paired lymphoma biopsies identified a region of
amplification on 12q12-14 that was detected in over half the
transformed DLBL cases and that was not seen in the FL
counterpart (Hough et al, 2001). These results suggested that
the 12q amplicon might be important in the transformation
from FL to DLBCL disease. The 12q12-14 amplicon is part of a
region that is associated with many malignancies (Riou et al,
1995; Reifenberger et al, 1996; Courjal & Theillet, 1997; Rao
et al, 1998). However, the amplification of 12q is highly
complex, exhibiting discontinuous regions of amplification
(Wolf et al, 1997) and regions that show gains or deletions do
not necessarily show conformity of amplification of genes
within these regions (Hyman et al, 2002; Martinez-Climent
et al, 2003; Zafarana et al, 2003). Importantly, a recent report
suggested that the 12cen-q15 amplicon is one of the regions
that could contain oncogenic pathways that are shared by the
various DLBCL subgroups (Bea et al, 2005). We, therefore,
investigated the amplification status and protein expression
profile of three selected genes that map to different regions on
the 12q12-14, as targets for the 12q12-14 amplification, after
recruiting additional samples that showed gains of the 12q12-
14 amplicon. These three genes were CDK2 (12q13.2), CDK4
(12q14.1) and GADD153 (12q13.3). In addition to being in
different regions on the 12q12-14, these genes were selected on
the basis of previous evidence of amplification and a role in cell
cycle (Rao et al, 1998; Maytin et al, 2001; Mao et al, 2002;
Murray, 2004).
Materials and methods
Clinical material
Paraffin embedded sections from paired historical biopsies of
22 patients with biopsy-proven FL at diagnosis and subsequent
transformation to DLBCL were obtained after being identified
using the regional clinical and pathological databases. This set
of paraffin embedded sections was used for DNA extraction
and included a previously published subset of tumour tissue
(Hough et al, 2001). The histological diagnosis was confirmed
prior to DNA extraction according to the World Health
Organisation classification (Harris et al, 1994).
Cell lines and paraffin embedding
The lymphoma cell line DoHH-2 (Kluin-Nelemans et al, 1991)
originated from a transformed lymphoma case and was
obtained from the German Collection of Micro-organisms
and Cell Culture. The lymphoma cell line HT (Beckwith et al,
1990) originated from a DLBCL case and was obtained from
the American Type Culture Collection (ATCC). The osteosar-
coma cell line SJSA-1 was obtained from the ATCC and was
selected because it showed amplification of the 12q using
comparative genomic hybridisation (CGH) (data not shown).
Paraffin embedding of cell lines was essentially as described by
others (Rhodes et al, 2002).
DNA extraction
Areas consisting of at least 50% tumour cells were identified by
immunocytochemistry using CD20, CD79a, CD43, CD3 and
CD45RO. Only sections with a similar percentage of tumour
cells were used for each FL/DLBCL pair. These areas were
micro-dissected from 6–10 serial tissue sections (5 mm) from
each biopsy. DNA was prepared using the Qiagen DNA tissue
kit and following the manufacturer’s protocol (Qiagen, UK).
DNA quality and integrity (OD260/OD280) was assessed using
spectophotometry (Lambda Bio UV/VIS spectrophotometer–
Perkin Elmer) and ethidium bromide stained Tris-buffered 1%
agarose gel.
Quantitative real time polymerase chain reaction
A total of 20–100 ng of extracted DNA was used in the
quantitative real time polymerase chain reaction (PCR)
reaction. A preliminary experiment has shown linear ampli-
fication of the template in the range 5–200 ng (data not
shown). PCR primers and TaqMan probe sequences (Table I)
were designed using the primer express 1.5 software against
published sequence-tagged site (STS) sequences and following
the Biosystems criteria. The probes were labelled with the
reporter dye 5,(6)-carboxyfluorescein at the 5¢ end and the
quencher dye 5,(6)-carboxy-tetramethyl-rhodamine at the 3¢
end. The reaction was performed using a PCR master mix with
5,(6)-carboxy-X-rhodamine as the background control dye
(Eurogentec, Oswell, UK), on a TaqMan ABI 7700 or 7900
(Applied Biosystems, Cheshire, UK). Control experiments
using identical samples were used to verify that both ABI 7700
Table I. Sequences of the primers and probes used in quantitative real-time polymerase chain reaction.
Gene Forward primer Reverse Primer TaqMan probe
Product
size (bp)
GAPDH TCTTACTCCTTGGAGGCCCATGT CATTTCCTGGTATGACAACGAATTT AATGAGGTCCACCACCCTGTTGCTGTAG 81
CDK2 CAGTTGCCAAGGATCCCTGAT GATGCCTAAACCCTAACTTCTAACTCCTA CCATTTTCCTCTGACGTCCACCTCCTACC 85
CDK4 GCTGCCATGGAAGGAAGAAA GCCTCAGAGATAAAGGCAAAGATT TGCCATTTCCCTTCTGGACACTGAGAG 77
GADD153 AAGTGGCTACTGACTACCCTCTCACTA GAGACCTTTCCTTTTGTCTACTCCAA TGACCCTCAATCCCACATACG CAGG 98
All sequences are in the 5¢–3¢ orientation.
CDK2, CDK4 and GADD153 deregulation in DLBCL
ª 2006 The AuthorsJournal Compilation ª 2006 Blackwell Publishing Ltd, British Journal of Haematology, 133, 612–621 613

and ABI 7900 yielded the same results. Primer and probe
concentrations were optimised for each gene (data not shown)
to give the lowest Ct and highest DRn for the same template
quantity, respectively. The PCR conditions used were as
follows: 2 min at 50�C, 10 min at 95�C and 40 cycles of 95�Cfor 15 s and 60�C for 1 min. The standard curves were
constructed within the linear range of amplification and using
serial dilutions of commercially available DNA pooled from
several individuals (Promega, Southampton, UK). This was
compared against standard curves constructed from DNA
pooled from 20 individuals in our laboratory and the results
were similar. All the samples were run in triplicates and the
plates were independently repeated in triplicates. The raw data
were analysed using sequence detection Software 2.0
(Applied Biosystems). Relative quantitation of the gene copy
number for each test gene was achieved by normalisation to
glyceraldehyde-3-phosphate dehydrogenase (GAPDH). All the
reactions were carried out as monoplex reactions as compe-
tition between the different sets of primers prevented multi-
plexing of the test gene with the endogenous gene in the same
reaction well (data not shown). A profile of normal gene copy
values for a specific gene was established from DNA extracted
from a panel of 20 normal individuals and included paraffin-
embedded normal tonsil sections. The normal range was
calculated by using the mean average of the 20 normal values
±2 SD. DNA extracted from formalin-fixed and paraffin-
embedded cell lines was used as a control. For statistical
analysis, one-tailed Student’s t-test for paired samples was used
to test the null hypothesis that the two sets of data came from
one population that has one mean, with the alternative
hypothesis being that one set had a larger mean than the other
(one tailed). The significance of the results was tested at an a of
0Æ05. The use of the Student’s t-test assumed normal distri-
bution of the population with standard deviation differences
being less than twofold between any two groups. Similar
skewness between the compared populations avoided distor-
tion of the P-values.
Immunohistochemistry
Five lm tissue sections mounted on 3-amino-propyl-tri-
ethoxysilone (APES)-coated slides were used for immuno-
staining. The sections were first de-paraffinised in xylene and
endogenous peroxidase activity was blocked using hydrogen
peroxide. Antigen retrieval was carried out by heating the
slides in a solution of 10 mmol/l tri-sodium citrate using a
microwave oven (800 W). The temperature was not allowed to
exceed 85�C to avoid disruption of tissue architecture and
maintain adhesion. The sections were then incubated in a
blocking solution of normal serum and incubated overnight at
4�C in the primary antibody solution. The CDK2 and CDK4
antibodies were obtained from Lab Vision/Neomarkers, Suf-
folk, UK) and the GADD153 antibody was obtained from
Santa Cruz Biotech (Middlesex, UK). For negative controls, a
solution containing IgG from the same primary antibody host
species was used (the same isotype). The immunoreactivity of
primary antibody was detected using a colorimetric method
and following the manufacturer’s instructions [Vectastain Elite
ABC and 3,3¢-diaminobenzidine (DAB) kits from Vector
Laboratories (Peterborough, UK)]. The immunostain images
were captured using a Nikon Cool Pix 990 digital camera
mounted on Nikon Biophot Microscope (Nikon UK Ltd,
Surrey, UK). The images were processed using nikonview 3TM
software. The evaluation of the staining of the sections
considered both the staining intensity and percentage of
positive tumour cells to take into consideration any hetero-
geneity of staining. The intensities of CDK2, CDK4 and
GADD153 expression were assessed by comparing the intensity
of the immunostain within the tumour cells to that of
surrounding ‘normal’ lymphoid cells, as determined by the
pathologists. In addition, the immunostaining results for a
particular candidate gene were compared with that of a
strongly positive (+3) control cell line. The three cell lines used
were DoHH-2, HT and SJSA-1 and they strongly stained for
CDK2, GADD153 and CDK4, except for DoHH-2, which
stained negatively for GADD153 and moderately (+2) for
CDK4. Using these criteria, tumours without any staining were
considered negative. Tumours with +1 staining intensity in
<80% of cells or +2 intensity in <30% of cells were considered
weakly positive (+1). Tumours with +1 staining intensity in
‡80% of cells, +2 intensity in 30–79%, or +3 intensity in <30%
were considered moderately positive (+2). Tumours with +2
intensity in ‡80%, or +3 intensity in ‡30% of cells were
considered strongly positive (+3). The correlation between the
quantitative real time PCR results and immunohistochemistry
was tested by Spearman’s s-test at an a of 0Æ05 (two-tailed),
using the Statistical Package for the Social Sciences (spss),
version 11 (SPSS Incorporation, Chicago, IL, USA).
Results
CDK2, CDK4 and GADD153 gene amplification
Figure 1 is a graphical representation of the gene amplification
results for the three genes investigated in this study. The gene
amplification results were normalised to the GAPDH gene. The
choice of an endogenous control gene localised to the 12 p arm
was due to the frequent occurrence of trisomy of chromosome
12 in lymphoma (Cabanillas et al, 1988; Offit et al, 1991).
Therefore, normalisation to the GAPDH gene rules out gene
copy number amplification due to entire chromosome 12 gain.
Normalisation to albumin resulted in comparable results (only
results showing normalisation to GAPDH are presented). The
normal ranges of CDK2, CDK4 and GADD153 gene copy
numbers in a series of 20 controls were 0Æ66–2Æ26, 0Æ31–2Æ20 and
0Æ38–1Æ96, respectively. Increased CDK2, CDK4 and GADD153
gene copy numbers were detected in 12 of 22 (55%), 12 of 22
(55%) and 18 of 22 (82%) of FL lymphoma cases, respectively.
In the transformed DLBCL lymphoma cases, increased CDK2,
CDK4 and GADD153 gene copy numbers were identified in 18
O. Al-Assar et al
ª 2006 The Authors614 Journal Compilation ª 2006 Blackwell Publishing Ltd, British Journal of Haematology, 133, 612–621

of 22 (82%), 20 of 22 (91%) and 20 of 22 (91%) of cases,
respectively. The concordant amplification of all three genes
occurred in seven of 22 (32%) of FL cases, compared with 15 of
22 (68%) of DLBCL cases. The average CDK2 gene copy
numbers were 2Æ70 (±0Æ23 SE) and 3Æ26 (±0Æ24 SE) in the FL
and transformed DLBCL lymphoma groups, respectively, with
the difference being statistically significant at a P-value of 0Æ002
(Fig 1A). No amplification of CDK2 was seen for any of the cell
lines examined. The average CDK4 gene copy numbers were
2Æ76 (±0Æ34 SE) and 4Æ14 (±0Æ42 SE) in the FL and DLBCL
groups, respectively, with the difference being statistically
significant (P ¼ 0Æ0009; Fig 1B). The SJSA-1 cell line showed a
23-fold increase in CDK4 gene copy number, whereas the
DoHH-2 and HT cell lines showed no amplification of this
gene. The average GADD153 gene copy numbers were 3Æ55
(±0Æ36 SE) and 4Æ23 (±0Æ33 SE) in the FL and DLBCL groups,
respectively, with the difference being statistically significant at
a P-value of 0Æ040 (Fig 1C). All the cell lines examined showed
GADD153 gene amplification, with the SJSA-1 cell line showing
the most prominent gain of 22 copies. In summary, the DLBCL
samples demonstrated the most prominent concurrent and
individual amplification of CDK2, CDK4 and GADD153 genes,
compared with the FL samples.
CDK2, CDK4 and GADD153 protein expression profiles
Table II details the scoring of the protein expression results for
the CDK2, CDK4 and GADD153 proteins. Immunostaining
for the CDK2 protein was detected in 20 of 21 cases (91%) and
all cases (100%) of the FL and DLBCL samples, respectively.
Some FL samples (8/21, 38%) showed moderate staining for
the CDK2 protein, whereas the majority of the DLBCL (15/22,
68%) samples showed strong staining. Figure 2A and B show
CDK2 staining in a representative case before and after
transformation, respectively. Immunostaining for the CDK4
protein was detected in nine of 21 cases (43%) and 16 of 22
cases (73%) of the FL and DLBCL cases, respectively. Most of
the FL samples (12/21, 57%) stained negatively for the CDK4
protein, whereas the majority of DLBCL samples (16/22, 73%)
stained positively for this protein. Figure 2C and D shows
CDK4 staining in a representative case before and after
transformation, respectively. Immunostaining for GADD153
protein could be detected in only one case (5%). Figure 2E and
F shows GADD153 staining in a representative case before and
after transformation, respectively. A graphical representation
of these results in the FL/DLBCL paired samples and a numeric
summary of these results presented as groups of FL and
DLBCL are shown in Fig 3 and Table III, respectively. There
was no statistically significant correlation between the gene
copy number and the protein expression in any of the groups.
Discussion
Areas of amplification and deletion identified in different
malignancies are good targets for the study of tumour
(A) CDK2
(C) GADD153
FL DLBCL
FL DLBCL
0
1
2
3
4
5
6
7
FL DLBCL
Gen
e co
py n
umbe
r
(B) CDK4
0
2
4
6
8
10
12
14
16
0
1
2
3
4
5
6
7
8
9
FL vs. DLBCLP-value = 0·002
FL vs. DLBCLP-value = 0·0009
FL vs. DLBCLP-value = 0·040
Fig 1. A graphical representation of the CDK2 (A), CDK4 (B) and
GADD153 (C) gene copy numbers in a series of 22 paired follicular
lymphoma/diffuse large B-cell lymphoma (FL/DLBCL) cases measured
by quantitative real-time polymerase chain reaction and normalised to
the GAPDH gene. The dotted lines describe the maximum values
detected in a panel of 20 normal controls and therefore provide a
threshold for positive gene amplification. The short, solid lines des-
cribe the mean average for that group. The P-values represent the
significance of the difference between the FL and DLBCL groups as
measured by the Student’s t-test.
CDK2, CDK4 and GADD153 deregulation in DLBCL
ª 2006 The AuthorsJournal Compilation ª 2006 Blackwell Publishing Ltd, British Journal of Haematology, 133, 612–621 615

development and progression. This is particularly important
when these changes are accompanied by changes in the protein
expression. It is assumed that chromosomal gains and
deletions have dosage effects on the expression of some of
the genes that map to these regions (Martinez-Climent et al,
2003). These changes in gene expression require high genomic
Table II. A summary of the protein expression
results for the CDK2, CDK4 and GADD153
proteins in follicular lymphoma/diffuse large B-
cell lymphoma (FL/DLBCL) cases and different
cell lines.
Total Number
Immunostaining strength
) +1 +2 +3
CDK2
FL 21 1 (5%) 7 (33%) 8 (38%) 5 (24%)
DLBCL
Cell lines
22
3
0 1 (5%) 6 (27%) 15 (68%)
SJSA-1, DoHH-2, HT
CDK4
FL 21 12 (57%) 9 (43%) 0 0
DLBCL
Cell lines
22
3
6 (27%) 9 (41%) 5 (23%)
DoHH-2
2 (9%)
SJSA-1, HT
GADD153
FL 21 0 0 0 0
DLBCL
Cell lines
22
3
0
DoHH-2
1 (5%) 0 0
SJSA-1, HT
Immunostaining strength is described as ‘)’ for negative expression, ‘+1’ for weak expression,
‘+2’ for moderate expression, and ‘+3’ for strong expression. The criteria for this categorisation
are described in the Materials and methods section.
Fig 2. Immunostaining for CDK2, CDK4 and GADD153 proteins in a representative paired lymphoma case using DAB substrate and haematoxylin
counterstain. (A) and (B) show CDK2 moderate (+2) and strong (+3) intensity staining in case 2 before and after transformation, respectively. (C)
and (D) show CDK4 weak (+1) and strong (+3) intensity staining in case 2 before and after transformation, respectively. (E) and (F) show GADD153
negative ()) and weak (+1) intensity staining in case 2 before and after transformation, respectively. Magnification was ·400 for all panels.
O. Al-Assar et al
ª 2006 The Authors616 Journal Compilation ª 2006 Blackwell Publishing Ltd, British Journal of Haematology, 133, 612–621
amplification, with the possibility of single (Monni et al, 1997)
or multiple (Kauraniemi et al, 2001) candidate genes mapping
to the same amplicon being involved. However, the presence of
a large number of target genes that map to the affected
chromosomal regions limits full exploration of potential
targets and the biological implications of these chromosomal
imbalances.
Therefore, to identify targets for the 12q12-14 amplification
in our samples, we examined the gene amplification status and
protein expression of three genes that map to different regions
on the 12q12-14: CDK2 (12q13.2), CDK4 (12q14.1) and
GADD153 (12q13.3). The choice of these genes does not
exclude the possibility of involvement of other genes in the
transformation process, especially in light of recent reports of
Patient number
N o r m a l R a n g eN o r m a l R a n g e
0
1
2
3
4
5
6
0123(A)
(B)
(C)
1 2 3 4 5 6 7 8 9 10 11 12 13 14 15 16 17 18 19 20 21 22
Gen
e co
py n
umbe
rIH
C
CDK2DLBCL
FL
N o r m a l R a n g eN o r m a l R a n g e
IHC
0
1
2
3
4
5
6
7
8
9
15
1 2 3 4 5 6 7 8 9 10 11 12 13 14 15 16 17 18 19 20 21 22
0123
Gen
e co
py n
umbe
r
CDK4DLBCL
FL
N o r m a l R a n g eN o r m a l R a n g e
IHC
3
0
1
2
3
4
5
6
7
8
1 2 3 4 5 6 7 8 9 10 11 12 13 14 15 16 17 18 19 20 21 22
012
Gen
e co
py n
umbe
r GADD153DLBCL
FL
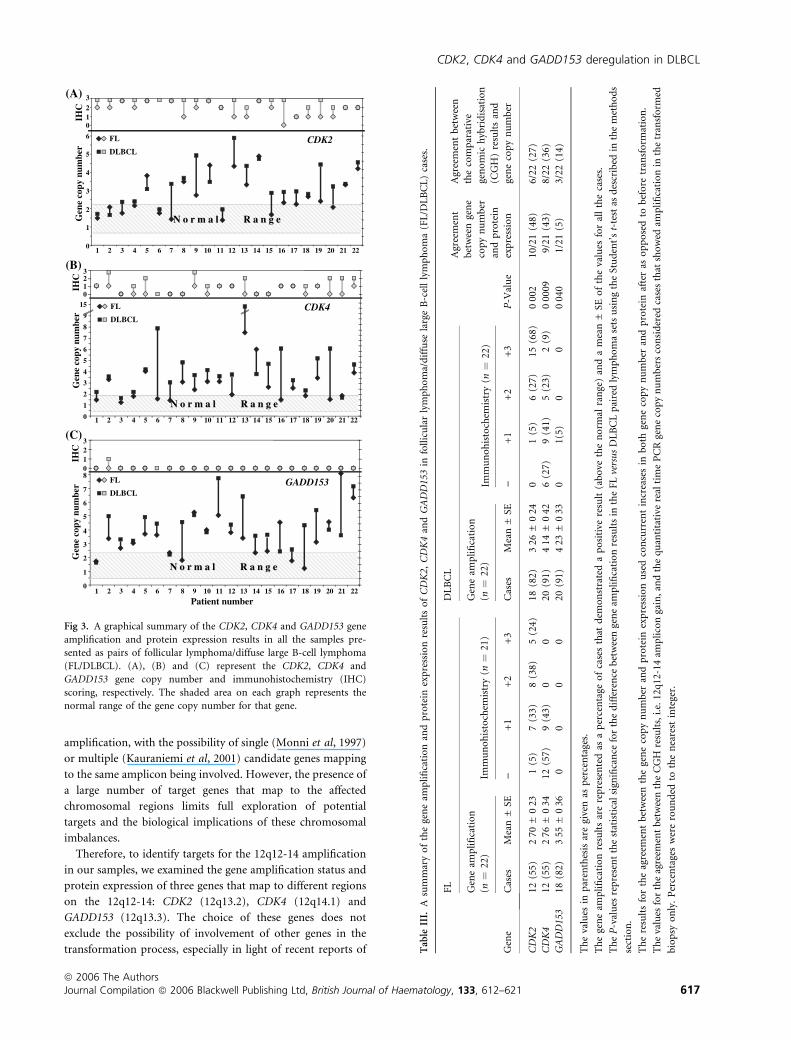
Fig 3. A graphical summary of the CDK2, CDK4 and GADD153 gene
amplification and protein expression results in all the samples pre-
sented as pairs of follicular lymphoma/diffuse large B-cell lymphoma
(FL/DLBCL). (A), (B) and (C) represent the CDK2, CDK4 and
GADD153 gene copy number and immunohistochemistry (IHC)
scoring, respectively. The shaded area on each graph represents the
normal range of the gene copy number for that gene.
Table
III.
Asu
mm
ary
of
the
gen
eam
pli
fica
tio
nan
dp
rote
inex
pre
ssio
nre
sult
so
fCDK2,
CDK4
andGADD153
info
llic
ula
rly
mp
ho
ma/
dif
fuse
larg
eB
-cel
lly
mp
ho
ma
(FL
/DL
BC
L)
case
s.
Gen
e
FL
DL
BC
L
P-V
alu
e
Agr
eem
ent
bet
wee
nge
ne
cop
yn
um
ber
and
pro
tein
exp
ress
ion
Agr
eem
ent
bet
wee
n
the
com
par
ativ
e
gen
om
ich
ybri
dis
atio
n
(CG
H)
resu
lts
and
gen
eco
py
nu
mb
er
Gen
eam
pli
fica
tio
n
(n¼
22)
Imm
un
oh
isto
chem
istr
y(n
¼21
)
Gen
eam
pli
fica
tio
n
(n¼
22)
Imm
un
oh
isto
chem
istr
y(n
¼22
)
Cas
esM
ean
±SE
)+
1+
2+
3C
ases
Mea
n±
SE)
+1
+2
+3
CDK2
12(5
5)2Æ
70±
0Æ23
1(5
)7
(33)
8(3
8)5
(24)
18(8
2)3Æ
26±
0Æ24
01
(5)
6(2
7)15
(68)
0Æ00
210
/21
(48)
6/22
(27)
CDK4
12(5
5)2Æ
76±
0Æ34
12(5
7)9
(43)
00
20(9
1)4Æ
14±
0Æ42
6(2
7)9
(41)
5(2
3)2
(9)
0Æ00
099/
21(4
3)8/
22(3
6)
GADD153
18(8
2)3Æ
55±
0Æ36
00
00
20(9
1)4Æ
23±
0Æ33
01(
5)0
00Æ
040
1/21
(5)
3/22
(14)
Th
eva
lues
inp
aren
thes
isar
egi
ven
asp
erce
nta
ges.
Th
ege
ne
amp
lifi
cati
on
resu
lts
are
rep
rese
nte
das
ap
erce
nta
geo
fca
ses
that
dem
on
stra
ted
ap
osi
tive
resu
lt(a
bo
veth
en
orm
alra
nge
)an
da
mea
n±
SEo
fth
eva
lues
for
all
the
case
s.
Th
eP
-val
ues
rep
rese
nt
the
stat
isti
cal
sign
ifica
nce
for
the
dif
fere
nce
bet
wee
nge
ne
amp
lifi
cati
on
resu
lts
inth
eF
Lversus
DL
BC
Lp
aire
dly
mp
ho
ma
sets
usi
ng
the
Stu
den
t’st-
test
asd
escr
ibed
inth
em
eth
od
s
sect
ion
.
Th
ere
sult
sfo
rth
eag
reem
ent
bet
wee
nth
ege
ne
cop
yn
um
ber
and
pro
tein
exp
ress
ion
use
dco
ncu
rren
tin
crea
ses
inb
oth
gen
eco
py
nu
mb
eran
dp
rote
inaf
ter
aso
pp
ose
dto
bef
ore
tran
sfo
rmat
ion
.
Th
eva
lues
for
the
agre
emen
tb
etw
een
the
CG
Hre
sult
s,i.
e.12
q12
-14
amp
lico
nga
in,
and
the
qu
anti
tati
vere
alti
me
PC
Rge
ne
cop
yn
um
ber
sco
nsi
der
edca
ses
that
sho
wed
amp
lifi
cati
on
inth
etr
ansf
orm
ed
bio
psy
on
ly.
Per
cen
tage
sw
ere
rou
nd
edto
the
nea
rest
inte
ger.
CDK2, CDK4 and GADD153 deregulation in DLBCL
ª 2006 The AuthorsJournal Compilation ª 2006 Blackwell Publishing Ltd, British Journal of Haematology, 133, 612–621 617

significant mRNA transcript increases of other genes, in
addition to CDK2 and CDK4, on the 12q12-14 amplicon in
DLBCL cases (Bea et al, 2005). In addition to previous reports
of the amplification of these genes in different malignancies
and role in the cell cycle (Rao et al, 1998; Mao et al, 2002; Bea
et al, 2005), these genes were selected because they showed no
amplification in a pilot study of a FL series with no evidence of
transformation to DLBCL (data not shown). Our published set
of paired FL/DLBCL samples was complemented with another
set of paired samples, which also showed amplification of the
12q12-14 amplicon in the transformed sample only using CGH
(data not shown). This provided us with a cohort of 44 paired
FL/DLBCL lymphoma samples from 22 patients.
A higher percentage of the DLBCL samples showed
amplification of the CDK2, CDK4 and GADD153 genes
compared with their FL counterparts (Fig 3 and Table III).
Furthermore, the concordant amplification of all these genes
occurred in 15 of 22 (68%) of DLBCL cases (Fig 3) compared
with only seven of 22 cases (32%) in the FL cases. Other
studies have demonstrated that CDK2 and CDK4 were both
deregulated at the genetic and mRNA levels (statistically
significant for CDK4 only in Bea et al, 2005) in DLBCL cases
(Martinez-Climent et al, 2003; Bea et al, 2005), and other
B-cell malignancies (Bea et al, 1999; Hernandez et al, 2005).
The level of CDK4 amplification in this study was also
demonstrated in a previous study (Rao et al, 1998). In
conclusion, the DLBCL samples in our study demonstrated
the most prominent concurrent and individual amplification
of CDK2, CDK4 and GADD153 genes, compared with the FL
samples.
Although these genes were concordantly amplified in seven
of 22 cases (32%) of FL cases, we could not detect an
amplification of the 12q12-14 in these cases. The inability of
CGH to detect amplifications in these seven FL cases is due
to its detection threshold, which is determined by the copy
number and the size of the amplified region (Bentz et al,
1998; Tachdjian et al, 2000). It is accepted that genetic
abnormalities are detected by CGH when the size of
chromosomal region affected is 10–12 Mb and smaller
regions can only be detected if there is a high level of
amplifications of target genes within these regions (Bentz
et al, 1998). Therefore, what appears to be a discrepancy
between the CGH and quantitative real time PCR results is
due to the intrinsic limitations of the former. We also verified
the amplification status of these three genes in one case using
interphase FISH (data not shown). The agreement between
the CGH results and gene copy numbers for the three genes
examined ranged between 14% and 36% of cases (3/22–8/22)
(Table III). Other researchers have also shown lack of
contiguity (Hyman et al, 2002; Zafarana et al, 2003) and
conformity of amplification of genes within regions of gains
or deletions detected in DLBCL cases by array CGH
(Martinez-Climent et al, 2003) or conventional CGH (Bea
et al, 2005). Because insufficient evidence has been provided
to link gene copy number changes and expression in the
transformation of B-cell NHL from FL to DLBCL, we
examined the protein expression of our candidate genes.
The CDK2 and CDK4 protein results should be considered
together because of their close link (reviewed by Sherr &
Roberts, 2004). The protein levels of these kinases are
biologically significant after binding to their cyclin partners
and becoming enzymatically active. Because CDK2 regulates
cell cycle progression through the interaction with both cyclin
E and cyclin A2, its functions extend beyond G1 regulation to
control events in S and G2/M phases. Early deregulation of the
CDK2 protein in our FL samples could have great impact on
the cell cycle with effects extending beyond G1, in light of the
broad substrates that CDK2 and its cyclin partners affect.
Unlike CDK2, the CDK4 protein showed different levels of
expression in the paired lymphoma samples (Fig 2C and D,
and Tables II and III). Although the majority of the FL cases
(57%, 12/21) showed no expression of the CDK4 protein, 73%
of DLBCL samples (16/22) expressed this protein. The
implications of deregulated CDK4 can be understood by
examining some of its biological functions. In complex with its
biological partner cyclin D, CDK4 has been shown to directly
affect the functions of CDK2 by mediating the expression of its
partners, cyclin E and cyclin A2, though E2F (Trimarchi &
Lees, 2002) and by sequestering p27Kip1 and p21Cip1, two of
CDK2 potent inhibitors (Sherr & Roberts, 2004). Therefore,
the deregulated expression of CDK4 in DLBCL could promote
further disruption of the cell cycle caused by an earlier CDK2
overexpression and aid in transformation. Essential for
oncogenic transformation could be the interplay among
CDK2, CDK4 and Cip/Kip proteins (Zou et al, 2002; Sherr
& Roberts, 2004). Other researchers have suggested that the
12cen-q15 amplicon might contain common oncogenic path-
ways for the different DLBCL subtypes (Bea et al, 2005).
Unfortunately, the effect of the deregulated expression of these
two kinases on the cell cycle in these tumours could not be
examined due to the lack of suitable biological material.
The CDK2 and CDK4 protein results were in agreement
with the dosage effect for these genes in 48% (10/21) and 43%
(9/21) of cases, respectively. In other malignancies too,
including other types of lymphomas, no absolute correlation
between genomic copy number and gene expression could be
demonstrated (Hughes et al, 2000; Phillips et al, 2001; Virta-
neva et al, 2001; Melendez et al, 2004), not even for highly
amplified genes (Hyman et al, 2002). Unfortunately, we could
only examine the mRNA levels in four patients for whom we
had suitable material. For those patients, there was an
agreement between the different genes copy numbers and
their mRNA transcripts (data not shown).
In contrast to the CDK2 and CDK4 profiles, the negative
expression of the GADD153 protein in all cases except one
demonstrated a complete lack of concordance with the relatively
high amplification levels of this gene (Fig 3C; Table III). The
mRNA for GADD153, which was examined in the limited
number of available samples using quantitative real time PCR
(data not shown), also showed increased transcript levels. Under
O. Al-Assar et al
ª 2006 The Authors618 Journal Compilation ª 2006 Blackwell Publishing Ltd, British Journal of Haematology, 133, 612–621
normal conditions, this ubiquitous early response gene is
expressed at low levels and its overexpression after exposure to
different agents has been shown to result in cell cycle arrest and
apoptosis (Maytin et al, 2001). Since lymphoma samples are
characterised by prolonged cell survival (McDonnell et al, 1990)
resulting from early overexpression of BCL-2, it is not surprising
that no expression of GADD153 could be detected in our
samples. The cases that we examined for the BCL-2 protein
showed strong staining for this protein (data not shown). It has
been demonstrated that overexpression of BCL-2 protein
suppresses GADD153-mediated apoptosis (McCullough et al,
2001). Furthermore, it has been shown that genes within the
same altered chromosomal regions respond differently to the
gain or loss of genetic material (Bea et al, 2005) and it has been
suggested that this is dependent on the individual regulation
mechanisms of these genes (Melendez et al, 2004). On the basis
of the mRNA results, these mechanisms could include post-
transcriptional control for GADD153 and emphasise a multi-
step transformation process (Martinez-Climent et al, 2003; de
Vos et al, 2003) that involves many alternative pathways.
In conclusion, this study provides the first report on the
status of CDK2, CDK4 and GADD153 proteins in pre- and
post-transformation B-cell lymphoma cases. The changes in
the gene dosage of these genes did not absolutely correlate with
increased protein levels. This is indicative of the involvement
of other gene specific regulatory mechanisms in controlling the
protein levels. In addition, these results highlight the import-
ance of examining the protein expression of candidate genes in
studying the transformation process to translate any gene
dosage changes into meaningful biological effects. The over-
expression of CDK2 in the vast majority of FL tumours could
entail a role for this kinase in oncogenesis and could possibly
complement apoptosis inhibition by the overexpression of the
BCL2 protein. The changes in CDK2 and CDK4 gene copy
numbers and protein overexpression in the majority of
transformed cases imply a functional role for these genes in
the multi-step transformation process mediated by their
multiple substrates and upstream targets. These targets effect
the biological functions of these kinases that are critical in
maintaining cell cycle regulation. Deregulation of CDK2 and
CDK4 would result in a perturbed cell cycle. In addition, these
two genes might be important targets for the 12q12-14
amplification in DLBCL but does not exclude the possibility
of involvement of other genes mapping to this region in the
transformation process. Other important genes on 12q12-14
should also be investigated for involvement in the transfor-
mation process. The lack of GADD153 protein expression in
almost all the samples highlights the involvement of factors
other than gene dosage underlying a complex transformation
process. These results could also help in identifying potential
targets for prognostic tests or therapeutic intervention. Iden-
tification of these targets could be greatly enhanced using a
functional proteomics approach to complement the profiles of
genomic aberrations and RNA expression in searching for
transformation-specific genes.
Acknowledgements
We thank David Edmundson, Yvonne Stephenson and Carrie
Wardle for their technical help in preparing the biopsy
material and paraffin embedding.
This work was funded by Weston Park Hospital Cancer
Appeal.
References
Armitage, J.O., Sanger, W.G., Weisenburger, D.D., Harrington, D.S.,
Linder, J., Bierman, P.J., Vose, J.M. & Purtilo, D.T. (1988) Correlation
of secondary cytogenetic abnormalities with histologic appearance in
non-Hodgkin’s lymphomas bearing t(14;18)(q32;q21). Journal of the
National Cancer Institute, 80, 576–580.
Bastion, Y., Sebban, C., Berger, F., Felman, P., Salles, G., Dumontet, C.,
Bryon, P.A. & Coiffier, B. (1997) Incidence, predictive factors, and
outcome of lymphoma transformation in follicular lymphoma
patients. Journal of Clinical Oncology, 15, 1587–1594.
Bea, S., Ribas, M., Hernandez, J.M., Bosch, F., Pinyol, M., Hernandez,
L., Garcia, J.L., Flores, T., Gonzalez, M., Lopez-Guillermo, A., Piris,
M.A., Cardesa, A., Montserrat, E., Miro, R. & Campo, E. (1999)
Increased number of chromosomal imbalances and high-level DNA
amplifications in mantle cell lymphoma are associated with blastoid
variants. Blood, 93, 4365–4374.
Bea, S., Zettl, A., Wright, G., Salaverria, I., Jehn, P., Moreno, V., Burek,
C., Ott, G., Puig, X., Yang, L., Lopez-Guillermo, A., Chan, W.C.,
Greiner, T.C., Weisenburger, D.D., Armitage, J.O., Gascoyne, R.D.,
Connors, J.M., Grogan, T.M., Braziel, R., Fisher, R.I., Smeland, E.B.,
Kvaloy, S., Holte, H., Delabie, J., Simon, R., Powell, J., Wilson,
W.H., Jaffe, E.S., Montserrat, E., Muller-Hermelink, H.K., Staudt,
L.M., Campo, E. & Rosenwald, A. (2005) Diffuse large B-cell lym-
phoma subgroups have distinct genetic profiles that influence tumor
biology and improve gene-expression-based survival prediction.
Blood, 106, 3183–3190.
Beckwith, M., Longo, D.L., O’Connell, C.D., Moratz, C.M. & Urba,
W.J. (1990) Phorbol ester-induced, cell-cycle-specific, growth
inhibition of human B-lymphoma cell lines. Journal of the National
Cancer Institute, 82, 501–509.
Bentz, M., Plesch, A., Stilgenbauer, S., Dohner, H. & Lichter, P. (1998)
Minimal sizes of deletions detected by comparative genomic
hybridization. Genes, Chromosomes and Cancer, 21, 172–175.
Cabanillas, F., Pathak, S., Trujillo, J., Manning, J., Katz, R.,
McLaughlin, P., Velasquez, W.S., Hagemeister, F.B., Goodacre, A. &
Cork, A. (1988) Frequent nonrandom chromosome abnormalities in
27 patients with untreated large cell lymphoma and immunoblastic
lymphoma. Cancer Research, 48, 5557–5564.
Cigudosa, J.C., Parsa, N.Z., Louie, D.C., Filippa, D.A., Jhanwar, S.C.,
Johansson, B., Mitelman, F. & Chaganti, R.S. (1999) Cytogenetic
analysis of 363 consecutively ascertained diffuse large B-cell lym-
phomas. Genes, Chromosomes and Cancer, 25, 123–133.
Courjal, F. & Theillet, C. (1997) Comparative genomic hybridization
analysis of breast tumors with predetermined profiles of DNA am-
plification. Cancer Research, 57, 4368–4377.
Elenitoba-Johnson, K.S., Gascoyne, R.D., Lim, M.S., Chhanabai, M.,
Jaffe, E.S. & Raffeld, M. (1998) Homozygous deletions at chromo-
some 9p21 involving p16 and p15 are associated with histologic
progression in follicle center lymphoma. Blood, 91, 4677–4685.
CDK2, CDK4 and GADD153 deregulation in DLBCL
ª 2006 The AuthorsJournal Compilation ª 2006 Blackwell Publishing Ltd, British Journal of Haematology, 133, 612–621 619

Elenitoba-Johnson, K.S., Jenson, S.D., Abbott, R.T., Palais, R.A.,
Bohling, S.D., Lin, Z., Tripp, S., Shami, P.J., Wang, L.Y., Coupland,
R.W., Buckstein, R., Perez-Ordonez, B., Perkins, S.L., Dube, I.D. &
Lim, M.S. (2003) Involvement of multiple signaling pathways in
follicular lymphoma transformation: p38-mitogen-activated protein
kinase as a target for therapy. Proceedings of the National Academy of
Sciences United States of America, 100, 7259–7264.
Godon, A., Moreau, A., Talmant, P., Baranger-Papot, L., Genevieve, F.,
Milpied, N., Zandecki, M. & Avet-Loiseau, H. (2003) Is
t(14;18)(q32;q21) a constant finding in follicular lymphoma? An
interphase FISH study on 63 patients. Leukemia, 17, 255–259.
Harris, N.L., Jaffe, E.S., Stein, H., Banks, P.M., Chan, J.K., Cleary, M.L.,
Delsol, G., De Wolf-Peeters, C., Falini, B., Gatter, K.C., Grogan,
T.M., Isaacson, P.G., Knowles, D.M., Mason, D.Y., Muller-Herme-
link, H.K., Pileri, S.A., Piris, M.A., Ralfkiaer, E. & Warnke, R.A.
(1994) A revised European-American classification of lymphoid
neoplasms: a proposal from the International Lymphoma Study
Group. Blood, 84, 1361–1392.
Hernandez, L., Bea, S., Pinyol, M., Ott, G., Katzenberger, T.,
Rosenwald, A., Bosch, F., Lopez-Guillermo, A., Delabie, J., Colomer,
D., Montserrat, E. & Campo, E. (2005) CDK4 and MDM2 gene
alterations mainly occur in highly proliferative and aggressive
mantle cell lymphomas with wild-type INK4a/ARF locus. Cancer
Research, 65, 2199–2206.
Hough, R.E., Goepel, J.R., Alcock, H.E., Hancock, B.W., Lorigan, P.C.
& Hammond, D.W. (2001) Copy number gain at 12q12-14 may be
important in the transformation from follicular lymphoma to dif-
fuse large B cell lymphoma. British Journal of Cancer, 84, 499–503.
Hubbard, S.M., Chabner, B.A., DeVita, Jr, V.T., Simon, R., Berard,
C.W., Jones, R.B., Garvin, A.J., Canellos, G.P., Osborne, C.K. &
Young, R.C. (1982) Histologic progression in non-Hodgkin’s lym-
phoma. Blood, 59, 258–264.
Hughes, T.R., Roberts, C.J., Dai, H., Jones, A.R., Meyer, M.R., Slade,
D., Burchard, J., Dow, S., Ward, T.R., Kidd, M.J., Friend, S.H. &
Marton, M.J. (2000) Widespread aneuploidy revealed by DNA mi-
croarray expression profiling. Nature Genetics, 25, 333–337.
Hyman, E., Kauraniemi, P., Hautaniemi, S., Wolf, M., Mousses, S.,
Rozenblum, E., Ringner, M., Sauter, G., Monni, O., Elkahloun, A.,
Kallioniemi, O.P. & Kallioniemi, A. (2002) Impact of DNA ampli-
fication on gene expression patterns in breast cancer. Cancer
Research, 62, 6240–6245.
Katzenberger, T., Ott, G., Klein, T., Kalla, J., Muller-Hermelink, H.K. &
Ott, M.M. (2004) Cytogenetic alterations affecting BCL6 are pre-
dominantly found in follicular lymphomas grade 3B with a diffuse
large B-cell component. American Journal of Pathology, 165, 481–490.
Kauraniemi, P., Barlund, M., Monni, O. & Kallioniemi, A. (2001) New
amplified and highly expressed genes discovered in the ERBB2
amplicon in breast cancer by cDNA microarrays. Cancer Research,
61, 8235–8240.
Kluin-Nelemans, H.C., Limpens, J., Meerabux, J., Beverstock, G.C.,
Jansen, J.H., de Jong, D. & Kluin, P.M. (1991) A new non-Hodgkin’s
B-cell line (DoHH2) with a chromosomal translocation
t(14;18)(q32;q21). Leukemia, 5, 221–224.
Lossos, I.S. & Levy, R. (2003) Higher grade transformation of follicular
lymphoma: phenotypic tumor progression associated with diverse
genetic lesions. Seminars in Cancer Biology, 13, 191–202.
Mao, X., Lillington, D., Child, F., Russell-Jones, R., Young, B. &
Whittaker, S. (2002) Comparative genomic hybridization analysis of
primary cutaneous B-cell lymphomas: identification of common
genomic alterations in disease pathogenesis. Genes, Chromosomes
and Cancer, 35, 144–155.
Martinez-Climent, J.A., Alizadeh, A.A., Segraves, R., Blesa, D., Rubio-
Moscardo, F., Albertson, D.G., Garcia-Conde, J., Dyer, M.J., Levy,
R., Pinkel, D. & Lossos, I.S. (2003) Transformation of follicular
lymphoma to diffuse large cell lymphoma is associated with a het-
erogeneous set of DNA copy number and gene expression altera-
tions. Blood, 101, 3109–3117.
Matolcsy, A., Casali, P., Warnke, R.A. & Knowles, D.M. (1996) Mor-
phologic transformation of follicular lymphoma is associated with
somatic mutation of the translocated Bcl-2 gene. Blood, 88, 3937–
3944.
Maytin, E.V., Ubeda, M., Lin, J.C. & Habener, J.F. (2001) Stress-in-
ducible transcription factor CHOP/gadd153 induces apoptosis in
mammalian cells via p38 kinase-dependent and -independent
mechanisms. Experimental Cell Research, 267, 193–204.
McCullough, K.D., Martindale, J.L., Klotz, L.O., Aw, T.Y. & Holbrook,
N.J. (2001) Gadd153 sensitizes cells to endoplasmic reticulum stress
by down-regulating Bcl2 and perturbing the cellular redox state.
Molecular and Cellular Biology, 21, 1249–1259.
McDonnell, T.J., Nunez, G., Platt, F.M., Hockenberry, D., London, L.,
McKearn, J.P. & Korsmeyer, S.J. (1990) Deregulated Bcl-2-im-
munoglobulin transgene expands a resting but responsive
immunoglobulin M and D-expressing B-cell population. Molecular
and Cellular Biology, 10, 1901–1907.
Melendez, B., Diaz-Uriarte, R., Cuadros, M., Martinez-Ramirez, A.,
Fernandez-Piqueras, J., Dopazo, A., Cigudosa, J.C., Rivas, C.,
Dopazo, J., Martinez-Delgado, B. & Benitez, J. (2004) Gene
expression analysis of chromosomal regions with gain or loss of
genetic material detected by comparative genomic hybridization.
Genes, Chromosomes and Cancer, 41, 353–365.
Monni, O., Joensuu, H., Franssila, K., Klefstrom, J., Alitalo, K. &
Knuutila, S. (1997) BCL2 overexpression associated with chromo-
somal amplification in diffuse large B-cell lymphoma. Blood, 90,
1168–1174.
Murray, A.W. (2004) Recycling the cell cycle: cyclins revisited. Cell,
116, 221–234.
Nanjangud, G., Rao, P.H., Hegde, A., Teruya-Feldstein, J., Donnelly,
G., Qin, J., Jhanwar, S.C., Zelenetz, A.D. & Chaganti, R.S. (2002)
Spectral karyotyping identifies new rearrangements, translocations,
and clinical associations in diffuse large B-cell lymphoma. Blood, 99,
2554–2561.
Offit, K., Jhanwar, S.C., Ladanyi, M., Filippa, D.A. & Chaganti, R.S.
(1991) Cytogenetic analysis of 434 consecutively ascertained speci-
mens of non-Hodgkin’s lymphoma: correlations between recurrent
aberrations, histology, and exposure to cytotoxic treatment. Genes,
Chromosomes and Cancer, 3, 189–201.
Pasqualucci, L., Neumeister, P., Goossens, T., Nanjangud, G., Chag-
anti, R.S., Kuppers, R. & Dalla-Favera, R. (2001) Hypermutation of
multiple proto-oncogenes in B-cell diffuse large-cell lymphomas.
Nature, 412, 341–346.
Phillips, J.L., Hayward, S.W., Wang, Y., Vasselli, J., Pavlovich, C.,
Padilla-Nash, H., Pezullo, J.R., Ghadimi, B.M., Grossfeld, G.D.,
Rivera, A., Linehan, W.M., Cunha, G.R. & Ried, T. (2001) The
consequences of chromosomal aneuploidy on gene expression pro-
files in a cell line model for prostate carcinogenesis. Cancer Research,
61, 8143–8149.
Pinyol, M., Cobo, F., Bea, S., Jares, P., Nayach, I., Fernandez, P.L.,
Montserrat, E., Cardesa, A. & Campo, E. (1998) p16(INK4a) gene
O. Al-Assar et al
ª 2006 The Authors620 Journal Compilation ª 2006 Blackwell Publishing Ltd, British Journal of Haematology, 133, 612–621
inactivation by deletions, mutations, and hypermethylation is
associated with transformed and aggressive variants of non-Hodgkin’s
lymphomas. Blood, 91, 2977–2984.
Rao, P.H., Houldsworth, J., Dyomina, K., Parsa, N.Z., Cigudosa, J.C.,
Louie, D.C., Popplewell, L., Offit, K., Jhanwar, S.C. & Chaganti, R.S.
(1998) Chromosomal and gene amplification in diffuse large B-cell
lymphoma. Blood, 92, 234–240.
Reifenberger, G., Ichimura, K., Reifenberger, J., Elkahloun, A.G.,
Meltzer, P.S. & Collins, V.P. (1996) Refined mapping of 12q13-q15
amplicons in human malignant gliomas suggests CDK4/SAS and
MDM2 as independent amplification targets. Cancer Research, 56,
5141–5145.
Rhodes, A., Jasani, B., Couturier, J., McKinley, M.J., Morgan, J.M.,
Dodson, A.R., Navabi, H., Miller, K.D. & Balaton, A.J. (2002) A
formalin-fixed, paraffin-processed cell line standard for quality
control of immunohistochemical assay of HER-2/neu expression in
breast cancer. American Journal of Clinical Pathology, 117, 81–89.
Richardson, M.E., Chen, Q.G., Filippa, D.A., Offit, K., Hampton, A.,
Koduru, P.R., Jhanwar, S.C., Lieberman, P.H., Clarkson, B.D. &
Chaganti, R.S. (1987) Intermediate-to high-grade histology of
lymphomas carrying t(14;18) is associated with additional nonran-
dom chromosome changes. Blood, 70, 444–447.
Riou, G., Barrois, M., Prost, S., Terrier, M.J., Theodore, C. & Levine,
A.J. (1995) The p53 and mdm-2 genes in human testicular germ-cell
tumors. Molecular Carcinogenesis, 12, 124–131.
Sherr, C.J. & Roberts, J.M. (2004) Living with or without cyclins and
cyclin-dependent kinases. Genes and Development, 18, 2699–2711.
Tachdjian, G., Aboura, A., Lapierre, J.M. & Viguie, F. (2000) Cyto-
genetic analysis from DNA by comparative genomic hybridization.
Annales de genetique, 43, 147–154.
The Non-Hodgkin’s Lymphoma Classification Project (1997) A clinical
evaluation of the International Lymphoma Study Group classifica-
tion of non-Hodgkin’s lymphoma. The Non-Hodgkin’s Lymphoma
Classification Project. Blood, 89, 3909–3918.
Trimarchi, J.M. & Lees, J.A. (2002) Sibling rivalry in the E2F family.
Nature Reviews Molecular Cell Biology, 3, 11–20.
Virtaneva, K., Wright, F.A., Tanner, S.M., Yuan, B., Lemon, W.J.,
Caligiuri, M.A., Bloomfield, C.D., de La Chapelle, A. & Krahe, R.
(2001) Expression profiling reveals fundamental biological differ-
ences in acute myeloid leukemia with isolated trisomy 8 and normal
cytogenetics. Proceedings of the National Academy of Sciences United
States of America, 98, 1124–1129.
de Vos, S., Hofmann, W.K., Grogan, T.M., Krug, U., Schrage, M.,
Miller, T.P., Braun, J.G., Wachsman, W., Koeffler, H.P. & Said, J.W.
(2003) Gene expression profile of serial samples of transformed
B-cell lymphomas. Laboratory Investigation, 83, 271–285.
Wolf, M., Aaltonen, L.A., Szymanska, J., Tarkkanen, M., Blomqvist, C.,
Berner, J.M., Myklebost, O. & Knuutila, S. (1997) Complexity of
12q13–22 amplicon in liposarcoma: microsatellite repeat analysis.
Genes, Chromosomes and Cancer, 18, 66–70.
Zafarana, G., Grygalewicz, B., Gillis, A.J., Vissers, L.E., van de Vliet, W.,
van Gurp, R.J., Stoop, H., Debiec-Rychter, M., Oosterhuis, J.W., van
Kessel, A.G., Schoenmakers, E.F., Looijenga, L.H. & Veltman, J.A.
(2003) 12p-amplicon structure analysis in testicular germ cell
tumors of adolescents and adults by array CGH. Oncogene, 22,
7695–7701.
Zou, X., Ray, D., Aziyu, A., Christov, K., Boiko, A.D., Gudkov, A.V. &
Kiyokawa, H. (2002) Cdk4 disruption renders primary mouse cells
resistant to oncogenic transformation, leading to Arf/p53-in-
dependent senescence. Genes and Development, 16, 2923–2934.
CDK2, CDK4 and GADD153 deregulation in DLBCL
ª 2006 The AuthorsJournal Compilation ª 2006 Blackwell Publishing Ltd, British Journal of Haematology, 133, 612–621 621