AdvISER-PYRO: Amplicon Identification using SparsE Representation of PYROsequencing signal
8
AdvISER-PYRO: Amplicon Identification using SparsE Representation of PYROsequencing signal J´ erˆ ome Ambroise 1,* , Anne-Sophie Piette 2,1 , Cathy Delcorps 2,1 , Leen Rigouts 3 , Bouke C. de Jong 3 , Leonid Irenge 2,1 , Annie Robert 4 , and Jean-Luc Gala 1,2 * 1 Center for Applied Molecular Technologies (CTMA), Institut de Recherche Exp´ erimentale et Clinique (IREC), Universit ´ e catholique de Louvain, Clos Chapelle-aux-Champs 30, 1200 Bruxelles, Belgium. 2 Defence Laboratories Department, Belgian Armed Forces, Brussels, Belgium. 3 Biomedical Sciences, Mycobacteriology unit, Institute of Tropical Medicine (ITM), Nationalestraat 155, 2018 Antwerpen, Belgium. 4 Epidemiology and Biostatistics Department (EPID), Institut de Recherche Exp ´ erimentale et Clinique (IREC), Universit ´ e catholique de Louvain, Clos Chapelle-aux-Champs 30, 1200 Bruxelles, Belgium. ABSTRACT Motivation: Converting a pyrosequencing signal into a nucleotide sequence appears highly challenging when signal intensities are low (unitary peak heights <5) or when complex signals are produced by several target amplicons. In these cases, the pyrosequencing software fails to provide correct nucleotide sequences. Accordingly, the objective was to develop the AdvISER- PYRO algorithm, performing an automated, fast and reliable analysis of pyrosequencing signals which circumvents those limitations. Results: In the current mycobacterial amplicon genotyping application, AdvISER-PYRO performed much better than the pyrosequencing software in the following two situations: when converting Single Amplicon Sample (SAS) signals into a correct single sequence (97.2 % vs 56.5 %), and when translating Multiple Amplicon Sample (MAS) signals into the correct sequence pair (74.5 %). Availability: AdvISER-PYRO is implemented in an R package (http://sites.uclouvain.be/md-ctma/index.php/softwares) and can be used in broad range of clinical applications including multiplex pyrosequencing and oncogene re-sequencing in heterogeneous tumor cell samples. Contact: [email protected] 1 INTRODUCTION Pyrosequencing is a DNA sequencing technology that has many applications including rapid genotyping of a very broad spectrum of bacteria. In this type of application, bacterial 16S rRNA gene sequence is a commonly used target for identifying organisms at the species and even strain level (Ronaghi & Elahi, 2002). * to whom correspondence should be addressed High throughput sequencing (NGS) is now emerging as a powerful technology able to characterize at the finest-scale the diversity in natural microbial and viral populations (Rosen et al., 2012). However, NGS is expensive and requires complex sample preparation and elaborate data analysis. Despite the increased use of NGS for the study of microbial diversity, pyrosequencing therefore remains a cost-effective solution for genotyping a portion of the bacterial genome that allows rapid bacterial or viral genotyping as well as rapid assessment of microbial antibiotic resistance (Amoako et al., 2012; Deccache et al., 2011). Pyrosequencing is based on pyrophosphate release during nucleotide incorporation (Ronaghi, 2001). The four possible nucleotides are sequentially dispensed in a predetermined order. The first chemi-luminescent signal produced during nucleotide incorporation is detected by a charge-coupled device camera in the pyrosequencer and displayed in a pyrogram TM . The pyrogram TM can then be converted automatically into a nucleotide sequence by dedicated software or visually by an experienced operator. The number of incorporated nucleotides at each position is computed from the corresponding peak height. The pyrosequencing data analysis software frequently produces reading errors in homopolymer regions due to the nonlinear light response following incorporation of consecutive identical nucleotides. However, pyrosequencing software interpretation is mostly reliable when a pyrogram TM with intermediate (>5) unitary peak heights (i.e., the peak heights observed after incorporation of a single nucleotide) is obtained from a Single Amplicon Sample (SAS, i.e. a sample that includes a single target amplicon), as in Figure 1-A where unitary peak heights are close to 30. 1 Associate Editor: Prof. Martin Bishop © The Author(s) 2013. Published by Oxford University Press. This is an Open Access article distributed under the terms of the Creative Commons Attribution Non- Commercial License (http://creativecommons.org/licenses/by-nc/3.0/), which permits non-commercial re- use, distribution, and reproduction in any medium, provided the original work is properly cited. For commercial re-use, please contact [email protected] Bioinformatics Advance Access published June 14, 2013 at Universite catholique de Louvain on June 21, 2013 http://bioinformatics.oxfordjournals.org/ Downloaded from
-
Upload
independent -
Category
Documents
-
view
0 -
download
0
Transcript of AdvISER-PYRO: Amplicon Identification using SparsE Representation of PYROsequencing signal

AdvISER-PYRO: Amplicon Identification using SparsERepresentation of PYROsequencing signalJerome Ambroise1,∗, Anne-Sophie Piette2,1, Cathy Delcorps2,1, LeenRigouts3, Bouke C. de Jong3, Leonid Irenge2,1, Annie Robert4, and Jean-LucGala1,2 ∗
1Center for Applied Molecular Technologies (CTMA), Institut de Recherche Experimentale etClinique (IREC), Universite catholique de Louvain, Clos Chapelle-aux-Champs 30, 1200 Bruxelles,Belgium.2Defence Laboratories Department, Belgian Armed Forces, Brussels, Belgium.3Biomedical Sciences, Mycobacteriology unit, Institute of Tropical Medicine (ITM), Nationalestraat155, 2018 Antwerpen, Belgium.4Epidemiology and Biostatistics Department (EPID), Institut de Recherche Experimentale etClinique (IREC), Universite catholique de Louvain, Clos Chapelle-aux-Champs 30, 1200 Bruxelles,Belgium.
ABSTRACTMotivation: Converting a pyrosequencing signal into a nucleotidesequence appears highly challenging when signal intensitiesare low (unitary peak heights <5) or when complex signalsare produced by several target amplicons. In these cases,the pyrosequencing software fails to provide correct nucleotidesequences. Accordingly, the objective was to develop the AdvISER-PYRO algorithm, performing an automated, fast and reliable analysisof pyrosequencing signals which circumvents those limitations.Results: In the current mycobacterial amplicon genotypingapplication, AdvISER-PYRO performed much better than thepyrosequencing software in the following two situations: whenconverting Single Amplicon Sample (SAS) signals into a correctsingle sequence (97.2 % vs 56.5 %), and when translating MultipleAmplicon Sample (MAS) signals into the correct sequence pair (74.5%).Availability: AdvISER-PYRO is implemented in an R package(http://sites.uclouvain.be/md-ctma/index.php/softwares) and can beused in broad range of clinical applications including multiplexpyrosequencing and oncogene re-sequencing in heterogeneoustumor cell samples.Contact: [email protected]
1 INTRODUCTIONPyrosequencing is a DNA sequencing technology that has manyapplications including rapid genotyping of a very broad spectrumof bacteria. In this type of application, bacterial 16S rRNA genesequence is a commonly used target for identifying organismsat the species and even strain level (Ronaghi & Elahi, 2002).
∗to whom correspondence should be addressed
High throughput sequencing (NGS) is now emerging as apowerful technology able to characterize at the finest-scale thediversity in natural microbial and viral populations (Rosen et al.,2012). However, NGS is expensive and requires complex samplepreparation and elaborate data analysis. Despite the increased use ofNGS for the study of microbial diversity, pyrosequencing thereforeremains a cost-effective solution for genotyping a portion of thebacterial genome that allows rapid bacterial or viral genotyping aswell as rapid assessment of microbial antibiotic resistance (Amoakoet al., 2012; Deccache et al., 2011).
Pyrosequencing is based on pyrophosphate release duringnucleotide incorporation (Ronaghi, 2001). The four possiblenucleotides are sequentially dispensed in a predetermined order.The first chemi-luminescent signal produced during nucleotideincorporation is detected by a charge-coupled device camerain the pyrosequencer and displayed in a pyrogramTM . ThepyrogramTM can then be converted automatically into anucleotide sequence by dedicated software or visually by anexperienced operator. The number of incorporated nucleotides ateach position is computed from the corresponding peak height.The pyrosequencing data analysis software frequently producesreading errors in homopolymer regions due to the nonlinearlight response following incorporation of consecutive identicalnucleotides. However, pyrosequencing software interpretation ismostly reliable when a pyrogramTM with intermediate (>5)unitary peak heights (i.e., the peak heights observed afterincorporation of a single nucleotide) is obtained from a SingleAmplicon Sample (SAS, i.e. a sample that includes a single targetamplicon), as in Figure 1-A where unitary peak heights are close to30.
1
Associate Editor: Prof. Martin Bishop
© The Author(s) 2013. Published by Oxford University Press.
This is an Open Access article distributed under the terms of the Creative Commons Attribution Non-
Commercial License (http://creativecommons.org/licenses/by-nc/3.0/), which permits non-commercial re-
use, distribution, and reproduction in any medium, provided the original work is properly cited. For
commercial re-use, please contact [email protected]
Bioinformatics Advance Access published June 14, 2013 at U
niversite catholique de Louvain on June 21, 2013
http://bioinformatics.oxfordjournals.org/
Dow
nloaded from
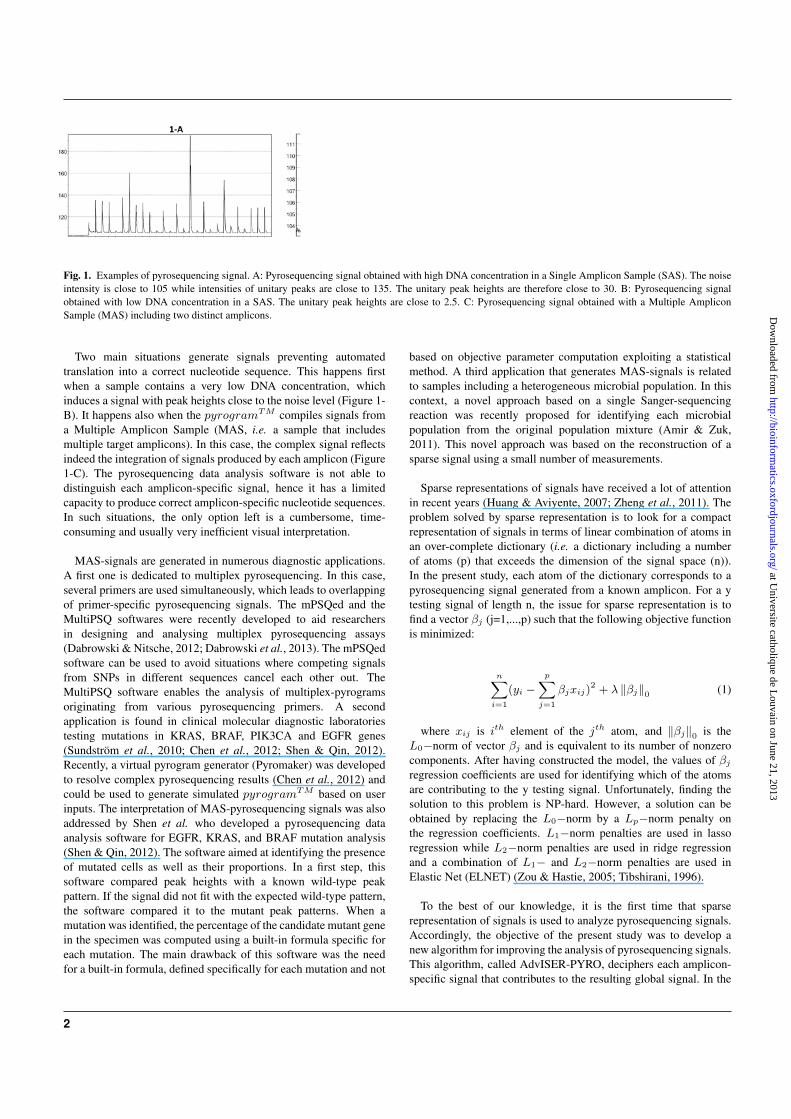
Fig. 1. Examples of pyrosequencing signal. A: Pyrosequencing signal obtained with high DNA concentration in a Single Amplicon Sample (SAS). The noiseintensity is close to 105 while intensities of unitary peaks are close to 135. The unitary peak heights are therefore close to 30. B: Pyrosequencing signalobtained with low DNA concentration in a SAS. The unitary peak heights are close to 2.5. C: Pyrosequencing signal obtained with a Multiple AmpliconSample (MAS) including two distinct amplicons.
Two main situations generate signals preventing automatedtranslation into a correct nucleotide sequence. This happens firstwhen a sample contains a very low DNA concentration, whichinduces a signal with peak heights close to the noise level (Figure 1-B). It happens also when the pyrogramTM compiles signals froma Multiple Amplicon Sample (MAS, i.e. a sample that includesmultiple target amplicons). In this case, the complex signal reflectsindeed the integration of signals produced by each amplicon (Figure1-C). The pyrosequencing data analysis software is not able todistinguish each amplicon-specific signal, hence it has a limitedcapacity to produce correct amplicon-specific nucleotide sequences.In such situations, the only option left is a cumbersome, time-consuming and usually very inefficient visual interpretation.
MAS-signals are generated in numerous diagnostic applications.A first one is dedicated to multiplex pyrosequencing. In this case,several primers are used simultaneously, which leads to overlappingof primer-specific pyrosequencing signals. The mPSQed and theMultiPSQ softwares were recently developed to aid researchersin designing and analysing multiplex pyrosequencing assays(Dabrowski & Nitsche, 2012; Dabrowski et al., 2013). The mPSQedsoftware can be used to avoid situations where competing signalsfrom SNPs in different sequences cancel each other out. TheMultiPSQ software enables the analysis of multiplex-pyrogramsoriginating from various pyrosequencing primers. A secondapplication is found in clinical molecular diagnostic laboratoriestesting mutations in KRAS, BRAF, PIK3CA and EGFR genes(Sundstrom et al., 2010; Chen et al., 2012; Shen & Qin, 2012).Recently, a virtual pyrogram generator (Pyromaker) was developedto resolve complex pyrosequencing results (Chen et al., 2012) andcould be used to generate simulated pyrogramTM based on userinputs. The interpretation of MAS-pyrosequencing signals was alsoaddressed by Shen et al. who developed a pyrosequencing dataanalysis software for EGFR, KRAS, and BRAF mutation analysis(Shen & Qin, 2012). The software aimed at identifying the presenceof mutated cells as well as their proportions. In a first step, thissoftware compared peak heights with a known wild-type peakpattern. If the signal did not fit with the expected wild-type pattern,the software compared it to the mutant peak patterns. When amutation was identified, the percentage of the candidate mutant genein the specimen was computed using a built-in formula specific foreach mutation. The main drawback of this software was the needfor a built-in formula, defined specifically for each mutation and not
based on objective parameter computation exploiting a statisticalmethod. A third application that generates MAS-signals is relatedto samples including a heterogeneous microbial population. In thiscontext, a novel approach based on a single Sanger-sequencingreaction was recently proposed for identifying each microbialpopulation from the original population mixture (Amir & Zuk,2011). This novel approach was based on the reconstruction of asparse signal using a small number of measurements.
Sparse representations of signals have received a lot of attentionin recent years (Huang & Aviyente, 2007; Zheng et al., 2011). Theproblem solved by sparse representation is to look for a compactrepresentation of signals in terms of linear combination of atoms inan over-complete dictionary (i.e. a dictionary including a numberof atoms (p) that exceeds the dimension of the signal space (n)).In the present study, each atom of the dictionary corresponds to apyrosequencing signal generated from a known amplicon. For a ytesting signal of length n, the issue for sparse representation is tofind a vector βj (j=1,...,p) such that the following objective functionis minimized:
n∑i=1
(yi −p∑
j=1
βjxij)2 + λ ∥βj∥0 (1)
where xij is ith element of the jth atom, and ∥βj∥0 is theL0−norm of vector βj and is equivalent to its number of nonzerocomponents. After having constructed the model, the values of βj
regression coefficients are used for identifying which of the atomsare contributing to the y testing signal. Unfortunately, finding thesolution to this problem is NP-hard. However, a solution can beobtained by replacing the L0−norm by a Lp−norm penalty onthe regression coefficients. L1−norm penalties are used in lassoregression while L2−norm penalties are used in ridge regressionand a combination of L1− and L2−norm penalties are used inElastic Net (ELNET) (Zou & Hastie, 2005; Tibshirani, 1996).
To the best of our knowledge, it is the first time that sparserepresentation of signals is used to analyze pyrosequencing signals.Accordingly, the objective of the present study was to develop anew algorithm for improving the analysis of pyrosequencing signals.This algorithm, called AdvISER-PYRO, deciphers each amplicon-specific signal that contributes to the resulting global signal. In the
2
at Universite catholique de L
ouvain on June 21, 2013http://bioinform
atics.oxfordjournals.org/D
ownloaded from

present study, AdvISER-PYRO was used to identify mycobacterialspecies by pyrosequencing. Considering the likely existence ofheterogenous mycobacterial populations in a clinical specimen, thiscase study appears particularly relevant. Indeed, the identificationof causative mycobacterial agents in infected samples can beaffected by the presence of other ubiquitous mycobacterial species(Covert et al., 1999). Moreover, coinfection with Mycobacteriumtuberculosis (MTB) and nontuberculous mycobacteria (NTB) inclinical samples, and notably in AIDS patients, can easily beoverlooked when using conventional identification methods, andpresents therefore a real challenge in diagnosis and treatment.This probably explains at least partially why evidence of dualinfection with MTB and NTB is scanty (Gopinath & Singh, 2009).The performance of AdvISER-PYRO in identifying mycobacterialamplicons was assessed using signals generated by SAS (n=220)and MAS (n=144), the latter containing 2 distinct amplicons.For SAS-signals, the AdvISER-PYRO performance was comparedto the percentage of correct identification obtained with thepyrosequencing data analysis software (PSQTM 96MA SoftwareV.2.1.1, Biotage AB, SE) and reflecting the pyrogramTM
translation into a correct nucleotide sequence.
2 METHODSSignals were generated with a pyrosequencer PSQTM 96 MA (BiotageAB, Sweden), following successive dispensation of 26 nucleotides. Thepredefined order of dispensation of these nucleotides was determinedaccording to the sequence tag corresponding to a hypervariable region ofthe Mycobacterium genome. Accordingly, dispensed nucleotides produceddistinct pyrogramTM peaks, each peak height being proportional to thenumber of identical nucleotides consecutively incorporated. In this study,a signal is defined as the global pattern integrating the 26 successive peakheights.
All amplicons of the current Mycobacterium target sequence startedwith the same single nucleotide. Accordingly, the first peak height wasnamed ’First Unitary Peak Height’ (FUPH) and was used as an indicatorof the global signal intensity. Pyrosequencing was performed as classicallydescribed. In brief, the Mycobacterium target sequence was first amplified byPCR. The PCR amplification was carried out using a couple of forward andbiotinylated reverse primers. The biotinylated amplicons were immobilizedon streptavidin-coated magnetic beads and denaturated. After denaturation,the biotinylated single-stranded amplicon was isolated and allowed tohybridize with a sequencing primer. Due to the close relatedness of somemycobacterial species (e.g. M. marinum and M. ulcerans) on one hand,and the genetic heterogeneity within other species (e.g. M. gordonae), asingle amplicon can correspond to more than one mycobacterial species andconversely, a mycobacterial species can be associated with more than onespecific amplicon (Table 1).
Pyrosequencing signals were generated from SAS (n=220) and MAS(n=144). SAS were generated from single mycobacterial clinical isolates.Three distinct types of MAS were analyzed in the current study. MAS-1were generated by mixing in various proportion (50/50 %; 33/66 %) theamplification products generated from 2 separate PCR performed on twodistinct mycobacterial clinical isolates (n =84). MAS-2 were generated witha single PCR performed on a reconstructed sample where DNA from twodistinct mycobacterial clinical isolates were mixed in various proportions(10/90 %; 25/75 %; 50/50 %; 75/25 %; 90/10 %) (n=45). MAS-3 weregenerated with a single PCR performed on natural clinical samples from
patients with a mycobacterial co-infection (n=15). In MAS-2 and MAS-3,the final proportion of both amplicons after PCR amplification was unknowndue to the amplicon-specific efficiency of the PCR reaction likely altering theinitial DNA proportions. The estimated proportion of the minor ampliconcould therefore vary widely between 0.1 % and 50.0 %.
All SAS- and MAS-signals were divided into training (SAS n=99),validation (SAS n=103; MAS n=122), and test (SAS n=18, MAS=22)datasets. A standardized learning dictionary was constructed based onsignals from the training dataset. AdvISER-PYRO hyperparameters weretuned on the validation dataset while performance was assessed on the testdataset. Given the small size of the test dataset, a bootstrap method was alsoapplied to provide a reliable evaluation of AdvISER-PYRO performance.
In parallel, all PyrogramsTM from SAS were also analyzed with thepyrosquencing data analysis software (PSQTM 96MA Software V.2.1.1,Biotage AB, SE) and translated into nucleotide sequences.
3 ALGORITHMThe first step in developing the AdvISER-PYRO was to createa standardized learning dictionary from the training dataset (SASn=99) that included at least one signal (i.e., the global patternintegrating the 26 successive peak heights) for each amplicon.Standardization of the dictionary was performed by dividing eachsignal (i.e., the 26 successive peak heights) by its correspondingFUPH. After standardization, all signals in the learning dictionarywere therefore characterized by a FUPH equal to 1.
The second step was to build a penalized linear model withthe y testing signal as response variable and all signals fromthe learning dictionary as predictor variables. In this model, thesum of regression coefficients corresponding to each amplicon wascomputed and recorded as the amplicon contribution to the signal.As the number of observations (i.e., the length of the signal whichwas n=26) was smaller than the number of variables (i.e., the totalnumber of atoms in the learning dictionary which was p > 33), L1−and L2−norm penalties were applied for estimating the regressioncoefficients. These penalties were the first two hyperparametersof AdvISER-PYRO. As the signal contribution from each atomshould have a positive value, an additional constraint imposingthis prerequisite was implemented. The intercept of the model wasalso set to 0. The penalized regression models were built using thepenalized function of the corresponding R package (Goeman, 2008).
In the third step, amplicons that significantly contributed to thesignal were selected. A specific amplicon was considered significantwhen its contribution to the signal was higher than the SignificantContribution Threshold, which was the third hyperparameter ofAdvISER-PYRO.
4 RESULTS4.1 Hyperparmeter optimization on the validation
datasetAll signals from the validation dataset (SAS n=103; MASn=122) were used to evaluate and optimize AdvISER-PYROhyperparameters. Accordingly, the percentage of correct identificationof SAS- and MAS-signals were computed with various values of theL1− and L2−norm penalties and of the Significant Contribution
3
at Universite catholique de L
ouvain on June 21, 2013http://bioinform
atics.oxfordjournals.org/D
ownloaded from
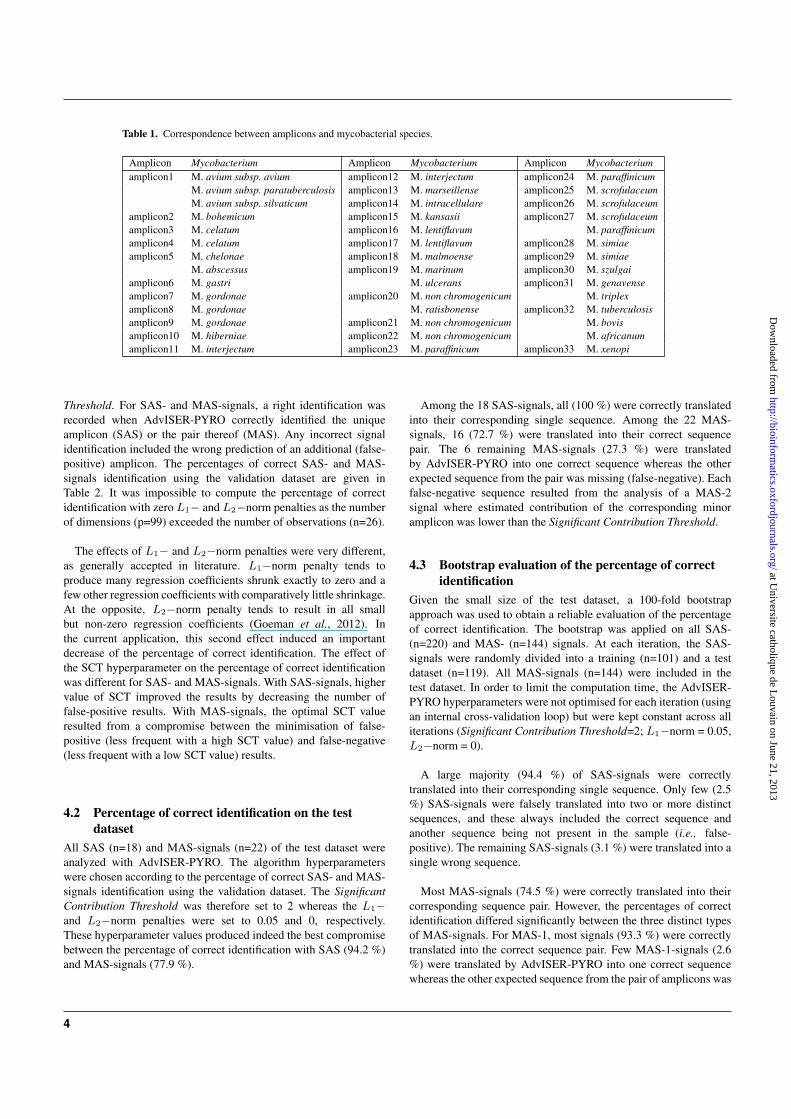
Table 1. Correspondence between amplicons and mycobacterial species.
Amplicon Mycobacterium Amplicon Mycobacterium Amplicon Mycobacteriumamplicon1 M. avium subsp. avium amplicon12 M. interjectum amplicon24 M. paraffinicum
M. avium subsp. paratuberculosis amplicon13 M. marseillense amplicon25 M. scrofulaceumM. avium subsp. silvaticum amplicon14 M. intracellulare amplicon26 M. scrofulaceum
amplicon2 M. bohemicum amplicon15 M. kansasii amplicon27 M. scrofulaceumamplicon3 M. celatum amplicon16 M. lentiflavum M. paraffinicumamplicon4 M. celatum amplicon17 M. lentiflavum amplicon28 M. simiaeamplicon5 M. chelonae amplicon18 M. malmoense amplicon29 M. simiae
M. abscessus amplicon19 M. marinum amplicon30 M. szulgaiamplicon6 M. gastri M. ulcerans amplicon31 M. genavenseamplicon7 M. gordonae amplicon20 M. non chromogenicum M. triplexamplicon8 M. gordonae M. ratisbonense amplicon32 M. tuberculosisamplicon9 M. gordonae amplicon21 M. non chromogenicum M. bovisamplicon10 M. hiberniae amplicon22 M. non chromogenicum M. africanumamplicon11 M. interjectum amplicon23 M. paraffinicum amplicon33 M. xenopi
Threshold. For SAS- and MAS-signals, a right identification wasrecorded when AdvISER-PYRO correctly identified the uniqueamplicon (SAS) or the pair thereof (MAS). Any incorrect signalidentification included the wrong prediction of an additional (false-positive) amplicon. The percentages of correct SAS- and MAS-signals identification using the validation dataset are given inTable 2. It was impossible to compute the percentage of correctidentification with zero L1− and L2−norm penalties as the numberof dimensions (p=99) exceeded the number of observations (n=26).
The effects of L1− and L2−norm penalties were very different,as generally accepted in literature. L1−norm penalty tends toproduce many regression coefficients shrunk exactly to zero and afew other regression coefficients with comparatively little shrinkage.At the opposite, L2−norm penalty tends to result in all smallbut non-zero regression coefficients (Goeman et al., 2012). Inthe current application, this second effect induced an importantdecrease of the percentage of correct identification. The effect ofthe SCT hyperparameter on the percentage of correct identificationwas different for SAS- and MAS-signals. With SAS-signals, highervalue of SCT improved the results by decreasing the number offalse-positive results. With MAS-signals, the optimal SCT valueresulted from a compromise between the minimisation of false-positive (less frequent with a high SCT value) and false-negative(less frequent with a low SCT value) results.
4.2 Percentage of correct identification on the testdataset
All SAS (n=18) and MAS-signals (n=22) of the test dataset wereanalyzed with AdvISER-PYRO. The algorithm hyperparameterswere chosen according to the percentage of correct SAS- and MAS-signals identification using the validation dataset. The SignificantContribution Threshold was therefore set to 2 whereas the L1−and L2−norm penalties were set to 0.05 and 0, respectively.These hyperparameter values produced indeed the best compromisebetween the percentage of correct identification with SAS (94.2 %)and MAS-signals (77.9 %).
Among the 18 SAS-signals, all (100 %) were correctly translatedinto their corresponding single sequence. Among the 22 MAS-signals, 16 (72.7 %) were translated into their correct sequencepair. The 6 remaining MAS-signals (27.3 %) were translatedby AdvISER-PYRO into one correct sequence whereas the otherexpected sequence from the pair was missing (false-negative). Eachfalse-negative sequence resulted from the analysis of a MAS-2signal where estimated contribution of the corresponding minoramplicon was lower than the Significant Contribution Threshold.
4.3 Bootstrap evaluation of the percentage of correctidentification
Given the small size of the test dataset, a 100-fold bootstrapapproach was used to obtain a reliable evaluation of the percentageof correct identification. The bootstrap was applied on all SAS-(n=220) and MAS- (n=144) signals. At each iteration, the SAS-signals were randomly divided into a training (n=101) and a testdataset (n=119). All MAS-signals (n=144) were included in thetest dataset. In order to limit the computation time, the AdvISER-PYRO hyperparameters were not optimised for each iteration (usingan internal cross-validation loop) but were kept constant across alliterations (Significant Contribution Threshold=2; L1−norm = 0.05,L2−norm = 0).
A large majority (94.4 %) of SAS-signals were correctlytranslated into their corresponding single sequence. Only few (2.5%) SAS-signals were falsely translated into two or more distinctsequences, and these always included the correct sequence andanother sequence being not present in the sample (i.e., false-positive). The remaining SAS-signals (3.1 %) were translated into asingle wrong sequence.
Most MAS-signals (74.5 %) were correctly translated into theircorresponding sequence pair. However, the percentages of correctidentification differed significantly between the three distinct typesof MAS-signals. For MAS-1, most signals (93.3 %) were correctlytranslated into the correct sequence pair. Few MAS-1-signals (2.6%) were translated by AdvISER-PYRO into one correct sequencewhereas the other expected sequence from the pair of amplicons was
4
at Universite catholique de L
ouvain on June 21, 2013http://bioinform
atics.oxfordjournals.org/D
ownloaded from

Table 2. Percentage of correct SAS- and MAS-signals identification with AdvISER-PYRO accordingto L1− and L2−norm penalties and the Significant Contribution Threshold.
Significant
L1−norm
SAS (n=103) MAS (n=122)Contribution L2−norm L2−norm
Threshold 0.00 0.01 0.05 0.10 0.50 0.00 0.01 0.05 0.10 0.50
1
0.00 / 90.3 84.5 82.5 68.9 / 62.3 58.2 52.5 29.50.01 89.3 89.3 84.5 82.5 68.9 65.6 62.3 59.0 52.5 29.50.05 89.3 90.3 84.5 82.5 68.9 67.2 62.3 59.0 52.5 29.50.10 89.3 90.3 84.5 82.5 68.9 66.4 61.5 59.0 52.5 29.50.50 89.3 90.3 84.5 82.5 68.9 65.6 63.1 59.0 51.6 29.5
2
0.00 / 94.2 93.2 91.3 83.5 / 77.0 75.4 73.0 59.00.01 94.2 94.2 93.2 91.3 83.5 77.9 77.0 74.6 73.0 59.00.05 94.2 94.2 93.2 91.3 83.5 77.9 77.0 73.8 73.0 59.00.10 94.2 94.2 93.2 91.3 83.5 77.9 77.0 74.6 73.0 59.00.50 94.2 94.2 93.2 91.3 83.5 77.0 77.9 75.4 71.3 59.0
3
0.00 / 95.1 95.1 94.2 90.3 / 66.4 66.4 65.6 59.00.01 95.1 95.1 95.1 94.2 90.3 66.4 66.4 65.6 65.6 59.00.05 95.1 95.1 95.1 94.2 90.3 66.4 66.4 66.4 65.6 59.00.10 95.1 95.1 95.1 94.2 90.3 66.4 66.4 66.4 65.6 59.00.50 95.1 95.1 95.1 94.2 90.3 67.2 65.6 65.6 64.8 58.2
missing (i.e., false-negative) or wrong. Few MAS-1-signals (4.1 %)were predicted with a third additional sequence (i.e., false-positive).The signal contributions of both amplicons were generally well-balanced but not perfectly representative of the amplicon proportionwithin the sample. The relative signal contribution of the minoramplicon was 37.2± 10.2% for samples with 50/50 % and 22.8±1.1% for samples with 33/66 % of both amplicons. For MAS-2 and MAS-3, some signals (53.9 % for MAS-2 and 30.7 % forMAS-3) were correctly translated into the correct sequence pair.Some MAS-2- and MAS-3-signals (46.1 % for MAS-2 and 51.5% for MAS3) were translated by AdvISER-PYRO into one correctsequence whereas the other expected sequence from the pair ofamplicons was missing (i.e., false-negative) or wrong. Some MAS-3-signals (17.8 %) were predicted with a third additional sequence(i.e., false-positive).
4.4 Comparison with the PSQTM 96 MA SoftwareV.2.1.1.
A leave-one-out cross-validation was applied on AdvISER-PYROin order to produce a single and unique answer for each SAS-signal. Six amplicons were excluded from the comparison betweenboth methods. These amplicons presented a single pyrosequencing-signal that was automatically included within the dictionary and wasconsequently excluded from the test dataset. The comparison wastherefore performed on 114 PyrogramsTM .
Most SAS-signals (208/214; 97.2 %) were correctly translatedinto a single correct sequence by AdvISER-PYRO. This percentageof correct identification was much higher than the percentageobtained with the PSQTM 96 MA Software V.2.1.1.that translated 121/214 (56.5 %) PyrogramsTM into correctnucleotide sequences. Compared to this software, the percentageof correct identification obtained with AdvISER-PYRO wasparticularly high at low (FUPH < 5) signal intensities (Figure 2).
020
4060
8010
0
First Unitary Peak Height
Rat
e of
cor
rect
s
igna
l int
erpr
etat
ion
0 5 10 15 20 25 30 35 40 45 50 55 60 65 70 75 80
AdvISER−PYROPSQTM 96 MA Software V.2.1.1
Fig. 2. Comparison of the percentage of correct identification as a functionof signal intensities (FUPH). The comparison was performed betweenAdvISER-PYRO and the PSQTM 96 MA Software V.2.1.1, usingLocal Polynomial Regression Models on identifications obtained with SAS-signals. The symbols on the x-axis represent the distribution of the FUPH inthe SAS dataset.
4.5 Illustration of AdvISER-PYRO applicationFigure 3 illustrates the results obtained with AdvISER-PYRO whenapplied on 4 distinct pyrosequencing signals.
In Figure 3A, a signal with a low FUPH (2.49) was generatedfrom a SAS. Despite this low signal-to-noise ratio, the signal wascorrectly converted in the corresponding single nucleotide sequence(amplicon 32). The correlation coefficient (r) between the predictedvalues of the penalized regression model and the 26 values of thesignal was higher than 0.99, confirming the identification reliabilityobtained with AdvISER-PYRO.
In Figure 3B, the signal was generated from a MAS-1 includingPCR product of amplicons 32 and 14 in equivalent proportion (50/50%). Both amplicons were correctly identified by AdvISER-PYROand the signal contributions of both amplicons were well-balancedbut not perfectly equivalent (41/59 %). The correlation coefficient(r) between the predicted values of the penalized regression model
5
at Universite catholique de L
ouvain on June 21, 2013http://bioinform
atics.oxfordjournals.org/D
ownloaded from

3−A: Correct identification with a SAS signal
Dispensation
Pea
k he
ight
− a
tom
con
trib
utio
n
01
23
45
67
T C T C A C T C T C G A C T G A C T G A C G A C T G
Amplicon 32Pyrosequencing signalr = 0.993
3−B: Correct identification with a MAS−1 signal
Dispensation
Pea
k he
ight
− a
tom
con
trib
utio
n
020
4060
8010
0
T C T C A C T C T C G A C T G A C T G A C G A C T G
Amplicon 18Amplicon 19Pyrosequencing signalr = 0.999
3−C: Wrong identification with a SAS signal
Dispensation
Pea
k he
ight
− a
tom
con
trib
utio
n
010
2030
40
T C T C A C T C T C G A C T G A C T G A C G A C T G
Amplicon 07Amplicon 08Pyrosequencing signalr = 0.759
3−D: Wrong identification with a MAS−2 signal
Dispensation
Pea
k he
ight
− a
tom
con
trib
utio
n
020
4060
8010
012
014
0
T C T C A C T C T C G A C T G A C T G A C G A C T G
Amplicon 32Pyrosequencing signalr = 0.999
Fig. 3. Four examples of signal identification with AdvISER-PYRO. The pyrosequencing signal is represented by vertical black lines. The contribution ofeach atom is represented with boxes stacked one on top of the other.
and the 26 values of the signal was higher than 0.99, confirming theidentification reliability obtained with AdvISER-PYRO.
In Figure 3C, the signal was generated from a SAS includinga single amplicon which was excluded from the dictionary. Thecontributions of atoms corresponding to two distinct amplicons(amplicons 07 and 08) are wrongly identified by AdvISER-PYRO. However, this situation induces a low correlation coefficient(r=0.759) between the predicted values of the penalized regressionmodel and the 26 values of the signal, pointing out the low reliabilityof the AdvISER-PYRO identification and allowing the operator toreject this result.
In Figure 3D, the signal was produced from a MAS-2 generatedwith a single PCR performed on a reconstructed sample where DNAfrom two distinct mycobacterial clinical isolates (correspondingto amplicon 32 and 14) were mixed in equal proportion (50/50%). The pyrosequencing signal was perfectly (r=1) modeled asa linear combination of signals corresponding to amplicon 32showing that initial DNA proportion was strongly altered after PCRamplification.
The computation time for each example was less than 1 secondon an Intel(R) Core(TM) i7-2640M CPU @ 2.80GHz computer.
DISCUSSIONThe AdvISER-PYRO algorithm appears as an efficient tool thatcan reliably be used to identify amplicons in pyrosequencingsignals generated by SAS or MAS. The first prerequisite is thatpyrosequencing signal analysis by AdvISER-PYRO requires thecorresponding amplicon representation in the dictionary. Otherwise,the model produced by AdvISER-PYRO would be wrong. Inthat case, the fitted values would be weakly correlated withthe pyrosequencing signal which will allow operators to avoiderroneous interpretation.
From this study, it also appears that a quantitative interpretationof signal contributions is not feasible. Indeed, the estimated relativecontribution of each amplicon in the MAS-2 pyrosequencing signals
6
at Universite catholique de L
ouvain on June 21, 2013http://bioinform
atics.oxfordjournals.org/D
ownloaded from

did not correspond to the initial ratio of each DNA target. Thisderives from significant differences in PCR amplification efficiencyof these DNA targets, hence to differences in the respective amountof amplicons to be pyrosequenced. Moreover, the estimated relativecontribution of each amplicon in the MAS-1 pyrosequencing signalsdid not correspond to the initial ratio of PCR product, as previouslyreported in Amoako et al. (2012) who showed that all primer-targetassociation does not perform equally well.
A second prerequisite for using AdvISER-PYRO is thateach amplicon produces a specific signal which is differentfrom signals generated by all other amplicons expected to beproduced in the genetic identification process. If this is indeedthe case, the AdvISER-PYRO algorithm can be applied to awide spectrum of pyrosequencing-based genotyping applicationsother than mycobacterial species typing, and is able to analysegenotyping data generated by various types of polymorphismsincluding single nucleotide polymorphism, single nucleotide repeatsequence, deletion, and insertion. A cyclic dispensation ordercan be used if it satisfies this second prerequisite (i.e. if itproduces distinct amplicon-specific signals). However, choosinga selected dispensation order can be advantageous in order tomaximise the signal differences inherent to pyrosequencing signalsproduced respectively by each type of amplicon according to thegenotyping application. Maximising signal differences could alsobe achieved by increasing the number of dispensed nucleotides withthe deleterious consequence that long reads are associated withhigher peak height variance. Consequently, the choice of an optimalnucleotide dispensation order is based on a difficult compromisebetween the quantity and the quality of the acquired information.
In the context of oncogene re-sequencing in heterogeneoustumor cell samples, AdvISER-PYRO could be used as a toolcomplementary to Pyromaker (Chen et al., 2012). The latter is usedto complete the representative learning dictionary by generating atheoretical pyrosequencing signal for each mutation for which nobiological sample is yet available, hence experimental signal isstill lacking in the dictionary. If multiplex pyrosequencing needs tobe carried out, AdvISER-PYRO could be applied to the analysisof complex signals obtained with multiplex primers designedwith the mPSQed software (Dabrowski & Nitsche, 2012). In thisstudy, AdvISER-PYRO showed a very high percentage of correctidentification with signals generated from samples containing 2distinct amplicons. Although this has not been yet tested and needsto be validated, it should be pointed out that AdvISER-PYRO canalso be used on samples containing more than 2 distinct amplicons.
In the present study, the optimisation of AdvISER-PYRO hyper-parameters was done on a validation dataset in order to obtain thehigher percentage of correct identification, irrespective of the impactof a false-positive or -negative results. However, such optimisationshould ideally be performed for each genotyping application byconsidering the global clinical context. In oncogene re-sequencingapplications, the SCT could indeed be defined in terms of relativecontribution by estimating the Limit of Blank (LoB) from a dilutionseries experiment. This LoB could be modulated in order tolimit the probability of either false-negative or -positive results byconsidering the clinical impact relative to both types of error.
As illustrated here, AdvISER-PYRO is expected to substantiallyhelp improving the reading and translation of the pyrogramTM
into a correct sequence or set of sequences in case of SAS-and MAS-signals respectively. Validation and optimization ofAdvISER-PYRO in clinical applications other than mycobacterialgenotyping are already under way.
ACKNOWLEDGEMENTWe would like to thank Michel Heusterspreute for his scientific andtechnical support in the design and development of pyrosequencingassays.
REFERENCESAmir, A. & Zuk, O. (2011) Bacterial community reconstruction
using compressed sensing. Journal of Computational Biology,18 (11), 1723–1741.
Amoako, K., Thomas, M., Kong, F., Janzen, T., Hahn, K.,Shields, M. & Goji, N. (2012) Rapid detection and antimicrobialresistance gene profiling of yersinia pestis using pyrosequencingtechnology. Journal of microbiological methods, 90(3), 228–34.
Chen, G., Olson, M., O’Neill, A., Norris, A., Beierl, K., Harada,S., Debeljak, M., Rivera-Roman, K., Finley, S., Stafford, A.et al. (2012) A virtual pyrogram generator to resolve complexpyrosequencing results. The Journal of Molecular Diagnostics,14 (2), 149–159.
Covert, T., Rodgers, M., Reyes, A. & Stelma, G. (1999)Occurrence of nontuberculous mycobacteria in environmentalsamples. Applied and environmental microbiology, 65 (6),2492–2496.
Dabrowski, P. & Nitsche, A. (2012) mpsqed: a software for thedesign of multiplex pyrosequencing assays. PloS one, 7 (6),e38140.
Dabrowski, P. W., Schroder, K. & Nitsche, A. (2013) Multipsq:a software solution for the analysis of diagnostic n-plexedpyrosequencing reactions. PloS one, 8 (3), e60055.
Deccache, Y., Irenge, L., Savov, E., Ariciuc, M., Macovei, A.,Trifonova, A., Gergova, I., Ambroise, J., Vanhoof, R. & Gala,J. (2011) Development of a pyrosequencing assay for rapidassessment of quinolone resistance in acinetobacter baumanniiisolates. Journal of microbiological methods, 86 (1), 115–118.
Goeman, J. (2008) Penalized: l1 (lasso) and l2 (ridge) penalizedestimation in glms and in the cox model. R package version 09-212008, ., .
Goeman, J., Meijer, R. & Chaturvedi, N. (2012) L1 and l2 penalizedregression models. cran.r-project.or, ., .
Gopinath, K. & Singh, S. (2009) Multiplex pcr assay forsimultaneous detection and differentiation of mycobacteriumtuberculosis, mycobacterium avium complexes and othermycobacterial species directly from clinical specimens. Journalof applied microbiology, 107 (2), 425–435.
Huang, K. & Aviyente, S. (2007) Sparse representation for signalclassification. Advances in neural information processingsystems, 19, 609.
Ronaghi, M. (2001) Pyrosequencing sheds light on dna sequencing.Genome research, 11 (1), 3–11.
7
at Universite catholique de L
ouvain on June 21, 2013http://bioinform
atics.oxfordjournals.org/D
ownloaded from

Ronaghi, M. & Elahi, E. (2002) Pyrosequencing for microbialtyping. Journal of Chromatography B, 782 (1), 67–72.
Rosen, M., Callahan, B., Fisher, D. & Holmes, S. (2012) Denoisingpcr-amplified metagenome data. BMC bioinformatics, 13 (1),283.
Shen, S. & Qin, D. (2012) Pyrosequencing data analysis software: auseful tool for egfr, kras, and braf mutation analysis. DiagnosticPathology, 7 (1), 56.
Sundstrom, M., Edlund, K., Lindell, M., Glimelius, B., Birgisson,H., Micke, P. & Botling, J. (2010) Kras analysis in colorectalcarcinoma: analytical aspects of pyrosequencing and allele-specific pcr in clinical practice. BMC cancer, 10 (1), 660.
Tibshirani, R. (1996) Regression shrinkage and selection via thelasso. Journal of the Royal Statistical Society. Series B(Methodological), ., 267–288.
Zheng, C., Zhang, L., Ng, T., Shiu, C. & Huang, D.(2011) Metasample-based sparse representation for tumorclassification. Computational Biology and Bioinformatics,IEEE/ACM Transactions on, 8 (5), 1273–1282.
Zou, H. & Hastie, T. (2005) Regularization and variable selectionvia the elastic net. Journal of the Royal Statistical Society: SeriesB (Statistical Methodology), 67 (2), 301–320.
8
at Universite catholique de L
ouvain on June 21, 2013http://bioinform
atics.oxfordjournals.org/D
ownloaded from