Transformation in South African asset management - 27four
194
Transformation in South African asset management BEE . conomics ™ 1 7 s u st a i n a b l e d e v e l o p m e n t go als ( S D G s ) t o t r a n sf o r m o u r w o rl d 2020
-
Upload
khangminh22 -
Category
Documents
-
view
0 -
download
0
Transcript of Transformation in South African asset management - 27four
Transformation in South African asset management
BEE.conomics™
17 sustainable development goals (SDGs) to transform our world
2020

2
3
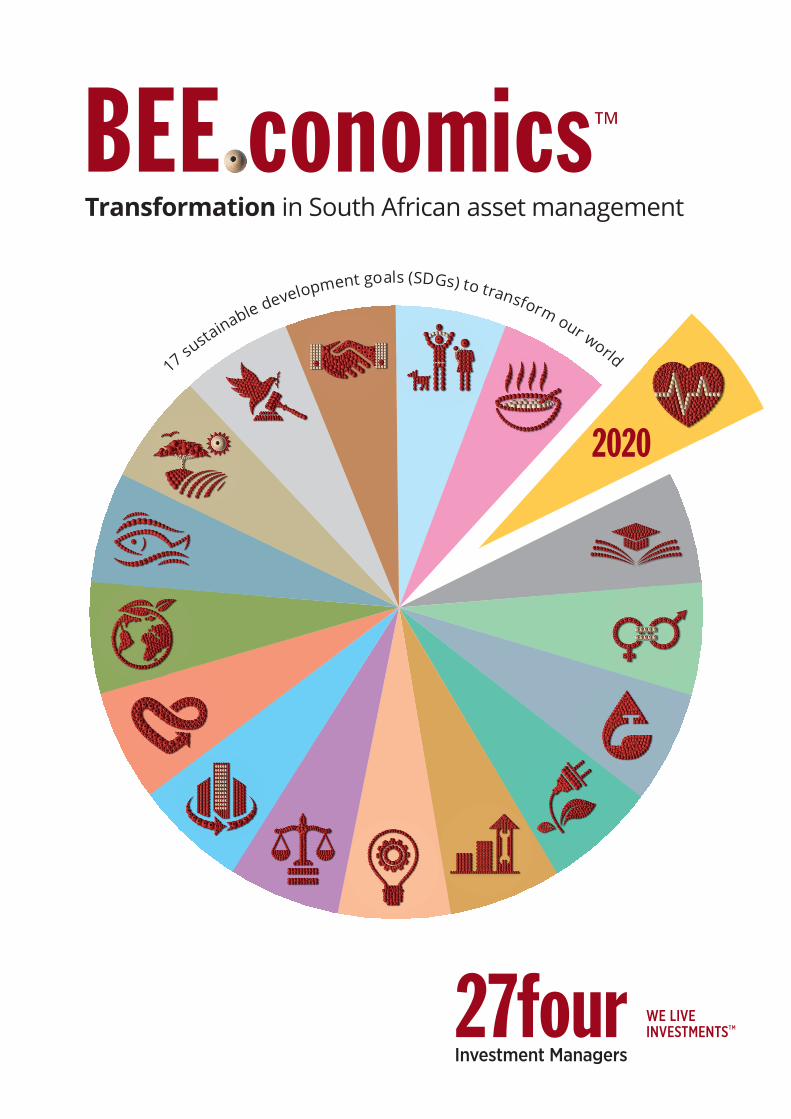
Contents
Abbreviations 4
Criteria and methodology 5
Foreword by Polo Leteka Radebe, President of ABSIP 6
Executive summary 7
A: Overall participation statisticsA1 Sector overview 12
A2 Colonialism, apartheid and democracy - the evolution of South Africanasset management 27
B: Public marketsB1 Impact of COVID-19 36
B2 Fund facts 47
B3 Using machine learning to select the best asset managers 59
B4 B-BBEE scorecard 65
B5 The shift to umbrella funds - does consolidation supporttransformation? 74
B6 Business sustainability and societal impact 78
B7 Team 87
B8 Regulations all asset managers need to be aware of 96
B9 Compliance and operations 97
B10 Product distribution 110
B11 Brand building and industry influence 119
B12 Environmental, social and governance 128
B13 Investment performance 137
B14 List of participants 145
C: Private marketsC1 Introduction 153
C2 Fund facts 154
C3 An investment consultant’s take on Regulation 28 and unlistedinvestments 186
C4 List of participants 188
Disclaimer / Terms and conditions of use 193
ABSIP Association of Black Securities and Investment Professionals
ASISA Association for Savings and Investment South Africa
AUM Assets Under Management
B-BBEE Broad-Based Black Economic Empowerment
CFA Chartered Financial Analyst
CIS Collective Investment Scheme
COFI Bill Conduct of Financial Institutions Bill
CRISA Code for Responsible Investing in South Africa
DFI Development Finance Institution
DTI Department of Trade and Industry
EAC Effective Annual Cost
EME Exempted Micro Enterprise
ESD Enterprise and Supplier Development
ESG Environmental, Social and Governance
FSC Amended Financial Services Sector Code of 2017
FSCA Financial Sector Conduct Authority
FSTC Financial Sector Transformation Council
GEPF Government Employees Pension Fund
GIPS Global Investment Performance Standards
GP General Partner
JSE Johannesburg Stock Exchange
LDI Liability Driven Investment
LISPs Linked Investment Services Providers
LP Limited Partner
LSM Living Standards Measure
NPAT Net Profit After Tax
PA Prudential Authority
PIC Public Investment Corporation
QSFI Qualifying Small Financial Institution
SARB South African Reserve Bank
SARS South African Revenue Services
SAVCA Southern Africa Venture Capital and Private Equity Association
SDGs Sustainable Development Goals
SED Socio-Economic Development
SOE State Owned Enterprise
TER Total Expense Ratio
TIC Total Investment Charge
UCITS Undertakings for Collective Investment in Transferable Securities
UN PRI United Nations Principles for Responsible Investment
4
Abbreviations

5
The survey has been designed with comparability toprevious years in mind. The report is also published
1 Questionnaire design Changing industry dynamics require an annual reassessment of therelevance of the questions asked.
2 Research content A key feature of the survey is the inclusion of research articles ofinterest and interviews with stakeholders.
3 Asset manager universe We cast our net wide to ensure that our universe is all-encompassing.
4 Invitation to participate Asset managers were invited to complete the online questionnaire on 2 June 2020.
5 Submission deadline The cut-off-date for participation was 14 July 2020.
6 Information collation Information submitted was cleaned, verified, collated and presentedin a visual format.
7 Commentary Statistics, facts and figures were interpreted, observations made andcommentary provided.
8 Publish The completed product is assembled for artwork, final editing and publication.
Criteria and methodologyPurpose of the survey
The purpose of this survey is to map the progress oftransformation in the South African asset managementsector and to showcase the universe of majority black-
Who would participate?
Asset managers which met the following criteria wereapproved for participation in the survey:
1. The company is at least 51% black-owned whereblack people hold at least 51% of the economicinterest and where black people hold at least 51%of exercisable voting rights.
2. At least 51% of the company’s board of directors areblack.
3. At least 51% of the company’s senior portfolio managers are black.
Research methodology
All data is presented as at 30 June 2020. The graphic below articulates the research process followed.
and made freely available for the benefit of all stake-holders across the savings and investments ecosystem.
4. The company is registered with the Financial SectorConduct Authority for the business that the companycarries out.
Random checks were conducted by 27four to verify thateach participant met the criteria. However, this was notindependently vetted. All information was voluntarilyprovided as is by participating firms.
owned, managed and controlled asset managers acrossboth public and private markets.

Forewordby Polo Leteka Radebe, President of ABSIP
6
The year 2020 is turning out to be a watershed momentfor the world at large and for South Africa in particular.As a country with a unique history premised on yearsof historical injustices and a unique transitional projectinto democratic rule, the South African story alwaysneeds to be narrated and articulated in a manner thatacknowledges the uniqueness of our society at large.
The rise and the spread of the coronavirus pandemichas forced a reset of what the world thought were therules of engagement and the ways of working and living.Similarly, in South Africa, it has forced us to confront somany of the fundamental fracture points inherent inour society that have become accepted rather thanchallenged. As a country that had a unique mission toproactively seek to heal and bridge the injustices of thepast and map a future of shared prosperity andsolidarity, South Africa by default had to come up withcreative and innovative ways of bridging its great socialdivides.
This is the basis of the various transformation initiativesand instruments that have been put in place over thepast 25 years. Key to these instruments is the regulatoryregime that seeks to provide guidance for various marketparticipants in various sectors on what needs to bedone in order to achieve meaningful transformation inthe various areas that they are in. The role of transfor-mation legislation in its various forms can therefore notbe over-emphasised in the South African context. Whatalso becomes very critical in relation to any form ofregulation and social leadership is the ability to monitorthe effectiveness of intervention instruments that havebeen proposed and implemented. To this end, the ideaof a policy barometer is an important concept for acountry like South Africa.
This is simply because whatever instruments of inter-vention are proposed and applied must be evaluatedagainst objective benchmarks that provide insights intothe effectiveness of such instruments in converging oursociety closer to shared characteristics rather thanamplifying our historic divides. In the financial servicessector, given its transversal and pervasive role acrossall sectors of our society and economy, it is even moreimportant to not only put transformation measures inplace but also to objectively assess and evaluate them.It is with this in mind that ABSIP is fully supportive ofthe 2020 Transformation in South African Asset Manage-ment Survey.
In our view, this survey serves as an important barometerthat enables us to track the performance and progressof transformation within the sector over a particularperiod of time. The reason why tracking and monitoringtransformation is quite important is that we all acknow-ledge that this sector is still dominated by a few marketparticipants who possess significant market power. Suchmarket power is amplified by the significant barriers ofaccess for incomers. The new and emerging players inthe asset management industry therefore need to beassisted in firstly understanding the market and alsoidentifying points of entry.
It is in a survey of this nature that we are able to identifywhether such initiatives exist and if so what theireffectiveness has been in ensuring that we open up thesector and create an ecosystem that is receptive to newentrants, and for black asset managers in particular, tobe able to succeed within the sector. As 27four Invest-ment Managers has conducted this BEE.conomicsTransformation in South African Asset ManagementSurvey for the past 12 years, it has become an importantreference point for deliberations around the table withinABSIP structures in analysing and understanding theasset management industry and what its ongoingchallenges are. It is with this in mind that we welcomethe 2020 survey which indicates to us that not only dowe still have a lot of work to do but also identifiesparticular areas of focus that must become the focusarea for ABSIP and the various role players in the assetmanagement sector going forward.
7
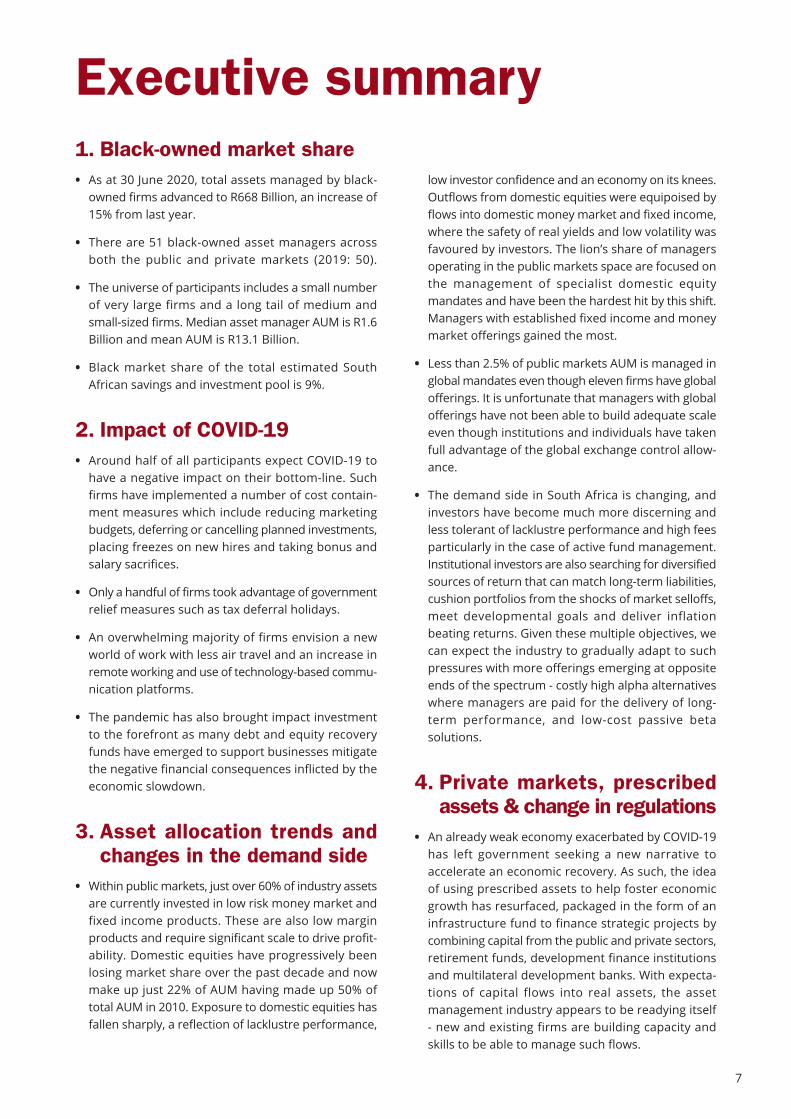
Executive summary1. Black-owned market share• As at 30 June 2020, total assets managed by black-
owned firms advanced to R668 Billion, an increase of15% from last year.
• There are 51 black-owned asset managers acrossboth the public and private markets (2019: 50).
• The universe of participants includes a small numberof very large firms and a long tail of medium andsmall-sized firms. Median asset manager AUM is R1.6Billion and mean AUM is R13.1 Billion.
• Black market share of the total estimated SouthAfrican savings and investment pool is 9%.
2. Impact of COVID-19• Around half of all participants expect COVID-19 to
have a negative impact on their bottom-line. Suchfirms have implemented a number of cost contain-ment measures which include reducing marketingbudgets, deferring or cancelling planned investments,placing freezes on new hires and taking bonus andsalary sacrifices.
• Only a handful of firms took advantage of governmentrelief measures such as tax deferral holidays.
• An overwhelming majority of firms envision a newworld of work with less air travel and an increase inremote working and use of technology-based commu-nication platforms.
• The pandemic has also brought impact investmentto the forefront as many debt and equity recoveryfunds have emerged to support businesses mitigatethe negative financial consequences inflicted by theeconomic slowdown.
3. Asset allocation trends andchanges in the demand side
• Within public markets, just over 60% of industry assetsare currently invested in low risk money market andfixed income products. These are also low marginproducts and require significant scale to drive profit-ability. Domestic equities have progressively beenlosing market share over the past decade and nowmake up just 22% of AUM having made up 50% oftotal AUM in 2010. Exposure to domestic equities hasfallen sharply, a reflection of lacklustre performance,
low investor confidence and an economy on its knees.Outflows from domestic equities were equipoised byflows into domestic money market and fixed income,where the safety of real yields and low volatility wasfavoured by investors. The lion’s share of managersoperating in the public markets space are focused onthe management of specialist domestic equitymandates and have been the hardest hit by this shift.Managers with established fixed income and moneymarket offerings gained the most.
• Less than 2.5% of public markets AUM is managed inglobal mandates even though eleven firms have globalofferings. It is unfortunate that managers with globalofferings have not been able to build adequate scaleeven though institutions and individuals have takenfull advantage of the global exchange control allow-ance.
• The demand side in South Africa is changing, andinvestors have become much more discerning andless tolerant of lacklustre performance and high feesparticularly in the case of active fund management.Institutional investors are also searching for diversifiedsources of return that can match long-term liabilities,cushion portfolios from the shocks of market selloffs,meet developmental goals and deliver inflationbeating returns. Given these multiple objectives, wecan expect the industry to gradually adapt to suchpressures with more offerings emerging at oppositeends of the spectrum - costly high alpha alternativeswhere managers are paid for the delivery of long-term performance, and low-cost passive betasolutions.
4. Private markets, prescribedassets & change in regulations
• An already weak economy exacerbated by COVID-19has left government seeking a new narrative toaccelerate an economic recovery. As such, the ideaof using prescribed assets to help foster economicgrowth has resurfaced, packaged in the form of aninfrastructure fund to finance strategic projects bycombining capital from the public and private sectors,retirement funds, development finance institutionsand multilateral development banks. With expecta-tions of capital flows into real assets, the assetmanagement industry appears to be readying itself- new and existing firms are building capacity andskills to be able to manage such flows.
8
• Twenty private markets firms completed our surveythis year, which have raised a total of R19.3 Billionacross 30 funds, representing both an increase inparticipation and AUM from last year. While the overallasset size is encouraging, it is important to note thatthe universe of participating firms’ AUM is highlyskewed, with many managers currently at subscaleand continuing to experience challenges of longfundraising cycles.
• The resulting growth in appetite for impact investmentthrough unlisted assets may precipitate a change toRegulation 28 of the Pension Funds Act, whichcurrently caps private equity and hedge funds at 15%.Calls have been made by SAVCA to separate hedgefunds from private equity and gradually increase theprivate equity limit. The Minister of Finance haspublicly flirted with the idea of increasing the limitindicating that this is under review by the NationalTreasury. Similar calls have been made to amendCISCA to allow unit trusts to hold unlisted exposure.
5. Scale and distribution• There are now two firms who each manage more
than R100 Billion and collectively represent almosthalf (48%) of total assets. Breaking beyond the R15Billion mark appears to be the largest challenge formanagers. Most private market participants fall inthe <R1 Billion category.
• Ninety percent of public market asset managers’ assetbase is sourced from institutional investors such asretirement funds and are therefore concerned aboutthe consolidation of retirement funds under umbrellaarrangements. This apprehension is not without meritas argued in “The Shift to Umbrella Funds – DoesConsolidation Support Transformation?”.
• Retail penetration appears to be lethargically prog-ressing with black-owned asset managers’ marketshare of the unit trust industry now at 9% representedby 25 firms managing 106 unit trust portfolios.
• Firms also envision a greater increase in mergers andacquisitions as companies harness skills, expertiseand resources together in a shift towards greatermarket consolidation.
6. ESG• Twelve firms are signatories to the UN PRI.
• Ninety percent of all firms integrate ESG into theirinvestment processes and over two-thirds of publicmarkets managers acknowledge that ESG factorshave impacted the risk and return characteristics ofthe portfolios they manage.
• The overwhelming majority of firms agree that thepandemic has once again exposed the fragility of thefinancial markets and current economic systems andthat a shift of alignment to achieving the UN SDGs isbecoming urgent.
7. Socio-economic statistics• The revenue model of asset management is built for
scale, and so the increase in industry AUM did nottranslate into an increase in job creation. The industrycurrently employs a total of 638 people, marginallydown from last year.
• There was little movement in the demographiccomposition of asset manager teams since 2019.None of the managers’ teams are homogenous andpositively reflect both race and gender diversity.
• There was a marked improvement in the number offirms achieving profitability as 76% of all firms indica-ted that they are profitable up from 68% recorded inthe previous year.
• There was overall improvement in the size of publicmarkets firms based on revenue as 44% (2019: 48%)are classified as EMEs, 34% (2019: 34%) as QSFIs and22% (2019: 17%) as large enterprises.
• Women representation at both ownership and direc-torship levels continue to disappoint relative to allother sectors within the economy (B-BBEE Commis-sion, 2020).
• Over half the universe of public markets managersprocure less than 20% of services from more than51% black-owned and / or 30% black women-ownedbusinesses suggesting that the industries from whichasset managers procure services from are largelyuntransformed.
• Going into 2021, transformation of the financial sectorwill be in the spotlight with new legislation focusedon achieving parity within the sector coming into play.Such legislation includes the Employment EquityAmendment Bill, currently in draft form, which willallow for the Minister of Employment and Labour toidentify sectoral numerical targets to ensure repre-sentation reflective of our demographics. We can alsoexpect to see the Conduct of Financial InstitutionsBill come into effect, and an updated iteration of theFinancial Sector Code gazetted.

9

10
17 sustainable developmentgoals (SDGs) to transform
our world
1. No poverty 2. Zero hunger 3. Good health& well-being
4. Quality education
7. Affordable& clean energy
8. Decent work &economic growth
9. Industry, innovation& infrastructure
10. Reducedinequalities
11. Sustainable cities& communities
12. Responsibleconsumption& production
13. Climate action 14. Life below water
5. Gender equality 6. Clean water& sanitation
15. Life on land 16. Peace, justice &strong institutions
17. Partnershipsfor the goals
Overallparticipationstatistics
11

12
SectoroverviewSection highlights
DECLINEDomestic equities have experiencedthe worst decline over the decade
51The number of black-owned assetmanagers across both public andprivate markets
R668 BillionTotal industry AUM
R1.6 BillionMedian asset manager AUM
R13.1 BillionMean asset manager AUM
8.8%Black market share of the total estimated South African savings and investment pool
8.7%Black market share of the unit trustindustry
10.5%Black market share of the privatemarkets industry
638The number of people employed in theindustry, down 4.5% from last year
76%The percentage of profitable firms
Decent work &economic growth
8
13
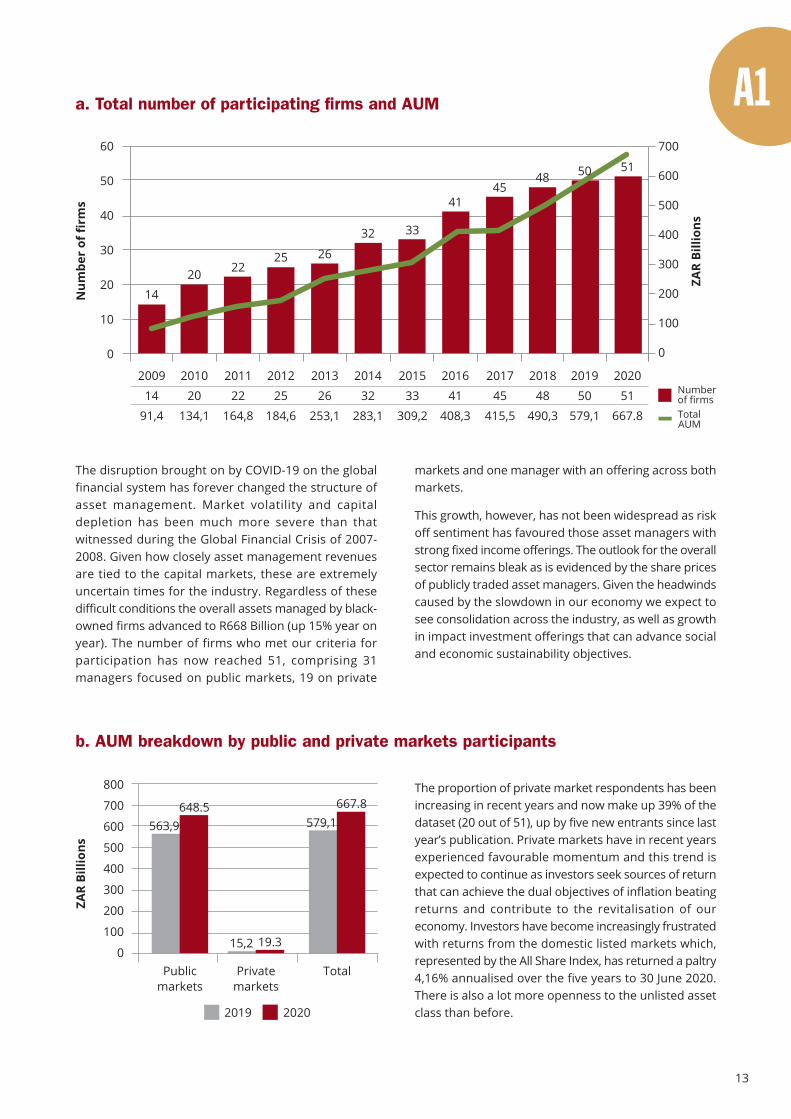
The proportion of private market respondents has beenincreasing in recent years and now make up 39% of thedataset (20 out of 51), up by five new entrants since lastyear’s publication. Private markets have in recent yearsexperienced favourable momentum and this trend isexpected to continue as investors seek sources of returnthat can achieve the dual objectives of inflation beatingreturns and contribute to the revitalisation of oureconomy. Investors have become increasingly frustratedwith returns from the domestic listed markets which,represented by the All Share Index, has returned a paltry4,16% annualised over the five years to 30 June 2020.There is also a lot more openness to the unlisted assetclass than before.
The disruption brought on by COVID-19 on the globalfinancial system has forever changed the structure ofasset management. Market volatility and capitaldepletion has been much more severe than thatwitnessed during the Global Financial Crisis of 2007-2008. Given how closely asset management revenuesare tied to the capital markets, these are extremelyuncertain times for the industry. Regardless of thesedifficult conditions the overall assets managed by black-owned firms advanced to R668 Billion (up 15% year onyear). The number of firms who met our criteria forparticipation has now reached 51, comprising 31managers focused on public markets, 19 on private
markets and one manager with an offering across bothmarkets.
This growth, however, has not been widespread as riskoff sentiment has favoured those asset managers withstrong fixed income offerings. The outlook for the overallsector remains bleak as is evidenced by the share pricesof publicly traded asset managers. Given the headwindscaused by the slowdown in our economy we expect tosee consolidation across the industry, as well as growthin impact investment offerings that can advance socialand economic sustainability objectives.
a. Total number of participating firms and AUM
Num
ber
of fi
rms
ZAR
Billi
ons
2018
48
490,3
60
50
40
30
20
10
0
700
600
500
400
300
200
100
0
2009
14
91,4
2010
20
134,1
2011
22
164,8
2012
25
184,6
2013
26
253,1
2014
32
283,1
2015
33
309,2
2016
41
408,3
2017
45
415,5
2019
50
579,1
2020
51
667.8
48
14
20 2225 26
32 33
4145
50 51
Numberof firmsTotalAUM
ZAR
Billi
ons
b. AUM breakdown by public and private markets participants
800
700
600
500
400
300
200
100
0Private
marketsPublic
marketsTotal
563,9
15,2
579,1648.5
19.3
667.8
2019 2020

14
Ascension Capital Partners
Eklavya Asset Managers
Idwala Capital
Makalani Management Company
Medu Capital
Tamela Capital Partners
Volantis Capital
Vuna Partners
2020 saw seven new participants join the survey withfive firms operating in private markets and two in publicmarkets. Makalani Management Company is not a newentrant to the survey. They previously only participatedunder public markets and now also participate underprivate markets. Idwala Capital and Tamela CapitalPartners are both re-entries to the survey havingpreviously participated in the 2018 edition. Buddingnew entrants Volantis Capital has come to market witha fixed income offering and Vuna Partners is a private
c. Exits and entrants to the survey
Entrants Public PrivateMarkets Markets
Acanthin
Black Mountain Investment Management
Convergence Partners Management
Differential Capital
Legacy Africa Fund Managers
Pan-African Asset Management
Exits Public PrivateMarkets Markets
equity manager focused on the mid-market sector.There were a total of six exits this year, five in publicmarkets and one in private markets. One of the six isno longer in operation. Reasons for non-participationinclude: missing the deadline to submit data, beingfocused on retail clients only, have experienced acontraction in AUM or not been successful in assetgathering, no longer meet the criteria for participationor find no value in participating.

15
d. Public markets participants
1
2
3
4
5
6
7
8
9
10
11
12
13
14
15
16
17
18
19
20
21
22
23
24
25
26
27
28
29
30
31
32
Prescient Investment Management
Vunani Fund Managers
Taquanta Asset Managers
Kagiso Asset Management
Makalani Management Company
Mergence Investment Managers
Argon Asset Management
Aeon Investment Management
Afena Capital
Meago Asset Managers
Sentio Capital Management
All Weather Capital
Prowess Investment Managers
Balondolozi Investment Services
Mianzo Asset Management
First Avenue Investment Management
Cachalia Capital
Perpetua Investment Managers
Benguela Global Fund Managers
Terebinth Capital
Fortitudine Vincimus Capital Advisors
Lodestar Fund Managers
Lunar Capital
MSM Property Fund
Independent Alternatives Investment Managers
Aluwani Capital Partners
Excelsia Capital
Value Capital Partners
Idwala Capital
Lima Mbeu Investment Managers
Ngwedi Investment Managers
Volantis Capital
21.84
20.95
20.77
18.59
15.89
15.76
15.26
15.16
14.67
14.30
13.01
12.17
11.59
10.22
9.92
9.42
8.14
7.75
7.36
7.25
5.92
5.50
5.46
4.91
4.91
4.58
4.17
4.00
2.92
2.81
1.92
1.03
R100 694.68
R42 158.65
R217 635.00
R30 291.88
R150.00
R32 592.97
R25 270.03
R12 377.62
R4 152.32
R7 935.00
R15 894.00
R8 029.00
R7 310.96
R5 454.00
R7 700.00
R5 646.76
R822.00
R9 678.57
R4 547.00
R7 163.20
R263.20
R904.00
R69.20
R268.68
R125.00
R87 421.26
R1 221.10
R5 480.02
R647.93
R532.85
R6 042.00
R0.00
38
33
39
47
8
48
30
8
12
12
20
13
14
16
14
6
3
26
16
6
3
2
2
2
3
34
10
16
2
6
10
4
Fund manager Years inoperation
AUM(ZAR Millions)
Total staffheadcount
Total R648 468.88 503
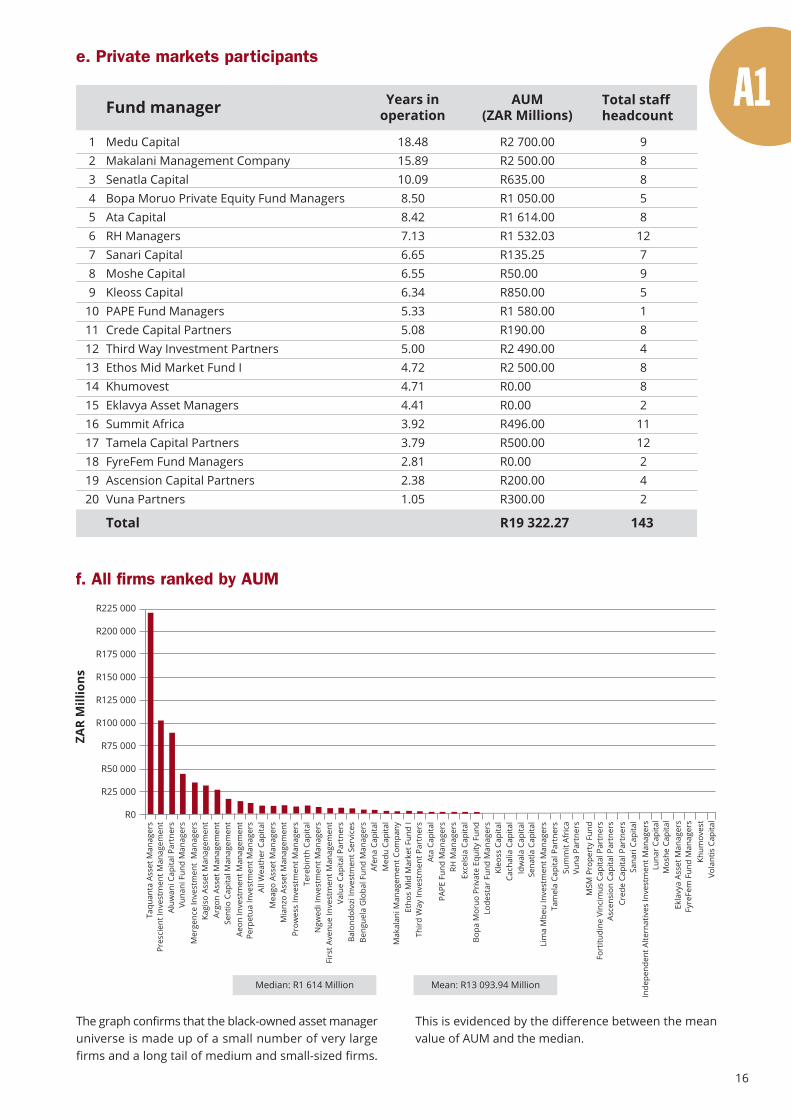
The graph confirms that the black-owned asset manageruniverse is made up of a small number of very largefirms and a long tail of medium and small-sized firms.
e. Private markets participants
123456789
1011121314151617181920
Medu CapitalMakalani Management CompanySenatla CapitalBopa Moruo Private Equity Fund ManagersAta CapitalRH ManagersSanari CapitalMoshe CapitalKleoss CapitalPAPE Fund ManagersCrede Capital PartnersThird Way Investment PartnersEthos Mid Market Fund IKhumovestEklavya Asset ManagersSummit AfricaTamela Capital PartnersFyreFem Fund ManagersAscension Capital PartnersVuna Partners
18.4815.8910.098.508.427.136.656.556.345.335.085.004.724.714.413.923.792.812.381.05
R2 700.00R2 500.00R635.00R1 050.00R1 614.00R1 532.03R135.25R50.00R850.00R1 580.00R190.00R2 490.00R2 500.00R0.00R0.00R496.00R500.00R0.00R200.00R300.00
98858
12795184882
1112242
Total R19 322.27 143
Fund manager Years inoperation
AUM(ZAR Millions)
Total staffheadcount
f. All firms ranked by AUM
ZAR
Mill
ions
R225 000
R200 000
R175 000
R150 000
R125 000
R100 000
R75 000
R50 000
R25 000
R0
Taqu
anta
Ass
et M
anag
ers
Pres
cien
t Inv
estm
ent M
anag
emen
tAl
uwan
i Cap
ital P
artn
ers
Vuna
ni F
und
Man
ager
sM
erge
nce
Inve
stm
ent
Man
ager
sKa
giso
Ass
et M
anag
emen
tAr
gon
Asse
t Man
agem
ent
Sent
io C
apita
l Man
agem
ent
Aeon
Inve
stm
ent M
anag
emen
tPe
rpet
ua In
vest
men
t Man
ager
sAl
l Wea
ther
Cap
ital
Mea
go A
sset
Man
ager
sM
ianz
o As
set M
anag
emen
tPr
owes
s In
vest
men
t Man
ager
sTe
rebi
nth
Capi
tal
Ngw
edi I
nves
tmen
t Man
ager
sFi
rst A
venu
e In
vest
men
t Man
agem
ent
Valu
e Ca
pita
l Par
tner
sBa
lond
oloz
i Inv
estm
ent S
ervi
ces
Beng
uela
Glo
bal F
und
Man
ager
sAf
ena
Capi
tal
Med
u Ca
pita
lM
akal
ani M
anag
emen
t Com
pany
Etho
s M
id M
arke
t Fun
d I
Thir
d W
ay In
vest
men
t Par
tner
sAt
a Ca
pita
lPA
PE F
und
Man
ager
sRH
Man
ager
sEx
cels
ia C
apita
lBo
pa M
oruo
Pri
vate
Equ
ity F
und
Lode
star
Fun
d M
anag
ers
Kleo
ss C
apita
lCa
chal
ia C
apita
lId
wal
a Ca
pita
lSe
natla
Cap
ital
Lim
a M
beu
Inve
stm
ent M
anag
ers
Tam
ela
Capi
tal P
artn
ers
Sum
mit
Afri
caVu
na P
artn
ers
MSM
Pro
pert
y Fu
ndFo
rtitu
dine
Vin
cim
us C
apita
l Par
tner
sAs
cens
ion
Capi
tal P
artn
ers
Cred
e Ca
pita
l Par
tner
sSa
nari
Cap
ital
Inde
pend
ent A
ltern
ativ
es In
vest
men
t Man
ager
sLu
nar
Capi
tal
Mos
he C
apita
lEk
lavy
a As
set M
anag
ers
Fyre
Fem
Fun
d M
anag
ers
Khum
oves
tVo
lant
is C
apita
l
Median: R1 614 Million Mean: R13 093.94 Million
This is evidenced by the difference between the meanvalue of AUM and the median.
16

17
This year, Prescient Investment Management joinsTaquanta Asset Managers in the plus R100 Billion club.Collectively the two managers represent almost half(48%) of total assets managed by all firms thatparticipated in the survey. Breaking beyond the R15
Billion mark appears to be the largest challenge formanagers. The majority of private market participantsfall in the <R1 Billion category. Little has changed fromprevious years as the data re-affirms the lopsidedtopography of this group of managers.
Concentration in the pool increased between 2019 and2020 with the top five and ten firms now representing72% and 86% of overall industry assets, respectively.The COVID-19 shock to the capital markets in Februarythis year resulted in members of retirement fundsswitching out of growth portfolios into low risk portfolios
heavily weighted to fixed income securities. Assetmanagers with established track records in fixed income,of which there are several in the top 10, were recipientsof this flow. In this light, the increase in concentrationlevels is not surprising.
g. Assets managed by firm size
>100bn
50 to 100bn
30 to 50bn
15 to 30bn
5 to 15bn
1 to 5bn
<1bn
Total AUM of firmin ZAR Billions
Number of firms
Total
1
1
2
4
5
10
18
1
1
2
3
6
11
21
1
1
2
4
6
11
23
1
2
2
3
9
13
20
2016201720182019
41454850
2
1
3
2
11
11
21
2020
51
h. Combined market share of top firms by AUM
% o
f ind
ustr
y as
sets
100%90%80%70%60%50%40%30%20%10%
0%
Top 5 Top 10
2014 2015 2016 2017 2018 2020
69,89%
88,01% 86,47%
68,59%76,83%
94,01%
74,21%
91,26%83,59%
64,96%
83,40%
67,04%
85.96%
71.95%
2019
18
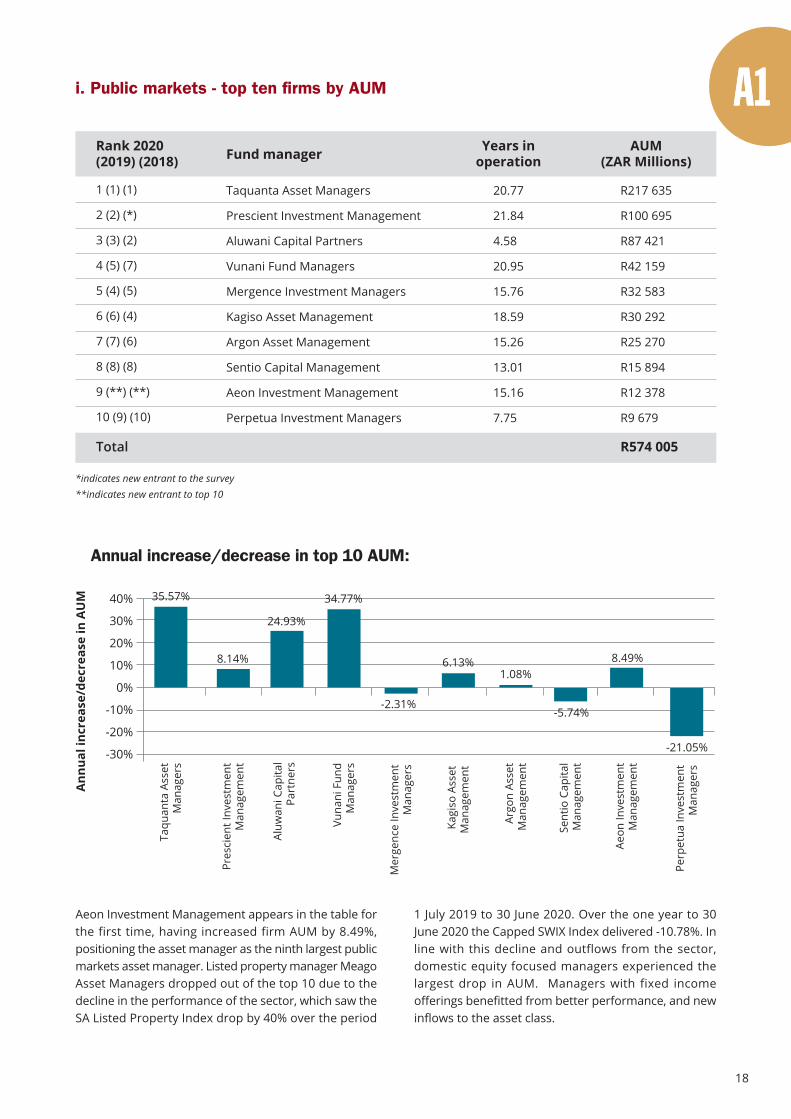
Aeon Investment Management appears in the table forthe first time, having increased firm AUM by 8.49%,positioning the asset manager as the ninth largest publicmarkets asset manager. Listed property manager MeagoAsset Managers dropped out of the top 10 due to thedecline in the performance of the sector, which saw theSA Listed Property Index drop by 40% over the period
1 July 2019 to 30 June 2020. Over the one year to 30June 2020 the Capped SWIX Index delivered -10.78%. Inline with this decline and outflows from the sector,domestic equity focused managers experienced thelargest drop in AUM. Managers with fixed incomeofferings benefitted from better performance, and newinflows to the asset class.
i. Public markets - top ten firms by AUM
R217 635
R100 695
R87 421
R42 159
R32 583
R30 292
R25 270
R15 894
R12 378
R9 679
AUM(ZAR Millions)
20.77
21.84
4.58
20.95
15.76
18.59
15.26
13.01
15.16
7.75
Taquanta Asset Managers
Prescient Investment Management
Aluwani Capital Partners
Vunani Fund Managers
Mergence Investment Managers
Kagiso Asset Management
Argon Asset Management
Sentio Capital Management
Aeon Investment Management
Perpetua Investment Managers
1 (1) (1)
2 (2) (*)
3 (3) (2)
4 (5) (7)
5 (4) (5)
6 (6) (4)
7 (7) (6)
8 (8) (8)
9 (**) (**)
10 (9) (10)
Years inoperationFund managerRank 2020
(2019) (2018)
R574 005Total
*indicates new entrant to the survey**indicates new entrant to top 10
Ann
ual i
ncre
ase/
decr
ease
in A
UM 40%
30%
20%
10%
0%
-10%
-20%
-30%
35.57%
8.14%
24.93%
34.77%
-2.31%
6.13%1.08%
-5.74%
8.49%
Annual increase/decrease in top 10 AUM:
Argo
n As
set
Man
agem
ent
Pres
cien
t Inv
estm
ent
Man
agem
ent
Kagi
so A
sset
Man
agem
ent
Mer
genc
e In
vest
men
tM
anag
ers
Sent
io C
apita
lM
anag
emen
t
Taqu
anta
Ass
etM
anag
ers
Aluw
ani C
apita
lPa
rtne
rs
Vuna
ni F
und
Man
ager
s
Aeon
Inve
stm
ent
Man
agem
ent
Perp
etua
Inve
stm
ent
Man
ager
s
-21.05%

19
j. Private markets - top ten firms by AUM
R2 700
R2 500
R2 500
R2 490
R1 614
R1 580
R1 532
R1 050
R850
R635
18.48
4.72
15.89
5.00
8.42
5.33
7.13
8.50
6.34
10.09
Medu Capital
Ethos Mid Market Fund I
Makalani Management Company
Third Way Investment Partners
Ata Capital
PAPE Fund Managers
RH Managers
Bopa Moruo Private Equity Fund Managers
Kleoss Capital
Senatla Capital
1(*)
2(2)
3(**)
4(3)
5(4)
6(5)
7(7)
8(6)
9(8)
10(9)
R17 451Total
AUM(ZAR Millions)
Years inoperationFund managerRank 2020 (2019)
Both Medu Capital and Makalani Management Companymake the top 10 this year with Summit Africa exitingthe top 10. Many of the firms are still raising capital forfund closure, whereas some have closed and begundeployment. Overall private market assets haveincreased from R15.2 Billion recorded last year to R19.3Billion this year - the top 10 account for 90% of thisfigure. This universe of managers include managersfocused on private equity, debt, and infrastructure.
As South Africa responds to its developmental needsthrough infrastructure investment, inviting blendedfinance and public private partnership opportunities,we expect this pool of managers to benefit from suchactivity. The biggest tailwind for the industry is theexpected increase in the retirement fund investmentlimit of 10% to private equity which we understand iscurrently under review by the National Treasury.
k. Black asset management market share of the overall savings pool in South Africa
To calculate the total black market share of the regulatedsavings pool in South Africa we need to first calculatethe total size of regulated savings stocks. This calculationis provided next and excludes short-term insurance,medical schemes and banking stocks. It is important to
note that there is no official source for this statistic anddifferent figures have been quoted in the industry,varying from R6.5 Trillion to R8.5 Trillion. The valuesprovided are from a range of sources which report atdifferent times.
*indicates new entrant to the survey**indicates new entrant to top 10
20
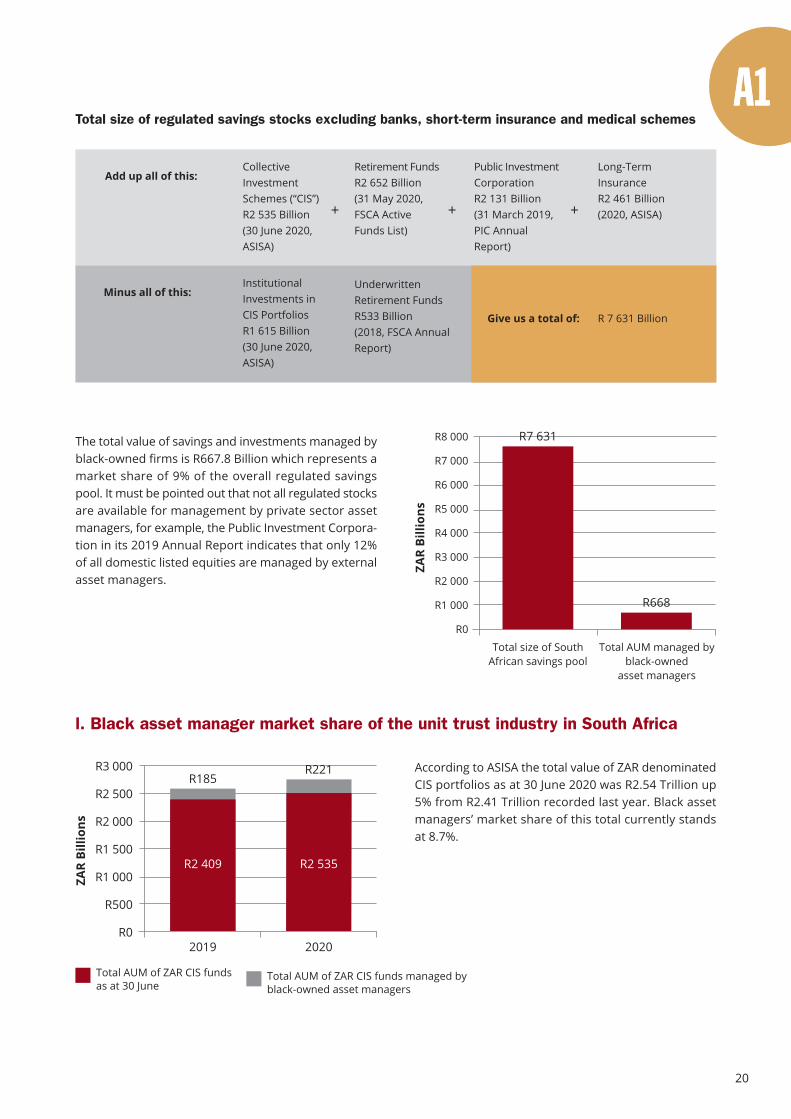
The total value of savings and investments managed byblack-owned firms is R667.8 Billion which represents amarket share of 9% of the overall regulated savingspool. It must be pointed out that not all regulated stocksare available for management by private sector assetmanagers, for example, the Public Investment Corpora-tion in its 2019 Annual Report indicates that only 12%of all domestic listed equities are managed by externalasset managers.
According to ASISA the total value of ZAR denominatedCIS portfolios as at 30 June 2020 was R2.54 Trillion up5% from R2.41 Trillion recorded last year. Black assetmanagers’ market share of this total currently standsat 8.7%.
ZAR
Billi
ons
R8 000
R7 000
R6 000
R5 000
R4 000
R3 000
R2 000
R1 000
R0
Total size of SouthAfrican savings pool
R7 631
R668
Total AUM managed byblack-owned
asset managers
l. Black asset manager market share of the unit trust industry in South Africa
Total AUM of ZAR CIS funds managed byblack-owned asset managers
Total AUM of ZAR CIS fundsas at 30 June
ZAR
Billi
ons
R3 000
R2 500
R2 000
R1 500
R1 000
R500
R02019 2020
R2 409 R2 535
R185
Total size of regulated savings stocks excluding banks, short-term insurance and medical schemes
Minus all of this:InstitutionalInvestments inCIS PortfoliosR1 615 Billion(30 June 2020,ASISA)
UnderwrittenRetirement FundsR533 Billion(2018, FSCA AnnualReport)
Add up all of this:CollectiveInvestmentSchemes (“CIS”)R2 535 Billion(30 June 2020,ASISA)
Retirement FundsR2 652 Billion(31 May 2020,FSCA ActiveFunds List)
Public InvestmentCorporationR2 131 Billion(31 March 2019,PIC AnnualReport)
Long-TermInsuranceR2 461 Billion(2020, ASISA)+ + +
Give us a total of: R 7 631 Billion
R221
21
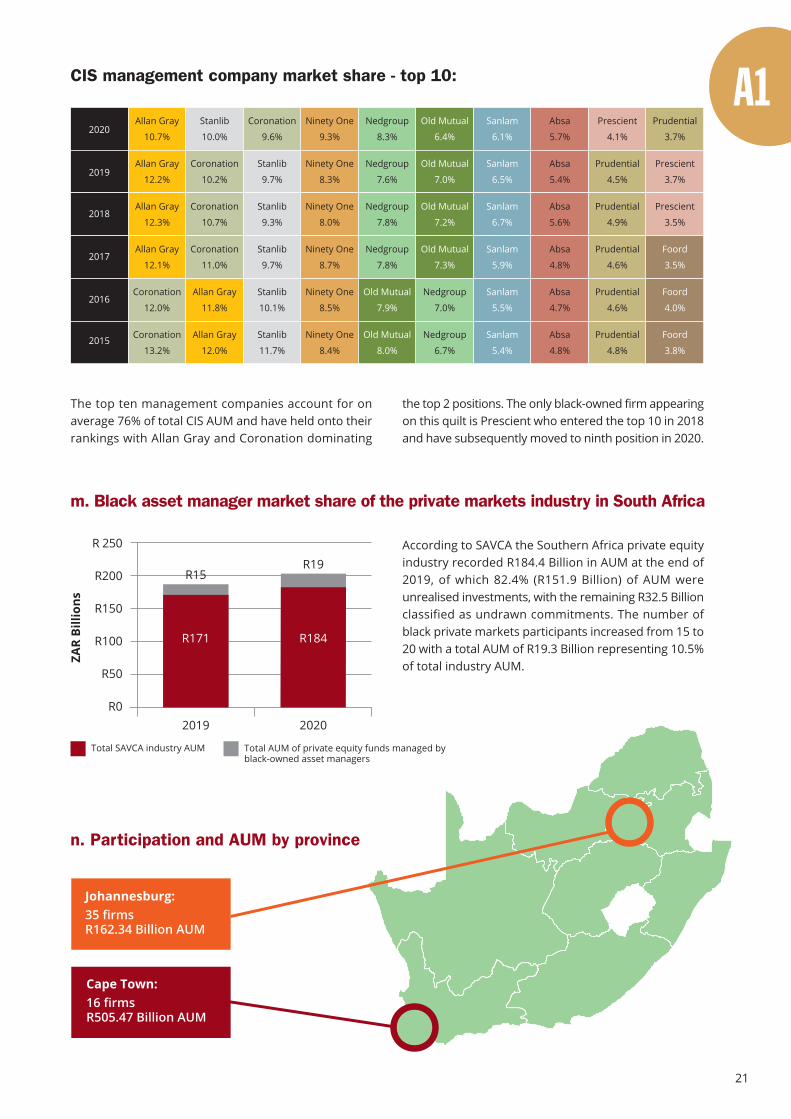
n. Participation and AUM by province
Cape Town:16 firmsR505.47 Billion AUM
Johannesburg:35 firmsR162.34 Billion AUM
According to SAVCA the Southern Africa private equityindustry recorded R184.4 Billion in AUM at the end of2019, of which 82.4% (R151.9 Billion) of AUM wereunrealised investments, with the remaining R32.5 Billionclassified as undrawn commitments. The number ofblack private markets participants increased from 15 to20 with a total AUM of R19.3 Billion representing 10.5%of total industry AUM.
The top ten management companies account for onaverage 76% of total CIS AUM and have held onto theirrankings with Allan Gray and Coronation dominating
2020
2019
2018
2017
2016
2015
Allan Gray
10.7%
Allan Gray
12.2%
Allan Gray
12.3%
Allan Gray
12.1%
Allan Gray
11.8%
Allan Gray
12.0%
Stanlib
10.0%
Stanlib
9.7%
Stanlib
9.7%
Stanlib
9.3%
Stanlib
10.1%
Stanlib
11.7%
Coronation
9.6%
Coronation
10.2%
Coronation
10.7%
Coronation
11.0%
Coronation
12.0%
Coronation
13.2%
Ninety One
9.3%
Ninety One
8.3%
Ninety One
8.0%
Ninety One
8.7%
Ninety One
8.5%
Ninety One
8.4%
Nedgroup
8.3%
Nedgroup
7.6%
Nedgroup
7.8%
Nedgroup
7.8%
Nedgroup
7.0%
Nedgroup
6.7%
Old Mutual
6.4%
Old Mutual
7.0%
Old Mutual
7.2%
Old Mutual
7.3%
Old Mutual
7.9%
Old Mutual
8.0%
Sanlam
6.1%
Sanlam
6.5%
Sanlam
6.7%
Sanlam
5.9%
Sanlam
5.5%
Sanlam
5.4%
Absa
5.7%
Absa
5.4%
Absa
5.6%
Absa
4.8%
Absa
4.7%
Absa
4.8%
Prescient
4.1%
Prescient
3.7%
Prescient
3.5%
Prudential
3.7%
Prudential
4.5%
Prudential
4.9%
Prudential
4.6%
Prudential
4.6%
Prudential
4.8%
Foord
3.5%
Foord
4.0%
Foord
3.8%
CIS management company market share - top 10:
m. Black asset manager market share of the private markets industry in South Africa
ZAR
Billi
ons
R 250
R200
R150
R100
R50
R0
Total AUM of private equity funds managed byblack-owned asset managers
Total SAVCA industry AUM
2019 2020
R171 R184
R15R19
the top 2 positions. The only black-owned firm appearingon this quilt is Prescient who entered the top 10 in 2018and have subsequently moved to ninth position in 2020.
22
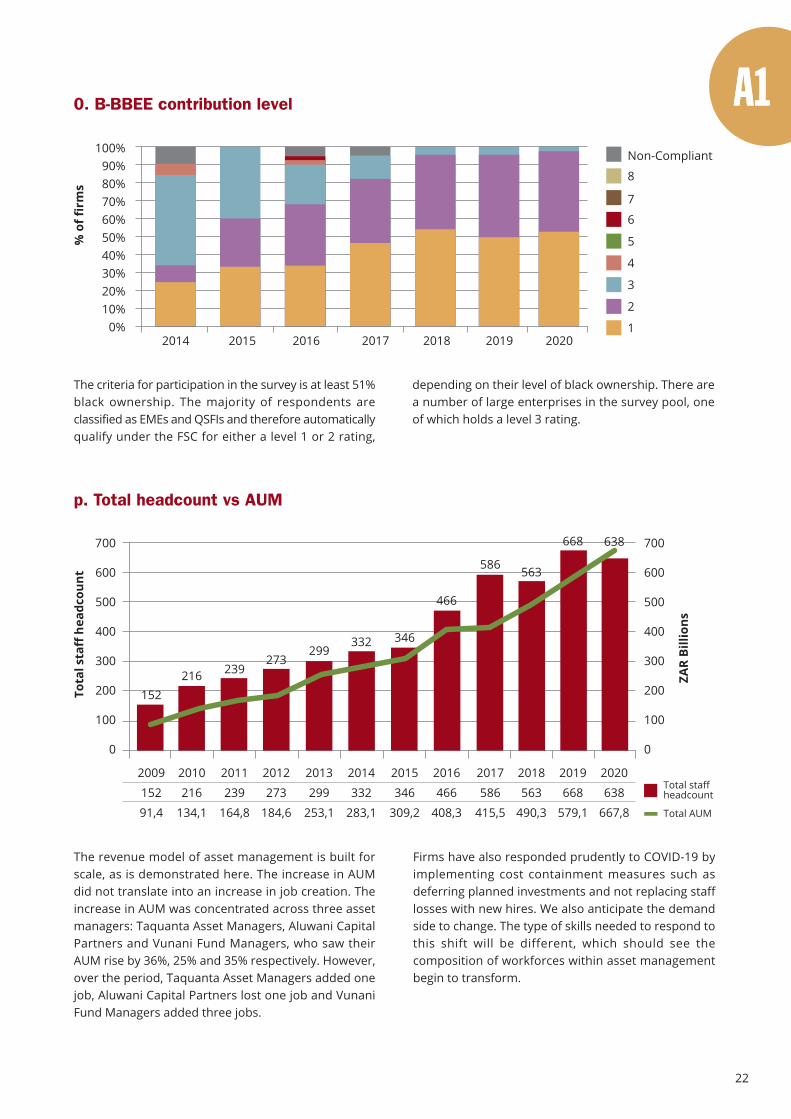
The criteria for participation in the survey is at least 51%black ownership. The majority of respondents areclassified as EMEs and QSFIs and therefore automaticallyqualify under the FSC for either a level 1 or 2 rating,
depending on their level of black ownership. There area number of large enterprises in the survey pool, oneof which holds a level 3 rating.
The revenue model of asset management is built forscale, as is demonstrated here. The increase in AUMdid not translate into an increase in job creation. Theincrease in AUM was concentrated across three assetmanagers: Taquanta Asset Managers, Aluwani CapitalPartners and Vunani Fund Managers, who saw theirAUM rise by 36%, 25% and 35% respectively. However,over the period, Taquanta Asset Managers added onejob, Aluwani Capital Partners lost one job and VunaniFund Managers added three jobs.
Firms have also responded prudently to COVID-19 byimplementing cost containment measures such asdeferring planned investments and not replacing stafflosses with new hires. We also anticipate the demandside to change. The type of skills needed to respond tothis shift will be different, which should see thecomposition of workforces within asset managementbegin to transform.
0. B-BBEE contribution level
% o
f fir
ms
Non-Compliant
8
7
6
5
4
3
2
12014 2015 2016 2017 2018 2019
100%90%80%70%60%50%40%30%20%10%
0%2020
Total staffheadcount
Total AUM
p. Total headcount vs AUM
Tota
l sta
ff h
eadc
ount
700
600
500
400
300
200
100
0
ZAR
Billi
ons
700
600
500
400
300
200
100
0
2009
152
91,4
2010
216
134,1
2011
239
164,8
2012
273
184,6
2013
299
253,1
2014
332
283,1
2015
346
309,2
2016
466
408,3
2017
586
415,5
2018
563
490,3
2019
668
579,1
2020
638
667,8
152216 239
273299
332 346
466
586 563
668 638
23
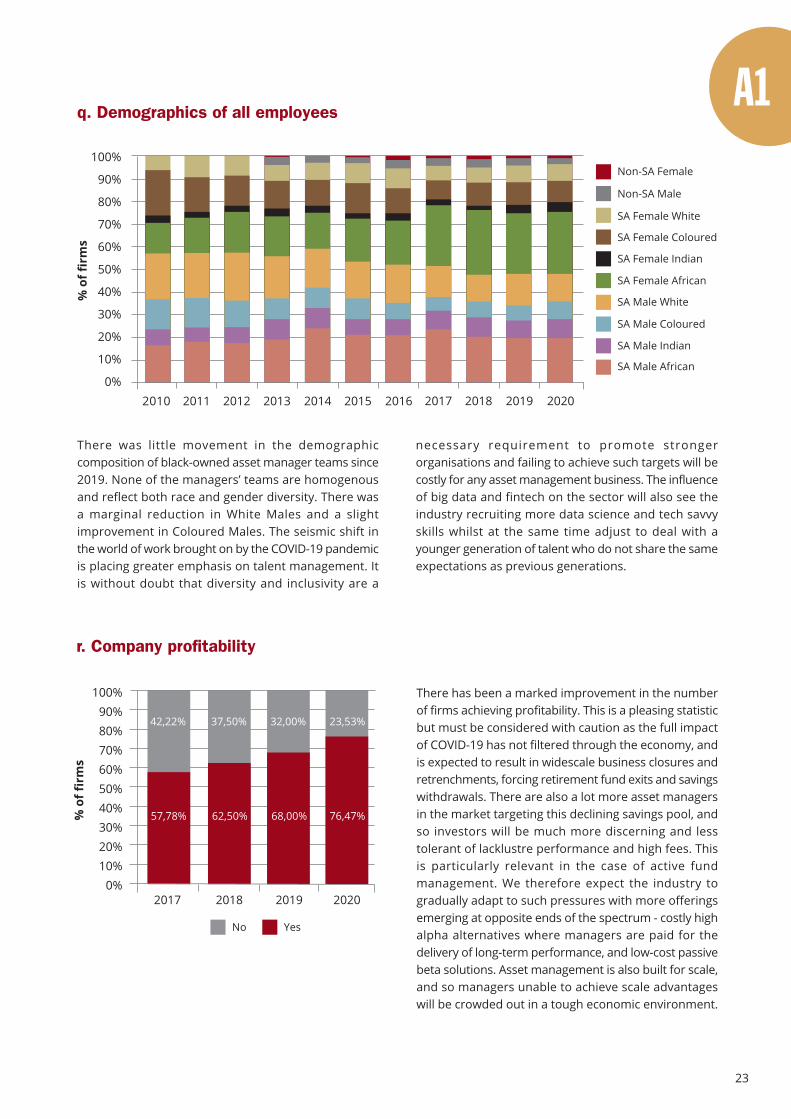
There was little movement in the demographiccomposition of black-owned asset manager teams since2019. None of the managers’ teams are homogenousand reflect both race and gender diversity. There wasa marginal reduction in White Males and a slightimprovement in Coloured Males. The seismic shift inthe world of work brought on by the COVID-19 pandemicis placing greater emphasis on talent management. Itis without doubt that diversity and inclusivity are a
necessary requirement to promote strongerorganisations and failing to achieve such targets will becostly for any asset management business. The influenceof big data and fintech on the sector will also see theindustry recruiting more data science and tech savvyskills whilst at the same time adjust to deal with ayounger generation of talent who do not share the sameexpectations as previous generations.
There has been a marked improvement in the numberof firms achieving profitability. This is a pleasing statisticbut must be considered with caution as the full impactof COVID-19 has not filtered through the economy, andis expected to result in widescale business closures andretrenchments, forcing retirement fund exits and savingswithdrawals. There are also a lot more asset managersin the market targeting this declining savings pool, andso investors will be much more discerning and lesstolerant of lacklustre performance and high fees. Thisis particularly relevant in the case of active fundmanagement. We therefore expect the industry togradually adapt to such pressures with more offeringsemerging at opposite ends of the spectrum - costly highalpha alternatives where managers are paid for thedelivery of long-term performance, and low-cost passivebeta solutions. Asset management is also built for scale,and so managers unable to achieve scale advantageswill be crowded out in a tough economic environment.
SA Male Indian
q. Demographics of all employees
% o
f fir
ms
Non-SA Male
SA Female White
SA Female Coloured
SA Female Indian
SA Female African
SA Male White
SA Male Coloured
Non-SA Female
SA Male African
100%
90%
80%
70%
60%
50%
40%
30%
20%
10%
0%2010 2011 2012 2013 2014 2015 2016 2017 2018 2019 2020
r. Company profitability
% o
f fir
ms
100%90%80%70%60%50%40%30%20%10%
0%
YesNo
20182017 2019
62,50%
37,50%
57,78%
42,22%
68,00%
32,00%
76,47%
23,53%
2020
24
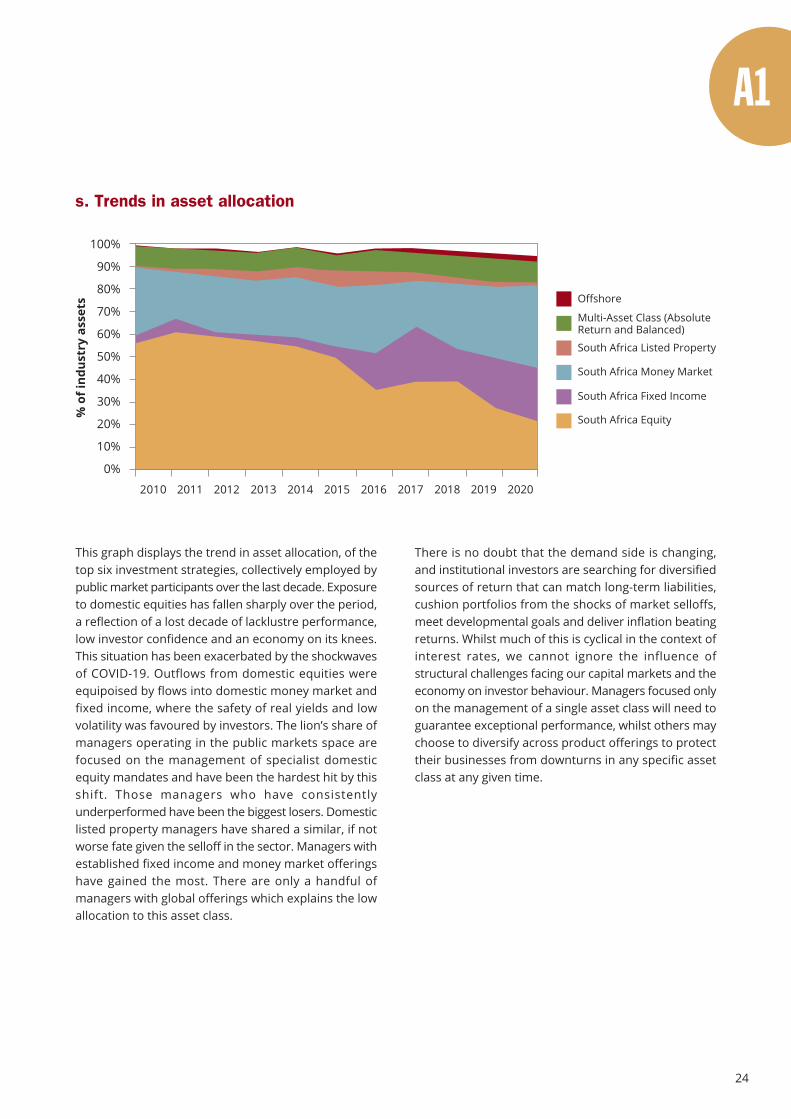
This graph displays the trend in asset allocation, of thetop six investment strategies, collectively employed bypublic market participants over the last decade. Exposureto domestic equities has fallen sharply over the period,a reflection of a lost decade of lacklustre performance,low investor confidence and an economy on its knees.This situation has been exacerbated by the shockwavesof COVID-19. Outflows from domestic equities wereequipoised by flows into domestic money market andfixed income, where the safety of real yields and lowvolatility was favoured by investors. The lion’s share ofmanagers operating in the public markets space arefocused on the management of specialist domesticequity mandates and have been the hardest hit by thisshift. Those managers who have consistentlyunderperformed have been the biggest losers. Domesticlisted property managers have shared a similar, if notworse fate given the selloff in the sector. Managers withestablished fixed income and money market offeringshave gained the most. There are only a handful ofmanagers with global offerings which explains the lowallocation to this asset class.
s. Trends in asset allocation
% o
f ind
ustr
y as
sets Offshore
Multi-Asset Class (AbsoluteReturn and Balanced)
South Africa Listed Property
South Africa Money Market
South Africa Fixed Income
South Africa Equity
100%
90%
80%
70%
60%
50%
40%
30%
20%
10%
0%
2010 2011 2012 2013 2014 2015 2016 2017 2018 2019 2020
There is no doubt that the demand side is changing,and institutional investors are searching for diversifiedsources of return that can match long-term liabilities,cushion portfolios from the shocks of market selloffs,meet developmental goals and deliver inflation beatingreturns. Whilst much of this is cyclical in the context ofinterest rates, we cannot ignore the influence ofstructural challenges facing our capital markets and theeconomy on investor behaviour. Managers focused onlyon the management of a single asset class will need toguarantee exceptional performance, whilst others maychoose to diversify across product offerings to protecttheir businesses from downturns in any specific assetclass at any given time.

25

26
Zero hunger
2
27
1. PwC, Africa Asset Management 20202. Alexander Forbes Manager Watch Annual Survey 2019
1845 - 1947: Era of colonisation
The institutionalisation of the savings and investmentssector began with the establishment of insurers andbanks in the 19th century, which saw the emergence ofthe bancassurance model. This model of crossshareholding between insurers and banks remainsprevalent today. For example, Sanlam and Absa sharea relationship, as do Old Mutual and Nedbank, Libertyand Standard Bank, and Momentum and FirstRand. Thebancassurance model also gave birth to the assetmanagement industry as these financial institutionsestablished investment management arms, to manage
Asset management plays a critical role in the functioningof the South African economy through the efficientmobilisation and allocation of savings. The sectorsupports financial market infrastructure and ensuresthe smooth functioning of the capital markets, abarometer of the health of an economy. The sector isalso a significant contributor to GDP. In fact, financialservices as a whole is the largest contributor to GDP, at22%1. The asset management industry is also well-regulated, thereby providing trust, confidence, andstability to the financial system.
South Africa’s status as the most mature financial marketin Africa is a culmination of its evolution from colonialism,through apartheid, and its eventual entry into the globalmarketplace following democracy in 1994. The structureand institutionalisation of the sector has largely beeninfluenced by the politics of the day. This review exploresthe periods before and after democracy and is sub-divided into distinct periods of political reign, control,and leadership.
life and other assets. According to Alexander Forbes2,as at the end of 2019, insurer owned asset managementfirms Old Mutual Investment Group, Sanlam InvestmentManagement, Stanlib Asset Management and MomentumAsset Managers are ranked one, five, six and thirteenby total assets under management respectively. On thisbasis, one could argue that South Africa has never reallyconceptualised a new economy and that the colonial orapartheid structure remains intact with a few companies,their subsidiaries, and associated companies dominatingthe sector.
We look at how each of these periods shaped SouthAfrican asset management and explore what lies ahead.
1845-1947 1948-1993 1994-2008 2009-todayANC rule
Golden period ofdemocracy
ANC rule
Period of politicaland economic crisis
Colonial rule
Period of Anglo BoerWars, British rule,
Union of SA
National Party rule
Period of apartheidbased on racial
segregation
Period before democracy Period after democracy
Colonialism, apartheid anddemocracy - the evolutionof South African assetmanagement
28
Nu
mb
er o
f m
emb
ers
18 000 000
16 000 000
14 000 000
12 000 000
10 000 000
8 000 000
6 000 000
4 000 000
2 000 000
0
Private sector members
Private sector assets
1990
1991
1992
1993
1994
1995
1996
1997
1998
1999
2000
2001
2002
2003
2004
2005
2006
2007
2008
2009
2010
2011
2012
2013
2014
2015
2016
2017
2018
AU
M M
illi
on
s
R5 000 000
R4 500 000
R4 000 000
R3 500 000
R3 000 000
R2 500 000
R2 000 000
R1 500 000
R1 000 000
R500 000
0
GEPF and other SOEs members
GEPF and other SOEs assets
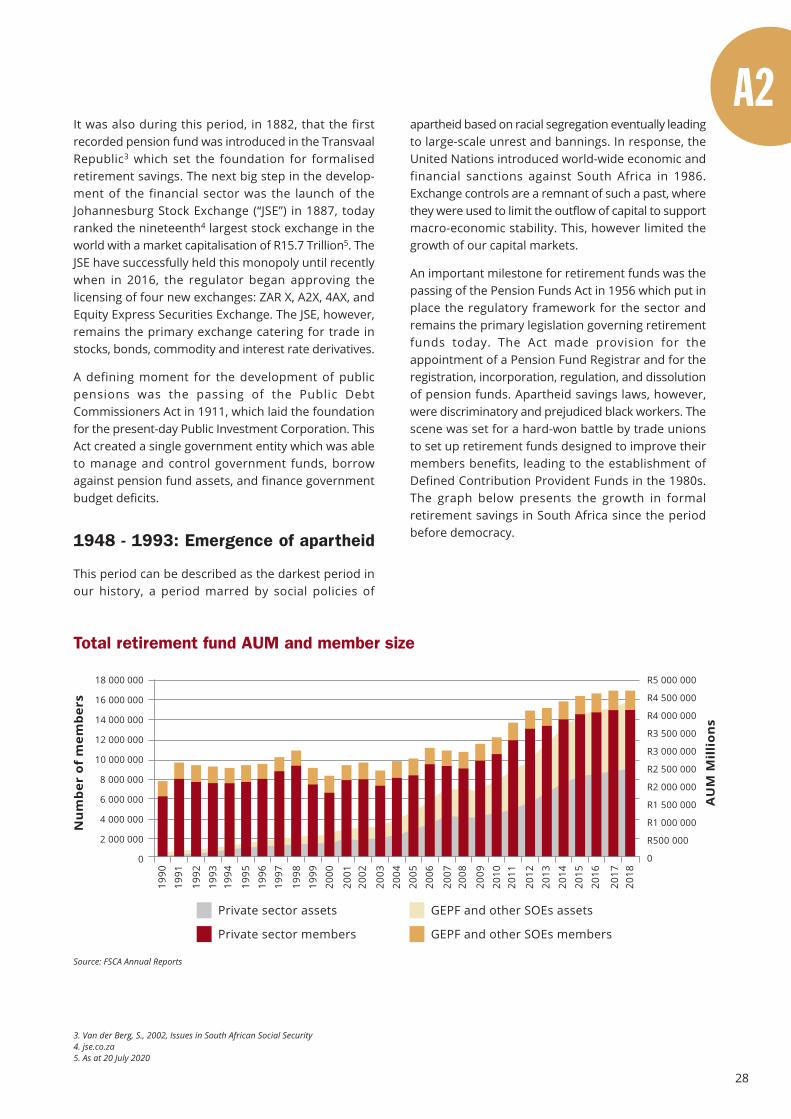
Total retirement fund AUM and member size
apartheid based on racial segregation eventually leadingto large-scale unrest and bannings. In response, theUnited Nations introduced world-wide economic andfinancial sanctions against South Africa in 1986.Exchange controls are a remnant of such a past, wherethey were used to limit the outflow of capital to supportmacro-economic stability. This, however limited thegrowth of our capital markets.
An important milestone for retirement funds was thepassing of the Pension Funds Act in 1956 which put inplace the regulatory framework for the sector andremains the primary legislation governing retirementfunds today. The Act made provision for theappointment of a Pension Fund Registrar and for theregistration, incorporation, regulation, and dissolutionof pension funds. Apartheid savings laws, however,were discriminatory and prejudiced black workers. Thescene was set for a hard-won battle by trade unionsto set up retirement funds designed to improve theirmembers benefits, leading to the establishment ofDefined Contribution Provident Funds in the 1980s.The graph below presents the growth in formalretirement savings in South Africa since the periodbefore democracy.
Source: FSCA Annual Reports
It was also during this period, in 1882, that the firstrecorded pension fund was introduced in the TransvaalRepublic3 which set the foundation for formalisedretirement savings. The next big step in the develop-ment of the financial sector was the launch of theJohannesburg Stock Exchange (“JSE”) in 1887, todayranked the nineteenth4 largest stock exchange in theworld with a market capitalisation of R15.7 Trillion5. TheJSE have successfully held this monopoly until recentlywhen in 2016, the regulator began approving thelicensing of four new exchanges: ZAR X, A2X, 4AX, andEquity Express Securities Exchange. The JSE, however,remains the primary exchange catering for trade instocks, bonds, commodity and interest rate derivatives.
A defining moment for the development of publicpensions was the passing of the Public DebtCommissioners Act in 1911, which laid the foundationfor the present-day Public Investment Corporation. ThisAct created a single government entity which was ableto manage and control government funds, borrowagainst pension fund assets, and finance governmentbudget deficits.
1948 - 1993: Emergence of apartheid
This period can be described as the darkest period inour history, a period marred by social policies of
3. Van der Berg, S., 2002, Issues in South African Social Security4. jse.co.za5. As at 20 July 2020
29
The move to Defined Contribution Funds triggered theentry of independent asset managers to the market.Ninety One (previously Investec Asset Management)and Coronation Fund Managers are examples of suchindependent firms which today are global brands andrank second and third by total assets under managementin South Africa, respectively. The rapid rise of independentasset manager participation was not inclusive. At theend of this period there were no black owned, managed,and controlled asset management companies in SouthAfrica.
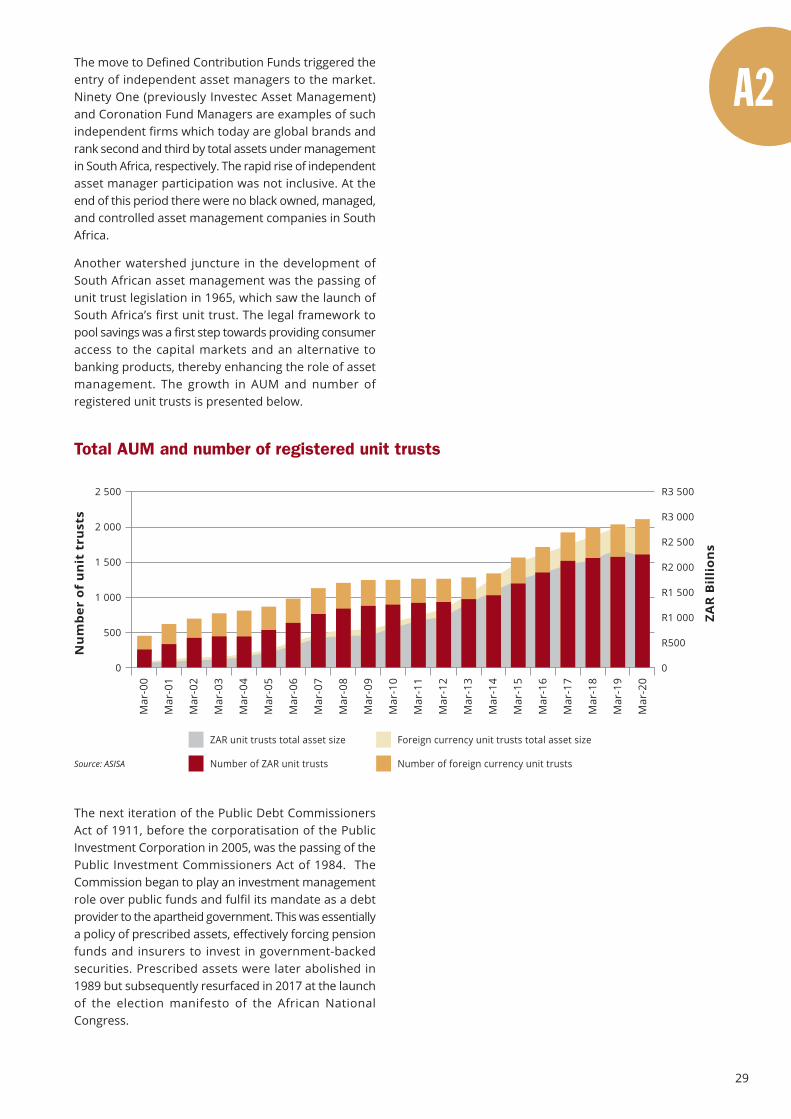
Another watershed juncture in the development ofSouth African asset management was the passing ofunit trust legislation in 1965, which saw the launch ofSouth Africa’s first unit trust. The legal framework topool savings was a first step towards providing consumeraccess to the capital markets and an alternative tobanking products, thereby enhancing the role of assetmanagement. The growth in AUM and number ofregistered unit trusts is presented below.
The next iteration of the Public Debt CommissionersAct of 1911, before the corporatisation of the PublicInvestment Corporation in 2005, was the passing of thePublic Investment Commissioners Act of 1984. TheCommission began to play an investment managementrole over public funds and fulfil its mandate as a debtprovider to the apartheid government. This was essentiallya policy of prescribed assets, effectively forcing pensionfunds and insurers to invest in government-backedsecurities. Prescribed assets were later abolished in1989 but subsequently resurfaced in 2017 at the launchof the election manifesto of the African NationalCongress.
Nu
mb
er o
f u
nit
tru
sts
ZAR
Bil
lio
ns
Total AUM and number of registered unit trusts
2 500
2 000
1 500
1 000
500
0
Mar
-00
Mar
-01
Mar
-02
Mar
-03
Mar
-04
Mar
-05
Mar
-06
Mar
-07
Mar
-08
Mar
-09
Mar
-10
Mar
-11
Mar
-12
Mar
-13
Mar
-14
Mar
-15
Mar
-16
Mar
-17
Mar
-18
Mar
-19
Mar
-20
R3 500
R3 000
R2 500
R2 000
R1 500
R1 000
R500
0
Number of ZAR unit trusts
ZAR unit trusts total asset size
Number of foreign currency unit trusts
Foreign currency unit trusts total asset size
Source: ASISA
30
In 1999 South Africa became a founding member of theG20. This has significance since subsequent regulatoryreforms introduced in the financial sector have beenpremised on G20 principles. Policymakers and regulatorshave often been criticised for being too focused onmeeting international standards without consideringimportant parochial features of the domestic economy.Putting it bluntly, the policies failed to transform thefinancial services industry to broaden the participationof black people in the sector. An example of South Africafulfilling its G20 commitments was when in 2015 hedgefunds which were previously unregulated, becameregulated under the Collective Investment SchemesControl Act (“CISCA”). Under the new legislation hedgefunds were required to be registered under CISCAapproved Hedge Fund Management Companies.However, the licensing approach was not supportive ofnew black entrants, inadvertently entrenching thedominant positioning of incumbents. This has beencorrected in subsequent legislation such as the InsuranceAct and the Draft Conduct of Financial Institutions Bill,where the regulator has adopted a more developmentalapproach and is explicitly supportive of transformationimperatives.
USD
ZAR
R 20
R18
R 16
R 14
R 12
R 10
R 8
R 6
R 4
R 2
R 0
ZAR
Mil
lio
ns
R60 000
R40 000
R20 000
R0
-R20 000
-R40 000
-R60 000
-R80 000
-100 000
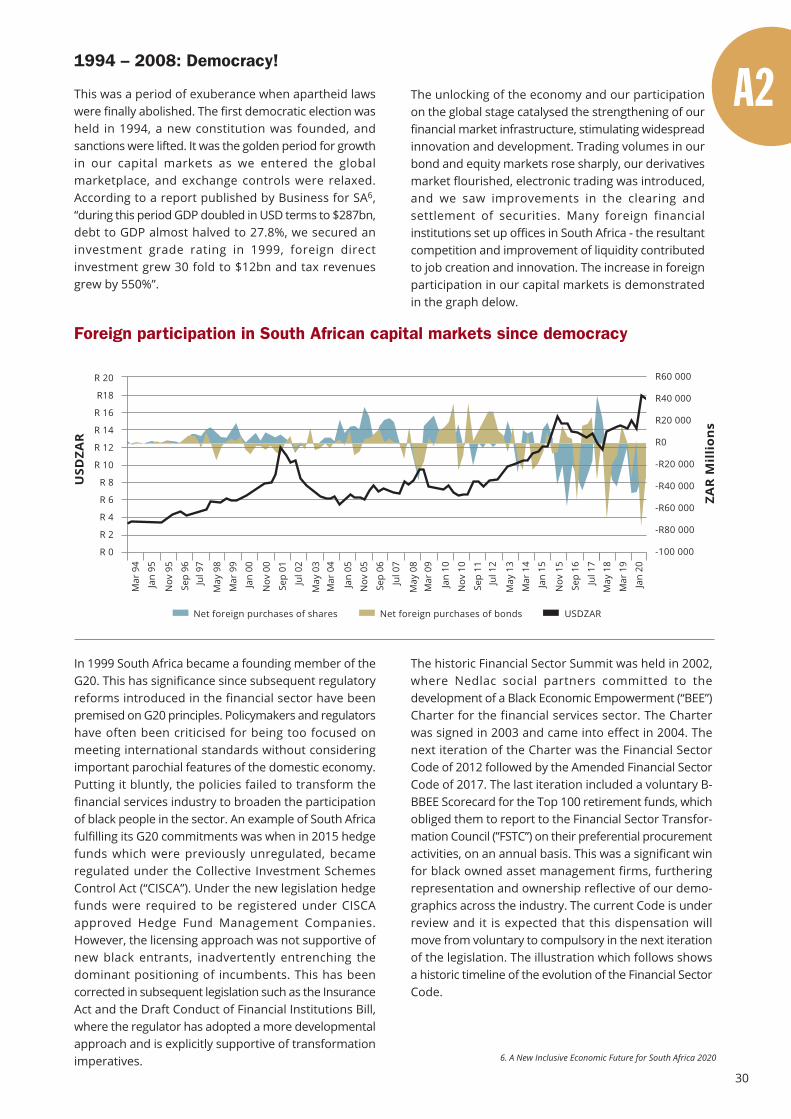
Foreign participation in South African capital markets since democracy
Mar
94
Jan
95
Nov
95
Sep
96Ju
l 97
May
98
Mar
99
Jan
00
Nov
00
Sep
01
Jul 0
2
May
03
Mar
04
Jan
05
Nov
05
Sep
06
Jul 0
7
May
08
Mar
09
Jan
10
Nov
10
Sep
11Ju
l 12
May
13
Mar
14
Jan
15
Nov
15
Sep
16
Jul 1
7
May
18
Mar
19
Jan
20
Net foreign purchases of shares Net foreign purchases of bonds USDZAR
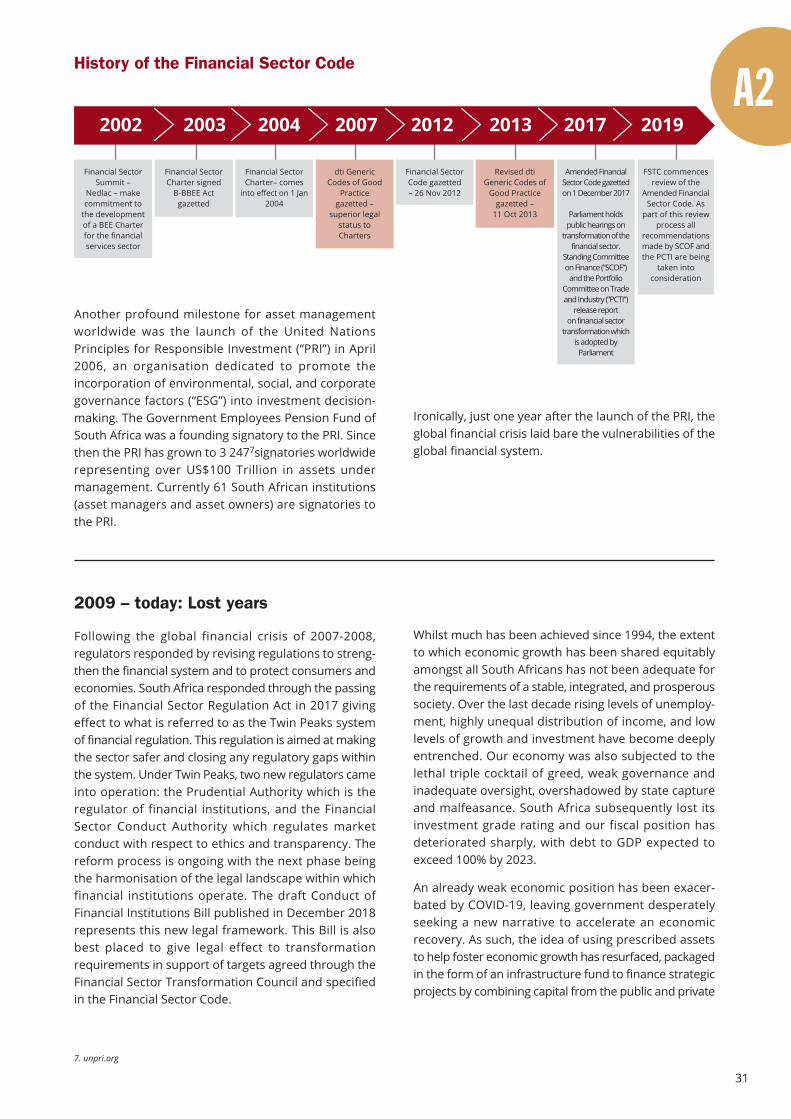
The historic Financial Sector Summit was held in 2002,where Nedlac social partners committed to thedevelopment of a Black Economic Empowerment (“BEE”)Charter for the financial services sector. The Charterwas signed in 2003 and came into effect in 2004. Thenext iteration of the Charter was the Financial SectorCode of 2012 followed by the Amended Financial SectorCode of 2017. The last iteration included a voluntary B-BBEE Scorecard for the Top 100 retirement funds, whichobliged them to report to the Financial Sector Transfor-mation Council (”FSTC”) on their preferential procurementactivities, on an annual basis. This was a significant winfor black owned asset management firms, furtheringrepresentation and ownership reflective of our demo-graphics across the industry. The current Code is underreview and it is expected that this dispensation willmove from voluntary to compulsory in the next iterationof the legislation. The illustration which follows showsa historic timeline of the evolution of the Financial SectorCode.
1994 – 2008: Democracy!
This was a period of exuberance when apartheid lawswere finally abolished. The first democratic election washeld in 1994, a new constitution was founded, andsanctions were lifted. It was the golden period for growthin our capital markets as we entered the globalmarketplace, and exchange controls were relaxed.According to a report published by Business for SA6,“during this period GDP doubled in USD terms to $287bn,debt to GDP almost halved to 27.8%, we secured aninvestment grade rating in 1999, foreign directinvestment grew 30 fold to $12bn and tax revenuesgrew by 550%”.
The unlocking of the economy and our participationon the global stage catalysed the strengthening of ourfinancial market infrastructure, stimulating widespreadinnovation and development. Trading volumes in ourbond and equity markets rose sharply, our derivativesmarket flourished, electronic trading was introduced,and we saw improvements in the clearing andsettlement of securities. Many foreign financialinstitutions set up offices in South Africa - the resultantcompetition and improvement of liquidity contributedto job creation and innovation. The increase in foreignparticipation in our capital markets is demonstratedin the graph delow.
6. A New Inclusive Economic Future for South Africa 2020
31
Another profound milestone for asset managementworldwide was the launch of the United NationsPrinciples for Responsible Investment (“PRI”) in April2006, an organisation dedicated to promote theincorporation of environmental, social, and corporategovernance factors (“ESG”) into investment decision-making. The Government Employees Pension Fund ofSouth Africa was a founding signatory to the PRI. Sincethen the PRI has grown to 3 2477signatories worldwiderepresenting over US$100 Trillion in assets undermanagement. Currently 61 South African institutions(asset managers and asset owners) are signatories tothe PRI.
2009 – today: Lost years
Following the global financial crisis of 2007-2008,regulators responded by revising regulations to streng-then the financial system and to protect consumers andeconomies. South Africa responded through the passingof the Financial Sector Regulation Act in 2017 givingeffect to what is referred to as the Twin Peaks systemof financial regulation. This regulation is aimed at makingthe sector safer and closing any regulatory gaps withinthe system. Under Twin Peaks, two new regulators cameinto operation: the Prudential Authority which is theregulator of financial institutions, and the FinancialSector Conduct Authority which regulates marketconduct with respect to ethics and transparency. Thereform process is ongoing with the next phase beingthe harmonisation of the legal landscape within whichfinancial institutions operate. The draft Conduct ofFinancial Institutions Bill published in December 2018represents this new legal framework. This Bill is alsobest placed to give legal effect to transformationrequirements in support of targets agreed through theFinancial Sector Transformation Council and specifiedin the Financial Sector Code.
History of the Financial Sector Code
2002 2003 2004 2007 2012 2013 2017 2019
Financial SectorSummit –
Nedlac – makecommitment to
the developmentof a BEE Charterfor the financialservices sector
Financial SectorCharter signed
B-BBEE Actgazetted
Financial SectorCharter– comes
into effect on 1 Jan2004
dti GenericCodes of Good
Practicegazetted –
superior legalstatus toCharters
Financial SectorCode gazetted– 26 Nov 2012
Revised dtiGeneric Codes of
Good Practicegazetted –
11 Oct 2013
Amended FinancialSector Code gazettedon 1 December 2017
Parliament holdspublic hearings on
transformation of thefinancial sector.
Standing Committeeon Finance (”SCOF”)
and the PortfolioCommittee on Tradeand Industry (”PCTI”)
release reporton financial sector
transformation whichis adopted byParliament
FSTC commencesreview of the
Amended FinancialSector Code. As
part of this reviewprocess all
recommendationsmade by SCOF andthe PCTI are being
taken intoconsideration
Ironically, just one year after the launch of the PRI, theglobal financial crisis laid bare the vulnerabilities of theglobal financial system.
Whilst much has been achieved since 1994, the extentto which economic growth has been shared equitablyamongst all South Africans has not been adequate forthe requirements of a stable, integrated, and prosperoussociety. Over the last decade rising levels of unemploy-ment, highly unequal distribution of income, and lowlevels of growth and investment have become deeplyentrenched. Our economy was also subjected to thelethal triple cocktail of greed, weak governance andinadequate oversight, overshadowed by state captureand malfeasance. South Africa subsequently lost itsinvestment grade rating and our fiscal position hasdeteriorated sharply, with debt to GDP expected toexceed 100% by 2023.
An already weak economic position has been exacer-bated by COVID-19, leaving government desperatelyseeking a new narrative to accelerate an economicrecovery. As such, the idea of using prescribed assetsto help foster economic growth has resurfaced, packagedin the form of an infrastructure fund to finance strategicprojects by combining capital from the public and private
7. unpri.org
32
The two-century long trajectory described here shedssome light on the way forward for the asset managementsector. The pendulum swing from prescribed to unpre-scribed, and back, reflects the changing social andeconomic dynamic in our country. These are tidal forces,to which the asset management industry must adapt,with transformation being a vital component.
There are a number of developing trends facing thesector - we list our top three which we anticipate willhave the most significant influence:
1 ESG will take centre stage. Both asset owners andpolicymakers will be uncompromising in their effortsto promote a more sustainable financial sector andeconomy. There will be a rise in demand for impactinvestment aligned to meeting UN SustainableDevelopment Goals, a collection of 17 global goalsdesigned to be a “blueprint to achieve a better andmore sustainable future for all”8. We will also see anincrease in public private partnerships and blendedfinance investments.
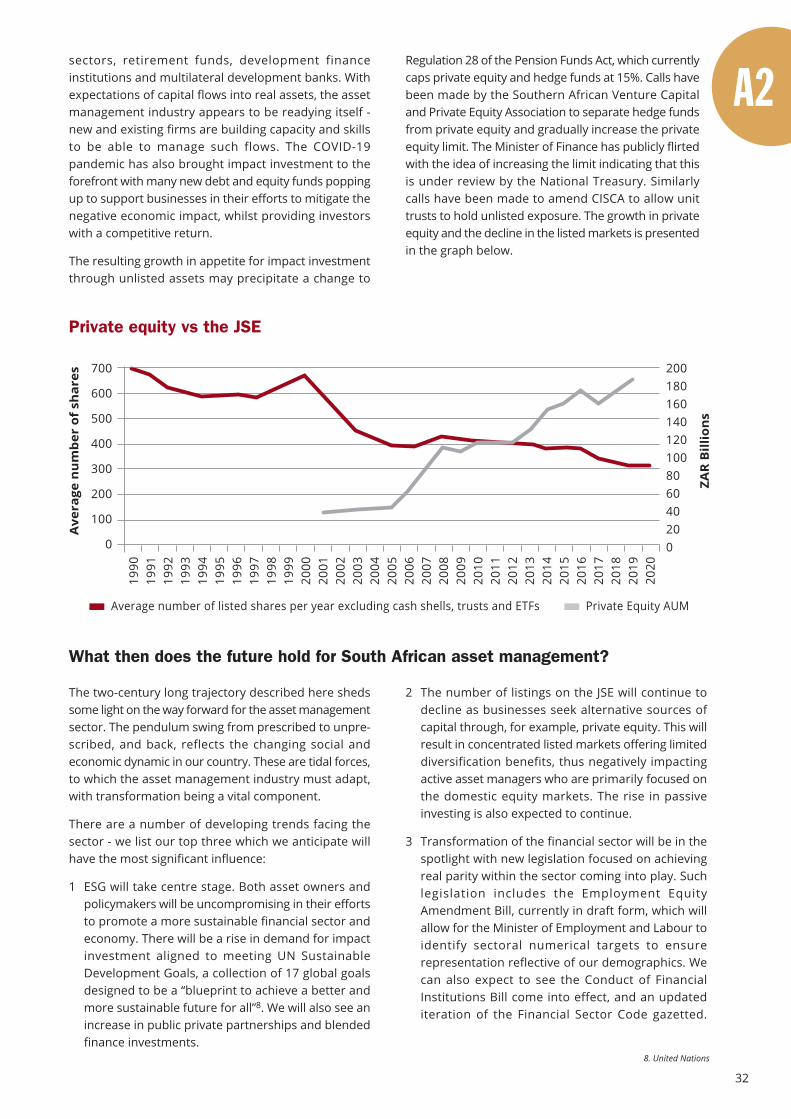
Ave
rage
nu
mbe
r of
sh
ares
Average number of listed shares per year excluding cash shells, trusts and ETFs Private Equity AUM
Private equity vs the JSE
ZAR
Bill
ion
s
700
600
500
400
300
200
100
0
200180160140120100806040200
1990
1991
1992
1993
1994
1995
1996
1997
1998
1999
2000
2001
2002
2003
2004
2005
2006
2007
2008
2009
2010
2011
2012
2013
2014
2015
2016
2017
2018
2019
2020
sectors, retirement funds, development financeinstitutions and multilateral development banks. Withexpectations of capital flows into real assets, the assetmanagement industry appears to be readying itself -new and existing firms are building capacity and skillsto be able to manage such flows. The COVID-19pandemic has also brought impact investment to theforefront with many new debt and equity funds poppingup to support businesses in their efforts to mitigate thenegative economic impact, whilst providing investorswith a competitive return.
The resulting growth in appetite for impact investmentthrough unlisted assets may precipitate a change to
Regulation 28 of the Pension Funds Act, which currentlycaps private equity and hedge funds at 15%. Calls havebeen made by the Southern African Venture Capitaland Private Equity Association to separate hedge fundsfrom private equity and gradually increase the privateequity limit. The Minister of Finance has publicly flirtedwith the idea of increasing the limit indicating that thisis under review by the National Treasury. Similarlycalls have been made to amend CISCA to allow unittrusts to hold unlisted exposure. The growth in privateequity and the decline in the listed markets is presentedin the graph below.
What then does the future hold for South African asset management?
2 The number of listings on the JSE will continue todecline as businesses seek alternative sources ofcapital through, for example, private equity. This willresult in concentrated listed markets offering limiteddiversification benefits, thus negatively impactingactive asset managers who are primarily focused onthe domestic equity markets. The rise in passiveinvesting is also expected to continue.
3 Transformation of the financial sector will be in thespotlight with new legislation focused on achievingreal parity within the sector coming into play. Suchlegislation includes the Employment EquityAmendment Bill, currently in draft form, which willallow for the Minister of Employment and Labour toidentify sectoral numerical targets to ensurerepresentation reflective of our demographics. Wecan also expect to see the Conduct of FinancialInstitutions Bill come into effect, and an updatediteration of the Financial Sector Code gazetted.
8. United Nations
33

34
Life on land
15

35
Publicmarkets
36
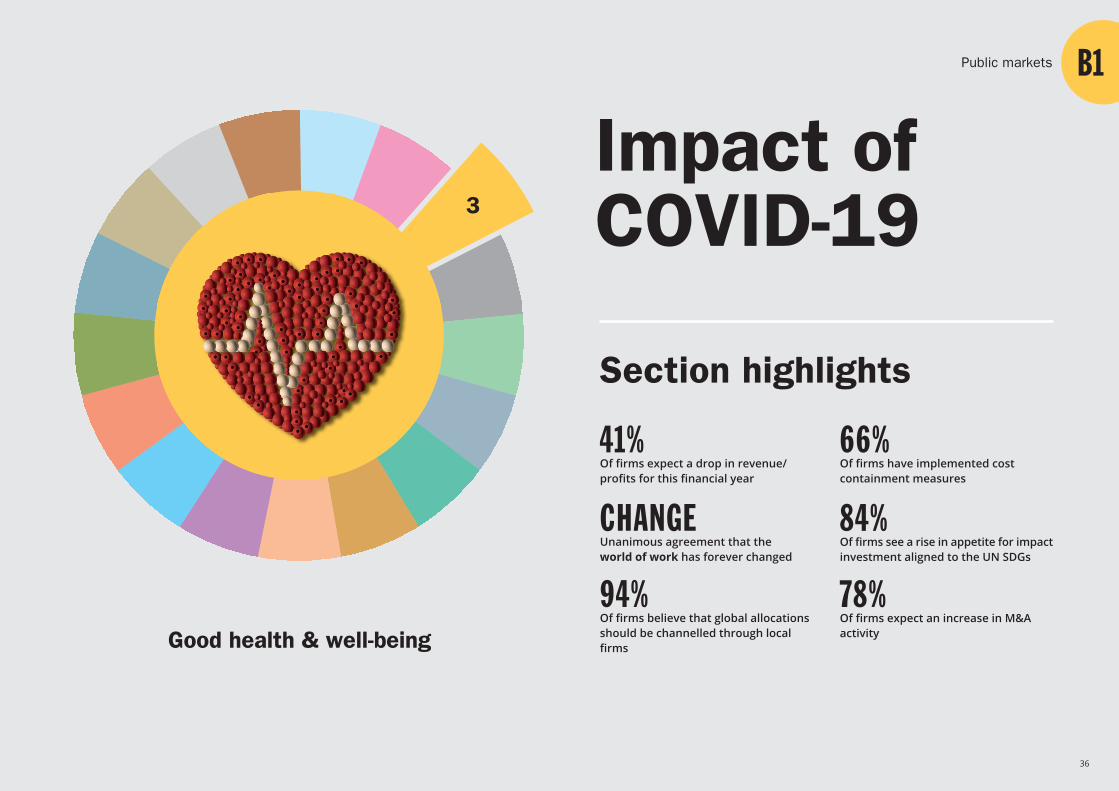
Impact ofCOVID-19
Section highlights
41%Of firms expect a drop in revenue/ profits for this financial year
CHANGEUnanimous agreement that theworld of work has forever changed
84%Of firms see a rise in appetite for impactinvestment aligned to the UN SDGs
94%Of firms believe that global allocations should be channelled through local firms
78%Of firms expect an increase in M&A activity
66%Of firms have implemented cost containment measures
Good health & well-being
Public markets
3
37
In the first week of January with South Africa continuingits sojourn into the New Dawn with a 20/20 vision ofgrowth and possibility, there was little anticipation ofwhat was to be in the coming months. COVID-19 hascome to the fore with dramatic economic and socialimplications - not only in South Africa, but across theglobe. The global pandemic has brought into questionpredicted trajectories for economic growth, employment,profitability, sustainable development and - vital within
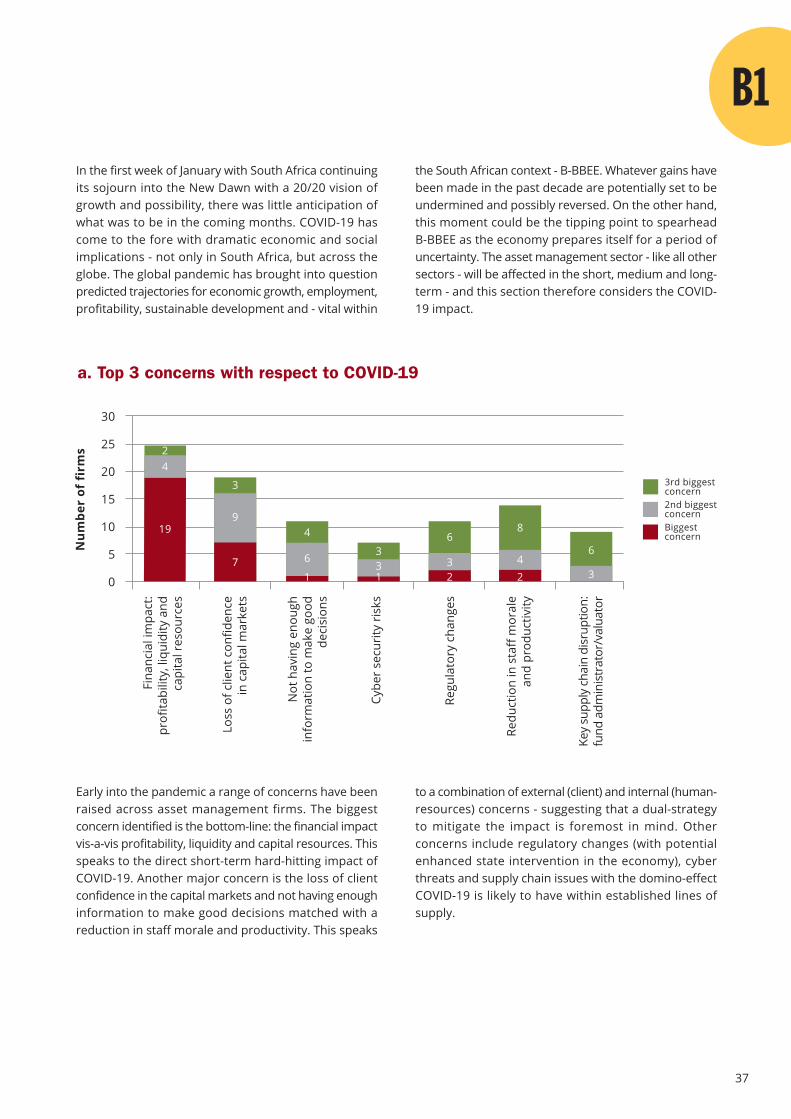
Early into the pandemic a range of concerns have beenraised across asset management firms. The biggestconcern identified is the bottom-line: the financial impactvis-a-vis profitability, liquidity and capital resources. Thisspeaks to the direct short-term hard-hitting impact ofCOVID-19. Another major concern is the loss of clientconfidence in the capital markets and not having enoughinformation to make good decisions matched with areduction in staff morale and productivity. This speaks
the South African context - B-BBEE. Whatever gains havebeen made in the past decade are potentially set to beundermined and possibly reversed. On the other hand,this moment could be the tipping point to spearheadB-BBEE as the economy prepares itself for a period ofuncertainty. The asset management sector - like all othersectors - will be affected in the short, medium and long-term - and this section therefore considers the COVID-19 impact.
to a combination of external (client) and internal (human-resources) concerns - suggesting that a dual-strategyto mitigate the impact is foremost in mind. Otherconcerns include regulatory changes (with potentialenhanced state intervention in the economy), cyberthreats and supply chain issues with the domino-effectCOVID-19 is likely to have within established lines ofsupply.
a. Top 3 concerns with respect to COVID-19
Num
ber
of f
irm
s
30
25
20
15
10
5
0
2nd biggestconcern
3rd biggestconcern
Regu
lato
ry c
hang
es
Fina
ncia
l im
pact
:pr
ofita
bilit
y, li
quid
ity a
ndca
pita
l res
ourc
es
Loss
of c
lient
con
fiden
cein
cap
ital m
arke
ts
Cybe
r se
curi
ty r
isks
Redu
ctio
n in
sta
ff m
oral
ean
d pr
oduc
tivity
Not
hav
ing
enou
ghin
form
atio
n to
mak
e go
odde
cisi
ons
Key
supp
ly c
hain
dis
rupt
ion:
fund
adm
inis
trat
or/v
alua
tor
Biggestconcern
24
19
3
9
7 6
4
1
331 2
6
3
8
42 3
6
38
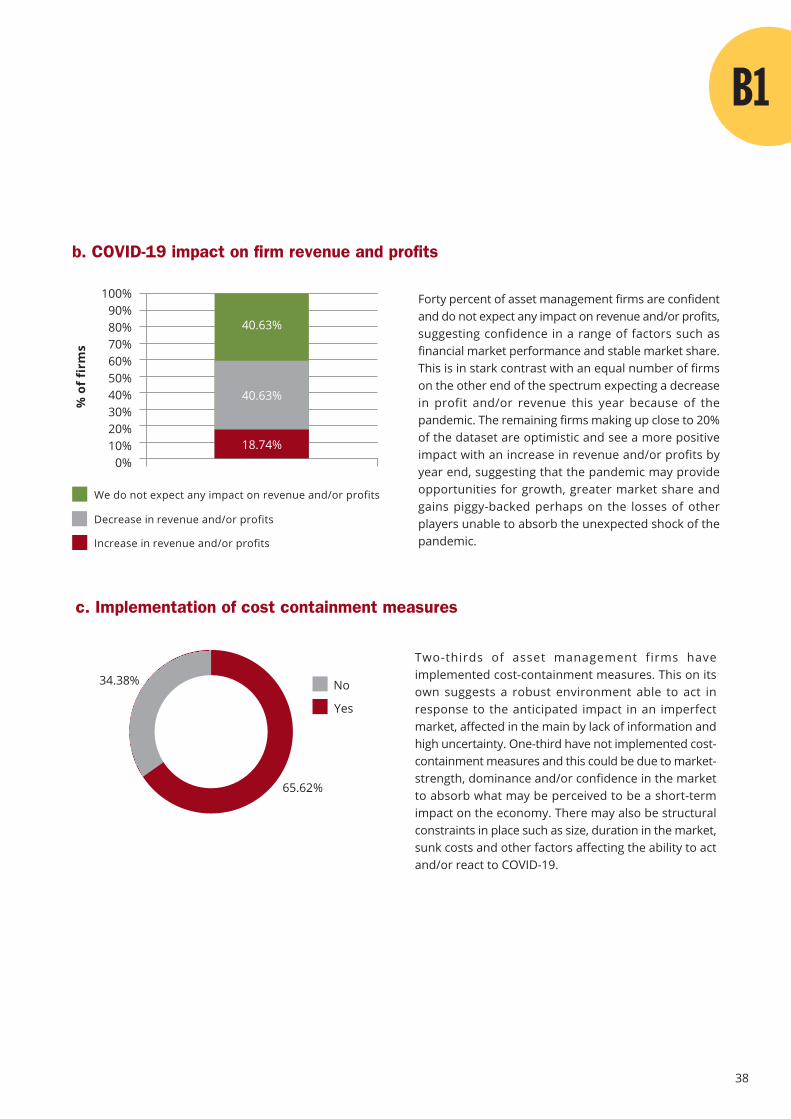
Forty percent of asset management firms are confidentand do not expect any impact on revenue and/or profits,suggesting confidence in a range of factors such asfinancial market performance and stable market share.This is in stark contrast with an equal number of firmson the other end of the spectrum expecting a decreasein profit and/or revenue this year because of thepandemic. The remaining firms making up close to 20%of the dataset are optimistic and see a more positiveimpact with an increase in revenue and/or profits byyear end, suggesting that the pandemic may provideopportunities for growth, greater market share andgains piggy-backed perhaps on the losses of otherplayers unable to absorb the unexpected shock of thepandemic.
Two-thirds of asset management firms haveimplemented cost-containment measures. This on itsown suggests a robust environment able to act inresponse to the anticipated impact in an imperfectmarket, affected in the main by lack of information andhigh uncertainty. One-third have not implemented cost-containment measures and this could be due to market-strength, dominance and/or confidence in the marketto absorb what may be perceived to be a short-termimpact on the economy. There may also be structuralconstraints in place such as size, duration in the market,sunk costs and other factors affecting the ability to actand/or react to COVID-19.
b. COVID-19 impact on firm revenue and profits
100%90%80%70%60%50%40%30%20%10%
0%
We do not expect any impact on revenue and/or profits
Decrease in revenue and/or profits
Increase in revenue and/or profits
40.63%
40.63%
18.74%
34.38%
65.62%
Yes
No
c. Implementation of cost containment measures
% o
f fi
rms
39
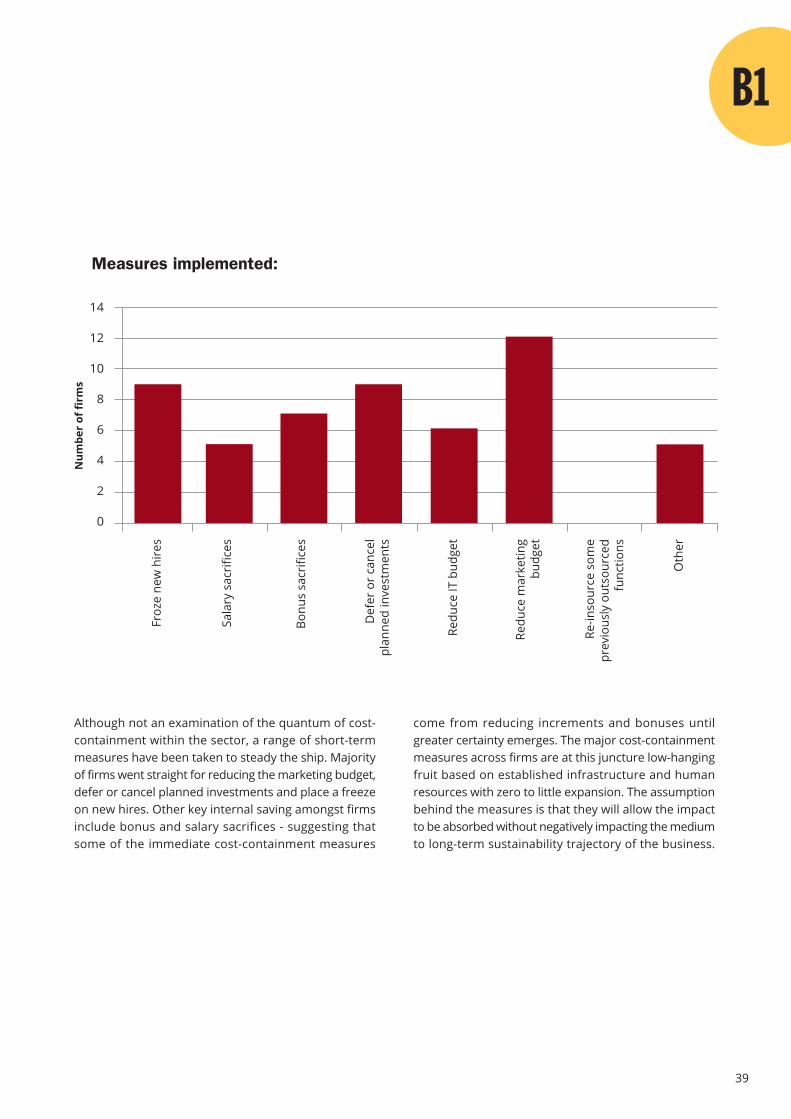
Although not an examination of the quantum of cost-containment within the sector, a range of short-termmeasures have been taken to steady the ship. Majorityof firms went straight for reducing the marketing budget,defer or cancel planned investments and place a freezeon new hires. Other key internal saving amongst firmsinclude bonus and salary sacrifices - suggesting thatsome of the immediate cost-containment measures
come from reducing increments and bonuses untilgreater certainty emerges. The major cost-containmentmeasures across firms are at this juncture low-hangingfruit based on established infrastructure and humanresources with zero to little expansion. The assumptionbehind the measures is that they will allow the impactto be absorbed without negatively impacting the mediumto long-term sustainability trajectory of the business.
Measures implemented:
Num
ber
of fi
rms
Froz
e ne
w h
ires
Sala
ry s
acri
fices
Bonu
s sa
crifi
ces
Def
er o
r ca
ncel
plan
ned
inve
stm
ents
Redu
ce IT
bud
get
Redu
ce m
arke
ting
budg
et
Re-in
sour
ce s
ome
prev
ious
ly o
utso
urce
dfu
nctio
ns
Oth
er
14
12
10
8
6
4
2
0
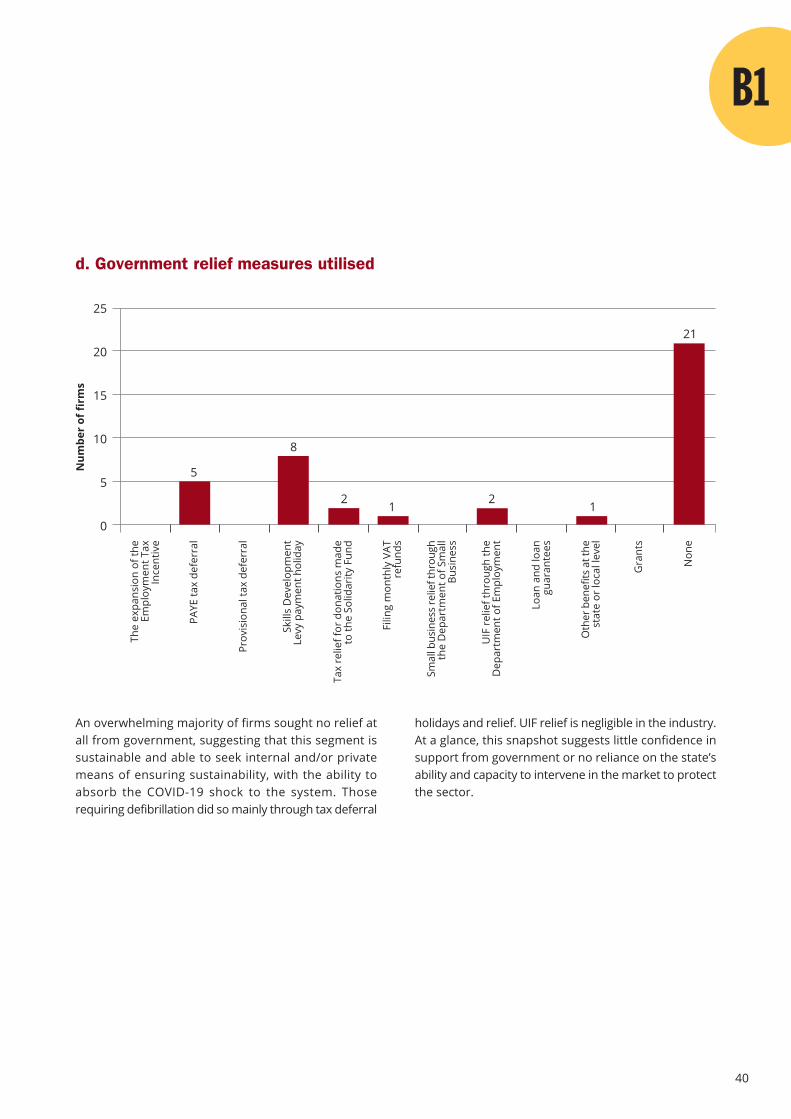
40
An overwhelming majority of firms sought no relief atall from government, suggesting that this segment issustainable and able to seek internal and/or privatemeans of ensuring sustainability, with the ability toabsorb the COVID-19 shock to the system. Thoserequiring defibrillation did so mainly through tax deferral
holidays and relief. UIF relief is negligible in the industry.At a glance, this snapshot suggests little confidence insupport from government or no reliance on the state’sability and capacity to intervene in the market to protectthe sector.
d. Government relief measures utilised
Num
ber
of fi
rms
25
20
15
10
5
0
The
expa
nsio
n of
the
Empl
oym
ent T
axIn
cent
ive
PAYE
tax
defe
rral
Prov
isio
nal t
ax d
efer
ral
Skill
s D
evel
opm
ent
Levy
pay
men
t hol
iday
Tax
relie
f for
don
atio
ns m
ade
to th
e So
lidar
ity F
und
Filin
g m
onth
ly V
ATre
fund
s
Smal
l bus
ines
s re
lief t
hrou
ghth
e D
epar
tmen
t of S
mal
lBu
sine
ss
UIF
rel
ief t
hrou
gh th
eD
epar
tmen
t of E
mpl
oym
ent
Loan
and
loan
guar
ante
es
Oth
er b
enef
its a
t the
stat
e or
loca
l lev
el
Gra
nts
Non
e
112 2
5
8
21
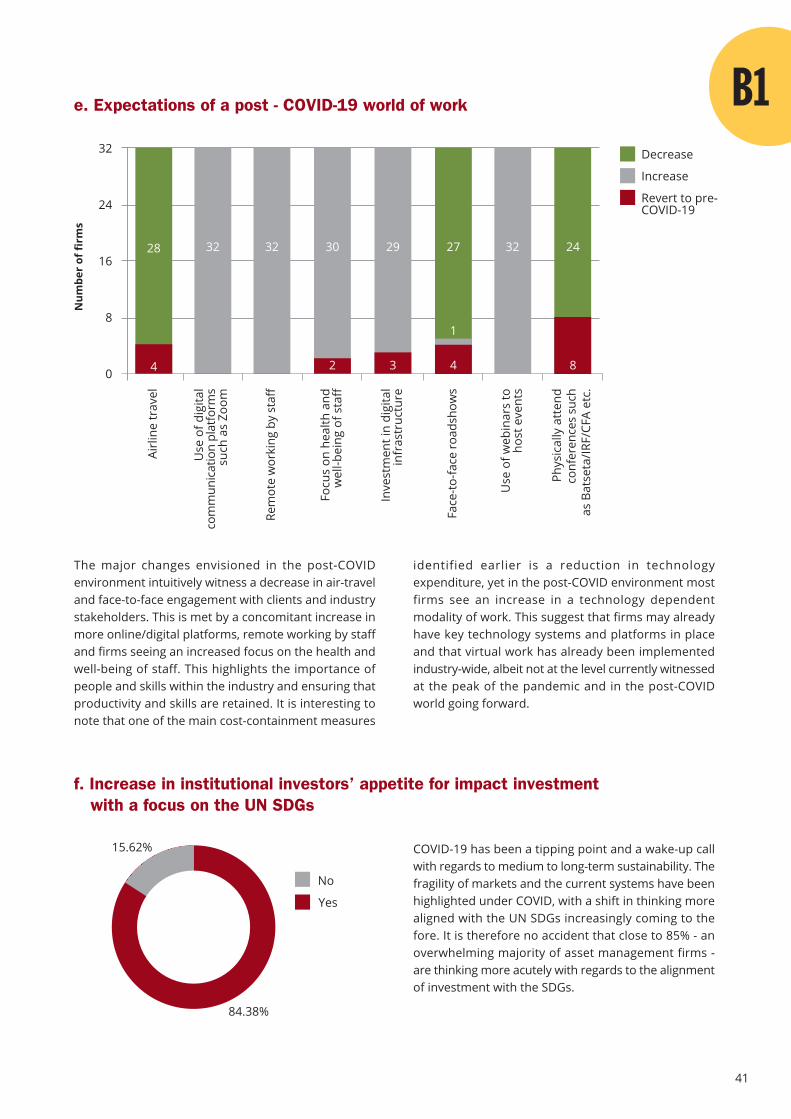
41
The major changes envisioned in the post-COVIDenvironment intuitively witness a decrease in air-traveland face-to-face engagement with clients and industrystakeholders. This is met by a concomitant increase inmore online/digital platforms, remote working by staffand firms seeing an increased focus on the health andwell-being of staff. This highlights the importance ofpeople and skills within the industry and ensuring thatproductivity and skills are retained. It is interesting tonote that one of the main cost-containment measures
COVID-19 has been a tipping point and a wake-up callwith regards to medium to long-term sustainability. Thefragility of markets and the current systems have beenhighlighted under COVID, with a shift in thinking morealigned with the UN SDGs increasingly coming to thefore. It is therefore no accident that close to 85% - anoverwhelming majority of asset management firms -are thinking more acutely with regards to the alignmentof investment with the SDGs.
identified earlier is a reduction in technologyexpenditure, yet in the post-COVID environment mostfirms see an increase in a technology dependentmodality of work. This suggest that firms may alreadyhave key technology systems and platforms in placeand that virtual work has already been implementedindustry-wide, albeit not at the level currently witnessedat the peak of the pandemic and in the post-COVIDworld going forward.
e. Expectations of a post - COVID-19 world of work
Decrease
Increase
Revert to pre-COVID-19
32
24
16
8
0
Num
ber
of fi
rms
4
28 32 32 30 29 32
2 3
1
27 24
4 8
Airl
ine
trav
el
Rem
ote
wor
king
by
staf
f
Use
of d
igita
lco
mm
unic
atio
n pl
atfo
rms
such
as
Zoom
Focu
s on
hea
lth a
ndw
ell-b
eing
of s
taff
Face
-to-fa
ce ro
adsh
ows
Inve
stm
ent i
n di
gita
lin
fras
truc
ture
Phys
ical
ly a
tten
d
c
onfe
renc
es s
uch
as B
atse
ta/IR
F/CF
A et
c.
Use
of w
ebin
ars
toho
st e
vent
s
84.38%
15.62%
Yes
No
f. Increase in institutional investors’ appetite for impact investmentwith a focus on the UN SDGs
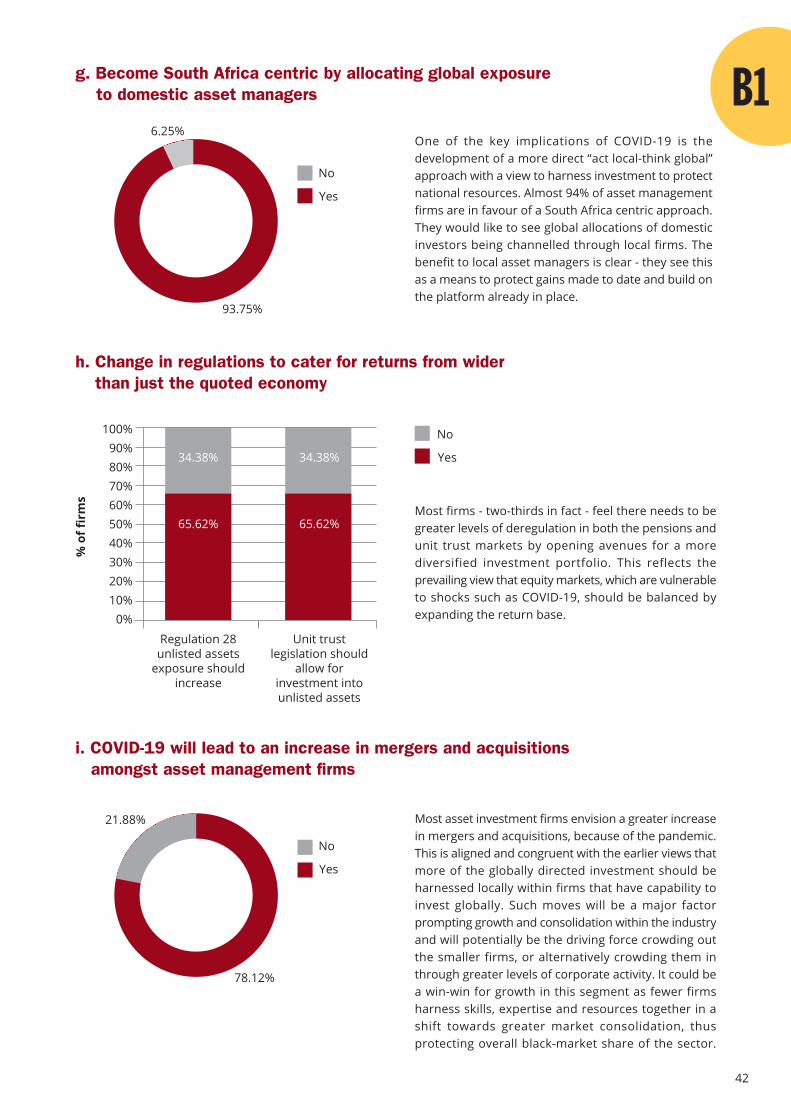
42
One of the key implications of COVID-19 is thedevelopment of a more direct “act local-think global”approach with a view to harness investment to protectnational resources. Almost 94% of asset managementfirms are in favour of a South Africa centric approach.They would like to see global allocations of domesticinvestors being channelled through local firms. Thebenefit to local asset managers is clear - they see thisas a means to protect gains made to date and build onthe platform already in place.
Most firms - two-thirds in fact - feel there needs to begreater levels of deregulation in both the pensions andunit trust markets by opening avenues for a morediversified investment portfolio. This reflects theprevailing view that equity markets, which are vulnerableto shocks such as COVID-19, should be balanced byexpanding the return base.
Most asset investment firms envision a greater increasein mergers and acquisitions, because of the pandemic.This is aligned and congruent with the earlier views thatmore of the globally directed investment should beharnessed locally within firms that have capability toinvest globally. Such moves will be a major factorprompting growth and consolidation within the industryand will potentially be the driving force crowding outthe smaller firms, or alternatively crowding them inthrough greater levels of corporate activity. It could bea win-win for growth in this segment as fewer firmsharness skills, expertise and resources together in ashift towards greater market consolidation, thusprotecting overall black-market share of the sector.
93.75%
6.25%
Yes
No
g. Become South Africa centric by allocating global exposureto domestic asset managers
h. Change in regulations to cater for returns from widerthan just the quoted economy
% o
f fir
ms
100%90%80%70%60%50%40%30%20%10%
0%
Unit trustlegislation should
allow forinvestment intounlisted assets
Regulation 28unlisted assets
exposure shouldincrease
34.38% Yes
No
34.38%
65.62% 65.62%
78.12%
21.88%
Yes
No
i. COVID-19 will lead to an increase in mergers and acquisitionsamongst asset management firms
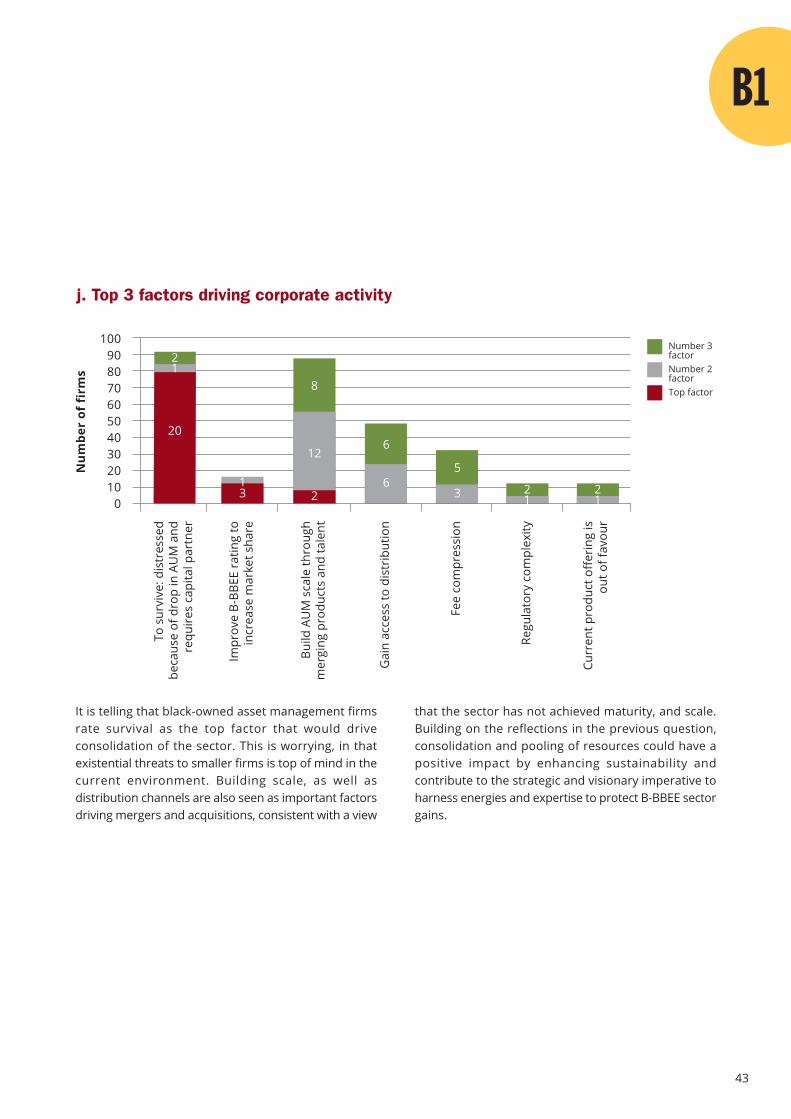
43
It is telling that black-owned asset management firmsrate survival as the top factor that would driveconsolidation of the sector. This is worrying, in thatexistential threats to smaller firms is top of mind in thecurrent environment. Building scale, as well asdistribution channels are also seen as important factorsdriving mergers and acquisitions, consistent with a view
that the sector has not achieved maturity, and scale.Building on the reflections in the previous question,consolidation and pooling of resources could have apositive impact by enhancing sustainability andcontribute to the strategic and visionary imperative toharness energies and expertise to protect B-BBEE sectorgains.
j. Top 3 factors driving corporate activity
Num
ber
of f
irm
s
100908070605040302010
0
Fee
com
pres
sion
To s
urvi
ve: d
istr
esse
dbe
caus
e of
dro
p in
AU
M a
ndre
quir
es c
apita
l par
tner
Impr
ove
B-BB
EE r
atin
g to
incr
ease
mar
ket s
hare
Gai
n ac
cess
to d
istr
ibut
ion
Regu
lato
ry c
ompl
exity
Build
AU
M s
cale
thro
ugh
mer
ging
pro
duct
s an
d ta
lent
Curr
ent p
rodu
ct o
ffer
ing
isou
t of f
avou
r
Number 3factorNumber 2factorTop factor
21
20
13
8
12
2
6
65
3 21
21

44
There is still a rainbow at both ends of the COVID-19storm. Most asset management firms do not see anymajor negative impact on their B-BBEE ratings. The mainones to keep an eye out on are skills development, andthe impact on the socio-economic environment. ESD
The thrust of the environmental snapshot analysis isthat most asset managers surveyed are frustrated byeconomic policy uncertainty, slow economic growth,high government debt, and financial marketperformance and volatility. Firms are divided on thethreat of competition a limited market brings andwhether they can withstand the de-risking of portfolios
by retirement funds. Also, the risks associated withchanging investor demand and behaviour is seen assignificant. The regulatory environment and politicalinterference also emerge as a concern for manycompanies. Encouragingly, most respondents feel thattheir investment performance signatures are resilient,or can be adapted, to the post COVID-19 environment.
and procurement scores are also a concern. The resultsindicate that black-owned managers are confident intheir ability to maintain control of their businesses butconcerned about how external factors will influencetheir B-BBEE rating.
k. Largest business risk factors in a post-COVID-19 environmentN
umbe
rof f
irm
s
32
24
16
8
0
Medium
High
Low
Cann
ibal
ism
bet
wee
n as
set
man
ager
s fo
r a
pool
of
capi
tal t
hat i
s no
t gro
win
g
Low
eco
nom
ic g
row
than
d go
vern
men
tin
debt
edne
ss
Subd
ued
perf
orm
ance
from
cap
ital m
arke
ts
Econ
omic
pol
icy
unce
rtai
nty
Ove
rly
com
plex
and
cos
tlyre
gula
tory
env
iron
men
t
Exce
ssiv
e m
arke
tvo
latil
ity
Polit
ical
inte
rfer
ence
Mem
bers
of r
etir
emen
tfu
nds
de-r
iski
ng
Inve
stm
ent s
tyle
is o
ut o
ffa
vour
with
the
curr
ent
mar
ket c
ycle
Chan
ging
inve
stor
dem
and
and
beha
viou
r
19
4
9
17
14
1
10
15
7
21
10
19
11
12
8
16
8 9
13
10
5
4
23
17
7
8
4
22
6
l. B-BBEE elements most likely to be negatively impacted because of COVID-19
Num
bero
f fi
rms
35
30
25
20
15
10
5
0
2
3
1 (leastnegatively)
Soci
o-Ec
onom
icD
evel
opm
ent a
ndCo
nsum
er E
duca
tion
Ow
ners
hip
Man
agem
ent
Cont
rol
Proc
urem
ent
and
ESD
Skill
s D
evel
opm
ent
4
5 (mostnegatively)

45

46
Affordable & clean energy
7
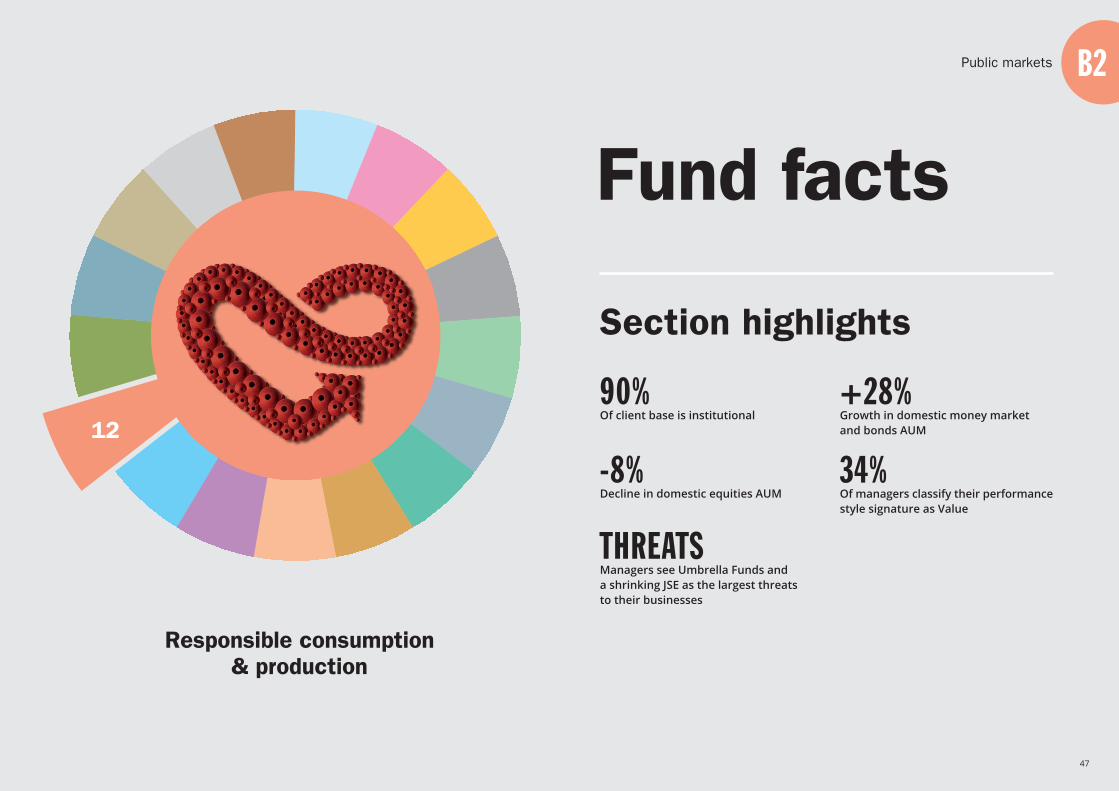
Responsible consumption& production
Section highlights
Fund facts
90%Of client base is institutional
-8%Decline in domestic equities AUM
34%Of managers classify their performancestyle signature as Value
THREATSManagers see Umbrella Funds anda shrinking JSE as the largest threatsto their businesses
+28%Growth in domestic money marketand bonds AUM
47
Public markets
12
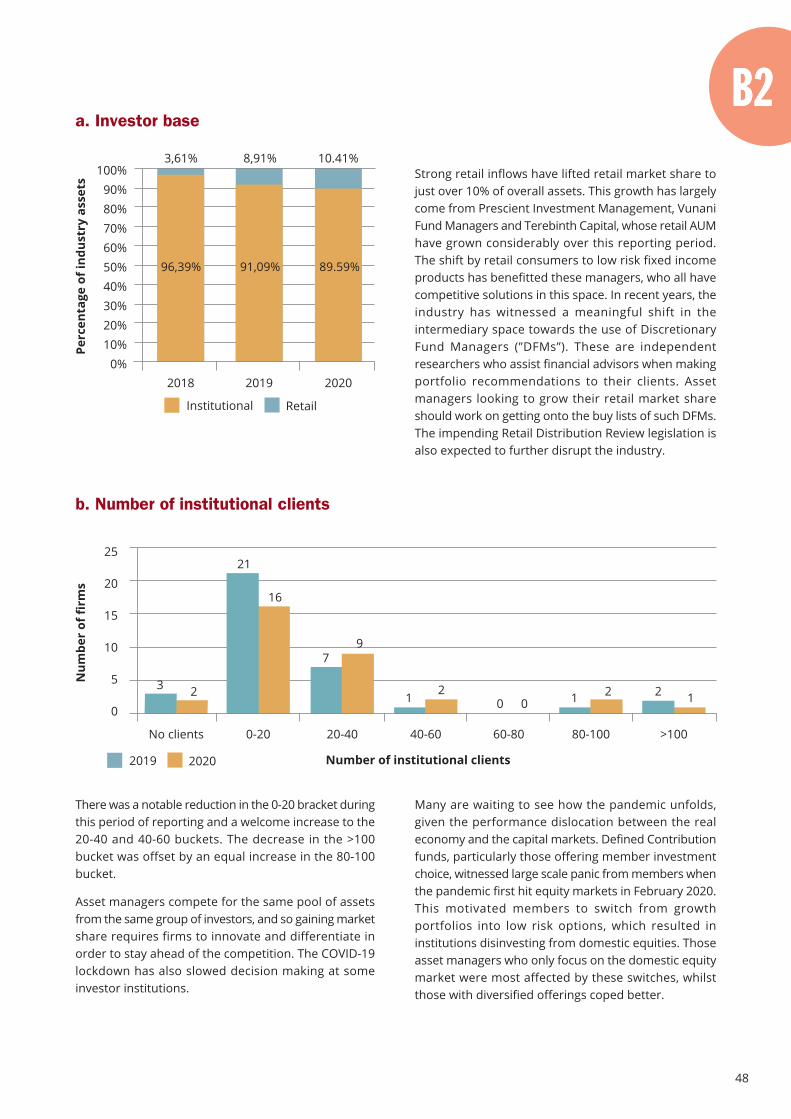
48
Strong retail inflows have lifted retail market share tojust over 10% of overall assets. This growth has largelycome from Prescient Investment Management, VunaniFund Managers and Terebinth Capital, whose retail AUMhave grown considerably over this reporting period.The shift by retail consumers to low risk fixed incomeproducts has benefitted these managers, who all havecompetitive solutions in this space. In recent years, theindustry has witnessed a meaningful shift in theintermediary space towards the use of DiscretionaryFund Managers (”DFMs”). These are independentresearchers who assist financial advisors when makingportfolio recommendations to their clients. Assetmanagers looking to grow their retail market shareshould work on getting onto the buy lists of such DFMs.The impending Retail Distribution Review legislation isalso expected to further disrupt the industry.
There was a notable reduction in the 0-20 bracket duringthis period of reporting and a welcome increase to the20-40 and 40-60 buckets. The decrease in the >100bucket was offset by an equal increase in the 80-100bucket.
Asset managers compete for the same pool of assetsfrom the same group of investors, and so gaining marketshare requires firms to innovate and differentiate inorder to stay ahead of the competition. The COVID-19lockdown has also slowed decision making at someinvestor institutions.
Many are waiting to see how the pandemic unfolds,given the performance dislocation between the realeconomy and the capital markets. Defined Contributionfunds, particularly those offering member investmentchoice, witnessed large scale panic from members whenthe pandemic first hit equity markets in February 2020.This motivated members to switch from growthportfolios into low risk options, which resulted ininstitutions disinvesting from domestic equities. Thoseasset managers who only focus on the domestic equitymarket were most affected by these switches, whilstthose with diversified offerings coped better.
a. Investor base
Perc
enta
ge o
f ind
ustr
y as
sets
100%90%80%70%60%50%40%30%20%10%
0%
RetailInstitutional
20192018 2020
91,09%96,39%
3,61% 8,91%
89.59%
10.41%
b. Number of institutional clients
Num
ber
of fi
rms
25
20
15
10
5
0
Number of institutional clients
60-80No clients 0-20 40-60 80-10020-40
3
21
1 0 1
7
>100
22
16
9
20 12
20202019
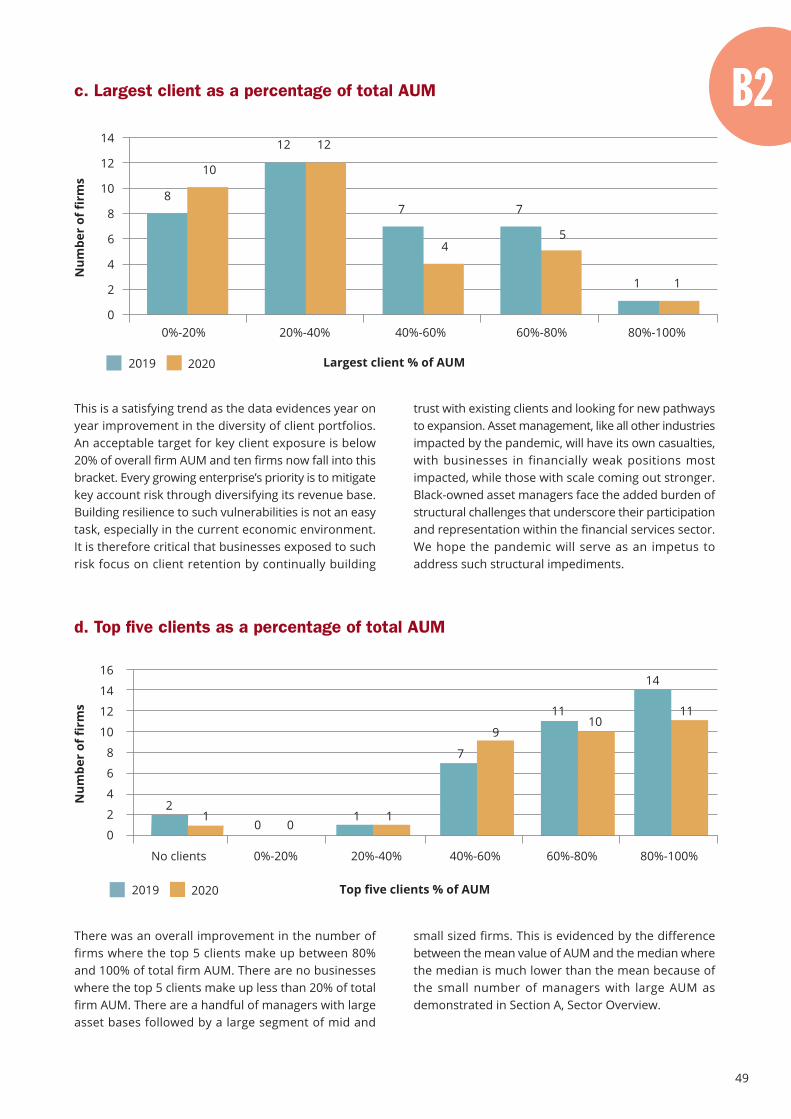
49
This is a satisfying trend as the data evidences year onyear improvement in the diversity of client portfolios.An acceptable target for key client exposure is below20% of overall firm AUM and ten firms now fall into thisbracket. Every growing enterprise’s priority is to mitigatekey account risk through diversifying its revenue base.Building resilience to such vulnerabilities is not an easytask, especially in the current economic environment.It is therefore critical that businesses exposed to suchrisk focus on client retention by continually building
There was an overall improvement in the number offirms where the top 5 clients make up between 80%and 100% of total firm AUM. There are no businesseswhere the top 5 clients make up less than 20% of totalfirm AUM. There are a handful of managers with largeasset bases followed by a large segment of mid and
trust with existing clients and looking for new pathwaysto expansion. Asset management, like all other industriesimpacted by the pandemic, will have its own casualties,with businesses in financially weak positions mostimpacted, while those with scale coming out stronger.Black-owned asset managers face the added burden ofstructural challenges that underscore their participationand representation within the financial services sector.We hope the pandemic will serve as an impetus toaddress such structural impediments.
small sized firms. This is evidenced by the differencebetween the mean value of AUM and the median wherethe median is much lower than the mean because ofthe small number of managers with large AUM asdemonstrated in Section A, Sector Overview.
c. Largest client as a percentage of total AUMN
umbe
r of
firm
s
14
12
10
8
6
4
2
00%-20% 20%-40% 40%-60% 60%-80% 80%-100%
Largest client % of AUM
8
12
7 7
1
12
1
10
45
d. Top five clients as a percentage of total AUM
Num
ber
of fi
rms
60%-80%
16
14
12
10
8
6
4
2
0
No clients 0%-20% 40%-60% 80%-100%20%-40%
Top five clients % of AUM
11
20
7
14
110
1
910
11
20202019
20202019
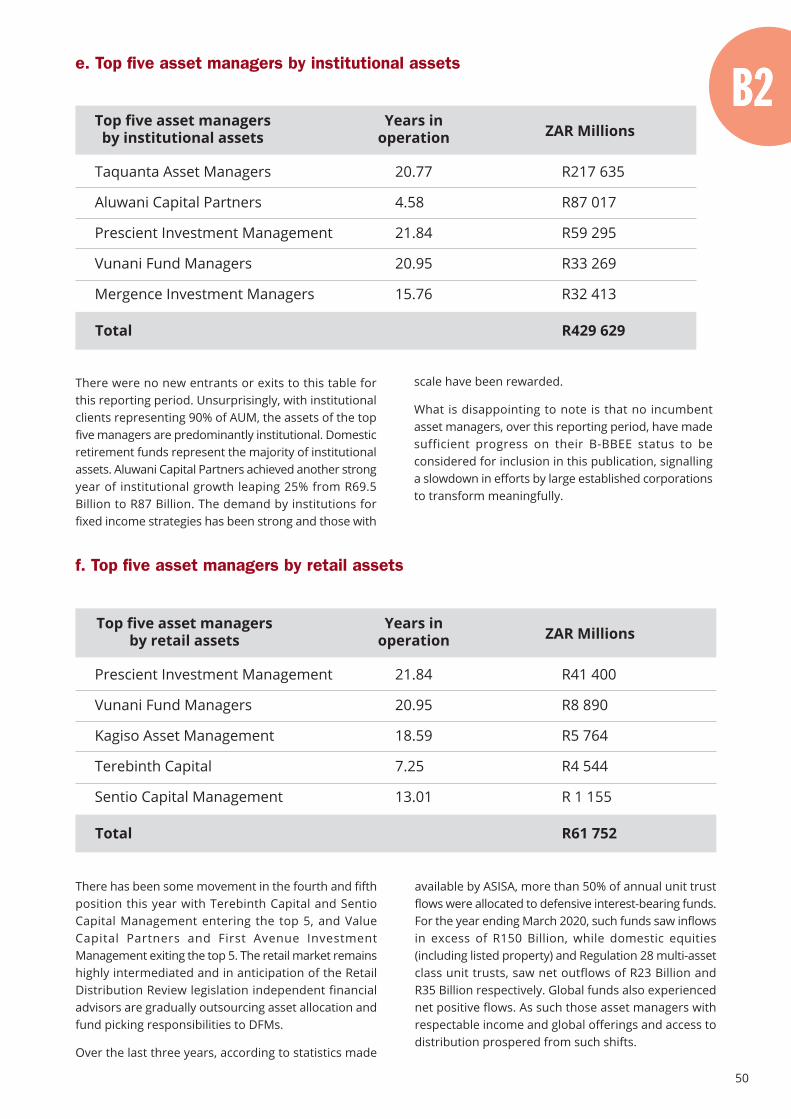
50
There were no new entrants or exits to this table forthis reporting period. Unsurprisingly, with institutionalclients representing 90% of AUM, the assets of the topfive managers are predominantly institutional. Domesticretirement funds represent the majority of institutionalassets. Aluwani Capital Partners achieved another strongyear of institutional growth leaping 25% from R69.5Billion to R87 Billion. The demand by institutions forfixed income strategies has been strong and those with
There has been some movement in the fourth and fifthposition this year with Terebinth Capital and SentioCapital Management entering the top 5, and ValueCapital Partners and First Avenue InvestmentManagement exiting the top 5. The retail market remainshighly intermediated and in anticipation of the RetailDistribution Review legislation independent financialadvisors are gradually outsourcing asset allocation andfund picking responsibilities to DFMs.
Over the last three years, according to statistics made
scale have been rewarded.
What is disappointing to note is that no incumbentasset managers, over this reporting period, have madesufficient progress on their B-BBEE status to beconsidered for inclusion in this publication, signallinga slowdown in efforts by large established corporationsto transform meaningfully.
available by ASISA, more than 50% of annual unit trustflows were allocated to defensive interest-bearing funds.For the year ending March 2020, such funds saw inflowsin excess of R150 Billion, while domestic equities(including listed property) and Regulation 28 multi-assetclass unit trusts, saw net outflows of R23 Billion andR35 Billion respectively. Global funds also experiencednet positive flows. As such those asset managers withrespectable income and global offerings and access todistribution prospered from such shifts.
e. Top five asset managers by institutional assets
Taquanta Asset Managers
Aluwani Capital Partners
Prescient Investment Management
Vunani Fund Managers
Mergence Investment Managers
Top five asset managersby institutional assets
Years inoperation ZAR Millions
20.77
4.58
21.84
20.95
15.76
R217 635
R87 017
R59 295
R33 269
R32 413
Total R429 629
f. Top five asset managers by retail assets
Prescient Investment Management
Vunani Fund Managers
Kagiso Asset Management
Terebinth Capital
Sentio Capital Management
Top five asset managersby retail assets
Years inoperation ZAR Millions
21.84
20.95
18.59
7.25
13.01
R41 400
R8 890
R5 764
R4 544
R 1 155
Total R61 752
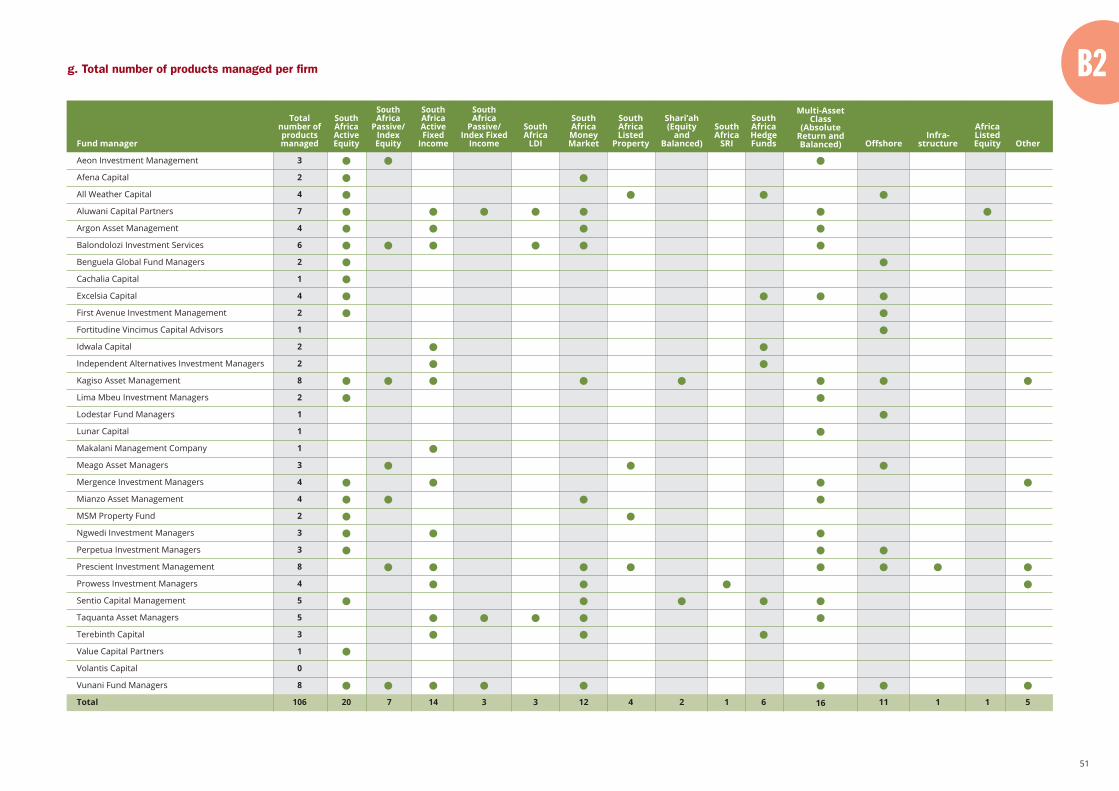
51
SouthAfricaActiveEquity
20
SouthAfrica
Passive/IndexEquity
7
SouthAfricaActiveFixed
Income
14
SouthAfrica
Passive/Index Fixed
Income
3
SouthAfrica
LDI
3
SouthAfricaListed
Property
4
Shari’ah(Equity
andBalanced)
2
SouthAfrica
SRI
1
SouthAfricaHedgeFunds
6
Multi-AssetClass
(AbsoluteReturn andBalanced)
16
Infra-structure
1
AfricaListedEquity
1
Other
5
Totalnumber ofproductsmanaged
3
2
4
7
4
6
2
1
4
2
1
2
2
8
2
1
1
1
3
4
4
2
3
3
8
4
5
5
3
1
0
8
106
Fund manager
Aeon Investment Management
Afena Capital
All Weather Capital
Aluwani Capital Partners
Argon Asset Management
Balondolozi Investment Services
Benguela Global Fund Managers
Cachalia Capital
Excelsia Capital
First Avenue Investment Management
Fortitudine Vincimus Capital Advisors
Idwala Capital
Independent Alternatives Investment Managers
Kagiso Asset Management
Lima Mbeu Investment Managers
Lodestar Fund Managers
Lunar Capital
Makalani Management Company
Meago Asset Managers
Mergence Investment Managers
Mianzo Asset Management
MSM Property Fund
Ngwedi Investment Managers
Perpetua Investment Managers
Prescient Investment Management
Prowess Investment Managers
Sentio Capital Management
Taquanta Asset Managers
Terebinth Capital
Value Capital Partners
Volantis Capital
Vunani Fund Managers
Total
g. Total number of products managed per firm
Offshore
11
SouthAfricaMoneyMarket
12
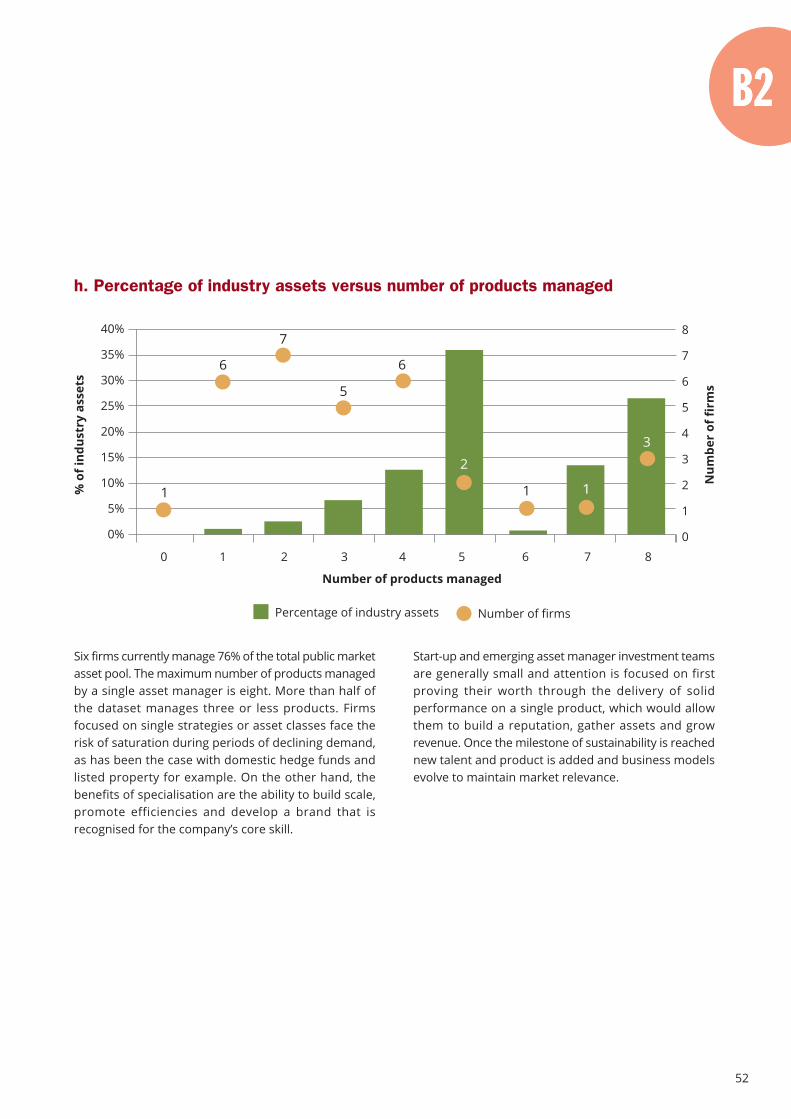
52
Six firms currently manage 76% of the total public marketasset pool. The maximum number of products managedby a single asset manager is eight. More than half ofthe dataset manages three or less products. Firmsfocused on single strategies or asset classes face therisk of saturation during periods of declining demand,as has been the case with domestic hedge funds andlisted property for example. On the other hand, thebenefits of specialisation are the ability to build scale,promote efficiencies and develop a brand that isrecognised for the company’s core skill.
Start-up and emerging asset manager investment teamsare generally small and attention is focused on firstproving their worth through the delivery of solidperformance on a single product, which would allowthem to build a reputation, gather assets and growrevenue. Once the milestone of sustainability is reachednew talent and product is added and business modelsevolve to maintain market relevance.
h. Percentage of industry assets versus number of products managed
% o
f ind
ustr
y as
sets
40%
35%
30%
25%
20%
15%
10%
5%
0%
Num
ber
of fi
rms
8
7
6
5
4
3
2
1
0
Number of firmsPercentage of industry assets
0 1 2 3 4 5 6 7 8
Number of products managed
11
6
7
5
6
2
1 1
3
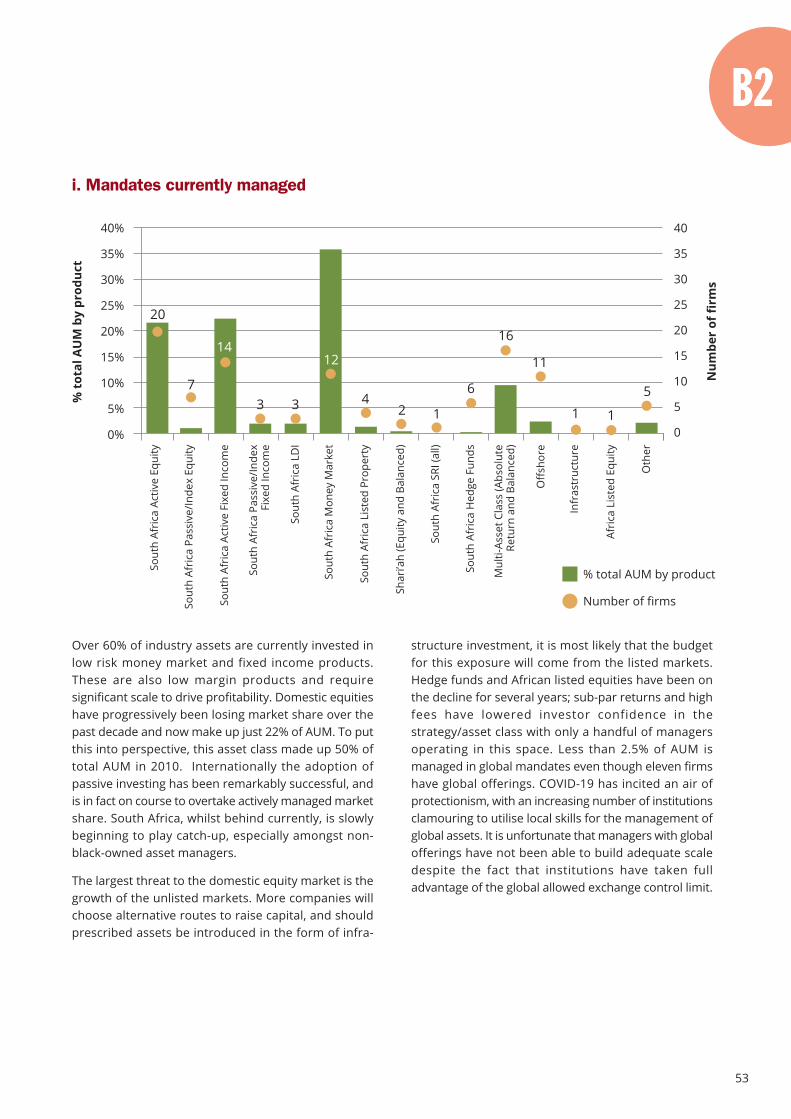
53
Over 60% of industry assets are currently invested inlow risk money market and fixed income products.These are also low margin products and requiresignificant scale to drive profitability. Domestic equitieshave progressively been losing market share over thepast decade and now make up just 22% of AUM. To putthis into perspective, this asset class made up 50% oftotal AUM in 2010. Internationally the adoption ofpassive investing has been remarkably successful, andis in fact on course to overtake actively managed marketshare. South Africa, whilst behind currently, is slowlybeginning to play catch-up, especially amongst non-black-owned asset managers.
The largest threat to the domestic equity market is thegrowth of the unlisted markets. More companies willchoose alternative routes to raise capital, and shouldprescribed assets be introduced in the form of infra-
structure investment, it is most likely that the budgetfor this exposure will come from the listed markets.Hedge funds and African listed equities have been onthe decline for several years; sub-par returns and highfees have lowered investor confidence in thestrategy/asset class with only a handful of managersoperating in this space. Less than 2.5% of AUM ismanaged in global mandates even though eleven firmshave global offerings. COVID-19 has incited an air ofprotectionism, with an increasing number of institutionsclamouring to utilise local skills for the management ofglobal assets. It is unfortunate that managers with globalofferings have not been able to build adequate scaledespite the fact that institutions have taken fulladvantage of the global allowed exchange control limit.
i. Mandates currently managed
% t
otal
AU
M b
y pr
oduc
t
40%
35%
30%
25%
20%
15%
10%
5%
0%
Num
ber
of fi
rms
40
35
30
25
20
15
10
5
0
Number of firms
% total AUM by productSout
h Af
rica
Act
ive
Equi
ty
Sout
h Af
rica
Pas
sive
/Inde
x Eq
uity
Sout
h Af
rica
Act
ive
Fixe
d In
com
e
Sout
h Af
rica
Pas
sive
/Inde
xFi
xed
Inco
me
Sout
h Af
rica
LD
I
Sout
h Af
rica
Mon
ey M
arke
t
Sout
h Af
rica
Lis
ted
Prop
erty
Shar
i’ah
(Equ
ity a
nd B
alan
ced)
Sout
h Af
rica
SRI
(all)
Sout
h Af
rica
Hed
ge F
unds
Mul
ti-As
set C
lass
(Abs
olut
eRe
turn
and
Bal
ance
d)
Off
shor
e
Infr
astr
uctu
re
Afri
ca L
iste
d Eq
uity
Oth
er
24
7
14
3 3
12
42 1
6
16
11
1 1
5
20
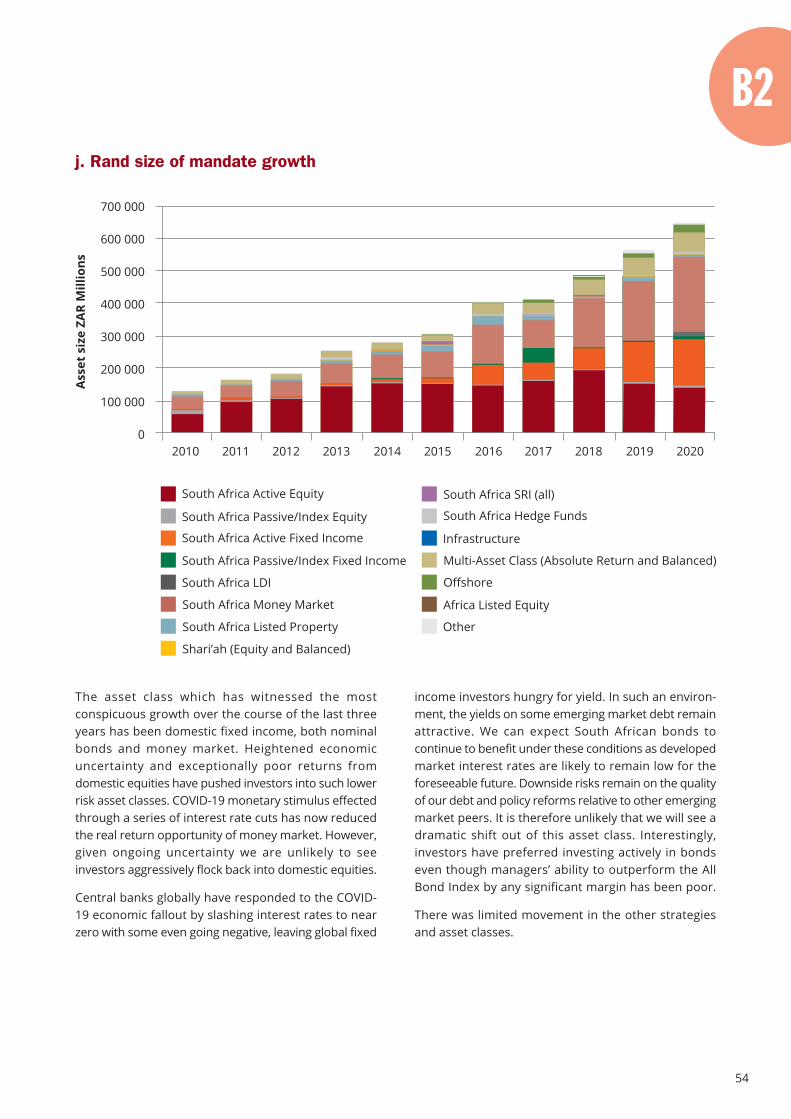
54
The asset class which has witnessed the mostconspicuous growth over the course of the last threeyears has been domestic fixed income, both nominalbonds and money market. Heightened economicuncertainty and exceptionally poor returns fromdomestic equities have pushed investors into such lowerrisk asset classes. COVID-19 monetary stimulus effectedthrough a series of interest rate cuts has now reducedthe real return opportunity of money market. However,given ongoing uncertainty we are unlikely to seeinvestors aggressively flock back into domestic equities.
Central banks globally have responded to the COVID-19 economic fallout by slashing interest rates to nearzero with some even going negative, leaving global fixed
income investors hungry for yield. In such an environ-ment, the yields on some emerging market debt remainattractive. We can expect South African bonds tocontinue to benefit under these conditions as developedmarket interest rates are likely to remain low for theforeseeable future. Downside risks remain on the qualityof our debt and policy reforms relative to other emergingmarket peers. It is therefore unlikely that we will see adramatic shift out of this asset class. Interestingly,investors have preferred investing actively in bondseven though managers’ ability to outperform the AllBond Index by any significant margin has been poor.
There was limited movement in the other strategiesand asset classes.
j. Rand size of mandate growth
Ass
et s
ize
ZAR
Mill
ions
700 000
600 000
500 000
400 000
300 000
200 000
100 000
02010 2011 2012 2013 2014 2015 2016 2017 2018 2019
Shari’ah (Equity and Balanced)
South Africa Listed Property
South Africa Money Market
South Africa LDI
South Africa Passive/Index Fixed Income
South Africa Active Fixed Income
South Africa Passive/Index Equity
South Africa Active Equity South Africa SRI (all)
South Africa Hedge Funds
Africa Listed Equity
Offshore
Infrastructure
Other
2020
Multi-Asset Class (Absolute Return and Balanced)
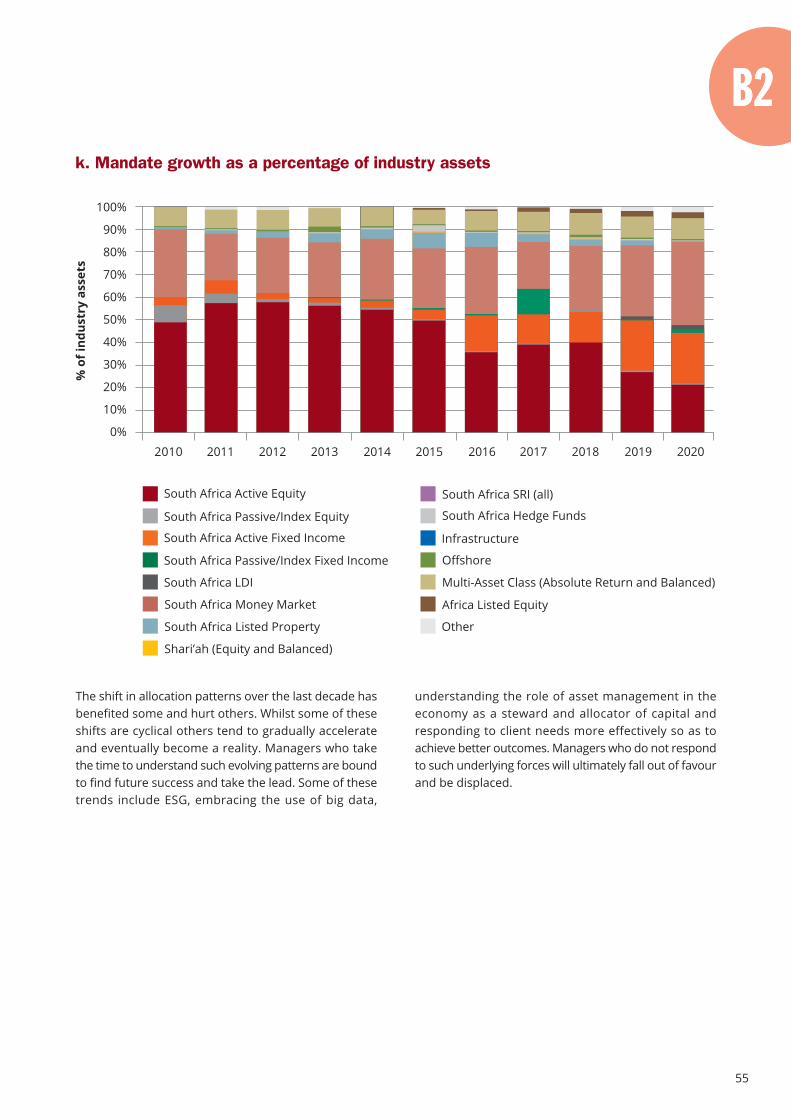
55
The shift in allocation patterns over the last decade hasbenefited some and hurt others. Whilst some of theseshifts are cyclical others tend to gradually accelerateand eventually become a reality. Managers who takethe time to understand such evolving patterns are boundto find future success and take the lead. Some of thesetrends include ESG, embracing the use of big data,
understanding the role of asset management in theeconomy as a steward and allocator of capital andresponding to client needs more effectively so as toachieve better outcomes. Managers who do not respondto such underlying forces will ultimately fall out of favourand be displaced.
k. Mandate growth as a percentage of industry assets
% o
f ind
ustr
y as
sets
100%
90%
80%
70%
60%
50%
40%
30%
20%
10%
0%
Shari’ah (Equity and Balanced)
South Africa Listed Property
South Africa Money Market
South Africa LDI
South Africa Passive/Index Fixed Income
South Africa Active Fixed Income
South Africa Passive/Index Equity
South Africa Active Equity South Africa SRI (all)
South Africa Hedge Funds
Africa Listed Equity
Offshore
Infrastructure
Other
2010 2011 2012 2013 2014 2015 2016 2017 2018 2019 2020
Multi-Asset Class (Absolute Return and Balanced)
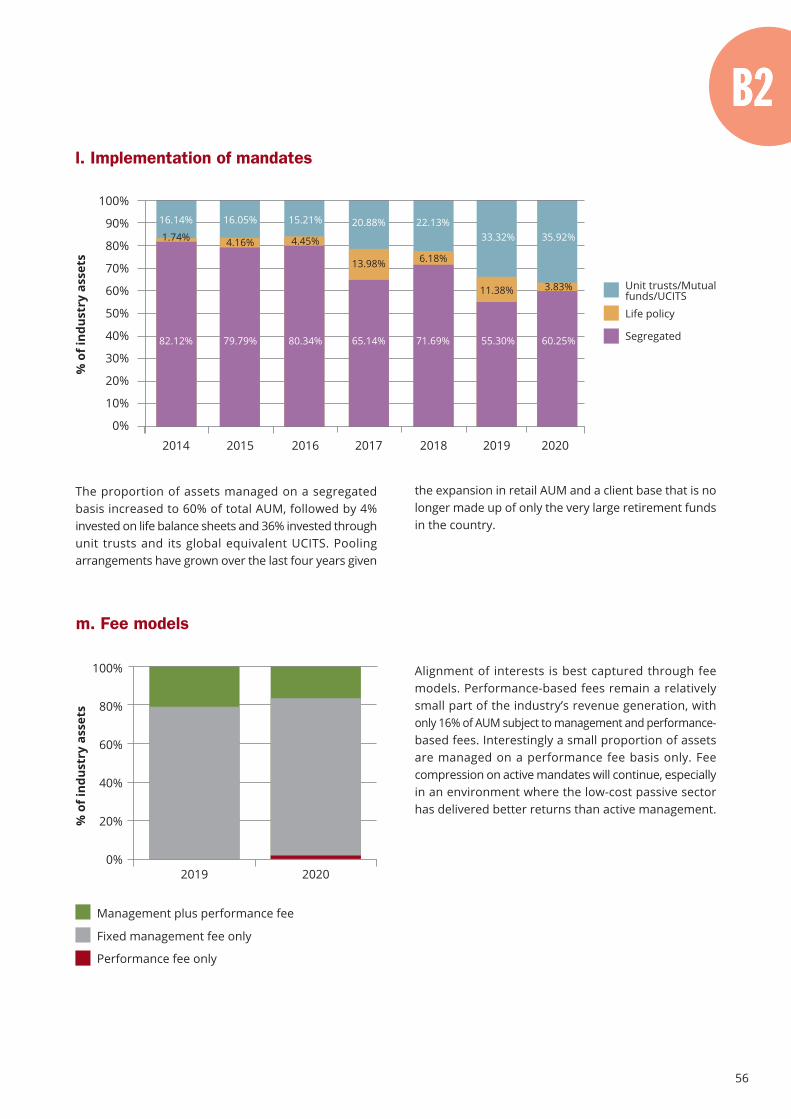
56
The proportion of assets managed on a segregatedbasis increased to 60% of total AUM, followed by 4%invested on life balance sheets and 36% invested throughunit trusts and its global equivalent UCITS. Poolingarrangements have grown over the last four years given
Alignment of interests is best captured through feemodels. Performance-based fees remain a relativelysmall part of the industry’s revenue generation, withonly 16% of AUM subject to management and performance-based fees. Interestingly a small proportion of assetsare managed on a performance fee basis only. Feecompression on active mandates will continue, especiallyin an environment where the low-cost passive sectorhas delivered better returns than active management.
the expansion in retail AUM and a client base that is nolonger made up of only the very large retirement fundsin the country.
l. Implementation of mandates
% o
f ind
ustr
y as
sets
Unit trusts/Mutualfunds/UCITS
Life policy
Segregated
100%
90%
80%
70%
60%
50%
40%
30%
20%
10%
0%
2014 2015 2016 2017 2018 2019 2020
82.12% 79.79% 80.34% 65.14% 71.69% 55.30% 60.25%
1.74% 4.16% 4.45%
13.98% 6.18%
11.38% 3.83%
16.14% 16.05% 15.21% 20.88% 22.13%33.32% 35.92%
m. Fee models
Management plus performance fee
Fixed management fee only
Performance fee only
% o
f ind
ustr
y as
sets
100%
80%
60%
40%
20%
0%1.53%
2019 2020
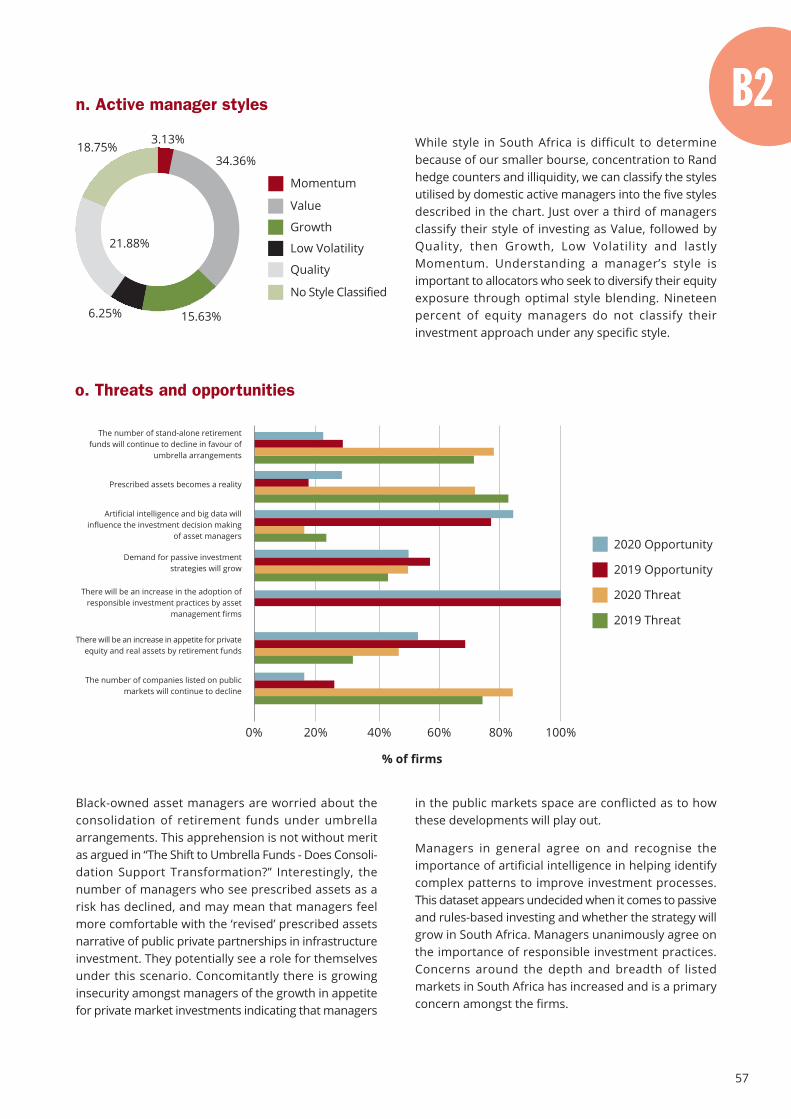
57
Black-owned asset managers are worried about theconsolidation of retirement funds under umbrellaarrangements. This apprehension is not without meritas argued in “The Shift to Umbrella Funds - Does Consoli-dation Support Transformation?” Interestingly, thenumber of managers who see prescribed assets as arisk has declined, and may mean that managers feelmore comfortable with the ‘revised’ prescribed assetsnarrative of public private partnerships in infrastructureinvestment. They potentially see a role for themselvesunder this scenario. Concomitantly there is growinginsecurity amongst managers of the growth in appetitefor private market investments indicating that managers
While style in South Africa is difficult to determinebecause of our smaller bourse, concentration to Randhedge counters and illiquidity, we can classify the stylesutilised by domestic active managers into the five stylesdescribed in the chart. Just over a third of managersclassify their style of investing as Value, followed byQuality, then Growth, Low Volatility and lastlyMomentum. Understanding a manager’s style isimportant to allocators who seek to diversify their equityexposure through optimal style blending. Nineteenpercent of equity managers do not classify theirinvestment approach under any specific style.
in the public markets space are conflicted as to howthese developments will play out.
Managers in general agree on and recognise theimportance of artificial intelligence in helping identifycomplex patterns to improve investment processes.This dataset appears undecided when it comes to passiveand rules-based investing and whether the strategy willgrow in South Africa. Managers unanimously agree onthe importance of responsible investment practices.Concerns around the depth and breadth of listedmarkets in South Africa has increased and is a primaryconcern amongst the firms.
n. Active manager styles
6.25%
34.36%
Growth
Low Volatility
3.13%18.75%
21.88%
15.63%
Momentum
Value
Quality
No Style Classified
o. Threats and opportunities
2020 Opportunity
2019 Opportunity
2020 Threat
2019 Threat
% of firms
The number of stand-alone retirementfunds will continue to decline in favour of
umbrella arrangements
Prescribed assets becomes a reality
Artificial intelligence and big data willinfluence the investment decision making
of asset managers
Demand for passive investmentstrategies will grow
There will be an increase in the adoption ofresponsible investment practices by asset
management firms
There will be an increase in appetite for privateequity and real assets by retirement funds
The number of companies listed on publicmarkets will continue to decline
0% 20% 60% 80%40% 100%

58
59
Using machine learningto select the best assetmanagersAs a selector of asset managers, 27four strives to provideits clients with the best risk-adjusted returns byidentifying managers who can consistently outperforminvestable benchmarks. We also remain committed tothe principles of diversity and inclusiveness through oursupport of black-owned, managed and controlled assetmanagers. One of the tools that can facilitate theintegration of our goals and our principles is theemerging science of machine learning. In this article weshed some light on this groundbreaking technology,and how 27four is actively developing machine learningtechniques for the selection of asset managers.
To most people, the notion of machines thinking andmaking decisions sounds like the theme of an 80’sscience fiction novel. What society doesn’t always fullygrasp is that we are already reliant on computerprograms (algorithms) for the completion of daily tasks,ranging from menial to complex. Applications rangefrom social media, kitchen appliances, to smart phonesand systems that govern credit card transactions. Asimple example is a spam filter on your email. Theprogrammed algorithm that determines whether anemail is spam learns from your actions in terms of whatmessages are 1) read, 2) read and deleted or 3) not readand deleted. The algorithm does this by determining aset of attributes that best predict whether the email isspam or not. These attributes include whether or notthe email contains ‘WARNING’ or ‘PROPOSAL’ in thesubject line or body (both have become common inspam and phishing emails). Importantly, the algorithmlearns to identify spam by analysing your actions, andtherefore organically adapts its rules to maximise itsaccuracy. This process is best known as machinelearning.
Arthur Samuel, a pioneer in the field of computer gamingand artificial intelligence, is credited with thepopularisation of the term ‘machine learning’ where hedefined it as ‘the field of study that gives computers theability to learn without being explicitly programmed’.Given that machine learning is all around us, why isn’tit applied to investments? We at 27four believe thequestion should be phrased differently. Instead of askingwhy, the real question is ‘how?’
Investment decisions and machinelearningThe use of machine learning can be synthesised intotwo discrete fields, namely classification and regression.The output of classification is generally binary i.e. ‘yes‚’or ‘no’ but can be extended to categorical classification,such is the case in alphanumeric character recognition.This is how automatic number plate recognition works.Regression would consider forecasting continuousnumbers (such as rainfall or temperatures) and generallycan be used with data that are indexed by time. Thebiggest difference is that classification is generally foundto be more accurate than regression-based time-seriesprediction. Obviously, it would be wonderful to be ableto predict the direction of the JSE or yields in governmentbonds, but the current set of tools available have limitedpredictive ability (if it weren’t the case, there would bea few more millionaires walking around). There ishowever benefit in converting time-based questionsinto classification problems.
Consider multi-managed multi-asset class funds. Thereare two sources of return or alpha for such a fund. Thefirst is strategic asset allocation, which involvesdetermining the optimal weights in different assetclasses that will translate into the highest risk-adjustedreturn. The second and equally important source ofalpha is manager selection, requiring the ability toidentify managers that are best placed to exceed theirrespective benchmarks. We have found that machinelearning can assist in finding the best managers. Butfirst, let’s frame the problem.
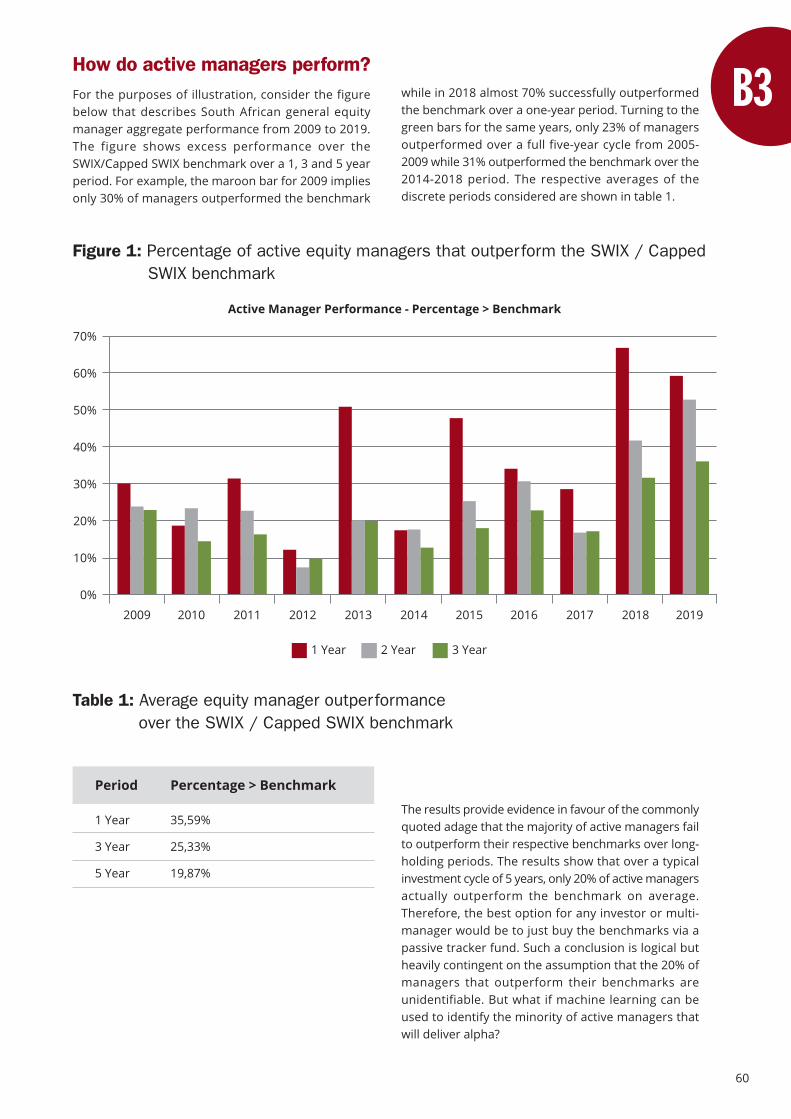
60
How do active managers perform?For the purposes of illustration, consider the figurebelow that describes South African general equitymanager aggregate performance from 2009 to 2019.The figure shows excess performance over theSWIX/Capped SWIX benchmark over a 1, 3 and 5 yearperiod. For example, the maroon bar for 2009 impliesonly 30% of managers outperformed the benchmark
Figure 1: Percentage of active equity managers that outperform the SWIX / Capped SWIX benchmark
Active Manager Performance - Percentage > Benchmark
70%
60%
50%
40%
30%
20%
10%
0%
2009 2010 2011 2012 2013 2014 2015 2016 2017 2018 2019
1 Year 2 Year 3 Year
while in 2018 almost 70% successfully outperformedthe benchmark over a one-year period. Turning to thegreen bars for the same years, only 23% of managersoutperformed over a full five-year cycle from 2005-2009 while 31% outperformed the benchmark over the2014-2018 period. The respective averages of thediscrete periods considered are shown in table 1.
1 Year 35,59%
3 Year 25,33%
5 Year 19,87%
Period Percentage > Benchmark
Table 1: Average equity manager outperformance over the SWIX / Capped SWIX benchmark
The results provide evidence in favour of the commonlyquoted adage that the majority of active managers failto outperform their respective benchmarks over long-holding periods. The results show that over a typicalinvestment cycle of 5 years, only 20% of active managersactually outperform the benchmark on average.Therefore, the best option for any investor or multi-manager would be to just buy the benchmarks via apassive tracker fund. Such a conclusion is logical butheavily contingent on the assumption that the 20% ofmanagers that outperform their benchmarks areunidentifiable. But what if machine learning can beused to identify the minority of active managers thatwill deliver alpha?

61
A classification problemIdentification of managers that will outperform theirrespective benchmarks can be articulated as a‘classification’ machine learning problem. Simply put,by using a number of explanatory variables (or ‘features’as used in the machine learning lexicon), can wedetermine which managers have a higher probabilityof outperforming the benchmark? Let us consider anumber of attributes that we would focus on as investorswhen evaluating managers, such as:
• Historical cumulative performance• Risk-adjusted performance• Performance consistency• Style• Proportion of return explained by style vs. manager
skill• Tracking error• Active share (off-benchmark share bets)• Active sector (off-benchmark sector bets)• Concentration of small capitalisation and illiquid
holdings
Theoretically, we could rank managers using the aboveset of attributes by assigning an equal weight to each.This simple heuristic makes sense but fails to determinewhich attribute is most important and whether thecurrent combination of attributes has predictive power.Machine learning solves this by optimising the weightof each attribute based on which contribute most tofuture performance.
Mathematically, the problem can be expressed as
perft = w1F1,t-1 + w2F2,t-1 + ...+ wnFn,t-1
Where perft is future performance of a manager, Fn
represents each attribute and wn represents the weightor importance of each attribute. The objective of anymachine learning algorithm is to optimise wn in orderto determine perft with the highest level of accuracy.
Figure 2: Manager attributes
Manager Attributes
1,0
0,8
0,6
0,4
0,2
0,0
A1 A2 A3 A4 A5 A6 A7 A8 A9 A10 A11 A12 A13 A14 A15 A16 A17 A18 A19 A20 A21 A22 A23 A24 A25 A26 A27 A28 A29 A30 A31 A32 A33 A34 A35 A36
Figure 2 shows an excerpt from the 27four machinelearning model that considers ten managers, two ofwhom outperform the benchmark (blue and maroonstars), across 36 attributes. The purpose of a machinelearning algorithm is to detect a pattern across the
features that best predict which managers have thehighest probability of outperforming the benchmark.One can then use the model to determine a predictionfor each manager, in the form of a probability ofoutperforming the benchmark.
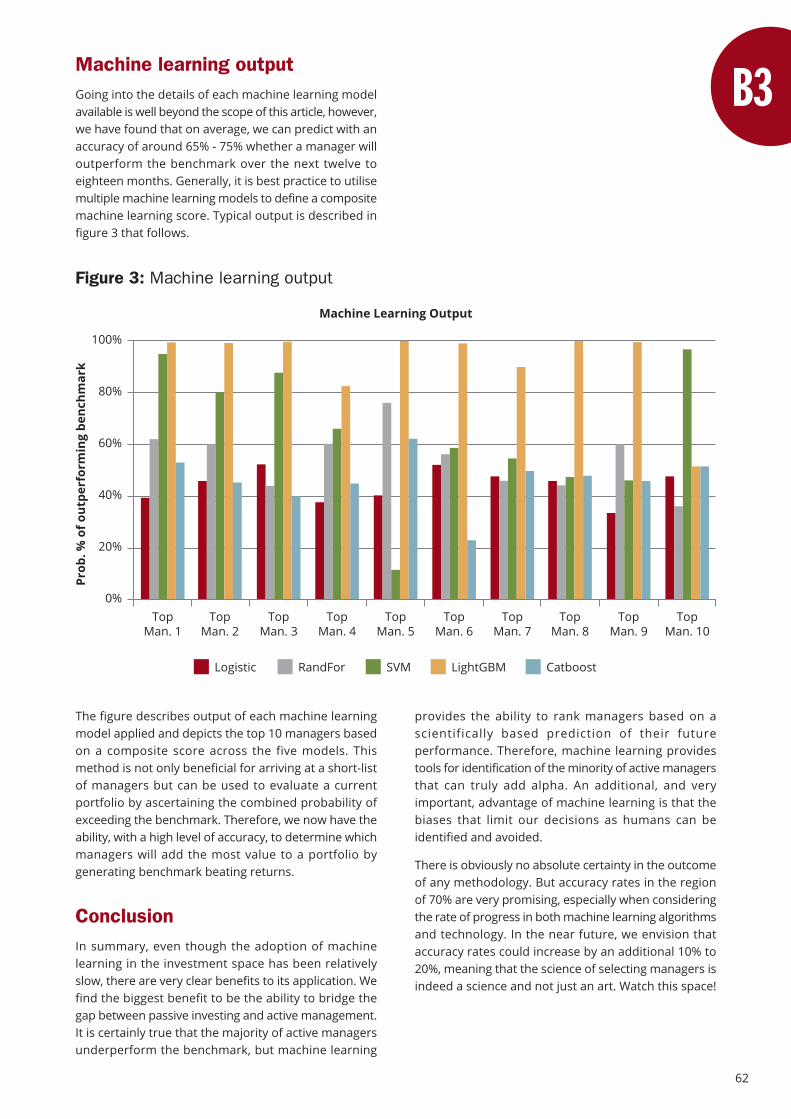
62
provides the ability to rank managers based on ascientifically based prediction of their futureperformance. Therefore, machine learning providestools for identification of the minority of active managersthat can truly add alpha. An additional, and veryimportant, advantage of machine learning is that thebiases that limit our decisions as humans can beidentified and avoided.
There is obviously no absolute certainty in the outcomeof any methodology. But accuracy rates in the regionof 70% are very promising, especially when consideringthe rate of progress in both machine learning algorithmsand technology. In the near future, we envision thataccuracy rates could increase by an additional 10% to20%, meaning that the science of selecting managers isindeed a science and not just an art. Watch this space!
Machine learning outputGoing into the details of each machine learning modelavailable is well beyond the scope of this article, however,we have found that on average, we can predict with anaccuracy of around 65% - 75% whether a manager willoutperform the benchmark over the next twelve toeighteen months. Generally, it is best practice to utilisemultiple machine learning models to define a compositemachine learning score. Typical output is described infigure 3 that follows.
Figure 3: Machine learning output
Machine Learning Output
Logistic RandFor SVM LightGBM Catboost
100%
80%
60%
40%
20%
0%Top
Man. 1Top
Man. 2Top
Man. 3Top
Man. 4Top
Man. 5Top
Man. 6Top
Man. 7Top
Man. 8Top
Man. 9Top
Man. 10
Prob
. % o
f out
perf
orm
ing
benc
hmar
k
The figure describes output of each machine learningmodel applied and depicts the top 10 managers basedon a composite score across the five models. Thismethod is not only beneficial for arriving at a short-listof managers but can be used to evaluate a currentportfolio by ascertaining the combined probability ofexceeding the benchmark. Therefore, we now have theability, with a high level of accuracy, to determine whichmanagers will add the most value to a portfolio bygenerating benchmark beating returns.
ConclusionIn summary, even though the adoption of machinelearning in the investment space has been relativelyslow, there are very clear benefits to its application. Wefind the biggest benefit to be the ability to bridge thegap between passive investing and active management.It is certainly true that the majority of active managersunderperform the benchmark, but machine learning

63

64
Clean water & sanitation
6

Reduced inequalities
65
44%Of firms are EMEs
Section highlights
B-BBEEscorecard
34%Of firms are QSFIs
22%Of firms are large
Public markets
10

66
Just over two thirds of asset managers submittedaffidavits indicating that the dataset is largely madeup of EMEs and QSFIs.
How participants are classified in terms of B-BBEE shedslight on the relative strength and size of black-ownedasset management firms. Under the FSC, an EME, QSFIand Generic enterprise is classified as follows:
There has been little movement between the threerevenue bands in the year that has passed. There arecurrently only seven firms in this segment who generateannual turnover greater than R50 Million, anotherconfirmation that the industry is made up of a handfulof large managers and a long tail of mid-sized and smallmanagers.
a. Affidavit or B-BBEE verification certificate submitted
31.25%
68.75%
Affidavit
Verification Certificate
EME Total annual revenue of up to R10 Million
QSFI Total annual revenue of more than R10 Million but less than R50 Million
Generic Total annual revenue of more than R50 Million
b. Classification by revenue
% o
f fir
ms
20202019
17,14%
34,29%
100%90%80%70%60%50%40%30%20%10%
0%
EME
QSFI
Generic (Large)
21.87%17.14%
34.38%34.29%
43.75%48.57%

67
Under the FSC an EME or QSFI which is 100% black-owned qualifies for elevation to a level one contributorand an EME or QSFI that is at least 51% black-ownedqualifies for elevation to a level two contributor. Giventhat 78% of this universe is classified as an EME or QSFIit is understandable that most managers hold level 1and 2 ratings. Hence the outlier with a level three ratingmust be a large enterprise.
According to the annual report published by the B-BBEECommission in 2020, black ownership in the financial
sector remains stubbornly low relative to other sectors(24,75% relative to national average of 29,66%). In fact,black ownership in the financial sector appears to bedecreasing annually in comparison to other sectors thathave witnessed an increase, indicating that a lot morework needs to be done to transform the sector.
c. B-BBEE contribution level
% o
f fi
rms
Non-Compliant
60%
50%
40%
30%
20%
10%
0%
37
2 31 4 5 6
50.00%
3.13% 0,00% 0,00% 0,00%
7
0,00%
8
0,00% 0,00%
46.88%
d. B-BBEE verification
There were ten firms who provided B-BBEE verificationcertificates and the verification agencies appointed isprovided in the graph below of which AQRate is thepreferred provider of this service.
Num
ber
of f
irm
s
5
4
3
2
1
0
AuthenticRating
Solutions
AQRate MooreStephens
RenaissanceSA Ratings
BEE OnlinePremierVerification
Empowerlogic
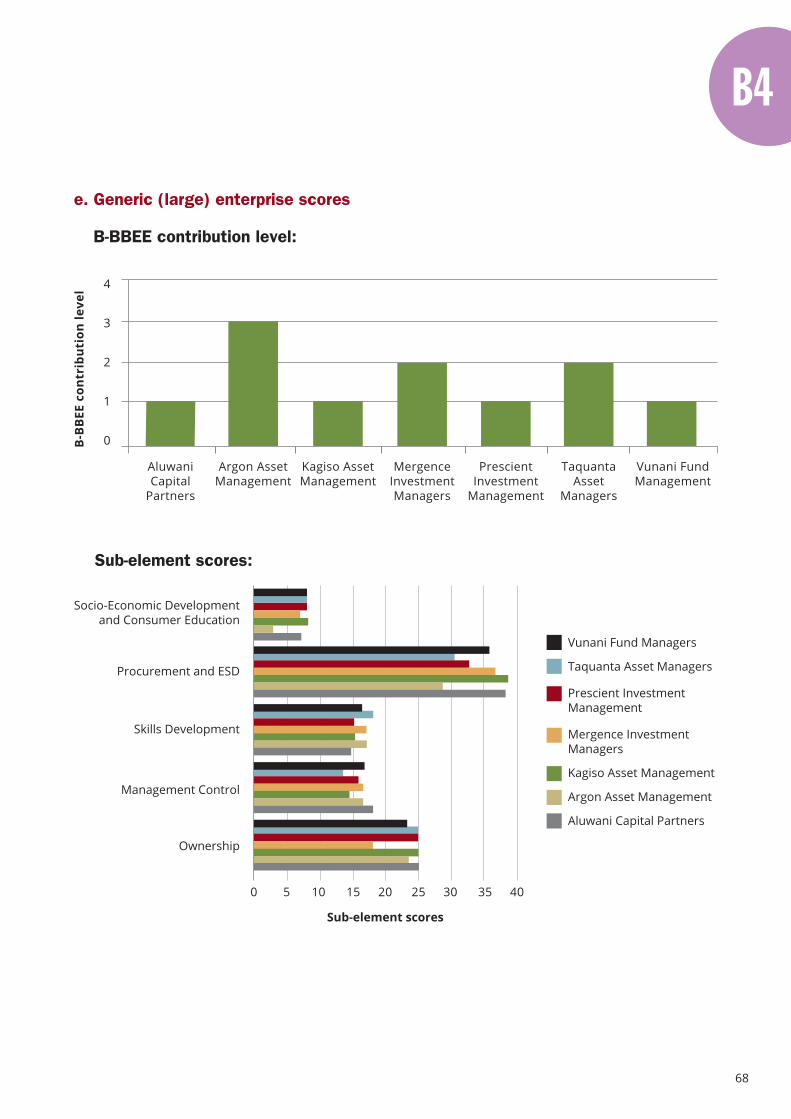
68
e. Generic (large) enterprise scores
B-BBEE contribution level:
B-B
BEE
con
trib
utio
n le
vel 4
3
2
1
0
PrescientInvestment
Management
AluwaniCapital
Partners
Argon AssetManagement
MergenceInvestmentManagers
TaquantaAsset
Managers
Kagiso AssetManagement
Vunani FundManagement
Sub-element scores:
Socio-Economic Developmentand Consumer Education
Procurement and ESD
Skills Development
Management Control
Ownership
Sub-element scores
Vunani Fund Managers
Taquanta Asset Managers
Prescient InvestmentManagement
Mergence InvestmentManagers
Kagiso Asset Management
Argon Asset Management
Aluwani Capital Partners
0 5 10 15 20 25 30 35 40
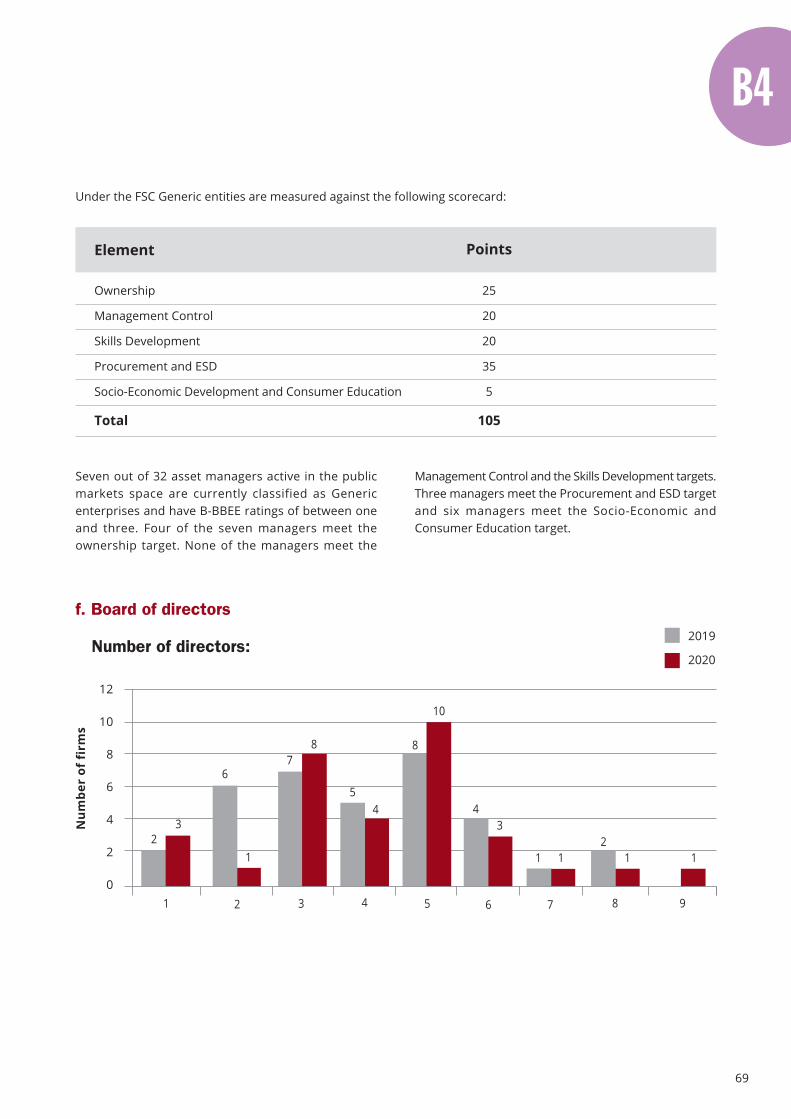
69
Seven out of 32 asset managers active in the publicmarkets space are currently classified as Genericenterprises and have B-BBEE ratings of between oneand three. Four of the seven managers meet theownership target. None of the managers meet the
Management Control and the Skills Development targets.Three managers meet the Procurement and ESD targetand six managers meet the Socio-Economic andConsumer Education target.
Under the FSC Generic entities are measured against the following scorecard:
Ownership
Management Control
Skills Development
Procurement and ESD
Socio-Economic Development and Consumer Education
Total
Element Points
25
20
20
35
5
105
f. Board of directors
Number of directors:2019
2020
Num
ber
of f
irm
s
12
10
8
6
4
2
081 2 3 4 5 6 7 9
23
6
1
78
54
8
10
43
1 1 1 12
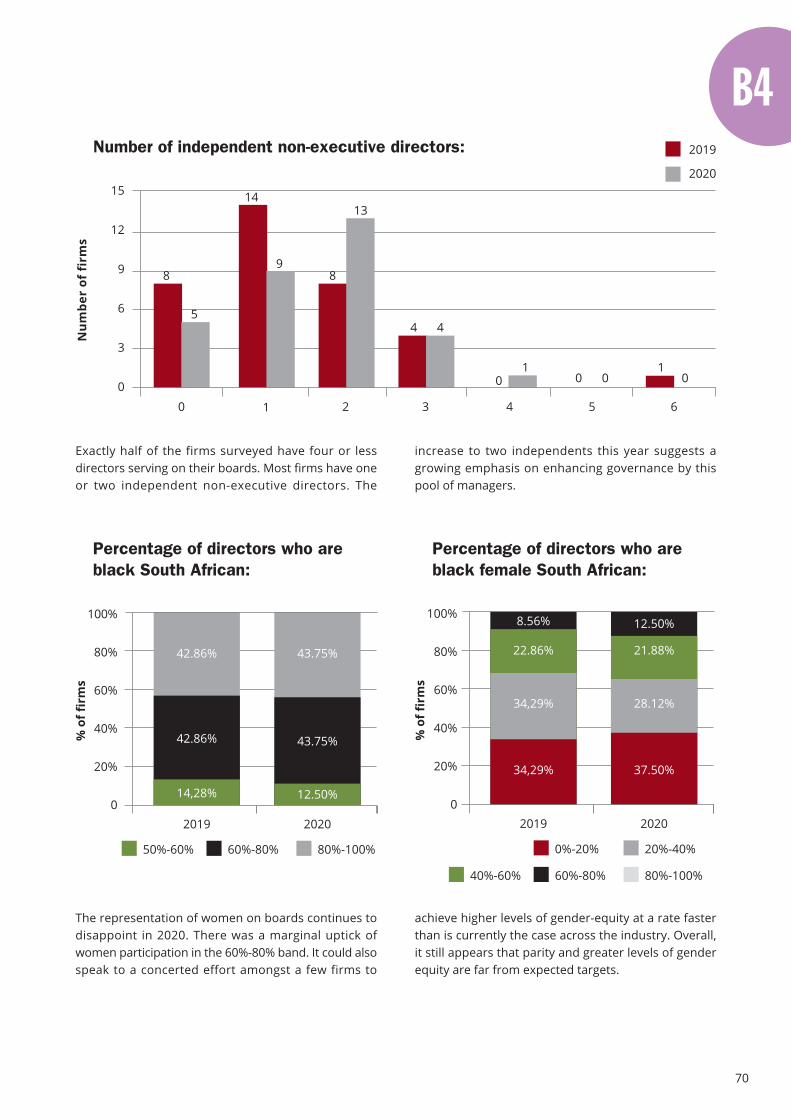
70
The representation of women on boards continues todisappoint in 2020. There was a marginal uptick ofwomen participation in the 60%-80% band. It could alsospeak to a concerted effort amongst a few firms to
achieve higher levels of gender-equity at a rate fasterthan is currently the case across the industry. Overall,it still appears that parity and greater levels of genderequity are far from expected targets.
Percentage of directors who areblack South African:
% o
f fir
ms
100%
80%
60%
40%
20%
020202019
42.86% 43.75%
42.86% 43.75%
14,28% 12.50%
80%-100%60%-80%50%-60%
Percentage of directors who areblack female South African:
% o
f fir
ms
100%
80%
60%
40%
20%
020202019
8.56% 12.50%
22.86% 21.88%
34,29% 28.12%
34,29% 37.50%
20%-40%0%-20%
80%-100%60%-80%40%-60%
Number of independent non-executive directors:
Num
ber
of f
irm
s
15
12
9
6
3
0
8
10 2 3 4 5 6
2019
2020
5
14
9
13
8
44
10 00 0
1
Exactly half of the firms surveyed have four or lessdirectors serving on their boards. Most firms have oneor two independent non-executive directors. The
increase to two independents this year suggests agrowing emphasis on enhancing governance by thispool of managers.
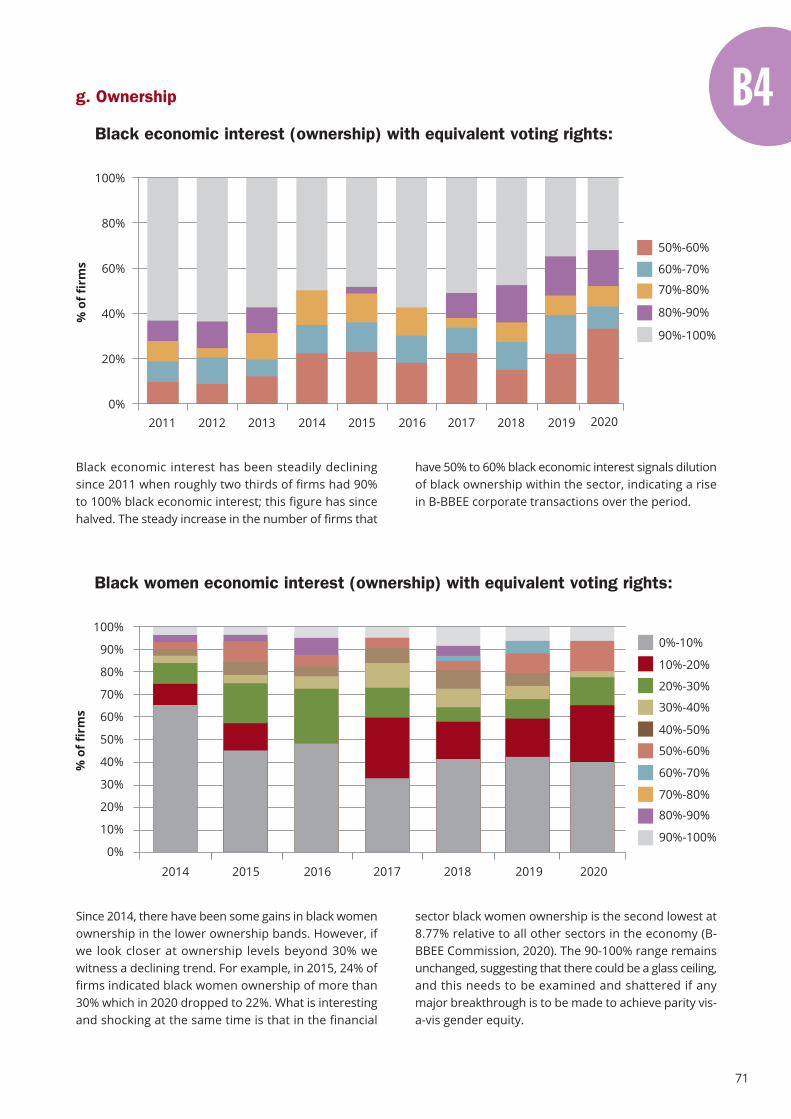
71
Black economic interest has been steadily decliningsince 2011 when roughly two thirds of firms had 90%to 100% black economic interest; this figure has sincehalved. The steady increase in the number of firms that
Since 2014, there have been some gains in black womenownership in the lower ownership bands. However, ifwe look closer at ownership levels beyond 30% wewitness a declining trend. For example, in 2015, 24% offirms indicated black women ownership of more than30% which in 2020 dropped to 22%. What is interestingand shocking at the same time is that in the financial
have 50% to 60% black economic interest signals dilutionof black ownership within the sector, indicating a risein B-BBEE corporate transactions over the period.
sector black women ownership is the second lowest at8.77% relative to all other sectors in the economy (B-BBEE Commission, 2020). The 90-100% range remainsunchanged, suggesting that there could be a glass ceiling,and this needs to be examined and shattered if anymajor breakthrough is to be made to achieve parity vis-a-vis gender equity.
g. Ownership
Black economic interest (ownership) with equivalent voting rights:
% o
f fir
ms
80%-90%
70%-80%
60%-70%
50%-60%
90%-100%
100%
80%
60%
40%
20%
0%2011 2012 2013 2014 2015 2016 2017 2018 2019 2020
Black women economic interest (ownership) with equivalent voting rights:
% o
f fir
ms
80%-90%
70%-80%
60%-70%
50%-60%
40%-50%
30%-40%
20%-30%
10%-20%
90%-100%
0%-10%100%
90%
80%
70%
60%
50%
40%
30%
20%
10%
0%
2014 2015 2016 2017 2018 2019 2020
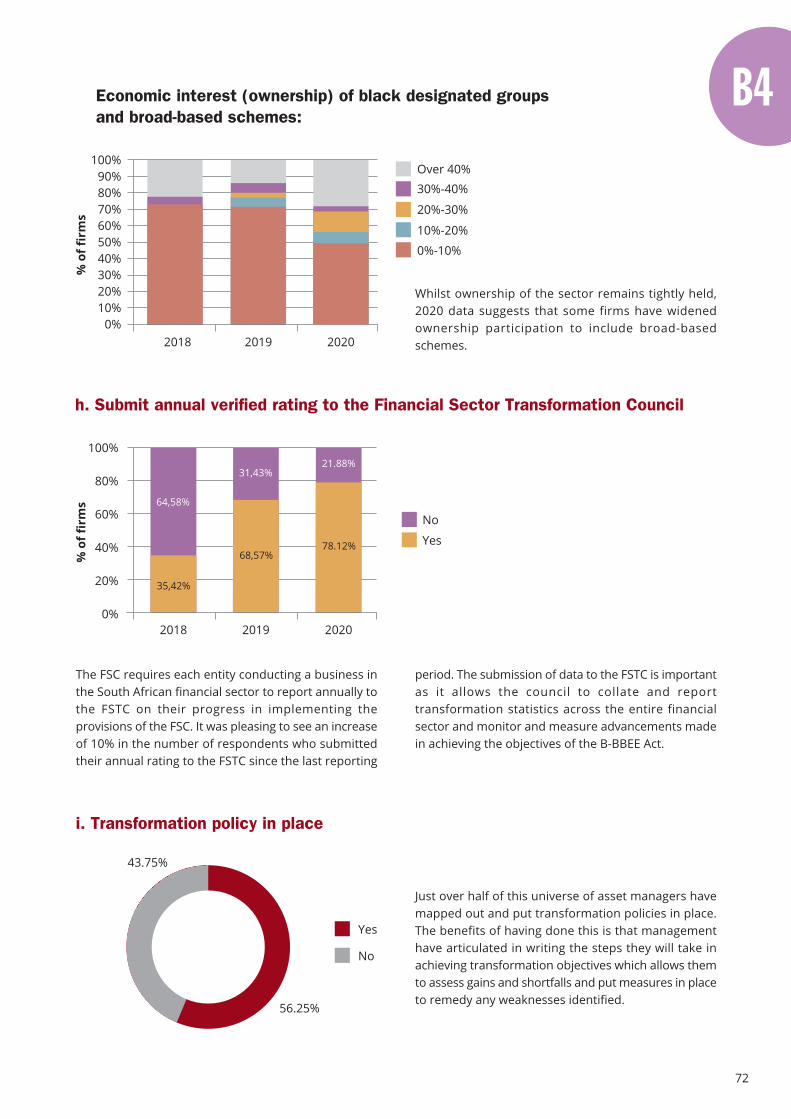
72
The FSC requires each entity conducting a business inthe South African financial sector to report annually tothe FSTC on their progress in implementing theprovisions of the FSC. It was pleasing to see an increaseof 10% in the number of respondents who submittedtheir annual rating to the FSTC since the last reporting
period. The submission of data to the FSTC is importantas it allows the council to collate and reporttransformation statistics across the entire financialsector and monitor and measure advancements madein achieving the objectives of the B-BBEE Act.
Economic interest (ownership) of black designated groupsand broad-based schemes:
% o
f fir
ms
100%90%80%70%60%50%40%30%20%10%
0%
30%-40%
20%-30%
10%-20%
0%-10%
Over 40%
2018 2019 2020
Whilst ownership of the sector remains tightly held,2020 data suggests that some firms have widenedownership participation to include broad-basedschemes.
h. Submit annual verified rating to the Financial Sector Transformation Council
% o
f fir
ms
100%
80%
60%
40%
20%
0%
Yes
No
2018 2019
35,42%
68,57%
64,58%
31,43%
2020
78.12%
21.88%
i. Transformation policy in place
43.75%
56.25%
Yes
No
Just over half of this universe of asset managers havemapped out and put transformation policies in place.The benefits of having done this is that managementhave articulated in writing the steps they will take inachieving transformation objectives which allows themto assess gains and shortfalls and put measures in placeto remedy any weaknesses identified.

73
The key finding here is that the visible hand of the statehas the potential to act as an impediment to marketparticipation, and this has the potential to hinderattainment of B-BBEE goals and the concomitant growthof the asset management market. This will beexacerbated due to the impact of COVID-19 with possiblegreater barriers to participation on the horizon shouldthere be more regulations and state involvement in thesector such as for example, the introduction ofprescribed assets legislation. With regards COFI - giventhat it has not yet come into play and the impact is yetto be seen - the jury is out with only less than a third ofasset management firms feeling positive that it willimprove financial sector inclusion and transformation.
j. In respect of the Amended Financial Sector Code of 2017
k. In respect of financial sector regulation
% o
f fir
ms
100%90%80%70%60%50%40%30%20%10%
0%Do you think that some
regulations have theunintended effect of
increasing the barriers toentry and impede the
growth of emerging blackenterprises within the
sector?
Do you think that the newConduct of Financial
Institutions (COFI) Bill willimprove inclusion andtransformation of the
financial sector?
18.75%
15.63%
12.50%
53.12%
Yes
No
Don’t have a view
68.75%
31.25%
Here we provide managers the opportunity to expresstheir views on the FSC. Across most firms, views arepositive with respect to fairness of targets and theestablishment of compliance mechanisms for licencing.Setting targets for asset consultants and making the B-BBEE Scorecard for Retirement Funds compulsory will
progress the penetration of black-owned asset managersin the pensions industry and therefore receives aresounding vote in favour of such targets. The jury isstill out with regards to the effectiveness of the FSC inmonitoring B-BBEE compliance of the sector.
100%90%80%70%60%50%40%30%20%10%
0%Do you think that
compliance with the codeshould be a condition of
licencing?
Do you think that specifictargets should be set for
asset consultants?
Do you think that thetargets are fair?
Would you like to see theB-BBEE Scorecard for
Retirement Fundsbecome compulsory?
Do you think that theFinancial Sector
Transformation Councilhas been effective in
monitoring and reportingon B-BBEE compliance
within the sector?
15.63%31.25%
15.62% 15.62%
53.12%15.63%
68.74%
12.50%
56.25%
9.38%
75.00%
3.13%
81.25%21.88%
25.00%
Yes
No
Don’t have a view
% o
f fir
ms
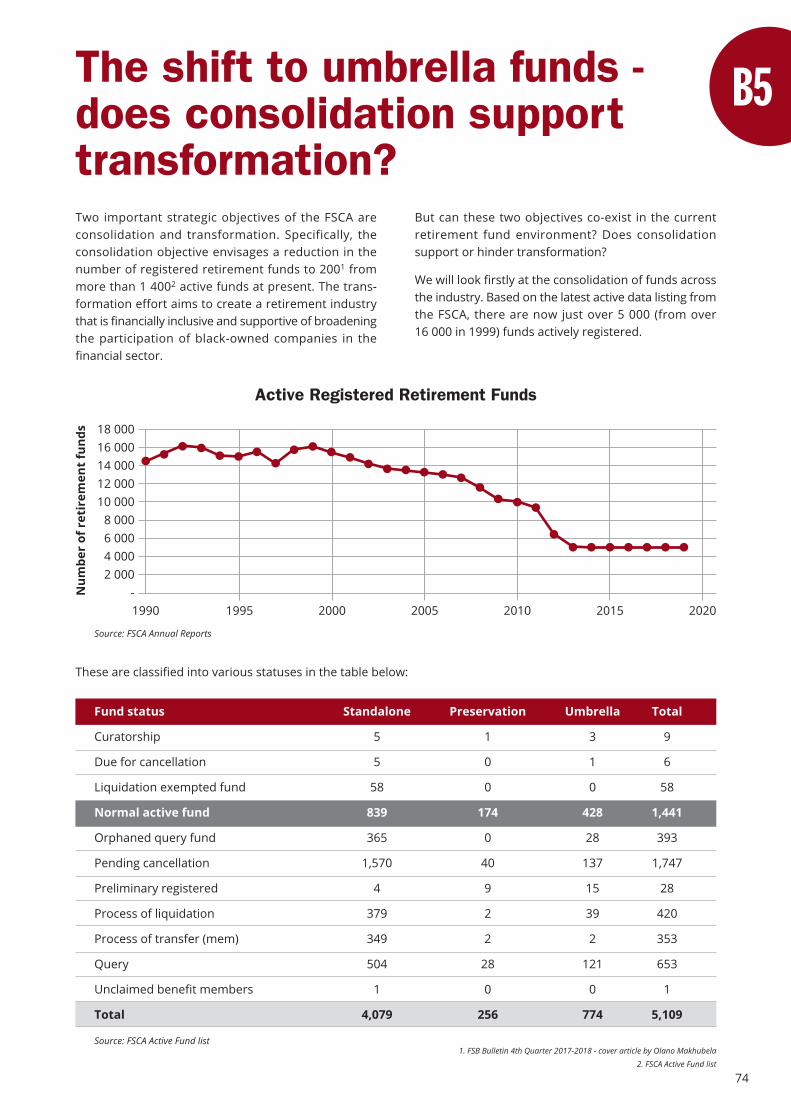
74
1. FSB Bulletin 4th Quarter 2017-2018 - cover article by Olano Makhubela
2. FSCA Active Fund list
Num
ber
of r
etir
emen
t fu
nds
Active Registered Retirement Funds
18 00016 00014 00012 00010 000
8 0006 0004 0002 000
-20201990 20152010200520001995
These are classified into various statuses in the table below:
Fund status Standalone Preservation Umbrella Total
Curatorship 5 1 3 9
Due for cancellation 5 0 1 6
Liquidation exempted fund 58 0 0 58
Normal active fund 839 174 428 1,441
Orphaned query fund 365 0 28 393
Pending cancellation 1,570 40 137 1,747
Preliminary registered 4 9 15 28
Process of liquidation 379 2 39 420
Process of transfer (mem) 349 2 2 353
Query 504 28 121 653
Unclaimed benefit members 1 0 0 1
Total 4,079 256 774 5,109
Source: FSCA Active Fund list
Source: FSCA Annual Reports
Two important strategic objectives of the FSCA areconsolidation and transformation. Specifically, theconsolidation objective envisages a reduction in thenumber of registered retirement funds to 2001 frommore than 1 4002 active funds at present. The trans-formation effort aims to create a retirement industrythat is financially inclusive and supportive of broadeningthe participation of black-owned companies in thefinancial sector.
But can these two objectives co-exist in the currentretirement fund environment? Does consolidationsupport or hinder transformation?
We will look firstly at the consolidation of funds acrossthe industry. Based on the latest active data listing fromthe FSCA, there are now just over 5 000 (from over16 000 in 1999) funds actively registered.
The shift to umbrella funds -does consolidation supporttransformation?
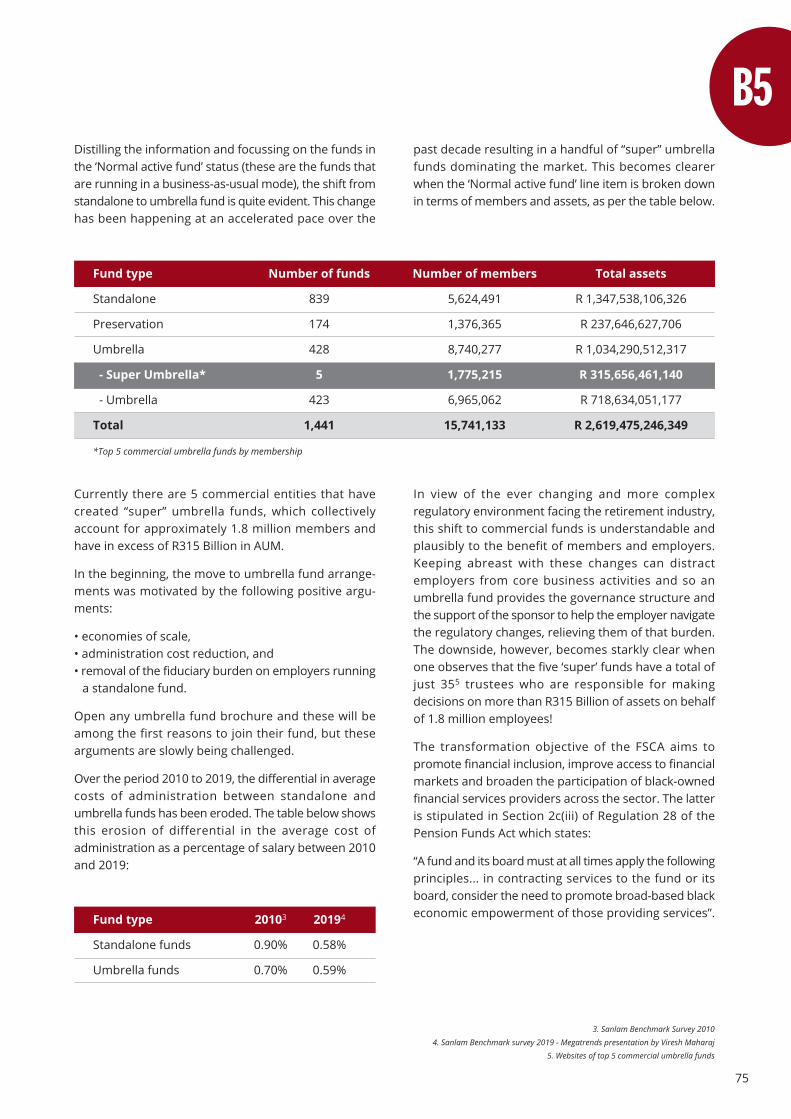
75
3. Sanlam Benchmark Survey 2010
4. Sanlam Benchmark survey 2019 - Megatrends presentation by Viresh Maharaj
5. Websites of top 5 commercial umbrella funds
Distilling the information and focussing on the funds inthe ‘Normal active fund’ status (these are the funds thatare running in a business-as-usual mode), the shift fromstandalone to umbrella fund is quite evident. This changehas been happening at an accelerated pace over the
In view of the ever changing and more complexregulatory environment facing the retirement industry,this shift to commercial funds is understandable andplausibly to the benefit of members and employers.Keeping abreast with these changes can distractemployers from core business activities and so anumbrella fund provides the governance structure andthe support of the sponsor to help the employer navigatethe regulatory changes, relieving them of that burden.The downside, however, becomes starkly clear whenone observes that the five ‘super’ funds have a total ofjust 355 trustees who are responsible for makingdecisions on more than R315 Billion of assets on behalfof 1.8 million employees!
The transformation objective of the FSCA aims topromote financial inclusion, improve access to financialmarkets and broaden the participation of black-ownedfinancial services providers across the sector. The latteris stipulated in Section 2c(iii) of Regulation 28 of thePension Funds Act which states:
“A fund and its board must at all times apply the followingprinciples... in contracting services to the fund or itsboard, consider the need to promote broad-based blackeconomic empowerment of those providing services”.
Currently there are 5 commercial entities that havecreated “super” umbrella funds, which collectivelyaccount for approximately 1.8 million members andhave in excess of R315 Billion in AUM.
In the beginning, the move to umbrella fund arrange-ments was motivated by the following positive argu-ments:
• economies of scale,• administration cost reduction, and• removal of the fiduciary burden on employers running
a standalone fund.
Open any umbrella fund brochure and these will beamong the first reasons to join their fund, but thesearguments are slowly being challenged.
Over the period 2010 to 2019, the differential in averagecosts of administration between standalone andumbrella funds has been eroded. The table below showsthis erosion of differential in the average cost ofadministration as a percentage of salary between 2010and 2019:
past decade resulting in a handful of “super” umbrellafunds dominating the market. This becomes clearerwhen the ‘Normal active fund’ line item is broken downin terms of members and assets, as per the table below.
Fund type Number of funds Number of members Total assets
Standalone 839 5,624,491 R 1,347,538,106,326
Preservation 174 1,376,365 R 237,646,627,706
Umbrella 428 8,740,277 R 1,034,290,512,317
- Super Umbrella* 5 1,775,215 R 315,656,461,140
- Umbrella 423 6,965,062 R 718,634,051,177
Total 1,441 15,741,133 R 2,619,475,246,349
*Top 5 commercial umbrella funds by membership
Fund type 20103 20194
Standalone funds 0.90% 0.58%
Umbrella funds 0.70% 0.59%
76
6. Data from annual trustee reports of 3 of the top five commercial Umbrella funds from 2014 to 2019
7. Comparison of data from 2017 and 2019 BEE.conomics Survey by 27four Investment Managers
Over the period from 2017 to 2019, the total assetsmanaged by black-owned asset managers across theentire savings and investments industry increased byonly 39%7 and off a low base. The proportion of assetsmanaged by black-owned asset managers withinumbrella funds is insignificant (refer to section titled“Product distribution”).
So, does consolidation support transformation? Thecost argument for moving to umbrella funds has beeneroded, the responsibility for a significant portion ofthe economy’s savings is in the hands of only 35 people,and the rate at which the assets in commercial funds is
growing compared to the growth in the proportion ofthese assets managed by black asset managers, wouldsuggest that consolidation is contrary to transformation.The FSCA needs to ensure that its consolidation policyis implemented in a way that is consistent with itstransformation policy.
2014 2019
Fund Members Total assets Members Total assets % change in assets
Sanlam Umbrella Fund 117,500 15,000,000,000 230,000 35,000,000,000 133%
Old Mutual SuperFund 262,853 34,000,000,000 456,715 112,000,000,000 229%
Liberty Corporate SelectionUmbrella Funds
277,697 30,067,557,153 311,655 36,600,000,000 22%
Total 658,050 79,067,557,153 998,370 183,600,000,000 132%
Retirement funds are a primary source of assets forblack-owned asset managers as the retail industry ishighly intermediated with high barriers to entry. Publicsector and union retirement funds have been supportiveof transformation imperatives and were the earliestmovers to support black-owned asset managers.However, gaining access to some of the private sectorretirement funds has been near impossible due to theintermediation of the “super” umbrella funds where themajority of assets are concentrated directly in the assetportfolios managed by the sponsors themselves.Umbrella funds are a form of asset gathering for such”super” funds and diversifying to independent assetmanagers would dilute their AUM and by proxy theirincome. Hence there is no incentive for them to do so.
Couple this with 60% of consultants4 indicating that theydo not consider B-BBEE when recommending serviceproviders to boards of trustees, increasing the proportionof assets managed by black-owned asset managers isgoing to be an uphill battle.
Over the past 5 years, the assets of 3 of the 5 superfunds increased by 132%6.

77

78
78%Of firms are profitable, up 10%
Section highlights
22%Of firms breakeven AUM is < R1 Billion
66%Of firms procure less than 40% of services from black-owned suppliers
Businesssustainabilityand societalimpact
Sustainable cities& communities
Public markets
11

79
There was an overall improvement in all threeprofitability indicators for the period ending June 2020.The impact of COVID-19 on these indicators will becomeclearer in the next print as the effects of the pandemicsweep through the economy and the sector.
More than two-thirds of companies were financedthrough personal finance - either that of the foundersor that of their friends and families. The data suggests
that other avenues of raising finance appears not tohave been fully explored or that asset management isnot a sector which funders typically support.
a. Business sustainability
Company profitability:
20202019
% o
f fir
ms
100%
80%
60%
40%
20%
0%
21.88%
78.12%
31,43%
68,57%
Yes No
Made an income tax payment to SARS in the last financial year:
Yes
No
20202019
% o
f fir
ms
100%
50%
0%
25.00%31.43%
75.00%68.57%
b. Mechanism used to finance company at start-up
Delivered three consecutive yearsof positive NPAT over last threefinancial years:
% o
f fir
ms
Traditional bankfinancing
80%
70%
60%
50%
40%
30%
20%
10%
0%Development
Finance Institutions(eg. NEF, IDC etc.)
Friends andfamily
Personal financePrivate equityand external
financing
9.38% 12.50%6.25% 3.13%
8,82%
68.75%
20202019
% o
f fir
ms
100%
80%
60%
40%
20%
0%
53.12%57.14%
46.88%42.86%
Yes No
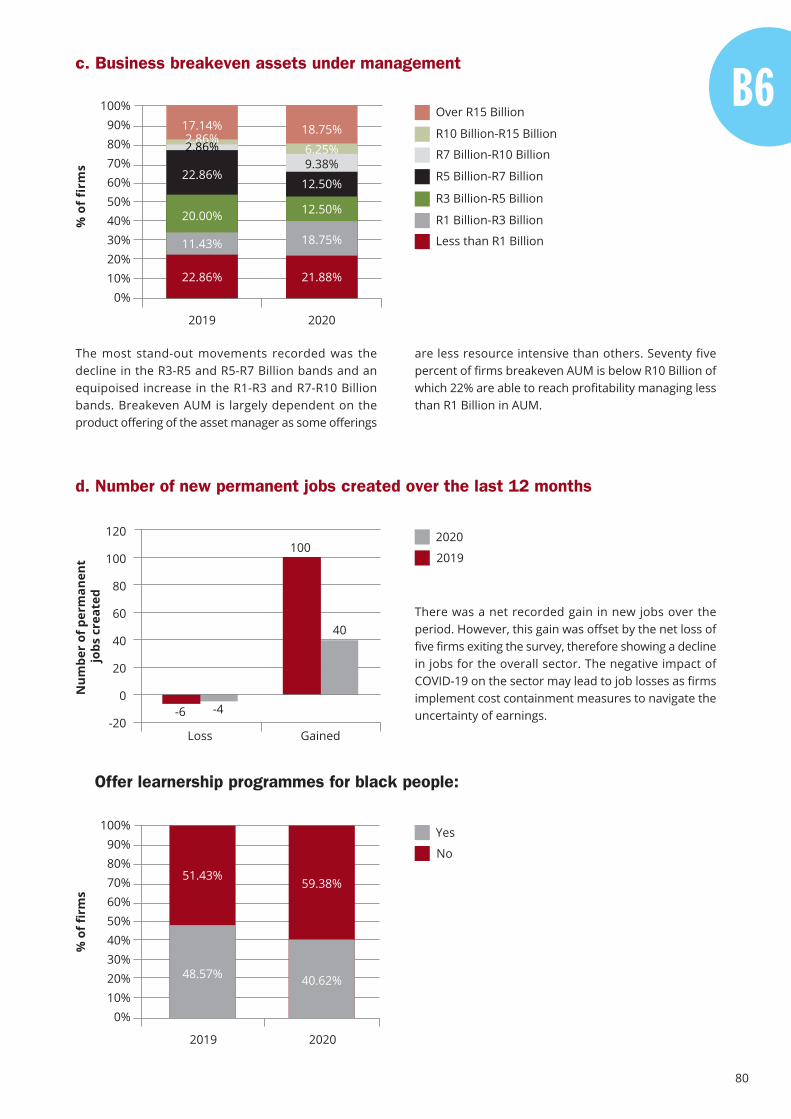
80
The most stand-out movements recorded was thedecline in the R3-R5 and R5-R7 Billion bands and anequipoised increase in the R1-R3 and R7-R10 Billionbands. Breakeven AUM is largely dependent on theproduct offering of the asset manager as some offerings
There was a net recorded gain in new jobs over theperiod. However, this gain was offset by the net loss offive firms exiting the survey, therefore showing a declinein jobs for the overall sector. The negative impact ofCOVID-19 on the sector may lead to job losses as firmsimplement cost containment measures to navigate theuncertainty of earnings.
are less resource intensive than others. Seventy fivepercent of firms breakeven AUM is below R10 Billion ofwhich 22% are able to reach profitability managing lessthan R1 Billion in AUM.
c. Business breakeven assets under management
Over R15 Billion
R10 Billion-R15 Billion
R7 Billion-R10 Billion
R5 Billion-R7 Billion
R3 Billion-R5 Billion
R1 Billion-R3 Billion
Less than R1 Billion
% o
f fi
rms
100%90%80%70%60%50%40%30%20%10%
0%
20202019
18.75%17.14%
6.25%2.86%2.86%
22.86%
20.00%
11.43%
9.38%
12.50%
12.50%
18.75%
d. Number of new permanent jobs created over the last 12 months
Num
ber
of p
erm
anen
t jo
bs c
reat
ed
120
100
80
60
40
20
0
-20Gained
2020
2019
Loss
-6 -4
100
40
Offer learnership programmes for black people:
% o
f fir
ms
100%90%80%70%60%50%40%30%20%10%
0%
20202019
48.57%
59.38%
40.62%
Yes
No
51.43%
22.86% 21.88%
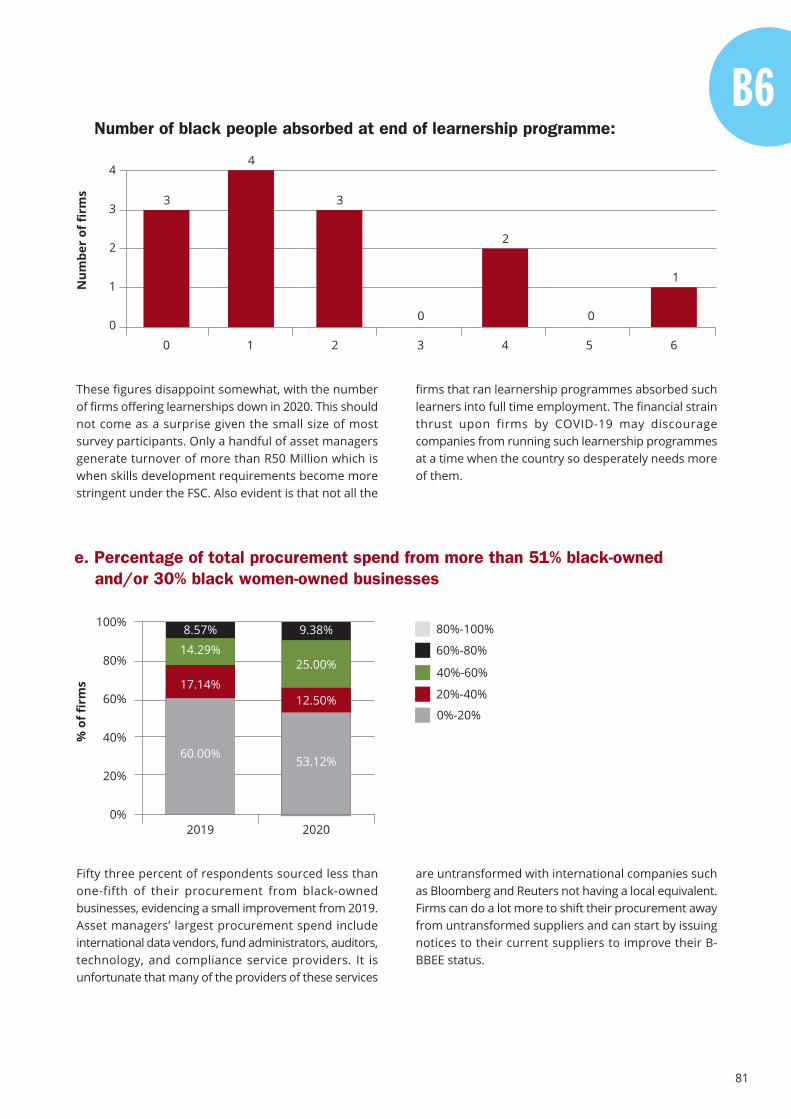
81
These figures disappoint somewhat, with the numberof firms offering learnerships down in 2020. This shouldnot come as a surprise given the small size of mostsurvey participants. Only a handful of asset managersgenerate turnover of more than R50 Million which iswhen skills development requirements become morestringent under the FSC. Also evident is that not all the
Fifty three percent of respondents sourced less thanone-fifth of their procurement from black-ownedbusinesses, evidencing a small improvement from 2019.Asset managers’ largest procurement spend includeinternational data vendors, fund administrators, auditors,technology, and compliance service providers. It isunfortunate that many of the providers of these services
firms that ran learnership programmes absorbed suchlearners into full time employment. The financial strainthrust upon firms by COVID-19 may discouragecompanies from running such learnership programmesat a time when the country so desperately needs moreof them.
are untransformed with international companies suchas Bloomberg and Reuters not having a local equivalent.Firms can do a lot more to shift their procurement awayfrom untransformed suppliers and can start by issuingnotices to their current suppliers to improve their B-BBEE status.
Number of black people absorbed at end of learnership programme:
Num
ber
of fi
rms
4
3
2
1
0
e. Percentage of total procurement spend from more than 51% black-ownedand/or 30% black women-owned businesses
% o
f fir
ms
60%-80%
40%-60%
20%-40%
0%-20%
80%-100%100%
80%
60%
40%
20%
0%
8.57%
14.29%
17.14%
9.38%
25.00%
12.50%
60.00%53.12%
20202019
0 2 3 4
3
4
2
0
1 5 6
3
1
0
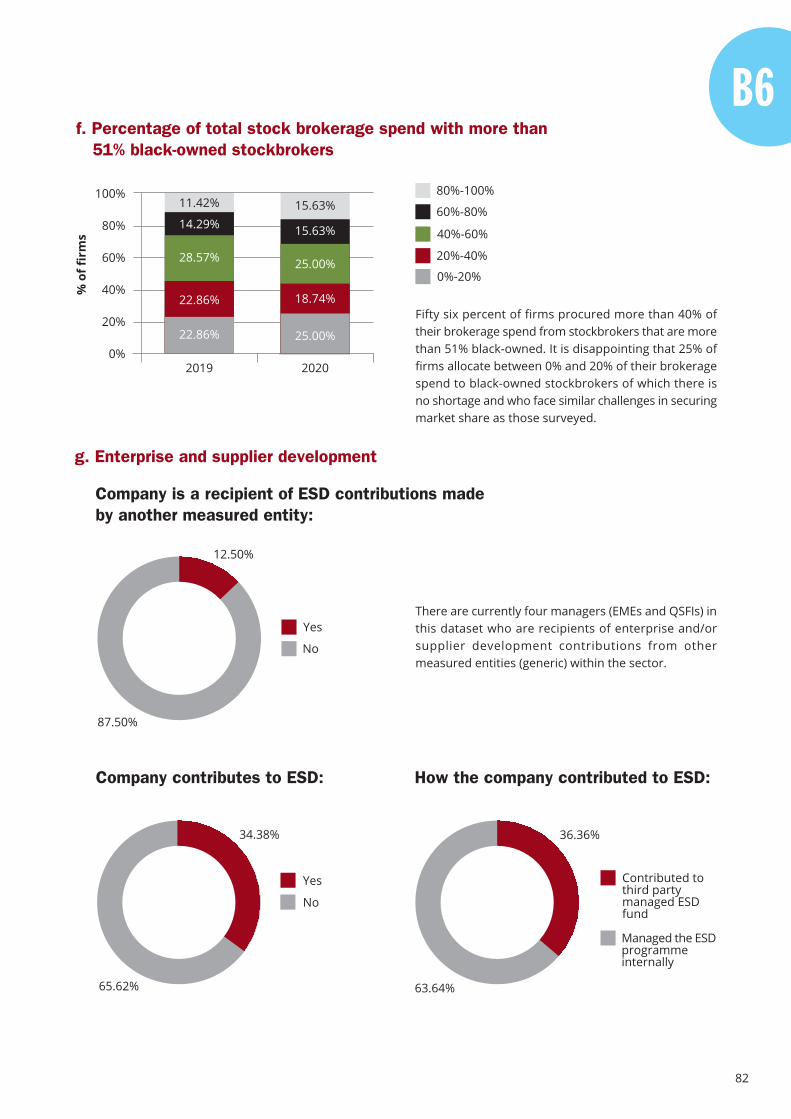
82
Fifty six percent of firms procured more than 40% oftheir brokerage spend from stockbrokers that are morethan 51% black-owned. It is disappointing that 25% offirms allocate between 0% and 20% of their brokeragespend to black-owned stockbrokers of which there isno shortage and who face similar challenges in securingmarket share as those surveyed.
There are currently four managers (EMEs and QSFIs) inthis dataset who are recipients of enterprise and/orsupplier development contributions from othermeasured entities (generic) within the sector.
f. Percentage of total stock brokerage spend with more than51% black-owned stockbrokers
% o
f fir
ms
60%-80%
40%-60%
20%-40%
0%-20%
80%-100%100%
80%
60%
40%
20%
0%
11.42% 15.63%
15.63%14.29%
25.00%
20202019
28.57%
22.86%
22.86%
18.74%
25.00%
g. Enterprise and supplier development
Company is a recipient of ESD contributions madeby another measured entity:
87.50%
12.50%
Yes
No
Company contributes to ESD:
65.62%
34.38%
Yes
No
How the company contributed to ESD:
63.64%
36.36%
Contributed tothird partymanaged ESDfund
Managed the ESDprogrammeinternally
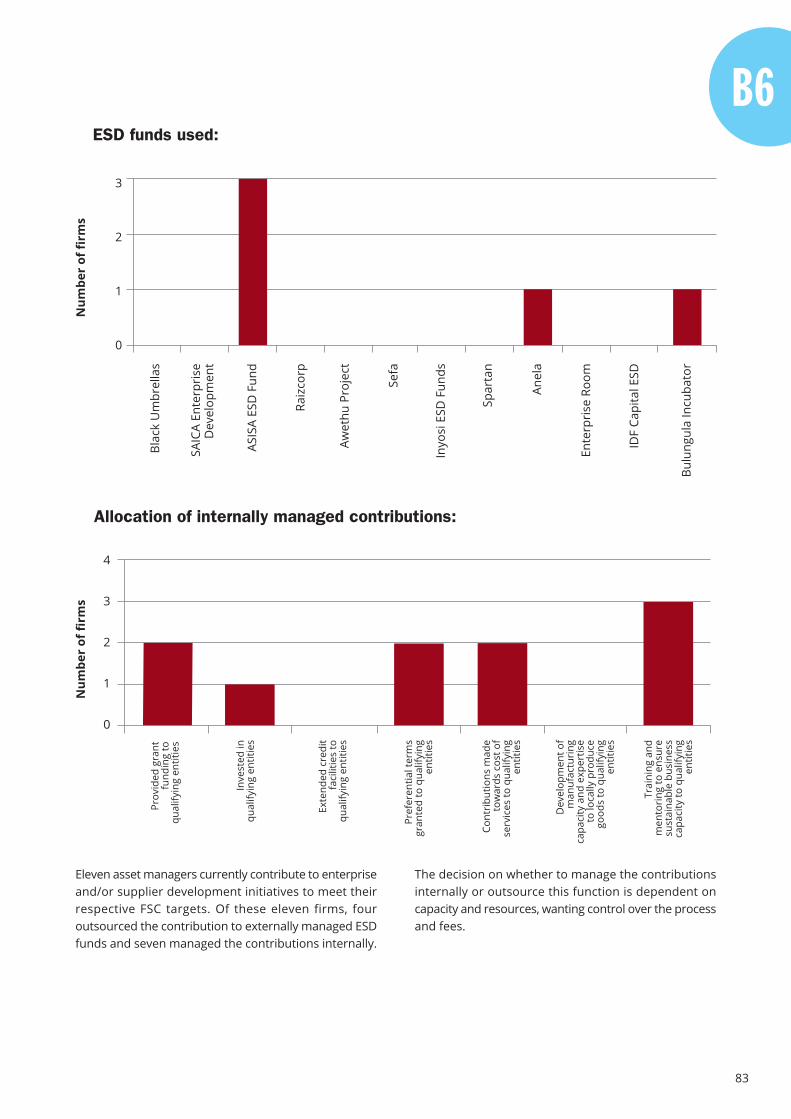
83
Num
ber
of fi
rms
Eleven asset managers currently contribute to enterpriseand/or supplier development initiatives to meet theirrespective FSC targets. Of these eleven firms, fouroutsourced the contribution to externally managed ESDfunds and seven managed the contributions internally.
The decision on whether to manage the contributionsinternally or outsource this function is dependent oncapacity and resources, wanting control over the processand fees.
ESD funds used:
Num
ber
of fi
rms
3
2
1
0Aw
ethu
Pro
ject
Blac
k U
mbr
ella
s
SAIC
A En
terp
rise
Dev
elop
men
t
Raiz
corp
Sefa
ASIS
A ES
D F
und
IDF
Capi
tal E
SD
Inyo
si E
SD F
unds
Spar
tan
Ente
rpri
se R
oom
Bulu
ngul
a In
cuba
tor
Anel
aAllocation of internally managed contributions:
Cont
ribu
tions
mad
eto
war
ds c
ost o
fse
rvic
es to
qua
lifyi
ngen
titie
s
Prov
ided
gra
ntfu
ndin
g to
qual
ifyin
g en
titie
s
Inve
sted
inqu
alify
ing
entit
ies
Pref
eren
tial t
erm
sgr
ante
d to
qua
lifyi
ngen
titie
s
Dev
elop
men
t of
man
ufac
turi
ngca
paci
ty a
nd e
xper
tise
to lo
cally
pro
duce
good
s to
qua
lifyi
ngen
titie
s
Exte
nded
cre
dit
faci
litie
s to
qual
ifyin
g en
titie
s
Trai
ning
and
men
tori
ng to
ens
ure
sust
aina
ble
busi
ness
capa
city
to q
ualif
ying
entit
ies
4
3
2
1
0
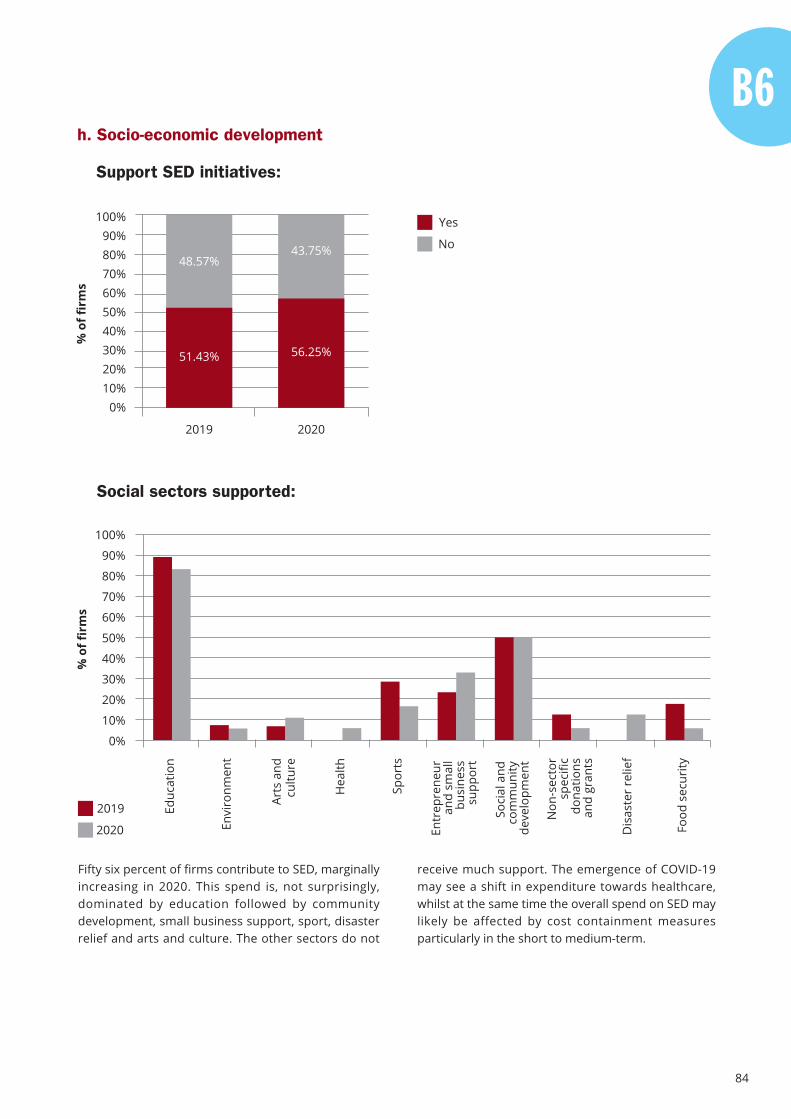
84
Fifty six percent of firms contribute to SED, marginallyincreasing in 2020. This spend is, not surprisingly,dominated by education followed by communitydevelopment, small business support, sport, disasterrelief and arts and culture. The other sectors do not
receive much support. The emergence of COVID-19may see a shift in expenditure towards healthcare,whilst at the same time the overall spend on SED maylikely be affected by cost containment measuresparticularly in the short to medium-term.
h. Socio-economic development
Support SED initiatives:
Yes
No
20202019
% o
f fir
ms
100%90%80%70%60%50%40%30%20%10%
0%
43.75%48.57%
51.43% 56.25%
Social sectors supported:
% o
f fir
ms
100%
90%
80%
70%
60%
50%
40%
30%
20%
10%
0%
Educ
atio
n
Envi
ronm
ent
Arts
and
cultu
re
Hea
lth
Spor
ts
Entr
epre
neur
and
smal
lbu
sine
sssu
ppor
t
Soci
al a
ndco
mm
unity
deve
lopm
ent
Non
-sec
tor
spec
ific
dona
tions
and
gran
ts
Dis
aste
r re
lief
Food
sec
urity
2019
2020
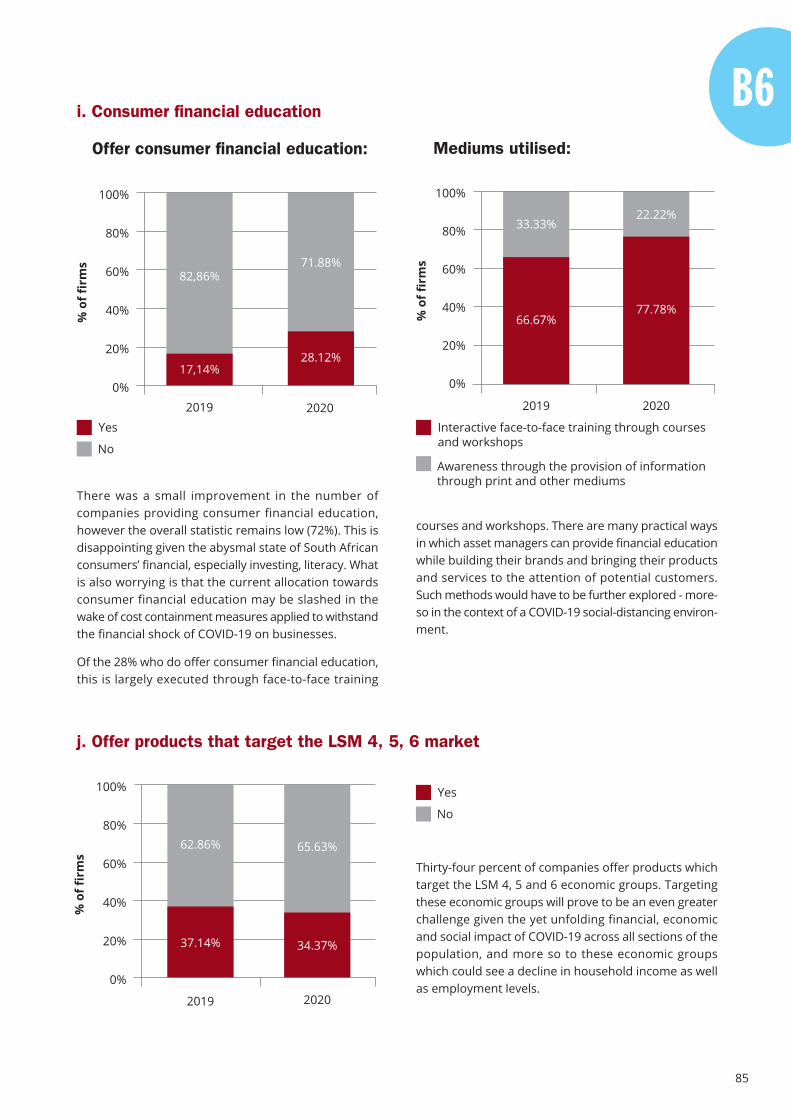
85
There was a small improvement in the number ofcompanies providing consumer financial education,however the overall statistic remains low (72%). This isdisappointing given the abysmal state of South Africanconsumers’ financial, especially investing, literacy. Whatis also worrying is that the current allocation towardsconsumer financial education may be slashed in thewake of cost containment measures applied to withstandthe financial shock of COVID-19 on businesses.
Of the 28% who do offer consumer financial education,this is largely executed through face-to-face training
courses and workshops. There are many practical waysin which asset managers can provide financial educationwhile building their brands and bringing their productsand services to the attention of potential customers.Such methods would have to be further explored - more-so in the context of a COVID-19 social-distancing environ-ment.
i. Consumer financial education
Offer consumer financial education:
% o
f fir
ms
100%
80%
60%
40%
20%
0%
20202019
71.88%
17,14%
82,86%
28.12%
Yes
No
j. Offer products that target the LSM 4, 5, 6 market
% o
f fir
ms
100%
80%
60%
40%
20%
0%
20202019
65.63%
37.14%
62.86%
34.37%
Yes
No
Mediums utilised:
% o
f fir
ms
Interactive face-to-face training through coursesand workshops
Awareness through the provision of informationthrough print and other mediums
100%
80%
60%
40%
20%
0%
20202019
22.22%
66.67%
33.33%
77.78%
Thirty-four percent of companies offer products whichtarget the LSM 4, 5 and 6 economic groups. Targetingthese economic groups will prove to be an even greaterchallenge given the yet unfolding financial, economicand social impact of COVID-19 across all sections of thepopulation, and more so to these economic groupswhich could see a decline in household income as wellas employment levels.
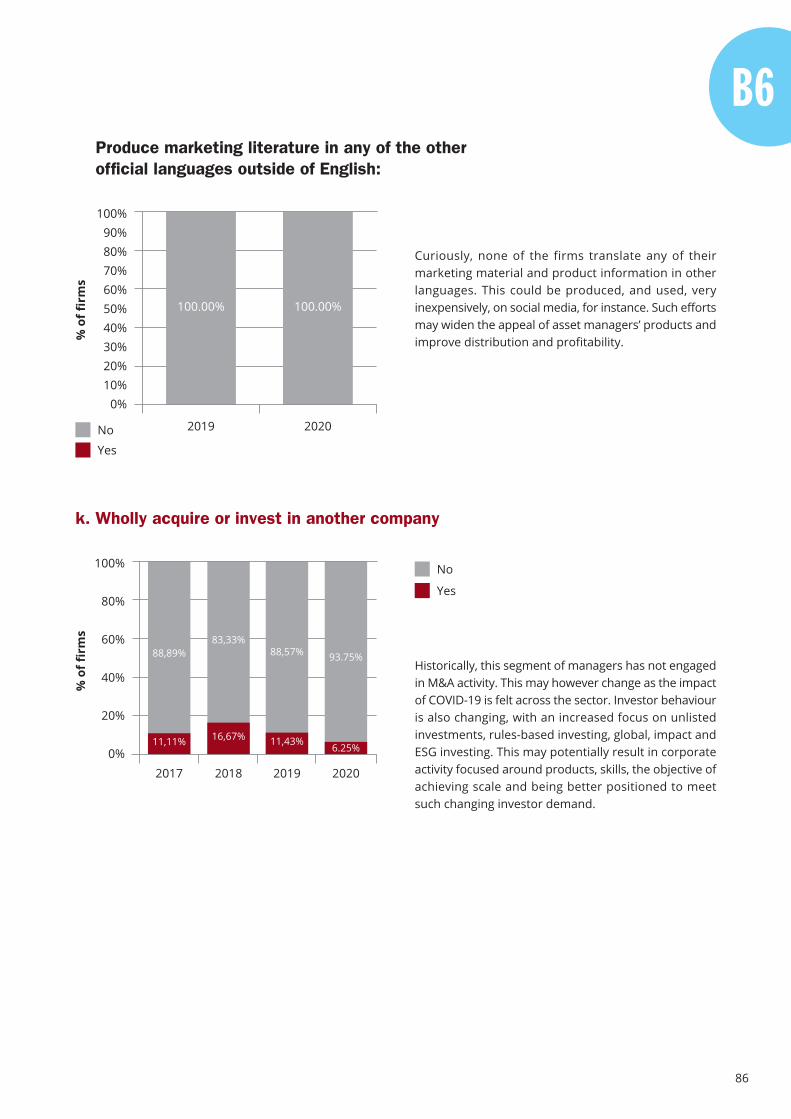
86
Historically, this segment of managers has not engagedin M&A activity. This may however change as the impactof COVID-19 is felt across the sector. Investor behaviouris also changing, with an increased focus on unlistedinvestments, rules-based investing, global, impact andESG investing. This may potentially result in corporateactivity focused around products, skills, the objective ofachieving scale and being better positioned to meetsuch changing investor demand.
Curiously, none of the firms translate any of theirmarketing material and product information in otherlanguages. This could be produced, and used, veryinexpensively, on social media, for instance. Such effortsmay widen the appeal of asset managers’ products andimprove distribution and profitability.
Produce marketing literature in any of the otherofficial languages outside of English:
% o
f fir
ms
Yes
No
100%90%80%70%60%50%40%30%20%10%
0%
20202019
100.00%100.00%
k. Wholly acquire or invest in another company
% o
f fir
ms
Yes
No100%
80%
60%
40%
20%
0%20182017 2019 2020
16,67%11,11% 11,43%
83,33%88,89% 88,57%
6.25%
93.75%
Section highlights
Team
503Total number of people employed, down 14% since 2017
PRIORITYImproving gender representationis a top talent management priorityfor firms
21%Of portfolio managers are women
87
Gender equality
Public markets
5
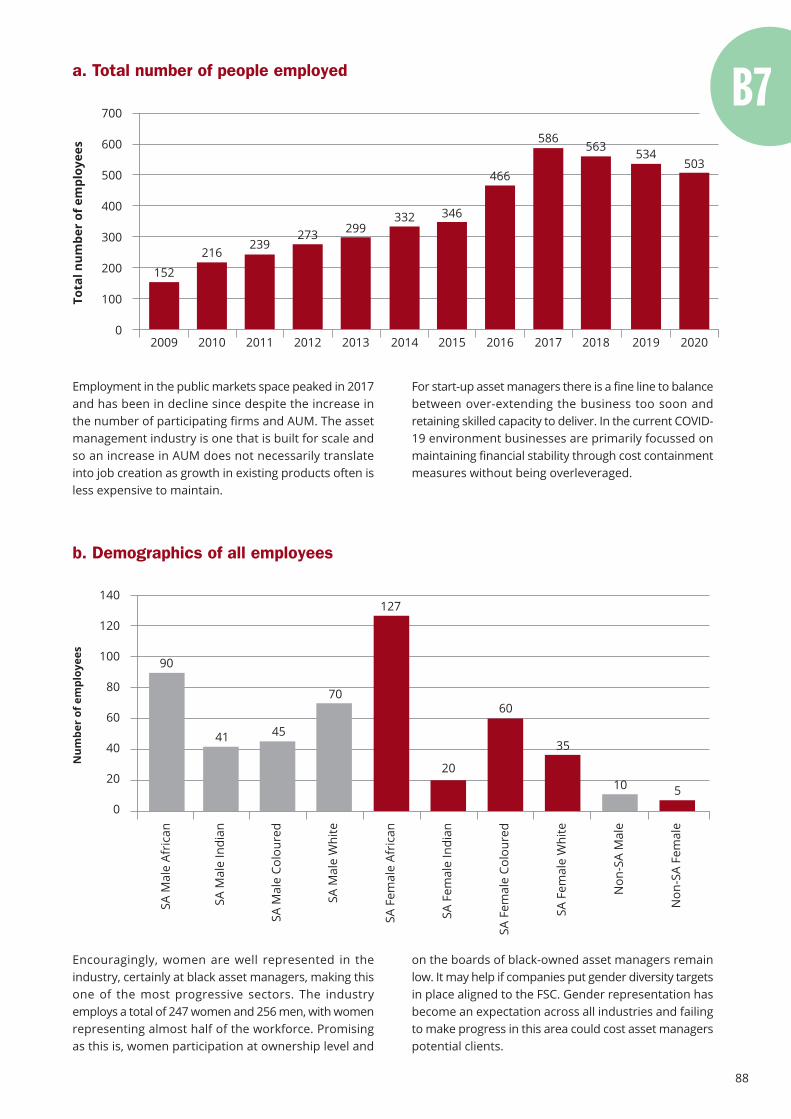
88
Employment in the public markets space peaked in 2017and has been in decline since despite the increase inthe number of participating firms and AUM. The assetmanagement industry is one that is built for scale andso an increase in AUM does not necessarily translateinto job creation as growth in existing products often isless expensive to maintain.
Encouragingly, women are well represented in theindustry, certainly at black asset managers, making thisone of the most progressive sectors. The industryemploys a total of 247 women and 256 men, with womenrepresenting almost half of the workforce. Promisingas this is, women participation at ownership level and
For start-up asset managers there is a fine line to balancebetween over-extending the business too soon andretaining skilled capacity to deliver. In the current COVID-19 environment businesses are primarily focussed onmaintaining financial stability through cost containmentmeasures without being overleveraged.
on the boards of black-owned asset managers remainlow. It may help if companies put gender diversity targetsin place aligned to the FSC. Gender representation hasbecome an expectation across all industries and failingto make progress in this area could cost asset managerspotential clients.
a. Total number of people employedTo
tal n
umbe
r of
em
ploy
ees
2009
700
600
500
400
300
200
100
02010 2011 2012 2013 2014 2015 2016 2017 2018 2019 2020
216239
273 299
466
586563
332
534503
152
346
b. Demographics of all employees
Num
ber
of e
mpl
oyee
s
SA M
ale
Afri
can
SA M
ale
Indi
an
SA M
ale
Colo
ured
SA M
ale
Whi
te
SA F
emal
e Af
rica
n
SA F
emal
e In
dian
SA F
emal
e Co
lour
ed
SA F
emal
e W
hite
Non
-SA
Mal
e
Non
-SA
Fem
ale
140
120
100
80
60
40
20
0
90
41 45
70
127
35
10 5
60
20
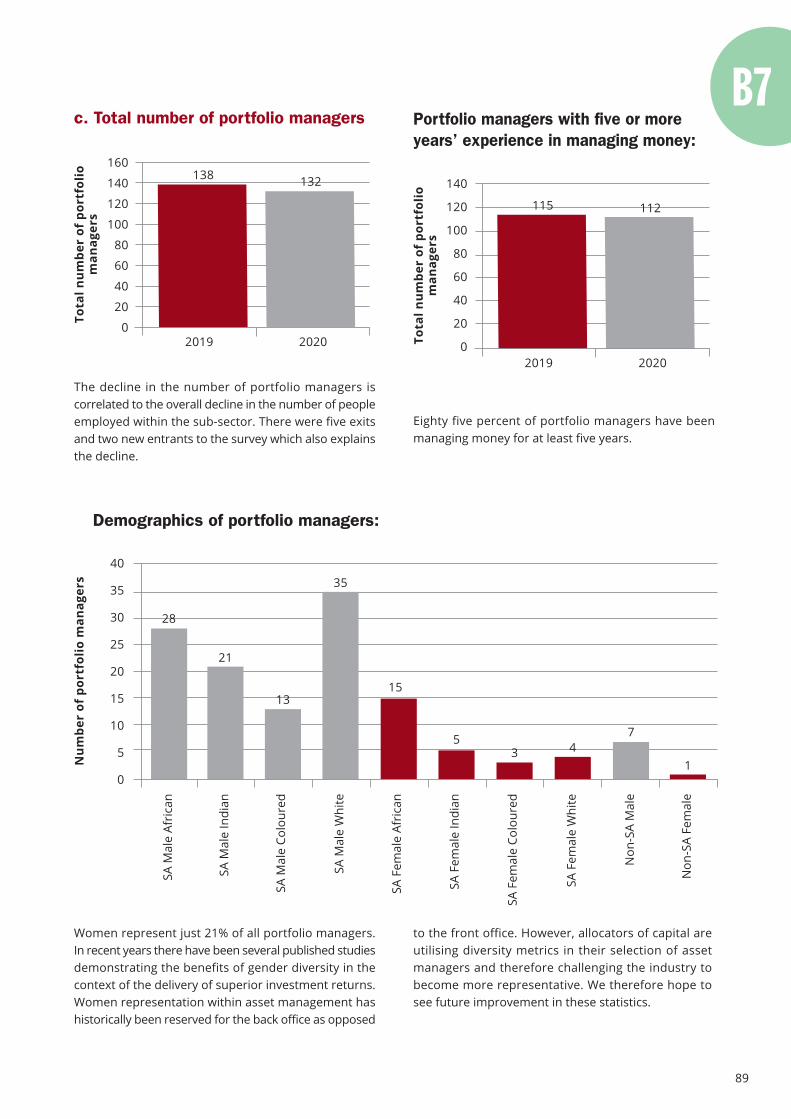
89
Eighty five percent of portfolio managers have beenmanaging money for at least five years.
Women represent just 21% of all portfolio managers.In recent years there have been several published studiesdemonstrating the benefits of gender diversity in thecontext of the delivery of superior investment returns.Women representation within asset management hashistorically been reserved for the back office as opposed
The decline in the number of portfolio managers iscorrelated to the overall decline in the number of peopleemployed within the sub-sector. There were five exitsand two new entrants to the survey which also explainsthe decline.
to the front office. However, allocators of capital areutilising diversity metrics in their selection of assetmanagers and therefore challenging the industry tobecome more representative. We therefore hope tosee future improvement in these statistics.
c. Total number of portfolio managers
Tota
l num
ber
of p
ortf
olio
man
ager
s
160
140
120
100
80
60
40
20
0
138 132
2019 2020
Portfolio managers with five or moreyears’ experience in managing money:
Tota
l num
ber
of p
ortf
olio
man
ager
s
140
120
100
80
60
40
20
0
115 112
2019 2020
Num
ber
of p
ortf
olio
man
ager
s
40
35
30
25
20
15
10
5
0
SA M
ale
Afri
can
SA M
ale
Indi
an
SA M
ale
Whi
te
SA F
emal
e W
hite
Non
-SA
Mal
e
Non
-SA
Fem
ale
SA M
ale
Colo
ured
SA F
emal
e Af
rica
n
SA F
emal
e In
dian
SA F
emal
e Co
lour
ed
28
21
13
35
15
54
7
13
Demographics of portfolio managers:

90
Women currently represent 42% of the analyst poolwhich is double the composition of women in portfoliomanagement. The data intimates a bottleneck forwomen transitioning from analyst to portfolio manager
and requires the industry to take a closer look at theirtalent management efforts and seek mechanisms whichpromote the advancement of gender diversity in profes-sional roles.
d. Total number of investment analysts
Tota
l num
ber
ofin
vest
men
t an
alys
ts
160
140
120
100
80
60
40
20
0
138122
2019 2020
The impact of the fall in overall jobs was hardest felt byanalysts (down 12%) as opposed to portfolio managers.The ratio of analysts to portfolio managers has droppedsince last year and will have to be monitored closely toensure that the talent pipeline and succession planningremains firmly on track and is not in fact a sign of decline.
Demographics of investment analysts:
40
35
30
25
20
15
10
5
0
Num
ber
ofin
vest
men
t an
alys
ts
SA M
ale
Afri
can
SA M
ale
Indi
an
SA M
ale
Colo
ured
SA M
ale
Whi
te
SA F
emal
e Af
rica
n
SA F
emal
e In
dian
SA F
emal
e Co
lour
ed
SA F
emal
e W
hite
Non
-SA
Mal
e
Non
-SA
Fem
ale
35
9
19
33
86
1 13
7
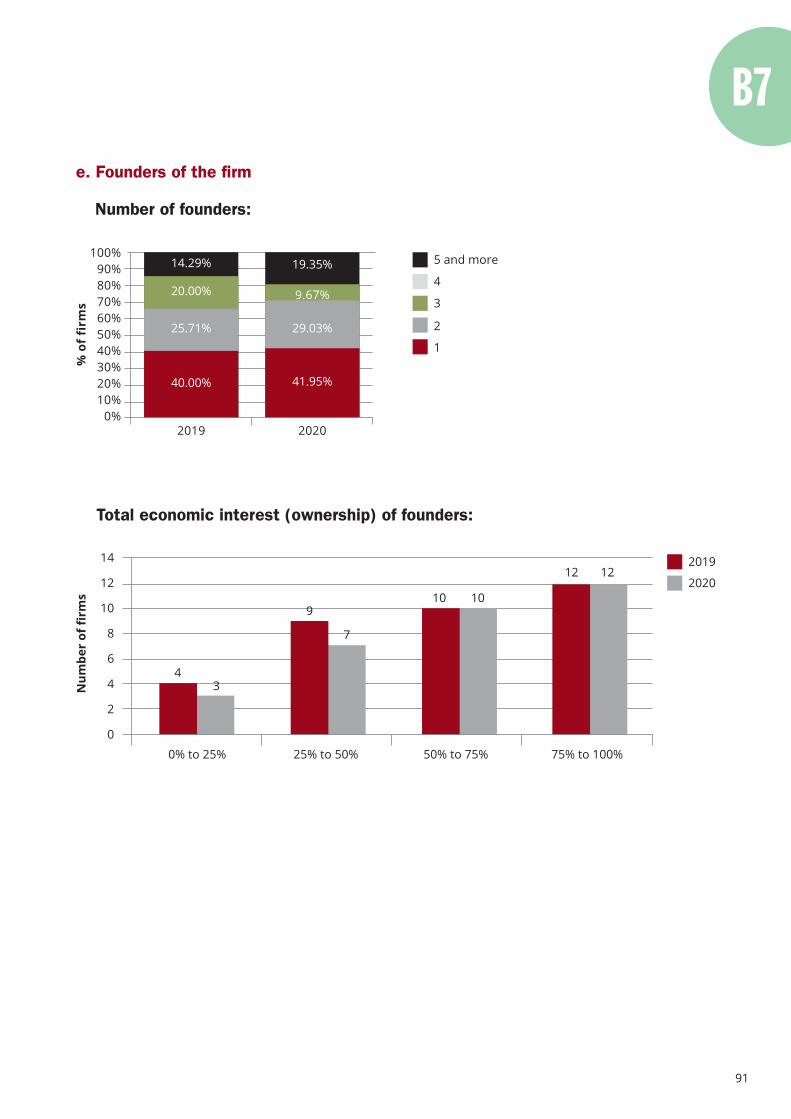
91
e. Founders of the firm
Number of founders:
% o
f fi
rms
Total economic interest (ownership) of founders:
Num
ber
of fi
rms
14
12
10
8
6
4
2
0
0% to 25% 25% to 50% 50% to 75% 75% to 100%
2020
2019
4
910
12
3
7
10
12
100%90%80%70%60%50%40%30%20%10%
0%2019 2020
40.00% 41.95%
25.71% 29.03%
20.00% 9.67%
14.29% 19.35%
2
3
4
5 and more
1
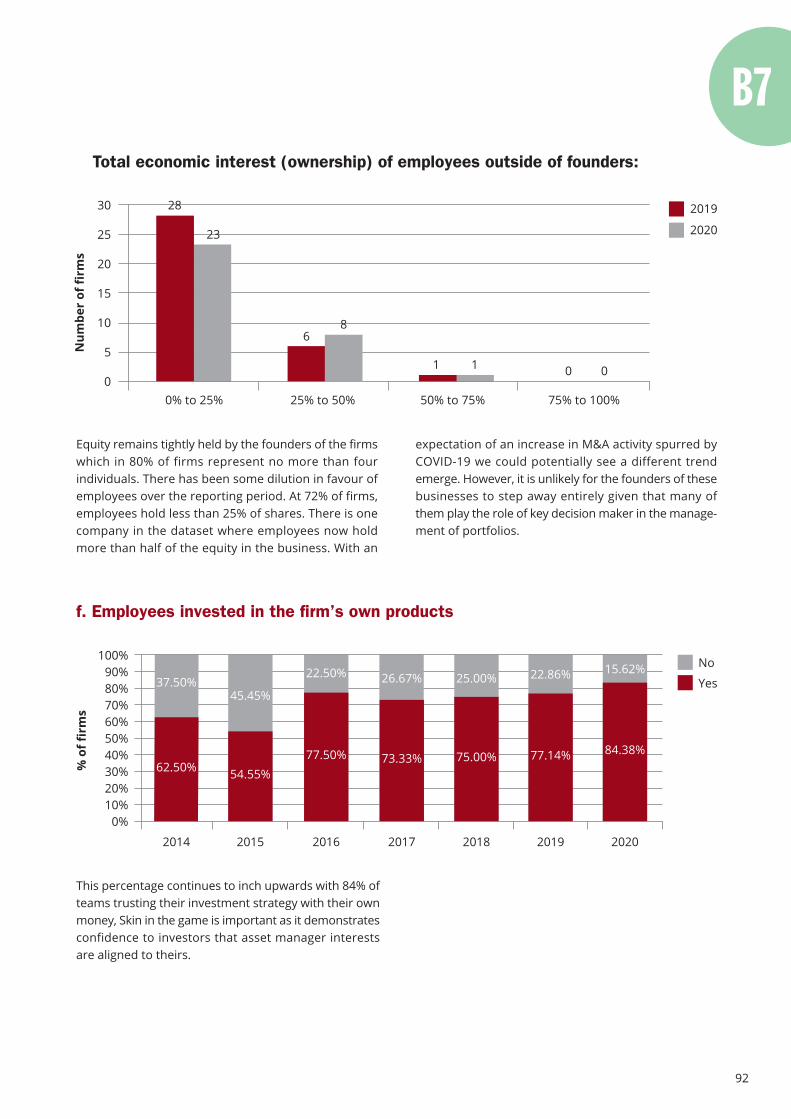
92
This percentage continues to inch upwards with 84% ofteams trusting their investment strategy with their ownmoney, Skin in the game is important as it demonstratesconfidence to investors that asset manager interestsare aligned to theirs.
Equity remains tightly held by the founders of the firmswhich in 80% of firms represent no more than fourindividuals. There has been some dilution in favour ofemployees over the reporting period. At 72% of firms,employees hold less than 25% of shares. There is onecompany in the dataset where employees now holdmore than half of the equity in the business. With an
expectation of an increase in M&A activity spurred byCOVID-19 we could potentially see a different trendemerge. However, it is unlikely for the founders of thesebusinesses to step away entirely given that many ofthem play the role of key decision maker in the manage-ment of portfolios.
Total economic interest (ownership) of employees outside of founders:
Num
ber
of fi
rms
30
25
20
15
10
5
00% to 25% 25% to 50% 50% to 75% 75% to 100%
2020
201928
6
0
23
8
1 0
f. Employees invested in the firm’s own products
% o
f fir
ms
100%90%80%70%60%50%40%30%20%10%
0%
Yes
No
20182014 2015 2017 20192016 2020
75.00%62.50% 54.55%
73.33% 77.14%77.50% 84.38%
25.00%37.50%45.45%
26.67% 22.86%22.50% 15.62%
1
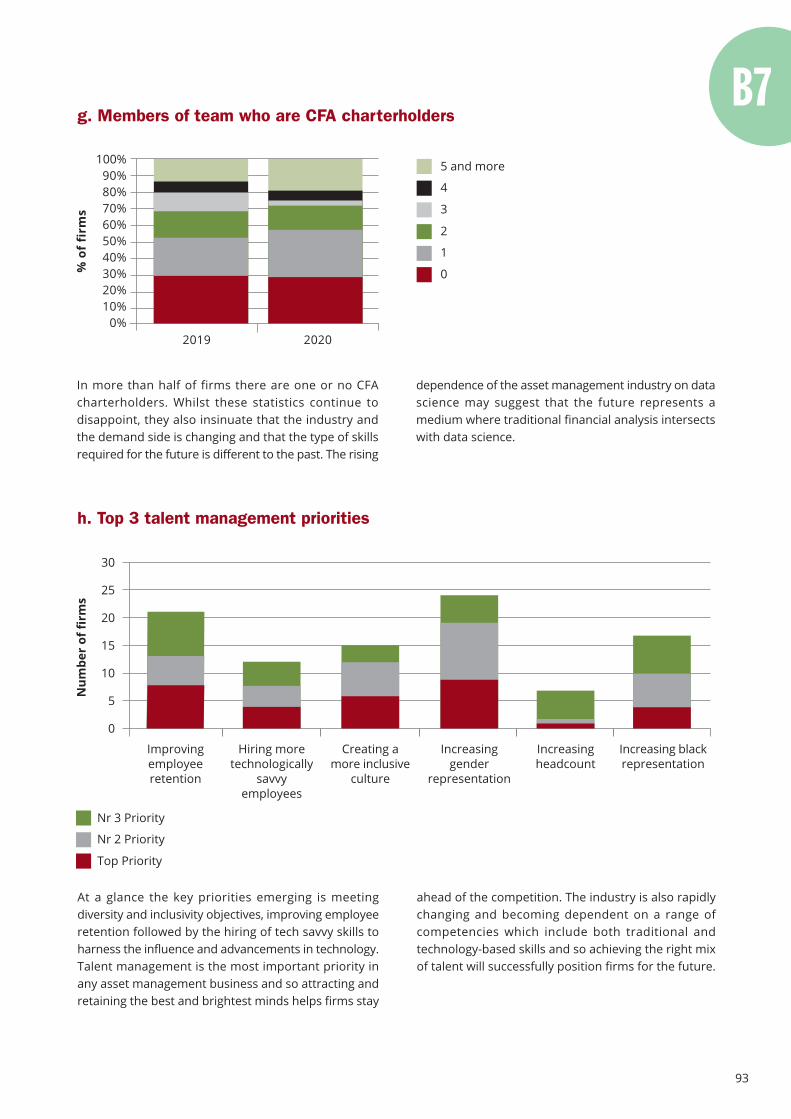
93
At a glance the key priorities emerging is meetingdiversity and inclusivity objectives, improving employeeretention followed by the hiring of tech savvy skills toharness the influence and advancements in technology.Talent management is the most important priority inany asset management business and so attracting andretaining the best and brightest minds helps firms stay
In more than half of firms there are one or no CFAcharterholders. Whilst these statistics continue todisappoint, they also insinuate that the industry andthe demand side is changing and that the type of skillsrequired for the future is different to the past. The rising
dependence of the asset management industry on datascience may suggest that the future represents amedium where traditional financial analysis intersectswith data science.
ahead of the competition. The industry is also rapidlychanging and becoming dependent on a range ofcompetencies which include both traditional andtechnology-based skills and so achieving the right mixof talent will successfully position firms for the future.
g. Members of team who are CFA charterholders
% o
f fi
rms
100%90%80%70%60%50%40%30%20%10%
0%2019 2020
1
2
3
4
0
5 and more
h. Top 3 talent management priorities
30
25
20
15
10
5
0
Num
ber
of fi
rms
Top Priority
Nr 2 Priority
Nr 3 Priority
Increasingheadcount
Improvingemployeeretention
Hiring moretechnologically
savvyemployees
Increasinggender
representation
Increasing blackrepresentation
Creating amore inclusive
culture
11,43%

White labeling | Compliance | Administration | Reporting
www.27four.com [email protected] @27four +27 21 671 2173
94
Don’t let yourbusiness get leftbehind.
95
Life below water
14
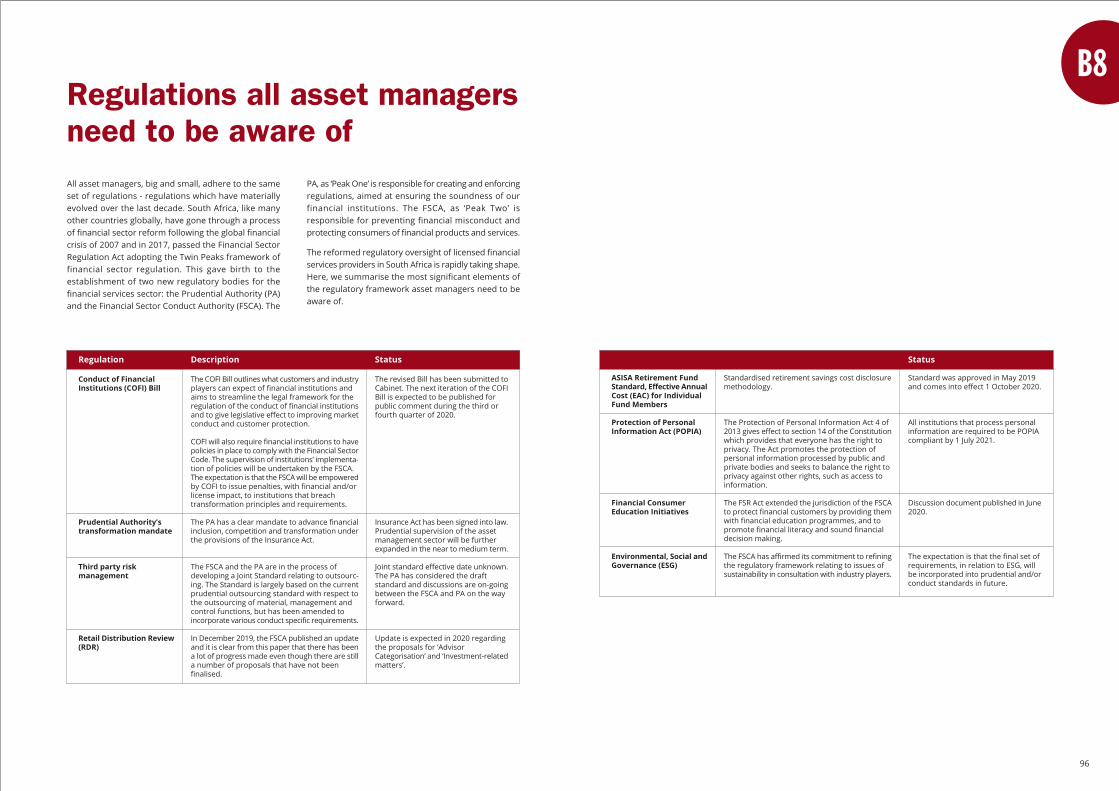
All asset managers, big and small, adhere to the sameset of regulations - regulations which have materiallyevolved over the last decade. South Africa, like manyother countries globally, have gone through a processof financial sector reform following the global financialcrisis of 2007 and in 2017, passed the Financial SectorRegulation Act adopting the Twin Peaks framework offinancial sector regulation. This gave birth to theestablishment of two new regulatory bodies for thefinancial services sector: the Prudential Authority (PA)and the Financial Sector Conduct Authority (FSCA). The
Regulations all asset managersneed to be aware of
PA, as ‘Peak One’ is responsible for creating and enforcingregulations, aimed at ensuring the soundness of ourfinancial institutions. The FSCA, as ‘Peak Two’ isresponsible for preventing financial misconduct andprotecting consumers of financial products and services.
The reformed regulatory oversight of licensed financialservices providers in South Africa is rapidly taking shape.Here, we summarise the most significant elements ofthe regulatory framework asset managers need to beaware of.
Regulation
Conduct of FinancialInstitutions (COFI) Bill
Prudential Authority’stransformation mandate
Third party riskmanagement
Retail Distribution Review(RDR)
Description
The COFI Bill outlines what customers and industryplayers can expect of financial institutions andaims to streamline the legal framework for theregulation of the conduct of financial institutionsand to give legislative effect to improving marketconduct and customer protection.
COFI will also require financial institutions to havepolicies in place to comply with the Financial SectorCode. The supervision of institutions’ implementa-tion of policies will be undertaken by the FSCA.The expectation is that the FSCA will be empoweredby COFI to issue penalties, with financial and/orlicense impact, to institutions that breachtransformation principles and requirements.
The PA has a clear mandate to advance financialinclusion, competition and transformation underthe provisions of the Insurance Act.
The FSCA and the PA are in the process ofdeveloping a Joint Standard relating to outsourc-ing. The Standard is largely based on the currentprudential outsourcing standard with respect tothe outsourcing of material, management andcontrol functions, but has been amended toincorporate various conduct specific requirements.
In December 2019, the FSCA published an updateand it is clear from this paper that there has beena lot of progress made even though there are stilla number of proposals that have not beenfinalised.
Status
The revised Bill has been submitted toCabinet. The next iteration of the COFIBill is expected to be published forpublic comment during the third orfourth quarter of 2020.
Insurance Act has been signed into law.Prudential supervision of the assetmanagement sector will be furtherexpanded in the near to medium term.
Joint standard effective date unknown.The PA has considered the draftstandard and discussions are on-goingbetween the FSCA and PA on the wayforward.
Update is expected in 2020 regardingthe proposals for ‘AdvisorCategorisation’ and ‘Investment-relatedmatters’.
96
Regulation
ASISA Retirement FundStandard, Effective AnnualCost (EAC) for IndividualFund Members
Protection of PersonalInformation Act (POPIA)
Financial ConsumerEducation Initiatives
Environmental, Social andGovernance (ESG)
Description
Standardised retirement savings cost disclosuremethodology.
The Protection of Personal Information Act 4 of2013 gives effect to section 14 of the Constitutionwhich provides that everyone has the right toprivacy. The Act promotes the protection ofpersonal information processed by public andprivate bodies and seeks to balance the right toprivacy against other rights, such as access toinformation.
The FSR Act extended the jurisdiction of the FSCAto protect financial customers by providing themwith financial education programmes, and topromote financial literacy and sound financialdecision making.
The FSCA has affirmed its commitment to refiningthe regulatory framework relating to issues ofsustainability in consultation with industry players.
Status
Standard was approved in May 2019and comes into effect 1 October 2020.
All institutions that process personalinformation are required to be POPIAcompliant by 1 July 2021.
Discussion document published in June2020.
The expectation is that the final set ofrequirements, in relation to ESG, willbe incorporated into prudential and/orconduct standards in future.
Complianceand operations
Section highlights
81%Of firms outsource compliance
19%Of firms have an internal audit function
50%Of firms hold < R20 Million Crime and Civil Liability cover
16%Of firms are covered for cyber risk
PREFERREDMaitland Fund Services is the most preferred fund administrator
97
Quality education
Public markets
4
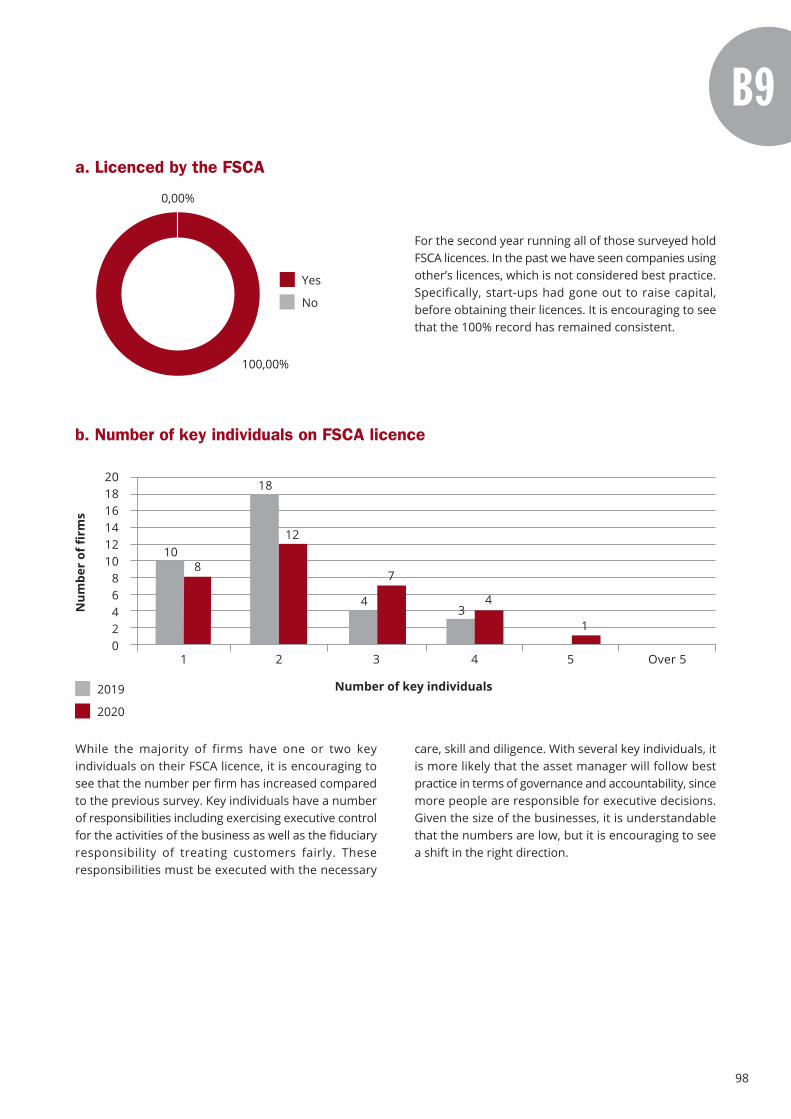
98
For the second year running all of those surveyed holdFSCA licences. In the past we have seen companies usingother’s licences, which is not considered best practice.Specifically, start-ups had gone out to raise capital,before obtaining their licences. It is encouraging to seethat the 100% record has remained consistent.
While the majority of firms have one or two keyindividuals on their FSCA licence, it is encouraging tosee that the number per firm has increased comparedto the previous survey. Key individuals have a numberof responsibilities including exercising executive controlfor the activities of the business as well as the fiduciaryresponsibility of treating customers fairly. Theseresponsibilities must be executed with the necessary
care, skill and diligence. With several key individuals, itis more likely that the asset manager will follow bestpractice in terms of governance and accountability, sincemore people are responsible for executive decisions.Given the size of the businesses, it is understandablethat the numbers are low, but it is encouraging to seea shift in the right direction.
a. Licenced by the FSCA
100,00%
0,00%
Yes
No
b. Number of key individuals on FSCA licence
1
Num
ber
of fi
rms
201816141210
86420
Number of key individuals2019
2020
52 4 Over 53
10
18
34
8
12
4
7
1
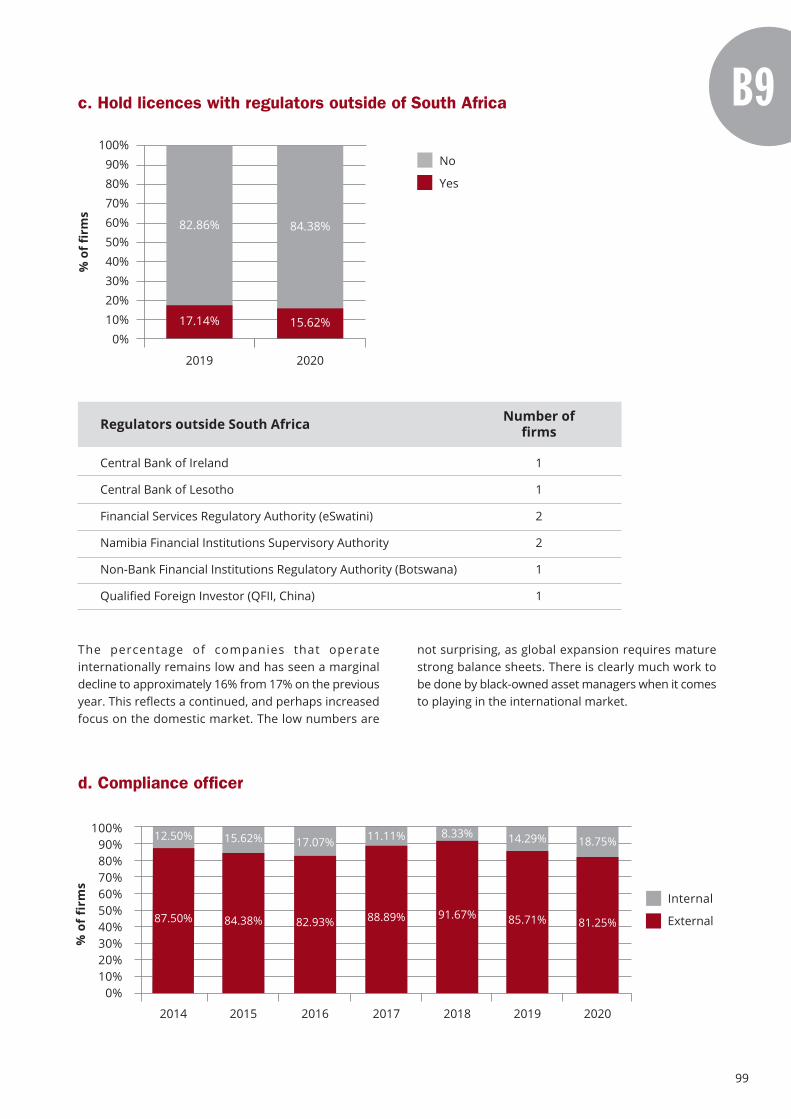
99
The percentage of companies that operateinternationally remains low and has seen a marginaldecline to approximately 16% from 17% on the previousyear. This reflects a continued, and perhaps increasedfocus on the domestic market. The low numbers are
not surprising, as global expansion requires maturestrong balance sheets. There is clearly much work tobe done by black-owned asset managers when it comesto playing in the international market.
c. Hold licences with regulators outside of South Africa%
of f
irm
s
100%90%80%70%60%50%40%30%20%10%
0%
20202019
17.14% 15.62%
No
Yes
82.86% 84.38%
Central Bank of Ireland
Central Bank of Lesotho
Financial Services Regulatory Authority (eSwatini)
Namibia Financial Institutions Supervisory Authority
Non-Bank Financial Institutions Regulatory Authority (Botswana)
Qualified Foreign Investor (QFII, China)
Regulators outside South Africa Number offirms
1
1
2
2
1
1
d. Compliance officer
% o
f fi
rms
100%90%80%70%60%50%40%30%20%10%
0%
External
Internal
20182014 2015 2017 20192016 2020
91.67%87.50% 84.38% 88.89% 85.71%82.93% 81.25%
8.33%12.50% 15.62% 11.11% 14.29%17.07% 18.75%

100
Our 2020 survey shows an increase to 19% of companieswith internal compliance officers, a 4% improvementsince 2019. The low percentage of black-owned assetmanagers that have internal compliance officers isconsistent with the make-up of this universe of managerswhere the large managers with scale and multiplelicences have appointed full-time compliance officerswhereas the smaller managers have outsourced thisfunction.
SNG Grant Thornton remains the single largestappointed auditor in the black-owned asset managementsegment. New entrants to this list include EY andIntegritas Auditors & Chartered Accountants. Smallerfirms are fee sensitive and seek to achieve an optimalbalance between costs, auditor reputation and capabilityas well as meeting their preferential procurement objec-tives.
There has been a steady decline in the use of the big 4following a number of high-profile corporate scandals.The asset management sector should lead by exampleand apply the same ESG principles to which they holdinvestee companies accountable when it comes to audittenure and the independence of audit partners.
Managers seeking to transform their supply chains donot have many options as there are a limited numberof black-owned external compliance officers, reflectinga potential black skills deficit in the compliance officerprofession. Managers who do outsource theircompliance function to such untransformed firms shouldpush for greater diversity in the teams that service them.
Compli-Serve SA
The Corporate Counsel
eComply
Independent Compliance Services
Moonstone Compliance
Outsourced Compliance Services
Simply Comply
External compliance officers Number of firms
e. External auditor
4
1
4
1
1
1
2
3
1
1
1
2
2
1
1
6
BDO
Certified Master Auditors
Deloitte
Exceed Johannesburg
EY
Integritas Auditors & CharteredAccountants
KPMG
Mazars
Moore
Nexia SAB&T
PKF
PwC
Reliable Accountants
RSM
RWFC
SNG Grant Thornton
Number offirmsExternal auditors
4
1
5
10
4
1
1
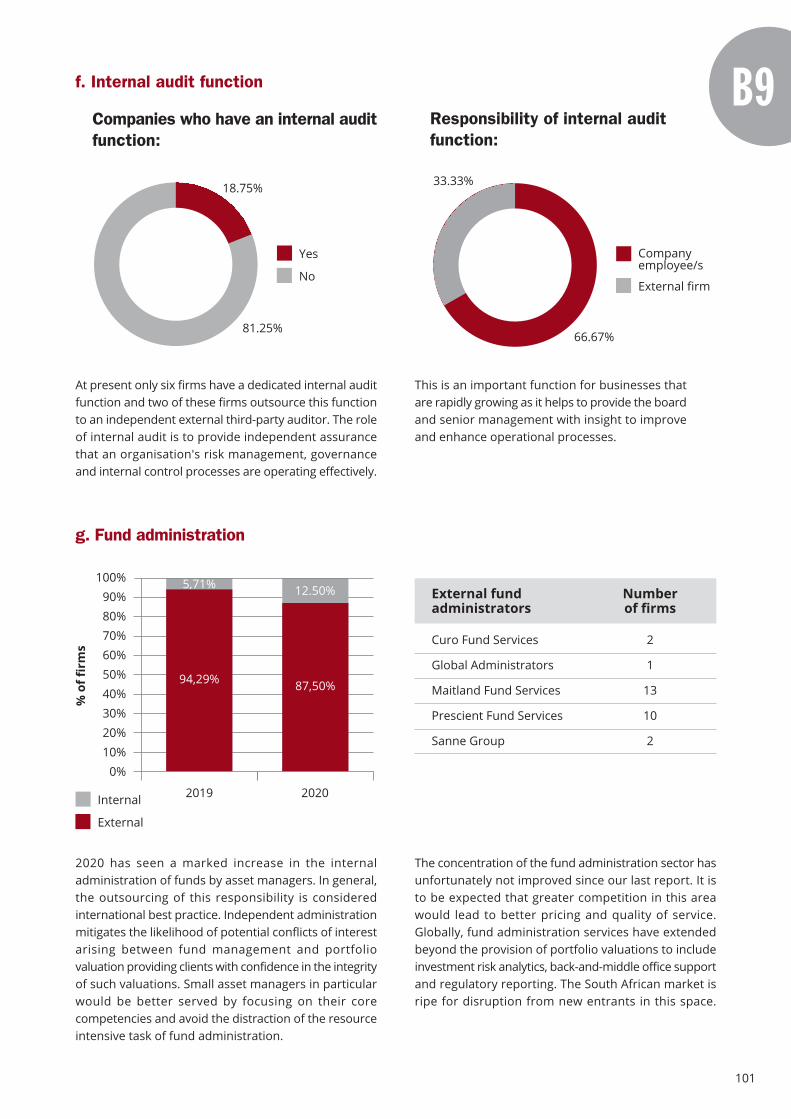
101
At present only six firms have a dedicated internal auditfunction and two of these firms outsource this functionto an independent external third-party auditor. The roleof internal audit is to provide independent assurancethat an organisation's risk management, governanceand internal control processes are operating effectively.
2020 has seen a marked increase in the internaladministration of funds by asset managers. In general,the outsourcing of this responsibility is consideredinternational best practice. Independent administrationmitigates the likelihood of potential conflicts of interestarising between fund management and portfoliovaluation providing clients with confidence in the integrityof such valuations. Small asset managers in particularwould be better served by focusing on their corecompetencies and avoid the distraction of the resourceintensive task of fund administration.
The concentration of the fund administration sector hasunfortunately not improved since our last report. It isto be expected that greater competition in this areawould lead to better pricing and quality of service.Globally, fund administration services have extendedbeyond the provision of portfolio valuations to includeinvestment risk analytics, back-and-middle office supportand regulatory reporting. The South African market isripe for disruption from new entrants in this space.
f. Internal audit function
Companies who have an internal auditfunction:
81.25%
18.75%
Yes
No
Responsibility of internal auditfunction:
33.33%
66.67%
Companyemployee/s
External firm
g. Fund administration
% o
f fir
ms
100%90%80%70%60%50%40%30%20%10%
0%
20202019
5,71%
Internal
External
94,29%
12.50%
87,50%
Curo Fund Services
Global Administrators
Maitland Fund Services
Prescient Fund Services
Sanne Group
Numberof firms
External fundadministrators
2
1
13
10
2
This is an important function for businesses thatare rapidly growing as it helps to provide the boardand senior management with insight to improveand enhance operational processes.

102
The two consecutive years of 100% compliance in termsof insurance cover is good news. In previous years wehave noted that several start-ups only bought insuranceafter they had raised AUM. On the downside, there arestill no black-owned insurers that asset managers can
turn to. Insurance pricing remains stubbornly high. Webelieve this is an area that the authorities should payattention to, with the aim of promoting greatercompetition and diversity in the industry.
h. Crime and civil liability and directors and officers liability insurance
Firms holding cover:
% o
f fi
rms
100%90%80%70%60%50%40%30%20%10%
0%
No
Yes
20182014 2015 2017 20192016 2020
97.92%
68.75% 74.19%93.33% 100.00%
90.00%100.00%
2.08%
31.25% 25.81%6.67%10.00%
Crime and Civil Liability
AIG
Camargue
Hollard
Lombard Insurance
Marsh
Mutual and Federal
Santam
Southern Cross
Stalker Hutchison Admiral
Zurich
7
6
3
2
1
1
5
0
5
2
Insurance providers Directors and Officers Liability
5
6
3
0
1
1
6
0
5
2

103
In previous editions we focused on the level of insurancecoverage as a percentage of firm AUM and groupedfirms, based on their cover, within bands of 0%-2%, 2%-4% and >4%. However, the bands were too wide anddid not provide sufficient insight into the level of coverheld by the dataset. Many firms grapple with determiningwhat insurance coverage they should have given thelimited guidance provided by insurance companies andthe regulator. We hope that by publishing the Randvalue of cover held by this group of managers it willserve as an industry benchmark against which firmscan measure themselves.
A key observation from the data is that managers holddifferent levels of cover for the two types of insurance.Around 40% of firms hold the minimum cover as isrequired by the FSCA. A little under 20% of firms holdmore than R100m cover across both insurancecategories.
Our previous report identified the emergence of cyber-attacks as a major threat facing financial institutions.Unfortunately, the companies surveyed this year indicatea decrease in the number of firms who have cyber-riskinsurance - down by almost 5% from the already lowbase of 20%. Having adequate measures in place to
prevent and respond to cybersecurity breaches shouldbe a priority especially as the use of data and technologysolutions expand. Hence the decline is disappointing.Possible reasons for the trend may include a lack ofawareness of the risk, and possibly the expense of thistype of insurance cover.
Rand value of annual cover:
R100m - 200m
R200m - 300m
R300m - 400m
R400m - 500m
>500m
R1m - 10m
R10m - 20m
R20m - 50m
R50m - 100m
% o
f fir
ms
Directors andOfficers Liability
Crime and CivilLiability
100%
90%
80%
70%
60%
50%
40%
30%
20%
10%
0%
40.63%
9.38%
18.75%
12.50%
6.25%
6.25%3.13%
3.13%
37.93%
20.69%
13.79%
10.34%
3.45%3.45%
3.45%6.90%
i. Cyber risk insurance
Firms holding cover:
No
Yes
% o
f fir
ms
100%90%80%70%60%50%40%30%20%10%
0%
20202019
80.00%
20.00%
84.38%
15.62%
2
2
1
ITOO
Camargue
Allianz Global Corporate andSpecialty SA
Numberof firmsInsurance providers
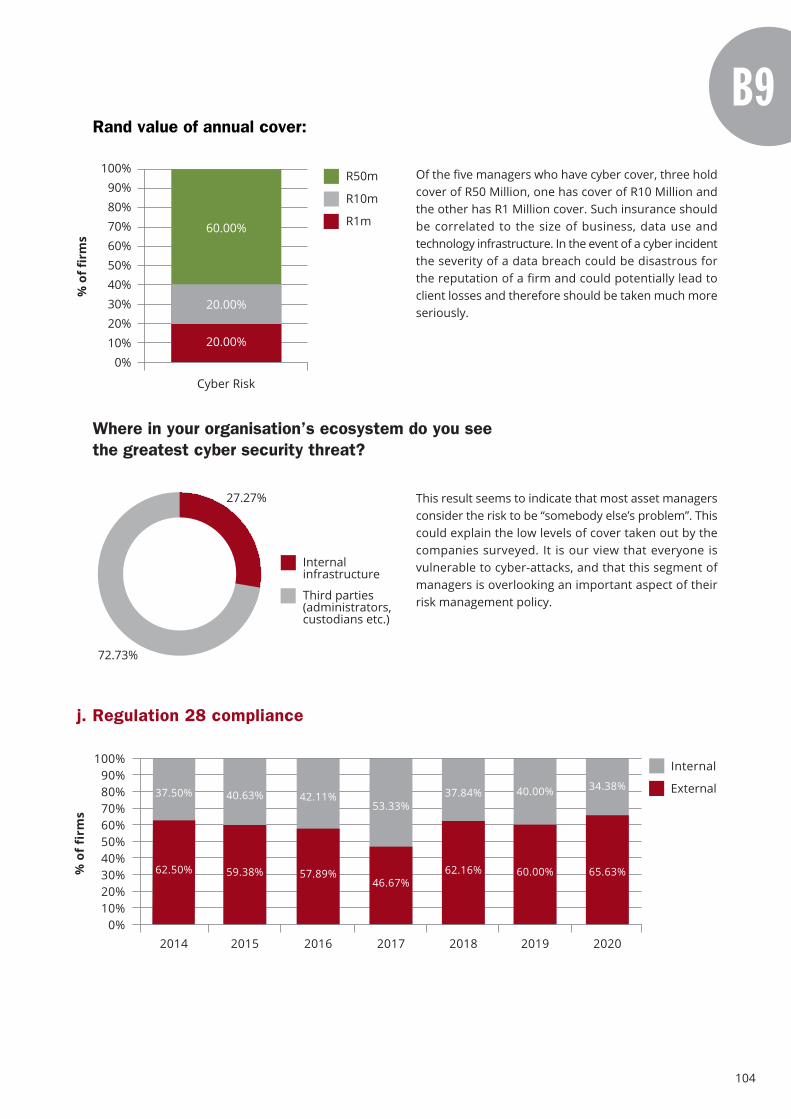
104
Of the five managers who have cyber cover, three holdcover of R50 Million, one has cover of R10 Million andthe other has R1 Million cover. Such insurance shouldbe correlated to the size of business, data use andtechnology infrastructure. In the event of a cyber incidentthe severity of a data breach could be disastrous forthe reputation of a firm and could potentially lead toclient losses and therefore should be taken much moreseriously.
This result seems to indicate that most asset managersconsider the risk to be “somebody else’s problem”. Thiscould explain the low levels of cover taken out by thecompanies surveyed. It is our view that everyone isvulnerable to cyber-attacks, and that this segment ofmanagers is overlooking an important aspect of theirrisk management policy.
% o
f fir
ms
100%90%80%70%60%50%40%30%20%10%
0%
Cyber Risk
R1m
R10m
Rand value of annual cover:
R50m
60.00%
20.00%
20.00%
Where in your organisation’s ecosystem do you seethe greatest cyber security threat?
72.73%
27.27%
Internalinfrastructure
Third parties(administrators,custodians etc.)
j. Regulation 28 compliance
100%90%80%70%60%50%40%30%20%10%
0%
% o
f fi
rms
External
Internal
20182014 2015 2017 20192016 2020
62.16%62.50% 59.38%46.67%
60.00%57.89% 65.63%
37.84%37.50% 40.63%53.33%
40.00%42.11%34.38%
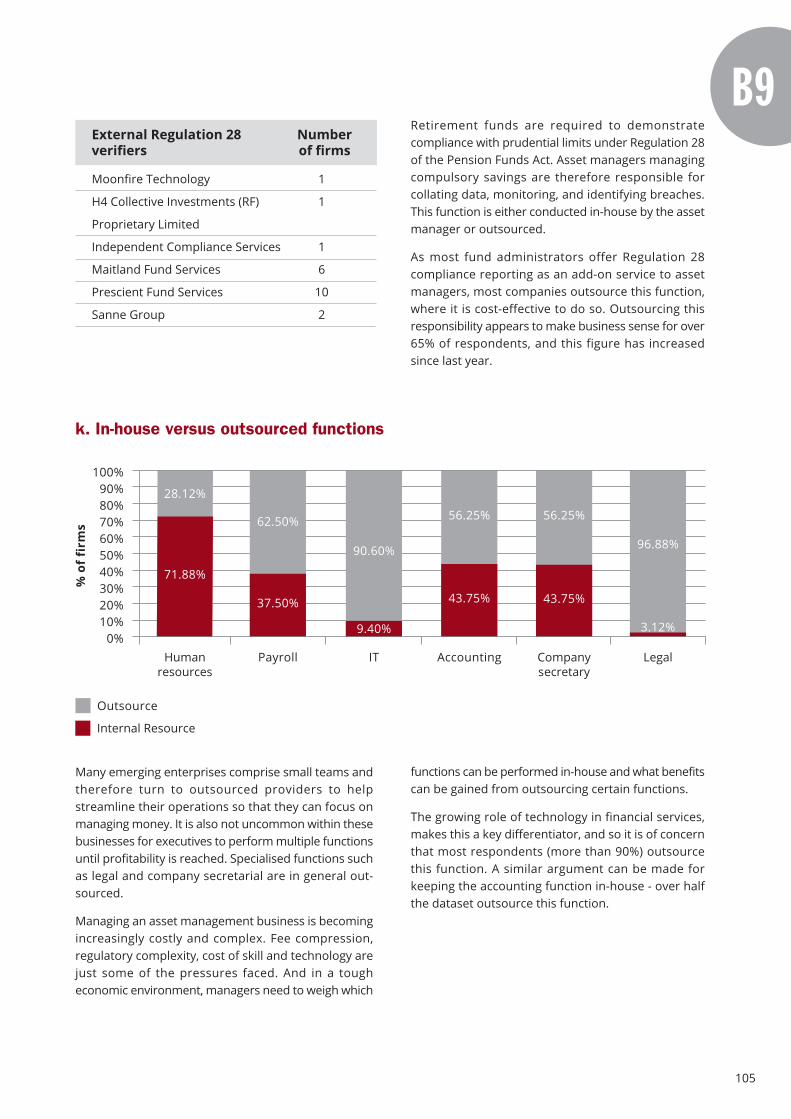
105
Retirement funds are required to demonstratecompliance with prudential limits under Regulation 28of the Pension Funds Act. Asset managers managingcompulsory savings are therefore responsible forcollating data, monitoring, and identifying breaches.This function is either conducted in-house by the assetmanager or outsourced.
As most fund administrators offer Regulation 28compliance reporting as an add-on service to assetmanagers, most companies outsource this function,where it is cost-effective to do so. Outsourcing thisresponsibility appears to make business sense for over65% of respondents, and this figure has increasedsince last year.
Many emerging enterprises comprise small teams andtherefore turn to outsourced providers to helpstreamline their operations so that they can focus onmanaging money. It is also not uncommon within thesebusinesses for executives to perform multiple functionsuntil profitability is reached. Specialised functions suchas legal and company secretarial are in general out-sourced.
Managing an asset management business is becomingincreasingly costly and complex. Fee compression,regulatory complexity, cost of skill and technology arejust some of the pressures faced. And in a tougheconomic environment, managers need to weigh which
functions can be performed in-house and what benefitscan be gained from outsourcing certain functions.
The growing role of technology in financial services,makes this a key differentiator, and so it is of concernthat most respondents (more than 90%) outsourcethis function. A similar argument can be made forkeeping the accounting function in-house - over halfthe dataset outsource this function.
Moonfire Technology
H4 Collective Investments (RF)
Proprietary Limited
Independent Compliance Services
Maitland Fund Services
Prescient Fund Services
Sanne Group
Numberof firms
External Regulation 28verifiers
1
1
1
6
10
2
k. In-house versus outsourced functions
100%90%80%70%60%50%40%30%20%10%
0%
% o
f fi
rms
Internal Resource
Outsource
Companysecretary
Humanresources
Payroll Accounting LegalIT
43.75%
71.88%
37.50% 43.75%
3.12%9.40%
56.25%
28.12%
62.50% 56.25%
96.88%90.60%
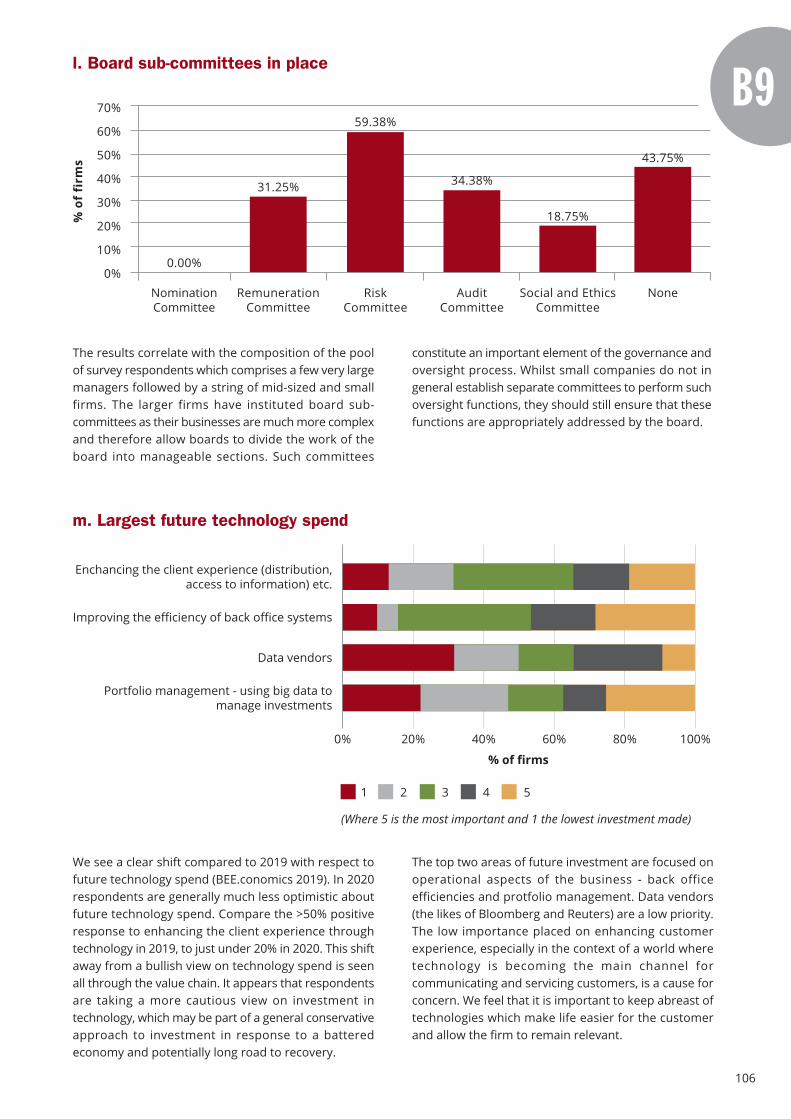
106
The results correlate with the composition of the poolof survey respondents which comprises a few very largemanagers followed by a string of mid-sized and smallfirms. The larger firms have instituted board sub-committees as their businesses are much more complexand therefore allow boards to divide the work of theboard into manageable sections. Such committees
We see a clear shift compared to 2019 with respect tofuture technology spend (BEE.conomics 2019). In 2020respondents are generally much less optimistic aboutfuture technology spend. Compare the >50% positiveresponse to enhancing the client experience throughtechnology in 2019, to just under 20% in 2020. This shiftaway from a bullish view on technology spend is seenall through the value chain. It appears that respondentsare taking a more cautious view on investment intechnology, which may be part of a general conservativeapproach to investment in response to a batteredeconomy and potentially long road to recovery.
constitute an important element of the governance andoversight process. Whilst small companies do not ingeneral establish separate committees to perform suchoversight functions, they should still ensure that thesefunctions are appropriately addressed by the board.
The top two areas of future investment are focused onoperational aspects of the business - back officeefficiencies and protfolio management. Data vendors(the likes of Bloomberg and Reuters) are a low priority.The low importance placed on enhancing customerexperience, especially in the context of a world wheretechnology is becoming the main channel forcommunicating and servicing customers, is a cause forconcern. We feel that it is important to keep abreast oftechnologies which make life easier for the customerand allow the firm to remain relevant.
l. Board sub-committees in place
70%
60%
50%
40%
30%
20%
10%
0%
% o
f fi
rms
Social and EthicsCommittee
NominationCommittee
RemunerationCommittee
AuditCommittee
NoneRiskCommittee
18.75%
0.00%
31.25% 34.38%
43.75%
59.38%
m. Largest future technology spend
Portfolio management - using big data tomanage investments
Enchancing the client experience (distribution,access to information) etc.
Improving the efficiency of back office systems
Data vendors
(Where 5 is the most important and 1 the lowest investment made)
1 2 3 4 5
0% 20% 40% 60% 80% 100%
% of firms
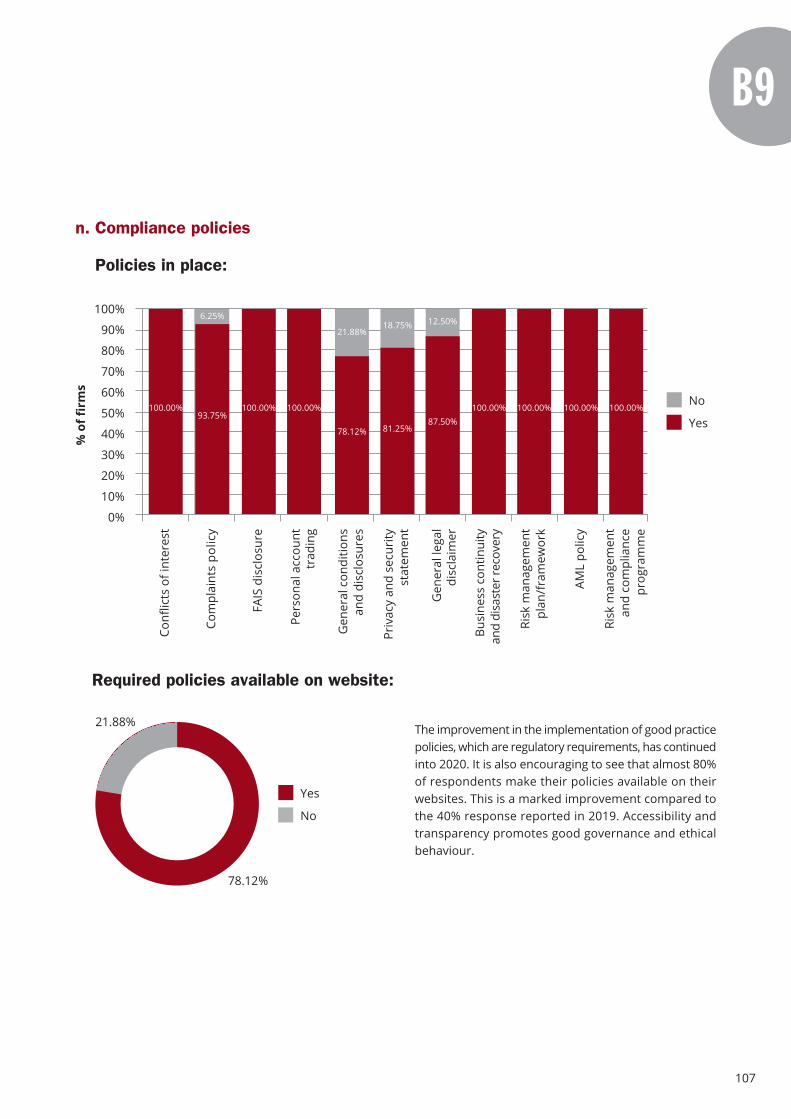
107
The improvement in the implementation of good practicepolicies, which are regulatory requirements, has continuedinto 2020. It is also encouraging to see that almost 80%of respondents make their policies available on theirwebsites. This is a marked improvement compared tothe 40% response reported in 2019. Accessibility andtransparency promotes good governance and ethicalbehaviour.
% o
f fir
ms
Com
plai
nts
polic
y
FAIS
dis
clos
ure
Pers
onal
acc
ount
trad
ing
Gen
eral
con
ditio
nsan
d di
sclo
sure
s
Gen
eral
lega
ldi
scla
imer
Busi
ness
con
tinui
tyan
d di
sast
er re
cove
ry
Risk
man
agem
ent
plan
/fra
mew
ork
100%
90%
80%
70%
60%
50%
40%
30%
20%
10%
0%
Conf
licts
of i
nter
est
Priv
acy
and
secu
rity
stat
emen
t
AML
polic
y
No
Yes
Risk
man
agem
ent
and
com
plia
nce
prog
ram
me
100.00% 100.00% 100.00% 100.00% 100.00% 100.00% 100.00%
n. Compliance policies
Policies in place:
21.88%18.75% 12.50%6.25%
78.12% 81.25%87.50%
93.75%
Required policies available on website:
78.12%
21.88%
Yes
No
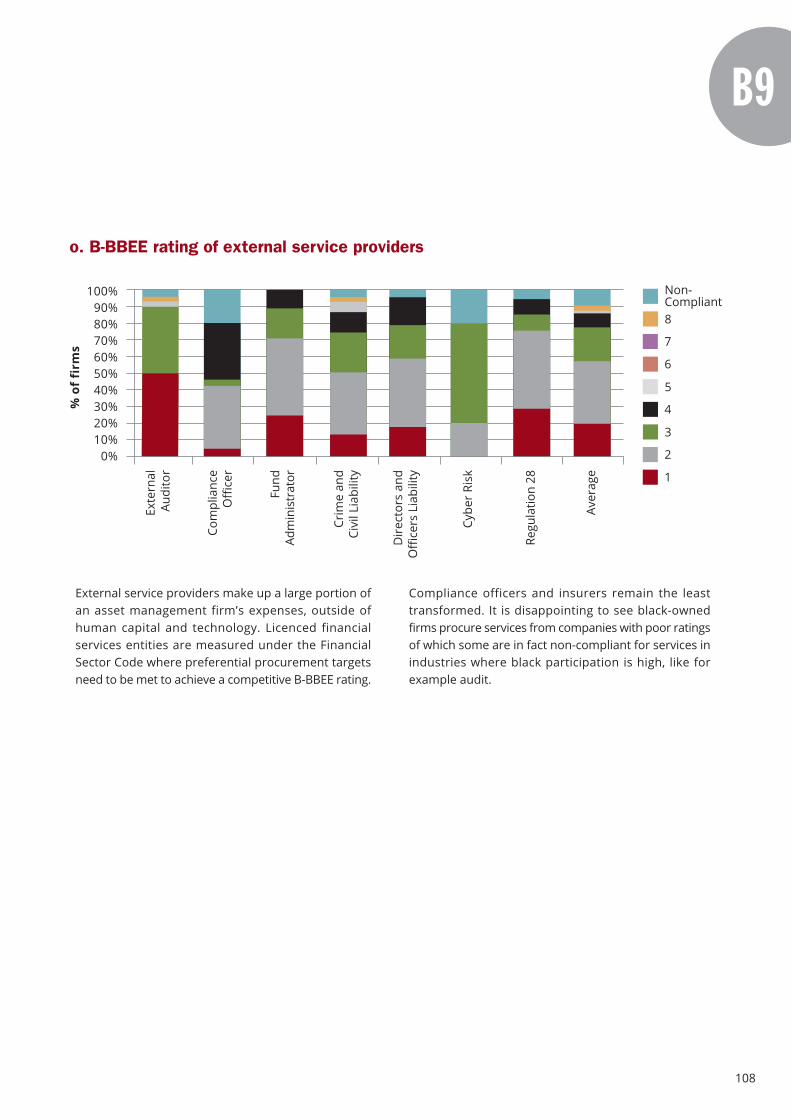
108
External service providers make up a large portion ofan asset management firm’s expenses, outside ofhuman capital and technology. Licenced financialservices entities are measured under the FinancialSector Code where preferential procurement targetsneed to be met to achieve a competitive B-BBEE rating.
Compliance officers and insurers remain the leasttransformed. It is disappointing to see black-ownedfirms procure services from companies with poor ratingsof which some are in fact non-compliant for services inindustries where black participation is high, like forexample audit.
o. B-BBEE rating of external service providers
% o
f fi
rms
100%90%80%70%60%50%40%30%20%10%
0%
7
8
6
4
5
2
3
1
Non-Compliant
Dir
ecto
rs a
ndO
ffic
ers
Liab
ility
Exte
rnal
Audi
tor
Com
plia
nce
Off
icer
Crim
e an
dCi
vil L
iabi
lity
Cybe
r Ri
sk
Fund
Adm
inis
trat
or
Regu
latio
n 28
Aver
age

109

110
Section highlights
Productdistribution
No poverty
LARGEST SOURCEAsset consultants are the largestsource of assets
IRELANDThe preferred domicile for globalfunds
40%Of firms’ funds are accessible through LISPS, up from 38%
19%Of firms’ funds are accessible through Umbrella Funds
106The number of registered unit trusts, up from 84
Public markets
1
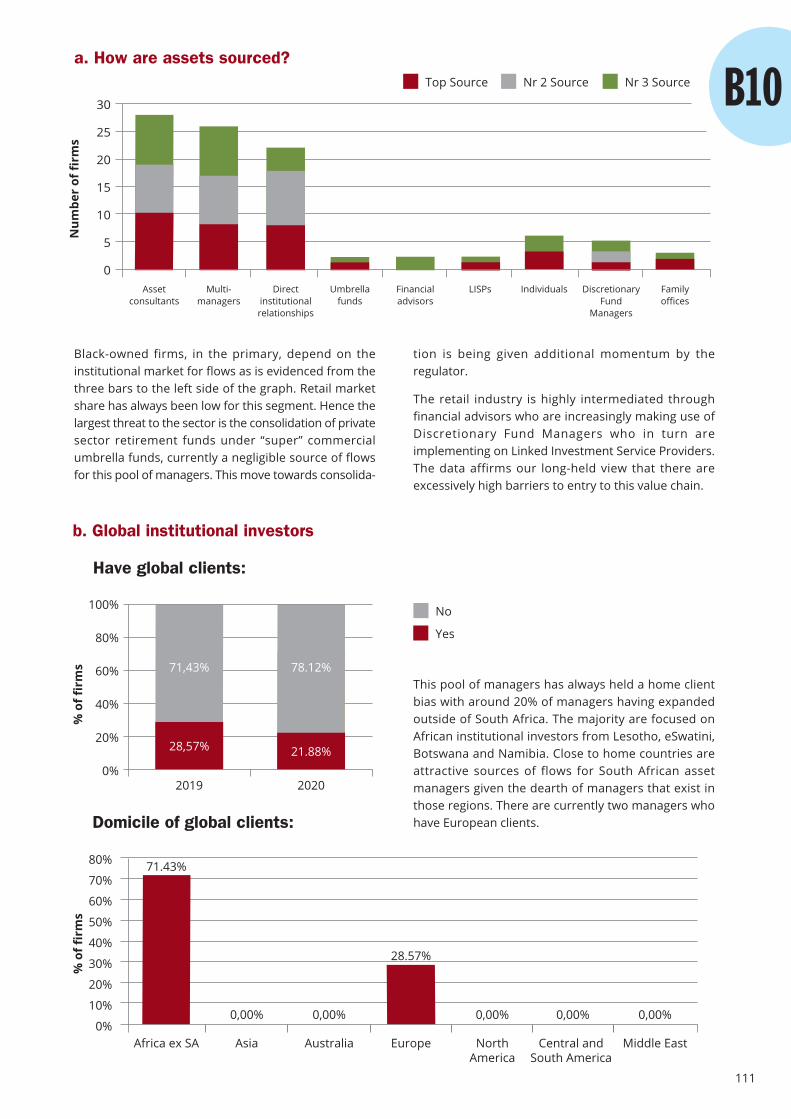
111
Black-owned firms, in the primary, depend on theinstitutional market for flows as is evidenced from thethree bars to the left side of the graph. Retail marketshare has always been low for this segment. Hence thelargest threat to the sector is the consolidation of privatesector retirement funds under “super” commercialumbrella funds, currently a negligible source of flowsfor this pool of managers. This move towards consolida-
This pool of managers has always held a home clientbias with around 20% of managers having expandedoutside of South Africa. The majority are focused onAfrican institutional investors from Lesotho, eSwatini,Botswana and Namibia. Close to home countries areattractive sources of flows for South African assetmanagers given the dearth of managers that exist inthose regions. There are currently two managers whohave European clients.
a. How are assets sourced?N
umbe
r of
firm
s
30
25
20
15
10
5
0Financialadvisors
Assetconsultants
Multi-managers
Umbrellafunds
Directinstitutionalrelationships
LISPs Individuals DiscretionaryFund
Managers
Familyoffices
Nr 2 SourceTop Source Nr 3 Source
b. Global institutional investors
Have global clients:
% o
f fir
ms
100%
80%
60%
40%
20%
0%2019 2020
28,57%
71,43%
21.88%
78.12%
No
Yes
Domicile of global clients:
% o
f fir
ms
80%
70%
60%
50%
40%
30%
20%
10%
0%North
AmericaAfrica ex SA Asia Europe Central and
South AmericaAustralia Middle East
0,00%
71.43%
0,00%
28.57%
0,00%0,00% 0,00%
tion is being given additional momentum by theregulator.
The retail industry is highly intermediated throughfinancial advisors who are increasingly making use ofDiscretionary Fund Managers who in turn areimplementing on Linked Investment Service Providers.The data affirms our long-held view that there areexcessively high barriers to entry to this value chain.
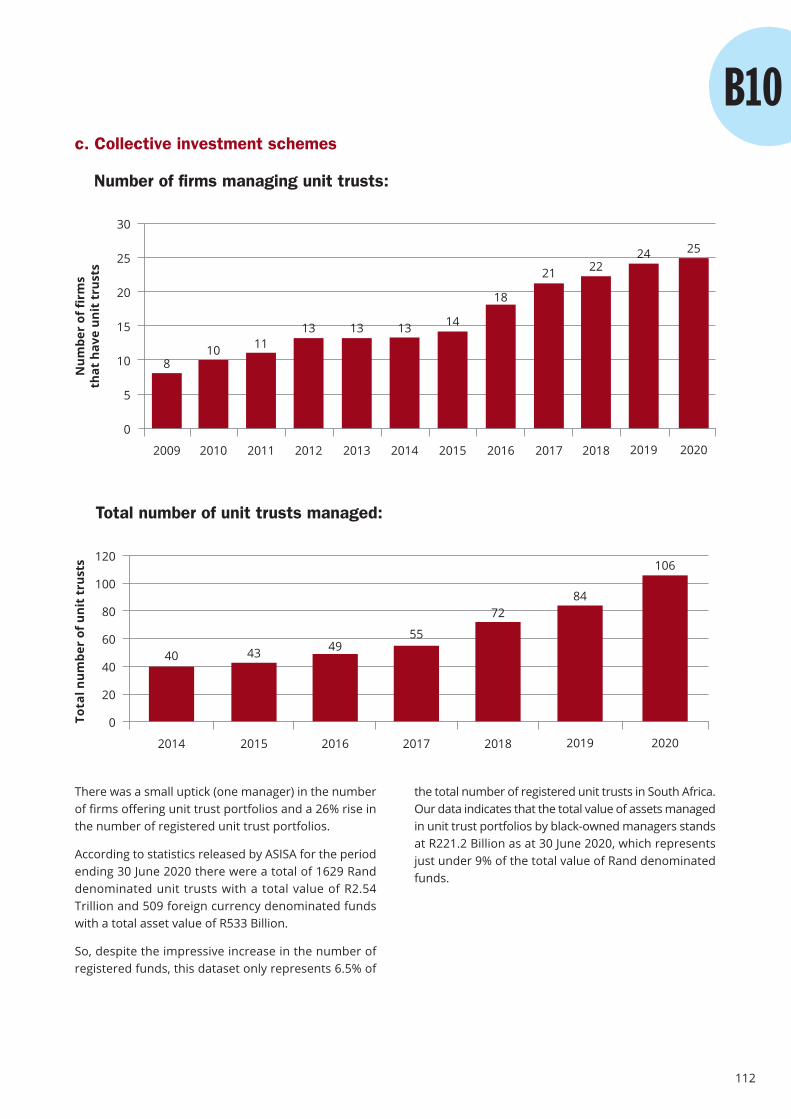
112
There was a small uptick (one manager) in the numberof firms offering unit trust portfolios and a 26% rise inthe number of registered unit trust portfolios.
According to statistics released by ASISA for the periodending 30 June 2020 there were a total of 1629 Randdenominated unit trusts with a total value of R2.54Trillion and 509 foreign currency denominated fundswith a total asset value of R533 Billion.
So, despite the impressive increase in the number ofregistered funds, this dataset only represents 6.5% of
the total number of registered unit trusts in South Africa.Our data indicates that the total value of assets managedin unit trust portfolios by black-owned managers standsat R221.2 Billion as at 30 June 2020, which representsjust under 9% of the total value of Rand denominatedfunds.
c. Collective investment schemes
Number of firms managing unit trusts:
Num
ber
of fi
rms
that
hav
e un
it t
rust
s
30
25
20
15
10
5
0
810 11
13 13 13 14
18
21 22
2009 2010 2011 2012 2013 2014 2015 2016 2017 2018 2019
24
2020
25
Total number of unit trusts managed:
120
100
80
60
40
20
0Tota
l num
ber
of u
nit
trus
ts
40 43 4955
7284
2014 2015 2016 2017 2018 2019 2020
106

113
Of the 25 managers who have registered unit trusts,more than half manage two or less funds. This is expectedas many of the firms who make up this dataset arespecialist managers focused on the management ofassets in no more than two asset classes.
Over the years hedge funds have given up market shareto other competitive products. Much of this lacklustreappetite has to do with muted performance, high costsand slow reporting. The largest threat to this industry
is that hedge funds are bucketed together with privateequity and collectively limited to 15% of a total retirementfund’s exposure to alternatives. The rise in private equitydoes not bode well for hedge funds as institutionalinvestors could potentially allocate their full Regulation28 allocation to such unlisted investments.
Number of CIS in securities:
2017
2018
2019
Num
ber
of fi
rms
2020
5 or more
9876543210
1 2 3 4
3
7 78 8
5
7
56
3 3
2
0
21 1
2
4 4
6
Number of CIS in hedge funds:
Num
ber
of fi
rms
6
5
4
3
2
1
0
5 or more
2017
2018
1 2 3 4
2019
2020
0 0 0 0 0 0 0 0
3
5
2 2
3
1
3
4
1
0 0
1
0

114
Of the firms with unit trust offerings, only two suchfirms have their own unit trust management companieswith the remainder opting for co-naming arrangements.This has not changed from last year. Given that PrescientInvestment Management forms part of a larger groupwhich operates one of the largest third-party unit trustmanagement companies and Kagiso Asset Managementis one of the top 5 managers by retail AUM, it is under-standable for these firms not to utilise co-naming arrange-ments. Anecdotally, for smaller firms the co-namingoption could be more beneficial and cost effective.
There are a number of co-naming partners available toselect from. The decision of which partner to choose islargely dependent on cost, reputation, the quality ofadministration services and B-BBEE. Africa Collective
Investments (RF) (Pty) Ltd, following corporate activityover the reporting period, has been renamed 27fourCollective Investments (RF) (Pty) Ltd.
CIS management companies:N
umbe
r of
firm
s
25
20
15
10
5
0
2014
2015
2016
2017
2018
2019
2020
Co-naming in Securities Have unit trust MancoCo-naming in Hedge Funds
4
75
1113
1715
2019
21
6
21 1
21
2 2
Firms that own a CIS managementcompany:
Kagiso Asset Management
Prescient Investment Management
Co-naming partners of choice:
Num
ber
of fi
rms
8
7
6
5
4
3
2
1
0
Co-naming in Securities Co-naming in Hedge Funds
Afr
ica
Co
llect
ive
Inve
stm
ents
Bo
uti
qu
e C
olle
ctiv
e In
vest
men
ts
7
0
3
0
5
IDS
Man
agem
ent
Co
mp
any
0
1
IP M
anag
emen
tC
om
pan
y
Mo
men
tum
Co
llect
ive
Inve
stm
ents
Pres
cien
t Man
agem
ent
Co
mp
any
Prim
e A
lter
nat
ive
Inve
stm
ents
Rea
l Fin
Co
llect
ive
Inve
stm
ent
Sch
emes
San
lam
Co
llect
ive
Inve
stm
ents
San
ne
Man
agem
ent
Co
mp
any
1
0
2
1
0
1
0 00
11
2
0
H4
Co
llect
ive
Inve
stm
ents
2
0

115
An overwhelming majority of participants hold the viewthat owning a unit trust management company is a non-core activity and that outsourcing this function leads toefficiency and productivity gains. It is also encouragingto observe that licencing is no longer considered abarrier to entry.
LISP platforms remain the largest distribution channelfor retail investors in South Africa. Independent FinancialAdvisors are placing more business on such platformson behalf of their clients as they allow them to switchbetween funds, deduct fees and manage and report onclient portfolios. There has been little improvement inthe percentage of firms whose products are availableon LISPs. This is an ongoing frustration for black-ownedfirms as the barriers to accessibility remain excessivelyhigh thereby limiting participation in the retail market.
The majority of managers have only accomplishedgetting their products loaded onto one and two LISPswith two managers succeeding on eight LISPs. Not all
LISPs are the same and some are more popular withfinancial advisors than others.
Reasons for not owning a CIS management company:%
of f
irm
s
100%
80%
60%
40%
20%
0%
Cannot meet licencing requirements
Other reasons
Easier to and cost effectiveto rent a CIS licence
2018 2019 2020
47.62%
19.05%
33.33%
57.14%
42.86%
82.61%
17.39%
d. LISPs
Unit trust products available on LISPs:
% o
f fir
ms
100%
80%
60%
40%
20%
0%
No Yes
20182017 2019 2020
31.82%28.57%37.50% 40.00%
68.18%71.43%62.50% 60.00%
Number of LISPs on which unit trusts are available:
Num
ber
of fi
rms
4
3
2
1
0
2017
2018
2019
2020
1 2 3 4 5 6 7 8
1
2 2
1 1
3
0
1
0
1
0
1
0
1 1
0 0 0
1 1
22
1
0 0
3
0
2
1
2
1 1
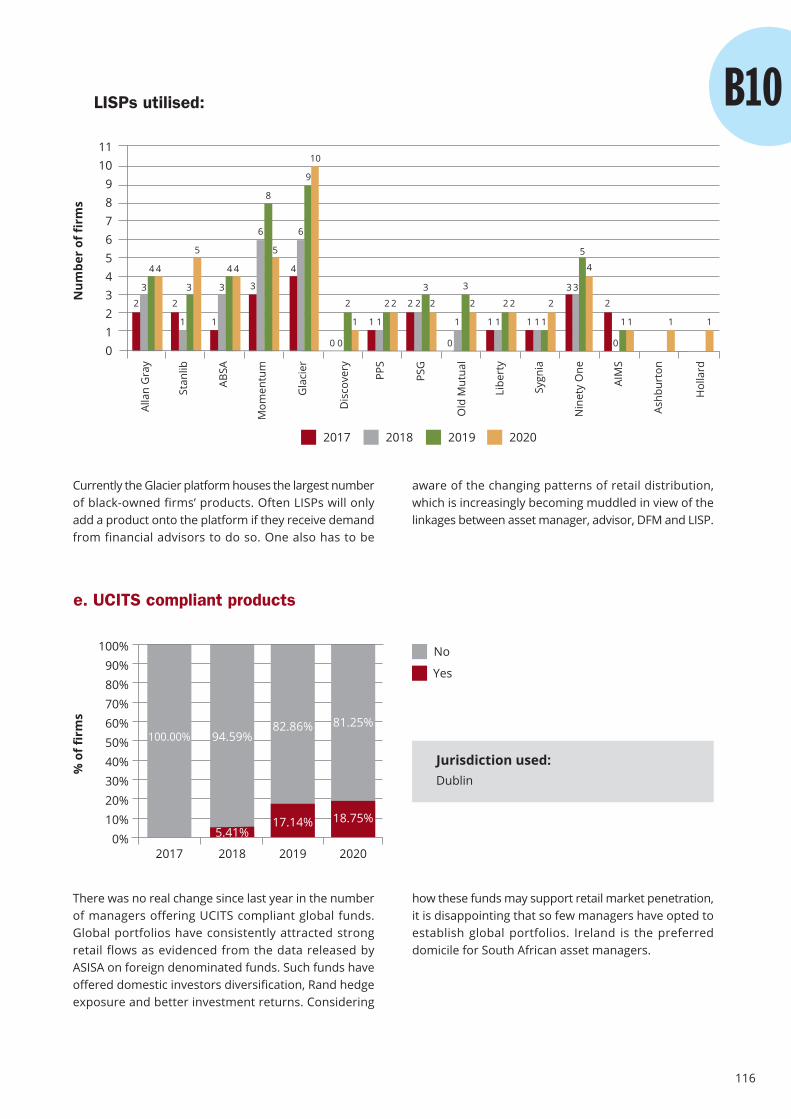
116
Currently the Glacier platform houses the largest numberof black-owned firms’ products. Often LISPs will onlyadd a product onto the platform if they receive demandfrom financial advisors to do so. One also has to be
There was no real change since last year in the numberof managers offering UCITS compliant global funds.Global portfolios have consistently attracted strongretail flows as evidenced from the data released byASISA on foreign denominated funds. Such funds haveoffered domestic investors diversification, Rand hedgeexposure and better investment returns. Considering
aware of the changing patterns of retail distribution,which is increasingly becoming muddled in view of thelinkages between asset manager, advisor, DFM and LISP.
how these funds may support retail market penetration,it is disappointing that so few managers have opted toestablish global portfolios. Ireland is the preferreddomicile for South African asset managers.
LISPs utilised:
Num
ber
of fi
rms
1110
9876543210
2017 2018 2019 2020
Alla
n G
ray
Stan
lib
ABSA
Mom
entu
m
Gla
cier
Dis
cove
ry
PPS
PSG
Old
Mut
ual
Libe
rty
Sygn
ia
Nin
ety
One
AIM
S
3
2
4
1
2
3 3
1
4
6
3
8
9
6
4
0
2
11
2 22
3
11
2
11
Ashb
urto
n
Hol
lard
1
0
1
2
4
5
4
5
10
2 2 2
111 1
2
3
2
1
0
33
5
4
e. UCITS compliant products
% o
f fir
ms
100%90%80%70%60%50%40%30%20%10%
0%
No
Yes
20182017 2019 2020
5.41%17.14% 18.75%
94.59%100.00%82.86% 81.25%
Jurisdiction used:Dublin
0
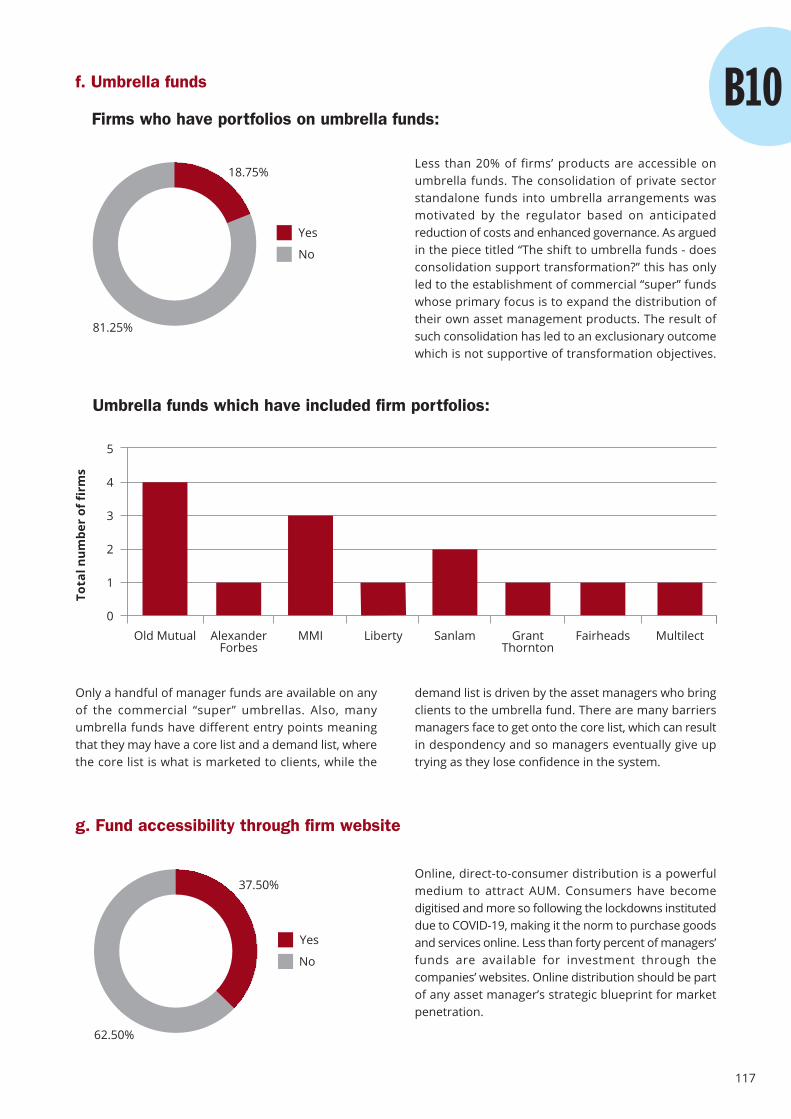
117
Less than 20% of firms’ products are accessible onumbrella funds. The consolidation of private sectorstandalone funds into umbrella arrangements wasmotivated by the regulator based on anticipatedreduction of costs and enhanced governance. As arguedin the piece titled “The shift to umbrella funds - doesconsolidation support transformation?” this has onlyled to the establishment of commercial “super” fundswhose primary focus is to expand the distribution oftheir own asset management products. The result ofsuch consolidation has led to an exclusionary outcomewhich is not supportive of transformation objectives.
Only a handful of manager funds are available on anyof the commercial “super” umbrellas. Also, manyumbrella funds have different entry points meaningthat they may have a core list and a demand list, wherethe core list is what is marketed to clients, while the
Online, direct-to-consumer distribution is a powerfulmedium to attract AUM. Consumers have becomedigitised and more so following the lockdowns instituteddue to COVID-19, making it the norm to purchase goodsand services online. Less than forty percent of managers’funds are available for investment through thecompanies’ websites. Online distribution should be partof any asset manager’s strategic blueprint for marketpenetration.
demand list is driven by the asset managers who bringclients to the umbrella fund. There are many barriersmanagers face to get onto the core list, which can resultin despondency and so managers eventually give uptrying as they lose confidence in the system.
f. Umbrella funds
Firms who have portfolios on umbrella funds:
81.25%
18.75%
Yes
No
Umbrella funds which have included firm portfolios:
5
4
3
2
1
0
Tota
l num
ber
of fi
rms
Old Mutual AlexanderForbes
MMI Liberty Sanlam GrantThornton
Fairheads Multilect
g. Fund accessibility through firm website
62.50%
37.50%
Yes
No
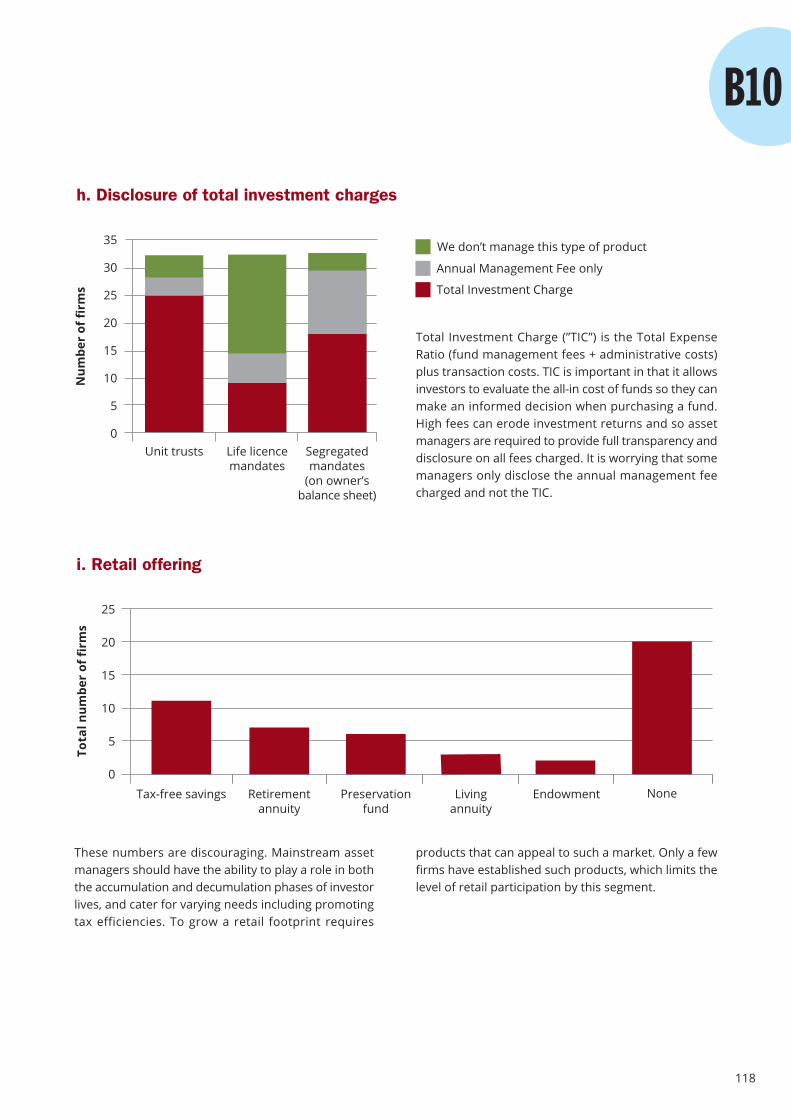
118
These numbers are discouraging. Mainstream assetmanagers should have the ability to play a role in boththe accumulation and decumulation phases of investorlives, and cater for varying needs including promotingtax efficiencies. To grow a retail footprint requires
Total Investment Charge (”TIC”) is the Total ExpenseRatio (fund management fees + administrative costs)plus transaction costs. TIC is important in that it allowsinvestors to evaluate the all-in cost of funds so they canmake an informed decision when purchasing a fund.High fees can erode investment returns and so assetmanagers are required to provide full transparency anddisclosure on all fees charged. It is worrying that somemanagers only disclose the annual management feecharged and not the TIC.
products that can appeal to such a market. Only a fewfirms have established such products, which limits thelevel of retail participation by this segment.
h. Disclosure of total investment charges
Num
ber
of fi
rms
35
30
25
20
15
10
5
0Life licencemandates
Unit trusts Segregatedmandates
(on owner’sbalance sheet)
We don’t manage this type of product
Annual Management Fee only
Total Investment Charge
i. Retail offering
Tota
l num
ber
of fi
rms
25
20
15
10
5
0
Tax-free savings Retirementannuity
Preservationfund
Livingannuity
Endowment None
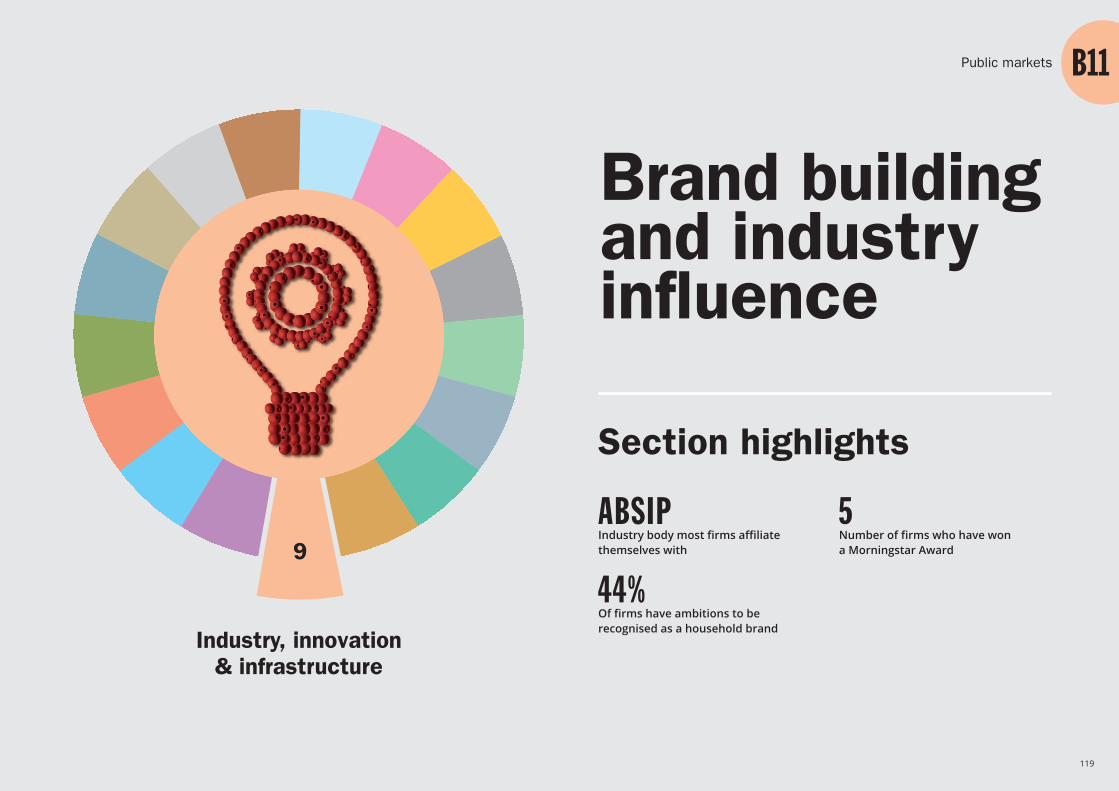
119
Brand buildingand industryinfluence
Industry, innovation& infrastructure
ABSIPIndustry body most firms affiliate themselves with
Section highlights
5Number of firms who have won a Morningstar Award
44%Of firms have ambitions to berecognised as a household brand
Public markets
9
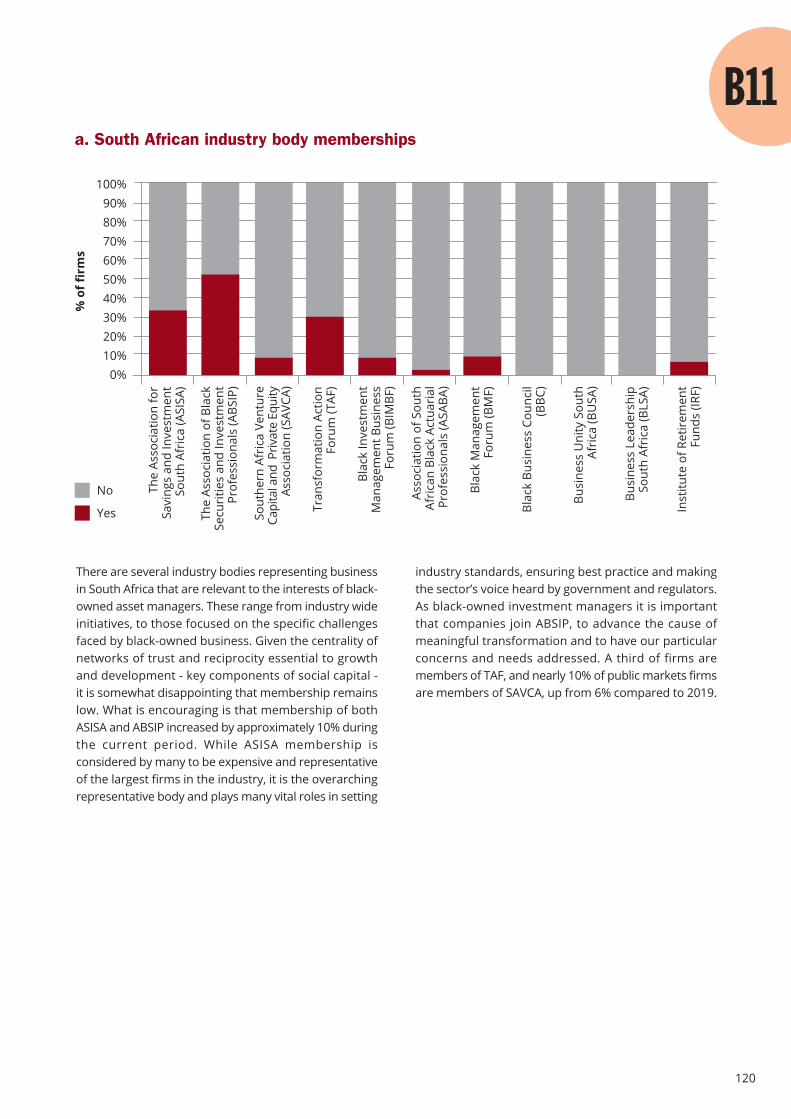
120
There are several industry bodies representing businessin South Africa that are relevant to the interests of black-owned asset managers. These range from industry wideinitiatives, to those focused on the specific challengesfaced by black-owned business. Given the centrality ofnetworks of trust and reciprocity essential to growthand development - key components of social capital -it is somewhat disappointing that membership remainslow. What is encouraging is that membership of bothASISA and ABSIP increased by approximately 10% duringthe current period. While ASISA membership isconsidered by many to be expensive and representativeof the largest firms in the industry, it is the overarchingrepresentative body and plays many vital roles in setting
industry standards, ensuring best practice and makingthe sector’s voice heard by government and regulators.As black-owned investment managers it is importantthat companies join ABSIP, to advance the cause ofmeaningful transformation and to have our particularconcerns and needs addressed. A third of firms aremembers of TAF, and nearly 10% of public markets firmsare members of SAVCA, up from 6% compared to 2019.
a. South African industry body memberships
% o
f fir
ms
100%90%80%70%60%50%40%30%20%10%
0%
The
Asso
ciat
ion
of B
lack
Secu
ritie
s an
d In
vest
men
t P
rofe
ssio
nals
(ABS
IP)
The
Asso
ciat
ion
for
Savi
ngs
and
Inve
stm
ent
Sout
h Af
rica
(ASI
SA)
Sout
hern
Afr
ica
Vent
ure
Capi
tal a
nd P
rivat
e Eq
uity
Asso
ciat
ion
(SAV
CA)
Blac
k In
vest
men
tM
anag
emen
t Bus
ines
sFo
rum
(BIM
BF)
Tran
sfor
mat
ion
Actio
nFo
rum
(TAF
)
Asso
ciat
ion
of S
outh
Afri
can
Blac
k Ac
tuar
ial
Prof
essi
onal
s (A
SABA
)
Blac
k Bu
sine
ss C
ounc
il(B
BC)
Blac
k M
anag
emen
tFo
rum
(BM
F)
Busi
ness
Uni
ty S
outh
Afri
ca (B
USA
)
Inst
itute
of R
etir
emen
tFu
nds
(IRF)
Busi
ness
Lea
ders
hip
Sout
h Af
rica
(BLS
A)
No
Yes
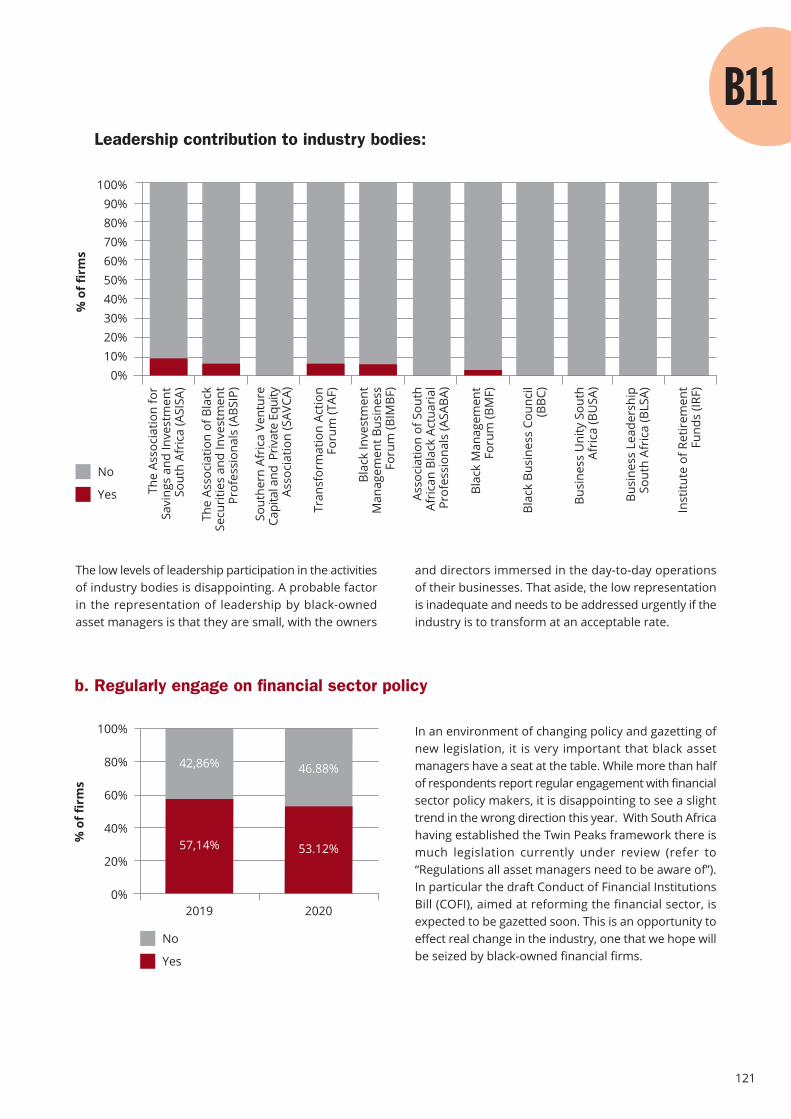
121
The low levels of leadership participation in the activitiesof industry bodies is disappointing. A probable factorin the representation of leadership by black-ownedasset managers is that they are small, with the owners
and directors immersed in the day-to-day operationsof their businesses. That aside, the low representationis inadequate and needs to be addressed urgently if theindustry is to transform at an acceptable rate.
In an environment of changing policy and gazetting ofnew legislation, it is very important that black assetmanagers have a seat at the table. While more than halfof respondents report regular engagement with financialsector policy makers, it is disappointing to see a slighttrend in the wrong direction this year. With South Africahaving established the Twin Peaks framework there ismuch legislation currently under review (refer to“Regulations all asset managers need to be aware of”).In particular the draft Conduct of Financial InstitutionsBill (COFI), aimed at reforming the financial sector, isexpected to be gazetted soon. This is an opportunity toeffect real change in the industry, one that we hope willbe seized by black-owned financial firms.
Leadership contribution to industry bodies:
% o
f fir
ms
100%90%80%70%60%50%40%30%20%10%
0%
The
Asso
ciat
ion
of B
lack
Secu
ritie
s an
d In
vest
men
t P
rofe
ssio
nals
(ABS
IP)
The
Asso
ciat
ion
for
Savi
ngs
and
Inve
stm
ent
Sout
h Af
rica
(ASI
SA)
Sout
hern
Afr
ica
Vent
ure
Capi
tal a
nd P
rivat
e Eq
uity
Asso
ciat
ion
(SAV
CA)
Blac
k In
vest
men
tM
anag
emen
t Bus
ines
sFo
rum
(BIM
BF)
Tran
sfor
mat
ion
Actio
nFo
rum
(TAF
)
Asso
ciat
ion
of S
outh
Afri
can
Blac
k Ac
tuar
ial
Prof
essi
onal
s (A
SABA
)
Blac
k Bu
sine
ss C
ounc
il(B
BC)
Blac
k M
anag
emen
tFo
rum
(BM
F)
Busi
ness
Uni
ty S
outh
Afri
ca (B
USA
)
Inst
itute
of R
etir
emen
tFu
nds
(IRF)
Busi
ness
Lea
ders
hip
Sout
h Af
rica
(BLS
A)
No
Yes
b. Regularly engage on financial sector policy
% o
f fir
ms
100%
80%
60%
40%
20%
0%2019 2020
42,86%
No
Yes
57,14%
46.88%
53.12%
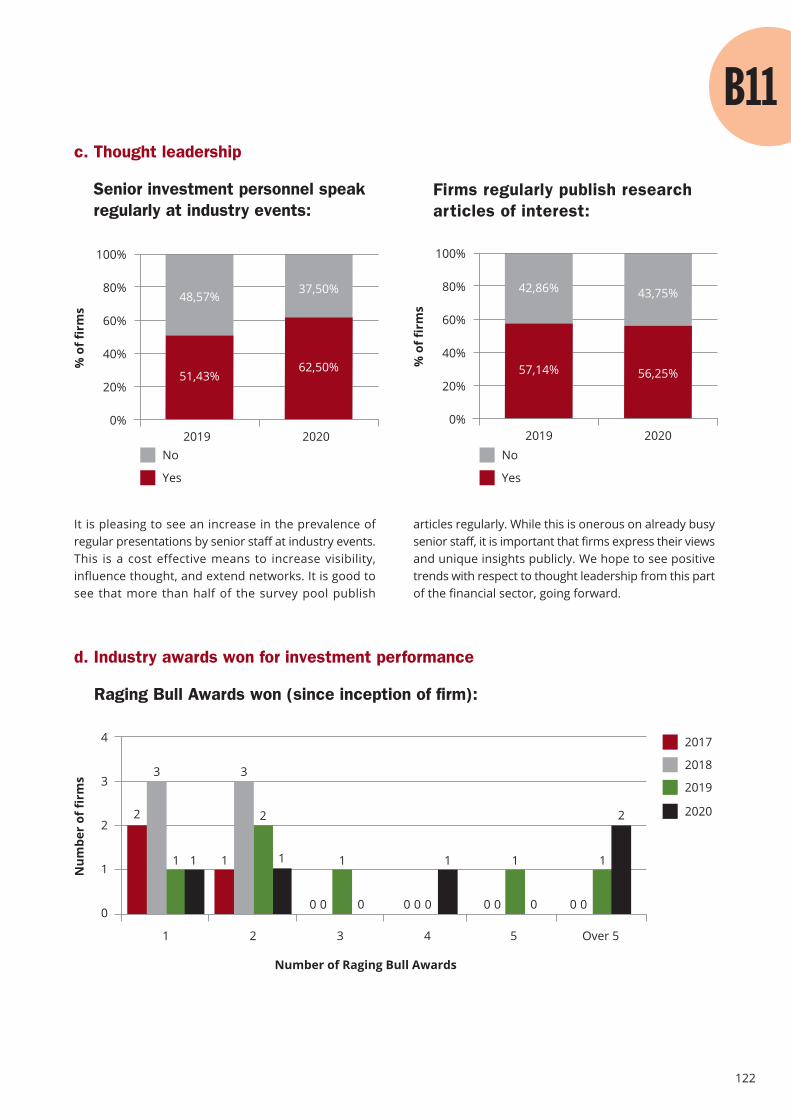
122
It is pleasing to see an increase in the prevalence ofregular presentations by senior staff at industry events.This is a cost effective means to increase visibility,influence thought, and extend networks. It is good tosee that more than half of the survey pool publish
articles regularly. While this is onerous on already busysenior staff, it is important that firms express their viewsand unique insights publicly. We hope to see positivetrends with respect to thought leadership from this partof the financial sector, going forward.
c. Thought leadership
Senior investment personnel speak regularly at industry events:
No
Yes
% o
f fir
ms
100%
80%
60%
40%
20%
0%2019 2020
48,57%
51,43%
37,50%
62,50%
Firms regularly publish researcharticles of interest:
% o
f fir
ms
100%
80%
60%
40%
20%
0%2019 2020
42,86%
No
Yes
57,14%
43,75%
56,25%
Num
ber
of fi
rms
4
3
2
1
0
Number of Raging Bull Awards
1 2 3 4 5 Over 5
2017
2018
2019
20202
3
1
0 0
1
0
1
0 0 0
1
0 0
2
1
3
2
11
0 0 0
1
d. Industry awards won for investment performance
Raging Bull Awards won (since inception of firm):
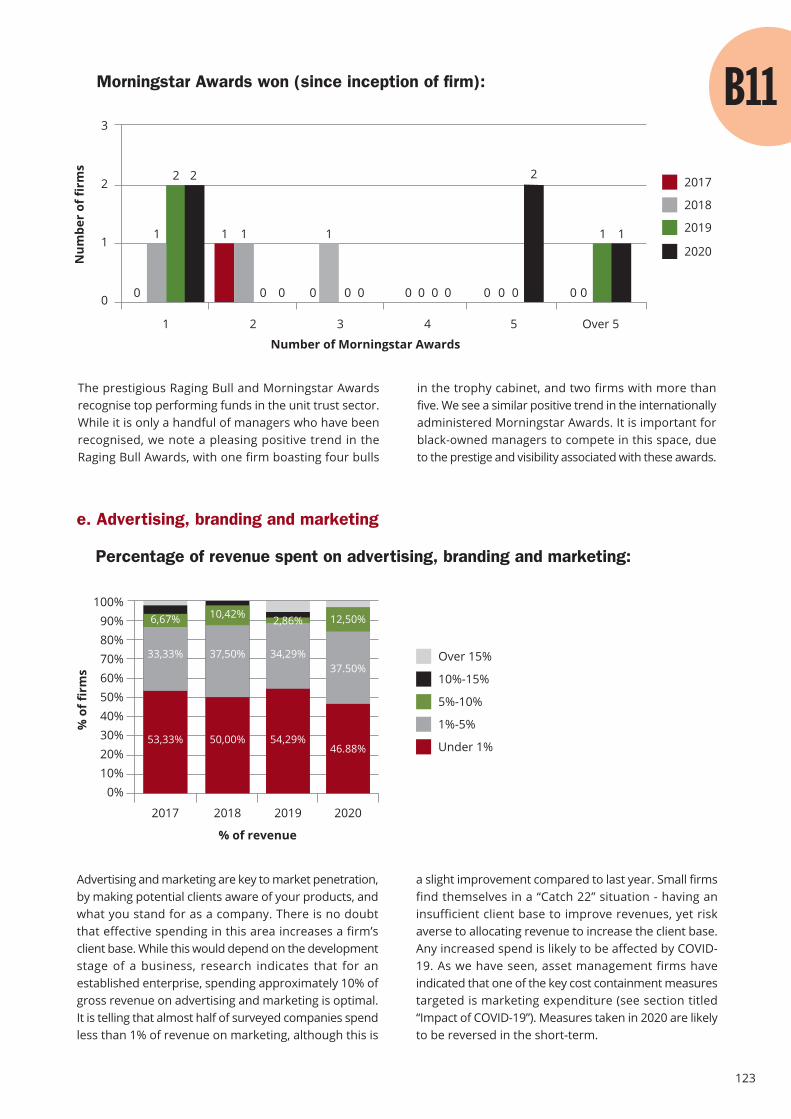
123
Advertising and marketing are key to market penetration,by making potential clients aware of your products, andwhat you stand for as a company. There is no doubtthat effective spending in this area increases a firm’sclient base. While this would depend on the developmentstage of a business, research indicates that for anestablished enterprise, spending approximately 10% ofgross revenue on advertising and marketing is optimal.It is telling that almost half of surveyed companies spendless than 1% of revenue on marketing, although this is
The prestigious Raging Bull and Morningstar Awardsrecognise top performing funds in the unit trust sector.While it is only a handful of managers who have beenrecognised, we note a pleasing positive trend in theRaging Bull Awards, with one firm boasting four bulls
in the trophy cabinet, and two firms with more thanfive. We see a similar positive trend in the internationallyadministered Morningstar Awards. It is important forblack-owned managers to compete in this space, dueto the prestige and visibility associated with these awards.
a slight improvement compared to last year. Small firmsfind themselves in a “Catch 22” situation - having aninsufficient client base to improve revenues, yet riskaverse to allocating revenue to increase the client base.Any increased spend is likely to be affected by COVID-19. As we have seen, asset management firms haveindicated that one of the key cost containment measurestargeted is marketing expenditure (see section titled“Impact of COVID-19”). Measures taken in 2020 are likelyto be reversed in the short-term.
Morningstar Awards won (since inception of firm):
Number of Morningstar Awards
Num
ber
of fi
rms
3
2
1
0
1 2 3 4 5 Over 5
2017
2018
2019
2020
0
1
2
0
1
0 00 0
2
1
0 0
11 1
0 0
2
0 0 0 0
e. Advertising, branding and marketing
Percentage of revenue spent on advertising, branding and marketing:
% o
f fir
ms
100%90%80%70%60%50%40%30%20%10%
0%
Over 15%
10%-15%
5%-10%
1%-5%
Under 1%
20182017 2019
50,00%
37,50%
53,33%
33,33%
54,29%
34,29%
2020
46.88%
37.50%
6,67% 10,42% 2,86% 12,50%
% of revenue
0
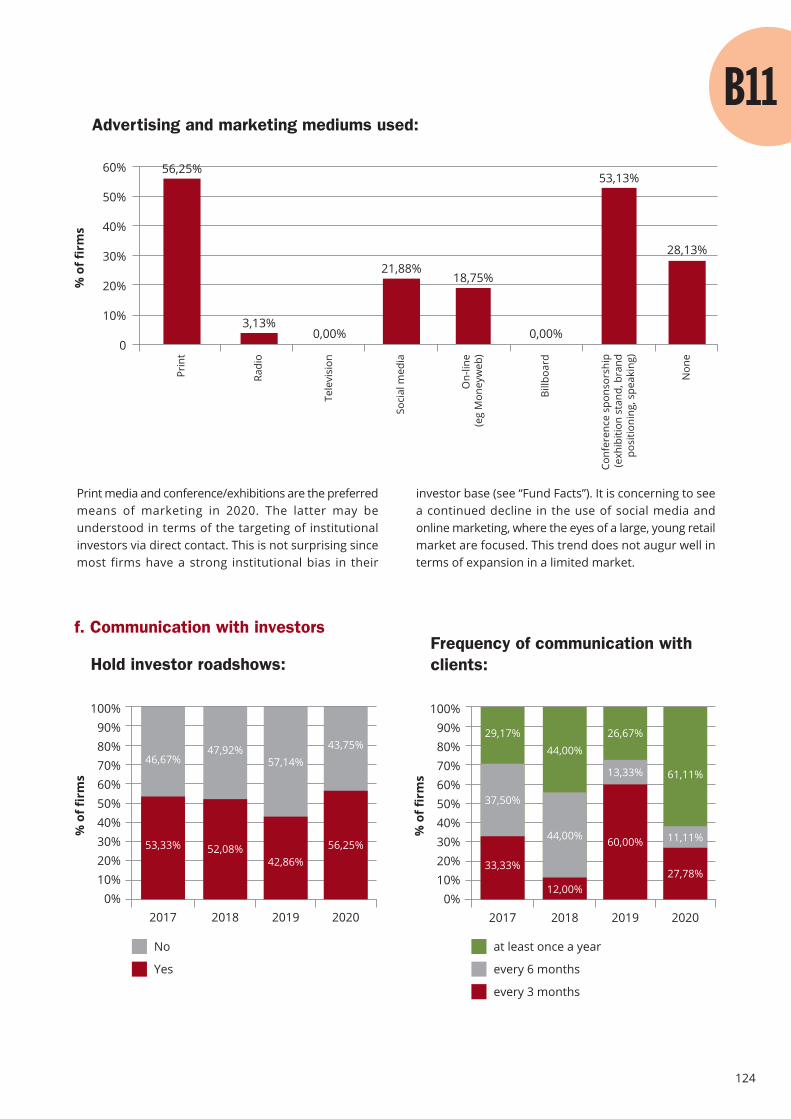
124
Print media and conference/exhibitions are the preferredmeans of marketing in 2020. The latter may beunderstood in terms of the targeting of institutionalinvestors via direct contact. This is not surprising sincemost firms have a strong institutional bias in their
investor base (see “Fund Facts”). It is concerning to seea continued decline in the use of social media andonline marketing, where the eyes of a large, young retailmarket are focused. This trend does not augur well interms of expansion in a limited market.
Advertising and marketing mediums used:
% o
f fir
ms
60%
50%
40%
30%
20%
10%
0
Prin
t
Radi
o
Tele
visi
on
Soci
al m
edia
On-
line
(eg
Mon
eyw
eb)
Billb
oard
Con
fere
nce
spon
sors
hip
(exh
ibiti
on s
tand
, bra
ndpo
sitio
ning
, spe
akin
g)
Non
e
56,25%
3,13%0,00% 0,00%
21,88%18,75%
53,13%
28,13%
f. Communication with investors
Hold investor roadshows:
% o
f fir
ms
100%90%80%70%60%50%40%30%20%10%
0%
No
Yes
20182017 2019
52,08%
47,92%
53,33%
46,67% 57,14%
2020
56,25%
43,75%
42,86%
Frequency of communication withclients:
% o
f fir
ms
100%90%80%70%60%50%40%30%20%10%
0%20182017 2019
44,00%29,17% 26,67%
2020
61,11%
every 6 months
every 3 months
at least once a year
12,00%
37,50%
11,11%
13,33%
33,33%
44,00% 60,00%
27,78%

125
The use of roadshows, a familiar tool in the industry,has returned to just over 55% in 2020, although onewould expect that social distancing in response to COVID-19 would adversely affect this measure in the nextsurvey cycle. What is worrying to see is the sharpdecrease in frequency of communication with clients,eroding the gain of 2019. For the first time there was
an uptick in the use of webinars which is reflective ofthe COVID-19 communication environment. Thepreferred means of communication however are stilldominated by email campaigns and company websites,reflecting an institutional rather than retail bias. Theprofessional network LinkedIn is used increasingly, butthe use of social media in general remains unpopular.
A fully functional website should be considered aminimum requirement for any business, and so, whileimproving, there is no excuse for the large proportion(nearly 30%) who do not maintain a website. The websiteis the first stop when seeking information about a
Medium used to communicate with investors:%
of f
irm
s
100%
90%
80%
70%
60%
50%
40%
30%
20%
10%
0%
Emai
l cam
paig
n
Blog
ging
Web
inar
s
Face
book
YouT
ube
Twitt
er
Link
edIn
Web
site
Mob
ile (e
g. S
MS,
vira
l mar
ketin
g)
Inst
agra
m
2018
2019
2020
g. Access through technology
Have a mobile app:
% o
f fir
ms
100%90%80%70%60%50%40%30%20%10%
0%
No
Yes
20182017 2019
2.70%
97.30%100.00% 97.14%
2020
100.00%
2.86%
Have a fully functional website:
% o
f fir
ms
100%90%80%70%60%50%40%30%20%10%
0%
No
Yes
20182017 2019
67.57%
32.43%
51.11%
48.89%34.29%
2020
71.88%
28.12%
65.71%
company, whether by institutional or retail investors.No companies are providing a mobile app in 2020,reflecting the immaturity of the industry in the retailspace, where this has become one of the most popularmeans for interacting with customers.
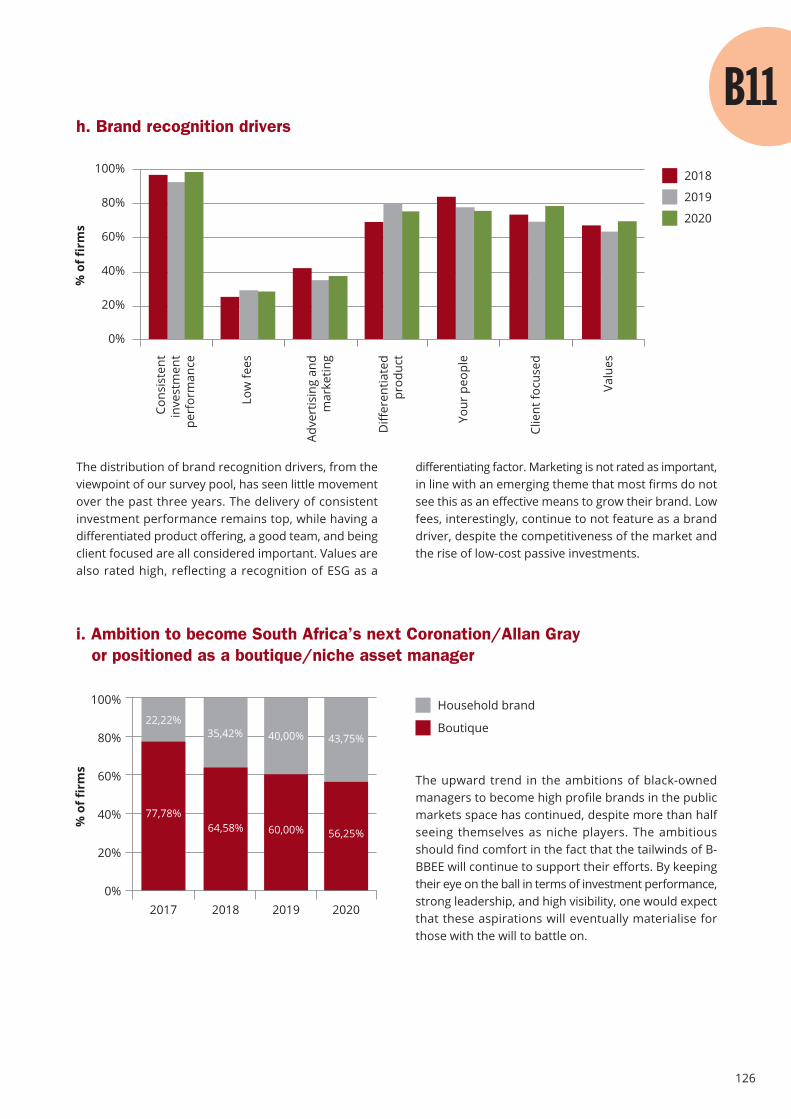
126
h. Brand recognition drivers
2018
2019
2020
The upward trend in the ambitions of black-ownedmanagers to become high profile brands in the publicmarkets space has continued, despite more than halfseeing themselves as niche players. The ambitiousshould find comfort in the fact that the tailwinds of B-BBEE will continue to support their efforts. By keepingtheir eye on the ball in terms of investment performance,strong leadership, and high visibility, one would expectthat these aspirations will eventually materialise forthose with the will to battle on.
The distribution of brand recognition drivers, from theviewpoint of our survey pool, has seen little movementover the past three years. The delivery of consistentinvestment performance remains top, while having adifferentiated product offering, a good team, and beingclient focused are all considered important. Values arealso rated high, reflecting a recognition of ESG as a
differentiating factor. Marketing is not rated as important,in line with an emerging theme that most firms do notsee this as an effective means to grow their brand. Lowfees, interestingly, continue to not feature as a branddriver, despite the competitiveness of the market andthe rise of low-cost passive investments.
Cons
iste
ntin
vest
men
tpe
rfor
man
ce
Low
fees
Adve
rtis
ing
and
mar
ketin
g
Diff
eren
tiate
dpr
oduc
t
Your
peo
ple
Clie
nt fo
cuse
d
Valu
es
% o
f fir
ms
i. Ambition to become South Africa’s next Coronation/Allan Grayor positioned as a boutique/niche asset manager
% o
f fir
ms
100%
80%
60%
40%
20%
0%
Household brand
Boutique
20182017 2019
64,58%
47.32%
77,78%
22,22%40,00%
2020
56,25%
43,75%
60,00%
35,42%
100%
80%
60%
40%
20%
0%

127

Environmental,social andgovernance
128
12Number of firms who are UN PRI signatories
Section highlights
38%Of firms have a dedicated ESG internal resource
69%Of firms acknowledge that ESG impactedthe risk and return characteristics of their portfoliosClimate action
Public markets
13
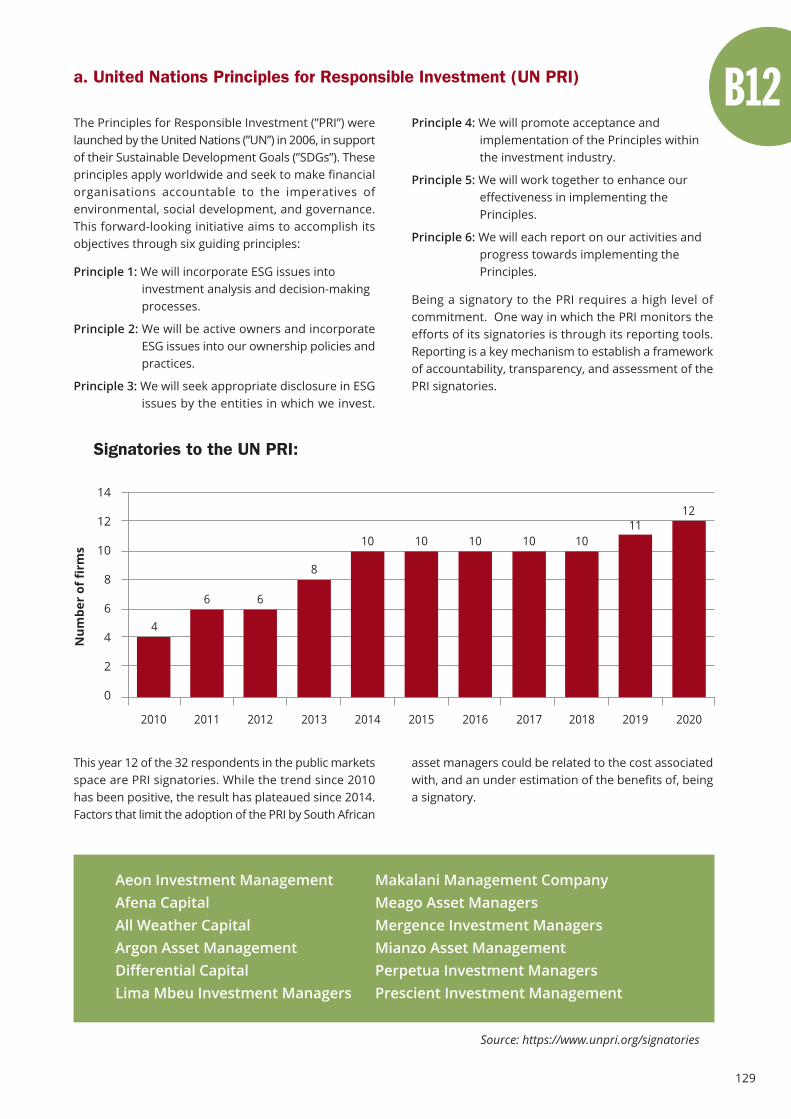
129
The Principles for Responsible Investment (”PRI”) werelaunched by the United Nations (”UN”) in 2006, in supportof their Sustainable Development Goals (”SDGs”). Theseprinciples apply worldwide and seek to make financialorganisations accountable to the imperatives ofenvironmental, social development, and governance.This forward-looking initiative aims to accomplish itsobjectives through six guiding principles:
Principle 1: We will incorporate ESG issues into investment analysis and decision-making processes.
Principle 2: We will be active owners and incorporateESG issues into our ownership policies andpractices.
Principle 3: We will seek appropriate disclosure in ESGissues by the entities in which we invest.
This year 12 of the 32 respondents in the public marketsspace are PRI signatories. While the trend since 2010has been positive, the result has plateaued since 2014.Factors that limit the adoption of the PRI by South African
a. United Nations Principles for Responsible Investment (UN PRI)
Principle 4: We will promote acceptance and implementation of the Principles within the investment industry.
Principle 5: We will work together to enhance our effectiveness in implementing the Principles.
Principle 6: We will each report on our activities and progress towards implementing the Principles.
Being a signatory to the PRI requires a high level ofcommitment. One way in which the PRI monitors theefforts of its signatories is through its reporting tools.Reporting is a key mechanism to establish a frameworkof accountability, transparency, and assessment of thePRI signatories.
asset managers could be related to the cost associatedwith, and an under estimation of the benefits of, beinga signatory.
Signatories to the UN PRI:
Num
ber
of fi
rms
14
12
10
8
6
4
2
0
2010 2011 2012 2013 2014 2015 2016 2017
4
6 6
8
10 10 10 10 10
2018
11
2019 2020
12
Aeon Investment Management Makalani Management CompanyAfena Capital Meago Asset ManagersAll Weather Capital Mergence Investment ManagersArgon Asset Management Mianzo Asset ManagementDifferential Capital Perpetua Investment ManagersLima Mbeu Investment Managers Prescient Investment Management
Source: https://www.unpri.org/signatories

130
A signatory is able to calculate their performance inregards to the principles set out by the UN PRI. Thereare modules which assess the various individualindicators, and the modules are rated from E to A+. Forthe purposes of illustrating the data numerically wehave converted the scores to percentages. The graphshows that the module “Strategy and Governance” hasthe majority of positive scores. Overall the managershave scores higher than 50% on the majority of themodules.
Of the companies that are signatories it does appear
CRISA is a local set of principles focused on the South African market. The effectiveness of the Code is dependenton collaboration by all participants in the industry.
The period 2014 to 2020 has seen significant growth inthe number of firms endorsing CRISA to a current valuegreater than 80%. While this bodes well, the resultcontrasts with the adoption rate of the PRI. Since CRISAis more “symbolic” and therefore less onerous on firmsthan the PRI, the results could reflect that, while firmssee the importance of ESG for long term sustainability,
that there is firm commitment to the goals of principledinvestment, reflecting a conscientious long-termapproach which is encouraging. There is variation interms of the investment categories, but even if limitedit is a clear indication of a move in the right direction.The trends can be explored going forward with a build-up of longitudinal data to assess the trajectory andalignment of strategy over time with respect to the 6PRI objectives. The 12 signatories will hopefully pavethe way for a more enabling environment for theimplementation and practice of the PRI.
b. The Code for Responsible Investing in South Africa (CRISA)
the cost and effort involved in implementation are stilla barrier to progress on this front. In the absence ofasset owner pressure and a champion to co-ordinatePRI objectives, there is no driver to effect movementtowards a paradigm that prioritises the six overarchingprinciples.
Signatory PRI Transparency Report scores:%
of
firm
s
100%90%80%70%60%50%40%30%20%10%
0%
40%-60%
20%-40%
80%-100%
60%-80%
0%-20%
PropertyStrategy andGovernance
Listed EquityActive Ownership
Fixed IncomeSSA
ListedIncorporation
Endorse CRISA:
% o
f fi
rms
No
Yes
100%90%80%70%60%50%40%30%20%10%
0%
2019
85,71%
14.29%
2020
81.25%
18.75%
20182014 2015 20172016
64,58%
35.42%
53,13%
46.88%
60,61%
39.39%
57,78%
42.22%
68,29%
31.71%
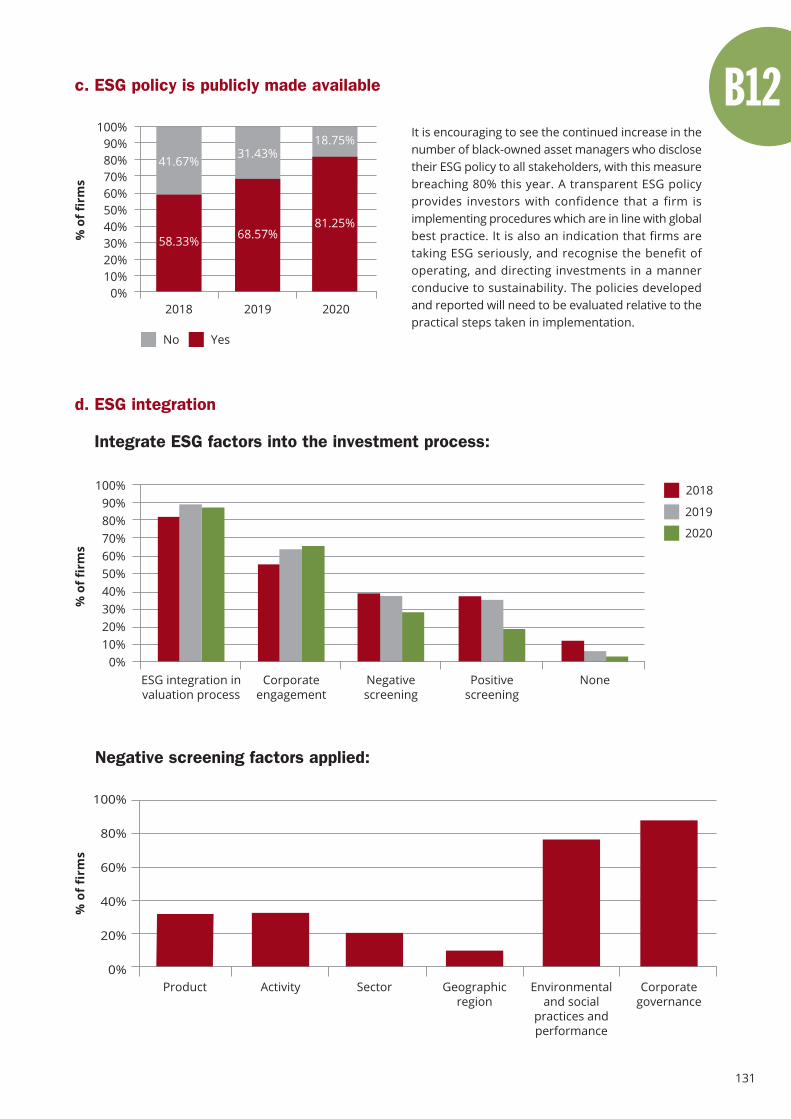
131
It is encouraging to see the continued increase in thenumber of black-owned asset managers who disclosetheir ESG policy to all stakeholders, with this measurebreaching 80% this year. A transparent ESG policyprovides investors with confidence that a firm isimplementing procedures which are in line with globalbest practice. It is also an indication that firms aretaking ESG seriously, and recognise the benefit ofoperating, and directing investments in a mannerconducive to sustainability. The policies developedand reported will need to be evaluated relative to thepractical steps taken in implementation.
c. ESG policy is publicly made available%
of f
irm
s
100%90%80%70%60%50%40%30%20%10%
0%
No Yes
2018 2019
41.67%
58.33%
31.43%
68.57%
2020
18.75%
81.25%
d. ESG integration
Integrate ESG factors into the investment process:
% o
f fir
ms
ESG integration invaluation process
Corporateengagement
Negativescreening
Positivescreening
None
100%90%80%70%60%50%40%30%20%10%
0%
2018
2019
2020
Negative screening factors applied:
% o
f fi
rms
Environmentaland social
practices andperformance
Product Activity Geographicregion
Corporategovernance
Sector
100%
80%
60%
40%
20%
0%
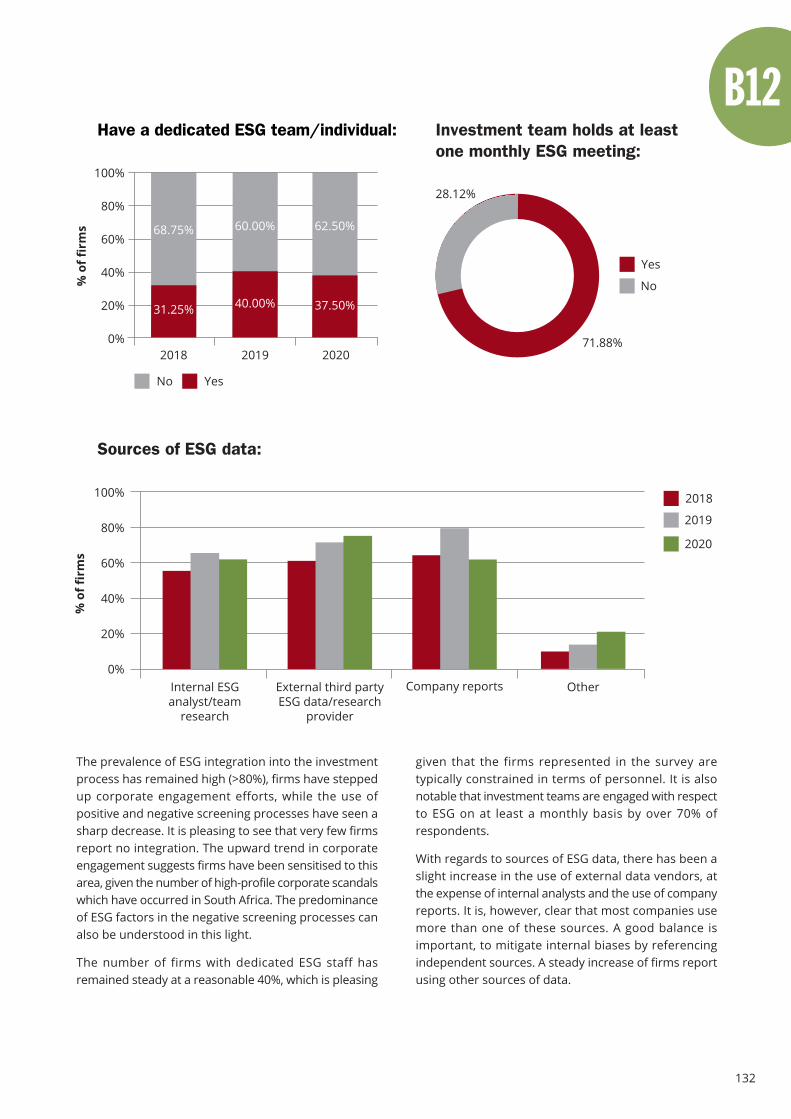
132
The prevalence of ESG integration into the investmentprocess has remained high (>80%), firms have steppedup corporate engagement efforts, while the use ofpositive and negative screening processes have seen asharp decrease. It is pleasing to see that very few firmsreport no integration. The upward trend in corporateengagement suggests firms have been sensitised to thisarea, given the number of high-profile corporate scandalswhich have occurred in South Africa. The predominanceof ESG factors in the negative screening processes canalso be understood in this light.
The number of firms with dedicated ESG staff hasremained steady at a reasonable 40%, which is pleasing
given that the firms represented in the survey aretypically constrained in terms of personnel. It is alsonotable that investment teams are engaged with respectto ESG on at least a monthly basis by over 70% ofrespondents.
With regards to sources of ESG data, there has been aslight increase in the use of external data vendors, atthe expense of internal analysts and the use of companyreports. It is, however, clear that most companies usemore than one of these sources. A good balance isimportant, to mitigate internal biases by referencingindependent sources. A steady increase of firms reportusing other sources of data.
Have a dedicated ESG team/individual:
% o
f fir
ms
100%
80%
60%
40%
20%
0%2018 2019
68.75%
31.25%
60.00%
40.00%
2020
62.50%
37.50%
71.88%
28.12%
Yes
No
Investment team holds at leastone monthly ESG meeting:
Sources of ESG data:
% o
f fir
ms
Internal ESGanalyst/team
research
External third partyESG data/research
provider
Company reports Other
100%
80%
60%
40%
20%
0%
2018
2019
2020
No Yes
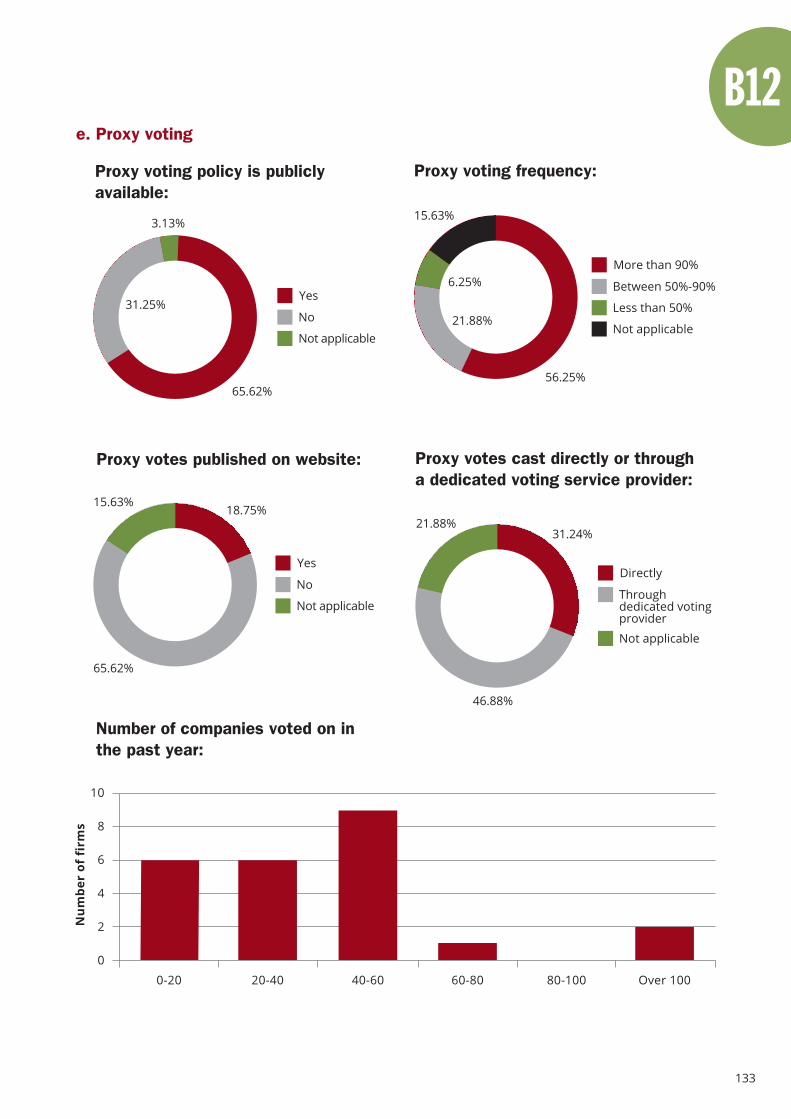
133
e. Proxy voting
Proxy voting policy is publiclyavailable:
65.62%
31.25%Yes
No
Not applicable
3.13%
Proxy voting frequency:
56.25%
More than 90%
Between 50%-90%
Less than 50%
Not applicable21.88%
6.25%
15.63%
Proxy votes published on website:
65.62%
18.75%15.63%
Yes
No
Not applicable
Proxy votes cast directly or througha dedicated voting service provider:
46.88%
31.24%
Directly
Throughdedicated votingprovider
Not applicable
21.88%
Number of companies voted on inthe past year:
Num
ber
of f
irm
s
10
8
6
4
2
0
0-20 Over 10080-10020-40 60-8040-60
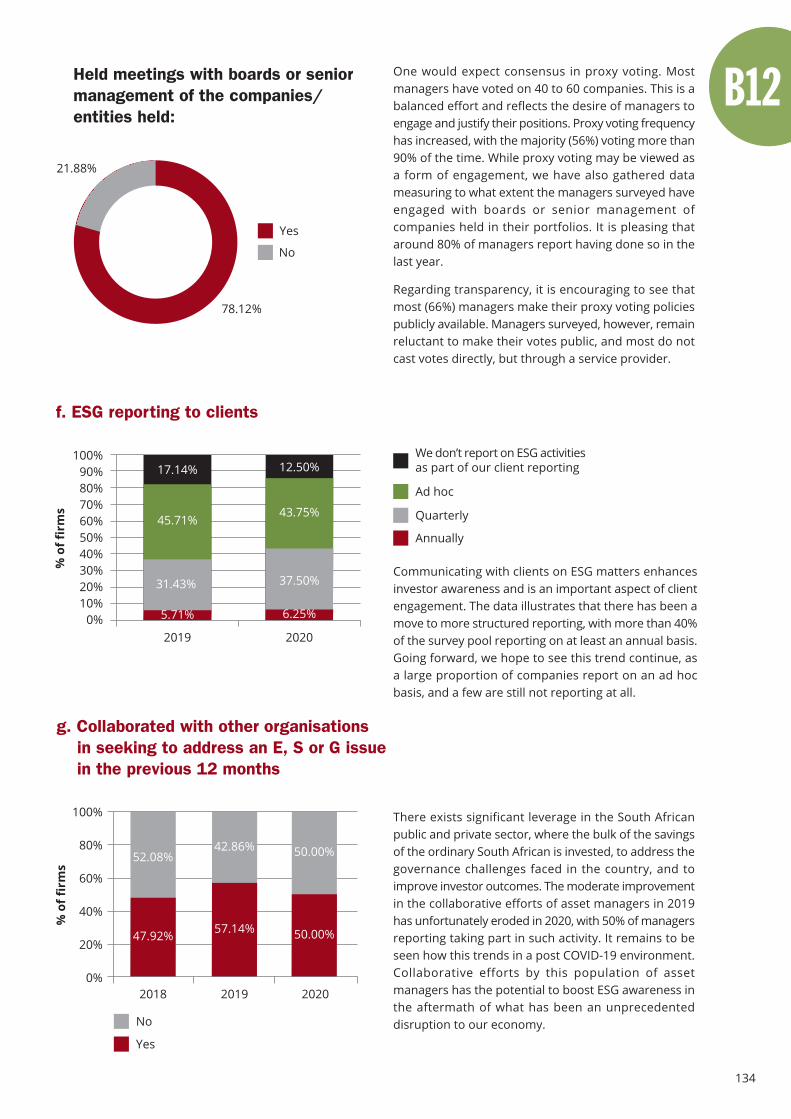
134
One would expect consensus in proxy voting. Mostmanagers have voted on 40 to 60 companies. This is abalanced effort and reflects the desire of managers toengage and justify their positions. Proxy voting frequencyhas increased, with the majority (56%) voting more than90% of the time. While proxy voting may be viewed asa form of engagement, we have also gathered datameasuring to what extent the managers surveyed haveengaged with boards or senior management ofcompanies held in their portfolios. It is pleasing thataround 80% of managers report having done so in thelast year.
Regarding transparency, it is encouraging to see thatmost (66%) managers make their proxy voting policiespublicly available. Managers surveyed, however, remainreluctant to make their votes public, and most do notcast votes directly, but through a service provider.
Communicating with clients on ESG matters enhancesinvestor awareness and is an important aspect of clientengagement. The data illustrates that there has been amove to more structured reporting, with more than 40%of the survey pool reporting on at least an annual basis.Going forward, we hope to see this trend continue, asa large proportion of companies report on an ad hocbasis, and a few are still not reporting at all.
There exists significant leverage in the South Africanpublic and private sector, where the bulk of the savingsof the ordinary South African is invested, to address thegovernance challenges faced in the country, and toimprove investor outcomes. The moderate improvementin the collaborative efforts of asset managers in 2019has unfortunately eroded in 2020, with 50% of managersreporting taking part in such activity. It remains to beseen how this trends in a post COVID-19 environment.Collaborative efforts by this population of assetmanagers has the potential to boost ESG awareness inthe aftermath of what has been an unprecedenteddisruption to our economy.
Held meetings with boards or seniormanagement of the companies/entities held:
78.12%
21.88%
Yes
No
f. ESG reporting to clients
% o
f fir
ms
100%90%80%70%60%50%40%30%20%10%
0%2019 2020
We don’t report on ESG activitiesas part of our client reporting
Ad hoc
Quarterly
Annually
5.71%
17.14%
31.43%
45.71%43.75%
37.50%
12.50%
6.25%
g. Collaborated with other organisations in seeking to address an E, S or G issue in the previous 12 months
% o
f fir
ms
100%
80%
60%
40%
20%
0%
No
Yes
2018 2019
52.08%
47.92%
42.86%
57.14%
2020
50.00%
50.00%
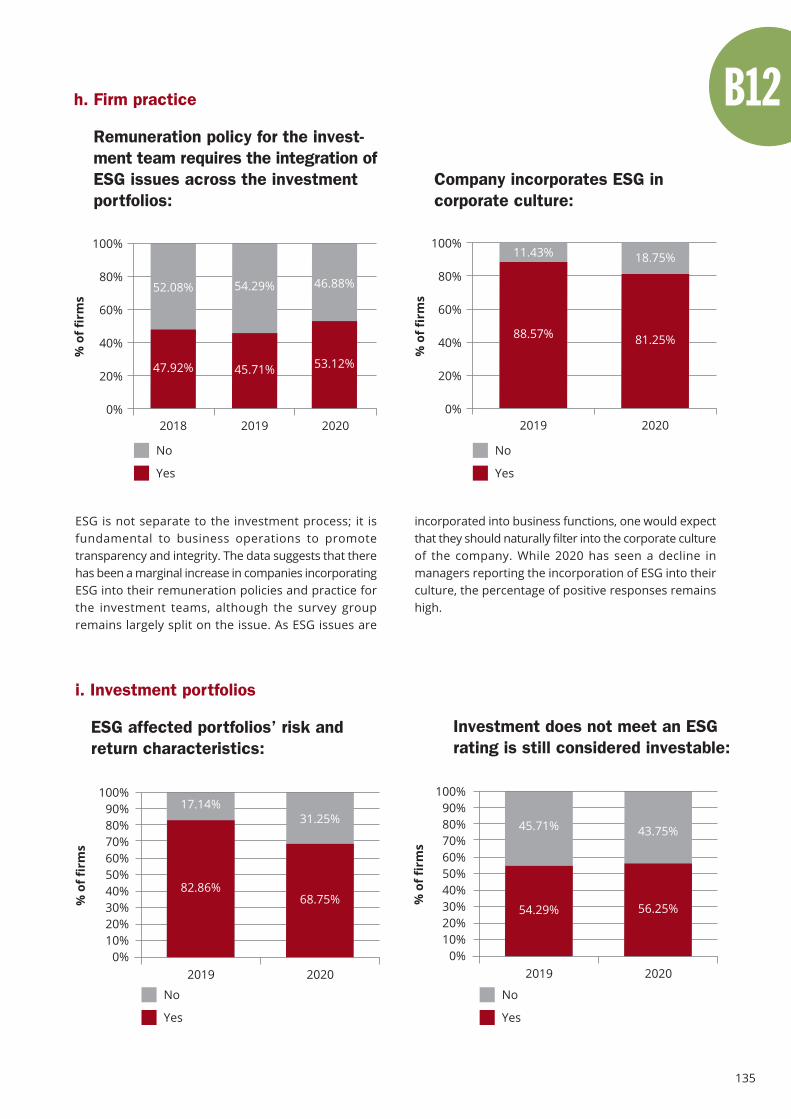
135
Investment does not meet an ESGrating is still considered investable:
Company incorporates ESG incorporate culture:
ESG is not separate to the investment process; it isfundamental to business operations to promotetransparency and integrity. The data suggests that therehas been a marginal increase in companies incorporatingESG into their remuneration policies and practice forthe investment teams, although the survey groupremains largely split on the issue. As ESG issues are
incorporated into business functions, one would expectthat they should naturally filter into the corporate cultureof the company. While 2020 has seen a decline inmanagers reporting the incorporation of ESG into theirculture, the percentage of positive responses remainshigh.
h. Firm practice
Remuneration policy for the invest-ment team requires the integration ofESG issues across the investment portfolios:
% o
f fir
ms
100%
80%
60%
40%
20%
0%
No
Yes
2018 2019
52.08%
47.92%
54.29%
45.71%
2020
46.88%
53.12%
% o
f fir
ms
100%
80%
60%
40%
20%
0%2019 2020
11.43%
No
Yes
88.57%
18.75%
81.25%
i. Investment portfolios
ESG affected portfolios’ risk andreturn characteristics:
% o
f fir
ms
100%90%80%70%60%50%40%30%20%10%
0%2019 2020
17.14%
No
Yes
82.86%
31.25%
68.75%
No
Yes
% o
f fir
ms
100%90%80%70%60%50%40%30%20%10%
0%2019 2020
45.71%
54.29%
43.75%
56.25%
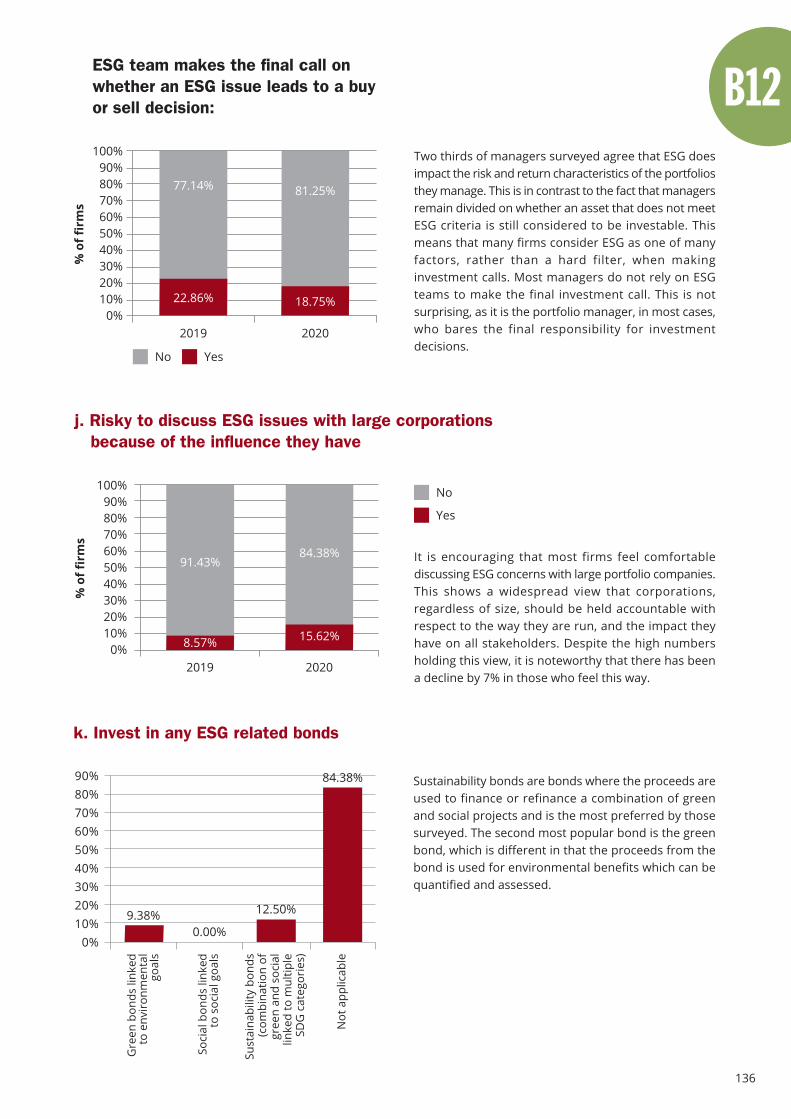
136
Two thirds of managers surveyed agree that ESG doesimpact the risk and return characteristics of the portfoliosthey manage. This is in contrast to the fact that managersremain divided on whether an asset that does not meetESG criteria is still considered to be investable. Thismeans that many firms consider ESG as one of manyfactors, rather than a hard filter, when makinginvestment calls. Most managers do not rely on ESGteams to make the final investment call. This is notsurprising, as it is the portfolio manager, in most cases,who bares the final responsibility for investmentdecisions.
It is encouraging that most firms feel comfortablediscussing ESG concerns with large portfolio companies.This shows a widespread view that corporations,regardless of size, should be held accountable withrespect to the way they are run, and the impact theyhave on all stakeholders. Despite the high numbersholding this view, it is noteworthy that there has beena decline by 7% in those who feel this way.
ESG team makes the final call onwhether an ESG issue leads to a buyor sell decision:
No Yes
j. Risky to discuss ESG issues with large corporationsbecause of the influence they have
% o
f fir
ms
100%90%80%70%60%50%40%30%20%10%
0%2019 2020
91.43%
No
Yes
8.57%
84.38%
15.62%
k. Invest in any ESG related bonds
% o
f fir
ms
100%90%80%70%60%50%40%30%20%10%
0%2019 2020
77.14%
22.86%
81.25%
18.75%
90%80%70%60%50%40%30%20%10%
0%
Sustainability bonds are bonds where the proceeds areused to finance or refinance a combination of greenand social projects and is the most preferred by thosesurveyed. The second most popular bond is the greenbond, which is different in that the proceeds from thebond is used for environmental benefits which can bequantified and assessed.
Gre
en b
onds
link
edto
env
iron
men
tal
goal
s
Soci
al b
onds
link
edto
soc
ial g
oals
Sust
aina
bilit
y bo
nds
(com
bina
tion
ofgr
een
and
soci
allin
ked
to m
ultip
leSD
G c
ateg
orie
s)
Not
app
licab
le
9.38%0.00%
12.50%
84.38%

137
Investmentperformance
Section details
Peace, justice & stronginstitutions
30 JUNE 2020Portfolio and benchmark returns are as at this date
ZARCurrency in which all data is quoted
FEESGross of fees performance is used except for South Africa Hedge Funds which are net of fees
ANNUALISEDReturns longer than 12 months are annualised
RISKWhere available, 3-year annualised volatility and tracking error are provided
INFORMATIONRATIODemonstrates how successful the assetmanager has been in outperforming thebenchmark considering the degree ofactive risk the asset manager assumedin achieving this return and is measuredover a 3-year period
Public markets
16

138
a. Multi-Asset Class
SA ABSOLUTE RETURN FUNDS
Risk statistics (3 years)
Fund name Benchmark 30-Jun # Quarter # 1 year # 3 years # 5 years # 7 years # 10 years # Volatility # Tracking # Information # error ratio
Balondolozi Absolute Return Fund CPI+3% 2,50% 2 11,70% 1 3,16% 5 8,30% 4 7,53% 4 8,17% 3 - - 7,79% 5 8,18% 5 0,20 4
Mianzo CPI+3% Fund CPI+3% 3,05% 1 10,52% 2 2,87% 6 5,81% 6 6,05% 6 - - - - 8,34% 6 8,74% 6 -0,09 6
Taquanta True Absolute Fund CPI+3% 0,68% 6 0,74% 6 8,83% 1 11,11% 1 11,40% 1 - - - - 1,01% 1 1,46% 1 3,06 1
Taquanta Absolute Fund CPI+3% 1,41% 3 4,73% 4 5,03% 4 9,29% 3 9,07% 3 7,86% 4 7,35% 3 3,62% 3 4,07% 3 0,65 3
Taquanta Pooled Reg 28 Absolute Fund CPI+3% 0,77% 5 2,65% 5 5,23% 3 10,43% 2 10,08% 2 8,44% 1 7,81% 2 2,78% 2 3,25% 2 1,17 2
Vunani Global Absolute Return Composite CPI+3% CPI+3% 1,16% 4 8,57% 3 5,76% 2 7,85% 5 7,01% 5 8,19% 2 9,18% 1 6,49% 4 6,78% 4 0,18 5
CPI+3% -0,36% -0,03% 5,05% 6,63% 7,50% 7,80% 7,94% 1,22%
Argon Absolute Return Fund CPI+4% 1,43% 5 6,76% 5 0,20% 4 4,85% 3 5,33% 1 7,66% 1 8,62% 1 6,02% 2 6,56% 2 -0,42 5
Mergence CPI + 4% Fund CPI+4% 2,95% 1 10,29% 3 0,63% 2 4,76% 4 5,04% 3 6,47% 4 7,79% 2 7,09% 3 7,57% 3 -0,38 3
Prescient Positive Return Fund CPI+4% 0,76% 6 5,04% 6 -2,59% 5 5,30% 2 5,17% 2 6,49% 3 6,49% 3 5,91% 1 6,36% 1 -0,37 2
Sentio Absolute Return Fund CPI+4% 2,91% 2 11,22% 1 -5,52% 6 1,90% 6 0,87% 5 4,83% 5 - - 9,79% 6 10,24% 6 -0,56 6
Vunani Domestic Absolute Return Composite CPI+4% CPI+4% 1,44% 4 10,30% 2 0,30% 3 4,25% 5 4,52% 4 6,53% 2 - - 7,90% 5 8,27% 5 -0,41 4
Vunani Global Absolute Return Composite CPI+4% CPI+4% 1,59% 3 9,58% 4 4,93% 1 7,43% 1 - - - - - - 7,75% 4 7,98% 4 -0,03 1
CPI+4% -0,28% 0,22% 6,05% 7,63% 8,50% 8,80% 8,94% 1,22%
Mergence CPI + 5 % (Local) Fund CPI+5% 3,51% 1 12,18% 1 -1,20% 2 4,78% 2 4,92% 2 6,66% 2 8,11% 2 8,83% 1 9,26% 2 -0,42 2
Vunani Global Absolute Return Composite CPI+5% CPI+5% 1,66% 2 10,23% 2 3,64% 1 6,44% 1 5,94% 1 8,14% 1 9,90% 1 8,99% 2 9,19% 1 -0,24 1
CPI+5% -0,19% 0,47% 7,05% 8,63% 9,50% 9,80% 9,94% 1,22%
Vunani Domestic Absolute Return Composite CPI+6% CPI+6% 2,25% 1 11,61% 1 -0,65% 1 3,63% 1 3,37% 1 6,04% 1 8,43% 1 9,99% 1 10,27% 1 -0,58 1
CPI+6% -0,11% 0,72% 8,05% 9,63% 10,50% 10,80% 10,94% 1,22%
Vunani Global Absolute Return Composite CPI+7% CPI+7% 1,17% 1 9,51% 1 2,86% 1 7,07% 1 5,51% 1 8,17% 1 10,96% 1 9,03% 1 9,20% 1 -0,39 1
CPI+7% -0,03% 0,97% 9,05% 10,63% 11,50% 11,80% 11,94% 1,22%
a. Multi-Asset Class (Absolute Return and Balanced)b. South Africa Hedge Fundsc. Offshored. South Africa Equitye. South Africa Fixed Incomef. South Africa Money Marketg. South Africa Incomeh. South Africa Listed Property
Performance and risk analysis is providedon the following product categories:
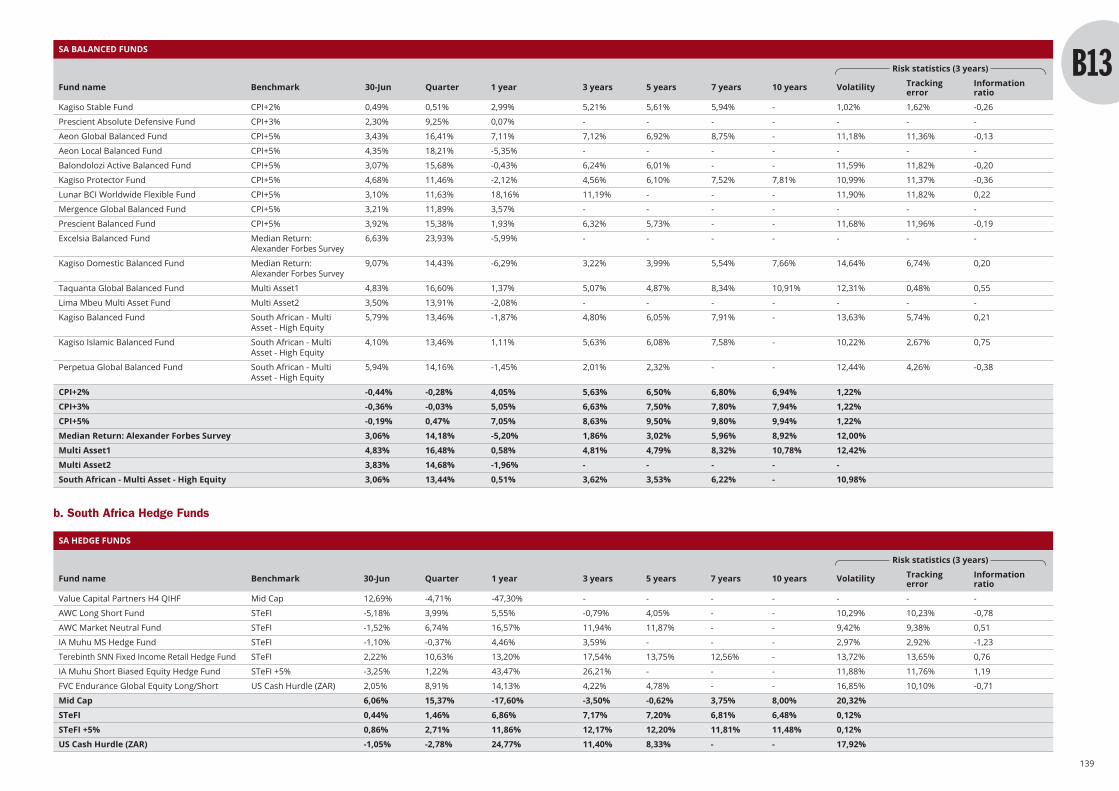
SA BALANCED FUNDS
Risk statistics (3 years)
Fund name Benchmark 30-Jun Quarter 1 year 3 years 5 years 7 years 10 years Volatility Tracking Information error ratio
Kagiso Stable Fund CPI+2% 0,49% 0,51% 2,99% 5,21% 5,61% 5,94% - 1,02% 1,62% -0,26
Prescient Absolute Defensive Fund CPI+3% 2,30% 9,25% 0,07% - - - - - - -
Aeon Global Balanced Fund CPI+5% 3,43% 16,41% 7,11% 7,12% 6,92% 8,75% - 11,18% 11,36% -0,13
Aeon Local Balanced Fund CPI+5% 4,35% 18,21% -5,35% - - - - - - -
Balondolozi Active Balanced Fund CPI+5% 3,07% 15,68% -0,43% 6,24% 6,01% - - 11,59% 11,82% -0,20
Kagiso Protector Fund CPI+5% 4,68% 11,46% -2,12% 4,56% 6,10% 7,52% 7,81% 10,99% 11,37% -0,36
Lunar BCI Worldwide Flexible Fund CPI+5% 3,10% 11,63% 18,16% 11,19% - - - 11,90% 11,82% 0,22
Mergence Global Balanced Fund CPI+5% 3,21% 11,89% 3,57% - - - - - - -
Prescient Balanced Fund CPI+5% 3,92% 15,38% 1,93% 6,32% 5,73% - - 11,68% 11,96% -0,19
Excelsia Balanced Fund Median Return: 6,63% 23,93% -5,99% - - - - - - -Alexander Forbes Survey
Kagiso Domestic Balanced Fund Median Return: 9,07% 14,43% -6,29% 3,22% 3,99% 5,54% 7,66% 14,64% 6,74% 0,20Alexander Forbes Survey
Taquanta Global Balanced Fund Multi Asset1 4,83% 16,60% 1,37% 5,07% 4,87% 8,34% 10,91% 12,31% 0,48% 0,55
Lima Mbeu Multi Asset Fund Multi Asset2 3,50% 13,91% -2,08% - - - - - - -
Kagiso Balanced Fund South African - Multi 5,79% 13,46% -1,87% 4,80% 6,05% 7,91% - 13,63% 5,74% 0,21Asset - High Equity
Kagiso Islamic Balanced Fund South African - Multi 4,10% 13,46% 1,11% 5,63% 6,08% 7,58% - 10,22% 2,67% 0,75Asset - High Equity
Perpetua Global Balanced Fund South African - Multi 5,94% 14,16% -1,45% 2,01% 2,32% - - 12,44% 4,26% -0,38Asset - High Equity
CPI+2% -0,44% -0,28% 4,05% 5,63% 6,50% 6,80% 6,94% 1,22%
CPI+3% -0,36% -0,03% 5,05% 6,63% 7,50% 7,80% 7,94% 1,22%
CPI+5% -0,19% 0,47% 7,05% 8,63% 9,50% 9,80% 9,94% 1,22%
Median Return: Alexander Forbes Survey 3,06% 14,18% -5,20% 1,86% 3,02% 5,96% 8,92% 12,00%
Multi Asset1 4,83% 16,48% 0,58% 4,81% 4,79% 8,32% 10,78% 12,42%
Multi Asset2 3,83% 14,68% -1,96% - - - - -
South African - Multi Asset - High Equity 3,06% 13,44% 0,51% 3,62% 3,53% 6,22% - 10,98%
SA HEDGE FUNDS
Risk statistics (3 years)
Fund name Benchmark 30-Jun Quarter 1 year 3 years 5 years 7 years 10 years Volatility Tracking Information error ratio
Value Capital Partners H4 QIHF Mid Cap 12,69% -4,71% -47,30% - - - - - - -
AWC Long Short Fund STeFI -5,18% 3,99% 5,55% -0,79% 4,05% - - 10,29% 10,23% -0,78
AWC Market Neutral Fund STeFI -1,52% 6,74% 16,57% 11,94% 11,87% - - 9,42% 9,38% 0,51
IA Muhu MS Hedge Fund STeFI -1,10% -0,37% 4,46% 3,59% - - - 2,97% 2,92% -1,23
Terebinth SNN Fixed Income Retail Hedge Fund STeFI 2,22% 10,63% 13,20% 17,54% 13,75% 12,56% - 13,72% 13,65% 0,76
IA Muhu Short Biased Equity Hedge Fund STeFI +5% -3,25% 1,22% 43,47% 26,21% - - - 11,88% 11,76% 1,19
FVC Endurance Global Equity Long/Short US Cash Hurdle (ZAR) 2,05% 8,91% 14,13% 4,22% 4,78% - - 16,85% 10,10% -0,71
Mid Cap 6,06% 15,37% -17,60% -3,50% -0,62% 3,75% 8,00% 20,32%
STeFI 0,44% 1,46% 6,86% 7,17% 7,20% 6,81% 6,48% 0,12%
STeFI +5% 0,86% 2,71% 11,86% 12,17% 12,20% 11,81% 11,48% 0,12%
US Cash Hurdle (ZAR) -1,05% -2,78% 24,77% 11,40% 8,33% - - 17,92%
139
b. South Africa Hedge Funds
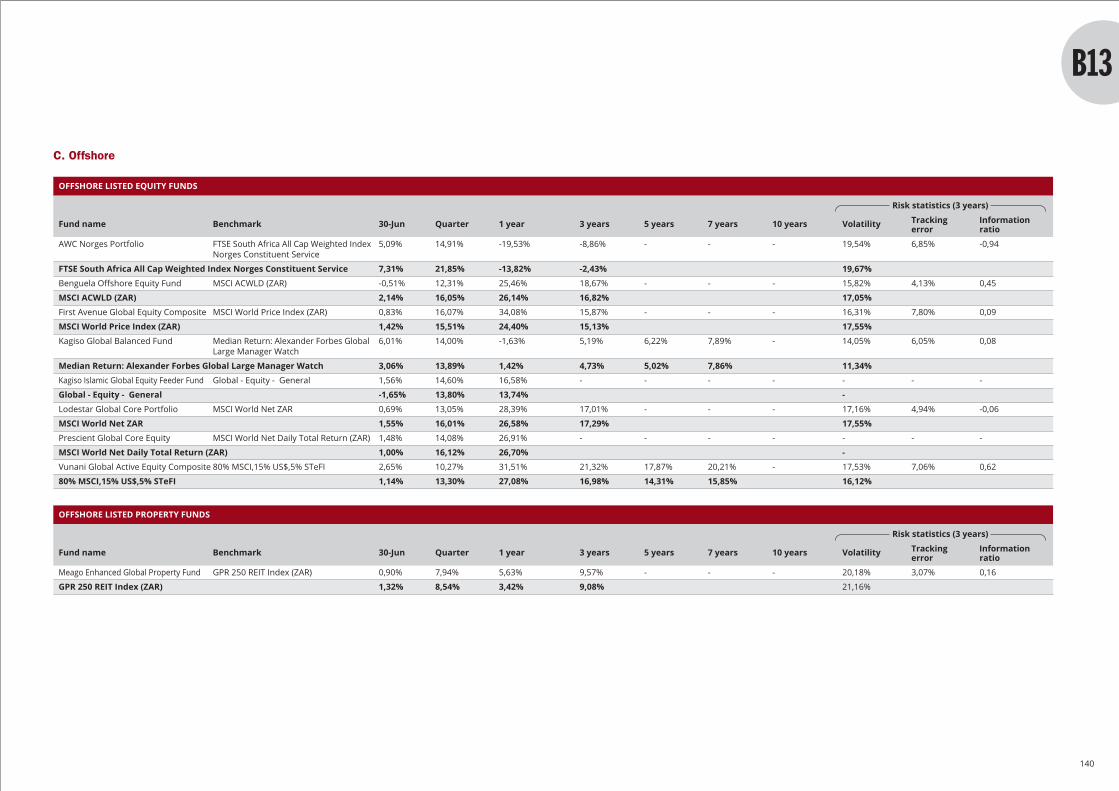
C. Offshore
OFFSHORE LISTED EQUITY FUNDS
Risk statistics (3 years)
Fund name Benchmark 30-Jun Quarter 1 year 3 years 5 years 7 years 10 years Volatility Tracking Information error ratio
AWC Norges Portfolio FTSE South Africa All Cap Weighted Index 5,09% 14,91% -19,53% -8,86% - - - 19,54% 6,85% -0,94Norges Constituent Service
FTSE South Africa All Cap Weighted Index Norges Constituent Service 7,31% 21,85% -13,82% -2,43% 19,67%
Benguela Offshore Equity Fund MSCI ACWLD (ZAR) -0,51% 12,31% 25,46% 18,67% - - - 15,82% 4,13% 0,45
MSCI ACWLD (ZAR) 2,14% 16,05% 26,14% 16,82% 17,05%
First Avenue Global Equity Composite MSCI World Price Index (ZAR) 0,83% 16,07% 34,08% 15,87% - - - 16,31% 7,80% 0,09
MSCI World Price Index (ZAR) 1,42% 15,51% 24,40% 15,13% 17,55%
Kagiso Global Balanced Fund Median Return: Alexander Forbes Global 6,01% 14,00% -1,63% 5,19% 6,22% 7,89% - 14,05% 6,05% 0,08Large Manager Watch
Median Return: Alexander Forbes Global Large Manager Watch 3,06% 13,89% 1,42% 4,73% 5,02% 7,86% 11,34%
Kagiso Islamic Global Equity Feeder Fund Global - Equity - General 1,56% 14,60% 16,58% - - - - - - -
Global - Equity - General -1,65% 13,80% 13,74% -
Lodestar Global Core Portfolio MSCI World Net ZAR 0,69% 13,05% 28,39% 17,01% - - - 17,16% 4,94% -0,06
MSCI World Net ZAR 1,55% 16,01% 26,58% 17,29% 17,55%
Prescient Global Core Equity MSCI World Net Daily Total Return (ZAR) 1,48% 14,08% 26,91% - - - - - - -
MSCI World Net Daily Total Return (ZAR) 1,00% 16,12% 26,70% -
Vunani Global Active Equity Composite 80% MSCI,15% US$,5% STeFI 2,65% 10,27% 31,51% 21,32% 17,87% 20,21% - 17,53% 7,06% 0,62
80% MSCI,15% US$,5% STeFI 1,14% 13,30% 27,08% 16,98% 14,31% 15,85% 16,12%
OFFSHORE LISTED PROPERTY FUNDS
Risk statistics (3 years)
Fund name Benchmark 30-Jun Quarter 1 year 3 years 5 years 7 years 10 years Volatility Tracking Information error ratio
Meago Enhanced Global Property Fund GPR 250 REIT Index (ZAR) 0,90% 7,94% 5,63% 9,57% - - - 20,18% 3,07% 0,16
GPR 250 REIT Index (ZAR) 1,32% 8,54% 3,42% 9,08% 21,16%
140

141
d. South Africa Equity
SA EQUITY FUNDS
Risk statistics (3 years)
Fund name Benchmark 30-Jun # Quarter # 1 year # 3 years # 5 years # 7 years # 10 years # Volatility # Tracking # Information # error ratio
Aeon Active Equity Composite SWIX All Share 6,68% 11 23,51% 6 -3,70% 2 3,80% 2 3,59% 1 8,57% 1 11,78% 1 16,37% 2 3,96% 11 0,45 4Aeon Smart Multi-Factor Equity Fund SWIX All Share 6,78% 10 22,99% 7 -5,59% 6 2,74% 4 2,28% 7 7,09% 3 - - 17,87% 9 2,66% 4 0,28 5All Weather NCIS General Equity Fund SWIX All Share 7,42% 8 24,22% 4 -7,93% 9 1,54% 8 3,06% 2 - - - - 18,99% 12 3,95% 10 -0,12 8ALUWANI SWIX Equity Fund SWIX All Share 7,25% 9 20,34% 12 -6,37% 7 4,10% 1 2,83% 3 - - - - 17,03% 5 2,46% 3 0,85 3Argon Specialist Domestic Equity SWIX All Share 7,52% 7 24,01% 5 -4,29% 3 2,78% 3 2,55% 5 8,49% 2 10,68% 4 18,46% 10 3,38% 6 1,06 1Excelsia Aggressive Equity SWIX SWIX All Share 8,91% 2 32,27% 1 -10,26% 13 -1,94% 13 - - - - - - 22,18% 14 7,60% 14 -0,52 12Excelsia Core Equity SWIX SWIX All Share 9,59% 1 29,08% 2 -6,63% 8 0,17% 12 - - - - - - 20,44% 13 4,39% 12 -0,42 10First Avenue General Equity SWIX Composite SWIX All Share 5,20% 14 14,69% 14 -12,00% 14 -4,21% 14 -2,32% 12 2,96% 8 - - 14,83% 1 4,89% 13 -1,27 14Mergence SWIX Fund SWIX All Share 8,80% 3 22,26% 8 -8,67% 11 0,44% 11 1,39% 10 6,92% 5 10,71% 3 17,18% 6 1,79% 2 -0,87 13Mianzo Active Equity Fund SWIX All Share 8,54% 4 24,43% 3 -10,01% 12 0,50% 10 0,90% 11 6,02% 7 - - 18,76% 11 3,40% 7 -0,44 11Perpetua Relative Value Equity Fund SWIX All Share 8,40% 5 21,35% 10 -1,93% 1 0,89% 9 1,62% 8 - - - - 16,95% 3 3,01% 5 -0,37 9Prescient Core Equity SWIX Fund SWIX All Share 7,69% 6 22,13% 9 -5,26% 5 2,45% 5 2,60% 4 - - - - 17,67% 7 0,49% 1 0,91 2Sentio General Equity Fund SWIX All Share 6,44% 12 20,08% 13 -8,67% 10 2,13% 7 1,51% 9 6,97% 4 10,93% 2 16,97% 4 3,63% 8 0,04 7Vunani Core Equity Composite SWIX All Share 6,14% 13 20,67% 11 -4,48% 4 2,40% 6 2,47% 6 6,73% 6 - - 17,84% 8 3,92% 9 0,10 6SWIX All Share 8,07% 22,09% -6,09% 2,00% 2,08% 7,05% 10,61% 17,68%Afena Capital Moderate Equity Capped SWIX Capped SWIX All Share 4,39% 17 15,17% 17 -21,82% 19 -4,66% 8 - - - - - - 16,99% 4 4,30% 7 -0,89 10Afena Capital Unconstrained Equity Capped SWIX Capped SWIX All Share 3,78% 19 13,42% 19 -20,91% 18 -4,92% 10 -2,12% 2 1,43% 3 - - 16,14% 2 5,15% 8 -0,80 8All Weather Capped SWIX Fund Capped SWIX All Share 6,62% 10 21,60% 7 -11,27% 11 - - - - - - - - - - - - - -ALUWANI CAPPED SWIX Equity Fund Capped SWIX All Share 6,22% 13 20,16% 11 -9,79% 4 1,24% 2 - - - - - - 16,89% 3 2,83% 3 0,73 1Balondolozi Active Equity Fund Capped SWIX All Share 6,13% 14 22,42% 3 -10,42% 7 - - - - - - - - - - - - - -Benguela Capped SWIX Composite Capped SWIX All Share 6,50% 11 18,22% 15 -9,31% 3 -1,23% 5 - - - - - - 15,71% 1 3,92% 5 -0,11 5Excelsia Core Equity Capped SWIX All Share 8,39% 4 28,23% 1 -10,75% 10 - - - - - - - - - - - - - -First Avenue Equity Capped SWIX Composite Capped SWIX All Share 4,31% 18 14,52% 18 -17,13% 17 - - - - - - - - - - - - - -Kagiso Core Equity Fund Capped SWIX All Share 9,17% 2 22,95% 2 -13,45% 14 -2,21% 6 - - - - - - 19,15% 9 4,11% 6 -0,34 6Kagiso Managed Equity Fund Capped SWIX All Share 13,02% 1 20,77% 9 -8,95% 1 1,28% 1 - - - - - - 19,67% 10 8,27% 10 0,25 2Lima Mbeu SA Equity Fund Capped SWIX All Share 6,41% 12 20,26% 10 -9,81% 5 - - - - - - - - - - - - - -Mergence Capped SWIX Fund Capped SWIX All Share 7,66% 5 21,66% 6 -13,43% 13 -2,37% 7 - - - - - - 17,21% 5 1,92% 1 -0,81 9Mianzo Tracker Equity Fund Capped SWIX All Share 6,92% 8 21,70% 4 -10,62% 8 -0,86% 4 -0,36% 1 5,38% 1 - - 18,15% 7 2,37% 2 -0,02 4Ngwedi Core Equity Fund Capped SWIX All Share 7,13% 6 18,56% 14 -12,57% 12 - - - - - - - - - - - - - -Perpetua True Value Equity Fund Capped SWIX All Share 8,53% 3 17,92% 16 -13,58% 15 -4,92% 9 -2,13% 3 1,58% 2 - - 18,18% 8 5,33% 9 -0,77 7Prescient Core Equity Capped SWIX Fund Capped SWIX All Share 6,64% 9 21,69% 5 -10,23% 6 - - - - - - - - - - - - - -Sentio Capped SWIX Fund Capped SWIX All Share 5,40% 16 19,73% 12 -13,73% 16 0,01% 3 - - - - - - 17,45% 6 3,73% 4 0,22 3Vunani Domestic Active Equity Capped SWIX Capped SWIX All Share 5,41% 15 19,39% 13 -9,13% 2 - - - - - - - - - - - - - -Vunani Domestic Passive Equity Composite Capped SWIX Capped SWIX All Share 6,96% 7 21,51% 8 -10,67% 9 - - - - - - - - - - - - - -Capped SWIX All Share 6,98% 21,64% -10,78% -0,81% 0,07% 5,51% - 17,45%Afena Capital Moderate Equity CAPI CAPI ALSI 4,90% 3 17,14% 4 -16,23% 4 -0,16% 4 0,85% 3 4,65% 2 6,85% 2 16,22% 2 3,94% 3 -0,99 4Afena Capital Core Equity CAPI CAPI ALSI 4,72% 4 18,99% 3 -12,65% 3 1,23% 3 - - - - - - 16,21% 1 3,04% 2 -0,83 3Cachalia Capital C Value Fund CAPI ALSI 6,74% 2 24,94% 1 0,70% 1 7,09% 1 4,56% 1 - - - - 18,31% 4 4,37% 4 0,76 1Mergence CAPI Fund CAPI ALSI 7,67% 1 22,88% 2 -7,55% 2 2,62% 2 2,89% 2 7,21% 1 10,48% 1 16,38% 3 1,77% 1 -0,64 2CAPI ALSI 7,03% 22,94% -5,64% 3,76% 3,41% 7,37% 10,55% 16,92%Kagiso Top 40 Tracker Fund Top 40 7,86% 2 24,97% 1 2,30% 1 7,44% 1 5,03% 1 8,51% 2 11,17% 2 16,86% 3 1,48% 1 0,51 1Prescient Core Equity ALSI Top 40 Fund Top 40 8,04% 1 23,80% 3 -0,33% 2 6,89% 2 4,89% 2 8,74% 1 11,41% 1 17,06% 2 0,66% 2 0,32 2Vunani Domestic Passive Equity Composite Top 40 Top 40 7,82% 3 24,01% 2 -0,76% 3 6,50% 3 4,70% 3 8,34% 3 11,14% 3 17,28% 1 0,17% 3 -1,04 3Top 40 7,85% 24,18% -0,55% 6,68% 4,82% 8,49% 11,23% 17,36%
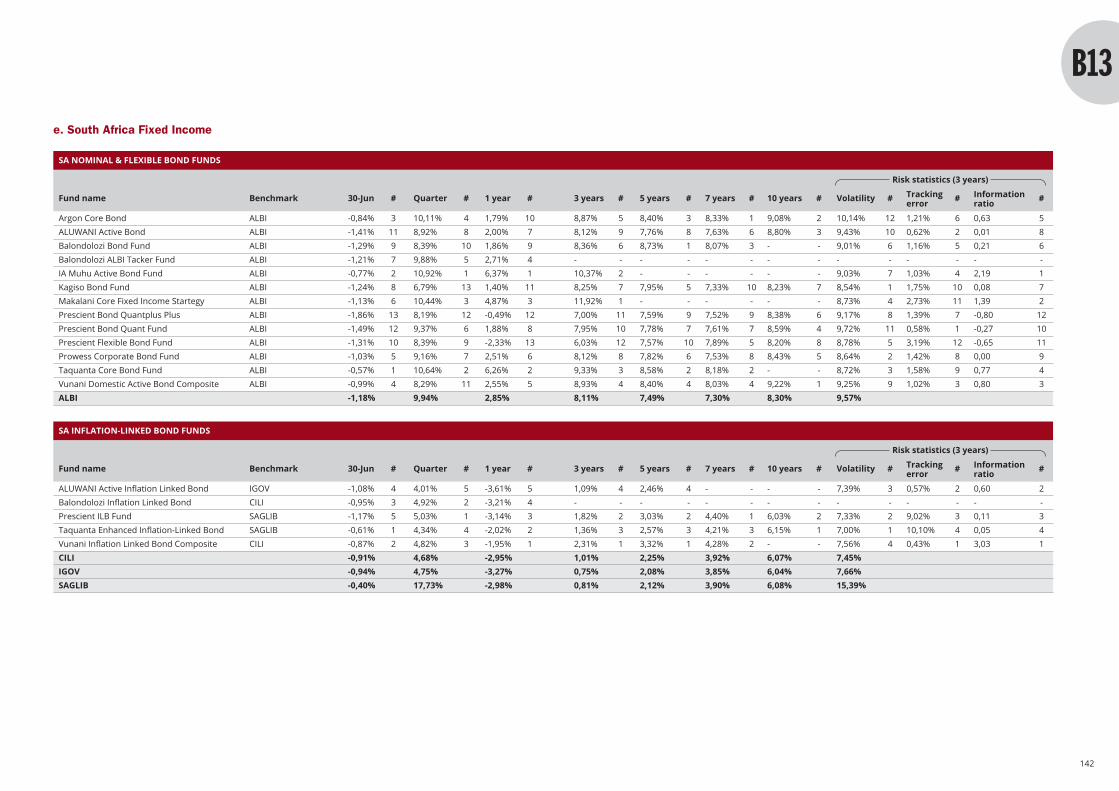
e. South Africa Fixed Income
SA NOMINAL & FLEXIBLE BOND FUNDS
Risk statistics (3 years)
Fund name Benchmark 30-Jun # Quarter # 1 year # 3 years # 5 years # 7 years # 10 years # Volatility # Tracking # Information # error ratio
Argon Core Bond ALBI -0,84% 3 10,11% 4 1,79% 10 8,87% 5 8,40% 3 8,33% 1 9,08% 2 10,14% 12 1,21% 6 0,63 5ALUWANI Active Bond ALBI -1,41% 11 8,92% 8 2,00% 7 8,12% 9 7,76% 8 7,63% 6 8,80% 3 9,43% 10 0,62% 2 0,01 8Balondolozi Bond Fund ALBI -1,29% 9 8,39% 10 1,86% 9 8,36% 6 8,73% 1 8,07% 3 - - 9,01% 6 1,16% 5 0,21 6Balondolozi ALBI Tacker Fund ALBI -1,21% 7 9,88% 5 2,71% 4 - - - - - - - - - - - - - -IA Muhu Active Bond Fund ALBI -0,77% 2 10,92% 1 6,37% 1 10,37% 2 - - - - - - 9,03% 7 1,03% 4 2,19 1Kagiso Bond Fund ALBI -1,24% 8 6,79% 13 1,40% 11 8,25% 7 7,95% 5 7,33% 10 8,23% 7 8,54% 1 1,75% 10 0,08 7Makalani Core Fixed Income Startegy ALBI -1,13% 6 10,44% 3 4,87% 3 11,92% 1 - - - - - - 8,73% 4 2,73% 11 1,39 2Prescient Bond Quantplus Plus ALBI -1,86% 13 8,19% 12 -0,49% 12 7,00% 11 7,59% 9 7,52% 9 8,38% 6 9,17% 8 1,39% 7 -0,80 12Prescient Bond Quant Fund ALBI -1,49% 12 9,37% 6 1,88% 8 7,95% 10 7,78% 7 7,61% 7 8,59% 4 9,72% 11 0,58% 1 -0,27 10Prescient Flexible Bond Fund ALBI -1,31% 10 8,39% 9 -2,33% 13 6,03% 12 7,57% 10 7,89% 5 8,20% 8 8,78% 5 3,19% 12 -0,65 11Prowess Corporate Bond Fund ALBI -1,03% 5 9,16% 7 2,51% 6 8,12% 8 7,82% 6 7,53% 8 8,43% 5 8,64% 2 1,42% 8 0,00 9Taquanta Core Bond Fund ALBI -0,57% 1 10,64% 2 6,26% 2 9,33% 3 8,58% 2 8,18% 2 - - 8,72% 3 1,58% 9 0,77 4Vunani Domestic Active Bond Composite ALBI -0,99% 4 8,29% 11 2,55% 5 8,93% 4 8,40% 4 8,03% 4 9,22% 1 9,25% 9 1,02% 3 0,80 3ALBI -1,18% 9,94% 2,85% 8,11% 7,49% 7,30% 8,30% 9,57%
SA INFLATION-LINKED BOND FUNDS
Risk statistics (3 years)
Fund name Benchmark 30-Jun # Quarter # 1 year # 3 years # 5 years # 7 years # 10 years # Volatility # Tracking # Information # error ratio
ALUWANI Active Inflation Linked Bond IGOV -1,08% 4 4,01% 5 -3,61% 5 1,09% 4 2,46% 4 - - - - 7,39% 3 0,57% 2 0,60 2Balondolozi Inflation Linked Bond CILI -0,95% 3 4,92% 2 -3,21% 4 - - - - - - - - - - - - - -Prescient ILB Fund SAGLIB -1,17% 5 5,03% 1 -3,14% 3 1,82% 2 3,03% 2 4,40% 1 6,03% 2 7,33% 2 9,02% 3 0,11 3Taquanta Enhanced Inflation-Linked Bond SAGLIB -0,61% 1 4,34% 4 -2,02% 2 1,36% 3 2,57% 3 4,21% 3 6,15% 1 7,00% 1 10,10% 4 0,05 4Vunani Inflation Linked Bond Composite CILI -0,87% 2 4,82% 3 -1,95% 1 2,31% 1 3,32% 1 4,28% 2 - - 7,56% 4 0,43% 1 3,03 1CILI -0,91% 4,68% -2,95% 1,01% 2,25% 3,92% 6,07% 7,45%IGOV -0,94% 4,75% -3,27% 0,75% 2,08% 3,85% 6,04% 7,66%SAGLIB -0,40% 17,73% -2,98% 0,81% 2,12% 3,90% 6,08% 15,39%
142
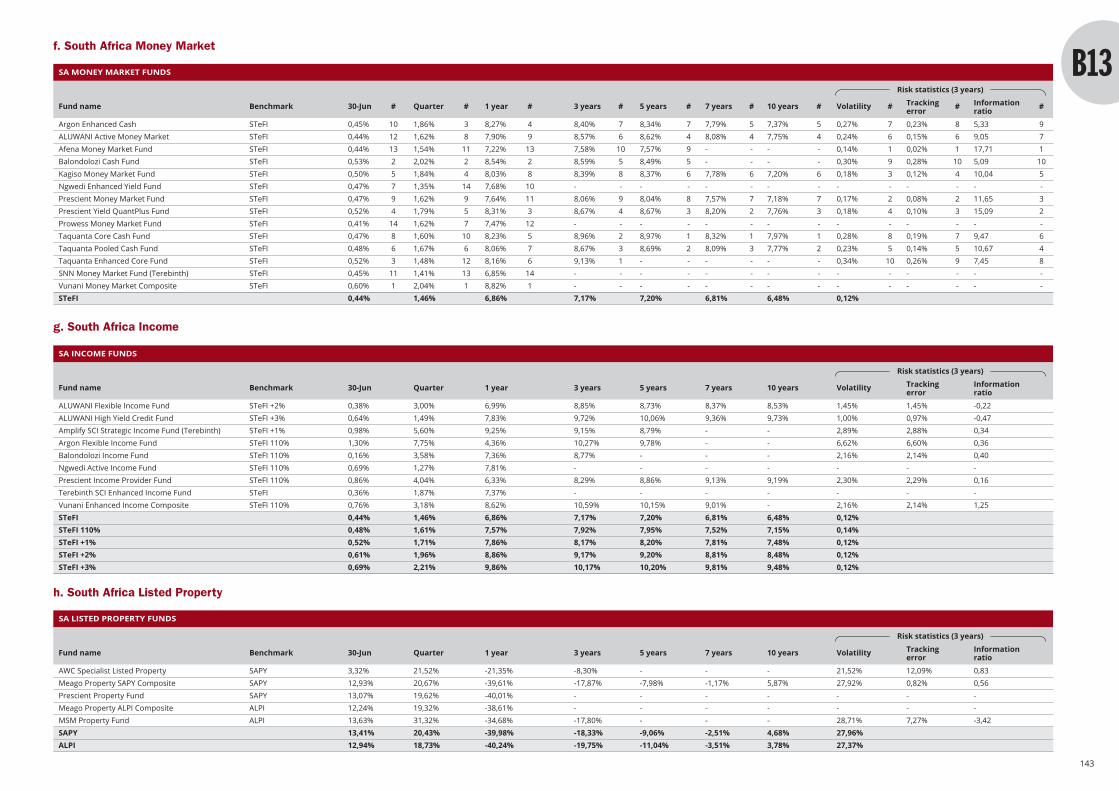
143
SA INCOME FUNDS
Risk statistics (3 years)
Fund name Benchmark 30-Jun Quarter 1 year 3 years 5 years 7 years 10 years Volatility Tracking Information error ratio
ALUWANI Flexible Income Fund STeFI +2% 0,38% 3,00% 6,99% 8,85% 8,73% 8,37% 8,53% 1,45% 1,45% -0,22ALUWANI High Yield Credit Fund STeFI +3% 0,64% 1,49% 7,83% 9,72% 10,06% 9,36% 9,73% 1,00% 0,97% -0,47Amplify SCI Strategic Income Fund (Terebinth) STeFI +1% 0,98% 5,60% 9,25% 9,15% 8,79% - - 2,89% 2,88% 0,34Argon Flexible Income Fund STeFI 110% 1,30% 7,75% 4,36% 10,27% 9,78% - - 6,62% 6,60% 0,36Balondolozi Income Fund STeFI 110% 0,16% 3,58% 7,36% 8,77% - - - 2,16% 2,14% 0,40Ngwedi Active Income Fund STeFI 110% 0,69% 1,27% 7,81% - - - - - - -Prescient Income Provider Fund STeFI 110% 0,86% 4,04% 6,33% 8,29% 8,86% 9,13% 9,19% 2,30% 2,29% 0,16Terebinth SCI Enhanced Income Fund STeFI 0,36% 1,87% 7,37% - - - - - - -Vunani Enhanced Income Composite STeFI 110% 0,76% 3,18% 8,62% 10,59% 10,15% 9,01% - 2,16% 2,14% 1,25STeFI 0,44% 1,46% 6,86% 7,17% 7,20% 6,81% 6,48% 0,12%STeFI 110% 0,48% 1,61% 7,57% 7,92% 7,95% 7,52% 7,15% 0,14%STeFI +1% 0,52% 1,71% 7,86% 8,17% 8,20% 7,81% 7,48% 0,12%STeFI +2% 0,61% 1,96% 8,86% 9,17% 9,20% 8,81% 8,48% 0,12%STeFI +3% 0,69% 2,21% 9,86% 10,17% 10,20% 9,81% 9,48% 0,12%
SA LISTED PROPERTY FUNDS
Risk statistics (3 years)
Fund name Benchmark 30-Jun Quarter 1 year 3 years 5 years 7 years 10 years Volatility Tracking Information error ratio
AWC Specialist Listed Property SAPY 3,32% 21,52% -21,35% -8,30% - - - 21,52% 12,09% 0,83Meago Property SAPY Composite SAPY 12,93% 20,67% -39,61% -17,87% -7,98% -1,17% 5,87% 27,92% 0,82% 0,56Prescient Property Fund SAPY 13,07% 19,62% -40,01% - - - - - - -Meago Property ALPI Composite ALPI 12,24% 19,32% -38,61% - - - - - - -MSM Property Fund ALPI 13,63% 31,32% -34,68% -17,80% - - - 28,71% 7,27% -3,42SAPY 13,41% 20,43% -39,98% -18,33% -9,06% -2,51% 4,68% 27,96%ALPI 12,94% 18,73% -40,24% -19,75% -11,04% -3,51% 3,78% 27,37%
SA MONEY MARKET FUNDS
Risk statistics (3 years)
Fund name Benchmark 30-Jun # Quarter # 1 year # 3 years # 5 years # 7 years # 10 years # Volatility # Tracking # Information # error ratio
Argon Enhanced Cash STeFI 0,45% 10 1,86% 3 8,27% 4 8,40% 7 8,34% 7 7,79% 5 7,37% 5 0,27% 7 0,23% 8 5,33 9ALUWANI Active Money Market STeFI 0,44% 12 1,62% 8 7,90% 9 8,57% 6 8,62% 4 8,08% 4 7,75% 4 0,24% 6 0,15% 6 9,05 7Afena Money Market Fund STeFI 0,44% 13 1,54% 11 7,22% 13 7,58% 10 7,57% 9 - - - - 0,14% 1 0,02% 1 17,71 1Balondolozi Cash Fund STeFI 0,53% 2 2,02% 2 8,54% 2 8,59% 5 8,49% 5 - - - - 0,30% 9 0,28% 10 5,09 10Kagiso Money Market Fund STeFI 0,50% 5 1,84% 4 8,03% 8 8,39% 8 8,37% 6 7,78% 6 7,20% 6 0,18% 3 0,12% 4 10,04 5Ngwedi Enhanced Yield Fund STeFI 0,47% 7 1,35% 14 7,68% 10 - - - - - - - - - - - - - -Prescient Money Market Fund STeFI 0,47% 9 1,62% 9 7,64% 11 8,06% 9 8,04% 8 7,57% 7 7,18% 7 0,17% 2 0,08% 2 11,65 3Prescient Yield QuantPlus Fund STeFI 0,52% 4 1,79% 5 8,31% 3 8,67% 4 8,67% 3 8,20% 2 7,76% 3 0,18% 4 0,10% 3 15,09 2Prowess Money Market Fund STeFI 0,41% 14 1,62% 7 7,47% 12 - - - - - - - - - - - - - -Taquanta Core Cash Fund STeFI 0,47% 8 1,60% 10 8,23% 5 8,96% 2 8,97% 1 8,32% 1 7,97% 1 0,28% 8 0,19% 7 9,47 6Taquanta Pooled Cash Fund STeFI 0,48% 6 1,67% 6 8,06% 7 8,67% 3 8,69% 2 8,09% 3 7,77% 2 0,23% 5 0,14% 5 10,67 4Taquanta Enhanced Core Fund STeFI 0,52% 3 1,48% 12 8,16% 6 9,13% 1 - - - - - - 0,34% 10 0,26% 9 7,45 8SNN Money Market Fund (Terebinth) STeFI 0,45% 11 1,41% 13 6,85% 14 - - - - - - - - - - - - - -Vunani Money Market Composite STeFI 0,60% 1 2,04% 1 8,82% 1 - - - - - - - - - - - - - -STeFI 0,44% 1,46% 6,86% 7,17% 7,20% 6,81% 6,48% 0,12%
f. South Africa Money Market
g. South Africa Income
h. South Africa Listed Property

144
Asset manager profiles | Public markets
145
Name of company: Aeon Investment Management(Pty) Ltd
Date of inception: May-05Website: www.aeonim.co.zaAddress: 4th Floor, The Citadel, 15 Cavendish
Street, Claremont, 7708Telephone: +27 21 204 6061Email: [email protected] person: Tshego ModiseTitle of contact person: Business Development ManagerTwitter: @AsiefMohamedFacebook: Aeon Investment ManagementInstagram: aeon_im_growthLinkedIn: Aeon Investment Management (Pty) Ltd
Name of company: Afena Capital (Pty) LtdDate of inception: Nov-05Website: www.afenacapital.comAddress: 6th Floor, Sunclare Building,
21 Dreyer Street, Claremont, 7708Telephone: +27 21 657 6240Email: [email protected] person: Thabang SengoaraTitle of contact person: Business Development ManagerLinkedIn: Afena Capital Proprietary Limited
Name of company: All Weather Capital (Pty) LtdDate of inception: May-08Website: www.allweather.co.zaAddress: 9th Floor, Katherine Towers, 1 Park
Lane, Wierda Valley, Sandton, 2196Telephone: +27 11 722 7382Email: [email protected] person: Mark ScholefieldTitle of contact person: Administrator
Name of company: ALUWANI Capital Partners (Pty) LtdDate of inception: Dec-15Website: www.aluwanicapital.comAddress: EPPF Office Park, 24 Georgian
Crescent East, Bryanston East, 2152Telephone: +27 21 204 3800Email: [email protected] person: Lonwabo DambuzaTitle of contact person: Business Development ManagerTwitter: @aluwani_capitalFacebook: ALUWANI Capital PartnersLinkedIn: ALUWANI Capital Partners

146
Name of company: Argon Asset Management(Pty) Ltd
Date of inception: Apr-05Website: www.argonassetmanagement.co.zaAddress: 1st Floor, Colinton House, The Oval,
1 Oakdale Road, Newlands, 7700Telephone: +27 21 670 6570Email: [email protected] person: Luyanda JoxoTitle of contact person: Executive
Name of company: Balondolozi Investment Services(Pty) Ltd
Date of inception: Apr-10Website: www.balondolozi.co.zaAddress: 1st Floor, Building 1, Glenhove
Square, 71 4th Street, HoughtonEstate, 2198
Telephone: +27 11 484 9023Email: [email protected] person: Yolande MokhantsoTitle of contact person: Business Development Manager
Name of company: Benguela Global Fund Managers(Pty) Ltd
Date of inception: Feb-13Website: www.benguelaglobal.comAddress: 3rd Floor, Rivonia Village, Cnr.
Rivonia Boulevard and Mutual Road,Rivonia, 2191
Telephone: +27 10 596 8500Email: [email protected] person: Thandi ZwambilaTitle of contact person: Business Development ManagerTwitter: @benguela_globalLinkedIn: Benguela Global Fund Managers
Name of company: Cachalia Capital (Pty) LtdDate of inception: May-12Website: www.cachaliacapital.co.zaAddress: 12th Floor, Sinosteel Plaza,
159 Rivonia Road, Sandton, 2196Telephone: +27 11 883 0146Email: [email protected] person: Mashuda CassimTitle of contact person: Executive
Name of company: Excelsia Capital (Pty) LtdDate of inception: May-16Website: www.excelsia.co.zaAddress: 3rd Floor, Sunclare Building,
21 Dreyer Street, Claremont, 7708Telephone: +27 21 276 1740Email: [email protected] person: Rajay AmbekarTitle of contact person: ExecutiveLinkedIn: Excelsia Capital
147
Name of company: First Avenue InvestmentManagement (Pty) Ltd
Date of inception: Sep-10Website: www.firstavenue.co.zaAddress: Ground Floor, 21 Fricker Road,
Illovo, 2196Telephone: +27 11 772 2480Email: [email protected] person: Neetin GovanTitle of contact person: AdministratorLinkedIn: First Avenue Investment Management
Name of company: Fortitudine Vincimus CapitalAdvisors (Pty) Ltd
Date of inception: Aug-14Website: www.fvcadvisors.comAddress: 12 Lover's Walk, Rondebosch, 7700Telephone: +27 82 854 0808Email: [email protected] person: Mike KaneTitle of contact person: Executive
Name of company: Idwala Capital (Pty) LtdDate of inception: Aug-17Website: www.idwalacapital.co.zaAddress: 1st Floor, 63 St. Andrew Street,
Birdhaven, 2196Telephone: +27 11 447 1099Email: [email protected] person: Nandi RodoloTitle of contact person: Executive
Name of company: Independent AlternativesInvestment Managers (Pty) Ltd
Date of inception: Aug-15Website: www.independentalternatives.co.zaAddress: Jupiter House, River Park,
42 Homestead Road, Rivonia, 2191Telephone: +27 11 234 0187Email: [email protected] person: Tatenda ChapindukaTitle of contact person: ExecutiveLinkedIn: Independent Alternatives Investment
Managers
Name of company: Kagiso Asset Management(Pty) Ltd
Date of inception: Dec-01Website: www.kagisoam.comAddress: 5th Floor, MontClare Place, Cnr. Main
& Campground Roads, Claremont,7708
Telephone: +27 21 673 6300Email: [email protected] person: Tisha PowellTitle of contact person: AdministratorLinkedIn: Kagiso Asset ManagementYouTube: Kagiso Asset Management
Name of company: Lima Mbeu InvestmentManagers (Pty) Ltd
Date of inception: Sep-17Website: www.limambeu.co.zaAddress: 2nd Floor, Fredman Towers,
13 Fredman Drive, Sandton, 2196Telephone: +27 10 023 0113Email: [email protected] person: Teboho TsotetsiTitle of contact person: ExecutiveLinkedIn: Lima Mbeu Investment Managers
(Pty) Ltd
Name of company: Lodestar Fund Managers (Pty) LtdDate of inception: Jan-15Website: www.lodestarfunds.comAddress: 2nd Floor, The Terraces, 25 Protea
Road, Claremont, 7735Telephone: +27 267 7812Email: [email protected] person: Reza KhanTitle of contact person: ExecutiveTwitter: @lodestarfundsLinkedIn: Lodestar Fund Managers
Name of company: Lunar Capital (Pty) LtdDate of inception: Jan-15Website: www.lunarcapital.co.zaAddress: 29 Seventh Street, Houghton Estate,
2198Telephone: +27 83 305 7860Email: [email protected] person: Sabir Mahomed MunshiTitle of contact person: ExecutiveTwitter: @sabirmunshiFacebook: Lunar CapitalLinkedIn: Sabir Munshi
Name of company: Makalani Management Company(Pty) Ltd
Date of inception: Aug-04Website: www.makalani.co.zaAddress: Ground Floor, 261 Oxford Road,
llovo, 2196Telephone: +27 11 428 0680Email: [email protected] person: Munier BadatTitle of contact person: ExecutiveTwitter: @MakalaniMCLinkedIn: Makalani Management Company
Name of company: Meago Asset Managers (Pty) LtdDate of inception: Mar-06Website: www.meago.co.zaAddress: 73 Oxford Road, Saxonwold, 2196Telephone: +27 11 646 2944Email: [email protected] person: Saneh MemelaTitle of contact person: Administrator
148

149
Name of company: Mergence Investment Managers(Pty) Ltd
Date of inception: Oct-04Website: www.mergence.co.zaAddress: 2nd Floor, Cape Town Cruise
Terminal, V&A Waterfront, DuncanRoad, 8001
Telephone: +27 21 433 2960Email: [email protected] person: Ronel BantjesTitle of contact person: ExecutiveTwitter: @MergenceIMFacebook: Mergence Investment ManagersLinkedIn: Mergence Investment ManagersYouTube: Mergence Investment Managers
Name of company: Mianzo Asset Management(Pty) Ltd
Date of inception: Aug-10Website: www.mianzo.co.zaAddress: Unit EG01 Vesta House, The Forum,
Northbank Lane, Century City, 8000Telephone: +27 21 552 3555Email: [email protected] person: Zukile NchukanaTitle of contact person: Business Development Manager
Name of company: MSM Property Fund (Pty) LtdDate of inception: Aug-15Website: www.msmpropertyfund.comAddress: 1st Floor, 3 Exchange Square,
87 Maude Street, Johannesburg,2196
Telephone: +27 64 097 6456Email: [email protected] person: Musi SkosanaTitle of contact person: ExecutiveTwitter: @MSMPropertyInstagram: @MSMPropertyLinkedIn: MSM Property FundYouTube: MSM Property Fund
Name of company: Ngwedi Investment Managers(Pty) Ltd
Date of inception: Aug-18Website: www.ngwedi.comAddress: Suite 4b, 1st Floor, Madison Place,
Constantia, 7848Telephone: +27 21 000 1900Email: [email protected] person: Monei Pudumo-RoosTitle of contact person: ExecutiveLinkedIn: Ngwedi Investment Managers
150
Name of company: Perpetua InvestmentManagers (Pty) Ltd
Date of inception: Oct-12Website: www.perpetua.co.zaAddress: 5th Floor, The Citadel, 15 Cavendish
Street, Claremont, 7708Telephone: +27 21 674 4274Email: [email protected] person: Kevin DantuTitle of contact person: Business Development ManagerTwitter: @Perpetua_InvestLinkedIn: Perpetua Investment Managers (Pty)
Ltd
Name of company: Prescient InvestmentManagement (Pty) Ltd
Date of inception: Sep-98Website: www.prescient.co.zaAddress: Block B, Silverwood Lane,
Steenberg Office Park, Tokai, 7945Telephone: +27 21 700 3629Email: [email protected] person: Kelly CastleTitle of contact person: Business Development ManagerLinkedIn: Prescient Investment Management
Name of company: Prowess Investment Managers(Pty) Ltd
Date of inception: Dec-08Website: www.prowessinvestments.comAddress: 20th Floor, Thibault Square,
1 Long Street, Cape Town, 8000Telephone: +27 21 565 0400Email: [email protected] person: Precious ButheleziTitle of contact person: Business Development ManagerTwitter: @ProwessManagersFacebook: ProwessInvestmentsLinkedIn: ProwessInvestments
Name of company: Sentio Capital Management(Pty) Ltd
Date of inception: Jul-07Website: www.sentio-capital.comAddress: 1st Floor, Illovo Edge, Building 3,
5 Harries Road, Illovo, 2196Telephone: +27 11 880 1994Email: [email protected] person: TC von Czettritz und NeuhausTitle of contact person: ExecutiveTwitter: @SentioCapitalInstagram: sentio_capitalLinkedIn: Sentio Capital Management
151
Name of company: Taquanta Asset Managers(Pty) Ltd
Date of inception: Sep-99Website: www.taquanta.comAddress: 7th Floor, Newlands Terraces,
Boundary Road, Newlands, 7700Telephone: +27 21 659 5100Email: [email protected] person: Ray WallaceTitle of contact person: ExecutiveTwitter: @AssetTaquantaFacebook: Taquanta Asset ManagersLinkedIn: Taquanta Asset Managers
Name of company: Terebinth Capital (Pty) LtdDate of inception: Apr-13Website: www.terebinthcapital.comAddress: 2nd Floor, Combined HQ Building,
4 Bridal Close, Tyger Valley, 7530Telephone: +27 21 943 4825Email: [email protected] person: Nomathibana MatshobaTitle of contact person: ExecutiveLinkedIn: Terebinth Capital
Name of company: Value Capital Partners (Pty) LtdDate of inception: Jul-16Website: www.valuecapital.co.zaAddress: 8th Floor, Rosebank Link,
173 Oxford Road, Rosebank, 2196Telephone: +27 10 060 0800Email: [email protected] person: Samuel SitholeTitle of contact person: ExecutiveFacebook: Value Capital PartnersLinkedIn: Value Capital Partners
Name of company: Volantis Capital (Pty) LtdDate of inception: Jun-19Website: www.volantis.co.zaAddress: The MARC, 129 Rivonia Road,
Johannesburg, 2196Telephone: +27 10 006 0035Email: [email protected] person: Sisa MayekisoTitle of contact person: ExecutiveTwitter: @Sisa_MayekisoFacebook: Sisa MayekisoLinkedIn: Sisa Mayekiso
Name of company: Vunani Fund Managers (Pty) LtdDate of inception: Jul-99Website: www.vunanifm.co.zaAddress: 6th Floor Letterstedt House,
Newlands-on-Main, Newlands, 7700Telephone: +27 21 670 4900Email: [email protected] person: Snowy MasakaleTitle of contact person: Executive

Privatemarkets
152

Introduction
Private markets investing in South Africa has enjoyed ahigher profile over the past year as listed markets havecontinued to deliver muted returns, and investors havebegun to look for diversification. In addition, theincreased focus on infrastructure investments fromgovernment, and the emphasis on public-privatepartnerships to achieve both investment returns andsocial impact targets has created an important role forprivate markets fund managers. That said, increasedallocations to unlisted investments are yet to come fromSouth African institutional investors, and offshoreinvestors in recent years have only been active in someniche areas of our unlisted markets.
From the perspective of black fund managers active inthe private markets space, they have continued toexperience the challenges of long fundraising cycles.There have been new allocations to black funds overthe past year, mainly driven through specificprogrammes of retirement funds designed to increasethe share of capital managed by black fund managers.However, the notable absence of the PIC in making newfund allocations, the continued absence of local DFIsfrom fund investing, and the increasing reluctance ofoffshore DFIs to invest in South Africa focused fundshave contributed to such long fundraising cycles.
153
The COVID-19 environment has also affected privatemarkets, both from the perspective of impact on dealmaking and portfolio companies, as well as prolongingfundraising. Managers are being asked by investors tofocus on existing portfolios and delay new fundraisinguntil portfolio companies are better positioned to rideout the economic impact of the pandemic. Practicaldifficulties in creating new contacts and performing duediligences have also lengthened investment cycles, inaddition to the valuation uncertainty that the pandemichas created. On the positive side, many managers werequick to adapt processes, and go back to the negotiatingtable to structure more downside protection and reviseddeal pricing into their agreements.
SAVCA now counts 49 full members as black fundmanagers, with a total of R53 Billion of reportedcommitments. This continues the positive trend oftransformation within the private markets investmentindustry, which has made great strides in recent years.
Twenty firms completed our survey this year, whichhave raised a total of R19.3 Billion across 30 funds,representing both an increase in participation and AUMfrom last year. While the overall asset size is encouraging,it is important to note that the universe of participatingfirms’ AUM is highly skewed, with a long tail of managerscurrently subscale.
We view the post-COVID-19 environment as a favourableone for private markets investing as a result of thescarcity of capital in the market. Companies with strongfinancial backing and access to good strategic thinkingwill be well positioned to gain market share and prosperin this environment. In our engagement with appointedand prospective black managers, we continue to beexcited by the opportunities identified and dealsexecuted. In general, we are pleased with the way thatmanagers are adapting to incorporate the current riskenvironment, and to include more earnings protectioninto their deal structuring.
While there are certainly challenges for black privatemarkets managers, as a cohort they continue to dodeals, build track record and find opportunities to invest.We are proud to partner with many of them to achievegood outcomes for our clients and the economy.
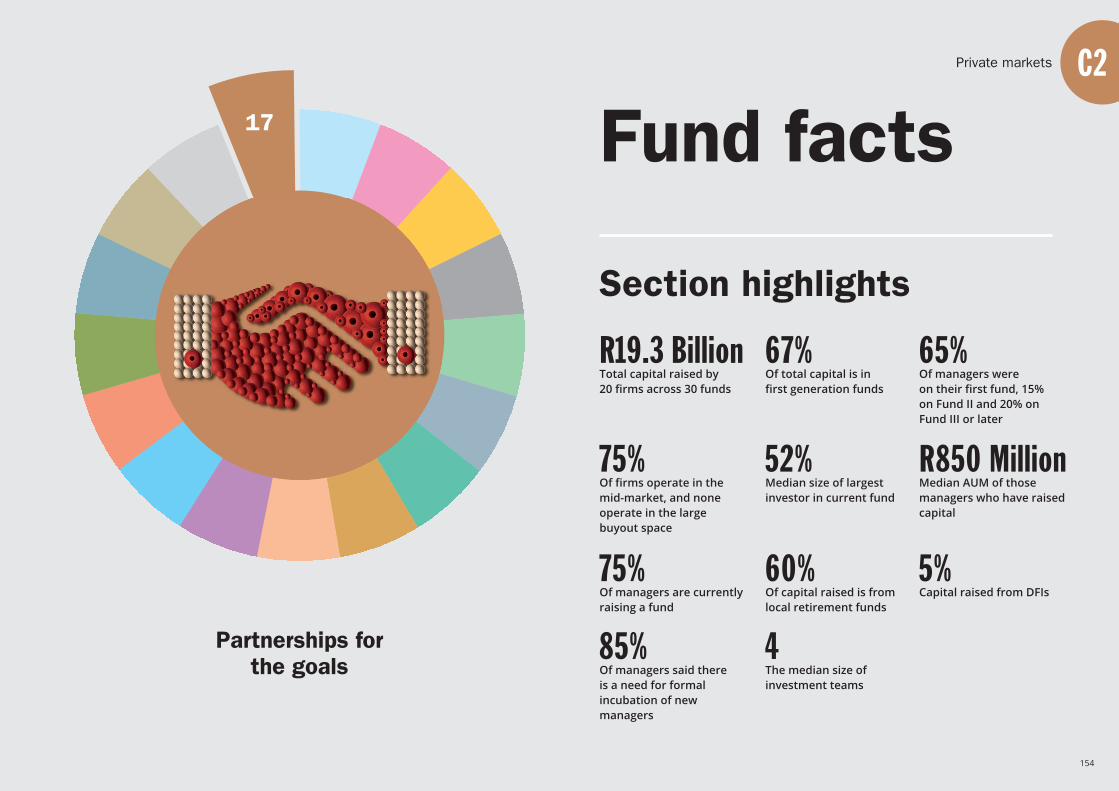
154
Fund facts
Section highlights
R19.3 BillionTotal capital raised by20 firms across 30 funds
67%Of total capital is in first generation funds
65%Of managers were on their first fund, 15% on Fund II and 20% on Fund III or later
75%Of firms operate in the mid-market, and none operate in the large buyout space
52%Median size of largestinvestor in current fund
R850 MillionMedian AUM of those managers who have raisedcapital
75%Of managers are currentlyraising a fund
60%Of capital raised is from local retirement funds
5%Capital raised from DFIs
85%Of managers said there is a need for formal incubation of new managers
4The median size of investment teams
Partnerships forthe goals
Private markets
17

155
90%Of firms integrate and contract ESGand transformation approaches with investors and portfolio companies
Section highlights
82%Of all staff employed are black South Africans
81%Of black staff are at partner/principallevel, 74% at associate level and 90% atanalyst level
COVID-19 impact
FINANCIAL IMPACTBiggest concern raised by 75% of firms
60%Of firms implemented cost contain-ment measures such as cancellingbonuses or reducing salaries
PAYE DEFERRALTop relief measure used by firms
90%Of firms believe that investors will be more focused on the SDGs in a post COVID-19 environment
91%Of capital raised is from local sources, with the balance split between North America and Europe
15%Of managers see the current regulations as supportive to new black entrants
Private markets
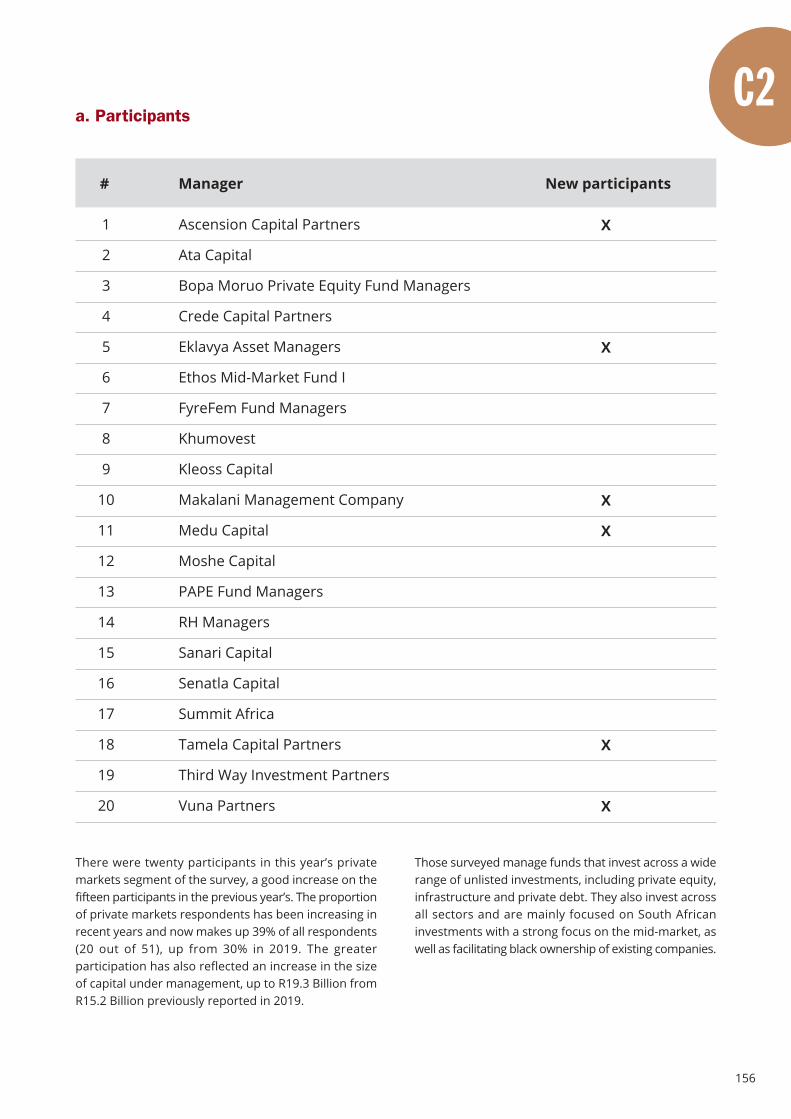
156
a. Participants
Ascension Capital Partners
Ata Capital
Bopa Moruo Private Equity Fund Managers
Crede Capital Partners
Eklavya Asset Managers
Ethos Mid-Market Fund I
FyreFem Fund Managers
Khumovest
Kleoss Capital
Makalani Management Company
Medu Capital
Moshe Capital
PAPE Fund Managers
RH Managers
Sanari Capital
Senatla Capital
Summit Africa
Tamela Capital Partners
Third Way Investment Partners
Vuna Partners
Manager New participants
X
X
X
X
X
X
#
1
2
3
4
5
6
7
8
9
10
11
12
13
14
15
16
17
18
19
20
There were twenty participants in this year’s privatemarkets segment of the survey, a good increase on thefifteen participants in the previous year’s. The proportionof private markets respondents has been increasing inrecent years and now makes up 39% of all respondents(20 out of 51), up from 30% in 2019. The greaterparticipation has also reflected an increase in the sizeof capital under management, up to R19.3 Billion fromR15.2 Billion previously reported in 2019.
Those surveyed manage funds that invest across a widerange of unlisted investments, including private equity,infrastructure and private debt. They also invest acrossall sectors and are mainly focused on South Africaninvestments with a strong focus on the mid-market, aswell as facilitating black ownership of existing companies.
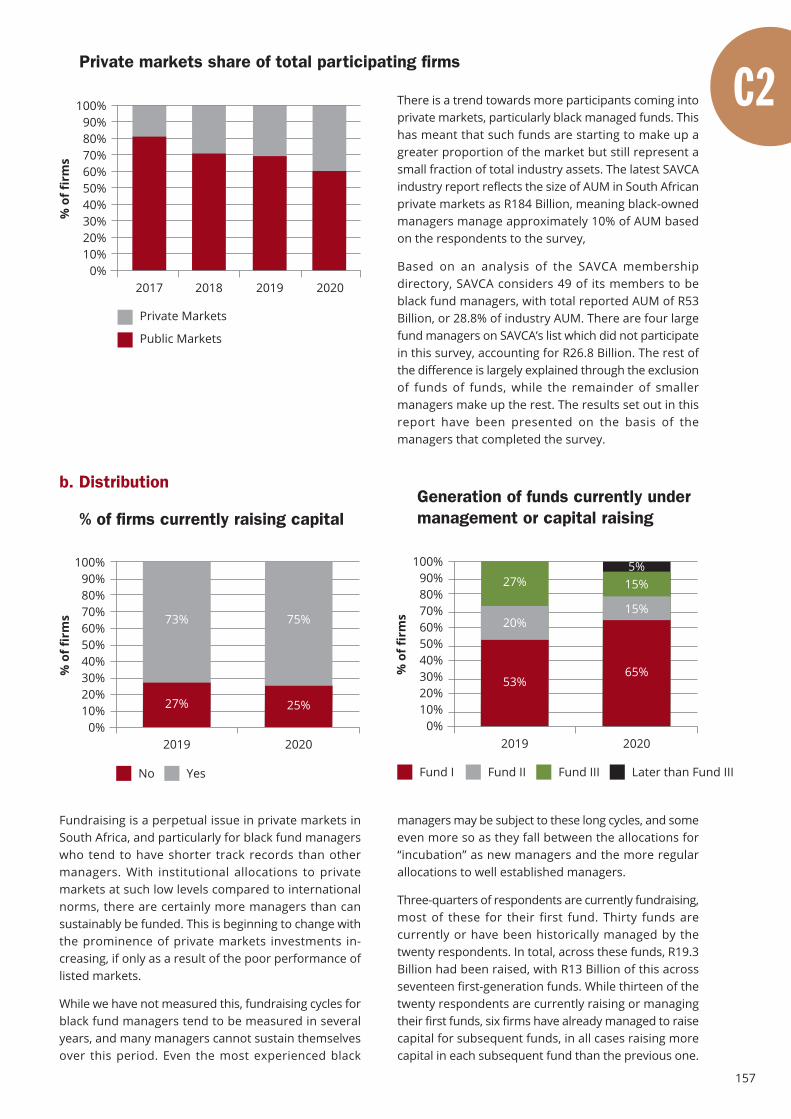
157
Private markets share of total participating firms%
of f
irm
s
100%90%80%70%60%50%40%30%20%10%
0%
Public Markets
Private Markets
2018 2019 20202017
There is a trend towards more participants coming intoprivate markets, particularly black managed funds. Thishas meant that such funds are starting to make up agreater proportion of the market but still represent asmall fraction of total industry assets. The latest SAVCAindustry report reflects the size of AUM in South Africanprivate markets as R184 Billion, meaning black-ownedmanagers manage approximately 10% of AUM basedon the respondents to the survey,
Based on an analysis of the SAVCA membershipdirectory, SAVCA considers 49 of its members to beblack fund managers, with total reported AUM of R53Billion, or 28.8% of industry AUM. There are four largefund managers on SAVCA’s list which did not participatein this survey, accounting for R26.8 Billion. The rest ofthe difference is largely explained through the exclusionof funds of funds, while the remainder of smallermanagers make up the rest. The results set out in thisreport have been presented on the basis of themanagers that completed the survey.
b. Distribution
% of firms currently raising capital
% o
f fir
ms
100%90%80%70%60%50%40%30%20%10%
0%2019 2020
73%
No Yes
27%
75%
25%
Generation of funds currently undermanagement or capital raising
% o
f fir
ms
100%90%80%70%60%50%40%30%20%10%
0%2019 2020
Later than Fund IIIFund IIIFund IIFund I
20%
53%
27%
15%
65%
15%5%
Fundraising is a perpetual issue in private markets inSouth Africa, and particularly for black fund managerswho tend to have shorter track records than othermanagers. With institutional allocations to privatemarkets at such low levels compared to internationalnorms, there are certainly more managers than cansustainably be funded. This is beginning to change withthe prominence of private markets investments in-creasing, if only as a result of the poor performance oflisted markets.
While we have not measured this, fundraising cycles forblack fund managers tend to be measured in severalyears, and many managers cannot sustain themselvesover this period. Even the most experienced black
managers may be subject to these long cycles, and someeven more so as they fall between the allocations for“incubation” as new managers and the more regularallocations to well established managers.
Three-quarters of respondents are currently fundraising,most of these for their first fund. Thirty funds arecurrently or have been historically managed by thetwenty respondents. In total, across these funds, R19.3Billion had been raised, with R13 Billion of this acrossseventeen first-generation funds. While thirteen of thetwenty respondents are currently raising or managingtheir first funds, six firms have already managed to raisecapital for subsequent funds, in all cases raising morecapital in each subsequent fund than the previous one.
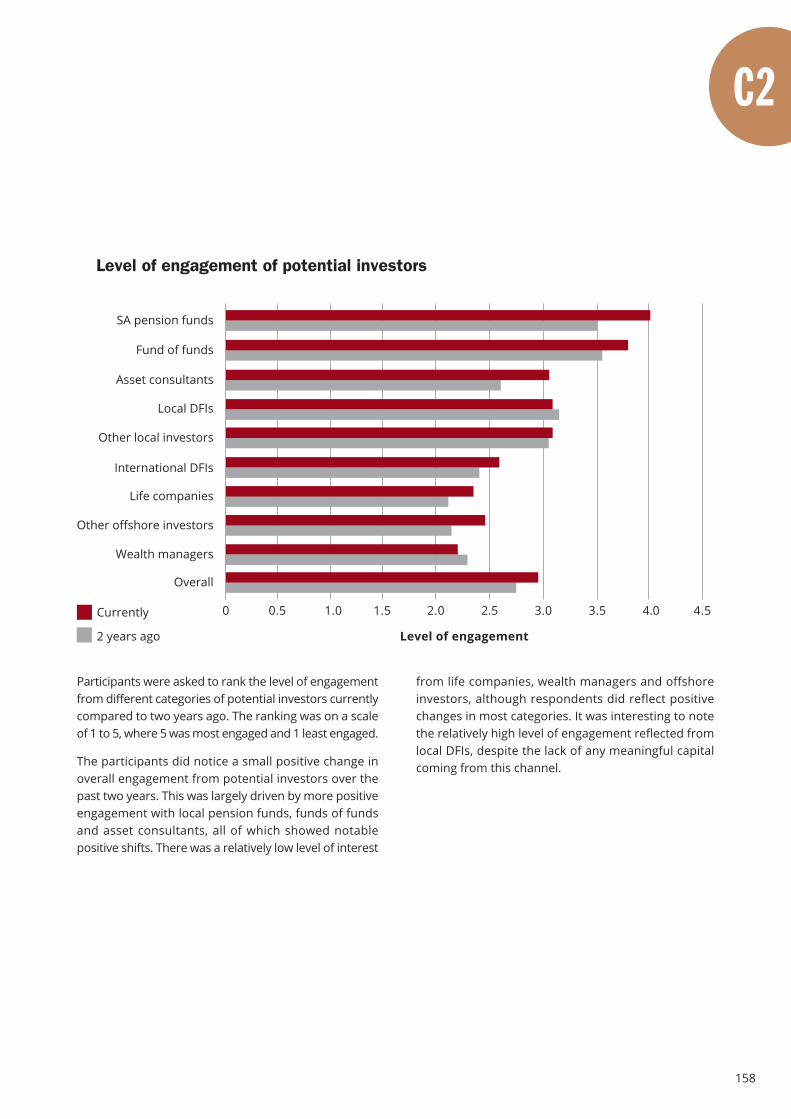
158
Level of engagement of potential investors
Currently
2 years ago
Participants were asked to rank the level of engagementfrom different categories of potential investors currentlycompared to two years ago. The ranking was on a scaleof 1 to 5, where 5 was most engaged and 1 least engaged.
The participants did notice a small positive change inoverall engagement from potential investors over thepast two years. This was largely driven by more positiveengagement with local pension funds, funds of fundsand asset consultants, all of which showed notablepositive shifts. There was a relatively low level of interest
from life companies, wealth managers and offshoreinvestors, although respondents did reflect positivechanges in most categories. It was interesting to notethe relatively high level of engagement reflected fromlocal DFIs, despite the lack of any meaningful capitalcoming from this channel.
SA pension funds
Fund of funds
Asset consultants
Other local investors
International DFIs
Life companies
Other offshore investors
Wealth managers
Overall
Local DFIs
0 0.5 1.5 2.0 3.01.0 2.5 3.5 4.54.0
Level of engagement
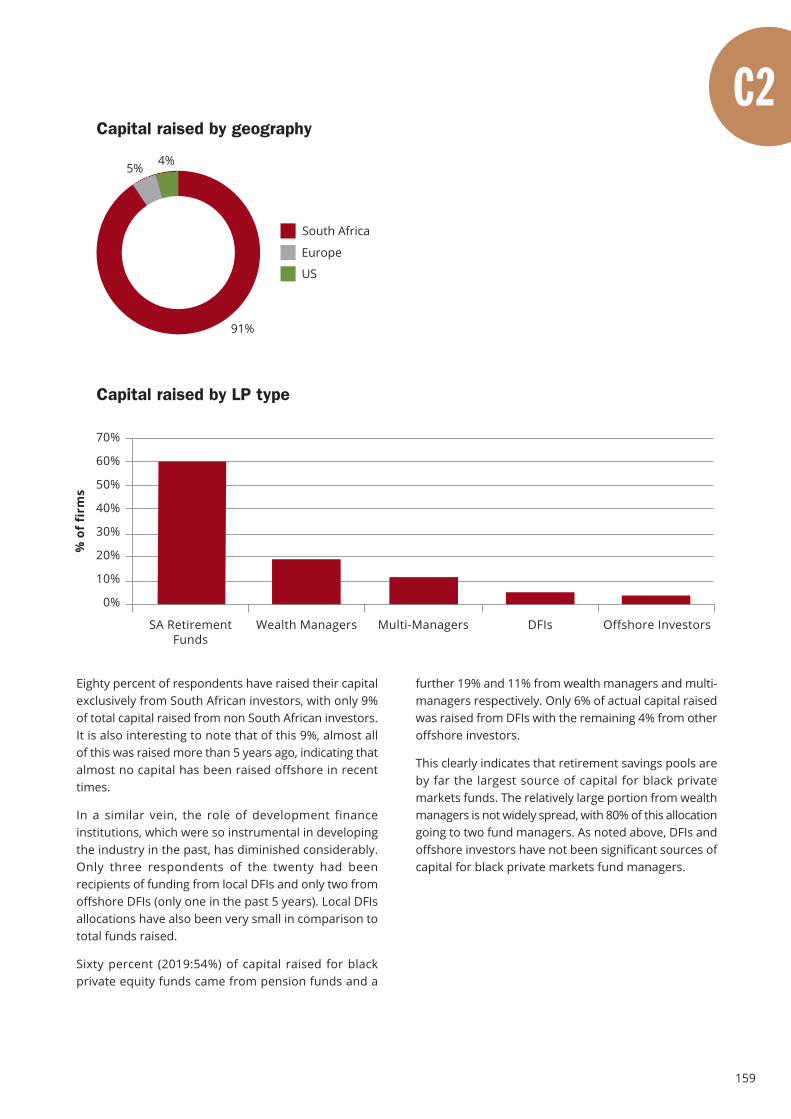
159
Capital raised by geography
91%
4%5%
South Africa
Europe
US
Capital raised by LP type
% o
f fi
rms
70%
60%
50%
40%
30%
20%
10%
0%
SA RetirementFunds
Offshore InvestorsWealth Managers DFIsMulti-Managers
Eighty percent of respondents have raised their capitalexclusively from South African investors, with only 9%of total capital raised from non South African investors.It is also interesting to note that of this 9%, almost allof this was raised more than 5 years ago, indicating thatalmost no capital has been raised offshore in recenttimes.
In a similar vein, the role of development financeinstitutions, which were so instrumental in developingthe industry in the past, has diminished considerably.Only three respondents of the twenty had beenrecipients of funding from local DFIs and only two fromoffshore DFIs (only one in the past 5 years). Local DFIsallocations have also been very small in comparison tototal funds raised.
Sixty percent (2019:54%) of capital raised for blackprivate equity funds came from pension funds and a
further 19% and 11% from wealth managers and multi-managers respectively. Only 6% of actual capital raisedwas raised from DFIs with the remaining 4% from otheroffshore investors.
This clearly indicates that retirement savings pools areby far the largest source of capital for black privatemarkets funds. The relatively large portion from wealthmanagers is not widely spread, with 80% of this allocationgoing to two fund managers. As noted above, DFIs andoffshore investors have not been significant sources ofcapital for black private markets fund managers.

160
Managers receiving at least some funding from each LP type
SA pension funds (incl. throughconsultants
Fund of funds
Other local investors
Life companies
Other offshore investors
Local DFIs
Wealth Managers
International DFIs
0% 10% 30% 40% 60%20% 50% 70%
Sixty-five percent of managers surveyed has previouslyraised capital from local retirement funds. Managerslargely target local institutional capital by approachingasset consultants, multi-managers and pension funds.This is where capital has historically mostly come from
for these funds. To a lesser extent, managers are alsolooking to DFIs and offshore investors, despite the muchlower historical number of commitments from theseparties.
Actual funds raised by fund generation
ZAR
Mill
ions
14 000
12 000
10 000
8 000
6 000
4 000
2 000
0Fund I Fund II Fund III+
Num
ber
of fu
nds
181614121086420
Number of funds
Total capital
Seventeen of the thirty funds that have been raised arefirst generation funds of the managers, while six secondfunds and five third or further funds have been raised.A further two fund vehicles have also been raised thatdo not fall into these categories, in that they were raisedto invest alongside other fund vehicles rather than fullfunds in their own right.

161
Total capital by size quartiles of funds raisedZA
R M
illio
ns
14 000
12 000
10 000
8 000
6 000
4 000
2 000
0Largest quartile Upper quartile Lower quartile Smallest quartile
It must be noted that there is a large dispersion in fundsizes, with the smallest 50% of managers having a totalof R1.8 Billion (9%) of capital, with 3 having no capitalraised to date. The largest 20% have R10.2 Billion (53%)of total capital. This does call into question the viabilityof some managers in the market.
For independent fund managers without a tie to a singlelarge investor, median commitments are between R100-
200 Million per LP, while some managers choose to tieup with a single large investor to supply the majority oftheir capital.
The median fund manager had R850 Million (2019: R635Million) under management from three LPs, and 25%of firms had just one LP making up more than 80% oftheir capital.
A big question in the transformation efforts of theindustry is the exact nature of the challenges to achievinga more transformed private markets industry, andwhether the market interventions being made are theright ones to help black managers to overcome thesechallenges. The view historically has been that difficultiesrelated to creating the confidence in investors and thetrust required for large allocations of capital to be
c. Bottlenecks and barriers
committed to black managers has been the single largestchallenge.
Several questions were asked of fund managers relatingto bottlenecks and barriers to their creation of successfulfund management businesses. Their answers reflectedsome positive developments and policy assistance butalso highlighted some key challenges.
Current regulations encourage newblack private markets fund entrantsand build skills
% o
f fir
ms
100%
80%
60%
40%
20%
0%2019 2020
Not sureNoYes
60%
33%
7%30%
55%
15%
The regulatory environment around black private marketsfund managers do provide significant advantages, suchas the ability to confer black ownership onto investeecompanies if certain criteria are met. In theory, thisshould assist portfolio companies to prosper throughbetter B-BBEE ratings and an increased ability to dobusiness with customers sensitive to B-BBEE ratingssuch as corporates and government entities.
In a significant change since the previous survey, only15% of managers felt that private equity fund regulationswere appropriate to encourage new entrants and buildskills. This was in contrast to the previous survey wherea majority thought that these regulations were appropriate.It is unclear why there has been such a reversal ofopinion in the current year, but we can postulate thatthe crowded fundraising environment is a significantcontributing factor.

162
% of firms who believe they are able to compete fairlyagainst the dominant incumbent GPs
% o
f fir
ms
100%90%80%70%60%50%40%30%20%10%
0%2019 2020
6%
47% 65%
35%
No
Yes
Don’t have a view
47%
The South African private markets industry is fairly wellestablished, with R184 Billion in AUM according to themost recent SAVCA industry report. Within thisestablished industry there are several larger playerswhich have built up capacity, networks, track recordand investor relationships over long periods of time.Newer entrants (which most black firms are) are naturallygoing to be at an earlier stage in their life cycle, andmay not have advanced all of these components of theirbusinesses to the same extent.
Opinion was divided on whether black private equityfunds were able to compete effectively with moreestablished firms, and was more negative than theprevious year. In analysing the responses, those blackmanagers with more extensive investor relationshipsfelt more able to compete with the wider universe offund managers.
Is there a need for formal incubation of new GPs?
% o
f fir
ms
100%
80%
60%
40%
20%
0%2019 2020
7%
93%
15%
85%
There was continued overwhelming support for furtherinterventions to assist black private equity managers,including making the B-BBEE Scorecard for RetirementFunds compulsory; for the SAVCA Fund ManagerDevelopment Programme which aims to build skills innew management teams, and for incubating new fundmanagers. Most respondents, but not all, felt that therewas a need for formal incubation of new private marketsmanagers. It is interesting to note that even of thosemanagers which had successfully raised capital, mostsaid there was a need for incubation of new GPs. Fromour understanding of the market and the origins of thevarious black managers, many have benefitted fromelements of incubation even if they have not formallybeen incubated.
Have LPs played an incubation role in your fund?
% o
f fir
ms
100%
80%
60%
40%
20%
0%
No Yes
2018 2019
70%
30%
73%
27%
2020
80%
20%
Only one in five respondents have had an LP who hasplayed a significant incubation role to assist the managerto navigate some of the early challenges of fundmanagement. From the responses received, there hasbeen no single active LP providing this assistance acrossthe market, but it has rather been individual LPs assistingparticular managers.
There does also seem to be a wide range of differentinterpretations of what constitutes incubation frommanager to manager, depending on their needs. Whatis clearly required from any incubation approach, is agreater collaboration from potential LPs to acceleratetime taken to get a new fund to first close.
No Yes
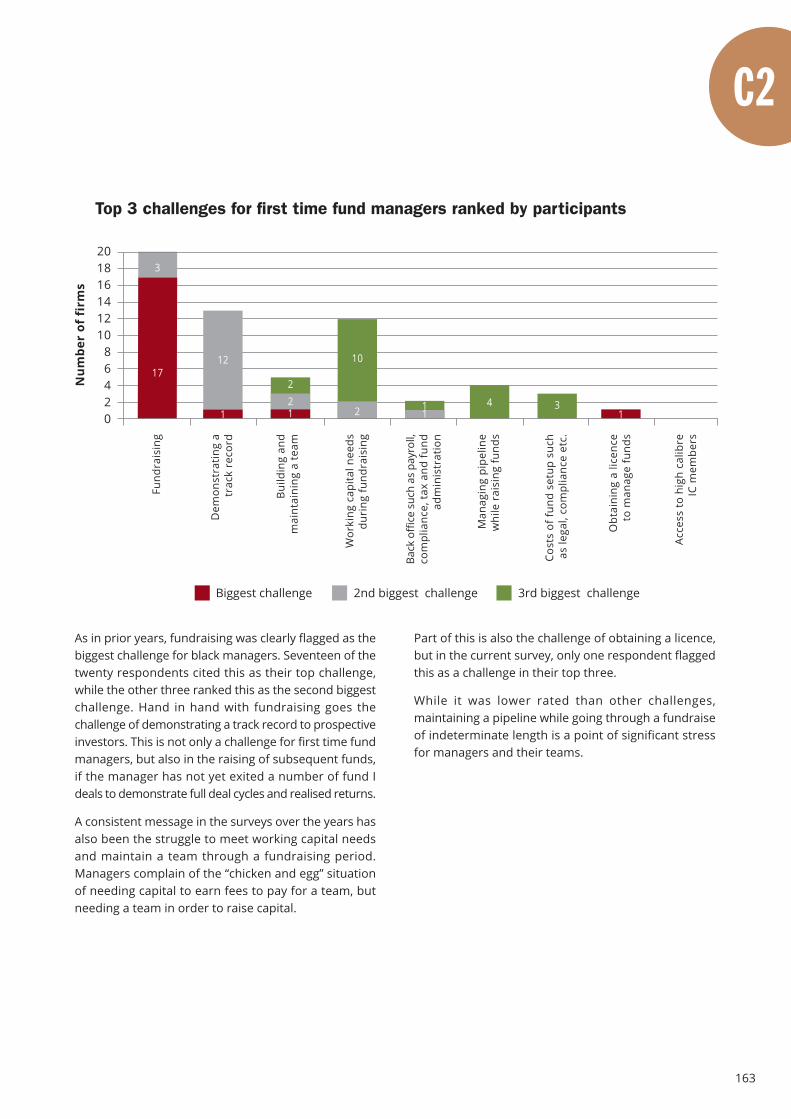
163
Top 3 challenges for first time fund managers ranked by participants
Num
ber
of f
irm
s
201816141210
86420
2nd biggest challengeBiggest challenge 3rd biggest challenge
4 311
17
3
1
12
2
10
22
1
Man
agin
g pi
pelin
ew
hile
rai
sing
fund
s
Cost
s of
fund
set
up s
uch
as le
gal,
com
plia
nce
etc.
Back
off
ice
such
as
payr
oll,
com
plia
nce,
tax
and
fund
adm
inis
trat
ion
Fund
rais
ing
Dem
onst
ratin
g a
trac
k re
cord
Wor
king
cap
ital n
eeds
duri
ng fu
ndra
isin
g
Bui
ldin
g an
dm
aint
aini
ng a
team
Obt
aini
ng a
lice
nce
to m
anag
e fu
nds
Acce
ss to
hig
h ca
libre
IC m
embe
rs
1
As in prior years, fundraising was clearly flagged as thebiggest challenge for black managers. Seventeen of thetwenty respondents cited this as their top challenge,while the other three ranked this as the second biggestchallenge. Hand in hand with fundraising goes thechallenge of demonstrating a track record to prospectiveinvestors. This is not only a challenge for first time fundmanagers, but also in the raising of subsequent funds,if the manager has not yet exited a number of fund Ideals to demonstrate full deal cycles and realised returns.
A consistent message in the surveys over the years hasalso been the struggle to meet working capital needsand maintain a team through a fundraising period.Managers complain of the “chicken and egg” situationof needing capital to earn fees to pay for a team, butneeding a team in order to raise capital.
Part of this is also the challenge of obtaining a licence,but in the current survey, only one respondent flaggedthis as a challenge in their top three.
While it was lower rated than other challenges,maintaining a pipeline while going through a fundraiseof indeterminate length is a point of significant stressfor managers and their teams.
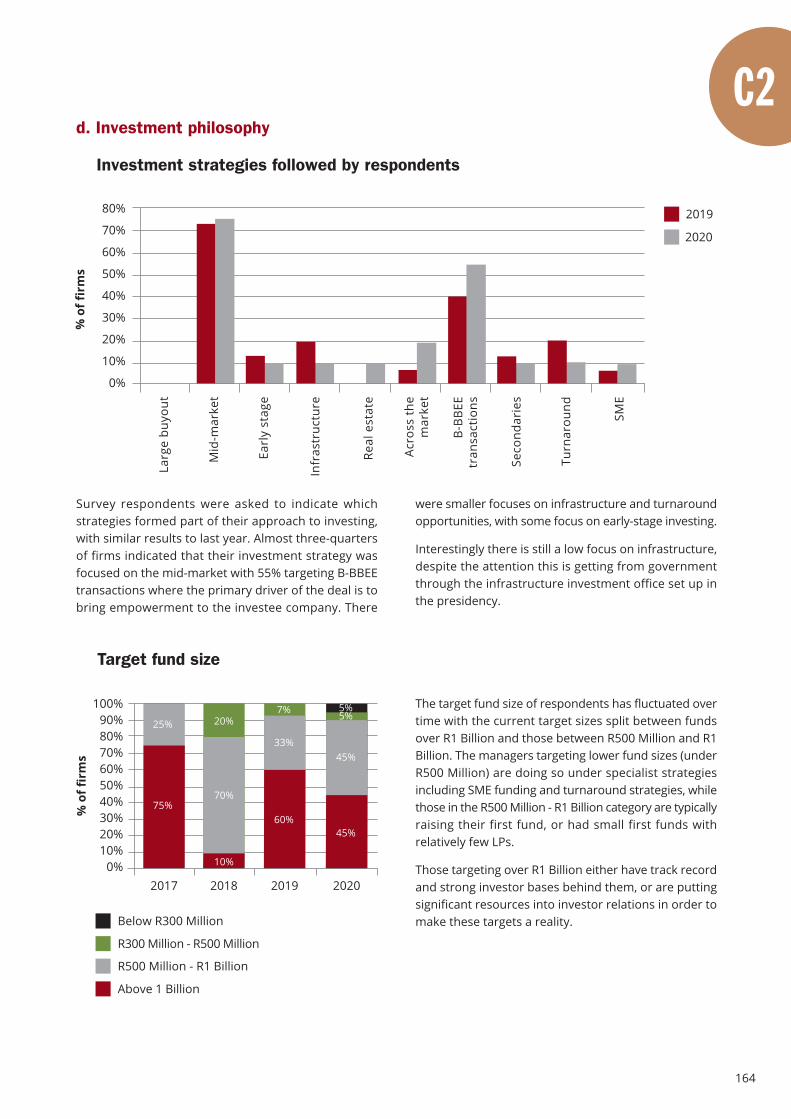
164
d. Investment philosophy
Investment strategies followed by respondents
% o
f fir
ms
80%
70%
60%
50%
40%
30%
20%
10%
0%
Larg
e bu
yout
Mid
-mar
ket
Earl
y st
age
Infr
astr
uctu
re
Real
est
ate
2019
2020
Acro
ss th
em
arke
t
B-B
BEE
tran
sact
ions
Seco
ndar
ies
Turn
arou
nd
SME
Survey respondents were asked to indicate whichstrategies formed part of their approach to investing,with similar results to last year. Almost three-quartersof firms indicated that their investment strategy wasfocused on the mid-market with 55% targeting B-BBEEtransactions where the primary driver of the deal is tobring empowerment to the investee company. There
were smaller focuses on infrastructure and turnaroundopportunities, with some focus on early-stage investing.
Interestingly there is still a low focus on infrastructure,despite the attention this is getting from governmentthrough the infrastructure investment office set up inthe presidency.
Target fund size
% o
f fir
ms
100%90%80%70%60%50%40%30%20%10%
0%
Below R300 Million
R300 Million - R500 Million
R500 Million - R1 Billion
Above 1 Billion
2017 2018
25% 20%
70%
2019
7%
33%
2020
5%5%
75%
10%
60%
45%
45%
The target fund size of respondents has fluctuated overtime with the current target sizes split between fundsover R1 Billion and those between R500 Million and R1Billion. The managers targeting lower fund sizes (underR500 Million) are doing so under specialist strategiesincluding SME funding and turnaround strategies, whilethose in the R500 Million - R1 Billion category are typicallyraising their first fund, or had small first funds withrelatively few LPs.
Those targeting over R1 Billion either have track recordand strong investor bases behind them, or are puttingsignificant resources into investor relations in order tomake these targets a reality.
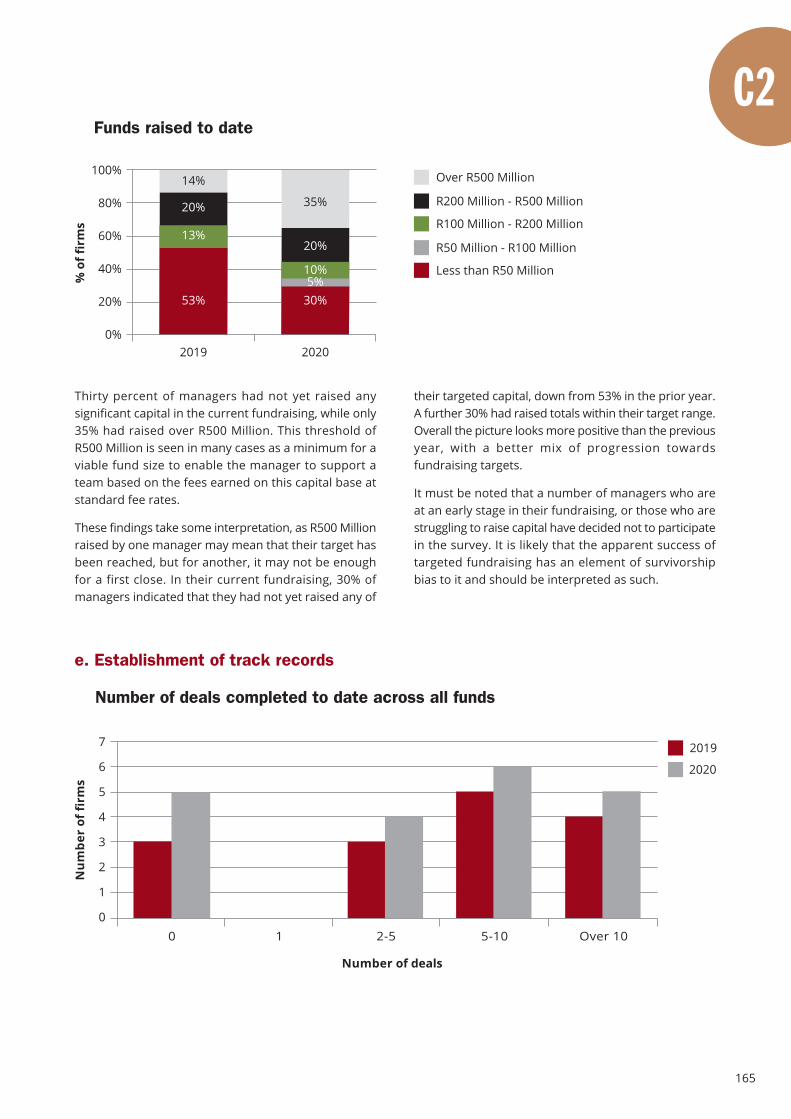
165
Funds raised to date
% o
f fir
ms
100%
80%
60%
40%
20%
0%2019 2020
R100 Million - R200 Million
R50 Million - R100 Million
Less than R50 Million
Over R500 Million
R200 Million - R500 Million
Thirty percent of managers had not yet raised anysignificant capital in the current fundraising, while only35% had raised over R500 Million. This threshold ofR500 Million is seen in many cases as a minimum for aviable fund size to enable the manager to support ateam based on the fees earned on this capital base atstandard fee rates.
These findings take some interpretation, as R500 Millionraised by one manager may mean that their target hasbeen reached, but for another, it may not be enoughfor a first close. In their current fundraising, 30% ofmanagers indicated that they had not yet raised any of
their targeted capital, down from 53% in the prior year.A further 30% had raised totals within their target range.Overall the picture looks more positive than the previousyear, with a better mix of progression towardsfundraising targets.
It must be noted that a number of managers who areat an early stage in their fundraising, or those who arestruggling to raise capital have decided not to participatein the survey. It is likely that the apparent success oftargeted fundraising has an element of survivorshipbias to it and should be interpreted as such.
e. Establishment of track records
Number of deals completed to date across all funds
Num
ber
of fi
rms
7
6
5
4
3
2
1
0
2019
2020
0 1 2-5 5-10 Over 10
Number of deals
53% 30%
13%
5%
20%
10%
20%
14%
35%
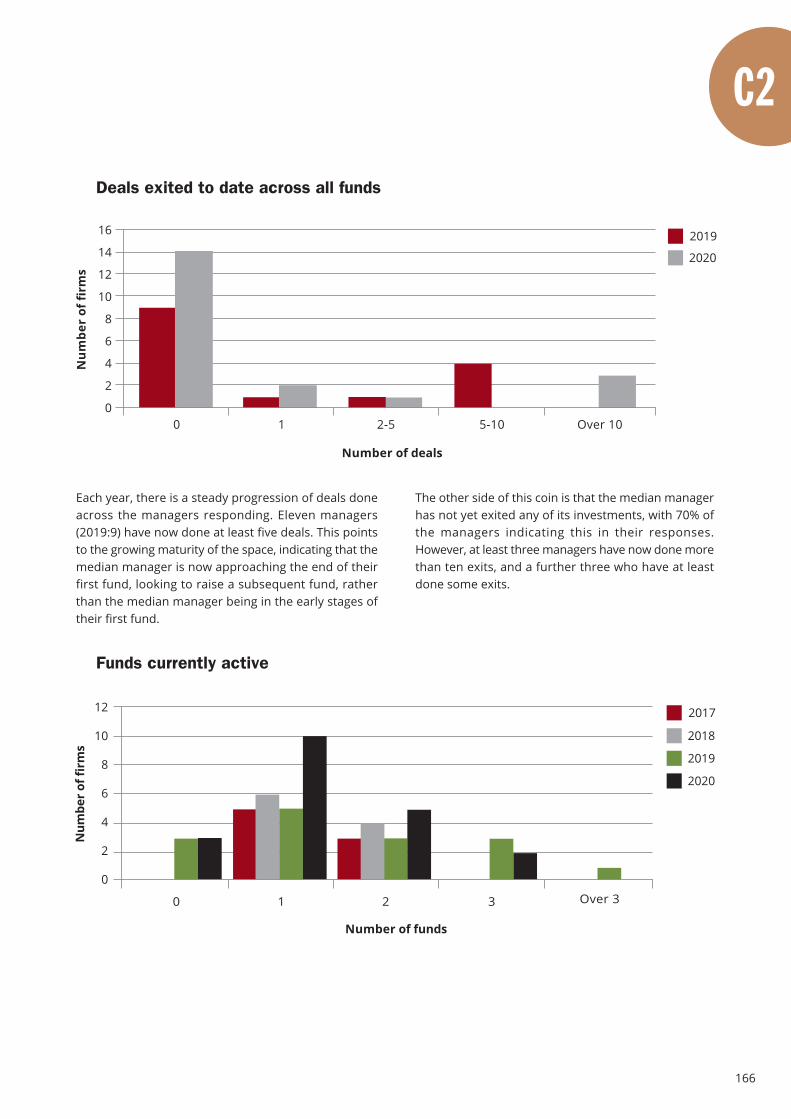
166
Each year, there is a steady progression of deals doneacross the managers responding. Eleven managers(2019:9) have now done at least five deals. This pointsto the growing maturity of the space, indicating that themedian manager is now approaching the end of theirfirst fund, looking to raise a subsequent fund, ratherthan the median manager being in the early stages oftheir first fund.
The other side of this coin is that the median managerhas not yet exited any of its investments, with 70% ofthe managers indicating this in their responses.However, at least three managers have now done morethan ten exits, and a further three who have at leastdone some exits.
Deals exited to date across all funds
Num
ber
of fi
rms
2019
2020
Number of deals
16
14
12
10
8
6
4
2
00 1 2-5 5-10 Over 10
Funds currently active
Num
ber o
f fir
ms
12
10
8
6
4
2
0
2017
2018
2019
2020
0 1 2 3 Over 3
Number of funds
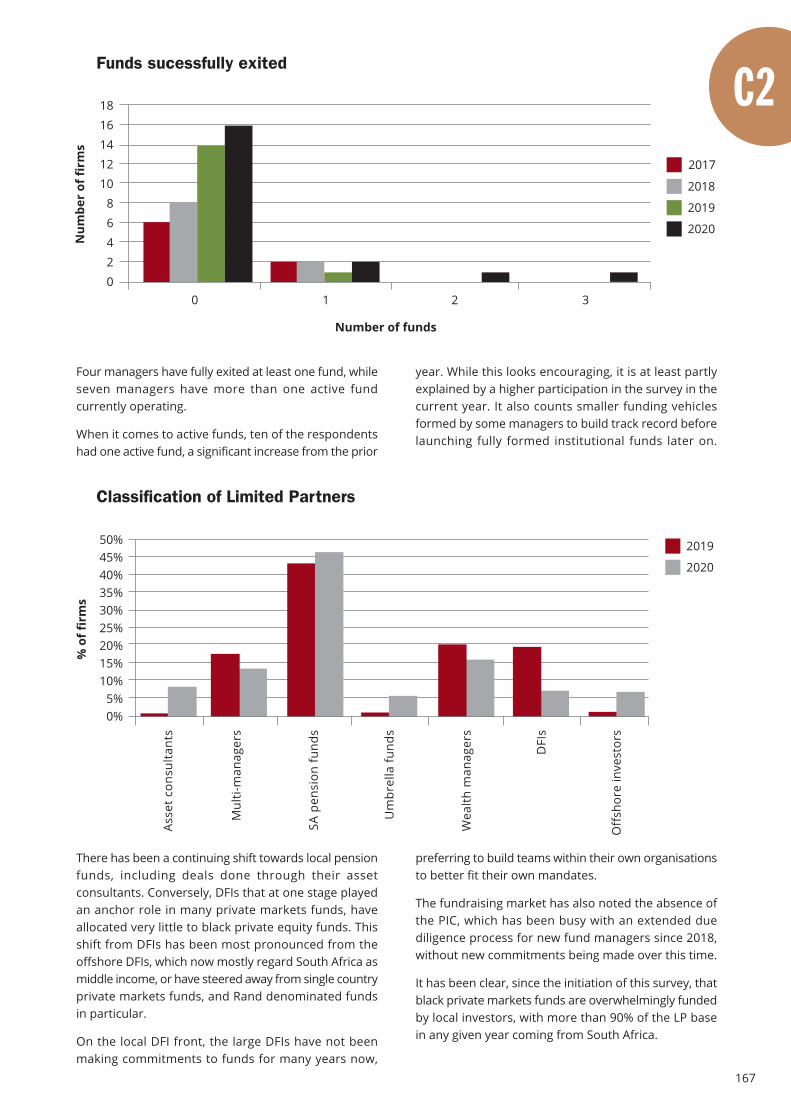
167
Funds sucessfully exitedN
umbe
r of
firm
s
1816141210
86420
Number of funds
2017
2018
2019
2020
0 1 2 3
Four managers have fully exited at least one fund, whileseven managers have more than one active fundcurrently operating.
When it comes to active funds, ten of the respondentshad one active fund, a significant increase from the prior
year. While this looks encouraging, it is at least partlyexplained by a higher participation in the survey in thecurrent year. It also counts smaller funding vehiclesformed by some managers to build track record beforelaunching fully formed institutional funds later on.
Classification of Limited Partners
% o
f fir
ms
50%45%40%35%30%25%20%15%10%
5%0%
2019
2020
Asse
t con
sulta
nts
Mul
ti-m
anag
ers
SA p
ensi
on fu
nds
Um
brel
la fu
nds
Wea
lth m
anag
ers
DFI
s
Off
shor
e in
vest
ors
There has been a continuing shift towards local pensionfunds, including deals done through their assetconsultants. Conversely, DFIs that at one stage playedan anchor role in many private markets funds, haveallocated very little to black private equity funds. Thisshift from DFIs has been most pronounced from theoffshore DFIs, which now mostly regard South Africa asmiddle income, or have steered away from single countryprivate markets funds, and Rand denominated fundsin particular.
On the local DFI front, the large DFIs have not beenmaking commitments to funds for many years now,
preferring to build teams within their own organisationsto better fit their own mandates.
The fundraising market has also noted the absence ofthe PIC, which has been busy with an extended duediligence process for new fund managers since 2018,without new commitments being made over this time.
It has been clear, since the initiation of this survey, thatblack private markets funds are overwhelmingly fundedby local investors, with more than 90% of the LP basein any given year coming from South Africa.

168
f. Brand building
Building a brand is an important part of the creation ofany business, including fund management businesses.We asked the respondents several questions aroundtheir brand building activities including their participation
in industry bodies, market presence and advertising.Overall it must be said that these activities were at alow level, but an overall improvement was noted fromthe previous year.
Industry membership and participation
No
Yes
100%90%80%70%60%50%40%30%20%10%
0%
% o
f fir
ms
Representation on SAVCA (or any other industry body)
% o
f fir
ms
100%
80%
60%
40%
20%
0%2019 2020
No
Yes
Black private markets funds are well represented onthe boards of SAVCA and other industry bodies, withalmost half of respondents confirming that they haverepresentation at this level. This is an improvementfrom last year when 40% of respondents said that theyhad representation at this level.
This improvement in transformation is also reflectedwithin the main industry body, SAVCA, which hascontinued to transform at both its board level as wellas the makeup of its executive team.
Eighty-five percent of respondents are members ofSAVCA as required by the Conditions for Private EquityInvestment under Regulation 28. Those that are not yetregistered are expected to be registered before theycan manage pension fund capital according to theseregulations. The next biggest representation is withABSIP, where 45% of respondents are members. There
is limited representation across the other business andpro-fessional bodies present in the market.
Only three respondents are members of the IRF, despiteretirement funds being easily the largest source ofcapital for black private markets funds.
The
Asso
ciat
ion
of B
lack
Secu
ritie
s an
d In
vest
men
t P
rofe
ssio
nals
(ABS
IP)
The
Asso
ciat
ion
for S
avin
gsan
d In
vest
men
t Sou
th A
fric
a(A
SISA
)
Sout
hern
Afr
ica
Vent
ure
Capi
tal a
nd P
riva
te E
quity
Asso
ciat
ion
(SAV
CA)
Blac
k In
vest
men
tM
anag
emen
t Bus
ines
sFo
rum
(BIM
BF)
Tran
sfor
mat
ion
Actio
nFo
rum
(TAF
)
Asso
ciat
ion
of S
outh
Afri
can
Blac
k Ac
tuar
ial
Prof
essi
onal
s (A
SABA
)
Blac
k Bu
sine
ss C
ounc
il(B
BC)
Blac
k M
anag
emen
tFo
rum
(BM
F)
Busi
ness
Uni
ty S
outh
Afri
ca (B
USA
)
Inst
itute
of R
etir
emen
tFu
nds
(IRF)
Busi
ness
Lea
ders
hip
Sout
h Af
rica
(BLS
A)
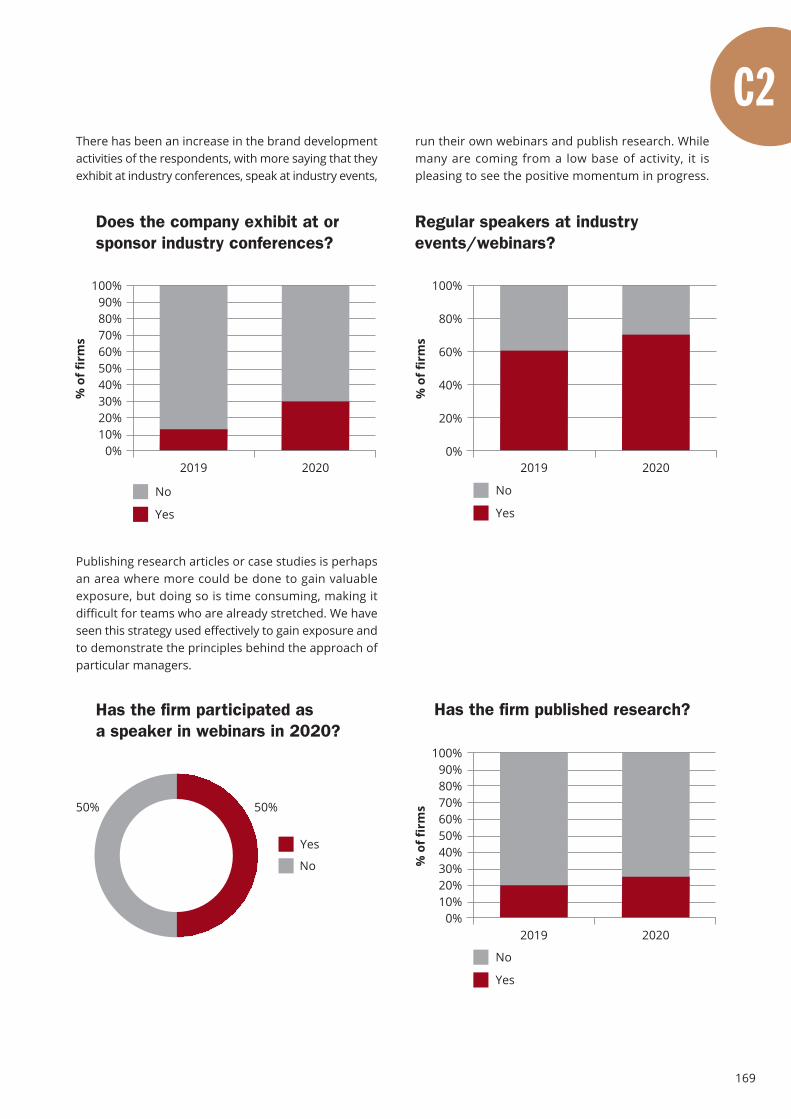
169
Regular speakers at industryevents/webinars?
Does the company exhibit at orsponsor industry conferences?
% o
f fir
ms
100%90%80%70%60%50%40%30%20%10%
0%2019 2020
No
Yes
% o
f fir
ms
100%
80%
60%
40%
20%
0%2019 2020
No
Yes
Publishing research articles or case studies is perhapsan area where more could be done to gain valuableexposure, but doing so is time consuming, making itdifficult for teams who are already stretched. We haveseen this strategy used effectively to gain exposure andto demonstrate the principles behind the approach ofparticular managers.
Has the firm participated asa speaker in webinars in 2020?
Yes
No
Has the firm published research?
% o
f fir
ms
100%90%80%70%60%50%40%30%20%10%
0%2019 2020
No
Yes
50% 50%
There has been an increase in the brand developmentactivities of the respondents, with more saying that theyexhibit at industry conferences, speak at industry events,
run their own webinars and publish research. Whilemany are coming from a low base of activity, it ispleasing to see the positive momentum in progress.
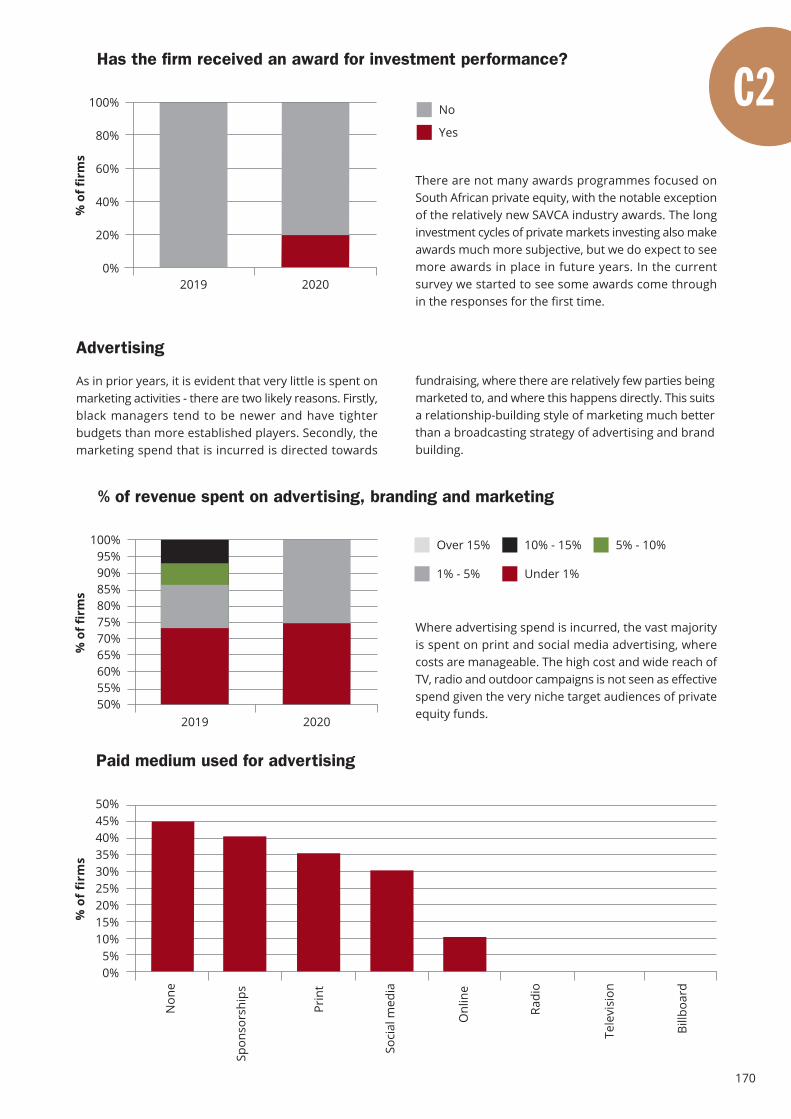
170
Has the firm received an award for investment performance?%
of f
irm
s
100%
80%
60%
40%
20%
0%2019 2020
No
Yes
There are not many awards programmes focused onSouth African private equity, with the notable exceptionof the relatively new SAVCA industry awards. The longinvestment cycles of private markets investing also makeawards much more subjective, but we do expect to seemore awards in place in future years. In the currentsurvey we started to see some awards come throughin the responses for the first time.
Advertising
As in prior years, it is evident that very little is spent onmarketing activities - there are two likely reasons. Firstly,black managers tend to be newer and have tighterbudgets than more established players. Secondly, themarketing spend that is incurred is directed towards
fundraising, where there are relatively few parties beingmarketed to, and where this happens directly. This suitsa relationship-building style of marketing much betterthan a broadcasting strategy of advertising and brandbuilding.
% of revenue spent on advertising, branding and marketing
% o
f fir
ms
100%95%90%85%80%75%70%65%60%55%50%
2019 2020
5% - 10%
1% - 5% Under 1%
Over 15% 10% - 15%
Where advertising spend is incurred, the vast majorityis spent on print and social media advertising, wherecosts are manageable. The high cost and wide reach ofTV, radio and outdoor campaigns is not seen as effectivespend given the very niche target audiences of privateequity funds.
Paid medium used for advertising
% o
f fi
rms
50%45%40%35%30%25%20%15%10%
5%0%
Billb
oard
Radi
o
Tele
visi
on
Onl
ine
Non
e
Spon
sors
hips
Soci
al m
edia
Prin
t
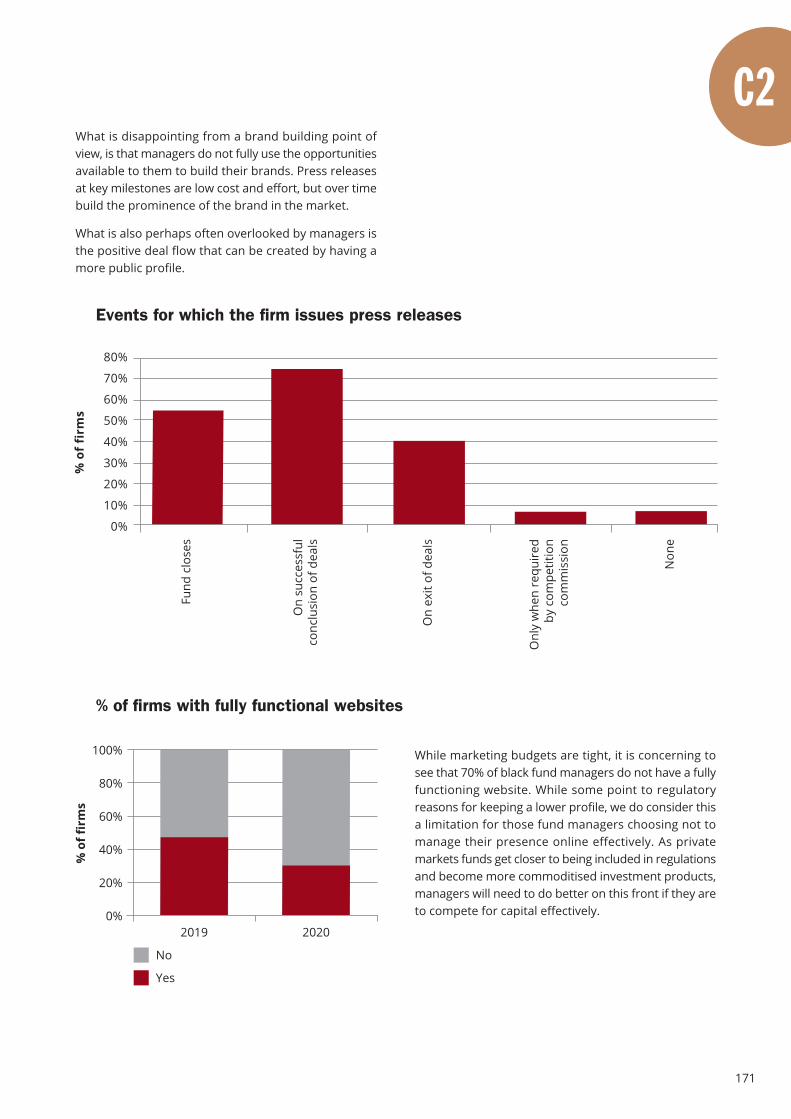
171
What is disappointing from a brand building point ofview, is that managers do not fully use the opportunitiesavailable to them to build their brands. Press releasesat key milestones are low cost and effort, but over timebuild the prominence of the brand in the market.
What is also perhaps often overlooked by managers isthe positive deal flow that can be created by having amore public profile.
Events for which the firm issues press releases
% o
f fi
rms
80%
70%
60%
50%
40%
30%
20%
10%
0%
Non
e
Fund
clo
ses
On
succ
essf
ulco
nclu
sion
of d
eals
Onl
y w
hen
requ
ired
by c
ompe
titio
nco
mm
issi
on
On
exit
of d
eals
While marketing budgets are tight, it is concerning tosee that 70% of black fund managers do not have a fullyfunctioning website. While some point to regulatoryreasons for keeping a lower profile, we do consider thisa limitation for those fund managers choosing not tomanage their presence online effectively. As privatemarkets funds get closer to being included in regulationsand become more commoditised investment products,managers will need to do better on this front if they areto compete for capital effectively.
% of firms with fully functional websites
% o
f fir
ms
100%
80%
60%
40%
20%
0%2019 2020
No
Yes
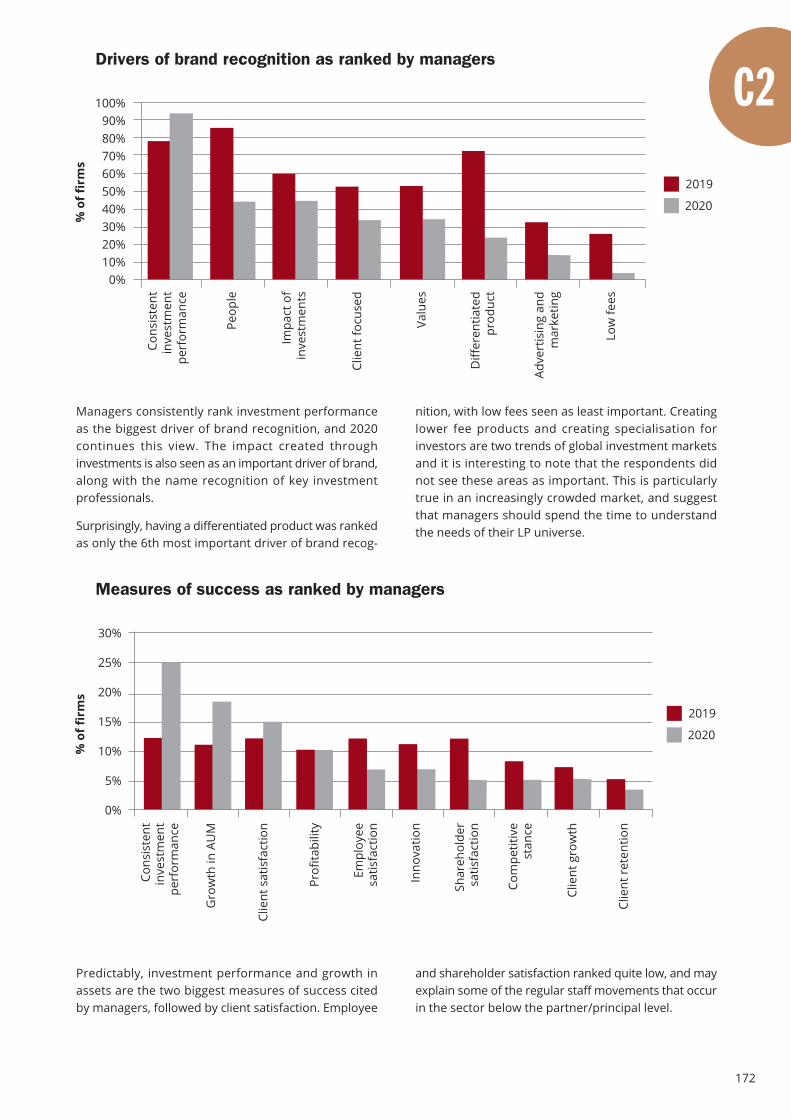
172
Drivers of brand recognition as ranked by managers%
of f
irm
s
100%90%80%70%60%50%40%30%20%10%
0%
2019
2020
Cons
iste
ntin
vest
men
tpe
rfor
man
ce
Peop
le
Impa
ct o
fin
vest
men
ts
Clie
nt fo
cuse
d
Valu
es
Diff
eren
tiate
dpr
oduc
t
Adve
rtis
ing
and
mar
ketin
g
Low
fees
Managers consistently rank investment performanceas the biggest driver of brand recognition, and 2020continues this view. The impact created throughinvestments is also seen as an important driver of brand,along with the name recognition of key investmentprofessionals.
Surprisingly, having a differentiated product was rankedas only the 6th most important driver of brand recog-
nition, with low fees seen as least important. Creatinglower fee products and creating specialisation forinvestors are two trends of global investment marketsand it is interesting to note that the respondents didnot see these areas as important. This is particularlytrue in an increasingly crowded market, and suggestthat managers should spend the time to understandthe needs of their LP universe.
Measures of success as ranked by managers
% o
f fir
ms
30%
25%
20%
15%
10%
5%
0%
2019
2020
Cons
iste
ntin
vest
men
tpe
rfor
man
ce
Gro
wth
in A
UM
Clie
nt s
atis
fact
ion
Prof
itabi
lity
Empl
oyee
satis
fact
ion
Inno
vatio
n
Shar
ehol
der
satis
fact
ion
Com
petit
ive
stan
ce
Clie
nt g
row
th
Clie
nt r
eten
tion
Predictably, investment performance and growth inassets are the two biggest measures of success citedby managers, followed by client satisfaction. Employee
and shareholder satisfaction ranked quite low, and mayexplain some of the regular staff movements that occurin the sector below the partner/principal level.
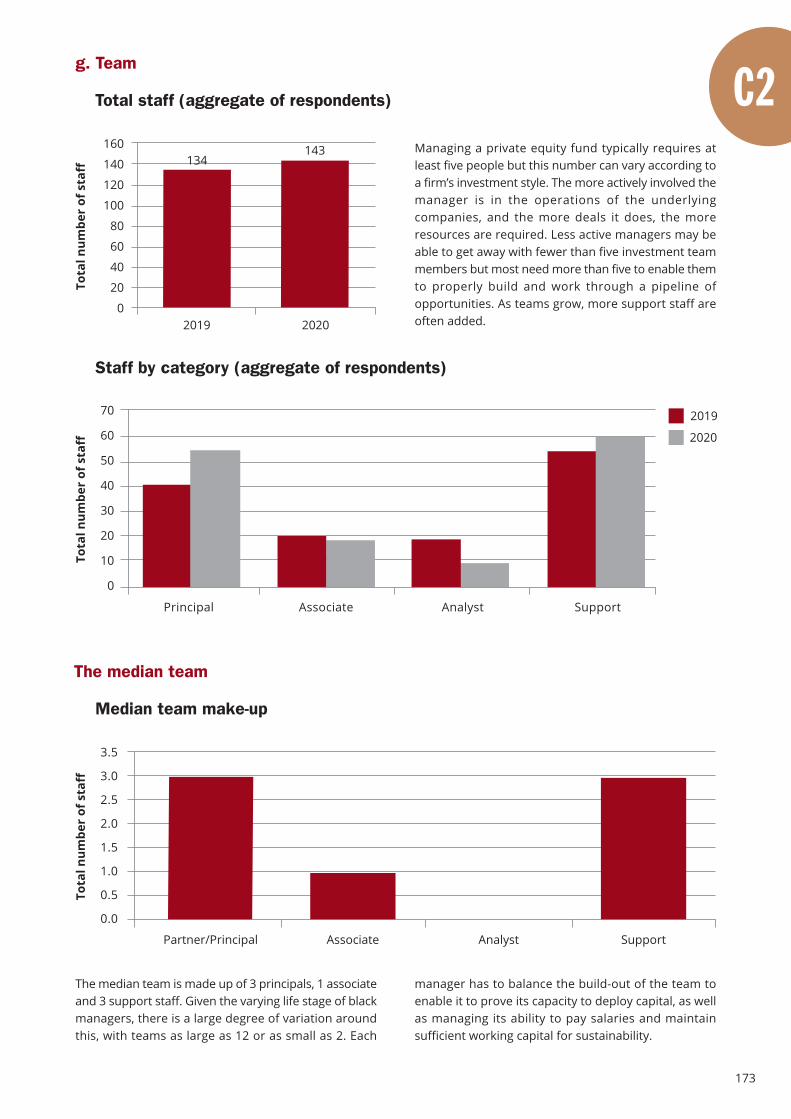
173
g. Team
Total staff (aggregate of respondents)
160
140
120
100
80
60
40
20
02019 2020
134143
Tota
l num
ber
of s
taff
Staff by category (aggregate of respondents)
Tota
l num
ber
of s
taff
70
60
50
40
30
20
10
0
2019
2020
Principal Associate Analyst Support
Managing a private equity fund typically requires atleast five people but this number can vary according toa firm’s investment style. The more actively involved themanager is in the operations of the underlyingcompanies, and the more deals it does, the moreresources are required. Less active managers may beable to get away with fewer than five investment teammembers but most need more than five to enable themto properly build and work through a pipeline ofopportunities. As teams grow, more support staff areoften added.
The median team
Median team make-up
3.5
3.0
2.5
2.0
1.5
1.0
0.5
0.0
SupportPartner/Principal Associate Analyst
The median team is made up of 3 principals, 1 associateand 3 support staff. Given the varying life stage of blackmanagers, there is a large degree of variation aroundthis, with teams as large as 12 or as small as 2. Each
manager has to balance the build-out of the team toenable it to prove its capacity to deploy capital, as wellas managing its ability to pay salaries and maintainsufficient working capital for sustainability.
Tota
l num
ber
of s
taff
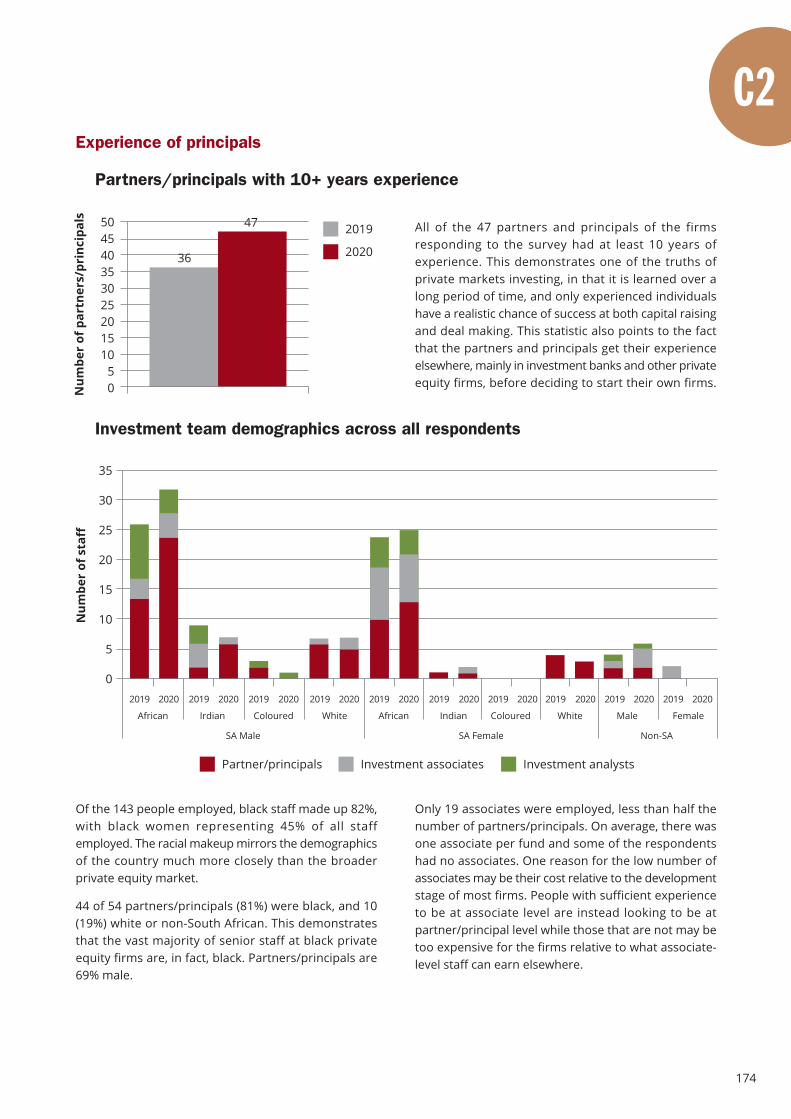
174
Experience of principals
Partners/principals with 10+ years experience
Num
ber
of p
artn
ers/
prin
cipa
ls 504540353025201510
50
2019
202036
47 All of the 47 partners and principals of the firmsresponding to the survey had at least 10 years ofexperience. This demonstrates one of the truths ofprivate markets investing, in that it is learned over along period of time, and only experienced individualshave a realistic chance of success at both capital raisingand deal making. This statistic also points to the factthat the partners and principals get their experienceelsewhere, mainly in investment banks and other privateequity firms, before deciding to start their own firms.
Investment team demographics across all respondents
Num
ber
of s
taff
35
30
25
20
15
10
5
0
African
2019 2020 2019 2020 2019 2020 2019 2020 2019 2020 2019 2020 2019 2020
Irdian Coloured White African Indian Coloured
2019 2020 2019 2020
White Male
2019 2020
Female
SA Male SA Female Non-SA
Investment analystsInvestment associatesPartner/principals
Of the 143 people employed, black staff made up 82%,with black women representing 45% of all staffemployed. The racial makeup mirrors the demographicsof the country much more closely than the broaderprivate equity market.
44 of 54 partners/principals (81%) were black, and 10(19%) white or non-South African. This demonstratesthat the vast majority of senior staff at black privateequity firms are, in fact, black. Partners/principals are69% male.
Only 19 associates were employed, less than half thenumber of partners/principals. On average, there wasone associate per fund and some of the respondentshad no associates. One reason for the low number ofassociates may be their cost relative to the developmentstage of most firms. People with sufficient experienceto be at associate level are instead looking to be atpartner/principal level while those that are not may betoo expensive for the firms relative to what associate-level staff can earn elsewhere.
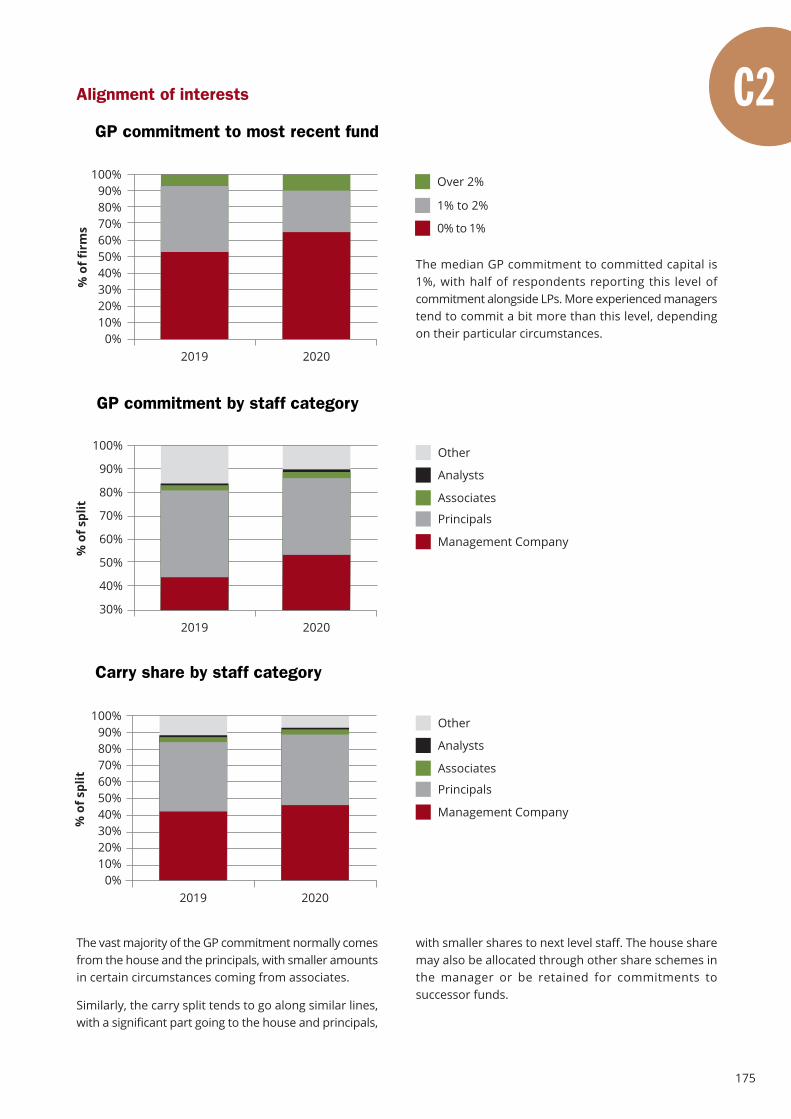
175
Alignment of interests
GP commitment to most recent fund
% o
f fir
ms
100%90%80%70%60%50%40%30%20%10%
0%2019 2020
Over 2%
1% to 2%
0% to 1%
The median GP commitment to committed capital is1%, with half of respondents reporting this level ofcommitment alongside LPs. More experienced managerstend to commit a bit more than this level, dependingon their particular circumstances.
GP commitment by staff category
% o
f spl
it
100%
90%
80%
70%
60%
50%
40%
30%2019 2020
Other
Analysts
Associates
Principals
Management Company
Carry share by staff category
% o
f spl
it
100%90%80%70%60%50%40%30%20%10%
0%2019 2020
Other
Analysts
Associates
Principals
Management Company
The vast majority of the GP commitment normally comesfrom the house and the principals, with smaller amountsin certain circumstances coming from associates.
Similarly, the carry split tends to go along similar lines,with a significant part going to the house and principals,
with smaller shares to next level staff. The house sharemay also be allocated through other share schemes inthe manager or be retained for commitments tosuccessor funds.
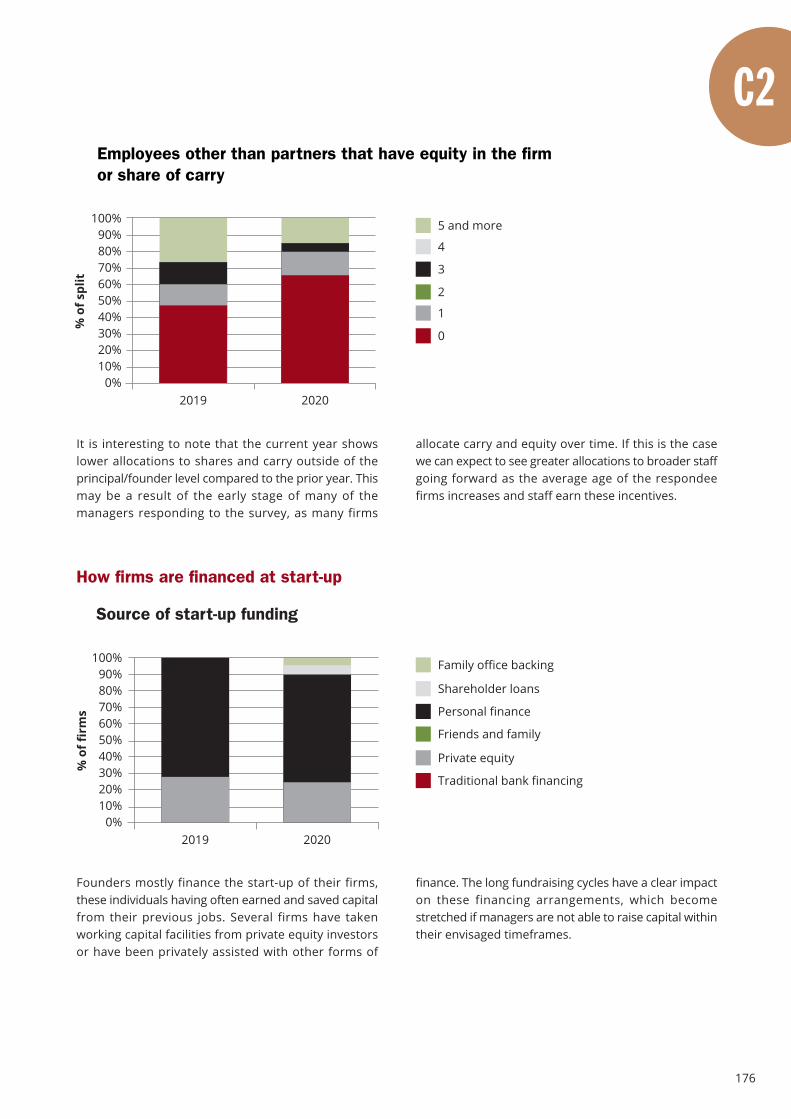
176
Employees other than partners that have equity in the firmor share of carry
% o
f spl
it
100%90%80%70%60%50%40%30%20%10%
0%2019 2020
4
3
2
1
0
5 and more
allocate carry and equity over time. If this is the casewe can expect to see greater allocations to broader staffgoing forward as the average age of the respondeefirms increases and staff earn these incentives.
It is interesting to note that the current year showslower allocations to shares and carry outside of theprincipal/founder level compared to the prior year. Thismay be a result of the early stage of many of themanagers responding to the survey, as many firms
How firms are financed at start-up
Source of start-up funding
% o
f fir
ms
100%90%80%70%60%50%40%30%20%10%
0%2019 2020
Friends and family
Private equity
Traditional bank financing
Family office backing
Shareholder loans
Personal finance
Founders mostly finance the start-up of their firms,these individuals having often earned and saved capitalfrom their previous jobs. Several firms have takenworking capital facilities from private equity investorsor have been privately assisted with other forms of
finance. The long fundraising cycles have a clear impacton these financing arrangements, which becomestretched if managers are not able to raise capital withintheir envisaged timeframes.
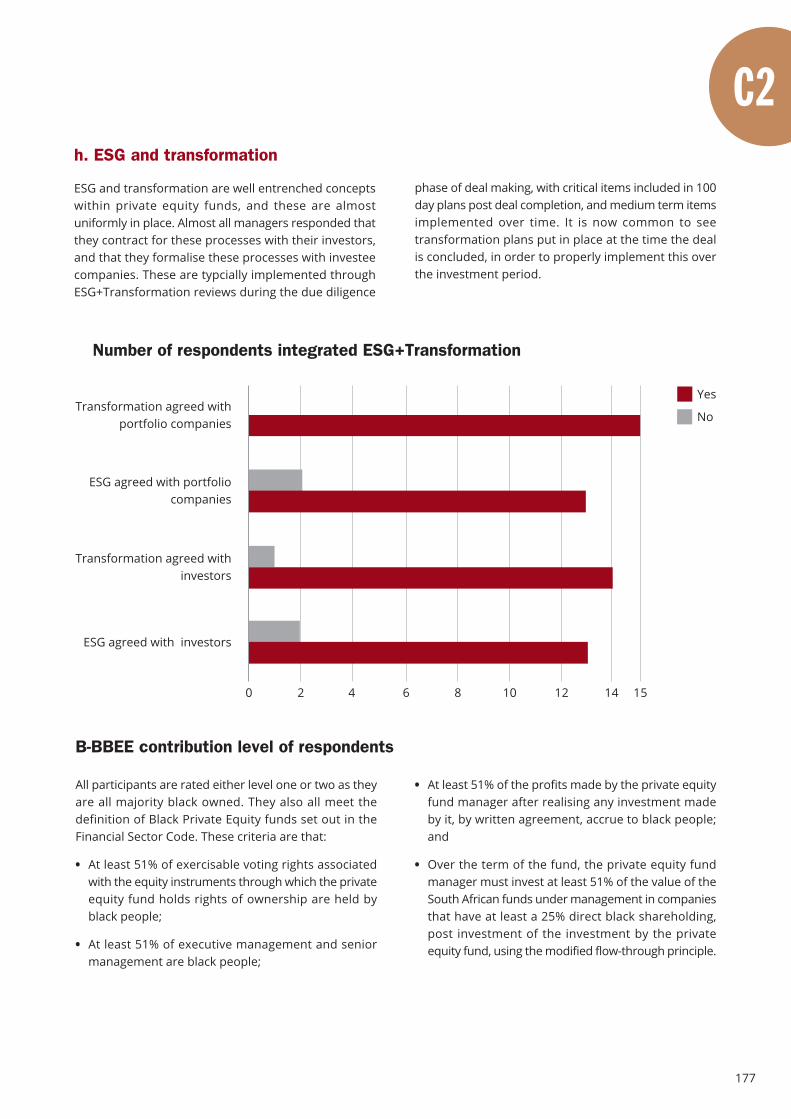
177
h. ESG and transformation
ESG and transformation are well entrenched conceptswithin private equity funds, and these are almostuniformly in place. Almost all managers responded thatthey contract for these processes with their investors,and that they formalise these processes with investeecompanies. These are typcially implemented throughESG+Transformation reviews during the due diligence
phase of deal making, with critical items included in 100day plans post deal completion, and medium term itemsimplemented over time. It is now common to seetransformation plans put in place at the time the dealis concluded, in order to properly implement this overthe investment period.
Number of respondents integrated ESG+Transformation
Yes
NoTransformation agreed with
portfolio companies
ESG agreed with portfoliocompanies
Transformation agreed with investors
ESG agreed with investors
0 2 6 8 124 10 14 15
B-BBEE contribution level of respondents
All participants are rated either level one or two as theyare all majority black owned. They also all meet thedefinition of Black Private Equity funds set out in theFinancial Sector Code. These criteria are that:
• At least 51% of exercisable voting rights associatedwith the equity instruments through which the privateequity fund holds rights of ownership are held byblack people;
• At least 51% of executive management and seniormanagement are black people;
• At least 51% of the profits made by the private equityfund manager after realising any investment madeby it, by written agreement, accrue to black people;and
• Over the term of the fund, the private equity fundmanager must invest at least 51% of the value of theSouth African funds under management in companiesthat have at least a 25% direct black shareholding,post investment of the investment by the privateequity fund, using the modified flow-through principle.
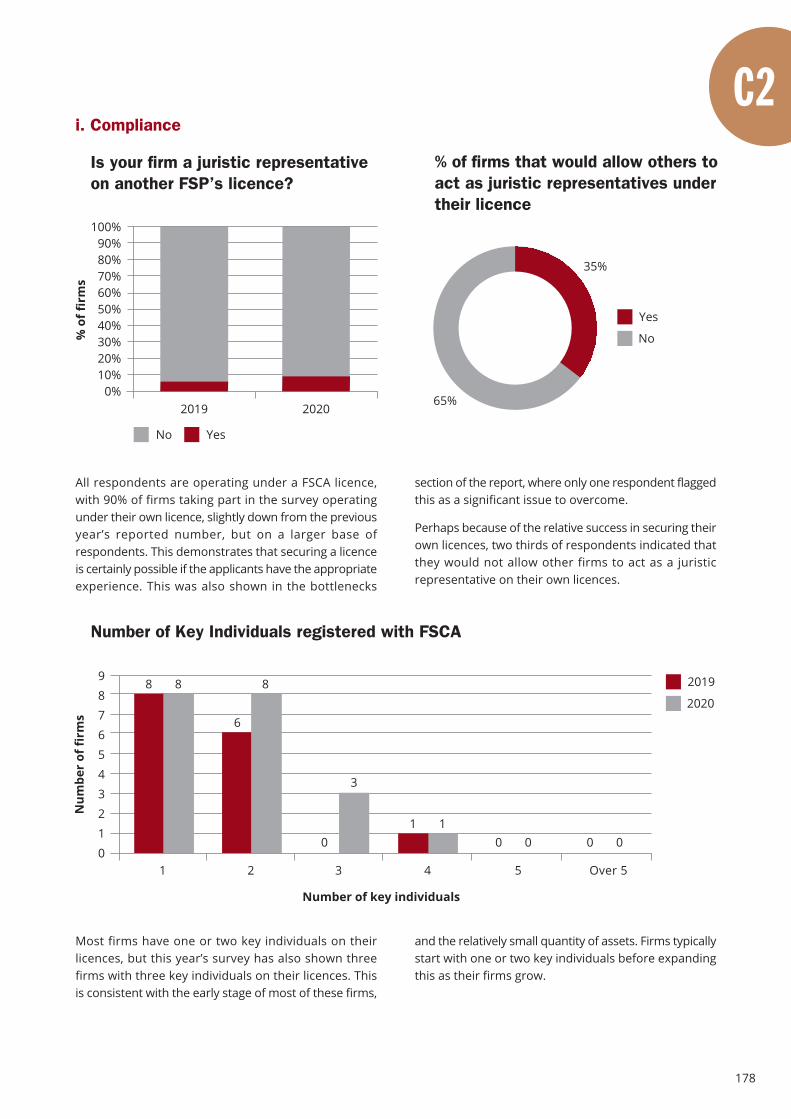
178
i. Compliance
Is your firm a juristic representativeon another FSP’s licence?
% o
f fir
ms
100%90%80%70%60%50%40%30%20%10%
0%2019 2020
No Yes
% of firms that would allow others toact as juristic representatives undertheir licence
65%
35%
Yes
No
All respondents are operating under a FSCA licence,with 90% of firms taking part in the survey operatingunder their own licence, slightly down from the previousyear’s reported number, but on a larger base ofrespondents. This demonstrates that securing a licenceis certainly possible if the applicants have the appropriateexperience. This was also shown in the bottlenecks
section of the report, where only one respondent flaggedthis as a significant issue to overcome.
Perhaps because of the relative success in securing theirown licences, two thirds of respondents indicated thatthey would not allow other firms to act as a juristicrepresentative on their own licences.
Number of Key Individuals registered with FSCA
Num
ber
of fi
rms
2019
2020
9876543210
1 2 3 4 5 Over 5
8 8 8
6
3
01 1
0 0 0 0
Number of key individuals
Most firms have one or two key individuals on theirlicences, but this year’s survey has also shown threefirms with three key individuals on their licences. Thisis consistent with the early stage of most of these firms,
and the relatively small quantity of assets. Firms typicallystart with one or two key individuals before expandingthis as their firms grow.
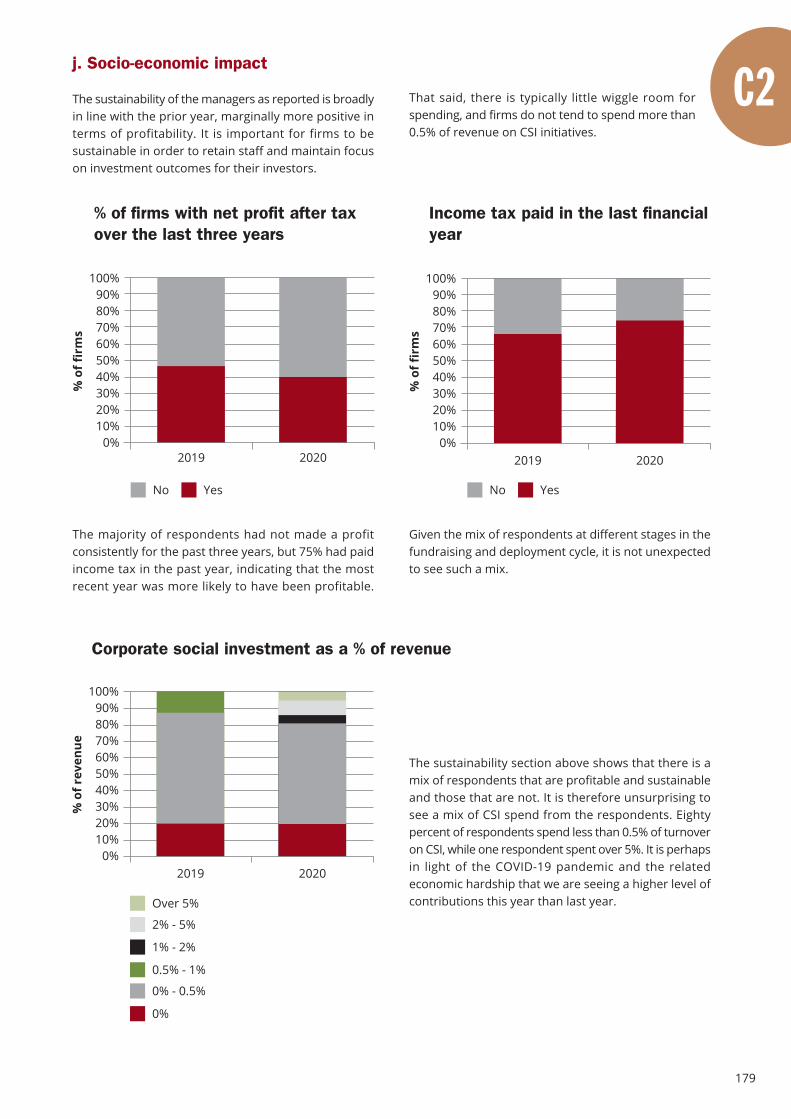
179
j. Socio-economic impact
The sustainability of the managers as reported is broadlyin line with the prior year, marginally more positive interms of profitability. It is important for firms to besustainable in order to retain staff and maintain focuson investment outcomes for their investors.
That said, there is typically little wiggle room forspending, and firms do not tend to spend more than0.5% of revenue on CSI initiatives.
% of firms with net profit after taxover the last three years
% o
f fir
ms
100%90%80%70%60%50%40%30%20%10%
0%
No Yes
2019 2020
Income tax paid in the last financialyear
% o
f fir
ms
100%90%80%70%60%50%40%30%20%10%
0%2019 2020
The majority of respondents had not made a profitconsistently for the past three years, but 75% had paidincome tax in the past year, indicating that the mostrecent year was more likely to have been profitable.
Given the mix of respondents at different stages in thefundraising and deployment cycle, it is not unexpectedto see such a mix.
% o
f rev
enue
100%90%80%70%60%50%40%30%20%10%
0%2019 2020
2% - 5%
1% - 2%
0.5% - 1%
0% - 0.5%
0%
Over 5%
The sustainability section above shows that there is amix of respondents that are profitable and sustainableand those that are not. It is therefore unsurprising tosee a mix of CSI spend from the respondents. Eightypercent of respondents spend less than 0.5% of turnoveron CSI, while one respondent spent over 5%. It is perhapsin light of the COVID-19 pandemic and the relatedeconomic hardship that we are seeing a higher level ofcontributions this year than last year.
No Yes
Corporate social investment as a % of revenue
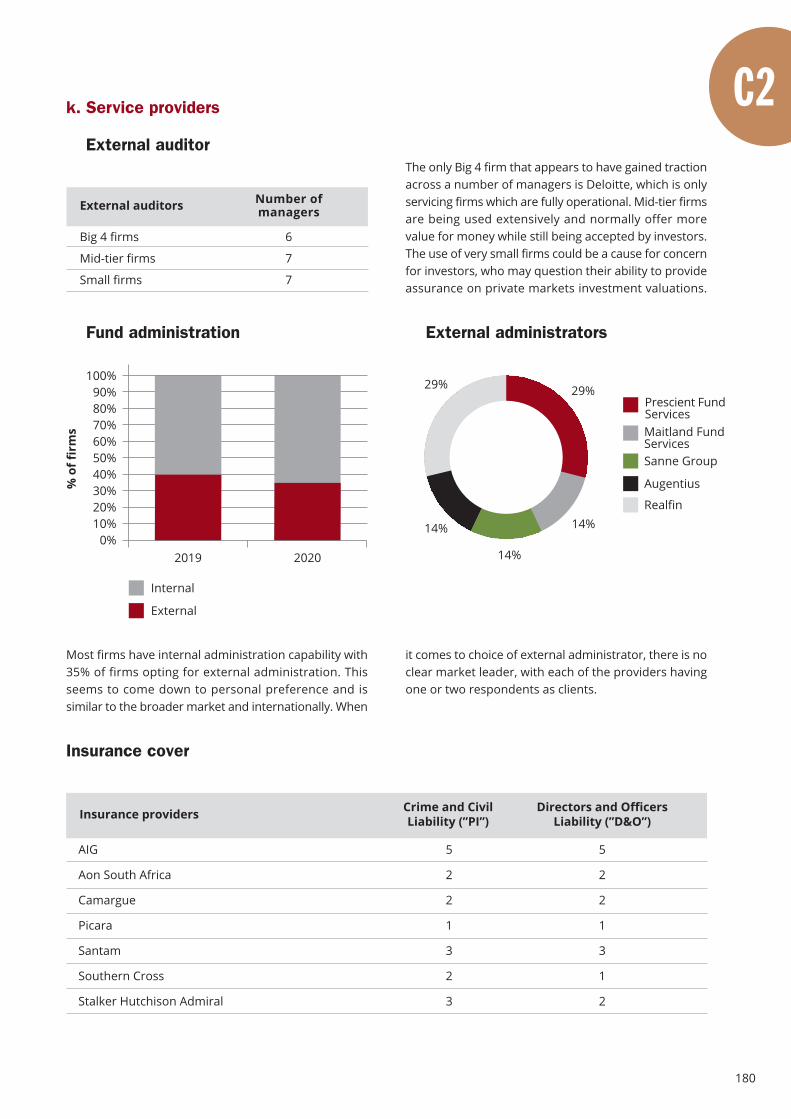
180
Big 4 firms
Mid-tier firms
Small firms
External auditors
6
7
7
Number ofmanagers
k. Service providers
External auditorThe only Big 4 firm that appears to have gained tractionacross a number of managers is Deloitte, which is onlyservicing firms which are fully operational. Mid-tier firmsare being used extensively and normally offer morevalue for money while still being accepted by investors.The use of very small firms could be a cause for concernfor investors, who may question their ability to provideassurance on private markets investment valuations.
% o
f fir
ms
100%90%80%70%60%50%40%30%20%10%
0%
Internal
External
2019 2020
Fund administration External administrators
14%
29%Prescient FundServicesMaitland FundServices
29%
Sanne Group
Augentius
Realfin14%
14%
Most firms have internal administration capability with35% of firms opting for external administration. Thisseems to come down to personal preference and issimilar to the broader market and internationally. When
it comes to choice of external administrator, there is noclear market leader, with each of the providers havingone or two respondents as clients.
AIG
Aon South Africa
Camargue
Picara
Santam
Southern Cross
Stalker Hutchison Admiral
Insurance providers Crime and CivilLiability (”PI”)
Directors and OfficersLiability (”D&O”)
5
2
2
1
3
2
3
5
2
2
1
3
1
2
Insurance cover
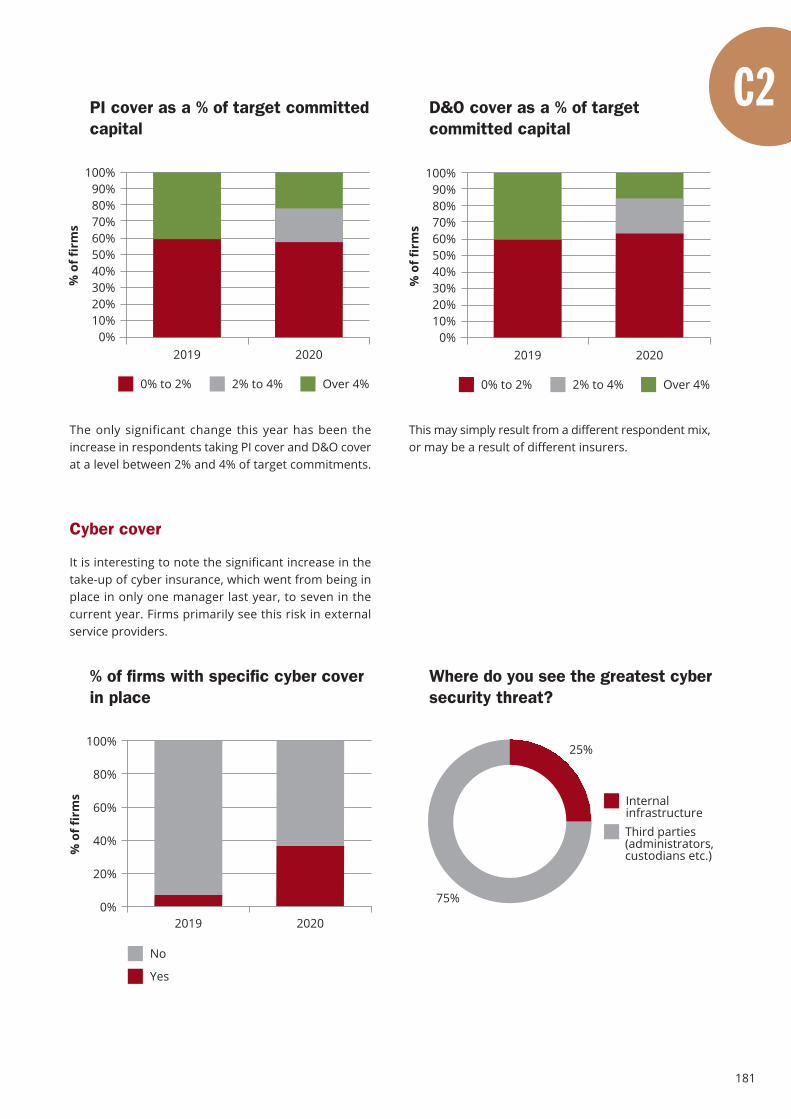
181
PI cover as a % of target committedcapital
2% to 4%0% to 2%
% o
f fir
ms
100%90%80%70%60%50%40%30%20%10%
0%2019 2020
Over 4%
D&O cover as a % of targetcommitted capital
2% to 4%0% to 2%
% o
f fir
ms
100%90%80%70%60%50%40%30%20%10%
0%2019 2020
Over 4%
The only significant change this year has been theincrease in respondents taking PI cover and D&O coverat a level between 2% and 4% of target commitments.
Cyber cover
It is interesting to note the significant increase in thetake-up of cyber insurance, which went from being inplace in only one manager last year, to seven in thecurrent year. Firms primarily see this risk in externalservice providers.
% of firms with specific cyber coverin place
% o
f fir
ms
100%
80%
60%
40%
20%
0%2019 2020
No
Yes
Where do you see the greatest cybersecurity threat?
75%
25%
InternalinfrastructureThird parties(administrators,custodians etc.)
This may simply result from a different respondent mix,or may be a result of different insurers.
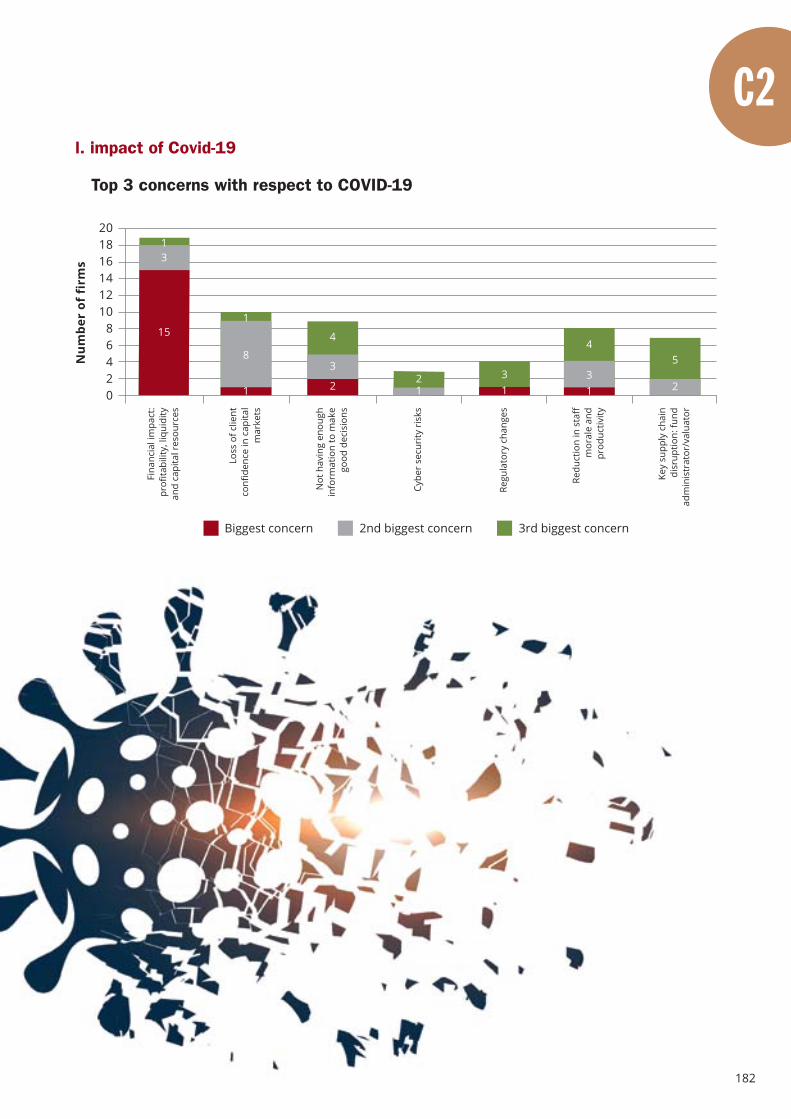
l. impact of Covid-19
Top 3 concerns with respect to COVID-19
Num
ber
of f
irm
s
201816141210
86420
2nd biggest concernBiggest concern 3rd biggest concern
Redu
ctio
n in
sta
ffm
oral
e an
dpr
oduc
tivity
4
Key
supp
ly c
hain
disr
uptio
n: fu
ndad
min
istr
ator
/val
uato
r
Regu
lato
ry c
hang
es
Fina
ncia
l im
pact
:pr
ofita
bilit
y, li
quid
ityan
d ca
pita
l res
ourc
es
Loss
of c
lient
conf
iden
ce in
cap
ital
mar
kets
Cybe
r se
curi
ty r
isks
Not
hav
ing
enou
ghin
form
atio
n to
mak
ego
od d
ecis
ions
13
1
8
1
12
3
415
3
1 231 2
5
182
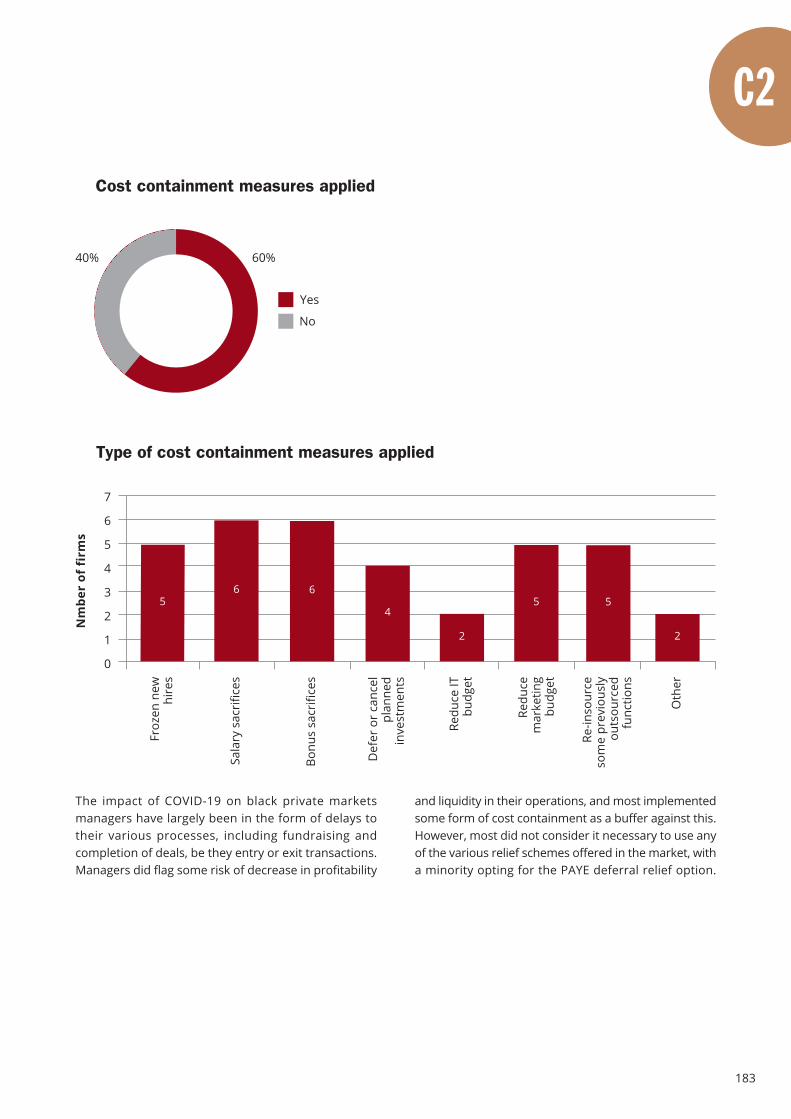
183
Cost containment measures applied
Yes
No
Type of cost containment measures applied
Nm
ber
of f
irm
s
7
6
5
4
3
2
1
0
Redu
cem
arke
ting
budg
et
Re-in
sour
ceso
me
prev
ious
lyou
tsou
rced
func
tions
Redu
ce IT
budg
et
Froz
en n
ewhi
res
Sala
ry s
acri
fices
Def
er o
r ca
ncel
plan
ned
inve
stm
ents
Bonu
s sa
crifi
ces
5
Oth
er
6 6
4
2
5 5
2
The impact of COVID-19 on black private marketsmanagers have largely been in the form of delays totheir various processes, including fundraising andcompletion of deals, be they entry or exit transactions.Managers did flag some risk of decrease in profitability
and liquidity in their operations, and most implementedsome form of cost containment as a buffer against this.However, most did not consider it necessary to use anyof the various relief schemes offered in the market, witha minority opting for the PAYE deferral relief option.
40% 60%
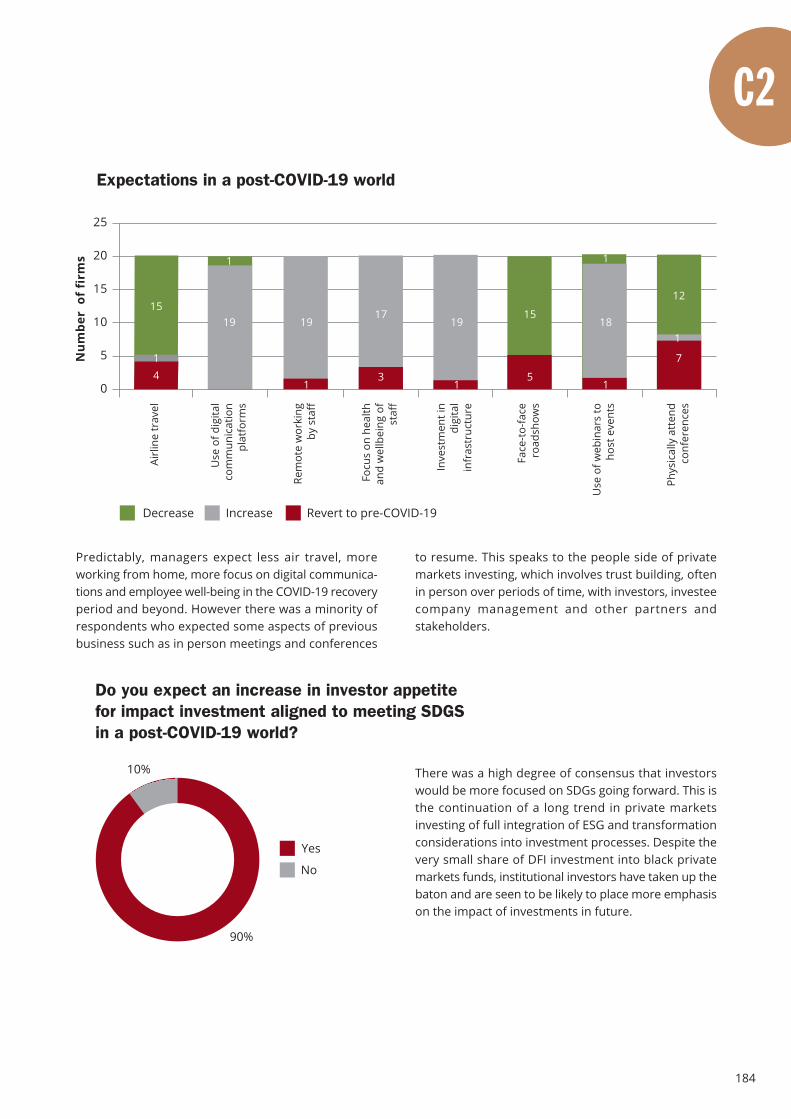
184
Expectations in a post-COVID-19 world
Num
ber
of
firm
s
25
20
15
10
5
0
Face
-to-
face
road
show
s
Use
of w
ebin
ars
toho
st e
vent
s
Inve
stm
ent i
ndi
gita
lin
fras
truc
ture
Airl
ine
trav
el
Use
of d
igita
lco
mm
unic
atio
npl
atfo
rms
Focu
s on
hea
lthan
d w
ellb
eing
of
staf
f
Rem
ote
wor
king
by s
taff
15
Decrease Increase Revert to pre-COVID-19
Phys
ical
ly a
tten
dco
nfer
ence
s
41
1
19
1
19
3
17
1
19
5
15
1
18
7
12
1
1
Do you expect an increase in investor appetitefor impact investment aligned to meeting SDGSin a post-COVID-19 world?
90%
10%
Yes
No
There was a high degree of consensus that investorswould be more focused on SDGs going forward. This isthe continuation of a long trend in private marketsinvesting of full integration of ESG and transformationconsiderations into investment processes. Despite thevery small share of DFI investment into black privatemarkets funds, institutional investors have taken up thebaton and are seen to be likely to place more emphasison the impact of investments in future.
Predictably, managers expect less air travel, moreworking from home, more focus on digital communica-tions and employee well-being in the COVID-19 recoveryperiod and beyond. However there was a minority ofrespondents who expected some aspects of previousbusiness such as in person meetings and conferences
to resume. This speaks to the people side of privatemarkets investing, which involves trust building, oftenin person over periods of time, with investors, investeecompany management and other partners andstakeholders.
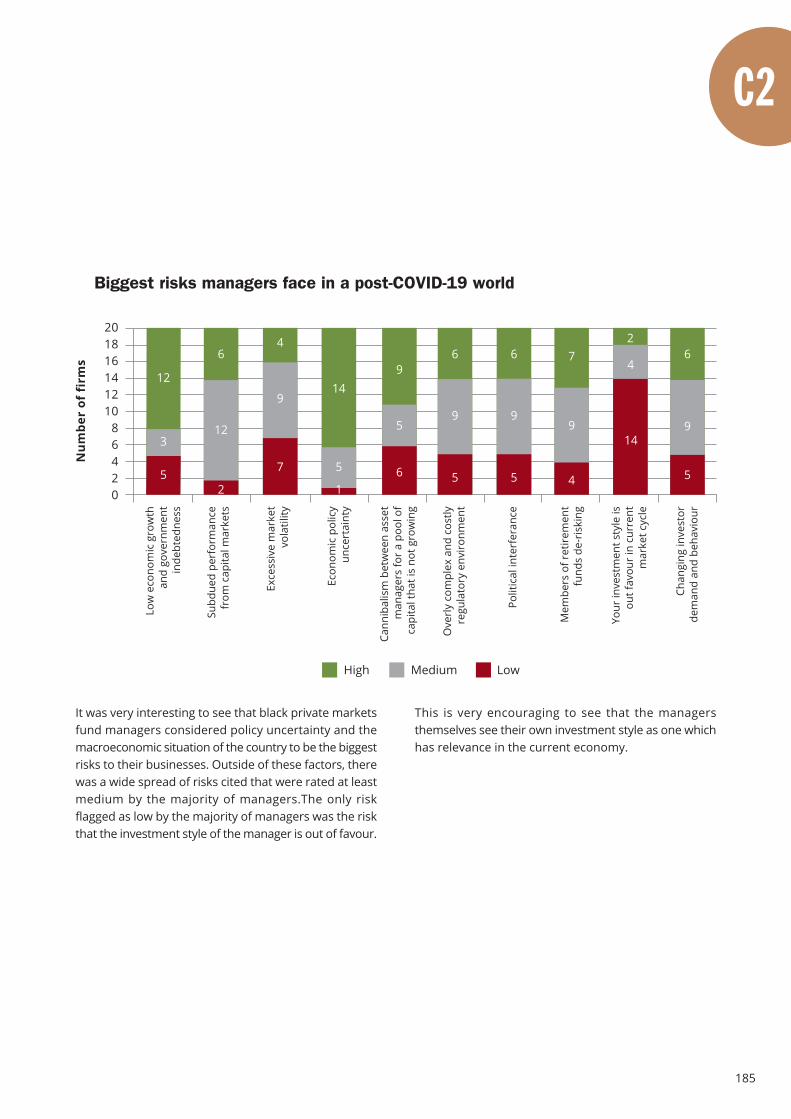
185
It was very interesting to see that black private marketsfund managers considered policy uncertainty and themacroeconomic situation of the country to be the biggestrisks to their businesses. Outside of these factors, therewas a wide spread of risks cited that were rated at leastmedium by the majority of managers.The only riskflagged as low by the majority of managers was the riskthat the investment style of the manager is out of favour.
Biggest risks managers face in a post-COVID-19 world
Num
ber
of f
irm
s
201816141210
86420
Medium LowHigh
Ove
rly
com
plex
and
cos
tlyre
gula
tory
env
iron
men
t
Polit
ical
inte
rfer
ance
Cann
ibal
ism
bet
wee
n as
set
man
ager
s fo
r a
pool
of
capi
tal t
hat i
s no
t gro
win
g
Low
eco
nom
ic g
row
than
d go
vern
men
tin
debt
edne
ss
Subd
ued
perf
orm
ance
from
cap
ital m
arke
ts
Econ
omic
pol
icy
unce
rtai
nty
Exce
ssiv
e m
arke
tvo
latil
ity
Your
inve
stm
ent s
tyle
isou
t fav
our
in c
urre
ntm
arke
t cyc
le
Chan
ging
inve
stor
dem
and
and
beha
viou
r
Mem
bers
of r
etir
emen
tfu
nds
de-r
iski
ng
9
6
9
6
5
9
3
12
12
6
5
149
4
4
2
9
6
9
7
5 5 562 1
7
14
54
This is very encouraging to see that the managersthemselves see their own investment style as one whichhas relevance in the current economy.
186
An interview with Shainal Sukha,investment consultant to Consolidated Retirement Fundfor Local Government (”CRF”)
An investment consultant’stake on Regulation 28 andunlisted investments
CRF, a large defined contribution scheme, has allocatedsignificant capital to unlisted investments when comparedto industry average allocations. Why have they done soand how can we get more pension funds making largercapital allocations within Regulation 28 limits, to privatemarkets and the real economy?
The following are some of the factors that led to CRF’slarge allocation to unlisted assets:
• The preamble of Regulation 28 of the Pension FundsAct states that funds should follow a risk-basedapproach to their investment strategy by targeting“adequate risk adjusted” returns. It goes further tostate that environmental, social and governancefactors should be considered as part of a “responsibleinvestment” approach. CRF therefore integrated ESGfactors into their decision-making and adopted aholistic approach to risk management. The result wasthat CRF not only targeted good risk-adjustedcommercial returns, but also sought to make a positiveenvironmental and social impact with its assets, sothat its members could retire in prosperous communi-ties and sustainable environments.
• In 2015, when the industry debated the concentrationof Naspers in our equity benchmarks, we noticed thatour clients’ capital kept going into a relatively expensiveand concentrated local stock market that wasbecoming increasingly global in its exposure.Companies were raising money locally to investoffshore, often with poor outcomes. Our clients werenot actually allocating a large portion of their capitallocally and into the real economy. An abundance ofcapital within domestic listed equity seemed to be
generating complacency and poor capital allocationdecisions by local companies. On the other hand,other areas of the economy, where capital was scarceoffered attractive return potential and better diversifi-cation benefits. So basic risk-management practiceand taking a prospective view resulted in CRF investinginto the local real economy, largely through alternativeasset classes.
• With Government fiscally constrained and Corporatesseeking certainty and confidence to invest, CRF feltfrustrated with the lack of progress and constant“circle of blame”. It therefore sought to use itsinfluence, as a large asset owner, to take action toreduce ESG risks for its members.
• CRF seeded an unlisted credit fund in 2015, which notonly targeted commercial returns, but being a blendedfinance fund, targeted job creation as well. Theexperience with this fund showed that it was possibleto generate good risk-adjusted returns, while alsohave a positive social impact, and this event enabledfurther investment into unlisted assets.
• Currently, CRF has allocated more than 18% to unlistedassets, all of which have performed in line withexpectations after all fees and costs. Of this, 12% hasa relatively high ESG impact.
It is important for Trustees to understand the flexibilitythat Regulation 28 provides and the benefits anddisadvantages of unlisted assets. Consider what will beappropriate for your fund. Do not be obsessed withdaily liquidity if your member profile is relatively youngand stable. Obtain a second opinion on complex issuesand make sure that your asset consultant is beingproactive and bringing suitable opportunities to thetable.
In your experience, what do you see as the key benefitsand risks of your clients investing in private markets?
Private markets allow one to exploit the illiquiditypremium and gain exposure to other risk premia. Thishelps to diversify risks for asset owners and providemore consistent and stable returns, depending on thenature of the investment. It generally channels capitalinto the real economy and can help to reduce negative
187
externalities or create positive externalities. However,private markets are not without risk and require greaterdue diligence and scrutiny. Private market fundsgenerally have lock-up periods, charge higher fees andhave higher cost structures. Concentration, liquidity andcredit risks can be quite high, and most funds are closelycorrelated to the economic and business cycle.
In light of the current economic environment, SAVCA haveproposed two amendments to Regulation 28: separatinghedge funds and private equity into independent assetclasses, each with their own caps and increasing theprivate equity cap from 10% to 15%. Do you think theseproposed changes to Regulation 28 will unlock additionalcapital or, in your view, what will?
We support SAVCA’s proposal to split out hedge fundsand private equity into separate categories as well asincrease the private equity limit to 15%. We do not seea need to make further changes to Regulation 28, aswe have shown through a case study of CRF thatRegulation 28 is not prescriptive and provides sufficientflexibility. While these changes may unlock additionalcapital from retirement funds, the biggest stumblingblock is not Regulation 28. What is lacking is theimplementation of Regulation 28 and application of itsprinciples by asset consultants and Trustees. If thestructural shortcomings in the industry (as per RobRusconi’s 2008 paper “Whose money is it anyway?”) areaddressed, particularly in asset consulting, it will allowfor better capital allocation into the real economy andapplication of Regulation 28. We should be thinkingabout making it easier for retirement funds to allocateto illiquid assets by offering some kind of liquidity facilityor perhaps offering open-ended funds. To address highfees, the industry could play a role in coming up withbetter-aligned fee structures, which are often cited byasset consultants as a huge stumbling block.
In light of the current economic environment and COVID-19 crisis, what in your experience does private marketinvesting deliver in terms of broader social benefit andimpact goals in the real economy? And will largerallocations be supportive in confronting the currenteconomic challenges being experienced in South Africa?
Climate change will amplify our social risks of highunemployment, poverty and inequality in South Africa.In my opinion, we have around ten years to urgentlytransition to a low carbon economy in a just manner.We also have ten years to achieve the United NationsSustainable Development Goals. The COVID-19pandemic has highlighted the weaknesses of our systembut given us an opportunity to “build back better”.
The next ten years will be a massive opportunity for theprivate markets industry. Given the lock-up periods,private market fund managers can take long-term viewsand invest in solutions that address long-term risks. Theprivate markets industry were early adopters of ESGintegration and generally invest in the real economy.The mainstreaming of impact investing will be the nextevolution of Responsible Investing, and the privatemarkets industry therefore has a critical role insupporting this move.
CRF has invested in a number of blended finance solutionswhere government agencies provide some form ofdownside protection to catalyse investment from othersources. These blended finance solutions aim to providecommercial returns and social impact outcomes forinvestors. What has been your client’s experience of thesepartnerships in terms of returns and impact?
CRF has invested in three blended finance funds, all ofwhich have delivered a positive experience thus far, interms of both risk and return. All three funds target jobcreation, which is an important part of CRF’s ResponsibleInvesting Policy. The funds are run by professional assetmanagers who also measure and report on the numberof jobs that are created. The Jobs Fund has been anexcellent partner in the process through their technicalinput and being receptive to investor concerns. Theirinvolvement has lowered risks for both investors andasset managers and we hope that Government willcreate a “second” Jobs Fund or equivalent.
Concessional capital, often provided by the Governmentor an entity like the Jobs Fund, does serve to make iteasier for retirement funds to invest in alternative assetclasses. The concessional capital can either reducedownside risks by offering a first loss guarantee or itcan act as a return enhancer, or both. We feel thatblended finance could help mobilise the finance industryto invest more in the real economy, to crowd in long-term asset owners and to create positive environmentaland social impact in our country. Blended finance fundscould also help meet our National Development Plantargets and address the United Nations SustainableDevelopment Goals.
188
Asset manager profiles | Private markets
Name of company: Ascension Capital Partners(Pty) Ltd
Date of inception: Feb-18Website: www.ascensioncapital.co.zaAddress: Die Groenhuis, 38 Garsfontein Road,
Pretoria, 0145Telephone: +27 87 357 9750Email: [email protected] person: Kabelo MojaTitle of contact person: Executive/Principal
Name of company: Ata Capital (Pty) LtdDate of inception: Feb-12Website: www.atacapital.co.zaAddress: 9th Floor, 90 Grayston Drive,
Sandton, 2196Telephone: +27 11 321 1629Email: [email protected] person: Maredi MampuruTitle of contact person: Executive/PrincipalLinkedIn: Ata CapitalYouTube: Ata Capital
Name of company: Bopa Moruo Private Equity FundManagers (Pty) Ltd
Date of inception: Jan-12Website: www.bopamoruo.co.zaAddress: 3 Exchange Square, 87 Maude Street,
Sandton, 2196Telephone: +27 84 909 9999Email: [email protected] person: Nthime KhoeleTitle of contact person: Executive/PrincipalLinkedIn: Bopa Moruo Private Equity
Name of company: Crede Capital Partners (Pty) LtdDate of inception: Jun-15Website: www.credecapital.co.zaAddress: Ground Floor, Vdara Office Park,
41 Rivonia Road, 2196Telephone: +27 11 268 6900Email: [email protected] person: Sandile SokhelaTitle of contact person: Executive/Principal
Name of company: Eklavya Asset Managers (Pty) LtdDate of inception: Jan-16Website: www.eklavyaam.comAddress: 2nd Floor, Suite 2.3, Open Workspace,
138 West Street, Sandton, 2195Telephone: +27 10 592 1867Email: [email protected] person: Satish BhalaTitle of contact person: Executive/Principal

189
Name of company: Ethos Mid Market Fund I (Pty) LtdDate of inception: Oct-15Website: www.ethos.co.zaAddress: 35 Fricker Road, Johannesburg, 2196Telephone: +27 11 328 7400Email: [email protected] person: Tabane MatheolaneTitle of contact person: Executive/PrincipalTwitter: @ethosmidmarketLinkedIn: Ethos Private Equity
Name of company: FyreFem Fund Managers (Pty) LtdDate of inception: Sep-17Website: www.fyrefem.comAddress: 10 Harrier Crescent, Douglasdale, 2191Telephone: +27 83 266 8125Email: [email protected] person: Cathy GoddardTitle of contact person: Executive/Principal
Name of company: Khumovest (Pty) LtdDate of inception: Sep-15Website: www.khumovest.comAddress: 2nd Floor, Building A, Silverpoint
Office Park, 22 Ealing Crescent, 2191Telephone: +27 11 883 2274Email: [email protected] person: Priyan PadayichieTitle of contact person: Executive/PrincipalTwitter: @Khmovest_SAFacebook: KhumovestLinkedIn: Khumovest South Africa
Name of company: Kleoss Capital (Pty) LtdDate of inception: Jun-14Website: www.kleosscapital.comAddress: One Vdara, 41 Rivonia Road,
Sandhurst, 2146Telephone: +27 11 666 1660Email: [email protected] person: Zain LaherTitle of contact person: Executive/PrincipalLinkedIn: Zain Laher
Name of company: Makalani Management Company(Pty) Ltd
Date of inception: Aug-04Website: www.makalani.co.zaAddress: 261 Oxford Road, Illovo, 2196Telephone: +27 11 428 0680Email: [email protected] person: Keshan PillayTitle of contact person: Executive/PrincipalTwitter: @MakalaniMCLinkedIn: Makalani Management Company

190
Name of company: Medu Capital (Pty) LtdDate of inception: Jan-02Website: www.meducapital.co.zaAddress: 4th Floor, 35 Ferguson Road,
Sandton, 2196Telephone: +27 11 268 9140Email: [email protected] person: Leone BoshoffTitle of contact person: AdministratorLinkedIn: Medu Capital
Name of company: Moshe Capital (Pty) LtdDate of inception: Dec-13Website: www.moshecapital.comAddress: 2nd Floor, The Place, 1 Sandton
Drive, Sandton, 2196Telephone: +27 11 326 9733Email: [email protected] person: Pauli van GreunenTitle of contact person: Administrator
Name of company: PAPE Fund Managers (Pty) LtdDate of inception: Mar-15Website: www.papefunds.co.zaAddress: 222a Grosvenor Road, Sandton,
2191Telephone: +27 82 653 8669Email: [email protected] person: Guy BaxterTitle of contact person: Executive/PrincipalTwitter: @papefunds
Name of company: RH Managers (Pty) LtdDate of inception: May-13Website: www.rhmanagers.co.zaAddress: 3rd Floor, 18 Melrose Boulevard,
Melrose Arch, 2076Telephone: +27 10 007 2171Email: [email protected] person: Quinton ZungaTitle of contact person: Executive/Principal
Name of company: Sanari Capital (Pty) LtdDate of inception: Nov-13Website: www.sanari.co.zaAddress: 7th Floor, 90 Grayston Drive,
Sandton, 2196Telephone: +27 76 456 3339Email: [email protected] person: Sipho SibekoTitle of contact person: Business Development
Manager/Investor RelationsTwitter: @SanariCapitalFacebook: SanariCapitalLinkedIn: SanariCapital
Name of company: Senatla Capital (Pty) LtdDate of inception: Jun-10Website: www.senatlacapital.comAddress: 9th Floor, The Forum,
2 Maude Street, Sandton, 2196Telephone: +27 11 784 5929Email: [email protected] person: Owen MaubaneTitle of contact person: Executive/Principal
Name of company: Summit PE Investment Managers(Pty) Ltd
Date of inception: Aug-16Website: www.summitafrica.comAddress: 3rd Floor, Vdara Building,
41 Rivonia Road, Sandhurst, 2196Telephone: +27 82 486 1928Email: [email protected] person: Langa MadonkoTitle of contact person: Business Development
Manager/Investor RelationsTwitter: @SummitAfrInstagram: @SummitAfricaLinkedIn: Summit Africa
Name of company: Tamela Capital Partners (Pty) LtdDate of inception: Sep-16Website: www.tamela.co.zaAddress: Ground Floor, Golden Oak House
Ballyoaks OfficePark, 35 BallyclareDrive, Bryanston, 2021
Telephone: +27 10 443 4615Email: [email protected] person: Beena MorarTitle of contact person: AdministratorLinkedIn: Tamela Group
Name of company: Third Way Investment Partners(Pty) Ltd
Date of inception: Jul-15Website: www.thirdway.co.zaAddress: 9th Floor, Katherine Towers,
39 Wierda Road West, Wierda Valley,Sandton, 2196
Telephone: +27 11 684 1192Email: [email protected] person: Fulu MakwetlaTitle of contact person: Executive/PrincipalTwitter: @ThirdWayZA
Name of company: Vuna Partners (Pty) LtdDate of inception: Jun-19Website: www.vunapartners.co.zaAddress: 3rd Floor, 28 Sturdee Avenue,
Rosebank, 2196Telephone: +27 10 595 4990Email: [email protected] person: Siya NhlumayoTitle of contact person: Executive/Principal
191
Advertorial
193
1. General
a. Please read the following sections carefully.
b. This document contains the terms and conditions which govern the use of the2020 BEE.conomics Transformation in South African asset management survey(the “Survey”). This document applies to all persons who use, read, process, collect, download, view, print, analyse, copy, update, modify, distribute, publishor make available in any other form, or access this Survey for any reason whatsoever. By using, reading, processing, collecting, downloading, viewing,printing, analysing, copying, updating, modifying, distributing, publishing or making available in any other form, or accessing this Survey or any of the information in the Survey, you accept that you have read, understand and agree to these terms and conditions in full.
c. This Survey contains information pertaining to inter alia -i. 27four Investment Managers Proprietary Limited (the “Company”);ii. the Companyís subsidiaries, holding companies, and/or any other company
forming part of the 27four group of companies (the “Group”) (the Companyand the Group are collectively referred to as “27four”); and/or
iii. 27four’s appointed agents, representatives, associated entities, financial services providers, asset managers, administrators and/or suppliers (collectively referred to as the “Relevant Entities”) and/or
iv. the services rendered or financial products supplied by 27four and/or theRelevant Entities and/or financial information pertaining to 27four and/orthe Relevant Entities.
2. Nature of the information and completeness
a. This Survey contains information which is purely factual and is not an expressionof an opinion or recommendation. It does not constitute financial product advice and should not be relied upon as such. The information contained inthe Survey does not take into account your personal objectives, financial situation or needs and you must determine whether the information is appropriate in terms of your particular circumstances.
b. This Survey contains summary information and the information is of generalbackground and does not purport to be complete, comprehensive or exhaustive.
c. The Survey has been prepared in good faith by 27four. To the extent available,the industry, market and competitive position data contained in this Survey has been obtained from official or third-party sources. Third-party industry publications, studies and surveys generally state that the data contained therein has been obtained from sources believed to be reliable, but there is no guarantee of the accuracy or completeness of such data. While 27four reasonably believes that each of these publications, studies and surveys hasbeen prepared by a reputable source, neither 27four nor the Relevant Entitiesnor any of their respective directors, officers, employees, advisers, representatives or agents have independently verified the data contained therein.
d. Past performance information given in this Survey is given for illustrative purposes only and should not be relied upon as (and is not) an indication of future performance.
e. The Survey may contain “forward-looking” statements relating to inter alia future strategy, events, expectations, prospects, developments and financialperformance. In some cases forward-looking statements may be identified by terminology such as “target”, “aim”, “can have”, “likely”, “should”, “would”, “may”, “will”, “could”, “expect”, “plan”, “intend”, “anticipate”, “believe”, “envisage”,“estimate”, “project”, “predict”, “potential” or “continue”, or the negative of suchterms or other comparable terminology. Such statements reflect current viewswith respect to future events and are only predictions and are subject to assumptions. These assumptions and views may or may not prove to be correct and are subject to inherent risks and uncertainties. Those risks and uncertainties include factors and risks specific to 27four and/or the RelevantEntities, such as development of their businesses, future capital expendituresand acquisitions, as well as general economic conditions and conditions in themarket, such as trends in the operating industry and market growth. Actual events or results may differ materially from the events or results expressed or implied in any forward-looking statement and such deviations are both normal and to be expected.
f. Calculations contained in this Survey are intended for the convenience of clients or contracting parties, may be approximations, and are intended onlyas guidelines. Should you wish to rely on any calculation, you are advised to verify the calculations before using them as 27four will not be liable for any inaccuracy in the calculation.
g. Whilst 27four is of the opinion that the views expressed in any such forward-looking statements are based on reasonable assumptions, neither 27four norany of the Relevant Entities makes any representation or warranty as to the accuracy or likelihood of fulfilment of any forward-looking statement, or anyevents or results expressed or implied in any forward-looking statement. Neither 27four nor any of the Relevant Entities guarantees future results, levelsof activity, performance or achievements nor are they under a duty to updateany forward-looking statements after the date of this Survey to confirm suchstatements to actual results or to changes in expectations. Any forward-looking statements made in this Survey reflect views held as at the date of theSurvey.
h. The information disclosed in this Survey is only current as at 30 June 2020, thedate of the Survey. 27four and/or the Relevant Entities shall have no obligationto review, update or correct the information in the Survey after the date of the Survey nor to notify recipients of any inaccuracy, incompleteness or changein the information contained in the Survey. 27four shall however be entitledto update, amend, supplement or otherwise alter the information containedin the Survey without notice.
Disclaimer/Terms and conditions of use
i. Neither 27four nor any of the Relevant Entities nor their respective employees,directors, agents, officers, servants, contractors, representatives and/or advisorsand/or other persons for whom in law 27four and/or the Relevant Entities maybe held liable or can be held accountable, assume any liability or make any representation or warranty, express or implied, as to the accuracy, completeness,reliability or fairness of any information, statements, representations or forecasts contained in this Survey or that such information, statements, representations or forecasts are not misleading or outdated, or are free fromerrors or misstatements and no reliance may be placed on this Survey.
j. Neither 27four nor any of the Relevant Entities nor their respective employees,directors, agents, officers, servants, contractors, representatives and/or advisorsand/or any other persons for whom in law 27four and/or the Relevant Entitiesmay be held liable shall under any circumstances whatsoever be held liable for any loss, damage, claim or costs (whether direct, indirect, incidental, special,punitive or consequential) whatsoever and howsoever suffered or incurred by any person including, without limitation, any loss of profits or revenues, orany loss of data, use, goodwill, or other intangible losses, as a result of or arising from placing reliance on, acting on or refraining from acting on anythingcontained in, or omitted from, the Survey, whether the loss, damage, claim orcosts arises as a result of negligence or gross negligence.
3. Distribution
a. The information in this Survey is for the exclusive use of clients, contracting parties of 27four and their advisors, readers or users of this Survey and/or people that have legal access to this Survey and such persons shall not reproduce or distribute the information, or any part thereof, without the priorwritten consent of 27four. The information contained in the Survey shall remain the property of 27four. 27four reserves the right to require the returnof the Survey (together with any copies or extracts thereof) to it at any time.
4. Not legally binding
a. This Survey is intended for information purposes only and no part of this Survey or any of the information in it shall form the basis of any agreement with 27four. No proposal put forward in this Survey is intended to be bindingupon 27four and/or any of the Relevant Entities whether by way of agreement,representation or otherwise.
b. The information contained in this Survey should not be used as a definitive basis for any decision, contract, commitment or action with respect to any proposed transaction, investment or otherwise.
c. Subscribing to any service or purchasing any product through 27four is subjectto 27four’s contractual terms and conditions and applicable law.
d. 27four and/or the Relevant Entities will not be obliged to carry out any proposalsor fulfil any terms mentioned in this Survey and will not be responsible for any loss or damage caused as a result of any person relying upon statementsin this Survey. All terms proposed are subject to, inter alia, obtaining the necessary internal approvals, the full legal review of the proposal and executionof all the required documentation.
5. Confidential information
a. This Survey may contain confidential information pertaining to the business of 27four and/or the Relevant Entities.
b. No part of this Survey may at any time be copied, reproduced or distributed,in whole or in part, at any time without the prior written consent of 27four and/or the Relevant Entities
.6. Breach of terms and conditions
a. 27four reserves the right to -
i. refuse further access to the Survey or any information in it if -
1. a person breaches any of these terms and conditions from time to timeor as may be applicable to the use of this Survey;
2. 27four is unable to verify or authenticate any information provided by aperson to it;
3. 27four believes that a person is conducting activities that are illegal, abusive, threaten the integrity of the Survey or may place 27four in disrepute;
ii. refer any breach to the police if such breach constitutes a crime; and
iii. claim damages for all losses and damages it may suffer and costs and expenses it may incur as a result of the breach.
7. Indemnity
a. Any person who accesses, reads or uses this Survey or any information in it hereby indemnifies and holds 27four and/or the Relevant Entities and any ofits respective directors, officers, employees, representatives, agents, licensors,and any third party information providers harmless from and against all claims,damages, losses, costs and expenses (whether direct, indirect, incidental, special, punitive or consequential) (including attorney and own client costs), resulting from any failure to adhere to these terms and conditions.