Validation of an updated Associative Transcriptomics platform ...
This journal is c The Royal Society of Chemistry 2012 Mol. BioSyst., 2012, 8, 1507–1519 1507
Cite this: Mol. BioSyst., 2012, 8, 1507–1519
Transcriptomics and systems biology analysis in identification of specific
pathways involved in cacao resistance and susceptibility to witches’
broom diseasew
Braz Tavares da Hora Junior,a Joice de Faria Poloni,bc Maıza Alves Lopes,ad
Cristiano Villela Dias,aKarina Peres Gramacho,
eIvan Schuster,
fXavier Sabau,
g
Julio Cezar De Mattos Cascardo,za Sonia Marli Zingaretti Di Mauro,h
Abelmon da Silva Gesteira,aiDiego Bonatto
cand Fabienne Micheli*
ag
Received 11th October 2011, Accepted 26th January 2012
DOI: 10.1039/c2mb05421c
This study reports on expression analysis associated with molecular systems biology of cacao-
Moniliophthora perniciosa interaction. Gene expression data were obtained for two cacao genotypes
(TSH1188, resistant; Catongo, susceptible) challenged or not with the fungus M. perniciosa and collected
at three time points through disease. Using expression analysis, we identified 154 and 227 genes that are
differentially expressed in TSH1188 and Catongo, respectively. The expression of some of these genes was
confirmed by RT-qPCR. Physical protein–protein interaction (PPPI) networks of Arabidopsis thaliana
orthologous proteins corresponding to resistant and susceptible interactions were obtained followed by
cluster and gene ontology analyses. The integrated analysis of gene expression and systems biology
allowed designing a general scheme of major mechanisms associated with witches’ broom disease
resistance/susceptibility. In this sense, the TSH1188 cultivar shows strong production of ROS and elicitors
at the beginning of the interaction with M. perniciosa followed by resistance signal propagation and ROS
detoxification. On the other hand, the Catongo genotype displays defense mechanisms that include the
synthesis of some defense molecules but without success in regards to elimination of the fungus. This
phase is followed by the activation of protein metabolism which is achieved with the production of
proteasome associated with autophagy as a precursor mechanism of PCD. This work also identifies
candidate genes for further functional studies and for genetic mapping and marker assisted selection.
Introduction
Cacao (Theobroma cacao L.) is a cash crop grown by approxi-
mately two million producers in more than 50 countries. It is
cultivated primarily to produce cacao liquor, butter and
powder for the chocolate industry; mainly for flavor properties.1
Unfortunately, destructive and newly encountered diseases have
been the major factors that limit cacao production in nearly all
producing countries. In Brazil, cacao plantations are destroyed
by the witches’ broom disease caused by the hemibiotrophic
Basidiomycota Agaricomycete Moniliophthora perniciosa
(Aime and Phillips-Mora),2 leading to important economic
and social changes in affected areas.3 Due to the economic
importance of cacao, recent molecular studies have been
developed4 and the use of functional genomics can be a key
step to speed up the development of cacao tree cultivars with
durable resistance to such diseases that at the same time have
high bean quality for chocolate production.
Among the molecular tools available for plant–pathogen
interaction studies, large scale expression analysis, such as
arrays, has become useful for studying global gene expression
aUniversidade Estadual de Santa Cruz (UESC), Departamento deCiencias Biologicas (DCB), Centro de Biotecnologia e Genetica(CBG), Rodovia Ilheus-Itabuna, km 16, 45662-900 Ilheus-BA,Brasil. E-mail: [email protected]
bUniversidade de Caxias do Sul, Rua Francisco Getulio Vargas,1130 Bairro Petropolis 95070-560–Caxias do Sul-RS, Brasil
c Universidade Federal do Rio Grande do Sul (UFRGS),Departamento de Biologia Molecular e Biotecnologia,Centro de Biotecnologia, Avenida Bento Goncalves 9500–Predio43421, Caixa Postal 15005, 91509-900 Porto Alegre—RS, Brasil
dUniversidade Estadual de Feira de Santana (UEFS), DCBio,Laboratorio de Genetica Toxicologica, Km 3, BR 116 (norte),44031-460 Feira de Santana-BA, Brasil
e Cocoa Research Center, CEPLAC/CEPEC, 45600-970 Itabuna-BA,Brasil
f COODETEC, Cascavel, Parana, Brasilg Centre de Cooperation International en Recherche Agronomique pourle Developpement (CIRAD), UMR DAP, Avenue Agropolis TA96/03,34398 Montpellier cedex 5, France
h Brazilian Clone Collection Center, Departamento de Tecnologia,FCAV-UNESP, 14884-900 Jaboticabal-SP, Brasil
i Embrapa Mandioca e Fruticultura Tropical, Rua Embrapa, s/n1,44380-000 Cruz das Almas-BA, Brasilw Electronic supplementary information (ESI) available. See DOI:10.1039/c2mb05421cz In memoriam.
MolecularBioSystems
Dynamic Article Links
www.rsc.org/molecularbiosystems PAPER
Publ
ishe
d on
28
Febr
uary
201
2. D
ownl
oade
d by
Uni
vers
idad
e Fe
dera
l do
Rio
Gra
nde
do S
ul o
n 23
/09/
2013
14:
10:5
1.
View Article Online / Journal Homepage / Table of Contents for this issue

1508 Mol. BioSyst., 2012, 8, 1507–1519 This journal is c The Royal Society of Chemistry 2012
as well as providing a robust approach for detecting novel genes
and information about previously uncharacterized genes. Arrays
have been successfully used to study plant development,5 stress6
and defense responses,7 and have been used to study trees,8
including cacao, under some biotic and abiotic stresses.9,10 The
difficulties related to transcriptomics or other high-throughput
method analysis reside in the large amount of data generated and
in the identification of the gene networks, as well as essential genes
from these networks involved in a given physiological mechanism.
Systems biology provides a framework for assembling models
of biological systems—using computational analysis—from
systematic measurements obtained by experimental analysis such
as genomics, transcriptomics, proteomics or other high-throughput
methods.11 Since systems biology was first introduced a decade
ago, considerable progress has been made in technologies for
global experimental measurement as well as in computational
analyses of these data to map and model the studied functions.12
Another principle emerging from the systems biology research is
that not only the physical components and interactions of a
system can be evidenced, but also it can map how the informa-
tion propagates through this system in response to perturbations.
Systems biology now embraces much of the life sciences and is
used to address many research problems across humans and
diverse model species, including plants,13–15 but only few analyses
were still developed regarding plant–pathogen interaction.16–18
To better understand the patterns of gene expression and signaling
events in cacao during its infection by witches’ broom disease, a
total of 2855 non-redundant sequences from susceptible and
resistant cDNA libraries19 were used in array analysis, followed
by RT-qPCR validation of some candidate genes and systems
biology study. The results allowed the design of general schemes
of resistant and susceptible cacao-M. perniciosa interactions and
the identification of candidate genes for marker assisted selection
(MAS) and biotechnological applications.
Results
Regulation at transcript level
Using a cDNA macroarray containing 2855 genes encoding
proteins of diverse functions, changes in specific gene transcript
levels in cacao challenged with M. perniciosa were analyzed. The
results of the statistical analysis revealed that 154 and 227 genes
were significantly differentially expressed based on F-tests for
TSH1188 and Catongo, respectively (S1 and S2, ESIw). The 154and 227 significant genes accounted for 5.4% and 8% of the total
genes on the array for TSH1188 and Catongo, respectively. By
analyzing all the significantly expressed genes, different kinds of
regulatory patterns were observed in the hierarchical clustering
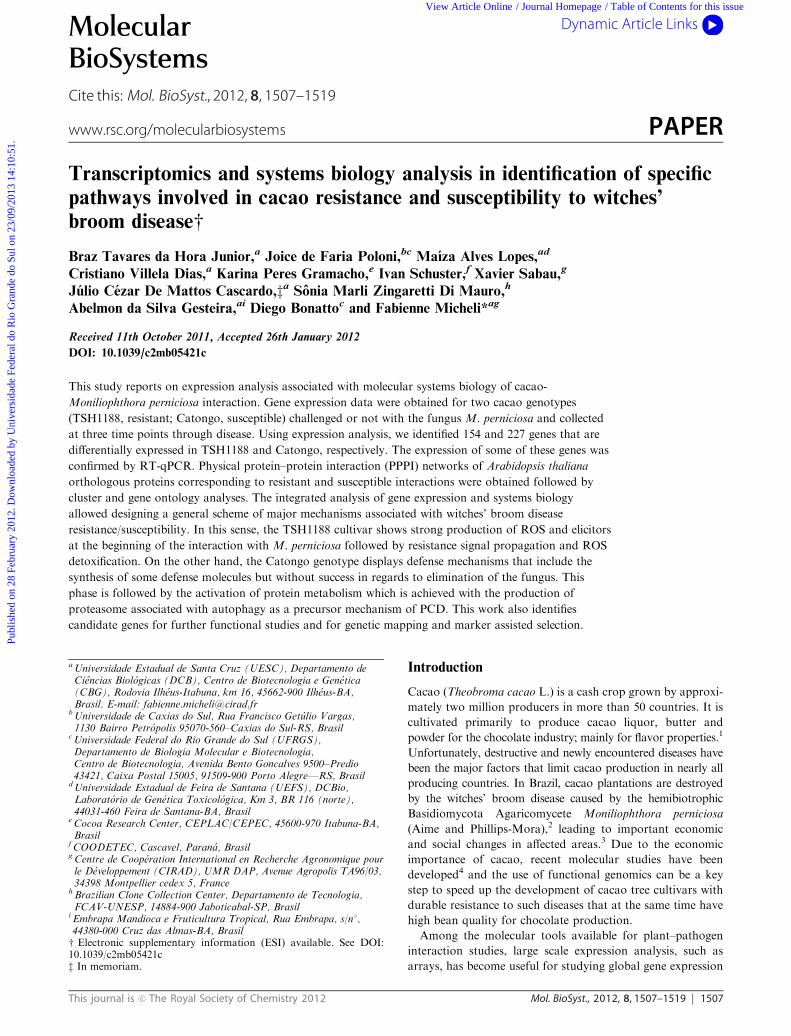
(Fig. 1A and 2A). On the TSH1188 cacao genes co-coordinately
expressed in response to theM. perniciosa infection, eight different
patterns were observed (Fig. 1D). Pattern I contains genes with
decreasing expression over time. Patterns II and VIII correspond
to genes with low expression at the early stages followed by high
expression at 30 days after infection or dai (with higher expression
in cluster VIII at 30 dai than in cluster II). Patterns III and VII
contain genes with higher expression at the early stages followed
by a repression at 30 dai (with a higher repression at 30 dai for
cluster III than for cluster VII). Pattern IV shows genes highly
expressed at the early stages followed by a constant decrease of
expression over time. Pattern V contains genes highly down-
regulated at the early stages and then showing a constant increase
of expression at 30 and 60 dai. Pattern VI represents genes with a
moderately constant expression at early stages and 30 dai, followed
by a slight increase of expression at 60 dai. Clusters I and IV are
detailed in Fig. 1B and C, respectively. Some interesting genes such
as the resistance gene candidate RGC2 and the calcineurin B-like
protein 10 (CBL10) were encountered (S 1, ESIw; Fig. 1C). On the
Catongo cacao genes co-coordinately expressed in response to
M. perniciosa infection nine different patterns were observed
(Fig. 2D). Pattern I shows genes with strong decreasing expression
until 30 dai followed by strong increasing expression at 60 dai.
Pattern II contains genes highly expressed at 60 dai. Pattern III
contains genes with decreasing expression over time. Pattern IV
represents genes highly expressed in uninfected plants (control)
and at 30 dai, and highly down-regulated at early stages and
60 dai. Inversely, pattern V shows genes highly expressed at early
stages and at 60 dai, and highly down-regulated in control and
30 dai. Pattern VI contains genes down-regulated at 30 dai, while
pattern VII contains genes highly expressed at early stages.
Pattern VIII contains genes highly down-regulated in control
plants and then with constant expression over time. Pattern IX
shows genes highly repressed in control plants and then showing
an increasing expression until 30 dai, followed by a decreasing
expression at 60 dai. Clusters II and VII, containing genes like
theMGR family or phosphatase 2C are detailed in Fig. 2B and C,
respectively. More up-regulated genes are encountered than down-
regulated ones, regardless of the genotype studied (Fig. 3A and C).
In TSH1188, among the 154 differentially expressed genes,
103 were exclusively only up-regulated and 25 down-regulated
(Fig. 3A and B). Likewise, among the 277 genes differentially
expressed in Catongo, 161 were only found up-regulated and 20
down-regulated (Fig. 3C and D). In both genotypes, the greatest
changes in transcript levels occurred at 60 dai for the up-regulated
genes (74 genes in TSH118; 128 genes in Catongo), then at the
early stages (26 genes in TSH118; 46 genes in Catongo) and finally
at 30 dai (6 genes in TSH118; 29 genes in Catongo) (Fig. 3A andC).
The higher amount of down-regulated genes was observed at the
early stages in TSH1188 (17 genes; Fig. 3B), while in Catongo, it
was found at 60 dai (37 genes; Fig. 3D). Only a few differentially
expressed genes have been observed at all stages studied (r3 genes
in common), except in the case of up-regulated Catongo genes
(17 genes in common). Thirty-two differentially expressed
sequences were common to TSH1188 and Catongo (Fig. 3E;
S1 and S2, ESIw) while 122 and 195 were exclusive from
TSH1188 and Catongo, respectively (Fig. 3E).
Gene expression by RT-qPCR
Gene expression by RT-qPCR was carried out for six genes
showing differential expression on macroarrays (S1 and S2,
ESIw, asterisks). We focused our attention on gene expression
at early stages of infection in TSH1188—which correspond to
expression of plant resistance mechanisms—and in later stages
of disease in Catongo—which correspond to the establishment
of the PCD process.19,20 The No-Hit (Fig. 4A), RGC2
(Fig. 4B), PPI (Fig. 4C) and HRGP (Fig. 4D) genes were
highly expressed at the early stages of infection in TSH1188, in
particular at 24 and 48 hai. The maximal relative intensity of
Publ
ishe
d on
28
Febr
uary
201
2. D
ownl
oade
d by
Uni
vers
idad
e Fe
dera
l do
Rio
Gra
nde
do S
ul o
n 23
/09/
2013
14:
10:5
1.
View Article Online
This journal is c The Royal Society of Chemistry 2012 Mol. BioSyst., 2012, 8, 1507–1519 1509
the expression was about 3.0 for No-Hit, RGC2 and PPI
(Fig. 4A–C) and about 1.5 for HRGP (Fig. 4D). In Catongo,
the PR10 and MRG genes were expressed mostly at 60 dai,
while the expression at the early stages and 30 dai was almost
constant and did not differ from the control expression
(Fig. 4E and F). It is interesting to note that for the PR10
gene the relative intensity of the expression at 60 dai is about
40 times higher than in the control (Fig. 4E).
TSH1188-M. perniciosa protein–protein interaction network
The analysis of the interactomic data concerning A. thaliana
orthologous protein corresponding to TSH1188-M. perniciosa
interaction allowed us to draw a physical protein–protein
interaction (PPPI) network containing 957 proteins and
14 768 connectors (Fig. 5). From 154 differentially expressed
TSH1188-M. perniciosa sequences, 135 have a corresponding
orthologous in A. thaliana and 71 were located on the PPPI
(S1, ESIw). Using gene ontology (GO) analyses, the most
representative biological processes observed in the A. thaliana
network related to the TSH1188-M. perniciosa interaction are
presented in S3 (ESIw). The PPPI network obtained for the
TSH1188-M. perniciosa interaction (Fig. 5A) could be divided into
functional sub-networks (Fig. 5B–G). The functional sub-network
corresponding to response to elicitors and signal propagation
(Fig. 5B) contains the RPM1 (disease resistance protein),
RIN4 (RPM1-interacting protein 4), PBS1 (serine/threonine
protein kinase), PBS2 (disease resistance protein), RPS2
(ribosomal protein S2) and RPS5 (NBS/LRR disease resistance
protein) known to be involved in HR in plants.21,22 These proteins
are linked to RAC1 (TIR-NBS-LRR) which is connected to
NPR1 (regulatory protein NPR1), an important regulator of
SAR.23 This sub-network also contains the FLS2 protein
(flagellin sensing receptor 2) which interacts with several
MAPK related to the WRKY genes (WRKY29, WRKY22
and WRKY33) known to play a role in the modulation of
several physiological processes such as responses to biotic and
abiotic stresses.24 RAC1 and the WRKY factors are con-
nected to the PAD4 (phytoalexin), which interacts with
CPR5 (Protein CPR5) known to be a negative regulator of
senescence.25 On the other hand, CPR5 is present in the cell
wall stability sub-network (Fig. 5E); it is linked to the trans-
cription factor ILR3 which is connected to the AT2G04400
Fig. 1 Hierarchical clustering illustrating groups of TSH1188 cacao genes co-ordinately expressed in response to M. perniciosa infection at early
stages, 30 dai and 60 dai. (A) Hierarchical clustering. Each column corresponds to a time measurement (early stages, 30 dai or 60 dai) and each row
corresponds to one gene. For each gene, the fold change of the mRNA level in the control and inoculated tissues is represented by red or green,
indicating up-regulation or down-regulation, respectively. The differentially expressed genes were classified into eight regulatory patterns (clusters),
indicated by numbers I through VIII. (B) Details of the hierarchical cluster I. (C) Details of the hierarchical cluster IV. (D) The eight different
regulatory patterns of expression. y-Axis represents standard least square means of the normalized gene expression level.Publ
ishe
d on
28
Febr
uary
201
2. D
ownl
oade
d by
Uni
vers
idad
e Fe
dera
l do
Rio
Gra
nde
do S
ul o
n 23
/09/
2013
14:
10:5
1.
View Article Online

1510 Mol. BioSyst., 2012, 8, 1507–1519 This journal is c The Royal Society of Chemistry 2012
protein (putative indole-3-glycerol phosphate synthase)
involved in the biosynthesis of phenylalanine, a precursor of
monolignols. RAC1 is also related to the subunits PBA1 and
PBE1 of proteasome known to be involved in plant defense;21
they interact with the protein AT5G58490 (cinnamoyl-CoA
reductase) involved in the biosynthesis of lignin, one of the
components implicated in the formation of a physical barrier
against pathogens.26 Other proteins promoting cell wall stability
in regard to resistance to pathogens were observed, such as
AT3G22440 (hydroxyproline-rich glycoprotein), AT3G63095
(proline-rich phosphoprotein) and AT3G29075 (glycine-rich
protein) (Fig. 5E). In the sub-network related to calcium
homeostasis (Fig. 5D), the proteins CAX3 and CAX1 (vacuolar
cation/proton exchanger 3 and 1) were encountered; they
interact with the protein kinase CIPK24 (CBL-interacting
serine/threonine-protein kinase 24) which acts in intracellular
ion homeostasis.27 CIPK24 is connected to CBL10 and CBL4
(calcineurin B-like protein 10 and 4), two calcium sensors, and
may be involved in the formation of a CLB/CIPK complex
required for ion detoxification and ion homeostasis regulated
by calcium.27 These proteins interact—via the ARA6
protein (uncharacterized protein AT3G54840.2)—with NADH
dehydrogenases (ND2, AT3G03100, ATMG01320.1 and
AT1G49140) and NADH-ubiquinone oxidorecdutase (ND1,
ND3, ND4, ND7 and ND9) (Fig. 5G; sub-network of proteins
related to the oxido-reduction stage of the cell). In this
sub-network, proteins promoting removal of H2O2 via the
ascorbate-GSH pathway28 were also encountered such as
monodehydroascorbate reductases (AT3G52880, AT3G09940
and AT3G27820), glutathione peroxidases (GPX7, GPX5) and
glutathione S-transferases (GST16, GST6, GST11, GST31 and
T28A8_90). The FLS2 present in the sub-network of proteins
related to response to elicitors and signal propagation also
interacts with GPA1 and GB1 (guanine nucleotide-binding
protein alpha-1 and beta subunits) which are both related to
autophagy (Fig. 5C). They are connected to AT1G60490
(putative phosphatidylinositol 3-kinase) and SAC6 (SAC1-
like protein) known to be involved in autophagy regulation
Fig. 2 Hierarchical clustering illustrating groups of Catongo cacao genes co-ordinately expressed in response to the M. perniciosa infection at
early stages, 30 dai and 60 dai. (A) Hierarchical clustering. Each column corresponds to a measurement time (early stages, 30 dai or 60 dai) and
each row corresponds to one gene. For each gene, the fold change of the mRNA level in control and inoculated tissues is represented by red or
green, indicating up-regulation or down-regulation, respectively. The differentially expressed genes were classified into nine regulatory patterns
(clusters), indicated by numbers I through IX. (B) Details of the hierarchical cluster II. (C) Details of the hierarchical cluster VII. (D) The nine
different regulatory patterns of expression. y-Axis represents standard least square means of the normalized gene expression level.
Publ
ishe
d on
28
Febr
uary
201
2. D
ownl
oade
d by
Uni
vers
idad
e Fe
dera
l do
Rio
Gra
nde
do S
ul o
n 23
/09/
2013
14:
10:5
1.
View Article Online

This journal is c The Royal Society of Chemistry 2012 Mol. BioSyst., 2012, 8, 1507–1519 1511
(REF 41) and formation of the autophagosome via ATG7,
AGT5, ATG3 (autophagy related protein 7, 5 and 3) and TOR
(rapamycin) proteins. The ATG8F (autophagy related
protein 8f) and AT5G19660 (subtilisin-like protein) proteins,
connected to them, were encountered; ATG8F is associated
with AT5G59420 (oxysterol-binding protein) and T7I23.13
(cathepsin B-like cysteine proteinase) both participating in
plant resistance to pathogens and programmed cell death.29
The last TSH1188-M. perniciosa sub-network corresponds to
proteins involved in the signalization of jasmonate and/or
ethylene, and contains lipoxygenases (LOX5, LOX2, AtLOX6),
AOC (allene oxide cyclase), OPR1, OPR2 and OPR3
(12-oxophytodienoate reductase) and COI1 (coronatine-
insensitive protein 1) which is known to be required for
defense processes regulated by jasmonate and elicitors.30
COI1 is connecting to the MAPK signalization pathway and
to the transcription factor ANAC (NAC domain-containing
protein 19) which plays an important role in defense
responses to stress.31 Another protein involved in the jasmo-
nate and/or ethylene signalization is the HUB1 protein
(E3 ubiquitin-protein ligase BRE1-like 1) which confers pro-
tection to necrotrophic pathogens; this protein also interacts
with RAC1 and FLS2.
Catongo-M. perniciosa protein–protein interaction network
The analysis of the interactomic data regarding A. thaliana
orthologous protein corresponding to the Catongo-M. perniciosa
interaction allowed us to draw a PPPI network containing
736 proteins and 13 084 connectors (Fig. 6). Among the
227 differentially expressed Catongo-M. perniciosa interaction
sequences, 203 have a corresponding orthologous in A. thaliana
and 89 were located on the PPPI (S2, ESIw). Using gene
ontology (GO) analyses, the most representative biological
processes observed in the A. thaliana network related to the
Catong-M. perniciosa interaction are presented in S3 (ESIw).The PPPI network obtained for the Catongo-M. perniciosa
interaction (Fig. 6A) could be divided into several functional
sub-networks (Fig. 6B–I). The main sub-network concerns the
synthesis and degradation of proteins (Fig. 6I). A great
number of ribosomal proteins were encountered (RPS3C,
RPL31C, RPL11B, RPN3a, RPL3A, AT3G13120 and
ATCG01310.1) which interact with a large variety of other
proteins. This sub-network also contains ubiquitins and proteins
involved in proteasomes; the proteasome PAC1 interacts with
AT3G53970 (proteasome inhibitor-related), PAF1 (proteasome
subunit alpha type-1-A), CNS (COP9 signalosome complex
subunit 1), T8F5.13 (ubiquitin), MBP1 (26S proteasome non-
ATPase regulatory subunit 4) and ahus5 (ubiquitin carrier
protein). The latter is connected to UBC27 (ubiquitin carrier
protein E2 27), UBC1 and UBC2 (ubiquitin-conjugating
enzyme E1 and E2) known to be related to plant defense
responses and protein turn-over.32 On the other hand, UBC27
is connected to scl30a (similar to serine/arginine rich protein);
a protein with an important function in constitutive and
alternative splicing33 and which is associated in this sub-network
to several cyclophilins (CYP63, CYP59, CYP57, CYP21-4).
Cyclophilins are involved in protein conformation modifica-
tions, activation of protein effectors and cellular transport.34
The sub-network presented in Fig. 6E corresponds to protein
related to stress (heat shock proteins—HSP); the proteins
F3F8.16 (14-3-3 protein) and GRF8 (14-3-3-like protein
GF14 kappa) are central in this network. They are connected
to (i) RPPL1 (putative disease resistance protein); (ii) HSC70
(HSP) which is the start point of connections with other HSP
(hsp70, HSC70-7, HSP17.4) or related proteins (AT2G17880,
putative DnaJ protein; HSFA1A, heat stress transcription
factor A-1a); (iii) HSP81-2 which interacts with proteins related
to calcium homeostase (Fig. 6D) such as AT3G43810.1
(calmodulin 7), CIPK24 (CBL-interaction serine/threonine
protein kinase 24), CIPK16 (CBL-interacting protein kinase 16),
CBL3 and CBL2 (calcineurin B-libe protein 3 and 2),
CAM2 (calmodulin 2), ACP1 (NaCl-inducible Ca2+-binding
protein-like) and CML5 (calmodulin-like protein 5); and (iv)
tubulin, actin and prefoldin (TUBA6, ACT7 and AT5G23290,
respectively). The ahus5 protein also interact with DL3250C
(elicitor like protein) which is related to proteins involved
in autophagy such as TOR, ATG7, AT1G60490 (putative
phosphatidylinositol 3-kinase) and SAC6 (Fig. 6C). In
the sub-network corresponding to protein related to auxin
Fig. 3 Venn diagrams showing the distribution of the differentially
expressed genes of cacao challenged with M. perniciosa. (A–D)
Between the three measurement times after inoculation (early stages,
30 dai and 60 dai). (A and B) Differentially expressed genes from
TSH1188. (C and D) Differentially expressed genes from Catongo.
(A and C) Up-regulated genes. (B and D) Down-regulated genes.
(E) Between the two cacao genotypes.
Publ
ishe
d on
28
Febr
uary
201
2. D
ownl
oade
d by
Uni
vers
idad
e Fe
dera
l do
Rio
Gra
nde
do S
ul o
n 23
/09/
2013
14:
10:5
1.
View Article Online

1512 Mol. BioSyst., 2012, 8, 1507–1519 This journal is c The Royal Society of Chemistry 2012
Fig. 4 Analysis of 6 differentially expressed genes. (A) No-Hit gene in TSH1188. (B) RGC2 in TSH1188. (C) PPI in TSH1188. (D) HRGP family
protein in TSH1188. (E) PR-10 in Catongo. (F) MRG family protein in Catongo. Up and down graphics correspond to macroarrays and RT-qPCR
experiments, respectively. Arrows indicate the main contribution to the gene expression at the early stage in TSH1188. nd: non determined.
Publ
ishe
d on
28
Febr
uary
201
2. D
ownl
oade
d by
Uni
vers
idad
e Fe
dera
l do
Rio
Gra
nde
do S
ul o
n 23
/09/
2013
14:
10:5
1.
View Article Online

This journal is c The Royal Society of Chemistry 2012 Mol. BioSyst., 2012, 8, 1507–1519 1513
signalization (Fig. 6G), auxin response proteins (IAA1, IAA3,
IAA8, ARF7), auxin transporter (AUX1), auxin-resistance
protein (AXR6, AXR3) and the protein TIR1 (transport
inhibitor response 1) were found. Connected to TIR1 and
AXR6, the proteins cul3a and cul3b (cullin 3a and b) and the
RBX1A (RING-box protein 1a) which form a complex
SCFTIR1 which, in response to auxin, acts ubiquitinating
the proteins AUX/IAA for degradation by proteasome,35
were also found. IAA1 is also connected to homeobox proteins
such as BP (homeobox protein knotted-1 like 1), BLH1
and BLH2 (BEL1-like homeodomain protein 1 and 2)
which participate in meristem development and are directly
related to auxin signalization (Fig. 6B). Related to BP, we
found the histidines CKI1, AHP3 and MUO10.6 and the
transcription factor TCP10. The IAA3 is also associated with
CHI2 (chalcone-flavone isomerase 2) involved in the phenyl-
propanoid pathway (Fig. 6F). CHI2 is related to several other
proteins involved in phenolic components such as tt5 (mutant
protein of chalcone isomerase), DFR (dihydroflavonol-4-
reductase), CYP75B1 (flavonoid 3’hydroxylase), LDOX
(leucoanthocyanidin dioxygenase), F3H (mutant protein of
flavanone-3-hydroxylase) and FS (flavonol synthase/flavanone
3-hydroxylase). The protein CHI-B (endochitinase B) known
to be related to defense against pathogens interacts with
tt5 and COI1, which is related to AXR2, AXR6 and RBX1A
(auxin signalization) and to LDOX (phenolic pathway)
(Fig. 6H).
Discussion
The expression analysis of TSH1188- and Catongo-M. perniciosa
interaction genes associated with a systems biology approach
allowed the establishment of a general scheme of biological
processes for each interaction through a time course (Fig. 7 and 8).
In TSH1188, the expression of genes involved in resistance
(from elicitors to signal propagation) from early stages to
60 dai (Fig. 7), was observed. Genes such as the resistance gene
candidate RGC2, the calcineurin B-like protein 10 (CBL10)
and the HRGP family protein were up-regulated in the first
72 hai (Fig. 1, cluster IV; Fig. 4B andD). HRGPs are important
plant cell wall structural components, involved in response to
pathogen attack.36 In cacao, HRGP may be involved in this
new cell layer formation, as a possible defense mechanism
against M. perniciosa. The RGC2 gene was induced at the
beginning of the resistant interaction (Fig. 4B) and only in this
interaction (S1 and S2, ESIw). The up-regulation of CBL10 in
TSH1188 (Fig. 1, cluster IV; Fig. 5D) is an event which may be
considered for a better understanding of the signaling pathways
of cacao resistance to witches’ broom disease. CBL is a small
protein containing multiple motifs for Ca2+ binding, and is
involved in protein kinase activity regulation.37 In Arabidopsis
thaliana, genes for CBL are differently regulated by stress, and
are involved in signaling mediated by calcium during the
response to biotic stresses.38 In two works developed in our
laboratories,20,39 it has been shown that Ca2+ may play an
important role in cacao susceptibility as well as in resistance to
M. perniciosa. Susceptible infected plants contain more calcium
oxalate crystals (COC) in the stem cortex than resistant ones.20
In the resistant plants, instead of COC, a high level of soluble
oxalic acid was found; this acts as a substrate to the oxalate
enzyme, which causes the release of ROS into the cells, possibly
blocking early infection.39 Systems biology confirmed that ROS
production and Ca2+ signalization are networks involved in
the early stages of the TSH1188-M. perniciosa interaction
(Fig. 5G and D; Fig. 7). Enzymes involved in ROS detoxification
like monodehydroascorbate reductases (e.g. AT3G52880) and
glutathione S-transferases (e.g. AT1G65820) were expressed
mainly at 60 dai (S1, ESIw; Fig. 1D, clusters VI and VII,
respectively; Fig. 7). At 60 dai, networks related to jasmonate
synthesis, cell wall stability and autophagy were observed
(Fig. 5C, E and F; Fig. 7); these three networks are interrelated
via RAC1, FLS2, and COI1.
In Catongo, we observed genes related to plant resistance
up-regulated at the early stage, such as OTU-like cysteine protease
and pathogenesis-related (PR) proteins (Fig. 2; cluster VII; S2,
ESIw; Fig. 8). The up-regulation in Catongo of cysteine
proteases—members of the proteolytic machinery involved
in plant defense response to the attack of pathogens40—and
PR proteins, such as endochitinase and thaumatin, suggest a local
defense gene induction in response to fungal invasion. Other
genes involved in signal transduction were also differentially
expressed on the first steps of the Catongo infection: protein
kinase, CBL-interacting protein kinase 16 and phosphatase
Fig. 5 Interactome network (physical protein–protein interaction
network) of the proteins involved in TSH1188-M. perniciosa inter-
action. (A) General network. Insets (in colour) represent subgraphs
detailed in B to G. (B) Subgraph (in purple) corresponding to proteins
related to response to elicitors and signal propagation. (C) Subgraph
(in green) corresponding to proteins related to autophagy. (D) Subgraph
(in yellow) corresponding to proteins related to calcium homeostasis.
(E) Subgraph (in blue) corresponding to proteins related to cell wall
stability. (F) Subgraph (in orange) corresponding to proteins related
to jasmonate/ethylene signalization pathway. (G) Subgraph (in red)
corresponding to proteins related to oxido-reduction stage of the cell.
Black and white circles indicate the proteins involved in the network
corresponding to the biological process; black circles indicate
proteins of the network which are also differentially expressed in the
macroarray.
Publ
ishe
d on
28
Febr
uary
201
2. D
ownl
oade
d by
Uni
vers
idad
e Fe
dera
l do
Rio
Gra
nde
do S
ul o
n 23
/09/
2013
14:
10:5
1.
View Article Online

1514 Mol. BioSyst., 2012, 8, 1507–1519 This journal is c The Royal Society of Chemistry 2012
type 2C (Fig. 2C, cluster VII). In response to biotic or abiotic
stresses, phosphatase 2C participates in the negative regula-
tion of MAP kinases.41 In Arabidopsis, analysis of plant
mutants for phosphatase 2C (APC2C1) demonstrated a key
role for this gene in regulating stress hormone levels, defense
responses, and MAPK activities, providing evidence that
AP2C1 activity might control the plant response to Botrytis
cinerea.42 Other proteins in response to stress—such as HSP,
molecular chaperones required to maintain and restore the
homeostasis during stress conditions43—are expressed in the
early stage but also at 30 and 60 dai (S2, ESIw; Fig. 6E and
Fig. 8). A large amount of genes involved in protein synthesis
and conformation and ribosomal proteins is expressed from
early stage to 60 dai (Fig. 8). The ribosomal proteins are
divided into two groups, one with decreasing expression from
early stage to 30 dai and one with increasing expression from
30 dai to 60 dai. The expression of the latter group of genes is
concomitant with the increase of the proteasome gene expres-
sion and autophagy (at 60 dai; Fig. 8). The synthesis of
proteasome and the occurrence of autophagy at 60 dai by
the systems biology analysis may be related to the beginning of
the PCD process observed in another study.20 Interestingly,
some other genes related to resistance were up-regulated at
60 dai in Catongo like a pathogenesis related protein PR10 as
obtained by macroarray and RT-qPCR (Fig. 2B; cluster II and
Fig. 5E). Previously, we showed that this protein has ribonuclease
and antifungal activity in M. perniciosa and Saccharomyces
cerevisiae.44 From the early stages to 60 dai, we observed an
increase of response to auxin genes associated with meristem
development and the flavonoides biosynthesis pathway (Fig. 8).
Fig. 6 Interactome network (physical protein–protein interaction network) of the proteins involved in Catongo-Moniliophthora perniciosa
interaction. (A) General network. Insets (in colour) represent subgraphs detailed in B to I. (B) Subgraph (in orange) corresponding to proteins
related to meristematic development. (C) Subgraph (in blue) corresponding to proteins related to autophagy. (D) Subgraph (in red) corresponding
to proteins related to calcium signalization. (E) Subgraph (in yellow) corresponding to proteins related to stress (Heat Shock Proteins).
(F) Subgraph (in black) corresponding to proteins related to flavonoides synthesis. (G) Subgraph (in green) corresponding to proteins related to auxin
signalization. (H) Subgraph (in light blue) corresponding to proteins related to resistance and defense against pathogens. (I) Subgraph (in purple)
corresponding to proteins related to synthesis and degradation of proteins (ribosomal proteins, proteasome and ubiquitins). Black and white
circles indicate the proteins involved in network corresponding to the biological process; black circles indicate proteins of the network which are
also differentially expressed in the macroarray.
Fig. 7 General scheme of biological processes involved in TSH1188-
M. perniciosa interaction. dai: day after inoculation; ROS: reactive
oxygen species.
Fig. 8 General scheme of biological processes involved in Catongo-
M. perniciosa interaction. dai: day after inoculation.
Publ
ishe
d on
28
Febr
uary
201
2. D
ownl
oade
d by
Uni
vers
idad
e Fe
dera
l do
Rio
Gra
nde
do S
ul o
n 23
/09/
2013
14:
10:5
1.
View Article Online
This journal is c The Royal Society of Chemistry 2012 Mol. BioSyst., 2012, 8, 1507–1519 1515
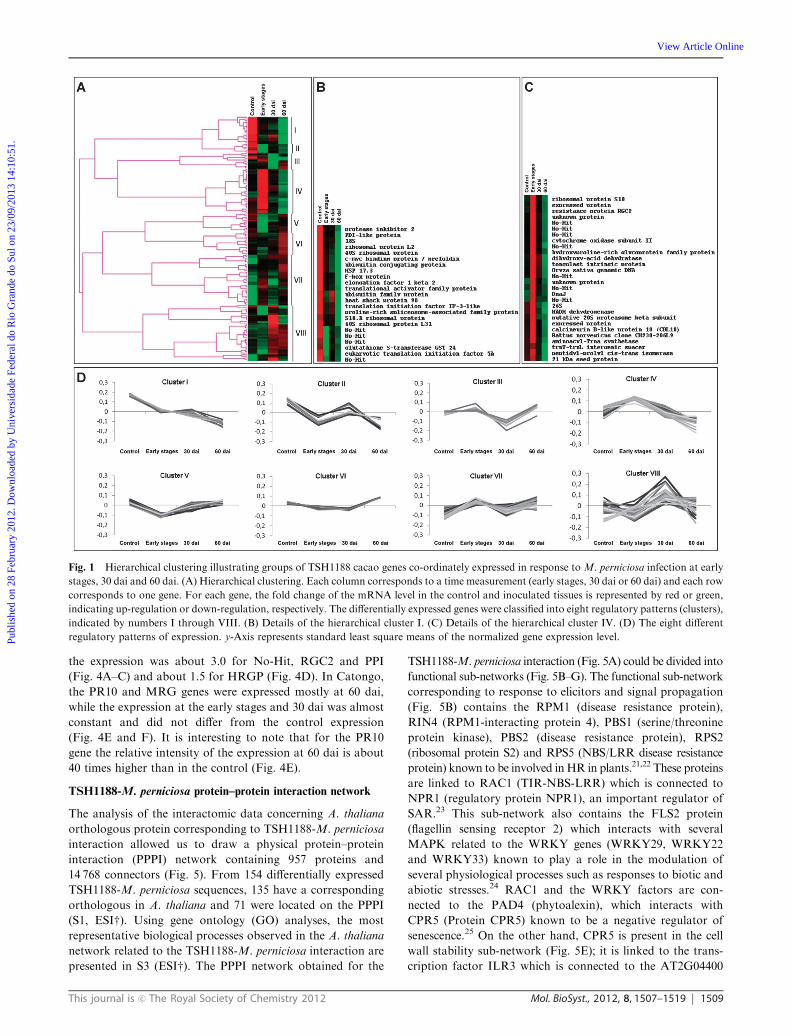
In Catongo, the symptoms of the disease became visible at 30 dai:
the apical meristem region presented hypertrophy and loss of
apical dominance, producing the characteristic green broom.20,45
At this stage, genes that play key roles in the early development
of shoot, such as beta-expansions and the TCP family transcrip-
tion factor, presented changes at their expression level (S2, ESIw;Fig. 2, cluster V). Beta-expansions are involved in the cell wall
matrix modification during plant growth and development and
allowed extension of cells and organs.46 The TCP family trans-
cription factors contain genes presenting the TCP domain, a
plant-specific DNA binding domain found in proteins from
diverse species, including the cycloidea (cyc) and Teosinte
Branched1 (TB1) gene products, and the PCF1 and PCF2
(DNA binding) proteins. Flavonoids were expressed mainly
at the early stage and at 60 dai as observed for a flavonoid
30-hydroxylase gene involved in the phenylpropanoid pathway
(Fig. 2, cluster V; S2, ESIw; Fig. 8). The phenylpropanoid
pathway results in the synthesis of thousands of compounds,
including flavonoids, anthocyanidins and tannins, acting as
phytoalexins,47 suggesting that the flavonoid 30-hydroxylase gene
may be involved in phytoalexin synthesis during disease progress.
Increase of secondary compounds such as tannins and flavonoids
in infected Catongo plants were previously observed in the
biochemical study of the cacao-M. perniciosa interaction.48
Material and methods
Plant material and fungus strains
Catongo (seedlings; susceptible to M. perniciosa) and TSH1188
plants (clones obtained through vegetative propagation; resistant
to M. perniciosa) Theobroma cacao L. varieties were grown in
sterile substrate in the greenhouse at CEPEC/CEPLAC (Cocoa
Research Center/Comissao Executiva do Plano da Lavoura
Cacaueira, Ilheus, Bahia, Brazil) under natural light and 90%
relative humidity as described.49 Apical meristems of one-hundred
and fifty four 4-week old-plantlets were inoculated by the droplet
method50 using a 2 � 105 ml�1 basidiospore suspension from the
M. perniciosa isolate Cp1441 CEPEC/CEPLAC strain. After
inoculation, plantlets were kept during 24 h at 25 1C � 2 1C in
a water-saturated atmosphere to allow M. perniciosa spore
germination, penetration and consequently infection.50 A spore
viability test (evaluation of spore germination) was carried out in
the humid chamber (25 1C) 24 h after inoculation (89% of
germinated spores) and compared to spore viability obtained
before inoculation (90%). Fifty-six control plantlets were inoculated
with sterile water and submitted to the same growing conditions
as the inoculated ones. Expression of susceptibility was estimated
4 weeks after inoculation by detection of the Catongo plants with
disease symptoms. Disease development was monitored on the
growing plants for a period of 90 days. Inoculated and non-
inoculated apical meristems from Catongo and TSH1188 were
harvested at 24, 48 and 72 hai, and 30 and 60 dai. Infected and
non-infected resistant and susceptible apical meristems were
harvested, frozen in liquid nitrogen and stored at �80 1C. Five
different meristems from different plants were pooled for each
harvesting time. Pooling samples before RNA extraction has the
advantage of reducing the variation caused by biological replica-
tion and sample handling.8 For the macroarray experiments,
three harvesting times were used: (i) a pool of the three earlier
stages (24, 48 and 72 hai), called early stages; (ii) 30 dai sample
corresponding to the initial formation of the green broom; and
(iii) 60 dai sample corresponding to the onset of dry broom
formation.20,45 The early stages correspond to a pool of trans-
cripts generated at 24, 48 and 72 hai, and physiologically
correspond to the steps preceding the green broom formation in
the susceptible interaction. The use of the early stage pool was
coherent and relevant with previous histological observations of
both susceptible and resistant cacao-M. perniciosa interactions:
basidiospore germination occurred 6 hai and well developed
germinative tubes were observed 12 hai.45,51,52 According to Silva
and Matsuoka,53 up until 72 h, no M. perniciosa hyphae were
observed in cacao tissues. After this initial interaction phase
(asymptomatic phase), differences were observed in fungal
development according to the plant genotype: susceptible cacao
showed a larger tissue area colonized by the fungus than the
resistant one. For these reasons, the early stage may be considered
as the initial stage of the interaction (asymptomatic phase essential
to adhesion and penetration of the fungus into the plant)
preceding the colonization phase. For the RT-qPCR experi-
ments, the 24, 48 and 72 hai samples were analyzed separately.
Macroarray procedure
A total of 2855 cDNAs were selected from TSH1188 (1675 clones)
and Catongo (1180 clones) libraries containing genes from the
different stages of witches’ broom disease development.19 The com-
plete 2855 inserts were amplified from the plasmid clones by PCR
in a final volume of 50 ml containing: 100 ng of DNA, 0.2 mM of
each primer (pDNR-F 5’-ATCAGTCGACGGTACCGGAC-30;
pDNR-R 50-ACAGCTATGACCATGTTCAC-30), 1X buffer,
0.4 mM dNTPs, 1 mM MgCl2, and 2 U Taq DNA polymerase.
A touchdown PCR was made under the following conditions:
5 min at 95 1C, followed by 10 cycles of 40 s at 94 1C, 45 s at
65 1C (decreasing of 0.2 1C per cycle), 1 min 20 s at 72 1C,
followed by 30 cycles of 40 s at 94 1C, 45 s at 62 1C, 1 min 20 s at
72 1C, and a final extension of 7 min at 72 1C done in an
Mastercycler gradient (Eppendorf). Quality of PCR products
was checked on 1% agarose gel stained with ethidium bromide.
After precipitation with 1 volume of isopropanol, concentration
of PCR products was obtained using the NanoDrop (Thermo
Scientific). Products with a concentration less than 200 ng ml�1
were re-amplified. PCR products were mixed in equal volume
with dimethyl sulfoxide in 384-well microtitre plates and proceeded
on to array production. Microtitre plates were replicated onto
Raybond-N+ membranes (Amersham Pharmacia Biotech)
using a Q-bot automated workstation (Genetix) in 5 � 5 array
configuration (with one blank spot in each 5 � 5 spot square).
Moreover, six blank 5 � 5 spot squares were applied on the
membranes and used as negative hybridization controls. These
blank spots were also used to determine the local background.
Membranes were treated for 5 min with denaturing buffer
(1.5 M NaCl, 0.5 M NaOH) and 10 min with neutralizing
buffer (1.5 M NaCl, 1 M Tris) then DNA was cross-linked to
the membrane at 1600 J cm�2 using the Ultraviolet Crosslinker
(CL1000, UVP). Two replicates for each clone were spotted on
each membrane; 16 identical membranes were obtained for each
cacao library and the same membrane was used for a given
treatment to avoid variation due to membrane manufacture.
Publ
ishe
d on
28
Febr
uary
201
2. D
ownl
oade
d by
Uni
vers
idad
e Fe
dera
l do
Rio
Gra
nde
do S
ul o
n 23
/09/
2013
14:
10:5
1.
View Article Online
1516 Mol. BioSyst., 2012, 8, 1507–1519 This journal is c The Royal Society of Chemistry 2012
Total RNA extraction and cDNA synthesis
Total RNAwas extracted from frozen tissues as described in ref. 49
with modifications,54 and cleaned using the RNeasy Plant Mini kit
as described by the manufacturer (Qiagen). The RNA was treated
with DNase according to the manufacturer (Fermentas), and
then separated on 1% DEPC-treated agarose gel and stained
with ethidium bromide to confirm RNA integrity and the
estimated RNA concentration. Since gene profiling requires a
large amount of RNA, global RNA amplification was obtained
as described.55 First strand cDNAs were reverse transcribed from
mRNA using 200 ng of total RNA, 0.1875 mg ml�1 of primer
dT(15)-T7 (50-AAACGACGGCCAGTGAATTGTAATACGAC-
TCACTATAGGCGCT(15)-30) and 2 U of RNase Out
(Invitrogen). The reaction was incubated at 70 1C for 3 min, and
then adjusted to 20 ml using 1X first strand buffer, 0.1875 mg ml�1 ofprimer TS (50-AAGCAGTGGTAACAACGCAGAGTACGC-
GGG-30), 4 mM dNTPs and 200 U of RevertAidt M-MuLV
Reverse Transcriptase (Fermentas). The reaction was incubated
at 42 1C for 1 h 30 min. Second strand cDNAwas obtained using
1X of Advantage PCR Buffer, 0.8 M dNTPs, 1 U RNase H and
3 ml of Advantage cDNA Polymerase Mix (Clontech) in a final
volume of 200 ml. The reaction was incubated 5 min at 37 1C to
degrade mRNA, 2 min at 94 1C, 1 min at 65 1C and 30 min at
75 1C. cDNA was purified by adding 0.1 mg linear acrylamide
(Ambion) and phenol-chloroform-isoamyl alcohol (25 : 24 : 1)
to the reaction and transferring it on Phase Lock Gel tubes
(Eppendorf). After centrifugation for 5 min at 13000 g, the
supernatant was precipitated by addition of 70 ml of ammonium
acetate 7.5 M and 1 ml of absolute ethanol. After washing with
800 ml of absolute ethanol, the pellet was resuspended on 30 ml ofDEPC water. The in vitro transcription was carried out using the
RiboMAXLarge Scale RNAProduction System-T7 kit according
to the manufacturer’s instructions (Promega). The reaction
mixture containing 1X T7 transcription buffer, 5 mM of each
rNTP, 1 U of RNase OUT (Invitrogen), 24.5 ml of purified
cDNA and 5 ml of T7 enzyme mix was incubated 4 h at 37 1C.
cRNA was purified by adding 500 ml of Trizol (Invitrogen) and100 ml of chloroform. The reaction was homogenized for 3 min,
centrifuged at 6708 g for 15 min, and the supernatant submitted
to isopropanol precipitation. The pellet was resuspended in 20 mlof DEPC water. For the final cDNA synthesis from cRNA, 8 mlof cRNA and 2 mg ml�1 of random hexamer primer (dN6) were
incubated at 70 1C for 3 min. After incubation, the following
reagents were added: 1X first strand buffer, 4 mM dNTPs,
2 mg ml�1 of dT(15)-T7 primer, 2 U RNase OUT (Invitrogen)
and 200 U of RevertAidt M-MuLV Reverse Transcriptase
(Fermentas) in a final volume of 40 ml. The reaction was
incubated at 42 1C for 1 h 30 min. cDNA quantification was
carried out on theGeneQuant Pro spectrophotometer (Amersham).
Concentrations of the cDNA from different plant samples
were comprised between 1.1 and 1.4 mg ml�1.
Hybridization conditions
The cDNA arrayed nylon membranes were hybridized with the
cDNA probes labeled according to the manufacturer’s instruction
(AlkPhos DirectTM labelling kit, Amersham Pharmacia Biotech)
and following the procedure as described.7,56 Hybridization
signals were detected using CDP-star chemiluminescence
(Amersham Pharmacia Biotech). The arrays were wrapped
in plastic wrap and exposed to ECL Hyperfilmt (Amersham
Biosciences) for 1 h 30 min. The target signal intensities were
scanned on a Kodak EDAS 290 imaging system. Three hybridi-
zations for each probe (experimental replicates) were used.
Data management and statistical analyses
Quantification of signal intensity representing hybridized
cDNA was performed using the BZScan program.57 Each
spot was first defined by an automatic grid positioning over
the array image, and then a manual checking and correction of
positioning for each spot were performed. The local back-
ground was determined using the six blank 5 � 5 spot squares
and the blank spot present in each 5 � 5 spot square. Intensity
values were calculated by the Quant Fit Calculated algorithm
which: (i) automatically subtracts the local background for
each spot; and (ii) determines qualitatively the non-confident
spots (quality metric, QM). Spots considered unsuitable for
accurate quantification because of artefacts were flagged and
excluded from further analysis. The intensity data were trans-
ferred into Microsoft Excel (Microsoft, Redmond, WA) files
for further analysis. For the raw data, a nonparametric,
intensity-dependent normalization method based on global
identification of self-consistent set (SCS) in one-colour macro-
array membrane was used to reduce the background without
affecting the signal measurement. The SCS was determined
after the genes passed through 4 successive filters as described.58
The filters are based on the absolute difference in rank position of
a gene’s contribution to the total expression on a single array
between arrays representing time points for each cacao-M.
perniciosa interaction condition. The SCS (S5, ESIw) representsall the genes whose expression is constant regardless of the
inoculation condition (with or without M. perniciosa infection),
the disease time course (early stages, 30 dai, 60 dai), or the
genotype (TSH1188 or Catongo) used. Based on the SCS values,
the expression rate for each gene was calculated (as a ratio of gene
value/average of SCS gene values), converted to the log2 base, and
statistically analyzed. The genes were determined as differentially
expressed if the fold change was higher than 2 or lower than �2,and if the difference of expression was statistically significant by
analysis of variance (ANOVA; P o 0.05) using the Microsoft
Office Excel software. Results were obtained by comparing
normalized experimental versus control data obtained from three
independent experimental replicates (S1 and S2, ESIw). In parallel,in order to identify temporal patterns of expression within the
M. perniciosa-responsive transcripts, we subjected the filtered,
normalized macroarray data points to CLUSTER package
analysis59 which classifies the data into groups based on
temporal expression patterns (without comparison with the
control). Fold changes were supplied to complete the hierarchical
clustering algorithm and graphic results of clustering were
visualized by the TreeView program (Fig. 1 and 2).
Reverse transcription quantitative PCR analysis
For reverse transcription quantitative PCR (RT-qPCR), the
cDNA was obtained by reverse transcription from total
RNA using 0.5 mg ml�1 of an oligo(dT)18 primer and the
RevertAidt M-MuLV Reverse Transcriptase as described by
Publ
ishe
d on
28
Febr
uary
201
2. D
ownl
oade
d by
Uni
vers
idad
e Fe
dera
l do
Rio
Gra
nde
do S
ul o
n 23
/09/
2013
14:
10:5
1.
View Article Online

This journal is c The Royal Society of Chemistry 2012 Mol. BioSyst., 2012, 8, 1507–1519 1517
the manufacturer (Fermentas). RT-qPCR analyses were used to
follow the expression pattern of a selected number of genes at
early stages of infection in TSH1188 and in later stages of disease
in Catongo. Six genes showing differential expression patterns on
macroarrays were analyzed by RT-qPCR: (i) in TSH1188,
resistance gene candidate 2 (RGC2), hydroxyproline-rich glyco-
protein family protein (HRGP), peptidyl-prolyl cis–trans isomerase
(PPI) and No-Hit genes; (ii) in Catongo, pathogenesis related
protein 10 and MRG family protein genes (S1 and S3, ESIw,asterisks). A b-tubulin gene was used as reference gene for the
RT-qPCR experiment. Specific primers were designed for each
gene (S6, ESIw). The RT-qPCR analysis was made using
SYBRGreens (Invitrogen) for fluorescence detection during
amplification. Assays were performed on the ABI PRISM
7500 Sequence Detection System (SDS) coupled to an ABI
PRISM 7500 SDS software (Applied Biosystems) using standard
settings. The 20 ml RT-PCR reaction consisted of SYBR Green
1X (Applied Biosciences), PCR buffer 1X, 0.1 mM dNTPs,
1.5 mM MgCl2, Rox 0.0625X (Invitrogen), 0.2 pmol of each
primer, 0.5 U of Taq Platinum (Invitrogen) and 100 ng of single
stranded cDNA. The thermal cycling conditions were 94 1C for
10 min, followed by 45 cycles of 94 1C for 15 s and 60 1C for 45 s.
A dissociation analysis was conducted after each amplification
in order to investigate primer, dimer and hairpin formation.
Melting temperature of the fragments was determined according
to the manufacturer’s protocol (Applied Biosystems). No-template
reactions were used as negative controls. The results obtained with
the Sequence Detection Software (Applied Biosystems) were
transferred to Microsoft Excel for further analysis. Raw expres-
sion levels were calculated from the average of three experimental
repetitions of ddCT (RQ) values. Non-inoculated plants (control)
were used as a calibrator for both varieties; for this reason, the
relative expression value of the control is always 1.0 (Fig. 4).
Systems biology analysis
In order to have information regarding physical protein–protein
interactions (PPPI) from the transcriptomics data from Theobroma
cacao, orthologous sequences of Arabidopsis thaliana were
used. For this purpose, A. thaliana proteins were obtained
by performing best-reciprocal BLASTP hits60 from the in silico
translation of T. cacao nucleotide sequences (S1 and S3, ESIw)using the BLASTX tool (http://blast.ncbi.nlm.nih.gov/Blast.cgi).
To obtain data regarding genetic and biochemical processes in
plant–pathogen interactions, we performed literature data
mining using the following biological literature databases:
(i) PubMed (http://www.ncbi.nlm.nih.gov/pubmed/), (ii) iHop
(http://www.ihop-net.org/UniPub/iHOP/), and (iii) The
Arabidopsis Information Resource (TAIR; http://www.
arabidopsis.org/). All literature data mining engines were used
with their default parameters. The data mining screening and PPPI
network design (interactome network) associated with pathogen
response and defense process was performed using the Cytoscape
software, version 2.5.0.61 These data were downloaded from the
STRING 8.3 (http://string.embl.de/) database. The interactome
networks obtained from this first screening were analyzed with
the Molecular Complex Detection (MCODE) software,62 a
Cytoscape plugin available at http://www.cytoscape.org/
plugins2.php in order to evaluate potential subgraphs that
were used further for network expansion. Gene ontology (GO)
clustering analysis was performed using the Biological Network
Gene Ontology (BiNGO)63 software, a Cytoscape plugin available
at http://chianti.ucsd.edu/cyto_web/plugins/index.php. The degree
of functional enrichment for a given cluster and category was
quantitatively assessed (p value) by hypergeometric distribution64
and a multiple test correction was applied using the false
discovery rate (FDR)65 algorithm, fully implemented in the BiNGO
software. Overrepresented biological process categories were
generated after FDR correction, with a significance level of 0.05.
Conclusion
The present expression analysis (macroarray validated with
RT-qPCR) combined with systems biology study allowed us
to design a general scheme of the resistant and susceptible
cacao-M. perniciosa interaction. We observed that TSH1188
shows strong production of ROS and elicitors at the beginning
of the interaction with M. perniciosa (from early stages to
30 dai) followed by resistance signal propagation and ROS
detoxification (at 30 and 60 dai). After the activation of
an aggressive early defense response, the plant activates
mechanisms to maintain ion homeostasis and to restructure
the cell keeping maximum viability of plant tissues (60 dai). In
Catongo, defense mechanisms include synthesis of phenolic
compounds, and the presence of cyclophilin and endochitinase
(early stage) but without success in regards to elimination of
the fungus. This phase is followed by the activation of protein
metabolism which is achieved with the production of proteasome
associated with autophagy (60 dai) as a precursor mechanism
of PCD. In parallel, the plant initiates a meristem differentia-
tion via auxins leading to broom formation (30 to 60 dai). This
work also provides a number of candidate genes valuable for
further functional studies of the cacao-M. perniciosa inter-
action. We detected some up-regulated genes in resistant
interaction cacao-M. perniciosa in the early stages such as
RGC2, CBL10 and HRGP which represent good candidates
for functional studies and as source of polymorphisms for
future experiments in genetic mapping and marker assisted
selection. Candidate genes will be placed on the cacao genome66
(http://cocoagendb.cirad.fr/gbrowse/cgi-bin/gbrowse/theobroma/)
and possibly co-localized with known QTLs for witches’
broom resistance.67,68 The differentially expressed genes identified
in this study also serve as the starting point for developing
antifungal strategies or biotechnological approaches as already
developed by other research teams.69 A good candidate for
over-expression in Theobroma cacao may be the PR-10 which
presents antifungal activity against M. perniciosa. In conclu-
sion, the analysis of large scale gene expression can be
considered as a prerequisite for both functional studies and
marker assisted selection, providing important results for a
better understanding of the cacao-M. perniciosa interaction.
Abbreviations and glossary terms
dai day after inoculation
EST expressed sequence tag
hai hour after inoculation
HR hypersensitive resistance
HRGP hydroxyproline rich glycoprotein
Publ
ishe
d on
28
Febr
uary
201
2. D
ownl
oade
d by
Uni
vers
idad
e Fe
dera
l do
Rio
Gra
nde
do S
ul o
n 23
/09/
2013
14:
10:5
1.
View Article Online
1518 Mol. BioSyst., 2012, 8, 1507–1519 This journal is c The Royal Society of Chemistry 2012
HSP heat shock protein
PR10 pathogenesis related protein 10
PCD programmed cell death
PPI peptidyl-prolyl cis–trans isomerase
PPPI physical protein–protein interaction
RGC2 resistance gene candidate 2
SAR systemic acquired resistance
Competing interests
The authors declare that they have no competing interests.
Authors’ contributions
BTHJ, XS, SMZM and ASG developed the macroarrays.
MAL and CVD obtained the RT-qPCR results. KPG was
responsible for theM. perniciosa collection and plant production
and inoculation. IS helped with the statistical analysis of
macroarrays. JFP and DB were responsible for the systems
biology analysis. JCMC contributed for the funding of the
project. BTHJ, JFP, DB and FM conducted the analysis and
interpreted the results. FM conceived the project and experiments,
obtained funds for the development and wrote this MS.
Acknowledgements
The work of BTHJ was supported by the Coordenacao de
Aperfeicoamento de Pessoal de Nıvel Superior (CAPES). The
work of MAL and CVD was supported by the Fundacao de
Amparo a Pesquisa do Estado da Bahia (FAPESB). JFP was
granted by the ConselhoNacional deDesenvolvimento Cientıfico e
Tecnologico (CNPq). We thank Maria Ines Ferro (UNESP-
Jaboticabal, Brazil) for the use of the laboratory infrastructure,
Fatima Ramos and Andre Luiz Pacheco Bomfim (UESC) for
technical assistance and Claudia Fortes Ferreira (Embrapa,
Cruz das Almas) for critical reading of the manuscript. This
research was supported by FAPESB, CNPq and the International
Foundation for Science (IFS).
References
1 E. O. Afoakwa, A. Paterson, M. Fowler and A. Ryan, Crit. Rev.Food. Sci. Nutr., 2008, 48, 840–857.
2 M. C. Aime and W. Phillips-Mora,Mycologia, 2005, 97, 1012–1022.3 L. Purdy and R. Schmidt, Annu. Rev. Phytopathol., 1996, 34,573–594.
4 F. Micheli, M. Guiltinan, K. P. Gramacho, M. J. Wilkinson,A. V. d. O. Figueira, J. C. d. M. Cascardo, S. Maximova andC. Lanaud, in Advances in Botanical Research, ed. K. Jean-Claudeand D. Michel, Academic Press, 2010, vol. 55, pp. 119–177.
5 A. C. Quiapim, M. S. Brito, L. A. S. Bernardes, I. daSilva,I. Malavazi, H. C. DePaoli, J. B. Molfetta-Machado, S. Giuliatti,G. H. Goldman and M. H. S. Goldman, Plant Physiol., 2009, 149,1211–1230.
6 J. I. Watkinson, A. A. Sioson, C. Vasquez-Robinet, M. Shukla,D. Kumar, M. Ellis, L. S. Heath, N. Ramakrishnan, B. Chevone,L. T. Watson, L. van Zyl, U. Egertsdotter, R. R. Sederoff andR. Grene, Plant Physiol., 2003, 133, 1702–1716.
7 A. Adomas and F. O. Asiegbu, Physiol. Mol. Plant Pathol., 2006,69, 140–152.
8 S. Duplessis, P.-E. Courty, D. Tagu and F. Martin, New Phytol.,2004, 165, 599–611.
9 B. Bailey, M. Strem, H. Bae, G. Demayolo and M. Guiltinan,Plant Sci., 2005, 168, 1247–1258.
10 B. Bailey, H. Bae, M. Strem, G. Antunezdemayolo, M. Guiltinan,J. Verica, S. Maximova and J. Bowers, Plant Physiol. Biochem.,2005, 43, 611–622.
11 P. Minorsky, Plant Physiol., 2003, 132, 404–409.12 H.-Y. Chuang, M. Hofree and T. Ideker, Annu. Rev. Cell
Dev. Biol., 2010, 26, 721–744.13 G. Srivastava, P. Li, J. Liu and D. Xu, BMC Syst. Biol., 2010,
4, S2.14 K. D. Edwards, A. Bombarely, G. W. Story, F. Allen, L. A. Mueller,
S. A. Coates and L. Jones, BMC Genom., 2010, 11, 142.15 D. Nero, G. Krouk, D. Tranchina and G. M. Coruzzi, BMC Syst.
Biol., 2009, 3, 59.16 G. Kint, C. Fierro, K. Marchal, J. Vanderleyden and S. C. J.
De Keersmaecker, Future Microbiol., 2010, 5, 313–328.17 K. Schreiber, W. Ckurshumova, J. Peek and D. Desveaux,
Plant J., 2008, 54, 522–531.18 A. Rotter, C. Camps, M. Lohse, C. Kappel, S. Pilati, M. Hren,
M. Stitt, P. Coutos-Thevenot, C. Moser, B. Usadel, S. Delrot andK. Gruden, BMC Plant Biol., 2009, 9, 104.
19 A. S. Gesteira, F. Micheli, N. Carels, A. Da Silva, K. Gramacho,I. Schuster, J. Macedo, G. Pereira and J. Cascardo, Ann. Bot.,2007, 100, 129–140.
20 G. O. Ceita, J. Macedo, T. Santos, L. Alemanno, A. S. Gesteira,F. Micheli, A. Mariano, K. Gramacho, D. C. Silva andL. Meinhardt, Plant Sci., 2007, 173, 106–117.
21 A. P. Hayward, J. Tsao and S. P. Dinesh-Kumar, Semin. CellDev. Biol., 2009, 20, 1041–1047.
22 T. Kawasaki, J. Nam, D. C. Boyes, B. F. Holt, D. A. Hubert,A. Wiig and J. L. Dangl, Plant J., 2005, 44, 258–270.
23 R. R. Weigel, C. Bauscher, A. J. P. Pfitzner and U. M. Pfitzner,Plant Mol. Biol., 2001, 46, 143–160.
24 P. J. Rushton, I. E. Somssich, P. Ringler and Q. J. Shen, TrendsPlant Sci., 2010, 15, 247–258.
25 H.-C. Jing, L. Anderson, M. J. G. Sturre, J. Hille andP. P. Dijkwel, J. Exp. Bot., 2007, 58, 3885–3894.
26 N. H. Bhuiyan, G. Selvaraj, Y. Wei and J. King, Plant SignalingBehav., 2009, 4, 158–159.
27 B.-G. Kim, R. Waadt, Y. H. Cheong, G. K. Pandey,J. R. Dominguez-Solis, S. Schultke, S. C. Lee, J. Kudla andS. Luan, Plant J., 2007, 52, 473–484.
28 O. Chew, J. Whelan and A. H. Millar, J. Biol. Chem., 2003, 278,46869–46877.
29 A. O. Avrova, N. Taleb, V.-M. Rokka, J. Heilbronn, E. Campbell,I. Hein, E. M. Gilroy, L. Cardle, J. E. Bradshaw, H. E. Stewart,Y. J. Fakim, G. Loake and P. R. J. Birch,Mol. Plant Pathol., 2004,5, 45–56.
30 K. Kazan and J. M. Manners, Plant Physiol., 2008, 146,1459–1468.
31 R. Lin, W. Zhao, X. Meng, M. Wang and Y. Peng, Plant Sci.,2007, 172, 120–130.
32 G. Shirsekar, L. Dai, Y. Hu, X. Wang, L. Zeng and G.-L. Wang,J. Plant Biol., 2010, 53, 10–18.
33 M. Isshiki, A. Tsumoto and K. Shimamoto, Plant Cell Online,2006, 18, 146–158.
34 I. Dubery, Biol. Plant., 2007, 51, 327–332.35 M. Quint, H. Ito, W. Zhang and W. M. Gray, Plant J., 2005, 43,
371–383.36 A. M. Showalter, J. N. Bell, C. L. Cramer, J. A. Bailey,
J. E. Varner and C. J. Lamb, Proc. Natl. Acad. Sci. U. S. A.,1985, 82, 6551–6555.
37 J. Shi, K.-N. Kim, O. Ritz, V. Albrecht, R. Gupta, K. Harter,S. Luan and J. Kudla, Plant Cell Online, 1999, 11, 2393–2406.
38 J. Kudla, Q. Xu, K. Harter, W. Gruissem and S. Luan, Proc. Natl.Acad. Sci. U. S. A., 1999, 96, 4718–4723.
39 C. V. Dias, J. S. Mendes, A. C. dos Santos, C. P. Pirovani, A. daSilva Gesteira, F. Micheli, K. P. Gramacho, J. Hammerstone,P. Mazzafera and J. C. de Mattos Cascardo, Plant Physiol.Biochem., 2011, 49, 917–922.
40 R. A. L. van der Hoorn and J. D. G. Jones, Curr. Opin. Plant Biol.,2004, 7, 400–407.
41 I. Meskiene, J. Biol. Chem., 2003, 278, 18945–18952.42 A. Schweighofer, V. Kazanaviciute, E. Scheikl, M. Teige,
R. Doczi, H. Hirt, M. Schwanninger, M. Kant, R. Schuurink,F. Mauch, A. Buchala, F. Cardinale and I. Meskiene, Plant CellOnline, 2007, 19, 2213–2224.
Publ
ishe
d on
28
Febr
uary
201
2. D
ownl
oade
d by
Uni
vers
idad
e Fe
dera
l do
Rio
Gra
nde
do S
ul o
n 23
/09/
2013
14:
10:5
1.
View Article Online

This journal is c The Royal Society of Chemistry 2012 Mol. BioSyst., 2012, 8, 1507–1519 1519
43 S. Baniwal, K. Bharti, K. Chan, M. Fauth, A. Ganguli, S. Kotak,S. Mishra, L. Nover, M. Port, K.-D. Scharf, J. Tripp, C. Weber,D. Zielinski and P. von Koskull-Doring, J. Biosci., 2004, 29, 471–487.
44 C. Pungartnik, A. C. da Silva, S. A. de Melo, K. P. Gramacho,J. C. de Mattos Cascardo, M. Brendel, F. Micheli and A. da SilvaGesteira, Mol. Plant-Microbe Interact., 2009, 22, 39–51.
45 S. Silva, E. Luz, O. Almeida, K. Gramacho and J. Bezerra,Agrotropica, 2002, 1, 1–23.
46 Y. Li, C. P. Darley, V. Ongaro, A. Fleming, O. Schipper, S. L. Baldaufand S. J. McQueen-Mason, Plant Physiol., 2002, 128, 854–864.
47 O. D. Ndoumou, T. G. Ndzomo and P. F. Djocgoue, Ann. Bot.,1996, 77, 153–158.
48 L. M. Scarpari, L. W. Meinhardt, P. Mazzafera, A. W. V. Pomella,M. A. Schiavinato, J. C. M. Cascardo and G. A. G. Pereira,J. Exp. Bot., 2005, 56, 865–877.
49 A. Gesteira, F. Micheli, C. Ferreira and J. Cascardo, Biotechniques,2003, 35, 494–496, 498–500.
50 G. Frias, L. Purdy and R. Schmidt, Plant Dis., 1995, 79, 787–791.51 T. Sreenivasan and S. Dabydeen, Modes of penetration of young
cocoa leaves by Crinipellis perniciosa, American PhytopathologicalSociety, St. Paul, MN, United States of America, 1989.
52 A. Kilaru and K. H. Hasenstein, Phytopathology, 2005, 95, 101–107.53 S. Silva and K. Matsuoka, Fitopatol. Bras., 1999, 24, 54–59.54 S. M. Rodrigues, V. L. Soares, T. M. de Oliveira, A. S. Gesteira,
W. C. Otoni andM. G. Costa,Mol. Biotechnol., 2007, 37, 220–224.55 E. Wang, J. Transl. Med., 2005, 3, 28.56 G. Li, J. Osborne and F. O. Asiegbu, Environ. Microbiol., 2006, 8,
1340–1350.57 F. Lopez, J. Rougemont, B. Loriod, A. Bourgeois, L. Loı,
F. Bertucci, P. Hingamp, R. Houlgatte and S. Granjeaud,BMC Genom., 2004, 5, 38.
58 N. L. Dawes and J. Glassey,Comp. Funct. Genomics, 2007, 2007, 1–13.59 M. B. Eisen, P. T. Spellman, P. O. Brown and D. Botstein,
Proc. Natl. Acad. Sci. U. S. A., 1998, 95, 14863–14868.
60 G. Moreno-Hagelsieb and K. Latimer, Bioinformatics, 2008, 24,319–324.
61 P. Shannon, A. Markiel, O. Ozier, N. S. Baliga, J. T. Wang,D. Ramage, N. Amin, B. Schwikowski and T. Ideker, Genome Res.,2003, 13, 2498–2504.
62 G. Bader and C. Hogue, BMC Bioinf., 2003, 4, 2.63 S. Maere, K. Heymans and M. Kuiper, Bioinformatics, 2005, 21,
3448–3449.64 I. Rivals, L. Personnaz, L. Taing and M.-C. Potier, Bioinformatics,
2007, 23, 401–407.65 Y. Benjamini and Y. Hochberg, J. R. Statist. Soc. Ser. B
(Methodological), 1995, 57, 289–300.66 X. Argout, J. Salse, J.-M. Aury, M. J. Guiltinan, G. Droc, J. Gouzy,
M. Allegre, C. Chaparro, T. Legavre, S. N. Maximova, M. Abrouk,F. Murat, O. Fouet, J. Poulain, M. Ruiz, Y. Roguet, M. Rodier-Goud, J. F. Barbosa-Neto, F. Sabot, D. Kudrna, J. S. S. Ammiraju,S. C. Schuster, J. E. Carlson, E. Sallet, T. Schiex, A. Dievart,M. Kramer, L. Gelley, Z. Shi, A. Berard, C. Viot, M. Boccara,A. M. Risterucci, V. Guignon, X. Sabau, M. J. Axtell, Z. Ma,Y. Zhang, S. Brown, M. Bourge, W. Golser, X. Song, D. Clement,R. Rivallan, M. Tahi, J. M. Akaza, B. Pitollat, K. Gramacho,A. D’Hont, D. Brunel, D. Infante, I. Kebe, P. Costet, R. Wing,W. R. McCombie, E. Guiderdoni, F. Quetier, O. Panaud,P. Wincker, S. Bocs and C. Lanaud, Nat. Genet., 2011, 43, 101–108.
67 V. T. Queiroz, C. T. Guimaraes, D. Anhert, I. Schuster,R. T. Daher, M. G. Pereira, V. R. M. Miranda, L. L. Loguercio,E. G. Barros, M. A. Moreira and G. Wricke, Plant Breed., 2003,122, 268–272.
68 F. G. Faleiro, V. T. Queiroz, U. V. Lopes, C. T. Guimaraes,J. L. Pires, M. M. Yamada, I. S. Araujo, M. G. Pereira, R. Schnell,G. A. d. S. Filho, C. F. Ferreira, E. G. Barros and M. A. Moreira,Euphytica, 2006, 149, 227–235.
69 S. Maximova, J.-P. Marelli, A. Young, S. Pishak, J. Verica andM. Guiltinan, Planta, 2006, 224, 740–749.
Publ
ishe
d on
28
Febr
uary
201
2. D
ownl
oade
d by
Uni
vers
idad
e Fe
dera
l do
Rio
Gra
nde
do S
ul o
n 23
/09/
2013
14:
10:5
1.
View Article Online
Copyright © 2022 FDOKUMEN