Evolutionary and Functional Properties of a Two-Locus -Globin Polymorphism in Indian House Mice

Transcription and Chromatin Organization of aHousekeeping Gene Cluster Containing an Integratedb-Globin Locus Control RegionDaan Noordermeer1., Miguel R. Branco2., Erik Splinter1, Petra Klous1, Wilfred van IJcken3, Sigrid
Swagemakers4, Manousos Koutsourakis1¤, Peter van der Spek4, Ana Pombo2*, Wouter de Laat1*
1 Department of Cell Biology and Genetics, Erasmus Medical Center, Rotterdam, The Netherlands, 2 MRC Clinical Sciences Centre, Faculty of Medicine, Imperial College
London, London, United Kingdom, 3 Erasmus Center for Biomics, Erasmus Medical Center, Rotterdam, The Netherlands, 4 Erasmus Center for Bioinformatics, Erasmus
Medical Center, Rotterdam, The Netherlands
Abstract
The activity of locus control regions (LCR) has been correlated with chromatin decondensation, spreading of activechromatin marks, locus repositioning away from its chromosome territory (CT), increased association with transcriptionfactories, and long-range interactions via chromatin looping. To investigate the relative importance of these events in theregulation of gene expression, we targeted the human b-globin LCR in two opposite orientations to a gene-dense region inthe mouse genome containing mostly housekeeping genes. We found that each oppositely oriented LCR influenced geneexpression on both sides of the integration site and over a maximum distance of 150 kilobases. A subset of genes wastranscriptionally enhanced, some of which in an LCR orientation-dependent manner. The locus resides mostly at the edge ofits CT and integration of the LCR in either orientation caused a more frequent positioning of the locus away from its CT.Locus association with transcription factories increased moderately, both for loci at the edge and outside of the CT. Theseresults show that nuclear repositioning is not sufficient to increase transcription of any given gene in this region. Weidentified long-range interactions between the LCR and two upregulated genes and propose that LCR-gene contacts viachromatin looping determine which genes are transcriptionally enhanced.
Citation: Noordermeer D, Branco MR, Splinter E, Klous P, van IJcken W, et al. (2008) Transcription and Chromatin Organization of a Housekeeping Gene ClusterContaining an Integrated b-Globin Locus Control Region. PLoS Genet 4(3): e1000016. doi:10.1371/journal.pgen.1000016
Editor: Jeannie T. Lee, Massachusetts General Hospital, United States of America
Received August 3, 2007; Accepted February 4, 2008; Published March 7, 2008
Copyright: � 2008 Noordermeer et al. This is an open-access article distributed under the terms of the Creative Commons Attribution License, which permitsunrestricted use, distribution, and reproduction in any medium, provided the original author and source are credited.
Funding: MRB and AP thank the Medical Research Council (UK) for funding. MRB was funded by Fundacao para a Ciencia e a Tecnologia (Portugal). This workwas supported by grants from the Dutch Scientific Organization (NWO) (016-006-026) and (912-04-082) to WdL.
Competing Interests: The authors have declared that no competing interests exist.
* E-mail: [email protected] (AP); [email protected] (WdL)
¤ Current address: Sanger Institute, Wellcome Trust Genome Campus, Hinxton, Cambridge, United Kingdom
. These authors contributed equally to this work
Introduction
One of the main aims in the post-genomic era has been to
understand how genes are regulated at the level of transcription,
giving rise to cell-type specific transcriptomes. Most of our
knowledge on the regulation of gene transcription is biased
towards studies of a small number of atypical genes showing highly
restricted expression patterns. Expression of these tissue-specific
genes is often controlled by distant transcription regulatory DNA
elements. The b-globin locus control region (LCR) is a prototype
of a strong mammalian regulatory DNA element. At its
endogenous position, the LCR enhances the expression of the
mouse b-globin-like genes 25–100 fold [1]. LCR-mediated
transcriptional enhancement has been correlated with chromatin
opening [2], histone acetylation of the locus (in case of the LCR of
the human growth hormone cluster) [3], the initiation of intergenic
transcripts [4,5], the spreading of a histone methyltransferase [6]
and intrachromosomal interactions with active genes via chroma-
tin looping [7,8]. At the level of nuclear organization, LCR activity
has been correlated with repositioning of loci away from their
chromosome territory (CT) and towards the nuclear interior, and
increased association with transcription factories [9,10]. However,
the relative importance of these events for the enhancement of
gene transcription is currently unclear.
Remarkably little is known about the regulation of more
ubiquitously expressed genes, which comprise the major part of
the coding genome. High-throughput expression studies revealed
that housekeeping genes often cluster in large gene-dense regions
on mouse and human chromosomes [11,12]. Breakpoints of
synteny were shown to be under-represented in these regions,
suggesting that this organization is under natural selection [13].
Gene expression seems to benefit from clustering along the linear
genomic sequence. When genes are integrated at random positions
in the genome, their expression is often subject to position effect
variegation [2]. Furthermore, reporter genes express at higher
levels when integrated in active gene-dense regions, indicating the
existence of domain-wide regulatory mechanisms [14].
It has been suggested that gene clustering promotes the
maintenance of transcriptionally competent domains of open or
decondensed chromatin across the gene-dense region, with
expression of individual genes being dictated by the availability
of specific transcription factors [14,15]. Another emerging
PLoS Genetics | www.plosgenetics.org 1 2008 | Volume 4 | Issue 3 | e1000016

hypothesis is that clustered genes may collectively stabilize their
position at nuclear zones of increased transcriptional competence,
which in turn would positively affect the expression levels of genes
within the cluster [12,16]. The location of genes relative to several
nuclear landmarks has been correlated with gene expression. For
example, activation of MHCII cluster genes, epidermal differen-
tiation complex (EDC) and Hox genes promotes a large-scale
relocation of the subchromosomal regions that contain them, away
from the respective CT [17,18,19]. In general however, there
seems to exist little correlation between gene activity and position
versus the CT [20,21,22,23,24].
Proximity of genomic regions to nuclear structures rich in the
RNA processing machinery has also been found to correlate with
increased expression. Gene-rich R-bands are more frequently
associated with ‘splicing speckles’ than their gene-poor counterparts,
G-bands [25], and transcriptional activity of the globin genes also
correlates with increased association with speckles [26]. Whilst it is
clear that transcription, and therefore co-transcriptional splicing, can
occur both away and near splicing speckles, it appears that locus
association with these structures may facilitate mRNA processing,
especially in the case of intron-rich transcripts, such as COL1A1
[27]. Lastly, proximity to clusters of multiple active RNA
polymerases (RNAP), known as transcription factories, may facilitate
expression of genes that lie adjacent on the linear DNA template
[28,29,30,31]. Live-cell imaging of GFP-tagged RNAP II shows that
RNAP II complexes are extremely mobile and can access the whole
nucleoplasm [32,33]. When active, RNAP II is immobile and found
in transcription factories that contain on average 8 active RNAP II
complexes [29,34,35]. Irrespective of cell type, the size of factories as
determined by electron microscopy is 50–70 nm [29,30,34].
Differences in transcriptional activity amongst different cell types
correlate with the number of factories present per nucleus, rather
than with changes in factory size [30].
While it is clear that gene expression is controlled at various
levels, it is difficult to assess the hierarchy and importance of each
level of regulation, as many of the observations are made on
different gene loci and in different types of cells, often cultured in
vitro. Here, we generated transgenic mice, isolated primary tissues
and analyzed in detail gene expression, chromatin structure and
nuclear positioning of a gene-dense region in the absence or
presence of an integrated b-globin LCR in opposite orientations.
We found that insertion of the LCR induced a relocation of the
locus away from the edge of its CT and increased the association
with RNAP II factories. The latter occurred independently of the
locus being positioned at the edge or outside the CT. Changes in
gene expression occurred bi-directionally and as far as 150 kb
from the site of LCR insertion, but were variable for individual
genes, depending on the orientation of the integrated LCR. The
fact that both orientations of the LCR caused a repositioning of
the locus away from its CT, yet genes within the locus responded
selectively to only one LCR orientation, shows that the observed
repositioning is not the only factor determining the increase in
transcription of the individual genes. The gene expression patterns
seem incompatible with tracking or spreading mechanisms, and
we demonstrate that the LCR physically interacts with the two
most upregulated genes. We propose that LCR-gene contacts via
chromatin looping are key to the upregulation of at least a number
of genes in this gene-dense region.
Results
Introduction of the b-globin LCR into a gene-denseregion
In order to study the relationship between chromatin structure,
nuclear organization and transcription regulation, we introduced
the human b-globin LCR in two orientations into a region on
mouse chromosome 8 that contains 18 genes within 300 kb. This
extremely gene-dense region, which we refer to as 8C3/C4, is
located within a 3 Mb gene cluster with 79 genes that resides in
the middle of chromosome 8 at the transition of band C3 and C4
(NCBI assembly m34) (Figure 1A and 1B). The genes at 8C3/C4
do not share sequence homology and encode for proteins that
function in very diverse cellular processes, suggesting that gene
clustering at this genomic location is not the result of sequence
duplication during evolution.
The b-globin LCR is a strong, erythroid-specific, regulatory
DNA element that confers position-independent and copy-number
dependent expression to transgenes in mice [2]. We targeted the
full, ,21 kb, human LCR in sense (S) and anti-sense (AS)
orientations into the Rad23a gene (gene 0 in Figure 1B) using
homologous recombination in ES cells (Figure 1C and 1D).
Rad23a is located centrally in 8C3/C4 and can be knocked out on
both alleles without getting an apparent change in phenotype, due
to the redundant presence of the homologous Rad23b gene in the
mouse genome [36]. Mice homozygous for the integrated LCR in
both orientations also did not show an abnormal phenotype. To
test for functionality of the integrated LCR, DNaseI hypersensi-
tivity assays were performed. Each of the 5 hypersensitive sites
(HSs) characteristic for the human b-globin LCR were found to be
present in E14.5 liver cells of LCR-S +/+ and LCR-AS +/+fetuses, indicating that the integrated LCR binds its normal
repertoire of transcription factors (Figure 1E).
Gene expression at 8C3/C4 in the presence of anintegrated LCR
To gain insight into the transcriptional organization of the wild-
type locus, we first performed a series of Affymetrix expression
array experiments in various tissues (Figure 2A). We found that
most of the genes within the region were expressed in all tissues,
but that within a given tissue expression levels varied greatly
between the genes. A few genes expressed only in a certain cell
type whereas others showed considerable differences in transcrip-
tion levels between tissues, which we found to reflect differences in
Author summary
Regulatory DNA elements are stretches of DNA thatcontrol transcription of genes even when they are locatedat a distance on the same chromosome. They are oftenincluded in DNA vectors to ensure transcription of rescuegenes in gene therapy approaches. It is known that uponintegration in the host genome, they can influenceexpression of host genes surrounding the integration site,but it is not known how they do so and over what distancethey can function. Here, we targeted a prototype strongregulatory DNA element, the b-globin Locus ControlRegion, to a defined position in the mouse genome andwe analyzed its effect on surrounding genes. We show thatthe locus control region can enhance transcription of atleast seven genes that may be as far as 150 kilobases away.In the presence of the locus control region, the genesoccupy a different location in the nucleus in a subset ofcells, which may explain how some, but not all of thesegenes are activated. The locus control region alsophysically contacts the genes it activates by formation ofDNA loops. We propose that these contacts are mostimportant for the long-range activation of gene expressionby regulatory DNA elements.
Integration of an LCR in a Gene-Dense Region
PLoS Genetics | www.plosgenetics.org 2 2008 | Volume 4 | Issue 3 | e1000016
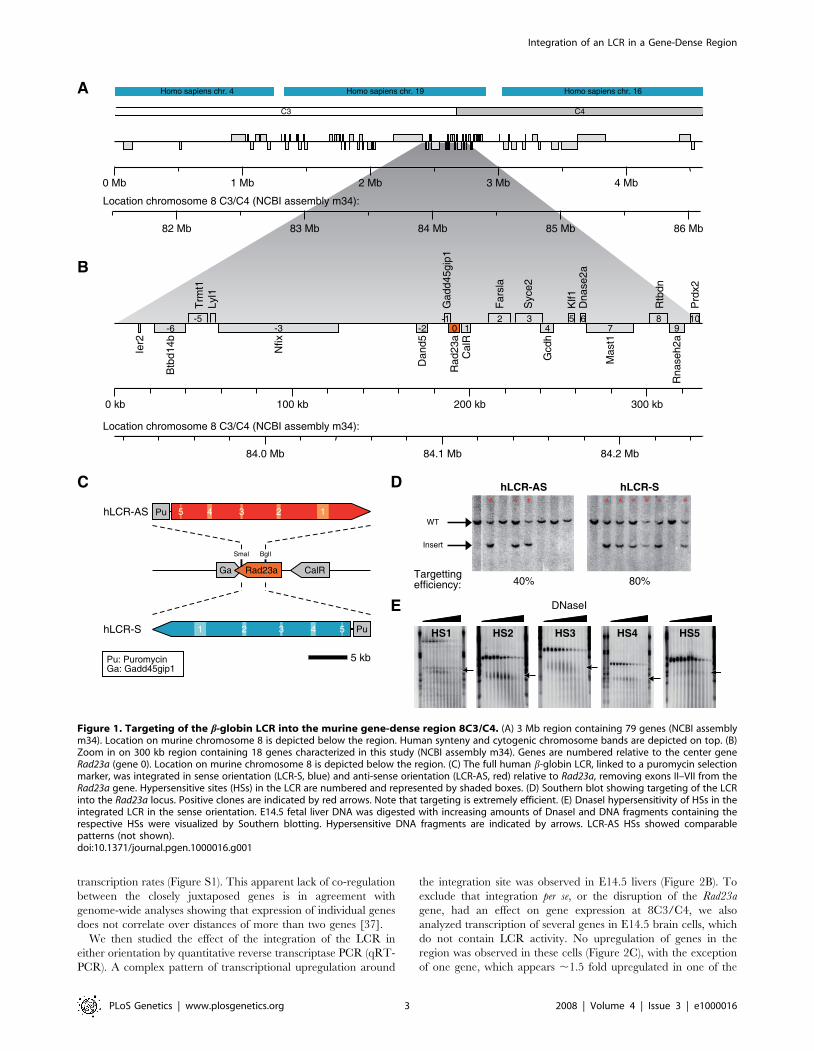
transcription rates (Figure S1). This apparent lack of co-regulation
between the closely juxtaposed genes is in agreement with
genome-wide analyses showing that expression of individual genes
does not correlate over distances of more than two genes [37].
We then studied the effect of the integration of the LCR in
either orientation by quantitative reverse transcriptase PCR (qRT-
PCR). A complex pattern of transcriptional upregulation around
the integration site was observed in E14.5 livers (Figure 2B). To
exclude that integration per se, or the disruption of the Rad23a
gene, had an effect on gene expression at 8C3/C4, we also
analyzed transcription of several genes in E14.5 brain cells, which
do not contain LCR activity. No upregulation of genes in the
region was observed in these cells (Figure 2C), with the exception
of one gene, which appears ,1.5 fold upregulated in one of the
Location chromosome 8 C3/C4 (NCBI assembly m34):
86 Mb
0 Mb 1 Mb 2 Mb 3 Mb 4 Mb
85 Mb84 Mb83 Mb82 Mb
C4C3
Homo sapiens chr. 16Homo sapiens chr. 19Homo sapiens chr. 4
Location chromosome 8 C3/C4 (NCBI assembly m34):
84.2 Mb84.1 Mb84.0 Mb
0 kb 100 kb 200 kb 300 kb
Rna
seh2
a
Mas
t1
Gcd
h
Cal
RR
ad23
a
Dan
d5Nfix
Btb
d14bIer2
Prd
x2
Rtb
dn
Dna
se2a
Klf1
Syc
e2
Fars
la
Gad
d45g
ip1
Lyl1
Trm
t1
A
B
0-2 1-3-6-5
42 3 5 6
78
910-1
hLCR-S
hLCR-AS Pu 5 1234
Pu51 2 3 4
SmaI
CalRGa
5 kb
C
HS1 HS2 HS3 HS4 HS5
DNaseI
Pu: PuromycinGa: Gadd45gip1
BglI
Rad23a
hLCR-ShLCR-AS
40% 80%Targetting efficiency:
WT
Insert
* * * * * * * * *D
E
Figure 1. Targeting of the b-globin LCR into the murine gene-dense region 8C3/C4. (A) 3 Mb region containing 79 genes (NCBI assemblym34). Location on murine chromosome 8 is depicted below the region. Human synteny and cytogenic chromosome bands are depicted on top. (B)Zoom in on 300 kb region containing 18 genes characterized in this study (NCBI assembly m34). Genes are numbered relative to the center geneRad23a (gene 0). Location on murine chromosome 8 is depicted below the region. (C) The full human b-globin LCR, linked to a puromycin selectionmarker, was integrated in sense orientation (LCR-S, blue) and anti-sense orientation (LCR-AS, red) relative to Rad23a, removing exons II–VII from theRad23a gene. Hypersensitive sites (HSs) in the LCR are numbered and represented by shaded boxes. (D) Southern blot showing targeting of the LCRinto the Rad23a locus. Positive clones are indicated by red arrows. Note that targeting is extremely efficient. (E) DnaseI hypersensitivity of HSs in theintegrated LCR in the sense orientation. E14.5 fetal liver DNA was digested with increasing amounts of DnaseI and DNA fragments containing therespective HSs were visualized by Southern blotting. Hypersensitive DNA fragments are indicated by arrows. LCR-AS HSs showed comparablepatterns (not shown).doi:10.1371/journal.pgen.1000016.g001
Integration of an LCR in a Gene-Dense Region
PLoS Genetics | www.plosgenetics.org 3 2008 | Volume 4 | Issue 3 | e1000016

B
0
1
2
3
4
6
Upr
egul
atio
n (v
s W
T)
5
11
12hLCR-S
hLCR-AS
7410-2-3-6-1-5 2 3 5 6
Expression levels in E14.5 Fetal Liver
p<0.001p<0.005p<0.05p<0.001
C
0
1
2
Upr
egul
atio
n (v
s W
T)
3
410-2-3-1 2 3 5 6 hHS5 mHS5
0
5
10
15
β−major
Binding of CTCF at HS5Expression levels in E14.5 Fetal Brain D
Rel
ativ
e en
richm
ent
A Expression levels in different tissues and developmental stagesE
xpre
ssio
n le
vel (
Affy
met
rix s
igna
l)
107
82 3 5 6-1-59410-2-3-6
8k
4k
0
2k
6k
NP
E14.5 Fetal liver
Adult liver
E14.5 Fetal brain
Figure 2. Gene expression in different tissues at 8C3/C4. (A) Expression levels in fetal liver, fetal brain and adult liver of genes at 8C3/C4represented on murine Affymetrix 430 2.0 Micro-array. NP: not present on the micro-array. (B) Upregulation of gene expression relative to WT levels(for each gene set at 1) in strains with the human b-globin LCR integrated at the Rad23a locus (orange). Expression levels were determined in E14.5fetal liver using qRT-PCR. Error bars depict 95% confidence intervals obtained from a Student’s t-test using the Welch-Satterthwaite approximation forthe degrees of freedom. P-values of significant differences in expression levels measured between the two oppositely LCRs are shown above therelevant genes. (C) Upregulation of gene expression relative to WT levels (for each gene set at 1) in E14.5 fetal brain containing the human b-globinLCR. Expression levels were determined using qRT-PCR. Error bars depict 95% confidence intervals. (D) Binding of CTCF at HS5 of the human b-globinLCR (hHS5), as determined by ChIP-analysis in E14.5 fetal liver. Enrichments were normalized to the endogenous b-major promoter. Endogenous b-globin HS5 (mHS5) is shown as a control. Error bars represent SE of at least two independent experiments.doi:10.1371/journal.pgen.1000016.g002
Integration of an LCR in a Gene-Dense Region
PLoS Genetics | www.plosgenetics.org 4 2008 | Volume 4 | Issue 3 | e1000016

transgenic lines. Possibly, this is due to its altered genetic
background. We conclude that the complex pattern of transcrip-
tional upregulation in fetal liver cells is dependent on the
erythroid-specific LCR activity.
In fetal liver, each oppositely oriented LCR enhanced the
expression of at least seven genes surrounding the integration site,
the most distal one (Ier2, gene 27) being over 150 kb away from
the integrated LCR. Both LCRs activated genes on the plus and
minus strands, as well as upstream and downstream of the
integration site, demonstrating bi-directional activity of the LCR.
The latter observation was somewhat surprising given that the
LCR is thought to function in a unidirectional manner in the b-
globin locus [38]. However, this finding was in agreement with
results showing that a marked b-globin gene placed upstream of
the LCR competes with downstream genes for activation by the
LCR [39]. We found that upstream gene activation occurred
despite the binding of the insulator protein CTCF to the outer
hypersensitive site (HS5) of the LCR (Figure 2D), confirming that
binding of CTCF does not necessarily lead to enhancer-blocking
[40].
Genes present in 8C3/C4 reacted very differently to the
integration of the two LCRs (Figure 2B). Genes at positions 21
(Gadd45gip1), +4 (Gcdh), and +6 (Dnase2a) relative to the
integration site (defined as gene position 0) were upregulated to
levels that were similar between both LCRs. Genes at positions
22 (Dand5) and +1 (CalR) also responded to both LCRs, but
reached significantly different levels of mRNA. Interspersed, at
positions 26 (Btbd14b), 25 (Trmt1), 23 (Nfix), +2 (Farsla) and +5
(Klf1) were genes not responding to the LCR in either orientation.
We reasoned that structural constraints or a lack of certain cis-
regulatory elements prevented these genes from communicating
with the LCR, or that they were transcribed already at maximum
rates in wild-type cells. The finding that gene +5 (Klf1) is not
upregulated by the LCR is particularly interesting, since this is
the only gene in the region that is specifically expressed in
erythroid cells. This suggests that upregulation of genes by the
LCR is not determined by a shared functional relationship.
Finally, the gene at position 24 (Lyl1) was significantly
upregulated only by the LCR integrated in the sense (S)
orientation, whereas the gene at position +3 (Syce2) responded
significantly only to LCR-AS.
Nuclear repositioning of 8C3/C4 by the integrated LCRThe LCR has been implicated in nuclear repositioning of loci
and we therefore analyzed whether LCR insertion had an effect on
the position of 8C3/C4 relative to the CT, the nuclear periphery,
transcription factories and splicing speckles. We first analyzed the
position of 8C3/C4 with and without the LCR (using a ,170 kb
BAC probe) relative to its own CT (labeled with a whole
chromosome 8 probe) in E14.5 fetal liver and brain cells (Figure 3).
For this, we performed cryo-FISH (fluorescence in situ hybridiza-
tion on thin cryosections), a novel technology that offers increased
resolution in the z-axis (150–200 nm) compared to standard 2D-
and 3D-FISH protocols (.500 nm) [24]. In the LCR samples, the
BAC signal had a similar dot-like appearance to wild-type cells,
despite the insertion of the 21 kb transgenic fragment (Figure 3A).
The distances between the center of each locus and the nearest CT
edge were then measured. As observed previously for other
actively transcribed gene clusters [23], WT 8C3/C4 in fetal liver
was already found mostly near the edge of its CT (61% within
0.2 mm of the edge), and 7% was .0.4 mm away from the edge,
looping out from the CT (Figure 3B). Insertion of the LCR in
either orientation caused a highly significant shift of the
distribution of distances between 8C3/C4 and the CT edge
towards a more external position (p,0.001; K-S test). The
percentage of loci found looped out at .0.4 mm away from the
CT increased from 7% in wild-type to 19% in LCR-S and 17% in
LCR-AS mice (Figure 3B). Thus, the LCR induces relocation of
8C3/C4 away from its CT, independently of its orientation in the
locus. In wild-type brain cells, 8C3/C4 is also found at the
periphery of its CT but does not relocate after LCR insertion
(Figure 3C). As the LCR is inactive in brain cells, these results
suggest that the repositioning of the locus in liver cells is dependent
on LCR activity. The repositioning of 8C3/C4 relative to its CT
does not reflect a change in radial nuclear position, as both wild-
type and LCR-integrated loci occupy the same preferred radial
position away from the nuclear periphery in fetal liver (data not
shown).
We next performed a cryo-immuno-FISH experiment to
determine the association of 8C3/C4 with splicing speckles, which
are the nucleoplasmic regions enriched for splicing factors [41].
We found the WT region often adjacent to (63%) or overlapping
with (21%) splicing speckles labeled with the Sm antigen, a
spliceosomal factor (Figure S2), as would be expected for a region
containing many active genes [25]. Integration of the LCR had no
effect on interaction frequencies with nuclear speckles, which may
be due to the already high interaction frequency of the WT locus.
As splicing speckles are located outside CTs, the preferred
association of 8C3/C4 with these domains is consistent with the
favored position of the locus towards the periphery or outside of its
CT.
We then analyzed whether the LCR influenced the association
of 8C3/C4 with foci containing the transcriptionally active
(serine2-phosphorylated) form of RNAP II, which marks tran-
scription factories as determined after co-localization with sites of
Br-UTP incorporation [29,42]. Using cryo-immuno-FISH to
simultaneously visualize the elongating isoform of RNAP II and
8C3/C4, we found that 51% of the WT alleles associated with
RNAP II foci, as scored visually, meaning that signals overlapped
or touched (without background pixels in between; Figure 4A).
Integration of the b-globin LCR had a small positive effect on the
frequency of association of 8C3/C4 with RNAP II foci, increasing
from 51% to 60% in wild-type versus LCR-S +/+ fetal liver
sections (p = 0.03; Fisher’s test using pooled data from two
independent hybridizations). To more carefully determine the
association of 8C3/C4 with factories in an unbiased fashion, we
performed distance measurements between the centers of the
fluorescent signals (Figure 4B). The two distance distributions
differed significantly, with loci in LCR-S cells being closer to
transcription factories than those in WT cells (p = 0.003, K-S test),
confirming the previous results. The largest difference observed in
individual distance categories was for loci closest to a factory
(,0.2 mm). In wild-type cells 15% of the loci were scored in this
category, while this percentage doubled to 29% in LCR-S cells. To
test whether these frequencies may also be explained by random,
non-functional associations with RNAP II foci, we performed an
in silico experiment. We used the experimental images of nuclei
labeled with RNAP II and applied a computational algorithm to
generate a randomly positioned locus within each nuclear section.
We subsequently measured the distance to the nearest factory and
found that the overall distribution of randomly positioned loci was
very different from the distributions measured for the wild-type
and the LCR-containing locus (Figure 4B; p,0.001, K-S test),
which were more frequently close to the factories. These results
suggest that the measured associations between 8C3/C4 loci and
transcription factories reflect functionally significant interactions
that are increased in the presence of the LCR. The increased
factory association may reflect the increased overall transcriptional
Integration of an LCR in a Gene-Dense Region
PLoS Genetics | www.plosgenetics.org 5 2008 | Volume 4 | Issue 3 | e1000016

activity of the region and/or be a consequence of the capacity of
the LCR to recruit RNAP II.
Given the concomitant relocation of the locus away from the
CT and its increased association with RNAP II in the presence of
the LCR, we tested whether LCR-mediated looping out from the
CT was driving the increased association with RNAP II foci. We
simultaneously visualized 8C3/C4, the territory of chromosome 8
and the active form of RNAP II in cryosections (Figure 4C).
Distances between 8C3/C4 and, respectively, the CT edge and
RNAP II foci were measured, and RNAP II association
frequencies (,0.2 mm) were scored for loci inside, outside and at
the edge (60.2 mm) of the CT (Figure 4D). The data showed that
in the presence of the LCR, the association frequency of 8C3/C4
with RNAP II foci increases independent of its position relative to
the CT (Figure 4D). Logistic regression analysis shows that the
increased association of 8C3/C4 with RNAP II is not dependent
Figure 3. Effect of LCR insertion on the positioning of 8C3/C4 in relation to its CT. (A) Cryosections from WT, LCR-S and LCR-AS fetal livernuclei were hybridized to a BAC probe containing the 8C3/C4 locus (red) and a chromosome 8 specific paint (green). Bars, 1 mm. (B) After cryo-FISH,the distances from the center of each locus to the nearest CT edge were measured (n$237 loci). Statistically significant differences were foundbetween the wild-type locus and both transgenic loci containing the LCR (p,0.001, K-S test). (C) Distances between 8C3/C4 and the CT edge weremeasured for sections from WT (n = 59 loci) and LCR-AS (n = 135 loci) fetal brain, showing no differences between the two populations (p = 0.45, K-Stest). Bars, 1 mm.doi:10.1371/journal.pgen.1000016.g003
Integration of an LCR in a Gene-Dense Region
PLoS Genetics | www.plosgenetics.org 6 2008 | Volume 4 | Issue 3 | e1000016

on CT position (p = 0.26), but solely on the presence of the LCR
(p = 0.0002). Logistic regression also indicates that the apparently
smaller effect of the LCR insertion for loci inside the CT is not
statistically different from effects at the edge or outside the CT,
although we cannot exclude that a regional effect was not observed
due to the small number of loci observed in this region.
Additionally, we found no correlation between distance to the
CT edge and distance to transcription factories for both WT
(R = 0.01) and LCR-S (R = 0.08) cells. The data suggest that LCR-
induced looping out of 8C3/C4 from the CT is not a prerequisite
for more frequent association with RNAP II foci. This is in
agreement with the observation that active transcription factories
are present within CTs, thus transcribing loci that are positioned
inside CTs [21,22,24,43].
Chromatin organization at 8C3/C4 in the presence of anintegrated LCR
We next investigated whether LCR-mediated upregulation of
gene expression was caused by the spreading of an epigenetic
signal from the LCR to the neighboring genes. In the human
growth hormone cluster, the spreading of histone H3 acetylation
from its LCR towards the target genes has been suggested to
underlie the enhancement of their expression [3,44] and to be
responsible for the bystander activation of an unrelated gene
present in the region [45], but the mechanism of such spreading is
unknown. Recently it was also suggested that the b-globin LCR
recruits an MLL2-containing protein complex, which after LCR-
binding, would dissociate to allow for the spreading of the histone
methyltransferase MLL2 and subsequent H3K4 methylation
specifically at the active gene promoter [6]. Both acetylation of
histone H3 and di- and trimethyl H3K4 are associated with active
chromatin and on a genome-wide basis the levels of trimethyl
H3K4 appear to correlate with transcriptional activity [46,47]. We
first performed chromatin immunoprecipitation (ChIP) experi-
ments on WT E14.5 fetal liver and fetal brain to analyze the
distribution of histone H3 acetylation (Figure 5A). A region-wide
analysis in both tissues revealed enrichment of hyperacetylated
histone H3 at the promoters of the actively transcribed genes, but
not at the inactive promoters or intergenic areas present in the
region (Figure 5A). Such punctuated, rather than domain-wide,
pattern of hyperacetylation was previously observed at gene-rich
regions in a genome-wide mapping study [48]. Tissue-specific
genes such as Nfix (23; active in fetal brain) and Klf1 (+5; active in
fetal liver) switch promoter acetylation status in relation to their
altered expression status in the two tissues. We subsequently
analyzed the effect of the LCR on histone acetylation levels at
8C3/C4. We found a marked change in the level of acetylation at
a site immediately downstream of the integrated LCR-S, and no or
minor changes at 12 other positions in the locus (Figure 5B).
Similar observations were made when we analyzed H3K4
trimethylation across 8C3/C4, although here we noticed that
increased levels of H3K4 tri-methylation corresponded with
elevated expression levels at some genes (24, +4, +6) (Figure 5C).
Figure 4. Effect of LCR insertion on the association of 8C3/C4 with transcription factories. (A) Nuclear sections from WT and LCR-S fetallivers (blue) were immunolabeled with an antibody against the Ser2-phosphorylated form of RNAP II (green), hybridized to the 8C3/C4 BAC probe(red), and the association of the locus with transciption factories was scored (n$231 loci). Bars, 1 mm. (B) To obtain an unbiased measurement offactory association, distances were measured between the centres of 8C3/C4 loci and the nearest RNAP II focus, showing significant differences in thedistances distributions between WT and LCR-S loci (p = 0.003, K-S test). Both loci are found in closer proximity to transcription factories than predictedby a random model (p,0.001, K-S test), in which loci were randomly placed inside experimental images of RNAP II-labeled nuclei and distancesmeasured. (C) The active form of RNAP II (blue or grayscale), 8C3/C4 (red; arrows) and chromosome 8 (green) were labeled as before. The nucleus isoutlined by a white line. Bars, 1 mm. (D) Distances of 8C3/C4 loci to the nearest CT edge and transcription factory were measured after performing thetriple labeling described above (C) in sections from WT and LCR-S fetal livers. The frequency of loci ,0.2 mm away from a transcription factory wascalculated within each position relative to the CT.doi:10.1371/journal.pgen.1000016.g004
Integration of an LCR in a Gene-Dense Region
PLoS Genetics | www.plosgenetics.org 7 2008 | Volume 4 | Issue 3 | e1000016

In general though, the minor changes observed in the presence of
the LCRs in acetylation and trimethylation levels of histone H3
appeared not to be strictly related to each other or to changes in
transcriptional activity. Most likely, the changes in gene expression
levels (2 to 6-fold) are too subtle to be reflected by changes in
histone modification patterns. To analyze whether our data were
influenced by differences in histone H3 occupancy, we performed
ChIP with an antibody against the C-terminus of histone H3
against a subset of sites in WT and transgenic livers (Figure 5D).
Considerable differences in H3 enrichment were observed in a
pattern generally opposite to the one found with the antibodies
against acetylated and trimethylated H3. Thus, H3 was most
abundantly present at intergenic regions and at inactive promoters
and relatively depleted from active promoters, as seen before [49].
Our data do not provide evidence for spreading of histone H3
acetylation or H3K4 trimethylation from the integrated LCRs.
This is in agreement with the observation that deletion of the
endogenous b-globin LCR has little effect on histone H3
acetylation patterns elsewhere in the b-globin locus [50]. We
argue that the complex pattern of transcriptional up-regulation
observed with the two LCRs is difficult to explain by a mechanism
involving the linear spreading of a signal from the LCR.
Chromatin looping was previously observed at the human and
mouse b-globin locus, where the LCR was found to specifically
D
0
1
2
3
4
5
Histone H3 - WT vs transgenic fetal livers
**-3
-4-2 0
-11
2 34
5 6
B Acetylated histone H3 - WT vs transgenic fetal livers
C Histone H3K4 me3 - WT vs transgenic fetal livers
Fetal brain
Fetal liver
A Acetylated histone H3 - Fetal liver vs fetal brainR
elat
ive
enric
hmen
t
0
25
50
75
100
* *-3 0
2-11
34-2
-4 657
89
10**
0
50
100
**-3
-4-2 0
-11
2 34
5 6
hLCR-S
hLCR-AS
WT
150
200
Rel
ativ
e en
richm
ent
0
5
10
**-3
-4-2 0
-11
2 34
5 6
15
Rel
ativ
e en
richm
ent
Rel
ativ
e en
richm
ent
ND
Figure 5. Chromatin organization at 8C3/C4 in the presence of the LCR. (A) Histone H3 acetylation at promoters (m) and other regions (*) of8C3/C4 in WT E14.5 fetal liver and brain as determined by ChIP-analysis. Enrichments were normalized to the Amylase promoter. (B) Histone H3acetylation at 8C3/C4 in WT and transgenic strains in E14.5 fetal liver. Enrichments were normalized to the Amylase promoter. (C) Histone H3 lysine 4tri-methylation at 8C3/C4 in WT and transgenic strains in E14.5 fetal liver. Enrichments were normalized to the endogenous b-major promoter. (D)Histone H3 occupancy at 8C3/C4 in WT and transgenic strains in E14.5 fetal liver. Enrichments were normalized to the endogenous b-major promoter.Error bars in all graphs represent standard error (SE) of at least two independent experiments.doi:10.1371/journal.pgen.1000016.g005
Integration of an LCR in a Gene-Dense Region
PLoS Genetics | www.plosgenetics.org 8 2008 | Volume 4 | Issue 3 | e1000016

contact the actively transcribed b-globin genes [7,8,51]. To
investigate whether increased expression levels were due to
looping of the integrated LCR with specific genes at 8C3/C4,
3C technology (Chromosome Conformation Capture) was applied
[52,53], using a recently developed Taqman approach for a more
accurate detection of crosslinked ligation products [54]. We
focused on a Rad23a restriction fragment that spanned the
integration site and designed one primer/probe combination that
could be used for the analysis of interactions with the Rad23a gene
in wild-type fetal liver cells, as well as for the analysis of
interactions with the integrated LCR in transgenic cells
(Figure 6). We found that upon introduction of the LCR,
interaction frequencies increased specifically between this site
and two fragments that contained the promoters of the two genes
that were most activated by the integrated LCRs, suggesting that
the LCR-dependent upregulation of these genes is mediated by
chromatin looping (Figure 6). None of the other restriction
fragments analyzed across 8C3/C4 showed a significant difference
in interaction frequency between the wild-type and transgenic loci,
not even when the fragments analyzed were at the promoters of
up-regulated genes. This is not unexpected, as the LCR has been
shown to contact only one gene at a time [55], such that increased
contacts with the large number of target genes at 8C3/C4 will
average out and be below the threshold of detection in the
population of cells analyzed. In combination with previous
observations made in the b-globin locus [7,8,51], we conclude
that physical interactions between the LCR and at least the genes
at +6 (DNaseII) and 22 (Dand5) are likely to be key to their
transcriptional enhancement.
Discussion
We have investigated the effect of the integration of the b-globin
LCR into a gene-dense region containing many housekeeping
genes. Two transgenic mouse lines were generated, each
containing an oppositely oriented LCR inserted at the same
genomic position. Gene activity, chromatin modifications and
chromatin structure were analyzed across a large genomic region
containing the integration site. In addition, detailed studies were
performed on the position of the locus relative to its chromosome
territory, the nuclear periphery and nuclear entities such as
speckles and transcription factories. To our knowledge, this is the
first study that analyzes in detail the impact of an integrated LCR
on its surrounding genes and chromatin. As the wild-type region is
already highly active, some of the changes induced by the LCR are
subtle. More profound effects may be expected if the LCR is
integrated at less active genomic positions. Nevertheless, our
results demonstrate that the LCR can act on a relatively large
number of genes (at least seven) spread over at least 150 kb, causes
nuclear repositioning of the targeted locus and physically contacts
the most upregulated genes via chromatin looping. Collectively,
the data provide an integrated view on LCR functioning and on
the various levels that control gene expression within a gene-dense
region.
Gene activation has been correlated with repositioning of loci
away from nuclear landmarks such as CTs, pericentromeric
heterochromatin or the nuclear periphery. One interpretation of
this phenomenon is that relocation critically drives transcription by
positioning loci in nuclear zones of increased transcriptional
competence. This idea may predict some degree of co-regulation
between genes closely juxtaposed on the chromosome template
[16]. We showed that introduction of the b-globin LCR into a
gene-dense region of functionally unrelated genes caused (1) the
more frequent positioning of this locus away from its CT, (2) a
small but significant increase in association frequency with
transcription factories, (3) no change in association frequency of
the locus with splicing speckles and no change in the nuclear radial
position. We also found an increase in expression levels of multiple
genes surrounding the integration site. LCR-driven repositioning
of the locus may facilitate increased transcriptional activity.
Nevertheless, we consider it unlikely that the subset of cells in
which 8C3/C4 is looped out from the CT can account for the
overall increased levels of expression. Transcription also takes
place at the interior of CTs [21,22,23,24] and we show here that
hLCR-S hLCR-ASWT
100 kb
0.025
0.05
0
Rel
ativ
e cr
ossl
ink
frequ
ency
(vs
rand
om)
0-2 1 42 3 5 6
78
9-1
0 kb
VIVIVIIII II
Figure 6. Chromatin looping at 8C3/C4 in the presence of the LCR. Relative crosslink frequencies (vs. random) in a part of the 300 kb regioncontaining the two most upregulated genes (genes 22, Dand5 and +6, Dnase2a). Crosslink frequencies between the fixed BglII fragment, depicted bya black bar, containing either the WT Rad23a gene or the LCR and other fragments, depicted by gray bars are visualized, as determined by 3C analysisand quantified by qPCR in WT and transgenic E14.5 fetal liver. Note that for the fixed fragment in each strain the same primer and Taqman probecombination was used. Error bars represent SE of at least three independent experiments.doi:10.1371/journal.pgen.1000016.g006
Integration of an LCR in a Gene-Dense Region
PLoS Genetics | www.plosgenetics.org 9 2008 | Volume 4 | Issue 3 | e1000016

8C3/C4 association with transcription factories increases both for
loci at the edge and outside the CT. Moreover and as discussed
below, our data demonstrate that at least for some genes
repositioning is not sufficient to drive increased transcriptional
activity.
Transcriptional enhancement was maximally 4–6 fold, which is
modest compared to the impact the mouse LCR has at its
endogenous position, where it increases b-major gene expression
25–100 fold [2]. An explanation for this difference could be that
more genes compete for interaction with the LCR at 8C3/C4.
Furthermore, gene promoter intrinsic properties could preclude
that the LCR increases their expression more efficiently. In
agreement with this notion is the fact that both the mouse and
human b-globin locus contain a second adult b-globin-like gene
(called b-minor and d-globin, respectively) that is activated much
less dramatically than their prototypic counterparts (b-major and
b-globin). For example, mouse b-minor expression is 10-fold less
than b-major expression and the difference between human d- and
b-globin gene expression is even more pronounced.
When we integrated an oppositely oriented LCR at the same
genomic position at 8C3C4, it had an identical impact on the
positioning of the locus relative to these nuclear landmarks, but
upregulated a partially overlapping yet different set of genes.
Previously it has been shown that tissue-specific genes surrounded
by housekeeping genes maintain their inactive status upon nuclear
repositioning in unrelated tissues [26]. This observation may be
explained by the absence of cell-type specific transcription factors
in these tissues [15]. In another recent study, Lnp, a gene located
near the Hoxd cluster, was shown to be active and not change its
expression level upon looping away from its CT during ES cell
differentiation [43]. We observed a similar phenomenon at 8C3/
C4, where genes at position 26 (Btbd14b), 25 (Trmt1), 23 (Nfix),
+2 (Farsla) and +5 (Klf1) did not change their expression. An
explanation for this may be that gene or chromatin intrinsic
properties preclude the more efficient transcription of these genes.
Importantly, the genes at position 24 (Lyl1) and +3 (Syce2), and to
a less significant extent 27 (Ier2) increased their transcription
activity, but responded to only one orientation of the LCR (as
confirmed independently by Affymetrix microarray expression
analysis (data not shown)). This shows that at least for these genes
repositioning is not sufficient to drive their upregulation and that
other mechanisms are involved.
Transcription regulation by the b-globin LCR has also been
associated with the spreading of histone acetylation (in case of the
LCR of the human growth hormone cluster) [3] and of the
methyltransferase MLL2 [6]. We find the same punctuated
pattern of acetylated and lysine-4 methylated histone H3
specifically at the active promoters of 8C3/C4 before and after
LCR integration and find no evidence for spreading of these
marks. The data do not exclude that the LCR attracts MLL2 and
subsequently spreads the methyltransferase across the locus.
However, the finding that genes distant to the LCR are
upregulated, while genes more proximal are not, is difficult to
explain by a mechanism involving the linear spreading of any
signal from the LCR. If spreading occurs, it also not clear why a
gene like Syce2 (+3) is upregulated by the LCR in one, but not the
other, orientation.
Previously, we have shown that the b-globin LCR contacts the
active genes in the b-globin locus [8,51]. Here, we find such
contacts being formed between the LCR and the most strongly
upregulated genes, suggesting that the ectopic LCR also acts by
looping. Looping is thought to result from random collisions
between chromatin sites that are stabilized when proteins bound to
these sites have affinity for each other [56]. Alternatively, looping
could also be the outcome of the LCR tracking along the
intervening chromatin fiber towards gene promoters. The latter
seems less compatible with our observation that LCR-S fails to
activate Syce2 at position +3 (a gene that is upregulated by LCR-
AS), while being able to upregulate the genes at position +4 and +6
further down the chromatin fiber. Spatial proximity of the LCR
with active genes is thought to increase the local concentration of
transcription factors and/or RNA polymerase II, which might
allow for more efficient transcription [56,57]. Productive loop
formation is predicted to depend on affinities between trans-acting
factors bound to the LCR and to the gene. Thus, at 8C3/C4, the
genes at position 26 (Btbd14b), 25 (Trmt1), 23 (Nfix), +2 (Farsla) and
+5 (Klf1) that are not upregulated in the presence of an LCR would
lack proteins that can interact with LCR-associated factors. This is
especially surprising for gene +5 (Klf1), since it encodes an erythroid
specific transcription factor, and therefore could be expected to bind
similar trans-acting factors to the promoter as the LCR. We notice,
however, that an erythroid-specific enhancer less than 1 kb
upstream of the promoter acts on this gene and may compete out
the LCR. Why would the productive formation of a loop be
dependent on the orientation of the LCR, as was found for some,
but not all, genes at 8C3/C4? The LCR encompasses more than
20 kb of DNA and is asymmetric with regard to nucleotide
sequence and transcription factor binding sites. One explanation
may therefore be that physical constraints intrinsic to the chromatin
fiber allow one, but not the other LCR to correctly juxtapose itself
relative to a given gene. Interestingly, the genes that respond to only
a single LCR are always located downstream of that particular
LCR. We found CTCF bound to the outer hypersensitive site 5 and
we propose that CTCF-mediated loops may interfere with contacts
between the LCR and some of the upstream genes.
How to interpret the looping out of 8C3/C4 from the CT
particularly when it contains an integrated LCR? One possibility is
that this reflects increased local decondensation of chromatin after
the insertion of 5 additional (erythroid-specific) DNase I
hypersensitive sites, which may result in increased mobility
[17,58]. Regulatory DNA elements, such as the LCR, serve as
binding platforms for trans-acting factors that locally disrupt the
nucleosome fiber, as revealed by DNaseI hypersensitivity, and
cause decondensation of the region. Indeed, live cell imaging
studies that measured the compaction of a transgene array
demonstrated that decondensation was not dependent on
transcription but was dictated by the binding of transcriptional
activator proteins [59]. A region-wide increase in accessibility may
facilitate the regulation of individual genes and the simultaneous
increase in mobility of the locus may promote the interaction with
RNAPII foci. The collective stabilization of a decondensed
chromatin state could explain why housekeeping genes tend to
cluster in the genome [15].
Materials and Methods
Gene targeting and the generation of transgenic miceFor the insertion of the human b-globin LCR into the mouse
Rad23a gene, the ClaI Neo resistance cassette of an existing Rad23a
targeting construct that removes Rad23a exon II–VII [36] was
replaced by a ClaI fragment containing a PGK-Puro resistance
cassette coupled to a 21.5 kb SalI-ClaI fragment containing the
human b-globin LCR. Constructs with the ClaI fragment in
opposite orientations were obtained: LCR-S, with hypersensitive
site 1 of the LCR at the 39-end of the Rad23a gene, and LCR-AS
with HS1 of the LCR at the 59-end of the Rad23a gene. Targeting
in Ola129-derived ES cells, blastocyst injection to generate
chimeric mice and breeding to obtain homozygous transgenic
Integration of an LCR in a Gene-Dense Region
PLoS Genetics | www.plosgenetics.org 10 2008 | Volume 4 | Issue 3 | e1000016

animals in an FVB background was done as described [36].
Genotyping was performed by Southern blot. Animal experiments
were carried out according to institutional and national guidelines
(Committee on Experiments with Laboratory Animals (DEC-
Consult); Ministry of Agriculture, Nature and Food Quality, The
Hague, The Netherlands).
DNaseI hypersensitivity assaysDNaseI hypersensitivity assays were carried out on isolated
nuclei from 6 E14.5 fetal livers. Nuclei were isolated in ice-cold
lysis mix (10 mM Tris-HCl pH 7.5, 10 mM NaCl, 3 mM MgCl2,
0.1% NP40) by dounce homogenisation and subsequent slow
spinning. Nuclei were incubated for 3 min at 37uC in lysis mix
without NP40, substituted with 1 mM CaCl2 and increasing
amounts of DNaseI. Reactions were stopped by adding equal
amounts of 26stop-mix (0.6 M NaCl, 20 mM Tris-HCl pH 8.0,
10 mM EDTA, 1% SDS), treated overnight with Proteinase K
and DNA purified with phenol/chlorophorm. Samples were
digested overnight (HS1, HS2: PstI; HS3, HS4, HS5: HinDIII),
run on 0.7% agarose gels and visualized by Southern blotting.
Primer sequences for Southern probes are presented in Table S1.
Affymetrix gene expression analysisTotal RNA was isolated using the RNeasy Mini kit (Qiagen,
Hilden, Germany) from livers and brains of three independent
embryos and mice. Biotinylated cRNA was generated using the
One-cycle Target Labeling and Control Reagents Kit (Affymetrix,
Santa Clara, California, United States). All previous procedures and
hybridization, washing and scanning of the Affymetrix Mouse
Genome 430 2.0 Arrays were done according to manufacturers’
instructions. Array-data was normalized using Bioconductor RMA
ca-tools. For each probe set, the values of the three independent
micro-arrays were averaged. When multiple probe sets represented
the same gene, the highest value was chosen to represent the gene.
Gene expression analysisTotal RNA was isolated as described previously (‘‘Affymetrix
gene expression analysis’’). cDNA synthesis was performed using
SuperScript II Reverse Transcriptase and Oligo(dT)12–18 primer
according to the manufacturer’s instructions (Invitrogen). Products
were quantified by qPCR, using Platinum Taq DNA polymerase
(Invitrogen) and SYBR Green (Sigma) on an Opticon 2 Real-Time
PCR Detection System (BioRad). Primer sequences in Table S1.
Transcript levels were normalized to the Hprt1 transcript,
encoding a relatively high expressed housekeeping gene on an
unrelated chromosome, verified in the Affymetrix gene expression
analysis not to be influenced by the integration of the human b-
globin LCR (results not shown).
Cell preparation and cryosectioningFor the preparation of cell blocks for cryosectioning, E14.5 fetal
liver and brain tissues were fixed in 4 and then 8% paraformal-
dehyde in 250 mM HEPES pH 7.6 (10 min and 2 h respectively)
[60]. Cell pellets were embedded in 2.1 M sucrose in phosphate-
buffered saline (PBS) and frozen in liquid nitrogen as described
previously [29]. Cryosections (140–180 nm in thickness, deduced
from interference colour) were cut using an UltraCut UCT52
ultracryomicrotome (Leica, Milton Keynes, UK), captured in
sucrose drops, and transferred to glass coverslips.
Cryo-FISHCryo-FISH was performed as described previously [24]. A
probe for the 8C3/C4 locus was obtained by labeling a BAC
(RP24-319P23) with biotin or rhodamine by nick-translation
(Roche). The BAC probe was co-precipitated with mouse Cot1
DNA (Roche; 1.7 mg/ml final concentration) and resuspended in
either hybridization buffer (50% deionized formamide, 10%
dextran sulfate, 26SSC, 50 mM phosphate buffer pH 7.0) or a
FITC-labeled mouse whole chromosome 8 paint (Applied Spectral
Imaging, Israel). Probes were denatured at 70uC for 10 min, and
re-annealed at 37uC for 30 min before hybridization. Probe
specificity was confirmed on mouse spleen metaphase spreads.
ImmunolabelingImmunolabeling of cryosections was performed as described
previously [24]. The biotin-labeled BAC probe for the 8C3/C4
locus was detected using rhodamine-conjugated neutravidin (1/
500; Molecular Probes), followed by a biotin-conjugated goat anti-
avidin antibody (1/500; Vector) and rhodamine-conjugated
neutravidin. Splicing speckles were detected with a human
autoimmune serum against Sm antigen (1/2000; ANA-CDC),
followed by a biotin-conjugated donkey anti-human antibody (1/
100; Jackson ImmunoResearch, West Grove, PA, USA) and an
AlexaFluor488-conjugated neutravidin (1/100; Molecular Probes).
Serine 2 phosphorylated RNAP II was immunolabeled with H5
(1/1000; Covance, Berkeley, CA, USA), followed by an IgM-
specific biotin-conjugated donkey anti-mouse antibody (1/250;
Jackson ImmunoResearch) and Alexa 488-conjugated neutravidin
or Alexa 647-conjugated streptavidin (1/100; Molecular Probes).
After immunolabeling and before cryo-FISH, antibodies were
fixed with 8% paraformaldehyde in 250 mM HEPES pH 7.6
(1 h), or with 2 mM EGS in PBS (30 min, 37uC).
Microscopy and image processingFor confocal laser scanning microscopy, images were collected
sequentially on a Leica TCS SP2 (1006 PL APO 1.40 Oil
objective) equipped with Argon (488 nm) and HeNe (543 nm;
633 nm) lasers. For wide-field light microscopy, images were
collected sequentially on a Delta-Vision Spectris system (Applied
Precision, Issaquah, USA) equipped with an Olympus IX70
widefield microscope (1006UPlanFl 1.3 Oil objective), a charge-
coupled device camera, and the following filters: DAPI, FITC,
RD-TR-PE, CY-5, CFP, YFP. The use of ultrathin cryosections
allows for the use of wide-field microscopy with no reduction in
axial (z) resolution and only a small reduction in lateral resolution.
No bleedthrough was detected in these conditions, and images
were collected without saturation of intensities. The images
presented were contrast stretched, without further thresholding
or filtering. For the generation of randomly positioned loci, the
experimental images collected for the analysis of 8C3/C4 position
relative to transcription factories were used. We developed a
macro on ImageJ (Wayne Rasband, NIH, USA) that thresholds
the DAPI signal and, for each locus, generates random coordinates
until they fall within the mask of the corresponding thresholded
nuclear section. These coordinates were used to measure the
distance to the nearest transcription factory.
Chromatin immunoprecipitationChIP was performed according to the Upstate protocol (http://
www.upstate.com), with two modifications: (1) E14.5 fetal livers
were made single cell by applying a cell-strainer cap (BD Falcon
#352340, BD Biosciences, San Jose, California, United States)
and (2) cells were fixed for 5 minutes in a 2% formaldehyde
solution at room temperature. Chromatin fragments were
quantified by qPCR (sequences of primers in Table S1) using
Platinum Taq DNA polymerase (Invitrogen, Carlsbad, California,
United States) and SYBR Green (Sigma, St. Louis, Missouri,
Integration of an LCR in a Gene-Dense Region
PLoS Genetics | www.plosgenetics.org 11 2008 | Volume 4 | Issue 3 | e1000016

United States) on an Opticon 2 Real-Time PCR Detection System
(Biorad, Hercules, California, United States). Enrichments were
calculated relative to the endogenous b-globin promoter and
values were normalized to input measurements. Antibodies used:
anti acetyl-Histone H3 (#06-599, Upstate, Charlottesville, Virgi-
nia, United States); anti K4 trimethyl H3 (#07-473, Upstate); anti
C-terminal-Histone H3 (#ab1791; Abcam, Cambridge, United
Kingdom); anti CTCF (H. Heath, manuscript in preparation).
Chromosome Conformation Capture (3C) analysis3C analysis was performed as described before, with slight
modifications [51,53,54]. 3C material was digested using the
restriction enzyme BglII. Ligation frequencies were quantified by
qPCR (Opticon 2 Real-Time PCR Detection System, Biorad)
using Platinum Taq DNA polymerase (Invitrogen) and double-dye
oligonucleotides (59FAM + 39TAMRA) as probe (sequences of
primers and probes in Table S1). To correct for differences in
quality and quantity of templates, ligation frequencies between the
fragments in the region on chromosome 8 were normalized to two
fragments in the Ercc3 locus, assumed to have a constant spatial
organization independent of the presence of the human b-globin
LCR. To correct for PCR amplification efficiency of different
primer sets a BglII digested and re-ligated control template
containing equimolar amounts of all possible ligation products was
used. This control template was composed of two BAC clones
containing all the analyzed fragments in the region (#RP24-
136A15 and RP24-319P23, Ensemble Genome Browser), a
construct containing the human b-globin LCR (see ‘‘Construction
of targeting vectors’’) and a PAC clone containing the Ercc3 locus
(#443-C18, MRC geneservice).
Accession numbersMicro-array data used for Figure 2: Gene Expression Omnibus
(GEO) GSE5891 (E14.5 fetal liver and E14.5 fetal brain) and
ArrayExpress E-MEXP-839 (adult liver) [61,62].
ENSEMBL Gene Ids: Ier2 (gene 27): ENSMUSG00000053560,
Btbd14b (gene 26): ENSMUSG00000001910, Trmt1 (gene 25):
ENSMUSG00000001909, Lyl1 (gene 24): EN-
SMUSG00000034041, Nfix (gene 23): ENSMUSG00000001911,
Dand5 (gene 22): ENSMUSG00000053226, Gadd45gip1 (gene 21):
ENSMUSG00000033751, (Rad23a (gene 0): EN-
SMUSG00000003813, CalR (gene +1): ENSMUSG00000003814,
Farsla (gene +2): ENSMUSG00000003808, Syce2 (gene +3):
ENSMUSG00000003824, Gcdh (gene +4): EN-
SMUSG00000003809), Klf1 (gene +5): ENSMUSG00000054191,
Dnase2a (gene +6): ENSMUSG00000003812
Supporting Information
Figure S1 Primary transcript levels of genes at 8C3/C4
Found at: doi:10.1371/journal.pgen.1000016.s001 (1.79 MB EPS)
Figure S2 Insertion of the LCR has no effect on the association
of 8C3/C4 with splicing speckles
Found at: doi:10.1371/journal.pgen.1000016.s002 (0.81 MB EPS)
Table S1 Primers and probes
Found at: doi:10.1371/journal.pgen.1000016.s003 (0.06 MB
DOC)
Acknowledgments
We thank Frank Grosveld for discussion, George Garinis and Marieke
Simonis for sharing expression data, Francisco Ramirez for the logistic
regression statistical testing, Bert van der Horst for providing targeting
constructs and Robert-Jan Palstra and other members of the laboratories
for assistance.
Author Contributions
Conceived and designed the experiments: AP WDL. Performed the
experiments: DN MRB ES PK. Analyzed the data: DN MRB. Contributed
reagents/materials/analysis tools: WI SS MK PS. Wrote the paper: DN
MRB WDL.
References
1. Epner E, Reik A, Cimbora D, Telling A, Bender MA, et al. (1998) The beta-
globin LCR is not necessary for an open chromatin structure or developmentally
regulated transcription of the native mouse beta-globin locus. Mol Cell 2:
447–455.
2. Grosveld F, van Assendelft GB, Greaves DR, Kollias G (1987) Position-
independent, high-level expression of the human beta-globin gene in transgenic
mice. Cell 51: 975–985.
3. Ho Y, Elefant F, Cooke N, Liebhaber S (2002) A defined locus control region
determinant links chromatin domain acetylation with long-range gene
activation. Mol Cell 9: 291–302.
4. Routledge SJ, Proudfoot NJ (2002) Definition of transcriptional promoters in the
human beta globin locus control region. J Mol Biol 323: 601–611.
5. Ling J, Ainol L, Zhang L, Yu X, Pi W, et al. (2004) HS2 enhancer function is
blocked by a transcriptional terminator inserted between the enhancer and the
promoter. J Biol Chem 279: 51704–51713.
6. Demers C, Chaturvedi CP, Ranish JA, Juban G, Lai P, et al. (2007) Activator-
mediated recruitment of the MLL2 methyltransferase complex to the beta-
globin locus. Mol Cell 27: 573–584.
7. Carter D, Chakalova L, Osborne CS, Dai YF, Fraser P (2002) Long-range
chromatin regulatory interactions in vivo. Nat Genet 32: 623–626.
8. Tolhuis B, Palstra RJ, Splinter E, Grosveld F, de Laat W (2002) Looping and
interaction between hypersensitive sites in the active beta-globin locus. Mol Cell
10: 1453–1465.
9. Ragoczy T, Telling A, Sawado T, Groudine M, Kosak ST (2003) A genetic
analysis of chromosome territory looping: diverse roles for distal regulatory
elements. Chromosome Res 11: 513–525.
10. Francastel C, Walters MC, Groudine M, Martin DI (1999) A functional
enhancer suppresses silencing of a transgene and prevents its localization close to
centrometric heterochromatin. Cell 99: 259–269.
11. Caron H, van Schaik B, van der Mee M, Baas F, Riggins G, et al. (2001) The
human transcriptome map: clustering of highly expressed genes in chromosomal
domains. Science 291: 1289–1292.
12. Lercher MJ, Urrutia AO, Hurst LD (2002) Clustering of housekeeping genes
provides a unified model of gene order in the human genome. Nat Genet 31:
180–183.
13. Singer GA, Lloyd AT, Huminiecki LB, Wolfe KH (2005) Clusters of co-
expressed genes in mammalian genomes are conserved by natural selection. Mol
Biol Evol 22: 767–775.
14. Gierman HJ, Indemans MH, Koster J, Goetze S, Seppen J, et al. (2007)
Domain-wide regulation of gene expression in the human genome. Genome Res
17: 1286–1295.
15. Sproul D, Gilbert N, Bickmore WA (2005) The role of chromatin structure in
regulating the expression of clustered genes. Nat Rev Genet 6: 775–781.
16. Chakalova L, Debrand E, Mitchell JA, Osborne CS, Fraser P (2005) Replication and
transcription: Shaping the landscape of the genome. Nat Rev Genet 6: 669–677.
17. Volpi EV, Chevret E, Jones T, Vatcheva R, Williamson J, et al. (2000) Large-
scale chromatin organization of the major histocompatibility complex and other
regions of human chromosome 6 and its response to interferon in interphase
nuclei. J Cell Sci 113 (Pt 9): 1565–1576.
18. Williams RR, Broad S, Sheer D, Ragoussis J (2002) Subchromosomal
positioning of the epidermal differentiation complex (EDC) in keratinocyte
and lymphoblast interphase nuclei. Exp Cell Res 272: 163–175.
19. Chambeyron S, Bickmore WA (2004) Chromatin decondensation and nuclear
reorganization of the HoxB locus upon induction of transcription. Genes Dev
18: 1119–1130.
20. Kurz A, Lampel S, Nickolenko JE, Bradl J, Benner A, et al. (1996) Active and
inactive genes localize preferentially in the periphery of chromosome territories.
J Cell Biol 135: 1195–1205.
21. Abranches R, Beven AF, Aragon-Alcaide L, Shaw PJ (1998) Transcription sites
are not correlated with chromosome territories in wheat nuclei. J Cell Biol 143:
5–12.
22. Verschure PJ, van Der Kraan I, Manders EM, van Driel R (1999) Spatial
relationship between transcription sites and chromosome territories. J Cell Biol
147: 13–24.
Integration of an LCR in a Gene-Dense Region
PLoS Genetics | www.plosgenetics.org 12 2008 | Volume 4 | Issue 3 | e1000016

23. Scheuermann MO, Tajbakhsh J, Kurz A, Saracoglu K, Eils R, et al. (2004)
Topology of genes and nontranscribed sequences in human interphase nuclei.
Exp Cell Res 301: 266–279.
24. Branco MR, Pombo A (2006) Intermingling of Chromosome Territories in
Interphase Suggests Role in Translocations and Transcription-Dependent
Associations. PLoS Biol 4: e138.
25. Shopland LS, Johnson CV, Byron M, McNeil J, Lawrence JB (2003) Clustering
of multiple specific genes and gene-rich R-bands around SC-35 domains:
evidence for local euchromatic neighborhoods. J Cell Biol 162: 981–990.
26. Brown JM, Leach J, Reittie JE, Atzberger A, Lee-Prudhoe J, et al. (2006)
Coregulated human globin genes are frequently in spatial proximity when active.
J Cell Biol 172: 177–187.
27. Johnson C, Primorac D, McKinstry M, McNeil J, Rowe D, et al. (2000)
Tracking COL1A1 RNA in osteogenesis imperfecta. splice-defective transcripts
initiate transport from the gene but are retained within the SC35 domain. J Cell
Biol 150: 417–432.
28. Iborra FJ, Pombo A, Jackson DA, Cook PR (1996) Active RNA polymerases are
localized within discrete transcription ‘‘factories’’ in human nuclei. J Cell Sci 109
(Pt 6): 1427–1436.
29. Pombo A, Jackson DA, Hollinshead M, Wang Z, Roeder RG, et al. (1999)
Regional specialization in human nuclei: visualization of discrete sites of
transcription by RNA polymerase III. Embo J 18: 2241–2253.
30. Faro-Trindade I, Cook PR (2006) A conserved organization of transcription
during embryonic stem cell differentiation and in cells with high C value. Mol
Biol Cell 17: 2910–2920.
31. Osborne CS, Chakalova L, Brown KE, Carter D, Horton A, et al. (2004) Active
genes dynamically colocalize to shared sites of ongoing transcription. Nat Genet.
32. Kimura H, Sugaya K, Cook PR (2002) The transcription cycle of RNA
polymerase II in living cells. J Cell Biol 159: 777–782.
33. Becker M, Baumann C, John S, Walker DA, Vigneron M, et al. (2002) Dynamic
behavior of transcription factors on a natural promoter in living cells. EMBO
Rep 3: 1188–1194.
34. Jackson DA, Iborra FJ, Manders EM, Cook PR (1998) Numbers and
organization of RNA polymerases, nascent transcripts, and transcription units
in HeLa nuclei. Mol Biol Cell 9: 1523–1536.
35. Martin S, Pombo A (2003) Transcription factories: quantitative studies of
nanostructures in the mammalian nucleus. Chromosome Res 11: 461–470.
36. Ng JM, Vermeulen W, van der Horst GT, Bergink S, Sugasawa K, et al. (2003)
A novel regulation mechanism of DNA repair by damage-induced and RAD23-
dependent stabilization of xeroderma pigmentosum group C protein. Genes Dev
17: 1630–1645.
37. Semon M, Duret L (2006) Evolutionary origin and maintenance of coexpressed
gene clusters in mammals. Mol Biol Evol 23: 1715–1723.
38. Tanimoto K, Liu Q, Bungert J, Engel JD (1999) Effects of altered gene order or
orientation of the locus control region on human beta-globin gene expression in
mice. Nature 398: 344–348.
39. Wai AW, Gillemans N, Raguz-Bolognesi S, Pruzina S, Zafarana G, et al. (2003)
HS5 of the human beta-globin locus control region: a developmental stage-
specific border in erythroid cells. Embo J 22: 4489–4500.
40. Defossez PA, Kelly KF, Filion G, Perez-Torrado R, Magdinier F, et al. (2005)
The human enhancer-blocker CTCF interacts with the transcription factor
kaiso. J Biol Chem 280: 43017–43023.
41. Xie SQ, Martin S, Guillot PV, Bentley DL, Pombo A (2006) Splicing speckles
are not reservoirs of RNA polymerase II, but contain an inactive form,
phosphorylated on serine2 residues of the C-terminal domain. Mol Biol Cell 17:
1723–1733.
42. Grande MA, van der Kraan I, de Jong L, van Driel R (1997) Nuclear
distribution of transcription factors in relation to sites of transcription and RNApolymerase II. J Cell Sci 110 (Pt 15): 1781–1791.
43. Morey C, Da Silva NR, Perry P, Bickmore WA (2007) Nuclear reorganisation
and chromatin decondensation are conserved, but distinct, mechanisms linked toHox gene activation. Development 134: 909–919.
44. Elefant F, Su Y, Liebhaber SA, Cooke NE (2000) Patterns of histone acetylationsuggest dual pathways for gene activation by a bifunctional locus control region.
Embo J 19: 6814–6822.
45. Cajiao I, Zhang A, Yoo EJ, Cooke NE, Liebhaber SA (2004) Bystander geneactivation by a locus control region. Embo J 23: 3854–3863.
46. Bernstein BE, Kamal M, Lindblad-Toh K, Bekiranov S, Bailey DK, et al. (2005)Genomic maps and comparative analysis of histone modifications in human and
mouse. Cell 120: 169–181.47. Guenther MG, Levine SS, Boyer LA, Jaenisch R, Young RA (2007) A
chromatin landmark and transcription initiation at most promoters in human
cells. Cell 130: 77–88.48. Roh TY, Cuddapah S, Zhao K (2005) Active chromatin domains are defined by
acetylation islands revealed by genome-wide mapping. Genes Dev 19: 542–552.49. Heintzman ND, Stuart RK, Hon G, Fu Y, Ching CW, et al. (2007) Distinct and
predictive chromatin signatures of transcriptional promoters and enhancers in
the human genome. Nat Genet 39: 311–318.50. Schubeler D, Francastel C, Cimbora DM, Reik A, Martin DI, et al. (2000)
Nuclear localization and histone acetylation: a pathway for chromatin openingand transcriptional activation of the human beta-globin locus. Genes Dev 14:
940–950.51. Palstra RJ, Tolhuis B, Splinter E, Nijmeijer R, Grosveld F, et al. (2003) The
beta-globin nuclear compartment in development and erythroid differentiation.
Nat Genet 35: 190–194.52. Dekker J, Rippe K, Dekker M, Kleckner N (2002) Capturing chromosome
conformation. Science 295: 1306–1311.53. Splinter E, Grosveld F, de Laat W (2004) 3C technology: analyzing the spatial
organization of genomic loci in vivo. Methods Enzymol 375: 493–507.
54. Splinter E, Heath H, Kooren J, Palstra RJ, Klous P, et al. (2006) CTCF mediateslong-range chromatin looping and local histone modification in the beta-globin
locus. Genes Dev 20: 2349–2354.55. Wijgerde M, Grosveld F, Fraser P (1995) Transcription complex stability and
chromatin dynamics in vivo. Nature 377: 209–213.56. Droge P, Muller-Hill B (2001) High local protein concentrations at promoters:
strategies in prokaryotic and eukaryotic cells. Bioessays 23: 179–183.
57. de Laat W, Grosveld F (2003) Spatial organization of gene expression: the activechromatin hub. Chromosome Res 11: 447–459.
58. Gilbert N, Boyle S, Fiegler H, Woodfine K, Carter NP, et al. (2004) Chromatinarchitecture of the human genome; gene-rich domains are enriched in open
chromatin fibers. Cell 118: 555–566.
59. Tumbar T, Sudlow G, Belmont AS (1999) Large-scale chromatin unfolding andremodeling induced by VP16 acidic activation domain. J Cell Biol 145:
1341–1354.60. Guillot PV, Xie SQ, Hollinshead M, Pombo A (2004) Fixation-induced
redistribution of hyperphosphorylated RNA polymerase II in the nucleus ofhuman cells. Exp Cell Res 295: 460–468.
61. Simonis M, Klous P, Splinter E, Moshkin Y, Willemsen R, et al. (2006) Nuclear
organization of active and inactive chromatin domains uncovered bychromosome conformation capture-on-chip (4C). Nat Genet 38: 1348–1354.
62. van der Pluijm I, Garinis GA, Brandt RM, Gorgels TG, Wijnhoven SW, et al.(2006) Impaired genome maintenance suppresses the growth hormone–insulin-
like growth factor 1 axis in mice with Cockayne syndrome. PLoS Biol 5: e2.
Integration of an LCR in a Gene-Dense Region
PLoS Genetics | www.plosgenetics.org 13 2008 | Volume 4 | Issue 3 | e1000016
Copyright © 2022 FDOKUMEN