Movement trajectory classification using supervised machine ...
at SciVerse ScienceDirect
Atmospheric Environment 61 (2012) 400e408
Contents lists available
Atmospheric Environment
journal homepage: www.elsevier .com/locate/atmosenv
Trajectory statistical analysis of atmospheric transport patterns and trendsin precipitation chemistry of a rural site in NE Spain in 1984e2009
Rebeca Izquierdo a,*, Anna Avila a, Marta Alarcón b
aCREAF, Cerdanyola del Vallès 08193, SpainbDepartament de Física i Enginyeria Nuclear, Universitat Politècnica de Catalunya, c/ Urgell 187, 08036 Barcelona, Spain
h i g h l i g h t s
< Precipitation SO42� and Hþ decreased but NO3
� increased (p < 0,05) at a NE Spain site.< In 1984e1993 these pollutants were mostly originated in central and eastern Europe.< Recently this shifted to marine traffic and eastern Europe and North Africa emissions.
a r t i c l e i n f o
Article history:Received 19 March 2012Received in revised form25 July 2012Accepted 28 July 2012
Keywords:MediterraneanLong-range transportPrecipitationBack-trajectoriesCluster analysisSourceereceptor model
* Corresponding author. Tel.: þ34 935813420; fax:E-mail address: [email protected] (R. Izquierdo
1352-2310/$ e see front matter � 2012 Published byhttp://dx.doi.org/10.1016/j.atmosenv.2012.07.060
a b s t r a c t
The aim of this study is to interpret the variation of precipitation chemistry during the last 25 years inMontseny (NE Spain) by taking into account the main air mass transport routes and emission sources. Tothis end, trajectory cluster analysis and sourceereceptor models were applied to an early monitoringperiod (1984e1993) and compared to a more recent one (1998e2009). A decrease of Atlantic advectionsand increase of African and European air flows was found. Cluster analysis and sourceereceptorapproaches showed that this region is under the influence of natural and anthropogenic sources fromthe local and long-range scale. Sulphate and Hþ source areas extended over a vast stretch of centralEurope in the early period, but were drastically reduced in the recent period, showing the effectiveness ofpollution abatement measures for S. On the other hand, NO3
� sources areas from central Europe strikinglyincreased. Ship emissions and industrialisation in Eastern Europe and North Africa seem to be acquiringa greater role in the recent period.
� 2012 Published by Elsevier Ltd.
1. Introduction
The atmospheric dynamics in the West Mediterranean Basin(WMB) is conditioned by complex interactions of climatic andtopographic effects that include the Azores high-pressure system,continental thermal lows over the Iberian Peninsula (IP thereafter)and the Sahara, orographic effects of the coastal ranges surroundingthe Mediterranean coast, marked seasonal variations in tempera-ture, humidity and rainfall and the arrival of frequent African dustintrusions (Millán et al., 1997; Rodríguez et al., 2003). Linked toclimate change, modifications in wind circulation and precipitationpatterns have been predicted for the Mediterranean region (Giorgiand Lionello, 2008), as well as an increase of African air masses(Moulin et al., 1997).
A systematic investigation on the emission sources and therainwater chemical composition is necessary to understand the
þ34 935814151.).
Elsevier Ltd.
consequences of pollution on ecosystems (Arsene et al., 2007). InEurope, the Convention on Long Range Transboundary Air Pollution(CLRTAP) launched several protocols to reduce sulphur andnitrogen emissions to the atmosphere in the 1970s. As a result,sulphur deposition steadily decreased throughout Europe in thelast 30 years (Stoddard et al., 1999; Skjelkvale et al., 2005), butsuccess has beenmore limited for nitrogen compounds (Gundersenet al., 2006).
Meteorological classification refers to the identification ofdistinct patterns that influence climate/weather-related variables(Riccio et al., 2007). Over the last several decades, TrajectoryStatistical analysis Methods (TSMs) have been used to examinetransport patterns and dynamical processes of air masses (Stohl,1996, 1998). Cluster analysis has been widely used to categorizeback trajectories (Dorling and Davies, 1995; Jorba et al., 2004) andto identify synoptic weather regimes and long-range transportpatterns that affect air pollution (Cape et al., 2000; Salvador et al.,2007). Cluster analysis is used to classify the air mass originarriving at a site, but it does not provide further information on the

R. Izquierdo et al. / Atmospheric Environment 61 (2012) 400e408 401
geographical location of potential source regions (Salvador et al.,2010). This is frequently resolved with TSMs which are helpful forestimating the spatial distribution of emissions based onmeasurements at a receptor site (Stohl, 1996; Begum et al., 2005).For the interpretation of source areas, the potential source contri-bution function (PSCF), Seibert’s concentration field methodology(Seibert et al., 1994) and Stohl’s redistributed model (Stohl, 1996)have been profusely used (Charron et al., 1998; Polissar et al., 2001;Hoh and Hites, 2004; Salvador et al., 2004).
The aim of this study is to characterize the synoptic climatologyand long-range transport of air pollutants arriving in Montseny (NESpain) in order to interpret the variation of precipitation chemistryduring the last 25 years. To this end, we have used back-trajectories,cluster analysis and sourceereceptor models for an early moni-toring period (1984e1993) which are compared to a more recentone (1998e2009).
2. Material and methods
2.1. Study site
La Castanya station (LC, 41�460N, 2�210E, 700 m) is located in theMontseny mountains of the Pre-litoral Catalan Range. Long-termbiogeochemical studies have been undertaken since the 1970s ina forest plot close to the atmospheric sampling site (Rodà et al.,1999). The site is amidst extensive holm-oak (Quercus ilex L.)forests in the Montseny Natural Park, 40 km to the NeNE fromBarcelona and 25 km from the Mediterranean coast (Fig. 1). Theclimate in Montseny is meso-Mediterranean sub-humid, with highinterannual precipitation variability (range: 503e1638 mm y�1,mean: 840 mm y�1 at LC, from 1983 to 2009). Summer droughtsare common and snow is sporadic. Mean air temperature was 9 �Cduring the period 1983e2000 at LC.
2.2. Sampling and chemical analysis
Precipitation was collected weekly at LC from August 1983 toJuly 2010 (no data from September 2000 to March 2002). Precipi-tation was collected with 2 open bulk-deposition collectors fromJanuary 1984eSeptember 2000 and March 2007eJuly 2010, andwith wet/dry collectors (ESM Andersen instruments, G78-1001)
Fig. 1. Map of La Castanya study site (LC), NE Spain.
from April 2002eJuly 2004, February 2005eMarch 2007, andFebruary 2009eJuly 2010. In the last period, bulk and wet-onlydeposition were sampled in parallel (only wet data reportedhere). Any detectable contamination (e.g. bird droppings) wasannotated and the sample, discarded.
Samples were taken to CREAF where they were processedaccording to previously described protocols (Avila, 1996; Avila andRodà, 2002). Conductivity, alkalinity and pH were measured inunfiltered samples within 48 h of sampling. Samples were filteredthrough 0.45 mm membrane filters and stored at �20 �C. Ionchromatography was used to determine the concentrations of Naþ,Kþ, Mg2þ, Ca2þ, NH4
þ, Cl�, NO3� and SO4
2�. Data quality was evaluatedby: (1) control solutions within analytical runs, and (2) an ionicratio (cation sum/anion sum) by accepting a 20% variation aboutthe central value (¼1.00).
Regression analysis was performed betweenwet-only and bulk-deposition data during the parallel sampling for each chemicalcompound and good correlations were obtained (R > 0.8,p < 0.001). Then, regressions betweenwet and bulk concentrationswere used for each analyte to obtain a complete bulk-depositiondatabase from 1984 to 2009. Years 2001, 2004 (for base cations)and 2005 were not included due to fragmentary sampling.
2.3. Cluster analysis
A daily meteorological analysis was undertaken based on 96-hisosigma back-trajectories at 12:00 h UTC and 1500 m asl byusing the HYSPLIT (Hybrid Single-Particle Lagrangian IntegratedTrajectory) 4.0 dispersion model from the Air Resources Laboratory(ARL, available at http://www.arl.noaa.gov/ready/hysplit4.html,Draxler and Rolph, 2003). This height can be taken as representa-tive of themean transport wind at a synoptic scalewithin the upperboundary layer. The meteorological input was obtained from theARL (Air Resources Laboratory) reanalysis database for the early 10-year monitoring period (1984e1993), and from FNL (1998e2004)and GDAS (Global Data Assimilation System) (2005e2009) fromthe NCEP (National Center for Environmental Prediction) for themost recent period (1998e2009).
Cluster analysis statistically aggregate observations into clusterssuch that each of them is as homogeneous as possible with respectto the clustering variables (Sharma, 1996). To compose each cluster,HYSPLIT has a grouping module based on variations in the TotalSpatial Variance (TSV) between different clusters which iscompared to the spatial variance (SPVAR) within each clustercomponent. The final number of clusters is determined by a changein TSV as clusters are iteratively paired (Draxler et al., 2009). Thisclustering methodology was applied to the daily trajectoriesobtained for an early (1984e1993) and recent (1998e2009) periodat Montseny.
Our rain chemistry database consisted of weekly observations;however, trajectories were obtained daily. We estimated a dailychemical concentration for the days with precipitation by propor-tionally correcting weekly chemical concentrations by the precip-itation contribution of the rainy days to the weekly amount. Therainy days within each week and their precipitation amount wereobtained from records at LC, and from the AEMET stations (SpanishMeteorological Service) of Turó de l’Home and Tagamanent whichare 7 and 8 km distant from LC, respectively. Precipitation events of<3 mmwere not included, and only the days with rainfall amountof >0.02 mm were considered for the determination of rain dayswithin a week.
The interpretation of the back trajectories was complementedwith meteorological synoptic maps and the DREAM dust forecastmodel (http://www.bsc.es/projects/earthscience/DREAM).
R. Izquierdo et al. / Atmospheric Environment 61 (2012) 400e408402
2.4. Sourceereceptor model
Sourceereceptor methodologies establish relationships betweena receptor point and the probable source areas by associating eachchemical concentration valuewith its corresponding back-trajectory.Daily 00:00 h and 12:00 h UTC 72-h back-trajectories at 1500 m aslwere computed for rainy days in both study periods. A gridwith 2601cells of 1� � 1� latitude and longitude was superimposed on theintegration trajectory field to map contributing areas.
Here, the Seibert methodology (Seibert et al., 1994), wherebya logarithmic mean chemical concentration is computed for eachgrid cell based on the residence time of the trajectories in the cells,was used:
log Cij ¼
P
lnijllog ClP
lnijl
where Cij is the concentration in the cell (i,j), l is the index of thetrajectory, nijl is the number of time steps of the trajectory l in thecell (i,j), and Cl is the chemical concentration measured at thereceptor point corresponding to the trajectory l. To reduce the cell’slocal variability (random noise), a smoothing was applied and thevalue of each cell was replaced by the average between the cell andits eight neighbouring cells. A final filter excluded cells with lessthan five end points, thus producing a more interpretable image.The obtained field map reflects each cell contribution to thechemical rain concentration at the receptor point.
Seibert’s and PSCF methods were both computed and a sensi-tivity analysis to different factors was applied. Although the modelswere sensitive to all factors and they pointed to similar sourceareas, for simplicity only results from the Seibert’s model will behere retained.
To quantitatively compare the obtained sourceereceptor mapswith European emissions, NOx and SO2 EMEP emission inventorydata were gridded at 1� � 1� cell resolution. Then, cell by cellSpearman’s rank correlations were calculated between the emis-sion data and model concentrations.
3. Results
3.1. General air flow transport patterns
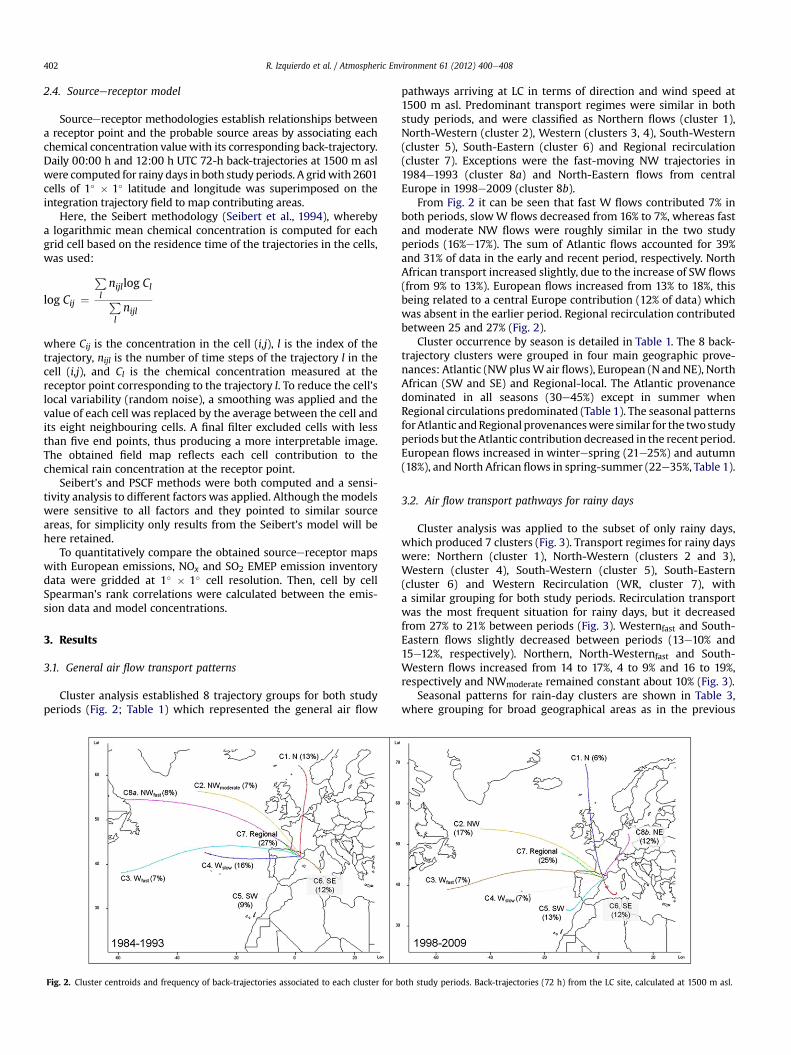
Cluster analysis established 8 trajectory groups for both studyperiods (Fig. 2; Table 1) which represented the general air flow
Fig. 2. Cluster centroids and frequency of back-trajectories associated to each cluster for b
pathways arriving at LC in terms of direction and wind speed at1500 m asl. Predominant transport regimes were similar in bothstudy periods, and were classified as Northern flows (cluster 1),North-Western (cluster 2), Western (clusters 3, 4), South-Western(cluster 5), South-Eastern (cluster 6) and Regional recirculation(cluster 7). Exceptions were the fast-moving NW trajectories in1984e1993 (cluster 8a) and North-Eastern flows from centralEurope in 1998e2009 (cluster 8b).
From Fig. 2 it can be seen that fast W flows contributed 7% inboth periods, slowW flows decreased from 16% to 7%, whereas fastand moderate NW flows were roughly similar in the two studyperiods (16%e17%). The sum of Atlantic flows accounted for 39%and 31% of data in the early and recent period, respectively. NorthAfrican transport increased slightly, due to the increase of SW flows(from 9% to 13%). European flows increased from 13% to 18%, thisbeing related to a central Europe contribution (12% of data) whichwas absent in the earlier period. Regional recirculation contributedbetween 25 and 27% (Fig. 2).
Cluster occurrence by season is detailed in Table 1. The 8 back-trajectory clusters were grouped in four main geographic prove-nances: Atlantic (NWplusWair flows), European (N and NE), NorthAfrican (SW and SE) and Regional-local. The Atlantic provenancedominated in all seasons (30e45%) except in summer whenRegional circulations predominated (Table 1). The seasonal patternsforAtlantic andRegional provenanceswere similar for the twostudyperiods but the Atlantic contribution decreased in the recent period.European flows increased in winterespring (21e25%) and autumn(18%), and North African flows in spring-summer (22e35%, Table 1).
3.2. Air flow transport pathways for rainy days
Cluster analysis was applied to the subset of only rainy days,which produced 7 clusters (Fig. 3). Transport regimes for rainy dayswere: Northern (cluster 1), North-Western (clusters 2 and 3),Western (cluster 4), South-Western (cluster 5), South-Eastern(cluster 6) and Western Recirculation (WR, cluster 7), witha similar grouping for both study periods. Recirculation transportwas the most frequent situation for rainy days, but it decreasedfrom 27% to 21% between periods (Fig. 3). Westernfast and South-Eastern flows slightly decreased between periods (13e10% and15e12%, respectively). Northern, North-Westernfast and South-Western flows increased from 14 to 17%, 4 to 9% and 16 to 19%,respectively and NWmoderate remained constant about 10% (Fig. 3).
Seasonal patterns for rain-day clusters are shown in Table 3,where grouping for broad geographical areas as in the previous
oth study periods. Back-trajectories (72 h) from the LC site, calculated at 1500 m asl.
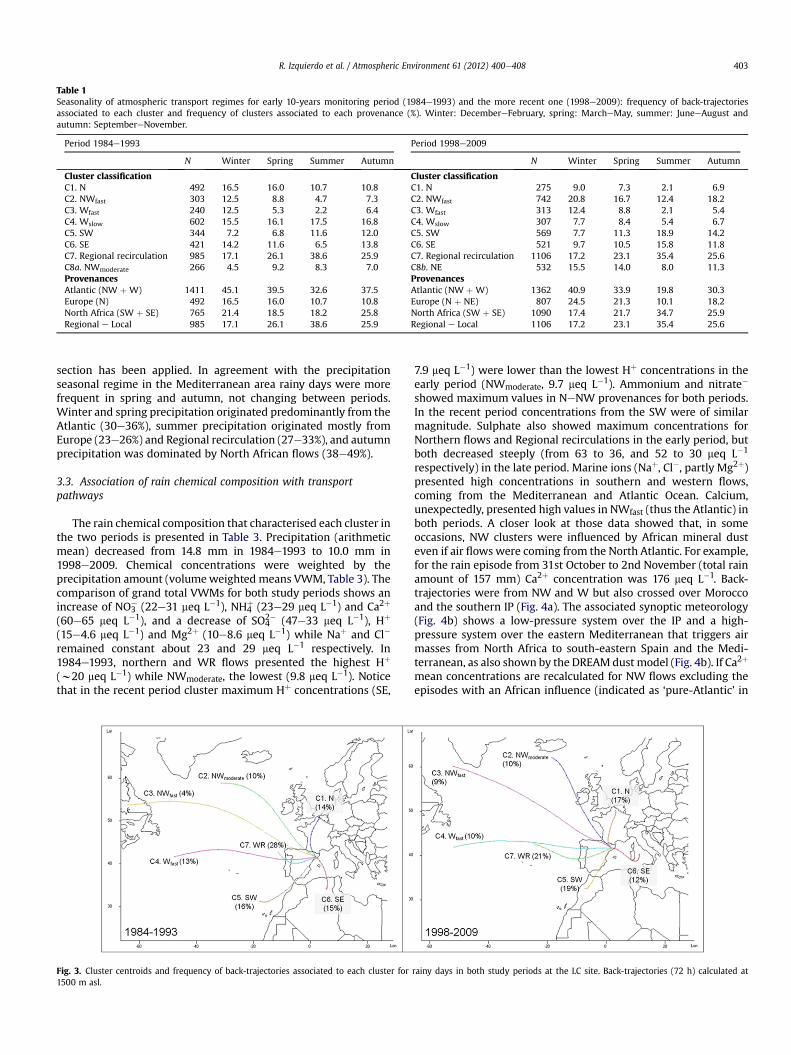
Table 1Seasonality of atmospheric transport regimes for early 10-years monitoring period (1984e1993) and the more recent one (1998e2009): frequency of back-trajectoriesassociated to each cluster and frequency of clusters associated to each provenance (%). Winter: DecembereFebruary, spring: MarcheMay, summer: JuneeAugust andautumn: SeptembereNovember.
Period 1984e1993 Period 1998e2009
N Winter Spring Summer Autumn N Winter Spring Summer Autumn
Cluster classification Cluster classificationC1. N 492 16.5 16.0 10.7 10.8 C1. N 275 9.0 7.3 2.1 6.9C2. NWfast 303 12.5 8.8 4.7 7.3 C2. NWfast 742 20.8 16.7 12.4 18.2C3. Wfast 240 12.5 5.3 2.2 6.4 C3. Wfast 313 12.4 8.8 2.1 5.4C4. Wslow 602 15.5 16.1 17.5 16.8 C4. Wslow 307 7.7 8.4 5.4 6.7C5. SW 344 7.2 6.8 11.6 12.0 C5. SW 569 7.7 11.3 18.9 14.2C6. SE 421 14.2 11.6 6.5 13.8 C6. SE 521 9.7 10.5 15.8 11.8C7. Regional recirculation 985 17.1 26.1 38.6 25.9 C7. Regional recirculation 1106 17.2 23.1 35.4 25.6C8a. NWmoderate 266 4.5 9.2 8.3 7.0 C8b. NE 532 15.5 14.0 8.0 11.3Provenances ProvenancesAtlantic (NW þ W) 1411 45.1 39.5 32.6 37.5 Atlantic (NW þ W) 1362 40.9 33.9 19.8 30.3Europe (N) 492 16.5 16.0 10.7 10.8 Europe (N þ NE) 807 24.5 21.3 10.1 18.2North Africa (SW þ SE) 765 21.4 18.5 18.2 25.8 North Africa (SW þ SE) 1090 17.4 21.7 34.7 25.9Regional e Local 985 17.1 26.1 38.6 25.9 Regional e Local 1106 17.2 23.1 35.4 25.6
R. Izquierdo et al. / Atmospheric Environment 61 (2012) 400e408 403
section has been applied. In agreement with the precipitationseasonal regime in the Mediterranean area rainy days were morefrequent in spring and autumn, not changing between periods.Winter and spring precipitation originated predominantly from theAtlantic (30e36%), summer precipitation originated mostly fromEurope (23e26%) and Regional recirculation (27e33%), and autumnprecipitation was dominated by North African flows (38e49%).
3.3. Association of rain chemical composition with transportpathways
The rain chemical composition that characterised each cluster inthe two periods is presented in Table 3. Precipitation (arithmeticmean) decreased from 14.8 mm in 1984e1993 to 10.0 mm in1998e2009. Chemical concentrations were weighted by theprecipitation amount (volumeweighted means VWM, Table 3). Thecomparison of grand total VWMs for both study periods shows anincrease of NO3
� (22e31 meq L�1), NH4þ (23e29 meq L�1) and Ca2þ
(60e65 meq L�1), and a decrease of SO42� (47e33 meq L�1), Hþ
(15e4.6 meq L�1) and Mg2þ (10e8.6 meq L�1) while Naþ and Cl�
remained constant about 23 and 29 meq L�1 respectively. In1984e1993, northern and WR flows presented the highest Hþ
(w20 meq L�1) while NWmoderate, the lowest (9.8 meq L�1). Noticethat in the recent period cluster maximum Hþ concentrations (SE,
Fig. 3. Cluster centroids and frequency of back-trajectories associated to each cluster for1500 m asl.
7.9 meq L�1) were lower than the lowest Hþ concentrations in theearly period (NWmoderate, 9.7 meq L�1). Ammonium and nitrate�
showed maximum values in NeNW provenances for both periods.In the recent period concentrations from the SW were of similarmagnitude. Sulphate also showed maximum concentrations forNorthern flows and Regional recirculations in the early period, butboth decreased steeply (from 63 to 36, and 52 to 30 meq L�1
respectively) in the late period. Marine ions (Naþ, Cl�, partly Mg2þ)presented high concentrations in southern and western flows,coming from the Mediterranean and Atlantic Ocean. Calcium,unexpectedly, presented high values in NWfast (thus the Atlantic) inboth periods. A closer look at those data showed that, in someoccasions, NW clusters were influenced by African mineral dusteven if air flows were coming from the North Atlantic. For example,for the rain episode from 31st October to 2nd November (total rainamount of 157 mm) Ca2þ concentration was 176 meq L�1. Back-trajectories were from NW and W but also crossed over Moroccoand the southern IP (Fig. 4a). The associated synoptic meteorology(Fig. 4b) shows a low-pressure system over the IP and a high-pressure system over the eastern Mediterranean that triggers airmasses from North Africa to south-eastern Spain and the Medi-terranean, as also shown by the DREAM dust model (Fig. 4b). If Ca2þ
mean concentrations are recalculated for NW flows excluding theepisodes with an African influence (indicated as ‘pure-Atlantic’ in
rainy days in both study periods at the LC site. Back-trajectories (72 h) calculated at
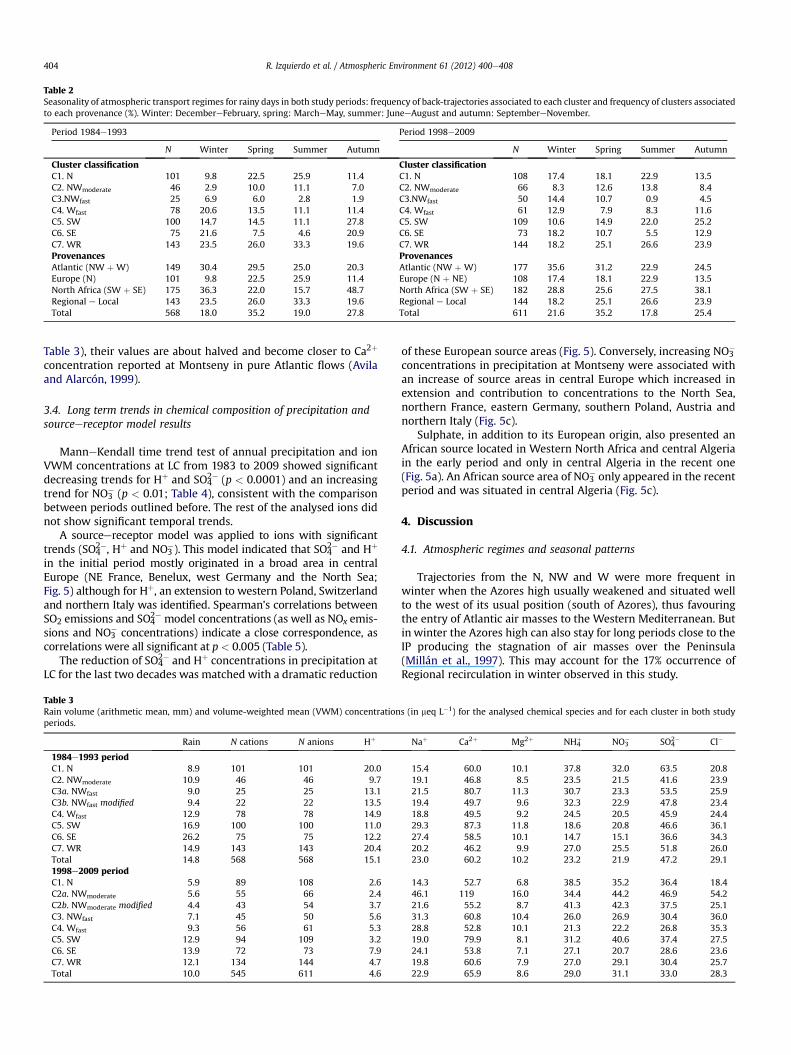
Table 2Seasonality of atmospheric transport regimes for rainy days in both study periods: frequency of back-trajectories associated to each cluster and frequency of clusters associatedto each provenance (%). Winter: DecembereFebruary, spring: MarcheMay, summer: JuneeAugust and autumn: SeptembereNovember.
Period 1984e1993 Period 1998e2009
N Winter Spring Summer Autumn N Winter Spring Summer Autumn
Cluster classification Cluster classificationC1. N 101 9.8 22.5 25.9 11.4 C1. N 108 17.4 18.1 22.9 13.5C2. NWmoderate 46 2.9 10.0 11.1 7.0 C2. NWmoderate 66 8.3 12.6 13.8 8.4C3.NWfast 25 6.9 6.0 2.8 1.9 C3.NWfast 50 14.4 10.7 0.9 4.5C4. Wfast 78 20.6 13.5 11.1 11.4 C4. Wfast 61 12.9 7.9 8.3 11.6C5. SW 100 14.7 14.5 11.1 27.8 C5. SW 109 10.6 14.9 22.0 25.2C6. SE 75 21.6 7.5 4.6 20.9 C6. SE 73 18.2 10.7 5.5 12.9C7. WR 143 23.5 26.0 33.3 19.6 C7. WR 144 18.2 25.1 26.6 23.9Provenances ProvenancesAtlantic (NW þ W) 149 30.4 29.5 25.0 20.3 Atlantic (NW þ W) 177 35.6 31.2 22.9 24.5Europe (N) 101 9.8 22.5 25.9 11.4 Europe (N þ NE) 108 17.4 18.1 22.9 13.5North Africa (SW þ SE) 175 36.3 22.0 15.7 48.7 North Africa (SW þ SE) 182 28.8 25.6 27.5 38.1Regional e Local 143 23.5 26.0 33.3 19.6 Regional e Local 144 18.2 25.1 26.6 23.9Total 568 18.0 35.2 19.0 27.8 Total 611 21.6 35.2 17.8 25.4
R. Izquierdo et al. / Atmospheric Environment 61 (2012) 400e408404
Table 3), their values are about halved and become closer to Ca2þ
concentration reported at Montseny in pure Atlantic flows (Avilaand Alarcón, 1999).
3.4. Long term trends in chemical composition of precipitation andsourceereceptor model results
ManneKendall time trend test of annual precipitation and ionVWM concentrations at LC from 1983 to 2009 showed significantdecreasing trends for Hþ and SO4
2� (p < 0.0001) and an increasingtrend for NO3
� (p < 0.01; Table 4), consistent with the comparisonbetween periods outlined before. The rest of the analysed ions didnot show significant temporal trends.
A sourceereceptor model was applied to ions with significanttrends (SO4
2�, Hþ and NO3�). This model indicated that SO4
2� and Hþ
in the initial period mostly originated in a broad area in centralEurope (NE France, Benelux, west Germany and the North Sea;Fig. 5) although for Hþ, an extension to western Poland, Switzerlandand northern Italy was identified. Spearman’s correlations betweenSO2 emissions and SO4
2� model concentrations (as well as NOx emis-sions and NO3
� concentrations) indicate a close correspondence, ascorrelations were all significant at p < 0.005 (Table 5).
The reduction of SO42� and Hþ concentrations in precipitation at
LC for the last two decades was matched with a dramatic reduction
Table 3Rain volume (arithmetic mean, mm) and volume-weighted mean (VWM) concentrationperiods.
Rain N cations N anions Hþ
1984e1993 periodC1. N 8.9 101 101 20.0C2. NWmoderate 10.9 46 46 9.7C3a. NWfast 9.0 25 25 13.1C3b. NWfast modified 9.4 22 22 13.5C4. Wfast 12.9 78 78 14.9C5. SW 16.9 100 100 11.0C6. SE 26.2 75 75 12.2C7. WR 14.9 143 143 20.4Total 14.8 568 568 15.11998e2009 periodC1. N 5.9 89 108 2.6C2a. NWmoderate 5.6 55 66 2.4C2b. NWmoderate modified 4.4 43 54 3.7C3. NWfast 7.1 45 50 5.6C4. Wfast 9.3 56 61 5.3C5. SW 12.9 94 109 3.2C6. SE 13.9 72 73 7.9C7. WR 12.1 134 144 4.7Total 10.0 545 611 4.6
of these European source areas (Fig. 5). Conversely, increasing NO3�
concentrations in precipitation at Montseny were associated withan increase of source areas in central Europe which increased inextension and contribution to concentrations to the North Sea,northern France, eastern Germany, southern Poland, Austria andnorthern Italy (Fig. 5c).
Sulphate, in addition to its European origin, also presented anAfrican source located in Western North Africa and central Algeriain the early period and only in central Algeria in the recent one(Fig. 5a). An African source area of NO3
� only appeared in the recentperiod and was situated in central Algeria (Fig. 5c).
4. Discussion
4.1. Atmospheric regimes and seasonal patterns
Trajectories from the N, NW and W were more frequent inwinter when the Azores high usually weakened and situated wellto the west of its usual position (south of Azores), thus favouringthe entry of Atlantic air masses to the Western Mediterranean. Butin winter the Azores high can also stay for long periods close to theIP producing the stagnation of air masses over the Peninsula(Millán et al., 1997). This may account for the 17% occurrence ofRegional recirculation in winter observed in this study.
s (in meq L�1) for the analysed chemical species and for each cluster in both study
Naþ Ca2þ Mg2þ NH4þ NO3
� SO42� Cl�
15.4 60.0 10.1 37.8 32.0 63.5 20.819.1 46.8 8.5 23.5 21.5 41.6 23.921.5 80.7 11.3 30.7 23.3 53.5 25.919.4 49.7 9.6 32.3 22.9 47.8 23.418.8 49.5 9.2 24.5 20.5 45.9 24.429.3 87.3 11.8 18.6 20.8 46.6 36.127.4 58.5 10.1 14.7 15.1 36.6 34.320.2 46.2 9.9 27.0 25.5 51.8 26.023.0 60.2 10.2 23.2 21.9 47.2 29.1
14.3 52.7 6.8 38.5 35.2 36.4 18.446.1 119 16.0 34.4 44.2 46.9 54.221.6 55.2 8.7 41.3 42.3 37.5 25.131.3 60.8 10.4 26.0 26.9 30.4 36.028.8 52.8 10.1 21.3 22.2 26.8 35.319.0 79.9 8.1 31.2 40.6 37.4 27.524.1 53.8 7.1 27.1 20.7 28.6 23.619.8 60.6 7.9 27.0 29.1 30.4 25.722.9 65.9 8.6 29.0 31.1 33.0 28.3
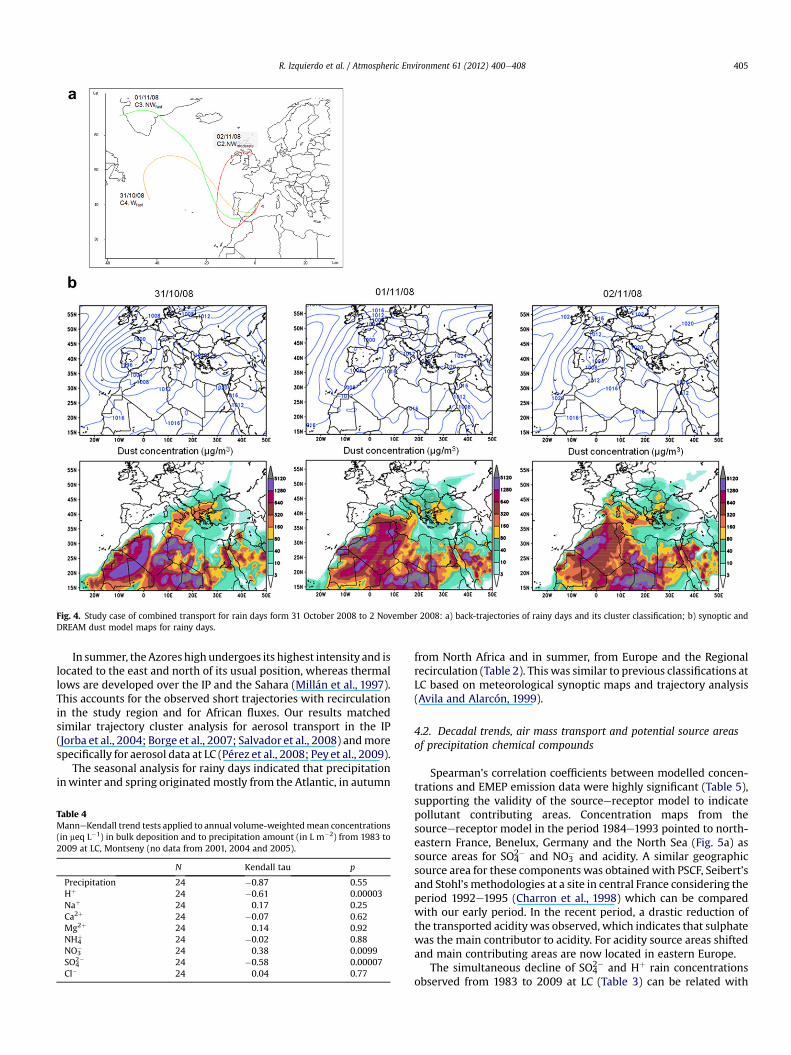
Fig. 4. Study case of combined transport for rain days form 31 October 2008 to 2 November 2008: a) back-trajectories of rainy days and its cluster classification; b) synoptic andDREAM dust model maps for rainy days.
R. Izquierdo et al. / Atmospheric Environment 61 (2012) 400e408 405
In summer, theAzores high undergoes its highest intensity and islocated to the east and north of its usual position, whereas thermallows are developed over the IP and the Sahara (Millán et al., 1997).This accounts for the observed short trajectories with recirculationin the study region and for African fluxes. Our results matchedsimilar trajectory cluster analysis for aerosol transport in the IP(Jorba et al., 2004; Borge et al., 2007; Salvador et al., 2008) andmorespecifically for aerosol data at LC (Pérez et al., 2008; Pey et al., 2009).
The seasonal analysis for rainy days indicated that precipitationinwinter and spring originatedmostly from the Atlantic, in autumn
Table 4ManneKendall trend tests applied to annual volume-weightedmean concentrations(in meq L�1) in bulk deposition and to precipitation amount (in L m�2) from 1983 to2009 at LC, Montseny (no data from 2001, 2004 and 2005).
N Kendall tau p
Precipitation 24 �0.87 0.55Hþ 24 �0.61 0.00003Naþ 24 0.17 0.25Ca2þ 24 �0.07 0.62Mg2þ 24 0.14 0.92NH4
þ 24 �0.02 0.88NO3
� 24 0.38 0.0099SO4
2� 24 �0.58 0.00007Cl� 24 0.04 0.77
from North Africa and in summer, from Europe and the Regionalrecirculation (Table 2). This was similar to previous classifications atLC based on meteorological synoptic maps and trajectory analysis(Avila and Alarcón, 1999).
4.2. Decadal trends, air mass transport and potential source areasof precipitation chemical compounds
Spearman’s correlation coefficients between modelled concen-trations and EMEP emission data were highly significant (Table 5),supporting the validity of the sourceereceptor model to indicatepollutant contributing areas. Concentration maps from thesourceereceptor model in the period 1984e1993 pointed to north-eastern France, Benelux, Germany and the North Sea (Fig. 5a) assource areas for SO4
2� and NO3� and acidity. A similar geographic
source area for these components was obtained with PSCF, Seibert’sand Stohl’s methodologies at a site in central France considering theperiod 1992e1995 (Charron et al., 1998) which can be comparedwith our early period. In the recent period, a drastic reduction ofthe transported acidity was observed, which indicates that sulphatewas the main contributor to acidity. For acidity source areas shiftedand main contributing areas are now located in eastern Europe.
The simultaneous decline of SO42� and Hþ rain concentrations
observed from 1983 to 2009 at LC (Table 3) can be related with
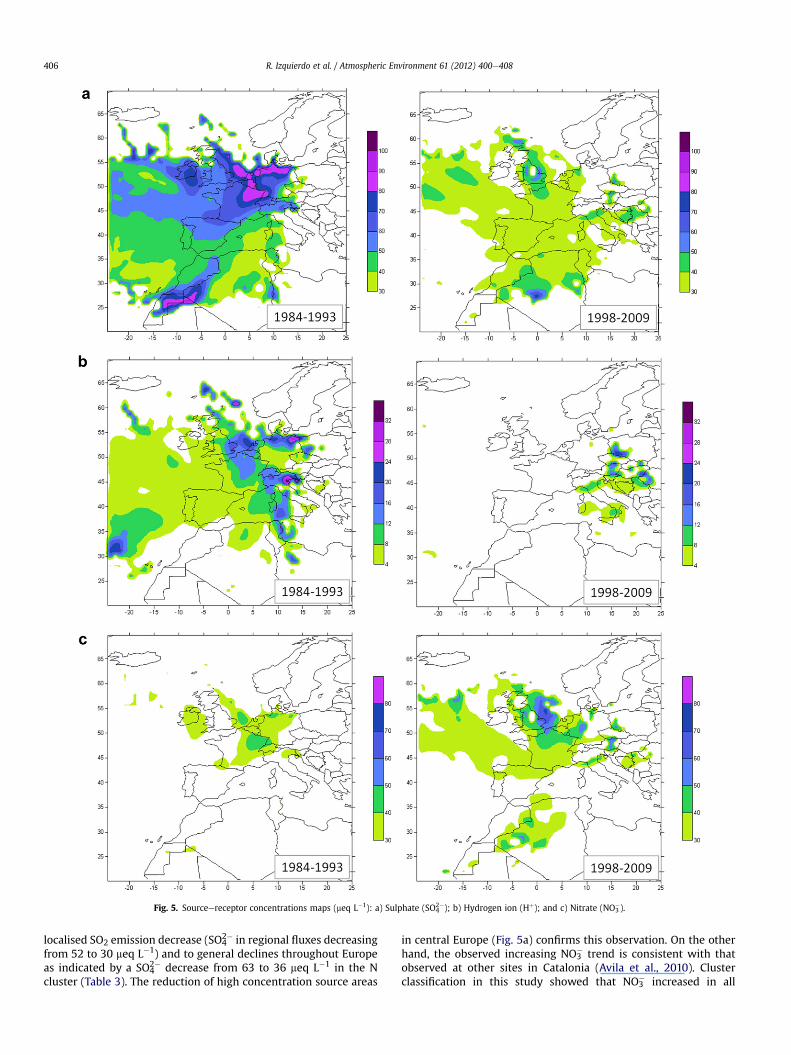
Fig. 5. Sourceereceptor concentrations maps (meq L�1): a) Sulphate (SO42�); b) Hydrogen ion (Hþ); and c) Nitrate (NO3
�).
R. Izquierdo et al. / Atmospheric Environment 61 (2012) 400e408406
localised SO2 emission decrease (SO42� in regional fluxes decreasing
from 52 to 30 meq L�1) and to general declines throughout Europeas indicated by a SO4
2� decrease from 63 to 36 meq L�1 in the Ncluster (Table 3). The reduction of high concentration source areas
in central Europe (Fig. 5a) confirms this observation. On the otherhand, the observed increasing NO3
� trend is consistent with thatobserved at other sites in Catalonia (Avila et al., 2010). Clusterclassification in this study showed that NO3
� increased in all
Table 5Spearman’s rank correlation coefficients (R) for concentrations vs. EMEP emissionvalues. Early period ¼ 1983e1994; recent period ¼ 1998e2009.
Valid N R p
NOxeNO3� early period 976 0.38 <0.000001
NOxeNO3� recent period 1042 0.17 <0.000001
SO2eSO42� early period 976 0.26 <0.000001
SO2eSO42� recent period 1042 0.09 0.004
R. Izquierdo et al. / Atmospheric Environment 61 (2012) 400e408 407
clusters, but the increase was more prominent for NW and SWfluxes, roughly doubling in the recent period (Table 3). Nitratesources in Europe were extended over larger areas and theircontribution to concentrations was intensified (Fig. 5c).
European S (and sometimes N) emissions on land are beingsuccessfully abated; however, recent studies indicate theincreasing role of maritime emissions (Endresen et al., 2003;Collins et al., 2008). The commercial shipping contribution hasbeen estimated at 5e8% of global anthropogenic SO2 emissionsand 15e30% of global fossil fuel NOx emissions (Eyring et al.,2005). In the North Sea, intense ship traffic to Rotterdam andHamburg is responsible for an increase in SO4
2�, NO3� and NH4
þ
aerosol concentrations by 50% in summer around this area(Matthias et al., 2010). The implementation of a sulphur emissioncontrol area (SECA) in the North Sea in 2007 was found to reduceSO2 and SO4
2� aerosol concentrations, though NO3� concentra-
tions slightly increased (Matthias et al., 2010). In our study, thehigh SO4
2� and NO3� concentrations from N and NWmoderate
clusters and the modelled source area over the North Sea (Fig. 5aand c) may be related with these increasing maritime pollutantemissions.
On the other hand, large recent SO2 emission reductions inEurope have played an important role in modifying nitrateaerosol concentrations. Since atmospheric ammonia is first usedto neutralize sulphate to form ammonium sulphate aerosols,particulate nitrate can only be formed if excess ammonia isavailable. With declining SO2 in the atmosphere, nitrate aerosolconcentrations have been found to be 25% higher than expectedif SO2 emissions were not reduced. This effect has been espe-cially large in Central and East Europe (Fagerli and Aas, 2008)and may have contributed to the increase of NO3
� rain concen-tration at LC observed in N and NW clusters. Ammonium aero-sols resulting from NH3 combination with sulphuric and nitricacids can be transported over several thousand kilometres(Hov and Hjollo, 1994; Charron et al., 1998). Ammonium nitrateaerosols are thermically unstable at >20 �C and this mightnot be properly represented in current sourceereceptormethodologies, such as the Seibert’s method here used. To ourknowledge trajectory models have not yet incorporated modulesconsidering chemical transformations during transport, nor wetdeposition processes.
Trajectories from North Africa are highly enriched in NO3� in the
recent period and their SO42� concentrations were similar to those
of northern air fluxes (Table 3). Furthermore, sourceereceptormaps showed high SO4
2� in southern Morocco and Central Algeria(Fig. 5a). Recent studies of African aerosols have shown that SO4
2�
in dust particles can be attributed to the dissolution of dolomite(CaMgCO3) and calcium sulphate derived from gypsum soils andsalt-lakes in specific areas of North Africa (Rodríguez et al., 2011),but these authors provide also detailed evidence of the influence ofindustrial activities being developed in North Africa (involvingcrude oil refineries, phosphate fertilizer industry, and powerplants) that have an influence on NO3
�, NH4þ and at least 60% of SO4
2�
of <10 mm content in particles transported in the Saharan Air Layer(Rodríguez et al., 2011).
5. Conclusions
Back-trajectory clustering showed a decrease of Atlanticadvections and an increase of African and European air flows.Precipitation in winter and spring predominantly originated fromthe Atlantic, in autumn from North Africa, and in summer, Euro-pean and Regional recirculation flows contributed similarly.
A significant decrease of SO42� and Hþ and an increase of NO3
�
was found in bulk deposition in Montseny. Cluster analysis anda sourceereceptor model indicated that NE Spain is under theinfluence of natural and anthropogenic sources from the local scaleand long-range transport. The reduction of SO4
2� and Hþ concen-trations in precipitation at LC for the last two decades was matchedwith a dramatic reduction of source areas in central Europe. ForNO3
�, initial small source areas in central Europe expanded towardsthe North Sea, northern France, eastern Germany, southern Poland,Austria and northern Italy. Ship emissions and the growing indus-trialisation in Eastern Europe and North Africa probably explainsthe location of the pollutants’ main source areas in the recentperiod.
Acknowledgements
We acknowledge the financial support from the SpanishGovernment (CGL2009-13188-C03-01, CGL2009-11205, CSD2008-00040-Consolider Montes grants and CSD2007-00067-ConsoliderGRACCIE). Mirna Lopez is thanked for assistance with back-trajectory analysis.
Appendix A. Supplementary material
Supplementary data related to this article can be found at http://dx.doi.org/10.1016/j.atmosenv.2012.07.060.
References
Arsene, C., Olariu, R.I., Mihalopoulos, N., 2007. Chemical composition of rainwater inthe northeastern Romania, Iasi region (2003e2006). Atmospheric Environment41, 9452e9467.
Avila, A., 1996. Time trends in the precipitation chemistry at a mountain site inNortheastern Spain for the period 1983e1994. Atmospheric Environment 30,1363e1373.
Avila, A., Alarcón, M., 1999. Relationship between precipitation chemistry andmeteorological situations at a rural site in NE Spain. Atmospheric Environment33, 1663e1677.
Avila, A., Rodà, F., 2002. Assessing decadal changes in rainwater alkalinity at a ruralMediterranean site in the Montseny Mountains (NE Spain). AtmosphericEnvironment 36, 2881e2890.
Avila, A., Molowny-Horas, R., Gimeno, B.S., Peñuelas, J., 2010. Analysis of decadaltime series in wet N concentrations at five rural sites in NE Spain. Water Air &Soil Pollution 207 (1e4), 123e138. http://dx.doi.org/10.1007/s11270-009-0124-7.
Begum, B.A., Kim, E., Jeong, C., Lee, D., Hopke, P.K., 2005. Evaluation of the potentialsource contribution function using the 2002 Quebec forest fire episode.Atmospheric Environment 39, 3719e3724.
Borge, R., Lumbreras, J., Vardoulakis, S., Kassomenos, P., Rodríguez, E., 2007. Analysisof long-range transport influences on urban PM10 using two-stage atmospherictrajectory clusters. Atmospheric Environment 41, 4434e4450.
Cape, J.N., Methven, J., Hudson, L.E., 2000. The use of trajectory cluster analysis tointerpret trace gas measurements at Mace Head, Ireland. Atmospheric Envi-ronment 34, 3651e3663.
Charron, A., Plaisance, H., Sauvage, S., Coddeville, P., Galloo, J.C., Guillermo, R., 1998.Intercomparison between three receptor-oriented models applied to acidicspecies in precipitation. Science of the Total Environment 223, 53e63.
Collins, W., Sanderson, M.G., Johnson, C., 2008. Impact of increasing ship emissionson air quality and deposition over Europe by 2030. Meteorologische Zeitschrift18, 25e39.
Dorling, S.R., Davies, T.D., 1995. Extending cluster analysis e synoptic meteorologylinks to characterise chemical climates at six north-west European monitoringstations. Atmospheric Environment 29 (2), 145e167.
Draxler, R.R., Rolph, G.D., 2003. HYSPLIT (HYbrid Single-Particle Lagrangian Inte-grated Trajectory) Model Access via NOAA ARL READY. NOAA Air ResourcesLaboratory, Silver Spring, MD. Website: http://www.arl.noaa.gov/ready/hysplit4.html.
R. Izquierdo et al. / Atmospheric Environment 61 (2012) 400e408408
Draxler, R.R., Stunder, B., Rolph, G., Taylor, A., 2009. HYSPLIT_4 User’s Guide. NOAAAir Resources Laboratory. http://www.arl.noaa.gov/documents/reports/hysplit_user_guide.pdf.
Endresen, Ø., Sørgård, E., Sundet, J.K., Dalsøren, S.B., Isaksen, I.S.A., Berglen, T.F.,Gravir, G., 2003. Emissions from international sea transportation and environ-mental impact. Journal of Geophysical Research 108 (D17), 4560. http://dx.doi.org/10.1029/2002JD002898.
Eyring, V., Köhler, H.W., van Aardenne, J., Lauer, A., 2005. Emissions from interna-tional shipping: 1. The last 50 years. Journal of Geophysical Research-Atmo-spheres 110 (D17), D17305.
Fagerli, H., Aas, W., 2008. Trends of nitrogen in air and precipitation: model resultsand observation at EMEP sites in Europe, 1980e2003. Environmental Pollution,448e461.
Giorgi, F., Lionello, P., 2008. Climate change projections for the Mediterraneanregion. Global and Planetary Change 63, 90e104. http://dx.doi.org/10.1016/j.gloplacha.2007.09.005.
Gundersen, P., Schmidt, I.K., Raulund-Rasmussen, K., 2006. Leaching of nitrate fromtemperate forests e effects of air pollution and forest management. Environ-mental Reviews 14 (1), 1e57. http://dx.doi.org/10.1139/a05-015.
Hoh, E., Hites, R.A., 2004. Sources of toxaphene and other organochlorine pesticidesin North America as determined by air measurements and potential sourcecontribution function analyses. Environmental Science and Technology 38,4187e4194.
Hov, O., Hjollo, B.A., 1994. Transport distance of ammonia and ammonium inNorthern Europe. 2. Its relation to emissions of SO2 and NOx. Journal ofGeophysical Research 99, 18749e18755.
Jorba, O., Pérez, C., Rocadensbosch, F., Baldasano, J.M., 2004. Cluster analysis of 4-day back trajectories arriving in the Barcelona area, Spain, from 1997 to 2002.Journal of Applied Meteorology 43, 887e901.
Matthias, V., Bewersdorff, I., Aulinger, A., Quante, M., 2010. The contribution of shipemissions to air pollution in the North Sea regions. Environmental Pollution158, 2241e2250.
Millán, M., Salvador, R., Mantilla, E., Kallos, G., 1997. Photo-oxidant dynamics in theMediterranean basin in summer: results from European research projects.Journal of Geophysical Research 102, 8811e8823.
Moulin, C., Lambert, C.E., Dulac, F., Dayan, U., 1997. Control of atmospheric export ofdust from North Africa by the North Atlantic Oscillation. Nature 387, 691e694.
Pérez, N., Pey, J., Castillo, S., Viana, M.M., Alastuey, A., Querol, X., 2008. Interpreta-tion of the variability of levels of regional background aerosols in the WesternMediterranean. Science of the Total Environment 407, 527e540.
Pey, J., Pérez, N., Castillo, S., Viana, M., Moreno, T., Pandolfi, M., López-Sebastián, J.M.,Alastuey, A., Querol, X., 2009. Geochemistry of regional background aerosols inthe Western Mediterranean. Atmospheric Research 94, 422e435.
Polissar, A.V., Hopke, P.K., Harris, J.M., 2001. Source regions for atmospheric aerosolmeasured at Barrow, Alaska. Environmental Science and Technology 35, 4214e4226.
Riccio, A., Giunta, G., Chianese, E., 2007. The application of a trajectory classificationprocedure to interpret air pollution measurements in the urban area of Naples(Southern Italy). Science of the Total Environment 376, 198e214.
Rodà, F., Retana, J., Gracia, C.A., Bellot, J., 1999. Ecology of Mediterranean EvergreenOak Forests. In: Ecological Studies, vol. 137. Springer, Berlin, 373 pp.
Rodríguez, S., Alastuey, A., Alonso-Pérez, S., Querol, X., Cuevas, E., Abreu-Afonso, J.,Viana, M., Pandolfi, M., de la Rosa, J., 2011. Transport of desert dust mixed withNorth African industrial pollutants in the subtropical Saharan Air Layer.Atmospheric Chemistry and Physics Discussions 11, 8841e8892. http://dx.doi.org/10.5194/acpd-11-8841-2011.
Rodríguez, S., Querol, X., Alastuey, A., Mantilla, E., 2003. Events affecting levels andseasonal evolution of airborne particulate matter concentrations in the WesternMediterranean. Environmental Science and Technology 37, 216e222.
Salvador, P., Artiñano, B., Alonso, D.G., Querol, X., Alastuey, A., 2004. Identificationand characterisation of sources of PM10 in Madrid (Spain) by statisticalmethods. Atmospheric Environment 38, 435e447.
Salvador, P., Artíñaño, B., Querol, X., Alastuey, A., Costoya, M., 2007. Characterisationof local and external contributions of atmospheric particulate matter ata background coastal site. Atmospheric Environment 41, 838e845.
Salvador, P., Artíñano, B., Querol, X., Alastuey, A., 2008. A combinedanalysis of backwardtrajectories and aerosol chemistry to characterise long-range transport episodes ofparticulate matter: the Madrid air basin, a case of study. Science of the Total Envi-ronment 390, 495e506. http://dx.doi.org/10.1016/j.scitotenv.2007.10.052.
Salvador, P., Artíñano, B., Pio, C., Afonso, J., Legrand, M., Puxbaum, H., Hammer, S.,2010. Evaluation of aerosol sources at European high altitude background siteswith trajectory statistical methods. Atmospheric Environment 44, 2316e2329.
Seibert, P., Kromp-Kolb, H., Balterpensger, U., Jost, D.T., Schwikowski, M., Kasper, A.,Puxbaum, H., 1994. Trajectory analysis of aerosol measurements at high alpinesites. In: Borrell, P.M.P., Cvitas, T., Seiler, W. (Eds.), Transport and Transformationof Pollutants in the Troposphere. Academic Publishing, Den Haag, pp. 689e693.
Sharma, S., 1996. Applied Multivariate Techniques. John Wiley & Sons, Inc., NewYork, 493 pp.
Skjelkvale, B.L., et al., 2005. Regional scale evidence for improvements in surfacewater chemistry 1990e2001. Environmental Pollution 137, 165e176.
Stoddard, J.L., et al., 1999. Regional trends in aquatic recovery from acidification inNorth America and Europe. Nature 401, 575e578.
Stohl, A., 1996. Trajectory statistics e a new method to establish sourceereceptorrelationships of air pollutants and its applications to the transport of particulatesulphate in Europe. Atmospheric Environment 30, 579e587.
Stohl, A., 1998. Computation, accuracy and applications of trajectories e a reviewand bibliography. Atmospheric Environment 32, 947e966.
Copyright © 2022 FDOKUMEN