TRAINING OF VISUAL SKILLS AND TRANSFERABILITY TO OVERALL RUGBY PERFORMANCE IMPROVEMENT
268
TRAINING OF VISUAL SKILLS AND TRANSFERABILITY TO OVERALL RUGBY PERFORMANCE IMPROVEMENT ANELIA LUDEKE
-
Upload
independent -
Category
Documents
-
view
5 -
download
0
Transcript of TRAINING OF VISUAL SKILLS AND TRANSFERABILITY TO OVERALL RUGBY PERFORMANCE IMPROVEMENT

TRAINING OF VISUAL SKILLS AND
TRANSFERABILITY TO OVERALL
RUGBY PERFORMANCE
IMPROVEMENT
ANELIA LUDEKE

TRAINING OF VISUAL SKILLS AND TRANSFERABILITY
TO OVERALL RUGBY PERFORMANCE IMPROVEMENT
By
ANELIA LUDEKE
DISSERTATION
Submitted in fulfilment of the requirements of the degree
DOCTOR PHILOSOPHIAE
In
OPTOMETRY
In the
FACULTY OF HEALTH SCIENCE
At the
UNIVERSITY OF JOHANNESBURG
SUPERVISOR: PROF JT FERREIRA
NOVEMBER 2010

ACKNOWLEDGEMENTS
I would like to offer individual thanks to the following people for their assistance in helping
me complete this thesis.
Professor Jannie Ferreira for supervising me to the completion of this thesis. Thank you for
your motivation, advice and patience.
Juliana van Staden at the Statcon Department for assisting me with the statistical results. I
admire you for your passion and commitment toward your work. Thank you for your advice
and support.
The staff at the Department of Optometry for their encouragement and moral support.
My parents, Koos and Julie Prinsloo, for all the years of encouraging me to persevere with
my studies.
All my family and friends for their continuous support.
Praise to God for giving me the strength, wisdom and courage to finish.
Frans for encouraging and supporting me through all this time, I would not have been able to
complete this thesis without your love and support.
Our beautiful little girl, Izebella, who unknowingly gave me the inspiration to finish.

ABSTRACT
Vision is a learned skill that implies an appropriate interpretation of what is seen and
interpreted (Abel, 1999). Neural pathways are established as a result of learning,
strengthened by achieving a task goal and grow stronger as practice progresses (Edelman,
1992).
According to Davis, Kimmet and Auty (1990) it takes 500 hours of practice to change a skill
and use that skill competently during competitions. Therefore, training sessions should be
structured around learning the perceptual and cognitive skills needed for successful decisions
in different environments (Vickers, 2007). Four elements - skill execution, concentration,
response time and decision-making - were identified and are known to have a great effect on
overall sports performance (Coffey and Reichow, 1995; Erickson, 2007 & Vickers, 2007). A
reliable model that could be used to evaluate performance levels by applying these four
cardinal elements of performance has been developed through this study.
Twenty five rugby players participated in the study which was conducted over a period of
three years. The sample was divided into four groups of which three were experimental and
one was a control group. Two of the three experimental groups, who came from different
regional teams, had specific visual training in the national side. The third experimental group
had off-season visual training only and the control group had no visual training at all. Two
methods were used to evaluate performance: in the first method three independent top class

raters conducted the performance evaluation and the second was based on data collection.
Both methods involved the Verusco© system.
The results indicated a poor correlation among the raters: two of the three raters agreed that
Group 4 (Regional team B, that played for the national side and had specific visual training)
performed significantly better than Group 3 (Regional team B that had no visual training) in
decision-making during season 1 and Group 1 (Regional team A) showed a significant
improvement in skill execution from season 1 to season 2. Group 1 (Regional team A) had
non–specific off-season visual training. Groups 2 (Regional team A, that played for the
national side) and 4 (Regional team B, that played for the national side) received specific
visual training and Group 3 (Regional team B) had no visual training at all.
According to the Verusco Trymaker Pro© system Group 3 (Regional team B that had no
visual training) and Group 4 (Regional team B, that played for the national side and had
specific visual training) showed significant improvement in decision-making from season 1
to season 2. Group 4 (Regional team B, that played for the national side and had specific
visual training) showed significant improvement in concentration from season 2 to season 3.
No correlation was found between the raters and the Verusco TryMaker Pro© system. For
this reason it was important to develop a reliable objective method for evaluating
performance like the one developed in the current study for the establishment of better and
more reliable results. The four main elements of performance were established and an index
for each of the elements was developed in order to establish an objective model for
performance.

TABLE OF CONTENTS
CHAPTER 1
INTRODUCTION 2
1. Project Background 2
2. Production of skilled movement 6
3. Introduction to the corner stones for sports vision 13
4. Introduction to rugby and the visual demands in rugby 14
5. Aim of the study 17
CHAPTER 2
PERCEPTION 19
1. Introduction 19
2. Corner stones for sports vision 20
3. Visual demands in rugby 32
CHAPTER 3
INFORMATION PROCESSING 42

CHAPTER 4
PERFORMANCE 58
1. The acquisition of motor skills 58
2. Expert versus novice athletes 72
CHAPTER 5
METHODOLOGY 82
1. Research design 82
2. Procedures 83
CHAPTER 6
RESULTS 97
1. Introduction 97
2. Different non-parametric analysis procedures 99
3. A comparison between the Verusco system and the individual raters 102
4. A correlation between the individual raters 103
5. Agreement among the individual raters 113
6. The significant results of individual raters and that of the
Verusco system 115

7. A model for the objective evaluation of vision related performance in rugby 134
8. The analysis of the four elements of performance using the data from the
Verusco system 137
CHAPTER 7
DISCUSSION AND CONCLUSION 143
1. Introduction 143
2. The four elements of performance 153
3. Conclusion 161
4. Recommendations 166
CHAPTER 8
REFERENCES 169
CHAPTER 9
APPENDIX 1 212
APPENDIX 2 214
APPENDIX 3 259
APPENDIX 4 260

CHAPTER 1
INTRODUCTION
1. Project background
2. Production of skilled movement
3. Introduction to the cornerstones for Sports
Vision
4. Introduction to Rugby and the visual demands in
rugby
5. Aim of the study
1

CHAPTER 1
INTRODUCTION
1. PROJECT BACKGROUND
What does the word vision mean? What effect does vision have on sport performance?
Are there differences in visual processing between elite and novice athletes? What is it that
distinguishes elite athletes from novices? Will improvement in visual skills necessarily
transfer to overall sport performance? All these questions have been asked in the past.
Experts have developed better specific programs to process information available in a sport
task (Abernethy, 1991; Bressan, 2003; Ferreira, 2002; Magill, 2001; Williams et al., 1999).
Abernethy (1986) introduced a two visual system approach. Hardware skills represent the
physical differences in the mechanical and optometric properties of the visual system and
software skills are the cognitive differences in the analysis, selection, coding and general
handling of visual information (Abernethy, 1987).
Research done by Abernethy and Wood (2001) has shown that visual training does not
necessarily transfer to overall sport performance. The reason for this could well be that in
office training or training of the hardware skills were used and not sport specific exercises
(Abernethy & Wood, 2001) as well as a limitation in the musculoskeletal system (Kluka,
2

1999).
The skills involved in the hardware system include static and dynamic visual
acuity, depth perception, accommodation, fusion, colour vision and contrast sensitivity
(Abernethy, 1986; Ferreira, 2002).
The software system includes aspects such as eye-hand and eye-body coordination, visual
adjustability, visual concentration, central-peripheral awareness, visual reaction time and
visualization (Ferreira, 2002). Calder (1999) found that sport-specific visual awareness
training significantly improve the on-field skill performance of hockey players. The
training involved a combination of hardware and software skill interventions both in office
and on the field.
The word vision is synonymous with the following concepts namely: eyesight, perception,
seeing, insight, discernment, mental picture, image, revelation, intuition (Adams et al.,
2000). The visual system provides information about the external environment and is
responsible for the conscious identification of objects that leads to visual perception
(Kluka, 1999; Schmidt & Wrisberg, 2008). Our vision incorporates both information from
the retina and that of eye movements and is known as active vision. Both the inputs from
the retina (active vision) and that from within the brain are being processed for visual
perception (Wurtz, McAlonan, Cavanaugh & Berman, 2011).
Sight is a physiological characteristic, but vision is a skill that must be learned because it
implies a proper interpretation of what is seen (Abel, 1999). Neural pathways are
established as a result of learning. Achieving a task goal strengthens neural pathways
which become increasingly stronger as practice progresses (Edelman, 1992). During a
3

learner’s life cycle many dynamically interconnected sub-systems develop at different rates
and stages (Handford et al., 1997). However, these subsystems may also constrict
behaviour as a whole and act as ‘rate limiters’ (Handford et al., 1997; Newell & Van
Emmerik, 1991; Thelen, 1995).
Researchers have shown that the brain matures neurologically when players are between
nineteen and twenty years of age. Physiologically, in the case of females, the body reaches
maturity between the ages nineteen and twenty and approximately three years later for
males (Balyi & Hamilton, 1999). Furthermore it takes 8-12 years or ten thousand hours of
training for talented players to reach elite levels (Ericsson & Charness, 1994; Ericsson et al,
1993, Sosniak, 1985). Therefore, players in the performance phase, ages 18 years and
older, are close to their maximum ability as far as physical and skill capacities are
concerned (Sosniak, 1985).
According to Davis, Kimmet and Auty (1986) it takes 500 hours worth of practice to
change an existing skill and to be able to use that skill during competitions. It could
therefore be difficult to improve speed, power, strength, endurance and technical skills of
players in the performance phase because players’ adaptation reserves are reduced
(Tschiene, 1988). However, it is still possible to optimize their capacities through specific
stimulus exposure and precise training (Tschiene, 1988).
Other constraints in motor behaviour could be due to fluctuations in a player’s emotional
state, caused by anxiety and arousal (Bootsma et al., 1992; Schmidt & Wrisberg, 2008), or
goal setting which may vary from performance to performance (Latash, 1993). These
4

factors could contribute to poor performance during competitions when time and intensity
are of critical importance (Bootsma et al, 1992).
The work reported in this thesis was undertaken to determine whether neurologically
mature players still have the ability to show improvement in performance, and also to
define the role that vision and specifically the visual skills have on performance. Previous
research did not evaluate sports performance during competitions. This current study is
unique in the sense that a number of players’ performance were evaluated during
competitions only and conducted over a period of 3 years. The video clips selected to
evaluate players during competitions are a reflection of their performance. Furthermore
conducting the study over a 3 year period has reduced the effect of variants in open skill
sports greatly, allowing the results to be valid. Four critical factors in sport performance
have been selected in the evaluation process from literature: skill execution, concentration,
response time and decision making, which are all known to have a considerable effect on
overall sports performance (Coffey and Reichow, 1995; Erickson, 2007 & Vickers, 2007).
This study has also developed a reliable model which could be used to evaluate
performance levels based on these four factors of sport performance.
5
2. PRODUCTION OF SKILLED MOVEMENT
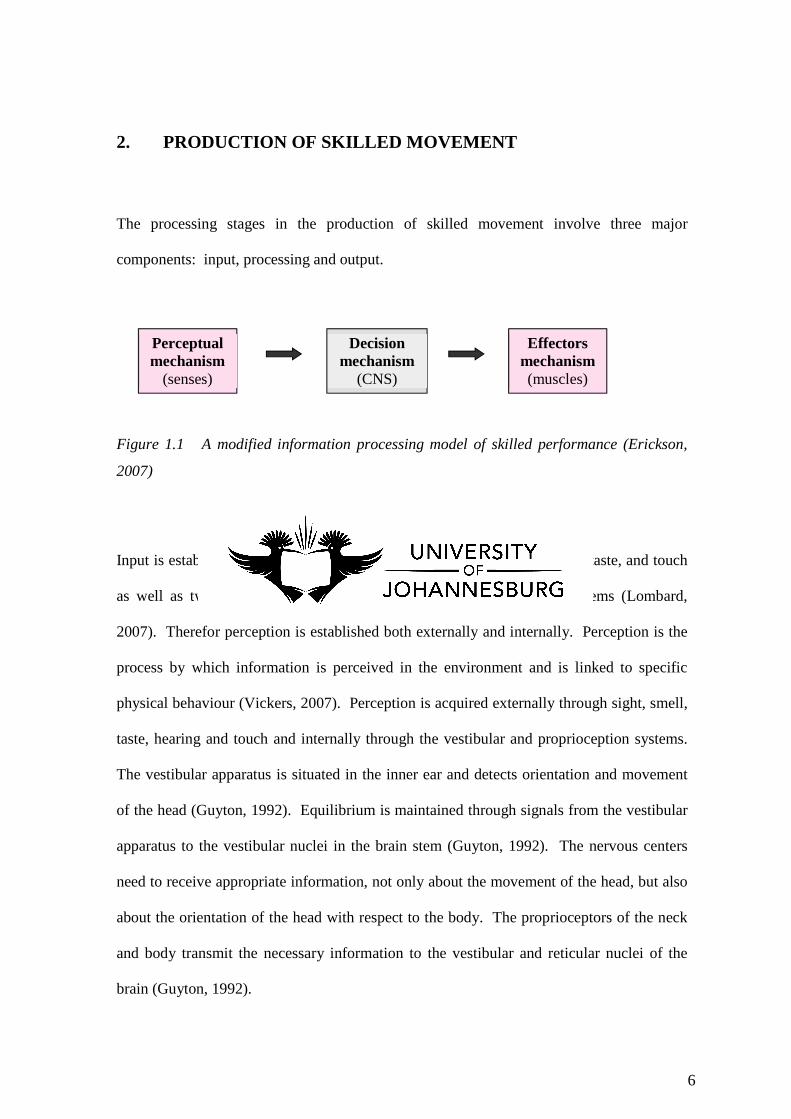
The processing stages in the production of skilled movement involve three major
components: input, processing and output.
Figure 1.1 A modified information processing model of skilled performance (Erickson,
2007)
Input is established through the five visible senses: vision, hearing, smell, taste, and touch
as well as two movement senses: the vestibular and proprioceptive systems (Lombard,
2007). Therefor perception is established both externally and internally. Perception is the
process by which information is perceived in the environment and is linked to specific
physical behaviour (Vickers, 2007). Perception is acquired externally through sight, smell,
taste, hearing and touch and internally through the vestibular and proprioception systems.
The vestibular apparatus is situated in the inner ear and detects orientation and movement
of the head (Guyton, 1992). Equilibrium is maintained through signals from the vestibular
apparatus to the vestibular nuclei in the brain stem (Guyton, 1992). The nervous centers
need to receive appropriate information, not only about the movement of the head, but also
about the orientation of the head with respect to the body. The proprioceptors of the neck
and body transmit the necessary information to the vestibular and reticular nuclei of the
brain (Guyton, 1992).
Perceptual
mechanism
(senses)
Decision
mechanism
(CNS)
Effectors
mechanism
(muscles)
6

According to Lombard (2007) eighty five percent of sensory information perceived from
the external environment is perceived through the visual system. Equilibrium can be
maintained through the visual system, even after destruction of the vestibular apparatus and
loss of proprioceptive information from the body (Guyton, 1992). The main sensory
receptors are therefore the visual and hearing senses (Lombard, 2007).
Sensory experience causes immediate reaction or may be stored as memory for future use
in order to determine appropriate reactions. The information received through the receptors
enters the central nervous system through the spinal nerves and are relayed to all parts of
the nervous system (Guyton, 1992). This includes the primary sensory areas: the spinal
cord, the reticular substance of the medulla, pons and mesencephalon, the cerebellum, the
thalamus and the somesthetic areas of the cerebral cortex (Guyton, 1992).
The major function of the central nervous system is the processing of information in order
to initiate the most appropriate motor response. However, the brain discards more than
ninety nine percent of information as irrelevant and serves as an integrative system where
only the most relevant information is processed for the appropriate motor function (Guyton,
1992). Relevant information is determined through stimulus identification, response
selection and response programming (Schmidt & Wrisberg, 2008).
Muscles and glands are known as effectors because they perform the functions transmitted
through the nerve signals. Reception of nerve impulses to the muscular system results in
motor action (Guyton, 1992; Schmidt & Wrisberg, 2008). Both extrinsic and intrinsic
feedback allows for change in the quality of the action and reinforces learning.
7

Schmidt (Schmidt & Wrisberg, 2008) introduced the conceptual model of motor
performance. Identifying information about a stimulus, select the program needed to
perform an action and program the action, are influenced by the information that is stored
in our memory and in the motor programs we have developed. A motor program is a set of
motor commands that is pre-structured and results in the production of a coordinated
movement (Schmidt & Lee, 2005). The movement commands moves through the spinal
cord to the muscles. The movement is being influenced by feedback loops. The M1 loop
relays sensory information from the muscles to the spinal cord. This automatically
maintains balance and stability. The M2 loop goes from the muscles up the spinal cord to
the brain to stored programs for the actions that is being performed. The M3 loop requires
conscious perception and attention from the sensory system (Vickers, 2007). These
feedback loops reacts to the reference of past and present experiences and movement is
corrected if an error has been perceived. The final two sources of feedback are related to
external information. Knowledge of results arises from the outcome of the movement and
knowledge of performance is concerned with technique and form. These two sources of
feedback have a great effect on how humans learn and perform motor skills (Vickers,
2007).
8

Intended outcome
And anticipated
feedback
Input
Movement outcome
Response programming
Muscles
Output
Comparator
Ex
trin
sic
Fee
db
ack
Stimulus identification
Response selection
Motor program
Spinal cord
Intr
insi
c F
eed
bac
k
Am
bie
nt
vis
ion
Proprioceptive feedback
Exteroceptive feedback
Focal vision
Knowledge of results
Knowledge of performance
Error
Desired state
Actual state
M1
M3
M2
Figure 1.2 Motor learning and control (Schmidt RA & Wrisberg CA, 2008)
9

One of the first information processing models for skilled performance was introduced by
Abernethy (1986) when he introduced the two visual system approach which has been
mentioned before. He introduced the visual system as a computer analogy of information
gathering and processing and divided it into a hardware and a software visual system.
Schmidt (1991) developed a model for motor learning and control from a cognitive-
behavioural perspective. The model consists of fourteen information-processing events, as
seen above.
Erickson (2007) improved the processing model of skilled performance which also explains
the schematic model of information processing. He proposed three central processing
mechanisms: the perceptual mechanism, the decision mechanism and the effector
mechanism. The perceptual mechanism receives information from the sensory receptors
which is then filtered and only the necessary information is processed. This mechanism is
responsible for organizing and interpreting processed information (Erickson, 2007).
The processed information is then delivered to the decision making mechanism which
determines the appropriate motor response, guided by an athletes past experiences. The
effector mechanism initiates and controls the motor response. Thus, neural commands,
which are necessary to produce the required motor response, are sent to the appropriate
brain centers in order to execute the motor action.
Vickers (2007) noted the importance of the perceptual-motor link between perception and
sports performance. When vision is involved, successful decision making is dependent on
10

‘gaze control’, the ability to know where, when and what to look at. She developed a
Three-Step Decision-Training Model as a method of coaching which is specifically aimed
at improving a players’ ability to make decisions about his/her actions. Figure 1.3
represents Vickers’ model.
1. Identify one decision the player has to make in competition. Highlight one
cognitive skill needed to make that decision.
Cognitive Skills
Anticipation Pattern
recognition
Attention Memory
Focus & concentration Problem solving
Decision making
2. Design a drill or progression of drills that trains the decision in a relevant sport
context using one of the cognitive triggers.
Cognitive Triggers
Object cues Reaction time cues
Location cues Memory cues
Quiet eye Kinaesthetic cues
Self-coaching cues
3. Select one or more of the decision tools to train the decision in a variety of contexts.
Decision-training tools
Variable practice Questioning
Random practice Video feedback
Bandwidth feedback External focus of
instruction
Hard first instruction &
modelling
Figure 1.3 Three-Step Decision Training Model (Vickers, 2007)
11

The perceptual-cognitive motor process is specified in each step.
Step 1: Identify a decision, and highlight a cognitive skill
Vickers (2007) recommended that each practice should focus on at least one of the seven
‘cognitive skills’ which have been identified. The seven cognitive skills are: anticipation,
attention, focus and concentration, pattern recognition, memory, problem solving and
decision making.
Step 2: Design an activity with a cognitive trigger
A drill or progression of drills should be designed or progression of drills to make decisions
similar or identical to the decision identified as the focus for practice. Each drill must have
a ‘cognitive trigger’. Vickers (2007) identified seven triggers: object triggers, location
cues, quiet eye cues, memory cues, reaction time cues, kinesthetic cues and self-coaching
cues. These triggers encourage players to focus their attention on relevant information or
to use their experience in decision making.
Step 3: Use decision-making tools to promote cognitive involvement
This step makes use of the seven tools of decision training to steer practice activities. The
seven decision training tools are known as: variable practice, random practice, bandwidth
feedback, questioning, video feedback, hand-first instruction and modeling and external
focus of instruction.
12
According to Vickers (2007) training sessions should be structured around learning the
perceptual and cognitive skills needed for successful decision making in different
environments.
To conclude, Vickers (2007) designed a coaching model to facilitate decision making in
sport. Decisions that players make during competitions must be identified initially. Drills
that train the decisions specifically in context need to be developed, and then drills for
decisions made in different contexts introduced.
3. INTRODUCTION TO THE CORNERSTONES FOR SPORTS
VISION
Coffey and Reichow (1990) identified benchmarks for sports vision: prevention of eye
injuries, visual correction through contact lenses which emphasize environmental factors in
sport, assessment of visual inefficiencies and visual abilities, and the enhancement of
specific visual abilities. Sports vision is built on four main cornerstones: protective
eyewear, corrective eyewear, visual skills evaluation and performance enhancement
(Ferreira, 2001).
Corrective eyewear, also known as ophthalmic devices, is used in correcting ametropic
visual impairments, such as myopia, hyperopia and astigmatism. The most common
ophthalmic devices used for the correction of these conditions are spectacles and contact
lenses (Moore & Ferreira, 2002).
13

Protective eyewear involves protection against eye injuries and exposure to environmental
factors. Protection of the eyes is particularly necessary in sports involving small, high
velocity projectiles (Vinger, 2000).
According to Moore and Ferreira (2002) the hardware and software visual skills which are
important in sport are static visual acuity, contrast sensitivity, accommodation flexibility,
fusion flexibility, stereopsis, colour vision, eye-hand coordination, eye-body coordination,
central peripheral awareness, visual reaction time and visual concentration. The
importance of these skills is different for different types of sports.
Performance may be enhanced by developing visual abilities, visual perception, decision
making and visual response time (Abernethy, 1991; Regan, 1992). Corrective eyewear,
protective eyewear and visual skill abilities can contribute to performance improvement
(Moore & Ferreira, 2002).
4. INTRODUCTION TO RUGBY AND ITS VISUAL DEMANDS
Rugby is a competitive, physical contact sport that requires physical and emotional
commitment to the game and has the capacity to produce great excitement (Winder, 1991).
It is one of the few sports which provide the opportunity for players with different
physiques and skills and of different genders and ages to participate in a controlled
environment (International Rugby Board, 2007).
14

Rugby is played by two teams, each consisting of fifteen players. The object of the game is
to contest for possession of the ball and score points. Rugby is a game that consists of
many parts (Pool, 2006), scrums, lineouts, mauls, rucks, kick offs, re-starts, attack and
defense (International Rugby Board, 2007). Scrums, lineouts, attack and defense are
known as unit skills. Support play, rucks and mauls, and kick offs and re-starts are known
as mini unit skills (Crawford, 1998 & Pool, 1992, 2006).
‘A Scrum is formed in the field of play when eight players from each team, bound together
in three rows each, close up with their opponents so that the heads of the front rows are
interlocked. This creates a tunnel into which a scrum half throws the ball, after which the
front row players compete for possession by hooking the ball with either of their feet.
The purpose of the lineout is to restart play after the ball has gone into touch, with a throw
in between two lines of players.
A maul occurs when a player carrying the ball is held by one or more opponents, and one
or more players of the ball carrier’s team bind on the ball carrier.
A ruck is a phase of play where one or more players from each team, who have to stay on
their feet, in physical contact, close around the ball on the ground. They then use their feet
to try to win or keep possession of the ball.
Kickoffs occur at the start of the match and the restart of the match after half time. Restart
kicks occur after a score or a touch down.
15

As one team attempts to maintain continuity of possession, the opposing team contests for
possession. This provides the essential balance between continuity of play and continuity
of possession and explains the difference between attack and defense.’
- International Rugby Board (2007).
A player needs the ability to perform a certain number of individual skills namely:
running, kicking, catching, tackling, handling the ball both while running and on the
ground and maintaining body position in contact (Stewart, 1987). Without these individual
skills it is difficult to perform as a mini unit or a unit.
According to Calder (1999), visual and specific visual awareness training improve both
visual skills and sport-specific skills significantly. The visual skills which play the biggest
role in rugby are eye-hand coordination, eye-body coordination, visual response time,
central-peripheral awareness and visual concentration (Calder, 2002; Ferreira, 2001), which
is in correlation with Erickson (2007) and Vickers (2007) where these skills form part of
the four critical performance factors in sport. Since vision is the most important sensory
system used for feedback (Lombard, 2007), more emphasis should be placed on vision and
the role it plays in the sporting environment (Pool, 2006).
16

5. AIM OF THE STUDY
The aim of the study was three-fold:
• there is a difference in the performance levels of groups of rugby participants in the
same training environment, performing at the same level of competition;
• groups of rugby participants in the same training environment who have been
exposed to visual training show a difference in performance levels over time when
performing at the same level of competition;
• the training of specific visual skills transfers to the overall improvement of rugby
performance.
Previous studies have shown improvement in visual skills (Calder, 1999; Loran &
MacEwen, 1995; Ludeke & Ferreira, 2003; Trachman & Kluka, 1993). Calder (1999)
found a significant improvement in the visual skill performance of field hockey players
who had sport-specific visual awareness training. The difference between the current study
and other studies involves players being evaluated during game situations. There is a
difference between performance during practice and performance during competition since
arousal and anxiety levels differ (Schmidt & Wrisberg, 2008). The question still remains,
however, whether specific visual training improves sport performance. Furthermore, how
much restriction is placed when an athlete reaches his/her performance phase, which is
between eighteen years and twenty-three years of age (Sosniak, 1985)?
17

CHAPTER 2
PERCEPTION
1. Introduction
2. Cornerstones for Sports Vision
3. Visual demands in Rugby
18

CHAPTER 2
PERCEPTION
1. INTRODUCTION
The word perception is synonymous with the word sense. The human brain perceives
information through seven senses: Five visible senses known as sight, hearing, smell, taste
and touch, and two movement senses are perceived through the vestibular system and
proprioception (Guyton, 1992 & Lombard, 2007). Although all seven senses play a role in
perception, sight is the most valuable sense, since eighty five percent of information is
perceived through the visual system (Gavrisky, 1969).
Chapter 2 consists of two sub headings, the four cornerstones of sports vision and the
visual demands in rugby. Perception through the visual system needs to be of exceptional
quality to produce good performance, which is established by using visual aids such as
corrective and protective eyewear. The visual skills discussed below explain the
various aspects which are necessary for vision as a whole. Performance follows
perception. After information has been perceived and processed, the reactor system is
activated and reaction takes place. The specific visual requirements for rugby are
discussed in detail below to emphasize the importance of vision in rugby.
19

2. CORNERSTONES FOR SPORTS VISION
The four corner stones for sports vision are the following:
• Corrective eyewear
• Protective eyewear
• Visual skills
• Performance enhancement
2.1 CORRECTIVE EYEWEAR
An athlete needs good vision for competing at national and international levels. Good
vision is defined as the minimum refractive status required for an athlete to perform at
his/her maximum level in a specific sport (Buys, 2002). The most common method of
visual correction would be correction through spectacles and contact lenses. Contact lens
wear is an obvious choice for visual correction in dynamic sports such as rugby, soccer,
baseball, hockey and racquet sports (Erickson, 2007). The using of contact lenses limits
problems such as visual field restrictions, aberrations, surface reflections, frame comfort
etc. According to a study done by Bausch & Lomb (1994) at the Olympic Games 15.5 %
of the athletes wore contact lenses as corrective method, while only 3.2 % wore spectacles.
The method for correcting ametropia should be sport specific and individual specific
(Garner, 1985; Hazel, 1995; Ramkisoon, 2002; Spinell, 1993), but hazardous and
environmental factors should also be taken into consideration. Rugby is a collision sport
20

which makes the wearing of spectacles difficult and therefore Soft contact lenses or other
unconventional methods such as orthokeratology would be a better choice (Ferreira, 2001).
Orthokeratology is a procedure that is used for low grade myopic patients up to 4.25D and
up to 1.50D for with-the-rule astigmatic patients (Marsden, 2000). Specially designed
lenses called reverse geometry lenses are worn overnight in order to improve unaided
visual acuity. Wearing these lenses results in the flattening of the central anterior corneal
curvature to reduce myopia, leaving the individual with a close to emmetropic state of
vision (Barr et al., 2003; Caroline, 2001; Lui et al., 2000; Ramkisoon, 2001; Swarbrick,
2006). According to Ramkisoon (2004), orthokeratology is a safe and effective way to
correct refractive error. Orthokeratology is a method which establishes normal, functional
vision, without requiring any optical aids. It is therefore a great alternative method to
correct refractive errors in athletes.
2.2 PROTECTIVE EYEWEAR
Participation in sports, especially sports involving balls, sharp objects, racquets, sticks, bats
or body contact exposes athletes to eye injuries (Vinger, 2000) and protective eyewear
protects them against eye injuries, exposure, environmental factors etc.
21

There is a spectrum of eye injuries which is classified according to specific sports (Ferreira,
2000)
• A sharp or penetrating injury is usually caused by a sharp object, which could
happen when throwing darts.
• A blow by a blunt object could be caused by a Cricket or Squash ball for example.
• A blow to the skull that might injure the optic pathways or cause a blow-out
fracture could happen in rugby or soccer for example.
Studies done on ocular trauma perceived during soccer or rugby games showed a relatively
low incidence (Burke et al., 1983; Jones, 1989; Larrison et al., 1990; Orlando & Doty,
1996; Vinger & Capao-Filipe, 2004). However athletes could be reluctant to wear
protective eyewear because of discomfort or poor vision or fogging or because of cosmetic
reasons (Erickson, 2007)
According to Woods (1987) 90 % of all eye injuries might be prevented if correct
protective measures are taken, but wearing protective eyewear is not always possible.
2.3 VISUAL SKILLS
Moore and Ferreira (2002) highlighted the importance of visual skills in sport and that the
importance of these skills is different for different types of sport. As previously mentioned
Abernethy (1986, 1987) divided visual skills into hardware and software visual skills. The
following visual skills are known as hardware visual skills: visual acuity, contrast
22

sensitivity, colour vision, stereopsis, and accommodation and fusion flexibility. The
software visual skills are: eye-hand coordination, eye-body coordination, central-
peripheral awareness, visual response time, visual concentration and decision making.
2.3.1 Static visual acuity
It is defined as the ability to see details of a stationary object distinctly under high contrast
conditions and is presented in a Snellen fraction. The universal method to test static visual
acuity involves the Snellen acuity chart. The Snellen letter is constructed on an equal-sided
grid, so that each limb width is one-fifth of the letter height. The size of the letters is then
expressed as Snellen fractions such as 6/6, 6/9, 6/12, etc. A normal static visual acuity is
considered to be 6/6 in adults (Buys, 2002; Ferreira, 2001).
Examination of static visual acuity using the Snellen E chart reveals serious validity issues.
The three-dimensional dynamic sports environment differs drastically from the clinical
assessment technique of determining the static visual acuity of the athlete (Planer, 1994).
Applegate and Applegate (1992) examined the effect of varied static visual acuity on the
foul-shooting performance of male subjects in basketball. They reported no significant
decrement in performance in visual acuities between 6/6 and 6/7.5. Considering the visual
demands of the respective environments for different sports, visual acuity will depend on
the requirements of a specific task (Blundell, 1985; Williams, Davids & Williams, 1999).
For example, rifle shooting requires high resolution of a target, whereas the visual acuity of
a rugby player needs to be far less accurate (Ferreira, 2001).
23

2.3.2 Contrast sensitivity
Contrast sensitivity measures athlete’s ability to process temporal or spatial information
about objects and their background under varying lighting conditions. It indicates the
smallest amount of contrast required to detect a visual stimulus (Kluka, 2001). The test
used to measure contrast sensitivity is the Vistech Chart, which consists of 6 rows of 8cm
diameter sine-wave gratings. In each row the spatial frequency remains the same but the
contrast differs. From row to row however, the spatial frequencies differ from top to
bottom (Buys, 2002; Ferreira, 2001).
Very little research has been published on the effect of contrast sensitivity function (CSF)
on sports performance. Trachtman (1995) investigated the enhancement of CSF through
sports vision programs and found that contrast sensitivity function can be improved as a
result of relaxation of accommodation biofeedback training. Researchers (Hoffman, Polan
& Powell, 1984; Kluka et al., 1995) have shown that athletes from different sports in which
the ball moves at high velocities have superior CSF compared to age-matched control
groups or non-athlete groups. Why athletes display higher CSF profiles than non-athletes
has not been clearly articulated. Whether athletes participate in sport because of their
superior CSF abilities or whether participation in sport enhances CSF is not yet clear
(Kluka, 2001).
2.3.3 Colour vision
Colour Vision deficiencies are assessed by the Farnsworth D15 test. Both red-green
deficiencies and yellow-blue anomalies are detected by this test (Buys, 2002; Ferreira,
2001). Colour vision deficiencies do not play a major role in rugby specifically (Ferreira,
24

2001). It is interesting to note, however, that approximately one in eleven white males is
colour deficient (Loran, 1999). This suggests that in a team, including the coaches, match
officials, reserves and medical and managerial teams, there could be two to three
participants who find it difficult to recognize certain colours. The ability to detect colour
differences between the uniforms of teammates and opponents may help a rugby player to
decide whether to throw a last minute pass or retain possession of the ball (Abernethy,
1991). Luckily this problem can easily be overcome by intensifying the colour contrasts
(Loran, 1999) or correcting the deficiency with colour contact lenses.
2.3.4 Stereopsis
Stereopsis is the ability to perceive depth, on the basis of retinal disparity clues. It is the
ability of the athlete’s eyes to utilize fused images rapidly and accurately to judge the
distance from an object (Katz, 1998). When an object point fails to stimulate
corresponding retinal points for the two eyes, it is said to stimulate on corresponding
points. The resulting stimulus situation is known as retinal disparity. Therefore, stereopsis
can only be achieved through binocular vision (Buys, 2002; Ferreira, 2001).
Miller (1960)
tested 162 subjects from five sports: volleyball, basketball, fencing,
swimming and gymnastics. According to Miller (1960) expert and intermediate athletes
showed superior depth perception compared to a group of novice subjects in the five sports
that are named above. An expert or elite athlete is one who consistently achieves the
highest statistics in a specific task in his or her sport, as documented by external authorities
(Vickers, 2007). Novelty is a deficiency of the simple motor-program notion, which
presumes that people are unable to produce new movements because they have not
25

developed specific motor programs for producing it (Schmidt & Wrisberg, 2008).
Blundell (1984) found significant differences in depth perception between championship
tennis players and both intermediate and beginner groups. The relationship between the
clinical evaluation and the context of depth in the sports action is questionable because the
evaluation is static compared to the dynamic environments of most sports. Perception and
estimation of depth change constantly with changes in movement of both the object and the
athlete (Williams, Davids & Williams, 1999). It is therefore difficult to estimate the
specific role of stereo depth in dynamic sport environments.
2.3.5 Accommodation flexibility
It is the ability to change accommodative and vergence postures quickly. Accommodation
is defined as the ability of the eye to focus clearly on objects at various distances, using the
crystalline lens (Buys, 2002; Ferreira, 2001).
In a study completed by Abernethy and Wood (2001) it was found that no significant
difference occurred in pre- to post training of accommodation. All participants in the
experiment experienced improvements. Authors concluded that it was the result of test
familiarity and not to the visual training program. The importance of accommodation in
certain sports such as rugby and cricket is debatable. In cricket specifically bowlers bowl
at speeds of between 80 – 150 km/h (McLeod & Jenkins, 1991). At the slow speed of 80
km/h the batsman needs to make a decision when the ball still has to travel 10m or 0.5s.
The whole process of perception, decision-making and stroke execution takes
approximately 0.45s. Any action that is initiated later than this will be ineffective (Ferreira,
2003; McLeod & Jenkins, 1991). Thus, the accommodation demand at 10m is almost
26
negligible (Ferreira, 2003). Rugby, on the other hand, is played at a much slower pace and
with a much bigger ball. Rugby players are capable to achieve passing velocities of
between 18.3 m/s and 38.1 m/s (Moritz & Haake, 2006). The question relating to the
importance of superior accommodative demand in certain sports is necessary to ask.
2.3.6 Fusion flexibility
Fusion is divided into motor and sensory fusion. Motor fusion is the movement of the eyes
that is made in response to retinal disparity stimuli in order to maintain single binocular
vision. Sensory fusion is the process where the visual stimuli images on the two retinas are
combined into a single percept (Buys, 2002; Ferreira, 2001).
Abernethy and Wood (2001) assessed vergence by using a Risley rotating prism to diverge
and converge the eyes while viewing distant objects, but found no improvements in
vergence in the participants. The changing temporal and spatial demands of dynamic
sports require disjunctive movements such as convergence and divergence to maintain
binocular vision (Blundell, 1985). In a Russian study about phoria and athletic
performance Graybiel, Jokl and Trapp (1955) reported that champion athletes were
significantly more orthophoric than non-athletes. Tatem (1973) found that athletes,
represented by basketball players, baseball players, gymnasts, tennis players and wrestlers,
were superior in vertical phoria compared with physical education majors. It would seem
that an athlete’s need to maintain fusion may be greater than that of a non-athlete. In fast
games such as cricket and tennis continual stress of the extra ocular muscular system may
deplete the fusional reserves over time and lead to performance decrements (Blundell,
1985).
27
2.3.7 Eye-hand coordination
Eye-hand coordination involves the synchronization of eyes and hands in the effectiveness
of a perceptual motor response to a visual sensory stimulus (Buys, 2002; Ferreira, 2001). It
is a measure of an athlete’s ability to effectively respond to a stimulus that involves hand
action. Previous studies on performance of eye-hand coordination where perceived fatigue
factors were present, showed no deterioration in this skill (Mollenberg et al., 2001).
Gender differences, where male athletes achieved faster times than female athletes in this
particular skill, have been reported (Coffey & Reichow, 1990; Klavora & Esposito, 2002).
It is a learned skill and can be improved by implementing various training techniques
(Loran & MacEwen, 1995).
2.3.8 Eye-body coordination
Eye-body coordination is the efficacy of an athlete to adjust his/her timing in response to a
visual stimulus and requires that the senses of vision, equilibrium and proprioception are
integrated (Buys, 2002; Ferreira, 2001; Rini & Werner, 1976). This skill is important in all
sports where rapid and efficient shifting of the balance in the legs and feet is required.
More attention should be given to making athletes more aware of their sensory abilities and
the fact that these abilities could be improved by following specific training programs
(Loran & MacEwen, 1995; Trachman & Kluka, 1993).
2.3.9 Central peripheral awareness
Central peripheral awareness is the ability of the athlete to maintain central fixation on a
target, yet be aware of what is happening to the sides or in the peripheral visual field (Buys,
2002; Ferreira, 2001). Central vision occurs in only three degrees of the total visual field
28
(Guyton, 1992). Central peripheral awareness is a function of visual perception and
evaluates the athlete’s ability to respond to central and peripheral stimuli without moving
the head (Buys, 2002; Ferreira, 2001). When this ability is lacking, athletes are required to
look around before they can respond, which often results in slow responses (Calder, 1999;
Planer, 1994). Previous studies have shown that athletes have a larger range of horizontal
and vertical visual fields than non-athletes (Berg & Killian, 1995; Graybiel et al., 1955;
Williams & Thirer, 1976). Athletes’ form recognition at peripheral locations also
appeared better than that of non-athletes (Buchellew, 1954; Christenson & Winkelstein,
1988; Hughes et al., 1993; Johnson, 1952). Central peripheral awareness is trainable
(Calder, 1999).
2.3.10 Visual response time
Visual response time is the time required to perceive and respond to visual stimuli (Buys,
2002; Ferreira, 2001; Planer, 1994). Kluka (1991) defined visual response time as the time
required from information processing until the first motor response, i.e. the speed with
which the brain interprets information and the action that follows after this. Visual acuity
does not have an influence on visual response time, but direction of motion in depth,
dynamic visual acuity and sport specific experience does (Gray & Regan, 2006; Millslagle,
2004). A superior ability in the latter skills could lead to superior visual response time.
Improving visual response time can result in faster visual processing of information and a
reduction in the time required for the neuromuscular system to send information to the
muscles (Erickson, 2007).
29
2.3.11 Visual concentration
Visual concentration is the ability to pay constant active attention to visual stimuli. It is
also a measure of how little visual information is required for the athlete to respond to a
stimulus (Buys, 2002; Ferreira, 2001). It is the driving force behind arousal and selective
attention (Downing & Pinker, 1985). Since this represents the driving force of the visual
perceptual system, hampered visual concentration can result in an overall poor motor
response. This may result in responses not only being too slow, but also inaccurate and
even inappropriate (Planer, 1994).
2.4 VISUAL PERFORMANCE ENHANCEMENT
A skill is a learned ability. It brings about a pre-determined result with maximum certainty
and maximum efficiency (Crawford, 1998). Leonard and Reyman (1988) defined skill as
the ability to achieve a result with optimal confidence and the minimal use of time and
energy. Magill (1993) defined skill as an action or task that has a specific goal to achieve,
it is an indicator of quality of performance. Schmidt and Lee (2005) defined skill as
“movements that are dependent on practice and experience for their execution, as opposed
to being genetically defined”. Skill acquisition implies learning and therefore skills can be
improved (Bressan 2003; Calder 1999; Ferreira, 2003; Hazel, 1995; Knudson & Kluka,
1997; Sherman, 1980). Motor skill learning involves a set of internal processes associated
with practice or experience leading to relatively permanent changes in human performance
(Kluka, 1999; Schmidt & Lee, 2005).
30

Coffey and Reichow (1995) divided visual enhancement training into three categories:
(1) Improving inefficient or inconsistent visual abilities; (2) developing visually dependent
motor function that is not as fast, quick, accurate or automatic as desired; (3) and
improving visual cognitive functions, which are critical for visual decision making during
competitions.
Erickson (2007) highlighted the following areas which are necessary for visual
performance enhancement: Treating vision insufficiencies, improving visual skills,
developing visual information processing skills, and enhancing visuomotor capabilities.
Vickers (2007) proposed her Decision Training Model for training and improving decision
making. She maintained that decision training is not just a relationship between perception
and motor performance, but also establishes an automatic connection between stimuli and
response. By using this model the cognitive thought processes of the players are developed
during practice sessions.
Decision-making is the process by which an appropriate movement response is selected as
well as the ability to assess a large number of situational cues and to select the most
appropriate response (Hodge & McKenzie, 1999). The ability to process visual
information quickly and accurately and facilitate performance during competitions
improves as expertise improves (Erickson, 2007). Studies done in badminton, baseball,
cricket, hockey, soccer, squash and tennis have shown that experts use advanced cues in
order to anticipate the outcome of an action (Abernethy, 1988; Abernethy, 1990; Abernethy
& Russell, 1984; Abernethy & Russell, 1987; Helsen & Pauwels, 1987; Houlston & Lowes,
31
1993; Isaacs & Finch, 1983; McLeod, 1987; Paull & Glencross, 1997; Starkes, 1995;
Williams & Burwitz, 1993).
3. VISUAL DEMANDS IN RUGBY
Schmidt and Lee (2005) defined skill as “movements that are dependent on practice and
experience for their execution, as opposed to being genetically defined”. The learning of a
motor skill occurs in stages: cognitive, associative and autonomous stages (Magill, 1993).
The cognitive stage is marked by a large number of errors in performance and is highly
variable. During the associative stage many of the basic fundamentals of the skill have to
some extent been learned. The errors are fewer and less gross in nature. The final stage of
learning is the autonomous stage. Here the skill has become almost automatic, the
individual has learned to perform most of the skill without thinking about it at all (Magill,
1993).
The following factors influence skilled performance: Player fatigue, arousal level, anxiety,
environmental conditions, knowledge of the performance required, previously learned
experiences, stages of growth and development, fitness levels, degree of motivation,
physical ability, vision, technique and the ability to think, interpret and select (Bootsma et
al., 1992; Crawford, 1998; Latash, 1993; Pool, 1992; Schmidt & Wrisberg, 2004).
The skills important in rugby are divided into individual skills, unit skills and mini unit
skills. Individual skills involve handling, running, kicking, tackling, falling in a tackle and
32

contact skills. Unit skills include the set pieces: lineouts and scrums, as well as attack and
defense. Support play, 2nd
phase play and kick starts are known as mini unit skills
(Crawford, 1998 & Pool, 1992, 2006).
3.1 INDIVIDUAL SKILLS
Individual skills form the fundamentals of rugby performance (Crawford, 1998)
Passing requires that an individual uses both hands, runs straight, looks at the receiver,
swings his arms and follows through. He needs to be aware of his surroundings. Different
passing techniques are used throughout a game: the standard pass, the dummy pass, the
spiral pass, the cleaning pass, the dive pass and the lob pass (Crawford, 1998; Pool, 1992,
2006). For executing the standard pass, both hands are required and the fingers are held
down the seam of the ball. The standard pass is used as the preferred option in most
instances since it is easier to catch and pass. By adjusting the fingers across the seam of the
ball, the standard pass is altered to the spiral pass. The spiral pass is used for passing over
longer distances because it ensures better accuracy and more speed. A dummy pass is used
for creating a gap in the defense in order to run through. The cleaning pass is used by the
scrum half to clear the ball away from a congested area and is achieved by spiraling the
ball, in order to get more distance. The foot is placed next to the ball and the ball is passed
in a single movement. The diving pass is used only if the scrum half is unable to use the
clearing pass and, when making a dive pass, the scrum half has to avoid any interference
from the opposition. The lob pass is used to pass over an opponent to a teammate. Visual
33

awareness is necessary to avoid interference from the opposition (Crawford, 1998; Pool,
1992, 2006).
Receiving a pass requires a player to keep his chin up and eyes open. The receiver should
position himself at the right depth to maintain his running speed and extend his arms in the
direction that the pass is coming from. This creates a target for the passer and increases
accuracy. He should keep his eyes on the ball until the ball has been received into his
hands (Crawford, 1998; Pool, 1992, 2006).
Catching a kicked ball should always be done from a side-on position. This protects the
player should a tackle be made and ensures that the ball will not be lost forward. A player
should contest for possession by jumping for the ball. The leading arm should be extended
towards the direction of the ball. The catch is made above eye level and the arms are
brought into the body (Crawford, 1998; Pool, 1992, 2006).
Picking up the ball from the ground requires that a player approaches the ball side on,
keeping his eyes on the ball. The front foot should be placed ahead of the ball while the
player keeps a low body position and a wide balance base. The ball should be secured with
both hands, one at the front and one at the back (Crawford, 1998; Pool, 1992, 2006).
Running involves four scenarios, running while in possession of the ball, creating space by
pushing off a defender while running, running in support of a ball carrier and running in
defense. The key factors for running are all the same: Always run towards a defender,
34

anticipate where the point of attack is going to be, position the ball away from the defender
and accelerate into space (Crawford, 1998; Pool, 1992, 2006).
The most important skills required for kicking are timing, balance, keeping the eyes on the
ball and keeping the head down. There are different kinds of kicks: kicking for distance,
the drop kick, the grubber kick, the up and under kick and the chip kick (Crawford, 1998;
Pool, 1992, 2006).
The accurate execution of a kick is determined by applying the right technique. A distance
kick is executed by holding the ball at a 45º angle, keeping the eyes on the ball, keeping the
head and shoulders still, placing the ball on the foot with the dominant hand, swinging the
leg straight through, pointing the toe downward at contact with the ball, following through
with the kicking foot and extending the opposite arm of the body to maintain balance.
The drop kick is executed by holding the ball in both hands, with the ball pointing
downwards. The eyes should be kept on the ball with the head and shoulders held still.
The ball is dropped to the ground to the side of the non-kicking foot and in front of the
kicking foot. The non-kicking foot should face the target. The height of the ball is
determined by the strike of the ball. For low kicks the ball should be struck close to the
ground. For high kicks the ball should be struck once it has bounced a bit higher. It is
important to follow through with the kicking foot towards the target.
The aim of the grubber kick is to have the ball roll end over end to allow it to be picked up
more easily. The ball is held in both hands while moving forward into a kicking position.
35

The eyes should be kept on the ball with strong peripheral awareness. The knee of the
kicking foot should be bent on the point of contact. The ball is kicked with the top of the
foot by using a short stabbing motion.
The up and under kick is used for applying pressure; the ball is kicked high into the air,
allowing for the attacking players to contest for the ball. The ball is struck with the top of
the foot. The point of contact is just behind the point of the ball, raising the toes on
contact. The eyes should be kept on the ball with the head held down. The higher the
follow through, the higher the ball will be kicked.
The chip kick is kicked just over the line of defense. The ball is kicked with the top of the
foot, bringing the toes up on contact with the ball, with a short follow through. It is
important to enable a backspin on the ball, which ensures that the ball pops up, making it
easier to regain possession of the ball. The eyes should be kept on the ball, and head held
down.
Forward momentum from the opposition is prevented through tackling. The defensive
player should position himself on the inside of the ball carrier, which limits the ball
carrier’s options. It should be the aim of the tackler to turn the ball carrier in the tackle in
order to regain possession of the ball.
When a player is being tackled, securing the ball is essential in order to establish pressure
and continuity in attack. The ball should be held in both hands, which promotes ball
security and continuity options.
36

The critical elements of performance, forms a fundamental part in the individual skills
where players need to take locations of opponents and teammates in consideration before
any decisions can be made. The elements are known as skill execution, concentration,
response time and decision making and have a great effect on overall sports performance
(Coffey and Reichow, 1995; Erickson, 2007 & Vickers, 2007). A reliable model that can
be used in the evaluation of performance levels through the four cardinal elements of
performance has been developed through this study.
3.2 UNIT SKILLS
The scrum acts as a restart when the forwards are bound together in a physical battle to win
possession of the ball. The scrum consists of a hooker, props, locks and loose forwards.
The ability to secure good possession of the ball in the scrum creates a platform for the
team to launch an attack. The decision-making players should be able to initiate the
attacking patterns according to the actions and location of the opposition. The two most
important visual skills needed in this activity will be awareness and decision making
(Crawford, 1998; Pool, 1992, 2006; Winder, 1991).
A lineout is awarded once the ball has crossed the touchline. Each lineout should consist of
a minimum of two players and a maximum of eight players from each team. That is, the
thrower or hooker, the jumpers, the lifters and the support players. The player who throws
the ball into the lineout has numerous options in order to dictate the lineout, since his team
determines the length of the lineout. The most significant factor in the lineout is delivering
37

the ball accurately to the intended receiver. This requires that the type and speed of the
service of the ball are assessed exactly during each throw in order to secure the ball
successfully. It is important that there is good communication between the thrower and
the jumpers and that every player understands his role. The jumper should react quickly,
keep his eyes on the ball and catch the ball with soft hands. The team who secures good
possession from the lineouts dominates play. (Crawford, 1998; Pool, 1992, 2006; Winder,
1991).
Attack is determined by the quality and speed of possession. The main purpose of attack is
applying continuous pressure on the opponents until a breach in the defense line occurs, in
order to score points. This is established by selecting, implementing and executing the
most effective strategies for each scenario during the game. The responsibility of decision-
making rests mainly on the scrum half, the fly half, the captain and the leader of the
forwards (Winder, 1991). According to Pool (2006) a player needs to have the ability to
summarize the situation before receiving the ball in order to select the most appropriate
action. It is the purpose of the seven backline players to create and exploit attacking
opportunities.
Winder (1991) stated four basic principles for successful backline play:
‘to progress beyond the gain line when in possession and to support the player in
possession of the ball to maintain continuity of play; to assess developing situations
continually and maintain awareness for creating and exploiting attacking and counter-
attacking opportunities; to pressurize opponents into making handling or decision-making
errors and to prevent them from crossing the gain line.’
38

The objective of the defense players is to prevent the ball carrier from crossing the
advantage line, limit time and space and enforce mistakes. However, the main objective is
to regain possession of the ball.
3.3 MINI UNIT SKILLS
Mini unit skills could also be described as continuity skills. These skills are utilized for
retaining possession of the ball. The purpose of the ball carrier is to maintain possession
while crossing the advantage line and generating ball retention to establish forward
movement by the supporting players.
Two distinct phases of continuity play are rucks and mauls. A maul is formed when the
ball is held above the ground and the ball carrier and one player from each team is in
physical contact with the ball carrier. The objective of the maul is to engage in group
opposition in order to move forward. The ball is transferred to the back of the maul in
order to initiate further play through the scrum half. A ruck is formed when the ball is on
the ground and one or more players from each team are in physical contact over the ball,
while staying on their feet. A ruck is formed with the purpose of establishing quick ball
possession and maintaining continuity (Crawford, 1998; Winder, 1991).
Kick-offs and drop-outs are used to resume play. The purpose of the restarts is to regain
possession of the ball, which requires consistency from the player taking the kick and
39

delivering the ball accurately to the target area. Securing possession during restarts is
achieved through structured and repetitive practice (Crawford, 1998; Winder, 1991).
The execution of all the above skills is dependent on each individual player, his strengths
and weaknesses, his ability to perform fine motor skills as well as his ability to interpret
visual information. According to Pool (2006) the difference between an average and elite
player is vision. The elite or talented player is always aware of his position and that of the
opposition. Pool (2006) also maintains that vision and decision making are inseparable.
Thus, the player with exceptional visual awareness is a superior decision maker, and
therefore an extraordinary athlete.
40

CHAPTER 3
INFORMATION
PROCESSING
41

CHAPTER 3
INFORMATION PROCESSING
An athlete who consistently achieves the highest statistics in a specific task in his or her
sport, as documented by external authorities is known as an elite athlete as mentioned
before (Vickers, 2007). Novelty is a deficiency of the simple motor-program notion, which
presumes that people are unable to produce new movements because they have not
developed specific motor programs for producing it (Schmidt & Wrisberg, 2008). Novel
athletes have a greater opportunity for ineffective and inefficient movements (Kluka,
1999). The distinction between elite and novice athletes is found in the execution of the
software skills (Ferreira, 2003; Ludeke & Ferreira, 2003). Elite athletes have the ability to
react more quickly to a stimulus than novices. According to Abernethy (1990) the
difference between expert performers and novices lies in the expression of the motor
system.
Figure 3.1 A modified information processing model of skilled performance ( Erickson,
2007)
Where in the process of perception, processing and reaction is superiority created? Is it
possible that expert performers utilize a different visual pathway under stressful conditions
Receptor
mechanism
(Senses)
Decision
mechanism
(CNS)
Effector
mechanism
(Muscles)
42

than novices do? Before this question can be answered one needs to look at the anatomy of
the nervous system.
The nervous system harbours a large number of lines of communication which control the
entire body. The principles of signalling in the brain are based on the following (Nicholls et
al., 2001):
1. Neurons act as the building block for perception
2. The input that a neuron receives determines the complexity of a message
Figure 3.2 The Human Visual System - Derived from the brain from top to bottom
[http://thebrain.mcgill.ca]
The Tectopulvinar and Geniculostriate systems are explained in the text below. In order to
assist easier understanding the systems have been colour coded throughout the text.
Optic
tectum
Occipital cortex
Areas 18 & 19
(extrastriate cortex)
Area 17
(striate
cortex)
Brainstem mechanisms controlling eye movements
Parietal
cortex
Area 7
Temporal cortex
Areas 20, 21 &
22
Magno
system
Parvo system
Geniculostriate system
Tectopulvinar
system
Ventral
stream
(what?)
Dorsal
stream
(where?)
thalamus
Thalamus
Pulvinar
LGN
43

The central nervous system is a gathering of cells which constantly receive information,
analyze and perceive it and makes decisions about it (Nicholls et al., 2001). Information is
processed in the retina already, after which it is transported via two main pathways, the
retinotectal and retinogeniculate pathways. The retinotectal pathway ends into the superior
colliculus, which is connected to motor nuclei in the brainstem as well as the visual cortex.
The retinogeniculate pathway forms two main streams, the magnocellular and parvocellular
streams, which carry dissimilar information to the visual cortex. From there information is
carried via two pathways, the dorsal and ventral streams, which end in the posterior parietal
cortex and the inferior temporal cortex respectively.
The retina acts as an illustration of the general principles of the nervous system (Guyton,
1992). Light which enters the eye passes through layers of transparent cells to the
photoreceptors. The signals that leave the eye through the optic nerve fibers of ganglion
cells provide the entire input for all of our vision (Guyton, 1992). Thus, before the sensory
signals reach the brain, a great deal of processing has already taken place (Milner &
Goodale, 1995).
The photoreceptors that are present in the retina are connected to the bipolar cells.
Photoreceptors have no obvious dendrites or axons (Nicholls et al., 2001). Activity in
photoreceptors does not arise through input from another neuron, but from an external
stimulus. The bipolar cells are connected to the ganglion cells. The axons of the ganglion
cells form the optic nerve. Axons of ganglion cells in the optic nerve conduct impulses
rapidly because they are surrounded by an insulating lipid sheath called myelin (Nicholls et
al., 2001).
44

Apart from this main connection of cells, there are also lateral connections through the
horizontal and the amacrine cells (Nicholls et al., 2001). Only amacrine and ganglion cells
give propagated action potentias, whereas photoreceptors, horizontal cells and bipolar cells
produce local graded signals.
Ganglion cells carry diverse information throughout the central and peripheral nervous
system (Milner & Goodale, 1995). The cell body contains the nucleus and other
intracellular organelles (Nicholls et al., 2001). The long process that leaves the cell body to
form connections with target cells is known as the axon. Dendrites are the branches upon
which incoming fibers make connections and act as receiving stations for excitation or
inhibition (Nicholls et al., 2001).
Glial cells do not have axons or dendrites and are not directly connected to neurons. Glial
cells are abundant throughout the nervous system and play a number of roles in neuronal
signalling (Nicholls et al., 2001). Myelin, which wraps itself around axons during
development, is formed by glial cells.
Information is transmitted to neurons by electrical and chemical signals (Guyton, 1992).
Nerve cells with similar properties are grouped together in layers throughout the nervous
system. The brain uses stereotyped electrical signals to process information. The signals
consist of changes in voltage, produced by electrical currents flowing across cell
membranes (Guyton, 1992).
45

Electrical signals generated by neurons fall into two main classes, localized graded
potentials and action potentials (Nicholls et al., 2001). Localized graded potentials are
generated by an extrinsic stimulus such as light falling on a photoreceptor in the eye.
Signals generated in synapses are highly similar in their electrical characteristics, but have
very different origins. All these signals are graded and localized to the site of origin and
their spread depends on the passive properties of nerve cells (Nicholls et al., 2001).
Action potentials are initiated by localized graded potentials (Nicholls et al., 2001). They
multiply rapidly over long distances and occur in a neuron with fixed amplitude and
duration. They are the only signals which provide the brain with information about the
visual world (Nicholls et al., 2001). The great number of cells and the diversity of
connections, rather that the types of signals, are what account for the complexity of the
tasks that can be undertaken in the brain.
Figure 3.3 Tectopulvinar System – Some axons in
the optic tracts bypass the LGN and terminate in the
optic tectum at the superior colliculus of the
midbrain.
The brain from top to bottom -
[http://thebrain.mcgill.ca]
46

Nerve impulses leave the retinas and pass through the optic nerves. At the optic chiasm all
the fibers from the nasal halves of the retinas cross to the opposite side, where they join the
fibers from the opposite temporal retinas to form the optic tracts. The fibers of each optic
tract form part of the visual pathways from the eye to the brain (Nicholls et al., 2001).
Referring to the diagram on the human visual system -
The retinotectal and the retinogeniculate pathways are the two largest pathways from the
eye to the brain (Milner & Goodale, 1995). The older retinotectal projection passes through
the magnocellular pathway and ends in the superior colliculus, which is interconnected
with a large number of other brain structures, including premotor and motor nuclei in the
brainstem and spinal cord (Milner & Goodale, 1995). It also sends projections via thalamic
nuclei, to a number of different sites in the cerebral cortex (Guyton, 1992; Milner &
Goodale, 1995).
The superior colliculus, a sensorimotor structure located on the dorsal surface of the
brainstem (Dreher & Robinson, 1991) is able to mediate some oculomotor movements
without cortical involvement (Dreher & Robinson, 1991). The superior colliculus plays an
important role in visual attention and spatial orientation ( Klier et al., 2003; Krauzlis et al.,
2004; Kustov & Robinson, 1996; Sparks, 1999).
Neurons in the superior colliculus are
sensitive to vision motion stimuli, which are the result of saccadic eye movements or body
movement (Dreher & Robinson, 1991). This implies that the superior colliculus is
responsible for navigational processing and therefore related to the peripheral or ‘where’
retina (Dreher & Robinson, 1991).
47

Each colliculus only represents the contralateral half of the visual field, and excludes the
ipsilateral half (Lane et al., 1973). This is due to the absence of anatomical connections
between the retinal ganglion cells in the temporal half of the retina and the contralateral
superior colliculus in primates (Dreher & Robinson, 1991). In many lower animals, visual
form is detected by this older system, using the superior colliculus in the same manner that
that mammals use the visual cortex. Is it possible that expert performers utilize this
pathway under pressure? The tectopulvinar system is a much shorter pathway and,
therefore, the motor reaction can be executed in a shorter period of time. The question
therefore remain: Is it possible that expert performers utilize a different visual pathway
under pressure than novices?
The newer retinogeniculate projection terminates in the dorsal part of the lateral geniculate
nucleus of the thalamus (LGNd), and is the most prominent visual pathway in primates
(Guyton, 1992; Milner & Goodale, 1995). Neurons in the lateral geniculate nucleus project
in turn to the cerebral cortex, with almost all of the fibers terminating in the primary visual
area or striate cortex (area V1) in the occipital lobe. The general belief is that subjective
visual experience in humans depends on the integrity of this projection system (Milner &
Goodale, 1995) and is responsible in humans for the perception of virtually all aspects of
visual form, colours and other consciously perceived vision (Guyton, 1992).
Although Ramon y Cajal’s (1995) scheme of the organization of the nervous system still
holds in general, essential new pathways and feedback groups have been discovered. One
of the earliest projections to leave the optic tract consists of a small bundle of fibers and
terminates in the suprachiasmatic nucleus, which, lies just above the optic chiasm in the
48

hypothalamic area (Milner & Goodale, 1995). There are also projections to the ventral
portion of the lateral geniculate nucleus, the pulvinar nucleus, the nucleus of the optic tract,
various pretectal nuclei, and a set of three nuclei in the brainstem known collectively as the
nuclei of the accessory optic tract (Milner & Goodale, 1995).
The lateral geniculate body serves two principal functions. Firstly, it serves as a relay
station of visual information from the optic tract to the visual cortex by way of the
geniculocalcarine tract. The signals from the two eyes are kept apart in the lateral
geniculate nucleus. This nucleus is composed of six nuclear layers (Guyton, 1992). The
second function of the lateral geniculate body is to control the transmission of signals to the
visual cortex (Guyton, 1992). The nucleus receives control signals from two major
sources. The corticofugal fibers return these signals from the primary visual cortex to the
lateral geniculate nucleus and the reticular areas of the mesencephalon. Both of these are
inhibitory and, when stimulated, can either turn off or suppress transmission through
selected portions of the dorsal lateral geniculate nucleus (Guyton, 1992).
Another distinction between the inputs to the visual cortex is derived from the projections
arising from the retina (Livingston & Hubel, 1988; Schiller & Logothetis, 1990). The cells
in the deeper layers, I and II, are larger than those in layers III, IV, V and VI giving rise to
the terms magnocellular and parvocellular layers (Perry et al., 1984). This classification
corresponds to that of the large and small retinal ganglion cells which project to the lateral
geniculate nucleus. Between each of the magno and parvo layers lies a zone of very small
cells, the interlaminar or koniocellular layers. Konio cells are functionally and
49

neurochemically (Hendry & Yoshiaka, 1994) distinct from magno and parvo cells and
provide a third channel to the visual cortex (Casagrande, 1994).
The axons of magnocellular (M) and parvocellular (P) neurons project to different
subdivisions of layer IV of primary visual cortex (Fitzpatrick et al., 1985). Different
functional properties are represented in the different layers. For example, cells in the four
dorsal parvocellular layers of the monkey LGN respond to lights of different colours with
fine discrimination (Goodale & Servos, 1999; White et al., 1998). In contrast, layers I and
II, the magnocellular layers, contain M-like cells which conduct impulses faster and are
colour insensitive (Golras, 1969; Kaplan & Shapley, 1982; Schiller & Malpeh, 1978).
They are much more sensitive to contrast than the P neurons (Goodale & Servos, 1999;
Sclar et al., 1990).
These two major pathways respond to different stimuli and may have different energetic
requirements and different oxygen demands (Liu et al., 2006). The magnocellular and
parvocellular pathways are not entirely separated. Interactions between these two
pathways can be found even in the visual cortex, V1 (Fitzpatrick et al., 1985; Lachica et al.,
1992; Sawatari & Callaway, 1996; Yabuta & Callaway, 1998).
Lateral geniculate neurons project through the optic radiation into the primary visual cortex
V1. The columnar organization of the visual cortex is evident in the constancy of receptive
field location through the entire depth of the cortex (Hubel & Wiesel, 1963; 1974;
Mountcastle, 1957). The visual cortex is organized into vertical clusters of cells with
similar functional attributes (Hubel & Wiesel, 1963, 1974). Cortical neurons which are
50

preferentially driven by the right or the left eye are grouped in ocular dominance columns.
Orientation columns consist of neurons of which the line or edge preferences are at similar
angles. Direction of movement (Weliky, 1996), spatial frequency (Tootell, 1981) and image
disparity (Le Vay & Voight, 1988) also appear in columnar arrangements in the visual
cortex.
The primary visual cortex is the terminus of the most direct visual signals from the eyes.
Signals from the macular area of the retina terminate near the occipital pole, while signals
from the more peripheral retina terminate in concentric circles anterior to the pole and
along the calcarine fissure. The secondary visual areas lie anterior, superior and inferior to
the primary visual cortex. Secondary signals are transmitted to these areas for further
analysis of visual meanings.
Two separate channels for the control of different phases of movements have already been
suggested in 1979 by Paillard and his colleagues (Beaubaton et al., 1979; Paillard et al.,
1981; Paillard, 1982; Trevarthen, 1968). According to their hypotheses, one system
analyzes positional cues and the other analyzes motion cues. The position channel is
activated by fixating on a target through the use of central vision. The motion channel uses
peripheral vision and tracks movement in the peripheral field (Previc, 1990).
Ungerleider and Mishkin (1982) distinguished two broad streams of projection from V1, a
dorsal stream and a ventral stream. The dorsal stream tells ‘where’ every object is at each
instant and whether it is moving. It uses information for action (Culham & Valyear, 2006).
After leaving the primary visual cortex, the signals of this pathway next flow generally into
51

the posterior midtemporal area, and thence upward into the broad occipitoparietal cortex.
At the anterior border of the latter area, the signals overlap with signals from the posterior
somatic association areas which analyze form and three-dimensional aspects of somatic
sensory signals (Newsome & Pare, 1988). Studies (Culham & Kanwisher, 2001; Fogassi &
Luppino, 2005; Grefkes & Fink, 2005; Ungerleider & Mishkin, 1982) have shown that
areas within the posterior parietal cortex might be active. This occurs not only when an
individual is preparing to act, but also when other actions are observed and during the
perceptual processing of attributers relevant to the action, even when no actions are
executed. The second pathway, namely the ventral stream, passes from the primary visual
cortex into the inferior ventral and medial regions of the occipital and temporal cortex. It is
the principal pathway for analysis of visual detail (Underleider & Mishkin, 1982). This
pathway is concerned with such visual features as recognizing letters, reading, determining
the texture of surfaces and determining detailed colours of objects.
The dorsal or parietal pathway is important for assessing motion and the spatial
relationships of form – properties similar to the M channels. Lesions in the dorsal, parietal
path result in neglect of a portion of the visual field and disruption of visuomotor
orientation. Lesions in the temporal cortex or the ventral pathway diminish visual
identification of objects, their colours and fine details (Underleider & Mishkin, 1982),
reflecting the properties of the P channels. The ventral stream is activated by awareness
(Tong et al., 1998), whereas the dorsal stream remains activated by objects, even when
these objects are not consciously perceived (Fang & He, 2005). Culham and Valyear
(2006) suggested that these unperceived stimuli relevant to actions are processed in the
52

dorsal stream. Thus, the dorsal stream could account for the ability of subjects to act
accurately towards objects without explicit awareness (Tong et al., 1998).
Goodale and Milner (1992) challenged the Ungerleider and Mishkin (1982) viewpoint since
their findings are based on perceptual representation. According to Goodale and Milner
(1992) and Milner and Goodale (1993, 1995) more emphasis should be placed on the
output requirements of the two systems. They propose that the dorsal stream, in close
conjunction with the premotor and prefrontal cortex, provides a specialized system for
controlling skilled action and that the ventral stream is primarily concerned with perceptual
functions, such as visual learning and object recognition. Thus, the systems involved in
transforming visual information into motor output are probably performed independently of
visual perception (Goodale & Milner, 1992).
The analysis of motion remains largely automatic and unconscious. Motion is analyzed by
the magnocellular-parietal component of the visual pathway. Magnocellular pathway
neurons are sensitive to moving stimuli, and this trait is maintained through V1 and V2 to
the middle temporal association cortex (area MT or V5). Area MT is retinotopically
mapped (Maunsell & Newsome, 1987). Neurons in this area are selective for the speed
and direction of a moving stimulus (Maunsell & Van Essen, 1983; Zeki, 1974) and are
clustered together into columns with similar preferred directions (Albright, 1984; Malonek
et al., 1994). When small regions of MT were chemically lesioned with a neurotoxin, a
monkey’s ability to detect a moving pattern of dots in a corresponding region of the visual
field was impaired, while thresholds for contrast were unaffected (Newsome & Pare, 1988).
53

It appears that representations within the left parietal cortex play a crucial role in the
storage and integration of knowledge about learned hand-object interactions, and that these
representations are distinct from those mediating the visuomotor transformations
underlying simple grasping actions (Johnson-Frey, 2003). Responses to observed actions
might depend on the richness of the observer’s own experience with such actions (McLeod,
1987). According to Buccino et al. (2004), the parietal cortex has a special role in observed
actions, which the observer intends to imitate later. These effects are more pronounced in
the left hemisphere, because of the role of the left hemisphere plays in acquiring and
storing skilled-movement representations (Buccino et al., 2004). Thus, parietal responses to
observed actions are most strongly activated when those actions are within the observer’s
repertoire (McLeod, 1987).
Since the neurons in the various layers in the LGN are predominantly innervated from
either eye, the first opportunity for significant interaction between the eyes must occur in
the cortex. The separation is maintained in layer IV of V1, where each simple cell is driven
by only one eye, the other being without effect. Mixing between the two eyes occurs in the
subsequent relay stations – which is in layers deeper toward the white matter and in layers
closer to the cortical surface.
How do the two sides of the brain mesh the right world and the left world together with no
hint of a seam or discontinuity? A cell in the right cortex that responds to a horizontal bar
in the middle of the field of vision should be connected somehow to its counterpart in the
left cortex which responds to the continuation of the same bar. Such interactions would
allow a complete picture to be formed with a minimum number of connections between the
54

two hemispheres. In experiments highly specific connections between neurons with
receptive fields exactly at the midline have been found to run from cortex to cortex through
the corpus callosum (Hubel & Wiesel, 1967).
Thus the shorter pathway to the motor cortex is through the retinotectal pathway.
The question can therefore be asked if elite athletes have mastered the use of this
pathway for information processing rather than using the longer retinogeniculate
pathway. Could it be that they process information to the motor cortex faster, which
gives them the edge over novices?
According to Ripoll et al. (1995) expert athletes develop specific cognitive skills to solve
complex sports problems. The link between perception and action processing is acquired
from early childhood (Hommel et al., 2001). The repetitive occurrence of movements
eventually leads to the creation of perception-action networks (Kibele, 2006). Researchers
(Trachtman & Venezia, 1994; Boer, 1986; Griffin & McBride, 1986) stated that athletes
who function in an enhanced alpha state utilize visual feedback information more rapidly,
hereby producing improved reaction times. Through extensive experience and anticipation,
the number of possible movement sequences may be limited, resulting in an appropriate
motor reaction (Tendenbaum, 2003). Although this argument on the concept of degrees of
freedom is still being investigated, there are no discrepancies between researchers on the
concept of practice. Athletes need extensive practice in order to develop automaticity and a
more sophisticated program, this then leads to higher order coordination in open skill
events (Schmidt et al, 1998). During continuous practice perceptual schemata of the
nervous system are formed, which improve in the understanding and anticipation of
55

specific game situation (McLeod & Jenkins, 1991). Accurate performance is therefore
reached through constant practice (Ericsson et al., 1993; Helsen et al., 2003). As
previously mentioned Ericsson and two colleagues (1993) found that elite performers, by
the age of twenty, had each totaled ten thousand hours of practice. By contrast the merely
good performers had totaled eight thousand hours, and the amateurs never practiced more
than about four thousand hours. One could therefore argue that elite athletes have special
perceptual schemata because of their extensive exposure to practice, enabling quicker
processing of information to the motor cortex. This could well be the distinction between
experts and novices.
Erickson’s (2007) model of skilled performance explains the schematic model of
information processing as mentioned before. He proposed three central processing
mechanisms: the perceptual mechanism, the decision mechanism and the effector
mechanism. The perceptual mechanism receives information from the sensory receptors,
after which it is filtered and only the necessary information is processed. This mechanism
is responsible for organizing and interpreting processed information (Erickson, 2007).
The processed information is then delivered to the decision making mechanism which
determines the appropriate motor response. This mechanism is guided by an athlete’s past
experiences. The effector mechanism initiates and controls the motor response.
56

CHAPTER 4
PERFORMANCE
1. The acquisition of motor skills
2. Expert versus novice athletes
57

CHAPTER 4
PERFORMANCE
1. THE ACQUISITION OF MOTOR SKILLS
A motor skill involves movement of the body that is goal-directed (Abernethy, 1991) and
can be measured according to a level of performance (Honeybourne, 2006; Schmidt &
Wrisberg, 2008). As mentioned before, Schmidt and Lee (2005) defined skill as
“movements that are dependent on practice and experience for their execution, as opposed
to being genetically defined”
Fitts (1964) was one of the first to classify motor skills. Skills involved in organizing
movement are discrete, serial and continuous (Fitts, 1964; Honeybourne, 2006; Kluka,
1999; Schmidt & Wrisberg, 2008). Skills with a defined beginning and end are known as
discrete skills, for example kicking and catching (Fitts, 1964; Honeybourne, 2006; Kluka,
1999; Schmidt & Wrisberg, 2008). Discrete skills which are linked together in order to
produce more complicated actions are known as serial skills, such as a gymnastic routine
(Fitts, 1964; Honeybourne, 2006; Kluka, 1999; Schmidt & Wrisberg, 2008). Movements
with no definite beginning or end are referred to as continuous skills (Schmidt & Wrisberg,
2008), such as swimming, skating and cycling (Fitts, 1964; Honeybourne, 2006; Kluka,
1999; Schmidt & Wrisberg, 2008). Other classifications followed, Broer (1966) classified
skills by purpose while Laban’s (The Dell, 1970) classification provides variations in
58

shape, effort, and movement technique as they relate to experiencing and learning through
motor behavior. Gentile (1972) and colleagues (1975) have developed a most
comprehensive and inclusive motor skill classification system. They classified skills based
upon environmental predictability. These skills are known as closed and open skills
(Abernethy, 1991; Honeybourne, 2006; Kluka, 1999; Schmidt & Wrisberg, 2008;
Wisemantel, 2002). Open skills are performed in a changing environment where timing
plays a role. This is in contrast with closed skills which take place in a predictable
environment with no time constraints (Abernethy, 1991; Honeybourne, 2006; Kluka, 1999;
Schmidt & Wrisberg, 2008; Wisemantel, 2002).
Motor performance is produced by executing a motor skill and motor learning takes place
as a result of continuous practice. Motor performance is an external process while motor
learning happens internally (Abernethy, 1991; Davis et al., 1986). Motor control indicates
human performance and the internal processes that command them (Kluka, 1999). Motor
learning is defined as a set of internal processes associated with practice or experience
leading to relatively permanent changes in the capability for motor skill (Schmidt & Lee,
2005). Motor development is known as a field of study concerning the changes in motor
behavior occurring as a result of growth, maturation and experience (Schmidt & Lee,
2005).
Fitts and Postner (1967) developed the classic three-stage model for the learning of a motor
skill. The first stage is known as the cognitive stage and represents the early stage of
learning where the learner determines which requirements are needed to perform the new
task (Abernethy, 1991; Honeybourne, 2006; Kluka, 1999; Wulf, 2007). Frequent errors
59

make performances quite variable. The learner senses that the behavior does not produce
the desired outcome but does not know what to do or how to do it differently to enhance
the quality of each performance (Kluka, 1999).
The second stage is the associative stage. The skills are performed more consistently
(Abernethy, 1991; Honeybourne, 2006). Movement becomes more automatic and stable
and attention could be directed towards other aspects of performance (Wulf, 2007).
Considerable improvement in performance takes place during this phase (Honeybourne,
2006). The learner also develops the ability to identify inappropriate performances and to
attempt solutions in subsequent trials of the skill in dynamic environments (Kluka, 1999).
The final phase of skilled learning is reached after extensive practice and is known as the
autonomous phase (Abernethy, 1991; Honeybourne, 2006; Wulf, 2007). Skills are largely
performed automatically at this stage and feedback is no longer necessary for motor control
(Abernethy, 1991; Honeybourne, 2006; Wulf, 2007). Movements are accurate and
effortless (Wulf, 2007), while motor programs have been formed completely and are stored
in the long-term memory (Honeybourne, 2006). Performers at this stage should direct
attention frequently towards the associative phase, since motor programs are reinforced by
practice in order to maintain superior levels of skill performance (Abernethy, 1991;
Honeybourne, 2006). It is not only the quantity of practice but also the quality of practice,
the quality of drills and the learning experience that leads to superior skill performance
drills and the learning experience (Kluka, 1999).
Traditional information-processing models of motor skill performance emphasize three
processes for the production of movement: perception, decision-making and execution of
60

movement (Abernethy, 1991; 1996). These models draw an analogy between the mind and
a computer and tend to neglect the role of the environment in executing action (Handford et
al., 1997; Schmidt & Lee, 1999; Schmidt & Wrisberg, 2008). Perception is an active
process which interprets sensory-stored information, as mentioned before (Lombard, 2007).
Decision-making is the process by which perceptual information is used for selecting an
appropriate movement response (Hodge & McKenzie, 1999). Execution of movement
results from organization, initiation and controlling of the selected response (Abernethy,
1991; Wisemantel, 2002). These information-processing models of motor control are no
longer universally accepted, but still provide a useful heuristic approach when considering
motor performance (Carello et al., 1984; Kelso, 1995).
The ecological approach has been proposed as a viable alternative to the information-
processing model, the former being modeled as a complex, dynamic human bio-mechanical
system (Davids et al., 1994; Williams et al., 1999). The acquisition of skilled movement is
proposed as a system which consists of two sub-systems: the dynamic system approach
(Kugler et al., 1980; 1982) and the perception-action approach (Gibson, 1966; 1979).
According to the dynamic system approach the way physical and chemical systems are
organized is responsible for constraining and stimulating behaviour. An example would be
the interaction of systems within the body which enables a person to walk. This process is
known as spontaneous self-organization (Haywood & Getchell, 2001). The components
which initiate movement are therefore as follows: self-organization of body systems, the
performer’s environment, and the demands of the task (Clark, 1995; Haywood & Getchell,
61

2001). Other features taken into consideration by the dynamic system are the maturation
and discontinuous nature of development (Haywood & Getchell, 2001).
Gibson (1966, 1979) proposed the perceptual-action approach. According to him the
development of perception and action cannot be separated. People assess their
environment in relation to themselves (Konczak, 1990). Individuals perceive their
environment constantly, which creates optic flow that provides information about time and
space (Gibson, 1966; 1979). Optic flow includes changes in the optic array created by
observer movement, for example, how visual information is perceived as it moves toward
or by us as a consequence of our own movements (Vickers, 2007). Therefore an individual
is able to perceive the change in size of the image of an oncoming car directly, judging the
time of collision without a complicated calculation of time and speed (Haywood &
Getchell, 2001). Other experiments showed that when an object travels toward a person
such as a ball approaching, or the person moves toward the object such as toward the take-
off point in long jumping, the change in size of the image on the retina is enough to trigger
a change in action (Lee, Lishman & Thomson, 1982).
Constant practice produces accurate performance (Ericsson et al., 1993; Helsen et al.,
2003); yet the performance of motor skills requires attention. According to Wulf et al
(1998, 1999, 2001) motor skill learning can be enhanced by the external focus of attention.
Thus, emphasis should be placed on the outcome of the action rather than on production of
the action. An example would be to direct a golfer’s attention to the head of the club
during the downswing rather than the swing of the arms.
62

Researchers (Ferrari, 1996; McCombs, 1989; Watkins, 1984; Wulf, 2007) have shown that
when an individual is actively involved in the learning process, information is processed
more deeply. Providing individuals with appropriate feedback and reinforcement is yet
another perspective of motor behavior. Figure 4.1 illustrates the process of feedback.
Knowledge of results Vision
Knowledge of performance Audition
Biofeedback Proprioception
Cutaneous
Figure 4.1 Graphic of the feedback system (Kluka, 1999)
There are two main classes for feedback, the first is internally from the production of
movement and is referred to as intrinsic feedback. Schmidt and Lee (2005) define intrinsic
feedback as ‘sensory information that arises from movement’. The second source of
feedback comes from external sources, such as feedback from a coach, video material or
formal analysis of movements, and is known as extrinsic feedback (Vickers, 2007).
Sources of extrinsic feedback may be grouped into two categories, knowledge of results
and knowledge of performance (Kluka, 1999). Knowledge of results refers to the outcome
Feedback
Sensory Augmented
External Internal
63

of a movement, while knowledge of performance refers to the characteristics of the
movement itself (Vickers, 2007). Augmented feedback, refers to information that is
provided outside the individual from a variety of sources during and after performance
(Kluka, 1999), which induces an external focus of attention, also leads to improved
performance (Shea & Wulf, 1999). Learning is more effective when feedback is presented
after good rather than bad trials (Chiviacowsky & Wulf, 2007). Feedback seems to have a
negative effect when given during the performance stage, but it seems to be more effective
when given during practice (Hurley & Lee, 2006). However, too much augmented
feedback may cause an individual to become too dependent on the coach, that leads to an
inability to process and interpret information independently (Salmoni et al., 1984; Williams
& Hodges, 2005).
Other factors that play a role in the acquisition of motor skills include the complexity of the
task, players’ current skill levels, internal and external motivation (Reid et al., 2007),
exposure to other sports between the ages eight to fourteen (Baker et al., 2003; Berry &
Abernethy, 2003; Côte et al., 2003), and sustained sport-specific practice (Ericsson et al.,
1993; Helsen et al., 2003).
Sosniak, (1985) explains the phases of learning as follows. The first phase of learning is
known as the playful phase and takes place between ages three to seven years. The effect
of this phase seemed to be to get the learner involved and hooked, and to get the learner to
need and want more information and expertise. The second phase of learning takes place
during the middle years, between the ages of ten and fourteen. This period is marked by a
tremendous amount of time spent on details. In the second phase of learning, teacher
64

instruction becomes more rational and less informal than earlier, and technical skills are the
core of lessons. A sense of competence is developed over a period of four to six years, and
a typical transition is made to the third phase of learning, the later years, between the ages
of sixteen and twenty (Sosniak, 1985). The later years is the time to make the ‘learned’ an
integral part of the learner and to find the meaning and emotion of the larger experience,
and to make it your own. Over the period of years the learner began finding and solving
their own problems and satisfying themselves rather than the teacher. Although the phases
of learning are not biologically determined, it empirically derives from the learner’s
experiences.
Balyi and Hamilton (2003) went further and designed a model of long term athlete
development. According to Balyi & Hamilton (2003) the baseline for the development of
an adult athlete is set between the ages six to sixteen. Critiques of this model argue that the
model is misguiding because of the lack of proper research evidence (Ruff, 2009).
Although the validity and reliability of this model is questioned, it still provides the stages
in athletic development. Balyi & Hamilton (2003) propose six stages of athletic
development which are shown in the schematic proposal below.
65

Figure 4.2 A long term athlete development (Balyi & Hamilton, 2003)
Overall development of motor skills should be established during the fundamental stage.
Specializing too early in a specific sport may result in one-sided preparation, injuries, early
burnout and early retirement (Balyi & Hamilton, 2003). However, there are sports which
require early specialization, but then specialization should only start from the age of eight.
These are gymnastics, rhythmic gymnastics, figure skating, diving and swimming (Balyi &
Hamilton, 2003).
Learning to train involves the fundamental training of sport skills. It is established between
the ages nine to twelve for girls and eight to eleven for boys (Balyi & Hamilton, 2003).
Stage three is the train-to-train phase, when sport-specific skills are consolidated and the
66

engine is built. The train-to-train phase is established during ages eleven and fifteen for
females and twelve to sixteen for males (Balyi & Hamilton, 2003). The train-to-compete
phase involves optimizing the engine and training positional skills inherent to the sport.
This is established through ages fifteen to twenty one for females and sixteen to twenty
three for males. Ages eighteen plus for females and nineteen plus for males are known as
the training-to-win phase. Performance and positional skills are maximized during this
stage and athletes at this level compete for excellence. The last developmental phase is
known as the retirement phase during which players are retained for coaching
administration (Balyi & Hamilton, 2003).
These developmental stages act as a guide for planning optimal performance. According to
Ericsson & Charness (1994) it takes ten thousand hours of extensive practice to excel at
anything.
Abernethy (1991) defined decision making as the process during which perceptual
information is used to determine an accurate response. There are combinations of factors
which play a role in decision making, namely coaches, players, playing patterns, context
and time (Johnson, 2006). Decision making is a dynamic process. It is usually made in a
natural or known environment with some degree of task familiarity (Orasanu & Connolly,
1993). Decisions in sport unfold over time (Johnson, 2006), but decision-making may also
be altered over time due to new information processed and physiological fatigue. Thus, the
same scenario at the beginning and end of a game may result in different decisions.
According to Johnson (2006) most decisions made by athletes are made under moderate or
high time pressure. An elite athlete should be able to make accurate decisions under high
67

pressure and execute them correctly (Abernethy, 1991). Decision training therefore
requires dynamic sampling of real events (Alain & Sarrazin, 1990; Williams et al., 1999) to
ensure that the athlete acquires the necessary knowledge in order to perform the appropriate
movement in time. Researchers (Blaxton, 1989; Morris et al., 1997) shown that the best
results were found when testing and learning environments closely resembled each other.
Other factors which play a role in performance are levels of arousal or the levels of
activation of the central nervous system. The relationship between arousal and the level of
performance is based on the inverted U hypothesis (Schmidt & Wrisberg, 2008). The best
level of performance takes place at a moderate arousal level, although each person has his
or her own zone of optimal function (Wrisberg, 1994).
Figure 4.2 below, explains the effect of arousal in performance. At a low level of arousal
an athlete has access to a large number of irrelevant cues, causing a sub-optimal level of
performance. At a moderate level of arousal only the most relevant cues are observed,
which can lead to an improvement in performance. High levels of arousal are the cause of
perceptual narrowing, and therefore, athletes miss valuable cues which can lead to freezing
or slower reaction timing (Easterbrook, 1959).
68

Figure 4.2 The cue-utilization hypothesis (Easterbrook, 1959)
Response selection requires processing, which can either be controlled or automatic
(Schmidt & Wrisberg, 2008). When a person performs a task requiring different mental
patterns, he/she has to decide between a number of responses. This type of processing is
slow, demands attention and is known as controlled processing. Automatic processing is
often found among highly skilled athletes. This is a fast processing method which requires
little attention and is the result of an enormous amount of practice (Schmidt & Wrisberg,
2008). With practice a person develops a production unit which is associated with a
specific stimulus and generates a specific action. An example of such a production unit
according to Allard & Burnett (1985) is seen in elite volleyball players where players react
to their opponent’s movement patterns. The movement patterns indicate what type of shot
will be executed (Allard & Burnett, 1985). Automatic processing therefore leads to quick
decision-making and response.
P
E
R
F
O
R
M
A
N
C
E
great
poor
low moderate high
AROUSAL
69

Although this method of processing is beneficial, an unexpected change in action at the last
moment could lead to an inappropriate response. Because of the initial response towards a
stimulus, a second movement will be delayed. When an athlete wants to cause a delay in
an opponent’s response, the time between the fake and the real movement should be
between 60 and 100 ms (Schmidt & Wrisberg, 2008). If the time is shorter than that, the
opponent may ignore the fake movement and react to the intended movement. If the time
is longer than 100ms, the opponent may react with only a slight delay which may not be
much slower than a normal response. The motor system can only produce one effective
motor program at a time. Therefore athletes need extensive practice in order to develop
automaticity and a more sophisticated program which leads to higher order coordination in
open skill events (Schmidt et al, 1998).
Training should be done both implicitly and explicitly. Substantial evidence proves that
implicit video-based perceptual training results in improved performance (Farrow &
Abernethy, 2002; Hodges et al., 2003; Howard et al., 1992; Raab et al., 2005; Vinter &
Perruchet, 2002). Thus, experienced athletes react faster than novices, due to earlier
stimulus processing which has been established through repeated instances during training
and competitions as part of the implicit learning process (Blundell, 1985; Hughes et al.,
1993; Kibele, 2006; Radlo et al., 2001). According to Kibele (2006) a two stage learning
process occurs during stimulus-reaction behaviour. During the first stage internal codes of
perceived movement sequences are established which are interconnected with motor codes.
This leads to fast motor reaction. The second stage is associated with perception (Kibele,
2006). Perception of a movement sequence activates the previously established motor
codes and primes a motor response without conscious control. Thus, fast motor responses
70

rely on two control systems, off-line control and on-line control (Elsner & Hommel, 2001;
Hommel, 2003). Off-line control involves a conscious intention to act. On-line control
takes place when motor processes are primed by perception, based on past experiences of
stimulus processing (Tulving & Schacter, 1990). Hommel et al (2001) state that motor
actions are linked to perceptual processes by a common coding of events. Therefore action
planning takes place according to the anticipated characteristics of the intended goal. The
link between perception and action processing is acquired from early childhood (Hommel
et al., 2001). The repetitive occurrence of movements eventually leads to perception-action
networks being created (Kibele, 2006). Thus, an individual will act on sensory input, even
if the effects were not intended (Hoffmann et al., 2004).
According to Vickers (2003) decision-making can be trained explicitly through traditional
behavioural training methods or through the decision training approach. Behavioural
training is skill orientated and leads to better skill performance (Vickers, 2003). The
movement pattern is broken down into small chunks and then slowly put together until the
entire movement has been mastered. Decision training involves a more cognitive
approach, rather than focusing only on executing the movement, and proposes that skills
should be learned in their entirety. Decision training leads to superior performance
(Szymanski, 1997; Vickers, 2003). Vickers et al (1999) indicated that behavioural training
was a more effective training method for novices, while decision training benefited
intermediate and advanced performers more. In an experiment done by Raab et al (2005) it
was shown that behavioural training induced better performance in the short term while
decision training improved performance in the long term. Thus, a combination of
71

behavioural and decision training should be introduced in order to improve both the
technical and tactical aspects of the game (Raab et al., 2005).
Many hours of training are needed to bring about minor improvements in elite performers.
There are several possible movement sequences for every motor response (Kibele, 2006)
but, through extensive experience and anticipation, the number of possible movement
sequences may be limited, resulting in a proper motor action (Tenenbaum, 2003). Motor
action only takes place once a critical threshold level has been reached and the perceived
movement features correspond with the motor codes of the motor response (Prinz, 1997;
Wickens et al., 1994). Thus only particular stimuli will initiate a motor action (Kibele,
2006). In order to establish accurate perception-action responses, perceptual skill training
is required, which produces action codes initiated by motor responses (Farrow &
Abernethy, 2002; Kibele, 2006).
2. EXPERT VERSUS NOVICE ATHLETES
Researchers (Ripoll, 1991; McLeod & Jenkins, 1991) show that a relationship exists
between an athlete’s level of expertise and his/her level of solving problems. Decision-
making by elite athletes depends on actual facts and needs less information to predict
forthcoming events. Research done by Newell and Simon (1972) showed that outstanding
performance is a result of increased knowledge skill, and experience. This was confirmed
by recent studies (Ericsson & Charness, 1994), which showed that extended training alters
the cognitive and physiological processes of experts. Ericsson (2003) has studied experts
72

in many fields and found that expert performers neutralize automaticity by developing
increasingly complex mental representations so they can achieve higher levels of control of
their performance. The elite performer is one who is able to maintain cognitive control
over all conditions encountered, no matter how difficult or unusual (Ericsson, 2003).
Another difference between experts and novices concerns the mode of visual scanning,
which is synthetic in experts and analytic in novices (Ripoll, 1991). Synthetic analysis
entails directing the gaze in a position from which the maximum number of events are seen
and grouped on the basis of one visual fixation (Mackworth & Burner, 1976; Papin et al.,
1984). It results in a mental process called ‘chunking’, when elements that occur in close
temporal proximity tend to combine into a pattern (De Groot, 1966), which constitutes an
essential aspect of skill acquisition (Keele, 1986). With limited time and a large amount of
information scattered over a large area, this behaviour becomes a necessity in most sport
situations.
Land and McLeod (2000) found that both low skilled and high skilled cricket players
tracked the ball as the ball was first delivered, but it was only the high skilled performer
who used a rapid anticipatory saccade to the bounce point, followed by a brief period of
tracking before the ball was struck. Thus, the elite performer is better at adapting his gaze
and picking up information so that the rapidly changing conditions may be perceived in
time to adjust the action effectively (Abernethy & Russell, 1984; Adams & Gibson, 1989;
Martell & Vickers, 2004; McLeod, 1987). McLeod (1987) also found that the difference
between expert and novices does not lie in the speed with which the perceptual system is
operated, but rather in organizing the motor system in such a way that the output of the
73

perceptual system is maximized. Less expert players follow the ball according to their
chronological order of vision; whereas experts use a holistic scanning process to orient
their gaze independently from the ball towards the intersection of several other visual cues.
Helsen and Pauwels (1992) and Ripoll (1991), state that experts use less fixations and the
mean duration of each fixation is higher than that of non-experts. This is in contrast with
Williams et al (1994) and Williams and Davids (1998) who found that expert players have
a higher frequency of fixations but of shorter duration. Both these findings are true
(Martell & Vickers, 2004), since a higher frequency of fixations occurs at the beginning of
an action and the longer duration of fixations during the last thirty percent of the action.
Abernethy and Russell (1987) and Goulet et al (1989), described no relationship between
subjects’ levels of experience and their visual strategies. The nature of the task where, for
instance, a player had to predict a forthcoming serve in badminton and tennis, could play a
role in this predicament. The chronology of the ritual, throwing the ball in the air, the serve
and the strike which appear in the same order, is in contrast with continuous situations
where players have to solve various unpredictable problems during longer periods of time
(Ripoll, 1991).
Studies done by Ripoll et al (1995) showed a clear relationship between the level of
experience and the visual strategies when the situation is continuous, long lasting and
presents a high level of uncertainty regarding the chronology and nature of events. They
also found that expert athletes develop specific cognitive skills to solve complex sports
problem situations and that expertise has more to do with the ability to detect specific cues
than with the speed of the response (Ripoll et al., 1995).
74

Anticipation is the ability to predict what will occur when preparing to perform a skill or
tactic (Vickers, 2007). It involves the ability to know or predict a series of events that
coincide with an external environmental demand (Tyldesley, 1981). An anticipation timing
task involves common skills such as hitting a pitched baseball, walking through a crowd
and passing another car while you are driving in traffic (Magill, 1993). Thus, a person
must accurately time his or her own movements with the action of another object. Visual
search is actively looking for information in the environment that will enable the performer
to determine what to do in a situation. This search is especially critical in situations where
there is a limited amount of time available for making an appropriate decision and response
(Magill, 1993). Anticipation depends on being able to select critical environmental cues in
advance so that the performer can anticipate action requirements. Visual search is
therefore and important element in performing in “time pressure’ situations. A need for
visual search exits for decision-making in many sport performance situations, where there
are many sources providing possible cues and there is a limited amount of time for
searching for and selecting the correct cues. For example, to return a serve in tennis, a
serve traveling at 40 to 45 m/sec allows the receiver only 500 to 600 msec for determining
how to respond. The player must search for the cues that will provide information about
the direction, speed, landing point and bounce characteristics of the ball so that an
appropriate return stroke can be selected, organized and executed (Magill, 1993).
Ripoll (1991) experimented with top level table tennis players to establish whether the level
of uncertainty of a situation influences the interaction between visual and motor behaviour.
Visual behaviour showed the following characteristics: (1) when there was no uncertainty,
gaze was not often directed towards the opponent; (2) during the ball flight the players
75

adopted an anticipated visual behaviour of directing the eyes in advance towards different
points on the ball’s flight; (3) during the strike, the head and the eyes which was stable
inside the orbit and aligned according to the position of the head axis, were quickly
directed towards the predicted direction of the ball-bat point of collision (Ripoll, 1991).
When there was no uncertainty, the players could plan ahead and time their subsequent
responses. Thus, the ball was returned without the player even looking at the opponent or
pursuing the ball.
Experienced table tennis players (Ripoll, 1991) develop a strategy to achieve an optimal
compromise between the limits of the ocular-motor properties and the physical
characteristics of the flight of the ball. Buser and Imbert (1975) found that the visual
pursuit capacity is limited to 0.7 rad s-1
and confirms the theories of Whiting (1969), Bahill
and La Ritz (1984) that it is not necessary to keep one’s eyes on the ball. Thus, expert
players employ cognitive strategies which adapt the sensory motor system in order to
overcome the basic limitation of the information processing system (Glencross, 1978;
Ripoll & Fleurance, 1988).
Increased levels of uncertainty on visual and motor behaviours showed an increase in the
scanning process and a decrease in the mean duration of each fixation, which meant that
the ball was systematically tracked over a longer period. The chronology of the visual
fixations was analyzed by Ripoll (1991), and it was found that players reduced the
uncertainty of the situation by asking the following questions internally: What kind of
stroke will the opponent make? At what moment will it be released? Where will it be
directed? The nature of the stroke could be solved by analyzing the orientation of the
76

opponent’s shoulder-line and guessing from previous occurring events. Analyzing the
angle formed by the forearm and the racket orientation could project the subsequent
landing (Abernethy & Russell, 1987; Goulet et al., 1989). Ripoll (1991) stated that an
increased level of uncertainty affects motor and visual behaviour. Pressure and uncertainty
cause antagonistic effects between the identification stage, when the semantic process
occurs, and the execution stage, when the sensor motor process is carried out (Ripoll,
1991). The greater the uncertainty, the more complex the visual strategy and the longer the
motor response took. Thus motor behaviour occurs once the semantic process has been
carried out and when the situation has been identified clearly. The semantic memory is the
sub-system of long-term memory that stores and provides our general knowledge about the
world that has been developed from past experiences (Magill, 1993).
An athlete has to pay attention to either the semantic or the sensory motor dimension of the
task in open skill sports (Ripoll, 1991). He can either use the maximum allocated time to
identify the situation in order to select the appropriate response, thus focusing on the
semantic characteristics, or process the situation incompletely and select an inadequate
response. Therefore an athlete cannot prepare himself correctly and organize his sensory
motor mechanisms before he understands the specific characteristics of the situation.
According to Ripoll (1991) expert athletes’ behaviour shows that high level skill demands,
coordination between the sensory motor and semantic visual functions in order to reach a
high level of performance.
McLeod and Jenkins (1991) stated that expert sportsmen are not dramatically better at
performing their tasks than non-experts. Everybody possesses the ability to produce
77

accurate timing, all that is needed is constant practice (McLeod & Jenkins, 1991). In a
study done by Abernethy (1987) in badminton, he only found a difference of about ten
percent in superiority between experts and novices, experts were found to be able to pick
up earlier advance information than novices. The expert group included players up to
national level and the novices had never played a game competitively. Continuous practice
leads to perceptual schemata of the nervous system being formed and, therefore, to
improvement in the understanding and anticipation of specific game situation (McLeod &
Jenkins, 1991).
After a perusal of the literature the following areas are necessary for visual performance
enhancement: treating vision insufficiencies, developing visual skills, improving visual
information processing skills, and enhancing visuo-motor capabilities and cognitive
functions (Coffey and Reichow, 1995; Erickson, 2007 & Vickers, 2007). In the current
study the following four major elements of performance enhancement were identified for
improved rugby performance: improving skill execution, visual concentration, response
time and decision-making.
As previously mentioned a motor skill entails movement in the body in order to achieve a
specific action (Abernethy, 1991) and can be measured according to the level of
performance (Honeybourne, 2006; Schmidt & Wrisberg, 2008). Visual concentration is the
ability to pay constant active attention to visual stimuli. It is also a measure of how little
visual information is required for the athlete to respond to a stimulus (Buys, 2002; Ferreira,
2001). Visual response time is the time required to perceive and respond to visual
stimulation (Buys, 2002; Ferreira, 2001; Planer, 1994). Decision-making is the process by
78

which an appropriate movement response is selected. It is the ability to assess a large
number of situational cues and select the most accurate response (Hodge & McKenzie,
1999). The ability to process visual information quickly and accurately and facilitate
performance during competitions improves as expertise improves (Erickson, 2007).
How is it possible to determine whether visual skills enhancement can be transferred to
performance? The challenge remains to find an objective, reliable way to evaluate
performance in game situations.
The ideal would be to analyze rugby players under conditions which are related to
performance, therefore analyzing them during competitions. It is difficult to determine
accurate performance during practice, because certain factors which are not present then,
play a role during competitions, such as emotional stress, arousal and pressure. Both a
subjective and objective method of evaluation was chosen to evaluate players during
competitions. The subjective method of evaluation was applied, using three independent
raters. However, other studies which used raters as part of their evaluation process found
an inconsistency among the raters (Venter, 2008; Van Velden, 2011). It was therefore
important to establish an objective method for evaluating the visual skills of rugby players.
The Verusco© system was identified for this purpose. This system analyses each
individual skill of every player for every single game played during a specific competition.
The only problem was that individual skills were discussed separately and not as a whole,
meaning that skills such as decision-making and response time were not accounted for. For
this reason a model was designed in order to evaluate these skills specifically. The
individual skills which play a role in decision-making and response time were all
79

incorporated to form part of an index of skills, with the purpose of establishing whether or
not improvements in performance took place over time. As decision-making, response
time, visual concentration and skill execution form the four main elements of performance,
used in this investigation, it might be possible to evaluate the transferability of
performance, using an objective method of evaluation.
80

CHAPTER 5
METHODOLOGY
1. Research Design
2. Procedures
81

CHAPTER 5
METHODOLOGY
1. RESEARCH DESIGN:
The first part of the study involved professional raters who evaluated twenty five players
over a three year period. The players who participated in the study were evaluated both by
means of a subjective and objective system of evaluation and were randomly selected from
two professional, regional rugby teams. The sample was divided into 4 groups - three
experimental groups and a control group. Some of the regional players also played for the
national side. Two of the three experimental groups had specific visual training with the
national side and came from different regional teams. The third experimental group had
off-season visual training and were regional players only. The control group were also
regional players only, but had no visual training at all. Thus, the third experimental group
and the control group consisted of regional players who did not play for the national side.
The purpose of the control group was to evaluate whether changes in performance could be
visually related.
The second part of the study involved the design of an evaluation model or index, based on
elements which rely on visual motor responses. This model is designed for evaluating the
four factors of performance (Coffey and Reichow, 1995; Erickson, 2007 & Vickers, 2007),
82

selected specifically for rugby: skill execution, visual concentration, decision-making and
response time.
2. PROCEDURES
2.1 SELECTION OF SUBJECTS
Ethical clearance for the study has been granted by the Ethics Committee of the University
of Johannesburg, the Rugby Unions for which the rugby players played as well as
Verusco©. Neither the Rugby Unions nor the players were identified for reasons of
confidentiality. Fifty subjects were selected to participate in the study. The subjects were
between twenty three and twenty eight years of age and played rugby professionally. The
subjects who were included in the study had to have played in the same regional team for
the period of the study which progressed over three years. Twenty five players actually
completed the study after three years. Some of the players went to play overseas and some
of them joined other provincial teams. This made the sample group small and could have
influenced the results.
The study was done in order to find an objective and reliable way to evaluate visual motor
performance and was divided into two parts. The first part involved the use of raters who
would evaluate players’ performances by studying video clips of each of the twenty five
players. The second part made use of the statistics produced by the Verusco TryMaker
83

Pro© system in order to develop a performance index which would establish an objective
evaluation process.
2.1.1 PART 1
The subjects were divided into four groups: group 1 (n=7) and group 2 (n=3) were
randomly selected from the same regional team, called Regional team A. Groups 3 (n=9)
and 4 (n=6) were randomly selected from another regional team, Regional team B. The
players selected for Groups 2 (Team A) and 4 (Team B) were regional players who were
also selected for the National side. The diagram below explains how the four groups were
distributed.
Group 1 (Regional team A) Off-season visual training
Group 2 (Regional team A, that played
for the National side) Specific visual training
Group 3 (Regional team B) No visual training
Group 4 (Regional team B, that played
for the National side) Specific visual training
84

The groups could not be equally distributed. This was due to no control over the selection
processes of the different teams. The players who were part of the study did not always get
selected to play from season to season. Some of the players left the country to play
overseas or left their current teams to play for other regional teams. The players that were
part of the study did not always get selected to play the same number of games. No
specific visual screenings were done prior to initial group assignments.
Group 1 had off-season visual training which involved basic visual training over a period
of three months. The training was done three times per week in the gymnasium, every
session lasting twenty minutes. Decision-making drills pertaining specifically to rugby
were performed during the official training sessions. The drills were designed to improve
strategic and tactical decision making, as a team, as units (backline and forward players), as
mini-units (inside and outside backs, lose forwards, locks and prop forwards) and also to
improve position specific rolls and responsibilities.
Group 2 trained in the same environment as group 1, with the exception that these players
had received specific visual awareness training in the national side. The training was not
done continuously and extended over a period of four months. Visual awareness training
on the field was done twice a week at ten minute intervals. These players also did
computer based visual training for a minimum of two hours per week. The computer
program was designed by a visual awareness coach and is commercially available. It was
specifically designed for improving eye-hand coordination, reaction time and visual
awareness.
85

Group 3 received no visual training and these players continued training in their normal
training environment.
Group 4 trained in the same environment as Group 3, with the exception that these players
had received specific visual awareness training at the National side (the same as Group 2).
The training was not done continuously, but extended in total over a period of four months.
Visual awareness training on the field was done twice a week at ten to twenty minute
intervals. These players were also doing the computer based visual training for a minimum
of two hours per week. The difference between Group 2 and 4 lay in their regional training
environments.
The Verusco TryMaker Pro system© was used to analyze the visual skills of players over a
period of three years after the necessary permission had been obtained. This system is an
elite rugby product developed by Verusco and includes analysis application and Verusco’s
coding services. Verusco© has eight to twelve coders coding the same game at a time. In
this manner they are able to go into great detail identifying 4500 – 5000 individual tasks in
each game. Each coder takes four to five hours to go through their 10 minutes of the game.
Over 45 working hours go into analyzing each TryMaker Pro© coded game, with another
five hours and more of checking and control. The system analyzes each subject’s position
specific performance, and also trend and tactical analysis. It has dozens of analyzing
functions which give useful information about players and teams, but it does not provide
any index of performance.
86
Video clips of each player in every game he played throughout the three seasons were
randomly selected from the Verusco© data bases. A total of forty five clips for each player
were selected over the three seasons, i.e. fifteen clips per season. Three top class
international raters were selected for evaluating individual players. Each player had to be
evaluated individually for each season on the four elements of performance: skill
execution, visual concentration, decision making and response time. The ratings were
classified into poor, average and excellent. The explanation for only choosing three
categories for the ratings, were to simplify the judging for the raters. Choosing more than 3
categories would be too technical in the evaluation of the four elements of performance.
The findings were then statistically analyzed. A copy of one of these video clips over the
three seasons had been attached (See CD).
2.1.2 PART 2
In this part of the study an objective evaluation performance model was initiated by using
data that were produced by the Verusco© system. It was necessary to develop such an
evaluation model since no model for evaluating performance objectively during the
competitive phase existed. All four elements of performance, skill execution, decision-
making, visual concentration and response time had to be evaluated objectively. However,
the Verusco© system only evaluates skill execution. Decision-making, visual
concentration and response time had to be calculated separately. Therefore an index was
created for each of these elements because many individual skills play a role in each of the
individual elements.
87

After careful consideration, agreement was reached by the raters and the designers of the
Verusco© system about the individuals skills to be selected for each element. Consistency
was assured by incorporating as many as possible of various individual skills into each
element, which resulted in an index. Each index was then processed into one entity and its
relative percentage determined. This was necessary in order to compare the raters’ results
with those of the Verusco TryMaker Pro© statistics.
Skill execution was calculated by the Verusco TryMaker Pro© system. Decision-making
consisted of turnovers won, turnovers lost, off-loads, good off-loads, bad off-loads, cleans
made, win possession, lost possession, breakdown efficiency, in-tackle pass, total amount
of ball carries, positive ball carries, negative ball carries, total attack, total defense, assist
tackle, putting-on-pressure, pick-and-go and the number of dummy passes thrown.
Concentration was determined by calculating the number of handling errors each player
made, divided by the time he played in total. Response time consisted of the following
individual skills: line breaks, tackle breaks, tackles per minute, tackles made, tackles
missed, turnovers forced, defender beaten, work rate, kick pressure and breakdown
turnover won.
The definition for each of the individual skills is listed below:
88

2.1.2.1 SKILL EXECUTION:
Leonard and Reyman (1988) defined skill as the ability to achieve a result with optimal
confidence and the minimal use of time and energy. Skill execution was calculated by the
Verusco Trymaker Pro© system for each player. An average was calculated by simply
adding all the individual averages and dividing the total by the total of games played.
2.1.2.2 DECISION MAKING:
Decision-making is the ability to assess a large number of situational cues and select the
most accurate response (Hodge & McKenzie, 1999). The ability to process visual
information quickly and accurately and facilitate performance during competitions
improves as expertise improves (Erickson, 2007). Decision-making was calculated by
adding all the individual skills which play a role in decision-making, both positive and
negative values and divide the total by the total number of games played by each player.
Each of the individual skills that form part of decision-making is discussed below:
Turnovers won (+)
This shows a player winning possession of the ball. It must be won during contact and in
contested situations, but it does not include the set pieces (e.g. lineout catches). It measures
the quality of the possession won with effort as well as turnover tackles, and will include
players who regain possession after a kick restart by his team.
89

Turnovers lost (-)
This shows the loss of possession by a player, except in cases where the turnover came
from conceding a penalty or free kick (these will be shown in the Penalty Lost column). It
will contain turnovers that lead to scrums for the opposition, turnover of ball to the
opposition through an ineffective action, losing the ball in the collision, being tackled into
touch and ineffective kicks (but not Effective Turnover kicks). It does not include turnovers
from starts of play (e.g. poor lineout throw, lost scrum, start half) as these are considered to
be team issues and not applicable to individual players.
Offloads (+)
They are passes of the ball whilst in tackle or off the ground immediately after a tackle.
Bad off-loads (-)
A bad off-load is a pass by a player whilst held in a tackle or being knocked off his feet by
the tackler in a tackle that has been executed poorly.
Good off-loads (+)
They are tackle passes and passing off the ground (passes whilst being tackled) which are
performed well.
Cleans made (+)
These include all occurrences where a player either removes opposition players out of the
breakdown or runs through the breakdown to clear space.
90

Possession won (+)
This includes all instances where a player gains possession of the ball from the opposition.
Possession lost (-)
These are the number of events when a player loses possession to the other team.
Breakdown efficiency (+)
The proportion of times a player arrives at a breakdown and does a PRA or PMA.
In tackle pass (+)
This is a pass while the passer is held in a tackle.
Ball Carries (+)
These show all the instances when the ball is carried by a player, including taking the ball
into a contact situation or not taking it into a contact situation (i.e. the same as the ball
carries in the players’ summary). Therefore it would need to include all coded carrying
actions and actions of taking the ball into contact (i.e. collision actions, excluding
laybacks). However, it would measure only one for each time the same player was in
possession of the ball; thus, any significant carry of the ball for more than 5m.
Total attack (+)
This shows the total of all the actions in the six attacking qualities columns.
91

Total defense (+)
This shows the total of all the actions in the five defensive qualities columns, but excludes
percentage of tackles.
Assist tackle (+)
These are tackles where the tackler is a secondary defender.
Putting-on-pressure (+)
This occurs when a player moves into the contact zone to influence the ball carrier, but
does not attempt to tackle him.
Pick-and-go (+)
This is an occurrence where player picks up ball to carry it without looking to pass.
Dummies (+)
These are the number of dummy events a player performs (ball in hand deception)
2.1.2.3 CONCENTRATION
Visual concentration is the ability to pay constant active attention to visual stimuli. It is
also a measure of how little visual information is required for an athlete to respond to a
stimulus (Buys, 2002; Ferreira, 2001). Visual concentration was calculated by determining
the number of handling errors made divided by the total amount of handling of the ball per
92

game. The percentage was determined for each game. All the percentages were added
together and divided by the total amount of games played.
2.1.2.4 RESPONSE TIME:
Visual response time is the time required to perceive and respond to visual stimulation
(Buys, 2002; Ferreira, 2001; Planer, 1994). Response time was calculated by adding all the
individual skills which play a role in response time, including both positive and negative
values. The total was divided by the total number of games played by each player. Each of
the individual skills that form part of response time is discussed below:
Line breaks (+)
The ball carrier breaks the defense line.
Tackle breaks (+)
The ball carrier breaks a tackle made by a defender.
Tackles per minute (+)
These are the total tackles per time spent on defense (ball in play).
Tackles made (+)
These are total tackles completed well.
93

Tackles missed (-)
These are total tackles completed poorly (i.e. ball carrier breaks tackle).
Turnover forced (+)
These are all turnovers gained by a defending player.
Defender beaten (+)
This shows when a player beats a defender, but does not break the defense line.
Work rate (+)
This is calculated by adding the total actions column and dividing it by the total minutes
played by the player. For example 30 actions divided by 60 minutes = a work rate of 0.5.
This is to be rounded to two decimal places (e.g. a work rate of 0.47886 becomes 0.48).
Kick pressure (+)
This can be the equivalent of putting pressure, but only in situations where the opposing
team is kicking the ball (i.e. putting pressure off the ball action coded on a kick).
Breakdown turnover won (+)
These are all turnover gains at the breakdown by the player.
Data were collected for all the players over the three seasons and then statistically
analyzed. The Statcon Department at the University of Johannesburg analyzed the data
over time for both subjective and objective methods of evaluation. Differences between
94

groups were considered statistically significant at p < 0.05. The rater reliability was firstly
determined by using the interclass correlation coefficient to measure consistency between
the raters. The interclass correlation coefficient assesses the consistency of quantitative
measurements made by different observers when measuring the same quantity (Nichols,
1998). The collected data between the groups were compared by using the Mann Whitney
U-test. The Mann-Whitney U test is used in order to determine the differences between
two individual groups. The Wilcoxon signed rank test was used to measure significant
improvement from one season to the next. The Friedman Test was used to evaluate
subjects who were measured over time.
95

CHAPTER 6
RESULTS
1. Introduction
2. Different non-parametric analysis procedures
3. A comparison between the Verusco system and the
individual raters
4. A correlation between the individual raters
5. Agreement among the individual raters
6. Discussion of the significant results of individual raters
and the Verusco system
7. A model for the objective evaluation of vision related
performance in rugby
8. The analysis of the four elements of performance using
the data from the Verusco system
96

CHAPTER 6
RESULTS
1. INTRODUCTION
This chapter reports all results that were calculated from the collected data in this study.
The data were used to develop a model for evaluating visual related performance.
The research was conducted over a period of three years in order to minimize the effects
other variants could play on performance. Two methods of evaluating performance were
used. The first method consisted of using three independent top class raters, and the second
by using data collection. Both methods involved the Verusco© system, which makes use
of data capturers which captures data of every game played during a season. Every player
therefore had a whole history of his performance during the season.
In the first method three raters analyzed video clips of game situations. The clips were
randomly selected for each player in the study and analyzed independently by each of the
raters, based on the four major elements of performance: skill execution, visual
concentration, response time and decision-making. Only fifteen clips of each player were
selected for each of the three seasons, because of the amount of time it took to analyze each
clip.
97

The second method involved copying the raw data from the Verusco© system. Since only
statistical data for the individual skills, unit skills and skill execution were described, an
index had to be developed in order to describe the other three elements of performance.
These elements were then evaluated for each of the twenty five players over a three year
period.
It was decided that non-parametric tests would be more appropriate in view of the small
group sizes. Four techniques were used to determine results, namely Interclass correlation
coefficients, the Mann-Whitney U-test, the Wilcoxon signed ranked test and the Friedman
test.
The original research questions examined the following factors: distinguishing
performance among groups of subjects in the same training environment, performing at the
same level of competition; determining the difference in player performance among players
who have had visual training over time; ascertaining whether software visual skills are
trainable and whether visual training transfers to overall improvement in sports
performance.
98

2. DIFFERENT NON-PARAMETRIC ANALYSIS PROCEDURES
2.1 INTERCLASS CORRELATION COEFFICIENTS
Interclass correlation coefficients were used to measure agreement between the raters for
each video clip from Season 1 to Season 2. The interclass correlation coefficient assesses
the consistency of quantitative measurements made by different observers when measuring
the same quantity (Nichols, 1998). The raters were chosen as a random factor, which had a
generalizing effect. This means that the results could be generalized to other raters. It was
important to determine whether the raters’ ratings correlated with each other without
actually arriving at the exact same scores. It is also important to note that the interclass
correlation coefficient depends on the range of observed values. Furthermore the range of
the interclass correlation coefficients is dependent on the homo or heterogeneous factor
within a group: i.e. the more homogenous, the smaller the interclass correlation
coefficients within that group would be (Nichols, 1998).
2.2 MANN-WHITNEY U TEST
The Mann-Whitney U test is used in order to determine the differences between two
individual groups. It is a non-parametric test and compares the medians of the two groups.
It converts the scores to ranks and then evaluates whether the ranks for the two groups
differ significantly (Pallant, 2007). For this reason the actual distribution of scores does
not matter. The main values to consider are the observed (z) value and the significance
99

level. The probability value (p) indicates the likelihood whether a given result could have
occurred by chance alone. The probability value (p) should be equal or smaller than .05 for
the result to have significant value. If a result is statistically significant, it means that the
groups are too different for the result to have happened by chance alone; thus the
probability of getting that result by chance alone is less than 5 % (Turner & Thayer, 2001).
2.3 WILCOXON SIGNED RANK TEST
The Wilcoxon signed rank test is used to determine, when subjects are measured on two
occasions. It is a non-parametric test and converts scores to ranks and compares them at
the different times (Pallant, 2007). It can also be used in situations where subjects are
compared according to specific criteria. If the significance level is equal to or smaller than
.05, (p ≤ 0.05), a statistically significant difference is present.
The data are presented as box-and-whisker plots. Box-and-whisker plots allow people to
explore data and to draw informal conclusions when two or more variables are present. A
box-and-whisker plot is a five number summary, which consists of the median, the
quartiles, and the smallest and greatest values in the distribution. A boxplot splits the data
set into quartiles. The body of the boxplot consists of a "box", which goes from the first
quartile (Q1) to the third quartile (Q3). Within the box, a vertical line is drawn at the Q2,
the median of the data set. Two horizontal lines, called whiskers, extend from the front and
back of the box. The front whisker goes from Q1 to the smallest non-outlier in the data set,
100

and the back whisker goes from Q3 to the largest non-outlier. If the data set includes one or
more outliers, they are plotted separately as points on the chart.
The median is indicated by the vertical line that runs down Range. For interest’s sake the
spread of all the data is represented on a boxplot by the horizontal distance between the
smallest value and the largest value, including any outliers.
Box and whisker diagram
Introduction to statistics [http://www.classpad101.com]
2.4 FRIEDMAN TEST
The Friedman Test is used to evaluate subjects who are measured at three or more
situations in time (Pallant, 2007). The results of this test indicate the presence of a
significant difference in the results across three time periods. Significance is indicated by a
significance level where p ≤ .05, thus the probability value (p) should be equal or smaller
than .05.
101

3. A COMPARISON BETWEEN THE VERUSCO SYSTEM AND
THE INDIVIDUAL RATERS
The Verusco system is an objective method of evaluation while the evaluation by three
individual highly qualified raters, chosen to evaluate the performance of individual players
over a period of time, was subjective. They were asked to evaluate each player’s
performance according to the following criteria: poor, average or excellent performance.
The results were compared by using the interclass correlation coefficient method in order to
determine agreement among the raters. Although the raters were reliable, their results
indicated poor correlation, which indicates that subjectivity played a role; therefore, it
seemed useful to make use of a more objective type of evaluation. The correlation between
the three raters and the Verusco system was not statistically measured. The results below
indicate that there was no agreement between the subjective and objective methods of
evaluation.
The Verusco system indicated a statistically significant improvement in decision-making
for Group 3 and 4 over time, while Raters 2 and 3 indicated that Group 4 performed
significantly better in decision-making during Season 1. The Verusco system also found a
significant improvement in visual concentration for Group 4 over time, while Raters 1 and
3 found an improvement in skill execution over time.
102

4. A CORRELATION BETWEEN THE INDIVIDUAL RATERS
This step of research determined the agreement between the raters when evaluating each
player. Inter-rater reliability measures the homogeneity of two or more raters in order to
establish the extent of consensus among the judges. For the purpose of categorical data,
consensus is measured as a number of agreements divided by the total number of
observations. For continuous data, consensus is measured by intra-class correlation.
Internal consistency analysis is done by using Cronbach’s alpha, which is a coefficient of
reliability (Novušis, 2003). A reliability coefficient of 0.70 or higher is considered as a
relatively high internal consistency. Kappa is a function of the ratio of agreements to
disagreements in relation to expected frequencies. By convention, a Kappa > .70 is
considered as acceptable inter-rater reliability. Another rule of thumb is that K = 0.40 to
0.59 is moderate, 0.60 – 0.79 is substantial and 0.80 is outstanding inter-rater reliability
(Novušis, 2003). Intra-class correlation (ICC) is a measure of the reliability of ratings for
two or more raters.
Table 1 – Table 6 display the descriptive statistics and intra-class correlation coefficients of
the raters from season 1 to season 3. They only display the video clips where the three
raters agreed (moderate to outstanding) about the performance of the players, i.e. where
they agreed that the players performed either poorly, on average or excellently in a specific
video clip in decision making, visual concentration, response time and skill execution.
Each of the elements of performance is displayed separately for each of the three seasons in
the tables 1 - 6.
103

TABLE 1 Descriptive statistics and intra-class correlation coefficient for Decision-
Making and Concentration – Season 1
Variable N ICC Sig 95 % confidence interval
Lower bound Upper bound
Decision-Making
Video Clip 1 25 0.609 0.003 0.24 0.815
Video Clip 4 25 0.471 0.03 -0.028 0.75
Video Clip 5 25 0.609 0.003 0.24 0.815
Video Clip 9 25 0.603 0.003 0.228 0.812
Nr of video clips rated average 25 0.526 0.014 0.078 0.776
Nr of video clips rated excellent 25 0.546 0.01 0.117 0.785
Concentration
Video Clip 2 25 0.463 0.033 -0.044 0.746
Video Clip 3 25 0.452 0.038 -0.065 0.741
Video Clip 5 25 0.609 0.003 0.241 0.815
Video Clip 9 25 0.488 0.024 0.005 0.758
Table 1 lists the data that showed an average intra-class correlation coefficient value of
0.40 and higher with a significant (p) value smaller than 0.05, as well as their respective
95 % confidence interval for decision-making and concentration, as can be seen from this
table. Low internal consistency was found in the decision-making and concentration clips
during season 1.
104

TABLE 2 Descriptive statistics and intra-class correlation coefficient for Skill
Execution and Response Time – Season 1
Variable N ICC Sig 95 % confidence interval
Lower bound Upper bound
Skill Execution
Video Clip 2 25 0.452 0.038 -0.064 0.741
Video Clip 4 25 0.511 0.017 0.05 0.769
Video Clip 5 25 0.671 0.001 0.361 0.844
Video Clip 9 25 0.443 0.042 -0.082 0.737
Nr of video clips rated poor 25 0.479 0.027 -0.014 0.753
Response Time
Video Clip 4 25 0.494 0.022 0.016 0.76
Video Clip 5 25 0.479 0.027 -0.013 0.753
Nr of video clips rated average 25 0.595 0.004 0.213 0.808
Nr of video clips rated excellent 25 0.464 0.033 -0.041 0.747
Table 2 lists a low internal consistency in the skill execution and response time clips during
season 1, where all the average intra-class coefficients were below 0.70. This indicates that
the raters did not agree (ICC > 0.7) on one of the four elements of performance for Season
1. Therefore the above results illustrate subjectivity, which points to the importance of an
objective method of evaluation.
105

TABLE 3 Descriptive statistics and intra-class correlation coefficient for Decision-
Making and Concentration– Season 2
Variable N ICC Sig 95 % confidence interval
Lower bound Upper bound
Decision-Making
Nr of video clips rated poor 25 0.513 0.017 0.053 0.769
Concentration
Video Clip 6 25 0.605 0.003 0.233 0.813
Video Clip 9 25 0.553 0.01 0.118 0.792
Nr of video clips rated poor 25 0.731 0 0.478 0.873
Table 3 lists a high internal consistency in concentration for the number of video clips rated
poor during season 2, where the average intra-class coefficients were 0.731 and p = 0.00.
The other video clips for decision-making and concentration all had ICC scores below 0.7
and no internal consistency was found among them.
106

TABLE 4 Descriptive statistics and intra-class correlation coefficient for Skill
Execution and Response Time – Season 2
Variable N ICC Sig 95 % confidence interval
Lower bound Upper bound
Skill Execution
Video Clip 6 25 0.611 0.003 0.245 0.816
Nr of video clips rated poor 25 0.638 0.001 0.296 0.829
Response Time
Nr of video clips rated poor 25 0.506 0.019 0.04 0.766
Table 4 lists a low internal consistency for the skill execution and response time clips
during season 2, where all the average intra-class coefficients were below 0.70. The only
consistency was found in the number of video clips that were rated poor for visual
concentration during Season 2, which is seen in Table 3. No agreement was found among
the raters about any of the other elements of performance during Season 2.
107

TABLE 5 Descriptive statistics and intra-class correlation coefficient for Decision-
Making and Concentration – Season 3
Variable N ICC Sig 95 % confidence interval
Lower bound Upper bound
Decision-Making
Average of all clips 25 0.704 0.018 0.076 0.927
Nr of video clips rated poor 25 0.684 0.024 0.011 0.922
Nr of video clips rated excellent 25 0.679 0.025 -0.003 0.921
Concentration
Video Clip 3 25 0.895 0 0.671 0.974
Video Clip 5 25 0.743 0.01 0.197 0.937
Video Clip 12 25 0.647 0.036 -0.104 0.913
Video Clip 15 25 0.78 0.005 0.313 0.946
Average of all clips 25 0.772 0.006 0.288 0.944
Nr of video clips rated poor 25 0.737 0.011 0.178 0.935
Nr of video clips rated excellent 25 0.729 0.013 0.154 0.934
Table 5 lists a high internal consistency for the total average scores of all the video clips for
decision-making during season 3. A high consistency were also found in video clips 3, 5,
15; the average for all the video clips rated poor and excellent for concentration showed
that the average intra-class coefficients were all higher that 0.70, with a p value smaller
than 0.05.
108

TABLE 6 Descriptive statistics and intra-class correlation coefficient for Skill
Execution and Response Time – Season 3
Variable N ICC Sig 95 % confidence interval
Lower bound Upper bound
Skill Execution
Video Clip 1 25 0.771 0.006 0.286 0.944
Video Clip 3 25 0.913 0 0.728 0.979
Video Clip 12 25 0.75 0.009 0.219 0.939
Average of all clips 25 0.877 0 0.615 0.97
Nr of video clips rated poor 25 0.883 0 0.635 0.971
Nr of video clips rated excellent 25 0.795 0.003 0.36 0.95
Response Time
Video Clip 11 25 0.617 0.049 -0.198 0.906
Video Clip 13 25 0.667 0.029 -0.042 0.918
Video Clip 15 25 0.735 0.011 0.171 0.935
Average of all clips 25 0.824 0.002 0.449 0.957
Nr of video clips rated poor 25 0.735 0.011 0.172 0.935
Nr of video clips rated good 25 0.698 0.02 0.057 0.926
Nr of video clips rated excellent 25 0.826 0.002 0.456 0.957
Table 6 lists a high internal consistency for video clips 1, 3, 12 - the average of all the
video clips and the number of video clips rated, poor and excellent for skill execution
during season 3. A high consistency was also found in video clips 11, 15 - the average for
all video clips and the number of video clips rated poor and excellent for response time,
where the average intra-class coefficients were all higher that 0.70 with a p value smaller
than 0.05.
109

Table 1 – 6 displayed the agreement among the three raters about each video clip that had
been assessed. The video clips where the intra-class correlation coefficients were higher
than 0.70, and where there was a significant value of p ≤ 0.05 were then analyzed to
determine if there was any significant improvement in the four elements of performance
over time. The Wilcoxon signed rank test was used for the analyses over time. This test is
used in situations where subjects are matched according to specific criteria. If a
significance level is equal or smaller than 0.05 it can be concluded that the difference
between the two scores is statistically significant. According to the Wilcoxon signed rank
test the only consistency among the three raters was found in skill execution between
season 1 and season 2 in the number of video clips per player rated poor in group 1, and for
response time in season 1 and 3 for the number of video clips per player rated average in
group 4.
Tables 7 – 8 display the significant improvement in skill execution and response time over
time as described by the Wilcoxon signed rank test. The number of poor clips reduced
significantly which indicates an improvement in the above skills.
110

TABLE 7 Descriptive Statistics for the number of video clips rated poor per
player, for Skill Execution from Season 1 to Season 2 for all the groups
Group N
Percentiles
25th 50th (Median) 75th
1
Skill Execution Poor S1 7 2.0000 3.3333 5.0000
Skill Execution Poor S2 7 0.6667 1.3333 3.0000
2
Skill Execution Poor S1 3 3.3333 3.3333 4.3333
Skill Execution Poor S2 3 3.3333 3.3333 3.6667
3
Skill Execution Poor S1 9 2.3333 3.0000 3.6667
Skill Execution Poor S2 9 2.3333 2.3333 3.3333
4
Skill Execution Poor S1 6 2.0000 2.6667 5.2500
Skill Execution Poor S2 6 1.4167 3.1667 4.7500
A significant correlation was found in skill execution in the number of poor performances
by players in group 1. There was a significant improvement in skill execution from season
1 to season 2, z = -2.371, p = .018. The median score decreased from season 1 (Md = 3.33)
to season 2 (Md = 1.333); thus the number of poor performances decreased from season 1
to season 2. The decrease in poor performance is therefore an indication that the players in
group 1 improved in skill execution over time.
111

TABLE 8 Descriptive Statistics per player for the number of average video clips,
for Response Time from Season 1 to Season 3 for groups 2 and 4
Group N
Percentiles
25th 50th (Median) 75th
2
Response Time Average S1 3 2.0000 2.1667 2.5000
Response Time Average S3 3 2.1111 2.4444 2.5556
4
Response Time Average S1 6 2.1250 2.2500 2.5417
Response Time Average S3 6 2.5556 2.5556 2.8333
A significant correlation was found in response time for the number of average
performances by players in group 4. There was a significant improvement in response
time from season 1 to season 3, z = -2.201, p = .028. The median score increased from
season 1 (Md = 2.25) to season 3 (Md = 2.56). Thus the average for all the video clips for
response time increased significantly from season 1 to season 3.
Tables 1 – 8 display the inconsistency and subjectivity of the raters. No significant
similarities were found among the three raters. For this reason it was decided to study the
video clips when two of the three raters agreed and the agreement was significant.
112
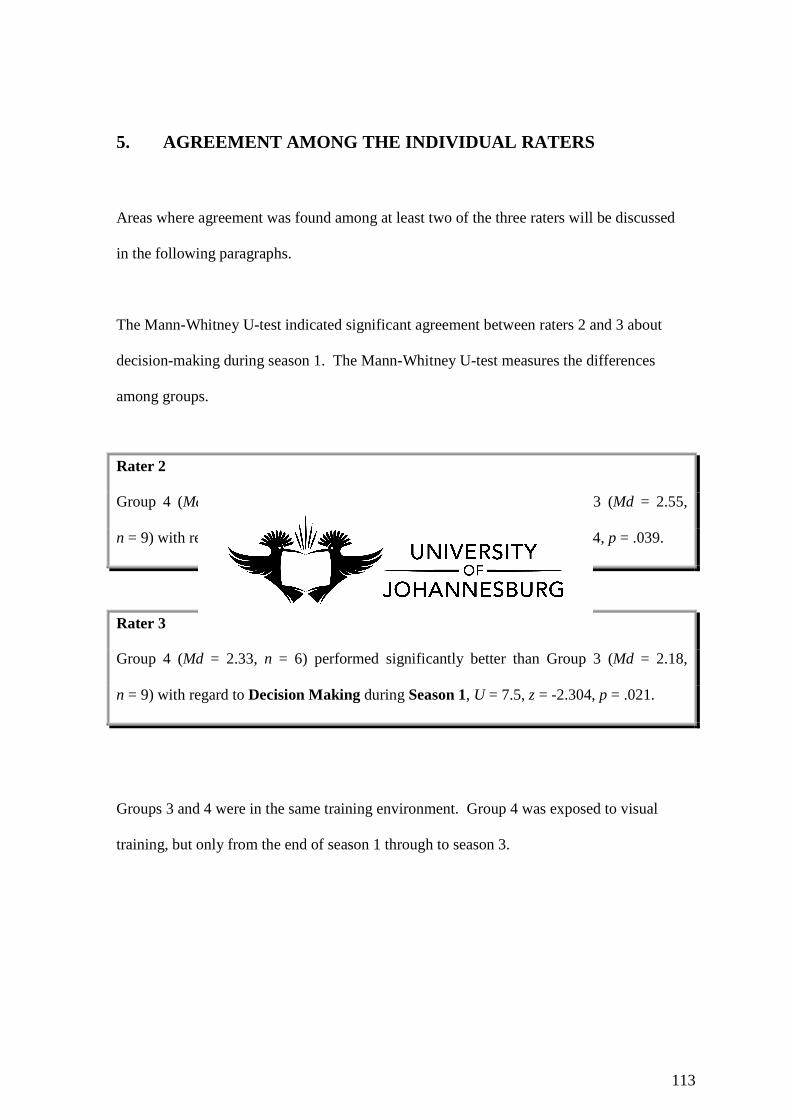
5. AGREEMENT AMONG THE INDIVIDUAL RATERS
Areas where agreement was found among at least two of the three raters will be discussed
in the following paragraphs.
The Mann-Whitney U-test indicated significant agreement between raters 2 and 3 about
decision-making during season 1. The Mann-Whitney U-test measures the differences
among groups.
Rater 2
Group 4 (Md = 2.73, n = 6) performed significantly better than Group 3 (Md = 2.55,
n = 9) with regard to Decision-Making during Season 1, U = 9.50, z = -2.064, p = .039.
Rater 3
Group 4 (Md = 2.33, n = 6) performed significantly better than Group 3 (Md = 2.18,
n = 9) with regard to Decision Making during Season 1, U = 7.5, z = -2.304, p = .021.
Groups 3 and 4 were in the same training environment. Group 4 was exposed to visual
training, but only from the end of season 1 through to season 3.
113

Significant agreement between raters 1 and 3 was also found for skill execution for group 1
from season 1 to season 2 through the Wilcoxon signed rank test. The Wilcoxon signed
rank test measures improvement over time.
Rater 1
Group 1 showed a significant improvement in Skill Execution from Season 1 to Season 2,
z = -2.366, p = .018. The median score improved from season 1 (Md = 2.29) to season 2
(Md = 2.63), with maximum values that increased from 2.75 (season 1) to 2.93 (season 2).
Rater 3
Group 1 showed a significant improvement in Skill Execution from Season 1 to Season 2,
z = -2.032, p = .042. The median score improved from season 1 (Md = 1.93) to season 2
(Md = 2.25), with maximum values that increased from 2.36 (season 1) to 2.64 (season 2)
114

6. THE SIGNIFICANT RESULTS OF INDIVIDUAL RATERS AND
THAT OF THE VERUSCO SYSTEM
6.1 RATER 1
The Mann-Whitney U-test, which is used to determination between two individual groups
on a continuous measure (Pallant, 2007), indicated no significant differences among groups
1 – 4 in any of the four elements of performance.
The Wilcoxon signed ranked test, which is used to determine repeated measures (Pallant,
2007), revealed that rater 1 found significant differences within group 1 in skill execution,
decision- making, concentration and response time over time. Rater 1 found no other
significant differences within the other groups.
The tables and graphs below indicate the significant improvement of skill execution,
decision-making, visual concentration and response time for group 1 over time, for rater 1.
Rater 1 found no significant improvement for groups 2, 3 and 4 over time.
115

6.1.1 SKILL EXECUTION WITHIN GROUP 1
TABLE 9 Descriptive Statistics for Rater 1 for Skill Execution from Season 1 to
Season 2 within all groups
Group Season Minimum 25th
Percentile 50th (Median) 75th
Percentile Maximum
1 1 1.80 1.9231 2.2857 2.6000 2.75
n=7 2 1.87 2.1429 2.6250 2.8333 2.93
2 1 1.80 1.8000 2.0000 2.2857 2.29
n=3 2 2.27 2.2667 2.2667 2.4000 2.40
3 1 2.00 2.0667 2.1429 2.5077 2.73
n=9 2 1.93 2.2071 2.2857 2.5420 2.62
4 1 1.73 1.8333 2.1333 2.4464 2.79
n=6 2 1.87 1.9167 2.1333 2.6833 2.73
Table 9 gives descriptive information about the graph below (graph 1) and should be read
in correlation with graph 1. Table 9 displays the minimum, maximum and median values
for all four groups for skill execution by rater 1. The information is displayed below in
graph 1 through a box and whisker plot
116

GRAPH 1 Box and Whisker plot for Skill Execution from Season 1 to Season 2 for
all four groups by Rater 1
According to rater 1 only group 1 showed a significant improvement in skill execution
from season 1 to season 2, z = -2.366, p = .018. The median score improved from season
1 (Md = 2.29) to season 2 (Md = 2.63), with maximum values increasing from 2.75
(Season 1) to 2.93 (Season 2). Rater 1 found no other significant differences in skill
execution within the other groups.
Group
4 321
3.0
2.5
2.0
1.5
1.0
Skill Execution Rater 1 Season 2
Skill Execution Rater 1 Season 1
117

6.1.2 DECISION-MAKING WITHIN GROUP 1
TABLE 10 Descriptive Statistics for Decision-Making from Season 1 to Season 2
within all groups by Rater 1
Group Season Minimum 25th
Percentile 50th (Median) 75th
Percentile Maximum
1 1 1.80 2.0000 2.5000 2.6000 2.67
n=7 2 2.00 2.2143 2.5333 2.8333 2.86
2 1 2.07 2.0667 2.2667 2.5714 2.57
n=3 2 2.07 2.0667 2.2667 2.6000 2.60
3 1 2.11 2.2667 2.5833 2.6259 2.64
n=9 2 2.27 2.4093 2.5714 2.6648 2.91
4 1 2.20 2.2500 2.4000 2.5786 2.71
n=6 2 2.13 2.1833 2.2000 2.6500 2.80
Table 10 gives descriptive information about the graph below (graph 2) and should be read
in correlation with graph 2. Table 10 display the minimum, maximum and median values
for all four groups for decision-making by rater 1. The information is displayed below in
graph 2 by means of a box and whisker plot.
118

Graph 2 below shows a significant improvement in decision-making within group 1 from
season 1 to season 2, z = -2.028, p = .043. The median score improved from season 1 (Md
= 2.5) to season 2 (Md = 2.53), with maximum values that increased from 2.67 (Season 1)
to 2.86 (Season 2).
GRAPH 2 Box and Whisker plot for Decision-Making from Season 1 to Season 2
for all four groups by Rater 1
Group
4 321
3.0
2.5
2.0
1.5
1.0
13 Decision Making Rater 1 Season 2
Decision Making Rater 1 Season 1
119

6.1.3 VISUAL CONCENTRATION WITHIN GROUP 1
TABLE 11 Descriptive Statistics for Visual Concentration from Season 1 to Season
2 for all groups by Rater 1
Group Season Minimum 25th
Percentile 50th (Median) 75th
Percentile Maximum
1 1 1.87 2.1333 2.4000 2.7333 2.92
n=7 2 2.00 2.2857 2.5385 2.7857 2.92
2 1 2.20 2.2000 2.2667 2.2857 2.29
n=3 2 2.07 2.0667 2.4000 2.4667 2.47
3 1 2.11 2.2405 2.3333 2.7244 3.00
n=9 2 2.21 2.4452 2.6000 2.7305 3.00
4 1 1.93 1.9333 2.2667 2.5964 2.79
n=6 2 2.13 2.1833 2.2333 2.5833 2.93
Table 11 gives descriptive information about the graph below (graph 3) and should be read
in correlation with graph 3. Table 11 displays the minimum, maximum and median values
for visual concentration within all four groups by rater 1. The information below in graph
3 is displayed by means of a box and whisker plot.
Graph 3 below showed a significant improvement in visual concentration within group 1,
from season 1 to season 2, z = -2.201, p = .028. The median score improved from season 1
(Md = 2.4) to season 2 (Md = 2.54), with maximum values that stayed the same from
season 1 to season 2 (Max = 2.92).
120

GRAPH 3 Box and Whisker plot for Visual Concentration from Season 1 to
Season 2 within all four groups by Rater 1
By looking at the graph one would assume a significant improvement in groups 2 and 3
from season 1 to season 2, but according to the Wilcoxon rank test the improvement was
not significant.
Group
4 321
3.0
2.5
2.0
1.5
1.0
18
13
15
16
21 Visual Concentration Rater 1 Season 2
Visual Concentration Rater 1 Season 1
121

6.1.4 RESPONSE TIME WITHIN GROUP 1
TABLE 12 Descriptive Statistics for Response Time from Season 1 to Season 2
within all groups for Rater 1
Group Season Minimum 25th
Percentile 50th (Median) 75th
Percentile Maximum
1 1 1.67 1.9333 2.4000 2.8000 3.00
n=7 2 2.13 2.2143 2.6000 2.8571 3.00
2 1 2.20 2.2000 2.2000 2.4286 2.43
n=3 2 2.07 2.0667 2.2667 2.8000 2.80
3 1 1.89 2.0643 2.3333 2.6077 3.00
n=9 2 2.00 2.1429 2.4286 2.7168 3.00
4 1 2.13 2.1833 2.3000 2.6286 2.80
n=6 2 2.20 2.2000 2.4000 2.6500 2.80
Table 12 gives descriptive information about the graph below (graph 4) and should be read
in correlation with graph 4. Table 12 display the minimum, maximum and median values
within all four groups for response time by rater 1. The information below in graph 4 is
displayed by means of a box and whisker plot.
122

Graph 4 shows a significant improvement in response time within group 1 from season 1
to season 2, z = -2.201, p = .028. The median score improved from season 1 (Md = 2.4) to
season 2 (Md = 2.6), with maximum values that stayed the same from season 1 to season 2
(Max = 3.0).
GRAPH 4 Box and Whisker plot for Response Time from Season 1 to Season 2
within all four groups by Rater 1
Group
4 321
3.0
2.5
2.0
1.5
1.0
Response Time Rater 1 Season 2
Response Time Rater 1 Season 1
123

6.2 RATER 2
The following results are the individual results for rater 2 for the improvement of all four
groups in the four elements of performance over time. The Mann-Whitney U-test which is
used for differentiating between two individual groups on a continuous measure (Pallant,
2007), indicated a significant difference between groups 3 and 4 during season 1 and
between groups 1 and 3 during season 2.
Group 4 (Md = 2.73, n = 6) performed significantly better than Group 3 (Md = 2.55,
n = 9) with regard to Decision-Making during Season 1, U = 9.50, z = -2.064, p = .039.
Group 3 (Md = 2.67, n = 9) performed significantly better than Group 1 (Md = 2.47,
n = 7) with regard to Response Time during Season 2, U = 12.5, z = -2.014, p = .044.
The Wilcoxon rank sum test revealed significant differences within groups 3 and 4 by rater
2 with regard to skill execution and response time. No other significant differences were
found. The descriptive statistics and box and whisker plot for skill execution and response
time are displayed below.
124
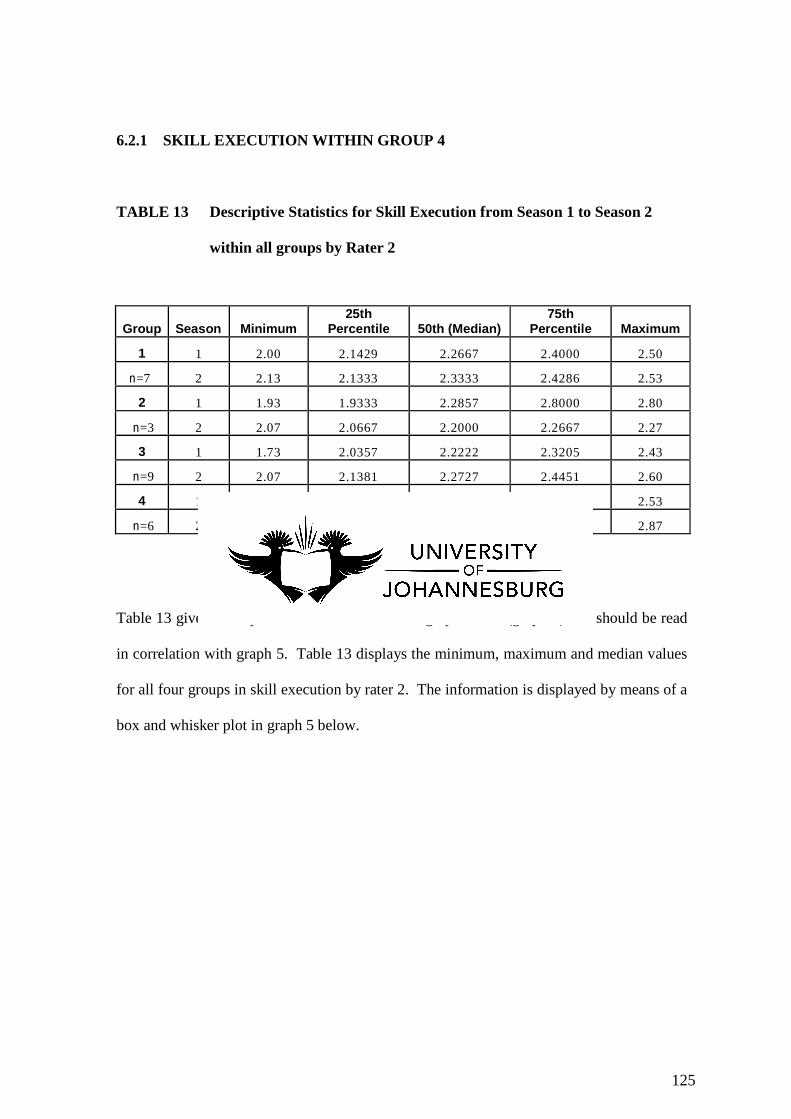
6.2.1 SKILL EXECUTION WITHIN GROUP 4
TABLE 13 Descriptive Statistics for Skill Execution from Season 1 to Season 2
within all groups by Rater 2
Group Season Minimum 25th
Percentile 50th (Median) 75th
Percentile Maximum
1 1 2.00 2.1429 2.2667 2.4000 2.50
n=7 2 2.13 2.1333 2.3333 2.4286 2.53
2 1 1.93 1.9333 2.2857 2.8000 2.80
n=3 2 2.07 2.0667 2.2000 2.2667 2.27
3 1 1.73 2.0357 2.2222 2.3205 2.43
n=9 2 2.07 2.1381 2.2727 2.4451 2.60
4 1 1.80 2.0000 2.2000 2.5083 2.53
n=6 2 2.20 2.2000 2.3667 2.7167 2.87
Table 13 gives descriptive information about the graph below (graph 5) and should be read
in correlation with graph 5. Table 13 displays the minimum, maximum and median values
for all four groups in skill execution by rater 2. The information is displayed by means of a
box and whisker plot in graph 5 below.
125

Group 4 showed a significant improvement in skill execution from season 1 to season 2,
z = -2.003, p = .045. The median score improved from season 1 (Md = 2.2) to season 2
(Md = 2.37), with maximum values that increased from 2.53 (Season 1) to 2.87 (Season 2).
GRAPH 5 Box and Whisker plot for Skill Execution from Season 1 to Season 2
within all four groups by Rater 2
Group
4 321
3.0
2.5
2.0
1.5
1.0
Skill Execution Rater 2 Season 2
Skill Execution Rater 2 Season 1
126

6.2.2 RESPONSE TIME WITHIN GROUPS 3 & 4
TABLE 14 Descriptive Statistics for Response Time from Season 1 to Season 2
within all groups by Rater 2
Group Season Minimum 25th
Percentile 50th (Median) 75th
Percentile Maximum
1 1 2.27 2.2857 2.4667 2.7333 2.73
n=7 2 2.13 2.2857 2.4667 2.5833 2.80
2 1 2.53 2.5333 2.6429 3.0000 3.00
n=3 2 2.40 2.4000 2.4667 2.8000 2.80
3 1 2.27 2.4000 2.5714 2.6333 2.71
n=9 2 2.43 2.5577 2.6667 2.7929 2.82
4 1 2.13 2.4333 2.7000 2.7643 2.86
n=6 2 2.60 2.7000 2.8333 2.9500 3.00
Table 14 gives descriptive information about the graph below (graph 6) and should be read
in correlation with graph 6. Table 14 displays the minimum, maximum and median values
in response time within all four groups by rater 2. The information is displayed by means
of a box and whisker plot in graph 6 below.
Graph 6 shows a significant improvement in response time within groups 3 and 4 from
season 1 to season 2. The median score for group 3 improved from season 1 (Md = 2.57)
to season 2 (Md = 2.67), z = -2.310, p = .021; and for group 4 from season 1 (Md = 2.7) to
season 2 (Md = 2.83), z = -2.201, p = .028. The maximum and minimum values also
increased.
127

GRAPH 6 Box and Whisker plot for Response Time from Season 1 to Season 2
within all four groups by Rater 2
The four elements of performance were measured within groups 2 and 4 over three seasons.
The Friedman Test was used for statistical analyses, evaluating subjects in three or more
situations over time. Rater 2 found the only significant difference in response time within
group 4. According to the Wilcoxon signed rank test a significant difference was found
between season 1 and season 2.
Group
4 321
3.0
2.5
2.0
1.5
1.0
24
Response Time Rater 2 Season 2
Response Time Rater 2 Season 1
128

TABLE 15 Descriptive Statistics for Response Time from Season 1 to Season 3
within groups 2 and 4 by Rater 2
Group Season Minimum 25th
Percentile 50th (Median) 75th
Percentile Maximum
2 1 2.53 2.5333 2.6429 3.0000 3.00
n=3 2 2.40 2.4000 2.4667 2.8000 2.80
3 2.33 2.3333 2.6667 2.8000 2.80
4 1 2.13 2.4333 2.7000 2.7643 2.86
n=6 2 2.60 2.7000 2.8333 2.9500 3.00
3 2.33 2.5833 2.7333 2.8167 2.87
Table 15 gives descriptive information about the graph below (graph 7) and should be read
in correlation with graph 7. Table 15 displays the minimum, maximum and median values
for all four groups in response time by rater 2. The information is displayed by means of a
box and whisker plot in graph 7 below.
The Friedman test showed that group 4 improved significantly in response time over time,
χ² (2, n= 6) = 6.870, p = .032. The median score improved from season 1 (Md = 2.7) to
season 2 (Md = 2.83), and decreased again in season 3 (Md = 2.73) with maximum values
that increased from 2.86 (season 1) to 3.0 (season 2) with a slight decrease (2.87) in season
3.
129

GRAPH 7 Box and Whisker plot for Response Time from Season 1 to Season 3
within groups 2 and 4 by Rater 2
The Wilcoxon signed rank test was performed to determine the position of the statistical
difference. It was found that the statistical difference occurred between seasons 1 and
seasons 2, z = -2.201, p = .028.
Group
42
3.0
2.5
2.0
1.5
1.0
20
24
Response Time Rater 2 Average Season 3
Response Time Rater 2 Average Season 2
Response Time Rater 2 Average Season 1
130
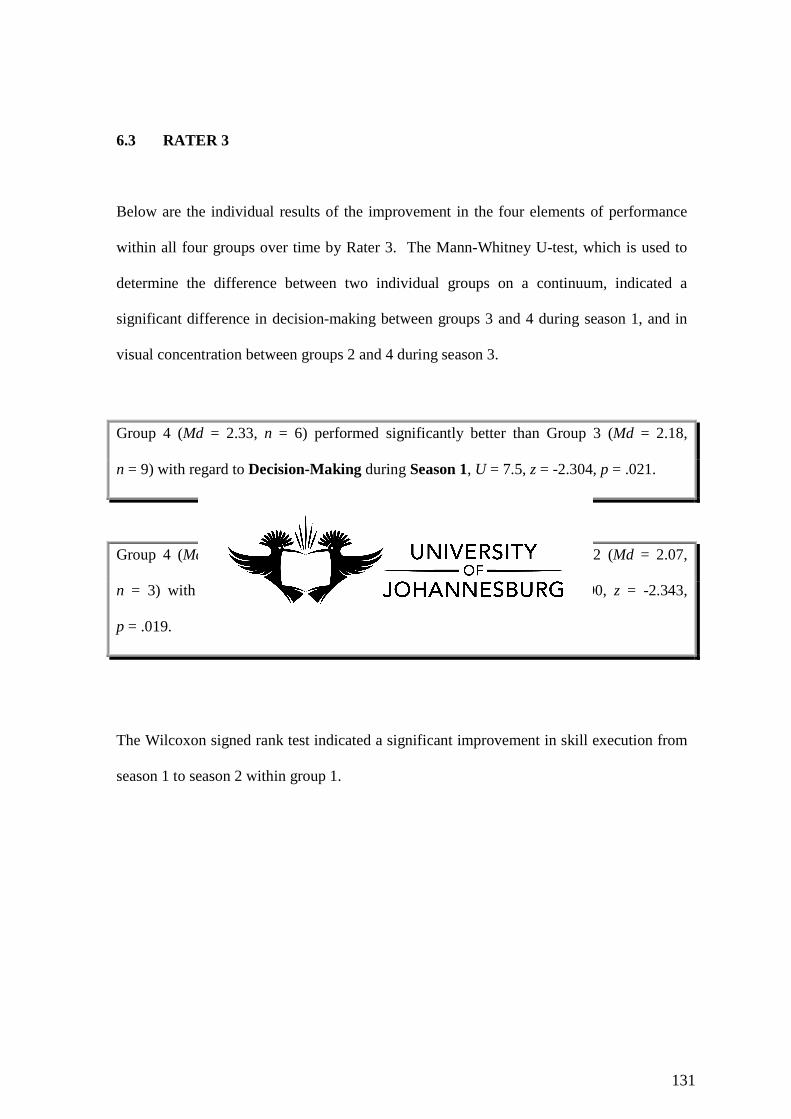
6.3 RATER 3
Below are the individual results of the improvement in the four elements of performance
within all four groups over time by Rater 3. The Mann-Whitney U-test, which is used to
determine the difference between two individual groups on a continuum, indicated a
significant difference in decision-making between groups 3 and 4 during season 1, and in
visual concentration between groups 2 and 4 during season 3.
Group 4 (Md = 2.33, n = 6) performed significantly better than Group 3 (Md = 2.18,
n = 9) with regard to Decision-Making during Season 1, U = 7.5, z = -2.304, p = .021.
Group 4 (Md = 2.57, n = 6) performed significantly better than Group 2 (Md = 2.07,
n = 3) with regard to Visual Concentration during Season 3, U = .000, z = -2.343,
p = .019.
The Wilcoxon signed rank test indicated a significant improvement in skill execution from
season 1 to season 2 within group 1.
131

TABLE 16 Descriptive Statistics for Skill Execution from Season 1 to Season 2
within all four groups by Rater 3
Group Season Minimum 25th
Percentile 50th (Median) 75th
Percentile Maximum
1 1 1.54 1.9167 1.9333 2.2000 2.36
n=7 2 1.86 2.0769 2.2500 2.4000 2.64
2 1 2.00 2.0000 2.0667 2.0667 2.07
n=3 2 1.93 1.9333 2.1333 2.4000 2.40
3 1 1.92 1.9643 2.0714 2.2667 2.38
n=9 2 1.87 1.9615 2.1333 2.3571 2.55
4 1 1.87 2.1167 2.2738 2.5000 2.60
n=6 2 1.73 2.0333 2.3333 2.4333 2.53
Table 16 gives descriptive information about the graph below (graph 8) and should be read
in correlation with graph 8. Table 16 displays the minimum, maximum and median values
within all four groups for skill execution for rater 3. The information is displayed by
means of a box and whisker plot in graph 8 below.
132

GRAPH 8 Box and Whisker plot for Skill Execution from Season 1 to Season 2
within all four groups by Rater 3
Group 1 showed a significant improvement in skill execution from season 1 to season 2,
z = -2.032, p = .042. The median score improved from season 1 (Md = 1.93) to season 2
(Md = 2.25), with maximum values that increased from 2.36 (season 1) to 2.64 (season 2).
Group
4 321
3.0
2.5
2.0
1.5
1.0
Skill Execution Rater 3 Season 2
Skill Execution Rater 3 Season 1
133

The inconsistency among the raters was the reason why we were compelled to determine a
more objective method of evaluation. Since the four elements of performance do not
consist out of a single entity an index had to be created.
7. A MODEL FOR THE OBJECTIVE EVALUATION OF VISION-
RELATED PERFORMANCE IN RUGBY
An index was created for each of the four elements of performance in individual and unit
skills: skill execution, concentration, decision-making, and response time. Each index was
then processed into one entity, which resulted in a model for assessing performance
objectively. After careful consideration, the individual raters as well as the designers of the
Verusco© system were in full agreement about the individual skills which would represent
each element. As many as possible of the relevant individual skills were incorporated for
more consistent results. Each of these indices was then processed into one entity and the
percentage of each was determined. This was necessary in order to compare individual
players when evaluating performance.
Skill execution was the only element of performance that was processed to reflect a
percentage by means of the Verusco© system. Concentration was determined by
calculating the number of handling errors by each player, divided by the time they played
in total. Response time consisted of the following individual skills: line breaks, tackle
breaks, tackles per minute, tackles made, tackles missed, turnovers forced, defender beaten,
work rate, kick pressure and breakdown turnover won. Decision-making consisted of
134

turnovers won, turnovers lost, off-loads, good off-loads, bad off-loads, cleans made,
possession won, possession lost, breakdown efficiency, in-tackle passes, total number of
ball carries, positive ball carries, negative ball carries, total attack, total defense, assist
tackle, putting-on-pressure, pick-and-go and the number of dummies thrown.
The percentage for skill execution was determined by the Verusco© system and therefore
no formula was calculated.
The formula for Visual Concentration:
The formula for Response Time:
a+b+c+d+(-e)+f+g+h+i+j
X=
10
Total of handling errors
X=
Total handling
135

Where
a = total line breaks (+)
b = total tackle breaks (+)
c = total tackles per minute (+)
d = total tackles made (+)
e = total tackles missed (-)
f = total turnovers forced (+)
g = total defenders beaten (+)
h = total work rate (+)
i = total kick pressure (+)
j = total breakdown turnovers won (+)
The formula for Decision Making:
Where
a = total turnovers won (+)
b = total turnovers lost (-)
c = total off-loads (+)
d = total good off-loads (+)
e = total bad off-loads (-)
f = total cleans made (+)
g = total of possession won (+)
h = total of possession lost (-)
i = total breakdown efficiency (+)
j = total in tackle passes (+)
k = total amount of ball carries (+)
l = total positive ball carries (+)
m = total negative ball carries (-)
n = total attack for all games (+)
a+(-b)+c+d+(-e)+f+g+(-h)+i+j+k+l+(-m)+n+o+p+q+r+s
X=
19
136

o = total defense for all games (+)
p = total of assisting tackles (+)
q = total putting pressure (+)
r = total pick-and-go’s (+)
s = total amount of dummies thrown (+)
8. THE ANALYSIS OF THE FOUR ELEMENTS OF
PERFORMANCE USING THE DATA FROM THE VERUSCO
SYSTEM
Table 17 and 18 shows the descriptive statistics for all four groups for the Verusco©
analyses for decision-making and visual concentration. Graphs 9 and 10 reflect the
descriptive data in a box and whisker plot fashion.
The Mann-Whitney U-test was used to measure differences between groups, but no
significant differences between the groups were indicated. The Wilcoxon signed rank test
measures changes over time and indicated a significant improvement in decision-making
within group 3 and group 4 from season 1 to season 2. There was also a significant
improvement in concentration within group 4 from season 2 to season 3. No significant
differences were found for skill execution and response time.
137

8.1 DECISION-MAKING
TABLE 17 Descriptive Statistics for Decision-Making from Season 1 to Season 2
within all four groups using the Verusco analysis
Group Season Minimum 25th
Percentile 50th
(Median) 75th
Percentile Maximum
1 1 1.44 4.8666 6.7295 8.6918 10.08
n=7 2 3.97 5.0663 7.0484 8.4895 10.84
2 1 6.81 6.9561 7.0984 7.1137 7.13
n=3 2 7.27 7.2700 7.5137 7.7574 7.76
3 1 4.16 4.8468 5.4484 6.5695 6.78
n=9 2 3.47 6.5524 7.9208 8.4134 8.85
4 1 5.64 5.7963 5.9903 7.8747 8.43
n=6 2 6.11 6.1679 6.6226 9.1353 9.8
Table 17 gives descriptive information about the graph below (graph 9) and should be read
in correlation with graph 9. Table 17 displays the minimum, maximum and median values
for all four groups for decision-making using the Verusco© analyses. The information is
displayed by means of a box and whisker plot below in graph 9.
138
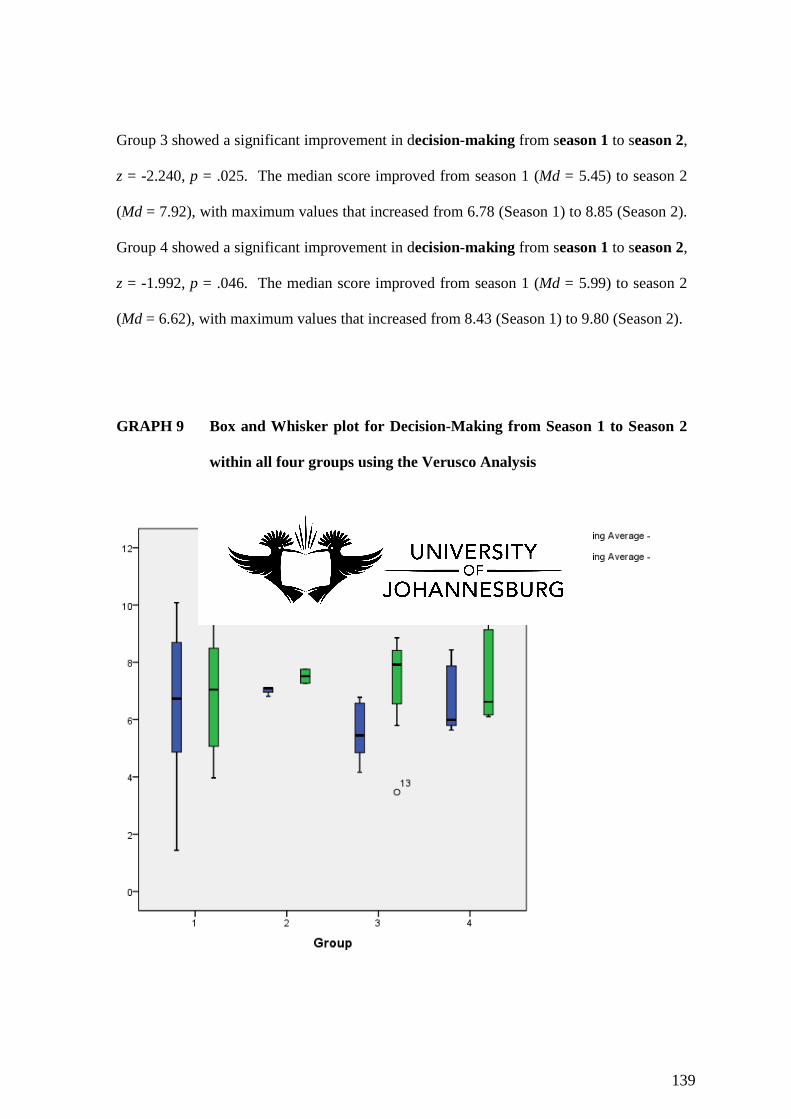
Group 3 showed a significant improvement in decision-making from season 1 to season 2,
z = -2.240, p = .025. The median score improved from season 1 (Md = 5.45) to season 2
(Md = 7.92), with maximum values that increased from 6.78 (Season 1) to 8.85 (Season 2).
Group 4 showed a significant improvement in decision-making from season 1 to season 2,
z = -1.992, p = .046. The median score improved from season 1 (Md = 5.99) to season 2
(Md = 6.62), with maximum values that increased from 8.43 (Season 1) to 9.80 (Season 2).
GRAPH 9 Box and Whisker plot for Decision-Making from Season 1 to Season 2
within all four groups using the Verusco Analysis
139

8.2 VISUAL CONCENTRATION
TABLE 18 Descriptive Statistics for Visual Concentration from Season 1 to Season
3 within all four groups using the Verusco analysis
Group Season Minimum 25th
Percentile 50th
(Median) 75th
Percentile Maximum
2 2 98.44 98.8200 99.2000 99.2750 99.35
n=3 3 98.38 98.4200 98.4600 98.9050 99.35
4 2 95.66 98.3100 98.5850 99.0900 99.19
n=6 3 98.56 98.7900 98.9300 99.3400 99.54
Table 18 gives descriptive information about the graph below (graph 10) and should be
read in correlation with graph 10. Table 18 displays the minimum, maximum and median
values for all four groups in visual concentration using the Verusco analyses. The
information is displayed by means of a box and whisker plot in graph 10 below.
Graph 10 below shows a significant improvement in concentration within group 4 from
season 2 to season 3, z = -2.207, p = .027. The median score improved from season 2 (Md
= 98.59) to season 3 (Md = 98.93) with maximum values that increased from 99.19 (season
2) to 99.54 (season 3).
140

GRAPH 10 Box and Whisker plot for Visual Concentration from Season 1 to
Season 3 within groups 2 and 4 using the Verusco Analysis
The objective method of evaluation of performance indicated an improvement within group
4 in decision-making and visual concentration from season 1 to season 3, and within group
3 in decision-making from season 1 to season 2.
When the intra-class correlation coefficient and the low consistency between the raters are
considered, the model for the four elements of performance, using the Verusco© system,
seems to be the more accurate method to evaluate performance.
141

CHAPTER 7
DISCUSSION AND
CONCLUSION
1. Introduction
2. The four elements of performance
3. Conclusion
4. Recommendations
142

CHAPTER 7
DISCUSSION AND CONCLUSION
1. INTRODUCTION
1.1 THE AIM
The aim of the study was to investigate whether
• there is a difference in the performance levels of groups of rugby participants in the
same training environment, performing at the same level of competition;
• groups of rugby participants in the same training environment who have been
exposed to visual training show a difference in performance levels over time when
performing at the same level of competition;
• the training of specific visual skills transfers to the overall improvement of rugby
performance.
143

1.2 BACKGROUND
Abernethy (1991) defined decision-making as the process in which perceptual information
is used to determine an accurate response. Decision-making correlates directly with overall
performance. The better the decision-making, the better the performance (Szymanski,
1997; Vickers, 2003). Decision training leads to superior performance (Szymanski, 1997;
Vickers, 2003). Other authors have also indicated that some visual skills are trainable
(Calder, 1999; Loran & MacEwen, 1995; Trachman & Kluka, 1993; Ludeke & Ferreira,
2003; Ferreira, 2003; Bressan, 2003). The decisive results obtained by using an index in
this study confirm the findings in literature that visual motor improvement is possible
through training. Furthermore, making use of an index to analyze performance excludes
subjectivity demonstrated in the results of the performance evaluation by individual raters.
Rugby is an open skill sport and, open skills are performed in a changing environment
where time pressure plays a role (Abernethy, 1991; Schmidt & Wrisberg, 2004;
Honeybourne, 2006; Wisemantel, 2002). Performance is affected by a number of factors:
environment, nutrition, physical and psychological factors, which are discussed below.
Extreme environmental factors affect the physiological, emotional, cognitive and social
processing resources of individuals (Paulus et al., 2009). A study done with Navy Seals
and Army Rangers, who were exposed to extreme environments during military training,
showed significant cognitive decline which was relative to baseline performance
(Lieberman et al., 2005). Impairment was noted in simple reaction time, visual perception,
vigilance, learning, memory and reasoning. Therefore, as individuals are exposed to
144

extreme environments, cognitive performance deteriorates (Maruff, 2006). The degree of
deterioration depends on the type of task, its duration, the level of training and the severity
of the extreme environment (Paulus et al., 2009).
According to Paulus et al., (2009) optimal performers have developed an internal body
state with an appropriate level to act. Sub-optimal performers have a mismatch between
the experienced body state and the necessary action to maintain homeostasis.
Thus, extreme conditions, like rain, heat, cold and altitude most definitely play a role in
performance.
Proper nutrition correlates directly with better physical performance (Lukaski, 2004). The
choice of food influence biochemical responses during exercise training, recovery from
exercise training and performance (Maughan, 2002). Carbohydrates are a primary source
of energy for the human body and if carbohydrate or muscle glycogen stores are depleted,
exercise intensity decreases and exhaustion sets in (Coggan & Coyle, 1991). High
carbohydrate diets in trained individuals have been shown to improve endurance exercise
performance (Coggan & Coyle, 1991; Sherman et al., 1991; Wright et al., 1991; Sherman
et al., 1989). Vitamins and minerals are the key regulators of health and performance
(Lukaski, 2004) and mineral deficiencies, such as iron, magnesium and zinc, may impair
performance.
The nourishment needs of an athlete are dependent on many factors: the type, duration and
frequency of sport activity, the body mass and composition of the individual as well as
145

environmental factors (American College of Sports Medicine, 2000). Athletes require
sufficient energy intakes to maintain body weight and body composition. Insufficient
energy intake may lead to loss of lean muscle mass (Pendergast et al., 1996), increased risk
of fatigue, injury and illness (Grandjean & Ruud, 1994; Grandjean, 1983) and diminished
performance (Ziegler et al., 2002).
According to Taylor et al., (1997) the characteristics of individuals who complete SEAL
training, known to be one of the most challenging military training programs, are mental
toughness, achievement motivation, physical strength, physical endurance, emotional
stability and team orientation.
Sports performance consists out of the following physical components: aerobic endurance,
anaerobic fitness, strength, muscle endurance, speed, agility, power, flexibility, body
composition, diet and nutrition and rest and relaxation (Dowson, 1999).
Aerobic endurance is the ability to withstand prolonged hard work and relies on the body’s
ability to produce energy through oxygen that is distributed to the muscles. Anaerobic
fitness is the ability to withstand high intensity distance training such as sprinting. This
system relies on the phosphocreatine and lactic acid energy systems to produce quick bursts
of energy (Dowson, 1999).
The maximum amount of force produced in one movement can be defined as strength,
which forms the basis of muscle endurance and power. Muscle endurance is measured by
the length of time or number of times a muscle can work against resistance without
146

fatiguing. Power, is a combination of strength and speed, is the ability of a muscle to
generate force in a short period of time. Speed is the maximum velocity an athlete is able
to produce and maintain, whereas agility is the ability to change direction quickly
(Dowson, 1999). Flexibility, the range of movement within a joint, minimizes injury and
allows athletes to achieve good technique in their chosen discipline. Body composition is
an athlete’s physical make up, for example mass and height.
Rest and recovery are critical parts of sport performance. Fatigue after training could lead
to low recovery rate, poor coordination and diminished speed and muscle contractions
power. Recovery should be a daily concern to prevent acute exhaustion and overtraining
(Bompa, 1999).
Another consideration in physical development is genetics. Genes are responsible for some
of the variations in human athletic performance (Brutsaert & Parra, 2006). Studies provide
strong support for the hypothesis that genetic factors determine both proximate measures of
human performance and, ultimately, athletic ability in various sporting disciplines.
Although elite athletes may be born with a favorable genetic constitution, athletic potential
requires years of focused training (Brutsaert & Parra, 2006). The effects of training on
variations in performance could be dramatic. The world record in the women’s marathon
has decreased by one hour since the 1960’s, and this is definitely due to improved training
techniques (Brutsaert & Parra, 2006). Thus, both genetics and early life environmental
experience contribute to adult athletic performance.
147

According to Hodge (2004) the key difference between winning and losing or between
good performance and poor performance may be the psychological rather than the physical
skill level. The elite athlete’s psychological profile should consist of the following skills:
mental preparation, concentration, confidence, high motivation and commitment, ability to
control anxiety and the ability to cope with pressure (Hardy et al., 1996; Mahoney et al.,
1987; Orlick & Partington, 1988; Thomas et al., 1999; Williams & Krane, 2001).
Motivation energizes, selects and directs performance. Motivation consists of two
components, intrinsic (from within) and extrinsic (external factors) motivation (Martens,
1987). Motivation must come from within in order to be effective and meaningful, while
extrinsic motivation is unlikely to have a lasting effect. Motivation is both wanting to and
having to do something and is a fundamental skill for developing mental toughness
(Hodge, 2004).
All athletes must learn to cope with stress and pressure in order to maintain their
composure. Coping with pressure means to control stress, anxiety and adversity in order to
achieve peak performance (Anshel et al., 1997; Cresswell & Hodge, 2004; Gould et al.,
1993).
Another key ingredient for successful performance in sport is self-confidence, which
greatly influences an athlete’s performance in situations where he is physically able to
perform a task but is uncertain about his capabilities (Hodge, 2004). The mentally tough
player has a strong level of self-confidence without being over-confident. Furthermore,
148

self-confidence is one of the fundamental building blocks of mental toughness (Bandura,
1977; Bandura, 1986; Hardy et al., 1996; Horsley, 1991).
The current study was conducted over a period of three years or three seasons.
Although the variants which have been mentioned above could impact on
performance on a given day, it is unlikely that it would impact on a selection of
performances over three seasons. It was because of these factors that the decision was
made to perform this study over three years. The only downside was that it impacted
on the number of participants
Figure 1.1 A modified information processing model of skilled performance (Erickson,
2007)
The perceptual mechanism receives information from the sensory receptors. The
information is then filtered and only necessary information is processed. The processed
information is then delivered to the decision-making mechanism which determines the
appropriate motor response. The effector mechanism initiates and controls the motor
response and is measured according to an athlete’s performance. The four elements of
performance, decision-making, response time, concentration and skill execution forms part
of the translator mechanism, which determines the outcome of performance.
Decision
mechanism
(CNS)
Effector
mechanism
(Muscles)
Receptor
mechanism
(Senses)
149

Both objective and subjective evaluation methods were used in the current study. The
subjective method of evaluation showed inconsistency and therefore a model of objective
evaluation was established. An index was created for each of the four main elements of
performance, skill execution, concentration, decision making and response time in order to
determine the effectiveness of visual training on performance.
The subjective method included a selection of video clips which was evaluated by three
independent raters. Video clips for each player were randomly selected from the Verusco©
data basis over a period of three seasons. Each video consisted of fifteen clips per player
for each of the three seasons. We were constricted to fifteen clips per player per season
due to the time needed for the evaluation process. The study was conducted over a period
of three years, which minimized the role played by variants. Four groups, three
experimental and one a control, consisted of regional and national regional rugby players,
who took part in the study. Two of the experimental groups had specific visual training at
the National side, the third experimental group had off-season visual training, and the
control group had no visual training at all. The purpose of the control group was to
evaluate whether changes in performance could be visually related.
Twenty-five players participated in the study. The small sample group was due to the
challenge of players moving to different regions or not participating because of injuries. It
was important that the study group had the same coaching staff over the three seasons and
therefore participated in the same region during that time, to minimize the variability
factors.
150

There was a low consistency between the raters, which pointed to subjectivity among them.
No correlation was found between the subjective (raters) and the objective method of
evaluation, which used the Verusco© data basis. Previous Studies (Venter, 2008; Van
Velden, 2011) also indicated subjectivity among raters, and for this reason, a more
objective method of evaluation was essential. An increase in the amount of video clips per
player might have an effect on the consistency between the raters, but unfortunately time is
a factor and it would take too much time to assess more clips. A model for performance
evaluation based on indices was developed, since no objective evaluation methods were
available. Evaluation based on a performance index is therefore a much more consistent
method for assessing performance.
Literature highlighted the following areas which enhance visual performance: treating
vision insufficiencies, enhancing visual skills, improving visual information processing
skills, developing visuo-motor competence and enhancing cognitive functions (Coffey and
Reichow, 1995; Erickson, 2007 & Vickers, 2007). Therefore, as mentioned before, the
following four major elements for improving performance in rugby specifically were
identified accordingly: skill execution enhancement, visual concentration, response time
and decision-making.
Verusco TryMaker Pro© coding services identify and capture between 4500 and 5000
individual tasks in each game for each player during a season. This system analyzes player
and position performance specifically and also does trend and tactical analysis. Although
most of the information needed for evaluating players is available on this system, only skill
execution is rated on the Verusco system. Visual concentration, response time and
151

decision-making are not rated as entities, but as separate individual skills. For this reason
indices were developed for each of the three other elements of performance to establish
whether improvement in performance had occurred.
As mentioned in the methodology chapter, the visual concentration index was determined
by calculating the number of handling errors each player committed, divided by the time
they played in total. The reaction time index consisted of the following individual skills:
line breaks, tackle breaks, tackles per minute, tackles made, tackles missed, turnovers
forced, defender beaten, work rate, kick pressure and breakdown turnover won. The
decision-making index consisted of turnovers won, turnovers lost, off-loads, good off-
loads, bad off-loads, cleans made, possession won, possession lost, breakdown efficiency,
in-tackle pass, total number of ball carries, positive ball carries, negative ball carries, total
attack, total defense, assist tackle, putting-on-pressure, pick-and-go and the number of
dummies thrown. The raters and the designers of the Verusco© system considered the
individual skills selected for each element and reached full agreement about them. For
more consistent results as many as possible of the individual skills were incorporated.
Each of these indexes was then processed into one entity and the percentage of each was
determined. This was necessary in order to compare players when evaluating their
performances.
The significance of using the Verusco Try Maker Pro© system is that players’ performance
could be assessed while they were participating in competitions. The clips that were made
for each individual player were also derived from the Verusco© system. Thus, both the
raters and the Verusco© system assessed the players during competitions.
152

Each of the four elements of performance will be discussed individually.
2. THE FOUR ELEMENTS OF PERFORMANCE
2.1 SKILL EXECUTION INDEX
Is skill execution trainable? Research done by Newell and Simon (1972) showed that
outstanding performance is a result of an increase in knowledge and skill due to extended
effects of experience. This theory was confirmed by recent studies (Ericsson & Charness,
1994), which showed that extended training alters experts’ cognitive and physiological
processes. McLeod and Jenkins (1991) stated that expert sportsmen are not dramatically
better at performing their tasks than non-experts. According to them everyone has the
ability to produce fine timing, but that the difference lies in constant practice (McLeod &
Jenkins, 1991). Continuous practice enables the nervous system to form perceptual
schemata, resulting in improved understanding and anticipation of specific game situations
(McLeod & Jenkins, 1991). Skill execution can therefore be improved through specific
training. For this reason the current study evaluated the effect of time on skill execution
and, therefore, the study was conducted over a period of three years.
Did skill execution improve over the three seasons?
153

According to the Verusco TryMaker Pro© system:
The Mann-Whitney U-test and the Wilcoxon signed rank test indicated no significant
improvement in the Verusco analysis. There was no significant improvement in skill
execution over time for any of the groups, and no significant differences between the
groups according to the Verusco TryMaker Pro© system.
According to the raters:
Two of the three raters (rater 1 & 3) indicated a significant improvement in skill execution
for group 1 (regional players) from season 1 to season 2. Group 4 (National regional
players) also showed a significant improvement in skill execution from season 1 to season
2 according to rater 2.
The objective method of evaluation indicated no improvement of skill execution within the
groups or over time. One could argue that in cases where two of the three raters agreed,
those results might be significant. Group 1 (regional players that had off-season visual
training) improved significantly over time. Group 1 had informal visual training for
fifteen minutes per day and four days per week during the off-season. Group 2 (National
regional players), from the same provincial side were exposed to specific visual training
during a four month period at the National side, and off-season visual training at their
regional side. One would expect a significant improvement in the latter players, but no
significant improvement was noted. The small sample group of only three players could
account for this. And also the fact that skill execution in mature players needs much more
training as mentioned by Davis, Kimmet and Auty (1986). It takes 500 hours of practice to
change an existing skill and to be able to use that skill during competitions.
154

2.2 VISUAL CONCENTRATION INDEX
Is visual concentration trainable? As previously mentioned, visual concentration is the
ability to pay constant active attention to visual stimuli. It is also a measure of how little
visual information is required for the athlete to respond to a stimulus (Ferreira, 2001; Buys,
2002). Since visual concentration represents the driving force of the visual perceptual
system, insufficient visual concentration will result in an overall poor motor response
(Downing & Pinker, 1985). Improvement in visual concentration will therefore contribute
to improved motor response. The visual concentration index was determined by
calculating the number of handling errors each player committed, divided by the time they
played in total.
Did visual concentration improve over the three seasons?
According to the Verusco TryMaker Pro system:
The Verusco analysis indicated a significant improvement in visual concentration for group
4 (National regional players) that were exposed to specific visual training during a four
month period at the National side from season 2 to season 3.
According to the raters:
Rater 1 found a significant improvement in visual concentration for group 1 (regional
players) that had off-season visual training from season 1 to season 2 and rater 3 within
group 4 (National regional players), that were exposed to specific visual training during a
four month period at the National side. They performed significantly better than group 2
155

(National regional players), who were exposed to specific visual training during a four
month period at the National side and off-season visual training at the regional side during
season three. Although the raters found significant improvement in some of the groups,
they did not agree about the specific groups.
As can be seen from the above results the only significant results were obtained by the
Verusco© system, an objective method of evaluation. It is important to note that the
improvement occurred in the groups who were exposed to visual training, either in the
National side or during the off-season.
2.3 RESPONSE TIME INDEX
Is response time trainable? Kluka (1991) defined visual response time as the time required
for information being processed until the first motor response, i.e. the speed with which the
brain interprets information and the action follows. Improving visual response time can
result in faster visual information processing and reduction in the time required for the
neuromuscular system to send information to the muscles (Erickson, 2007). The reaction
time index consists of the following individual skills: line breaks, tackle breaks, tackles per
minute, tackles made, tackles missed, turnovers forced, defender beaten, work rate, kick
pressure and breakdown turnover won.
Did response time improve over the three seasons?
156

According to the Verusco TryMaker Pro© system:
The Mann-Whitney U-test and the Wilcoxon signed rank test indicated no significant
improvement in response time. There were no significant improvement in skill execution
over time for any of the groups, and no significant differences among the groups, according
to the Verusco TryMaker Pro© system.
According to the raters:
There was also no consensus among the raters about significant improvement in response
time. Rater 1 found a significant improvement in response time for group 1 (regional
players who had off-season visual training) from season 1 to season 2. Rater 2 indicated
that group 3 (regional players who had no visual training exposure) performed significantly
better in response time than group 1 (regional players who had off-season visual training)
during season 2. He also found a significant improvement in response time within group 3
(regional players who had no visual training exposure) and group 4 (National regional
players who had specific visual training at the National side) from season 1 to season 2.
There was no consensus among the raters about significant improvement in response time
between the groups. The Verusco TryMaker Pro© system also showed no significant
improvement. For this reason one could argue that response time did not improve
significantly over the three seasons. There were no control over the visual training and the
time spent on visual training was restricted. One could also argue that response time would
have improved if more time would have been spent on game related visual training. It also
raises the question about the usefulness of computer based training programmes.
157

2.4 DECISION MAKING INDEX
Is decision making trainable? Decision making is the process by which an appropriate
movement response is selected. It is the ability to assess a large number of situational cues
and to select the most accurate response (Hodge & McKenzie, 1999). The ability to
process visual information quickly and accurately and facilitate performance during
competitions improves as expertise improves (Erickson, 2007). Vickers (2007) proposed
the decision training model for training and improving decision making. According to her,
decision training is not just a relationship between perception and motor performance but it
establishes an automatic connection between stimuli and response. The decision making
index consists of turnovers won, turnovers lost, off-loads, good off-loads, bad off-loads,
cleans made, possession won, possession lost, breakdown efficiency, in-tackle passes, total
number of ball carries, positive ball carries, negative ball carries, total attack, total defence,
assist tackle, putting-on-pressure, pick-and-go and the number of dummies thrown.
Did decision-making improve over the three seasons?
According to the Verusco TryMaker Pro system:
The Verusco analysis indicated a significant improvement in decision making for group 3
(regional players that had no visual training exposure) and group 4 (National regional
players that had specific visual training at the National side) from season 1 to season 2.
158

According to the raters:
Rater 2 & 3 agreed that group 4 (National regional players that had specific visual training
at the National side) performed significantly better than group 3 (Regional players that had
no visual training exposure) in decision making during season 1. Rater 1 also found a
significant improvement in decision making in group 1 (Regional players who had off-
season visual training) from season 1 to season 2.
Group 3 had no visual training, while group 4 had specific visual training during the four
months at the National side. A significant difference was found in both groups who were
in the same training environment over time, although only group 4 was exposed to specific
visual training. Improvement in decision making could therefore not only be due to visual
training exposure, since the improvement could also be due to experience.
According to the literature (Ripoll, 1991), the distinction between experts and novices in
reaching high levels of performance is found in high level skill demands and the
coordination of sensor motor and semantic visual functions. Although both groups of
players play for professional sides in regional teams (groups 3 & 4), the players in group 4
were also playing for the National side. Neither group 3 nor group 4 had any visual
training at the start of the study, yet the players in group 4 performed significantly better in
decision making. These players could be seen as more skilled due to the fact that they
made better decisions than the other players and that might be a reason for the selection to
the National side.
159

No significant differences were found in decision making between groups 1 and 2 during
season 1. Group 1 consisted out of regional players and group 2 out of National regional
players. The small sample group in group 2 could well account for this. It is possible that
their might have been a significant difference if the sample group had been bigger.
The above results show a significant improvement in skills over time. Groups 1, 2 and 4
had visual training exposure, but group 3 did not. Although group 3 did not receive any
visual training, their decision making still improved significantly. Factors which could also
have been played a role in improving skills over time could be experience and improved
physical and mental abilities.
The specific visual training for groups 2 and 4 was only for ten minutes twice a week over
a four month period. They did receive generic computer training for improving these
visual skills and there was a minimum requirement about how much time they had to spend
on computer training. It could have a much greater effect on visual performance if these
players had had longer and more frequent exposure to the specific on-field visual training.
According to McLeod and Jenkins (1991) expert sportsmen are not dramatically better at
performing tasks than non-experts. They maintain that everybody has the ability to
produce fine timing and that the difference lies in constant practice. Continuous practice
enables the nervous system to form perceptual schemata, which improve understanding and
anticipation in specific game situations (McLeod & Jenkins, 1991). Constant practice leads
to accurate performance (Ericsson et al., 1993; Helsen et al., 2003). The ability to process
160

visual information quickly and accurately and facilitate performance during competitions
improves as expertise improves (Erickson, 2007).
Could it be that experts are able to process information to the motor cortex faster, which
gives them the edge over novices? Have elite athletes mastered using the shorter
retinotectal pathway through the Superior Colliculus for information processing, rather than
the long retinogeniculate pathway through the Lateral Geniculate Nucleus? As mentioned
before, elite athletes have special perceptual schemata which are formed by constant
practice, resulting in quicker processing of information to the motor cortex. Visual training
could therefore definitely complement physical training in establishing the perceptual
schemata. Constant practice will automatically lead to the four elements of performance
being improved over time. The current study does not indicate improvement in visual
motor performance as a result of visual training. This could be because these players were
in a developmental phase, or not enough time was spent on specific on-field visual
enhancement training.
3. CONCLUSION
In the current study a model was designed to establish an objective method of evaluating
performance. The evaluation model consists of the four elements of performance: skill
execution, visual concentration, response time and decision making. An index was
designed for each of the four essential elements of performance for analyzing visual
161

performance objectively. This is the only method which evaluates true visual performance
in rugby since it measures performance during competitive play objectively.
The aim of the study was to determine whether players in the same training environment
performed differently and whether visual training exposure had an impact on performance.
We wanted to establish whether visual skills are trainable and whether improvement in
these skills could transfer to overall sports performance.
The results did indicate that players in the same regional team performed differently.
Group 4, who were selected for the National side, performed better in decision-making than
group 3 in Season 1. No visual training was done during season 1. There were no
differences between groups 1 and 2. This could be because group 2 was such a small
sample. More accurate decision making separated group 4 from group 3, which was
probably the reason for their selection to the National side.
The only group who was not exposed to visual training was group 3. Rater 2 found a
significant improvement in group 3 for response time from season 1 to season 2. He also
found that group 3 performed significantly better than group 1 in season 2. Decision
making improved significantly over time for group 3, as was indicated by the Verusco
TryMaker Pro© system. Improvement did take place without any visual training.
Therefore visual training cannot be isolated as the only element leading to improved sports
performance. One could argue that groups 1, 2 & 4, who had visual enhancement training,
did not spend enough time on specific game related visual enhancement training. Previous
research demonstrated the importance of specific visual training and introduced the SAFID
162

approach, which was specifically adapted to imposed demands (Ferreira, 2002). The
training and competition environment should be closely simulated since the improvement
and transition of skills are more effective in such an environment (Ferreira, 2002).
However, the question remains whether the difference would not have been significant if
the players had spent more time on specific visual training.
The study did indicate that players improved in decision making, concentration and skill
execution over time. This is a confirmation of previous studies that visual skills are
trainable. Venter (2008) indicated that specific visual training improved visual skills, which
also correlated with previous studies (Calder, 1999; Loran & MacEwen, 1995; Trachman &
Kluka, 1993; Ludeke & Ferreira, 2003; Ferreira, 2003; Bressan, 2003). An assumption can
be made for rugby specifically that improvement in these four visual skills, skill execution,
visual concentration, response time and decision making, would lead to improved overall
sports performance.
The results indicated that all regional players improved over time, not only the players
exposed to visual training. As discussed previously, many factors play a role in overall
sport performance. Elite players have a superior ability to utilize advanced information in
order to activate the motor system (Muller & Abernethy, 2006; Muller et al., 2009;
McLeod, 1987). Lifelong experience, from early intra-uterine exposures to advanced
training techniques by professionals, all contribute to human athletic ability (Brutsaert &
Parra, 2005).
163

It is therefore important to take all influencing factors, including visual training, into
consideration when conditioning players.
Conclusion: Although visual training could not be isolated in all the elements of
performance in the current study, previous studies have indicated a relationship between
visual training and improvement in visual skills. The researcher therefore suggests that
more focused attention should be directed towards younger players where a bigger margin
in improvement is possible, and that sport specific training, also known as the SAFID
approach, should be used as the method of training visual skills. Visual training should
take place more frequently, and the objective model for performance evaluation should be
developed further.
Although fifty high performance players were recruited for the study, once they were
divided into four groups, the study ended up with small sample groups. The fact that the
players that participated in the study moved to different provinces or got injured made it
difficult to establish a big sample group. For this reason we ended up with only twenty five
players.
There was no control over the specific visual training. The players that were chosen for the
National side participated in a specific visual training program with a sports vision
enhancement specialist. The specialist used visual enhancing techniques to improve the
elements of performance. The researcher had no influence on these training techniques and
could only elaborate on the time spent on these techniques. It is important that the players
follow a specific visual training programme and that there is control over the parameters,
164

like the type and time spent on visual training. This is therefore a severe limitation to this
study and it is therefore suggested to rather make use of high school teams for a future pilot
study since better control can be implemented.
Large quantities of training need to be arranged for minor improvements in elite
performers. Furthermore there are several possible movement sequences for every motor
response (Kibele, 2006). Through extensive experience and anticipation, the number of
possible movement sequences could be limited, resulting in proper motor reactions
(Tendenbaum, 2003). Motor reaction only takes place once a critical threshold level has
been reached and the perceived movement features correspond with the motor codes of the
motor response (Prinz, 1997; Wickens et al.,1994;). Thus, only particular stimuli will
initiate a motor reaction (Kibele, 2006). Providing perceptual skill training by developing
motor responses in order to produce appropriate action codes, would establish accurate
perception-action responses (Farrow & Abernethy, 2002; Kibele, 2006).
It was difficult to isolate visual training as the only factor on performance, because of the
many factors that are important in performance, such as physical and mental abilities and
experience. The results indicated that other factors definitely played a role in performance,
for instance the fact that group 3 was not exposed to visual training, yet also showed
improvement in decision making and response time over 2 seasons. It is clear that much
more attention should be given to the nature and duration of visual exercises.
There were no objective methods of evaluation of performance for three of the four main
elements of performance: visual concentration, response time and decision making. An
165

index for each of these elements had to be developed to establish an objective evaluation
model. The individual skills that were incorporated into the four elements of performance
were chosen very carefully, but not all the individual skills were incorporated because of
the different positions that are played in rugby. Kicking, for instance, is usually only
executed by the fly half, scrum half and full back and was therefore excluded from
decision-making. Lineouts only involve the forward players and the lineout jumpers
specifically and were also excluded from response time and decision making. Each of the
individual skills was chosen after careful consideration in order to establish a reliable
objective model of evaluation. It may be wise to consider positions played in rugby and
therefore design a model that is more position specific.
4. RECOMMENDATIONS FOR FUTURE INVESTIGATION
Recommendations are as follows:
• The Verusco TryMaker Pro© system should incorporate the performance index or a
similar index into its system for the easier assessment of player performance over
time.
• The use of raters in evaluating players should be abandoned because of the
subjectivity of this method. It has been found that the individual’s opinion around
the technical part of the game of rugby differs too much.
166

• Caution should be exercised when selecting video clips and more video clips of
each of the four performance elements specifically should be captured. An
increased amount of video clips in each of the four elements would contribute to a
more accurate result.
• Larger experimental groups should be used where possible, as they would give
results more credibility. A performance model such as the TryMaker Pro© system
should be included in the system. A performance model would contribute to the
easier assessment of performance enhancement.
• More frequent and more task related visual enhancement training sessions should be
provided. As previously mentioned it takes 500 hours of practice to change an
existing skill (Davis, Kimmet and Auty, 1986). It is therefore necessary to increase
the amount of visual enhancement training sessions in order to improve visual
performance.
• The model of performance should be developed further and made more position
specific. This would contribute towards more specific and accurate results.
167

CHAPTER 8
REFERENCES
168

CHAPTER 8
REFERENCES
Abel R. The eye care revolution. New York: Kensington Books, 1999, 239.
Abernethy B. Enhancing sports performance through clinical and experimental
optometry. Clinical Experimental Optometry, 1986, 69 (5): 186-196.
Abernethy B. Selective attention in fastball sports II: Expert-novice differences. The
Australian Journal of Science and Medicine in Sport, 1987, 19 (4): 7-16.
Abernethy B. The effects of age and expertise upon perceptual skill development in
racquet sport. Research Quarterly for Exercise and Sport, 1988, 59 (3): 210-221.
Abernethy B. Expertise, visual search and information pick-up in squash. Perception,
1990, 19: 63.
Abernethy B. Acquisition of Motor Skills. In: Pyke FS(ed), Better coaching,
advanced coach’s manual. Improving the athlete. Canberra: Australian Coaching
Council, 1991, 6: 82-94.
169

Abernethy B. Visual search strategies and decision-making in sport. International
Journal of Sports Psychology, 1991, 22: 189-210.
Abernethy B. Training the visual-perceptual skills of athletes. The American Journal
of Sport Science, 1996, 24 (6): 89-92.
Abernethy B & Russell DG. Advance cue utilization by skilled cricket batsmen.
Australian Journal of Science and Medicine in Sport, 1984, 16: 2-10.
Abernethy B & Russel DG. The relationship between expertise and visual search
strategy in a racquet sport. Human Movement Science, 1987, 6 (4): 283-319.
Abernethy B & Wood JM. Do generalized visual training programmes for sport really
work? Journal of Sports Science, 2001, 19: 203-22.
Adams D, Knight L, Summers E, Grandison A, McGinley D, Shearer T, Forde C,
Holmes A, Brookes I & O’Neill M. Collins Paperback English Thesaurus. Glasgow:
HarperCollins Publishers Ltd, 2000.
Adams R and Gibson A. Moment of ball release identification by cricket batsmen. The
Australian Journal of Science and Medicine in sport, 1989, 21: 10-13.
Alain C & Sarrazin C. Study of decision making in squash competition: A computer
simulation approach. Canadian Journal of Sport Sciences, 1990, 15 (3): 193-200.
170
Albright TD. Direction and orientation selectivity of neurons in visual area MT of the
macaque. Journal of Neurophysiology, 1984, 52: 1106-1130.
Allard F & Burnett N. Skill in sport. Canadian Journal of Psychology, 1985, 39: 294-
312.
American College of Sports Medicine, American Dietetic Association, Dietitians of
Canada. Joint position statement: nutrition and athletic performance. Medicine and
Science in Sports and Exercise, 2000.
Anshel MH, Williams LRT & Hodge K. Cross-cultural and gender differences on
coping style in sport. International Journal of Sport Psychology, 1997, 28: 141-156.
Applegate RA & Applegate RA. Set shot shooting performance and visual acuity in
basketball. Optometry and Vision Science, 1992, 69: 765-768.
Bahill AT & La Ritz T. Why can’t batters keep their eyes on the ball? Scientific
American, 1984, 72: 249-253.
Baker J, Côte J & Abernethy B. Sport-specific practice and the development of expert
decision-making in team ball sports. Journal of Applied Sport Psychology, 2003, 15:
12-25.
171

Balyi I & Hamilton A. North-American Soccer: Overplayed and underdeveloped.
Long-Term planning Part IV: The training to compete phase of training. Performance
Conditioning for Soccer, 1999, 5 (4): 4-10.
Balyi I & Hamilton A. A long-term athlete development. Trainability and physical
preparation of tennis players. In M Reid, A Quinn & M Crespo (eds), Strength and
conditioning for tennis. ITF: London, 2003: 49-57.
Bandura A. Self-efficacy: Toward a unifying theory of behaviour change.
Psychological Review, 1977, 8: 191-215.
Bandura A. Social foundations of thought and actions: A social cognitive theory.
Englewood Cliffs, NJ: Prentice Hall, 1986.
Barr JT, Rah MJ, Jackson JM & Jones LA. Orthokeratology and corneal refractive
therapy: a review and recent findings. Eye & Contact Lens: Science and Clinical
Practice, 2003, 29 (1): 49-53.
Bausch & Lomb. Survey at an Olympic vision centre. Lillehammer, 1994.
Beaubaton D, Grangetto A & Paillard J. Contribution of positional and movement cues
to visuomotor reaching in split-brain monkey. In S Russell, MW Van Hof & G
Berlucchi (eds.), Structure and function of cerebral commissures. Baltimore:
University Park Press, 1979: 371-384.
172

Berg WP & Killian SM. Size of the visual field in collegiate fast-pitch softball players
and non-athletes. Perceptual and Motor Skills, 1995, 81: 1307.
Berry J & Abernethy B. Expert game-based decision-making in Australian football.
How is it developed and how can it be trained? Research Report in Australian Football
League, 2003.
Blaxton TA. Investigating dissociations among memory measure: Support for a
transfer-appropriate processing framework. Journal of Experimental Psychology:
Learning, Memory and Cognition, 1989, 15: 657-668.
Bloom B. Developing talent in young people. New York: Ballantines, 1985.
Blundell NL. Critical visual-perceptual attributes of championship level tennis players.
In MI Howell, BD Wilson (eds.), Kinesiological sciences. Proceedings of the VII
Commonwealth and International conference on sport, physical education, recration
and dance. Brisbane: University of Queensland, 1984: 51-59.
Blundell NL. The contribution of vision to the learning and performance of sport skills:
Part 1. The role of selected visual parameters. The Australian Journal of Science and
Medicine in Sport, 1985, 17 (3): 3-11.
Boer LC. Attention tasks and their relation to aging and flight experience. National
Technical Information Service, Report S2421, 1986.
173

Bompa TO. Periodization. Theory and methodology of training, 4th
edition. US:
Human Kinetics, 1999.
Bootsma RJ, Bakker FC, Van Snippenberg FJ & Tdlohreg CW. The effects of anxiety
on perceiving the reachability of passing objects. Ecological Psychology, 1992, 4: 1-
16.
Bressan ES. Effects of visual skills training, vision coaching and sports vision
dynamics on the performance of a sport skill. African Journal for Physical, Health
Education, Recreation and Dance, 2003, 9 (1): 20-31.
Broer MR. Efficiency of human movement. Philadelphia: W.B. Saunders, 1966.
Brutsaert TD & Parra EJ. What makes a champion? Explaining variation in human
athletic performance. Respiratory Physiology & Neurobiology, 2006, 151: 109-123.
Buccino G, Vogt S, Ritzl A, Fink GR, Zilles K, Freund HJ & Rizzolatti G. Neural
circuits underlying imitation learning of hand actions: an event-related fMRI study.
Neuron, 2004, 42: 323-334.
Buchellew WF. Peripheral perception and reaction time of athletes and non-athletes.
Illinois: University of Illinois, 1954.
174

Burke MJ, Sanitato JJ, Vinger PF, Raymond LA & Kulwin DR. Soccerball-induced
eye injuries. The Journal of the American Medical Association, 1983, 249 (19): 2682-
2685.
Buser P and Imbert M. Nerophysiologie fonctionelle. Paris: Hermann, 1975.
Buys H. The development of Norms and Protocols in Sports Vision evaluations.
Johannesburg: RAU, 2002: 27-52.
Calder SL. Enhanced skill performance of field hockey players following a programme
of visual awareness training. Cape Town: University of Cape Town, 1999.
Calder SL. See the point – seeing better is playing better. SA Rugby Transformation,
2002.
Carello C, Turvey MT, Kugler PN. Inadequacies in the computer metaphor. In
Gazzaniga M (ed), Handbook of Cognitive Neuroscience. New York: Plenum, 1984:
229-248.
Caroline PJ. Contemporary Orthokeratology. Contact Lens & Anterior Eye, 2001, 24:
41-46.
Casagrande VA. A third parietal visual pathway to primate area V1. Trends
Neuroscience, 1994, 17: 305-310.
175
Chiviacowsky S & Wulf G. Feedback after good trials enhances learning. Research
Quarterly for exercise and sport, 2007, 78: 40-47.
Christenson GN & Winkelstein AM. Visual skills of athletes versus non-athletes:
developing of a sports vision testing battery. Journal of the American Optometric
Association, 1988, 59: 666-675.
Clark JE. On becoming skillfull: Patterns and constraints. Research Quarterly, 1995,
66: 173-183.
ClassPad 101: Introduction to statistics.
[http://www.classpad101.com/lessons/lesson11b.html] first accessed Sept 2010
Coffey B & Reichow AW. Optometric evaluation of the elite athlete. Problems in
Optometry, 1990, 2 (1): 32-58.
Coffey B & Reichow AW. Visual performance enhancement in sports optometry. In
DFC Loran & CJ MacEwan (eds.), Sports Vision. London: Butterworth Heinemann,
1995.
Coggan AR & Coyle FF. Carbohydrate ingestion during prolonged exercise: effects
on metabolism and performance. Research Quarterly for Exercise and Sport, 1991,
1991: 1.
176

Côte J, Baker J & Abernethy B. From play to practice: A Developmental framework
for the acquisition of expertise in team sports. In: Starkes JL, Ericsson KA, (eds.),
Expert Performance in Sport: Recent Advances in Research on Sport Expertise.
Champaign: Human Kinetics, 2003: 89-113.
Crawford E. Principles of rugby coaching. Wellington: NZRFU, 1998.
Cresswell S & Hodge K. Coping skills: role of trait sport confidence and trait
anxiety, 2004, 98 (2): 433-438.
Culham JC & Kanwisher NG. Neuroimaging of cognitive functions in human parietal
cortex. Current opinion in Neurobiology, 2001, 11: 157-163.
Culham JC & Valyear KF. Human parietal cortex in action. Current opinion in
Neurobiology, 2006, 16: 205-212.
Davids K, Handford C & Williams AM. The natural physical alternative to cognitive
theories of motor behaviour: An invitation for interdisciplinary research in sports
science? Journal of Sports Sciences, 1994, 12: 495-528.
De Groot AD. Thought and choice in chess. The Hague, Netherlands: Mouton.
1966.
Dell C. A primer for movement description. New York: Dance Notation Bureau, Inc.,
1970.
177

Downing CJ & Pinker S. The spatial structure of visual attention. In MI Posner &
OSM Martin (eds.) Attention and Performance XI. Hillsdale New York: Lawrence
Erlbaum Associates, 1985: 171-187.
Dowson M. The fitness adviser. A practical guide for athletes, coaches and trainers.
Auckland: Harper Collins Publishers, 1999.
Dreher B & Robinson SR. Neuroanatomy of the visual pathways and their
development. In J Cronly-Dillon, Vision and visual dysfunction. UK: Macmillan
Press Ltd, 1991: 150-170.
Easterbrook JA. The effect of emotion on cue utilization and the organization of
behaviour. Psychological Review, 1959, 66: 183-201.
Edelman G. Bright air, Brilliant fire: On the matter of mind. New York: Penguin,
1992.
Elsner B & Hommel B. Effect anticipation and action control. Journal of
Experimental Psychology: Human Perception and Performance, 2001, 27: 229-240.
Erickson G. Sports Vision: Vision care for the enhancement of sports performance.
Missouri: Butterworth Heinemann, 2007.
178

Ericsson KA. How the expert performance approach differs from traditional
approaches to expertise in sport: In search of a shared theoretical framework for
studying expert performance. In J.L. Starkes & K.A. Ericsson (Eds.), Expert
performance in sports: Advances in research on sport expertise. Champaign, IL:
Human Kinetics, 2003: 371-402.
Ericsson KA & Charness N. Expert Performance: Its structure and acquisition.
American Psychologist, August 1994, 49 (8): 725-747.
Ericsson KA, Krampe RT & Tesch-Romer C. The role of deliberate practice in the
acquisition of expert performance. Psychology review, 1993, 100: 363-406.
Fang F & He S. Cortical responses to invisible objects in the human dorsal and ventral
pathways. Nature of Neuroscience, 2005, 8: 1380-1385.
Farrow D & Abernethy B. Can anticipatory skills be learned through implicit video
based perceptual training? Journal of Sports Sciences, 2002, 20: 471-485.
Ferrari M. Observing the observers: self-regulation in the observational learning of
motor skills. Developmental Review, 1996, 16: 203-240.
Ferreira JT. Why all sports people need to protect their eyes. Sports Trader, 2000, 21
(4): 34-45.
179

Ferreira JT. Sports Vision and Rugby. Sports Vision Assessment Manual, Academy of
Sports Vision. Johannesburg: RAU University, 2001.
Ferreira JT. Sports vision as a hardware and software system. Eyesight, July 2002: 40.
Ferreira JT. The application of sports vision in cricket. Eyesite, March 2003: 41-43.
Fitts PM & Posner MI. Human performance. Belmont, CA: Brooks/Cole, 1967.
Fitts PM. Perceptual-motor skills learning. In AW Melton (Ed.), Categories of human
learning. New York: Academic Press, 1964: 243-285.
Fitzpatrick D, Lund JS & Blasdel GG. Intrinsic connections of macaque striate cortex:
Afferent and efferent connections of lamina 4C. Journal of Neuroscience, 1985, 5:
3329-3349.
Fogassi L & Luppino G. Motor functions of the parietal lobe. Current opinion in
Neurobiology, 2005, 15: 626-631.
Garner AI. Scoring with sports vision. Optometric Management Magazine, 1985, 21
(8): 24-32.
Gentile AM. A working model of skill acquisition with application to teaching. Quest,
1972, 17: 3-23.
180

Gentile AM, Higgins JR, Miller EA & Rosen BM. The structure of motor tasks.
Movement, 1975, 7: 11-28.
Gibson JJ. An ecological approach to visual perception. Boston: Houghton Mifflin,
1979.
Gibson JJ. The senses considered as perceptual systems. Boston: Houghton Mifflin,
1966.
Glencross DJ. Psychology and Sport. Sydney: McGraw-Hill, 1978.
Golras P. Antidromic responses of orthodromically identified ganglion cells in monkey
retina. Journal of Physiology, 1969, 201: 407-419.
Goodale MA & Milner AD. Separate visual pathways for perception and action.
Trends in Neurosciences, 1992, 15: 20-25.
Goodale MA & Servos P. Visual control of prehension. In Schmidt RA & Lee TD
(eds.), Motor control and learning: A behavioral emphasis. US: Human Kinetics,
1999: 87-121.
Gould D, Finch L & Jackson S. Coping strategies used by National champion Figure
Skater. Research Quarterly for Exercise and Sport, 1993, 64: 453-468.
181

Goulet C, Bard C & Fleury M. Expertise differences in preparing to return a tennis
serve: A visual information processing approach. Journal of Sport and Exercise
Psychology, 1989, 11: 382-398.
Grandjean AC, Ruud JS. Nutrition for Cyclists. Clinical Journal of Sports Medicine,
1994, 13: 235.
Grandjean AC. Vitamins, diet and the athlete. Clinical Journal of Sports Medicine,
1983, 2: 105.
Gray R & Regan DM. Unconfounding the direction of motion in depth, time to passage
and rotation rat on an approaching object. Vision Research, 2006, 46: 2388.
Graybiel A, Jokl E & Trapp C. Russian studies of vision in relation to physical activity
and sports. Research Quarterly of the American Association for health, physical
education, recreation and dance, 1955, 26: 480.
Grefkes C & Fink GR. The functional organization of the intraparietal sulcus in
humans and monkeys. Journal of Anatomy, 2005, 207: 3-17.
Griffen GR & McBride DK. Multitask performance: Predicting success in Naval
aviation primary flight training. National Technical Information Service, Report
U8619, 1986.
182
Guyton AC. Human physiology and mechanisms of disease, (5th
Edition). US,
Philadelphia: WB Saunders company, 1992: 380-391.
Handford C, Davids K, Bennett S & Button C. Skill acquisition in sport: Some
applications of a solving practice ecology. Journal of Sport Sciences, 1997, 15: 621-
640.
Hardy L, Jones G & Gould D. Understanding psychological preparation for sport:
Theory and practice of elite performers. New York: John Wiley & Sons, 1996.
Haywood KM & Getchell N. Life span motor development, (3rd
edition). US: Human
Kinetics, 2001.
Hazel CA. The efficacy of sports vision practice and its role in clinical optometry.
Clinical and Experimental Optometry, 1995, 78 (3): 98-104.
Helsen W & Pauwels JM. The use of a simulator in the evaluation and training of
tactical skills in football. In T Reilly, A Lees, K Davids et al. (eds.), Science and
football. London: E & FN Spon, 1987: 493-497.
Helsen W & Pauwels JM. A cognitive approach to visual search in sport. In Brogan D
and Carr K, Visual search, Vol II. London: Taylor and Francis, 1992.
183

Helsen WF, Starkes JL & Hodges NJ. Team sports and the theory of deliberate
practice. Journal of Sport Exercise Psychology, 2003, 15: 12-25.
Hendry SHC, Yoshiaka T. A neurochemically distinct third channel in the macaque
dorsal geniculate nucleus. Science, 1994, 264: 575-577.
Hodge K. Sport motivation. New Zealand: Reed Publishing, 2004.
Hodge K & McKenzie A. Thinking Rugby. New Zealand: Reed Publishing, 1999.
Hodges NJ, Chua R & Franks IM. The role of video in facilitating perception and
action of a novel coordination movement. Journal of Motor Behaviour, 2003, 35: 247-
260.
Hoffman LG, Polan G & Powell J. The relationship of contrast sensitivity functions to
sports vision. Journal of the American Optometric Association, 1984, 55: 747.
Hoffmann J, Stoecker Ch & Kunde W. Anticipatory control of actions. International
Journal of Sport and Exercise Psychology, 2004, 2: 346-361.
Holmes C, Jones R, Harland A & Petzing J. Ball launch characteristics for elite rugby
union players. In: E Maritz & S Haake (eds), The Engineering of Sport 6, Vol 1:
Developments for Sports. Springer: New York, 2006: 211-216.
184

Hommel B. Planning and representing intentional action. The Scientific World
Journal, 2003, 3: 593-608.
Hommel B, Müsseler J, Aschersleben G & Prinz W. The theory of event coding
(TEC): A framework for perception and action planning. Behavioural and Brain
Sciences, 2001, 24: 849-937.
Honeybourne J. Acquiring skill in sport: An Introduction. Great Britain: Routledge,
2006.
Horsley C. Developing assertiveness skills in sport. Excel, 1991, 7: 15-19.
Houlston DR & Lowes R. Anticipatory cue utilisation processes amongst expert and
non-expert wicket-keepers in cricket. International Journal of Sport Psychology, 1993,
24: 59.
Howard JH, Mutter SA & Howard DV. Serial pattern learning by event observation.
Journal of Experimental Psychology: Learning, Memory and Cognition, 1992, 18:
1029-1039.
Hubel DH & Wiesel TN. Shape and arrangement of columns in cat striate cortex.
Journal of Physiology, 1963b, 165: 559-568.
185

Hubel DH & Wiesel TN. Cortical and callosal connections concerned with the vertical
meridian of visual field in the cat. Journal of Neurophysiology, 1967, 30: 1561-1573.
Hubel DH & Wiesel TN. Sequence regularity and geometry of orientation columns in
the monkey striate cortex. Journal of Comparative Neurology, 1974, 158: 267-294.
Hughes PK, Blundell NL & Walters JM. Visual and psychomotor performance of elite,
intermediate and novice table tennis competitors. Clinical and Experimental
Optometry, 1993, 76: 51-60.
Hurley SR & Lee TD. The influence of augmented feedback and prior learning on the
acquisition of a new bimanual coordination pattern. Human Movement Science, 2006,
25: 339-348.
International Rugby Board. Laws of the game Rugby Union. Dublin: IRB, 2007.
Isaacs LD & Finch AE. Anticipating timing of beginning and intermediate tennis
players. Perceptual and Motor Skills, 1983, 57: 451.
Johnson JG. Cognitive modeling of decision making in sports. Psychology of sport
and exercise, 2006, 7: 631-652.
Johnson WG. Peripheral perception of athletes and non-athletes and the effect of
practice. University of Illinois, 1952.
186

Johnson-Frey SH. Cortical representations of human tool use. In Johnson-Frey SH
(ed.), Taking action: Cognitive Neuroscience perspectives on intentional acts. MIT
Press, 2003.
Jones NP. Eye injury in sport. Sports Medicine, 1989, 7: 163-181.
Kaplan E & Shapley RM. X and Y cells in the lateral geniculate nucleus of macaque
monkeys. Journal of Physiology, 1982, 330: 125-143.
Katz J. Vision training for the volleyball player. Sports Vision, 1998, 14 (3): 22-26.
Keele SW. Motor control. In L. Kaufman, J Thomas & K Boff (Eds.), Handbook of
perception and performance: Vol 2. New York: Wiley, 1986: 30-60.
Kelso JAS. Dynamic Patterns: The self-organization of brain and behaviour.
Cambridge, MA: MIT Press, 1995.
Kibele A. Non-consciously controlled decision making for fast motor reaction sin
sports – A priming approach for motor responses to non-consciously perceived
movement features. Psychology of Sport and Exercise, 2006, 7: 591-610.
Klavora P & Esposito JG. Sex differences in performance on three novel continuous
response tasks. Perceptual and Motor Skills, 2002, 95: 49.
187

Klier E, Wang H & Crawford D. Three-Dimentional Eye-Head Coordination is
implemented downstream from the superior colliculus. Journal of Neurophysiology,
2003, 89: 2839-2853.
Kluka DA. Visual skills: Considerations in learning motor skills for sports. Alabama
State Association for Health, Physical education, Recreation and Dance Journal, 1991,
14 (1): 41-43.
Kluka DA. Motor behaviour. From learning to performance. USA: Morton
Publishing, 1999.
Kluka DA. What we know about contrast sensitivity function and sport performance.
International academy of sports vision, 2001, 16 (3): 26-27.
Kluka DA, Love PA, Sanet R, Hillier C, Stroops S & Schneider HM. Contrast
sensitivity function profiling: by sport and sport ability level. International journal of
sports vision, 1995, 2: 5.
Knudson D & Kluka DA. The impact of vision and vision training on sports
performance. Journal of physical education, recreation and dance, 1997, 68 (4): 17-
24.
188

Konczak J. Toward an ecological theory of motor development: The relevance of the
Gibsonian approach to vision for motor development research. In JE Clark & JH
Jumphrey (Eds.), Advances in motor development research (Vol. 3). New York: AMS
Press, 1990: 201-224.
Krauzlis R, Liston D & Carello C. Target selection and the superior colliculus: goals,
choices and hypotheses. Vision Research, 2004, 44: 1445-1451.
Kugler PN, Kelso JAS & Turvey MT. On the concept of coordinative structures in
dissipative structures. I. Theoretical lines of convergence. In GE Stelmach & J
Requin (Eds.), Tutorials in motor behaviour. New York: North-Holland, 1980: 3-47.
Kugler PN, Kelso JAS & Turvey MT. On the control and coordination of naturally
developing systems. In JAS Kelso & JE Clark (Eds.), The development of movement
control and coordination. New York: Wiley, 1982: 5-78.
Kustov A, Robinson D. Shared neural control of attentional shifts and eye movements.
Nature, 1996, 384: 74-77.
Lachica EA, Beck PD & Casagrande VA. Parallel pathways in macaque striate cortex:
Anatomically defined columns in layer III. Proceedings of the National Academy of
Sciences of the United States of America, 1992, 89: 3566-3570.
189

Land MF & McLeod P. From eye movements to actions: How batsmen hit the ball.
Nature Neuroscience, 2000, 3: 1340-1345.
Lane RH, Allman JM, Kaas JH & Miezin FM. The visuotopic organization of the
superior colliculus of the owl monkey and the bush baby. Brain research, 1973, 60 (2):
335-349.
Larrison WI, Hersh PS, Kunzweiler T & Shingleton BJ. Sport-related ocular trauma.
Ophthalmology, 1990, 97: 1266-1269.
Latash M. Control of Human movement. Champaign, IL: Human Kinetics, 1993.
Le Vay S & Voight T. Ocular dominance and disparity coding in cat visual cortex.
Vision of Neuroscience, 1988, 1: 395-414.
Lee DN, Lishman JR & Thomson JA. Regulation of gait in long jumping. Journal of
experimental psychology: Human perception and performance, 1982, 8: 448-459.
Leonard WM & Reyman JE. The odds of attaining professional athlete status:
Refining the computations. Sociology of Sport Journal, 1988, 5 (2): 162-169.
190

Lieberman HR, Bathalon GP, Falco CM, Kramer FM, Morgan III CA & Niro P.
Severe decrements in cognition function and mood induced by sleep loss, heat,
dehydration, and under-nutrition during simulated combat. Biological Psychiatry, 2005,
57 (4): 422.
Liu CSJ, Bryan RN, Miki A, Woo JH, Liu GT & Elliott MA. Magnocellular and
Parvocellular visual pathways have different blood oxygen level-dependant signal time
courses in human primary visual cortex. American Journal of neuroradiology, Sep
2006, 27: 1628-1634.
Liu W, Edwards MH & Cho P. Contact lens in myopia reduction from orthofocus to
accelerated orthokeratology. Contact Lens & Anterior Eye, 2000, 23: 68.
Livingstone, M & Hubel D. Segregation of form, color, movement and depth:
Anatomy, physiology and perception. Science, 1988, 240: 740-749.
Lombard A. Sensory Intelligence (Sensoriese intelligensie). Welgemoed, SA: Metz
Press, 2007.
Loran D. The role of vision in decision making of soccer referees. Optician, May 1999,
5702 (217): 34-38.
Loran DFC & MacEwan CJ. Sports Vision. Oxford: Butterworth-Heinemann Ltd,
1995.
191

Ludeke A & Ferreira JT. The difference in visual skills between professional versus
non-professional rugby players. The South African Optometrist, 2003, 62 (4): 150-
158.
Lukaski HC. Vitamin and mineral status. Effects on physical performance. Nutrition,
2004, 20 (632): 632-644.
Mackworth NH & Burner JS. How adults and children search and recognize pictures?
In NH Mackworth & JS Bruner (Eds.), Eye movements and psychological process.
Hillsdale, NJ, Lawrence, Erlbaum. 1976: 307-321.
Magill RA. Motor Learning: Concepts and Application (4th
edition). USA: Brown &
Benchmark Publishers, 1993.
Magill RA. Motor Learning: Concepts and Application (6th
edition.). New York:
McGraw-Hill, 2001.
Mahoney M, Gabriel T & Perkins T. Psychological skills and exceptional performance.
The Sport Psychologist, 1987, 1 (3): 181-199.
Malonek D, Tootell RBH & Grinvald A. Optical imaging reveals the functional
architecture of neurons processing shape and motion in owl monkey area MT.
Proceedings of the Royal Society of London, Proceedings of Biological Sciences, 1994,
258: 109-119.
192

Martell SG & Vickers JN. Gaze characteristics of elite and near-elite athletes in ice
hockey defensive tactics. Human Movement Science, 2004, 22 (6): 689-712.
Martens R. Coaches guide to sport psychology. Champaign, Illinois: Human Kinetics,
1987.
Marsden H. Orthokeratology. Academy Orlando, 2000.
Maughan R. The athlete’s diet: nutritional goals and dietary strategies. Proceedings of
the nutrition society, 2002, 61: 87.
Maunsell JH & Newsome WT. Visual processing in monkey extrastriate cortex.
Annual review of neuroscience, 1987, 10: 363-401.
Maunsell JHR & Van Essen DC. Functional properties of neurons in the middle
temporal visual area (MT) of the macaque monkey. I. Selectivity for stimulus direction,
speed and orientation. Journal of neurophysiology, 1983, 49: 1127-1147.
Maruff P, Snyder P, McStephen M, Collie A, Darby D. Cognitive deterioration
associated with an expedition in an extreme desert environment. British Journal of
Sports Medicine, 2006, 40 (6): 556.
193

McCombs ML. Self-regulated learning and achievement: a phenomenological view.
In: Zimmerman BJ, Schunk DH, editors. Self-regulated learning and academic
achievement theory, research, and practice: progress in cognitive development
research. New York: Springer-Verlag, 1989: 51-82.
McLeod P & Jenkins S. Timing accuracy and decision time in high-speed ball games.
International Journal of Sport Psychology, 1991, 22: 279-295.
McLeod P. Visual reaction time and high-speed ball games. Perception, 1987, 16: 48-
59.
Miller DM. The relationship between some visual perceptual factors and the degree of
success realised by sports performance. PhD Dissertation Abstracts International,
University of Southern California, 1960, 21: 1455.
Millslagle D. Coincidence anticipation and dynamic visual acuity in young
adolescents. Perceptual and Motor Skills, 2004, 99: 1147.
Milner AD & Goodale MA. Visual pathways to perception and action. In Hicks TP,
Molotchnikoff S and Ono T (eds.), Progress in brain research: The visually responsive
neuron: From basic neurophysiology to behavior. Amsterdam: Elsevier, 1993.
Milner AD & Goodale MA. The visual brain in action. Oxford: Oxford University
Press, 1995.
194

Mollenberg O, Jendrusch G & Heck H. Table tennis specific eye hand (bat)
coordination and visual depth perception. In Mester J, King G, Struder H et al (eds.),
Perspectives and profiles. Sixth Annual congress of the European College of Sport
Science 15th
congress of the German Society of Sports Science. Cologne, July 2001:
1249.
Moore LA & Ferreira JT. An overview of sports vision. In Blau WJ, Donegan JF,
Duke AF et al (eds.), Opto-Ireland 2002: Optics and photonics technologies and
applications. Proceedings of the International Society for Optical Engineering. Ireland,
September 2002, 4879: 1017 – 1019.
Morris CD, Bransford JD & Franks JJ. Levels of processing versus transfer appropriate
processing. Journal of Verbal Learning and Verbal Behaviour, 1997, 16: 519-533.
Mountcastle VB. Modality and topographic properties of single neurons of cat’s
somatic sensory cortex. Journal of Neurophysiology, 1957, 20: 408-434.
Muller S & Abernethy B. Batting with occluded vision: An in-situ examination of the
information pick-up and interceptive skills of high- and low-skilled cricket batsmen.
Journal of Science and Medicine in Sport, 2006, 9 (6): 446-458.
195

Muller S, Abernethy B, Reece J, Rose M, Eid M, McBean R, Hart T & Abreu C. An
in-situ examination of the timing of information pick-up for interception by cricket
batsmen of different skill levels. Psychology of Sport and Exercise, 2009, 10 (6): 644-
652.
Newell A & Simon HA. Human problem solving. Englewood Cliffs, NJ: Prentice
Hall, 1972.
Newell KM & Van Emmerik REA. Are Gesell’s developmental principles general
principles for the acquisition of coordination? In J Clark & Humphrey J (Ed.),
Advances in Motor development Research III. New York: AMS Press, 1991: 143-164.
Newsome WT & Pare EB. A selective impairment of motion perception following
lesions of the middle temporal visual area (MT). Journal of neuroscience, 1988, 8:
2201-2211.
Nicholls JG, Martin AR, Wallace BG & Fuchs PA. From neuron to brain. USA:
Sinauer Associates Inc., 2001: 1-21, 379-446.
Nichols DP. Choosing an intraclass correlation coefficient. SPSS Keywords, 1998, 67.
Novušis MJ. SPSS 12.0 Statistical procedures companion. New Jersey: Prentice Hall
Inc., 2003.
196

Orasanu J & Connolly T. The reinvention of decision-making. In G Klein, R Orasanu,
R Calderwood & C Zsambok (Eds.), Decision-making in action: Models and methods.
Norwood, NJ: Ablex, 1993: 3-20.
Orlando RG & Doty JH. Ocular sports trauma: a private sports study. Journal of the
American Optometric Association, 1996, 67 (2): 77-80.
Orlick T & Partington J. Mental links to excellence. The Sport Psychologist, 1988, 2
(2): 105-130.
Paillard J, Jordan P & Brouchon M. Visual motion cues in prismatic adaptation:
evidence for separate and additive processes. Acta Psychologica, 1981, 48: 253-270.
Paillard J. The contribution of peripheral and central vision to visually guided
reaching. In Ingle DJ, Goodale MA, Mansfield RJW (eds.), The analysis of visual
behavior. MA: MIT Press, 1982: 367-388.
Pallant J. SPSS Survival manual, A step by step guide to data analysis using SPSS
version 15, 3rd
edition. New York: Open University Press, 2007.
Papin JP, Metges PJ, Amalberti PR. Use of Nac eye mark recorder by radiologists. In
AG Gale & F Johnson (Eds.), Theoretical and applied aspects of eye movements
research. North-Holland: Elsevier Science Publisher, 1984: 323-330.
197

Paull G & Glencross D. Expert perception and decision making in baseball.
International Journal of Sport Psychology, 1997, 28: 35.
Paulus MP, Potterat EG, Taylor MK, Van Orden KF, Bauman J, Momen N, Padilla GA
& Swain JL. A neuroscience approach to optimizing brain resources for human
performance in extreme environments. Neuroscience & Biobehavioural reviews, July
2009, 3 (7): 1080-1088.
Pendergast DR, Horvath PJ, Leddy JJ & Venkatraman JT. The role of dietary fat on
performance, metabolism and health. The American Journal of Sports Medicine, 1996,
24: S53-S58.
Perry VII, Ochler R & Cowey A. Retinal ganglion cells that project to the dorsal lateral
geniculate nucleus in the macaque monkey. Neuroscience, 1984, 12: 1101-1123.
Planer PM. Sports vision manual. International academy of sports vision. Harrisburg,
1994.
Pool G. Wenrugby (Winning rugby). Cape Town: Tafelberg Publishers, 1992.
Pool G. Rugby, verstaan die spel: ‘n visuele uiteensetting (understanding the game of
rugby, a visual display). Stellenbosch: Rapid Access Publishers, 2006.
198

Previc FH. Functional specialization in the lower and upper visual fields in humans: Its
ecological origins and neurophysiological implications. Behavioral and Brain Science,
1990, 13: 519-575.
Prinz W. Perception and action planning. European Journal of Cognitive Psychology,
1997, 9: 129-154.
Raab M, Masters RSW & Maxwell JP. Improving the ‘how’ and ‘what’ decisions of
elite table tennis players. Human Movement Science, 2005, 24: 326-344.
Radlo SJ, Janelle CM, Barba DA & Frehlich SG. Perceptual decision making for
baseball pitch recognition: using P300 latency and amplitude to index attentional
processing. Research Quarterly in Exercise and Sport, 2001, 72: 22-31.
Ramon y Cajal DS. Histology of the nervous system. Vol. 2, New York: Oxford
University Press, 1995.
Ramkisoon P. Othokeratology study notes. Academy of Sports Vision, Johannesburg:
RAU, 2001.
Ramkisoon P. The role of sports vision. Vision, July/August 2002: 21-22.
Ramkisoon P. A clinical evaluation of overnight orthokeratology as a method of vision
correction. Johannesburg: RAU, 2004.
199

Reid M, Crespo M, Lay B & Berry J. Skill acquisition in tennis: Research and current
practice. Journal of Science and Medicine in Sport, 2007, 10: 1-10.
Rini L & Werner P. Perceptual-Motor Development Equipment – inexpensive ideas
and activities. New York: Johan Wiley & Sons Inc., 1976: 11.
Regan D. Visual judgements and misjudgements in cricket and the art of flight.
Perception, 1992, 21: 91-115.
Ripoll H & Fleurance P. What does keeping one’s eye on the ball mean? Ergonomics,
1988, 31(11): 1647-1654.
Ripoll H, Kerlirzin Y, Stien J & Reine B. Analysis of information processing, decision
making and visual strategies in complex problem solving sport situations. Human
Movement Science, 1995, 14: 325-349.
Ripoll H. The understanding-acting process in sport: The relationship between the
semantic and the sensor motor visual function. International Journal of Psychology,
1991, 22: 221-243.
Salmoni A, Schmidt RA & Walter CB. Knowledge of results and motor learning: a
review and critical reappraisal. Psychology Bulletin, 1984, 95: 355-386.
200

Sawatari A & Callaway EM. Convergence of mango and parvocellular pathways in
bayer 4B of macaque primary visual cortex. Nature, 1996, 380: 442-446.
Schiller PH & Logothetis NK. The color-opponent and broad-band channels of the
primate visual system. Trends in Neurosciences, 1990, 13: 392-398.
Schiller PH & Malpeh IG. Functional specificity of lateral geniculate nucleus laminae
of the rhesus monkey. Journal of neurophysiology, 1978, 41: 788-797.
Schmidt RA. Motor learning and performance: From principles to practice.
Champaign, IL: Human Kinetics, 1991.
Schmidt RA & Lee T. Motor control and learning: A behavioral emphasis (3rd
edition). Champaign, IL: Human Kinetics, 1999.
Schmidt RA & Lee T. Motor control and learning: A behavioural emphasis (4th
edition). Champaign, IL: Human Kinetics, 2005.
Schmidt RA & Wrisberg CA. Motor learning and performance, (4th edition).
Champaign, IL: Human Kinetics, 2008.
Schmidt RA, Heuer H, Ghodsian D & Young DE. Generalized motor programs and
units of action in bimanual coordination. In M. Latash (Ed.), Bernstein’s traditions in
motor control. Champaign, IL: Human Kinetics, 1998: 329-360.
201

Sclar G, Maunsell JHR & Lennie P. Coding of image contrast in central visual
pathways of the macaque monkey. Vision Research, 1990, 30: 1-10.
Shea CH & Wulf G. Enhancing motor learning through external-focus instructions and
feedback. Human Movement Science, 1999, 18: 553-571.
Sherman A. Overview of research information regarding vision and sport. Journal of
the American Optometric Association, 1980, 51: 659-665.
Sherman WM, Peden MC & Wright DA. Carbohydrate feedings 1h before exercise
improves cycling performance. American Journal of Clinical Nutrition, 1991, 54: 866.
Sherman WM, Brodowicz G, Wright DA, Allen WK, Simonsen J & Dernbach A.
Effects of 4h pre-exercise carbohydrate feedings on cycling performance. Medicine and
Science in Sports and Exercise, 1989, 21: 598.
Sosniak LA. Phases of learning. In: B Bloom (ed.), Developing talent in young people.
New York: Ballantine books, 1985: 409-438.
Sparks D. Conceptual issues related to the role of the superior colliculus in the control
of gaze. Current opinion in Neurobiology, 1999, 6 (9): 698-707.
Spinell MR. Contact lenses for athletes. Optometry Clinics, 1993, 3: 57.
202

Starkes JL. A new technology and field test of advance cue usage in volleyball.
Research Quarterly for exercise and sport, 1995, 66: 162.
Swarbrick HA. Orthokeratology review and update. Clinical and Experimental
Optometry, 2006, 89: 124-143.
Szymanski B. Techniktraining in den Sportspielen. Bewegungszentriert older
situationsbezogen? [Technical training in games: Movement oriented or situation
oriented?]. Hamburg: Czwalina, 1997.
Taylor SR, Rogers GC & Driver HS. Effects of training volume on sleep,
psychological and selected physiological profiles of elite female swimmers. Medicine
and Science in Sport, 1997, 29 (5): 688-693.
Tatem JA. Personality and physical variables between and among tennis players and
other athletes and non-athletes. Unpublished doctoral thesis. Springfield College,
1973.
Tendenbaum G. Expert athletes: An integrated approach to decision making. In J.L.
Starkes & KE Ericsson (Eds.), Expert performance in sports: advances in research on
sport expertise. Champaign, IL: Human Kinetics, 2003: 191-218.
The brain from top to bottom.
[http://thebrain.mcgill.ca/flash/a/a_02/a_02_cr/a_02_cr_vis/a_02_cr_vis.html] website – first accessed
May 2009.
203

Thelen E. Motor development: A new syntheses. American Psychologist, 1995a, 50:
79-95.
Thomas P, Murphy S & Hardy L. Test of performance strategies (TOPS):
Development and preliminary validation of a comprehensive measure of athlete’s
psychological skills. Journal of Sports Sciences, 1999, 17: 697-711.
Tong F, Nakayama K, Vaughan JT & Kanwisher N. Binocular rivalry and visual
awareness in human extrastriate cortex. Neuron, 1998, 21: 753-759.
Tootell RB, Silverman MS & De Valois RL. Spatial frequency columns in primary
visual cortex. Science, 1981, 214: 813-815.
Trachtman JN. Accommodative micro-fluctuations: diagnosis and treatment with
biofeedback. A pilot investigation. International journal of sports vision, 1995, 2 (1):
36-44.
Trachtman JN & Kluka DA. Future trends in vision as it relates to sports performance.
International Journal of Sports Vision. 1993, 1, 1-7.
Trachtman J & Venezia CM. Central information processing and beta brain waves.
Proceedings of the 1994 association for applied psychophysiology and biofeedback.
Wheat ridge, CO: Association for applied psychophysiology and biofeedback, 1994.
204

Trevarthen CB. Two mechanisms of vision in primates. Psychologische Forschung,
1968, 31: 299-337.
Tschiene P. The throwing events: Recent trends in technique on training. New studies
in athletics, 1988, 1: 7-17.
Tulving E & Schacter DL. Priming and human memory systems. Science, 1990, 247:
301-306.
Turner JR & Thayer JF. Introduction to analysis of variance: design, analysis &
interpretation. Thousand Oaks, California: Sage, 2001.
Tyldesley DA. Motion prediction and movement control in fast ball games. In I.M.
Cockerill & W.W. MacGillivary (Eds.), Vision and Sport. Cheltenham, UK: Stanley
Thornes Publishers, Ltd, 1981.
Ungerleider LG & Mishkin M. Two cortical visual systems. In DJ Ingle, RJW
Mansfield & MS Goodale (eds.), The analysis of visual behavior. Cambridge, MA:
MIT Press, 1982: 549-586.
Van Velden GD. The effect of a perceptual-motor training programme on the
coincident anticipation timing and batting performance of club cricket players.
Stellenbosch: Stellenbosch University, 2011.
205

Venter SC. The effects of intervention programmes on the development of visual skills
in 15 to 18 year old rugby players. Johannesburg: University of Johannesburg, 2008.
Vickers JN. Decision training: An innovative approach to coaching. Canadian
Journal for Women in coaching, 2003, 3: 1-9.
Vickers JN. Perception, cognition, and decision training: The quiet eye in action.
Champaign, IL: Human Kinetics, 2007.
Vickers JN, Livingston L, Umeris-Bohnert S and Holden D. Decision training: The
effects of complex instruction, variable practice and reduced delayed feedback on the
acquisition and transfer of a complex motor skill. Journal of Sports Sciences, 1999, 17:
357-367.
Vinger PF. A practical guide for sports eye protection. The Physician and
Sportsmedicine, 2000, 28 (6): 49.
Vinger PF & Capao-Filipe JA. The mechanism and prevention of soccer eye injuries.
British Journal of Ophthalmology, 2004, 88: 167-168.
Vinter A & Perruchet P. Implicit motor learning through observational training in
adults and children. Memory & Cognition, 2002, 30: 256-261.
206

Watkins D. Students’ perceptions of factors influencing tertiary learning. Higher
Educational Research and Development, 1984, 3 (1): 33-50.
Weliky M, Bosking W & Fitzpatrick D. A systematic map of direction preference in
primary visual cortex. Nature, 1996, 379: 725-728.
White AJ, Wilder HD, Goodchild AK, Sefton AJ & Martin PR. Segregation of
receptive field properties in the lateral geniculate nucleus of a new-world monkey, the
marmosel callithrix jacchus. Journal of Neurophysiology, 1998, 80: 2063-2076.
Whiting HTA. Acquiring ball skills: A psychological approach. London: G Bell,
1969.
Wickens J, Hyland B & Anson G. Cortical cell assemblies: A possible mechanism for
motor programs. Journal of Motor Behaviour, 1994, 26: 66-82.
Williams AM & Burwitz L. Advance cue utilisation in soccer. In T Reilly, J Clarys, A
Stibbe (eds.), Science and Football II. London: E & FN Spon, 1993: 239-244.
Williams AM & Hodges NJ. Practice, instruction and skill acquisition in soccer:
challenging tradition. Journal of Sports Science, 2005, 23 (6): 637-650.
Williams AM and Davids K. Visual search strategy, selective attention and expertise in
soccer. Research Quarterly for Exercise and Sport, 1998, 69 (2): 111-129.
207

Williams JM & Krane V. Psychological characteristics of peak performance. In J.M.
Williams (Ed.). Applied Sport Psychology: Personal growth to peak performance.
Mountain View, CA: Mayfield, 2001.
Williams JM & Thirer J. Vertical and horizontal peripheral vision in male and female
athletes and non-athletes. Research Quarterly for the American Association for health,
physical education, recreation and dance,1976, 46: 200.
Williams AM, Davids K & Williams JG. Visual Perception and Action in Sport. New
York: Routledge, 1999: 60-95.
Williams AM, Davids K, Burwitz L and Williams JG. Visual search strategies of
experienced and inexperienced soccer players. Research Quarterly for Exercise and
Sport, 1994, 65 (2): 127-135.
Winder P. Rugby tactics. London: A & C Black, 1991.
Wisemantel S. Talent identification and talent enhancement programmes in Australian
Rugby Union. Rugby research. A selection of level 3 coaching and refereeing papers.
Australian Rugby Union Ltd, 2002: 139-153.
Woods TA. Eye protection for the child athlete. Review of Optometry, 1987.
208

Wright DA, Sherman WMn& Dernbach AR. Carbohydrate feedings before, during or
in combination improve cycling endurance performance, Journal of Applied
Physiology, 1991, 71: 1082.
Wrisberg CA. The arousal-performance relationship. Quest, 1994, 46: 60-77.
Wulf G. Attention and motor skill learning. US: Human Kinetics, 2007.
Wulf G. Self-controlled practice enhances motor learning: implications for
physiotherapy. Physiotherapy, 2007, 93: 96-101.
Wulf G, Höß M & Prinz W. Instructions for motor learning: Differential effects of
internal versus external-focus of attention. Journal of Motor Behaviour, 1998, 30:
169-179.
Wulf G, Lauterbach B & Toole T. Learning advantages of an external focus of
attention in golf. Research Quarterly for Exercise and Sport, 1999, 70: 120-126.
Wulf G, Shea CH, Park J. Attention in motor performance: Preferences for and
advantages of an external focus. Research Quarterly for exercise and sport, 2001, 72:
335-344.
Wurtz RH, McAlonan K, Cavanaugh J & Berman RA. Thalmic pathways for active
vision. Trends in cognitive sciences, 2011, 15 (4): 177-184.
209

Yabuta NH & Callaway EM. Functional streams and local connections of layer 4C
neurons in primary visual cortex of the macaque monkey. Journal of Neuroscience,
1998, 18: 9489-9499.
Zeki SM. Functional organization of a visual area in the posterior bank of the superior
temporal sulcus of the rhesus monkey. Journal of physiology, 1974, 236: 549-573.
Ziegler PJ, Jonnalagadda SS, Nelson JA, Lawrence C & Baciak B. Contribution of
meals and snacks to nutrient intake of male and female elite figure skaters during peak
competitive season. Journal of the American College of Nutrition, 2002, 21 (2): 114-
119.
210

CHAPTER 9
APPENDIX
211

CHAPTER 9
APPENDIX 1
Illustration of the Verusco© evaluation system
212

.9ico4
t.9op6!s
o-=
EEfE
fsUO
c.9
.fr-=8Ec!.ooIB6CggFg
!!cE'f8
!oE8d(,0
'g-O6F6-!
o
='E@u
eo>resP,E
cg:6ooF@
PEgi9
Jc8i6oq.E€u-=g>
=EXEVt -9vtx€lFo(r€a!Eku
+.E^
-flEl o!F 3Ac,b -EE=:9
= ES
f B-.F !!6 tg6 ts'
z rqtr e4ourdsF2
ooodoodooddooooooodooots
ooodddooododdoooddQ6odN
ooooddoo<doooodododtddo
odoooddoo6doood+odH€dds
ooooooooooooooooooooooo
oooooooooooooooooooooo0
o{dFodNdnooado660dtNo6<d r d d td - d9
oooNoooodooodoiddoodoo6
ooodoooodooodooodoooooo
otHoo6dod6do6od6@oodddN ddF
o o gdoo o ddo dd dooo dddo oa)o
ooo00000000000000000000
o9' dQ qrFooo6oSdoF{ oddHoo66 - | Nr dddHF e+@o I o-69
oioNoooooooooooddoododo
tQoq|+ad600d{FtsF@@do9tso66.! ct I gl ci.!.1 \ 4 o! q d o! I u! dl q .!.1 o) { I tso - i o - ct .i ri ct ct j - ct d d d d .i -i ct ct ci et
D868b8t88F8SS88g8F8g8RSte d ddFidd"i {diiij-si-"i ci@ o I o o 6€ F o qt 6
ooodooood0oododddoodooo
ooo{dtoodooddodooHodooo
ddddHodoooddooodoHooiN6
dQoodtodHo@dni€6@oo6d@odddHddddNd-6
oN@o{ooo0Fooo@+o@{ooooo!o€d@600F600 0€9F66H66
<oaOurg|-Lrx JEZOa dd6F?>
F$$$F$$$E$$$$$EFF$FFF$E
213

APPENDIX 2
Data collection tables for individual skills, for each of the players over the
three seasons
Table 1 consists out of data collected from the Verusco© system for all the different skills
that forms part of the four elements of performance. The amount scored for each skill for
all the games played during a season were recorded for each player. Table 2 consists out of
the determined averages for the above data.
214

TABLE 1SEASON 1
PLAYERS GROUP Min
Line
Breaks
Tackle
Breaks
Tacle per
min
Tackles
missed
Tackles
made
Turnover
forced
Defender
beaten work rate
kick
pressure
A 1 80 3\6 0\3 0.5/0.7 1\27 9\182 0\17 0\3 0.35\0.48 0\10
80 1\7 0\2 0.8/0.6 5\32 8\119 1\7 0\2 0.28\0.44 0\13
48 0\6 1\10 1.0/0.7 4\33 6\129 2\12 1\10 0.54\0.54 2\22
80 2\11 1\8 0.2/0.6 0\24 4\139 0\14 1\8 0.23\0.47 1\6
TOTAAL 288 6\31 2\23 2.5\2.6 10\116 27\569 3\50 2\23 1.4\1.93 3\51
% 288 19.35 8.7 96.15 8.62 4.75 6 8.7 72.54 5.88
B 1 80 0\6 0\3 1.3/0.7 6\27 20\182 1\17 0\3 0.74\0.48 0\10
80 0\7 0\2 0.9/0.6 3/32 13\119 1\7 0\2 0.63\0.44 1\13
80 2\6 2\10 1.4/0.7 1/33 21\129 1\12 2\10 0.89\0.54 2\22
73 0\6 1\9 1.1/0.6 2\22 15\139 0\13 1\9 0.74\0.55 0\8
54 1\10 1\13 0.8/0.5 2\26 5\87 1\14 1\13 0.83\0.7 1\16
22 0\6 0\10 0.8/0.6 0\33 4\181 1\14 0\10 0.87\0.57 1\22
80 1\6 0\5 1.4/0.7 2\44 28\174 2\13 0\5 0.9\0.56 0\9
73 0\10 0\4 0.8/0.6 3\29 12\162 1\12 0\4 0.62\0.49 1\18
80 0\6 0\4 1.2/0.8 4\52 22\207 2\11 0\4 0.75\0.52 1\20
80 0\9 0\6 0.9/0.6 1\23 16\155 0\20 0\6 0.6\0.55 2\19
80 1\11 0\8 1.3/0.6 3\24 21\139 2\14 0\8 0.68\0.47 0\6
TOTAAL 782 5\83 4\74 11.9\7 27\345 177\1674 12\147 4\74 8.25\5.87 9\163
% 782 6.02 5.41 170 7.83 10.57 8.16 5.41 140.55 5.52
C 1 67 0\6 0\3 0.7/0.7 2\27 10\182 1\17 0\3 0.6\0.48 0\10
80 0\7 0\2 0.4/0.6 2\32 5\119 0\7 0\2 0.34\0.44 0\13
80 0\6 0\10 0.7/0.7 3\33 8\129 0\12 0\10 0.42\0.54 1\22
33 0\6 0\9 0.1/0.6 0\22 1\139 0\13 0\9 0.18\0.55 0\8
29 0\6 0\5 0.7/0.7 2\44 3\174 0\13 0\5 0.44\0.56 0\9
55 0\10 0\4 0.5/0.6 2\29 5\162 0\12 0\4 0.46\0.49 0\18
48 0\6 0\4 0.8/0.8 3\52 7\207 0\11 0\4 0.38\0.52 0\20
20 0\9 0\6 0.9/0.6 1\23 4\155 0\20 0\6 0.59\0.55 0\19
26 0\11 0\8 0.6/0.6 0\24 3\139 1\14 0\8 0.41\0.47 0\6
TOTAAL 438 0 0 5.4\5.9 15\286 46\1406 2\119 0\51 3.82\4.55 1\115
% 438 0 0 91.53 5.24 3.27 1.68 0 83.96 0.87
Reaction time
215

D 1 15 0\6 0\3 0.2/0.7 1\27 0\182 1\17 0\3 0.26\0.48 0\10
26 0\6 0\9 0.8/0.6 1\22 4\139 0\13 0\9 0.66\0.55 1\8
20 0\10 0\13 0/0.5 0\26 0\87 0\14 0\13 0.68\0.7 0\16
TOTAAL 61 0 0 1\2.8 2\75 4\408 1\44 0\25 1.6\1.73 1\24
% 61 0 0 35.71 2.67 0.98 2.22 0 92.49 4.17
E 1 80 0\10 0\4 0.9/0.6 0\29 17\162 1\12 0\4 0.51\0.49 1\18
60 1\6 0\4 0.8/0.8 2\52 11\207 2\11 0\4 0.54\0.52 2\20
80 0\9 0\6 0.9/0.6 1\23 13\155 0\20 0\6 0.53\0.55 2\19
TOTAAL 220 1\25 0 2.6\2 3\104 41\524 3\43 0\14 1.58\1.56 5\57
% 220 4 0 130 2.88 7.82 6.98 0 101.28 8.77
F 1 80 1\6 0\3 0.9/0.7 3\27 15\182 1\17 0\3 0.56\0.48 2\10
80 0\7 0\2 1.0/0.6 6\32 11\119 0\7 0\2 0.41\0.44 0\13
80 0\6 0\10 0.7/0.7 1\33 11\129 0\12 0\10 0.57\0.54 1\22
50 0\6 0\9 0.9/0.6 3\22 6\139 0\13 0\9 0.52\0.55 0\8
80 1\10 0\13 0.9/0.5 4\26 8\87 1\14 0\13 0.74\0.7 0\16
64 0\6 0\10 1.0/0.6 4\33 14\181 0\14 0\10 0.54\0.57 1\22
52 0\6 0\5 1.0/0.7 3\44 11\174 1\13 0\5 0.72\0.56 0\9
50 0\10 0\4 0.8/0.6 2\29 8\162 1\12 0\4 0.54\0.49 2\18
80 0\6 0\4 0.8/0.8 3\52 14\207 0\11 0\4 0.51\0.52 2\20
80 0\9 0\6 0.7/0.6 1\23 13\155 1\20 0\6 0.51\0.55 0\19
80 1\11 1\8 0.6/0.6 2\24 9\139 0\14 1\8 0.5\0.47 0\6
TOTAAL 776 3\83 1\74 9.3\7 32\345 120\1674 5\147 1\74 6.12\5.87 8\163
% 776 3.61 1.35 132.86 9.28 7.17 3.4 1.35 104.26 4.91
G 1 77 0\6 0\3 0.9/0.7 1\27 17\182 1\17 0\3 0.69\0.48 1\10
80 1\7 1\2 0.8/0.6 1\32 12\119 1\7 1\2 0.51\0.44 0\13
80 1\6 1\10 0.9/0.7 3\33 11\129 1\12 1\10 0.66\0.54 3\22
80 0\6 3\9 0.7/0.6 1\22 10\139 0\13 3\9 0.61\0.55 0\8
80 0\10 3\13 1.0/0.5 3\26 11\87 1\14 3\13 0.85\0.7 2\16
80 0\6 3\10 0.6/0.6 0\33 14\181 2\14 3\10 0.74\0.57 1\22
49 0\6 1\5 0.9/0.7 1\44 11\174 1\13 1\5 0.61\0.56 0\9
80 1\10 2\4 0.9/0.6 0\29 17\162 1\12 2\4 0.69\0.49 2\18
80 0\6 1\4 1.3/0.8 3\52 25\207 1\11 1\4 0.81\0.52 0\20
80 0\9 1\6 0.6/0.6 0\23 11\155 1\20 1\6 0.61\0.55 0\19
80 0\11 0\8 0.8/0.6 2\24 13\139 3\14 0\8 0.56\0.47 0\6
TOTAAL 846 3\83 16\74 1.4\7 15\345 152\1674 13\147 16\74 7.34\5.87 9\163
% 846 3.61 21.62 200 4.35 9.08 8.84 21.62 125.04 5.52
216

H 2 80 1\6 0\3 0.6/0.7 3\27 10\182 1\17 0\3 0.41\0.48 2\10
80 0\7 0\2 0.5/0.6 4\32 4\119 1\7 0\2 0.4\0.44 4\13
80 0\6 1\10 0.5/0.7 1\33 7\129 1\12 1\10 0.68\0.54 2\22
54 0\6 0\9 0.8/0.6 1\22 7\139 1\13 0\9 0.86\0.55 0\8
80 0\10 1\13 0.4/0.5 0\26 6\87 1\14 1\13 0.82\0.7 2\16
80 1\6 1\10 0.6/0.6 2\33 12\181 1\14 1\10 0.69\0.57 1\22
80 0\6 1\5 0.8/0.7 4\44 12\174 0\13 1\5 0.8\0.56 0\9
80 1\10 0\4 0.2/0.6 0\29 3\162 1\12 0\4 0.38\0.49 0\18
80 2\6 0\4 0.5/0.8 3\52 9\207 0\11 0\4 0.45\0.52 1\20
80 0\9 0\6 0.5/0.6 4\23 5\155 1\20 0\6 0.39\0.55 0\19
80 2\11 0\8 0.8/0.6 1\24 13\139 1\14 0\8 0.59\0.47 0\6
TOTAAL 854 7\83 4\74 6.2\7 23\345 88\1674 9\147 4\74 6.47\5.87 12\163
% 854 8.43 5.41 88.57 6.67 5.26 6.12 5.41 110.22 7.36
I 2 65 0\6 1\3 0.5/0.7 0\27 8\182 0\17 1\3 0.33\0.48 0\10
80 1\7 0\2 0.1/0.6 0\32 1\119 1\7 0\2 0.29\0.44 0\13
67 0\6 0\10 0.1/0.7 2\33 0\129 0\12 0\10 0.25\0.54 1\22
80 2\6 0\9 0.1/0.6 0\22 2\139 0\13 0\9 0.31\0.55 1\8
60 0\10 2\13 0.4/0.5 0\26 4\87 2\14 2\13 0.57\0.7 0\16
68 1\6 1\10 0.5/0.6 0\33 10\181 2\14 1\10 0.53\0.57 0\22
80 2\6 0\5 0.5/0.7 5\23 8\174 2\13 0\5 0.46\0.56 0\9
80 1\10 0\4 0.5/0.6 4\29 7\162 0\12 0\4 0.3\0.49 0\18
80 0\6 1\4 0.5/0.8 4\52 7\207 2\11 1\4 0.33\0.52 2\20
21 1\9 1\6 0.8/0.6 1\23 3\155 1\20 1\6 0.77\0.55 0\19
TOTAAL 681 8\72 6\66 4\6.4 16\321 50\1535 10\133 6\66 4.14\5.4 4\157
% 681 11.11 9.09 62.5 4.98 3.26 7.52 9.09 76.67 2.55
J 2 80 0\6 0\3 0.3/0.7 0\27 7\182 2\17 0\3 0.23\0.48 0\10
80 0\6 1\10 0.4/0.7 1\33 6\129 0\12 1\10 0.24\0.54 2\22
80 2\6 2\9 0.5/0.6 3\22 5\139 0\13 2\9 0.47\0.55 0\8
80 2\10 1\13 0.3/0.5 0\26 4\87 2\14 1\13 0.64\0.7 0\16
80 1\6 3\10 0.7/0.6 3\33 12\181 0\14 3\10 0.55\0.57 2\22
80 1\6 1\5 0.9/0.7 1\44 18\174 1\13 1\5 0.54\0.56 2\9
30 0\10 1\4 0.9/0.6 4\29 3\162 0\12 1\4 0.41\0.49 0\18
80 1\6 0\4 0.6/0.8 2\52 11\207 1\11 0\4 0.3\0.52 0\20
74 0\9 0\6 0.3/0.6 0\23 6\155 0\20 0\6 0.31\0.55 1\19
80 0\11 1\8 0.6/0.6 3\24 9\139 0\14 1\8 0.34\0.47 1\6
TOTAAL 744 7\76 10\72 3.3\6.4 17\313 8\1555 6\140 10\72 4.03\5.43 8\150
% 744 9.21 13.89 51.56 5.43 0.51 4.29 13.89 74.22 5.33
217

K 3 80 1\8 0\10 0.8/0.5 1\17 11\88 0\12 0\10 0.54\0.56 1\15
66 0\8 0\6 1.2/0.5 5\37 11\113 0\8 0\6 0.59\0.53 0\18
55 1\6 0\12 0.8/0.5 1\36 10\143 0\9 0\12 0.66\0.56 1\32
43 0\5 0\6 1.0/0.8 2\60 10\262 0\17 0\6 0.63\0.61 2\12
TOTAAL 244 2\27 0 3.8\2.3 9\150 42\606 0 0\32 2.42\2.26 4\77
% 244 7.41 0 165.22 6 6.93 0 0 107.08 5.19
L 3 60 1\8 0\10 0.4/0.5 0\17 4\88 0\12 0\10 0.55\0.56 1\15
62 0\8 0\6 0.6/0.6 1\37 7\113 0\8 0\6 0.45\0.53 1\18
35 0\6 0\12 0.4/0.5 1\36 4\143 1\9 0\12 0.43\0.56 0\32
58 1\5 0\6 0.7/0.8 2\60 11\262 1\17 0\6 0.69\0.61 0\12
50 0\1 0\4 0.7/0.6 2\36 8\157 0\14 0\4 0.48\0.52 3\31
40 0\6 0\7 0.2/0.5 0\20 1\91 0\12 0\7 0.72\0.53 1\16
51 0\9 0\9 1.0/0.7 2\54 10\158 0\17 0\9 0.41\0.53 0\16
51 0\5 0\8 0.5/0.6 2\21 3\125 0\9 0\8 0.38\0.48 0\20
59 0\7 0\9 0.8/0.7 2\35 8\131 0\18 0\9 0.56\0.49 0\13
34 0\8 0\7 0.9/0.6 0\27 7\145 1\13 0\7 0.83\0.55 0\13
53 2\13 0\7 0.6/0.6 0\29 6\128 1\16 0\7 0.58\0.47 1\13
TOTAAL 553 4\76 0 6.8\6.7 12\372 69\1541 4\145 0\85 6.08\5.83 7\199
% 553 5.26 0 101.49 3.23 4.48 2.76 0 104.29 3.52
M 3 11 0\8 0\6 0.4/0.6 0\37 1\113 0\8 0\6 0.28\0.53 1\18
14 0\1 0\4 0.4/0.6 0\36 1\157 1\14 0\4 1.78\0.52 0\31
21 1\13 1\7 0.6/0.6 1\29 2\128 0\16 1\7 0.75\0.47 1\13
TOTAAL 46 1\22 1\17 1.4\1.8 1\102 4\3985 1\38 1\17 2.81\1.52 2\62
% 46 4.55 5.88 77.78 0.98 1.01 2.63 5.88 184.87 3.23
N 3 80 2\8 3\10 0.2/0.5 0\17 3\88 3\12 3\10 0.35\0.56 0\15
80 1\8 3\6 0.5/0.6 2\37 6\113 1\8 3\6 0.47\0.53 0\18
80 1\6 2\12 0.3/0.5 3\36 3\143 1\9 2\12 0.38\0.56 0\32
80 0\5 0\6 0.4/0.8 2\60 8\262 1\17 0\6 0.25\0.61 0\12
80 0\1 1\4 0.3/0.6 1\36 6\157 1\14 1\4 0.31\0.52 1\31
80 0\6 1\7 0.2/0.5 1\20 2\91 1\12 1\7 0.34\0.53 0\16
80 2\9 2\9 0.5/0.7 4\54 5\158 0\17 2\9 0.49\0.53 1\16
80 1\5 1\8 0.2/0.6 1\21 3\125 1\9 1\8 0.38\0.48 1\20
73 0\7 2\9 0.4/0.7 0\35 6\131 2\18 2\9 0.38\0.49 0\13
80 1\8 3\7 0.2/0.6 1\27 2\145 0\13 3\7 0.31\0.55 1\13
80 0\13 1\7 0.2/0.6 0\29 4\128 2\16 1\7 0.3\0.47 4\13
TOTAAL 873 8\76 19\85 3.4\6.7 15\372 48\1541 13\145 19\85 3.96\5.83 8\199
% 873 10.53 22.35 50.75 4.03 3.11 8.97 22.35 67.92 4.02
218

O 3 80 0\8 0\10 0.4/0.5 3\17 2\88 0\12 0\10 0.20\0.56 0\15
33 1\8 0\6 0.7/0.6 2\37 3\113 0\8 0\6 0.42\0.53 1\18
80 0\6 0\7 0.7/0.5 3\20 6\91 1\12 0\7 0.39\0.53 3\16
80 1\9 0\9 0.7/0.7 4\54 9\158 2\17 0\9 0.39\0.53 1\16
80 1\5 0\8 0.4/0.6 0\21 7\125 0\9 0\8 0.17\0.48 1\20
80 1\7 0\9 0.3/0.7 2\35 3\131 1\18 0\9 0.19\0.49 0\13
80 0\8 0\7 0.6/0.6 7\27 4\145 0\13 0\7 0.28\0.55 3\13
65 1\13 2\7 0.3/0.6 1\29 3\128 2\16 2\7 0.29\0.47 0\13
TOTAAL 578 5\64 2\63 4.1\4.8 22\240 37\979 6\105 2\63 2.33\4.14 9\124
% 578 7.81 3.17 85.42 9.17 3.78 5.71 3.17 56.28 7.26
P 3 80 0\6 1\7 0.8/0.5 3\20 8\91 0\12 1\7 0.45\0.53 1\16
74 0\9 0\9 1.5/0.7 9\54 17\158 0\17 0\9 0.58\0.53 2\16
80 0\5 0\8 1.0/0.6 2\21 14\125 0\9 0\8 0.49\0.48 3\20
80 0\7 0\9 1.1/0.7 6\35 11\131 1\18 0\9 0.5\0.49 5\13
80 0\8 0\7 1.1/0.6 3\27 17\145 0\13 0\7 0.54\0.55 1\13
80 2\13 1\7 1.1/0.6 5\29 13\128 1\16 1\7 0.53\0.47 1\13
TOTAAL 474 2\48 2\47 6.6\3.7 28\186 80\778 2\85 2\47 3.09\3.05 13\91
% 474 4.17 4.26 178.38 15.05 10.28 2.35 4.26 101.31 14.29
Q 3 43 0\8 1\10 0.8/0.5 2\17 5\88 0\12 1\10 0.49\0.56 0\15
48 0\8 0\6 0.8/0.6 3\37 5\113 1\8 0\6 0.63\0.53 2\18
21 0\6 0\12 1.2/0.5 0\36 8\143 0\9 0\12 0.87\0.56 1\32
66 0\6 1\7 1.1/0.5 2\20 9\91 2\12 1\7 0.91\0.53 2\16
68 0\9 0\9 0.9/0.7 4\54 11\158 0\17 0\9 0.69\0.53 2\16
58 0\5 0\8 1.3/0.6 2\21 13\125 0\9 0\8 0.75\0.48 1\20
68 1\7 1\9 1.0/0.7 5\35 10\131 2\18 1\9 0.55\0.49 1\13
71 0\8 1\7 0.8/0.6 0\27 13\145 1\13 1\7 0.82\0.55 2\13
80 1\13 0\7 0.7/0.6 2\29 9\128 0\16 0\7 0.46\0.47 2\13
TOTAAL 523 2\70 4\75 8.6\5.3 20\276 83\1122 6\114 4\75 6.17\4.7 13\156
% 523 2.86 5.33 162.26 7.25 7.4 5.26 5.33 131.28 8.33
R 3 66 1\6 1\12 0.2/0.5 0\36 3\143 1\9 1\12 0.3\0.56 1\32
% 66 16.67 8.33 40 0 2.1 11.11 8.33 53.57 3.13
S 3 14 1\6 0\12 0.2/0.6 0\36 1\143 0\9 0\12 0.35\0.56 0\32
20 0\1 0\4 0.4/0.6 0\36 2\157 1\14 0\4 0.55\0.52 0\31
38 0\13 1\7 0.5/0.6 0\29 3\128 0\16 1\7 0.21\0.47 0\13
TOTAAL 72 1\20 1\23 1.1\1.8 0 6\428 1\39 1\23 1.11\1.55 0\76
% 72 5 4.35 61.11 0 1.4 2.56 4.35 71.61 0
219

T 4 33 0\8 0\10 0.2/0.5 1\17 0\88 0\12 0\10 0.12\0.56 1\15
80 1\6 0\12 0.4/0.5 2\36 6\143 0\9 0\12 0.35\0.56 2\32
80 1\5 0\6 0.4/0.8 0\60 9\262 0\17 0\6 0.28\0.61 1\12
80 1\1 0\4 0.4/0.6 1\36 8\157 0\14 0\4 0.2\0.52 1\31
54 0\6 0\7 0.2/0.5 0\20 2\91 0\2 0\7 0.37\0.53 3\16
80 0\9 0\9 0.5/0.7 5\54 5\158 1\17 0\9 0.24\0.53 2\16
80 0\5 0\8 0.6/0.6 3\21 7\125 2\9 0\8 0.23\0.48 0\20
80 0\7 2\9 0.3/0.7 1\35 3\131 0\18 2\9 0.23\0.49 1\13
80 1\8 0\7 0.5/0.6 3\27 5\145 1\13 0\7 0.23\0.55 0\13
42 2\13 0\7 0.5/0.6 3\29 1\128 0\16 0\7 0.24\0.47 1\13
TOTAAL 689 6\68 2\79 4\6.1 19\335 46\1428 4\127 2\79 2.49\5.3 12\181
% 689 8.82 2.53 65.57 5.67 3.22 3.15 2.53 46.98 6.63
U 4 80 0\8 0\10 0.5/0.5 1\17 6\88 2\12 0\10 0.75\0.56 0\15
26 0\8 0\6 0.5/0.6 1\37 1\113 0\8 0\6 0.61\0.53 1\18
45 0\6 0\12 0\0.5 0\36 0\143 0\9 0\12 0.73\0.56 1\32
34 0\1 0\4 0.4/0.6 0\36 3\157 0\14 0\4 0.76\0.52 0\31
54 0\6 0\7 0.5/0.5 0\20 4\91 1\12 0\7 0.61\0.53 0\16
49 0\9 0\9 0.5/0.7 1\54 5\158 4\17 0\9 0.57\0.53 0\16
51 0\5 0\8 0.4/0.6 0\21 4\125 1\9 0\8 0.46\0.48 1\20
59 0\7 0\9 1.0/0.7 4\35 8\131 0\18 0\9 0.48\0.49 0\13
34 0\8 0\7 0.8/0.6 1\27 5\145 0\13 0\7 0.63\0.55 1\13
49 0\13 0\7 0.4/0.6 0\29 4\128 0\16 0\7 0.47\0.47 0\13
TOTAAL 481 0 0 5\5.9 8\312 40\1279 8\128 0\79 6.07\5.22 4\187
% 481 0 0 84.75 2.56 3.13 6.25 0 116.28 2.14
V 4 80 1\8 1\10 0.2/0.5 2\17 1\88 2\12 1\10 0.16\0.56 1\15
80 1\8 1\6 0.4/0.6 1\37 6\113 2\8 1\6 0.29\0.53 0\18
80 0\6 3\12 0.4/0.5 4\36 4\143 0\9 3\12 0.31\0.56 1\32
71 1\5 1\6 0.7/0.8 4\60 12\262 1\17 1\6 0.39\0.61 3\12
80 0\1 1\4 1.1/0.6 8\36 15\157 2\14 1\4 0.46\0.52 3\31
80 1\6 0\7 0.2/0.5 1\20 2\91 0\12 0\7 0.14\0.53 0\16
76 2\9 1\9 0.8/0.7 3\54 11\158 1\17 1\9 0.34\0.53 0\16
80 0\5 0\8 0.4/0.6 0\21 6\125 1\9 0\8 0.26\0.48 2\20
80 1\7 0\9 0.4/0.7 1\35 5\131 3\18 0\9 0.26\0.49 0\13
80 0\8 0\7 0.1/0.6 0\27 2\145 1\13 0\7 0.26\0.55 1\13
80 1\13 0\7 0.4/0.6 1\29 5\128 2\16 0\7 0.19\0.47 0\13
TOTAAL 867 8\76 8\85 5.1\6.7 25\372 69\1541 15\145 8\85 3.06\5.83 11\199
% 867 10.53 9.41 76.12 6.72 4.48 10.34 9.41 52.49 5.53
220

W 4 41 1\8 0\10 0.3/0.5 1\17 1\88 1\12 0\10 0.76\0.56 1\15
54 0\8 0\8 0.6/0.6 2\37 5\113 0\8 0\6 0.33\0.53 1\18
35 0\6 0\12 0.5/0.5 4\36 2\143 0\9 0\12 0.43\0.56 3\32
58 0\5 0\6 1.0/0.8 4\60 13\262 0\17 0\6 0.58\0.61 0\12
46 0\1 0\4 0.5/0.6 3\36 4\157 0\14 0\4 0.31\0.52 1\31
26 0\6 0\7 0.7/0.5 0\20 4\91 0\12 0\7 0.55\0.53 0\16
31 0\9 0\9 1.2/0.7 1\54 8\158 0\17 0\9 0.55\0.53 0\16
29 0\5 0\8 0.5/0.6 1\21 2\125 0\9 0\8 0.51\0.48 0\20
21 0\7 0\9 0.3/0.7 0\35 1\131 0\18 0\9 0.33\0.49 0\13
46 2\8 0\7 0.9/0.6 2\27 7\145 0\13 0\7 0.65\0.55 0\13
31 0\13 0\7 0.9/0.6 1\29 5\128 1\16 0\7 0.52\0.47 1\13
TOTAAL 418 3\76 0 7.4\6.7 19\372 52\1541 2\145 0\85 5.52\5.83 7\199
% 418 3.95 0 110.45 511 3.37 1.38 0 94.68 3.52
X 4 80 1\8 1\10 0.1/0.5 0\17 2\88 0\12 1\10 1.13\0.56 2\15
80 2\8 0\8 0.5/0.6 0\37 8\113 0\8 0\6 1.09\0.53 1\18
80 0\6 5\12 0.6/0.5 2\36 11\143 0\9 5\12 1.02\0.56 4\32
80 0\5 1\6 0.5/0.8 3\60 10\262 3\17 1\6 0.82\0.61 0\12
66 0\1 1\4 0.4/0.6 1\36 6\157 0\14 1\4 0.9\0.52 0\31
80 2\6 1\7 0.4/0.5 1\20 4\91 2\12 1\7 1.1\0.53 0\16
76 1\9 0\9 0.4/0.7 3\54 5\158 1\17 0\9 1.00\0.53 1\16
80 0\5 0\8 0.6/0.6 2\21 7\125 1\9 0\8 0.9\0.48 3\20
80 0\7 0\9 0.7/0.7 1\35 10\131 2\18 0\9 0.9\0.49 1\13
80 2\8 1\7 0.7/0.6 2\27 10\145 1\13 1\7 0.97\0.55 0\13
59 0\13 0\7 0.8/0.6 2\29 8\128 1\16 0\7 0.88\0.47 2\13
TOTAAL 841 8\76 10\87 5.7\6.7 17\372 81\1541 11\145 10\85 10.71\5.83 14\199
% 841 10.53 11.49 85.07 4.57 5.26 7.59 11.76 183.7 7.04
Y 4 80 1\8 0\10 0.4/0.5 0\17 5\88 0\12 0\10 0.70\0.56 1\15
80 1\6 0\12 0.7/0.5 4\36 13\143 2\9 0\12 0.68\0.56 2\32
80 0\5 1\6 1.1/0.8 5\60 23\262 2\17 1\6 0.79\0.61 2\12
80 0\1 0\4 0.7/0.6 2\36 13\157 2\14 0\4 0.56\0.52 2\31
80 0\6 0\7 0.9/0.5 0\20 12\91 1\12 0\7 0.68\0.53 0\16
80 1\9 1\9 0.5/0.7 2\54 8\158 1\17 1\9 0.56\0.53 0\16
80 0\5 0\8 0.5/0.6 0\21 8\125 1\9 0\8 0.54\0.48 0\20
80 0\7 0\9 1.1/0.7 3\35 14\131 2\18 0\9 0.5\0.49 0\13
80 0\8 0\7 0.9/0.6 2\27 14\145 3\13 0\7 0.63\0.55 1\13
80 0\13 0\7 0.7/0.6 3\29 8\128 2\16 0\7 0.47\0.47 0\13
TOTAAL 800 3\68 2\79 7.5\6.1 21\335 118\1428 16\137 2\79 6.11\5.3 8\181
% 800 4.41 2.53 122.95 6.27 8.26 11.68 2.53 115.28 4.42
221

SEASON 1
turnover
won
turnover
lost Off Loads
Good off
loads
Bad off
loads cleans
Win
possession
Lost
possession
Breakdown
efficiency
In tackle
pass
Ball
carries
Pos
carries
Neg
Carries
total
attack
total
defence
0\18 1\17 0\7 0\6 0\1 8\145 0\28 1\10 60 0\5 3\58 3\54 0\4 18\321 10\261
1\6 2\22 0\11 0\8 0\3 5\154 0\25 0\15 85.7 0\9 3\69 3\67 0\2 12\363 10\162
2\8 2\26 0\17 0\14 0\3 4\172 0\23 1\20 83.3 0\16 4\78 3\74 1\4 15\463 11\184
0\10 3\19 0\23 0\18 0\5 1\130 0\18 3\18 33.3 0\20 6\80 5\73 1\7 13\373 5\185
3\42 8\84 0 0 0\12 18\601 0 5\63 262.3\4 0 16\285 14\268 2\17 58\1520 36\792
7.14 9.52 0 0 0 3 0 7.94 65.58 0 5.61 5.22 11.76 3.82 4.55
3\18 0\17 2\7 2\6 0\1 10\145 0\28 0\10 71.4 1\5 8\58 8\54 0\4 22\321 37\261
1\6 0\22 0\11 0\8 0\3 22\154 1\25 0\15 80 0\9 5\69 4\67 1\2 30\363 20\162
1\8 1\26 3\17 3\14 0\3 21\172 0\23 1\20 100 3\16 9\78 8\74 1\4 42\463 29\184
0\11 2\18 1\13 0\10 1\3 19\195 4\24 2\14 88.5 1\10 3\88 3\81 0\7 33\456 21\202
1\10 2\23 3\32 3\26 0\6 19\270 0\24 1\13 82.6 3\28 7\139 7\128 0\11 37\705 8\138
1\11 1\30 0\16 0\8 0\8 8\169 1\35 1\26 86.7 0\15 1\82 1\73 0\9 10\435 9\255
2\13 1\23 2\17 2\11 0\6 14\169 4\23 1\18 80.6 2\13 8\83 8\75 0\8 30\439 42\234
1\9 1\19 0\14 0\10 0\4 11\132 1\29 1\17 80.6 0\12 4\63 4\57 0\6 21\352 24\233
2\13 1\20 1\11 0\9 1\2 7\121 2\20 1\19 79.3 1\10 9\56 8\48 1\8 22\323 38\295
0\16 0\26 0\15 0\7 0\8 13\179 0\29 0\16 89.7 1\12 8\81 8\71 0\10 23\432 25\229
3\10 0\19 0\23 0\18 0\5 15\130 0\18 0\18 72.4 0\20 2\80 2\73 0\7 27\373 27\185
14\125 9\446 12\176 10\127 2\49 159\1836 13\278 8\186 911.8\11 12\150 64\877 61\801 3\56 297\4662 280\2378
11.2 2.02 6.82 7.87 4.08 8.66 4.68 4.3 82.89 8 7.3 7.62 5.36 6.37 11.77
1\18 0\17 0\7 0\6 0\1 22\145 1\28 0\10 82.1 0\5 3\58 3\54 0\4 25\321 15\261
0\6 0\22 0\11 0\8 0\3 20\154 0\25 0\15 84 0\9 2\69 0\67 0\2 22\363 5\162
0\8 0\26 0\17 0\14 0\3 20\172 0\23 0\20 82.1 0\16 1\78 1\74 0\4 23\463 11\184
0\11 0\18 0\13 0\10 0\3 5\195 0\24 0\14 50 0\10 0\88 0\81 0\7 5\456 1\202
0\13 0\23 0\17 0\11 0\6 8\169 1\23 0\18 75 0\13 2\83 2\75 0\8 10\439 3\234
1\9 0\19 0\14 0\10 0\4 17\132 0\29 0\17 77.8 0\12 2\63 2\57 0\6 19\352 6\233
0\13 0\20 0\11 0\9 0\2 8\121 1\20 0\19 64.7 0\10 1\56 1\48 0\8 10\323 8\295
0\16 0\26 0\15 0\7 0\8 8\179 0\29 0\16 50 0\12 0\81 0\71 0\10 8\432 4\229
1\10 0\19 0\23 0\18 0\5 5\130 1\18 0\18 75 0\20 1\80 1\73 0\7 6\373 4\185
3\104 0\190 0 0 0\35 113\1397 4\219 0\147 640.7\9 0 12\656 10\600 0\56 128\3522 57\1985
2.88 0 0 0 0 8.09 1.83 0 71.19 0 1.83 1.67 0 3.63 2.87
Decision Making
222
0\18 1\17 1\7 1\6 0\1 0\145 1\28 0\10 0 1\5 1\58 1\54 0\4 4\321 0\261
0\11 0\18 0\13 0\10 0\3 0\195 1\24 0\14 0 0\10 1\88 0\81 1\7 12\456 5\202
0\10 0\23 2\32 2\26 0\6 0\270 2\24 0\13 0 1\28 5\139 4\128 1\11 14\705 0\138
0\39 1\58 3\52 3\42 0\10 0\610 4\76 0\37 0 2\43 7\285 5\263 2\22 28\1482 5\901
0 1.72 5.77 7.14 0 0 5.26 0 0 4.65 2.46 1.9 9.09 1.89 0.55
1\9 0\19 0\14 0\10 0\4 15\132 0\29 0\17 55.9 0\12 3\63 3\57 0\6 20\352 21\233
1\13 0\20 0\11 0\9 0\2 8\121 2\20 0\19 100 0\10 4\56 3\48 1\8 15\323 17\295
1\16 3\26 0\15 0\7 0\8 19\179 0\29 2\16 63.6 0\12 2\81 2\71 0\10 24\432 18\229
3\38 3\65 0 0 0\14 42\432 2\78 2\52 219.5\3 0 9\524 8\176 1\24 59\1107 56\757
7.89 4.62 0 0 0 9.72 2.56 3.85 73.17 0 1.72 4.55 4.17 5.33 7.4
1\18 1\17 0\7 0\6 0\1 15\145 1\28 1\10 76 0\5 4\58 4\54 0\4 23\321 22\261
0\6 1\22 3\11 3\8 0\3 10\154 0\25 1\15 88.9 3\9 3\69 3\67 0\2 19\363 14\162
0\8 0\26 2\17 1\14 1\3 19\172 0\23 0\20 91.3 2\16 4\78 4\74 0\4 31\463 15\184
0\11 0\18 1\13 0\10 1\3 11\195 0\24 0\14 84.6 1\10 5\88 5\81 0\7 20\456 6\202
1\10 1\23 3\32 2\26 1\6 30\270 0\24 1\13 86.5 2\28 6\139 6\128 0\11 50\705 9\138
0\11 0\30 1\16 1\8 0\8 7\169 0\35 0\26 69.2 1\15 5\82 3\73 2\9 18\435 17\255
1\13 0\23 3\17 3\11 0\6 7\169 1\23 0\18 77.8 3\13 5\83 5\75 0\8 22\439 15\234
0\9 1\19 1\14 1\10 0\4 6\132 2\29 1\17 100 1\12 4\63 4\57 0\6 15\352 12\233
1\13 1\20 0\11 0\9 0\2 17\121 0\20 1\19 86.2 0\10 1\56 1\48 0\8 20\323 21\295
1\16 0\26 1\15 0\7 1\8 11\179 1\29 0\16 89.5 1\12 4\81 3\71 1\10 21\432 20\229
1\10 2\19 0\23 0\18 0\5 12\130 0\18 2\18 81 0\20 3\80 3\73 0\7 27\373 13\185
6\120 7\243 15\176 11\127 4\49 145\1836 5\278 7\186 931\11 14\150 41\877 41\801 3\67 266\4662 164\2378
5 2.88 8.52 8.66 8.16 7.9 1.8 3.76 84.64 9.33 4.68 5.12 4.48 5.71 6.9
1\18 0\17 2\7 2\6 0\1 8\145 1\28 0\10 82.6 2\5 14\58 14\54 0\4 26\321 27\261
1\6 3\22 0\11 0\8 0\3 7\154 4\25 3\15 73.3 0\9 12\69 12\67 0\2 25\363 16\162
0\8 3\26 5\17 4\14 1\3 12\172 2\23 3\20 90 5\16 14\78 13\74 1\4 36\463 17\184
0\11 2\18 2\13 2\10 0\3 8\195 1\24 2\14 94.4 2\10 12\88 11\81 1\7 33\456 16\202
2\10 1\23 6\32 6\26 0\6 18\270 2\24 1\13 83.9 6\28 18\139 18\128 0\11 49\705 19\138
3\11 3\30 0\16 0\8 0\8 12\169 5\35 3\26 85.2 0\15 10\82 10\73 0\9 31\435 28\255
2\13 0\23 0\17 0\11 0\6 7\169 0\23 0\18 81.3 0\13 6\83 5\75 1\8 14\439 16\234
2\9 0\19 0\14 0\10 0\4 10\132 1\29 0\17 68 0\12 6\63 5\57 1\6 28\352 27\233
1\13 1\20 2\11 2\9 0\2 11\121 3\20 0\19 82.8 2\10 9\56 7\48 2\8 27\323 38\295
1\16 1\26 2\15 2\7 0\8 17\179 0\29 1\16 78.6 2\12 8\81 6\71 2\10 31\432 18\229
1\10 0\19 6\23 4\18 2\5 3\130 2\18 0\18 72.7 6\20 15\80 13\73 2\7 28\373 17\185
14\120 14\243 25\176 22\127 3\49 113\1836 21\278 13\186 892.8/11 25\150 124\877 114\801 10\67 328\4662 239\2378
11.67 5.76 14.2 17.32 6.12 6.15 7.55 6.99 81.16 16.67 14.14 14.23 14.93 7.04 10.05
223

1\18 2\17 0\7 0\6 0\1 1\145 3\28 0\10 100 0\5 1\58 1\54 0\4 20\321 13\261
1\6 4\22 0\11 0\8 0\3 3\154 3\25 1\15 75 0\9 1\69 1\67 0\2 23\363 9\162
1\8 4\26 0\17 0\14 0\3 1\172 3\23 1\20 50 0\16 1\78 1\74 0\4 44\463 10\184
0\11 5\18 1\13 0\10 1\3 5\195 3\24 2\14 100 0\10 7\88 6\81 1\7 35\456 12\202
1\10 3\23 0\32 0\26 0\6 2\270 2\24 0\13 66.7 0\28 6\139 6\128 0\11 55\705 11\138
1\11 2\30 1\16 1\8 0\8 6\169 9\35 0\26 75 1\15 3\82 3\73 0\9 41\435 14\255
0\13 5\23 0\17 0\11 0\6 4\169 2\23 2\18 100 0\13 5\83 4\75 1\8 46\439 18\234
1\9 2\19 2\14 1\10 1\4 2\132 5\29 1\17 66.7 1\12 5\63 4\57 1\6 26\352 4\233
0\13 2\20 0\11 0\9 0\2 0\121 3\20 2\19 66.7 0\10 1\56 1\48 0\8 23\323 13\295
1\16 3\26 0\15 0\7 0\8 6\179 5\29 1\16 70 0\12 2\81 2\71 0\10 25\432 6\229
1\10 5\19 1\23 1\18 0\5 2\130 1\18 2\18 75 1\20 2\80 1\73 1\7 32\373 15\185
8\120 37\243 5\176 3\127 2\49 32\1836 39\278 12\186 845.1\11 3\150 34\877 30\801 4\76 370\4662 125\2378
6.67 15.23 2.84 2.36 4.08 1.74 14.03 6.45 76.83 2 3.88 3.75 5.26 7.94 5.26
0\18 2\17 0\7 0\6 0\1 4\145 2\28 0\10 80 0\5 4\58 4\58 0\4 13\321 8\261
1\6 4\22 2\11 1\8 1\3 2\154 5\25 1\15 83.3 1\9 5\69 4\67 1\2 21\363 2\162
0\8 2\26 0\17 0\14 0\3 2\172 5\23 1\20 75 0\16 4\78 4\74 0\4 16\463 1\184
1\11 2\18 0\13 0\10 0\3 8\195 3\24 2\14 90.9 0\10 4\88 4\81 0\7 21\456 4\202
2\10 1\23 1\32 1\26 0\6 5\270 5\24 0\13 85.7 1\28 7\139 6\128 1\11 28\705 6\138
1\11 4\30 1\16 0\8 1\8 3\169 5\35 3\26 83.3 1\15 5\82 5\73 0\9 24\435 12\255
2\13 4\23 3\17 1\11 2\6 5\169 5\23 3\18 80 2\13 8\83 7\75 1\8 27\439 10\234
0\9 0\19 1\14 0\10 0\4 5\132 3\29 0\17 100 1\12 3\63 3\57 0\6 15\352 9\233
2\13 1\20 1\11 1\9 0\2 4\121 3\20 0\19 83.3 1\10 4\56 4\48 0\8 13\323 13\295
1\16 2\26 2\15 0\7 2\8 2\179 3\29 1\16 100 2\12 2\81 2\71 0\10 12\432 4\229
10\115 22\224 11\153 4\109 6\44 40\1706 39\260 11\168 861.5\10 9\130 46\797 43\732 3\69 190\4289 69\2193
8.7 9.82 7.19 3.67 13.64 2.34 15 6.55 86.15 6.92 5.77 5.87 4.35 4.43 3.15
1\18 2\17 1\7 0\6 1\1 5\145 3\28 2\10 55.6 0\5 4\58 3\54 1\4 10\321 8\261
0\8 0\26 1\17 1\14 0\3 4\172 2\23 0\20 71.4 1\16 3\78 3\74 0\4 11\463 8\184
1\11 0\18 1\13 1\10 0\3 16\195 0\24 0\14 95.2 1\10 8\88 8\81 0\7 31\456 7\202
1\10 3\23 2\32 2\26 0\6 18\270 2\24 1\13 82.6 2\28 11\139 11\128 0\11 45\705 6\138
0\11 1\30 3\16 1\8 2\8 7\169 0\35 1\26 84.6 3\15 7\82 7\73 0\9 28\435 16\255
1\13 0\23 1\17 1\11 0\6 11\169 0\23 0\18 83.3 1\13 4\83 3\75 1\8 22\439 21\234
0\9 1\19 1\14 0\10 1\4 3\132 0\29 1\17 100 1\12 2\63 2\57 0\6 9\352 3\233
1\13 2\20 0\11 0\9 0\2 4\121 1\20 2\19 71.4 0\10 3\56 3\48 0\8 12\323 12\295
0\16 1\26 1\15 0\7 1\8 8\179 1\29 1\16 80 1\12 5\81 4\71 1\10 16\432 7\229
0\10 0\19 3\23 3\18 0\5 2\130 1\18 0\18 83.3 3\20 8\80 8\73 0\7 15\373 12\185
5\119 10\221 14\165 9\119 5\46 78\1682 10\253 8\171 807.4\10 13\141 55\808 52\734 3\74 199\4299 100\2216
4.2 4.52 8.48 7.56 10.87 4.64 3.95 4.68 80.74 9.22 6.81 7.08 4.05 4.63 4.51
224

0\11 7\23 1\8 0\6 1\2 4\250 2\27 3\17 87.5 1\7 6\116 4\96 2\20 31\527 12\141
0\7 1\22 0\8 0\7 0\1 4\214 2\28 1\20 100 0\6 3\87 3\83 0\4 27\471 12\168
0\5 5\34 1\11 1\9 0\2 2\214 0\32 0\29 66.7 1\11 2\79 2\68 0\11 25\452 11\215
0\13 3\22 0\11 0\10 0\1 0\205 2\26 2\14 100 0\10 1\79 1\66 0\13 14\408 13\324
0\36 16\101 2\38 1\32 1\6 10\883 6\113 6\80 354.2\4 2\34 12\361 10\313 2\48 97\1858 46\848
0 15.84 5.26 3.13 16.67 1.13 5.31 7.5 88.55 5.88 3.32 3.19 4.17 5.22 5.42
0\11 1\23 0\8 0\6 0\2 21\250 0\27 1\17 68.6 0\7 5\116 3\96 2\20 26\527 7\141
0\7 1\22 0\8 0\7 0\1 15\214 0\28 5\20 81 0\6 4\87 4\83 0\4 19\471 9\168
1\5 1\34 0\11 0\9 0\2 6\214 0\32 4\29 80 0\11 0\79 0\68 0\11 8\452 7\215
1\13 0\22 1\11 1\10 0\1 22\205 1\26 2\14 63.6 0\10 3\79 3\66 0\13 28\408 12\324
0\12 0\20 0\6 0\6 0\0 7\175 0\25 5\21 78.6 0\6 1\74 1\67 0\7 9\388 15\231
0\6 0\19 0\14 0\12 0\2 16\242 0\27 0\15 75 0\13 5\103 4\93 1\10 27\503 2\136
0\14 0\18 0\12 0\11 0\1 9\160 0\30 6\17 59.1 0\11 1\88 1\77 0\11 11\400 10\232
0\8 0\26 0\10 0\8 0\2 11\164 0\26 2\25 59.1 0\9 2\68 2\64 0\4 15\389 4\184
0\13 0\20 0\14 0\12 0\2 18\189 0\29 1\14 66.7 0\11 4\76 4\70 0\6 23\406 10\181
1\11 0\16 0\5 0\5 0\0 14\212 0\21 1\16 78.9 0\2 1\74 1\68 0\6 17\442 11\213
1\10 0\13 0\13 0\11 0\2 11\158 0\22 0\15 73.7 0\11 7\77 7\74 0\3 21\360 10\200
4\110 3\233 1\112 1\97 0\15 150\2183 1\293 27\203 784.3\11 0 33\921 30\826 3\95 204\4746 97\2225
3.64 1.29 0.89 1.03 0 6.87 0.34 13.3 71.3 0 3.58 3.63 3.16 4.3 4.36
0\7 0\22 0\8 0\7 0\1 0\214 1\28 0\20 0 0\6 0\87 0\83 0\4 1\471 2\168
1\12 1\20 1\6 1\6 0\0 0\175 0\25 0\21 100 1\6 2\74 2\67 0\7 23\388 2\231
0\10 1\13 0\13 0\11 0\2 0\158 1\22 1\15 50 0\11 3\77 3\74 0\3 12\360 4\200
1\29 2\52 1\27 1\24 0\3 0\547 2\75 1\56 150\3 1\23 5\238 5\224 0\14 36\1219 8\599
3.45 3.85 3.7 4.17 0 0 2.67 1.79 50 4.35 2.1 2.23 0 2.95 1.34
1\11 2\23 0\8 0\6 0\2 5\250 8\27 2\17 75 0\7 9\116 8\96 1\20 24\527 4\141
0\7 5\22 0\8 0\7 0\1 6\214 10\28 3\20 100 0\6 9\87 8\83 1\4 30\471 8\168
0\5 6\34 1\11 1\9 0\2 5\214 9\32 5\29 80 1\11 10\79 8\68 2\11 27\452 3\215
0\13 1\22 1\11 1\10 0\1 5\205 4\26 0\14 85.7 1\10 3\79 3\66 0\13 12\408 8\324
1\12 2\20 0\6 0\6 0\0 5\175 5\25 1\21 85.7 0\6 6\74 5\67 1\7 17\388 8\231
0\6 2\19 3\14 2\12 1\2 5\242 7\27 1\15 87.5 3\13 10\103 7\93 3\10 23\503 4\136
0\14 0\18 1\12 1\11 0\1 8\160 4\30 0\17 81.8 1\11 11\88 10\77 1\11 32\400 7\232
0\8 5\26 0\10 0\8 0\2 6\164 5\26 2\25 70 0\9 7\68 7\64 0\4 25\389 5\184
0\13 5\20 1\14 1\12 0\2 6\189 8\29 3\14 80 1\11 5\76 4\70 1\6 21\406 7\181
0\11 2\16 0\5 0\5 0\0 3\212 5\21 1\16 57.1 0\2 7\74 7\68 0\6 22\442 3\213
0\10 0\13 0\13 0\11 0\2 6\158 3\22 0\15 88.9 0\11 4\77 4\74 0\3 16\360 8\200
2\110 30\233 7\112 6\97 1\15 60\2183 68\293 18\203 891.7\11 7\97 81\921 71\826 10\75 249\4746 65\2225
1.82 12.88 6.25 6.19 6.67 2.75 23.21 8.87 81.06 7.22 8.79 8.6 10.53 5.25 2.92
225

0\11 2\23 0\8 0\6 0\2 7\250 0\27 2\17 64.3 0\7 3\116 3\96 0\20 13\527 3\141
0\7 1\22 2\8 1\7 1\1 1\214 0\28 1\20 66.7 1\6 5\87 4\83 1\4 9\471 5\168
2\6 0\19 0\14 0\12 0\2 13\242 1\27 0\15 100 0\13 3\103 3\93 0\10 18\503 13\136
2\14 0\18 0\12 0\11 0\1 5\160 1\30 0\17 92.3 0\11 2\88 2\77 0\11 13\400 18\232
0\8 0\26 0\10 0\8 0\2 2\164 0\26 0\25 75 0\9 1\68 1\64 0\4 5\389 9\184
1\13 0\20 1\14 1\12 0\2 3\189 1\29 0\14 66.7 0\11 4\76 3\70 1\6 11\406 4\181
0\11 1\16 1\5 1\5 0\0 4\212 0\21 1\16 66.7 0\2 4\74 4\68 0\6 14\442 8\213
2\10 0\13 1\13 1\11 0\2 3\158 2\22 0\15 100 1\11 3\77 3\74 0\3 13\360 6\200
7\80 4\157 5\84 4\72 1\12 38\1589 5\210 4\139 631.7\8 2\70 25\689 23\625 2\64 96\3498 66\1455
8.75 2.55 5.95 5.56 8.33 2.39 2.38 2.88 78.96 2.86 3.63 3.68 3.13 2.74 4.54
0\6 3\19 1\14 1\12 0\2 3\242 0\27 2\15 100 0\13 3\103 3\93 0\10 27\503 9\136
0\14 0\18 1\12 1\11 0\1 3\160 0\30 0\17 80 1\11 2\88 2\77 0\11 23\400 20\232
0\8 3\26 0\10 0\8 0\2 1\164 1\26 2\25 66.7 0\9 1\68 1\64 0\4 22\389 17\184
1\13 0\20 0\14 0\12 0\2 1\189 2\29 0\14 50 0\11 3\76 2\70 1\6 23\406 17\181
0\11 2\16 0\5 0\5 0\0 3\212 2\21 1\16 66.7 0\2 2\74 2\68 0\6 24\442 19\213
0\10 1\13 2\13 2\11 0\2 5\158 1\22 1\15 60 1\11 3\77 2\74 1\3 28\360 14\200
1\62 9\112 4\68 4\59 0\9 16\1125 6\155 6\102 423.4/6 2\57 14\486 12\446 2\40 147\2500 96\1146
1.61 8.04 5.88 6.78 0 1.42 3.87 5.88 70.57 3.51 2.88 2.69 5 5.88 8.38
0\11 0\23 0\8 0\6 0\2 5\250 1\27 0\17 71.4 0\7 6\116 6\96 0\20 13\527 8\141
1\7 3\22 0\8 0\6 0\1 13\214 2\28 3\20 90 0\6 4\87 4\83 0\4 18\471 12\168
0\5 0\34 0\11 0\9 0\2 7\214 0\32 0\29 66.7 0\11 0\79 0\68 0\11 7\452 11\215
1\6 0\19 0\14 0\12 0\2 30\242 2\27 1\15 92.9 0\13 9\103 9\93 0\10 41\503 19\136
0\14 2\18 1\12 1\11 0\1 16\160 1\30 2\17 83.3 1\11 10\88 9\77 1\11 28\400 19\232
0\8 1\26 1\10 0\8 1\2 15\164 1\26 2\25 91.7 1\9 5\68 5\64 0\4 22\389 21\184
0\13 0\20 1\14 1\12 0\2 11\189 2\29 0\14 71.4 1\11 5\76 5\70 0\6 21\406 17\181
1\11 1\16 0\13 0\5 0\0 25\212 0\21 2\16 84.2 0\2 6\74 5\68 1\6 33\442 25\213
0\10 1\13 0\13 0\11 0\2 14\158 0\22 2\15 78.6 0\11 3\77 3\74 0\3 19\360 18\200
3\85 8\191 3\103 2\80 1\14 136\1803 9\242 12\168 730.2\9 3\81 48\768 46\693 2\75 202\3950 150\1670
3.53 4.19 2.91 2.5 7.14 7.54 3.72 7.14 81.13 3.7 6.25 6.64 2.67 5.11 8.98
1\5 0\34 2\11 1\9 1\2 3\214 3\32 0\29 50 2\11 4\79 3\68 1\11 14\452 6\215
20 0 18.18 11.11 50 1.4 9.38 0 50 18.18 5.06 4.41 9.09 3.1 2.79
0\5 0\34 0\11 0\9 0\2 1\214 0\32 1\29 100 0\11 1\79 1\68 0\11 3\452 2\215
1\12 0\20 0\6 0\6 0\0 3\175 0\25 0\21 60 0\6 1\74 1\67 0\7 8\388 3\231
0\10 1\13 0\13 0\11 0\2 1\158 1\22 1\15 50 0\11 1\77 1\74 0\3 5\360 3\200
1\27 1\67 0 0 0\4 5\547 1\79 2\65 210\3 0 3\230 3\209 0\21 16\1200 8\646
3.7 1.49 0 0 0 0.91 1.27 3.08 70 0 1.3 1.44 0 1.33 1.24
226

0\11 0\23 0\8 0\6 0\2 2\250 0\27 0\17 76.9 0\7 1\116 0\96 1\20 3\527 1\141
0\5 2\34 2\11 1\9 1\2 7\214 5\32 2\29 71.4 2\11 2\79 2\68 0\11 18\452 10\215
0\13 3\22 1\11 1\10 0\1 2\205 1\26 2\14 50 1\10 4\79 2\66 2\13 12\408 10\324
0\12 1\20 0\6 0\6 0\0 4\175 0\26 0\21 83.3 0\6 2\74 2\67 0\7 7\388 9\231
0\6 0\19 1\14 1\12 0\2 5\242 1\27 0\15 55.6 1\13 8\103 7\93 1\10 15\503 5\136
0\14 2\18 1\12 1\11 0\1 3\160 4\30 1\17 62.5 1\11 4\88 4\77 0\11 10\400 9\232
1\8 0\26 1\10 1\8 0\2 2\164 2\26 0\25 80 1\9 3\68 2\64 1\4 9\389 9\184
1\13 0\20 1\14 1\12 0\2 2\189 1\29 0\14 50 1\11 5\76 4\70 1\6 13\406 5\181
1\11 0\16 3\5 3\5 0\0 1\212 2\21 0\16 66.7 2\2 5\74 4\68 1\6 12\442 6\213
0\10 0\13 0\13 0\11 0\2 2\158 0\22 0\15 40 0\11 4\77 3\74 1\3 8\360 2\200
3\103 8\211 10\104 9\90 1\14 30\1969 16\266 5\183 636.4\10 9\91 38\834 30\743 8\91 107\4275 66\2057
2.91 3.79 9.62 10 7.14 1.52 6.02 2.73 63.64 9.89 4.56 4.04 8.79 2.5 3.21
4\11 0\23 0\8 0\6 0\2 39\250 2\27 0\17 67.9 0\7 2\116 1\96 1\20 44\527 16\141
0\7 0\22 0\8 0\7 0\1 11\214 0\28 0\20 82.4 0\6 1\87 1\83 0\4 12\471 4\168
0\5 1\34 1\11 1\9 0\2 27\214 0\32 1\29 71.1 1\11 1\79 1\68 0\11 30\452 3\215
0\12 1\20 0\6 0\6 0\0 18\175 0\25 1\21 88 0\6 2\74 2\67 0\7 21\388 5\231
0\6 1\19 0\14 0\12 0\2 22\242 1\27 1\15 74.2 0\13 4\103 4\93 0\10 28\503 5\136
2\14 0\18 0\12 0\11 0\1 10\160 3\30 0\17 81.8 0\11 0\88 0\77 0\11 14\400 14\232
0\8 0\26 0\10 0\8 0\2 13\164 1\26 1\25 66.7 0\9 0\68 0\64 0\4 16\389 7\184
0\13 0\20 0\14 0\12 0\2 18\189 0\29 0\14 71.9 0\11 0\76 0\70 0\6 18\406 10\181
0\11 1\16 0\5 0\5 0\0 8\212 1\21 2\16 73.3 0\2 2\74 2\68 0\6 11\442 10\213
0\10 0\13 0\13 0\11 0\2 16\158 1\22 1\15 75 0\11 3\77 3\74 0\3 19\360 4\200
6\97 4\211 1\101 1\87 0\14 182\1978 9\267 7\189 752.3\10 1\87 15\842 14\760 1\82 213\4338 78\1901
6.19 1.9 0.99 1.15 0 9.2 3.37 3.7 75.23 1.15 1.78 1.84 1.22 4.91 4.1
0\11 0\23 0\8 0\6 0\2 1\250 5\27 0\17 50 0\7 4\116 4\96 0\20 11\527 2\141
1\7 2\22 0\8 0\7 0\1 6\214 1\28 0\20 77.8 0\6 4\87 4\83 0\4 15\471 8\168
0\5 2\34 0\11 0\9 0\2 6\214 1\32 2\29 88.9 0\11 5\79 5\68 0\11 19\452 6\215
1\13 0\22 2\11 1\10 1\1 1\205 2\26 0\14 66.7 2\10 3\79 3\66 0\13 9\408 19\324
2\12 3\20 0\6 0\6 0\0 4\175 3\25 2\21 85.7 0\6 6\74 6\67 0\7 15\388 22\231
0\6 1\19 0\14 0\12 0\2 3\242 1\27 1\15 100 0\13 4\103 4\93 0\10 9\503 2\136
1\14 2\18 0\12 0\11 0\1 2\160 6\30 2\17 100 0\11 3\88 3\77 0\11 13\400 13\232
1\8 6\26 1\10 1\8 0\2 4\164 3\26 5\25 100 1\9 1\68 1\64 0\4 12\389 9\184
2\13 1\20 0\14 0\12 0\2 5\189 7\29 0\14 57.1 0\11 2\76 2\70 0\6 14\406 7\181
2\11 2\16 0\5 0\5 0\0 2\212 3\21 1\16 83.3 0\2 6\74 6\68 0\6 14\442 7\213
1\10 1\13 0\13 0\11 0\2 1\158 3\22 0\15 71.4 0\11 3\77 3\74 0\3 6\360 9\200
11\110 20\233 3\112 2\97 1\15 35\2183 35\293 13\203 880.9\11 3\97 41\921 41\826 0\95 137\4746 104\2225
10 8.58 2.68 2.02 6.67 1.6 11.95 6.4 80.08 3.09 4.45 4.96 0 2.89 4.67
227

0\11 2\23 2\8 2\6 0\2 7\250 1\27 2\17 76.9 2\7 16\116 15\96 1\20 29\527 2\141
0\7 0\22 0\8 0\7 0\1 7\214 0\28 1\20 70 0\6 2\87 2\83 0\4 12\471 6\168
0\5 0\34 0\11 0\9 0\2 5\214 0\32 0\29 70 0\11 2\79 2\68 0\11 8\452 7\215
0\13 1\22 0\11 0\10 0\1 13\205 1\26 1\14 70 0\10 7\79 6\66 1\13 20\408 14\324
0\12 0\20 0\6 0\6 0\0 3\175 0\25 0\21 50 0\6 4\74 4\67 0\7 7\388 7\231
0\6 0\16 0\14 0\12 0\2 8\242 0\27 0\15 100 0\13 1\103 1\93 0\10 10\503 4\136
0\14 1\18 0\12 0\11 0\1 5\160 1\30 1\17 70 0\11 4\88 4\77 0\11 9\400 8\232
0\8 0\26 0\10 0\8 0\2 9\164 0\26 1\25 83.3 0\9 3\68 3\64 0\4 12\389 3\184
0\13 0\20 0\14 0\12 0\2 3\189 1\29 0\14 50 0\11 3\76 3\70 0\6 6\406 1\181
0\11 0\16 0\5 0\5 0\0 18\212 0\21 0\16 80 0\2 2\74 2\68 0\6 23\442 7\213
1\10 2\13 1\13 1\11 0\2 5\158 1\22 2\15 87.5 1\11 2\77 2\74 0\3 8\360 8\200
1\110 6\233 3\112 3\97 0\15 83\2183 5\293 8\203 807.7/11 3\97 46\921 44\826 2\95 144\4746 67\2225
0.91 2.58 2.68 3.09 0 3.8 1.71 3.94 73.43 3.09 4.99 5.33 2.11 3.03 3.01
2\11 5\23 1\8 1\6 0\2 0\250 4\27 3\17 50 1\7 7\116 5\96 2\20 83\527 7\141
0\7 3\22 1\8 1\7 0\1 0\214 4\28 1\20 60 0\6 3\87 3\83 0\4 76\471 11\168
0\5 5\34 0\11 0\9 0\2 0\214 5\32 2\29 66.7 0\11 8\79 7\68 1\11 64\452 18\215
2\13 5\22 2\11 2\10 0\1 0\205 1\26 1\14 66.7 2\10 6\79 5\66 1\13 54\408 12\324
1\12 1\20 2\6 2\6 0\0 0\175 3\25 0\21 50 2\6 4\74 4\67 0\7 52\388 7\231
1\6 2\19 2\14 2\12 0\2 1\242 2\27 1\15 100 2\13 4\103 3\93 1\10 83\503 5\136
1\14 6\18 4\12 4\11 0\1 0\160 3\30 2\17 100 4\11 8\88 7\77 1\11 67\400 9\232
1\8 4\26 2\10 2\8 0\2 0\164 8\26 3\25 0 2\9 4\68 4\64 0\4 61\389 11\184
2\13 7\20 2\14 0\12 2\2 1\189 1\29 3\14 60 1\11 2\76 2\70 0\6 59\406 13\181
1\11 1\16 0\5 0\5 0\0 1\212 4\21 1\16 50 0\2 3\74 2\68 1\6 66\442 12\213
1\10 1\13 1\13 1\11 0\2 2\158 1\22 1\15 50 1\11 3\77 2\74 1\3 41\360 11\200
10\110 40\233 17\112 15\97 2\15 5\2183 36\293 18\203 653.4\11 15\97 52\921 44\826 8\95 706\4746 116\2225
9.09 17.17 15.18 15.46 1.33 2.29 12.29 8.87 59.4 15.46 5.65 5.33 8.42 14.88 5.21
0\11 0\23 0\8 0\6 0\2 31\250 0\27 0\17 75.6 0\7 11\116 8\96 3\20 50\527 6\141
0\5 2\34 0\11 0\9 0\2 20\214 2\32 2\29 71.9 0\11 6\79 6\68 0\11 38\452 16\215
1\13 0\22 0\11 0\10 0\1 26\205 3\26 0\14 82.4 0\10 5\79 4\66 1\13 35\408 28\324
1\12 1\20 1\6 1\6 0\0 16\175 2\25 2\21 75 1\6 5\74 4\67 1\7 28\388 17\231
0\6 0\19 1\14 1\12 0\2 29\242 3\27 0\15 84.2 1\13 5\103 3\93 2\10 41\503 13\136
0\14 1\18 0\12 0\11 0\1 27\160 3\30 0\17 86.1 0\11 6\88 5\77 1\11 37\400 8\232
3\8 0\26 0\10 0\8 0\2 17\164 3\26 0\25 90.5 0\9 8\68 8\64 0\4 32\389 11\184
1\13 1\20 0\14 0\12 0\2 16\189 2\29 1\14 76 0\11 2\76 2\70 0\6 23\406 17\181
1\11 0\16 0\5 0\5 0\0 20\212 4\21 0\16 76.7 0\2 5\74 5\68 0\6 33\442 17\213
0\10 1\13 0\13 0\11 0\2 19\158 5\22 1\15 92 0\11 5\77 5\74 0\3 28\360 10\200
4\103 6\211 2\107 2\90 0\14 221\1969 27\265 6\183 810.4\10 2\91 58\834 50\743 7\97 310\4275 143\2057
3.88 2.84 1.87 2.22 0 11.22 10.19 3.28 81.04 2.2 6.95 6.73 7.22 7.25 6.95
228

SEASON 2
PLAYERS GROUP Min
Line
Breaks
Tackle
Breaks
Tacle per
min
Tacles
missed
Tackles
made
Turnover
forced
Defender
beaten work rate
kick
pressure
A 1 54 0\7 0\4 0.2/0.5 0\12 2\90 0\9 0\4 0.09\0.38 0\20
80 0\2 0\2 0.2/0.6 0\27 4\133 0\13 0\2 0.23\0.47 1\25
80 0\3 1\5 0.3/0.7 0\32 6\171 1\14 1\5 0.3\0.54 0\20
TOTAAL 214 0 1\11 0.7\1.8 0 12\394 1\36 1\11 0.62\1.39 1\65
% 214 0 9.09 38.89 0 3.05 2.78 9.09 44.6 1.54
B 1 80 2\7 0\4 0.9/0.5 1\12 13\90 1\9 0\4 0.57\0.38 2\20
80 0\5 1\8 1.2/0.7 4\24 12\111 4\15 1\8 0.7\0.46 1\12
19 0\7 0\3 1.2/0.6 1\28 3\98 2\13 0\3 0.84\0.49 0\14
80 1\8 1\5 1/0.7 2\45 18\176 0\20 1\5 0.81\0.56 2\12
80 1\2 0\2 1.2/0.6 2\27 17\133 2\13 0\2 0.61\0.47 3\25
80 0\3 0\5 1/0.7 1\32 19\171 0\14 0\5 0.81\0.54 3\20
50 0\10 0\7 1.2/0.5 3\23 11\117 0\10 0\7 0.88\0.7 4\34
51 0\6 1\2 1.3/0.6 4\25 9\105 0\14 1\2 0.67\0.47 2\18
80 0\11 0\2 1.2/0.5 3\23 17\108 3\21 0\2 0.76\0.5 2\18
80 0\16 2\11 0.9/0.6 0\20 12\113 4\15 2\11 0.69\0.52 2\10
80 0\12 0\6 1.3/0.6 2\33 19\121 2\16 0\6 0.64\0.41 2\14
65 0\5 0\4 1.1/0.4 1\14 14\96 0\7 0\4 0.61\0.43 1\29
TOTAAL 825 4\92 5\59 11.5\7 24\306 164\1439 18\167 5\59 8.59\5.93 24\226
% 825 4.35 8.47 164.29 7.84 11.4 10.78 8.47 144.86 10.62
C 1 48 0\7 0\4 0.6/0.5 1\12 5\90 0\9 0\4 0.35\0.38 2\20
47 0\2 0\2 0.9/0.6 2\27 8\133 1\13 0\2 0.55\0.47 0\25
71 0\10 0\7 0.4/0.5 1\23 5\117 0\10 0\7 0.69\0.7 0\34
80 0\6 0\2 0.4/0.6 1\25 6\105 1\14 0\2 0.44\0.47 1\18
52 0\11 0\8 0.6/0.6 1\31 5\127 2\16 0\8 0.4\0.5 0\26
20 0\11 0\2 0.2/0.5 0\23 1\108 0\21 0\2 0.25\0.5 0\18
TOTAAL 318 0 0 3.1\3.3 6\141 30\680 4\83 0\25 2.68\3.02 3\141
% 318 0 0 93.94 4.26 4.41 4.82 0 88.74 2.13
D 1 80 0\7 0\4 0.5/0.5 2\12 5\90 0\9 0\4 0.31\0.38 2\20
80 0\5 0\8 0.5/0.7 2\24 5\111 1\15 0\8 0.49\0.46 1\12
69 0\8 0\5 0.6/0.7 2\45 9\176 1\20 0\5 0.52\0.56 1\12
Reaction Time
229

33 0\3 0\5 0.6/0.7 1\32 4\171 0\14 0\5 0.28\0.54 0\20
TOTAAL 262 0 0 2.2\2.6 7\113 23\548 2\58 0\22 1.6\1.94 4\64
% 262 0 0 84.62 6.19 4.2 3.45 0 82.47 6.25
E 1 48 0\7 0\4 0.4/0.5 2\12 2\90 0\9 0\4 0.23\0.38 0\20
80 0\5 0\8 0.9/0.7 1\24 11\111 0\15 0\8 0.47\0.46 0\12
48 0\7 0\3 0.3/0.6 0\28 3\98 0\13 0\3 0.48\0.49 1\14
47 0\8 0\5 0.7/0.7 1\45 8\176 1\20 0\5 0.49\0.56 0\12
37 0\2 0\2 0.6/0.6 0\27 5\133 2\13 0\2 0.46\0.47 1\25
64 0\11 0\2 0.7/0.5 1\23 8\108 0\21 0\2 0.41\0.5 0\18
80 1\16 0\11 1.3/0.6 2\20 16\113 2\15 0\11 0.65\0.52 1\10
80 0\12 0\6 1.0/0.6 3\33 13\121 0\16 0\6 0.53\0.41 2\14
80 1\5 0\4 0.6/0.4 2\14 8\96 0\7 0\4 0.46\0.43 1\29
TOTAAL 564 2\73 0 6.5\5.2 12\226 74\1046 5\129 0\45 4.18\4.22 6\154
% 564 2.74 0 125 5.31 7.07 3.88 0 99.05 3.9
F 1 80 1\7 2\4 0.7/0.5 1\12 10\90 0\9 2\4 0.45\0.38 3\20
80 0\7 0\3 0.7/0.6 1\24 8\98 0\13 0\3 0.33\0.49 1\14
20 0\2 0\2 1.2/0.6 2\27 3\133 1\13 0\2 0.4\0.47 0\25
80 0\10 0\7 0.5/0.5 0\23 9\117 0\14 0\7 0.55\0.7 3\34
80 0\6 0\2 0.6/0.6 1\25 9\105 1\14 0\2 0.31\0.47 1\18
80 0\11 0\8 0.6/0.6 1\31 10\127 2\16 0\8 0.41\0.5 0\26
53 0\12 3\6 1.0/0.6 2\33 7\121 1\16 3\6 0.49\0.41 0\14
80 1\5 0\4 0.5/0.4 0\14 9\96 0\7 0\4 0.39\0.43 3\29
TOTAAL 553 2\60 5\36 5.8\4.4 8\189 65\887 5\102 5\36 3.33\3.85 11\180
% 553 3.33 13.89 131.82 4.23 7.33 4.9 13.89 86.49 6.11
G 1 80 1\7 0\4 0.8/0.5 2\12 10\90 0\9 0\4 0.47\0.38 2\20
80 1\7 0\3 0.7/0.6 0\24 11\98 1\13 0\3 0.64\0.49 0\14
80 0\8 1\5 1.4/0.7 7\45 22\176 4\20 1\5 0.79\0.56 1\12
80 0\2 1\2 1.0\0.6 3\27 13\133 2\13 1\2 0.57\0.47 1\25
80 0\3 0\5 0.9/0.7 2\32 17\171 3\14 0\5 0.79\0.54 3\20
80 2\10 3\7 0.7/0.5 2\23 11\117 1\10 3\7 0.91\0.7 4\34
80 1\6 0\2 0.9/0.6 2\25 12\105 2\14 0\2 0.75\0.47 3\18
80 0\11 2\8 1.0/0.6 4\31 14\127 3\16 2\8 0.6\0.5 2\26
TOTAAL 640 5\54 7\36 7.4\4.8 22\219 110\1017 16\109 7\36 5.52\4.11 16\169
% 640 9.26 19.44 154.17 10.05 10.82 14.68 19.44 134.31 9.47
230

H 2 80 0\6 0\2 0.4/0.6 2\25 4\105 2\14 0\2 0.54\0.47 3\18
80 0\11 0\8 0.5/0.6 3\31 6\127 0\16 0\8 0.59\0.5 4\26
80 1\11 0\2 0.8/0.5 1\23 13\108 0\21 0\2 0.72\0.5 1\18
80 0\16 0\11 0.6/0.6 4\20 4\113 0\15 0\11 0.59\0.52 2\10
80 1\12 0\6 0.8/0.6 3\33 10\121 1\16 0\6 0.57\0.41 2\14
80 0\5 0\4 0.4/0.4 2\14 5\96 1\7 0\4 0.46\0.43 1\29
TOTAAL 480 2\61 0 3.5\3.3 15\146 42\670 4\89 0\33 3.47\2.83 13\115
% 480 3.28 0 106.06 10.27 6.27 4.49 0 122.61 11.3
I 2 47 0\3 0\5 0.1/0.7 0\32 1\171 1\14 0\5 0.32\0.54 0\20
80 0\10 1\7 0.1/0.5 0\23 1\117 0\10 1\7 0.38\0.7 1\34
80 2\6 0\2 0.1/0.6 0\25 2\105 2\14 0\2 0.36\0.47 0\18
80 2\11 1\8 0.2/0.6 0\31 3\127 1\16 1\8 0.39\0.5 1\26
80 0\11 0\2 0.2/0.5 1\23 3\108 4\21 0\2 0.26\0.5 1\18
80 1\16 1\11 0.3/0.6 1\20 3\113 1\15 1\11 0.36\0.52 0\10
80 0\12 1\6 0.5/0.6 2\33 6\121 0\16 1\6 0.29\0.41 1\14
80 0\5 0\4 0.3/0.4 0\14 5\96 0\7 0\4 0.41\0.43 1\29
TOTAAL 607 5\74 4\45 1.8\4.5 4\201 24\958 9\113 4\45 2.77\4.07 5\169
% 607 6.76 8.89 40 1.99 2.51 7.96 8.89 68.06 2.96
J 2 80 1\7 2\4 0.3/0.5 0\12 5\90 1\9 2\4 0.29\0.38 1\20
80 0\7 0\3 0.5/0.6 4\28 4\98 1\13 0\3 0.31\0.49 1\14
80 3\8 0\5 0.5/0.7 3\45 8\176 0\20 0\5 0.45\0.56 0\12
80 0\2 0\2 0.4/0.6 2\27 5\133 0\13 0\2 0.29\0.47 2\25
80 1\3 2\5 0.5/0.7 1\32 9\171 1\14 2\5 0.36\0.54 1\20
80 3\10 1\7 0.3/0.5 0\23 6\117 0\10 1\7 0.5\0.7 0\34
80 0\6 0\2 0.6/0.6 2\25 7\105 2\14 0\2 0.34\0.47 1\18
80 2\11 3\8 0.3/0.6 1\31 4\127 1\16 3\8 0.4\0.5 2\26
80 0\11 0\2 0.4/0.5 1\23 6\108 1\21 0\2 0.36\0.5 1\18
80 4\16 2\11 0.1/0.6 0\20 2\113 0\15 2\11 0.38\0.52 1\10
78 3\12 0\6 0.3/0.6 2\33 3\121 0\16 0\6 0.27\0.41 1\14
80 0\5 0\4 0.4/0.4 1\14 5\96 1\7 0\4 0.33\0.43 4\29
TOTAAL 958 17\98 10\59 4.6\6.9 17\313 64\1455 8\168 10\59 4.28\5.97 15\240
% 958 17.35 16.95 66.67 5.43 4.4 4.76 16.95 71.69 6.25
K 3 80 0\8 0\2 0.7/0.4 2\13 10\78 1\14 0\2 0.51\0.4 2\26
80 0\6 0\4 0.8/0.5 0\24 10\94 1\11 1\4 0.55\0.45 1\14
77 0\6 1\5 0.4/0.6 1\24 5\103 0\9 1\5 0.53\0.53 3\15
80 0\2 0\1 0.8/0.6 2\22 12\148 0\9 0\1 0.4\0.41 1\14
231

66 0\2 0\2 0.6/0.6 0\23 10\143 0\11 0\2 0.56\0.5 0\13
80 0\9 0\9 0.7/0.7 2\26 10\156 1\11 0\9 0.51\0.48 1\26
54 0\1 0\5 0.7/0.7 0\40 10\135 2\11 0\5 0.62\0.47 2\28
TOTAAL 517 0 1\28 4.7\4.1 7\172 67\857 5\76 2\28 3.68\3.24 10\136
% 517 0 3.57 114.63 4.07 7.82 6.58 7.14 113.58 7.35
L 3 60 0\2 0\1 0.4/0.6 0\22 4\148 1\9 0\1 0.4\0.41 0\14
60 0\2 0\2 0.7/0.6 0\23 10\143 0\11 0\2 0.45\0.5 1\13
72 0\9 0\9 0.6/0.7 1\26 9\156 0\11 0\9 0.38\0.48 2\26
74 0\1 0\5 0.9/0.7 1\40 13\135 1\11 0\5 0.57\0.47 1\28
72 0\13 0\5 0.4/0.6 1\34 6\128 0\8 0\5 0.61\0.59 1\30
80 0\4 0\1 0.3/0.6 0\20 5\109 3\21 0\1 0.57\0.45 0\19
80 0\18 0\4 0.7/0.6 2\20 9\114 0\9 0\4 0.4\0.47 0\19
80 1\11 1\6 0.8/0.6 3\26 12\132 0\12 1\6 0.64\0.5 1\11
74 0\11 1\7 0.6/0.5 4\29 6\99 0\8 1\7 0.45\0.51 0\30
74 1\10 0\8 0.8/0.6 0\23 16\161 4\23 0\8 0.54\0.47 1\18
TOTAAL 726 2\81 2\48 6.2\6.1 12\263 90\1325 9\123 2\48 5.01\4.85 7\208
% 726 2.47 4.17 101.64 4.56 6.79 7.32 4.17 103.3 3.37
M 3 17 0\2 0\2 0.3/0.6 0\23 1\143 0\11 0\2 0.9\0.5 1\13
44 0\1 0\5 0.5/0.7 1\40 4\135 0\11 0\5 0.87\0.47 1\28
TOTAAL 61 0 0 0.8/1.3 1\63 5\278 0 0\7 1.77\0.97 2\41
% 61 0 0 61.54 1.59 1.8 0 0 182.47 4.88
N 3 80 0\8 0\2 0.1/0.4 0\13 1\78 1\14 0\2 0.25\0.4 0\26
80 0\6 0\4 0.4/0.5 1\24 5\94 3\11 0\4 0.35\0.45 0\14
77 0\6 0\5 0.4/0.6 2\24 3\103 0\9 0\5 0.32\0.53 0\15
80 0\2 0\1 0.2/0.6 0\22 3\148 1\9 0\1 0.24\0.41 1\14
80 0\2 0\2 0.3/0.6 0\23 4\143 0\11 0\2 0.33\0.5 1\13
80 1\9 0\9 0.3/0.7 0\26 5\156 1\11 0\9 0.35\0.48 1\26
80 0\1 0\5 0.7/0.7 3\40 8\135 1\11 0\5 0.31\0.47 3\28
80 0\13 1\5 0.2/0.6 1\34 3\128 2\8 1\5 0.45\0.59 4\30
60 0\4 0\1 0.1/0.6 1\20 0\109 2\21 0\1 0.25\0.45 0\19
TOTAAL 697 1\51 1\34 2.7\5.3 8\226 32\1094 11\105 1\34 2.85\4.28 10\185
% 697 1.96 2.94 50.94 3.54 2.93 10.48 2.94 66.59 5.41
O 3 80 3\8 0\2 0.3/0.4 3\13 2\78 0\14 0\2 0.29\0.4 2\26
80 0\6 0\4 0.5/0.5 5\24 3\94 0\11 0\4 0.16\0.45 0\14
80 1\6 0\5 0.7/0.6 2\24 9\103 0\9 0\5 0.33\0.53 0\15
232

80 0\2 0\1 0.5/0.6 3\22 6\148 1\9 0\1 0.33\0.41 1\14
80 0\2 0\2 0.9/0.6 3\23 13\143 1\11 0\2 0.31\0.5 0\13
80 2\9 0\9 0.5/0.7 3\26 6\156 2\11 0\9 0.3\0.48 0\26
80 0\1 1\5 0.2/0.7 2\40 2\135 0\11 1\5 0.25\0.47 2\28
26 0\4 0\1 0.8/0.6 0\20 3\109 2\21 0\1 0.53\0.45 0\19
80 2\18 0\4 0.7/0.6 2\20 9\114 0\9 0\4 0.34\0.47 1\19
80 2\11 0\6 0.2/0.6 0\26 4\132 0\12 0\6 0.29\0.5 1\11
80 2\11 2\7 0.4/0.5 2\29 5\99 1\8 2\7 0.39\0.51 2\30
80 0\10 0\8 0.7/0.6 3\23 11\161 3\23 0\8 0.33\0.47 0\18
TOTAAL 906 12\88 3\54 6.4\7 28\290 73\1472 10\149 3\54 3.85\5.64 9\233
% 906 13.64 5.56 91.43 9.66 4.96 6.71 5.56 68.26 3.86
P 3 68 1\13 0\5 0.9/0.6 6\34 8\128 0\8 0\5 0.66\0.59 3\30
80 0\4 0\1 0.9/0.6 3\20 11\109 3\21 0\1 0.51\0.45 2\19
80 2\18 0\4 0.7/0.6 2\20 9\114 0\9 0\4 0.51\0.47 3\19
78 0\11 1\6 0.5/0.6 2\26 6\132 0\12 1\6 0.46\0.5 2\11
80 2\11 1\7 0.8/0.5 3\29 11\99 1\8 1\7 0.66\0.51 6\30
80 1\10 0\8 1.0/0.6 4\23 18\161 0\23 0\8 0.57\0.47 1\18
TOTAAL 466 6\67 2\31 4.8\3.5 20\152 63\743 4\81 2\31 3.37\2.99 17\127
% 466 8.96 6.45 137.14 13.16 8.48 4.94 6.45 112.71 13.39
Q 3 30 0\8 0\2 0.3/0.4 1\13 1\78 0\14 0\2 0.3\0.4 2\26
26 0\6 1\4 1.0/0.5 0\24 5\94 0\11 1\4 0.76\0.45 2\14
80 0\6 0\5 0.9/0.6 5\24 8\103 0\9 0\5 0.61\0.53 1\15
65 0\2 0\1 1.1/0.6 2\22 12\148 1\9 0\1 0.57\0.41 1\14
63 0\2 1\2 0.9/0.6 2\23 11\143 0\11 1\2 0.73\0.5 4\13
80 2\9 4\9 1.1/0.7 0\26 19\156 0\11 4\9 0.81\0.48 2\26
70 0\1 0\5 1.1/0.7 5\40 12\135 0\11 0\5 0.55\0.47 3\28
57 1\4 0\1 0.7/0.6 4\20 5\109 1\21 0\1 0.4\0.45 0\19
80 1\18 1\4 0.3/0.6 0\20 5\114 1\9 1\4 0.56\0.47 1\19
69 1\11 2\6 0.5/0.6 0\26 8\132 3\12 2\6 0.63\0.5 0\11
61 0\11 1\7 0.4/0.5 1\29 5\99 1\8 1\7 0.38\0.51 1\30
50 0\10 1\8 0.6/0.6 0\23 8\161 0\23 1\8 0.46\0.47 0\18
TOTAAL 731 5\88 11\54 8.9\7 20\290 99\1472 7\149 11\54 6.76\5.64 17\233
% 731 5.68 20.37 127.14 6.9 6.73 4.7 20.37 119.86 7.3
R 3 56 2\6 0\5 0.8/0.6 4\24 5\103 1\9 0\5 0.46\0.53 0\15
65 2\2 0\1 0.6/0.6 0\22 7\148 0\9 0\1 0.39\0.41 1\14
80 0\2 0\2 1.0/0.6 4\23 14\143 3\11 0\2 0.59\0.5 2\13
233
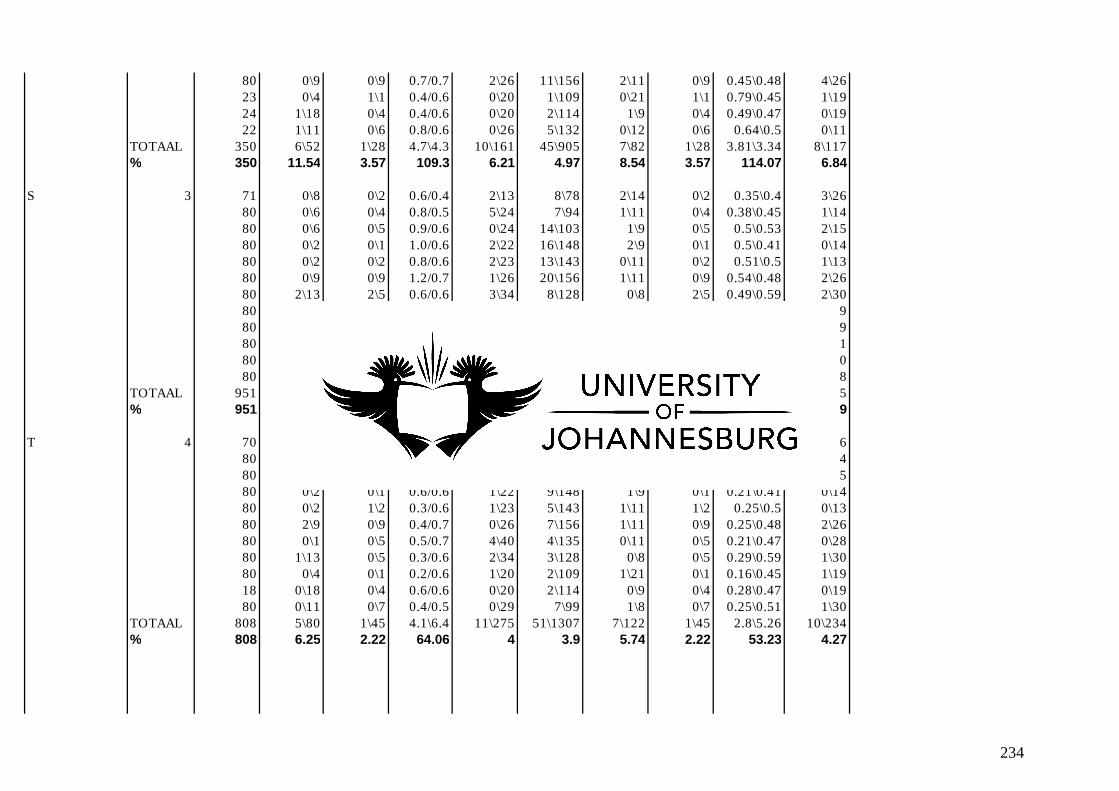
80 0\9 0\9 0.7/0.7 2\26 11\156 2\11 0\9 0.45\0.48 4\26
23 0\4 1\1 0.4/0.6 0\20 1\109 0\21 1\1 0.79\0.45 1\19
24 1\18 0\4 0.4/0.6 0\20 2\114 1\9 0\4 0.49\0.47 0\19
22 1\11 0\6 0.8/0.6 0\26 5\132 0\12 0\6 0.64\0.5 0\11
TOTAAL 350 6\52 1\28 4.7\4.3 10\161 45\905 7\82 1\28 3.81\3.34 8\117
% 350 11.54 3.57 109.3 6.21 4.97 8.54 3.57 114.07 6.84
S 3 71 0\8 0\2 0.6/0.4 2\13 8\78 2\14 0\2 0.35\0.4 3\26
80 0\6 0\4 0.8/0.5 5\24 7\94 1\11 0\4 0.38\0.45 1\14
80 0\6 0\5 0.9/0.6 0\24 14\103 1\9 0\5 0.5\0.53 2\15
80 0\2 0\1 1.0/0.6 2\22 16\148 2\9 0\1 0.5\0.41 0\14
80 0\2 0\2 0.8/0.6 2\23 13\143 0\11 0\2 0.51\0.5 1\13
80 0\9 0\9 1.2/0.7 1\26 20\156 1\11 0\9 0.54\0.48 2\26
80 2\13 2\5 0.6/0.6 3\34 8\128 0\8 2\5 0.49\0.59 2\30
80 0\4 0\1 1.0/0.6 2\20 13\109 1\21 0\1 0.47\0.45 4\19
80 1\18 0\4 0.4/0.6 0\20 6\114 1\9 0\4 0.51\0.47 1\19
80 2\11 0\6 0.6/0.6 0\26 11\132 1\12 0\6 0.53\0.5 1\11
80 1\11 0\7 0.6/0.5 3\29 7\99 1\8 0\7 0.49\0.51 5\30
80 2\10 1\8 0.6/0.6 1\23 12\161 2\23 1\8 0.53\0.47 5\18
TOTAAL 951 8\100 3\54 9.1\6.9 21\284 135\1465 13\146 3\54 5.8\5.76 27\235
% 951 8 5.56 131.88 7.39 9.22 8.9 5.56 100.69 11.49
T 4 70 0\8 0\2 0.2/0.4 1\13 2\78 0\14 0\2 0.26\0.4 2\26
80 0\6 0\4 0.4/0.5 0\24 7\94 2\11 0\4 0.36\0.45 2\14
80 2\6 0\5 0.2/0.6 1\24 3\103 0\9 0\5 0.28\0.53 1\15
80 0\2 0\1 0.6/0.6 1\22 9\148 1\9 0\1 0.21\0.41 0\14
80 0\2 1\2 0.3/0.6 1\23 5\143 1\11 1\2 0.25\0.5 0\13
80 2\9 0\9 0.4/0.7 0\26 7\156 1\11 0\9 0.25\0.48 2\26
80 0\1 0\5 0.5/0.7 4\40 4\135 0\11 0\5 0.21\0.47 0\28
80 1\13 0\5 0.3/0.6 2\34 3\128 0\8 0\5 0.29\0.59 1\30
80 0\4 0\1 0.2/0.6 1\20 2\109 1\21 0\1 0.16\0.45 1\19
18 0\18 0\4 0.6/0.6 0\20 2\114 0\9 0\4 0.28\0.47 0\19
80 0\11 0\7 0.4/0.5 0\29 7\99 1\8 0\7 0.25\0.51 1\30
TOTAAL 808 5\80 1\45 4.1\6.4 11\275 51\1307 7\122 1\45 2.8\5.26 10\234
% 808 6.25 2.22 64.06 4 3.9 5.74 2.22 53.23 4.27
234

U 4 50 0\8 0\2 0.2/0.4 0\13 2\78 1\14 0\2 0.38\0.4 0\26
54 0\6 0\4 0.6/0.5 0\24 7\94 2\11 0\4 0.43\0.45 1\14
54 0\6 0\5 0.6/0.6 0\24 5\103 0\9 0\5 0.68\0.53 0\15
46 0\2 0\1 0.7/0.6 0\22 6\148 0\9 0\1 0.5\0.41 0\14
45 0\2 0\2 0.4/0.6 1\23 3\143 1\11 0\2 0.43\0.5 0\13
56 1\9 1\9 0.7/0.7 0\26 7\156 2\11 1\9 0.55\0.48 0\26
66 0\1 0\5 1.4/0.7 3\40 18\135 2\11 0\5 0.62\0.47 1\28
60 0\13 0\5 0.8/0.6 1\34 9\128 0\8 0\5 0.62\0.59 1\30
57 0\4 0\1 0.6/0.6 1\20 6\109 1\21 0\1 0.3\0.45 1\19
56 0\18 0\4 0.7/0.6 2\20 5\114 2\9 0\4 0.45\0.47 0\19
49 1\11 0\6 1.1/0.6 4\26 5\132 0\12 0\6 0.51\0.5 1\11
57 0\11 1\7 0.7/0.5 3\29 8\99 1\8 1\7 0.35\0.51 1\30
49 0\10 0\8 0.7/0.6 1\23 8\161 2\23 0\8 0.43\0.47 0\18
TOTAAL 699 2\101 2\60 9.2\7.6 16\324 89\1600 14\157 2\59 6.25\6.23 6\263
% 699 1.98 3.33 121.05 4.94 5.56 8.92 3.39 100.32 2.28
V 4 80 3\8 1\2 0.2/0.4 0\13 3\78 4\14 1\2 0.31\0.4 1\26
80 0\6 0\4 0.3/0.5 4\24 1\94 0\11 0\4 0.13\0.45 0\14
80 1\6 0\5 0.1/0.6 0\24 2\103 1\9 0\5 0.19\0.53 0\15
80 0\2 0\1 0.4/0.6 1\22 7\148 0\9 0\1 0.23\0.41 2\14
80 1\2 0\2 0.1/0.6 0\23 2\143 2\11 0\2 0.21\0.5 0\13
70 0\9 1\9 0.7/0.7 4\26 6\156 0\11 1\9 0.21\0.48 0\26
80 0\1 0\5 0.2/0.7 1\40 3\135 1\11 0\5 0.16\0.47 0\28
80 2\13 1\5 0.3/0.6 1\34 5\128 2\8 1\5 0.33\0.59 1\30
80 2\4 0\1 0.2/0.6 0\20 3\109 1\21 0\1 0.2\0.45 0\19
62 5\18 1\4 0.4/0.6 0\20 5\114 2\9 1\4 0.42\0.47 2\19
71 0\11 0\7 0.5/0.6 3\26 5\132 0\12 0\6 0.21\0.5 1\11
80 3\10 2\8 0.4/0.6 2\23 7\161 2\23 2\8 0.33\0.47 0\18
TOTAAL 923 17\90 6\53 3.8\7.1 16\295 49\1501 15\149 6\52 2.93\5.72 7\233
% 923 18.89 11.32 53.52 5.42 3.26 10.07 11.54 51.22 3
W 4 59 0\1 1\5 1.0/0.7 2\40 12\135 1\11 1\5 0.56\0.47 2\28
20 0\13 0\5 0.5/0.6 1\34 2\128 0\8 0\5 0.5\0.59 1\30
23 0\4 0\1 0.7/0.6 0\20 2\109 2\21 0\1 0.7\0.45 0\19
24 1\18 0\4 0.9/0.6 0\20 4\114 0\9 0\4 0.49\0.47 1\19
31 2\11 0\7 0.6/0.6 1\26 8\132 1\12 0\6 0.39\0.5 0\11
23 0\11 0\7 0/0.5 0\29 0\99 0\8 0\7 0.91\0.51 0\30
30 0\10 0\8 1.1/0.6 1\23 7\161 2\23 0\8 0.57\0.47 1\18
TOTAL 461 4\101 2\60 8.9/7.6 11\324 63\1600 6\157 2\59 6.91\6.23 11\263
235

% 461 3.96 3.33 117.11 3.4 3.94 3.82 3.39 110.91 4.18
X 4 80 2\8 1\2 0.2/0.4 0\13 4\78 0\14 1\2 0.8\0.4 2\26
80 0\6 0\4 0.4/0.5 1\24 5\94 0\11 0\4 0.99\0.45 2\14
77 0\6 0\5 0.3/0.6 0\24 4\103 0\9 0\5 1.19\0.53 3\15
80 0\2 1\1 0.6/0.6 3\22 7\148 1\9 1\1 0.74\0.41 0\14
63 1\2 0\2 0.3/0.6 1\23 4\143 2\11 0\2 0.93\0.5 0\13
80 1\9 2\9 0.3/0.7 0\26 6\156 0\11 2\9 0.9\0.48 0\26
36 0\1 0\5 0.3/0.7 0\40 2\135 0\11 0\5 0.83\0.47 2\28
80 3\13 0\5 0.5/0.6 1\34 8\128 0\8 0\5 1.14\0.59 1\30
80 0\4 0\1 0.6/0.6 1\20 8\109 0\21 0\1 0.93\0.45 3\19
80 2\18 2\4 0.4/0.6 2\20 4\114 0\9 2\4 0.94\0.47 2\19
80 0\11 0\7 0.2/0.6 0\26 2\132 1\12 0\6 1.04\0.5 2\11
74 2\11 1\7 0.5/0.5 0\29 8\99 1\8 1\7 1.07\0.51 1\30
80 1\10 0\8 0.3/0.6 1\23 5\161 2\23 0\8 0.74\0.47 1\18
TOTAAL 970 12\101 7\60 4.9\7.6 10\324 67\1600 7\157 7\59 12.24\6.23 19\263
% 970 11.88 11.67 64.47 3.09 4.19 4.46 11.86 196.47 7.22
Y 4 80 0\2 0\1 0.8/0.6 1\22 14\148 0\9 0\1 0.53\0.41 2\14
80 0\2 0\2 0.9/0.6 1\23 16\143 1\11 0\2 0.63\0.5 0\13
80 0\9 0\9 0.7/0.7 0\26 13\156 0\11 0\9 0.54\0.48 5\26
80 0\1 0\5 0.7/0.7 3\40 9\135 0\11 0\5 0.5\0.47 2\28
80 1\13 0\5 0.7/0.6 4\34 8\128 0\8 0\5 0.64\0.59 1\30
80 0\4 0\1 0.6/0.6 1\20 8\109 1\21 0\1 0.46\0.45 2\19
62 0\18 0\4 0.4/0.6 1\20 4\114 1\9 0\4 0.47\0.47 0\19
80 0\11 0\7 0.6/0.6 2\26 9\132 3\12 0\6 0.45\0.5 1\11
80 0\11 0\7 0.7/0.5 3\29 8\99 1\8 0\7 0.53\0.51 0\30
72 0\10 0\8 0.8/0.6 2\23 12\161 1\23 0\8 0.53\0.47 2\18
TOTAAL 774 1\81 0 6.9\6.1 18\263 101\1325 8\123 0\48 5.28\4.85 15\208
% 774 1.23 0 113.11 6.84 7.62 6.5 0 108.87 7.21
236

SEASON 2
turnover
won
turnover
lost Off Loads
Good off
loads
Bad off
loads Cleans
Win
possession
Lost
possession
Breakdown
efficiency
In tackle
pass
Ball
carries
Pos
carries
Neg
Carries
total
attack
total
defence
%
0\6 1\20 0\8 0\5 0\3 0\135 3\27 1\15 0 0\7 0\52 0\47 0\5 3\303 2\150
0\12 1\20 0\9 0\4 0\5 4\150 1\16 0\25 83.3 0\8 3\75 3\65 0\10 13\351 5\217
0\8 1\24 0\11 0\11 0\0 7\174 2\21 1\21 76.9 0\9 2\91 2\82 0\9 14\395 10\247
0\26 3\64 0 0 0\8 11\459 6\64 2\61 160.2\3 0 5\218 5\194 0\24 30\1049 17\614
0 4.69 0 0 0 2.4 9.38 3.28 53.4 0 2.29 2.58 0 2.86 2.77
1\6 0\20 2\8 1\5 1\3 10\135 3\27 0\15 91.3 1\7 4\52 4\47 0\5 21\303 25\150
4\14 1\16 1\16 1\15 0\1 19\165 3\27 1\15 88.2 1\3 9\77 9\71 0\6 35\384 21\169
2\10 0\26 1\11 1\8 0\3 5\199 1\31 0\21 100 0\8 2\87 2\81 0\6 10\433 6\157
0\18 0\29 0\23 0\18 0\5 16\147 2\26 0\22 96 0\7 11\92 11\83 0\9 38\409 27\259
2\12 0\20 0\9 0\4 0\5 12\150 2\16 0\25 91.7 0\8 6\75 4\65 2\10 21\351 28\217
0\8 0\24 0\11 0\11 0\0 22\174 0\21 0\21 88.9 0\9 6\91 6\82 0\9 35\395 30\247
0\7 4\34 0\16 0\10 0\6 15\287 0\29 4\33 86.4 0\15 9\147 8\131 1\16 28\635 16\207
0\14 2\24 0\15 0\13 0\2 11\159 2\21 2\24 94.4 0\12 5\83 5\79 0\4 19\400 15\168
3\18 0\16 1\22 1\18 0\4 16\151 1\33 0\13 93.9 0\17 4\72 3\64 1\8 26\393 35\205
3\11 0\14 1\20 0\15 1\5 14\168 2\21 1\15 96.9 1\18 6\95 6\80 0\15 29\456 26\169
2\11 0\20 0\6 0\3 0\3 14\108 0\0 0\13 91.3 0\5 2\61 2\56 0\5 23\302 28\189
0\5 0\33 0\15 0\14 0\1 11\133 0\0 1\28 91.7 0\13 0\61 0\50 0\11 18\347 22\164
17\134 7\276 6\172 4\134 2\38165\1976 16\252 9\245 1110.7\12 3\122 64\993 60\889 4\104 303\4808 279\2301
12.69 2.54 3.49 2.99 5.26 8.35 6.35 3.67 92.56 2.46 6.45 6.75 3.85 6.3 12.13
0\6 0\20 0\8 0\5 0\3 10\135 1\27 0\15 71.4 0\7 0\52 0\47 0\5 10\303 7\150
1\12 1\20 0\9 0\4 0\5 12\150 1\16 0\25 88.2 0\8 2\75 2\65 0\10 15\351 11\217
0\7 0\34 0\16 0\10 0\6 41\287 0\29 0\33 88.5 0\15 2\147 1\131 1\16 43\635 6\207
1\14 1\24 0\15 0\13 0\2 22\159 1\21 1\24 82.9 0\12 2\83 2\79 0\4 26\400 9\168
2\12 0\27 0\20 0\14 0\6 10\145 1\26 0\29 70.6 0\19 2\73 2\68 0\5 13\385 8\211
0\18 0\16 0\22 0\18 0\4 2\151 0\33 0\13 85.7 0\17 0\72 0\64 0\8 2\393 3\205
4\69 2\141 0 0 0\26 97\1027 4\152 1\139 487.3\6 0 8\502 7\454 1\48 109\2467 44\1158
5.8 1.42 0 0 0 9.44 2.63 0.72 81.22 0 1.59 1.54 2.08 4.42 3.8
0\6 3\20 0\8 0\5 0\3 0\135 1\27 1\15 0 0\7 2\52 1\47 1\5 18\303 7\150
0\14 1\16 0\16 0\15 0\1 1\165 3\27 0\15 100 0\3 2\77 1\71 1\6 33\384 6\169
1\18 1\29 1\23 1\18 0\5 1\147 0\26 0\22 100 0\7 3\92 3\83 0\9 25\409 11\259
Decision Making
237

0\8 0\24 0\11 0\11 0\0 0\174 1\21 0\21 0 0\9 1\91 0\82 1\9 5\395 4\247
1\46 5\89 1\58 1\49 0\9 2\621 5\101 1\73 200\4 0 8\312 5\283 3\29 81\1491 28\825
2.17 5.62 1.72 2.04 0 0.32 4.95 1.37 50 0 2.56 1.77 10.34 5.43 3.39
0\6 0\20 0\8 0\5 0\3 6\135 0\27 0\15 72.7 0\7 1\52 0\47 1\5 9\303 2\150
1\14 0\16 0\16 0\15 0\1 18\165 1\27 0\15 86.7 0\3 5\77 5\71 0\6 24\384 14\169
0\10 0\26 0\11 0\8 0\3 15\199 0\31 2\21 75 0\8 1\87 1\81 0\6 17\433 6\157
1\18 0\29 0\23 0\18 0\5 8\147 0\26 0\22 100 0\7 4\92 4\83 0\9 13\409 10\259
2\12 0\20 0\9 0\4 0\5 3\150 0\16 0\25 85.7 0\8 2\75 2\65 0\10 7\351 10\217
0\18 0\16 0\22 0\18 0\4 11\151 0\33 0\13 78.3 0\17 2\72 2\64 0\8 14\393 12\205
2\11 0\14 1\20 1\15 0\5 18\168 1\21 1\15 96.2 1\18 5\95 5\80 0\15 27\456 25\169
0\11 0\20 0\6 0\3 0\3 13\108 0\0 0\13 95.7 0\5 6\61 5\56 1\5 19\302 23\189
0\5 1\33 1\15 1\14 0\1 19\133 0\0 1\28 82.6 1\13 2\61 2\50 0\11 28\347 9\164
6\105 1\194 2\130 2\100 0\30111\1356 2\181 4\167 772.9\9 2\86 28\672 26\597 2\75 158\3378 111\1679
5.71 0.52 1.54 2 0 8.19 1.1 2.4 85.88 2.33 4.17 4.36 2.67 4.68 6.61
0\6 1\20 2\8 2\5 0\3 6\135 1\27 0\15 81.8 2\7 4\52 4\47 0\5 20\303 16\150
0\10 0\26 0\11 0\8 0\3 8\199 1\31 0\21 82.4 0\8 0\87 0\81 0\6 15\433 11\157
1\12 0\20 0\9 0\4 0\5 0\150 2\16 0\25 0 0\8 2\75 2\65 0\10 4\351 4\217
0\7 1\34 3\16 2\10 1\6 13\287 0\29 1\33 84 3\15 5\147 5\131 0\16 26\635 18\207
1\14 0\24 0\15 0\13 0\2 6\159 1\21 0\24 75 0\12 3\83 3\79 0\4 13\400 12\168
2\12 1\27 0\20 0\14 0\6 12\145 0\26 1\29 88.2 0\19 4\73 4\68 0\5 20\385 13\211
1\11 0\20 0\6 0\3 0\3 6\108 0\0 0\13 83.3 0\5 3\61 3\56 0\5 17\302 9\189
0\5 2\33 0\15 0\14 0\1 7\133 0\0 1\28 92.9 0\13 2\61 2\50 0\11 15\347 16\164
5\77 5\204 5\100 4\71 1\29 58\1316 5\150 3\188 587.6\8 5\87 23\639 23\577 0\62 130\3156 99\1463
6.49 2.45 5 5.63 3.45 4.41 3.33 1.6 73.45 5.75 3.6 3.99 0 4.12 6.77
0\6 3\20 1\8 0\5 0\3 11\135 0\27 3\15 77.8 1\7 8\52 7\47 1\5 22\303 16\150
2\10 2\26 1\11 1\8 0\3 14\199 1\31 1\21 87 1\8 15\87 15\81 0\6 34\433 17\157
3\18 2\29 2\23 1\18 1\5 12\147 1\26 2\22 72.4 2\17 7\92 6\83 1\9 27\409 36\259
2\12 1\20 1\9 1\4 0\5 9\150 0\16 1\25 88.5 1\8 7\75 7\65 0\10 19\351 27\217
3\8 1\24 3\11 3\11 0\0 9\174 4\21 1\21 85 3\9 15\91 14\82 1\9 32\395 31\247
2\7 5\34 2\16 1\10 1\6 19\287 2\29 5\33 91.2 2\15 16\147 15\131 1\16 51\635 22\207
4\14 1\24 3\15 1\13 2\2 12\159 3\21 2\24 86.4 3\12 13\83 13\79 0\4 35\400 25\168
2\12 2\27 0\20 0\14 0\6 13\145 2\26 2\29 85.7 0\19 4\73 4\68 0\5 21\385 27\211
18\87 17\204 13\113 8\83 4\30 99\1396 13\197 17\190 674\8 13\95 85\700 81\636 4\64 241\3311 201\1616
20.69 8.33 11.5 9.64 13.33 70.92 6.6 8.95 84.25 13.68 12.14 12.74 6.25 7.28 12.44
238

1\14 3\24 0\15 0\13 0\2 3\159 3\21 1\24 80 0\12 1\83 1\79 0\4 35\400 8\168
0\12 3\27 0\20 0\14 0\6 4\145 0\26 1\29 100 0\19 1\73 1\68 0\5 34\385 13\211
0\18 5\16 2\22 2\18 0\4 3\151 3\33 1\13 100 2\17 3\72 3\64 0\8 42\393 16\205
0\11 0\14 1\20 1\15 0\5 4\168 0\21 0\15 83.3 1\18 1\95 1\80 0\15 41\456 6\169
0\11 4\20 1\6 1\3 0\3 0\108 0\0 0\13 100 1\5 2\61 1\56 1\5 32\302 14\189
1\5 6\33 0\15 0\14 0\1 0\133 0\0 1\28 80 0\13 1\61 1\50 0\11 26\347 11\164
2\71 21\134 4\98 4\77 0\21 14\864 6\101 4\122 543.3\6 4\84 9\445 8\397 1\48 210\2283 68\1106
2.82 15.67 4.08 5.19 0 1.62 5.94 3.28 90.55 4.76 2.02 2.02 2.08 9.2 6.15
0\8 1\24 0\11 0\11 0\0 4\174 2\21 1\21 100 0\9 3\91 1\82 2\9 12\395 3\247
0\7 1\34 0\16 0\10 0\6 11\287 6\29 0\33 100 0\15 7\147 6\131 1\16 28\635 2\207
2\14 1\24 0\15 0\13 0\2 7\159 6\21 1\24 100 0\12 5\83 5\79 0\4 25\400 4\168
0\12 3\27 0\20 0\14 0\6 6\145 3\26 3\29 100 0\19 5\73 4\68 1\5 26\385 5\211
2\18 1\16 3\22 2\18 1\4 5\151 7\33 0\13 100 2\17 3\72 2\64 1\8 15\393 6\205
0\11 2\14 2\20 1\15 1\5 3\168 8\21 2\15 75 2\18 8\95 4\80 4\15 26\456 3\169
1\11 0\20 0\6 0\3 0\3 3\108 0\0 1\13 85.7 0\5 4\61 4\56 0\5 13\302 10\189
0\5 4\33 2\15 2\14 0\1 1\133 0\0 0\28 100 2\13 12\61 10\50 2\11 25\347 8\164
5\86 13\192 7\125 5\98 2\27 40\1325 32\151 8\176 760.7\8 6\108 47\683 36\610 11\73 170\3313 41\1560
5.81 6.77 5.6 5.1 7.4 3.02 21.19 4.55 95.09 5.56 6.88 5.9 15.07 5.13 2.63
1\6 1\20 1\8 0\5 1\3 4\135 2\27 0\15 100 1\7 2\52 1\47 1\5 15\303 8\150
1\10 3\26 1\11 1\8 0\3 6\199 4\31 2\21 100 1\8 5\87 3\81 2\6 19\433 6\157
0\18 4\29 2\23 2\18 0\5 10\147 0\26 4\22 90.9 1\17 9\92 9\83 0\9 28\409 8\259
0\12 1\20 1\9 1\4 0\5 8\150 0\16 1\25 100 1\8 4\75 4\65 0\10 16\351 7\217
0\8 1\24 1\11 1\11 0\0 4\174 1\21 1\21 100 1\9 5\91 5\82 0\9 18\395 11\247
0\7 1\34 2\16 2\10 0\6 11\287 0\29 1\33 100 1\15 10\147 10\131 0\16 31\635 9\207
2\14 3\24 2\15 2\13 0\2 4\159 0\21 3\24 77.8 2\12 6\83 6\79 0\4 16\400 11\168
1\12 1\27 5\20 5\14 0\6 2\145 2\26 1\29 100 5\19 10\73 8\68 2\5 25\385 7\211
1\18 1\16 3\22 3\18 0\4 8\151 0\33 1\13 90 3\17 5\72 4\64 1\8 20\393 9\205
0\11 2\14 3\20 3\15 0\5 1\168 1\21 2\15 100 3\18 13\95 11\80 2\15 27\456 3\169
0\11 0\20 0\6 0\3 0\3 10\108 0\0 0\13 91.7 0\5 3\61 3\56 0\5 17\302 4\189
0\5 1\33 6\15 6\14 0\1 3\133 0\0 1\28 100 5\13 6\61 4\50 2\11 17\347 9\164
6\132 19\287 27\176 26\133 1\43 71\1956 10\251 17\259 1150.4\12 24\148 78\989 68\886 10\103 249\4809 92\2343
4.55 6.62 15.34 19.55. 2.33 3.63 3.98 6.56 95.87 16.22 7.89 7.67 9.71 5.18 3.93
0\8 2\22 0\7 0\4 0\3 0\163 1\41 0\17 33.3 0\7 0\50 0\42 0\8 28\346 13\130
0\6 4\21 0\6 0\1 0\5 2\192 1\40 0\14 50 0\5 5\62 5\57 0\5 33\395 11\139
0\4 1\18 0\7 0\3 0\4 3\237 0\26 0\18 80 0\6 2\76 2\70 0\6 32\476 9\157
0\10 1\20 0\5 0\5 0\0 2\127 0\20 0\24 100 0\4 2\50 2\48 0\2 18\276 14\214
239

0\5 5\24 0\5 0\5 0\0 2\195 2\32 1\15 100 0\5 2\71 1\59 1\12 27\391 10\203
0\7 2\26 0\5 0\4 0\1 1\143 1\27 2\17 80 0\5 3\57 2\51 1\6 28\350 13\224
1\5 7\22 1\4 0\3 1\1 1\190 4\39 1\15 100 1\4 0\63 0\55 0\8 23\373 14\193
1\45 22\153 1\39 0 1\14 11\1247 9\225 41\120 543.3\7 1\36 14\429 12\382 2\47 189\2607 84\1260
2.22 14.38 2.56 0 7.14 0.88 4 3.33 77.61 2.78 3.26 3.14 4.26 7.25 6.67
1\10 2\20 1\5 1\5 0\0 9\127 0\20 6\24 70 1\4 3\50 2\48 1\2 15\276 9\214
0\5 0\24 0\5 0\5 0\0 7\195 0\32 0\15 81.8 0\5 2\71 2\59 0\12 9\391 18\203
0\7 2\26 0\5 0\4 0\1 11\143 0\27 2\17 76.5 0\5 3\57 3\51 0\6 15\350 12\224
1\5 0\22 0\4 0\3 0\1 19\190 1\39 1\15 78.1 0\4 3\63 3\55 0\8 23\373 19\193
0\6 0\34 0\8 0\4 0\4 28\220 0\33 1\19 90.2 0\6 3\102 2\90 1\12 33\495 11\211
3\14 0\22 2\9 2\6 0\3 28\168 1\26 2\23 88.2 2\7 2\71 2\68 0\3 35\364 11\170
0\7 0\24 0\12 0\11 0\1 18\177 0\28 1\20 85.7 0\11 3\68 3\64 0\4 22\405 10\165
0\6 0\16 0\9 0\5 0\4 23\189 0\27 2\12 85.7 0\7 5\75 4\71 1\4 31\415 20\190
0\2 1\30 0\8 0\7 0\1 17\195 0\40 2\21 84.6 0\7 4\86 4\76 0\10 24\458 9\157
2\10 2\34 1\10 1\6 0\4 11\112 2\43 2\21 68.4 1\7 4\62 4\59 0\3 18\327 22\242
7\72 7\252 4\75 4\56 0\19171\1716 4\315 19\187 809.2\10 4\63 32\705 29\641 3\64 225\3854 141\1969
9.72 2.78 5.33 7.14 0 9.97 1.27 10.16 80.92 6.35 4.54 4.52 4.69 5.84 7.16
0\5 0\24 0\5 0\5 0\0 0\195 0\32 0\15 0 0\5 1\71 1\59 0\12 13\391 2\203
0\5 3\22 0\4 0\3 0\1 0\190 3\39 1\15 100 0\4 2\63 1\55 1\8 31\373 7\193
0\10 3\46 0 0 0\1 0\385 3\71 1\30 100\2 0 3\134 2\114 1\20 44\764 9\396
0 6.52 0 0 0 0 4.23 3.33 50 0 2.24 1.75 5 5.76 2.27
0\8 4\22 0\7 0\4 0\3 3\163 9\41 2\17 71.4 0\7 6\50 4\42 2\8 18\346 2\130
1\6 0\21 0\6 0\1 0\5 6\192 12\40 0\14 75 0\5 5\62 3\57 2\5 21\395 7\139
0\4 2\18 1\7 1\3 0\4 4\237 5\26 0\18 88.9 1\6 5\76 4\70 1\6 22\476 3\157
1\10 1\20 0\5 0\5 0\0 6\127 5\20 1\24 70 0\4 4\50 4\48 0\2 14\276 5\214
0\5 4\24 1\5 1\5 0\0 6\195 6\32 2\15 100 0\5 3\71 3\59 0\12 20\391 6\203
1\7 4\26 0\5 0\4 0\1 6\143 5\27 0\17 80 0\5 3\57 2\51 1\6 20\350 8\224
0\5 0\22 0\4 0\3 0\1 6\190 6\39 1\15 77.8 0\4 4\63 4\55 0\8 13\373 12\193
1\6 6\34 0\8 0\4 0\4 5\220 12\33 2\19 100 0\6 5\102 5\90 0\12 28\495 8\211
0\14 2\22 1\9 1\6 0\3 1\168 8\26 1\23 100 1\7 4\71 3\68 1\3 14\364 1\170
4\65 23\209 3\56 3\35 0\21 43\1635 68\284 9\162 763.1\9 2\49 39\602 32\540 7\62 170\3466 52\1641
6.15 11 5.36 8.57 0 2.63 23.94 5.56 84.79 4.08 6.48 5.93 11.29 4.9 3.17
0\8 0\22 0\7 0\4 0\3 7\163 1\41 0\17 88.9 0\7 1\50 1\42 0\8 17\346 6\130
0\6 1\21 0\6 0\1 0\5 5\192 1\40 1\14 70 0\5 3\62 3\57 0\5 9\395 4\139
0\4 0\18 0\7 0\3 0\4 8\237 0\26 0\18 78.6 0\6 4\76 4\70 0\6 14\476 12\157
240

1\10 2\20 0\5 0\5 0\0 9\127 1\20 2\24 100 0\4 3\50 2\48 1\2 13\276 13\214
1\5 0\24 0\5 0\5 0\0 6\195 1\32 0\15 100 0\5 2\71 1\59 1\12 9\391 16\203
2\7 0\26 1\5 1\4 0\1 6\143 1\27 0\17 81.8 1\5 1\57 1\51 0\6 13\350 11\224
0\5 2\22 0\4 0\3 0\1 7\190 1\39 2\15 87.5 0\4 4\63 4\55 0\8 14\373 6\193
2\14 0\22 0\9 0\6 0\3 5\168 0\26 0\23 100 0\7 3\71 3\68 0\3 8\364 6\170
0\7 1\24 0\12 0\11 0\1 12\177 1\28 1\20 100 0\11 2\68 2\64 0\4 17\405 10\165
0\6 1\16 1\9 0\5 1\4 7\189 0\27 1\12 100 0\7 4\75 4\71 0\4 15\415 8\190
0\2 2\30 1\8 1\7 0\1 10\195 1\40 2\21 81.3 1\7 7\86 7\76 0\10 23\458 8\157
2\10 1\34 1\10 0\6 1\4 3\112 3\43 1\21 87.5 1\7 3\62 3\59 0\3 11\327 15\242
8\84 10\279 4\87 2\60 2\27 85\2088 11\389 10\217 1075.6\12 3\75 37\791 35\720 2\71 163\4576 115\2184
9.52 3.58 4.6 3.33 7.41 4.07 2..83 4.61 89.63 4 4.68 4.86 2.82 3.56 5.27
0\6 4\34 0\8 0\4 0\4 8\220 1\33 2\19 91.7 0\6 4\102 3\90 1\12 33\495 12\211
3\14 1\22 0\9 0\6 0\3 9\168 1\26 0\23 80 0\7 1\71 1\68 0\3 24\364 17\170
0\7 3\24 2\12 2\11 0\1 3\177 0\28 3\20 66.7 2\11 6\68 6\64 0\4 29\405 12\165
0\6 2\16 1\9 1\5 0\4 3\189 1\27 0\12 100 1\7 4\75 3\71 1\4 28\415 8\190
0\2 2\30 1\8 1\7 0\1 4\195 1\40 1\21 100 1\7 5\86 4\76 1\10 35\458 18\157
0\10 3\34 0\10 0\6 0\4 2\112 0\43 0\21 75 0\7 2\62 1\59 1\3 26\327 20\242
3\45 15\160 4\56 4\39 0\17 29\1061 4\197 6\116 513.4\6 4\45 22\464 18\428 4\36 175\2464 87\1135
6.67 9.38 7.14 10.26 0 2.73 2.03 5.17 85.57 8.89 4.74 4.21 11.11 7.1 7.67
0\8 0\22 0\7 0\4 0\3 5\163 0\41 0\17 75 0\7 0\50 0\42 0\8 5\346 4\130
1\6 0\21 0\6 0\1 0\5 6\192 0\40 0\14 90 0\5 4\62 3\57 1\5 11\395 9\139
0\4 0\18 1\7 1\3 0\4 27\237 0\26 0\18 97.1 1\6 5\76 5\70 0\6 34\476 15\157
1\10 0\20 0\5 0\5 0\0 12\127 1\20 0\24 93.3 0\4 8\50 8\48 0\2 22\276 15\214
1\5 2\24 0\5 0\5 0\0 18\195 0\32 2\15 100 0\5 6\71 5\59 1\12 25\391 21\203
0\7 3\26 1\5 0\4 1\1 17\143 0\27 2\17 86.7 1\5 7\57 6\51 1\6 36\350 29\224
0\5 0\22 0\4 0\3 0\1 17\190 0\39 0\15 91.3 0\4 2\63 2\55 0\8 20\373 18\193
0\14 1\22 1\9 1\6 0\3 3\168 1\26 1\23 100 1\7 6\71 6\68 0\3 16\364 7\170
1\7 3\24 2\12 2\11 0\1 13\177 4\28 3\20 95.5 2\11 10\68 8\64 2\4 34\405 11\165
3\6 1\16 2\9 1\5 1\4 11\189 3\27 0\12 71.4 1\7 12\75 11\71 1\4 30\415 14\190
0\2 4\30 0\8 0\7 0\1 7\195 2\40 4\21 72.7 0\7 6\86 5\76 1\10 16\458 7\157
0\10 1\34 0\10 0\6 0\4 3\112 2\43 1\21 90 0\7 6\62 6\59 0\3 12\327 11\242
7\84 15\279 7\87 5\60 2\27139\2088 13\389 13\217 1063\12 6\75 72\791 65\720 7\71 261\4576 161\2184
8.33 5.38 8.05 8.33 7.41 6.66 3.34 5.99 88.58 8 9.1 9.03 9.86 5.7 7.37
0\4 0\18 0\7 0\3 0\4 7\237 3\26 0\18 83.3 0\6 8\76 8\70 0\6 18\476 8\157
0\10 1\20 1\5 1\5 0\0 9\127 0\20 1\24 84.6 1\4 3\50 3\48 0\2 15\276 10\214
0\5 2\24 1\5 1\5 0\0 19\195 3\32 3\15 92.6 1\5 5\71 4\59 1\12 28\391 19\203
241

1\7 1\26 0\5 0\4 0\1 11\143 1\27 2\17 65.2 0\5 4\57 4\51 0\6 17\350 19\224
0\14 0\22 0\9 0\6 0\3 9\168 2\26 0\23 100 0\7 5\71 4\68 1\3 16\364 2\170
1\7 0\24 0\12 0\11 0\1 4\177 1\28 0\20 100 0\11 2\68 2\64 0\4 7\405 5\165
0\6 0\16 0\9 0\5 0\4 3\189 0\27 0\12 83.3 0\7 1/75 1\71 0\4 6\415 8\190
2\53 4\150 2\52 2\39 0\13 62\1236 10\186 6\129 609\7 2\45 28\468 26\431 2\37 107\2677 71\1323
3.77 2.67 3.85 5.13 0 5.02 5.38 4.65 87 4.44 5.98 6.03 5.41 4 5.37
2\8 2\22 0\7 0\4 0\3 4\163 0\41 1\17 83.3 0\7 4\50 4\42 0\8 13\346 14\130
0\6 3\21 0\6 0\1 0\5 7\192 1\40 2\14 84.6 0\5 6\62 6\57 0\5 18\395 12\139
1\4 1\18 0\7 0\3 0\4 10\237 1\26 1\18 93.8 0\6 6\76 5\70 1\6 20\476 20\157
2\10 0\20 1\5 1\5 0\0 5\127 0\20 0\24 80 1\4 7\50 7\48 0\2 17\276 23\214
0\5 2\24 0\5 0\5 0\0 9\195 1\32 1\15 94.1 0\5 7\71 7\59 0\12 20\391 21\203
1\7 4\26 0\5 0\4 0\1 6\143 1\27 3\17 83.3 0\5 3\57 3\51 0\6 17\350 26\224
0\6 2\34 0\8 0\4 0\4 6\220 1\33 1\19 90.9 0\6 8\102 7\90 1\12 26\495 13\211
1\14 2\22 0\9 0\6 0\3 10\168 1\26 2\23 100 0\7 3\71 3\68 0\3 18\364 20\170
1\7 2\24 0\12 0\11 0\1 12\177 5\28 1\20 100 0\11 6\68 6\64 0\4 30\405 11\165
0\6 1\16 2\9 2\5 0\4 12\189 1\27 0\12 100 2\7 8\75 8\71 0\4 29\415 13\190
0\2 2\30 0\8 0\7 0\1 11\195 1\40 1\21 68.4 0\7 4\86 4\76 0\10 24\458 15\157
1\10 2\34 1\10 1\6 0\4 4\112 3\43 3\21 85.7 1\7 7\62 7\59 0\3 18\327 24\242
9\85 23\291 4\91 4\61 0\30 96\2118 16\383 16\221 1064.1\12 4\77 69\830 67\755 2\75 250\4698 212\2202
10.59 7.9 4.4 6.56 0 4.53 4.18 7.24 88.68 5.19 8.31 8.87 2.67 5.32 9.63
0\8 1\22 2\7 1\4 1\3 1\163 4\41 1\17 100 2\7 6\50 6\42 0\8 14\346 4\130
1\6 0\21 3\6 0\1 3\5 10\192 5\40 0\14 70.6 2\5 4\62 4\57 0\5 19\395 10\139
0\4 3\18 2\7 0\3 2\4 5\237 1\26 3\18 75 0\6 7\76 7\70 0\6 16\476 6\157
2\10 2\20 0\5 0\5 0\0 1\127 1\20 2\24 75 0\4 3\50 3\48 0\2 6\276 11\214
0\5 2\24 0\5 0\5 0\0 4\195 2\32 2\15 88.9 0\5 6\71 4\59 2\12 13\391 7\203
0\7 2\26 1\5 1\4 0\1 3\143 1\27 2\17 60 1\5 3\57 3\51 0\6 10\350 10\224
0\5 0\22 0\4 0\3 0\1 5\190 2\39 0\15 100 0\4 3\63 3\55 0\8 13\373 4\193
1\6 2\34 2\8 2\4 0\4 4\220 2\33 2\19 77.8 2\6 7\102 7\90 0\12 17\495 6\211
0\14 2\22 1\9 1\6 0\3 3\168 4\26 1\23 100 0\7 4\71 4\68 0\3 10\364 3\170
0\7 2\24 1\12 0\11 1\1 0\177 1\28 2\20 100 1\11 1\68 1\64 0\4 3\405 2\165
1\2 0\30 0\8 0\7 0\1 5\195 1\40 0\21 71.4 0\7 4\86 4\76 0\10 11\458 9\157
5\74 16\263 12\76 5\53 7\23 41\2007 24\352 15\203 918.7\11 8\67 48\756 46\680 2\76 132\4329 72\1963
6.76 6.08 15.79 9.43 30.43 2.04 6.82 7.39 83.52 11.94 6.35 6.76 2.63 3.05 3.67
242

0\8 0\22 0\7 0\4 0\3 17\163 1\41 0\17 76.2 0\7 0\50 0\42 0\8 17\346 2\130
2\6 1\21 0\6 0\1 0\5 11\192 1\40 1\14 82.4 0\5 0\62 0\57 0\5 11\395 12\139
0\4 1\18 0\7 0\3 0\4 22\237 2\26 1\18 88.5 0\6 5\76 4\70 1\6 29\476 8\157
0\10 1\20 1\5 1\5 0\0 11\127 0\20 2\24 88.2 1\4 1\50 1\48 0\2 14\276 9\214
0\5 2\24 0\5 0\5 0\0 11\195 2\32 0\15 100 0\5 3\71 3\59 0\12 14\391 5\203
1\7 0\26 0\5 0\4 0\1 14\143 2\27 0\17 85.7 0\5 2\57 2\51 0\6 20\350 11\224
2\5 0\22 0\4 0\3 0\1 13\190 2\39 0\15 83.3 0\4 3\63 3\55 0\8 17\373 24\193
0\6 1\34 1\8 0\4 1\4 16\220 0\33 1\19 88.9 0\6 4\102 4\90 0\12 22\495 15\211
1\14 0\22 1\9 1\6 0\3 4\168 0\26 1\23 85.7 1\7 2\71 2\68 0\3 7\364 10\170
1\7 0\24 0\12 0\11 0\1 14\177 2\28 0\20 87 0\11 1\68 1\64 0\4 17\405 8\165
0\6 0\16 0\9 0\5 0\4 13\189 0\27 0\12 81.8 0\7 4\75 4\71 0\4 18\415 7\190
0\2 0\30 1\8 1\7 0\1 5\195 1\40 0\21 77.8 1\7 2\86 2\76 0\10 9\458 11\157
0\10 1\34 1\10 0\6 1\4 7\112 2\43 1\21 91.7 0\7 2\62 2\59 0\3 11\327 10\242
7\90 7\313 5\95 3\64 2\31158\2308 15\422 7\236 1117.2\13 3\81 29\893 28\810 1\83 206\5071 132\2395
7.78 2.24 5.26 4.69 6.45 6.85 3.55 2.97 85.94 3.7 3.25 3.46 1.2 4.06 5.51
2\8 0\22 2\7 1\4 1\3 6\163 4\41 0\17 85.7 2\7 5\50 4\42 1\8 19\346 6\130
0\6 3\21 1\6 0\1 1\5 3\192 1\40 2\14 100 1\5 1\62 1\57 0\5 8\395 2\139
1\4 2\18 0\7 0\3 0\4 3\237 2\26 1\18 83.3 0\6 4\76 4\70 0\6 12\476 3\157
0\10 1\20 0\5 0\5 0\0 4\127 1\20 1\24 83.3 0\4 1\50 1\48 0\2 8\276 10\214
2\5 1\24 0\5 0\5 0\0 4\195 4\32 0\15 100 0\5 2\71 2\59 0\12 13\391 4\203
0\7 2\26 0\5 0\4 0\1 2\143 5\27 1\17 50 0\5 2\57 2\51 0\6 9\350 6\224
0\5 2\22 0\4 0\3 0\1 3\190 6\39 1\15 100 0\4 2\63 2\55 0\8 10\373 3\193
1\6 5\34 1\8 0\4 1\4 2\220 6\33 3\19 75 1\6 8\102 7\90 1\12 19\495 7\211
1\14 2\22 0\9 0\6 0\3 2\168 0\26 1\23 66.7 0\7 1\71 1\68 0\3 12\364 4\170
2\7 2\24 1\12 1\11 0\1 1\177 0\28 0\20 100 1\11 5\68 5\64 0\4 16\405 10\165
0\6 1\16 0\9 0\5 0\4 5\189 2\27 1\12 100 0\7 1\75 1\71 0\4 9\415 6\190
0\10 5\34 0\10 0\6 0\4 0\112 4\43 4\21 33.3 0\7 5\62 5\59 0\3 18\327 8\242
9\88 26\283 5\87 2\57 3\30 35\2113 35\382 15\215 977.3\12 5\74 37\807 35\734 2\73 153\4613 69\2108
10.23 9.19 5.75 3.51 10 1.66 9.16 6.98 81.44 6.76 4.58 4.77 2.74 3.32 3.28
0\5 1\22 1\4 1\3 0\1 9\190 1\39 1\15 81.8 1\4 6\63 4\55 2\8 19\373 14\193
0\6 0\34 1\8 1\4 0\4 3\220 0\33 0\19 80 0\6 1\102 1\90 0\12 5\495 5\211
1\14 0\22 0\9 0\6 0\3 3\168 1\26 0\23 83.3 0\7 7\71 7\68 0\3 11\364 5\170
0\7 1\24 0\12 0\11 0\1 3\177 0\28 1\20 66.7 0\11 2\68 1\64 1\4 7\405 5\165
0\6 0\16 2\9 0\5 0\4 3\189 1\27 0\12 100 0\7 0\75 0\71 0\4 3\415 9\190
0\2 1\30 0\8 0\7 0\1 10\195 0\40 0\21 100 0\7 8\86 6\76 2\10 21\458 0\157
0\10 1\34 0\10 0\6 0\4 2\112 2\43 0\21 100 0\7 4\62 4\59 0\3 7\327 10\242
1\90 11\313 5\95 3\64 0\31 71\2308 10\422 8\236 1079.9\13 2\81 54\893 46\810 8\83 149\5071 86\2395
243

1.11 3.51 5.26 4.69 0 3.08 2.37 3.39 83.07 2.47 6.05 5.68 9.64 2.94 3.59
0\8 6\22 2\7 2\4 0\3 0\163 9\41 1\17 100 2\7 6\50 6\42 0\8 57\346 7\130
0\6 5\21 1\6 0\1 1\5 1\192 9\40 1\14 80 1\5 5\62 5\57 0\5 72\395 7\139
0\4 2\18 2\7 0\3 2\4 0\237 1\26 3\18 66.7 2\6 5\76 2\70 3\6 84\476 8\157
1\10 5\20 1\5 1\5 0\0 1\127 4\20 0\24 100 0\4 3\50 3\48 0\2 51\276 8\214
0\5 3\24 1\5 1\5 0\0 0\195 6\32 1\15 33.3 1\5 7\71 5\59 2\12 54\391 5\203
0\7 6\26 1\5 1\4 0\1 0\143 7\27 3\17 0 1\5 11\57 10\51 1\6 66\350 6\224
0\5 1\22 1\4 1\3 0\1 0\190 2\39 1\15 0 1\4 3\63 3\55 0\8 26\373 4\193
0\6 11\34 0\8 0\4 0\4 0\220 1\33 5\19 50 0\6 7\102 7\90 0\12 81\495 10\211
0\14 4\22 2\9 0\6 2\3 0\168 3\26 2\23 66.7 1\7 5\71 5\68 0\3 62\364 12\170
0\7 6\24 2\12 2\11 0\1 0\177 3\28 3\20 100 2\11 6\68 6\64 0\4 67\405 8\165
1\6 0\16 1\9 1\5 1\4 0\189 4\27 0\12 71.4 1\7 4\75 4\71 0\4 75\415 8\190
0\2 0\30 3\8 2\7 1\1 0\195 5\40 0\21 0 3\7 6\86 4\76 2\10 70\458 9\157
0\10 8\34 1\10 0\6 1\4 0\112 7\43 3\21 100 1\7 4\62 2\59 2\3 51\327 8\242
2\90 57\313 18\95 11\64 8\31 2\2308 61\422 23\236 768.1\13 16\81 72\893 62\810 10\83 816\5071 100\2395
2.22 18.21 18.95 17.19 2.58 0.09 14.45 9.75 59.08 19.75 8.06 7.65 12.05 16.09 4.18
0\10 2\20 0\5 0\5 0\0 16\127 2\20 2\24 95 0\4 2\50 2\48 0\2 24\276 18\214
1\5 1\24 1\5 1\5 0\0 23\195 1\32 1\15 89.3 1\5 5\71 4\59 1\12 32\391 18\203
0\7 0\26 1\5 1\4 0\1 17\143 0\27 0\17 86.4 1\5 1\57 0\51 1\6 25\350 18\224
0\5 1\22 1\4 1\3 0\1 21\190 0\39 1\15 90.9 1\4 3\63 3\55 0\8 28\373 12\193
0\6 1\34 1\8 0\4 1\4 30\220 1\33 0\19 93.8 1\6 5\102 5\90 0\12 42\495 9\211
0\14 1\22 0\9 0\6 0\3 20\168 1\26 3\23 100 0\7 3\71 3\68 0\3 27\364 10\170
0\7 1\24 1\12 1\11 0\1 19\177 2\28 2\20 95.5 0\11 3\68 3\64 0\4 25\405 4\165
0\6 0\16 1\9 1\5 0\4 15\189 8\27 0\12 93.8 1\7 5\75 5\71 0\4 26\415 10\190
0\2 0\30 1\8 1\7 0\1 18\195 4\40 0\21 83.3 1\7 5\86 4\76 1\10 34\458 8\157
1\10 1\34 2\10 2\6 0\4 13\112 3\43 2\21 70.6 1\7 5\62 5\59 0\3 23\327 15\242
2\72 8\252 9\75 8\56 1\19192\1716 22\315 11\187 898.6\10 7\63 37\705 34\641 3\64 286\3854 122\1969
2.78 3.17 12 14.29 5.26 11.19 6.98 5.88 89.86 11.11 5.25 5.3 4.69 7.42 6.2
244

SEASON 3
PLAYERS GROUP Min
Line
Breaks
Tackle
Breaks
Tacle per
min
Tacles
missed
Tackles
made
Turnover
forced
Defender
beaten work rate
kick
pressure
H 2 30 0\5 0\3 0.3/0.7 0\25 2\151 1\11 0\3 0.57\0.41 0\11
42 1\7 0\8 0.9/0.7 1\31 7\148 0\12 0\3 0.86\0.55 2\20
53 0\15 0\6 0.5/0.7 0\31 6\151 0\13 0\6 0.61\0.54 2\21
80 1\10 0\5 0.9/0.8 6\43 10\170 0\16 0\5 0.76\0.59 5\23
80 0\4 0\0 0.9/0.8 2\35 14\184 1\20 0\0 0.59\0.45 2\14
80 2\15 0\8 0.9/0.7 4\34 14\169 0\12 0\8 0.85\0.62 1\19
70 0\9 0\5 0.6/0.6 4\32 6\141 1\9 0\5 0.53\0.46 2\25
80 0\4 0\3 0.6/0.6 3\24 8\138 1\13 0\3 0.51\0.43 4\21
25 0\10 0\6 0.3/0.4 1\20 1\99 0\11 0\6 0.48\0.59 0\14
TOTAAL 540 4\79 0\44 5.9/6 21\275 68\1351 4\117 0\39 5.76\4.64 18\168
% 540 5.06 0 98.33 7.64 5.03 3.42 0 124.14 10.71
I 2 80 0\3 0\3 0.5/0.6 0\30 10\136 1\16 0\3 0.33\0.41 1\9
80 2\11 1\3 0.1/0.5 1\17 1\113 0\12 1\3 0.26\0.49 1\15
80 1\18 0\6 0.5/0.7 1\22 6\115 2\12 0\6 0.35\0.55 0\18
80 1\5 0\6 0.2/0.6 1\20 2\125 1\9 0\6 0.31\0.46 0\1
80 1\15 0\6 0.2/0.7 2\40 2\176 2\17 0\6 0.21\0.44 0\20
80 0\17 1\8 0.5/0.7 1\29 8\136 1\18 1\8 0.45\0.58 0\20
80 3\23 2\8 0.3/0.6 2\30 4\114 1\8 2\8 0.51\0.63 1\24
TOTAAL 560 8\92 4\40 2.3\4.4 8\188 33\915 8\92 4\40 2.42\3.56 3\107
% 560 8.7 10 52.27 4.26 3.61 8.7 10 67.98 2.8
J 2 72 1\7 0\1 0.4/0.5 1\16 5\96 0\8 0\1 0.35\0.45 1\28
80 0\6 1\4 0.7/0.6 1\22 11\126 2\13 1\4 0.4\0.43 0\22
80 0\5 0\1 0.8/0.7 2\22 12\146 3\18 0\1 0.45\0.46 1\7
80 2\5 1\3 0.7/0.7 3\25 10\151 0\11 1\3 0.36\0.41 0\11
80 0\7 0\8 0.4/0.7 2\31 6\148 1\12 0\3 0.39\0.55 1\20
80 0\15 0\6 0.8/0.7 5\31 10\151 0\12 0\6 0.36\0.54 1\21
80 1\10 1\5 0.9/0.8 1\43 10\170 2\16 1\5 0.51\0.59 0\23
67 0\4 0\0 0.5/0.8 1\35 7\184 0\20 0\0 0.31\0.45 1\14
80 3\15 1\8 0.5/0.7 1\34 10\169 0\12 1\8 0.5\0.62 0\19
80 2\9 1\5 0.2/0.6 0\32 3\141 1\9 1\5 0.39\0.46 1\25
80 0\4 1\3 0.6/0.6 1\24 10\138 1\13 1\3 0.35\0.43 0\21
Reaction Time
245

80 1\7 1\2 0.3/0.6 0\21 5\144 1\20 1\2 0.35\0.51 0\23
80 5\10 1\6 0.4/0.4 1\20 6\99 0\11 1\6 0.56\0.59 0\14
TOTAAL 1019 15\104 8\52 7.2\8.4 19\356 105\1863 11\175 8\47 5.28\6.49 6\248
% 1019 14.42 15.38 85.71 5.34 5.64 6.29 17.02 81.36 2.42
T 4 80 1\7 1\13 0.1/0.4 0\11 2\73 0\9 1\13 0.26\0.48 0\24
80 0\3 0\5 0.4/0.5 2\24 4\108 0\12 0\5 0.24\0.56 0\19
80 0\5 0\6 0.5/0.6 3\23 6\145 0\10 0\6 0.21\0.52 4\16
54 1\14 0\3 0.3/0.6 1\37 2\103 0\10 0\3 0.26\0.53 0\13
44 0\5 0\3 0.7/0.7 2\35 6\175 0\17 0\3 0.16\0.51 0\16
80 0\5 0\0 0.1/0.7 1\44 2\181 0\19 0\0 0.14\0.46 4\26
80 1\4 1\7 0.4/0.5 1\38 6\112 1\14 1\7 0.3\0.58 2\31
80 0\5 0\4 0.5/0.7 2\37 7\162 0\18 0\4 0.2\0.49 0\16
80 1\9 0\12 0.2/0.5 0\11 4\111 1\14 0\12 0.26\0.51 4\21
64 0\6 0\2 0.3/0.7 2\51 2\164 3\23 0\2 0.25\0.49 0\23
80 2\14 0\10 0.4/0.6 1\17 5\113 1\19 0\10 0.31\0.56 0\13
TOTAAL 802 6\77 2\65 3.9\6.5 15\328 46\1447 6\165 2\65 2.59\5.69 14\218
% 802 7.79 3.08 60 4.57 3.18 3.64 3.08 4.55 6.42
U 4 43 3\14 0\3 0.9/0.6 2\37 7\103 0\10 0\3 0.64\0.53 0\13
64 1\5 1\3 0.9/0.7 6\35 8\175 2\17 1\3 0.64\0.51 0\16
80 0\5 0\0 1.0/0.7 2\44 21\181 0\19 0\0 0.46\0.46 1\26
54 0\4 0\7 0.4/0.5 1\38 4\112 0\14 0\7 0.52\0.58 1\31
64 0\5 1\4 0.5/0.7 2\37 6\162 1\18 1\4 0.42\0.49 1\16
59 0\2 0\0 0.8/0.8 3\43 8\161 1\15 0\0 0.52\0.47 0\1
66 0\9 0\5 0.6/0.6 1\19 6\102 1\17 0\5 0.41\0.47 1\19
65 0\9 0\12 0.5/0.5 0\11 6\111 1\14 0\12 0.37\0.51 1\21
TOTAAL 495 4\53 2\34 5.6\5.1 17\264 66\1107 6\124 2\34 3.98\4.02 5\143
% 495 7.55 5.88 109.8 6.44 5.96 4.84 5.88 99 3.5
V 4 80 0\7 1\13 0.1/0.4 0\11 2\73 0\9 1\13 0.16\0.48 0\24
54 1\3 1\5 0.2/0.5 0\24 2\108 1\12 1\5 0.22\0.56 3\19
80 1\14 0\3 0.2/0.6 2\37 1\103 0\10 0\3 0.15\0.53 0\13
80 0\5 0\3 0.5/0.7 0\35 9\175 0\17 0\3 0.2\0.51 0\16
70 2\5 0\0 0.4/0.7 0\44 8\181 3\19 0\0 0.37\0.46 2\26
54 0\4 0\7 0.1/0.5 1\38 1\112 2\14 0\7 0.26\0.58 3\31
76 2\5 0\4 0.3/0.7 1\37 5\162 1\18 0\4 0.36\0.49 0\16
80 0\2 0\0 0.6/0.8 3\43 7\161 3\15 0\0 0.25\0.47 1\11
74 1\9 2\5 0.4/0.6 0\19 6\102 3\17 2\5 0.39\0.47 2\19
246
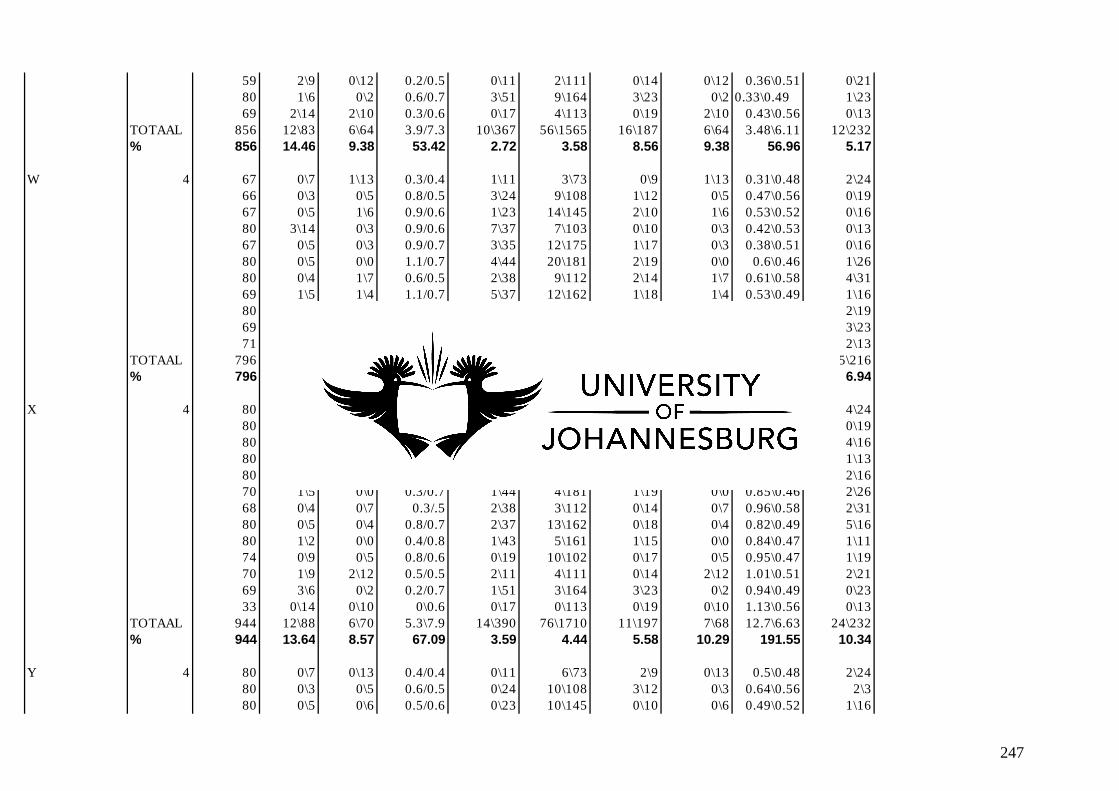
59 2\9 0\12 0.2/0.5 0\11 2\111 0\14 0\12 0.36\0.51 0\21
80 1\6 0\2 0.6/0.7 3\51 9\164 3\23 0\2 0.33\0.49 1\23
69 2\14 2\10 0.3/0.6 0\17 4\113 0\19 2\10 0.43\0.56 0\13
TOTAAL 856 12\83 6\64 3.9/7.3 10\367 56\1565 16\187 6\64 3.48\6.11 12\232
% 856 14.46 9.38 53.42 2.72 3.58 8.56 9.38 56.96 5.17
W 4 67 0\7 1\13 0.3/0.4 1\11 3\73 0\9 1\13 0.31\0.48 2\24
66 0\3 0\5 0.8/0.5 3\24 9\108 1\12 0\5 0.47\0.56 0\19
67 0\5 1\6 0.9/0.6 1\23 14\145 2\10 1\6 0.53\0.52 0\16
80 3\14 0\3 0.9/0.6 7\37 7\103 0\10 0\3 0.42\0.53 0\13
67 0\5 0\3 0.9/0.7 3\35 12\175 1\17 0\3 0.38\0.51 0\16
80 0\5 0\0 1.1/0.7 4\44 20\181 2\19 0\0 0.6\0.46 1\26
80 0\4 1\7 0.6/0.5 2\38 9\112 2\14 1\7 0.61\0.58 4\31
69 1\5 1\4 1.1/0.7 5\37 12\162 1\18 1\4 0.53\0.49 1\16
80 0\9 0\5 0.4/0.6 0\19 5\102 2\17 0\5 0.36\0.47 2\19
69 0\6 0\2 0.9/0.7 5\51 9\164 1\23 0\2 0.49\0.49 3\23
71 1\14 0\10 0.7/0.6 2\17 7\113 0\19 0\10 0.45\0.56 2\13
TOTAAL 796 5\77 4\58 8.6\6.6 33\336 107\1438 12\168 4\58 5.15\5.65 15\216
% 796 6.49 6.9 130.3 9.82. 7.44 7.14 6.9 91.15 6.94
X 4 80 4\7 2\13 0.2/0.4 0\11 3\73 2\9 2\13 1.14\0.48 4\24
80 0\3 1\5 0.5/0.5 2\24 6\108 1\12 1\5 1.05\0.56 0\19
80 0\5 1\6 0.6/0.6 1\23 11\145 2\10 1\6 0.99\0.52 4\16
80 1\14 0\3 0.2/0.6 2\37 4\103 0\10 1\3 1.11\0.53 1\13
80 1\5 0\3 0.5/0.7 0\35 10\175 1\17 0\3 0.91\0.51 2\16
70 1\5 0\0 0.3/0.7 1\44 4\181 1\19 0\0 0.85\0.46 2\26
68 0\4 0\7 0.3/.5 2\38 3\112 0\14 0\7 0.96\0.58 2\31
80 0\5 0\4 0.8/0.7 2\37 13\162 0\18 0\4 0.82\0.49 5\16
80 1\2 0\0 0.4/0.8 1\43 5\161 1\15 0\0 0.84\0.47 1\11
74 0\9 0\5 0.8/0.6 0\19 10\102 0\17 0\5 0.95\0.47 1\19
70 1\9 2\12 0.5/0.5 2\11 4\111 0\14 2\12 1.01\0.51 2\21
69 3\6 0\2 0.2/0.7 1\51 3\164 3\23 0\2 0.94\0.49 0\23
33 0\14 0\10 0\0.6 0\17 0\113 0\19 0\10 1.13\0.56 0\13
TOTAAL 944 12\88 6\70 5.3\7.9 14\390 76\1710 11\197 7\68 12.7\6.63 24\232
% 944 13.64 8.57 67.09 3.59 4.44 5.58 10.29 191.55 10.34
Y 4 80 0\7 0\13 0.4/0.4 0\11 6\73 2\9 0\13 0.5\0.48 2\24
80 0\3 0\5 0.6/0.5 0\24 10\108 3\12 0\3 0.64\0.56 2\3
80 0\5 0\6 0.5/0.6 0\23 10\145 0\10 0\6 0.49\0.52 1\16
247

80 0\14 0\3 0.8/0.6 1\37 12\103 0\10 0\3 0.60\0.53 1\13
80 0\5 0\3 1.0/0.7 2\35 17\175 4\17 0\3 0.61\0.51 0\16
80 0\5 0\0 0.8/0.7 6\44 12\181 6\19 0\0 0.4\0.46 2\26
26 0\4 0\7 0.9/0.5 0\38 4\112 0\14 0\7 0.73\0.58 2\31
80 0\5 0\4 0.7/0.7 2\37 12\162 3\18 0\4 0.54\0.49 0\16
80 0\2 0\0 0.7/0.8 1\43 11\161 0\15 0\0 0.51\0.47 2\11
74 0\9 0\5 1.0/0.6 0\19 12\102 3\17 0\5 0.47\0.47 0\19
80 0\9 1\12 0.7/0.5 0\11 11\111 1\14 1\12 0.57\0.51 0\21
80 0\6 0\2 0.6/0.7 3\51 10\164 1\23 0\2 0.49\0.49 1\23
80 0\14 0\10 0.6/0.6 0\17 8\113 1\19 0\10 0.54\0.56 2\13
TOTAAL 980 0\88 1\70 9.3\7.9 15\390 135\1710 24\197 1\68 7.08\6.63 15\232
% 980 0 1.43 117.72 3.85 7.89 12.18 1.47 106.79 6.47
248

SEASON 3
turnover
won
turnover
lost Off Loads
Good off
loads
Bad off
loads Cleans
Win
possession
Lost
possession
Breakdown
efficiency
In tackle
pass
Ball
carries
Pos
carries
Neg
Carries
total
attack
total
defence
1\8 1\17 0\7 0\6 0\1 1\113 0\0 1\16 100 0\6 3\53 3\49 0\4 13\283 4\214
0\10 3\19 0\12 0\7 0\5 0\191 0\0 1\19 66.7 0\11 4\73 4\68 0\5 7\148 11\231
0\10 0\31 0\10 0\7 0\3 1\204 0\0 1\29 100 0\7 1\87 0\73 1\14 22\434 10\219
0\11 5\25 0\6 0\5 0\1 5\210 0\0 2\25 100 0\5 4\87 3\77 1\10 44\444 17\262
1\18 6\23 1\6 0\5 1\1 0\106 0\0 3\18 66.7 1\4 1\50 1\48 0\2 28\264 19\271
0\11 6\32 2\20 1\18 1\2 1\171 0\0 3\28 83.3 1\15 5\95 5\86 0\9 49\485 19\257
1\9 0\27 1\20 1\17 0\3 3\131 0\0 0\24 80 0\15 3\78 3\71 0\7 28\342 9\214
2\9 4\18 0\7 0\7 0\2 0\113 1\1 1\16 80 0\7 0\62 0\55 0\7 26\297 15\216
0\10 0\25 0\28 0\24 0\4 1\238 0\0 0\29 100 0\24 0\121 0\106 0\15 10\550 2\157
5\96 25\217 4\116 2\96 2\22 12\1477 1\1 12\204 776.7\9 2\94 21\706 19\633 2\73 227\3247 106\2041
5.21 11.52 3.45 2.08 9.09 0.81 100 5.88 86.3 2.13 2.97 3 2.74 6.99 5.19
0\10 0\14 2\18 1\15 1\3 4\96 0\0 0\10 100 1\12 3\60 2\47 1\13 15\300 11\186
0\8 4\27 0\13 0\9 0\4 5\156 0\0 2\24 77.8 0\10 7\83 7\76 0\7 19\408 2\181
1\5 2\30 1\21 0\12 1\9 7\187 0\0 2\16 90 0\18 3\94 2\87 1\7 18\480 10\181
0\6 3\20 1\16 1\13 0\3 8\120 0\0 1\13 100 1\15 4\68 3\61 1\7 22\353 3\198
1\13 1\16 1\10 1\8 0\2 4\89 0\0 1\14 71.4 1\10 2\42 1\36 1\6 13\266 4\259
1\10 3\21 0\16 0\15 0\1 8\175 0\0 2\19 100 0\15 5\99 5\93 0\6 25\478 11\216
1\7 3\28 2\23 2\16 0\7 12\228 0\0 1\24 94.4 1\17 7\119 6\106 1\13 33\580 8\176
4\59 16\156 7\117 5\88 2\29 48\1051 0\0 9\120 633.6\7 4\97 31\565 26\506 5\59 145\2865 49\1397
6.78 10.26 5.98 5.68 6.9 4.57 0 7.5 90.51 4.12 5.49 5.14 8.47 5.06 3.51
0\7 1\19 2\13 2\9 0\4 6\161 0\0 1\13 77.8 1\10 6\64 4\56 2\8 19\375 6\160
2\10 2\23 2\10 2\8 0\2 4\117 0\0 2\19 71.4 2\7 4\54 4\51 0\3 16\126 16\203
2\15 0\24 4\15 4\14 0\1 9\134 0\0 0\23 100 4\14 4\62 1\54 3\8 20\327 16\221
0\8 1\17 2\7 1\6 1\1 2\113 0\0 2\16 100 2\6 4\53 3\49 1\4 18\283 11\214
1\10 2\19 4\12 1\7 3\5 5\191 0\0 2\19 88.9 3\11 9\73 9\68 0\5 21\430 10\231
0\10 2\31 0\10 0\7 0\3 9\205 0\0 2\29 86.7 0\7 3\87 3\73 0\14 15\434 14\219
2\11 1\25 3\6 3\5 0\1 8\210 0\0 2\25 90 2\5 4\87 3\77 1\10 22\444 19\262
0\18 1\23 2\6 2\5 0\1 1\106 0\0 1\18 75 2\4 4\50 4\48 0\2 12\264 9\271
0\11 4\32 .\20 2\18 1\2 7\171 0\0 3\28 88.9 2\15 8\95 8\86 0\4 29\485 11\257
1\9 3\27 1\20 1\17 0\3 11\131 0\0 3\24 84.6 1\15 5\78 4\71 1\7 26\342 5\214
1\9 0\18 1\7 1\5 0\2 5\113 0\1 0\16 92.3 1\7 5\62 5\55 0\7 12\297 16\216
Decision Making
249

1\16 1\27 3\23 3\17 0\6 6\139 0\0 1\20 100 1\20 7\80 5\67 2\13 21\377 7\239
0\10 0\25 6\28 6\24 0\4 6\238 0\0 0\29 100 4\24 14\121 11\106 3\15 38\550 7\157
10\144 18\310 30\177 28\142 5\35 79\2029 0\1 19\279 1155.6\13 25\145 77\966 64\861 13\100 269\4734 147\2864
6.94 5.81 16.95 19.72. 14.29 3.89 0 6.81 88.89 17.24 7.97 7.43 13 5.68 5.13
0\11 3\36 2\19 2\16 0\3 6\182 3\31 3\26 87.5 1\16 7\84 6\73 1\11 19\449 2\132
0\6 0\15 0\14 0\13 0\1 10\266 1\31 0\11 100 0\14 3\102 3\84 0\18 15\509 4\166
0\8 0\15 0\12 0\12 0\0 6\197 0\27 0\14 85.7 0\11 1\82 1\75 0\7 7\420 10\206
0\6 1\16 0\6 0\4 0\2 3\218 3\37 0\13 80 0\6 5\89 5\79 0\10 11\481 3\160
0\14 0\13 0\11 0\9 0\2 1\162 0\24 0\15 100 0\7 0\59 0\54 0\5 1\348 6\267
0\8 0\22 0\4 0\3 0\1 3\122 0\39 0\11 75 0\3 1\39 1\39 0\0 5\287 6\261
1\12 2\26 0\6 0\5 0\1 7\259 0\29 2\21 81.8 0\4 4\96 4\92 0\4 14\512 10\179
0\16 1\24 0\9 0\8 0\1 1\136 1\32 1\17 100 0\8 2\60 1\55 1\5 9\334 7\249
1\10 0\12 1\13 1\11 0\2 5\186 0\25 1\13 70 1\8 3\85 3\76 0\9 12\447 9\164
1\15 1\24 0\6 0\6 0\0 8\150 3\32 1\20 77.8 0\4 4\62 4\51 0\11 13\352 3\236
1\16 1\17 1\13 0\5 0\2 6\205 3\33 2\15 100 1\11 3\96 3\92 0\4 19\490 6\188
4\122 9\220 4\113 3\92 0\15 56\2083 14\340 10\176 957.8\11 3\92 33\854 31\770 2\84 125\4629 66\2208
3.28 4.09 3.54 3.26 0 2.69 4.12 5.68 87.07 3.26 3.86 4.03 2.38 2.7 2.99
1\6 0\16 0\6 0\4 0\2 12\218 1\37 0\13 87 0\6 2\89 2\79 0\10 15\481 12\160
2\14 0\13 1\11 1\9 0\2 14\162 0\24 0\15 87 0\7 4\59 4\54 0\5 21\348 20\267
0\8 0\22 0\4 0\3 0\1 11\122 0\39 0\11 85 0\3 0\39 0\39 0\0 11\287 26\261
0\12 1\26 0\6 0\5 0\1 17\259 0\29 1\21 79.3 0\4 3\96 2\92 1\4 21\512 7\179
1\16 0\24 0\9 0\8 0\1 7\136 3\32 1\17 80 0\8 6\60 5\55 1\5 14\334 13\249
1\16 0\28 0\10 0\4 0\6 14\165 1\21 0\23 92.3 0\8 1\60 1\54 0\6 16\351 15\216
0\13 2\19 0\11 0\9 0\2 13\174 1\28 2\10 73.9 0\8 4\78 4\71 0\7 17\396 10\170
0\10 0\12 1\13 1\11 0\2 13\186 1\25 0\13 78.9 1\8 3\85 2\76 1\9 17\447 7\164
5\95 3\160 2\70 2\53 0\17101\1422 7\235 4\123 663.4\8 1\52 23\566 20\520 3\46 132\3156 110\1666
5.26 1.88 2.86 3.77 0 7.1 2.98 3.25 82.93 1.92 4.06 3.85 6.52 4.18 6.6
0\11 2\36 0\19 0\16 0\3 1\182 3\31 2\26 100 0\16 5\84 4\73 1\11 10\449 3\132
0\6 1\15 0\14 0\13 0\1 0\266 2\31 1\11 0 0\14 3\102 3\84 0\18 7\509 5\166
0\6 1\16 0\6 0\4 0\2 1\218 2\37 1\13 100 0\6 4\89 4\79 0\10 10\481 2\160
0\14 0\13 0\11 0\9 0\2 3\162 0\24 0\15 100 0\7 1\59 1\54 0\5 5\348 11\267
2\8 1\22 0\4 0\3 0\1 2\122 3\39 1\11 66.7 0\3 0\39 0\39 0\0 13\287 13\261
2\12 1\26 1\6 0\5 1\1 4\259 3\29 1\21 80 1\4 2\96 2\92 0\4 8\512 6\179
1\16 5\24 0\9 0\8 0\1 4\136 9\32 2\17 100 0\8 4\60 3\55 1\5 20\334 7\249
4\16 1\28 0\10 0\4 0\6 2\165 0\21 1\23 50 0\8 3\60 3\54 0\6 8\351 12\216
3\13 1\19 1\11 1\9 0\2 7\174 1\28 1\10 88.9 1\8 5\78 5\71 0\7 17\396 12\170
250
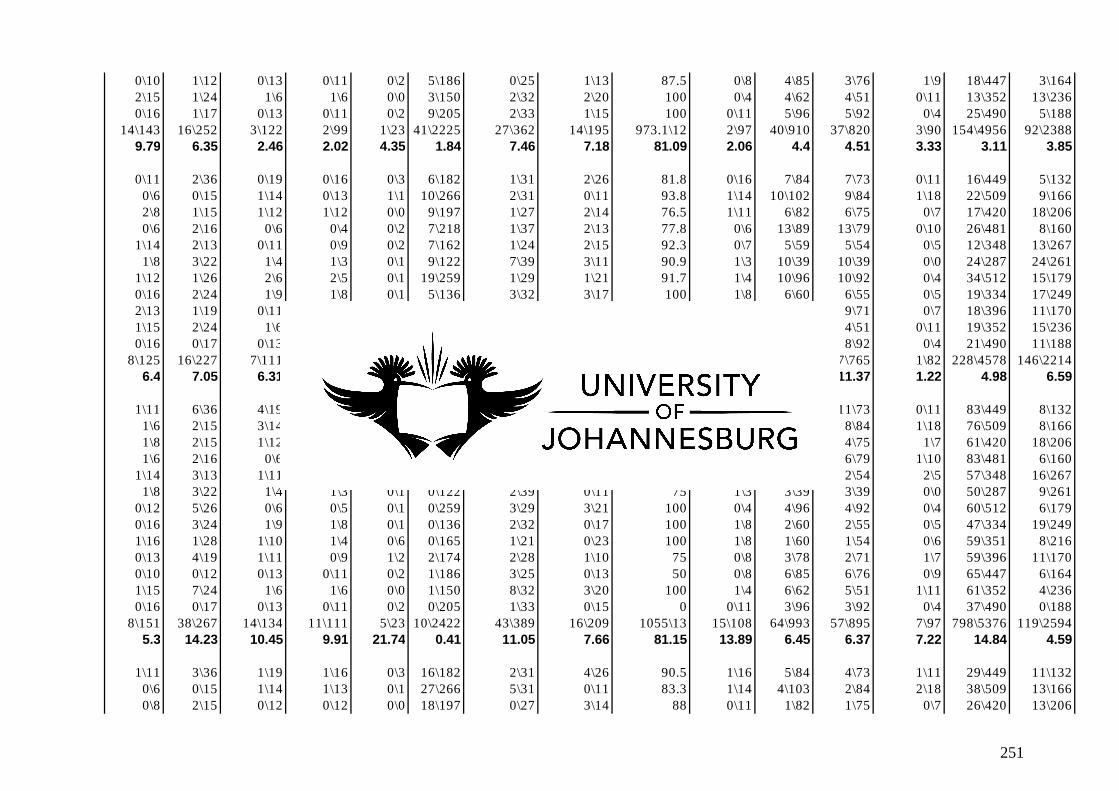
0\10 1\12 0\13 0\11 0\2 5\186 0\25 1\13 87.5 0\8 4\85 3\76 1\9 18\447 3\164
2\15 1\24 1\6 1\6 0\0 3\150 2\32 2\20 100 0\4 4\62 4\51 0\11 13\352 13\236
0\16 1\17 0\13 0\11 0\2 9\205 2\33 1\15 100 0\11 5\96 5\92 0\4 25\490 5\188
14\143 16\252 3\122 2\99 1\23 41\2225 27\362 14\195 973.1\12 2\97 40\910 37\820 3\90 154\4956 92\2388
9.79 6.35 2.46 2.02 4.35 1.84 7.46 7.18 81.09 2.06 4.4 4.51 3.33 3.11 3.85
0\11 2\36 0\19 0\16 0\3 6\182 1\31 2\26 81.8 0\16 7\84 7\73 0\11 16\449 5\132
0\6 0\15 1\14 0\13 1\1 10\266 2\31 0\11 93.8 1\14 10\102 9\84 1\18 22\509 9\166
2\8 1\15 1\12 1\12 0\0 9\197 1\27 2\14 76.5 1\11 6\82 6\75 0\7 17\420 18\206
0\6 2\16 0\6 0\4 0\2 7\218 1\37 2\13 77.8 0\6 13\89 13\79 0\10 26\481 8\160
1\14 2\13 0\11 0\9 0\2 7\162 1\24 2\15 92.3 0\7 5\59 5\54 0\5 12\348 13\267
1\8 3\22 1\4 1\3 0\1 9\122 7\39 3\11 90.9 1\3 10\39 10\39 0\0 24\287 24\261
1\12 1\26 2\6 2\5 0\1 19\259 1\29 1\21 91.7 1\4 10\96 10\92 0\4 34\512 15\179
0\16 2\24 1\9 1\8 0\1 5\136 3\32 3\17 100 1\8 6\60 6\55 0\5 19\334 17\249
2\13 1\19 0\11 0\9 0\2 8\174 3\28 1\10 81.3 0\8 9\78 9\71 0\7 18\396 11\170
1\15 2\24 1\6 1\6 0\0 14\150 0\32 2\20 90 1\4 4\62 4\51 0\11 19\352 15\236
0\16 0\17 0\13 0\11 0\2 10\205 2\33 0\15 100 0\11 8\96 8\92 0\4 21\490 11\188
8\125 16\227 7\111 6\96 1\15104\2071 22\343 18\173 976.1\11 6\92 88\847 87\765 1\82 228\4578 146\2214
6.4 7.05 6.31 6.25 6.67 5.02 6.41 10.4 88.74 6.52 10.39 11.37 1.22 4.98 6.59
1\11 6\36 4\19 2\16 2\3 2\182 8\31 5\26 100 4\16 11\84 11\73 0\11 83\449 8\132
1\6 2\15 3\14 3\13 0\1 2\266 4\31 2\11 80 3\14 9\102 8\84 1\18 76\509 8\166
1\8 2\15 1\12 1\12 0\0 1\197 5\27 0\14 75 1\11 5\82 4\75 1\7 61\420 18\206
1\6 2\16 0\6 1\4 1\2 0\218 2\37 1\13 100 2\6 7\89 6\79 1\10 83\481 6\160
1\14 3\13 1\11 0\9 1\2 1\162 2\24 1\15 100 1\7 4\59 2\54 2\5 57\348 16\267
1\8 3\22 1\4 1\3 0\1 0\122 2\39 0\11 75 1\3 3\39 3\39 0\0 50\287 9\261
0\12 5\26 0\6 0\5 0\1 0\259 3\29 3\21 100 0\4 4\96 4\92 0\4 60\512 6\179
0\16 3\24 1\9 1\8 0\1 0\136 2\32 0\17 100 1\8 2\60 2\55 0\5 47\334 19\249
1\16 1\28 1\10 1\4 0\6 0\165 1\21 0\23 100 1\8 1\60 1\54 0\6 59\351 8\216
0\13 4\19 1\11 0\9 1\2 2\174 2\28 1\10 75 0\8 3\78 2\71 1\7 59\396 11\170
0\10 0\12 0\13 0\11 0\2 1\186 3\25 0\13 50 0\8 6\85 6\76 0\9 65\447 6\164
1\15 7\24 1\6 1\6 0\0 1\150 8\32 3\20 100 1\4 6\62 5\51 1\11 61\352 4\236
0\16 0\17 0\13 0\11 0\2 0\205 1\33 0\15 0 0\11 3\96 3\92 0\4 37\490 0\188
8\151 38\267 14\134 11\111 5\23 10\2422 43\389 16\209 1055\13 15\108 64\993 57\895 7\97 798\5376 119\2594
5.3 14.23 10.45 9.91 21.74 0.41 11.05 7.66 81.15 13.89 6.45 6.37 7.22 14.84 4.59
1\11 3\36 1\19 1\16 0\3 16\182 2\31 4\26 90.5 1\16 5\84 4\73 1\11 29\449 11\132
0\6 0\15 1\14 1\13 0\1 27\266 5\31 0\11 83.3 1\14 4\103 2\84 2\18 38\509 13\166
0\8 2\15 0\12 0\12 0\0 18\197 0\27 3\14 88 0\11 1\82 1\75 0\7 26\420 13\206
251

0\6 1\16 0\6 0\4 0\2 27\218 2\37 1\13 90 0\6 3\89 2\79 1\10 35\481 13\160
2\14 0\13 2\11 2\9 0\2 22\162 3\24 1\15 95.8 1\7 3\59 3\54 0\5 28\348 21\267
0\8 1\22 0\4 0\3 0\1 14\122 6\39 1\11 77.8 0\3 1\39 1\39 0\0 17\287 15\261
0\12 0\26 0\6 0\5 0\1 7\259 0\29 0\21 90.9 0\4 2\96 2\92 0\4 13\512 6\179
3\16 2\24 2\9 0\8 0\1 15\136 1\32 2\17 90.9 2\8 3\60 3\55 0\5 27\334 16\249
0\16 0\28 1\10 1\4 0\6 13\165 1\21 0\23 95 1\8 8\60 8\54 0\6 28\351 13\216
0\13 1\19 1\11 1\9 0\2 14\174 4\28 1\10 86.7 1\8 3\78 2\71 1\7 23\396 12\170
0\10 3\12 2\13 2\11 0\2 17\186 3\25 2\13 80.8 1\8 6\85 6\76 0\9 34\447 12\164
0\15 1\24 0\6 0\6 0\0 15\150 3\32 2\20 85.7 0\4 3\62 2\51 1\11 26\352 13\236
1\16 2\17 1\13 0\11 1\2 22\205 1\33 2\15 83.9 1\11 3\96 3\92 0\4 30\490 13\188
7\151 16\267 11\134 8\111 1\23227\2422 31\389 19\209 1139.3\13 9\108 45\993 39\895 6\97 354\5376 171\2594
4.64 5.99 8.21 7.21 4.35 9.37 7.97 9.09 87.64 8.33 4.53 3.69 6.19 6.58 6.59
252
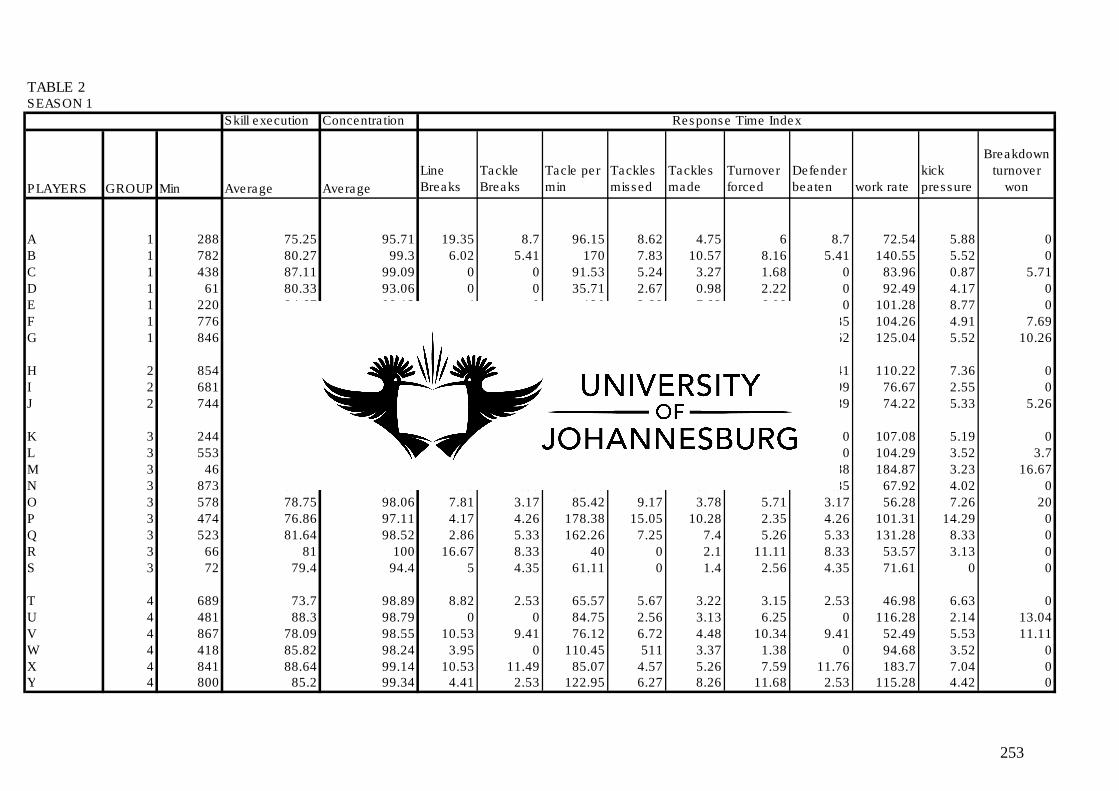
TABLE 2SEASON 1
Skill execution Concentration
PLAYERS GROUP Min Average Average
Line
Breaks
Tackle
Breaks
Tacle per
min
Tackles
missed
Tackles
made
Turnover
forced
Defender
beaten work rate
kick
pressure
Breakdown
turnover
won
A 1 288 75.25 95.71 19.35 8.7 96.15 8.62 4.75 6 8.7 72.54 5.88 0
B 1 782 80.27 99.3 6.02 5.41 170 7.83 10.57 8.16 5.41 140.55 5.52 0
C 1 438 87.11 99.09 0 0 91.53 5.24 3.27 1.68 0 83.96 0.87 5.71
D 1 61 80.33 93.06 0 0 35.71 2.67 0.98 2.22 0 92.49 4.17 0
E 1 220 84.67 98.12 4 0 130 2.88 7.82 6.98 0 101.28 8.77 0
F 1 776 75.64 99.25 3.61 1.35 132.86 9.28 7.17 3.4 1.35 104.26 4.91 7.69
G 1 846 82.64 99.32 3.61 21.62 200 4.35 9.08 8.84 21.62 125.04 5.52 10.26
H 2 854 83.64 99 8.43 5.41 88.57 6.67 5.26 6.12 5.41 110.22 7.36 0
I 2 681 81.4 98.54 11.11 9.09 62.5 4.98 3.26 7.52 9.09 76.67 2.55 0
J 2 744 78.9 99 9.21 13.89 51.56 5.43 0.51 4.29 13.89 74.22 5.33 5.26
K 3 244 72.75 95.35 7.41 0 165.22 6 6.93 0 0 107.08 5.19 0
L 3 553 85.36 99.25 5.26 0 101.49 3.23 4.48 2.76 0 104.29 3.52 3.7
M 3 46 82.75 81.28 4.55 5.88 77.78 0.98 1.01 2.63 5.88 184.87 3.23 16.67
N 3 873 81.82 98.43 10.53 22.35 50.75 4.03 3.11 8.97 22.35 67.92 4.02 0
O 3 578 78.75 98.06 7.81 3.17 85.42 9.17 3.78 5.71 3.17 56.28 7.26 20
P 3 474 76.86 97.11 4.17 4.26 178.38 15.05 10.28 2.35 4.26 101.31 14.29 0
Q 3 523 81.64 98.52 2.86 5.33 162.26 7.25 7.4 5.26 5.33 131.28 8.33 0
R 3 66 81 100 16.67 8.33 40 0 2.1 11.11 8.33 53.57 3.13 0
S 3 72 79.4 94.4 5 4.35 61.11 0 1.4 2.56 4.35 71.61 0 0
T 4 689 73.7 98.89 8.82 2.53 65.57 5.67 3.22 3.15 2.53 46.98 6.63 0
U 4 481 88.3 98.79 0 0 84.75 2.56 3.13 6.25 0 116.28 2.14 13.04
V 4 867 78.09 98.55 10.53 9.41 76.12 6.72 4.48 10.34 9.41 52.49 5.53 11.11
W 4 418 85.82 98.24 3.95 0 110.45 511 3.37 1.38 0 94.68 3.52 0
X 4 841 88.64 99.14 10.53 11.49 85.07 4.57 5.26 7.59 11.76 183.7 7.04 0Y 4 800 85.2 99.34 4.41 2.53 122.95 6.27 8.26 11.68 2.53 115.28 4.42 0
Response Time Index
253

SEASON 1
turnover
won
turnover
lost
Off
Loads
Good
off
loads
Bad off
loads cleans
Win
posses-
sion
Lost
posses-
sion
Break-
down
efficien-
cy
In tackle
pass
Ball
carries
Pos
carries
Neg
Carries
total
attack
total
defence
Assist
tackle
Putting
pressure
Pick
and go
Dum-
mies
7.14 9.52 0 0 0 3 0 7.94 65.58 0 5.61 5.22 11.76 3.82 4.55 5,04 6.46 0 5.26
11.2 2.02 6.82 7.87 4.08 8.66 4.68 4.3 82.89 8 7.3 7.62 5.36 6.37 11.77 14.32 5.99 9.84 4.89
2.88 0 0 0 0 8.09 1.83 0 71.19 0 1.83 1.67 0 3.63 2.87 2.36 1.95 4.17 0
0 1.72 5.77 7.14 0 0 5.26 0 0 4.65 2.46 1.9 9.09 1.89 0.55 1.11 1.54 0 5.88
7.89 4.62 0 0 0 9.72 2.56 3.85 73.17 0 1.72 4.55 4.17 5.33 7.4 9.29 9.05 5.56 4.26
5 2.88 8.52 8.66 8.16 7.9 1.8 3.76 84.64 9.33 4.68 5.12 4.48 5.71 6.9 4.13 7.09 3.28 4.35
11.67 5.76 14.2 17.32 6.12 6.15 7.55 6.99 81.16 16.67 14.14 14.23 14.93 7.04 10.05 10.19 5.13 6.56 3.26
6.67 15.23 2.84 2.36 4.08 1.74 14.03 6.45 76.83 2 3.88 3.75 5.26 7.94 5.26 5.34 6.11 0 27.72
8.7 9.82 7.19 3.67 13.64 2.34 15 6.55 86.15 6.92 5.77 5.87 4.35 4.43 3.15 3.38 5.23 0 6.02
4.2 4.52 8.48 7.56 10.87 4.64 3.95 4.68 80.74 9.22 6.81 7.08 4.05 4.63 4.51 3.38 6.73 0 7.06
0 15.84 5.26 3.13 16.67 1.13 5.31 7.5 88.55 5.88 3.32 3.19 4.17 5.22 5.42 5.63 3.75 0 11.91
3.64 1.29 0.89 1.03 0 6.87 0.34 13.3 71.3 0 3.58 3.63 3.16 4.3 4.36 5.14 1.59 6.99 1.45
3.45 3.85 3.7 4.17 0 0 2.67 1.79 50 4.35 2.1 2.23 0 2.95 1.34 2.33 1.56 3.7 9.68
1.82 12.88 6.25 6.19 6.67 2.75 23.21 8.87 81.06 7.22 8.79 8.6 10.53 5.25 2.92 2.16 5.01 0.7 5.8
8.75 2.55 5.95 5.56 8.33 2.39 2.38 2.88 78.96 2.86 3.63 3.68 3.13 2.74 4.54 3.88 9.19 0 5.61
1.61 8.04 5.88 6.78 0 1.42 3.87 5.88 70.57 3.51 2.88 2.69 5 5.88 8.38 6.84 9.64 0 13.79
3.53 4.19 2.91 2.5 7.14 7.54 3.72 7.14 81.13 3.7 6.25 6.64 2.67 5.11 8.98 6.37 6.76 3.33 0.84
20 0 18.18 11.11 50 1.4 9.38 0 50 18.18 5.06 4.41 9.09 3.1 2.79 2.86 4.71 0 0
3.7 1.49 0 0 0 0.91 1.27 3.08 70 0 1.3 1.44 0 1.33 1.24 0 2.5 0 0
2.91 3.79 9.62 10 7.14 1.52 6.02 2.73 63.64 9.89 4.56 4.04 8.79 2.5 3.21 2.01 6.56 1.53 1.54
6.19 1.9 0.99 1.15 0 9.2 3.37 3.7 75.23 1.15 1.78 1.84 1.22 4.91 4.1 3.28 2.18 1.59 0
10 8.58 2.68 2.02 6.67 1.6 11.95 6.4 80.08 3.09 4.45 4.96 0 2.89 4.67 1.89 5.99 0.7 2.17
0.91 2.58 2.68 3.09 0 3.8 1.71 3.94 73.43 3.09 4.99 5.33 2.11 3.03 3.01 4.32 3.67 2.8 2.9
9.09 17.17 15.18 15.46 1.33 2.29 12.29 8.87 59.4 15.46 5.65 5.33 8.42 14.88 5.21 4.32 5.62 6.99 18.843.88 2.84 1.87 2.22 0 11.22 10.19 3.28 81.04 2.2 6.95 6.73 7.22 7.25 6.95 3.44 6 7.63 5.39
Decision Making Index
254

SEASON 2
Skill execution Concentration
PLAYERS GROUP Min Average Average
Line
Breaks
Tackle
Breaks
Tacle per
min
Tacles
missed
Tackles
made
Turnover
forced
Defender
beaten Work rate
Kick
pressure
Breakdown
turnover
won
A 1 214 77.33 96.75 0 9.09 38.89 0 3.05 2.78 9.09 44.6 1.54 0
B 1 825 80.73 99.42 4.35 8.47 164.29 7.84 11.4 10.78 8.47 144.86 10.62 25
C 1 318 86.33 98.62 0 0 93.94 4.26 4.41 4.82 0 88.74 2.13 0
D 1 262 72.33 96.75 0 0 84.62 6.19 4.2 3.45 0 82.47 6.25 0
E 1 564 83.88 99.05 2.74 0 125 5.31 7.07 3.88 0 99.05 3.9 5.26
F 1 553 77.63 99.96 3.33 13.89 131.82 4.23 7.33 4.9 13.89 86.49 6.11 10
G 1 640 82.13 98.55 9.26 19.44 154.17 10.05 10.82 14.68 19.44 134.31 9.47 20
H 2 480 82.33 98.44 3.28 0 106.06 10.27 6.27 4.49 0 122.61 11.3 0
I 2 607 85.13 99.2 6.76 8.89 40 1.99 2.51 7.96 8.89 68.06 2.96 0
J 2 958 84.17 99.35 17.35 16.95 66.67 5.43 4.4 4.76 16.95 71.69 6.25 0
K 3 517 80.57 98.47 0 3.57 114.63 4.07 7.82 6.58 7.14 113.58 7.35 0
L 3 726 83.9 99.29 2.47 4.17 101.64 4.56 6.79 7.32 4.17 103.3 3.37 0
M 3 61 86.8 95.8 0 0 61.54 1.59 1.8 0 0 182.47 4.88 0
N 3 697 83.33 98.83 1.96 2.94 50.94 3.54 2.93 10.48 2.94 66.59 5.41 0
O 3 906 77.92 99.07 13.64 5.56 91.43 9.66 4.96 6.71 5.56 68.26 3.86 14.29
P 3 466 76.8 97.77 8.96 6.45 137.14 13.16 8.48 4.94 6.45 112.71 13.39 0
Q 3 731 84.69 99.17 5.68 20.37 127.14 6.9 6.73 4.7 20.37 119.86 7.3 28.57
R 3 350 85.08 98.39 11.54 3.57 109.3 6.21 4.97 8.54 3.57 114.07 6.84 0
S 3 951 76.67 99.19 8 5.56 131.88 7.39 9.22 8.9 5.56 100.69 11.49 0
T 4 808 80.75 98.76 6.25 2.22 64.06 4 3.9 5.74 2.22 53.23 4.27 0
U 4 699 84.85 95.66 1.98 3.33 121.05 4.94 5.56 8.92 3.39 100.32 2.28 0
V 4 923 77.25 98.41 18.89 11.32 53.52 5.42 3.26 10.07 11.54 51.22 3 0
W 4 461 82.85 98.31 3.96 3.33 117.11 3.4 3.94 3.82 3.39 110.91 4.18 0
X 4 970 89.15 99.19 11.88 11.67 64.47 3.09 4.19 4.46 11.86 196.47 7.22 0Y 4 774 85.5 99.09 1.23 0 113.11 6.84 7.62 6.5 0 108.87 7.21 0
Response Time Index
255

SEASON 2
turnover
won
turnover
lost
Off
Loads
Good
off
loads
Bad off
loads cleans
Win
posses-
sion
Lost
posses-
sion
Break-
down
efficiency
In tackle
pass
Ball
carries
Pos
carries
Neg
Carries
total
attack
total
defence
Assist
tackle
Putting
pressure
Pick
and go
Dum-
mies
%
0 4.69 0 0 0 2.4 9.38 3.28 53.4 0 2.29 2.58 0 2.86 2.77 0 4.700 0 3.5700
12.69 2.54 3.49 2.99 5.26 8.35 6.35 3.67 92.56 2.46 6.45 6.75 3.85 6.3 12.13 17.28 7.98 10.84 1.56
5.8 1.42 0 0 0 9.44 2.63 0.72 81.22 0 1.59 1.54 2.08 4.42 3.8 5.78 2.58 1.96 0
2.17 5.62 1.72 2.04 0 0.32 4.95 1.37 50 0 2.56 1.77 10.34 5.43 3.39 0.73 4.13 0 13.51
5.71 0.52 1.54 2 0 8.19 1.1 2.4 85.88 2.33 4.17 4.36 2.67 4.68 6.61 6.4 5.22 6.1 1.04
6.49 2.45 5 5.63 3.45 4.41 3.33 1.6 73.45 5.75 3.6 3.99 0 4.12 6.77 7.48 7.61 0.85 2.94
20.69 8.33 11.5 9.64 13.33 7.09 6.6 8.95 84.25 13.68 12.14 12.74 6.25 7.28 12.44 15.98 7.13 15.83 5.8
2.82 15.67 4.08 5.19 0 1.62 5.94 3.28 90.55 4.76 2.02 2.02 2.08 9.2 6.15 3.8 9.37 0 20.9
5.81 6.77 5.6 5.1 7.4 3.02 21.19 4.55 95.09 5.56 6.88 5.9 15.07 5.13 2.63 1.28 3.65 0.82 4.26
4.55 6.62 15.34 19.55. 2.33 3.63 3.98 6.56 95.87 16.22 7.89 7.67 9.71 5.18 3.93 1.16 6.63 0 12.8
2.22 14.38 2.56 0 7.14 0.88 4 3.33 77.61 2.78 3.26 3.14 4.26 7.25 6.67 7.59 5.79 0 15.39
9.72 2.78 5.33 7.14 0 9.97 1.27 10.16 80.92 6.35 4.54 4.52 4.69 5.84 7.16 7.63 4.12 10.61 0.89
0 6.52 0 0 0 0 4.23 3.33 50 0 2.24 1.75 5 5.76 2.27 1.41 2.47 6.25 4.35
6.15 11 5.36 8.57 0 2.63 23.94 5.56 84.79 4.08 6.48 5.93 11.29 4.9 3.17 2.42 4.99 0 17.05
9.52 3.58 4.6 3.33 7.41 4.07 2..83 4.61 89.63 4 4.68 4.86 2.82 3.56 5.27 4.66 8.16 1.35 3.94
6.67 9.38 7.14 10.26 0 2.73 2.03 5.17 85.57 8.89 4.74 4.21 11.11 7.1 7.67 6.6 9.69 0 28.21
8.33 5.38 8.05 8.33 7.41 6.66 3.34 5.99 88.58 8 9.1 9.03 9.86 5.7 7.37 5.7 6.76 6.76 0.79
3.77 2.67 3.85 5.13 0 5.02 5.38 4.65 87 4.44 5.98 6.03 5.41 4 5.37 7.66 6.65 0 1.41
10.59 7.9 4.4 6.56 0 4.53 4.18 7.24 88.68 5.19 8.31 8.87 2.67 5.32 9.63 7.75 9.05 0 12.98
6.76 6.08 15.79 9.43 30.43 2.04 6.82 7.39 83.52 11.94 6.35 6.76 2.63 3.05 3.67 1.17 6.94 0 2.46
7.78 2.24 5.26 4.69 6.45 6.85 3.55 2.97 85.94 3.7 3.25 3.46 1.2 4.06 5.51 5.7 3.9 0 0.7
10.23 9.19 5.75 3.51 10 1.66 9.16 6.98 81.44 6.76 4.58 4.77 2.74 3.32 3.28 2.25 5.87 0 2.4
1.11 3.51 5.26 4.69 0 3.08 2.37 3.39 83.07 2.47 6.05 5.68 9.64 2.94 3.59 4.99 3.46 3.57 1.4
2.22 18.21 18.95 17.19 2.58 0.09 14.45 9.75 59.08 19.75 8.06 7.65 12.05 16.09 4.18 2.14 6.82 26.19 25.872.78 3.17 12 14.29 5.26 11.19 6.98 5.88 89.86 11.11 5.25 5.3 4.69 7.42 6.2 4.8 5.76 6.06 3.57
Decision Making Index
256

SEASON 3
Skill execution Concentration
PLAYERS GROUP Min Average Average
Line
Breaks
Tackle
Breaks
Tacle per
min
Tacles
missed
Tackles
made
Turnover
forced
Defender
beaten work rate
kick
pressure
Breakdown
turnover
won
H 2 540 83.56 98.38 5.06 0 98.33 7.64 5.03 3.42 0 124.14 10.71 11.8
I 2 560 84.43 98.46 8.7 10 52.27 4.26 3.61 8.7 10 67.98 2.8 0
J 2 1019 79.62 99.35 14.42 15.38 85.71 5.34 5.64 6.29 17.02 81.36 2.42 0
T 4 802 80.17 98.88 7.79 3.08 60 4.57 3.18 3.64 3.08 45.52 6.42 0
U 4 495 85.67 98.79 7.55 5.88 109.8 6.44 5.96 4.84 5.88 99 3.5 0
V 4 856 81.42 98.98 14.46 9.38 53.42 2.72 3.58 8.56 9.38 56.96 5.17 0
W 4 796 85 98.56 6.49 6.9 130.3 9.82. 7.44 7.14 6.9 91.15 6.94 0
X 4 944 90.69 99.54 13.64 8.57 67.09 3.59 4.44 5.58 10.29 191.55 10.34 0Y 4 980 85.92 99.34 0 1.43 117.72 3.85 7.89 12.18 1.47 106.79 6.47 0
Response Time Index
257
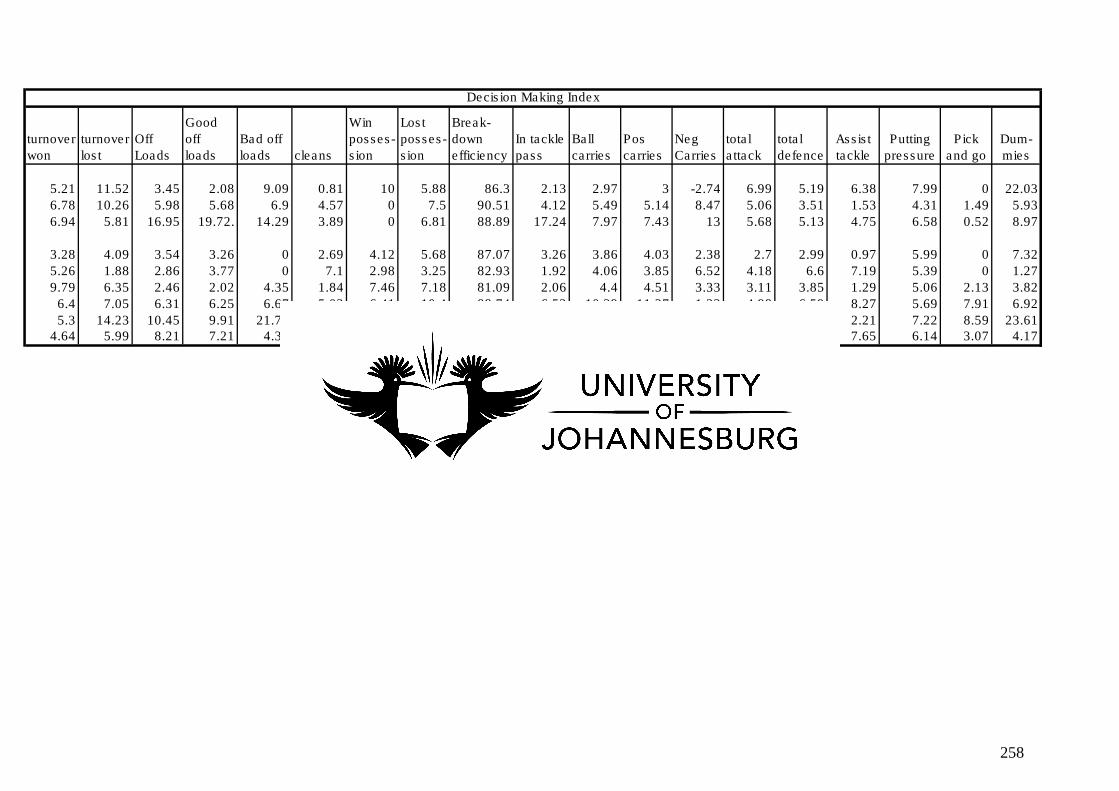
turnover
won
turnover
lost
Off
Loads
Good
off
loads
Bad off
loads cleans
Win
posses-
sion
Lost
posses-
sion
Break-
down
efficiency
In tackle
pass
Ball
carries
Pos
carries
Neg
Carries
total
attack
total
defence
Assist
tackle
Putting
pressure
Pick
and go
Dum-
mies
5.21 11.52 3.45 2.08 9.09 0.81 10 5.88 86.3 2.13 2.97 3 -2.74 6.99 5.19 6.38 7.99 0 22.03
6.78 10.26 5.98 5.68 6.9 4.57 0 7.5 90.51 4.12 5.49 5.14 8.47 5.06 3.51 1.53 4.31 1.49 5.93
6.94 5.81 16.95 19.72. 14.29 3.89 0 6.81 88.89 17.24 7.97 7.43 13 5.68 5.13 4.75 6.58 0.52 8.97
3.28 4.09 3.54 3.26 0 2.69 4.12 5.68 87.07 3.26 3.86 4.03 2.38 2.7 2.99 0.97 5.99 0 7.32
5.26 1.88 2.86 3.77 0 7.1 2.98 3.25 82.93 1.92 4.06 3.85 6.52 4.18 6.6 7.19 5.39 0 1.27
9.79 6.35 2.46 2.02 4.35 1.84 7.46 7.18 81.09 2.06 4.4 4.51 3.33 3.11 3.85 1.29 5.06 2.13 3.82
6.4 7.05 6.31 6.25 6.67 5.02 6.41 10.4 88.74 6.52 10.39 11.37 1.22 4.98 6.59 8.27 5.69 7.91 6.92
5.3 14.23 10.45 9.91 21.74 0.41 11.05 7.66 81.15 13.89 6.45 6.37 7.22 14.84 4.59 2.21 7.22 8.59 23.614.64 5.99 8.21 7.21 4.35 9.37 7.97 9.09 87.64 8.33 4.53 3.69 6.19 6.58 6.59 7.65 6.14 3.07 4.17
Decision Making Index
258

APPENDIX 3
Enclosed disc - illustration of video clips
259

APPENDIX 4
Ethical clearance letter
260