TRAILOKYA RAJ OJHA ANALYSIS OF KEY PERFORMANCE ...
70
TRAILOKYA RAJ OJHA ANALYSIS OF KEY PERFORMANCE INDICATORS IN SOFT- WARE DEVELOPMENT Master of Science Thesis Examiner: Professor Kari Systä Examiner and topic approved by the Council of the Faculty of Computing and Electrical Engineering on 9 April 2014
-
Upload
khangminh22 -
Category
Documents
-
view
0 -
download
0
Transcript of TRAILOKYA RAJ OJHA ANALYSIS OF KEY PERFORMANCE ...

TRAILOKYA RAJ OJHA
ANALYSIS OF KEY PERFORMANCE INDICATORS IN SOFT-
WARE DEVELOPMENT
Master of Science Thesis
Examiner: Professor Kari Systä Examiner and topic approved by the Council of the Faculty of Computing and Electrical Engineering on 9 April 2014

i
ABSTRACT
TAMPERE UNIVERSITY OF TECHNOLOGY
Master’s Degree Programme in Information Technology
OJHA, TRAILOKYA RAJ: Analysis of Key Performance Indicators in Software
Development
Master of Science Thesis, VI+ 63 pages
May 2014
Major: Software Systems
Examiner: Professor Kari Systä
Keywords: key performance indicators, KPI, software development process,
global software development, GSD, performance, CMMI
Productivity, quality, efficiency, speed and fit for purpose are the major factors to be
considered in software development. Every software development company wants to
develop a well performing, easy to use, effective, and efficient software. Implementing
a set of key performance indicators (KPIs) helps to trace the productivity, efficiency,
and quality of the software. KPIs helps to find a gap between expected and achieved
productivity and quality of the software. KPIs not only find the gap, but also provide the
reasons for performance deviation and ideas for improvement. The main goal of this
thesis is to provide an understanding about different factors affecting software attributed
such as productivity, quality, efficiency, speed and fit for purpose of software and im-
portance of KPIs to improve these attributes of software. This thesis provides an overall
view about KPIs in software development.
The thesis includes the description about different factors affecting software attrib-
utes in software development process and global software development (GSD) process.
This thesis also includes the analysis of the factors affecting software attributes and in-
troducing suitable set of KPIs for each. In this thesis a brief description about impor-
tance of Capability Maturity Model Integration (CMMI) in software development is
also incorporated. To achieve the goals, findings from own academic projects and pre-
vious research studies are collected, analyzed and concluded. For GSD approach, sec-
ondary data sets from two different studies are analyzed. From findings, a set of sample
KPIs is suggested.
The conclusion extracted from this thesis is; regular and proper measurement of
productivity, quality, efficiency, and speed of the software helps to keep track on objec-
tives. Results obtained from regular measurement also helps to take proper action in
time, if the software development is deviating from predefined objectives. After reading
this thesis one can get an idea about factors affecting productivity, quality, efficiency,
and response time of software in different aspects, importance of KPIs in software de-
velopment and a set of sample KPIs for each aspect.

ii
PREFACE
This Master of Science Thesis has been accomplished in the Department of Pervasive
Computing at Tampere University of Technology, Finland. I would like to express my
sincere thanks to all the people who contributed their valuable ideas, guidance and time
to complete this thesis.
I am pleased to express my deepest gratitude to my thesis supervisor Professor Kari
Systä for his continuous support and supervision from preliminary level to concluding
level. Without his support and guidance this thesis could not be completed.
My sincere thank also goes to Professor Tommi Mikkonen for his kind support dur-
ing this thesis work.
I would like to thank to all my friends for their encouragement, support and help
during thesis writing period. I am equally thankful to Juvenes Cafe staffs for providing
coffee continuously, without which I might not be able to concentrate in thesis work.
Finally, I would like to thank my family; parents, elder brother, both elder sisters,
both nephews and niece for their continuous support, love, blessing, and standing with
me in each obstacle.
Trailokya Raj Ojha
Tampere, April, 2014

iii
TABLE OF CONTENTS
Abstract ......................................................................................................................... i
Preface .......................................................................................................................... ii
Table of Contents ......................................................................................................... iii
List of Figures ............................................................................................................... v
Abbreviations .............................................................................................................. vi
1. Introduction........................................................................................................... 1
2. Key Performance Indicators .................................................................................. 4
2.1 Measurement and Metrics .............................................................................. 4
2.2 Motivations for measurement ........................................................................ 5
2.3 Key Performance Indicators .......................................................................... 6
2.3.1 Roles and Importance of measuring KPIs ......................................... 8
2.3.2 Applications of KPIs......................................................................... 9
2.4 SMART KPIs .............................................................................................. 10
3. Software Development and Software Development Process ................................ 12
3.1 Software development and its measurement................................................. 12
3.1.1 Needs for Software Measurement ................................................... 15
3.2 Software development and metrics .............................................................. 16
3.3 Software Analytics ...................................................................................... 18
3.4 Process Models for Software Development .................................................. 19
3.4.1 Ad-hoc programming model ........................................................... 20
3.4.2 Plan-Driven software development model ....................................... 21
3.4.3 Iterative change-driven software development model ...................... 22
3.5 Software Development Process improvement .............................................. 23
3.5.1 Capability Maturity Model Integration (CMMI) and KPIs .............. 24
3.5.2 Agile development measurements ................................................... 28
3.6 Key Performance Indicators for software ..................................................... 29
3.6.1 Challenges of developing software KPIs and their mitigation ........ 30
3.6.2 Software KPI perspectives .............................................................. 31
3.7 Commonly used KPIs for Software Development ........................................ 32
3.7.1 Schedule Adherence ....................................................................... 33
3.7.2 Task completion rate (TCR)............................................................ 33
3.7.3 Rework cost factor .......................................................................... 34
3.7.4 Cost Performance Index (CPI) ........................................................ 34
3.7.5 Fault slip through ............................................................................ 35
3.7.6 Customer Satisfaction ..................................................................... 36
3.7.7 Defect Rate ..................................................................................... 36
3.8 Proposed KPIs ............................................................................................. 37
3.8.1 Budget Adherence .......................................................................... 37
3.8.2 Effort Adherence ............................................................................ 37

iv
3.8.3 Schedule Performance Index (SPIn) ................................................ 38
3.8.4 On schedule start rate ...................................................................... 39
3.8.5 Extra time spent for implementation ............................................... 39
3.8.6 Average cost per bug ...................................................................... 39
3.8.7 Requirement change cost (RCC) factor .......................................... 40
4. Global Software Development............................................................................. 41
4.1 Definition .................................................................................................... 41
4.2 The GSD model ........................................................................................... 42
4.3 Challenges of GSD model ........................................................................... 44
4.4 Performance Improvement of GSD Project .................................................. 45
4.4.1 Improving GSD project performance using simulation .................... 46
4.4.2 An empirical study on GSD project performance ............................ 48
4.4.3 Discussion based on both studies .................................................... 50
4.5 Sample KPIs for GSD.................................................................................. 51
4.5.1 Work Dispersion ............................................................................. 51
4.5.2 Effort Adherence ............................................................................ 52
4.5.3 Defect Rate ..................................................................................... 53
4.5.4 Requirement change cost (RCC) factor ........................................... 53
5. Conclusions......................................................................................................... 55
5.1 Conclusion .................................................................................................. 55
5.2 Limitations .................................................................................................. 56
5.3 Future work ................................................................................................. 57
References .................................................................................................................. 58

v
LIST OF FIGURES
Figure 2.1 Onion analogy of Perfromance Measures .................................................... 7
Figure 3.1 Software development process measurement and improvement flow diagram
................................................................................................................................... 15
Figure 3.2 Paradigm of software analytics .................................................................. 18
Figure 3.3 Evolution of software development models ............................................... 20
Figure 3.4 Iterative change-driven software development model ................................. 22
Figure 3.5 Five-Levels of CMM model ...................................................................... 25
Figure 3.6 Three Critical Dimensions ......................................................................... 26
Figure 3.7 Three perspectives of KPIs ........................................................................ 32
Figure 4.1 Global Software Development (GSD) Model ............................................ 42
Figure 4.2 System flow diagram for in-house and GSD projects ................................. 47
Figure 4.3 Empirical Research Model ........................................................................ 48

vi
ABBREVIATIONS
Abbreviations Description
ACSI American Customer Satisfaction Index
BA British Airlines
CMMI Capability Maturity Model Integration
COCOMO Constructive Cost Model
CPI Cost Performance Index
DES Discrete Event Sub model
FP Function Point
FPE Function Point Estimation
GSD Global Software Development
GSE Global Software Engineering
I&V Integration and Verification
IE Interaction Effect
KLoC Kilo Lines of Code
KPI Key Performance Indicator
KRI Key Result Indicator
LoC Lines of Code
PI Performance Indicator
QA Quality Assurance
QMA Quality Management Approach
RCC Requirement Change Cost
RI Result Indicator
SCR Software Change Request
SD System Dynamics
SEI Software Engineering Institute
SPIn Schedule Performance Index
SPI Software Process Improvement
SQA Software Quality Assurance
SRGM Software Reliability Growth Model
TCR Task Completion Rate
TEE Task Effort Estimation
US United States
XP Extreme Programming

1
1. INTRODUCTION
The field of technology is growing rapidly and the pace of its growth has been exponen-
tial. Whatever the technology is, from a huge aircraft to a small calculator, some kind of
software is used. The major factors to be considered are correctness, usability, quality,
productivity, fit for purpose, and performance related issues of software. Choosing a
proper software development process helps to develop a well performing software. Se-
lection of software development process depends on the nature and complexity of the
problem. Productivity, quality, response time, and efficiency of software can be in-
creased by introducing a set of key performance indicators (KPIs). KPIs are quantifiable
measurements agreed on beforehand and KPIs reflect the success factor of an organiza-
tion.
Having a clearly defined set of goals is a key success factor for an organization.
Each company operates with their predefined set of goals. Only few companies can de-
fine their goals properly and could achieve desired performance level. To achieve or-
ganizational goal successfully, strong strategy need to be introduced [1]. In today’s sce-
nario, a set KPIs is used to achieve organizational goal and to increase performance
significantly. To be a successful and competitive company in today’s market, well de-
fined set of KPIs need to be implemented [1]. A set of proper KPIs helps to secure im-
portant competitive factors of the organization [1]. Few examples of such competitive
factors are; high performance, high quality, good service, delivery in time, low cost and
efficiency and effectiveness [2].
Since few decades, many research studies have been conducted about KPIs. The
positive effects of KPIs include the control over the schedule, cost, risks, and failures.
Successful implementation of KPIs also helps to increase productivity, quality, and re-
sponse time and reduce development cost of the software product. However, most of the
organizations fail to develop and implement proper set of KPIs. Performance measure-
ment of any system identifies the gap between desired and achieved performances. Cor-
rectly designed key performance indicators identify where the improvement is necessary
[3]. KPIs in software development are used to measure products and development proc-
esses to initialize product and process improvements based on the feedback from meas-
urements [4].
It is important to have clearly defined, unambiguous, effective and simple set of
KPIs to achieve goals. KPIs can be different according to the organization, type of pro-
jects they are performing, and their objectives. According to [1], a key performance
indicator should tell a story, represents a reduction or construction of reality and act as a
base to spin a story around. Same authors further argued that human resource is the
most critical resource for a successful business. While designing performance indicators
one should be aware of individual behaviour. KPIs should not affect negatively on the
behaviour of individuals participating in development team.

2
Earlier software development methods have been mainly focusing on the correctness
of software. These development methods were not aware of performance issues in the
development process. Along with the evolution of development models, performance
issues in software development process have been introduced. To address the perform-
ance issues in traditional software development methods, several new approaches have
been introduced mainly focusing in performance measurement. Performance measure-
ment of software development can be done by introducing relevant KPIs.
Currently, global software development (GSD) is one of the most attracting software
development approaches because of GSD’s benefits in different aspects such as; cost
reduction and availability of skilled manpower. GSD approach uses remotely located
development sites to perform the software development activities. In-house project per-
forms better compared to GSD projects. In-house software performs better in terms of
quality whereas, GSD in terms of cost. In GSD approach, this is caused due to less fre-
quent communication between cross-site workers, language barriers, time-zone and in-
tercultural issues. Improving the different factors such as; frequent communication,
proper development strategy and proper set of key performance indicators, cross-site
project can perform better than in-house project performance [5].
The main purpose of this thesis is to analyze different factors affecting software
productivity and to suggest proper set of key performance indicators. Moreover, produc-
tivity of software development process and GSD are also parts of thesis objectives. To
meet the goals, different research articles and their results have been studied, and ana-
lyzed. A set of KPIs for software development is recommended according to the find-
ings from different literatures. For GSD, data sets from two different studies have been
analyzed and based on the result obtained; a set of GSD KPIs is proposed. To write this
thesis, academic projects, books, articles, and literatures are taken as references. This
thesis provides an overall view of KPIs in software development.
By the end of this thesis, the reader will have an overall idea about key performance
indicators in software development. The reader will also get an idea about factors affect-
ing productivity, quality, cost, efficiency, and response time of software in different
aspects, importance of KPIs in performance improvement, and a proper set of KPIs in
each aspect.
The thesis comprises of five different chapters as summarized below.
Chapter 1 is an introduction itself and includes motivation and research objectives.
Chapter 2 provides the fundamentals of measurement, key performance indicators, and
importance and application area of KPIs. Chapter 3 provides the information about
software measurement, analytics, metrics and KPIs in software development. It also
introduces briefly about software KPI perspectives. Moreover, software KPIs develop-
ment risks and their mitigation are also described. This chapter also describes the
CMMI model and its effect on productivity, quality, efficiency, and response time of
software. Lastly, a set of sample KPIs for software development is recommended.

3
Chapter 4 provides detail information about global software development model and
related performance improvement technique. A set of sample KPIs for GSD is recom-
mended at the end of chapter 4. Finally, chapter 5 presents the conclusion, limitation
and future work.

4
2. KEY PERFORMANCE INDICATORS
Productivity measurement is an important activity in an organization. Measurement of
productivity identifies the gap between desired (or preplanned) performance and current
(or achieved) performance of a system or an organization. Correctly designed key
performance indicators help to identify where the improvement is necessary [3]. This
chapter introduces the measurement and its importance, key performance indicators,
needs and importance of key performance indicators and its applications. There are not
any specific steps to develop key performance indicators, but there are some general
guidelines. SMART KPIs is one of such guidelines for designing KPIs.
2.1 Measurement and Metrics
Measurement is the foundation for any scientific activities. Without measurement, it is
difficult to conclude what the system does and how efficient it is. According to [6], sci-
entific measurement is a “rule for assigning numbers to objects in such a way as to rep-
resent quantities of attributes.” Measurement can be of anything like size, weight, per-
formance or character. An attribute is a feature or property of the entity, such as the
weight, height or character of a person, functionality of the program code, or the dura-
tion of the lecture. Measurement “consists of rules for assigning symbols to objects so
as to (1) represent quantities of attributes numerically (scaling) or, (2) define whether
the objects fall in the same or different categories with respect to a given attribute (clas-
sification)” [7]. Attributes of the objects and events are the basic things to be measured.
The logic behind scientific measurement is that there is something to be measured, a
basic concept. Basic concept and its measurement are different things and can be distin-
guished with conceptual and operational definitions. A conceptual definition describes a
concept in terms of other concepts [6]. For example, the price fluctuation (up and down)
of any product, conceptually it is defined as price and fluctuation. An operational defini-
tion describes the operations that need to be performed to measure a concept [6].
Measurement result may not be same as expected result. The difference between
achieved (measured) output and expected output is called error. This error may occur
due to system defect or incorrect measurement methodology or some other factors. Thus
while performing the measurement; one should be aware of the possibility of deviation
in predefined and measured output. One priority should be set to achieve accurate and
consistent output throughout the measurement process.

5
Metrics are used to evaluate applications, projects, products, and processes, and they
enable a quantitative comparison with other products, processes, applications, and IT
projects.
Metrics are most often calculated from (basic) measures or their combinations and
are typically compared with a baseline or an expected result. Sometimes they are more
precisely called relative metrics since they bring absolute figures in a relation to each
other. Their actual and estimated values have to be measured incidentally and must be
documented on several aggregation levels to allow for drilling down into more detailed
data.
Process metrics is composed of data recordings and metrics analysis. Data recording
is an integration of data collection and validation. Whereas metrics analysis is
composed of data transformation, analysis and metrics decision making. During data
collection, there might be a chance of getting some invalid data. To avoid invalid data
for uniformity and accuracy of data, proper selection of data source, selection of
suitable data collection tool and development of standardized report is essential. Data
validation is an activity to monitor whether the data collection process executes
according to the plan and metrics activities are correct and meets requirements [31].
Data validation should guarantee validness and consistency of collected data.
Metrics analysis is used to compare the metrics outputs that has been transformed
with baseline parameters and decided whether it matches with predefined goal of
metrics or not. The result retrieved from process analysis becomes the reference for
process improvement. From metrics decision making process, responsible manager
knows where and what kind of problems are there in metrics. After identifying
problems, manager takes action for process improvement and make a new plan for the
next process. Decision analysis processing method is used for process improvement.
Finally new software process cycle is started with improved process metrics.
2.2 Motivations for measurement
All available parameters should not be measured rather ‘what is important’ should be
measured. Measurement team should be aware of the main objective of the measure-
ment process so that the measured output does not vary with required output. One
statement from a literature regarding the importance of measurement: “If you want to
improve something, you have to measure it” [13]. Without measurement, fact cannot be
identified and without fact, improvement is difficult.
According to [8], there are four main reasons to explain why measurement is neces-
sary: (1) making the most of limited resources, (2) improving decision making process,
(3) monitoring performance and providing feedback, and (4) learning and improving.
Making the most of limited resources
In some cases, resources are limited and may not meet all the requirements and de-
mands. Traditionally, in such cases available resource is allocated according to the pri-

6
orities. Increasing the resources can help to address the all requirements. “With limited
resources, public-sector managers have to spend better, i.e. secure better outcomes for
the same budget”[8]. Another desired characteristic is effectiveness. It answers the
question: ‘have the objectives for which resources were allocated been attained?’ Meas-
uring the results is the best way of answering this question. Effectiveness concerns
stakeholders as potential beneficiaries of policies. [8]
Improving decision making process
Measurement of performance highlights strengths and weaknesses, gives an idea of
the progress made over time and helps decision-makers to compare courses of action
and identify the most effective mechanisms [8]. From measurements, decision makers
come to know about the current status of the order. If the measurement shows
unexpected deviation in outcome, decision makers may change the strategy and take
appropriate action to keep the system in track.
Monitoring performance and providing feedback
Regular monitoring of the performance provides early warnings of actual or
potential problems. If measuring uncovers the problem, some alternative solution can be
found in time. Otherwise it may lead towards wrong interpretation. A set of measured
data at different stages of the development process provides the information about
performance and chance of occurrence of un unexpected result. Proper analysis of the
measured data gives an image of development progress, and a chance of occurrence of
risks. Proper feedback system helps to keep the development process in track leading
towards successful completion.
Learning and improving
Relevant and accurate measurement develops real knowledge about work, which
forms the foundation for real performance improvement. Accurate and timely measured
data becomes base for benchmarking, problem solving and justifications leading
towards improvement. Without systematic and continuous measurement and proper
analysis of measured data sets, system performance improvement is likely to be
impossible.
2.3 Key Performance Indicators
Key performance indicator (KPI) is a set of different measurements to keep track on the
organizational performance. Regular measurement of correctness, usability, quality,
productivity, fit for purpose, and performance related issues of a project helps to iden-
tify the status of the project. Identifying project status at different stage of development
helps to increase the organizational performance. Organizational performance is the
most important for its current and future success.
Key performance indicators suggest that what should we do to increase performance
significantly. Key Result Indicators (KRIs) tells how you have done and Performance

7
Indicators (PIs) tells you what to do but none of them tells you about what to do to
increase the performance dramatically [9]. These three performance measures (KRIs,
PIs and KPIs) are shown in an onion analogy in figure 2.1.
Whatever the key performance indicators are, they must be quantifiable and they
should consider the goals of the organization. KPIs should be flexible and need to
address changing goals of the organization. Goals change as the organisation changes in
reaction to external factors or as it gets closer to achieving its original goals. To be a
successful company in today’s modern society, it is important to have different
performance indicators that capture important competitive factors. Examples of
competitive factors are; high quality, good service, fast deliveries, low cost and so on
[2]. According to [10], ”key performance indicators are quantifiable measurements
agreed to beforehand, that reflect the critical success factor of an organization. They
will differ depending on the organization.”
A university can set key performance indicator on student graduation rate, sales
department of a company may focus on its sales rate, a software company focus on cost
and time spent to develop, quality, fit for purpose, cost, and response time of software.
Graduation rate, sales rate, cost of software, time spent, quality, fit for purpose, cost,
and response time; all of them are measurable.
Key performance indicators suggest what you need to do to increase productivity of
the organization against its goals. It should focus on strategic value of organization
rather than any non critical objectives. Each team is not necessarily required to know
about all KPIs but should be aware of those KPIs that correspond to their work. KPIs
are monitored in parallel to progress of the project in regular intervals so that one can
keep track on success and failure of the project. According to [11], ”key performance
indicators are quantitative and qualitative measures used to review the organization’s
KRIs
PIs and RIs
KPIs
Peel the skin to find PIs
Peel to the core to
find KPIs
Figure 2.1 Onion analogy of Perfromance Measures [9]

8
progress against its goals. These are broken down and set as targets for achievement by
departments and individuals.”
In this thesis, the definition given by [10] will be used. This definition states clearly
that KPIs should be quantifiable and measurable, should reflect the critical success
factor, and should be defined beforehand. All these parameters are necessary things to
be included while designing KPIs.
The general assumption is that KPIs are good for projects, process and team but not
suitable for individuals. It is because if individual performance is measured, individual
may try to show high KPIs showing high performance rather than actual results.
However, it is not impossible to calculate individuals KPIs. Individual performance is
calculated from the team performance and project outcome. KPIs of project, process and
team reflects the KPIs of individual. However it is not only the factor affecting
individual’s performance assessment; there are many other factors which directly affect
an individual’s performance. While designing KPIs designers need to be aware that
KPIs should not affect negatively on the behavior of individuals participating in the
team. Performance indicators can have motivating and de-motivating factors. These
factors depend on the metrics designed. Metrics is used as a motivating factor but not
for making teams morale down. Always focus on the goals rather than metrics. One
thing that might be considered to prevent exploiting KPIs is that KPIs can balance each
other. For instance, while a KPI measures the quality of the product another KPI may
assess development speed.
KPIs are monitored in very short and regular intervals. The shorter the measurement
interval, the more efficient the KPI is. Generally, KPIs are measured hourly, daily or in
some cases weekly. Monthly, quarterly or yearly measurement cannot be a KPI because
it cannot be a key to the business [9]. The measured KPIs should tell what action need
to take next. British Airlines (BA) ”Late plane KPI” can be taken as an example of
frequently measured KPI as described in section 2.3.2.
The thing that can not be measured, can not be managed and if it is not managed, we
do not measure it. To control on measure, it should be clear that what does key
performance indicators do exactly and for which system is it. To control on measure and
to meet the standard, KPIs can be designed following the SMART KPI rules as
explained in section 2.4.
2.3.1 Roles and Importance of measuring KPIs
To maintain quality, cost, time, and competitiveness, an organization should manage all
stakeholders such as; employees, process, activities and other hidden parts of the
business. System for effective measuring of performances is used to understand, adjust
and improve business in all department of the organization [12].
Performance measurement of an organization is the qualitative expression of results
by predefined performance indicators. Success of an organization is defined by the
result obtained from its performance measurement. This result can also be used to make

9
future development strategies. Selection of proper KPIs for performance measurement
and performance appraisal is the most important activities for finding success rate of
organization. All information obtained from measurements is useful for business
representation, but the critical one is used to represent whole organizational business.
Besides all above explained functions, other performance indicator functions are:
Developing and guiding function- develop base for formulation and implementation
of the strategy.
Motivation function- assure management to get the target (fulfill goals) and
motivates stakeholders to realize goals in higher level [14].
KPIs can be financial and non-financial indicators. Organization can use them to test
how successful are these indicators to achieve goals. KPIs are static and stable
indicators that carry more meaning when comparing information. KPIs help to focus
individuals on the organizational goal and his/her job by keeping emotions away.
Keeping individuals focused on their jobs helps to clarify their roles and responsibilities
and minimizes stress and confusion throughout the team. Moreover, helps to maintain a
happier working environment and to be more efficient. It makes easier to both parties
(management and employee) to agree on personal growth, skill development and wages
increment being based on factual information from KPI.
2.3.2 Applications of KPIs
Following example illustrates the applications of key performance indicators, where
organizational success factor is drastically increased just considering on one indicator.
Example 1: British Airlines (BA) ”Late plane KPI”
This example concerns a senior BA officer, who takes an initiation to improve
British Airways (BA) in 1980 concentrating in one KPI. BA ”Late plane KPI” is a KPI
used to measure the delay time of each BA planes. The system was set so that if a BA
plane was delayed with quantifiable threshold period, the officer was informed no
matter wherever he was around the world [9]. If any BA plane was delayed beyond a
threshold period, the BA manager at the relevant airport receives a personal call from
BA official. BA late plane KPI established an instant communication mechanism to all
related personnel to recover the lost time as agreed in beforehand. Instant
communication mechanism was set between manager, ground crew, traffic controller,
flight attendants, and liaison officer. If departure/arrival time and flight delay time was
not measured frequently, they might fail to get exact information about each flight and
could not be able to improve the system to fly in time. Implementation of ”late plane
KPI” helped to improve the critical success factor of BA by reducing the bad impression
about planes not leaving on time.
According to [9], late plane KPI addressed and improved in:

10
Cost in airport surcharges, passenger accommodation for overnight because of
planes being “curfewed” due to noise restrictions late at night.
Customer’s dissatisfaction.
Contributed more to ozone depletion (environmental impact) as additional fuel
was used in order to make up time during the flight.
Negative impact on staff development as they learned to replicate the bad habits
that created late planes.
Adversely affected supplier relationship and servicing schedules resulting in
poor service quality.
Employee dissatisfaction, as they were constantly “firefighting” and dealing
with frustrated customers.
From this example, one can see how KPI plays role to improve the organizational
success.
2.4 SMART KPIs
SMART KPI is not a KPI but is a guideline for designing any key performance
indicators. Key performance indicators are used to keep track on the performance of an
organization, a process, a product or even an individual showing how these things are
performing against their goal. KPIs need to be related with the organizational goals and
act accordingly.
SMART KPI is the a term which is used to describe the most relevant key
performance indicators being used in any organization. These are key factors for
improving performance [15]. All KPIs developed based on SMART KPI are able to
measure the performance of the organization, system or process efficiently. The term
SMART stands for-
S- Specific
M- Measurable
A - Achievable
R- Relevant
T- Timely
Specific
Key performance indicators should be specific to the individual task, process,
functional area or objective and should be explained very clearly. KPI should explain
clearly to the individual or team what he/she or the team should do in terms of
performance to success. In general, KPI should task specific and should be explained
clearly.
Measurable
KPIs need to be measurable in terms of different aspects of the task. They should be
designed so that team or individual get feedback on their performance regarding the task
they are performing. Non measurable things can not be key performance indicators.

11
Achievable
KPIs should be realistically achievable. KPI should be easy to understand and need
to set so that it is easy to meet the goals. Hyphothetical and impossible things should not
be included while designing KPIs.
Relevant
The KPI must give more insight in the performance of the organization in obtaining
its strategy. If a KPI does not measure a part of the strategy, acting on it does not affect
the organizations’ performance. Therefore, an irrelevant KPI is useless.
Timely
KPIs should have appropriate standard time frame. Lately developed projects do not
get significant meaning and it does not improve software product and organizational
performance.

12
3. SOFTWARE DEVELOPMENT AND SOFTWARE
DEVELOPMENT PROCESS
Since past few decades, productivity, quality, efficiency, fit for purpose, cost, and re-
sponse time of software are placed in centre point in software development. Such pa-
rameters can be monitored, measured and improved by introducing a set of KPIs. Un-
fortunately, there is not any exact key or rule to develop and implement key perform-
ance indicators. However, there are some common practices which seem best in most of
the organizations. One of such KPI development guideline is SMART KPIs.
Along with software development, number of research studies have been started to
integrate performance analysis into the software development process. Earlier software
development methods have the main focus on correctness of software. Later on, along
with evolution of software development practice, performance related issues have been
placed in centre point. Several new models have been introduced to address the per-
formance related issues in traditional software development models. The newly intro-
duced models have the main focus in performance measurement by introducing relevant
KPIs [16]. KPIs can be for any stage of the development process, some can be for the
whole process. This chapter deals with the different aspects of software development
and software development process. Finally, a set of sample KPIs for software develop-
ment is explained.
3.1 Software development and its measurement
A measurement is an indication of the size, quantity, amount or dimension of a particu-
lar attribute of a product or process. For example, the number of errors in the system is a
measurement. Software metrics is different than software measurement. Metrics is a
quantitative measure of the degree to which a system, component, or process possesses
a given attribute. For example, the number of errors per person day would be a metric.
Software measurements give rise to software metrics. [17]
Due to the very nature of software engineering, measurement is necessary because
careful planning, monitoring, and controlling methods are needed. In the absence of
those methods, risk for software failure may exceed and it may not be controlled by the
development team and industry [18]. Measuring the software and software development
process are essential for improving the software engineering practice. Software meas-
urement should identify and measure non-trivial characteristics related to software qual-
ity. It must provide answers to the problems defined [19]. Measurement in any software
organization helps to realize the business value of the organization. It is hard to predict

13
for any software organization operating at its optimum performance without knowing
their current state and goal [20]. “Software measurement is the approach to control and
manage the software process and to track and improve its performance”[20]. According
to [21], software engineering measurements should place more emphasis on the validity
of the mathematical (and statistical) tools which have been (and are currently) used in
their development.
The best practice to access and improve the software development process is its
measurement that means by measuring the time duration, faults, failure, cost and effort
[22]. Measurement results obtained from previous software projects in a similar context
helps to design a prediction model for future projects. According to [23], a software
measurement process is a systematic method of measuring, assessing, and adjusting the
software development process using objective data. Within such a systematic approach,
data is collected based on known or anticipated development issues, concerns, ques-
tions, or needs. The data are analyzed with respect to the characteristics of the software
development process and products, and used to assess progress, quality, and perform-
ance throughout the development.
Measurement is an important part of software development. Measurement helps to
understand the software development progress. Measurement is also useful to analyze
and evaluate the development process. Like physics, there is not any generalized system
of measurement for software. However, heuristic rules, the general trends, expertise,
prediction and analogous conclusion are used as software measurement system. Soft-
ware measurement cannot be concluded with measurement values, physical analogy and
thresholds. It is a generic analytic process.
Because of the human involvement in software development, some measurement
aspects are closer to social science than natural science. The nature of measurement
being closer to social and natural sciences might lead towards facing many challenges.
Solving such challenges may need inventive ideas from other fields.
Numbers of models have been proposed for software process measurement. Many of
them are parameterized with the important features of the process to be measured [24].
Parameters are extracted from collected data sets of the process and are used to compute
metrics. From these metrics, one can find the useful information for process controlling.
Software Reliability Growth Model (SRGM) is one of the most popular processes for
software reliability testing [25]. This model shows the relationship between testing time
and the number of faults found during that time frame. Testing time and number of
faults found are the parameters for the SRGM model. These parameters are evaluated
based on the test report prepared by the test team. Thus, SRGM provides useful infor-
mation like number of residual defects in the software [24].
The software process measurement model to define and collect process metrics was
first described by [24]. The author has defined the model in Petri nets; the model is en-
acted and allowed for automatic measurement of process data. The downside of this
model is that it could neither be applicable to express structure and statics relationships
nor to model complex systems [26].

14
One of the best practices to measure software development process is to represent
the process as a mathematical model and to define its metrics. Representation of soft-
ware development process in the mathematical model helps to identify the relationship
between the process and corresponding features. There are numbers of metrics defined
for software development process. For example, Cyclomatic Number is one. Cyclomatic
Number is a graph based metrics following graph theory. It is compatible with all pro-
gramming languages to convert code in terms of graph theory. [24]
The basic concept of software measurement relies on entity (objects), relationship
between entities and their attributes. An entity in the software might be a program
(code), an action such as designing or developing or even occurring in certain specific
time. The relationship between entities helps to relate each other and attributes are the
properties of specific entities (for example in a software program; size, speed of execu-
tion, reusability, maintainability).
Measurement and analysis of measured data helps us in:
Characterizing software product and actual code written, resources used and
environment.
Evaluating the software product, its code and other factors against plan.
To improve productivity of software by identifying the root cause, ineffi-
ciencies and barriers.
Software development process can be measured with the flow diagram shown in
figure 3.1. Firstly, team involved in software development selects proper development
process model, then makes a plan or estimation according to the requirements and re-
sources available. After establishing baseline estimations, process is implemented in
real field and different performance factors are measured accordingly. Measured data
are analyzed against planning, if the measurement meets the requirement, development
process is completed and accepted. Otherwise need to check whether the process needs
to be changed or not? If the process needs to be changed, a new process is implemented
otherwise; planning or estimation needs to be reviewed.
Software measurement is used to measures the efficiency, productivity, complexity,
quality, speed and other features of the software and software development process.

15
Figure 3.1 Software development process measurement and improvement flow diagram
3.1.1 Needs for Software Measurement
Without measurement, it is likely impossible to achieve significant improvement, but
the use of measurement as part of an improvement strategy grants broader benefits [27].
Software measurement helps to increase quality, productivity, and customer satisfaction.
To maintain product quality, development time and cost, it is necessary to establish a
common platform to specify, accept and develop a software product with pre-agreed
standard. For which one need to establish measurement system to check the quality and
standard of the product. Measurement of the software is necessary to understand and
establish a general agreement on the product quality.
Software measurement makes easy to understand “what I need to improve” rather
“what measurement should I use!” [20]. Software measurement helps management team
to make an important decision at different stages of the software development. It also
helps to identify how the improvement is done and what needs to be improved. Soft-
ware measurement indicates the successfulness of the software. Measurement helps to
keep track on the goal and plans according to the activities performing by team. Success
of the software is determined and measured by the degree of software project and its

16
portfolio in the top line (for example revenue) and bottom line (for example profit and
loss) [20].
Software measurement in different perspectives helps to visualize the productivity,
correctness, quality and other factors for software development. Measurement is used to
predict future progress and improvements, and to redefine several factors such as cost
schedule, and objective in case of necessity.
3.2 Software development and metrics
A software metrics has a long history as software engineering. Software metrics is in-
troduced to address the quality problem in early indicators such as KRIs and PIs. It is
used to measure the properties of software and reflects the software development effort
towards the priorities of user. Initially measuring the size of software with LoC (lines of
code) or KLoC (kilo lines of code) and defect count were used as a software metrics.
However, the drawback of using LoC or KLoC to measure the size of the program in
terms of effort, complexity and functionality was realized later. It was also realized to
have more discriminating measurements to cope with a diversity of programming lan-
guages. Finally, the LoC measure in assembly languages and high-level languages is
distinguished in terms of effort, complexity and functionality.
A Metric is a measurement of the degree that any attribute belongs to a system,
product or process. For example, the number of errors per person hours would be a met-
ric [17]. Thus, software measurements give rise to software metrics. According to [28],
“Software metrics is the term used to describe the wide range of activities concerned
with measurement in software engineering. These activities range from producing num-
bers that characterize properties of software code (these are the classic software `met-
rics') through to models that help predict software resource requirements and software
quality. The subject also includes the quantitative aspects of quality control and assur-
ance - and this covers activities like recording and monitoring defects during develop-
ment and testing.”
“Software metrics deals with the measurement of the software product and the proc-
ess by which it is developed.” [29]
Software metrics can be classified in terms of product and process metrics. Product
metrics measures the software continuously in development lifecycle. It may measure
the size and complexity of program code or the size of the document produced. On the
other side, process metrics measures the different indicators such as development time,
success or failure of methodology used in the development process. In addition software
metrics can also be categorized as primitive or computed metrics and subjective or ob-
jective metrics.
Most of the software metrics are defined by individuals and tested in a limited envi-
ronment (especially in their own environment). It works in that environment but if it is
tested in a different environment it may fail to provide unexpected result. These differ-
ences are not surprising in view of the lack of clear definitions and testable hypothesis

17
[29]. If LoC is a software metrics, it can be best suited for the assembly programming
languages where for every simple thing, programmer should write code. However, it
may not suite for high level language where most of the code is auto generated.
Software product metrics can be measured according to their functionality as; crit i-
cal code, coverage, summary, maintainability and reusability. Moreover, the types of
product metrics for these measures are token, control flow, composite and system met-
rics. A metrics calculated by counting tokens in the source code of a system, program or
program unit is known as token metrics. The metrics based on the qualitative analysis of
control graph of the program is called control flow metrics. A hybrid metrics that
combine control flow metrics with token metrics in order to overcome the weaknesses
of simple metrics is known as composite metrics. A metrics that measures the large-
scale properties of a system, usually the quality of a system design is known as system
metrics. System metrics are considered the most useful because they can be extracted
during an early phase of a project, system design, and hence are capable of predicting
more. [30]
Process management is the core and essential activity in modern software
development process for software quality assurance. It plays a vital role in software
process management and capability assessment [31]. Software process metrics relates to
the development process, standards and methods and activities. It consists of the team,
resource metrics, management metrics, defect metrics, and progress metrics.
Process metrics is a series of activities carried on by many roles according to the
plan under certain constraint condition [32]. Therefore, process metrics itself is a
process [31]. The constraints of software process metrics are manifested as the
resources to implement process metrics, among these human resources is the most
important resource [31]. Software process metrics is used for process improvement. Its
output can be used as a guideline for the next step activities. Various documents in a
different stage could be the result of software process metrics. Such documents are;
project status report, assessment report and state summary report.
One of the common metrics in earlier days to measure software size was Lines of
Code (LoC). Number of lines of code depends on the programming language in which
the software is programmed. One software programmed in a high-level language can
have a larger size in terms of LoC than one programmed in a low-level language. Codes
are auto generated in high-level programming language, but that does not happen in a
low-level language. In this case, KLoC may not be the proper magnitude to compare the
size of the software. Counting function point can be a proper way to measure software
size in such case. Function point is independent of programming language, but this
method is complex and requires more effort. To cope with the above mentioned
problems, realization of effort required might be one proper way to size the software.
Effort requirement is dependent on various factors like work environment, experience,
technology, tools, and methods used. Therefore, choosing a method to measure software
size depends upon the situation, nature of software, and programming languages.

18
Careful consideration on software metrics makes easy to develop a set of KPIs for
software. “Remember to use metrics as a motivating force and not for beating down a
team's morale. Keep the focus on the goals, not the metrics” [33]. “The right metrics can
help you to make sure your teams are on track to achieve goals and provide a good
return on your investment in them” [33]. From software metrics analysis, organization
can take action to identify and fix the software defects. Measurement should be on
behalf of the organization to boost up organizational strategy and metrics should be
visible, providing necessary milestones upon which to make the strategy [33].
3.3 Software Analytics
Software measurement and metrics are low-level measures compared to software ana-
lytics [67]. The role of software analytics is to use quantitative skills and domain
knowledge to combine many types of quantitative and qualitative information and from
the most complete insight. The relationship between software measurement, metrics and
analytics is shown in figure 3.2. Measurement is about ‘what?’ metrics is about ‘how
much?’ and analytics is about ‘why?’. Software measurement and metrics are necessary
to achieve software analytics. [67]
Figure 3.2 Paradigm of software analytics [67]
The objective of software analytics is to obtain insightful and actionable information
from software artefacts to help software practitioners accomplish their target tasks
around software systems, software users, and software development process [34]. Such

19
tasks include performance problem identification, choosing the best test case and know-
ing about product features. Target is best described by intuitive information that can be
drawn from a collection of raw data with analytical technologies. Software analytics
helps decision makers to extract important information from available data sets. Data
sets play a vital role in software analytics because it contains a huge amount of informa-
tion.
Software analytics focuses three major stakeholders of software such as software
system, developers and end users. Software engineers and analytics involved in soft-
ware development process have a common interest to improve quality, productivity,
response time and cost. Software quality deals with security, reliability, usability and
performance. The primary technologies employed by software analytics include large-
scale computing (to handle large-scale datasets), analysis algorithms in machine learn-
ing, data mining and pattern recognition (to analyze data), and information visualization
(to help with data analysis and presenting insights) [34].
Software analytics should be real time and actionable; they should include action-
able advice. If something is happening in any system or a scenario, analytics action
should be taken instantly. Actionable analytics must work in real time and should be
faster than the rate of change of effects in a project [35]. Analytics decision should be
made based on current data rather than old ones. Old data might not have complete in-
formation, some information might not be collected in those data or there might be
some parameters changed.
Data to be analyzed by software analytics are collected from source code, require-
ment specification, test reports and end-user feedback. Collected data are analyzed by
software analytics to get insightful information about various aspects of software. Such
information is useful to understand the software quality, services, knowledge towards
task performance and dynamics of software development.
3.4 Process Models for Software Development
Main purpose of software development process model is to “determine the order of the
stages involved in software development and evolution and to establish the transition of
criteria for progressing from one stage to the next” [36]. There have been proposed dif-
ferent software development models depending on the complexity and nature of prob-
lems. Software development models started from ad-hoc programming leading towards
traditional plan-driven models and then towards iterative change-driven software devel-
opment [37]. Specifically, ad-hoc programming approach includes code-and-fix model
and stage wise model. Plan-driven approach includes incremental model, waterfall
model, evolutionary model, spiral model and V-model. Similarly, iterative change-
driven approach includes agile software development model. The evolution of software
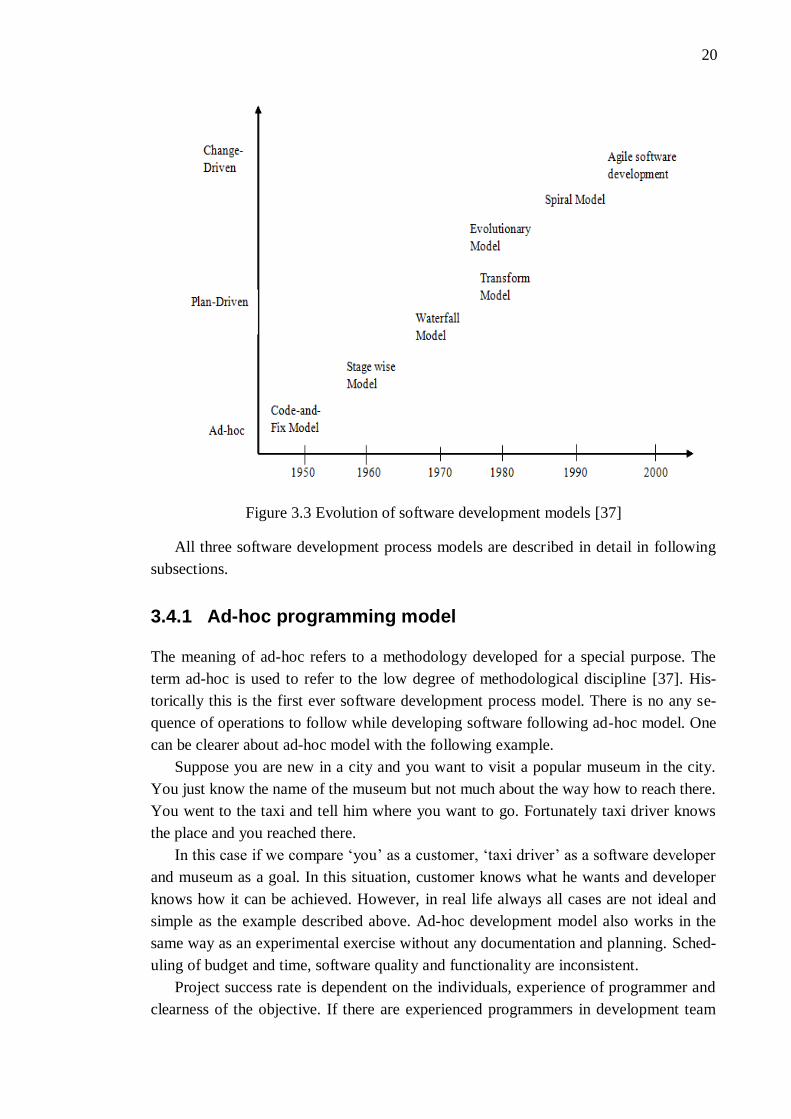
development models is shown in figure 3.3.
20
Figure 3.3 Evolution of software development models [37]
All three software development process models are described in detail in following
subsections.
3.4.1 Ad-hoc programming model
The meaning of ad-hoc refers to a methodology developed for a special purpose. The
term ad-hoc is used to refer to the low degree of methodological discipline [37]. His-
torically this is the first ever software development process model. There is no any se-
quence of operations to follow while developing software following ad-hoc model. One
can be clearer about ad-hoc model with the following example.
Suppose you are new in a city and you want to visit a popular museum in the city.
You just know the name of the museum but not much about the way how to reach there.
You went to the taxi and tell him where you want to go. Fortunately taxi driver knows
the place and you reached there.
In this case if we compare ‘you’ as a customer, ‘taxi driver’ as a software developer
and museum as a goal. In this situation, customer knows what he wants and developer
knows how it can be achieved. However, in real life always all cases are not ideal and
simple as the example described above. Ad-hoc development model also works in the
same way as an experimental exercise without any documentation and planning. Sched-
uling of budget and time, software quality and functionality are inconsistent.
Project success rate is dependent on the individuals, experience of programmer and
clearness of the objective. If there are experienced programmers in development team

21
and customer is clear about his need, ad-hoc model can be successful. Otherwise, this
model could not give a good software product.
3.4.2 Plan-Driven software development model
Plan driven approach of software development is more formal and specific approach. In
this model all desired properties of the end product (objectives) should be clarified and
clearly stated before the development process starts. Plan-driven approaches have been
defined as document-driven, code-driven and traditional process models [36]. Plan-
driven software development approach mainly focuses on defining the cost, schedule
and scope of the project with documentation. Instead of starting coding directly as in the
early software development practices, different phases of the development process have
been introduced in this approach. Particularly, need to design prior to coding, need to
define and analyze requirements prior to designing, and need to make test plan before
testing and modification were identified [36].
A software engineering seminar held in Germany in 1968 by NATO Science com-
mittee [38] made key recommendations for standardization of software development
process. Seminar recommended to emphasis in cost, quality and development practice.
Few years later after this seminar, in 1970, W. Royce develop the initial version of the
waterfall model. Waterfall model provided two major advantages over stepwise model.
Such advantages are: introducing the prototype parallel to the requirement analysis and
design stage and feedback loop between the sequential stages [36]. These days waterfall
model is being used in such cases where requirements are clearly stated beforehand.
The varied version of the waterfall model with improvements is called V-model.
Different phases of the V-model are similar to that of the waterfall model. However,
such phases are oriented in V shape. In this model Implementation (coding) is placed in
the intersection part of the model, requirement identification, analysis and design are
placed in the left part of the V shape where as verification and testing are placed in the
right part of the V shape. This model demonstrates the relationship between each devel-
opment phases and corresponding testing. V model is simple and easy to use and most
important thing is that defects are found in early stage so that it can be saved from wast-
ing time and money.
According to [36], waterfall model works well for those software products where in-
teractive user interface is not important part. Same author further argues that, if the
software needs to have interactive user interface, waterfall model may fail. It is because,
user interface design is highly subjective part and customers rarely understand the re-
quirements well. As an outcome, “document-driven standards have pushed many
projects to elaborate specifications of poorly understood user interfaces and decision-
support functions, followed by the design and development of large quantities of
unusable code" [36].
The spiral model of the software process is a risk driven process model with com-
bined advantages of both top-down and bottom-up concepts. This model combines the

22
features of both waterfall and prototyping models. Software development may face
many risks such as requirement changes, loss of key personnel, cost overrun, lack of
time, technology unawareness. To overcome this problem, unlike other models, spiral
model performs risk analysis at every stage of development. The spiral model follows
the same sequence of steps following risk identification in each iteration. Risk identifi-
cation in every iteration helps to be prepared for upcoming risks and finding a solution
to mitigate possible risks.
The basic idea behind plan driven software development model is not to accept
changes during development. However, affecting factors can be fixed during the proc-
ess. If it is necessary to make a change during development, model can be used dynami-
cally with repetitions in some specific phase(s) or entire process.
3.4.3 Iterative change-driven software development model
A software development model with multiple sequential iterations is called an iterative
change-driven model. Each iteration follows the same set of activities; requirement
analysis, design, development and testing to get software prototype. Iteration is contin-
ued until the final version as per the customer requirement is developed. A prototype
released after iterations is defined as a stable, integrated and partially complete system
[39]. New features and functionalities added to each prototype to get the final version of
the product. The main use of an iterative change-driven model is for careful analysis of
requirements, design, development and testing and verification of each prototype
against requirements in each cycle. Iterative change-driven model is shown in figure
3.4.
Figure 3.4 Iterative change-driven software development model
In agile software development model, each development cycle is referred as iteration or
sprint. Currently, agile development methodology is considered as an iterative change-

23
driven model but the history of iterative change driven model is considerably longer
[37]. It seems that many of the early developed software development models also fol-
lowing iterative model, but the only difference is that how prototype is evolved (either
with formal interaction with clients or not).
Spiral model developed by Boehm [36], is also an iterative change driven model
with four phases in each iteration such as; (1) determine objectives, alternatives and
constraints, (2) evaluate alternatives, identify and resolve risks, (3) develop, verify the
next-level product and (4) plan the next phase. As spiral model is risk-driven model, it
follows the iteration according to the risk. It allows adoption of any kind combination of
other software development process models as per demand.
Agile software development model is an iterative and incremental development
model. Major activities like requirement identification and verification are done in di-
rect coordination between clients and development team. While implementing agile
software development, each project needs to be handled differently and need to be fitted
to address the requirements. In agile practice, self motivated and well organized teams
are in a key role. Such teams are responsible for delivering a working prototype in each
cycle of software development. Extreme programming (XP) is one of the best known
agile practices.
3.5 Software Development Process improvement
“Many software-engineering organizations today want to improve their software-
development processes to improve product quality and development-team productivity
and reduce product development time, thereby increase competitiveness and profitabil-
ity”[40]. The first step to addressing software problem is to treat entire software devel-
opment related tasks as a single process which can be measured, controlled and im-
proved [41]. Improvement of software development process helps to maintain balance
between time, cost and quality of software. However, most of the companies fail to
identify the key factor (key performance indicators) affecting the performance of the
development process. A wide variety of methods, such as, configuration management,
defect prevention, function point analysis, quality function deployment, software quality
assurance (SQA), software-reliability engineering, and total quality management, usu-
ally puts project managers in dilemma to choose the proper method in proper time [40].
The motivation of software process improvement is a result of a competitive market,
customer’s demand well performing software product and to make substantial profit
margin. Process improvement approach is not applied without studying the current per-
formance and status of the development process. Once performance and status of the
software development process is studied, either process improvement approach is ap-
plied or development process is changed. Most often, improvement approach is applied
rather than changing the existing process till it is possible to improve. “The selection
and successful implementation of improvements depend on many variables, such as the

24
current process maturity, skill base, organization, and business issues such as cost, risk,
and implementation speed” [40].
To improve software productivity, quality, efficiency, and response time of soft-
ware) in noticeable amount and to find the barriers of the performance improvement,
any software development organization need to keep track on:
(i) Current status of the software development process.
(ii) Designing a model of the desired process.
(iii) List the process improvement actions according to priority.
(iv) Make a plan to execute these actions.
(v) Commit the resources to execute the plan.
Management team involved improving software development process comes to be
clear about the areas where improvement is needed and what KPIs need to be designed
to improve productivity, quality, efficiency, and response time of software.
Once the loophole for performance decrement is identified (step 1), one can devise a
process improvement model (step 2) by analyzing problems and requirements. Thereaf-
ter one can prepare a set of KPIs for the software development process (step 3) accord-
ing to the priority objectives. Once it is succeeded to design KPIs, only their proper im-
plementation is needed. To implement KPIs for software development process im-
provement often requires significant investment in training and effort.
3.5.1 Capability Maturity Model Integration (CMMI) and KPIs
The Capability Maturity Model (CMM) was originally developed and published in
1988 by Watts Humphrey at Software Engineering Institute (SEI). Primary aim of the
CMM is to assist United States (US) department of Defence in software related activi-
ties. One year earlier, SEI released a framework briefly describing the process maturity.
“It described an evolutionary software development process improvement path from an
ad-hoc, immature process to a mature, disciplined process”[42]. According to [41],
software project processes are depicted on five-level system as shown in figure 3.5. Ba-
sic principle behind software process improvement is to identify whether the develop-
ment process is under statistical control or not, if yes, it performs well, otherwise it is
not possible until it comes under statistical control [41].
Capability Maturity Model Integration (CMMI) is the successor of CMM model.
According to SEI [43], CMMI helps to "integrate traditionally separate organizational
functions, set process improvement goals and priorities, provide guidance for quality
processes, and provide a point of reference for appraising current processes."
“CMMI is an application of the principles introduced almost a century ago to this
never ending cycle of process improvement”[44]. CMMI is a proven performance man-
agement approach with many successful results showing that it works. CMMI helps to
organizations for increased productivity and quality, improved cycle time, and more
accurate and predictable schedules and budgets.

25
Figure 3.5 Five-Levels of CMM model [41]
Productivity, quality, efficiency, response time, and sped of the software product is
observed by individuals participated in the software development activities. It is desir-
able to integrate a range of success aspects while considering project performance [42].
Software engineering and organizational factors need to be considered to increase pro-
ductivity, quality, efficiency, and response time of software. Software engineering fac-
tors are efficiency and effectiveness. Organizational factors are control, communication,
and organizational knowledge. Efficiency is measured by the software quality, opera-
tional cost, time and budget. Effectiveness is measured by applicability and adaptability
of the software product [42].
There are several dimensions an organization can focus for software process im-
provement. Typically an organization focuses on three critical dimensions. Such critical
dimensions are; procedure and methods, people and tools and equipments. Critical di-
mensions that organization focuses are shown in figure 3.6.
The CMMI model provides two methods (1) continuous representation and (2)
staged representation of the software process improvement. These methods are also
called model representations [45]. Continuous representation and staged representation
approached are associated with capability levels and maturity levels of CMMI
respectively. Using the continuous representation enables you to achieve “capability
levels” and using the staged representation enables you to achieve “maturity levels”
[44].

26
Figure 3.6 Three Critical Dimensions [45]
Continuous Representation
Continuous representation uses capability levels to characterize the state of the
organization’s processes relative to an individual process area [44]. Continuous
representation helps an organization to evaluate each process areas individually.
Continuous representation allows identifying and focusing on trouble spots and
measuring improvement progress on a finer-grained scale [45]. In individual process
area, capability levels are used to measure the improvement path from an unperformed
process to an optimizing process. These levels are means for incrementally improving
the process corresponding to a given process area [44].
The CMMI’s six capability levels are as shown in table 3.1.
Table 3.1 CMMI Capability Levels
Index Capability Level
0 Icomplete
1 Performed
2 Managed
3 Defined
4 Quantitatively Managed
5 Optimizing

27
Staged Representation
The staged representation uses maturity levels to characterize the overall state of the
organization’s processes relative to the model as a whole [44]. It is less detailed than the
continuous representation, but it provides a higher-level view of the entire organization,
and a simple, straightforward, easily understandable label, with more direct commercial
implications [45]. Staged representation provides the standardized measure of process
maturity level. Maturity levels apply to an organization’s process improvement
achievement across multiple process areas. These levels are means of improving the
processes corresponding to a given set of process areas [44].
The CMMI five maturity levels are shown in table 3.2.
Table 3.2 CMMI maturity levels
Index Maturity Level
1 Initial
2 Managed
3 Defined
4 Quantitatively Managed
5 Optimizing
Software process improvement (SPI) helps to improve the software productivity
significantly. Implementation of CMMI model is one means of software process im-
provement. Software improvement can be achieved by focusing on different fields of
software development. Some of the fields are; selecting proficient employee, process
standardization, adequate documentation, continuous quality measurement and their
controlling, and introducing basic project management processes. Implementation of
CMMI model helps project managers to understand and control the software product
quality very closely. Managerial activities refer to the manager’s strategy to motivate
employees to act according to the organizational strategy, procedure and goals. Control
activities refer to the defining and documenting the task assignment, defining the way of
work being done, defining standards and performance guidelines, and defining the proc-
esses.
A survey conducted by [46] in 61 software companies gives an important conclusion
that software process maturity be closely associated with improved software product
performance. A similar case study conducted by [47] for Hughes Aircraft indicates that
organizations implementing CMM model achieves higher software quality, higher de-
velopment productivity and, faster cycle time. The results achieved from these studies
indicate that, it is one of the best options to implement CMM model to achieve higher
software quality and to achieve significant improvement in productivity.

28
CMMI model focuses on “what to do” approach rather “how to do” approach. Team
members can include “how to do” approach to carry out tasks assigned to them without
modifying “what to do.”
3.5.2 Agile development measurements
Team is a key in agile software development process; most of the measurements in agile
methodology are team centric and related to the working process of teams [4]. Measur-
ing different aspects (such as people, team, task and quality) of software development
process facilitate project managers to control and understand the development process
[48].
Practically, individuals might not spend whole working time on assigned work.
They may spend some time on meetings, phone calls, emails, coffee and so on, that’s
why real effective working time should be taken in account. From effective working
time, individual’s performance factor can be calculated. Considering this factor, a man-
ager can design a team to execute the project. Manager can assign the task according to
individual’s ability to execute tasks. If someone is unable to perform according to
his/her performance factor due to some reason; manager could be able to identify this by
looking individual’s performance factor and can try to fix it [48]. Project manager can
make an accurate plan by examining team’s performance factor. Task related KPIs can
help to visualize the project progress and estimated time left to complete the project. If
the measurements show productivity relative to plan, it is not necessary to take any ac-
tion and to modify anything within the team. However, if there is an unexpected delay,
it lowers the business value and needs re-planning for rest of the user stories [48]. It is
easy to figure out which iteration is taking more time and which iteration has more de-
fects.
Quality is one of the most important factors of software and needs to be maintained
throughout the development process. To improve the quality of the software product,
careful testing and bug fixing is necessary. Identifying and fixing the bugs according to
criticality, fixing bugs reported by client in time helps to grow software quality.
Few metrics to manage software project being developed under agile software
development process are described below [49].
1. Defect -free stories delivered
Each user stories contain unique functionality and customer needs same fea-
ture in the software as they explained in the story. Each user stories should
be delivered without any defect. Otherwise, it is not counted as successfully
delivered story.
2. Customer satisfaction
Satisfying the customer by delivering them well performing product is a goal
for agile software development team. Customer satisfaction can be measured
by making a scale of satisfaction level and asking them to fill their satisfac-

29
tion level. Satisfaction scale can be made in any way like scaling from 0 to 5
or 0 to 10 or any other, main thing is that you should be able to understand
their satisfaction level.
3. Consistent velocity
Velocity should remain constant throughout iterations. If there is a small de-
viation in velocity after some iteration, it signals that there is something go-
ing wrong. If velocity deviation is not maintained as constant, it causes soft-
ware failure.
A set of key performance indicators in agile software development model can be
listed according to the different aspects.
Person: Individual total effort, remaining effort, weekly or monthly working hours,
effectiveness and total available hours.
Team: Total available working hours, team effectiveness, total remaining working
hours, capacity, team task completion rate and team velocity.
Task: Total available task, number of completed tasks, average task effort (in hours),
remaining task effort, successful software delivery rate.
Quality: total reported bugs, total unique confirmed bugs, number of severe bugs,
solved number of bugs, effort spent in bug fixing (in hours), bug fixing rate, test success
rate and test failure rate.
3.6 Key Performance Indicators for software
Software development organizations implement measurement as their daily
management and technical activity. Software measurements help to track the
information regarding software productivity, quality, speed, fit for purpose, and
response time. Software measurement gives rise to software metrics. Metrics should be
available to all the members of development team. Specially metrics should be available
for managers to make decisions and as evidence for future use. In order to keep software
development in track, in parallel to objectives, it is necessary to define a set of KPIs.
Some KPIs in the set are applicable for specific software development phases and some
for whole software development lifecycle [50]. Same author argues that, in successful
software organizations, measurement-derived information is treated as an important
resource and is made available to decision makers throughout all levels of management.
Having many KPI is neither practical nor efficient but there should be enough KPIs to
measure the software productivity, quality, speed, fit for purpose, and response time.
Software KPIs are significant high level measures during software development and
are used by decision makers to identify achievement towards goals. KPIs are based on
the primitives from software metric that are directly measured. Some metric primitives
are function point estimation (FPE), task effort estimation (TEE), bug severity, actual
task effort, and bug fixing.

30
For example, ”Defect Rate” is a most commonly used KPI in software companies.
For this KPI, one needs to measure defects, design metrics and then KPI can be
measured. The measurement for defect rate can be number of defects per man day (the
number of errors in some specific days). Similarly a metrics is the degree of occurance
of defects per man day (average errors per man day). A KPI is the defect rate. The
relationship between software measurement, metrics and KPIs can be expressed as in
figure 3.2. In this figure the KPI lies in the innermost two layers.
Key performance indicators are quantifiable measurements [10], non measurable
indicators can not be KPIs for software. Same author further argued that, KPIs should
always be measurable and they should reflect the critical success factor of the software.
Non measurable KPIs could not provide the factual information. Sufficient
measurements are recorded in whole life cycle of software development. These
measurements are complex in nature and software metrics translates it into simple
indicators known as KPIs. According [10], KPIs are derived from measurement metrics
and obviously are measurable and reflects the success factor of software. KPIs differ
according to the organization and nature and criticality of software projects.
3.6.1 Challenges of developing software KPIs and their
mitigation
Design and implementation of good KPIs seems easy. Practically there are several
challenges while implementing measurement related results specially like KPIs. As
described in [51], some of the such challenges in software companies are as described
following sub sections.
1. Lack of historical data
Availability of previously measured metrics helps to focus on specific prob-
lem and to design proper set of KPIs. Without historical data it is hard to get
efficient and effective KPIs.
Lack of historical data is a severe risk which needs to be reduced. This
risk can be neutralized by defining KPI perspectives clearly and minutely. A
KPI perspective allows individuals to understand each element of KPI per-
spectives clearly. After defining KPI perspective, we need to capture data
according to the defined perspective elements.
2. Various data source
To develop accurate, effective, and efficient KPI, multiple sources of data
and multiple numbers of data collection methods are necessary. For example
if there was not any similar project in past or if there are limited number of
data collection methods. This makes hard to predict the nature of data and
misleads the design of KPIs. Some example of multiple data sources are:

31
similar past projects, project plan, quality assurance (QA) reports, and test
reports.
To minimize this risk, either we can buy some software company KPI
tools or we can collect data manually or we can build it in own software
firm. Selection of any option among these three depends upon the size of the
team. If development team is small then first option is suitable. If develop-
ment team is large then we need to go through second or third option.
3. Wrong measurement
It is already described that sufficient and accurate data help to design accu-
rate KPIs. If wrong data are measured from different data source, it can nev-
er lead towards design of successful KPIs.
This is not a severe risk because wrong measurement can be controlled
by regular monitoring and evaluation. Normally, in manual work this mis-
take occurs, but this can be controlled if individuals are sincere towards their
work.
3.6.2 Software KPI perspectives
Key performance indicators play an inevitable role for software performance
measurement and it needs to be analyzed from a different point of view. Because of the
different nature of software and organizations, there are not universal key performance
indicators. Software KPIs are especially drawn from three perspective as described
below [51]. The three Software KPI perspectives are shown in figure 3.7.
1. Quality
2. Innovation
3. Effort
Quality
Quality is the most important perspective. Quality needs to be maintained in whole
software development lifecycle. In this perspective, the main issues to be focused are
(1) number of issues per project or per sprint, (2) number of critical issues found (3)
average time required to resolve each issue, and (4) number of test cases per project and
documentation.
Number of issues per project is the ratio between the new issues appeared versus
issues those are resolved. This ratio helps to track whether the number of problems is
reducing or increasing. Analyzing the quality helps the development team to identify
issue generating processes and technologies.
Finding the critical issues helps to identify where the project is facing most
significant problems and require instant action. Such critical issues need to be fixed
instantly otherwise they may cause software failure.

32
Effort
Man month for a project is a major effort estimation unit. The best practice in each
software project to estimate effort is to estimate man month for a specific task and the
entire project. This gives an estimated number of human resource required per project
per amount of time.
Innovation
Impovement and enhancement according to different specific areas of software and
top enhancers of the project should be kept in mind for quality, efficient and effective
software product. This idea helps to identify which area of the software requires most
work and cost which needs less. Along with the enhancement, who is the most active
and dynamic person in enhancement can also be monitored. This helps for calculating
individual performance reviews.
Figure 3.7 Three perspectives of KPIs [51]
3.7 Commonly used KPIs for Software Development
In order to follow the productivity, quality, efficiency, and response time of software
development process, one needs to define a set of KPIs. In this section, the KPIs
suggested from different literatures are dscribed.

33
3.7.1 Schedule Adherence
It is the measure of the deviation between planned and actual delivery time. Planned
delivery time is the predefined (before starting actual implementation) product delivery
time and actual delivery time is the date in which some intermediate version of the
product or final version of the product is delivered to the customer. This KPI provides
the information about how well the project is performing against its schedule. The de-
viation between the planned schedule and actual time used to complete the software
development is the actual schedule adherence.
According to [50], schedule adherence can be calculated with the following formula.
Where,
ActualTime = Actual finish date-planned start date and
PlannedTime = Planned start date-planned finish date.
The best possible schedule adherence is 100% that can be achieved using equation 3.1.
Different software development process model may require a varied amount of time
to complete the same project. If requirements are predefined and not changing in the
future, waterfall model takes less time to complete compared to other software devel-
opment models resulting better schedule accuracy. On the other hand, if requirements
are changeable in the future, evolutionary software development model can provide
better schedule accuracy than a waterfall model. Schedule adherence helps to select
suitable software development process model in future for a similar problem.
If schedule adherence is calculated task wise and there is not planned start time for
intermediate tasks, earliest planned start time can be used [50].
This KPI helps to estimate the schedule for upcoming similar projects and software
development process, if there are any.
3.7.2 Task completion rate (TCR)
This KPI helps to measure successful completion rate of tasks assigned to employees. A
task is said to be successfully completed if and only if it fulfils all the predefined re-
quirements. TCR of similar past projects developed with same development process
helps to better estimate for new projects.
TCR can be calculated by dividing the number of employees who have successfully
completed the assigned task by total number of employees performing on tasks [52].
TCR can also be calculated as the ratio between the number of successfully com-
pleted tasks and the total number of tasks. This can be calculated as:

34
For example, if 9 out of 10 employees completed task successfully, its TCR would
be 9/10, that is 90%.
More than 75% TCR is acceptable and 100% TCR is the best achievement [52].
However, in reality, TCR target depends upon the priority, nature, complexity, and cost
of the tasks. If tasks are critical and cost expensive, higher TCR is required.
3.7.3 Rework cost factor
When software does not perform according to requirements, rework is needed. Rework
refers to detecting and fixing infected part, phase, or process of the software develop-
ment. Rework cost factor KPI shows a cost factor by which rework is needed in soft-
ware development process to complete the software project successfully. Rework cost
depends upon the nature of defects and expertise available for the task performance.
Rework cost factor is the ratio between total rework costs within a process versus actual
cost to complete the process [52]. This ratio can be shown as:
Where, total rework cost within a process is a total cost used to fix (rework) the
wrongly done tasks. As described in [52], total rework cost within a process can be cal-
culated by adding all costs while reworking, such as, hourly rework wages, resource
usage cost and other if any.
In addition of calculating rework cost factor, this KPI can also be used to visualize
overall productivity, quality, efficiency, and response time of software.
3.7.4 Cost Performance Index (CPI)
Cost is one of the most important factors for software project success and need to be
measured at different stages of the project development. Some stage of software devel-
opment might demand more expense than expected. In such case, reasons for the more
cost demanding need to be identified and solved. Otherwise, until project completion, it
might exceed the cost dramatically.
CPI helps to identify whether the software project is behind or ahead the schedule in
terms of cost until some specific time. Simply this KPI shows the actual cost of work
done so far and remaining cost of work to be completed [53]. CPI is helpful to measure
the efficiency of the budget spent in the project for specific time period.
CPI is the ratio between estimated costs of work performed versus actual cost of the
work performed. CPI can be calculated using following formula.

35
Where,
Estimate cost of work performed is the preplanned budget to complete particular
task of the project. Actual cost of work performed is the actual amount of budget spent
to complete particular task of the project.
If CPI is less than one, it means the actual cost to complete particular task is higher
than the planned cost for it. Moreover, this indicates that at current state project is not
successful in terms of budget. If CPI is greater than one, it means the actual cost spent
to complete the task is less than the planned cost for it. Moreover, this indicates that at
current state project is successful in terms of budget.
For example, budgeted cost for the project is €50,000. Project is supposed to be
completed in 5 months. After monthly review of the first month, it was found that 15%
of the project has been completed with the total cost of €9,000. However, initially it was
planned that 20% of the project needs to be completed in one month. Let’s see how CPI
shows project performance.
After calculation, CPI found to be 0.83 which is less than 1. It shows that at current
state project is not successful in terms of budget.
3.7.5 Fault slip through
The most important task before software delivery is to perform its testing in different
stages. Customers always want to get a bug free product which will perform properly
without providing any unwanted results. Different types of software testing help to
minimize faults in software product and increases productivity, quality, efficiency, and
response time of software.
Fault slip through KPI measures the supplier’s ability to capture faults before
making deliveries to I&V(integration and verification) [50]. This KPI should be
implemented keeping in mind that (i) clients can perform functional testing and they
might found faults and (ii) external organization may conduct I&V testing.
Fault report is prepared by identifying the functional mismatch between functional
testing and integration and verification test report. Fault reports are analyzed to get the
best result (0% fault). Fault slip through can be calculated as shown in equation (3.6)
[50].
Faults are classified according to the functional testing and/or integration and
verification testing rather than the person who perform testing [50]. Fault reports which
do not contain true faults (duplicated, canceled or rejected) are ignored. Fault reports
that contain minor faults not affecting the major objective of the software are also
ignored.

36
3.7.6 Customer Satisfaction
Customers are key stakeholders for software development. Customers make profit to the
business. It is important to keep track about customer satisfaction level in software
delivered to them. If customers are satisfied with the product and service provided by
product, they may associate with business for long term. If they are satisfied with the
product, they can recommend to others also.
This KPI measures the level of customer satisfaction towards software product
developed for them. This KPI provides answer for: whether the software developed
satisfies all features and requirement? are customers happy with the services provided
by software? Customer satisfaction on software developed depends on the quality, user
friendly, easy to use, availability, timely delivery and performance.
One of the commonly used customer satisfaction measure is American Customer
Satisfaction Index (ACSI) [54]. To calculate this index, we need to carry out a survey
among customers using the software. Customer satisfaction, expectancy and
performance of the product versus customer ideal need to be measured in the scale of 1
(lowest) to 10 (highest). This index can be calculated using following formula.
Where,
’Sat’ refers to the satisfactory; ’Exp’ refers to the expectancy, and ’Per’ refers to the
performance. 100% is the best possible achievement.
3.7.7 Defect Rate
Software defect is a flaw in any software product which causes software to perform in
an unexpected way and results an unexpected output. From the user point of view, soft-
ware defect is the failure of the software to perform task as expected by user. In soft-
ware engineering practice, software defect rate is calculated to identify the quality of
software being developed by the organization.
Software defect rate is the numbers of defects over the opportunities for error during
the specific time frame [65]. Software defects lead towards software failure. Software
defect rate can be calculated as the ratio of the number of defects versus software size
[66]. Software size is measured either in term of thousand lines of code (KLoC) or func-
tion points (FP).
Best possible result for defect rate is 0% and can be calculated using equation (3.8).
Defect rate can be calculated task wise, development site wise or project wise. This
KPI helps to predict the average defect rate in a similar future software projects. Identi-

37
fying the reasons for occurrence of defects in present project helps to minimize the de-
fects in similar future projects.
3.8 Proposed KPIs
KPIs can be designed according to the software development process being used and the
nature of software being developed. One way of categorizing KPIs is according to the
KPI perspectives. In this section a set of KPIs is proposed based on the KPI
perspectives.
3.8.1 Budget Adherence
Budget Adherence KPI is used to measure the deviation in amount (money) of the
estimated budget. It is the difference between estimated budget and actual budget
required to complete software development. Variance can be positive or negative
depending upon the actual expense of the budget to complete project and estimated
budget. If the variance is close to zero, it is treated as a good estimation. Budget
deviation can be calculated by using following formula.
The best possible budget adherence is 0 (zero). It means there is no deviation in
planned budget.
Developing same software in different software development process may need var-
ied amount of budget resulting in different budget deviation. This KPI helps to observe
the cost variation over some time interval within specific software development process.
It also provides the information about budget needed to complete a similar project in
different software development process. If software development process needs to be
selected on the basis of budget deviation, budget adherence can be a suitable KPI to
select the proper software development process.
3.8.2 Effort Adherence
Effort adherence is the measure of the deviation in estimated effort to complete software
development. When someone thinks about software development, careful effort estima-
tion is necessary. Effort in software development includes the work done in various
stages (from problem identification to installation) of development by individuals in-
volved in software development process.
This KPI helps to identify how much less or more effort is (deviation) used to
complete the software development. Effort adherence KPI also measures the software
company’s ability to successfully complete software development process with commit-
ted amount of effort. Effort adherence can be calculated as:

38
The best possible result for effort adherence is 100%.
ActualEffort is the actual amount of efforts spent to successfully complete the soft-
ware development process. PlannedEffort is the estimated amount of effort to success-
fully complete the software development process.
Different software development process model may require a varied amount of ef-
forts to complete the same project. If requirements are predefined and not changing in
the future, waterfall model takes less effort and time to complete compared to other
software development models. On the other hand, if requirements are changeable in the
future, evolutionary software development model can provide a better result than water-
fall model.
This KPI is useful for understanding the variance in estimated and actual effort. It also
helps to estimate future similar projects.
3.8.3 Schedule Performance Index (SPIn)
Proper scheduling of the tasks and activities helps to estimate the completion time of the
project. Task performance according to schedule leads project to successful completion
and delivery of the project in time.
Schedule performance index (SPIn) KPI helps to get information about whether the
project development is behind or ahead the schedule. SPIn shows how efficiently time is
used to complete the project relative to the plan. SPIn can be calculated by comparing
what have been completed in particular time frame and what need to be completed. It is
the measure of achieved progress compared to the plan. SPIn indicates how efficient the
project is in terms of time.
SPIn is the ratio between estimated amounts of work performed versus the actual
amount of the work performed. SPIn can be calculated using the following formula.
Earned value is estimated time to complete particular task of the project. Actual cost
of work performed is the actual amount of time spent to complete particular task of the
project.
If SPIn is less than one, it means the actual time spent to complete certain task is
greater than the planned time for it. Moreover, this indicates that at current state project
is not successful in terms of schedule. If SPIn is greater than one, it means the actual
time spent to complete the task is less than the planned time for it. Also, this indicates
that at current state project is successful in terms of schedule.

39
3.8.4 On schedule start rate
Starting project on planned schedule helps to complete and deliver the project in time.
In addition, it helps to improve the software quality and customer satisfaction. Early
started projects may need fewer budgets than late started ones.
This KPI is the ratio between numbers of tasks started in time relative to those start-
ed lately. This KPI helps to identify the rate at which project tasks are starting beyond
the planned start time. On schedule start rate can be calculated as:
where,
Number of tasks started beyond planned start time is the total number of tasks
started after planned time. Number of tasks started in a planned time is the total number
of tasks started according to the planned time.
If on schedule start rate is greater than 1, it indicates good project performance. If on
schedule start rate is less than 1, it indicates that the project has more tasks starting later
than planned start time and this is obviously not god performance.
3.8.5 Extra time spent for implementation
Every software development team needs to make a plan to complete development in
time. Sometimes they may fail to meet the target and time runs out of estimation. Im-
plementation delay may occur due to different reasons such as; unclear design, lack of
technology, and lack of knowledge towards technology.
This KPI helps to minimize the extra time used in the implementation in future simi-
lar projects. It is similar to schedule adherence KPI. Number of extra months spent for
the implementation is the difference between implementation completed time and esti-
mated implementation completion time. Number of extra months spent for implementa-
tion can be calculated using following formula.
This KPI helps to find a variation in planned and actual implementation completion
time. Minimum possible best result for this KPI is less than or equal to 0. If the result is
zero, it means no deviation in implementation time. If the result is less than 0, there is
positive deviation that means implementation is completed earlier than planned date.
3.8.6 Average cost per bug
This KPI measures the average cost spent to fix a bug. Average cost per bug is the ratio
between total maintenance costs related to the number of bugs fixed. Measuring average

40
cost per bug helps to estimate and compare resource productivity in certain time frame.
Cost per bug can be calculated using following formula.
It helps to predict total maintenance cost and the average cost in bug fixing for similar
future projects.
3.8.7 Requirement change cost (RCC) factor
RCC factor KPI is used to identify the cost to address the changed requirements. As a
KPI, requirement change cost factor measures the increase or decrease in project cost.
The value for requirement change cost factor KPI is expressed in percentage and can be
calculated using following formula.
This KPI helps to predict the average cost per requirement change in similar future
projects.

41
4. GLOBAL SOFTWARE DEVELOPMENT
Over a decade ago, many software companies started software development in distrib-
uted environment [55]. The aim of globalization is to explore low costs, minimizing
local IT skill scarcity, access to the large range of skilled experts and to remain focused
on core competencies. Current days, many research studies have been conducted in
GSD. Main focus of studies is towards understanding the factors supporting to establish
virtual workplaces. In this chapter, we will discuss GSD model, factors affecting global
software development, consequences of two different research studies and few sample
examples of KPI used in GSD.
4.1 Definition
Developing software in distributed environment is known as global software develop-
ment (GSD) approach. In GSD, development sites are scattered around the world [55].
GSD has a number of benefits such as low development cost and availability of skilled
manpower. According to [55][56], benefits of GSD approach includes:
Availability of a large amount of experienced experts in the field.
Low salary expense (salary range, for example, in South-Asian market is less
than that in European and American market).
Time zone effectiveness: Having development teams located in different time
zones can allow organizations to increase the daily working hours in “follow-
the-sun” development model decreasing cycle time.
Virtual teams are created in GSD to utilize the resource and to start project devel-
opment at various parts of the world [57]. Due to a number of benefits, GSD is good
choice for software companies [58]. A well designed team based organization can ex-
pect better problem solving, better productivity and better resource utilization [59].
According to [60], Global Software Development (GSD) is also known as Global
Software Engineering (GSE). Same author defines GSD as “Software work undertaken
at geographically separated locations across national boundaries in a coordinated fash-
ion involving real time or asynchronous interaction.”
In GSD, both parties (organization and employee) get benefits. Organization gets
skilled employees around the world and employee gets the job at their own place. Ex-
perts involved in particular distributed projects can contribute from different part of the
world to various teams located in a different location. GSD model allows teams to work
independently. However, sometimes distributed teams need to coordinate for certain
activities. Carefully designed teams have always better tendency to understand prob-

42
lems and ideas to solve it. Carefully designed GSD teams can plan for high quality
products, increased creativity, and innovation. When critical resources are inaccessible
(especially critical information), even well organized teams fail to meet their objective.
Inaccessibility to the critical information might occur in GSD due to various affecting
factors of GSD. This leads organizations towards creating virtual teams. In virtual team
workers can act independently without direct and face to face communication.
If the main focus is cost reduction rather than increasing quality and efficiency,
GSD is suitable software development approach. Otherwise, if the major concern is in
quality, efficiency and productivity than cost reduction, GSD might not be best choice.
In such case, in-house software development approach is suitable.
4.2 The GSD model
GSD also follows the basic software development stages. In GSD model, in case of
large projects, different tasks are assigned to different remote development sites. In the
case of a small project (in size) or large remote development site (in terms of number of
developers), projects can be assigned to a single site. In GSD approach, task division
among remote development sites depends on organizational strategy.
The commonly used GSD model is shown in figure 4.1.
Figure 4.1 Global Software Development (GSD) Model [61]

43
This model contains mainly three subcomponents named as Discrete-event (DES), Sys-
tem Dynamics (SD), and Interaction Effect (IE). Each sub model has their different
functional areas and result they provide.
Discrete-event sub-model (DES)
DES provides the ability to explicitly represent the process structure and mechanisms
used to transfer work products and to coordinate activities. Discrete-event simulation
can capture actual process level details, and the ability to represent each work product
of the development process as being unique through the use of attributes attached to
each work product, such as size and complexity. [61]
Site specific DES sub models for each development sites and global DES sub model
combines to form overall DES model. Site specific DES provides the information about
distribution overhead and distribution effort loss [61]. Global DSE sub model gathers
information from all site specific DSE sub model. Moreover, it provides information
about the project status and project progress.
System Dynamics sub-model (SD)
SD sub-model monitors and controls the project progress. This sub model is also re-
sponsible for monitoring and identifying workforce required meeting the overall project
schedule. [61]
Site specific SD model and global SD model combines to form overall SD model
for GSD. Site specific SD model is responsible for providing information on different
aspects such as, human resource activities, manpower allocation, quality control and
productivity of the project in each site [61]. Project progress status, factors affecting
progress (if any), planning and controlling other activities in its sub models are the main
responsibility of SD sub model.
Interaction Effect sub-model (IE)
The IE sub model calculates the coordination efficiency of a distributed team (relative
to the coordination efficiency of the single-site team), and then applies the coordination
effect to the productivity before sending it to the DES sub-model. [61]
Interaction Effect (IE) sub model is responsible for capturing fundamental and or-
ganizational factors. IE sub model fascinates the coordination and interaction between
workers from different sites. Productivity and defect rate related information can be
shared with SD sub model, if the workers are from same development site [61]. If
workers are from different sites, IE sub model processes the productivity before sending
to DES sub model.
The GSD model shown in figure 4.1 contains two development sites. However, if
there are more than two remote sites, we can add them too, in parallel with available
two sites. The number of remote development sites is not limited in this model.

44
4.3 Challenges of GSD model
In GSD practice, stakeholders from different countries, language and culture are in-
volved in software development tasks. This may cause the possibility of miscommuni-
cation and misunderstanding during software development process. Experts from the
field have realized that working in GSD is more challenging than managing the most
complex project developed in the same site [62]. Some of the challenges in GSD are
described in this section.
1. Socio-cultural issues
In any software development team, it is necessary to have continuous and
adequate communication to understand the task. In GSD, it requires close
cooperation between individuals of different cultural background [55]. Cul-
tural difference may occur in many dimensions such as way of communica-
tion, cultural and social values, language and the way to behave with others
[55][62]. These factors may cause misunderstanding between individuals
who are not known face to face and are from different culture and society.
Cultural differences also cause communication problems. In some society,
there might be direct and straight communication culture, which might seem
rude way of communication to someone from different cultural background.
2. Lack of Communication
Frequent communication is necessary for software development activities.
Especially, early stage of software development needs adequate communica-
tion between individuals involved in the development process to understand
the problem statement, requirement specification and their own task
[55][22]. Unclear and informal communication leads to increased project
time. In single site software development practice, frequent communication
is possible, in fact, it happens. In contrast of same site software development,
the frequency of communication drops off drastically as the physical separa-
tion increases [58]. In a study of engineering organizations by T. Allen, it is
stated that, physical distance between team members negatively affects the
amount of communication [58]. Furthermore, he argued that, when engi-
neers’ offices were about 30 meters or more apart, the frequency of commu-
nication dropped to nearly the same level as they are many miles away. This
problem occurs frequently in software organizations as distance increases.
3. Strategic issues
To conduct large project in GSD, whole project is divided into independent
tasks and assigned to different remote workstations. However, task assign-
ment across the remote sites is not easy. Task assignment depends upon the
available resources, experts, technology and infrastructure at the site [55].
Another issue in implementing GSD is that, individuals might be afraid of

45
the possibility of relocating and need of extensive travelling [55]. Address-
ing these issues is one of the significant challenges for the organization.
4. Technical issues
A software development organization cannot work with the same tools and
technologies for a long time. Tools and technology need to be changed with
time. Sometimes decision for change in tools and techniques from governing
body might causes problems in different remote working sites. It is because;
many staffs in remote working site might not be familiar with new tools and
techniques. They may need training for new tools and techniques. This may
take long time and lead towards delay in project delivery.
5. Project management issues
Managing project in GSD is one of the challenging tasks. There are a num-
ber of development teams in many GSD sites. Each team in the site has its
own tasks to perform. While integrating the code, it becomes difficult to
manage the project. Especially when teams share process between sites, lack
of synchronization particularly can be critical, for example, development and
testing teams located in different sites might have possibility of defining unit
tested code differently [55]. “Synchronization requires commonly defined
milestones and clear entry and exit criteria”[55]. Best GSD project manage-
ment always consider about the socio-cultural diversity and its impact on
project.
GSD challenges can be minimized by introducing related KPIs to address them. Above
mentioned challenges can be minimized by introducing a KPI as described in the sec-
tion 4.5.1.
4.4 Performance Improvement of GSD Project
The global software development practice causes the negative impact on project per-
formance even in high process maturity environments [5][56]. In GSD model, there is
less frequent communication between cross site workers. Less frequent communication
and coordination between cross-sites cause a decrease in developer’s performance.
These negative effects of GSD can be neutralized with its several positive effects. One
important benefit of GSD approach is; no overlapped working time in different devel-
opment sites. This happens due to different time zone. As a result, longer working hours
per day can be achieved. If GSD team could become able to establish proper develop-
ment strategy and proper set of key performance indicators, cross-site project perform-
ance can be better than in-house project performance [5].
In GSD, the major factors affecting the project performance are communication fre-
quency, language barriers, time-zone, and intercultural factors. Sometimes these factors
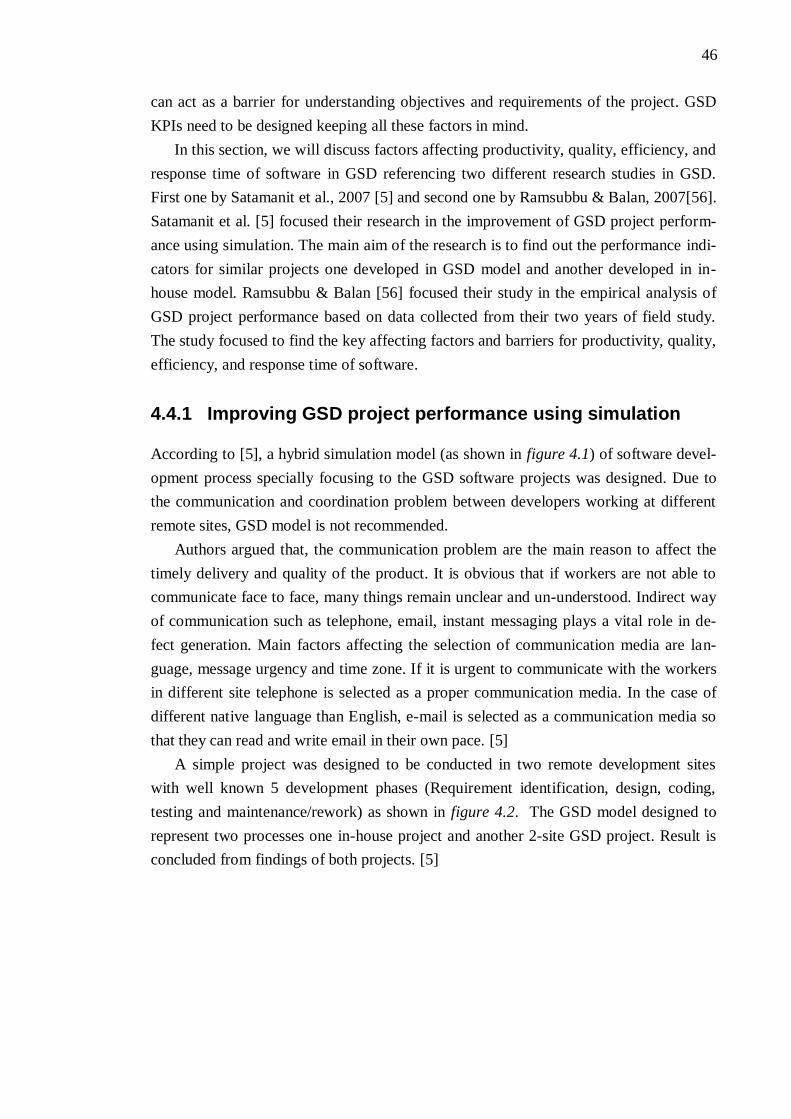
46
can act as a barrier for understanding objectives and requirements of the project. GSD
KPIs need to be designed keeping all these factors in mind.
In this section, we will discuss factors affecting productivity, quality, efficiency, and
response time of software in GSD referencing two different research studies in GSD.
First one by Satamanit et al., 2007 [5] and second one by Ramsubbu & Balan, 2007[56].
Satamanit et al. [5] focused their research in the improvement of GSD project perform-
ance using simulation. The main aim of the research is to find out the performance indi-
cators for similar projects one developed in GSD model and another developed in in-
house model. Ramsubbu & Balan [56] focused their study in the empirical analysis of
GSD project performance based on data collected from their two years of field study.
The study focused to find the key affecting factors and barriers for productivity, quality,
efficiency, and response time of software.
4.4.1 Improving GSD project performance using simulation
According to [5], a hybrid simulation model (as shown in figure 4.1) of software devel-
opment process specially focusing to the GSD software projects was designed. Due to
the communication and coordination problem between developers working at different
remote sites, GSD model is not recommended.
Authors argued that, the communication problem are the main reason to affect the
timely delivery and quality of the product. It is obvious that if workers are not able to
communicate face to face, many things remain unclear and un-understood. Indirect way
of communication such as telephone, email, instant messaging plays a vital role in de-
fect generation. Main factors affecting the selection of communication media are lan-
guage, message urgency and time zone. If it is urgent to communicate with the workers
in different site telephone is selected as a proper communication media. In the case of
different native language than English, e-mail is selected as a communication media so
that they can read and write email in their own pace. [5]
A simple project was designed to be conducted in two remote development sites
with well known 5 development phases (Requirement identification, design, coding,
testing and maintenance/rework) as shown in figure 4.2. The GSD model designed to
represent two processes one in-house project and another 2-site GSD project. Result is
concluded from findings of both projects. [5]

47
Figure 4.2 System flow diagram for in-house and GSD projects [5]
Software projects in both environments, after running 30 different configurations
(we can say 30 samples), three parameters (effort, duration and defects) were recorded.
The parameter effort used is the total number of hours spent to develop a project in both
environments separately. The parameter duration is the time span in days used to com-
plete the project. Latent defect is the cumulative number of defects in the software
product in both environments. From recorded metrics, mean is calculated to compare
the performance. Processed data are shown in table 4.1.
Table 4.1: Performance comparison between in-house and GSD project [5]
Strategy Effort in hours Duration in days Latent defects
Mean Mean Mean
In-house 7118.70 181.13 82.16
GSD 12,162.38 278.21 197.80
Difference
(%)
70.9% 53.6% 140.8%
Comparison result shows that the in-house project performed much better than the
GSD project with 70.9% less effort, 53.6% less time and very good quality with 140.8%
fewer defects. From this calculation, it was concluded that GSD project has poor per-
formance than in-house project performance. From above mentioned results, it clearly
shows that the software development in GSD model has significantly high effort and
defects. From this result, GSD model cannot be recommended.
Model was re-designed in an optimistic way that is assuming GSD as in-house
model. In this improved model, communication infrastructure was improved, clear
documents (problem statements, design) were provided by reducing the knowledge
transfer time, communication frequency was improved and frequent meeting as in same
site development was arranged. Each parameter affecting the GSD model were im-
proved and set as in-house development practice. After re-setting all affecting parame-
ters, both (GSD and in-house) projects were run again to see the performance improve-
ment. Results are shown in table 4.2.

48
Table 4.2: Performance comparison between in-house and improved GSD project [5]
Strategy Effort in hours Duration in days Latent defects
Mean Mean Mean
In-house 7,118.70 181.13 82.16
GSD 7,527.77 175.71 175.55
Difference
(%)
5.7% -3.0% 113.7%
From this result set, we can see that effort spent (only 5.7% higher than in-house)
and time duration to complete (3 % less than in-house). The project is significantly im-
proved, but the quality (defect rate) is still worse. If the labour cost in remote sites is
comparatively lower than the in-house (single site) model, on the basis of effort and
duration GSD model can be recommended. If the quality is the primary consideration,
GSD approach cannot be recommended. In the second case, it was called best GSD
model by fixing the parameters as in-house model, even though the quality is in nega-
tive side. From this measurement, it can be said that GSD projects always lags quality
than in-house projects.
4.4.2 An empirical study on GSD project performance
Ramsubbu & Balan [56] designed a framework for their study based on the economic
view of software development. They designed a research model including factors affect-
ing software development and related project performance indicators. To understand the
development process in detail and to model the factors affecting project performance
and software development, they introduce few control variables. The model used by
[56] in their research study is shown in figure 4.3.
Figure 4.3 Empirical Research Model [56]
”The claimed benefits of being dispersed and reported obstacles in managing global
teams raise a question of cost benefit analysis when dispersing project teams and

49
activities. Understanding the influence of dispersion on project outcomes is crucial to
support decisions making on adopting a “going-global” strategy in new projects and
improving performance of ongoing projects [64].” Work dispersion describes how dis-
tributed the projects development process is [56]. The same authors further argued that,
the work dispersion between development sites can be calculated using Herfindahl-
Hirschman Index - a well tested and widely used measurement index. Herfindahl-
Hirschman Index measures how expanded or diverse a company is. Work dispersion
can be calculated using equation (4.1) [56]. Work dispersion is measured as unit less
quantity.
Work dispersion and quality management approaches (QMA) were treated as factors
affecting the software development. The authors [56] used related key performance in-
dicators to define quality of software in terms of development productivity and confor-
mance quality. Development productivity is the ratio of software size in function points
and total effort in hours. Total effort is the total hour spent in the project development
from starting phase till handing over the project to the customer. Conformance quality is
the measure of the number of different and unique errors detected by customers during
the acceptance test before software delivery. As the number of defects increases, soft-
ware quality decreases accordingly.
After setting the research model, different parameters for forty two (42) completed
projects were recorded. Duration of the observation was for two years and it was in the
same software company. All the projects were developed in well known GSD model.
During the period of two years, one of the researchers was present in the site continu-
ously. Data collection also included few interviews from high level managers to the
developers.
After getting actual data set, regression analysis was performed on the observed data
set and different perspectives of results were discussed. Some major effects and results
are stated below.
Firstly, development productivity is negatively affected by the work dispersion,
even in high process maturity. From the graphs plotted in [56], it shows an exponential
decrease in productivity as dispersion increases. On the other hand, it is seen that dis-
persion does not affect the quality significantly. The analysis suggested that, if we ex-
pect to increase the quality we need to compromise in productivity. Moreover, if we
expect high productivity we need to compromise in quality. Both parameters have a
reciprocal relationship.
Secondly, investment in quality management approaches (QMA) minimizes signifi-
cantly the effect of work dispersion in project performance. From the graph in [56],
productivity loss was decreased dramatically to 0.1% from 1% loss by investing in
QMA (mainly appraisal bases and failure based) [56].

50
Lastly, it was said that QMAs has significantly positive effects in product productiv-
ity. From results, it was found that appraisal based QMA has the highest impact on
software productivity than failure based QMAs. However, prevention based QMA did
not show a positive impact on productivity. Similarly in case of quality, failure based
approach showed highest impact than prevention based approach. Appraisal based ap-
proach did not show any significant positive effect on the quality.
4.4.3 Discussion based on both studies
The first study conducted by [5] was mainly focused on the comparison between the
effectiveness of GSD practice and in-house software development practice. The re-
search was performed with different implementation of GSD project and compared with
same in-house project. From observed data set it seemed that in-house software devel-
opment practice produces best performing software product than ideal (most efficient)
GSD projects. The main affecting parameters of GSD such as effort, duration and qual-
ity (in terms of defects), all were in negative side than in-house practice. To complete a
software project in GSD approach, it took longer duration, demand more effort and had
more defects resulting in low quality software compared to in-house software develop-
ment practice. In my experience and view, GSD model takes more time to complete
same task than that in in-house development practice due to lack of communication,
different native languages and culture. In GSD, if there is a small misunderstanding or
confusion, it takes a long time to get the response from corresponding person working
in different development site. It happens especially when there is less than 10% of
working time overlap. Whereas, same problem can be solved within a hour in in-house
development practice.
It is found from the experimental data that globally developed software products are
of lower quality than in-house developed software products.
In the second study [56] was focused on multiple GSD projects developed in one
remote development site. From the result set it is found that, productivity and quality
have a reciprocal relationship. If we need to increase productivity, we need to compro-
mise in quality. Productivity is affected by the work dispersion negatively; productivity
starts decreasing exponentially even dispersion increases slowly. However software
quality is not hampered significantly by dispersion. Structured engineering approached
minimized the effect of dispersion in project performance. Investment in quality man-
agement approaches has varied dimensions of positive effects on project performance.
The result shows that projects designed in distributed environment did not need more
rework from both (development productivity and conformance quality) perspectives. It
was believed that software projects developed in distributed environment needs more
maintenance time than in-house developed software projects.

51
4.5 Sample KPIs for GSD
To improve productivity, quality, efficiency, and response time of software, introducing
a set of KPIs is a well known practice in software development. In GSD model, KPIs
can be introduced to improve productivity, quality, efficiency, and response time of
software.
In in-house software development, whole development team works at same site and
project managers are up to date with the development productivity, quality, cost and
other factors of the project. If there are any problems or misunderstanding regarding the
requirements and development activities in in-house software development, it can be
solved instantly. It is possible due to frequent and face-to-face communication in in-
house development. Where as in GSD, teams are scattered around the world and man-
agers and staffs working in different sites cannot communicate frequently as in in-house
software development method. Because of several factors affecting GSD project devel-
opment (see section 4.3), establishing KPIs in GSD is more important than that in in-
house software development. Few samples KPIs applicable in GSD will be discussed in
this section.
4.5.1 Work Dispersion
Work dispersion is the KPI used to measure the percentage of work performed at differ-
ent remote development sites. Work dispersion indicates how distributed a projects de-
velopment process is (as described in section 4.4.2). Work dispersion can be calculated
using equation (4.1). A value of zero work dispersion measure indicates that the soft-
ware project is completely co-located, and an increasing value represents increasing
levels of work dispersion [56].
From the results obtained from [56], it is found that even in the high process matur-
ity environment; work dispersion has negative effect on productivity. The result ob-
tained by same author shows that, the exponential decrease in productivity as work dis-
persion increases. The marginal decrease in productivity is much higher as dispersion
starts to increase and this has to be taken into consideration when teams initiate distrib-
uted development [56]. However from the same study, it is found that, in the high proc-
ess maturity environment, work dispersion does not have a significant direct effect on
conformance quality.
In GSD, the productivity in remote site seems to be decreased because of the lack of
direct supervision and ownership. Increased physical distance in GSD reduces the
communication frequency causing the decreased productivity. Technical and socio-
cultural issues are also equally responsible to lower down the productivity in remote
development sites. When main development site decides to change tools and technol-
ogy, the workers in remote site needs to get trained for new tools and technology.
Working with new technology reduces the individual’s productivity resulting to the de-
creased productivity in remote sites. Managers can decide to choose GSD model than
in-house development model, if the main concern is about cost rather than productivity

52
and quality. The result found in table 4.1 and table 4.2 shows that productivity and qual-
ity of the GSD product are lower than that of in-house product.
In distributed work environment, there are many challenges as described in section
4.3. These challenges can be minimized by setting a common development environment
including changes, problems, version tracking, test, and project management activities.
Communication problems can be minimized by introducing an infrastructure for col-
laborative sessions, including instant messaging, net meeting, group chat, online calen-
dar and video conference facilities. Project management issues can be minimized by
introducing a system for regular updates of project management information and team
web pages. Technical issues can be minimized by establishing project kickoff meetings,
establishing common communication protocol, and provide frequent training at remote
sites. Socio-cultural issues can be minimized through employee exchange program be-
tween different remote sites. Exchanging employees from different cultural background
helps to get-to-know about different cultural values and norms.
Applying three quality management approaches (prevention-based, appraisal-based,
and failure-based) as described in section 4.4.2 can minimize the negative effects of
work dispersion. Specifically failure based QMA [56] helps to reduce the loss of pro-
ductivity due to work dispersion.
4.5.2 Effort Adherence
Managing the effort required to complete a project is one of the challenges in the GSD.
Unlike in in-house software development method, total effort required to complete a
GSD project is affected by many factors such as, language problems, different time
zone (non-overlapped working time), communication frequency. A study conducted by
[5] suggested that increasing the overlap of work hour’s results reduced total effort
since it allows for synchronous communication, which facilitates better coordination
between sites. Increasing synchronous communication allows the efficient coordination
and results increased productivity.
Increased distance in GSD reduces the communication frequency (see section 4.3),
which can contribute to lower productivity, thus higher effort. Total effort is increased if
the overhead of distribution is increased. Different culture makes it more difficult to
communicate and coordinate; therefore, effort will be higher.
When developers are more familiar with one another, they coordinate better and
have higher productivity. Frequent meetings help to improve trust among team mem-
bers, and thus reduce effort. As recommended by [5], establishing frequent communica-
tion system, interaction programs between cross site workers and somehow overlapped
working hours are the main solutions to reduce the total effort in GSD.
If the total amount of effort required to complete the project is increased, there is a
deviation in planned amount of effort to complete the project. This can be calculated
using equation (3.10) as described in section 3.8.2.

53
4.5.3 Defect Rate
In the context of GSD, when teams are separated by distance and/or time, communica-
tion effectiveness is lowered down. The leaner communication media causes the higher
miscommunication causing defects. According to [5], communication media affects the
defect generation multiplier. For example, communication over the telephone can gen-
erate more defects than a face-to-face meeting. [5]
Defect rate can be calculated using equation (3.8) as described in section 3.7.7.
From past studies [56][5], it shows that the defect rate in GSD is higher than in-
house software development model. Statistics in table 4.1 and table 4.2 above clearly
shows that GSD project has a large number of defects than in-house projects. Because
of the different factors affecting GSD, the number of defects increases in software pro-
ject. In my experience, while working in GSD model, each remote development site has
their own coding standards, depth of knowledge and understanding about problems.
Each site complete tasks assigned to them and are compiled to develop complete soft-
ware. Because of different ways of completing tasks in remote sites, number of defects
increases in final software product.
Normally, in case of application software, most software defects are encountered
within two years of its release and in case of operating system, more than 95% of de-
fects are encountered within four years of its release [65].
Measuring defect rate helps the management to decide whether the project should be
GSD or local. Management can recommend for GSD if the major concern is about cost
and availability of skilled manpower around the word. If the main concern is about
quality (in terms of latent defects), productivity and development time, local develop-
ment needs to be selected rather than GSD.
4.5.4 Requirement change cost (RCC) factor
Requirement changes occur in each software development practice but in global soft-
ware development practice, it is a more usual case. It is because the developers working
in remote development sites are away from the customers and cannot communicate di-
rectly with the customers. Changes can be forced either from the client side or software
development team side. The requirement change from customer side comes mainly due
to the misunderstanding of the customers. In GSD, both types of changes occur in dif-
ferent stages of development. Changing a requirement or adding a new requirement
changes the estimated project cost, time and effort. Addressing each changed require-
ment costs according to its volume, stage at which it is changed and what kind of
changes it is (removed or added). If the requirement is added the project cost increases
depending on at which stage it is added.
If the customers are clear about their requirements in advance, the RCC factor re-
duces significantly. Reduced RCC factor helps to increase productivity. RCC factor can
be minimized by introducing continuous communication system (for example, online
conference, net meeting, and instant messaging) with customers especially in the early

54
phase of software development. Managers can recommend to use GSD model if the
requirements are clearly defined and there is less possibility of requirement changes in
future.
The RCC factor KPI can be calculated using equation (3.15) as described in section
3.8.7.

55
5. CONCLUSIONS
In this chapter, we will discuss the conclusions made from different literature findings.
This chapter also includes limitations of the study and possible future work on the
study.
5.1 Conclusion
The aim of this study was set to analyze and evaluate different research studies to find
the factors affecting productivity, speed, quality, and response time of software and key
ideas to improve it. From a number of research studies, the result has been drawn.
Any software product developed by a group or organization need to perform accord-
ing to requirements. However, some software products fail to meet the requirements.
Few reasons for this have been found from this study. Factors affecting productivity,
speed, quality, and response time of software are unclear objectives and requirements,
inefficient planning, estimation, and scheduling, and knowledge level. In addition man-
agement and organizational issues are also responsible for software productivity. Every
time customers may not be able to explain requirements clearly. In such case, actual
problem and customer requirements need to be clearly studied by development team. It
helps development team in two ways, one to understand the problem clearly and another
fewer requirement changes during development. This saves resources, time, and budget.
Finding the means to increase productivity of software development is one of the
challenging tasks. Even a small change in development strategy may increase productiv-
ity, quality, efficiency, and response time of software significantly. From various
research studies it is found that, using a set of carefully designed KPIs is the best
practice to increase productivity, quality, efficiency, and response time of software.
Planning, estimation, and implementation strategy are the main factors affecting
software quality and performance. When these activities are performed on the basis of
software metrics, analytics report and previous experience in similar projects, productiv-
ity, quality, efficiency, and response time of software can be improved significantly.
Software metrics translates the complex measures obtained at different stage of software
development in simpler performance indicators. KPIs helps to access current status and
future strategy of software development. While designing KPIs, we may have to face
some risks such as; lack of historical data, unavailability of multiple data source, and
wrong measurements. Such risks can be minimized introducing a proper risk
minimization strategy. Effective and efficient design of KPIs needs to follow KPI
design perspectives and risk minimization strategy.

56
Selection of software development process depends on the nature of the problem to
be solved. If existing development process is not performing well, either it needs to be
improved or changed. In a general case, process improvement is preferred rather than
changing it. Process improvement approach is applied only after analyzing its current
performance. Selection of process improvement depends upon different factors such as;
process maturity, skills, organizational and business issues.
Implementation of CMMI model helps to identify the areas where improvement is
needed. Moreover, CMMI helps to know what kind of KPIs need to be designed to
improve software development process performance. Implementation of CMMI model
is one means of the performance improvement. CMMI suggest focusing on different
organizational and managerial aspects. Some of the such aspects are; process
standardization, product and process quality measurement, and selecting proficient
employees. Effectiveness of implementation of CMMI model can be concluded as: (1)
process maturity is closely associated with improved software product performance and
(2) organization implementing CMMI model achieves higher software quality,
development productivity and faster cycle time.
Global software development process is found to be cost effective. Development of
software in GSD costs less than the development of same software in in-house
development approach. The main factors affecting productivity, quality, efficiency, and
response time of software in GSD are; less frequent communication, socio-cultural is-
sues, language problem and non-overlapped working times. If the labour cost in remote
sites is comparatively lower than the in-house (single site) model, GSD model can be
recommended. Moreover, if the quality is a primary consideration, GSD approach can-
not be recommended. Even in approved GSD model, quality is not satisfactory.
The key idea behind development and implementation of KPIs is to improve pro-
ductivity, quality, efficiency, and response time of software. In this study, for single site
software development approach, scheduling, planning, cost, time, and testing related
KPIs are recommended. For GSD, in addition to above mentioned KPIs, communica-
tion effectiveness, defect, work dispersion, and maintenance related KPIs are recom-
mended. Implementation of KPIs also assists to get an idea about where and what per-
formance related issues are arising. Significant improvement in productivity of software
development can be achieved by measuring right attributes and taking right action in the
right time.
5.2 Limitations
Current study is conducted for partial fulfilment of Master’s of Science Thesis course.
Gathering all required resources and environment during this period was difficult. This
causes to perform the research study based on different literatures and previous similar
research. Furthermore, knowledge and experience from past academic and profession
projects is applied. Actual and primary data are not included. Some data from other re-
search studies are used and analyzed. If the study were conducted in real software de-

57
velopment environment for longer time, it would give better outcome. If primary data
were available, more realistic result might be possible. Shortly, unavailability of real
software development environment and primary data is the main limitation of this study.
5.3 Future work
This study is based on previously conducted research studies and their analysis. If
enough time and resources are available, this study can be extended to real software
development practice. Findings from real software development environment reflect the
actual scenario and effects of KPI implementation. From this, we could be able to con-
clude the practical results. Hence, in the future, study can be conducted in real software
development environment to get more accurate and efficient results.

58
REFERENCES
[1] Falck, M. & Karlsson, F. Key Performance Indicators - The key to success?
Jönköping 2011. Master degree thesis. Jönköping University. 48 p.
[2] Kennerey, M. & Neely, A. Measuring performance in a changing business envi-
ronment. International Journal of Operations & Production Management Vol. 23
(2003) 2. pp 213-229.
[3] Weber, A. & Thomas, R. Key performance indicators. Measuring and Managing
the Maintenance Function. Ivara Corporation, Burlington (2005).
[4] Mannila, J. Key Performance Indicators in Agile Software Development. Tam-
pere 2013. Bachelor degree thesis. Satakunta University of Applied Sciences. 70
p.
[5] Setamanit, S-O., Wakeland, W. & Raffo, D. Improving global software devel-
opment project performance using simulation. Management of Engineering and
Technology, Portland International Center for IEEE (2007). pp 2458-2466.
[6] Nunnally, J. C. Psychometric Theory. Second Edition. New York 1967,
McGraw-Hill.
[7] Nunnally, J.C., & Bernstein, I.H. Psychometric Theory. Third Edition. New
York 1994, McGraw-Hill.
[8] Delorme, P. & Chatelin, O. The Role and Use of Performance Measurement
Indicators. EuropeAid Policy Steering, Aid Delivery Methods Program of Euro-
pean Commission. February 2011. Available at:
http://www.dochas.ie/Shared/Files/4/Guide_on_Performance_Measurement.pdf
[Last accessed on: 9.5.2014].
[9] Parmenter, D. Key Performance Indicators: developing, implementing, and us-
ing winning KPIs. New Jersey 2007 and 2010, John Wiley & Sons. 236 p.
[10] O’Neill, MJ. Measuring Workplace Performance. Second Edition. USA 2007,
CRC Press.

59
[11] FinPa New Media, Key Performance Indicators, FinPa New Media, Melbourne
2009.
[12] Summers, D. Quality Management: Creating and sustaining organizational ef-
fectiveness. London 2005, Pearson Prentice Hall.
[13] Radovic, M., Karapandzic, S. Z. Process Engineering. Beograd 2005, Faculty of
Organizational Science.
[14] Pesalj, B. Enterprise performance measuring, Traditional and Nowadays con-
cepts. Belgrade 2006, Faculty of Economy. pp. 15-16.
[15] Smart KPIs [Online]. [Accessed on: 12.11.2013]. Available at:
http://www.smartkpis.com/.
[16] Balsamo, S., et al. Model-based performance prediction in software develop-
ment: A survey. Software Engineering, IEEE Transactions on 30.5 (2004). pp
295-310.
[17] Web Reference
http://en.wikiversity.org/wiki/Topic:Software_Metrics_and_Measurement
[viewed on 23.4.2014].
[18] Morasca, S. “Software Measurement” Handbook of Software Engineering and
Knowledge Engineering. Volume 1. Singapore 2001, World Scientific Publish-
ing Co. Pte. Ltd. pp. 239-276.
[19] Endres, A. & Rombach, D.: A Handbook of Software and Systems Engineering
–Empirical Observation, Laws and Theories. Reading, USA 2003, Addison-
Wesley.
[20] Ebert, C., & Reiner, D., eds. Software Measurement: Establish Extract, Evalu-
ate, and Execute. Berlin 2007, Springer. 561 p.
[21] Henderson-Seller, B. The Mathematical Validity of Software Metrics. ACM
SIGSOFT Software Engineering Notes 21.5 (1996): pp. 89-94.
[22] Hetzel, B. Making software measurement work: Building an effective measure-
ment program. John Wiley & Sons, Inc., 1993.
[23] Rozum, JA. Defining and understanding software measurement data. Proc. of
the 5th Annual Conference on Applications of Software Measurement (1994).

60
[24] Matsumoto, K., Kusumoto, S., Kikuno, T., and Torii, K. A New Framework of
Measuring Software Development Processes. Software Metrics Symposium,
1993. Proceedings, First International. IEEE (1993).
[25] Musa, J.D., Iannino A. and Okumoto K. Software Reliability: Measurement,
Prediction, Application. 1987. McGraw -Hill.
[26] Morisio, M. A Methodology to Measure the Software Process. Silver Falls 1995,
Proceedings of the 7th Annual Oregon Workshop on Software Metrics.
[27] McGarry, J., Card, D. et al. Practical Software Measurement: Objective Infor-
mation for Decision Makers. 2002, Addison-Wesley.
[28] Fenton, NE. & Neil, M. Software metrics: successes, failures and new direc-
tions. The journal of Systems and Software 47.2(1999). pp 149-157.
[29] Mills, EE. Software Metrics, SEI Curriculum Module SEI-CM-12- 1.1. Carnegie
Mellon University, Software Engineering Institute (1988).
[30] Yuan, Z. & Hankley, WJ. Software Quality Metrics. (1999). [Accessed on
18.2.2014]. Available at:
http://people.cis.ksu.edu/~hankley/d841/Fa99/chap8.html#paper
[31] Xu, R., et al. Research on CMMI-based software process metrics. Computer and
Computational Science. IMSCCS'06. First International Multi-Symposiums,
IEEE 2(2006). pp 391-397.
[32] Florac, WA. & Carleton, AD. Measuring the Software Process: Statistical Pro-
cess Control for Software Process Improvement. 1999. Addison Wesley.
[33] Crispin, L. & Gregory, J. Agile Testing. Volume 6. Boston 2010, Addison-
Wesley.
[34] Zhang, D. et al. Software Analytics in Practice: Mini tutorial. Software Engi-
neering (ICSE), 34th International Conference on IEEE, 2012. pp 997-997.
[35] Menzies,T. & Zimmermann, T. Software Analytics: So What?. IEEE Software,
30.4(2013). pp 31-37.
[36] Boehm, B.W. A spiral model of software development and enhancement. Com-
puter 21.5 (1988). pp. 61-72.

61
[37] Salo, O. Enabling Software Process Improvement in Agile Software Develop-
ment Teams and Organisations. Oulu, 2006. Dissertation. University of Ou-
lu.149 p.
[38] NATO Science Committee. Software Engineering: Report of a Conference
Sponsored by the NATO Science Committee. Naur, P. & Randell, B. (eds.). Sci-
entific Affairs Division, NATO. Garmisch, 7. 11 Oct., 1968. 231 p.
[39] Larman, C. Agile and Iterative Development: A Manager.s Guide. Boston 2004,
Pearson Education Inc. 342 p.
[40] Paulish, D.J. & Carleton, A.D. Case studies of software-process-improvement
measurement. Computer, IEEE 27.9 (1994). pp. 50-57.
[41] Humphrey, W.S. Characterizing the software process: a maturity framework.
Software, IEEE 5.2 (1988). pp. 73-79.
[42] Jiang, J.J., et al. An exploration of the relationship between software develop-
ment process maturity and project performance. Information & Management,
Elsevier B.V. 41.3 (2004). pp. 279-288.
[43] Software Engineering Institute, CMMI, (1999). [http://www.sei.cmu.edu/cmmi/
and http://whatis.cmmiinstitute.com/]
[44] Team, CMMI Product. CMMI® for Development, Version 1.3, improving pro-
cesses for developing better products and services. no. CMU/SEI-2010-TR-033.
Software Engineering Institute (2010).
[45] Constantinescu, R., & Iacob, IM. Capability maturity model integration. Journal
of Applied Quantitative Methods 2.1 (2007): 187.
[46] Herbsleb, J.D. & Goldenson, D.R. A system survey of CMM experience and
results. Proceedings of ICSE 18 (1996). pp. 323–330.
[47] Humphrey, W.S., Snyder, T.R. & Willis, R.R. Software process improvement at
Hughes Aircraft. IEEE Software 8.4 (1991). pp. 11–23.
[48] Cheng, TH., Jansen, S. & Remmers, M. Controlling and monitoring agile soft-
ware development in three Dutch product software companies. Proceedings of
the 2009 ICSE Workshop on Software Development Governance, IEEE Com-
puter Society (2009).

62
[49] Palermo, J. Managing an Agile Software Project. Code Magazine, TX 77379-
USA, 2008.
[50] Antolić Ž. An Example of Using Key Performance Indicators for Software De-
velopment Process Efficiency Evaluation. Croatia 2008, R&D Center, Ericsson
Nikola Tesla d.d. 6 p.
[51] Shayan, C. KPI for Software development. 8 p. [Last Accessed on: 31.8.2013].
Available at: www.ChrisShayan.com.
[52] Web Reference: http://www.taskmanagementsoft.com/ [viewed on 20.1.2014].
[53] Task Management Software [Online]. [Accessed on 10.2.2014]. Available at:
http://www.taskmanagementsoft.com/products/taskmanagerpro/tutorials/customi
zation-guide/cost-performance-index-cpi-per-project.php.
[54] American Customer Satisfaction Index (ACSI) [Online]. [Accessed on
10.02.2014]. Available at: http://www.theacsi.org/.
[55] Herbsleb, J.D. & Moitra, D. Global software development. Software, IEEE 18.2
(2001). pp. 16-20.
[56] Ramasubbu, N. & Balan, R.K. Globally distributed software development pro-
ject performance: an empirical analysis. Proceedings of the 6th joint meeting of
the European software engineering conference and the ACM SIGSOFT sympo-
sium on the foundations of software engineering. ACM, 2007.
[57] Cramton, Catherine Durnell, and Sheila Simsarian Webber. "Relationships
among geographic dispersion, team processes, and effectiveness in software de-
velopment work teams." Journal of Business Research 58.6 (2005). pp. 758-765.
[58] Herbsleb, J.D. & Mockus, A. An empirical study of speed and communication in
globally distributed software development. Software Engineering, IEEE Trans-
actions on 29.6 (2003). pp. 481-494.
[59] Lurey, J.S. & Raisinghani, M.S. An empirical study of best practices in virtual
teams. Information & Management 38.8 (2001). pp. 523-544.
[60] Sahay, S. Nicholson, B. & Krishna, S. Global IT Outsourcing: Software Devel-
opment Across Borders. 2003, Cambridge University Press.

63
[61] Setamanit, S-O, Wakeland, W. & Raffo, D. Planning and improving global
software development process using simulation. Proceedings of the 2006 inter-
national workshop on Global software development for the practitioner. ACM,
2006.
[62] Musat, D. Hindrances for Agility: Detection and Recomendations. Karlskrona,
Sweden 2011. Blekinge Institute of Technology. 69 p.
[63] Allen, T.J. Managing the Flow of Technology. 1977, MIT Press.
[64] Anh, ND., Cruzes, DS., & Conradi, R. Dispersion, coordination and perfor-
mance in global software teams: A systematic review. Proceedings of the ACM-
IEEE international symposium on Empirical software engineering and meas-
urement. ACM, 2012.
[65] Kan, S. H. Metrics and models in software quality engineering. 2002, Addison-
Wesley Longman Publishing Co. Inc.
[66] Web Reference: http://softwaretestingfundamentals.com/ [viewed on
20.1.2014].
[67] Buse, RPL. & Zimmermann, T. Analytics for software development. Proceed-
ings of the FSE/SDP workshop on Future of software engineering research.
ACM, 2010. pp. 77-80