Trade Sustainability Impact Assessment of the EU-Korea FTA
165
IBM Belgium in association with DMI, Ticon, & TAC January 2008 Website: www.eu-korea-sia.org e-mail: [email protected] The project is financed by DG Trade but the study is independent. The analysis and conclusions expressed are those of the Consultant and do not reflect the views of the European Commission. Trade Sustainability Impact Assessment of the EU-Korea FTA: Draft Midterm Report (Phase Two) Framework Contract Commission 2007 Lot n°5 – project N°2007/139648
-
Upload
khangminh22 -
Category
Documents
-
view
3 -
download
0
Transcript of Trade Sustainability Impact Assessment of the EU-Korea FTA

IBM Belgium
in association with DMI, Ticon, & TAC
January 2008
Website: www.eu-korea-sia.org
e-mail: [email protected]
The project is financed by DG Trade but the study is independent. The analysis and conclusions expressed are those of the Consultant and do not reflect the views of the
European Commission.
Trade Sustainability Impact Assessment
of the EU-Korea FTA:
Draft Midterm Report (Phase Two)
Framework Contract Commission 2007 Lot n°5 – project N°2007/139648

Reference: Trade 2007/349757/1 Trade Sustainability Impact Assessment of the Free Trade Agreement to be negotiated between the European Community and the Republic of Korea
January 2008 Page 2 of 165
AACCRROONNYYMMSS AANNDD AABBBBRREEVVIIAATTIIOONNSS ACEA: European Automobile Manufacturers Association ACP: Africa Caribbean and Pacific countries ASEAN: Association of South East Asian Nations CAP: Common Agricultural Policy (of the European Union) CCA: Causal Chain Analysis CEE: Central and Eastern Europe CEPS: Centre for European Policy Studies CGE: Computable General Equilibrium CIS: Commonwealth of Independent States CLEPA: European Association of Automotive Suppliers CS: Civil society CSD: Commission on Sustainable Development CTA: Technical Centre for Agricultural and Rural Cooperation ACP-EU CTESS Committee on Trade and Environment Special Session CZ: Czech Republic DCs: Developing Countries DDA: Doha Development Agenda DGs: Directorate Generals of the European Commission DOTS Direction of Trade Statistics EBA: Everything But Arms EC: European Commission EFTA: European Free Trade Agreement EGs Environmental Goods EGS Environmental Goods and Services EIA: Environmental Impact Assessment EMF: European Metalworkers Federation ER: Environmental Reviews EPAS: Economic Partnership Agreements EU: European Union EU-15 European Union Member States prior to 2004 EU-25 European Union Member States prior to 2007 EU-27 European Union Member States since 2007 FAO: Food and Agriculture Organization of the United Nations FDI Foreign Direct Investment FLEGT: EU Action Plan for Forest Law Enforcement, Governance and Trade FTA: Free Trade Area GAR: Global Analysis Report GATS: General Agreement on Trade in Services GATT: General Agreement on Tariffs and Trade GCC: Gulf Cooperation Council GDI: Gender-related development index GDP: Gross Domestic Product GEM: Gender empowerment measure GSP: Generalised System of Preferences HDI: Human Development Index HIPC: Heavily Indebted Poor Countries HME: Hyundai Motor Europe GmbH HMMC: Hyundai Motor Manufacturing Czech HS: Harmonised System IA: Impact Assessment ICTSD International Centre for Trade and Sustainable Development ISC: International Steering Committee ILO: International Labour Organisation IMF: International Monetary Fund IPR: Intellectual Property Rights KAMA: Korea Automobile Manufacturers Association KCFTA: Korea–Chile Free Trade Agreement
Reference: Trade 2007/349757/1 Trade Sustainability Impact Assessment of the Free Trade Agreement to be negotiated between the European Community and the Republic of Korea
January 2008 Page 3 of 165
KIEP: Korean Institute for International Economics KITA: Korean International Trade Association KORUS: Korea US FTA KRW: Korean Won LDCs: Least Developed Countries MDGs: Millennium Development Goals M&E: Mitigation and enhancement measures MNCs: Multinational Corporations MOE: Ministry of Environment MPV : Multi-Purpose Vehicle NGOs: Non-Governmental Organisations NACE: Nomenclature des activités économiques dans la Communauté
Européenne NMS: New Member States NAFTA: North America Free Trade Agreement NTB: Non-Tariff Barriers NTM: Non-Tariff Measures NUTS II: Nomenclature of Territorial Units for Statistics Level II ODA: Official Development Assistance OECD: Organisation for Economic Co-operation and Development OPZs: Outward processing zones PECS Pan European Cumulation System PERS: Prior environmental review system PPS: Purchasing power standards PSEs: Producer Support Estimates R&D: Research and Development REPS: Regional Emissions Projection System ROO: Rules of Origin RTA: Regional Trade Agreement Trade SIA: Trade Sustainability Impact Assessment SIC: Standard Industrial Classification SITC: Standard International Trade Classification SK: Slovak Republic SMEs: Small and Medium Enterprises SPS: Sanitary and Phytosanitary Measures STEs: State Trading Entities TCA: Trade and Cooperation Agreement TOR: Terms of Reference TRIPS: Trade-Related aspects of Intellectual Property rights TRTA: Trade-Related Technical Assistance UK: United Kingdom UNDP: United Nations Development Programme UNEP: United Nations Environmental Programme UN-ESCAP: United Nations Economic and Social Commission for Asia and the
Pacific UNESCO: United Nations Educational, Scientific and Cultural Organization UNCTAD: United Nations Conference on Trade and Development US: United States USTR: United States Trade Representative VDA: German Association of the Automotive Industry WB: World Bank WHO: World Health Organization WTO: World Trade Organization WSSD: World Summit on Sustainable Development
Reference: Trade 2007/349757/1 Trade Sustainability Impact Assessment of the Free Trade Agreement to be negotiated between the European Community and the Republic of Korea
January 2008 Page 4 of 165
TTAABBLLEE OOFF CCOONNTTEENNTTSS
11.. IINNTTRROODDUUCCTTIIOONN ................................................................................................................................................................................................................1100 11..11.. AAiimmss ooff tthhee iinn--ddeepptthh PPhhaassee 22 ssttuuddyy.................................................................................................................................................................. 1100 11..22.. MMeetthhooddoollooggyy ...................................................................................................................................................................................................................................... 1100 11..33.. CCoonnssuullttaattiioonn PPrroocceessss .............................................................................................................................................................................................................. 1133 11..44.. OOuuttlliinnee ooff tthhee ssttrruuccttuurree ooff tthhee rreeppoorrtt ............................................................................................................................................................ 1177
22.. AAUUTTOOMMOOTTIIVVEE SSEECCTTOORR ..........................................................................................................................................................................................1199 22..11.. IInnttrroodduuccttiioonn .......................................................................................................................................................................................................................................... 1199 22..22.. IInndduussttrryy PPrrooffiillee:: EEUU ................................................................................................................................................................................................................ 2211 22..33.. IInndduussttrryy PPrrooffiillee KKoorreeaa .......................................................................................................................................................................................................... 2255 22..44.. KKoorreeaa--EEUU FFDDII aanndd TTrraaddee ................................................................................................................................................................................................ 2299 22..55.. SSuussttaaiinnaabbiilliittyy IImmppaacctt AAsssseessssmmeenntt ...................................................................................................................................................................... 3300 22..66.. RReeffeerreenncceess .............................................................................................................................................................................................................................................. 3355 22..77.. AAnnnneexx ............................................................................................................................................................................................................................................................ 3366
33.. AAGGRRIICCUULLTTUURREE,, FFOOOODD AANNDD BBEEVVEERRAAGGEESS SSEECCTTOORR ..............................................................................................................3399 33..11.. IInnttrroodduuccttiioonn .......................................................................................................................................................................................................................................... 3399 33..22.. EEUU PPrroocceesssseedd FFooooddss SSeeccttoorr PPrrooffiillee .................................................................................................................................................................. 4400 33..33.. EEUU--KKoorreeaa AAggrriiccuullttuurraall TTrraaddee.................................................................................................................................................................................... 4433 33..44.. AAggrrii--FFoooodd SSeeccttoorr iinn KKoorreeaa ............................................................................................................................................................................................ 4444 33..55.. SSuussttaaiinnaabbiilliittyy IImmppaacctt AAsssseessssmmeenntt ...................................................................................................................................................................... 4499
44.. FFIINNAANNCCIIAALL SSEERRVVIICCEESS..............................................................................................................................................................................................5555 44..11.. GGlloobbaall ffiinnaanncciiaall sseerrvviiccee ddeevveellooppmmeennttss........................................................................................................................................................ 6611 44..22.. TThhee ffiinnaanncciiaall sseerrvviicceess sseeccttoorr iinn KKoorreeaa.......................................................................................................................................................... 6622 44..33.. RReegguullaattiioonn aanndd ssuuppeerrvviissiioonn .......................................................................................................................................................................................... 7711 44..44.. TThhee ffiinnaanncciiaall sseerrvviicceess sseeccttoorr iinn tthhee EEUU ...................................................................................................................................................... 7777 44..55.. IInnssuurraannccee .................................................................................................................................................................................................................................................. 7799 44..66.. OOvveerrvviieeww ooff tthhee EEUU rreegguullaattiioonn ffoorr ffiinnaanncciiaall sseerrvviicceess .......................................................................................................... 8811 44..77.. EEUU--KKoorreeaa ttrraaddee iinn ffiinnaanncciiaall sseerrvviicceess.............................................................................................................................................................. 8833 44..88.. PPootteennttiiaall EEccoonnoommiicc IImmppaacctt ooff tthhee EEUU--KKoorreeaa FFTTAA .................................................................................................................. 8899 44..99.. SSoocciiaall iimmppaacctt ...................................................................................................................................................................................................................................... 9922 44..1100.. EEnnvviirroonnmmeennttaall iimmppaacctt .......................................................................................................................................................................................................... 9933
55.. EENNVVIIRROONNMMEENNTTAALL GGOOOODDSS AANNDD SSEERRVVIICCEESS ....................................................................................................................................9955 55..11.. BBaacckkggrroouunndd aanndd SSeeccttoorr DDeeffiinniittiioonn .................................................................................................................................................................... 9955 55..22.. SSeeccttoorr OOvveerrvviieeww............................................................................................................................................................................................................................ 9977 55..33.. SSuussttaaiinnaabbiilliittyy IImmppaacctt AAsssseessssmmeenntt ...................................................................................................................................................................... 9988 55..44.. RReeffeerreenncceess .......................................................................................................................................................................................................................................... 110000 55..55.. AAnnnneexx ...................................................................................................................................................................................................................................................... 110022
66.. RRUULLEESS OOFF OORRIIGGIINN....................................................................................................................................................................................................111199 66..11.. IInnttrroodduuccttiioonn ...................................................................................................................................................................................................................................... 111199 66..22.. RRuulleess ooff OOrriiggiinn iinn OOtthheerr FFTTAAss............................................................................................................................................................................ 112200 66..33.. KKeeyy AAnnaallyyttiiccaall aanndd PPoolliiccyy IIssssuueess .................................................................................................................................................................... 112211 66..44.. RReeffeerreenncceess .......................................................................................................................................................................................................................................... 112222 66..55.. AAnnnneexx:: SSuummmmaarryy ooff EEaasstt AAssiiaann FFTTAAss .................................................................................................................................................... 112244
77.. TTEECCHHNNIICCAALL RREEGGUULLAATTIIOONNSS AANNDD SSTTAANNDDAARRDDSS ......................................................................................................................112299 77..11.. TTeecchhnniiccaall BBaarrrriieerrss ttoo TTrraaddee...................................................................................................................................................................................... 112299 77..22.. SSuussttaaiinnaabbiilliittyy IImmppaacctt AAsssseessssmmeenntt .................................................................................................................................................................. 113300
88.. IINNTTEELLLLEECCTTUUAALL PPRROOPPEERRTTYY PPRROOTTEECCTTIIOONN ....................................................................................................................................113322 88..11.. IInnttrroodduuccttiioonn ...................................................................................................................................................................................................................................... 113322 88..22.. EEuurrooppeeaann UUnniioonn:: RReecceenntt DDeevveellooppmmeennttss .............................................................................................................................................. 113322

Reference: Trade 2007/349757/1 Trade Sustainability Impact Assessment of the Free Trade Agreement to be negotiated between the European Community and the Republic of Korea
January 2008 Page 5 of 165
88..33.. EEUU--KKoorreeaa IIssssuueess iinn IInntteelllleeccttuuaall PPrrooppeerrttyy RRiigghhttss...................................................................................................................... 113333 88..44.. SSuussttaaiinnaabbiilliittyy IImmppaacctt AAsssseessssmmeenntt .................................................................................................................................................................. 113355 88..55.. RReeffeerreenncceess .......................................................................................................................................................................................................................................... 113377
99.. IINNVVEESSTTMMEENNTT AANNDD EECCOONNOOMMYY WWIIDDEE EEFFFFEECCTTSS........................................................................................................................113388 99..11.. TThheeoorreettiiccaall bbaacckkggrroouunndd .................................................................................................................................................................................................. 113388 99..22.. OOvveerrvviieeww ooff iinnvveessttmmeenntt iinn KKoorreeaa .................................................................................................................................................................. 113399 99..33.. OOvveerrvviieeww ooff iinnvveessttmmeenntt iinn tthhee EEuurrooppeeaann UUnniioonn ...................................................................................................................... 114499 99..44.. PPootteennttiiaall IImmppaacctt ooff tthhee EEUU KKoorreeaa FFTTAA.................................................................................................................................................. 115533 99..55.. RReeffeerreenncceess .......................................................................................................................................................................................................................................... 115588
1100.. GGLLOOBBAALL AANNAALLYYSSIISS................................................................................................................................................................................................115599 1100..11.. MMeetthhooddoollooggyy .................................................................................................................................................................................................................................. 115599 1100..22.. AAssssuummppttiioonnss ffoorr tthhee mmooddeelllliinngg eexxeerrcciissee .............................................................................................................................................. 115599 1100..33.. RReessuullttss ooff ssiimmuullaattiioonnss ...................................................................................................................................................................................................... 116600 1100..44.. CCoommppaarriissoonn wwiitthh ootthheerr ssttuuddiieess ............................................................................................................................................................................ 116622 1100..55.. CCoonncclluuddiinngg OObbsseerrvvaattiioonnss ............................................................................................................................................................................................ 116633 1100..66.. RReeffeerreenncceess .......................................................................................................................................................................................................................................... 116644

Reference: Trade 2007/349757/1 Trade Sustainability Impact Assessment of the Free Trade Agreement to be negotiated between the European Community and the Republic of Korea
January 2008 Page 6 of 165
LLIISSTT OOFF TTAABBLLEESS
Table 1.1: Core and Second Tier Target and Process Sustainability Indicators......................12
Table 1.2: Significance Criteria and Scoring ............................................................................12
Table 1.3: Participants in the Seoul Workshop ........................................................................17
Table 2.1: Total European Sales to September 2007 ..............................................................22
Table 2.2: Best Selling Brands in Europe 2006........................................................................22
Table 2.3: Top Selling Models 2006 .........................................................................................22
Table 2.4: World Rankings 2005 ..............................................................................................27
Table 2.5: Major Japanese Manufacturers ...............................................................................29
Table 2.6: Average CO2 emissions of major car manufacturing groups in 2006.....................35
Table 3.1: Labour Productivity Food and Beverage Industry 2004 ..........................................41
Table 3.2: Leading EU Food and Drink Export Categories 2005 .............................................41
Table 3.3: World Leading Food Exporters 2005.......................................................................42
Table 3.4: Leading Food Exporters to Korea 2005: .................................................................43
Table 3.5: EU 27 Food and Beverages Exports to Korea 2000-2006......................................44
Table 3.6: Major Agricultural Imports from EU (2004-2006, average) .....................................51
Table 4.1: Structure of Korean trade in services ......................................................................57
Table 4.2: Financial Institutions under the Supervision of the FSC/FSS .................................63
Table 4.3: Largest commercial banks in Korea (end-2006 figures) .........................................64
Table 4.4: Largest insurance companies in Korea ...................................................................68
Table 4.5: Largest asset management companies in Korea (2005) ........................................70
Table 4.6: Changes in Asset Classification Standards in Korea ..............................................72
Table 4.7: Minimum Loan Loss Provision Ratios in Korea.......................................................73
Table 4.8: Asset Classification and Provisioning for Korean Insurance Companies ...............74
Table 4.9: Minimum Legal Capital Requirements ....................................................................76
Table 4.10: General statistics on the European banking sector as at 31.12.2005...................77
Table 4.11: Largest EU banks (2006).......................................................................................78
Table 4.12: Insurance groups in European business ...............................................................81
Table 4.13: Largest trading nations in insuarance services (2005)..........................................84
Table 4.14: Largest trading nations in financial services excluding insurance (2005) .............85
Table 4.15: Korean exports and imports of financial services, 2005 (mn $) ............................86
Table 4.16: EU15 exports and imports of financial services, 2005 (mn $)...............................87
Table 4.17: Foreign bank’s market share of Korean banking sector........................................88
Table 4.18: Number of Overseas Branches of Domestic Financial Institutions .......................88
Table 4.19: Copenhagen results, macroeconomic changes ....................................................89
Table 4.20: Changes in sectoral output in EU (% change from baseline)................................90
Table 4.21: Changes in sectoral output in Korea (% change from baseline) ...........................90
Reference: Trade 2007/349757/1 Trade Sustainability Impact Assessment of the Free Trade Agreement to be negotiated between the European Community and the Republic of Korea
January 2008 Page 7 of 165
Table 4.22: Copenhagen results, import changes....................................................................91
Table 4.23: Percent change in output by sector in EU25 and Korea .......................................91
Table 4.24: Labour employment in the Full FTA, % change in Korea and EU25 ....................92
Table 5.1: Environmental Service Sectors Subject to Plurilateral Request.............................97
Table A.1: Trade Statistics (Imports - Exports) Eur27 and Member States / Korea, Republic of For commodity 850720 in Year 2004,2005,2006 ...............................................................102
Table A.1.1: Tariff table (Code 8507204190) .........................................................................103
Table A.1.2: Tariff table (Code 8507204990) .........................................................................103
Table A.1.3: Tariff table (Code 8507209290) .........................................................................103
Table A.2: Trade Statistics (Imports - Exports) Eur27 and Member States / Korea, Republic of For commodity 853710 in Year 2004,2005,2006 ...............................................................104
Table A.2.1: Tariff table (Code 8537101090) .........................................................................105
Table A.2.2: Tariff table (Code 8537109190) .........................................................................105
Table A.2.3: Tariff table (Code 8537109999) .........................................................................105
Table A.3: Trade Statistics (Imports - Exports) Eur27 and Member States / Korea,Republic of For commodity 854140 in Year 2004,2005,2006 ...................................................................106
Table A.3.1: Tariff table (Code 8541401000) .........................................................................107
Table A.3.2: Tariff table (Code 8541409000) .........................................................................107
Table A.4: Trade Statistics (Imports - Exports) Eur27 and Member States / Korea, Republic of For commodity 848340 in Year 2004,2005,2006 ...............................................................108
Table A.4.1: Tariff table (Code 8483402190) .........................................................................109
Table A.4.2: Tariff table (Code 8483402390) .........................................................................109
Table A.4.3: Tariff table (Code 8483402590) .........................................................................109
Table A.5: Trade Statistics (Imports - Exports) Eur27 and Member States / Korea, Republic of For commodity 848360 in Year 2004,2005,2006 ...............................................................110
Table A.5.1: Tariff table (Code 8483602090) .........................................................................111
Table A.5.2: Tariff table (Code 8483608090) .........................................................................111
Table A.6: Trade Statistics (Imports - Exports) Eur27 and Member States / Korea, Republic of For commodity 850231 in Year 2004,2005,2006 ...............................................................112
Table A.6.1: Tariff table (Code 8502310090) .........................................................................112
Table A.7: Trade Statistics (Imports - Exports) Eur27 and Member States / Korea, Republic of For commodity 841410 in Year 2004,2005,2006 ...............................................................113
Table A.7.1: Tariff table (Code 8414102590) .........................................................................114
Table A.7.2: Tariff table (Code 8414108190) .........................................................................114
Table A.7.3: Tariff table (Code 8414108990) .........................................................................114
Table A.8: Trade Statistics (Imports - Exports) Eur27 and Member States / Korea, Republic of For commodity 842139 in Year 2004,2005,2006 ...............................................................115
Table A.8.1: Tariff table (Code 8421392090) ........................................................................116
Table A.8.2: Tariff table (Code 8421394090) .........................................................................116
Table A.8.3: Tariff table (Code 8421396090) .........................................................................116
Table A.9: Trade Statistics (Imports - Exports) Eur27 and Member States / Korea, Republic of For commodity 842199 in Year 2004,2005,2006 ...............................................................117
Reference: Trade 2007/349757/1 Trade Sustainability Impact Assessment of the Free Trade Agreement to be negotiated between the European Community and the Republic of Korea
January 2008 Page 8 of 165
Table A.9.1: Tariff table (Code 8421990099) .........................................................................118
Table 9.1: Comparison of investment effort in various economies ........................................141
Table 9.2: Business environment and governance Indicators ...............................................143
Table 9.3: Korea's ranking in Doing Business 2008...............................................................144
Table 9.4: Human resources in R&D (2005) ..........................................................................145
Table 9.5: Korean FDI in the EU (2003-2005)........................................................................152
Table 9.6: Estimates of country-specific coefficient in the Investment model ........................155
Table 9.7: Results of the Investment model ...........................................................................156
Table 9.8: Results of the GDP model – Differences with a base case over the period 2008-2015........................................................................................................................................158
Table 10.1: Comparison of Copenhagen Scenarios ..............................................................160
Table 10.2: FTA Effects on GDP (% from the base case)......................................................163
Reference: Trade 2007/349757/1 Trade Sustainability Impact Assessment of the Free Trade Agreement to be negotiated between the European Community and the Republic of Korea
January 2008 Page 9 of 165
LLIISSTT OOFF FFIIGGUURREESS Figure 4.1: Korea – Employment by sector ..............................................................................56
Figure 4.2: Korea total trade in services...................................................................................57
Figure 4.3: Share of services and financial services in the EU25 GDP ...................................58
Figure 4.4: EU25 – Employment by sector...............................................................................59
Figure 4.5: European trade in services - EU15 ........................................................................60
Figure 4.6: Share of financial services in the EU25 GDP.........................................................61
Figure 4.7: The Top 50 Financial Centres GFCI rating versus Sensitivity to instrumental factors .......................................................................................................................................67
Figure 4.8: Insurance market maturity in Korea (2005)............................................................69
Figure 4.9: Insurance premium in EU15 (1994-2005) ..............................................................80
Figure 4.10: Korea trade in insurance and financial services ..................................................86
Figure 4.11: European trade insurance and financial services – EU15 ...................................87
Figure 9.1: Role of investment in economic growth in Korea.................................................140
Figure 9.2: Long-term evolution of investment spending in Korea.........................................141
Figure 9.3: Breakdown by type of investment ........................................................................142
Figure 9.4: Business environment and governance Indicators ..............................................143
Figure 9.5: R&D Investment (2005)........................................................................................144
Figure 9.6: Breakdown of FDI in Korea by sector (cumulative flows 1980-2005) ..................147
Figure 9.7: Number of BITs and DTTs concluded and cumulated between 1980 and 2006 148
Figure 9.8: Foreign investment in Korea by investing country ...............................................148
Figure 9.9: Investment and GDP growth in the EU ................................................................149
Figure 9.10: Breakdown of EU investment by type of investment (2006) ..............................150
Figure 9.11: Innovation gap between the EU and Japan by indicator....................................151
Figure 9.12: Overall innovation gap between the EU and Japan, 2002-06............................151
Figure 9.13: Developed countries: FDI outflows, 1995-2006 (Billions of dollars) ..................152
Figure 9.14: Technology progress variable: historic growth rate and projections..................157
Figure 10.1: Sensitivity Analysis to Armington Elasticity Specification ..................................161
Figure 10.2: Impact of Armington Trade Elasticities on Services...........................................162
Reference: Trade 2007/349757/1 Trade Sustainability Impact Assessment of the Free Trade Agreement to be negotiated between the European Community and the Republic of Korea
January 2008 Page 10 of 165
11.. IINNTTRROODDUUCCTTIIOONN This report constitutes Phase Two of the Trade Sustainability Impact Assessment (TSIA) for the potential Free Trade Agreement currently being negotiated between the EU and Korea. It includes in-depth studies of selected sectors and horizontal issues in order to supplement the general qualitative and quantitative analysis carried out in the first phase for the overall impacts on both sides. The sectors and the horizontal issues analysed in this report were identified in the first phase Global Analysis Report (GAR).
11..11.. AAIIMMSS OOFF TTHHEE IINN--DDEEPPTTHH PPHHAASSEE 22 SSTTUUDDYY This report aims to analyse in-depth the expected economic, social and environmental impacts of trade and investment liberalisation measures which can be taken within the framework of the EU-Korea FTA negotiations as part of the overall objective of the project as defined in the Terms of Reference:
“The Trade SIA study should provide a deeper understanding of the sustainability impacts of the trade and investment aspects of the Free Trade Agreement and the mechanisms through which they might affect both the EU and Korea”.
For Phase 2 of the TSIA EU – Korea study, the following is expected from the Consultant:
“Carry out a detailed Trade SIAs on the sectors and horizontal issues identified in the first phase of the study.”
11..22.. MMEETTHHOODDOOLLOOGGYY Trade SIAs are based on the analysis of causal chain effects which seek to identify significant cause-effect links between a proposed change in trade policy and its social (including gender and poverty), environmental and economic impacts. The analysis combines qualitative and quantitative approaches, uses sustainability indicators and is based on the principle of proportionate analysis. The analysis focuses on the nine core indicators identified in the Trade SIA methodology (three for each dimension of Sustainable Development). The Trade SIA is also a tool to strengthen further the Commission’s ongoing dialogue with stakeholders1 and with its trading partners.
AANNAALLYYTTIICCAALL AANNDD QQUUAANNTTIITTAATTIIVVEE TTOOOOLLSS
The Consultant has used a wide range of quantitative and qualitative tools in the different phases of the study. During Phase One an overall global and trade context analysis was undertaken including a review of the quantitative and qualitative studies of a potential EU Korea FTA previously carried out by DG Trade. The latest findings and developments from related research and other sources have been used. Particular focus is attached to potential third country indirect and longer-term dynamic effects of the potential EU Korea FTA.
During Phase 2 quantitative and qualitative analysis of the detailed sustainability indicators in all three dimensions of sustainability have been undertaken for the three sectors. The existing quantitative models are reviewed and adapted as appropriate. Survey research tools will be used to survey selected industries and target groups. Again there is an emphasis on third country indirect effects and dynamic effects.
1 In accordance with the main categories of potential stakeholders as identified in the European Commission Communication (2002 704 final) summarised in table 3 of the SIA Hanbook (p.24/25) and also taking into account section 5.4.2 of the SIA Handbook - (Civil society groups targeted for consultation).
Reference: Trade 2007/349757/1 Trade Sustainability Impact Assessment of the Free Trade Agreement to be negotiated between the European Community and the Republic of Korea
January 2008 Page 11 of 165
RREEVVIIEEWW OOFF EEXXIISSTTIINNGG RREESSUULLTTSS
A detailed literature review of existing results and the outcomes of past studies will be used as the basis for the work as appropriate. The Communication on Impact Assessment and related guidelines (COM (2002) 276) as well as DG Trade’s SIA Handbook provide guidance on how economic, social and environmental impacts will be assessed.
AASSSSEESSSSMMEENNTT FFRRAAMMEEWWOORRKK
Attention will be paid to building a coherent and rigorous assessment framework, in particular in areas where the existing framework needs to be strengthened This will inevitably lead to the reduction in the scope of the work finally carried out by focussing on specific sectors, social groups and potentially affected geographical areas. The choice of sectors, social groups and areas must be rational and justified. Further reduction in the scope of the analysis will be made following consultations and will aim at prioritising key issues and potentially affected geographical areas.
Each reduction in scope of the analysis must be done on the basis of a clearly explained and rational approach including:
1) An analytical and rational assessment phase using relevant assessment tools and including quantitative analysis and modelling. This assessment will identify a limited number of issues, social groups and geographical areas which appear to be significant in terms of the scale or importance of the impacts expected.
2) Confirmation of the relevance of these key issues in potentially affected geographical areas through the consultation of stakeholders and trading partners.
Regarding the effects on the EU, this analysis will include general assessments at the level of the EU 27, the national level and the regional level (in particular for the weakest regions of the enlarged EU). More detailed assessments will be made for geographical areas that will be most affected by the sustainability impacts in the selected sectors.
EEVVAALLUUAATTEE TTHHEE SSUUSSTTAAIINNAABBIILLIITTYY IIMMPPAACCTT OOFF TTHHEE TTRRAADDEE AASSPPEECCTTSS OOFF TTHHEE EEUU-- KKOORREEAA FFTTAA
The analysis focuses on the sectoral and horizontal aspects of the effects of the proposed FTA on sustainability (economic, social and environmental context) in the EU and Korea. It identifies areas on which increased trade or investment activities are likely to have an impact, both positive and/or negative. The assessment provides an analysis in the EU and Korea at an aggregate level as well as of specific regions that are key or most representative of the impacts expected depending on the level of information and the nature of the impacts for each sector.
Indicators
The SIA methodology uses a core group of sustainability indicators to measure the impact that further liberalization and changes in rule-making might have on sustainability. Both target and process indicators are used. While Target indicators serve to indicate the final impact on sustainable development, Process indicators assess the compatibility on the long term of the policy decision with sustainable development.
These indicators are balanced between economic, environmental and social indicators (see the table following). The purpose of this table is simply to illustrate the different types of indicators.
Reference: Trade 2007/349757/1 Trade Sustainability Impact Assessment of the Free Trade Agreement to be negotiated between the European Community and the Republic of Korea
January 2008 Page 12 of 165
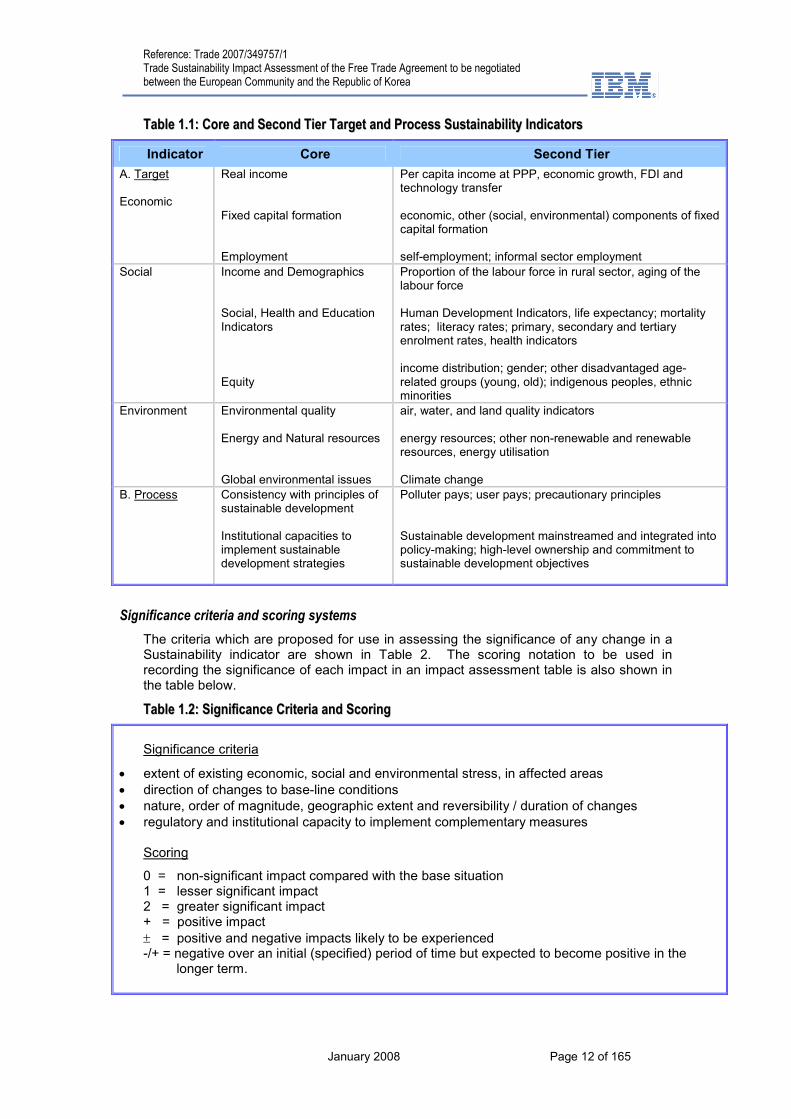
TTaabbllee 11..11:: CCoorree aanndd SSeeccoonndd TTiieerr TTaarrggeett aanndd PPrroocceessss SSuussttaaiinnaabbiilliittyy IInnddiiccaattoorrss
Indicator Core Second Tier
A. Target Economic
Real income Fixed capital formation Employment
Per capita income at PPP, economic growth, FDI and technology transfer economic, other (social, environmental) components of fixed capital formation self-employment; informal sector employment
Social Income and Demographics Social, Health and Education Indicators Equity
Proportion of the labour force in rural sector, aging of the labour force Human Development Indicators, life expectancy; mortality rates; literacy rates; primary, secondary and tertiary enrolment rates, health indicators income distribution; gender; other disadvantaged age-related groups (young, old); indigenous peoples, ethnic minorities
Environment Environmental quality Energy and Natural resources Global environmental issues
air, water, and land quality indicators energy resources; other non-renewable and renewable resources, energy utilisation Climate change
B. Process
Consistency with principles of sustainable development Institutional capacities to implement sustainable development strategies
Polluter pays; user pays; precautionary principles Sustainable development mainstreamed and integrated into policy-making; high-level ownership and commitment to sustainable development objectives
Significance criteria and scoring systems
The criteria which are proposed for use in assessing the significance of any change in a Sustainability indicator are shown in Table 2. The scoring notation to be used in recording the significance of each impact in an impact assessment table is also shown in the table below.
TTaabbllee 11..22:: SSiiggnniiffiiccaannccee CCrriitteerriiaa aanndd SSccoorriinngg
Significance criteria
• extent of existing economic, social and environmental stress, in affected areas • direction of changes to base-line conditions • nature, order of magnitude, geographic extent and reversibility / duration of changes • regulatory and institutional capacity to implement complementary measures
Scoring
0 = non-significant impact compared with the base situation 1 = lesser significant impact 2 = greater significant impact + = positive impact
± = positive and negative impacts likely to be experienced -/+ = negative over an initial (specified) period of time but expected to become positive in the longer term.
Reference: Trade 2007/349757/1 Trade Sustainability Impact Assessment of the Free Trade Agreement to be negotiated between the European Community and the Republic of Korea
January 2008 Page 13 of 165
AANNAALLYYTTIICCAALL TTOOOOLLSS AANNDD MMEETTHHOODD
Trade SIAs are based on the analysis of causal chains which identify the significant cause-effect link between a proposed change in trade policy and its social, environmental and economic impacts. This analysis, as far as possible, combines qualitative and quantitative approaches, uses sustainability indicators and is based on the principle of proportionate analysis. Quantitative assessments are provided whenever modelling tools and results are available. Different quantitative and qualitative approaches are utilised and the results are compared. The analysis is based on a detailed and comprehensive description of the trade and investment context underlying the future agreement’s implementation and of trade measures to be included in the agreement. In particular, it includes an analysis of:
• The trade flows (goods, services (with modes/sectors features) and investment flows.
• The existing tariff and non-tariff barriers.
• The sensitivity of sectors involved, including services and rules issues.
• A detailed characterisation of each trade and investment measure to be negotiated.
• A description of the market conditions.
For all cross-cutting issues, such as investment, an analysis of the potential economic and policy implications and the sustainability impacts is presented.
11..33.. CCOONNSSUULLTTAATTIIOONN PPRROOCCEESSSS There are several consultation processes in the EU-Korea TSIA. There are consultation meetings arranged in Brussels with various European stakeholder groups including representatives of member states, industry associations and civil society. A workshop was organised with a wide range of stakeholder groups in Korea. The TSIA team has received comments and input including detailed submissions through email to the TSIA website, [email protected]. Finally the team members in both Europe and Korea have actively contacted various stakeholders including industry groups and civil society organisations.
FFIIRRSSTT CCOONNSSUULLTTAATTIIOONN MMEEEETTIINNGG IINN BBRRUUSSSSEELLSS
On November 30, 2007, a public consultation meeting was held in Brussels to present the preliminary findings of the Phase1 Global Analysis Report. Members of the team conducting the SIA and a number of EC staff were present. Among the institutions and organisations represented were the Embassy of Japan, European Pharmaceuticals Federation, ICT Federation, European Satellite Operators Association, European Automobile Manufacturers Association (ACEA), Eurochambres, European Economic and Social Committee, Korean International Trade Association (KITA)- Brussels Office, Korean Mission to the EU, Toyota, Europe, Volkswagen Europe, and UK Government, BERR-DFID.
SSEEOOUULL WWOORRKKSSHHOOPP
As presented in the Draft GAR, the major dimension of the SIA is to “provide a deeper understanding of the sustainability impacts of the trade and investment aspects of the Free Trade Agreement and of the mechanisms through which they might affect both the EU and Korea”. In line with the methodological guidelines for SIAs, this is achieved through a participatory process that strives to include as broad a spectrum of relevant stakeholders as possible. Despite constraints of time, this was achieved through a workshop conducted in Seoul on Friday, December 14
th.
The workshop was organised back to back with the consultations held in Brussels on 30th
of November 2007 and was structured against the draft GAR which was made available on the EU-Korea SIA web site, so as to allow and elicit comments.
Reference: Trade 2007/349757/1 Trade Sustainability Impact Assessment of the Free Trade Agreement to be negotiated between the European Community and the Republic of Korea
January 2008 Page 14 of 165
The workshop took place in the prestigious COEX international centre and exhibit hall of Seoul, thereby providing high visibility to the event, and to the EU, through a large display of guiding banners from the public access points in the street through the entire COEX building.
The event had been prepared with a mail invitation letter disseminated to over 1500 potential participants of academic research centres, think tanks, advocacy groups, public administration representatives and civil society organisations. Member states were invited through the EU Delegation in Korea.
A flyer, printed in Korean and English, recapitulated the details of the event, and provided a detailed schedule of the workshop and the list of the main interventions and commentators.
At the workshop, participants were presented with a bound copy of various Korean and English translations of presentations, a full English version of the draft GAR, and a Korean version of an executive summary of the Draft GAR.
The workshop was structured around 4 main sessions each with the following focus:
A) EU-Korea Relations in a global context B) Comments and discussion on the three dimensions or pillars (economic, social and
environmental) of the impact assessment of the EU-Korea FTA C) Sectoral impacts and issues for the EU-Korea FTA D) Horizontal issues for the EU-Korea FTA Each session included a series of presentations flagging the main issues, within the broad perspective of the session. The four presentation sessions were complemented by a smaller round table where participants could interview the consultants and open debate on points of particular interest.
Introductory remarks were made by Mr Gareth Steel, from the Trade and Sustainable Development Unit in the EC DG trade in Brussels, who summarised the main features of SIAs and their participatory approach, and by the Korean International Trade Association (KITA) board Director Lee, Joong Ho.
The first session was a presentation by the Team of consultants of the methodological approach and of some of the main findings as encapsulated in the draft GAR. It detailed in particular the varying levels of convergence between the EU and Korea in terms of economic development (GDP) and in terms of human development index (HDI). It also presented asymmetries, in particular in services, between the EU and Korea. It also insisted on the transformations at work and on the importance of sectoral issues above strict tariff issues.
Another presentation was centred on the SIA of the FTA and more specifically on the social dimensions and challenges facing the 2 prospective partners of the FTA .
Professor Inkyo Cheong, of the Inha University, and specialist of FTAs, devoted his intervention to the impacts of the FTA on Korea’s manufacturing sectors. His presentation made reference to environmental regulatory concerns in relation to REACH and generally environmental standards.
The second session was structured around Korean views on the FTA. It offered a broad scope panel of speakers including a journalist from the Korean Economic Daily, the coordinator of the Korean Federation for Environmental Movement, a representative of the Office of Health and Environment, and various academic authorities and researchers. Among the points in discussion, the timing of the SIA came into question, as being late compared to the negotiations. The simultaneity of the negotiations between EU and Korea and the implementation of the US and Korea FTA was underlined. The Korean side offered various interpretations for the EU motivations to enter the FTA.
Particular focus was put on the perceived contradiction between the EU and Korea regarding environmental standards, whereby the EU would try and strengthen environmental standards while Korea would rather try and ease regulations. The need
Reference: Trade 2007/349757/1 Trade Sustainability Impact Assessment of the Free Trade Agreement to be negotiated between the European Community and the Republic of Korea
January 2008 Page 15 of 165
and level to which services should be considered under the FTA also was reviewed, as well as issues of realistic timeframes.
The SIA exercise as such was declared a very positive best practice by the representative of the civic group, as it was claimed that apart from this EU supported activity social and environmental impacts were neither researched nor costed. The specific case of the Korea US-FTA was cited as a comparison.
The discussion also brought forward the need to differentiate and tailor the details of the agreement to respond to the needs of small-scale farmers.
The topics covered also included the consequences of the potential privatisation of the government procurement market, in particular in reference to utilities such as water, and stated the Korean SMEs constraints in applying strict environmental regulations. The issue of gradual and optimal timeframe for implementation of the FTA came under discussion. One intervention presented the perspective of the consumer and the need to have the consumer feel benefits from lower tariffs. References were made to the need to diversify the economy and not have it rest so heavily on so few exports. Currency issues were reviewed, and the appreciation of the won was assessed as a constraint to competitiveness.
The third session was devoted to the sectors that have been screened for detailed review under Phase II of the SIA. Interventions were sector specific.
The choice of the agriculture sector was broadly validated, and the EU developed methodology of the SIA was again praised as a best practice, and a useful tool to monitor the FTA. Main focus was on determining “mutually beneficial” mechanisms. The intervention insisted on the discrepancy in size of the EU (12M) and Korea (1,1M) agricultural populations.
Regarding the automobile sector, main features of the intervention included stressing that the EU has high tariffs and that Korea wishes a rapid lowering of the tariffs. As regards NTBs, issues regarding technology standards were raised and the need to reach mutual recognition was stressed. The position of the EU on safeguard measures was considered as too strict.
The Financial sector was assessed as fragmented and therefore needing a grace period, to allow the Korean services to build up capacity. It was recommended to pay particular attention to cross border transactions. Finally liberalisation of the financial sector was viewed as a balancing exercise between the EU and the US.
The sector of environmental goods and services, selected in line with the DDA, underscored the low level of environmental services in Korea. The sub-themes of water management and of renewable energy were found of high value for the SIA. The GAR was criticised for being too narrow in scope, and the intervention concluded with the need for a staged negotiation.
The fourth session was structured around the cross-cutting themes defined in the GAR.
Main issues regarding the rules of origin related to the value-addition mechanisms and ratios; it used comparative data with the US to seek a lowering of ratios to identify goods under the rule of origin. The comparison with the US was also made in relation to remanufactured products, with the specific case of medical products made with other products and related health considerations.
Regarding IP, main considerations related to the need to prioritise GIOs to be protected and to select standards and scope of IP protection. The need to register IPRs with each EU country and the attendant language constraints were viewed as a major drawback by the Korean side. Finally issues related to the organisation of the attorney profession were discussed.
Regarding TBT and SPS, main issues related to the lengthy Korean certification process; the changes in environmental standards were also discussed and the insistence of the EU on animal welfare.
Reference: Trade 2007/349757/1 Trade Sustainability Impact Assessment of the Free Trade Agreement to be negotiated between the European Community and the Republic of Korea
January 2008 Page 16 of 165
The final intervention was devoted to investments and services, and touched upon issues related to visa, and professions such as the legal profession.
Round-table:
The four sessions were complemented by a closing round table session where the consultants took questions from the participants who wanted to take the issues previously treated a step further and there was opportunity for wider discussion.
The round table picked up on the issue of mutual recognition in the case of legal services, and architects indicating that professional standards and accreditation were an important issue in opening trade in services.
The discussion included a critical assessment of the Korea-Chile FTA in consideration of the lack of positive benefits reaped by the Korean consumer. In the view of one consumer NGO representative there was not sufficient increase in trade and competition as a result of the Korea Chile FTA in order to provide real benefits to consumers. Some concerns were expressed that the EU had a hidden agenda in using the FTA as a beachhead towards other Asian Markets.
A leading representative of the business community voiced the wish that the FTA be coupled with cooperation agreements, possibly covering sensitisation campaigns among business and consumers.
The FTA was also linked with the tentative 2012 deadline for the Kyoto protocol implementation and greater cooperation on clean technologies. It was felt that cooperation on environmental technologies was a promising avenue to pursue.
Key points for consideration:
- The workshop provided an overall validation of the choice of sectors such as foreseen in the GAR for in-depth exploration for Phase II of the SIA.
- The SIA process is broadly considered a welcome participative tool on the Korean side to enhance the public-private dialogue on the social and environmental issues framing the economic dimension of the FTA. The EU approach to Sustainability Impact Assessment of potential FTAs was recognised as providing an otherwise not existing forum to examine environmental concerns in particular, and the EU is globally credited for adopting an integrated approach to the Sustainability Impact of the FTA, with emphasis on the social and environmental dimensions.
- There is plenty of room to deepen knowledge of EU institutions and functioning among Korean society and stakeholders of the FTA. There is in particular an unmet demand on the part of the Korean stakeholders to clarify the articulation of national economic data, policies and interests of the EU members, with the overall mandate of the EU and the particular focus of the DGs in terms of economic policies and external relations.
- The specific role of the European Commission and the implications of the common external trade policy of the European Union were not well understood by some participants. Some participants believed it would be necessary for Korea to negotiate and to sign agreements with all the 27 EU member states in a manner analogous to Korea ASEAN, where Korea has bilateral FTAs with nine of ten ASEAN members.
- There is awareness of the need for Korea to open its economy, but there are many fears, including that the services sector in particular is not ready and needs time to adjust.
- The EU is positively viewed as a balancing weight in the global trade system, and the simultaneity of the EU and US Korea FTA is seen as unique in Asia and fraught with opportunities and challenges.
- While Korea has acquired experience with FTAs through its negotiations with Chile, ASEAN, EFTA and the US, there is still a rather weak knowledge base in broader society about economic social and environmental impacts.
Reference: Trade 2007/349757/1 Trade Sustainability Impact Assessment of the Free Trade Agreement to be negotiated between the European Community and the Republic of Korea
January 2008 Page 17 of 165
PPAARRTTIICCIIPPAATTIIOONN IINN TTHHEE WWOORRKKSSHHOOPP
The workshop offered simultaneous translation services of high quality throughout.
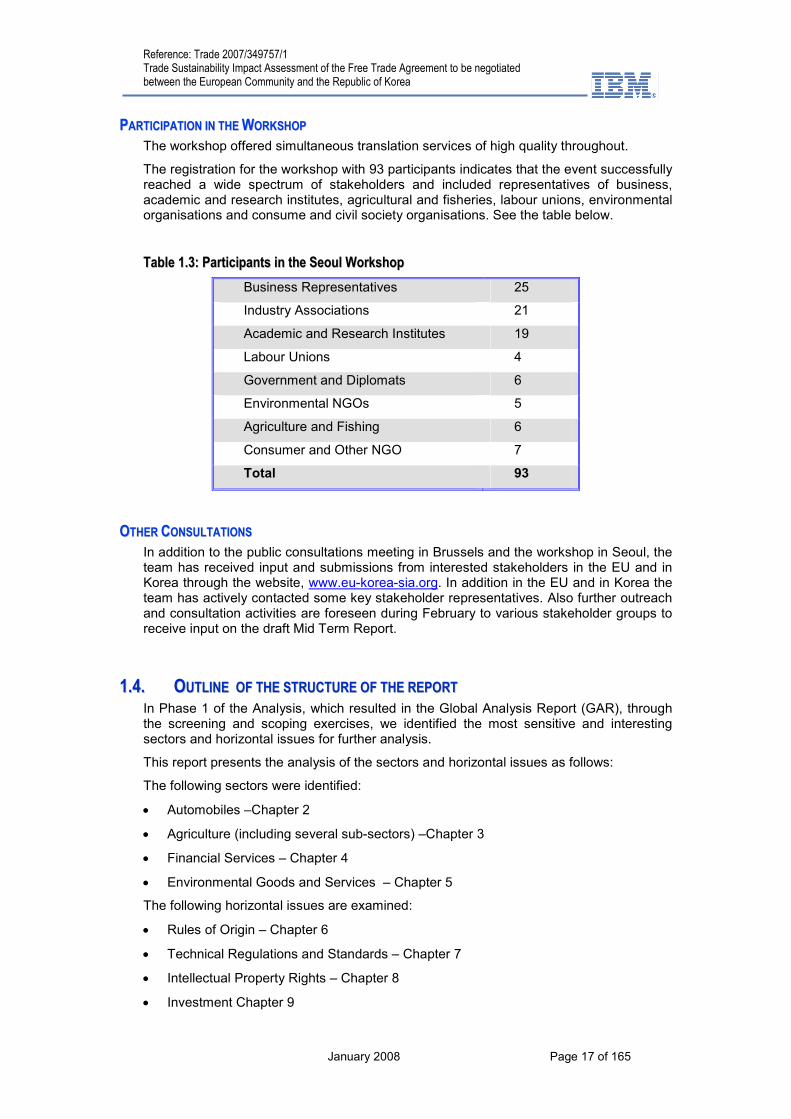
The registration for the workshop with 93 participants indicates that the event successfully reached a wide spectrum of stakeholders and included representatives of business, academic and research institutes, agricultural and fisheries, labour unions, environmental organisations and consume and civil society organisations. See the table below.
TTaabbllee 11..33:: PPaarrttiicciippaannttss iinn tthhee SSeeoouull WWoorrkksshhoopp
Business Representatives 25
Industry Associations 21
Academic and Research Institutes 19
Labour Unions 4
Government and Diplomats 6
Environmental NGOs 5
Agriculture and Fishing 6
Consumer and Other NGO 7
Total 93
OOTTHHEERR CCOONNSSUULLTTAATTIIOONNSS
In addition to the public consultations meeting in Brussels and the workshop in Seoul, the team has received input and submissions from interested stakeholders in the EU and in Korea through the website, www.eu-korea-sia.org. In addition in the EU and in Korea the team has actively contacted some key stakeholder representatives. Also further outreach and consultation activities are foreseen during February to various stakeholder groups to receive input on the draft Mid Term Report.
11..44.. OOUUTTLLIINNEE OOFF TTHHEE SSTTRRUUCCTTUURREE OOFF TTHHEE RREEPPOORRTT In Phase 1 of the Analysis, which resulted in the Global Analysis Report (GAR), through the screening and scoping exercises, we identified the most sensitive and interesting sectors and horizontal issues for further analysis.
This report presents the analysis of the sectors and horizontal issues as follows:
The following sectors were identified:
• Automobiles –Chapter 2
• Agriculture (including several sub-sectors) –Chapter 3
• Financial Services – Chapter 4
• Environmental Goods and Services – Chapter 5
The following horizontal issues are examined:
• Rules of Origin – Chapter 6
• Technical Regulations and Standards – Chapter 7
• Intellectual Property Rights – Chapter 8
• Investment Chapter 9
Reference: Trade 2007/349757/1 Trade Sustainability Impact Assessment of the Free Trade Agreement to be negotiated between the European Community and the Republic of Korea
January 2008 Page 18 of 165
Based on the relevance of these sectors and horizontal issues for the EU and Korea, on the expected changes in production structures, on anticipated social and environmental impacts and on consultations with civil society we have decided to select these sectors (and sub-sectors) and horizontal issues for further study. Phase two is designed to further analyse the abovementioned sectors and horizontal issues in more depth, to provide tools of analysis, examples, and understanding of what is expected to occur as a result of the conclusion and implementation of a Free Trade Agreement (FTA) between the EU and Korea. The quantitative CGE modelling analysis of Phase 1 is taken as the starting point for this analysis. The quantitative analysis is either further deepened in this study and explained or (partially) challenged based on further findings from in-depth research and consultations with civil society. This report does not look at policy recommendations but rather at the expected impacts without consideration of possible policy responses. Policy recommendations and the expected source for policy recommendations (FTA or EA) are addressed in the final phase of the study.
The structure of the report follows the lines of the sectors and horizontal issues that were identified in the Global Analysis Report. Chapter’s two to nine cover the sectors and horizontal issues (see above). Chapter ten reviews the overall impacts of the EU Korea FTA.
Reference: Trade 2007/349757/1 Trade Sustainability Impact Assessment of the Free Trade Agreement to be negotiated between the European Community and the Republic of Korea
January 2008 Page 19 of 165
22.. AAUUTTOOMMOOTTIIVVEE SSEECCTTOORR
22..11.. IINNTTRROODDUUCCTTIIOONN
SSTTAATTIISSTTIICCAALL CCLLAASSSSIIFFIICCAATTIIOONN
There are five sub-sectors in the automotive industry, and three classification systems for sources of data (SITC, HS, and NACE). The five sub-sectors are: Vehicles and Engines; Bodies; Automotive Parts; Tyres; and Automotive Electrical Components. In the classification system in common use in the EU, these are allocated to NACE 34 Manufacture of Motor Vehicles (and trailers), which is further subdivided into 341 – Manufacture of MVs, 342 – Manufacture of Bodies, and 343 – Manufacture of Parts and Accessories.
These grouping are specific to the automotive industry, but there are many other areas of manufacturing that contribute to the automotive sector, including metals and materials, and processes such as forging and casting. However, it is not possible to separate out the automotive elements within the NACE or SIC codes for these sectors. Use of a classification such as NACE 34 therefore understates the proportion of the economy that is dependent on the automotive manufacturing industry to a degree.
For international trade data, the classifications (SITC) for the auto industry are 781 – Motor Vehicles, and 783 – Motor Parts. The HS data are more detailed and are the basis for the EU tariff classification system. Trade data are available on both an SITC and HS basis.
IINNDDUUSSTTRRYY AANNDD GGLLOOBBAALL WWIIDDEE DDEEVVEELLOOPPMMEENNTTSS
Capacity Growth in Developing Countries
A major global development, which will have a major impact on the industry in the coming years, and against which any EU Korea FTA adjustments need to be considered is the expansion both in demand and in production capacity in developing countries. The industry may be mature in markets such as North America, Europe and Japan, where over-capacity continues to affect profitability. But globally the industry is set for huge expansion with the motorisation of China and India. Within a few years China will replace Japan as the second-largest national market after America. Some 180 new factories, each producing an average of 300,000 vehicles, are set to double global annual production, to 110m units a year over the next 5-10 years2. Many of these plants have already been built or are in the process of being built in a wide range of countries, not just China and India, but in countries such as Russia, Turkey, and Thailand. Their initial focus will be not premium saloons, but basic vehicles selling for less than €10,000 ($13,000). The most extreme example is that of Tata in India which is soon to launch a car for one lakh rupees, i.e. for less than €2,000. Both European and Korean companies are part of this wider development, with Fiat linking up with Tata and with Hyundai expanding its China-based production capacity. Also as discussed below, European auto manufacturers are investing in Russia and other emerging markets. The possibility of these producers eventually moving up-market and challenging EU producers in mainstream segments is a highly likely eventuality.
Today's established big producers, many of which have merged their way to giant status, remain hampered by legacy costs and operating problems and could now be beaten by new entrants. The new car industries springing up in China and India will account for most
2 Garel Rhys, director of the Centre for Automotive Industry Research at Cardiff University

Reference: Trade 2007/349757/1 Trade Sustainability Impact Assessment of the Free Trade Agreement to be negotiated between the European Community and the Republic of Korea
January 2008 Page 20 of 165
of tomorrow's extra production. As their output starts to reach markets around the world, the question is: which of today's big carmakers will be hurt the most?
This poses real strategic challenges for the established carmakers, for many of whom small, cheap cars are not a natural market. Germany’s small-car subsidiaries, such as BMW's Mini and Daimler's Smart car, are not cheap cars. For German carmakers in particular, cost levels are too high and brands too valuable to compromise with low-budget overtones.
The difficulty however with entirely abandoning the volume market and focusing exclusively on the premium market, is that carmakers need to spread the costs of research and development over as many vehicles as possible. For example, new electronic fuel injection systems which can make fast cars more powerful, also can be used to improve fuel economy in budget models.
The dynamic ramifications of easier access for Korean carmakers in Europe will be played out against this wider backdrop. That this could present strategic opportunities (with Hyundai’s small car expertise and production base in China) as well as possible threats should be borne in mind.
Industry Consolidation
Intense competition in the industry has laid behind the long wave of mergers, takeovers and joint ventures, entered into as a way of holding down costs and benefiting from other carmaker’s technological advances. In more recent years, the need to develop cleaner engines and manufacture less-profitable, lower-emission small cars have been the main drivers of the matchmaking process in Europe.
Consolidation in cars may not be as obvious to the consumer as it is say, in personal computers. Numerous badges still remains, as mergers and alliances between firms over the years have simply bundled, rather than destroyed, brands. No fewer than 58 brands survive among the ten largest manufacturers. Nevertheless the industry has experienced a 20-year consolidation spree that has seen, for instance, GM swallow Saab and Daewoo, while signing up Isuzu, Subaru and Suzuki in Japan, taking key stakes in them in order to share their small-car expertise and gain access to the Asian market.
The strategy of consolidating behind the brands has not been entirely successful: indeed there is an inverse correlation between the number of brands a firm possesses and profitability (e.g. GM has twice the number of brands of its closest competitor, Ford, but is second to last in the profitability league). Toyota, the industry's profitability champion, has only four brands and a handful of models, but a huge range of variants
The Daimler-Chrysler deal, at the time the world's biggest industrial merger, was driven by the growing cost of electronics systems in luxury cars. Mercedes was the world leader in such sophisticated electronics, but it was not a volume car producer, which meant it laboured with a higher cost base. Daimler's hope was that, by buying Chrysler, it could enter the volume end of the car market in one step, and so spread the costs of new technology over a much bigger output. It did not work out that way. After the merger Daimler and Chrysler together were worth less in stock-market terms than Daimler alone was before the merger. Subsequently, Chrysler has been divested.
In contrast, the other big recent merger, that of Renault and Nissan was a success (at least for Renault), as the French company gained global scale, and after the turnaround at Nissan was supported by Nissan's earnings. The strategy of sharing overheads and technology seems to be bearing fruit in this case.
Ford, the next biggest brand-acquirer, has taken over Jaguar, Aston Martin, Land Rover and Volvo, while it has also bought heavily into Mazda. But Jaguar is still a loss-maker after an investment topping $5 billion and Volvo has only recently moved into profit. Some of these brands are in the process of divestiture.
Of the big carmakers, Toyota has avoided the consolidation game. Given the speed at which it is growing (output has expanded by 1.5m vehicles in the past five years, half the
Reference: Trade 2007/349757/1 Trade Sustainability Impact Assessment of the Free Trade Agreement to be negotiated between the European Community and the Republic of Korea
January 2008 Page 21 of 165
total growth in world production) Toyota is expected to soon become the world’s largest carmaker. Its market capitalisation, at $150 billion, is greater than that of GM, Ford and Chrysler combined.
The Korean car industry has not been immune to the consolidation and globalisation trends. The largest manufacturer, Hyundai, took over Kia ten years ago, while Renault has a strategic stake in Renault Samsung and General Motors in Daewoo.
From an analysis point of view, one obvious implication of the whole process of consolidation and mergers is that it greatly muddies the concept of ‘European’ versus ‘non-European’ or Korean versus non-Korean companies versus automobiles since investment linkages can be as significant as trade. European and Korean automotive producers both face challenges about how to respond to globalisation.
EU-Korea Negotiations
In the negotiations to date, the focus has been on removal or phase out of tariffs (10% for the EU and 8% for Korea), and on NTBs such as standards. Generally, the EU has offered to eliminate or phase out all its import tariffs on Korean goods within seven years, and remove tariffs on 80 percent of the goods within three years after a deal comes into force. The Korean offer would eliminate tariffs on a range of products over 5, 7, 0r 10 years. Korea is holding out for an improvement in Europe's offer to eliminate its 10 percent automotive tariff within seven years. The EU is also demanding that Korea match tariff offers on cars and other products it granted the U.S. in its FTA negotiations. In addition to the FTA with the USA, South Korea has also signed FTAs with Chile, Singapore, EFTA and ASEAN.
Brussels is also asking Seoul to cut regulations for European carmakers by applying international standards instead of different domestic rules. The EU is being asked to exclude South Korean cars from the EU’s regulations on emission control, but Brussels is refusing this because the regulations must apply to all imported cars.
22..22.. IINNDDUUSSTTRRYY PPRROOFFIILLEE:: EEUU
MMAARRKKEETT SSIIZZEE AANNDD SSHHAARREE
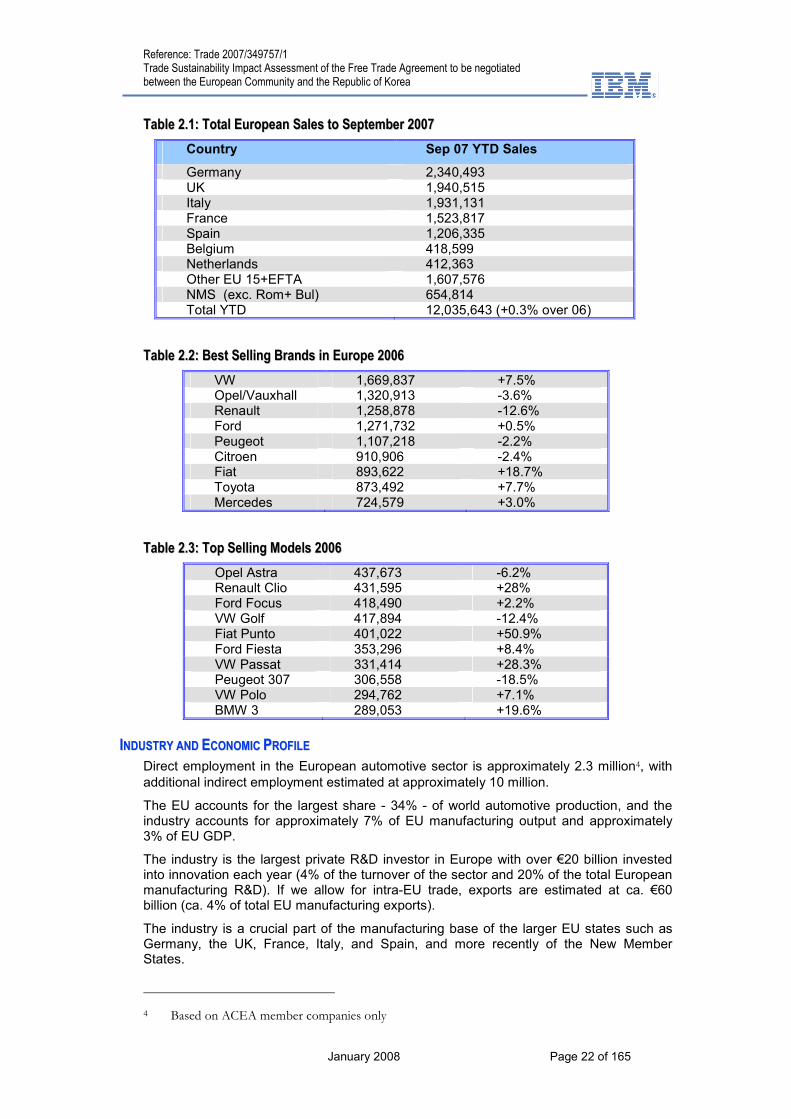
European new car sales in 2006 totalled 15,545,613 units, an increase of 0.7% over 2005. Germany is the largest single market, with total new car registrations in 2006 of 3,468,028, and with the Volkswagen Golf being the best selling model. Italy was in second place with 2,347,758 units, and the United Kingdom in third place with sales of 2,344,864. The UK’s best selling model was the Ford Focus. The best selling model overall was the Opel Astra3.
Europe’s best performing brand of 2006 was VW, while in descending order the top ten was completed by Opel/Vauxhall, Renault, Ford, Peugeot, Citroen, Fiat, Toyota, Mercedes and BMW. Fiat recorded the largest increase in sales from this group with an 18.7% rise in new car registrations mainly due to strong sales of the Fiat Grande Punto. If the sales of Peugeot and Citroen are combined into the group sales of PSA Peugeot Citroen, then it would rank as the largest selling ‘brand’. However each of these two brands has its own identity and its own commercial policy.
3 Opel is the main General Motors (GM) brand in Europe, except in the UK where GM’s other European subsidiary, Vauxhall Motors, still uses its own brand name.
Reference: Trade 2007/349757/1 Trade Sustainability Impact Assessment of the Free Trade Agreement to be negotiated between the European Community and the Republic of Korea
January 2008 Page 22 of 165
TTaabbllee 22..11:: TToottaall EEuurrooppeeaann SSaalleess ttoo SSeepptteemmbbeerr 22000077
Country Sep 07 YTD Sales
Germany 2,340,493 UK 1,940,515 Italy 1,931,131 France 1,523,817 Spain 1,206,335 Belgium 418,599 Netherlands 412,363 Other EU 15+EFTA 1,607,576 NMS (exc. Rom+ Bul) 654,814 Total YTD 12,035,643 (+0.3% over 06)
TTaabbllee 22..22:: BBeesstt SSeelllliinngg BBrraannddss iinn EEuurrooppee 22000066
VW 1,669,837 +7.5% Opel/Vauxhall 1,320,913 -3.6% Renault 1,258,878 -12.6% Ford 1,271,732 +0.5% Peugeot 1,107,218 -2.2% Citroen 910,906 -2.4% Fiat 893,622 +18.7% Toyota 873,492 +7.7% Mercedes 724,579 +3.0%
TTaabbllee 22..33:: TToopp SSeelllliinngg MMooddeellss 22000066
Opel Astra 437,673 -6.2% Renault Clio 431,595 +28% Ford Focus 418,490 +2.2% VW Golf 417,894 -12.4% Fiat Punto 401,022 +50.9% Ford Fiesta 353,296 +8.4% VW Passat 331,414 +28.3% Peugeot 307 306,558 -18.5% VW Polo 294,762 +7.1% BMW 3 289,053 +19.6%
IINNDDUUSSTTRRYY AANNDD EECCOONNOOMMIICC PPRROOFFIILLEE
Direct employment in the European automotive sector is approximately 2.3 million4, with additional indirect employment estimated at approximately 10 million.
The EU accounts for the largest share - 34% - of world automotive production, and the industry accounts for approximately 7% of EU manufacturing output and approximately 3% of EU GDP.
The industry is the largest private R&D investor in Europe with over €20 billion invested into innovation each year (4% of the turnover of the sector and 20% of the total European manufacturing R&D). If we allow for intra-EU trade, exports are estimated at ca. €60 billion (ca. 4% of total EU manufacturing exports).
The industry is a crucial part of the manufacturing base of the larger EU states such as Germany, the UK, France, Italy, and Spain, and more recently of the New Member States.
4 Based on ACEA member companies only

Reference: Trade 2007/349757/1 Trade Sustainability Impact Assessment of the Free Trade Agreement to be negotiated between the European Community and the Republic of Korea
January 2008 Page 23 of 165
For example, in the UK, notwithstanding many high profile plant closures over the years, the industry accounts for just over 10% of overall manufacturing output, a higher figure than the 8% it accounted for in the mid-1990s. Also in the UK, the industry directly employs 210-220,000 people, or 6.5% of the overall manufacturing workforce.
The car business accounts for one in seven manufacturing jobs in Germany, and these are high-paying ‘good’ jobs. Germany is the world champion in taking out automotive patents, and its car firms spend €16 billion a year on research and development (VDA).
But the industry faces major and diverse challenges, including growing international competition, changing societal demands related to mobility, environmental concerns and road safety, shifts in demand around the world and skills shortages to replace an ageing workforce.
In addition to the 9 or 10 major players, the industry includes a substantial number of independent suppliers to which about 2/3 of production is outsourced. The overall industry output includes cars, light trucks and vans, buses and coaches, medium and heavy trucks, motorcycles and agricultural and forestry tractors.
The industry has experienced significant consolidation through mergers and acquisitions. Currently the main players in the EU car industry are:
• Daimler AG (the ill fated merger with Chrysler was officially ended in May 2007);
• Volkswagen;
• BMW;
• Fiat;
• Renault;
• PSA Peugeot Citroen;
• Ford Europe;
• GM/Opel;
• Toyota; and
• Porsche.
Toyota Europe was only admitted as a full member of ACEA in January 20085 (even though Ford and GM which are based outside Europe have been members for years).
In addition to Toyota, which has 8 plants plus one soon to open in Russia, other Japanese carmakers have a substantial manufacturing presence in Europe, i.e. Nissan (Sunderland in the UK and Barcelona, Spain), Mitsubishi (the Netherlands and Turin, Italy), Suzuki (Hungary) and Honda. Mazda is unique in having no manufacturing presence in Europe.
TTHHEE IINNDDUUSSTTRRYY IINN NNEEWW MMEEMMBBEERR SSTTAATTEESS ((NNMMSS))
Background
In almost all Central and Eastern European countries the car industry has represented a priority area of Foreign Direct Investment. Western car firms have been the leading investors in every country, ranging from Poland to Uzbekistan. No major independent car producer survived, and only a handful of truck and bus producers survived.
International production networks have been developing in the region since the early 1990s. Vertically–integrated European car manufacturers were the first to extend their production networks into Eastern Europe, using acquisitions as a means of opening markets and gaining local market share. The Central European parts of these networks
5 Toyota Europe employs 55,000 people directly and has five assembly plants that built 808,000 vehicles in 2007, and three parts plants that manufactured 864,000 engines and 564,000 transmissions.
Reference: Trade 2007/349757/1 Trade Sustainability Impact Assessment of the Free Trade Agreement to be negotiated between the European Community and the Republic of Korea
January 2008 Page 24 of 165
were intended to assemble lower–end cars or to function as second– or third–tier suppliers for western component suppliers that followed the core firm to the East. These international production networks were also used to pressure domestic bargaining partners, including trade unions and governments.6
While there is some trade of components and cars within the region itself, the networks are primarily geared towards Western Europe. Luxury car producers and/or car producers that have built up more open networks in their home base have been far less eager to move into Eastern Europe in order to establish a production base.
Unlike the Japanese, South–Korean car producers have relatively closed and vertically integrated production networks, and as such they are not much different from the other Western European vertically integrated car producers. Hyundai (and Daewoo before them) have used their Eastern European production network as an entry strategy into the Western European market in which they face significant entry barriers.
Today managers are handing their eastern factories more complex tasks. Volkswagen, the German group that was among the first big industrial groups to move into the region, initially saw its plants in the Czech Republic and Slovakia as a source of cheaper models such as the Polo. Today, VW Slovakia's range includes the luxury Touareg SUV.
Current Situation
Total production in the Czech Republic, Slovakia, Slovenia, Poland, and Romania in 2006 was 2.4 million, ahead of the UK (1.6 m.) and just behind Spain (2.8M.). The dominant regional producer is the CZ, which produced 850,000 in 2006 (up from 450,000 in 2004), overtaking Poland. The JV there between Toyota and Peugeot, which started up in 2005, created 3,000 jobs, and produces 300,000 cars a year, 99% for export.
But the CZ may be overhauled by Slovakia, which produced 295,000 cars in 2006, and which now hosts Kia, PSA Peugeot Citroën and Volkswagen. Some experts believe that Slovakia, with a population of 5.4m, could become the world's leading carmaking country measured in output per capita. Kia's greenfield factory in Zilina, which started operating at the end of 2006, has the capacity to produce 300,000 cars a year. Peugeot's factory has a similar capacity. And Volkswagen, which builds SUVs in Slovakia for export, produced 238,000 cars last year.
All this has attracted a new wave of international suppliers. Many South Korean firms have followed Kia to Slovakia and will soon start to supply its parent company, Hyundai, which has just started building a €1 billion ($1.3 billion) new factory over the border in the Czech Republic, due to open in October 2008. (Hyundai and Kia have done something similar in America, positioning their supplier base between their two manufacturing sites.) The Czech government, which has provided around €200m in incentives, hopes this will create a total of 12,000 new jobs in a region with high unemployment. A joint venture between Toyota and Peugeot, which got going in the country two years ago, created 3,000 jobs and now makes 300,000 cars a year, 99% of them for export.
Central Europe is an attractive place to build cars for many reasons. Labour costs are lower than elsewhere in Europe, many countries now have established car-parts industries, and Japanese and South Korean firms value the proximity to western European customers. “If we try and do everything from South Korea, we cannot know what exactly European customers want,” Bae In-Kyu, the boss of Kia's Slovakian plant
6 In 1990–1992 Fiat took over FSM in Poland, Volkswagen acquired Skoda, General Motors (in particular its German subsidiary Opel) acquired Eastern German Wartburg and Renault took a controling interest in Revoz of Slovenia. The investments were targeted at capturing local market shares and were also intended to further develop regional networks of production in which the Central European parts of the network (primarily) assembles cars for the lower end of the market or functions as second or even third tier supplier for western component suppliers that followed the core firm to the East.

Reference: Trade 2007/349757/1 Trade Sustainability Impact Assessment of the Free Trade Agreement to be negotiated between the European Community and the Republic of Korea
January 2008 Page 25 of 165
has been quoted. Making cars in Slovakia also cuts delivery times and sidesteps import taxes.
Lower wages, combined with proximity to the big west European markets, help reduce production costs. That is despite the extra cost of logistics—two or three times higher than for cars built in Western Europe, says a study by the Fraunhofer group at Vienna's University of Technology—and an inevitable loss of quality.
However, recruiting staff is getting harder, and infrastructure in the region is under strain. Most of the roads that serve Renault's plant in Novo Mesto, 40 miles east of Ljubljana, are only single carriageways.
Only VW, among the German carmakers, has taken advantage of the opportunity for lower costs offered by assembling cars in central Europe. VW builds Audis, Seats and three types of Volkswagen at its plant in Slovakia. It also builds various cars in Bosnia, the Czech Republic, Hungary and Poland. Opel (a subsidiary of GM), builds cars in Hungary and Poland. BMW and Porsche have ventured only as far as Leipzig in the former East Germany. (Although Porsche's Cayenne SUV is made on the same platform as VW's Touareg, which is assembled in Slovakia; and BMW builds diesel engines in Austria.) Mercedes has no plants east of the Oder
Toyota is already making cars in Kolin, in the Czech Republic; Peugeots and Citroëns are being assembled by agreement at the same plant. Then there is Renault/Nissan in Romania and Slovenia.
22..33.. IINNDDUUSSTTRRYY PPRROOFFIILLEE KKOORREEAA
Korean automobile production in 2006 was 3.84 million units domestically and 960,000 units overseas. In 2007, domestic production increased to 4.06 million units and overseas production reached 1.15 million (including new production at the Kia Slovakia plant). Thus, local and international Korean automobile production reached 5.21 million units, passing the 5 million mark for the first time. This is equivalent to just over 7% of world production.
The Hyundai Kia Automotive Group is by far the largest. It was formed through the merger of Korea’s first (Hyundai) and second (Kia) largest car companies in 1998, with the Hyundai Motor Company regarded as the de facto representative of the group. The third largest company is Daewoo, which is majority owned by GM, with other important shareholders being Suzuki and the Korea Development Bank. The next largest is SsangYong Motors, which specialises in SUVs and 4X4s. Majority control of it was acquired by Shanghai Automotive Industry Corporation (SIAC) in 2004. Finally, there is Renault Samsung; in 2000 Renault acquired the Samsung Groups Automobile Division, and re-opened the plant at Busan (production in 2006 was 121,855 vehicles
KKOORREEAANN IIMMPPOORRTT AANNDD EEXXPPOORRTT MMAARRKKEETTSS
An FTA agreement that liberalises access to the Korea market for EU automobiles needs to be placed in context against an existing market share that, while small, is showing rapid growth. Thus, according to KAMA (CEPS Study 2006), in 2006 EU MV sales in Korea amounted to 29,404 units, equivalent to a 3.1% share of the overall MV market (935,681 units), and a 72% share of the import market (40,530 units). Between 2001 and 2006, the market for MV imports in Korea has already increased five-fold, without any improvements in market access.
Reference: Trade 2007/349757/1 Trade Sustainability Impact Assessment of the Free Trade Agreement to be negotiated between the European Community and the Republic of Korea
January 2008 Page 26 of 165
The market share of imported cars in Korea exceeded 5% in 2007 for the first time, with new registrations increasing by 27.4% from the previous year to 50,300 units. The import market is continuing to increase despite stagnant domestic demand, with widening import choice, particularly at the moderately priced (around 30 M. Won per unit) levels.
Imported vehicles tend to cluster in the larger size market segments, with 75% of imports rated at 2000 cc or higher, and the great majority of these are European. Thus, in 2006, five of the top ten best selling large cars were European (BMW, Audi, Mercedes Benz, and Volkswagen) with the others being Japanese (Lexus and Honda) and American (Ford). On the basis of this market profile, the most probable outcome of improved access for European models would be a displacement of large engine Japanese imports. Within Europe, the most likely beneficiaries would appear to be, again based on the present market profile, the German auto-makers, BMW, Mercedes-Benz, and Volkswagen.
However, imports of the smaller and medium-sized models, instead of the large-sized (over 3,000cc) luxury sedans in the past, have increased, capturing 25% of the total imported car market. Imported cars exceeding 3,000 cc account for one-third of the sales of the same-class models in the domestic market. Sales of imported cars are expected to further increase in case the Korea-U.S. FTA and EUFTA are concluded. In the period January-September 2007, sales of imported cars grew at a rate of 28.4%, compared to a rate of 6.7% for domestic models.
The projected doubling of Korean per capita incomes by 2010 is another factor that is likely to sustain and grow domestic demand for larger, European car models with a prestige brand. This income growth in itself would likely sustain market growth, irrespective of any tariff reductions.
In 2007, Korean car exports exceeded 2.8 million units for the first time, an increase of almost 9% from the previous year. North America and Western Europe accounted for just under 50% of this, but this share is dropping as sales surge in emerging markets (exports to eastern Europe increased by 15%). Exports to Western Europe sharply decreased due to the weakened price competitiveness of Korean cars caused by Hyundai’s line-up adjustment, Kia’s expanded local production, Japanese firms’ strengthened price competitiveness, and European firms’ expansion of sales of small cars.
Hyundai Profile
In April 2007 Hyundai began construction of its €1.1 billion manufacturing plant in Nosovice, Czech Republic. When completed in March 2009, Hyundai Motor Manufacturing Czech (HMMC) will have the capacity to build 200,000 vehicles annually beginning with the i30 C-segment five-door hatchback and a yet-to-be-revealed compact minivan. In the second phase, an additional 100,000 units per annum of capacity will be added by 2011 to build a third model. Building awareness of the Hyundai brand, this plant is aimed at helping Hyundai compete on an equal footing with other European-based automakers. The Hyundai plant is expected to generate a total of 12,000 new jobs in a region of high unemployment.
HMMC and the plant of its affiliate Kia Motors Slovakia located just 85km away stand to benefit from synergies generated by their close proximity and the sharing of suppliers and other support functions. Eleven key Korean-based suppliers to the Hyundai Kia Automotive Group are already in operation serving the Kia Motors Slovakia plant. An additional three have announced intentions to set up, bringing the total to 14. Slovakia’s Kia plant has a capacity of 300,000 vehicles (Slovakia produced 295,000 in 2006; it also has a PSA Peugeot plant (300,000 capacity), and a VW SUV plant (capacity 238,000).
Japanese and South Korean firms value proximity to Western customers, which cuts delivery times and import taxes. But staff recruitment is getting harder, and infrastructure in the region is under strain.
Hyundai deemed a European manufacturing base essential in order to face the intensifying competition in the European C-segment, which accounts for approximately 30 percent of EU sales. Hyundai has also invested €50 million in a

Reference: Trade 2007/349757/1 Trade Sustainability Impact Assessment of the Free Trade Agreement to be negotiated between the European Community and the Republic of Korea
January 2008 Page 27 of 165
European Design and Technical Centre which designed the i30 hatchback and wagon, and in 2006 it opened a new European sales and marketing headquarters in Offenbach in Germany to better support local sales. The Czech plant is the final link in the chain providing Hyundai with the full range of local capabilities to serve the European market from design and engineering, to production, marketing, sales and after-service.
In the first phase, it is anticipated that 2,845 new jobs will be directly created, with an additional 675 in the second phase expansion, bringing total employment at HMMC to 3,520 people. At the supplier level, it is anticipated a further 4,000 jobs will be created, providing a significant impetus to the growth and development of the Czech economy. In compliance with EU guidelines, Czech authorities extended incentives valued at 15 percent of the total investment, the maximum permissible under EU regulation.
A European manufacturing base was deemed essential in order to achieve Hyundai’s long-term sales targets in Europe. With HMMC coming on-stream in 2009, Hyundai’s European sales are forecast to grow from a current volume of approximately 360,000 units (2006) to 620,000 units in 2010 (these sales forecasts have been revised upwards from earlier levels).
Hyundai Motor Europe GmbH (HME) was established in 2000. Located in Offenbach, Germany, it coordinates all marketing, sales and aftersales activities in all of Hyundai’s 26 European markets. Hyundai is the third largest Asian automobile brand in Europe. The annual European sales volume reached 360,000 vehicles in 2006. Leading brands are the small car B-segment models, the Getz (26% of sales in 2006), and the Atos (11%), and the Sports Utility Vehicle market (the smaller Tucson – 19% of sales - and the larger Santa FE – 14% of sales), in which it ranked No. 3 in 2005. SUV sales increased by 40% in 2006.
A European C-segment 5-door hatchback (codenamed FD), and a concept Crossover Utility Vehicle (CUV) made of alternative materials that help save fuel and offer enhanced pedestrian safety were unveiled by Hyundai at the 2007 Geneva Motor Show.
The Hyundai-Kia Automotive Group ranks as the sixth largest automotive manufacturer in the world. In Automotive News’ survey of global automotive sales and production, Hyundai Motor Co. and its subsidiary Kia Motors Corp. registered an 11.6 percent jump in global sales in 2005 to 3,715,096 units7. It was the largest percentage gain of any carmaker in the million-plus sales category. With it, Hyundai and Kia climbed one spot in the global rankings.
Hyundai has enjoyed double digit sales gains in the Chinese, Indian and Russian markets while in the more competitive North American and European markets, a more modest pace of growth has been registered.
TTaabbllee 22..44:: WWoorrlldd RRaannkkiinnggss 22000055
Ranking Automaker 2005 Global Sales
1 General Motors 8,381,805
2 Toyota Motor Corp. 8,120,000
3 Ford Motor Co. 6,208,700
4 Volkswagen AG 5,242,793
5 DaimlerChrysler AG 4,854,700
6 Hyundai-Kia Automotive Group 3,715,095
7 Nissan Motor Co. 3,597,748
8 PSA/Peugeot-Citroen SA 3,390,000
9 Honda Motor Co. 3,365,000
10 Renault SA 2,533,428
*Source: Automotive News June 5, 2006 Edition
7 The survey results include sales of cars, light trucks, commercial vehicles and buses.
Reference: Trade 2007/349757/1 Trade Sustainability Impact Assessment of the Free Trade Agreement to be negotiated between the European Community and the Republic of Korea
January 2008 Page 28 of 165
In Europe, in 2006, (ACEA data), Hyundai-Kia drew even with Nissan to become the second most popular import brand in Europe (EU 23 + EFTA). Hyundai has been gaining additional market share - and image - with new models that attract customer groups interested in high-end products. Albeit not inexpensive, vehicles like the all-new Santa Fe, the Sonata and Grandeur are more affordable than competitor models and this constitutes a major growth opportunity. Hyundai’s new high-end D- and E-segment sedans Sonata and Grandeur have also produced good sales results so far and the company anticipates the new diesel versions to reach even more consumers. In addition, the new Santa Fe European style SUV is expected to fortify Hyundai’s No 3 position in the European SUV market.
Within six years Hyundai has managed to secure an 11.4 per cent share in the highly competitive European SUV market. In 2005 Hyundai ranked as the third most popular SUV brand in Europe, sales reaching close to 100,000 units. In some European countries Hyundai has even taken the No. 1 position in SUV sales.
Kia Profile
Kia was founded in 1944 and is Korea’s oldest carmaker. 13 manufacturing and assembly operations in nine countries produce more than 1.3 million vehicles a year. Its €1 billion investment in Slovakia will build 4 models – the cee’d 5 door HB, the cee’d Sporty Wagon, Pro-cee’d 3 door, and the Sportage SUV. It will employ 2,600, and its aim is to be the most productive car plant in Europe, producing 100 cars per employee per year.
In the Czech Republic, the cee’d was the best selling imported car in 2006, while in Finland it was no. 1 in its class – beating the Golf, Octavia, Auris, and Focus.
Other Kia brands selling in Europe are the Picanto A segment small car (leading seller), Sorento mid size SUV (no. 2), the Sportage (no. 3), the Carnival MPV, and the Car-ens compact MPV. Spain was Kia’s biggest market in 2006. Demand is also very strong in the CEE market, with sales increasing by 42% in 2006. The Picanto mini is the second best seller in its class.
Kia has been the fastest growing auto brand in Europe for the last 3 years – with sales growing by 70% from 155,229 in 2003 to 264,872 in 2005. Kia sold only 80,000 cars in Europe in 2002.
Kia is targeting overall European sales of 500,000 by 2008, up from 300,000 in 2006.
The Cee’d is a bid to capture market share in the highly competitive compact sector. This sector is dominated by the Golf and offers much better margins than smaller economy cars. Kia builds diesel engines in Russelsheim, Germany – the backyard of GM’s Opel unit. It also has a new design centre near Frankfurt.
The Japanese share of auto sales in Europe in 2005 was 13.5% - Kia’s share was 3.9% as its sales soared by 40%.
EEXXIISSTTIINNGG BBIILLAATTEERRAALL TTRRAADDEE AANNDD IINNVVEESSTTMMEENNTT PPRROOFFIILLEE
The EU is Korea's second-largest trading partner after China, with bilateral trade reaching approximately €60 billion in 2006. Unofficial estimates suggest a free trade agreement would boost that figure by as much as 40 percent in the long run. If implemented, the free trade pact would be the largest for Korea, surpassing the agreement signed in June with the U.S. that is still under legislative review.
The EU is also the largest foreign investor in Korea.
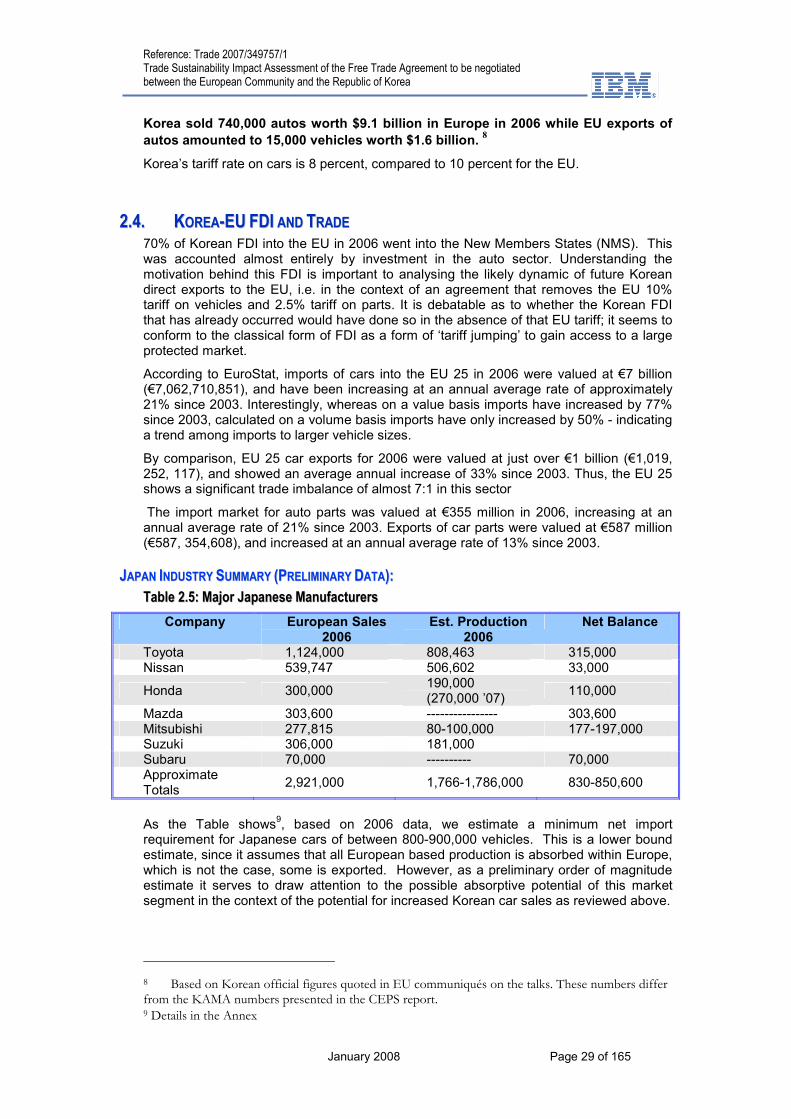
Reference: Trade 2007/349757/1 Trade Sustainability Impact Assessment of the Free Trade Agreement to be negotiated between the European Community and the Republic of Korea
January 2008 Page 29 of 165
Korea sold 740,000 autos worth $9.1 billion in Europe in 2006 while EU exports of
autos amounted to 15,000 vehicles worth $1.6 billion. 8
Korea’s tariff rate on cars is 8 percent, compared to 10 percent for the EU.
22..44.. KKOORREEAA--EEUU FFDDII AANNDD TTRRAADDEE 70% of Korean FDI into the EU in 2006 went into the New Members States (NMS). This was accounted almost entirely by investment in the auto sector. Understanding the motivation behind this FDI is important to analysing the likely dynamic of future Korean direct exports to the EU, i.e. in the context of an agreement that removes the EU 10% tariff on vehicles and 2.5% tariff on parts. It is debatable as to whether the Korean FDI that has already occurred would have done so in the absence of that EU tariff; it seems to conform to the classical form of FDI as a form of ‘tariff jumping’ to gain access to a large protected market.
According to EuroStat, imports of cars into the EU 25 in 2006 were valued at €7 billion (€7,062,710,851), and have been increasing at an annual average rate of approximately 21% since 2003. Interestingly, whereas on a value basis imports have increased by 77% since 2003, calculated on a volume basis imports have only increased by 50% - indicating a trend among imports to larger vehicle sizes.
By comparison, EU 25 car exports for 2006 were valued at just over €1 billion (€1,019, 252, 117), and showed an average annual increase of 33% since 2003. Thus, the EU 25 shows a significant trade imbalance of almost 7:1 in this sector
The import market for auto parts was valued at €355 million in 2006, increasing at an annual average rate of 21% since 2003. Exports of car parts were valued at €587 million (€587, 354,608), and increased at an annual average rate of 13% since 2003.
JJAAPPAANN IINNDDUUSSTTRRYY SSUUMMMMAARRYY ((PPRREELLIIMMIINNAARRYY DDAATTAA))::
TTaabbllee 22..55:: MMaajjoorr JJaappaanneessee MMaannuuffaaccttuurreerrss
Company European Sales 2006
Est. Production 2006
Net Balance
Toyota 1,124,000 808,463 315,000 Nissan 539,747 506,602 33,000
Honda 300,000 190,000 (270,000 ’07)
110,000
Mazda 303,600 ---------------- 303,600 Mitsubishi 277,815 80-100,000 177-197,000 Suzuki 306,000 181,000 Subaru 70,000 ---------- 70,000 Approximate Totals
2,921,000 1,766-1,786,000 830-850,600
As the Table shows
9, based on 2006 data, we estimate a minimum net import
requirement for Japanese cars of between 800-900,000 vehicles. This is a lower bound estimate, since it assumes that all European based production is absorbed within Europe, which is not the case, some is exported. However, as a preliminary order of magnitude estimate it serves to draw attention to the possible absorptive potential of this market segment in the context of the potential for increased Korean car sales as reviewed above.
8 Based on Korean official figures quoted in EU communiqués on the talks. These numbers differ from the KAMA numbers presented in the CEPS report. 9 Details in the Annex
Reference: Trade 2007/349757/1 Trade Sustainability Impact Assessment of the Free Trade Agreement to be negotiated between the European Community and the Republic of Korea
January 2008 Page 30 of 165
22..55.. SSUUSSTTAAIINNAABBIILLIITTYY IIMMPPAACCTT AASSSSEESSSSMMEENNTT
MMEETTHHOODDOOLLOOGGYY FFOORR IIMMPPAACCTT AANNAALLYYSSIISS
The TSIA utilises two methodologies for economic impact analysis for the automotive sector. One methodology is based on an aggregate computable general equilibrium (CGE) model based on the GTAP model which focuses on long run effects and on potential trade effects but does not capture FDI and production location effects. The other methodological approach is a microeconomic partial equilibrium analysis built up from the analysis of industry market segments and company strategies. The partial equilibrium analysis focuses on shorter term impacts and on the impacts of FDI and plant location decisions. The two approaches are complementary and provide different perspectives on the range of potential economic impacts over time. The alternative potential economic impacts have important implications for the social impacts.
CCOOMMPPUUTTAABBLLEE GGEENNEERRAALL EEQQUUIILLIIBBRRIIUUMM MMOODDEELL--BBAASSEEDD AANNAALLYYSSIISS OOFF EECCOONNOOMMIICC IIMMPPAACCTTSS
A study conducted by Copenhagen Economics Quantitative Analysis examines the potential impacts on the automotive sector utilising a Computable General Equilibrium Model—the GTAP model. The Copenhagen Economics study indicates that there are relatively large potential impacts of the EU-Korea FTA on trade and production in automobiles with Korean automotive production expanding 28 percent and EU automotive production contracting 1.7 percent in the longer term. As is discussed in the Global Analysis chapter below, the Copenhagen Economics study makes assumptions about the barriers to trade in services and the potential impacts of removal of these barriers. As a result the Copenhagen Economics study predicts large increases in net EU exports of services to Korea and large increases in net exports of Korean manufactured goods to the EU.
The TSIA has conducted a comparable study using the GTAP model to examine the economic impacts of the EU Korea FTA. Our results differ, because we do not make the same assumptions as Copenhagen Economics on the magnitude of the barriers on trade in services and the nature of the response to the removal of barriers to trade in service. Our approach recognises that much of the expansion of trade in services involves expansion of FDI instead of large increases in cross border trade in services. As a result the shifts in production for both goods producing and services industries are much less. The broader issues in the differences in the modelling approaches used by Copenhagen Economics and by the TSIA are discussed in more length in the Global Analysis chapter below. Our focus here is on the implications for the economic impacts in the automotive sector.
The results of our CGE analysis using the GTAP model of the automotive sector is that Korean production expands about 6 per cent due to the EU Korea FTA in the longer term and that automotive production in Europe also expands but very modestly about .4 percent. The reasons for this result that EU auto production expands slightly while Korean auto production expands significantly are that the removal of the automotive tariff on a bilateral basis leads to lower automotive prices in both economies resulting in some expansion of the demand for automobiles and that there is also some displacement of third country imports since MFN tariffs are maintained at the level to be achieved with a successful conclusion of the Doha negotiations in the WTO.
Note that this CGE model based analysis does not examine FDI effects and it does not address non-tariff barriers. These issues are addressed in the Microeconomic Partial Equilibrium Analysis.
Reference: Trade 2007/349757/1 Trade Sustainability Impact Assessment of the Free Trade Agreement to be negotiated between the European Community and the Republic of Korea
January 2008 Page 31 of 165
Economic Impacts
Increased competition from Korean car imports within the European car market resulting from the (phased) elimination of the 10% EU tariff is the primary economic impact. A secondary level impact will arise from the elimination of the Korean 8% tariff (and also a presumed agreement on standards issues) and the improved access for EU producers within the Korean market. In terms of scale however, the EU market impact predominates.
The general economic context of the next few years will be an important factor conditioning outcomes. One development that cannot be overlooked is the rising trend in oil prices, but the net effect on the market is unclear; on the one hand while it may reduce car traffic levels, it may also induce a trend to new, more fuel-efficient car replacement, thereby boosting new car sales. An appreciating euro is another potentially significant macroeconomic factor (or for that mater an appreciating won), but again the net effect is unclear, as virtually all car makers (the major exception being the German premium car makers) have substantial non-euro based manufacturing and supply operations. In the longer term exchange rate effects may be fully or partially reversed depending on global financial markets and the evolution of global trade and payments flows. Nonetheless, since exchange rates often “overshoot” the adjustment process can be more difficult in a difficult macroeconomic environment.
Macro-economic factors aside, there are at least four other important conditioning factors:
• Phase-In Period
• Response by European Car Makers
• General Market Growth
• The extent of import (mainly Japanese) displacement
Overall effects will be mitigated, in the sense of being deferred, through the tariff phase-out period that is agreed to. A seven year phase-out is currently the offer under consideration, and this length of phase–out would offer a substantial breathing space to allow European producers to adjust.
Natural Market Growth
In the context of a seven year phase in period, we need to allow for the process of natural market growth to absorb some of the anticipated increase in imports. However, recent market growth has been sluggish – thus, in 2006 sales increased by only 0.7% over 2005, and this pattern continued into 2007, with ytd sales to September only increasing by 0.3%. No doubt there is a cyclical dimension since sales expanded more rapidly in previous years but environmental concerns and higher energy costs could lead to lower trend rates of growth in automobile sales in the EU in the future.
The ‘Swing’ Factor of Czech/Slovak Production
Given the substantial investment that has occurred, the expanded European-based production by Hyundai and Kia will certainly absorb some proportion of product that would otherwise have been imported. Because these plants do not supply the full Hyundai/Kia range however, imports will continue. But if Hyundai struggles to meet its 2010 targets, there may even be a drop (possibly temporary) in imports from 2006 levels, with the focus on maximising output levels at the new plants. There is a precedent for this; in the USA, auto imports from South Korea have been falling since 2005, precisely at the time Hyundai began production in Alabama (but parts exports may be increasing)
European Industry Response
The auto industry is an intensely competitive industry; hence, notwithstanding the Hyundai Group’s exceptionally strong performance in past years, there are no guarantees that it will meet its declared targets. European carmakers will unquestionably respond with new designs, more innovative marketing campaigns, etc. Hyundai’s new and larger
Reference: Trade 2007/349757/1 Trade Sustainability Impact Assessment of the Free Trade Agreement to be negotiated between the European Community and the Republic of Korea
January 2008 Page 32 of 165
model range is also moving into the traditionally core European model range, and a strong reaction has to be expected.
The EU automotive industry is not one monolithic bloc, it is made up of a mixture of producers and market segments, with strong product and brand differentiation. The likely overall impact of tariff free Korean market access will be mitigated by this market structure.
A primary feature of the industry is its division into corporate groupings. Product differentiation by means of branding is a defining feature of the car industry, and suppresses, to varying degrees, the impact of price-based competition. Through this factor, the industry enjoys a level of competitive resilience to the overt threat that Korean car imports may pose. While vehicles may be viewed as close substitutes within each market segment, substitution across segments will be more limited.
The companies (and their employment base) that specialise in high performance and large car production are likely to be most immune. These are predominantly German, i.e.Mercedes, BMW, and Porsche. But Volkswagen, the maker of Audis and the closest Germany as a full-range carmaker, is a different case and it combines the Volkswagen, SEAT and Skoda brands which are all pitched to the mid-market range and compete with each other.
Overall we would expect that European manufacturers will respond dynamically by introducing new models, upgrading production technology, adjusting pricing strategies and adjusting sourcing patterns. It is quite possible that net European output will rise in the medium term due to these dynamic factors.
Base Case and FTA Impact Scenarios
Two FTA impact scenarios are evaluated, a low-medium impact scenario and a high impact scenario. Each is evaluated in terms of FTA induced import impacts incremental to the Base Case.
Base Case:
The Base Case hinges on the assumptions made with respect to the market absorption of NMS production and imports. We assume full take-up of Kia plant production (300,000 units) in years 2008 and 2009, but initially only Phase 1 take-up of Hyundai plant production (200,000 units in 2009 and 2010). We note that the Kia plant has a diversified output mix of at least 4 models, hence should be easier to absorb. The Hyundai expansion displaces the C segment imports that currently comprise approximately 30% of Hyundai imports (100,000 units). Hyundai's imports become more concentrated in the B segment and SUV ranges. Thus, we assume under the base case a gradual (by end 2010) ramp-up in combined CEE production of 500,000 units.
Total Korean sales, all imports, were 740,000 units in 2006, having averaged increases of 10-20% (in a slow growing market) in preceding years. With overall market growth having slowed to the 1% or less range in recent years, it is possible but perhaps not likely that this rate of sales expansion can be sustained. At 5%, Korean sales would still be exceeding overall sales growth by a factor of 5:1. Under this scenario, Korean car sales would grow to approximately 900,000 units by end 2010. Allowing for NMS output as summarised above of 500,000 units, this equates to imports of 400,000 units, i.e. a drop of approximately 340,000 from 2006 levels. It is against this estimated import level of 400,000 units by end 2010 that incremental FTA impacts are assessed.
Beyond 2010, we would need to allow for the additional production of 100,000 units at the new Hyundai plant. This would be predicated on market conditions as they evolve in the intervening years. If it occurs, a temporary dip in imports in the years 2011-2012 would be likely. This would be temporary however and not materially alter the longer term outcome.
Another element of the base case would an expected decline in the market share of EU exports to Korea as a proportion of total Korean automotive imports. The most important factor would be the preferential access available to other exporters based in the US or
Reference: Trade 2007/349757/1 Trade Sustainability Impact Assessment of the Free Trade Agreement to be negotiated between the European Community and the Republic of Korea
January 2008 Page 33 of 165
ASEAN who will have preferred access to the Korean market if the EU Korea FTA is not concluded.
FTA High Impact Scenario:
Under this high impact scenario we assume that the Hyundai/Kia group achieve their 2010 sales target of 1.2 million, which combined with other Korean imports, equates to a total of 1.3 million units by end 2010, and a net import increase from 2007 of 400,000 units.
FTA Low Impact Scenario:
Under this scenario, Hyundai's sales target is either delayed (e.g through a graduated tariff phase-out) or only partially met (e.g. through a strong EU industry response). A pro-competitive industry response is suggested by the GTAP simulations summarised elsewhere in this report. Additional factors are a) a reduced ROO threshold (for Korea) of 40% from the current 60%, and elimination of duty drawback for use of imports from China, and b) escalating logistics costs to shipping cars from Korea. In this scenario therefore, we assume 2010 sales of 1.1 million units, equivalent to a net import gain of 200,000 units over the base case. This is a scenario which on balance we feel is a more likely outcome.
Market Displacement Effects and Japanese Imports:
From an EU economic perspective, as well as from a social perspective, the question of whether EU based production or imports are displaced is the critical one. Since by far the bulk of European car imports are Japanese, with closely competing models and market perceptions to Korean, and needing to sustain the 10% tariff, it is that market segment that would appear to be most obviously at risk.
As earlier shown, we have a lower bound estimate for Japanese car imports of 900,000 plus vehicles.
On a strictly proportional – and highly conservative - basis (as a share of 2006 sales) this segment could be expected to absorb at least 10% of the displacement effect, equivalent to 40,000 units and 20,000 units respectively under high and low impact scenarios. This however is a highly conservative scenario – as the appendix below elaborates, there are segments of the Japanese import market that are highly vulnerable to greater Korean competition, and the probable impact will be higher than the proportional impact assumed. Increased EU Exports to Korea
For the European automotive sector agreement on common international standards and better co-operation on conformity assessment procedures are key issues. Achievement of EU negotiating objectives in this area will be important to ensuring that some potential economic benefits are realised from the EU Korea FTA in terms of increased exports to Korea in order to offset at least to some degree increased competitive challenges in the EU market. The beneficiaries (in terms of employees and production location) of increased exports however are different from those that feel the impact of displaced sales in the European market.
Currently, EU car sales in Korea fall in the 30-40,000 range, and have been growing at 10% or more a year. With agreements as summarised above, this rate of growth would accelerate. However, even if it were to double from its current Base case levels, it would still only equate to an output increase of 3-4,000 units annually. While this would be a real gain for a number of companies, it is dwarfed in overall terms by the production impacts within the EU market.
Reference: Trade 2007/349757/1 Trade Sustainability Impact Assessment of the Free Trade Agreement to be negotiated between the European Community and the Republic of Korea
January 2008 Page 34 of 165
Social Impacts
Social impacts will arise essentially through the displacement of production at older and less cost efficient plants. It is impossible to predict where exactly that will fall, so a ‘representative’ form of analysis is required.
For our base maximum impact scenario, we are estimating a core vehicle displacement of 300,000 units (high impact) and 150,000 units (low Impact).
Dispersion and Attrition:
A large number of mitigating factors need to be applied to that basic estimate. From a social impact perspective (i.e. as regards the possibility of plant closures), a key question is whether this impact would be absorbed e.g. by being dispersed among different plants, or by being accommodated through the processes of attrition or early retirement, through shorter working hours, reduced shifts, and fewer contract workers, etc. Indeed the high cost of redundancies in some European countries while it can inhibit new employment creation, also can inhibit plant closures and mass lay-offs through the medium of these measures.
This would comprise the more benign of the possible scenarios.
Plant Closure:
A second scenario is that of a plant closure. It is of course impossible to predict which of the dozens of car plants in Europe might be at risk of this, but there are a number whose history and model base would make them more vulnerable10. One would need to be very careful in attributing closure of any of these plants to an FTA, since a number have hovered on the brink of closure for some years anyway.
They can however be used from an analytical perspective to simulate the possible scale of regional social impacts, as well as the mitigating effect of the employment and social safety nets in operation at these plants/countries. The automobile industry operates a high standard of safety net norms which would come into play in these circumstances.
Institutional Context
In terms of context, the European Commission and the main industry and workers' organisations in the car sector recently announced a new partnership to help better anticipate and manage change in the EU's automotive industry. The initiative brings together the Commission and the European Automotive Manufacturers' Association (ACEA), the European Association of Automotive Suppliers (CLEPA) and the European Metalworkers Federation (EMF). It will monitor developments in the industry, while the partners will exchange know-how on managing restructuring in a socially responsible way.
The “European Partnership for the anticipation of change in the automotive industry”, commits the partners (EU, governments, companies, trade unions and regions) to a series of concrete actions, including:
• A new observatory on change in the automobile industry, including employment and skills needs;
• Collecting and exchange of best practice on socially responsible restructuring, with a view to developing recommendations at a later stage;
• Better use of funding (such as the European Social Fund and European Globalisation Fund) to support anticipation and adaptation to change.
10 The Nissan plant outside Barcelona and the Mitsubishi plant at Born in the Netherlands to name just two.
Reference: Trade 2007/349757/1 Trade Sustainability Impact Assessment of the Free Trade Agreement to be negotiated between the European Community and the Republic of Korea
January 2008 Page 35 of 165
Environmental Impacts
On the basis of the different fuel efficiency and environmental performance of various models the environmental impacts of an FTA would appear to be on balance relatively minor. As the table below indicates, some European carmakers (PSA, Fiat) post a superior performance to the Japanese, and Korean carmakers. This is in part a function of the average model size, and in part a function of engine design.
Korean carmakers are actively targeting the mid-size and larger engine categories, and if that is reflected in the increased sales in Europe, there may be no net environmental gains.
According to KAMA’s submission to the Commission, KAMA has reduced its fleet average co2 emission from 197g/km in 1995 to 167g/km in 2005, and has confirmed its commitment to meet the 140g/km target by 2009.
Data released by the European Federation for Transport and the Environment, an environmental lobby group, showed European carmakers made little progress on fuel efficiency or CO2 emissions in 2006. The European Automobile Manufacturers’ Association stalled at 160g/km. The figure for Japanese carmakers fell from 166 to 161 and that for Korean from 167 to 164, with Toyota leading the way.
PSA Peugeot Citroën of France topped the fuel efficiency table with 142g/km, ahead of Italy’s Fiat on 144 and France’s Renault on 147. DaimlerChrysler was bottom with 188.
TTaabbllee 22..66:: AAvveerraaggee CCOO22 eemmiissssiioonnss ooff mmaajjoorr ccaarr mmaannuuffaaccttuurriinngg ggrroouuppss iinn 22000066
Position Group Fleet average CO2 emissions in 2006 (g/km)
1 PSA Peugeot Citroen 142 2 Fiat 144 3 Renault 147 4 Toyota 153 5 Honda 154 6 General Motors 157 7 Ford 162 8 Suzuki 166 9 Volkswagen 166 10 Hyundai 167 11 Nissan 168 12 Mazda 173 13 BMW 184 14 DaimlerChrysler 188
Source: Federation for Transport and the Environment 2007
The EU and Korean industry face similar challenges in reducing CO2 emissions and achieving higher levels of fuel efficiency.
22..66.. RREEFFEERREENNCCEESS
ACEA: European Automobile Manufacturers Association; European Automobile Industry Report 2007/08, Brussels, 2007.
Automotive News, World Car Manufacturer Rankings, 2006.
Centre for European Policy Studies; A Qualitative Analysis of a potential FTA between the EU and South Korea, July 2007.
Copenhagen Economics; Economic Impact of a Potential FTA between the EU and Korea, March 2007.

Reference: Trade 2007/349757/1 Trade Sustainability Impact Assessment of the Free Trade Agreement to be negotiated between the European Community and the Republic of Korea
January 2008 Page 36 of 165
European Industrial Relations Observatory; various reports on industrial relations in the European automotive sector, 2000-2004.
European Partnership for the Anticipation of Change in the Automotive Sector; report of proceedings on restructuring forum, Brussels, 17/18 October 2007.
European Federation for Transport & Environment: Report on European Carmakers co2 emissions 2006; Brussels, 18 November 2007.
European Competitiveness Report 2004; background report on key indicators on competitiveness of the EU automotive industry, Brussels 13 January, 2005.
Financial Times, ‘Fragmented Trade Lanes’, 27 March 2007
Gunther Verheugen, VP of EC responsible for Enterprise and Industry; ‘Future Automotive Technologies’, speech, Brussels, 10 May 2006.
Hyundai-Kia Corporate Web Site
Korean Automobile Manufacturers Association (KAMA) 2007: KAMA’s Comments to the Commission on Consultations to reduce co2 emissions on Passenger Vehicles and Light Commercial Vehicles.
Korean Automobile Industry Research Institute; Performance of Korean Car Industry 2007, Seoul, 2007.
WTO: Trade Policy Review of the Republic of Korea, Report by the Secretariat, 18 August 2004.
US Trade Numbers; ‘US Korea Car Imports’, 10 April 2007.
22..77.. AANNNNEEXX
JJAAPPAANNEESSEE CCAARR MMAAKKEERR IINNDDUUSSTTRRYY PPRROOFFIILLEE
Toyota
Toyota has a substantial manufacturing presence in Europe, with nine manufacturing plants in seven countries. Toyota’s newest plant is in St. Petersburg, Russia, which became operational in December 2007, assembling the Camry with a projected annual capacity of 50,000 units. Toyota became a full member of ACEA as of January 2008.
Toyota’s European sales target for 2008 is 1.2 million vehicles. Toyota European sales in 2006 totalled 1,124,000 units, while vehicle manufacture totalled 808,463 units (plus 863,507 engines and 568,212 transmissions). Toyota’s European market share (as of Jan-June 2007) is 5.8%, and is increasing rapidly – sales up 14% over 2006 and market share up from 3.6% in 2000. Apart from its European manufacturing operations, Toyota has also had a European Design Centre (in France) since 2000. The top selling Corolla was designed and built in Europe – as was the Avensis, which was the first ‘European’ Toyota to be exported to Japan
Recent new Toyota models include the Auris – a C segment Hatchback, which was launcghed in February 2007 and is being built in the UK and Turkey. There is also the new concept minicar the Endo.
Toyota’s first European manufacturing plant was in the UK (1992), in Burnaston, Derbyshire. It has a production capacity of 285,000 vehicles, and manufactures the Auris – the new C-segment hatchback - and the Avensis. Employment is 4,100. Engines are manufactured at another plant in Deeside, North Wales.
Toyota began production in Valenciennes, France in 2001, manufacturing the Yaris (1.3 and 1.4 litre engines) for sale within the EU. This plant has a capacity of 240,000
Reference: Trade 2007/349757/1 Trade Sustainability Impact Assessment of the Free Trade Agreement to be negotiated between the European Community and the Republic of Korea
January 2008 Page 37 of 165
vehicles. The plant also produces diesel and petrol engines, and employment of approximately 3,000..
A plant in Turkey was opened in 2002, producing the Corolla, with a capacity of almost 200,000 vehicles, for sales mainly to Europe. The new Auris is also being produced here.
A plant at Kolin in the Czech Republic was opened in 2005, in a joint venture with PSA Peugeot Citroen, to produce a small, entry level vehicle with joint branding, and with a production capacity of 300,000. Of this total. 100,000 will under the Toyota Avgo brand.
A diesel engine plant was opened in Jelcz-Laskowice Poland in 2005, with a capacity of 180,000 and employment of 1,100. Another plant producing transmissions and engines opened in Walbryzych Poland in 2002, with employment of 2,000, and capacity of 250,000 transmissions.
An older plant in Caetano Portugal produces Dyna and Hiace vehicles, and employs 360 people.
Toyota is the market leader in the area of hybrid vehicles (Honda is no.2). Since hybrids were first launched in Europe in 2000, Toyota’s sales levels surpassed the 100,000 level in 2007. Uptake is now increasing rapidly, with more than 50% of Toyota’s cumulative European sales achieved in the last 18 months. The Toyota Prius was the world’s first mass-produced hybrid vehicle and is Toyota’s best selling hybrid, selling at the rate of about 3:1 to the Lexus hybrid.
Mazda
Mazda has no European production facilities. All European car sales are imports from Japan. Mazda sold 303,600 vehicles in Europe in 2006, a 13 percent increase on 2005. Leading vehicle models were the Mazda3 (97,772 units), the Mazda 6 (89,940 units) amd the Mazda5 (47,477 units).
Mitsubishi
Mitsubishi’s European sales (2006) totalled 277,815 units.
The only Mitsubishi model produced in Europe is the Colt, which is manufactured at Born in the Netherlands (the Colt) and under licence at Turin, in Italy. There is a design centre in Germany. Other Mitsubishi models include the Lancer, the Galant, the Pajero, and the Outlander.
The Colt is a B segment car with sales in 2006 of approximately 85,000 units. The Lancer (75,000 units) is the second biggest selling car (especially in Russia).
The Colt CZC is a new cabriolet being designed and built in Italy under contract to Pininfarina design and coach builders.
Currently plant in Holland produces only one vehicle, the Mitsubishi Colt 1.1-1.5 litre, since 2004. It also produced the Colt’s sister vehicle, the Smart Forfour, for Daimler Chrysler, until production ceased in mid-2006. The plant's long-term survival has been in question since 2001, when then Mitsubishi Motors Chief Operating Officer Rolf Eckrodt stated that its annual vehicle production capacity had to increase to 280,000 if it wished to remain economically viable Following industrial action in 2005 protesting the discontinuation of the Smart Forfour, Mitsubishi confirmed its commitment to keeping the factory open, but only as far as the end of the current Colt's life cycle in 2009 In September 2007 Mitsubishi announced that European market versions of the Mitsubishi Outlander would be produced in the Netherlands from 2008, which unions said would help secure the future of the plant.
Nissan
Nissan’s European sales in 2007 totalled 570,513 units (up 5.7% from 2006). Sales of the new Qashqai model topped 100,000. The Russian market is very strong, accounting for 120,000 units. Nissan will be opening a manufacturing plant in Russia in 2009.
Reference: Trade 2007/349757/1 Trade Sustainability Impact Assessment of the Free Trade Agreement to be negotiated between the European Community and the Republic of Korea
January 2008 Page 38 of 165
In 2006, Nissan produced 506,602 vehicles in Europe, almost 80% of which is built at the Nissan plant in Sunderland in the UK. Its main product is the Micra, it also produces the Note, a 5 door Hatchback, and the new Qashqai HB/SUV crossover. Production of the Almera ended in 2006 and the Primera is being phased out. It is the most productive car plant in Europe. Employs 4500 direct + 500 contract.
Nissan employs around 12,000 people in its European design, research and development, manufacturing, logistics, and sales and marketing operations. Head Office is in Trappes (Paris), France.
Nissan also has a manufacturing plant near Barcelona in Spain. It produces the Navara (pickup truck), the Primastar (Van) and the Pathfinder – a large SUV. It laid off 450 people, 10% of its workforce in Jan 2008; production was transferred to Thailand. In 2004 the plant was threatened with closure. Capacity is just under 200,000 vehicles, mainly SUVs, pickups, cars and light commercial vehicles.
Nissan expects its output at the plant to fall by 7 percent in 2008 to 179,000 vehicles this year,
Honda
Honda’s European sales in 2007 sales expected at 380,000 – up 23% from 2006. The target for 2008 is 420,000 sales. Sales are boosted by rising demand in Russia and CEE.
By 2010 10% of Honda sales are projected to be from hybrids.
Honda has a manufacturing plant at Swindon (opened in 1987) in the UK, which employs 4,900 (700 added in 2007). It manufactures the Civic range, and has added shifts and increased capacity from 190,000 to 270,000 (in 2007). In 2007 it added manufacture of the CRV to that of the Civic.
Suzuki
Suzuki had European sales of 306,000 units in 2006, with three models, the Swift, the SX 4, and the Grand Vitara. . It produced 181,000 units (Swift, SX4 and the Ignis which is exported to Poland) at its plant in Esztergom in Hungary (established 1992). This plant has surplus capacity, of up to 270,000.
The cross-overs prevalent in the industry is illustrated by the fact that Suzuki will be using a new PSA Peugeot Citroen 1.6-litre turbodiesel for its Hungarian-built SX4 crossover. This supplements the Fiat Powertrain turbodiesel.
Subaru
Subaru’s European sales are about 70.000 (mainly the Impreza). Subaru and Nissan have a close corporate relationship. In 2007, Subaru introduced the new 1.0 litre Justy model for the European market; this is manufactured in Japan.

Reference: Trade 2007/349757/1 Trade Sustainability Impact Assessment of the Free Trade Agreement to be negotiated between the European Community and the Republic of Korea
January 2008 Page 39 of 165
33.. AAGGRRIICCUULLTTUURREE,, FFOOOODD AANNDD BBEEVVEERRAAGGEESS SSEECCTTOORR
33..11.. IINNTTRROODDUUCCTTIIOONN
For both the EU and for Korea, the food processing and primary agriculture sectors are vital industry sectors, providing substantial employment opportunities and livelihoods in different regions and in rural areas. There are an estimated 11 million farmers within the EU (4-5 million in the NMS), and over 60% of the EU 27 population still live in rural areas. Another 3.8 million are employed in food processing. Farming is a key platform for economic diversification in these areas. Because of its significant social dimension, liberalisation of the farm sector has always proved challenging, but at the same time has been necessary to respond to the changing global environment. Primary agriculture accounts for approximately 8% of Korean employment, a proportionately much higher figure than for the EU.
For both the EU, and for Korea, the impact of any trade liberalising agreement in terms of the rural and social network requires careful evaluation. Much of the primary workforce (in both regions) is relatively lower income and older and therefore susceptible to adjustment impacts and challenges. Because of the more highly protected structure of Korean agriculture, its smaller overall size and lower relative export potential (vis a vis the EU), and the fact that it has not yet tackled structural reform, concern over potentially disruptive impacts is greater on the Korean side.
Within the EU, the agri-food sector (including beverages) accounts for an estimated 3% of GDP and almost 14% of manufacturing output, with turnover (EU15) valued at €836 million (2005). The EU is also a major world exporter of foodstuffs. The industry has a substantial presence in all European countries, even in the most highly urbanised and industrialised member states (such as the UK where farming covers ¾ of the land area and employs over half a million people.)
R&D and technological innovation is a feature of the European industry, with the Korean sector more focused on self sufficiency objectives and less on market led product innovation.
The past and ongoing reform of the CAP, e.g. the decoupling of support payments and phase-out of export subsidies, as well as the improved EU market access on offer through the WTO, requires balanced market openings on the part of Europe’s trade partners. Increasing incomes and changing tastes in Asia are also creating many new opportunities for European food producers. An FTA with Korea would be part of that. Coherence with the WTO process and the agricultural packages on the table would be required.
Farming accounts for approximately 3.5% of Korean GDP. Small-scale farming is prevalent, and productivity levels in the sector are one third of the national average. Producer supports (in terms of PSEs), although declining, were almost double the OECD average in 2003. It is a highly politically sensitive sector, and food security concerns are a priority. The ‘multifunctionality’ of agriculture is sometimes cited by Korean negotiators to request exemptions from market opening measures. The industry has a wide geographic spread, and the goal of balanced national development is pursued. Agricultural products comprise approximately 2.5% of Korean exports, and 9% of imports. The sector is highly protected, with key sub-sectors, such as rice, routinely exempted from market access concessions.
Statistically this covers NACE Group 15 – Processed Foods and Beverages, and NACE Code 01 – Primary Agriculture.
Reference: Trade 2007/349757/1 Trade Sustainability Impact Assessment of the Free Trade Agreement to be negotiated between the European Community and the Republic of Korea
January 2008 Page 40 of 165
33..22.. EEUU PPRROOCCEESSSSEEDD FFOOOODDSS SSEECCTTOORR PPRROOFFIILLEE The EU 27 is by far the largest food producing economy in the world.
According to the CIAA, the Industry association that represents 25 national federations, 32 EU sector associations, and 22 major food and drink companies, the following industry statistics applied as of 2005:
Turnover: €836 billion, accounting for 13.6% of manufacturing activity in the EU15, and 3% of GDP, larger than the automotive and chemical industries. The industry has been expanding at approximately 2% a year over the last ten years;
Employment: 3.8 million people, the leading employer (13%) in the EU manufacturing sector. The industry has a relatively high proportion of part-time employment, and its productivity and wage levels are below those of other EU manufacturing sectors;
Number of companies; Over 280,000 enterprises are in the sector. While large companies (250 +employees) account for less than 1% of the number of enterprises, they account for 52% of turnover and 38% of employment,
Exports: €57.9 billion (2006) with intra-EU trade totalling €146 billion (2005). .
Global Market Share: 20%, and shrinking.
The industry is naturally largest in the larger Member States (France, Germany, etc.), but an indication of its EU-wide regional and social significance is the fact that it is the largest manufacturing industry in at least 10 Member States.
R&D and technological innovation is an important component of the sector. Much of this arises in response to the demands of the marketplace (e.g. for convenience foods or more healthy foods), but is also industry driven, with food research programmes a common adjunct to many company operations.
The key segments of the industry are:
• Meat and Meat Products – 20% of T/O
• Beverages – 15.5% of T/O
• Dairy Products – 15.3% of T/O
• Animal Feeds – 6.5% of T/O
• Processed Fruits and Vegetables – 6.3% of T/O
• Oils and Fats – 4.2% of T/O
• Grain mill and starch products – 3.9% of T/O
• Fish products – 2.5% of T/O, and
• Various Food Products, 26% of T/O. This category (NACE 15.8) includes bakery, pastry, sugar, chocolate and confectionery, and pasta products.
The industry is challenged on a number of fronts, in particular:
• competing in the international market place;
• negotiating with an increasingly concentrated retail and distribution sector;
• securing access to competitively priced raw materials and inputs, with uncertainty over how this will be impacted by CAP reforms; and
• complying with new environmental guidelines.

Reference: Trade 2007/349757/1 Trade Sustainability Impact Assessment of the Free Trade Agreement to be negotiated between the European Community and the Republic of Korea
January 2008 Page 41 of 165
Labour productivity in the industry remains well below that of major developed country competitors such as the USA, while at the same time it is growing much faster in developing countries. Productivity increases in Brazil and China are being driven by a shift to more value added products. This is increasing competition in world markets.
TTaabbllee 33..11:: LLaabboouurr PPrroodduuccttiivviittyy FFoooodd aanndd BBeevveerraaggee IInndduussttrryy 22000044
Country/Region $VA Per Employee
USA 86,959 Japan 82,548 Canada 62,471 Australia 58,096 EU 25 49,323 Brazil 18,823 China 9,493
In overall terms, the food and drinks industry is characterised by a relatively low overall energy intensity, although major differences exist within its sub-sectors. In total, the food and drinks industry accounts for about 8% of industrial energy use. Besides food manufacturers, the actions of farmers, packaging suppliers, the transport sector, retailers, etc. can all have a significant impact on the environmental life cycle of food products.
EEXXTTEERRNNAALL TTRRAADDEE PPRROOFFIILLEE::
Extra-EU exports grew to €57.9 Billion in 2006, an increase of 11.4% over 2005, which in turn showed a 7% increase over 2004. Exports had been broadly static in the period since 2000. The USA is the leading export market (22%), followed by Russia (8%) and Japan (7%).
South Korea is an important market, and ranked ninth in 2006, with sales of €946 million (26% of Japan’s level). Exports to Korea grew by 27% in the period 2000-2005; with the exception of China (growth of 72%), this performance was better than that of the other principal Asian markets of Thailand, Malaysia, and Indonesia. In the same period (2000-2005) imports from South Korea to the EU (€83 million in 2005) declined by 25%. The EU maintains an 11:1 edge over Korea in terms of the trade balance in this sector.
In terms of global EU exports, spirits and wine are respectively the first and second leading export categories.
TTaabbllee 33..22:: LLeeaaddiinngg EEUU FFoooodd aanndd DDrriinnkk EExxppoorrtt CCaatteeggoorriieess 22000055
Category Export Value 2005 €million
Spirits 5,642 Wine 4,672
Food Preparations 2,702 Cheese 2,022 Pork Meat 1,989
Beer 1,729 Concentrated Milk 1,689
Sugars 1,456 Malt Extract 1,439 Biscuits 1,404 Chocolate 1,300 Olive Oil 1,176
Source: CIAA Data and Trends 2006
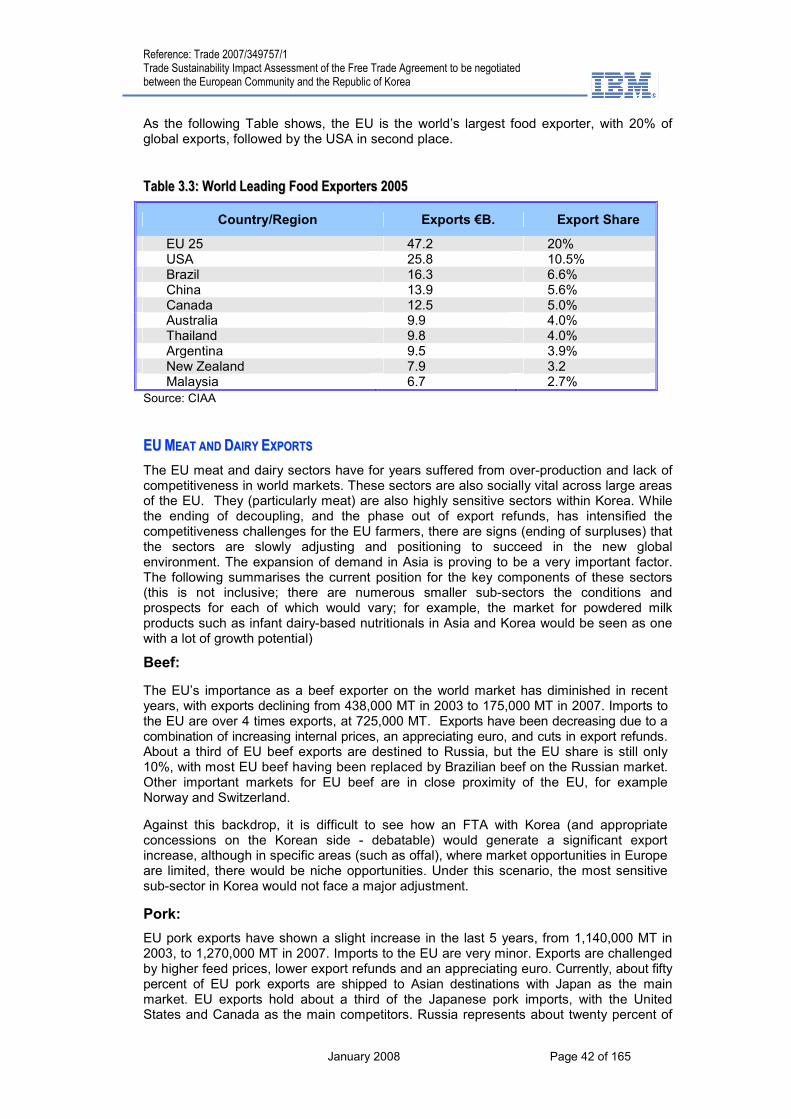
Reference: Trade 2007/349757/1 Trade Sustainability Impact Assessment of the Free Trade Agreement to be negotiated between the European Community and the Republic of Korea
January 2008 Page 42 of 165
As the following Table shows, the EU is the world’s largest food exporter, with 20% of global exports, followed by the USA in second place.
TTaabbllee 33..33:: WWoorrlldd LLeeaaddiinngg FFoooodd EExxppoorrtteerrss 22000055
Country/Region Exports €B. Export Share
EU 25 47.2 20% USA 25.8 10.5% Brazil 16.3 6.6% China 13.9 5.6% Canada 12.5 5.0% Australia 9.9 4.0% Thailand 9.8 4.0% Argentina 9.5 3.9% New Zealand 7.9 3.2 Malaysia 6.7 2.7%
Source: CIAA
EEUU MMEEAATT AANNDD DDAAIIRRYY EEXXPPOORRTTSS
The EU meat and dairy sectors have for years suffered from over-production and lack of competitiveness in world markets. These sectors are also socially vital across large areas of the EU. They (particularly meat) are also highly sensitive sectors within Korea. While the ending of decoupling, and the phase out of export refunds, has intensified the competitiveness challenges for the EU farmers, there are signs (ending of surpluses) that the sectors are slowly adjusting and positioning to succeed in the new global environment. The expansion of demand in Asia is proving to be a very important factor. The following summarises the current position for the key components of these sectors (this is not inclusive; there are numerous smaller sub-sectors the conditions and prospects for each of which would vary; for example, the market for powdered milk products such as infant dairy-based nutritionals in Asia and Korea would be seen as one with a lot of growth potential)
Beef:
The EU’s importance as a beef exporter on the world market has diminished in recent years, with exports declining from 438,000 MT in 2003 to 175,000 MT in 2007. Imports to the EU are over 4 times exports, at 725,000 MT. Exports have been decreasing due to a combination of increasing internal prices, an appreciating euro, and cuts in export refunds. About a third of EU beef exports are destined to Russia, but the EU share is still only 10%, with most EU beef having been replaced by Brazilian beef on the Russian market. Other important markets for EU beef are in close proximity of the EU, for example Norway and Switzerland.
Against this backdrop, it is difficult to see how an FTA with Korea (and appropriate concessions on the Korean side - debatable) would generate a significant export increase, although in specific areas (such as offal), where market opportunities in Europe are limited, there would be niche opportunities. Under this scenario, the most sensitive sub-sector in Korea would not face a major adjustment.
Pork:
EU pork exports have shown a slight increase in the last 5 years, from 1,140,000 MT in 2003, to 1,270,000 MT in 2007. Imports to the EU are very minor. Exports are challenged by higher feed prices, lower export refunds and an appreciating euro. Currently, about fifty percent of EU pork exports are shipped to Asian destinations with Japan as the main market. EU exports hold about a third of the Japanese pork imports, with the United States and Canada as the main competitors. Russia represents about twenty percent of
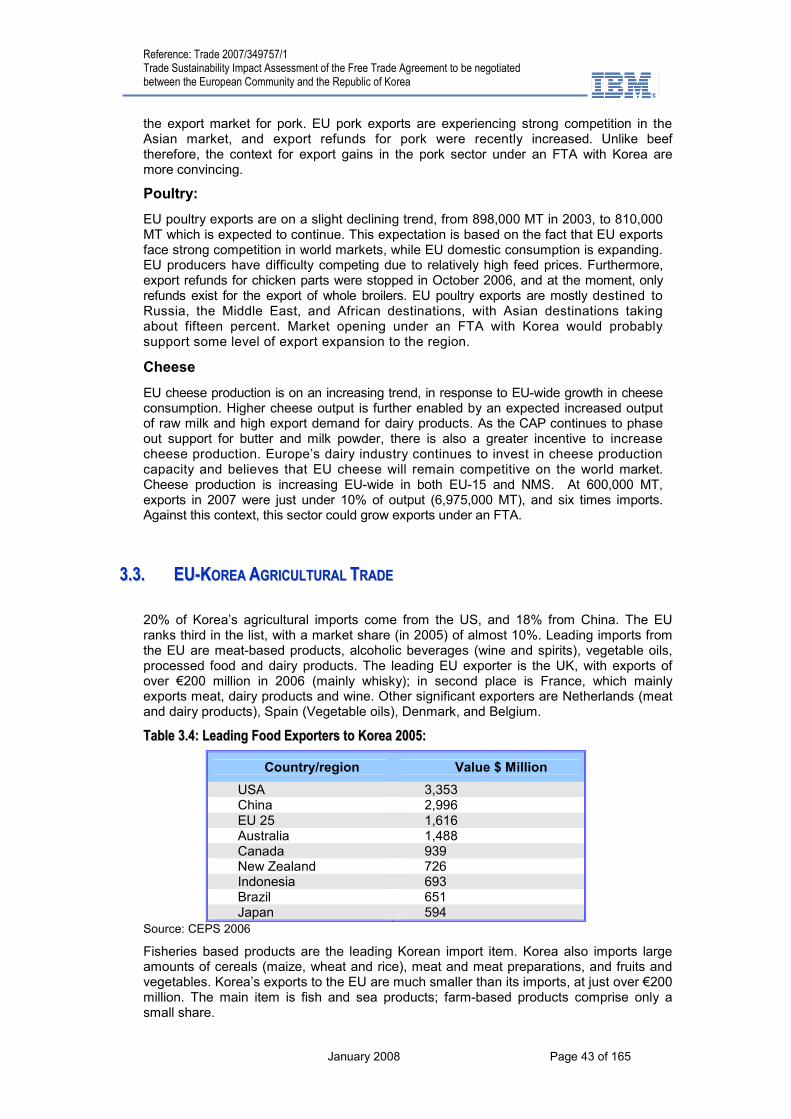
Reference: Trade 2007/349757/1 Trade Sustainability Impact Assessment of the Free Trade Agreement to be negotiated between the European Community and the Republic of Korea
January 2008 Page 43 of 165
the export market for pork. EU pork exports are experiencing strong competition in the Asian market, and export refunds for pork were recently increased. Unlike beef therefore, the context for export gains in the pork sector under an FTA with Korea are more convincing.
Poultry:
EU poultry exports are on a slight declining trend, from 898,000 MT in 2003, to 810,000 MT which is expected to continue. This expectation is based on the fact that EU exports face strong competition in world markets, while EU domestic consumption is expanding. EU producers have difficulty competing due to relatively high feed prices. Furthermore, export refunds for chicken parts were stopped in October 2006, and at the moment, only refunds exist for the export of whole broilers. EU poultry exports are mostly destined to Russia, the Middle East, and African destinations, with Asian destinations taking about fifteen percent. Market opening under an FTA with Korea would probably support some level of export expansion to the region.
Cheese
EU cheese production is on an increasing trend, in response to EU-wide growth in cheese consumption. Higher cheese output is further enabled by an expected increased output of raw milk and high export demand for dairy products. As the CAP continues to phase out support for butter and milk powder, there is also a greater incentive to increase cheese production. Europe’s dairy industry continues to invest in cheese production capacity and believes that EU cheese will remain competitive on the world market. Cheese production is increasing EU-wide in both EU-15 and NMS. At 600,000 MT, exports in 2007 were just under 10% of output (6,975,000 MT), and six times imports. Against this context, this sector could grow exports under an FTA.
33..33.. EEUU--KKOORREEAA AAGGRRIICCUULLTTUURRAALL TTRRAADDEE
20% of Korea’s agricultural imports come from the US, and 18% from China. The EU ranks third in the list, with a market share (in 2005) of almost 10%. Leading imports from the EU are meat-based products, alcoholic beverages (wine and spirits), vegetable oils, processed food and dairy products. The leading EU exporter is the UK, with exports of over €200 million in 2006 (mainly whisky); in second place is France, which mainly exports meat, dairy products and wine. Other significant exporters are Netherlands (meat and dairy products), Spain (Vegetable oils), Denmark, and Belgium.
TTaabbllee 33..44:: LLeeaaddiinngg FFoooodd EExxppoorrtteerrss ttoo KKoorreeaa 22000055::
Country/region Value $ Million
USA 3,353 China 2,996 EU 25 1,616 Australia 1,488 Canada 939 New Zealand 726 Indonesia 693 Brazil 651 Japan 594
Source: CEPS 2006
Fisheries based products are the leading Korean import item. Korea also imports large amounts of cereals (maize, wheat and rice), meat and meat preparations, and fruits and vegetables. Korea’s exports to the EU are much smaller than its imports, at just over €200 million. The main item is fish and sea products; farm-based products comprise only a small share.

Reference: Trade 2007/349757/1 Trade Sustainability Impact Assessment of the Free Trade Agreement to be negotiated between the European Community and the Republic of Korea
January 2008 Page 44 of 165
TTaabbllee 33..55:: EEUU 2277 FFoooodd aanndd BBeevveerraaggeess EExxppoorrttss ttoo KKoorreeaa 22000000--22000066
SITC Grouping 2000 (€) 2006 (€)
0: Food and Live Animals Total
478,700,220 668,399,240
00: Live Animals 28,856,672 5,560,337
01: Meat and Meat Preparations
178,693,657 325,505,369
02: Dairy Products 38,445,065 57,759,283
03: Fisheries 29,236,676 32,196,077
04: Cereals & Cereals Preparations
66,153,837 24,878,232
05: Vegetables & Fruit 18,672,378 27,256,066
06:Sugar and Sugar Preparations
12,131,072 20,596,126
07: Coffee, Tea, Spices & Manufactures
37,897,546 48,928,968
08: Animal Feed 29,260,969 33,392,805
09: Misc. Edible Products 65,376,840 92,325,742
11: Beverages 282,347,225 277,535,387
11217: Wine (non-sparkling)
18,433,205 39,667,643
11241: Whiskies 228,453,987 200,885,543
Food and Beverages Total €761.047 million €945.934 million
Source: Eurostat
With a total value exceeding €945 million, the Korean market for EU exports of Food and Beverages exceeds that of China, which was valued at €880 million in 2006. It was equivalent to 26% of the Japanese import market of €3.67 billion.
The national profile of EU food exporters to Korea is highly diversified, with 12 of the 27 exporting over €10 million each in 2006 (including Poland and Hungary from the NMS). The top five national exporters are France, the Netherlands, Belgium, Denmark, and Spain (all exporting over €50 million in 2006, with France and the Netherlands exceeding €100 million). Although France accounts for approximately half of Meat exports, this category is still quite diversified nationally. France dominates Wine exports, and the UK dominates whiskey exports11.
33..44.. AAGGRRII--FFOOOODD SSEECCTTOORR IINN KKOORREEAA The rapid industrialisation of Korea since the early 1960s has dramatically transformed its economy, from one that was predominantly rural 30 years ago, to one that today is predominantly industrial. One measure of this change is the decline in agriculture’s share of GDP from more than 45% in the early 1960s to 3% today. In the same period, the share of agriculture in employment fell from 65% to below 8%, and the share of the rural population fell from almost 45% in 1970 to 7% today.
11 Because of transhipment and possible reporting errors, the nationality of shipment reporting is not 100% accurate.
Reference: Trade 2007/349757/1 Trade Sustainability Impact Assessment of the Free Trade Agreement to be negotiated between the European Community and the Republic of Korea
January 2008 Page 45 of 165
The labour force engaged in agriculture has been steadily declining, from over 3 million in the early 1990s to less than 2 million today. With migration of the young to the cities, the age profile of farming has dramatically increased. Currently 94% of total farm operators are over 40 years old, and 53% are over 60 years old. The job mobility of these farmers is very limited. This is one of the main factors behind the social and political sensitivity of rice farming in Korea; rice cultivation is favoured by older farmers as they are accustomed to the farming environment and rice farming requires less labour.
Rice is the most important food in Korea, accounting for about 28% of total agricultural production. Rice consumption however has been falling due to changes in eating habits, whereas consumption of fruits and vegetables has increased. These changes have led to a continuous decrease in rice production, and to an increase in vegetables, fruits, and livestock and poultry production. The major agricultural products are rice, pig, beef cattle, milk, chicken, radish, soya beans, potatoes, watermelon, garlic, tomato, ginseng and cabbage.
Korean agriculture is characterised by high government support levels and a low level of market orientation. Most support is provided through market price supports, largely for rice. Support to producers (% PSE) has decreased from 74% in 1990 to 63% in 2005, but it is still more than double the OECD average. Korean consumers pay on average two and a half times the world price for agricultural commodities. The price of rice in Korea is more than three times that of the average price of rice on the international market; consumers pay three times the average world prices for beef, two times for pork and milk, and 3.5 times for garlic. Apart from market price supports, import restrictions in the form of licences and quotas have been the main instruments for controlling agricultural trade and prices. Combined policies of production support and import restrictions kept agricultural prices above world levels.
Korea is a mountainous country with only 20% of arable land, and thus faces serious limitations in its natural resource base. Combined with the shrinkage in the agricultural economy, and increased food demand from urban areas, Korea has built up a heavy reliance on agricultural imports. The process of globalisation and changes in consumption habits has also increased the demand for new types of – imported - agricultural products. This is contributing to a significant trade deficit, estimated at $11.5 billion (2005) annually, according to the CEPS report12. According to this report, Korea’s imports of Food ($11.6 billion) and agricultural raw materials ($5.1 billion) totalled $16.7 billion in 2005, while Korea’s exports of Food ($3 billion) and Agricultural raw materials ($2.3 billion) totalled $5.3 billion in 2005. Food Imports have been increasing at an annual average of just over 8% since the year 2000.
RREEVVIIEEWW OOFF KKOORREEAANN AAGGRRIICCUULLTTUURREE
According to the most recent (2004) WTO TPR review, notwithstanding the general liberalising trend in recent years, protection levels in agriculture, averaging 52.2% remain very high in contrast to relatively low industrial tariffs averaging 6.7%. Out of quota tariffs as high as 200% also apply to certain commodities.
Average tariffs are highest for vegetable products (HS section 2), at 100% and tariff escalation is a feature of semi-processed food, beverages and tobacco. Tariff barriers are very high on products that are important for the preparation of Korean specialty foods and face potential competition especially from China. For example, the tariff is 630% for sesame, 360% for garlic, and 270% for pepper. Tariffs for meat products, although still very high by international standards, are lower: 40% for beef, 22.5% for pig meat and 18% for chicken.
Korea still has the “developing country” status in the WTO as far as agriculture is concerned. This status mostly shelters Korean agriculture from radical reductions in agricultural protection resulting from WTO agreements.
There was only slight liberalisation of agriculture under the Korea Chile FTA.
12 Table A2.2 CEPS Report.
Reference: Trade 2007/349757/1 Trade Sustainability Impact Assessment of the Free Trade Agreement to be negotiated between the European Community and the Republic of Korea
January 2008 Page 46 of 165
Tariff quotas for beef were replaced by a tariff (currently at 40%) in 2001.
Agricultural imports remain constrained by a variety of NTMs, such as administration of tariff quotas by SOEs and producer associations, and ostensibly health-based import licensing systems. While standards and regulations in the food sector are being increasingly harmonised with international norms, significant differences, including in conformity testing, inspection, and acceptance of overseas results, seemingly remain in food. Quarantine arrangements and SPS requirements are noticeably strict for fruit imports.
In August 2003, the Korea Customs Service introduced more rigorous customs inspections on agricultural products, including peppers, garlic, sesame seeds, onions, carrots, and seasoning powders. The import sample inspected to check prices was also raised to 20%. The authorities indicate that these measures were implemented not to restrict imports, but to prevent illegal importation and duty evasion from under-invoicing, and to meet the need for increased laboratory analysis under paperless customs clearances. The sample size used for analysis was lowered for qualified importers with good compliance records from March 2004.
Direct export subsidies to reduce marketing costs apply to several agricultural goods, and the sector also benefits from substantial domestic financial support under the WTO Green Box or the de minimis provisions.
In-quota tariff rates for agricultural imports ranged from zero to 50% in 2004. Above-quota rates are generally very high; many are well over 100%. Some tariff quotas operate, in effect, as quantitative restrictions, whereby prohibitively high out-of-quota tariffs prevent above quota imports. The average fill rate of tariff quotas is around 70%. In 2003, fill ratios were low for several product groupings, including evaporative milk (0%), whey (15.3%), garlic (71.8%), red-peppers (70.2%) and ginger (47.1%). The consistently large unfilled share of tariff quotas on some items, even with relatively low in-quota duties, suggests that their administration and allocation may be restricting imports.
Tariff quotas, and the import quota on rice, are allocated or operated by designated state-trading enterprises, such as the MAF for rice and barley, or various producer associations. State-trading enterprises impose additional mark-ups on top of the in-quota tariff on certain items.
Legislative responsibility for regulating food safety and quality is diversified and overlaps with several ministries. Responsibility for food safety, pharmaceuticals and cosmetics rests with the Ministry of Health and Welfare (MHW) and its agency, the Korean Food and Drug Administration (KFDA).13 KFDA ensures that domestic and imported food products (except meat, dairy and egg products, which are handled by the MAF) are sanitarily safe and correctly labelled. The Ministry of Maritime Affairs and Fisheries (MMAF) is responsible for fish products, and its National Fisheries and Products Inspection System inspects fish imports (and exports). MOCIE inspects imported alcoholic beverages. The Ministry of the Environment is responsible for the safety of bottled water.
The main laws affecting food standards are the Food Sanitation Act of 1986, the Food Code and the Food Additive Code. KFDA is committed to aligning Korean food standards to international norms, especially CODEX. To facilitate harmonization, the Food Code and the Food Additives Code have been modified significantly, and further changes are expected. All food additives require pre-approval. Korea's Food Code is claimed to fall short of international standards, especially relating to food additives.14 For example, Korea seemingly prohibits certain ingredients, food colours, dyes, and food manufacturing processes that are considered safe by international (e.g. CODEX) standards.
13 The Food Safety Bureau develops general policies on food safety management and provides guidance to food-related businesses. It supervises the overall food hygiene according to CODEX provisions, and manages import and export inspection and certification systems. 14 USTR (2003), p. 243-245.
Reference: Trade 2007/349757/1 Trade Sustainability Impact Assessment of the Free Trade Agreement to be negotiated between the European Community and the Republic of Korea
January 2008 Page 47 of 165
KFDA has facilitated food imports through two systems: "authorized overseas inspection agencies", introduced in 1996, has been extended to include 45 agencies in eight countries. Certified imports from these agencies are not inspected in Korea. The "pre-confirmation-based registration system of imported foods" was introduced in August 2002. Foodstuffs pre-approved and registered based on advanced test certification and pre-inspection at the exporter's premises are exempt from import inspections. Such approval is provided on a product-by-product basis; non-processed products are excluded. According to the authorities, overseas test results submitted by foreign inspection agencies are accepted by KFDA for imported food, which is therefore exempt from KFDA testing. Korea has not joined the APEC MRA on Conformity Assessment of Foods and Food Products.
KFDA plans to reform the inspection system for food imports by reducing inspections. The quantity of imports inspected is to be eventually reduced by applying sophisticated selective inspections.15 Imports are to be categorized to simplify inspections. Imports with no past record of inspection violations, such as liquors and coffee beans, will only require notification, while other items will be subject to only simplified "sensor" inspections, mainly to determine freshness
Korea bans imports, for example, of live cattle, sheep and goats, and certain products from countries where BSE and foot and mouth diseases are known to occur.
Food packaging standards to reduce domestic waste apply equally to domestic and imported products. For example, the use of PVC packaging on certain food products prohibited. Regulated shelf-life limits on livestock products (including milk) were abolished from July 2003, and are now decided by processors.
Korea maintains export subsidies for certain farm products. In 2001, these totalled W 25.95 billion, and covered fruit (W 7.73 million), flowers (W 6.97 million), vegetables (W 8.59 million), kimchi (W 1.77 billion), ginseng (W 0.73 billion) and livestock (W 0.16 billion). The subsidies were used to reduce exporters' marketing costs, and are exempt from WTO reduction commitments.
Korea's WTO commitments to date have provided only limited disciplines on domestic agricultural support.
KKOORRUUSS FFTTAA PPRROOVVIISSIIOONNSS::
The precise details of any EU-Korea agreement in this area are still lacking. A useful guide to the broad parameters of what might emerge is the KORUS FTA (U.S. agricultural exports to Korea have averaged about $3 billion annually in recent years, making Korea their sixth largest agricultural export market).
Negotiations on the KORUS FTA were concluded on April 1 2007.
More than half (or $1.6 billion) of current U.S.farm exports to Korea will become duty-free immediately, including wheat, corn for feed, soybeans for crushing, hides and skins, and cotton, plus a broad range of high value agricultural products such as almonds, pistachios, bourbon whiskey, wine, raisins, grape juice, orange juice, fresh cherries, frozen french fries, frozen orange juice concentrate, and pet food.
U.S. farm products benefiting from expanded market opportunities with two-year tariff phase-outs include avocados, lemons, dried prunes, and sunflower seeds. In addition, U.S. farm products benefiting from expanded market opportunities with five-year tariff phase-outs include food preparations, chocolate and chocolate confectionary, sweet corn, sauces and preparations, other fodder and forage (alfalfa), breads and pastry, grapefruit, and dried mushrooms.
Other U.S. farm products that will benefit from expanded market access opportunities through tariff rate quotas include skim and whole milk powder, whey for food use, cheese, dextrins and modified starches, barley, popcorn, and soybeans for food use.
15 KOIS, 14 January 2004.
Reference: Trade 2007/349757/1 Trade Sustainability Impact Assessment of the Free Trade Agreement to be negotiated between the European Community and the Republic of Korea
January 2008 Page 48 of 165
Market access was also expanded for beef and pork products, pears, apples, grapes and oranges.
The key agreements covering agriculture were as follows16:
Immediate duty free access for approximately two-thirds of US products, including wheat, corn, soybeans for crushing, hides and skins and cotton, plus a broad range of high value processed and horticultural products, such as almonds, pistachios, bourbon whiskey, wine, raisins, grape juice, fresh cherries, frozen french fries, and frozen orange juice concentrate.
For all beef products, Korea will eliminate its tariffs through a 15-year straight-line tariff phase out with a safeguard that begins growing from 270,000 MT, a quantity that is 17% larger than the largest historical US shipments. Korea’s tariffs on beef products range up to 40%.
For pork, all frozen and processed pork products will be duty-free in 2014. Fresh and chilled pork products will be phased out in 10 years, and subject to a 10-year safeguard that is higher than historical trade and grows 6% annually.
For poultry, tariffs on most poultry cuts including legs will be eliminated in 10 years. Tariffs on frozen breasts and wings will be eliminated in 12 years. Tariffs on egg and albumin products will be eliminated over 5 to 12 years.
For dairy, Korea agreed to establish tariff-rate quotas (TRQs) that provide immediate duty-free access on double current shipment volumes of U.S. dairy exports.
For soybeans, Korea will provide immediate duty free on beans for crushing. In addition, Korea will establish a 25,000 Metric ton TRQ for high-value Identity Preserved food-grade beans that for the first time can be sold outside of Korea’s State Trading Enterprise. That State Trading Enterprise has been marking up food grade beans by as much as 80%.
For corn, tariffs will be immediately eliminated on feed corn. Tariffs will also be immediately eliminated on “distiller’s dried grains,” an important by-product from our growing ethanol industry that is used as livestock feed.
For potatoes, Korea will grant immediate duty-free on chipping potatoes during the US shipping season, immediate on french fries, and significant immediate duty-free access on dehydrated potatoes in a 5,000 MT TRQ.
For processed products, tariffs on most of the processed food tariff lines will be eliminated in five years or less. Processed tomatoes and tomato paste will be duty-free immediately.
For wine, Korea will immediately eliminate all tariffs on wine.
For tree nuts, current duties on tree nuts range from 8% to 45%. Korea will immediately eliminate the tariffs on almonds and pistachios, and will eliminate the tariffs on shelled walnuts in six years.
For oranges, the FTA establishes front-loaded seasonal tariff cuts that benefit 70% of exports through an immediate reduction from 50% down to 30% and a seven-year phase out. Access for shipments earlier in the year is provided by a tariff rate-quota. Korea is the 4th largest export market for U.S. oranges.
For orange juice, tariffs on frozen concentrate will be eliminated immediately; tariffs on lemons will be eliminated in two years; and tariffs on grapefruit will be eliminated in five years.
For table grapes, a five-year front-loaded tariff elimination schedule will benefit an estimated 70% of U.S. grape exports to Korea. Tariffs on the remaining 30% of exports will be eliminated over 17 years.
16 Trade Facts; Office of the US Trade Representative May 2007
Reference: Trade 2007/349757/1 Trade Sustainability Impact Assessment of the Free Trade Agreement to be negotiated between the European Community and the Republic of Korea
January 2008 Page 49 of 165
Other Fruits and Vegetables:
Tariffs on Avocados and dried plums will be eliminated within two years.
Non-citrus juices: tariffs on cranberry and prune juices will be eliminated in five years. Tariffs on grape juice will be eliminated immediately.
Tariffs on fresh strawberries will be eliminated in nine years.
Korea’s tariffs on apples (other than Fuji) will be eliminated within 10 years, and tariffs on pears (other than Asian varieties) will be eliminated within 10 years. Tariffs on Fuji apples and Asian pears will be eliminated within 20 years.
Fresh asparagus, eggplants, celery, cucumbers, and spinach will be duty-free immediately.
Tariffs on fresh carrots, broccoli, cauliflower, and peas will be eliminated in five years.
Implications of KORUS for EU Trade
The KORUS FTA represents a very comprehensive undertaking with respect to agricultural based trade. Given that the EU and the USA are major farm trade competitors, the completion of an EU-Korea FTA against that backdrop has some key implications:
Firstly, it will help maintain the competitiveness of a wide range of competing EU products – such as wine, whiskey, processed foods -- in the Korean market place;
Secondly, it will mean that the adjustment impacts within Korea flowing from the EU-Korea agreement taken in isolation are likely to be considerably reduced. This is especially so for the following products, where the EU and Korea are close competitors, and where the potential increase in EU exports is significant. According to the CEPS study, the EU products with most potential are:
Whiskey – Tariff of 20-30%
Wine – Tariff of 15%
Beef – Tariff of 40%
Pork and Pork Products – Tariff of 22.5%
Cheese - Tariff of 36%
Processed Foods – Tariff Average of 30%
Butter – Tariff of 89%
33..55.. SSUUSSTTAAIINNAABBIILLIITTYY IIMMPPAACCTT AASSSSEESSSSMMEENNTT
EECCOONNOOMMIICC IIMMPPAACCTTSS:: EEUU
The primary economic impact of an EU-Korea Agreement is likely to be a relatively small but nonetheless valuable expansion in European food exports to the Asian region. European food producers are increasingly active in expanding exports and in establishing subsidiaries and joint ventures in the region in recognition of its major market potential, driven by population and income growth, changing tastes, and improved market access. But the EU is facing stiff competition from other established food producers, and FTAs such as that envisaged with Korea will be instrumental in securing European exporters position in the region. Improved access to this additional and expanding market outlet will consolidate and strengthen the industry, sustaining industry employment and profitability. This will be the principal economic impact of an agreement.
Because the details of any agreement are still unknown, the areas of expansion cannot be definitively identified. On the basis of previous Korea FTAs, e.g. with Chile and particularly the USA, some contact with industry, and evaluation of the EU supply
Reference: Trade 2007/349757/1 Trade Sustainability Impact Assessment of the Free Trade Agreement to be negotiated between the European Community and the Republic of Korea
January 2008 Page 50 of 165
position, the areas of improved market access and hence EU export expansion are likely to include the following:
Alcoholic Beverages: Korea is already an attractive market for EU whisky and wine producers, notwithstanding relatively high tariff barriers. Sales of Scotch increased by over 26% in 2006. The removal or phase out of tariffs will confer a significant pricing and marketing advantage for the industry, and especially so relative to the market position of primary EU competitors such as the USA and Chile (in wine). There are many additional taxes and levies however that will dilute this effect. With rising incomes and a growing middle class, Asia generally is proving to be an important growth market for EU whisky and wine producers, and they should be one of the prime beneficiaries of any agreement.
Processed and Prepared Foods: The EU is home to a very strong base of internationally competitive processed and prepared foods manufacturers (e.g. Tate & Lyle, Danone, Nestle Europe, Ferrero, InBev SA, Diageo etc. plus dozens of mid-sized companies), who already have established themselves, both in terms of export sales and Asia-based production facilities, in the region. Elimination or reduction of the tariff on prepared foods (averaging 30%), in the context of rising Korean incomes and changing tastes will also boost sales of EU based companies in the market place. Based on the KORUS precedent, a range of processed fruit and vegetable products (e.g. fruit juices, tomato paste, nuts etc.) are likely to be beneficiaries of early tariff removal, and likely gainers under an agreement.
Also, as covered below, if the issue of geographical indicators is effectively addressed in the agreement, a wide range of Korean produced substitutes could be displaced by the authentic European product, thus boosting EU export sales in these areas.
Primary Products: Because of the wide range of primary products, and the specific sensitivities of Korean sub-sectors, it is difficult to generalise about this category. The probable agreement terms for items in this category are less certain, due to the sensitivity of these sectors within Korea. The possible scenarios for the principal meat-based and dairy sectors were discussed above. Both because the beef sector is highly sensitive within Korea, and is therefore likely to be granted an extended phase-in period (as per KORUS), and because of competition from the USA, as well the constrained surplus supply position and improving EU domestic market, any export expansion increase for this sector (other than for specialty cuts such as offal) is likely to be limited. The prospect for an expansion in pork-based products appears more favourable, both because of the EU supply position and the example of a more accelerated tariff phase out under KORUS. There also appears to be real opportunities for certain dairy products, such as cheeses, butter, and powdered milk.
EECCOONNOOMMIICC IIMMPPAACCTTSS:: KKOORREEAA
An EU-Korea FTA is not expected to have as much of an effect on the agriculture and fishery industries of Korea as the KORUS FTA.
The EU is expected to concentrate on expanding exports of processed foodstuffs such as alcoholic beverages and processed dairy products such as butter and cheese. Any increase in the export of Korean food products to the EU is expected to be small, and concentrated in non-sensitive areas such as ramyon (instant noodle) and kimchi.
Korea’s imports of farm products from the EU are concentrated in a relatively small number of items. Major items in excess of $10 million annually imported from the EU are pork, whisky, dairy products, olive oil, wine, starch, cigarettes, and chicken; these items together account for 70.4% of total agricultural imports from the EU. Import items valued between $3-10 million are chocolate, assorted feeds, grape juice, cheese, and barley (malt), and these items account for 15.3% of total imports of agricultural products from the EU. Thus, imports of agricultural products from the EU, unlike from the USA, are currently concentrated on a smaller number of items.
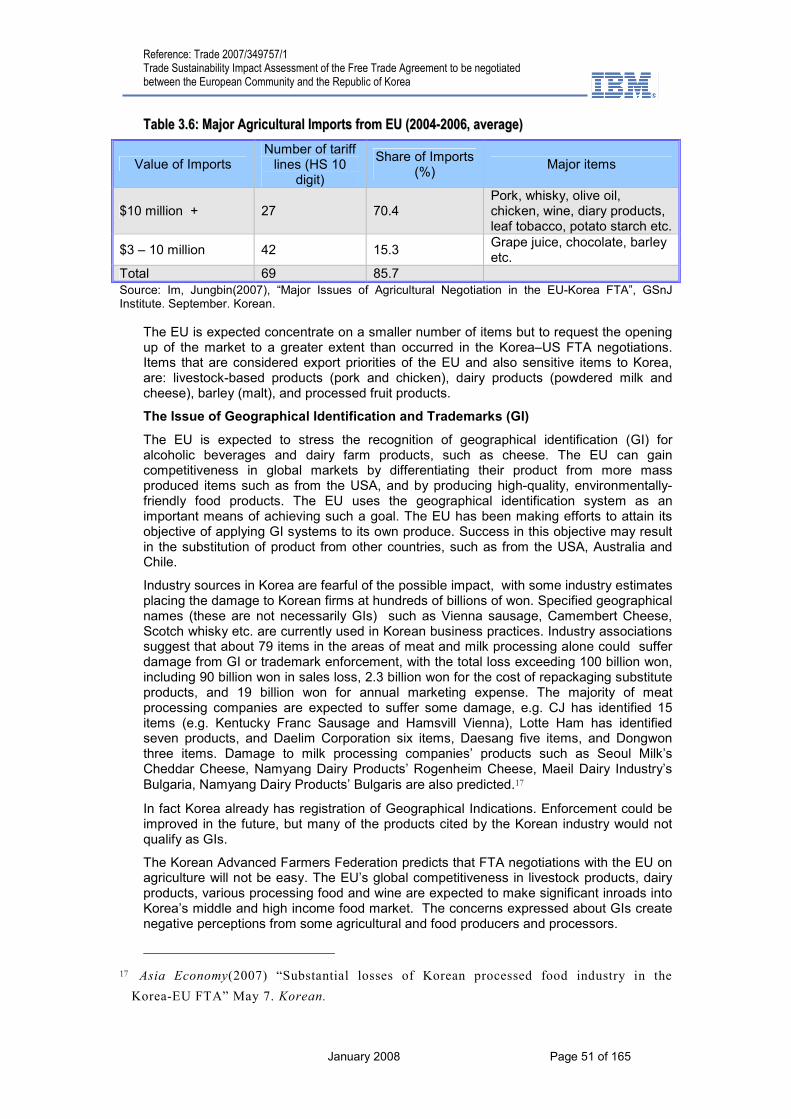
Reference: Trade 2007/349757/1 Trade Sustainability Impact Assessment of the Free Trade Agreement to be negotiated between the European Community and the Republic of Korea
January 2008 Page 51 of 165
TTaabbllee 33..66:: MMaajjoorr AAggrriiccuullttuurraall IImmppoorrttss ffrroomm EEUU ((22000044--22000066,, aavveerraaggee))
Value of Imports Number of tariff lines (HS 10
digit)
Share of Imports (%)
Major items
$10 million + 27 70.4 Pork, whisky, olive oil, chicken, wine, diary products, leaf tobacco, potato starch etc.
$3 – 10 million 42 15.3 Grape juice, chocolate, barley etc.
Total 69 85.7 Source: Im, Jungbin(2007), “Major Issues of Agricultural Negotiation in the EU-Korea FTA”, GSnJ Institute. September. Korean.
The EU is expected concentrate on a smaller number of items but to request the opening up of the market to a greater extent than occurred in the Korea–US FTA negotiations. Items that are considered export priorities of the EU and also sensitive items to Korea, are: livestock-based products (pork and chicken), dairy products (powdered milk and cheese), barley (malt), and processed fruit products.
The Issue of Geographical Identification and Trademarks (GI)
The EU is expected to stress the recognition of geographical identification (GI) for alcoholic beverages and dairy farm products, such as cheese. The EU can gain competitiveness in global markets by differentiating their product from more mass produced items such as from the USA, and by producing high-quality, environmentally-friendly food products. The EU uses the geographical identification system as an important means of achieving such a goal. The EU has been making efforts to attain its objective of applying GI systems to its own produce. Success in this objective may result in the substitution of product from other countries, such as from the USA, Australia and Chile.
Industry sources in Korea are fearful of the possible impact, with some industry estimates placing the damage to Korean firms at hundreds of billions of won. Specified geographical names (these are not necessarily GIs) such as Vienna sausage, Camembert Cheese, Scotch whisky etc. are currently used in Korean business practices. Industry associations suggest that about 79 items in the areas of meat and milk processing alone could suffer damage from GI or trademark enforcement, with the total loss exceeding 100 billion won, including 90 billion won in sales loss, 2.3 billion won for the cost of repackaging substitute products, and 19 billion won for annual marketing expense. The majority of meat processing companies are expected to suffer some damage, e.g. CJ has identified 15 items (e.g. Kentucky Franc Sausage and Hamsvill Vienna), Lotte Ham has identified seven products, and Daelim Corporation six items, Daesang five items, and Dongwon three items. Damage to milk processing companies’ products such as Seoul Milk’s Cheddar Cheese, Namyang Dairy Products’ Rogenheim Cheese, Maeil Dairy Industry’s Bulgaria, Namyang Dairy Products’ Bulgaris are also predicted.17
In fact Korea already has registration of Geographical Indications. Enforcement could be improved in the future, but many of the products cited by the Korean industry would not qualify as GIs.
The Korean Advanced Farmers Federation predicts that FTA negotiations with the EU on agriculture will not be easy. The EU’s global competitiveness in livestock products, dairy products, various processing food and wine are expected to make significant inroads into Korea’s middle and high income food market. The concerns expressed about GIs create negative perceptions from some agricultural and food producers and processors.
17 Asia Economy(2007) “Substantial losses of Korean processed food industry in the
Korea-EU FTA” May 7. Korean.
Reference: Trade 2007/349757/1 Trade Sustainability Impact Assessment of the Free Trade Agreement to be negotiated between the European Community and the Republic of Korea
January 2008 Page 52 of 165
SSOOCCIIAALL IIMMPPAACCTTSS:: EEUU
Farming and food-processing are vital sectors for the EU in terms of employment and social impacts, which are regionally dispersed and nation wide. The industry has a substantial presence in all European countries, even in the most highly urbanised and industrialised member states (such as the UK where farming covers ¾ of the land area and employs over half a million people.) There are an estimated 11-12 million farmers in the EU (4-5 million in the NMS), and over 60% of the EU 27 population still live in rural areas. Farming is a key platform for economic diversification in these areas. Because of its huge social dimension, liberalisation of this sector will always prove difficult, but at the same time is essential to respond to the changing global environment.
Because an EU-Korea FTA would secure enhanced market access for both primary and processed EU farm products, the agreement should –at least in general terms - help to secure this rural economy. With EU exports to Korea currently accounting for only 1.5% of total exports, and 0.1% of total turnover, the positive impacts arising from export gains are likely to be small when observed at the broad community-wide level.
At the sub-aggregate level however, impacts will be more apparent. As observed earlier, labour productivity within the EU food processing industry is at levels significantly below those of its major developed country competitors. This FTA, and the expanded market access it offers, should boost labour productivity in a small but not inconsequential way in the industry, thereby helping to secure the industry’s employment base. The farming side of the industry is a highly localised enterprise, and real social benefits in terms of enhanced viability of operations, more secure income flows, retention of farm labour, and so forth, are probable outcomes at that local level. Because of the range of sub-sectors involved, and their dispersal throughout the community, these localised effects will also be felt across all Member States and regions. There thus will be positive and regionally dispersed impacts differentiated by the sector affected.
Of the sectors provisionally identified as beneficiaries from an agreement, some examples of regional diffusion of benefits are likely to include:
• Scotch whisky (and to a lesser extent Irish whisky), an industry with dozens of operations in relatively remote regions where alternative employment opportunities are limited;
• The various national wine industries, whose operations are crucial to the social economy of France, Italy, Spain and more, and who face intense competition in domestic and international markets.
• The dairy farming industry, which has a strong presence in Denmark, the Netherlands, Ireland, and more, an industry that has only very recently begun to consolidate itself after a long period of price and over-supply pressures.
These sector-based examples could be replicated for many others, with virtually every region of the community benefiting to some degree.
SSOOCCIIAALL IIMMPPAACCTTSS:: KKOORREEAA
As regards Korea, with its protected farming industry, the following are some likely social and community impacts.
Rural Economy and Society Impacts
Because the EU stands to be a clear gainer in economic terms, and the biggest beneficiary in terms of expanded exports from any agreement, the likelihood is that any negative social impacts arising from the liberalisation of this sector will be concentrated in Korea.

Reference: Trade 2007/349757/1 Trade Sustainability Impact Assessment of the Free Trade Agreement to be negotiated between the European Community and the Republic of Korea
January 2008 Page 53 of 165
Because of its highly protected structure, its smaller size and lower export potential, and the fact that it has not yet tackled structural reform, impacts are likely to be greater on the Korean side. Primary agriculture accounts for approximately 8% of Korean employment, and 3.5% of Korean GDP, a proportionately much higher figure than for the EU. Small scale farming is prevalent, and productivity levels in the sector are one third of the national average. Producer supports (in terms of PSEs), although declining, were almost double the OECD average in 2003. It is a highly politically sensitive sector, and food security concerns are a priority. The ‘multifunctionality’ of agriculture is commonly cited by Korean negotiators in requesting exemptions to market liberalising measures.
A Korea-EU FTA therefore could potentially have negative impacts in terms of the Korean rural economy. Much of the primary workforce is low income and elderly, and therefore susceptible to impact along these lines. Off farm and self-employment options are limited, and some mitigation measures might be necessary. On the other hand, the incremental impact of any agreement with the EU is diminished in the context of the market liberalisation that would in any event occur with the KORUS FTA and other FTAs currently being implemented. Certainly the conclusion of the Doha negotiations would have some implications for more competition in the Korean processed food market.
However, as mentioned above, the main impact of an agreement is expected to be at the processing industry level, with relatively minor impacts at the primary level (due to extended protection phase-out for sensitive sectors, the differential impact of KORUS, and strengthening market conditions in Europe etc.). There may be some small impacts in sectors such as pork and dairy. However, Korea introduced a special assistance law for Korea’s first FTA with Chile in order to support agricultural adjustment in 2004. The government also made a law for supporting structural adjustment in the agricultural sector in 2006. These programmes were designed to facilitate structural adjustment but without guarantees of support for farmers. Nevertheless they function as partial social safety nets, and in the context of overall relatively minor impacts, should help mitigate any negative adjustments.
Cost of Living Benefits:
As already mentioned, Korean food prices are among the highest in the OECD, largely as a result of the protection afforded Korean farmers. Yet Korea is a highly urbanised country, and the share of incomes allocated to food is high. Increased and more competitively priced food imports could have an important impact in terms of ameliorating cost of living increases, which in turn would benefit the less well off and those for whom food expenditures account for a larger share of the overall household budget.
According to the Korean Statistical Information System, a representative urban household earned 3,070,000Won, and spent 520,000Won – or 17% - on food (95,000Won, or 18% of total food spending was on processed food) in 2004. By comparison, 12.7% of the average EU 25 household expenditure in 2004 was accounted for by food & beverages18. Allowing for the slightly differing bases of calculation, it thus appears that on average, food expenditures in Korea are around 50% higher per household than in the EU. The impact of the agreement in increasing the supply of more competitively priced food products in Korea therefore should have positive anti-poverty and cost of living effects.
EENNVVIIRROONNMMEENNTTAALL IIMMPPAACCTTSS
Within the EU 27, rural areas account for 90% of the territory, hence the extent and type of farming (e.g. use of nitrates, pesticides etc.) is crucial for land use, animal welfare, and environmental quality overall. Since reform of the CAP, the EU Rural Development Policy has become the key restructuring instrument and has been explicitly framed to support sustainable farming measures and practices (e.g. enrolment of farmers in REPS
18 Eurostat Household Expenditure Survey 2004.
Reference: Trade 2007/349757/1 Trade Sustainability Impact Assessment of the Free Trade Agreement to be negotiated between the European Community and the Republic of Korea
January 2008 Page 54 of 165
programmes). Similarly, within the processed foods sector, environmental issues abound, such as disposal of effluent, waste packaging, etc. More recently the environmental impact of global trade in food has arisen as a key issue.
The impact on environmental indicators, particularly biodiversity and environmental quality, will ultimately depend on the depth and scale of the agreement, and the production response it induces in the European farming sector. It is difficult to see, given the relatively small scale of the potential export expansion and the associated production response, that there would be any measurable impacts. EU exports to Korea currently account for about 1.5% of the EU total, and about 0.1% of total industry turnover. At these levels, it is difficult to see how any conceivable export increment would induce production changes with identifiable environmental impacts.
One potential channel for environmental benefit would be via the improved scale economies of individual farm or processing operations that would flow from access to a wider market. While not a significant factor at the economy wide level, the improved profitability of individual operations would support expenditures by individual operators on environmental upgrades and environmental compliance.
RREEFFEERREENNCCEESS
Centre for European Policy Studies, A Qualitative Analysis of a Potential FTA between the EU and South Korea, July 2007.
CIAA, Confederation of the Food and Drink Industries of the EU, Brussels; The Competitiveness of the EU Food and Drink Industry, benchmarking report, 2007 update.
CIAA: Data and Trends 2006.
CIAA: Annual Report 2006.
CIAA: Managing Environmental Sustainability in European Food and Drink Industries, 2006.
Copenhagen Economics, Economic Impact of a Potential FTA between the EU and Korea, March 2007.
European Commission, Competitiveness of the European Food Industry, Economic and Legal Assessment, Brussels November 28, 2006.
Eurostat Household Expenditure Survey 2004.
European Dairy Association, Brussels, Major Issues Dossier September 2007.
GSnJ Institute, Seoul, Korea, ‘Major Issues of Agricultural Negotiation in the EU-Korea FTA’, September 2007.
Office of US Trade Representative, Assessment of US-Korea FTA 2007.
USDA Foreign Agricultural Service, various market reports 2006-2007.
WTO, Trade Policy Review of Republic of Korea, Report by the Secretariat, 18 August 2004.
Reference: Trade 2007/349757/1 Trade Sustainability Impact Assessment of the Free Trade Agreement to be negotiated between the European Community and the Republic of Korea
January 2008 Page 55 of 165
44.. FFIINNAANNCCIIAALL SSEERRVVIICCEESS
FFIINNAANNCCIIAALL AACCTTIIVVIITTIIEESS WWIITTHHIINN TTHHEE GGLLOOBBAALL SSEERRVVIICCEE SSEECCTTOORR IINN KKOORREEAA AANNDD TTHHEE EEUU
In both Korea and the EU, the global service sector is by far the largest in the respective economies.
In Korea, the services value added was 57.2% of GDP in 2006. This share stays above 50% since 1992, oscillating between 51% in 1992 and 57.5% in 2002. Employment in services sector has steadily and sharply increased, from 46.7% of total employment in 1990 to 61.2% in 2000 and 65.1% in 2005, at the expense of a decline in the share of agriculture and to a lesser extent of industry.
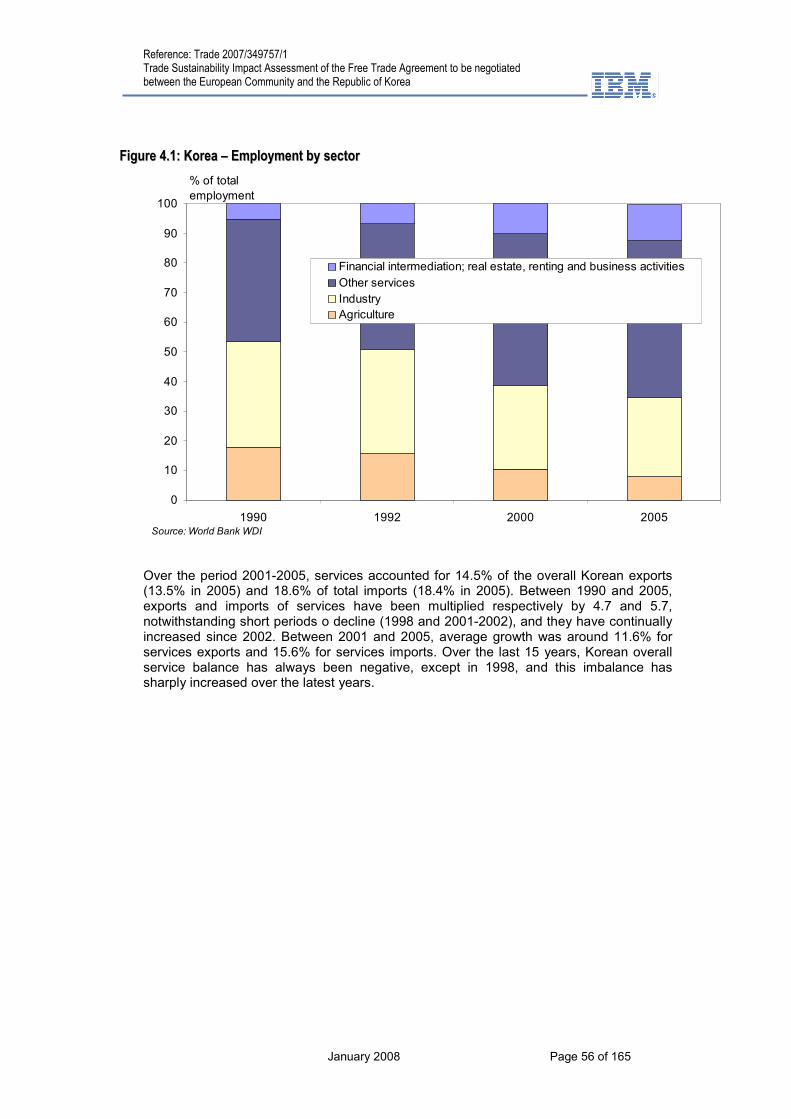
Reference: Trade 2007/349757/1 Trade Sustainability Impact Assessment of the Free Trade Agreement to be negotiated between the European Community and the Republic of Korea
January 2008 Page 56 of 165
FFiigguurree 44..11:: KKoorreeaa –– EEmmppllooyymmeenntt bbyy sseeccttoorr
0
10
20
30
40
50
60
70
80
90
100
1990 1992 2000 2005
% of total
employment
Financial intermediation; real estate, renting and business activities
Other services
Industry
Agriculture
Source: World Bank WDI
Over the period 2001-2005, services accounted for 14.5% of the overall Korean exports (13.5% in 2005) and 18.6% of total imports (18.4% in 2005). Between 1990 and 2005, exports and imports of services have been multiplied respectively by 4.7 and 5.7, notwithstanding short periods o decline (1998 and 2001-2002), and they have continually increased since 2002. Between 2001 and 2005, average growth was around 11.6% for services exports and 15.6% for services imports. Over the last 15 years, Korean overall service balance has always been negative, except in 1998, and this imbalance has sharply increased over the latest years.

Reference: Trade 2007/349757/1 Trade Sustainability Impact Assessment of the Free Trade Agreement to be negotiated between the European Community and the Republic of Korea
January 2008 Page 57 of 165
FFiigguurree 44..22:: KKoorreeaa ttoottaall ttrraaddee iinn sseerrvviicceess
0
10 000
20 000
30 000
40 000
50 000
60 000
70 000
1990 1995 2000 2005
mn USD
Imports
Exports
Source: OECD
Whether it is Korean service imports or exports, transportation is the most significant import (apart from “Other services” which summarizes several categories of business services). Afterwards, the tourism sector in Korea has also a significant share: around 13% in service exports and 26% in service imports. Insurance and financial services have lesser impact. By 2005, it account for 1.6% of the total imports of services. In comparison, these services counted for 1% in 2000. In terms of exports, share of insurance and financial services in total service exports increased from 2.5% in 2000 to 4% in 2005.
TTaabbllee 44..11:: SSttrruuccttuurree ooff KKoorreeaann ttrraaddee iinn sseerrvviicceess
Structure of Korean service imports
(% of total services)
Structure of Korean service exports
(% of total services)
Total services (mn USD) 58 788 45 129 Total services (mn USD)
Transportation 34.3 52.9 Transportation
Travel 26.2 12.9 Travel
Insurance & financial services 1.6 4.0 Insurance & financial services
Other services (computer, information, communication and other commercial services) 37.9 30.2
Other services (computer, information, communication and other commercial services)
The financial service sector in Korea produced a value added of EUR 53 bn (2006), 7.5% of the country’s total GDP, and the sector employed more than 750,000 persons. This

Reference: Trade 2007/349757/1 Trade Sustainability Impact Assessment of the Free Trade Agreement to be negotiated between the European Community and the Republic of Korea
January 2008 Page 58 of 165
figure reaches 2.9 mn if real estate, renting and business activities in financial services are added.
In the EU, activities in services amount to 71.6% of the total GDP in 2005, a steady increase over the last decade (67.6% in 1995). Within services, the major contributor to GDP is “Real estate, renting and business activities” (22%), followed by “Wholesale and retail trade; repair of motor vehicles, motorcycles and personal and household goods“ (11.5%).
FFiigguurree 44..33:: SShhaarree ooff sseerrvviicceess aanndd ffiinnaanncciiaall sseerrvviicceess iinn tthhee EEUU2255 GGDDPP
0%
20%
40%
60%
80%
100%
1995 1996 1997 1998 1999 2000 2001 2002 2003 2004 2005
Other services
Financial services
Industry
Agriculture
Source: Eurostat
Employment in services has slightly increased between 2000 and 2005 (from 64.7% of total employment to 67.9%). Looking at the EU15 over a longer term period, the share of services has moved from 64.4% in 1995 to 69.7% in 2005. A very large majority of women (82.3% of total female employment) in EU25 and 56.5% of men work in services sector.
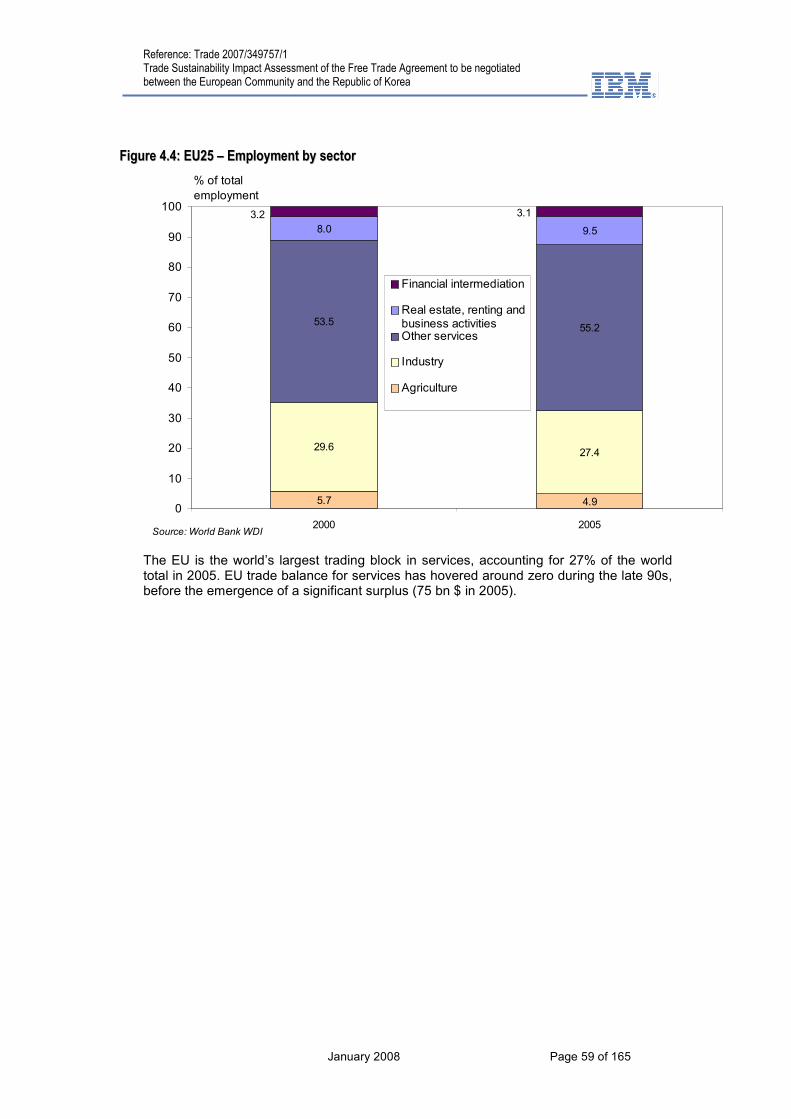
Reference: Trade 2007/349757/1 Trade Sustainability Impact Assessment of the Free Trade Agreement to be negotiated between the European Community and the Republic of Korea
January 2008 Page 59 of 165
FFiigguurree 44..44:: EEUU2255 –– EEmmppllooyymmeenntt bbyy sseeccttoorr
5.7 4.9
29.627.4
53.555.2
8.0 9.5
3.2 3.1
0
10
20
30
40
50
60
70
80
90
100
2000 2005
% of total
employment
Financial intermediation
Real estate, renting andbusiness activitiesOther services
Industry
Agriculture
Source: World Bank WDI
The EU is the world’s largest trading block in services, accounting for 27% of the world total in 2005. EU trade balance for services has hovered around zero during the late 90s, before the emergence of a significant surplus (75 bn $ in 2005).
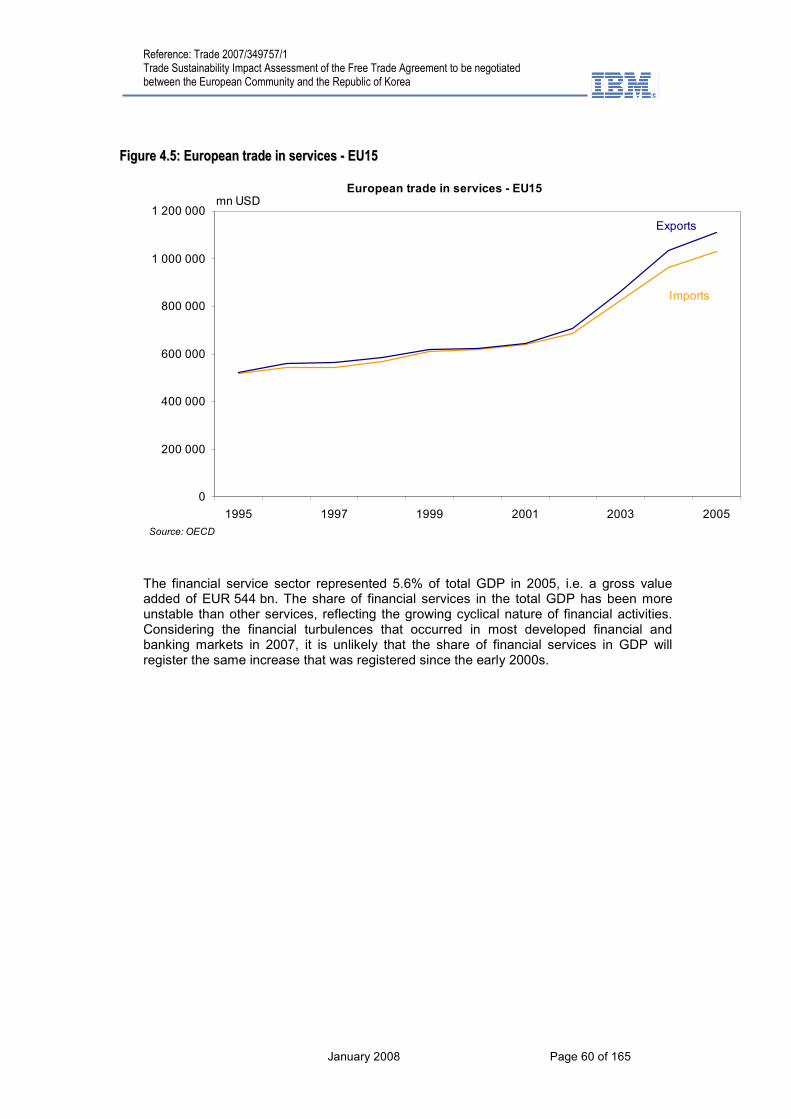
Reference: Trade 2007/349757/1 Trade Sustainability Impact Assessment of the Free Trade Agreement to be negotiated between the European Community and the Republic of Korea
January 2008 Page 60 of 165
FFiigguurree 44..55:: EEuurrooppeeaann ttrraaddee iinn sseerrvviicceess -- EEUU1155
European trade in services - EU15
0
200 000
400 000
600 000
800 000
1 000 000
1 200 000
1995 1997 1999 2001 2003 2005
mn USD
Imports
Exports
Source: OECD
The financial service sector represented 5.6% of total GDP in 2005, i.e. a gross value added of EUR 544 bn. The share of financial services in the total GDP has been more unstable than other services, reflecting the growing cyclical nature of financial activities. Considering the financial turbulences that occurred in most developed financial and banking markets in 2007, it is unlikely that the share of financial services in GDP will register the same increase that was registered since the early 2000s.

Reference: Trade 2007/349757/1 Trade Sustainability Impact Assessment of the Free Trade Agreement to be negotiated between the European Community and the Republic of Korea
January 2008 Page 61 of 165
FFiigguurree 44..66:: SShhaarree ooff ffiinnaanncciiaall sseerrvviicceess iinn tthhee EEUU2255 GGDDPP
4.2
4.4
4.6
4.8
5.0
5.2
5.4
5.6
5.8
1995 1996 1997 1998 1999 2000 2001 2002 2003 2004 2005
% of GDP
Over he period 2000-2005, the share of employment in financial intermediation has remained stable (3.2% to 3.1%), and the number of people employed has increased by 100,000, from 6.05 mn to 6.15 mn.
44..11.. GGLLOOBBAALL FFIINNAANNCCIIAALL SSEERRVVIICCEE DDEEVVEELLOOPPMMEENNTTSS
There have been many deep changes in the global financial industry over the past decades, as the combination of a deeper international integration (implying much larger cross-border financial flows and a growing need for products in new markets), of an increasing concentration in the corporate sector (implying the need for such corporate entities to have access to very large pools of funding on a world-scale basis, while seeking advisory services for mergers and acquisition), of major technical and financial innovations (real-time settlements through enhanced computer systems, derivative instruments, etc.), and of regulatory changes (from the London Big Bang more than 20 years ago to the EC Directive on Markets in Financial Instruments, MiFID), has produced a unique platform for established players to grow and diversify while new entrants in the market have come to play a major role.
In strategic terms, these changes have induced multi-faceted transformation among financial intermediation companies worldwide, with a growing differentiation between institutions associated with blurred boundaries between activities.
� On one side, many companies in the financial intermediation have set out a strategy to become “global super financial houses”, which have the size and capital, the geographic reach and the technology level to engage into all (or almost all) different segments of the financial intermediation. Around a “core” institution (usually a commercial bank) is built a dense network of related companies or new in-house departments dealing with investment banking (M&A, primary market activities), brokerage (equity, fixed-income, money instruments, funds…), and payment systems (credit cards, transfers, pooled treasury management …). Such a strategy is not yet
Reference: Trade 2007/349757/1 Trade Sustainability Impact Assessment of the Free Trade Agreement to be negotiated between the European Community and the Republic of Korea
January 2008 Page 62 of 165
clear among the largest banks in the world, but Citigroup, HSBC, BNPP, Deutsche Bank, BBVA or ING are probably the best examples of this world ambition in the banking industry, and Axa, Allianz or AIG in the insurance industry. The development of “bancassurance” is clearly a point in this type of strategy.
� At the opposite side, there has been a massive development of “niche players”, sometime very big in size, but specialising on one or a couple of market segments where they aim for leadership. We find here asset management companies (Robeco, Invesco, Fidelity,), specialised banks (State Street, Bank of New York), brokers or specialist insurers. Here, a critical element has been the emergence of non-financial companies in the financial sector (e.g. retailers, Internet based payment systems, …)
� In between these two “extremes” remain a large array of institutions which usually have kept an “historic” presence in a given market (typically the domestic retail market for banks and insurance companies, or the retail investors for brokers) and tried to expand in “targeted” activities, either in the same areas but in different countries (e.g. leasing companies) or in different market segments (e.g. Société Générale and equity derivatives).
� Finally, it is essential to remember that the financial intermediation industry include a large number of “particular” companies, ranging from mutual saving societies to cooperative banks, postal services proposing financial products.
Such strategic and institutional changes in the structure of financial intermediation companies have been accompanied by massive changes in the regulation and supervision. The very long process of putting the Basel II capital adequacy regulation into operation, as well as the new SEPA and MiFID directives are the most glaring examples of the issues facing regulators and operators.
The current difficulties in financial and monetary markets in the US and in the EU, triggered by the real estate problems in the US but clearly associated with the past innovations in market instruments and trading, have been a healthy reminder of the difficulties in finding an adequate balance between financial innovations and financial supervision.
44..22.. TTHHEE FFIINNAANNCCIIAALL SSEERRVVIICCEESS SSEECCTTOORR IINN KKOORREEAA Financial institutions in Korea are broadly grouped into banks, non-bank financial institutions, insurance companies, securities companies and other financial institutions. All of them are under the regulatory supervision of the FSC (Financial Supervisory Committee) / FSS (Financial Supervisory Service). The table below gives the number of registered companies in each category of financial institutions
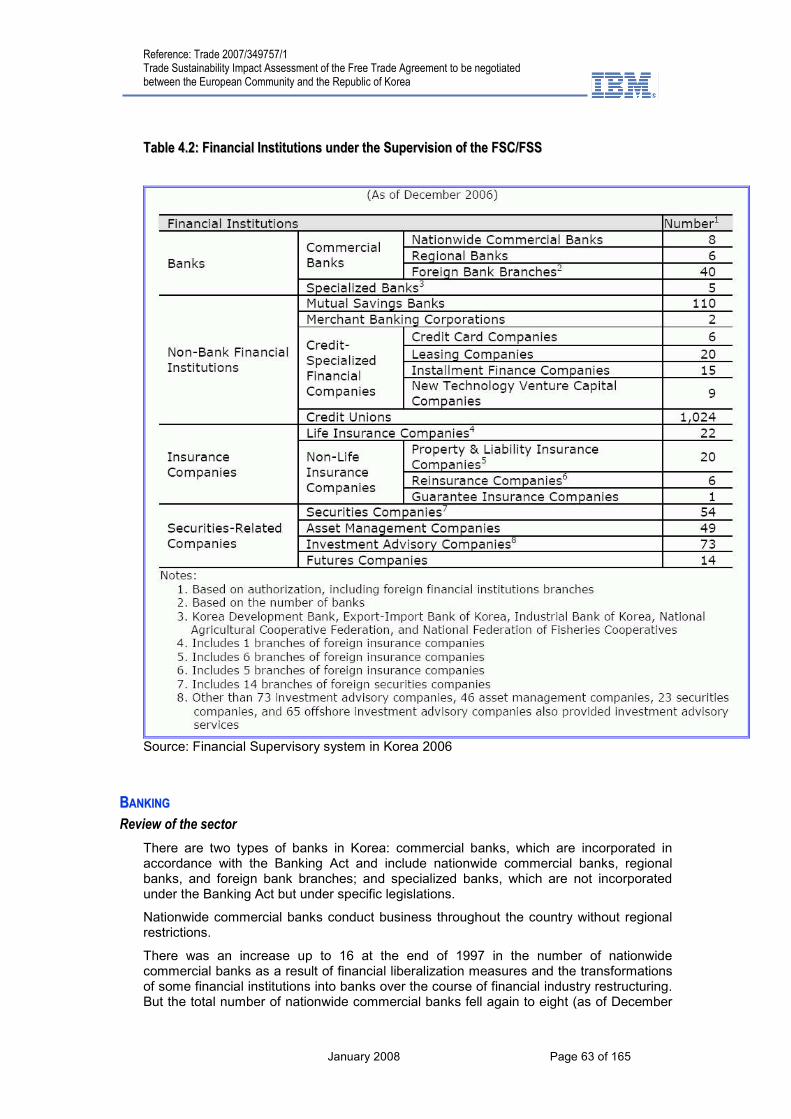
Reference: Trade 2007/349757/1 Trade Sustainability Impact Assessment of the Free Trade Agreement to be negotiated between the European Community and the Republic of Korea
January 2008 Page 63 of 165
TTaabbllee 44..22:: FFiinnaanncciiaall IInnssttiittuuttiioonnss uunnddeerr tthhee SSuuppeerrvviissiioonn ooff tthhee FFSSCC//FFSSSS
Source: Financial Supervisory system in Korea 2006
BBAANNKKIINNGG
Review of the sector
There are two types of banks in Korea: commercial banks, which are incorporated in accordance with the Banking Act and include nationwide commercial banks, regional banks, and foreign bank branches; and specialized banks, which are not incorporated under the Banking Act but under specific legislations.
Nationwide commercial banks conduct business throughout the country without regional restrictions.
There was an increase up to 16 at the end of 1997 in the number of nationwide commercial banks as a result of financial liberalization measures and the transformations of some financial institutions into banks over the course of financial industry restructuring. But the total number of nationwide commercial banks fell again to eight (as of December

Reference: Trade 2007/349757/1 Trade Sustainability Impact Assessment of the Free Trade Agreement to be negotiated between the European Community and the Republic of Korea
January 2008 Page 64 of 165
2006) as a result of bank closures and mergers in the aftermath of the 1997 financial crisis.
Regional banks were first established in 1967 in an effort to better balance regional economic development and provide greater access to financial services to the regional and rural areas. There were ten regional banks that were operating at the end of 1997, but the number fell to six as a result of closures and mergers in the wake of the 1997 financial crisis.
Foreign bank branches were first allowed into Korea in 1967 to encourage the inflow of foreign capital and gain greater access to international capital markets. In 1984, the government began to remove restrictions on foreign branches in an effort to "level the playing field" for foreign banks, and in 1991 significantly eased regulations on foreign banks to promote greater competition among the banks operating in Korea. More specifically, the government allowed foreign banks to open multiple branches under the same standards and procedures as those applied to domestic banks and to compete on equal footing with domestic banks. As of December 2006, there were 40 foreign banks.
The main sources of funds for commercial banks in Korea are deposits in domestic currency (53.4% as of December 2006) and bonds (12.2% as of December 2006). The main uses of funds are lending in domestic currency (58.2% as of December 2006) and securities investments (17.4% as of December 2006).
Specialized banks were established during the 1960s primarily to supplement the commercial banks in areas where they could not supply sufficient funds due to limited capital, profitability, and expertise and also to support specific industrial sectors that were given priority by the government in its economic development plans. With changing market conditions, however, specialized banks began to expand their businesses into commercial banking. Nonetheless, their share of capital allocation to the specific sectors they were originally intended to serve is still relatively high.
The following table provides descriptive information on the largest banks in Korea, with figures for total assets, capital and the ratio of capital strength. For information, the ranks of the Korean banks among Asian and world banks is indicated.
TTaabbllee 44..33:: LLaarrggeesstt ccoommmmeerrcciiaall bbaannkkss iinn KKoorreeaa ((eenndd--22000066 ffiigguurreess))
ranking Asia (ranking world)
name Capital $bn Assets $bn Capital / assets ratio
7 (62) Kookmin Bank 14.3 213.9 6.7%
10 (67) Woori Bank 10.7 228.0 4.7%
15 (76) Shinhan Bank 9.5 190.3 5.0%
16 (na) Nat’l Agriculture Coop. Fed.
8.8 154.7 5.7%
17 (91) Hana Financial Group 8.2 124.8 6.6%
21 (na) Industrial Bank of Korea 6.1 111.4 5.5%
24 (146) KEB 5.1 76.9 6.6%
36 (na) SC First Bank 2.8 61.5 4.6%
69 (350) Pusan Bank 1.3 23.3 5.6%
71 (461) Daegu Bank 1.2 24.8 4.8%
109 554) Kwangju Bank 0.7 14.9 4.5%
119 (594) Kyongnam Bank 0.6 13.8 4.3%
176 (934) Jeonbuk Bank 0.3 6.1 4.3%
total 69.5 1 244.4 5.6%
Source: The Banker
We can derive three points from the table:

Reference: Trade 2007/349757/1 Trade Sustainability Impact Assessment of the Free Trade Agreement to be negotiated between the European Community and the Republic of Korea
January 2008 Page 65 of 165
• The largest Korean banks fare quite well in Asia, as the 7 biggest institutions are among Asia’s 25 largest, with the large Chinese and Australian banks, and above banks from Singapore, India or Taiwan.
• However, none of them is among the largest players on a worldwide basis, with the biggest Korean institution (Kookmin Bank) being ranked 62, and the combined assets of all 13 banks listed above being lower than the assets of the world’s largest bank (Citigroup, with assets of 1882 bn $).
• There is a clear gap among Korean institutions between the 6 largest and the others. The 6 largest have assets above 400 bn $ and their cumulative assets amount to 82% of the total. The smaller banks are mostly regional institutions, while the others have both a nationwide reach and significant international operations.
KKEEYY IISSSSUUEESS AANNDD CCHHAALLLLEENNGGEESS
Since the crisis of 1997, Korea banks have faced repeated periods of difficulties followed by sharp positive reversal, after decades of steady development based mostly on large credit distribution to the largest Korean groups. The excessive leverage in such groups and the reliance on short-term borrowings was a major factor behind the transmission of the currency shock of 1997 to a full blown banking crisis that has imposed massive Government and international interventions.
The guarantee extended by the government to international borrowings by Korean bansk back in 1997-98 and the need to restore rapidly the normal functioning of the financial system led authorities to engage in a forceful restructuring of the sector, combining the sale of impaired assets to defeasance companies, recapitalisation of the banks, mergers between weaker institutions and opening to foreign investors.
After a rapid recovery in the early 2000s, another form of bubble developed in the form of extremely rapid growth of consumer credit and credit cards operations within Korea. Seen as a critical diversification element away from the concentration on corporate lending, this market segment was then under fierce competition, leading to market share strategies that did not recognize the increasing risks taken. With a mild slowdown in economic activity and household income, such a “blind run” competition strategy turned out into another significant crisis for the financial industry, with massive losses and a renewed need for market consolidation as soon as 2003-04.
Today, Korean banks face a couple of important challenges, many of which are also related to the government strategy to make Korea the financial hub of East Asia:
� Korean banks are still too small to compete on a global scale, notably with the rapid emergence of new competitors in region (mostly from China) and thelong-expected recovery of Japanese banks.
� Notwithstanding this relatively small size by international standards, Korean banks are still dealing with an economy where the credit leverage is quite high; non-bank financial intermediation remains limited, and most banks have yet to develop large and efficient investment banking operations. The high credit leverage means that any cyclical slowdown has a direct effect on bank profitability, with possible self-reinforcing mechanisms leading to potential periods of credit crunch and stronger cyclical reversals.
� The Korean government has embarked on a very ambitious strategy of making Korea a financial hub for East Asia, in-between Japan (with a major domestic focus of banks and many institutional / administrative rigidities) and China (with less sophisticated institutions and the political premium related to the nature of the Chinese political regime). To achieve this aim, authorities have enacted new regulations in 2007, nicknamed “big bang” as a reference to the changes that occurred in Europe in the late 70s and 80s, in order to pave the way for the creation of powerful and competitive financial conglomerates operating in different segments of the financial industry. The Capital Markets Integration act, to come into force in January 2009, will bring Korean regulation in line with global practices, lower barriers that

Reference: Trade 2007/349757/1 Trade Sustainability Impact Assessment of the Free Trade Agreement to be negotiated between the European Community and the Republic of Korea
January 2008 Page 66 of 165
compartmentalise financial institutions and activities, and reinforce the supervisory regulations.
However, Korea faces much competition to get to this regional hub position, not least from Japan, China, Hong Kong and Singapore, which have quite a large number of advantages.
The City of London has recently published an updated analysis on the main financial centres worldwide19, with a thorough examination of their respective advantages and obstacles. Ranking 50 different locations, with London and New York coming way above the others; among Asian locations, Hong Kong and Singapore are first (rank 3 and 4, immediately after the largest world centres), followed by Sydney (9
th) and
Tokyo (10th); Seoul comes at the 42
nd position, below Beijing and Osaka. This simply
shows that Korea will have to move forcefully towards a more open, internationalised and multi-market financial centres to achieve the government’s aim of becoming a financial hub.
The chart and comments next page are derived from this Report, and show that Seoul is among the centres that are not yet highly rated, but which might be able to improve rapidly if they can address their critical obstacles. The five major sets of factors that support the development of an international financial centre include people and skills, the financial business environment, financial market access, market and related infrastructures and general competitiveness of the economy.
19 The Global Financial Centres Index, September 2007
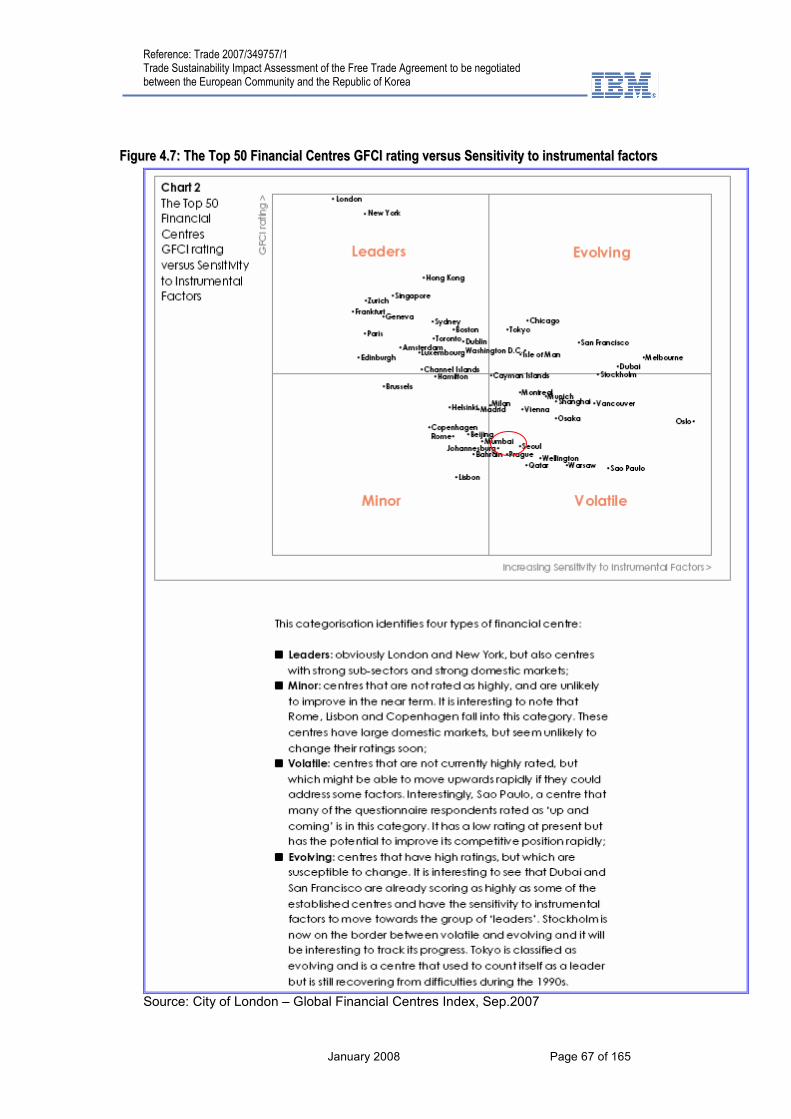
Reference: Trade 2007/349757/1 Trade Sustainability Impact Assessment of the Free Trade Agreement to be negotiated between the European Community and the Republic of Korea
January 2008 Page 67 of 165
FFiigguurree 44..77:: TThhee TToopp 5500 FFiinnaanncciiaall CCeennttrreess GGFFCCII rraattiinngg vveerrssuuss SSeennssiittiivviittyy ttoo iinnssttrruummeennttaall ffaaccttoorrss
Source: City of London – Global Financial Centres Index, Sep.2007
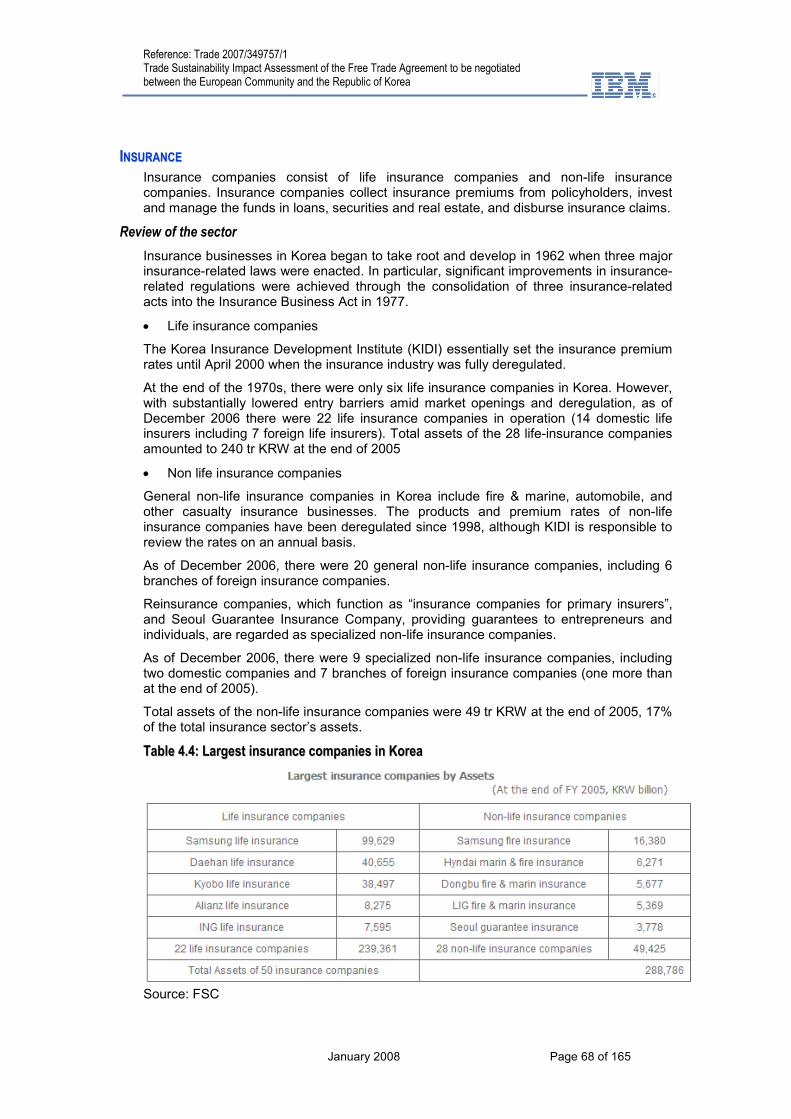
Reference: Trade 2007/349757/1 Trade Sustainability Impact Assessment of the Free Trade Agreement to be negotiated between the European Community and the Republic of Korea
January 2008 Page 68 of 165
IINNSSUURRAANNCCEE
Insurance companies consist of life insurance companies and non-life insurance companies. Insurance companies collect insurance premiums from policyholders, invest and manage the funds in loans, securities and real estate, and disburse insurance claims.
Review of the sector
Insurance businesses in Korea began to take root and develop in 1962 when three major insurance-related laws were enacted. In particular, significant improvements in insurance-related regulations were achieved through the consolidation of three insurance-related acts into the Insurance Business Act in 1977.
• Life insurance companies
The Korea Insurance Development Institute (KIDI) essentially set the insurance premium rates until April 2000 when the insurance industry was fully deregulated.
At the end of the 1970s, there were only six life insurance companies in Korea. However, with substantially lowered entry barriers amid market openings and deregulation, as of December 2006 there were 22 life insurance companies in operation (14 domestic life insurers including 7 foreign life insurers). Total assets of the 28 life-insurance companies amounted to 240 tr KRW at the end of 2005
• Non life insurance companies
General non-life insurance companies in Korea include fire & marine, automobile, and other casualty insurance businesses. The products and premium rates of non-life insurance companies have been deregulated since 1998, although KIDI is responsible to review the rates on an annual basis.
As of December 2006, there were 20 general non-life insurance companies, including 6 branches of foreign insurance companies.
Reinsurance companies, which function as “insurance companies for primary insurers”, and Seoul Guarantee Insurance Company, providing guarantees to entrepreneurs and individuals, are regarded as specialized non-life insurance companies.
As of December 2006, there were 9 specialized non-life insurance companies, including two domestic companies and 7 branches of foreign insurance companies (one more than at the end of 2005).
Total assets of the non-life insurance companies were 49 tr KRW at the end of 2005, 17% of the total insurance sector’s assets.
TTaabbllee 44..44:: LLaarrggeesstt iinnssuurraannccee ccoommppaanniieess iinn KKoorreeaa
Source: FSC
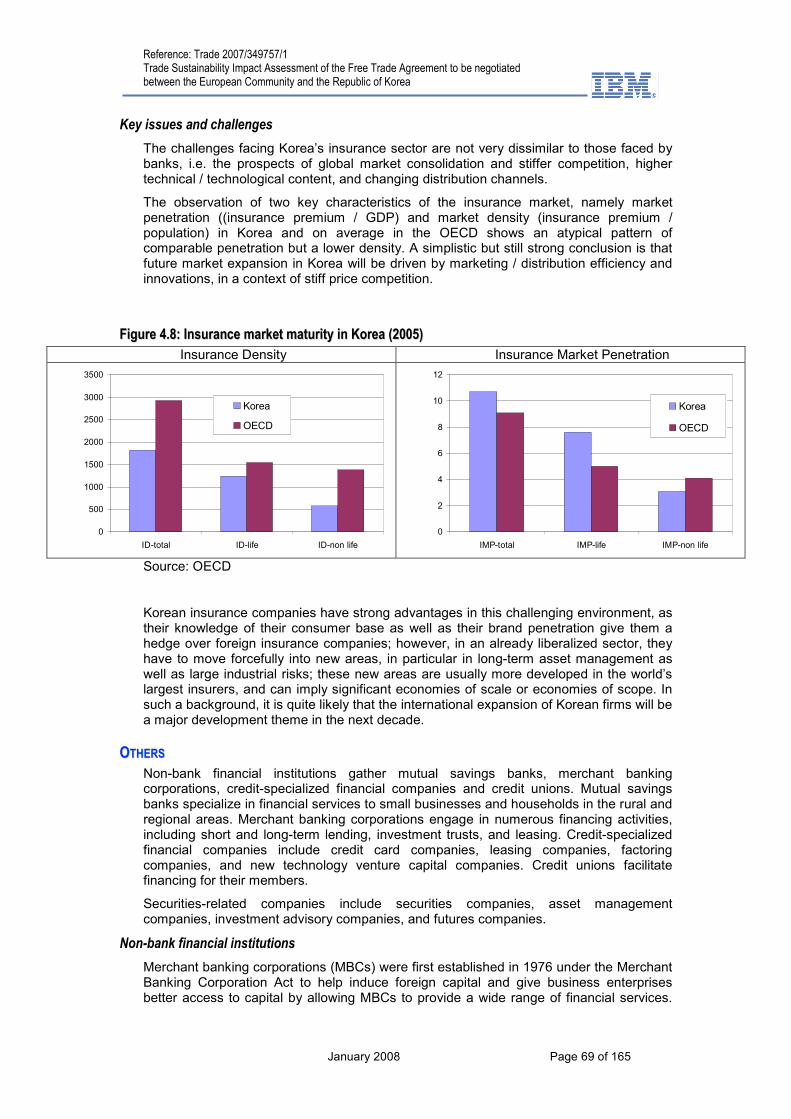
Reference: Trade 2007/349757/1 Trade Sustainability Impact Assessment of the Free Trade Agreement to be negotiated between the European Community and the Republic of Korea
January 2008 Page 69 of 165
Key issues and challenges
The challenges facing Korea’s insurance sector are not very dissimilar to those faced by banks, i.e. the prospects of global market consolidation and stiffer competition, higher technical / technological content, and changing distribution channels.
The observation of two key characteristics of the insurance market, namely market penetration ((insurance premium / GDP) and market density (insurance premium / population) in Korea and on average in the OECD shows an atypical pattern of comparable penetration but a lower density. A simplistic but still strong conclusion is that future market expansion in Korea will be driven by marketing / distribution efficiency and innovations, in a context of stiff price competition.
FFiigguurree 44..88:: IInnssuurraannccee mmaarrkkeett mmaattuurriittyy iinn KKoorreeaa ((22000055))
Insurance Density Insurance Market Penetration
0
500
1000
1500
2000
2500
3000
3500
ID-total ID-life ID-non life
Korea
OECD
0
2
4
6
8
10
12
IMP-total IMP-life IMP-non life
Korea
OECD
Source: OECD
Korean insurance companies have strong advantages in this challenging environment, as their knowledge of their consumer base as well as their brand penetration give them a hedge over foreign insurance companies; however, in an already liberalized sector, they have to move forcefully into new areas, in particular in long-term asset management as well as large industrial risks; these new areas are usually more developed in the world’s largest insurers, and can imply significant economies of scale or economies of scope. In such a background, it is quite likely that the international expansion of Korean firms will be a major development theme in the next decade.
OOTTHHEERRSS
Non-bank financial institutions gather mutual savings banks, merchant banking corporations, credit-specialized financial companies and credit unions. Mutual savings banks specialize in financial services to small businesses and households in the rural and regional areas. Merchant banking corporations engage in numerous financing activities, including short and long-term lending, investment trusts, and leasing. Credit-specialized financial companies include credit card companies, leasing companies, factoring companies, and new technology venture capital companies. Credit unions facilitate financing for their members.
Securities-related companies include securities companies, asset management companies, investment advisory companies, and futures companies.
Non-bank financial institutions
Merchant banking corporations (MBCs) were first established in 1976 under the Merchant Banking Corporation Act to help induce foreign capital and give business enterprises better access to capital by allowing MBCs to provide a wide range of financial services.

Reference: Trade 2007/349757/1 Trade Sustainability Impact Assessment of the Free Trade Agreement to be negotiated between the European Community and the Republic of Korea
January 2008 Page 70 of 165
Since the financial crisis in 1997, the number of MBCs was sharply reduced, and as of December 2006, there were two MBCs in operation.
Mutual savings banks (MSBs) were introduced under the Mutual Savings Banks Act in 1972 to provide credit access and other financial services to households and small businesses in the rural and regional areas. As of December 2006, the numbers of MSBs stood at 110, a significant drop from a peak of 350 just after the introduction of MSBs in 1972.
Credit unions are non-profit cooperative financial institutions, owned and controlled by the members who use their services. As of December 2006, there were 1,024 credit unions.
Credit-specialized financial companies (CSFCs) consist of credit card companies, leasing companies, installment finance companies, and new technology venture capital companies. As of December 2006, there were six credit card companies and 15 banks operating credit card businesses, 20 leasing companies, 15 installment finance companies and 9 new technology venture capital companies.
Securities-sector companies
Securities companies are established and regulated under the Securities and Exchange Act (SEA) to carry on the securities business, dividing into three basic areas: brokerage, dealing and underwriting. As of December 2006, there were 54 securities companies operating in Korea, including 14 branches and 5 local firms (subsidiaries) of foreign securities companies.
Futures companies were first introduced in 1997 under the Futures Trading Act, which was enacted in 1996 in order to promote the growth of futures business as well as the development of a futures market. As of December 2006, there were 14 futures companies in operation.
Asset Management Companies are defined as operating indirect investment property as a trustee of an investment trust or an investment company licensed by the FSC. As of December 2006, 49 asset management companies were in business. Asset management has enjoyed a very rapid growth as it opened up a very large range of saving instruments at a moment when pension issues and ageing are favouring long-term savings.
TTaabbllee 44..55:: LLaarrggeesstt aasssseett mmaannaaggeemmeenntt ccoommppaanniieess iinn KKoorreeaa ((22000055))
Source: FSC
Investment advisory business was first introduced in 1987 with an amendment to the Securities and Exchange Act. A further revision of the Securities Investment Trust Business Act in 1995 separated the securities investment advisory business from the investment trust business. The Act on Asset Management Business that covers asset management and investment advisory companies was legislated in October 2003 and was effective in January 2004.
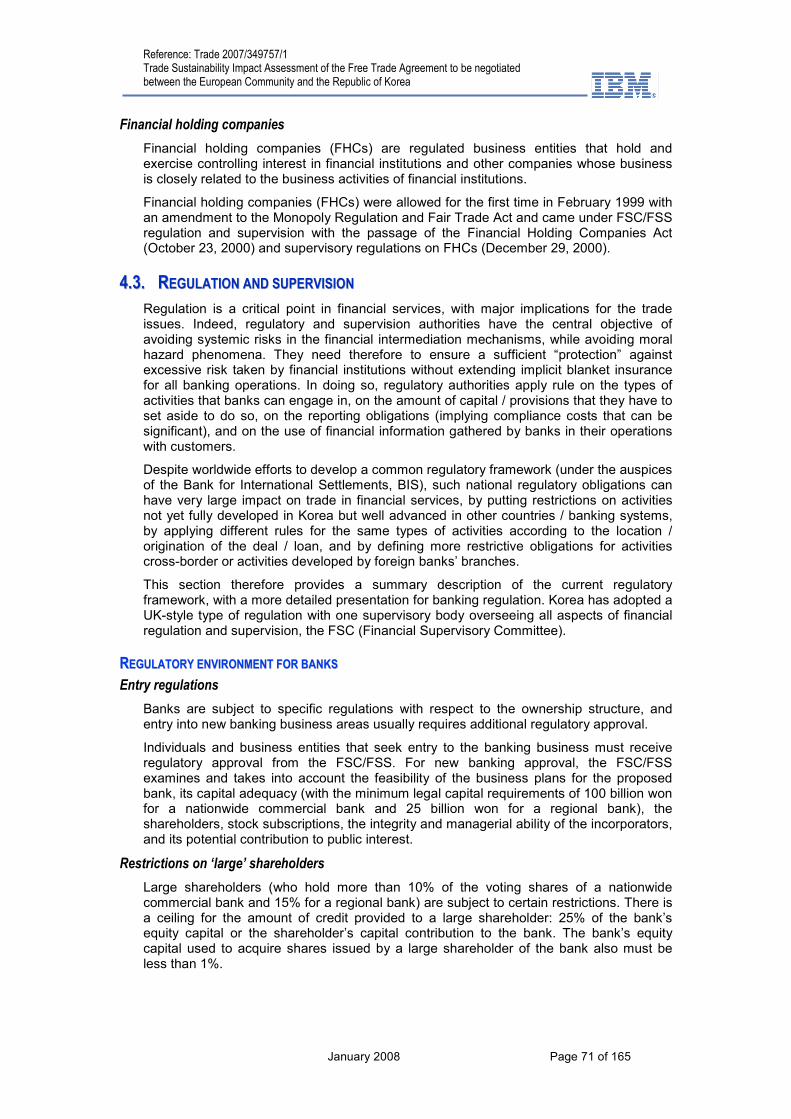
Reference: Trade 2007/349757/1 Trade Sustainability Impact Assessment of the Free Trade Agreement to be negotiated between the European Community and the Republic of Korea
January 2008 Page 71 of 165
Financial holding companies
Financial holding companies (FHCs) are regulated business entities that hold and exercise controlling interest in financial institutions and other companies whose business is closely related to the business activities of financial institutions.
Financial holding companies (FHCs) were allowed for the first time in February 1999 with an amendment to the Monopoly Regulation and Fair Trade Act and came under FSC/FSS regulation and supervision with the passage of the Financial Holding Companies Act (October 23, 2000) and supervisory regulations on FHCs (December 29, 2000).
44..33.. RREEGGUULLAATTIIOONN AANNDD SSUUPPEERRVVIISSIIOONN
Regulation is a critical point in financial services, with major implications for the trade issues. Indeed, regulatory and supervision authorities have the central objective of avoiding systemic risks in the financial intermediation mechanisms, while avoiding moral hazard phenomena. They need therefore to ensure a sufficient “protection” against excessive risk taken by financial institutions without extending implicit blanket insurance for all banking operations. In doing so, regulatory authorities apply rule on the types of activities that banks can engage in, on the amount of capital / provisions that they have to set aside to do so, on the reporting obligations (implying compliance costs that can be significant), and on the use of financial information gathered by banks in their operations with customers.
Despite worldwide efforts to develop a common regulatory framework (under the auspices of the Bank for International Settlements, BIS), such national regulatory obligations can have very large impact on trade in financial services, by putting restrictions on activities not yet fully developed in Korea but well advanced in other countries / banking systems, by applying different rules for the same types of activities according to the location / origination of the deal / loan, and by defining more restrictive obligations for activities cross-border or activities developed by foreign banks’ branches.
This section therefore provides a summary description of the current regulatory framework, with a more detailed presentation for banking regulation. Korea has adopted a UK-style type of regulation with one supervisory body overseeing all aspects of financial regulation and supervision, the FSC (Financial Supervisory Committee).
RREEGGUULLAATTOORRYY EENNVVIIRROONNMMEENNTT FFOORR BBAANNKKSS
Entry regulations
Banks are subject to specific regulations with respect to the ownership structure, and entry into new banking business areas usually requires additional regulatory approval.
Individuals and business entities that seek entry to the banking business must receive regulatory approval from the FSC/FSS. For new banking approval, the FSC/FSS examines and takes into account the feasibility of the business plans for the proposed bank, its capital adequacy (with the minimum legal capital requirements of 100 billion won for a nationwide commercial bank and 25 billion won for a regional bank), the shareholders, stock subscriptions, the integrity and managerial ability of the incorporators, and its potential contribution to public interest.
Restrictions on ‘large’ shareholders
Large shareholders (who hold more than 10% of the voting shares of a nationwide commercial bank and 15% for a regional bank) are subject to certain restrictions. There is a ceiling for the amount of credit provided to a large shareholder: 25% of the bank’s equity capital or the shareholder’s capital contribution to the bank. The bank’s equity capital used to acquire shares issued by a large shareholder of the bank also must be less than 1%.
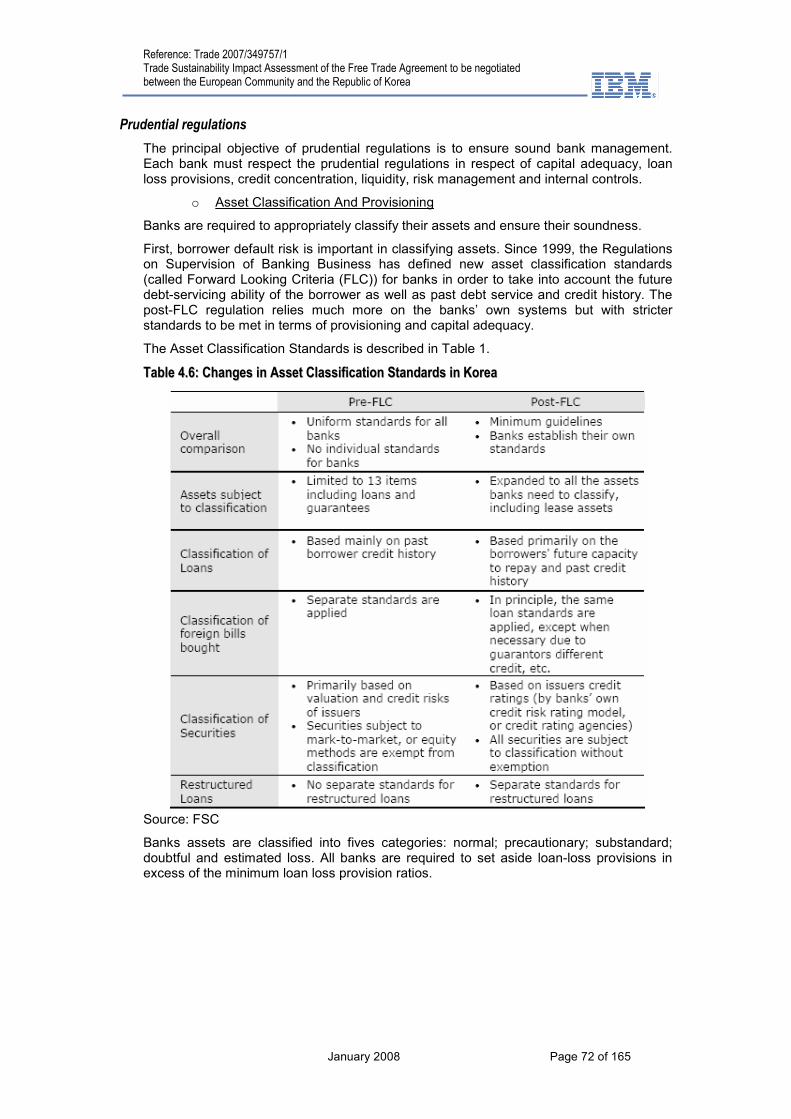
Reference: Trade 2007/349757/1 Trade Sustainability Impact Assessment of the Free Trade Agreement to be negotiated between the European Community and the Republic of Korea
January 2008 Page 72 of 165
Prudential regulations
The principal objective of prudential regulations is to ensure sound bank management. Each bank must respect the prudential regulations in respect of capital adequacy, loan loss provisions, credit concentration, liquidity, risk management and internal controls.
o Asset Classification And Provisioning
Banks are required to appropriately classify their assets and ensure their soundness.
First, borrower default risk is important in classifying assets. Since 1999, the Regulations on Supervision of Banking Business has defined new asset classification standards (called Forward Looking Criteria (FLC)) for banks in order to take into account the future debt-servicing ability of the borrower as well as past debt service and credit history. The post-FLC regulation relies much more on the banks’ own systems but with stricter standards to be met in terms of provisioning and capital adequacy.
The Asset Classification Standards is described in Table 1.
TTaabbllee 44..66:: CChhaannggeess iinn AAsssseett CCllaassssiiffiiccaattiioonn SSttaannddaarrddss iinn KKoorreeaa
Source: FSC
Banks assets are classified into fives categories: normal; precautionary; substandard; doubtful and estimated loss. All banks are required to set aside loan-loss provisions in excess of the minimum loan loss provision ratios.

Reference: Trade 2007/349757/1 Trade Sustainability Impact Assessment of the Free Trade Agreement to be negotiated between the European Community and the Republic of Korea
January 2008 Page 73 of 165
TTaabbllee 44..77:: MMiinniimmuumm LLooaann LLoossss PPrroovviissiioonn RRaattiiooss iinn KKoorreeaa
Source: FSC
o Credit Restrictions
Credit restrictions were instituted after amendments to the Banking Act and the Regulations on Banking Supervision in May 1999 in accordance with an agreement with the IMF in an effort to bring Korea’s bank credit practices up to international best practices. Hence, under the Banking Act, no bank may expose more than 20% of its total capital in loans and credit guarantees to a single individual borrower or corporate borrower or more than 25% of its total capital to an inter-linked business group in loans and credit guarantees. In addition, the sum of the credit extended to single individuals or inter-linked business groups that exceed 10% of the bank’s total capital must be less than 500% of the bank’s total capital. Moreover, the amount of credit provided to a large shareholder is limited.
o Liquidity Ratios
The FSC/FSS requires banks to keep the won-liquidity ratio (defined as the ratio of won-denominated assets with maturity of less than 3 months to won-denominated liabilities with maturity of less than 3 months including merchant banking account) above 100%.
o Financial Disclosure
Under the Banking Act, commercial banks must disclose their balance sheet as of the book closing date, income statement for the fiscal year, and a consolidated financial statement in the form prescribed by the FSC/FSS.
In order to ensure that the depositors, the shareholders, and other market participants are adequately informed of the financial status of the banks, the FSC/FSS has also instituted more rigorous mandatory disclosure of management performance. Domestic banks and foreign bank branches are required to make periodic disclosures on the financial soundness, profitability, productivity, sources and uses of funds, among others.
Management evaluation system and prompt corrective actions
o Management Evaluation System
The FSC/FSS evaluates the management status of banks and assigns a rating for their overall operations and a composite rating using the CAMELS (Capital adequacy, Asset quality, Management, Earnings, Liquidity, and Sensitivity to market risk) bank rating system for the head offices of domestic banks and overseas subsidiaries. The ROCA (Risk management, Operational control, Compliance, and Asset quality) system is used for overseas branches of domestic banks and domestic branches of foreign banks.
o Prompt Corrective Actions
The FSC/FSS has adopted a concrete trigger system of prompt corrective actions (PCA) for problematic banks. When the BIS capital ratio or the overall evaluation result of a bank falls below the minimum criteria, the FSC/FSS takes the necessary prompt and appropriate actions to correct the problem.
Reference: Trade 2007/349757/1 Trade Sustainability Impact Assessment of the Free Trade Agreement to be negotiated between the European Community and the Republic of Korea
January 2008 Page 74 of 165
Banks that receive a Management Improvement Recommendation or Management Improvement Requirement must submit a management improvement plan to the FSC/FSS within two months after receiving the FSC/FSS supervisory action, and those that receive Management Improvement Orders may be subject to, in addition to the measures from Management Improvement Requirement, capital write-down, suspension of top management, appointment of a receiver, merger with another financial institution, suspension of business within six months, or revocation of banking license.
The FSC/FSS may also take informal supervisory actions to force banks to exert autonomous and preliminary efforts through an agreement between the FSC/FSS and the banks to improve banking operations. Banks may be required to submit a management improvement plan, a letter of commitment, or a memorandum of understanding with the FSC/FSS in the likelihood of further deterioration in the CAMELS ratings or management guidance ratios (BIS capital adequacy ratio, won liquidity ratio, etc.) of the banks.
RREEGGUULLAATTOORRYY EENNVVIIRROONNMMEENNTT FFOORR IINNSSUURRAANNCCEE CCOOMMPPAANNIIEESS
As for the banking sector, regulation of the insurance activities is a critical element in the sector healthy development as well as the expansion of trade in insurance. The central objective of the regulatory authorities is to ensure the protection of the insurers by making sure that the level of risks taken in the management of the technical reserves of the insurance companies is consistent with the future obligations of the insurers vis-à-vis insured companies and persons, with a much higher level of uncertainty for life-insurance because of the time-span of companies’ obligations to insured people, and for natural disaster / very large industrial risks, because of the random nature of events and the potential for very large claims if the insured event does occur.
The main aspects of the insurance regulation cover entry conditions, prudential supervision, and management evaluation.
Entry regulations
The minimum capital required for insurance business is 30 billion won. Given that, when any insurer intends to engage in a single-line insurance business, the amount of the paid-in capital or funds should be not less than 5 billion won (3 billion won for foreign insurer). Insurers also are required to have adequate professional manpower and physical facilities, and feasible and sound business plan. Moreover, major investors must be financially able to make full investments and have a sound financial standing and social credit.
Prudential regulations
In order to ensure sound capital and asset ratios, insurers must maintain a solvency margin ratio of 100% or greater. As a benchmark for financial soundness of insurers, the FSC/FSS has adopted the EU-based solvency margin ratio, which is computed as a ratio of actual solvency margin to statutory solvency margin.
o Asset Classification
Insurers must also classify their assets (into five different classes: normal, precautionary, substandard, doubtful, and estimated loss) according to their soundness and appropriate mandatory allowances for bad assets.
TTaabbllee 44..88:: AAsssseett CCllaassssiiffiiccaattiioonn aanndd PPrroovviissiioonniinngg ffoorr KKoorreeaann IInnssuurraannccee CCoommppaanniieess
Source: FSC
Reference: Trade 2007/349757/1 Trade Sustainability Impact Assessment of the Free Trade Agreement to be negotiated between the European Community and the Republic of Korea
January 2008 Page 75 of 165
o Restrictions On Insurers’ Asset Management
Prudent and sound management of insurers’ assets are essential to protect the policyholders. The FSS regulates insurers’ asset management to ensure safety, liquidity, profitability, and public interest of the assets.
Insurance companies are prohibited from the following activities: acquisition of precious metals & jewelry and antiques; acquisition of non-business-purpose real estate holdings; lending intended for speculation in securities; lending intended for acquisition of its own shares; lending intended to fund political activities; lending to the officers or employees; and any activity that undermines the safety and soundness of the company assets.
Management evaluation system and prompt corrective actions
o Management Evaluation System
The evaluation criteria for insurers differ from those for banks with varying weights assigned to each of the CAMEL evaluation components.
The FSS seeks to enhance the reliability of the evaluation system for insurance companies by making all insurers that have operated continuously for 2 or more years subject to an on-site evaluation. The results of this evaluation are not disclosed but used as internal data by the FSS for supervisory purposes, including PCA for management improvement recommendations, requirements, or orders depending on the outcome of the evaluation.
We can remark that in addition to the on-site examinations, the FSS conducts off-site surveillance of insurance companies through the existing surveillance system that monitors the soundness of the insurance companies. The off-site surveillance may also entail analysis of various business reports and documents. Off-site surveillance may used for recommending or ordering management improvements, adjusting evaluation rating of management status, or for making preparations for future examinations of problematic insurers and their weaknesses.
o Prompt Corrective Actions
The FSS may order management improvement plan from insurers under PCA, which may include management improvement recommendations, management improvement requirements, or management improvement orders to prevent insolvency and to ensure sound management.
RREEGGUULLAATTIIOONN OOFF NNOONN--BBAANNKK FFIINNAANNCCIIAALL IINNSSTTIITTUUTTIIOONNSS
Non-bank financial institutions are regulated by a set of rules akin to those applied to banks. Here again, such rules have to combine the necessary prudential and control elements, without having discriminatory effects and establishing undue barriers to market access. The next paragraphs summarize these regulations.
o Entry Regulations
The incorporation of NBFIs requires regulatory approval and license from the FSC/FSS, and meet certain criteria (minimum legal capital requirement, sound business infrastructure, etc.).
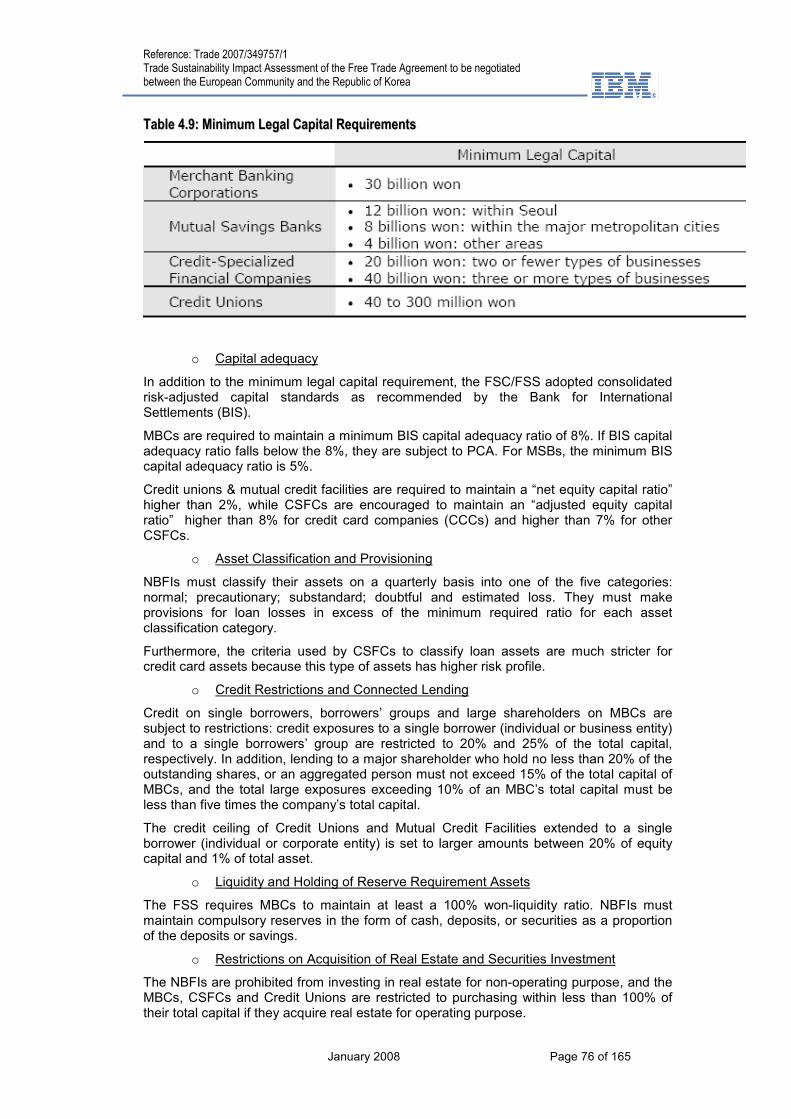
Reference: Trade 2007/349757/1 Trade Sustainability Impact Assessment of the Free Trade Agreement to be negotiated between the European Community and the Republic of Korea
January 2008 Page 76 of 165
TTaabbllee 44..99:: MMiinniimmuumm LLeeggaall CCaappiittaall RReeqquuiirreemmeennttss
o Capital adequacy
In addition to the minimum legal capital requirement, the FSC/FSS adopted consolidated risk-adjusted capital standards as recommended by the Bank for International Settlements (BIS).
MBCs are required to maintain a minimum BIS capital adequacy ratio of 8%. If BIS capital adequacy ratio falls below the 8%, they are subject to PCA. For MSBs, the minimum BIS capital adequacy ratio is 5%.
Credit unions & mutual credit facilities are required to maintain a “net equity capital ratio” higher than 2%, while CSFCs are encouraged to maintain an “adjusted equity capital ratio” higher than 8% for credit card companies (CCCs) and higher than 7% for other CSFCs.
o Asset Classification and Provisioning
NBFIs must classify their assets on a quarterly basis into one of the five categories: normal; precautionary; substandard; doubtful and estimated loss. They must make provisions for loan losses in excess of the minimum required ratio for each asset classification category.
Furthermore, the criteria used by CSFCs to classify loan assets are much stricter for credit card assets because this type of assets has higher risk profile.
o Credit Restrictions and Connected Lending
Credit on single borrowers, borrowers’ groups and large shareholders on MBCs are subject to restrictions: credit exposures to a single borrower (individual or business entity) and to a single borrowers’ group are restricted to 20% and 25% of the total capital, respectively. In addition, lending to a major shareholder who hold no less than 20% of the outstanding shares, or an aggregated person must not exceed 15% of the total capital of MBCs, and the total large exposures exceeding 10% of an MBC’s total capital must be less than five times the company’s total capital.
The credit ceiling of Credit Unions and Mutual Credit Facilities extended to a single borrower (individual or corporate entity) is set to larger amounts between 20% of equity capital and 1% of total asset.
o Liquidity and Holding of Reserve Requirement Assets
The FSS requires MBCs to maintain at least a 100% won-liquidity ratio. NBFIs must maintain compulsory reserves in the form of cash, deposits, or securities as a proportion of the deposits or savings.
o Restrictions on Acquisition of Real Estate and Securities Investment
The NBFIs are prohibited from investing in real estate for non-operating purpose, and the MBCs, CSFCs and Credit Unions are restricted to purchasing within less than 100% of their total capital if they acquire real estate for operating purpose.

Reference: Trade 2007/349757/1 Trade Sustainability Impact Assessment of the Free Trade Agreement to be negotiated between the European Community and the Republic of Korea
January 2008 Page 77 of 165
MBCs and MSBs also are prohibited from investing in securities such as stocks or long-term bonds in excess of 100% of their equity capital. However, government bonds and Monetary Stabilization Bonds issued by the Bank of Korea are exempted from this requirement. On the other hand, Credit Unions are not allowed to invest in high-risk securities, such as stocks, nonguaranteed corporate bonds or corporate bonds with lower than BBB+ rating.
o Financial Disclosures
The NBFIs are required to disclose their annual reports, including the balance sheets and the income statements for each fiscal year. They must also disclose consolidated financial statements in the form prescribed by the FSS.
In order to ensure that the general public (in particular the depositors and shareholders) is adequately informed of the NBFIs, the FSS enforces the mandatory disclosure rules to. The disclosure must cover financial information relating to the asset soundness, profitability, productivity, and the sources and uses of their capital.
o Management evaluation system
The FSC/FSS adopted CAMEL evaluation system for NBFIs. The primary purpose of the evaluation system is to identify and respond to credit distress and other problems at an early stage. The FSC/FSS takes into account the results of the management evaluation and ratings for its supervisory and examination measures, and an NBFI with a rating worse than the critical criteria may be subject to PCAs.
o Prompt corrective actions
When the BIS capital adequacy ratio or the overall evaluation result of MBCs and MSBs falls below the minimum criteria, the FSC/FSS may take actions to correct the problems, and MBCs and MSBs receiving PCA measures must submit rehabilitation plan to the FSS within one month from the date of the PCA. Also, PCA is applied to CSFCs.
Credit Unions also are subject to PCA but FSC/FSS the FSC/FSS delegated the authority to regulate Credit Unions and issue Request for Improvement on Financial Status (RIFS) to the National Credit Union Federation of Korea (NACUFOK). The NACUFOK may take actions against Credit unions that fail to comply with the minimum criteria. Credit unions that receive a RIFS must submit a rehabilitation plan to the NACUFOK within one month from the date of issuing a RIFS.
44..44.. TTHHEE FFIINNAANNCCIIAALL SSEERRVVIICCEESS SSEECCTTOORR IINN TTHHEE EEUU
BBAANNKKIINNGG
Banking industry and banking activities are highly developed in the EU, with many of the largest worldwide institutions, highly efficient credit mechanisms and a strong regulatory framework.
TTaabbllee 44..1100:: GGeenneerraall ssttaattiissttiiccss oonn tthhee EEuurrooppeeaann bbaannkkiinngg sseeccttoorr aass aatt 3311..1122..22000055
Banks1
Branch offices
1
Staff2
Total assets Loans
3
Securities
acquired4
Deposits5
Debt securiti
es issues
6
Capital &
reserves
mn bn €
Total, bn €
Total, bn €
Total, bn € bn € bn €
EU27 7 071 206 143 2.98 33 267 14 370 6 172 13 618 5 453 1 713
Source: European Banking Federation
By construction, European banks are therefore at the centre of the global transformation that was summarized before in the Report.
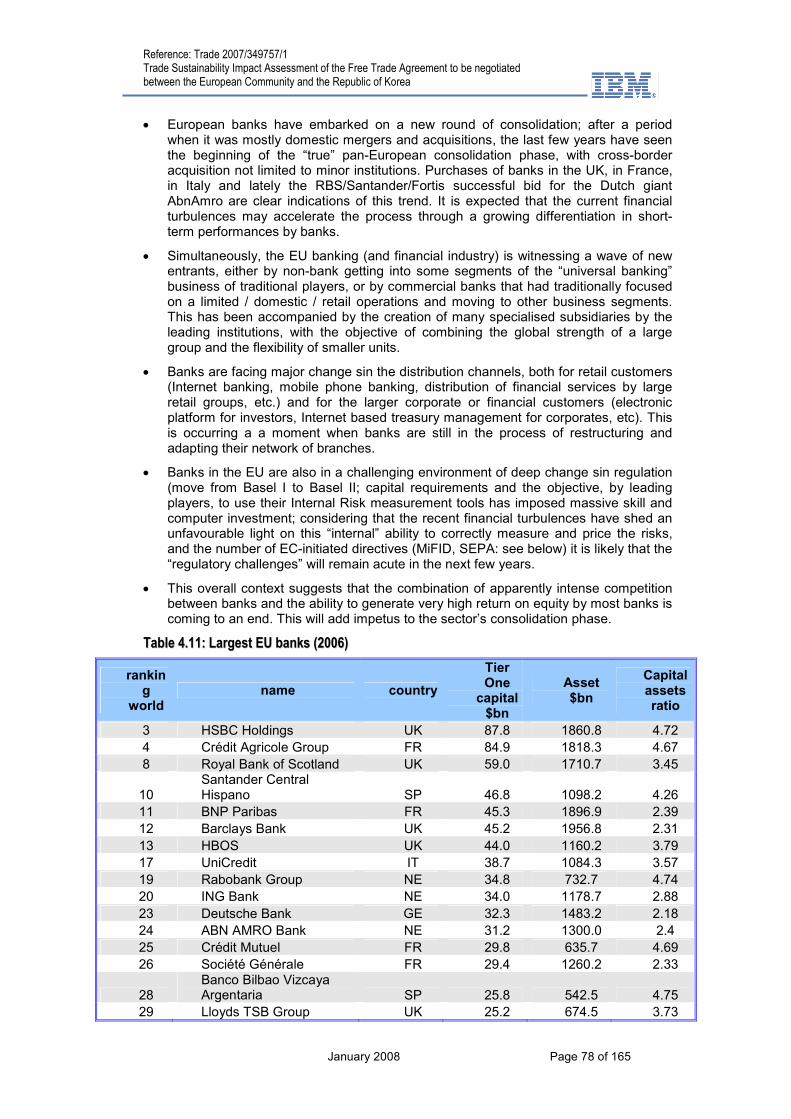
Reference: Trade 2007/349757/1 Trade Sustainability Impact Assessment of the Free Trade Agreement to be negotiated between the European Community and the Republic of Korea
January 2008 Page 78 of 165
• European banks have embarked on a new round of consolidation; after a period when it was mostly domestic mergers and acquisitions, the last few years have seen the beginning of the “true” pan-European consolidation phase, with cross-border acquisition not limited to minor institutions. Purchases of banks in the UK, in France, in Italy and lately the RBS/Santander/Fortis successful bid for the Dutch giant AbnAmro are clear indications of this trend. It is expected that the current financial turbulences may accelerate the process through a growing differentiation in short-term performances by banks.
• Simultaneously, the EU banking (and financial industry) is witnessing a wave of new entrants, either by non-bank getting into some segments of the “universal banking” business of traditional players, or by commercial banks that had traditionally focused on a limited / domestic / retail operations and moving to other business segments. This has been accompanied by the creation of many specialised subsidiaries by the leading institutions, with the objective of combining the global strength of a large group and the flexibility of smaller units.
• Banks are facing major change sin the distribution channels, both for retail customers (Internet banking, mobile phone banking, distribution of financial services by large retail groups, etc.) and for the larger corporate or financial customers (electronic platform for investors, Internet based treasury management for corporates, etc). This is occurring a a moment when banks are still in the process of restructuring and adapting their network of branches.
• Banks in the EU are also in a challenging environment of deep change sin regulation (move from Basel I to Basel II; capital requirements and the objective, by leading players, to use their Internal Risk measurement tools has imposed massive skill and computer investment; considering that the recent financial turbulences have shed an unfavourable light on this “internal” ability to correctly measure and price the risks, and the number of EC-initiated directives (MiFID, SEPA: see below) it is likely that the “regulatory challenges” will remain acute in the next few years.
• This overall context suggests that the combination of apparently intense competition between banks and the ability to generate very high return on equity by most banks is coming to an end. This will add impetus to the sector’s consolidation phase.
TTaabbllee 44..1111:: LLaarrggeesstt EEUU bbaannkkss ((22000066))
ranking
world name country
Tier One
capital $bn
Asset $bn
Capital assets ratio
3 HSBC Holdings UK 87.8 1860.8 4.72
4 Crédit Agricole Group FR 84.9 1818.3 4.67
8 Royal Bank of Scotland UK 59.0 1710.7 3.45
10 Santander Central Hispano SP 46.8 1098.2 4.26
11 BNP Paribas FR 45.3 1896.9 2.39
12 Barclays Bank UK 45.2 1956.8 2.31
13 HBOS UK 44.0 1160.2 3.79
17 UniCredit IT 38.7 1084.3 3.57
19 Rabobank Group NE 34.8 732.7 4.74
20 ING Bank NE 34.0 1178.7 2.88
23 Deutsche Bank GE 32.3 1483.2 2.18
24 ABN AMRO Bank NE 31.2 1300.0 2.4
25 Crédit Mutuel FR 29.8 635.7 4.69
26 Société Générale FR 29.4 1260.2 2.33
28 Banco Bilbao Vizcaya Argentaria SP 25.8 542.5 4.75
29 Lloyds TSB Group UK 25.2 674.5 3.73

Reference: Trade 2007/349757/1 Trade Sustainability Impact Assessment of the Free Trade Agreement to be negotiated between the European Community and the Republic of Korea
January 2008 Page 79 of 165
30 Groupe Caisse d’Epargne FR 24.2 710.8 3.4
31 Groupe Banques Populaires FR 22.3 402.1 5.54
32 Fortis Bank BE 22.3 888.6 2.5
34 Commerzbank GE 20.4 801.2 2.55
TOTAL 783 23 196 3.4%
Source: The Banker
44..55.. IINNSSUURRAANNCCEE
Here again, EU insurance groups and companies are among the world leaders, and have undoubtedly a global reach, in terms of activities as well as geographic coverage. The threshold for critical size has increased in parallel with the rise in the individual size of large risks and the internationalisation of the insurance markets.
The key challenges faced by the EU insurance sector include:
� The increasing technical content of insurance coverage, with cross-market instruments and technical triggers that imply a substantial improvement in skills.
� The persistence of significant uncertainties regarding the level of risks either embedded in contracts or materialised in specific market or areas: for life-insurance, the current financial markets’ environment is clearly suggesting that performances will be affected and the asset-liability balance, including on contingent off-balance sheet items, may be more difficult. For non-life insurance, the markets are probably more stable ands less subjected to financial turbulences, but the largest companies are facing critical uncertainties on some of the “largest” industrial, catastrophic or weather-related risks.
The overall insurance market in the EU has registered a strong growth over the past years, with an increase of 70% in total grow premium between 2001 and 2005. The acceleration has been visible for both life and non-life insurance activities, albeit non-life premium appear to stabilize in 2005.
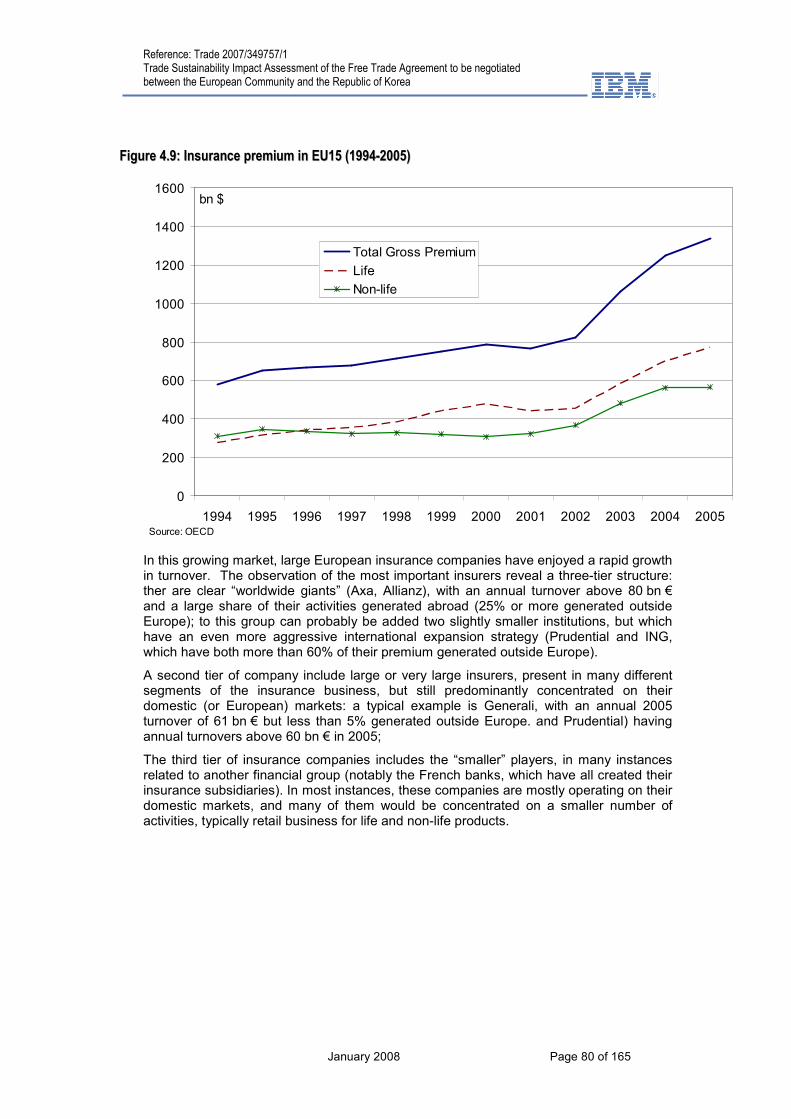
Reference: Trade 2007/349757/1 Trade Sustainability Impact Assessment of the Free Trade Agreement to be negotiated between the European Community and the Republic of Korea
January 2008 Page 80 of 165
FFiigguurree 44..99:: IInnssuurraannccee pprreemmiiuumm iinn EEUU1155 ((11999944--22000055))
0
200
400
600
800
1000
1200
1400
1600
1994 1995 1996 1997 1998 1999 2000 2001 2002 2003 2004 2005
Total Gross Premium
Life
Non-life
bn $
Source: OECD
In this growing market, large European insurance companies have enjoyed a rapid growth in turnover. The observation of the most important insurers reveal a three-tier structure: ther are clear “worldwide giants” (Axa, Allianz), with an annual turnover above 80 bn € and a large share of their activities generated abroad (25% or more generated outside Europe); to this group can probably be added two slightly smaller institutions, but which have an even more aggressive international expansion strategy (Prudential and ING, which have both more than 60% of their premium generated outside Europe).
A second tier of company include large or very large insurers, present in many different segments of the insurance business, but still predominantly concentrated on their domestic (or European) markets: a typical example is Generali, with an annual 2005 turnover of 61 bn € but less than 5% generated outside Europe. and Prudential) having annual turnovers above 60 bn € in 2005;
The third tier of insurance companies includes the “smaller” players, in many instances related to another financial group (notably the French banks, which have all created their insurance subsidiaries). In most instances, these companies are mostly operating on their domestic markets, and many of them would be concentrated on a smaller number of activities, typically retail business for life and non-life products.
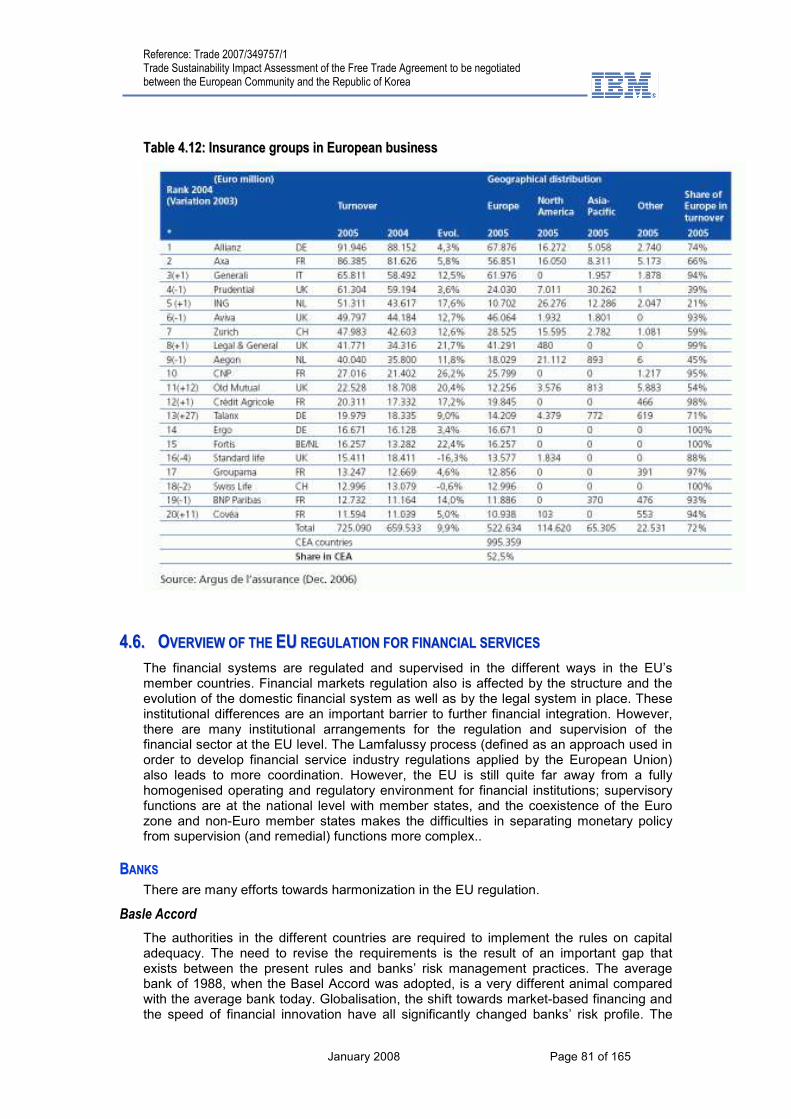
Reference: Trade 2007/349757/1 Trade Sustainability Impact Assessment of the Free Trade Agreement to be negotiated between the European Community and the Republic of Korea
January 2008 Page 81 of 165
TTaabbllee 44..1122:: IInnssuurraannccee ggrroouuppss iinn EEuurrooppeeaann bbuussiinneessss
44..66.. OOVVEERRVVIIEEWW OOFF TTHHEE EEUU RREEGGUULLAATTIIOONN FFOORR FFIINNAANNCCIIAALL SSEERRVVIICCEESS
The financial systems are regulated and supervised in the different ways in the EU’s member countries. Financial markets regulation also is affected by the structure and the evolution of the domestic financial system as well as by the legal system in place. These institutional differences are an important barrier to further financial integration. However, there are many institutional arrangements for the regulation and supervision of the financial sector at the EU level. The Lamfalussy process (defined as an approach used in order to develop financial service industry regulations applied by the European Union) also leads to more coordination. However, the EU is still quite far away from a fully homogenised operating and regulatory environment for financial institutions; supervisory functions are at the national level with member states, and the coexistence of the Euro zone and non-Euro member states makes the difficulties in separating monetary policy from supervision (and remedial) functions more complex..
BBAANNKKSS
There are many efforts towards harmonization in the EU regulation.
Basle Accord
The authorities in the different countries are required to implement the rules on capital adequacy. The need to revise the requirements is the result of an important gap that exists between the present rules and banks’ risk management practices. The average bank of 1988, when the Basel Accord was adopted, is a very different animal compared with the average bank today. Globalisation, the shift towards market-based financing and the speed of financial innovation have all significantly changed banks’ risk profile. The
Reference: Trade 2007/349757/1 Trade Sustainability Impact Assessment of the Free Trade Agreement to be negotiated between the European Community and the Republic of Korea
January 2008 Page 82 of 165
current Accord, which is based on a simple scheme of very broad risk categories, hence needed to be revised. Moreover, the current Accord applies in a uniform way to all types of credit institutions, from the smallest local savings banks to the largest global players, regardless of the quality of their risk management.
The Markets in Financial Instruments Directive (MIFID)
The MIFID (that formed part of the European Financial Services Plan (EFSP) identifying a series of measures considered necessary to complete the European single financial market) has important effect on the regulatory environment affecting financial services in EU.
According to MIFID, investment firms can offer their services across borders, and stock exchanges will face direct competition from banks in trading both equities and bonds. Indeed, MiFID should allow financial institutions to offer their service in the UE’s member countries with a single permission of their country’s supervisor authority. However, this new opportunity generates new series of obligations on transparency (about defining a clear execution policy, documenting it and informing the client of all the policy’s details).
The Single Euro Payment Area (SEPA)
Harmonising and unifying the financial infrastructure across, the SEPA will open up new business opportunities.
The SEPA seeks to unify payments infrastructure across the EU to achieve lower costs and greater transactional efficiency. Hence, it should improve inter-bank efficiency within the EU.
Finally, it will promote global change. It provides a common framework, language and standards as the banking industry uses and evolves in response to the prevailing market forces, compelling fundamental change to how we conduct business and deliver services to our customers around the world.
IINNSSUURRAANNCCEE CCOOMMPPAANNIIEESS
Although supervisory issues have moved high on the agenda of European policy makers, in the context of the Financial Services Action Plan (FSAP) and the Lamfalussy report, the insurance sector has been the least regarded.
The Committee of European Insurance and Occupational Pensions Supervisors (CEIOPS), consisting of representatives from the European supervisory authorities, has been developed and implemented the new Solvency II regulations. The draft directives for Solvency II should lead to a more efficient European insurance market that would better serve the needs of both policyholders and shareholders.
Solvency II is the EU’s project to reform prudential regulation of insurance, providing a safety net for policyholders and supporting market stability. In order to meet commitment to economic reform in Europe, Solvency II must take insurance sector’s vital economic functions of risk management and capital allocation, and the challenges EU companies are facing in the global economy.
Solvency requirements
Solvency II can contribute by creating a level playing field in prudential requirements for insurers, fostering a deeper single market in insurance services, with benefits for users as well as providers, and more efficient allocation of capital.
Solvency II should set capital requirements which are capable of providing early warning that triggers increased supervision or intervention. This requires a higher (for some firms) and far more risk sensitive capital requirement than under Solvency I. This is achievable and compatible with safeguarding the competitiveness of the EU insurance sector as long as Solvency II takes into account the total capital available across the sector.
Capital requirements represent regulators’ views about the minimum level of capital that firms should hold to have a reasonable expectation of being able to continue to meet their
Reference: Trade 2007/349757/1 Trade Sustainability Impact Assessment of the Free Trade Agreement to be negotiated between the European Community and the Republic of Korea
January 2008 Page 83 of 165
obligations to policyholders. Firms may hold capital in excess of regulatory requirements for various reasons including capacity to deliver their business strategy and to achieve a certain credit rating.
The Solvency Capital Requirement (SCR) should be a risk-based capital requirement which guarantees the minimum capital strength to maintain appropriate policyholder protection and market stability in Solvency II; it is therefore the key solvency control level for regulators and firms. When a firm does not meet the SCR, it will be required to re-establish capital to the level of the SCR, based on a concrete plan with a realistic timeframe submitted to the supervisor for approval.
Finally, Solvency II allows firms to calculate their SCR using a “standardised approach” or an internal model. The standardised approach will apply a relatively simple formula, which will relate capital requirements to key risk categories. In this context, all firms also have the option of using their internal models in place of all or parts of the standardised approach. However, regulatory approval will be required to help ensure that it is reasonable to rely on a firm’s model for regulatory capital purposes.
Risk management in practice
The current EU directives governing solvency focus on capital requirements (including “prudent” estimation of liabilities) to provide policyholder protection rather than on the quality of risk management. Under the existing directives two firms with the same liabilities and asset profile may have the same capital requirement notwithstanding the fact that one may have higher quality risk management.
The use of increasingly sophisticated quantitative tools and integrated firm-wide approaches to risk management is developing through the industry. The Solvency II framework should be designed to foster these changes by:
- providing adequate incentives for firms to use company-specific internal models which provide estimates of capital requirements that capture the company’s risk profile better than a standardised approach;
- designing an approach to the supervisory review process which encourages firms’ to engage in substantive assessment of risks rather than just compliance with the letter of regulatory requirements;
- providing an appropriate treatment of reinsurance and other forms of risk mitigation.
44..77.. EEUU--KKOORREEAA TTRRAADDEE IINN FFIINNAANNCCIIAALL SSEERRVVIICCEESS The EU and Korea are leading trading nations for financial services and insurance. The EU25, excluding intra-EU trade is the world’s largest exporter of both insurance and other financial services.
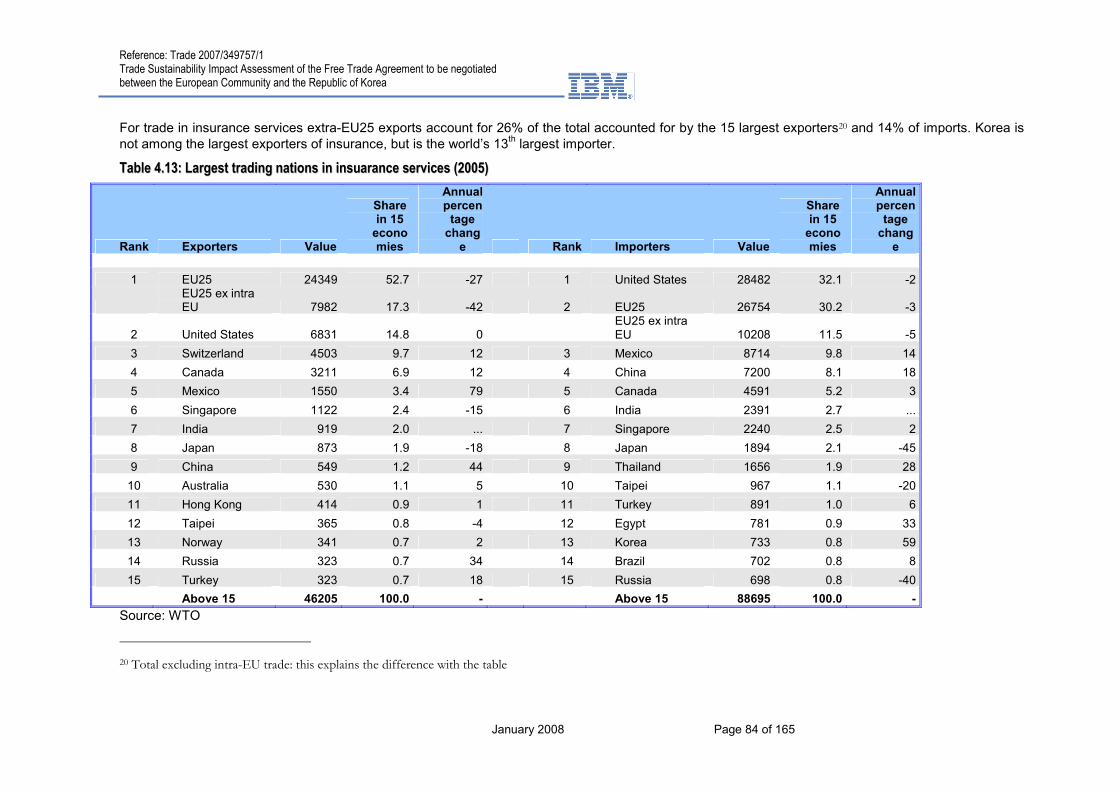
Reference: Trade 2007/349757/1 Trade Sustainability Impact Assessment of the Free Trade Agreement to be negotiated between the European Community and the Republic of Korea
January 2008 Page 84 of 165
For trade in insurance services extra-EU25 exports account for 26% of the total accounted for by the 15 largest exporters20 and 14% of imports. Korea is not among the largest exporters of insurance, but is the world’s 13
th largest importer.
TTaabbllee 44..1133:: LLaarrggeesstt ttrraaddiinngg nnaattiioonnss iinn iinnssuuaarraannccee sseerrvviicceess ((22000055))
Rank Exporters Value
Share in 15 economies
Annual percentage chang
e Rank Importers Value
Share in 15 economies
Annual percentage chang
e
1 EU25 24349 52.7 -27 1 United States 28482 32.1 -2
EU25 ex intra EU 7982 17.3 -42 2 EU25 26754 30.2 -3
2 United States 6831 14.8 0 EU25 ex intra EU 10208 11.5 -5
3 Switzerland 4503 9.7 12 3 Mexico 8714 9.8 14
4 Canada 3211 6.9 12 4 China 7200 8.1 18
5 Mexico 1550 3.4 79 5 Canada 4591 5.2 3
6 Singapore 1122 2.4 -15 6 India 2391 2.7 ...
7 India 919 2.0 ... 7 Singapore 2240 2.5 2
8 Japan 873 1.9 -18 8 Japan 1894 2.1 -45
9 China 549 1.2 44 9 Thailand 1656 1.9 28
10 Australia 530 1.1 5 10 Taipei 967 1.1 -20
11 Hong Kong 414 0.9 1 11 Turkey 891 1.0 6
12 Taipei 365 0.8 -4 12 Egypt 781 0.9 33
13 Norway 341 0.7 2 13 Korea 733 0.8 59
14 Russia 323 0.7 34 14 Brazil 702 0.8 8
15 Turkey 323 0.7 18 15 Russia 698 0.8 -40
Above 15 46205 100.0 - Above 15 88695 100.0 -
Source: WTO
20 Total excluding intra-EU trade: this explains the difference with the table

Reference: Trade 2007/349757/1 Trade Sustainability Impact Assessment of the Free Trade Agreement to be negotiated between the European Community and the Republic of Korea
January 2008 Page 85 of 165
For the other financial services, the extra-EU25 has an almost 40% share of the total trade registered for the 15 largest trading nations, 10 percentage points above the US share. Korea is already the world’s 7
th exporter, but does not appear in the list of the largest importers.
TTaabbllee 44..1144:: LLaarrggeesstt ttrraaddiinngg nnaattiioonnss iinn ffiinnaanncciiaall sseerrvviicceess eexxcclluuddiinngg iinnssuurraannccee ((22000055))
(Million dollars and percentage)
Rank Exporters Value Share in
15 economies
Annual % change
Rank Importers Value Share in
15 economies
Annual % change
1 EU25 96001 58.3 19 1 EU25) 46721 62.9 21
EU25 ex intra EU 44070 26.8 19 EU25 ex intra EU 17709 23.8 19
2 United States 34081 20.7 13 2 United States 12349 16.6 7
3 Switzerland 10402 6.3 10 3 Japan 2687 3.6 1
4 Hong Kong 6322 3.8 39 4 Canada 2356 3.2 9
5 Japan 5044 3.1 14 5 Hong Kong 1406 1.9 21
6 Singapore 3695 2.2 50 6 Taipei 1370 1.8 55
7 Korea 1651 1.0 52 7 Norway 1237 1.7 5
8 Canada 1590 1.0 40 8 India 1227 1.7 ...
9 Taipei 1517 0.9 33 9 Switzerland 1023 1.4 19
10 India 1468 0.9 ... 10 Russia 892 1.2 28
11 Australia 764 0.5 3 11 Singapore 788 1.1 18
12 Norway 733 0.4 23 12 Brazil 737 1.0 48
13 South Africa 534 0.3 26 13 Mexico 550 0.7 33
14 Brazil 507 0.3 20 14 Indonesia 539 0.7 -9
15 Russia 390 0.2 44 15 Australia 408 0.5 2
Above 15 164700 100.0 - Above 15 74290 100.0 -
Source: WTO
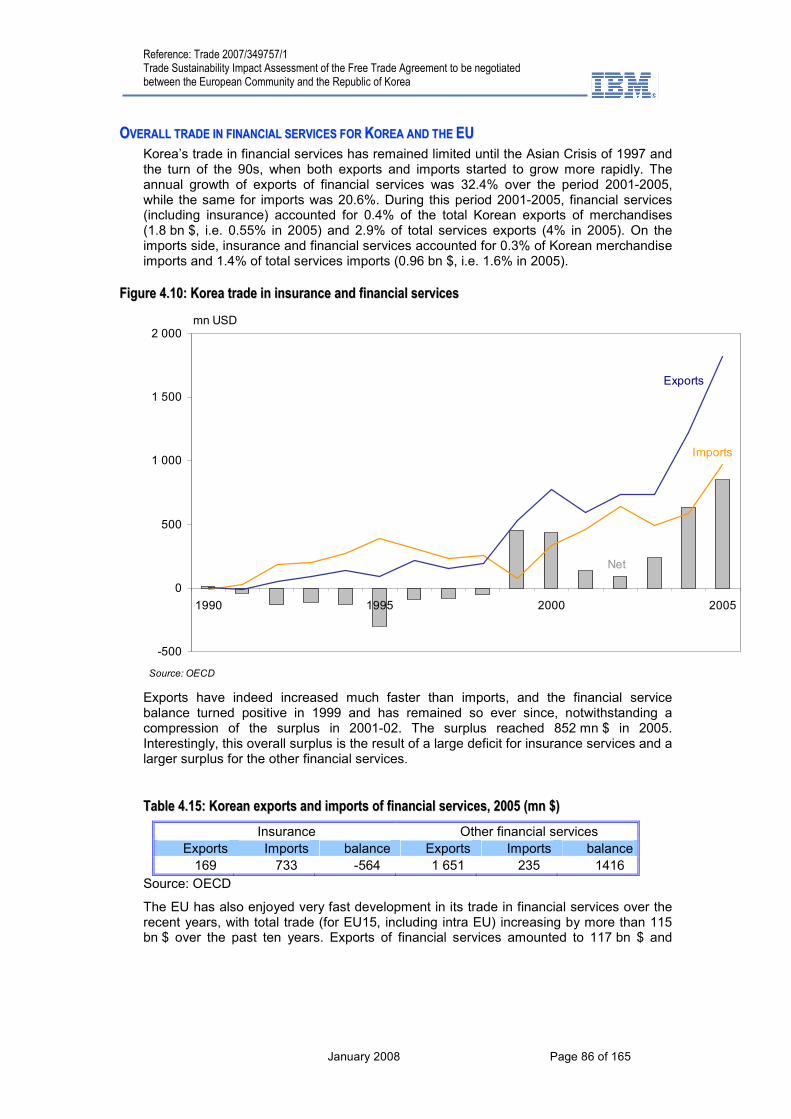
Reference: Trade 2007/349757/1 Trade Sustainability Impact Assessment of the Free Trade Agreement to be negotiated between the European Community and the Republic of Korea
January 2008 Page 86 of 165
OOVVEERRAALLLL TTRRAADDEE IINN FFIINNAANNCCIIAALL SSEERRVVIICCEESS FFOORR KKOORREEAA AANNDD TTHHEE EEUU
Korea’s trade in financial services has remained limited until the Asian Crisis of 1997 and the turn of the 90s, when both exports and imports started to grow more rapidly. The annual growth of exports of financial services was 32.4% over the period 2001-2005, while the same for imports was 20.6%. During this period 2001-2005, financial services (including insurance) accounted for 0.4% of the total Korean exports of merchandises (1.8 bn $, i.e. 0.55% in 2005) and 2.9% of total services exports (4% in 2005). On the imports side, insurance and financial services accounted for 0.3% of Korean merchandise imports and 1.4% of total services imports (0.96 bn $, i.e. 1.6% in 2005).
FFiigguurree 44..1100:: KKoorreeaa ttrraaddee iinn iinnssuurraannccee aanndd ffiinnaanncciiaall sseerrvviicceess
-500
0
500
1 000
1 500
2 000
1990 1995 2000 2005
mn USD
Imports
Exports
Source: OECD
Net
Exports have indeed increased much faster than imports, and the financial service balance turned positive in 1999 and has remained so ever since, notwithstanding a compression of the surplus in 2001-02. The surplus reached 852 mn $ in 2005. Interestingly, this overall surplus is the result of a large deficit for insurance services and a larger surplus for the other financial services.
TTaabbllee 44..1155:: KKoorreeaann eexxppoorrttss aanndd iimmppoorrttss ooff ffiinnaanncciiaall sseerrvviicceess,, 22000055 ((mmnn $$))
Insurance Other financial services
Exports Imports balance Exports Imports balance
169 733 -564 1 651 235 1416
Source: OECD
The EU has also enjoyed very fast development in its trade in financial services over the recent years, with total trade (for EU15, including intra EU) increasing by more than 115 bn $ over the past ten years. Exports of financial services amounted to 117 bn $ and

Reference: Trade 2007/349757/1 Trade Sustainability Impact Assessment of the Free Trade Agreement to be negotiated between the European Community and the Republic of Korea
January 2008 Page 87 of 165
imports to 69 bn $ in 200521. The positive balance was therefore 32 bn $, and 26 bn $ when using the WTO data (EU25 ex. Intra EU), very significant figures when put alongside the overall current account position of the EU.
FFiigguurree 44..1111:: EEuurrooppeeaann ttrraaddee iinnssuurraannccee aanndd ffiinnaanncciiaall sseerrvviicceess –– EEUU1155
0
20 000
40 000
60 000
80 000
100 000
120 000
140 000
1992 1994 1996 1998 2000 2002 2004
mn USD
Imports
Exports
Source: OECD
Net
As for Korea, the EU15 is enjoying a hefty trade surplus for non-insurance financial services (almost 50 bn $), while trade in insurance shows a marginal negative balance (-1.4 bn $).
TTaabbllee 44..1166:: EEUU1155 eexxppoorrttss aanndd iimmppoorrttss ooff ffiinnaanncciiaall sseerrvviicceess,, 22000055 ((mmnn $$))
Insurance Other financial services
Exports Imports balance Exports Imports balance
23 789 25 252 -1463 93 216 44 106 49110
Source: OECD
Precise bilateral trade statistics are not readily available for analysis. Details for the EU exports by destinations provide however a valid picture of the bilateral relations. In 2005, EU25 exports of financial services to Korea reached 417 mn $ (0.43% of its total financial services exports). In the same time, exports of insurance services was equal to 109 mn $ (0.45% of EU25 total insurance services exports). In comparison, US exports of financial services to Korea reached 344 mn $ (1.01% of US total financial services exports) and exports of insurance services was equal to 74 mn $ (1.08% of US total insurance services exports).
21 The OECD figures are different from the WTO data because they deal with the EU15 and not the EU25, and they include intra-EU trade in financial services. The OECD figures for 2005 and the EU25 are 118 bn $ for exports and 72.6 bn $ for imports.
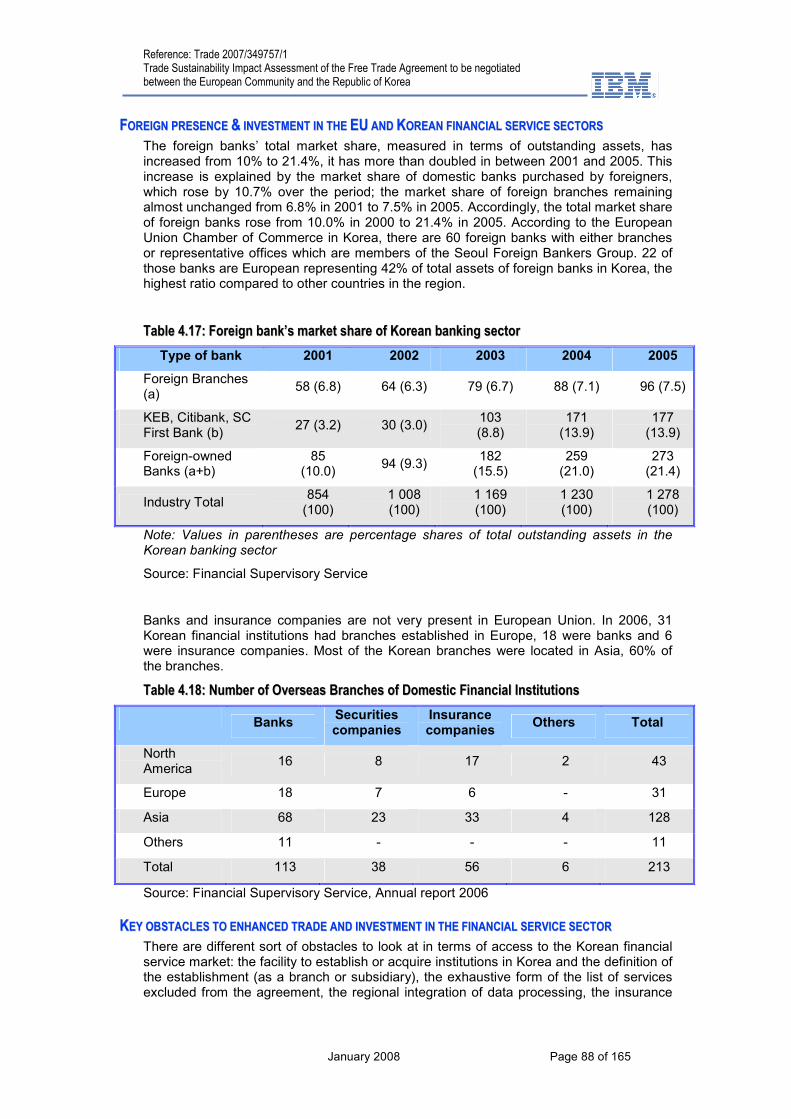
Reference: Trade 2007/349757/1 Trade Sustainability Impact Assessment of the Free Trade Agreement to be negotiated between the European Community and the Republic of Korea
January 2008 Page 88 of 165
FFOORREEIIGGNN PPRREESSEENNCCEE && IINNVVEESSTTMMEENNTT IINN TTHHEE EEUU AANNDD KKOORREEAANN FFIINNAANNCCIIAALL SSEERRVVIICCEE SSEECCTTOORRSS
The foreign banks’ total market share, measured in terms of outstanding assets, has increased from 10% to 21.4%, it has more than doubled in between 2001 and 2005. This increase is explained by the market share of domestic banks purchased by foreigners, which rose by 10.7% over the period; the market share of foreign branches remaining almost unchanged from 6.8% in 2001 to 7.5% in 2005. Accordingly, the total market share of foreign banks rose from 10.0% in 2000 to 21.4% in 2005. According to the European Union Chamber of Commerce in Korea, there are 60 foreign banks with either branches or representative offices which are members of the Seoul Foreign Bankers Group. 22 of those banks are European representing 42% of total assets of foreign banks in Korea, the highest ratio compared to other countries in the region.
TTaabbllee 44..1177:: FFoorreeiiggnn bbaannkk’’ss mmaarrkkeett sshhaarree ooff KKoorreeaann bbaannkkiinngg sseeccttoorr
Type of bank 2001 2002 2003 2004 2005
Foreign Branches (a)
58 (6.8) 64 (6.3) 79 (6.7) 88 (7.1) 96 (7.5)
KEB, Citibank, SC First Bank (b)
27 (3.2) 30 (3.0) 103 (8.8)
171 (13.9)
177 (13.9)
Foreign-owned Banks (a+b)
85 (10.0)
94 (9.3) 182 (15.5)
259 (21.0)
273 (21.4)
Industry Total 854 (100)
1 008 (100)
1 169 (100)
1 230 (100)
1 278 (100)
Note: Values in parentheses are percentage shares of total outstanding assets in the Korean banking sector
Source: Financial Supervisory Service
Banks and insurance companies are not very present in European Union. In 2006, 31 Korean financial institutions had branches established in Europe, 18 were banks and 6 were insurance companies. Most of the Korean branches were located in Asia, 60% of the branches.
TTaabbllee 44..1188:: NNuummbbeerr ooff OOvveerrsseeaass BBrraanncchheess ooff DDoommeessttiicc FFiinnaanncciiaall IInnssttiittuuttiioonnss
Banks
Securities companies
Insurance companies
Others Total
North America
16 8 17 2 43
Europe 18 7 6 - 31
Asia 68 23 33 4 128
Others 11 - - - 11
Total 113 38 56 6 213
Source: Financial Supervisory Service, Annual report 2006
KKEEYY OOBBSSTTAACCLLEESS TTOO EENNHHAANNCCEEDD TTRRAADDEE AANNDD IINNVVEESSTTMMEENNTT IINN TTHHEE FFIINNAANNCCIIAALL SSEERRVVIICCEE SSEECCTTOORR
There are different sort of obstacles to look at in terms of access to the Korean financial service market: the facility to establish or acquire institutions in Korea and the definition of the establishment (as a branch or subsidiary), the exhaustive form of the list of services excluded from the agreement, the regional integration of data processing, the insurance
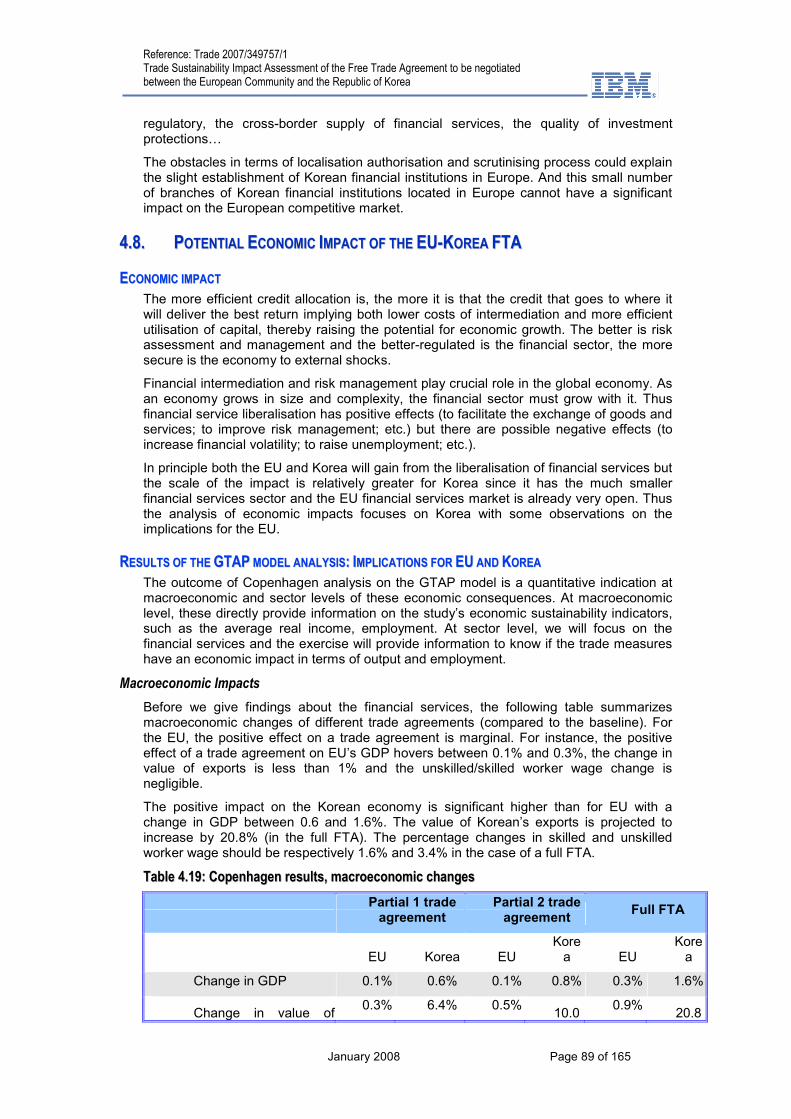
Reference: Trade 2007/349757/1 Trade Sustainability Impact Assessment of the Free Trade Agreement to be negotiated between the European Community and the Republic of Korea
January 2008 Page 89 of 165
regulatory, the cross-border supply of financial services, the quality of investment protections…
The obstacles in terms of localisation authorisation and scrutinising process could explain the slight establishment of Korean financial institutions in Europe. And this small number of branches of Korean financial institutions located in Europe cannot have a significant impact on the European competitive market.
44..88.. PPOOTTEENNTTIIAALL EECCOONNOOMMIICC IIMMPPAACCTT OOFF TTHHEE EEUU--KKOORREEAA FFTTAA
EECCOONNOOMMIICC IIMMPPAACCTT
The more efficient credit allocation is, the more it is that the credit that goes to where it will deliver the best return implying both lower costs of intermediation and more efficient utilisation of capital, thereby raising the potential for economic growth. The better is risk assessment and management and the better-regulated is the financial sector, the more secure is the economy to external shocks.
Financial intermediation and risk management play crucial role in the global economy. As an economy grows in size and complexity, the financial sector must grow with it. Thus financial service liberalisation has positive effects (to facilitate the exchange of goods and services; to improve risk management; etc.) but there are possible negative effects (to increase financial volatility; to raise unemployment; etc.).
In principle both the EU and Korea will gain from the liberalisation of financial services but the scale of the impact is relatively greater for Korea since it has the much smaller financial services sector and the EU financial services market is already very open. Thus the analysis of economic impacts focuses on Korea with some observations on the implications for the EU.
RREESSUULLTTSS OOFF TTHHEE GGTTAAPP MMOODDEELL AANNAALLYYSSIISS:: IIMMPPLLIICCAATTIIOONNSS FFOORR EEUU AANNDD KKOORREEAA
The outcome of Copenhagen analysis on the GTAP model is a quantitative indication at macroeconomic and sector levels of these economic consequences. At macroeconomic level, these directly provide information on the study’s economic sustainability indicators, such as the average real income, employment. At sector level, we will focus on the financial services and the exercise will provide information to know if the trade measures have an economic impact in terms of output and employment.
Macroeconomic Impacts
Before we give findings about the financial services, the following table summarizes macroeconomic changes of different trade agreements (compared to the baseline). For the EU, the positive effect on a trade agreement is marginal. For instance, the positive effect of a trade agreement on EU’s GDP hovers between 0.1% and 0.3%, the change in value of exports is less than 1% and the unskilled/skilled worker wage change is negligible.
The positive impact on the Korean economy is significant higher than for EU with a change in GDP between 0.6 and 1.6%. The value of Korean’s exports is projected to increase by 20.8% (in the full FTA). The percentage changes in skilled and unskilled worker wage should be respectively 1.6% and 3.4% in the case of a full FTA.
TTaabbllee 44..1199:: CCooppeennhhaaggeenn rreessuullttss,, mmaaccrrooeeccoonnoommiicc cchhaannggeess
Partial 1 trade agreement
Partial 2 trade agreement
Full FTA
EU Korea EU Korea EU
Korea
Change in GDP 0.1% 0.6% 0.1% 0.8% 0.3% 1.6%
Change in value of 0.3% 6.4% 0.5%
10.00.9%
20.8

Reference: Trade 2007/349757/1 Trade Sustainability Impact Assessment of the Free Trade Agreement to be negotiated between the European Community and the Republic of Korea
January 2008 Page 90 of 165
exports % %
Unskilled worker wage 0.0% 1.0% 0.0% 1.6% 0.0% 3.4%
Skilled worker wage 0.0% 0.6% 0.0% 0.8% 0.0% 1.6%
Note: All results are reported as percentage change compared to baseline
Trade liberalization has positive net income effects on both economies, in all scenarios. As could be expected, the gains from liberalization are higher the more trade barriers are removed, i.e. economic gains in the two partial scenarios are smaller than for a full free trade agreement.
The analyses of the expected changes in sector output reveal a pattern where EU European services sectors will increase. For Korea, the effects of trade are expected to be the opposite, i.e. causing an expansion in the output of merchandise, while the service sector is expected to contract.
Indeed, as mentioned next tables, the share of the financial sector in total output is around 7.2 in Korea and 4.4 in EU, but the negative impact on this sector in Korea is higher than the positive impact in EU.
Sectoral Economic Impacts for the EU and Korea
TTaabbllee 44..2200:: CChhaannggeess iinn sseeccttoorraall oouuttppuutt iinn EEUU ((%% cchhaannggee ffrroomm bbaasseelliinnee))
Scenario
Financial sector Partial1 Partial2 Full FTA Share of sector in total output
Financial and banking services 0.02 0.05 0.17 3.3
Insurance -0.05 -0.08 -0.21 1.1
Note: All results are reported as percentage change compared to baseline
TTaabbllee 44..2211:: CChhaannggeess iinn sseeccttoorraall oouuttppuutt iinn KKoorreeaa ((%% cchhaannggee ffrroomm bbaasseelliinnee))
Scenario
Financial sector Partial1 Partial2 Full FTA Share of sector in total output
Financial and banking services -0.23 -0.6 -2.17 5.9
Insurance -0.28 -0.28 -0.19 1.3
Note: All results are reported as percentage change compared to baseline
The following table gives information about Korean import value in baseline and different trade agreements and the EU25 share of total Korean Imports in financial and banking services and in the insurance sector.
Financial services can contribute to economic growth and to the growth of a wide range of activities. In our base case, the EU25 share of total Korean imports in the financial and banking services represents 31.7%. One significant result is that in the case of a full FTA, the Korean imports coming from EU25 should expand at least two fold. Indeed, as mentioned the next table, the EU25 of total Korean imports increases to 72.4% in a full FTA from 31.7% in the baseline scenario.
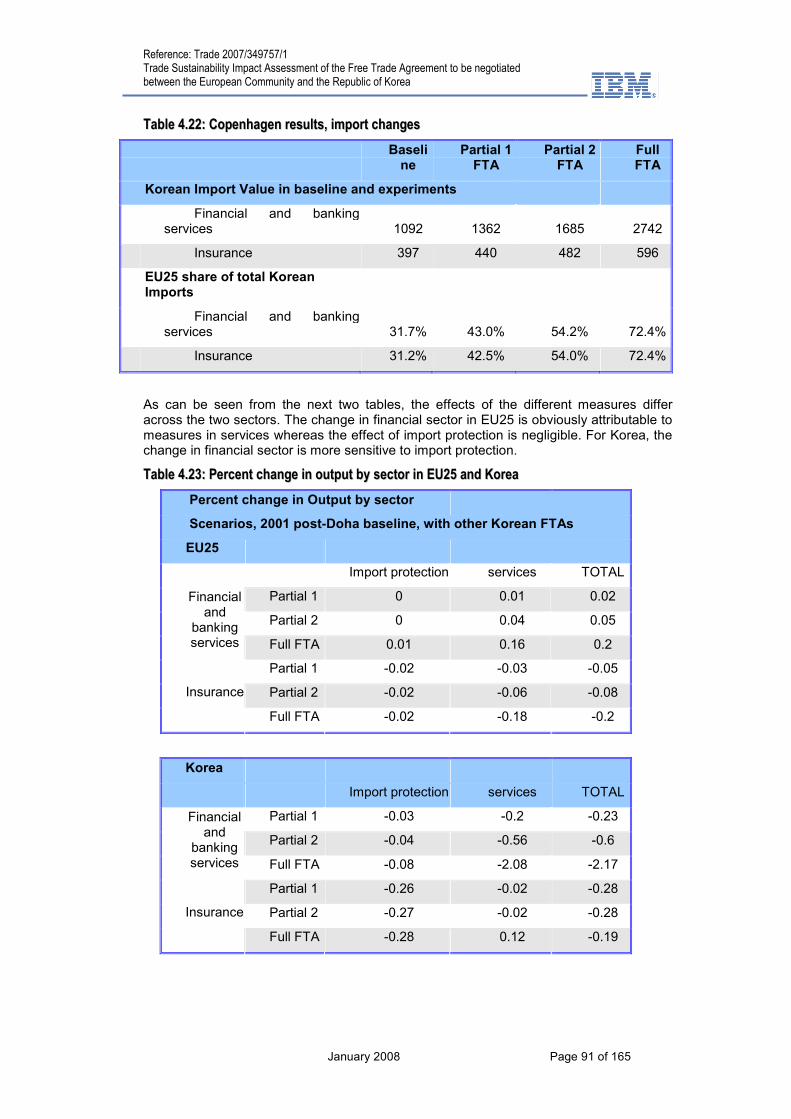
Reference: Trade 2007/349757/1 Trade Sustainability Impact Assessment of the Free Trade Agreement to be negotiated between the European Community and the Republic of Korea
January 2008 Page 91 of 165
TTaabbllee 44..2222:: CCooppeennhhaaggeenn rreessuullttss,, iimmppoorrtt cchhaannggeess
Baseline
Partial 1 FTA
Partial 2 FTA
Full FTA
Korean Import Value in baseline and experiments
Financial and banking services 1092 1362 1685 2742
Insurance 397 440 482 596
EU25 share of total Korean Imports
Financial and banking services 31.7% 43.0% 54.2% 72.4%
Insurance 31.2% 42.5% 54.0% 72.4%
As can be seen from the next two tables, the effects of the different measures differ across the two sectors. The change in financial sector in EU25 is obviously attributable to measures in services whereas the effect of import protection is negligible. For Korea, the change in financial sector is more sensitive to import protection.
TTaabbllee 44..2233:: PPeerrcceenntt cchhaannggee iinn oouuttppuutt bbyy sseeccttoorr iinn EEUU2255 aanndd KKoorreeaa
Percent change in Output by sector
Scenarios, 2001 post-Doha baseline, with other Korean FTAs
EU25
Import protection services TOTAL
Partial 1 0 0.01 0.02
Partial 2 0 0.04 0.05
Financial and
banking services Full FTA 0.01 0.16 0.2
Partial 1 -0.02 -0.03 -0.05
Partial 2 -0.02 -0.06 -0.08 Insurance
Full FTA -0.02 -0.18 -0.2
Korea
Import protection services TOTAL
Partial 1 -0.03 -0.2 -0.23
Partial 2 -0.04 -0.56 -0.6
Financial and
banking services Full FTA -0.08 -2.08 -2.17
Partial 1 -0.26 -0.02 -0.28
Partial 2 -0.27 -0.02 -0.28 Insurance
Full FTA -0.28 0.12 -0.19
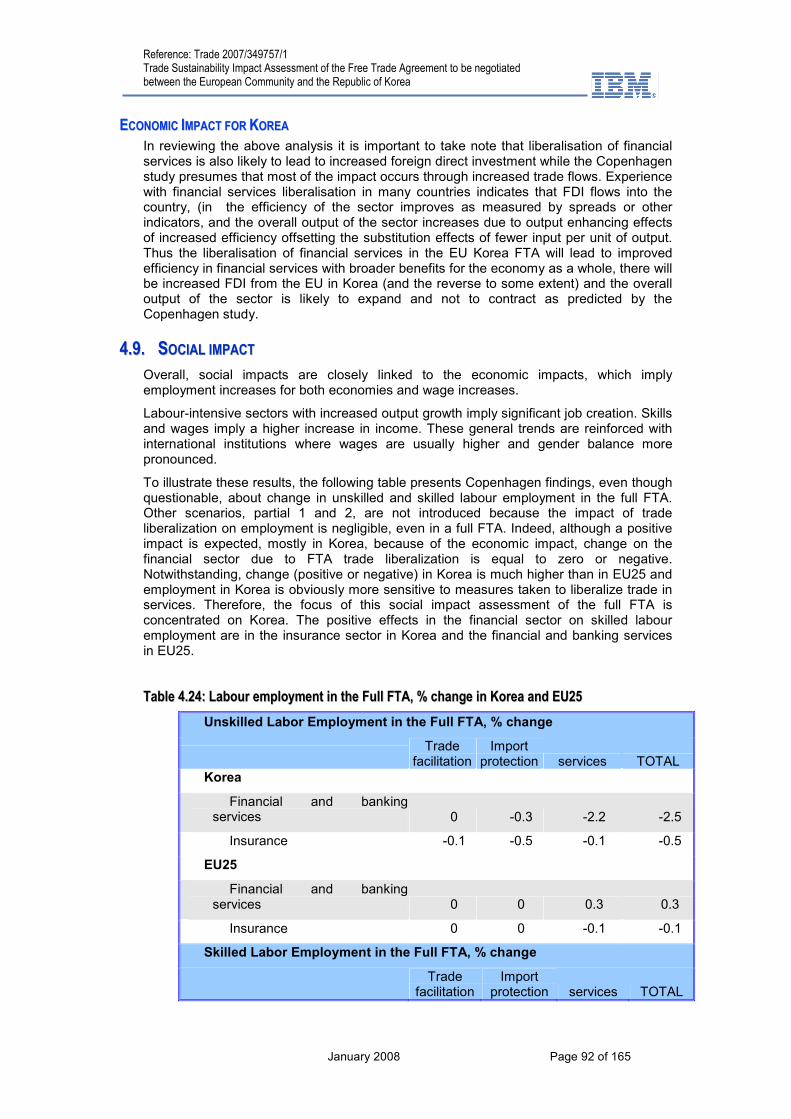
Reference: Trade 2007/349757/1 Trade Sustainability Impact Assessment of the Free Trade Agreement to be negotiated between the European Community and the Republic of Korea
January 2008 Page 92 of 165
EECCOONNOOMMIICC IIMMPPAACCTT FFOORR KKOORREEAA
In reviewing the above analysis it is important to take note that liberalisation of financial services is also likely to lead to increased foreign direct investment while the Copenhagen study presumes that most of the impact occurs through increased trade flows. Experience with financial services liberalisation in many countries indicates that FDI flows into the country, (in the efficiency of the sector improves as measured by spreads or other indicators, and the overall output of the sector increases due to output enhancing effects of increased efficiency offsetting the substitution effects of fewer input per unit of output. Thus the liberalisation of financial services in the EU Korea FTA will lead to improved efficiency in financial services with broader benefits for the economy as a whole, there will be increased FDI from the EU in Korea (and the reverse to some extent) and the overall output of the sector is likely to expand and not to contract as predicted by the Copenhagen study.
44..99.. SSOOCCIIAALL IIMMPPAACCTT
Overall, social impacts are closely linked to the economic impacts, which imply employment increases for both economies and wage increases.
Labour-intensive sectors with increased output growth imply significant job creation. Skills and wages imply a higher increase in income. These general trends are reinforced with international institutions where wages are usually higher and gender balance more pronounced.
To illustrate these results, the following table presents Copenhagen findings, even though questionable, about change in unskilled and skilled labour employment in the full FTA. Other scenarios, partial 1 and 2, are not introduced because the impact of trade liberalization on employment is negligible, even in a full FTA. Indeed, although a positive impact is expected, mostly in Korea, because of the economic impact, change on the financial sector due to FTA trade liberalization is equal to zero or negative. Notwithstanding, change (positive or negative) in Korea is much higher than in EU25 and employment in Korea is obviously more sensitive to measures taken to liberalize trade in services. Therefore, the focus of this social impact assessment of the full FTA is concentrated on Korea. The positive effects in the financial sector on skilled labour employment are in the insurance sector in Korea and the financial and banking services in EU25.
TTaabbllee 44..2244:: LLaabboouurr eemmppllooyymmeenntt iinn tthhee FFuullll FFTTAA,, %% cchhaannggee iinn KKoorreeaa aanndd EEUU2255
Unskilled Labor Employment in the Full FTA, % change
Trade
facilitation Import
protection services TOTAL Korea
Financial and banking services 0 -0.3 -2.2 -2.5
Insurance -0.1 -0.5 -0.1 -0.5
EU25
Financial and banking services 0 0 0.3 0.3
Insurance 0 0 -0.1 -0.1
Skilled Labor Employment in the Full FTA, % change
Trade
facilitation Import
protection services TOTAL
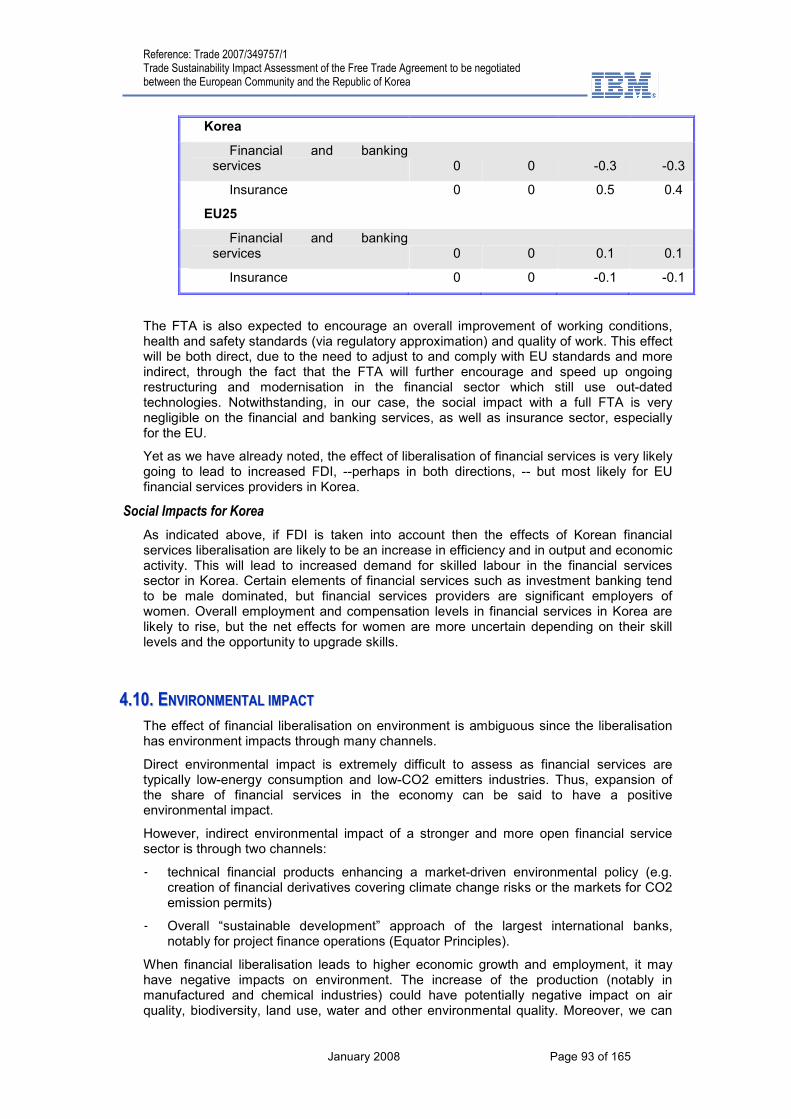
Reference: Trade 2007/349757/1 Trade Sustainability Impact Assessment of the Free Trade Agreement to be negotiated between the European Community and the Republic of Korea
January 2008 Page 93 of 165
Korea
Financial and banking services 0 0 -0.3 -0.3
Insurance 0 0 0.5 0.4
EU25
Financial and banking services 0 0 0.1 0.1
Insurance 0 0 -0.1 -0.1
The FTA is also expected to encourage an overall improvement of working conditions, health and safety standards (via regulatory approximation) and quality of work. This effect will be both direct, due to the need to adjust to and comply with EU standards and more indirect, through the fact that the FTA will further encourage and speed up ongoing restructuring and modernisation in the financial sector which still use out-dated technologies. Notwithstanding, in our case, the social impact with a full FTA is very negligible on the financial and banking services, as well as insurance sector, especially for the EU.
Yet as we have already noted, the effect of liberalisation of financial services is very likely going to lead to increased FDI, --perhaps in both directions, -- but most likely for EU financial services providers in Korea.
Social Impacts for Korea
As indicated above, if FDI is taken into account then the effects of Korean financial services liberalisation are likely to be an increase in efficiency and in output and economic activity. This will lead to increased demand for skilled labour in the financial services sector in Korea. Certain elements of financial services such as investment banking tend to be male dominated, but financial services providers are significant employers of women. Overall employment and compensation levels in financial services in Korea are likely to rise, but the net effects for women are more uncertain depending on their skill levels and the opportunity to upgrade skills.
44..1100.. EENNVVIIRROONNMMEENNTTAALL IIMMPPAACCTT
The effect of financial liberalisation on environment is ambiguous since the liberalisation has environment impacts through many channels.
Direct environmental impact is extremely difficult to assess as financial services are typically low-energy consumption and low-CO2 emitters industries. Thus, expansion of the share of financial services in the economy can be said to have a positive environmental impact.
However, indirect environmental impact of a stronger and more open financial service sector is through two channels:
- technical financial products enhancing a market-driven environmental policy (e.g. creation of financial derivatives covering climate change risks or the markets for CO2 emission permits)
- Overall “sustainable development” approach of the largest international banks, notably for project finance operations (Equator Principles).
When financial liberalisation leads to higher economic growth and employment, it may have negative impacts on environment. The increase of the production (notably in manufactured and chemical industries) could have potentially negative impact on air quality, biodiversity, land use, water and other environmental quality. Moreover, we can

Reference: Trade 2007/349757/1 Trade Sustainability Impact Assessment of the Free Trade Agreement to be negotiated between the European Community and the Republic of Korea
January 2008 Page 94 of 165
identify two opposite effects of production on environmental sustainability. The first effect is the scale effect: the increase of industrialisation implies a higher output, and considering that technologies remain the same, this is detrimental to environment. However, the implementation of new techniques and cleaner technologies may improve the environmental situation. This second opposite effect is the clean technology effect, and financial liberalisation will affect positively environmental quality through this effect.
The liberalisation of financial services also has possible positive indirect impacts. The entry of more developed financial institutions that hold new financial products related to environment (Green Mortgages; Green Car Loans; etc.). In this context, the entry of EU’s financial institutions may contribute to the improvement of environmental quality in Korea. Indeed, EU financial institutions are more advanced in terms of environment.

Reference: Trade 2007/349757/1 Trade Sustainability Impact Assessment of the Free Trade Agreement to be negotiated between the European Community and the Republic of Korea
January 2008 Page 95 of 165
55.. EENNVVIIRROONNMMEENNTTAALL GGOOOODDSS AANNDD SSEERRVVIICCEESS
55..11.. BBAACCKKGGRROOUUNNDD AANNDD SSEECCTTOORR DDEEFFIINNIITTIIOONN Environmental Goods and Services is a unique sector in the sense that it does not refer to a narrowly defined economic sector or subsector of the economy based on traditional definitions. Instead the focus on the environmental goods and services sector has come from international negotiations in the WTO. The focus on negotiations on environmental goods and services were mandated in the Ministerial declaration launching the Doha negotiations in the WTO. The reason that environmental goods services were included in the Doha negotiations is that it was considered a useful way to reinforce synergies between trade liberalisation and environmental protection and sustainability objectives.
Indeed the definition and scope of the Environmental Goods and Services Sector has become a substantial issue both in the context of the Doha negotiations and in the broader context of the global debate about sustainable development including but not limited to the recent discussions and negotiation about climate change.
In passing it is worth noting that there have been other agreements in the WTO which have encompassed quite broad or diverse sectors of the economy. For example the Civil Aircraft agreement which is a plurilateral agreement under the WTO covers a broad array of industrial activities and products. Indeed when we examine some of the detailed products classified as environmental goods we will note that there are special tariff lines of zero duty for products utilised for civil aircraft. Similarly the Information Technology Agreement covers a broad array of tariff lines and a relatively diverse array of products.
It is necessary to have a review of these definitional issues but as we shall see after reviewing the Doha negotiations, the definitional issues are less problematic for the EU and Korea in the context of the FTA negotiations for both Environmental Goods and Services than is the case in the Doha negotiations.
Definitions of Environmental Goods
environmental goods could be conceptualized in a number of ways ways. One is to distinguish between "end use" and "environmentally preferable technologies and products". The first is the conventional conception that focuses on treating a specific environmental problem through the end use of a particular good or service. This characterizes the traditional classification of EGs and includes goods such as wastewater treatment or air-pollution-control equipment that have an environmental end use; that is, they directly address an environmental problem or provide environmental amelioration. This is the focus of lists that have been developed by the OECD and APEC.22
The second conceptualization includes environmentally preferable products (EPPs), which includes clean technologies.23 The United Nations Conference on Trade and Development defines EPPs as products that cause significantly less “environmental harm” at some stage of their life cycle than alternative products that serve the same purpose, or products whose production and sale contribute significantly to the preservation of the environment (UNCTAD 1995). In this case, the primary purpose of the product or service is usually not to remedy an environmental problem. The environmental benefits may arise during and as a result of the production method, during the course of its use, or during the disposal stage of the product (Clare and others 2007). A wide array of products such as renewable energy and energy efficient technologies could all conceivably be classified as EPPs.
22 These lists have been analysed and compared by Steenblik, “Environmental Goods: Comparison of the APEC and OECD Lists.” 23 This approach has been emphasized in the discussions related to climate change. See for example, The World Bank, “International Trade and Climate Change Economic, Legal, and Institutional Perspectives”, 2008. A draft of this study was circulated in 2007 and received considerable attention.

Reference: Trade 2007/349757/1 Trade Sustainability Impact Assessment of the Free Trade Agreement to be negotiated between the European Community and the Republic of Korea
January 2008 Page 96 of 165
The negotiations of environmental goods in the WTO have covered both categories of environmental goods. A number of countries introduced proposals for environmental goods since 2005. Among those countries were the EU and Korea along with Canada, Japan, New Zealand, United States and Chinese Taipei. The resulting list was very long covering more than 400 HS codes. In April 2007, a consolidated proposal was made by a group consisting of Canada, European Communities, Japan, Korea, New Zealand, Norway, Separate Customs Territory of Taiwan, Penghu, Kinmen and Matsu, Switzerland, and the United States. The so-called “Friends” group reviewed the lists of products proposed on the basis of environmental and customs workability criteria and produced a selected set of products that, in their view, offers the potential for a high degree of convergence among Members. The revised list has resulted in a sharpened focus on items with particular environmental relevance and interest across the wider membership. The cosponsors presented this "Potential Convergence Set" of products in an effort to encourage a more focused engagement on products of interest and to spur further
momentum in these important negotiations.
Many developing countries have been sceptical about the list approach in the Doha negotiations in the Committee on Trade and Environment Special Session (CTESS). India and other developing countries have emphasised the products covered by the relevant HS codes also have other uses than environmental applications and that the approach should be based on end-use including the environmental project approach.24 The non-paper of India and others focused on the identification of environmental activities that could be agreeable to Members, with a view to achieving environmental and developmental goals.25 In the co-sponsors' view, developing country Members could select some environmental activities, depending on their priorities, as subject to possible special and differential (S&D) treatment.
The divergence between developed and developing countries on the definition of environmental goods in the Doha negotiations has proved to be a serious difficulty in the negotiations.
Definition of Environmental Services
Within the services dimension, WTO negotiations towards further liberalisation of environmental (and other) services began before Doha as part of the so-called ‘built-in agenda’ agreed during the Uruguay Round. According to Article XIX of the GATS, the so-called “built-in agenda”, Members started discussions on negotiating formats and procedures in 2000.
Although issues related to environmental services have been raised in the CTESS, the Services aspects of the negotiations on Environmental Goods and Services have been handled primarily in the Services negotiations.
On 28 February 2006, the EU, Australia, Canada, Japan, Korea, New Zealand, Norway, Singapore, Switzerland, Chinese Taipei, and the United States circulated a collective (or plurilateral) request to 23 members, mainly advanced developing countries, with a view to bind the existing level of openness for environmental services and in some cases provide new market access opportunities for foreign services providers. Specifically, the request covers waste water, waste management, protection of ambient air and climate, noise and vibration, remediation and clean up services, nature and landscape protection; and other environmental protection services. However, it explicitly excludes any request for water for human use (i.e. the collection, purification and distribution of natural water) that formerly proved controversial among many developed and developing countries and civil society groups.
24 WTO, TN/TE/W/51, 54, 60, 62, 67. 25 WTO, "Integrated Approach to Paragraph 31(iii)", Submission by Argentina and India, JOB(07)/77, 6 June 2007.
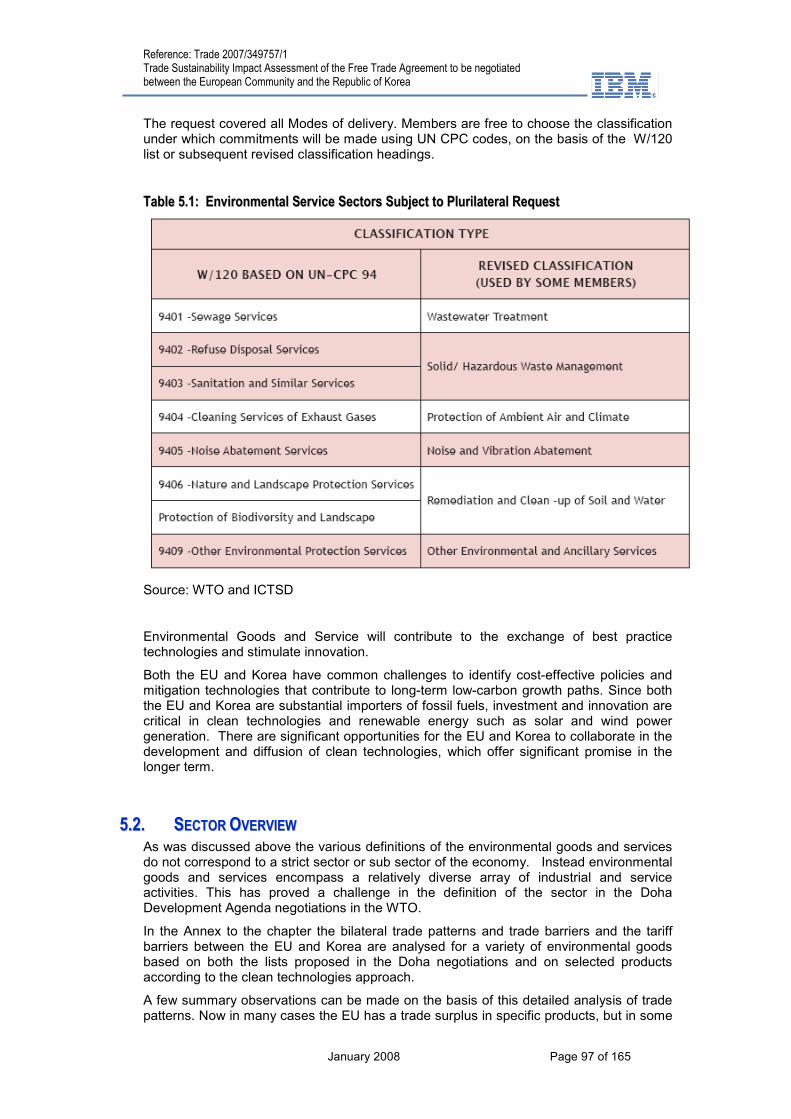
Reference: Trade 2007/349757/1 Trade Sustainability Impact Assessment of the Free Trade Agreement to be negotiated between the European Community and the Republic of Korea
January 2008 Page 97 of 165
The request covered all Modes of delivery. Members are free to choose the classification under which commitments will be made using UN CPC codes, on the basis of the W/120 list or subsequent revised classification headings.
TTaabbllee 55..11:: EEnnvviirroonnmmeennttaall SSeerrvviiccee SSeeccttoorrss SSuubbjjeecctt ttoo PPlluurriillaatteerraall RReeqquueesstt
Source: WTO and ICTSD
Environmental Goods and Service will contribute to the exchange of best practice technologies and stimulate innovation.
Both the EU and Korea have common challenges to identify cost-effective policies and mitigation technologies that contribute to long-term low-carbon growth paths. Since both the EU and Korea are substantial importers of fossil fuels, investment and innovation are critical in clean technologies and renewable energy such as solar and wind power generation. There are significant opportunities for the EU and Korea to collaborate in the development and diffusion of clean technologies, which offer significant promise in the longer term.
55..22.. SSEECCTTOORR OOVVEERRVVIIEEWW As was discussed above the various definitions of the environmental goods and services do not correspond to a strict sector or sub sector of the economy. Instead environmental goods and services encompass a relatively diverse array of industrial and service activities. This has proved a challenge in the definition of the sector in the Doha Development Agenda negotiations in the WTO.
In the Annex to the chapter the bilateral trade patterns and trade barriers and the tariff barriers between the EU and Korea are analysed for a variety of environmental goods based on both the lists proposed in the Doha negotiations and on selected products according to the clean technologies approach.
A few summary observations can be made on the basis of this detailed analysis of trade patterns. Now in many cases the EU has a trade surplus in specific products, but in some
Reference: Trade 2007/349757/1 Trade Sustainability Impact Assessment of the Free Trade Agreement to be negotiated between the European Community and the Republic of Korea
January 2008 Page 98 of 165
cases Korea has a trade surplus. The overall trade balance is not so significant. More important than the trade balance it is striking that there is significant two way trade in most products and furthermore there is significant trade between Korea and a number of EU member states within these different product groupings.
This pattern of intra-industry trade suggests a high degree of complementary and further liberalisation is like to result in expanded intra-industry trade between the EU and Korea. This is likely to stimulate innovation as well as facilitating more efficient utilisation of the products and better use of technology. Expansion of trade in the products and the services will offer both static and dynamic efficiency benefits with little likelihood of adverse social impacts or adjustment challenges.
55..33.. SSUUSSTTAAIINNAABBIILLIITTYY IIMMPPAACCTT AASSSSEESSSSMMEENNTT
EECCOONNOOMMIICC IIMMPPAACCTTSS
For the base case analysis we are assuming a successful outcome of the Doha Development Agenda. Yet it is not very clear at this point what might be the scope of a potential Doha outcome in Environmental Goods and Services. However, as the discussion of the Doha negotiations on the Environmental Goods and Services might suggest, it seems likely that even with a successful Doha outcome there would be scope for additional removal of trade barriers between the EU and Korean for Environmental Goods and Services.
If in the alternative, a successful outcome of the Doha negotiations is delayed yet again, the negotiation of a comprehensive approach to EGS by the EU and Korea could send a positive signal for the multilateral negotiations.
The pattern of intra-industry trade that we observe in various environmental goods suggests that the pattern of adjustment is likely to positive involving further intra-industry specialisation on detailed product basis. The trade flows of environmental products would increase in both directions between the EU and Korea reflecting increased specialisation. The stimulus to innovation and the likely response of increased FDI including cross-hauling of FDI with FDI increasing in both directions would be an additional source of dynamism in the sector.
As was noted above, the Environmental Goods Sector is very diverse and comprises many different product groupings. It is useful to distinguish Environmental Goods in a policy context related to considering the environmental impacts of liberalisation, but the Environmental Goods are drawn from a large number of machinery industries.
For the purposes of assessing the economic impacts of liberalising Environmental Goods we examine the impact for the electrical machinery and other machinery sectors within which these products are included.
Economic Impact on Korea
Based on the analysis with the GTAP model reported by the study by Copenhagen Economics, the other machinery and electrical machinery sectors have in Korea have substantial increases in output due to the EU Korea FTA. In particular electrical machinery output increases 27 percent, the second largest increase after automobiles, and other machinery output increases 10 percent. (Copenhagen Economics, p59) Thus Korea is likely to benefit significantly from positive output effects as well as increased scale effects and dynamic benefits through product specialisation and induced innovation through the removal of barriers to trade in Environmental Goods in the EU-Korea FTA. Since EC tariffs on environmental goods tend to be lower than other machinery products the effects may be somewhat less in terms of aggregate output effects, but the scale, specialisation and innovation effects would still be likely to be generated.
Liberalisation of environmental services is likely to lead to increased FDI in the sector and enhanced diffusion of technologies. Output of the sector is likely to increase modestly due to lower costs and better technologies.
Reference: Trade 2007/349757/1 Trade Sustainability Impact Assessment of the Free Trade Agreement to be negotiated between the European Community and the Republic of Korea
January 2008 Page 99 of 165
Economic Impact on the European Union
Based on the analysis with the GTAP model reported by the study by Copenhagen Economics, the other machinery and electrical machinery sectors have in the EU 25 have decreases in output due to the EU Korea FTA. In particular other machinery output decreases 1.7 percent and electrical machinery output decreases .7 percent. (Copenhagen Economics, p59) Thus if Environmental Goods share the output response of the other elements of machinery then there are likely to be negative output effects in the EU but some positive impacts will come from increased scale effects at the product level, increased product specialisation and dynamic benefits through induced innovation through the removal of barriers to trade in Environmental Goods in the EU-Korea FTA. Since EC tariffs on environmental goods tend to be lower than other machinery products and the GSP rate is zero for most environmental goods, the effects may be somewhat less in terms of aggregate output effects, but the scale, specialisation and innovation effects would still be likely to be generated.
Liberalisation of Environmental Services in the FTA is likely to lead to increased EU investment in the sector enhancing the capabilities of EU based service providers. Reverse Korean investment in Europe may also occur but this will also contribute to the exchange of best practice technologies and stimulate innovation.
SSOOCCIIAALL IIMMPPAACCTTSS
Social Impacts on Korea
In terms of Social Impacts, in the Copenhagen Economics study, in the full liberalisation scenario Korea experiences rising employment of 24 percent for electrical machinery and 10 percent for other machinery for unskilled labour and employment increases of 8.7 percent for electrical machinery and 4.7 percent for other machinery in the case of skilled labour. The increase in employment is likely to be less pronounced for Environmental Goods in Korea than for other elements in these sectors since the EC tariffs for Environmental Goods are relatively lower and the GSP tariff for environmental goods is zero in most cases.
Social Impacts on the EU
In terms of the Social Impacts on the EU, the employment of unskilled workers contracts 1.8 percent for electrical machinery and .5 percent for other machinery according to the Copenhagen Economics study. For skilled workers, employment contracts .7 percent in electrical machinery and contracts .2 percent for skilled workers in other machinery in the EU.
This is a maximum potential impact on the EU and the impact is likely to be less for Environmental Goods since the EU tariff on environmental products tends to be low and the GSP tariff is zero in most cases. The overall pattern of a shift to skilled workers from low skilled workers as a result of liberalisation of Environmental Goods and Services is likely to be valid for the EU.
EENNVVIIRROONNMMEENNTTAALL IIMMPPAACCTTSS
The environmental impacts are likely to be strongly positive for both the EU and Korea from liberalisation of Environmental Goods and Services. Korea, especially as the smaller partner, will benefit in terms of technology enhancement. There are significant potential benefits from the lower costs of environmental goods and services and the stimulus to the adoption and diffusion of clean technologies. The World Bank study on Climate Change cited earlier suggests that adoption of clean technologies or environmentally preferable products offers significant promise in achieving environmental objectives. Liberalisation of Environmental Goods and Service will contribute to the exchange of best practice technologies and stimulate innovation.
Reference: Trade 2007/349757/1 Trade Sustainability Impact Assessment of the Free Trade Agreement to be negotiated between the European Community and the Republic of Korea
January 2008 Page 100 of 165
Both the EU and Korea have common challenges to identify cost-effective policies and mitigation technologies that contribute to long-term low-carbon growth paths. Since both the EU and Korea are substantial importers of fossil fuels, investment and innovation are critical in clean technologies and renewable energy such as solar and wind power generation. There are significant opportunities for the EU and Korea to collaborate in the development and diffusion of clean technologies, which offer significant promise in the longer term.
55..44.. RREEFFEERREENNCCEESS Alavi, R., An Overview of Key Markets, Tariffs and Non-tariff Measures on Asian Exports of
Select Environmental Goods, ICTSD Trade and Environment Series Issue Paper No. 4., International Centre for Trade and Sustainable Development, Geneva, Switzerland, 2007.
Bora, B., Teh, R., Tariffs and Trade in Environmental Goods, Workshop on Environmental Goods, WTO Secretariat, Geneva, 11 October 2004.
Claro, E., Lucas, N., Sugathan, M., Marconini, M. and Lendo, E., Trade in Environmental Goods and Services and Sustainable Development: Domestic Considerations and Strategies for WTO Negotiations, ICTSD Environmental Goods and Services Series, Policy Discussion Paper, International Centre for Trade and Sustainable Development, Geneva, Switzerland, 2007.
Commission of the European Communities, (2004), Stimulating Technologies for Sustainable Development: An Environmental Technologies Action Plan for the European Union, Communication from the Commission to the Council and the European Parliament.
Jae-Hyup Lee, Jintaek Whang, Identifying Complementary Measures to Ensure the Maximum Realisation of Benefits from the Liberalisation of Trade in Environmental Goods and Services. Case Study: Korea, OECD Trade and Environment Working Paper No. 2004-03, OECD, 2006.
Kennett, M., Steenblik, R., Environmental Goods and Services A Synthesis of Country Studies, OECD Trade and Environment Working Paper No. 2005-03, OECD, 2005.
Lendo, E. (2005). Defining Environmental Goods and Services: A Case Study of Mexico, ICTSD Trade and Environment Series Issue Paper No. 1, CEC and ICTSD, Geneva, Switzerland.
OECD Observer, Policy Brief, Climate Change: Meeting the Challenge to 2050, OECD, 2007.
Steenblik, R., Drouet, D., Stubbs, G., Synergies between trade in environmental services and trade in environmental goods, OECD Trade and Environment Working Paper No. 2005-01, OECD, 2005.
Steenblik, R., Environmental Goods: A Comparison of the APEC and OECD Lists, OECD Trade and Environment Working Paper No. 2005-04, OECD, 2005.
Steenblik, R., Liberalisation of Trade in Renewable Energy and Associated Technologies: Biodiesel, Solar Thermal and Geothermal Energy, OECD Trade and Environment Working Paper No. 2006-01, OECD, 2006.
Steenblik, R. OECD Secretariat (Trade Directorate), Environmental Goods: Lessons from GATT and WTO Sectoral Initiatives, WTO Workshop on Environmental Goods Geneva, 11 October 2004.
UNCTAD (United Nations Conference on Trade and Development), 1995, Environmentally Preferable Products (EPPs) as a Trade Opportunity for Developing Countries.UNCTAD/COM/70. Geneva: UNCTAD.
United Nations Development Programme, Human Development Report 2007/2008, 2007.
World Bank, International Trade and Climate Change: Economic, Legal, and Institutional Perspectives, 2008.

Reference: Trade 2007/349757/1 Trade Sustainability Impact Assessment of the Free Trade Agreement to be negotiated between the European Community and the Republic of Korea
January 2008 Page 101 of 165
World Trade Organisation, Submissions to the Committee on Trade and Environment by India and others, TN/TE/W/51, 54, 60, 62, 67.
WTO, "Integrated Approach to Paragraph 31(iii)", Submission by Argentina and India, JOB(07)/77, 6 June 2007.
WTO, “CONTINUED WORK UNDER PARAGRAPH 31 (iii) OF THE DOHA MINISTERIAL DECLARATION” Submission by Canada, European Communities, Japan, Korea, New Zealand, Norway, Separate Customs Territory of Taiwan, Penghu, Kinmen and Matsu, Switzerland, and the United States, JOB(07)/54, 27 April 2007.
WTO, Summary Report on the NINETEENTH MEETING of the COMMITTEE ON TRADE AND ENVIRONMENT IN SPECIAL SESSION, 11-12 June 2007, Note by the Secretariat, TN/TE/R/19, 8 August 2007.
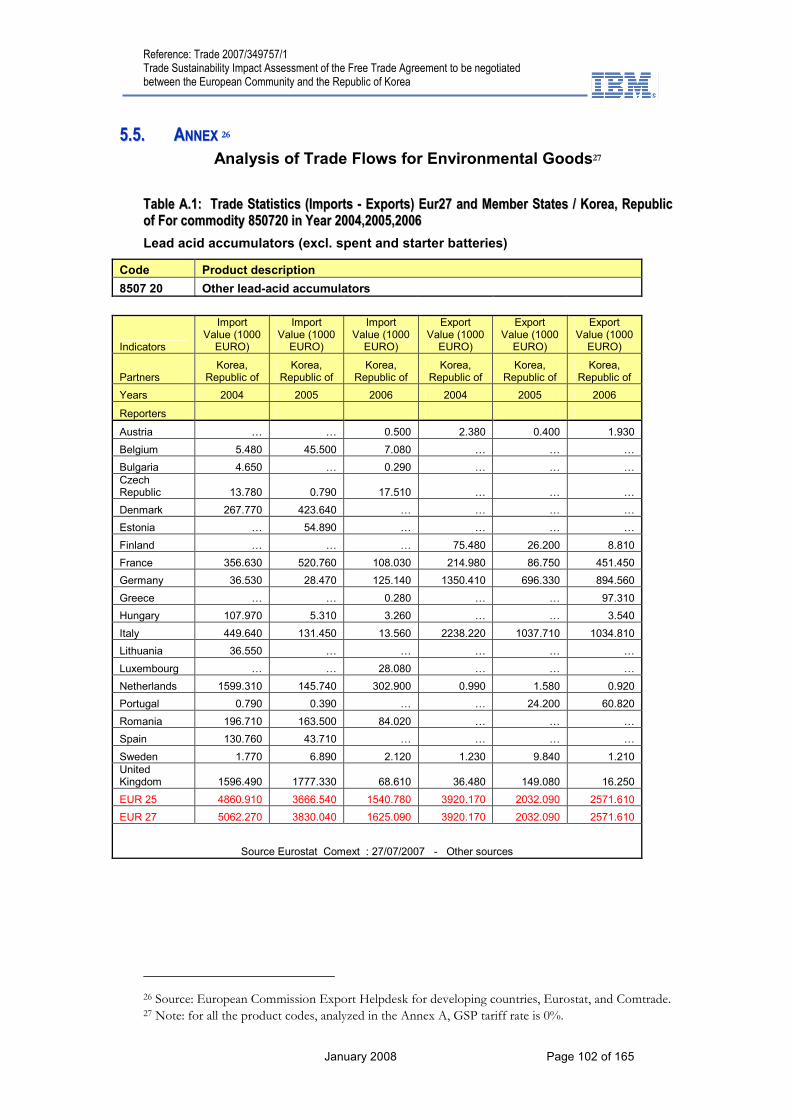
Reference: Trade 2007/349757/1 Trade Sustainability Impact Assessment of the Free Trade Agreement to be negotiated between the European Community and the Republic of Korea
January 2008 Page 102 of 165
55..55.. AANNNNEEXX 2266
Analysis of Trade Flows for Environmental Goods27
TTaabbllee AA..11:: TTrraaddee SSttaattiissttiiccss ((IImmppoorrttss -- EExxppoorrttss)) EEuurr2277 aanndd MMeemmbbeerr SSttaatteess // KKoorreeaa,, RReeppuubblliicc ooff FFoorr ccoommmmooddiittyy 885500772200 iinn YYeeaarr 22000044,,22000055,,22000066
Lead acid accumulators (excl. spent and starter batteries)
Code Product description
8507 20 Other lead-acid accumulators
Indicators
Import Value (1000 EURO)
Import Value (1000 EURO)
Import Value (1000 EURO)
Export Value (1000 EURO)
Export Value (1000 EURO)
Export Value (1000 EURO)
Partners Korea,
Republic of Korea,
Republic of Korea,
Republic of Korea,
Republic of Korea,
Republic of Korea,
Republic of
Years 2004 2005 2006 2004 2005 2006
Reporters
Austria … … 0.500 2.380 0.400 1.930
Belgium 5.480 45.500 7.080 … … …
Bulgaria 4.650 … 0.290 … … … Czech Republic 13.780 0.790 17.510 … … …
Denmark 267.770 423.640 … … … …
Estonia … 54.890 … … … …
Finland … … … 75.480 26.200 8.810
France 356.630 520.760 108.030 214.980 86.750 451.450
Germany 36.530 28.470 125.140 1350.410 696.330 894.560
Greece … … 0.280 … … 97.310
Hungary 107.970 5.310 3.260 … … 3.540
Italy 449.640 131.450 13.560 2238.220 1037.710 1034.810
Lithuania 36.550 … … … … …
Luxembourg … … 28.080 … … …
Netherlands 1599.310 145.740 302.900 0.990 1.580 0.920
Portugal 0.790 0.390 … … 24.200 60.820
Romania 196.710 163.500 84.020 … … …
Spain 130.760 43.710 … … … …
Sweden 1.770 6.890 2.120 1.230 9.840 1.210 United Kingdom 1596.490 1777.330 68.610 36.480 149.080 16.250
EUR 25 4860.910 3666.540 1540.780 3920.170 2032.090 2571.610
EUR 27 5062.270 3830.040 1625.090 3920.170 2032.090 2571.610
Source Eurostat Comext : 27/07/2007 - Other sources
26 Source: European Commission Export Helpdesk for developing countries, Eurostat, and Comtrade. 27 Note: for all the product codes, analyzed in the Annex A, GSP tariff rate is 0%.
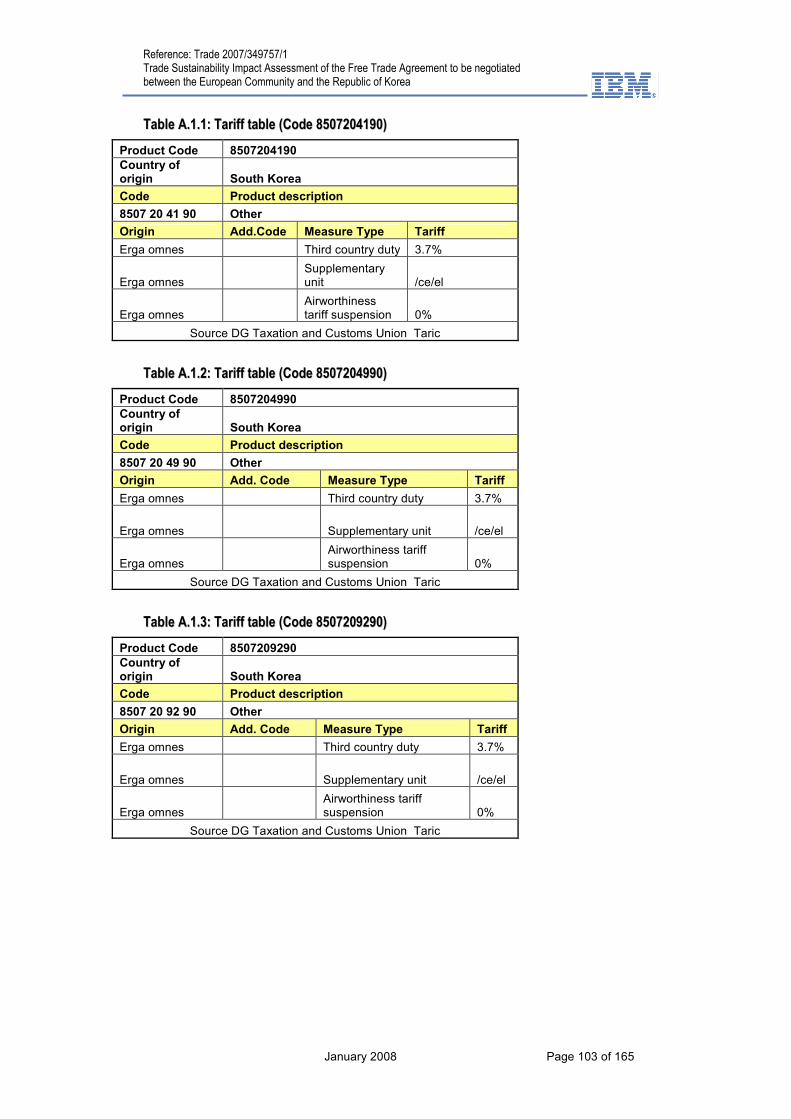
Reference: Trade 2007/349757/1 Trade Sustainability Impact Assessment of the Free Trade Agreement to be negotiated between the European Community and the Republic of Korea
January 2008 Page 103 of 165
TTaabbllee AA..11..11:: TTaarriiffff ttaabbllee ((CCooddee 88550077220044119900))
Product Code 8507204190 Country of origin South Korea
Code Product description
8507 20 41 90 Other
Origin Add.Code Measure Type Tariff
Erga omnes Third country duty 3.7%
Erga omnes Supplementary unit /ce/el
Erga omnes Airworthiness tariff suspension 0%
Source DG Taxation and Customs Union Taric
TTaabbllee AA..11..22:: TTaarriiffff ttaabbllee ((CCooddee 88550077220044999900))
Product Code 8507204990 Country of origin South Korea
Code Product description
8507 20 49 90 Other
Origin Add. Code Measure Type Tariff
Erga omnes Third country duty 3.7%
Erga omnes Supplementary unit /ce/el
Erga omnes Airworthiness tariff suspension 0%
Source DG Taxation and Customs Union Taric
TTaabbllee AA..11..33:: TTaarriiffff ttaabbllee ((CCooddee 88550077220099229900))
Product Code 8507209290 Country of origin South Korea
Code Product description
8507 20 92 90 Other
Origin Add. Code Measure Type Tariff
Erga omnes Third country duty 3.7%
Erga omnes Supplementary unit /ce/el
Erga omnes Airworthiness tariff suspension 0%
Source DG Taxation and Customs Union Taric

Reference: Trade 2007/349757/1 Trade Sustainability Impact Assessment of the Free Trade Agreement to be negotiated between the European Community and the Republic of Korea
January 2008 Page 104 of 165
TTaabbllee AA..22:: TTrraaddee SSttaattiissttiiccss ((IImmppoorrttss -- EExxppoorrttss)) EEuurr2277 aanndd MMeemmbbeerr SSttaatteess // KKoorreeaa,, RReeppuubblliicc ooff FFoorr ccoommmmooddiittyy 885533771100 iinn YYeeaarr 22000044,,22000055,,22000066
Boards, cabinets and similar combinations of apparatus for electric control or the distribution of electricity, for a voltage <= 1.000 V
Code Product description
8537 10 For a voltage not exceeding 1 000 V
Indicators
Import Value (1000 EURO)
Import Value (1000 EURO)
Import Value (1000 EURO)
Export Value (1000 EURO)
Export Value (1000 EURO)
Export Value (1000 EURO)
Partners Korea,
Republic of Korea,
Republic of Korea,
Republic of Korea,
Republic of Korea,
Republic of Korea,
Republic of
Years 2004 2005 2006 2004 2005 2006
Reporters
Austria 17.590 65.780 130.640 684.070 436.910 1125.400
Belgium 20574.830 18431.450 14088.440 1682.300 1803.160 2462.750
Bulgaria 6.840 18.000 8.360 … … …
Cyprus 10.240 … 6.850 … … … Czech Republic 57.150 64.240 730.010 8.070 18.890 31.190
Denmark 36.050 13.500 87.220 1407.100 2359.040 2857.990
Estonia 1.290 0.040 0.220 … … …
Finland 38.040 5.140 34.230 173.770 93.390 206.630
France 440.310 1496.320 888.780 15039.280 3057.110 9251.280
Germany 3265.140 3024.990 14960.840 39184.950 53404.750 64238.440
Greece 9.630 23.130 … … … …
Hungary 37.230 41.290 368.930 8.120 … 248.840
Ireland 57.200 18.520 0.880 5.730 … …
Italy 255.500 263.520 359.520 1110.670 2048.300 3471.080
Latvia … 0.330 6.910 … … 0.050
Lithuania 1.680 12.880 28.760 … … …
Luxembourg … … … 18.720 0.190 …
Netherlands 203.470 686.680 71.380 3745.530 2915.850 5906.570
Portugal 36.320 21.590 9.100 … … …
Romania 274.470 2211.650 2252.990 … … 966.480
Slovenia 5.270 5.870 5.340 4.480 2.760 5.910
Spain 114.940 1294.420 843.870 596.010 657.630 732.700
Sweden 4201.210 2925.750 1537.390 880.710 1046.040 948.570 United Kingdom 6741.140 18294.520 20837.840 3045.490 4992.250 8223.540
EUR25 37024.250 46895.500 55698.430 67605.770 72837.430 99734.050
EUR27 37305.560 49125.150 57959.780 67605.770 72837.430 100700.530
Source Eurostat Comext : 27/07/2007 - Other sources

Reference: Trade 2007/349757/1 Trade Sustainability Impact Assessment of the Free Trade Agreement to be negotiated between the European Community and the Republic of Korea
January 2008 Page 105 of 165
TTaabbllee AA..22..11:: TTaarriiffff ttaabbllee ((CCooddee 88553377110011009900))
Product Code 8537101090 Country of origin South Korea
Code Product description
8537 10 10 90 Other
Origin Add.Code Measure Type Tariff
Erga omnes Third country duty 2.1%
Erga omnes Airworthiness tariff suspension 0%
Source DG Taxation and Customs Union Taric
TTaabbllee AA..22..22:: TTaarriiffff ttaabbllee ((CCooddee 88553377110099119900))
Product Code 8537109190 Country of origin South Korea
Code Product description
8537 10 91 90 Other
Origin Add. Code Measure Type Tariff
Erga omnes Third country duty 2.1%
Erga omnes Airworthiness tariff suspension 0%
Source DG Taxation and Customs Union Taric
TTaabbllee AA..22..33:: TTaarriiffff ttaabbllee ((CCooddee 88553377110099999999))
Product Code 8537109999 Country of origin South Korea
Code Product description
8537 10 99 99 Other
Origin Add. Code Measure Type Tariff
Erga omnes Third country duty 2.1%
Erga omnes Airworthiness tariff suspension 0%
Source DG Taxation and Customs Union Taric

Reference: Trade 2007/349757/1 Trade Sustainability Impact Assessment of the Free Trade Agreement to be negotiated between the European Community and the Republic of Korea
January 2008 Page 106 of 165
TTaabbllee AA..33:: TTrraaddee SSttaattiissttiiccss ((IImmppoorrttss -- EExxppoorrttss)) EEuurr2277 aanndd MMeemmbbeerr SSttaatteess // KKoorreeaa,,RReeppuubblliicc ooff FFoorr ccoommmmooddiittyy 885544114400 iinn YYeeaarr 22000044,,22000055,,22000066
Photosensitive semiconductor devices, incl. photovoltaic cells whether or not assembled in modules or made up into panels; light emitting diodes (excl. photovoltaic generators)
Code Product description
8541 40
Photosensitive semiconductor devices, including photovoltaic cells whether or not assembled in modules or made up into panels; light-emitting diodes
Indicators
Import Value (1000 EURO)
Import Value (1000 EURO)
Import Value (1000 EURO)
Export Value (1000 EURO)
Export Value (1000 EURO)
Export Value (1000 EURO)
Partners Korea,
Republic of Korea,
Republic of Korea,
Republic of Korea,
Republic of Korea,
Republic of Korea,
Republic of
Years 2004 2005 2006 2004 2005 2006
Reporters
Austria 84.160 159.410 179.410 210.260 290.300 665.370
Belgium 16.460 14.710 48.450 0.930 30.840 10.230
Bulgaria 50.360 13.200 16.380 0.120 … …
Cyprus 2.650 3.650 4.040 … … … Czech Republic 9.670 85.350 79.040 … 83.870 144.240
Denmark 15.590 26.210 285.240 3.690 25.120 35.390
Estonia … 0.410 5.540 0.020 … …
Finland 90.870 221.730 248.250 16.460 1.430 41.060
France 421.040 478.830 587.910 203.760 334.660 259.020
Germany 5390.650 6296.640 7883.660 3862.110 7487.100 24748.500
Greece 24.550 26.310 13.820 … … …
Hungary 3654.080 4000.390 2519.800 4339.930 1842.150 2.120
Ireland … 1.460 196.030 … …
Italy 228.000 2277.130 5708.890 11.310 137.370 54.830
Latvia … 20.040 9.430 … … …
Lithuania … … 2.860 … … …
Luxembourg … … 1.110 0.020 … …
Netherlands 146.210 312.100 524.540 126.520 13.300 102.330
Portugal … 0.390 2.740 … … 1.070
Romania 20.570 7.670 96.640 … 149.490 …
Slovenia 6.480 51.270 261.680 1.220 2.680 12.270
Spain 12.810 137.090 6525.820 … 55.130 186.750
Sweden 126.200 224.790 363.480 12.770 4.290 65.260 United Kingdom 2637.000 711.890 723.130 677.720 753.320 927.380
EUR25 13423.890 16054.590 27444.410 9475.200 11070.080 27262.270
EUR27 13494.820 16075.460 27557.430 9475.320 11219.570 27262.270
Source Eurostat Comext : 27/07/2007 - Other sources
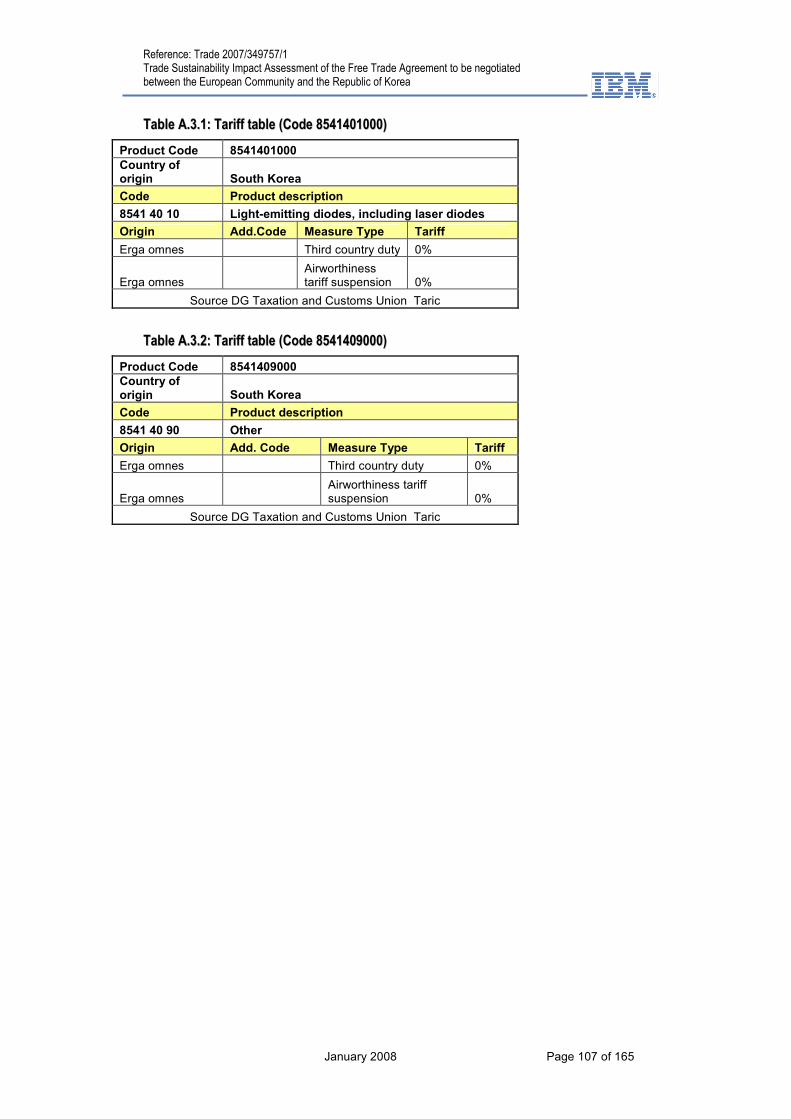
Reference: Trade 2007/349757/1 Trade Sustainability Impact Assessment of the Free Trade Agreement to be negotiated between the European Community and the Republic of Korea
January 2008 Page 107 of 165
TTaabbllee AA..33..11:: TTaarriiffff ttaabbllee ((CCooddee 88554411440011000000))
Product Code 8541401000 Country of origin South Korea
Code Product description
8541 40 10 Light-emitting diodes, including laser diodes
Origin Add.Code Measure Type Tariff
Erga omnes Third country duty 0%
Erga omnes Airworthiness tariff suspension 0%
Source DG Taxation and Customs Union Taric
TTaabbllee AA..33..22:: TTaarriiffff ttaabbllee ((CCooddee 88554411440099000000))
Product Code 8541409000 Country of origin South Korea
Code Product description
8541 40 90 Other
Origin Add. Code Measure Type Tariff
Erga omnes Third country duty 0%
Erga omnes Airworthiness tariff suspension 0%
Source DG Taxation and Customs Union Taric
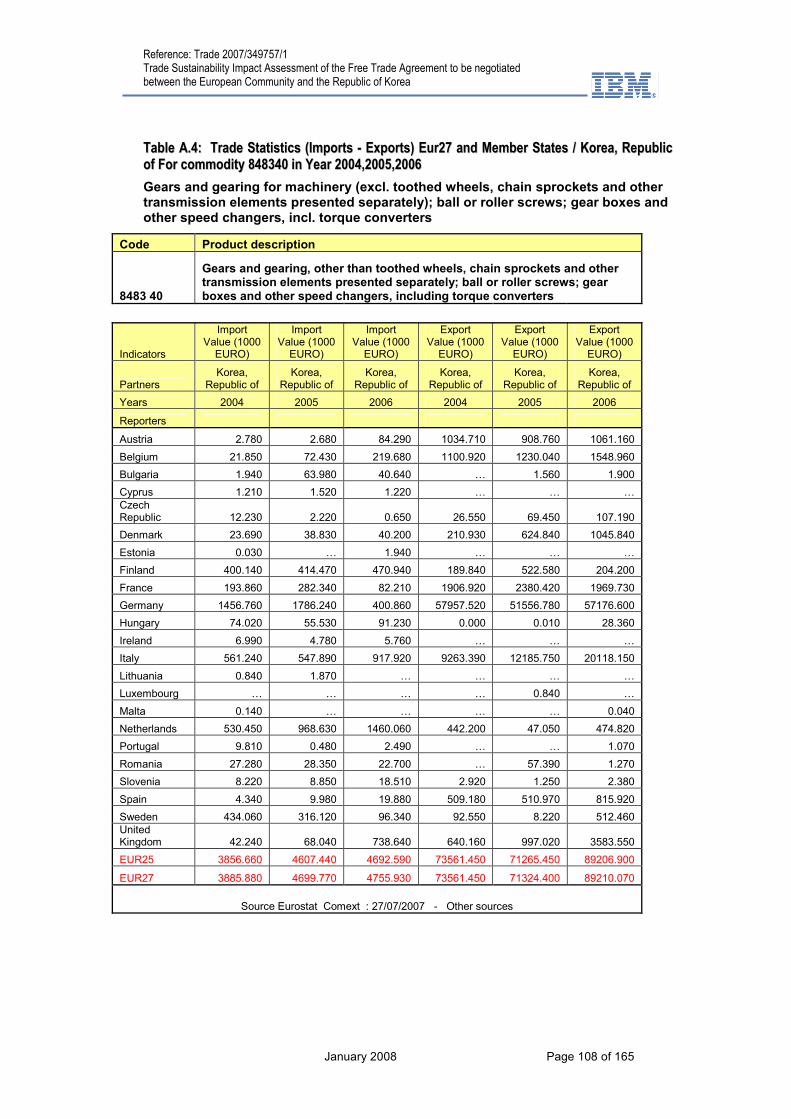
Reference: Trade 2007/349757/1 Trade Sustainability Impact Assessment of the Free Trade Agreement to be negotiated between the European Community and the Republic of Korea
January 2008 Page 108 of 165
TTaabbllee AA..44:: TTrraaddee SSttaattiissttiiccss ((IImmppoorrttss -- EExxppoorrttss)) EEuurr2277 aanndd MMeemmbbeerr SSttaatteess // KKoorreeaa,, RReeppuubblliicc ooff FFoorr ccoommmmooddiittyy 884488334400 iinn YYeeaarr 22000044,,22000055,,22000066
Gears and gearing for machinery (excl. toothed wheels, chain sprockets and other transmission elements presented separately); ball or roller screws; gear boxes and other speed changers, incl. torque converters
Code Product description
8483 40
Gears and gearing, other than toothed wheels, chain sprockets and other transmission elements presented separately; ball or roller screws; gear boxes and other speed changers, including torque converters
Indicators
Import Value (1000 EURO)
Import Value (1000 EURO)
Import Value (1000 EURO)
Export Value (1000 EURO)
Export Value (1000 EURO)
Export Value (1000 EURO)
Partners Korea,
Republic of Korea,
Republic of Korea,
Republic of Korea,
Republic of Korea,
Republic of Korea,
Republic of
Years 2004 2005 2006 2004 2005 2006
Reporters
Austria 2.780 2.680 84.290 1034.710 908.760 1061.160
Belgium 21.850 72.430 219.680 1100.920 1230.040 1548.960
Bulgaria 1.940 63.980 40.640 … 1.560 1.900
Cyprus 1.210 1.520 1.220 … … … Czech Republic 12.230 2.220 0.650 26.550 69.450 107.190
Denmark 23.690 38.830 40.200 210.930 624.840 1045.840
Estonia 0.030 … 1.940 … … …
Finland 400.140 414.470 470.940 189.840 522.580 204.200
France 193.860 282.340 82.210 1906.920 2380.420 1969.730
Germany 1456.760 1786.240 400.860 57957.520 51556.780 57176.600
Hungary 74.020 55.530 91.230 0.000 0.010 28.360
Ireland 6.990 4.780 5.760 … … …
Italy 561.240 547.890 917.920 9263.390 12185.750 20118.150
Lithuania 0.840 1.870 … … … …
Luxembourg … … … … 0.840 …
Malta 0.140 … … … … 0.040
Netherlands 530.450 968.630 1460.060 442.200 47.050 474.820
Portugal 9.810 0.480 2.490 … … 1.070
Romania 27.280 28.350 22.700 … 57.390 1.270
Slovenia 8.220 8.850 18.510 2.920 1.250 2.380
Spain 4.340 9.980 19.880 509.180 510.970 815.920
Sweden 434.060 316.120 96.340 92.550 8.220 512.460 United Kingdom 42.240 68.040 738.640 640.160 997.020 3583.550
EUR25 3856.660 4607.440 4692.590 73561.450 71265.450 89206.900
EUR27 3885.880 4699.770 4755.930 73561.450 71324.400 89210.070
Source Eurostat Comext : 27/07/2007 - Other sources

Reference: Trade 2007/349757/1 Trade Sustainability Impact Assessment of the Free Trade Agreement to be negotiated between the European Community and the Republic of Korea
January 2008 Page 109 of 165
TTaabbllee AA..44..11:: TTaarriiffff ttaabbllee ((CCooddee 88448833440022119900))
Product Code 8483402190 Country of origin South Korea
Code Product description
8483 40 21 90 Other
Origin Add.Code Measure Type Tariff
Erga omnes Third country duty 3.7%
Erga omnes Airworthiness tariff suspension 0%
Source DG Taxation and Customs Union Taric
TTaabbllee AA..44..22:: TTaarriiffff ttaabbllee ((CCooddee 88448833440022339900))
Product Code 8483402390 Country of origin South Korea
Code Product description
8483 40 23 90 Other
Origin Add. Code Measure Type Tariff
Erga omnes Third country duty 3.7%
Erga omnes Airworthiness tariff suspension 0%
Source DG Taxation and Customs Union Taric
TTaabbllee AA..44..33:: TTaarriiffff ttaabbllee ((CCooddee 88448833440022559900))
Product Code 8483402590 Country of origin South Korea
Code Product description
8483 40 25 90 Other
Origin Add. Code Measure Type Tariff
Erga omnes Third country duty 3.7%
Erga omnes Airworthiness tariff suspension 0%
Source DG Taxation and Customs Union Taric
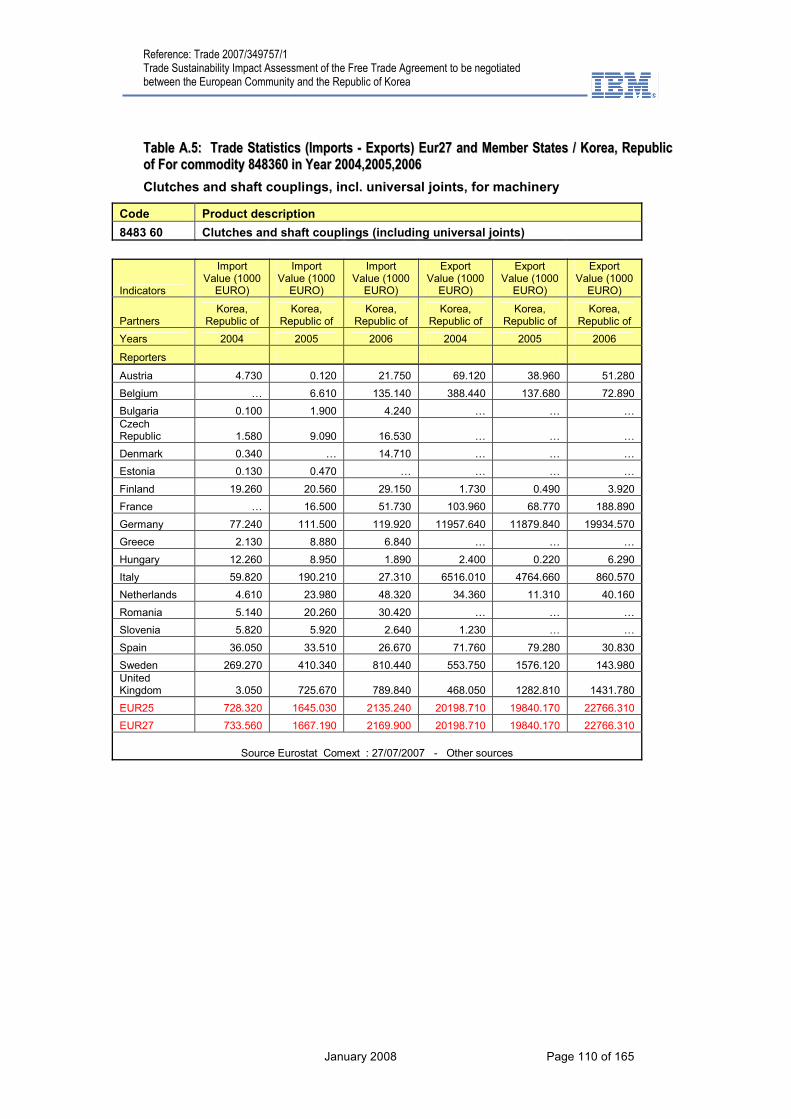
Reference: Trade 2007/349757/1 Trade Sustainability Impact Assessment of the Free Trade Agreement to be negotiated between the European Community and the Republic of Korea
January 2008 Page 110 of 165
TTaabbllee AA..55:: TTrraaddee SSttaattiissttiiccss ((IImmppoorrttss -- EExxppoorrttss)) EEuurr2277 aanndd MMeemmbbeerr SSttaatteess // KKoorreeaa,, RReeppuubblliicc ooff FFoorr ccoommmmooddiittyy 884488336600 iinn YYeeaarr 22000044,,22000055,,22000066
Clutches and shaft couplings, incl. universal joints, for machinery
Code Product description
8483 60 Clutches and shaft couplings (including universal joints)
Indicators
Import Value (1000 EURO)
Import Value (1000 EURO)
Import Value (1000 EURO)
Export Value (1000 EURO)
Export Value (1000 EURO)
Export Value (1000 EURO)
Partners Korea,
Republic of Korea,
Republic of Korea,
Republic of Korea,
Republic of Korea,
Republic of Korea,
Republic of
Years 2004 2005 2006 2004 2005 2006
Reporters
Austria 4.730 0.120 21.750 69.120 38.960 51.280
Belgium … 6.610 135.140 388.440 137.680 72.890
Bulgaria 0.100 1.900 4.240 … … … Czech Republic 1.580 9.090 16.530 … … …
Denmark 0.340 … 14.710 … … …
Estonia 0.130 0.470 … … … …
Finland 19.260 20.560 29.150 1.730 0.490 3.920
France … 16.500 51.730 103.960 68.770 188.890
Germany 77.240 111.500 119.920 11957.640 11879.840 19934.570
Greece 2.130 8.880 6.840 … … …
Hungary 12.260 8.950 1.890 2.400 0.220 6.290
Italy 59.820 190.210 27.310 6516.010 4764.660 860.570
Netherlands 4.610 23.980 48.320 34.360 11.310 40.160
Romania 5.140 20.260 30.420 … … …
Slovenia 5.820 5.920 2.640 1.230 … …
Spain 36.050 33.510 26.670 71.760 79.280 30.830
Sweden 269.270 410.340 810.440 553.750 1576.120 143.980 United Kingdom 3.050 725.670 789.840 468.050 1282.810 1431.780
EUR25 728.320 1645.030 2135.240 20198.710 19840.170 22766.310
EUR27 733.560 1667.190 2169.900 20198.710 19840.170 22766.310
Source Eurostat Comext : 27/07/2007 - Other sources
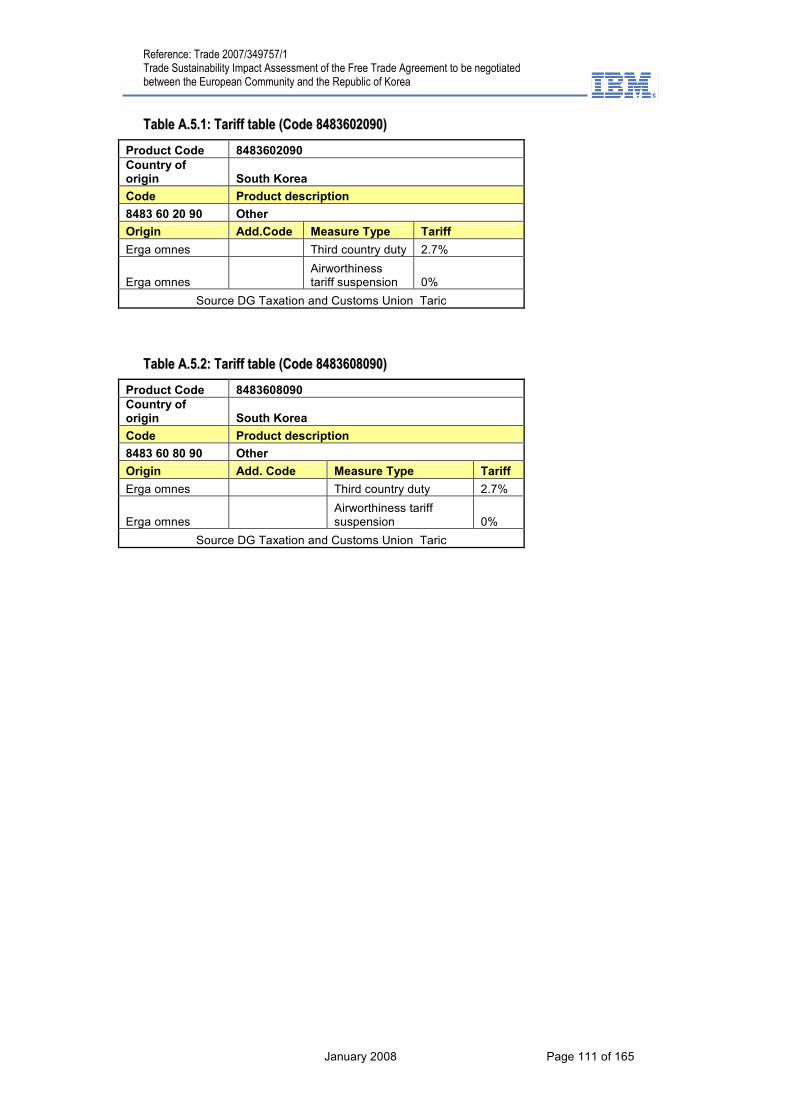
Reference: Trade 2007/349757/1 Trade Sustainability Impact Assessment of the Free Trade Agreement to be negotiated between the European Community and the Republic of Korea
January 2008 Page 111 of 165
TTaabbllee AA..55..11:: TTaarriiffff ttaabbllee ((CCooddee 88448833660022009900))
Product Code 8483602090 Country of origin South Korea
Code Product description
8483 60 20 90 Other
Origin Add.Code Measure Type Tariff
Erga omnes Third country duty 2.7%
Erga omnes Airworthiness tariff suspension 0%
Source DG Taxation and Customs Union Taric
TTaabbllee AA..55..22:: TTaarriiffff ttaabbllee ((CCooddee 88448833660088009900))
Product Code 8483608090 Country of origin South Korea
Code Product description
8483 60 80 90 Other
Origin Add. Code Measure Type Tariff
Erga omnes Third country duty 2.7%
Erga omnes Airworthiness tariff suspension 0%
Source DG Taxation and Customs Union Taric
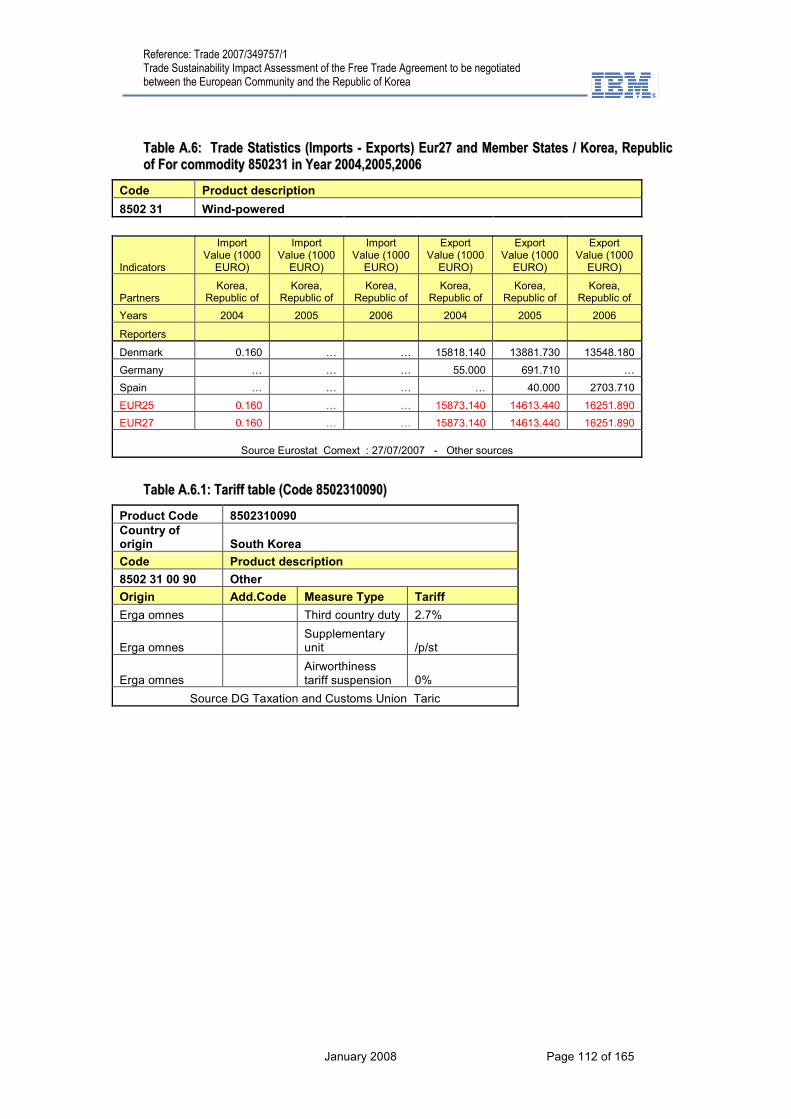
Reference: Trade 2007/349757/1 Trade Sustainability Impact Assessment of the Free Trade Agreement to be negotiated between the European Community and the Republic of Korea
January 2008 Page 112 of 165
TTaabbllee AA..66:: TTrraaddee SSttaattiissttiiccss ((IImmppoorrttss -- EExxppoorrttss)) EEuurr2277 aanndd MMeemmbbeerr SSttaatteess // KKoorreeaa,, RReeppuubblliicc ooff FFoorr ccoommmmooddiittyy 885500223311 iinn YYeeaarr 22000044,,22000055,,22000066
Code Product description
8502 31 Wind-powered
Indicators
Import Value (1000 EURO)
Import Value (1000 EURO)
Import Value (1000 EURO)
Export Value (1000 EURO)
Export Value (1000 EURO)
Export Value (1000 EURO)
Partners Korea,
Republic of Korea,
Republic of Korea,
Republic of Korea,
Republic of Korea,
Republic of Korea,
Republic of
Years 2004 2005 2006 2004 2005 2006
Reporters
Denmark 0.160 … … 15818.140 13881.730 13548.180
Germany … … … 55.000 691.710 …
Spain … … … … 40.000 2703.710
EUR25 0.160 … … 15873.140 14613.440 16251.890
EUR27 0.160 … … 15873.140 14613.440 16251.890
Source Eurostat Comext : 27/07/2007 - Other sources
TTaabbllee AA..66..11:: TTaarriiffff ttaabbllee ((CCooddee 88550022331100009900))
Product Code 8502310090 Country of origin South Korea
Code Product description
8502 31 00 90 Other
Origin Add.Code Measure Type Tariff
Erga omnes Third country duty 2.7%
Erga omnes Supplementary unit /p/st
Erga omnes Airworthiness tariff suspension 0%
Source DG Taxation and Customs Union Taric
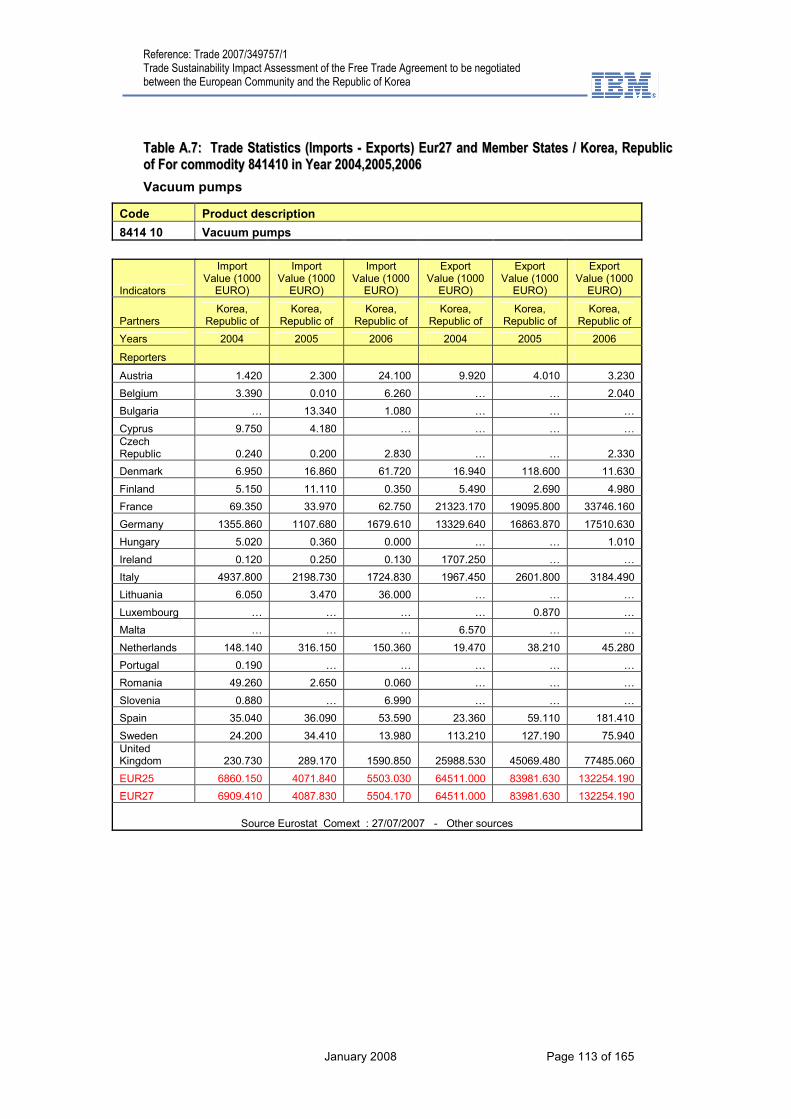
Reference: Trade 2007/349757/1 Trade Sustainability Impact Assessment of the Free Trade Agreement to be negotiated between the European Community and the Republic of Korea
January 2008 Page 113 of 165
TTaabbllee AA..77:: TTrraaddee SSttaattiissttiiccss ((IImmppoorrttss -- EExxppoorrttss)) EEuurr2277 aanndd MMeemmbbeerr SSttaatteess // KKoorreeaa,, RReeppuubblliicc ooff FFoorr ccoommmmooddiittyy 884411441100 iinn YYeeaarr 22000044,,22000055,,22000066
Vacuum pumps
Code Product description
8414 10 Vacuum pumps
Indicators
Import Value (1000 EURO)
Import Value (1000 EURO)
Import Value (1000 EURO)
Export Value (1000 EURO)
Export Value (1000 EURO)
Export Value (1000 EURO)
Partners Korea,
Republic of Korea,
Republic of Korea,
Republic of Korea,
Republic of Korea,
Republic of Korea,
Republic of
Years 2004 2005 2006 2004 2005 2006
Reporters
Austria 1.420 2.300 24.100 9.920 4.010 3.230
Belgium 3.390 0.010 6.260 … … 2.040
Bulgaria … 13.340 1.080 … … …
Cyprus 9.750 4.180 … … … … Czech Republic 0.240 0.200 2.830 … … 2.330
Denmark 6.950 16.860 61.720 16.940 118.600 11.630
Finland 5.150 11.110 0.350 5.490 2.690 4.980
France 69.350 33.970 62.750 21323.170 19095.800 33746.160
Germany 1355.860 1107.680 1679.610 13329.640 16863.870 17510.630
Hungary 5.020 0.360 0.000 … … 1.010
Ireland 0.120 0.250 0.130 1707.250 … …
Italy 4937.800 2198.730 1724.830 1967.450 2601.800 3184.490
Lithuania 6.050 3.470 36.000 … … …
Luxembourg … … … … 0.870 …
Malta … … … 6.570 … …
Netherlands 148.140 316.150 150.360 19.470 38.210 45.280
Portugal 0.190 … … … … …
Romania 49.260 2.650 0.060 … … …
Slovenia 0.880 … 6.990 … … …
Spain 35.040 36.090 53.590 23.360 59.110 181.410
Sweden 24.200 34.410 13.980 113.210 127.190 75.940 United Kingdom 230.730 289.170 1590.850 25988.530 45069.480 77485.060
EUR25 6860.150 4071.840 5503.030 64511.000 83981.630 132254.190
EUR27 6909.410 4087.830 5504.170 64511.000 83981.630 132254.190
Source Eurostat Comext : 27/07/2007 - Other sources

Reference: Trade 2007/349757/1 Trade Sustainability Impact Assessment of the Free Trade Agreement to be negotiated between the European Community and the Republic of Korea
January 2008 Page 114 of 165
TTaabbllee AA..77..11:: TTaarriiffff ttaabbllee ((CCooddee 88441144110022559900))
Product Code 8414102590 Country of origin South Korea
Code Product description
8414 10 25 90 Other
Origin Add.Code Measure Type Tariff
Erga omnes Third country duty 1.7%
Erga omnes Supplementary unit /p/st
Erga omnes Airworthiness tariff suspension 0%
Source DG Taxation and Customs Union Taric
TTaabbllee AA..77..22:: TTaarriiffff ttaabbllee ((CCooddee 88441144110088119900))
Product Code 8414108190 Country of origin South Korea
Code Product description
8414 10 81 90 Other
Origin Add. Code Measure Type Tariff
Erga omnes Third country duty 1.7%
Erga omnes Supplementary unit /p/st
Erga omnes Airworthiness tariff suspension 0%
Source DG Taxation and Customs Union Taric
TTaabbllee AA..77..33:: TTaarriiffff ttaabbllee ((CCooddee 88441144110088999900))
Product Code 8414108990 Country of origin South Korea
Code Product description
8414 10 89 90 Other
Origin Add. Code Measure Type Tariff
Erga omnes Third country duty 1.7%
Erga omnes Supplementary unit /p/st
Erga omnes Airworthiness tariff suspension 0%
Source DG Taxation and Customs Union Taric

Reference: Trade 2007/349757/1 Trade Sustainability Impact Assessment of the Free Trade Agreement to be negotiated between the European Community and the Republic of Korea
January 2008 Page 115 of 165
TTaabbllee AA..88:: TTrraaddee SSttaattiissttiiccss ((IImmppoorrttss -- EExxppoorrttss)) EEuurr2277 aanndd MMeemmbbeerr SSttaatteess // KKoorreeaa,, RReeppuubblliicc ooff FFoorr ccoommmmooddiittyy 884422113399 iinn YYeeaarr 22000044,,22000055,,22000066
Machinery and apparatus for filtering or purifying gases (excl. isotope separators and intake air filters for internal combustion engines)
Code Product description
8421 39 Other
Indicators
Import Value (1000 EURO)
Import Value (1000 EURO)
Import Value (1000 EURO)
Export Value (1000 EURO)
Export Value (1000 EURO)
Export Value (1000 EURO)
Partners Korea,
Republic of Korea,
Republic of Korea,
Republic of Korea,
Republic of Korea,
Republic of Korea,
Republic of
Years 2004 2005 2006 2004 2005 2006
Reporters
Austria 5.770 14.440 29.930 802.780 716.170 3275.030
Belgium 139.520 107.800 221.900 303.090 689.250 860.690
Bulgaria 3.470 14.730 226.630 … … …
Cyprus 0.220 … 0.240 … … … Czech Republic 9.740 10.050 158.630 5.990 … 4.350
Denmark … 0.080 0.130 565.870 262.520 451.550
Estonia 22.150 46.290 68.830 … … …
Finland 0.670 5.650 3.860 119.770 566.670 3798.970
France 37.960 476.160 46.080 330.700 209.900 432.080
Germany 680.770 1866.560 1338.400 9191.620 9681.810 13940.740
Greece 23.000 … 1.560 2.160 … …
Hungary 71.370 76.480 57.660 … … …
Ireland 8.750 0.140 1.160 … 30.720
Italy 683.990 537.650 715.750 1412.810 589.400 992.910
Lithuania … … 1.330 … … …
Luxembourg 0.270 5.970 0.130 0.300 … 44.920
Malta 0.500 … … … … …
Netherlands 381.480 501.250 574.360 542.730 776.920 1079.490
Portugal 11.580 22.890 43.330 1.230 … 48.290
Romania 99.310 425.290 400.480 … … …
Slovenia 6.070 7.100 10.380 0.170 … …
Spain 36.700 75.560 61.560 28.590 50.950 8.180
Sweden 28.610 0.610 0.890 1262.660 1719.880 248.840 United Kingdom 70.970 90.950 118.820 1537.810 1536.710 2235.610
EUR25 2464.230 4000.920 4809.880 18115.810 19012.510 30936.680
EUR27 2567.010 4440.940 5436.990 18115.810 19012.510 30936.680
Source Eurostat Comext : 27/07/2007 - Other sources
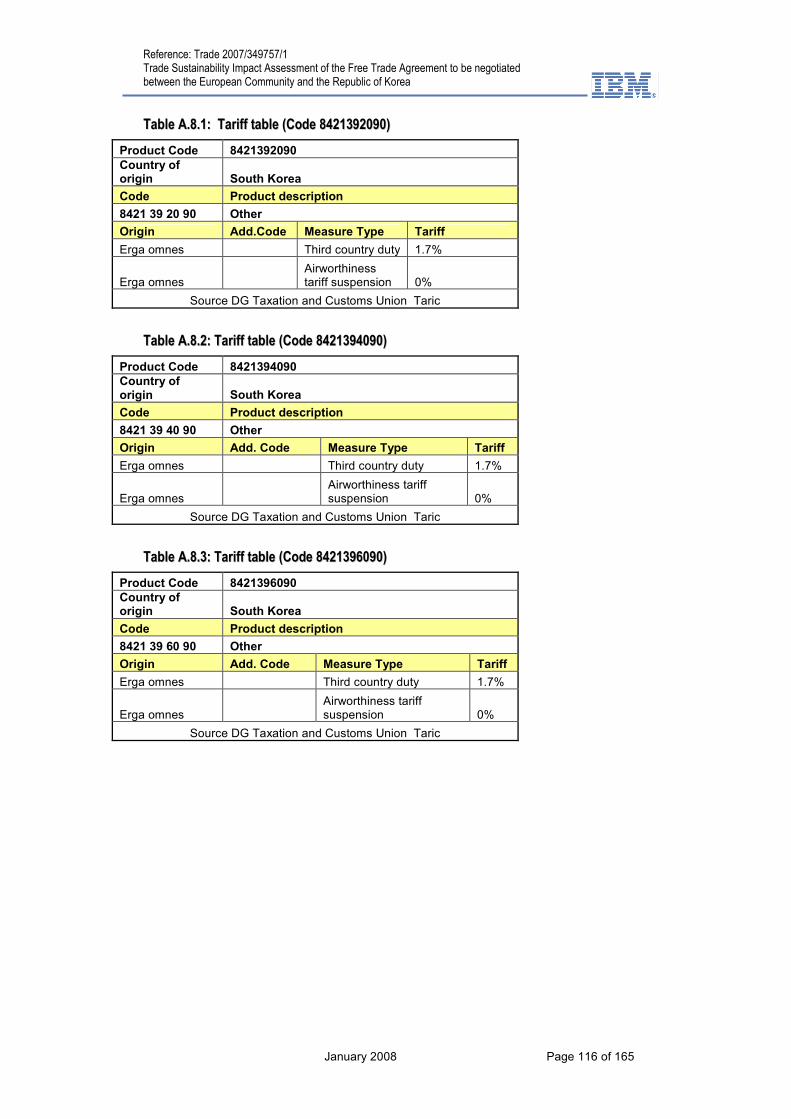
Reference: Trade 2007/349757/1 Trade Sustainability Impact Assessment of the Free Trade Agreement to be negotiated between the European Community and the Republic of Korea
January 2008 Page 116 of 165
TTaabbllee AA..88..11:: TTaarriiffff ttaabbllee ((CCooddee 88442211339922009900))
Product Code 8421392090 Country of origin South Korea
Code Product description
8421 39 20 90 Other
Origin Add.Code Measure Type Tariff
Erga omnes Third country duty 1.7%
Erga omnes Airworthiness tariff suspension 0%
Source DG Taxation and Customs Union Taric
TTaabbllee AA..88..22:: TTaarriiffff ttaabbllee ((CCooddee 88442211339944009900))
Product Code 8421394090 Country of origin South Korea
Code Product description
8421 39 40 90 Other
Origin Add. Code Measure Type Tariff
Erga omnes Third country duty 1.7%
Erga omnes Airworthiness tariff suspension 0%
Source DG Taxation and Customs Union Taric
TTaabbllee AA..88..33:: TTaarriiffff ttaabbllee ((CCooddee 88442211339966009900))
Product Code 8421396090 Country of origin South Korea
Code Product description
8421 39 60 90 Other
Origin Add. Code Measure Type Tariff
Erga omnes Third country duty 1.7%
Erga omnes Airworthiness tariff suspension 0%
Source DG Taxation and Customs Union Taric
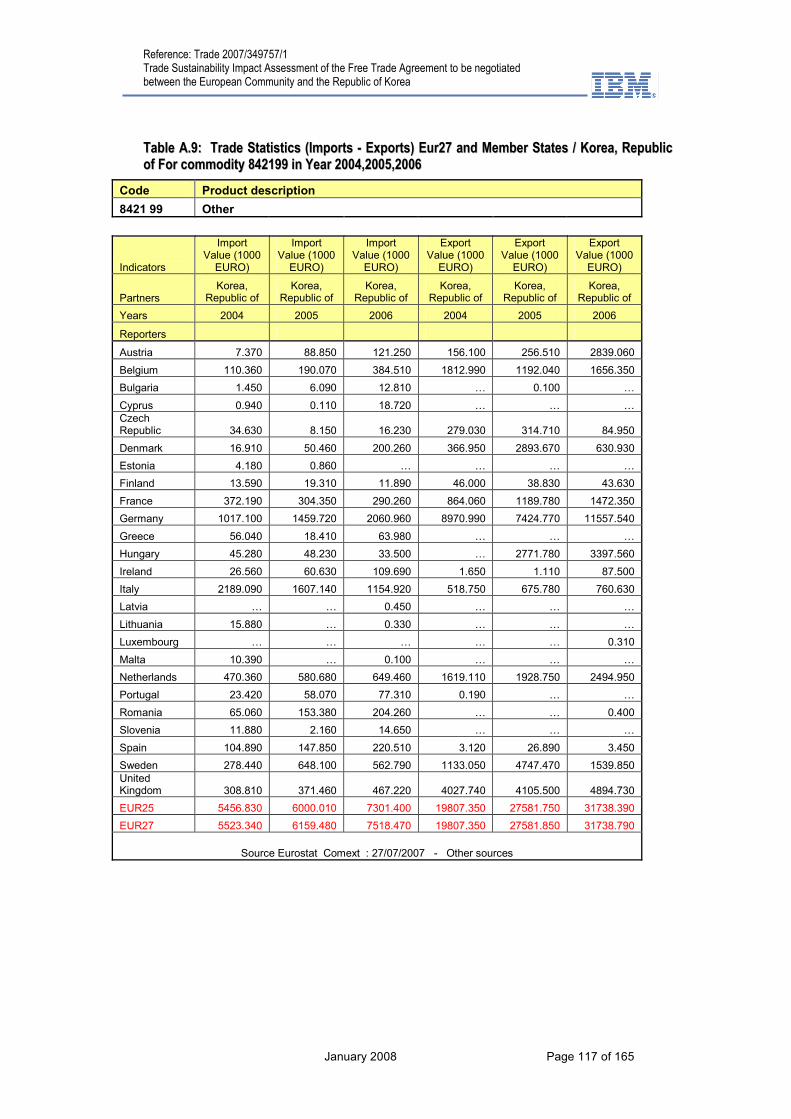
Reference: Trade 2007/349757/1 Trade Sustainability Impact Assessment of the Free Trade Agreement to be negotiated between the European Community and the Republic of Korea
January 2008 Page 117 of 165
TTaabbllee AA..99:: TTrraaddee SSttaattiissttiiccss ((IImmppoorrttss -- EExxppoorrttss)) EEuurr2277 aanndd MMeemmbbeerr SSttaatteess // KKoorreeaa,, RReeppuubblliicc ooff FFoorr ccoommmmooddiittyy 884422119999 iinn YYeeaarr 22000044,,22000055,,22000066
Code Product description
8421 99 Other
Indicators
Import Value (1000 EURO)
Import Value (1000 EURO)
Import Value (1000 EURO)
Export Value (1000 EURO)
Export Value (1000 EURO)
Export Value (1000 EURO)
Partners Korea,
Republic of Korea,
Republic of Korea,
Republic of Korea,
Republic of Korea,
Republic of Korea,
Republic of
Years 2004 2005 2006 2004 2005 2006
Reporters
Austria 7.370 88.850 121.250 156.100 256.510 2839.060
Belgium 110.360 190.070 384.510 1812.990 1192.040 1656.350
Bulgaria 1.450 6.090 12.810 … 0.100 …
Cyprus 0.940 0.110 18.720 … … … Czech Republic 34.630 8.150 16.230 279.030 314.710 84.950
Denmark 16.910 50.460 200.260 366.950 2893.670 630.930
Estonia 4.180 0.860 … … … …
Finland 13.590 19.310 11.890 46.000 38.830 43.630
France 372.190 304.350 290.260 864.060 1189.780 1472.350
Germany 1017.100 1459.720 2060.960 8970.990 7424.770 11557.540
Greece 56.040 18.410 63.980 … … …
Hungary 45.280 48.230 33.500 … 2771.780 3397.560
Ireland 26.560 60.630 109.690 1.650 1.110 87.500
Italy 2189.090 1607.140 1154.920 518.750 675.780 760.630
Latvia … … 0.450 … … …
Lithuania 15.880 … 0.330 … … …
Luxembourg … … … … … 0.310
Malta 10.390 … 0.100 … … …
Netherlands 470.360 580.680 649.460 1619.110 1928.750 2494.950
Portugal 23.420 58.070 77.310 0.190 … …
Romania 65.060 153.380 204.260 … … 0.400
Slovenia 11.880 2.160 14.650 … … …
Spain 104.890 147.850 220.510 3.120 26.890 3.450
Sweden 278.440 648.100 562.790 1133.050 4747.470 1539.850 United Kingdom 308.810 371.460 467.220 4027.740 4105.500 4894.730
EUR25 5456.830 6000.010 7301.400 19807.350 27581.750 31738.390
EUR27 5523.340 6159.480 7518.470 19807.350 27581.850 31738.790
Source Eurostat Comext : 27/07/2007 - Other sources
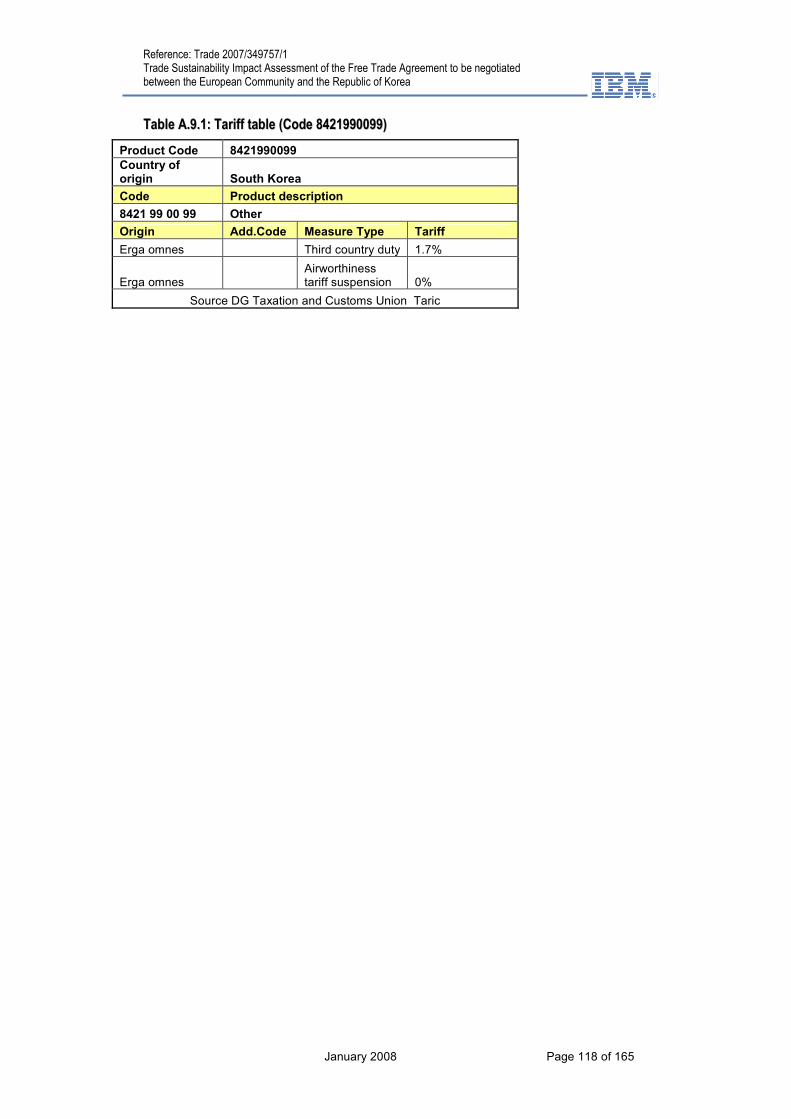
Reference: Trade 2007/349757/1 Trade Sustainability Impact Assessment of the Free Trade Agreement to be negotiated between the European Community and the Republic of Korea
January 2008 Page 118 of 165
TTaabbllee AA..99..11:: TTaarriiffff ttaabbllee ((CCooddee 88442211999900009999))
Product Code 8421990099 Country of origin South Korea
Code Product description
8421 99 00 99 Other
Origin Add.Code Measure Type Tariff
Erga omnes Third country duty 1.7%
Erga omnes Airworthiness tariff suspension 0%
Source DG Taxation and Customs Union Taric
Reference: Trade 2007/349757/1 Trade Sustainability Impact Assessment of the Free Trade Agreement to be negotiated between the European Community and the Republic of Korea
January 2008 Page 119 of 165
66.. RRUULLEESS OOFF OORRIIGGIINN
66..11.. IINNTTRROODDUUCCTTIIOONN Countries form free-trade areas with the objective of enhancing trade in goods "originating" amongst themselves. This is compatible with Article XXIV of the GATT 1994 under the WTO which permits the creation of customs unions and free trade areas when “substantially all the trade …in products originating in such territories”.28 Members of an FTA retain control of their trade policies towards the rest of the world and have separate tariff schedules and independent commercial policies for the trade with third countries. In contrast in a customs union, the members have a common external tariff and a common commercial policy.29
Within any free-trade area, duty-free trade is limited to goods "originating" within it. Rules of origin therefore lie at the heart of every FTA. In their narrowest form they could exclude goods containing any third country content. In practice, however, FTAs often permit varying degrees of third country content levels. The policy and practical questions involve how much third country content is allowed and under what conditions.
PPUURRPPOOSSEE OOFF RRUULLEESS OOFF OORRIIGGIINN
The purpose of rules of origin is to limit trade deflection. An FTA gives preferred access to products from the partner country. If the partner has a zero duty on an important component such as for example, textile fabrics which are utilised in the manufacturing of clothing while the other member of the FTA has high tariffs on the import of textiles, then in the absence of rules of origin, there will be incentive to tranship the fabric through the partner country in order to qualify for the preferred tariff access. This is referred to as trade deflection; the purpose of rules of origin is to limit trade deflection where goods are simply rerouted to take advantage of tariff preferences. Such deflection of trade clearly does not involve originating products. More complex is when the fabric is imported into the partner country and then cut and assembled into clothing in the partner country. This is considered to be a deflection of production if the differences in the external tariff structures and commercial policies of the FTA partners create significant incentives for this relocation of the production activity.
Rules of origin fall into four main categories:-
Wholly originating products: Natural resource and agricultural products are considered to be originating if they are produced with the territory of the FTA partner.
Percentage rules: A product is considered originating if the cost of materials and components imported from outside a free-trade area does not exceed a specified percentage of its ex-works price or the FOB price.
Sufficient transformation: A product is considered to be "sufficiently transformed", and therefore originating, if its tariff heading (a four digit code) under the Harmonised System of the World Customs Organisation is different from those of its imported contents according to agreed rules.
Processing requirements: A product is considered originating if specified minimum processing operations have been carried out within the exporting country.
CCUUMMUULLAATTIIOONN
The Pan-European Cumulation System (PECS), as this innovative scheme is widely known, was introduced in 1997. Its result was effective creation of a Pan-European free
28 The quote is from Article XXIV 8(b) referring to FTAs in the GATT 1994. Almost identical language is contained in Article XXIV 8(a) referring to customs unions. 29 The European Union represents a very advanced and integrated customs union with a common commercial policy, but the EU has FTAs with a number of partner countries or regional groupings.
Reference: Trade 2007/349757/1 Trade Sustainability Impact Assessment of the Free Trade Agreement to be negotiated between the European Community and the Republic of Korea
January 2008 Page 120 of 165
trade zone in industrial goods. Turkey, which had been in customs union with the EU since 1996, joined the PECS in 1999.
PECS Rules of Origin
Every individual product, as defined by its tariff heading, has a prescribed rule of origin under the PECS. These rules vary considerably, as illustrated by the examples below:-
Product groups: General rule of origin
1 Food: Maximum 10% imported content
2 Books; glass products; iron and steel products; jewellery; tools; toys: Sufficient transformation
3 Clothing: Manufacture from yarn (not fabric)
4 Photographic, medical and surgical equipment: Sufficient transformation AND maximum 40% imported content; OR maximum 30% imported content
5 Aircraft; boats; furniture; ships: Sufficient transformation OR maximum 40% imported content
6 Cars; clocks; locomotives; musical instruments; trucks; watches: Maximum 40% imported content
The PECS gives any product (including components and materials) considered to have originated in one country within the PECS zone originating status in every other country within the PECS zone. Such products can therefore be traded duty-free anywhere within the PECS zone.
The PECS also gives manufacturers great sourcing flexibility. In effect most manufacturers in the PECS zone have as much freedom as they could wish to source components and materials from anywhere, both inside and outside the PECS zone, without risking losing duty-free status on trade within the PECS zone.
Cumulation is often permitted in an FTA so that products produced in one partner which are exported to the other partner, and are processed or assembled in the other partner can be re-exported to the another FTA partner regardless of whether the processing or assembly was sufficient to confer origin on the product.
66..22.. RRUULLEESS OOFF OORRIIGGIINN IINN OOTTHHEERR FFTTAASS In this section we review briefly the treatment of rules of origin in other FTAs in East Asia and in the Korea US FTA (KORUS).
EEAASSTT AASSIIAANN FFTTAASS
Two economists from the Asian Development Bank have prepared recently a comprehensive survey of ROO in East Asian FTA.30 Rules of origin (ROO are a particularly interesting aspect of East Asian FTAs. For manufactured goods, ROOs may be of three types: (i) a change in tariff classification (CTC) rule defined at a detailed Harmonized System (HS) level; (ii) a regional (or local) value content (VC) rule which means that a product must satisfy a minimum regional (or local) value in the exporting country or region of an FTA; and (iii) a specific process (SP) rule which requires a specific production process for an item.
In the Annex Table 9 reproduced from the Masahiro and Wignaraja paper provides an overview of the main ROOs adopted by 30 concluded FTAs in East Asia for which information on ROO was available.
Strikingly, the majority of FTAs in East Asia (20) have
adopted a combination of the three ROOs rather than applying a single rule. Of the
30 Kawai, Masahiro and Ganeshan Wignaraja, “ASEAN+3 or ASEAN+6: Which Way Forward?” WTO/HEI conference Multilateralizing Regionalism, Geneva, September 2007

Reference: Trade 2007/349757/1 Trade Sustainability Impact Assessment of the Free Trade Agreement to be negotiated between the European Community and the Republic of Korea
January 2008 Page 121 of 165
remaining FTAs, 3 use the value added rule only, another 3 use value added and/or CTC rule, and another 4 use value added and/or SP rule. The simplest ROO can be found in the AFTA and the ASEAN-PRC FTA, which specifies a 40 % regional value content across all tariffs. Meanwhile many agreements involving Japan, Korea and Singapore tend to use a combination of ROOs. The latter introduces complexity and additional costs for business.
Additional insights can be obtained through examination of the ROOs applied to the major auto and auto parts products in selected major concluded FTAs. ASEAN’s FTAs vary somewhat in their ROOs. For instance, the 40% value content rules applies for AFTA and for the ASEAN-PRC FTA but more stringent ROOs for some products (e.g. 45% value content applies for HS 8703, 8704 and 8708) are found in the ASEAN-Korea FTA. Furthermore, as Kawai and Wignaraja note, the ROOs for the same products are different in bilateral FTAs involving the same major economy.31 In the Japan-Malaysia FTA, the value content requirement for HS8703 and 8711 is 60% while in the Japan-Thailand FTA, it is 40% for the same two products. Similarly differences can be found in the case of Singapore-Australia FTA and Thailand-Australia FTA.
KKOORREEAA--UUSS FFTTAA
In terms of the determination of the application of preferential tariff rates, Korea and the US agreed to detailed specific rules of origin for applying the preferential tariffs in order to limit trade deflection.32 There was common agreement that a product wholly obtained or produced entirely in the territory of one or both of the countries is an originating good. Detailed rules were agreed in the Korea US FTA to the application of the specific rules for determining the relevant criteria for determining the rule of origin on product by product basis, utilising the change in tariff schedule criteria, value added criteria, or substantial transformation based on an important operation or process criteria.
As for the value or price for determining rules of origin, Korea and the US agreed to use the FOB price rather than ex-work price, similar to the cases of NAFTA, Korea-Chile FTA, and Korea-Singapore FTA. This is different from the cases of EFTA, EEA, EFTA-Singapore and EFTA-Mexico FTAs, which adopted ex-work price criterion.
In the KORUS, it was agreed to cumulate the raw materials from the territory of one party, used in the production of a good in the territory of the other party - as originating materials in order to facilitate trade in primary materials. In addition, it was agreed that a good that does not undergo a change in tariff classification pursuant to the annex is nonetheless an originating good if the value of all non-originating materials used in the production of the good does not exceed 10 % of the adjusted value of the good, which is the same ‘De Minimis’ clause as that of the Korea-EFTA FTA. In case of textile and apparel products, however, a different rule from that of the Korea-EFTA FTA is applied; A textile or apparel good that is not an originating good, shall nonetheless be considered to be an originating good if the total weight of all such fibers or yarns in that component is not more than seven percent of the total weight of that component. In the Korea-EFTA FTA, ten percent rule of the total weight was applied.
As for fungible goods and materials, Korea and the US agreed that the determination of whether fungible goods or materials such as grain, coal, scrap iron are originating goods, shall be made the use of inventory management method such as last-in, first-out, or first-in first-out in order to simplify the determination of rules of origin and to increase convenience.
66..33.. KKEEYY AANNAALLYYTTIICCAALL AANNDD PPOOLLIICCYY IISSSSUUEESS There are several analytical and policy issues some of which have offsetting effects. First rules of origin in sectors such as textiles and clothing or automobiles, where there are
31 Ibid. p.16. 32 The Rules of Origin chapter in the Korea US FTA is 105 pages and there are additional related provisions in other chapters such as that related to Clothing.

Reference: Trade 2007/349757/1 Trade Sustainability Impact Assessment of the Free Trade Agreement to be negotiated between the European Community and the Republic of Korea
January 2008 Page 122 of 165
some divergences in tariff structures vis a vis third countries, need to be relatively strict in order to limit the scope for deflections of trade or deflection of production due to divergences in the external tariff structure of the EU and Korea.
Second Korea proposes rules of origin with lower content requirements which are lower than the normal European Rules of Origin. At least in some sectors, (depending on the structure of external tariffs and the incentives for deflection of trade or production), there is a rationale for lower content requirements for the EU Korea FTA than the normal European rules. Since due to its geographic location, Korea is unable to benefit from Pan European Cumulation through sourcing of components from other countries with FTAs with the EU even if Korea were eligible for the Pan European rules. The more natural sourcing partners for Korean enterprises are in East or Southeast Asia.
66..44.. RREEFFEERREENNCCEESS
Ahn, Choong Yong, Richard Baldwin, and Inkyo Cheong, (ed) 2005 East Asian Economic Regionalism: Feasibilities and Challenges (Netherlands: Springer).
Baldwin, Richard. 2007. “Managing the Noodle Bowl: The Fragility of East Asian Regionalism.” ADB Working Paper Series on Regional Economic Integration, No. 7, Office of Regional Economic Integration, Asian Development Bank, Manila.
Bchir, Mohamed Hedi and Michel Fouquin. 2006. “Economic Integration in Asia: Bilateral Free Trade Agreements Versus Asian Single Market.” CEPII Discussion Papers No. 15 (October), d’Etudes Prospectives et d’Informations Internationales, Paris.
Cheong, Inkyo. 2005. “Estimation of Economic Effects of FTAs in East Asia—CGE Approach.” Choong Yong Ahn, Richard Baldwin, and Inkyo Cheong, East Asian Economic Regionalism: Feasibilities and Challenges (Netherlands: Springer), pp. 139–155.
Cheong, Inkyo and Jungran Cho. 2007. “Market Access in FTAs: Assessment Based on Rules of Origin and Agricultural Trade Liberalization.” RIETI Discussion Paper Series 07-E-016 (March), Research Institute of Economy, Trade and Industry, Tokyo.
Fiorentino, Robert V., Luis Verdeja, and Christelle Toqueboeuf. 2007. “The Changing Landscape of Regional Trade Agreements: 2006 Update.” WTO Discussion Paper 12 (May), World Trade Organization, Geneva.
Gilbert, John, Robert Scollay, and Bijit Bora. 2004. “New Regional Trading Developments in the Asia-Pacific Region.” In S. Yusuf, N. Altaf and K. Nabeshima, eds., Global Change and East Asian Policy Initiatives (Washington, DC: World Bank), pp. 121–190.
Gill, Indermit and Homi Kharas. 2007. An East Asian Renaissance: Ideas for Economic Growth, World Bank, Washington, DC.
James, William E. 2006. “Rules of Origin in Emerging Asia-Pacific Preferential Trade Agreements: Will PTAs Promote Trade and Development?” ARTNeT Working Paper Series, No. 19 (August), Asia-Pacific Research and Training Network on Trade, UNESCAP, Bangkok.
Kawai, Masahiro and Ganeshan Wignaraja, “ASEAN+3 or ASEAN+6: Which Way Forward?” WTO/HEI conference Multilateralizing Regionalism, Geneva, September 2007
Lee, Chang Jae, Hyung-Gon Jeong, HanSung Kim, and Ho Kyung Bang. 2006. “From East Asian FTAs to an EAFTA: Typology of East Asian FTAs and Implications for an EAFTA.” Policy Analyses 06-01 (December), Korea Institute for International Economic Policy, Seoul.
Lee, Jong-Wha and Innwon Park. 2005. “Free Trade Areas in East Asia: Discriminatory or Non-Discriminatory?” World Economy, 28:1 (January), pp. 21–48.
Manchin, Miriam and Annette O. Pelkmans-Balaoing. 2007. “Rules of Origin and the Web of East Asian Free Trade Agreements.” World Bank Policy Research Working Paper 4273 (July), World Bank, Washington, DC.
Reference: Trade 2007/349757/1 Trade Sustainability Impact Assessment of the Free Trade Agreement to be negotiated between the European Community and the Republic of Korea
January 2008 Page 123 of 165
Organisation for Economic Co-operation and Development (OECD). 2003. Regionalism and Multilateral Trading System. Secretary General, Paris.
Piermartini, Roberta and Robert Teh. 2005. “Demystifying Modelling Methods for Trade Policy.” WTO Discussion Paper 10 (September), World Trade Organization, Geneva.
World Bank. 2005. Global Economic Prospects 2005: Trade, Regionalism and Development. World Bank, Washington, DC.
Reference: Trade 2007/349757/1 Trade Sustainability Impact Assessment of the Free Trade Agreement to be negotiated between the European Community and the Republic of Korea
January 2008 Page 124 of 165
66..55.. AANNNNEEXX:: SSUUMMMMAARRYY OOFF EEAASSTT AASSIIAANN FFTTAASS3333
33 Source Kawai, Masahiro and Ganeshan Wignaraja, “ASEAN+3 or ASEAN+6: Which Way Forward?” WTO/HEI conference Multilateralizing Regionalism, Geneva, September 2007
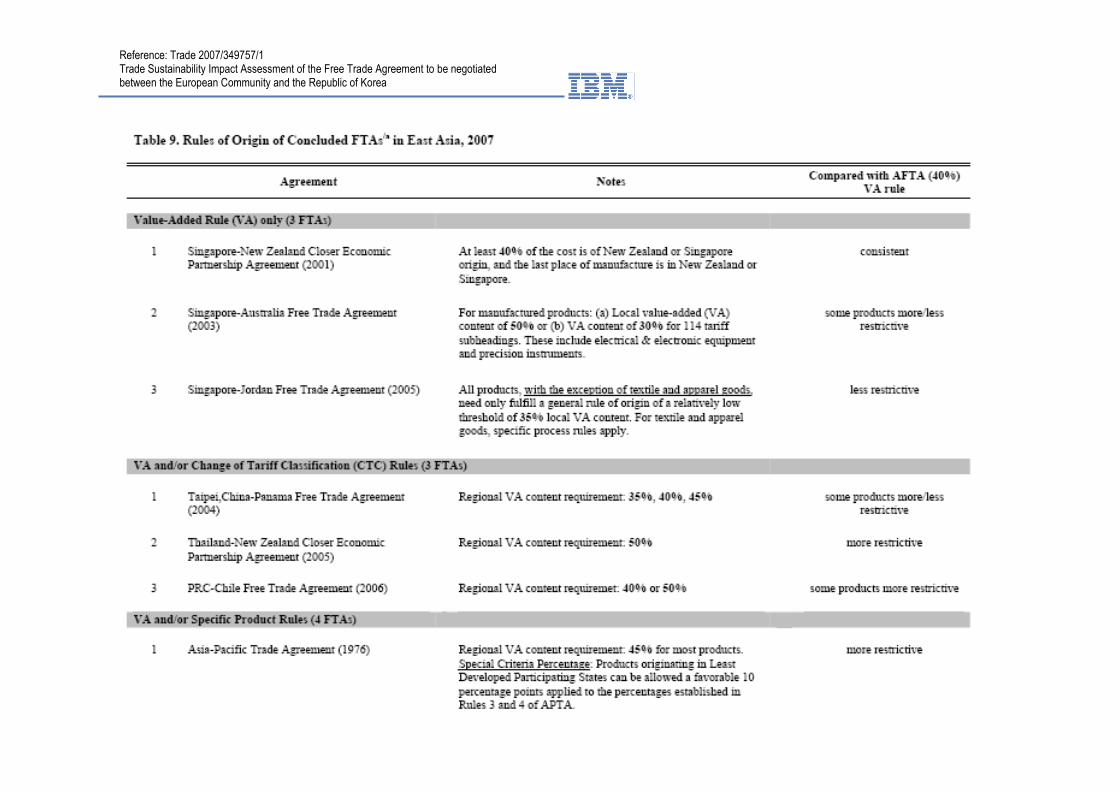
Reference: Trade 2007/349757/1 Trade Sustainability Impact Assessment of the Free Trade Agreement to be negotiated between the European Community and the Republic of Korea
January 2008 Page 125 of 165
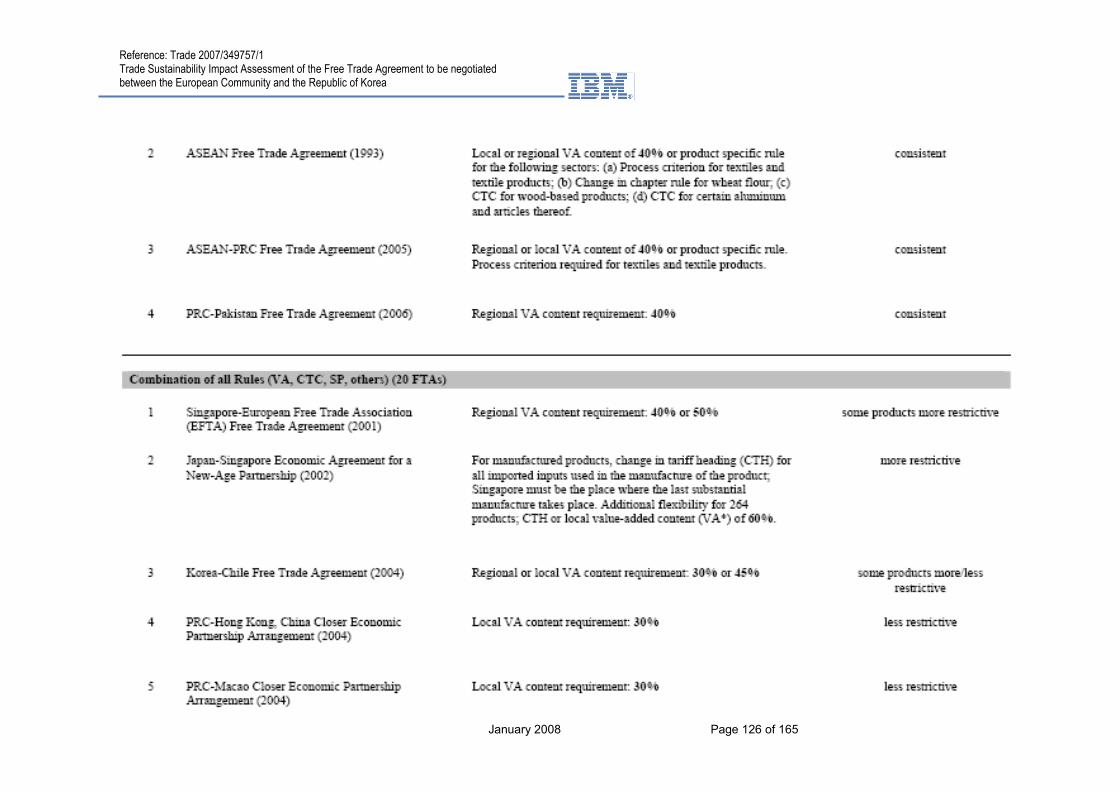
Reference: Trade 2007/349757/1 Trade Sustainability Impact Assessment of the Free Trade Agreement to be negotiated between the European Community and the Republic of Korea
January 2008 Page 126 of 165
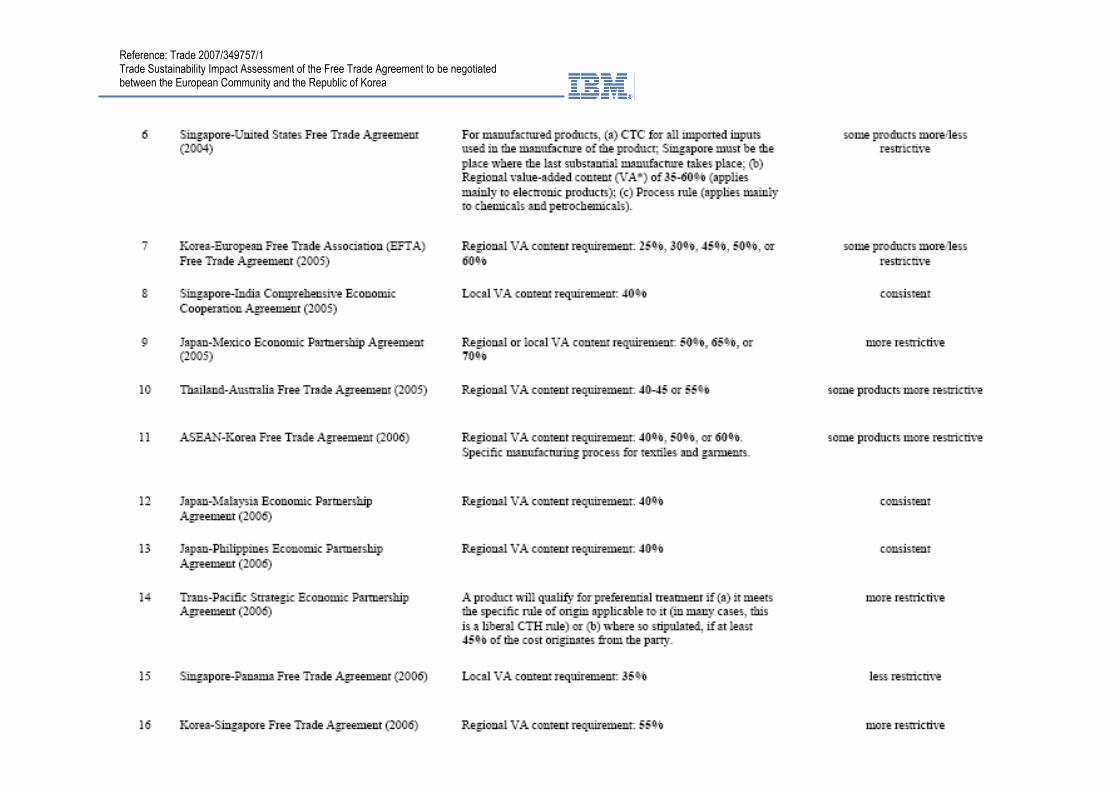
Reference: Trade 2007/349757/1 Trade Sustainability Impact Assessment of the Free Trade Agreement to be negotiated between the European Community and the Republic of Korea
January 2008 Page 127 of 165
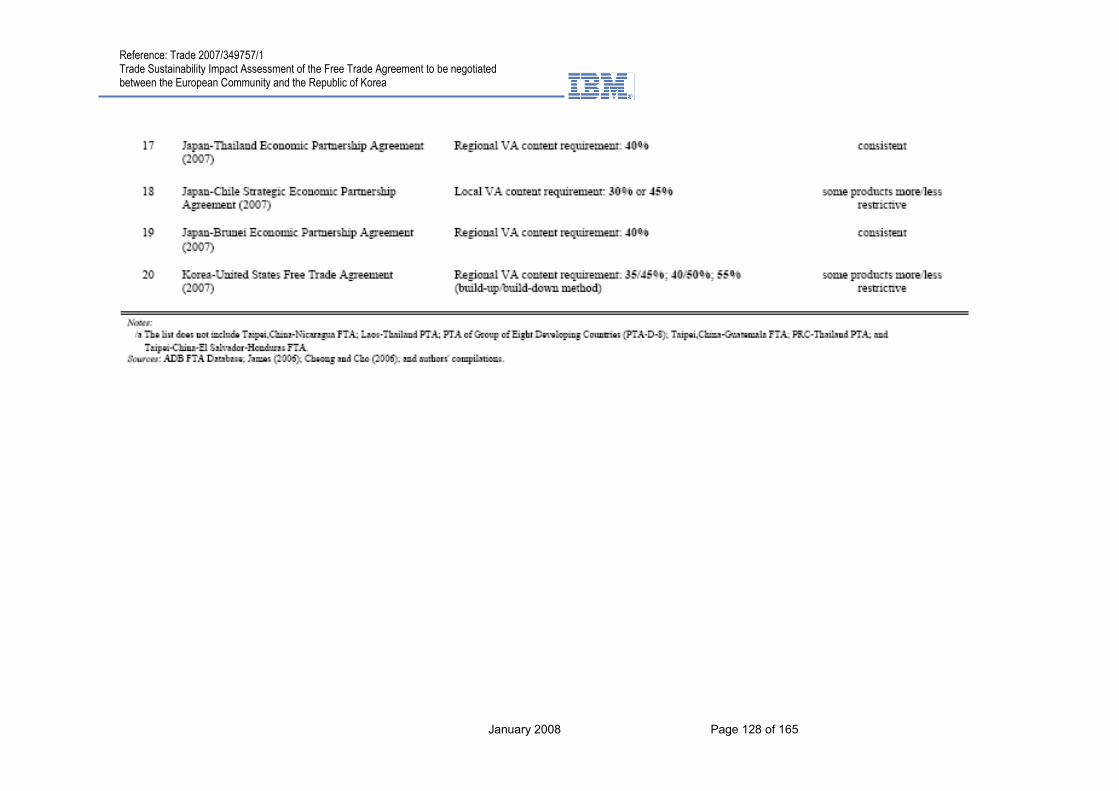
Reference: Trade 2007/349757/1 Trade Sustainability Impact Assessment of the Free Trade Agreement to be negotiated between the European Community and the Republic of Korea
January 2008 Page 128 of 165
Reference: Trade 2007/349757/1 Trade Sustainability Impact Assessment of the Free Trade Agreement to be negotiated between the European Community and the Republic of Korea
January 2008 Page 129 of 165
77.. TTEECCHHNNIICCAALL RREEGGUULLAATTIIOONNSS AANNDD SSTTAANNDDAARRDDSS The Qualitative Analysis study and other studies have emphasised the importance of addressing effectively the issues related to all aspects of TBT and SPS issues. Certainly for industries such as automobiles common approaches to technical regulations and standards including those related to pollution, fuel economy and carbon loadings could help to resolve some EU-Korea trade frictions and ensure broader benefits of the EU-Korea FTA. It is interesting to note that the Korea US negotiations devoted considerable effort to TBT and SPS issues but the response from US industry groups was sceptical.
Most of FTAs concluded by the EU address the issues of technical regulations and standards superficially. For example, the common approach in the FTAs with the MED countries is to include norms obliging the EU trading partners to promote the use of the EU technical rules and standards for industrial and agri-food products and certification procedures. However, no specific measures and timelines are defined regarding implementation of the FTA articles. Provisions relating to TBT in the EU-Chile FTA are more detailed. However, they also lack specificity, making the respective part of the agreement a kind of declaration rather than a binding document. One of the important issues under the EU-Chile agreement is the establishment of a Committee on Standards, Technical Regulations and Conformity assessment in order to create a forum for discussions of issues relating to reforms in technical regulations sphere.
Technical regulation provisions within the European Association Agreements (EAA) signed between the EU and candidate countries in the 1990s were the most far reaching in terms of stated goals. In particular, the candidate countries were obliged to fully implement rules and procedures equivalent to those applied in the EU. Later all the candidate countries signed Protocols on European Conformity Assessment and Acceptance of Industrial Products (PECA). The protocols provided for mutual recognition on the basis of the acquis communautaire. Although PECAs are relevant to candidate countries only and were part of the pre-accession strategy, their successful implementation led the EU to initiate inclusion of similar agreements with the countries of the Mediterranean region and the CIS. From the point of view of the EU, an important issue is to improve the process for cooperation and adoption by the Parties of common standards and approaches in key sectors of technical regulation.
77..11.. TTEECCHHNNIICCAALL BBAARRRRIIEERRSS TTOO TTRRAADDEE
Non-tariff barriers that are in the form of standards and technical regulations can be tackled by regulatory cooperation. The TBT (Technical Barriers to Trade) agreement in the WTO establishes a presumption that countries should use international norms as a basis for technical regulations. However, under the TBT agreement in the countries may establish different standards if there are fundamental climactic or technological factors which make it necessary to have different national standards. Like many countries, Korea has its own standards-setting procedures which tend to favour domestic producers.
If Korea adopts or harmonises its technical regulations and standards with another country’s standards (e.g. US standards), which are different from international standards, then EU exporters will be placed at a disadvantage in the Korean market.
According to the KORUS, both Korea and the US affirm their commitment to comply with the WTO TBT agreement and in particular with the WTO TBT Committee Decision to promote reliance on international standards that are consensus based. There are commitments to co-operate in the development of standards, technical regulations and conformity-assessment procedures. The KORUS also provides for more transparency and procedural guidelines for new technical regulations and standards (publication, timing, possibility to make written comments). Moreover, KORUS will establish a bilateral committee to strengthen FTA and WTO commitments on TBTs. Many of these arrangements (such as national treatment) are based on the TBT agreement and could

Reference: Trade 2007/349757/1 Trade Sustainability Impact Assessment of the Free Trade Agreement to be negotiated between the European Community and the Republic of Korea
January 2008 Page 130 of 165
be expected of all WTO members to be normal good practice. Some of the provisions go beyond WTO commitments (i.e. the provision to allow 60 days for written comments on proposals for new rules and regulations).
Under the special sub-heading of Automotive Standards (Article 9.7) in Chapter 9 on technical barriers to trade in KORUS, the parties agreed to cooperate in the World Forum for Harmonization of Vehicle Regulations of the United Nations Economic Commission for Europe standards for motor vehicle environmental performance and safety.
Although the KORUS approach to TBT has some utility, the TBT provisions of the KORUS have been criticised by the US industry advisory group. The report of the US Industry Trade Advisory Committee on Standards and Technical Trade Barriers (ITAC 16) states:
“The Committee finds that the objectives and priorities it has recommended to U.S. negotiators have only been partially addressed. KORUS contains several important improvements in the TBT provisions over previously negotiated free trade agreements, notably with regard to transparency in the development of standards, technical regulations, national treatment and conformity assessment procedures. The Committee commends U.S. negotiators for achieving these advances.
Nonetheless, the Committee still has serious concerns about the effectiveness of the TBT provisions in enabling the United States to address a wide range of technical trade barriers that continue to limit Korean market access to U.S. industry.”34
EEUU--KKOORREEAA BBIILLAATTEERRAALL EEXXPPEERRIIEENNCCEE
There has been some experience with the Joint Committee between the EU and Korea seeking to address bilateral issues in the field of technical regulations and standards. Some progress has been made on issues related to technical regulations and standards for cosmetics, but issues are still outstanding for automobiles and electronics. Enhanced mechanisms to deal with technical regulations and standards as well as conformity assessment procedures are important issues for a number of industry groups in the EU.
77..22.. SSUUSSTTAAIINNAABBIILLIITTYY IIMMPPAACCTT AASSSSEESSSSMMEENNTT
EECCOONNOOMMIICC IIMMPPAACCTTSS
Economic Impact on Korea
For Korea, the greater use of international standards in technical regulations and standards will involve some competitive challenges for a range of products in the Korean market place, but there are potential benefits in terms of lowering the cost of effective access to international markets.
Economic Impact on the EU
For some industries in the EU such as automobiles and the electronics sector, agreement on common international standards and better co-operation on conformity assessment procedures are key issues.
34 USTR, Report of the Industry Trade Advisory Committee on Standards and Technical
Trade Barriers (ITAC 16), April 25, 2007.
Reference: Trade 2007/349757/1 Trade Sustainability Impact Assessment of the Free Trade Agreement to be negotiated between the European Community and the Republic of Korea
January 2008 Page 131 of 165
SSOOCCIIAALL IIMMPPAACCTTSS
Social Impact on Korea
The direct social impacts on Korea from greater use of international standards are likely to very modest. There will be some indirect effects from increased import market shares in selected industries such as automobiles but this is likely to be offset or more than offset by increased exports.
Social Impact on the EU
For the EU enterprises and for their workers involved in a number of important industries such as automobiles and electrical and electronic products, more effective cooperation on technical regulations and standards are important to ensuring that potential economic benefits are realised from the EU Korea FTA in order to offset at least to some degree increased competitive challenges in the EU market.
EENNVVIIRROONNMMEENNTTAALL IIMMPPAACCTT
The connection between technical regulation and standards and the protection of the environment is not widely recognised, but it is important none the less. As the World Bank study on International Trade and Climate Change 2008 indicates, the development and diffusion of clean technologies and environmentally preferred products are the most effective means to address environmental challenges such as climate change.
Greater use of international standards for technical regulations and standards and cooperation in the development of new standards can contribute to the development and diffusion of clean technologies and environmentally preferred products.

Reference: Trade 2007/349757/1 Trade Sustainability Impact Assessment of the Free Trade Agreement to be negotiated between the European Community and the Republic of Korea
January 2008 Page 132 of 165
88.. IINNTTEELLLLEECCTTUUAALL PPRROOPPEERRTTYY PPRROOTTEECCTTIIOONN
88..11.. IINNTTRROODDUUCCTTIIOONN Although there has been progress in recent years, intellectual property issues in the EU Korea FTA negotiations are a sensitive and important set of issues of concern to European traders and investors and to Korean traders and investors.
88..22.. EEUURROOPPEEAANN UUNNIIOONN:: RREECCEENNTT DDEEVVEELLOOPPMMEENNTTSS The intellectual property rights (IPR) regime in the EU is governed by both Community-wide legislation and legislation in the Member States, Member States' legislation takes into account Community legislation, and commitments under international agreements, including the European Patent Convention, World Intellectual Property Organization (WIPO) conventions and treaties, and the WTO TRIPS Agreement. Intellectual property legislation is considered fundamental to the achievement of the Lisbon objectives.
Trade marks and industrial designs
The accession of the EC to the Madrid Protocol took effect on 1 October 2004. Trade mark owners from Member countries of the Madrid Protocol are able to designate the EC in their application for international trade mark registration. If not refused by the Office for Harmonization in the Internal Market (OHIM), protection is effective in all 25 EC Member States as if it had been applied for or registered directly with OHIM. The owners may also use a trade mark application filed or registered at OHIM as the basis for an international application under the Madrid Protocol.
35 The Commission also enacted a Regulation to
amend rules for the implementation of existing EC trade-mark legislation with the objective of clarifying the registration procedures and the challenge or opposition procedure and to facilitate electronic filing.
36
Patents
Procedures for filing patents can be carried out at the national and international levels.37
The Commission has launched a review of its patent policy, as part of a general effort to harmonize the internal market, by focusing on three main issues: possible introduction of a Community patent, improvements to the current system, and the determination of possible areas for harmonization.
38 Further to a comprehensive consultation exercise
launched on 16 January 2006, a public hearing on the contemplated reforms was held on 12 July 2006. More than 2,500 submissions were received.
The proposal for a single EC patent was originally presented in 2000 and a common political approach was reached in 2003.
39 Disagreement over translation requirements
and jurisdictional issues has so far prevented final agreement on the introduction of the EC patent. Another pending issue was the reform of the European Patent Convention, to which the EC is not party, while all of its Member States are. Some of these Member States have been engaged in the establishment of a European Patent Litigation Agreement (EPLA); three issues need to be addressed before they become party to such an Agreement: the text of the Agreement would have to be brought into line with EC legislation, the relationship with the EC Court of Justice would have to be clarified, and a mandate would have to be granted by the Council to the Commission to take part in the ongoing negotiations (with a possible view of EC accession to the EPLA).
40 EC
legislation covers some of the areas under consideration in the ongoing EPLA
35 For further details on the EC's accession to the Madrid Protocol, see WTO (2004). 36 Commission Regulation No. 1041/2005 of 29 June 2005. 37 See WTO (2004), for a description of the procedures at these levels. 38 Commission, Press Release IP/06/38 of 16 January 2006. 39 See WTO (2004), for further details. 40 European Commission European Commission (2006f), Questionnaire on the Patent System in Europe, 9 January 2006, Brussels.
Reference: Trade 2007/349757/1 Trade Sustainability Impact Assessment of the Free Trade Agreement to be negotiated between the European Community and the Republic of Korea
January 2008 Page 133 of 165
negotiations, e.g. Council Regulation No. 44/2001 on recognition and enforcement of judgements, and Directive No. 2004/48/EC on enforcement of intellectual property rights through civil procedures.
Regulation No. 816/2006 on compulsory licensing of patents relating to the manufacture of pharmaceutical products for export to countries with public health problems was adopted on 27 May 2006. With this Regulation, the EC has created a legal basis for the granting of compulsory licences for export purposes, as foreseen by the WTO General Council Decisions of 30 August 2003 and 6 December 2005.
41
Geographical indications
Council Regulation No. 510/2006 of 20 March 2006 repealed Council Regulation N° 2081/92 on the protection of geographical indications and designations of origin for agricultural products and foodstuffs. The new legislation, i.e. Council Regulation No. 510/2006, addressed the following issues:
• clarification and simplification of the registration procedure;
• a better definition of responsibilities between Member States and the Commission;
• the need to clarify that the provisions under Council Regulation No. 2081/92 on equivalence and reciprocity did not apply to GIs corresponding to geographical areas located in other WTO Members;
• opening registration directly to producer groups in third countries and not through their national administration; and
• clarifying the procedures concerning amendments to specifications, objections, or cancellation in the event of failure to respect specifications.
42
Enforcement
Commission Regulation No. 1891/2004 of 21 October 2004 lays down provisions to implement Council Regulation No. 1383/2003, which concerns IPR enforcement at the EC's external borders.
In November 2004, the Commission adopted a strategy to improve IPR enforcement in third countries.
43 The strategy proposed the identification of priority countries and the
implementation of measures such as technical assistance, awareness raising, and political dialogue. The EC is also reviewing the IPR chapter of its bilateral agreements to address enforcement concerns, and has appointed IPR experts in the EC delegations in various third countries. In 2005, it launched a survey covering IPR enforcement in some 40 countries; the results of the survey were announced in October 2006.
44 The results of
the increased seizures of counterfeit goods and the survey of European business has reinforced EU interest in strengthening collaboration with partner countries on enforcement of Intellectual Property rights especially in the area of counterfeit goods.
88..33.. EEUU--KKOORREEAA IISSSSUUEESS IINN IINNTTEELLLLEECCTTUUAALL PPRROOPPEERRTTYY RRIIGGHHTTSS In the Korea-EU Joint Committee meetings, the protection of IPR has been one of the main issues of interest for the EU. During consultation with the EUCCK, it became clear that, the status of Korean legislation has improved, but mainly the problems were focused on implementation and enforcement. To give an example, under the current Korean law, a person found guilty of trademark infringement may be sentenced up to maximum of 7 years imprisonment or up to 100,000,000 KRW (approximately 80,000 euros) in fines. In reality, the Korean courts are very reluctant to sentence actual jail terms. Furthermore, the fines issued by the courts are nominal. Thus, there is a lack of deterrent effect on the
41 European Commission, Press Release IP/06/550 of 28 April 2006. 42 COM(2005) 698 final/2. Brussels. 43 Commission Press release IP/04/1352 of 10 November 2004. 44 The survey was viewed at: http://ec.europa.eu/trade/issues/sectoral/intell_property/survey2006_ en.htm.
Reference: Trade 2007/349757/1 Trade Sustainability Impact Assessment of the Free Trade Agreement to be negotiated between the European Community and the Republic of Korea
January 2008 Page 134 of 165
infringers of intellectual property rights. For example, to a counterfeiter whose net yearly profit is more than 80,000 euros, a modest 400 euros fine once or twice a year is just a cost of doing business, not a deterrent. (EUCCK, 2007).
Despite the general lack of will by the government enforcement agencies, there are other enforcement bodies that are an exception, such as the Korea Customs Service. Korea Customs Service utilizes innovative methods and works actively to control counterfeits, however the Korea Customs Service has jurisdiction only at the border. For domestic issues, the National Police Agency and/or the Prosecutors Office have the jurisdiction and they are less proactive.
Another issue with IPR implementation is lack of capacity to deal with a large number of IPR cases. According to Ministry of Justice, currently there are 35 prosecutors assigned to IPR related cases. However, the problem is that although these prosecutors are assigned to IPR department, not all of their workload is related to IPR issues. EUCCK was often informed that the prosecutors are overburdened because they have to handle “other criminal matters.”
Another area of IPR implementation problem that is fast expanding is in the e-commerce. Korea is very strong on e-commerce, thus internet has become a popular business tool for counterfeiters. In terms of trademark infringement enforcement by the Korean government, again, there is a lack of will power and effort to enforce. The National Police Agency has a special force called the “Cyber Police,” however very little enforcement actions are actually conducted for IPR infringement matters. This is a systematic problem. Internet enforcement is difficult and time consuming because the criminal is not readily apparent. Most internet-based offenders also do not carry a large quantity of inventory (it is the nature of the internet based business). Furthermore, due to the courts’ ‘weak’ punishment, many internet offenders receive little or no punishment, thus further demoralizing the enforcement agencies.
RREEVVIIEEWW OOFF TTHHEE KKOORRUUSS OONN IINNTTEELLLLEECCTTUUAALL PPRROOPPEERRTTYY RRIIGGHHTTSS
In the Korea-US FTA, the major issues covered by the Agreements on Protection of Intellectual Property Rights were copyrights, trademarks and patents, followed by its enforcement.
Copyrights
As for copyrights, first, both parties agreed on extending the terms of protection until the death of the author or 70 years, with a grace-period of 2 years after becoming effective. Second, claims for broadcast compensation were set as an exception to national treatment. Third, ‘temporary’ copies are allowed, such as temporary storing in the computer RAM drive, with an exception made for ‘fair use’. Fifth, circumvention of technical safeguards is prohibited, with the possibility of discussing additional exceptions. Sixth, there were agreements reinforcing liabilities of Internet Service Providers for copyright infringement. Seventh, prohibition of receiving or distributing encrypted satellite signals was agreed upon. Eighth, government agencies are required to use legitimate computer software.
Trademarks
The coverage of exclusive validity of trademarks is limited to designated products and ‘identical, similar’ products. Trademarks are granted as ‘first-in-time, first-in-right principle’ to trademarks and geographical indications (GIs), which needs improvement in the Korean system. That is, the Korean government promised to revise its domestic rules on GIs. Both sides will abolish requirements for license recording and provide protection for sound marks, scent marks, and certification marks.
Patents
Both countries will introduce compensation for delays in granting patents when the registration is delayed 4 years after application and 3 years after judgment. The extended

Reference: Trade 2007/349757/1 Trade Sustainability Impact Assessment of the Free Trade Agreement to be negotiated between the European Community and the Republic of Korea
January 2008 Page 135 of 165
patent terms to 20 years after application. Also, the grace-period for publication will be extended from 6-months to 12-months as well as reinforcing standards for patent invalidations by abolishing conditions not in use.
Enforcement
For uniform enforcement, both countries worked on the system of compensation for damages on infringements of trademarks and patents, in order to decide the maximum and minimum compensation beforehand, not interfering with the principles of actual compensation for damages. The court of justice will prohibit exporting products which infringe intellectual property rights, while the judicial authorities will prosecute infringements of intellectual property rights without accusation. Moreover, both sides will introduce a report system on suspicious products infringing copyrights that will automatically suspend export and inform the owner.
In the further negotiation completed in 30 June, the United States and Korea, both agreed to provide a waiver on disputes for eighteen month after the launch of the FTA in the fields of the violation of IPRs of the pharmaceuticals.
The Korean government has become more active in the protection of IPRs, as it observes rapidly growing cases of the violation of the protection of trademarks and copyrights of Korean companies and rights holders in China.
88..44.. SSUUSSTTAAIINNAABBIILLIITTYY IIMMPPAACCTT AASSSSEESSSSMMEENNTT
EECCOONNOOMMIICC IIMMPPAACCTTSS
Economic Impact on Korea
The key economic issues for Korea are the challenge of moving from an economy where intellectual property enforcement has been weak to an economy with better protection of intellectual property rights. Korean enterprises and consumers will have costs from foregoing infringing products, but the Korean economy will benefit from improved incentives for investment and innovation with better protection of intellectual property rights.
While FDI is the most important means of transferring technology, weak intellectual property rights (IPR) regimes (or regimes perceived as weak) often inhibit diffusion of specific technologies. The response of European based multinational enterprises as with other developed country firms, which are subject domestically to much stronger IPRs, is often to transfer little knowledge along with the product or to engage in only a limited range of manufacturing or processing activities, thus impeding widespread dissemination of innovative technologies. Increased FDI is one of the important potential benefits of the EU Korea FTA, but the stimulus to FDI will be influenced by the extent to which IPRs can be more effectively implemented and enforced.
One issue that is challenging on the Korean side is the protection of Geographical Indications. As the analysis in the Agriculture Chapter above indicates a number food products in Korea use Geographic designations in their branding. The rebranding of these products poses significant costs in the short to medium term.
Economic Impact on the EU
For a variety of enterprises and traders in the EU the effective protection of intellectual property rights is an important issue in the EU Korea FTA. Certainly for producers of luxury products, for audio visual products and for chemicals and pharmaceuticals, among others, more effective protection of intellectual property rights is a key issue. Potential benefits from increased trade and from FDI of the EU Korea FTA will depend upon the extent to which there is better enforcement of intellectual property rights.
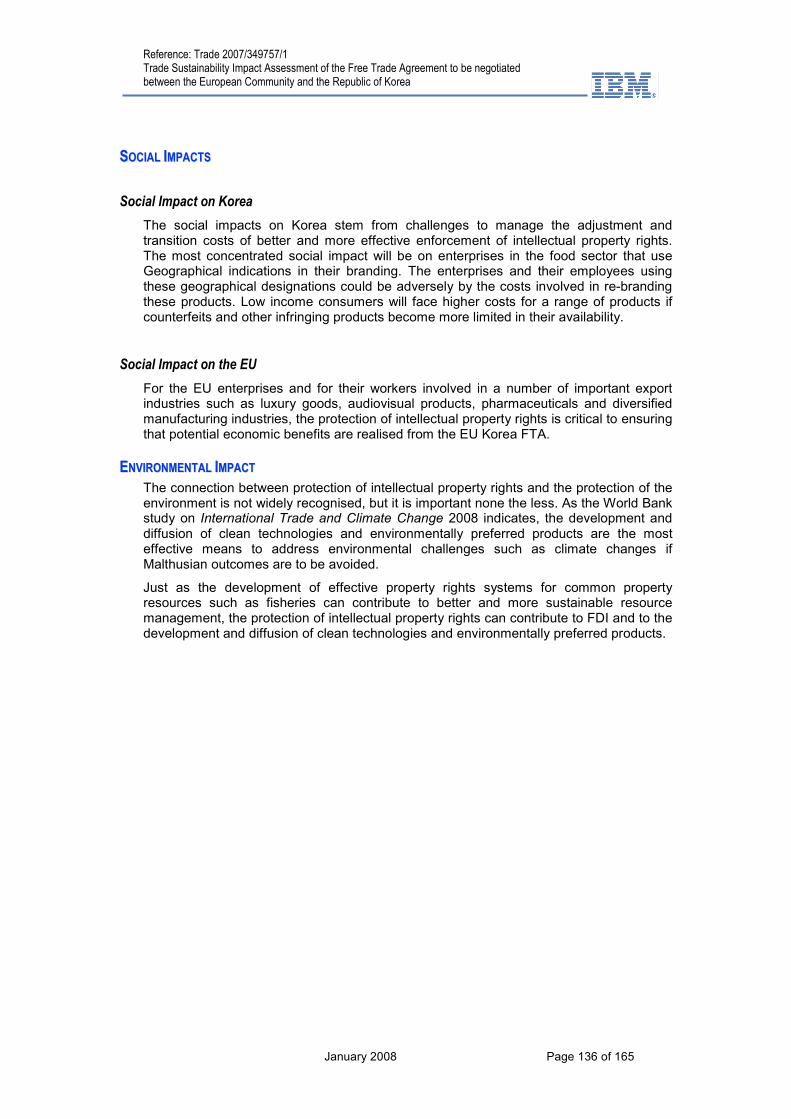
Reference: Trade 2007/349757/1 Trade Sustainability Impact Assessment of the Free Trade Agreement to be negotiated between the European Community and the Republic of Korea
January 2008 Page 136 of 165
SSOOCCIIAALL IIMMPPAACCTTSS
Social Impact on Korea
The social impacts on Korea stem from challenges to manage the adjustment and transition costs of better and more effective enforcement of intellectual property rights. The most concentrated social impact will be on enterprises in the food sector that use Geographical indications in their branding. The enterprises and their employees using these geographical designations could be adversely by the costs involved in re-branding these products. Low income consumers will face higher costs for a range of products if counterfeits and other infringing products become more limited in their availability.
Social Impact on the EU
For the EU enterprises and for their workers involved in a number of important export industries such as luxury goods, audiovisual products, pharmaceuticals and diversified manufacturing industries, the protection of intellectual property rights is critical to ensuring that potential economic benefits are realised from the EU Korea FTA.
EENNVVIIRROONNMMEENNTTAALL IIMMPPAACCTT
The connection between protection of intellectual property rights and the protection of the environment is not widely recognised, but it is important none the less. As the World Bank study on International Trade and Climate Change 2008 indicates, the development and diffusion of clean technologies and environmentally preferred products are the most effective means to address environmental challenges such as climate changes if Malthusian outcomes are to be avoided.
Just as the development of effective property rights systems for common property resources such as fisheries can contribute to better and more sustainable resource management, the protection of intellectual property rights can contribute to FDI and to the development and diffusion of clean technologies and environmentally preferred products.
Reference: Trade 2007/349757/1 Trade Sustainability Impact Assessment of the Free Trade Agreement to be negotiated between the European Community and the Republic of Korea
January 2008 Page 137 of 165
88..55.. RREEFFEERREENNCCEESS European Commission (2006), Questionnaire on the Patent System in Europe, 9 January
2006, Brussels.
International Intellectual Property Alliance (2004), 2004 Special 301 Report, South Korea Available at: http://www.iipa.com/.
Kim, HC. et al. (2005), An Analysis of the Economic Effects of a Korea-EU FTA and Policy Implications on the Korean Economy, Policy Analysis 05-09, KIEP.
Ministry of Foreign Affairs and Trade of Korea (2006), The 5th Korea-EU Joint Committee Meeting (in Korean).
Ministry of Foreign Affairs and Trade of Korea (2007), The Final Outcomes of KORUS FTA by Sector, April (in Korean).
USTR (2007), “Trade Facts: Free Trade with Korea, summary of the KORUS FTA” (www.ustr.gov).
USTR (2007), “The Text of the KORUS FTA” (www.ustr.gov).
USTR (2007), “Reports of Industry Advisory Groups on the KORUS FTA” (www.ustr.gov).
World Bank, International Trade and Climate Change: Economic, Legal, and Institutional Perspectives, 2008.
WTO, Trade Policy Review: European Communities, WT/TPR/S/177, 22 January 2007
WTO, Trade Policy Review: Republic of Korea, WT/TPR/S/137, 18 August 2004

Reference: Trade 2007/349757/1 Trade Sustainability Impact Assessment of the Free Trade Agreement to be negotiated between the European Community and the Republic of Korea
January 2008 Page 138 of 165
99.. IINNVVEESSTTMMEENNTT AANNDD EECCOONNOOMMYY WWIIDDEE EEFFFFEECCTTSS
99..11.. TTHHEEOORREETTIICCAALL BBAACCKKGGRROOUUNNDD As both Korea and the EU are large and mature economies already very open to international trade, it is likely that a significant part of the overall impact of an EU-Korea FTA will come through increased investment and larger capital accumulation.
Increased investment in a context of free trade agreements between mature economies comes mostly through three inter-dependant ways: one is an expected increase in foreign direct investment, from both the signatories to the FTA and from other trading partners willing to take advantage of the benefits offered by the FTA; the second is an expected increase in domestic investment because of competitive reaction by local producers, the third one is through the expected increase in technology content of investment accelerating the convergence process between the FTA signatories.
Economic growth literature has repeatedly analysed the effect of investment and foreign direct investment on growth. Results show that investment has positive effect on growth, although the impact of FDI is more ambiguous. The following sections provide a short reminder of the main theoretical elements of the discussion.
IINNVVEESSTTMMEENNTT AANNDD GGRROOWWTTHH
According to economic literature, equipment investment can promote economic growth.
The purchase and the use of machines embodying the most advanced technological knowledge allow increasing the GDP. According to De Long and Summer (1991), Economic historians note that mechanization played a central role in the economic growth and that the richest countries are those that were first in inventing and applying capital intensive technologies (Pollard, 1982). The history of economic growth is often written as if nations and industries either seized the opportunity to intensify their specialization in manufactures and grew rapidly, or failed to seize such opportunities and stagnated (Rostow, 1958; Gerschenkron, 1962).
Second, new growth theories consider that equipment investment affects economic growth through positive spillovers (Romer, 1986). It is natural to think that spillovers are larger in some sectors than others. Manufacturing accounts for 95% of private-sector research and development in America, and within manufacturing the equipment sector accounts for more than half of research and development (Summers, 1990). Exploring the possible special role of equipment investment seems worthwhile: it is a natural place to expect external economies and linkages to be important.
Korea has a high growth and a high rate of capital accumulation. Several empirical studies show also that the growth of the East Asian developing countries can be explained by the accumulation of factors of production, especially physical capital (Young, 1995; Collins and Bosworth, 2003).
FFDDII AANNDD GGRROOWWTTHH
Many economists show that FDI plays positive role in economic growth. FDI can increase the domestic investment. The economic benefits of FDI result from positive spill-over from the presence of foreign firms that:
• trigger transfers of technology
• facilitate the restructuring of firms
• promote international trade
• strengthen competition
• support human capital formation
Reference: Trade 2007/349757/1 Trade Sustainability Impact Assessment of the Free Trade Agreement to be negotiated between the European Community and the Republic of Korea
January 2008 Page 139 of 165
According to Maddison (1984) and Abramovitz (1986), the greatest advantage late-comers have in economic development vis-à-vis front-runners is the technological gap between them. Late-comers can increase the productivity by adopting advanced technology so that they can catch up with front-runners. The foreign direct investment allows this technological transfer. Thus, it generates positive spillovers on domestic investment.
However, the results of empirical studies on the positive spillovers generated by FDI for host countries are ambiguous at both the micro and macro levels (Alfaro, 2003). For example, positive effects of FDI spillovers are revealed by Caves (1974) in Australia and by Kokko (1994) in Mexico. However, Haddad and Harrison’s (1993) findings in Morocco and Aitken and Harrison’s (1999) in Venezuela do not support the positive spillovers hypothesis.
In a recent survey of the literature, Hanson (2001) argues that evidence that FDI generates positive spillovers for host countries is weak. In a review of micro data on spillovers from foreign-owned to domestically owned firms, Gorg and Greenwood (2002) conclude that the effects are mostly negative.
Reviewing the micro literature Lipsey (2002) argues that there is evidence of positive effects of FDI (Alfaro, 2003). However, surveying the macro empirical research led Lipsey to conclude that there is no consistent relation between the size of inward FDI stocks or flows and the economic growth. Moreover, there is need for more consideration of the different circumstances that obstruct or promote spillovers. Borensztein et al. (1998), Xu (2000), and Alfaro et al. (2003) suggest that educational level, development of local financial markets, and other local conditions play an important role in allowing the positive effects of FDI to materialize. The growth performance of Korea, as other East Asian developing economies, depends also on the ability to acquire and adapt foreign technology (Harvie and Lee, 2003).
The effect of FDI in host country may depend on the sector. Alfaro (2003) shows that foreign direct investments in the primary sector tend to have a negative effect on growth, while investments in manufacturing have a positive one.
Finally, many empirical studies have linked FDI with innovation and technology catch-up. Innovation is a complex and poorly understood phenomenon, but according to OECD (2006), among measures promoting growth, openness to foreign investment is important because foreign-performed R&D has a significant effect on domestic multifactor productivity growth. FDI also is a source of extra capital, encourages efficient production, stimulates technology transfer and fosters the exchange of managerial know-how (EU foreign direct investment yearbook 2007). Thus, it can improve the productivity of business and to make economies more competitive.
99..22.. OOVVEERRVVIIEEWW OOFF IINNVVEESSTTMMEENNTT IINN KKOORREEAA
MMAACCRROOEECCOONNOOMMIICC RREEVVIIEEWW
In 2006, Korea remains one of the fastest growing economies in the OECD as its GDP growth accelerated to its fastest rate in four years, reaching now a rate at 5%. This acceleration spurred by a recovery in domestic demand and strong exports. In 2007, a continued expansion in investment, particularly in manufacturing, and a recovery in construction have underpinned a rebound in domestic demand over the year.
The following chart introduces this section by showing the contributions of each GDP components since 2002. It clearly shows that the high GDP growth in 2006 is mostly explained by higher contributions of private consumption and net exports but also by the increasing contribution of investment. Indeed, the increase in total investment contributed 1.0 percentage point to overall GDP growth.

Reference: Trade 2007/349757/1 Trade Sustainability Impact Assessment of the Free Trade Agreement to be negotiated between the European Community and the Republic of Korea
January 2008 Page 140 of 165
FFiigguurree 99..11:: RRoollee ooff iinnvveessttmmeenntt iinn eeccoonnoommiicc ggrroowwtthh iinn KKoorreeaa
-1.0
0.0
1.0
2.0
3.0
4.0
5.0
6.0
7.0
8.0
2002 2003 2004 2005 2006
Government consumption Investment
Net exports Private consumption
Statistical discrepancy
Percentage
points
Source: Bank of Korea
The total investment in Korea is considered as a driver of the economy because the ratio of total investment over GDP remains very high over a long period. Moreover, this ratio is stable since the end of the Asian financial crisis, at around 30%.

Reference: Trade 2007/349757/1 Trade Sustainability Impact Assessment of the Free Trade Agreement to be negotiated between the European Community and the Republic of Korea
January 2008 Page 141 of 165
FFiigguurree 99..22:: LLoonngg--tteerrmm eevvoolluuttiioonn ooff iinnvveessttmmeenntt ssppeennddiinngg iinn KKoorreeaa
0
5
10
15
20
25
30
35
40
45
1970 1975 1980 1985 1990 1995 2000 2005
-10
-5
0
5
10
15
Total investment (% GDP) (left scale)
GDP growth (right scale)
% of GDP annual % change
Source: World Bank
To have a global investment overview, the table below gives an international comparison on few indicators related to GDP and investment. It shows that Korea has still a very high share of GDP devoted to capital accumulation despite the maturity of the country in terms of global levels of development: only China, in our short sample, has a (much) higher investment ratio than Korea, and the Korean ratio is significantly above the average for the OECD.
TTaabbllee 99..11:: CCoommppaarriissoonn ooff iinnvveessttmmeenntt eeffffoorrtt iinn vvaarriioouuss eeccoonnoommiieess
2005-2006 GDP growth Investment growth
Total investment (% GDP)
Korea 5.0 3.2 29.0
China 11.1 14.8 41.5
Indonesia 5.5 5.8 24.0
India 9.4 15.3 29.5
Brazil 3.7 8.7 16.8
Russia 6.7 9.7 17.8
OECD average
2.8 4.8 20.7
Source: World Bank, OECD
The breakdown of total investment by component reveals the very large share of non-residential construction (44% in 2006), which includes fixed structures for companies expanding their production facilities, but also commercial investment (e.g. shopping

Reference: Trade 2007/349757/1 Trade Sustainability Impact Assessment of the Free Trade Agreement to be negotiated between the European Community and the Republic of Korea
January 2008 Page 142 of 165
centres) and spending on infrastructures (e.g. roads, ports, etc.) Investment in non-transport equipment (machinery, identified in Korean statistics as “metal products and machinery”) has a relatively stable share in total investment, hovering between 15% and 20%.
FFiigguurree 99..33:: BBrreeaakkddoowwnn bbyy ttyyppee ooff iinnvveessttmmeenntt
0%
10%
20%
30%
40%
50%
60%
70%
80%
90%
100%
1990 1995 2000 2006
Metal products and machinery Transport equipment
Housing Other constructions
Other productsSource: TAC,
OECD
As suggested in our short review of the theoretical discussion on FDI, investment and growth, the relationship between these three variables is highly dependent on the overall “business environment” in which companies operate. Anecdotal evidence also suggests that improvements in this business environment made to attract further FDI have a strongly positive effect on the total investment performances.
The qualities of Korea’s business environment are therefore critical in assessing the potential impact of higher FDI and higher investment induced by the FTA.
There are many different ways to analyze the business environment, and there are identically many different sources with specific methods or particular angles.
Here, we first use the World Bank’s Governance Indicators, separated into six dimensions: political stability, government effectiveness, regulatory quality, voice and accountability, rule of law and control of corruption. We use TAC’s statistical harmonization of the indicators in order to allow an easier comparison, between indicators and across countries. This statistical harmonization brings all indicators on a scale from 1 (best possible measure) and 100 (worst possible measure). The tables below provide the comparison between Korea on one side, other developing countries in Asia and some EU member states on the other. The chart after the table illustrates Korea’s relative performances against the averages for the emerging and developed markets. It shows that improvement are still possible to bring Korea’s environment closer to the situation in the large EU member states, notably for the Rule of Law, Regulatory quality and Control of corruption
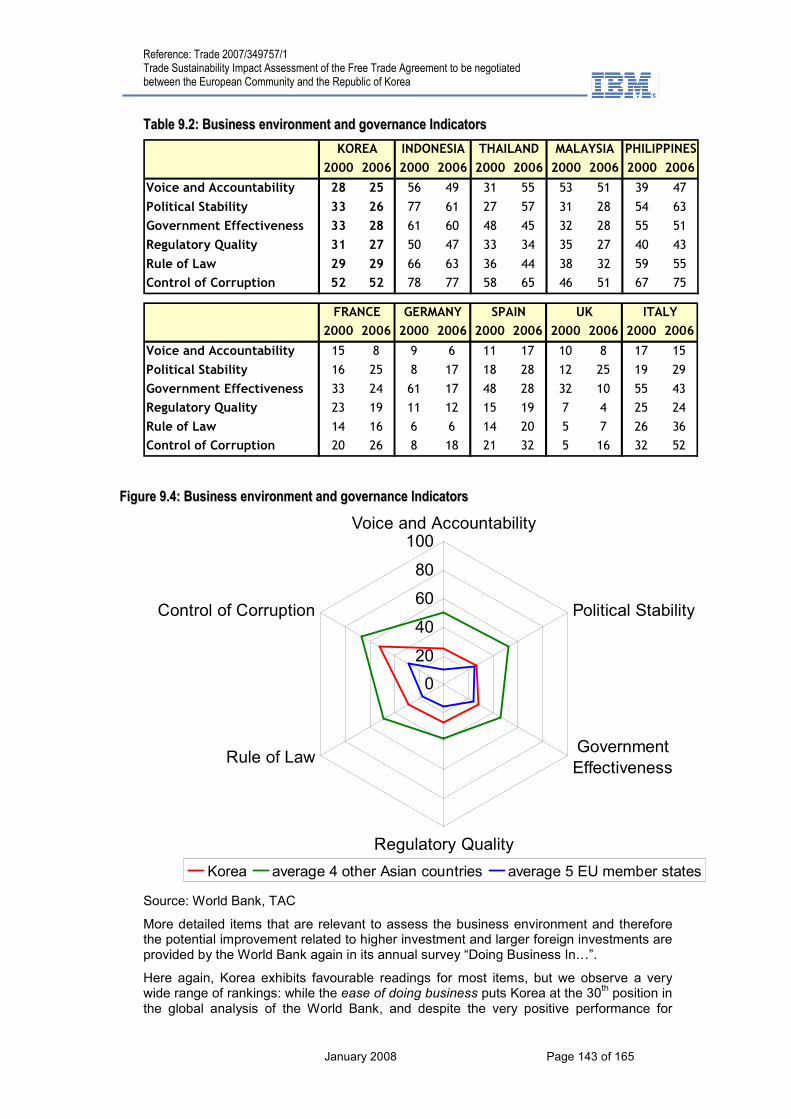
Reference: Trade 2007/349757/1 Trade Sustainability Impact Assessment of the Free Trade Agreement to be negotiated between the European Community and the Republic of Korea
January 2008 Page 143 of 165
TTaabbllee 99..22:: BBuussiinneessss eennvviirroonnmmeenntt aanndd ggoovveerrnnaannccee IInnddiiccaattoorrss
2000 2006 2000 2006 2000 2006 2000 2006 2000 2006
Voice and Accountability 28 25 56 49 31 55 53 51 39 47
Political Stability 33 26 77 61 27 57 31 28 54 63
Government Effectiveness 33 28 61 60 48 45 32 28 55 51
Regulatory Quality 31 27 50 47 33 34 35 27 40 43
Rule of Law 29 29 66 63 36 44 38 32 59 55
Control of Corruption 52 52 78 77 58 65 46 51 67 75
KOREA INDONESIA THAILAND MALAYSIA PHILIPPINES
2000 2006 2000 2006 2000 2006 2000 2006 2000 2006
Voice and Accountability 15 8 9 6 11 17 10 8 17 15
Political Stability 16 25 8 17 18 28 12 25 19 29
Government Effectiveness 33 24 61 17 48 28 32 10 55 43
Regulatory Quality 23 19 11 12 15 19 7 4 25 24
Rule of Law 14 16 6 6 14 20 5 7 26 36
Control of Corruption 20 26 8 18 21 32 5 16 32 52
ITALYFRANCE GERMANY SPAIN UK
FFiigguurree 99..44:: BBuussiinneessss eennvviirroonnmmeenntt aanndd ggoovveerrnnaannccee IInnddiiccaattoorrss
0
20
40
60
80
100Voice and Accountability
Political Stability
Government
Effectiveness
Regulatory Quality
Rule of Law
Control of Corruption
Korea average 4 other Asian countries average 5 EU member states
Source: World Bank, TAC
More detailed items that are relevant to assess the business environment and therefore the potential improvement related to higher investment and larger foreign investments are provided by the World Bank again in its annual survey “Doing Business In…”.
Here again, Korea exhibits favourable readings for most items, but we observe a very wide range of rankings: while the ease of doing business puts Korea at the 30
th position in
the global analysis of the World Bank, and despite the very positive performance for
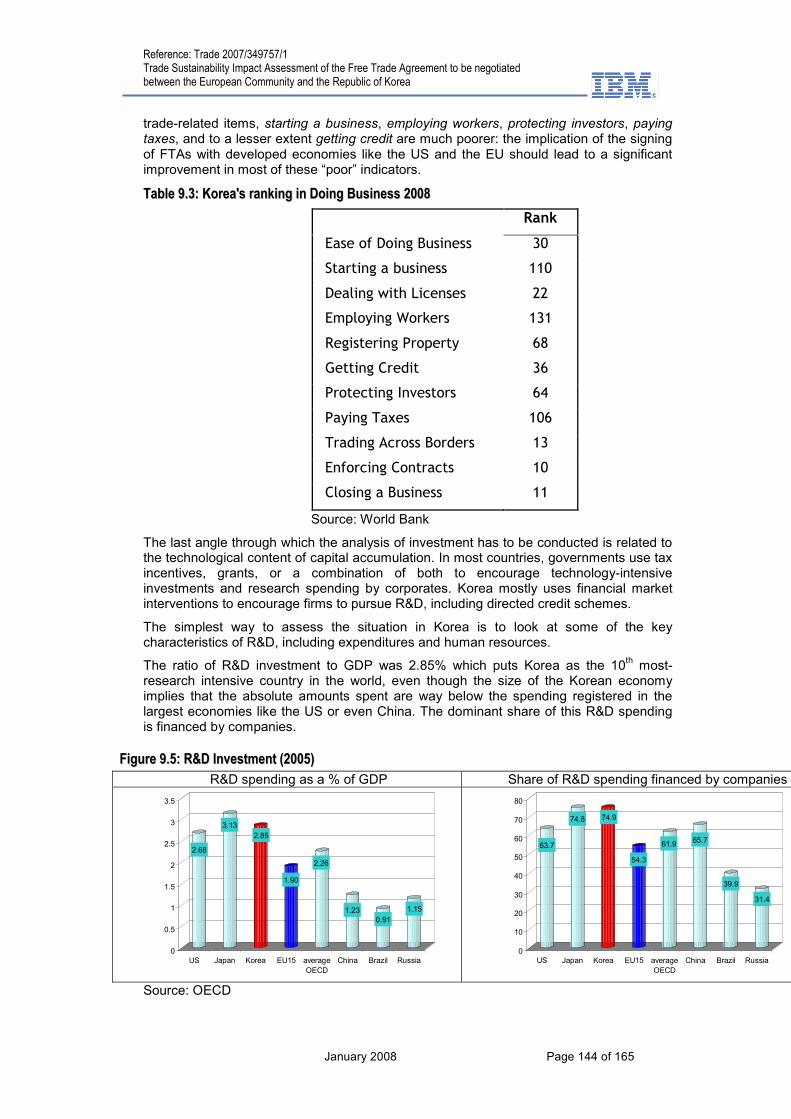
Reference: Trade 2007/349757/1 Trade Sustainability Impact Assessment of the Free Trade Agreement to be negotiated between the European Community and the Republic of Korea
January 2008 Page 144 of 165
trade-related items, starting a business, employing workers, protecting investors, paying taxes, and to a lesser extent getting credit are much poorer: the implication of the signing of FTAs with developed economies like the US and the EU should lead to a significant improvement in most of these “poor” indicators.
TTaabbllee 99..33:: KKoorreeaa''ss rraannkkiinngg iinn DDooiinngg BBuussiinneessss 22000088
Rank
Ease of Doing Business 30
Starting a business 110
Dealing with Licenses 22
Employing Workers 131
Registering Property 68
Getting Credit 36
Protecting Investors 64
Paying Taxes 106
Trading Across Borders 13
Enforcing Contracts 10
Closing a Business 11
Source: World Bank
The last angle through which the analysis of investment has to be conducted is related to the technological content of capital accumulation. In most countries, governments use tax incentives, grants, or a combination of both to encourage technology-intensive investments and research spending by corporates. Korea mostly uses financial market interventions to encourage firms to pursue R&D, including directed credit schemes.
The simplest way to assess the situation in Korea is to look at some of the key characteristics of R&D, including expenditures and human resources.
The ratio of R&D investment to GDP was 2.85% which puts Korea as the 10th most-
research intensive country in the world, even though the size of the Korean economy implies that the absolute amounts spent are way below the spending registered in the largest economies like the US or even China. The dominant share of this R&D spending is financed by companies.
FFiigguurree 99..55:: RR&&DD IInnvveessttmmeenntt ((22000055))
R&D spending as a % of GDP Share of R&D spending financed by companies
2.68
3.13
2.85
1.90
2.26
1.230.91
1.15
0
0.5
1
1.5
2
2.5
3
3.5
US Japan Korea EU15 average
OECD
China Brazil Russia
63.7
74.8 74.9
54.3
61.965.7
39.9
31.4
0
10
20
30
40
50
60
70
80
US Japan Korea EU15 average
OECD
China Brazil Russia
Source: OECD

Reference: Trade 2007/349757/1 Trade Sustainability Impact Assessment of the Free Trade Agreement to be negotiated between the European Community and the Republic of Korea
January 2008 Page 145 of 165
The observation of the number of researchers (divided by the population) points towards the same positive R&D position of Korea, even though with more nuances (for instance, the Korean figure is identical to the OECD average, while it is notably above the average for R&D spending).
TTaabbllee 99..44:: HHuummaann rreessoouurrcceess iinn RR&&DD ((22000055))
number of researchers (per
1000 persons)
US 9.6
Japan 10.4
Korea 6.9
EU15 6.1
average OECD 6.9
China 1.2
Brazil 1
Russia 7.2
Source: OECD
The lower ratios observed for the EU15, compared to Korean R&D efforts, could suggest that the technological spill-over expected from increased investment from the EU would not be very significant. However, the remark about absolute size of the economies, added to the stronger interest of high-tech companies for investing in mature markets (as opposed to commodity-driven foreign investment) lead us to believe that cross-corporate cooperation in technology and research, intra-industry developments and the mutual attraction of a large pool of highly skilled researchers would support Korea’s “full convergence” with the most technology-intensive economies.
FFOORREEIIGGNN DDIIRREECCTT IINNVVEESSTTMMEENNTT
Korea has long been regarded as a country with significant restriction on foreign investment inflows and control of domestic companies by foreign investors.
After the Asian financial crisis of 1997 however, the Korean government launched an aggressive policy to establish an open FDI regime, recognizing that FDI would play an essential role for Korea’s recovery from the financial crisis and sustained economic growth and development. The Foreign Investment Promotion Act (FIPA), enacted in 1998, provides for FDI liberalization and protection. It also provides for various kinds of incentives and measures to improve the business and living conditions for foreign investors.
As of June 2004, 99.8 percent of all business sectors classified under the Korean Standard Industrial Classification have been liberalized for foreign direct investment. Out of 1,058 business sectors, only two – radio broadcasting and television broadcasting – remain wholly restricted, and 26 other sectors are partially restricted to FDI. All types of FDI are currently allowed including company establishment, M&As, acquisition of stocks, and long-term loan. Various kinds of investment incentives have been put in place. For example, with the revision of FIPA in December 2003, site supports were expanded to cover not only the sites of foreign-invested companies, but also various foreign investor facilities such as schools, hospitals, drugstores and residence. Furthermore, foreign-invested enterprises are allowed to take advantage of free land and various tax breaks in the Foreign Investment Zones and Free Economic Zones.
Efforts have been made to improve the business environment by simplifying administrative procedures and establishing cooperative industrial relations. The Foreign Investment Service Centre, whose main function was to provide investment support services for foreign investors, was reorganized into Invest KOREA in 2004. Invest KOREA provides a project-oriented one-stop service where a Project Manager supports foreign investors through the entire range of investment procedures. Furthermore, the Office of Investment Ombudsman (OIO) within Invest KOREA designates a Home Doctor who helps foreign-invested companies resolve any grievances or difficulties they may

Reference: Trade 2007/349757/1 Trade Sustainability Impact Assessment of the Free Trade Agreement to be negotiated between the European Community and the Republic of Korea
January 2008 Page 146 of 165
come across while operating in Korea. In addition, a special support team for labour relations was organized at Invest KOREA in 2004 to help foreign-invested enterprises address labour issues. At the same time, establishing more multi-language schools, facilitating visa extensions, and improving medical services have improved the living conditions for foreign investors.
The 46.5 bn $ of FDI inflows into Korea between 1998 and 2005 were more than double the amount received during the previous 35 years, and much larger than the $10 billion received between 1991 and 1997. As a result, the stock of inward FDI rose from 2% of GDP in 1990 to 8% in 2005, according to UNCTAD (2006).
While the global investment boom during the second half of the 1990s explains some of the increase, a number of factors encouraged the surge in FDI flows to Korea. First, the extensive restructuring in the financial and corporate sectors in the wake of the crisis created a large market for cross-border M&As. More than half of the 30 largest business groups in 1998 either went bankrupt or entered workout programmes Second, the government removed many restrictions on FDI while making vigorous efforts to attract foreign investors. Third, a significant decline in stock and land prices made investment more attractive for foreign investors. Increased FDI inflows played a pivotal role in Korea’s strong recovery following the 1997 crisis by providing significant capital, technology and management skills. Foreign affiliates in Korea accounted for almost a quarter of the increase in manufacturing turnover between 1997 and 2003 and their labour productivity in the manufacturing sector is estimated to be 25% higher than in domestic firms (MOCIE, 2005). However, the role of foreign-affiliated firms in the service sector has been less important.
However, despite these successes, Korea still has a reputation and an image of a “difficult” country for foreign investors. The past few years have seen a steady exit flow from world leaders (Wal-Mart and Carrefour in the retail distribution, Pfizer or Nestlé in manufacturing). The rationale for such exits is not clear, except that these multinationals viewed their potential profit growth and returns as inadequate. The low expectations for future profits have been attributed to a strong “home bias” for consumer and corporate buying behaviour, to the stiff competition by large and medium-sized Korean corporations, and occasionally by a restrictive administrative guidance or regulations.
FDI into Korea were concentrated on a limited number of sectors, with a broad balance between manufacturing (40% of the cumulative flows over 1980-2005) and services (49%). The largest recipient sectors were financial services (23% of total) and electronics (16%).

Reference: Trade 2007/349757/1 Trade Sustainability Impact Assessment of the Free Trade Agreement to be negotiated between the European Community and the Republic of Korea
January 2008 Page 147 of 165
FFiigguurree 99..66:: BBrreeaakkddoowwnn ooff FFDDII iinn KKoorreeaa bbyy sseeccttoorr ((ccuummuullaattiivvee fflloowwss 11998800--22000055))
Others
14%
Business
services
5%
Chemicals
8%
Electronics
16%
Transportation
equipment
7%
Other
manufacturing
12%
Trade /
distribution
11%
Financial
services
22%
Machinery &
equipment
5%
Source: MOFE
The multi-track approach to FTA pursued by the Korean government is heralding a new trade environment. Even though the total global FDI volume is on a steady increase, much of them are concentrated on several countries such as China and the United Kingdom. The UNCTAD’s World Investment Report 2006 also confirms this trend in FDI flows. China’s share in the total global FDI rose from 2.9% in 2000 to 5.4% in 2005. During 2002-2004, 885 R&D investments made in Asia and 723 of them went to China and India.
Against this backdrop, a mid to long term FDI vision and strategy was announced by the Ministry of Commerce Industry and Energy in 2006. The purport of the vision and strategy is to properly address changes in FDI environment, to enhance awareness of FDI and to set up a direction toward FDI attraction. The FDI policy is also focusing on integration with economic policies and actual contribution to the Korean economy.
The universe of international investment agreements (IIAs) continues to grow in number and complexity. In 2006, 73 bilateral investment treaties (BITs), 83 double taxation treaties (DTTs) were concluded in the world. The role of developing countries in international investment rule-making is growing. At the end of 2006, they were party to 76% of all BITs , 61% of all DTTs, and 81% of all other IIAs. For the first time, Republic of Korea takes part in the top 10 signatories of BITs worldwide (with two others developing countries: China and Egypt).
As the following chart shows, the number of BITs and DTTs concluded steadily increases since the 1990s in Korea and European Union. What we could also mostly observe is the high increase in treaties since 2000s in Korea.

Reference: Trade 2007/349757/1 Trade Sustainability Impact Assessment of the Free Trade Agreement to be negotiated between the European Community and the Republic of Korea
January 2008 Page 148 of 165
FFiigguurree 99..77:: NNuummbbeerr ooff BBIITTss aanndd DDTTTTss ccoonncclluuddeedd aanndd ccuummuullaatteedd bbeettwweeeenn 11998800 aanndd 22000066
Bilateral investement and double taxation treaties (cumulative) 1980-2006 in Republic of Korea
0
5
10
15
20
25
1980-1984 1985-1989 1990-1994 1995-1999 2000-2006
Annual BITs and DTTs
0
10
20
30
40
50
60
70
80
Cumulative BITs and DTTs since 1980
Source: UNCTAD
The largest foreign investors in Korea are the EU taken as a whole, the US and Japan: altogether, these three regions account for 77% of the cumulative FDI inflows into Korea over the period 1962-2006. The leading position of the EU as a foreign investor in Korea is related to an average size of investment significantly larger than for the other investors. Indeed, the total number of investment operations from EU countries, over the period 1962-2006, was less than 5,000 against 7,400 operations from the US and 9,350 from Japan, but the average (current) amount of investment per operation was 8.6 mn $ for EU investment, against 4.8 mn $ for US investments, 2.1 mn $ for Japanese, and 1.9 mn $ for all other investors.
FFiigguurree 99..88:: FFoorreeiiggnn iinnvveessttmmeenntt iinn KKoorreeaa bbyy iinnvveessttiinngg ccoouunnttrryy
US
29%
Japan
16%EU
32%
Others
23%
Source: MOFE
Among EU investing countries, the Netherlands have a particular place (35% of all EU FDI in Korea), in relation with the very large investments and co-operations in the electronics industry. The other large investing European countries are Germany (18%), the UK (16%) and France (12%).
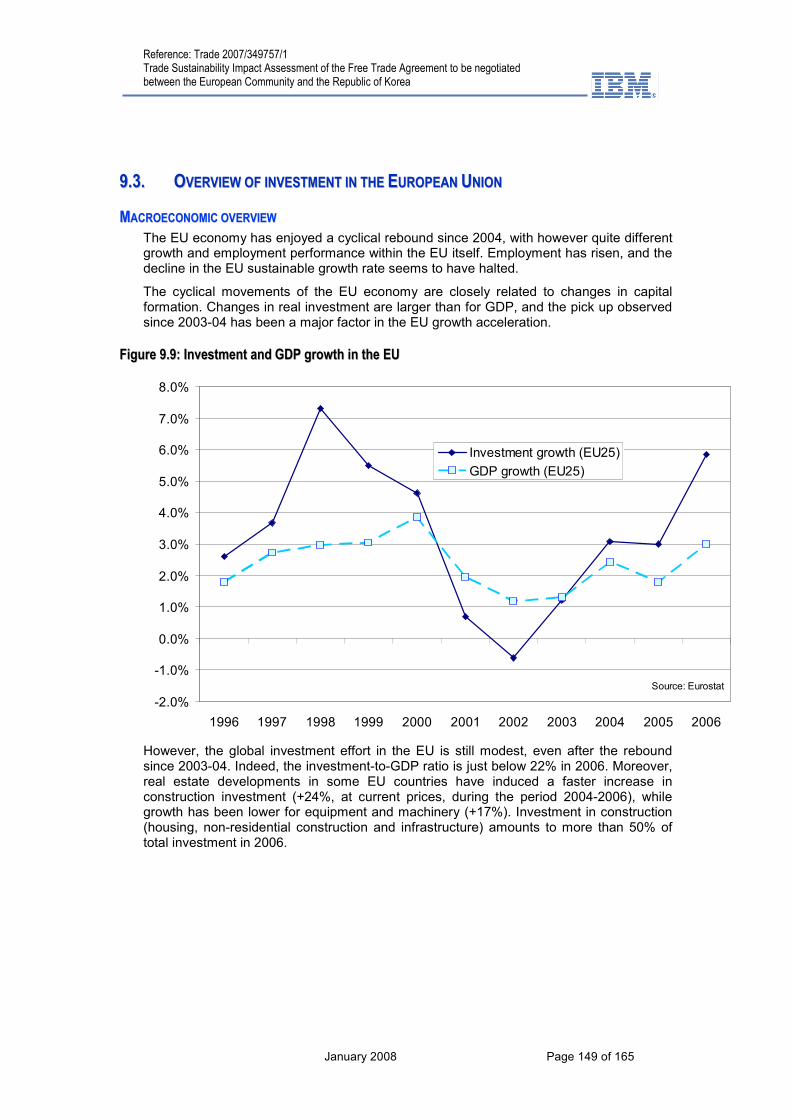
Reference: Trade 2007/349757/1 Trade Sustainability Impact Assessment of the Free Trade Agreement to be negotiated between the European Community and the Republic of Korea
January 2008 Page 149 of 165
99..33.. OOVVEERRVVIIEEWW OOFF IINNVVEESSTTMMEENNTT IINN TTHHEE EEUURROOPPEEAANN UUNNIIOONN
MMAACCRROOEECCOONNOOMMIICC OOVVEERRVVIIEEWW
The EU economy has enjoyed a cyclical rebound since 2004, with however quite different growth and employment performance within the EU itself. Employment has risen, and the decline in the EU sustainable growth rate seems to have halted.
The cyclical movements of the EU economy are closely related to changes in capital formation. Changes in real investment are larger than for GDP, and the pick up observed since 2003-04 has been a major factor in the EU growth acceleration.
FFiigguurree 99..99:: IInnvveessttmmeenntt aanndd GGDDPP ggrroowwtthh iinn tthhee EEUU
-2.0%
-1.0%
0.0%
1.0%
2.0%
3.0%
4.0%
5.0%
6.0%
7.0%
8.0%
1996 1997 1998 1999 2000 2001 2002 2003 2004 2005 2006
Investment growth (EU25)
GDP growth (EU25)
Source: Eurostat
However, the global investment effort in the EU is still modest, even after the rebound since 2003-04. Indeed, the investment-to-GDP ratio is just below 22% in 2006. Moreover, real estate developments in some EU countries have induced a faster increase in construction investment (+24%, at current prices, during the period 2004-2006), while growth has been lower for equipment and machinery (+17%). Investment in construction (housing, non-residential construction and infrastructure) amounts to more than 50% of total investment in 2006.
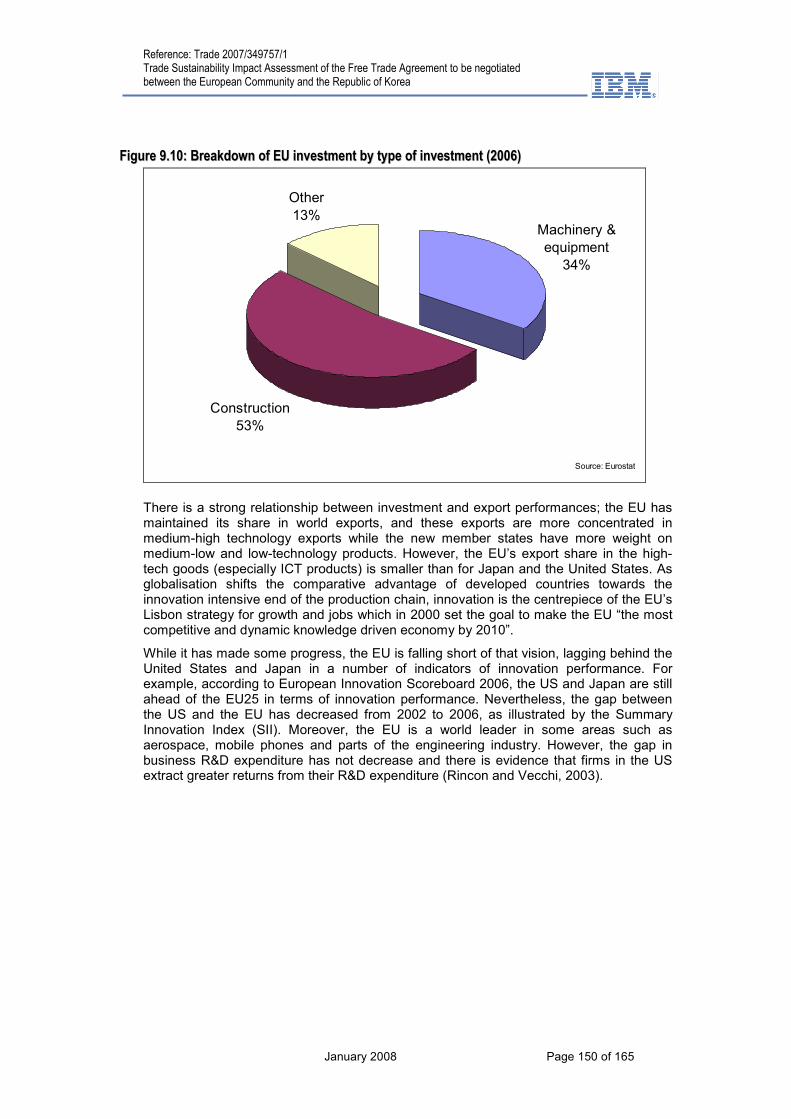
Reference: Trade 2007/349757/1 Trade Sustainability Impact Assessment of the Free Trade Agreement to be negotiated between the European Community and the Republic of Korea
January 2008 Page 150 of 165
FFiigguurree 99..1100:: BBrreeaakkddoowwnn ooff EEUU iinnvveessttmmeenntt bbyy ttyyppee ooff iinnvveessttmmeenntt ((22000066))
Machinery &
equipment
34%
Construction
53%
Other
13%
Source: Eurostat
There is a strong relationship between investment and export performances; the EU has maintained its share in world exports, and these exports are more concentrated in medium-high technology exports while the new member states have more weight on medium-low and low-technology products. However, the EU’s export share in the high-tech goods (especially ICT products) is smaller than for Japan and the United States. As globalisation shifts the comparative advantage of developed countries towards the innovation intensive end of the production chain, innovation is the centrepiece of the EU’s Lisbon strategy for growth and jobs which in 2000 set the goal to make the EU “the most competitive and dynamic knowledge driven economy by 2010”.
While it has made some progress, the EU is falling short of that vision, lagging behind the United States and Japan in a number of indicators of innovation performance. For example, according to European Innovation Scoreboard 2006, the US and Japan are still ahead of the EU25 in terms of innovation performance. Nevertheless, the gap between the US and the EU has decreased from 2002 to 2006, as illustrated by the Summary Innovation Index (SII). Moreover, the EU is a world leader in some areas such as aerospace, mobile phones and parts of the engineering industry. However, the gap in business R&D expenditure has not decrease and there is evidence that firms in the US extract greater returns from their R&D expenditure (Rincon and Vecchi, 2003).

Reference: Trade 2007/349757/1 Trade Sustainability Impact Assessment of the Free Trade Agreement to be negotiated between the European Community and the Republic of Korea
January 2008 Page 151 of 165
FFiigguurree 99..1111:: IInnnnoovvaattiioonn ggaapp bbeettwweeeenn tthhee EEUU aanndd JJaappaann bbyy iinnddiiccaattoorr
Source: European Commission, 2006
FFiigguurree 99..1122:: OOvveerraallll iinnnnoovvaattiioonn ggaapp bbeettwweeeenn tthhee EEUU aanndd JJaappaann,, 22000022--0066
Source: European Commission, 2006
Many developed countries, notably in the EU, have adopted policies to improve their attractiveness for FDI to benefit from the relationship between innovation and foreign investment.
FFOORREEIIGGNN DDIIRREECCTT IINNVVEESSTTMMEENNTT IINN TTHHEE EEUU
Developed-country’s multinational companies remained the leading sources of FDI, accounting for 84% of global outflows in 2006 (According to World Investment Report, 2007). About half of world outflows originated from European Union (EU) countries, notably the UK, France and Spain.
EU inward FDI (excluding intra-EU FDI) declined by 24% between 2001 and 2004, but registered a sharp increase of 77% between 2004 and 2005, from EUR 53 billion to EUR 94 billion.
In terms of stock of inward FDI in the EU, the US is by far the largest investing country (44% of the total), with Switzerland, Japan and Canada amounting to a cumulative share of 23%. The total share of Asian countries in the EU inward FDI stock (figures for the end

Reference: Trade 2007/349757/1 Trade Sustainability Impact Assessment of the Free Trade Agreement to be negotiated between the European Community and the Republic of Korea
January 2008 Page 152 of 165
of 2004) was a modest 8.2%, and Korea’s share was only 0.3%, far below that of Hong Kong (0.8%) and Singapore (1.3%).
Being driven by large operations, Korean FDI inflows have been highly volatile over the recent period, with a range of 195-2,100 mn $ over 2001-2006. One of the most significant changes in Korea’s FDI into the EU is the very rapidly growing number and size of operations in the new member states, which have offered a relatively low-cost production platform within the single market for the large Korean industrial groups.
TTaabbllee 99..55:: KKoorreeaann FFDDII iinn tthhee EEUU ((22000033--22000055))
mn $ 2003 2004 2005 2006
total 193.9 680.6 558.6 1069.9 new member states (NMS) 36 130 335.9 745.8
EU15 157.9 550.6 222.7 324.1
NMS as % of total 18.6% 19.1% 60.1% 69.7%
Source: Korea ExIm Bank
FDI outflows from the EU25 declined modestly in 2006 after two successive years of rapid acceleration. Observed over a longer time period, EU outward FDI have followed two very clear waves, mostly driven by the accession process initiated at the end of the 90s and by a strong increase in FDI to China since 2003-04.
FFiigguurree 99..1133:: DDeevveellooppeedd ccoouunnttrriieess:: FFDDII oouuttfflloowwss,, 11999955--22000066 ((BBiilllliioonnss ooff ddoollllaarrss))
Source: UNCTAD, 2007
According to the World Development Report (2007), services continued to dominate FDI flows between developed countries in 2006.
The importance of manufacturing increased in terms of both target and acquiring firms, while the importance of the primary sector declined compared to 2005. Cross-border M&As in the manufacturing sector of developed countries rose by 45% in terms of sales and by 57% in terms of purchases, led by a significant increase in the metals and metal product, printing and publishing and electrical and electronic equipment industries. M&As in chemicals and chemical products remained the same as in 2005, while the metal industry was the largest recipient in the manufacturing sector in 2006, due to the fact that the largest cross-border M&A deal in 2006 was the acquisition of Arcelor by Mittal.
Finally, services continued to be the main target and acquiring sector for cross-border M&As in developed countries. M&A activity was particularly intense in financial services, mainly due to ongoing financial deregulation and restructuring. M&As also increased significantly in telecommunications and tourism. There was a significant increase in FDI in R&D activities, especially in the pharmaceutical and automotive industries in 2006.
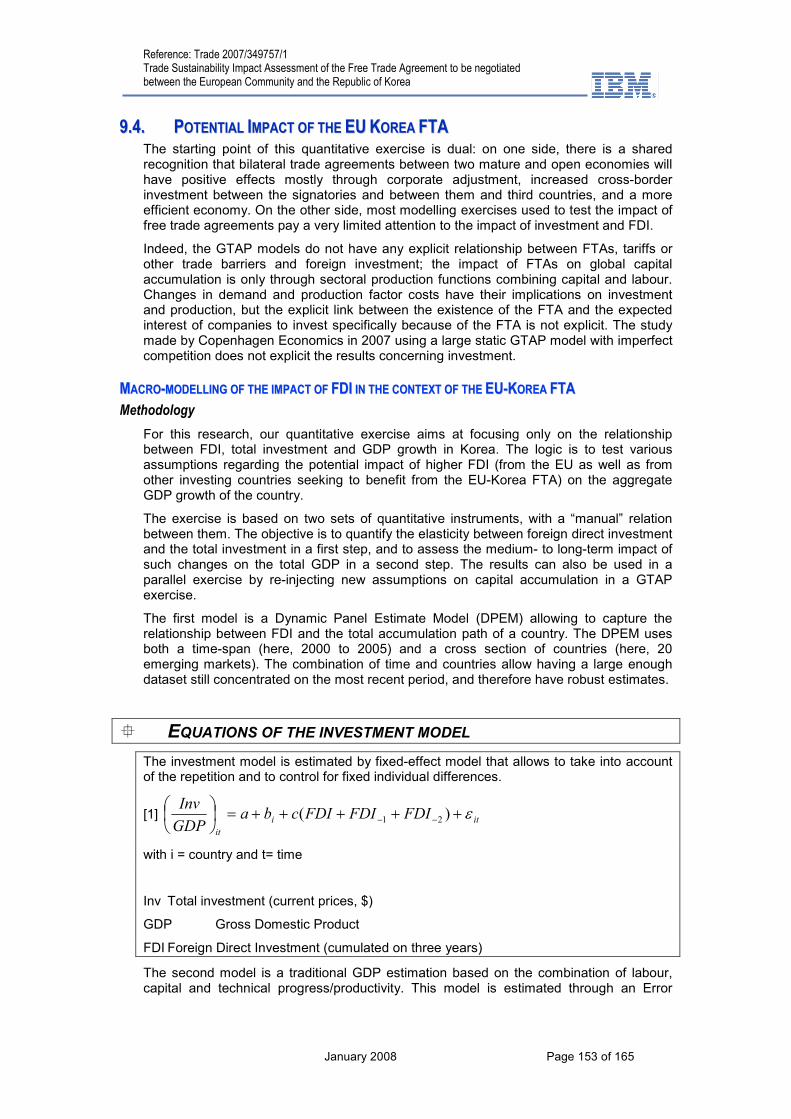
Reference: Trade 2007/349757/1 Trade Sustainability Impact Assessment of the Free Trade Agreement to be negotiated between the European Community and the Republic of Korea
January 2008 Page 153 of 165
99..44.. PPOOTTEENNTTIIAALL IIMMPPAACCTT OOFF TTHHEE EEUU KKOORREEAA FFTTAA The starting point of this quantitative exercise is dual: on one side, there is a shared recognition that bilateral trade agreements between two mature and open economies will have positive effects mostly through corporate adjustment, increased cross-border investment between the signatories and between them and third countries, and a more efficient economy. On the other side, most modelling exercises used to test the impact of free trade agreements pay a very limited attention to the impact of investment and FDI.
Indeed, the GTAP models do not have any explicit relationship between FTAs, tariffs or other trade barriers and foreign investment; the impact of FTAs on global capital accumulation is only through sectoral production functions combining capital and labour. Changes in demand and production factor costs have their implications on investment and production, but the explicit link between the existence of the FTA and the expected interest of companies to invest specifically because of the FTA is not explicit. The study made by Copenhagen Economics in 2007 using a large static GTAP model with imperfect competition does not explicit the results concerning investment.
MMAACCRROO--MMOODDEELLLLIINNGG OOFF TTHHEE IIMMPPAACCTT OOFF FFDDII IINN TTHHEE CCOONNTTEEXXTT OOFF TTHHEE EEUU--KKOORREEAA FFTTAA
Methodology
For this research, our quantitative exercise aims at focusing only on the relationship between FDI, total investment and GDP growth in Korea. The logic is to test various assumptions regarding the potential impact of higher FDI (from the EU as well as from other investing countries seeking to benefit from the EU-Korea FTA) on the aggregate GDP growth of the country.
The exercise is based on two sets of quantitative instruments, with a “manual” relation between them. The objective is to quantify the elasticity between foreign direct investment and the total investment in a first step, and to assess the medium- to long-term impact of such changes on the total GDP in a second step. The results can also be used in a parallel exercise by re-injecting new assumptions on capital accumulation in a GTAP exercise.
The first model is a Dynamic Panel Estimate Model (DPEM) allowing to capture the relationship between FDI and the total accumulation path of a country. The DPEM uses both a time-span (here, 2000 to 2005) and a cross section of countries (here, 20 emerging markets). The combination of time and countries allow having a large enough dataset still concentrated on the most recent period, and therefore have robust estimates.
� EQUATIONS OF THE INVESTMENT MODEL
The investment model is estimated by fixed-effect model that allows to take into account of the repetition and to control for fixed individual differences.
[1] iti
it
FDIFDIFDIcbaGDP
Invε+++++=
−− )( 21
with i = country and t= time
Inv Total investment (current prices, $)
GDP Gross Domestic Product
FDI Foreign Direct Investment (cumulated on three years)
The second model is a traditional GDP estimation based on the combination of labour, capital and technical progress/productivity. This model is estimated through an Error
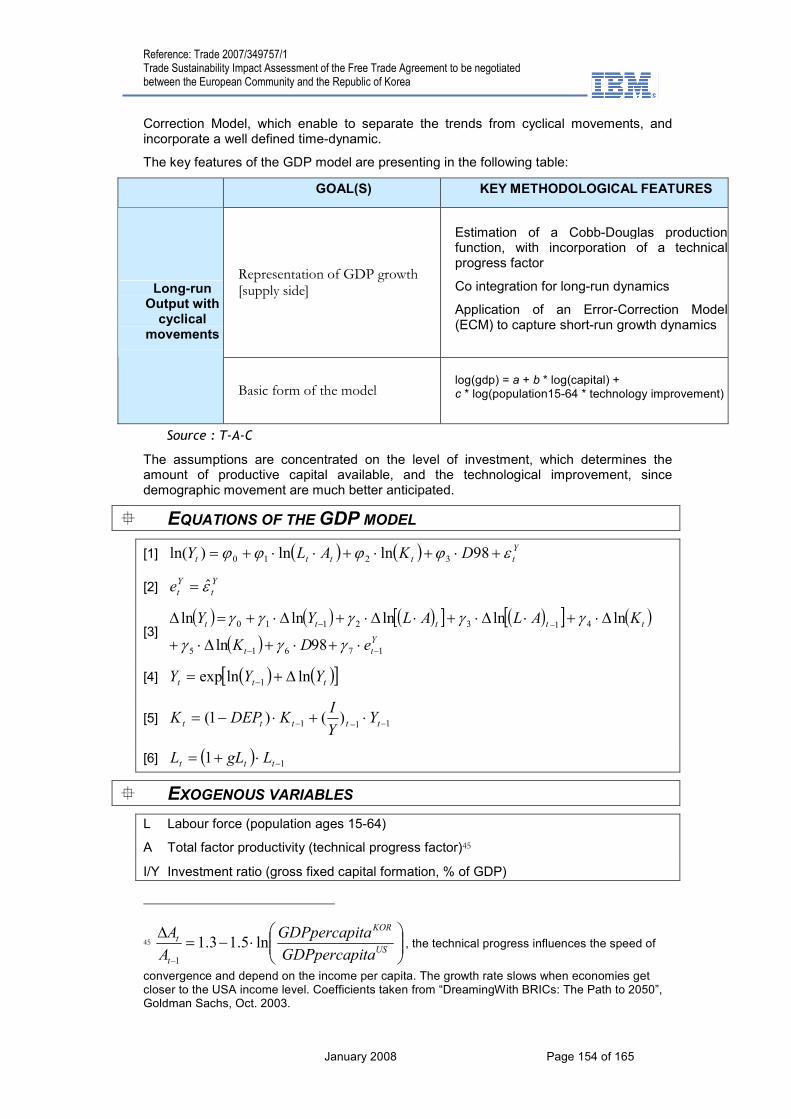
Reference: Trade 2007/349757/1 Trade Sustainability Impact Assessment of the Free Trade Agreement to be negotiated between the European Community and the Republic of Korea
January 2008 Page 154 of 165
Correction Model, which enable to separate the trends from cyclical movements, and incorporate a well defined time-dynamic.
The key features of the GDP model are presenting in the following table:
GOAL(S) KEY METHODOLOGICAL FEATURES
Representation of GDP growth [supply side]
Estimation of a Cobb-Douglas production function, with incorporation of a technical progress factor
Co integration for long-run dynamics
Application of an Error-Correction Model (ECM) to capture short-run growth dynamics
Long-run Output with cyclical
movements
Basic form of the model log(gdp) = a + b * log(capital) + c * log(population15-64 * technology improvement)
Source : T-A-C
The assumptions are concentrated on the level of investment, which determines the amount of productive capital available, and the technological improvement, since demographic movement are much better anticipated.
� EQUATIONS OF THE GDP MODEL
[1] ( ) ( ) Y
ttttt DKALY εϕϕϕϕ +⋅+⋅+⋅⋅+= 98lnln)ln( 3210
[2] Y
t
Y
te ε̂=
[3] ( ) ( ) ( )[ ] ( )[ ] ( )
( ) Y
tt
ttttt
eDK
KALALYY
17615
4132110
98ln
lnlnlnlnln
−−
−−
⋅+⋅+∆⋅+
∆⋅+⋅∆⋅+⋅∆⋅+∆⋅+=∆
γγγ
γγγγγ
[4] ( ) ( )[ ]ttt YYY lnlnexp 1 ∆+= −
[5] 111 )()1( −−− ⋅+⋅−= ttttt YY
IKDEPK
[6] ( ) 11 −⋅+= ttt LgLL
� EXOGENOUS VARIABLES
L Labour force (population ages 15-64)
A Total factor productivity (technical progress factor)45
I/Y Investment ratio (gross fixed capital formation, % of GDP)
45
⋅−=
∆
−US
KOR
t
t
taGDPpercapi
taGDPpercapi
A
Aln5.13.1
1
, the technical progress influences the speed of
convergence and depend on the income per capita. The growth rate slows when economies get closer to the USA income level. Coefficients taken from “DreamingWith BRICs: The Path to 2050”, Goldman Sachs, Oct. 2003.
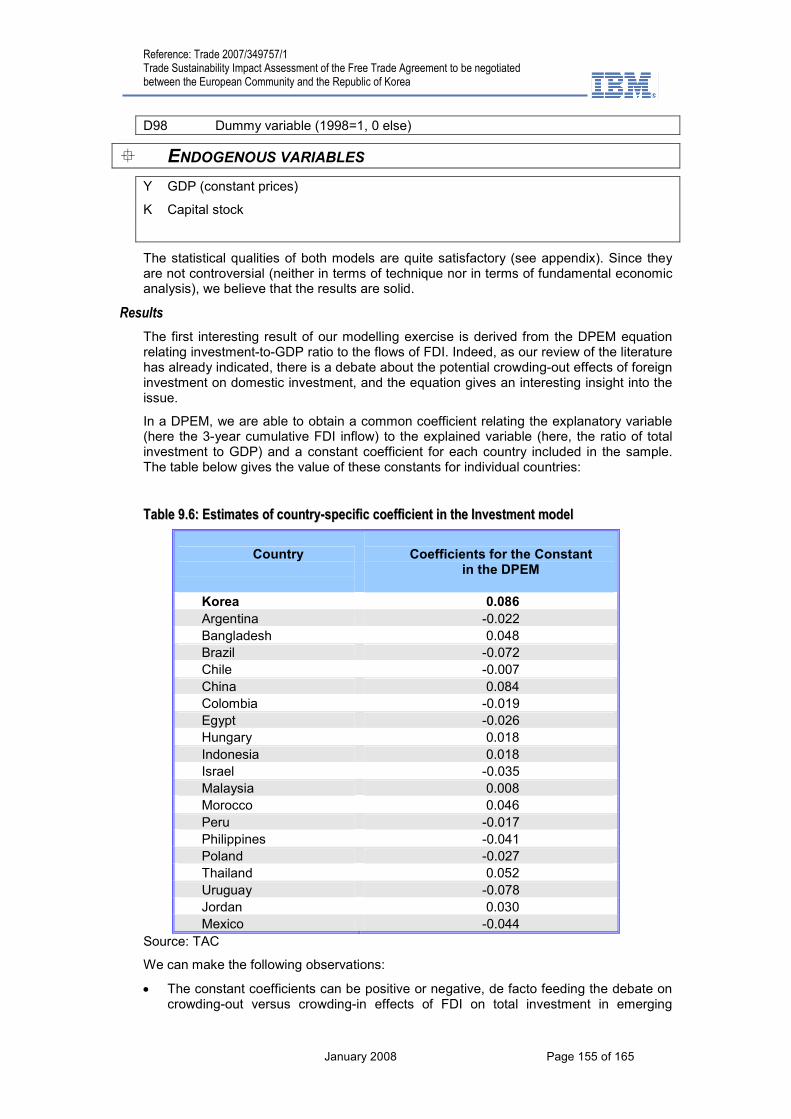
Reference: Trade 2007/349757/1 Trade Sustainability Impact Assessment of the Free Trade Agreement to be negotiated between the European Community and the Republic of Korea
January 2008 Page 155 of 165
D98 Dummy variable (1998=1, 0 else)
� ENDOGENOUS VARIABLES
Y GDP (constant prices)
K Capital stock
The statistical qualities of both models are quite satisfactory (see appendix). Since they are not controversial (neither in terms of technique nor in terms of fundamental economic analysis), we believe that the results are solid.
Results
The first interesting result of our modelling exercise is derived from the DPEM equation relating investment-to-GDP ratio to the flows of FDI. Indeed, as our review of the literature has already indicated, there is a debate about the potential crowding-out effects of foreign investment on domestic investment, and the equation gives an interesting insight into the issue.
In a DPEM, we are able to obtain a common coefficient relating the explanatory variable (here the 3-year cumulative FDI inflow) to the explained variable (here, the ratio of total investment to GDP) and a constant coefficient for each country included in the sample. The table below gives the value of these constants for individual countries:
TTaabbllee 99..66:: EEssttiimmaatteess ooff ccoouunnttrryy--ssppeecciiffiicc ccooeeffffiicciieenntt iinn tthhee IInnvveessttmmeenntt mmooddeell
Country
Coefficients for the Constant
in the DPEM
Korea 0.086
Argentina -0.022
Bangladesh 0.048
Brazil -0.072
Chile -0.007
China 0.084
Colombia -0.019
Egypt -0.026
Hungary 0.018
Indonesia 0.018
Israel -0.035
Malaysia 0.008
Morocco 0.046
Peru -0.017
Philippines -0.041
Poland -0.027
Thailand 0.052
Uruguay -0.078
Jordan 0.030
Mexico -0.044
Source: TAC
We can make the following observations:
• The constant coefficients can be positive or negative, de facto feeding the debate on crowding-out versus crowding-in effects of FDI on total investment in emerging
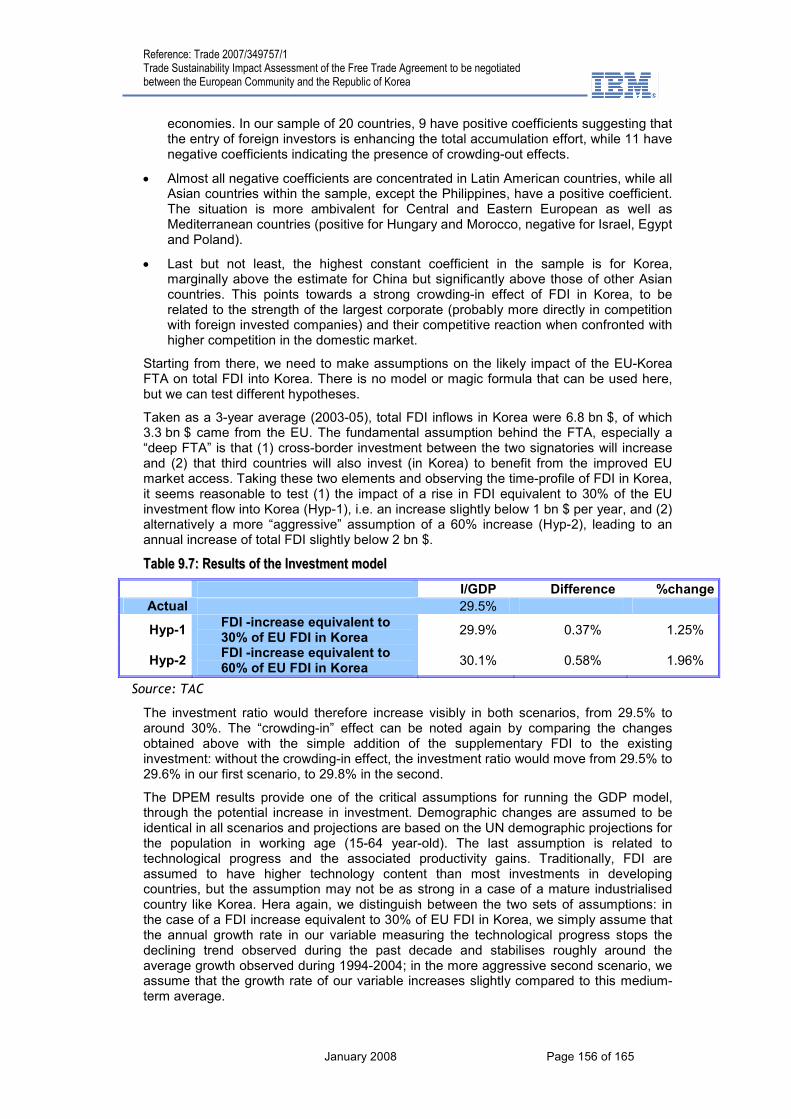
Reference: Trade 2007/349757/1 Trade Sustainability Impact Assessment of the Free Trade Agreement to be negotiated between the European Community and the Republic of Korea
January 2008 Page 156 of 165
economies. In our sample of 20 countries, 9 have positive coefficients suggesting that the entry of foreign investors is enhancing the total accumulation effort, while 11 have negative coefficients indicating the presence of crowding-out effects.
• Almost all negative coefficients are concentrated in Latin American countries, while all Asian countries within the sample, except the Philippines, have a positive coefficient. The situation is more ambivalent for Central and Eastern European as well as Mediterranean countries (positive for Hungary and Morocco, negative for Israel, Egypt and Poland).
• Last but not least, the highest constant coefficient in the sample is for Korea, marginally above the estimate for China but significantly above those of other Asian countries. This points towards a strong crowding-in effect of FDI in Korea, to be related to the strength of the largest corporate (probably more directly in competition with foreign invested companies) and their competitive reaction when confronted with higher competition in the domestic market.
Starting from there, we need to make assumptions on the likely impact of the EU-Korea FTA on total FDI into Korea. There is no model or magic formula that can be used here, but we can test different hypotheses.
Taken as a 3-year average (2003-05), total FDI inflows in Korea were 6.8 bn $, of which 3.3 bn $ came from the EU. The fundamental assumption behind the FTA, especially a “deep FTA” is that (1) cross-border investment between the two signatories will increase and (2) that third countries will also invest (in Korea) to benefit from the improved EU market access. Taking these two elements and observing the time-profile of FDI in Korea, it seems reasonable to test (1) the impact of a rise in FDI equivalent to 30% of the EU investment flow into Korea (Hyp-1), i.e. an increase slightly below 1 bn $ per year, and (2) alternatively a more “aggressive” assumption of a 60% increase (Hyp-2), leading to an annual increase of total FDI slightly below 2 bn $.
TTaabbllee 99..77:: RReessuullttss ooff tthhee IInnvveessttmmeenntt mmooddeell
I/GDP Difference %change
Actual 29.5%
Hyp-1 FDI -increase equivalent to 30% of EU FDI in Korea
29.9% 0.37% 1.25%
Hyp-2 FDI -increase equivalent to 60% of EU FDI in Korea
30.1% 0.58% 1.96%
Source: TAC
The investment ratio would therefore increase visibly in both scenarios, from 29.5% to around 30%. The “crowding-in” effect can be noted again by comparing the changes obtained above with the simple addition of the supplementary FDI to the existing investment: without the crowding-in effect, the investment ratio would move from 29.5% to 29.6% in our first scenario, to 29.8% in the second.
The DPEM results provide one of the critical assumptions for running the GDP model, through the potential increase in investment. Demographic changes are assumed to be identical in all scenarios and projections are based on the UN demographic projections for the population in working age (15-64 year-old). The last assumption is related to technological progress and the associated productivity gains. Traditionally, FDI are assumed to have higher technology content than most investments in developing countries, but the assumption may not be as strong in a case of a mature industrialised country like Korea. Hera again, we distinguish between the two sets of assumptions: in the case of a FDI increase equivalent to 30% of EU FDI in Korea, we simply assume that the annual growth rate in our variable measuring the technological progress stops the declining trend observed during the past decade and stabilises roughly around the average growth observed during 1994-2004; in the more aggressive second scenario, we assume that the growth rate of our variable increases slightly compared to this medium-term average.
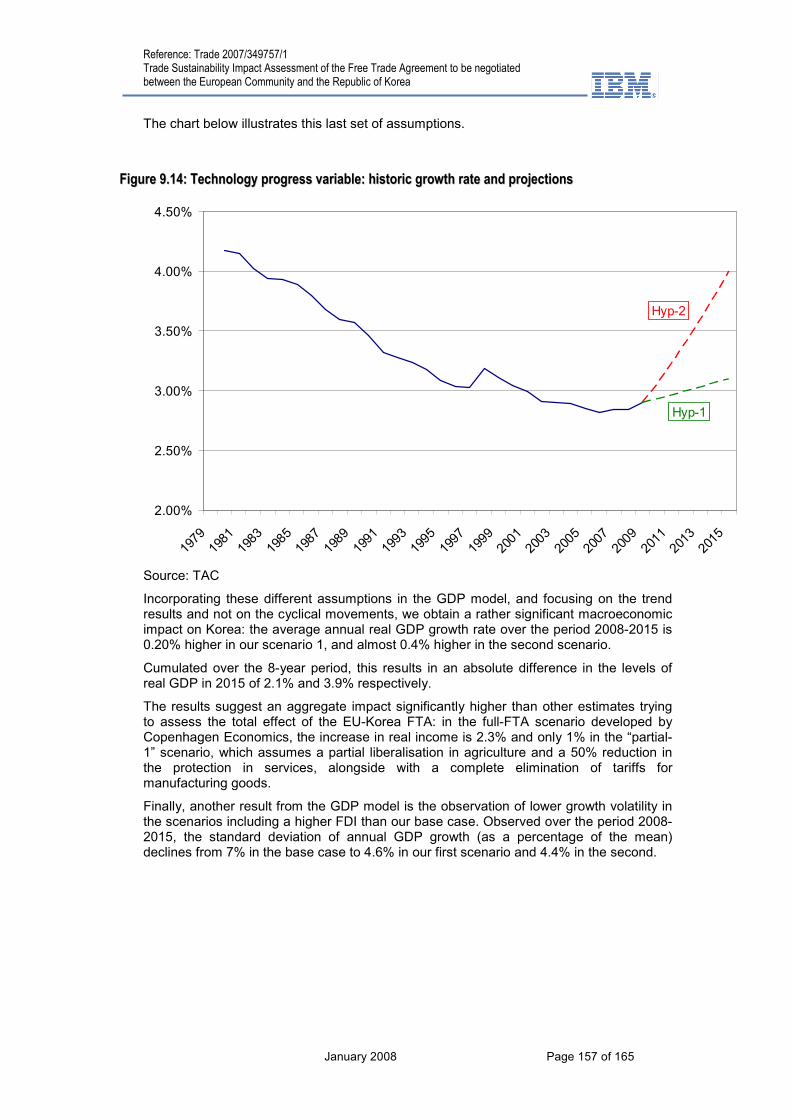
Reference: Trade 2007/349757/1 Trade Sustainability Impact Assessment of the Free Trade Agreement to be negotiated between the European Community and the Republic of Korea
January 2008 Page 157 of 165
The chart below illustrates this last set of assumptions.
FFiigguurree 99..1144:: TTeecchhnnoollooggyy pprrooggrreessss vvaarriiaabbllee:: hhiissttoorriicc ggrroowwtthh rraattee aanndd pprroojjeeccttiioonnss
2.00%
2.50%
3.00%
3.50%
4.00%
4.50%
1979
1981
1983
1985
1987
1989
1991
1993
1995
1997
1999
2001
2003
2005
2007
2009
2011
2013
2015
Hyp-2
Hyp-1
Source: TAC
Incorporating these different assumptions in the GDP model, and focusing on the trend results and not on the cyclical movements, we obtain a rather significant macroeconomic impact on Korea: the average annual real GDP growth rate over the period 2008-2015 is 0.20% higher in our scenario 1, and almost 0.4% higher in the second scenario.
Cumulated over the 8-year period, this results in an absolute difference in the levels of real GDP in 2015 of 2.1% and 3.9% respectively.
The results suggest an aggregate impact significantly higher than other estimates trying to assess the total effect of the EU-Korea FTA: in the full-FTA scenario developed by Copenhagen Economics, the increase in real income is 2.3% and only 1% in the “partial-1” scenario, which assumes a partial liberalisation in agriculture and a 50% reduction in the protection in services, alongside with a complete elimination of tariffs for manufacturing goods.
Finally, another result from the GDP model is the observation of lower growth volatility in the scenarios including a higher FDI than our base case. Observed over the period 2008-2015, the standard deviation of annual GDP growth (as a percentage of the mean) declines from 7% in the base case to 4.6% in our first scenario and 4.4% in the second.
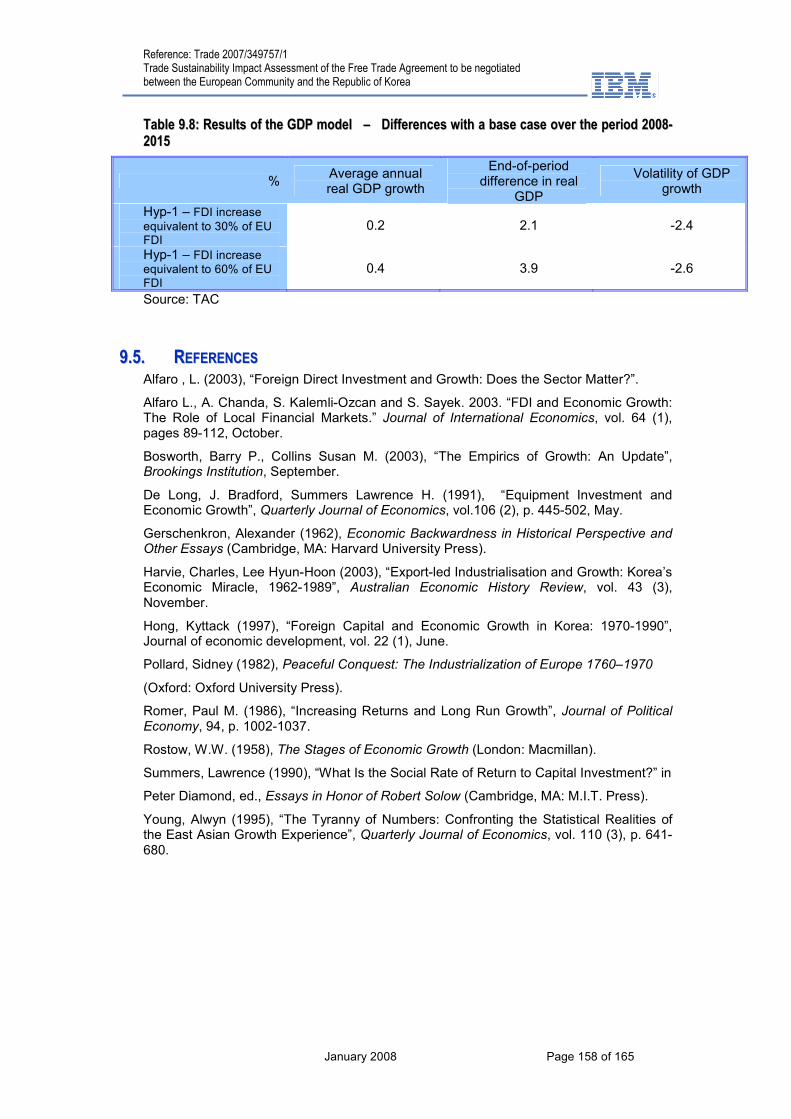
Reference: Trade 2007/349757/1 Trade Sustainability Impact Assessment of the Free Trade Agreement to be negotiated between the European Community and the Republic of Korea
January 2008 Page 158 of 165
TTaabbllee 99..88:: RReessuullttss ooff tthhee GGDDPP mmooddeell –– DDiiffffeerreenncceess wwiitthh aa bbaassee ccaassee oovveerr tthhee ppeerriioodd 22000088--22001155
% Average annual real GDP growth
End-of-period difference in real
GDP
Volatility of GDP growth
Hyp-1 – FDI increase equivalent to 30% of EU FDI
0.2 2.1 -2.4
Hyp-1 – FDI increase equivalent to 60% of EU FDI
0.4 3.9 -2.6
Source: TAC
99..55.. RREEFFEERREENNCCEESS Alfaro , L. (2003), “Foreign Direct Investment and Growth: Does the Sector Matter?”.
Alfaro L., A. Chanda, S. Kalemli-Ozcan and S. Sayek. 2003. “FDI and Economic Growth: The Role of Local Financial Markets.” Journal of International Economics, vol. 64 (1), pages 89-112, October.
Bosworth, Barry P., Collins Susan M. (2003), “The Empirics of Growth: An Update”, Brookings Institution, September.
De Long, J. Bradford, Summers Lawrence H. (1991), “Equipment Investment and Economic Growth”, Quarterly Journal of Economics, vol.106 (2), p. 445-502, May.
Gerschenkron, Alexander (1962), Economic Backwardness in Historical Perspective and Other Essays (Cambridge, MA: Harvard University Press).
Harvie, Charles, Lee Hyun-Hoon (2003), “Export-led Industrialisation and Growth: Korea’s Economic Miracle, 1962-1989”, Australian Economic History Review, vol. 43 (3), November.
Hong, Kyttack (1997), “Foreign Capital and Economic Growth in Korea: 1970-1990”, Journal of economic development, vol. 22 (1), June.
Pollard, Sidney (1982), Peaceful Conquest: The Industrialization of Europe 1760–1970
(Oxford: Oxford University Press).
Romer, Paul M. (1986), “Increasing Returns and Long Run Growth”, Journal of Political Economy, 94, p. 1002-1037.
Rostow, W.W. (1958), The Stages of Economic Growth (London: Macmillan).
Summers, Lawrence (1990), “What Is the Social Rate of Return to Capital Investment?” in
Peter Diamond, ed., Essays in Honor of Robert Solow (Cambridge, MA: M.I.T. Press).
Young, Alwyn (1995), “The Tyranny of Numbers: Confronting the Statistical Realities of the East Asian Growth Experience”, Quarterly Journal of Economics, vol. 110 (3), p. 641-680.
Reference: Trade 2007/349757/1 Trade Sustainability Impact Assessment of the Free Trade Agreement to be negotiated between the European Community and the Republic of Korea
January 2008 Page 159 of 165
1100.. GGLLOOBBAALL AANNAALLYYSSIISS
1100..11.. MMEETTHHOODDOOLLOOGGYY The analysis of the global impact of a potential FTA agreement between EU and Korea has already been done by a number of actors: the KIEP (2005), Pukyong (2006), Copenhagen Economics (March, 2007), the CEPS (November, 2007). Most of the times, the overall gains are estimated to be quite low for Korea and negligible for EU.
This study is following a previous one written by Copenhagen Economics and the professor François. They did many calculations in order to evaluate the overall economic impact of an FTA over for Korea and EU, through a highly technical GTAP model. Again, all the results that they obtain are calculated through the GTAP database 6 and general equilibrium model (CGE model), a framework that is widely used to evaluate the impact of such FTA agreements. This particular version of CGE model is a multi-country and multi-sector general equilibrium model with a very large database and a set of exogenous variables on trade tariffs that allow testing various liberalisation assumptions. But when Copenhagen Economics did their evaluation, the GTAP 7 was not yet available and all the calculations were made by using the version 6 that is using very old data (data for 2001). Unfortunately the GTAP 7 database that was expected to be deliverable at the end of 2007 and would allow a major update of the Copenhagen Economics results was not ready in January 2008 and it should only be available in mid-2008. Consequently, the reference database that is used in our simulations is the same as in the previous study (the GTAP database version 6.2 with 2001 data).
It should be noted that if CGE models and particularly the GTAP model are widely used to evaluate the global impact of FTA over regions are also widely criticized by many academic researchers (Kehoe, 2002; McKitrick, 1998; Jorgenson, 1984). The main criticism is usually about the parameters that are used in these models and on the fact that the results should always be used with caution. As for econometric models, the accuracy of such CGE models depends highly on the accuracy of the equation and parameters. But, for example, the trade elasticities are not always estimated precisely econometrically. Then any error or dynamic change of the parameter over the evaluation period could have a great impact on the results (see Lucas Critique).
In the following section we will successively present the assumptions and guidelines that we used to run our GTAP evaluation process, the results of the simulations and finally a brief comparison with the results obtained in other studies.
1100..22.. AASSSSUUMMPPTTIIOONNSS FFOORR TTHHEE MMOODDEELLLLIINNGG EEXXEERRCCIISSEE The basic principle of this global modelling exercise is to evaluate the global impact of an EU/Korea FTA through a GTAP framework. In order not to do again something that had already been done, we start from the Copenhagen Economics study that had been done in March 2007. Then, the idea is on one side to reproduce the results obtained on the different scenarios tested by professor François and on the other side to try to understand the impact of some parameters and finally to go further on various assumption and GTAP model parameters.
As pointed out by the previous study there is a big problem with the GTAP 6.2 database on services as all these tariff lines are equal to zero. Copenhagen Economics are using their own estimated tariff in place of these “missing” figures. These new figures were estimated by using a panel of countries and imports estimated through a Gravity Model. Then, any difference on imports that is not explained directly by a variable in the model is implicitly assumed to represent a tariff barrier. All the calculations are done by using a combination of GTAP elasticity of substitution and the results obtained from the Gravity Model. On the basis of this model, the tariff barrier on services in Korea is very high (46%) and much lower in EU25 (17%). This is a crucial element as the initial GTAP database does not include any tariff on services between EU and Korea.
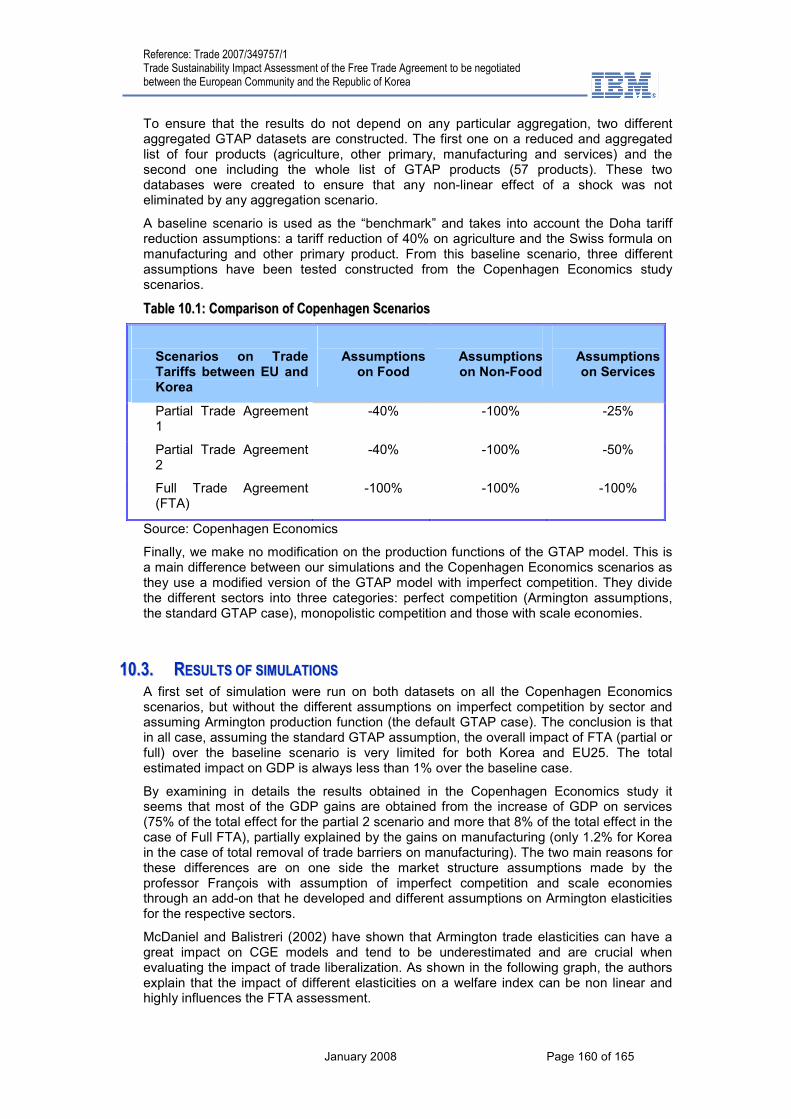
Reference: Trade 2007/349757/1 Trade Sustainability Impact Assessment of the Free Trade Agreement to be negotiated between the European Community and the Republic of Korea
January 2008 Page 160 of 165
To ensure that the results do not depend on any particular aggregation, two different aggregated GTAP datasets are constructed. The first one on a reduced and aggregated list of four products (agriculture, other primary, manufacturing and services) and the second one including the whole list of GTAP products (57 products). These two databases were created to ensure that any non-linear effect of a shock was not eliminated by any aggregation scenario.
A baseline scenario is used as the “benchmark” and takes into account the Doha tariff reduction assumptions: a tariff reduction of 40% on agriculture and the Swiss formula on manufacturing and other primary product. From this baseline scenario, three different assumptions have been tested constructed from the Copenhagen Economics study scenarios.
TTaabbllee 1100..11:: CCoommppaarriissoonn ooff CCooppeennhhaaggeenn SScceennaarriiooss
Scenarios on Trade Tariffs between EU and Korea
Assumptions on Food
Assumptions on Non-Food
Assumptions on Services
Partial Trade Agreement 1
-40% -100% -25%
Partial Trade Agreement 2
-40% -100% -50%
Full Trade Agreement (FTA)
-100% -100% -100%
Source: Copenhagen Economics
Finally, we make no modification on the production functions of the GTAP model. This is a main difference between our simulations and the Copenhagen Economics scenarios as they use a modified version of the GTAP model with imperfect competition. They divide the different sectors into three categories: perfect competition (Armington assumptions, the standard GTAP case), monopolistic competition and those with scale economies.
1100..33.. RREESSUULLTTSS OOFF SSIIMMUULLAATTIIOONNSS A first set of simulation were run on both datasets on all the Copenhagen Economics scenarios, but without the different assumptions on imperfect competition by sector and assuming Armington production function (the default GTAP case). The conclusion is that in all case, assuming the standard GTAP assumption, the overall impact of FTA (partial or full) over the baseline scenario is very limited for both Korea and EU25. The total estimated impact on GDP is always less than 1% over the baseline case.
By examining in details the results obtained in the Copenhagen Economics study it seems that most of the GDP gains are obtained from the increase of GDP on services (75% of the total effect for the partial 2 scenario and more that 8% of the total effect in the case of Full FTA), partially explained by the gains on manufacturing (only 1.2% for Korea in the case of total removal of trade barriers on manufacturing). The two main reasons for these differences are on one side the market structure assumptions made by the professor François with assumption of imperfect competition and scale economies through an add-on that he developed and different assumptions on Armington elasticities for the respective sectors.
McDaniel and Balistreri (2002) have shown that Armington trade elasticities can have a great impact on CGE models and tend to be underestimated and are crucial when evaluating the impact of trade liberalization. As shown in the following graph, the authors explain that the impact of different elasticities on a welfare index can be non linear and highly influences the FTA assessment.
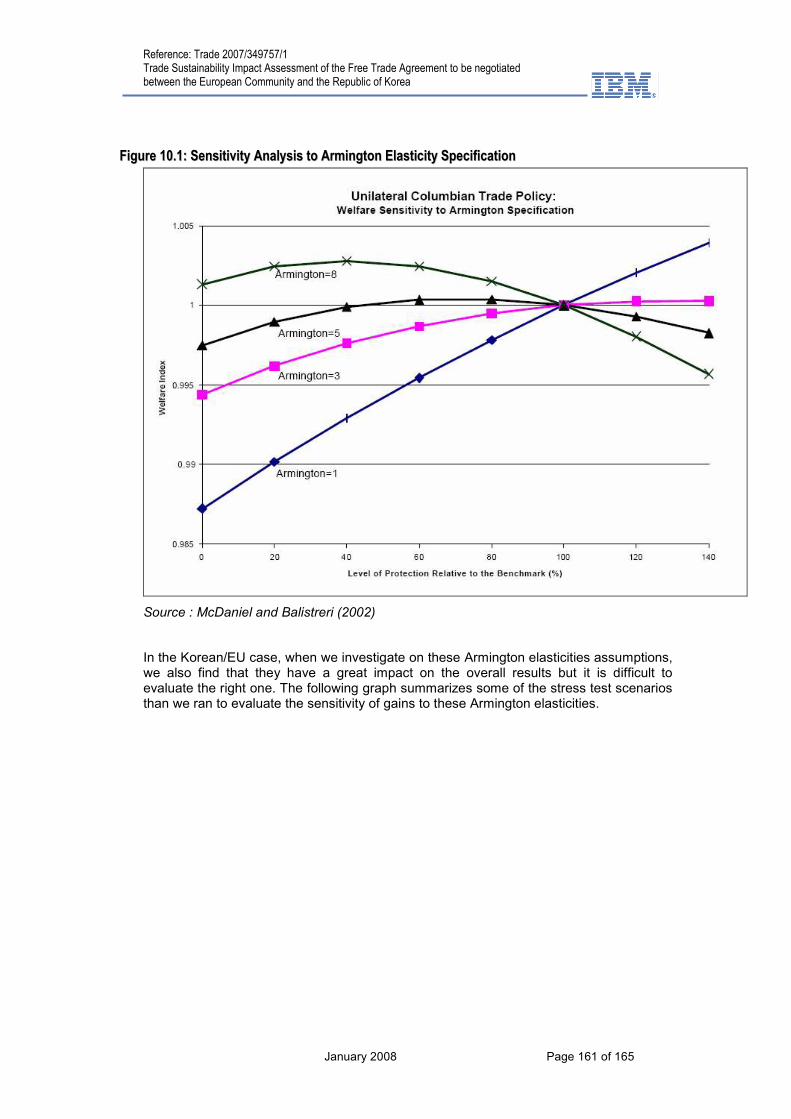
Reference: Trade 2007/349757/1 Trade Sustainability Impact Assessment of the Free Trade Agreement to be negotiated between the European Community and the Republic of Korea
January 2008 Page 161 of 165
FFiigguurree 1100..11:: SSeennssiittiivviittyy AAnnaallyyssiiss ttoo AArrmmiinnggttoonn EEllaassttiicciittyy SSppeecciiffiiccaattiioonn
Source : McDaniel and Balistreri (2002)
In the Korean/EU case, when we investigate on these Armington elasticities assumptions, we also find that they have a great impact on the overall results but it is difficult to evaluate the right one. The following graph summarizes some of the stress test scenarios than we ran to evaluate the sensitivity of gains to these Armington elasticities.

Reference: Trade 2007/349757/1 Trade Sustainability Impact Assessment of the Free Trade Agreement to be negotiated between the European Community and the Republic of Korea
January 2008 Page 162 of 165
FFiigguurree 1100..22:: IImmppaacctt ooff AArrmmiinnggttoonn TTrraaddee EEllaassttiicciittiieess oonn SSeerrvviicceess
Source: Consultant
The results that are presented on the previous graph show again that in the case of an EU/Korea FTA, the overall economic impact is expected to be low for both Korea and EU and highly sensitive to the assumptions on market structure (perfect competition or monopoly) and Armington trade elasticities.
1100..44.. CCOOMMPPAARRIISSOONN WWIITTHH OOTTHHEERR SSTTUUDDIIEESS As mentioned earlier, many studies already evaluated the overall potential economic impact of an FTA between EU and Korea.
• The first one, written by the KIEP in 2005 uses a standard GTAP model augmented with capital accumulation effects. They define three scenarios, with a central one that seem to the Partial 2 scenario developed by Copenhagen Economics.
• The second one, written by Pukyong in 2006, is mentioned by the Centre for European Policy Studies in their report on “Qualitative Analysis of a Potential Free Trade Agreement between the European Union and South Korea”, written in November 2007. They use a dynamic but more restrictive version of the GTAP model (GDyn).
• The Copenhagen Economic study was written in 2007 and uses intensively the GTAP 6 database and model. The professor Francois also uses an add-on to introduce imperfect competition and economies of scale on various sectors.
• Finally, the SIA team developed two frameworks, the first one using a standard GTAP Armington model without any adjustment on elasticities and a second one with different assumptions on Armington elasticities. As an illustrative example, we also
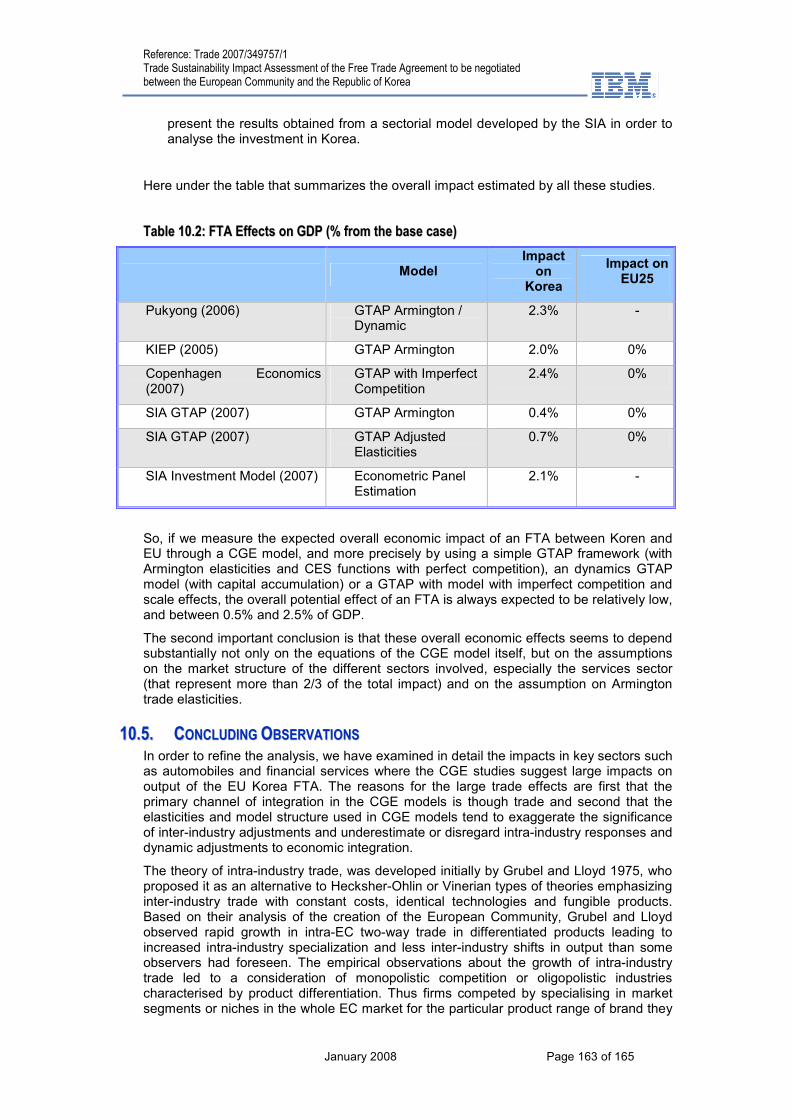
Reference: Trade 2007/349757/1 Trade Sustainability Impact Assessment of the Free Trade Agreement to be negotiated between the European Community and the Republic of Korea
January 2008 Page 163 of 165
present the results obtained from a sectorial model developed by the SIA in order to analyse the investment in Korea.
Here under the table that summarizes the overall impact estimated by all these studies.
TTaabbllee 1100..22:: FFTTAA EEffffeeccttss oonn GGDDPP ((%% ffrroomm tthhee bbaassee ccaassee))
Model Impact on
Korea
Impact on EU25
Pukyong (2006) GTAP Armington / Dynamic
2.3% -
KIEP (2005) GTAP Armington 2.0% 0%
Copenhagen Economics (2007)
GTAP with Imperfect Competition
2.4% 0%
SIA GTAP (2007) GTAP Armington 0.4% 0%
SIA GTAP (2007) GTAP Adjusted Elasticities
0.7% 0%
SIA Investment Model (2007) Econometric Panel Estimation
2.1% -
So, if we measure the expected overall economic impact of an FTA between Koren and EU through a CGE model, and more precisely by using a simple GTAP framework (with Armington elasticities and CES functions with perfect competition), an dynamics GTAP model (with capital accumulation) or a GTAP with model with imperfect competition and scale effects, the overall potential effect of an FTA is always expected to be relatively low, and between 0.5% and 2.5% of GDP.
The second important conclusion is that these overall economic effects seems to depend substantially not only on the equations of the CGE model itself, but on the assumptions on the market structure of the different sectors involved, especially the services sector (that represent more than 2/3 of the total impact) and on the assumption on Armington trade elasticities.
1100..55.. CCOONNCCLLUUDDIINNGG OOBBSSEERRVVAATTIIOONNSS In order to refine the analysis, we have examined in detail the impacts in key sectors such as automobiles and financial services where the CGE studies suggest large impacts on output of the EU Korea FTA. The reasons for the large trade effects are first that the primary channel of integration in the CGE models is though trade and second that the elasticities and model structure used in CGE models tend to exaggerate the significance of inter-industry adjustments and underestimate or disregard intra-industry responses and dynamic adjustments to economic integration.
The theory of intra-industry trade, was developed initially by Grubel and Lloyd 1975, who proposed it as an alternative to Hecksher-Ohlin or Vinerian types of theories emphasizing inter-industry trade with constant costs, identical technologies and fungible products. Based on their analysis of the creation of the European Community, Grubel and Lloyd observed rapid growth in intra-EC two-way trade in differentiated products leading to increased intra-industry specialization and less inter-industry shifts in output than some observers had foreseen. The empirical observations about the growth of intra-industry trade led to a consideration of monopolistic competition or oligopolistic industries characterised by product differentiation. Thus firms competed by specialising in market segments or niches in the whole EC market for the particular product range of brand they
Reference: Trade 2007/349757/1 Trade Sustainability Impact Assessment of the Free Trade Agreement to be negotiated between the European Community and the Republic of Korea
January 2008 Page 164 of 165
produce. Not surprisingly, in the 1980s the scale economies argument has been progressively linked to new models of international trade under imperfect competition, drawing abundantly from industrial economics (Helpman and Krugman 1985, Smith and Venables 1988).
A different but complementary line of analysis is the analysis based on Neo-Ricardian perspectives emphasising differences in technology and endogenous technologies. (Romer 1986, Aghion and Howitt 1998, and Lipsey, Carlaw and Beckar, 2006)
In either goods or services industries, if in the integration zone there are well developed monopolistic competition or oligopolistic industries with differentiated products or services (or bundles thereof), then when barriers to trade and investment are removed the result is less of a flow response of shipping millions of tons of fungible products through trade leading to large inter-industry shifts and instead the result is much more complex. There are potential scale effects, product specialisation effects, pro-competitive pricing effects, and induced direct investment and innovation effects occurring with less actual trade effects. The increase in contestability becomes more important than the increased actual trade flows.
There are two broad conclusions that can be made about the economic analysis of the EU-Korea FTA. First the overall economic effects of the EU-Korea FTA are likely to be modest whatever the metric or methodology used to analyse the potential economic effects because both partners already have very open economies and highly integrated into the world economy. Second, the emergence of Korea as a developed economy and the degree of overlap that has developed in the industry structure for goods and for services between the EU and Korea suggests that there are increased opportunities for intra-industry specialisation, scale effects, pro-competitive effects and induced investment and innovation effects.
These broad conclusions have implications for the assessment of the potential social and environmental impacts of the EU Korea FTA. In terms of the Social Impacts, there are unlikely to be large inter-industry shifts in output and employment that could lead to disruption of labour markets at either a national or regional level. In the medium to longer term both the EU and Korea face common challenges to increase productivity and labour force participation and employment rates in order to sustain economic growth with a stable and aging population.
In terms of Environmental Impacts, the convergence in economic development levels is leading to greater commonality in concerns about protection of the environment. The potential economic benefits of increased productivity and enhanced technology could translate into the development of, and the increased use and diffusion of clean technologies.
1100..66.. RREEFFEERREENNCCEESS
CEPS, Edwards, Glania, Kim, Lee, Matthes, Tekce, A Qualitative Analysis of a Potential Free Trade Agreement Between the European Union and South Korea, November 2007.
Copenhagen Economics, Joseph François, Economic Impact of a Potential Trade Agreement Between the European Union and Korea, a Report for the European Commission, March 2007.
Grubel, H. and Lloyd, P., Intra-Industry Trade, London, MacMillan, 1975.
Helpman, E. and Krugman, P., Market Structure and Foreign Trade : Increasing Returns, Imperfect Competition and the International Economy, Cambridge, Mass., MIT Press, 1985.
Reference: Trade 2007/349757/1 Trade Sustainability Impact Assessment of the Free Trade Agreement to be negotiated between the European Community and the Republic of Korea
January 2008 Page 165 of 165
Hertel, Hummels, Ivanic, Keeney, How confident can we be in CGE-Based Assessments of Free Trade Agreements?, March 2004.
Jong, Huan Ko, Economic Relations Between Korea and the EU, presented at the Seoul National University in 2006 and cited in a CEPS report in Nov. 2007.
Jorgenson, Econometric Methods for Applied General Equilibrium Analysis, Applied General Equilibrium Analysis, Cambridge Univ. Press, 1984.
Kehoe, An Evaluation of the Performance of Applied General Equilibrium Models of the Effects of NAFTA on CGE Analysis of NAFTA, 5
th Annual Conf on Global Economic
Analysis, Taiwan, 2002.
Richard G. Lipsey, Kenneth I. Carlaw, and Clifford Bekar, ECONOMIC TRANSFORMATIONS:General Purpose Technologies and Long Term Growth, Oxford 2006
McDaniel, Balisteri, A Discussion on Armington Trade Substitution Elasticities, Jan. 2002.
McKitrick, The Econometric Critique of Computable General Equilibrium Modeling: The Role of Parameter Estimation, Economic Modeling, 1998.
Romer, Paul M. (1986), “Increasing Returns and Long Run Growth”, Journal of Political Economy, 94, p. 1002-1037.
Smith, A. and Venables, A. 1988, Completing the Internal Market in the EC : Some Industry Simulations, European Economic Review, Vol. 32, pp. 1501-25.
Smith, A. and Venables A. 1991, Economic Integration and Market Access, European Economic Review, Vol. 35, pp. 388-95.