JAKO202125240491726.pdf - Korea Science
26
Asian Journal for Public Opinion Research - ISSN 2288-6168 (Online) Vol. 9 No.3 August 2021: 240-265 http://dx.doi.org/10.15206/ajpor.2021.9.3.240 240 Evaluating the Quality of Public Services Through Social Media Nori Wilantika 1 Politeknik Statistika STIS Jakarta, Indonesia Septian Bagus Wibisono The Agency for Meteorology, Climatology, and Geophysics, Indonesia Abstract Public services need to be evaluated regularly to identify areas that need further improvement. Data collection via Twitter is affordable and timely, so it has the potential to be utilized to evaluate the quality of public service. This study utilizes tweets mentioning three service units of the provincial government of Jakarta and applies both sentiment analysis and topic classification to predict a rating/score of public service quality. The research goal is to examine if the evaluation of public services based on social media data is possible. The findings indicate that the use of Twitter has an advantage in terms of sample size and variety of opinions. Tweets can be translated into scores as well. Nonetheless, the representativeness issue and the predominance of complaint tweets can affect the reliability of the results. Keywords: public services, government agencies, satisfaction, Twitter, sentiment analysis, Indonesia One of the primary functions of government is to provide public services. The New Public Service theory (Cui, 2009; Denhardt & Denhardt, 2000) makes it clear that the primary role of government is shifting from steering people’s actions through regulation and decree to serving its citizens. Government institutions are used to acting as the single provider of public services without competition. However, 1 All correspondence concerning this article should be addressed to Nori Wilantika at Jalan Otto Iskandardinata No.64C Jakarta, Indonesia, 13330 or by email at [email protected].
-
Upload
khangminh22 -
Category
Documents
-
view
3 -
download
0
Transcript of JAKO202125240491726.pdf - Korea Science
Asian Journal for Public Opinion Research - ISSN 2288-6168 (Online) Vol. 9 No.3 August 2021: 240-265
http://dx.doi.org/10.15206/ajpor.2021.9.3.240
240
Evaluating the Quality of Public Services Through Social Media
Nori Wilantika1
Politeknik Statistika STIS Jakarta, Indonesia
Septian Bagus Wibisono
The Agency for Meteorology, Climatology, and Geophysics, Indonesia
Abstract
Public services need to be evaluated regularly to identify areas that need further
improvement. Data collection via Twitter is affordable and timely, so it has the
potential to be utilized to evaluate the quality of public service. This study utilizes
tweets mentioning three service units of the provincial government of Jakarta and
applies both sentiment analysis and topic classification to predict a rating/score of
public service quality. The research goal is to examine if the evaluation of public
services based on social media data is possible. The findings indicate that the use of
Twitter has an advantage in terms of sample size and variety of opinions. Tweets can
be translated into scores as well. Nonetheless, the representativeness issue and the
predominance of complaint tweets can affect the reliability of the results.
Keywords: public services, government agencies, satisfaction, Twitter,
sentiment analysis, Indonesia
One of the primary functions of government is to provide public services. The New
Public Service theory (Cui, 2009; Denhardt & Denhardt, 2000) makes it clear that the
primary role of government is shifting from steering people’s actions through
regulation and decree to serving its citizens. Government institutions are used to
acting as the single provider of public services without competition. However,
1 All correspondence concerning this article should be addressed to Nori Wilantika at Jalan Otto Iskandardinata No.64C Jakarta, Indonesia, 13330 or by email at [email protected].
Asian Journal for Public Opinion Research - ISSN 2288-6168 (Online) Vol. 9 No.3 August 2021: 240-265
http://dx.doi.org/10.15206/ajpor.2021.9.3.240
241
excellent service delivery to the citizens is still an obligation as compensation for the
taxes paid by citizens. More importantly, several studies show that the quality of public
service significantly affects citizen satisfaction with these services (Kaura, 2013; Li &
Shang, 2020; Psomas, 2020), and citizen satisfaction with the quality of public services
positively affects their trust in government (Citrin & Green, 1986; Mishler & Rose,
2001; Salim et al., 2017). The consequences of the trust in government are reflected in
the public’s attitude. Trust encourages political participation and compliance with the
law, paying taxes, and public policies (Levi & Stoker, 2000). Deteriorating confidence
in government can lead to citizen revolutions and even civil wars (Salim et al., 2017).
To achieve high-quality public service, in line with the New Public Management
and quality management principles discussed by Psomas (2020), it is necessary to
periodically evaluate how government services are delivered. A commonly used
evaluation method is through citizen satisfaction surveys. These are used in most
OECD countries on a regular basis to identify areas that need further improvement
(Benmansour, 2019; OECD, 2017). In Indonesia, a similar survey called the Assessment
of Bureaucratic-Reform Results (SHPRB) is conducted annually by the Ministry of
Administrative and Bureaucratic Reform (KemenPANRB). Citizen satisfaction surveys
aim to measure citizens’ satisfaction level with service quality (Benmansour, 2019; ur
Rahim & Shirazi, 2018). Citizen satisfaction surveys result in an interval scale from
totally dissatisfied to completely satisfied (Akinboade et al., 2012; Benmansour, 2019),
a satisfaction rating (Chodzaza & Gombachika, 2013), or a satisfaction index (ur Rahim
& Shirazi, 2018).
Survey shortcomings are usually associated with the data collection method.
Based on our review of the literature, many customer satisfaction surveys, citizens’
opinions are collected using face-to-face interviews or focus groups, as was done by
researchers in Qatar (Benmansour, 2019), Pakistan (ur Rahim & Shirazi, 2018), Yemen
(Salim et al., 2017), Ghana (Anaman et al., 2017), Malawi (Chodzaza & Gombachika,
2013), and South Africa (Akinboade et al., 2012). These traditional methods usually
are quite costly and time-consuming (Qi et al., 2020). Sample size is the most
important element that influences the cost (Barbu & Isaic-Maniu, 2011). Therefore, the
number of respondents is limited to a certain number and is reduced by the number

Asian Journal for Public Opinion Research - ISSN 2288-6168 (Online) Vol. 9 No.3 August 2021: 240-265
http://dx.doi.org/10.15206/ajpor.2021.9.3.240
242
of non-responses. As the number of respondents is limited, the number of opinions
collected on the satisfaction survey are also limited. Another drawback is the flexibility
and the variety of information covered which is also limited by the items available on
the questionnaire.
Many researchers suggest using social media data as a supplement or even a
replacement for conventional surveys (Kwak & Cho, 2018). Aligned with the global
development of data collection methods, which tends to move in the direction of faster
and less costly, data collection from social media is affordable and timely (Barbu &
Isaic-Maniu, 2011; Kwak & Cho, 2018). With the rapid growth of social media, people
tend to use social media to express their feelings, including their opinion towards the
services offered by government agencies (McGregor, 2019; Murphy et al., 2014).
Clearly, public opinion is available on social media in huge numbers, making it possible
to be collected in large amounts and varieties. With a million stable, active users,
Twitter is frequently used to gauge public opinion with regard to specific topics rather
than other social media platforms (Qi et al., 2020).
This study focuses on exploring the potential of Twitter as a measuring tool to
evaluate the quality of public services. Research conducted by Martin-Domingo et al.
(2019) shows that using sentiment analysis techniques, a Twitter dataset can be used
to evaluate airport service quality. Several studies have tried to utilize tweets to
evaluate public satisfaction towards government agencies (Aziz et al., 2018; Lailiyah et
al., 2017; Pratama & Purwarianti, 2017; Seki, 2016; Susilawati, 2016). However, the
research mostly focused on the prediction of sentiment polarity or mostly discussed
topics related to certain services. To our knowledge, none of this research identifies
how social media can be used beyond the traditional public service evaluation
methods. This research takes a step further by examining if the evaluation of public
service based on social media data and machine learning is appropriate and feasible.
This research may act as a basis for further research related to social media utilization
in government evaluation and policymaking. Most studies about government social
media predominantly set their focus on the management of social media, including
social media strategy and improvement of citizen engagement (Medaglia & Zheng,
2016). Research that shows concrete examples of how citizen opinion from social
Asian Journal for Public Opinion Research - ISSN 2288-6168 (Online) Vol. 9 No.3 August 2021: 240-265
http://dx.doi.org/10.15206/ajpor.2021.9.3.240
243
media can be used in government evaluation and policymaking is rather limited. As a
pilot test, we conducted the evaluation of public services delivered by the provincial
government of Jakarta.
Theoretical Background
Measurement Aspects of Public Service Quality
are several aspects or dimensions that are measured in service quality
evaluations. The service quality measurement model most referred to, SERVQUAL,
defines 5 service quality aspects or dimensions to be measured: assurance, empathy,
reliability, responsiveness, and tangibles. However, according to Bai and Ye (2005),
public service characteristics are different from common services, and it is necessary
to use a special quality measurement system to evaluate public services. Generally,
government institutions will develop their own guidelines or regulations on public
service evaluation.
In Indonesia, regulations related to the evaluation of public service
performance (SHPRB) are outlined in KemenPANRB Regulation No.1 of 2015, No.14 of
2014, and No.16 of 2014. According to those regulations, aspects or dimensions that
are measured in service quality evaluations consist of:
1) Service procedures/flow. This aspect relates to the ease of procedures in
every stage of service delivery.
2) Service requirements. This refers to accessibility, comprehensibility, and
consistency of information about all things that must be prepared to receive the
service.
3) Service costs. This aspect refers to conformity of the amount and procedures
related to the payment of fees with the information provided to citizens.
4) Service time. This refers to compliance with the opening hours, closing
hours, and the time required to complete the entire service.
5) Service officers. This aspect assesses the ease of recognition, friendliness,
politeness, and quickness of officers in responding to users’ needs. Officers must not
Asian Journal for Public Opinion Research - ISSN 2288-6168 (Online) Vol. 9 No.3 August 2021: 240-265
http://dx.doi.org/10.15206/ajpor.2021.9.3.240
244
be discriminatory and may not ask for money outside the service costs.
6) Service software/apps. This criterion assesses the reliability, ease of use, and
responsiveness of software applications used for service delivery.
7) Facilities and supporting infrastructure for services. This is measured by the
availability of special buildings or spaces for the services, waiting rooms, and parking
lots, special toilets for service users, facilities for disabled users, lactation rooms, and
complaint facilities.
In this study, people's opinions from social media were categorized into these
seven aspects. Categorizing people’s opinion about public service into seven categories is
a text classification problem. Text or topic classification is the task of classifying texts or
documents into different predefined topics or labels (Bencke et al., 2020; Liu, 2012). Since
text or topic classification is a classification problem, any existing supervised learning
method is applicable (Liu, 2012). Previous research used different approaches to build the
classifier model. Some researchers claimed that the Decision Tree Classifier has one of the
best performances (Bencke et al., 2020; Chamby-Diaz & Bazzan, 2019). Altammami and
Rana (2017) found that one of the most accurate algorithms is the support vector machine
(SVM). The Naıve Bayes algorithm, which achieved surprisingly high accuracy on
classification tasks (Zhang et al., 2018), was also used in Zhu (2018) and Burnap et al.
(2017). Based on the previous research, this research used the Decision Tree, the SVM,
and the Naıve Bayes algorithms to build the aspect classifier. The classified tweets were
then used to predict the public services quality score.
Text-based Score Prediction
In general, the final result of public service evaluation is a satisfaction score or
rating (Chodzaza & Gombachika, 2013), or a satisfaction index (ur Rahim & Shirazi,
2018). The score shows the level of quality of public services such as totally
dissatisfied, poor, good, excellent, or completely satisfied (Akinboade et al., 2012;
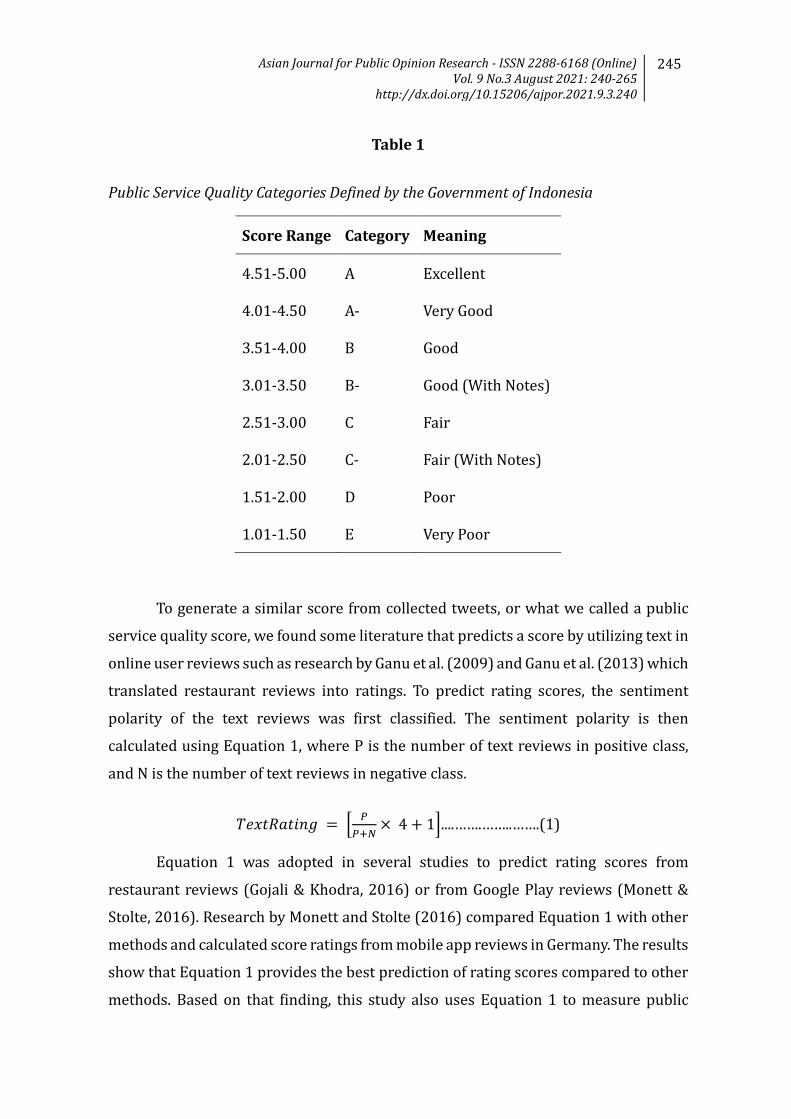
Benmansour, 2019). In Indonesia, according to KemenPANRB Regulation No.17 of
2017, the assessment of public service quality results in a score. The score was
classified into 8 categories shown in Table 1. Each category represents the
performance of public service providers from Very Poor to Excellent.
Asian Journal for Public Opinion Research - ISSN 2288-6168 (Online) Vol. 9 No.3 August 2021: 240-265
http://dx.doi.org/10.15206/ajpor.2021.9.3.240
245
Table 1
Public Service Quality Categories Defined by the Government of Indonesia
Score Range Category Meaning
4.51-5.00 A Excellent
4.01-4.50 A- Very Good
3.51-4.00 B Good
3.01-3.50 B- Good (With Notes)
2.51-3.00 C Fair
2.01-2.50 C- Fair (With Notes)
1.51-2.00 D Poor
1.01-1.50 E Very Poor
To generate a similar score from collected tweets, or what we called a public
service quality score, we found some literature that predicts a score by utilizing text in
online user reviews such as research by Ganu et al. (2009) and Ganu et al. (2013) which
translated restaurant reviews into ratings. To predict rating scores, the sentiment
polarity of the text reviews was first classified. The sentiment polarity is then
calculated using Equation 1, where P is the number of text reviews in positive class,
and N is the number of text reviews in negative class.
𝑇𝑇𝑇𝑇𝑇𝑇𝑇𝑇𝑇𝑇𝑇𝑇𝑇𝑇𝑇𝑇𝑇𝑇𝑇𝑇 = � 𝑃𝑃𝑃𝑃+𝑁𝑁
× 4 + 1�....…….……..…….(1)
Equation 1 was adopted in several studies to predict rating scores from
restaurant reviews (Gojali & Khodra, 2016) or from Google Play reviews (Monett &
Stolte, 2016). Research by Monett and Stolte (2016) compared Equation 1 with other
methods and calculated score ratings from mobile app reviews in Germany. The results
show that Equation 1 provides the best prediction of rating scores compared to other
methods. Based on that finding, this study also uses Equation 1 to measure public

Asian Journal for Public Opinion Research - ISSN 2288-6168 (Online) Vol. 9 No.3 August 2021: 240-265
http://dx.doi.org/10.15206/ajpor.2021.9.3.240
246
service satisfaction based on tweets, in a form of public service quality (PSQ) score. As
the formula needs sentiment polarity, we also built a classifier to obtain the sentiment
polarity of each tweet.
Sentiment analysis is applied to distinguish opinion orientation (positive and
negative), such as from comments on Twitter (Sokolowska et al., 2019) or in a Facebook
group (Kaur et al., 2019). Some studies used unsupervised learning methods by
utilizing lexicon-based sentiment analysis tools such as the MeaningCloud (Singh et al.,
2018), Theysay (Martin-Domingo et al., 2019), VADER (Georgiadou et al., 2020), and
SentiWordNet (Aziz et al., 2018; Lailiyah et al., 2017). Lexicon-based sentiment
analysis is a robust and an excellent cross-domain performance method for sentiment
analysis (Madan et al., 2018). Nonetheless, Indonesian lexical resources for sentiment
are very limited (Koto & Rahmaningtyas, 2017). Since sentiment analysis is a text
classification task, many researchers used supervised learning methods like Naıve
Bayes (Corallo et al., 2015; Susilawati, 2016), SVM (Aziz et al., 2018; Corallo et al.,
2015), and Random Forest (Rekha et al., 2019). Therefore, we built the sentiment
classifier using a supervised approach, based on studies, that used Naıve Bayes, SVM,
and Random Forest.
Pilot Test Approach
We conducted the evaluation of public services delivered by the provincial government
of Jakarta, Indonesia. We chose provincial government of Jakarta as a pilot test because,
according to a survey in 2018 by the Indonesian Internet Service Providers Association
(APJII), the highest Internet user penetration in Indonesia is in Jakarta. The social
media data were collected only from Twitter. The first reason is because in Indonesia
almost all government institutions have their own official Twitter account in line with
the Minister of Communication and Information encouragement to increase public
communication via social media. Second, the number of Twitter users in Indonesia is
the fifth largest in the world, and the tweet posting activity is the third greatest in the
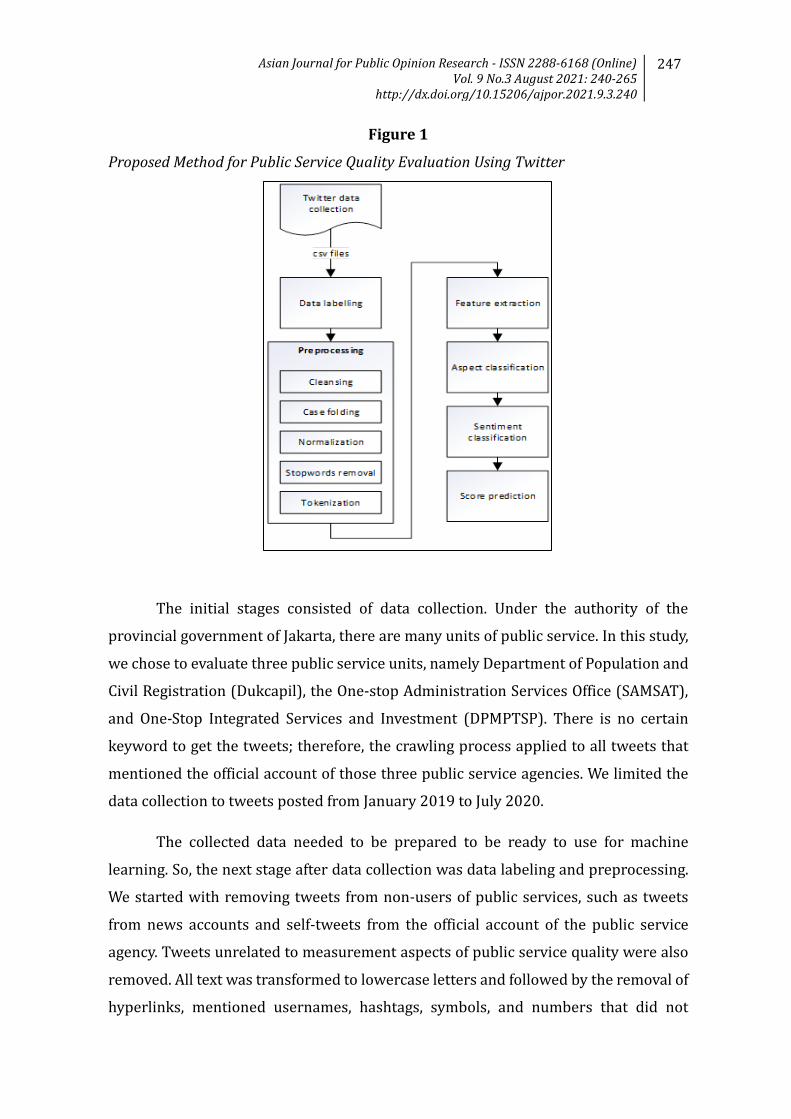
world (Aziz et al., 2018). The flow to evaluate public service quality through social
media is shown in Figure 1. It is following the general framework of text analysis (Hu
& Liu, 2012), with an addition to the last stage, namely translating tweets into PSQ
scores.
Asian Journal for Public Opinion Research - ISSN 2288-6168 (Online) Vol. 9 No.3 August 2021: 240-265
http://dx.doi.org/10.15206/ajpor.2021.9.3.240
247
Figure 1
Proposed Method for Public Service Quality Evaluation Using Twitter
The initial stages consisted of data collection. Under the authority of the
provincial government of Jakarta, there are many units of public service. In this study,
we chose to evaluate three public service units, namely Department of Population and
Civil Registration (Dukcapil), the One-stop Administration Services Office (SAMSAT),
and One-Stop Integrated Services and Investment (DPMPTSP). There is no certain
keyword to get the tweets; therefore, the crawling process applied to all tweets that
mentioned the official account of those three public service agencies. We limited the
data collection to tweets posted from January 2019 to July 2020.
The collected data needed to be prepared to be ready to use for machine
learning. So, the next stage after data collection was data labeling and preprocessing.
We started with removing tweets from non-users of public services, such as tweets
from news accounts and self-tweets from the official account of the public service
agency. Tweets unrelated to measurement aspects of public service quality were also
removed. All text was transformed to lowercase letters and followed by the removal of
hyperlinks, mentioned usernames, hashtags, symbols, and numbers that did not
Asian Journal for Public Opinion Research - ISSN 2288-6168 (Online) Vol. 9 No.3 August 2021: 240-265
http://dx.doi.org/10.15206/ajpor.2021.9.3.240
248
represent time. All slang words in remaining tweets were replaced with proper
Indonesian spelling based on an Indonesian colloquial dictionary (Aliyah Salsabila et
al., 2019). All stop words were also removed using Tala's (2003) dictionary. The
preprocessing ended with removing duplicate tweets. Duplicate tweets were
identified by similar username or similar tweet texts.
After the preprocessing stage, all clean tweets were divided into training and
testing dataset. Tweets collected from 2019 were prepared as the training dataset
while tweets collected from 2020 were prepared as testing dataset. We applied several
machine learning methods to the training dataset, as discussed in the previous section,
to build the aspect classifiers and sentiment classifiers. Each algorithm was combined
with three different forms of Bag of Words (BOW) used to represent the value of each
feature, namely term frequency–inverse document frequency (TF-IDF), term frequency, and
binary term occurrences. The dataset was propagated using Synthetic Minority Over-
sampling Technique (SMOTE). SMOTE is an oversampling technique that multiplies
minority class to decrease over-fitting and bias from supervised data mining process
(Aggarwal, 2016). Each of the training datasets was individually processed into a cross-
validation with 10 k-fold. Cross-validation with 10 k-fold is recommended for accurate
estimation and it has relatively low bias (Han et al., 2012).We then compared the
performance of all classifiers built from the three algorithms. The performance was
analyzed and evaluated based on accuracy, precision, recall, and F1 score. The classifier
with the best performance was selected and used to predict the aspect and the sentiment
of the 2020 tweets. To evaluate the result of the prediction, we compared the aspect and
sentiment of each tweet with the manual labels by annotators.
Based on the predicted aspect and sentiment, at the last stage we calculated the
public service quality (PSQ) score. As discussed in previous section, Equation 1
provides the best prediction to generate a score from text or tweets. In the same way
as the formula was used in Ganu et al., (2009, 2013), Gojali and Khodra (2016), and
Monett and Stolte (2016), the PSQ score was calculated as follows:
𝑃𝑃𝑃𝑃𝑃𝑃 𝑃𝑃𝑆𝑆𝑆𝑆𝑆𝑆𝑇𝑇 = 1𝑛𝑛∑ 𝑃𝑃𝑃𝑃𝑃𝑃 𝑃𝑃𝑆𝑆𝑆𝑆𝑆𝑆𝑇𝑇 𝑖𝑖 𝑛𝑛𝑖𝑖=1 ....…….……..…….….(2)
𝑃𝑃𝑃𝑃𝑃𝑃 𝑃𝑃𝑆𝑆𝑆𝑆𝑆𝑆𝑇𝑇 𝑖𝑖 is the sub-score for each service unit, with 𝒏𝒏 is the number of service

Asian Journal for Public Opinion Research - ISSN 2288-6168 (Online) Vol. 9 No.3 August 2021: 240-265
http://dx.doi.org/10.15206/ajpor.2021.9.3.240
249
units (in our case, 𝒏𝒏=3).
𝑃𝑃𝑃𝑃𝑃𝑃 𝑃𝑃𝑆𝑆𝑆𝑆𝑆𝑆𝑇𝑇 𝑖𝑖 = 1𝑚𝑚∑ � 𝑃𝑃𝑖𝑖𝑖𝑖
𝑃𝑃𝑖𝑖𝑖𝑖+𝑁𝑁𝑖𝑖𝑖𝑖× 4 + 1�𝑚𝑚
𝑗𝑗=1 ....…….…….….(3)
where: 𝒋𝒋 are measurement aspects of public service quality (in our case, 𝒋𝒋 = 𝟏𝟏,𝟐𝟐,𝟑𝟑, … ,𝟕𝟕) 𝑷𝑷𝒊𝒊𝒋𝒋 is the number of tweets in positive class in aspect 𝒋𝒋 service unit 𝒊𝒊 𝑵𝑵𝒊𝒊𝒋𝒋 is the number of tweets in negative class in aspect 𝒋𝒋 service unit 𝒊𝒊
The following is the algorithm for calculating the PSQ Score of Jakarta Provincial
Government using Equations 2 and 3. 1. i=Dukcapil,SAMSAT,DPMPTSP 2. For each service unit i 3. j=procedure, requirements, costs, time, service officers, software/apps,
facilities 4. For each aspect j of service unit 5. Count the number of tweets in positive class (Pij) 6. Count the number of tweets in negative class (Nij) 7. Calculate the PSQ Score of aspect j (Pij/(Pij+Nij)*4+1) 8. End For 9. Calculate PSQ score of service unit i = the average PSQ score of all aspect j of
service unit i 10. End For 11. Calculate PSQ Score of Jakarta Provincial Government = the average PSQ score
of service unit i
The PSQ score range is 1 to 5. The score was then converted into the public
service quality category shown in Table 1, referring to Public Service Quality
Categories from Indonesia Government.
Result and Discussion
Based on the pilot test, we found that the evaluation of public services using social
media has both possibilities and limitations. The strengths and weaknesses are
analyzed from several perspectives. The first point of view is from the size and
representativeness of collected tweets. Second, the relevance of collected tweets to
measurement aspects of public service quality. Finally, we describe the pros and cons
of the result of satisfaction score prediction.
Asian Journal for Public Opinion Research - ISSN 2288-6168 (Online) Vol. 9 No.3 August 2021: 240-265
http://dx.doi.org/10.15206/ajpor.2021.9.3.240
250
Collected Tweets: Size Versus Representativeness
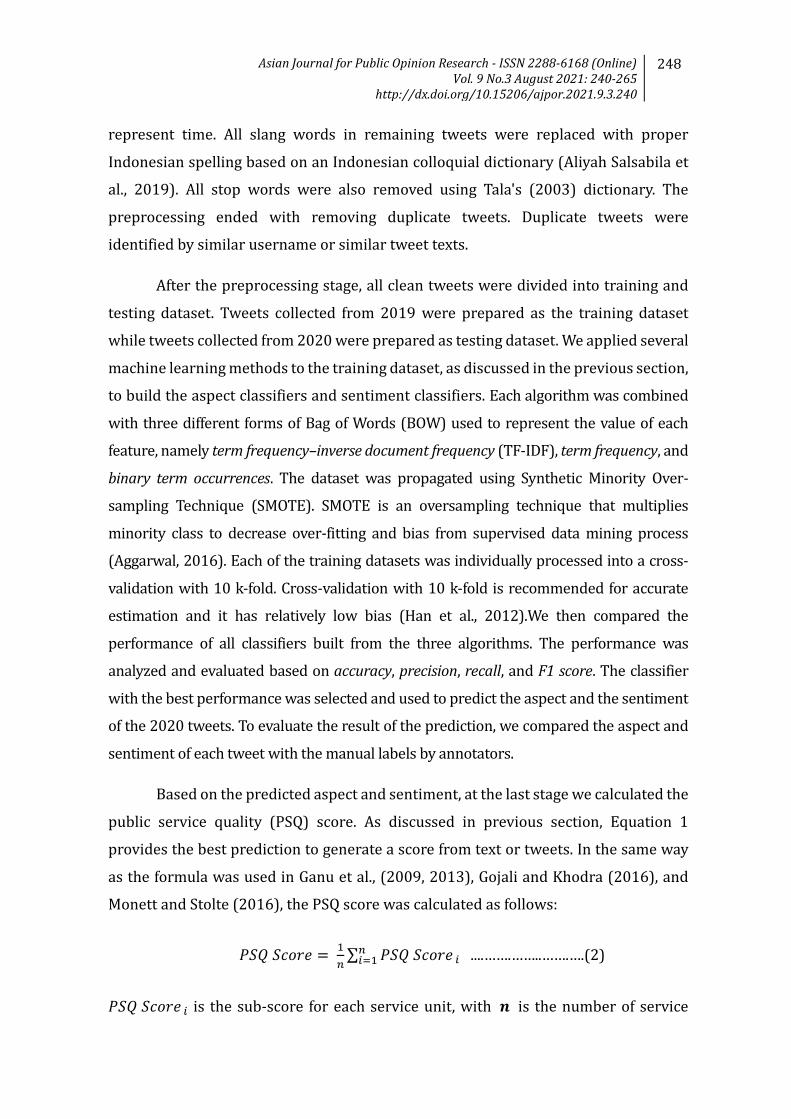
We successfully collected 3,718 tweets from 2019 and 9,564 tweets from 2020.
The examples of the collected tweets related to public service of the Jakarta provincial
government are shown in Table 2.
Table 2
Examples of Collected Tweets Mentioning Three Public Service Units of the Jakarta
Government
Original Tweets Translated Tweets
@ccdukcapil @dukcapiljakarta mau ngurus NIK sm KK kok gak responsive bgt yah udh di email dr kmrn dan ditelfon, bahkan udah di WA dr kemarin.. tolong mba/mas dijawab.. saya mau daftar NPWP jd gak bisa krn no KK sm NIK gak sesuai.
@ccdukcapil @dukcapiljakarta I want to register my citizen card number, how come it's not quite responsive, I've emailed and reached you, I've even been on WhatsApp since yesterday. Please answer. I can’t register my tax number since my citizen card number is not valid.
ga usah pakek akun atau ga perlu login, kemarin ngajuinnya, prosesnya cepat 10 menitan rata rata
Don't need to use an account or log in, I submitted it yesterday, the process was fast, finished in around 10 minutes
Selamat sore, dari awal April saya sudah bayar pajak tahunan lewat samsat online nasional tetapi sampai sekarang belum dikirim stnknya ke rumah @samsat_jaktim @HumasPajakJkt
Good afternoon, since the beginning of April I have paid my annual tax through the online national tax payment system but until now the receipt has not been sent to me @samsat_jaktim's house @HumasPajakJkt
The total number of cleaned tweets after the preprocessing stage was 1,897
tweets, 728 tweets from 2019 and 1169 tweets from 2020. This shows the potential
for evaluating public services using social media in terms of sample size. This number
is very large when compared to the number of respondents in SHPRB, which was only
30 people per public service unit, or when compared to other customer satisfaction
surveys such as (Chodzaza & Gombachika, 2013) who were only able to collect 92
Asian Journal for Public Opinion Research - ISSN 2288-6168 (Online) Vol. 9 No.3 August 2021: 240-265
http://dx.doi.org/10.15206/ajpor.2021.9.3.240
251
respondents due to non-response issues. During the preprocessing, tweets that are
collected have been confirmed to come from a unique user account so that each tweet can
represent one respondent. As discussed in (Kwak & Cho, 2018), we confirm that the use
of social media has an advantage in terms of a larger number of respondents. This number
is expected to continue to increase, in line with the increasing use of social media
(Martin-Domingo et al., 2019) and increasing participation in online public services
(United Nations Department of Economic and Social Affairs, 2018, 2020).
Based on the collected tweets, tweets-related to Jakarta provincial government
public services significantly increased in 2020. Based on our analysis, the increase in
the number of tweets was related to the large-scale social restrictions policy (PSBB)
enforced by the governor of Jakarta to control the impact of the COVID-19 pandemic.
The increase began in April 2020 and continued until June 2020, the same time as
PSBB enforcement in Jakarta. Due to PSBB, the local government in Jakarta was
limiting the activities of its agencies and delivering most of their services online. This
phenomenon is interesting and shows that, since the public cannot directly see the
officials in charge of public services, the communication between the public and the
agencies happens through the long-distance communication media, one of which is the
government social media account.
From the data collection stage, we collected not only the text of the tweets, but also
other attributes such as date, time, and username. Unfortunately, other attributes such as
age, gender, and user location could not be collected because these data are protected by
Twitter and cannot be accessed by the public (Twitter, 2021). Consequently, although
tweets can be collected in a very large number, we cannot guarantee that they are
representing the demographics and locations of public service users. Thus, the results of
the evaluation of public services obtained through social media are likely to be biased.
Indeed, many researchers from various fields consistently point out this
representativeness issue (Kwak & Cho, 2018). Some researchers also stated that public
opinion obtained from social media only represents Internet users, not the entire
population (Steinmetz et al., 2014; Valliant & Dever, 2011). However, some other
researchers stated that this issue will lose relevance as Internet penetration increases
(Kroh et al., 2016). Also, with a great number of respondents, the representativeness may

Asian Journal for Public Opinion Research - ISSN 2288-6168 (Online) Vol. 9 No.3 August 2021: 240-265
http://dx.doi.org/10.15206/ajpor.2021.9.3.240
252
be overstated (Heiervang & Goodman, 2011). In addition, the demographics of users, such
as age and gender, can be estimated using machine learning (Chang et al., 2010; Karimi et
al., 2016; Mislove et al., 2011), and thereafter the users can be sampled using certain
sampling methods such as random sampling (Barbera & Rivero, 2015) or quota sampling
(Barbera & Rivero, 2015; Davis, 2017).
Relevance of Tweets to the Aspects of Public Service
In most public service quality measurements, there are defined aspects to be
measured. The advantage of social media usage is that tweets can be grouped into
those defined aspects. Categorization can be done either manually by humans or
automatically using machine learning. Based on this classification, we can conduct the
analysis and get the results of the evaluation of public services like the results of the
conventional survey.
Table 3
Number of Tweets Mentioning Three Public Service Units of the Jakarta Provincial
Government Based on Aspect, Year, and Sentiment
Aspects Year Positive Negative Procedures 2019 42 109
2020 10 115 Requirements 2019 6 26
2020 2 53 Costs 2019 0 8
2020 0 11 Time 2019 33 150
2020 22 197 Service Officers
2019 99 70 2020 112 96
Software/ Apps
2019 7 111 2020 18 367
Facilities 2019 11 56 2020 5 161
Note. 2019 n=728; 2020 n=1,169; N=1,897

Asian Journal for Public Opinion Research - ISSN 2288-6168 (Online) Vol. 9 No.3 August 2021: 240-265
http://dx.doi.org/10.15206/ajpor.2021.9.3.240
253
However, there are some pros and cons when it comes to categorizing these
tweets' aspects. First, the number of tweets for each aspect cannot be controlled. The
number of tweets between aspects is not balanced. As shown in Table 3, the 2019
tweets were most frequently categorized as time-related, while the 2020 tweets were
most frequently categorized as software/apps-related. It can be interpreted that higher
proportion represents the level of importance of public service aspects from the users’
point of view. However, when the number of tweets in an aspect is very small, the
aspect becomes difficult to analyze. It can be seen in Table 3 that the aspect with almost
no tweets is cost. There are only 20 tweets related to the cost aspect, 8 tweets in 2019
and 11 tweets in 2020.
As a second limitation, there are many tweets that do not fit into any category
and must be removed: 2,990 tweets in 2019 or 80.42% were eliminated at the
preprocessing stage, while 8,395 tweets (87.78%) from 2020 were eliminated. The
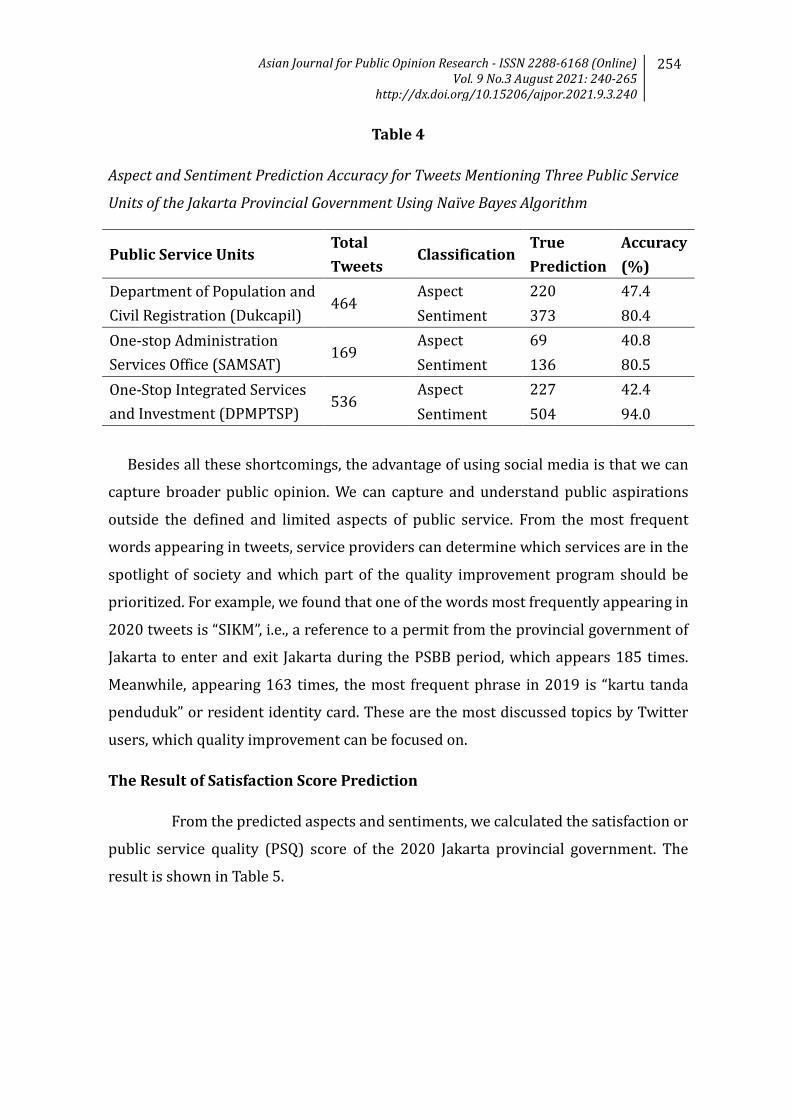
eliminated tweets mostly contain questions. The third limitation is related to the
accuracy of the aspect classifier using machine learning. Accuracy shows the
percentage of tweets that are classified correctly against the total number of tweets
(Han et al., 2012). The aspect classifier was built using the Naıve Bayes algorithm,
which was found to have the best performance, as well as the sentiment classifier. The
accuracy of the aspect classifier is shown in Table 4, side by side with the performance
of classifier for sentiment prediction. Table 4 shows that the aspect prediction
accuracy tends to be low. It is much lower than the sentiment prediction accuracy. Low
accuracy risks many tweets being categorized into the wrong aspect. Although there
are no certain criteria for a successful prediction model (Kwak & Cho, 2018), our
proposed method on aspect classification needs to be further examined before
replication.
Asian Journal for Public Opinion Research - ISSN 2288-6168 (Online) Vol. 9 No.3 August 2021: 240-265
http://dx.doi.org/10.15206/ajpor.2021.9.3.240
254
Table 4
Aspect and Sentiment Prediction Accuracy for Tweets Mentioning Three Public Service
Units of the Jakarta Provincial Government Using Naïve Bayes Algorithm
Public Service Units Total Tweets
Classification True Prediction
Accuracy (%)
Department of Population and Civil Registration (Dukcapil)
464 Aspect 220 47.4 Sentiment 373 80.4
One-stop Administration Services Office (SAMSAT)
169 Aspect 69 40.8 Sentiment 136 80.5
One-Stop Integrated Services and Investment (DPMPTSP)
536 Aspect 227 42.4 Sentiment 504 94.0
Besides all these shortcomings, the advantage of using social media is that we can
capture broader public opinion. We can capture and understand public aspirations
outside the defined and limited aspects of public service. From the most frequent
words appearing in tweets, service providers can determine which services are in the
spotlight of society and which part of the quality improvement program should be
prioritized. For example, we found that one of the words most frequently appearing in
2020 tweets is “SIKM”, i.e., a reference to a permit from the provincial government of
Jakarta to enter and exit Jakarta during the PSBB period, which appears 185 times.
Meanwhile, appearing 163 times, the most frequent phrase in 2019 is “kartu tanda
penduduk” or resident identity card. These are the most discussed topics by Twitter
users, which quality improvement can be focused on.
The Result of Satisfaction Score Prediction
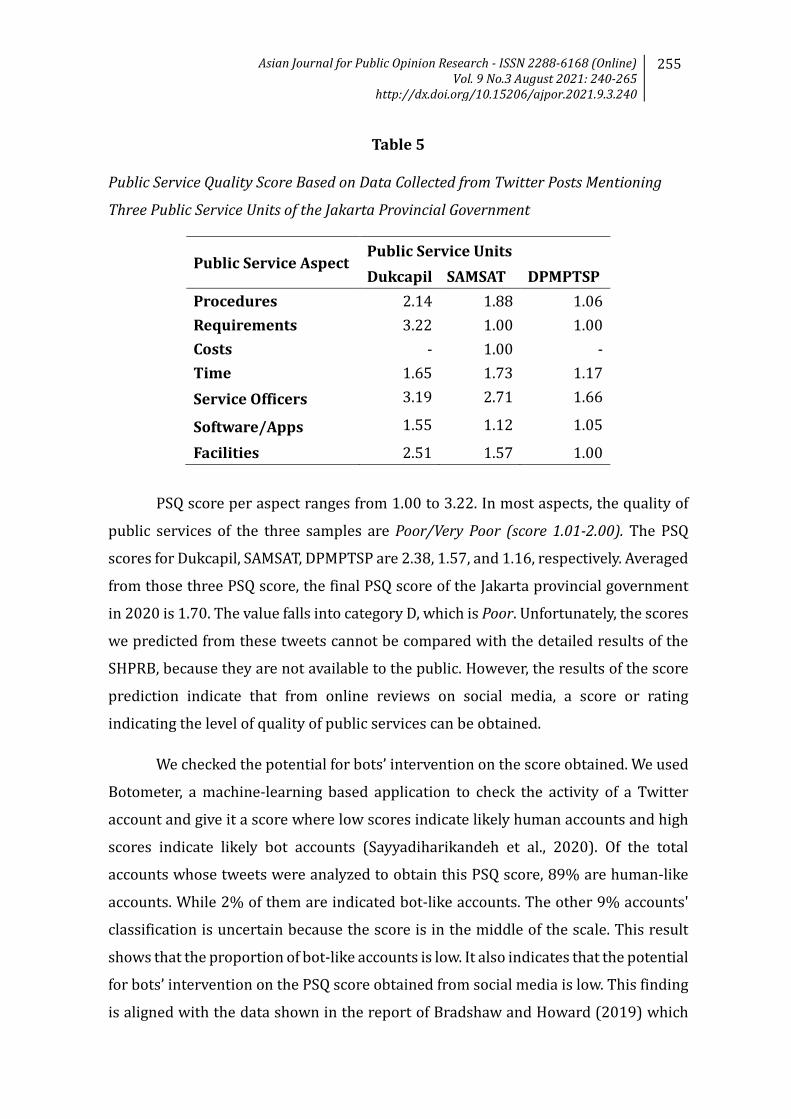
From the predicted aspects and sentiments, we calculated the satisfaction or
public service quality (PSQ) score of the 2020 Jakarta provincial government. The
result is shown in Table 5.
Asian Journal for Public Opinion Research - ISSN 2288-6168 (Online) Vol. 9 No.3 August 2021: 240-265
http://dx.doi.org/10.15206/ajpor.2021.9.3.240
255
Table 5
Public Service Quality Score Based on Data Collected from Twitter Posts Mentioning
Three Public Service Units of the Jakarta Provincial Government
Public Service Aspect Public Service Units Dukcapil SAMSAT DPMPTSP
Procedures 2.14 1.88 1.06 Requirements 3.22 1.00 1.00 Costs - 1.00 - Time 1.65 1.73 1.17 Service Officers 3.19 2.71 1.66
Software/Apps 1.55 1.12 1.05
Facilities 2.51 1.57 1.00
PSQ score per aspect ranges from 1.00 to 3.22. In most aspects, the quality of
public services of the three samples are Poor/Very Poor (score 1.01-2.00). The PSQ
scores for Dukcapil, SAMSAT, DPMPTSP are 2.38, 1.57, and 1.16, respectively. Averaged
from those three PSQ score, the final PSQ score of the Jakarta provincial government
in 2020 is 1.70. The value falls into category D, which is Poor. Unfortunately, the scores
we predicted from these tweets cannot be compared with the detailed results of the
SHPRB, because they are not available to the public. However, the results of the score
prediction indicate that from online reviews on social media, a score or rating
indicating the level of quality of public services can be obtained.
We checked the potential for bots’ intervention on the score obtained. We used
Botometer, a machine-learning based application to check the activity of a Twitter
account and give it a score where low scores indicate likely human accounts and high
scores indicate likely bot accounts (Sayyadiharikandeh et al., 2020). Of the total
accounts whose tweets were analyzed to obtain this PSQ score, 89% are human-like
accounts. While 2% of them are indicated bot-like accounts. The other 9% accounts'
classification is uncertain because the score is in the middle of the scale. This result
shows that the proportion of bot-like accounts is low. It also indicates that the potential
for bots’ intervention on the PSQ score obtained from social media is low. This finding
is aligned with the data shown in the report of Bradshaw and Howard (2019) which
Asian Journal for Public Opinion Research - ISSN 2288-6168 (Online) Vol. 9 No.3 August 2021: 240-265
http://dx.doi.org/10.15206/ajpor.2021.9.3.240
256
claimed that Indonesia is not a country where government agencies manipulate
opinions on social media using bots or individual actors. Still, based on this report, bots
and individual actors in Indonesia tend to manipulate opinions related to politics,
especially the opposition (Bradshaw & Howard, 2019).
Another finding from this research is that tweets related to public services by
the Jakarta provincial government were dominated by tweets with negative sentiment;
81% of all tweets are tweets with negative sentiment. The detailed proportion of
negative tweets per aspect can be seen in Table 3. Except for the aspect of service
officers, on the other six aspects, the proportion of tweets with negative sentiment is
much higher than the number of positive tweets. It affects the final PSQ score of the
Jakarta provincial government, putting it into the Poor category. Most PSQ scores per
aspect also fall into the Poor or Very Poor category.
Apart from being more numerous, the content of negative tweets tends to be
more detailed than the positive ones. In negative tweets, users tell in detail every
complaint or problem experienced. On the other hand, in positive tweets, users only
say thank you without explaining what they are thanking for. Atypical example of
positive tweet is:
“@dukcapiljakarta terima kasih banyak atas segala bantuannya”
Translation:
“@dukcapiljakarta thank you very much for all your help”
A typical example of negative tweet is:
“mestinya aplikasi mengupdate menginformasikan kartu tanda
penduduk tercetak min fleksibel kasihan masyarakat bolak kelurahan
kartu tanda penduduknya”
Translation:
“There should be an app to inform the public of the progress of identity cards. People
should not go back and forth to the sub-district office just to get the information”
Asian Journal for Public Opinion Research - ISSN 2288-6168 (Online) Vol. 9 No.3 August 2021: 240-265
http://dx.doi.org/10.15206/ajpor.2021.9.3.240
257
This dominance of negative tweets is commonplace. It has been found that online
complaints are a common practice (Hutchinson, 2020). Other survey results (Sprout
Social, 2017) show that if customers saw inappropriate behavior or performance, 47%
of them would call out the company on social media, while only 8% would remain
silent. It is feared that the dominance of these negative tweets will cause bias in the
PSQ score.
Conclusion and Future Research
This research shows that Twitter, as one social media platform, has potential to be used
for the evaluation of public services. First, the use of social media has an advantage in
terms of sample size. This size is predicted to increase along with the increase in social
media users and public participation in online services. Then, in a public service
evaluation, government institutions commonly develop guidelines or regulations defining
aspects or dimensions to be measured. By using Twitter, we can collect tweets and classify
them according to those aspects manually by humans or automatically using machine
learning. More than that, the collected tweets vary greatly and are not limited to the
aspects, showing that Twitter serves as a remarkable tool to understand public opinion.
Last, using sentiment analysis technique, we can calculate a satisfaction score or rating
like in a customer satisfaction survey. In this study, the score is named as the Public Service
Quality (PSQ) Score. Having checked using an application called Botometer, we have
confirmed that the score is not influenced by bots or individual actors.
Even so, we know that Twitter analysis cannot be a perfect solution. We cannot
be assured that the collected tweets represent all public service users demographically
or geographically.; Some researchers have stated that representativeness of the
respondents may be overstated with a large number of respondents. It is quite possible
that many people who are satisfied with government services never bother to express
their opinion through social media. There is a predominance of tweets with negative
sentiments from the collected tweets, and it is feared this will affect the satisfaction
score. Further work is needed to overcome these limitations.
For further utilization of government social media, our paper shows how the
government can leverage citizen opinion from their official account to evaluate the

Asian Journal for Public Opinion Research - ISSN 2288-6168 (Online) Vol. 9 No.3 August 2021: 240-265
http://dx.doi.org/10.15206/ajpor.2021.9.3.240
258
quality of public service that they provide. The result score could be used to
complement the results of conventional public opinion surveys. The method suggests
that the government can listen to broad public opinion, detect complaints, and identify
areas of good and poor aspects of service quality. The Indonesian case is not easily
generalized. Our proposed method should be examined in other cases to extend the
analysis to a much larger sample. We also realize that there are many countries where
Twitter is not popular. While this study only pays attention to Twitter, further study is
needed to examine whether our proposed method can be applied to other social media
platforms.
This research also shows a step further of textual analysis by combining both
sentiment analysis and topic classification to translate tweets into a score, especially
in the public sector domain. However, we have shown that the model built to classify
users’ posts into several classes of public service aspects is not perfect. The models for
aspect classification built in this study have low accuracy and therefore need to be
studied more deeply in future research.
References
Aggarwal, C. C. (2016). Outlier analysis (2nd ed.). Springer. https://doi.org/10.1007/978-1-4614-6396-2
Akinboade, O. A., Kinfack, E. C., & Mokwena, M. P. (2012). An analysis of citizen satisfaction with public service delivery in the Sedibeng district municipality of South Africa. International Journal of Social Economics, 39(3), 182–199. https://doi.org/10.1108/03068291211199350
Aliyah Salsabila, N., Ardhito Winatmoko, Y., Akbar Septiandri, A., & Jamal, A. (2019). Colloquial Indonesian Lexicon. Proceedings of the 2018 International Conference on Asian Language Processing, IALP 2018, 226–229. https://doi.org/10.1109/IALP.2018.8629151
Altammami, S. H., & Rana, O. F. (2017). Topic identification system to filter Twitter feeds. Proceedings - 2016 3rd International Conference on Soft Computing and Machine Intelligence, ISCMI 2016, 206–213. https://doi.org/10.1109/ISCMI.2016.14
Anaman, K. A., Quaye, R., & Amankwah, E. (2017). Evaluation of Public Weather Services by Users in the Formal Services Sector in Accra, Ghana. Modern Economy, 08(07), 921–945. https://doi.org/10.4236/me.2017.87065
Asian Journal for Public Opinion Research - ISSN 2288-6168 (Online) Vol. 9 No.3 August 2021: 240-265
http://dx.doi.org/10.15206/ajpor.2021.9.3.240
259
Aziz, M. N., Firmanto, A., Miftah Fajrin, A., & Hari Ginardi, R. V. (2018). Sentiment
analysis and topic modelling for identification of government service satisfaction. Proceedings - 2018 5th International Conference on Information Technology, Computer and Electrical Engineering, ICITACEE 2018, 125–130. https://doi.org/10.1109/ICITACEE.2018.8576974
Bai, C., & Ye, C. (2005). Construct a public service quality evaluation model: Evidence from Chinese public service industry. 2005 International Conference on Services Systems and Services Management, Proceedings of ICSSSM’05, 1, 508–513. https://doi.org/10.1109/ICSSSM.2005.1499525
Barbera, P., & Rivero, G. (2015). Understanding the political representativeness of Twitter users. Social Science Computer Review, 33(6), 712–729. https://doi.org/10.1177/0894439314558836
Barbu, A., & Isaic-Maniu, A. (2011). Data collection in Romanian market research: A comparison between prices of PAPI, CATI and CAWI. Management & Marketing, 6(3), 349–364.
Bencke, L., Cechinel, C., & Munoz, R. (2020). Automated classification of social network messages into smart cities dimensions. Future Generation Computer Systems, 109, 218–237. https://doi.org/10.1016/j.future.2020.03.057
Benmansour, N. A. (2019). Citizens and expatriates satisfaction with public services in Qatar – evidence from a survey. International Journal of Social Economics, 46(3), 326–337. https://doi.org/10.1108/IJSE-03-2018-0118
Bradshaw, S., & Howard, P. N. (2019). The global disinformation disorder: 2019 global inventory of organised social media manipulation. University of Oxford. https://comprop.oii.ox.ac.uk/wp-content/uploads/sites/93/2019/09/CyberTroop-Report19.pdf
Burnap, P., Colombo, G., Amery, R., Hodorog, A., & Scourfield, J. (2017). Multi-class machine classification of suicide-related communication on Twitter. Online Social Networks and Media, 2, 32–44. https://doi.org/10.1016/j.osnem.2017.08.001
Chamby-Diaz, J. C., & Bazzan, A. L. C. (2019). Identifying traffic event types from Twitter by multi-label classification. Proceedings - 2019 Brazilian Conference on Intelligent Systems, BRACIS 2019, 806–811. https://doi.org/10.1109/BRACIS.2019.00144
Chang, J., Rosenn, I., Backstrom, L., & Marlow, C. (2010). EPluribus: Ethnicity on social networks. Proceedings of the Fourth International AAAI Conference on Weblogs and Social Media, 18–25.
Chodzaza, G. E., & Gombachika, H. S. H. (2013). Service quality, customer satisfaction
Asian Journal for Public Opinion Research - ISSN 2288-6168 (Online) Vol. 9 No.3 August 2021: 240-265
http://dx.doi.org/10.15206/ajpor.2021.9.3.240
260
and loyalty among industrial customers of a public electricity utility in Malawi. International Journal of Energy Sector Management, 7(2), 269–282. https://doi.org/10.1108/IJESM-02-2013-0003
Citrin, J., & Green, D. P. (1986). Presidential leadership and the resurgence of trust in government. British Journal of Political Science, 16(4), 431–453. https://doi.org/10.1017/S0007123400004518
Corallo, A., Fortunato, L., Matera, M., Alessi, M., Camillo, A., Chetta, V., Giangreco, E., & Storelli, D. (2015). Sentiment analysis for government: An optimized approach. In P. Perner (Ed.), Machine Learning and Data Mining in Pattern Recognition. MLDM 2015. Lecture notes in computer science, 9166, pp. 98–112. Springer International Publishing. https://doi.org/10.1007/978-3-319-21024-7_7
Cui, W. (2009). A scientific inspection of public service of new countryside in China. Proceedings of the 2009 6th International Conference on Service Systems and Service Management, ICSSSM ’09, 363–367. https://doi.org/10.1109/ICSSSM.2009.5174909
Davis, D. H. (2017). Is Twitter a generalizable public sphere? A comparison of 2016 presidential campaign issue importance among general and Twitter publics. Proceedings of the 8th International Conference on Social Media & Society, 1–5. https://doi.org/10.1145/3097286.3097317
Denhardt, R. B., & Denhardt, J. V. (2000). The new public service: Serving rather than steering. Public Administration Review, 60(6), 549–559. https://doi.org/10.1111/0033-3352.00117
Ganu, G., Elhadad, N., & Marian, A. (2009). Beyond the stars: Improving rating predictions using review text content. WebDB, 9, 1–6.
Ganu, G., Kakodkar, Y., & Marian, A. (2013). Improving the quality of predictions using textual information in online user reviews. Information Systems, 38(1), 1–15. https://doi.org/10.1016/j.is.2012.03.001
Georgiadou, E., Angelopoulos, S., & Drake, H. (2020). Big data analytics and international negotiations: Sentiment analysis of Brexit negotiating outcomes. International Journal of Information Management, 51(November), 102048. https://doi.org/10.1016/j.ijinfomgt.2019.102048
Gojali, S., & Khodra, M. L. (2016). Aspect based sentiment analysis for review rating prediction. 4th IGNITE Conference and 2016 International Conference on Advanced Informatics: Concepts, Theory and Application, ICAICTA 2016, 1–6. https://doi.org/10.1109/ICAICTA.2016.7803110
Han, J., Kamber, M., & Pei, J. (2012). Data mining: Concepts and techniques (3rd ed.). Morgan Kaufmann Publishers.
Asian Journal for Public Opinion Research - ISSN 2288-6168 (Online) Vol. 9 No.3 August 2021: 240-265
http://dx.doi.org/10.15206/ajpor.2021.9.3.240
261
Heiervang, E., & Goodman, R. (2011). Advantages and limitations of web-based
surveys: Evidence from a child mental health survey. Social Psychiatry and Psychiatric Epidemiology, 46, 69–76. https://doi.org/10.1007/s00127-009-0171-9
Hu, X., & Liu, H. (2012). Text analytics in social media. In C. C. Aggarwal & C. Zhai (Eds.), Mining Text Data, 53(9), 385-414. Springer US. https://doi.org/10.1007/978-1-4614-3223-4_12
Hutchinson, A. (2020). Who’s complaining, and what are the most common reasons for calling out businesses on social? [Infographic]. Retrieved August 7, 2021 from https://www.socialmediatoday.com/news/whos-complaining-and-what-are-the-most-common-reasons-for-calling-out-bus/570076/
Karimi, F., Wagner, C., Lemmerich, F., Jadidi, M., & Strohmaier, M. (2016). Inferring gender from names on the web: A comparative evaluation of gender detection methods. Proceedings of the 25th International Conference Companion on World Wide Web, 53–54. https://doi.org/http://dx.doi.org/10.1145/2872518.2889385
Kaur, W., Balakrishnan, V., Rana, O., & Sinniah, A. (2019). Liking, sharing, commenting and reacting on Facebook: User behaviors’ impact on sentiment intensity. Telematics and Informatics, 39, 25–36. https://doi.org/10.1016/j.tele.2018.12.005
Kaura, V. (2013). Antecedents of customer satisfaction: A study of Indian public and private sector banks. International Journal of Bank Marketing, 31(3), 167-186. https://doi.org/10.1108/02652321311315285
Koto, F., & Rahmaningtyas, G. Y. (2017). Inset lexicon: Evaluation of a word list for Indonesian sentiment analysis in microblogs. 2017 International Conference on Asian Language Processing (IALP), 2018-Janua(December), 391–394. https://doi.org/10.1109/IALP.2017.8300625
Kroh, M., Ludtke, D., Duzel, S., & Winter, F. (2016). Response error in a web survey and a mailed questionnaire: The role of cognitive functioning. SOEPpapers on Multidisciplinary Panel Data Research, 888. https://doi.org/10.2139/ssrn.2920616
Kwak, J. A., & Cho, S. K. (2018). Analyzing public opinion with social media data during election periods: A selective literature review. Asian Journal for Public Opinion Research, 5(4), 285–301. https://doi.org/10.15206/ajpor.2018.5.4.285
Lailiyah, M., Sumpeno, S., & Purnama, I. K. E. (2017). Sentiment analysis of public complaints using lexical resources between Indonesian sentiment lexicon and sentiwordnet. 2017 International Seminar on Intelligent Technology and Its
Asian Journal for Public Opinion Research - ISSN 2288-6168 (Online) Vol. 9 No.3 August 2021: 240-265
http://dx.doi.org/10.15206/ajpor.2021.9.3.240
262
Application: Strengthening the Link Between University Research and Industry to Support ASEAN Energy Sector, ISITIA 2017 - Proceeding, 2017-Janua, 307–312. https://doi.org/10.1109/ISITIA.2017.8124100
Levi, M., & Stoker, L. (2000). Political trust and trustworthiness. Annual Review of Political Science, 3, 475–507. https://doi.org/10.1146/annurev.polisci.3.1.475
Li, Y., & Shang, H. (2020). Service quality, perceived value, and citizens’ continuous-use intention regarding e-government: Empirical evidence from China. Information and Management, 57(3), 103197. https://doi.org/10.1016/j.im.2019.103197
Liu, B. (2012). Sentiment analysis and opinion mining. Synthesis Lectures on Human Language Technologies, 5(1), 1–184. https://doi.org/10.2200/S00416ED1V01Y201204HLT016
Madan, A., Arora, R., & Roy, N. R. (2018). Sentiment analysis of Indians on GST. In B. Panda, S. Sharma, & N. Roy (Eds.), Data Science and Analytics. REDSET 2017. Communications in Computer and Information Science, 799, 568–575. https://doi.org/10.1007/978-981-10-8527-7_47
Martin-Domingo, L., Martın, J. C., & Mandsberg, G. (2019). Social media as a resource for sentiment analysis of airport service quality (ASQ). Journal of Air Transport Management, 78(January), 106–115. https://doi.org/10.1016/j.jairtraman.2019.01.004
McGregor, S. C. (2019). Social media as public opinion: How journalists use social media to represent public opinion. Journalism, 20(8), 1070–1086. https://doi.org/10.1177/1464884919845458
Medaglia, R., & Zheng, L. (2016). Characterizing government social media research: Towards a grounded overview model. 2016 49th Hawaii International Conference on System Sciences (HICSS), 2016-March, 2991–2999. https://doi.org/10.1109/HICSS.2016.375
Mishler, W., & Rose, R. (2001). What are the origins of political trust? Testing institutional and cultural theories in post-communist societies. Comparative Political Studies, 34(1), 30–62. https://doi.org/10.1177/0010414001034001002
Mislove, A., Lehmann, S., Ahn, Y.-Y., Onnela, J.-P., & Rosenquist, J. N. (2011). Understanding the demographics of Twitter users. Proceedings of the International AAAI Conference on Web and Social Media.
Monett, D., & Stolte, H. (2016). Predicting star ratings based on annotated reviews of mobile apps. Proceedings of the 2016 Federated Conference on Computer Science and Information Systems, FedCSIS 2016, 8(June 2015), 421–428.

Asian Journal for Public Opinion Research - ISSN 2288-6168 (Online) Vol. 9 No.3 August 2021: 240-265
http://dx.doi.org/10.15206/ajpor.2021.9.3.240
263
https://doi.org/10.15439/2016F141
Murphy, J., Link, M. W., Childs, J. H., Tesfaye, C. L., Dean, E., Stern, M., Pasek, J., Cohen, J., Callegaro, M., & Harwood, P. (2014). Social media in public opinion research: Executive summary of the AAPOR task force on emerging technologies in public opinion research. Public Opinion Quarterly, 78(4), 788–794. https://doi.org/10.1093/poq/nfu053
OECD. (2017). Government at a Glance 2017. https://doi.org/https://doi.org/https://doi.org/10.1787/gov_glance-2017-en
Pratama, T., & Purwarianti, A. (2017). Topic classification and clustering on Indonesian complaint tweets for Bandung government using supervised and unsupervised learning. Proceedings - 2017 International Conference on Advanced Informatics: Concepts, Theory and Applications, ICAICTA 2017, July 2016. https://doi.org/10.1109/ICAICTA.2017.8090981
Psomas, E. (2020). Determining the impact of service quality on citizens’ satisfaction and the role of citizens’ demographics. The case of the Greek citizen’s service centers. TQM Journal. https://doi.org/10.1108/TQM-12-2019-0274
Qi, B., Costin, A., & Jia, M. (2020). A framework with efficient extraction and analysis of Twitter data for evaluating public opinions on transportation services. Travel Behaviour and Society, 21(May), 10–23. https://doi.org/10.1016/j.tbs.2020.05.005
Rekha, V., Raksha, R., Patil, P., Swaras, N., & Rajat, G. L. (2019). Sentiment analysis on Indian government schemes using Twitter data. 2019 International Conference on Data Science and Communication, IconDSC 2019, 1–5. https://doi.org/10.1109/IconDSC.2019.8817036
Salim, M., Peng, X., Almaktary, S., & Karmoshi, S. (2017). The impact of citizen satisfaction with government performance on public trust in the government: Empirical evidence from urban Yemen. Open Journal of Business and Management, 5(2), 348–365. https://doi.org/10.4236/ojbm.2017.52030
Sayyadiharikandeh, M., Varol, O., Yang, K. C., Flammini, A., & Menczer, F. (2020). Detection of novel social bots by ensembles of specialized classifiers. Proceedings of the 29th ACM International Conference on Information & Knowledge Management, 2725–2732. https://doi.org/10.1145/3340531.3412698
Seki, Y. (2016). Use of Twitter for analysis of public sentiment for improvement of local government service. 2016 IEEE International Conference on Smart Computing, SMARTCOMP 2016, 1–3. https://doi.org/10.1109/SMARTCOMP.2016.7501726
Asian Journal for Public Opinion Research - ISSN 2288-6168 (Online) Vol. 9 No.3 August 2021: 240-265
http://dx.doi.org/10.15206/ajpor.2021.9.3.240
264
Singh, P., Sawhney, R. S., & Kahlon, K. S. (2018). Sentiment analysis of demonetization
of 500 & 1000 rupee banknotes by Indian government. ICT Express, 4(3), 124–129. https://doi.org/10.1016/j.icte.2017.03.001
Sokolowska, M., Mazurek, M., Majer, M., & Podpora, M. (2019). Classification of user attitudes in Twitter -beginners guide to selected machine learning libraries. IFAC-PapersOnLine, 52(27), 394–399. https://doi.org/10.1016/j.ifacol.2019.12.692
Sprout Social. (2017). Call-out culture: People, brands & the social media power struggle. https://media.sproutsocial.com/uploads/2017/08/2017-q3-sprout-social-index.pdf
Steinmetz, S., Bianchi, A., Tijdens, K., & Biffignandi, S. (2014). Improving web survey quality. A data quality perspective. John Wiley & Sons Ltd.
Susilawati, E. (2016). Public services satisfaction based on sentiment analysis: Case study: Electrical services in Indonesia. 2016 International Conference on Information Technology System and Innovation (ICITSI), 1-6. https://doi.org/10.1109/ICITSI.2016.7858241
Tala, F. Z. (2003). A Study of Stemming Effects on Information Retrieval in Bahasa Indonesia. Master's project, Universiteit van Amsterdam. https://eprints.illc.uva.nl/id/eprint/740/1/MoL-2003-02.text.pdf
Twitter. (2021). Search API. Twitter. https://developer.twitter.com/en/docs/twitter-api/premium/search-api/guides/operators
United Nations Department of Economic and Social Affairs. (2018). United Nations E-Government Survey 2018: Gearing E-Government to Support Transformation Towards Sustainable and Resilient Societies. United Nations. https://publicadministration.un.org/egovkb/Portals/egovkb/Documents/un/2018-Survey/E-Government Survey 2018_FINAL for web.pdf
United Nations Department of Economic and Social Affairs. (2020). E-Government Survey 2020 - Digital Government in the Decade of Action for Sustainable Development: With Addendum on COVID-19 Response. United Nations. https://publicadministration.un.org/egovkb/en-us/Reports/UN-E-Government-Survey-2020
ur Rahim, F., & Shirazi, N. S. (2018). Fiscal decentralization and citizen’s satisfaction from local public service delivery in Pakistan. International Journal of Ethics and Systems, 34(1), 122-142. https://doi.org/10.1108/IJOES-04-2017-0066
Valliant, R., & Dever, J. A. (2011). Estimating propensity adjustments for volunteer web surveys. Sociological Methods and Research, 40(1), 105–137. https://doi.org/10.1177/0049124110392533
Asian Journal for Public Opinion Research - ISSN 2288-6168 (Online) Vol. 9 No.3 August 2021: 240-265
http://dx.doi.org/10.15206/ajpor.2021.9.3.240
265
Zhang, L., Hall, M., & Bastola, D. (2018). Utilizing Twitter data for analysis of
chemotherapy. International Journal of Medical Informatics, 120, 92–100. https://doi.org/10.1016/j.ijmedinf.2018.10.002
Zhu, Q. (2018). Classification of trending topics in Twitter. Proceedings - 2018 International Conference on Computational Science and Computational Intelligence, CSCI 2018, 274–277. https://doi.org/10.1109/CSCI46756.2018.00060
Biographical Notes Nori Wilantika is an assistant professor in the Department of Statistical Computing at Politeknik Statistika STIS in Jakarta, Indonesia. She completed her master’s degree in information technology at the University of Indonesia. Her research interests include e-participation and opinion mining. She can be reached at Jalan Otto Iskandardinata No.64C Jakarta, Indonesia, 13330 or by email at [email protected]. Septian Bagus Wibisono is an information technology professional at The Agency for Meteorology, Climatology, and Geophysics of The Republic of Indonesia. He completed his master’s degree in information technology at the University of Indonesia. His major research interests focus on machine learning and data science. He can be reached at Jalan Angkasa I No.2, Kemayoran, Jakarta, Indonesia, 10610 or by email at [email protected]. Date of Submission: 2021-03-20 Date of Acceptance: 2021-07-28