Application of FTA Analysis for Calculation of the Probability of ...
11
applied sciences Article Application of FTA Analysis for Calculation of the Probability of the Failure of the Pressure Leaching Process Stefan Markulik 1, *, Marek Šolc 2 , Jozef Petrík 2 , Michaela Balážiková 1 , Peter Blaško 2 , Juraj Kliment 2 and Martin Bezák 3 Citation: Markulik, S.; Šolc, M.; Petrík, J.; Balážiková, M.; Blaško, P.; Kliment, J.; Bezák, M. Application of FTA Analysis for Calculation of the Probability of the Failure of the Pressure Leaching Process. Appl. Sci. 2021, 11, 6731. https://doi.org/ 10.3390/app11156731 Academic Editor: Ilaria Cacciotti Received: 18 June 2021 Accepted: 16 July 2021 Published: 22 July 2021 Publisher’s Note: MDPI stays neutral with regard to jurisdictional claims in published maps and institutional affil- iations. Copyright: © 2021 by the authors. Licensee MDPI, Basel, Switzerland. This article is an open access article distributed under the terms and conditions of the Creative Commons Attribution (CC BY) license (https:// creativecommons.org/licenses/by/ 4.0/). 1 Department of Safety and Quality, Faculty of Mechanical Engineering, Technical University of Kosice, Letna 1/9, 04200 Kosice, Slovakia; [email protected] 2 Institute of Materials and Quality Engineering, Faculty of Materials, Metallurgy and Recycling, Technical University of Kosice, Letna 1/9, 04200 Kosice, Slovakia; [email protected] (M.Š.); [email protected] (J.P.); [email protected] (P.B.); [email protected] (J.K.) 3 Faculty of Mechanical Engineering, Technical University of Kosice, Letna 1/9, 04200 Kosice, Slovakia; [email protected] * Correspondence: [email protected]; Tel.: +421-55-602-2646 Abstract: European Union legislation requires organizations to assess their processes in the context of risk management. The main task of risk management is to manage all risks that can significantly affect the outcome of processes. The article is focused on risk evaluation in pressure leaching at elevated temperature using the method Fault Tree Analysis (FTA). The effectivity of pyrite and arsenic pyrite decomposition by oxidative pressure leaching is influenced by the duration of the process, by the temperature, concentration of the leaching solution and by a density of the slurry. It was found that, under equitable conditions, the arsenic pyrite decomposes more intensely than pyrite. Under laboratory conditions, leaching is performed in an autoclave. Due to the aggressive environment, increased pressure and temperature, process failure is possible. Its probability was calculated by FTA. It has been found that the probability of the top event in the examined process was disproportionately high (0.057) and represents an invitation to take corrective actions. The Monte Carlo method was used for the simulation of the effect the probability of basic events on the probability of the top event—the failure of the leaching process. Keywords: tetrahedrite; pyrite; arsenic pyrite; pressure leaching; failure tree analysis (FTA); Monte Carlo method 1. Introduction Currently, it is very important to ensure the continuous improvement of all processes in the industry. It is this improvement of processes in organizations that should ensure the constant competitiveness of organizations in the market. The process of oxidative leaching in autoclaves is a complicated process that can be influenced by several factors. Even one factor can cause an error in the system, or process failure, where it is then necessary to subsequently look for the causes of the failure. The FTA method is used to evaluate the causes that lead to system failure. The FTA is a quantitative evaluation technique that identifies an event as the top event and systematically arranges all the causes of the error in a top-down structure that looks like a tree in order to calculate the probability of occurrence of the top event [1]. According to Luo W. et al. FTA computes a large class of system reliability properties and measures based on the fault tree that model’s failure propagation in a system [2]. Risk assessment methods are often used in industrial processes to avoid risks and reduce losses [3,4]. The aim of the work is to study the application of the FTA method in the process of assessing and minimizing the risk of total failure of the leaching process, which can lead to damage to health or even endanger the lives of operating personnel in addition to Appl. Sci. 2021, 11, 6731. https://doi.org/10.3390/app11156731 https://www.mdpi.com/journal/applsci
-
Upload
khangminh22 -
Category
Documents
-
view
0 -
download
0
Transcript of Application of FTA Analysis for Calculation of the Probability of ...
applied sciences
Article
Application of FTA Analysis for Calculation of the Probabilityof the Failure of the Pressure Leaching Process
Stefan Markulik 1,*, Marek Šolc 2 , Jozef Petrík 2, Michaela Balážiková 1, Peter Blaško 2 , Juraj Kliment 2
and Martin Bezák 3
�����������������
Citation: Markulik, S.; Šolc, M.;
Petrík, J.; Balážiková, M.; Blaško, P.;
Kliment, J.; Bezák, M. Application of
FTA Analysis for Calculation of the
Probability of the Failure of the
Pressure Leaching Process. Appl. Sci.
2021, 11, 6731. https://doi.org/
10.3390/app11156731
Academic Editor: Ilaria Cacciotti
Received: 18 June 2021
Accepted: 16 July 2021
Published: 22 July 2021
Publisher’s Note: MDPI stays neutral
with regard to jurisdictional claims in
published maps and institutional affil-
iations.
Copyright: © 2021 by the authors.
Licensee MDPI, Basel, Switzerland.
This article is an open access article
distributed under the terms and
conditions of the Creative Commons
Attribution (CC BY) license (https://
creativecommons.org/licenses/by/
4.0/).
1 Department of Safety and Quality, Faculty of Mechanical Engineering, Technical University of Kosice,Letna 1/9, 04200 Kosice, Slovakia; [email protected]
2 Institute of Materials and Quality Engineering, Faculty of Materials, Metallurgy and Recycling,Technical University of Kosice, Letna 1/9, 04200 Kosice, Slovakia; [email protected] (M.Š.);[email protected] (J.P.); [email protected] (P.B.); [email protected] (J.K.)
3 Faculty of Mechanical Engineering, Technical University of Kosice, Letna 1/9, 04200 Kosice, Slovakia;[email protected]
* Correspondence: [email protected]; Tel.: +421-55-602-2646
Abstract: European Union legislation requires organizations to assess their processes in the contextof risk management. The main task of risk management is to manage all risks that can significantlyaffect the outcome of processes. The article is focused on risk evaluation in pressure leaching atelevated temperature using the method Fault Tree Analysis (FTA). The effectivity of pyrite andarsenic pyrite decomposition by oxidative pressure leaching is influenced by the duration of theprocess, by the temperature, concentration of the leaching solution and by a density of the slurry.It was found that, under equitable conditions, the arsenic pyrite decomposes more intensely thanpyrite. Under laboratory conditions, leaching is performed in an autoclave. Due to the aggressiveenvironment, increased pressure and temperature, process failure is possible. Its probability wascalculated by FTA. It has been found that the probability of the top event in the examined processwas disproportionately high (0.057) and represents an invitation to take corrective actions. TheMonte Carlo method was used for the simulation of the effect the probability of basic events on theprobability of the top event—the failure of the leaching process.
Keywords: tetrahedrite; pyrite; arsenic pyrite; pressure leaching; failure tree analysis (FTA); MonteCarlo method
1. Introduction
Currently, it is very important to ensure the continuous improvement of all processesin the industry. It is this improvement of processes in organizations that should ensure theconstant competitiveness of organizations in the market. The process of oxidative leachingin autoclaves is a complicated process that can be influenced by several factors. Even onefactor can cause an error in the system, or process failure, where it is then necessary tosubsequently look for the causes of the failure.
The FTA method is used to evaluate the causes that lead to system failure. TheFTA is a quantitative evaluation technique that identifies an event as the top event andsystematically arranges all the causes of the error in a top-down structure that looks likea tree in order to calculate the probability of occurrence of the top event [1]. Accordingto Luo W. et al. FTA computes a large class of system reliability properties and measuresbased on the fault tree that model’s failure propagation in a system [2]. Risk assessmentmethods are often used in industrial processes to avoid risks and reduce losses [3,4].
The aim of the work is to study the application of the FTA method in the processof assessing and minimizing the risk of total failure of the leaching process, which canlead to damage to health or even endanger the lives of operating personnel in addition to
Appl. Sci. 2021, 11, 6731. https://doi.org/10.3390/app11156731 https://www.mdpi.com/journal/applsci
Appl. Sci. 2021, 11, 6731 2 of 11
material losses. By identifying the riskiest branch, attention will be focused on eliminatingsignificant sources of dangers and threats. The results obtained have great potential for usein future safety research as well as in the hydrometallurgical leaching process. They provethat the application of the FTA method is suitable for improving not only the analyzedleaching process, but also seems to be suitable for other hydrometallurgical technologiesthat work with aggressive substances, often at high temperature and pressure.
2. Characteristics of the Leaching Process in the Context of Risk Assessment
The technology of oxidation leaching in autoclaves is a complicated process. De-pending of leaching conditions several processes may run simultaneously in the closedautoclave, e.g., sorption of the gaseous oxygen in the solution, mass transport from thefluid volume to solid particles, diffusion of reagents through the boundary surface layerson the surface of solid particles, diffusion of the products of chemical reactions in the solu-tion. Oxidation of sulfides runs by means of dissolved oxygen in a liquid phase wherebysorption of oxygen by leaching solution plays an important role [5–7].
Decomposition of the real flotation sulfide concentrate is a goal of the process.Processes of dissolution, oxidation, diffusion, precipitation, and hydrolysis can be
described by the following reactions:
2FeS2(s) + 15/2O2(g) + 8OH−(aq) → Fe2O3(s) + 4SO2−
4 (aq) + 4H2O(l) (1)
2FeAsS(s) + 10OH−(aq) + 7O2(g) → Fe2O3(s) + 2AsO3−
4 (aq) + 2SO2−4 (aq) + 5H2O(l) (2)
The flotation sulfide concentrate from Pezinok (Slovak Republic) was used for theexperimental work. Chemical composition of the concentrate is listed in Table 1. As regardsthe mineralogical composition, it contained pyrite, arsenic pyrite, tailings, silica, and shale.
Table 1. Chemical composition of the concentrate (wt. %).
ConcentrateFe As S SiO2 Al2O3 Au Sb Cu
27.00 7.78 23.76 15.6 9.88 0.0041 0.23 0.17
Rotating autoclave LAMPART of 4 l volume was used for leaching; oxygen wasintroduced through a pressure reducer. The concentrate was mixed with a relevant volumeof the solution of NaOH a slurry of different density with the ratio L:S (liquid/solid)between 5:1 and 20:1 was formed. The concentration of the leaching solution NaOH variedfrom 3.55 to 7.1 M and applied temperatures ranged between 120 and 185 ◦C. After thetemperature reached the required values, the reaction time 90–300 min was measured. Allexperiments were carried out at a constant initial pressure of oxygen 0.9 MPa which wassufficient for the course of oxidizing reactions in the system. Mikloš and Fröhlich proposedthat in the equipment used for pressure leaching the highest efficiencies of the paralleldecomposition of both sulfides was achieved at the following conditions: concentrationof the leaching solution–3.55 M NaOH, the temperature of 185 ◦C, the initial pressure ofO2–0.9 MPa, time–180 min [8].
Due to the aggressive environment, increased pressure and temperature, the failure ofthe leaching process is possible. Its probability was calculated by Fault Tree Analysis (FTA).
The term “failure” (fault = top event in FTA terminology) means the prematuretermination of leaching, the result of which is unusable and implies material and financialloss or damage to health.
The goals of the work are:
1. To calculate the probability of the top event-the failure (early termination) of theleaching process using the FTA.
2. To model the impact of the dynamic of the probability of base events on the top eventusing the Monte Carlo method.
Appl. Sci. 2021, 11, 6731 3 of 11
3. Propose an effective improvement of the leaching process in order to effectivelyreduce the probability of the top event.
3. Fault Tree Analysis (FTA) Analysis
The gradual development of civilization brings together, along with many technicalfacilities, the possibility of significant damage to the natural environment and one of thegreatest possible threats to it is chemical failures and disasters [9]. Occupational riskassessment is one of the employer’s core duties but there are no practical implementingprovisions for the use of hazard identification and risk assessment methods [10–13].
As mentioned above, leaching in the autoclave is accompanied by the risk of materialdamage and in the worst case an injury to the health of the operator. This fact is influencedby risk factors such as the aggressive environment due to an alkaline slurry reaction, hightemperature, and pressure, electrical installation, the risk of injury from handling by heavyautoclave. They together create an indirect risk of a failure, for example, if the operator isinjured, the autoclave will be out of service with great probability. These sources of risk, inview of their indirect action, are not considered in the construction of FTA [14,15].
Many authors, for example Girmanová et al., propose to construct a cause-and-effectdiagram, also called Ishikawa’s diagram by its creator, before constructing a fault tree. Itallows for “clarification” of the problem and is often serviceable as a basis for the graphicdesign of a “tree”. The aim is to identify the sources that contribute to the analysis problemand the relationships between them [16–18].
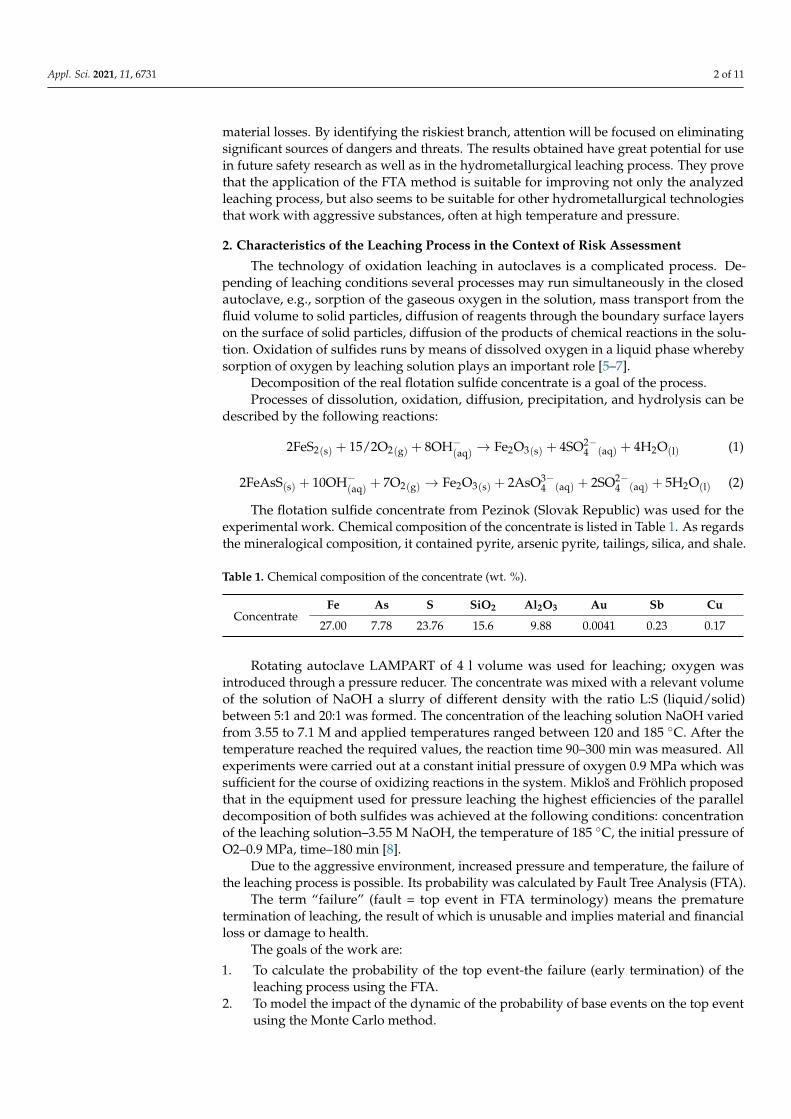
The diagram is a visualization tool for categorizing the potential causes of the problem—the top event to identify its basic or root causes. The design of the diagram looks much likea skeleton of a fish. Fishbone diagrams are typically worked right to left, with each large“bone”, or “ribs”, of the fish branching out to include smaller bones containing more detail.The head and backbone of the fish list the top event—the problem or issue to be studied.Five “causes” that contribute to the problem (Materials, Machines, Manpower, Methods,Measurement, and Environment) create the first bones (ribs) of the fish [19]. Other, morespecific levels of bones (horizontal, vertical, horizontal...) can be added to the “ribs” untilthe cause of the problem can be divided into subcategories. The practical number of levelsis usually four to five. The lowest level is a basic event. When the diagram is complete, weprovide an overview of the possible causes (not symptoms) of the solved problem. It isimportant to explore more times repeating subcategories to find a link between them oreliminate unnecessary duplication. Correctly designed diagram significantly facilitates thedesign of fault tree analysis.
As can be seen in Figure 1, the ribs have been modified according to actual problemsof the leaching process (Material-tested concentrate, Machine—autoclave, Methods, En-vironment, Measurement methods, and Appraisers). The whole diagram was not usedto construct the FTA; it did not address the problem of the appraiser, which is rather amatter of human resources. The influence of the environment was also not considered. Itdoes not have a statistically significant influence on the probability of the process failurein according to the results of the observation (the autoclave is in a heated room, and itis isolated from plants that would negative (for example dustiness) affect its operation.Problems with negligible probability of occurrence have also not been considered.
Appl. Sci. 2021, 11, 6731 4 of 11Appl. Sci. 2021, 11, x FOR PEER REVIEW 4 of 11
Figure 1. Ishikawa diagram.
Failure Tree Analysis (FTA) is a qualitative and quantitative analysis of the failure in the shape of a tree [20]. It defines the relationship between a top event—a failure—and basic events (roots), which are the faults of the lowest elements of the system or external influences. Logical links, that is, branch of the tree of failures, are made up of gates using the logical symbols (AND) and (OR). The gate has one output event and several input events. The “AND” gate uses a logical sum. It represents a combination of independent events. That is, the probability of any input event to an AND gate is unaffected by any other input event to the same gate. It is “favorable”—an adverse event at the output P(G) occurs only if all events at the input (Ai) occur at the same time. The probability of an output event at this type of gate is calculated using Equation (3).
P(G) P(A ) (3)
P(G) 1 (1 P(A )) (4)
The “OR” gate is “unfavorable”—an adverse event at the output P(G) occurs when either of event occurs at an input (Ai). The probability of an event at the output of this type of gate is calculated using Equation (4). From the knowledge of the probability of occurrence of a base event or the intensity of its occurrence, it is possible to estimate the probability or intensity of the occurrence of a top event. The “tree” creation process and subsequent calculation are documented in STN EN 61025: 2007 [21].
The fault tree is in a shape that can be understood, analyzed and modified if neces-sary to simplify the identification of the failure. From the highest level of the failure—the top event—it is possible to proceed at tree level to a base event. In this way, it is possible to investigate any dependencies in the system as well as its subsystems [22,23]. In analyz-ing this method, a systematic approach is necessary, as it is necessary to capture the func-tional linkages between the elements of the monitored system. The FTA method going from the top down through the tree makes it easy to recognize the causal dependence of the top event. FTA is particularly suited for the analysis of complex systems that consist of functionally dependent subsystems serving to fulfil a defined function. It is particularly suited to cases where the process of analysis requires many different specialists. FTA method was first used in 1962 by Bell Telephone Laboratories in the development of in-tercontinental ballistic missiles (Minuteman Intercontinental Ballistic Missile Launch Con-trol System) and was improved by Boeing in 1966. It started to be used in the nuclear power industry since 1975. Its use in this industry experienced a significant increase after an accident in Three Mile Island in 1979. It is an important part of reliability engineering.
Figure 1. Ishikawa diagram.
Failure Tree Analysis (FTA) is a qualitative and quantitative analysis of the failure inthe shape of a tree [20]. It defines the relationship between a top event—a failure—andbasic events (roots), which are the faults of the lowest elements of the system or externalinfluences. Logical links, that is, branch of the tree of failures, are made up of gates usingthe logical symbols (AND) and (OR). The gate has one output event and several inputevents. The “AND” gate uses a logical sum. It represents a combination of independentevents. That is, the probability of any input event to an AND gate is unaffected by anyother input event to the same gate. It is “favorable”—an adverse event at the output P(G)occurs only if all events at the input (Ai) occur at the same time. The probability of anoutput event at this type of gate is calculated using Equation (3).
P(G) =n
∏i=1
P(Ai) (3)
P(G) = 1−n
∏i=1
(1− P(Ai)) (4)
The “OR” gate is “unfavorable”—an adverse event at the output P(G) occurs wheneither of event occurs at an input (Ai). The probability of an event at the output of thistype of gate is calculated using Equation (4). From the knowledge of the probability ofoccurrence of a base event or the intensity of its occurrence, it is possible to estimate theprobability or intensity of the occurrence of a top event. The “tree” creation process andsubsequent calculation are documented in STN EN 61025: 2007 [21].
The fault tree is in a shape that can be understood, analyzed and modified if necessaryto simplify the identification of the failure. From the highest level of the failure—the topevent—it is possible to proceed at tree level to a base event. In this way, it is possible toinvestigate any dependencies in the system as well as its subsystems [22,23]. In analyzingthis method, a systematic approach is necessary, as it is necessary to capture the functionallinkages between the elements of the monitored system. The FTA method going fromthe top down through the tree makes it easy to recognize the causal dependence of thetop event. FTA is particularly suited for the analysis of complex systems that consist offunctionally dependent subsystems serving to fulfil a defined function. It is particularlysuited to cases where the process of analysis requires many different specialists. FTAmethod was first used in 1962 by Bell Telephone Laboratories in the development ofintercontinental ballistic missiles (Minuteman Intercontinental Ballistic Missile LaunchControl System) and was improved by Boeing in 1966. It started to be used in the nuclearpower industry since 1975. Its use in this industry experienced a significant increase afteran accident in Three Mile Island in 1979. It is an important part of reliability engineering.
It is most used in nuclear technology, in complex systems such as aircraft, chemicaloperations, and complex information systems [24]. It allows easy understanding of the
Appl. Sci. 2021, 11, 6731 5 of 11
system and its functional links, as well as its impact factors. If these trees are extensive, it isadvisable to use the computing technique, since the process of verifying the tree’s faults inthe usual way would be difficult. Evolved from the works of Rajkumar et al. and Plurathe aim of qualitative or logical analysis is to find all reasonably possible combinationsof factors operating conditions, environmental conditions, human errors and faults ofelements of which could lead to the top event [25,26]. A manual solution in a qualitativeanalysis of the fault tree is currently done only in the case of simple trees (usually a fewtens of basic events), otherwise special software products must be used. If the parametersof confidence (probability of developing) of basic events are known, it is possible to make aquantitative fault tree analysis. The goal of this procedure is:
• The systematic identification of all possible combinations of (basic) causes leading tothe top event;
• Easy definition of the top event probability in the system or its arbitrary part;• Creating a model (causal dependence) for examining the security of the monitored
system to know the input/output interactions;• Modelling for simulation of safety, reliability, etc.;• Provide a transparent analytical listing of logical operations existing in the tracking
system;• Display of the monitored system in the form of a graphical model in which quantitative
and qualitative data are recorded;• Recognition of individual risk factors in the risk analysis process.
The FTA proceeds in steps. Clemens and Vesely et al. present the main principles ofcreation of FTA in their works. The specific sequence of steps is not unified; the sequencebelow is the minimum that each analysis must contain [27–30]:
1. Definition of the analyzed system, purpose and extent of the analysis, and basicassumptions that have been adopted. Prerequisites should include the conditionsunder which the monitored system is operated (normal operation, maintenance,special operations...). The amount of information required is subject to the purpose ofthe analysis. Knowledge of one person is often inadequate, and professional groupsneed to be set up to obtain sufficient information. In this step, it is useful to usestatistical methods and quality tools (e.g., process map, Failure Mode and EffectAnalysis FMEA, flowchart, regulatory diagrams, trend analysis, Pareto and Ishikawadiagram).
2. Definition of a top event-specifying an undesirable event means defining the onset orexistence of dangerous conditions, the inability of the system to perform the requiredfunctions. The top event must be defined clearly and unambiguously.
3. Construction of the failure tree—the tree is a graphical representation consisting ofindividual elements that are bound by logical operations describing the observedprocess. It is necessary to distinguish between conditional and unconditional states inthe process of the construction.
4. Evaluation of tree failure can be quantitative (numeric) or qualitative (logical) [16,26–28].
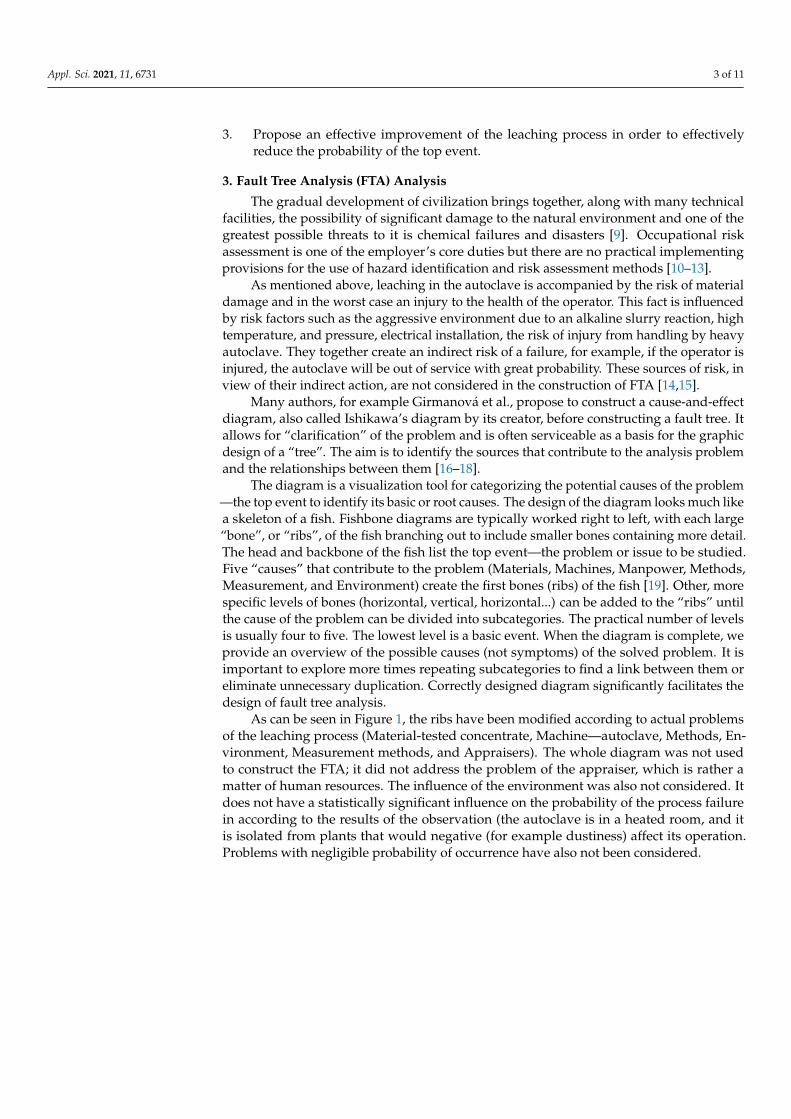
In the case of quantitative FTA, the direct calculation method, the minimal critical cutmethod and the simulation method (e.g., Monte Carlo) are most used. The probability ofeach basic event listed in Table 2. The probability was evaluated using data, collected over9 years. During this period 1011 leaching experiments were performed. Some data, e.g.,probability of event A was evaluated based on even longer observations. Electrical currentprovides the heating and movement (rotation) of the autoclave. From the point of view ofthe failures associated with the current, basic events considered were included in the gateG1. The fault tree with the individual basic events and gates is shown in Figure 2. FactorA-total (electric) power fault (the probability of the event was based on the long-termobservation (factor J in Table 1) [31].
Appl. Sci. 2021, 11, 6731 6 of 11Appl. Sci. 2021, 11, x FOR PEER REVIEW 6 of 11
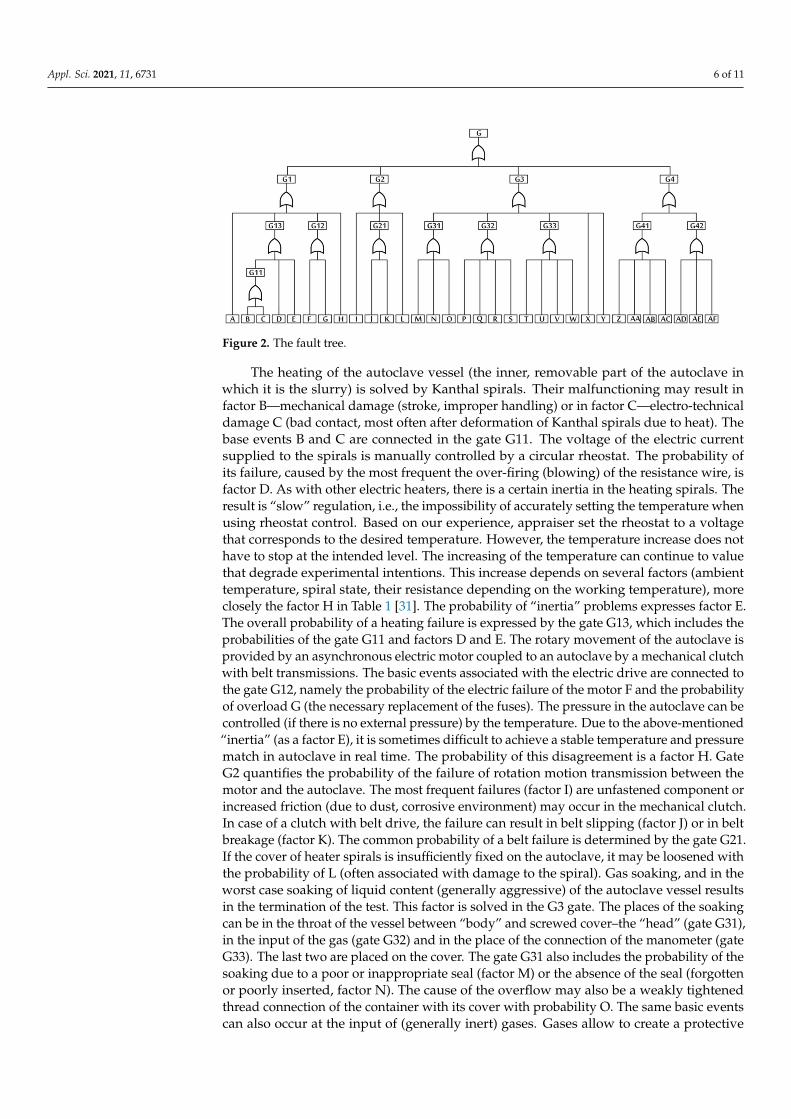
Figure 2. The fault tree.
The heating of the autoclave vessel (the inner, removable part of the autoclave in which it is the slurry) is solved by Kanthal spirals. Their malfunctioning may result in factor B—mechanical damage (stroke, improper handling) or in factor C—electro-tech-nical damage C (bad contact, most often after deformation of Kanthal spirals due to heat). The base events B and C are connected in the gate G11. The voltage of the electric current supplied to the spirals is manually controlled by a circular rheostat. The probability of its failure, caused by the most frequent the over-firing (blowing) of the resistance wire, is factor D. As with other electric heaters, there is a certain inertia in the heating spirals. The result is “slow” regulation, i.e., the impossibility of accurately setting the temperature when using rheostat control. Based on our experience, appraiser set the rheostat to a volt-age that corresponds to the desired temperature. However, the temperature increase does not have to stop at the intended level. The increasing of the temperature can continue to value that degrade experimental intentions. This increase depends on several factors (am-bient temperature, spiral state, their resistance depending on the working temperature), more closely the factor H in Table 1 [31]. The probability of “inertia” problems expresses factor E. The overall probability of a heating failure is expressed by the gate G13, which includes the probabilities of the gate G11 and factors D and E. The rotary movement of the autoclave is provided by an asynchronous electric motor coupled to an autoclave by a mechanical clutch with belt transmissions. The basic events associated with the electric drive are connected to the gate G12, namely the probability of the electric failure of the motor F and the probability of overload G (the necessary replacement of the fuses). The pressure in the autoclave can be controlled (if there is no external pressure) by the tem-perature. Due to the above-mentioned “inertia” (as a factor E), it is sometimes difficult to achieve a stable temperature and pressure match in autoclave in real time. The probability of this disagreement is a factor H. Gate G2 quantifies the probability of the failure of rota-tion motion transmission between the motor and the autoclave. The most frequent failures (factor I) are unfastened component or increased friction (due to dust, corrosive environ-ment) may occur in the mechanical clutch. In case of a clutch with belt drive, the failure can result in belt slipping (factor J) or in belt breakage (factor K). The common probability of a belt failure is determined by the gate G21. If the cover of heater spirals is insufficiently fixed on the autoclave, it may be loosened with the probability of L (often associated with damage to the spiral). Gas soaking, and in the worst case soaking of liquid content (gen-erally aggressive) of the autoclave vessel results in the termination of the test. This factor is solved in the G3 gate. The places of the soaking can be in the throat of the vessel between “body” and screwed cover–the “head” (gate G31), in the input of the gas (gate G32) and in the place of the connection of the manometer (gate G33). The last two are placed on the cover. The gate G31 also includes the probability of the soaking due to a poor or inappro-priate seal (factor M) or the absence of the seal (forgotten or poorly inserted, factor N). The cause of the overflow may also be a weakly tightened thread connection of the container
Figure 2. The fault tree.
The heating of the autoclave vessel (the inner, removable part of the autoclave inwhich it is the slurry) is solved by Kanthal spirals. Their malfunctioning may result infactor B—mechanical damage (stroke, improper handling) or in factor C—electro-technicaldamage C (bad contact, most often after deformation of Kanthal spirals due to heat). Thebase events B and C are connected in the gate G11. The voltage of the electric currentsupplied to the spirals is manually controlled by a circular rheostat. The probability ofits failure, caused by the most frequent the over-firing (blowing) of the resistance wire, isfactor D. As with other electric heaters, there is a certain inertia in the heating spirals. Theresult is “slow” regulation, i.e., the impossibility of accurately setting the temperature whenusing rheostat control. Based on our experience, appraiser set the rheostat to a voltagethat corresponds to the desired temperature. However, the temperature increase does nothave to stop at the intended level. The increasing of the temperature can continue to valuethat degrade experimental intentions. This increase depends on several factors (ambienttemperature, spiral state, their resistance depending on the working temperature), moreclosely the factor H in Table 1 [31]. The probability of “inertia” problems expresses factor E.The overall probability of a heating failure is expressed by the gate G13, which includes theprobabilities of the gate G11 and factors D and E. The rotary movement of the autoclave isprovided by an asynchronous electric motor coupled to an autoclave by a mechanical clutchwith belt transmissions. The basic events associated with the electric drive are connected tothe gate G12, namely the probability of the electric failure of the motor F and the probabilityof overload G (the necessary replacement of the fuses). The pressure in the autoclave can becontrolled (if there is no external pressure) by the temperature. Due to the above-mentioned“inertia” (as a factor E), it is sometimes difficult to achieve a stable temperature and pressurematch in autoclave in real time. The probability of this disagreement is a factor H. GateG2 quantifies the probability of the failure of rotation motion transmission between themotor and the autoclave. The most frequent failures (factor I) are unfastened component orincreased friction (due to dust, corrosive environment) may occur in the mechanical clutch.In case of a clutch with belt drive, the failure can result in belt slipping (factor J) or in beltbreakage (factor K). The common probability of a belt failure is determined by the gate G21.If the cover of heater spirals is insufficiently fixed on the autoclave, it may be loosened withthe probability of L (often associated with damage to the spiral). Gas soaking, and in theworst case soaking of liquid content (generally aggressive) of the autoclave vessel resultsin the termination of the test. This factor is solved in the G3 gate. The places of the soakingcan be in the throat of the vessel between “body” and screwed cover–the “head” (gate G31),in the input of the gas (gate G32) and in the place of the connection of the manometer (gateG33). The last two are placed on the cover. The gate G31 also includes the probability of thesoaking due to a poor or inappropriate seal (factor M) or the absence of the seal (forgottenor poorly inserted, factor N). The cause of the overflow may also be a weakly tightenedthread connection of the container with its cover with probability O. The same basic eventscan also occur at the input of (generally inert) gases. Gases allow to create a protective
Appl. Sci. 2021, 11, 6731 7 of 11
or desired atmosphere in the autoclave and, to a certain extent, to regulate the internalpressure. The gas input closes the valve, screwed onto the cover of the vessel. FactorP represents the probability of selecting an improper sealing of the screwed connection,factor Q probability of the absence of the sealing and factor R inadequate tightening of thethreaded (screwed) connection between the valve and the cover. Factor S is the probabilityof imperfect valve closure. The manometer threaded (screwed) to the cover of the vessel ofthe autoclave serves for the measurement of its internal pressure. Factor T represents theprobability of selecting an improper sealing of the screwed connection, factor U probabilityof the absence of the sealing and factor V inadequate tightening of the threaded (screwed)connection between the manometer and the cover. The probability of using a manometerwith a too small range is the factor W is also covered by gate G33. If the pressure in thevessel of the autoclave exceeds its upper limit, the destruction of the manometer withthe following consequences may be possible. Temperature measurement in the autoclaveallows the dead-ended tube firmly coupled to the cover reaching the autoclave vessel. Theanalysis of the failures for temperature measurement is given in gate G4. The leachedslurry is placed in a vessel that is inserted into the autoclave. Its purpose is to avoidthe contact of the aggressive slurry with the body of the autoclave. The probability ofthe leakage of the slurry out of the working vessel due to an inappropriate setting of theautoclave is the factor X and the effect of overloading the vessel is the factor Y. The G4 gatecombines the probability of failure of the autoclave measuring devices. Uncontrollableand potentially a serious accident can occur due to the extreme pressure and temperatureincrease in the vessel (intense overflow or “explosion”) if the measuring devices fail. Thetemperature of the slurry, its pressure and the reaction time are measured during autoclaveoperation. The temperature is measured by a thermocouple whose thermoelectric voltagemeasures a suitable electronic thermometer. The probability of failure of a thermometerdevice indicates the gate G41. The gate G41 joints the probability of failure of the electronicthermometer (factor Z), the probability of breakage (mechanical damage) of the usedthermocouple (factor AA), damage to the ceramic cover of the thermocouple (factor AB),and the short-circuit (unwanted contact between thermocouple wires out of the isolation)of the thermocouple (or connecting wires) AC. Gate G42 indicates the probability of failureof the manometer due to the jamming of the mechanical parts with the probability of ADor damage due to the aggressive leaching media AE. The most recent underlying cause isan incorrect indication of the start time of the experiment and its end (or its absence) withthe probability of AF.
All the gates considered are “OR”. The probability of gate G1 is 0.02622, G2 gate:0.00748, G3 gate: 0.01460 and Gate G4: 0.00936. The riskiest G1 gate appears to characterizethe device for rotation of the autoclave vessel. The probability of the top event is 0.05653,i.e., 5.7%.
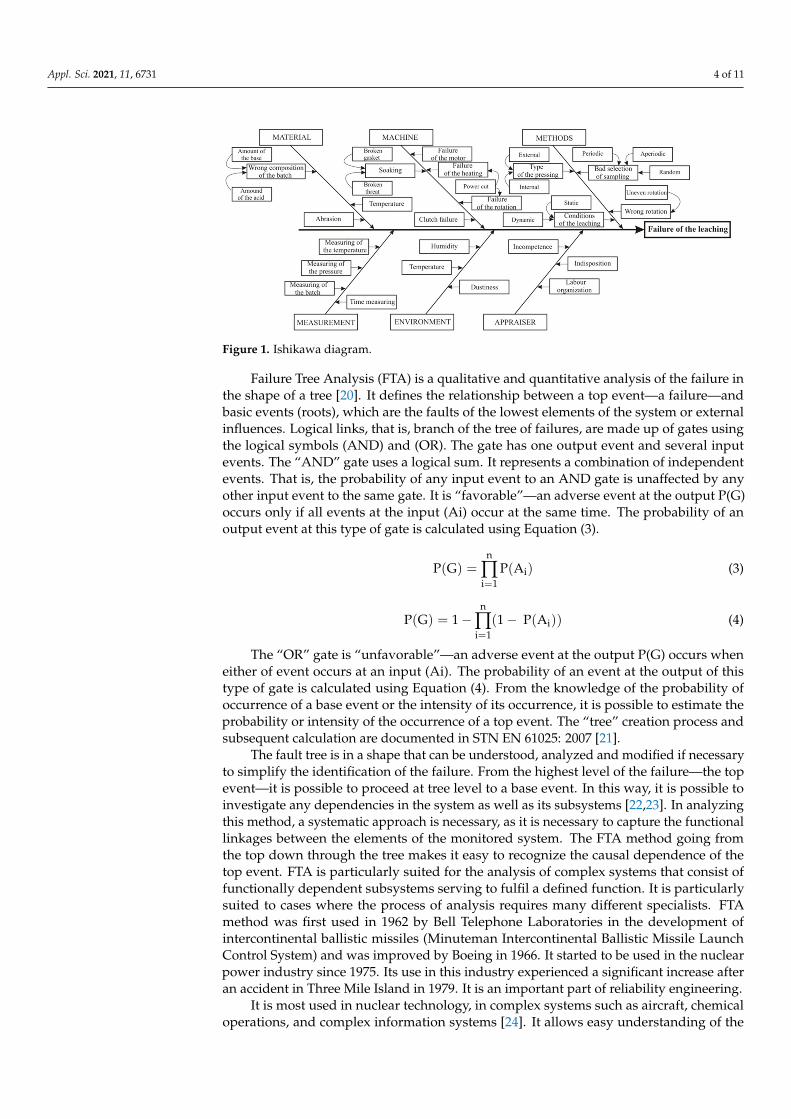
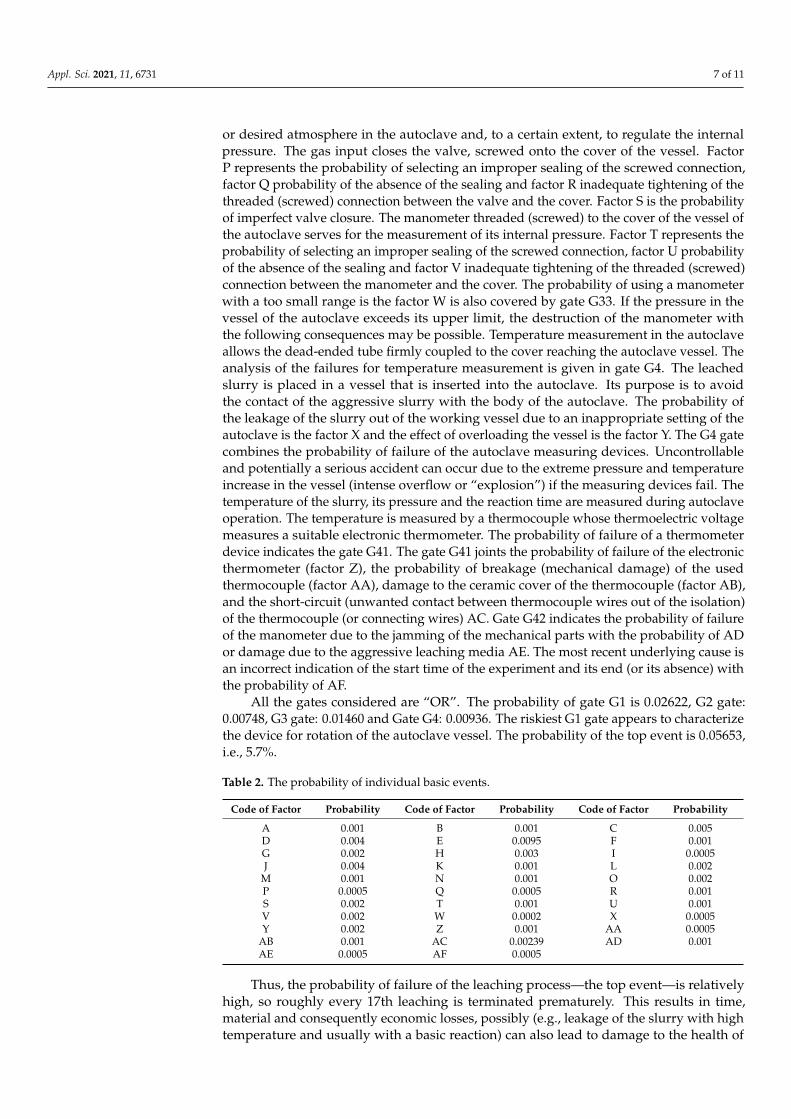
Table 2. The probability of individual basic events.
Code of Factor Probability Code of Factor Probability Code of Factor Probability
A 0.001 B 0.001 C 0.005D 0.004 E 0.0095 F 0.001G 0.002 H 0.003 I 0.0005J 0.004 K 0.001 L 0.002
M 0.001 N 0.001 O 0.002P 0.0005 Q 0.0005 R 0.001S 0.002 T 0.001 U 0.001V 0.002 W 0.0002 X 0.0005Y 0.002 Z 0.001 AA 0.0005
AB 0.001 AC 0.00239 AD 0.001AE 0.0005 AF 0.0005
Thus, the probability of failure of the leaching process—the top event—is relativelyhigh, so roughly every 17th leaching is terminated prematurely. This results in time,material and consequently economic losses, possibly (e.g., leakage of the slurry with hightemperature and usually with a basic reaction) can also lead to damage to the health of
Appl. Sci. 2021, 11, 6731 8 of 11
the appraiser. Therefore, it is advisable to reduce the probability of a top event. The “treeof failures” makes it easy for us to find a “critical cut”, which is to take the direction ofeliminating the causes of the failure. In our case, they are branches that connect in theG1 gate.
4. Monte Carlo Method
The Monte Carlo method has a wide use of simulation of experiments, throughcounting of some integrals, to solving differential equations. The basic idea of the method isvery simple: we want to determine the mean value of a quantity that is the result of randomaction [32]. A computerized model is created and after enough overrun simulations, datacan be processed by standard statistical methods, such as determining the mean, medianand the standard deviation. The method is named after Monte Carlo, known for its casinosand especially roulette. The term was first used by physicists in 1940 to build an Americanatomic bomb.
Besides the mathematical problems, the Monte Carlo method is used to solve economicproblems, particularly in insurance and finance. The method helps to solve deterministicand probabilistic tasks by many times repeated random experiments on the input datasample. The method was dealt with by many authors, the works of Knežo, Raychaudhuri,Kuselman et al., Petrík and Blaško, and Sienkowski were used in the paper [33–36].
The impact of a certain dynamics of the probability of occurrence of basic events wassimulated by Monte Carlo. We assumed that they varied within ± 10% of the value inTable 2 according to the triangular distribution. The calculation was performed usingQUANTUM XL software with 10,000 simulations. In this case, the probability of anunsuccessful (the failure-early termination) leaching process would increase to 15.7%.
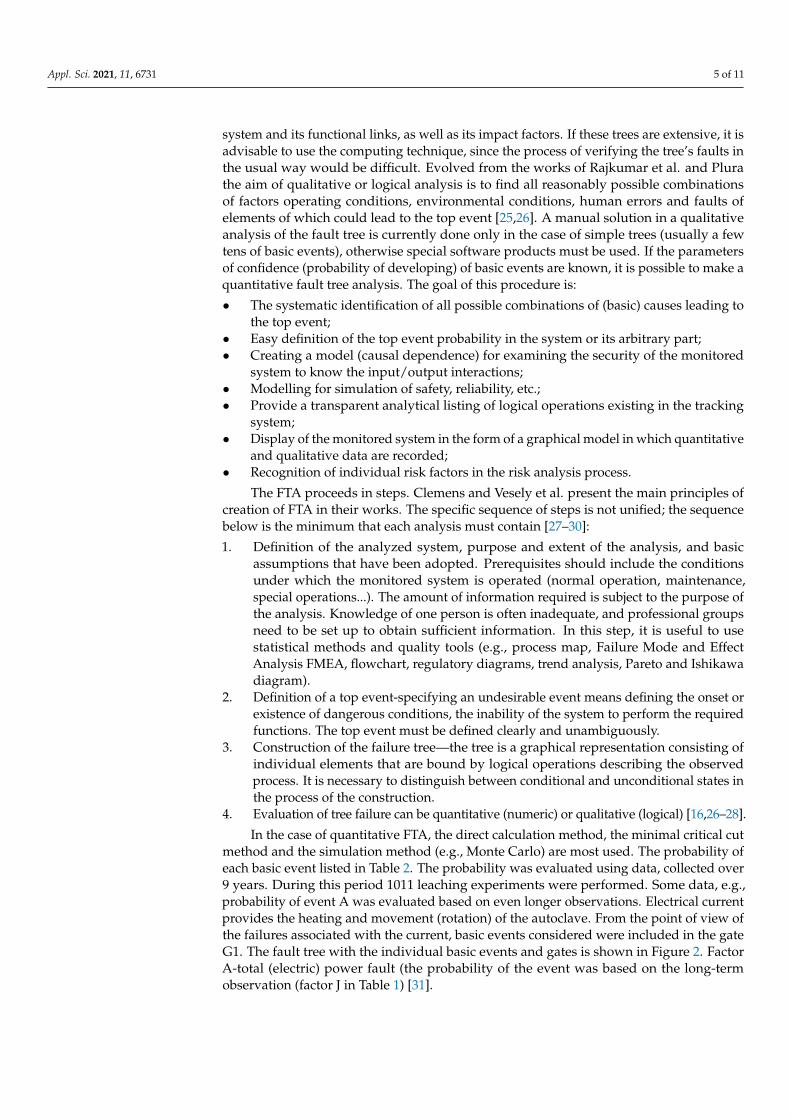
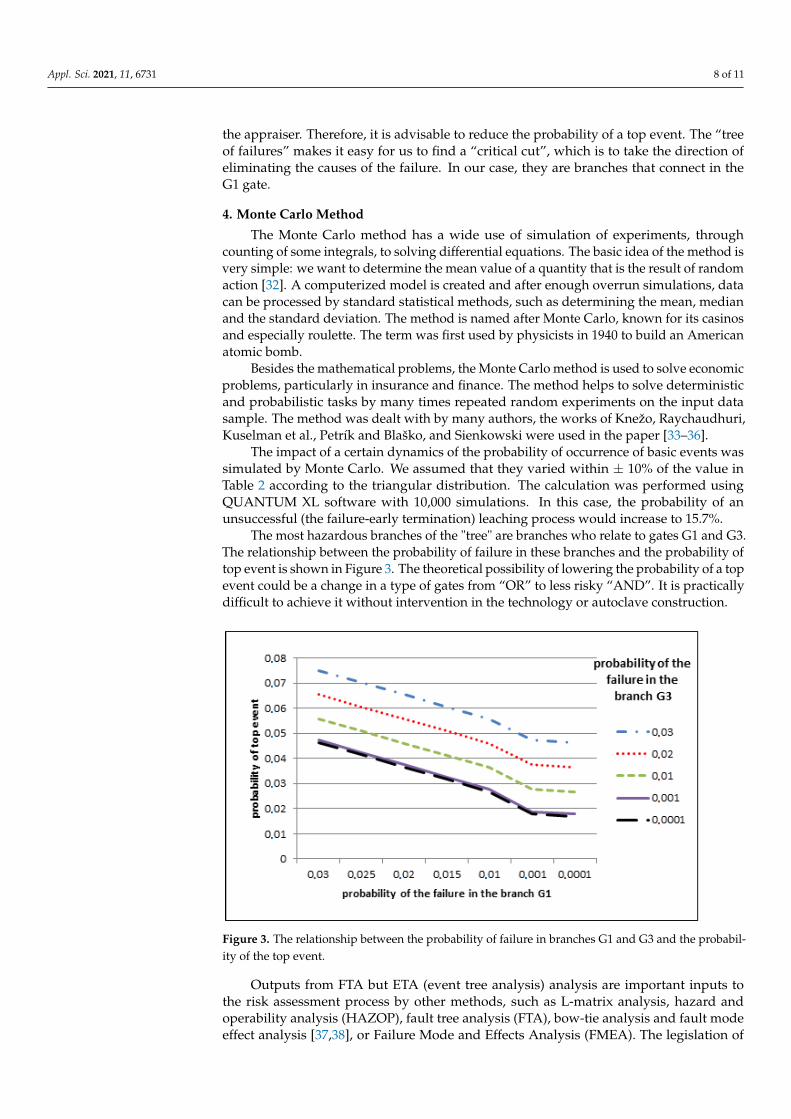
The most hazardous branches of the "tree" are branches who relate to gates G1 and G3.The relationship between the probability of failure in these branches and the probability oftop event is shown in Figure 3. The theoretical possibility of lowering the probability of a topevent could be a change in a type of gates from “OR” to less risky “AND”. It is practicallydifficult to achieve it without intervention in the technology or autoclave construction.
Appl. Sci. 2021, 11, x FOR PEER REVIEW 8 of 11
Thus, the probability of failure of the leaching process—the top event—is relatively high, so roughly every 17th leaching is terminated prematurely. This results in time, material and consequently economic losses, possibly (e.g., leakage of the slurry with high temperature and usually with a basic reaction) can also lead to damage to the health of the appraiser. Therefore, it is advisable to reduce the probability of a top event. The “tree of failures” makes it easy for us to find a “critical cut”, which is to take the direction of eliminating the causes of the failure. In our case, they are branches that connect in the G1 gate.
4. Monte Carlo Method The Monte Carlo method has a wide use of simulation of experiments, through
counting of some integrals, to solving differential equations. The basic idea of the method is very simple: we want to determine the mean value of a quantity that is the result of random action [32]. A computerized model is created and after enough overrun simula-tions, data can be processed by standard statistical methods, such as determining the mean, median and the standard deviation. The method is named after Monte Carlo, known for its casinos and especially roulette. The term was first used by physicists in 1940 to build an American atomic bomb.
Besides the mathematical problems, the Monte Carlo method is used to solve economic problems, particularly in insurance and finance. The method helps to solve deterministic and probabilistic tasks by many times repeated random experiments on the input data sample. The method was dealt with by many authors, the works of Knežo, Raychaudhuri, Kuselman et al., Petrík and Blaško, and Sienkowski were used in the paper [33–36].
The impact of a certain dynamics of the probability of occurrence of basic events was simulated by Monte Carlo. We assumed that they varied within ± 10% of the value in Table 2 according to the triangular distribution. The calculation was performed using QUANTUM XL software with 10,000 simulations. In this case, the probability of an un-successful (the failure-early termination) leaching process would increase to 15.7%.
The most hazardous branches of the "tree" are branches who relate to gates G1 and G3. The relationship between the probability of failure in these branches and the proba-bility of top event is shown in Figure 3. The theoretical possibility of lowering the proba-bility of a top event could be a change in a type of gates from “OR” to less risky “AND”. It is practically difficult to achieve it without intervention in the technology or autoclave construction.
Figure 3. The relationship between the probability of failure in branches G1 and G3 and the proba-bility of the top event. Figure 3. The relationship between the probability of failure in branches G1 and G3 and the probabil-ity of the top event.
Outputs from FTA but ETA (event tree analysis) analysis are important inputs tothe risk assessment process by other methods, such as L-matrix analysis, hazard andoperability analysis (HAZOP), fault tree analysis (FTA), bow-tie analysis and fault modeeffect analysis [37,38], or Failure Mode and Effects Analysis (FMEA). The legislation of
Appl. Sci. 2021, 11, 6731 9 of 11
the Slovak Republic, based on the directives of the European Union, Council Directive89/391/EEC on the introduction of measures to encourage improvements in the safety andhealth of workers at work and Council Directive 89/392/EEC machinery directive, showsorganizations to manage their risks. The FTA used in solving the problem presented in thearticle is also suitable for this purpose.
5. Conclusions
The probability of the top event-early termination of the leaching process in autoclavecalculated by FTA is 5.7%. The most hazardous is the branch connected with gate G1,which includes electrical and mechanical components providing rotation of the autoclave.If the variability of the probability of basic events increases by 10%, the probability of thetop event increase to 15.7% according to the Monte Carlo method. Decreasing of the topevent probability is practically difficult to achieve it without intervention in the technologyor autoclave construction.
The results obtained have great potential for use in future safety research as well asin the hydrometallurgical leaching process. They prove that the application of the FTAmethod is suitable for improving not only the analyzed leaching process, but also seems tobe suitable for other hydrometallurgical technologies that work with aggressive substances,often at high temperature and pressure.
The presented example of the use of FTA in the production process in which thereis a possibility of damage to the health of employees as well as material and financiallosses contributes to meeting the requirements of European Union legislation, which showsorganizations to manage risks.
Author Contributions: Management and validation, writing and final review, S.M. and J.K.; appli-cation of statistical, mathematical techniques, J.P. and P.B.; research and verification, M.Š.; develop-ment of methodology, S.M. and J.P.; data collection, P.B., M.B. (Michaela Balážiková), M.B. (MartinBezákand). All authors have read and agreed to the published version of the manuscript.
Funding: This contribution is the result of the implementation of the following projects: KEGA No.019TUKE-4/2020 “Application-oriented education in ISO 9001:2015 requirements implementation”.
Institutional Review Board Statement: Not applicable.
Informed Consent Statement: Not applicable.
Data Availability Statement: Not applicable.
Acknowledgments: Not applicable.
Conflicts of Interest: The authors declare no conflict of interest.
References1. Tavakoli, M.; Nafar, M. Modification of the FFTA method for calculating and analyzing the human reliability of maintenance
groups in power transmission grids. Int. J. Syst. Assur. Eng. Manag. 2021, 1–14. [CrossRef]2. Luo, W.; Wei, O.; Wan, H. SATMCS: An Efficient SAT-Based Algorithm and Its Improvements for Computing Minimal Cut Sets.
IEEE Trans. Reliab. 2021, 70, 575–589. [CrossRef]3. Zhu, H.-L.; Liu, S.-S.; Qu, Y.-Y.; Han, X.-X.; He, W.; Cao, Y. A new risk assessment method based on belief rule base and fault tree
analysis. Proc. Inst. Mech. Eng. Part O J. Risk Reliab. 2021, 235, 1748006X2110114. [CrossRef]4. Hudák, R.; Šarik, M.; Dadej, R.; Živcák, J.; Harachová, D. Material and Thermal analysis of Laser Sinterted Products. Acta Mech.
Autom. 2013, 7, 15–19. [CrossRef]5. Rusanen, L.; Aromaa, J.; Forsen, O. Pressure Oxidation of Pyrite-Arsenopyrite Refractory Gold Concentrate. Physicochem. Probl.
Miner. Process. 2013, 49. [CrossRef]6. Correia, M.N.; Carvalho, J.; Monhemius, A. Study of the autoclave leaching of a tetrahedrite concentrate. Miner. Eng. 1993, 6,
1117–1125. [CrossRef]7. Koslides, T.; Ciminelli, V. Pressure oxidation of arsenopyrite and pyrite in alkaline solutions. Hydrometallurgy 1992, 30, 87–106.
[CrossRef]8. Mikloš, V.; Fröhlich, L. Decomposition of Pyrite and Arsenopyrite by Pressure Oxidation of Tetrahedrite Raw Materials. Metalurgija
2002, 41, 29–32.
Appl. Sci. 2021, 11, 6731 10 of 11
9. Zarczynski, A. Environmental Hazard by Major Accidents in the Polish Chemical Industry. Zagrozenie srodowiska Na TereniePolski Ze Strony Powaznych Awarii w Zakładach Przemysłu Chemicznego. Chem. Rev. 2015, 1, 45–51. [CrossRef]
10. Dobrzynska, E. Ocena ryzyka zwiazanego z wystepowaniem substancji chemicznych na stanowiskach pracy. Metody bezpomi-arowe w bazie CHEMPYŁ. Przemysł Chem. 2018, 1, 155–160. [CrossRef]
11. Shafiee, M.; Enjema, E.; Kolios, A. An Integrated FTA-FMEA Model for Risk Analysis of Engineering Systems: A Case Study ofSubsea Blowout Preventers. Appl. Sci. 2019, 9, 1192. [CrossRef]
12. Dado, M.; Hnilica, R.; Kotus, M.; Kotek, L. Use of virtual reality in machinery safety education. In Proceedings of the ICERIProceedings, 10th International Conference of Education, Research and Innovation (ICERI2017), Seville, Spain, 16–18 November2017; Proceedings Paper; WOS: 000429975302127. IATED-INT Association Technology Education & Development: Valencia,Spain, 2017; ISBN 978-84-697-6957-7.
13. Novakova, R.; Paulikova, A.; Cekanova, K. More Wood, Better Management, Increasing Effectiveness: Starting Points and Perspective.In Proceedings of the Scientific Papers, Prague, Czech Republic, 24–26 May 2017; Dudik, R., Ed.; Ceská Zemedelská Univerzita vPraze, Lesnická Fakulta: Prague, Czech Republic; WoodEMA Instituce: Zagreb, Croatia, 2017; ISBN 978-80-213-2761-0.
14. Gabriska, D. Evaluation of the Level of Reliability in Hazardous Technological Processes. Appl. Sci. 2020, 11, 134. [CrossRef]15. Takahashi, M.; Anang, Y.; Watanabe, Y. A Safety Analysis Method for Control Software in Coordination with FMEA and FTA.
Information. 2021, 12, 79. [CrossRef]16. Girmanová, L.; Mikloš, V.; Palfy, P.; Petrík, J.; Sütoová, A.; Šolc, M. Nástroje a Metódy Manažérstva Kvality; ELFA, s.r.o.: Košice,
Slovakia, 2009; ISBN 978-80-553-0144-0. (In Slovak)17. Tureková, I.; Tomková, V.; Bagalová, T. Work at Height in Safety Work Plan Management. Adv. Mater. Res. 2014, 919, 523–526.
[CrossRef]18. Halfarova, P.; Ustyugova, T.; Vykydal, D. The application of Fuzzy FMEA. In Proceedings of the 22nd International Conference
on Metallurgy and Materials (METAL), Brno, Czech Republic, 15–17 May 2013; Technical University of Ostrava VSB: Ostrava,Czech Republic, 2013; pp. 1909–1913.
19. Markulik, S.; Nagyova, A.; Turisova, R.; Villinsky, T. Improving Quality in the Process of Hot Rolling of Steel Sheets. Appl. Sci.2021, 11, 5451. [CrossRef]
20. Bujna, M.; Dostál, P. Assessment of Selected Equipment by Method FTA. Acta Univ. Agric. Silvic. Mendel. Brun. 2017, 65,1655–1661. [CrossRef]
21. IEC 61025. Fault Tree Analysis (FTA); International Electrotechnical Commission IEC: Geneva, Switzerland, 2006.22. Husar, J.; Knapcikova, L.; Balog, M. Implementation of Material Flow Simulation as a Learning Tool. In Advances in Design,
Simulation and Manufacturing; Lecture Notes in Mechanical, Engineering; Ivanov, V., Rong, Y., Trojanowska, J., Venus, J.,Liaposhchenko, O., Zajac, J., Pavlenko, I., Edl, M., Perakovic, D., Eds.; Springer International Publishing: Cham, Switzerland,2019; pp. 33–41, ISBN 978-3-319-93586-7.
23. Toth, T.; Hudak, R.; Zivcak, J. Dimensional verification and quality control of implants by additive manufacturing. Qual. Innov.Prosper. 2015, 19. [CrossRef]
24. Monkova, K.; Hric, S.; Knapcikova, L.; Vagaska, A.; Matiskova, D. Application of simulation for product quality enhancement.In Proceedings of the International Conference on Informatics, Management Engineering and Industrial Application (IMEIA),Phuket, Thailand, 24–25 April 2016; DEStech Transactions on Engineering and Technology Research: Lancaster, PA, USA, 2016;pp. 216–220.
25. Patil, R.B.; Waghmode, L.Y.; Chikali, P.B.; Mulla, T.S. An Overview of Fault Tree Analysis (FTA) Method for Reliability Analysis &Life Cycle Cost (LCC) Management. In Proceedings of the Second International Conference on Emerging Trends in Engineering(SICETE), Nagpur, India, 16–18 December 2009; p. 6.
26. Plura, J. Plánování a Neustálé Zlepšování Jakosti; Computer Press: Praha, Czech Republic, 2001; ISBN 978-80-7226-543-5. (In Czech)27. Clemens, P.L. Fault Tree Analysis; Technology Sverdrup: Pittsburg, CA, USA, 1993; 96p, Available online: http://
rischioatmosfereesplosive.studiomarigo.it/profiles/marigo2/images/file/1736612536.pdf (accessed on 22 July 2021).28. Vesely, W.; Stamatelatos, M.; Dugan, J.; Fragola, J.; Minarick, J.; Railsback, J. FTA Handbook with Aerospace Applications; NASA
Langley Research Center: Washington, DC, USA, 2002. Available online: http://www.hq.nasa.gov/office/codeq/doctree/fthb.pdf (accessed on 22 July 2021).
29. Živcák, J.; Šarik, M.; Hudák, R. FEA simulation of thermal processes during the direct metal laser sintering of Ti64 titaniumpowder. Measurement 2016, 94, 893–901. [CrossRef]
30. Pacaiová, H.; Andrejiová, M.; Balažiková, M.; Tomašková, M.; Gazda, T.; Chomová, K.; Hijj, J.; Salaj, L. Methodology for ComplexEfficiency Evaluation of Machinery Safety Measures in a Production Organization. Appl. Sci. 2021, 11, 453. [CrossRef]
31. Blaško, P.; Petrík, J. FTA analysis of the failure in the horizontal fluidity test. Met. Mater. Eng. 2015, 21, 229–240. [CrossRef]32. Liu, J.; Yang, H.; Wei, D.; Song, X. Time Distribution Simulation of Household Power Load Based on Travel Chains and Monte
Carlo–A Study of Beijing in Summer. Sustainability 2021, 13, 6651. [CrossRef]33. Knežo, D. O Metóde Monte Carlo a Možnostiach jej Aplikácií. Transf. Inovácií 2012, 24, 178–181. Available online: https:
//www.sjf.tuke.sk/transferinovacii/pages/archiv/transfer/24-2012/pdf/178-181.pdf (accessed on 22 July 2021). (In Slovak).34. Raychaudhuri, S. Introduction to Monte Carlo simulation. In Proceedings of the 2008 Winter Simulation Conference, Miami, FL,
USA, 7–10 December 2008; Institute of Electrical and Electronics Engineers (IEEE): Piscataway, NJ, USA, 2008; pp. 91–100.

Appl. Sci. 2021, 11, 6731 11 of 11
35. Kuselman, I.; Pennecchi, F.; Epstein, M.; Fajgelj, A.; Ellison, S. Monte Carlo simulation of expert judgments on human errors inchemical analysis—A case study of ICP–MS. Talanta 2014, 130, 462–469. [CrossRef]
36. Sienkowski, S. Estimation of Random Variable Distribution Parameters by the Monte Carlo Method. Metrol. Meas. Syst. 2013, 20,249–262. [CrossRef]
37. Sabol, R.; Klein, P.; Ryba, T.; Hvizdos, L.; Varga, R.; Rovnak, M.; Sulla, I.; Mudronova, D.; Galik, J.; Polacek, I.; et al. NovelApplications of Bistable Magnetic Microwires. Acta Physica Polonica A 2017, 131, 1150–1152. [CrossRef]
38. Özfirat, M.K.; Özkan, E.; Kahraman, B.; Sengün, B.; Yetkin, M.E. Integration of risk matrix and event tree analysis: A naturalstone plant case. Sadhana 2017, 42, 1741–1749. [CrossRef]