Trade Analysis of Retail and Service Industries in North Dakota for Planning Local Economic...
28
Agricultural Economics Report No. 363 October, 1996 TRADE ANALYSIS OF RETAIL AND SERVICE INDUSTRIES IN NORTH DAKOTA FOR PLANNING LOCAL ECONOMIC DEVELOPMENT Sanjib Bhuyan Quentin Burdick Center for Cooperatives * Department of Agricultural Economics North Dakota State University * Fargo, ND 58105-5636
-
Upload
independent -
Category
Documents
-
view
4 -
download
0
Transcript of Trade Analysis of Retail and Service Industries in North Dakota for Planning Local Economic...

Agricultural Economics Report No. 363 October, 1996
TRADE ANALYSIS OF RETAIL AND SERVICE INDUSTRIES IN NORTHDAKOTA FOR PLANNING LOCAL ECONOMIC DEVELOPMENT
Sanjib Bhuyan
Quentin Burdick Center for Cooperatives * Department of Agricultural Economics North Dakota State University * Fargo, ND 58105-5636
TRADE ANALYSIS OF RETAIL AND SERVICE INDUSTRIES IN NORTH DAKOTA FOR
PLANNING LOCAL ECONOMIC DEVELOPMENT
Sanjib Bhuyan
Department of Agricultural EconomicsNorth Dakota State University
Fargo, ND 58105-5636
The analyses and views reported in this paper are those of the author. They are not necessarilyendorsed by the Department of Agriculture or by North Dakota State University.
North Dakota State University is committed to the policy that all persons shall have equal access toits programs, and employment without regard to race, color, creed, religion, national origin, sex,age, marital status, disability, public assistance status, veteran status, or sexual orientation.
Information on other titles in this series may be obtained from: Department of AgriculturalEconomics, North Dakota State University, P.O. Box 5636, Fargo, ND 58105. Telephone: 701-231-7441, Fax: 701-231-7400, or e-mail: [email protected].
Copyright © 1996 by Sanjib Bhuyan. All rights reserved. Readers may make verbatim copies ofthis document for non-commercial purposes by any means, provided that this copyright noticeappears on all such copies.
TRADE ANALYSIS OF RETAIL AND SERVICE INDUSTRIES IN NORTH DAKOTA FOR
PLANNING LOCAL ECONOMIC DEVELOPMENT
Sanjib Bhuyan
ABSTRACT
Trade analysis of retail and service sectors allows economic development practioners toevaluate the performance of these sectors in their respective communities. Estimation of marketpotential identifies specific business categories (e.g., computer stores) that have potential forfurther growth. Trade analysis of retail and service sectors in North Dakota shows that except ina few urban counties, such as Cass, Grand Forks, or Burleigh, these sectors were inefficient inretaining and attracting customer dollars. Market potential estimation of over 130 specificbusiness categories showed that a considerable number of business categories have potential forfurther growth, e.g., computer and software stores, used merchandise stores, and heavyconstruction equipment rental and leasing services.
Key words: trade analysis, market potential, economic development

PREFACE
Preparation of this report was funded by cooperative research agreement FMHA-94-57between the Rural Business and Cooperative Development Service, Rural Economic andCommunity Development, USDA, and the North Dakota State University AgriculturalExperiment Station. Dr. Randall Torgerson of the RBCS/RECD/USDA, served as liaison; andDr. David Cobia was the principal investigator. This report also contributes to NDSUAgricultural Experiment Station project 1394, titled “Strategies for Rural CooperativeDevelopment."
The study is based on secondary data collected from public domain sources. The authoris grateful to David Cobia, Larry Stearns, Dean Bangsund, Jay Leitch, Vidya Satyanarayana, andCole Gustafson for their comments on an earlier draft. However, any remaining errors are thesole responsibility of the author. Ms. Donna Adam is appreciated for her assistance in preparingthe printer-ready copy of this report.

TABLE OF CONTENTS
ABSTRACT . . . . . . . . . . . . . . . . . . . . . . . . . . . . . . . . . . . . . . . . . . . . . . . . . . . . . . . . . . . . . . . . ii
HIGHLIGHTS . . . . . . . . . . . . . . . . . . . . . . . . . . . . . . . . . . . . . . . . . . . . . . . . . . . . . . . . . . . . . . . iii
BACKGROUND . . . . . . . . . . . . . . . . . . . . . . . . . . . . . . . . . . . . . . . . . . . . . . . . . . . . . . . . . . . . . 1
RETAIL AND SERVICE SECTOR PERFORMANCE . . . . . . . . . . . . . . . . . . . . . . . . . . . . . . 3
MARKET POTENTIAL OF RETAIL AND SERVICE SECTOR INDUSTRIES. . . . . . . . . . . 7Retail Trade Industries. . . . . . . . . . . . . . . . . . . . . . . . . . . . . . . . . . . . . . . . . . . . . . . . . . . 10Service Sector Industries. . . . . . . . . . . . . . . . . . . . . . . . . . . . . . . . . . . . . . . . . . . . . . . . . 13
CONCLUSIONS . . . . . . . . . . . . . . . . . . . . . . . . . . . . . . . . . . . . . . . . . . . . . . . . . . . . . . . . . . . . 18
REFERENCES . . . . . . . . . . . . . . . . . . . . . . . . . . . . . . . . . . . . . . . . . . . . . . . . . . . . . . . . . . . . . 19
LIST OF TABLES
Table 1: Trade Performance of Retail and Service Sectors in North Dakota by County, 1992 . . . . . . . . . . . . . . . . . . . . . . . . . . . . . . . . . . . . . . . . . . . . . . . . . . . . . . . . . . . . . . . . 4
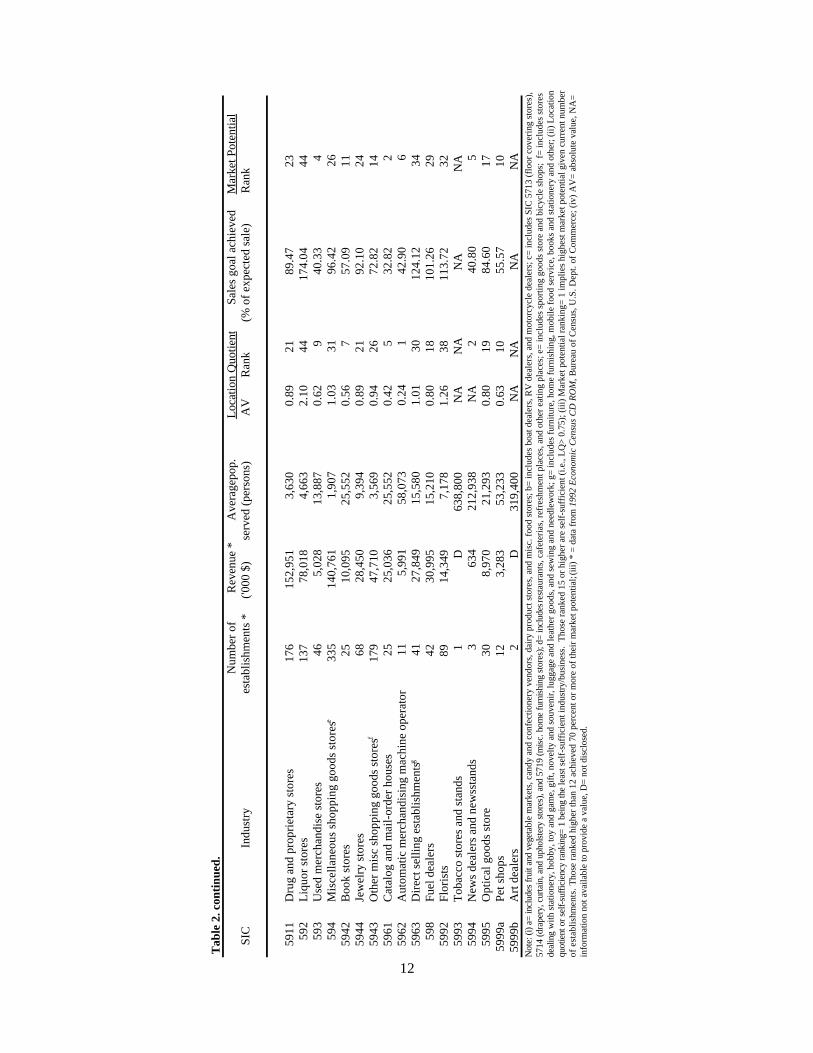
Table 2: Market Potential and Other Related Information on Retail Industries in North Dakota, 1992. . . . . . . . . . . . . . . . . . . . . . . . . . . . . . . . . . . . . . . . . . . . . . . . . . . . . . . . . 11
Table 3: Market Potential and Other Related Information on Service Industries in North Dakota, 1992. . . . . . . . . . . . . . . . . . . . . . . . . . . . . . . . . . . . . . . . . . . . . . . . . . . . . . . . . 15
FIGURE
Figure 1: County Trade Pull Factors of Retail and Service Sectors, North Dakota, 1992. . . . . . 6
ii
ABSTRACT
Trade analysis of retail and service sectors allows economic development practioners toevaluate the performance of these sectors in their respective communities. Estimation of marketpotential identifies specific business categories (e.g., computer stores) that have potential forfurther growth. Trade analysis of retail and service sectors in North Dakota shows that except ina few urban counties, such as Cass, Grand Forks, or Burleigh, these sectors were inefficient inretaining and attracting customer dollars. Market potential estimation of over 130 specificbusiness categories showed that a considerable number of business categories have potential forfurther growth, e.g., computer and software stores, used merchandise stores, and heavyconstruction equipment rental and leasing services.
Key words: trade analysis, market potential, economic development
iii
HIGHLIGHTS
This study evaluates the performance of retail and service sectors in 53 North Dakotacounties and analyzes the availability and market potential of over 130 retail and service sectorbusinesses in the state. The analyses are conducted using central place theory-based regionaleconomics models and secondary data.
Trade analysis is an inexpensive and relatively simple way to assess the performance oflocal retail and service sector activities in terms of attracting customer dollars, market size, orgrowth potential of businesses. Knowledge of such information has proven useful in buildingawareness and support for local economic development activities (Harris and Shonkwiler, 1996). Trade analysis provides answers to questions such as ‘‘what is the level of goods and servicescurrently provided locally and what goods and services are imported from elsewhere?’’ Or ‘‘whatis the market size, in terms of sales dollars in a specific line of business?’’ And ‘‘given theexisting demand and competition, does his/her line of business have market or businesspotential?’’
Over the years, both the population and businesses have declined gradually in nearly allcounties in North Dakota--the exceptions are the relatively urban counties of Cass, Grand Forks,Burleigh, Ward, and Stutsman. The U.S. Small Business Administration (1995) reported thatduring 1991-92 business failure in the state was 16.4% compared to the national average of9.9%. In terms of population, while the U.S. population rose by 9.8% during 1980-92,population in North Dakota fell by 2.1%. A recent report by the U.S. Small BusinessAdministration (SBA, 1995) shows that retail sales in North Dakota (adjusted for inflation) fellabout 20 percent from 1980 to 1988. Such shrinkage in population and economic activity wassubstantially more severe in outlying rural areas and towns than in areas with relatively higherpopulation such as Cass County, which includes the City of Fargo.
The purpose of this paper is to (1) analyze the effectiveness of retail and service sectors inNorth Dakota counties in attracting potential consumer purchases and (2) to examine whichkinds of retail and service businesses have the potential for future growth in the state. Evaluationof retail and service sector performances in North Dakota shows that for most counties these twosectors were less successful in retaining and attracting customer purchases. Moreover, thesituation has deteriorated over the last decade for most rural counties in the state. Given such anoutcome, the past or ongoing economic development programs and strategies to improvebusiness environment and attract customers may not have been as desired. However, it is morethan likely that the situation would have been worse had no economic development programsbeen undertaken in these communities. Reevaluation of on-going economic developmentprograms and strategies may be required to improve the performance of retail and service tradesin those communities that did not perform well. Active cooperation among private businesses,potential entrepreneurs, or economic development agencies may also contribute towardsimproving retail and service sectors performances in North Dakota.

iv
Analysis of market potential of specific businesses in retail and service sectors has shownthat among the 130-plus business categories selected for this study, the following have highermarket potential in their respective sectors: in the service sector -- computer rent/lease andmaintenance services; public golf courses; and heavy construction equipment rental and leasingservices retail sector -- computer and software stores; catalog and mail-order houses; and usedmerchandise stores. These are some of the businesses that may be targeted by potentialentrepreneurs in North Dakota for opening new business ventures. However, before deciding toopen a new business venture, an entrepreneur must conduct a thorough feasibility study as a partof his/her business plan. For those interested in starting a new business in North Dakota, contactthe Department of Economic Development and Finance at (701) 221-5320 for information andassistance or regional economic development commissions for further information.

Research Associate, Quentin Burdick Center for Cooperatives, North Dakota State University,*
Fargo.
TRADE ANALYSIS OF RETAIL AND SERVICEINDUSTRIES IN NORTH DAKOTA FOR
PLANNING LOCAL ECONOMIC DEVELOPMENT
Sanjib Bhuyan*
BACKGROUND
It is common for economists and development planners to conduct applied research andextension education programs to help local economic development practioners evaluate theperformance of their local business sectors, e.g., retail sector. It is essential for the economicdevelopment practioners to know how effective the retail or service sectors in their communityare in attracting potential consumer purchases. This information is important, because if thesesectors are not performing well, local business and community leaders will need to reevaluatetheir on-going programs and strategies and start new ones to improve the performance of variouslocal businesses. Conversely, communities where these sectors are doing well may intensifytheir existing economic development strategy. Bringing such performance evaluations to a groupof citizens or decision-makers concerned with the economic future of a community has provenuseful in building awareness and support for local economic development activities (Harris andShonkwiler, 1996).
Trade analysis is a commonly used procedure to provide local economic developmentplanners and decision makers with information about current local retail and service sectoractivities (Shaffer, 1989; Ariyaratne and Darling, 1995). Trade analysis is an inexpensive andrelatively simple way to obtain information such as relative performance of differentcommunities in attracting customer dollars, market size, or performance of specific businesscategories. Economic development practioners face questions such as what is the level of goodsand services currently provided locally and what goods and services are imported fromelsewhere? A crucial question faced by any entrepreneur is what is the market size, in terms ofsales dollars, in his/her line of business? And given the existing demand and competition, doeshis/her line of business have market or business potential? Trade analysis tries to provideanswers to such questions.
Over the years, both population and businesses are declining gradually in nearly allcounties in North Dakota--the exceptions are the relatively urban counties of Cass, Grand Forks,Burleigh, Ward, and Stutsman. Declining population and businesses put financial stress on thesecommunities to provide and maintain services such as local credit, health services, garbagedisposal, grocery stores, and other retail and service related outlets. For instance, on averageNorth Dakota residents drive 68 miles to and from the closest hospital (Hamm et al., 1993). TheU.S. Small Business Administration (1995) reported that during 1991-92 business failure in thestate was 16.4% compared to the national average of 9.9%. In terms of population, while the

2
U.S. population rose by 9.8% during 1980-92, population in North Dakota fell by 2.1%. Arecent report by the U.S. Small Business Administration (SBA, 1995) shows that retail sales inNorth Dakota (adjusted for inflation) fell about 20% from 1980 to 1988. Such shrinkage inpopulation and economic activity was substantially more severe in outlying rural areas and townsthan in areas with relatively higher population such as Cass County, which includes the City ofFargo.
Economic development efforts in North Dakota are carried out by organizations such aslocal and regional economic development agencies (e.g., Traill County Economic DevelopmentCommission), by state government agencies (e.g., Department of Economic Development andFinance), and trade associations (e.g., North Dakota Association of Rural Electric Cooperatives). In some rural communities, cooperatives have taken direct action by entering into new venturesto keep small town businesses alive and well. For example, Farmers Union Oil Company inLidgerwood had taken over a lumber store and a grocery store which were closing, and recentlyreported a profit of over $12,000 in each operation (Miller, 1996).
Irrespective of the measures or strategies used by economic development planners andpractioners to retain local customers and attract outside customers, some communities may notbe able to make much progress. These communities may not be able to make strategicinvestment in commercial development, often a common way of attracting customers, sincemany small communities are usually unable to garner the financial strength necessary to makesuch investments. In some circumstances, those communities with poorly performing retailand/or service sectors may cooperate with adjacent communities with similar characteristics toprovide combined and stronger retail and service sectors offerings to their residents and outsideconsumers.
Another way of retaining local customer dollars is to provide locally the goods andservices that are in demand. Residents in Bonaparte, Iowa (population: 465) cooperated to invest$2,000 each to become partners in the local stores to save this hamlet from economic ruin. Withsimilar concerted efforts, some rural communities in North Dakota may also be able to maketheir economies more healthy. Potential entrepreneurs who may not have the financial strengthnecessary to open a new business may cooperate to open a new business venture as a cooperative. To survive in a competitive business environment, similar kinds of businesses in adjacent ruralcommunities may cooperate to combine resources to capture benefits a single business enterprisemay not realize if the tasks were undertaken individually (Bhuyan, 1996).
While the purpose of this paper is not to analyze customers’ shopping patterns or findingways to retain customer dollars locally, an attempt is made (1) to analyze the effectiveness ofretail and service sectors in North Dakota counties in attracting potential consumer purchases and(2) to examine which kinds of retail and service businesses have the potential for future growthin the state. Most of the past trade analysis for North Dakota focused on evaluating theperformance of the retail sector (Bangsund et al., 1991; Leistritz and Wanzek, 1993). A fewothers went further to evaluate trade performance of specific business categories, such as eating

3
and drinking places, automotive dealers, and drug stores (Bangsund et al., 1995). This study isbroader in scope as it estimates market potentials of over 130 retail and service businesscategories in addition to evaluating the trade performance of retail and service sectors in NorthDakota.
RETAIL AND SERVICE SECTOR PERFORMANCE
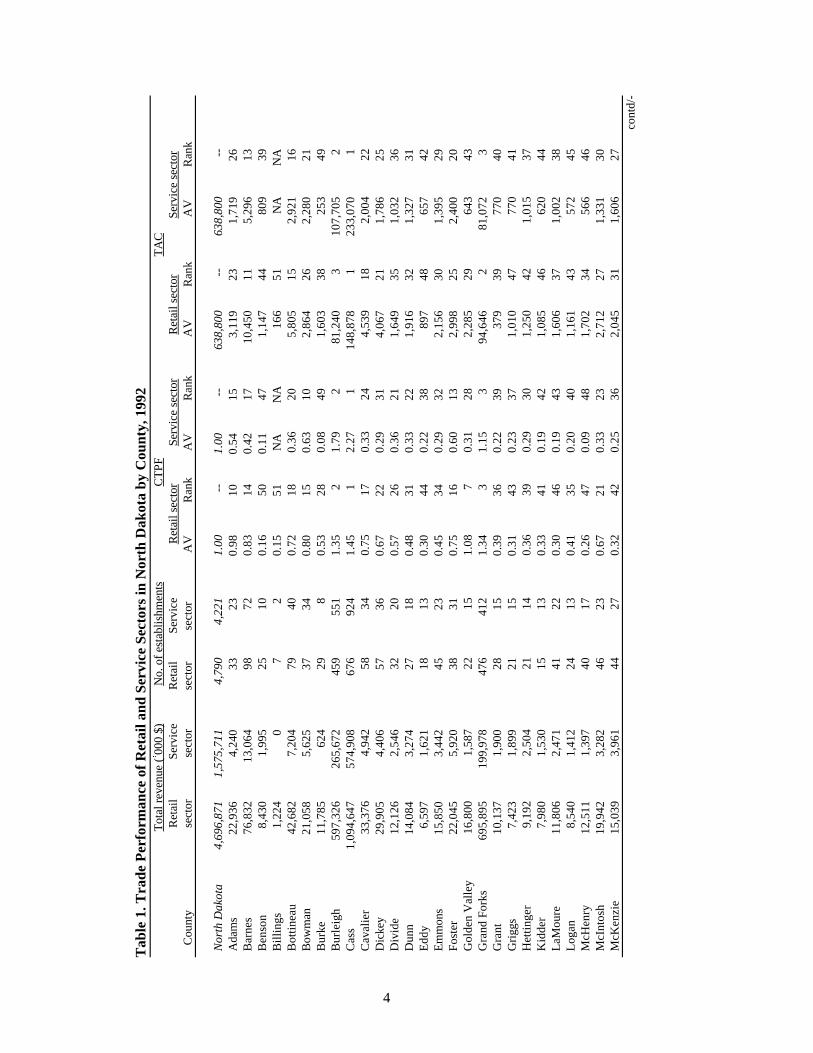
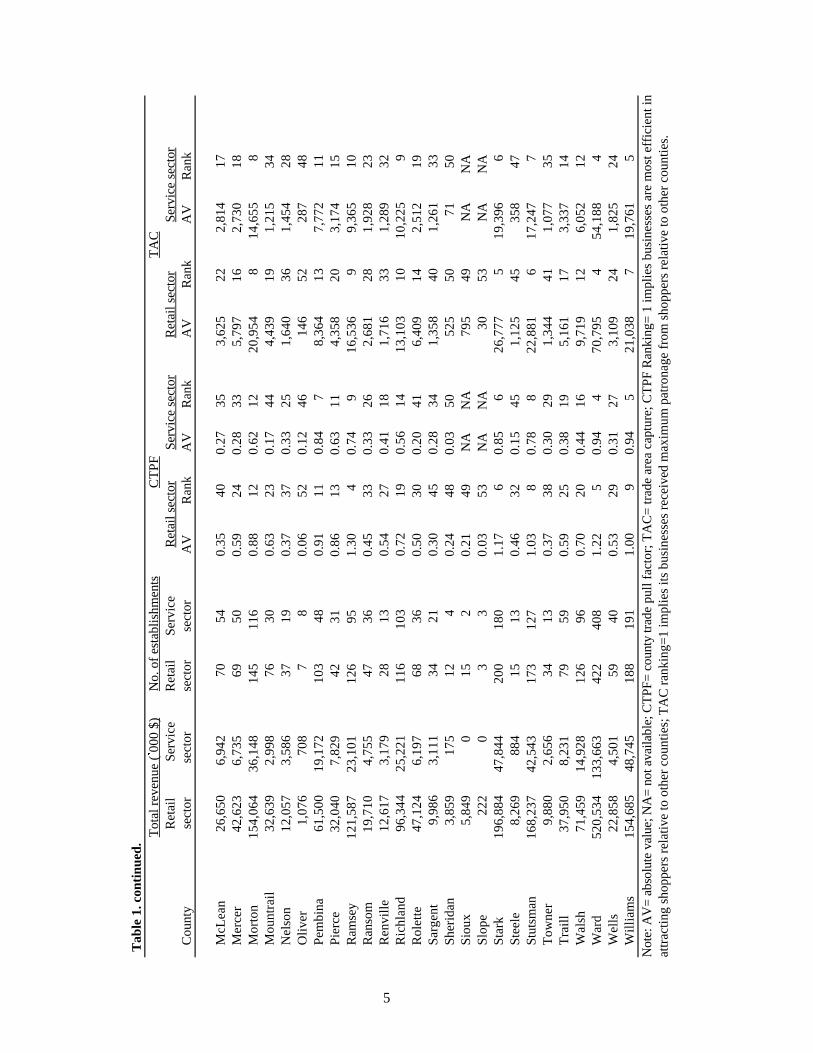
Evaluation of retail and service sectors performance at the county level is carried outusing County Trade Pull Factors (CTPF) and Trade Area Captures (TAC) for North Dakotacounties in 1992. The CTPF is a measure of relative performance of retail or service activities ina county compared to the respective state averages. It is computed by dividing the per capitacounty sales by per capita North Dakota sales for each sector, i.e., CTPF is the per capita retail orservice sales in each county relative to that of the state for the retail or service sector. Datasources were the 1990 Census of Population and Housing and the 1992 Economic Census, bothpublished by the U.S. Department of Commerce. Obviously, the pull factors for both retail andservice sectors at the state level are equal to 1.00. If a county has a CTPF value less than 1.00 in,for example, retail trade, then its retail trade is losing customers to other counties orcommunities; conversely, a CTPF value greater than 1.00 implies that the county attractscustomers from other communities or counties.
The purpose of estimating TAC is to measure how many customers are drawn to aparticular community to shop for specific products or services. TAC is one way of measuringmarket capture by existing establishments in retail or service sectors in a community/county. It iscomputed by multiplying the community/county population by its CTPF. Both CTPF and TACvalues are used to evaluate the performance of retail and service sectors in each county.
There were over 4,700 retail and 4,200 service establishments in North Dakota in 1992which grossed over $4.6 billion and $1.5 billion in sales, respectively (Table 1). Only 4 countiescrossed the half-billion dollar mark in retail sales (Cass, Grand Forks, Burleigh, and Wardcounties) and only one county reached this mark in service revenue (Cass County). Among 53counties, Slope County (population: 907) had the lowest retail sales, which amounted to$222,000, or a per capita yearly sale of only $244.76. Data on service revenue was not availablefor Billings, Sioux, and Slope counties. Over 45% of retail and over 57% of serviceestablishments were concentrated in the counties which have the major population centers inNorth Dakota: Cass, Grand Forks, Burleigh, Ward, and Stutsman. Each of the followingcounties reported less than 10 establishments in either retail or service sectors: Billings, Burke,Oliver, Sheridan, Sioux, and Slope.
4
Tab
le 1
. Tra
de P
erfo
rman
ce o
f Ret
ail a
nd S
ervi
ce S
ecto
rs in
Nor
th D
akot
a by
Cou
nty,
199
2T
otal
rev
enue
(&00
0 $
)N
o. o
f est
ablis
hmen
tsC
TP
FT
AC
Ret
ail
Ser
vice
Ret
ail
Ser
vice
Ret
ail s
ecto
rS
ervi
ce s
ecto
rR
etai
l sec
tor
Ser
vice
sec
tor
Cou
nty
sect
or
sect
orse
ctor
sect
orA
VR
ank
AV
Ran
kA
VR
ank
AV
Ran
k
No
rth
Da
kota
4,6
96
,87
11
,57
5,7
11
4,7
90
4,2
21
1.0
0--
1.0
0--
63
8,8
00
--6
38
,80
0--
Ada
ms
22
,93
64
,24
03
32
30
.98
10
0.5
41
53
,11
92
31
,71
92
6B
arn
es
76
,83
21
3,0
64
98
72
0.8
31
40
.42
17
10
,45
01
15
,29
61
3B
en
son
8,4
30
1,9
95
25
10
0.1
65
00
.11
47
1,1
47
44
80
9 3
9B
illin
gs
1,2
24
0 7
20
.15
51
NA
NA
16
65
1N
AN
AB
ott
ine
au
42
,68
27
,20
47
94
00
.72
18
0.3
62
05
,80
51
52
,92
11
6B
owm
an2
1,0
58
5,6
25
37
34
0.8
01
50
.63
10
2,8
64
26
2,2
80
21
Bu
rke
11
,78
56
24
29
80
.53
28
0.0
84
91
,60
33
82
53
49
Bu
rle
igh
59
7,3
26
26
5,6
72
45
95
51
1.3
52
1.7
92
81
,24
03
10
7,7
05
2C
ass
1,0
94
,64
75
74
,90
86
76
92
41
.45
12
.27
11
48
,87
81
23
3,0
70
1C
ava
lier
33
,37
64
,94
25
83
40
.75
17
0.3
32
44
,53
91
82
,00
42
2D
icke
y2
9,9
05
4,4
06
57
36
0.6
72
20
.29
31
4,0
67
21
1,7
86
25
Div
ide
12
,12
62
,54
6 3
22
00
.57
26
0.3
62
11
,64
93
51
,03
23
6D
un
n1
4,0
84
3,2
74
27
18
0.4
83
10
.33
22
1,9
16
32
1,3
27
31
Ed
dy
6,5
97
1,6
21
18
13
0.3
04
40
.22
38
89
74
86
57
42
Em
mon
s1
5,8
50
3,4
42
45
23
0.4
53
40
.29
32
2,1
56
30
1,3
95
29
Fo
ste
r2
2,0
45
5,9
20
38
31
0.7
51
60
.60
13
2,9
98
25
2,4
00
20
Go
lde
n V
alle
y1
6,8
00
1,5
87
22
15
1.0
87
0.3
12
82
,28
52
96
43
43
Gra
nd
Fo
rks
69
5,8
95
19
9,9
78
47
64
12
1.3
43
1.1
53
94
,64
62
81
,07
23
Gra
nt
10
,13
71
,90
02
81
50
.39
36
0.2
23
93
79
39
77
04
0G
riggs
7,4
23
1,8
99
21
15
0.3
14
30
.23
37
1,0
10
47
77
04
1H
ett
ing
er
9,1
92
2,5
04
21
14
0.3
63
90
.29
30
1,2
50
42
1,0
15
37
Kid
de
r7
,98
01
,53
01
51
30
.33
41
0.1
94
21
,08
54
66
20
44
La
Mo
ure
11
,80
62
,47
14
12
20
.30
46
0.1
94
31
,60
63
71
,00
23
8L
og
an
8,5
40
1,4
12
24
13
0.4
13
50
.20
40
1,1
61
43
57
24
5M
cHe
nry
12
,51
11
,39
74
01
70
.26
47
0.0
94
81
,70
23
45
66
46
McI
nto
sh1
9,9
42
3,2
82
46
23
0.6
72
10
.33
23
2,7
12
27
1,3
31
30
McK
en
zie
15
,03
93
,96
14
42
70
.32
42
0.2
53
62
,04
53
11
,60
62
7 con
td/-
5
T
able
1. c
ontin
ued. T
ota
l re
ven
ue
(&00
0 $
)N
o. o
f est
ablis
hmen
tsC
TP
FT
AC
Ret
ail
Ser
vice
Ret
ail
Ser
vice
Ret
ail s
ecto
rS
ervi
ce s
ecto
rR
etai
l sec
tor
Ser
vice
sec
tor
Cou
nty
sect
orse
ctor
sect
orse
ctor
AV
Ran
kA
VR
ank
AV
Ran
kA
VR
ank
McL
ea
n2
6,6
50
6,9
42
70
54
0.3
54
00
.27
35
3,6
25
22
2,8
14
17
Me
rce
r4
2,6
23
6,7
35
69
50
0.5
92
40
.28
33
5,7
97
16
2,7
30
18
Mo
rto
n1
54
,06
43
6,1
48
14
51
16
0.8
81
20
.62
12
20
,95
48
14
,65
58
Mo
un
tra
il3
2,6
39
2,9
98
76
30
0.6
32
30
.17
44
4,4
39
19
1,2
15
34
Ne
lso
n1
2,0
57
3,5
86
37
19
0.3
73
70
.33
25
1,6
40
36
1,4
54
28
Oliv
er
1,0
76
70
87
80
.06
52
0.1
24
61
46
52
28
74
8P
em
bin
a6
1,5
00
19
,17
21
03
48
0.9
11
10
.84
78
,36
41
37
,77
21
1P
ierc
e3
2,0
40
7,8
29
42
31
0.8
61
30
.63
11
4,3
58
20
3,1
74
15
Ram
sey
12
1,5
87
23
,10
11
26
95
1.3
04
0.7
49
16
,53
69
9,3
65
10
Ran
som
19
,71
04
,75
54
73
60
.45
33
0.3
32
62
,68
12
81
,92
82
3R
en
ville
12
,61
73
,17
92
81
30
.54
27
0.4
11
81
,71
63
31
,28
93
2R
ich
lan
d9
6,3
44
25
,22
11
16
10
30
.72
19
0.5
61
41
3,1
03
10
10
,22
59
Ro
lett
e 4
7,1
24
6,1
97
68
36
0.5
03
00
.20
41
6,4
09
14
2,5
12
19
Sa
rge
nt
9,9
86
3,1
11
34
21
0.3
04
50
.28
34
1,3
58
40
1,2
61
33
Sh
eri
da
n3
,85
91
75
12
40
.24
48
0.0
35
05
25
50
71
50
Sio
ux
5,8
49
01
52
0.2
14
9N
AN
A7
95
49
NA
NA
Slo
pe
22
20
33
0.0
35
3N
AN
A3
05
3N
AN
AS
tark
19
6,8
84
47
,84
42
00
18
01
.17
60
.85
62
6,7
77
51
9,3
96
6S
tee
le8
,26
98
84
15
13
0.4
63
20
.15
45
1,1
25
45
35
84
7S
tuts
man
16
8,2
37
42
,54
31
73
12
71
.03
80
.78
82
2,8
81
61
7,2
47
7T
ow
ne
r9
,88
02
,65
63
41
30
.37
38
0.3
02
91
,34
44
11
,07
73
5T
raill
37
,95
08
,23
17
95
90
.59
25
0.3
81
95
,16
11
73
,33
71
4W
als
h7
1,4
59
14
,92
81
26
96
0.7
02
00
.44
16
9,7
19
12
6,0
52
12
Wa
rd5
20
,53
41
33
,66
34
22
40
81
.22
50
.94
47
0,7
95
45
4,1
88
4W
ells
22
,85
84
,50
15
94
00
.53
29
0.3
12
73
,10
92
41
,82
52
4W
illia
ms
15
4,6
85
48
,74
51
88
19
11
.00
90
.94
52
1,0
38
71
9,7
61
5N
ote:
AV
= a
bsol
ute
valu
e; N
A=
not
ava
ilabl
e; C
TP
F=
cou
nty
trad
e pu
ll fa
ctor
; TA
C=
trad
e ar
ea c
aptu
re; C
TP
F R
anki
ng=
1 im
plie
s bu
sine
sses
are
mos
t effi
cien
t in
attr
actin
g sh
oppe
rs r
elat
ive
to o
ther
cou
ntie
s; T
AC
ran
king
=1
impl
ies
its b
usin
esse
s re
ceiv
ed m
axim
um p
atro
nage
from
sho
pper
s re
lativ
e to
oth
er c
ount
ies.

A D A M S0 .9 80 .5 4
B A R N E S0 .8 30 .4 2
B E N S O N0 .1 60 .1 1
B I L L I N G S0 .1 5N A
B O T T I N E A U0 .7 20 .3 6
B O W M A N0 .8 00 .6 3
B U R K E0 .5 30 .0 8
B U R L E I G H1 .3 51 .7 9 C A S S
1 .4 52 .2 7
C A V A L I E R0 .7 50 .3 3
D I C K E Y0 .6 70 .2 9
D I V I D E
0 .5 70 .3 6
D U N N
0 .4 80 .3 3
E D D Y0 .3 00 .2 2
E M M O N S0 .4 50 .2 9
F O S T E R0 .7 50 .6 0
G R A N D F O R K S1 .3 41 .1 5
G R A N T0 .3 90 .2 2
G R I G G S0 .3 10 .2 3
H E T T I N G E R0 .3 60 .2 9
K I D D E R0 .3 30 .1 9
L A M O U R E0 .3 00 .1 9
L O G A N0 .4 10 .2 0
M C H E N R Y0 .2 60 .0 9
M C I N T O S H0 .6 70 .3 3
M C K E N Z I E0 .3 20 .2 5 M C L E A N
0 .3 50 .2 7M E R C E R
0 .5 90 .2 8
M O R T O N0 .8 80 .6 2
M O U N T R A I L0 .6 30 .1 7
N E L S O N0 .3 70 .3 3
O L I V E R0 .0 60 .1 2
P E M B I N A0 .9 10 .8 4
P I E R C E0 .8 60 .6 3
R A M S E Y1 .3 00 .7 4
R A N S O M0 .4 50 .3 3
R E N V I L L E0 .5 4
0 .4 1
R I C H L A N D0 .7 20 .5 6
R O L E T T E0 .5 00 .2 0
S A R G E N T0 .3 00 .2 8
S H E R I D A N
0 .2 40 .0 3
S I O U X0 .2 1N A
S L O P E0 .0 3N A
S T A R K1 .1 70 .8 5
S T E E L E0 .4 60 .1 5
S T U T S M A N1 .0 30 .7 8
T O W N E R0 .3 70 .3 0
T R A I L L0 .5 90 .3 8
W A L S H0 .7 00 .4 4
W A R D
1 .2 20 .9 4
W E L L S0 .5 30 .3 1
W I L L I A M S
1 .0 00 .9 4
G O L D E NV A L L E Y
1 .0 80 .3 1
6
In terms of CTPF for the retail sector, 8 counties out of 53 had pull factors greater than 1.00:Burleigh (1.35), Cass (1.45), Golden Valley (1.08), Grand Forks (1.34), Ramsey (1.30), Stark (1.17),Stutsman (1.03), and Ward (1.22). Williams County had a pull factor equal to 1.00, closely followedby Adams County (0.98). The remaining 43 counties had retail pull factors less than 1.00. Thecounties that showed lowest retail pull factors include Benson (0.16), Billings (0.15), McHenry(0.26), Oliver (0.06), Sheridan (0.24), Sioux (0.21), and Slope (0.03). In a previous study whereCTPF for retail sectors in North Dakota counties were computed for 1980 and 1990, Bangsund etal. (1995) found that 13 counties out of 53 had CTPF values greater than 1.00 in 1980 while thatcount dropped to 10 in 1990. The only counties that had a retail CTPF of greater than 1.00 in 1980,1990, and 1992 were Burleigh, Cass, Golden Valley, Grand Forks, Ramsey, Stark, Stutsman, andWard. Among these, Burleigh, Cass, and Grand Forks counties were able to improve their abilityto attract customers, i.e., they showed an increase in the retail CTPF value. For example, the CTPFincreased from 1.10 in 1990 to 1.35 in 1992 for Burleigh County and from 1.20 to 1.45 for CassCounty during the same period. Therefore, the trend of urban counties pulling more and moredollars from non-urban counties is continuing. On the other hand, Golden Valley, Stark, andStutsman counties showed a slight decline in CTPF value from 1990, and Ramsey County’s retailCTPF value remained unchanged. Economic development agencies and public policy makers maywant to examine the factors responsible for declining business performance in the concerned NorthDakota counties/communities.
Figure 1: County Trade Pull Factors (CTPF) of Retail and Service Sectors, North Dakota, 1992 (CTPF values at top and bottom refer to the retail and the service sectors, respectively. NA = not available)
When it comes to the service industry, most North Dakota counties did not perform well.
7
Only 3 counties had a service sector CTPF greater than 1.00: Cass (2.27), Burleigh (1.79), andGrand Forks (1.15). Figure 1 shows the retail and service sector CTPF (and TAC values) for all53 counties in North Dakota. Counties with strong trade pull factors, whether retail or servicerelated, have large urban or metro areas which include a dominant city, e.g., Fargo in CassCounty or Grand Forks in Grand Forks County. Each of these cities has a well established andwell organized business community and generally caters to 20,000 or more residents. Suchcharacteristics may have contributed toward these counties’ ability to attract more customers totheir retail and service establishments compared to other counties in the state. Not surprisingly,mostly rural counties with low population had lower pull factors in both retail and servicesectors, e.g., Sheridan County's (pop. 2,148 in 1990) retail pull factor was 0.24 and service pullfactor was 0.03.
The TAC estimates show the relative level of patronage received by businessestablishments (retail or service) in a community. Retail and service business establishments inCass County were the most efficient in capturing their potential customer base and thus receivedthe maximum patronage among 53 counties (Table 1). The continued growth of retail andservice businesses in the Fargo-Moorhead area is an indication of the continued ability of theretail and service sectors in that area to attract customers from other communities. In terms ofTAC values, Cass County was most efficient in attracting customer dollars, followed byBurleigh, Grand Forks, Ward, and Stark counties. On the other hand, the retail sector businessesin Slope, Oliver, Billings, Sheridan, and Sioux counties were the least efficient in attractingpotential customers, while similar inefficiency was shown by the service sector businesses inBurke, Sheridan, Oliver, Steele, and McHenry counties.
MARKET POTENTIAL OF RETAIL AND SERVICE SECTOR INDUSTRIES
To analyze the growth potential of individual business categories (e.g., beauty and barbershops) two measures are used: market potential and location quotient. The analysis is conductedat the 3- and 4-digit Standard Industrial Classification (SIC) levels for 48 retail businesscategories (e.g., grocery stores) and 88 service business categories (e.g., beauty and barbershops). Data on sales, number of establishments, and employment in individual businesscategories were obtained from the 1992 Economic Census. Data on per capita income wereobtained from the Statistical Abstract of the United States, 1994, while population and sectoralemployment data came from the 1990 Census of Population and Housing.
Many of these 48 retail and 88 service business categories identified here are notavailable in most North Dakota counties. Therefore, when estimating market potential forspecific retail and service business categories, this study assumes uniformity in terms ofdistribution of population and business establishments in the state, i.e., estimates are stateaverages. In reality, a majority of the retail and service businesses in North Dakota are located inthe urban counties of Burleigh, Cass, Grand Forks, Stutsman, and Ward. For this reason,overestimation of market potentials for some business categories, particularly those that areurban oriented, is possible. In addition, the out-of-state demands for retail and service related
ETSx'Per capita salesx( Total populationND(per capita income in North Dakota(ND)
National per capita income.
ETSgas. serv. stn. '134,705,359249,908,000
( 638,800( 15,68818,177
' 0.53902( 638,800( 0.86307' 297,177 (000$).
xx ETS
ETSETS
ETS
x
8
(1)
(2)
goods and services from North Dakota establishments are assumed negligible relative to in-statedemands. Although a detailed feasibility study of a specific business is an effective countermeasure against such potential defects, it is beyond the scope of this study. Conducting such adetailed feasibility study would be a next step for a potential entrepreneur who is consideringopening a new business venture in a category that has business potential.
Market potential is the expected total sales of a commodity, a group of commodities, or aservice in a market for all firms (U.S. Department of Commerce, 1979). This definition isslightly modified to suit the needs of this study where the interest is to identify businesses thathave potential for further growth.
To identify businesses with market potential, the following steps are taken:
Step 1: Expected total sales (ETS) of business category x (e.g., gasoline service stations)in North Dakota in 1992 is estimated by
Per capita sales is the national average per capita sales in category and is obtained by dividingthe total national revenue in business by total U.S. population. is a demand relatedconcept. Although this measure ignores differences in state consumption patterns except foradjusting the level by relative state income, it does provide a readily calculated estimate ofmarket size (Shaffer, 1989).
Estimation of is demonstrated using the gasoline service stations category. Thenecessary data to compute are total U.S. revenue (1992) $134,705,359,000; total U.S.population (1990) 249,908,000; North Dakota population (1990) 638,800; per capita income inNorth Dakota and the United States (1992) $15,688 and $18,177, respectively. Then, the for gasoline service stations for 1992 is (rounded),
Step 2: The share of actual revenue to the expected total sales in 1992 is estimated for business. This share is termed %%sales goal achieved,&& and defined as
Sales goal achievedx'Actual total sales in1992x
ETSx in 1992,
Sales goal achievedgas. serv. stn. '297,177 (000$)439,968(000$)
( 100 '148.05%.
LQ for x'Percent of North Dakota employment in x
Percent of U.S. employment in x.
LQLQ
x
9
(3)
(4)
(5)
and expressed in percentage terms. Continuing the demonstration, using (3), it can be shown thatgasoline service station category exceeded expected sales in 1992, i.e.,
Step 3: All business categories are ranked in terms of their respective sales goal achieved inascending order, i.e., 1 being the business with the least amount of sales goal achieved. Based onsales goal achieved in 1992, the gasoline service stations category is ranked 39th out of the 46ranked retail trade categories in North Dakota.
Those businesses that either did or did not achieve their total sales potential in 1992 areidentified in Step 3. To identify the businesses that may have potential for further growth it isassumed that those businesses that have achieved 70% or more of their expected total sales havereached market saturation and, thus, have no further growth potential. On the other hand, thosebusinesses that have yet to reach at least 70% of their expected sales have unfulfilled demandand, thus, have potential for growth. A ranking of 1 in Step 3 thus implies a market potentialranking of 1, indicating the business category that has the highest market potential.
Location quotient is an additional measure used to supplement the above procedure fordetermining market potential. A common question faced by communities in both rural and urbanareas is what is the level of goods and services currently provided locally and what goods andservices are imported from elsewhere--location quotient ( ) provides an answer to suchquestions. thus is a measure of self-sufficiency of goods or services in a community(Shaffer, 1989). Location quotient is a commonly used tool to identify non-manufacturingindustries for industrial recruitment, which is a popular economic development strategy. Forexample, Doescher et al. (1986) used this tool to identify non-manufacturing industries forindustrial recruitment in Oklahoma.
Location quotient is defined as the ratio of the share of state employment in a particularbusiness category ( ) to the share of national employment in that category:
LQgas. serv. stn. '2,590 / 53,309
675,080 / 19,485,666'1.40.
LQ'1
LQ<1 x(LQ>1)
x
LQ
LQ
LQ
LQLQ>1.25
10
(6)
10
A location quotient of 1 ( ) means that local consumption demand is met through localproduction of specified good or service (Shaffer, 1989). Similarly, a location quotient of lessthan one ( ) means lack of self-sufficiency in good or service , i.e., what is produced oravailable is not sufficient to meet the local demand. A location quotient greater than 1means that the concerned state or community has a larger proportion of its employment inindustry than does the nation or whatever economic aggregate is used as the denominator inequation (5).
Continuing the demonstration, using (5), s for the gasoline service stations categoryare estimated as follows: total persons employed in North Dakota and the United States in thegasoline service stations category, respectively were 2,590 and 675,080 (1992); total retail sectoremployment in North Dakota and the United States in 1990 were 53,309 and 19,485,666,respectively. Thus, using (5), the for gasoline service stations category is
Although location quotient has such shortcomings as assuming identical state andnational demand and supply functions and similar tastes and preferences and income levels, it isa reliable measure of local self-sufficiency (Shaffer, 1989). To reduce the problem ofmisinterpretation of estimated s, a disaggregated 4-digit SIC level data is used in this studyand a lower threshold point is selected to determine self-sufficiency. It is assumed that anestimated in the range 0.75 - 1.25 suggests self-sufficiency while those below 0.75 suggestlack of self-sufficiency, and suggests abundance of that business or service. While lackof self-sufficiency implies potential for new business or possible expansion of existing ones, anabundance of business or services implies market saturation if export is not a principal activity inthat particular business or service category.
Retail Trade Industries
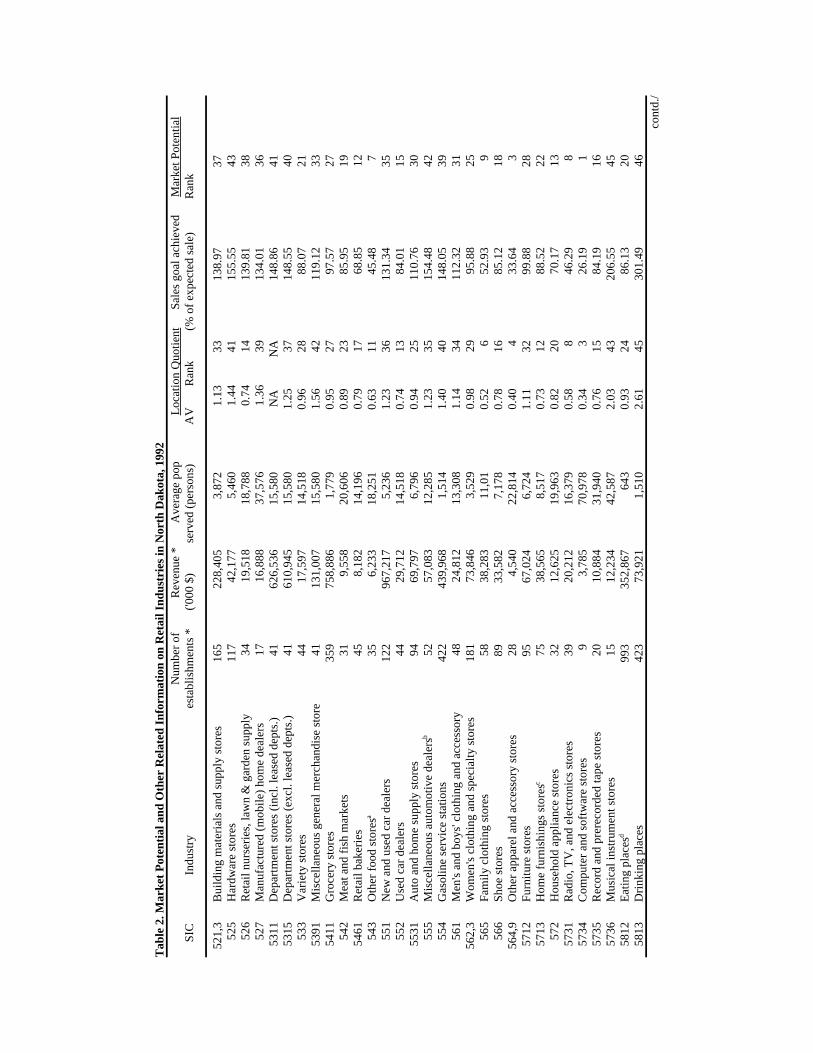
Retail sector was the second largest provider of employment in North Dakota in 1990(19% of total employment). A list of 48 available retail trades in North Dakota presented inTable 2 shows the number of establishments, sales, average population served, location quotient,and sales goal achieved for each retail business category. Among the retail business categories,the eating places category (for SIC numbers, see Table 2) had the highest number ofestablishments in North Dakota, while the maximum revenue (almost $1 billion) was earned bythe new and used car dealers. On average, existing eating places in North Dakota served 643persons while some other categories catered to several thousand people per establishment, e.g.,mobile home dealers serving over 37,000 people per establishment.
Tab
le 2
. Mar
ket P
oten
tial a
nd O
ther
Rel
ated
Info
rmat
ion
on R
etai
l Ind
ustr
ies
in N
orth
Dak
ota,
199
2
Num
ber
of
R
even
ue *
Ave
rage
pop
L
ocat
ion
Quo
tient
Sal
es g
oal a
chie
ved
M
arke
t Pot
entia
l
S
IC
In
du
stry
e
sta
blis
hm
en
ts *
('0
00
$)
se
rve
d (
pe
rso
ns)
AV
R
an
k
(
% o
f e
xpe
cte
d s
ale
)
Ra
nk
52
1,3
Bu
ildin
g m
ate
ria
ls a
nd
su
pp
ly s
tore
s1
65
22
8,4
05
3,8
72
1.1
33
31
38
.97
37
52
5H
ard
wa
re s
tore
s1
17
42
,17
75
,46
01
.44
41
15
5.5
54
35
26
Re
tail
nu
rse
rie
s, la
wn
& g
ard
en
su
pp
ly3
41
9,5
18
18
,78
80
.74
14
13
9.8
13
85
27
Ma
nu
fact
ure
d (
mo
bile
) h
om
e d
ea
lers
17
16
,88
83
7,5
76
1.3
63
91
34
.01
36
53
11
De
pa
rtm
en
t st
ore
s (i
ncl
. le
ase
d d
ep
ts.)
41
62
6,5
36
15
,58
0N
AN
A1
48
.86
41
53
15
De
pa
rtm
en
t st
ore
s (e
xcl.
lea
sed
de
pts
.)4
16
10
,94
51
5,5
80
1.2
53
71
48
.55
40
53
3V
ari
ety
sto
res
44
17
,59
71
4,5
18
0.9
62
88
8.0
72
15
39
1M
isce
llan
eo
us
ge
ne
ral m
erc
ha
nd
ise
sto
re4
11
31
,00
71
5,5
80
1.5
64
21
19
.12
33
54
11
Gro
cery
sto
res
35
97
58
,88
61
,77
90
.95
27
97
.57
27
54
2M
ea
t a
nd
fis
h m
ark
ets
31
9,5
58
20
,60
60
.89
23
85
.95
19
54
61
Re
tail
ba
keri
es
45
8,1
82
14
,19
60
.79
17
68
.85
12
54
3O
the
r fo
od
sto
res
35
6,2
33
18
,25
10
.63
11
45
.48
7a
55
1N
ew
an
d u
sed
ca
r d
ea
lers
12
29
67
,21
75
,23
61
.23
36
13
1.3
43
55
52
Use
d c
ar
de
ale
rs4
42
9,7
12
14
,51
80
.74
13
84
.01
15
55
31
Au
to a
nd
ho
me
su
pp
ly s
tore
s9
46
9,7
97
6,7
96
0.9
42
51
10
.76
30
55
5M
isce
llan
eo
us
au
tom
otiv
e d
ea
lers
52
57
,08
31
2,2
85
1.2
33
51
54
.48
42
b
55
4G
aso
line
se
rvic
e s
tatio
ns
42
24
39
,96
81
,51
41
.40
40
14
8.0
53
95
61
Me
n's
an
d b
oys
' clo
thin
g a
nd
acc
ess
ory
48
24
,81
21
3,3
08
1.1
43
41
12
.32
31
56
2,3
Wo
me
n's
clo
thin
g a
nd
sp
eci
alty
sto
res
18
17
3,8
46
3,5
29
0.9
82
99
5.8
82
55
65
Fa
mily
clo
thin
g s
tore
s5
83
8,2
83
11
,01
0.5
26
52
.93
95
66
Sh
oe
sto
res
89
33
,58
27
,17
80
.78
16
85
.12
18
56
4,9
Oth
er
ap
pa
rel a
nd
acc
ess
ory
sto
res
28
4,5
40
22
,81
40
.40
43
3.6
43
57
12
Fu
rnitu
re s
tore
s9
56
7,0
24
6,7
24
1.1
13
29
9.8
82
85
71
3H
om
e f
urn
ish
ing
s st
ore
s7
53
8,5
65
8,5
17
0.7
31
28
8.5
22
2c
57
2H
ou
seh
old
ap
plia
nce
sto
res
32
12
,62
51
9,9
63
0.8
22
07
0.1
71
35
73
1R
ad
io,
TV
, a
nd
ele
ctro
nic
s st
ore
s3
92
0,2
12
16
,37
90
.58
84
6.2
98
57
34
Co
mp
ute
r a
nd
so
ftw
are
sto
res
93
,78
57
0,9
78
0.3
43
26
.19
15
73
5R
eco
rd a
nd
pre
reco
rde
d t
ap
e s
tore
s2
01
0,8
84
31
,94
00
.76
15
84
.19
16
57
36
Mu
sica
l in
stru
me
nt
sto
res
15
12
,23
44
2,5
87
2.0
34
32
06
.55
45
58
12
Ea
ting
pla
ces
99
33
52
,86
76
43
0.9
32
48
6.1
32
0d
58
13
Dri
nki
ng
pla
ces
42
37
3,9
21
1,5
10
2.6
14
53
01
.49
46
con
td./
12
Tab
le 2
. con
tinue
d.N
umbe
r of
Rev
enue
*
Ave
rage
pop.
Loca
tion
Quo
tient
Sal
es g
oal a
chie
ved
Mar
ket P
oten
tial
SIC
In
du
stry
est
ab
lish
me
nts
*
(
'00
0 $
)
serv
ed
(p
ers
on
s)
AV
R
an
k
(
% o
f e
xpe
cte
d s
ale
)
R
an
k
59
11
Dru
g a
nd
pro
pri
eta
ry s
tore
s1
76
15
2,9
51
3,6
30
0.8
92
18
9.4
72
35
92
Liq
uo
r st
ore
s1
37
78
,01
84
,66
32
.10
44
17
4.0
44
45
93
Use
d m
erc
ha
nd
ise
sto
res
46
5,0
28
13
,88
70
.62
94
0.3
34
59
4M
isce
llan
eo
us
sho
pp
ing
go
od
s st
ore
s3
35
14
0,7
61
1,9
07
1.0
33
19
6.4
22
6e
59
42
Bo
ok
sto
res
25
10
,09
52
5,5
52
0.5
67
57
.09
11
59
44
Jew
elr
y st
ore
s6
82
8,4
50
9,3
94
0.8
92
19
2.1
02
45
94
3O
the
r m
isc
sho
pp
ing
go
od
s st
ore
s1
79
47
,71
03
,56
90
.94
26
72
.82
14
f
59
61
Ca
talo
g a
nd
ma
il-o
rde
r h
ou
ses
25
25
,03
62
5,5
52
0.4
25
32
.82
25
96
2A
uto
ma
tic m
erc
ha
nd
isin
g m
ach
ine
op
era
tor
11
5,9
91
58
,07
30
.24
14
2.9
06
59
63
Dir
ect
se
llin
g e
sta
blis
hm
en
ts4
12
7,8
49
15
,58
01
.01
30
12
4.1
23
4g
59
8F
ue
l de
ale
rs4
23
0,9
95
15
,21
00
.80
18
10
1.2
62
95
99
2F
lori
sts
89
14
,34
97
,17
81
.26
38
11
3.7
23
25
99
3T
ob
acc
o s
tore
s a
nd
sta
nd
s1
D6
38
,80
0N
AN
AN
AN
A5
99
4N
ew
s d
ea
lers
an
d n
ew
ssta
nd
s3
63
42
12
,93
8N
A2
40
.80
55
99
5O
ptic
al g
oo
ds
sto
re3
08
,97
02
1,2
93
0.8
01
98
4.6
01
75
99
9a
Pe
t sh
op
s1
23
,28
35
3,2
33
0.6
31
05
5.5
71
05
99
9b
Art
de
ale
rs2
D3
19
,40
0N
AN
AN
AN
AN
ote:
(i)
a= in
clud
es fr
uit a
nd v
eget
able
mar
kets
, can
dy a
nd c
onfe
ctio
nery
ven
dors
, dai
ry p
rodu
ct s
tore
s, a
nd m
isc.
food
sto
res;
b=
incl
udes
boa
t dea
lers
, RV
dea
lers
, and
mot
orcy
cle
deal
ers;
c=
incl
udes
SIC
571
3 (f
loor
cov
erin
g st
ores
),57
14 (
drap
ery,
cur
tain
, and
uph
olst
ery
stor
es),
and
571
9 (m
isc.
hom
e fu
rnis
hing
sto
res)
; d=
incl
udes
re
stau
rant
s, c
afet
eria
s, r
efre
shm
ent p
lace
s, a
nd o
ther
eat
ing
plac
es; e
= in
clud
es s
port
ing
good
s st
ore
and
bicy
cle
shop
s; f
= in
clud
es s
tore
sde
alin
g w
ith s
tatio
nery
, hob
by, t
oy a
nd g
ame,
gift
, nov
elty
and
sou
veni
r, lu
ggag
e an
d le
athe
r go
ods,
and
sew
ing
and
need
lew
ork;
g=
incl
udes
furn
iture
, hom
e fu
rnis
hing
, mob
ile fo
od s
ervi
ce, b
ooks
and
sta
tione
ry a
nd o
ther
; (ii)
Loc
atio
nqu
otie
nt o
r se
lf-su
ffici
ency
ran
king
= 1
bei
ng th
e le
ast s
elf-
suffi
cien
t ind
ustr
y/bu
sine
ss.
Tho
se r
anke
d 15
or
high
er a
re s
elf-
suffi
cien
t (i.e
., LQ
> 0
.75)
; (iii
) M
arke
t pot
entia
l ran
king
= 1
impl
ies
high
est m
arke
t pot
entia
l giv
en c
urre
nt n
umbe
ro
f e
sta
blis
hme
nts.
Tho
se r
anke
d hi
gher
tha
n 1
2 a
chie
ved
70
per
cent
or
mor
e of
the
ir m
arke
t po
tent
ial;
(iii)
* =
da
ta fr
om 1
99
2 E
con
om
ic C
en
sus
CD
RO
M,
Bur
eau
of C
ensu
s,
U.S
. D
ep
t. o
f Com
mer
ce;
(iv)
AV
= a
bsol
ute
valu
e, N
A=
info
rmat
ion
not a
vaila
ble
to p
rovi
de a
val
ue, D
= n
ot d
iscl
osed
.

13
Location quotient or self-sufficiency estimation of retail business categories in NorthDakota ranged from 0.24 in the automatic merchandising machine operators category to 2.61 inthe drinking places category. Among the 48 retail business categories, the state is self-sufficientin those ranked 15 or higher, i.e., their estimated location quotient is greater than 0.75. Thefollowing businesses are ranked among the ten least self-sufficient businesses in North Dakota:news dealers and newsstands; computer and software stores; apparel and accessory stores;catalog and mail-order houses; family clothing stores; book stores; radio, TV, and electronicsstores; used merchandise stores; and pet shops. The existing business establishments in theseretail business categories were unable to fulfill the local/state demand for their respective serviceor merchandise. This also implies that to fulfill the local/state demand, these goods and serviceswere imported from out-of-state sources; customers of these businesses shopped away from thelocal stores.
In terms of the extent of sales goal achieved by the existing establishments andconsequent evaluation of market potential of individual business categories, those retailcategories ranked 12 or higher in Table 2 are considered lacking potential for further growthbecause they already achieved 70% or more of their sales goal. For those business categories forwhich market potential could not be estimated, a potential entrepreneur may conduct moredesegregated market research (e.g., city level) to study their respective business potential. Market potential rankings of retail businesses show that computer and software stores categoryhave the highest market potential in North Dakota, followed by catalog and mail-order houses. Itis likely that the ranking of the catalog and mail-order businesses could be either over- or under-estimated because this business caters to both out-of-state and in-state customers. Other retailbusinesses among the top 10 categories with high potential for future growth are apparel andaccessory stores; used merchandise stores; news dealers and newsstands; automaticmerchandising machine operators; food stores (other than grocery stores, meat and fish markets,and retail bakeries); radio, TV, and electronics stores; family clothing stores; and pet shops.
Service Sector Industries
The service sector was the largest employer in North Dakota in 1990 (35% of totalemployment), reflecting a pattern similar to the national average. A list of 88 service categoriesavailable in North Dakota is presented in Table 3. Among the service categories, the maximumnumber of establishments was reported by the beauty and barber shop category (total 369)followed closely by the automotive repair shops (total 360). In terms of earnings, the maximumearning was reported by offices and clinics of doctors of medicine (over $420 million). As in theretail sector, those ranked 38 and higher are considered self-sufficient because their locationquotient was 0.75 or higher. Self-sufficiency rankings show that computer rent/lease andmaintenance services were the least self-sufficient service category in North Dakota in 1992. This kind of service was imported from out-of-state sources to satisfy local or in-state demand.Other services that were identified as lacking self-sufficiency are camps and recreational vehicleparks; personal supply services such as employment agencies; theatrical production; heavy

14
construction equipment rental and leasing services; interior designing; watch, clock, and jewelryrepair services; commercial photography, art, and graphics services; photocopying andduplicating services; and advertising services.
In Table 3, businesses ranked 37 or higher achieved 70% or more of their marketpotential and are considered lacking further growth potential. Among the service businesses forwhich market potential rankings were obtained, computer lease/rent and maintenance servicestops the ranking, indicating it has the highest potential for further growth. Other businesscategories with higher market potentials are public golf courses; heavy construction equipmentrental and leasing; personnel supply services; photocopying and duplicating services; advertising;commercial photography, art and graphic services; computer programming and data processingservices; mailing, copying, photography, and steno services; and management and publicrelations services.

15
Tab
le 3
. Mar
ket P
oten
tial a
nd O
ther
Rel
ated
Info
rmat
ion
on S
ervi
ce In
dust
ries
in N
orth
Dak
ota,
199
2N
umbe
r of
Rev
enue
*
Ave
rage
pop
.
L
ocat
ion
Quo
tient
Sal
es g
oal a
chie
ved
Mar
ket P
oten
tial
SIC
In
dust
ryes
tabl
ishm
ents
*('0
00 $
)
ser
ved
(per
sons
)A
VR
ank
(% o
f exp
ecte
d sa
le)
Ran
k
70
11
aH
ote
ls
69
64
,50
89
,25
80
.86
49
52
.73
32
70
11
bM
ote
ls,
mo
tor
ho
tels
, a
nd
to
uri
st c
ou
rts
16
05
9,7
12
3,9
93
2.6
26
52
30
.60
66
70
2R
oo
min
g a
nd
bo
ard
ing
ho
use
s4
34
41
59
,70
00
.74
37
52
.93
33
70
3C
am
ps
an
d r
ecr
ea
tion
al v
eh
icle
pa
rks
12
1,0
71
53
,23
30
.15
22
8.2
81
67
21
La
un
dry
, cle
an
ing
, an
d g
arm
en
t se
rvic
es
11
92
9,6
35
5,3
68
0.7
63
97
8.3
74
57
22
Ph
oto
gra
ph
ic s
tud
ios,
po
rtra
it5
28
,15
31
2,2
85
0.7
53
81
15
.81
57
72
3,4
Be
au
ty a
nd
ba
rbe
r sh
op
s3
69
33
,27
01
,73
11
.40
59
14
5.7
56
07
25
Sh
oe
re
pa
ir s
ho
ps
an
d s
ho
e s
hin
e p
arl
or
10
85
76
3,8
80
1.6
46
21
40
.86
59
72
6F
un
era
l se
rvic
e a
nd
cre
ma
tori
es
68
23
,20
89
,39
41
.07
55
14
7.2
36
27
29
1T
ax
retu
rn p
rep
ara
tion
se
rvic
es
44
3,0
59
14
,51
80
.79
43
10
7.0
45
47
29
9M
isce
llan
eo
us
pe
rso
na
l se
rvic
es,
n.e
.c.
35
5,3
70
18
,25
10
.61
29
62
.65
37
a
72
99
aD
iet
an
d w
eig
ht
red
uci
ng
se
rvic
es
16
2,8
80
39
,92
50
.91
52
86
.34
46
73
1A
dve
rtis
ing
ag
en
cie
s &
se
rvic
es
(all
typ
es)
28
8,0
96
22
,81
40
.31
10
18
.86
77
32
Ad
just
me
nt,
co
llect
ion
, cre
dit
ag
en
cie
s3
19
,94
42
0,6
06
0.8
75
17
3.2
84
27
33
Ma
ilin
g, c
op
yin
g, p
ho
tog
rap
hy,
ste
no
. se
rv.
43
9,0
05
14
,85
60
.32
12
22
.26
10
73
31
Dir
ect
ma
il a
dve
rtis
ing
se
rvic
es
5D
12
7,7
60
NA
NA
NA
NA
73
34
Ph
oto
cop
yin
g a
nd
du
plic
atin
g s
erv
ice
s5
1,3
92
12
7,7
60
0.2
49
18
.21
67
33
5C
om
me
rcia
l ph
oto
gra
ph
y, a
rt,
an
d g
rap
hic
s1
62
,91
03
9,9
25
0.2
38
20
.32
87
33
8S
ecr
eta
ria
l an
d c
ou
rt r
ep
ort
ing
se
rvic
es
17
D3
7,5
76
NA
NA
NA
NA
73
42
Dis
infe
ctin
g a
nd
pe
st c
on
tro
l se
rvic
es
3D
21
2,9
33
NA
NA
NA
NA
73
49
Bu
ildin
g c
lea
nin
g a
nd
ma
inte
na
nce
se
rvic
es
12
9D
4,9
52
NA
NA
NA
NA
73
52
Me
dic
al e
qu
ipm
en
t re
nta
l an
d le
asi
ng
97
,35
77
0,9
78
1.1
95
71
07
.23
55
73
53
He
avy
co
nst
ruct
ion
eq
uip
re
nta
l an
d le
asi
ng
41
,29
81
59
,70
00
.22
51
5.1
74
73
59
Eq
uip
me
nt
ren
tal a
nd
lea
sin
g,
n.e
.c4
12
3,8
42
15
,58
00
.63
30
73
.07
41
73
6P
ers
on
ne
l su
pp
ly s
erv
ice
s (e
mp
. ag
en
., e
tc.)
26
14
,99
72
4,5
69
0.1
53
17
.81
57
37
Co
mp
ute
r p
rog
ram
, d
ata
pro
cess
, o
the
r5
74
8,3
70
11
,20
70
.32
11
21
.69
97
37
7C
om
pu
ter
ren
t/le
ase
, m
ain
ten
an
ce,
n.e
.c.
14
3,4
96
45
,62
90
.11
11
0.4
02
b
73
8M
isce
llan
eo
us
bu
sin
ess
se
rvic
es
13
44
8,3
59
4,7
67
0.4
12
24
3.0
42
8c
73
83
Ne
ws
syn
dic
ate
2D
31
9,4
00
NA
NA
NA
NA
73
84
Ph
oto
fin
ish
ing
lab
ora
tori
es
21
16
,77
03
0,4
19
1.3
15
81
72
.19
63
73
89
aS
ign
pa
intin
g s
ho
ps
71
,69
39
1,2
57
1.5
86
11
46
.53
61 co
ntd
./
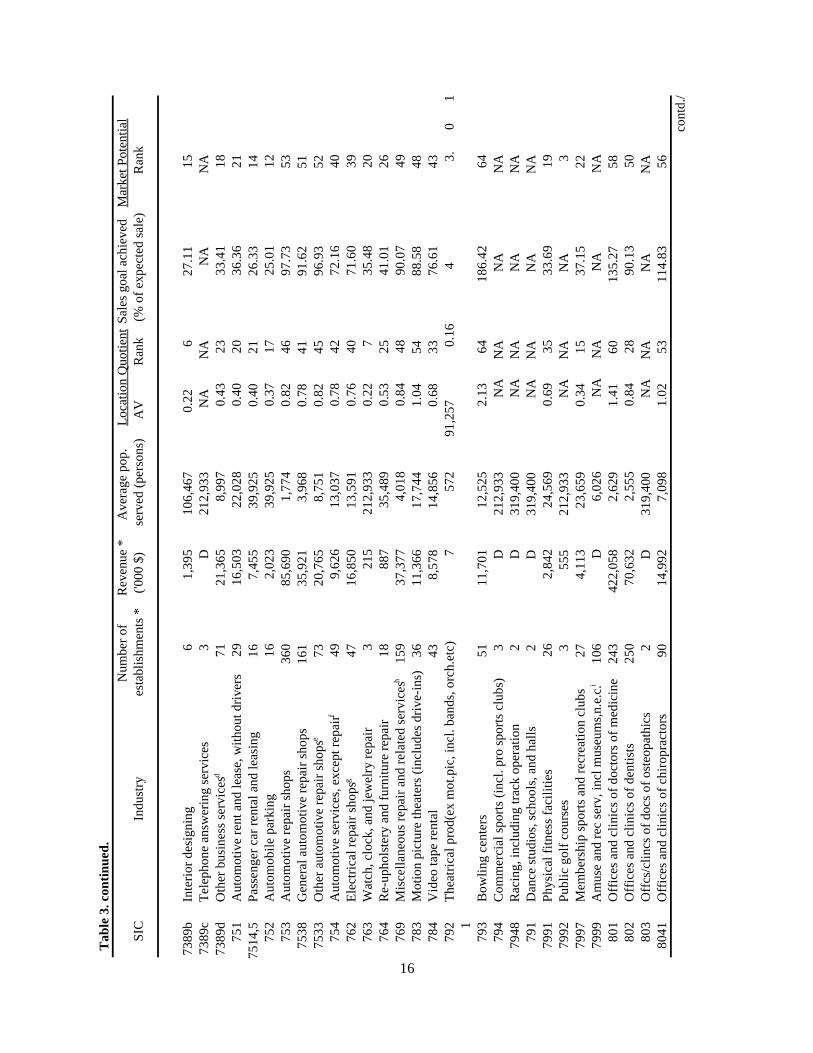
16
Tab
le 3
. con
tinue
d.N
umbe
r of
Rev
enue
*
Ave
rage
pop
.
Lo
catio
n Q
uotie
nt Sal
es g
oal a
chie
ved
Mar
ket P
oten
tial
SIC
Indu
stry
esta
blis
hmen
ts *
('000
$)
se
rved
(pe
rson
s)A
VR
ank
(% o
f ex
pect
ed s
ale)
Ran
k
73
89
bIn
teri
or
de
sig
nin
g6
1,3
95
10
6,4
67
0.2
26
27
.11
15
73
89
cT
ele
ph
on
e a
nsw
eri
ng
se
rvic
es
3D
21
2,9
33
NA
NA
NA
NA
73
89
dO
the
r b
usi
ne
ss s
erv
ice
s7
12
1,3
65
8,9
97
0.4
32
33
3.4
11
8d
75
1A
uto
mo
tive
re
nt a
nd
lea
se, w
itho
ut d
rive
rs2
91
6,5
03
22
,02
80
.40
20
36
.36
21
75
14
,5P
ass
en
ge
r ca
r re
nta
l an
d le
asi
ng
16
7,4
55
39
,92
50
.40
21
26
.33
14
75
2A
uto
mo
bile
pa
rkin
g1
62
,02
33
9,9
25
0.3
71
72
5.0
11
27
53
Au
tom
otiv
e r
ep
air
sh
op
s3
60
85
,69
01
,77
40
.82
46
97
.73
53
75
38
Ge
ne
ral a
uto
mo
tive
re
pa
ir s
ho
ps
16
13
5,9
21
3,9
68
0.7
84
19
1.6
25
17
53
3O
the
r a
uto
mo
tive
re
pa
ir s
ho
ps
73
20
,76
58
,75
10
.82
45
96
.93
52
e
75
4A
uto
mo
tive
se
rvic
es,
exc
ep
t re
pa
ir4
99
,62
61
3,0
37
0.7
84
27
2.1
64
0f
76
2E
lect
rica
l re
pa
ir s
ho
ps
47
16
,85
01
3,5
91
0.7
64
07
1.6
03
9g
76
3W
atc
h,
clo
ck,
an
d je
we
lry
rep
air
32
15
21
2,9
33
0.2
27
35
.48
20
76
4R
e-u
ph
ols
tery
an
d fu
rnitu
re r
ep
air
18
88
73
5,4
89
0.5
32
54
1.0
12
67
69
Mis
cella
ne
ou
s re
pa
ir a
nd
re
late
d s
erv
ice
s1
59
37
,37
74
,01
80
.84
48
90
.07
49
h
78
3M
otio
n p
ictu
re th
ea
ters
(in
clu
de
s d
rive
-in
s)3
61
1,3
66
17
,74
41
.04
54
88
.58
48
78
4V
ide
o t
ap
e r
en
tal
43
8,5
78
14
,85
60
.68
33
76
.61
43
79
2T
he
atr
ica
l pro
d(e
x m
ot.
pic
, in
cl.
ba
nd
s, o
rch
.etc
)7
57
29
1,2
57
0.1
64
3.
01
17
93
Bo
wlin
g c
en
ters
51
11
,70
11
2,5
25
2.1
36
41
86
.42
64
79
4C
om
me
rcia
l sp
ort
s (i
ncl
. p
ro s
po
rts
clu
bs)
3D
21
2,9
33
NA
NA
NA
NA
79
48
Ra
cin
g, i
ncl
ud
ing
tra
ck o
pe
ratio
n2
D3
19
,40
0N
AN
AN
AN
A7
91
Dan
ce s
tudi
os, s
choo
ls, a
nd h
alls
2D
319,
400
NA
NA
NA
NA
79
91
Ph
ysic
al f
itne
ss f
aci
litie
s2
62
,84
22
4,5
69
0.6
93
53
3.6
91
97
99
2P
ub
lic g
olf
cou
rse
s3
55
52
12
,93
3N
AN
AN
A3
79
97
Me
mb
ers
hip
sp
ort
s a
nd
re
cre
atio
n c
lub
s2
74
,11
32
3,6
59
0.3
41
53
7.1
52
279
99A
mus
e an
d re
c se
rv, i
ncl m
useu
ms,
n.e.
c.1
06
D6,
026
NA
NA
NA
NA
i
80
1O
ffic
es
an
d c
linic
s o
f do
cto
rs o
f me
dic
ine
24
34
22
,05
82
,62
91
.41
60
13
5.2
75
88
02
Off
ice
s a
nd
clin
ics
of
de
ntis
ts2
50
70
,63
22
,55
50
.84
28
90
.13
50
80
3O
ffcs/
clin
cs o
f doc
s of
ost
eopa
thic
s2
D31
9,40
0N
AN
AN
AN
A8
04
1O
ffic
es
an
d c
linic
s o
f ch
iro
pra
cto
rs9
01
4,9
92
7,0
98
1.0
25
31
14
.83
56 co
ntd
./

17
Tab
le 3
. con
tinue
d.N
umbe
r of
Rev
enue
*A
vera
ge p
op.
Lo
catio
n Q
uo
tien
t
Sal
es g
oal a
chie
ved
Mar
ket P
oten
tial
S
IC
Indu
stry
est
ablis
hmen
ts *
(
'000
$)
s
erve
d (p
erso
ns)
AV
Ran
k
(
% o
f exp
ecte
d sa
le)
R
ank
80
42
Off
ice
s a
nd
clin
ics
of
op
tom
etr
ists
64
21
,63
59
,98
11
.82
63
19
8.5
46
58
04
3O
ffic
es
an
d c
linic
s o
f p
od
iatr
ists
71
,38
29
1,2
57
0.3
71
63
2.6
31
78
04
9O
ffic
e/c
linic
of
he
alth
pra
ctiti
on
er
31
6,5
43
20
,60
60
.57
27
48
.24
29
80
51
Ski
lled
nu
rsin
g c
are
faci
litie
s9
D7
0,9
78
NA
NA
NA
NA
80
52
aIn
term
ed
iate
ca
re fa
cilit
ies
16
D3
9,9
25
NA
NA
NA
NA
80
52
bN
urs
ing
an
d p
ers
on
al c
are
faci
litie
s3
D2
12
,93
3N
AN
AN
AN
A8
06
2G
en
era
l me
dic
al a
nd
su
rgic
al h
osp
itals
1D
63
8,8
00
NA
NA
NA
NA
80
7M
ed
ica
l an
d d
en
tal l
ab
ora
tori
es
28
27
,79
52
2,8
14
0.6
53
28
7.1
34
78
08
Ho
me
he
alth
ca
re s
erv
ice
s1
58
,61
24
2,5
87
0.4
52
43
7.4
92
38
09
Mis
c he
alth
and
alli
ed s
ervi
ces,
n.e
.c.
16
D39
,925
NA
NA
NA
NA
j
81
Le
ga
l se
rvic
es
33
59
1,5
86
1,9
07
0.5
82
84
1.0
62
78
23
Lib
rari
es
(pa
rt o
f e
du
catio
na
l se
rvic
es)
1D
63
8,8
00
NA
NA
NA
NA
82
4V
oca
tion
al s
cho
ols
(in
cl.
da
ta p
roc.
sch
.)5
D1
27
,76
0N
AN
AN
AN
A8
24
4B
usi
ne
ss a
nd
se
cre
tari
al s
cho
ols
4D
15
9,7
00
NA
NA
NA
NA
83
5C
hild
da
y ca
re s
erv
ice
s1
46
9,0
12
4,3
75
0.8
75
07
7.5
14
48
32
Ind
ivid
ua
l an
d fa
mily
so
cia
l se
rvic
es
18
2,0
91
35
,48
90
.79
44
55
.95
35
83
3Jo
b t
rain
ing
, vo
catio
na
l re
ha
bili
tatio
n8
1,2
28
79
,85
00
.40
19
38
.00
25
83
6R
esi
de
ntia
l ca
re2
14
,90
03
0,4
19
0.6
53
15
0.9
63
18
39
So
cia
l se
rvic
es,
n.e
.c.
10
60
26
3,8
80
3.7
16
64
8.5
33
08
71
1E
ng
ine
eri
ng
se
rvic
es
65
36
,70
89
,82
80
.33
13
25
.50
13
87
12
Arc
hite
ctu
ral s
erv
ice
s3
41
3,1
79
18
,78
80
.53
26
53
.13
34
87
13
Su
rve
yin
g s
erv
ice
s1
21
,90
85
3,2
33
0.4
01
83
7.9
32
48
72
Acc
ou
ntin
g, a
ud
itin
g, a
nd
bo
okk
ee
pin
g1
91
46
,57
93
,34
50
.68
34
62
.03
36
87
31
Co
mm
erc
ial p
hys
ica
l/bio
log
ica
l re
sea
rch
7D
91
,25
7N
AN
AN
AN
A8
73
2C
om
me
rcia
l eco
n, s
oci
o, e
du
c. r
ese
arc
h3
D2
12
,93
3N
AN
AN
AN
A8
73
4T
est
ing
lab
ora
tori
es
20
6,6
95
31
,94
00
.73
36
63
.71
38
87
4M
an
ag
em
en
t an
d p
ub
lic r
ela
tion
s se
rvic
es
92
30
,88
06
,94
30
.33
14
24
.42
11
Not
e: (
i) a=
incl
udes
SIC
729
9a; b
= in
clud
es c
ompu
ter
rent
al a
nd le
asin
g, m
aint
enan
ce a
nd r
epai
r, a
nd c
ompu
ter
rela
ted
serv
ices
; c=
incl
udes
det
ectiv
e ag
enci
es a
nd p
rote
ctio
n se
rvic
es, a
rmor
ed c
ar s
ervi
ces,
and
sec
urity
sys
tem
ser
vice
s;d=
incl
udes
follo
win
g se
rvic
es: p
acka
ging
and
labe
ling,
wat
er s
ofte
ning
and
con
ditio
ning
, tra
ding
sta
mp,
con
vent
ion
and
trad
e sh
ow, a
nd p
rivat
e m
ail c
arrie
r; e
= in
clud
es b
ody
repa
ir, ti
re r
etre
adin
g an
d re
pair,
aut
omot
ive
glas
s re
plac
emen
t,tr
ansm
issi
on r
epai
r, r
adia
tor
repa
ir, b
rake
, fr
ont
end
repa
ir an
d w
heel
al
ignm
ent,
carb
uret
or r
epai
r, a
utom
otiv
e el
ectr
ical
rep
air
shop
s; f=
incl
udes
car
was
hes,
lubr
icat
ion
shop
s, to
win
g, e
tc.;
g= in
clud
es r
adio
and
TV
rep
air,
ref
riger
atio
nan
d A
C r
epai
r, a
nd e
lect
rical
/ele
ctro
nic
repa
ir sh
ops;
h=
incl
udes
wel
ding
rep
air,
arm
atur
e re
win
ding
, far
m m
achi
nery
& e
quip
men
t rep
air,
law
n m
ower
/oth
er s
mal
l eng
ine
repa
ir, s
ewer
and
sep
tic ta
nk c
lean
ing
serv
ice,
and
oth
er r
elat
edse
rvic
es; i
= in
clud
es m
useu
ms,
art
gal
lerie
s, b
otan
/zoo
logi
cal g
arde
ns, r
olle
r sk
atin
g rin
ks, i
ce s
katin
g rin
ks; j
= in
clud
es k
idne
y di
alys
is c
ente
rs a
nd s
peci
alty
out
patie
nt fa
cilit
ies.
(ii)
Loc
atio
n qu
otie
nt o
r se
lf-su
ffici
ency
ran
king
= 1
bei
ngth
e le
ast s
elf-s
uffic
ient
indu
stry
/bus
ines
s. T
hose
ran
ked
38 o
r hi
gher
are
sel
f-su
ffici
ent (
i.e.,
LQ>
0.75
); (
iii)
Mar
ket p
oten
tial r
anki
ng=
1 im
plie
s th
e hi
ghes
t giv
en c
urre
nt n
umbe
r of
est
ablis
hmen
ts. T
hose
indu
strie
s ra
nked
hig
her
than
37
achi
eved
70
perc
ent o
r m
ore
of th
eir
mar
ket p
oten
tial;
(iv)
*= d
ata
from
1
99
2 E
con
om
ic C
en
sus
CD
RO
M, B
urea
u of
Cen
sus,
U.S
. Dep
t of C
omm
erce
; (v)
AV
= a
bsol
ute
valu
e, N
A =
info
rmat
ion
not a
vaila
ble
to p
rovi
de a
val
ue, D
= n
otdi
sclo
sed.

18
CONCLUSIONS
Evaluation of retail and service sector performances in North Dakota shows that for mostcounties these two sectors were less successful in retaining and attracting customer purchases. Moreover, the situation has deteriorated over the last decade for most rural counties in the state. Given such an outcome, the past or on-going economic development programs and strategies toimprove business environment and attract customers may not have been as desired. However, itis more than likely that the situation would have been worse had no economic developmentprograms been undertaken in these communities. Nonetheless, finding the cause of inefficientretail and service sector performance and incorporating countervailing strategies should be apriority in any new economic development plans in most communities in North Dakota.
Reevaluation of on-going economic development programs and strategies may berequired to improve the performance of retail and service trades in those communities that didnot perform well. Active cooperation among private businesses, potential entrepreneurs, oreconomic development agencies may also contribute towards improving retail and service sectorsperformances in North Dakota. Conversely, business leaders and economic developmentplanners in those counties where these two sectors are performing well may strengthen theirexisting economic development strategies to improve their competitive advantage.
Analysis of market potential of specific businesses in retail and service sectors has shownthere is considerable number of businesses in North Dakota with substantial potential for futuregrowth. For example, among the 130-plus business categories, the following are found to havehigher market potential in their respective sectors: in the service sector -- computer rent/lease andmaintenance services; public golf courses; and heavy construction equipment rental and leasing;in the retail sector -- computer and software stores; catalog and mail-order houses; and usedmerchandise stores. Those businesses that are identified as having market potential may betargeted by potential entrepreneurs in North Dakota for opening new business ventures. However, before deciding to open a new business venture, an entrepreneur must conduct athorough feasibility study as a part of his/her business plan. For those interested in starting newbusiness in North Dakota, contact the Department of Economic Development and Finance at(701) 221-5320 for information and assistance or regional economic development commissionsfor further information.
19
REFERENCES
Ariyaratne, C., and D. Darling, 1995. "County retail trade activity and changes from 1990through 1994," Kansas Business Review, 18(3): 24-29.
Bangsund, D. A., F. L. Leistritz, H. E. Bastow-Shoop, and R. Anderson, 1995. Community tradeanalysis handbook: A guide to using and interpreting information available to ruralbusinesses and communities, Extension Report No. 24, Department of AgriculturalEconomics and NDSU Extension Service, North Dakota State University, Fargo, ND.
Bangsund, D. A., F. L. Leistritz, J. K. Wanzek, D. Zetocha, and H. E. Bastow-Shoop, 1991. North Dakota trade areas: An overview, Agricultural Economics Report No. 265,Department of Agricultural Economics, North Dakota State University, Fargo, ND.
Bhuyan, S., 1996. Potential applications for shared-services cooperatives in North Dakota,Agricultural Economics Miscellaneous Report No. 178, Department of AgriculturalEconomics, North Dakota State University, Fargo, ND.
Doescher, T., R. Dauffenbach, and L. Warner, 1986. "Identification of target industries forindustrial recruiting in a non-metropolitan area," Review of Regional Economics andBusiness, April, 3-12.
Hamm, R. R. , J. M. Thompson, J. K. Wanzek, and F. L. Leistritz, 1993. Medical services in North Dakota, Agricultural Economics Statistical Series No. 52, Institute for Businessand Industry Development and Department of Agricultural Economics, North DakotaState University, Fargo.
Harris, T. R., and T. S. Shonkwiler, 1996. “Impact of dependency of central place functions,”paper presented at the Free Sessions, 1996 AAEA annual meetings, San Antonio, TX.
Leistritz, F. L., and J. K. Wanzek, 1993. North Dakota 1993: Patterns and trends in economicactivity, Agricultural Economics Statistical Series, Report No. 53, Department ofAgricultural Economics, North Dakota State University, Fargo, ND.
Miller, P., 1996. "Keeping main street alive," Cooperative Profiles, 3rd Quarter, published byCENEX-Land O' Lakes, MN.
Shaffer, R., 1989. Community Economics: Economic Structure and Change in SmallerCommunities, Iowa State University Press, Ames, IA.
Small Business Administration (SBA), 1995. "1993 Small Business Profiles - North Dakota," inThe National Economic, Social, and Environmental Data Bank (CD-ROM), Office of
20
Advocacy, U.S. Small Business Administration, Department of Commerce, Washington,DC.
U.S. Department of CommerceStatistical Abstract of the United States, 1994.1992 Economic Census, CD-ROM.1990 Census of Population and Housing (various issues).Measuring Markets: Guide to the use of Federal and State statistical data, 1979.