Distortion correction for diffusion-weighted MRI tractography and fMRI in the temporal lobes
Upload
independentCategory
view
1download
0
The printing of this thesis was financially supported by: Abbott, Chiesi, Eurocept,
Nestlé Nutrition, Nutricia Nederland, Novo Nordisk, the Research School
of Behavioural and Cognitive Neurosciences, Rijksuniversiteit Groningen,
Universitair Medisch Centrum Groningen.
Functional development at school age of newborn infants at risk.
© Copyright 2011, E. Roze, The Netherlands
All rights reserved. No part of this thesis may be reproduced, stored in a
retrieval system, or transmitted in any form or by any means, without the written
permission from the author or, when appropriate, from the publishers of the
publications.
ISBN: 978-90-367-5169-8
ISBN electronic version: 978-90-367-5168-1
Cover design and Layout: Stephan Eikens, Leeuwarden
Printing: Drukkerij Ridderprint, Ridderkerk

RIJKSUNIVERSITEIT GRONINGEN
Functional Development at School Age of
Newborn Infants at Risk
Proefschrift
ter verkrijging van het doctoraat in de
Medische Wetenschappen
aan de Rijksuniversiteit Groningen
op gezag van de
Rector Magnificus, dr. E. Sterken,
in het openbaar te verdedigen op
woensdag 7 december 2011
om 12:45 uur
door
Elise Roze
geboren op 12 december 1985
te Kampen

Promotor(es): Prof. Dr. A.F. Bos (UMC Groningen)
Beoordelingscommissie: Prof. Dr. P.J.J. Sauer (UMC Groningen)
Prof. Dr. L.S. de Vries (UMC Utrecht)
Prof. Dr. F.J. Walther (UMC Leiden)

Paranimfen: Petra Hoen
Elise Verhagen

Functional Development at School Age of Newborn Infants at Risk
Chapter 1 General introduction and outline of the thesis
Part 1 Functional outcome of infants exposed prenatally to
environmental pollutants
Chapter 2 Prenatal exposure to organohalogens, including
brominated flame retardants, influences motor,
cognitive, and behavioral performance at school age
Environmental Health Perspectives 2009;117(12):1953-1958
Part 2 Functional outcome of newborn infants with brain
injury
Chapter 3 Risk factors for adverse outcome in preterm infants with
periventricular hemorrhagic infarction
Pediatrics 2008;122(1):e46-e52
Chapter 4 Functional outcome at school age of preterm infants
with periventricular hemorrhagic infarction
Pediatrics 2009;123(6):1493-1500
Chapter 5 Long-term neurological outcome of term-born children
treated with two or more anti-epileptic drugs in the
neonatal period
Early Human Development 2011; DOI 10.1016/
j.earlhumdev.2011.06.012
Chapter 6 Tractography of the corticospinal tracts in infants with
focal perinatal injury: comparison with normal controls
and to motor development
Neuroradiology 2011; accepted
Part 3 Functional outcome of newborn infants with
systemic diseases
11
31
33
59
61
83
107
133
167
Table of contents

Chapter 7 Functional impairments at school age of children with
necrotizing enterocolitis or spontaneous intestinal
perforation
Pediatric Research 2011; DOI 10.1203/
PDR.0b013e31823279b1
Chapter 8 Functional impairments at school age of preterm born
children with late-onset sepsis
Early Human Development 2011; DOI 10.1016/j.
earlhumdev.2011.06.008
Chapter 9 Motor and cognitive outcome at school age of children
with surgically treated intestinal obstructions in the
neonatal period
Submitted
Part 4 Functional outcome: how various aspects of
neurodevelopment interrelate
Chapter 10 Developmental trajectories from birth to school age in
healthy term-born children
Pediatrics 2010;126(5):e1134-e1142
Chapter 11 Neuropsychological profiles at school age of very
preterm born children compared to term-born peers
Submitted
Chapter 12 General discussion and future perspectives
Chapter 13 Summary in English
Nederlandse samenvatting
Dankwoord
About the author
List of publications
Abbreviations
Authors and affiliations
169
195
217
235
237
263
287
308
314
322
326
328
332
336


Chapter 1
GENERAL INTRODUCTION
AND OUTLINE OF THE THESIS
ELISE ROZE

Functional Development at School Age of Newborn Infants at Risk
The main goal of this thesis is to establish the long-term, school age outcome of
newborn infants with perinatal risk factors of adverse outcome. Early in the life
of newborn infants major steps in brain development take place. These form the
basis of ongoing neuronal ripening and outgrowth that continues from childhood
well into adolescence.1 The organization of brain structures throughout this
period are important for the child’s motor, cognitive, and behavioral functioning
later in life. Several environmental aspects during prenatal and postnatal life may
interfere with developmental processes in a child’s brain. To various degrees these
may have an impact on long-term development. On the one hand, persistent
environmental pollutants and deficiencies of nutritional components such as
long-chain polyunsaturated fatty acids, to which the whole population is more or
less exposed, are known to have mild effects on the development of the central
nervous system. On the other hand, preterm birth and neonatal disease, both of
which occur less frequently, have a much greater impact on neurodevelopment.
Environmental Pollutants
Prenatal exposure to environmental pollutants may lead to less optimal conditions
for brain development in fetal life. Examples of environmental pollutants are
organohalogens, used extensively as flame retardants as well as in other
industrial applications. During pregnancy, these compounds are transferred
across the placenta to the fetus. During this critical period for fetal growth and
development, these compounds may interfere with brain development by
disrupting neurotransmitters and interfering with endocrine systems.2,3 Animal
studies indicated that prenatal exposure to different brominated flame retardants
may cause long-lasting behavioral alterations, particularly in motor activity and
cognitive behavior.4,5 To date, the long-term effects of prenatal exposure to
environmental pollutants in humans have not been investigated. We hypothesized
that brominated flame retardants may have subtle effects on motor, cognitive, and
behavioral outcome in children at school age.
13Chapter 1 General Introduction and Outline of the Thesis
Preterm Birth
Preterm birth, a relative common complication of pregnancy, has a considerable
impact on the neurodevelopment of newborn infants. Overall, 8% to 12% of all births
occur before 37 weeks of gestation. Very preterm births (<32 weeks of gestation)
occur in around 1% to 2% of pregnancies. Over the past decades, advances in
neonatal intensive care have led to a decrease in the mortality of infants born
preterm. As a consequence, more and more surviving children of very low birth
weight, i.e. below 1500 grams, now participate in everyday life, school, and reach
adulthood. Throughout their lives, however, the long-term neurodevelopmental
impairments following preterm birth remain a significant problem.
Perinatal and Neonatal Risk Factors for Adverse Outcome
Preterm infants are exposed to various extra-uterine characteristics that may
interfere with developmental processes that would normally take place in utero.
They may, for example, lead to altered oxygen delivery to body and brain tissue,
changes in cerebral blood flow and metabolism, and altered nutritional delivery.
Changes in these physiological processes may lead to less optimal conditions
for brain development and may contribute to the risk of brain damage. Indeed,
low gestational age and low birth weight are well known risk factors for adverse
neurodevelopmental outcome.6
In addition, several diseases of the neonatal period have been identified as risk
factors for neurodevelopmental impairments among preterm infants. These
diseases can be classified into overt types of brain injury that directly affect the
structure and organization of the brain, or systemic diseases of which one would
not in itself expect a direct influence on brain development, even though these
diseases are associated with adverse neurodevelopmental outcome.
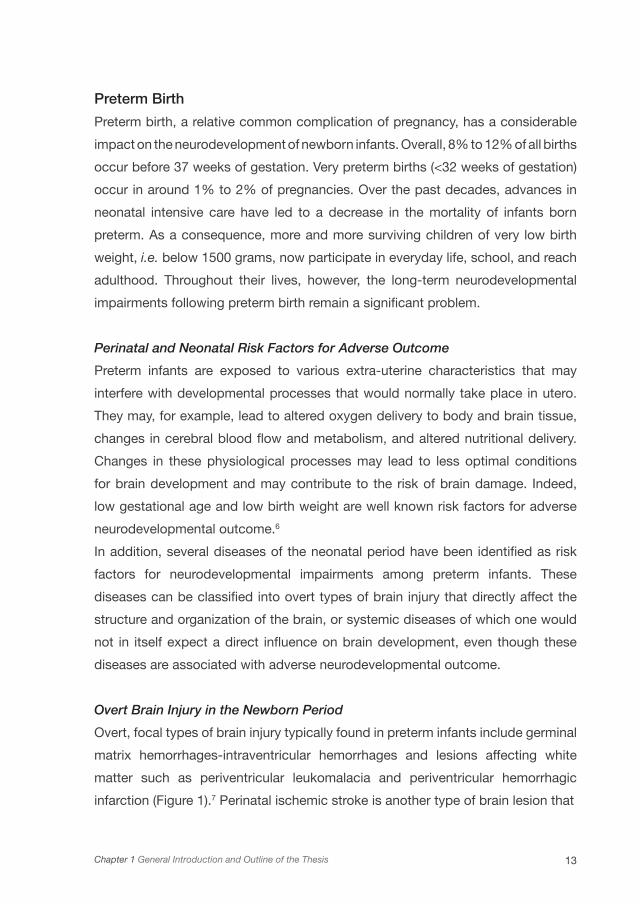
Overt Brain Injury in the Newborn Period
Overt, focal types of brain injury typically found in preterm infants include germinal
matrix hemorrhages-intraventricular hemorrhages and lesions affecting white
matter such as periventricular leukomalacia and periventricular hemorrhagic
infarction (Figure 1).7 Perinatal ischemic stroke is another type of brain lesion that

Functional Development at School Age of Newborn Infants at Risk
is found mainly in fullterm infants. This lesion is characterized by focal disruption
of cerebral blood flow secondary to either arterial or venous thrombosis or
embolization (Figure 1). These different types of brain injury are associated with
the development of cerebral palsy.8-10
Figure 1. Cranial ultrasound scans of an infant with periventricular hemorrhagic infarction in (a) a coronal and (b) sagittal plane, and (c) Magnetic Resonance Images of an infant with perinatal ischemic stroke at the cortical level and (d) the level of the basal ganglia
15Chapter 1 General Introduction and Outline of the Thesis
Systemic Diseases in the Newborn Period
Systemic diseases in preterm infants that may arise in the neonatal period
include sepsis, necrotizing enterocolitis, and bronchopulmonary dysplasia
following prolonged ventilatory support. Although these infants do not often
exhibit abnormalities on cranial ultrasound scans, they still have adverse
neurodevelopmental outcome at 2 years of age.11-13 Various authors suggested that
inflammation may lead to more diffuse types of brain damage in these infants.14-
16 The effect of these diseases on long-term motor, cognitive, and behavioral
functioning is unknown.
Long-term Outcome
While the rates of major handicaps among preterm-born children have remained
relatively constant over the last decade, the prevalence of milder dysfunctions
seem to be increasing. Cognitive, behavioral, and mild motor problems without
major motor deficits are now the most dominant neurodevelopmental sequelae in
children born preterm.17,18
Motor Outcome
One of the most well-recognized motor impairments following preterm birth is
cerebral palsy (CP). This permanent, non-progressive neurological condition occurs
in around 5% to 10% of very low birth weight infants.19,20 It involves disorders of
movement, posture, and motor function and may lead to limitations in performing
daily activities. Gross motor functioning in children with CP and the impact on
everyday routines can be assessed with the Gross Motor Function Classification
System (GMFCS). This is a functional, five level classification system for CP based
on self-initiated movement with particular emphasis on sitting (truncal control) and
walking.21 Children with CP can present with additional neurosensory deficits such
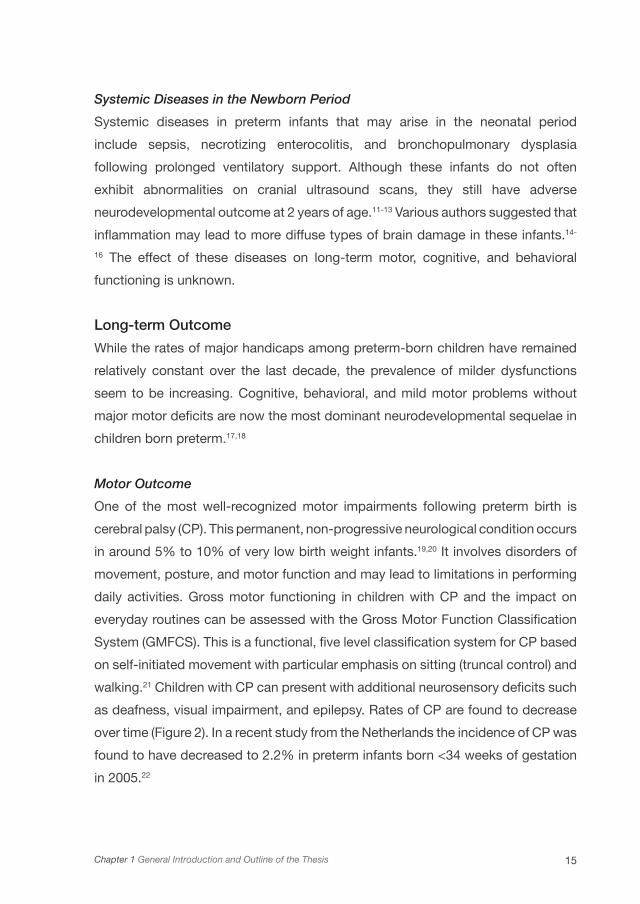
as deafness, visual impairment, and epilepsy. Rates of CP are found to decrease
over time (Figure 2). In a recent study from the Netherlands the incidence of CP was
found to have decreased to 2.2% in preterm infants born <34 weeks of gestation
in 2005.22

Functional Development at School Age of Newborn Infants at Risk
Error bars represent the standard error. Adapted from Platt MJ et al.23
Nevertheless, many preterm children who do not develop CP may still present
with impaired motor skills. A recent meta-analysis on the prevalence of motor-skill
impairment in preterm children without CP reported a pooled estimate of 40.5%
for mild to moderate impairment (defined as 5th to 15th percentile on standardized
tests) and 19.0% for moderate impairment (defined as < 5th percentile).24 The latter is
frequently found in children with Developmental Coordination Disorder (DCD).
Intellectual and Neuropsychological Outcome
Cognitive problems are increasingly recognized among preterm-born children without
major handicaps.25 Previous studies reported intelligence quotients that were 4 to 10
points lower in preterm children compared to fullterm controls. This equals a decline
of 0.3 to 0.6 standard deviations.25-27 In addition, higher percentages of preterm-born
children have borderline IQ scores (i.e. IQs between 70 and 85) with a prevalence of
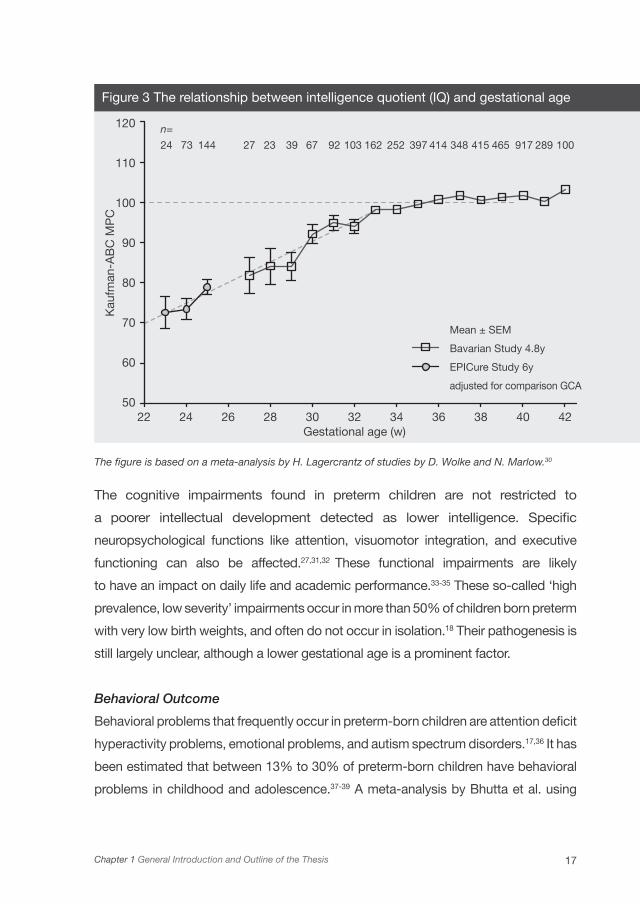
15% to 37% compared to their term-born peers.28,29 In addition, in a meta-analysis
of 1556 cases, Bhutta et al. showed that there is an inverse relationship of both birth
weight and gestational age with intellectual development in preterm-born children at
school age.6 Figure 3 shows that especially in the lower gestational age ranges there
is a steep decline in intellectual functioning.
1981 1982 1983 1984 1985 1986 1987 1988 1989 1990 1991 1992 1993 1994 1995 Birth year
120
100
80
60
40
20
0
Gestational age 28-31 weeksGestational <28 weeks
Birt
h p
reva
lenc
e p
er 1
000
live
birt
hs
Figure 2 Gestational-age-specific birth prevalence of cerebral palsy (3-year moving average), from nine European centers, 1981–1995
17Chapter 1 General Introduction and Outline of the Thesis
The figure is based on a meta-analysis by H. Lagercrantz of studies by D. Wolke and N. Marlow.30
The cognitive impairments found in preterm children are not restricted to
a poorer intellectual development detected as lower intelligence. Specific
neuropsychological functions like attention, visuomotor integration, and executive
functioning can also be affected.27,31,32 These functional impairments are likely
to have an impact on daily life and academic performance.33-35 These so-called ‘high
prevalence, low severity’ impairments occur in more than 50% of children born preterm
with very low birth weights, and often do not occur in isolation.18 Their pathogenesis is
still largely unclear, although a lower gestational age is a prominent factor.
Behavioral Outcome
Behavioral problems that frequently occur in preterm-born children are attention deficit
hyperactivity problems, emotional problems, and autism spectrum disorders.17,36 It has
been estimated that between 13% to 30% of preterm-born children have behavioral
problems in childhood and adolescence.37-39 A meta-analysis by Bhutta et al. using
120
110
100
90
80
70
60
50
n=
24 27 39 9273 23 67144 103 397 917162 415414 289252 465348 100
Mean ± SEM
Bavarian Study 4.8y
EPICure Study 6y
adjusted for comparison GCA
22 24 26 28 30 32 34 36 38 40 42Gestational age (w)
Kau
fman
-AB
C M
PC
Figure 3 The relationship between intelligence quotient (IQ) and gestational age
Functional Development at School Age of Newborn Infants at Risk
formal diagnostic criteria (the Diagnostic and Statistical Manual), found a pooled
relative risk of attention deficit hyperactivity disorder of 2.64 for preterm-born children
compared to controls.6
Children’s competencies and behavioral and emotional problems can be assessed
by a parental questionnaire, the Child Behavior Checklist (CBCL).40 A study by
Reijneveld et al. showed that around 13% of preterm-born children without overt
brain lesions have behavioral problems that can be detected with the CBCL.41 Both
internalizing and externalizing problems were found, with social and attentional
behavior most frequently affected. The exact pathophysiology of behavioral disorders
among preterm-born children is unclear, but an interaction between neurobiological
vulnerability and environmental aspects seems likely.42 The role of specific neonatal
morbidities in behavioral problems remain to be elucidated.
Functional Outcome at School Age
When performing follow-up studies to determine the effect of disease in early life on
long-term outcome, it is important to think about which tests to use and at what age
certain skills can best be assessed. We were particularly interested in the functional
outcome of children, i.e. their motor, cognitive, and behavioral functioning. The aim of
functional assessment is to determine a child’s ability to perform essential everyday
tasks and to fulfill the social roles expected of a physically and emotionally healthy
individual of the same age and culture.43
Regarding the child’s age at testing, school age is a more reliable age on which
to base a prediction on functioning in later life and adulthood than, for example,
toddler age. It is often not until school age that impairments in motor, cognitive, and
behavioral functioning come to light. The reason being that at school age functional
demands are higher than at younger ages. Also, from 6 years of age onwards, a wider
variety of tests are available and more precise assessment of attention and school
achievement is possible. Previously existing problems, not apparent earlier, become
evident at school age when functions involving these deficits are challenged.44 There
is growing evidence of an increased incidence of cognitive and functional disability
among preterm-born children at school age.17,45 Moreover, at school age academic
achievements can also be measured and later correlated to outcome in adulthood.
19Chapter 1 General Introduction and Outline of the Thesis
How Various Aspects of Neurodevelopment Interrelate
The motor, cognitive, and behavioral problems following preterm birth often do not
occur in isolation. We know, for example, that children with cerebral palsy are at
increased risk of cognitive and behavioral impairments, which may be associated
with the specific types of brain injury they suffered.46,47 In children with ‘high
prevalence, low severity’ impairments, however, these relationships are less clear.
Since most studies on neurodevelopmental outcome of preterm infants describe
group means on motor, cognitive, and behavioral tests, we know little about the
co-occurrence of impairments in functions among individual children. Regarding
neuropsychological functions, it is unclear how many preterm-born children suffer
from impairments in one or multiple domains and how neuropsychological functions
interrelate. Some studies reported that specifically preterm children with low
intelligence are at risk of developing problems in attention, memory, and executive
functions,48,49 while other studies suggested there may be preterm children with
specific neuropsychological dysfunctions in whom intellectual development is
preserved.50,51
Another issue is that of the stability of test scores obtained from birth until
school age. The majority of outcome studies of preterm-born children consider
neurodevelopmental outcome at two years of age assessed with the Bayley Scales
of Infant Development, as a measure for long-term development. We know that in
high-risk infants, such as extreme low birth weight infants, early neurological tests
scores have a strong predictive value for functioning later in life. Less is known,
however, about the stability of developmental trajectories in children with only a
mild risk of adverse outcome, or in healthy, term-born children.
Prediction of Outcome in the Early Period
In order to guide treatment and to counsel parents we need predictors of
neurodevelopmental outcome of preterm and ill fullterm infants for the neonatal
period. In addition, early identification of infants at risk of mild to moderate motor,
cognitive, and behavioral impairments could lead to early implementation of
individual intervention strategies in order to improve long-term outcome.
Knowledge of the effects of specific neonatal diseases on long-term outcome

Functional Development at School Age of Newborn Infants at Risk
may contribute to making reliable prognoses in the neonatal period. In addition,
neonatal assessment methods such as the Nursery Neurobiological Risk Score
(NBRS) and the Score for Neonatal Acute Physiology (SNAP), both of which aim
to summarize illness severity in newborn infants in their first days to weeks of
life, may also contribute to reliable estimates of neurodevelopmental outcome.
Although NBRS scores in relation to long-term outcome have never been studied,
previous studies did show that higher NBRS scores are associated with mental,
motor, and neurological impairments at 2 years of age.52
In addition, several techniques are available to assess the integrity of the central
nervous system of newborn infants shortly after birth. These include neuroimaging
techniques such as cranial ultrasound (CUS) and magnetic resonance imaging
(MRI), the observation and assessment of the quality of spontaneous general
movements, and the neonatal neurological examination.
The increased use of CUS and MRI in the neonatal period has led to an increased
understanding of common cerebral pathologies in newborn infants and global brain
development after preterm birth. Global white matter damage revealed by CUS and
MRI is quite common in children born preterm, and relations with motor function
have been found in the short-term.53,54 To date, clear associations of cognition
with pathological changes on neuroimaging have not been demonstrated beyond
doubt.55 This also holds for mild motor impairments in the long-term.
New imaging techniques may provide insight into microstructural changes in preterm
brain development. One such technique, diffusion tensor imaging (DTI), studies
the diffusion properties of water among different regions of the brain. Quantitative
measures derived from DTI provide an objective and reproducible assessment of
white matter and provides insights into neonatal brain development and injury.56-59
These quantitative measures include the apparent diffusion coefficient (ADC), a
measure of the overall magnitude of water diffusion, and fractional anisotropy (FA)
(the fraction of diffusion that can be attributed to anisotropic diffusion). Additionally,
DTI allows us to visualize white matter tracts such as the corticospinal tract in-vivo.
In diffusion tractography it is assumed that the direction of greatest diffusion in an
imaging voxel is parallel to the underlying dominant fibre orientation. By following
this direction of greatest diffusion on a voxel by voxel basis, it is possible to

21Chapter 1 General Introduction and Outline of the Thesis
generate three dimensional reconstructions of white matter tracts. This technique
allows the quantitative assessment of white matter tracts in regions of relatively
low FA such as in unmyelinated white matter in the neonatal brain.60,61 As yet, the
prognostic value of diffusion characteristics of the corticospinal tract for motor
outcome in newborn infants with focal brain injury is unknown.
Aims of the thesis
Our main aim was to establish the motor, cognitive, and behavioral outcome of
newborn infants with perinatal risk factors for adverse outcome at school age. Our
secondary aims were two-fold:
I. to investigate the interrelationship between motor, cognitive, and
neuropsychological development up to school age in preterm- born infants
compared to healthy, fullterm infants and
II. to relate perinatal and cerebral characteristics of newborn infants to long-
term neurodevelopmental outcome.
Part 1. Functional outcome of infants exposed prenatally to environmental
pollutants
In Part 1 we describe the outcome at school age of healthy Dutch children
who were exposed prenatally to environmental pollutants. In Chapter 2 we
describe the influence of prenatal exposure to organohalogen compounds,
including widely used brominated flame retardants, on motor, cognitive,
and behavioral outcome in healthy term-born children at school age.
Part 2. Functional outcome of newborn infants with brain injury
Part 2 of the thesis reviews the outcome of newborn infants with
different types of brain injury and assesses the relation between cerebral
characteristics and outcome. In Chapter 3 we determine risk factors
for adverse outcome (i.e. mortality and motor outcome at 18 months
of age) in preterm infants with periventricular hemorrhagic infarction. In
Chapter 4 we establish the functional outcome at school age, i.e. the
motor, cognitive, and behavioral outcome, of preterm-born children with
Functional Development at School Age of Newborn Infants at Risk
periventricular hemorrhagic infarction. We also describe cerebral risk
factors for adverse outcome. In Chapter 5 we describe the neurological
outcome of fullterm infants with neonatal seizures who required two or
more anti-epileptic drugs. We also determine the prognostic value of
treatment efficacy and seizure etiology for outcome. In Chapter 6 we
describe a novel technique, DTI, to assess diffusion characteristics of the
corticospinal tracts in newborn infants with focal neonatal ischemic brain
lesions, and the relation between conventional MRI and tractography
findings with later motor function in these infants.
Part 3. Functional outcome of newborn infants with systemic diseases
Part 3 reviews the functional outcome of preterm and term-born infants
with systemic diseases in the neonatal period and the role of inflammation
on development at school age. In Chapters 7 and 8 we describe functional
impairments in motor, cognitive, and behavioral development at school
age of preterm-born children with necrotizing enterocolitis, spontaneous
intestinal perforation and sepsis in which inflammation played a key role.
In Chapter 9 we establish the outcome at school age of newborn infants
with intestinal obstructions treated surgically during their first days of life.
In this intestinal condition inflammation does not play a prominent role.
Part 4. Functional outcome: How various aspects of neurodevelopment
interrelate
The final part of the thesis focuses on developmental processes and the
association between various developmental domains in preterm-born and
term-born children. In Chapter 10 we describe developmental trajectories
of healthy term-born children until school age. More specifically, we
determine the stability of scores on motor development tests from birth
until school age, and we determine the added value of the scores on early
motor tests for complex cognitive functions at school age. In Chapter 11
we establish the neuropsychological profiles at school age of a cohort of
very preterm-born children compared to term-born controls. In addition, we

23Chapter 1 General Introduction and Outline of the Thesis
describe their relation with academic performance, and identify neonatal
characteristics related to the neuropsychological profiles of preterm-born
children at school age.
In Chapter 12 we provide a general discussion of our findings and some
future perspectives. In Chapter 13 we summarize the findings set out in
this thesis in English and Dutch.
Functional Development at School Age of Newborn Infants at Risk
1. Sowell ER, Trauner DA, Gamst A, Jernigan TL.
Development of cortical and subcortical brain
structures in childhood and adolescence: a structural
MRI study. Dev Med Child Neurol 2002;44:4-16.
2. Solomon GM, Schettler T. Environment and health:
6. Endocrine disruption and potential human health
implications. CMAJ 2000;163:1471-1476.
3. Weisglas-Kuperus N. Neurodevelopmental,
immunological and endocrinological indices of
perinatal human exposure to PCBs and dioxins.
Chemosphere 1998;37:1845-1853.
4. Gee JR, Moser VC. Acute postnatal exposure to
brominated diphenylether 47 delays neuromotor
ontogeny and alters motor activity in mice.
Neurotoxicol Teratol 2008;30:79-87.
5. Viberg H, Fredriksson A, Eriksson P. Neonatal
exposure to polybrominated diphenyl ether (PBDE
153) disrupts spontaneous behaviour, impairs
learning and memory, and decreases hippocampal
cholinergic receptors in adult mice. Toxicol Appl
Pharmacol 2003;192:95-106.
6. Bhutta AT, Cleves MA, Casey PH, Cradock MM,
Anand KJS. Cognitive and behavioral outcomes of
school-aged children who were born preterm - A
meta-analysis. JAMA 2002;288:728-737.
7. Volpe JJ. Neurology of the Newborn. 5th ed.
Philadelphia, PA: Elsevier; 2008.
8. de Vries LS, Rademaker KJ, Groenendaal F, et al.
Correlation between neonatal cranial ultrasound,
MRI in infancy and neurodevelopmental outcome
in infants with a large intraventricular haemorrhage
with or without unilateral parenchymal involvement.
Neuropediatrics 1998;29:180-188.
9. Bass WT, Jones MA, White LE, Montgomery TR,
Aiello F, Karlowicz MG. Ultrasonographic differential
diagnosis and neurodevelopmental outcome of
cerebral white matter lesions in premature infants. J
Perinatol 1999;19:330-336.
10. Mercuri E, Rutherford M, Cowan F, et al. Early
prognostic indicators of outcome in infants
with neonatal cerebral infarction: a clinical,
electroencephalogram, and magnetic resonance
imaging study. Pediatrics 1999;103:39-46.
11. Stoll BJ, Hansen NI, Adams-Chapman I, et al.
Neurodevelopmental and growth impairment among
extremely low-birth-weight infants with neonatal
infection. JAMA 2004;292:2357-2365.
12. Hintz SR, Kendrick DE, Stoll BJ, et al.
Neurodevelopmental and growth outcomes of
extremely low birth weight infants after necrotizing
enterocolitis. Pediatrics 2005;115:696-703.
References

25Chapter 1 General Introduction and Outline of the Thesis
13. Schmidt B, Asztalos EV, Roberts RS, Robertson
CM, Sauve RS, Whitfield MF. Impact of
bronchopulmonary dysplasia, brain injury, and
severe retinopathy on the outcome of extremely
low-birth-weight infants at 18 months: results from
the trial of indomethacin prophylaxis in preterms.
JAMA 2003;289:1124-1129.
14. Shah DK, Doyle LW, Anderson PJ, et al. Adverse
neurodevelopment in preterm infants with postnatal
sepsis or necrotizing enterocolitis is mediated by
white matter abnormalities on magnetic resonance
imaging at term. J Pediatr 2008;153:170-175.
15. Glass HC, Bonifacio SL, Chau V, et al. Recurrent
postnatal infections are associated with progressive
white matter injury in premature infants. Pediatrics
2008;122:299-305.
16. Gagliardi L, Bellu R, Zanini R, Dammann O.
Bronchopulmonary dysplasia and brain white
matter damage in the preterm infant: a complex
relationship. Paediatr Perinat Epidemiol
2009;23:582-590.
17. Aylward GP. Neurodevelopmental outcomes of
infants born prematurely. J Dev Behav Pediatr
2005;26:427-440.
18. Johnson S. Cognitive and behavioural outcomes
following very preterm birth. Sem Fetal Neonatal
Med 2007;12:363-373.
19. Hack M, Flannery DJ, Schluchter M, Cartar L,
Borawski E, Klein N. Outcomes in young adulthood
for very-low-birth-weight infants. N Engl J Med
2002;346:149-157.
20. Himmelmann K, Hagberg G, Uvebrant P. The
changing panorama of cerebral palsy in Sweden. X.
Prevalence and origin in the birth-year period 1999-
2002. Acta Paediatr 2010;99:1337-1343.
21. Palisano R, Rosenbaum P, Walter S, Russell D,
Wood E, Galuppi B. Development and reliability
of a system to classify gross motor function in
children with cerebral palsy. Dev Med Child Neurol
1997;39:214-233.
22. van Haastert IC, Groenendaal F, Uiterwaal CS, et al.
Decreasing incidence and severity of cerebral palsy
in prematurely born children. J Pediatr
2011;159:86-91.
23. Platt MJ, Cans C, Johnson A, et al. Trends in
cerebral palsy among infants of very low birthweight
(<1500 g) or born prematurely (<32 weeks) in
16 European centres: a database study. Lancet
2007;369:43-50.
24. Williams J, Lee KJ, Anderson PJ. Prevalence of
motor-skill impairment in preterm children who do
not develop cerebral palsy: a systematic review. Dev
Med Child Neurol 2010;52:232-237.
25. Aylward GP. Cognitive and neuropsychological
outcomes: more than IQ scores. Ment Retard Dev
Disabil Res Rev 2002;8:234-240.

Functional Development at School Age of Newborn Infants at Risk
26. Taylor HG, Klein N, Minich NM, Hack M. Middle-
school-age outcomes in children with very low
birthweight. Child Dev 2000;71:1495-1511.
27. Van Braeckel KNJA, Butcher PR, Geuze RH,
van Duijn MA, Bos AF, Bouma A. Less efficient
elementary visuomotor processes in 7- to 10-year-
old preterm-born children without cerebral palsy:
an indication of impaired dorsal stream processes.
Neuropsychology 2008;22:755-764.
28. Whitfield MF, Grunau RV, Holsti L. Extremely
premature (< or = 800 g) schoolchildren: multiple
areas of hidden disability. Arch Dis Child Fetal
Neonatal Ed 1997;77:F85-F90.
29. Vohr BR, Wright LL, Dusick AM, et al.
Neurodevelopmental and functional outcomes of
extremely low birth weight infants in the National
Institute of Child Health and Human Development
Neonatal Research Network, 1993-1994. Pediatrics
2000;105:1216-1226.
30. Lagercrantz H. The hard problem. Acta Paediatr
2008;97:142-143.
31. Taylor HG. Children born preterm or with very low
birth weight can have both global and selective
cognitive deficits. J Dev Behav Pediatr
2006;27:485-486.
32. Mulder H, Pitchford NJ, Hagger MS, Marlow N.
Development of executive function and attention
in preterm children: a systematic review. Dev
Neuropsychol 2009;34:393-421.
33. Feder KP, Majnemer A, Bourbonnais D, Platt R,
Blayney M, Synnes A. Handwriting performance in
preterm children compared with term peers at age 6
to 7 years. Dev Med Child Neurol 2005;47:163-170.
34. Saigal S, den Ouden L, Wolke D, et al. School-age
outcomes in children who were extremely low birth
weight from four international population-based
cohorts. Pediatrics 2003;112:943-950.
35. Aarnoudse-Moens CS, Oosterlaan J, Duivenvoorden
HJ, van Goudoever JB, Weisglas-Kuperus N.
Development of preschool and academic skills in
children born very preterm. J Pediatr
2011;158:15-20.
36. Johnson S, Hollis C, Kochhar P, Hennessy E, Wolke
D, Marlow N. Psychiatric disorders in extremely
preterm children: longitudinal finding at age 11
years in the EPICure study. J Am Acad Child
Adolesc Psychiatry 2010;49:453-463.
37. Gray RF, Indurkhya A, McCormick MC. Prevalence,
stability, and predictors of clinically significant
behavior problems in low birth weight children at 3,
5, and 8 years of age. Pediatrics 2004;114:736-743.
38. Botting N, Powls A, Cooke RW, Marlow N. Attention
deficit hyperactivity disorders and other psychiatric
outcomes in very low birthweight children at 12
years. J Child Psychol Psychiatry 1997;38:931-941.

27Chapter 1 General Introduction and Outline of the Thesis
39. Elgen I, Sommerfelt K, Markestad T. Population
based, controlled study of behavioural problems
and psychiatric disorders in low birthweight children
at 11 years of age. Arch Dis Child Fetal Neonatal Ed
2002;87:F128-F132.
40. Achenbach TM, Edelbrock C. Manual for the
Child Behavior Checklist: 4–18 and 1991 profile.
Burlington, VT: Univ. of Vermont, Department of
Psychiatry; 1991.
41. Reijneveld SA, de Kleine MJ, van Baar AL, et al.
Behavioural and emotional problems in very preterm
and very low birthweight infants at age 5 years. Arch
Dis Child Fetal Neonatal Ed 2006;91:F423-F428.
42. Bendersky M, Lewis M. Environmental risk,
biological risk, and developmental outcome.
Developmental Psychology 1994;30:484-494.
43. Vohr BR. Cognitive and functional outcomes of
children born preterm. In: Nosarti C, Murray RM,
Hack M, editors. Neurodevelopmental Outcomes
of Preterm Birth. Cambridge, UK: Cambridge
University Press; 2010. p.141-163.
44. Aylward GP. Methodologcial considerations in
neurodevelopmental outcome sutdies of infants
born prematurely. In: Nosarti C, Murray RM,
Hack M, editors. Neurodevelopmental Outcomes
of Preterm Birth. Cambridge, UK: Cambridge
University Press; 2010. p.164-175.
45. Hack M, Friedman H, Fanaroff AA. Outcomes
of extremely low birth weight infants. Pediatrics
1996;98:931-937.
46. Sigurdardottir S, Vik T. Speech, expressive
language, and verbal cognition of preschool children
with cerebral palsy in Iceland. Dev Med Child Neurol
2011;53:74-80.
47. Himmelmann K, Beckung E, Hagberg G, Uvebrant
P. Gross and fine motor function and accompanying
impairments in cerebral palsy. Dev Med Child Neurol
2006;48:417-423.
48. Dewey D, Crawford SG, Creighton DE, Sauve RS.
Long-term neuropsychological outcomes in very
low birth weight children free of sensorineural
impairments. J Clin Exp Neuropsychol
1999;21:851-865.
49. Herrgard E, Luoma L, Tuppurainen K, Karjalainen S,
Martikainen A. Neurodevelopmental profile at five
years of children born at < or = 32 weeks gestation.
Dev Med Child Neurol 1993;35:1083-1096.
50. Korkman M, Mikkola K, Ritari N, et al.
Neurocognitive test profiles of extremely low birth
weight five-year-old children differ according to
neuromotor status. Dev Neuropsychol
2008;33:637-655.
51. Grunau RE, Whitfield MF, Davis C. Pattern of
learning disabilities in children with extremely low
birth weight and broadly average intelligence. Arch
Pediatr Adolesc Med 2002;156:615-620.

Functional Development at School Age of Newborn Infants at Risk
52. Brazy JE, Eckerman CO, Oehler JM, Goldstein RF,
O’Rand AM. Nursery Neurobiologic Risk Score:
Important factors in predicting outcome in very low
birth weight infants. J Pediatr 1991;118:783-792.
53. Spittle AJ, Brown NC, Doyle LW, et al. Quality
of general movements is related to white matter
pathology in very preterm infants. Pediatrics
2008;121:e1184-e1189.
54. Bos AF, Martijn A, Okken A, Prechtl HFR. Quality of
general movements in preterm infants with transient
periventricular echodensities. Acta Paediatr
1998;87:328-335.
55. Hart AR, Whitby EW, Griffiths PD, Smith MF.
Magnetic resonance imaging and developmental
outcome following preterm birth: review of current
evidence. Dev Med Child Neurol 2008;50:655-663.
56. Huppi PS, Maier SE, Peled S, et al. Microstructural
development of human newborn cerebral white
matter assessed in vivo by diffusion tensor magnetic
resonance imaging. Pediatr Res 1998;44:584-590.
57. Neil JJ, Shiran SI, McKinstry RC, et al. Normal
brain in human newborns: apparent diffusion
coefficient and diffusion anisotropy measured
by using diffusion tensor MR imaging. Radiology
1998;209:57-66.
58. Seghier ML, Lazeyras F, Zimine S, et al.
Combination of event-related fMRI and diffusion
tensor imaging in an infant with perinatal stroke.
Neuroimage 2004;21:463-472.
59. Ward P, Counsell S, Allsop J, et al. Reduced
fractional anisotropy on diffusion tensor magnetic
resonance imaging after hypoxic-ischemic
encephalopathy. Pediatrics 2006;117:e619-e630.
60. Behrens TE, Johansen-Berg H, Woolrich MW, et
al. Non-invasive mapping of connections between
human thalamus and cortex using diffusion imaging.
Nat Neurosci 2003;6:750-757.
61. Counsell SJ, Dyet LE, Larkman DJ, et al. Thalamo-
cortical connectivity in children born preterm
mapped using probabilistic magnetic resonance
tractography. Neuroimage 2007;34:896-904.

29Chapter 1 General Introduction and Outline of the Thesis


Chapter 2 Prenatal exposure to organohalogens, including brominated
flame retardants, influences motor, cognitive,
and behavioral performance at school age
PART 1Functional outcome of infants exposed prenatally
to environmental pollutants


Chapter 2
PRENATAL EXPOSURE TO ORGANOHALOGENS,
INCLUDING BROMINATED FLAME RETARDANTS,
INFLUENCES MOTOR, COGNITIVE, AND
BEHAVIORAL PERFORMANCE AT SCHOOL AGE
ELISE ROZE, LISETHE MEIJER, ATTIE BAKKER, KOENRAAD N. J. A. VAN BRAECKEL,
PIETER J. J. SAUER, AREND F. BOS
ENVIRONMENTAL HEALTH PERSPECTIVES 2009;117(12):1953-1958

Functional Development at School Age of Newborn Infants at Risk
Abstract
Background
Organohalogen compounds (OHCs) are known to have neurotoxic effects on the
developing brain.
Objective
We investigated the influence of prenatal exposure to OHCs, including brominated
flame retardants, on motor, cognitive, and behavioral outcome in healthy children
of school age.
Methods
This study was part of the prospective Groningen infant COMPARE (Comparison
of Exposure-Effect Pathways to Improve the Assessment of Human Health
Risks of Complex Environmental Mixtures of Organohalogens) study. It included
62 children in whose mothers the following compounds had been determined
in the 35th week of pregnancy: 2,2´-bis-(4 chlorophenyl)-1,1´-dichloroethene,
pentachlorophenol (PCP), polychlorinated biphenyl congener 153 (PCB-153),
4-hydroxy-2,3,3´,4´,5-pentachlorobiphenyl (4OH-CB-107), 4OH-CB-146, 4OH-CB-
187, 2,2´,4,4´-tetrabromodiphenyl ether (BDE-47), BDE-99, BDE-100, BDE-153,
BDE-154, and hexabromocyclododecane. Thyroid hormones were determined
in umbilical cord blood. When the children were 5–6 years of age, we assessed
their neuropsychological functioning: motor performance (coordination, fine motor
skills), cognition (intelligence, visual perception, visuomotor integration, inhibitory
control, verbal memory, and attention), and behavior.
35Chapter 2 Prenatal Exposure to Organohalogens, including Brominated Flame Retardants, influences Motor, Cognitive, and Behavioral Performance at School Age
Results
Brominated flame retardants correlated with worse fine manipulative abilities,
worse attention, better coordination, better visual perception, and better behavior.
Chlorinated OHCs correlated with less choreiform dyskinesia. Hydroxylated
polychlorinated biphenyls correlated with worse fine manipulative abilities,
better attention, and better visual perception. The wood protective agent (PCP)
correlated with worse coordination, less sensory integrity, worse attention, and
worse visuomotor integration.
Conclusions
Our results demonstrate for the first time that transplacental transfer of
polybrominated flame retardants is associated with the development of children at
school age. Because of the widespread use of these compounds, especially in the
United States, where concentrations in the environment are four times higher than
in Europe, these results cause serious concern.
Functional Development at School Age of Newborn Infants at Risk
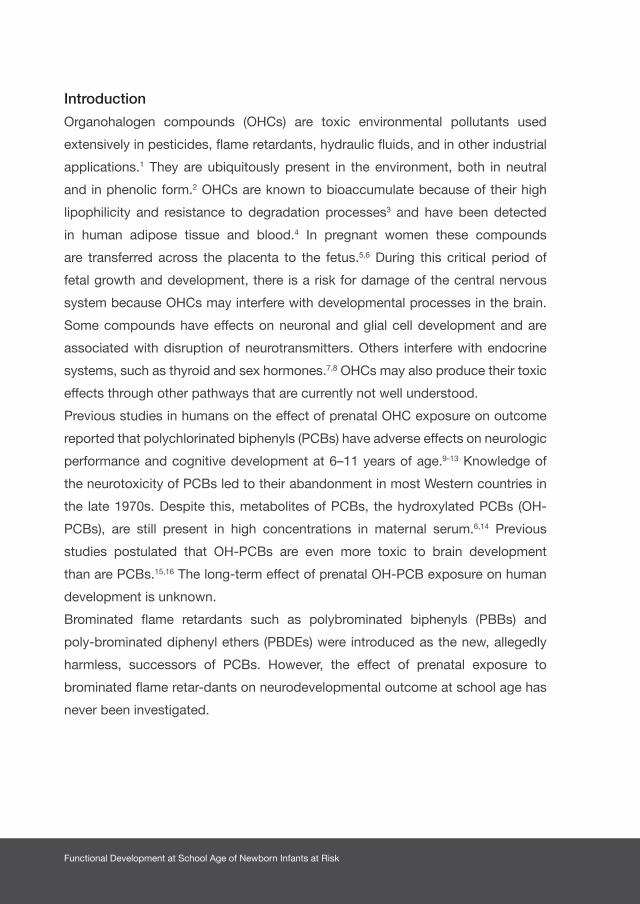
Introduction
Organohalogen compounds (OHCs) are toxic environmental pollutants used
extensively in pesticides, flame retardants, hydraulic fluids, and in other industrial
applications.1 They are ubiquitously present in the environment, both in neutral
and in phenolic form.2 OHCs are known to bioaccumulate because of their high
lipophilicity and resistance to degradation processes3 and have been detected
in human adipose tissue and blood.4 In pregnant women these compounds
are transferred across the placenta to the fetus.5,6 During this critical period of
fetal growth and development, there is a risk for damage of the central nervous
system because OHCs may interfere with developmental processes in the brain.
Some compounds have effects on neuronal and glial cell development and are
associated with disruption of neurotransmitters. Others interfere with endocrine
systems, such as thyroid and sex hormones.7,8 OHCs may also produce their toxic
effects through other pathways that are currently not well understood.
Previous studies in humans on the effect of prenatal OHC exposure on outcome
reported that polychlorinated biphenyls (PCBs) have adverse effects on neurologic
performance and cognitive development at 6–11 years of age.9-13 Knowledge of
the neurotoxicity of PCBs led to their abandonment in most Western countries in
the late 1970s. Despite this, metabolites of PCBs, the hydroxylated PCBs (OH-
PCBs), are still present in high concentrations in maternal serum.6,14 Previous
studies postulated that OH-PCBs are even more toxic to brain development
than are PCBs.15,16 The long-term effect of prenatal OH-PCB exposure on human
development is unknown.
Brominated flame retardants such as polybrominated biphenyls (PBBs) and
poly-brominated diphenyl ethers (PBDEs) were introduced as the new, allegedly
harmless, successors of PCBs. However, the effect of prenatal exposure to
brominated flame retar-dants on neurodevelopmental outcome at school age has
never been investigated.

37Chapter 2 Prenatal Exposure to Organohalogens, including Brominated Flame Retardants, influences Motor, Cognitive, and Behavioral Performance at School Age
The primary aim of this explorative study was to investigate the influence of
prenatal OHC exposure, including OH-PCBs and PBDEs, on motor, cognitive, and
behavioral outcomes in healthy Dutch children at 5–6 years of age.
OHCs are also known to influence fetal thyroid hormone levels.17 Because thyroid
hormones are involved in neurodevelopmental processes, our second aim was
to investigate whether thyroid hormone levels at birth were related to outcome in
these children.
Functional Development at School Age of Newborn Infants at Risk
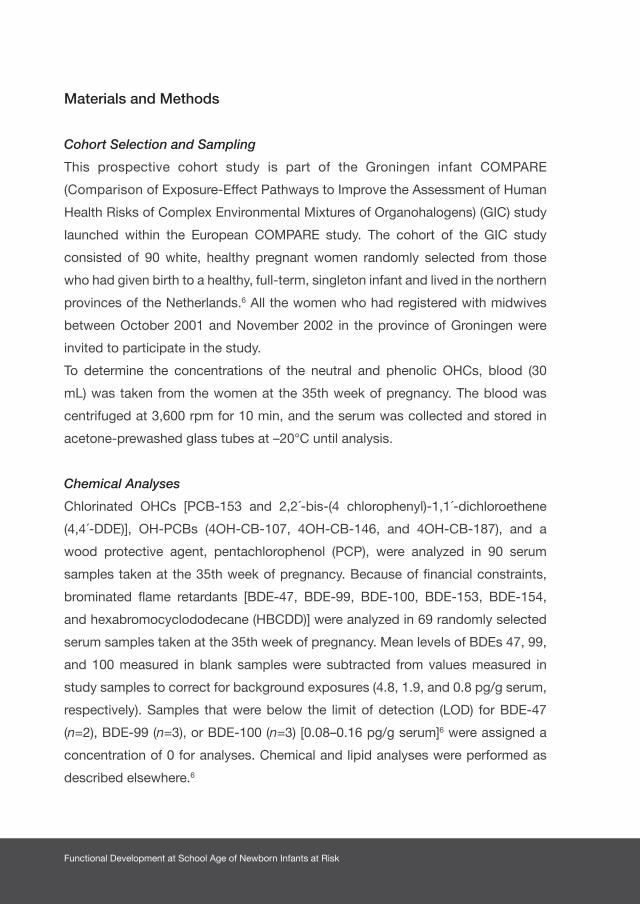
Materials and Methods
Cohort Selection and Sampling
This prospective cohort study is part of the Groningen infant COMPARE
(Comparison of Exposure-Effect Pathways to Improve the Assessment of Human
Health Risks of Complex Environmental Mixtures of Organohalogens) (GIC) study
launched within the European COMPARE study. The cohort of the GIC study
consisted of 90 white, healthy pregnant women randomly selected from those
who had given birth to a healthy, full-term, singleton infant and lived in the northern
provinces of the Netherlands.6 All the women who had registered with midwives
between October 2001 and November 2002 in the province of Groningen were
invited to participate in the study.
To determine the concentrations of the neutral and phenolic OHCs, blood (30
mL) was taken from the women at the 35th week of pregnancy. The blood was
centrifuged at 3,600 rpm for 10 min, and the serum was collected and stored in
acetone-prewashed glass tubes at –20°C until analysis.
Chemical Analyses
Chlorinated OHCs [PCB-153 and 2,2´-bis-(4 chlorophenyl)-1,1´-dichloroethene
(4,4´-DDE)], OH-PCBs (4OH-CB-107, 4OH-CB-146, and 4OH-CB-187), and a
wood protective agent, pentachlorophenol (PCP), were analyzed in 90 serum
samples taken at the 35th week of pregnancy. Because of financial constraints,
brominated flame retardants [BDE-47, BDE-99, BDE-100, BDE-153, BDE-154,
and hexabromocyclododecane (HBCDD)] were analyzed in 69 randomly selected
serum samples taken at the 35th week of pregnancy. Mean levels of BDEs 47, 99,
and 100 measured in blank samples were subtracted from values measured in
study samples to correct for background exposures (4.8, 1.9, and 0.8 pg/g serum,
respectively). Samples that were below the limit of detection (LOD) for BDE-47
(n=2), BDE-99 (n=3), or BDE-100 (n=3) [0.08–0.16 pg/g serum]6 were assigned a
concentration of 0 for analyses. Chemical and lipid analyses were performed as
described elsewhere.6

39Chapter 2 Prenatal Exposure to Organohalogens, including Brominated Flame Retardants, influences Motor, Cognitive, and Behavioral Performance at School Age
Thyroid Hormone Analyses
Thyroxin (T4), free T4, reverse triiodothyronin (rT3), triiodothyronin (T3), thyroid-
stimulating hormone (TSH), and thyroid-binding globulin levels were determined in
the umbilical cord blood of the 90 women, provided that enough cord blood was
available to perform the analyses.
Follow-up
We intended to include the 69 children for whom all the neutral and phenolic OHC
concentrations had been determined. The children were invited prospectively to
participate in an extensive follow-up program that assessed motor performance,
cognition, and behavior at 5–6 years of age. Parents gave their informed consent
for themselves and their children to participate in the follow-up program before
the study. The study was approved by the Medical Ethical Committee of the
University Medical Center Groningen and complied with all applicable international
regulations.
Motor Outcome
To determine the children’s motor outcomes, we administered the Movement
ABC, a standardized test of motor skills for children 4–12 years of age.18 This test,
which is widely used in practice and in research, yields a score for total movement
performance based on separate scores for manual dexterity (fine motor skills), ball
skills, and static and dynamic balance (coordination). Items on the Movement ABC
included, for example, posting coins in a bank box, drawing a line between two
existing lines of a figure, catching a bean bag, and jumping over a rope. The test
required 20–30 min to administer. The tasks that make up the Movement ABC are
representative of the motor skills that are required of children attending elementary
school and are adapted to the children’s ages.
Supplementary to the Movement ABC, we assessed qualitative aspects of
coordination and balance and fine manipulative abilities and the presence of
choreiform dyskinesia, associated movements, sensory integrity, and tremors
with Touwen’s age-specific neurologic examination.19 Approximately 20–30%
of children from the general population obtain nonoptimal scores on one or two

Functional Development at School Age of Newborn Infants at Risk
clusters of neurologic functions on Touwen’s neurologic examination. If a child’s
score is nonoptimal on a specific item of the examination, the total score can still
be within the normal range.20,21
Finally, we administered the Dutch version of the Developmental Coordination
Disorder Questionnaire (DCD-Q).22 This questionnaire, which is filled out by the
parents, was developed to identify motor problems in children ≥ 4 years of age.
It contains 17 items relating to motor coordination, which are classified into
three categories: control during movement, fine motor skills/writing, and general
coordination.
Cognitive Outcome
Total, Verbal, and Performance Intelligence levels were assessed using a short
form of the Wechsler Preschool and Primary Scale of Intelligence, revised (WPPSI-
R).23 Examples on items of the WPPSI-R are vocabulary, picture completion, and
reproduction of block designs.
In addition, we assessed several neuropsychological functions to investigate whether
these were impaired by prenatal OHC exposure. They were assessed by subtests
of the NEPSY-II (Neuropsychological Assessment, 2nd ed.), a neuropsychological
battery for children.24 Central visual perception was assessed using the “geometric
puzzles” subtest, in which the child is asked to match two shapes outside a grid with
shapes inside the grid. Visuomotor integration was assessed by the “design copying”
subtest, in which the child is asked to reproduce geometric forms of increasing
complexity. Visuomotor integration involves the integration of visual information
with finger–hand movements. Furthermore, we assessed inhibitory control with the
“inhibition” subtest, which assesses the inhibitory control of automated behavior.
In the first timed task, the child is asked to name a set of figures (i.e., squares and
circles); in the second timed task, the child is asked to name the opposite of what
is shown (i.e., squares instead of circles and circles instead of squares).
We assessed verbal memory using a standardized Dutch version of the Rey’s
Auditory Verbal Learning Test (AVLT).25 This test consists of five learning trials with
immediate recall of words (tested after each presentation), a delayed recall trial,
and a delayed recognition trial.25

41Chapter 2 Prenatal Exposure to Organohalogens, including Brominated Flame Retardants, influences Motor, Cognitive, and Behavioral Performance at School Age
We measured sustained attention and selective attention with the two subtests
“Score!” and “Sky Search” of the Test of Everyday Attention for Children.26
Sustained attention involves maintaining attention over an extended period of
time. Selective attention refers to the ability to select target information from an
array of distracters.27 For example, the children were asked to count tones in 10
items, varying from 9 to 15 tones per item.
The total duration of the follow-up was approximately 2.5 hr. Test scores obtained
when a child was too tired and uncooperative, as assessed by the experimenter,
were excluded.
Behavioral Outcome
To obtain information on the children’s competencies and their behavioral and
emotional problems, the parents completed the Child Behavior Checklist (CBCL)28
and the teachers filled out the Teacher’s Report Form.28 These questionnaires
consist of a total scale and two subscales: internalizing problems (emotionally
reactive, anxious/depressed scales, somatic complaints, withdrawn behavior) and
externalizing problems (attention problems and aggres-sive behavior).
In addition, the parents filled out an attention deficit/hyperactivity disorder
(ADHD) questionnaire that contains 18 items on inattention, hyperactivity, and
impulsivity.29
To gain insight in the socioeconomic status (SES) and home environmental factors
that may influence development, the highest level of maternal education and the
Home Observation for Measurement of the Environment (HOME) questionnaire
were assessed during the first year after birth during an earlier stage of the GIC
study.6
Functional Development at School Age of Newborn Infants at Risk
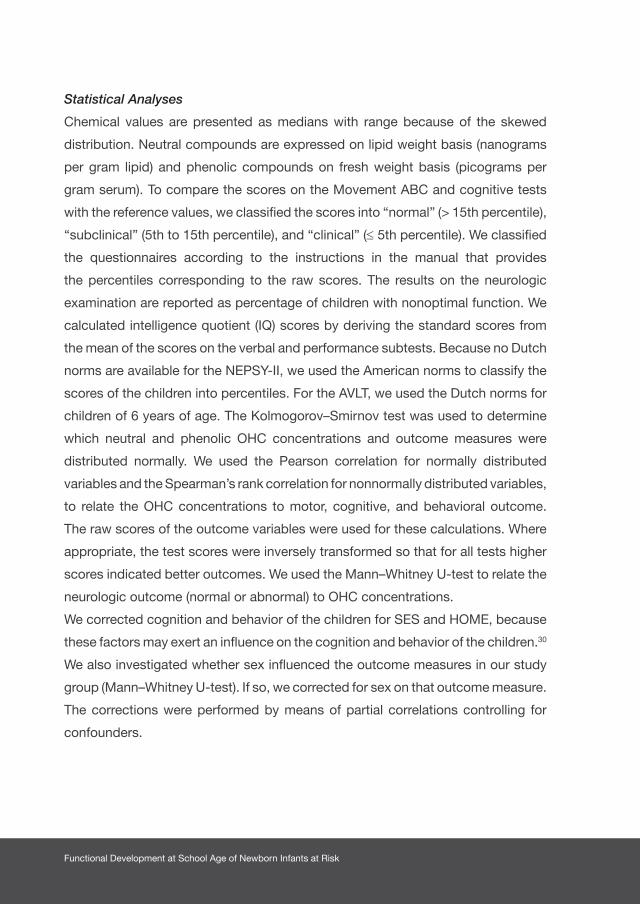
Statistical Analyses
Chemical values are presented as medians with range because of the skewed
distribution. Neutral compounds are expressed on lipid weight basis (nanograms
per gram lipid) and phenolic compounds on fresh weight basis (picograms per
gram serum). To compare the scores on the Movement ABC and cognitive tests
with the reference values, we classified the scores into “normal” (> 15th percentile),
“subclinical” (5th to 15th percentile), and “clinical” (≤ 5th percentile). We classified
the questionnaires according to the instructions in the manual that provides
the percentiles corresponding to the raw scores. The results on the neurologic
examination are reported as percentage of children with nonoptimal function. We
calculated intelligence quotient (IQ) scores by deriving the standard scores from
the mean of the scores on the verbal and performance subtests. Because no Dutch
norms are available for the NEPSY-II, we used the American norms to classify the
scores of the children into percentiles. For the AVLT, we used the Dutch norms for
children of 6 years of age. The Kolmogorov–Smirnov test was used to determine
which neutral and phenolic OHC concentrations and outcome measures were
distributed normally. We used the Pearson correlation for normally distributed
variables and the Spearman’s rank correlation for nonnormally distributed variables,
to relate the OHC concentrations to motor, cognitive, and behavioral outcome.
The raw scores of the outcome variables were used for these calculations. Where
appropriate, the test scores were inversely transformed so that for all tests higher
scores indicated better outcomes. We used the Mann–Whitney U-test to relate the
neurologic outcome (normal or abnormal) to OHC concentrations.
We corrected cognition and behavior of the children for SES and HOME, because
these factors may exert an influence on the cognition and behavior of the children.30
We also investigated whether sex influenced the outcome measures in our study
group (Mann–Whitney U-test). If so, we corrected for sex on that outcome measure.
The corrections were performed by means of partial correlations controlling for
confounders.

43Chapter 2 Prenatal Exposure to Organohalogens, including Brominated Flame Retardants, influences Motor, Cognitive, and Behavioral Performance at School Age
When correlations between OHCs and outcome did not reach significance, we
explored their relationship by means of scatterplots, to determine whether some
other, nonlinear relationship existed.
In this article, negative correlations indicate that higher OHC concentrations were
related to worse outcome and positive correlations indicate that higher OHC
concentrations were related to better outcome. Throughout the analyses, p<.05
was considered to be statistically significant. SPSS 14.0 software for Windows
(SPSS Inc, Chicago, IL, USA) was used for all the analyses.

Functional Development at School Age of Newborn Infants at Risk
Results
Of the 69 children invited, 62 (90%) participated in the follow-up program. Six sets
of parents declined the invitation to participate. One girl had to be excluded because
she suffered severe cognitive impairment of unknown origin and therefore could not
be tested. The OHC concentrations of the seven children not followed up were not
different from those who did participate.
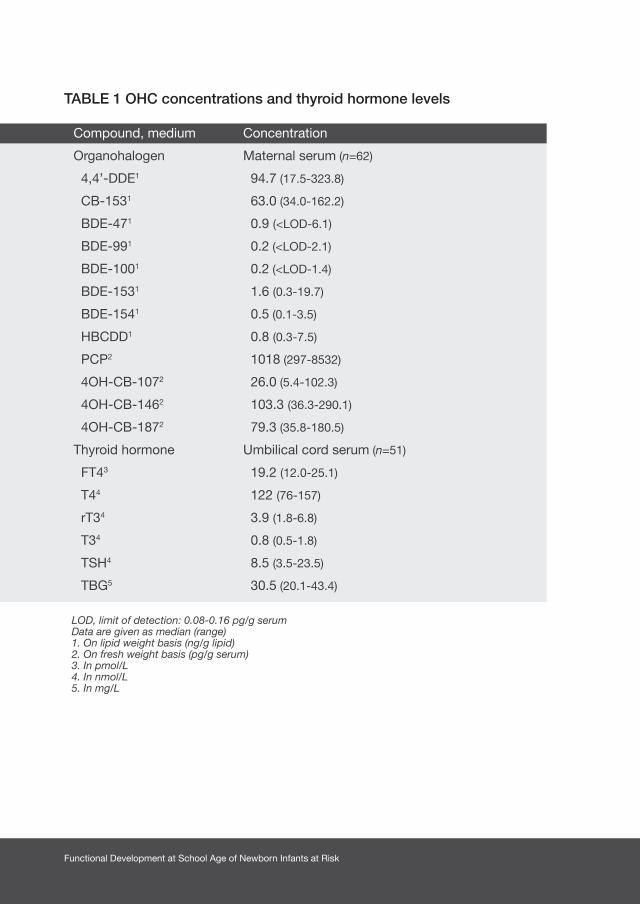
Table 1 shows the concentrations of the neutral and phenolic OHCs measured at
the 35th week of pregnancy of the 62 mothers and the concentrations of the thyroid
hormones in the umbilical cord blood of 51 mothers.
The mean maternal age was 32 years (range, 24–42 years). The highest level of maternal
education was primary school for 4 mothers, secondary school for 30 mothers, and
tertiary school for 28 mothers. The mean score on the HOME questionnaire was 33
(range, 24–37).
Outcome at School Age
The cohort consisted of 38 boys and 24 girls. The mean age at follow-up was 5
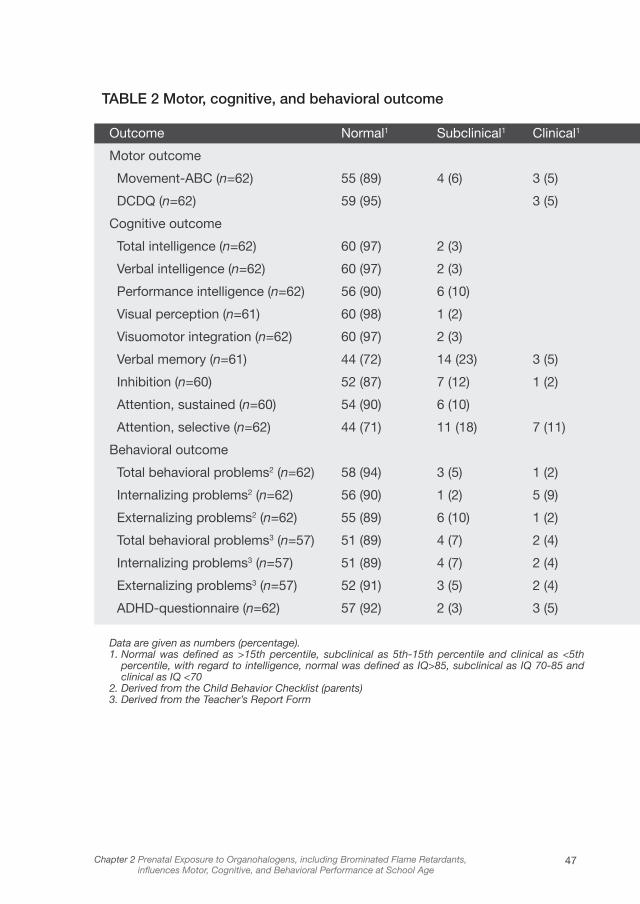
years 10 months (range, 5 years 8 months to 6 years 2 months). Table 2 presents an
overview of the children’s motor, cognitive, and behavioral outcomes. We excluded
the test scores of two children on inhibition and sustained attention and scores of
one child on visual perception and verbal memory, because they were too tired and
uncooperative to attend the assessment. Their OHC concentrations were not different
from those who did participate.
The scores of the children were comparable to the reference values, except for selective
attention, verbal memory, and internalizing and externalizing behavioral problems, on
which the children obtained slightly worse scores compared with the reference values.
The mean (± SD) for total IQ of the children was 103 ± 9 (range, 82–125); mean verbal
IQ, 102 ± 9 (range, 83–130); and mean performance IQ, 103 ± 13 (range, 73–133).
According to the neurologic examination, we found that of the 62 children examined,
1 child (2%) had coordination problems, 2 children (3%) had mild tremors, 18 children
(29%) had nonoptimal fine manipulative abilities, and 21 children (34%) had nonoptimal
sensory integration.
45Chapter 2 Prenatal Exposure to Organohalogens, including Brominated Flame Retardants, influences Motor, Cognitive, and Behavioral Performance at School Age
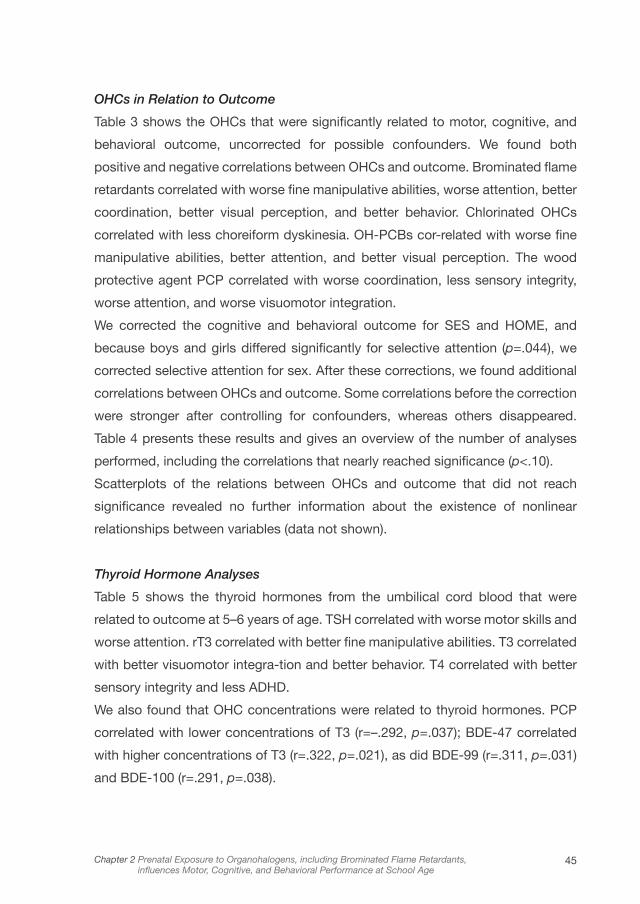
OHCs in Relation to Outcome
Table 3 shows the OHCs that were significantly related to motor, cognitive, and
behavioral outcome, uncorrected for possible confounders. We found both
positive and negative correlations between OHCs and outcome. Brominated flame
retardants correlated with worse fine manipulative abilities, worse attention, better
coordination, better visual perception, and better behavior. Chlorinated OHCs
correlated with less choreiform dyskinesia. OH-PCBs cor-related with worse fine
manipulative abilities, better attention, and better visual perception. The wood
protective agent PCP correlated with worse coordination, less sensory integrity,
worse attention, and worse visuomotor integration.
We corrected the cognitive and behavioral outcome for SES and HOME, and
because boys and girls differed significantly for selective attention (p=.044), we
corrected selective attention for sex. After these corrections, we found additional
correlations between OHCs and outcome. Some correlations before the correction
were stronger after controlling for confounders, whereas others disappeared.
Table 4 presents these results and gives an overview of the number of analyses
performed, including the correlations that nearly reached significance (p<.10).
Scatterplots of the relations between OHCs and outcome that did not reach
significance revealed no further information about the existence of nonlinear
relationships between variables (data not shown).
Thyroid Hormone Analyses
Table 5 shows the thyroid hormones from the umbilical cord blood that were
related to outcome at 5–6 years of age. TSH correlated with worse motor skills and
worse attention. rT3 correlated with better fine manipulative abilities. T3 correlated
with better visuomotor integra-tion and better behavior. T4 correlated with better
sensory integrity and less ADHD.
We also found that OHC concentrations were related to thyroid hormones. PCP
correlated with lower concentrations of T3 (r=–.292, p=.037); BDE-47 correlated
with higher concentrations of T3 (r=.322, p=.021), as did BDE-99 (r=.311, p=.031)
and BDE-100 (r=.291, p=.038).
Functional Development at School Age of Newborn Infants at Risk
TABLE 1 OHC concentrations and thyroid hormone levels
LOD, limit of detection: 0.08-0.16 pg/g serumData are given as median (range)1. On lipid weight basis (ng/g lipid) 2. On fresh weight basis (pg/g serum)3. In pmol/L4. In nmol/L5. In mg/L
Compound, medium
Organohalogen
4,4’-DDE1
CB-1531
BDE-471
BDE-991
BDE-1001
BDE-1531
BDE-1541
HBCDD1
PCP2
4OH-CB-1072
4OH-CB-1462
4OH-CB-1872
Thyroid hormone
FT43
T44
rT34
T34
TSH4
TBG5
Concentration
Maternal serum (n=62)
94.7 (17.5-323.8)
63.0 (34.0-162.2)
0.9 (<LOD-6.1)
0.2 (<LOD-2.1)
0.2 (<LOD-1.4)
1.6 (0.3-19.7)
0.5 (0.1-3.5)
0.8 (0.3-7.5)
1018 (297-8532)
26.0 (5.4-102.3)
103.3 (36.3-290.1)
79.3 (35.8-180.5)
Umbilical cord serum (n=51)
19.2 (12.0-25.1)
122 (76-157)
3.9 (1.8-6.8)
0.8 (0.5-1.8)
8.5 (3.5-23.5)
30.5 (20.1-43.4)
47Chapter 2 Prenatal Exposure to Organohalogens, including Brominated Flame Retardants, influences Motor, Cognitive, and Behavioral Performance at School Age
TABLE 2 Motor, cognitive, and behavioral outcome
Outcome Normal1 Subclinical1 Clinical1
Motor outcome
Movement-ABC (n=62) 55 (89) 4 (6) 3 (5)
DCDQ (n=62) 59 (95) 3 (5)
Cognitive outcome
Total intelligence (n=62) 60 (97) 2 (3)
Verbal intelligence (n=62) 60 (97) 2 (3)
Performance intelligence (n=62) 56 (90) 6 (10)
Visual perception (n=61) 60 (98) 1 (2)
Visuomotor integration (n=62) 60 (97) 2 (3)
Verbal memory (n=61) 44 (72) 14 (23) 3 (5)
Inhibition (n=60) 52 (87) 7 (12) 1 (2)
Attention, sustained (n=60) 54 (90) 6 (10)
Attention, selective (n=62) 44 (71) 11 (18) 7 (11)
Behavioral outcome
Total behavioral problems2 (n=62) 58 (94) 3 (5) 1 (2)
Internalizing problems2 (n=62) 56 (90) 1 (2) 5 (9)
Externalizing problems2 (n=62) 55 (89) 6 (10) 1 (2)
Total behavioral problems3 (n=57) 51 (89) 4 (7) 2 (4)
Internalizing problems3 (n=57) 51 (89) 4 (7) 2 (4)
Externalizing problems3 (n=57) 52 (91) 3 (5) 2 (4)
ADHD-questionnaire (n=62) 57 (92) 2 (3) 3 (5)
Data are given as numbers (percentage).1. Normal was defined as >15th percentile, subclinical as 5th-15th percentile and clinical as <5th
percentile, with regard to intelligence, normal was defined as IQ>85, subclinical as IQ 70-85 and clinical as IQ <70
2. Derived from the Child Behavior Checklist (parents)3. Derived from the Teacher’s Report Form

Functional Development at School Age of Newborn Infants at Risk
TABLE 3 OHCs in relation to outcome
Organohalogen Function Correlation p-value coefficient (R)3
Brominated flame retardants
BDE-47 Attention, sustained 0.267 0.039
Internalizing behavior1 0.301 0.018
Total behavioral outcome1 0.288 0.024
Coordination2 0.255 0.045
BDE-99 Internalizing behavior1 0.323 0.013
Total behavioral outcome1 0.281 0.032
BDE-100 Coordination2 0.309 0.014
Internalizing behavior1 0.403 0.001
Externalizing behavior1 0.305 0.017
Total behavioral outcome1 0.389 0.002
BDE-153 Visual perception 0.289 0.026
BDE-154 Fine manipulative abilities2 0.300 0.018
HBCDD Coordination2 0.290 0.023
Chlorinated OHCs
PCB-153 Choreiform dyskinesia2 0.345 0.007
4OH-CB-107 Fine manipulative abilities2 0.311 0.016
Attention, selective 0.293 0.021
Visual perception 0.278 0.030
4OH-CB-187 Attention, selective 0.318 0.012
4,4’-DDE Choreiform dyskinesia2 0.308 0.016
Wood protective agent
PCP Coordination2 0.363 0.004
Sensory integrity2 0.0344
Visuomotor integration 0.287 0.024
Attention, selective 0.254 0.046
Behavioral outcome was corrected for environmental confounders (HOME) 1. Derived from the Child Behavior Checklist (parents)2. Derived from Touwen’s neurological examination3. Positive correlations indicate better outcome and negative correlations indicate worse outcome 4. Calculated by the Mann-Whitney U test
-
-
-
-
-
-

49Chapter 2 Prenatal Exposure to Organohalogens, including Brominated Flame Retardants, influences Motor, Cognitive, and Behavioral Performance at School Age
TAB
LE 4
Co
rrel
atio
n co
effic
ient
s fo
r O
HC
s in
rel
atio
n to
out
com
e, c
orr
ecte
d f
or
SE
S, H
OM
E, a
nd s
ex
BDE-
47BD
E-99
BDE-
100
BDE-
153
BDE-
154
HBC
DD
PCB-
153
4,4’
-DD
E4O
H-C
B-10
74O
H-C
B-14
64O
H-
CB-
187
PCP
Mov
emen
t-AB
CC
oord
inat
ion1
0.29
0**
0.24
4*0.
239*
-0.3
63**
*Fi
ne m
anip
ulat
ive
abili
ties1
-0.2
53*
-0.3
11**
Trem
ors1
Sen
sory
inte
grat
ion1
Cho
reifo
rm d
yski
nesi
a10.
345*
**0.
308*
*0.
228*
DC
D-Q
Tota
l int
ellig
ence
0.39
3**
Verb
al in
telli
genc
e0.
479*
**P
erfo
rmal
inte
llige
nce
0.31
5*-0
.337
**Vi
sual
per
cept
ion
-0.2
55*
Visu
omot
or in
tegr
atio
nVe
rbal
mem
ory
-0.7
23#
Inhi
bitio
n-0
.310
*-0
.355
**-0
.346
**A
ttent
ion,
sus
tain
ed-0
.264
**-0
.264
**-0
.261
*A
ttent
ion,
sel
ectiv
e0.
230*
0.43
9***
Tota
l beh
avio
ral o
utco
me2
0.27
6**
0.23
1*In
tern
aliz
ing
beha
vior
20.
237*
0.28
3**
0.25
3*0.
344*
*E
xter
naliz
ing
beha
vior
2-0
.278
*To
tal b
ehav
iora
l out
com
e3-0
.314
*-0
.411
**In
tern
aliz
ing
beha
vior
30.
265*
0.23
6*-0
.298
*E
xter
naliz
ing
beha
vior
3-0
.288
*-0
.328
**A
DH
D Q
uest
ionn
aire
Dat
a ar
e sh
own
as c
orre
latio
n co
effic
ient
s, *
p<
.10,
**
p<
.05,
# p
<.0
1 1.
Der
ived
from
Tou
wen
’s n
euro
logi
cal e
xam
inat
ion
2. D
eriv
ed fr
om t
he C
hild
Beh
avio
r C
heck
list
(par
ents
) 3.
Der
ived
from
the
Tea
cher
’s R
epor
t Fo
rm

Functional Development at School Age of Newborn Infants at Risk
TABLE 5 Thyroid hormones in relation to outcome
Thyroid hormone Function Correlation p-value coefficient (r)3
TSH General motor skills1 0.430 0.002
Fine manipulative abilities 0.291 0.038
Attention, sustained 0.298 0.038
rT3 Fine manipulative abilities 0.279 0.047
T3 Visuomotor integration 0.308 0.028
Internalizing behavior2 0.319 0.031
T4 Sensory integrity 0.0074
Attention deficit/hyperactivity 0.380 0.009
1. Assessed with the Developmental Coordination Disorder Questionnaire2. Derived from the Child Behavior Checklist (parents)3. Positive correlations indicate better outcome and negative correlations indicate worse outcome 4. Calculated by the Mann-Whitney U test
-
-
-
51Chapter 2 Prenatal Exposure to Organohalogens, including Brominated Flame Retardants, influences Motor, Cognitive, and Behavioral Performance at School Age
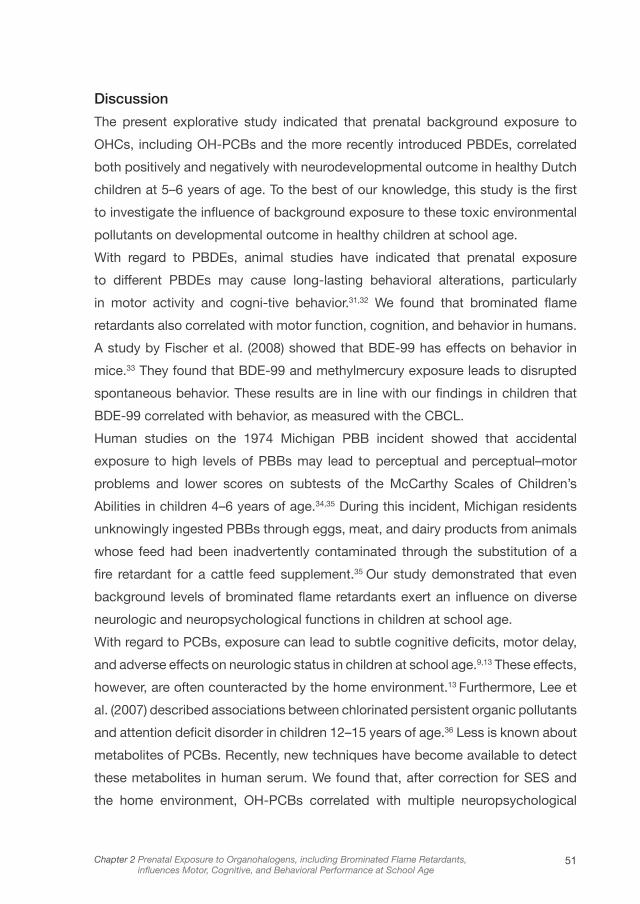
Discussion
The present explorative study indicated that prenatal background exposure to
OHCs, including OH-PCBs and the more recently introduced PBDEs, correlated
both positively and negatively with neurodevelopmental outcome in healthy Dutch
children at 5–6 years of age. To the best of our knowledge, this study is the first
to investigate the influence of background exposure to these toxic environmental
pollutants on developmental outcome in healthy children at school age.
With regard to PBDEs, animal studies have indicated that prenatal exposure
to different PBDEs may cause long-lasting behavioral alterations, particularly
in motor activity and cogni-tive behavior.31,32 We found that brominated flame
retardants also correlated with motor function, cognition, and behavior in humans.
A study by Fischer et al. (2008) showed that BDE-99 has effects on behavior in
mice.33 They found that BDE-99 and methylmercury exposure leads to disrupted
spontaneous behavior. These results are in line with our findings in children that
BDE-99 correlated with behavior, as measured with the CBCL.
Human studies on the 1974 Michigan PBB incident showed that accidental
exposure to high levels of PBBs may lead to perceptual and perceptual–motor
problems and lower scores on subtests of the McCarthy Scales of Children’s
Abilities in children 4–6 years of age.34,35 During this incident, Michigan residents
unknowingly ingested PBBs through eggs, meat, and dairy products from animals
whose feed had been inadvertently contaminated through the substitution of a
fire retardant for a cattle feed supplement.35 Our study demonstrated that even
background levels of brominated flame retardants exert an influence on diverse
neurologic and neuropsychological functions in children at school age.
With regard to PCBs, exposure can lead to subtle cognitive deficits, motor delay,
and adverse effects on neurologic status in children at school age.9,13 These effects,
however, are often counteracted by the home environment.13 Furthermore, Lee et
al. (2007) described associations between chlorinated persistent organic pollutants
and attention deficit disorder in children 12–15 years of age.36 Less is known about
metabolites of PCBs. Recently, new techniques have become available to detect
these metabolites in human serum. We found that, after correction for SES and
the home environment, OH-PCBs correlated with multiple neuropsychological

Functional Development at School Age of Newborn Infants at Risk
functions at school age: fine manipulative abilities, choreiform dyskinesia, verbal
memory, inhibition, and behavior. Our results indicate that OH-PCBs might even
be more neurotoxic than PCBs, as postulated in animal studies.15,16
OHCs are known to exert their neurotoxic influence by affecting thyroid hormone
homeostasis. It is hypothesized that OHCs affect thyroid hormone homeostasis
by interfering with thyroid hormone signaling in the developing brain, by changing
intracellular thyroid hormone availability, and by interacting directly at the level
of the thyroid hormone receptors. On the one hand, OHCs have a high affinity
for thyroid hormone receptors and lead to a decrease in thyroid hormone levels,
whereas levels of TSH increase through hormonal feedback mechanisms. Previous
studies on pregnant women and their infants found that PCBs are associated with
higher levels of TSH and lower levels of T4.37 We found that PCP correlated with
lower levels of thyroid hormone but brominated flame retardants correlated with
higher levels of thyroid hormone. It is unknown whether the underlying mechanism
by which PCBs affect thyroid hormones is the same for these OHCs. Our study
disclosed consistent relations between thyroid hormones and outcome. We found
that TSH correlated with worse neuropsychological functions. Thyroid hormones
(T3 and T4), by contrast, correlated with better outcome. These findings, together
with the negative correlations between OHCs and development, seem to confirm
the hypothesis that thyroid hormone homeostasis may be involved.
Because the threshold levels of toxicity for the different OHCs are unknown, we
did not statistically test low versus high levels of OHCs in relation to outcome. The
toxic equivalents of most of the OHCs investigated are also unknown. Research
has shown that some compounds enhance each other, whereas others counteract
each other. No data are available for all the compounds tested in our study. As a
consequence, we explored relations between OHCs and outcome at school age
by means of correlations. Because this study is, to the best of our knowledge,
the first to investigate the association between background levels of OHCs and
outcome at school age, it was difficult to hypothesize on the expected effect on
the outcome measures. Our study might serve as a basis for power calculations
for future studies, because it demonstrates the variability of various parameters
and their mutual associations.

53Chapter 2 Prenatal Exposure to Organohalogens, including Brominated Flame Retardants, influences Motor, Cognitive, and Behavioral Performance at School Age
It was striking that we found both positive and negative correlations between
OHCs and outcome. It is difficult to determine the implications of these results for
functioning in later life. The multiple statistical analyses that were performed might
have played a role in this finding. Furthermore, it is difficult to determine how many
of these effects can reliably be assigned to the specific contaminants, because
some of them were likely to show some degree of collinearity. Other contaminants
that were not measured, such as methyl mercury, might also have played a role.
We did not compare postnatal OHC concentrations with outcome at 5–6 years
of age because previous studies have pointed out that the most serious effects
of neurotoxic OHCs are produced on developmental processes that occur
prenatally.13,38
Concentrations of PBDEs in the environment are much higher in the United States
than in Europe, Asia, or Australia.3,39 Levels of PBDEs in breast milk have been
increasing in the past 20–30 years, along with the serum levels in the general
population worldwide.4,39,40 The fact that even low background levels of OHCs, as
is the case in the Netherlands, may interfere with developmental processes, as
illustrated by the present study, indicates that there is an urgent need for further
research. We believe that future research should focus on longitudinal follow-up of
children exposed to OHCs and should investigate the effect and nature of specific
OHCs. Besides, the effect of combinations of OHCs (by means of composite
scores) on neurodevelopment in large cohorts should also be investigated.
Conclusions
Prenatal background exposure to OHCs not previously studied correlated with
neuropsychological functioning in children at school age. PBDEs, used extensively
worldwide, correlated with motor performance, attention, visual perception, and
behavior, and we found the same results for OH-PCBs. We believe that unrelenting
efforts should be made to find safe alternatives for these compounds.
Functional Development at School Age of Newborn Infants at Risk
1. Mariussen E, Fonnum F. Neurochemical targets and
behavioral effects of organohalogen compounds: an
update. Crit Rev Toxicol 2006;36:253–289.
2. Law RJ, Alaee M, Allchin CR, et al. Levels and
trends of polybrominated diphenylethers and other
brominated flame retardants in wildlife. Environ Int
2003;29:757–770.
3. Rahman F, Langford KH, Scrimshaw MD, Lester
JN. Polybrominated diphenyl ether (PBDE) flame
retardants. Sci Total Environ 2001;275:1–17.
4. Jensen AA. Polychlorobiphenyls (PCBs),
polychlorodibenzo-p-dioxins (PCDDs) and
polychlorodibenzofurans (PCDFs) in human
milk, blood and adipose tissue. Sci Total Environ
1987;64:259–293.
5. Lanting CI, Huisman M, Muskiet FA, van der Paauw
CG, Essed CE, Boersma ER. Polychlorinated
biphenyls in adipose tissue, liver, and brain from nine
stillborns of varying gestational ages. Pediatr Res
1998;44:222–225.
6. Meijer L, Weiss J, van Velzen M, Brouwer A, Bergman
A, Sauer PJ. Serum concentrations of neutral and
phenolic organohalogens in pregnant women and
some of their infants in the Netherlands. Environ Sci
Technol 2008;42:3428–3433.
7. Solomon GM, Schettler T. Environment and health:
6. Endocrine disruption and potential human health
implications. CMAJ 2000;163:1471–1476.
8. Weisglas-Kuperus N. Neurodevelopmental,
immunological and endocrinological indices of
perinatal human exposure to PCBs and dioxins.
Chemosphere 1998;37:1845–1853.
9. Boersma ER, Lanting CI. Environmental exposure
to polychlorinated biphenyls (PCBs) and dioxins.
Consequences for longterm neurological and
cognitive development of the child lactation. Adv Exp
Med Biol 2000;478:271–287.
10. Chen YC, Guo YL, Hsu CC, Rogan WJ. Cognitive
development of Yu-Cheng (“oil disease”) children
prenatally exposed to heat-degraded PCBs. JAMA
1992;268:3213–3218.
11. Jacobson JL, Jacobson SW. Intellectual impairment
in children exposed to polychlorinated biphenyls in
utero. N Engl J Med 1996;335:783–789.
12. Stewart PW, Lonky E, Reihman J, Pagano J, Gump
BB, Darvill T. The relationship between prenatal PCB
exposure and intelligence (IQ) in 9-year-old children.
Environ Health Perspect 2008;116:1416–1422.
13. Vreugdenhil HJ, Lanting CI, Mulder PG, Boersma
ER, Weisglas-Kuperus N. Effects of prenatal PCB
and dioxin background exposure on cognitive and
motor abilities in Dutch children at school age. J
Pediatr 2002;140:48–56.
References

55Chapter 2 Prenatal Exposure to Organohalogens, including Brominated Flame Retardants, influences Motor, Cognitive, and Behavioral Performance at School Age
14. Guvenius DM, Aronsson A, Ekman-Ordeberg G,
Bergman A, Norèn K. Human prenatal and postnatal
exposure to polybrominated diphenyl ethers,
polychlorinated biphenyls, polychlorobiphenylols,
and pentachlorophenol. Environ Health Perspect
2003;111:1235–1241.
15. Kimura-Kuroda J, Nagata I, Kuroda Y. Disrupting
effects of hydroxy-polychlorinated biphenyl
(PCB) congeners on neuronal development of
cerebellar Purkinje cells: a possible causal factor
for developmental brain disorders? Chemosphere
2007;67:S412–S420.
16. Kitamura S, Jinno N, Suzuki T, et al. Thyroid
hormone-like and estrogenic activity of hydroxylated
PCBs in cell culture. Toxicology 2005;208:377–387.
17. Zoeller RT. Environmental chemicals impacting
the thyroid: targets and consequences. Thyroid
2007;17:811–817.
18. Smits-Engelsman BCM. Movement Assessment
Battery for Children. Lisse, the Netherlands: Swets
& Zeitlinger; 1998.
19. Touwen BCL. Examination of the Child with Minor
Neurological Dysfunction. London, UK: William
Heinemann; 1979.
20. Hadders-Algra M. Two distinct forms of minor
neurological dysfunction: perspectives emerging
from a review of data of the Groningen Perinatal
Project. Dev Med Child Neurol 2002;44:561–571.
21. Peters LH, Maathuis KG, Kouw E, Hamming M,
Hadders-Algra M. Test-retest, inter-assessor and
intra-assessor reliability of the modified Touwen
examination. Eur J Paediatr Neurol
2008;12:328–333.
22. Schoemaker MM, Flapper B, Verheij NP, Wilson
BN, Reinders-Messelink HA, de Kloet A. Evaluation
of the Developmental Coordination Disorder
Questionnaire as a screening instrument. Dev Med
Child Neurol 2006;48:668–673.
23. van der Steene G, Bos A. Wechsler Preschool and
Primary Scale of Intelligence, Revised. Vlaams-
Nederlandse aanpassing, handleiding [in Dutch].
Lisse, the Netherlands: Swets & Zeitlinger; 1997.
24. Korkman M, Kirk U, Kemp SL. NEPSY II. Clinical
and Interpretative Manual. San Antonio, TX:
Psychological Corporation; 2007.
25. van den Burg W, Kingma A. Performance of 225
Dutch school children on Rey’s Auditory Verbal
Learning Test (AVLT): parallel test-retest reliabilities
with an interval of 3 months and normative data.
Arch Clin Neuropsychol 1999;14:545–559.
26. Manly T, Anderson V, Nimmo-Smith I, Turner A,
Watson P, Robertson IH. The differential assessment
of children’s attention: the Test of Everyday
Attention for Children (TEA-Ch), normative sample
and ADHD performance. J Child Psychol Psychiatry
2001;42:1065–1081.
Functional Development at School Age of Newborn Infants at Risk
27. Heaton SC, Reader SK, Preston AS, et al. The
Test of Everyday Attention for Children (TEA-Ch):
patterns of performance in children with ADHD and
clinical controls. Child Neuropsychol
2001;7:251–264.
28. Achenbach TM, Rescorla LA. Manual for the ASEBA
Preschool Forms and Profiles. Burlington, VT:
University of Vermont, Research Center for Children,
Youth and Families; 2000.
29. Scholte EM, van der Ploeg JD. ADHD-vragenlijst
(AVL) handleiding [in Dutch]. Houten, the
Netherlands: Bohn Stafleu Van Loghum; 2004.
30. Tong S, Baghurst P, Vimpani G, McMichael A.
Socioeconomic position, maternal IQ, home
environment, and cognitive development. J Pediatr
2007;151:284–288.
31. Gee JR, Moser VC. Acute postnatal exposure to
brominated diphenylether 47 delays neuromotor
ontogeny and alters motor activity in mice.
Neurotoxicol Teratol 2008;30:79–87.
32. Viberg H, Fredriksson A, Eriksson P. Neonatal
exposure to polybrominated diphenyl ether (PBDE
153) disrupts spontaneous behaviour, impairs
learning and memory, and decreases hippocampal
cholinergic receptors in adult mice. Toxicol Appl
Pharmacol 2003;192:95–106.
33. Fischer C, Fredriksson A, Eriksson P. Coexposure
of neonatal mice to a flame retardant PBDE 99
(2,2’,4,4’,5-pentabromodiphenyl ether) and methyl
mercury enhances developmental neurotoxic
defects. Toxicol Sci 2008;101:275–285.
34. Schwartz EM, Rae WA. Effect of polybrominated
biphenyls (PBB) on developmental abilities in young
children. Am J Public Health 1983;73:277–281.
35. Seagull EA. Developmental abilities of children
exposed to polybrominated biphenyls (PBB). Am J
Public Health 1983;73:281–285.
36. Lee DH, Jacobs DR, Porta M. Association of serum
concentrations of persistent organic pollutants with
the prevalence of learning disability and attention
deficit disorder. J Epidemiol Community Health
2007;61:591–596.
37. Koopman-Esseboom C, Morse DC, Weisglas-
Kuperus N, et al. Effects of dioxins and
polychlorinated biphenyls on thyroid hormone
status of pregnant women and their infants. Pediatr
Res 1994;36:468–473.
38. Jacobson JL, Jacobson SW, Humphrey HE. Effects
of in utero exposure to polychlorinated biphenyls
and related contaminants on cognitive functioning in
young children. J Pediatr 1990;116:38–45.
39. Costa LG, Giordano G. Developmental neurotoxicity
of polybrominated diphenyl ether (PBDE) flame
retardants. Neurotoxicology 2007;28:1047–1067.

57Chapter 2 Prenatal Exposure to Organohalogens, including Brominated Flame Retardants, influences Motor, Cognitive, and Behavioral Performance at School Age
40. Sjodin A, Jones RS, Focant JF, et al. Retrospective
time-trend study of polybrominated diphenyl ether
and polybrominated and polychlorinated biphenyl
levels in human serum from the United States.
Environ Health Perspect 2004;112:654–658

Chapter 3 Risk factors for adverse outcome in preterm
infants with periventricular hemorrhagic infarction
Chapter 4 Functional outcome at school age of preterm
infants with periventricular hemorrhagic infarction
Chapter 5 Long-term neurological outcome of term-born
children treated with two or more
anti-epileptic drugs in the neonatal period
Chapter 6 Tractography of the corticospinal tracts in infants
with focal perinatal injury: comparison with
normal controls and to motor development
PART 2Functional outcome of newborn infants
with brain injury


Chapter 3
RISK FACTORS FOR ADVERSE OUTCOME IN
PRETERM INFANTS WITH PERIVENTRICULAR
HEMORRHAGIC INFARCTION
ELISE ROZE, JORIEN M. KERSTJENS, CAREL G.B. MAATHUIS, HENDRIK J. TER
HORST, AREND F. BOS
PEDIATRICS 2008;122(1):E46-E52
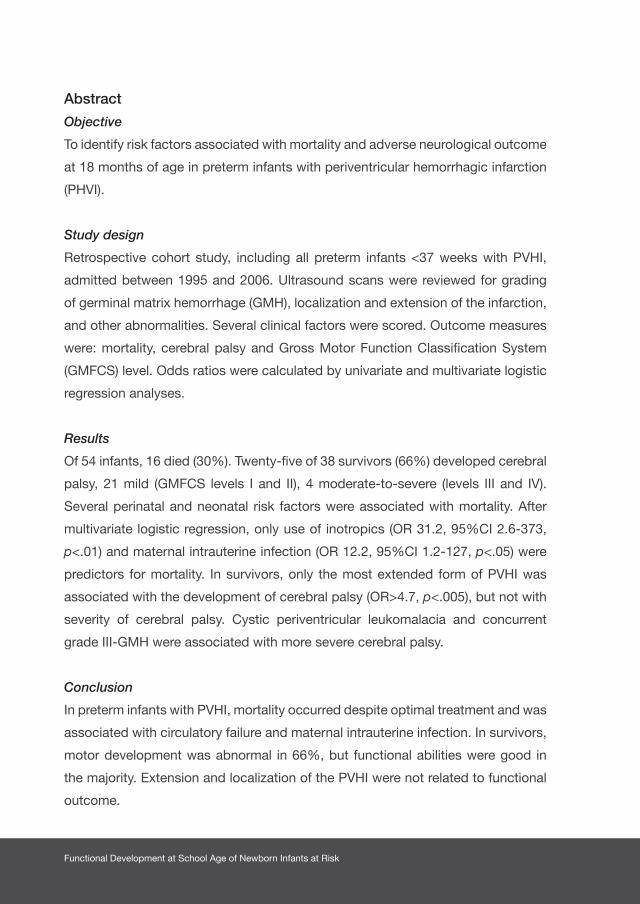
Functional Development at School Age of Newborn Infants at Risk
Abstract
Objective
To identify risk factors associated with mortality and adverse neurological outcome
at 18 months of age in preterm infants with periventricular hemorrhagic infarction
(PHVI).
Study design
Retrospective cohort study, including all preterm infants <37 weeks with PVHI,
admitted between 1995 and 2006. Ultrasound scans were reviewed for grading
of germinal matrix hemorrhage (GMH), localization and extension of the infarction,
and other abnormalities. Several clinical factors were scored. Outcome measures
were: mortality, cerebral palsy and Gross Motor Function Classification System
(GMFCS) level. Odds ratios were calculated by univariate and multivariate logistic
regression analyses.
Results
Of 54 infants, 16 died (30%). Twenty-five of 38 survivors (66%) developed cerebral
palsy, 21 mild (GMFCS levels I and II), 4 moderate-to-severe (levels III and IV).
Several perinatal and neonatal risk factors were associated with mortality. After
multivariate logistic regression, only use of inotropics (OR 31.2, 95%CI 2.6-373,
p<.01) and maternal intrauterine infection (OR 12.2, 95%CI 1.2-127, p<.05) were
predictors for mortality. In survivors, only the most extended form of PVHI was
associated with the development of cerebral palsy (OR>4.7, p<.005), but not with
severity of cerebral palsy. Cystic periventricular leukomalacia and concurrent
grade III-GMH were associated with more severe cerebral palsy.
Conclusion
In preterm infants with PVHI, mortality occurred despite optimal treatment and was
associated with circulatory failure and maternal intrauterine infection. In survivors,
motor development was abnormal in 66%, but functional abilities were good in
the majority. Extension and localization of the PVHI were not related to functional
outcome.
63Chapter 3 Risk Factors for Adverse Outcome in Preterm Infants with Periventricular Hemorrhagic Infarction
Introduction
Periventricular hemorrhagic infarction (PVHI), formerly described as a grade
IV germinal matrix hemorrhage (GMH), is seen in approximately 10 to 15% of
preterm infants with GMH.1 It is presumably caused by pressure of the GMH on
the periventricular terminal vein that drains the cerebral hemisphere.2-4 This leads
to venous congestion in the periventricular white matter and subsequently to
ischemia and hemorrhage. PVHI, or venous infarction, is now considered as a
complication of the GMH instead of an extension of the GMH.4
Mortality in preterm infants with PVHI has been found to range between 38 and
60%.1,5-7 Surviving preterm infants with PVHI are at high risk for developing cerebral
palsy and for an abnormal neurological examination beyond 12 months’ adjusted
age.8-11 Several factors in the perinatal period are associated with PVHI. These
include lower gestational age, emergency caesarean section, low Apgar scores,
need for respiratory resuscitation, pneumothorax, pulmonary hemorrhage, patent
ductus arteriosus, acidosis, and neonatal seizures.1,6,7,12,13
It is unknown, within a group of preterm infants with PVHI, which perinatal and
neonatal characteristics are associated with mortality and adverse neurological
outcome. The aim of this study was therefore to identify perinatal and neonatal
risk factors for mortality and adverse neurological outcome at 18 months of age in
preterm infants with PVHI.
Functional Development at School Age of Newborn Infants at Risk
Methods
Patients
In a retrospective analysis, we studied infants who had been admitted to the
Neonatal Intensive Care Unit (NICU) of the University Medical Center Groningen
(UMCG) between 1995 and 2006. We intended to include preterm infants
(gestational age < 37 weeks) with PVHI diagnosed by cranial ultrasonography. To
this end we searched the patient database (which contains all diagnoses of every
infant admitted to the NICU) on infants diagnosed with PVHI, venous infarction,
GMH grade IV and parenchymal cerebral bleeding. We excluded patients with
major chromosomal and congenital abnormalities.
Cranial Ultrasonography Classification
According to the routine scanning protocol of our unit, the first ultrasound scan
was made within 72 hours after birth and then at a minimum of weekly intervals
until stabilization or the disappearance of any abnormality. The scans were
performed by means of real-time mechanical sector scanners equipped with a 7.5
MHz transducer.
All infants admitted to our NICU are subjected to the scanning protocol, if they match
one of the following criteria: gestational age < 35 weeks, birth weight < 1500 grams,
complicated delivery with a risk for brain injury, perinatal asphyxia, and suspected
congenital cerebral malformation.
Three experts (AFB, JK, HTH) reviewed the serial ultrasound scans of the infants
who were included after the patient database search, to determine whether PVHI
was present or not. The experts were blind as to the infants’ outcome. The final
study group was defined after this review.
We scored several characteristics of the PVHI. These included unilateral or bilateral
infarction, left or right-sided infarction, localization and extension of the infarction
(frontal, parietal, occipital or combinations) and residual abnormalities (e.g.
porencephalic cysts). When bilateral, the localization and extension were based on
the side that was affected most. Next we scored additional cerebral abnormalities.
These included grade of GMH (grades I, II or III),14 unilateral or bilateral GMH,
presence or emergence of posthemorrhagic ventricular dilatation (PHVD) and cystic
65Chapter 3 Risk Factors for Adverse Outcome in Preterm Infants with Periventricular Hemorrhagic Infarction
periventricular leukomalacia (PVL). PHVD was defined as a lateral ventricle size of
more than 0.33 according to Evans’ index (the right and left lateral horn width
divided by the maximum internal skull width).15 Cystic periventricular leukomalacia
was classified as stage 2 or worse, according to de Vries et al.16
When the experts disagreed, the scans involved were re-evaluated by all experts,
together. In all cases a consensus was reached on a final score.
Perinatal Risk Factors
We reviewed the medical charts of the infants for perinatal and neonatal risk
factors. These included signs of maternal intrauterine infection, early onset sepsis,
asphyxia, intrauterine growth restriction, respiratory failure, circulatory failure
and neonatal seizures. Maternal intrauterine infection was based on such clinical
signs as fetal tachycardia and maternal fever (>38°C), often combined with the
use of maternal antibiotics. We also scored the presence of premature rupture
of membranes (>24h) and histological characteristics of the placenta for signs of
inflammation. Early onset sepsis was diagnosed by a positive blood culture and/
or clinical signs within the first 48 hours of life. Asphyxia was determined by Apgar
scores after 1 and 5 minutes (<5), resuscitation (external heart massage and/or
use of epinephrine) and umbilical cord pH (arterial pH <7.10). Intrauterine growth
restriction was scored if birth weight was below the 10th centile, according to
the Dutch intrauterine growth standards.17 Respiratory failure, defined as need for
ventilatory support, was scored by mode and duration of the support, idiopathic
respiratory distress syndrome, pneumothorax, and the presence of respiratory
acidosis. Circulatory failure was defined as hemodynamic instability and scored
by the need for fluid resuscitation and use of inotropics during the first week, often
combined with metabolic acidosis (pH<7.15).
Late onset morbidity was also recorded. This included retinopathy of prematurity
(ROP), late onset sepsis, necrotizing enterocolitis (NEC), and bronchopulmonary
dysplasia (BPD). Late onset sepsis was diagnosed by a positive blood culture
and/or clinical signs after the first 5 days of life. BPD was defined as oxygen
dependency beyond 36 weeks post-menstrual age.
Functional Development at School Age of Newborn Infants at Risk
Outcome
We determined the mortality rate and cause of death in the study group. Follow-
up of the survivors was part of the regular follow-up program of preterm infants
and consisted of a pediatric and neurological examination at 3, 6, 12 and 18 to 24
months’ corrected age, based on Touwen.18 The presence or absence of cerebral
palsy was determined when infants had reached the age of at least 18 months,
following Hagberg’s criteria.19
In case of cerebral palsy, gross motor functioning was scored by a physiatrist using
the Gross Motor Function Classification System (GMFCS).20 This is a functional,
five level classification system for cerebral palsy based on self-initiated movement
with particular emphasis on sitting (truncal control) and walking. A higher level
correlates with more serious impairment of functional abilities. Level I represents
children who walk without restrictions but have limitations in more advanced
gross motor skills, e.g. co-ordination and balance. Level II represents those who
walk without assistive devices but have limitations in walking outdoors and in
the community, e.g. running and jumping. Level III represents children who walk
with assistive mobility devices and have limitations in walking outdoors and in the
community. Level IV represents those with limitations in self-mobility, these children
use power mobility outdoors and in the community. Level V represents those with
severely limited self-mobility even with the use of assistive technology.20
To investigate whether the outcome of preterm infants with PVHI at our NICU
changed over time we studied mortality rate, development of cerebral palsy, and
GMFCS throughout the study period.
67Chapter 3 Risk Factors for Adverse Outcome in Preterm Infants with Periventricular Hemorrhagic Infarction
Statistical Analysis
We calculated odds ratios by univariate logistic regression to determine which
perinatal and neonatal factors and which cerebral characteristics were related to
mortality. We repeated these calculations in the survivors for the development of
cerebral palsy. We used chi2 for trend to relate the severity of cerebral palsy to the
risk factors and cerebral characteristics, and to calculate the changes in outcome
throughout the study period. Finally, we used backward multivariate logistic
regression analysis to determine which risk factors detected by the univariate
analyses (with p<.10) had independent prognostic value for outcome. Throughout
the analyses p<.05 was considered to be statistically significant. SPSS software
for Windows, version 14.0 (SPSS Inc. Chicago, Illinois) was used for all analyses.
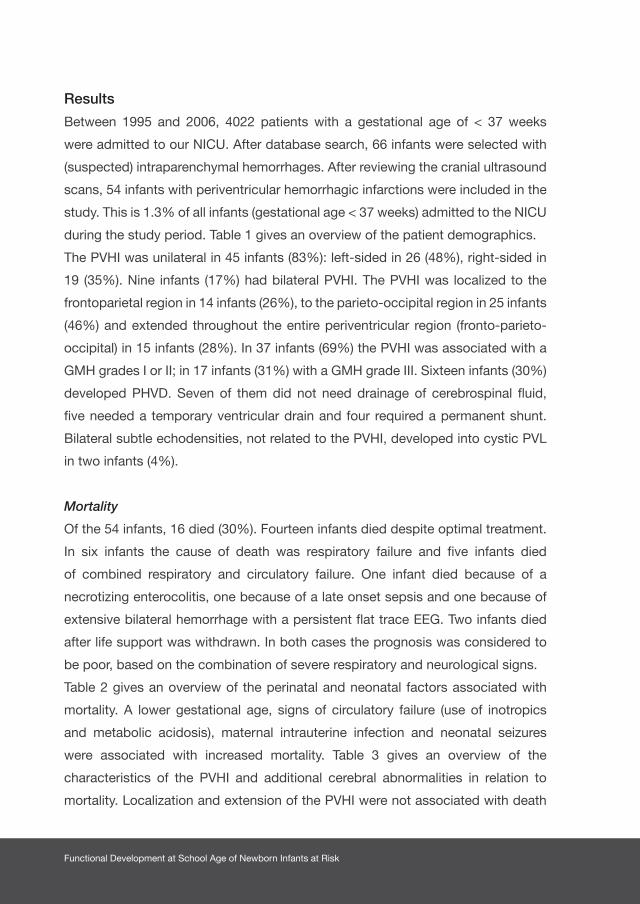
Functional Development at School Age of Newborn Infants at Risk
Results
Between 1995 and 2006, 4022 patients with a gestational age of < 37 weeks
were admitted to our NICU. After database search, 66 infants were selected with
(suspected) intraparenchymal hemorrhages. After reviewing the cranial ultrasound
scans, 54 infants with periventricular hemorrhagic infarctions were included in the
study. This is 1.3% of all infants (gestational age < 37 weeks) admitted to the NICU
during the study period. Table 1 gives an overview of the patient demographics.
The PVHI was unilateral in 45 infants (83%): left-sided in 26 (48%), right-sided in
19 (35%). Nine infants (17%) had bilateral PVHI. The PVHI was localized to the
frontoparietal region in 14 infants (26%), to the parieto-occipital region in 25 infants
(46%) and extended throughout the entire periventricular region (fronto-parieto-
occipital) in 15 infants (28%). In 37 infants (69%) the PVHI was associated with a
GMH grades I or II; in 17 infants (31%) with a GMH grade III. Sixteen infants (30%)
developed PHVD. Seven of them did not need drainage of cerebrospinal fluid,
five needed a temporary ventricular drain and four required a permanent shunt.
Bilateral subtle echodensities, not related to the PVHI, developed into cystic PVL
in two infants (4%).
Mortality
Of the 54 infants, 16 died (30%). Fourteen infants died despite optimal treatment.
In six infants the cause of death was respiratory failure and five infants died
of combined respiratory and circulatory failure. One infant died because of a
necrotizing enterocolitis, one because of a late onset sepsis and one because of
extensive bilateral hemorrhage with a persistent flat trace EEG. Two infants died
after life support was withdrawn. In both cases the prognosis was considered to
be poor, based on the combination of severe respiratory and neurological signs.
Table 2 gives an overview of the perinatal and neonatal factors associated with
mortality. A lower gestational age, signs of circulatory failure (use of inotropics
and metabolic acidosis), maternal intrauterine infection and neonatal seizures
were associated with increased mortality. Table 3 gives an overview of the
characteristics of the PVHI and additional cerebral abnormalities in relation to
mortality. Localization and extension of the PVHI were not associated with death

69Chapter 3 Risk Factors for Adverse Outcome in Preterm Infants with Periventricular Hemorrhagic Infarction
or survival. Only three infants had PVHI limited to the frontal region and all three
survived. Of additional cerebral abnormalities, GMH grade III was present more
frequently in infants who died than in survivors. As a consequence, GMH grades I
and II were present more frequently in survivors.
Neurological Outcome
Of the 38 surviving children, 13 (34%) were normal and 25 (66%) had developed
cerebral palsy. Four infants (11%) had cerebral palsy with moderate to severe
functional limitations, GMFCS levels III (n=1) and IV (n=3). These four infants all
had bilateral cerebral palsy. Twenty one infants (55%) had mild, unilateral cerebral
palsy, GMFCS levels I (n=10) and II (n=11).
Table 4 gives an overview of the cerebral characteristics on ultrasound in relation
to the development of cerebral palsy and GMFCS levels. All children with extensive
PVHI (fronto-parieto-occipital, n=8) developed cerebral palsy, with GMFCS levels
I or II (OR > 4.7 p=.04). We could not identify any other localization of the PVHI
that correlated with the development and severity of cerebral palsy. Concerning
additional cerebral abnormalities, GMH grade III was associated with higher
GMFCS levels, thus with more severe cerebral palsy. Only four infants had GMFCS
levels III or IV. In two of them bilateral cystic PVL (and GMH grade III) was present,
in the other two we could not identify any reason why these infants in particular
developed a more severe cerebral palsy.
Perinatal and neonatal factors (including late onset morbidity) did not correlate with
the development and severity of cerebral palsy, only intrauterine growth restriction
nearly reached significance (p=.06). Of the survivors, two children were born after
intrauterine growth restriction; one had GMFCS level II and one level IV.
Trends in Outcome over Time
Mortality decreased from 1995 to 2006 (p=.03). In addition, the incidence of
cerebral palsy in surviving children also decreased (p=.01). The severity of cerebral
palsy, measured by the GMFCS level, did not change during the study period.
Functional Development at School Age of Newborn Infants at Risk
Multivariate Logistic Regression Analysis
Since the clinical and cerebral characteristics are likely to be interdependent, we
performed a multivariate logistic regression analysis to investigate which factors
contributed independently to mortality. Perinatal and neonatal factors and cerebral
characteristics which had shown associations with mortality at p<.10 were entered
as predictors: gestational age, maternal intrauterine infection, Apgar score at 1
minute, pneumothorax, signs of circulatory failure, neonatal seizures, GMH grade
III, bilateral GMH and fronto-parieto-occipital extension of the PVHI. Only maternal
intrauterine infection (OR 12.2; 95% CI 1.2 – 127, p=.04) and signs of circulatory
failure (use of inotropics during the first week, OR 31.2; 95% CI 2.6 - 373, p=.007)
remained in the model. We did not perform a multivariate logistic regression
analysis on survivors to determine independent predictors for the development
and severity of cerebral palsy, because only one association was found in the
univariate analyses for both development and severity of cerebral palsy.

71Chapter 3 Risk Factors for Adverse Outcome in Preterm Infants with Periventricular Hemorrhagic Infarction
TABLE 1 Patient demographics
Number n=54
Males/ females 32/ 22
Gestational age (weeks) 27.7 (25.4-35.0)
Birth weight (grams) 1050 (700-2430)
IUGR (<P10) n=4 (7)
Maternal intrauterine infection1 n=11 (20)
Early onset sepsis n=7 (13)
Asphyxia
Resuscitation2 n=2 (4)
Apgar at 1’ 4 (1-9)
Apgar at 5’ 8 (2-10)
Umbilical cord pH 7.21 (6.83-7.42)
Respiratory failure
Ventilatory support (IPPV or HFO) n=47 (87)
Pneumothorax n=9 (17)
Respiratory acidosis n=14 (26)
Circulatory failure
Inotropics n=27 (50)
Metabolic acidosis n=10 (19)
Neonatal seizures n=13 (24)
Mortality n=16 (30)
Age of death 5.5 days (1-120)
Late neonatal morbidity
ROP (grade I-II vs. grade III-V) 11 (20) vs. 2 (5)
Late onset sepsis 14 (26)
Necrotizing enterocolitis 3 (6)
Bronchopulmonary dysplasia 14 (26)
Data are given as median (minimum-maximum) or numbers (percentage).1. Maternal intrauterine infection was scored by clinical signs as fetal tachycardia and maternal fever
(>38°C), often combined with the use of maternal antibiotics2. Resuscitation was scored in case of external heart massage and/or use of epinephrine
Abbreviations: IUGR, intrauterine growth restriction; IPPV, intermittent positive pressure ventilation; HFO, high frequency oscillation; ROP, retinopathy of prematurity
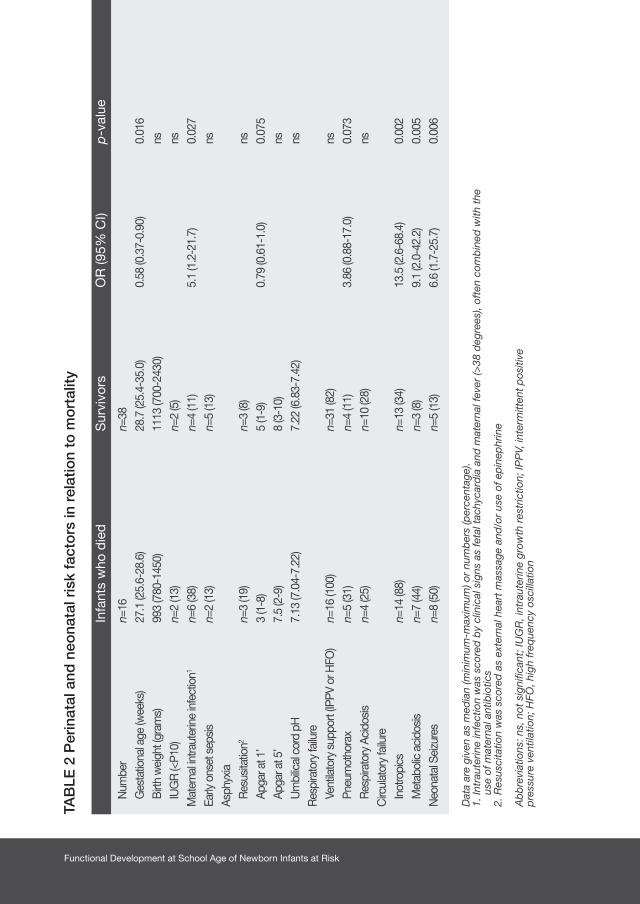
Functional Development at School Age of Newborn Infants at Risk
TAB
LE 2
Per
inat
al a
nd n
eona
tal r
isk
fact
ors
in r
elat
ion
to m
ort
ality
Infa
nts
who
die
d
S
urvi
vors
OR
(95%
CI)
p
-val
ue
Num
ber
n=
16
n=
38G
esta
tiona
l age
(wee
ks)
27
.1 (2
5.6-
28.6
)
28
.7 (2
5.4-
35.0
)
0.58
(0.3
7-0.
90)
0.
016
Birt
h w
eigh
t (gr
ams)
993
(780
-145
0)
1113
(700
-243
0)
nsIU
GR
(<P1
0)
n=
2 (1
3)
n=
2 (5
)
nsM
ater
nal in
traut
erin
e in
fect
ion1
n=
6 (3
8)
n=
4 (1
1)
5.1
(1.2
-21.
7)
0.
027
Early
ons
et s
epsi
s
n=2
(13)
n=5
(13)
nsAs
phyx
iaR
esus
itatio
n2
n=3
(19)
n=3
(8)
ns
Apga
r at 1
’
3 (1
-8)
5
(1-9
)
0.
79 (0
.61-
1.0)
0.07
5Ap
gar a
t 5’
7.
5 (2
-9)
8
(3-1
0)
ns
Um
bilic
al c
ord
pH
7.
13 (7
.04-
7.22
)
7.
22 (6
.83-
7.42
)
ns
Res
pira
tory
failu
re
Vent
ilato
ry s
uppo
rt (IP
PV o
r HFO
)
n=16
(100
)
n=
31 (8
2)
ns
Pneu
mot
hora
x
n=5
(31)
n=4
(11)
3.
86 (0
.88-
17.0
)
0.07
3R
espi
rato
ry A
cido
sis
n=
4 (2
5)
n=
10 (2
8)
nsC
ircul
ator
y fa
ilure
Inot
ropi
cs
n=
14 (8
8)
n=13
(34)
13.5
(2.6
-68.
4)
0.
002
Met
abol
ic a
cido
sis
n=
7 (4
4)
n=
3 (8
)
9.
1 (2
.0-4
2.2)
0.00
5N
eona
tal S
eizu
res
n=
8 (5
0)
n=
5 (1
3)
6.6
(1.7
-25.
7)
0.
006
Dat
a ar
e gi
ven
as m
edia
n (m
inim
um-m
axim
um) o
r nu
mb
ers
(per
cent
age)
.1.
Intr
aute
rine
infe
ctio
n w
as s
core
d b
y cl
inic
al s
igns
as
feta
l tac
hyca
rdia
and
mat
erna
l fev
er (>
38 d
egre
es),
ofte
n co
mb
ined
with
the
us
e of
mat
erna
l ant
ibio
tics
2. R
esus
cita
tion
was
sco
red
as
exte
rnal
hea
rt m
assa
ge a
nd/o
r us
e of
ep
inep
hrin
e
Ab
bre
viat
ions
: ns,
not
sig
nific
ant;
IUG
R, i
ntra
uter
ine
grow
th r
estr
ictio
n; IP
PV,
inte
rmitt
ent
pos
itive
p
ress
ure
vent
ilatio
n; H
FO, h
igh
freq
uenc
y os
cilla
tion
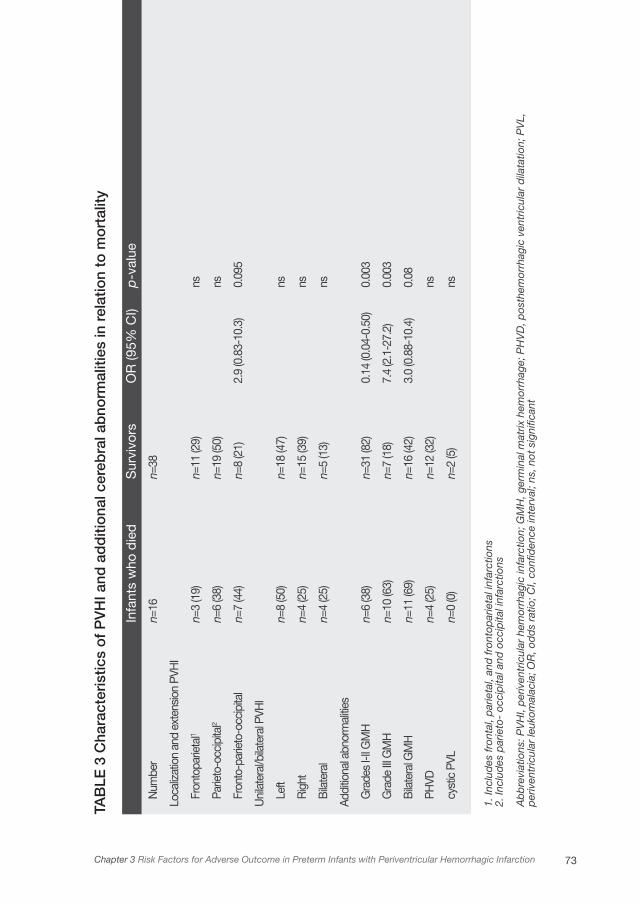
73Chapter 3 Risk Factors for Adverse Outcome in Preterm Infants with Periventricular Hemorrhagic Infarction
TAB
LE 2
Per
inat
al a
nd n
eona
tal r
isk
fact
ors
in r
elat
ion
to m
ort
ality
Infa
nts
who
die
d
S
urvi
vors
OR
(95%
CI)
p
-val
ue
Num
ber
n=
16
n=
38G
esta
tiona
l age
(wee
ks)
27
.1 (2
5.6-
28.6
)
28
.7 (2
5.4-
35.0
)
0.58
(0.3
7-0.
90)
0.
016
Birt
h w
eigh
t (gr
ams)
993
(780
-145
0)
1113
(700
-243
0)
nsIU
GR
(<P1
0)
n=
2 (1
3)
n=
2 (5
)
nsM
ater
nal in
traut
erin
e in
fect
ion1
n=
6 (3
8)
n=
4 (1
1)
5.1
(1.2
-21.
7)
0.
027
Early
ons
et s
epsi
s
n=2
(13)
n=5
(13)
nsAs
phyx
iaR
esus
itatio
n2
n=3
(19)
n=3
(8)
ns
Apga
r at 1
’
3 (1
-8)
5
(1-9
)
0.
79 (0
.61-
1.0)
0.07
5Ap
gar a
t 5’
7.
5 (2
-9)
8
(3-1
0)
ns
Um
bilic
al c
ord
pH
7.
13 (7
.04-
7.22
)
7.
22 (6
.83-
7.42
)
ns
Res
pira
tory
failu
re
Vent
ilato
ry s
uppo
rt (IP
PV o
r HFO
)
n=16
(100
)
n=
31 (8
2)
ns
Pneu
mot
hora
x
n=5
(31)
n=4
(11)
3.
86 (0
.88-
17.0
)
0.07
3R
espi
rato
ry A
cido
sis
n=
4 (2
5)
n=
10 (2
8)
nsC
ircul
ator
y fa
ilure
Inot
ropi
cs
n=
14 (8
8)
n=13
(34)
13.5
(2.6
-68.
4)
0.
002
Met
abol
ic a
cido
sis
n=
7 (4
4)
n=
3 (8
)
9.
1 (2
.0-4
2.2)
0.00
5N
eona
tal S
eizu
res
n=
8 (5
0)
n=
5 (1
3)
6.6
(1.7
-25.
7)
0.
006
Dat
a ar
e gi
ven
as m
edia
n (m
inim
um-m
axim
um) o
r nu
mb
ers
(per
cent
age)
.1.
Intr
aute
rine
infe
ctio
n w
as s
core
d b
y cl
inic
al s
igns
as
feta
l tac
hyca
rdia
and
mat
erna
l fev
er (>
38 d
egre
es),
ofte
n co
mb
ined
with
the
us
e of
mat
erna
l ant
ibio
tics
2. R
esus
cita
tion
was
sco
red
as
exte
rnal
hea
rt m
assa
ge a
nd/o
r us
e of
ep
inep
hrin
e
Ab
bre
viat
ions
: ns,
not
sig
nific
ant;
IUG
R, i
ntra
uter
ine
grow
th r
estr
ictio
n; IP
PV,
inte
rmitt
ent
pos
itive
p
ress
ure
vent
ilatio
n; H
FO, h
igh
freq
uenc
y os
cilla
tion
TAB
LE 3
Cha
ract
eris
tics
of
PV
HI a
nd a
dd
itio
nal c
ereb
ral a
bno
rmal
ities
in r
elat
ion
to m
ort
ality
Infa
nts
who
die
d
Sur
vivo
rs
OR
(95%
CI)
p-v
alue
Num
ber
n=
16
n=38
Loca
lizat
ion
and
exte
nsio
n PV
HI
Fron
topa
rieta
l1
n=3
(19)
n=
11 (2
9)
ns
Parie
to-o
ccip
ital2
n=
6 (3
8)
n=19
(50)
ns
Fron
to-p
arie
to-o
ccip
ital
n=
7 (4
4)
n=
8 (2
1)
2.
9 (0
.83-
10.3
) 0.
095
Uni
late
ral/b
ilate
ral P
VHI
Left
n=
8 (5
0)
n=
18 (4
7)
ns
Rig
ht
n=
4 (2
5)
n=
15 (3
9)
ns
Bila
tera
l
n=4
(25)
n=5
(13)
ns
Addi
tiona
l abn
orm
alitie
s
Gra
des
I-II G
MH
n=6
(38)
n=31
(82)
0.14
(0.0
4-0.
50)
0.00
3
Gra
de II
I GM
H
n=
10 (6
3)
n=7
(18)
7.4
(2.1
-27.
2)
0.00
3
Bila
tera
l GM
H
n=
11 (6
9)
n=16
(42)
3.0
(0.8
8-10
.4)
0.08
PHVD
n=4
(25)
n=
12 (3
2)
ns
cyst
ic P
VL
n=
0 (0
)
n=
2 (5
)
ns
1. In
clud
es fr
onta
l, p
arie
tal,
and
fron
top
arie
tal i
nfar
ctio
ns2.
Incl
udes
par
ieto
- oc
cip
ital a
nd o
ccip
ital i
nfar
ctio
ns
Ab
bre
viat
ions
: PV
HI,
per
iven
tric
ular
hem
orrh
agic
infa
rctio
n; G
MH
, ger
min
al m
atrix
hem
orrh
age;
PH
VD
, pos
them
orrh
agic
ven
tric
ular
dila
tatio
n; P
VL,
p
eriv
entr
icul
ar le
ukom
alac
ia; O
R, o
dd
s ra
tio; C
I, co
nfid
ence
inte
rval
; ns,
not
sig
nific
ant
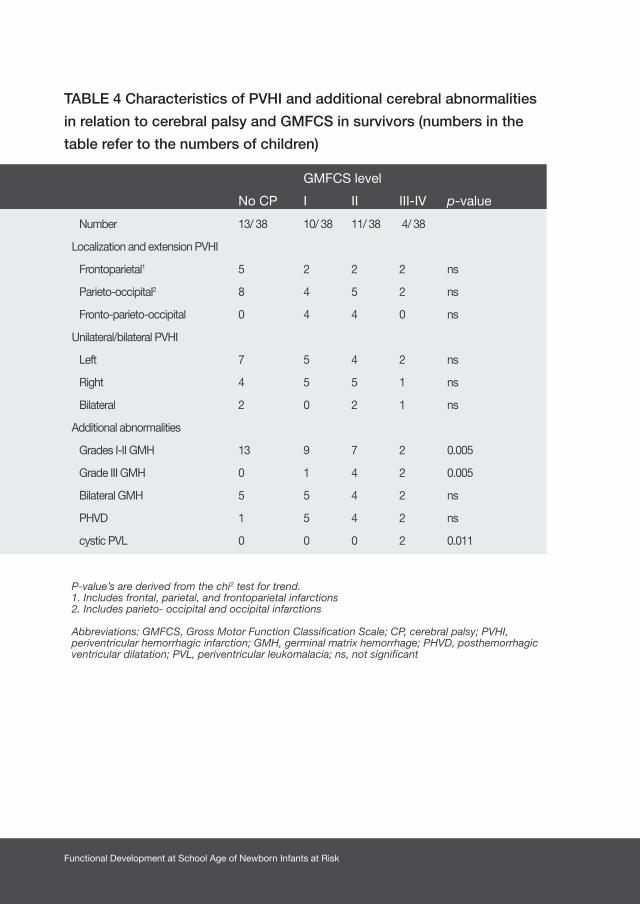
Functional Development at School Age of Newborn Infants at Risk
TABLE 4 Characteristics of PVHI and additional cerebral abnormalities
in relation to cerebral palsy and GMFCS in survivors (numbers in the
table refer to the numbers of children)
GMFCS level
No CP I II III-IV p-value
Number 13/ 38 10/ 38 11/ 38 4/ 38
Localization and extension PVHI
Frontoparietal1 5 2 2 2 ns
Parieto-occipital2 8 4 5 2 ns
Fronto-parieto-occipital 0 4 4 0 ns
Unilateral/bilateral PVHI
Left 7 5 4 2 ns
Right 4 5 5 1 ns
Bilateral 2 0 2 1 ns
Additional abnormalities
Grades I-II GMH 13 9 7 2 0.005
Grade III GMH 0 1 4 2 0.005
Bilateral GMH 5 5 4 2 ns
PHVD 1 5 4 2 ns
cystic PVL 0 0 0 2 0.011
P-value’s are derived from the chi2 test for trend.1. Includes frontal, parietal, and frontoparietal infarctions2. Includes parieto- occipital and occipital infarctions
Abbreviations: GMFCS, Gross Motor Function Classification Scale; CP, cerebral palsy; PVHI, periventricular hemorrhagic infarction; GMH, germinal matrix hemorrhage; PHVD, posthemorrhagic ventricular dilatation; PVL, periventricular leukomalacia; ns, not significant
75Chapter 3 Risk Factors for Adverse Outcome in Preterm Infants with Periventricular Hemorrhagic Infarction
Discussion
We identified several risk factors predictive for mortality and adverse neurological
outcome at 18 months of age in preterm infants with PVHI. A low gestational age,
neonatal seizures, signs of circulatory failure (use of inotropics and metabolic
acidosis), maternal intrauterine infection and an associated GMH grade III were
related to mortality. Independent predictors were circulatory failure and maternal
intrauterine infection. Sixty six percent of the survivors developed cerebral palsy.
Only the most extended PVHI (fronto-parieto-occipital) was associated with
the development of cerebral palsy. Characteristics of the PVHI (localization and
extension) were not related to the severity of cerebral palsy. However, additional
cerebral abnormalities such as GMH grade III and cystic PVL were associated with
more severe cerebral palsy.
We found a lower mortality (30%) compared to previous studies, which reported
percentages from 38 to 60%.1,5-7,21 It is striking that in our study the extension of
the PVHI was not related to mortality. This association was reported by Guzzetta
et al. in 19865 and recently by Bassan et al.22 An explanation for the difference
might be the characteristics of the study groups. Both studies reported a higher
percentage of infants with extended lesions (50-66%) than the present study
(28%). The percentage of infants with associated GMH grade III in these studies
was also much higher (80-88% versus 31%).5,22 This suggests that morbidity of the
infants in the present study might have been less severe than in these previous
studies. Advances in neonatal care, better imaging techniques and decisions
regarding withdrawal of life support might also have influenced the association.22
In the present study, most of the infants who died had suffered respiratory or
circulatory failure, unresponsive to treatment.
We found that mortality in infants with PVHI was associated with low gestational
age, maternal intrauterine infections, signs of circulatory failure, an associated
GMH grade III and neonatal seizures. After multivariate logistic regression analysis,
only circulatory failure (use of inotropics) and signs of maternal intrauterine
infection were independent predictors for mortality. Circulatory failure, leading
to disturbances of systemic and cerebral hemodynamics, is identified as a risk
factor for the emergence of PVHI in several studies.7,12,13 Apparently, this factor

Functional Development at School Age of Newborn Infants at Risk
is associated not only with the emergence of PVHI but also with a considerably
increased risk of dying (OR 31.2) in case of PVHI. The association of mortality
with maternal intrauterine infections in the present study was less strong and just
reached significance. Intrauterine (perinatal) infections and inflammation have been
associated in particular with periventricular leukomalacia23 and not with PVHI.13,24
However, other larger studies have demonstrated that intrauterine infections,
chorio-amnionitis, placental inflammation and early sepsis are associated with
GMH grade III and PVHI.25-27 Although the percentage of infants with signs of
maternal intrauterine infection was low in the present study, our data suggest that
its presence increases the risk of dying.
Neurological outcome at the age of 18 months was normal in 34% of the survivors.
The remaining infants developed cerebral palsy, which was mild in most cases.
The percentage of infants developing cerebral palsy after PVHI in the present
study was similar to previous studies, ranging from 60 to 90%.1,5,8,9,11,22 Of all
cerebral characteristics investigated, only the most extended localization (fronto-
parieto-occipital) was associated with the development of cerebral palsy. This was
also found by Bassan et al.22 There is controversy about anterior frontal lesions.
Rademaker et al. demonstrated in a small study of 20 infants that a localization
of PVHI in the occipital region was associated with the development of cerebral
palsy.8 A localization more frontally, anterior of the trigonum, was associated with a
normal outcome.8 Bassan et al. found the opposite, i.e. anterior frontal involvement
of the PVHI was associated with an abnormal neuromotor examination at the age
of 1 year.22 We could not confirm any of these results. In our study, we found that
some infants with frontal, frontoparietal and parieto-occipital lesions developed
cerebral palsy, but others did not. Concerning perinatal and neonatal risk factors,
no associations existed with the development of cerebral palsy.
Functional limitations in children developing cerebral palsy were mostly mild, with
GMFCS levels I and II. Only a few infants had cerebral palsy with more severe
functional limitations. This was associated with additional cerebral abnormalities,
such as cystic PVL and an associated GMH grade III. It is known that cystic PVL
causes more severe neurological sequelae than PVHI.1,11,28 To our surprise, GMFCS
levels were not related to localization and extension of the PVHI, nor to any other
77Chapter 3 Risk Factors for Adverse Outcome in Preterm Infants with Periventricular Hemorrhagic Infarction
perinatal or neonatal risk factor. Other studies in infants with PVHI and functional
outcomes are scarce and do not report about outcomes of the infants in terms of
functional abilities and limitations.
As a retrospective analysis, the present study is subject to potential limitations.
We took care to include all children with PVHI, but perhaps we still missed some.
Being a single-center study, caution should be taken to generalize our results to
other centers. Perinatal and neonatal care has changed considerably during the
long range of years covered by this study (1995-2006). During the last 20 years,
the incidence of severe intracranial hemorrhages has declined rapidly.26 Factors
that were risk factors in the past are not necessarily risk factors at present.
We did not confirm the PVHI on cranial ultrasound scans using magnetic resonance
imaging in all infants. We are confident however, that we could reliably make the
diagnosis of PVHI by cranial ultrasonography alone. Earlier studies comparing
magnetic resonance imaging with cranial ultrasonography in PVHI showed that
ultrasonography is a reliable method for diagnosing PVHI.1,10 The distinction
between bilateral PVHI and cystic PVL is sometimes difficult to make.1,10 We used
the criteria mentioned in De Vries et al.1 to differentiate between the two types
of brain lesions. In our opinion, we could reliably make this distinction because
ultrasound scans were performed at least at weekly intervals. Only two infants had
both PVHI and cystic PVL. This incidence is similar to other studies.1,10
All surviving children were examined at follow-up at a minimum of 18 months’
corrected age. We realize that 18 months is a bit young to determine the GMFCS
level reliably. It is known that the GMFCS is a rather stable measure from the age
of two onwards.29 In the present study, most children had already turned two. With
this in mind, the GMFCS levels in the majority of the infants who had developed
cerebral palsy would remain low, indicating rather good gross motor functioning.
Functional Development at School Age of Newborn Infants at Risk
Conclusion
We identified several risk factors predictive for mortality and adverse neurological
outcome at 18 months of age in preterm infants with PVHI. Thirty percent of the infants
died, mostly with respiratory and/or circulatory failure, unresponsive to treatment.
Circulatory failure and maternal intrauterine infection, but not characteristics of the
PVHI, were independently predictive for mortality. Sixty six percent of the survivors
developed cerebral palsy, which was mild in most cases. Only the most extended
PVHI (fronto-parieto-occipital) was associated with the development of cerebral
palsy. Characteristics of the PVHI (localization and extension) were not related to
the severity of cerebral palsy, but the presence of concurrent GMH grade III and
cystic PVL were associated with more severe cerebral palsy.
Acknowledgements
We greatly acknowledge the help of Dr. T. Brantsma - van Wulfften Palthe in
Utrecht, for correcting the English. This study was part of the research program
of the post-graduate school, Behavioral and Cognitive Neurosciences (BCN),
University of Groningen and supported by a Junior Scientific Masterclass grant of
the University of Groningen.

79Chapter 3 Risk Factors for Adverse Outcome in Preterm Infants with Periventricular Hemorrhagic Infarction
1. de Vries LS, Roelants-van Rijn AM, Rademaker KJ,
van Haastert I, Beek FJ, Groenendaal F. Unilateral
parenchymal haemorrhagic infarction in the preterm
infant. Eur J Paediatr Neurol 2001;5:139-149.
2. Takashima S, Mito T, Ando Y. Pathogenesis of
periventricular white matter hemorrhages in preterm
infants. Brain Dev 1986;8:25-30.
3. Volpe JJ. Brain injury in the premature infant:
overview of clinical aspects, neuropathology, and
pathogenesis. Semin Pediatr Neurol
1998;5:135-151.
4. Volpe JJ. Neurology of the Newborn. 4th ed.
Philadelphia, PA: W.B.Saunders; 2001.
5. Guzzetta F, Shackelford GD, Volpe S, Perlman
JM, Volpe JJ. Periventricular intraparenchymal
echodensities in the premature newborn: critical
determinant of neurological outcome. Pediatrics
1986;78:995-1006.
6. Perlman JM, Rollins N, Burns D, Risser
R. Relationship between periventricular
intraparenchymal echodensities and germinal matrix-
intraventricular hemorrhage in the very low birth
weight neonate. Pediatrics 1993;91:474-480.
7. Bassan H, Feldman HA, Limperopoulos C, et al.
Periventricular hemorrhagic infarction: Risk factors
and neonatal outcome. Pediatr Neurol
2006;35:85-92.
8. Rademaker KJ, Groenendaal F, Jansen GH, Eken P,
de Vries LS. Unilateral haemorrhagic parenchymal
lesions in the preterm infant: shape, site and
prognosis. Acta Paediatr 1994;83:602-608.
9. de Vries LS, Rademaker KJ, Groenendaal F, et al.
Correlation between neonatal cranial ultrasound,
MRI in infancy and neurodevelopmental outcome
in infants with a large intraventricular haemorrhage
with or without unilateral parenchymal involvement.
Neuropediatrics 1998;29:180-188.
10. Bass WT, Jones MA, White LE, Montgomery TR,
Aiello F, Karlowicz MG. Ultrasonographic differential
diagnosis and neurodevelopmental outcome of
cerebral white matter lesions in premature infants. J
Perinatol 1999;19:330-336.
11. Cioni G, Bos AF, Einspieler C, et al. Early
neurological signs in preterm infants with unilateral
intraparenchymal echodensity. Neuropediatrics
2000;31:240-251.
12. Osborn DA, Evans N, Kluckow M. Hemodynamic
and antecedent risk factors of early and late
periventricular/intraventricular hemorrhage in
premature infants. Pediatrics 2003;112:33-39.
13. Bass WT, Schultz SJ, Burke BL, White LE, Khan
JH, Karlowicz MG. Indices of hemodynamic and
respiratory functions in premature infants at risk for
the development of cerebral white matter injury. J
Perinatol 2002;22:64-71.
14. Volpe JJ. Intraventricular hemorrhage in the
premature infant - current concepts. Part II. Ann
Neurol 1989;25:109-116.
References

Functional Development at School Age of Newborn Infants at Risk
15. Evans WA. An encephalographic ratio for estimating
ventricular enlargement and cerebral atrophy. Arch
Neurol Psychiatry 1942;47:931-937.
16. de Vries LS, Eken P, Dubowitz LMS. The spectrum
of leukomalacia using cranial ultrasound. Behav
Brain Res 1992;49:1-6.
17. Kloosterman GJ. On intrauterine growth. The
significance of prenatal care. Int J Gynaecol Obstet
1970;8:895-912.
18. Touwen BCL. Neurological Development in Infancy.
London, UK: William Heinemann Medical Books
Ltd.; 1976.
19. Hagberg B, Hagberg G, Olow I. The changing
panorama of cerebral palsy in Sweden 1954-1970.
I. Analysis of the general changes. Acta Paediatr
Scand 1975;64:187-192.
20. Palisano R, Rosenbaum P, Walter S, Russell D,
Wood E, Galuppi B. Development and reliability
of a system to classify gross motor function in
children with cerebral palsy. Dev Med Child Neurol
1997;39:214-233.
21. de Vries LS, van Haastert IC, Rademaker KJ,
Koopman-Esseboom C, Groenendaal F. Ultrasound
abnormalities preceding cerebral palsy in high-risk
infants. J Pediatr 2004;144:815-820.
22. Bassan H, Benson CB, Limperopoulos C, et al.
Ultrasonographic features and severity scoring
of periventricular hemorrhagic infarction in
relation to risk factors and outcome. Pediatrics
2006;117:2111-2118.
23. Dammann O, Leviton A. Infection remote from the
brain, neonatal white matter damage, and cerebral
palsy in the preterm infant. Semin Pediatr Neurol
1998;5:190-201.
24. Turner MA, Vause S, Howell L, et al. Isolated
parenchymal lesions on cranial ultrasound in very
preterm infants in the context of maternal infection.
Early Hum Dev 2007;83:63-68.
25. Hansen A, Leviton A. Labor and delivery
characteristics and risks of cranial ultrasonographic
abnormalities among very-low-birth-weight
infants. The Developmental Epidemiology Network
Investigators. Am J Obstet Gynecol
1999;181:997-1006.
26. Thorp JA, Jones PG, Clark RH, Knox E, Peabody
JL. Perinatal factors associated with severe
intracranial hemorrhage. Am J Obstet Gynecol
2001;185:859-862.
27. Linder N, Haskin O, Levit O, et al. Risk factors for
intraventricular hemorrhage in very low birth weight
premature infants: A retrospective case-control
study. Pediatrics 2003;111:e590-e595.
28. Pierrat V, Duquennoy C, van Haastert I, Ernst M,
Guilley N, de Vries LS. Ultrasound diagnosis and
neurodevelopmental outcome of localised and
extensive cystic periventricular leucomalacia. Arch
Dis Child Fetal Neonatal Ed 2001;84:F151-F156.

81Chapter 3 Risk Factors for Adverse Outcome in Preterm Infants with Periventricular Hemorrhagic Infarction
29. Palisano RJ, Cameron D, Rosenbaum PL, Walter
SD, Russell D. Stability of the gross motor function
classification system. Dev Med Child Neurol
2006;48:424-428.

Chapter 4
FUNCTIONAL OUTCOME AT SCHOOL AGE OF
PRETERM INFANTS WITH PERIVENTRICULAR
HEMORRHAGIC INFARCTION
ELISE ROZE, KOENRAAD N. J. A. VAN BRAECKEL, CHRISTA N. VAN DER VEERE,
CAREL G. B. MAATHUIS, ALBERT MARTIJN, AREND F. BOS
PEDIATRICS 2009;123(6):1493-1500
Functional Development at School Age of Newborn Infants at Risk
Abstract
Objective
Our objective was to determine motor, cognitive and behavioral outcome at school
age in preterm children with periventricular hemorrhagic infarction (PVHI) and to
identify cerebral risk factors for adverse outcome.
Methods
This was a prospective cohort study of all preterm infants who were <37 weeks’
gestation, had periventricular hemorrhagic infarction (PVHI), and were admitted
between 1995 and 2003. Ultrasound scans were reviewed for characteristics
of PVHI and other cerebral abnormalities. At 4 to 12 years motor outcome was
assessed by the Gross Motor Function Classification System (GMFCS) and the
Manual Ability Classification System (MACS), by a neurological examination
(Touwen), an intelligence test (WISC-III/WPPSI-R), and tests for visual-motor
integration (VMI), visual perception (TVPS) and verbal memory. Behavior was
assessed by the Child Behavior Checklist (CBCL), and Behavior Rating Inventory
of Executive Function (BRIEF).
Results
Of 38 infants, 15 (39%) died. Twenty-one of 23 survivors were included in the follow-
up. Four were neurologically normal, one had minor neurological dysfunction,
thirteen had unilateral spastic cerebral palsy (CP) and three bilateral CP.
Coordination, associated movements and fine manipulative abilities were affected
most according to the neurological examination. GMFCS: seven children level 1,
seven level 2, one level 3, two level 4. MACS: four children normal, eight level 1,
seven level 2, two level 3. The mean and median total intelligence quotient (IQ)
was 83 (range 55-103, SD 11). Visual perception was normal in 88%, visuomotor
integration was normal in 74% and verbal memory was normal in 50% of the
children. Behavior was normal in 53% and executive functions were normal in
65% and 29% (parents and teachers). Characteristics of the PVHI were not related
to functional motor outcome and intelligence.
85Chapter 4 Functional Outcome at School Age of Preterm Infants with Periventricular Hemorrhagic Infarction
Posthemorrhagic ventricular dilatation (PHVD) was a risk factor for poorer total
and performance intelligence and abnormal fine manipulative abilities.
Conclusions
The majority of surviving preterm children with PVHI had CP with limited functional
impairment at school age. Intelligence was within one SD of the norm of preterm
children without lesions in 60% to 80% of the children. Verbal memory, in particular,
was affected. Behavioral and executive function problems occurred slightly more
than in preterm infants without lesions. The functional outcome at school age of
preterm children with PVHI is better than previously thought.
Functional Development at School Age of Newborn Infants at Risk
Introduction
Periventricular hemorrhagic infarction (PVHI) is a complication of a germinal matrix
hemorrhage (GMH) in which extension to the periventricular region occurs. PVHI
is seen in 1% to 3% of preterm infants.1,2 Mortality in preterm infants with PVHI
ranges between 30% and 60%.2-4 Although mortality has decreased during the
last years, PVHI is still considered a disastrous lesion and is sometimes associated
with withdrawal of care.5-7
Outcome studies of 2 to 3-year-old children reported that 50% to 85% of children
with PVHI develop cerebral palsy (CP)2-5,8 and that cognition is impaired in 20%
to 79% of children.4,7,9 Functional outcome at school age in preterm infants with
PVHI, however, is still largely unknown. Therefore the first aim of this study was to
determine motor, cognitive and behavioral outcome in preterm children with PVHI
at school age.
Some studies suggested that particular subtypes of PVHI are related to adverse
outcome, while others do not demonstrate this relationship.2,4,8,10,11 Our second
aim was therefore to identify cerebral risk factors for adverse outcome.
87Chapter 4 Functional Outcome at School Age of Preterm Infants with Periventricular Hemorrhagic Infarction
Methods
Patients
We selected preterm infants who had been admitted to the Neonatal Intensive Care
Unit (NICU) of the University Medical Center Groningen (UMCG) between 1995 and
2003, who were < 37 weeks’ gestational and who had PVHI diagnosed by cranial
ultrasonography. We found the infants by searching the patient database, which
contains all diagnoses of every infant admitted to the NICU, for infants diagnosed
with PVHI, venous infarction, GMH grade 4 and parenchymal cerebral bleeding.
We excluded patients with major chromosomal and congenital anomalies.
Cranial Ultrasonography Classification
In accordance with the routine scanning protocol of our unit the first ultrasound
scan was made within 72 hours after birth and subsequently at weekly intervals until
stabilization or disappearance of any abnormality. The scans were made by means
of real-time mechanical sector scanners equipped with a 7.5 MHz transducer. This
scanning protocol is observed for each infant admitted to our NICU with at least
one of the following criteria: gestational age < 35 weeks, birth weight < 1500 g, a
complicated delivery with risk for brain injury, perinatal asphyxia, and suspected
congenital cerebral malformation. Infants with a gestational age > 35 weeks were
scanned in case of clinical signs suggestive of intracranial pathology.
The cranial ultrasound scans of the infants selected for this study were reviewed by
two experts (AFB, AM) to determine whether PVHI was present or not. The experts
were blind as to the infants’ outcome. In case the experts disagreed with one
another they re-evaluated the scans in question, together. In all cases a consensus
was reached on the final score. The final study group was defined after this review
procedure.
We scored several characteristics of the PVHI, i.e. unilateral or bilateral infarction,
left or right-sided infarction, localization and extension of the infarction (frontal,
parietal, occipital or combinations) and residual abnormalities (e.g. porencephalic
cysts). In case of bilateral PVHI localization and extension were based on the
side that was affected most. Next, we scored additional cerebral abnormalities,
i.e. grade of GMH (grade 1, 2 or 3),12 unilateral or bilateral GMH, presence or

Functional Development at School Age of Newborn Infants at Risk
emergence of posthemorrhagic ventricular dilatation (PHVD), and cystic
periventricular leukomalacia (PVL). PHVD was defined as a lateral ventricle size
of > 0.33 according to Evans’ index (the right and left lateral horn width divided
by the maximum internal skull width).13 Cystic periventricular leukomalacia was
classified as stage 2 or worse, according to De Vries et al.14
Follow-up
The children were invited prospectively to participate in an extension of the routine
follow-up program. It entailed the assessment of motor performance, cognition
and behavior at the age of 4 to 12 years. Parents gave their informed consent
to participate in the follow-up program. The study was approved by the Medical
Ethical Committee of the University Medical Center Groningen.
Motor Outcome
On the basis of the reports of the routine follow-up program we determined
the presence or absence of CP following Bax’ criteria.15 In case of CP, gross
motor functioning was scored by a physiatrist using the Gross Motor Function
Classification System (GMFCS). This is a functional, five level classification system
for CP based on self-initiated movement with particular emphasis on sitting (truncal
control) and walking.16 During the follow-up program at school age the presence or
absence of CP and GMFCS scores were re-evaluated.
To classify the manual abilities of the children, we used the Manual Ability
Classification System (MACS). The MACS is a functional, five level system for CP
in which levels are based on the children’s ability to handle objects and their need
for assistance or adaptations to perform manual tasks in daily life.17 The MACS
was scored by both the investigator (ER) and the parents. Higher levels of GMFCS
and MACS indicate serious impairment of functional abilities (Table 1).
To determine the children’s neurological status, we administered Touwen’s
neurological examination to children without CP and those with GMFCS levels 1
and 2.18 This age-specific neurological examination assesses posture and muscle
tone, reflexes, presence of choreiform dyskinesia, coordination and balance, fine
manipulative ability, cranial nerves, associated movements, and sensory integrity.19
89Chapter 4 Functional Outcome at School Age of Preterm Infants with Periventricular Hemorrhagic Infarction
Cognitive Outcome
Total, verbal and performance intelligence were assessed using a short form of the
Wechsler Intelligence Scale for Children, third version (WISC-III) in children over 5
years of age.20 In younger children, we used the Wechsler Preschool and Primary
Scale of Intelligence, revised (WPPSI-R).21
In addition, we assessed visual perception, visuomotor integration and verbal
memory to investigate whether these neuropsychological functions were
specifically impaired in preterm infants with PVHI. Central visual perception was
assessed using two subtests (visual form-constancy and visual closure) of the Test
of Visual-Perceptual Skills, revised (TVPS-R).22 We used the Beery developmental
test of visual-motor integration (VMI, 4th Edition) to assess visuomotor integration.23
Visuomotor integration involves the integration of visual information with finger-
hand movements.
In children over 5 years of age, we assessed verbal memory using Rey’s Auditory
Verbal Learning Test (AVLT).24 This test consists of five learning trials with immediate
recall of words (tested after each presentation), a delayed recall trail and a delayed
recognition trial.24
Test scores obtained when a child was inattentive or too tired, as assessed by the
experimenter, were excluded.
Behavioral Outcome
In order to obtain information on children’s competencies and behavioral/emotional
problems the parents of children over 5 years of age completed the Child Behavior
Checklist (CBCL).25 The CBCL consists of one total scale and two subscales, i.e.
internalizing problems (withdrawn behavior, somatic complaints, and anxious/
depressed scales) and externalizing problems (delinquent and aggressive behavior
scales).
Functional Development at School Age of Newborn Infants at Risk
In addition, the parents and the teachers filled in the Behavior Rating Inventory of
Executive Function (BRIEF)26 for children over 4 years of age. The BRIEF assesses
executive functioning involved in well-organized, purposeful, goal-directed,
and problem-solving behavior. Examples of executive functioning are the ability
to inhibit competing actions of attractive stimuli, the flexibility to shift problem-
solving strategies if necessary, and the ability to monitor and evaluate one’s own
behavior.
Statistical Analyses
IQ scores were calculated by the median of scores on the verbal and performance
subtests. We used the percentiles on the standardization samples of each cognitive
test to classify the scores into ‘normal (>P15)’, ‘subclinical (P5-P15)’ and ‘clinical
(<P5)’. For the CBCL and the BRIEF we used a similar classification following the
criteria in the manual. We corrected the scores on visuomotor integration, visual
perception and verbal memory for mental age, which was calculated by using
the IQ scores. We used the Chi2, the Mann-Whitney U test and Spearman’s rank
correlation where appropriate to relate motor, cognitive and behavioral outcomes
to cerebral characteristics and late onset morbidity. Throughout the analyses p<.05
was considered to be statistically significant. SPSS 14.0 software for Windows,
(SPSS Inc, Chicago, IL) was used for all the analyses.
91Chapter 4 Functional Outcome at School Age of Preterm Infants with Periventricular Hemorrhagic Infarction
Results
Between 1995 and 2003, 3034 patients with a gestational age of < 37 weeks were
admitted to our NICU. After database search and review of the cranial ultrasound
scans, 38 infants with periventricular hemorrhagic infarctions were included in the
study. Of these 38 infants, 15 (39%) died in the neonatal period. Twenty one of the
23 survivors participated in the follow-up program – two sets of parents declined
the invitation to participate.
Patient Characteristics
Table 2 shows an overview of the patient demographics and the cerebral
characteristics of the 21 surviving infants. The demographics of the two children
who did not participate were slightly better than the children included in our study
(median gestational age 31.8 weeks and median birth weight 1178 g).
Eight infants developed PHVD in addition to the PVHI. One of them did not require
drainage of cerebrospinal fluid, three infants required a temporary ventricular
drain and four were fitted with a permanent shunt. In one infant bilateral subtle
echodensities in the periventricular region, not related to the PVHI, developed into
cystic PVL.
The mean age at follow-up was 8.7 years (range 4.4 to 12.5 years). Three children
were 4 to 5 years old. In these three children some cognitive tests were not
administered because norms were only available for children of 5 years and older.
None of the children were blind.
Motor Outcome
Of 21 children, five (24%) were neurologically normal and sixteen (76%) had CP.
Thirteen children had unilateral CP with limited functional impairment, GMFCS
levels 1 (n=6) and 2 (n=7). One child with GMFCS level 1 did not have CP but
showed limited functional disabilities and minor neurological dysfunction. Three
children had GMFCS levels 3 (n=1) and 4 (n=2). These three infants all had bilateral
spastic CP. The functional manual abilities were normal in four children, eight
children had MACS level 1, seven had level 2, and two had level 3.
According to the neurological examination (assessed in eighteen children),
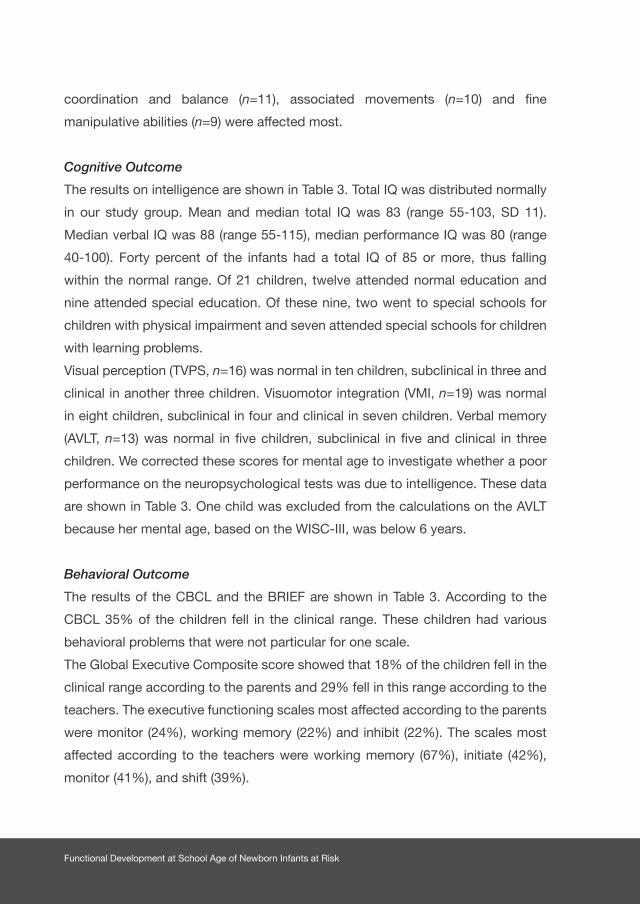
Functional Development at School Age of Newborn Infants at Risk
coordination and balance (n=11), associated movements (n=10) and fine
manipulative abilities (n=9) were affected most.
Cognitive Outcome
The results on intelligence are shown in Table 3. Total IQ was distributed normally
in our study group. Mean and median total IQ was 83 (range 55-103, SD 11).
Median verbal IQ was 88 (range 55-115), median performance IQ was 80 (range
40-100). Forty percent of the infants had a total IQ of 85 or more, thus falling
within the normal range. Of 21 children, twelve attended normal education and
nine attended special education. Of these nine, two went to special schools for
children with physical impairment and seven attended special schools for children
with learning problems.
Visual perception (TVPS, n=16) was normal in ten children, subclinical in three and
clinical in another three children. Visuomotor integration (VMI, n=19) was normal
in eight children, subclinical in four and clinical in seven children. Verbal memory
(AVLT, n=13) was normal in five children, subclinical in five and clinical in three
children. We corrected these scores for mental age to investigate whether a poor
performance on the neuropsychological tests was due to intelligence. These data
are shown in Table 3. One child was excluded from the calculations on the AVLT
because her mental age, based on the WISC-III, was below 6 years.
Behavioral Outcome
The results of the CBCL and the BRIEF are shown in Table 3. According to the
CBCL 35% of the children fell in the clinical range. These children had various
behavioral problems that were not particular for one scale.
The Global Executive Composite score showed that 18% of the children fell in the
clinical range according to the parents and 29% fell in this range according to the
teachers. The executive functioning scales most affected according to the parents
were monitor (24%), working memory (22%) and inhibit (22%). The scales most
affected according to the teachers were working memory (67%), initiate (42%),
monitor (41%), and shift (39%).
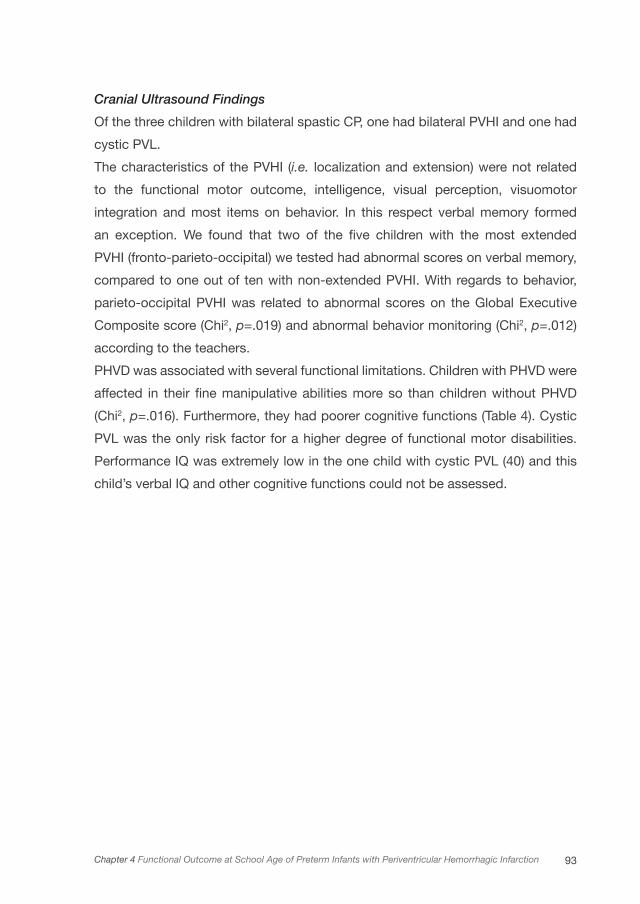
93Chapter 4 Functional Outcome at School Age of Preterm Infants with Periventricular Hemorrhagic Infarction
Cranial Ultrasound Findings
Of the three children with bilateral spastic CP, one had bilateral PVHI and one had
cystic PVL.
The characteristics of the PVHI (i.e. localization and extension) were not related
to the functional motor outcome, intelligence, visual perception, visuomotor
integration and most items on behavior. In this respect verbal memory formed
an exception. We found that two of the five children with the most extended
PVHI (fronto-parieto-occipital) we tested had abnormal scores on verbal memory,
compared to one out of ten with non-extended PVHI. With regards to behavior,
parieto-occipital PVHI was related to abnormal scores on the Global Executive
Composite score (Chi2, p=.019) and abnormal behavior monitoring (Chi2, p=.012)
according to the teachers.
PHVD was associated with several functional limitations. Children with PHVD were
affected in their fine manipulative abilities more so than children without PHVD
(Chi2, p=.016). Furthermore, they had poorer cognitive functions (Table 4). Cystic
PVL was the only risk factor for a higher degree of functional motor disabilities.
Performance IQ was extremely low in the one child with cystic PVL (40) and this
child’s verbal IQ and other cognitive functions could not be assessed.
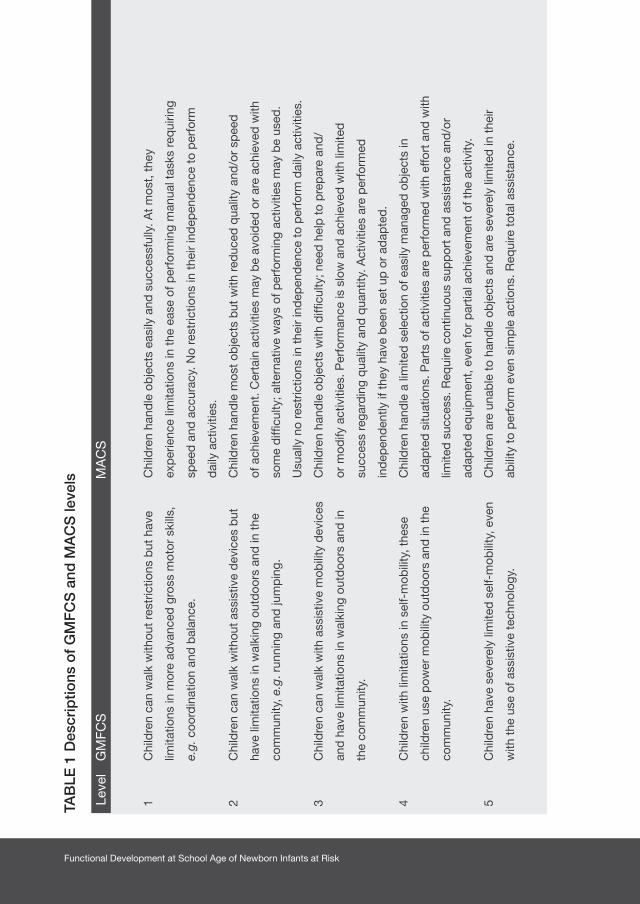
Functional Development at School Age of Newborn Infants at Risk
TAB
LE 1
Des
crip
tions
of
GM
FC
S a
nd M
AC
S le
vels
Leve
l G
MFC
S
MA
CS
Chi
ldre
n ha
ndle
ob
ject
s ea
sily
and
suc
cess
fully
. At
mos
t, t
hey
exp
erie
nce
limita
tions
in t
he e
ase
of p
erfo
rmin
g m
anua
l tas
ks r
equi
ring
spee
d a
nd a
ccur
acy.
No
rest
rictio
ns in
the
ir in
dep
end
ence
to
per
form
dai
ly a
ctiv
ities
.
Chi
ldre
n ha
ndle
mos
t ob
ject
s b
ut w
ith r
educ
ed q
ualit
y an
d/o
r sp
eed
of a
chie
vem
ent.
Cer
tain
act
iviti
es m
ay b
e av
oid
ed o
r ar
e ac
hiev
ed w
ith
som
e d
ifficu
lty; a
ltern
ativ
e w
ays
of p
erfo
rmin
g ac
tiviti
es m
ay b
e us
ed.
Usu
ally
no
rest
rictio
ns in
the
ir in
dep
end
ence
to
per
form
dai
ly a
ctiv
ities
.
Chi
ldre
n ha
ndle
ob
ject
s w
ith d
ifficu
lty; n
eed
hel
p t
o p
rep
are
and
/
or m
odify
act
iviti
es. P
erfo
rman
ce is
slo
w a
nd a
chie
ved
with
lim
ited
succ
ess
rega
rdin
g q
ualit
y an
d q
uant
ity. A
ctiv
ities
are
per
form
ed
ind
epen
den
tly if
the
y ha
ve b
een
set
up o
r ad
apte
d.
Chi
ldre
n ha
ndle
a li
mite
d s
elec
tion
of e
asily
man
aged
ob
ject
s in
adap
ted
situ
atio
ns. P
arts
of a
ctiv
ities
are
per
form
ed w
ith e
ffort
and
with
limite
d s
ucce
ss. R
equi
re c
ontin
uous
sup
por
t an
d a
ssis
tanc
e an
d/o
r
adap
ted
eq
uip
men
t, e
ven
for
par
tial a
chie
vem
ent
of t
he a
ctiv
ity.
Chi
ldre
n ar
e un
able
to
hand
le o
bje
cts
and
are
sev
erel
y lim
ited
in t
heir
abili
ty t
o p
erfo
rm e
ven
sim
ple
act
ions
. Req
uire
tot
al a
ssis
tanc
e.
1 C
hild
ren
can
wal
k w
ithou
t re
stric
tions
but
hav
e
limita
tions
in m
ore
adva
nced
gro
ss m
otor
ski
lls,
e.g.
coo
rdin
atio
n an
d b
alan
ce.
2 C
hild
ren
can
wal
k w
ithou
t as
sist
ive
dev
ices
but
have
lim
itatio
ns in
wal
king
out
doo
rs a
nd in
the
com
mun
ity, e
.g. r
unni
ng a
nd ju
mp
ing.
3 C
hild
ren
can
wal
k w
ith a
ssis
tive
mob
ility
dev
ices
and
hav
e lim
itatio
ns in
wal
king
out
doo
rs a
nd in
the
com
mun
ity.
4 C
hild
ren
with
lim
itatio
ns in
sel
f-m
obili
ty, t
hese
child
ren
use
pow
er m
obili
ty o
utd
oors
and
in t
he
com
mun
ity.
5 C
hild
ren
have
sev
erel
y lim
ited
sel
f-m
obili
ty, e
ven
with
the
use
of a
ssis
tive
tech
nolo
gy.

95Chapter 4 Functional Outcome at School Age of Preterm Infants with Periventricular Hemorrhagic Infarction
TAB
LE 1
Des
crip
tions
of
GM
FC
S a
nd M
AC
S le
vels
Leve
l G
MFC
S
MA
CS
Chi
ldre
n ha
ndle
ob
ject
s ea
sily
and
suc
cess
fully
. At
mos
t, t
hey
exp
erie
nce
limita
tions
in t
he e
ase
of p
erfo
rmin
g m
anua
l tas
ks r
equi
ring
spee
d a
nd a
ccur
acy.
No
rest
rictio
ns in
the
ir in
dep
end
ence
to
per
form
dai
ly a
ctiv
ities
.
Chi
ldre
n ha
ndle
mos
t ob
ject
s b
ut w
ith r
educ
ed q
ualit
y an
d/o
r sp
eed
of a
chie
vem
ent.
Cer
tain
act
iviti
es m
ay b
e av
oid
ed o
r ar
e ac
hiev
ed w
ith
som
e d
ifficu
lty; a
ltern
ativ
e w
ays
of p
erfo
rmin
g ac
tiviti
es m
ay b
e us
ed.
Usu
ally
no
rest
rictio
ns in
the
ir in
dep
end
ence
to
per
form
dai
ly a
ctiv
ities
.
Chi
ldre
n ha
ndle
ob
ject
s w
ith d
ifficu
lty; n
eed
hel
p t
o p
rep
are
and
/
or m
odify
act
iviti
es. P
erfo
rman
ce is
slo
w a
nd a
chie
ved
with
lim
ited
succ
ess
rega
rdin
g q
ualit
y an
d q
uant
ity. A
ctiv
ities
are
per
form
ed
ind
epen
den
tly if
the
y ha
ve b
een
set
up o
r ad
apte
d.
Chi
ldre
n ha
ndle
a li
mite
d s
elec
tion
of e
asily
man
aged
ob
ject
s in
adap
ted
situ
atio
ns. P
arts
of a
ctiv
ities
are
per
form
ed w
ith e
ffort
and
with
limite
d s
ucce
ss. R
equi
re c
ontin
uous
sup
por
t an
d a
ssis
tanc
e an
d/o
r
adap
ted
eq
uip
men
t, e
ven
for
par
tial a
chie
vem
ent
of t
he a
ctiv
ity.
Chi
ldre
n ar
e un
able
to
hand
le o
bje
cts
and
are
sev
erel
y lim
ited
in t
heir
abili
ty t
o p
erfo
rm e
ven
sim
ple
act
ions
. Req
uire
tot
al a
ssis
tanc
e.
TABLE 2 Patient demographics
Data are given as median (minimum-maximum) or as numbers (percentage).1. Resuscitation was scored in case of external heart massage and/or use of epinephrine2. Includes frontal, parietal, and frontoparietal infarctions3. Includes parieto-occipital and occipital infarctionsAbbreviations: IUGR- intrauterine growth restriction; IPPV- intermittent positive pressure ventilation; HFO- high frequency oscillation; PVHI- periventricular hemorrhagic infarction; GMH- germinal matrix hemorrhage; PHVD- posthemorrhagic ventricular dilatation
Number n=21Males/females 12/ 9 Gestational age (weeks) 27.6 (25.4-35.0)Birth weight (grams) 1045 (700-2430)IUGR (<P10) n=1 (5)
AsphyxiaResuscitation1 n=3 (14)Apgar at 5 minutes (n=21) 8 (3-10) Umbilical cord pH (n=17) 7.21(6.83-7.42)
Ventilatory support (IPPV or HFO) n=19 (90)Neonatal seizures (clinical) n=3 (14)Late onset morbidity
Retinopathy of prematurity (grade 1-2 vs. 3 and worse) n=7 (33) vs. n=2 (10)Necrotizing enterocolitis n=1 (5)Late onset sepsis n=4 (19)Bronchopulmonary dysplasia n=12 (57)
Socioeconomic status Below average n=6 (30)Average n=6 (30)Above average n=8 (40)
Characteristics of PVHIFrontoparietal2 n=5 (24)Parieto-occipital3 n=11 (52)Fronto-parieto-occipital n=5 (24)Left / Right n=10 (48) vs. n=9 (43)Bilateral n=2 (9)Porencephalic cysts n=12 (57)
Additional cerebral abnormalitiesGrade 1-2 GMH n=17 (33)Grade 3 GMH n=4 (19)Unilateral GMH n=12 (57)Bilateral GMH n=9 (43)PHVD n=8 (38)

Functional Development at School Age of Newborn Infants at Risk
TABLE 3 Cognitive and behavioral outcome in preterm infants with PVHI
Normal2 Subclinical2 Clinical2
Cognitive outcome
Total intelligence (n=19) 8 (42) 9 (48) 2 (11)
Verbal intelligence (n=19) 14 (73) 3 (16) 2 (11)
Performance intelligence (n=21) 7 (33) 10 (48) 4 (19)
Visual perception (n=16)1 14 (88) 2 (12) 0 (0)
Form-constancy (n=15) 12 (80) 2 (13) 1 (7)
Visual closure (n=14) 9 (65) 3 (21) 2 (14)
Visuomotor integration (n=19)1 14 (74) 3 (16) 2 (10)
Verbal memory (n=12)1 6 (50) 3 (25) 3 (25)
Delayed recall 6 (50) 3 (25) 3 (25)
Recognition 10 (77) 2 (23)
Behavioral outcome
Total behavioral Problems (n=17) 9 (53) 2 (12) 6 (35)
Internalizing problems (n=17) 12 (70) 2 (12) 3 (18)
Externalizing problems (n=17) 14 (82) 2 (12) 1 (6)
Executive functioning (parents) (n=17) 11 (65) 3 (18) 3 (18)
Executive functioning (teachers) (n=17) 5 (29) 7 (41) 5 (29)
Data are given as numbers (percentage).1. After correcting for mental age2. Normal was defined as >P15, subclinical as P5-P15 and clinical <P5, with regard to intelligence,
normal was defined as IQ 85-115, subclinical as IQ 70-85 and clinical as IQ <70
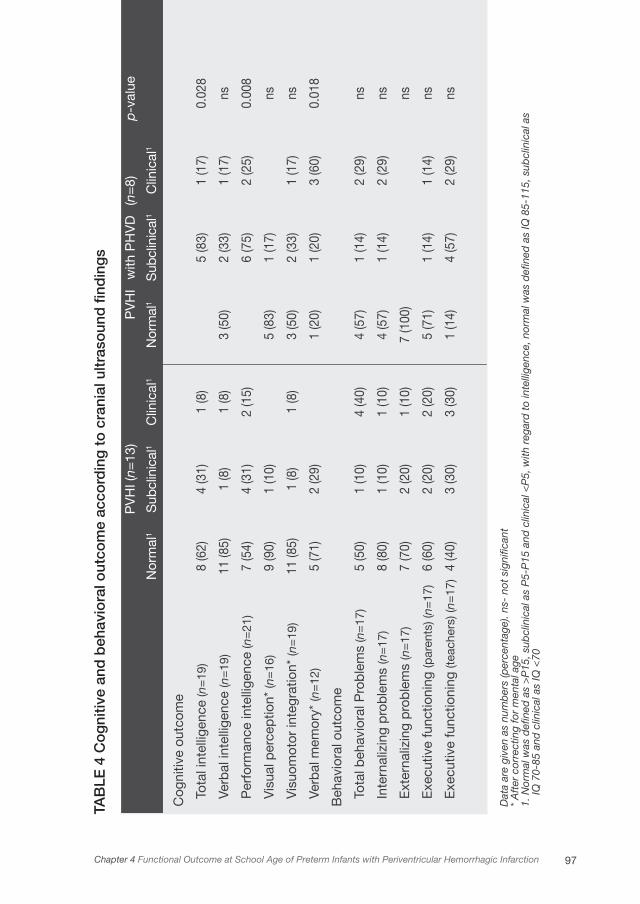
97Chapter 4 Functional Outcome at School Age of Preterm Infants with Periventricular Hemorrhagic Infarction
TAB
LE 4
Co
gni
tive
and
beh
avio
ral o
utco
me
acco
rdin
g t
o c
rani
al u
ltras
oun
d fi
ndin
gs
Dat
a ar
e gi
ven
as n
umb
ers
(per
cent
age)
. ns-
not
sig
nific
ant
* A
fter
cor
rect
ing
for
men
tal a
ge1.
Nor
mal
was
defi
ned
as
>P
15, s
ubcl
inic
al a
s P
5-P
15 a
nd c
linic
al <
P5,
with
reg
ard
to
inte
llige
nce,
nor
mal
was
defi
ned
as
IQ 8
5-11
5, s
ubcl
inic
al a
s
IQ 7
0-85
and
clin
ical
as
IQ <
70
Cog
nitiv
e ou
tcom
e
Tota
l int
ellig
ence
(n=
19)
Verb
al in
telli
genc
e (n
=19
)
Per
form
ance
inte
llige
nce
(n=
21)
Vis
ual p
erce
ptio
n* (n
=16
)
Vis
uom
otor
inte
grat
ion*
(n=
19)
Verb
al m
emor
y* (n
=12
)
Beh
avio
ral o
utco
me
Tota
l beh
avio
ral P
rob
lem
s (n
=17
)
Inte
rnal
izin
g p
rob
lem
s (n
=17
)
Ext
erna
lizin
g p
rob
lem
s (n
=17
)
Exe
cutiv
e fu
nctio
ning
(par
ents
) (n=
17)
Exe
cutiv
e fu
nctio
ning
(tea
cher
s) (n
=17
)
8 (6
2)
11 (8
5)
7 (5
4)
9 (9
0)
11 (8
5)
5 (7
1)
5 (5
0)
8 (8
0)
7 (7
0)
6 (6
0)
4 (4
0)
4 (3
1)
1 (8
)
4 (3
1)
1 (1
0)
1 (8
)
2 (2
9)
1 (1
0)
1 (1
0)
2 (2
0)
2 (2
0)
3 (3
0)
1 (8
)
1 (8
)
2 (1
5)
1 (8
)
4 (4
0)
1 (1
0)
1 (1
0)
2 (2
0)
3 (3
0)
3 (5
0)
5 (8
3)
3 (5
0)
1 (2
0)
4 (5
7)
4 (5
7)
7 (1
00)
5 (7
1)
1 (1
4)
5 (8
3)
2 (3
3)
6 (7
5)
1 (1
7)
2 (3
3)
1 (2
0)
1 (1
4)
1 (1
4)
1 (1
4)
4 (5
7)
1 (1
7)
1 (1
7)
2 (2
5)
1 (1
7)
3 (6
0)
2 (2
9)
2 (2
9)
1 (1
4)
2 (2
9)
0.02
8
ns
0.00
8
ns ns
0.01
8
ns ns ns ns ns
Nor
mal
1
PV
HI (
n=13
)
Sub
clin
ical
1C
linic
al1
PV
HI
Nor
mal
1
with
PH
VD
Sub
clin
ical
1
(n=
8) Clin
ical
1
p-v
alue

Functional Development at School Age of Newborn Infants at Risk
Discussion
The present study indicated that the majority of children who had PVHI as preterm
infants developed CP at school age (mean: 8 years), but mostly with limited
functional impairment. On average, their intelligence was 17 IQ points lower than
the average of the norm populations, but a majority (57%) still attended normal
education. Of the other cognitive functions investigated verbal memory was
particularly affected. Behavioral functioning was abnormal in 35% of the children
and executive functioning was abnormal in 18% and 29% (parents and teachers).
Hardly any associations between the characteristics of the PVHI and functional
outcome were found.
The strength of this study is that we investigated outcome at school age (4 to 12
years), which is more reliable than studying outcome at 2 to 3 years of age, as
was the case in previous studies. We investigated motor, cognitive and behavioral
functioning extensively and could therefore reliably describe the overall functional
outcome of preterm children with PVHI.
In the present study 76% of the surviving children developed CP, which is similar
to previous studies, with prevalences ranging from 50% to 85%.2-5,8 Functionally,
motor outcome was only mildly restricted in the majority of the children. This result
was also found by Brouwer et al. They found that 73% of children with PVHI, who
developed CP, have GMFCS levels 1 and 2.7 In our study, children’s coordination
and balance, associated movements and fine manipulative abilities were affected
most. This is in agreement with the main characteristics of CP.15 However, abnormal
reflexes and postural problems, which are also characteristics of CP, were found
in only a minority of our children with CP. The presence of associated movements
indicates neurological dysfunction and may be part of the hemisyndrome, in which
case the neurologically impaired side shows more such movements.18
Previous studies showed no consensus on cognitive outcome in children with
PVHI. Percentages of children with normal cognition range from only 20% up to
79%.4,7,9 In the present study, cognitive tests revealed that intelligence was within
1 SD of the mean of the norm group in 40% of the children and total IQ was
approximately 17 points lower than that of the norm population. At first sight it
seems that only a small proportion of children with PVHI is not affected cognitively.

99Chapter 4 Functional Outcome at School Age of Preterm Infants with Periventricular Hemorrhagic Infarction
However, preterm infants with similar gestational age but without lesions are already
known to have lower IQs. A recent review of Aylward revealed that the IQ scores
of preterm children are approximately 4 to 9 points lower when compared to term
controls.27 A study of Taylor et al., from the same era as our own study, showed
that preterm children had IQ scores that were 10 points lower than controls.28
In this study, mean gestational age, birth weight and age of testing were similar
to those of our study. From our own data it is known that, at 8 years of age, the
mean IQ of preterm children without lesions is 5 points lower than that of the norm
population.29 Therefore, if we take these children as the norm and compare our
group to them, then 60% to 80% of the children would score within one SD of the
mean.
After correcting for mental age, visual perception and visuomotor integration were
normal in the majority of children (88% and 74% respectively). In a previous study,
visuomotor integration in children with intraparenchymal echodensities leading
to porencephaly was impaired in comparison to a control group.30 Vollmer et
al., however, could not demonstrate differences in visuomotor integration after
parenchymal compared to non-parenchymal lesions.31 Our results suggested that
the children’s poorer visual perception and visuomotor integration were related to
a lower intellectual level rather than to a specific visual-perceptual or visuomotor
impairment, since the majority of children scored within the normal range after
correcting for mental age.
By contrast, verbal memory might be a function that is affected in children with
PVHI since, after correcting for mental age, only 50% of the children fell within
the normal range. Especially recall of memorized words was impaired, and not
recognition. Our results on memory are in line with previous studies, which showed
that preterm infants are at risk for deficits in working memory and in recognition
memory.32-34 This is the case especially in infants who sustained white matter
injury.33
Behavioral problems occurred in 35% of the children with PVHI. Reijneveld et al.
reported in 2006 that 13% of 402 preterm children without lesions had behavioral
problems.35 The children had a similar gestational age, birth weight and SES
compared to those in our study. Gray et al. reported in 2004 that 20% of 869
Functional Development at School Age of Newborn Infants at Risk
preterm children with higher gestational age (mean 32 weeks) and birth weight
(mean 1799 grams), had behavioral problems.36 In the present study, executive
functions were abnormal in 18% and 29% (parents and teachers), compared to
13% in preterm infants without lesions.37 We also found that more children were
in the subclinical group compared to a norm population, while the percentage of
children in the clinical group was comparable.
It is striking that we hardly found associations between particular subtypes of
the PVHI and outcome, since the common understanding is that larger lesions
are prognostic for adverse outcome.8,10 The inability of ultrasound scans to
predict outcome may be due to, for example, small sample size, different medical
interventions or SES. In a previous study involving 36 infants, we did find that the
most extended localization of PVHI (fronto-parieto-occipital) is associated with the
development of CP, but not with the severity at 18 months.2 Two previous studies
reported that more severe PVHI is associated with poorer cognitive outcome.4,9
Sherlock et al. found that children with intraparenchymal echodensities and
porencephaly have lower IQ scores.30 We found no such associations.
Regarding additional cerebral abnormalities, we found that PHVD was a risk
factor for abnormal manipulative abilities and for poorer total and performance
intelligence. This is in line with earlier studies, which also found that PHVD is a risk
factor for lower intelligence. Ment et al. found that ventriculomegaly in 4-year-olds
is an independent predictor of a very low total IQ (<70) compared to intraventricular
hemorrhage with parenchym involvement and other risk factors in age mates.38
Brouwer et al. showed that infants with intraparenchymal lesions and PHVD score
significantly lower on developmental outcome than infants with intraparenchymal
lesions without PHVD at 2 years of age.7
The results on outcome at school age in children with PVHI, as demonstrated by
the present study, were better than was previously thought. Studies on risk factors
for adverse outcome in preterm infants often classify infants with parenchymal
lesions at great risk for adverse outcomes,31,39,40 but when focussing specifically on
preterm infants with PVHI, the present study showed that the majority of children
had only limited functional impairment. It appeared that the characteristics of the
PVHI in themselves were not risk factors for adverse outcome. An explanation for
101Chapter 4 Functional Outcome at School Age of Preterm Infants with Periventricular Hemorrhagic Infarction
this finding might be that the influence of PVHI on short-term outcome decreases
later on in life. Development and learning may have contributed to a better outcome
than previously reported. Little understood processes involving plasticity of the
brain may have contributed to this phenomenon.
This study is subject to potential limitations such as it being a single center study
and the small number of children. It stands to question whether our results are
applicable to other nurseries. We tried to minimize this problem by the use of
standardized testing. Another limitation is that we did not include neuroimaging in
our follow-up program. We therefore may have missed small but relevant additional
lesions.
Hence, our results should be interpreted with caution. Further research with larger
groups is needed to investigate outcome in adulthood after PVHI at preterm age.
Conclusions
The majority of surviving preterm infants with PVHI had CP with limited functional
impairment at school age. In 60% to 80% of the children intelligence was within
1 SD of the mean of preterm children without lesions. Verbal memory in particular
may be affected by the PVHI. Behavioral functioning was abnormal in 35% of
the children and executive functioning was abnormal in 18% and 29% (parents
and teachers). Hardly any associations existed between the characteristics of the
PVHI and functional outcome. PHVD was an independent risk factor for lower
intelligence (performance and total) and fine manipulative abilities. Functional
outcome at school age of preterm children with PVHI is better than previously
reported.
Acknowledgements
We greatly acknowledge the help of Dr Titia Brantsma - van Wulfften Palthe in
Utrecht, for correcting the English. Further, we acknowledge the help of Drs Jorien
M. Kerstjens and Henk J. ter Horst for reviewing the ultrasound scans, and Dr. Mijna
Hadders-Algra for her suggestions regarding a previous version of the manuscript.
This study was part of the research program of the postgraduate school for
Behavioral and Cognitive Neurosciences (BCN), University of Groningen.

Functional Development at School Age of Newborn Infants at Risk
1. Hamrick SEG, Miller SP, Leonard C, et al. Trends in
severe brain injury and neurodevelopmental outcome
in premature newborn infants: The role of cystic
periventricular leukomalacia. J Pediatr
2004;145:593-599.
2. Roze E, Kerstjens JM, Ter Horst HJ, Maathuis CGB,
Bos AF. Risk factors for adverse outcome in preterm
infants with periventricular hemorrhagic infarction.
Pediatrics 2008;122:e46-e52.
3. de Vries LS, Roelants-van Rijn AM, Rademaker KJ,
van Haastert I, Beek FJ, Groenendaal F. Unilateral
parenchymal haemorrhagic infarction in the preterm
infant. Eur J Paediatr Neurol 2001;5:139-149.
4. Guzzetta F, Shackelford GD, Volpe S, Perlman
JM, Volpe JJ. Periventricular intraparenchymal
echodensisties in the premature newborn: critical
determinant of neurological outcome. Pediatrics
1986;78:995-1006.
5. Bassan H, Feldman HA, Limperopoulos C, et al.
Periventricular hemorrhagic infarction: Risk factors
and neonatal outcome. Pediatr Neurol
2006;35:85-92.
6. Larroque B, Marret S, Ancel PY, et al. White matter
damage and intraventricular hemorrhage in very
preterm infants: the EPIPAGE study. J Pediatr
2003;143:477-483.
7. Brouwer A, Groenendaal F, van Haastert
IL, Rademaker K, Hanlo P, de Vries L.
Neurodevelopmental outcome of preterm infants
with severe intraventricular hemorrhage and therapy
for post-hemorrhagic ventricular dilatation. J Pediatr
2008;152:648-654.
8. Rademaker KJ, Groenendaal F, Jansen GH, Eken P,
de Vries LS. Unilateral haemorrhagic parenchymal
lesions in the preterm infant: shape, site and
prognosis. Acta Paediatr 1994;83:602-608.
9. Bassan H, Limperopoulos C, Visconti K, et al.
Neurodevelopmental outcome in survivors of
periventricular hemorrhagic infarction. Pediatrics
2007;120:785-792.
10. Dudink J, Lequin M, Weisglas-Kuperus N,
Conneman N, Goudoever JV, Govaert P. Venous
subtypes of preterm periventricular haemorrhagic
infarction. Arch Dis Child Fetal Neonatal Ed
2008;93:F201-F206.
11. Bassan H, Benson CB, Limperopoulos C, et al.
Ultrasonographic features and severity scoring
of periventricular hemorrhagic infarction in
relation to risk factors and outcome. Pediatrics
2006;117:2111-2118.
12. Volpe JJ. Intraventricular hemorrhage in the
premature infant - current concepts. Part II. Ann
Neurol 1989;25:109-116.
13. Evans WA. An encephalographic ratio for estimating
ventricular enlargement and cerebral atrophy. Arch
Neurol Psychiatry 1942;47:931-937.
References

103Chapter 4 Functional Outcome at School Age of Preterm Infants with Periventricular Hemorrhagic Infarction
14. de Vries LS, Eken P, Dubowitz LMS. The spectrum
of leukomalacia using cranial ultrasound. Behav
Brain Res 1992;49:1-6.
15. Bax M, Goldstein M, Rosenbaum P, et al. Proposed
definition and classification of cerebral palsy, April
2005. Dev Med Child Neurol 2005;47:571-576.
16. Palisano R, Rosenbaum P, Walter S, Russell D,
Wood E, Galuppi B. Development and reliability
of a system to classify gross motor function in
children with cerebral palsy. Dev Med Child Neurol
1997;39:214-233.
17. Morris C, Kurinczuk JJ, Fitzpatrick R, Rosenbaum
PL. Reliability of the manual ability classification
system for children with cerebral palsy. Dev Med
Child Neurol 2006;48:950-953.
18. Touwen BCL. Examination of the Child with Minor
Neurological Dysfunction. 2nd ed. London, UK:
William Heinemann Medical Books Ltd.; 1979.
19. Hadders-Algra M. Two distinct forms of minor
neurological dysfunction: perspectives emerging
from a review of data of the Groningen Perinatal
Project. Dev Med Child Neurol 2002;44:561-571.
20. Kort W, Compaan EL, Bleichrodt N, et al. WISC-III
NL Handleiding. Amsterdam, the Netherlands: NIP
dienstencentrum; 2002.
21. van der Steene G, Bos A. Wechsler Preschool and
Primary Scale of Intelligence, revised. Vlaams-
Nederlandse aanpassing, handleiding. Lisse, the
Netherlands: Swets & Zeitlinger; 1997.
22. Gardner MF. Test of Visual-Perceptual Skills (Non-
Motor) – Revised. Hydesville, CA: Psychological and
Educational Publications Inc; 1996.
23. Beery KE BN. Developmental Test of Visual-Motor
Integration, 4th edition, revised ed. Parsippany, NJ:
Modern Curriculum Press; 1997.
24. van den Burg W, Kingma A. Performance of 225
Dutch school children on Rey’s Auditory Verbal
Learning Test (AVLT): parallel test-retest reliabilities
with an interval of 3 months and normative data.
Arch Clin Neuropsychol 1999;14:545-559.
25. Verhulst FC, van der Ende J, Koot HM. Manual
for the Child Behavior Checklist: 4–18 (In Dutch).
Rotterdam: Department of Child and Adolescent
Psychiatry, Erasmus University; 1996.
26. Gioia GA ,Isquith PK, Guy SC, Kenworthy L.
BRIEF—Behavior Rating Inventory of Executive
Function: professional manual. Odessa, FL:
Psychological Assessment Resources; 2000.
27. Aylward GP. Cognitive and neuropsychological
outcomes: more than IQ scores. Ment Retard Dev
Disabil Res Rev 2002;8:234-240.
28. Taylor HG, Klein N, Minich NM, Hack M. Middle-
school-age outcomes in children with very low
birthweight. Child Dev 2000;71:1495-1511.

Functional Development at School Age of Newborn Infants at Risk
29. van Braeckel KNJA, Butcher PR, Geuze RH, van
Duijn MAJ, Bos AF, Bouma JM. Less efficient
elementary visuomotor processes in 7- to 10-year
old preterm born children without cerebral palsy:
an indication of impaired dorsal stream processes.
Neuropsychology 2008;in press.
30. Sherlock RL, Synnes AR, Eckstein GR, et al. Long
term outcome after neonatal intraparenchymal
echodensities with porencephaly. Arch Dis Child
Fetal Neonatal Ed 2008;93:F127-31
31. Vollmer B, Roth S, Riley K, et al. Long-term
neurodevelopmental outcome of preterm children
with unilateral cerebral lesions diagnosed by
neonatal ultrasound. Early Hum Dev
2006;82:655-661.
32. de Haan M, Bauer PJ, Georgieff MK, Nelson CA.
Explicit memory in low-risk infants aged 19 months
born between 27 and 42 weeks of gestation. Dev
Med Child Neurol
2000;42:304-312.
33. Woodward LJ, Edgin JO, Thompson D, Inder TE.
Object working memory deficits predicted by early
brain injury and development in the preterm infant.
Brain 2005;128:2578-2587.
34. Vicari S, Caravale B, Carlesimo GA, Casadei AM,
Allemand F. Spatial working memory deficits in
children at ages 3-4 who were low birth weight,
preterm infants. Neuropsychology
2004;18:673-678.
35. Reijneveld SA, de Kleine MJ, van Baar AL, et al.
Behavioural and emotional problems in very preterm
and very low birthweight infants at age 5 years. Arch
Dis Child Fetal Neonatal Ed 2006;91:F423-F428.33.
36. Gray RF, Indurkhya A, McCormick MC. Prevalence,
stability, and predictors of clinically significant
behavior problems in low birth weight children at 3,
5, and 8 years of age. Pediatrics
2004;114:736-743.
37. Anderson PJ, Doyle LW. Executive functioning in
school-aged children who were born very preterm
or with extremely low birth weight in the 1990s.
Pediatrics 2004;114:50-57.
38. Ment LR, Vohr B, Allan W et al. The etiology and
outcome of cerebral ventriculomegaly at term in
very low birth weight preterm infants. Pediatrics
1999;104:243-248.
39. Sherlock RL, Anderson PJ, Doyle LW.
Neurodevelopmental sequelae of intraventricular
haemorrhage at 8 years of age in a regional cohort
of ELBW/very preterm infants. Early Hum Dev
2005;81:909-916.
40. Hoekstra RE, Ferrara TB, Couser RJ, Payne
NR, Connett JE. Survival and long-term
neurodevelopmental outcome of extremely
premature infants born at 23-26 weeks’ gestational
age at a tertiary center. Pediatric 2004;113:e1-e6.

105Chapter 4 Functional Outcome at School Age of Preterm Infants with Periventricular Hemorrhagic Infarction

Chapter 5
LONG-TERM NEUROLOGICAL OUTCOME OF
TERM-BORN CHILDREN TREATED WITH TWO
OR MORE ANTI-EPILEPTIC DRUGS IN THE
NEONATAL PERIOD
MARISKA J. VAN DER HEIDE, ELISE ROZE, CHRISTA N. VAN DER VEERE,
HENDRIK J. TER HORST, OEBELE F. BROUWER, AREND F. BOS
EARLY HUMAN DEVELOMENT 2011; DOI 10.1016/J.EARLHUMDEV.2011.06.012
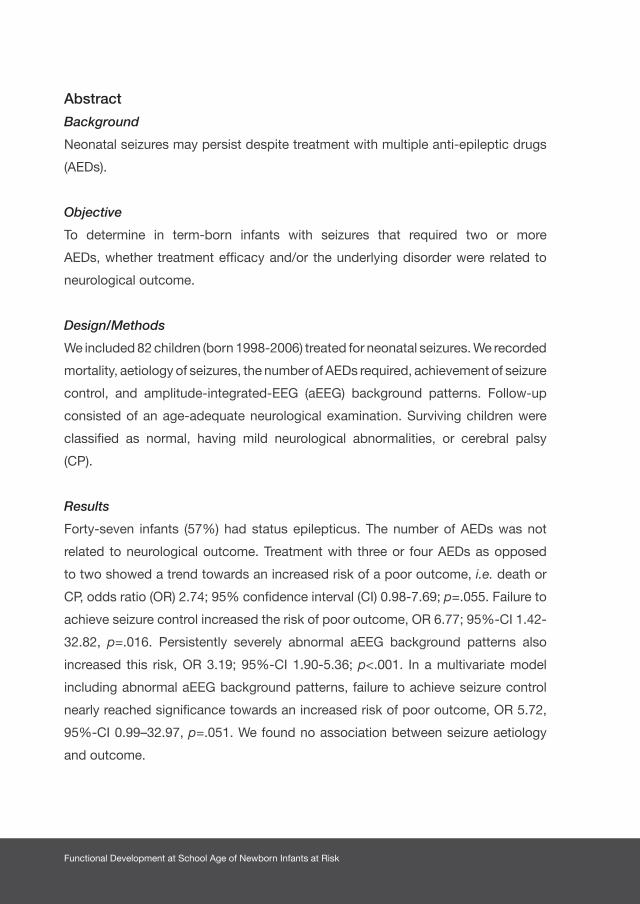
Functional Development at School Age of Newborn Infants at Risk
Abstract
Background
Neonatal seizures may persist despite treatment with multiple anti-epileptic drugs
(AEDs).
Objective
To determine in term-born infants with seizures that required two or more
AEDs, whether treatment efficacy and/or the underlying disorder were related to
neurological outcome.
Design/Methods
We included 82 children (born 1998-2006) treated for neonatal seizures. We recorded
mortality, aetiology of seizures, the number of AEDs required, achievement of seizure
control, and amplitude-integrated-EEG (aEEG) background patterns. Follow-up
consisted of an age-adequate neurological examination. Surviving children were
classified as normal, having mild neurological abnormalities, or cerebral palsy
(CP).
Results
Forty-seven infants (57%) had status epilepticus. The number of AEDs was not
related to neurological outcome. Treatment with three or four AEDs as opposed
to two showed a trend towards an increased risk of a poor outcome, i.e. death or
CP, odds ratio (OR) 2.74; 95% confidence interval (CI) 0.98-7.69; p=.055. Failure to
achieve seizure control increased the risk of poor outcome, OR 6.77; 95%-CI 1.42-
32.82, p=.016. Persistently severely abnormal aEEG background patterns also
increased this risk, OR 3.19; 95%-CI 1.90-5.36; p<.001. In a multivariate model
including abnormal aEEG background patterns, failure to achieve seizure control
nearly reached significance towards an increased risk of poor outcome, OR 5.72,
95%-CI 0.99–32.97, p=.051. We found no association between seizure aetiology
and outcome.

109Chapter 5 Long-Term Neurological Outcome of Term-Born Children Treated with Two or More Anti-Epileptic Drugs in the Neonatal Period
Conclusions
In term-born infants with seizures that required two or more AEDs outcome was
poorer if seizure control failed. The number of AEDs required to reach seizure
control and seizure aetiology had limited prognostic value.

Functional Development at School Age of Newborn Infants at Risk
Introduction
The incidence of seizures is higher in the neonatal period than in any other period
of life and is estimated at approximately 3 per 1000 live births.1,2 In term infants, the
most common cause of seizures is perinatal asphyxia. Other causes are cerebral
infarction, cerebral haemorrhage, and infection.1,3-5 Neonatal seizures are associated
with the development of neurological impairments in later life, such as cerebral palsy
(CP), microcephaly, epilepsy, and psychomotor retardation.3,4
Several anti-epileptic drugs (AEDs) are used for the treatment of neonatal seizures.
Throughout the world, in accordance to international guidelines, phenobarbitone is
the first choice of treatment. Failing this, a number of other AEDs including midazolam,
lidocaine, phenytoin, diazepam, and clonazepam are available as second-choice
drugs. Seizures may, however, persist in some infants despite treatment with multiple
AEDs. This may either be a reflection of the severity of the underlying brain disorder
that leads to the seizures, or the damaging effect of the recurrent and ongoing seizures
themselves, or a combination of both. Ronen et al. suggest that the necessity to treat
seizures with multiple drugs and the success of anticonvulsive treatment to achieve
seizure control may have prognostic value for neurological outcome.1
To date, the long-term neurodevelopmental outcome of children with recurrent
seizures during the neonatal period is largely unknown. Particularly, the association
between long-term outcome and the number of AEDs required and whether seizure
control had been achieved, is unknown. Our primary aim, therefore, was to determine
whether treatment efficacy, i.e. the number of AEDs required and seizure control,
had prognostic value for outcome in term-born infants treated with two or more
AEDs. Our second aim was to determine whether the underlying disorder causing
the seizures had prognostic value for outcome. Our hypotheses were that a higher
number of AEDs and the seizures persisting despite therapy were associated with
poor outcome, irrespective of the underlying disorder.
111Chapter 5 Long-Term Neurological Outcome of Term-Born Children Treated with Two or More Anti-Epileptic Drugs in the Neonatal Period
Materials and Methods
Subjects
We selected all the term-born infants that had been admitted to the Neonatal
Intensive Care Unit (NICU) of the University Medical Center Groningen between 1
January 1998 and 31 December 2006 and that had been diagnosed with seizures.
The study was approved by the Medical Ethical Committee of University Medical
Center Groningen. We examined the infants’ medical charts and included those
infants that had been treated with two or more AEDs. We excluded infants with
major chromosomal and congenital anomalies.
Perinatal and Neonatal Clinical Data
From the medical charts we obtained data on gestational age, birth weight, Apgar
scores, and mode of delivery and we noted the age of onset of the seizures in
hours after birth. Asphyxia was diagnosed by the presence of at least two of the
following signs: foetal distress (abnormal cardiotocogram and/or meconium-
stained amniotic fluid), Apgar scores of <5 after 5 minutes, need for artificial
ventilation for >5 minutes, resuscitation (external heart massage and/or the
use of epinephrine), and umbilical cord pH (arterial pH <7.10). We identified the
causes of seizures, based on the combination of findings regarding the history,
physical and neurological examination, laboratory results, e.g. blood glucose, and
neuro-imaging, all obtained during the first weeks after birth. Neuroimaging was
performed by cranial ultrasonography, in many cases complemented by Magnetic
Resonance Imaging.
Amplitude Integrated EEG (aEEG) Patterns
We started recording of infants admitted with seizures or suspected seizures
immediately following admission. The aEEGs were recorded by either one of
two cerebral function monitors (CFM): the analogue Lectromed® Multitrace 2
or the digital Olympic® CFM 6000 (from September 2003 onwards). When the
former was used, it was calibrated every 24 hours. The nursing staff recorded
all nursing and medical procedures including the occurrence of clinical seizures
and the timing of the administration of all medication. The aEEGs were analyzed
Functional Development at School Age of Newborn Infants at Risk
by pattern recognition based on Toet et al.6 For this study, we assessed the
patterns on the presence of epileptic discharges and status epilepticus (epileptic
state).7 We also analyzed background patterns such as continuous normal voltage
(CNV), discontinuous normal voltage (DNV), continuous low voltage (CLV), burst
suppression (BS), and flat trace (FT).
Treatment of Seizures
We obtained information on treatment with AEDs from the medical and nursery
charts. According to the protocol at our NICU, the drug of first choice was
phenobarbitone at a loading dose of 20 mg/kg, administered intravenously.
Approximately 30 to 60 minutes were allowed to establish, both clinically and
electrographically, whether the seizures had stopped. If they persisted or recurred,
we administered an additional 10 mg/kg phenobarbitone. Our second-choice drug
was lidocaine (2 mg/kg intravenous loading dose, 6 mg/kg/h maintenance therapy)
if the seizures persisted. Midazolam (0.05 mg/kg intravenous loading dose, 0.15
mg/kg/h maintenance therapy) was our third-choice drug. In infants born from
2001 onwards, our second-choice drug for treating seizures was midazolam and
lidocaine our third-choice. We used the same dosing schedules as mentioned
above. During the entire study period clonazepam was our fourth-choice drug (0.1
mg/kg administered intravenously and repeated after 10 minutes, if necessary).
We evaluated the effect of treatment both clinically, as recorded in the medical
charts, and according to the aEEG recordings. We considered treatment with AEDs
to have been successful, i.e. seizure control was achieved, if the seizures stopped
(no more seizures) and did not recur, neither clinically nor electrographically.
Outcome
We determined the mortality rate and cause of death. Follow-up of the survivors
was part of the regular follow-up programme of children that had been admitted
to the NICU, and consisted of paediatric and neurological examinations. Parents
gave their informed consent to participate in the follow-up programme.
The follow-up programme consisted of Hempel’s age-specific neurological
examination for children aged one-and-a-half to four years.8 This examination

113Chapter 5 Long-Term Neurological Outcome of Term-Born Children Treated with Two or More Anti-Epileptic Drugs in the Neonatal Period
was developed to detect subtle neurological abnormalities by observing the
child during play. It assesses seven subcategories: posture, coordination of trunk
and extremities, fluency and adequacy of movements, sensorimotor functions,
cranial nerves and development.8 Children with abnormalities on two or more
subcategories were diagnosed as having minor neurological dysfunction (MND).9
For children older than four years we used Touwen’s age-specific neurological
examination.10 Eight subcategories were assessed: posture and muscle tone,
reflexes, choreiform dyskinesia, coordination and balance, fine manipulative ability,
cranial nerves, sensory integrity, and rarely occurring dysfunctions including an
excess of associated movements. The children were diagnosed as having MND in
the presence of dysfunction in three or more subcategories.9,10
Following Bax’ criteria, the presence or absence of cerebral palsy (CP) was
determined when infants had reached the age of at least 18 months.11 In case of CP,
gross motor functioning was scored using the Gross Motor Function Classification
System (GMFCS).12 This is a functional, five level classification system for CP based
on self-initiated movement with particular emphasis on sitting (truncal control)
and walking. The higher the level the more serious the impairment of functional
abilities.
Epilepsy at Follow-up
In addition to categorising outcome as normal, mild, or major neurological
abnormalities, we determined the presence of epilepsy during follow-up. Epilepsy
was defined as at least two unprovoked seizures a year during follow-up. In these
cases we also recorded whether anti-epileptic treatment was started.
Statistical Analyses
For all the statistical analyses we used SPSS version 16.0. We first established
whether the infant had survived the neonatal period. Next we classified outcome
into any of four categories: normal, mild neurological abnormalities, major
neurological abnormalities, and death. Children classified as normal showed no
neurological signs or the neurological dysfunction was below the cut-off for MND.
Children classified as having mild neurological abnormalities had MND but no CP.
Functional Development at School Age of Newborn Infants at Risk
Children with CP were classified as having major neurologic abnormalities.
We used the X2 test for trend and Fisher’s exact test to evaluate the relations between
seizure aetiology, the number of AEDs, seizure control, and outcome results. To do
logistic regression analyses, we divided the above mentioned four categories into
two groups: ‘good outcome’ (normal and mild neurological abnormalities) and ‘poor
outcome’ (major neurological abnormalities and death). In addition, we assessed the
relation between the presence of epilepsy at follow-up and seizure-related factors
during the neonatal period. Results were expressed in odds ratios (OR) including
95% confidence intervals (CI). Finally, we performed backward multiple logistic
regression analyses to determine which factors were independently associated with
outcome. Throughout the analyses p<.05 was considered statistically significant.
115Chapter 5 Long-Term Neurological Outcome of Term-Born Children Treated with Two or More Anti-Epileptic Drugs in the Neonatal Period
Results
Between 1998 and 2006, 147 term infants with neonatal seizures were admitted to
our NICU. Fifty-two infants were treated with one drug only and were not included
in the study for that reason. Ninety-five infants were treated with two or more AEDs.
After excluding 13 infants with major congenital or chromosomal abnormalities, 82
children remained.
Patient Characteristics
In Table 1 we present an overview of the patient characteristics and the underlying
causes of the seizures. In all cases the onset of the seizures was from half an hour to
more than five days after birth. Asphyxia was the most common cause of the seizures
(n=55) followed by subdural haemorrhage (n=8), arterial cerebral infarction (n=7), and
infection (n=6). Ten children had two potential causes for the seizures. All ten had
intracranial haemorrhages or cerebral infarctions, combined with asphyxia in five
children, bacterial infection in one child, a combination of subdural/subarachnoidal
and intraparenchymal haemorrhage in two children, and a combination of subdural
haemorrhage and infarction in two children.
aEEG Patterns
The aEEG recordings of the infants showed status epilepticus at admission in 26
infants (32%) and during the clinical course in another 21 infants (26%). In 29 infants
(35%), background activity of the aEEG at admission was scored as DNV or CNV,
in 14 (17%) as BS and in 13 infants (16%) as FT. During admission, aEEG patterns
of 48 infants (59%) remained normal or normalised into CNV or DNV. In 34 infants
(41%) the patterns remained or became severely abnormal, i.e. FT and BS. During
the clinical course, the most severely abnormal aEEG patterns were FT in 21 infants
(26%), BS in 27 (33%), and status epilepticus (without FT or BS) in 16 infants (20%).
Eighteen infants (22%) had consistently normal (CNV or DNV) aEEG patterns.
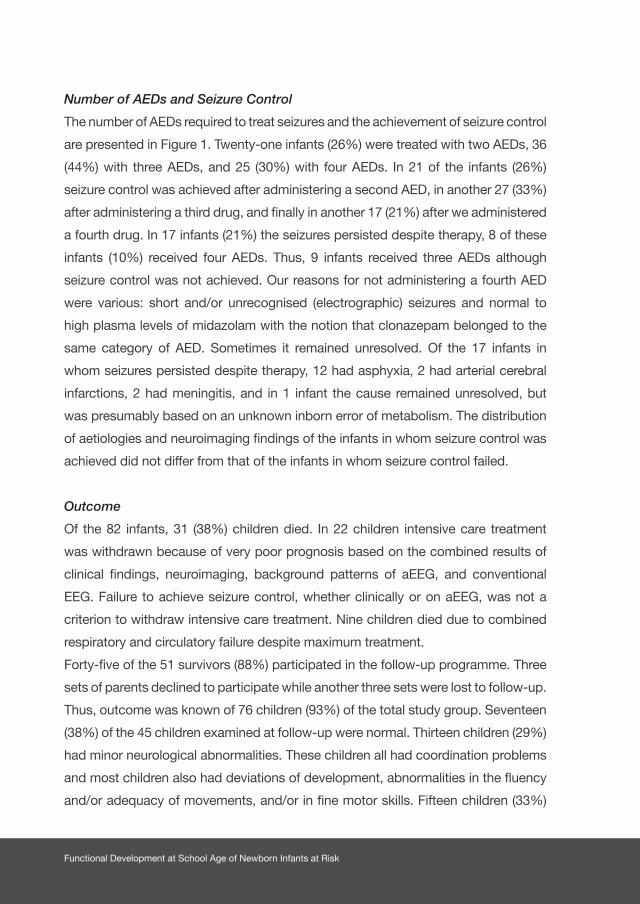
Functional Development at School Age of Newborn Infants at Risk
Number of AEDs and Seizure Control
The number of AEDs required to treat seizures and the achievement of seizure control
are presented in Figure 1. Twenty-one infants (26%) were treated with two AEDs, 36
(44%) with three AEDs, and 25 (30%) with four AEDs. In 21 of the infants (26%)
seizure control was achieved after administering a second AED, in another 27 (33%)
after administering a third drug, and finally in another 17 (21%) after we administered
a fourth drug. In 17 infants (21%) the seizures persisted despite therapy, 8 of these
infants (10%) received four AEDs. Thus, 9 infants received three AEDs although
seizure control was not achieved. Our reasons for not administering a fourth AED
were various: short and/or unrecognised (electrographic) seizures and normal to
high plasma levels of midazolam with the notion that clonazepam belonged to the
same category of AED. Sometimes it remained unresolved. Of the 17 infants in
whom seizures persisted despite therapy, 12 had asphyxia, 2 had arterial cerebral
infarctions, 2 had meningitis, and in 1 infant the cause remained unresolved, but
was presumably based on an unknown inborn error of metabolism. The distribution
of aetiologies and neuroimaging findings of the infants in whom seizure control was
achieved did not differ from that of the infants in whom seizure control failed.
Outcome
Of the 82 infants, 31 (38%) children died. In 22 children intensive care treatment
was withdrawn because of very poor prognosis based on the combined results of
clinical findings, neuroimaging, background patterns of aEEG, and conventional
EEG. Failure to achieve seizure control, whether clinically or on aEEG, was not a
criterion to withdraw intensive care treatment. Nine children died due to combined
respiratory and circulatory failure despite maximum treatment.
Forty-five of the 51 survivors (88%) participated in the follow-up programme. Three
sets of parents declined to participate while another three sets were lost to follow-up.
Thus, outcome was known of 76 children (93%) of the total study group. Seventeen
(38%) of the 45 children examined at follow-up were normal. Thirteen children (29%)
had minor neurological abnormalities. These children all had coordination problems
and most children also had deviations of development, abnormalities in the fluency
and/or adequacy of movements, and/or in fine motor skills. Fifteen children (33%)
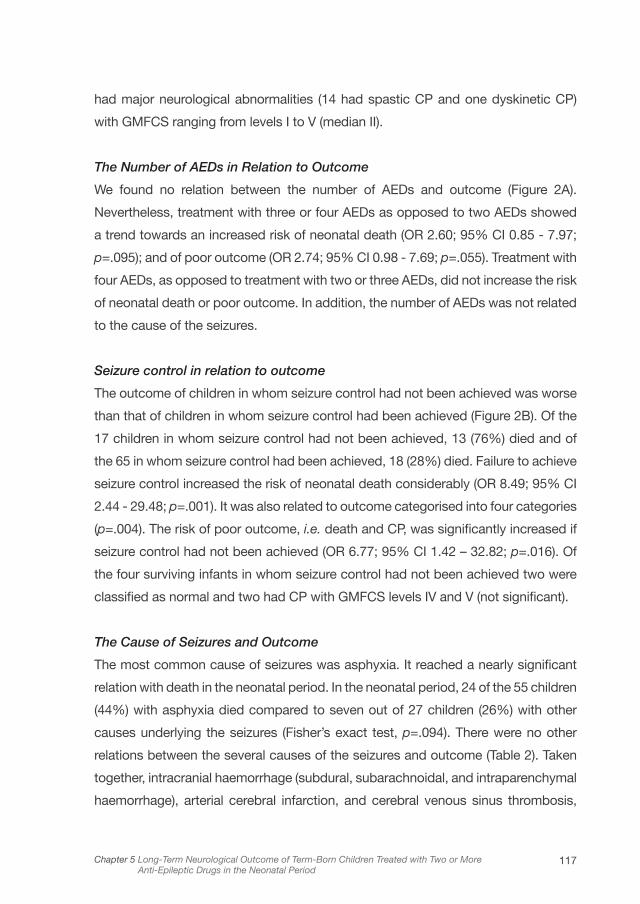
117Chapter 5 Long-Term Neurological Outcome of Term-Born Children Treated with Two or More Anti-Epileptic Drugs in the Neonatal Period
had major neurological abnormalities (14 had spastic CP and one dyskinetic CP)
with GMFCS ranging from levels I to V (median II).
The Number of AEDs in Relation to Outcome
We found no relation between the number of AEDs and outcome (Figure 2A).
Nevertheless, treatment with three or four AEDs as opposed to two AEDs showed
a trend towards an increased risk of neonatal death (OR 2.60; 95% CI 0.85 - 7.97;
p=.095); and of poor outcome (OR 2.74; 95% CI 0.98 - 7.69; p=.055). Treatment with
four AEDs, as opposed to treatment with two or three AEDs, did not increase the risk
of neonatal death or poor outcome. In addition, the number of AEDs was not related
to the cause of the seizures.
Seizure control in relation to outcome
The outcome of children in whom seizure control had not been achieved was worse
than that of children in whom seizure control had been achieved (Figure 2B). Of the
17 children in whom seizure control had not been achieved, 13 (76%) died and of
the 65 in whom seizure control had been achieved, 18 (28%) died. Failure to achieve
seizure control increased the risk of neonatal death considerably (OR 8.49; 95% CI
2.44 - 29.48; p=.001). It was also related to outcome categorised into four categories
(p=.004). The risk of poor outcome, i.e. death and CP, was significantly increased if
seizure control had not been achieved (OR 6.77; 95% CI 1.42 – 32.82; p=.016). Of
the four surviving infants in whom seizure control had not been achieved two were
classified as normal and two had CP with GMFCS levels IV and V (not significant).
The Cause of Seizures and Outcome
The most common cause of seizures was asphyxia. It reached a nearly significant
relation with death in the neonatal period. In the neonatal period, 24 of the 55 children
(44%) with asphyxia died compared to seven out of 27 children (26%) with other
causes underlying the seizures (Fisher’s exact test, p=.094). There were no other
relations between the several causes of the seizures and outcome (Table 2). Taken
together, intracranial haemorrhage (subdural, subarachnoidal, and intraparenchymal
haemorrhage), arterial cerebral infarction, and cerebral venous sinus thrombosis,

Functional Development at School Age of Newborn Infants at Risk
were not related with outcome either. Finally, the outcome of the ten children with
more than one potential cause for the seizures did not differ from the children with a
single aetiology for seizures.
aEEG Patterns and Outcome
The outcome of the children was significantly related to the course of the aEEG
patterns. Out of the 33 children in whom aEEG patterns became or remained
severely abnormal (FT and BS), 31 had a poor outcome, i.e. death and CP. Still, of
the 43 children in whom background patterns became or remained normal, 15 had
a poor outcome (Fisher’s exact, p<.001). There was a significant relation between an
abnormal background pattern on the last aEEG registration and poor outcome (OR
3.19; 95% CI 1.90-5.36; p< .001).
Status epilepticus was observed on aEEG in 44 of the 76 children of whom
outcome data were available. Twenty of them died, 12 developed CP, 4 had mild
neurological abnormalities and 8 were classified normal. Of the 32 children in whom
status epilepticus was not observed on aEEG, 11 died, 3 developed CP, 9 had
mild abnormalities and 9 were classified normal. This distribution nearly reached
significance (X2 test for trend, p=.074).
Epilepsy at Follow-up
Epilepsy was diagnosed during follow-up in 13 of the 45 surviving children (29%):
ten during the first year, two the second year, and one child during the fourth year.
Epilepsy was more frequent in children with major neurological abnormalities, i.e. CP
(X2 test for trend, p=.004). There was no relation between the development of epilepsy
and the number of AEDs, causes of the seizures, specific neuroimaging findings,
presence of status epilepticus on aEEG, and achievement of seizure control.
Multivariate Analysis
We performed a multivariate logistic regression analysis to investigate which
seizure-related factors contributed independently to death and poor outcome.
Factors which had shown associations with poor outcome at p<.10 were entered
as predictors: seizure control, and treatment with three or four AEDs, as opposed
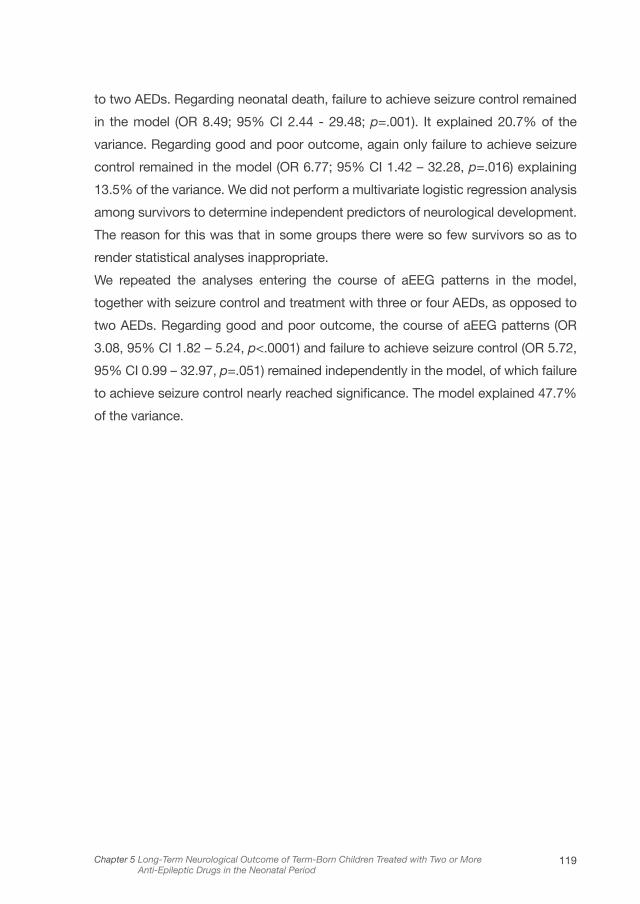
119Chapter 5 Long-Term Neurological Outcome of Term-Born Children Treated with Two or More Anti-Epileptic Drugs in the Neonatal Period
to two AEDs. Regarding neonatal death, failure to achieve seizure control remained
in the model (OR 8.49; 95% CI 2.44 - 29.48; p=.001). It explained 20.7% of the
variance. Regarding good and poor outcome, again only failure to achieve seizure
control remained in the model (OR 6.77; 95% CI 1.42 – 32.28, p=.016) explaining
13.5% of the variance. We did not perform a multivariate logistic regression analysis
among survivors to determine independent predictors of neurological development.
The reason for this was that in some groups there were so few survivors so as to
render statistical analyses inappropriate.
We repeated the analyses entering the course of aEEG patterns in the model,
together with seizure control and treatment with three or four AEDs, as opposed to
two AEDs. Regarding good and poor outcome, the course of aEEG patterns (OR
3.08, 95% CI 1.82 – 5.24, p<.0001) and failure to achieve seizure control (OR 5.72,
95% CI 0.99 – 32.97, p=.051) remained independently in the model, of which failure
to achieve seizure control nearly reached significance. The model explained 47.7%
of the variance.
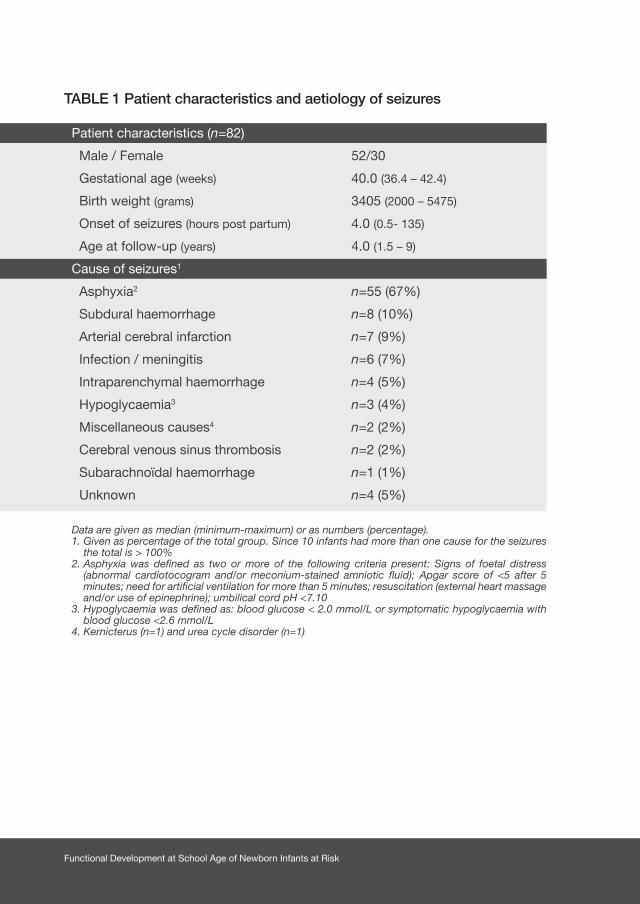
Functional Development at School Age of Newborn Infants at Risk
TABLE 1 Patient characteristics and aetiology of seizures
Patient characteristics (n=82)
Male / Female 52/30
Gestational age (weeks) 40.0 (36.4 – 42.4)
Birth weight (grams) 3405 (2000 – 5475)
Onset of seizures (hours post partum) 4.0 (0.5- 135)
Age at follow-up (years) 4.0 (1.5 – 9)
Cause of seizures1
Asphyxia2 n=55 (67%)
Subdural haemorrhage n=8 (10%)
Arterial cerebral infarction n=7 (9%)
Infection / meningitis n=6 (7%)
Intraparenchymal haemorrhage n=4 (5%)
Hypoglycaemia3 n=3 (4%)
Miscellaneous causes4 n=2 (2%)
Cerebral venous sinus thrombosis n=2 (2%)
Subarachnoïdal haemorrhage n=1 (1%)
Unknown n=4 (5%)
Data are given as median (minimum-maximum) or as numbers (percentage).1. Given as percentage of the total group. Since 10 infants had more than one cause for the seizures
the total is > 100%2. Asphyxia was defined as two or more of the following criteria present: Signs of foetal distress
(abnormal cardiotocogram and/or meconium-stained amniotic fluid); Apgar score of <5 after 5 minutes; need for artificial ventilation for more than 5 minutes; resuscitation (external heart massage and/or use of epinephrine); umbilical cord pH <7.10
3. Hypoglycaemia was defined as: blood glucose < 2.0 mmol/L or symptomatic hypoglycaemia with blood glucose <2.6 mmol/L
4. Kernicterus (n=1) and urea cycle disorder (n=1)
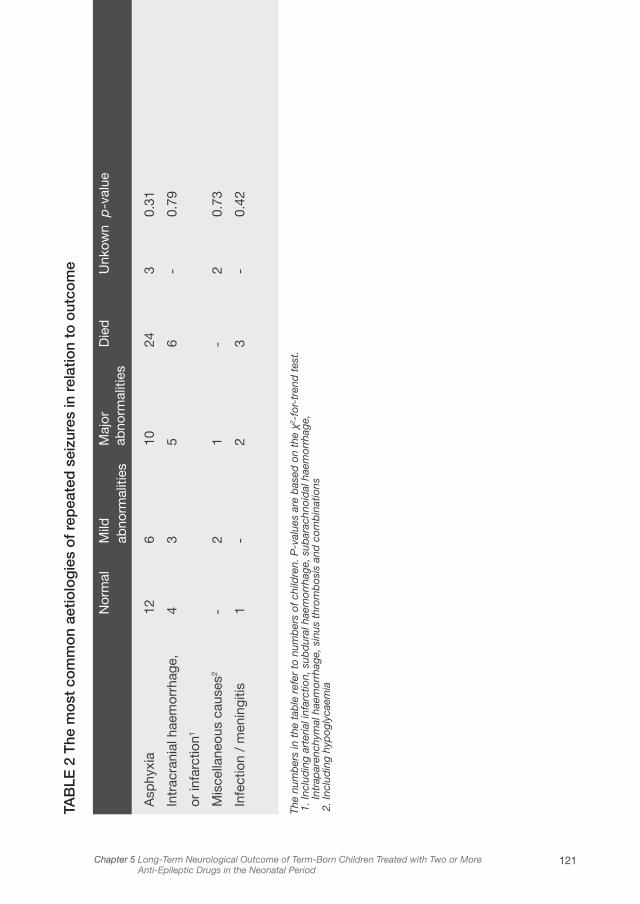
121Chapter 5 Long-Term Neurological Outcome of Term-Born Children Treated with Two or More Anti-Epileptic Drugs in the Neonatal Period
TAB
LE 2
The
mo
st c
om
mo
n ae
tiolo
gie
s o
f re
pea
ted
sei
zure
s in
rel
atio
n to
out
com
e
The
num
ber
s in
the
tab
le r
efer
to
num
ber
s of
chi
ldre
n. P
-val
ues
are
bas
ed o
n th
e χ2
-for
-tre
nd t
est.
1. I
nclu
din
g ar
teria
l inf
arct
ion,
sub
dur
al h
aem
orrh
age,
sub
arac
hnoi
dal
hae
mor
rhag
e,
Intr
apar
ench
ymal
hae
mor
rhag
e, s
inus
thr
omb
osis
and
com
bin
atio
ns 2
. Inc
lud
ing
hyp
ogly
caem
ia
Asp
hyxi
a
Intr
acra
nial
hae
mor
rhag
e,
or in
farc
tion1
Mis
cella
neou
s ca
uses
2
Infe
ctio
n /
men
ingi
tis
Nor
mal
12 4 - 1
Mild
ab
norm
aliti
es
6 3 2 -
Maj
or
abno
rmal
ities
10 5 1 2
Die
d
24 6 - 3
Unk
own
3 - 2 -
p-v
alue
0.31
0.79
0.73
0.42
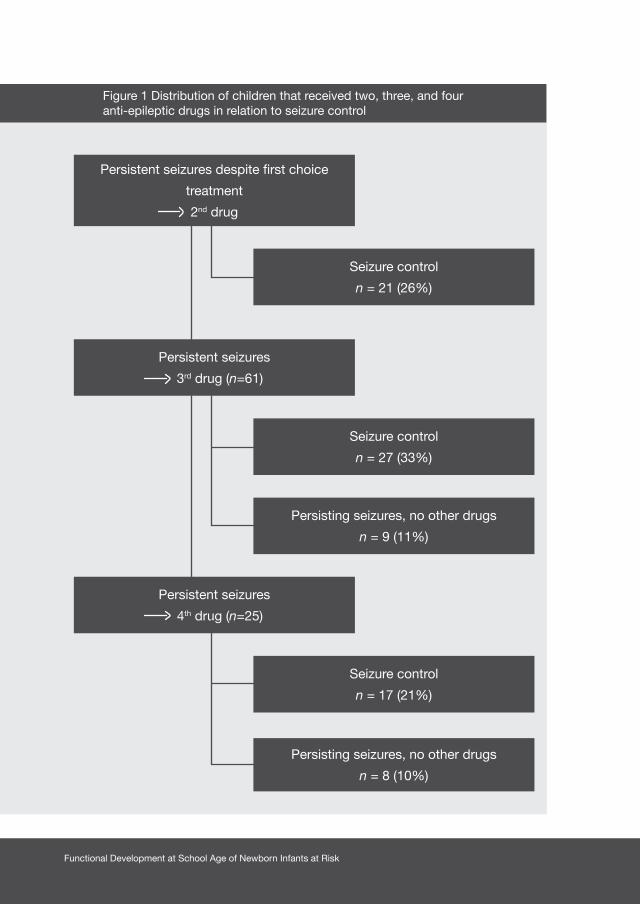
Functional Development at School Age of Newborn Infants at Risk
Persistent seizures
3rd drug (n=61)
Persistent seizures
4th drug (n=25)
Seizure control
n = 27 (33%)
Seizure control
n = 17 (21%)
Persisting seizures, no other drugs
n = 9 (11%)
Persisting seizures, no other drugs
n = 8 (10%)
Persistent seizures despite first choice
treatment
2nd drug
Seizure control
n = 21 (26%)
Figure 1 Distribution of children that received two, three, and fouranti-epileptic drugs in relation to seizure control
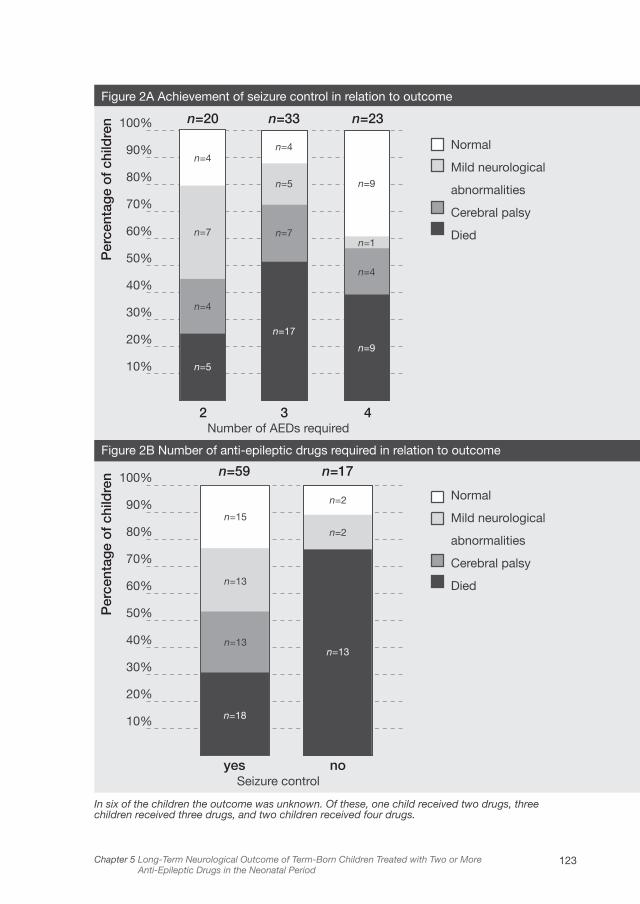
123Chapter 5 Long-Term Neurological Outcome of Term-Born Children Treated with Two or More Anti-Epileptic Drugs in the Neonatal Period
In six of the children the outcome was unknown. Of these, one child received two drugs, three children received three drugs, and two children received four drugs.
100%
90%
80%
70%
60%
50%
40%
30%
20%
10%
100%
90%
80%
70%
60%
50%
40%
30%
20%
10%
Per
cent
age
of
child
ren
Per
cent
age
of
child
ren
n=20
2
n=59
yes
Number of AEDs required
Seizure control
n=33
3
n=17
no
n=23
4
Normal
Mild neurological
abnormalities
Cerebral palsy
Died
Normal
Mild neurological
abnormalities
Cerebral palsy
Died
Figure 2A Achievement of seizure control in relation to outcome
Figure 2B Number of anti-epileptic drugs required in relation to outcome
n=4n=4
n=9
n=7
n=5
n=1
n=4
n=13
n=13
n=15
n=2
n=2
n=7
n=4
n=5
n=18
n=13
n=17
n=9

Functional Development at School Age of Newborn Infants at Risk
Discussion
With this study we demonstrated that seizures persisting despite anticonvulsant
treatment in children receiving two or more AEDs were highly prognostic for poor
outcome. Especially the risk of neonatal death was significantly increased. Moreover,
we found that an increasing number of AEDs required to control seizures had some
prognostic value. Treatment with three or four AEDs, as opposed to two AEDs,
increased the risk of poor outcome: either death or CP. Seizure aetiology was not
associated with outcome.
Our most striking finding was that failure to achieve seizure control was strongly
associated with poor outcome rather than the number of AEDs required. Not
surprisingly, persistently severely abnormal aEEG background patterns were most
predictive of a poor outcome. Previously, the predictive value of aEEG background
patterns have been demonstrated beyond doubt in asphyxiated infants.5-7 In our
study, asphyxia was by far the most common cause of therapy-resistant seizures.
It was found in two thirds of our children. Still, failure to achieve seizure control
remained independently in the multivariate model, although its predictive value for
adverse outcome now just failed to reach statistical significance. Previously, Castro
et al. also reported that seizures persisting despite adequate therapy are prognostic
for adverse outcome.13 They found that outcome at one year was better in children
with seizure control with two or more AEDs than in children with persistent seizures
with single or two-drug treatment.13 Their study group, however, was very small with
only 13 children receiving midazolam as second-choice drug. Ronen et al., in their
study on risk factors for adverse outcome following neonatal seizures, suggested
that the need for multiple AEDs is a sign for poor outcome.1 Unlike us, they also
included children that had been treated with only one AED. It is not clear from their
study whether treatment with two or more AEDs, as opposed to one drug only,
increased the risk of poor outcome. Possibly this fact was responsible for their
findings. Our study on a large, high-risk group of children since they all required two
or more AEDs, makes us believe that in these children achieving seizure control is
more important than the number of AEDs required in the management of neonatal
seizures.

125Chapter 5 Long-Term Neurological Outcome of Term-Born Children Treated with Two or More Anti-Epileptic Drugs in the Neonatal Period
We did not find a relation between seizure aetiology and outcome. Others have
reported that prognosis is strongly related to the aetiology of the seizures.4 In particular,
asphyxia and cerebral haemorrhage are related to poor outcome.1,4,11 We think that
the discrepancy can be explained by the differences in study populations. The
seizures in the children of our study were difficult to treat because two or more AEDs
were considered clinically necessary. Perhaps the severity of the underlying brain
damage, irrespective of its cause, led to the seizures being impervious to treatment.
We found that asphyxia was a relatively common cause for the seizures among
children that died, but the association just failed to reach statistical significance.
In the present study the age at follow-up ranged from one-and-a half to nine years.
We only investigated neurological and motor functioning; cognitive functions were
not tested in our follow-up programme. Of the surviving children the outcome in
38% was normal, in 29% it was mildly abnormal, and in 33% outcome was severely
abnormal. Other studies on neonatal seizures, without considering the number of
AEDs, report comparable percentages of surviving children with normal outcomes
(35-54%), mildly abnormal outcomes (37%), and severely abnormal outcomes
(28%).1,4,14 This suggests that the requirement of multiple AEDs is not a poor
prognostic sign per se. This is supported by our finding that outcome did not differ
between children that required three versus four AEDs.
We found that 29% of the surviving children developed epilepsy three months or
more after discharge from our NICU. The development of epilepsy was strongly
related to CP. Other studies in term-born infants that do not distinguish between the
number of AEDs, reported percentages ranging from 9.4 to 29%.1,4,14-16 As was the
case in our study, they found a strong association between development of epilepsy
and poor neurological outcome.15 We were unable to identify neonatal risk factors
that were independently associated with the development of epilepsy.
It may well be that cerebral injury is the keystone of a poor response to AEDs. It
explains the adverse outcome in children with seizures persisting despite therapy.
Whether the seizures themselves are harmful for the brain remains unresolved. Several
studies indicated that seizures may disrupt brain development in infants.2,17,18 This
is in line with our findings of a better neurological outcome in the children in whom
seizure control had been achieved. Other studies found the number or duration of
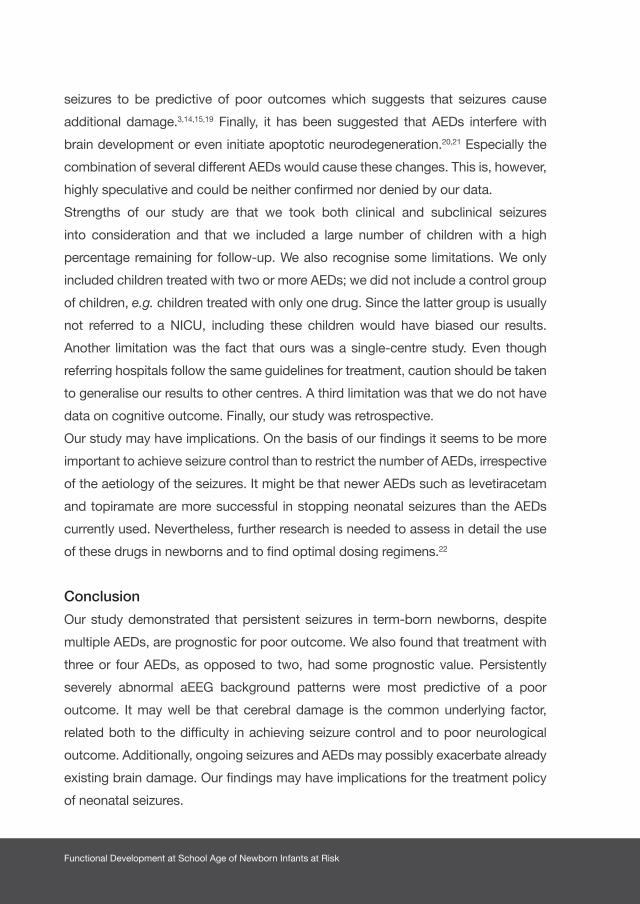
Functional Development at School Age of Newborn Infants at Risk
seizures to be predictive of poor outcomes which suggests that seizures cause
additional damage.3,14,15,19 Finally, it has been suggested that AEDs interfere with
brain development or even initiate apoptotic neurodegeneration.20,21 Especially the
combination of several different AEDs would cause these changes. This is, however,
highly speculative and could be neither confirmed nor denied by our data.
Strengths of our study are that we took both clinical and subclinical seizures
into consideration and that we included a large number of children with a high
percentage remaining for follow-up. We also recognise some limitations. We only
included children treated with two or more AEDs; we did not include a control group
of children, e.g. children treated with only one drug. Since the latter group is usually
not referred to a NICU, including these children would have biased our results.
Another limitation was the fact that ours was a single-centre study. Even though
referring hospitals follow the same guidelines for treatment, caution should be taken
to generalise our results to other centres. A third limitation was that we do not have
data on cognitive outcome. Finally, our study was retrospective.
Our study may have implications. On the basis of our findings it seems to be more
important to achieve seizure control than to restrict the number of AEDs, irrespective
of the aetiology of the seizures. It might be that newer AEDs such as levetiracetam
and topiramate are more successful in stopping neonatal seizures than the AEDs
currently used. Nevertheless, further research is needed to assess in detail the use
of these drugs in newborns and to find optimal dosing regimens.22
Conclusion
Our study demonstrated that persistent seizures in term-born newborns, despite
multiple AEDs, are prognostic for poor outcome. We also found that treatment with
three or four AEDs, as opposed to two, had some prognostic value. Persistently
severely abnormal aEEG background patterns were most predictive of a poor
outcome. It may well be that cerebral damage is the common underlying factor,
related both to the difficulty in achieving seizure control and to poor neurological
outcome. Additionally, ongoing seizures and AEDs may possibly exacerbate already
existing brain damage. Our findings may have implications for the treatment policy
of neonatal seizures.

127Chapter 5 Long-Term Neurological Outcome of Term-Born Children Treated with Two or More Anti-Epileptic Drugs in the Neonatal Period
Acknowledgements
This study was part of the research programme of the postgraduate School for
Behavioral and Cognitive Neurosciences, University of Groningen. Elise Roze was
supported by a grant from the Junior Scientific Master Class of the University of
Groningen. We greatly acknowledge the help of Dr. T. Brantsma–van Wulfften Palthe
for correcting the English manuscript.
Functional Development at School Age of Newborn Infants at Risk
1. Ronen GM, Buckley D, Penney S, Streiner DL. Long-
term prognosis in children with neonatal seizures: a
population-based study. Neurology
2007;69:1816-1822.
2. Volpe JJ. Neurology of the Newborn, 5th ed.
Philadelphia, PA: W.B.Saunders; 2008.
3. McBride MC, Laroia N, Guillet R. Electrographic
seizures in neonates correlate with poor
neurodevelopmental outcome. Neurology
2000;55:506-513.
4. Tekgul H, Gauvreau K, Soul J, et al. The current
etiologic profile and neurodevelopmental outcome
of seizures in term newborn infants. Pediatrics
2006;117:1270-1280.
5. Van Rooij LGM, Toet MC, Osredkar D, van Huffelen
AC, Groenendaal F, de Vries LS. Recovery of
amplitude integrated electroencephalographic
background patterns within 24 hours of perinatal
asphyxia. Arch Dis Child Fetal Neonatal Ed
2005;90:F245-F251.
6. Toet MC, Hellstrom-Westas L, Groenendaal F, Eken
P, de Vries LS. Amplitude integrated EEG 3 and 6
hours after birth in full term neonates with hypoxic-
ischaemic encephalopathy. Arch Dis Child Fetal
Neonatal Ed 1999;81:F19-F23.
7. Ter Horst HJ, Sommer C, Bergman KA, Fock JM, van
Weerden TW, Bos AF. The prognostic significance
of aEEG patterns during the first 72 hours after
birth in severely asphyxiated neonates. Pediatr Res
2004;55:1026-1033.
8. Hempel MS. Neurological development during
toddling age in normal children and children at risk of
developmental disorders. Early Hum Dev
1993;34:47-57.
9. Hadders-Algra M. Developmental coordination
disorder: is clumsy motor behavior caused by
a lesion of the brain at early age? Neural Plast
2003;10:39-50.
10. Touwen BCL. Examination of the Child with Minor
Neurological Dysfunction, 2nd ed. London, UK:
William Heinemann Medical Books Ltd.; 1979.
11. Bax M, Goldstein M, Rosenbaum P, et al. Proposed
definition and classification of cerebral palsy, April
2005. Dev Med Child Neurol 2005;47:571-576.
12. Palisano R, Rosenbaum P, Walter S, Russell D,
Wood E, Galuppi B. Development and reliability
of a system to classify gross motor function in
children with cerebral palsy. Dev Med Child Neurol
1997;39:214-233.
13. Castro Conde JR, Hernandez Borges AA,
Domenech Martinez E, Gonzalez Campo C, Perera
Soler R. Midazolam in neonatal seizures with no
response to phenobarbital. Neurology 2005;64:876-
879.
14. Toet MC, Groenendaal F, Osredkar D, van Huffelen
AC, de Vries LS. Postneonatal epilepsy following
amplitude-integrated EEG-detected neonatal
seizures. Pediatr Neurol 2005;32:241-247.
References

129Chapter 5 Long-Term Neurological Outcome of Term-Born Children Treated with Two or More Anti-Epileptic Drugs in the Neonatal Period
15. Pisani F, Cerminara C, Fusco C, Sisti L. Neonatal
status epilepticus vs recurrent neonatal seizures
- Clinical findings and outcome. Neurology
2007;69:2177-185.
16. Kwong KL, Wong SN, So KT. Epilepsy in children
with cerebral palsy. Pediatr Neurol 1998;19:31-36.
17. Rennie JM, Boylan GB. Neonatal seizures and their
treatment. Curr Opin Neurol 2003;16:177-181.
18. Thibeault-Eybalin MP, Lortie A, Carmant L. Neonatal
Seizures: Do They Damage the Brain? Pediatr
Neurol 2009;40:175-180.
19. Klinger G, Chin CN, Beyene J, Perlman M.
Predicting the outcome of neonatal bacterial
meningitis. Pediatrics 2000;106:477-482.
20. Kaindl AM, Sifiringer M, Koppelstaetter A, et al.
Erythropoietin Protects the Developing Brain from
Hyperoxia-Induced Cell Death and Proteome
Changes. Ann Neurol 2008;64:523-534.
21. Bittigau P, Sifringer M, Genz K, et al. Antiepileptic
drugs and apoptotic neurodegeneration in the
developing brain. Proc Natl Acad Sci U S A
2002;99:15089-15094.
22. Furwentsches A, Bussmann C, Ramantani G, et al.
Levetiracetam in the treatment of neonatal seizures:
a pilot study. Seizure 2010;19:185-189.

Chapter 6
TRACTOGRAPHY OF THE CORTICOSPINAL
TRACTS IN INFANTS WITH FOCAL PERINATAL
INJURY: COMPARISON WITH NORMAL
CONTROLS AND TO MOTOR DEVELOPMENT
ELISE ROZE, POLLY A. HARRIS, GARETH BALL, LEIRE Z. ELORZA, RODRIGO M.
BRAGA, JOANNA M. ALLSOP, NAZAKAT MERCHANT, EMMA PORTER, TOMOKI
ARICHI, A. DAVID EDWARDS, MARY A. RUTHERFORD, FRANCES M. COWAN,
SERENA J. COUNSELL
NEURORADIOLOGY 2011; ACCEPTED
Functional Development at School Age of Newborn Infants at Risk
Abstract
Purpose
Our aims were 1. to assess the corticospinal tracts (CSTs) in infants with focal injury
and healthy term controls using probabilistic tractography and 2. to correlate the
conventional MRI and tractography findings in infants with focal injury with their later
motor function.
Methods
We studied 20 infants with focal lesions and 23 controls using magnetic resonance
imaging (MRI) and diffusion tensor imaging. Tract volume, fractional anisotropy (FA),
apparent diffusion coefficient (ADC) values, axial (AD) and radial diffusivity (RD) of
the CSTs were determined. Asymmetry indices (AIs) were calculated by comparing
ipsilateral to contralateral CSTs. Motor outcome was assessed using a standardized
neurological examination.
Results
Conventional MRI was able to predict normal motor development (n=9) or hemiplegia
(n=6). In children who developed a mild motor asymmetry (n=5), conventional MRI
predicted a hemiplegia in 2 and normal motor development in 3 infants. The AIs for
tract volume, FA, ADC and RD showed a significant difference between controls and
infants who developed a hemiplegia and RD also showed a significant difference in
AI between controls and infants who developed a mild asymmetry.
Conclusion
Conventional MRI was able to predict subsequent normal motor development or
hemiplegia following focal injury in newborn infants. Measures of RD obtained from
diffusion tractography may offer additional information for predicting a subsequent
asymmetry in motor function.

133Chapter 6 Tractography of the Corticospinal Tracts in Infants with Focal Perinatal Injury: Comparison with Normal Controls and to Motor Development
Introduction
Neonatal arterial ischemic stroke (AIS) and hemorrhagic parenchymal infarction (HPI)
can be reliably identified on magnetic resonance imaging (MRI). AIS most commonly
affects the territory of the left middle cerebral artery (MCA)1 whilst HPI occurs mainly
in preterm infants affecting tissue adjacent to the body of the lateral ventricles.
Motor impairment and hemiplegia frequently follow focal lesions in the region of the
corticospinal tracts (CST).2-5 Conventional MRI studies have demonstrated that injury
to the basal ganglia, posterior limb of the internal capsule (PLIC), and hemispheric
tissue following AIS is associated with hemiplegia, whereas injury to only one or two
of these sites is associated with a good motor outcome.2 In preterm infants with HPI
asymmetry in the signal intensity in the PLIC on MRI at term equivalent age (TEA) is
associated with the development of a hemiplegia.5
Diffusion tensor imaging (DTI) is an MRI technique that characterizes the diffusion
properties of water molecules in tissue. In cerebral white matter (WM) water diffuses
preferentially along the direction of axons (axial diffusion, AD) and is relatively
restricted perpendicular to axons (radial diffusion, RD), this directional dependence
is termed anisotropy. Quantitative measures derived from DTI provide objective and
reproducible assessment of WM and have provided insights into neonatal brain
development and injury.6-9 Additionally, DTI allows visualization of WM tracts in-vivo.
In diffusion tractography it is assumed that the direction of greatest diffusion in a voxel
is parallel to the underlying dominant fibre orientation. By following this direction of
greatest diffusion on a voxel by voxel basis, 3 dimensional reconstructions of WM
tracts are possible. Probabilistic tractography allows the quantitative assessment of
WM tracts in regions of relatively low FA such as in unmyelinated WM.10,11
Diffusion imaging in acute AIS shows the region of infarction as high signal intensity
(SI) on DTI and low SI on the ADC map, representing restricted diffusion of water
molecules, before the infarction is clearly visualised on conventional imaging.12,13
With AIS DTI changes in the PLIC, cerebral peduncle and brainstem remote from the
stroke in the acute period are associated with the developmental of hemiplegia.14,15
There is little data on DTI in preterm infants with HPI in the acute period, however,
tractography is able to demonstrate disruption of the affected CSTs on later imaging.11
To our knowledge, there have been no studies assessing the CSTs in infants with

Functional Development at School Age of Newborn Infants at Risk
focal lesions using tractography in the neonatal period. Furthermore, there have
been few tractography studies assessing the healthy infant brain.16,17
The primary aim of this study was to assess, in infants with a focal lesion of perinatal
onset, the CSTs from the cerebral peduncle to the cortex using probabilistic
tractography and to correlate the conventional MRI and tractography findings at
term with later motor function. We hypothesized that asymmetries in CST diffusion
properties would predict impaired motor function. In order to achieve our primary
aim we needed to establish normative values for the diffusion properties of the CSTs
in healthy infants.
135Chapter 6 Tractography of the Corticospinal Tracts in Infants with Focal Perinatal Injury: Comparison with Normal Controls and to Motor Development
Materials and Methods
Approval for MRI was granted by the local Research Ethics Committee and written
parental consent was obtained prior to scanning.
Subjects
Infants born between October 2005 and October 2009 who underwent MRI and DTI,
had an AIS or HPI and who had a neurodevelopmental assessment at ≥12 months of
age were included. We also studied 23 healthy term-born control infants.
Imaging
MRI was performed on a Philips 3 Tesla system using a phased array head coil. Case
infants were sedated with 30-50 mg/kg oral chloral hydrate. Control infants were
imaged during postprandial sleep. Throughout the examination, pulse oximetry and
electrocardiography were monitored and a pediatrician trained in MRI procedures
was in attendance.
3D MPRAGE and dual echo weighted imaging was obtained prior to DTI. Single shot
echo planar DTI was acquired in either 15 or 32 non-collinear directions using the
following parameters: TR 7230-9765 ms, TE 49 ms, slice thickness 2mm, voxel size
1.75 x1.75 x 2mm3, b value 750 s/mm2. The data were acquired with a SENSE factor
of 2. All MR images were reviewed by an experienced perinatal neuroradiologist
(M.A.R.) unaware of outcome.
Probabilistic Tractography
Image processing was performed using FSL18 and scalar maps of ADC, FA, λ1, λ2
and λ3 were generated. Seed and waypoint masks were generated on color coded
FA maps and tractography was performed as described previously.19
Assessment of Motor Function
Neurological status was assessed using the Hammersmith Infant Neurological
Examination20 and the presence of hemiplegia was determined. Asymmetries of limb
function and hand preference were looked for and the independence and quality
of finger movements noted. Children with minor asymmetries of tone, posture or
Functional Development at School Age of Newborn Infants at Risk
reflexes or a hand preference but who had normal symmetrical independent finger
movements and good bimanual function were classified as being asymmetrical but
not to have a hemiplegia.
Statistical Analyses
Volume, FA, ADC, AD (λ1) and RD ([λ2 + λ3]/2) of the CSTs were determined. From
the control infant data an asymmetry index (AI) for these parameters was calculated
using [2 x (mean left tract–mean right tract))/(mean left tract+ mean right tract)].21
For the infants with a focal lesion an AI for these parameters was determined using
[2 x (mean contralateral tract-mean ipsilateral tract))/ (mean contralateral+ mean
ipsilateral tract)]. The AI for tract volume, FA, ADC, AD and RD in the case infants
were assessed to see if they were outside the AI range obtained in the healthy
controls. Next, the data were tested for normality and found compatible with a
normal distribution. One way ANOVA was performed to assess between groups
differences in AIs of the diffusion measures (controls and cases which were divided
into 3 groups based on their motor performance; those who had no evidence of
asymmetry, those who had an asymmetry and those who developed a hemiplegia).
Results were corrected for multiple comparisons using a Bonferroni test. Where
a significant difference was observed, post-hoc analyses were performed using
Tukey’s HSD and Dunnett’s test.
Tractography was repeated in 5 healthy controls. The coefficient of variation was
<3% for tract volume and FA.

137Chapter 6 Tractography of the Corticospinal Tracts in Infants with Focal Perinatal Injury: Comparison with Normal Controls and to Motor Development
Results
Subjects
Twenty-four infants were found to have a unilateral focal lesion underwent MRI and
DTI between October 2005 and October 2009. DTI data was corrupt due to motion
in 1, could not be retrieved from archive in 1 and follow-up data was not available
for 2 cases. Our study group consisted of 20 infants who had MRI and DTI data
available for analysis and who had early neurodevelopmental assessment. The
infants were imaged at a median age of 24 (range 3 – 97) days after birth, at a median
post-menstrual age of 41 (range 39 – 46+5) weeks. Their clinical characteristics are
shown in Table S1. We also studied 23 healthy term control infants, with a median
gestational age of 40 weeks (range 38 - 41+5) and median birth-weight of 3657 grams
(range 2790-4304).
MRI Findings
MRI findings for the infants are described in Table 1. Based on the criteria of 3 site
involvement (basal ganglia, PLIC, hemisphere) in MCA infarction2 or asymmetrical
PLIC at TEA following HPI,5 the imaging findings predicted a hemiplegia in 8 infants
and normal motor development in 12. No lesions or PLIC asymmetries were found in
the control infants. Conventional MRI, diffusion images and ADC maps for an infant
with subsequent normal motor function and an infant who developed a hemiplegia
are shown in Figures 1 and 2 respectively.
Tractography
Infants with lesions: DTI was obtained in 15 non-collinear directions in 9 infants and
in 32 noncollinear directions in 11 infants. In 3 infants who had extensive brain injury
we were not able to generate a connectivity distribution in the CST in the hemisphere
ipsilateral to the injury. Figure 3 shows the CSTs in an infant with subsequent normal
motor function (3a) and in an infant who developed a hemiplegia (3b and c).
Healthy control infants: In the 23 control infants, DTI was obtained in 15 non-
collinear directions in 8 infants and in 32 non-collinear directions in 15. There were
no significant differences in volume (p=.23), FA (p=.32), ADC (p=.83), AD (p=.73) or
Functional Development at School Age of Newborn Infants at Risk
RD (p=.91) between left and right CSTs in the controls. The values for volume, FA,
ADC, AD, and RD for the CSTs in all infants are shown in Table S2. The AIs of the
tract parameters from the infants with lesions and the controls are shown in Figure
S1.
Motor Outcome (Case Infants Only)
The median age at follow-up was 22.5 (range 12-48) months. Six infants developed
a hemiplegia contralateral to the lesion, 5 developed a mild motor asymmetry and 9
had no evidence of asymmetry in motor function.
Correlation between Conventional MRI Findings and Motor Performance
Conventional MRI findings predicted normal motor outcome in all 9 infants who had
no evidence of motor asymmetry and predicted a hemiplegia in all 6 infants who
developed a hemiplegia. In the 5 infants with a mild motor asymmetry, conventional
MRI was predictive of a hemiplegia in 2 and of normal motor development in 3
infants.
Combining the results for infants who developed a hemiplegia or asymmetry,
conventional MRI predicted an abnormal motor outcome in 8/11 children. The
sensitivity of conventional MRI to predict an abnormal motor outcome was 73%
and the specificity for prediction of a normal motor outcome was 100%.
Correlation of Tractography Findings and Motor Performance
Tract volume, FA, ADC, AD and RD were within the normal range for AI in all children
who had no evidence of motor asymmetry.
The 3 infants in whom tractography was unsuccessful due to extensive brain injury
developed a hemiplegia. In the remaining 3 infants who developed a hemiplegia, the
AI was outside the normal range for FA, volume and RD in all 3 and for ADC in 2.
In the 5 infants who developed a mild motor asymmetry, the AI was outside the
normal range for at least one diffusion measure in 4 infants (reduced volume in 2,
reduced FA value in 1 and increased RD in 3).
Combining the results for the infants who developed a hemiplegia or asymmetry, an
AI outside the normal range in ≥1 DTI measurement predicted an abnormal motor

139Chapter 6 Tractography of the Corticospinal Tracts in Infants with Focal Perinatal Injury: Comparison with Normal Controls and to Motor Development
outcome in 10/11 children. The sensitivity to predict an abnormal motor outcome
was 91% and the specificity for prediction of a normal motor outcome was 100%.
Results of Between Groups Differences Analyses of AIs
One way ANOVA demonstrated a significant difference in AI between the 4
groups (controls and cases who were divided into 3 groups based on their motor
performance) in tract volume (p=.05), FA (p<.0001), ADC (p=.015) and RD (p<.0001).
There was no significant between groups difference in AD (p=.95).
Results of Post-Hoc Analyses
Table 3 shows the results of the post-hoc analyses comparing AIs for tract volume,
FA, ADC and RD between healthy controls and the case infants.
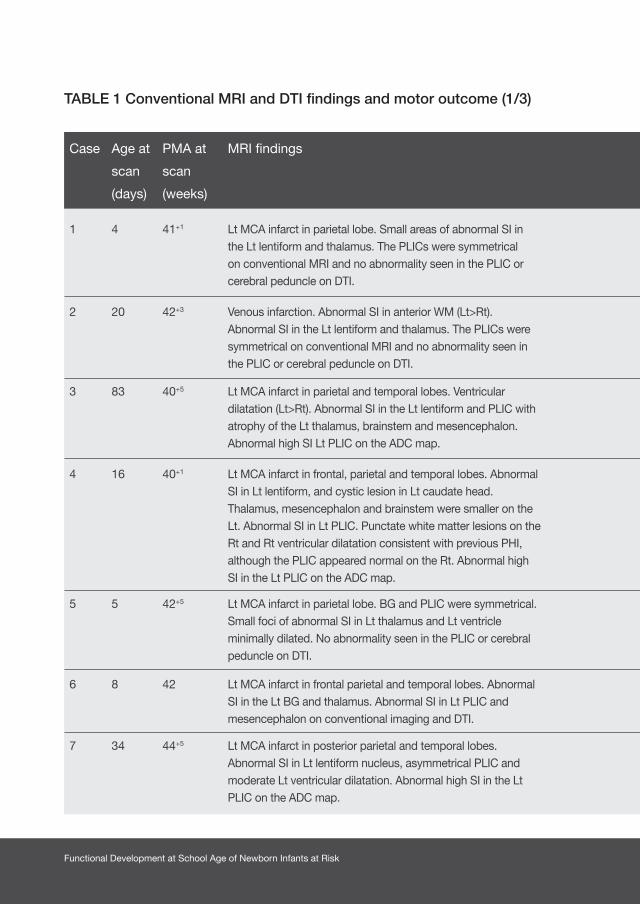
Functional Development at School Age of Newborn Infants at Risk
TABLE 1 Conventional MRI and DTI findings and motor outcome (1/3)
Case Age at
scan
(days)
PMA at
scan
(weeks)
MRI findings Prediction of motor
performance from
conventional MRI
AI outside
control range
Age at
assessment
(months)
Motor performance
1 4 41+1 Lt MCA infarct in parietal lobe. Small areas of abnormal SI in the Lt lentiform and thalamus. The PLICs were symmetrical on conventional MRI and no abnormality seen in the PLIC or cerebral peduncle on DTI.
No asymmetry No 48 Mild asymmetry Lt hand preference but good independent finger movements bilaterally
2 20 42+2 Venous infarction. Abnormal SI in anterior WM (Lt>Rt). Abnormal SI in the Lt lentiform and thalamus. The PLICs were symmetrical on conventional MRI and no abnormality seen in the PLIC or cerebral peduncle on DTI.
No asymmetry No 24 No asymmetry
3 83 40+5 Lt MCA infarct in parietal and temporal lobes. Ventricular dilatation (Lt>Rt). Abnormal SI in the Lt lentiform and PLIC with atrophy of the Lt thalamus, brainstem and mesencephalon. Abnormal high SI Lt PLIC on the ADC map.
Rt hemiplegia Volume, FA, ADC and RD
36 Rt hemiplegia
4 16 40+1 Lt MCA infarct in frontal, parietal and temporal lobes. Abnormal SI in Lt lentiform, and cystic lesion in Lt caudate head. Thalamus, mesencephalon and brainstem were smaller on the Lt. Abnormal SI in Lt PLIC. Punctate white matter lesions on the Rt and Rt ventricular dilatation consistent with previous PHI, although the PLIC appeared normal on the Rt. Abnormal high SI in the Lt PLIC on the ADC map.
Rt hemiplegia Volume, FA and RD
36 Rt hemiplegia
5 5 42+5 Lt MCA infarct in parietal lobe. BG and PLIC were symmetrical. Small foci of abnormal SI in Lt thalamus and Lt ventricle minimally dilated. No abnormality seen in the PLIC or cerebral peduncle on DTI.
No asymmetry No 24 No asymmetry
6 8 42 Lt MCA infarct in frontal parietal and temporal lobes. Abnormal SI in the Lt BG and thalamus. Abnormal SI in Lt PLIC and mesencephalon on conventional imaging and DTI.
Rt hemiplegia Tractography not possible on affected side
24 Rt hemiplegia
7 34 44+5 Lt MCA infarct in posterior parietal and temporal lobes. Abnormal SI in Lt lentiform nucleus, asymmetrical PLIC and moderate Lt ventricular dilatation. Abnormal high SI in the Lt PLIC on the ADC map.
Rt hemiplegia Volume, FA, ADC and RD
15 Rt hemiplegia
Case Age at
scan
(days)
PMA at
scan
(weeks)
MRI findings Prediction of motor
performance from
conventional MRI
AI outside
control range
Age at
assessment
(months)
Motor performance
1 4 41+1 Lt MCA infarct in parietal lobe. Small areas of abnormal SI in the Lt lentiform and thalamus. The PLICs were symmetrical on conventional MRI and no abnormality seen in the PLIC or cerebral peduncle on DTI.
No asymmetry No 48 Mild asymmetry Lt hand preference but good independent finger movements bilaterally
2 20 42+3 Venous infarction. Abnormal SI in anterior WM (Lt>Rt). Abnormal SI in the Lt lentiform and thalamus. The PLICs were symmetrical on conventional MRI and no abnormality seen in the PLIC or cerebral peduncle on DTI.
No asymmetry No 24 No asymmetry
3 83 40+5 Lt MCA infarct in parietal and temporal lobes. Ventricular dilatation (Lt>Rt). Abnormal SI in the Lt lentiform and PLIC with atrophy of the Lt thalamus, brainstem and mesencephalon. Abnormal high SI Lt PLIC on the ADC map.
Rt hemiplegia Volume, FA, ADC and RD
36 Rt hemiplegia
4 16 40+1 Lt MCA infarct in frontal, parietal and temporal lobes. Abnormal SI in Lt lentiform, and cystic lesion in Lt caudate head. Thalamus, mesencephalon and brainstem were smaller on the Lt. Abnormal SI in Lt PLIC. Punctate white matter lesions on the Rt and Rt ventricular dilatation consistent with previous PHI, although the PLIC appeared normal on the Rt. Abnormal high SI in the Lt PLIC on the ADC map.
Rt hemiplegia Volume, FA and RD
36 Rt hemiplegia
5 5 42+5 Lt MCA infarct in parietal lobe. BG and PLIC were symmetrical. Small foci of abnormal SI in Lt thalamus and Lt ventricle minimally dilated. No abnormality seen in the PLIC or cerebral peduncle on DTI.
No asymmetry No 24 No asymmetry
6 8 42 Lt MCA infarct in frontal parietal and temporal lobes. Abnormal SI in the Lt BG and thalamus. Abnormal SI in Lt PLIC and mesencephalon on conventional imaging and DTI.
Rt hemiplegia Tractography not possible on affected side
24 Rt hemiplegia
7 34 44+5 Lt MCA infarct in posterior parietal and temporal lobes. Abnormal SI in Lt lentiform nucleus, asymmetrical PLIC and moderate Lt ventricular dilatation. Abnormal high SI in the Lt PLIC on the ADC map.
Rt hemiplegia Volume, FA, ADC and RD
15 Rt hemiplegia
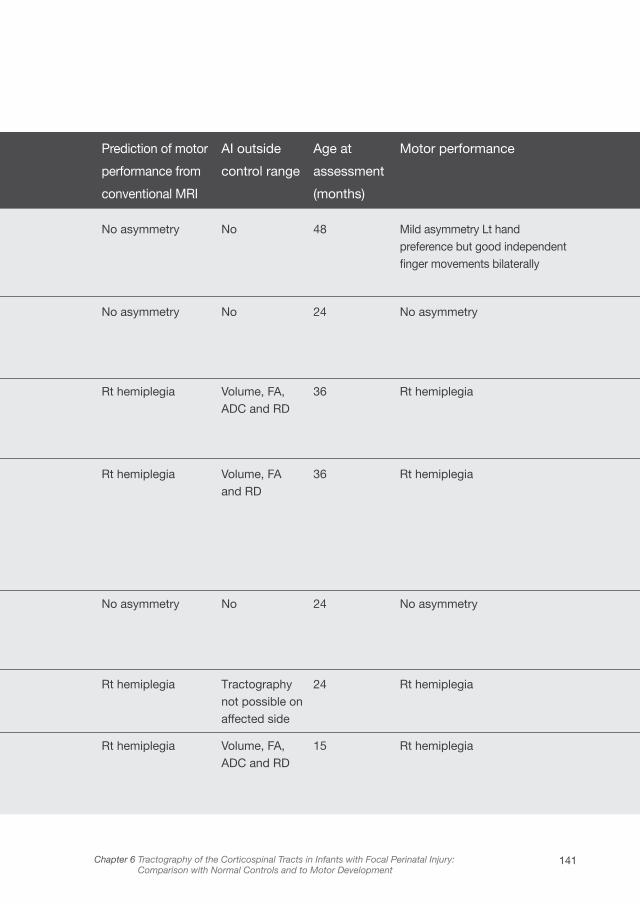
141Chapter 6 Tractography of the Corticospinal Tracts in Infants with Focal Perinatal Injury: Comparison with Normal Controls and to Motor Development
Case Age at
scan
(days)
PMA at
scan
(weeks)
MRI findings Prediction of motor
performance from
conventional MRI
AI outside
control range
Age at
assessment
(months)
Motor performance
1 4 41+1 Lt MCA infarct in parietal lobe. Small areas of abnormal SI in the Lt lentiform and thalamus. The PLICs were symmetrical on conventional MRI and no abnormality seen in the PLIC or cerebral peduncle on DTI.
No asymmetry No 48 Mild asymmetry Lt hand preference but good independent finger movements bilaterally
2 20 42+2 Venous infarction. Abnormal SI in anterior WM (Lt>Rt). Abnormal SI in the Lt lentiform and thalamus. The PLICs were symmetrical on conventional MRI and no abnormality seen in the PLIC or cerebral peduncle on DTI.
No asymmetry No 24 No asymmetry
3 83 40+5 Lt MCA infarct in parietal and temporal lobes. Ventricular dilatation (Lt>Rt). Abnormal SI in the Lt lentiform and PLIC with atrophy of the Lt thalamus, brainstem and mesencephalon. Abnormal high SI Lt PLIC on the ADC map.
Rt hemiplegia Volume, FA, ADC and RD
36 Rt hemiplegia
4 16 40+1 Lt MCA infarct in frontal, parietal and temporal lobes. Abnormal SI in Lt lentiform, and cystic lesion in Lt caudate head. Thalamus, mesencephalon and brainstem were smaller on the Lt. Abnormal SI in Lt PLIC. Punctate white matter lesions on the Rt and Rt ventricular dilatation consistent with previous PHI, although the PLIC appeared normal on the Rt. Abnormal high SI in the Lt PLIC on the ADC map.
Rt hemiplegia Volume, FA and RD
36 Rt hemiplegia
5 5 42+5 Lt MCA infarct in parietal lobe. BG and PLIC were symmetrical. Small foci of abnormal SI in Lt thalamus and Lt ventricle minimally dilated. No abnormality seen in the PLIC or cerebral peduncle on DTI.
No asymmetry No 24 No asymmetry
6 8 42 Lt MCA infarct in frontal parietal and temporal lobes. Abnormal SI in the Lt BG and thalamus. Abnormal SI in Lt PLIC and mesencephalon on conventional imaging and DTI.
Rt hemiplegia Tractography not possible on affected side
24 Rt hemiplegia
7 34 44+5 Lt MCA infarct in posterior parietal and temporal lobes. Abnormal SI in Lt lentiform nucleus, asymmetrical PLIC and moderate Lt ventricular dilatation. Abnormal high SI in the Lt PLIC on the ADC map.
Rt hemiplegia Volume, FA, ADC and RD
15 Rt hemiplegia
Case Age at
scan
(days)
PMA at
scan
(weeks)
MRI findings Prediction of motor
performance from
conventional MRI
AI outside
control range
Age at
assessment
(months)
Motor performance
1 4 41+1 Lt MCA infarct in parietal lobe. Small areas of abnormal SI in the Lt lentiform and thalamus. The PLICs were symmetrical on conventional MRI and no abnormality seen in the PLIC or cerebral peduncle on DTI.
No asymmetry No 48 Mild asymmetry Lt hand preference but good independent finger movements bilaterally
2 20 42+3 Venous infarction. Abnormal SI in anterior WM (Lt>Rt). Abnormal SI in the Lt lentiform and thalamus. The PLICs were symmetrical on conventional MRI and no abnormality seen in the PLIC or cerebral peduncle on DTI.
No asymmetry No 24 No asymmetry
3 83 40+5 Lt MCA infarct in parietal and temporal lobes. Ventricular dilatation (Lt>Rt). Abnormal SI in the Lt lentiform and PLIC with atrophy of the Lt thalamus, brainstem and mesencephalon. Abnormal high SI Lt PLIC on the ADC map.
Rt hemiplegia Volume, FA, ADC and RD
36 Rt hemiplegia
4 16 40+1 Lt MCA infarct in frontal, parietal and temporal lobes. Abnormal SI in Lt lentiform, and cystic lesion in Lt caudate head. Thalamus, mesencephalon and brainstem were smaller on the Lt. Abnormal SI in Lt PLIC. Punctate white matter lesions on the Rt and Rt ventricular dilatation consistent with previous PHI, although the PLIC appeared normal on the Rt. Abnormal high SI in the Lt PLIC on the ADC map.
Rt hemiplegia Volume, FA and RD
36 Rt hemiplegia
5 5 42+5 Lt MCA infarct in parietal lobe. BG and PLIC were symmetrical. Small foci of abnormal SI in Lt thalamus and Lt ventricle minimally dilated. No abnormality seen in the PLIC or cerebral peduncle on DTI.
No asymmetry No 24 No asymmetry
6 8 42 Lt MCA infarct in frontal parietal and temporal lobes. Abnormal SI in the Lt BG and thalamus. Abnormal SI in Lt PLIC and mesencephalon on conventional imaging and DTI.
Rt hemiplegia Tractography not possible on affected side
24 Rt hemiplegia
7 34 44+5 Lt MCA infarct in posterior parietal and temporal lobes. Abnormal SI in Lt lentiform nucleus, asymmetrical PLIC and moderate Lt ventricular dilatation. Abnormal high SI in the Lt PLIC on the ADC map.
Rt hemiplegia Volume, FA, ADC and RD
15 Rt hemiplegia
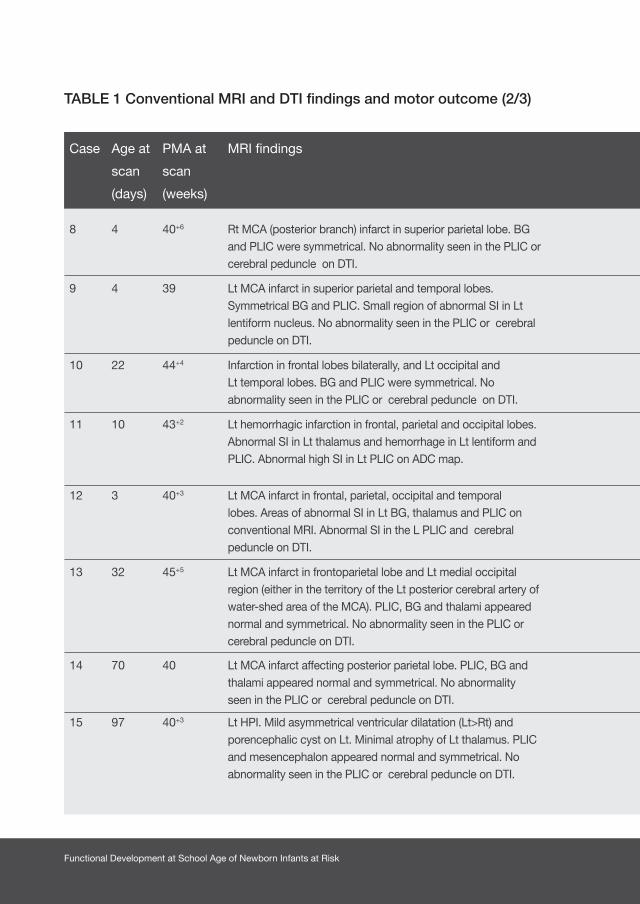
Functional Development at School Age of Newborn Infants at Risk
TABLE 1 Conventional MRI and DTI findings and motor outcome (2/3)
Case Age at
scan
(days)
PMA at
scan
(weeks)
MRI findings Prediction of motor
performance from
conventional MRI
AI outside
control range
Age at
assessment
(months)
Motor performance
8 4 40+6 Rt MCA (posterior branch) infarct in superior parietal lobe. BG and PLIC were symmetrical. No abnormality seen in the PLIC or cerebral peduncle on DTI.
No asymmetry No 13 No asymmetry
9 4 39 Lt MCA infarct in superior parietal and temporal lobes. Symmetrical BG and PLIC. Small region of abnormal SI in Lt lentiform nucleus. No abnormality seen in the PLIC or cerebral peduncle on DTI.
No asymmetry RD 15 Mild asymmetry Preference for Lt hand. Good independent finger movements bilaterally but pincer grip better on Lt.
10 22 44+4 Infarction in frontal lobes bilaterally, and Lt occipital and Lt temporal lobes. BG and PLIC were symmetrical. No abnormality seen in the PLIC or cerebral peduncle on DTI.
No asymmetry No 12 No asymmetry
11 10 43+2 Lt hemorrhagic infarction in frontal, parietal and occipital lobes. Abnormal SI in Lt thalamus and hemorrhage in Lt lentiform and PLIC. Abnormal high SI in Lt PLIC on ADC map.
Rt hemiplegia FA and RD 16 Good independent finger move-ments bilaterally but pincer grip better on Lt. Mild asymmetry in tone and increased flexibility Lt leg
12 3 40+3 Lt MCA infarct in frontal, parietal, occipital and temporal lobes. Areas of abnormal SI in Lt BG, thalamus and PLIC on conventional MRI. Abnormal SI in the L PLIC and cerebral peduncle on DTI.
Rt hemiplegia Tractography not possible on affected side
15 Rt hemiplegia
13 32 45+5 Lt MCA infarct in frontoparietal lobe and Lt medial occipital region (either in the territory of the Lt posterior cerebral artery of water-shed area of the MCA). PLIC, BG and thalami appeared normal and symmetrical. No abnormality seen in the PLIC or cerebral peduncle on DTI.
No asymmetry No 13 No asymmetry
14 70 40 Lt MCA infarct affecting posterior parietal lobe. PLIC, BG and thalami appeared normal and symmetrical. No abnormality seen in the PLIC or cerebral peduncle on DTI.
No asymmetry No 24 No asymmetry
15 97 40+3 Lt HPI. Mild asymmetrical ventricular dilatation (Lt>Rt) and porencephalic cyst on Lt. Minimal atrophy of Lt thalamus. PLIC and mesencephalon appeared normal and symmetrical. No abnormality seen in the PLIC or cerebral peduncle on DTI.
No asymmetry No 25 No asymmetry
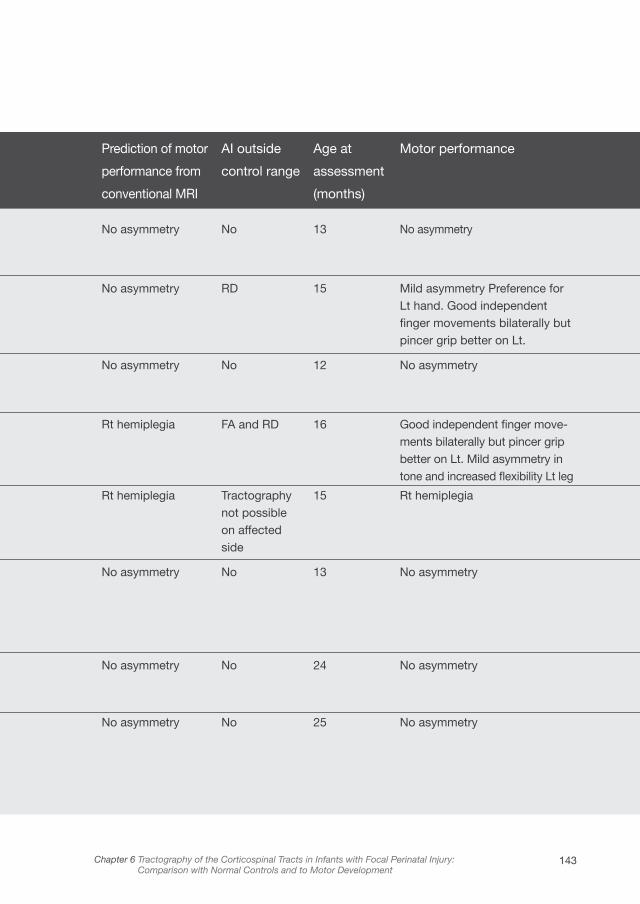
143Chapter 6 Tractography of the Corticospinal Tracts in Infants with Focal Perinatal Injury: Comparison with Normal Controls and to Motor Development
Case Age at
scan
(days)
PMA at
scan
(weeks)
MRI findings Prediction of motor
performance from
conventional MRI
AI outside
control range
Age at
assessment
(months)
Motor performance
8 4 40+6 Rt MCA (posterior branch) infarct in superior parietal lobe. BG and PLIC were symmetrical. No abnormality seen in the PLIC or cerebral peduncle on DTI.
No asymmetry No 13 No asymmetry
9 4 39 Lt MCA infarct in superior parietal and temporal lobes. Symmetrical BG and PLIC. Small region of abnormal SI in Lt lentiform nucleus. No abnormality seen in the PLIC or cerebral peduncle on DTI.
No asymmetry RD 15 Mild asymmetry Preference for Lt hand. Good independent finger movements bilaterally but pincer grip better on Lt.
10 22 44+4 Infarction in frontal lobes bilaterally, and Lt occipital and Lt temporal lobes. BG and PLIC were symmetrical. No abnormality seen in the PLIC or cerebral peduncle on DTI.
No asymmetry No 12 No asymmetry
11 10 43+2 Lt hemorrhagic infarction in frontal, parietal and occipital lobes. Abnormal SI in Lt thalamus and hemorrhage in Lt lentiform and PLIC. Abnormal high SI in Lt PLIC on ADC map.
Rt hemiplegia FA and RD 16 Good independent finger move-ments bilaterally but pincer grip better on Lt. Mild asymmetry in tone and increased flexibility Lt leg
12 3 40+3 Lt MCA infarct in frontal, parietal, occipital and temporal lobes. Areas of abnormal SI in Lt BG, thalamus and PLIC on conventional MRI. Abnormal SI in the L PLIC and cerebral peduncle on DTI.
Rt hemiplegia Tractography not possible on affected side
15 Rt hemiplegia
13 32 45+5 Lt MCA infarct in frontoparietal lobe and Lt medial occipital region (either in the territory of the Lt posterior cerebral artery of water-shed area of the MCA). PLIC, BG and thalami appeared normal and symmetrical. No abnormality seen in the PLIC or cerebral peduncle on DTI.
No asymmetry No 13 No asymmetry
14 70 40 Lt MCA infarct affecting posterior parietal lobe. PLIC, BG and thalami appeared normal and symmetrical. No abnormality seen in the PLIC or cerebral peduncle on DTI.
No asymmetry No 24 No asymmetry
15 97 40+3 Lt HPI. Mild asymmetrical ventricular dilatation (Lt>Rt) and porencephalic cyst on Lt. Minimal atrophy of Lt thalamus. PLIC and mesencephalon appeared normal and symmetrical. No abnormality seen in the PLIC or cerebral peduncle on DTI.
No asymmetry No 25 No asymmetry

Functional Development at School Age of Newborn Infants at Risk
TABLE 1 Conventional MRI and DTI findings and motor outcome (3/3)
Case Age at
scan
(days)
PMA at
scan
(weeks)
MRI findings Prediction of motor
performance from
conventional MRI
AI outside
control range
Age at
assessment
(months)
Motor performance
16 93 39 Rt MCA (posterior branch) infarct in superior parietal lobe. BG and PLIC were symmetrical. No abnormality seen in the PLIC or cerebral peduncle on DTI.
Lt hemiplegia Volume 24 Slight tightness in Lt ankle. Symmetrical upper limb function.
17 30 46+5 Lt MCA infarct in superior parietal and temporal lobes. Symmetrical BG and PLIC. Small region of abnormal SI in Lt lentiform nucleus. No abnormality seen in the PLIC or cerebral peduncle on DTI.
No asymmetry Volume and RD
21 Mild asymmetry with increased tone and less spontaneous movement on Rt. Symmetrical hand function.
18 26 44+5 Infarction in frontal lobes bilaterally, and Lt occipital and Lt temporal lobes. BG and PLIC were symmetrical. No abnormality seen in the PLIC or cerebral peduncle on DTI.
No asymmetry No 21 No asymmetry
19 29 45+2 Lt hemorrhagic infarction in frontal, parietal and occipital lobes. Abnormal SI in Lt thalamus and hemorrhage in Lt lentiform and PLIC. Abnormal high SI in Lt PLIC on ADC map.
No asymmetry No 18 No asymmetry
20 71 40+2 Lt MCA infarct in frontal, parietal, occipital and temporal lobes. Areas of abnormal SI in Lt BG, thalamus and PLIC on conventional MRI. Abnormal SI in the L PLIC and cerebral peduncle on DTI.
Lt hemiplegia Tractography not possible on affected side
27 Lt hemiplegia
Case Age at
scan
(days)
PMA at
scan
(weeks)
MRI findings Prediction of motor
performance from
conventional MRI
AI outside
control range
Age at
assessment
(months)
Motor performance
16 93 39 Rt HPI. Mild ventricular dilatation with porencephalic cyst on the Rt. Abnormal SI in superior portion of Rt PLIC and lentiform on MRI and DTI.
Lt hemiplegia Volume 24 Slight tightness in Lt ankle. Symmetrical upper limb function.
17 30 46+5 Lt MCA infarct affecting fronto-parietal lobe. Abnormal SI in the Lt ALIC. PLIC, BG and thalami appeared normal and symmetrical. No abnormality seen in the PLIC or cerebral peduncle on DTI.
No asymmetry Volume and RD
21 Mild asymmetry with increased tone and less spontaneous movement on Rt. Symmetrical hand function.
18 26 44+5 Infarct in Rt posterior parietal lobe. PLIC, BG and thalami appeared normal and symmetrical. No abnormality seen in the PLIC or cerebral peduncle on DTI.
No asymmetry No 21 No asymmetry
19 29 45+2 Lt MCA infarct. Abnormal SI in Lt caudate head and atrophy of Lt thalamus. PLIC appeared normal and symmetrical on MRI and DTI.
No asymmetry No 18 No asymmetry
20 71 40+2 Large Rt MCA infarct with involvement of the BG, thalamus and PLIC. Atrophy of the Rt mesencephalon and brain stem. Ventricular dilatation on Rt. Abnormal high SI in R PLIC on ADC map.
Lt hemiplegia Tractography not possible on affected side
27 Lt hemiplegia
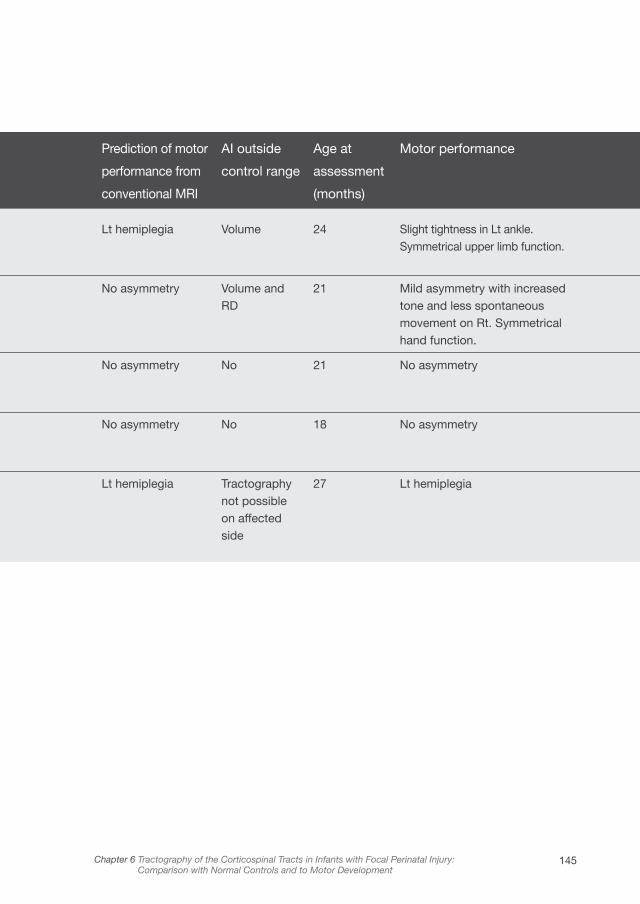
145Chapter 6 Tractography of the Corticospinal Tracts in Infants with Focal Perinatal Injury: Comparison with Normal Controls and to Motor Development
Case Age at
scan
(days)
PMA at
scan
(weeks)
MRI findings Prediction of motor
performance from
conventional MRI
AI outside
control range
Age at
assessment
(months)
Motor performance
16 93 39 Rt MCA (posterior branch) infarct in superior parietal lobe. BG and PLIC were symmetrical. No abnormality seen in the PLIC or cerebral peduncle on DTI.
Lt hemiplegia Volume 24 Slight tightness in Lt ankle. Symmetrical upper limb function.
17 30 46+5 Lt MCA infarct in superior parietal and temporal lobes. Symmetrical BG and PLIC. Small region of abnormal SI in Lt lentiform nucleus. No abnormality seen in the PLIC or cerebral peduncle on DTI.
No asymmetry Volume and RD
21 Mild asymmetry with increased tone and less spontaneous movement on Rt. Symmetrical hand function.
18 26 44+5 Infarction in frontal lobes bilaterally, and Lt occipital and Lt temporal lobes. BG and PLIC were symmetrical. No abnormality seen in the PLIC or cerebral peduncle on DTI.
No asymmetry No 21 No asymmetry
19 29 45+2 Lt hemorrhagic infarction in frontal, parietal and occipital lobes. Abnormal SI in Lt thalamus and hemorrhage in Lt lentiform and PLIC. Abnormal high SI in Lt PLIC on ADC map.
No asymmetry No 18 No asymmetry
20 71 40+2 Lt MCA infarct in frontal, parietal, occipital and temporal lobes. Areas of abnormal SI in Lt BG, thalamus and PLIC on conventional MRI. Abnormal SI in the L PLIC and cerebral peduncle on DTI.
Lt hemiplegia Tractography not possible on affected side
27 Lt hemiplegia
Case Age at
scan
(days)
PMA at
scan
(weeks)
MRI findings Prediction of motor
performance from
conventional MRI
AI outside
control range
Age at
assessment
(months)
Motor performance
16 93 39 Rt HPI. Mild ventricular dilatation with porencephalic cyst on the Rt. Abnormal SI in superior portion of Rt PLIC and lentiform on MRI and DTI.
Lt hemiplegia Volume 24 Slight tightness in Lt ankle. Symmetrical upper limb function.
17 30 46+5 Lt MCA infarct affecting fronto-parietal lobe. Abnormal SI in the Lt ALIC. PLIC, BG and thalami appeared normal and symmetrical. No abnormality seen in the PLIC or cerebral peduncle on DTI.
No asymmetry Volume and RD
21 Mild asymmetry with increased tone and less spontaneous movement on Rt. Symmetrical hand function.
18 26 44+5 Infarct in Rt posterior parietal lobe. PLIC, BG and thalami appeared normal and symmetrical. No abnormality seen in the PLIC or cerebral peduncle on DTI.
No asymmetry No 21 No asymmetry
19 29 45+2 Lt MCA infarct. Abnormal SI in Lt caudate head and atrophy of Lt thalamus. PLIC appeared normal and symmetrical on MRI and DTI.
No asymmetry No 18 No asymmetry
20 71 40+2 Large Rt MCA infarct with involvement of the BG, thalamus and PLIC. Atrophy of the Rt mesencephalon and brain stem. Ventricular dilatation on Rt. Abnormal high SI in R PLIC on ADC map.
Lt hemiplegia Tractography not possible on affected side
27 Lt hemiplegia
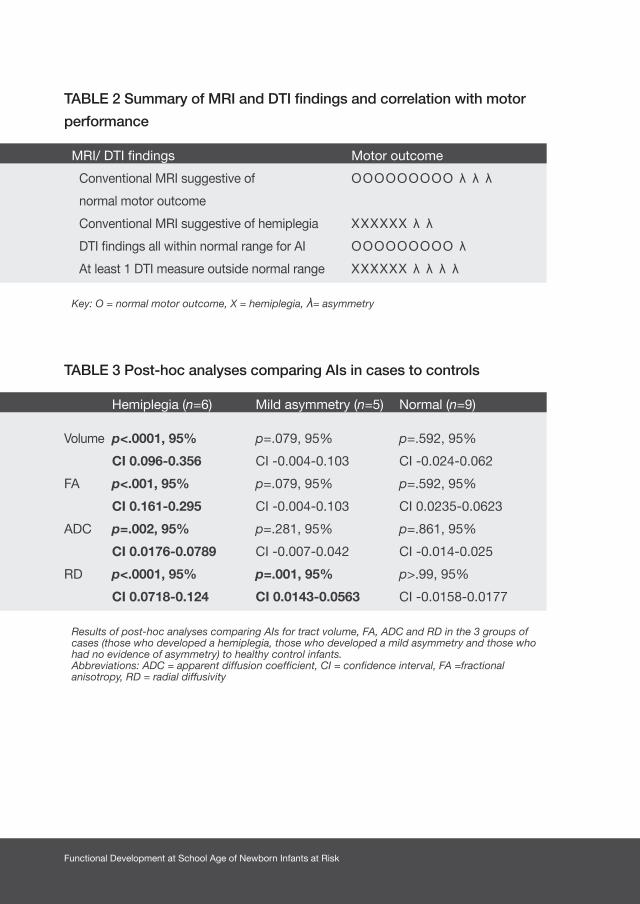
Functional Development at School Age of Newborn Infants at Risk
TABLE 2 Summary of MRI and DTI findings and correlation with motor
performance
MRI/ DTI findings Motor outcome
Conventional MRI suggestive of OOOOOOOOO λ λ λ
normal motor outcome
Conventional MRI suggestive of hemiplegia XXXXXX λ λ
DTI findings all within normal range for AI OOOOOOOOO λ
At least 1 DTI measure outside normal range XXXXXX λ λ λ λ
Key: O = normal motor outcome, X = hemiplegia, λ= asymmetry
TABLE 3 Post-hoc analyses comparing AIs in cases to controls
Hemiplegia (n=6) Mild asymmetry (n=5) Normal (n=9)
Volume p<.0001, 95% p=.079, 95% p=.592, 95%
CI 0.096-0.356 CI -0.004-0.103 CI -0.024-0.062
FA p<.001, 95% p=.079, 95% p=.592, 95%
CI 0.161-0.295 CI -0.004-0.103 CI 0.0235-0.0623
ADC p=.002, 95% p=.281, 95% p=.861, 95%
CI 0.0176-0.0789 CI -0.007-0.042 CI -0.014-0.025
RD p<.0001, 95% p=.001, 95% p>.99, 95%
CI 0.0718-0.124 CI 0.0143-0.0563 CI -0.0158-0.0177
Results of post-hoc analyses comparing AIs for tract volume, FA, ADC and RD in the 3 groups of cases (those who developed a hemiplegia, those who developed a mild asymmetry and those who had no evidence of asymmetry) to healthy control infants.Abbreviations: ADC = apparent diffusion coefficient, CI = confidence interval, FA =fractional anisotropy, RD = radial diffusivity

147Chapter 6 Tractography of the Corticospinal Tracts in Infants with Focal Perinatal Injury: Comparison with Normal Controls and to Motor Development

Functional Development at School Age of Newborn Infants at Risk
TABLE S1 Patient characteristics (1/2)
Case Sex GA BW (g) Birth HC
(cm)
Antenatal Delivery Cord
pH
Apgar
(1’ /5’)
Respiratory support Onset of
Clinical seizures
1 M 40+4 3506 35.5 Normal antenatal history Em CS for failure to progress.
7.34 9/10 - 72 hours
2 F 39+4 2504 35.2 Normal antenatal history SVD not known
9/10 - Day 13
3 M 28+6 1370 27.3 Oligohydramnios at 28+3 weeks. IUGR (<10th centile)
Em CS for cord prolapse, preterm
not known
2/4 Ventilated 48 hours, CPAP 8 days
None
4 F 37+6 1850 31.5 IUGR (<10th centile) Em CS for sub-optimal CTG.
7.38 9/9 - Day 1
5 M 42 4000 35.0 Normal antenatal history Forceps following failed ventouse, PROM Meconium
7.25 4/9 O2 14 hours
6 M 40+6 3500 35.3 Irregular fetal heart rate at 26 weeks GA. Normal fetal echo Variable decelerations on CTG for 2 hrs before delivery
Em CS following failed ventouse for failure to progress. PROM 48 hrs
7.3 5/10 O2 19 hours
7 F 39+6 3250 33.4 Normal antenatal history SVD. not known
8/9 - 38 hours
8 M 40+2 3300 34.4 Maternal depression Maternal fever in labor and decelerations on CTG
Em CS. Therapeutic hypothermia for suspected HIE
7.1 1/6 O2 5 hours
9 M 38+3 3440 37.2 Maternal diabetes and Vitamin D deficiency Em CS for failure to progress. Thick meconium
7.2 8/9 O2 23 hours
10 F 41+3 3000 35.4 Normal antenatal history Em CS Thick meconium 7.04 2/5 Ventilated till day 3, CPAP till day 17. Nasal prong O2 till day 21
8 hours
11 M 41+6 3890 35.0 Normal antenatal history Em CS for failure to progress
7.1 8/9 - 9 hours
Case Sex GA
(wk)
BW (g) Birth HC
(cm)
Antenatal Delivery Cord
pH
Apgar
(1’ /5’)
Respiratory support Onset of
Clinical seizures
1 M 40+4 3506 35.5 Normal antenatal history Em CS for failure to progress.
7.34 9/10 - 72 hours
2 F 39+4 2504 35.2 Normal antenatal history SVD not known
9/10 - Day 13
3 M 28+6 1370 27.3 Oligohydramnios at 28+3 weeks. IUGR (<10th centile)
Em CS for cord prolapse, preterm
not known
2/4 Ventilated 48 hours, CPAP 8 days
None
4 F 37+6 1850 31.5 IUGR (<10th centile) Em CS for sub-optimal CTG.
7.38 9/9 - Day 1
5 M 42 4000 35.0 Normal antenatal history Forceps following failed ventouse, PROM Meconium
7.25 4/9 O2 14 hours
6 M 40+6 3500 35.3 Irregular fetal heart rate at 26 weeks GA. Normal fetal echo Variable decelerations on CTG for 2 hrs before delivery
Em CS following failed ventouse for failure to progress. PROM 48 hrs
7.3 5/10 O2 19 hours
7 F 39+6 3250 33.4 Normal antenatal history SVD. not known
8/9 - 38 hours
8 M 40+2 3300 34.4 Maternal depression Maternal fever in labor and decelerations on CTG
Em CS. Therapeutic hypothermia for suspected HIE
7.1 1/6 O2 5 hours
9 M 38+3 3440 37.2 Maternal diabetes and Vitamin D deficiency Em CS for failure to progress. Thick meconium
7.2 8/9 O2 23 hours
10 F 41+3 3000 35.4 Normal antenatal history Em CS Thick meconium 7.04 2/5 Ventilated till day 3, CPAP till day 17. Nasal prong O2 till day 21
8 hours
11 M 41+6 3890 35.0 Normal antenatal history Em CS for failure to progress
7.1 8/9 - 9 hours

149Chapter 6 Tractography of the Corticospinal Tracts in Infants with Focal Perinatal Injury: Comparison with Normal Controls and to Motor Development
Case Sex GA BW (g) Birth HC
(cm)
Antenatal Delivery Cord
pH
Apgar
(1’ /5’)
Respiratory support Onset of
Clinical seizures
1 M 40+4 3506 35.5 Normal antenatal history Em CS for failure to progress.
7.34 9/10 - 72 hours
2 F 39+4 2504 35.2 Normal antenatal history SVD not known
9/10 - Day 13
3 M 28+6 1370 27.3 Oligohydramnios at 28+3 weeks. IUGR (<10th centile)
Em CS for cord prolapse, preterm
not known
2/4 Ventilated 48 hours, CPAP 8 days
None
4 F 37+6 1850 31.5 IUGR (<10th centile) Em CS for sub-optimal CTG.
7.38 9/9 - Day 1
5 M 42 4000 35.0 Normal antenatal history Forceps following failed ventouse, PROM Meconium
7.25 4/9 O2 14 hours
6 M 40+6 3500 35.3 Irregular fetal heart rate at 26 weeks GA. Normal fetal echo Variable decelerations on CTG for 2 hrs before delivery
Em CS following failed ventouse for failure to progress. PROM 48 hrs
7.3 5/10 O2 19 hours
7 F 39+6 3250 33.4 Normal antenatal history SVD. not known
8/9 - 38 hours
8 M 40+2 3300 34.4 Maternal depression Maternal fever in labor and decelerations on CTG
Em CS. Therapeutic hypothermia for suspected HIE
7.1 1/6 O2 5 hours
9 M 38+3 3440 37.2 Maternal diabetes and Vitamin D deficiency Em CS for failure to progress. Thick meconium
7.2 8/9 O2 23 hours
10 F 41+3 3000 35.4 Normal antenatal history Em CS Thick meconium 7.04 2/5 Ventilated till day 3, CPAP till day 17. Nasal prong O2 till day 21
8 hours
11 M 41+6 3890 35.0 Normal antenatal history Em CS for failure to progress
7.1 8/9 - 9 hours
Case Sex GA
(wk)
BW (g) Birth HC
(cm)
Antenatal Delivery Cord
pH
Apgar
(1’ /5’)
Respiratory support Onset of
Clinical seizures
1 M 40+4 3506 35.5 Normal antenatal history Em CS for failure to progress.
7.34 9/10 - 72 hours
2 F 39+4 2504 35.2 Normal antenatal history SVD not known
9/10 - Day 13
3 M 28+6 1370 27.3 Oligohydramnios at 28+3 weeks. IUGR (<10th centile)
Em CS for cord prolapse, preterm
not known
2/4 Ventilated 48 hours, CPAP 8 days
None
4 F 37+6 1850 31.5 IUGR (<10th centile) Em CS for sub-optimal CTG.
7.38 9/9 - Day 1
5 M 42 4000 35.0 Normal antenatal history Forceps following failed ventouse, PROM Meconium
7.25 4/9 O2 14 hours
6 M 40+6 3500 35.3 Irregular fetal heart rate at 26 weeks GA. Normal fetal echo Variable decelerations on CTG for 2 hrs before delivery
Em CS following failed ventouse for failure to progress. PROM 48 hrs
7.3 5/10 O2 19 hours
7 F 39+6 3250 33.4 Normal antenatal history SVD. not known
8/9 - 38 hours
8 M 40+2 3300 34.4 Maternal depression Maternal fever in labor and decelerations on CTG
Em CS. Therapeutic hypothermia for suspected HIE
7.1 1/6 O2 5 hours
9 M 38+3 3440 37.2 Maternal diabetes and Vitamin D deficiency Em CS for failure to progress. Thick meconium
7.2 8/9 O2 23 hours
10 F 41+3 3000 35.4 Normal antenatal history Em CS Thick meconium 7.04 2/5 Ventilated till day 3, CPAP till day 17. Nasal prong O2 till day 21
8 hours
11 M 41+6 3890 35.0 Normal antenatal history Em CS for failure to progress
7.1 8/9 - 9 hours
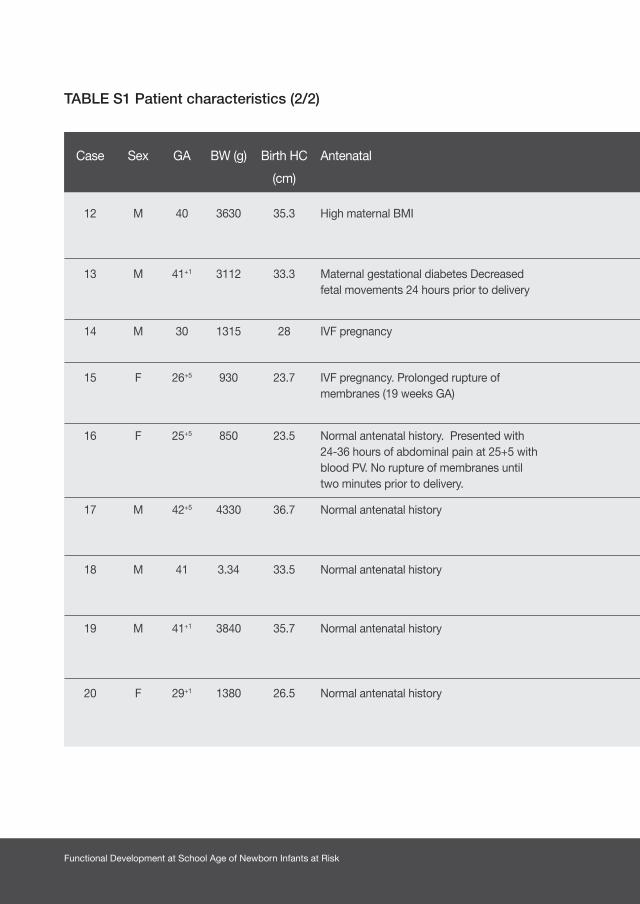
Functional Development at School Age of Newborn Infants at Risk
TABLE S1 Patient characteristics (2/2)
Case Sex GA BW (g) Birth HC
(cm)
Antenatal Delivery Cord
pH
Apgar
(1’ /5’)
Respiratory support Onset of
Clinical seizures
12 M 40 3630 35.3 High maternal BMI SVD Cord around neck. Floppy at birth, initial hypoglycemia
7.17 5/9 O2 Day 1
13 M 41+1 3112 33.3 Maternal gestational diabetes Decreased fetal movements 24 hours prior to delivery
Em CS for fetal bradycardia Thick meconium
7.2 8/9 O2 13 hours
14 M 30 1315 28 IVF pregnancy “Elective” CS for high risk pregnancy
not known
9/10 n-CPAP for 6 hours None
15 F 26+5 930 23.7 IVF pregnancy. Prolonged rupture of membranes (19 weeks GA)
Emergency CS 7.2 8/9 Ventilated for 5 hours. N-CPAP till day 18. Nasal prong O2 till day 41
None
16 F 25+5 850 23.5 Normal antenatal history. Presented with 24-36 hours of abdominal pain at 25+5 with blood PV. No rupture of membranes until two minutes prior to delivery.
Spontaneous vaginal delivery
not known
6/9 Ventilated till day 4. CPAP till day 58. Nasal prong O2 till day 73
None
17 M 42+5 4330 36.7 Normal antenatal history Vaginal ventouse- transient fetal bradycardia
7.23 9/9 - 24 hours
18 M 41 3.34 33.5 Normal antenatal history Spontaneous vaginal delivery Thick meconium
7.15 6/9 5 inflation breaths at delivery
12 hours
19 M 41+1 3840 35.7 Normal antenatal history Em CS for fetal bradycardia.Thick meconium.
not known
7/9 - 12 hours
20 F 29+1 1380 26.5 Normal antenatal history Emergency CS for fetal bradycardia
not known
8/9 Ventilated for 1 day, CPAP for 10 day and nasal prong O2 for 6 days
None

151Chapter 6 Tractography of the Corticospinal Tracts in Infants with Focal Perinatal Injury: Comparison with Normal Controls and to Motor Development
Case Sex GA BW (g) Birth HC
(cm)
Antenatal Delivery Cord
pH
Apgar
(1’ /5’)
Respiratory support Onset of
Clinical seizures
12 M 40 3630 35.3 High maternal BMI SVD Cord around neck. Floppy at birth, initial hypoglycemia
7.17 5/9 O2 Day 1
13 M 41+1 3112 33.3 Maternal gestational diabetes Decreased fetal movements 24 hours prior to delivery
Em CS for fetal bradycardia Thick meconium
7.2 8/9 O2 13 hours
14 M 30 1315 28 IVF pregnancy “Elective” CS for high risk pregnancy
not known
9/10 n-CPAP for 6 hours None
15 F 26+5 930 23.7 IVF pregnancy. Prolonged rupture of membranes (19 weeks GA)
Emergency CS 7.2 8/9 Ventilated for 5 hours. N-CPAP till day 18. Nasal prong O2 till day 41
None
16 F 25+5 850 23.5 Normal antenatal history. Presented with 24-36 hours of abdominal pain at 25+5 with blood PV. No rupture of membranes until two minutes prior to delivery.
Spontaneous vaginal delivery
not known
6/9 Ventilated till day 4. CPAP till day 58. Nasal prong O2 till day 73
None
17 M 42+5 4330 36.7 Normal antenatal history Vaginal ventouse- transient fetal bradycardia
7.23 9/9 - 24 hours
18 M 41 3.34 33.5 Normal antenatal history Spontaneous vaginal delivery Thick meconium
7.15 6/9 5 inflation breaths at delivery
12 hours
19 M 41+1 3840 35.7 Normal antenatal history Em CS for fetal bradycardia.Thick meconium.
not known
7/9 - 12 hours
20 F 29+1 1380 26.5 Normal antenatal history Emergency CS for fetal bradycardia
not known
8/9 Ventilated for 1 day, CPAP for 10 day and nasal prong O2 for 6 days
None
Abbreviations: EmCS = emergency cesarean section, SVD = spontaneous vaginal delivery, PROM = prolonged rupture of membranes, IUGR = intra-uterine growth restriction, HIE = hypoxic-ischemic encephalopathy, GA = gestational age, M = male, F = female, BMI = body mass index
Case Sex GA BW (g) Birth HC
(cm)
Antenatal Delivery Cord
pH
Apgar
(1’ /5’)
Respiratory support Onset of
Clinical seizures
12 M 40 3630 35.3 High maternal BMI SVD Cord around neck. Floppy at birth, initial hypoglycemia
7.17 5/9 O2 Day 1
13 M 41+1 3112 33.3 Maternal gestational diabetes Decreased fetal movements 24 hours prior to delivery
Em CS for fetal bradycardia Thick meconium
7.2 8/9 O2 13 hours
14 M 30 1315 28 IVF pregnancy “Elective” CS for high risk pregnancy
not known
9/10 n-CPAP for 6 hours None
15 F 26+5 930 23.7 IVF pregnancy. Prolonged rupture of membranes (19 weeks GA)
Emergency CS 7.2 8/9 Ventilated for 5 hours. N-CPAP till day 18. Nasal prong O2 till day 41
None
16 F 25+5 850 23.5 Normal antenatal history. Presented with 24-36 hours of abdominal pain at 25+5 with blood PV. No rupture of membranes until two minutes prior to delivery.
Spontaneous vaginal delivery
not known
6/9 Ventilated till day 4. CPAP till day 58. Nasal prong O2 till day 73
None
17 M 42+5 4330 36.7 Normal antenatal history Vaginal ventouse- transient fetal bradycardia
7.23 9/9 - 24 hours
18 M 41 3.34 33.5 Normal antenatal history Spontaneous vaginal delivery Thick meconium
7.15 6/9 5 inflation breaths at delivery
12 hours
19 M 41+1 3840 35.7 Normal antenatal history Em CS for fetal bradycardia.Thick meconium.
not known
7/9 - 12 hours
20 F 29+1 1380 26.5 Normal antenatal history Emergency CS for fetal bradycardia
not known
8/9 Ventilated for 1 day, CPAP for 10 day and nasal prong O2 for 6 days
None
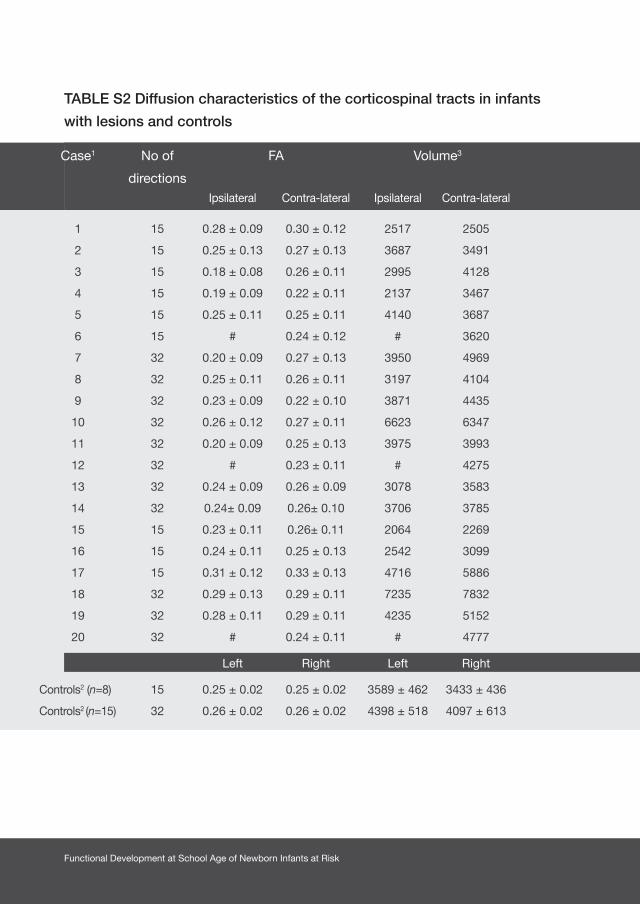
Functional Development at School Age of Newborn Infants at Risk
TABLE S2 Diffusion characteristics of the corticospinal tracts in infants
with lesions and controls
Case1 No of
directions
FA Volume3 Axial diffusivity4 ADC value Radial diffusivity4
Ipsilateral Contra-lateral Ipsilateral Contra-lateral Ipsilateral Contra-lateral Ipsilateral Contra-lateral Ipsilateral Contra-lateral
1 15 0.28 ± 0.09 0.30 ± 0.12 2517 2505 1.54 ± 0.32 1.62 ± 0.26 1.12 ± 0.25 1.22 ± 0.20 1.01 ± 0.20 1.02 ± 0.20
2 15 0.25 ± 0.13 0.27 ± 0.13 3687 3491 1.66 ± 0.30 1.69 ± 0.28 1.31 ± 0.27 1.32 ± 0.27 1.14 ± 0.30 1.13 ± 0.30
3 15 0.18 ± 0.08 0.26 ± 0.11 2995 4128 1.56 ± 0.44 1.55 ± 0.26 1.32 ± 0.39 1.21 ± 0.20 1.20± 0.40 1.04 ± 0.20
4 15 0.19 ± 0.09 0.22 ± 0.11 2137 3467 1.66 ± 0.29 1.64 ± 0.30 1.38 ± 0.28 1.33 ± 0.24 1.25 ± 0.30 1.17 ± 0.30
5 15 0.25 ± 0.11 0.25 ± 0.11 4140 3687 1.49 ± 0.15 1.55 ± 0.15 1.19 ± 0.26 1.21 ± 0.25 1.03 ± 0.30 1.04 ± 0.30
6 15 # 0.24 ± 0.12 # 3620 # 1.56 ± 0.24 # 1.24 ± 0.18 # 1.08 ± 0.20
7 32 0.20 ± 0.09 0.27 ± 0.13 3950 4969 1.50 ± 0.39 1.49 ± 0.35 1.25 ± 0.38 1.16 ± 0.33 1.13 ± 0.40 1.00 ± 0.30
8 32 0.25 ± 0.11 0.26 ± 0.11 3197 4104 1.56 ± 0.27 1.51 ± 0.26 1.21 ± 0.21 1.19 ± 0.21 1.04 ± 0.20 1.03 ± 0.20
9 32 0.23 ± 0.09 0.22 ± 0.10 3871 4435 1.37 ± 0.22 1.48 ± 0.23 1.10 ± 0.18 1.20 ± 0.21 0.97 ± 0.20 1.07 ± 0.20
10 32 0.26 ± 0.12 0.27 ± 0.11 6623 6347 1.43 ± 0.26 1.41 ± 0.28 1.13 ± 0.23 1.10 ± 0.23 0.97 ± 0.30 0.95 ± 0.20
11 32 0.20 ± 0.09 0.25 ± 0.13 3975 3993 1.46 ± 0.28 1.49 ± 0.34 1.20 ± 0.25 1.18 ± 0.32 1.07 ± 0.30 1.02 ± 0.30
12 32 # 0.23 ± 0.11 # 4275 # 1.60 ± 0.43 # 1.30 ± 0.29 # 1.14 ± 0.30
13 32 0.24 ± 0.09 0.26 ± 0.09 3078 3583 1.34 ± 0.22 1.34 ± 0.20 1.06 ± 0.18 1.05 ± 0.18 0.92 ± 0.20 0.91 ± 0.20
14 32 0.24± 0.09 0.26± 0.10 3706 3785 1.11 ± 0.19 1.07± 0.23 0.90 ± 0.19 0.88 ± 0.20 0.80 ± 0.23 0.79 ± 0.20
15 15 0.23 ± 0.11 0.26± 0.11 2064 2269 1.69 ± 0.23 1.60 ± 0.23 1.32 ± 0.25 1.29 ± 0.23 1.14 ± 0.30 1.13 ± 0.30
16 15 0.24 ± 0.11 0.25 ± 0.13 2542 3099 1.63 ± 0.33 1.59 ± 0.22 1.30 ± 0.32 1.27 ± 0.23 1.13 ± 0.34 1.11 ± 0.26
17 15 0.31 ± 0.12 0.33 ± 0.13 4716 5886 1.50 ± 0.19 1.58 ± 0.24 1.15 ± 0.12 1.12 ± 0.16 0.98 ± 0.25 0.93 ± 0.20
18 32 0.29 ± 0.13 0.29 ± 0.11 7235 7832 1.59 ± 0.33 1.46 ± 0.25 1.17 ± 0.24 1.10 ± 0.19 0.96 ± 0.38 0.93 ± 0.20
19 32 0.28 ± 0.11 0.29 ± 0.11 4235 5152 1.45 ± 0.22 1.46 ± 0.22 1.10 ± 0.17 1.12 ± 0.20 0.95 ± 0.20 0.93 ± 0.21
20 32 # 0.24 ± 0.11 # 4777 # 1.64 ± 0.24 # 1.31 ± 0.23 # 1.14 ±0.27
Left Right Left Right Left Right Left Right Left Right
Controls2 (n=8) 15 0.25 ± 0.02 0.25 ± 0.02 3589 ± 462 3433 ± 436 1.23 ± 0.14 1.25 ± 0.14 0.97 ± 0.10 0.99 ± 0.10 0.84 ± 0.09 0.85 ± 0.09
Controls2 (n=15) 32 0.26 ± 0.02 0.26 ± 0.02 4398 ± 518 4097 ± 613 1.49 ± 0.08 1.50 ± 0.07 1.17 ± 0.07 1.17 ± 0.06 1.01 ± 0.07 1.01 ± 0.07

153Chapter 6 Tractography of the Corticospinal Tracts in Infants with Focal Perinatal Injury: Comparison with Normal Controls and to Motor Development
Case1 No of
directions
FA Volume3 Axial diffusivity4 ADC value Radial diffusivity4
Ipsilateral Contra-lateral Ipsilateral Contra-lateral Ipsilateral Contra-lateral Ipsilateral Contra-lateral Ipsilateral Contra-lateral
1 15 0.28 ± 0.09 0.30 ± 0.12 2517 2505 1.54 ± 0.32 1.62 ± 0.26 1.12 ± 0.25 1.22 ± 0.20 1.01 ± 0.20 1.02 ± 0.20
2 15 0.25 ± 0.13 0.27 ± 0.13 3687 3491 1.66 ± 0.30 1.69 ± 0.28 1.31 ± 0.27 1.32 ± 0.27 1.14 ± 0.30 1.13 ± 0.30
3 15 0.18 ± 0.08 0.26 ± 0.11 2995 4128 1.56 ± 0.44 1.55 ± 0.26 1.32 ± 0.39 1.21 ± 0.20 1.20± 0.40 1.04 ± 0.20
4 15 0.19 ± 0.09 0.22 ± 0.11 2137 3467 1.66 ± 0.29 1.64 ± 0.30 1.38 ± 0.28 1.33 ± 0.24 1.25 ± 0.30 1.17 ± 0.30
5 15 0.25 ± 0.11 0.25 ± 0.11 4140 3687 1.49 ± 0.15 1.55 ± 0.15 1.19 ± 0.26 1.21 ± 0.25 1.03 ± 0.30 1.04 ± 0.30
6 15 # 0.24 ± 0.12 # 3620 # 1.56 ± 0.24 # 1.24 ± 0.18 # 1.08 ± 0.20
7 32 0.20 ± 0.09 0.27 ± 0.13 3950 4969 1.50 ± 0.39 1.49 ± 0.35 1.25 ± 0.38 1.16 ± 0.33 1.13 ± 0.40 1.00 ± 0.30
8 32 0.25 ± 0.11 0.26 ± 0.11 3197 4104 1.56 ± 0.27 1.51 ± 0.26 1.21 ± 0.21 1.19 ± 0.21 1.04 ± 0.20 1.03 ± 0.20
9 32 0.23 ± 0.09 0.22 ± 0.10 3871 4435 1.37 ± 0.22 1.48 ± 0.23 1.10 ± 0.18 1.20 ± 0.21 0.97 ± 0.20 1.07 ± 0.20
10 32 0.26 ± 0.12 0.27 ± 0.11 6623 6347 1.43 ± 0.26 1.41 ± 0.28 1.13 ± 0.23 1.10 ± 0.23 0.97 ± 0.30 0.95 ± 0.20
11 32 0.20 ± 0.09 0.25 ± 0.13 3975 3993 1.46 ± 0.28 1.49 ± 0.34 1.20 ± 0.25 1.18 ± 0.32 1.07 ± 0.30 1.02 ± 0.30
12 32 # 0.23 ± 0.11 # 4275 # 1.60 ± 0.43 # 1.30 ± 0.29 # 1.14 ± 0.30
13 32 0.24 ± 0.09 0.26 ± 0.09 3078 3583 1.34 ± 0.22 1.34 ± 0.20 1.06 ± 0.18 1.05 ± 0.18 0.92 ± 0.20 0.91 ± 0.20
14 32 0.24± 0.09 0.26± 0.10 3706 3785 1.11 ± 0.19 1.07± 0.23 0.90 ± 0.19 0.88 ± 0.20 0.80 ± 0.23 0.79 ± 0.20
15 15 0.23 ± 0.11 0.26± 0.11 2064 2269 1.69 ± 0.23 1.60 ± 0.23 1.32 ± 0.25 1.29 ± 0.23 1.14 ± 0.30 1.13 ± 0.30
16 15 0.24 ± 0.11 0.25 ± 0.13 2542 3099 1.63 ± 0.33 1.59 ± 0.22 1.30 ± 0.32 1.27 ± 0.23 1.13 ± 0.34 1.11 ± 0.26
17 15 0.31 ± 0.12 0.33 ± 0.13 4716 5886 1.50 ± 0.19 1.58 ± 0.24 1.15 ± 0.12 1.12 ± 0.16 0.98 ± 0.25 0.93 ± 0.20
18 32 0.29 ± 0.13 0.29 ± 0.11 7235 7832 1.59 ± 0.33 1.46 ± 0.25 1.17 ± 0.24 1.10 ± 0.19 0.96 ± 0.38 0.93 ± 0.20
19 32 0.28 ± 0.11 0.29 ± 0.11 4235 5152 1.45 ± 0.22 1.46 ± 0.22 1.10 ± 0.17 1.12 ± 0.20 0.95 ± 0.20 0.93 ± 0.21
20 32 # 0.24 ± 0.11 # 4777 # 1.64 ± 0.24 # 1.31 ± 0.23 # 1.14 ±0.27
Left Right Left Right Left Right Left Right Left Right
Controls2 (n=8) 15 0.25 ± 0.02 0.25 ± 0.02 3589 ± 462 3433 ± 436 1.23 ± 0.14 1.25 ± 0.14 0.97 ± 0.10 0.99 ± 0.10 0.84 ± 0.09 0.85 ± 0.09
Controls2 (n=15) 32 0.26 ± 0.02 0.26 ± 0.02 4398 ± 518 4097 ± 613 1.49 ± 0.08 1.50 ± 0.07 1.17 ± 0.07 1.17 ± 0.06 1.01 ± 0.07 1.01 ± 0.07
1. Data are given as mean ± standard deviation of the individual connectivity distributions 2. Data are given as mean ± standard deviation of the whole group 3. In mm3 4. Value * 10-3
# Indicates that connectivity distributions could not be generated.
Case1 No of
directions
FA Volume3 Axial diffusivity4 ADC value Radial diffusivity4
Ipsilateral Contra-lateral Ipsilateral Contra-lateral Ipsilateral Contra-lateral Ipsilateral Contra-lateral Ipsilateral Contra-lateral
1 15 0.28 ± 0.09 0.30 ± 0.12 2517 2505 1.54 ± 0.32 1.62 ± 0.26 1.12 ± 0.25 1.22 ± 0.20 1.01 ± 0.20 1.02 ± 0.20
2 15 0.25 ± 0.13 0.27 ± 0.13 3687 3491 1.66 ± 0.30 1.69 ± 0.28 1.31 ± 0.27 1.32 ± 0.27 1.14 ± 0.30 1.13 ± 0.30
3 15 0.18 ± 0.08 0.26 ± 0.11 2995 4128 1.56 ± 0.44 1.55 ± 0.26 1.32 ± 0.39 1.21 ± 0.20 1.20± 0.40 1.04 ± 0.20
4 15 0.19 ± 0.09 0.22 ± 0.11 2137 3467 1.66 ± 0.29 1.64 ± 0.30 1.38 ± 0.28 1.33 ± 0.24 1.25 ± 0.30 1.17 ± 0.30
5 15 0.25 ± 0.11 0.25 ± 0.11 4140 3687 1.49 ± 0.15 1.55 ± 0.15 1.19 ± 0.26 1.21 ± 0.25 1.03 ± 0.30 1.04 ± 0.30
6 15 # 0.24 ± 0.12 # 3620 # 1.56 ± 0.24 # 1.24 ± 0.18 # 1.08 ± 0.20
7 32 0.20 ± 0.09 0.27 ± 0.13 3950 4969 1.50 ± 0.39 1.49 ± 0.35 1.25 ± 0.38 1.16 ± 0.33 1.13 ± 0.40 1.00 ± 0.30
8 32 0.25 ± 0.11 0.26 ± 0.11 3197 4104 1.56 ± 0.27 1.51 ± 0.26 1.21 ± 0.21 1.19 ± 0.21 1.04 ± 0.20 1.03 ± 0.20
9 32 0.23 ± 0.09 0.22 ± 0.10 3871 4435 1.37 ± 0.22 1.48 ± 0.23 1.10 ± 0.18 1.20 ± 0.21 0.97 ± 0.20 1.07 ± 0.20
10 32 0.26 ± 0.12 0.27 ± 0.11 6623 6347 1.43 ± 0.26 1.41 ± 0.28 1.13 ± 0.23 1.10 ± 0.23 0.97 ± 0.30 0.95 ± 0.20
11 32 0.20 ± 0.09 0.25 ± 0.13 3975 3993 1.46 ± 0.28 1.49 ± 0.34 1.20 ± 0.25 1.18 ± 0.32 1.07 ± 0.30 1.02 ± 0.30
12 32 # 0.23 ± 0.11 # 4275 # 1.60 ± 0.43 # 1.30 ± 0.29 # 1.14 ± 0.30
13 32 0.24 ± 0.09 0.26 ± 0.09 3078 3583 1.34 ± 0.22 1.34 ± 0.20 1.06 ± 0.18 1.05 ± 0.18 0.92 ± 0.20 0.91 ± 0.20
14 32 0.24± 0.09 0.26± 0.10 3706 3785 1.11 ± 0.19 1.07± 0.23 0.90 ± 0.19 0.88 ± 0.20 0.80 ± 0.23 0.79 ± 0.20
15 15 0.23 ± 0.11 0.26± 0.11 2064 2269 1.69 ± 0.23 1.60 ± 0.23 1.32 ± 0.25 1.29 ± 0.23 1.14 ± 0.30 1.13 ± 0.30
16 15 0.24 ± 0.11 0.25 ± 0.13 2542 3099 1.63 ± 0.33 1.59 ± 0.22 1.30 ± 0.32 1.27 ± 0.23 1.13 ± 0.34 1.11 ± 0.26
17 15 0.31 ± 0.12 0.33 ± 0.13 4716 5886 1.50 ± 0.19 1.58 ± 0.24 1.15 ± 0.12 1.12 ± 0.16 0.98 ± 0.25 0.93 ± 0.20
18 32 0.29 ± 0.13 0.29 ± 0.11 7235 7832 1.59 ± 0.33 1.46 ± 0.25 1.17 ± 0.24 1.10 ± 0.19 0.96 ± 0.38 0.93 ± 0.20
19 32 0.28 ± 0.11 0.29 ± 0.11 4235 5152 1.45 ± 0.22 1.46 ± 0.22 1.10 ± 0.17 1.12 ± 0.20 0.95 ± 0.20 0.93 ± 0.21
20 32 # 0.24 ± 0.11 # 4777 # 1.64 ± 0.24 # 1.31 ± 0.23 # 1.14 ±0.27
Left Right Left Right Left Right Left Right Left Right
Controls2 (n=8) 15 0.25 ± 0.02 0.25 ± 0.02 3589 ± 462 3433 ± 436 1.23 ± 0.14 1.25 ± 0.14 0.97 ± 0.10 0.99 ± 0.10 0.84 ± 0.09 0.85 ± 0.09
Controls2 (n=15) 32 0.26 ± 0.02 0.26 ± 0.02 4398 ± 518 4097 ± 613 1.49 ± 0.08 1.50 ± 0.07 1.17 ± 0.07 1.17 ± 0.06 1.01 ± 0.07 1.01 ± 0.07
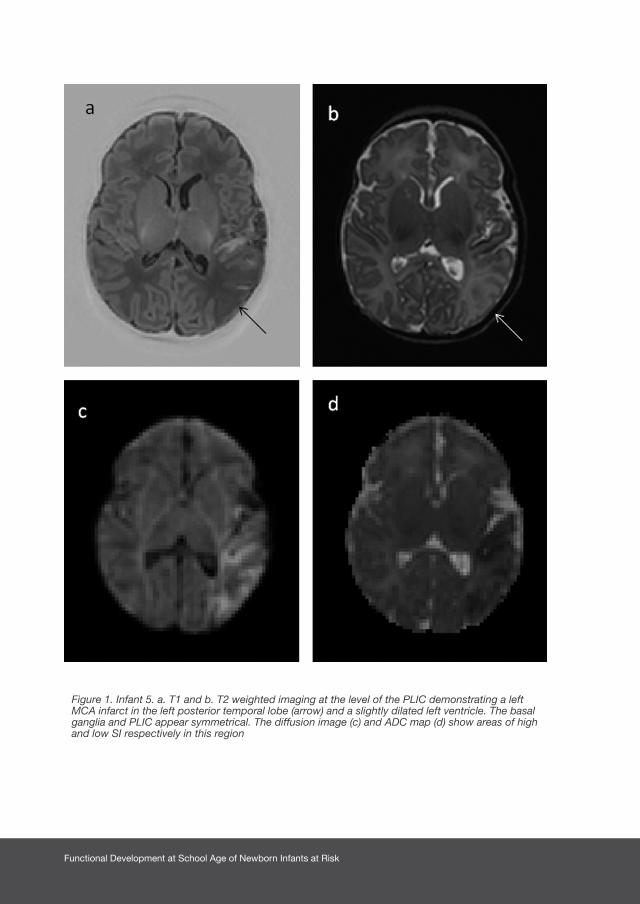
Functional Development at School Age of Newborn Infants at Risk
Figure 1. Infant 5. a. T1 and b. T2 weighted imaging at the level of the PLIC demonstrating a left MCA infarct in the left posterior temporal lobe (arrow) and a slightly dilated left ventricle. The basal ganglia and PLIC appear symmetrical. The diffusion image (c) and ADC map (d) show areas of high and low SI respectively in this region
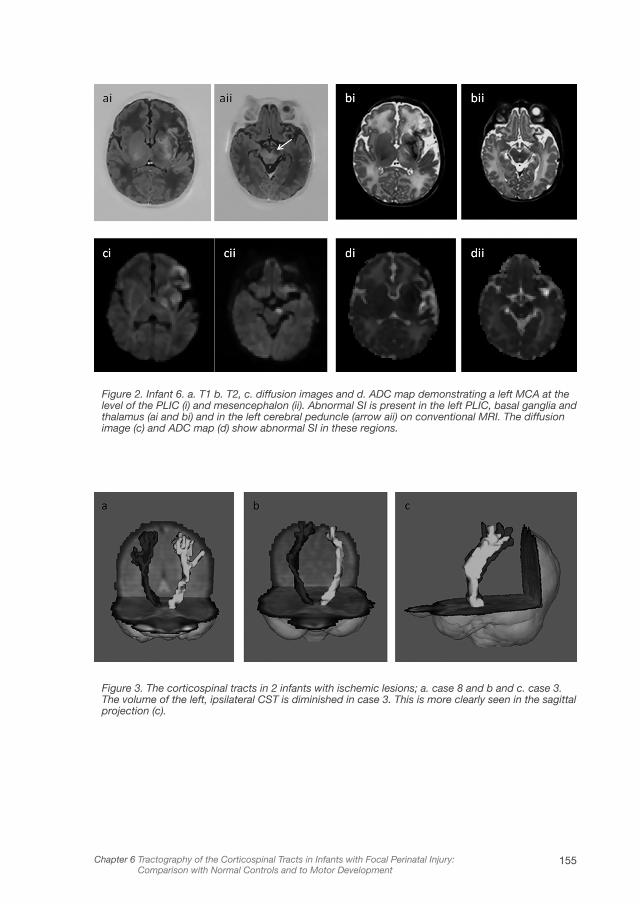
155Chapter 6 Tractography of the Corticospinal Tracts in Infants with Focal Perinatal Injury: Comparison with Normal Controls and to Motor Development
Figure 2. Infant 6. a. T1 b. T2, c. diffusion images and d. ADC map demonstrating a left MCA at the level of the PLIC (i) and mesencephalon (ii). Abnormal SI is present in the left PLIC, basal ganglia and thalamus (ai and bi) and in the left cerebral peduncle (arrow aii) on conventional MRI. The diffusion image (c) and ADC map (d) show abnormal SI in these regions.
Figure 3. The corticospinal tracts in 2 infants with ischemic lesions; a. case 8 and b and c. case 3. The volume of the left, ipsilateral CST is diminished in case 3. This is more clearly seen in the sagittal projection (c).
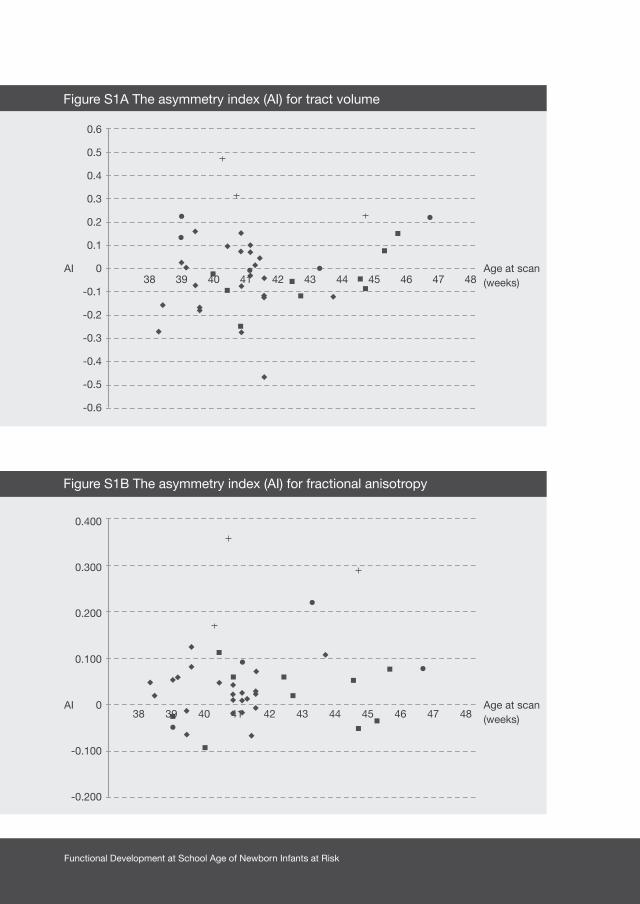
Functional Development at School Age of Newborn Infants at Risk
0.6
0.5
0.4
0.3
0.2
0.1
AI 0
-0.1
-0.2
-0.3
-0.4
-0.5
-0.6
0.400
0.300
0.200
0.100
AI 0
-0.100
-0.200
Age at scan (weeks)
Age at scan (weeks)
38 39 40 41 42 43 44 45 46 47 48
38 39 40 41 42 43 44 45 46 47 48
Figure S1A The asymmetry index (AI) for tract volume
Figure S1B The asymmetry index (AI) for fractional anisotropy
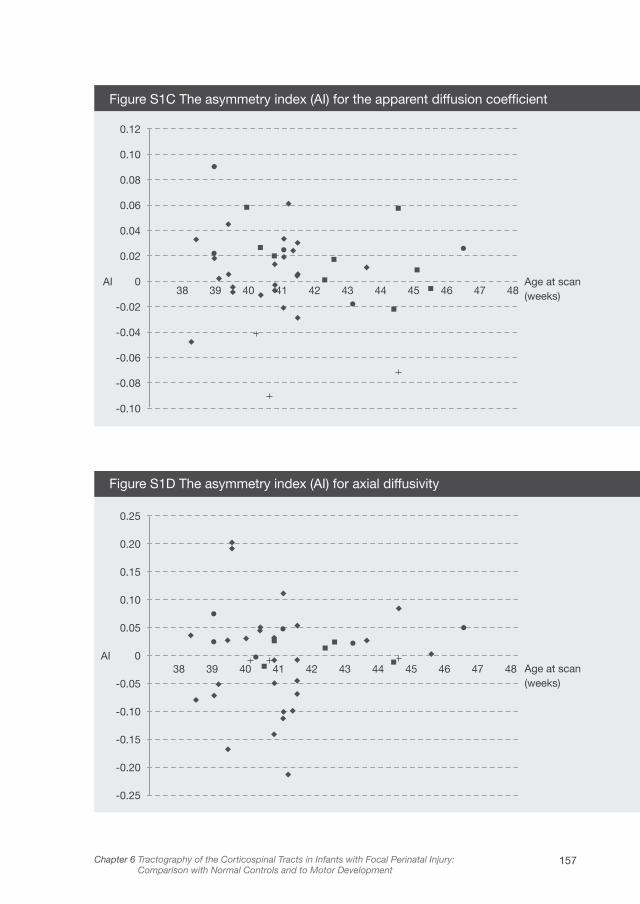
157Chapter 6 Tractography of the Corticospinal Tracts in Infants with Focal Perinatal Injury: Comparison with Normal Controls and to Motor Development
0.25
0.20
0.15
0.10
0.05
AI 0
-0.05
-0.10
-0.15
-0.20
-0.25
Age at scan (weeks)
Figure S1D The asymmetry index (AI) for axial diffusivity
0.12
0.10
0.08
0.06
0.04
0.02
AI 0
-0.02
-0.04
-0.06
-0.08
-0.10
Age at scan (weeks)
Figure S1C The asymmetry index (AI) for the apparent diffusion coefficient
38 39 40 41 42 43 44 45 46 47 48
38 39 40 41 42 43 44 45 46 47 48
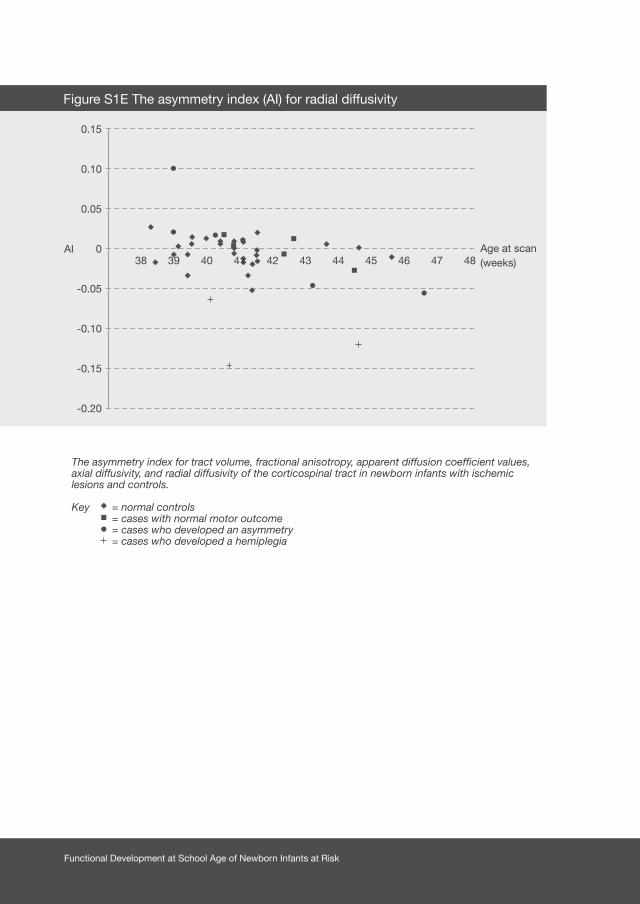
Functional Development at School Age of Newborn Infants at Risk
The asymmetry index for tract volume, fractional anisotropy, apparent diffusion coefficient values, axial diffusivity, and radial diffusivity of the corticospinal tract in newborn infants with ischemic lesions and controls.
Key = normal controls = cases with normal motor outcome = cases who developed an asymmetry = cases who developed a hemiplegia
0.15
0.10
0.05
AI 0
-0.05
-0.10
-0.15
-0.20
Age at scan (weeks)
Figure S1E The asymmetry index (AI) for radial diffusivity
38 39 40 41 42 43 44 45 46 47 48

159Chapter 6 Tractography of the Corticospinal Tracts in Infants with Focal Perinatal Injury: Comparison with Normal Controls and to Motor Development
Discussion
In this study we examined a group of healthy control infants and a group with
unilateral perinatally acquired focal lesions using diffusion tractography of the
CSTs in the neonatal period. Our analyses revealed that, whilst the AI for AD did
not show any differences between cases and controls, the AI for all the other
diffusion measures we assessed showed a significant difference between controls
and infants who developed a hemiplegia and RD also showed a significant
difference in AI between controls and infants who developed a mild asymmetry.
We established a normal range for asymmetry of diffusion measures from the
control infants, which when within the normal range for all diffusion characteristics
in case infants were associated with normal motor development. All infants who
developed a hemiplegia either had at least 3 diffusion measures outside the
normal range, or tractography could not be performed. In the five children who
developed a mild motor asymmetry, at least 1 of the DTI measures was outside
the normal range in 4. Of interest, the functional asymmetry was very mild in the
child whose DTI findings were within the normal range and this child had good
independent finger movements bilaterally at 4 years of age and a normal gait.
The conventional MRI findings were similar; no asymmetry in motor function was
predicted in all 9 children who had no evidence of asymmetry, and hemiplegia was
predicted in all 6 children who subsequently developed a hemiplegia. However,
for children who developed a mild motor asymmetry conventional MRI predicted
a hemiplegia in 2 and normal motor development in 3 infants. The 2 cases where
tractography correctly predicted an abnormal outcome and conventional MRI did
not were imaged 3 days and 29 days after the onset of clinical seizures. The ability
of conventional MRI or tractography to predict abnormal motor development
does not, therefore, appear to be related to the time of imaging after injury. The
specificity for prediction of good motor performance was 100% for both MRI and
tractography, and the sensitivity for prediction of abnormal motor performance
was 73% for MRI and 91% for tractography.
Our study group included all the term born infants with AIS who were imaged
neonatally and had good quality DTI over a 4 year period. The incidence of
hemiplegia in the term infants with AIS in our study (6 of 14) is similar to that reported

Functional Development at School Age of Newborn Infants at Risk
in other MRI studies of neonatal infarction.2 We included 3 infants who were born
preterm who had an MCA territory infarction, 2 preterm infants who had HPI and a
term born infant with venous HPI in addition as the motivation for this study was to
determine whether tractography can provide additional information compared to
conventional MRI alone in infants who reflect the common unilateral focal lesions
presenting to the clinical neonatologist and radiologist. Our results suggest that
tractography offers little extra prognostic information compared to that which can
be obtained from conventional MRI in infants with normal motor outcome or who
develop a hemiplegia. However, tractography may be useful in identifying those
infants who subsequently develop a mild motor asymmetry. In this study, both
cases where MRI was predictive of normal motor development and tractography
findings were asymmetrical developed an asymmetry. We accept that our study
is limited by a relatively small subject group and the early age at assessment for
some infants. In addition, it remains to be seen whether the children with mild
motor problems will develop a mild hemiplegia in later childhood, although that
appears unlikely in the child who was assessed at 4 years. In the study by Mercuri
et al only one child who was asymmetrical at 2 years had a mild hemiplegia at 5.5
years.22
Studies have shown that an increased SI at the level of the PLIC and the cerebral
peduncle on diffusion weighted images (DWIs), indicating areas of restricted
diffusion, is followed by the development of a hemiplegia in infants with AIS.15
Kirton et al. examined DWIs from 14 neonates with AIS and found a difference in
relative affected volume of the CST using slice-by-slice analysis, when comparing
children with good and poor motor outcome.14 Similar findings have been reported
in the adult brain following stroke, with marked reductions in anisotropy following
ischemia being associated with the structural breakdown of WM fibers.24,25 This
decrease in anisotropy is presumably caused by Wallerian degeneration (WD), that
is the anterograde degeneration of axons and myelin sheaths after proximal axonal
or cell body injury, which is observed as subtle changes in SI on conventional
imaging.5,26 The asymmetries in tract volume, FA and RD observed in infants who
developed motor impairments in this present study may be early markers of the
progressive disintegration of fibers due to WD.

161Chapter 6 Tractography of the Corticospinal Tracts in Infants with Focal Perinatal Injury: Comparison with Normal Controls and to Motor Development
Using an AI to assess differences between the injured and contra-lateral CSTs
allowed us to combine data acquired using 2 different diffusion schemes, and
offers the possibility of performing larger studies comparing data from different
imaging centers in future studies. Another advantage of this approach is that we
were able to assess images obtained over a wide age range following birth, and so
imaging in the acute period following the injury was not essential.
Our secondary aim was to establish normative values for diffusion characteristics
of the CSTs in healthy control infants at term which, to our knowledge, have
not been reported in such a large group previously. Aeby et al. assessed CST
development using probabilistic tractography and, in 6 healthy term infants, they
reported a mean FA of around 0.23, close to our finding of 0.26.17 Other studies
using a deterministic approach reported slightly higher FA values at TEA in infants
who were born preterm.27 By using a probabilistic approach, we could delineate
tracts not only in areas with high FA, but also areas with lower FA values, such as
the peripheral portion of the tract close to the motor cortex, which may explain
this difference. Previous studies have demonstrated a trend towards differences
in tract volume and FA between hemispheres in preterm infants at TEA,28 however,
we did not demonstrate inter-hemispheric differences in either volume or FA in our
healthy term-born controls.
In summary, both conventional MRI and tractography of the CSTs performed in
the neonatal period were able to predict subsequent normal motor development
or hemiplegia following ischemic injury. Diffusion tractography appears to offer
additional information over conventional MRI in predicting a subsequent mild
motor asymmetry.

Functional Development at School Age of Newborn Infants at Risk
1. Benders MJ, Groenendaal F, Uiterwaal CS, et al.
Maternal and infant characteristics associated with
perinatal arterial stroke in the preterm infant. Stroke
2007;38:1759-1765.
2. Mercuri E, Rutherford M, Cowan F, et al. Early
prognostic indicators of outcome in infants
with neonatal cerebral infarction: a clinical,
electroencephalogram, and magnetic resonance
imaging study. Pediatrics 1999;103:39-46.
3. deVeber GA, MacGregor D, Curtis R, Mayank S.
Neurologic outcome in survivors of childhood arterial
ischemic stroke and sinovenous thrombosis. J Child
Neurol 2000;15:316-324.
4. Sreenan C, Bhargava R, Robertson CM. Cerebral
infarction in the term newborn: clinical
presentation and long-term outcome. J Pediatr
2000;137:351-355.
5. de Vries LS, Groenendaal F, van Haastert I, Eken P,
Rademaker KJ, Meiners LC. Asymmetrical myelination
of the posterior limb of the internal capsule in infants
with periventricular haemorrhagic infarction: An early
predictor of hemiplegia. Neuropediatrics
1999;30:314-319.
6. Huppi PS, Maier SE, Peled S, et al. Microstructural
development of human newborn cerebral white
matter assessed in vivo by diffusion tensor magnetic
resonance imaging. Pediatr Res 1998;44:584-590.
7. Neil JJ, Shiran SI, McKinstry RC, et al. Normal brain in
human newborns: apparent diffusion coefficient and
diffusion anisotropy measured by using diffusion tensor
MR imaging. Radiology 1998;209:57-66.
8. Seghier ML, Lazeyras F, Zimine S, et al. Combination of
event-related fMRI and diffusion tensor imaging in an
infant with perinatal stroke. Neuroimage
2004;21:463-472.
9. Ward P, Counsell S, Allsop J, et al. Reduced fractional
anisotropy on diffusion tensor magnetic resonance
imaging after hypoxicischemic encephalopathy.
Pediatrics 2006;117:e619-e630.
10. Behrens TE, Johansen-Berg H, Woolrich MW, et al.
Non-invasive mapping of connections between human
thalamus and cortex using diffusion imaging. Nat
Neurosci 2003;6:750-757.
11. Counsell SJ, Dyet LE, Larkman DJ, et al. Thalamo-
cortical connectivity in children born preterm mapped
using probabilistic magnetic resonance tractography.
Neuroimage 2007;34:896-904.
12. Dudink J, Mercuri E, Al-Nakib L, et al. Evolution
of unilateral perinatal arterial ischemic stroke on
conventional and diffusion weighted MR imaging. Am
J Neuroradiol 2009;30:998-1004.
13. Krishnamoorthy KS, Soman TB, Takeoka M, Schaefer
PW. Diffusion-weighted imaging in neonatal cerebral
infarction: clinical utility and follow-up. J Child Neurol
2000;15:592-602.
References

163Chapter 6 Tractography of the Corticospinal Tracts in Infants with Focal Perinatal Injury: Comparison with Normal Controls and to Motor Development
14. Kirton A, Shroff M, Visvanathan T, deVeber G.
Quantified corticospinal tract diffusion restriction
predicts neonatal stroke outcome. Stroke
2007;38:974-980.
15. de Vries LS, Van der Grond J, van Haastert IC,
Groenendaal F. Prediction of outcome in new-
born infants with arterial ischaemic stroke using
diffusion-weighted magnetic resonance imaging.
Neuropediatrics 2005;36:12-20.
16. Gilmore JH, Lin W, Corouge I, et al. Early postnatal
development of corpus callosum and corticospinal
white matter assessed with quantitative tractography.
Am J Neuroradiol 2007;28:1789-1795.
17. Aeby A, Liu Y, De Tiege, X, et al. Maturation of
thalamic radiations between 34 and 41 weeks’
gestation: a combined voxel-based study and
probabilistic tractography with diffusion tensor
imaging. Am J Neuroradiol 2009;30:1780-1786.
18. Smith SM, Jenkinson M, Woolrich MW, et al.
Advances in functional and structural MR image
analysis and implementation as FSL. Neuroimage
2004;23:S208-S219.
19. Bassi L, Chew A, Merchant N, et al. Diffusion tensor
imaging in preterm infants with punctate white matter
lesions. Pediatr Res 2011; 69:561-566.
20. Haataja L, Mercuri E, Regev R, et al. Optimality score
for the neurologic examination of the infant at 12 and
18 months of age. J Pediatr 1999;135:153-161.
21. Choi CH, Lee JM, Koo BB, et al. Sex differences in the
temporal lobe white matter and the corpus callosum:
a diffusion tensor tractography study. Neuroreport
2010;21:73-77.
22. Mercuri E, Barnett A, Rutherford M, et al. Neonatal
cerebral infarction and neuromotor outcome at school
age. Pediatrics 2004;113: 95-100.
23. Puig J, Pedraza S, Blasco G, et al. Wallerian
degeneration in the corticospinal tract evaluated by
diffusion tensor imaging correlates with motor deficit
30 days after middle cerebral artery ischemic stroke.
Am J Neuroradiol 2010;31:1324-1330.
24. Pierpaoli C, Barnett A, Pajevic S, et al. Water
diffusion changes in Wallerian degeneration and their
dependence on white matter architecture. Neuroimage
2001;13:1174-1185.
25. Werring DJ, Toosy AT, Clark CA, et al. Diffusion
tensor imaging can detect and quantify corticospinal
tract degeneration after stroke. J Neurol Neurosurg
Psychiatry 2000;69:269-272.
26. Bouza H, Dubowitz LM, Rutherford M, Pennock JM.
Prediction of outcome in children with congenital
hemiplegia: a magnetic resonance imaging study.
Neuropediatrics 1994;25:60-66.
27. Adams E, Chau V, Poskitt KJ, Grunau RE, Synnes
A, Miller SP. Tractographybased quantitation of
corticospinal tract development in premature
newborns. J Pediatr 2010;156:882-888.

Functional Development at School Age of Newborn Infants at Risk
28. Liu Y, Baleriaux D, Kavec M, et al. Structural
asymmetries in motor and language networks
in a population of healthy preterm neonates at
term equivalent age: a diffusion tensor imaging
and probabilistic tractography study. Neuroimage
2010;51:783-788.

165Chapter 6 Tractography of the Corticospinal Tracts in Infants with Focal Perinatal Injury: Comparison with Normal Controls and to Motor Development


Chapter 7 Functional impairments at school age of children
with necrotizing enterocolitis or
spontaneous intestinal perforation
Chapter 8 Functional impairments at school age of
preterm born children with late-onset sepsis
Chapter 9 Motor and cognitive outcome at school age
of children surgically treated for intestinal obstructions
in the first days of life
PART 3Functional outcome of newborn infants with
systemic diseases

Chapter 7
FUNCTIONAL IMPAIRMENTS AT SCHOOL
AGE OF CHILDREN WITH NECROTIZING
ENTEROCOLITIS OR SPONTANEOUS
INTESTINAL PERFORATION
ELISE ROZE, BASTIAAN D.P. TA, MEIKE H. VAN DER REE, JOZIEN C. TANIS,
KOENRAAD N. J. A. VAN BRAECKEL, JAN B.F. HULSCHER, AREND F. BOS
PEDIATRIC RESEARCH 2011; DOI 10.1203/PDR.0B013E31823279B1
Functional Development at School Age of Newborn Infants at Risk
Abstract
We aimed to determine motor, cognitive, and behavioral outcome at school age of
children that had either necrotizing enterocolitis (NEC) or spontaneous intestinal
perforation (SIP). This case-control study included infants with NEC Bell’s stage-
IIA onwards, infants with SIP and matched controls (1996-2002). At school age
we assessed motor skills, intelligence, visual perception, visuomotor integration,
verbal memory, attention, behavior, and executive functions. Of 93 infants with
NEC or SIP, 28 (30%) died. We included 52 of 65 survivors for follow-up. At mean
age 9 years we found that 68% of the children had borderline or abnormal scores
on the Movement Assessment Battery for Children (versus 45% of controls). Their
mean total intelligence quotient (IQ) was 86±14 compared to 97±9 in the controls.
Additionally, attention and visual perception were affected (p<.01 and p=.02). In
comparison to controls, surgically treated children were at highest risk for adverse
outcome. In conclusion, at school age the motor functions and intelligence of many
children with NEC or SIP were borderline or abnormal and, specifically, attention
and visual perception were impaired. Children with NEC or SIP form a specific risk-
group for functional impairments at school age even though the majority does not
have overt brain pathology.
171Chapter 7 Functional Impairments at School Age of Children with Necrotizing Enterocolitis or Spontaneous Intestinal Perforation
Introduction
Necrotizing enterocolitis (NEC) is a common, acute gastrointestinal disease in newborn,
mostly preterm infants. The clinical manifestation and course of NEC can vary from
non-specific symptoms requiring conservative treatment to a fulminant disease with
major abdominal and systemic symptoms requiring surgery.
Spontaneous intestinal perforation (SIP) is a less common gastrointestinal disorder. Its
incidence has increased over time with the increasing rate of survival of very low birth
weight infants. Infants with SIP have clinical and radiographic features that are often
less pronounced than infants with NEC, but they always require surgical treatment.1
Mortality in infants with NEC or SIP is found to range between 15 to 30%.1,2
Newborn infants with NEC or SIP often require prolonged ventilatory support and
they are prone to develop sepsis, which both can lead to white matter injury.3 In
addition, they often have difficulty tolerating enteral feeding that subjects them to
inadequate nutrition and growth impairment. All these factors contribute to the risk
of neurodevelopmental disabilities. Earlier studies reported that ~20% of the infants
with NEC develop cerebral palsy (CP) while even more children have cognitive
impairments.4,5 Most of these studies, however, only followed the children up to the
age of 2 years. Furthermore, infants with SIP are frequently excluded from outcome
studies since SIP is a different disease than NEC, while they have similar presenting
signs. Consequently, the neurodevelopmental outcome at school age of children with
NEC or SIP is unknown. Since functional demands at school age are higher than at
younger ages, more specific motor, cognitive, and behavioral deficits that were not
detected previously may now become apparent.
The first aim of our study was to determine the motor, cognitive, and behavioral
outcome at school age of children with the gastrointestinal diseases NEC or SIP
compared to control children of similar gestational age. Our second aim was to identify
disease-related risk factors for adverse outcome, such as type of treatment, Bell’s
stage, and presence of late onset sepsis. We hypothesized that children with surgically
treated NEC (SurgNEC) would be at highest risk for neurodevelopmental impairments
compared to children with SIP and medically treated NEC (MedNEC), since they had
often been severely ill for a significant period of time and their illness was frequently
complicated with perforation.

Functional Development at School Age of Newborn Infants at Risk
Methods
Patients
We selected all newborn infants that were admitted to the Neonatal Intensive Care
Unit (NICU) of the University Medical Center Groningen between 1996-2002 and
diagnosed with either NEC, from Bell’s stage-IIA onwards, or SIP. We found the
infants by searching the patient database on the diagnoses NEC, and intestinal and
gastric perforations. We also included control infants from our NICU that were born in
the same period (1996-2002) and matched for gender and gestational age. We aimed
at including 1.5-2 times as many control infants as cases in the subgroups of infants
with gastrointestinal diseases (i.e. MedNEC (n=15), SurgNEC (n=17), SIP (n=20)).
We therefore included 31 controls. We excluded patients with major chromosomal
anomalies. The infants in the control group were comparable to our study group in
all respects except that they did not have gastrointestinal diseases (Table 1).6 The
diagnosis of either NEC or SIP was made in a multi-disciplinary setting, involving
neonatologists, pediatric surgeons and radiologists based on i. clinical signs,
including abdominal distention and discoloration, bloody stools, and circulatory
and respiratory instability; II. radiological signs consistent with either pneumatosis
intestinalis, pneumoperitoneum or both; and III. the extent of the affected bowel during
surgery. All of the infants with SIP and SurgNEC underwent laparotomy in the acute
phase of the illness. We reviewed the medical charts for neonatal and disease-related
characteristics. Disease severity in the infants with NEC was classified according to
Bell’s stages by using the clinical, radiographic, and laparotomy findings.7 We also
recorded the number of disease-related reoperations in the first year of life.
Follow-up
The children were invited prospectively to participate in an extension of the routine
follow-up program which was supervised by a child neuropsychologist (K.N.J.A.B.).
The program entailed the assessment of motor performance, cognition, and
behavior at the age of 6 to 13 years. The follow-up took approximately 2.5 hours
to complete including breaks. Parents gave their written informed consent to
participate in the follow-up program. The study was approved by the Medical
Ethical Committee of the University Medical Center Groningen.
173Chapter 7 Functional Impairments at School Age of Children with Necrotizing Enterocolitis or Spontaneous Intestinal Perforation
Motor Outcome
We determined the presence or absence of CP following Bax’ criteria.8 In case
of CP, gross motor functioning was scored with the Gross Motor Function
Classification System (GMFCS), a functional, five level classification system for
CP.9 Higher GMFCS levels indicate more severe functional impairments.
To assess the children’s motor outcome we administered the Movement
Assessment Battery for Children (Movement-ABC), a standardized test of motor
skills for children.10 This test yields a total motor performance score that is based on
subscores for manual dexterity (fine motor skills), ball skills, and static and dynamic
balance (coordination). The higher the score, the poorer the performance.
We also measured height and weight of the children which are expressed as
z-scores.
Cognitive Outcome
Total, verbal, and performance intelligence were assessed using a shortened
version of the Wechsler Intelligence Scale for Children, third edition, Dutch version
(WISC-III-NL).11 In addition, we assessed central visual perception and visuomotor
integration with the subtests Geometric Puzzles and Design Copying of the NEPSY-
II, a neuropsychological test battery for children.12 Visuomotor integration involves
the integration of visual information with finger-hand movements.
We assessed verbal memory with a standardized Dutch version of Rey’s Auditory
Verbal Learning Test.13
We measured selective attention and attentional control with the subtests Map
Mission and Opposite Worlds of the Test of Everyday Attention for Children.14
Selective attention refers to a child’s ability to select target information from an
array of distractors. Attentional control refers to the ability to shift attention flexibly
and adaptively.
Behavioral Outcome
To obtain information on the children’s behavioral and emotional competencies
and problems we asked the parents to complete the Child Behavior Checklist.15
It consists of two subscales, one for internalizing problems (withdrawn behavior,

Functional Development at School Age of Newborn Infants at Risk
somatic complaints, and anxious/depressed scales) and one for externalizing
problems (delinquent and aggressive behavior scales), and a composite total
scale.
The parents also filled out the Behavior Rating Inventory of Executive Function16 to
assess executive functioning involved in well-organized, purposeful, goal-directed,
and problem-solving behavior.
Test scores obtained when a child was too tired and/or uncooperative (as
assessed by the trained experimenter) as well as incomplete questionnaires, were
excluded.
The experimenter was blinded to the presence or absence of gastrointestinal
diseases in the children.
Statistical Analyses
We classified the intelligence quotients (IQs) as normal (IQ≥85), borderline (mildly
abnormal, IQ 70-85), moderately abnormal (IQ 69-55), and severely abnormal
(IQ<55). We used the percentiles on the standardization samples of the Movement-
ABC and cognitive tests to classify raw scores into normal (>P15), borderline (P5-
P15), and abnormal (<P5). For the Child Behavior Checklist and Behavior Rating
Inventory of Executive Function we used a similar classification following the
criteria in the manual. Visual inspection of the histograms and Q-Q plots were used
to determine which outcome measures were normally distributed. We then used
the Student’s t, Mann-Whitney U, and Chi2 test where appropriate to compare the
outcome measures of the study group with the control group and to relate disease
characteristics to outcome. We used backward logistic regression analysis to
calculate the odds ratios (ORs) for worse outcome when comparing the children
with gastrointestinal diseases to the controls, and the children with SurgNEC
to the groups of children with both MedNEC and SIP. We repeated the logistic
regression analyses, adjusting for severe cerebral pathology. Cerebral pathology
was detected by serial cranial ultrasound scans, and defined as severe in case
of grade III germinal matrix hemorrhage, post-hemorrhagic ventricular dilatation,
periventricular hemorrhagic infarction and cystic periventricular leukomalacia.
Next, to identify additional disease-related risk factors for adverse outcome,

175Chapter 7 Functional Impairments at School Age of Children with Necrotizing Enterocolitis or Spontaneous Intestinal Perforation
we performed a univariate analysis to relate age at development of NEC, Bell’s
stage, localization of SIP (gastric or intestinal), presence of late onset sepsis, age
at surgery, and multiple surgeries to outcome within the group of children with
gastrointestinal diseases. Throughout the analyses p<.05 was considered to be
statistically significant. SPSS 16.0 software for Windows (SPSS Inc, Chicago, IL)
was used for the analyses. The analyses were performed by E.R. and A.F.B. with
support from a statistician.
Functional Development at School Age of Newborn Infants at Risk
Results
Between 1996-2002 a total of 3,947 patients were admitted to our NICU. After
database search 59 infants with NEC and 34 infants with SIP were included.
Twenty (34%) of the infants with NEC and 8 (24%) of the infants with SIP died in
the neonatal period. A total of 65 survivors with gastrointestinal diseases remained
of whom 52 (80%) participated in the follow-up program – 8 sets of parents
declined the invitation to participate, 4 could not be traced, and 1 child could not
be assessed as a result of being deaf. We included 31 control infants from our
NICU for follow-up.
Patient Characteristics
Table 1 gives an overview of the patient demographics of the children with
gastrointestinal diseases and the controls. The demographics of the 13 children
who did not participate were comparable to the children included in our study
(n=7 with NEC, n=6 with SIP, median gestational age 28.9 weeks, birth weight
1,100 grams). The child that could not be assessed as a result of being deaf had
MedNEC.
Of the 15 infants with MedNEC, 13 had Bell’s stage-IIA and 2 stage-IIB. One of
these infants was surgically treated for an intestinal stenosis several weeks after
recovering from NEC. Of the 17 infants with SurgNEC, 1 had Bell’s stage-IIA, 1
stage-IIB, 3 stage-IIIA, and 12 stage-IIIB.
Two of the 20 infants with SIP had a stomach perforation and 18 had an intestinal
perforation. All infants with SIP and SurgNEC underwent laparotomy in the acute
phase of their gastrointestinal disease. One child with SIP received postnatal
steroids from day 11 onwards because of respiratory problems, prior to the
development of SIP.
During childhood, 3 children required pediatric intensive care treatment for
respiratory support, which was not related to their gastrointestinal disease from
the neonatal period. One child with MedNEC had subglottic laryngitis, one child
with SIP required a cardiac intervention for pulmonary artery stenosis and one
control child had a respiratory syncytial virus infection.
177Chapter 7 Functional Impairments at School Age of Children with Necrotizing Enterocolitis or Spontaneous Intestinal Perforation
Follow-up
The mean age at follow-up was 9.3 years (range 6.2-13.3 years). At school age we
found that 1 child had visual problems requiring prescription glasses, 4 children
had hearing problems requiring hearing aids, and 4 children had epilepsy. These
disabilities were not found in the control group. Regarding growth, we found that
children with gastrointestinal diseases had a mean height z-score of -0.37 (SD,
1.17), weight of 0.09 (SD 1.34), and head circumference of -0.40 (SD 1.09). In the
control children this was -0.40 (SD 0.95) for height, 0.11 (SD 1.57) for weight, and
-0.43 (SD 1.45) for head circumference.
Motor Outcome
Of the 52 children with gastrointestinal diseases, 3 developed unilateral CP (6%)
and 5 bilateral CP (9%). Their functional impairments were limited to GMFCS level-I
in 3 and level-II in 4 children. One child with severe functional impairments had
GMFCS level-IV. In the control group only 1 child developed bilateral CP (5%) with
GMFCS level-II. The increased incidence of CP in the children with gastrointestinal
diseases was almost significant (p=.08).
The median scores on the Movement-ABC are shown in Table 2. The child with
severe CP (GMFCS-IV) was not assessed with the Movement-ABC. The children
with gastrointestinal diseases scored significantly worse than the controls on the
total Movement-ABC score and on the subtests fine motor skills and coordination.
In Table 3 we classified the outcome into the categories normal, borderline, and
abnormal, and present the ORs for worse outcome, after correction for cerebral
pathology. Sixty-eight percent of the children with gastrointestinal diseases
obtained borderline or abnormal scores on the Movement-ABC with an OR of
2.27 compared to controls. Before correction for cerebral pathology, ORs for
borderline /abnormal outcome on the total score of the Movement-ABC and
abnormal outcome on coordination were slightly higher. (OR 2.66, 95% CI 1.06-
6.68, p=.04, and OR 3.64, 95% CI 1.20-11.02, p=.02 respectively). All other ORs
were the same.

Functional Development at School Age of Newborn Infants at Risk
Cognitive and Behavioral Outcome
Of the 52 children with gastrointestinal diseases 15 (28%) attended special
education classes and 14 (27%) had to repeat classes. In the control group (n=31) 1
child (3%) attended a special education class and 8 (26%) had to repeat classes.
Table 2 shows the mean and median scores, where appropriate, on the cognitive
and behavioral measures. For 3 children with gastrointestinal diseases the
neuropsychological tests were too difficult because of very low IQ scores. In
comparison to the controls the children with gastrointestinal diseases scored
significantly lower on intelligence (total, verbal, and performance), visual perception,
and attention. There was a trend towards lower scores on visuomotor integration.
On the delayed recall of verbal memory they scored slightly better than the controls.
The incidence of behavioral problems in the groups was comparable.
In Table 3 we classified the scores into the categories normal, borderline, and
abnormal including the ORs for worse outcome after correction for cerebral
pathology. The children whose neuropsychological functions could not be
assessed were included in the category abnormal. Regarding IQ, we found that
n=3 children had moderately abnormal total IQs, whilst n=2 had severely abnormal
total IQs; for verbal IQ this was n=5 and n=2 and for performance IQ n=5 and n=2
respectively. The ORs confirmed the analyses of the mean scores except for visual
perception in which case the OR was not significant. The better scores on verbal
memory were not confirmed by the ORs. Analyses without correction for cerebral
pathology revealed similar results with slightly different ORs, but no differences in
level of significance (data not shown). Only ORs for borderline /abnormal verbal IQ
and visuomotor integration were higher prior to correction (OR 3.28, 95% CI 0.99-
10.88, p=.05 and OR 4.15, 95% CI 1.10-15.66, p=.03, respectively).
Disease Characteristics in relation to Outcome
Subsequently, we determined whether the disease characteristics of the children
with gastrointestinal diseases were related to outcome at school age. Between
the subgroups of children with gastrointestinal diseases (MedNEC, SurgNEC, and
SIP) no differences in outcome were found. Next, we analyzed the outcomes of the
subgroups in comparison to the controls. In Figure 1 we provide the Movement-
179Chapter 7 Functional Impairments at School Age of Children with Necrotizing Enterocolitis or Spontaneous Intestinal Perforation
ABC and IQ scores. The children with SIP had the highest Movement-ABC scores,
which indicates adverse outcome. The IQ scores of the children with MedNEC,
SurgNEC, and SIP were lower than those of the controls. We found the biggest
differences for children with SurgNEC or SIP.
In Table 4 we present the ORs for borderline /abnormal outcome of the children
with MedNEC, SurgNEC, or SIP in comparison to the control group. The children
with SIP had a significant increased risk for worse motor outcome compared to
the controls. The ORs for lower intelligence reached significance in the children
with SurgNEC and SIP, and showed a trend towards significance in children with
MedNEC. The children with SurgNEC were at risk for worse visuomotor integration.
Attention was worse in all three groups, although only the ORs of the children with
SurgNEC and SIP reached significance. When calculating the ORs for abnormal
outcome only, the domains in which the children had increased ORs for worse
outcome were similar, apart from some empty fields (data not shown).
Analyses without correction for cerebral pathology showed that visual perception
tended to be worse in children with SIP compared to controls (OR 4.93, 95% CI
0.87-27.88, p=.07). All other ORs were the same before and after correction.
None of the additional disease-related risk factors (the age at development of
NEC, Bell’s stage, localization of SIP (gastric or intestinal), presence of late onset
sepsis, age at surgery, and multiple surgeries) were related to adverse
outcome at school age.
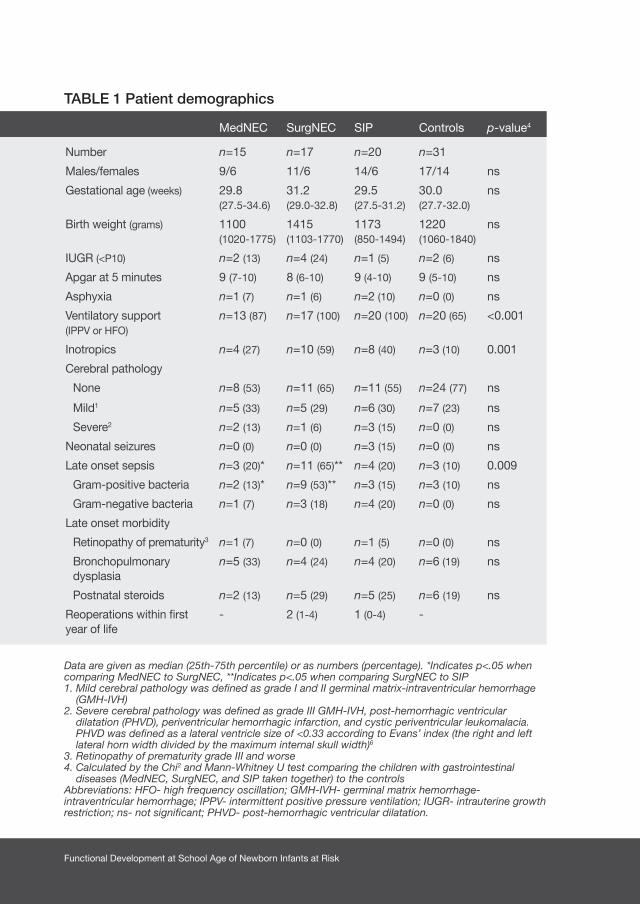
Functional Development at School Age of Newborn Infants at Risk
TABLE 1 Patient demographics
Data are given as median (25th-75th percentile) or as numbers (percentage). *Indicates p<.05 when comparing MedNEC to SurgNEC, **Indicates p<.05 when comparing SurgNEC to SIP1. Mild cerebral pathology was defined as grade I and II germinal matrix-intraventricular hemorrhage
(GMH-IVH) 2. Severe cerebral pathology was defined as grade III GMH-IVH, post-hemorrhagic ventricular
dilatation (PHVD), periventricular hemorrhagic infarction, and cystic periventricular leukomalacia. PHVD was defined as a lateral ventricle size of <0.33 according to Evans’ index (the right and left lateral horn width divided by the maximum internal skull width)6
3. Retinopathy of prematurity grade III and worse 4. Calculated by the Chi2 and Mann-Whitney U test comparing the children with gastrointestinal
diseases (MedNEC, SurgNEC, and SIP taken together) to the controls Abbreviations: HFO- high frequency oscillation; GMH-IVH- germinal matrix hemorrhage-intraventricular hemorrhage; IPPV- intermittent positive pressure ventilation; IUGR- intrauterine growth restriction; ns- not significant; PHVD- post-hemorrhagic ventricular dilatation.
MedNEC SurgNEC SIP Controls p-value4
Number n=15 n=17 n=20 n=31
Males/females 9/6 11/6 14/6 17/14 ns
Gestational age (weeks) 29.8 (27.5-34.6)
31.2 (29.0-32.8)
29.5 (27.5-31.2)
30.0 (27.7-32.0)
ns
Birth weight (grams) 1100 (1020-1775)
1415 (1103-1770)
1173 (850-1494)
1220 (1060-1840)
ns
IUGR (<P10) n=2 (13) n=4 (24) n=1 (5) n=2 (6) ns
Apgar at 5 minutes 9 (7-10) 8 (6-10) 9 (4-10) 9 (5-10) ns
Asphyxia n=1 (7) n=1 (6) n=2 (10) n=0 (0) ns
Ventilatory support (IPPV or HFO)
n=13 (87) n=17 (100) n=20 (100) n=20 (65) <0.001
Inotropics n=4 (27) n=10 (59) n=8 (40) n=3 (10) 0.001
Cerebral pathology
None n=8 (53) n=11 (65) n=11 (55) n=24 (77) ns
Mild1 n=5 (33) n=5 (29) n=6 (30) n=7 (23) ns
Severe2 n=2 (13) n=1 (6) n=3 (15) n=0 (0) ns
Neonatal seizures n=0 (0) n=0 (0) n=3 (15) n=0 (0) ns
Late onset sepsis n=3 (20)* n=11 (65)** n=4 (20) n=3 (10) 0.009
Gram-positive bacteria n=2 (13)* n=9 (53)** n=3 (15) n=3 (10) ns
Gram-negative bacteria n=1 (7) n=3 (18) n=4 (20) n=0 (0) ns
Late onset morbidity
Retinopathy of prematurity3 n=1 (7) n=0 (0) n=1 (5) n=0 (0) ns
Bronchopulmonary dysplasia
n=5 (33) n=4 (24) n=4 (20) n=6 (19) ns
Postnatal steroids n=2 (13) n=5 (29) n=5 (25) n=6 (19) ns
Reoperations within first year of life
- 2 (1-4) 1 (0-4) -

181Chapter 7 Functional Impairments at School Age of Children with Necrotizing Enterocolitis or Spontaneous Intestinal Perforation
MedNEC SurgNEC SIP Controls p-value4
Number n=15 n=17 n=20 n=31
Males/females 9/6 11/6 14/6 17/14 ns
Gestational age (weeks) 29.8 (27.5-34.6)
31.2 (29.0-32.8)
29.5 (27.5-31.2)
30.0 (27.7-32.0)
ns
Birth weight (grams) 1100 (1020-1775)
1415 (1103-1770)
1173 (850-1494)
1220 (1060-1840)
ns
IUGR (<P10) n=2 (13) n=4 (24) n=1 (5) n=2 (6) ns
Apgar at 5 minutes 9 (7-10) 8 (6-10) 9 (4-10) 9 (5-10) ns
Asphyxia n=1 (7) n=1 (6) n=2 (10) n=0 (0) ns
Ventilatory support (IPPV or HFO)
n=13 (87) n=17 (100) n=20 (100) n=20 (65) <0.001
Inotropics n=4 (27) n=10 (59) n=8 (40) n=3 (10) 0.001
Cerebral pathology
None n=8 (53) n=11 (65) n=11 (55) n=24 (77) ns
Mild1 n=5 (33) n=5 (29) n=6 (30) n=7 (23) ns
Severe2 n=2 (13) n=1 (6) n=3 (15) n=0 (0) ns
Neonatal seizures n=0 (0) n=0 (0) n=3 (15) n=0 (0) ns
Late onset sepsis n=3 (20)* n=11 (65)** n=4 (20) n=3 (10) 0.009
Gram-positive bacteria n=2 (13)* n=9 (53)** n=3 (15) n=3 (10) ns
Gram-negative bacteria n=1 (7) n=3 (18) n=4 (20) n=0 (0) ns
Late onset morbidity
Retinopathy of prematurity3 n=1 (7) n=0 (0) n=1 (5) n=0 (0) ns
Bronchopulmonary dysplasia
n=5 (33) n=4 (24) n=4 (20) n=6 (19) ns
Postnatal steroids n=2 (13) n=5 (29) n=5 (25) n=6 (19) ns
Reoperations within first year of life
- 2 (1-4) 1 (0-4) -
TABLE 2 Motor, cognitive, and behavioral outcome in children with
gastrointestinal diseases (NEC or SIP) versus controls
Data are given as mean (standard deviation, range) for normally distributed variables or median (25th-75th percentile) for non normally distributed variables. NS; not significant# p-values derived from Student t-test or Mann-Whitney u test1. Raw-scores2. Intelligence quotients3. Percentiles4. T-scores
Children with gastrointestinal diseases (n=52)
Controls (n=31) p-values#
Age at follow-up 9.6 (2.2, 6.2-13.2) 8.9 (1.6, 6.8-13.3) ns
Motor outcome (n=82)1
Movement-ABC total 10 (7-20) 8 (5-13) 0.037
Fine motor skills 6 (3-9) 3 (1-6) 0.008
Ball skills 2 (0-5) 3 (1-5) ns
Coordination 4 (2-8) 2 (0-4) 0.006
Cognitive outcome
Total intelligence2 86 (14, 45-118) 97 (9, 79-119) <0.001
Verbal intelligence2 87 (15, 50-125) 98 (12, 78-128) 0.001
Performance intelligence2 84 (15, 40-110) 95 (10, 78-118) 0.001
Visual perception (n=72)3 43 (29, 0.1-100) 61 (29, 5-98) 0.02
Visuomotor integration (n=80)3 47 (35, 0-100) 61 (30, 9-100) 0.08
Verbal memory (n=80)3 48 (39, 0-100) 48 (29, 1-91) ns
Delayed recall (n=74)3 54 (33, 0.1-99) 38 (30, 1-95) 0.04
Recognition (n=75)1 29 (2, 21-30) 29 (2, 22-30) ns
Selective attention (n=79)3 16 (6-50) 50 (25-63) 0.01
Attentional control (n=80)3 16 (3-50) 50 (16-75) 0.005
Behavioral outcome (n=81)
Total behavioral problems4 55 (11, 29-88) 55 (11, 34-81) ns
Internalizing problems4 53 (11, 33-77) 54 (13, 33-73) ns
Externalizing problems4 53 (11, 33-83) 52 (12, 33-82) ns
Executive functioning3 50 (27-81) 51 (30-66) ns
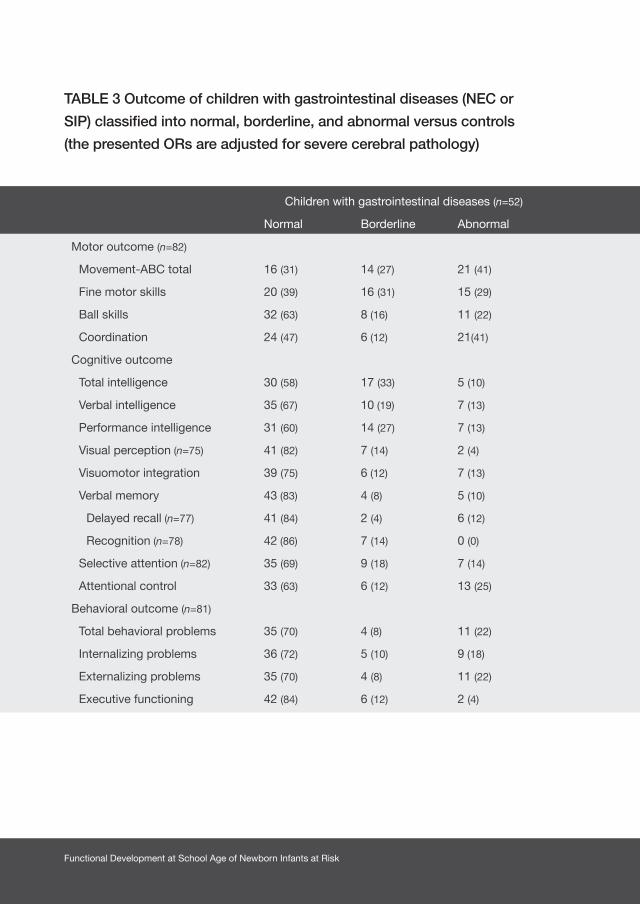
Functional Development at School Age of Newborn Infants at Risk
TABLE 3 Outcome of children with gastrointestinal diseases (NEC or
SIP) classified into normal, borderline, and abnormal versus controls
(the presented ORs are adjusted for severe cerebral pathology)
Children with gastrointestinal diseases (n=52) Controls (n=31) OR (95% CI)1 OR (95% CI)2
Normal Borderline Abnormal Normal Borderline Abnormal
Motor outcome (n=82)
Movement-ABC total 16 (31) 14 (27) 21 (41) 17 (55) 6 (19) 8 (26) 2.27* (0.90-5.78) 1.69 (0.62-4.59)
Fine motor skills 20 (39) 16 (31) 15 (29) 21 (68) 7 (23) 3 (10) 3.23** (1.27-8.33) 3.89** (1.02-14.77)
Ball skills 32 (63) 8 (16) 11 (22) 18 (58) 9 (29) 4 (13) 0.61 (0.23-1.57) 1.86 (0.54-6.44)
Coordination 24 (47) 6 (12) 21(41) 22 (71) 4 (13) 5 (16) 2.75** (1.06-7.12) 3.05* (0.99-9.43)
Cognitive outcome
Total intelligence 30 (58) 17 (33) 5 (10) 29 (94) 2 (6) 10.63‡ (2.29-49.35) ||
Verbal intelligence 35 (67) 10 (19) 7 (13) 27 (87) 4 (13) 2.66 (0.77-9.10) ||
Performance intelligence 31 (60) 14 (27) 7 (13) 25 (81) 6 (19) 2.82* (0.99-8.06) ||
Visual perception (n=75) 41 (82) 7 (14) 2 (4) 23 (92) 2 (8) 3.63 (0.75-17.70) ||
Visuomotor integration 39 (75) 6 (12) 7 (13) 28 (90) 3 (10) 3.29* (0.85-12.84) ||
Verbal memory 43 (83) 4 (8) 5 (10) 26 (84) 1 (3) 4 (13)
Delayed recall (n=77) 41 (84) 2 (4) 6 (12) 20 (71) 6 (21) 2 (7) 0.53 (0.17-1.61) 1.95 (0.37-10.41)
Recognition (n=78) 42 (86) 7 (14) 0 (0) 24 (83) 2 (7) 3 (10)
Selective attention (n=82) 35 (69) 9 (18) 7 (14) 27 (87) 2 (6) 2 (6) 4.01** (1.22-13.22) 3.54 (0.72-17.36)
Attentional control 33 (63) 6 (12) 13 (25) 26 (84) 2 (6) 3 (10) 3.81** (1.26-11.50) 4.15** (1.10-15.66)
Behavioral outcome (n=81)
Total behavioral problems 35 (70) 4 (8) 11 (22) 20 (65) 5 (16) 6 (19)
Internalizing problems 36 (72) 5 (10) 9 (18) 18 (58) 4 (13) 9 (29)
Externalizing problems 35 (70) 4 (8) 11 (22) 25 (81) 2 (6) 4 (13)
Executive functioning 42 (84) 6 (12) 2 (4) 27 (87) 2 (6) 2 (6)

183Chapter 7 Functional Impairments at School Age of Children with Necrotizing Enterocolitis or Spontaneous Intestinal Perforation
Children with gastrointestinal diseases (n=52) Controls (n=31) OR (95% CI)1 OR (95% CI)2
Normal Borderline Abnormal Normal Borderline Abnormal
Motor outcome (n=82)
Movement-ABC total 16 (31) 14 (27) 21 (41) 17 (55) 6 (19) 8 (26) 2.27* (0.90-5.78) 1.69 (0.62-4.59)
Fine motor skills 20 (39) 16 (31) 15 (29) 21 (68) 7 (23) 3 (10) 3.23** (1.27-8.33) 3.89** (1.02-14.77)
Ball skills 32 (63) 8 (16) 11 (22) 18 (58) 9 (29) 4 (13) 0.61 (0.23-1.57) 1.86 (0.54-6.44)
Coordination 24 (47) 6 (12) 21(41) 22 (71) 4 (13) 5 (16) 2.75** (1.06-7.12) 3.05* (0.99-9.43)
Cognitive outcome
Total intelligence 30 (58) 17 (33) 5 (10) 29 (94) 2 (6) 10.63‡ (2.29-49.35) ||
Verbal intelligence 35 (67) 10 (19) 7 (13) 27 (87) 4 (13) 2.66 (0.77-9.10) ||
Performance intelligence 31 (60) 14 (27) 7 (13) 25 (81) 6 (19) 2.82* (0.99-8.06) ||
Visual perception (n=75) 41 (82) 7 (14) 2 (4) 23 (92) 2 (8) 3.63 (0.75-17.70) ||
Visuomotor integration 39 (75) 6 (12) 7 (13) 28 (90) 3 (10) 3.29* (0.85-12.84) ||
Verbal memory 43 (83) 4 (8) 5 (10) 26 (84) 1 (3) 4 (13)
Delayed recall (n=77) 41 (84) 2 (4) 6 (12) 20 (71) 6 (21) 2 (7) 0.53 (0.17-1.61) 1.95 (0.37-10.41)
Recognition (n=78) 42 (86) 7 (14) 0 (0) 24 (83) 2 (7) 3 (10)
Selective attention (n=82) 35 (69) 9 (18) 7 (14) 27 (87) 2 (6) 2 (6) 4.01** (1.22-13.22) 3.54 (0.72-17.36)
Attentional control 33 (63) 6 (12) 13 (25) 26 (84) 2 (6) 3 (10) 3.81** (1.26-11.50) 4.15** (1.10-15.66)
Behavioral outcome (n=81)
Total behavioral problems 35 (70) 4 (8) 11 (22) 20 (65) 5 (16) 6 (19)
Internalizing problems 36 (72) 5 (10) 9 (18) 18 (58) 4 (13) 9 (29)
Externalizing problems 35 (70) 4 (8) 11 (22) 25 (81) 2 (6) 4 (13)
Executive functioning 42 (84) 6 (12) 2 (4) 27 (87) 2 (6) 2 (6)
Data are given as number (percentage). Normal was defined as >P15, borderline as P5-P15 and abnormal <P5, with regard to intelligence, normal was defined as IQ >85, borderline as IQ 70-85 and abnormal as IQ <70. Data are given as odds ratio (95% confidence interval) derived from logistic regression analyses, corrected for severe cerebral pathology. *p<.10, **p<.05, ‡p<.01 || Could not be determined due to absence of abnormal controls. Empty fields in OR columns indicate that ORs were not calculated due to lack of significance after comparing the mean scores.1. Odds ratios for borderline and abnormal outcome2 .Odds ratios for abnormal outcome
Children with gastrointestinal diseases (n=52) Controls (n=31) OR (95% CI)1 OR (95% CI)2
Normal Borderline Abnormal Normal Borderline Abnormal
Motor outcome (n=82)
Movement-ABC total 16 (31) 14 (27) 21 (41) 17 (55) 6 (19) 8 (26) 2.27* (0.90-5.78) 1.69 (0.62-4.59)
Fine motor skills 20 (39) 16 (31) 15 (29) 21 (68) 7 (23) 3 (10) 3.23** (1.27-8.33) 3.89** (1.02-14.77)
Ball skills 32 (63) 8 (16) 11 (22) 18 (58) 9 (29) 4 (13) 0.61 (0.23-1.57) 1.86 (0.54-6.44)
Coordination 24 (47) 6 (12) 21(41) 22 (71) 4 (13) 5 (16) 2.75** (1.06-7.12) 3.05* (0.99-9.43)
Cognitive outcome
Total intelligence 30 (58) 17 (33) 5 (10) 29 (94) 2 (6) 10.63‡ (2.29-49.35) ||
Verbal intelligence 35 (67) 10 (19) 7 (13) 27 (87) 4 (13) 2.66 (0.77-9.10) ||
Performance intelligence 31 (60) 14 (27) 7 (13) 25 (81) 6 (19) 2.82* (0.99-8.06) ||
Visual perception (n=75) 41 (82) 7 (14) 2 (4) 23 (92) 2 (8) 3.63 (0.75-17.70) ||
Visuomotor integration 39 (75) 6 (12) 7 (13) 28 (90) 3 (10) 3.29* (0.85-12.84) ||
Verbal memory 43 (83) 4 (8) 5 (10) 26 (84) 1 (3) 4 (13)
Delayed recall (n=77) 41 (84) 2 (4) 6 (12) 20 (71) 6 (21) 2 (7) 0.53 (0.17-1.61) 1.95 (0.37-10.41)
Recognition (n=78) 42 (86) 7 (14) 0 (0) 24 (83) 2 (7) 3 (10)
Selective attention (n=82) 35 (69) 9 (18) 7 (14) 27 (87) 2 (6) 2 (6) 4.01** (1.22-13.22) 3.54 (0.72-17.36)
Attentional control 33 (63) 6 (12) 13 (25) 26 (84) 2 (6) 3 (10) 3.81** (1.26-11.50) 4.15** (1.10-15.66)
Behavioral outcome (n=81)
Total behavioral problems 35 (70) 4 (8) 11 (22) 20 (65) 5 (16) 6 (19)
Internalizing problems 36 (72) 5 (10) 9 (18) 18 (58) 4 (13) 9 (29)
Externalizing problems 35 (70) 4 (8) 11 (22) 25 (81) 2 (6) 4 (13)
Executive functioning 42 (84) 6 (12) 2 (4) 27 (87) 2 (6) 2 (6)
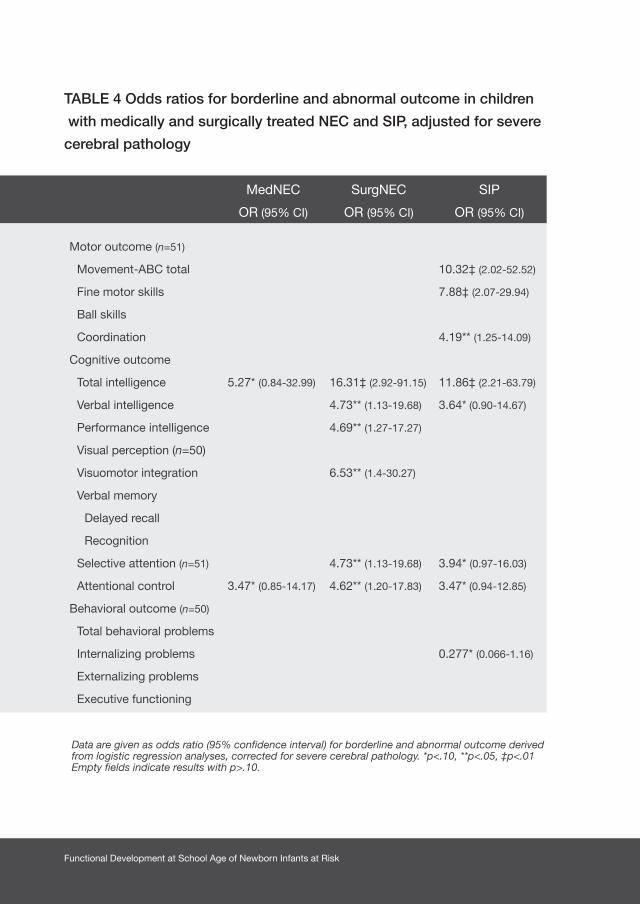
Functional Development at School Age of Newborn Infants at Risk
TABLE 4 Odds ratios for borderline and abnormal outcome in children
with medically and surgically treated NEC and SIP, adjusted for severe
cerebral pathology
MedNEC SurgNEC SIP
OR (95% CI) OR (95% CI) OR (95% CI)
Motor outcome (n=51)
Movement-ABC total 10.32‡ (2.02-52.52)
Fine motor skills 7.88‡ (2.07-29.94)
Ball skills
Coordination 4.19** (1.25-14.09)
Cognitive outcome
Total intelligence 5.27* (0.84-32.99) 16.31‡ (2.92-91.15) 11.86‡ (2.21-63.79)
Verbal intelligence 4.73** (1.13-19.68) 3.64* (0.90-14.67)
Performance intelligence 4.69** (1.27-17.27)
Visual perception (n=50)
Visuomotor integration 6.53** (1.4-30.27)
Verbal memory
Delayed recall
Recognition
Selective attention (n=51) 4.73** (1.13-19.68) 3.94* (0.97-16.03)
Attentional control 3.47* (0.85-14.17) 4.62** (1.20-17.83) 3.47* (0.94-12.85)
Behavioral outcome (n=50)
Total behavioral problems
Internalizing problems 0.277* (0.066-1.16)
Externalizing problems
Executive functioning
Data are given as odds ratio (95% confidence interval) for borderline and abnormal outcome derived from logistic regression analyses, corrected for severe cerebral pathology. *p<.10, **p<.05, ‡p<.01Empty fields indicate results with p>.10.

185Chapter 7 Functional Impairments at School Age of Children with Necrotizing Enterocolitis or Spontaneous Intestinal Perforation
40
30
20
10
0
14
12
10
8
6
4
2
0
M-A
BC
tot
al s
core
M-A
BC
sub
test
sco
re
Figure 1A Movement-ABC scores in children with gastrointestinal diseases
compared to controls
Total score Fine motor skills Ball skills Coordination
*
**
The Movement-ABC total score is shown on the left y-axis, scores on the subtests are shown on the right y-axis. *Indicates p<.05 in comparison to controls. MedNEC SurgNEC SIP Controls
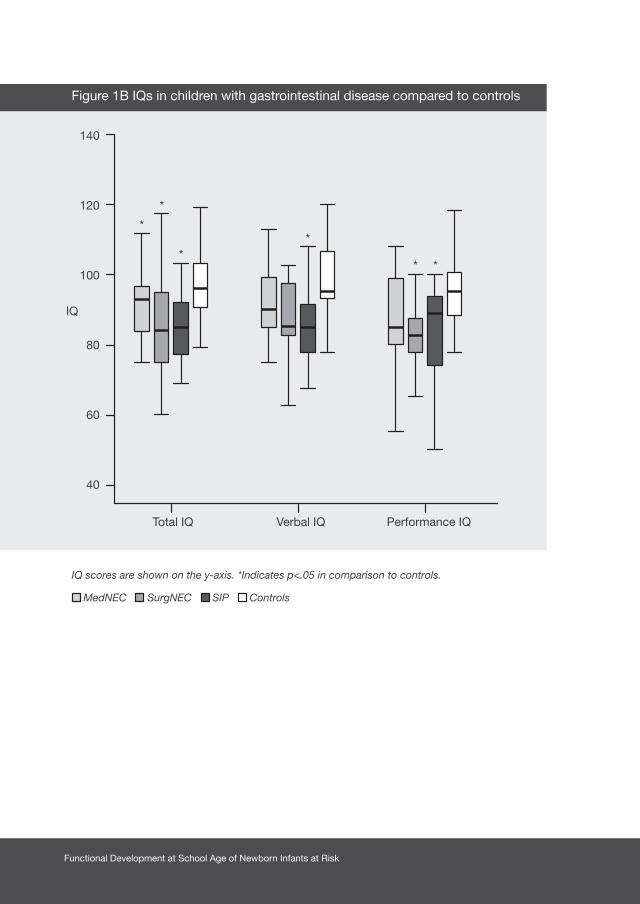
Functional Development at School Age of Newborn Infants at Risk
Figure 1B IQs in children with gastrointestinal disease compared to controls
140
120
100
80
60
40
IQ
Total IQ Verbal IQ Performance IQ
IQ scores are shown on the y-axis. *Indicates p<.05 in comparison to controls. MedNEC SurgNEC SIP Controls
*
*
**
* *
187Chapter 7 Functional Impairments at School Age of Children with Necrotizing Enterocolitis or Spontaneous Intestinal Perforation
Discussion
This study showed that at school age 68% of newborn infants with gastrointestinal
diseases (NEC or SIP) had borderline or abnormal motor outcomes. On average
their intelligence was 11 IQ points lower than matched control children without
gastrointestinal diseases. In addition, their attention and visual perception were
impaired. Visuomotor integration was also affected, albeit to a lesser extent. Behavioral
problems and executive functions were comparable to the control group. Surgically
treated children were at highest risk for abnormal outcome at school age when
compared to the controls. These findings remained present after correction for severe
cerebral pathology of the children.
We found that at a mean age of 9 years 15% of the children with NEC or SIP had
developed CP and as many as 40% had abnormal motor skills. These results were
similar to the findings of previous studies on the neurodevelopmental outcome of
survivors with NEC at 2 to 3 years of age. These studies reported that around 20%
of children develop CP and that 31% of children with NEC have an abnormal (<70)
Psychomotor Developmental Index.4,5
With regard to cognitive outcome we found that the mean IQ of children with NEC or
SIP was 86, which was considerably lower than that of the control children. Although
we found that at school age only 10% of the children had an abnormal total IQ (<70),
43% had IQ scores below 85, which is the approximate cut-off point for being able
to attend regular education in the Netherlands. Hintz et al. found that at 2 years of
age children with NEC have a Mental Developmental Index that is 6 points lower than
controls and that 41% of the children obtain an abnormal score (<70).5 Thus, although
the percentage of children with abnormal intelligence at school age seems smaller in
our study, the difference in mean scores with matched control children seems to be
higher in our population as compared to Hintz’ study. At school age cognition can be
determined more reliably since behavioral aspects fit the testing situation better and
test validity is higher.
Functional Development at School Age of Newborn Infants at Risk
In addition to lower intelligence, we also found poorer selective attention, attentional
control, visual perception, and visuomotor integration in children with NEC or SIP.
These specific cognitive deficits, which may only come to light when the children reach
school age, may hamper school performance even further. A case in point is poor
attention that may affect learning.
With regards to the incidence of behavioral problems and executive functions the study
group was comparable to the controls, even though in both groups the incidence of
behavioral problems was increased compared to the reference population. It is known
that ~20% of preterm infants develop behavioral problems, which is comparable to our
findings.17,18 Apparently, the presence of gastrointestinal disease does not increase this
risk still further.
It is likely that the neurodevelopmental impairments we found in the survivors with NEC
or SIP are the result of a combination of factors the infants were subjected to during
the neonatal period. NEC and associated tissue injury initially leads to an inflammatory
response. The subsequent release of pro-inflammatory cytokines by the activation
of microglial cells in the brain, leads to injury to the pre-oligodendrocytes and axons
in the white matter. These glial cells, which play an important role in myelination of
the immature brain, are highly vulnerable to damage.19 The increased permeability
of the blood-brain barrier during inflammation further increases the susceptibility of
the brain to this inflammatory response.20 Both NEC and SIP can be complicated by
sepsis, which is associated with an increased risk for overt, but also more subtle and
diffuse, white matter abnormalities.3,21,22 Furthermore, infants with gastrointestinal
diseases are at risk for respiratory and circulatory insufficiency which contribute to
cerebral hypoxemia. Indeed, in this study we found that the children with NEC or SIP
had been ventilated significantly more frequently and had required more inotropes as
compared to the controls. Finally, nutritional difficulties and the presence of short bowel
syndrome after surgery are other factors that could contribute to impaired growth and
neurodevelopment.23,24
Our second aim was to identify risk factors for adverse outcome in children with
gastrointestinal diseases. Since infants with SurgNEC had often been severely ill for a
significant length of time - an illness that was frequently complicated with perforation -
we hypothesized that their outcome would be worse than infants with SIP and MedNEC.
189Chapter 7 Functional Impairments at School Age of Children with Necrotizing Enterocolitis or Spontaneous Intestinal Perforation
In this light it was striking that we did not find any significant differences in outcome
at school age within the group of children with gastrointestinal diseases, although we
did find a 10% higher mortality rate in children with overall NEC compared to SIP.
Perhaps the pathophysiological mechanisms mainly responsible for worse outcome
were similar among these children irrespective of mode of treatment and additional
disease related factors. The size of the study group may also have limited our ability to
detect significant differences in development between groups.
When compared to controls, however, we did find that surgically treated children
(both NEC and SIP) were at higher risk for worse outcome. Previous studies reported
that two-year-old children with SurgNEC were at higher risk for abnormal motor and
cognitive outcome than children with MedNEC compared to controls.5,25,26 The few
studies that compared the outcome of children with SurgNEC to SIP found worse
outcomes for children with NEC.1,27 In contrast, we found particularly high ORs for
worse motor outcome in children with SIP. We were puzzled by this finding. One could
suggest that the slightly higher rate of severe cerebral pathology in the children with
SIP of our cohort played a role, however, after correction for cerebral pathology our
results did not change. Perhaps it was a chance finding due to the low number of
children in the subgroups.
To the best of our knowledge this is the first study that determines the functional outcome
at school age of children with NEC or SIP. The strength of this study is that we examined
in great detail a broad range of motor and cognitive skills and behavioral aspects that
might limit functional abilities at school age. Moreover, we included control children
that were matched for gender, gestational age, and birth year. A possible limitation is
that this was a single-center study. Moreover, 1 child could not be assessed as a result
of being deaf. Outcome of the children with gastrointestinal diseases may thus have
been slightly worse than we reported.
Our study showed that survivors of either NEC or SIP form a specific high-risk group
for functional impairments at school age, in the majority in the absence of overt brain
pathology as can be detected on cranial ultrasonography. Not only their motor outcome,
but also their cognitive outcome was significantly impaired. Their intelligence, for
example, was barely better compared to preterm children with severe brain lesions.28,29
In our opinion, therefore, these children deserve to be followed-up up to school age

Functional Development at School Age of Newborn Infants at Risk
since it is likely that they are coping with impairments that require intervention. This
study also touches on the question of the pathophysiological mechanisms responsible
for these long-term functional impairments. We believe that MRI in the neonatal period
may help to clarify these pathophysiological mechanisms, and should be part of the
neurodevelopmental assessment in these children.
Acknowledgements
We greatly acknowledge the help of Dr. T. Brantsma – van Wulfften Palthe for correcting
the English manuscript and Dr. V. Fidler for support in the statistical analysis.

191Chapter 7 Functional Impairments at School Age of Children with Necrotizing Enterocolitis or Spontaneous Intestinal Perforation
1. Adesanya OA, O’Shea TM, Turner CS, Amoroso
RM, Morgan TM, Aschner JL. Intestinal perforation
in very low birth weight infants: growth and
neurodevelopment at 1 year of age. J Perinatol
2005;25:583-589.
2. Lin PW, Stoll BJ. Necrotising enterocolitis. Lancet
2006;368:1271-1283.
3. Shah DK, Doyle LW, Anderson PJ, et al. Adverse
neurodevelopment in preterm infants with postnatal
sepsis or necrotizing enterocolitis is mediated by
white matter abnormalities on magnetic resonance
imaging at term. J Pediatr 2008;153:170-175.
4. Soraisham AS, Amin HJ, Al Hindi MY, et al.
Does necrotising enterocolitis impact the
neurodevelopmental and growth outcomes in
preterm infants with birthweight < or =1250 g? J
Paediatr Child Health 2006;42:499-504.
5. Hintz SR, Kendrick DE, Stoll BJ, et al.
Neurodevelopmental and growth outcomes of
extremely low birth weight infants after necrotizing
enterocolitis. Pediatrics 2005;115:696-703.
6. Evans WA. An encephalographic ratio for estimating
ventricular enlargement and cerebral atrophy. Arch
Neurol Psychiatry 1942;47:931-937.
7. Bell MJ, Ternberg JL, Feigin RD, et al. Neonatal
necrotizing enterocolitis. Therapeutic decisions
based upon clinical staging. Ann Surg 1978;187:1-7.
8. Bax M, Goldstein M, Rosenbaum P, et al. Proposed
definition and classification of cerebral palsy. Dev
Med Child Neurol 2005;47:571-576.
9. Palisano R, Rosenbaum P, Walter S, Russell D, Wood
E, Galuppi B. Development and reliability of a system
to classify gross motor function in children with
cerebral palsy. Dev Med Child Neurol
1997;39:214-233.
10. Smits-Engelsman BCM. Movement Assessment
Battery for Children. Lisse, the Netherlands: Swets
& Zeitlinger; 1998.
11. Kort W, Compaan EL, Bleichrodt N, et al. WISC-
III NL Manual. Amsterdam, the Netherlands: NIP
dienstencentrum; 2002.
12. Korkman M, Kirk U, Kemp SL. NEPSY II. Clinical
and Interpretative Manual. San Antonio, TX;
PsychCorp. A Brand of Harcourt Assessments:
2007.
13. van den Burg W, Kingma A. Performance of 225
Dutch school children on Rey’s Auditory Verbal
Learning Test (AVLT): parallel test-retest reliabilities
with an interval of 3 months and normative data.
Arch Clin Neuropsychol 1999;14:545-559.
14. Manly T, Anderson V, Nimmo-Smith I, Turner A,
Watson P, Robertson IH. The differential assessment
of children’s attention: the Test of Everyday
Attention for Children (TEA-Ch), normative sample
and ADHD performance. J Child Psychol Psychiatry
2001;42:1065-1081.
15. Achenbach TM, Edelbrock C. Manual for the
Child Behavior Checklist: 4–18 and 1991 profile.
Burlington, VT: Univ. of Vermont, Department of
Psychiatry; 1991.
References

Functional Development at School Age of Newborn Infants at Risk
16. Gioia GA, Isquith PK, Guy SC, Kenworthy L.
BRIEF--Behavior Rating Inventory of Executive
Function: professional manual. Odessa, FL:
Psychological Assessment Resources; 2000.
17. Reijneveld SA, de Kleine MJ, van Baar AL, et al.
Behavioural and emotional problems in very preterm
and very low birthweight infants at age 5 years. Arch
Dis Child Fetal Neonatal Ed 2006;91:F423-F428.
18. Gray RF, Indurkhya A, McCormick MC. Prevalence,
stability, and predictors of clinically significant
behavior problems in low birth weight children at 3,
5, and 8 years of age. Pediatrics 2004;114:736-743.
19. Volpe JJ. Postnatal sepsis, necrotizing entercolitis,
and the critical role of systemic inflammation in
white matter injury in premature infants. J Pediatr
2008;153:160-163.
20. Abbott NJ. Inflammatory mediators and modulation
of blood-brain barrier permeability. Cell Mol
Neurobiol 2000;20:131-147.
21. Volpe JJ. Neurobiology of periventricular
leukomalacia in the premature infant. Pediatr Res
2001;50:553-562.
22. Glass HC, Bonifacio SL, Chau V, et al. Recurrent
postnatal infections are associated with progressive
white matter injury in premature infants. Pediatrics
2008;122:299-305.
23. Cole CR, Hansen NI, Higgins RD, Ziegler TR, Stoll
BJ. Very low birth weight preterm infants with
surgical short bowel syndrome: incidence, morbidity
and mortality, and growth outcomes at 18 to 22
months. Pediatrics 2008;122:e573-e582.
24. Lucas A, Morley R, Cole TJ, Gore SM. A
randomised multicentre study of human milk versus
formula and later development in preterm infants.
Arch Dis Child Fetal Neonatal Ed
1994;70:F141-F146.
25. Tobiansky R, Lui K, Roberts S, Veddovi M.
Neurodevelopmental outcome in very low
birthweight infants with necrotizing enterocolitis
requiring surgery. J Paediatr Child Health
1995;31:233-236.
26. Martin CR, Dammann O, Allred EN, et al.
Neurodevelopment of extremely preterm infants
who had necrotizing enterocolitis with or without
late bacteremia. J Pediatr 2010;157:751-756.
27. Blakely ML, Tyson JE, Lally KP, et al. Laparotomy
versus peritoneal drainage for necrotizing
enterocolitis or isolated intestinal perforation in
extremely low birth weight infants: outcomes
through 18 months adjusted age. Pediatrics
2006;117:e680-e687.
28. Roze E, Van Braeckel KN, van der Veere CN,
Maathuis CG, Martijn A, Bos AF. Functional
outcome at school age of preterm infants with
periventricular hemorrhagic infarction. Pediatrics
2009;123:1493-1500.

193Chapter 7 Functional Impairments at School Age of Children with Necrotizing Enterocolitis or Spontaneous Intestinal Perforation
29. Downie AL, Frisk V, Jakobson LS. The impact of
periventricular brain injury on reading and spelling
abilities in the late elementary and adolescent years.
Child Neuropsychol 2005;11:479-495.

Chapter 8
FUNCTIONAL IMPAIRMENTS AT
SCHOOL AGE OF PRETERM BORN
CHILDREN WITH LATE-ONSET SEPSIS
MEIKE H. VAN DER REE, JOZIEN C. TANIS,
KOENRAAD N. J. A. VAN BRAECKEL, AREND F. BOS, ELISE ROZE
EARLY HUMAN DEVELOPMENT 2011; DOI 10.1016/J.EARLHUMDEV.2011.06.008
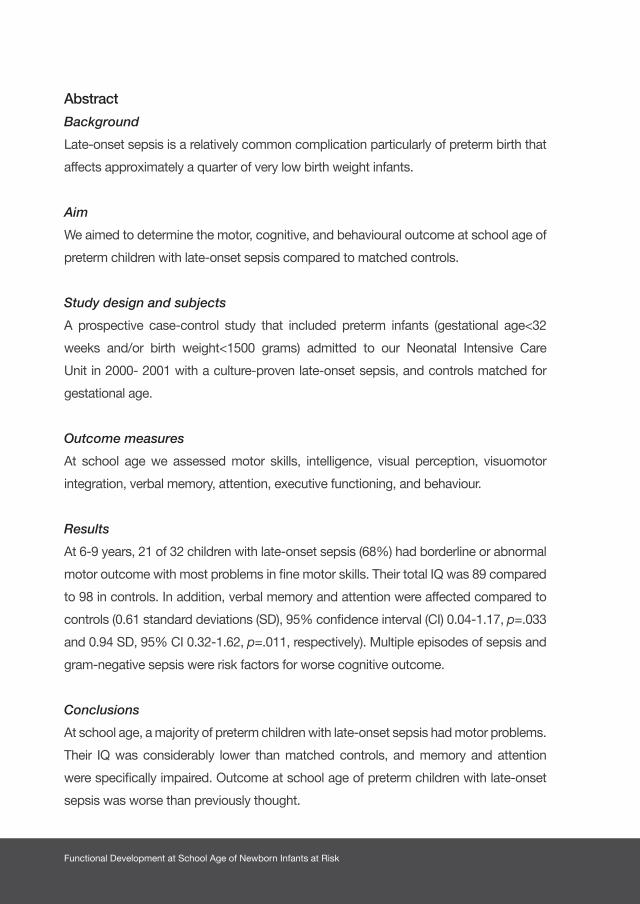
Functional Development at School Age of Newborn Infants at Risk
Abstract
Background
Late-onset sepsis is a relatively common complication particularly of preterm birth that
affects approximately a quarter of very low birth weight infants.
Aim
We aimed to determine the motor, cognitive, and behavioural outcome at school age of
preterm children with late-onset sepsis compared to matched controls.
Study design and subjects
A prospective case-control study that included preterm infants (gestational age<32
weeks and/or birth weight<1500 grams) admitted to our Neonatal Intensive Care
Unit in 2000- 2001 with a culture-proven late-onset sepsis, and controls matched for
gestational age.
Outcome measures
At school age we assessed motor skills, intelligence, visual perception, visuomotor
integration, verbal memory, attention, executive functioning, and behaviour.
Results
At 6-9 years, 21 of 32 children with late-onset sepsis (68%) had borderline or abnormal
motor outcome with most problems in fine motor skills. Their total IQ was 89 compared
to 98 in controls. In addition, verbal memory and attention were affected compared to
controls (0.61 standard deviations (SD), 95% confidence interval (CI) 0.04-1.17, p=.033
and 0.94 SD, 95% CI 0.32-1.62, p=.011, respectively). Multiple episodes of sepsis and
gram-negative sepsis were risk factors for worse cognitive outcome.
Conclusions
At school age, a majority of preterm children with late-onset sepsis had motor problems.
Their IQ was considerably lower than matched controls, and memory and attention
were specifically impaired. Outcome at school age of preterm children with late-onset
sepsis was worse than previously thought.

197Chapter 8 Functional Impairments at School Age of Preterm Born Children with Late-Onset Sepsis
Introduction
Late-onset sepsis is still a common complication in preterm infants admitted to
the neonatal intensive care unit despite a variety of strategies to prevent infection.
Among very low birth weight infants (<1500 grams), who are highly susceptible
to infection, around 25% develop one or more episodes of late-onset sepsis.1
Gram-positive bacteria, particularly coagulase-negative staphylococci (CoNS), are
the most common pathogens leading to late-onset sepsis.1 Mortality in preterm
infants with late-onset sepsis is about 20%.1
During the early neonatal period the brain and its white matter are vulnerable to
inflammation and changes in cerebral blood flow that can follow from late-onset
sepsis. Previous studies have indeed shown a relation between sepsis and white
matter abnormalities in preterm infants.2,3 These abnormalities contribute to the
risk of neurodevelopmental impairments among preterm infants with late-onset
sepsis. An earlier study reported that approximately 30% of children with neonatal
sepsis have motor impairments at 2 years of age, while even more children may
develop cognitive impairments.4 It is unknown whether these impairments are
persistent throughout school age, and whether specific cognitive deficits that may
further hamper school performance, are present.5
The first aim of our study was to determine the motor, cognitive, and behavioural
outcome at school age of children with late-onset sepsis compared to control
children of similar gestational age. Our second aim was to identify sepsis-related
risk factors for adverse outcome.
Functional Development at School Age of Newborn Infants at Risk
Methods
Patients
We retrospectively included preterm infants (gestational age <32 weeks and/or
birth weight <1500 grams) from the Neonatal Intensive Care Unit (NICU) of the
University Medical Center Groningen, who had been admitted between November
2000 and December 2001 and were diagnosed with late-onset. Late-onset sepsis
was defined as a positive blood culture occurring 96 hours or more after birth. We
also included control infants from our NICU. For every 2 infants with late-onset
sepsis we selected 1 control infant. These control infants were born in the same
period and matched for gestational age. We did not include infants, as either cases
or controls, in whom the diagnosis of late-onset sepsis was suspected, but not
confirmed by positive blood cultures. Infants with major congenital malformations
or syndromes were also not included.
During the study period, a total of 249 infants with gestational age <32 weeks and/
or birth weight <1500 grams were admitted to our NICU. After database search, 51
infants with late-onset sepsis (20%) were included in the study. Of 51 infants with
late-onset sepsis, 10 (20%) died in the neonatal period. A total of 41 survivors with
late-onset sepsis remained. Of these, 3 children were excluded since they were
diagnosed with neurofibromatosis I, Bartter syndrome and Fallot’s tetralogy. Two
sets of parents could not be traced. We then included 18 control infants born in
2000 and 2001 from our NICU for follow-up, since we aimed to include 1 control
for every 2 infants with late-onset sepsis. After inviting the parents and children for
follow-up, it appeared that 4 sets of parents declined the invitation to participate.
The final number of included children is thus 32 children with late-onset sepsis
(78%) and 18 control children.

199Chapter 8 Functional Impairments at School Age of Preterm Born Children with Late-Onset Sepsis
Perinatal and neonatal risk factors
We reviewed the medical charts of the patients for neonatal and sepsis-related
characteristics. We used the Score for Neonatal Acute Physiology Index, second
version (SNAP-II), to compare newborn illness severity in the late-onset sepsis
group with the control group. The SNAP-II is validated to predict risk of in-hospital
morbidity. This physiology-based score uses 6 routinely available vital signs and
laboratory results from the first 24 hours after birth.6 The higher the total score, the
more severe the infant’s illness.
Follow-up
The parents of the eligible patients were asked to bring their children to an extension
of the routine follow-up program for the research study. It entailed the assessment
of motor performance, cognition, and behaviour at the age of 6 to 9 years. Parents
gave their written informed consent to participate in the follow-up program and to
publication of the results. The total duration of the examination was approximately
2.5 hours including breaks. Incomplete assessments and test scores obtained
when a child was too tired or uncooperative, as assessed by the experimenter,
were excluded. The study was approved by the Medical Ethical Committee of the
University Medical Center Groningen.
Motor Outcome
On the basis of the reports of the routine follow-up program we determined the
presence or absence of cerebral palsy (CP) following Bax’ criteria.7 In case of CP,
gross motor functioning was scored using the Gross Motor Function Classification
System (GMFCS). This is a functional, five level classification system for CP based
on self-initiated movement with particular emphasis on sitting (truncal control) and
walking.8 Higher GMFCS levels indicate more functional impairments.
To assess the children’s motor outcome we administered the Movement Assessment
Battery for Children (Movement ABC), a standardised test of motor skills for children.9
This test yields a score for total movement performance based on separate subscores
for manual dexterity (fine motor skills), ball skills, and static and dynamic balance
(coordination). The higher the score, the poorer the performance.
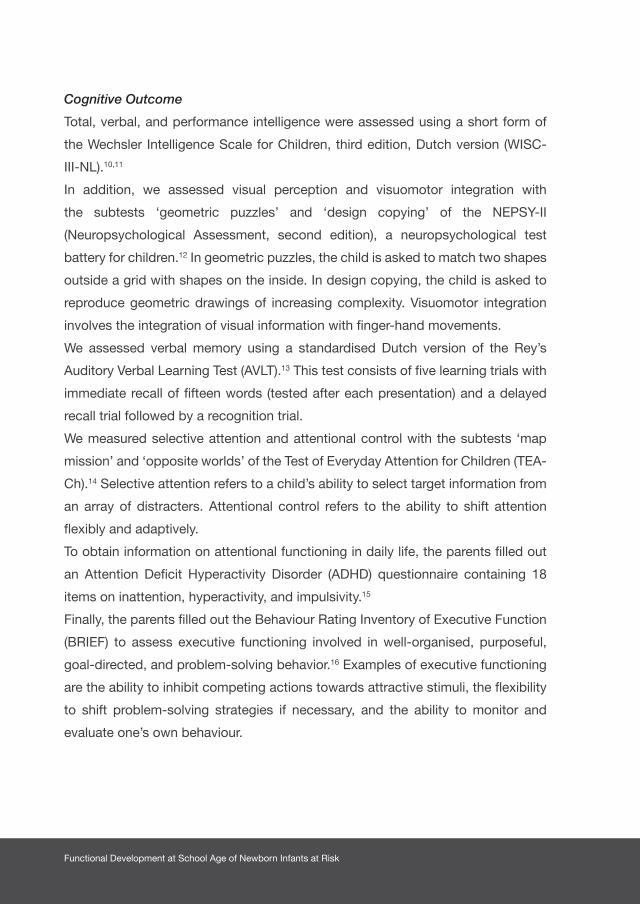
Functional Development at School Age of Newborn Infants at Risk
Cognitive Outcome
Total, verbal, and performance intelligence were assessed using a short form of
the Wechsler Intelligence Scale for Children, third edition, Dutch version (WISC-
III-NL).10,11
In addition, we assessed visual perception and visuomotor integration with
the subtests ‘geometric puzzles’ and ‘design copying’ of the NEPSY-II
(Neuropsychological Assessment, second edition), a neuropsychological test
battery for children.12 In geometric puzzles, the child is asked to match two shapes
outside a grid with shapes on the inside. In design copying, the child is asked to
reproduce geometric drawings of increasing complexity. Visuomotor integration
involves the integration of visual information with finger-hand movements.
We assessed verbal memory using a standardised Dutch version of the Rey’s
Auditory Verbal Learning Test (AVLT).13 This test consists of five learning trials with
immediate recall of fifteen words (tested after each presentation) and a delayed
recall trial followed by a recognition trial.
We measured selective attention and attentional control with the subtests ‘map
mission’ and ‘opposite worlds’ of the Test of Everyday Attention for Children (TEA-
Ch).14 Selective attention refers to a child’s ability to select target information from
an array of distracters. Attentional control refers to the ability to shift attention
flexibly and adaptively.
To obtain information on attentional functioning in daily life, the parents filled out
an Attention Deficit Hyperactivity Disorder (ADHD) questionnaire containing 18
items on inattention, hyperactivity, and impulsivity.15
Finally, the parents filled out the Behaviour Rating Inventory of Executive Function
(BRIEF) to assess executive functioning involved in well-organised, purposeful,
goal-directed, and problem-solving behavior.16 Examples of executive functioning
are the ability to inhibit competing actions towards attractive stimuli, the flexibility
to shift problem-solving strategies if necessary, and the ability to monitor and
evaluate one’s own behaviour.
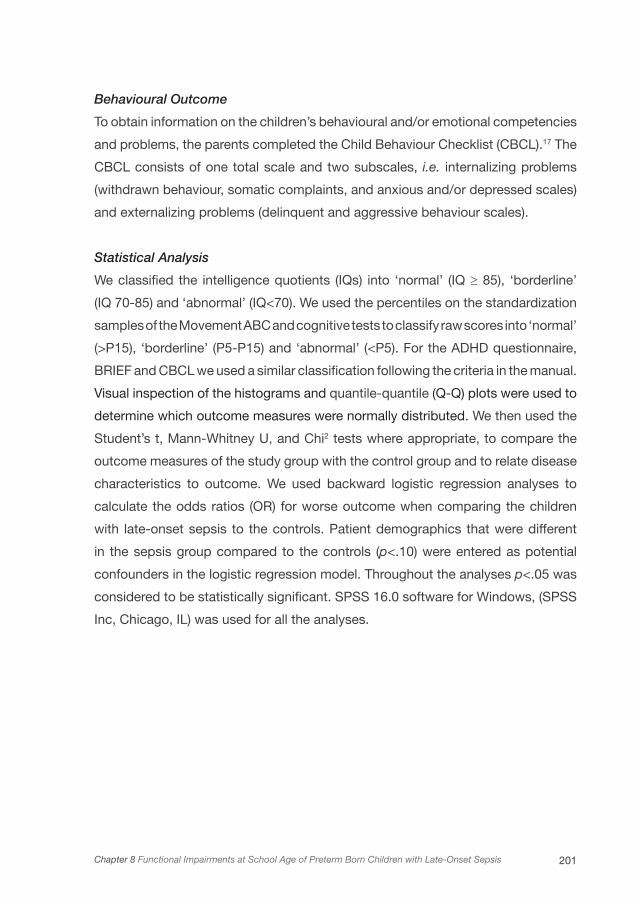
201Chapter 8 Functional Impairments at School Age of Preterm Born Children with Late-Onset Sepsis
Behavioural Outcome
To obtain information on the children’s behavioural and/or emotional competencies
and problems, the parents completed the Child Behaviour Checklist (CBCL).17 The
CBCL consists of one total scale and two subscales, i.e. internalizing problems
(withdrawn behaviour, somatic complaints, and anxious and/or depressed scales)
and externalizing problems (delinquent and aggressive behaviour scales).
Statistical Analysis
We classified the intelligence quotients (IQs) into ‘normal’ (IQ ≥ 85), ‘borderline’
(IQ 70-85) and ‘abnormal’ (IQ<70). We used the percentiles on the standardization
samples of the Movement ABC and cognitive tests to classify raw scores into ‘normal’
(>P15), ‘borderline’ (P5-P15) and ‘abnormal’ (<P5). For the ADHD questionnaire,
BRIEF and CBCL we used a similar classification following the criteria in the manual.
Visual inspection of the histograms and quantile-quantile (Q-Q) plots were used to
determine which outcome measures were normally distributed. We then used the
Student’s t, Mann-Whitney U, and Chi2 tests where appropriate, to compare the
outcome measures of the study group with the control group and to relate disease
characteristics to outcome. We used backward logistic regression analyses to
calculate the odds ratios (OR) for worse outcome when comparing the children
with late-onset sepsis to the controls. Patient demographics that were different
in the sepsis group compared to the controls (p<.10) were entered as potential
confounders in the logistic regression model. Throughout the analyses p<.05 was
considered to be statistically significant. SPSS 16.0 software for Windows, (SPSS
Inc, Chicago, IL) was used for all the analyses.

Functional Development at School Age of Newborn Infants at Risk
Results
Table 1 shows an overview of the patient demographics of the 32 infants with late-
onset sepsis and the 18 controls. There were no significant or nearly significant
differences in demographics between the groups, therefore none of these
characteristics were entered as potential confounders in the logistic regression
model for the prediction of outcome.
Eight children (25%) had more than one episode of sepsis. Thirty children had
a gram-positive blood culture (n=27 coagulase-negative Staphylococci and n=4
Staphylococcus aureus). Four children had a gram-negative blood culture caused
by Enterobacter cloacae in 2 infants, by Klebsiella pneumoniae in 1, and by
Klebsiella oxytoca in 1. Thus two children had both a gram-positive and a gram-
negative blood culture. None of the children had a fungal sepsis.
Motor Outcome
The mean age at follow up was 8.4 years (range 6.8 to 9.1 years). Of 32 children
with late-onset sepsis, 5 developed CP (16%). Their functional impairments were
limited to GMFCS level I in 1 child and level II in 2 children. Two children had more
severe functional impairments with GMFCS level III and IV. In the control group
none of the children developed CP.
Mean scores on the Movement ABC are shown in Table 2. The two children with
severe CP could not be assessed by the Movement ABC because the tasks were
too difficult for them. Children with late-onset sepsis showed significantly worse
fine motor skills, and a trend towards a worse total Movement ABC score.
Table 3 shows the motor outcome classified into three different groups: normal
(P>15), borderline (P5- P15) and abnormal (<P15). This is graphically shown in Figure
1. The two children with severe CP were included in the category ‘abnormal’.
As it is apparent from Table 3, 68% of the children with late-onset sepsis obtained
a borderline or an abnormal total score on the Movement ABC, with an OR for
the borderline and abnormal outcome of 3.30. In accordance with analyses of the
mean scores, most problems were found in fine motor skills (OR 5.46).
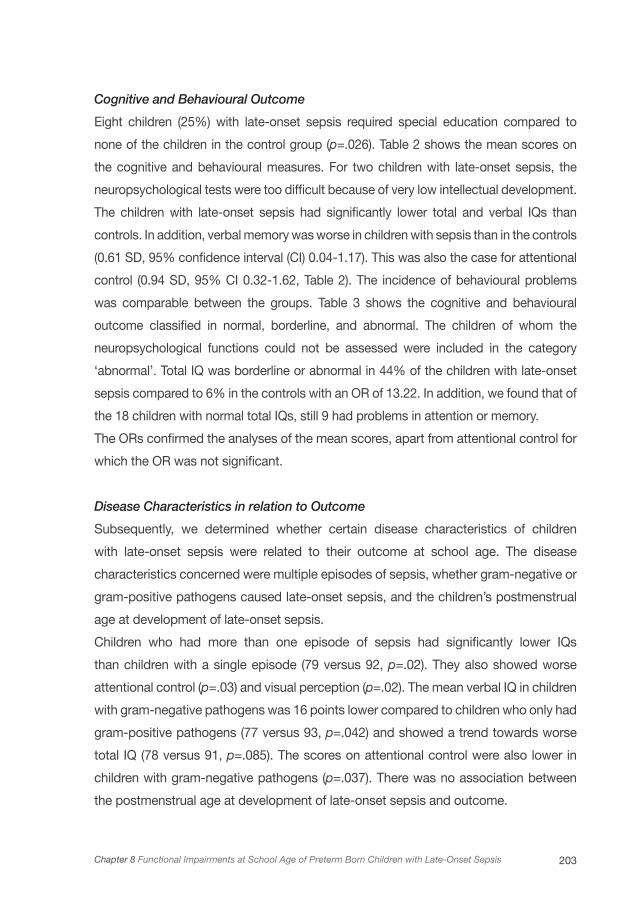
203Chapter 8 Functional Impairments at School Age of Preterm Born Children with Late-Onset Sepsis
Cognitive and Behavioural Outcome
Eight children (25%) with late-onset sepsis required special education compared to
none of the children in the control group (p=.026). Table 2 shows the mean scores on
the cognitive and behavioural measures. For two children with late-onset sepsis, the
neuropsychological tests were too difficult because of very low intellectual development.
The children with late-onset sepsis had significantly lower total and verbal IQs than
controls. In addition, verbal memory was worse in children with sepsis than in the controls
(0.61 SD, 95% confidence interval (CI) 0.04-1.17). This was also the case for attentional
control (0.94 SD, 95% CI 0.32-1.62, Table 2). The incidence of behavioural problems
was comparable between the groups. Table 3 shows the cognitive and behavioural
outcome classified in normal, borderline, and abnormal. The children of whom the
neuropsychological functions could not be assessed were included in the category
‘abnormal’. Total IQ was borderline or abnormal in 44% of the children with late-onset
sepsis compared to 6% in the controls with an OR of 13.22. In addition, we found that of
the 18 children with normal total IQs, still 9 had problems in attention or memory.
The ORs confirmed the analyses of the mean scores, apart from attentional control for
which the OR was not significant.
Disease Characteristics in relation to Outcome
Subsequently, we determined whether certain disease characteristics of children
with late-onset sepsis were related to their outcome at school age. The disease
characteristics concerned were multiple episodes of sepsis, whether gram-negative or
gram-positive pathogens caused late-onset sepsis, and the children’s postmenstrual
age at development of late-onset sepsis.
Children who had more than one episode of sepsis had significantly lower IQs
than children with a single episode (79 versus 92, p=.02). They also showed worse
attentional control (p=.03) and visual perception (p=.02). The mean verbal IQ in children
with gram-negative pathogens was 16 points lower compared to children who only had
gram-positive pathogens (77 versus 93, p=.042) and showed a trend towards worse
total IQ (78 versus 91, p=.085). The scores on attentional control were also lower in
children with gram-negative pathogens (p=.037). There was no association between
the postmenstrual age at development of late-onset sepsis and outcome.

Functional Development at School Age of Newborn Infants at Risk
TABLE 1 Patient demographics
Late-onset sepsis
(n=32)
Controls (n=18) p-value+
Males/females 22/10 9/9 0.16
Gestational age (weeks) 28.9 (25.7-33.4) 28.9 (25.7-33.6) 0.74
Birth weight (grams) 1010 (600-1690) 1122 (640-1455) 0.81
Very Low Birth Weight n=29 (91) n=18 (100) 0.25
IUGR (<P10) n=12 (38) n=5 (28) 0.35
Apgar at 5 minutes 8 (5-10) 9 (1-10) 0.67
SNAP-II score 14 (5-40) 19 (5-31) 0.26
Asphyxia none none #
Ventilatory support (IPPV or HFO) n=29 (91) n=14 (78) 0.20
Inotropics n=5 (16) n= 4 (22) 0.41
Cerebral pathology
Mild GMH-IVH1 n=9 (29) n=4 (22) 0.48
Severe GMH-IVH1 n=1 (3) None 0.66
Cystic PVL None None #
Noncystic PVL3 n=18 (56) n=8 (44) 0.38
Late-onset morbidity
Retinopathy of prematurity2 n=1 (3) None 0.64
Bronchopulmonary dysplasia n=9 (28) n=4 (22) 0.46
Meningitis n=2 (6) none 0.41
Necrotizing enterocolitis n=2 (6) n=2 (11) 0.46
Data are given as median (minimum-maximum) or as numbers (percentage). None of the patient demographics were significantly different between the groups. # Could not be determined due to absence of the demographic in both groups. + p-values derived from chi2 and Mann-Whitney U tests1. Mild GMH-IVH was defined as grade I and II, severe GMH-IVH as grade III and periventricular hemorrhagic infarction 2. Retinopathy of prematurity grade III and worse 3. Defined as periventricular echodensities present for more than 1 weekAbbreviations: IUGR- intrauterine growth restriction; IPPV- intermittent positive pressure ventilation; HFO- high frequency oscillation; GMH-IVH- germinal matrix haemorrhage-intraventricular haemorrhage; PVL- periventricular leukomalacia
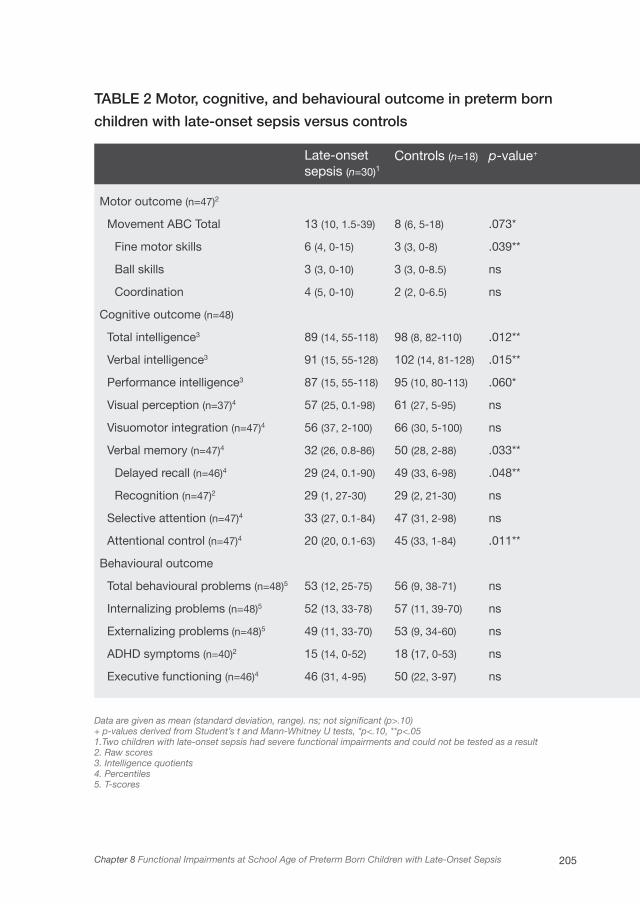
205Chapter 8 Functional Impairments at School Age of Preterm Born Children with Late-Onset Sepsis
TABLE 2 Motor, cognitive, and behavioural outcome in preterm born
children with late-onset sepsis versus controls
Data are given as mean (standard deviation, range). ns; not significant (p>.10)+ p-values derived from Student’s t and Mann-Whitney U tests, *p<.10, **p<.051. Two children with late-onset sepsis had severe functional impairments and could not be tested as a result2. Raw scores3. Intelligence quotients4. Percentiles5. T-scores
Late-onset sepsis (n=30)1
Controls (n=18) p-value+
Motor outcome (n=47)2
Movement ABC Total 13 (10, 1.5-39) 8 (6, 5-18) .073*
Fine motor skills 6 (4, 0-15) 3 (3, 0-8) .039**
Ball skills 3 (3, 0-10) 3 (3, 0-8.5) ns
Coordination 4 (5, 0-10) 2 (2, 0-6.5) ns
Cognitive outcome (n=48)
Total intelligence3 89 (14, 55-118) 98 (8, 82-110) .012**
Verbal intelligence3 91 (15, 55-128) 102 (14, 81-128) .015**
Performance intelligence3 87 (15, 55-118) 95 (10, 80-113) .060*
Visual perception (n=37)4 57 (25, 0.1-98) 61 (27, 5-95) ns
Visuomotor integration (n=47)4 56 (37, 2-100) 66 (30, 5-100) ns
Verbal memory (n=47)4 32 (26, 0.8-86) 50 (28, 2-88) .033**
Delayed recall (n=46)4 29 (24, 0.1-90) 49 (33, 6-98) .048**
Recognition (n=47)2 29 (1, 27-30) 29 (2, 21-30) ns
Selective attention (n=47)4 33 (27, 0.1-84) 47 (31, 2-98) ns
Attentional control (n=47)4 20 (20, 0.1-63) 45 (33, 1-84) .011**
Behavioural outcome
Total behavioural problems (n=48)5 53 (12, 25-75) 56 (9, 38-71) ns
Internalizing problems (n=48)5 52 (13, 33-78) 57 (11, 39-70) ns
Externalizing problems (n=48)5 49 (11, 33-70) 53 (9, 34-60) ns
ADHD symptoms (n=40)2 15 (14, 0-52) 18 (17, 0-53) ns
Executive functioning (n=46)4 46 (31, 4-95) 50 (22, 3-97) ns
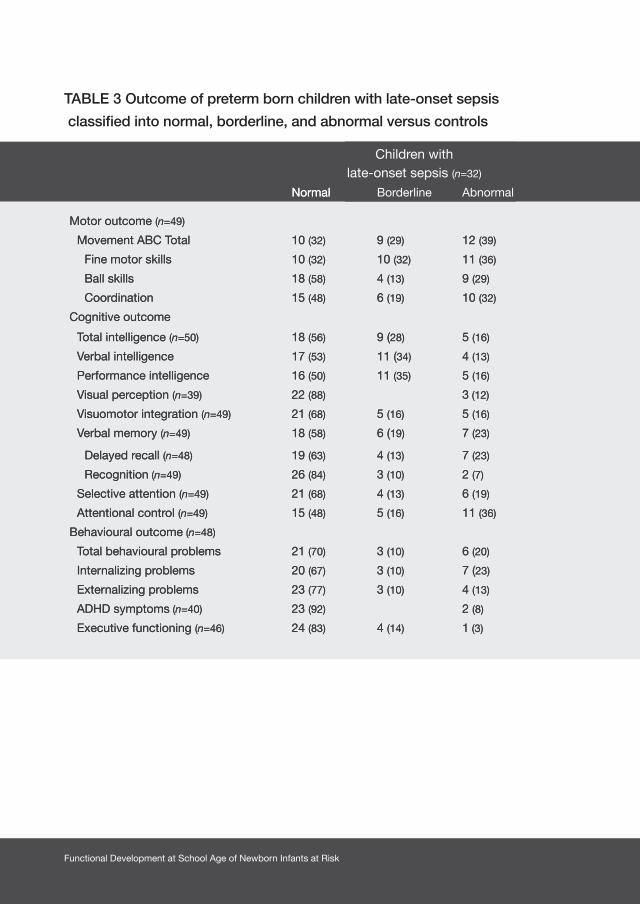
Functional Development at School Age of Newborn Infants at Risk
TABLE 3 Outcome of preterm born children with late-onset sepsis
classified into normal, borderline, and abnormal versus controls
Children with late-onset sepsis (n=32)
Controls (n=18) OR (95% CI)1 OR (95% CI)2
Normal Borderline Abnormal Normal Borderline Abnormal
Motor outcome (n=49)
Movement ABC Total 10 (32) 9 (29) 12 (39) 11 (61) 2 (11) 5 (28) 3.30 (0.98-11.07)* 1.64 (0.47-5.79)
Fine motor skills 10 (32) 10 (32) 11 (36) 13 (72) 3 (17) 2 (11) 5.46 (1.52-19.58)*** 4.40 (0.85-22.77)*
Ball skills 18 (58) 4 (13) 9 (29) 12 (67) 3 (17) 3 (17) 1.44 (0.43-4.85) 2.05 (0.47-8.83)
Coordination 15 (48) 6 (19) 10 (32) 13 (72) 3 (17) 2 (11) 2.77 (0.79-9.67) 3.81 (0.73-19.87)
Cognitive outcome
Total intelligence (n=50) 18 (56) 9 (28) 5 (16) 17 (94) 1 (6) 13.22 (1.57-111.74)** #
Verbal intelligence 17 (53) 11 (34) 4 (13) 15 (83) 3 (17) 4.41 (1.07-18.27)** #
Performance intelligence 16 (50) 11 (35) 5 (16) 14 (78) 4 (22) 3.50 (0.95-12.97)* #
Visual perception (n=39) 22 (88) 3 (12) 13 (93) 1 (7) 1.77 (0.17-18.86) #
Visuomotor integration (n=49) 21 (68) 5 (16) 5 (16) 16 (89) 1 (6) 1 (6) 3.81 (0.73-19.87) 3.27 (0.35-30.48)
Verbal memory (n=49) 18 (58) 6 (19) 7 (23) 16 (89) 1 (6) 1 (6) 5.78 (1.13-29.61)** 4.96 (0.56-44.10)
Delayed recall (n=48) 19 (63) 4 (13) 7 (23) 13 (72) 5 (28) 1.51 (0.42-5.37) #
Recognition (n=49) 26 (84) 3 (10) 2 (7) 13 (72) 2 (11) 3 (17) 0.50 (0.12-2.04) 0.35 (0.05-2.29)
Selective attention (n=49) 21 (68) 4 (13) 6 (19) 16 (89) 1 (6) 1 (6) 3.81 (0.73-19.87) 4.08 (0.45-37.00)
Attentional control (n=49) 15 (48) 5 (16) 11 (36) 13 (72) 2 (11) 3 (17) 2.77 (0.79-9.67) 2.75 (0.65-11.62)
Behavioural outcome (n=48)
Total behavioural problems 21 (70) 3 (10) 6 (20) 12 (67) 2 (11) 4 (22) 0.86 (0.25-3.00) 0.88 (0.21-3.64)
Internalizing problems 20 (67) 3 (10) 7 (23) 9 (50) 3 (17) 6 (33) 0.50 (0.15-1.63) 0.61 (1.67-2.22)
Externalizing problems 23 (77) 3 (10) 4 (13) 14 (78) 2 (11) 2 (11) 1.07 (0.26-4.31) 1.23 (0.21-7.51)
ADHD symptoms (n=40) 23 (92) 2 (8) 13 (87) 2 (13) # 0.57 (0.07-4.50)
Executive functioning (n=46) 24 (83) 4 (14) 1 (3) 15 (88) 1 (6) 1 (6) 1.56 (0.27-9.10) 0.57 (0.03-9.7)
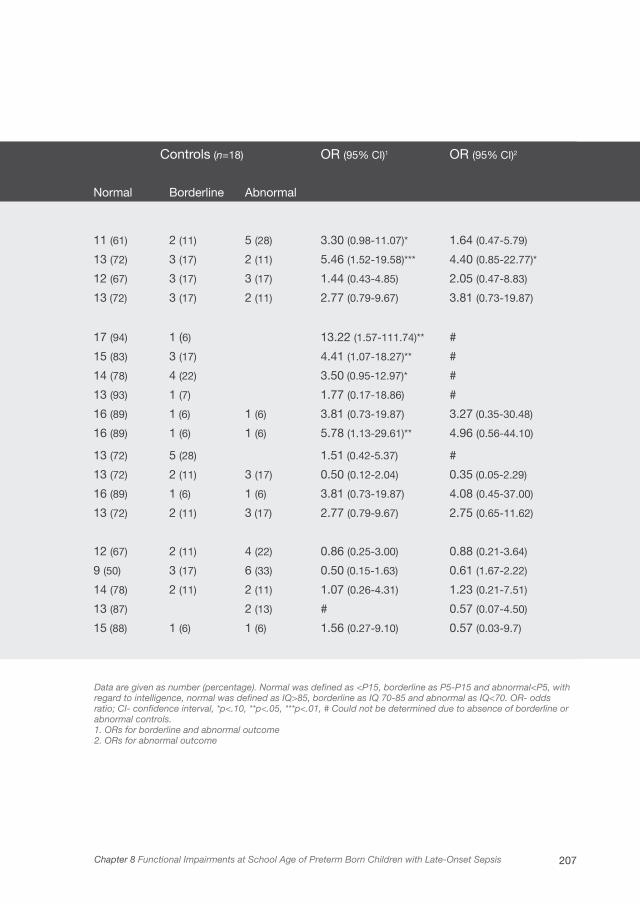
207Chapter 8 Functional Impairments at School Age of Preterm Born Children with Late-Onset Sepsis
Children with late-onset sepsis (n=32)
Controls (n=18) OR (95% CI)1 OR (95% CI)2
Normal Borderline Abnormal Normal Borderline Abnormal
Motor outcome (n=49)
Movement ABC Total 10 (32) 9 (29) 12 (39) 11 (61) 2 (11) 5 (28) 3.30 (0.98-11.07)* 1.64 (0.47-5.79)
Fine motor skills 10 (32) 10 (32) 11 (36) 13 (72) 3 (17) 2 (11) 5.46 (1.52-19.58)*** 4.40 (0.85-22.77)*
Ball skills 18 (58) 4 (13) 9 (29) 12 (67) 3 (17) 3 (17) 1.44 (0.43-4.85) 2.05 (0.47-8.83)
Coordination 15 (48) 6 (19) 10 (32) 13 (72) 3 (17) 2 (11) 2.77 (0.79-9.67) 3.81 (0.73-19.87)
Cognitive outcome
Total intelligence (n=50) 18 (56) 9 (28) 5 (16) 17 (94) 1 (6) 13.22 (1.57-111.74)** #
Verbal intelligence 17 (53) 11 (34) 4 (13) 15 (83) 3 (17) 4.41 (1.07-18.27)** #
Performance intelligence 16 (50) 11 (35) 5 (16) 14 (78) 4 (22) 3.50 (0.95-12.97)* #
Visual perception (n=39) 22 (88) 3 (12) 13 (93) 1 (7) 1.77 (0.17-18.86) #
Visuomotor integration (n=49) 21 (68) 5 (16) 5 (16) 16 (89) 1 (6) 1 (6) 3.81 (0.73-19.87) 3.27 (0.35-30.48)
Verbal memory (n=49) 18 (58) 6 (19) 7 (23) 16 (89) 1 (6) 1 (6) 5.78 (1.13-29.61)** 4.96 (0.56-44.10)
Delayed recall (n=48) 19 (63) 4 (13) 7 (23) 13 (72) 5 (28) 1.51 (0.42-5.37) #
Recognition (n=49) 26 (84) 3 (10) 2 (7) 13 (72) 2 (11) 3 (17) 0.50 (0.12-2.04) 0.35 (0.05-2.29)
Selective attention (n=49) 21 (68) 4 (13) 6 (19) 16 (89) 1 (6) 1 (6) 3.81 (0.73-19.87) 4.08 (0.45-37.00)
Attentional control (n=49) 15 (48) 5 (16) 11 (36) 13 (72) 2 (11) 3 (17) 2.77 (0.79-9.67) 2.75 (0.65-11.62)
Behavioural outcome (n=48)
Total behavioural problems 21 (70) 3 (10) 6 (20) 12 (67) 2 (11) 4 (22) 0.86 (0.25-3.00) 0.88 (0.21-3.64)
Internalizing problems 20 (67) 3 (10) 7 (23) 9 (50) 3 (17) 6 (33) 0.50 (0.15-1.63) 0.61 (1.67-2.22)
Externalizing problems 23 (77) 3 (10) 4 (13) 14 (78) 2 (11) 2 (11) 1.07 (0.26-4.31) 1.23 (0.21-7.51)
ADHD symptoms (n=40) 23 (92) 2 (8) 13 (87) 2 (13) # 0.57 (0.07-4.50)
Executive functioning (n=46) 24 (83) 4 (14) 1 (3) 15 (88) 1 (6) 1 (6) 1.56 (0.27-9.10) 0.57 (0.03-9.7)
Data are given as number (percentage). Normal was defined as <P15, borderline as P5-P15 and abnormal<P5, with regard to intelligence, normal was defined as IQ>85, borderline as IQ 70-85 and abnormal as IQ<70. OR- odds ratio; CI- confidence interval, *p<.10, **p<.05, ***p<.01, # Could not be determined due to absence of borderline or abnormal controls.1. ORs for borderline and abnormal outcome 2. ORs for abnormal outcome
Children with late-onset sepsis (n=32)
Controls (n=18) OR (95% CI)1 OR (95% CI)2
Normal Borderline Abnormal Normal Borderline Abnormal
Motor outcome (n=49)
Movement ABC Total 10 (32) 9 (29) 12 (39) 11 (61) 2 (11) 5 (28) 3.30 (0.98-11.07)* 1.64 (0.47-5.79)
Fine motor skills 10 (32) 10 (32) 11 (36) 13 (72) 3 (17) 2 (11) 5.46 (1.52-19.58)*** 4.40 (0.85-22.77)*
Ball skills 18 (58) 4 (13) 9 (29) 12 (67) 3 (17) 3 (17) 1.44 (0.43-4.85) 2.05 (0.47-8.83)
Coordination 15 (48) 6 (19) 10 (32) 13 (72) 3 (17) 2 (11) 2.77 (0.79-9.67) 3.81 (0.73-19.87)
Cognitive outcome
Total intelligence (n=50) 18 (56) 9 (28) 5 (16) 17 (94) 1 (6) 13.22 (1.57-111.74)** #
Verbal intelligence 17 (53) 11 (34) 4 (13) 15 (83) 3 (17) 4.41 (1.07-18.27)** #
Performance intelligence 16 (50) 11 (35) 5 (16) 14 (78) 4 (22) 3.50 (0.95-12.97)* #
Visual perception (n=39) 22 (88) 3 (12) 13 (93) 1 (7) 1.77 (0.17-18.86) #
Visuomotor integration (n=49) 21 (68) 5 (16) 5 (16) 16 (89) 1 (6) 1 (6) 3.81 (0.73-19.87) 3.27 (0.35-30.48)
Verbal memory (n=49) 18 (58) 6 (19) 7 (23) 16 (89) 1 (6) 1 (6) 5.78 (1.13-29.61)** 4.96 (0.56-44.10)
Delayed recall (n=48) 19 (63) 4 (13) 7 (23) 13 (72) 5 (28) 1.51 (0.42-5.37) #
Recognition (n=49) 26 (84) 3 (10) 2 (7) 13 (72) 2 (11) 3 (17) 0.50 (0.12-2.04) 0.35 (0.05-2.29)
Selective attention (n=49) 21 (68) 4 (13) 6 (19) 16 (89) 1 (6) 1 (6) 3.81 (0.73-19.87) 4.08 (0.45-37.00)
Attentional control (n=49) 15 (48) 5 (16) 11 (36) 13 (72) 2 (11) 3 (17) 2.77 (0.79-9.67) 2.75 (0.65-11.62)
Behavioural outcome (n=48)
Total behavioural problems 21 (70) 3 (10) 6 (20) 12 (67) 2 (11) 4 (22) 0.86 (0.25-3.00) 0.88 (0.21-3.64)
Internalizing problems 20 (67) 3 (10) 7 (23) 9 (50) 3 (17) 6 (33) 0.50 (0.15-1.63) 0.61 (1.67-2.22)
Externalizing problems 23 (77) 3 (10) 4 (13) 14 (78) 2 (11) 2 (11) 1.07 (0.26-4.31) 1.23 (0.21-7.51)
ADHD symptoms (n=40) 23 (92) 2 (8) 13 (87) 2 (13) # 0.57 (0.07-4.50)
Executive functioning (n=46) 24 (83) 4 (14) 1 (3) 15 (88) 1 (6) 1 (6) 1.56 (0.27-9.10) 0.57 (0.03-9.7)

Functional Development at School Age of Newborn Infants at Risk
Abnormal
Borderline
Normal
LOS- late-onset sepsis. *p<.10, **p<.05
LOS controls
Total scoreLOS controls
Fine motor skillsLOS controls
Ball skillsLOS controls
Coordination
100%
80%
60%
40%
20%
0%
* **
Figure 1 Motor outcome according to the Movement ABC in preterm born
children with late-onset sepsis compared to controls

209Chapter 8 Functional Impairments at School Age of Preterm Born Children with Late-Onset Sepsis
Discussion
This study demonstrated that motor outcome at school age of a majority
of preterm infants who survived late-onset sepsis was either borderline or
abnormal. On average, their intelligence was 9 points lower than matched control
children without late-onset sepsis. In addition, attention and verbal memory
were specifically impaired, while visual perception, visuomotor integration, and
executive functioning were not affected. The incidence of behavioural problems
was comparable between the groups. Within the group of children with late-onset
sepsis, more than one episode of sepsis and sepsis caused by gram-negative
bacteria were risk factors for worse outcome.
Late-onset sepsis remains a significant neonatal complication that affects up to
16,000 VLBW infants annually in the United States alone.1,18 To the best of our
knowledge this is the first study that established the functional outcome at school
age of children with late-onset sepsis. Our study showed that at a mean of 8.4
years of age, 39% of children with late-onset sepsis had abnormal Movement
ABC scores. This is higher than the previous findings of Stoll et al. in a large cohort
study (n=6314) on early outcome in extremely low birth weight infants (<1000g)
with either early or late-onset sepsis. They found that at 2 years of age, 27% of
children with sepsis had an abnormal (<70) Psychomotor Developmental Index
score of the Bayley Scales of Infant Development.4
Regarding cognition, we found that the IQs of our study group were considerably
lower than in the controls. Moreover, at school age 44% had IQ scores below 85,
which is an approximate cut-off point for being able to attend regular education
in the Netherlands. In the controls this was only 6%. Stoll et al. found that 37%
of children with sepsis had an abnormal (<70) Mental Developmental Index (MDI)
score of the Bayley Scales of Infant Development at 2 years of age, compared to
22% in the controls.4
Our study included infants of <32 weeks of gestational age and late-onset sepsis,
while the study by Stoll et al. included only extremely low birth weight infants of
lower gestational ages than our study. It thus appears that the motor and cognitive
impairments as found in preterm infants with late-onset sepsis at school age
are worse than previously reported. At school age, outcome can be determined
Functional Development at School Age of Newborn Infants at Risk
more reliably due to higher test validity and behaviour of the children that fits the
testing situation better. Moreover, at school age more subtle cognitive deficits may
come to light since school is more demanding which could make compensation
strategies more difficult to use.
In addition to lower intelligence, we also found poorer attentional control and
verbal memory. These specific cognitive deficits, which have not been identified
previously, can further hamper school performance. Poor attention and verbal
memory, for example, may both affect learning. One could speculate that these
impairments are attributable to lower IQs, especially verbal IQ, which may have had
an influence on verbal memory. We also found children with normal IQs, however,
who had problems with attention and verbal memory. It thus appears that sepsis-
induced brain disruptions in particular have a negative impact on the development
of networks in the brain involved in these functions.
It is likely that the functional impairments as found in our study are the result of a
multifactorial process leading to brain injury in which inflammatory mediators play
an essential role. The preterm brain and its white matter are highly vulnerable to
damage by inflammation and ischemia.19 During infectious episodes, the brain
is exposed to pro-inflammatory cytokines released by microglial cells. These
cytokines inhibit proliferation of neuronal precursor cells and contribute to damage
to the pre-oligodendrocytes, which play an important role in myelination of the
brain.20,21 Ischemia of brain areas can result from hypotension which is associated
with sepsis. Recently, it was postulated that the presence of systemic cytokines
may be related to a disturbance in cerebrovascular autoregulation and diminished
cerebral blood flow.21,22 In addition to the role of pro-inflammatory cytokines,
the injurious effects of microglial activation also relate to the release of reactive
oxygen and nitrogen species in infants with sepsis.23 Finally, sepsis and the
subsequent increase in cytokines are related to the development of germinal matrix
haemorrhage-intraventricular haemorrhage (GMH-IVH), particularly in infants with
early-onset sepsis.24 In our series GMH-IVH was already present before the late-
onset sepsis occurred. However the slight increased number of GMH-IVH among
infants with late-onset sepsis versus controls, although not significant, may have
worsened neurodevelopmental outcome. It has been postulated that brain injury

211Chapter 8 Functional Impairments at School Age of Preterm Born Children with Late-Onset Sepsis
in the setting of systemic inflammation not only leads to destruction of tissue but
may also lead to altered brain development, even though the exact mechanisms
have yet to be uncovered.20
Our secondary aim was to identify sepsis-related risk factors for adverse outcome.
In our study, multiple episodes of sepsis were related to worse cognitive outcome.
Progressive white matter injury which follows from recurrent infection may be
responsible for this finding.25 Additionally, a gram-negative sepsis was related to
worse cognitive outcome even though it was found only in four children. Previous
studies already showed that infants with a gram-negative sepsis are often more
severely ill, have a higher mortality rate, and may have a different immune response
than infants with gram-positive infections.26,27
A limitation of this study was the relatively small study and control group. Since this
was a single centre study, generalizability to other centres needs to be established.
Moreover, not all the tests were completed by all the children due to unwillingness
to cooperate because the tasks were too difficult. This was particularly the case in
the sepsis group. Outcome in the sepsis group may thus have been even slightly
worse than we reported. We included fewer control children than children with
late-onset sepsis in the study since we were particularly interested in the outcome
of children with late-onset sepsis and therefore used standardised tests. We
included the control children to take into account the degree of prematurity. We
aimed at including control children that were as similar as possible in neonatal
characteristics compared to the study group, which is also apparent from the
clinical characteristics and SNAP scores of the children, to rule out the potential
role of other risk factors for adverse outcome. The strengths of this study are
that we examined in great detail a broad range of motor and cognitive skills and
behavioural aspects that might limit functional abilities at school age compared to
matched control children.
The functional impairments at school age as identified in the present study were
worse than one would expect based on previous outcome studies at 2 years of
age. We believe that in children with late-onset sepsis the focus of attention should
be on early identification of children at risk for functional impairments so as not
to miss opportunities for intervention. In addition, preventive measures beyond
Functional Development at School Age of Newborn Infants at Risk
antibiotics should be considered to prevent brain pathology. Previous quality
improvement studies showed that it may be possible to reduce infection rates
and to improve the outcome of neonatal care by implementation of preventive
measures.28,29 More research is needed to determine the exact pathophysiological
mechanisms responsible for the neurodevelopmental impairments in children
with late-onset sepsis. In particular, the question why certain children do and
others do not exhibit significant functional impairments at school age. Differences
in neuroprotective capacities of the brain, but also differences in environmental
aspects during childhood, may play a role.
Acknowledgements
This study was part of the research program of the Research School for Behavioural
and Cognitive Neurosciences, University of Groningen, the Netherlands. We greatly
acknowledge the help of Dr. T. Brantsma – van Wulfften Palthe for correcting the
English manuscript. Elise Roze was financially supported by a Junior Scientific
Master Class grant of the Research School for Behavioural and Cognitive
Neurosciences, University of Groningen, the Netherlands. No study sponsors were
involved.

213Chapter 8 Functional Impairments at School Age of Preterm Born Children with Late-Onset Sepsis
1. Stoll BJ, Hansen N, Fanaroff AA, et al. Late-
onset sepsis in very low birth weight neonates:
The experience of the NICHD Neonatal Research
Network. Pediatrics 2002;110:285-291.
2. Shah DK, Doyle LW, Anderson PJ, et al. Adverse
neurodevelopment in preterm infants with postnatal
sepsis or necrotizing enterocolitis is mediated by
white matter abnormalities on magnetic resonance
imaging at term. J Pediatr 2008;153:170-175.
3. Graham EM, Holcroft CI, Rai KK, Donohue PK, Allen
MC. Neonatal cerebral white matter injury in preterm
infants is associated with culture positive infections
and only rarely with metabolic acidosis. Am J Obstet
Gynecol 2004;191:1305-10.
4. Stoll BJ, Hansen NI, Adams-Chapman I, et al.
Neurodevelopmental and growth impairment among
extremely low-birth-weight infants with neonatal
infection. JAMA 2004;292(19):2357-2365.
5. Hack M, Taylor HG, Drotar D, et al. Poor predictive
validity of the Bayley Scales of Infant Development
for cognitive function of extremely low birth weight
children at school age. Pediatrics 2005;116:333-341.
6. Richardson DK, Corcoran JD, Escobar GJ, Lee
SK. SNAP-II and SNAPPE-II: Simplified newborn
illness severity and mortality risk scores. J Pediatr
2001;138:92-100.
7. Bax M, Goldstein M, Rosenbaum P, et al. Proposed
definition and classification of cerebral palsy, April
2005. Dev Med Child Neurol 2005;47:571-576.
8. Palisano R, Rosenbaum P, Walter S, Russell D, Wood
E, Galuppi B. Development and reliability of a system
to classify gross motor function in children with
cerebral palsy. Dev Med Child Neurol
1997;39:214-233.
9. Smits-Engelsman BCM. Movement Assessment
Battery for Children. Lisse, the Netherlands: Swets &
Zeitlinger; 1998.
10. Kort W, Compaan EL, Bleichrodt N, et al. WISC-III
NL Handleiding. Amsterdam: NIP dienstencentrum;
2002.
11. Gregoire J. Comparison of three short forms
of the Wechsler intelligence scale for children
- third edition (WISC-III). Eur Rev Appl Psychol
2000;50:437-441.
12. Korkman M, Kirk U, Kemp SL. NEPSY II. Clinical
and Interpretative Manual. San Antonio, TX:
PsychCorp. A Brand of Harcourt Assessments;
2007.
13. van den Burg W, Kingma A. Performance of 225
Dutch school children on Rey’s Auditory Verbal
Learning Test (AVLT): parallel test-retest reliabilities
with an interval of 3 months and normative data.
Arch Clin Neuropsychol 1999;14:545-559.
14. Manly T, Anderson V, Nimmo-Smith I, Turner A,
Watson P, Robertson IH. The differential assessment
of children’s attention: the Test of Everyday
Attention for Children (TEA-Ch), normative sample
and ADHD performance. J Child Psychol Psychiatry
2001;42:1065-1081.
References

Functional Development at School Age of Newborn Infants at Risk
15. Scholte EM, van der Ploeg JD. ADHD-vragenlijst
(AVL) handleiding. Houten, the Netherlands: Bohn
Stafleu Van Loghum; 2004.
16. Gioia GA, Isquith PK, Guy SC, Kenworthy L.
BRIEF—Behavior Rating Inventory of Executive
Function: professional manual. Odessa, FL:
Psychological Assessment Resources; 2000.
17. Achenbach TM, Edelbrock C. Manual for the
Child Behavior Checklist: 4–18 and 1991 profile.
Burlington, VT: Univ. of Vermont, Department of
Psychiatry; 1991.
18. Hamilton BE, Martin JA, Ventura SJ. Births:
Preliminary Data for 2007. Hyattsville, ML: National
Center for Health Statistics; 2009.
19. Adams-Chapman I, Stoll BJ. Neonatal infection
and long-term neurodevelopmental outcome in the
preterm infant. Curr Opin Infect Dis
2006;19:290-297.
20. Malaeb S, Dammann O. Fetal inflammatory
response and brain injury in the preterm newborn. J
Child Neurol 2009;24:1119-1126.
21. Volpe JJ. Postnatal sepsis, necrotizing entercolitis,
and the critical role of systemic inflammation in
white matter injury in premature infants. J Pediatr
2008;153:160-163.
22. Yanowitz TD, Potter DM, Bowen A, Baker RW,
Roberts JM. Variability in cerebral oxygen delivery
is reduced in premature neonates exposed to
chorioamnionitis. Pediatr Res 2006;59:299-304.
23. Khwaja O, Volpe JJ. Pathogenesis of cerebral white
matter injury of prematurity. Arch Dis Child Fetal
Neonatal Ed 2008;93:F153-F161.
24. Heep A, Behrendt D, Nitsch P, Fimmers R, Bartmann
P, Dembinski J. Increased serum levels of interleukin
6 are associated with severe intraventricular
haemorrhage in extremely premature infants. Arch
Dis Child Fetal Neonatal Ed 2003;88:F501-F504.
25. Glass HC, Bonifacio SL, Chau V, et al. Recurrent
postnatal infections are associated with progressive
white matter injury in premature infants. Pediatrics
2008;122:299-305.
26. Stoll BJ, Gordon T, Korones SB, et al. Late-onset
sepsis in very low birth weight neonates: a report
from the National Institute of Child Health and
Human Development Neonatal Research Network. J
Pediatr 1996;129:63-71.
27. Blanco A, Solis G, Arranz E, Coto GD, Ramos A,
Telleria J. Serum levels of CD14 in neonatal sepsis
by Gram-positive and Gram-negative bacteria. Acta
Paediatr 1996;85:728-732.
28. Horbar JD, Rogowski J, Plsek PE, et al.
Collaborative quality improvement for neonatal
intensive care. NIC/Q Project Investigators of the
Vermont Oxford Network. Pediatrics
2001;107:14-22.
29. Kilbride HW, Wirtschafter DD, Powers RJ, Sheehan
MB. Implementation of evidence-based potentially
better practices to decrease nosocomial infections.
Pediatrics 2003;111:e519-e533.

215Chapter 8 Functional Impairments at School Age of Preterm Born Children with Late-Onset Sepsis

Chapter 9
MOTOR AND COGNITIVE OUTCOME AT
SCHOOL AGE OF CHILDREN WITH
SURGICALLY TREATED INTESTINAL
OBSTRUCTIONS IN THE NEONATAL PERIOD
RACHEL M. ELSINGA, ELISE ROZE, KOENRAAD N. J. A. VAN BRAECKEL,
JAN B. F. HULSCHER, AREND F. BOS
SUBMITTED
Functional Development at School Age of Newborn Infants at Risk
Abstract
Objective
To determine motor and cognitive outcome at school age in children with surgically
treated intestinal obstructions as newborns, and to identify clinical risk factors for
adverse outcome.
Study design
Cohort study of infants born during 1995-2002 with atresia, stenosis, or intestinal
malrotation. At 6 to13 years we assessed their motor functioning, intelligence, attention,
visual perception, visuomotor integration, and verbal memory.
Results
Of 44 children three (7%) died. Twenty-seven survivors (66%) were included for follow-
up (median gestational age 36.7 weeks, birth weight 3000 g). Motor outcome was
abnormal (<5th percentile) in 22% of the children. This was worse than the reference
population (p<.01). Scores on selective attention were abnormal in 15% of the children
(p<.01). Other cognitive functions were not affected. Lower birth weight and intestinal
perforation were risk factors for poorer motor outcome (r2=53.0) while intrauterine growth
restriction was a risk factor for poorer selective attention (r2=36.6).
Conclusions
Children treated surgically for intestinal obstructions in the neonatal period had an
increased risk for poor motor functioning and selective attention at school age. Low
birth weight, IUGR, and intestinal perforation were risk factors for adverse outcomes. We
recommend to closely follow the motor and attentional development of these children.
219Chapter 9 Motor and Cognitive Outcome at School Age of Children with Surgically Treated Intestinal Obstructions in the Neonatal Period
Introduction
An intestinal obstruction is a gastrointestinal complication that leads to impaired
bowel passage. It occurs in approximately 9 out of every 10,000 newborn infants.1,2
It can be caused by congenital malformations of the intestine such as an intestinal
atresia or stenosis, or by a malrotation of the intestine. Infants who present with
such an obstruction often require surgery in the neonatal period to uplift the
obstruction, promote normal bowel function and allow oral feeding.
In this early period of life, infants with obstructions are submitted to several
potentially harmful factors, like physiological stress during surgery, that may lead
to adverse neurodevelopmental outcome.3 Furthermore, they undergo general
anesthesia at a very young age. Studies in rodents showed that the use of
anesthetics during the cerebral growth spurt has an adverse influence on long-
term neurological development.4,5
Although these factors are recognized risk factors for adverse neurodevelopmental
outcome, the motor and cognitive outcome at school age of newborn infants with
surgically treated intestinal obstructions is unknown. Our main aim was, therefore,
to determine the outcome of such infants by assessing their motor and cognitive
performance at school age. Motor and cognitive outcomes measured at school age
are known to be more robust and predictive for later life than outcomes measured
at pre-school age. Our secondary aim was to explore which clinical factors were
associated with adverse outcome.

Functional Development at School Age of Newborn Infants at Risk
Methods
Patients
We selected all infants who had been admitted to the NICU of the University Medical
Center Groningen between 1995 and 2002, and who were diagnosed by laparotomy
and found to have duodenal, jejunal, ileal, or colon atresia or ileal stenosis, or
malrotation of the intestine. We excluded patients with major chromosomal and
congenital anomalies other than single atresias or stenoses.
Follow-up
The children were invited prospectively to participate in this follow-up study which
was an extension of the regular follow-up program. It entailed the assessment of
motor performance and cognition at the age of 6 to 13 years. Parents gave their
informed consent for their children to participate in the follow-up program. The
study was approved by the Medical Ethical Committee of the University Medical
Center Groningen.
Motor Outcome
To determine the children’s motor outcome, we administered the Movement
Assessment Battery for Children (Movement ABC), a standardized test of motor
skills for children aged 4 to 12 years.6 This test yields a score for total movement
performance based on subscales for fine motor skills, ball skills, and balance. The
tasks composing the Movement ABC are representative of the motor skills that
are required of children attending elementary school in the Netherlands and are
adapted to the individual child’s age.
Cognitive Outcome
We assessed total, verbal, and performance intelligence using a shortened version
of the Wechsler Intelligence Scale for Children, third edition, Dutch version (WISC-
III-NL).7,8
In addition, we assessed several neuropsychological functions. To assess attention
we administered two subtests of the Test of Everyday Attention for Children (TEA-
Ch).9 For selective attention we used the subtest “map mission”. Selective attention
221Chapter 9 Motor and Cognitive Outcome at School Age of Children with Surgically Treated Intestinal Obstructions in the Neonatal Period
refers to a child’s ability to select target information from an array of distracters. We
measured attentional control with the subtest “opposite worlds”. Attentional control
refers to the child’s ability to change attentional focus flexibly and adaptively.
We assessed visual perception with the subtest “geometric puzzles” and visuomotor
integration with the subtest “design copying” of the NEPSY-II.10 Visual perception
refers to the child’s ability to perform mental rotations and visuospatial analyses.
Visuomotor integration involves integrating visual information with finger-hand
movements.
We assessed verbal memory with a standardized Dutch version of Rey’s Auditory
Verbal Learning Test (AVLT).11 This test consists of five learning trials of fifteen words
each, followed by an immediate recall trial, a delayed recall trial, and a delayed
recognition trial, both after a delay of approximately 20 minutes.
Statistical Analysis
We classified the scores of the Movement ABC, TEA-Ch, and NEPSY-II into
normal (≥ 15th percentile), borderline (5th to 15th percentile), and abnormal (< 5th
percentile), in accordance with the manual based on a Dutch reference population.
To classify the scores of the WISC-III-NL and AVLT we used the norm scores,
means, and standard deviations of the reference population. Normal was defined
as ≥ -1 standard deviation (SD), borderline as -1 to -2 SDs, abnormal as < -2 SDs.
In addition, we calculated the z scores based on the norm scores and percentiles
given in the test manuals.
In order to compare the outcome of the study group with the norm scores of the
reference population, we used the one-sample Student t test in case of normality
and the Wilcoxon signed rank test in case of non-normality.
To determine whether clinical characteristics were related to adverse outcome, we
calculated odds ratios (ORs) by univariate logistic regression. Adverse outcome was
defined as an abnormal score (< 5th percentile). We subsequently used backward
multivariate logistic regression to determine which risk factors detected by the
univariate analysis (p<.10) had independent prognostic value for outcome.
Throughout the analyses, p<.05 was considered statistically significant. We used
SPSS 16.0 software for Windows (SPSS Inc, Chicago, IL) for all the analyses.

Functional Development at School Age of Newborn Infants at Risk
Results
Patient characteristics
A database search resulted in 44 children who met our inclusion criteria, three (7%)
of whom died in the neonatal period. Twenty-seven (66%) out of the 41 survivors
were included in the follow-up study. The parents of seven children declined the
invitation to participate and seven other children could not be traced. Table 1
shows the patient demographics of the infants who were included in the follow-up.
Two infants were born preterm (<32 weeks) and had an extremely low birth weight
(<1000 g). The gestational age of the surviving infants who did not participate in
this study, was comparable to that of the study group (median 37.4 weeks, range
30.7-42.1). The birth weight of the survivors who did not participate was slightly
lower (median 2298 g, range 1120-3700) compared to the median of 3000 g in the
study group. The number of infants with intrauterine growth restriction (IUGR) was
comparable (n=3, 21%).
The most common type of obstruction was atresia (n=16). One child had an ileal
stenosis. In eight infants the obstruction was caused by a malrotation, in four of
whom the malrotation was complicated by a volvulus, while two infants suffered
from a volvulus without a malrotation. The median age at surgery was 3 days (range
1-22). Six infants required at least one more operation under general anesthesia
during their first year, while four required more than one subsequent operation
(median 2).
Follow-up
The mean age at follow-up was 9.5 years (6.6 – 13.2). The total score on the
Movement ABC, expressed as a z score, was significantly lower than the reference
population (p<.01; Figure 1). All motor domains were affected, with most problems
encountered on the balance test on which 33% of the children obtained abnormal
scores (Figure 2A).
We present the cognitive outcomes of the children in Figure 1 (z scores). Their
mean total IQ was 99 (range 63-120), their mean verbal IQ was 102 (range 65-123),
and their mean performance IQ was 96 (range 55-123). These scores did not differ
significantly from those of the reference population.
223Chapter 9 Motor and Cognitive Outcome at School Age of Children with Surgically Treated Intestinal Obstructions in the Neonatal Period
Regarding the other cognitive functions, only selective attention was worse in the
children with surgically treated obstructions compared to the reference population
(p<.01). Thirty percent of the children with intestinal obstructions had borderline
or abnormal scores on selective attention (Figure 2B). The scores on attentional
control, visuomotor integration, and verbal memory did not differ from the reference
population. The scores on visual perception were slightly better than the reference
population (p<.01; Figure 1). We were unable to test the visual perception of two
children because the test proved too difficult for them. In Figure 2B they are
classified as abnormal.
Clinical Factors in relation to Outcome
Subsequently, we investigated whether clinical characteristics of the neonatal
period were related to abnormal outcomes at school age. We entered the following
clinical characteristics in a univariate logistic analysis: gestational age, birth
weight, IUGR, presence of volvulus, presence of perforation, intestinal resection,
and late onset sepsis. In Table 2 we present the factors that were significantly
related to worse outcome after univariate analysis. After multivariate analyses, only
perforation and birth weight were related to abnormal total motor functioning. The
model including these variables explained 53.0% of the variance (r2). For selective
attention, IUGR remained in the model with a proportion of declared variance (r2)
of 36.6%.
To determine whether these poorer outcomes at school age were solely determined
by prematurity and perforation (motor outcome), and IUGR (attentional outcome),
we repeated the analyses after excluding the children with these risk factors. This
had no effect on any of the results.

Functional Development at School Age of Newborn Infants at Risk
TABLE 1 Patient demographics
Number n=27Males/females 13/14 Gestational age (weeks) 36.7 (28.9-42.0)
Birth weight (grams) 3000 (710-5065)
IUGR (<P10) n=6 (22)
Asphyxia n=1 (4)
Apgar at 1 minute (n=21) 8 (2-10)
Apgar at 5 minutes (n=21) 9 (3-10) Late onset morbidity
Late onset sepsis n=7 (26)
Bronchopulmonary dysplasia1 n=1 (4)
Characteristics of intestinal obstructionAtresia n=16 (59)
Duodenal atresia n=3 (11)
Jejunal atresia n=4 (15)
Ileal atresia n=6 (22)
Colonal atresia n=3 (11)
Ileal stenosis n=1 (4)
Malrotation without volvulus n=4 (15)
Malrotation plus volvulus n=4 (15)
Isolated volvulus n=2 (22)
ComplicationsPerforation n=5 (19)
Short bowel syndrome n=1 (4) Surgical characteristics
Intestinal resection n=16 (59)
Jejunal resection n=5 (19)
Ileal resection n=5 (19)
Colonal resection n=1 (4)
Jejunal plus ileal resection excluding ileocoecal valve n=1 (4)
Ileal plus colonal resection including ileocoecal valve n=4 (15)
Length of resected intestine 13.5 (1-50)
Data are given as median (minimum-maximum) or as numbers (percentage). 1. Bronchopulmonary dysplasia was defined as oxygen dependence beyond 36 weeks postmenstrual ageAbbreviation: IUGR - intrauterine growth restriction
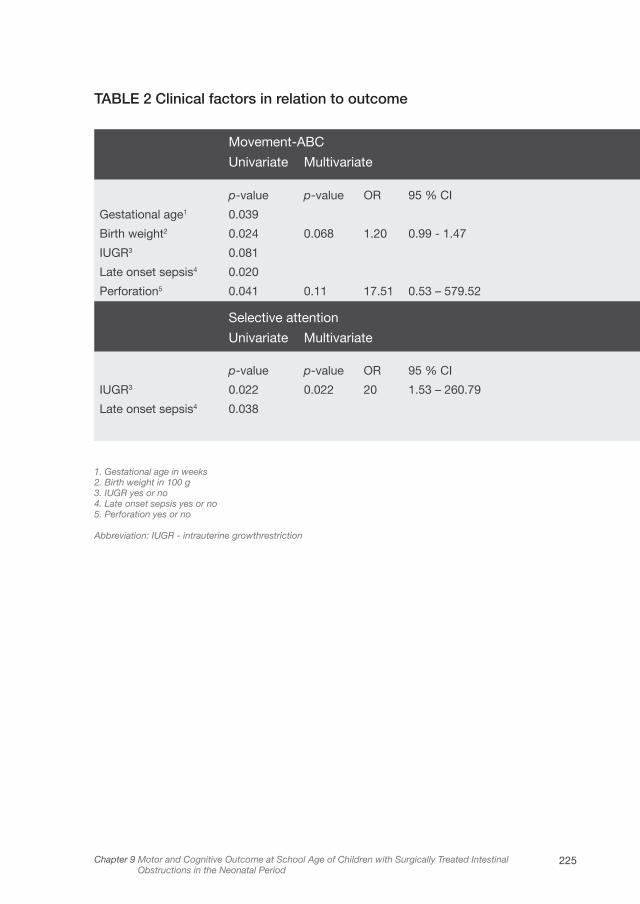
225Chapter 9 Motor and Cognitive Outcome at School Age of Children with Surgically Treated Intestinal Obstructions in the Neonatal Period
TABLE 2 Clinical factors in relation to outcome
Movement-ABC
Univariate Multivariate
p-value p-value OR 95 % CI
Gestational age1 0.039
Birth weight2 0.024 0.068 1.20 0.99 - 1.47
IUGR3 0.081
Late onset sepsis4 0.020
Perforation5 0.041 0.11 17.51 0.53 – 579.52
Selective attention
Univariate Multivariate
p-value p-value OR 95 % CI
IUGR3 0.022 0.022 20 1.53 – 260.79
Late onset sepsis4 0.038
1. Gestational age in weeks2. Birth weight in 100 g3. IUGR yes or no4. Late onset sepsis yes or no5. Perforation yes or no
Abbreviation: IUGR - intrauterine growthrestriction
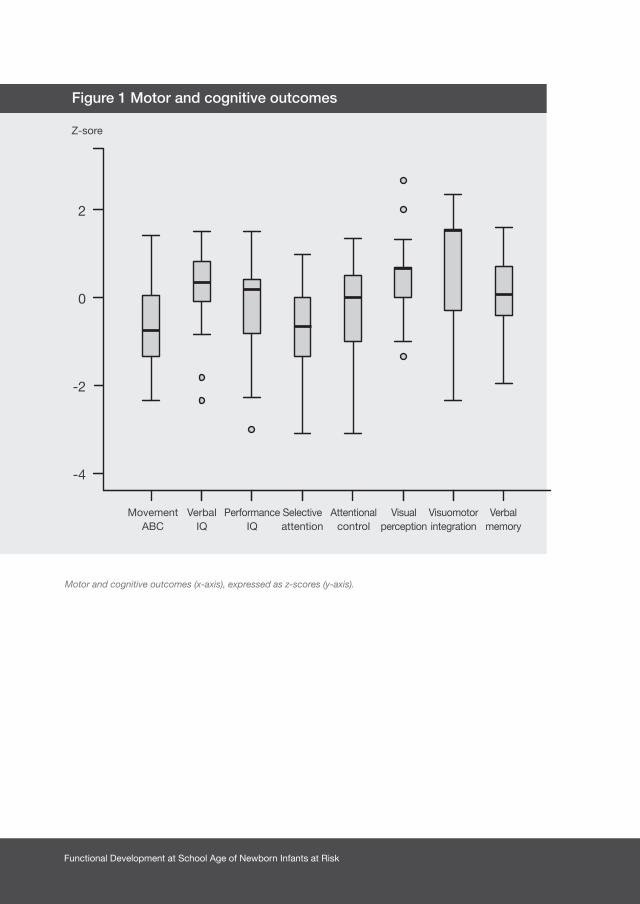
Functional Development at School Age of Newborn Infants at Risk
Motor and cognitive outcomes (x-axis), expressed as z-scores (y-axis).
2
0
-2
-4
MovementABC
Z-sore
VerbalIQ
PerformanceIQ
Selectiveattention
Attentionalcontrol
Visualperception
Visuomotorintegration
Verbalmemory
Figure 1 Motor and cognitive outcomes

227Chapter 9 Motor and Cognitive Outcome at School Age of Children with Surgically Treated Intestinal Obstructions in the Neonatal Period
Figure 2A Motor outcome of children with surgically treated intestinal
obstructions
Figure 2B Cognitive outcome of children with surgically treated
intestinal obstructions
Data are expressed as number of children with normal, borderline, and abnormal scores.
100%
90%
80%
70%
60%
50%
40%
30%
20%
10%
0%
100%
90%
80%
70%
60%
50%
40%
30%
20%
10%
0%
Norm
n=19 n=20n=18
n=22n=23n=23 n=23n=23n=21n=19
n=1n=1n=1 n=2n=2n=5n=4
n=4n=3n=3 n=2n=2
n=1n=4
n=18
n=9
n=4n=2
n=2
n=5n=5n=6
Norm
Total motor
Intelligence
Fine skills
Selectiveattention
Visuomotor integration
Ball skills
Attentionalcontrol
Verbal memory
immediate
Verbal memory delayed
Balance
Visual perception
Normal
Normal
Borderline
Borderline
Abnormal
Abnormal

Functional Development at School Age of Newborn Infants at Risk
Discussion
This study showed that at school age more than twenty percent of children with
surgically treated intestinal obstructions in the neonatal period showed abnormal
motor functioning and fifteen percent showed abnormal selective attention. The
scores obtained by our study group on these functions were significantly lower
than those of the reference population. Outcomes were not affected on intelligence,
visual perception, visuomotor integration, and verbal memory. Low birth weight,
IUGR, and the presence of an intestinal perforation were risk factors for adverse
outcomes in infants with an intestinal obstruction that was treated surgically.
Since to our knowledge ours was the first study to determine the motor and
cognitive outcome at school age of mainly term-born children treated surgically
for intestinal obstructions in the neonatal period we are unable to compare our
results to other outcome studies. Most studies deal with preterm born children
who require surgery during the first weeks after birth. This makes it difficult to
review our results in the light of existing literature.
A previous study on the outcome of preterm infants with necrotizing enterocolitis
(NEC) found that surgically treated children had poorer neurodevelopmental
outcomes at 18 to 22 months than medically managed children.12 Partly, this could
be explained by a higher baseline risk for adverse outcome in the surgical group,
since these children were more severely ill. Nevertheless, this higher baseline risk
did not completely explain the variance. Possibly other factors associated with
surgical treatment like physiological stress and anesthesia, also played a role.
A study in term-born children with surgically treated congenital heart diseases
in the neonatal period showed that these children too were at risk for
adverse neurodevelopmental outcome at school age.13 This group showed lower
intelligence and fine motor skills as well as more specific neuropsychological
deficits in memory and attention. In our study group we found that motor function
and attention were also affected. Although both study groups required surgery for
a congenital anomaly in the neonatal period, the children with congenital heart
disease presumably had periods of reduced cerebral blood flow and oxygenation,
which may have further increased their risk for neurodevelopmental impairments.
This was not the case in our group.

229Chapter 9 Motor and Cognitive Outcome at School Age of Children with Surgically Treated Intestinal Obstructions in the Neonatal Period
In our study, low birth weight, IUGR, and intestinal perforation were related to poorer
outcome at school age. Low birth weight and IUGR are well-known risk factors
for neurodevelopmental impairments up to school age.14,15 In preterm infants,
perforation as a complication of the intestinal disease NEC was also a risk factor
for adverse outcome at school age.16 Perforation is frequently associated with
inflammation and infection. Particularly in preterm infants, systemic inflammation
is associated with cerebral white matter abnormalities.17,18 Brain development of
term-born infants is in a much more mature phase in terms of neuronal migration
and cortical folding than that of preterms. Nevertheless, to a large extent
myelination and dendritic and axonal arborization still have to take place.19,20 Our
finding that poorer motor and attentional outcomes were still present after we had
excluded children with the above mentioned risk factors, led us to believe that
additional, presumably surgery and disease-related factors, had also played a role
in our study. These included, for example, physiological stress during surgery, and
anesthesia. Rodent studies showed that the use of anesthesia during the cerebral
growth spurt can lead to neuroapoptosis and has an adverse influence on long-
term behavioral development.4,5 It may well be that maturational processes which
normally occur from birth until years postnatally, are also susceptible to injury from
anesthetic factors. Furthermore, infants with intestinal obstructions receive parenteral
nutrition for a considerable period of time, and approximately twelve percent of the
infants with surgically treated intestinal atresia suffer from short bowel syndrome, a
condition which subjects them to ongoing nutritional problems.2 Parenteral nutrition
and prolonged nutritional deficiencies are described as having an adverse influence
on cognition and learning at pre-school age.21 Although parenteral nutrition might
have played a role, ongoing nutritional deficiencies most likely did not, since in our
study only one child suffered from short bowel syndrome.
Our study was subject to potential limitations. It was a single-center study therefore
its generalizability to other centers needs to be established. We tried to minimize
this problem by using standardized tests. Another potential limitation was that
we compared the outcomes of our study group to a reference population rather
than to a control group. Despite this we did not expect an overestimation of the
differences between our study group and reference scores, since these reference

Functional Development at School Age of Newborn Infants at Risk
scores were obtained within the last ten years. Potentially, an underestimation of
the described effect of intestinal obstructions and surgery on outcome is more
likely since cognitive outcomes from the reference population may only have
increased over time, the so-called Flynn effect.22
To our knowledge, ours was the first study to investigate the motor and cognitive
outcome at school age of children who had been treated surgically for intestinal
obstructions during the first weeks of life. The strength of this study was that we
examined a broad range of motor and cognitive functions at school age. Motor
and cognitive outcomes measured at school age are known to be more robust
and predictive for later life than when measured at pre-school age. Since intestinal
obstructions are associated with few neonatal comorbidities, we believe that the
adverse motor and attentional outcomes at school age as found in the present
study could be ascribed mainly to the intestinal obstruction and its surgical
treatment. Since a significant proportion of children with intestinal obstructions
showed motor and attentional problems at school age, we recommend that these
children be followed-up and screened for motor and attentional deficits. Future
studies on larger cohorts of children who underwent surgical treatment in the
neonatal period could reveal perioperative factors which contribute to adverse
outcome at school age.
231Chapter 9 Motor and Cognitive Outcome at School Age of Children with Surgically Treated Intestinal Obstructions in the Neonatal Period
1. Berseth CL. Disorders of the intestines and pancreas.
In: Taeush WH BR, editor. Avery’s Disease of the
Newborn. Philadelphia: Saunders; 1998. p.918.
2. la Vecchia LK, Grosfeld JL, West KW, Rescorla FJ,
Scherer LR, Engum SA. Intestinal atresia and stenosis:
a 25-year experience with 277 cases. Arch Surg
1998;133:490-496.
3. Anand KJ, Hansen DD, Hickey PR. Hormonal-metabolic
stress responses in neonates undergoing cardiac
surgery. Anesthesiology 1990;73:661-670.
4. Jevtovic-Todorovic V, Hartman RE, Izumi Y, et al.
Early exposure to common anesthetic agents causes
widespread neurodegeneration in the developing
rat brain and persistent learning deficits. J Neurosci
2003;23:876-882.
5. Mellon RD, Simone AF, Rappaport BA. Use of
anesthetic agents in neonates and young children.
Anesth Analg 2007;104:509-520.
6. Smits-Engelsman BCM. Movement Assessment Battery
for Children. Lisse, the Netherlands: Swets & Zeitlinger;
1998.
7. Kort W, Compaan EL, Bleichrodt N, et al. WISC-III
NL Handleiding. Amsterdam, the Netherlands: NIP
dienstencentrum; 2002.
8. Grégoire J. Comparison of three short forms of the
Wechsler Intelligence Scale for Children - third edition
(WISC-III). Eur Rev Appl Psychol 2000;50:437-441.
9. Manly T, Anderson V, Nimmo-Smith I, Turner A,
Watson P, Robertson IH. The differential assessment
of children’s attention: the Test of Everyday Attention
for Children (TEA-Ch), normative sample and ADHD
performance. J Child Psychol Psychiatry
2001;42:1065-1081.
10. Korkman M, Kirk U, Kemp SL. NEPSY II. Clinical and
Interpretative Manual. San Antonio, TX: PsychCorp. A
Brand of Harcourt Assessments; 2007.
11. Van den Burg W, Kingma A. Performance of 225 Dutch
school children on Rey’s Auditory Verbal Learning Test
(AVLT): parallel test-retest reliabilities with an interval of
3 months and normative data. Arch Clin Neuropsychol
1999; 14:545-559.
12. Hintz SR, Kendrick DE, Stoll BJ, et al.
Neurodevelopmental and growth outcomes of
extremely low birth weight infants after necrotizing
enterocolitis. Pediatrics 2005;115:696-703.
13. Miatton M, De Wolf D, Francois K, Thiery E,
Vingerhoets G. Neuropsychological performance
in school-aged children with surgically corrected
congenital heart disease. J Pediatr 2007;151:73-78.
14. Allen MC. Neurodevelopmental outcomes of preterm
infants. Curr Opin Neurol 2008;21:123-128.
15. Kiechl-Kohlendorfer U, Ralser E, Pupp Peglow U,
Reiter G, Trawoger R. Adverse neurodevelopmental
outcome in preterm infants: risk factor profiles for
different gestational ages. Acta Paediatr
2009; 98:792-796.
References

Functional Development at School Age of Newborn Infants at Risk
16. Neubauer AP, Voss W, Kattner E. Outcome of
extremely low birth weight survivors at school
age: the influence of perinatal parameters on
neurodevelopment. Eur J Pediatr 2008;167:87-95.
17. Volpe JJ. Postnatal sepsis, necrotizing entercolitis,
and the critical role of systemic inflammation in white
matter injury in premature infants. J Pediatr
2008; 153:160-163.
18. Shah DK, Doyle LW, Anderson PJ, et al. Adverse
neurodevelopment in preterm infants with postnatal
sepsis or necrotizing enterocolitis is mediated by white
matter abnormalities on magnetic resonance imaging
at term. J Pediatr 2008;153:170-175.
19. Brody BA, Kinney HC, Kloman AS, Gilles FH.
Sequence of central nervous system myelination in
human infancy. I. An autopsy study of myelination. J
Neuropathol Exp Neurol 1987;46:283-301.
20. Volpe JJ. Neurology of the Newborn. 5th ed.
Philadelphia, PA: Elsevier; 2008.
21. Yehuda S, Rabinovitz S, Mostofsky DI. Nutritional
deficiencies in learning and cognition. J Pediatr
Gastroenterol Nutr 2006;43:S22-S25.
22. Flynn JR. Massive IQ gains in 14 nations: What
IQ tests really measure. Psychological Bulletin
1987;101:171-191.

233Chapter 9 Motor and Cognitive Outcome at School Age of Children with Surgically Treated Intestinal Obstructions in the Neonatal Period


Chapter 10 Developmental trajectories from birth to
school age in healthy term-born children
Chapter 11 Neuropsychological profiles at school age of very
preterm born children compared to term-born peers
PART 4Functional outcome: how various aspects of
neurodevelopment interrelate

Chapter 10
DEVELOPMENTAL TRAJECTORIES FROM BIRTH
TO SCHOOL AGE IN HEALTHY TERM-BORN
CHILDREN
ELISE ROZE, LISETHE MEIJER, KOENRAAD N. J. A. VAN BRAECKEL, SELMA A. J.
RUITER, JANNEKE L. M. BRUGGINK, AREND F. BOS
PEDIATRICS 2010;126(5):E1134-E1142

Functional Development at School Age of Newborn Infants at Risk
Abstract
Objective
To determine the stability of the scores obtained on tests of motor development
from birth until school age in healthy, full-term, singletons and to determine whether
early motor scores were associated with more complex cognitive functions such
as attention and memory, at school age.
Patients and Methods
This longitudinal prospective cohort study included 77 infants. During the neonatal
period their motor development was determined with Prechtl’s neurological
examination, in early infancy with Touwen’s neurological examination and general
movement assessment, at toddler age with Hempel’s neurological examination
and the psychomotor developmental index from the Bayley Scales of Infant
Development, Second Edition, Dutch Version (BSID-II-NL), and at school age with
the Movement ABC. Cognition was determined at toddler age with the mental
developmental index from the BSID-II-NL and at school age with an intelligence
test and attention and memory tests.
Results
The mean absolute difference in standardized motor scores over all time points
was 1.01 SD (95% confidence interval: 0.91-1.11). Only the explained proportions
of variance of maternal socioeconomic status (SES) and verbal intelligence were
significant for sustained attention and verbal memory (r2=0.104, p=.030 and
r2=0.074, p=.027, respectively). The children’s scores on early motor tests added
little value for their motor and cognitive development at school age.
Conclusions
In healthy children the stability of motor development from birth until school age is
low. Maternal SES and verbal intelligence rather than the infants’ scores on early
motor tests signified added value for complex cognitive functions at school age.
239Chapter 10 Developmental Trajectories from Birth to School Age in Healthy Term-Born Children
Introduction
Over the past decades there has been a growing interest in the prediction of outcome
from early infancy to performance at school age, particularly in infants at high risk
of developmental deficits. Gestational age, for example, is a strong predictor of
later motor and cognitive deficits.1,2 In high-risk infants, such as extreme low birth
weight infants, early neurological tests scores have a strong predictive value for
functioning later in life. In other words, children with early developmental delays,
such as motor impairments, have relatively stable developmental trajectories until
school age. This indicates that early alterations in brain development have an
important impact on the integrity and maturation of the central nervous system
during childhood.
Less is known about the stability of developmental trajectories in healthy, term-
born children. Previous studies suggested that in a norm population the age of
reaching developmental milestones predicts development later in life.3-5 Others
questioned whether a child’s developmental trajectory can be readily predicted
since it is influenced by a number of biological and environmental factors, such
as socio-economic status (SES), as well as medical, social, and developmental
interventions.6-8
To gain insight into the developmental trajectories of healthy children, our first aim
was to determine the stability of scores on motor development tests from birth
until school age in healthy, full-term, singletons.
There is growing evidence that early motor impairment may be related to later
cognitive problems. Therefore our second aim was to determine whether the
scores on tests of motor development in a normal population were associated
with performance at school age, particularly complex cognitive functions such as
attention and verbal memory.
Functional Development at School Age of Newborn Infants at Risk
Patients and Methods
Participants
The cohort of this study consisted of 90, white, healthy, and randomly selected
pregnant women who met the following inclusion criteria: giving birth to a healthy,
full-term, singleton infant, and who lived in one of the three northern provinces of
the Netherlands. All women registered with midwifes and gynecologists between
October 2001 and November 2002 in the province of Groningen were invited to
participate in the study. This cohort was originally established for a study on the
influence of prenatal exposure to environmental compounds on the development
of healthy children.9
Follow-up
The children were invited prospectively to participate in an extensive longitudinal
follow-up program. It entailed the assessment of motor performance and cognition
from birth until school age at five to seven years. Prior to the study parents gave
their informed consent for themselves and their children to participate in the
follow-up program. The study was approved by the Medical Ethical Committee of
the University Medical Center Groningen.
Neonatal Period
When the infants were ten days old we administered Prechtl’s neonatal neurological
examination.10 It contains sixty items for which an optimal range is defined. For
example, this test assesses excitability (e.g. apathy), motility, tonus (e.g. hypotonia,
dystonia), asymmetries, and visuomotor integration. We noted the presence of
possible neonatal neurological abnormalities and made a clinical interpretation of
the infant’s neurological condition. This led to the infant being classified as normal,
suspect, or abnormal. We also gave each infant a total neurological optimality
score (Prechtl’s optimality score, range 0-60).
Early Infancy
When the infants reached the age of twelve weeks, we performed Touwen’s
neurological examination to evaluate the infants’ neurological condition.11 This test
241Chapter 10 Developmental Trajectories from Birth to School Age in Healthy Term-Born Children
assesses neurological items similar to the neonatal neurological examination in an
age-specific context. Again, we obtained a total neurological optimality score for
each infant (Touwen’s optimality score, range 0-60) and classified the infants as
being normal, suspect, or abnormal.
At this age we also assessed the infants’ quality of spontaneous general movements
according to Prechtl et al.12-14 This is the age at which fidgety movements emerge;
movements characterized by small amplitude, moderate speed, and variable
acceleration. We assessed the quality of fidgety movements and scored them
as normal, abnormal (i.e. amplitude, speed, and jerkiness were exaggerated) or
absent. In addition, we calculated the infants’ motor optimality score (range 5-28
points) by assessing the quality of their fidgety movements, the quality and age-
adequacy of their concurrent motor repertoire, and the presence and normality of
their motor patterns.14,15
Toddler Age
When the children reached the age of eighteen months, we assessed their motor
and cognitive development with the Bayley Scales of Infant Development, Second
Edition, Dutch Version (BSID-II-NL).16 The BSID-II-NL contains items on the mental
and psychomotor development of children, and generates a mental developmental
index (MDI) and psychomotor developmental index (PDI). Furthermore, we
administered Hempel’s age-specific neurological examination to evaluate the
children’s neurological condition. This neurological examination contains items
on posture, coordination of trunk and extremities, gross and fine motor function,
visuomotor integration and sensory function.17 For each infant we obtained a total
neurological optimality score (Hempel’s optimality score, range 0-57) and we
classified them as normal, suspect, or abnormal.
During this period we measured the mothers’ verbal intelligence with the Wechsler
Adult Intelligence Scale (WAIS).18
School Age
When the children reached the age of five to seven years, we assessed their
motor and cognitive development. We determined their motor outcome with the
Functional Development at School Age of Newborn Infants at Risk
Movement ABC, a standardized test of motor skills for children aged four to twelve
years.19 This test, which is widely used in both practice and research, yields a score
on total movement performance based on separate scores for manual dexterity
(fine motor skills), ball skills, and static and dynamic balance (coordination). For
example, items on the Movement ABC include posting coins in a bank box, drawing
a line in between two existing lines on a figure, catching a bean bag, and jumping
over a rope. The tasks on the Movement ABC are representative of the motor skills
that are required of children attending elementary school and are adapted to the
children’s ages.
The children’s cognitive development was assessed by a shortened form of the
Wechsler Preschool and Primary Scale of Intelligence, revised (WPPSI-R).20 We
used the subtests vocabulary, picture completion, and reproduction of block
designs to measure total, verbal, and performance intelligence.
In addition, we measured the children’s attention and verbal memory. Sustained
attention and selective attention were measured with the two subtests ‘Score!’
and ‘Sky search’ of the Test of Everyday Attention for Children (TEA-Ch).21
Sustained attention involves maintaining attention over an extended period of time.
Selective attention refers to the ability to select target information from an array
of distractors.22 We assessed verbal memory with a standardized Dutch version
of Rey’s Auditory Verbal Learning Test (AVLT).23 This test consists of five learning
trials with immediate recall of words (tested after each presentation), a delayed
recall trial, and a delayed recognition trial.
To gain insight in maternal SES, we determined the mother’s highest level of
education during the first year after birth.
A summary of the different tests that were used, including time period, abbreviations
and range of scores, is provided in Table 1.
Statistical Analyses
Intelligence quotient (IQ) scores were calculated by the mean of scores on the verbal
and performance subtests that were assessed. We classified scores on the BSID-
II-NL, Movement ABC and cognitive tests into ‘normal’ (>15th percentile), ‘suspect’
(5th> to ≤15th percentile), and ‘abnormal’ (≤5th percentile). For the neurological
243Chapter 10 Developmental Trajectories from Birth to School Age in Healthy Term-Born Children
examination the same classification was made, based on the criteria from the
manuals. We explored the relationship between the scores on the developmental
tests with Pearson’s and Spearman’s correlation coefficients, where appropriate.
For the BSID-II-NL, Movement ABC, and intelligence scores we used the norm
scores from the manuals, whereas for Prechtl’s, Touwen’s, Hempel’s, and the
motor optimality score we used the raw scores, since norm scores are unavailable.
The correlations were calculated both before and after correction for SES, as SES
may act as a confounding factor on both motor and cognitive development.24,25
To investigate the stability of the scores obtained on motor development tests, we
first calculated the z-scores for each test to be able to compare the different tests.
Subsequently, we calculated the differences in z-scores between the different time
points (i.e. between Prechtl’s optimality score and the motor optimality score, the
motor optimality score and Touwen’s optimality score, Touwen’s optimality score
and the PDI, the PDI and Hempel’s optimality score, and Hempel’s optimality score
and the Movement ABC). We then determined the mean absolute difference over
all time points.
We calculated the proportion of variance (r2) in development at school age
explained by the scores on the early tests and maternal characteristics, in order to
compare the added value of the latter. For normally distributed variables we used
a linear regression model. For non-normal variables we used a logistic regression
model in which we compared the normal children with the suspect and abnormal
children at school age. Throughout the analyses p<.05 was considered statistically
significant, which is uncorrected for multiple comparisons.
We used SPSS 14.0 software for Windows (SPSS Inc, Chicago, IL) for all the
analyses.

Functional Development at School Age of Newborn Infants at Risk
Results
Of the 90 children invited, 77 (86%) participated in the follow-up program at school
age. Eight sets of parents declined the invitation to take part in the follow-up and
4 sets of parents could not be traced. One girl had to be excluded because she
suffered severe cognitive impairment of unknown origin and could not be tested as
a result. The demographics of the children are shown in Table 2.
Follow-up
The mean age at follow-up in the neonatal period was ten days (range eight to
twelve days). The mean for Prechtl’s optimality score derived from the neurological
examination (n=75) was 50 (range 39-59).
During early infancy the mean age at follow-up was twelve weeks (range eleven to
thirteen weeks). The mean for Touwen’s optimality score (n=77) was 45 (range 35-
51). Regarding the quality of spontaneous general movements (n=72), 69 children
showed normal fidgety movements, 2 showed abnormal fidgety movements, and
in 1 child fidgety movements were absent. The mean motor optimality score was
25 (range 10-28).
At toddler age, the mean age at follow-up was eighteen months (range seventeen
months and three weeks to eighteen months and one week). The mean Hempel’s
optimality score (n=75) was 43 (range 31-54). According to the BSID-II-NL, the
mean for the PDI (n=75) was 93 (range 69-118) and for the MDI (n=75) the mean
was 96 (range 66-125).
The mean age at follow-up at school age was six years and one month (range five
years and eight months to seven years and six months). The mean total IQ of the
children was 102 (range 82-125, SD 9), the mean verbal IQ was 100 (range 78-130,
SD 10), and the mean performance IQ was 103 (range 73-133, SD 12). In Table 3 we
present an overview of the longitudinal test results classified as normal, suspect and
abnormal. On the whole, the test scores were comparable to a reference population.
The neurological outcome in early infancy and toddler age, mothers’ intelligence,
and intelligence of the children at school age were slightly better than one would
expect in the total population. Furthermore, selective attention was slightly better
than sustained attention, although comparable to a reference population.
245Chapter 10 Developmental Trajectories from Birth to School Age in Healthy Term-Born Children
Stability of the Developmental Scores over Time
Figure 1 shows the correlations between the developmental scores at the various
ages and the total score on the Movement ABC. Hempel’s optimality score at
toddler age correlated significantly with motor outcome at school age both before
and after correction for SES (r=0.244, p=.035 and r=0.273, p=.018, respectively).
The MDI at toddler age correlated significantly with motor outcome at school age
after correction for SES (r=0.272, p=.019). Further analysis revealed that the MDI
and Hempel’s optimality score correlated significantly, in particular with the manual
dexterity subtest (both r=0.276, p=.019) of the Movement-ABC.
Figure 2 shows the correlations between the developmental test scores and
total intelligence at school age. None of these correlations reached significance.
Nevertheless, we found a trend towards correlation between the MDI at toddler
age and intelligence at school age before correction for SES (r=0.194, p=.098).
We also correlated the test scores in the neonatal period, early infancy, and toddler
age with one another. After correcting for SES, we found that the motor optimality
score in early infancy correlated with the PDI at toddler age (r=0.262, p= 0.030). At
toddler age we found a correlation between the PDI and Hempel’s optimality score
(r=0.284, p=.015) and the MDI and Hempel’s optimality score (r= 0.299, p=.011).
The correlation between the MDI and PDI was also significant (r=0.417, p<.001). At
school age, we found that the children’s motor development correlated significantly
with intelligence and sustained attention (r=0.267, p=.021 and r=0.337, p=.004).
Intelligence correlated significantly with selective attention and verbal memory
(r=0.253, p=.034 and r=0.268, p=.024).
After transforming the test scores to z-scores and calculating the mean absolute
difference in z-scores between the time points, the largest difference in the test
scores was observed between Prechtl’s optimality score (neonatal period) and the
motor optimality score (early infancy), and Touwen’s optimality score (early infancy)
and the PDI (toddler age), with mean absolute differences of 1.03 SD (95% confidence
interval (CI): 0.81-1.24) and 1.15 SD (95% CI: 0.96-1.35), respectively. The mean
absolute difference over all the time points was 1.01 SD (95% CI: 0.91-1.11).
Figure 3 shows the distribution of the neurological test scores at the different time
points, divided into three categories (<33rd percentile, 33rd> to ≤66th percentile,
Functional Development at School Age of Newborn Infants at Risk
>66th percentile) of motor performance at school age. As is apparent from Figure
3, there is little consistency in the motor trajectories of the children over time.
One can see in the second column that in early infancy, the distribution of motor
performance was approximately equivalent across all three neurological test score
groups. With increasing age, however, the tests do enable us to better identify
those children that will obtain motor scores below the 33rd percentile at school
age.
Early Predictors of Motor and Cognitive Development at School Age
The Movement ABC percentiles, IQ, and verbal memory were normally distributed,
and were therefore included in a linear regression model. Attention was not normally
distributed and was therefore included in a logistic regression model.
Table 4 gives the proportion of variance in motor and cognitive development at
school age explained by early tests scores and maternal SES and verbal intelligence.
Furthermore, we present the r2 for the complete model. Table 4 shows that the r2s
for the complete model on all outcome variables are low. We found significant
but low r2s for the MDI on motor development at school age (r2=0.074, p=.018),
SES on sustained attention (r2=0.104, p=.030), and mothers’ verbal intelligence on
verbal memory of the children at school age (r2=0.074, p=.027).
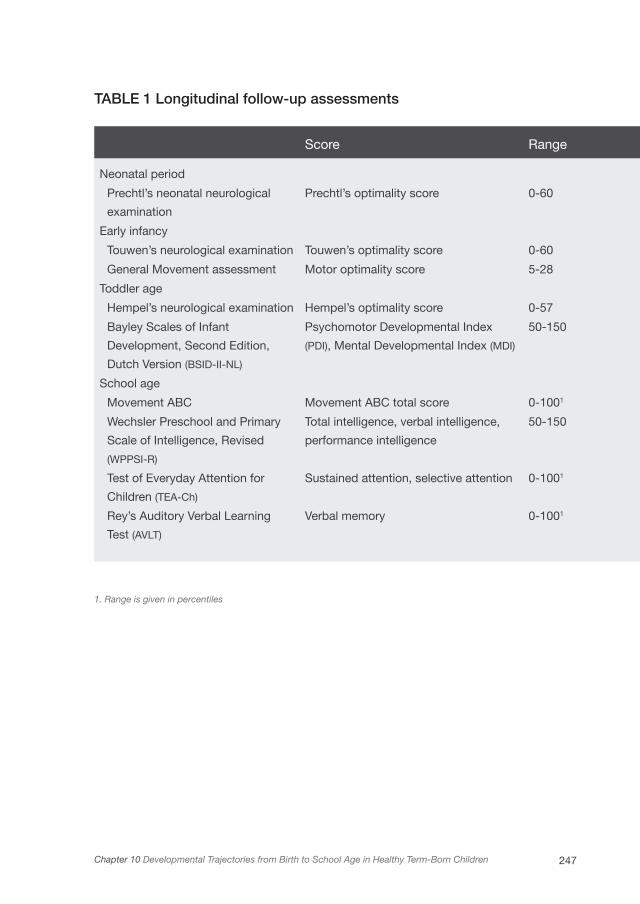
247Chapter 10 Developmental Trajectories from Birth to School Age in Healthy Term-Born Children
TABLE 1 Longitudinal follow-up assessments
Score Range
Neonatal period
Prechtl’s neonatal neurological
examination
Prechtl’s optimality score 0-60
Early infancy
Touwen’s neurological examination Touwen’s optimality score 0-60
General Movement assessment Motor optimality score 5-28
Toddler age
Hempel’s neurological examination Hempel’s optimality score 0-57
Bayley Scales of Infant
Development, Second Edition,
Dutch Version (BSID-II-NL)
Psychomotor Developmental Index
(PDI), Mental Developmental Index (MDI)
50-150
School age
Movement ABC Movement ABC total score 0-1001
Wechsler Preschool and Primary
Scale of Intelligence, Revised
(WPPSI-R)
Total intelligence, verbal intelligence,
performance intelligence
50-150
Test of Everyday Attention for
Children (TEA-Ch)
Sustained attention, selective attention 0-1001
Rey’s Auditory Verbal Learning
Test (AVLT)
Verbal memory 0-1001
1. Range is given in percentiles
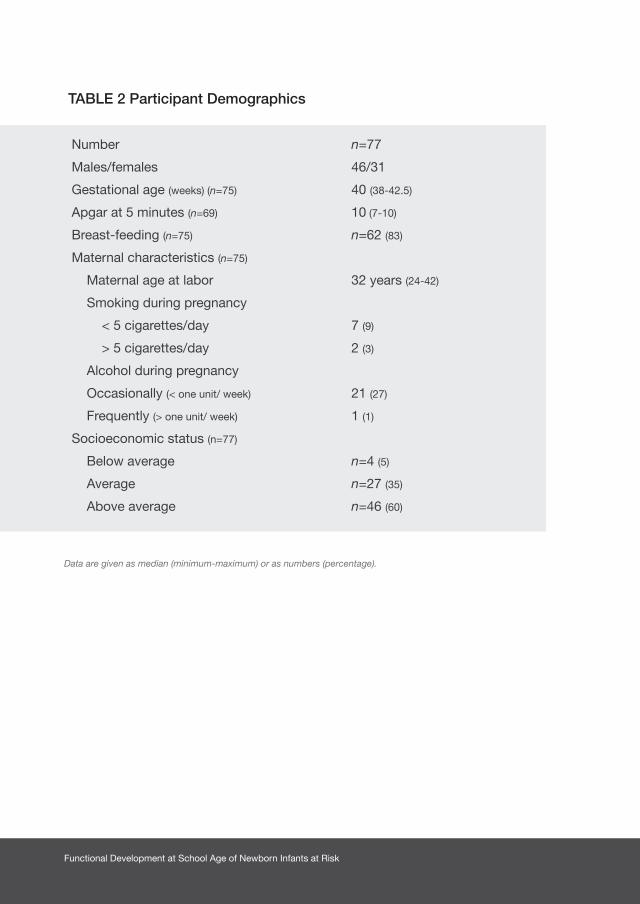
Functional Development at School Age of Newborn Infants at Risk
TABLE 2 Participant Demographics
Number n=77
Males/females 46/31
Gestational age (weeks) (n=75) 40 (38-42.5)
Apgar at 5 minutes (n=69) 10 (7-10)
Breast-feeding (n=75) n=62 (83)
Maternal characteristics (n=75)
Maternal age at labor 32 years (24-42)
Smoking during pregnancy
< 5 cigarettes/day 7 (9)
> 5 cigarettes/day 2 (3)
Alcohol during pregnancy
Occasionally (< one unit/ week) 21 (27)
Frequently (> one unit/ week) 1 (1)
Socioeconomic status (n=77)
Below average n=4 (5)
Average n=27 (35)
Above average n=46 (60)
Data are given as median (minimum-maximum) or as numbers (percentage).

249Chapter 10 Developmental Trajectories from Birth to School Age in Healthy Term-Born Children
TABLE 3 Longitudinal test results
Normal Suspect Abnormal
Mothers’ Verbal Intelligence (n=68) 65 2 1
Neonatal period
Prechtl’s optimality score (n=75)1 69 6 0
Early infancy
Touwen’s optimality score (n=77)1 76 1 0
Motor optimality score (n=71)2 36 32 3
Toddler age
Hempel’s optimality score (n=75)1 70 5 0
Mental Developmental Index (n=75)3 63 11 1
Psychomotor Developmental Index (n=75)3 56 17 2
School age
Movement ABC, total score (n=77)3 65 7 5
Total intelligence (n=76)3 73 3 0
Verbal intelligence (n=76)3 73 3 0
Performance intelligence (n=76)3 70 6 0
Sustained attention (n=74)3 59 11 4
Selective attention (n=75)3 67 4 4
Verbal memory (n=75)3 60 8 7
Data are given as numbers (percentage).1. Classification into normal, suspect and abnormal was based on presence of neurological abnormalities2. Normal was defined as a motor optimality score of 28, or 26 with reduced age adequacy of movements, suspect
as a motor optimality score of 20-26, abnormal was the absence of fidgety movements or presence of abnormal fidgety movements
3. Normal was defined as >15th percentile, suspect as 5th-15th percentile and abnormal as <5th percentile

Functional Development at School Age of Newborn Infants at Risk
TAB
LE 4
Exp
lain
ed p
rop
ort
ions
of
vari
ance
on
mo
tor
and
co
gni
tive
dev
elo
pm
ent
at s
cho
ol a
ge
Mot
or d
evel
opm
ent
Inte
llige
nce
Atte
ntio
nVe
rbal
mem
ory
(r2 )
1(r
2 )1
Sus
tain
ed (r
2 )2S
elec
tive
(r2 )2(r
2 )2
Com
ple
te m
odel
30.
184
0.14
90.
278
0.39
40.
176
Soc
ioec
onom
ic s
tatu
s0.
000
0.00
80.
104*
0.00
00.
009
Mot
hers
’ Ver
bal
inte
llige
nce
0.00
30.
048
0.01
20.
078
0.07
4*
Neo
nata
l per
iod
Pre
chtl’
s op
timal
ity s
core
(n=
75)
0.00
40.
018
0.04
90.
021
0.00
7
Ear
ly in
fanc
y
Touw
en’s
op
timal
ity s
core
(n=
77)
0.00
10.
001
0.00
60.
076
0.00
4
Mot
or o
ptim
ality
sco
re (n
=71
)0.
039
0.00
40.
003
0.08
30.
005
Tod
dle
r ag
e
Hem
pel’s
opt
imal
ity s
core
(n=7
5)0.
069
0.00
00.
082
0.01
50.
014
Men
tal D
evel
opm
enta
l Ind
ex (n
=75)
0.07
4*0.
038
0.00
00.
058
0.02
7
Psy
chom
otor
Dev
elop
men
tal I
ndex
(n=7
5)0.
009
0.01
10.
000
0.02
30.
000
*p<
.05
1. r
2 d
eter
min
ed w
ith li
near
reg
ress
ion
mod
el
2. r
2 d
eter
min
ed w
ith lo
gist
ic r
egre
ssio
n m
odel
3.
r2
of t
he c
omp
lete
mod
el, i
nclu
din
g al
l the
dev
elop
men
tal t
est
scor
es, s
ocio
econ
omic
sta
tus,
and
mot
hers
’ ver
bal
inte
llige
nce
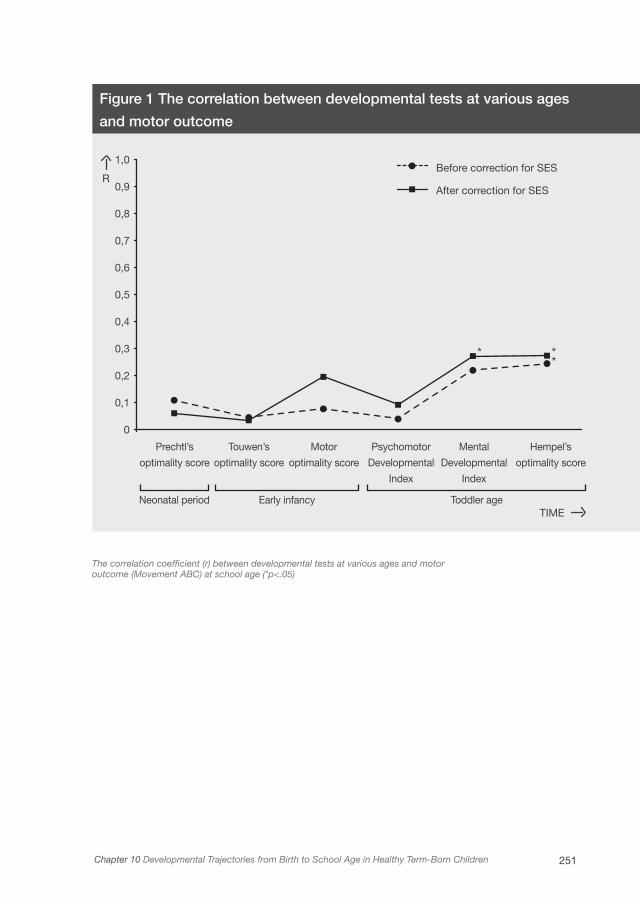
251Chapter 10 Developmental Trajectories from Birth to School Age in Healthy Term-Born Children
Figure 1 The correlation between developmental tests at various ages
and motor outcome
The correlation coefficient (r) between developmental tests at various ages and motoroutcome (Movement ABC) at school age (*p<.05)
1,0
0,9
0,8
0,7
0,6
0,5
0,4
0,3
0,2
0,1
0
Prechtl’s
optimality score
Neonatal period Early infancy Toddler age
Touwen’s
optimality score
Motor
optimality score
Psychomotor
Developmental
Index
Mental
Developmental
Index
Hempel’s
optimality score
Before correction for SES
After correction for SES
TIME
R
* **
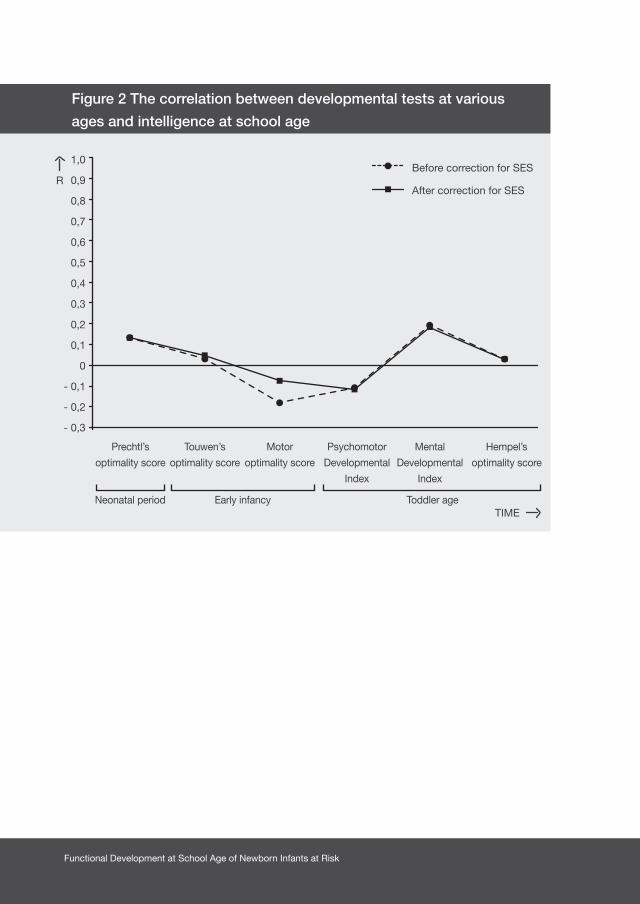
Functional Development at School Age of Newborn Infants at Risk
Figure 2 The correlation between developmental tests at various
ages and intelligence at school age
1,0
0,9
0,8
0,7
0,6
0,5
0,4
0,3
0,2
0,1
0
- 0,1
- 0,2
- 0,3
Prechtl’s
optimality score
Neonatal period Early infancy Toddler age
Touwen’s
optimality score
Motor
optimality score
Psychomotor
Developmental
Index
Mental
Developmental
Index
Hempel’s
optimality score
Before correction for SES
After correction for SES
TIME
R
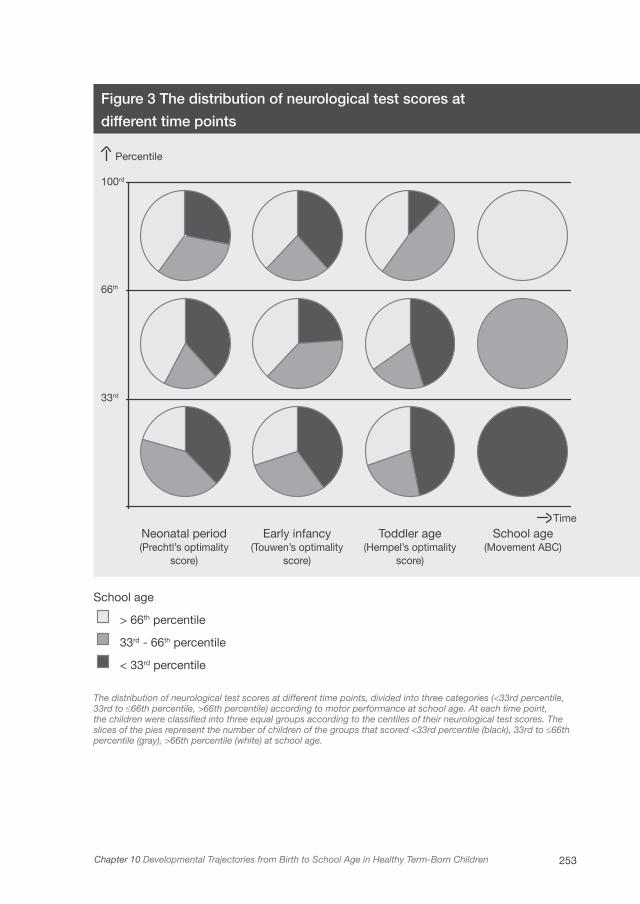
253Chapter 10 Developmental Trajectories from Birth to School Age in Healthy Term-Born Children
33rd
100rd
66th
Percentile
Neonatal period(Prechtl’s optimality
score)
Early infancy(Touwen’s optimality
score)
Toddler age(Hempel’s optimality
score)
School age(Movement ABC)
Time
Figure 3 The distribution of neurological test scores at
different time points
School age
> 66th percentile
33rd - 66th percentile
< 33rd percentile
The distribution of neurological test scores at different time points, divided into three categories (<33rd percentile, 33rd to ≤66th percentile, >66th percentile) according to motor performance at school age. At each time point, the children were classified into three equal groups according to the centiles of their neurological test scores. The slices of the pies represent the number of children of the groups that scored <33rd percentile (black), 33rd to ≤66th percentile (gray), >66th percentile (white) at school age.
Functional Development at School Age of Newborn Infants at Risk
Discussion
The results of our study demonstrated that the stability of motor development was
limited in healthy, term-born, singletons from birth until school age. Moreover, in
healthy children the added value of developmental tests at early ages to predict
intelligence and more complex cognitive functions at school age was low. Only
the contribution of maternal SES and verbal intelligence was significant, though
limited, to sustained attention and verbal memory at school age.
Previous studies showed contrasting results on the stability of motor development
in healthy children. A study of Ridgway et al. found that the age at which certain
milestones (i.e. walking and unaided standing) are reached has prognostic value for
physical educational grades at fourteen years of age.26 Another study showed that
early fine and gross motor development at four to forty-eight months, as measured
with a parental questionnaire, is not related to fine and gross motor development
at six to twelve years of age.25 Our study showed that in healthy children even
the standardized assessment of motor and neurological performance during the
neonatal period, early infancy, and toddler age had limited predictive value for
motor development at school age. This means that results on outcome studies
based on a single measurement at an early age should be interpreted with utmost
caution.
Possible explanations for these conflicting results may be that different tests at
various ages may or may not measure the same function. Also, previous studies
have used many different measures at different ages. In addition the nature of the
investigated relationships may vary. Certain studies may have searched for small
effects that may not be relevant in everyday clinical practice, but may give a clue
about neurodevelopment.
The aim of several theories on motor development is to describe the mechanisms
involved in the development of motor functions. These theories shifted from the
idea that motor development is a gradual unfolding of predetermined patterns
in the central nervous system towards the notion that environmental factors
and sensory information play an important role in motor development.27-29 The
Neuronal Group Selection Theory states that cortical and subcortical systems in
the brain are dynamically organized into variable neuronal networks, the structure

255Chapter 10 Developmental Trajectories from Birth to School Age in Healthy Term-Born Children
and function of which are selected by development and behavior. The selection of
neuronal networks on the basis of afferent information plays a significant role in this
process. According to this theory, variation in developmental parameters, such as
motor performance, developmental sequence, or the duration of developmental
stages is the key to normal development.29 Our findings that the stability in
motor development until school age is limited, might be a reflection of this large
variability.
In this study, however, we did find some correlations between test scores obtained
at consecutive ages. We found correlations between the motor optimality score at
early infancy and the PDI at toddler age, and between Hempel’s optimality score
at toddler age and the Movement ABC at school age. This might be explained by
the fact that these measurements were obtained at subsequent ages. It is striking
to note in this respect that the MDI at toddler age, being considered a cognitive
measure, correlated with motor development rather than cognitive development
at school age. Indeed, the MDI contains items that require the use of fine motor
skills. This could explain our finding that the MDI correlated with manual dexterity
on the Movement ABC.
Various studies reported that in preterm born children the trajectory of motor
development is more stable. For example, Erikson et al. found that a majority
of preterm children show a stable motor development that could be predicted
by low birth weight and the presence of cerebral damage such as periventricular
leukomalacia.30 Other studies also found that early neurological assessments
are predictive of later neurodevelopmental outcome in preterm infants.31,32 This
seems to indicate that certain risk factors have such a strong impact on neurologic
development that it cannot be counteracted by, for example, SES, experience and
training, and other environmental factors. The development of healthy children, by
contrast, is more susceptible to variations in these factors.
With regard to the relationship between motor and cognitive development, we did
not find any early motor test score that contributed significantly to intelligence,
attention, and verbal memory at school age. This is in contrast to the finding of
Piek et al. who stated that gross motor functioning, measured with a parental
questionnaire, accounted for a significant proportion of the variance for cognitive
Functional Development at School Age of Newborn Infants at Risk
performance.25 Other studies suggested that specific items on motor tests, such
as aspects of the quality of spontaneous movements, or the age of reaching
milestones, might have predictive value for later cognitive development.5,33 Our
study showed that with regard to overall motor performance of children in early
life, there was no clear relation with cognitive development at school age. The only
factors that contributed significantly to the variance in complex cognitive functions
were maternal SES and verbal intelligence. This finding is supported by previous
studies that found that mother-infant interactions and environmental quality play
an important role in intellectual development at pre-school age.34,35 In our study,
this observation counts for complex cognitive functions, i.e. attention and memory,
in particular.
Several considerations should be taken into account when interpreting the present
results. Firstly, whether the different tests at the various ages measured the same
functions. The neurological examinations measure the integrity of the central nervous
system and identify infants at risk for minor and major neurological dysfunction,
while the Movement ABC at school age is a rather quantitative test of daily motor
skills. Infants identified as having minor neurological dysfunction, however, are at
risk of developing clumsy motor behavior and obtaining abnormal Movement ABC
scores.36 Furthermore, we found that at toddler age, for example, the results of the
neurological examination correlated highly with the children’s PDI and MDI. This
may reflect that these tests measure similar functions or aspects of development
that are interrelated. It is a fact that the BSID-II-NL and the neurological examination
both include a number of similar items. Secondly, the children’s behavioral state
might have had an impact on the test results. Especially during the first year of life,
children’s behavioral state might have led to an increased variability in test results
that may have made it difficult to find a relationship with development at school
age.
We aimed to report our results transparent, and therefore we did not adjust our
threshold of significance (p=.05) for multiple comparisons. This explorative study
assessed motor function at 4 time points, and cognition at 2 time points. A multiple
comparison correction would thus set our significance level around p=.01-.02.
Since the number of significant findings in our study was already limited, this

257Chapter 10 Developmental Trajectories from Birth to School Age in Healthy Term-Born Children
adjustment would not have changed the main findings of our study. Finally, we
observed that the SES of our study population was relatively high and our sample
size was thus biased to the upper classes. This limitation may also have influenced
our findings.
As a suggestion for future studies, it would be interesting to see how developmental
trajectories would evolve beyond school age, since little is known about motor
stability into adulthood.
Conclusion
Our study showed that in a cohort of healthy children motor developmental
trajectories varied considerably. Moreover, the added value of early assessments
of motor development for later cognitive function is limited. This leads us to believe
that a single abnormal test result at a certain age in an individual child at risk for
developmental delay should be interpreted cautiously. The effect of the risk factor
on development must be quite large to come to light at every assessment until
school age. If a certain risk factor only has a moderate impact on development, it
may soon be counteracted by factors that are known to have an important impact
on development. Cases in point are maternal SES and verbal intelligence and
possibly other factors that have yet to be discovered.
Acknowledgements
This study was part of the research program of the postgraduate school for
Behavioral and Cognitive Neurosciences, University of Groningen. We greatly
acknowledge the help of Dr. V. Fidler for statistical advice, Dr. T. Brantsma van
Wulfften Palthe for correcting the English manuscript, and E. Drent for help with
the Figures.
Functional Development at School Age of Newborn Infants at Risk
1. Goyen TA, Lui K. Longitudinal motor development of
“apparently normal” high-risk infants at 18 months, 3
and 5 years. Early Hum Dev 2002;70:103-115.
2. Larroque B, Ancel PY, Marret S, et al.
Neurodevelopmental disabilities and special care of
5-year-old children born before 33 weeks of gestation
(the EPIPAGE study): a longitudinal cohort study.
Lancet 2008;371:813-820.
3. Biringen Z, Emde RN, Campos JJ, Appelbaum MI.
Affective reorganization in the infant, the mother,
and the dyad: the role of upright locomotion and its
timing. Child Dev 1995;66:499-514.
4. Taanila A, Murray GK, Jokelainen J, Isohanni M,
Rantakallio P. Infant developmental milestones: a 31-
year follow-up. Dev Med Child Neurol
2005;47:581-586.
5. Murray GK, Jones PB, Kuh D, Richards M. Infant
developmental milestones and subsequent cognitive
function. Ann Neurol 2007;62:128-136.
6. Goodman JF. Infant intelligence: Do we, can we,
should we assess it? In: Reynolds CR, Kamphaus
RW, eds. Handbook of Psychological and
Educational Assessment of Children: Intelligence and
Achievement. New York, NY: Guilford Press;
2002. p.183-208.
7. Noble KG, McCandliss BD, Farah MJ.
Socioeconomic gradients predict individual
differences in neurocognitive abilities. Dev Sci
2007;10:464-480.
8. Aylward GP. Developmental screening and
assessment: what are we thinking? J Dev Behav
Pediatr 2009;30:169-173.
9. Roze E, Meijer L, Bakker A, Van Braeckel
KNJA, Sauer PJJ, Bos AF. Prenatal exposure
to organohalogens, including brominated flame
retardants, influences motor, cognitive, and
behavioral performance at school age. Environ Health
Perspect 2009;117:1953-1958.
10. Prechtl HFR. The Neurological Examination of the
Full-term Newborn Infant. 2nd ed. London, UK:
William Heineman medical books Ltd.; 1977.
11. Touwen BCL. Neurological Development in Infancy.
London, UK: William Heinemann Medical Books
Ltd.; 1976.
12. Prechtl HFR. Qualitative changes of spontaneous
movements in fetus and preterm infant are a marker
of neurological dysfunction (Editorial). Early Hum
Dev 1990;23:151-158.
13. Einspieler C, Bos AF, Ferrari F, Cioni G, Prechtl HFR.
Prechtl’s Method on the Qualitative Assessment of
General Movements in Preterm, Term and Young
Infants. London, UK: McKeith Press; 2004.
14. Bruggink JL, Einspieler C, Butcher PR, Van Braeckel
KN, Prechtl HF, Bos AF. The quality of the early
motor repertoire in preterm infants predicts minor
neurologic dysfunction at school age. J Pediatr
2008;153:32-39.
References

259Chapter 10 Developmental Trajectories from Birth to School Age in Healthy Term-Born Children
15. Bruggink JL, Einspieler C, Butcher PR, Stremmelaar
EF, Prechtl HF, Bos AF. Quantitative aspects of the
early motor repertoire in preterm infants: do they
predict minor neurological dysfunction at school
age? Early Hum Dev 2009;85:25-36.
16. Van der Meulen BF, Ruiter SAJ, Lutje Spelberg HC,
Smrkovsky M. Bayley Scales of Infant Development-
II, Dutch Version. Amsterdam, the Netherlands:
Harcourt Assessment; 1983.
17. Hempel MS. Neurological development during
toddling age in normal children and children at
risk of developmental disorders. Early Hum Dev
1993;34:47-57.
18. Stinissen J, Willems PJ, Coetsier P, Hulsman WLL.
Manual for the Dutch Translated and Adapted
Version of the Wechsler Adult Intelligence Scale
(WAIS). Lisse, the Netherlands: Swets & Zeitlinger;
1970.
19. Smits-Engelsman BCM. Movement Assessment
Battery for Children. Handleiding. Lisse, the
Netherlands: Swets & Zeitlinger; 1998.
20. van der Steene G, Bos A. Wechsler Preschool and
Primary Scale of Intelligence, revised. Vlaams-
Nederlandse aanpassing, handleiding. Lisse, the
Netherlands: Swets & Zeitlinger; 1997.
21. Manly T, Anderson V, Nimmo-Smith I, Turner A,
Watson P, Robertson IH. The differential assessment
of children’s attention: the Test of Everyday
Attention for Children (TEA-Ch), normative sample
and ADHD performance. J Child Psychol Psychiatry
2001;42:1065-1081.
22. Heaton SC, Reader SK, Preston AS, et al. The
Test of Everyday Attention for Children (TEA-Ch):
patterns of performance in children with ADHD and
clinical controls. Child Neuropsychol
2001;7:251-264.
23. van den Burg W, Kingma A. Performance of 225
Dutch school children on Rey’s Auditory Verbal
Learning Test (AVLT): parallel test-retest reliabilities
with an interval of 3 months and normative data.
Arch Clin Neuropsychol 1999;14:545-559.
24. Tong S, Baghurst P, Vimpani G, McMichael A.
Socioeconomic position, maternal IQ, home
environment, and cognitive development. J Pediatr
2007;151:284-288.
25. Piek JP, Dawson L, Smith LM, Gasson N. The
role of early fine and gross motor development
on later motor and cognitive ability. Hum Mov Sci
2008;27:668-681.
26. Ridgway CL, Ong KK, Tammelin TH, Sharp S,
Ekelund U, Jarvelin MR. Infant motor development
predicts sports participation at age 14 years:
northern Finland birth cohort of 1966. PLoS One
2009;4:e6837.

Functional Development at School Age of Newborn Infants at Risk
27. Illingworth RS. The Development of the Infant and
Young Child: Normal and Abnormal Development.
3rd ed. Edinburgh, UK: Churchill Livingstone; 1966.
28. Thelen E, Corbetta D, Kamm K, Spencer JP,
Schneider K, Zernicke RF. The transition to
reaching: mapping intention and intrinsic dynamics.
Child Dev 1993;64:1058-1098.
29. Hadders-Algra M. The Neuronal Group Selection
Theory: a framework to explain variation in normal
motor development. Dev Med Child Neurol
2000;42:566-572.
30. Erikson C, Allert C, Carlberg EB, Katz-Salamon M.
Stability of longitudinal motor development in very
low birthweight infants from 5 months to 5.5 years.
Acta Paediatr 2003;92:197-203.
31. Picciolini O, Gianni ML, Vegni C, Fumagalli M,
Mosca F. Usefulness of an early neurofunctional
assessment in predicting neurodevelopmental
outcome in very low birthweight infants. Arch Dis
Child Fetal Neonatal Ed 2006;91:F111-F117.
32. Frisone MF, Mercuri E, Laroche S, et al. Prognostic
value of the neurologic optimality score at 9 and 18
months in preterm infants born before 31 weeks’
gestation. J Pediatr 2002;140:57-60.
33. Butcher PR, van Braeckel K, Bouma A, Einspieler
C, Stremmelaar EF, Bos AF. The quality of preterm
infants’ spontaneous movements: an early indicator
of intelligence and behaviour at school age. J Child
Psychol Psychiatry 2009;50:920-930.
34. Bee HL, Barnard KE, Eyres SJ, et al. Prediction of
IQ and language skill from perinatal status, child
performance, family characteristics, and mother-
infant interaction. Child Dev 1982;53:1134-1156.
35. Johnson W, McGue M, Iacono WG. Socioeconomic
Status and School Grades: Placing their Association
in Broader Context in a Sample of Biological and
Adoptive Families. Intelligence 2007;35:526-541.
36. Jongmans M, Mercuri E, de Vries LS, Dubowitz
LMS, Henderson SE. Minor neurological signs
and perceptual-motor difficulties in prematurely
born children. Arch Dis Child Fetal Neonatal Ed
1997;76:F9-14.

261Chapter 10 Developmental Trajectories from Birth to School Age in Healthy Term-Born Children

Chapter 11
NEUROPSYCHOLOGICAL PROFILES AT
SCHOOL AGE OF VERY PRETERM BORN
CHILDREN COMPARED TO TERM-BORN PEERS
ELISE ROZE, LISETHE MEIJER, KOENRAAD N. J. A. VAN BRAECKEL, SELMA A. J.
RUITER, JANNEKE L. M. BRUGGINK, AREND F. BOS
SUBMITTED
Functional Development at School Age of Newborn Infants at Risk
Abstract
Objective
To establish neuropsychological profiles at school age in very preterm-born
children compared to the profiles of term-born children.
Study design
Comparative study including 60 very preterm-born children (gestational age ≤32
weeks) and 120 term-born controls. At school age, we assessed intelligence,
visuomotor integration, verbal memory, attention, and executive functioning.
Subsequently, we investigated co-occurrence of abnormal (<5th percentile) and
suspect-abnormal (<15th percentile) neuropsychological outcomes in preterm
children compared to controls.
Results
At mean 8.8 years, 55% of preterm children had suspect-abnormal
neuropsychological outcomes in multiple (≥2) domains, versus 25% of the controls
(OR 3.67, 95%-confidence interval 1.90-7.06). In preterm children with multiple
impairments, verbal memory, attention, and performance IQ were mostly affected.
No typical pattern of co-occurrence of neuropsychological impairments was
specific to preterm children, except for those that included low performance IQ
(OR 5.43, 95%-confidence interval 1.75-16.81). The higher the number of suspect-
abnormal neuropsychological domains, the worse the academic achievement
(p<.01).
Conclusions
A majority of preterm children had multiple neuropsychological impairments. Low
performance IQ was characteristic of profiles including multiple neuropsychological
impairments in preterm children but not in controls. Differences in neuropsychological
profiles between preterms and controls may reflect an altered organization of brain
structures in preterm children.

265Chapter 11 Neuropsychological Profiles at School Age of Very Preterm Born Children Compared to Term-Born Peers
Introduction
Preterm birth is a common complication of pregnancy. Very preterm birth (<32
weeks gestation) occurs in around 1-2% of pregnancies. In the early neonatal
period, various factors in the extra-uterine environment contribute to the risk of
mild, to occasionally more severe, brain lesions in preterm infants. Early disruptions
and alterations in brain development can lead to functional impairments in motor,
cognitive, and behavioral development that may persist into childhood and even
adulthood.1-3 These functional impairments are likely to have an impact on daily life
and academic achievement.4,5
The cognitive impairments found in preterm children are not restricted to a poorer
intellectual development detected as lower intelligence. Specific neuropsychological
functions like attention, visuomotor integration, and executive functioning can also
be affected.6,7 Previous studies reported that specifically preterm children with low
intelligence are at risk for problems in these domains,8,9 while others suggested
there may be preterm children with specific neuropsychological dysfunctions in
whom intellectual development is preserved.10,11 As yet, very few studies described
the co-occurrence of impairments in neuropsychological functions in preterm
children.
Insight into the neuropsychological profiles, including intelligence, of preterm
children could reveal whether (I) preterm children develop a pattern of co-
occurring impairments in specific neuropsychological domains, or (II) multiple
neuropsychological domains are impaired without a pattern emerging, or (iii) in
most children a single neuropsychological domain is impaired. Identification of the
nature of these profiles could guide diagnostics and intervention. Our primary aim
was to establish the neuropsychological profiles at school age in a Dutch cohort of
very preterm-born children (gestational age ≤ 32 weeks), and to compare them to
the profiles of term-born children. Our second aim was to determine whether these
neuropsychological profiles relate to academic achievement. Finally, we aimed
to identify neonatal characteristics related to the neuropsychological profiles of
preterm-born children at school age.
Functional Development at School Age of Newborn Infants at Risk
Methods
Patients
This comparative study included 60 randomly selected preterm infants (gestational age
≤32 weeks) who had been admitted to the Neonatal Intensive Care Unit of the University
Medical Center Groningen (1996-2002). Most of these children had participated in
previous cohort studies on the outcome of preterm children with specific neonatal risk
factors, either as a case or control. We excluded children with major chromosomal and
congenital anomalies. The response rate at school age was 85%. For every preterm
child, we retrospectively included two randomly selected fullterm-born control children
born in 2002 and 2003, who lived in the northern provinces of the Netherlands. The
control children were initially recruited for the Lollypop study as described elsewhere.12
Of the fullterm born controls the response rate at school age was 73%.
Measures and Procedure
We reviewed the preterm-born children’s medical charts and recorded neonatal
characteristics and morbidities. These were gender, gestational age, birth weight, Apgar
score at 5 minutes, the presence of intrauterine growth restriction (IUGR), asphyxia,
ventilatory support, bronchopulmonary dysplasia (BPD), early and late onset sepsis,
necrotizing enterocolitis (NEC), and cerebral pathologies such as germinal matrix
hemorrhage-intraventricular hemorrhage (GMH-IVH), periventricular hemorrhagic
infarction (PVHI), post-hemorrhagic ventricular dilatation (PHVD), cystic periventricular
leukomalacia (PVL), and neonatal seizures.
Socioeconomic status was determined by classifying the highest occupation of both
parents into below average, average, and above average according to the Dutch
standard classification of occupations.
The preterm-born children were invited prospectively to participate in an extension
of our routine follow-up program. The control children did the same follow-up
program. It entailed the assessment of motor performance, neuropsychological
functions including intelligence, and behavior at the age of 6 to 12 years. Including
breaks the program took approximately 2.5 hours to complete. We report here on the
children’s neuropsychological functions including intelligence, as we were particularly
interested in the cognitive development of the children. We did not include the
267Chapter 11 Neuropsychological Profiles at School Age of Very Preterm Born Children Compared to Term-Born Peers
children’s performances on motor tests. Parents gave their written, informed consent
to participate in the follow-up program and the study was approved by the Medical
Ethical Committee of the University Medical Center Groningen.
Neuropsychological Outcome
Total, verbal, and performance intelligence were assessed using a shortened version
of the Wechsler Intelligence Scale for Children, third edition, Dutch version. We used
the subtests Vocabulary and Similarities to assess verbal intelligence and Picture
Arrangement and Block Design to assess performance intelligence.13
In addition, we assessed visuomotor integration with the subtest Design Copying of
the NEPSY-II, a neuropsychological test battery for children.14 In this subtest the child
is asked to copy geometric shapes of increasing complexity. Visuomotor integration
involves the integration of visual information with finger-hand movements.
We assessed verbal memory with a standardized Dutch version of Rey’s Auditory Verbal
Learning Test.15 This test consists of five learning trials of fifteen words with immediate
recall after each presentation and a delayed recall trial followed by a recognition trial.
We measured selective attention and attentional control with the subtests Map Mission
and Opposite Worlds of the Test of Everyday Attention for Children, Dutch version.16 In
Map Mission the child is asked to encircle as many symbols of a restaurant as possible
in one minute among distracting symbols on a map. In Opposite Worlds the child is
asked to read a string of digits 1 and 2 as 2 and 1 respectively as quickly as possible
(inhibition of automated reading). Selective attention refers to a child’s ability to select
target information from an array of distractors. Attentional control refers to the child’s
ability to shift attention flexibly and adaptively. Finally, the parents filled out the Behavior
Rating Inventory of Executive Function to assess executive functioning involved in well-
organized, purposeful, goal-directed, and problem-solving behavior as observed by the
parents in daily life.17 Examples of executive functioning are the ability to inhibit competing
actions towards attractive stimuli, the flexibility to shift problem-solving strategies when
necessary, and the ability to monitor and evaluate one’s own behavior. If children were
too tired and/or uncooperative (as assessed by the trained experimenter), we excluded
their test scores. Incomplete questionnaires were also excluded. We recorded the type
of education the children received and whether they had repeated classes.
Functional Development at School Age of Newborn Infants at Risk
Statistical Analyses
We used age-specific norm scores as provided in the manuals for all the
neuropsychological tests. We classified the intelligence quotients (IQs) into normal
(IQ ≥ 85), suspect (IQ 70 to 85) and abnormal (IQ<70). We used the percentiles on
the standardization samples of the neuropsychological tests to classify raw scores
into normal (≥ 15th percentile), suspect (5th to 15th percentile), and abnormal (< 5th
percentile). Verbal memory and attention have two different parameters that each
measure specific aspects of these functions. For each child we classified verbal
memory and attention as suspect or abnormal if either one of the two parameters
was suspect or abnormal.
First, to compare the neuropsychological test scores of preterm children and
controls we used the Student’s t-test for normally distributed variables and
the Mann-Whitney U test for non-normally distributed variables. Second, we
explored the neuropsychological profiles by graphically displaying the co-
occurrence of abnormal (< 5th percentile) and suspect-abnormal (< 15th percentile)
neuropsychological outcomes of each child. We then calculated odds ratios for
obtaining an abnormal outcome on at least one neuropsychological domain or
multiple (≥2) abnormal neuropsychological domains in preterms versus controls
by logistic regression analyses. These analyses were repeated after correction for
gender and socioeconomic status. Since we used age-specific norm scores, we did
not correct for age at testing. Third, to gain insight into combinations of impairments,
we tested differences in co-occurrence of neuropsychological impairments between
preterms and controls using the Chi2 test. Finally, we used the Student’s t-test and
Pearson correlation for normally distributed variables and the Mann-Whitney U test
and Spearman’s rank correlation for non-normally distributed variables to relate the
neonatal characteristics to the neuropsychological profiles in the preterm children.
The characteristics were gender, gestational age, birth weight, IUGR, ventilatory
support, BPD, early and late onset sepsis, NEC, mild cerebral pathology (i.e. GMH-
IVH grade I or II), and severe cerebral pathologies (i.e. either GMH-IVH grade III,
PVHI, PHVD or cystic PVL). We used SPSS 16.0 software for Windows (SPSS Inc,
Chicago, IL) for all the analyses and p<.05 was considered statistically significant
throughout.
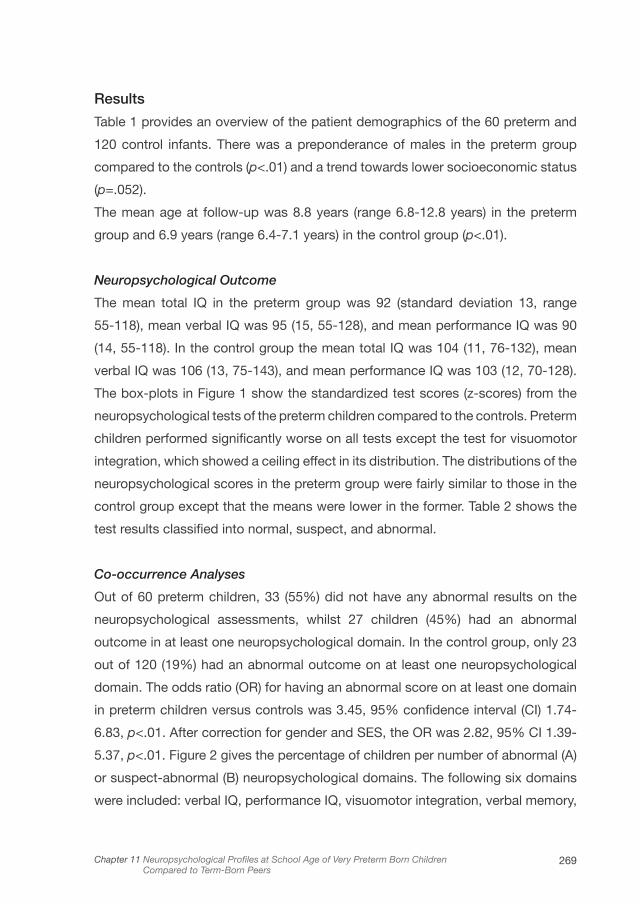
269Chapter 11 Neuropsychological Profiles at School Age of Very Preterm Born Children Compared to Term-Born Peers
Results
Table 1 provides an overview of the patient demographics of the 60 preterm and
120 control infants. There was a preponderance of males in the preterm group
compared to the controls (p<.01) and a trend towards lower socioeconomic status
(p=.052).
The mean age at follow-up was 8.8 years (range 6.8-12.8 years) in the preterm
group and 6.9 years (range 6.4-7.1 years) in the control group (p<.01).
Neuropsychological Outcome
The mean total IQ in the preterm group was 92 (standard deviation 13, range
55-118), mean verbal IQ was 95 (15, 55-128), and mean performance IQ was 90
(14, 55-118). In the control group the mean total IQ was 104 (11, 76-132), mean
verbal IQ was 106 (13, 75-143), and mean performance IQ was 103 (12, 70-128).
The box-plots in Figure 1 show the standardized test scores (z-scores) from the
neuropsychological tests of the preterm children compared to the controls. Preterm
children performed significantly worse on all tests except the test for visuomotor
integration, which showed a ceiling effect in its distribution. The distributions of the
neuropsychological scores in the preterm group were fairly similar to those in the
control group except that the means were lower in the former. Table 2 shows the
test results classified into normal, suspect, and abnormal.
Co-occurrence Analyses
Out of 60 preterm children, 33 (55%) did not have any abnormal results on the
neuropsychological assessments, whilst 27 children (45%) had an abnormal
outcome in at least one neuropsychological domain. In the control group, only 23
out of 120 (19%) had an abnormal outcome on at least one neuropsychological
domain. The odds ratio (OR) for having an abnormal score on at least one domain
in preterm children versus controls was 3.45, 95% confidence interval (CI) 1.74-
6.83, p<.01. After correction for gender and SES, the OR was 2.82, 95% CI 1.39-
5.37, p<.01. Figure 2 gives the percentage of children per number of abnormal (A)
or suspect-abnormal (B) neuropsychological domains. The following six domains
were included: verbal IQ, performance IQ, visuomotor integration, verbal memory,

Functional Development at School Age of Newborn Infants at Risk
attention, and executive functioning. Like the controls, the majority of preterm
children with an abnormal neuropsychological outcome had functional limitations
in only one domain (Figure 2A). The preterm children, however, had multiple
neuropsychological impairments more frequently, i.e. in 2 or more domains, than
the control children (9/60 (15%) versus 4/116 (3%), OR 5.12, 95% CI 1.51-17.39,
p<.01). After correction, the OR was 4.65, 95% CI 1.33-16.35, p=.02. Regarding
suspect-abnormal outcomes (Figure 2B), a majority of preterm children had
multiple neuropsychological impairments, which again was more frequent than
in the controls (33/60 (55%) versus 30/120 (25%), OR 3.67, 95% CI 1.90-7.06,
p<.01). After correction, the OR was 3.02, 95% CI 1.49-6.12, p<.01. An abnormal
IQ (<70) always co-occurred with multiple neuropsychological impairments. None
of the control children had abnormal IQs.
Of the preterm children with only one abnormal domain (n=18), most children had
problems with verbal memory (n=9), followed by visuomotor integration (n=4),
attention (n=4), and executive functioning (n=1). In the controls (n=19), although less
frequent, the distribution of problems in neuropsychological outcomes was similar.
Inspection of the neuropsychological profiles of the preterm children (n=9) and
controls (n=4) with two or more abnormal neuropsychological domains revealed
no clear pattern of combinations of abnormal outcomes (data not shown). Table
3 shows the frequency of suspect-abnormal outcomes in neuropsychological
domains in children with one versus multiple neuropsychological impairments
(≥ 2 suspect-abnormal domains). Within the group of preterm children, attention,
verbal memory, and performance IQ were abnormal in a majority of preterm
children with ≥ 2 suspect-abnormal outcomes. In comparison to the controls, a
suspect-abnormal performance IQ was more frequently accompanied by additional
neuropsychological impairments in preterm children than in control children (OR
5.43, 95% CI 1.75-16.81).

271Chapter 11 Neuropsychological Profiles at School Age of Very Preterm Born Children Compared to Term-Born Peers
Neuropsychological Profile in relation to Academic Achievement
Table 4A gives the academic achievement (normal education, normal education
but repeated classes, special education) of the preterm and control children. It also
provides the median number of suspect-abnormal neuropsychological domains per
type of academic achievement (normal education, normal education but repeated
classes, special education). Out of the six preterm children that received special
education, five attended special schools for children with learning problems and
one attended a school for children with behavioral problems. In the control group,
one child attended a school for children with learning problems and one attended
a school for children with language and hearing problems. The median number
of suspect-abnormal neuropsychological domains was significantly higher for
children repeating classes and attending special education, both in the preterm
(p< .01) and control group (p< .01). Table 4B gives the type of neuropsychological
impairments in relation to academic achievement in preterm children. Verbal IQ,
performance IQ, visuomotor integration and attention were significantly more
frequently affected in children repeating classes and children attending special
education. This was not found for verbal memory and executive functions.
Neonatal Characteristics and Neuropsychological Profiles
The preterm children’s birth weight correlated with the number of abnormal and
suspect-abnormal neuropsychological domains (r=-0.267, p=.04 and r=-0.353,
p<.01, respectively). This was not found for gestational age. We also found that
preterm children with IUGR had significantly more suspect-abnormal outcomes
than preterm children without IUGR (median 3 versus 2 suspect-abnormal
outcomes, p=.017). This was also found for late-onset sepsis (median 2 versus 1,
p=.019) and severe cerebral pathology (median 4 versus 1, p=.016).

Functional Development at School Age of Newborn Infants at Risk
TABLE 1 Patient demographics
Preterm infants
(GA<32 weeks) n=60
Control infants n=120
Males/females 41/ 19 57/63
Gestational age (weeks) 29.4 (27.3-30.8) 40.0 (39.0-40.0)
Birth weight (grams) 1138 (941-1410) 3590 (3250-3945)
Socioeconomic status1
Below average 14 (23%) 24 (20%)
Average 33 (55%) 47 (39%)
Above average 13 (22%) 49 (41%)
Neonatal complications
IUGR (<P10) 11 (18%)
Apgar at 5 minutes 9 (4-10)
Asphyxia 1 (2%)
Ventilatory support (IPPV or HFO) 50 (83%)
Early onset sepsis 3 (5%)
Cerebral pathology
GMH-IVH grade I or II 12 (20%)
GMH-IVH grade III or PVHI 1 (2%)
Cystic PVL 0 (0%)
PHVD 2 (3%)
Neonatal seizures 0 (0%)
Late onset morbidity
Late onset sepsis 24 (40%)
Necrotizing enterocolitis 8 (13%)
Bronchopulmonary dysplasia 20 (33%)
Data are given as median (25th-75th percentile) or as numbers (percentage).1. According to the standard Dutch occupational classificationAbbreviations: GMH-IVH- germinal matrix hemorrhage-intraventricular hemorrhage; HFO- high frequency oscillation; IPPV- intermittent positive pressure ventilation; IUGR- intrauterine growth restriction; PHVD- post-hemorrhagic ventricular dilatation; PVHI- periventricular hemorrhagic infarction; PVL- periventricular leukomalacia.
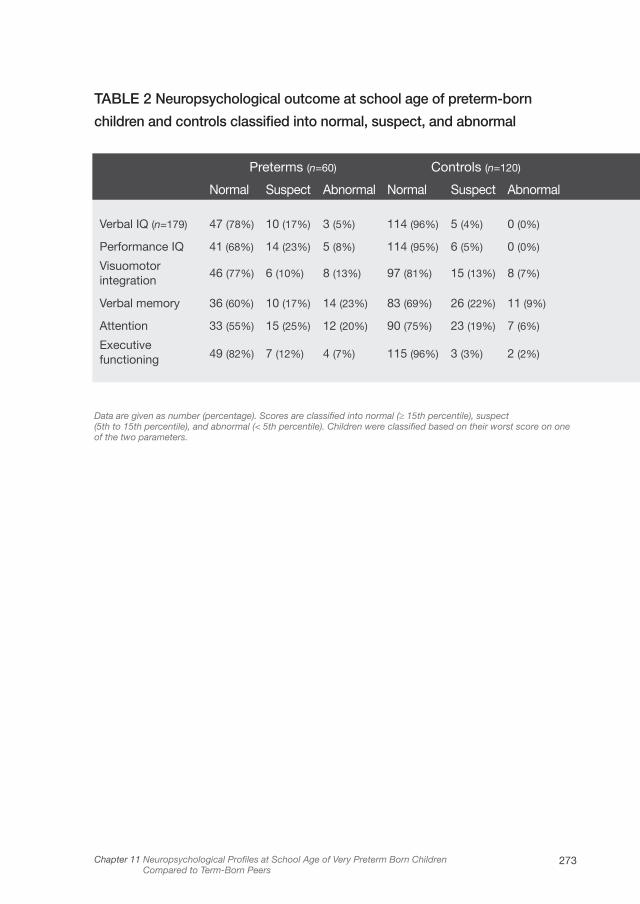
273Chapter 11 Neuropsychological Profiles at School Age of Very Preterm Born Children Compared to Term-Born Peers
TABLE 2 Neuropsychological outcome at school age of preterm-born
children and controls classified into normal, suspect, and abnormal
Preterms (n=60) Controls (n=120)
Normal Suspect Abnormal Normal Suspect Abnormal
Verbal IQ (n=179) 47 (78%) 10 (17%) 3 (5%) 114 (96%) 5 (4%) 0 (0%)
Performance IQ 41 (68%) 14 (23%) 5 (8%) 114 (95%) 6 (5%) 0 (0%)
Visuomotor integration
46 (77%) 6 (10%) 8 (13%) 97 (81%) 15 (13%) 8 (7%)
Verbal memory 36 (60%) 10 (17%) 14 (23%) 83 (69%) 26 (22%) 11 (9%)
Attention 33 (55%) 15 (25%) 12 (20%) 90 (75%) 23 (19%) 7 (6%)
Executive functioning 49 (82%) 7 (12%) 4 (7%) 115 (96%) 3 (3%) 2 (2%)
Data are given as number (percentage). Scores are classified into normal (≥ 15th percentile), suspect (5th to 15th percentile), and abnormal (< 5th percentile). Children were classified based on their worst score on one of the two parameters.
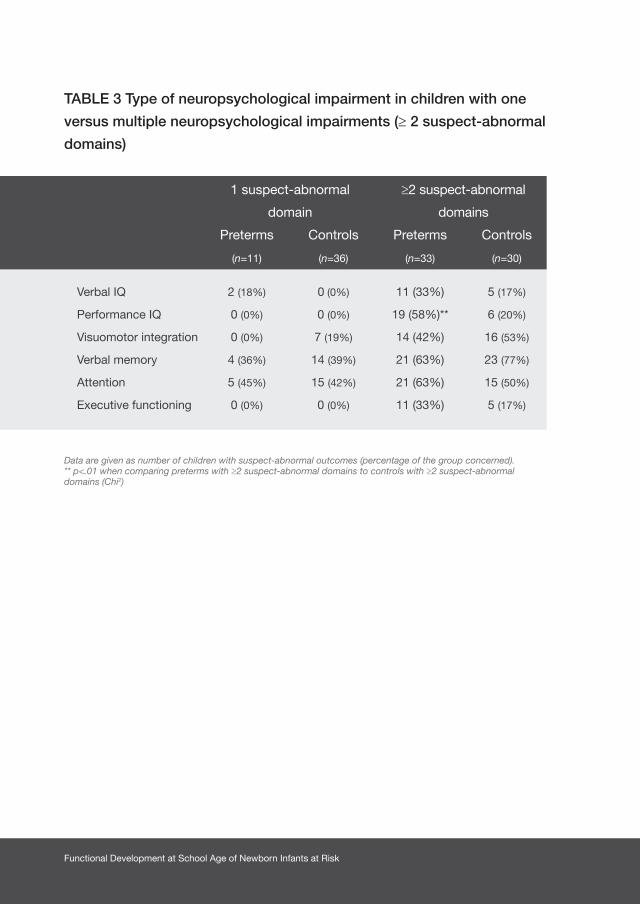
Functional Development at School Age of Newborn Infants at Risk
TABLE 3 Type of neuropsychological impairment in children with one
versus multiple neuropsychological impairments (≥ 2 suspect-abnormal
domains)
1 suspect-abnormal
domain
≥2 suspect-abnormal
domains
Preterms
(n=11)
Controls
(n=36)
Preterms
(n=33)
Controls
(n=30)
Verbal IQ 2 (18%) 0 (0%) 11 (33%) 5 (17%)
Performance IQ 0 (0%) 0 (0%) 19 (58%)** 6 (20%)
Visuomotor integration 0 (0%) 7 (19%) 14 (42%) 16 (53%)
Verbal memory 4 (36%) 14 (39%) 21 (63%) 23 (77%)
Attention 5 (45%) 15 (42%) 21 (63%) 15 (50%)
Executive functioning 0 (0%) 0 (0%) 11 (33%) 5 (17%)
Data are given as number of children with suspect-abnormal outcomes (percentage of the group concerned). ** p<.01 when comparing preterms with ≥2 suspect-abnormal domains to controls with ≥2 suspect-abnormal domains (Chi2)
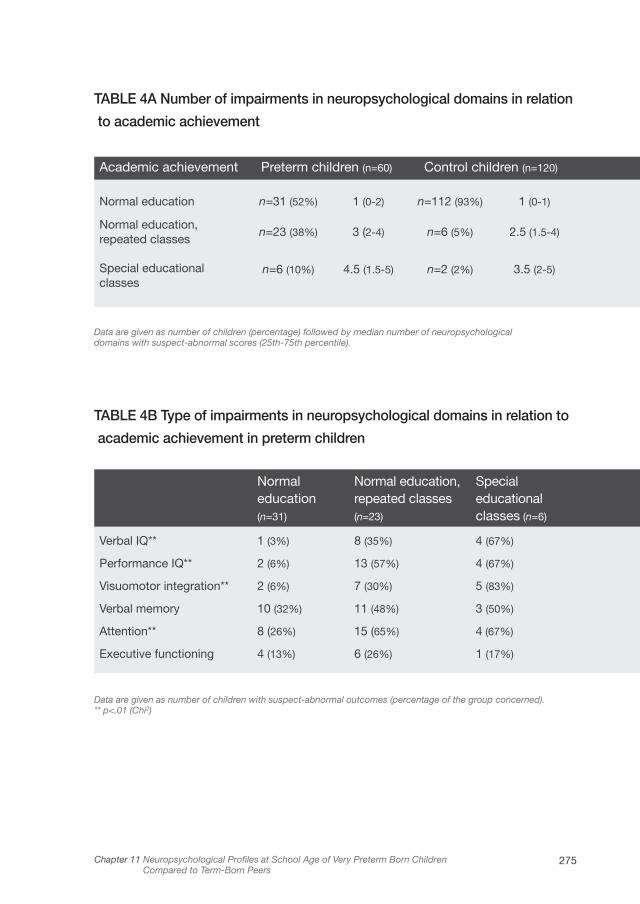
275Chapter 11 Neuropsychological Profiles at School Age of Very Preterm Born Children Compared to Term-Born Peers
TABLE 4A Number of impairments in neuropsychological domains in relation
to academic achievement
Academic achievement Preterm children (n=60) Control children (n=120)
Normal education n=31 (52%) 1 (0-2) n=112 (93%) 1 (0-1)
Normal education, repeated classes
n=23 (38%) 3 (2-4) n=6 (5%) 2.5 (1.5-4)
Special educational classes
n=6 (10%) 4.5 (1.5-5) n=2 (2%) 3.5 (2-5)
Data are given as number of children (percentage) followed by median number of neuropsychological domains with suspect-abnormal scores (25th-75th percentile).
TABLE 4B Type of impairments in neuropsychological domains in relation to
academic achievement in preterm children
Normal education (n=31)
Normal education, repeated classes (n=23)
Special educational classes (n=6)
Verbal IQ** 1 (3%) 8 (35%) 4 (67%)
Performance IQ** 2 (6%) 13 (57%) 4 (67%)
Visuomotor integration** 2 (6%) 7 (30%) 5 (83%)
Verbal memory 10 (32%) 11 (48%) 3 (50%)
Attention** 8 (26%) 15 (65%) 4 (67%)
Executive functioning 4 (13%) 6 (26%) 1 (17%)
Data are given as number of children with suspect-abnormal outcomes (percentage of the group concerned). ** p<.01 (Chi2)
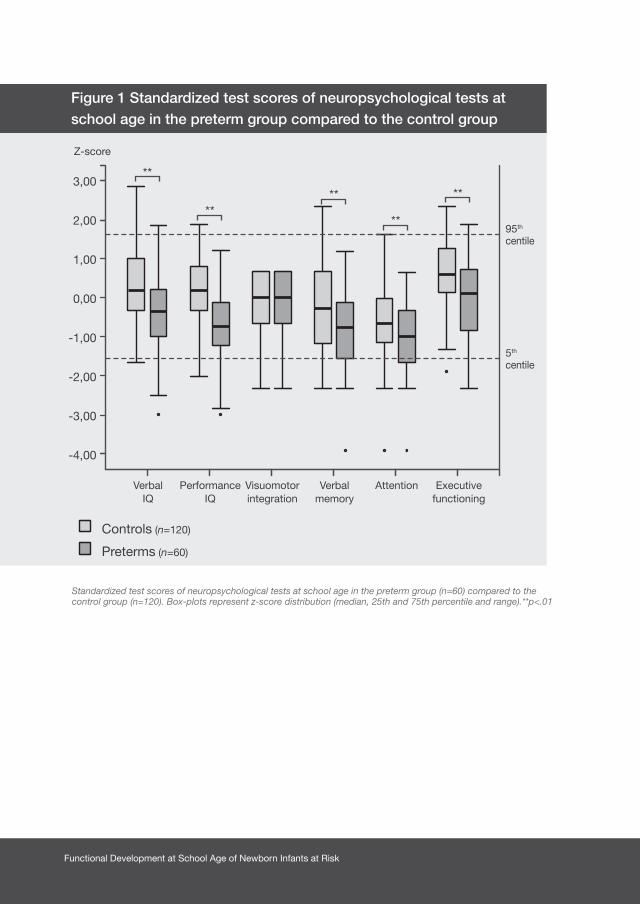
Functional Development at School Age of Newborn Infants at Risk
Figure 1 Standardized test scores of neuropsychological tests at school age in the preterm group compared to the control group
Standardized test scores of neuropsychological tests at school age in the preterm group (n=60) compared to the control group (n=120). Box-plots represent z-score distribution (median, 25th and 75th percentile and range).**p<.01
3,00
2,00
1,00
0,00
-1,00
-2,00
-3,00
-4,00
95th centile
5th centile
Z-score
Performance IQ
Visuomotorintegration
Verbal memory
Attention Executivefunctioning
Verbal IQ
Controls (n=120)
Preterms (n=60)
**
****
**
**

277Chapter 11 Neuropsychological Profiles at School Age of Very Preterm Born Children Compared to Term-Born Peers
Fig
ure
2B P
erce
ntag
es o
f ch
ildre
n b
y nu
mb
er o
f
susp
ect-
abno
rmal
neu
rop
sych
olo
gic
al o
utco
mes
Fig
ure
2A P
erce
ntag
es o
f ch
ildre
n b
y nu
mb
er
of
abno
rmal
neu
rop
sych
olo
gic
al o
utco
mes
80%
70%
60%
50%
40%
30%
20%
10% 0%
Num
ber
of n
euro
psy
chol
ogic
al d
omai
ns w
ith s
usp
ect-
abno
rmal
sco
res
03
14
25
Percentage
Con
trol
s (n
=12
0)
Con
trol
s w
ith a
bno
rmal
IQs
(n=
0/12
0)
Pre
term
s (n
=60
)
Pre
term
s w
ith a
bno
rmal
IQs
(n=
6/60
)
n=54
n=16
n=36
n=11
n=24
n=17
n=3
n=6
n=2
n=1
n=5
n=5
n=54
80%
70%
60%
50%
40%
30%
20%
10% 0%
Num
ber
of n
euro
psy
chol
ogic
al d
omai
ns w
ith a
bno
rmal
sco
res
03
14
25
Percentage
Con
trol
s (n
=12
0)
Con
trol
s w
ith a
bno
rmal
IQs
(n=
0/12
0)
Pre
term
s (n
=60
)
Pre
term
s w
ith a
bno
rmal
IQs
(n=
6/60
)
n=97
n=33
n=18
n=4
n=1
n=3
n=3
n=1
n=19
Six
Neu
rop
sych
olog
ical
dom
ains
wer
e in
clud
ed: v
erb
al IQ
, per
form
ance
IQ, v
isuo
mot
or in
tegr
atio
n, v
erb
al m
emor
y, a
tten
tion,
and
exe
cutiv
e fu
nctio
ning
. Sus
pec
t-ab
norm
al IQ
s (<
85) o
r ab
norm
al IQ
s (<
70) c
over
eith
er v
erb
al o
r p
erfo
rman
ce IQ
.
Functional Development at School Age of Newborn Infants at Risk
Discussion
This study showed that a majority (55%) of very preterm-born children had
suspect-abnormal outcomes in multiple neuropsychological domains, which was
more than in controls (25%). We found no typical neuropsychological profile or co-
occurrence of impairments in specific neuropsychological domains among preterm
children compared to controls, but in children with multiple suspect-abnormal
domains, verbal memory, attention, and performance IQ were mostly affected. Low
performance IQ was characteristic of profiles including multiple neuropsychological
impairments in preterm children but not in controls. These neuropsychological
impairments were related to academic achievement in the sense that more
neuropsychological domains were impaired in children who repeated classes and
attended special schools. The neonatal characteristics related to multiple suspect-
abnormal neuropsychological outcomes at school age were birth weight, IUGR,
late-onset sepsis, and severe cerebral pathology. Many preterm-born children had
thus been exposed to factors that, presumably through altered brain development,
led to impairments in combinations of neuropsychological domains that seemed
to hamper academic achievement.
The novelty of this study is that to provide insight into the effect of prematurity
on later neuropsychological outcome, we investigated the co-occurrence
of neuropsychological impairments in preterm children by examining
neuropsychological profiles, rather than reporting impairments across preterm
children. Comparing these profiles to the profiles of a large cohort of term-born
children enabled us to determine whether a typical neuropsychological profile was
attributable to very preterm birth.
We could not confirm a neuropsychological profile typical for preterm children,
since most preterm children were impaired in multiple neuropsychological domains
without a pattern emerging. Nevertheless, impaired attention, verbal memory, and
performance IQ were the neuropsychological domains most frequently involved in
preterm children with suspect-abnormal outcomes in multiple neuropsychological
domains. Previously, these functions have been identified as being affected by
prematurity,18,19 but they now also appear to be affected in combination with
impairments in other neuropsychological domains. Previous studies also reported

279Chapter 11 Neuropsychological Profiles at School Age of Very Preterm Born Children Compared to Term-Born Peers
that neuropsychological impairments are found in preterm children with poor
intellectual development.9,20 Our study confirmed these findings by showing that
most preterm children with low IQs had multiple neuropsychological impairments.
Interestingly, when comparing the preterm profile to the profile of controls,
specifically low performance IQ was more frequently accompanied by additional
neuropsychological impairments in the preterm group, but not for instance attention
or verbal memory. Perhaps preterm-born children cannot compensate sufficiently
for other multiple impaired neuropsychological domains to achieve a normal
performance IQ while full-term born children can. If only one domain is impaired
then both preterm and control children can compensate sufficiently to achieve a
normal performance IQ. A substantial group of preterm children remained who
had suspect-abnormal outcomes in one or more domains in the absence of low
IQs. Others also stated that very preterm children can be at risk for neurocognitive
impairment despite average intelligence.10,11 Therefore, our study suggests that
including only general intellectual development in a follow-up program for preterm
children may wrongfully classify a preterm child as developing normally thereby
missing possible specific neuropsychological problems.
In our study the number of suspect-abnormal neuropsychological domains was
clearly related to academic achievement. We know that up to half of former very
low birth weight infants require special assistance in school.21 Learning difficulties
typical for preterm children, e.g. in the field of reading, spelling, mathematics, or
writing can be independent of IQ scores.5,22 It may well be that combinations of
problems in neuropsychological functions as found here, such as attention and
visuomotor integration underlie such learning difficulties.
Regarding neonatal characteristics, we found that birth weight was related to
the neuropsychological profile of preterm children. There is an inverse relation
between birth weight and intellectual development in preterm-born children.18
Moreover, increased rates of neurocognitive impairments such as problems in
attention, executive functioning, and a decline in school achievement occur with
decreasing birth weight.5,21,23 Our study adds that birth weight also affects the
number of neuropsychological domains affected at school age.
Several characteristics of preterm brain development may be involved in the

Functional Development at School Age of Newborn Infants at Risk
underpinnings of these neuropsychological profiles at school age. First, disruption
of processes of brain connectivity such as synaptogenesis and corticogenesis that
normally occur in the intra-uterine environment, can lead to structural changes
in brain organization in preterm children that persist into young adulthood.24-26 In
addition to alterations in brain development, perinatal brain injury also affects brain
maturation processes.27 Particularly the white matter of preterm infants is vulnerable
to damage, for example from inflammatory responses in case of sepsis.28 These
disruptions and alterations in brain development may have several functional
implications. For example, diminished cortical volumes have been related to
lower intellectual development,29 altered pathways of brain activation to attention
allocation,30 and disturbed connectivity between posterior brain regions and the
prefrontal cortex to worse executive functions in preterm children.31 Nevertheless,
the direct functional implications of combinations of these processes, and how
they lead to specific neuropsychological profiles at a later age, remain poorly
understood.
This study was limited by a relatively small sample size. To increase the power
of our study, we included twice as many controls as preterm children. Preterm
and control children were not prospectively matched, which led to an imbalance
in gender and a trend towards lower socioeconomic status in the preterm group.
Low socioeconomic status is known to be involved in the etiology of prematurity.
We cannot elucidate the potential role of lower socioeconomic status in the
development and persistence of neuropsychological impairments in the preterm
children of our study although after correction for socioeconomic status our
results did not change. In our study, verbal memory and attention had two different
parameters that each measured specific aspects of these functions. Children were
classified suspect or abnormal if either one of the two was suspect or abnormal,
which may have led to an inflation of the number of children being classified as
such compared to other domains that were based on a single measure. Finally,
this was an exploratory study in which we chose to test those neuropsychological
functions that have been reported to be poorer in preterm born children. Due
to limited attention span of the children, we were unable to test all possible
neuropsychological functions, leaving out e.g. language functions.
281Chapter 11 Neuropsychological Profiles at School Age of Very Preterm Born Children Compared to Term-Born Peers
In conclusion, a majority of preterm children had suspect-abnormal outcomes on
multiple neuropsychological domains. There was no typical pattern of impairment
in specific neuropsychological domains that distinguished preterm children from
controls, though low performance IQ was characteristic of profiles including
multiple neuropsychological impairments in preterm children but not in controls.
The number of suspect-abnormal neuropsychological domains was related
to worse academic achievement. This study points to the necessity of early
identification of children at risk for complex neuropsychological profiles and raises
the question of how to implement intervention strategies that could contribute to
improving the outcome of these children. We recommend screening for a wide
range of neuropsychological functions including verbal memory, attention and
performance IQ, when performing neuropsychological diagnostics.
Acknowledgements
This study was part of the research program of the Research School for Behavioral
and Cognitive Neurosciences, University of Groningen, the Netherlands. It was
financially supported by the Dutch Brain Foundation and a research grant awarded
by FrieslandCampina and Friso Infant Nutrition. We greatly acknowledge the help
of Dr. T. Brantsma – van Wulfften Palthe for correcting the English manuscript.

Functional Development at School Age of Newborn Infants at Risk
1. Marlow N, Hennessy EM, Bracewell MA, Wolke D.
Motor and executive function at 6 years of age after
extremely preterm birth. Pediatrics
2007;120:793-804.
2. Doyle LW, Anderson PJ. Adult outcome of extremely
preterm infants. Pediatrics 2010;126:342-351.
3. Dall’oglio AM, Rossiello B, Coletti MF, et al. Do
healthy preterm children need neuropsychological
follow-up? Preschool outcomes compared with term
peers. Dev Med Child Neurol 2010;52:955-961.
4. Feder KP, Majnemer A, Bourbonnais D, Platt R,
Blayney M, Synnes A. Handwriting performance in
preterm children compared with term peers at age 6
to 7 years. Dev Med Child Neurol 2005;47:163-170.
5. Aarnoudse-Moens CS, Weisglas-Kuperus N, van
Goudoever JB, Oosterlaan J. Meta-analysis of
neurobehavioral outcomes in very preterm and/
or very low birth weight children. Pediatrics
2009;124:717-728.
6. Taylor HG, Klein N, Drotar D, Schluchter M, Hack M.
Consequences and risks of <1000-g birth weight for
neuropsychological skills, achievement, and adaptive
functioning. J Dev Behav Pediatr 2006;27:459-469.
7. Van Braeckel KNJA, Butcher PR, Geuze RH,
van Duijn MA, Bos AF, Bouma A. Less efficient
elementary visuomotor processes in 7- to 10-year-
old preterm-born children without cerebral palsy:
an indication of impaired dorsal stream processes.
Neuropsychology 2008;22:755-764.
8. Dewey D, Crawford SG, Creighton DE, Sauve RS.
Long-term neuropsychological outcomes in very
low birth weight children free of sensorineural
impairments. J Clin Exp Neuropsychol
1999;21:851-865.
9. Herrgard E, Luoma L, Tuppurainen K, Karjalainen S,
Martikainen A. Neurodevelopmental profile at five
years of children born at < or=32 weeks gestation.
Dev Med Child Neurol 1993; 35:1083-1096.
10. Korkman M, Mikkola K, Ritari N, et al.
Neurocognitive test profiles of extremely low birth
weight five-year-old children differ according to
neuromotor status. Dev Neuropsychol
2008;33:637-655.
11. Grunau RE, Whitfield MF, Davis C. Pattern of
learning disabilities in children with extremely low
birth weight and broadly average intelligence. Arch
Pediatr Adolesc Med 2002;156:615-620.
12. Kerstjens JM, Bos AF, ten Vergert EM, de Meer G,
Butcher PR, Reijneveld SA. Support for the global
feasibility of the Ages and Stages Questionnaire
as developmental screener. Early Hum Dev
2009;85:443-447.
13. Gregoire J. Comparison of three short forms
of the Wechsler intelligence scale for children
- third edition (WISC-III). Eur Rev Appl Psychol
2000;50:437-41.
References
283Chapter 11 Neuropsychological Profiles at School Age of Very Preterm Born Children Compared to Term-Born Peers
14. Korkman M, Kirk U, Kemp SL. NEPSY II. Clinical
and Interpretative Manual. San Antonio (TX):
PsychCorp. A Brand of Harcourt Assessments;
2007.
15. van den Burg W, Kingma A. Performance of 225
Dutch school children on Rey’s Auditory Verbal
Learning Test (AVLT): parallel test-retest reliabilities
with an interval of 3 months and normative data.
Arch Clin Neuropsychol 1999;14:545-559.
16. Manly T, Anderson V, Nimmo-Smith I, Turner A,
Watson P, Robertson IH. The differential assessment
of children’s attention: the Test of Everyday
Attention for Children (TEA-Ch), normative sample
and ADHD performance. J Child Psychol Psychiatry
2001;42:1065-1081.
17. Gioia GA, Isquith PK, Guy SC, Kenworthy L.
BRIEF—Behavior Rating Inventory of Executive
Function: Professional Manual. Odessa, FL:
Psychological Assessment Resources; 2000.
18. Bhutta AT, Cleves MA, Casey PH, Cradock MM,
Anand KJS. Cognitive and behavioral outcomes of
school-aged children who were born preterm - A
meta-analysis. JAMA 2002;288:728-737.
19. Briscoe J, Gathercole SE, Marlow N. Everyday
memory and cognitive ability in children born
very prematurely. J Child Psychol Psychiatry
2001;42:749-754.
20. Pasman JW, Rotteveel JJ, Maassen B.
Neurodevelopmental profile in low-risk preterm
infants at 5 years of age. Eur J Paediatr Neurol
1998;2:7-17.
21. Taylor HG, Klein N, Minich NM, Hack M. Middle-
school-age outcomes in children with very low
birthweight. Child Dev 2000;71:1495-511.
22. Anderson P, Doyle LW. Neurobehavioral outcomes
of school-age children born extremely low birth
weight or very preterm in the 1990s. JAMA
2003;289:3264-3272.
23. Klebanov PK, Brooks-Gunn J, McCormick MC.
School achievement and failure in very low birth
weight children. J Dev Behav Pediatr
1994;15:248-256.
24. Huttenlocher PR, Dabholkar AS. Regional
differences in synaptogenesis in human cerebral
cortex. J Comp Neurol 1997;387:167-178.
25. Allin M, Walshe M, Fern A, et al. Cognitive
maturation in preterm and term born adolescents.
J Neurol Neurosurg Psychiatry 2008;79:381-386.
26. Counsell SJ, Edwards AD, Chew AT, et al. Specific
relations between neurodevelopmental abilities
and white matter microstructure in children born
preterm. Brain 2008;131:3201-3208.
27. Ferriero DM. Medical progress - Neonatal brain
injury. New Engl J Med 2004;351:1985-1995.

Functional Development at School Age of Newborn Infants at Risk
28. Shah DK, Doyle LW, Anderson PJ, et al. Adverse
neurodevelopment in preterm infants with postnatal
sepsis or necrotizing enterocolitis is mediated by
white matter abnormalities on magnetic resonance
imaging at term. J Pediatr 2008;153:170-175.
29. Peterson BS, Vohr B, Staib LH, et al. Regional
brain volume abnormalities and long-term cognitive
outcome in preterm infants. JAMA
2000;284:1939-1947.
30. Lawrence EJ, Rubia K, Murray RM, et al. The neural
basis of response inhibition and attention allocation
as mediated by gestational age. Hum Brain Mapp
2009;30:1038-1050.
31. Skranes J, Lohaugen GC, Martinussen M, et al.
White matter abnormalities and executive function
in children with very low birth weight. Neuroreport
2009;20:263-266.

285Chapter 11 Neuropsychological Profiles at School Age of Very Preterm Born Children Compared to Term-Born Peers


Chapter 12
GENERAL DISCUSSION AND FUTURE
PERSPECTIVES
ELISE ROZE
Functional Development at School Age of Newborn Infants at Risk
The main aim of this thesis was to establish the motor, cognitive, and behavioral
outcome at school age of newborn infants with perinatal risk factors for adverse
outcome. The secondary aims were i. to investigate the interrelationship between
motor, cognitive, and neuropsychological development until school age in preterm
born infants compared to healthy, term-born infants and ii. to relate perinatal and
cerebral characteristics of newborn infants to long-term neurodevelopmental
outcome. To this end, we determined the impact of several perinatal risk factors
on long-term outcome. These ranged from persistent environmental pollutants, to
which the whole population is exposed and that showed a mild effect on long-term
neurodevelopmental outcome, to perinatal brain injury and systemic disease, to
which only a minority of children is exposed, but that had a much greater impact
on outcome at school age.
With regard to environmental pollutants we found that prenatal background
exposure to organohalogen compounds (OHCs) correlated with neuropsychological
functioning at 5 to 6 years of age in healthy Dutch children (Part 1, Chapter 2).1
In particular, polybrominated diphenyl ethers (PBDEs) that are used extensively
worldwide, correlated with motor performance, attention, visual perception, and
behavior. In this explorative study, the first of its kind to examine this relationship,
we found both negative and positive correlations between compounds and
outcome.
A more recent study by Herbstman et al. from the United States of America also
found an association between PBDEs and outcome in children. They found that
PBDE congeners were inversely related to neurodevelopmental indices such as
the psychomotor and mental developmental index of the Bayley Scales of Infant
Development and intelligence quotients in children at 1 to 6 years of age.2 They
found a difference in mean intellectual developmental scores of 5 to 8 points in
children who were in the highest 20% of prenatal exposure to PBDEs compared to
those in the lower 80% of exposure.
We did not find a relation between compounds and intellectual development. This
may be explained by the fact that in the Unites States, concentrations of OHCs are
at least 4 times higher than in Europe.3,4 In line with our study, a study by Gascon
et al. from Spain found that exposure to PBDEs was related to reduced attention

289Chapter 12 General Discussion and Future Perspectives
in children.5 In contrast to our study, however, they found that exposure during
childhood was related to outcome rather than prenatal exposure.
One of the potential mechanisms through which OHCs have an adverse effect on
neurodevelopment is through interference with thyroid hormone signaling in the
developing brain. Thyroid hormone plays a role in synaptogenesis and myelination
in the developing brain during the prenatal and postnatal period.6 In addition, two
other studies described an effect of organohalogens on neurotransmitter systems.7,8
Finally, an in vitro study recently showed that primary fetal human neural progenitor
cells exposed to the PBDEs BDE-47 and BDE-99 had decreased migration distance
and reduced differentiation into neurons and oligodendrocytes.9
In future studies we should examine which of the correlations we found in our
study can be confirmed in larger samples. It would also be interesting to perform
a longitudinal follow-up study of children exposed to OHCs in order to investigate
whether potential effects on neurodevelopment last throughout childhood
and continue into adulthood. Finally, the isolated effects of specific OHCs and
combinations of OHCs should be further investigated, as was done in the study
by Gascon et al.5
Subsequently, in Part 2 of the thesis, we determined the short-term and long-term
outcome of newborn infants who suffered from overt types of brain injury in the
perinatal and neonatal period.
Firstly, we found that in preterm infants with periventricular hemorrhagic infarction
(PVHI), mortality occurred in 30% of the infants despite optimal treatment (Chapter
3).10 We also found that circulatory failure and maternal intrauterine infection in
these infants were associated with an increased risk of mortality. Previously, these
factors were described as risk factors for the emergence of PVHI11-13 but they also
appear to increase the risk of mortality. In the survivors, we found that at 18 months
of age motor development was abnormal in 66%, but functional abilities were
good in the majority of surviving children. In this study the percentage of children
who developed CP after PVHI was similar to that found in previous studies, i.e.
ranging from 60% to 90%.14-17
Secondly, we performed a follow-up study at 4 to 12 years of age of preterm-
born children with PVHI in order to determine to what extent PVHI had an impact
Functional Development at School Age of Newborn Infants at Risk
on outcome at school age (Chapter 4).18 Again, we found that the majority of the
surviving children who had suffered PVHI as infants had cerebral palsy with limited
functional impairment at school age. Intelligence was within 1 SD of the norm of
preterm-born children without lesions in 60% to 80% of the children. In particular
verbal memory was affected. Behavioral problems and executive function
problems occurred only slightly more compared to preterm infants without lesions.
Previous studies showed no consensus on cognitive outcome in children with
PVHI. The percentages of children with normal cognition range from only 20% up
to 79%.15,19,20 In many studies on the long-term outcome of preterm-born children,
children with severe brain injury, including PVHI, are often described as being on
the worst end of the outcome spectrum and they have very poor prognoses.21-23
In our cohort study of children with PVHI, however, we found that the functional
abilities in the majority of children were rather good and that a majority of children
was able to attend normal education. Our conclusion from these two studies is,
therefore, that the functional outcome at school age of preterm-born children with
periventricular hemorrhagic infarction is better than was previously thought.
To our surprise, in neither of our two studies were we able to relate the extent
and localization of PVHI to functional outcome (Chapters 3 and 4). We only found
that the most extended PVHIs (fronto-parieto-occipital) were associated with the
development of CP at 18 months, but not with the severity of CP. Previous studies
reported that more severe PVHIs and the presence of porencephaly are associated
with poorer cognitive outcome.15,20,24 It is difficult to determine why we were unable
to demonstrate such a relation. Small sample size, different medical interventions,
or socioeconomic status may have been involved, while potential interindividual
differences in the ability to recover from such a lesion may also have played a
role.
In Chapter 5 we studied the outcome of term-born infants with seizures who
required multiple anti-epileptic drugs (AEDs). We found a mortality rate of 38%.
In the survivors, motor development was normal in around a third of the children,
a third had minor neurological abnormalities and a third had major neurological
abnormalities. In addition, we found that outcome was poorer if seizure control
failed, whilst the etiology of the seizures and the number of AEDs required to reach
291Chapter 12 General Discussion and Future Perspectives
seizure control had limited prognostic value. We speculate that the severity of
cerebral injury is the keystone of a poor response to AEDs. Additionally, it may also
be that the seizures themselves are harmful to the brain. Previous studies stated
that neonatal seizure as such may have a disruptive effect on brain development
in infants.25-27 Others found the number and duration of seizures to be predictive of
poor outcomes.28-31 This phenomenon possibly explains why we found that failing
to achieve seizure control was associated with worse outcome.
The studies in Part 2 showed to what extent brain lesions in newborn infants can
affect motor, cognitive, and behavioral outcome at school age and how treatment-
related factors are involved. Already in the neonatal period the question arises to
what extent brain lesions will influence later neurodevelopment of children.
In the final chapter of Part 2, our aim was to determine the prognostic value of an
advanced magnetic resonance imaging (MRI) technique for motor development
in newborns with focal perinatal brain injury (Chapter 6). We also aimed to
determine the added value for clinical practice of tractography to conventional
MRI in predicting motor outcome. We found that the diffusion characteristics
of corticospinal tracts of infants with focal perinatal injury (i.e. either arterial
ischemic stroke or hemorrhagic parenchymal infarction, equivalent to PVHI) were
prognostic for subsequent normal motor development, mild motor asymmetry or
the development of a hemiplegia. Particularly, the added value of tractography
to conventional MRI is that it identifies children who developed mild motor
asymmetries. We speculated that the asymmetries that we found in volume,
fractional anisotropy, and radial diffusivity of corticospinal tracts observed in
infants who developed motor impairments may be early markers of the progressive
disintegration of fibers due to Wallerian degeneration. Wallerian degeneration is
the anterograde degeneration of axons and myelin sheaths after proximal axonal
or cell body injury.32,33 It thus seems that advanced MRI techniques that study the
diffusion properties of water in different brain regions may have the potential of
providing early prognostic information for functional outcome in newborn infants
with brain lesions, including mild impairments.
In Part 3 of the thesis we studied the functional outcome at school age of preterm
and term-born infants who suffered systemic diseases in the neonatal period.
Functional Development at School Age of Newborn Infants at Risk
These diseases included necrotizing enterocolitis (NEC), spontaneous intestinal
perforations (SIP), sepsis, and surgically treated intestinal obstructions. Off-hand
one would perhaps not expect these diseases to have a direct effect on motor,
cognitive, and behavioral functioning in later life. Nevertheless, we found that they
led to functional impairments at school age.
In the first study we found that 68% of the newborn infants with NEC or SIP
had borderline or abnormal motor outcomes as measured with the Movement
Assessment Battery for Children. On average, their intelligence was 11 intelligence
quotient (IQ) points lower than matched control children without gastrointestinal
diseases. In addition, their attention and visual perception was impaired (Chapter
7). In the second study on preterm-born infants with late-onset sepsis we also
found that 68% of the children had borderline or abnormal motor outcomes. On
average, their intelligence was 9 IQ points lower than matched control children
without late-onset sepsis and their attention and verbal memory was affected
(Chapter 8). The final cohort we investigated in Part 3 consisted mostly of term-
born infants treated surgically for intestinal obstructions in the first days of life
(Chapter 9). In these children we also found functional impairments at school age
albeit to a lesser extent. Of the included children, 33% had borderline or abnormal
motor outcomes, compared to 15% in a reference population. In addition,
selective attention was affected, whilst global cognitive development and other
neuropsychological functions were preserved.
The potential mechanism in these systemic diseases that is responsible for the
functional impairments we found at school age, is multifactorial with a key role for
neuroinflammation. In systemic diseases leading to inflammation there is cross-
talk between the central nervous system and the periphery.34 The emergence
of, for example NEC, SIP, and sepsis initially lead to a systemic inflammatory
response. Subsequently, pro-inflammatory cytokines are released by the activation
of microglial cells in the brain. These cytokines inhibit proliferation of neuronal
precursor cells and contribute to damage to the pre-oligodendrocytes that play
an important role in the myelination of the brain.35-37 The increased permeability
of the blood-brain barrier during inflammation further increases the susceptibility
of the brain to this inflammatory response.38 In addition, these ill infants are at
293Chapter 12 General Discussion and Future Perspectives
risk of respiratory and circulatory insufficiency that can lead to hypotension
and subsequent hypoxemia and ischemia of brain areas. It was suggested
recently that systemic cytokines are related to a disturbance in cerebrovascular
autoregulation and diminished cerebral blood flow.36,39 These events may lead to
a cascade of reactions in the brain, including the release of reactive oxygen and
nitrogen species.40 Indeed, previous studies showed that NEC, SIP, and sepsis are
associated with an increased risk of overt, but also more subtle and diffuse, white
matter abnormalities.41,42
In the children with surgically treated intestinal obstructions in the neonatal
period, who were mostly term-born, inflammation presumably also played a role
albeit to a lesser extent. We suggest that physiological stress during surgery, and
anesthesia-related factors may lie at the basis of their impairments. In an animal
study it was found that the use of anesthesia during the cerebral growth spurt
can lead to neuro-apoptosis and an adverse long-term behavioral outcome.43 In
addition, there are maturational processes of neuronal riping and outgrowth which
normally occur from birth until years postnatally that are potentially susceptible
to injury from anesthetic agents. In term-born infants suffering from brain injury, a
different pattern is observed compared to preterm-born infants. At this stage of
brain development it is the central grey matter regions, especially the basal ganglia
and thalami, which are specifically vulnerable to hypoxic–ischaemic injury. To date,
it is unknown if these structures are also affected in term-born infants that undergo
surgery.
Interestingly, in children with NEC and SIP we also found that surgical treatment
was a risk factor for adverse outcome. Whether the harmfull effects of anesthetics
on the brain and physiological stress during surgery are the result of the same
pathophysiological processes in preterm and term-born infants is an important
topic of future studies.
Parenteral nutrition and prolonged nutritional deficiencies have previously also
been described as risk factors for adverse outcome, particularly for cognition and
learning at pre-school age.44 Nutritional problems may have played a role in all
three studies.

Functional Development at School Age of Newborn Infants at Risk
From the studies described in Parts 2 and 3 it is apparent that both overt brain
lesions and more diffuse, inflammation driven types of brain injury can contribute to
functional impairments at school age. Table 1 summarizes the main findings of the
different studies. It shows that most motor problems were found in children with
PVHI. In addition to the data shown in the table, in this cohort 76% of the children
developed CP compared to only 33% in the children with convulsions, 15% in the
children with NEC and SIP, 16% in the children with late-onset sepsis, and none
of the children with intestinal obstructions. With regard to cognitive outcomes,
however, the differences between the different cohorts were less pronounced.
Particularly when comparing children with PVHI to children with NEC, SIP, and
late-onset sepsis the differences in IQs were only 3 and 6 points, respectively (see
Table 1). The impairments in neuropsychological functions, although in different
domains, also were of fairly similar magnitude.

295Chapter 12 General Discussion and Future Perspectives
TAB
LE 1
Fun
ctio
nal o
utco
me
at s
cho
ol a
ge
of
new
bo
rns
with
ove
rt b
rain
lesi
ons
and
sys
tem
ic d
isea
ses
New
bor
ns w
ith o
vert
bra
in le
sion
sN
ewb
orns
with
sys
tem
ic d
isea
ses
New
bor
ns w
ith
PV
HI
New
bor
ns w
ith
seiz
ures
New
bor
ns w
ith
NE
C/S
IP
New
bor
ns w
ith
late
-ons
et s
epsi
s
New
bor
ns in
test
inal
obst
ruct
ions
Num
ber
n=21
n=45
n=52
n=32
n=27
Ges
tatio
nal a
ge (w
eeks
)27
.6 (2
5.4–
35.0
)40
.0 (3
6.9
– 42
.1)
30.5
(25.
2-40
.0)
28.9
(25.
7-33
.4)
36.7
(28.
9-42
.0)
Birt
h w
eigh
t (g
ram
s)10
45 (7
00–2
430)
3525
(200
0 –
5475
)12
53 (7
10-3
200)
1010
(600
-169
0)30
00 (7
10-5
065)
Age
at
asse
ssm
ent (
year
s) 8
.74.
0 9
.3 8
.4 9
.5
Mot
or o
utco
me
(nor
mal
/bor
der
line/
abno
rmal
)1
24%
/29%
/47%
38%
/36%
/27%
31%
/27%
/41%
32%
/29%
/39%
70%
/7%
/22%
Inte
llect
ual o
utco
me
(mea
n IQ
)83
unkn
own
8689
99
Neu
rop
sych
olog
ical
out
com
eV
isuo
mot
or
inte
grat
ion,
mem
ory
affe
cted
unkn
own
Att
entio
n, v
isua
l
per
cep
tion
affe
cted
Att
entio
n, m
emor
y
affe
cted
Att
entio
n af
fect
ed
Beh
avio
ral o
utco
me
(nor
mal
/bor
der
line/
abno
rmal
)2
53%
/12%
/35%
unkn
own
70%
/8%
/22%
70%
/10%
/20%
unkn
own
1. N
orm
al w
as d
efine
d a
s >
P15
, bor
der
line
as P
5-P
15 a
nd a
bno
rmal
as
<P
5 fo
r ch
ildre
n w
ith N
EC
/SIP
, lat
e-on
set
sep
sis,
and
inte
stin
al o
bst
ruct
ions
. For
chi
ldre
n w
ith P
VH
I and
se
izur
es, n
orm
al w
as d
efine
d a
s no
neu
rolo
gica
l ab
norm
aliti
es, b
ord
erlin
e as
chi
ldre
n w
ith m
inor
neu
rolo
gica
l dys
func
tions
or
a gr
oss
mot
or fu
nctio
n cl
assi
ficat
ion
syst
em
(GM
FCS
) lev
el I,
and
ab
norm
al a
s ≥
GM
FCS
leve
l II
2. A
sses
sed
with
the
Chi
ld B
ehav
ior
Che
cklis
t. N
orm
al, b
ord
erlin
e, a
nd a
bno
rmal
wer
e d
efine
d in
acc
ord
ance
with
the
man
ual
Functional Development at School Age of Newborn Infants at Risk
It is difficult to determine why motor functioning is affected most in children with
PVHI, whilst cognitive functioning is affected to a similar extent in both preterms
with systemic disease and overt brain lesions. In PVHI there is a germinal matrix
hemorrhage that causes pressure on the periventricular terminal vein that drains
the cerebral hemisphere.25 This leads to venous congestion in the periventricular
white matter and subsequently to ischemia and hemorrhage resulting in local
destruction of brain tissue of variable magnitude. In the local destruction of tissue
caused by PVHI it may be that the corticospinal tract, which plays a central role in
motor functioning, is involved more often whilst this is the case less often in preterm
infants with systemic disease. How perinatal brain injury can lead to impairments in
cognitive functioning is less well understood. What we do know is that disruptions
in white matter involving myelination and dendritic connections have an impact
on cortical circuits connecting different brain regions and this impact has been
related to cognitive functions. For example, disruptions of the circuitry connecting
frontal, striatal, and thalamic regions have been associated with dysregulation of
attention.45 In addition, potentially as a result of decreased connectivity, reduced
gray matter volumes have also been related to cognitive functions. For example,
intellectual development has been correlated particularly with gray matter volumes
of the sensorimotor cortex, midtemporal cortex, and corpus callosum.46,47 Finally,
deep gray matter structures are related to neuropsychological functions such as
reduced hippocampal volume that is associated with memory deficits.48
Global, diffuse white matter injury, which is the most common type of brain injury
in the preterm infant, lies at the basis of these changes in brain connectivity and
regional volumes and is responsible for the deficits in functional outcome.49 Among
a number of previous studies, a recent paper by Volpe et al. pointed out that pre-
oligodendrocytes are the principal cellular target in cerebral white matter injury,
the most important form of brain injury and subsequently of neurological disability
in preterm infants.50 In their paper, Volpe et al. state that primary injury to pre-
oligodendrocytes relates to a confluence of maturation-dependent characteristics
that render these cells vulnerable to two principal upstream mechanisms, hypoxia-
ischemia and systemic infection or inflammation. These upstream mechanisms
converge on three interacting downstream mechanisms, i.e. microglial activation,
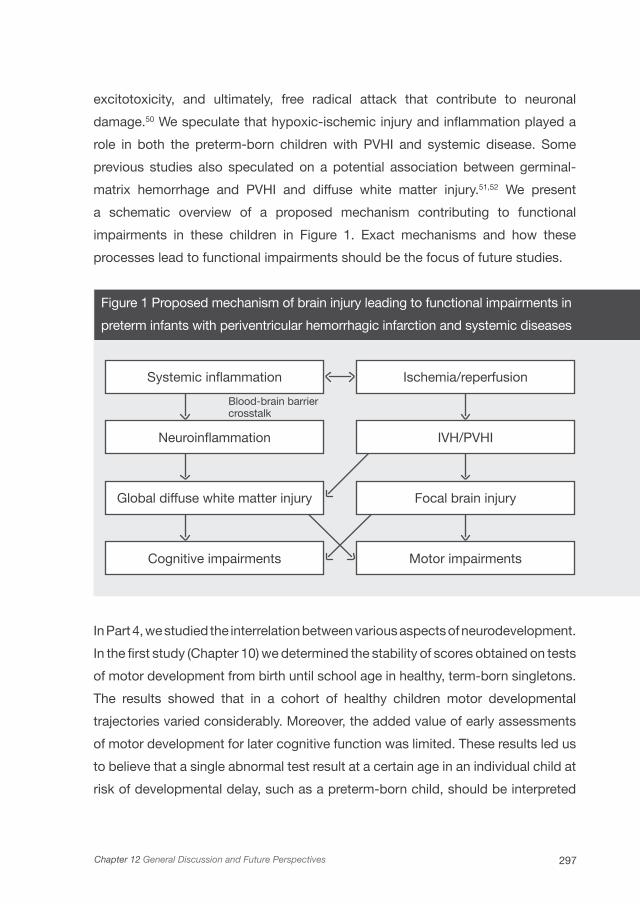
297Chapter 12 General Discussion and Future Perspectives
excitotoxicity, and ultimately, free radical attack that contribute to neuronal
damage.50 We speculate that hypoxic-ischemic injury and inflammation played a
role in both the preterm-born children with PVHI and systemic disease. Some
previous studies also speculated on a potential association between germinal-
matrix hemorrhage and PVHI and diffuse white matter injury.51,52 We present
a schematic overview of a proposed mechanism contributing to functional
impairments in these children in Figure 1. Exact mechanisms and how these
processes lead to functional impairments should be the focus of future studies.
Figure 1 Proposed mechanism of brain injury leading to functional impairments in
preterm infants with periventricular hemorrhagic infarction and systemic diseases
In Part 4, we studied the interrelation between various aspects of neurodevelopment.
In the first study (Chapter 10) we determined the stability of scores obtained on tests
of motor development from birth until school age in healthy, term-born singletons.
The results showed that in a cohort of healthy children motor developmental
trajectories varied considerably. Moreover, the added value of early assessments
of motor development for later cognitive function was limited. These results led us
to believe that a single abnormal test result at a certain age in an individual child at
risk of developmental delay, such as a preterm-born child, should be interpreted
Systemic inflammation Ischemia/reperfusion
Neuroinflammation IVH/PVHI
Global diffuse white matter injury Focal brain injury
Cognitive impairments Motor impairments
Blood-brain barriercrosstalk
Functional Development at School Age of Newborn Infants at Risk
cautiously. The effect of a risk factor on development must be quite large to come
to light at every assessment until school age. If a certain risk factor only has a
moderate impact on development, it may soon be counteracted by factors that
are known to have an important impact on development. Cases in point identified
in our study were maternal SES and verbal intelligence, but possibly other factors
as well that have yet to be discovered.
In the second study (Chapter 11) we established the neuropsychological
profiles at school age in very preterm-born children compared to the profiles of
term-born children. We found that a majority of preterm children had multiple
neuropsychological impairments. We could not confirm a neuropsychological
profile typical for preterm children, although we did find that performance IQ
was characteristic of profiles including multiple neuropsychological impairments
in preterm children but not in controls. Moreover, we found an inverse relation
between birth weight and the number of neuropsychological domains that were
affected. This phenomenon has not been described before. We speculate that
differences in neuropsychological profiles between preterms and controls may
reflect an altered organization of brain structures in preterm children, presumably
mediated by white matter injury.
The studies described in this thesis were subject to potential limitations. First,
they were single-center studies. Their generalizability to other centers needs to
be established. In addition, due to the limited attention span of the children, we
were unable to test all possible neuropsychological functions that may be affected
by perinatal risk factors leaving out language functions, for example. We chose a
school age test battery that included most of the functions that may be affected by
preterm birth and perinatal brain injury. Finally, in most of the studies, neuroimaging
consisted of cranial ultrasonography in the neonatal period only. Although cranial
ultrasonography is a reliable method for diagnosing most overt brain lesions in the
neonatal period, including PVHI,14,53 we may have missed additional, more subtle
lesions that may also have had an impact on neurodevelopmental outcome.

299Chapter 12 General Discussion and Future Perspectives
Conclusion and Future Perspectives
This thesis provides insight into the question to what extent certain risk factors
encountered during the perinatal period have an impact on functional outcome at
school age. The proposed pathophysiological mechanisms were different for the
various risk factors and they were often complex and multifactorial. Environmental
pollutants mainly interfere with normal brain development by affecting hormone
systems involved in synaptogenesis and myelination of neurons. They led to a mild
effect on long-term outcome within the normal range. In preterm-born children
with systemic disease, neuroinflammation lies at the basis of disrupting normal
development, whilst in preterm-born children with overt types of brain lesions
both local destruction of tissue and diffuse white matter injury may have played
a role in the functional impairments we found at school age. This thesis touches
on the question of the exact pathophysiological mechanisms responsible for the
long-term functional impairments, a question that should be the focus of future
studies.
One question remains: why did some children in our study have more favorable
outcomes at school age than others who had similar clinical diseases in the
neonatal period? We hinted at environmental factors that play a role in functional
development, such as maternal intelligence and socioeconomic status, possibly
contributing to cognitive development in children (Chapter 10). But also other, less
well understood factors such as genetic factors for susceptibility and recovery of
brain disruptions, may be involved.54,55
A better understanding of factors that play a role in the development and recovery
from brain injury could guide future intervention attempts aimed at improving the
long-term outcome of newborn infants suffering from perinatal brain injury. More
recently, potential interventions to improve outcome have become a focus of
research. These include intervention strategies providing neuroprotection, neural
recovery or neurogenesis by means of cerebral plasticity. They can be deployed at
a neurobiological level such as administrating anti-inflammatory and anti-apoptotic
drugs, growth factors, and hypothermia in the early neonatal period following
perinatal brain injury.56-58 Additionally, numerous studies developed a variety of
Functional Development at School Age of Newborn Infants at Risk
intervention strategies at a functional level. Several aspects of early development
such as motor, cognitive, and behavioral development, as well as mother–infant
interaction, are emphasized depending on the outcomes targeted.59 To date,
early developmental interventions have been unable to show a lasting effect on
motor outcome in preterm-born children. Regarding cognitive development, they
have reported positive short-term effects but these benefits were not persistent
throughout school age.59 Future research should investigate which newborn infants
at risk for adverse outcome will benefit most from intervention strategies, which
aspects of the different programs are most useful, and how these programs can
be implemented cost-effectively.
Based on the findings of this thesis, we advocate that close follow-up of newborn
infants with a complicated neonatal history is all-important. Follow-up should
not only include children who suffered from perinatal brain injury but should also
include children who suffered systemic diseases in the neonatal period. Moreover,
children should be assessed at various ages until school age, since developmental
impairments may not come to light at every assessment (Chapter 10), or may
only come to light by the time children start going to school. The assessment
battery should include several aspects of neurocognitive functioning, for example,
attention and visuomotor skills. Limiting the follow-up program for preterm children
to include only the assessment of general intellectual development may wrongfully
classify a preterm-born child as developing normally. Specific neuropsychological
problems may be missed in so doing (Chapter 11). We therefore recommend that
measures of motor, intellectual, neuropsychological, and behavioral functioning be
included in the follow-up program. Finally, MRI not only during the neonatal period,
but also during follow-up may help to visualize pathophysiological mechanisms
responsible for functional impairments. MRI should, therefore, be incorporated in
neurodevelopmental assessment whenever possible.
Adequate follow-up of newborn infants leads to the timely identification of
functional impairments and in so doing creates the earliest possible opportunity
for intervention.
301Chapter 12 General Discussion and Future Perspectives
1. Roze E, Meijer L, Bakker A, Van Braeckel
KNJA, Sauer PJJ, Bos AF. Prenatal exposure
to organohalogens, including brominated flame
retardants, influences motor, cognitive, and
behavioral performance at school age. Environ Health
Perspect 2009;117:1953-1958.
2. Herbstman JB, Sjodin A, Kurzon M, et al. Prenatal
exposure to PBDEs and neurodevelopment. Environ
Health Perspect 2010;118:712-719.
3. Costa LG, Giordano G. Developmental neurotoxicity
of polybrominated diphenyl ether (PBDE) flame
retardants. Neurotoxicology 2007;28:1047-1067.
4. Rahman F, Langford KH, Scrimshaw MD, Lester
JN. Polybrominated diphenyl ether (PBDE) flame
retardants. Sci Total Environ 2001;275:1-17.
5. Gascon M, Vrijheid M, Martinez D, et al. Effects
of pre and postnatal exposure to low levels of
polybromodiphenyl ethers on neurodevelopment and
thyroid hormone levels at 4 years of age. Environ Int
2011;37:605-611.
6. Bernal J. Thyroid hormone receptors in brain
development and function. Nat Clin Pract Endocrinol
Metab 2007;3:249-259.
7. Weisglas-Kuperus N. Neurodevelopmental,
immunological and endocrinological indices of
perinatal human exposure to PCBs and dioxins.
Chemosphere 1998;37:1845-1853.
8. Solomon GM, Schettler T. Environment and health:
6. Endocrine disruption and potential human health
implications. CMAJ 2000;163:1471-1476.
9. Schreiber T, Gassmann K, Gotz C, et al.
Polybrominated diphenyl ethers induce
developmental neurotoxicity in a human in vitro
model: evidence for endocrine disruption. Environ
Health Perspect 2010;118:572-578.
10. Roze E, Kerstjens JM, Maathuis CG, Ter Horst
HJ, Bos AF. Risk Factors for Adverse Outcome in
Preterm Infants With Periventricular Hemorrhagic
Infarction. Pediatrics 2008;122:e46-e52.
11. Bassan H, Feldman HA, Limperopoulos C, et al.
Periventricular hemorrhagic infarction: Risk factors
and neonatal outcome. Pediatr Neurol
2006;35:85-92.
12. Osborn DA, Evans N, Kluckow M. Hemodynamic
and antecedent risk factors of early and late
periventricular/intraventricular hemorrhage in
premature infants. Pediatrics 2003;112:33-39.
13. Thorp JA, Jones PG, Clark RH, Knox E, Peabody
JL. Perinatal factors associated with severe
intracranial hemorrhage. Am J Obstet Gynecol
200;185:859-862.
14. de Vries LS, Roelants-van Rijn AM, Rademaker KJ,
van Haastert I, Beek FJ, Groenendaal F. Unilateral
parenchymal haemorrhagic infarction in the preterm
infant. Eur J Paediatr Neurol 2001;5:139-149.
15. Guzzetta F, Shackelford GD, Volpe S, Perlman
JM, Volpe JJ. Periventricular intraparenchymal
echodensisties in the premature newborn: critical
determinant of neurological outcome. Pediatrics
1986;78:995-1006.
References

Functional Development at School Age of Newborn Infants at Risk
16. Cioni G, Bos AF, Einspieler C, et al. Early
neurological signs in preterm infants with unilateral
intraparenchymal echodensity. Neuropediatrics
2000;31:240-251.
17. Bassan H, Benson CB, Limperopoulos C, et al.
Ultrasonographic features and severity scoring
of periventricular hemorrhagic infarction in
relation to risk factors and outcome. Pediatrics
2006;117:2111-2118.
18. Roze E, Van Braeckel KN, van der Veere CN,
Maathuis CG, Martijn A, Bos AF. Functional
outcome at school age of preterm infants with
periventricular hemorrhagic infarction. Pediatrics
2009;123:1493-1500.
19. Brouwer A, Groenendaal F, van Haastert
IL, Rademaker K, Hanlo P, de Vries L.
Neurodevelopmental outcome of preterm infants
with severe intraventricular hemorrhage and therapy
for post-hemorrhagic ventricular dilatation. J Pediatr
2008;152:648-654.
20. Bassan H, Limperopoulos C, Visconti K, et al.
Neurodevelopmental outcome in survivors of
periventricular hemorrhagic infarction. Pediatrics
2007;120:785-792.
21. Vollmer B, Roth S, Riley K, et al. Long-term
neurodevelopmental outcome of preterm children
with unilateral cerebral lesions diagnosed by
neonatal ultrasound. Early Hum Dev
2006;82:655-661.
22. Sherlock RL, Anderson PJ, Doyle LW.
Neurodevelopmental sequelae of intraventricular
haemorrhage at 8 years of age in a regional cohort
of ELBW/very preterm infants. Early Hum Dev
2005;81:909-916.
23. Hoekstra RE, Ferrara TB, Couser RJ, Payne
NR, Connett JE. Survival and long-term
neurodevelopmental outcome of extremely
premature infants born at 23-26 weeks’ gestational
age at a tertiary center. Pediatrics 2004;113:e1-e6.
24. Sherlock RL, Synnes AR, Eckstein GR, et al. Long
term outcome after neonatal intraparenchymal
echodensities with porencephaly. Arch Dis Child
Fetal Neonatal Ed 2008;93:F127-F131.
25. Volpe JJ. Neurology of the Newborn. 5th ed.
Philadelphia, PA: Elsevier; 2008.
26. Rennie JM, Boylan GB. Neonatal seizures and their
treatment. Curr Opin Neurol 2003;16:177-181.
27. Thibeault-Eybalin MP, Lortie A, Carmant L. Neonatal
seizures: do they damage the brain? Pediatr Neurol
2009;40:175-180.
28. McBride MC, Laroia N, Guillet R. Electrographic
seizures in neonates correlate with poor
neurodevelopmental outcome. Neurology
2000;55:506-513.
29. Pisani F, Cerminara C, Fusco C, Sisti L. Neonatal
status epilepticus vs recurrent neonatal seizures:
clinical findings and outcome. Neurology
2007;69:2177-2185.

303Chapter 12 General Discussion and Future Perspectives
30. Klinger G, Chin CN, Beyene J, Perlman M.
Predicting the outcome of neonatal bacterial
meningitis. Pediatrics 2000;106:477-482.
31. Toet MC, Groenendaal F, Osredkar D, van Huffelen
AC, de Vries LS. Postneonatal epilepsy following
amplitude-integrated EEG-detected neonatal
seizures. Pediatr Neurol 2005;32:241-247.
32. de Vries LS, Groenendaal F, van Haastert I, Eken
P, Rademaker KJ, Meiners LC. Asymmetrical
myelination of the posterior limb of the internal
capsule in infants with periventricular haemorrhagic
infarction: An early predictor of hemiplegia.
Neuropediatrics 1999;30:314-319.
33. Puig J, Pedraza S, Blasco G, et al. Wallerian
degeneration in the corticospinal tract evaluated
by diffusion tensor imaging correlates with motor
deficit 30 days after middle cerebral artery ischemic
stroke. Am J Neuroradiol 2010;31:1324-1330.
34. Degos V, Favrais G, Kaindl AM, et al. Inflammation
processes in perinatal brain damage. J Neural
Transm 2010;117:1009-1017.
35. Malaeb S, Dammann O. Fetal inflammatory
response and brain injury in the preterm newborn. J
Child Neurol 2009;24:1119-1126.
36. Volpe JJ. Postnatal sepsis, necrotizing entercolitis,
and the critical role of systemic inflammation in
white matter injury in premature infants. J Pediatr
2008;153:160-163.
37. Adams-Chapman I, Stoll BJ. Neonatal infection
and long-term neurodevelopmental outcome in the
preterm infant. Curr Opin Infect Dis
2006;19:290-297.
38. Abbott NJ. Inflammatory mediators and modulation
of blood-brain barrier permeability. Cell Mol
Neurobiol 2000;20:131-147.
39. Yanowitz TD, Potter DM, Bowen A, Baker RW,
Roberts JM. Variability in cerebral oxygen delivery
is reduced in premature neonates exposed to
chorioamnionitis. Pediatr Res 2006;59:299-304.
40. Khwaja O, Volpe JJ. Pathogenesis of cerebral white
matter injury of prematurity. Arch Dis Child Fetal
Neonatal Ed 2008;93:F153-F161.
41. Volpe JJ. Neurobiology of periventricular
leukomalacia in the premature infant. Pediatr Res
2001;50:553-562.
42. Shah DK, Doyle LW, Anderson PJ, et al. Adverse
neurodevelopment in preterm infants with postnatal
sepsis or necrotizing enterocolitis is mediated by
white matter abnormalities on magnetic resonance
imaging at term. J Pediatr 2008;153:170-175.
43. Jevtovic-Todorovic V, Hartman RE, Izumi Y, et
al. Early exposure to common anesthetic agents
causes widespread neurodegeneration in the
developing rat brain and persistent learning deficits.
J Neurosci 2003;23:876-882.
44. Yehuda S, Rabinovitz S, Mostofsky DI. Nutritional
deficiencies in learning and cognition. J Pediatr
Gastroenterol Nutr 2006;43:S22-S25.

Functional Development at School Age of Newborn Infants at Risk
45. Aylward GP. Neurodevelopmental outcomes of
infants born prematurely. J Dev Behav Pediatr
2005;26:427-440.
46. Peterson BS, Vohr B, Staib LH, et al. Regional
brain volume abnormalities and long-term cognitive
outcome in preterm infants. JAMA
2000;284:1939-1947.
47. Nosarti C, Al-Asady MH, Frangou S, Stewart AL,
Rifkin L, Murray RM. Adolescents who were born
very preterm have decreased brain volumes. Brain
2002;125:1616-1623.
48. Isaacs EB, Lucas A, Chong WK, et al. Hippocampal
volume and everyday memory in children of very
low birth weight. Pediatr Res 2000;47:713-720.
49. Volpe JJ. Brain injury in premature infants: a
complex amalgam of destructive and developmental
disturbances. Lancet Neurol 2009;8:110-124.
50. Volpe JJ, Kinney HC, Jensen FE, Rosenberg PA.
The developing oligodendrocyte: key cellular target
in brain injury in the premature infant. Int J Dev
Neurosci 2011;29:423-440.
51. Folkerth RD. Neuropathologic substrate of cerebral
palsy. J Child Neurol 2005;20:940-949.
52. Kuban K, Sanocka U, Leviton A, et al. White
matter disorders of prematurity: association with
intraventricular hemorrhage and ventriculomegaly.
The Developmental Epidemiology Network. J
Pediatr 1999;134:539-546.
53. Bass WT, Jones MA, White LE, Montgomery TR,
Aiello F, Karlowicz MG. Ultrasonographic differential
diagnosis and neurodevelopmental outcome of
cerebral white matter lesions in premature infants. J
Perinatol 1999;19:330-336.
54. Harding DR, Dhamrait S, Whitelaw A, Humphries
SE, Marlow N, Montgomery HE. Does interleukin-6
genotype influence cerebral injury or developmental
progress after preterm birth? Pediatrics
2004;114:941-947.
55. Bi B, Salmaso N, Komitova M, et al. Cortical glial
fibrillary acidic protein-positive cells generate
neurons after perinatal hypoxic injury. J Neurosci
2011;31:9205-9221.
56. Johnston MV, Fatemi A, Wilson MA, Northington F.
Treatment advances in neonatal neuroprotection
and neurointensive care. Lancet Neurol
2011;10:372-382.
57. Ma D, Hossain M, Chow A, et al. Xenon and
hypothermia combine to provide neuroprotection
from neonatal asphyxia. Ann Neurol
2005;58:182-193.
58. Carty ML, Wixey JA, Reinebrant HE, Gobe
G, Colditz PB, Buller KM. Ibuprofen inhibits
neuroinflammation and attenuates white matter
damage following hypoxia-ischemia in the immature
rodent brain. Brain Res 2011;1402:9-19.

305Chapter 12 General Discussion and Future Perspectives
59. Orton J, Spittle A, Doyle L, Anderson P, Boyd R. Do
early intervention programmes improve cognitive
and motor outcomes for preterm infants after
discharge? A systematic review. Dev Med Child
Neurol 2009;51:851-859.


Chapter 13
SUMMARY IN ENGLISH
NEDERLANDSE SAMENVATTING
DANKWOORD
ABOUT THE AUTHOR
LIST OF PUBLICATIONS
ABBREVIATIONS
AUTHORS AND AFFILIATIONS
ELISE ROZE

Functional Development at School Age of Newborn Infants at Risk
Summary in English
The main goal of this thesis was to establish the functional outcome of newborn
infants with perinatal risk factors of adverse outcome. The functional outcome
indicates the motor, cognitive, and behavioral skills and abilities that are relevant
for functioning in daily life. To this end, we studied the impact of risk factors ranging
from prenatal exposure to environmental pollutions to neonatal systemic diseases
and overt brain lesions on long-term, school age outcome.
In Part 1 we studied the functional outcome of infants exposed prenatally to
environmental pollutants. We found that transplacental transfer of polybrominated
flame retardants was associated with the development of children at school
age. Brominated flame retardants correlated with worse fine manipulative
abilities, worse attention, better coordination, better visual perception, and better
behavior. Chlorinated organohalogens correlated with less choreiform dyskinesia.
Hydroxylated polychlorinated biphenyls correlated with worse fine manipulative
abilities, better attention, and better visual perception. The wood protective agent
correlated with worse coordination, less sensory integrity, worse attention, and
worse visuomotor integration. Because of the widespread use of these compounds
our findings cause serious concern (Chapter 2).
In Part 2 we determined the functional outcome of newborn infants with brain
injury. We found that in 54 preterm infants born <37 weeks of gestation with
periventricular hemorrhagic infarction (PVHI), mortality occurred in 30%. Of the
survivors, 66% developed cerebral palsy, which was mild in 21 children (Gross
Motor Function Classification System (GMFCS) levels I and II) and moderate to
severe in 4 (levels III and IV). Use of inotropics and maternal intrauterine infection
were independent predictors for mortality (odds ratio (OR) 31.2, 95% confidence
interval (CI) 2.6-373, p<.01 and OR 12.2, 95% CI 1.2-127, p<.05 respectively).
In survivors, only the most extended form of PVHI was associated with the
development of cerebral palsy (OR>4.7, p<.005), but not with severity of cerebral
palsy. Cystic periventricular leukomalacia and concurrent grade III germinal matrix
hemorrhage were associated with more severe cerebral palsy. We concluded from

309Chapter 13
this study that in preterm infants with PVHI, mortality occurred despite optimal
treatment and was associated with circulatory failure and maternal intrauterine
infection. In survivors, motor development was abnormal in 66%, but functional
abilities were good in the majority. Extension and localization of the PVHI were not
clearly related to functional outcome (Chapter 3).
We then studied the functional outcome at school age of preterm infants with
PVHI. Of 38 infants, 15 (39%) died. Twenty-one of 23 survivors were included
in the follow-up. Four were neurologically normal, 1 had minor neurological
dysfunction, 13 had unilateral spastic cerebral palsy (CP), and 3 bilateral CP.
Coordination, associated movements and fine manipulative abilities were affected
most according to the neurological examination. The GMFCS was level I in 7
children, level II in 7 children, level III in one child, and level IV in 2 children. The
Manual Ability Classification System score was normal in 4 children, level I in 8
children, level II in 7 children, and level III in 2 children. The mean and median total
intelligence quotient (IQ) was 83 (range 55-103, standard deviation (SD) 11). Visual
perception was normal in 88%, visuomotor integration was normal in 74% and
verbal memory was normal in 50% of the children. Behavior was normal in 53%
and executive functions were normal in 65% and 29% (parents and teachers).
Characteristics of the PVHI were not related to functional motor outcome and
intelligence. Posthemorrhagic ventricular dilatation was a risk factor for poorer
total and performance intelligence and abnormal fine manipulative abilities. We
concluded from this study that the majority of surviving preterm children with
PVHI had CP with limited functional impairment at school age. Intelligence was
within 1 SD of the norm of preterm children without lesions in 60% to 80% of
the children. Verbal memory, in particular, was affected. Behavioral and executive
function problems occurred slightly more than in preterm infants without lesions.
The functional outcome at school age of preterm children with PVHI was better
than previously thought (Chapter 4).
We also studied the outcome of 82 term-born infants with seizures that required
two or more anti-epileptic drugs (AEDs) and determined whether treatment efficacy
and/or the underlying disorder were related to neurological outcome. We found that
47 infants (57%) had status epilepticus. The number of AEDs was not related to
Functional Development at School Age of Newborn Infants at Risk
neurological outcome. Treatment with three or four AEDs as opposed to two showed
a trend towards an increased risk of a poor outcome, i.e. death or CP, (OR 2.74; 95%
CI 0.98-7.69, p=.055). Failure to achieve seizure control increased the risk of poor
outcome (OR 6.77; 95% CI 1.42-32.82, p=.016). Persistently severely abnormal aEEG
background patterns also increased this risk (OR 3.19; 95% CI 1.90-5.36, p<.001).
In a multivariate model including abnormal aEEG background patterns, failure to
achieve seizure control nearly reached significance towards an increased risk of poor
outcome, (OR 5.72, 95% CI 0.99–32.97, p=.051). We found no association between
seizure aetiology and outcome. We concluded from this study that in term-born
infants with seizures that required two or more AEDs outcome was poorer if seizure
control failed. The number of AEDs required to reach seizure control and seizure
aetiology had limited prognostic value (Chapter 5).
We then describe an advanced magnetic resonance imaging (MRI) technique,
diffusion tensor imaging, to assess diffusion characteristics of the corticospinal
tracts in 20 newborn infants with focal neonatal ischemic brain lesions compared
to 21 healthy term controls. Conventional MRI was able to predict normal motor
development (n=9) or a unilateral spastic cerebral palsy (n=6). In children who
developed a mild motor asymmetry (n=5), conventional MRI predicted a unilateral
spastic cerebral palsy in 2 and normal motor development in 3 infants. The asymmetry
indices for tract volume, fractional anisotropy, apparent diffusion coefficient and
radial diffusivity showed a significant difference between controls and infants who
developed a unilateral spastic cerebral palsy and radial diffusivity also showed
a significant difference in asymmetry index between controls and infants who
developed a mild asymmetry. We concluded from this study that conventional MRI
was able to predict subsequent normal motor development or unilateral spastic
cerebral palsy following focal injury in newborn infants. Measures of radial diffusivity
obtained from diffusion tractography may offer additional information for predicting
a subsequent asymmetry in motor function (Chapter 6).
In Part 3 we determined the functional outcome of preterm and term-born
infants with systemic diseases in the neonatal period and we studied the role of
inflammation on development at school age. First, we determined motor, cognitive,

311Chapter 13
and behavioral outcome at school age of children that had either necrotizing
enterocolitis (NEC) or spontaneous intestinal perforation (SIP). We included 52
of 65 survivors for follow-up. At mean age 9 years we found that 68% of the
children had borderline or abnormal scores on the Movement Assessment Battery
for Children (versus 45% of controls). Their mean total intelligence quotient (IQ)
was 86±14 compared to 97±9 in the controls. Additionally, attention and visual
perception were affected (p<.01 and p=.02). In comparison to controls, surgically
treated children were at highest risk for adverse outcome. In conclusion, we found
that at school age the motor functions and intelligence of many children with
NEC or SIP were borderline or abnormal and, specifically, attention and visual
perception were impaired. We stated that children with NEC or SIP form a specific
risk-group for functional impairments at school age even though the majority did
not have overt brain pathology (Chapter 7).
We then determined the motor, cognitive, and behavioral outcome at school age of
preterm children with late-onset sepsis compared to matched controls. At 6-9 years,
21 of 32 children with late-onset sepsis (68%) had borderline or abnormal motor
outcome with most problems in fine motor skills. Their total IQ was 89 compared
to 98 in controls. In addition, verbal memory and attention were affected more
often compared to controls (0.61 SD, 95% CI 0.04-1.17, p=.033 and 0.94 SD, 95%
CI 0.32-1.62, p=.011, respectively). Multiple episodes of sepsis and gram-negative
sepsis were risk factors for worse cognitive outcome. We concluded that at school
age, a majority of preterm children with late-onset sepsis had motor problems.
Their IQ was considerably lower than matched controls, and memory and attention
were specifically impaired. Outcome at school age of preterm children with late-
onset sepsis was worse than previously thought (Chapter 8).
Finally, we established the outcome at school age of newborn infants with intestinal
obstructions treated surgically during their first days of life. Of 44 children, three (7%)
died. Twenty-seven survivors (66%) were included for follow-up (median gestational
age 36.7 weeks, birth weight 3000 grams). Motor outcome was abnormal (<5th
percentile) in 22% of the children. This was worse than the reference population
(p<.01). Scores on selective attention were abnormal in 15% of the children (p<.01).
Other cognitive functions were not affected. Lower birth weight and intestinal

Functional Development at School Age of Newborn Infants at Risk
perforation were risk factors for poorer motor outcome (r2=0.53) while intrauterine
growth restriction was a risk factor for poorer selective attention (r2=0.366). We
concluded that children treated surgically for intestinal obstructions in the neonatal
period had an increased risk for poor motor functioning and selective attention at
school age. Low birth weight, IUGR, and intestinal perforation were risk factors for
adverse outcomes. We recommended to closely follow the motor and attentional
development of these children (Chapter 9).
The final part of the thesis focused on developmental processes and the
association between various developmental domains in preterm-born and term-
born children (Part 4). First, we described developmental trajectories of 77 healthy
term-born children until school age. We found that the mean absolute difference
in standardized motor scores over all time points was 1.01 SD. Only the explained
proportions of variance of maternal socioeconomic status (SES) and verbal
intelligence were significant for sustained attention and verbal memory (r2=0.104,
p=.030 and r2=0.074, p=.027 respectively). The children’s scores on early motor
tests added little value for their motor and cognitive development at school age.
We concluded that in healthy children the stability of motor development from
birth until school age is low. Maternal SES and verbal intelligence rather than the
infants’ scores on early motor tests signified added value for complex cognitive
functions at school age (Chapter 10).
In the final chapter we established the neuropsychological profiles at school age
of a cohort of very preterm-born children compared to term-born controls. We
found that at mean 8.8 years, 55% of preterm children had suspect-abnormal
neuropsychological outcomes in multiple (≥2) domains, versus 25% of the controls
(OR 3.67, 95% CI 1.90-7.06). In preterm children with multiple impairments, verbal
memory, attention, and performance IQ were mostly affected. No typical pattern
of co-occurrence of neuropsychological impairments was specific to preterm
children, except for those that included low performance IQ (OR 5.43, 95% CI 1.75-
16.81). The higher the number of suspect-abnormal neuropsychological domains,
the worse the academic achievement (p<.01). We concluded from this study that
a majority of preterm children had multiple neuropsychological impairments. Low

313Chapter 13
performance IQ was characteristic of profiles including multiple neuropsychological
impairments in preterm children but not in controls. We speculated that differences
in neuropsychological profiles between preterms and controls may reflect an
altered organization of brain structures in preterm children (Chapter 11).
The studies as reported in this thesis provided insight in to what extent certain
risk factors from the perinatal period have an impact on functional outcome at
school age. The proposed pathophysiological mechanisms were different for the
various risk factors and they were often complex and multifactorial. Environmental
pollutants mainly interfere with normal brain development by affecting hormone
systems involved in synaptogenesis and myelination of neurons. They led to a mild
effect on long-term outcome within the normal range. In preterm-born children
with systemic disease, neuroinflammation is at the basis of disruption of normal
development whilst in preterm-born children with overt types of brain lesions
both local destruction of tissue and diffuse white matter injury may have played a
role in the functional impairments we found at school age. Based on the findings
of this thesis, we advocate that newborn infants with a complicated neonatal
period should be followed up closely until school age. We recommend to include
measures of motor, intellectual, neuropsychological and behavioral functioning in
a follow-up program. Adequate follow-up of newborn infants could lead to the
early identification of functional impairments so as to identify opportunities for
early intervention.
Functional Development at School Age of Newborn Infants at Risk
Nederlandse samenvatting
Het hoofddoel van dit proefschrift was het vaststellen van de functionele
ontwikkeling op schoolleeftijd van pasgeboren kinderen met perinatale
risicofactoren voor een gestoorde ontwikkeling. Hierbij gaat het om de motorische,
cognitieve en gedragsmatige ontwikkeling die het functioneren beïnvloeden. Om
dit te onderzoeken hebben we de invloed van verschillende risicofactoren op de
ontwikkeling bepaald, variërend van prenatale blootstelling aan neurotoxische
milieuverontreinigende stoffen tot systemische ziekten en verschillende cerebrale
laesies die op kunnen treden in de neonatale periode.
In Deel 1 van het proefschrift hebben we de functionele uitkomst bestudeerd
van kinderen die prenataal blootgesteld zijn aan vlamvertragers. We vonden dat
de transplacentaire overdracht van gebromeerde vlamvertragers geassocieerd
is met de ontwikkeling van kinderen op schoolleeftijd. Gebromeerde
vlamvertragers correleerden met een slechtere fijne motoriek, een slechtere
aandacht, een betere coördinatie, een betere visuele perceptie en beter gedrag.
Gechloreerde organohalogenen correleerden met minder choreiforme dyskinesie.
Gehydroxyleerde, gechloreerde bifenylen correleerden met een slechtere
fijne motoriek, een betere aandacht en een betere visuele perceptie. De hout
beschermende stof PCP correleerde met een slechtere coördinatie, vermindering
van sensore integriteit, een slechtere aandacht en een slechtere visuomotore
integratie. Deze stoffen worden wereldwijd op grote schaal toegepast. We
concluderen daarom dat deze bevindingen leiden tot zorg (Hoofdstuk 2).
In Deel 2 van het proefschrift hebben we de functionele ontwikkeling van
pasgeboren kinderen met cerebrale laesies onderzocht. Allereerst vonden we
een sterfte van 30% bij prematuur geboren kinderen (zwangerschapsduur <37
weken) met een cerebraal veneus infarct (n=54). Van de overlevers ontwikkelde
66% een cerebrale parese. Deze was mild bij 21 kinderen (Gross Motor Function
Classification System (GMFCS) niveau I en II) en matig tot ernstig bij 4 kinderen
(niveau III en IV). We vonden dat het gebruik van inotropica en de aanwezigheid
van maternale intra-uteriene infectie onafhankelijke voorspellers zijn voor sterfte
315Chapter 13
in deze groep (odds ratio (OR) 31.2, 95% betrouwbaarheidsinterval (BHI) 2.6-373,
p<.01 en OR 12.2, 95% BHI 1.2-127, p<.05 respectievelijk). Bij de overlevers was
alleen de meest uitgebreide vorm van het veneus infarct geassocieerd met de
ontwikkeling van cerebrale parese (OR>4.7, p<.005), maar niet met de ernst ervan.
Cystische periventriculaire leukomalacie en het optreden van een graad III lamina
germinalis bloeding waren wel geassocieerd met een ernstigere vorm van cerebrale
parese. We concluderen naar aanleiding van deze studie dat sterfte bij prematuur
geboren kinderen met een veneus infarct optrad ondanks optimale behandeling
en geassocieerd was met circulatoir falen en maternale intra-uteriene infectie.
Van de overlevers was de motorische ontwikkeling afwijkend bij 66%, hoewel
de functionele mogelijkheden in de meerderheid goed waren. De uitgebreidheid
en lokalisatie van het infarct waren niet duidelijk gerelateerd aan de functionele
ontwikkeling van de kinderen (Hoofdstuk 3).
Vervolgens hebben we de functionele ontwikkeling op schoolleeftijd onderzocht
van prematuur geboren kinderen met een veneus infarct. Van 38 kinderen
stierven er 15 (39%). Eenentwintig van de 23 overlevende kinderen werden
geïncludeerd in de follow-up. Vier waren neurologisch normaal, 1 had minor
neurological dysfunction, 13 hadden een unilaterale spastische cerebrale parese
en 3 een bilaterale spastische cerebrale parese. De coördinatie, geassocieerde
bewegingen en fijne motoriek van de kinderen was het meest aangedaan. De
GMFCS score was bij 7 kinderen niveau I, bij 7 kinderen niveau II, bij 1 kind niveau
III en bij 2 kinderen niveau IV. De Manual Ability Classification System score was
bij 4 kinderen normaal, bij 8 kinderen niveau I, bij 7 kinderen niveau II en bij 2
kinderen niveau III. Het gemiddelde en mediane intelligentie quotiënt (IQ) was 83
(range 55-103, standaarddeviatie (SD) 11). De visuele perceptie was normaal bij
88%, de visuomotore integratie was normaal bij 74% en het verbaal geheugen
was normaal bij 50% van de kinderen. Het gedrag was normaal bij 53% en de
executieve functies waren normaal bij 65% en 29% van de kinderen (ouders en
leerkrachten). Karakteristieken van het veneus infarct waren niet gerelateerd aan
de functionele motorische ontwikkeling en de intelligentie. Posthemorrhagische
ventrikel dilatatie was een risicofactor voor een slechter totaal en performaal IQ
en een abnormale fijne motoriek. We concludeerden uit dit onderzoek dat de
Functional Development at School Age of Newborn Infants at Risk
meerderheid van de overlevende kinderen met een veneus infarct een cerebrale
parese ontwikkelt, hoewel de functionele beperkingen op schoolleeftijd gering zijn.
Bij 60% tot 80% van de kinderen was de intelligentie binnen 1 SD van het IQ
van prematuur geboren kinderen zonder deze cerebrale laesie. Vooral het verbaal
geheugen was aangedaan bij deze groep. Het gedrag en de executieve functies
waren iets vaker aangedaan dan bij prematuren zonder een veneus infarct. De
functionele ontwikkeling op schoolleeftijd van prematuur geboren kinderen met
een veneus infarct was beter dan wat voorheen gedacht werd (Hoofdstuk 4).
Daarna hebben we de uitkomst onderzocht van 82 à terme geboren kinderen met
convulsies, die daarvoor 2 of meer anti-epileptica (AEDs) nodig hadden. We hebben
ook onderzocht of de effectiviteit van de behandeling en/of de onderliggende
stoornis gerelateerd zijn aan de neurologische ontwikkeling. Zevenenveertig
kinderen (57%) hadden een status epilepticus. Het aantal verschillende AEDs
dat gebruikt is voor de behandeling van de convulsies was niet gerelateerd aan
de neurologische ontwikkeling. We vonden wel een trend richting een slechtere
uitkomst (sterfte of cerebrale parese) bij kinderen die met 3 of 4 middelen waren
behandeld in vergelijking met kinderen die 2 middelen kregen (OR 2.74; 95% BHI
0.98-7.69, p=.055). Het niet onder controle krijgen van de convulsies gaf ook een
verhoogd risico op een slechte uitkomst (OR 6.77; 95% BHI 1.42-32.82, p=.016).
Persisterende ernstig afwijkende aEEG achtergrond patronen droegen vooral bij
aan een verhoogd risico (OR 3.19; 95% BHI 1.90-5.36, p<.001). In een multivariaat
model waarin afwijkende aEEG achtergrond patronen werden meegenomen, kwam
het niet onder controle krijgen van de convulsies eruit als trend voor een slechtere
uitkomst (OR 5.72, 95% BHI 0.99–32.97, p=.051). Er bestond geen relatie tussen
de oorzaak van de convulsies en de neurologische ontwikkeling. We concluderen
uit dit onderzoek dat de uitkomst van à terme geboren kinderen met convulsies
die daarvoor 2 of meer middelen kregen slechter was als de convulsies niet onder
controle te krijgen waren. Het aantal AEDs die nodig waren om de convulsies onder
controle te krijgen en de oorzaak van de convulsies hadden maar zeer beperkte
prognostische waarde (Hoofdstuk 5).
Tenslotte hebben we een geavanceerde MRI techniek gebruikt (diffusion tensor
imaging) om de diffusie eigenschappen van de corticospinale baan te bestuderen

317Chapter 13
bij 20 pasgeboren kinderen met focale, ischemische neonatale hersenlaesies. We
vergeleken de eigenschappen met die van 21 gezonde, à terme geboren controle
kinderen. Conventionele MRI bleek in staat tot het voorspellen van een normale
motorische ontwikkeling (n=9) of een unilaterale spastische cerebrale parese
(n=6). Van de kinderen die een milde motorische asymmetrie ontwikkelden (n=5),
voorspelde de conventionele MRI een unilaterale spastische cerebrale parese bij
2 kinderen en een normale ontwikkeling bij 3 kinderen. De DTI asymmetrie indices
voor corticospinale baan volume, fractionele anisotropie, gemiddelde diffusie
coëfficiënt en radiale diffusiviteit lieten een significant verschil zien tussen controle
kinderen en kinderen die een unilaterale spastische cerebrale parese hadden
ontwikkeld. Daarnaast liet radiale diffusiviteit ook een significant verschil zien in
asymmetrie index tussen controle kinderen en kinderen met een milde motorische
asymmetrie. We concluderen daarom dat met behulp van conventionele MRI
een goede voorspelling van normale motorische ontwikkeling of een unilaterale
spastische cerebrale parese gegeven kan worden bij pasgeboren kinderen met
focale hersenschade. Door middel van metingen van radiale diffusiviteit verkregen
met DTI kan gedifferentieerd worden tussen kinderen die zich normaal ontwikkelen,
een milde motorische asymmetrie ontwikkelen of een unilaterale spastische
cerebrale parese ontwikkelen (Hoofdstuk 6).
In Deel 3 van het proefschrift hebben we de functionele uitkomst onderzocht van
prematuur en à terme geboren kinderen met systemische ziekten in de neonatale
periode. Eerst hebben we de motorische, cognitieve en gedragsmatige ontwikkeling
op schoolleeftijd onderzocht van kinderen met necrotiserende enterocolitis (NEC)
of een spontane geïsoleerde darmperforatie (SIP). We hebben 52 van de 65
overlevers geïncludeerd voor follow-up. Op een gemiddelde leeftijd van 9 jaar
vonden we dat 68% van de kinderen mild afwijkende of afwijkende scores had
op de Movement Assessment Battery for Children (vergeleken met 45% van de
controles). De gemiddelde intelligentie quotient (IQ) score was 86±14 vergeleken
met 97±9 bij de controles. Daarnaast waren aandacht en visuele perceptie vaker
aangedaan (p<.01 en p=.02). In vergelijking met de controles hadden geopereerde
kinderen het hoogste risico op een gestoorde ontwikkeling. Concluderend vonden
Functional Development at School Age of Newborn Infants at Risk
we dat de motorische functies en intelligentie van veel kinderen met NEC en SIP
aangedaan waren op schoolleeftijd. Kinderen met NEC en SIP vormen dus een
specifieke risico groep voor functionele beperkingen op schoolleeftijd terwijl de
meerderheid bij cerebrale beeldvorming geen grote cerebrale pathologie had
(Hoofdstuk 7).
Vervolgens hebben we de motorische, cognitieve en gedragsmatige ontwikkeling
op schoolleeftijd onderzocht van kinderen met een late-onset sepsis vergeleken
met gematchte controles. Op een leeftijd van 6-9 jaar hadden 21 van de 32
kinderen met late-onset sepsis (68%) een mild afwijkende of afwijkende motorische
ontwikkeling, met vooral problemen in de fijne motoriek. Het totale IQ was 89
vergeleken met 98 bij de controles. Daarnaast waren het verbaal geheugen en
aandacht ook aangedaan vergeleken met controles (0.61 SD, 95% BHI 0.04-1.17,
p=.033 en 0.94 SD, 95% BHI 0.32-1.62, p=.011 respectievelijk). Meerdere episodes
van sepsis en een gram-negatieve sepsis waren risicofactoren voor een slechtere
cognitieve uitkomst. We concluderen daarom dat op schoolleeftijd de meerderheid
van prematuur geboren kinderen met een late-onset sepsis motorische problemen
had. Het IQ was aanzienlijk lager dan bij gematchte controles en het geheugen en
de aandacht waren specifiek aangedaan. De ontwikkeling op schoolleeftijd van
deze kinderen was slechter dan tot nu toe gedacht (Hoofdstuk 8).
Tenslotte hebben we de ontwikkeling op schoolleeftijd vastgesteld van
pasgeboren kinderen met darm obstructies die daarvoor geopereerd zijn in de
eerste levensdagen. Van 44 kinderen stierven er 3 (7%). Zevenentwintig overlevers
(66%) werden geïncludeerd in de follow-up (mediane gestatieduur 36.7 weken,
geboortegewicht 3000 gram). De motorische ontwikkeling was afwijkend (<5e
percentiel) bij 22% van de kinderen. Dit was slechter dan in een referentie
populatie (p<.01). De scores op selectieve aandacht waren afwijkend bij 15% van
de kinderen (p<.01). Er waren geen andere cognitieve functies aangedaan. Een
lager geboortegewicht en darm perforatie waren risicofactoren voor een slechtere
motorische uitkomst (r2=0.53) terwijl intra-uteriene groeivertraging een risicofactor
was voor een slechtere selectieve aandacht (r2=0.366). We concluderen dat
kinderen die in de neonatale periode geopereerd zijn aan een darmobstructie
een verhoogd risico hebben op problemen van de motorische ontwikkeling en de

319Chapter 13
aandacht op schoolleeftijd. We bevelen daarom aan deze functies nauwgezet te
vervolgen bij deze kinderen (Hoofdstuk 9).
Het laatste deel van het proefschrift richt zich op ontwikkelingsprocessen en de
associatie tussen verschillende ontwikkelingsdomeinen bij prematuur en à terme
geboren kinderen (Deel 4). Allereerst hebben we de ontwikkelingstrajecten tot op
schoolleeftijd beschreven van 77 gezonde à terme geboren kinderen. We vonden dat
het gemiddelde absolute verschil in gestandaardiseerde motorische scores tussen
alle meetmomenten 1.01 SD bedroeg. Alleen de proportie verklarende variantie
van maternale sociaal economische status (SES) en maternaal verbale intelligentie
droegen significant bij aan volgehouden aandacht en het verbaal geheugen van de
kinderen (respectievelijk r2=0.104, p=.030 and r2=0.074, p=.027). De motorische
scores van de kinderen op eerdere motorische testen droegen weinig bij aan de
voorspelling van hun motorische en cognitieve ontwikkeling op schoolleeftijd. We
concluderen dat de stabiliteit in motorische ontwikkeling vanaf de geboorte tot
aan schoolleeftijd bij gezonde kinderen laag is. SES en de verbale intelligentie van
moeder zijn belangrijker dan de scores op motorische en neurologische tests voor
het latere cognitieve functioneren van de kinderen (Hoofdstuk 10).
In het laatste hoofdstuk hebben we de neuropsychologische profielen op
schoolleeftijd onderzocht bij een cohort prematuur geboren kinderen (gestatieduur
≤32 weken), in vergelijking met à terme geboren controles. Op een leeftijd van
8.8 jaar had 55% van de prematuur geboren kinderen een mild afwijkende of
afwijkende neuropsychologische ontwikkeling op meerdere (≥2) domeinen. Dit
was slechts 25% bij de controles (OR 3.67, 95% BHI 1.90-7.06). Bij prematuur
geboren kinderen met meerdere aangedane domeinen, waren vooral het
verbaal geheugen, de aandacht en het performaal IQ aangedaan. We konden bij
prematuren geen typisch patroon aantonen, wat betreft het gelijktijdig voorkomen
van neuropsychologische beperkingen, hoewel het performaal IQ wel vaker in
combinatie met andere domeinen was aangedaan (OR 5.43, 95% BHI 1.75-
16.81). Hoe meer domeinen er mild afwijkend of afwijkend waren, hoe slechter
de schoolprestaties (p<.01). We concluderen daarom dat de meerderheid van
prematuur geboren kinderen beperkingen had in meerdere neuropsychologische

Functional Development at School Age of Newborn Infants at Risk
domeinen. Een laag performaal IQ was karakteristiek voor profielen van prematuur
geboren kinderen die op meerdere domeinen beperkingen hadden. Dit gold niet
voor controles. We speculeren dat verschillen in neuropsychologische profielen
tussen prematuren en controles verklaard kunnen worden door een veranderde
organisatie van hersenstructuren bij prematuur geboren kinderen (Hoofdstuk 11).
De verschillende studies die in dit proefschrift zijn beschreven geven inzicht in
de mate waarin bepaalde risicofactoren uit de perinatale periode de functionele
ontwikkeling op schoolleeftijd kunnen beïnvloeden. De pathofysiologische
mechanismen zijn verschillend voor de verschillende factoren en zijn vaak
complex en multifactorieel. Milieuverontreinigende stoffen kunnen de normale
hersenontwikkeling beïnvloeden door te interfereren met hormoonsystemen die
een rol spelen bij de synaptogenese en myelinisatie van neuronen. Ze hadden een
mild effect op de lange termijn uitkomst welke binnen de normale range viel. Bij
prematuur geboren kinderen met systemische ziekten ligt neuroinflammatie aan
de basis van verstoring van de normale hersenontwikkeling, terwijl bij prematuur
geboren kinderen met ernstige hersenpathologie zowel lokale destructie van weefsel
als diffuse witte stofschade een rol kan spelen bij de functionele beperkingen op
schoolleeftijd.
Op basis van de bevindingen van deze studies pleiten wij ervoor dat pasgeboren
kinderen met een gecompliceerde periode vervolgd worden in hun ontwikkeling
tot op schoolleeftijd. Zowel de motorische, intellectuele, neuropsychologische als
gedragsmatige ontwikkeling zou vervolgd moeten worden. Adequate follow-up
van pasgeboren kinderen kan leiden tot de vroege identificatie van functionele
beperkingen die mogelijk interventie vereisen.

321Chapter 13
Functional Development at School Age of Newborn Infants at Risk
Dankwoord
Dit proefschrift is het resultaat van een MD/PhD traject binnen de onderzoekslijn
Neonatale Neurologie van de afdeling Neonatologie, Beatrix Kinderziekenhuis,
Universitair Medisch Centrum Groningen. Onderzoek doen doe je niet alleen, dat
leerde ik al snel. Daarom wil ik graag een aantal mensen bedanken die mij geholpen
hebben bij het onderzoek en bijgedragen hebben aan het plezier en enthousiasme
dat ik daarbij had. Mocht ik daarbij iemand vergeten dan is dit niet bewust en niet
persoonlijk bedoeld.
Allereerst wil ik mijn promotor Prof. Dr. A.F. Bos bedanken. Beste Arie, jij was
gedurende mijn promotietraject mijn steun en toeverlaat. Jij valt overduidelijk onder
het kopje ‘de professionele begeleider’, uit het boekje ‘Promoveren, een wegwijzer
voor de beginnend wetenschapper’ dat je me gaf aan het begin van mijn promotie
traject. “De professional heeft altijd tijd voor je, leest stukken snel, voorziet ze
van adequaat commentaar, motiveert je, en combineert de rollen van coach en
beoordelaar op bewonderenswaardige wijze.” Ik heb veel bewondering voor jou als
wetenschapper. Met jouw kritische en wetenschappelijke blik wist je mijn veldwerk
naar een hoger niveau te tillen. Daarnaast heb je mij de ruimte gegeven om eigen
ideeën te ontplooien en heb je mij als jonge onderzoeker geprikkeld tot nadenken.
We hadden vaak op een prettige manier discussies waarbij je mij de ruimte gaf om
mijn (soms kritische) mening te geven. Naast het onderzoek hebben we ook in onze
vrije tijd verschillende dingen ondernomen. Je hebt jouw passie voor klassieke
muziek en opera op me overgedragen doordat je me op congressen meenam
naar opera’s van onder andere Mozart en Verdi. Wij als onderzoekers namen jou
daarop mee naar een opera in het marionetten theater. Een iets andere entourage
maar minstens net zo onderhoudend. Dit waren bijzondere ervaringen voor mij.
Ook in jouw gezin heb ik een warm welkom gekregen. Regelmatig kwam ik samen
met Ewold of Elise pizza’s bij jullie bakken en deden we spelletjes met Judith,
Fionneke en Jasper. Arie, met jou als voorbeeld ben ik gepassioneerd geraakt
voor de zorg voor zieke pasgeboren kinderen. Ik had mij geen betere Doktervater
kunnen wensen.

323Chapter 13
Lieve Elise, jij bent naast een goede vriendin ook een intelligente en gezellige
collega om mee samen te werken en een trouwe paranimf. Wat hebben wij veel
mooie momenten beleefd de afgelopen jaren. We vlogen de hele wereld over om
anderen te vertellen over ons onderzoek en geïnspireerd te raken door de verhalen
van anderen. We deelden een werkkamer en hielden elkaar (en ook de andere
kamergenoten) ieder moment van de dag op de hoogte van de voortgang van ons
onderzoek. Wij werden vaak gekscherend ´de Elises´ genoemd. Soms vonden we
dat vervelend, maar eigenlijk was ik er altijd heel trots op. Jij was altijd bereid een
kritische blik te werpen op een abstract of paper van mijn hand. Samen hielpen
we elkaar waar mogelijk om ons onderzoek te verbeteren en onze persoonlijke
ambities waar te maken. Zo´n vriendschap en collegialiteit is in mijn ogen goud
waard.
Lieve Petra, naast een goede vriendin ben je een fantastische paranimf geweest.
Heel erg bedankt voor al je meedenken en enthousiaste helpen bij de laatste
loodjes rondom het proefschrift en de verdediging. Ook heb ik fijne herinneringen
aan de gezellige lunches en borrels die we samen met collega Kingma en Verhagen
hadden. Dank daarvoor!
Daarnaast heb ik heel plezierig met andere jonge en meer ervaren onderzoekers
samengewerkt. Koen, jij leerde mij de basis van de neuropsychologie en het
testen van diverse neurocognitieve functies. Met jouw Belgische humor en
kritische wetenschappelijke toon wist je mijn onderzoek van nuttig commentaar te
voorzien. Christa van der Veere, jij leerde me het Touwen neurologisch onderzoek
en de brede variabiliteit van de normale ontwikkeling herkennen. Carel Maathuis,
jij leerde me veel over de klinische kenmerken en behandeling van kinderen met
een cerebrale parese. Janneke Bruggink, Henk ter Horst, Jorien Kerstjens en
Lisethe Meijer, de prettige samenwerking die we hadden heeft geleid tot mooie
onderzoeksresultaten. Mijn dank hiervoor.
Prof. Dr. Mijna Hadders-Algra wil ik bedanken voor haar kritische blik op de opzet
en uitwerking van enkele van de onderzoeksprojecten.
Er zijn diverse studenten waar ik mee samen heb gewerkt en waarvan er velen
tevens co-auteur zijn op één van de papers. Attie, Bastiaan, Janyte, Jozien,
Mariska, Meike, en Rachel bedankt voor de prettige samenwerking. Daarnaast

Functional Development at School Age of Newborn Infants at Risk
gaat mijn dank uit naar de andere neonatologen en fellows voor hun kritische blik
en repliek op mijn onderzoek bij het bespreken van onderzoeksprojecten en het
oefenen van voordrachten tijdens de researchbesprekingen op dinsdagochtend.
Dan waren er verschillende ganggenoten en onderzoekers van de Neonatologie die
gezelligheid brachten in de koffiepauzes: Annemiek, Annemieke, Bertine, Carianne,
Chris Peter, Deirdre, Eryn, Hiltje, Ingrid, José, Karin, Marrit, Martijn, Menno,
Michelle, Nicole, Marieke, Paul, Tina en Tjitske. Ook wil ik enkele secretaresses
en beleidsmedewerkers van het Beatrix Kinderziekenhuis bedanken voor advies,
ondersteuning en interesse in mijn onderzoek: onder andere Janette Tienkamp,
Jannie Tjassing en Aad van Mourik.
During my PhD I went abroad for 4 months to the Hammersmith Hospital in London,
England. I want to thank Dr. S.J.J. Counsell and Dr. F.M. Cowan for giving me the
opportunity to work under their supervision on a challenging and very interesting
research project. Dear Serena, dear Frances, you taught me a lot about MRI and
DTI techniques and made me feel very welcome in your research group. Also I
want to thank Prof. Dr. M.A. Rutherford for the collaboration.
Dear Amy, Gareth, and Polly, it was great sharing an office with you, but particularly
the out of office drinks that we had in the evenings and weekends made my stay
in London very pleasant. Isotta, as my GM sister you were a great colleague and
friend. Finishing my project in London while staying in your penthouse in Notting
Hill was very pleasant. Ash, Guiliana, Jasenka, Joanna, Rodrigo, Vanessa, Veena,
and many others also contributed to the great time that I had in London.
De Junior Scientific Masterclass wil ik bedanken voor de mogelijkheid die ik heb
gekregen om dit onderzoek in de vorm van een MD/PhD traject uit te voeren.
Dr. Titia Brantsma – van Wulfften Palthe wil ik bedanken voor de beoordeling van
mijn artikelen op het Engels en Stephan Eikens voor het ontwerpen van de cover
en de lay-out van het proefschrift.
De leden van de leescommissie, Prof. Dr. P.J.J. Sauer, Prof. Dr. L.S. de Vries en Prof.
Dr. F.J. Walther wil ik bedanken voor hun kundige beoordeling van het proefschrift.
Daarnaast wil ik Prof. Dr. P.J.J. Sauer bedanken voor de prettige samenwerking
die we hebben gehad.
Lieve familie en vrienden, ook al waren jullie niet inhoudelijk betrokken bij mijn

325Chapter 13
onderzoek toch wil ik jullie bedanken. Papa en mama voor het (zelf)vertrouwen
dat jullie me mee hebben gegeven, het relativeringsvermogen en de interesse die
jullie altijd hadden in mijn onderzoek. Joline en Loes, mijn lieve zussen waarmee
ik in mijn vrije tijd veel heb ondernomen om zo even los te komen van studie en
onderzoek.
Lieve Ewold, jouw onvoorwaardelijk liefde en luisterend oor zijn van onschatbare
waarde voor mij geweest. Wij zijn maatjes en stimuleren elkaar om het beste uit
onszelf te halen, zowel in het werk als in ons privéleven. Op de juiste momenten
bracht jij mij een kopje koffie of bracht je me met de auto naar het ziekenhuis als
het weer eens regende. Dat jij mij dan ook nog altijd hielp met het maken van
figuren in de artikelen is dan bijzaak, maar ik ben je er zeer dankbaar voor!
Tenslotte wil ik de ouders en kinderen bedanken die geparticipeerd hebben in het
onderzoek. Zonder hen hadden we dit onderzoek niet kunnen uitvoeren.
Functional Development at School Age of Newborn Infants at Risk
About the author
Elise Roze was born on 12 December 1985 in Kampen, the Netherlands. In 2003 she
graduated from secondary school at the Ichthus College in Kampen. Subsequently,
she successfully completed the first year of a degree program (propedeuse) in
Psychology at the University of Groningen. In 2004 she started studying Medicine
at the University of Groningen. She developed a special interest in Pediatrics and
participated in a research project at the Division of Neonatology of the Beatrix
Children’s Hospital under the supervision of Prof. dr. Arend F. Bos. This project
resulted in an MD/PhD trajectory in 2008, the results of which are presented in this
thesis. An MD/PhD trajectory is a challenging program enabling medical students
to combine studying for a master’s in Medicine with doing research for a PhD thesis
in two years’ extra time. In 2010 Elise went to England for four months to work on
one of her PhD projects under the supervision of Dr. Serena J.J. Counsell and Dr.
Frances M. Cowan of the MRC Clinical Sciences Centre at Hammersmith Hospital
in London. She further developed her skills as a researcher by presenting her work
at national and international conferences, supervising trainees, and participating in
the PhD curriculum of TULIPS (Training Upcoming Leaders in Pediatric Science).
Currently, she is doing her final clinical rotation at the department of Pediatrics of
the Martini Hospital in Groningen. In 2012 she will receive her master’s degree in
Medicine. It is her ambition to become an academic pediatrician and she hopes to
dedicate future research towards improving the neurodevelopmental outcome of
newborn infants at risk and towards understanding the underlying mechanisms of
perinatal brain injury.

327Chapter 13

Functional Development at School Age of Newborn Infants at Risk
Articles
Harris PA, Ball G, Roze E, Merchant N, Arichi T, Porter E, Allsop JM, Edwards AD,
Rutherford MA, Counsell SJ. A 3D diffusion tractography atlas of the healthy infant
brain. 2011; submitted
Tanis JC, van der Ree MH, Roze E, Huis in ’t Veld AEH, van den Berg PP, Van
Braeckel KNJA, Bos AF. Functional outcome at school age of children born preterm
and small for gestational age. 2011; submitted
Holwerda JC, Van Braeckel KNJA, Roze E, Hoving EW, Maathuis CGB, Brouwer
OF, Martijn A, Bos AF. Cognitive, motor and behavioral outcome at school age of
children with posthemorrhagic hydrocephalus. 2011; submitted
Roze E, Bos AF. Neurological and cognitive development of preterm infants up to
school age. 2011; submitted
Roze E, Van Braeckel KNJA, Kerstjens JM, Reijneveld SA, Bos AF. Neuro-
psychological profiles at school age of very preterm-born children compared to
term-born peers. 2011; submitted
Kaandorp JJ, van Bel F, Veen S, Derks JB, Groenendaal JB, Rijken M, Roze E,
Uniken Venema MMA, Rademaker CMA, Bos AF, Benders MJNL. Long-term
neuroprotective effects of allopurinol after moderate perinatal asphyxia. Follow-up
of two randomised controlled trials. Arch Dis Child 2011; accepted
Roze E, Harris PA, Ball G, Elorza LZ, Braga RM, Allsop JM, Merchant N, Porter
E, Arichi T, Edwards AD, Rutherford MA, Cowan FM, Counsell SJ. Tractography
of the corticospinal tracts in infants with focal perinatal injury: comparison with
normal controls and to motor development. Neuroradiology 2011; accepted
List of publications

329Chapter 13
Bos AF, Roze E. Neurodevelopmental outcome in preterm infants. Dev Med Child
Neurol 2011;53(suppl.4):35-39
Roze E, Ta BDP, van der Ree MH, Tanis JC, Van Braeckel KNJA, Bos AF. Functional
impairments at school age of children with necrotizing enterocolitis or spontaneous
intestinal perforation. Pediatr Res 2011; DOI 10.1203/PDR.0b013e31823279b1
Van der Heide M, Roze E, van der Veere CN, ter Horst HJ, Brouwer OF, Bos AF.
Long-term neurological outcome of term-born children treated with two or more
anti-epileptic drugs in the neonatal period. Early Hum Dev 2011; DOI 10.1016/j.
earlhumdev.2011.06.012
Van der Ree MH, Tanis JC, Van Braeckel KNJA, Bos AF, Roze E. Functional
impairments at school age of preterm born children with late-onset sepsis. Early
Hum Dev 2011; DOI 10.1016/j.earlhumdev.2011.06.008
Ta BPD, Roze E, Bos AF, Rassouli-Kirchmeier R, Hulscher JBF, Long-term
neurodevelopmental impairment in neonates surgically treated for necrotising
enterocolitis: the enterostomy is associated with worse outcome. Eur J Pediatr
Surg 2011;21:58-64.
Roze E, Meijer L, Van Braeckel KNJA, Ruiter SAJ, Bruggink JLM, Bos AF.
Developmental trajectories from birth to school age in healthy term-born children.
Pediatrics 2010;126:e1134-1142.
Roze E, Meijer L, Bakker A, Van Braeckel KNJA, Sauer PJJ, Bos AF. Prenatal
exposure to organohalogens, including brominated flame retardants, influences
motor, cognitive, and behavioral performance at school age. Environm Health
Persp 2009;117:1953-1958.
Functional Development at School Age of Newborn Infants at Risk
Roze E, Van Braeckel KNJA, van der Veere C, Maathuis CGB, Martijn A, Bos
AF. Functional outcome at school age of preterm infants with periventricular
hemorrhagic infarction. Pediatrics 2009;123:1493-1500
Roze E, Kerstjens JM, Maathuis CGB, ter Horst HJ, Bos AF. Risk factors for
adverse outcome in preterm infants with periventricular hemorrhagic infarction.
Pediatrics 2008;122:e46-e52
Other
Eggermont LHP, Roze E. Chapter 3.3. The importance of exercise- Brain and
Cognition. In: The importance of exercise, Cahier of the Foundation for Life
Sciences and Society. 2012; in press
Roze E, Bos AF. Cerebrale Parese. JA! 21st edition, 2010 (Jeugdgezondheidszorg
actueel, tijdschrift voor artsen Jeugdgezondheidszorg)

331Chapter 13

Functional Development at School Age of Newborn Infants at Risk
ADC apparentdiffusioncoefficient
ADHD AttentionDeficitHyperactivityDisorder
AEDs anti-epileptic drugs
aEEG amplitudeintegratedelectro-encephalography
AI asymmetryindex
AIS arterial ischemic stroke
AVLT AuditoryVerbalLearningTest
BG basalganglia
BPD bronchopulmonarydysplasia
BRIEF BehaviorRatingInventoryofExecutiveFunction
BS burstsuppression
BSID-II-NL BayleyScalesofInfantDevelopment,secondedition,Dutchversion
CBCL ChildBehaviorChecklist
CFM CerebralFunctionMonitor
CI confidenceinterval
CLV continuouslowvoltage
CNV continuousnormalvoltage
CoNS coagulase-negativestaphylococci
CP cerebralpalsy
CST corticospinal tract
DCDQ DevelopmentalCoordinationDisorderQuestionnaire
DNV discontinuousnormalvoltage
DTI diffusion tensor imaging
DWI diffusion weighted images
FA fractionalanisotropy
FT flattrace
FT4 freethyroxin
GA gestational age
GIC Groningen-infant-COMPARE
GMFCS GrossMotorFunctionClassificationSystem
Abbreviations

333Chapter 13
GMH germinal matrix hemorrhage
GMH-IVH germinal matrix haemorrhage-intraventricular haemorrhage
HOME Home Observation for Measurement of the Environment
HPI hemorrhagic parenchymal infarction
IQ intelligence quotient
IUGR intrauterine growth restriction
MACS ManualAbilityClassificationSystem
MCA middle cerebral artery
MDI mental developmental index
MedNEC medically treated necrotizing enterocolitis
Movement-ABC Movement Assessment Battery for Children
MND minor neurological dysfunction
MRI magnetic resonance imaging
NEC necrotizing enterocolitis
NEPSY Neuropsychological Assessment
NICU Neonatal Intensive Care Unit
OH-PCBs hydroxylated polychlorinated biphenyls
OHCs organohalogen compounds
OR odds ratio
PBBs polybrominated biphenyls
PBDEs polybrominated diphenyl ethers
PCBs polychlorinated biphenyls
PCP pentachlorophenol
PDI psychomotor developmental index
PHVD posthemorrhagic ventricular dilatation
PLIC posterior limb of the internal capsule
PVHI periventricular hemorrhagic infarction
PVL periventricular leukomalacia
Q-Q plot quantile-quantile plot
RD radial diffusion

Functional Development at School Age of Newborn Infants at Risk
ROP retinopathy of prematurity
rT3 reverse triiodothyronin
SD standard deviation
SES socioeconomic status
SI signal intensity
SIP spontaneous intestinal perforation
SNAP Score for Neonatal Acute Physiology
SurgNEC surgically treated necrotizing enterocolitis
T3 triiodothyronin
T4 thyroxin
TBG thyroid binding globulin
TEA term equivalent age
TEA-Ch Test of Everyday Attention for Children
TRF Teacher’s Report Form
TSH thyroid stimulating hormone
TVPS Test of Visual-Perceptual Skills
VMI test of Visual-Motor Integration
WAIS Wechsler Adult Intelligence Scale
WISC Wechsler Intelligence Scale for Children
WM white matter
WPPSI Wechsler Preschool and Primary Scale of Intelligence
WPPSI-R Wechsler Preschool and Primary Scale of Intelligence, revised

335Chapter 13
Functional Development at School Age of Newborn Infants at Risk
From the division of Neonatology, Beatrix Children’s Hospital, University
Medical Center Groningen, University of Groningen, the Netherlands
AREND F. BOS, ATTIE BAKKER, KOENRAAD N.J.A. VAN BRAECKEL, JANNEKE
L. M. BRUGGINK, RACHEL M. ELSINGA, MARISKA J. VAN DER HEIDE, HENDRIK
J. TER HORST, JORIEN M. KERSTJENS, MEIKE H. VAN DER REE, ELISE ROZE,
JOZIEN C. TANIS, CHRISTA N. VAN DER VEERE
From the Beatrix Children’s Hospital, University Medical Center Groningen,
University of Groningen, the Netherlands
LISETHE MEIJER, PIETER J.J. SAUER
From the department of Surgery, University Medical Center Groningen,
University of Groningen, Groningen, the Netherlands
BASTIAAN D.P. TA, JAN B.F. HULSCHER
From the department of Neurology, University Medical Center Groningen,
University of Groningen, Groningen, the Netherlands
OEBELE F. BROUWER
From the center for Rehabilitation, University Medical Center Groningen,
University of Groningen, Groningen, the Netherlands
CAREL G.B. MAATHUIS
From the department of Radiology, University Medical Center Groningen,
University of Groningen, Groningen, the Netherlands
ALBERT MARTIJN
From the department of Health Sciences, University Medical Center Groningen,
University of Groningen, Groningen, the Netherlands
SIJMEN A. REIJNEVELD
AUTHORS & AFFILIATIONS

337Chapter 13
From the department of Special Needs, Education and Child Care, Faculty
of Behavioral and Social Sciences, University of Groningen, Groningen, the
Netherlands
SELMA A.J. RUITER
From the centre for the Developing Brain, Imperial College, Hammersmith
Campus, and the Medical Research Council, Clinical Sciences Centre,
Hammersmith Hospital, London, United Kingdom
JOANNA M. ALLSOP, GARETH BALL, RODRIGO M. BRAGA, SERENA J.
COUNSELL, POLLY A. HARRIS
From the division of Neonatology, Imperial College Healthcare, National
Health Service Trust, London, United Kingdom
TOMOKI ARICHI, FRANCES M. COWAN, A. DAVID EDWARDS, NAZAKAT
MERCHANT, EMMA PORTER, MARY A. RUTHERFORD
From the department of Psychiatry and Clinical Psychobiology, Faculty of
Medicine, University of Barcelona, Barcelona, Spain
LEIRE ZUBIAURRE ELORZA

Functional Development at School Age of Newborn Infants at Risk

339Chapter 13
Copyright © 2022 FDOKUMEN