TR-20 - Natural Resources Conservation Service
330
TR-20 COMPUTER PROGRAM FOR PROJECTFORMULATION HYDROLOGY Revised by The Hydrology Unit and The Technology Development Support Staff Soil Conservation Service February 1992
-
Upload
khangminh22 -
Category
Documents
-
view
3 -
download
0
Transcript of TR-20 - Natural Resources Conservation Service

TR-20
COMPUTER PROGRAM
FOR
PROJECT FORMULATION
HYDROLOGY
Revised by
The Hydrology Unit and The Technology Development Support Staff
Soil Conservation Service
February 1992

TECHNICAL RELEASE 20 COMPUTER PROGRAM FOR PROJECT FORNDLATION
HYDROLOGY
TABLE OF CONTENTS
CHAPTER 1 - INTRODUCTION . . . . . . . . . . . . . . . . . . . . . . . . . . . . . . . . . . ..I
1.1 Program Purpose 1 1.2 Computer Requirements 2 1.3 Program Operation 2 1.4 Program Availability 7~
CHAPTER2 - PROGRAN DESCRIPTION . . . . . . . . . . . . . . . . . . . . . . . . . . . ..a
2.1 Methodology for Hydrology and Hydraulics 8 2.2 Program Organization 12. 2.3 Capabilities and Limitations 12 2.4 Input Data Structure 15
CHAPTER3 - INPUT PREPARATION . . . . . . . . . . . . . . . . . . . . . . . . . . . ...16
3.1 Minimum Data Requirements 16 3.2 Input Preparation and Worksheets 17 3.3 Input Data Sequence 19 3.4 Watershed Subdivisions 25 3.5 Schematic Drawing 26 3.6 Input Record Format Conventions 28 3.7 Job Control Record Specifications . . . . . . . . . . . . . . . . . . ...29
3.7.1 Discussion of Input 29 3.7.2 JOB 34 3.7,3 TITLE 36
~3.7.4 ENDJOB 37
3.8 Tabular Data Record Specifications....................38 3.8.1 Discussion of Input 38 3.8.2 Flow Duration Increment Table (DURINC) 48 3.8.3- Stream Cross Section Data Table (XSECTN) 50 3.8.4 Structure Data Table (STRICT) 52 3.8.5 Dimensionless Hydrograph Table (DINHYD) 54 3.8.6 Cumulative Rainfall Table ~(RAINFL) 56 3.8.7 Read Discharge Hydrograph Table (RBADND) 58
3.9 Standard Control Record Specifications..........-.....63 3.9.1 Discussion of Input 63 3.9.2 RUNOFF . ~73 3.9.3 RBSVOR 75 3.9.4 REACH . 77 3.9.5 ADDHYD 80 3.9.6 SAVNOV 82 3.9.7 DIVERT 83

ii
&gg
3.9.0 ENDATA 86 3.10 Executive Control Record Specifications..............87
3.10.1 Discussion of Input a7 3.10.2 LIST 94 3.10.3 BASFLO 96 3.10.4 INCREM 98 3.10.5 COMPUT 99 3.10.6 ENDCMP 101
3.11 Modify Standard Control Record Specifications.......102 3.11.1 Discussion olE Input 102 3.11.2 INSERT 104 3.11.3 ALTER 10s 3.11.4 DELETE 106
3.12 Intermediate Peak Record Specifications.............107 3.12.1 Discussion of Input 107 3.12.2 IPEAKS 109 3.12.3 PEAKS 110
Chapter 4 - OUTPUT DESCRIPTION . . . . . . . . . . . . . . . . . . . . . . . . . ...112
4.1 Input Images (SO-80 :List) 112 4.2 Message Page 113 4.3 Page Headings 113 4.4 Operation Results 113 4.5 Cross Section Discharge/End Area Data Plots 115 4.6 Summary Tables 115 4.7 Output Files Generated 118
Chapter 5 - OUTPUT USE . . . . . . . . . . . . . . . . . . . . . . . . . . . . . . . . . . . . 121
5.1 Checking Input and Output 121 5.2 Interpretation of Output 123 5.3 Calibration of the Model 125 5.4 Program Messages 133
5.4.1 Errors 133 5.4.2 -Warnings 140 5.4.3 Messages - Ihformational 150
REFERENCES . . . . . . . . . . . . . . . . . . . . . . . . . . . . . . . . . . . . . . . . . . . . . . . . 155
GLOSSARY . . . . . . . . . . . . . . . . . . . . . . . . . . . . . . . . . . . . . . . . . . . . . . . . . . 156
CONVERSIONS . . . . . . . . . . . . . . . . . . . . . . . . . . . . . . . . . . . . . . . . . . . . ...162
APPENDICES ,. - _ . . . . . . . . . . . . ..*..................................
APPENDIX A - Description of Sample Jobs A-l APPENDIX B - Sample Job 1 B-l APPENDIX C - Sample Job 2 C-l APPENDIX D - Sample Job 3 D-l APPENDIX E - Sample Job 4 E-l

iii
APPENDIX F - Sample Job 5 F-l APPENDIX G - Standard Worksheets APPENDIX H - Associated Utility Programs
G-l H-l
Data Input Program H-l Data Check Program H-2
Number
l-l-- 3-1-- 3-2-- 3-3-- 3-7-1-- 3-7-2-- '3-7-3-- 3-7-4-- 3-8-2-- 3-8-3-- 3-0-4-- 3-8-5-- 3-8-6-- 3-8-7-- 3-9-1-1--
3-9-l-2- - 3-9-2-- 3-9-3-- 3-9-4-- 3-9-5-- 3-9-6-- 3-9-7-- 3-9-8-- 3-10-2-- 3-10-3-- 3-10-4-- 3-10-s-- 3-10-6-- 3-11-2-- 3-11-3-- 3-11-4-- 3-12-2-- 3-12-3-- 5-1--
LIST OF TABLES Paae TR-20 Program File Descriptions. 5 Input Data for Small Watershed. 16 List of TR-20 Input Data Worksheets. 18 Preferred Input Sequence. 21 Input Options to Obtain Generated Files. 30 JOB record 34 TITLE records 36 ENDJOB recordl 37 DURINC table records 48 XSECTN table records 50 STRUCT table records 52 DIMHYD~table records 54 RAINFL table records 56 READHD table records 58 Association of Cross Section/Structure Numbers 62
with TR-20 Standard Control Records. Standard Control Output Options. RUNOFF record RESVOR record REACH record ADDHYD record SAVMOV record DIVERT record ERDATA record LIST record BASFM record INCREM record COXPUT record ENDCMP record INSERT record
-ALTER record DELETE record IPEAES record PEAKS record Alternatives Compared - Sample Job 5 - Rain
Stem Peak Discharge (cfs). Sensitivity of Input Parameters--Example. A Procedure for Calibrating and Validating
the TR-20 Model.
70 73 75 77 80
2 86
2 98 99
101 104~ 105 106 109 110 124
127 130

iv
Number LIST OF FIGURES &gg
2-l -- 3-.5 -- 3-7-2-- 3-7-3-- 3-7-4-- 3-8-1-- 3-8-2-- 3-8-3-- 3-8-4-- 3-a-5-- 3-0-6-- 3-0-7-- 3-9-1-1-- 3-9-1-2-- 3-9-2-- 3-9-3-- 3-9-4-- 3-9-5-- 3-9-6-- 3-9-7-- 3-9-8-- 3-10-1-1-- 3-10-1-2-- 3-10-1-3--
3-10-2-- 3-10-3-- 3-10-4-- 3-10-5-- 3-10-6-- 3-11-2-- 3-11-3-- 3-11-4-s 3-12-3--
simplified Processing Sequence in TR-20. ,Sample Schematic Drawing. JOB record example TITLE record example ENDJOB record example Flood Hydrograph with Flow Duration Identified. DURINC records example XSECTN records example STRUCT records example DIMHYD records example RAINFL records example READHD records example Divert - Procedure 1 with Constant Flow. Divert - Procedure 2 with Division of Flow. RUNOFF record 'example RESVOR record example REACH record examples ADDHYD record example SAVKOV record example DIVERT record examples ENDATA record example Example of Executive Contra1 input Baseflow, Procedures 1 and 2. Hydrograph coo'rdinates for main time increment
of 0.5 h0ur.s. LIST record example BASFLO record examples INCREM record example ConPUT record example ENDCHP record example INSERT record example ALTER record e!xample DELETE record example IPEAES and PEARS records example
13 27 35 36 37 39 49 51 53 55 57 60 68 69 74 76 78 81 a2 85 06 . 87 88 90
95 97 98
100 101 104 105 106 111

TEC?iNICAL RELEASE 20
COKPDTER PROGRAM FOR PROJECT FORMULATION
HYDROLOGY
CHAPTER 1. INTRODUCTION
This chapter describes the Soil Conservation Service (SCS) Computer Program for Project Formulation, Hydrology (TR-20) in terms of the purpose, computer requirements, operation, and availability of the program. in detail:
The remaining chapters describe the program methodology, organization,
capabilities, limitations, and data structure; input preparation; and output description and use. The appendices contain a sample job showing five progressive levels of complexity, blank input worksheets, and associated utility programs for input and data checking.
1.1 PROGRAM PURPOSE
The TR-20 computer progrem assists the engineer in hydrologic evaluation of flood events for use in analysis of water resource projects. The program is a physically based event model which computes direct runoff resulting from any synthetic or natural rainstorm. There is no provision for recovery of initial abstraction or infiltration during periods of no rainfall within an event.
The program develops flood hydrographs from runoff and routes the flow through stream channels and reservoirs. Routed hydrographs are combined with those from tributaries. Procedures for hydrographi separation by branching or diversion of flow and for adding ba.seflow are provided.
The program uses procedures described in the SCS National Engineering Handbook, Se&ion 4, Hydrology (NM-4) except for the reach flood routing procedure. The reach routing is described in Hydrology N&e 2.
Peak discharges, their times of occurrence, water surface elevations and duration elf flows can be computed at any desired cross section or structure. Complete discharge hydrographs, as well as discharge hydrograph elevations, can be obtained if requested. The program provides for the analysis of up to nine different kainstorq distributions over a watershed under various’ combinations of land treatment, floodwater retarding structures, diversions, ~amd channel modifications. Such analysis can be performed on as many as 200 subwatersheds or reaches and 99 structures in any one continuous run.
The program was originally developed by the Hydrology Branch

2
of the Soil Conservation Service (SCS) in cooperation with the Hydrology Laboratory, Agricultural Research Service (ARS), through a contract with C-E-I-R, Inc. Numerous modifications and additions have been made since by the SCS.
1.2 COMF'UTER REQUIREMENTS.
TR-20 is written in FORTRAN 77 computer language for an IBM compatible microcomputer with a PC-DOS or MS-DOS operating system. It was compiled using the Microsoft FORTRAN Compiler to nzn either with or without a math coprocessor. Use with a math coprocessor is strongly recommended to speed up execution.
The program requires about 320 kilobytes of available memory. Floppy disk systems are adequate for small TR-20 runs, but for larger runs the program and output should be stored on a hard disk. About .5 to 1 megablyte of storage space should be available to load and exec,ute an average run.
1.3 PROGRAM OPERATION
Before operating TR-20 on a miorocomputer be sure to read the instructions on setting up and loading the program in the README file. This file is on the program diskette. The file also contains any last minute changes that didn't make this manual. The system error *TOO many open files* will occur if not enough files and buffezs are opened in your config.sys file upon booting the SySteIB. At least 15 files and 15 buffers are recommended.
There are two ways to run TR-20, interactively and by a batch file. The interactive procedure is explained first in the sections below. The alternate batch file procedure that follows can be used when it is desirable to run jobs unattended, such as jobs run back to back overnight.
To execute,the programr enter TR20 preceded by the proper DOS path, and press return. Once the program is loaded, the organization or individual responsible for support of the program, the program title, version date or number, and a disclaimer will appear on the screen.
Next, you will be asked three questions to be answered with Y (yes) or N (no). The first asks if you want a listing of input as part of the output. The second asks if you waht the page of user notes with tlhe output. The user notes contain information for new users and lists important program changes between versions. The third question asks if you want to write all warnings and messages to a separate file rather than have them appear as part of the regular output.

3 A note on who to contact if you have questions or comments on the program will be displayed following the three questions. The program title and version identification is then repeated.
These screens are shown in Appendix B, pg. B-S and B-9.
Disk Snace
An important disk space warning is displayed next. Sufficient disk space for temporary and output files must be provided for a successful run. The amount of space depends on the amount of input data and the number and type of output files and options selected in the input file.
If TX-20 is loaded and run from a hard disk, the default drive directory you execute the program from will need space (usually 50 to 100 K) for internal temporary files. These files will be automatically erased at the normal termination of a job. If any temporary files remain in the directory from aborted jobs (their names start with BZ), they should be erased to save disk space. Input files can be entered from any drive and directory, including a floppy disk. The output data, if sent to a file,, can be directed to any drive and directory with space aveilable. All other optional output files (which include ECCN2, RRADRD, Messages, and graphics files) can also be written to any drive and directory, so additional space must be available in the l~ocation selected.
If TR-20 is loaded and run from a floppy disk, when the space warning appears, the program disk must be replaced with an input data or scratch disk with adequate space for the temporary files. Space must also be provided on the replacement disk for the generated output files. If not replaced, the job usualiy aborts due to lack of space.
If it is apparent that not enough disk space will be available, the run can be stopped by using the CONTROL-BREAK keys. After adequate space is provided the run can be restarted.
After the disk space warning, a prompt appears on the screen for the input drive ID and input file name. The response must include the path, the drive and directory needed to access the input file unless the file is on the default drive. If the specified input file does not exist in the given location, the input prompt will reappear.
. . - .

4
Outnut Device or File
The next screen prompt is for the primary output device or file name.. The output can be sent directly to an attached printer, the display scrE!en, or to a file.
The recommended choice is to assign a file name,~complete with drive and directory (path) as needed. If the uses enters a carriage return, the program will assign a default file~name consisting of the path and prefix of the input file, with the extension changed to "out". The program will execute quickly and the output file can be reviewed on the screen or printed if needed later.
The "CON" Option Will slow the execution somewhat as the output data will scroll past on the screen. Depending on the computer system the SCrOlLl may be stopped by the SCROLL LOCX or CONTROL-S keys to review the output, but nothing will be saved. Program status messages sent to the screen during execution will not be displayed with the WON* option.
The "PRN" option prints the output directly to an attached printer. This usually sltows the program execution. Both VONm and "PRN" are device system names that may vary with the computer system.
Gsu-ated FiU.?
The files generated as part of the output are named automatically by the program depending on your answer to the next question. The program asks for the output drive ID and file name prefix for all the generated files. If an output file name has been assigned, the default has the same location land prefix as this. If the user wishes to use a different drive ID and prefix, these must be specified. The question will not be asked, however, if the output data is sent directly to the screen or to the printer. In these cases, the generated files will be automatically assigned to ~the input file prefix and location.
Table l-l lists all temporary and generated files that are used by tha program. : The generated files use the user's file prefix and an extension assigned by the program. If generated Ecm2, READHD, Messages, or graphics files with those names already exist, using the same file prefix from a previous run, the files will be writte:n over.
~11 the files in Table l-l are opened when the program is executed. However, only generated files with the proper input options given are saved at the end of a job. See Table 3-7-l (p. IO) for required input options to save gtierated files.' ~11 temporary and unused files are deleted at the normal end of the job.

TABLE l-l. TR-20 PROGRAM FILE DESCRIPTIONS
UNIT TYPE
1 temp. or 2/ graphics
2 temp.
3. ECONZ
4 temp. or 21 graphics
5 read
6 print
7 temp.
8 temp.
9 READHD
10, warnings and
meaaagaa
11 graphics
12 graphics
NAME l/ RECORD ASSIGNED LENGTH
---
"prefix"., TS2
67
67
w-v 80
'*prefix**.TEC 80
ewe
"pref ix".TSl
---
m-s
m-w
B-B 80
"prafix".TRB 80
"prefix".lMG 80
67
67
80
80
80
51
71
DESCRIPTION
Temporary storage for summary Table 2,data.
Condensed REACH output data.
Current Standard Control data.
Output data for ECON2 after merge ~of units 7 & 8.
Temporary storage for Summary Table 1 data.
Condensed output for Summary Table 1 data.
Standard input unit for reading.
Standard output unit for printing.
Temporary flow duration data for ECON2 before -we.
Temporary peek flow data for ECONZ before
Output for saved RBABBU data.
Optional listing m-20 warnings maaaagea .
tabular
of and
Candanead output flow duration aata.
for _ .
Condensed output for hydrograph data.
l/ Automatically uses nprefix* of. users choice from input or output filename.
21 Used as graphics file if GRAPHICS option is on JOB record.

6
The graphics files are ASC:II files containing run identification and preselelcted detailed output data in condensed tabular format. Separate files can be used to save peak, reach, flow duration and hydrograph information. A separate utility program is needed to plot the information. SCS has developed a prototype plotting program for this purpose that uses proprietary Graphics Kernel System (GKS) software.
titernate Batch File Proce~&xs
In order to avoid having to enter the above information interactively, a batch processing procedure is available. It requires a data file named ADTOTRZO.DAT to be set up in the same directory as the TP-20 program.
The AUTOTR2O.DAT data file must contain the wwerg only to the six items in the following order:
1. Listing of input data desired? Y or N 2. Include the user notes? Y or N 3. Include warnings and messages? Y or N 4. Complete input file path and name. 5.. Complete output file path and neme or device. 6. Complete output file path & prefix name for all
generated files.
Question six does not need to be included if the answer to item five is ~PRN or CON. Each answer must be on a separate record (line)..
If the AUTOTRZO.DAT file exists, it will be used automatically. If it doesn't exist, interactive keyboard input is required. When svitching from batch to interactive processing, be sure the file is deleted or the answers are deleted.
The status of the computations is displayed on the screen the output is directed to a file or printer. The current _
vhen
cross section or structure number, alternate ana storm wzng processsd will flash on tine screen until it is completed. This information is displaiyed in the order of input in the Standard and Executive Controls until the job is terminated and the program returns to the WS Operating System.
Error or warning messages from the prcgram will not shov up on the screen.when the output.is~ directed to'a .file or printer.or if the message file has been requested.. The~umer must examine the. output and the message file if requested to determine if the job ran correctly. Only operating system errors will be displayed on the screen.

Runnina Multinle TR-20 Jobs
Sometimes it is desirable to handle more than one job in the same run. This can only accomplished by inserting the complete sets of input data for the jobs back to back under the same input file name. After completing a job or ending it on a fatal error, the program will search for the start~of another job. If it doesn't find another job, the run will end. The entire output Of all the jobs will be~included in the initial output file names given.
1.4 PROGRAW AVAILABILITY
The TR-20 executable program and user manual may be obtained by non-federal users from the National Technical Information Service. The program and associated utility programs are supplied on diskettes.
The program and user manual are available from:
National Technical Information Service U.S. Department of Commerce 5285 Port Royal Road Springfield, Virginia 22161 (703 - 487-4650)
The program is available to Federal Government agencies from:
Engineering Division Soil conservation Service P.O. Box 2890 Washington, D.C. 20013
The program is usually available to state and local public agencies by contacting the SCS State Conservationist in the state where the agency is located.

TECHNICAL RELEASE 20
COMPUTER PROGRRM FOR PROJECT FORKULATION
HYDROLOGY
CHAPTER 2. PROGRAM DESCRIPTION
This chapter provides an understanding of the TR-20 computer program organization and features. Terminology ancj acronyms used solely for this computer program are defined the first time they are used and in the Glossary. general use by engineers ,is not defined.
Terminology in
To use this program effectively, an understanding of the procedures described in SCS National Engineering Handbook, Section 4 (hereafter referred to as NM-4) is suggested.
2.1 METHODOLOGY FOR HYDROLOGY AND HYDRAULICS
Subwatprshed DelineatiqD
The watershed should be divided into as many subwatersheds as required to define hydrologic and alternative structural effects. Hydrologic effects are influenced by entrance of tributaries, watershed shape, valley slope changes, homogeneity of the runoff curve number and existing or proposed water impoundment structures. Each subwatershed is assumed to bs hydrologically homogeneous and should not have an area greater than 25 square miles. See Chapter 6, NEH-4.
Either actual or synthetic cumulative rainfall distributions may be used. Rainfall distributions (time versus cumulative depth) must be representative of the watsrshed area under study. This could be by individual subxatersheds or the entire watershed.
Runoff A mass curve of runoff is developed for each subwatershed. The runoff curve number I(CN), rainfall volume, and rainfall distribution are the input variables needed to determine this mass curve. Average antecedent runoff condition CN's are determined by the user for each subvatershed based on soil, land use, and hydrologic condition information, as described in Chapters 7, 8, and 9, yEHy4. - . 'The runoff volume (Q) in inches is computed using the SCS runoff equation outlined in Chapter 10; NEW4. If the user requests, the CN will be adjusted for the low or high antecedent runoff condition (ARC) according to Table 10.1, NM-4. If the user needs to adjust the runoff volume within

these ARC's, either the CN's or rainfall will need to be adjusted.
BvdroqIgnh Develooment
An incremental unit hydrograph is developed for each subwatershed similar to the procedure shown in Chapter 16, NEli-4. The unit hydrograph time increment (delta 0) is calculated to preserve both the peak discharge and total hydrograph volume if possible. Initially, delta D is set to the smaller of 0.1333 of the time of concentration (Tc), the rainfall time increment, or the main time increment specified by the user. Then to preserve the peak, delta D is adjusted to coincide with the peak time of the unit hydrograph. If the program limit of internal time increments (1200) is exceeded, delta D is further adjusted to preserve the total volume. If the initial delta D is greater than the unit hydrograph peak time, the volume can be tzuncated.
Coordinates of the incremental unit hydrograph are determined as shown in Example 1, Chapter 16, NM-4 using delta 0, Tc, and the drainage area. The incremental runoff is determined for each delta 0. The composite flood hydrograph is computed by summing the incremental hydrograph ordinates as shown in the same example.
After the composite flood hydrograph has been generated at the internal delta D time increments, it is saved at the main time increment starting with the beginning of runoff. A maximum of 400 discharge coordinates at the main time increment can be stored for any composite flood hydrograph. The original hydrograph based on the internal delta D is not saved.
The peak flow value of tlhe composite flood hydrograph is computed by a separate routine that utilizes the Gregory-Newton forward difference formula for fitting a 2nd degree polynomial through the three largest consecutive hydrograph values saved at the main time increment (Wylie, p. 94). In multiple peaked hydrographs up to ten peaks may be computed.
The primary concern when selecting the main time increment is' to provide an adequate definition of the hydrograph. The main time increment should be about 0.1 to 0.2 of the shortest subvatershed Tc for the best hydrograph definition. Ratios of 0.3 to 0.5 may be acceptable for occasional subwatersheds with small Tc's within the system of larger m&watersheds. Hydrograph definition decreases when the time increment is larger than this range alf values due to the shape of the unit hydrograph and the rainfall time increment. Generally, the main time! increment need not be smaller than' 0.05 to 0.1 hour.
Several other factors must be considered by the user when selecting the.main time increment. The user must consider the

10
longest duration hydrograph, with respect to time, that is developed during the analysis of a watershed. a ten day outflow hydrograph is needed,
For example, if a main time increment
of 0.6 hour would provide the necessary 240 hours (400 coordinates x 0.6 = 240). HOWever, for a small watershed with a time of concentration of 0.25 hour, a main time increment of no more than 0.1 hour is needed to define the composite hydrograph. The user must also consider, when selecting the main time increment, how much of the hydrograph volume at the end of the watershed is needed to develop the peak outflow. The maximum of 400 coordinates applies to all hydrographs that are'generated by the operations in the program.
only one main time increment should normally be used in any one pass through the watershed. The use of multiple time increments in a single pass through a watershed requires some care to ensure that the t:Lme increments increase downstream. They may decrease if the calculations begin at the headwaters of a tributary, but should then increase again for downstream subwatersheds.
Rss-voir Routine The composite flood hydrograph is routed through a reservoir using the Storage-Indication methodas described in Chapter 17, NM-4. The working curve is not used; instead the working equation is solved during a process in which interpolations are made in the elevation-discharge-storage data for the structure. The starting elevation for routing or the pool elevation when runoff begins must be specified by the user.
The main time increment ie used as the routing time interval. Abrupt changes in the discharge-storage curve may require a smaller main time increment to obtain a satisfactory outflow hydrograph than that needed for hydrograph development.
The outflow hydrograph in cfs and/or elevation can be printed at multiples of the main ,time increment (subject to the 400 point limit). The peak discharges and associated elevations are determined using the :peak flow routine described in the previous Hydrograph Development section.
l%saaaG
The composite flood hydrograph is routed through a valley reach using a Hodified Attenuation-Kinematic (Modified Att-Kin) method as described in Hydrology Note 2. The routing time interval is the main time increment. The routing reach length (L) is specified by the user. separate channel and
valley reach lengths are permitted. The main time increment and the reach lengths must be chosen to provide routing parameters within the limits of the procedure to obtain a satisfactory outflow hydrograph.

11
The routing coefficient is developed from the valley storage-dkscharge curve (Q = kSm, where Q = discharge, s = valley storage and "k" and nmn are the coefficient and exponent of the relationship) that represents the reach and the maximum inflow hydrograph peak discharge and volume. The user must provide either a cross section rating curve (Q vs. A, where A = cross sectional area) or the **x" and %t** values which describes a rating curve (Q = XA', where A = S/L).
Flow Duration
When a flood hydrograph is selected for a flow duration analysis, the hydrograph discharge points based on the main time increment are sorted in a temporary array from highest to lowest. The discharge associated with a given duration is then interpolated from this array. This approximate procedure is accurate within discharges associated with one time increment. The advantage of the procedure is that only one interpolation is required for each duration and the hydrograph can contain any number of multiple peaks.
Up to 12 durations are automatically selected by the program to define the flow duration characteristics of the flood hydrograph based on its total duration above baseflov. The durations and associated discharges selected for display are determined by the folloving:
24 hours or less 2 hours over 24 to 36 hours 3 hours over 36 to 48 hours 4 hours over 48 to 72 hours 6 hours over 72 to 96 hours 8 hours over 96 to 144 hours 12 hours over 144 hours 24 hours
The last duration in the display is set by the greater of constant baeeflw or zero discharge. Checks are made for shorter, truncated, and still rising hydrographs. If a zero damage elevation is given, the zero damage diecharge duration is noted. -
ff SCS ECDNZ Computer Program output is requested for a flood duration damage analysis, three user selected durations can be entered. Discharges associated with those durations are directly interpolated fromkhe tsmporary sortsd hydrograph array at the same time as the automatically selected durations.. Checks or limits .on the threa'ECCN2 durations include shorter, truncated, and rising hydrogrsphs, as well as
.. baseflow.

12
2.2 PROGRAM ORGANIZATION
A brief description of the functions of the program and of some of its characteristics will help to better understand the organization of the program operations and the instructions for the preparation of input data. A simplified processing sequence for TR-20 is given in Figure 2-1. It shows the sequence in which the VariOUS major functions are performed.
Input data described on input data sheets or in a separate input program can be entered at a computer terminal. Input data can be tabular data (structure data, stream cross section data, cumulative rainfall data, and dimensionless hydrograph data), Standard Control d,ata, and Executive Control data. Briefly, the Standard Control data are used to describe the physical watershed conditions and the Executive Control data are used to describe the :meteorological conditions and to control processing.
2.3 CAPABILITIES AND LIMITATIONS
Any one TR-20 job can:
1. Route through up to 99 structures and an unlimited number of variations for each structure.
2.. Route through up to 200 stream reaches and an unlimited number of channel modifications for each reach.
3. Develop composite flalod hydrographs each based on maximum of 1200 internal (delta D) time increments before conversion to the main time increment.
4. Save flood hydrographs at selected points in a watershed and print out the discharge and elevation for each coordinate. Hydlrographs are saved with up to 400 main time increment coordinates, beginning at the start of runoff.
5. Store up to seven computed flood hydrographs at any one time.
6. Do as many as 99 alternates in a vatershed, and ten different storms for each alternate with variations in rainfall amounts, rainfall starting times and duration, and antecedent moisture condition.
7.. Develop and route the runoff from as many as 9 different rainfall distributions. storm runoff depths and durations are defined in either dimensionless or actual units.

13
LLIstin9 ‘01 011 input (optioml)
t #toI. phypital
rotwrrhrd chorostrrimtls~ and Standard Control)
t )Pld x-*ntiona (aptlon01)
I
Print rO*Ult. Of eomputotim*
No+
Figure 2-l. Sl8Pl IfiOd Proces8 ng sequence in W-20
- .

14
a. Combine hydrographs from an almost unlimited number of tributaries and reaches (the limitation being the total number of Standard Control operations).
9. Divide flood hydrographs into two separate hydrographs.
lo. Enter flood discharge hydrographs and route them through a watershed.
11. Compute up to 12 flow duration values for a flood hydrograph.
The only restriction to those items described as being unlimited is the processing cost and the practicability of dealing with too much output data.
AS a limitation the program does not provide for losses of runoff in the transmission of the flood hydrograph due to seepage or other causes of flood water loss.
in A further limitation of 600 Standard Control records will be described in Section 3.6. There is also a limit of 24,000 peaks that can be displayed in the Summary Tables. The number of peaks is equal to the product of the number of storms, the number of alternates, and the sum of the number of cross sections and the number of structures: Number of Peeks = (storms x Alternates x (Cross Sections + Structures)).
The current program has been developed with strict adherence to a policy of having it:
(1)
(2)
(3)
(4)
as flexible as possible with a minimum of change in the presentation and use! of input data frowprevious versions;
provide for the maximum use of engineering judgment;
engineer oriented rether #an mechine oriented; and
written in the FOFtTNAN 77 language to provide for ease in future extensions, elterations, and recompilation for other computer hardware.
The input data worksheets are in a user oriented format with headings familiar to field engineers. The program output.is arranged for ease in reading and is identified with. notations consistent with SCS pub:lications. .No effort was made to save processing time at the expense of engineer time.
'A complete TP-20 run for an average watershed can be processed. within 3-4 minutes on a microcomputer. However, the processing time and total cost is increased each time an error in input data.has to be searched out, corrected, and the data

15
returned to the computer. To reduce costs due to errors, the input and data check programs should always be used to enter and check a new or revised set of input data. See Appendix H.
2.4 INPUT DATA STBTJCTDRE
The input data for a TR-20 run consists of the following six general record types: Job Control, Tabular Data, Standard Control, Executive Control, Modify Standard Control and Intermediate Peaks.
The Job Control records are JOB, up to two titles, and ENDJOB. In a run, the JOB and TITLE records must appear first and the ENDJOB record must appear last.
The Tabular Data, which follows the TITLE records can be subdivided into the following types of data: Flow Duration Increments for ECON2, Structure, Stream Cross Section, Cumulative Rainfall, Dimensionless Hydrograph, and Read Discharge Hydrograph. the program may require a hydrograph to be routed through a
For example, one of the operations in
specific structure. In order to perform this function, the computer xi11 recall ,the Structure Data Table as the necessary input for routing through the partictdar StNctuN.
The Standard Control records describe the hydrologic configuration of the watershed. They prescribe the exact sequence in which hydrographs are to be developed for subwatershed areas, routed through structures and stream reaches and combined at tributary junctions and ends of reaches. The Standard Control thus establishes a series of consecutive steps through which any numbat of hydrologic events can be routed for analysis. The BNDATA record is used to signify the end of the Standard Control and precedes the Executive Control records.
The Executive Control records: (1) initiate and control the computational process, (2) provide baseflow data, and (3) describe the meteorological characteristics of each situation to be applied to the watershed. This includes rainfall depth, duration and~distribution, baseflow, and the portion (all or part) of the watushed to be analyzed, including structures through which the storm is to be routed. The RRDCRP record is used to signify the end of a pass through a watershed or a group of subwatersheds thereby allowing meteorological and tabular conditions to be changed by the user before further processing.
After initial computational passes through the watershed, the Modify Standard Contxol records may 'be used to modify the Standard Contiol. This may be done to describe an alternative watershed situation to be analyzed. This includes changing subwatershed data and the sequence of computation. Executive Control records must then be provided for subsequent analysis-

16
TECBNICAL RELEASE 20 COMPUTER PROGRAM FOR PROJECT FOP.MJLATION
HYDROLOGY
CHAPTER :I. INPUT PREPARATION
3.1 MINIWUW DATA REQUIREWENTS
TR-20 can handle Complex as well as very simple problems such as developing the hydrograph for one watershed. Analysis of a simple problem can be set up with a.:5 few as ten records, including data. An example of the required types of input data for a small watershed
is summarized in Table 3-1.
Table 3-1. EXAWPLE INPUT DATA FOR SWALL WATERSHED
Tvoe of Data WtamDle
For each subwatershed (at least one required): drainage area - sq. mi. 1.2 sq. mi.
_ runoff curve number 75. time of cohcentration - hours 0.33 hours
To develop a flood hydrograph: rainfall (required)
antecedent runoff condition 2 rainfall depth - inches 5.2 inches rain table number (table defined in program) 2
main time increment for hydrograph, etc. 0.1 hours
For each valley reach: length of reach (channel and/or valley) cross section data (elevation, discharge,
and end area)
5400. feet table*
or rating curve coefficients wxw and -rn*
For each structure:
0.5, 1.3
alevation, discharge, and storage table*
+ Where %ablem is given, the input is a complete table consisting of at least three lines of data.

17
3.2 INPUT PREPARATION AND WORKSHEETS
A blank form for listing each type of input data is included in ~Appendix G. Each 80-column line of data on the form is a record with.data fields to be entered at a computer terminal. The 80 columns across the top of the form represent the 80 positions on a record. A data field is a column or group of columns denoting specific data in a record. Different record types perform specific operations. The ordering of the Standard Control records determines the sequence inwhich the operations are to be performed. There can be up to 600 Standard Control records for each m-20 job.
The "Data Code",heading (Input forms, Appendix G, Columns 2), indicates the type of data on that record. For example '*Sn signifies that the line contains tabular data. The data code is a required entry and is preprinted on the tabular worksheets. The TB2OINPT program described in Appendix H automatically inserts the appropriate data code.
An 'Operation Name” appears in Columhs 4 through 9 of all records except those containing tabular data. These names identify for.the user the type of operation performed or type of data entered. The digit in column 11 is the Vperation NumbeP and identifies the type of operation. It must be entered unless it is a blank. The rest of the entry on each line is described in the following sections, except for the optional record identification datafield in Columns 73 to 00 which is on all records.
Great care should be taken to assure that w are m in all of the real number data fields (see Section 3.6). Omissionof these decimal points is the most common source of error. Commas must not be used for'any reason in numeric data; for example, to signify~ thousands.
When using the worksheets to enter data, preprinted data must be crossed out on all unused lines. Blank lines are not allowed in the input data. A list of TB-:20 input data forms is given in Table 3-2. Brief instructions fox the preparation of input data are printed on each form.
Schemetic drawings, computer listings of input data, and computer output for five ample jobs are shown in Appendices B through F. The program*8 initial computer screens and completed input data sheets are only ahown for the first sample job in Appendix 8.

10 Table 3-2. LIST OF TR-20 INPUT DATA WORKSHEETS
Form Title - Record Tvoe*
Worksheet Appendix Number G JSCS-ENG) Paae No.
Job and Title - JOB, TITLE
Dimensionless Iiydrograph Table - 4 DIMIiYD
Structure Data - 3 STRUCT
Stream Cross Section Data - 2 XSECTN
Cumulative Rainfall Tables - 5 RAINFL
Flov Duration Increment Table - 1 DURINC
Standard Control for Watershed - 6 RUNOFF 1, 6 RESVOR 2, 6 REACH 3, 6 ADDIiYD 4, 6 SAVBOV 5, 6 DIVERT 6, EBDATA
264 G-2
265** G-7**
269 G-6
270 G-5
271+* G-9**
272 G-4
273 G-16 h 273A G-18
Executive Control - 7 LIST, 7 BASPLO 5, 7 IN- 6, 7 COMPDT 7, EBDCMP 1, EBDJOB 2~
274 C 274A
Nodify Standard Control - 7 INSERT 2, 7 ALTER3, 7 DELETE 4
275
Read Discharge Hydrograph - 7 RBADBD 8, 7REimiD9
276
Intermediate Peaks - IPEAKS, PEARS 277
G-19 G-21
G-22 G-23
G-24
G-25
l Record types are identified by their unique data code, operation name, and operation number.
l * Standard Tables are preloaded in the program. However, the user may override them by entering another DIHDyD or.a RAINFL table with the seme number. The preloaded standard tables are listed in Appendix G after the vorkehset to which they apply.
Preparation of input data prior to filling out vorksheets can be divided into the folloving xeguirements and functions:
1. Prepare a schematic drawing (section 3.5) for the watershed that conveniently identifies the subvatershed locations, drainage areas, CD's, Tc's, and reach lengths. It should display all alternate structural systems together with the routing and evaluation reaches through ,which they are to be analyzed.

19
2. Establish a Standard Control list for the watershed.
3. Compile the tabular data to support the requirements of the Standard Control list. This may consist of structural data, stream cross section data, hydrograph data,
cumulative rainfall data, read discharge and the dimensionless hydrograph tables.
4. Establish the Executive Control records that describe each storm and alternative situation that is to be analyzed through the Standard Control list.
5. Determine the job and output options needed to evaluate the correctness of results.
display and
A simple example of these types of input data are shown Job #1 in Appendix 8.
in Sample
3.3 INPUT DATA SEQUENCE
A number of the various kinds of input records are required to be in a particular order for the TR-20 program to run. The narrative in this SeCtiOn Will concentrate on the required general order and purpose of certain records.. Table 3.3 summarizes the preferred order of input for all the various record types in detail. Further sections of this chapter will describe the exact input needed for the individual records.
The JOB record is required to initiate and identify each job. It must be the first record in the data set. Various options are available on the JOB record for program output for use with other SCB programs and for the amount of detail to be output with the run.
The TITLE record, or records, must follow the JOB record. One TITLE record is mendatory; there can be two TITLE records if desired. These are often used to gives descriptive information on the job, such as the watershed location and conditions and/or project and user documentation. Whatever is in the TITLE records appears on top of each page of output.
The various kinds of tabular data (DURINC, DIWWD, RAINFL, XSECTN, BTRUCT) cora,after these introductory records. Tabular data may come in any order as long aLe they are in front of the Executive, Control that-uses them. Rany times a job will not need all the different kinds of tabular data that can be used. Bach table of tabular date must end with an BNDTBL record.
The Standard Control instructions for the watershed normally follow . the tabular data. These rclcorde (RUNOFF, RRACR, RBSVOR, ADDRYD,
SAVNOV, DIVRRT) describe the way that the user wiehee'the hydrographe to be developed, combined and routed within the system of subwatersheds that-make up the watershed under study. The. records must be set up in the same order that one wants these developments, combinations and routinge to occur. The data in the

20
various records describe the physical conditions of the watershed: the size of the drainage areas, the length of reaches and so on. The Standard Control must be in front of the Executive Control that uses it and the last Standard Control record must be followed by an ENDATA record.
'The Executive Control records (LIST, IN-, BASFLO, COMPUT, ENDCBP) come next. These records set the meteorological conditions for the watershed and define over how much of it they extend. For example, the COMPDT record designates; where to begin and end calculations, how much rain to use and the rainfall's duration, which raintable is applicable and which antecedlent runoff condition to use. READHD tabular data, LIST, INCRM a.nd BASFLO must precede the COMPUT record in which they are used. The ENDCHP record marks the end of a pass
~through the watershed.
Host data sets will end at t.his point with an ENDJOB record. However, if the user wishes to incorporate modifications within the watershed in the same run, i.nstead of making separate runs, they can leave out the ENDJOB record and add any changes to the tabular data and Modify Standard Control instead. A new set of Executive Control instructions must be supplied to run these changes. This can ba followed by any number of cambinations of changes to the tabular
:data and Stzmdard Control ahd new sets of Executive Control records.. The MDJOB record must follalw the last set of Executive Control records unless Intermediate Peaks are to be calculated.
When using the IPEAES and PEAKS records to obtain peak discharges at ' intermediate points within subwatersheds, one must place these records after the last ENDCMP at the end of the program. An ENDJOB record must follow them.
The 'Record Identificationa space in columns 73 through 80 on all records can be filled in if desired when all input data for a watershed have been complete!d and put in order. The numbering in the sample jobs starts with 10 on the first line and increments by 10. The numbers are right justified. The remaining columns in the 73 - 80 Record Identification field can be used for abbreviated words, letters, etc. to assi.st in identifying the data in the output.

21
TABLE 3.3. PREFERRED INPUT SEQUENCE
We nmut/RECORP DeSCriDtiOn
JOB Job identification for TR20. Includes options for data output. Required for job to run, must be first record.
TITLE Identifying and/or descriptive data for job. One TITLE record is required; two may be
used. TITLE records musty follow the JOB record.
Tabular Data Provides tables for input data as needed. May or may not be required depending on job. Bach table must end with BNDTBL record.
1 DURINC Flow Duration Increments Table. Used with ECON option in JOB record. Only one DDRINC table is allowed in a
job.
4DIHHYD
Table must end withENDTBL.
Dimensionless Hydrograph Table. .Standard SCS hydrograph (Peak factor -
484) is preloaded into program and need not be entered as part of data.
To use any other dimsnsionless hydrograph, one must enter it as a DIHtiYD table.
Table must end with ENDTBL.
5 RAINPL Cumulative Rainfall Table. Six standard SCS rainfall distributions
are prsloaded into program and need not be entered.
Actual storm rainfall and nonstandard distributions must be entered as a mass curve in a RAINPL table.
Table must end with BNDTEL.
2 XSECTN Stream Cross Section Data Table. Rsguired if program will perform a reach
routing without given coefficients. Lists elevation, discharge and end-area
data for a given cross section. Table.must end with BNDTBL.

22
TABLE 3.3. PREFERRED INPUT SEQUENCE (Cont'd.)
3 STRUCT Structure Data or Reservoir Table. Required if program will perform routing
through an existing or proposed structure.
Provides elevation, discharge, and storage data for the reservoir.
Table must end with ENDTBL.
Standard Control Describes physical characteristics of watersh,ed and defines order in which hydrographs are generated, routed, and combined.
Standard,Control records of the types shown below must be ahead of Executive Control in which they are used.
At least one Standard Control record must be pres*ent (the most likely one is RUNOFF).
_. The complete list of Standard Controls
must be followed by ENDATA.
6 RUNOFF 1 Generates a hydrograph for an area, given the size of the drainage area, the runoff curve number, and the time of concentration.
Various output options can be specified.
6REACB3 Routes a hydrograph through a stream reach.
User must either provide a XSECTN table in the Tabular Data for the reach, or specify "xW and emn on the REACH record.
Reach length is necessary. Various output options can be specified.
6 RESVOR 2 Routes hydrograph through a reservoir structure.
STRUCT table with outlet data must be part of Tabular data (unless structure is a Null Structure, see Section 3.8.1 in text).
Elevation at which routing starts if necessary. A blank in this entry will start routing at the lowest elevation given in the structural data table.
Various output options can be specified.
6 ADDHyD4 .
Adds'two hydrographs together. Various Idutput options can be specified.

23
TABLE 3.3. PREFERRED INPUT SEQUENCE (Cont'd.)
6 DIVERT 6 Splits flow into two hydrographs to account for diversion or division of flow.
Various output options can be specified.
6 SAVMOV 5 Allows user to move hydrographs into or out of storage locations if necessary.
RWDATA Must follow last Standard Control record.
7RRADHD Used to introduce a given hydrograph into the current run.
Must follow EWDATA and precede the COWXIT record that uses it.
Can introduce a hydrograph generated by another program or source, or one generated by another TR-20 run.
Executive Control Needed to define hydrologic conditions of the watershed and to control processing of storms within the watershed.
All input data used by these records must be ahead of the Executive Control.
7 LIST
7 IN-6
Will list portions or all of the current input data to the prograx.
Specifies the main time increment used in storing, routing, adding, and displaying hydrographs.
Must precede CONRUT record(s) that use it.
7BAsm5 Used to introduce or change a baseflow. Wust precede COWPUT record(s) that use it.
7coKPuT7 Designates beginning and ending points of a ru.nF the rainfall amount and duration to use, the rainfall table number, and antecedent moisture condition.
Specifies alternate and storm numbers for each pass.
At least one CONPUT is required for output.
ENDCMPl Signals the,.end of a set of computations _ (pass) and resets program to start of . Standard Control.
Follows CONPUT record(s).

24
TABLE 3.3. PREFERRED INPUT SEQUENCE (Cont'd.)
Modified Tabular Data
Modify Standard Control
7 ALTER 3
7 DELETE 4
7 INSRRT 2
New Executive Control
IPRARS
PEAKS
ENDJOB 2
New tabular data tables for describing changes in the job.
Must precede the Executive Control that use the new tables.
Changes data in previous Standard Control records.
Records must be in the order that the Standsrd Control list is modified.
Must precede the Executive Control that uses it.
Changes the designated Standard Control records as shown.
Deletes the designated Standard Control records.
Places one or more new lines in the Standard Control following the designated location.
As needed to make alternate runs with changed conditions specified by rest of modif.ied data.
Indicates Intermediate Peak data are reguerrted.
Reguirad to recognize intermediate peaks. Rust fo,llov the last ENDCRP record.
Sets locations at which Intermediate Peak data ,are computed based on given drain,aqe areas.
must follow IPEAKS record.
Ends all processing on job. Required to end job.

25
3.4 WATERSHED SUBDIVISIONS
A watershed is subdivided i:nto hydrologically homogeneous Subwatersheds. A flood hydrograph is developed for each of these subwatersheds. The attenua,tion and translation of these hydrographs, 'due to structures and to floodplain storage and hydraulics, are determined :by flood routing.
Section 2.1 briefly describles these procedures and gives specific references to the applicablle portions of NEH-4. The major considerations in defining subwatersheds are also described in Section 2.1 under subwaterslhed delineation.
The sizes of the subwatersheds should be relatively uniform. Unless a~hydrograph is needed for ,a subwatershed that is very small in comparison to the other subwatersheds, there is usually little advantage to include it as a separate subwatershed.
The difficulty comes from defining the hydrographs with the main time increment. This is discussed under Hydrograph Development in Section 2.1. For example, ia hydrograph developed by combining hydrographs from draining areas of 0.1, 2.1, and 15.2~square miles is only as accurate as the hydrograph from the larger area since it has a much larger drainage area and time of concentration than the smallest drainage area. Therefore, unless there is a need for the hydrographs for the two smaller subwatersheds (e.g., a potential structure site), only one hydrograph should be developed for the total drainage area of 17.4 square miles or the large area should be broken into smaller, more uniformly sized areas.
Another consideration in subdividing watersheds is the reach length used in routing. A cross section is generally used to represent the stream or valley reach through which hydrographs will be flood routed using the Modified Att-Kin routing procedure. The reaohes should be as long as practical when considering the detail for which the watershed hydrology is analyzed. In general, each reach will extend from one tributary to another. The Intermediate Peak procedure will allow the development of peak discharges for points within a reach (subwatershed) where such information is needed.
Any analysis of existing and with project conditions should use the same watershed subdivisions to obtain comparable results.

26
3.5 SCHEMATIC DRAWING
A schematic drawing is a flow diagram that shows subwatershed delineation and the relationships of subwatersheds, structures, and reaches. The schematic drawing for the watershed is an important aid in compiling input data and is especially important to those checking and handling the data through processing and documentation, A sample schematic drawing including a legend showing suggested symbols is shown in front of each sample job in the appendices. The schematic drawing discussed in this section is from Appendix D, page D-2, but is reflected here i%?. Figure 3-l for convenience.
-A schematic drawing should be completed before preparing the input I data. The location of all potential structures to be considered
should be shown together with all cross sections that represent reaches and junctions. The structures and cross sections should be numbered in the sequence in which they will be routed. This sequence facilitates settinq up the job, checking and verifying. The drainage area above each structure and the area of local drainage to each reach are inserted as shown on Figure 3-l. The reach length, runoff curve lnumber, and time of concentration should also be included for ready reference.
A cross section representing a rating section for a reach should be ~shown at the downstream end of the reach, even though the surveyed .section may be at another location. The rating section gives the average cross-sectional flo$w and end area of a routing reach. If more than one rating is available for a reach, the ratings may be averaged by the user. Cross sections can also be a means of denoting reference locations in the system. This is illustrated on Figure 3-1, where 1 and 2 represent rating sections while 4 merely denotes a reference location or an expedient for designating a location. The use of reference locations can aid greatly in describing the Standard Control for the watershed.
The sample schematic drawing shows that a hydrograph is to be developed for the area of structure 1 with a drainage area of 1.20 square miles, a runoff curve number of 75, and a time of concentration of 0.33 hours.- This hydrograph is to be routed through structure 1 and then through reach 1 using a stream cross saction rating table for a reach length of 5400 feet. Each reach is referred to by the number alf the cross section at the downstream end of the reach on the schematic. Another runoff hydrograph is to be developed for the intervening area (0.46 sq. mi.) between structure 1 and cross section 1 and aldded to the reach routed hydrograph at the downstream end of reach 1. This combined hydrograph is to be reach routed through reach 2 with a reach length of 3000 feet.

27
LEGEND
&k Rmcll Lwptll - Fat
. . mid ha cceft. Ix)X~t (Cl1 1.2@ omlnqr Ara - SqJa-c 111a
El .s3) or (TC - lmlrc)
Figure 3-1 Sample Schematic Drawing

28 Another runoff hydrograph is to be developed upstream of structure 2 (D.A.=0.44 sq: mi.), routed through structure 2, and then through reach 3 using given *@xn and "m" values. A runoff hydrograph for the intervening area (D.A.=0.31 sq. mi.) is to be developed and combined withy the hydrograph routed through reach 3. The hydrographs at sections 2 and 3 are then to be combined at location number 4, shown on the schematic drawing as a dashed line. The hydrograph at location 4 is to be routed through reach 5.
A diversion structure is located at the downstream end of reach 5 that will divert part of the hydrograph to section 8 out of the watershed. The remaining portion of the hydrograph is to be routed ‘through reach 6 and combined with a runoff hydrograph for the intervening area (D.A.-l.30 Sg. mi.).
This schematic drawing would normally be used for all alternatives, even those not including structures 1 and 2 and the diversion structure at section 5. In cases where structures are not to be included in an alternative, they would be shown in the input data as null structures (see p. 42 for discussion of null structures). Separate schematic drawings are shown for each alternate in Sample Job 5 (Appendix F, page F-2) to give a better understanding of the complexity of the example.
3.6 INPUT RECORD FORMAT CONVENTIONS
This section describes the input record format conventions used in this manual. The detailed instructions that follow for the individual records give the purpose, use, relation to other records, and data field requirements for columns 1 t0 72.
The data fields are designated by columns, value to bs entered, and type of characters to be used. The type of characters in a data field are indicated by the following convention:
A=
N=
I=
Alphanumeric, (letters or numeric) data which can appear in any location within specified columns.
Numeric, numbsrs which can appear in any location within spscified columns and must include decimal points, and plus or minus signs.
Integer, numbers (no decimal points) which can occur in any location within specified columns.
Ix- Integer, numbers (no decimal points) which occur in a fixedposition and must be right justified.
. . - .

29
e = Essential data for use of record. Error message will be printed and job execution is normally terminated if this data is omitted.
(-) = Negative data is allowed.
The Record Identification field, in.columns 73 through 80 is not included in the detailed instructions that follow. Alphanumeric data is permitted in all columns of the field. See section 3.3 for suggested uses for this field in ordering input and identifying autput.
The desiqnations are combined as necessary to describe a particular type of data entry; for instance “Ae** means essential alphanumeric data, and “-Ne” means essential numeric data which may be negative.
3.7 JOB CONTROL RECORD SPECIFICATIONS
There are three types of Job Control records, all of which are required for a job to run. These are the JOB, TITLE, and EBDJOB recordo.
3.7.1 DISCUSSION OF INPUT
Job (see also pp. 34-35 and Worksheet SCS-ENG-264, Paqe G-2)
The input data begins with the JOB record. The JOB record is required for each job. The letters *JOB" in coluuns l-3 is the only required entry. There are seven additional fields for processing options. Up to seven output files uay be generated by TR-20 (hro transport files, four qraphic files and one warning and message filer. To obtain some of the optional transport and graphic files, selection of options on both the JOB record and Standard Control records are required. Table 3-7-l lists the options both in the JOB record and in the Standard Control records that are used to generate various files.
The processing options in the JOB record remain in effect through all alternates and storms until reset by another JOB record at the beqinnfnq of another TR-20 job. The JOB record options are discussed below. .The Standard Control Options are discussed in section 3.9.1.

30
TABLE 3-7-l. INPUT OPTIONS TO OBTAIN GENERATED FILES
TYPE NAXE l/ REQUIRED OPTIONS PREPIX. BLLSC
RJZADHD "prefix".TRD
ECONZ "prefix" .TEC
Summary
Summary
Quration
"prefix".TSl
Hydrograph eprefixe.TBY
Warnings aprefixw.TMG and
me6eagee
w-art Fflea --- FILE
ECON ii SUMMARY or SUM
and DUR
GRAPHICS & SUMMARY or SUM
GRAPHICS --
GRAPHICS DUR
GRAPHICS FILE
-4-
Hydrographs in READHD foreat.
Output data for ECONZ: Peak flow data only; With Flow duration data (DURINC Table required).
Suemary Table 1 data.
Summary Table 2 (REACH) data.
All flow duration data.
Hydrograph data (compressed) . Al60 vritee RBADHD file).
Optional listing of allvarningand messages.
I/ Uses nprefixm from mnput or output file naee, or users choice. 21 JOB = JOB record required option. 31 SC = Standard Contxol racord reguired option, 800 section
3.9.). for eelection~ inetxuctione. 41 Requires Yes answer to third question when initiating a mm, see
section 1.5 for discussion.
. .

31 @TEXSHED IDENTIFICAT:~ (COl. 11-18) -- Alphanumeric Watershed identifier (maximum 8 characters) for output.
ECON OPTION (Cal. 21-24) -- The SCS computer programs, ECONZ and URDl, require percent chance versus discharge data. A peak discharge and flow duration file can be created by the TR-20 program with the ECON option. The peak discharge and flow durations can be related to runoff volumes and percent chance.
The ECON option is invoked by entering ECON in the data field. The user can select cross sections and structures that are to be included for peak discharges in this data by placing "1" in the SUM column (71) of the output options on the Standard Control records. The sl,JlQQ~y option (Col. 51-57) 011 the job record will also provide the peak discharge data but at every cross section and structure.
Peak discharges for each alternate and each storm will be provided. Summary Tables 3 and 4 and a separate output file will contain the peak discharge information prepared for the ECON option.
Cross sections and structures selected for flow duration data are included in the ECON file by placing a "1" in the DUD column (67) of the output options on the standard control records. The DDRINC table (Section 3.8.2.) must also be entered. This provides time flow data for each alternate and storm that uses that standard control record. Summary Table 3A contains both the peak discharge and flow duration information developed for the ECON option.
The EdoN output file is automatically named by the program with the user's choice as to file prefix and the extension TEC (nprefixw.TEC).
pRrNT (COl. 31-39) -- The Print option field is columns 31-39 of the JOB record. The default option, called NOPRINT, provides a reduced printing of output if the field is left blank. To obtain the PUIURINT option, enter FULLPRINT in the data field.
The FDTJ.?RINT option will generate considerable output that can effectively conceal pertinent data. However, Standard Control or other input errors may be overlooked without checking the FDLLPRINT data at least once on every job. It is suggested that the first pass through a watershsd bs made using FULLPRINT. The bulk.of.the output is the step-by-step list of each standard control instruction, related basic data, and waning messages printed as the operations are executed. This detailed printout including multiple peaks is suppressed unless individual options on ,the standard control records are selected.

32
With NOPRINT, all changes to tabular data and Executive Control records are printed as before. NO step-by-step output information will be printed unless the individual Standard Control output options are selected. Exceptions are warning messages and divert option hydrorjraphs which are automatic.
Summary Tables are not affected by the Print options. An example of the default Noprint output iS shown in Appendix C. An example of FULLPRINT output is shown in Appendix B. The Standard Control output options are discussed in Section 3.9.1.
m OPTION (Col. 41-48) -- Generally, a pass is the processing one time through a complete watershed. A pass is usually
.~ represented by the results of a particular set of conditions within a watershed such as a specific storm rainfall over the watershed for a certain alternative. The pass number is incremented by one when a ENDCWP Executive Control Record is encountered.
The default value for the initial pass number is 1 for each TR-20 job. The user may change the initial pass number with the PASS option by placing PASS=XXX in the data field. The XXX is a right justified integer.
OPTIOrJ (COl. 51-57) -- By placing SDMHARY in this field the user will not have to enter individual SDM options on the Standard Control operations to obtain the summery tables described in Section 4.1.6. All operations (except SAVMOV for all alternates and storms) will be included in Summery Tables 1 and 3. If the user wants to control what operations are displayed, this field should be left blank and the user must specify the desired individual SUM options described in Section 3.9.1.
If both the SD'MXARY and all the SUM options are left blank no SUmmary Tables 1 or 3 or Intermediate Peaks output will be provided. Combined with the no-print option and no other Standard Control options selected, this will result in e Lllll with no computational results printed out.
PLOT am (COl. 61-68) -- The plot Option can be USSd t0 obtain line plots of discharge vs. end area for cross Sections having tabular data or to generate output files for use with SCS graphic software. These are obtained by control word options placed in the data field. There are four options when using plot. These are:
1. PLOTS- Provides a discharge-end area line plot for each cross section before the results of routings are processed and printed. Accompanying each plot is,a tabulation of elevation vs. rxponent Wm.H It is good practice to obtain tlie plots at least once with the output to facilitate checking of the results.

33
2. GRAPHICS - Saves output data in files for use with SCS graphics software.
3. ENDPLoT - Obtains plots of XSECTN data without any other. processing. The listing of input data and the plots will be printed, but routings will not be done nor any other output printed. The ENDPLOT option can be used to check the cross section data separately prior to processing.
4. BLANK- No plots or graphics data are generated during the processing of the data when the data field is left blank.
TftleRacorQQ (See also p. 36 and Worksheet SCS-EWG-264 Page G-2)
One or two TITLE records follow the JOB record providing a one or two line description that is printed at the top of each page of output. The word "TITLE" is the only required entry in these records. The descriptions are entered in columns 11-72. At least one TITLE record is required for a job to run.
m iob rem (See also p. 37 and Worksheet SCS-BWG-274, Page G-19)
An BWBJOB record is required at the end of a TB-20 job. It can follow the last BWDCWP record or the last PwlS record. For a discussion on the .BWDCWP and PBAKS~records, see Section 3.10.1 and Section 3.12.1.
Wheti an IPBNZS record is encountered a check is made to see if a PEAKS record follows. If there is none, the job is ended. Any PBAKS records found are processed until a BWDJOB record is found. Then the TB-20 job is ended.
After an EWDJOB record is encountered a check is made to see if there is another JOB record to initiate another TB-20 job. If there is none, control returns to the computer operating systm.
. .

3.7.2 JOB Record
Table 3-l-2. JOB record
JOB - record indicates thee beginning of a job. All variables and coefficients are set to program default values end all hydrograph storage arrays are initialized to zero- Seven data fields provide identification and processing options for the program. For discussion see page 29.
l-3 JOB
5-9 TR-20
11-18 WATERSHED ID
21-24 ECON
31-39
41-48
51-57
PULLPRINT
PASS=xxx
SUNMARY
61-68 PLOTS
GRAPHICS
BWDPLOT
Ae
A
A
A
A
I
A
A
A
A
DeSCriDtiOD
Required data code signifying a TR-20 job follows.
Program identifier.
Watershed identification.
Used to request that a peak discharge, flow duration data file be created for SCS ECONZ/URBl computer programs.
Used to request FULLPRINT option. 'Leave blank for Noprint option.
Used to assign a pass number other than 1. X%X is a three digit integer, right justified.
Use only if Summary Tables 1 and 3 or 3A are to include all Standard Control operations (except SAVHOV).
Pour options as follows: 1.
2.
3.
Provides plotted discharge- end area plots for cross section tables with regular output.
Data files for use with SCS graphics programs are generated.
Request cross section discharge-end area plots only. Routings through watershed will not be done.

JOB 35 m-e 4. Leave blank if no plots
or graphics data files are desired.
Figure 3-7-2.. JOB record example
This record causes a TR-20 job to be initiated. The Watershed Identification ia ROCKCR. A data set containing peek discharge data will be created for later input to the SCS ECONZ or URBl program. The FULLPRINT option for the output will be invoked. The pa86 number is four, indicating that three other passes were made previously. The summary tables will include all Standard Control operations encountered. No plots of any stream cross section data or graphics data files will be made. The record identification number i8 IO.

3.7.3 TITLE Records TlTLE Table 3-7-3. TITLE records
TITLE -- record pkovides a line of descriptive text to be printed at top of each page. Two TITLE records are allowed, one is required per job. For discussion, see page 33.
Data Fir14 BUB ZYEB (columns)
. DescrlDtlon
l-5 TITLE Ae Required data code signifying a TITLE record.
11-72 TEXT A Optional descriptive text in alphanumeric characters to be listed at the top of each output page.
Figure 3-7-3. TITLE record example
I a-m’- : I - I
-----------,rr,*,.+m . . . . “.,ogll,ae. -“*,-,) m---------m :- : Y”‘Y
T I Tl.L y///n IlllllJJj , t I t
, : I c
Both lines of the job title will appear at the top of each page of output. The record numbers, 20 and 30, will not appear as part of the title.

3.7.4 ENDJOB Record
Table 3-7-4. ENDJOB record
ENDJOB -- indicates the end of a job.
Data Field L!su.e (columns)
ENDJOB3’
For discussion, see page 33. . D==rlDtipn
2 I Data Code, blank or zero.
4-9 ENDJOB A Operation name.
11 2 Ie Operation number.
Figure 3-7-4. ENDJOB record example
The ENDJOB record is required at the end of each TR20 job in a TR-20 run. If intexmedfate peak records are used at the end of a TR-20 job, the ENDJOB record must follow the last PEAKS record.
.

38
3.8 TABULAR DATA SPECIFICATIONS
3.8.1 Discussion of Input
There are six tabular data formats~to support the Standard Control ,records. The tabular data formats are: (1) Flow Duration Increment, (2) Stream Cross Section, (3) Structure, (4) -Dimensionless Hydrograph, (5) Cumulative Rainfall, and (6) Read Discharge Hydrograph.
peach tabular data set has a header line specifying the type of data .that is entered before the actual tabular data lines. Each line of ~the tabular data has an “8” in column 2 and five 12-column numeric .~data fields. Decimal points must accompany all figures in the numeric data fields. Commas must not be used with figures to denote thousands. If the worksheets are used, all unused lines must be crossed out and not entered.
Each tabular data set must be followed by a 9 ENDTBL record. One of the most common errors in preparing input data is to omit the 9 EWDTBL line.
-Worksheet SCS-ERG-272, Page G-4) (See also p. 48 and
TIYE-FLOW records are generated in the ECON2 output file for a user ._ selected hydrograph at the flow~duration increments entered in the 1 DDRINC Table. The SCS ECONZ computer progrem uses the TINE-FLGW records for a flood duration damage analysis.
In addition to the 1 DDRINC Table, the ECON option on the JOB record and the DUR option on the selected Standard Control records, must be activated in the input to obtain the TIWE-FLOW records in the ECONZ file. Only one 1 DDRINC Table is recognized in a TR-20 job; subsequent ones following a Executive Control will be ignored.
Three durations in increasing order of magnitude can be entered in the numeric data fields of the 1 DURINC Table. The durations can be in hours or days. The program will convert days to hours for the output. The maximum discharges in cfs associated with the durations are computed-from each fl+ hydrograph selected in the Standard Control. The computed flows consider only the peak portion of multiple waked flood hydrographs and do not consider the time between peak8 as part of the flow duration time. See Figure 3.2 for an illustration of a flood hydrograph with 6, 12, and 24 hr flow durations identified.
- .

39
1800 -
1600 -
1400 -
F 1200 -
z 1000 -
l% 0’ 800 -
5 600 - (0 .-
~0 400 -
Duration=hrs cfs
0 (Peak) 1660 2 1440 4 1360 6 860 12 420
120 120
0 2 4 6 8 10 1214161820222426283032
Time (hours)
Figure 3-8-l. Flood hydrograph with flow duration identified
’

40
If the 1 DDRINC table is omitted from a job with or without the ECON option on, TIME-FLOW records will not be generated. The standard flood hydrograph flow duration analysis, however, will still be performed for up to 12 durations when the DUR option is activated on the Standard-Control (See pp. 48-49).
Stre Workihmeet iCS-ENG-270, Page G-5
Cro s Section Data Table (2 XSECTNL (See also p. 50 and
The stream cross section table relates the water surface elevation to discharge in cubic feet per second per square mile (cam) or cubic
~ feet per second (cfs) and to the cross-sectional end area in square r feet. These data may be from 1) water surface profiles, 2) a user
weighted average of flow and end area at tvo or more cross sections or 3) solution of Manning's equation assuming uniform flow.
The important consideration is that the cross section data should represent the hydraulic conditions for the reach through which reach routing is to be performed. It is necessary that the user enter flow and end area data for elevations belovbankfull as well as data for flows up to or larger than those expected to be routed in order to define the complete rating curve accurately.
The number of the cross section on the,2 XSECTN record must correspond with the cross section number of the RXACH record. The cross section ID number must be betveen 1 and 200, inclusive. If
: discharge is given in csm the total drainage area above the cross section must be shovn in columns 25-36 on the 2 XSECTX record. The figure shovn in this space is multiplied by the discharge in csm in order to convert to cfs. Usually the discharge in columns 37-48 of cross section input data is given in cfs and a figure of 1.0 is put in the drainage area field of the 2 XSECTN record. The number of data entries describing each cross section cannot exceed 20.
The optional bankfull elevation in columns 37-48 of the 2 XSECTN record is shovn on the discharge-end area plot and is used to trigger a vaming message if less than two cross section data points are below bankfull.
The optional zero damage elevation in columns 49-60 of the 2 XSECTN record is used with the flow duration analysis to flag results at this elevation.

41
The lov ground elevation or the lowest floodplain elevation in a cross-section (columns 61-72 of the 2 XSECTN record) is required if separate channel and flood Plain lengths are given on the REACH Standard Control record. The modified Att-Kin routing~procedure ~accounts for differences in channel and valley storage based on changes in reach length at the 10~ ground elevation. The lov ground elevation must not be higher than the bar&full elevation for the interpolation routine to work.
The discharge-end area data in Coluuhs 25-36 and 37-48 are used to compute the discharge-storage equation representative of the reach. (See section 3.9.1. under 6 REACH 3.) The first data point must be at zero discharge and zero end area. All other data points (minimum of 2) must be greater than zero and increase in magnitude with elevation.
The SCS vater surface profile program (WSPZ) can be used to generate rating tables for use in TR-20. Columns 61-72 of these tables may contain data on acres flooded in addition to the elevation, discharge, and end area data. The acres flooded columns are not read by TR-20 and do not cause an error.
If the channel represented by a cross section is to be modified as an alternati,ve consideration, a new cross sectidn data table is made up for the modified cross section and inserted ahead of the Executive Control records for the alternate. Any number of alternative channel conditions for any one section or sections can be compared by inserting each new cross section data table ahead of the respective Executive Control records. If two cross sections are entered with the same cross section number, the last one entered will be used.
The nuabering of cross sections need not be in consecutive order. Similarly, the cross section data tables can be in any order when inserted in the runstreem. However, chances of error will be minimized if they are numbered and placed in the runstream in the order in which they appear in the Standard Control routing seguence and follow a natural sequence in the watershed. The elevations, discharges, and end areas in columns 25 through 60 must increase between successive lines of data; however, they need not increase by a.constant incremeht. Linear interpolation is used between data for the elevations and discharges shown. Also, a linear extensions through the last two values of elevation and discharge is used to extrapolate discharge beyond the highest elevation given in the table when the cross section has insufficient capacity.

42
Structure Data Table (3 STRUCT) (See also p. 52 and Worksheet SCS-ENG-269, Page G-6)
Structure data tables relate the water-surface elevation to spillway discharge and- reservoir storage. between 1 and 99, inclusive.
The Structure ID number must be The numbering of StNCtUreS must
correspond with the structure number on the RESVOR Standard Control record. Structure numbering need not be consecutive, and the data table preceding each respective set of Executive Control records can be inserted into the runstream in any order. Nowever, chances of error will be minimized if the StrUCtUrsS are numbered and placed in the runstream in the order in which they appear in the Standard
Control routing sequence.
The first data record in columns 25-36 should always begin with aero discharge. This usually COrreSpOndS to the Crest elevation of the low stage outlet in the principal spillway. "Starting Elevation,n
See the explanation of columns 25-36, of the Standard Control RESVOR
record, Section 3.9.1, if routing begins above or below the crest elevation of the low stage outlet.
The elevation, discharges, and volumes in columns 25-60 must increase between successive lines of data: however, they need not
-'increase by a constant increment. A linear interpolation is used 'between data for the elevations shown. If needed, an extrapolation of data above the highest elevation is performed by extending a line linearly through the last two data entries.
The Storage Indication method of reservoir routing requires that the main time increment (in the Executive Control), the discharge, and storage (from the structure data table) must be such that the following inequality holds true (See chapter 17, NEIi-4):
PS 2 < delta t
where: 0 = the outflow in cfs at a line in the table,
S = the storage in cfs-hours (acre-feet x 12.1) at the same line in the table,
delta t = the main time increment in hours
If this inequality is not true, oscillations will occur in the descending limb of the hydrograph and may include negative discharges, peak outflow greater than peak inflow, and/or outflow volume greater #an inflow volume. A warning message in the output alerts the user to the problem. The usual need is to decrease the delta t or make smaller elevation increments in the structure table, especially near significapt changes in flow conditions. ,
There are usually two structure conditions described for each site. One is the Null structure, and the other is for the existing structure or as it would be designed or constructed. The Null

43
StrUCtUre condition represents the present condition in a watershed where a structure is proposed to be located. The Null structure is used to avoid having to modify the Standard Control sequence between processing for "presentn and for "with project" conditions. This can also be done using Modify Standard Control statements (section 3.11).
A Null structure is indicated by one of two methods. The first method is placing a 3 STRUCT record followed by a 9 ENDTBL record without any intervening '*an data records. A second method is leaving out all structure table records referring to a structure. To use the Null structure by the first method, the two records (3 STRUCT and 9 ENDTBL) are inserted into the runstream with Tabular data prior to the Executive Control records to which they pertain (See appendix F, sample Job 5, for the use of Null structures).
When a new structure table with the same ID number is entered, the new structure table replaces any previous data for the table. When a structure table, including a null table (first method), is entered, it remains in effect until replaced. When only 2 records for a Null structure are found (or no structure data as in the second method) the RESVOR inflow hydrograph is moved into the RRSVOR outflow hydrograph storage location without any routing. For "with project" conditions, the complete structure data table is inserted ~ahead of the Executive Control records to which it pertains. Any number of structure conditions can be processed for each numbered site with each structure data table inserted ahead of the appropriate Executive Control records.
Bach structure data table must have a structure number and a 9 RWDTBL record. The number of data records describing a structure cannot exceed 20.
Worksheet SCS-EWG-265, Page G-7) (See also p. 54 and
The dimensionless unit hydrograph is used in the RUNOFF operation for developing flood hydrographs from subwatersheds. The standard SCS dimensionless unit hydrograph with a peak rate factor of 401 1s contained in the program and is not required in the input. The standard SCS dimensionless hydrograph is shown in Appendix G, page G-0. It is &leo described in Chapter 16, NRR 4.
This input table is required only if another dimensionless unit hydrograph is used. The data records contain the ratio of discharge to peak diecherge for each increment of the dimensionless time scale. The number of entries must not exceed 105. The product of the number of non-zero entries plus one and the dimensionless time increment (column 25-36 of the.9 DIRliYD record) must egual 1,D.
This peak rate factor is not an input item. It is calculated by the program and displayed when the DIWRYD table is entered.

44
w ‘v reRainfall RAINF (See also p. 56 and Worksheet SCS-ENG-271, Page G-9)
TRi20 was designed to allow almost complete freedom for input of storm rainfall and its time distribution. There are four methods to input cumulative rainfall distributions. They differ in the specifications of the rainfall volume and duration with both actual and dimensionless values available for use. The four methods are:
1. cumulative rainfall in inches - time increment in hours.
2. cumulative rainfall in inches - dimensionless time increments.
3. cumulative dimensionless rainfall - time increment in hours.
4. cumulative dimensionless rainfall - dimensionless time increment.
Up to a total of nine actual or synthetic rainfall distributions can -be us&in any run. They can be input using the Cumulative-Rainfall ~Table.~ RAINPI, Table 7, in Appendix D (p. D-3), shows how an act-1 storm rainfall can be described. The values from left to right in the five data fields are accumulated rainfall depths, in inches, for l-hour time increments. Any time increment can be selected to describe an actual storm, but the smaller the increment, the better the hydrograph definition. The time increment is specified in column 25-36 of the 5 RAINFL record.
The number of records in the body of the formet cannot exceed 60 (300 entries). This means that if a l-hour time increment is specified, storms up to 299 hours duration can be used. All five data fields must be completed on each line or the entire line crossed out. Note that 12,16 inches, at 42 hours, in columns 37-48 of the last data record in RAINFL Table 7, Appendix D is the end of rainfall, however, the value of 12.16 inches is repeated in data 8columns 49-72 to complete the line. The 9 RRDTRL record must follow each RAINFL table.
Each cumulative rainfall table must be labeled with ~a separate table number between 1 end 9, inclusive, for its identification. The actual storr in Appendix D, is identified as Table Number 7 on the header record in column 11. When it is desired to route this storm through the watershed, Rainfall Table Number 7 is specified in the
. Executive Control COHPUT record. Note further that a 1.0 appears undu both the rainfall depth and rainfall duration data fields in the Executive Control because Table 7. contains the cumulative
.rainfall. depth in inches and time increment in hours.
The SCS has six standard synthetic rainfall distributions. The standard distributions are listed as in Tables 1 through 6 on pages

45
G-lo to G-15 in Appendix G. Each standard table has been designed to be used for a distinct purpose and has certain limitations. The standard tables are designed to adapt the rainfall distributions over a wide range of drainage areas and times of concentration. The user is offered a choice of the six standard distributions due to the variation of climatic and watershed conditions. If none of the standard distributions are suitable the user may choose to enter other distributions.
The six standard rainfall distributions as shown in RAINFL Tables 1 through 6 in Appendix~G have been preloaded into TR-20. The user does not need to enter these tables, but needs only to use the proper rain table number on the COMPUT record. The user may override any of these tables by entering a new RAINFL table of the same table number.
The 24-hour type I distribution (Table l), which is shown on page G-10, is used in the Pacific maritime climate area of Central and Southern California and is accepted in some other areas because it approximates peaks resulting from less severe short duration intensities. The time increment used for this distribution is 0.1 hour.
The 24-hour type IS distribution (Table 2), which is shown on pege G-11, is generally used in the summer.thunderstorm area of the UniteGStates east of the Cascade and Sierra-Nevada Hountains. The time increment of 0.1 hour gives good definition of the resulting hydrcqraph for the short duration intensities.
The 24-hour type IA distribution (Table 3), which is shown on page G-12, is recommended for watersheds subject to low intensity storms normally associated with frontal storms such as on the coastal side of the Cascade Hountains in Oregon, Washington and Northern California. The time increment used for this distribution is 0.1 hour.
The 24-hour type III distribution (Table 4) which is showh on page G-13, is generally used along the coastal areas of the eastern and southeastern United States. It reflects the influence..of hurricane type rains in these areas. The time increment used for the distribution is 0.1 hour.
The 48-hour type 11 storm distribution, ~(Table S), which is shown on paqe G-14, is similar in xaxiaum intensities to the Type II 24-hour storm - The tixe increxent used for this distribution is 0.5 hour. The 48-hour distribution can be used in watersheds where tixes of concentration for the entire watershed exceed 24 hours. Tha storm distribution used should most nearly match the precipitation pattern. The 48-hour distribution should be evaluated by the user for applicability, especially in relation to peaks and runoff volume.

46
Note that these standard 24- and 48- hour distribution tables are dimensionless rainfall vs. time increment (0.1 or 0.5) in hours tables. Each entry in the table iS the ratio of the storm accumulation to total storm depth.
When any of-fhese five standard 24- and'48- hour distribution tables are specified-in the COWUT Executive Control record, a storm rainfall depth in inches must be shown in columns 37-48 of the COMPUT record because these units are dimensionless, and a 1.0 for duration in columns 49-60 because time increment is hours. There is no limit to the number of storm rainfall depths that can be routed through the watershed when these tables are used. (There is a limit
; of ten storms if the output data is to be used in ECOK2.)
The cumulative rainfall table for the SCS standard emergency spillway and freeboard hydtograph distribution (Table 6) is shown on page G-15. This table is a dimensionless rainfall vs. dimensionless time table used primarily within SCS for structural design. Both depth and duration must be supplied in columns 37-48 and 49-60, respectively, on the CORIWT record when this rainfall table is specified. It is the same as the design storm distribution in Figure 2-6, TR-60. There is no limit to the number of storm depths and durations that can be routed when specifying this rainfall table. Storm duration or area1 corrections to design rainfall amounts must be made before data are entered. This distribution is undesirable for peak flow frequency studies since with dimensionless time, as the duration increases, the rainfall intensities deoreese.
m OD&iQL -- The runoff option, invoked by placing a one in column 17 Of the 5 RAINFL record, is used only when the data to be entered arc for a cumulative runoff table. When the Rainfall (Runoff) Table Number is requested on the COMWT operation, the progrem Will use a Runoff Curve Number,of 100 for all hydrograph development in that pass in place of the curve numbers entered in the Standard Control. Use of a different rainfall table with a blank in column 17 will revert the curve numbers back to their original values. This can also be accomplished with seme rainfall table by leaving column 17 blank on the 5 RAINFL record, followed by the 9 ENDTRL record without any data records.
The runoff option will allow the user to change all the curve numbers in the Standard Control at once within a job without wing Hodify Standard Control operations. It should be used with caution, however, since the runoff distribution will be used for development of all hydrographs specified within the FROH/THRv fields on the CoMmT operation.
The runoff option can be acti;ated fork a preloaded rainfall table by entering the 5 RAINFL X record with a 1 in column 17, followed by a 9 RNDTBL recokd. A user-entered rainfall table with a 1 in Column 17 of the 5 RAINFL X record will also use the runoff option. To turn the option off with a user-entered rainfall table, enter the 5 RAINFL X record with a blank in column 17, and follow it immediately with a 9 RNDTBL record.

Read Dischara Hvdroaraoh Data Table ( READHD) (See also p. 58 and Wor&+heet SCS-ENG-276, Page z-24)
The Read Discharge Hydrograph table provides ~a means of introducing hydrographs at any desired point in the watershed. Time must be in hours and discharge in cfs. .The table enables the user to insert stream-gage or known hydrograph data where appropriate. The table also makes it possible to break the processing of large watersheds into two or more parts for easier handling. The table further enables the user to reprocess a lower portion of the watershed with outflow hydrographs from the upper portion of a previous run. The two latter cases require subsequent TR-20 jobs to be run.
Although the 7 RRADRD is a table and is discussed here with the other tables, it is in the Executive Control series as denoted by the 7 data code and must be placed after the ENDATA record and before the COKPUT record in which the hydrograph will be used.
The Read Discharge Hydrograph data differ from other tabular data in two respects. into one of the
First, they are actual hydrographs that go directly
Section 3.9.1. seven hydrograph storage locations described in Second, each table is inserted into the runstream
ahead of the COMPUT record that will require the data.
For example, a "6" in column 17 of the 7 RRADRD 8 record would place the hydrograph in storage location 6. The hydrograph would then be used the next time storage location 6 was called in the Standard Control.
The 7 RENXiD 9 record, the second line on the Read Discharge Iiydrograph format provides appropriate spaces for entering any of the following: (1) the time in hours at which the zero time of rainfall is related to the first point of the.hydrograph; (2) the time increment between data points in hours; (3) the drainage area in square miles associated with the hydrograph; and (4) the baseflow in cfs, if any, included in the read hydrograph. This baseflow is independent of any baseflow introduced into the data with the BASFLO record.
The table is unlike other tabular data formats in that it can be continued on additional sheets using no more than400 coordinates (SO records) by crossing out the 9 ENDTDL line on all but the last sheet. The body of the table is similar to the other tables ih that each lins musk be complete or crossed out, decimal points must be shown and commas denoting thousands must not be used.

3.8.2 Flow Duration Increment Table
Table 3-8-2. DDRINC table records
DURINC - Prmides entry of three user selected .durations to generate TIME-FLOW r-&cords to go with ECONZ data. For discussion, see page 38.
pat Field (coLlns)
_ Record # 1
2 1
4-9 DDRINC
Reaord # 2
2
13-17 HOUR or DAYS Ae
25-36 Duration Ne
- 37-48 Duration Ne
49-60 Duration Ne
Record # 3
2
4-9
Value
8
XYER
Ie~
A
Ie
9 Ie
BWDTBL A
Descriction
Data code signifying DUBINC table.
Operation name.
Data code signifying data in table.
Units for durations.
1st duration (shortest).
2nd duration.
3rd duration (longest).
Data code signifying end of table.
Operation name.

Figure 3-8-2. DURING records example DUR\NC 49
This DDUINC Table lists the 3 durations in hours desired Zor use with ECDN2 data in Sample Job 5, Appendix F.

3.0.3 Stream Cross Section Data Table X SE CT N5’ Table 3-S-3. XSECTN table records
XSECTN - Describes hydraulic conditions.for a segment through which .reach routing is performed. For discussion, see page 40.
Data Fl ld ,c01uI&
y&&g 2YE.e
Record I1
2 2 1e
4-9 XSECTN A
13-15 001-200 Ie
25-36 DA or 1.0 Ne
.~ 37-40 Elev.
._ 49-60 Elev.
61-72 Elev.
(-)N
(--IN
(-IN
Roccrd #l-21
2 8 Ie
25-36 Elev. (-)Ne
37-48 Discharge Ne
49-60 End Area Ne
md Reoord
2 9 Ie
4-9 ENDTBL A
Descriotion
Data code signifying XSECTN table.
Operation name.
Cross Section ID Number.
Drainage Area: actual in Sq. miles if discharge is in CSM, 1.0 if discharge is in CFS.
Bankfull elevation in feet.
Zero damage elevation in feet.
Low ground elevation in feet.
Data Code signifying data in table. Each record is one line of data.
Elevation in feet.
Discharge in CPS or CSU.
End Area of cross section.
Data code signifying end of table.
operation name.

Figure 3-a-3. XSECTN records example
51
KSECTN
This XSE- table represents cross-section or reach 003 which has entries for discharge in cfr (cu@ic feet per second), so the drainage area is set to 1.0, a bankfull elevation of 10.9 feet, a zero damage elevation of 11.9 feet and a low ground elevation of 10.9 feet. Data entries in the table for elevation, diecharge and end area mu8t be increasing. The values for discharge and end area must both begin with a z-0 (0.0) vklue for.the first entry.

3.8.4 Structure Data Table 5TRUCTs2 Table 3-8-4. STRUCT table records
STRUCT - Relates water-surface elevation to spillway discharge and : reservoir storage. For discussion, see page 42.
Data Field (columns)
Record I1
2
4-9
16-17
Record In-21
2
25-36
37-48
49-60
Bmd Record
2
4-9
Value
3 Ie
STRUCT A
01-99 Ie
8 Ie
Elev (-)Ne
Discharge Ne
Storage Ne
9 Ie
ENDTBL A
Descriotion
Data code signifying STRUCT table.
Operation name.
Structure identification number.
Data code signifying data in table. Each record is one line of data.
Elevation in feet.
Spillway discharge in cfs.
Reservoir storage in acre-feet..
Data code signifying end of table.
Operation name.

Figure 3-8-4. STRUCT records example STRUCT 53
This STRICT table represents structure 03 which has data entriee for elevation, discharge and reservoir storage which must be increasing. The first discharge entry must be zero (0.0).
. .

3.8.5 Dimensionless Hydrograph Table D I M HYg4 ,Table 3-8-5. DIRHYD table records
DIRBYD - Defines the dimensionless unit hydrograph used to g.enerate runoff hydrdgraphs in the program. For discussion, see page 43.
Data Field Value Descrioi&2D (columns)
Record I1
2 4 Ie
4-9
25-36
DIBBYD A
Time Ne Increment
_ Record #l-l:
2 8 Ie
13-24 Incremental Ne 25-36 w~ograph 37-48 Ratios 49-60 61-72
md Record
2 9
4-9 ENDTBL A Operation name.
Ie
Data code signifying DIRBYD table.
Operation name.
Dimensionless time increment used in hydrograph table.
Data code signifying data in table. Naximum of 21 data records.
Ratio of discharge to peak discharge for each increment of dimensionless time scale. First and last entries must be zero. Last line must be completed with zeroes. Each line included must have five values.
Data code signifying end of table.

Figure 3-8-S. DIMHYD records example
55
‘DIM I-ND
This DZMHYD table with 51 entries has a dimensionless time increment of 0.02. The entries ara the ratio of discharge to peek discharge at each incremental time unit. 0.00.
Entries must begin and end with

3.8.6 Cumulative Rainfall Table
Table 3-6-6. RAINFL table records
RA1NFt ”
RAINFL - Desc_ribes rainfall distribution used to generate runoff hydrographs;- For discussion, see page 44.
P ta field (~01umns)
Value . . PescrlDtion
Rooord I1
2
4-9
11
17
25-36
Record #2-U
2
13-24 25-36 37-48 49-60 61-72
5
RAINFL
l-9
1 or blank I
Time Increment
8 Ie
Rainfall Depth inches
or Ratio of depth
- to total depth
Ie
A
Ie
Ne
Ne
Data code signifying RAINFL table.
Operation name.
Rainfall table identification number, use 1 to 9.
Runoff Option for CN = 100. Leave blank to use standard control CU’S.
Time increment used in rainfall table in hours~ or dimensionless.
Data code signifying data in table. Maximum of 60 data records.,
Accuzaulated rainfall depth for actual storm or the ratio of the depth to total depth at a given time for a dimensionless rainfall.
and ileoord
2 9 Ie Data code,signifying end of table.
.4-9 ENDTBL A Operation name.

Figure 3-8-6. RAINFL records example
57
RAINFL
035 I (1. I o.olDs I l .071r I 0.097 I It. _ ..a I O.lY 6. c ,,*
These records-describe rainfall table 1, which has a dimensionless rainfall amount of 1.0 and time increment of 0.5 hour. When used it will ovenmite the type I Rainfall Table with 0.1 hour time increment that is in the default storage location 1. Note: the last line of data is filled in with the last table value.
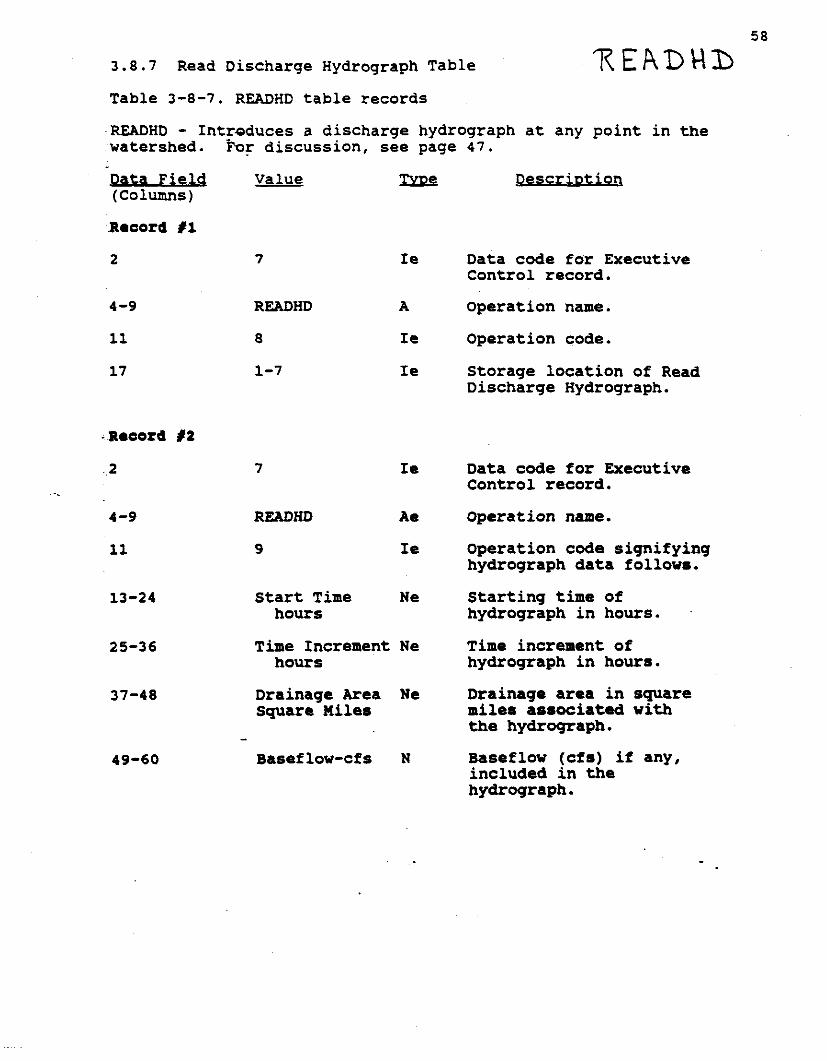
58
3.8.7 Read Discharge Hydrograph Table 'READHB Table 3-8-7. READHD table records
-READHD- Introduces a discharge hydrograph at any point in the
Data Field (columns)
Record tl
2
4-9
11
17
13-24
25-36
37-48
49-60 Baseflow-cfs N
For discussion, see page 47.
7
7
READHD
9
Start Time hours
Ie
A
Ie
Ie
Ie
Ae
Ie
Ne
Time Increment Ne hours
Drainage Area Ne Square Miles
Descriotion
Data code for Executive Control record.
operation name.
Operation code.
Storage location of Read Discharge Hydrograph.
Data code for Executive Control record.
Operation name.
Operation code signifying hydrograph data follows.
Starting time of hydrograph in hours.
Time increment of hydrograph in hours.
Drainage area in square miles associated with the hydrograph.
Baseflow (cfs) if any, included in the hydrograph.
- .

Data Field (colunlns)
Value EYE!2
Record #3-03-
2 a Ie
13-24 Discharge-cfs Ne 25-36 II 37-48 II
.49-60 .I, 61-72 8,
Bad Record
2 9 Ie
4-9 ENDTBL A
REAUm 59
DescriDtion
Data code signifying data in table. Maximum of 80 data records.
Discharge in cfs in Read Hydrograph at selected time increment. Up to 400 points may be used. Fill last line with last discharge.
Data code signifying end of table.
Operation name.

Figure 3-0-7. RISDHD records example READHB 6o
This READHD table describes a hydrograph to be inserted i? storage location 3. The hydrograph has a starting time of 6.0 hours after rainfall begins and a time inixement of 0.1 hours. The watershed associated with it is 1.66 square miles in area, and there is 5 cfs baseflow included in the hydrograph. The values in the body of the table are discharge in cfs at the 0.1 hour time increments.

61
3.9 STANDARD CONTROL RECORD SPECIFICATIONS
3.9.1 Discussion of Input
The StandardControl (see worksheets, Appendix G, pages G-16 and G-18) is used to set forth the sequence in which flood routings through the reaches and structures of a watershed will be performed. The records cause a runoff hydrograph to be developed, to be routed through a structure or stream reach, and to be added to a hydrograph for an intervening area. Standard Control commands are also used to move a hydrograph to a different location in computer storage, or to divide it into two separate hydrographs~.
A "6" must be inserted in column 2, the "Data Code", for all Standard Control records except RNDATA. The "Operation" (Columns 4 through 11) is described by a name and code number. The operation names and code numbers are RD'NOFF 1, RESVOR 2, REACH 3, ADDHYD 4, SAVHOV 5, and DIVERT 6. The operation names are for the convenience of the user while the corresponding code number in column 11 identifies to the computer the operation to be performed.
The @@xsection/structure" heading (Columns 13 thru 17, of the Standard Control worksheet, see p G-16) contains blank space* that are to be filled with either the cross section number or the structure number. Never use both a cross section and structure number on the same line. Leading zeros do not need to be inserted in the number field but the number must be right justified (no blanks or decimals to the right of the number)' within the field. The largest numbers that ten be expressed for any structure or cross section era 99 and 200, respectively. The smellest number, in either case, is 1. Ways in which cross section/structure numbers are associated with the records in TR-20 are given in Table 3-9-l-l.
Appendices B through F show completed Standud Control inetructions for five related sample jobs. For example, in Sample Job Number 1 (Appendix B and repeated here for the readers' convenience) the first record, RUNOFF 1, causes an inflow hydrograph to be developed for the area above structure 01. The record, RESVOR 2, causes the inflow hydrograph to be routed'throuqh structure 01. The record, REACH 3, causes the outflow from structure 01 to be routed through the next stream reach (001). The EWDATA record signifies completion of the Standard Control.
In sample Job Number 2 (Appendix C)~, continuing downstream the RUNOFF 1 record for cross section 001 causes a hydrograph to be developed for the local inflow to the reach previously routed. The ADDHYD 4 record causes the~rea.ch routed hydrograph to be Combined with the local inflow hydrograph at.cross section 001. TheREACN3 operation instructs the computer to do the stream routing through reech 002. Thus, the routing sequence cam be directed from one riach to the next.

62 Table 3-9-l-l. Association of cross section/structure number
with TR-20 Standard Control records
Record
6 RUNOFF- -1.
Number as
Cross section or structure
6 RESVOR 2 Structure
6 REACH3 Cross section
6 ADDHYD 4 Cross section Point at which the two or structure hydrographs are combined.
6 SAVl4OV 5 Cross section or structure
Hydrograph being moved internally between storage locations.
6DIVERT6 Cross section or structure
What the number desianates
Drainage area for which the hydrograph is developed.
Structure through which routing is performed.
Terminal point to which the stream reach routing is performed.
Inflow hydrograph to be diverted and output hydroqraph number 1.
The "Hydrograph Number" heading (Columns 19, 21 and 23 of the Standard Control worksheet, see G-16) provides spaces in which hydrograph storage locations are designated by numbers 1 through 7. Each storage location will hold up to the maximum number of points allowed by the program (400). Each' Standard Control operation may need up to three hydrograph storage locations identified. One or two of the hydrograph numbers may be required as input to perform the Standard Control operation and the ,third hydrograph storage number to save the resultant hydrograph. DIVERT is different in that it has one input hydrograph and two output hydrograph storage locations.
All seven numbered hydrograph storage locations are similar and may be used interchangeably for input and output hydrographs of any operation. Hgwever , in order to keep track of hydrographs and assist in error detection the user should standardize storage locations by selecting three locations for the MoperatfngW hydrograph storages. The new user might generally use location 5, 6, and 7 as the "operatingn storage locations. For example, 6 ADDHYD 4 5 6 7 would take the hydrographs in locations 5 and 6, add them, and place the resulting hydrograph in location 7. The remaining storage locations (1 to 4) serve as temporary locations to save hydrographs until needed.
The cardinal rule to remember is that only one hydrograph Can occupy any one storage location at a time and that there must be a hydrograph in the storage location from which an operation is

63
"calling it up." An output hydrograph remains in a storage location ready for use until it is used as an input hydrograph. The input hydrograph storage locations, for all Standard Control operations except SAVNOV, are cleared immediately after the hydrograph(s) are used. It is recommended that all storage locations be checked for compliance vi_fh these rules before input data are submitted for data entry. The same storage location number must not be used in the input and the output for a single operation.
The three data fields; columns 25 through 36, 37 through 48, and 49 through 60 of the Standard Control are filled vith data according to the individual headings as explained below. Data entered in each of these fields must have a decimal point. If no decimal point is entered its location is assumed but probably not where the user intended. No error message is printed for this error, however, any time such data are printed and the number of given positions are exceeded, asterisks are printed in the edited listing of Standard Control records. Commas must not be used within data fields tom indicate thousands.
Different output options may be specified in columns 61-72 of the Standard Control. These options are discussed at the end of this section.
6 RUNOFF 1 (See also p. 73)
The RUNOFF record causes a runoff hydrograph to' be developed for a subwatershed. The input data are drainage area in square miles, curve number CN, and time of concentration in hours. The drainage area includes that area of the subwatershed that contributes runoff to the hydrograph peak. Determination of the CN is described in Chapters 7, 0, and 9, NM-4. Techniques in NM-4, Chapter 15 may be used to estimate the time of concentration.
6 RESVOR 2 (See ah0 p. 75)
The RBSVOR record causes an inflow hydrograph to be routed through a structure such as a reservoir, starting with the outflow discharge at the elevation corresponding to the beginning of the storm. The "Start Routing Elevation ft. " is the water-surface elevation of the reservoir at the beginning of the storm. If "Start Routing Elevation ft." is left blank, routing begins at the first elevation on the structure data table (page B-5). There are three ways to start routings:
(1) At the principal spillway crest with outflow discharge egua& to zero. Normally the starting elevation will be
the lowest crest of the principal spillway. The ,storage associated with the starting elevation can be equal te or greater 'than zero.

64
(2) Belov the principal spillway crest with zero discharge. The structure table must start below the elevation of the principal spillway. The second and following data records on the structure data table must have a discharge greater than zero and-must increase in storage.. Therefore, a small discharee (less than 1 cfs) may have to be shown, even though it is not.the case. This condition exists when the reservoir level at the start of the storm is drawn down below the crest of the principal spillway.
(3) Above the principal spillway crest where discharge is greater than zero. This condition exists when the reservoir level at the start of the storm is higher than the crest of the principal spillway due to an earlier storm or baseflow.
Routing starts at the start routing elevation or the first elevation of the structure data table and continues until the outflow discharge returns to zero outflov or where it ends because of the maximum point storage limitation. The volume of the outflow hydrograph will not alvays be equal to inflov. It Will include the ~volume between the starting elevation and the elevation at sero discharge, baseflow, or vhen it is truncated because of the maximum point storage limitation. The outflow volume is normally less in condition (2) above, when the additional storage below the crest is filled. In condition (3), the outflow volume is normally greater as the additional stage above the crest is converted to outflow.
A RESVOR record should be included in the Standard Control for all potential and existing reservoir sites. This will eliminate modifying the Standard Control for alternative structural combinations. This is done by specifying Null structures in the alternatives without structures). Null structures are discussed in section 3.8.1.
6 REACH 3 (See alSO p. 77)
The REACH record causes the computer to route an inflow hydrograph through a stream reach. There are two input procedures to represent the discharge-end area relationship in the reach: a 2 XSECTN rating table or "xe and nmw coefficients.
A single reech length or separate floodplain and channel lengths can be entered on the RE?K!R record by the user depending on the procedure. Separate reach lengths CM only be used with the 2 XSECTN rating table procedure as the lw ground elevation has to be identified. The low ground elevation is considered the dividing line between channel and floodplain storage.
In short reaches,~ attenuat.ion is lost as the.MOdifi&I~;~~ 'routing procedure tends toward a kinematic routing. reaches, with major attenuation, the.inflow hyatograph peak used to .detem'ine the routing parameters may not be representative of the reach. Guidelines for selecting reach lengths are in Hydrology Note 2.

65
It should be recognized that entering data in the 2 XSECTN table, in general, will result in more accurate routing than entering *IX** and QP coefficients on the REACH record. curve as described by a single pair of
In usual cases, one power "x" and "m" values will not
adequately fi_t the rating curve for a cross SeCtiOn with channel and floodplain flows. However, it may be convenient .in some cases to provide a cross section rating in the form of coefficients for rating curves. Once the discharge-storage relation is established for the reach, the routing coefficient is calculated that is used to perform the routing. Details on how the routing coefficient is calculated and how the Modified Att-Kin routing is accomplished are given in Hydrology Note 2.
BEACH Procedure 1 -- If columns 37-48 in the REACH record are left ~blank, a cross section table (2 XSECTN) must have been previously 'entered and will be used. An "mu value will be determined for each flow listed in the table. The logarithmic slope of the line between each two consecutive data points is weighted by the difference in flow between the two points. In this way, "m" can be computed for each flow in the table based on flow from the lowest flow to the flow in question.
The computation of %P by the program is described in Hydrology Note 2. This method allows the -mu used in the reach routing to change when the slope of the discharge-end area curve changes. In typical cross sections (with channel and floodplain) the slope of the discharge-end area curve changes (becomes flatter) when the discharge exceeds channel capacity and then changes (bacomes steeper) again at a point where water fills the floodplain and depth of flow increases in the floodplain.
It is optional to enter a floodplain length in columns 49-60.
If entered, the reach length in columns 25-36 must be the channel length and the low ground elevation must be entered in columns 61-72 of the first record in the XSECTN Table.
m Procem -- Columns 37-48 and 49-60 in the REACIi record provide the option of specifying cross section coefficients ("x" and "ma) for a rating curve equation. If cross section parameters have been estimated for one reason or another, corresponding coefficients from the eguation Q = xA' (where Q = discharge and A = cross section end area representative of the reach) can be inserted. Guidelines for estimating "x" and "m* for trapezoidal and triangular cross section shapes are given in Hydrology Note 2. Use of these guidelines requires a minimum amount of topographic and roughness information.
The coefficient "xw is transformed to k, where k = x/(L') and L is the single reach length specified in columns 25-36. The reach routing is performed using Q = kS, which is a straight line log-log relation between discharge (Q) and reach storage (S = LA). When coefficienti "x* and nm* are entered, the actual cross section

66
discharge end-area data as given on a corresponding cross section (2 XSECTN) table are not used.
6 ADDHYD 4 (-See also p. 80)
The ADDHYD record causes the hydrographs from two hydrograph storage locations to be combined and places the resultant hydrograph in a third storage location. Only two hydrographs can be combined at one time. For example, if three hydrographs are to be combined to describe a final hydrograph, two ADDHYD records are needed. If the time increments of the hydrographs do not correspond with the current main time increment, they will be adjusted to the main time increment before they are added. When two hydrographs are adjusted and added with different start of runoff times and/or time increments, it is possible to lose volume of runoff by truncation due to the maximum point storage limitation.
6 SAVMOV 5 (See also p. 82)
The SAVMCW record causes the hydrograph in one computer storage location to be placed in another storage location. To facilitate keeping track of hydrographs, the user may standardize on storage locations 5, 6, and 7 as the "operating 'I locations and use the other locations as temporary storage. In thiS'CaSe, 6 SAWOV 5 will remove a hydrograph from computer storage location 5, 6, or 7 and place it into location 1, 2, 3 or 4 for safe keeping until called up
as input for a subsequent operation.
For example, the computer "operatinge storage locations can thus be vacated in order to transfer operations to a tributary. When operations are completed for the tributary, a 6 SAVKOV 5 can recall the hydrograph from its storage location I, 2, 3 or 4 and place it back into an 8*operatingea location 5 or 6 for adding the tributary to main stem.
Since the SAVMOV input hydrograph storage location is not cleared until replaced by another hydrograph, SAVMOV records can also be used in downstream branching situations. Both the input and output storage location on the SAVMOV record will contain the seme hydrograph until the location numbers are reused. Thus, two separate standard control sequences~ can be setup downstream from the SAVHOV . Three separate branches are possible with beck to beck SAVMOV records containing the some inflow hydrograph. Additional branches rsquire additional SAVMOV records. With only seven storage locations available, there is a limit of six branches possible.
As an example of branching, the SAVMOV record can be used to help evaluate different project alternatives by storing reSUltS of pert of the watershed for reuse. For instance,-consider a watershed With up&ream subwatersheds inwhich no changes in land use are expected and downstream subwatersheds where proposed projects Will altar their characteristics. The user can calculate hydrographs down to

67 the last ADDHYD combining hydragraphs for the upstream subwatersheds and using SAVMOV, store these results in two places at once. The non-project condition can then be evaluated continuing downstream. Next, instead of going back to the top of the watershed and duplicating-%he calculations, the hydrograph stored by the SAVhOV * command can be used to evaluate with project conditions on the downstream watersheds. This can significantly reduce the number of standard control records in a run.
6 DIVERT 6 (See also p. ,83)
The DIVERT record is used to separate a hydrograph into two 'hydrographs. An example of the use Of DIVERT is where the maximum 'flow in a channel must be limited and the excess flow diverted into a floodway or bypass that may or may not reenter the channel at some point downstream in the watershed.
There are three hydroqraphs involved in this operation - an input hydrograph that is to be separated into output hydrograph #I and output hydrograph P2. These output hydrographs cannot be stored in the same storage location as the input hydrograph. The cross section or structure ID number (columns 13-15 or 16-17) applies to the input hydrograph as well as to the output hydrograph #I. The Cross section number for output hydrograph #2 is placed in a data field (columns 49-60) that requires a decimal point.
Two procedures are available to divert a hydrograph. The first procedure diverts all flow above a constant discharge provided in ~01-8 25-36. If this data field is left blank, the second procedure is assumed and flow is divided based on elevation- discharge data.
To divide the drainage area between the two output hydrographa, place the portion of the drainage area that is to be associated with the output hydrograph #l in decimal fraction form in columns 37-49. If one square mile of a total of ten square miles drainage area is to be associated with output hydrograph #l, the entry in columns 37-49 would be 0.1. The balance of the drainage area will be associated with output hydrograph #2. If columns 37-49 are left blank, the entire drainage area qoeS with output hydrograph #2. The drainage areas are not used for separating the hyckographrr but are used to compike the output hydrograph runoff volumes in watershed inches and the peak flows in cs= in Summery Table 1.
The cro8S section identification number of output hydrograph /2 must be followed by a decimal ( e.g., 008.) in columns 49-60. For
. procedure 2, this data field cannot be blank, zero, or a structure ID number.
_ Both output hydrographs from a DIVERT operation can be used downstream in a watershed. output hydrograph I1 can be moved downstream by using its hydroqraph storage location number as the input to the next Standard Control operation. output hydrograph tt

could be diverted out of the watershed or it may be brought into the Standard Control sequence at some downstream location. However, the user can reverse the diversion by using the hydrograph storage location number for output I2 as input to the next Standard Control
68
operation and-output Xl would then Be diverted. -_
Both DIVERT procedures will split constant baseflow. The program's accounting will not include any constant baseflow in the storm runoff volume.
m -- This separates a hydrograph into two hydrographs where one hydrograph contains that portion of the inflow hydrograph below a constant specified discharge (column 25-36, outflow hydrograph Yl) and the second hydrograph contains that portion above the specified discharge (outflow hydrograph #2) as shown in Figure 3-9-l-l. Rating tables entered for cross section/structure ID numbers are ignored in procedure 1.
INFLOW COySTANT FLOW
Figure 3-9-1-1. Divert - Procedure 1 with constant flow
D I VERTED FLOW

69
The most common use of procedure 1 is where a control structure blocks the channel and allows flow down the channel only through one or more pipes. The remaining flow goes over a weir at or above the elevation required for full pipe flow into either off-channel storage or a floodvay. See Sample Job 3, Appendix D for an example of procedure>.
This divides a hydrograph into two hydrographs at a split in flow based on the capacity of each branch. columns 25-36 are left blank or zero and the Cross section ID numbers in columns 13-15 and 49-60 must represent 2 XSECTN tables in the tabular input data. All discharges.will be proportioned using an elevation versus discharge rating table representative of each branch.
The elevation, discharge, and end area columns of the two cross section data tables need to be completed. The elevations of the two output hydrographs are assumed to be equal to~the inflow hydrograph. Therefore, it is essential that the elevations for the two ratings be based on the same datum and be located near the physical control that determines the flow split. It is not necessary that the lowest elevations of the two tables be the same. Figure 3-9-l-2 shows how the hydrographs are separated.
INFLOW
FLOW AT CROSS SECTION 2
FLdW AT CROSS SECTION 1
FIGURE 3-Q-l-Z. DIVERT Procedure 2 with variable flow

70 The most common use of procedure 2 is where a stream branches into two streams or into a stream and a floodway. See Sample Job 5, Alternate 4, Appendix F for anexample of procedure 2.
ENDATA (See also p. 86)
The ENDATA record must be entered at the end of the Standard Control record list. It signifies the end of one complete pass through the watershed.
OUTPUT OPTIONS
The spaces under the "Output Options" heading (Columns 61-71) on all of the Standard Control records permit one to choose the type and kind of hydrograph data to be obtained as output. Table 3-9-l-2 contains information on the six available options. See also Table 3-7-1, p. 30 for the required input option combinations with the JOB record to obtain generated files. If none of the output options or FULLSRINT or SURMARY are selected, the respective operations will be completed without providing any meaningful output.
TABLE 3-9-l-2. Standard Control output options
Output Use "1" in Column Produces the fOllowina OUtDUC .
p/v 61 Peak discharge in cfs; peak time in hours; (Peak/ volume of water above constant baseflow Volume) under the hydrograph in inches depth,
acre-feet and cfs-hours; and the constant baseflow value in cfs are displayed. Triangular baseflow is included in the volume of the hydrographs. If a rating table is available, the peak elevations are given. Up to 10 highest multiple peaks for each hydrograph will be displayed.
If the PULLPRINT option is specified in the JOB record, the P/V option will automatically display the above information for all Standard Control records.
HYD 63 Discharge versus time hydrograph is displayed in tabular form. The main time increment is the time interval between tabulated discharges. Only that part of the hydrograph above zero flow or above baseflow if there is baseflow, is shown (subject~to the 400 point limit).

71
ELEV 65 Elevation versus time hydrograph is displayed in tabular form. The elevation value will correspond to the HYD option discharge value. The ELEV option is usually requested only at cross sections and structures and then only if a rating table is available. For example, the ELEV option should not be selected on the RUNOFF records, nor at REACH records without cross-sectional data.
DDR 67
FILE 69
Discharge versus duration of time that a discharge is equalled or exceeded is tabulated. Up to twelve time-discharge values are shown depending on total base time of the hydrograph. The duration table provides a comment if the hydrograph is truncated or if it is terminated at base flow or below zero damage. To obtain duration data for ECONZ the 1 DURINC table must be entered along with the DWR option at the requested cross sections.
A discharge hydrograph file is generated in a "Read Discharge Hydrograph* (7 READHD) format for use as input to a subsequent TR-20 run. Each hydrograph is identified by the XSECTN/STRUCT number and the alternate and storm numbers in column 73-80 of the first two records. To also display the hydrograph in the output for identification comparison the HYD option mist be set to 1. The discharge hydrograph file will be saved on the directory and file name prefix of the users choice and an extension of TRD (*prefix*.TRD). See also Table l-l (p. 5).
SW4 71 The Standard Control operation results are saved for Summary Tables 1 and 3 and ECCNZ/DRRl generated files. Each entry in the summary is identified by alternate, storm nuxber, and the cross section or structure identification number. Only the largest peak discharge for each hydrograph~is listed in the summary. If the summary is called for at more than one operation with the same cross section or structure number, only the last summary location will be printed in Sunmaty Tables 3 and 4.
- .

72
If the SUMMARY option is specified on the JOB record, the SUM output option on individual operations is not needed. One of these options must be used to save peak information if the ECON option is specified on the JOB record. -_

3.9.2 RUNOFF - STANDARD CONTROL RUfUO~F 73 Table 3-9-2. RUNOFF record
RUNOFF - Generates a runoff hydrograph for a watershed with given data. For dikussion, see page 63.
Pat Fiel (coLns) d
Value m2s DescriDtion
2 6 Ie
4-9
11
13-15
RUNOFF
1
Subvatershed ID
OR
Structure ID
A
Ie
Ie
16-17 Ie
23 l-7 Ie
25-36 DA, sq. mi. Ne
37-48 CN Ne
49-60 Tc, hours Ne
61 1* I
63
65
67
69
71
1*
1*
-1*
1*
1+
I
I
I
I
I
Data Code signifying Standard Control record.
Operation name.
Operation number.
Cross section number, 1 thru 200, right justified,
OR
Structure number, 1 thru 99 right justified.
Output hydrograph storage location no., 1 thru 7 .
Contributing drainage area, sq miles.
Runoff curve number.
Time of concentration, hours.
P/V, display up to ten peak discharges and runoff volume.
HYD, display discharge hydrograph.
ELRV, display elevation of hydrograph.
DUR, display flov duration data.
FILE, generate discharge hydrograph file.
SUM,. save results for summary tables.
l Enter 1 to select output option otherwise leave it blank.

Figure 3-9-2. RUNOFF record example RUNOFF 74
The RUNOFF record shown above would cause an inflow hydrograph to be developed fcr structure 1 in storage location 6. The subwatershed has a drainage of 1.20 square miles, a CN of 75 and a time of concentration of 0.33 hours. The peak discharge, volume, hydrograph, and flow duration of runoff will be displayed in the output and the results will be tabulated in Summary Tables 1 and 3.

3.9.3 RESVOR - STANDARD CONTROL RE5voR;5 Table 3-9-3. RESVOR record
RESVOR - Routes inflow hvdrograph through a structure. For discussion, see page 63.-
-_ lBta Fi Id (columns)
Value pescr iot ion
2 6 Ie
4 RESVOR A
4-9 2 Ie
16-17 Structure ID Ie
19 l-7 Ie
23 1-7 Ie
25-36 Start Routing Elev. Feet
Ne
61
63
65
67
69
71
1'
1*
I*
1'
1*
I.*
Data code signifying Standard Control record.
Operation name.
Operation number.
Structure number, 1 through 99, right justified.
Input hydrograph storage location no., 1 thru 7.
Output hydrograph storage location no., 1 thru 7.
Surface elevation in feet, that routing begins.
P/V display up to ten peak discharges and runoff volume.
?IYD, display discharge hydrograph.
RLRV, display elevation of hydrograph.
DUR, display flov duration data.
FILE, generate discharge hydrograph file.
SUH, save results for summary tables.
l Enter 1 to select the option otherwise leave it blank.

Figure 3-9-3. RESVOR record example
75
REsvO R
..The RSSVOR record shown above would cause the hydrograph in storage location 6 to be routed through structure 1 and the routed hydrograph to be placed in storage location 7. The routing would begin in the structure at elevation 521.5 feet. The peak discharge, volume under the outflow hydrograph, output hydrograph, the water surface elevations and flow duration data will be displayed and the results will be tabulated in Summary Tables 1 and 3.
- .

3.9.4 REACH - STANDARD CONTROL REACH 77 Table 3-9-4. REACH record
REACH - Routes an inflow hydrograph through a stream (Procedure 17 using cross-sectional data: (Procedure and ?a" values representing a cross-section rating. see page 64.
Data Field w EYE (Columns)
2 6
4-0 REACH
11 3
13-15 Section ID
19 1-7
23 l-7
25-36 Reach Length, ft.
Ie
A
Ie
Ie
Ie
Is
Ne
DescriDtion
reach: 2) - using '@x*~ For discussion,
Data code signifying Standard Control record.
Operation name.
Operation number.
Cross section number, 1 thru 200, right justified.
Input hydrograph storage location no., 1 thru 7.
Output hydrograph storage location no., 1 thru 7.
Reach length, feet (see columns 49-60 Procedure 1).
Procedure 1 - Cross-sectional data
37-48 b Leave blank.
49-60 Flood Plain N Floodplain length, feet Length, ft. (optional). If used, the
entry in columns 25-36 must be the channel reach length and the low ground elevation must be entered in columns 61-72 of 2 XSECTN header record.
Procedure 2 - "x8' and WP values
. 37-40 "X" Ne Coefficient, "xn in Q = XA'.
49-60' "m#, Ne Exponent, YIP in Q = xA*.
Data Field (columns)
61
63
65
67
69
71
y&& TYDe
1. I -
1. I
1* I
If I
1* I
1* I
tctnci-i 73
Descriution
P/V, display up to ten peak discharges and runoff volume.
HYD, display discharge hydrograph.
ELEV, display elevation of hydrograph.
DUR, display flov duration data.
FILE, generate discharge hydrograph file.
SUM, save results for summary tables.
l Enter 1 to select the option othervise leave it blank.
Figure 3-Q-4. REACH record examples
Procedure 1:
This REACH record causes the hydrograph in storage location 7 to be routed through 5400 feet of channel represented by cross section 1 with the outflow hydrograph stored in location 5. The floodplain length is 5200 feet, indicating a meandering pattern for this reach of the stream. The program will use the cross section data in XSECTH 001 to do the routing. The peak discharge, volume, and flov duration data will be displayed and the results tabulated in Sm~y Tables 1, 2, and 3.

Procedure 2:
This REACH record causes the hydrograph in storage location 7 to be routed through 5400 feet of channel represented by cross section 1 with the outflow hydrograph stored in location 5. The **x" and 9p values provided are used in the routing procedure. discharge,
The peak the volume under the outflow hydrograph, and the outflow
hydrograph flow duration data will be displayed. The results will be tabulated in Summary Tables 1, 2, and 3.
.

3.9:s ADDHYD - STANDARD CONTROL ADIIHYD a’ Table 3-9-5. ADDHYD record
ADDHYD - Adds two hydrographs together to generate the resultant hydrograph.-Tar discussion, see page 66.
Data Field (columns)
Value XYB jkSCriDtiOn
2 6 Ie
4-9 ADDHYD A
11 4 Ie
13-15 Section ID Ie
16-17
19
21
23 l-7
61 1* I
63 1* I
OR Structure ID Ie
I-7 Ie
l-7 Ie
Ie
65 1* I
67 1* I
69 1* I
71 If I sun, save results for summary table.
l Enter 1 to select the option otherwise leave it blank. *
Data code signifying Standard Control record.
Operation name.
operation number.
Cross section no., 1 thru 200, right justified,
OR Structure no. , 1 thru 99, right justified.
Input hydrograph storage location no., 1 thru 7.
Input hydrograph storage location no., 1 thru 7.
Output hydrograph storage location no., 1 thru 7.
P/V, display up to ten peak discharges and runoff volume.
HYD, display discharge hydrograph.
EIEV, display elevation of hydrograph.
DDR, display flow duration data.
FILE, generate discharge hydrograph file.

Figure 3-9-S. ADDWD " ADDHYD record example
This ADDHYD record causes the hydrograph in storage location 5 to be combined (added) with the hydrograph in location 6 and the resulting hydrograph Flaced in location 7. The peak discharge(s), the volume under the hydrograph, the output hydrograph, and flow duration data will be displayed and the results will Abe tabulated in Summary Tables 1 and 3.
- .

3.9.6 SAVMOV - STANDARD CONTROL
Table 3-9-6. SAVMOV record
5 A”Pl*Va2
Data Field (columns)
2
4-9
11
13-15
~l6-17
~l9
23
-SAVMOV - Moves a hydrograph without changing it from one storage location to -another. The hydrograph in both locations can then be available as input into other Standard Control operations. For
--discussion, see page 66.
Value XYES Descriution
6 Ie Data Code signifying Standard Control record.
SAVKOV A Operation name.
5 Ie Operation number.
Section ID Ie Cross section number 1 thru 200, right justified.
OR OR
Structure ID Ie Structure number 1 thru 99, right justified.
l-7 Ie **From1 h drograph storage . y location no., 1 thru 7.
l-7 Ie uTon hydrograph storage location no., 1 thru 7.
Figure 3-9-6. SAVMOV record example
This SAl?lOV record causes the hydrograph in hydrograph storage location 5 to be copied to location 1. The associated cross section numberist. No output options are active with SAVMOV.

3.9.7 DIVERT - STANDARD CONTROL DIVERT *3 Table 3-9-7. DIVERT record
Divert - Separates flow into: (Procedure 1) tvo~hydrographs, above and below a constant discharge; between two fating curves.
(Procedure 2) two hydrographs split For discussion, see page 67.
Data Field (columns)
2
4-9
11
13-15
16-17
19
21
23
Value m28 Descriotioq
6 Ie
DIVERT A
6 Ie
Section ID* Ie
OR
Structure ID* Ie
l-7
l-7
l-7
Ie
Ie
Ie
Data Code signifying Standard Control record
Operation name.
Operation number.
CrOSS section number 1 thru 200, right justified,
OR
Structure number 1 thru 99, right justified.
Input hydrograph storage location no. 1 thru 7.
Output hydrograph /l storage location no. 1 thru 7.
Output hydrograph 52 storage location no., 1 thru 7.
Procedure 1 - divert constant discharge
25-36 Discharge Ne Specified discharge in cfs above which hydrograph is to be diverted, output hydrograph No. 1.
37-48 bA,fraction N Decimal fraction of drainage area to be associated with output hydrograph #I (used only to split the drainage area).
49-60 Section ID N Cross .section number followed by associated with output a decimal point hydrograph #2 (1. to 2OD.i.

Data Field w TvDe Descriotion (columns)
INERT 84
Procedure 2 - divide flow between two rating curves
25-36 -_ -- Leave Blank.
~~ 37-48 DA,fraction N Decimal fraction of drainage area to be associated with output hydrograph #1 (used only to split the drainage area) .
49-60 Section ID Ne Cross-section number followed by associated with output decimal point hydrograph #2 (1. to 200.).
Required for Procedure #2.
61 l'f I P/V, display up to ten peak discharges and runoff volume.
63 1" I HYD. display discharge hydrograph.
65 1*+ I ELEV display elevations associated with hydrograph.
67 I*' I DUR; display flow duration data.
69 1*+ I PILE, generate discharge hydrcqraph file.
71~ 1** I SUM, save results for summary tables. _
Notes: l Input ID number is associated l * Enter 1 to select the option,
with output hydrograph #l. otherwise leave it blank.

Figure 3 -9-7. DIVERT record examples
Procedure Yl:
DIVERT *5
This divert record causes the hydrograph in storage location 5 to be separated into two hydrographs. The hydrograph equal to and less than 100 cfs will be placed into storage location 7 and will be associated with cross section 5. The remainder of the hydrograph, all discharges above 100 cfs, will be placed into storage location 1 as output hydrograph #2 and it is associated with cross section 8. Output hydrograph fl represents 401 of the drainage araa. Therefore, 40% of the drainage area will be associated with cross section 5 and 602 with cross section 0. The peak discharges, the hydrographs, volumes and flow duration data will be displayed and the results tabulated in Summary Tables 1 and 3.
This example is similar to the example for procedure 1. The primary difference is that since columns 25-36 are blank, procedure C2 is invoked. The input hydrograph will be split proportionately using the data in cross section tables number 5, and number 8. Ninety percent (9Oa) of the drainage area will be associated with cross sectton number 5. Both hydrographs will be displayed and'results included in Summary Tables R hnd 3.

3.9.8 - ENDATA - STANDARD CONTROL ENDATA a6 Table 3-9-a.'ENDATA record
initial pasathrough the watershed. ENDATA - Indicates the end of the Standard Control records for the
For discussion, see page 70.
pata Field u TYDe (columns)
2 -- I
~4-9 ENDATA Ae
11 -- I
Figure 3-9-a. ENDATA record example
Descriotion
Data Code, blank or zero.
Operation name.
Data Code, blank or zero.
The ENDATA record signifies that the Standard Control sequence and all tabular data for the initial pass of the job have been read in and the Executive Control will follow.
. .

a7
3.10 EXECLTIVE CONTROL RECORD SPECIFICATIONS
3.10.1 Discussion of Input
The Executiv; Control has tvo functions: (1) t0 cause the Standard Control records to be executed and (2) to provide additional data necessary for processing. The Executive Control consists of five types of records (see forms, Appendix G, pages G-19 and G-21). They are LIST, BASFLO, INCREM, CORPUT, and ENDCMP. The 7 READHD table is also an Executive Control type, but it is covered under Tabular Data in Section 3.8.7 of this manual. The Executive Control records are placed after the Standard Control records and tabular data to vhich they pertain.
While the Standard Control is used to describe the physical characteristics of the watershed, the Executive Control is used to prescribe the meteorological conditions of the watershed including the baseflow. The workhorse of the Executive Control record is the COMPDT record. Its purpose is to prescribe the rainfall and the part of the watershed over which that rainfall is to occur.
All Executive Control records except EUDCMP must have a "7* in column 2. Columns 4-9 are used for the Executive Control operation name. Column 11 is used for the Executive Control operation number which is used by the computer to identify the type of operation.
An exsmple taken from a worksheet in Sample Job '1, Appendix B, is repeated below. The three Executive Control records in the example are the minimum required for a TR-20 computer run. The 7 INCREB 6 record prescribes the main time increment to be used in the run. The 7 COHPTJT 7 record causes computations to begin at structure 1 of the Standard Control and proceed through cross section 1 using the rainfall data given in the remainder of the line. The BBDGBR 1 record causes the COHPDT record computations to end. EBDJOB is a job control record but is shown here to identify its typical location.
Figure 3-10-l-l. Example of Executive Control input

7 LIST (See also p. 94)
The LIST Executive control record causes a list of current tabular .data and standard control records (including output options in effect) to be displayed. The LIST record will normally be placed (1) prior to3he first COMPUT record and/or; (2) after changes in
~tabular data end Modify Standard Control. The user has the option ~,to list the current Standard Control, the current cross section and istructure tables, the flow duration increment table, dimensionless hydrograph table and the rainfall tables, or the entire input data file. One may further choose to list all of the rainfall tables embedded in the program or a selected one.
.7 BASFLO 5 (See also p. 96)
The BASFL.0 Executive Control record causes a baseflow to be added to a flood hydrograph. 'Iwo baseflow procedures are available (1) constant and (2) triangular baseflow. For both procedures, the BASFM precedes a COMPUT. The COMPUT will govern the reaches or subwatersheds in which baseflow will be added. Only one BASFUI record may be used ahead of a COMPUT. If more than one is entered. the last one entered will be used. Both baseflow procedures may be
mused in the same job providing the above restrictions are met. JFigure 3-5 illustrates both procedures.
Sum of original hydrograph and triangle basef low
Figure 3-10-l-2. BASFLOW, Procedure 1 and 2

89
BASEFLOW Procedure 1 -- A uniform constant rate of baseflow can be added to hydrographs only in a reach routing. The total baseflow in cfs is entered in columns 25-36 of the BASFLO record. Procedure 1 is invoked by leaving columns 37-48 and 49-60 either blank or zero.
The baseflow‘will be combined only with the inflow hydrograph in the next REACH routing following the COMPDT. If a runoff precedes this reach, no baseflow is contained in the hydrograph for that r-off. The baseflow is added in the reach and will remain the same through subsequent reaches that are in a downstream sequence until the ENDCMP is encountered or a new BASFLO and COMPDT record combination is entered. The new baseflow can be greater or less than the one previous. The previous cfs baseflow that is in use is replaced with the new cfs when a new BASFLQ record is entered. A new BASFI.0 of zero or a ENDCMP will eliminate the constant baseflow in the next reach. The baseflow can be changed at any downstream reach by breaking the COMPUT series into appropriate FROM-THRU segments and inserting a new BASFLO record.
Tributaries need to have separate BASFLO and COMPDT records if constant baseflow is to be included in tributary hydrographs. Baseflow from tributaries will be added to main stem baseflow when hydrographs are added.
Constant baseflow is assumed to be the flow prior to, during, and continuing on after the storm runoff. In practice, flood hydrographs are stored in the program with their first and last point at zero cfs or at the constant cfs baseflow, unless the maximum point limitation truncates the hydrograph. When hydrographs of different start of runoff and base times are added, the constant baseflow of the shorter hydrograph is still added to the base of the longer hydrograph.
The DIVERT Standard Control record (both procedures) will split constant baseflow. However, the program's accounting will not include any constant baseflow in the storm runoff volume.
Besides actual baseflow, Procedure 1 is commonly used to represent a steady flow source unrelated to the storm runoff being modeled such as prolonged release rates from a previous storm at a structure or swamp outlet.
-- A triangular baseflow hydrograph can be rshed runoff hydrograph. The volume of baseflow
in watershed inches is entered in columns 25-36. The peak time in hours from the beginning of the runoff to the baseflow hydrograph peak is entered in columns 37~48. The time in hours for the triangular hydrograph base is entered in columns 49-60. This base time must be less #an or,egual to the time associated with then
'maximum 400 hydrograph coordinate points to hvoid a fatal program error.

90
The triangular baseflow will be combined with the next and all subsequent runoff hydrographs including tributaries, until a END- record is encountered or a new or zero BASFM and COMPUT record combination is added. Triangular baseflow can not be separated from the flood hydrograph once it is added. It is included in the storm runoff volump each time it is added to a runoff hydrograph.
.Procedure 2 can be used to represent storm related ground water flow or flow from small lakes or svamps that can be delineated as storage areas with triangular baseflow outflow hydrographs.
~7 INCRM 6 (See also p. 98)
The INCRM Executive Control record specifies the main time increment in hours. It rema~ins in effect until superseded by the insertion of a new INCREM record.
All hydrographs generated will be stored and printed at time intervals given by this main time increment with a maximum of 400 coordinates. It is important that the main time increment be made short enough to adequately describe the hydrographs for the smaller subwatershed and large enough that, when multiplied by the number of coordinates, will extend past the peak periods of larger hydrographs
-so as not to significantly truncate the hydrograph volume used in 'reach and reservoir routing.
0 0 ‘i; Q
/
Time start
i Runoff
Instantaneous peak is determined by curvilinear interpolation
196 197 196 199 200 201 202
Figure 3-10-1-3. Hydrograph coordinates for main time increment of 0.5 hours

91
Increments of 0.5 hr., demonstrated in Figure 3-10-1-3,~ will not adequately define the hydrograph peak for a small subwatershed having a time of concentration of less than one hour (See Hydrograph Development, Section 2.1).
Conversely, ‘a main time increment of 0.1 hr. will define only 40 hours of a hydrograph.
with 400 coordinates In some cases this
requires that less accuracy in runoff hydrograph definition be tolerated to obtain enough of the larger watershed hydrographs.
The computed peak, as described in Hydrograph Development, Section 2.1, is computed by fitting a curve through the three highest
~consecutive main time increment points and very rarely falls on a hydrograph coordinate.
An INCRM record must precede the first COMPDT record of any series of CORPUS records. The main time increment is usually held constant during the entire pass through a watershed. It may vary during a pass through the watershed if the time increments increase as one moves down through the Standard Control.
The main time increment is also the time interval used in the Storage Indication method of reservoir routing and in the Modified Att-Kin method of reach routing. A discussion of the time increment in relation to .accuracy of reservoir routing is contained in Section 3.0.1 under structure Data Table. For more accurate reach routings the time increment is recommended to be less than the reach travel time. Details concerning time increments and travel times are in Hydrology Note 2.
7 COkLPuT 7 (See also p. 99)
The CDHPUT Executive Control record controls the processing within a watershed. It specifies the cross section and/or structure locations where routings are to begin and end. It also gives the rainfall starting time, depth and duration, rain table number and antecedent runoff condition that is to apply between the beginning and ending locations. A single COHPDT record may extend over the Standard Control records of an entire watershed or of a part of a watershed. The user may specify an alternate number (1 to 99) and a storm number (1 to 99, with no more than 10 storms per run) on each COHPUT recordto keep track of the passes through the watershed.
- .

92
The starting point for computation iS specified by a cross section or structure number (but not both). This number must correspond to a cross section or structure that appears in the xsection/structure
-column of a record in the standard Control. Computations will :commence with-the first cross section or structure number specified sunder "from'i-in the COMPUT record and continue through the sequence :of Standard Cdntrol operations until the end of the first inconsecutive occurrence of the CrOSS Section or Structure specified
under "thru" has been reached and completed. The computation stops when a record is encountered with a cross section or structure number different and beyond that under "thru". The next Executive Control record is then executed. For example, a COMPUT record contains cross section numbers FROM 001 TIiRU 007. If two operations at the top of the standard control are both numbered 001, computation begins with the first operation labeled 001. Near the bottom of the standard control, REACH 007 is followed immediately by ADDHYD 007. The program will compute through the ADDHYD. However, if the REACH 007 is followed by RUNOFF 008 and then ADDRYD 007, the computations stop at REACH 007.
Thus, a COMPUT record for Sample Job 3, Appendix D, instructed processing from structure 01 through cross section 004, computation would stop after the 6 ADDHYD 004 record, which is the last Standard Control reccrd for cross section 004. The next instruction is another COMPUT record commencing with the next record in the Standard Control list. The next COMPUT could have changes in one or more data fields: or it could have been an RNDCMP record, resetting the Standard Control list to the first record. This would enable the user to make changes in the tabular or Standard Control data and then continue with another set of Executive Control records.
The rainfall that is to apply to the area covered by the COKPUT record is specified by giving a Rain Table number (column 61) and starting time (Column 25-36) on the COHPUT record. Proper multipliers, or actual values, are entered in Columns 37-48 and 49-60 for Rainfall Depth and Rainfall Duration.
In Standard SCS Rain Tables 1 through 5 (program defaults), the rainfall depth is dimensionless and the time increment is in hours with a~ total duration of 24 or 48 hours. Therefore, the rainfall depth in inches must be inserted as a multiplier under Rainfall Depth, and a 1.0 under Rainfall Duration. In Standard SCS Rain Table 6 (program default), both the rainfall depth and the time are dimensionless. Therefore, the rainfall depths in inches and duration in hours are inserted as multipliers under both Rainfall Depth (column 37-48) and Rainfall Duration (column 49-60), respectively, on the COHPUT record. Natural storms usually defined as cumulative rainfall depth in inches and time increment in hours may be assigned any table number from 1 through 9. In these cases a 1.0 should be inserted under both Rainfall Depth and Rainfall Duration on the COMPUT record.
An Antecedent Runoff Condition of 1, 2, or 3 must be specified under ARC ~(column 63 of the COMPUT record). They represent the three

93
antecedent runoff conditions (ARC) I, II, and III described in Chapter 4, NEH-4, where ARC I and III are runoff condition limits. The runoff curve numbers on the RUNOFF records in the Standard Control format are for an ARC II condition (the average antecedent runoff condition). When a dry condition limit, I, or a wet condition limit, III, are specified under ARC, the curve number is adjusted according to Table 10.1 of NEH 4 by the program. When using a natural storm where the runoff curve number falls between ARC I and ARC II or between ARC II and ARC III, the user should enter the adjusted runoff curve numbers on the RUNOFF Standard Control records and enter ARC 2 on the COHPUT record. The entry describing ARC on the COMFVT record must be numeric (1, 2, or 3,) although historically the literature has used the Roman ~numerals I, II, and III.
Xn many cases, a uniform rainfall will be applied over the entire watershed so that only a single COMPDT record is required. However, a series of COMPUT records may be given with different rainfall depths extending over different parts of the watershed. Normally, these COKPDT records will extend over successive parts of the
Standard Control list. For a given COHPUT record, the cross section or structure numbers appearing under VhruiV must always be farther down the Standard Control list than the cross section or structure numbers appearing under “from.* Likewise the cross section or structure numbers appearing in one of a series of COKPUT records (not separated by an ENDCMPrecord) must also be farther down on the Standard Control list than the cross section or structure given for a previous COMPUT instruction. A series of COHPUT records may also be used within a single pass through the Standard Control list for changing baseflow, the starting time of rainfall, the rain table, and the runoff condition (ARC).
ENDCHP 1 (See also p. 101)
An ENDCMP record signifies the end of one or more COMPUT records in a series. Normally this completes a "pass'* through the entire watershed. There is no limit on the number of passes that can be made through a watershed. The Pass Number will be sequentially increased by one each time an ENDCKP record is encountered.
All hydrograph storage locations are cleared with an ENDCFIP. At this point, (I) additional COMPUT records may be used with a different storm, or (2) additional or changed tabular data and/or Modify Standard Control can be followed by additional Executive Control, such as LIST, INCREK, BASFLO and COMPUT records to process the modification, or (3) the ENDJOB record may be used to end the job.

LEJ- 44 3.10.2 LIST - EXECUTIVE CONTROL
Table 3-10-2. LIST record
LIST - Causes the entire set of current tabular and Standard Control input data or specified portions of it to be listed in the output. For discussion, see page 88.
-, pa a Field (cLns)
2
4-7
11
25-36
37-48 1.*
49-60
Value
7
LIST A Operation name.
1.*
B Blank or zero
N Output current Control only.
RAINFL Table Number 1. to 10.*
zY.es DescriDtion
Ie Data code signifying Executive Control record.
Standard Enter a 1.
N Output current XSECTN and STRUCT tables only. Enter a 1.
N Output current DURINC, DIMHYD, and RAINFL tables only. To list a single rainfall table, enter its number 1. to 9. To show all the rainfall tables, enter 10. The DURINC and DIMBYD tables are automatic.
l Numbers in Data Fields (columns 25-60) must be followed by decimal points. To obtain a complete set of current data, leave all of these columns blank.

Figure 3-10-2. LIST record example LI 5-r g5
This LIST record causes the current DURINC and DIMHYD tables, rainfall table 2, and the Standard Control (inciading output options in effect at the time the LIST record is encountered) to be listed in the output. XSECTN and STRUCT tables will not listed.

3.10.3 BASFLO - EXECUTIVE CONTROL W35FLOg5 Table 3-10-3. BASFLO record
BASFLO - Causes a baseflow to be added to a flood hydrograph. For discussion,-see page 88-90.
Data Field y&&g xYE8 .
Pescrlotl on (Columns)
2 7 Ie Data code signifying Executive Control record.
4-9 BASFLO A Operation name.
11 5 Ie Operation number.
Procedure 1 - Baseflow is constant
25-36 Baseflow Ne Baseflow, cfs, to be added to cfs next reach inflow hydrograph.
37-60 se Leave Blank.
- Procedure 2 - Baseflow is triangular hydrograph
25-36 Volume Ne Volume of baseflow in inches watershed inches, to be added
to all subwatershed runoff hydrographs.
37-48 Peak Time Ne. Time, in hours to peak hours of baseflow hydrograph
(measured from beginning of runoff).
49-60 Base Time Ne hours
Time, in hours, of triangular hydrograph base (must be within 400 point limitation).

Figure 3-10-3. BASFLO record examples
Procedure 1 (constant baseflow):
37
33AAF LO
This BASFLO record will cause a baseflow of 10.0 cfs to be added to the next reach routed hydrograph. It will remain the same in all downstream hydrographs associated with the COMPDT records following this BASFLC record unless an ENDCMP record is encountered or the baseflow is changed by succeeding BASFLC and COMPUT records.
'Procedure 2 (triangular baseflow hydrograph):
This BASF’LO record will cause a hydrograph in the shape of a triangle to he added to the next runoff hydrograph. It will be added to all runoff hydrographs associated with the next and all subsequent COXPUT records until an ENDCMP record is encountered or the baseflov is changed by succeeding BASFLO and COMPUT records. The baseflov hydrograph will have a total volume (area under the triangle) of 0.26 watershed inches. The hydrograph will begin at the start of runoff, peak at 17.0 hours and have a base of 20.2 hours.

3.10.4 INCRM - EXECUTIVE CONTROL
Table 3-10-4. INcREM record
WREMg8
INCRM - Specifies the main time increment in hours used to store and route a11 hydrographs. For discussion, see.page 90.
Data Field w m2s . . DescrlDt 10n
(columns)
2 7 Ie Data code signifying Executive Control record.
4-9 INCREM A Operation name.
11 6 Ie Operation number.
25-36 Main Time Ne Main time increment in hours, Increment usually in the range of 0.1
hours to 1.0 hours.
Figure 3-10-4. INCREM record example
This INCREM record causes all hydrographs created within the F-20 program to have a main time increment of 0.1 hours unless the main time incrameiit is changed by a.subseguent INCREU record. Since there are 400 hydrograph ordinates, the runoff hydrographs will have a base time of 40 hours from the time runoff begins. It is suggested that the user select the time increment to the nearest tenth of an hour (0.1) as this will facilitate reading the hydrograph tables in the output listing.

3.10.5 COMPUT - EXECUTIVE CONTROL
Table 3-10-5. COMPUT record
COM PUTgg
CONPUT - controls processing within a watershed. It designates where to begin and end Standard Control computations, gives rainfall table, starting time, depth, duration, antecedent runoff condition, and alternate and storm labels. For discussion, see page 91.
Data Field Value (columns)
2 7
4-9 COMPUT a
11 7 Ie
13-15 Section ID I
OR
16-17 Structure ID
19-21
22-23 Structure ID
25-36 Start Time hours
37-48 Depth inches
or - 1.0
Section ID I
OR
49-60. Duration hours
1::
Tvoe DescriDtion
le Data code signifying Executive Control record.
Operation name.
Operation number.
*From" or beginning cross section no. justified,
1 thru 200, right
OR
z V+romn or beginning structure no. 1 thru 99, right justified.
VhruH or ending cross section no. 1 thru 200, right justified,
OR
I nThrulg or ending structure no. 1 thru 99, right justified.
Ne Starting time in hours: zero if left blank.
Ne Rainfall depth. If a unit RAINFL table depth is used, enter total rain depth in inches; or if the RAINFL table used cumulative rainfall in inches, enter 1.0.
Ne. Rainfall duration. If a unit RAINFL table duration is used, enter total puration in hours; or if the RAINFL table time increment.is in hours, enter 1.0.

Data Field Value (columns)
61 1-9
63 l-3 Ie
DescriWion
Ie
66-67 01-99
70-71 01-99 I
Rain table number, 1 thru 9; same as COlumn 11 of selected 5 RAINFL table header record.
Antecedent runoff condition, 1, 2, or 3; normally 2 for average runoff condition.
Alternate number, 01 thru 99; assigned by user to a particular alternative condition. Usually reflects different watershed physical condition.
Storm number, 01 thru 99; assigned by user with limit of 10 storms per run. Often used to designate different rainfall depths (runoff frequency) with standard SCS RAINFL tables.
Figure 3-10-5. COMPUT record exemple
This COHPUT record causes hydrographs to be developed and routings to be performed beginning at structure number 1 through cross section 1 (See sample Job Number 1, Appendix 8). This is one pass through the complete watershed. The starting time is zero hours. The Standard SCS RAXNFL table number 2 is to be used with 5.2 inches of rainfall to create the runoff hydrographs. Since 1.0 is entered in the rainfall duration'field, the duration of the rainfall Will be as prescribed in the RAINFL table number 2, (240 increments at 0.1 hours = 24 hours). The antecedent runoff condition is 2. The alternate number and stona number are both 1.

3.10.6 ENDCMP - EXECUTIVE CONTROL
101
END CM-P Table 3-10-6. ENDCMP record
ENDCMP - indicates the end of a series of Standard Control computations-through a watershed. For discussion, see page 93.
Pa FL U (c:%Irix)
Value Descriotion
2 I Data Code, blank or zero. -
4-9 ENDCMP A Operation name.
11 1 Ie Operation number.
The ENDCMP record is required at the end of a series (one or more) CONPUT records. The user may compute through a portion of, or the entire watershed any number of times. Each time the ENDCMP record is used to end a series of COMPDT records. The COHPUT record must always be followed by another COMPUT record, a BASFLO and then a COMPUT record, or an ENDCKP record. Each time an ENDCMP record is encountered the Pass Number is incremented by one.

102
3.11 MODIFY STANDARD CONTROL RECORD SPECIFICATIONS
3.11.1 Discussion of Input
Having previously described the Standard Control list as a means of establishing a fixed sequence of operations, the means of modifying this fixed sequence for successive passes is described here. The Modify Standard Control records are INSERT, ALTER, and DELETE (see worksheet, Appendix G, page G-22-23). They provide for inserting new records into the Standard Control list, altering data in existing records and deleting any record in the list.
When modifying the Standard Control, processing begins at the top of the Standard Control list and passes one time sequentially through the list. The,new Standard Control records must appear in the same sequence as their corresponding records appear in the Standard Control list. Any number or combination of INSERT, ALTER, and DELETE records can be used to maintain this sequence. Modify Standard Control changes are permanently saved automatically in the Standard Control operation sequence.
There iS no limit to the number of INSERT, ALTER, and DELETE records that may be used, except that the number of Standard Control records at any time cannot exceed 600. Subject to this constraint, there is
y also no limit to the number of records that can follow a single Hodify Standard Control record.
= It is recommended that a LIST record be entered after Modify Standard Control records have been entered. This causes a listing of the current records and enables the user to check if the correct changes have been made.
7 INSERT 2 (See also p. 104)
The INSERT record is used to place one or more new Standard Control records,into the existing Standard Control list. It specifies the cross section or structure number after which the insertion is desired. The insertion will be made after the last cross section or structure number in a contiguous series. If there are two series of the same number (separated by some intervening numbers) the insertion will be made at the end of the first series. In Sample Job 5, Appendix F, the first INSERT record in the 3rd alternate. is related to section 2 (see page F-7). The two Standard Control records that follow for structure 3 will be inserted after reach 2 in the prior Standard Control list.
The modified sequence must be a continuous sequence of records that ' fit into the overall Standard Control sequence. This often requires
deleting or altering some of the original sequence in'order to achieve a continuous sequence. An INSERT record must be used for each location at which an insertion of new data is desired, and any INSERT record must be placed.in the same order in which these locations appear on the original Standard Control list.

103
An INSERT record may not be used to place a record before the first record or after the last record in the Standard Control. Job 5, Appendix F,
In Sample a SAVMOV record was used at the end of the list
to avoid this situation (Alternate 1, p. F-6). This allowed the insertion after section 7 in Alternate-4 of a REACH at section 6 and an ADDHYD at-section 9.
7 ALTER 3 (See also p. 105)
The ALTER record allows changes to be made in a record in the Standard Control sequence. The Standard Control records following the ALTER record completely replace the records to be changed. In locating these records, data given in columns 1 through 17 must be identical with the Standard Control record being altered.
There are situations where two or more Standard Control records will have identical data in columns 1 thru 17. In this case, the change would apply to the first occurrence of the record. If alterations were desired in the second record, the cross section on the Standard Control list would need to be changed to some unused cross section number (reference location). This affixes a unique cross section number as previously described in Section 3.5.
In Sample Job 5, Appendix F, the ALTER record is used in Alternate 3 to revise the reach length for section 3 to 2,000 feet. The reach length was 4,600 feet in the Standard Control for Alternates 1 and 2. The exn and 9P values remained unchanged, but have to be repeated on the new REACH record.
7 DELETE 4 (See also p. 106)
The DELETE record causes the deletion of the Standard Control records that follow it. When the data in columns 1 thru 17 of the Standard Control record following the DELETE record is identical to that same data on a record in the Standard Control sequence, that record is erased from the Standard Control sequence.
In Sample Job 5, Appendix F, the DELETE record is used to delete the RUNOFF and RRSVOR records for structure'2 from the Standard Control list for Alternate 3. Further down in the same Modify Standard. Control sequence then DRLETE record is used again to delete the RUNOFF and ADDHYD for section 3. Compare listings of input data on pp. F-6, F-13, F-22, and F-29 to see the changes made.

3.11.2 INSERT - MODIFY STANDARD CONTROL
Table 3-11-2. INSERT record
104
INSERT
-INSERT - Allows placement of one or more new lines in the Standard ,Control foll‘oving the last use-of,-the specified cross section or :,structure number in a contiguous series. For discussion, see page 102.
Data Field (column)
'_ 2
4-9
11
13-15
;16-17
Value
7
INSERT
L
Section ID
OR
Structure ID
TYW
Ie
A
Ie
I
I
Descriution
Data code signifying Modify Standard Control record.
Operation name.
Operation number.
Cross section number 1 thru 200, right justified,
OR
Structure no 1 thru 99, right justified.
This INSERT record would cause a search of the Standard Control list until finding the first occurrence of cross section 2, then insert the above RUNOFF record into.the Standard Coptrol list at a point immediately following the last occurrence of records in a contiguous
.serieq containing cross section 2. .If there are several series of records containing cross section 2, the insertion will be made after the last record in the first series.

3.11.3 ALTER - MODIFY STANDARD CONTROL
1C5
ALTER Table 3-11-3. ALTER record
ALTER - Allows changes to be made in the Standard Control if records that follow-match~ prior Standard Controls in column 1 to 17. For discussion, see page 103.
Data Fiel@ &&g ZYES (coluluns)
Descrintiog
2 7 Ie Data code signifying Modify Standard Control record.
4-0 ALTER A Operation name.
11 3 Ie Operation number.
This ALTER record would caube a search of the Standard Control list until the REACH record having rection 3 in column6 13-15 is found. The old REACH record is then replaced with the new REACH record for section 3 6hm above. Column6 l-17 in the existing-REACH record must be identical with those in the replacement REACH record.

106
3.11.4 DELETE - MODIFY STANDARD CONTROL IDELETE Table 3-11-4. DELETE record
~-DELETE - Remqves an entire standard Control record from prior .Standard Control list if records that follow match in columns 1 to
17. For discussion, see page 103.
Data Field Value (columns)
TyDe DescriDtion
2 7 Ie Data code signifying Modify Standard Control record.
4-9 DELETE A Operation name.
11 4 Ie Operation number.
Figure 3-11-4. DELETE record example
This Delete record would cause a search through the Standard Control list until the first occurrence of a RUNOFF record for structure 2 is found. The RUNOFF record for structure 2 would .then be deleted from the Standard Control list.

107
3.12 INTERMEDIATE PEAR RECORD SPECIFICATIONS
3.13.1 Discussion of Input
Peaks can be-computed for additional locations between cross sections/structures using the. intermediate peaks records (see worksheet, Appendix G, page G-25). Such intermediate locations may be needed for economic evaluation of the watershed but may not be necessary for development of the hydrology and hydraulics. Using intermediate peaks can reduce the number of Standard Control records by eliminating some small subwatersheds and short reaches.
Intermediate Peaks are interpolated between two cross sections/structures based on relative drainage area size. The following relationships are used in the interpolation.
Peak, = Peak, x (D.A.,/D.A.,) -
where: Exponent = log (Peak,/Peak,)
log (D.A.JD.A.,)
and: Pea% = peak discharge,~cfs D.A. = drainage area, square niles subscript 1~ = intermediate location subscript 1 and 2 = upstream and downstream
reference section or structure
Intermediate peak records are placed at the end of a job after the last ENDCKP record at the end of the last set of Executive Control. An ERDJOB record is used after the last PEARS record. (See sample job 5, Appendix F, the last three input records on F-8.)
IPEARS (See also p. 109)
The IPEAXS record initiates the computation and precedes the PEAK.9 records.
PEARS (see also p. 110)
The intermediate peak locations are defined on PEAKS records. There is no limit to the number of intermediate peaks that can be calculated in a job. Up to four intermediate locations can be identified on each PEAKS record.

108
The computations are based on Summary Table 3 or 3A (3/3A) drainage areas and peaks. If there are multiple Standard Control operations
,with the same cross section/structure number, only the peak and drainage area of the last operation are saved in Summary Table 3/3A
~ and are available for the computations. If the drainage area is changed between alternates in a job, Summary Table 3/3A will only retain the last drainage area used for a specific cross section/structure number. This will give erroneous intermediate peaks for previous alternates.
Computed intermediate peaks are displayed in Summary Table 4. Summary Table 4 is similar in format to Summary Table 3/3A.
Intermediate peak data are inserted into the ECONZ generated file if the ECON option (columns 21-25) was selected in the JOB record.
A flow duration analysis cannot be conducted at intermediate peak locations since no hydrograph is available. However, if TIME-FLOW records are requested by the DUR Standard Control option for the THRU ID on the PEAKS record, the ECONZ file will contain TIME-FLOW records with a "USE TIME-FLOW XXX" message where "XXX" is the THOU cross section or structure ID on the PEAKS record.

3.12.2 IPEAKS - INTERMEDIATE PEAKS
Table 3-12-2. IPEAKS record
139
1% AKS
IPEAKS- Initiates optional intermediate peak computations. The IPEAKS recordmust follow the last Executive Control of the job and precede all PEAKS records. For discussion, see page 107.
Data Field Value w (columns)
Descriotion
4-8 IPEAKS Ae Operation name.
Example: (Included on the PEAKS record example on p. 111)
The IPEAKS record flags the PEAKS records that follow it.

3.12.3 PEAKS - INTERMEDIATE PEAKS
110
‘PEAKS
Table 3-12-3. PEAKS record
PEAKS- Locates and computes intermediate peak discharge values ,,betmeen cross: sections/structures. For discussion, see page 107.
pata Field (columns)
4-8
13-15
16-17
19-21
22-23
25-30, 37-42, 49-54, 61-66
31-36, 43-48, 55-60, 67-72
Value
PEARS Operation name.
From Upstream Section ID
Ae
I Cross section no. 1 thru 200 just upstream of intermediate points, right justified,
OR OR
From Structure ID I
I
I
Ae
N
Structure no. 1 thru 99 just upstream of intermediate points, right justified.
Thru Downstream Section ID
OR
Thru Structure ID
Intermediate Point ID's
D.A., sq mi
Descriotion
Cross section no. 1 thru 200 just downstream of intermediate points, right justified,
OR
Structure no. 1 thru 99 just .downstream of intermediate points, right justified.,
Identifier for intermediate points (up to 4 on one record).
Drainage area in Square miles associated with identifier in preViOUS field.

Figure 3-12-3. IPEAKS and PEAKS records example
37-e / .a-60
The PEAKS record that follows the IPEAKS record has two intermediate point locations identified. Intermediate point 7A, having a drainage araa of 3.9 square miles, and intermediate point a 7B, having a drainage area of 4.0 square miles, lie between cross sections'6 and 7 for which TR-20 computations have been completed. Peak rates of flow will be determined at these two intermediate points using the equations in Section 3.12.1 with subscripts 1 and 2 representing cross sections 6 and 7, and the subscript I representing point 7A and then point 78. An ENDJOB record follows the PEAKS record.
- .

. - --L
TECHNICAL RELEASE 20 COMPUTER PROGRAM FOR PROJECT FORMULATION
HYDROLOGY
.CHAPTER 4. OUTPUT DESCRIPTION
The type and amount of output can be controlled by input ~options on the JOB record (Section 3.7.2) and by the output options on the Standard Control records (Section 3.9.1).
All output associated with the TR-20 microcomputer program is contained within 80 columns and is paginated with headings to facilitate its use. If any input or computed value exceeds the number of allotted output spaces, all asterisks are inserted in the output field.
Examples of different types of output are shown within the sample jobs in Appendices B through F. Appendix A contains an index of TR-20 input and output features and where they are first demonstrated within the sample jobs.
The TR-20 output can be grouped into seven categories for purpose of discussion: (1) input images, (2) message page, (3) page headings, (4) cross section data plots, (5) operation results, (6) summary tables, and (7) output files generated for other SCS programs. Each of these categories is discussed in the sections below.
4.1 INPUT IMAGES (80-80 LIST)
At the start of each run, the input can be listed for all the jobs i in the run. This is called the "SO-80 List" because the entire 80
column image of each input record is displayed exactly as it was entered. This list is given only if requested on the initial computer screen (See Section 1.3). The list provides a ready reference of the input associated with the output that follows.
All characters will be shovn exactly as they appear on the input records. No data checks are made. In later processing, if illegal characters are discovered in any numeric data field, the job will not run successfully. To avoid many of these types of errors, use of the TR-20-data check program (see,Appendix Ii) is recommended. User comments are not permitted in the input except where specified on the TITLE records and in the record identification fields.
Tabular data (standard rainfall tables and the DIHHYD) preloaded in . the program will not be in the SO-80 list but may be obtained by
using the Executive Control 7 LIST record with appropriate options (See Section 3.10.2).

4.2 MESSAGE PAGE
The message page which contains user notes is output only if requested on the initial computer screen at the front of each job (see Section 4.3). The message page Will contain information the user should be aware of when using the m-20 program. page will change as needed in the official SCS version.
The message Minor
revisions, modifications, or error COrreCtiOnS will be noted on this page as they are inserted into the program.
4.3 PAGE HEADINGS
The output is divided into page size increments for the user's convenience in viewing, printing, and filing the results. Headings are displayed at the top of each page except for the SO-SO List.
The program identification (TR-20) is shown on the left of the first header line followed by dashes across the page. In the upper left corner starting on the second line is the watershed identification with the current date and time the program was executed below it. The title records are centered in the middle with the pass number on the bottom line. The program revision date and page number are in the upper right corner.
The page numbering is continuous within a run, starting with one on the first page of output. The pass number is increased by one each time an ENDcMp is encountered.
4.4 OPERATION RESULTS
The LIST operation (Section 3.10.2) generates a listing of input data that is current for the alternate and storm to be processed next. This list represents the machine interpretation of the input data including all preceding data modifications. Most data checks will have been made and automatic output options turned on. Numeric values may vary one or more digits from the input due to the number of significant digits displayed. The input options on the LIST record control the amount and type of items in each list.
The Executive Control records are not included with the LIST operation. It is recommended that LIST beused primarily the first time all data are entered and then whenever the Standard Control records ara modified. This LIST of data is separate from the 80-80 list.mentioned on p. 112.

114
The other Executive C,ontrol operations Only echo their input when detected. whenever a new COMPUT record iS encountered, the information associated with it will be displayed at the top of a new page beneath the page heading. If a new SASFLO or INCREM precedes the COMPVT, the new value will also be displayed. The Record Identificatlen field accompanies each Executive Control to help identify it. 'When the ENDCWP record is encountered, a message *'Computations Completed for Pass XXX" will be shown. The ENDJOB record will trigger an "End of XX Jobs in this run" message following the summary tables.
The Standard Control operations used with a COWPUT can be followed step by step if the FULLPRINT option on the JOB record is used. The FULLPRINT option will display for each Standard Control operation: its input, computed intermediate parameters, up to ten computed peaks with their times and elevations if available, and the runoff volume above baseflow under the outflow hydrograph. The intermediate parameters for the RUNOFF operation are: the computed runoff curve number if ARC 1 or 3 is specified on the COMPUTE record; and the computed internal time increment used to develop the hydrograph. The REACH operation intermediate parameters shown are: the coefficients used in the routing; and the computed peak travel time, which is the difference in time between the maximum hydrograph coordinates of the inflow and outflow hydrographs.
-The hydrograph coordinates, including both outflow hydrographs for a -DIVERT operation, can be obtained if the HYD or FILE output options
are requested on the Standard Control records. Discharges in the hydrographs are converted to whole numbers (integers) for the output, except for small discharges under about 100 cfs that are displayed to two decimal places. The READHD and graphic files,
'however, contain all integers. The starting time associated with -each hydrograph is the time from start of rainfall to the start of runoff. This allows the program to handle up to 400 coordinate points above zero cfs or baseflow. Discharges less than 0.5 cfs when converted to integers may be treated as part of the starting time.
If the FULLPRINT option is not used, the peak and volume data are displayed only if requested with the Standard Control output option (P/V) * Warning messages will be evoked regardless of the print option, but they may be more difficult to interpret without FULLPRINT. It is advisable to obtain FULLPRINT the first trial pass through a vatershed and in complex watershed situations to be sure the watershed is being modeled correctly. The reason for multiple peaks should be analyzed if they occur. They can be detected only by using FULLPRINT or the Peak/Volume (P/V) output options.

115
4.5 CROSS SECTION DISCHARGE/END AREA DATA PLOTS
Log-log plots of input cross SeCtiOn data are provided to display the discharge-end area curve used in calculating the exponent l*mll at each cross section elevation when the option PLOTS is included in the JOB record in column 61-67. The bankfull discharge and end area are plotted on.the axis if the bankfull elevation is given on the 2 XSECTN header record (column 37-48). The BANKFDLL elevation may help determine the significance of any change in slope of the plotted data. The computed **rnS1 values are tabulated with the plot. The actual value of "m" used in a reach routing is interpolated from this "rn" value table based on the routed outflow, providing '~8 is within the prescribed limits of the program.
The plots are not obtained when the "xn and 91~~ coefficients are entered in the REACH operation. The plots are also not obtained if Column 61-67 are left blank or the GRAPHICS option is invoked on the JO0 record. However, it is anticipated that the GRAPHICS option when fully developed will provide an alternate means to provide discharge-end area plots from the input data. If the ENDPLOT option is used on the JOB record, the cross section data will be plotted and the job will be terminated without further execution. This enables the user to examine the plots for reasonableness before committing the job for processing. It is advisable to obtain the plots the first time cross sections are used and the last time as job documentation.
4.6 SUMUARY TABLES
The summary tables provide documentation and easy comparisons for checking and analyzing results. The SUMMARY option on the JOB record will provide information on each Standard Control operation except SAVMOV without having to use the SUM output option (Column 71) on each operation. Of the 10 possible peaks, only the maximum peak information for each operation is included in the summary tables. If sKlMMARY is not used, only the operations with the SUM output option designated in the Standard Control will be shown in the summary tables. All peak discharges are displayed as integers in the summary tables.

Each of the Summary Tables is preceded by a heading which contains a short description of the table and notes pertaining to that table. Some of the notes are common to several tables. A brief explanation of the various notes follows.
F- FLAT TOP- HYDROGRAPH
T - TRUNCATED HYDROGRAPH
R- RISING TRUNCATED HYDROGRAPH
S - SHORT HYDROGRAPH
QUESTION KARK (1) AFTER: OUTFLOWPEAK-J4&K. NUMBER ROUTING ITERATIONS USED.
QUESTION UARK (?) AFTER: ATT-KIN COEFF - VALUE OUT- SIDE ACCEPTABLE LIMITS.
A hydrograph with no single peak value, but rather a series of consecutive maximum values.
A hydrograph that does not return to zero or baseflow within the maximum number of points limitation. The program 'truncates' or cuts off such a hydrograph at the discharge of the last point.
A hydrograph that is truncated on its rising limb without reaching a peak.
A hydrograph that is shorter in total duration than the longest specified duration in the DURINC table.
The maximum allowed number of reach routing iterations (10) has been used. The user should review the input parameters affecting this operation for reasonableness.
The program has used a routing coefficient of 1.0, which is usually outside of acceptable limits. The outflow hydrograph is identical to the inflow hydrograph. The user should examine input values affecting the reach routing.
marv Table 1, -- This is a tabulation of.tbe results of the Standard Control operations in the order in which they are performed. The table is subdivided by alternate number and storm number. The rainfall information and main time increment associated with the operations is given ahead of each operation's outflow runoff volume, maximum peak discharge rate, its time of occurrence. and water surface elevation if applicable. The accumulated drainage areas and the peak rate in csm are also computed and displayad. Whenever the rainfall information or main time increment changes, the new amount, duration,.starting time, table number, antecedent runoff condition or increment is listed ahead of the Standard Control operations to which they apply.

Examples of Summary Table 1 can be found after the computations in all the sample jobs in Appendices B to F. All operations (except SAVMOV) for all cross sections, structures, storms, and alternates are displayed if requested by the SUM or SUMMARY option.
Summarv Table 2. -- This is a tabulation of the reach routing results and parameters used in the routing. A major difference between this table and Summary Table 1 is that the peak discharges and times are based on the maximum hydrograph coordinate at a multiple of the main time increment rather than the interpolated peak used in the normal output. All reach routings are tabulated in the order they are performed, subdivided by alternate number, storm number and baseflow. This table is automatic if reach routing was performed.
The reach routings are identified by their cross section ID numbers and reach lengths. if provided.
The floodplain reach length is listed separately
The routing parameters displayed include the coefficient @x*1, the power or exponent **rn**, length factor "k*", peak ratio "Q*" (outflow/inflow) and the Modified Att-Kin routing coefficient *SC*‘. See Hydrology Note 2 for more detailed descriptions of these parameters.
The Modified Att-Kin coefficient should be less than 1.0 and preferably less than 0.67. If the coefficient is 1.0, the inflow and outflow hydrographs are identical. To reduce the coefficient the user may reduce the main time increment or increase the reach length.
Appendices B through P contain examples of Summary Table 2. Each REACH operation is displayed regardless of the summary options specified. This allows the user to quickly compare the effectiveness of the reach routing in a job.
Summarv Table 3. -- This table is a listing of maximum peak discharges, ordered by cross section or structure ID number, by alternate number, and by storm number. The peak discharges are sorted in descending order by ID number with structures listed before cross sections. If more than one Standard Control operation is identified with the same ID number, only the peak discharges from the last one in the Standard Control sequence will be used in Summary Table 3.
The format displayed in Summary Table 3 iS Similar to the file generated when the ECON output option is entered on the JOB record.
The intermediate peak computations use the peaks and drainage area shm in Summary Table 3. The drainage area displayed in the table is the one associated~ with the Standard Control operation. If the drainage area changes within a job for this operation, only the last drainage area, used will be retained and displayed. This could result in erroneous intermediate peak results.

118
Both Summary Table 3 and Summary Table ,I are given whenever the SUMMARY or individual SUM output options are specified. Appendices B thru E contain examples of Summary Table 3.
If the ECON -and associated flow duration options are all selected, Summary Table 3A will be substituted for Summary'Table 3 as seen in Appendix F.
Summarv Table 3A. -- This table lists the maximum peak flows and the flow durations ordered by cross section or structure ID for each alternate and storm number. It is similar in format to Summary Table 3, except that only three storms can be displayed per page.
To obtain Summary Table 3A, a DDRINC table has to be entered, the ECON option on the JOB record and at least one DUB option on the Standard Control has to be ,selected. An example of SUmtiaq Table 3A is contained in Sample Job 5 in Appendix F.
Summary Table 4. -- This is a tabulation of the intermediate peak data in a format similar to Summary Table 3. All intermediate peak locations entered on the PEAKS records are listed in the sequence they are entered and peaks are ordered by alternate number and by storm number. Like Summary Table 3, if more than one, only the last operation associated with a cross section or structure ID and its last drainage area are used. Appendix F contains an example of Summary Table 4.
4.7 OUTPUT FILES GENERATED
Machine readable files for input into other SCS programs can be generated for certain selected information computed in a TR-20 job. The files can be written to the userf’s choice of file directory. Table 3-7-1, on p. 30, contains the program defined file names, required input options, and general description of these files.
The following sections provide additional information on the output files that can be saved for future use:
-- These files summarize detailed output information and related input items in condensed tabular format. Separate ASCII files are used to save Summary Table 1, Summary Table Z(~reach data) , hydrographs, and flow duration data. A separate utility program is needed to read these files and plot the information. SCS has developed a prototype plotting program that uses proprietary Graphics Kernel System (GKS) software for this purpose.

11s
To obtain these files, the GRAPHICS option (Col. 61-67) on the JOB record and the appropriate Standard Control output option (see Table 3-7-1, p. 30) must be selected. To keep the hydrograph data file within reasocable storage limits, the FILE option should be judiciously used.
pischarae Hvdroaraohs. -- These are generated in the format of the Read Discharge Hydrograph Table (RRADHD, Section 3.8.7). For each job, the hydrographs generated are numbered consecutively starting with one. The hydrographs might be reentered into another segment of TR-20 or inserted into the DAMS2 computer program for further processing. To obtain this READHD file, the FILE output option (Column 69) on the Standard Control operation must be set to 1. See the last page of Appendix C, Sample Job 2, for an example of a discharge hydrograph file. The READHD file name generated by the program has the user's file prefix, and the extension **.TRD."
@CON2/DRRl Flow-Freauencv Datq. -- These are generated from Summary Table 3 or 3A and Summary Table 4 peak discharge data. The storms are sorted by alternate and ordered by magnitude of the peak, so that the largest peak value is generated first. This means storms within an alternate do not have to follow a set order of computation.
The data file is generated in the FLOW-FREQ and TIME-FLOW record formats required as input to the SCS Economics - Floodwater Damages (ECON2) and the SCS Urban Floodwater Damage Evaluation (URBl) computer programs. The ECON option on the JOB record (Columns 21-24) and either the SUWMARY option (Columns 51-57) on the JOB record or the SUM output option (Column 71) on the Standard Control operation must be used to save the desired information for Summary Table 3. Time-flow data is only provided for peaks at cross sections or structures where the DUR option (Column 67) is selected and the DURING table is in the Tabular Data. Intermediate peak data from Summary Table 4 is included in FLOW-FREQ format if the ECON option is given on the JOB record and in the TIME-FLOW format if the TBRU ID in the Standard Control has the DUR option selected.
The first records in the ECON2 output file will be the ECONZ job record followed by the TR-20 TITLE records. Next, will be a DUR-INCT Table. This table will contain the given durations in the correct To and From Field increment format for the ECON2 Computer Program. The To and From fields will be equal for the last table increment. Then, three TIM+FLOW records (three durations) Will follow each appropriate PEIAK-FLOW record in the file if the DUR option is selected on the Standard Control. The TIME-PLOW record information will also be shown in summary Table 3A.
A message code letter is provide in the output if any special or problem condition exist in the flow duration computations. The following condition codes may be displayed ifs a user selected duration:

'T' - gives a flow duration value when the flood hydrograph is truncated due to the maximum hydrograph point number limitation in TR-20.
'R' - gives a flow duration value when the flood hydrograph is still rising toward a peak when truncated by the same maximum point limitation.
'S' - exceeds the time base of the entire flood hydrograph.
\B' - is at or below a constant baseflow discharge.
Flow durations unable to be calculated by the above conditions will be shown as asterisks in the output.
See Appendix F, Sample Job 5, ~for an example of an ECON peak discharge file. The ECON file name generated by the program has the user's file prefix and the extension “.TEC.”

121
TECHNICAL RELEASE 20 COMPUTER PROGRAM FOR PROJECT FORMULATION
HYDROLOGY
CHAPTER 5. OUTPUT USE
This chapter discusses the use of the output. It includes considerations in checking the input and output, interpretation of the output, and calibration and verification. It also lists all of the program error, warning and informational messages with short discussions on eliminate them
why they are triggered and suggested ways to from the output.
5.1 CHECKING INPUT AND OUTPUT
The user must always check input for accuracy and completeness and check output for reasonableness. The following precautions and checks should be made by a user to validate the output from any TR- 20 run.
1. Always put a decimal in a real number field such as in Columns 25 through 60 on the Standard Control records and in all real data fields in tabular data. This is a very common input error. The user can make this type of error easier to detect by left justifying input data in decimal fields. Therefore, if the decimal is omitted, the program will place the default decimal at the end of the data field. This will cause the number read to be larger than it actually is and will frequently result in error messages or all asterisks in corresponding numeric fields in the output.
2. The first part of the output should be a 80-80 list of the input data. This should be CAREFULLY checked for correctness. The alignment of data field is an important check. Insertion or deletion to an input record by an editor can inadvertently move subsequent data out of their field.
The alignment of data field is an important check. Insertions or deletions to In input record by an editor can inadvertently move subsequent data out of their field.
3. All tabular data and all Standard Control data, followed by an ENDATA record must precede the Executive Control records that pertain to them. There is one exception to this, the READHD table must follow the ENDATA record.and precede the COMPUTE record that uses it -- otherwise, the program will go into a loop pnd have to be stopped by the user. - .
4. Check the cross section elevation-discharge-end area table input for increasing values with successive elevations. If there is any decrease, a fatal error results.

122
5. Check the structure elevation-discharge-storage table input for the following:
a. The main time increment should be related to the discharge and storage at each table elevation. Half the discharge should always be less than the storage divided by the main time increment; see Section 3.8.1 under Structure Data Table for the full expression with unit conversions.
b. Successive elevation, discharge, and storage values must increase. If any values decrease a fatal error results.
6. Check the "Start Routing Elev. " field on the Standard Control RESVOR record(s). It may Contain an elevation higher than the lowest elevation in the corresponding STRUCT table, but it must not contain an elevation lower than any value in the table. If there is baseflow at the reservoir site, the "Start Routing Elev." should correspond to an elevation in the STRUCT table at which the baseflow will pass through the principal spillway.
!Jf the "Start Routing Elev." contains an elevation higher than the ,zero discharge in the table or constant baseflow for the pool elevation at the beginning of routing the apparent volume of outflow
-will be increased as the initial volume will be drained in the 'routing. If the "Start Routing E1ev.w is lower then the elevation .where significant outflow begins (true crest of principal spillway), the volume will be decreased as the additional storage has to be filled before outflow starts.
.7. The record identification field, Columns 73-80, should always be used. This field is shown in various places in the output to help the user keep track of what is happening and is also associated with many error messages so the user can locate errors faster.
8. The output should be ~examined for the occurrence of asterisks filling a data field. This means that the numbex intended for that field was larger than allowed by the FORTRAN format statement in the progr-. This applies to the 80-80 Listing of Input Data as Well as the remainder of the TR-20 output. Asterisks could trigger an unrelated errbr or warning message.
9. Search the output file or printed hardcopy for the occurrence of asterisks in columns 1 to 3. This usually indicates an error, warning, or regular message that might otherwise go unnoticed. The
' effect the messages have on the completeness and reasonableness of the output can be determined by referring to the remarks and actions to be taken in regard to the messages in Section 5.4.

123
10. Examine the summary tables for notes (letters or question marks) that follow data fields. These may indicate the run is unsatisfactory due to truncated hydrographs or poor selection of input parametprs. See Section 4.6 for description of the notes.
11. Spot check the output by closely examining the summary table data. In Summary Table 1, especially compare the accumulated drainage area with that at known locations and the consistency of the runoff volume with that obtained directly from rainfall using the runoff curve number. In Summary Table 2, compare the parameters used in the reach routing between reaches to determine if the routing effects are predictable. In Summary Tables 3, 3A and 4 compare the peak discharges between alternates and storms to see if the magnitudes and order are predictable and reasonable.
12. If there are discrepancies or questionable results in the output and the input is satisfactory, warranted using the FDLLPRIRT,
more detailed output may be SDMMARY, HYD, or DDR output options.
5.2 INTERPRETATION OF OUTPUT
As mentioned in the previous section, the first check of the output data should actually be a thorough review of the program input data. Although use of the data check program (see Appendix IX) will eliminate many gross input errors, it does not guard against typing errors, number transposition, leaving out a line of data, and other such data entry mistakes. It is the first responsibility of the user to carefully check and correct these type of errors.
The output data itself should be checked for consistency, error or warning messages, and reasonable results. It is important that the user bear in mind the logical and expected results of a series of operations and continually compare these with the program output; In a large job, this is often easier if the job is broken up into a series of smaller steps. The user may wish to develop tables or graphs in an alternate format to those in the program to trace peaks downstream in some way meaningful to the project. Table 5.1 is an alternate format to the summary tables for the user to summarize output data if it is desired to look at the results in some logical sequence on the main stream or a tributary. This example, based on comparison of peak flow (CFS)~ and alternates by storm from Sample Job 5 in Appendix F, is only one method by which the many factors such as peak time, peak discharge (CSM) and runoff volume can be tabulated. Only the structure sites and main stem ADDRYD and REACH operations with no local drainage area added were selected for comparison in the example.

124
Table 5.1. .Alternatives Compared - Sample Job 5 - Main Stem Discharge (cfs)
peak
Total -_ LD 123 Alternatives 11 (sq.. mi.) 1 2 3 4
Storm #1 (5.2" Rainfall - _
Structure 01 1.20 ADDHYD 001 1.66 REACH 002 1.66
Structure 2/ 02 0.44 Structure 2/ 03 0.75
ADDHYD 004 2.41 REACH 005 2.51 etc.
Yr. Frequency)
2128 929 1516 1116 1073 894
837 ~247 -- --
1436 1166 910 816
Storm #2 (2.6" Rainfall =-
Structure 01 1.20 ADDHYD 001 1.66 REACH 002 1.B6
Structure 21 02 0.414 Structure 2/ 03 0.75
ADDHYD 004 2.411 REACH 005 2.41 etc.
Yr. Frequency)
527 153 415 204 340 182
238 100 -- --
473 270 265 203
l/ Alternative 1 - No sites. ” 2- Sites 1 and 2 in place.
929 2131 1113 1515 891 1072
-- -- 51F 542
935 1577 602 946
153 528 202 405 180 332
-- -- 41 148
214 439 168 256
” 3- Sites 1 and 3 in place (Site 3 is downstream from Site 2).
n 4 - No sites. Baseflov varies between alternates.
21 Structure-is on a lateraLl.

125
5.3 CALIBRATION OF THE MODEL
If at all possible, the user should calibrate or validate the results of a-TR-20 run against an independent source of measured data. The measured data can come from a stream gage within the watershed or from regional regression equations of stream gage data outside the watershed.
Calibration involves adjusting input parameters until the computed output compares with measured values. Validation involves replication of measured values with computed values without adjusting input parameters. If a split sample set is used, the TR- 20 model can be calibrated with half of the data and validated with the remainder of the data.
Calibration of the model with a range of storm or flood hydrographs from stream gage data in or downstream of the watershed under study is the ideal'case. If enough years of gage data are available a statistical discharge-frequency relationship may be developed. TR-20 can be calibrated to produce a similar discharge-frequency relationship for a range of return periods such as from the 2-year to loo-year flood. This may be advantageous in checking the reasonableness of a loo-year flood modeled by TR-20 when there are no measured discharges approaching that magnitude.
Calibration with gage data, however, is not always possible. Calibration in this case involves adjusting the input parameters in the program soothe computed hydrograph matches the recorded flood hydrograph for a given event. The peak rate of flow, runoff volume, and hydrcgraph shape are the measured data used for comparison. Any base flow separation is done before the hydrograph calibration is made. Looking at the difference between the computed and the recorded hydrograph, the user must select parameters to adjust and estimate the direction and magnitude of adjustment. Any adjustments to the input parameters must stay within reasonable physical limits. It is best to change parameters one at a time to see clearly the effects of that change. This technique also tests the sensitivity of the selected parameters.
Input parameters that affect the runoff volume include the amount, duration and uniformity of occurrence of the rainfall, the runoff curvenumber, antecedent runoff condition, the drainage area, and presence or absence of base flow, diversions, and transmission losses. Generally, the runoff volume increases as the total storm amount, runoff curve number, and drainage area increase. The runoff volume decreases as transmission losses and base flow increase.
.

126
The timing and the flood hydrograph shape are affected by the time of concentration, reservoir and reach routing, location in the routing sequence, the shape of the unit hydrograph, and the direction of-the storm movement across the watershed. The runoff hydrograph Shape is directly related to the time of concentration. Generally the. flood hydrograph's time base increases as the time of concentration and the amount of available reservoir and channel storage in the watershed increase or as the watershed shape narrows. The flood hydrograph is also a function of the unit hydrograph shape.
Storm characteristics such as rainfall duration and the time and area1 distribution also have an impact on the flood hydrograph
~. shape. Increasing the duration of rainfall lengthens the time base of the hydrograph. Mu1tipl.e bursts of rainfall will usually cause multiple peaks on small watersheds, but may have indistinguishable effects on larger watersheds. Non-uniform area1 distribution of rainfall, vith high runoff near the watershed outlet will usually result in a rapid rise, sharp peak, and a rapid recession vhile high runoff in the headvaters will usually produce a slov rise, a broader peak, and a slow recession.
:Peak discharge is affected by the runoff volume, the time of concentration, available storage, unit hydrograph shape, drainage area, the storm movement over the watershed, and the distribution and amount of rainfall. The parameters that impact the peak discharge are the same as those that affect the volume of runoff and the flood hydrograph shape. Therefore, it becomes more and more important that the sensitivity of the parameters be closely evaluated and their variation monitored.
As an example of sensitivity, some of the input parameters were varied one at a time and their impact on peak discharge and time analyzed. The results are shown in Table 5-2. The upstream watershed in Sample Job ~1 in Appendix B vas used to develop the information.
.

TABLE 5-2.
Variable -_
RUNOFF ODeration
Drainage Area
Curve Number
Time Concentration
Rain Depth
ARC
Rain Table
Main Time Increment
PESVOR ODeration
Table Discharge
Table Storage
Start Elev.
127
Sensitivity of Input Parameters - Example
Variation l/ m Peak Disch. Peak Time cfs (%) hrs (%)
-em 1.2 sq.mi. 2128 (100%) 12.09 (100%) 90% 1.08 sq.mi 1915 (90%) 12.09 (100%)
110% 1.32 sq.mi 2341 (110%) 12.09 (100%)
-mm 75 2128 (100%) 12.09 (100%) 90% 68 1628 (77%) 12.10 (100%)
110% 83 2733 (128%) 12.09 (100%)
--- 0.33 hr 2128 (100%) 12.09 90%
(100%) 0.30 hr 2224 (105%) 12.08 (100%)
110% 0.36 hr 2050 (96%) 12.11 (100%)
--- 5.20 in 2128 (100%) 12.09 (100%) 90% 4.68 in 1794 (84%) 12.09 (100%)
110% 5.72 in 2480 (117%) 12.09 (100%)
--- 2 2128 (100%) 12.09 (100%) --a 1 858 (40%) 12.12 (100%) e-m 3 3087 (145%) 12.08 (100%)
--- Type 2 (Tbl. 2) 2128 (100%) 12.09 (100%) --- Type 1 (Tbl. 1) 1069 (50%) 10.09 (83%) --- Type lA (Tbl. 3) 436 (20%) 8.07 (67%) --- Type 3 (Tbl. 4) 1543 (73%) 12.24 (101%)
--- 0.1 hrs 2128 (100%) 12.09 (100%) --- 0.05 hrs 2131 (100%) 12.09 (100%) --- 0.2 hrs 1943 (91%) 12.08 (100%)
me-
90% 110%
S-B
90% 110%
--- 521.5 --- 521.0 --- 522.0
-em
---
---
e-s
---
---
929 (100%) 12.35 (100%) 890 (96%) 12.36 (100%) 986 (106%) 12.34 (100%)
929 (100%) 12.35 (100%) 981 (106%) 12.34 (100%) 874 (94%) 12.37 (100%)
929 (100%). 12.35 (100%) 916 (99%) 12.36 (100%) 942 (101%) 12.35 (100%)

128
TABLE 5-2 Cont'd
Variable Variatica 1/ y=&j
-_
Main Time Increment
REACH Oueration
preach Length
Coef f . "x8'
Exponent nmn
Main Time Increment
(100%)
90% 110%
--- 90%
110%
--- 90%
110%
m-w
---
---
0.1 hrs 929 (100%) 12.35 (100%) 0.05 hrs 934 (101%) 12.35 (100%) 0.2 hrs 922 (99%) 12.41 {loo%)
5400 ft 4860 ft 5940 ft
0.42 0.38 0.46
1.35 1.22 1.49
0.1 hrs
0.05 hrs
0.2 hrs
Peak Disch. Peak Time CfS (%I hrs (%)
729 (100%) 750 ,(103%) 709 (97%)
729 (100%) 714 (98%) 742 (102%)
729 (100%) 570 (78%) 838 (115%)
729 (100%)
728 (100%)
736 (101%)
12.79 {lOO%) 12.76 (100%) 12.82 (100%)
12.79 (100%) 12.81 (100%) 12.77 (100%)
12.79 (100%) 13.23 (104%) 12.63 (99%)
12.79 (100%)
12.76
12.86 (100%)
l/ When variation in percent is shown, 90% = 10% lower and 110% 10% higher then the initial valve.

129
A typical procedure for calibrating the TR-20 model is shown in .Table 5-3. It is assumed that adequate stream gage, rainfall amount and distribution and flood history data are available to work with. Major historical storms may not be desirable for calibration if recorded stream gage data is estimated and watershed and hydraulic conditions have changed.
The extent of calibration depends on the purpose the hydrologic model serves and on the amount and quality of data available for comparison.
If there is no recording stream gage within the watershed, an acceptable alternative is comparison of the peak discharges for selected frequencies with the peak flow frequency curves of available crest stage data. State or other agency publications or frequency curves generated from selected stream gaging stations in the area can also be used for this purpose.
Another method of calibration is to compare actual high water marks from known events with the computed high water marks from the TR-20 hydrologic model and the water surface profile hydraulic model. This alternative is the least desirable alternative because the source of the difference in water surface elevations can be a function of both the hydrologic and hydraulic models. Thus, care must be used in selecting and adjusting the parameters.

130
Table 5-3. A procedure for Calibrating the TR-20 model.
Steps:
1.
2.
3.
4.
5.
6.
Select-at least two calibration storms with the following characteristics:
a.
b.
C.
d.
8.
storms large enough to produce significant flooding.
storms with essentially uniform rainfall distribution and amount over the watershed.
storms produced usually by isolated thunderstorms with hydroqraphs that can be easily separated out in the stream gage data.
recent storms if watershed conditions (i.e. urban development) have changed significantly or if major changes in hydraulic storage and flow characteristics are included in the TR-20 model.
storms that did not produce unusual hydraulic conditions such as major dam failure or questionable gage information (i.e. unanticipated obstruction, loss or bypass of the gage).
Plot the gaged storm hydroqraphs and separate baseflow and flow not related tam the selected storms.
Measure volume of'stom runoff in the gaged hydroqraph and convert to inches alf runoff over the watershed.
Determine curve numbers; (CN) for the watershed at the gage for each storm using the actual rainfall and measured runoff volume in inches.
Compare each storm CN at antecedent runoff condition II and estimate the antecedent runoff condition related to the storm.
Compare the estimated ARC for each storm with the expected-storm ARC based on the flood history. If they don't agree - recheck the rainfall and runoff volumes Or discard the stow and try another. If the ARC?0 are in reasonable agreement, the calibration process can beqin.

131
Table 5-3 (continued)
7. To calibrate each storm, adjust the TR-20 CN'S and ARC to produce-the storm runoff volume, peak, and timing as nearly-as possible. The simplest way is to use the storm CN with ARC 2.
0. Using TR-20 and the actual rainfall table for each calibration storm, produce the computed hydrograph at the gage. Plot this hydrograph on the actual storm runoff gaged hydrograph. Be sure to include baseflow if used in TR-20. Heed all warning messages.
9. Check the volume of direct runoff from the ~~-20 unadjusted hydrograph with that of the actual storm. If not the same, recheck step 7 to make adjustments in the CN's or ARC. Also, examine the shape of the TR-20 hydrograph to see if changes in baseflow are warranted.
10. If the runoff volume and general shape is satisfactory, examine the timing and sharpness of the TR-20 hydrograph peak. If there are multiple peaks, note their spacing and relative magnitude. If they don't correspond with the gaged hydrograph, reexamine the input parameters that could affect the peak discharge (i.e. time of concentrations, available storage, representative cross sections, unit hydrograph shape, rainfall distributions, watershed conditions at the time of the storm, etc.). Adjust if necessary within reasonable physical limits.
11. If the above Standard Control and other input parameters are reasonable, consider adjusting the main stem reach velocity parameters next. If there is too little attenuation in the reaches, it could be caused by either the shortness of the reach or by a high velocity. If there is too much attenuation the reach may be too long or the velocity may be too slow. Velocity in the reach is highly dependent on the Manning's Wn, which should be checked for reasonableness.
If XSECTR tables are used for reach routings, a Manning's VP badto be selected for each reach in order to develop the table. Revising the tables based on higher Manning's *nW values will increase the storage for any given discharge. This will result in more attenuation (lower peaks) and time delay in the reaches. Lower Manning's "nn values will result in.the opposite effect, less attenuation and an advance in time. When high wa+er marks are available, the Kanning's "nN values can be adjusted in addition to the hydrologic parameters in the . TR-20 calibration. The elevation of the high water marks should be matched with the estimated elevation -discharge-frequency from TR-20 runs.

132
Table 5-3 (continued)
If cross section coefficients are used for reach routing, incremental increases in "x" and "m" will usually increa-e the peak discharge and advance the peak time. of the two, the 9P value is more sensitive than the "x* value. Adjustment of the "x1@ and "mn values to best match the hydrographs should be considered when the reach storage calculated using the end area from the representative reach cross section could differ from the actual total reach storage.
.~ 12. Repeat the procedure in steps 7 to 11 for the next calibration storm. Make adjustments as before in the input parameters and compare to the adjustments needed for the earlier storm(s).
13. Select, or average adjustments if appropriate, and rerun storms if necessary to document the calibration.
14. Run the validation or verification storms in the adjusted TR-20 model, using the storm CN and ARC and compare with the gaged hydrographs. The volume of runoff, hydrograph shape, and peaks should agree within reasonable limits to have a successful calibration and a valid TR-20 model.

133
ERRORS A - E
5.4 PROGRAn MESSAGES
The TR-20 Pr‘ogram will output messages in response to incorrect or questionable input, or in some cases to explain results. All messages begin and end with three consecutive asterisks (***).
Messages are grouped into three categories:
Errors - Incorrect data, run is terminated at point of error. Correct input and rerun.
Warnings - Questionable data, run will continue, but check assumptions and results. Revise input if warranted.
Messages - Informational, be aware of what triggered the message and take appropriate action if necessary.
Program manages are listed alphabetically by category below. Each message is followed by remarks on why the message was given and suggested corrective action items if needed.
5.4.1 Errors
s "DIVERT" MUST WAVE VALUE IN DATA FIELD fl AND/OR FIELD #3. RUN TERMINATED.
Remarks: The first procedure for DIVERT requires a discharge in ~01’s. 25-36. The second procedure requires a cross section location for output in ~01's. 49-60.
Action: Correct DIVERT record according to procedure being used, and rerun.
. 'ENDATA" ENCOUNTERED IN STANDARD CONTROL, RUN TERWINATED. LAST EXECUTIVE CONTROLRECORD FOLLOWS:
Remarks: Only one ENDATA can follow the Standard Control. One was found after the ALTER OR DELETE record shown.
Action: Remove the ENDATA that follows the record shown and rerun.
s ERROR Occurred - Run TR-20 Data check
Remarks: A serious error stopped the run. It is probably an .input error that the Data Check Program could,identify. This m&sage appears On the screen. The output file often contains information on what needs correcting.
Action: Run Data Check Program, correct input and rerun.

134
ERRORS F - L l men xsEcrIoN/s~~ucr~E ID ON “conPuT’* MISSING,
RUN TERnINATED.
Remarks: Th~e,e*FROMw ID on the COMPUT record shown after the message must have a cross section number (l-200) or a structure number (l- 99).
Action: Add appropriate ID and rerun.
. FROM XSECTION/STRUCTURE XC ON "COMPUT" NOT FOUND IN STANDARD CONTROL, RUN TERMINATED.
Remarks: The WFROM" xsection/structure ID on the COMPUT record shown after the message does not match any of the xsection/structure ID's in the Standard Control. This message also occurs if a xsection/structure ID is used in a set of COBPUT's with no intervening ENDCMP where the ID's would overlap if the Standard Controls were processed in the given sequence, as in the example (8 . ..COBPUT..OO1...002...~~ :followed by ~~COKPUT..OO2...003.~~
Action: Correct ID and re:run or add missing record and rerun.
. HYDROGWH STORAGE LOCAIION PROBLEM. RUB DATA CHECK PROGRAM FOR HELP. RUB TERHINATED.
Remarks: The hydrograph storage locations are not correctly accounted for in the Standard Control.
Action: Run data check program, correct error, and rerun.
l INITIAL DISCBARGE IN THE STRUCTURE TABLE MUST BE ZERO CPS. RUN TERMINATED.
Remarks: The first elevation in the STRUCT table must have set0 cfs, but the storage in acre-feet can be greater than zero.
Action: Correct rating taible and rerun.
l LESS THAN THREE POINTS IN "OIMHYO". RUN TERMINATED.
Remarks: Thb dimensionless hydrograph to be used in the program must be dmfined by 4 to 101 points.
Action: Correct the oIuB!fo table by adding an appropriate number of . points and rerun.
. LESS THAH THREE POINTS IN RATING FOR XSECTN xxx.
Remarks: Cross section r#ating tables must contain 3 or more . points. The maximum is 20 points.
Action: Develop appropriate number of data points for rating table or use "xm and "rnn values instead.

135
ERRORS N - RA
. NEGATIVE OR ZERO REACH LENGTH, RUN TERMINATED.
Remarks: The-program Will not accept values equal to or less than zero as a reach length in the REACH Standard Control.
Action: Correct reach length and rerun.
. NEGATIVE X OR Fl VALUE ON "REACH", RUN TERMINATED.
Remarks: than zero.
The "x" and "on values iri the REACH record must be greater See Hydrology Note No. 2 for suggested values.
Action : Correct error and rerun.
. NO RATING TABLE OR ROUTING COEFFICIENTS. RUN TERMINATED.
Remarks: WX" , U,",
A CrOSS-SeCtiOn ID has been used on a REACH record, but no or cross section data has been provided for it.
Action: Provide appropriate reach data for the cross section, and rerun. If cross-section ID is erroneous, correct and renm.
a NO XSECTION/STRUCTURE ID FOUND ON STANDARD CONTROL WHILE PROCESSING "COBPUT", RUB TERMINATED.
Remarks : A xsection/structure ID number was found to be missing in the Standard Control when the COMPUT record that follows the message was being processed.
Action: Find and add the appropriate ID in the Standard Control or revise the COMPUT and rerun.
l RAINFALL DEPTH MD DURATION BUST BE GREATER TBAN ZERO. RUN TERMINATED.
Remarks: The rainfall depth and duration must be greater than zero to generate a hydrograph.
Action: Correct values and rerun.
. RAINPAIJ, DEPTB AND/OR DURATION OTHER THAB 1.0 ENTERED, BUT RAINTABLE x IS NOT DIMENSIONLESS. RUB TERMINATED. ERROROCCURRED WHILE PROCESSING FOLLOWING RECORD:
Remarks: The last rainfall depth in. the table is greater than 1.0, or the number of values in the RAINFL table times the time interval is greater than 1.0. .
Action: If the R?LINFL table is not dimensionless, change the depth and/or duration to 1.0 on the Executive Control COMPUT record and rerun.

136
ERRORS RA - RE
9 RAINTABLE xx IS NOT A VALID NUMBER. RUN TEMINATED.
Remarks: Thkraintable ID listed is outside the range of 1to 9.
Action: Correct raintable ID to one within range 1 to 9 and rerun.
m REACH ROUTING COEFFICIENTS MUST BE IN PAIRS, RUN TERMINATED.
-Remarks: Both *@x" and Yam* must be given in the REACH record.
Action: Add missing values to data, or use actual cross section data for the reach routing and rerun.
. “READHD” ENCOUNTERED IN EXECUTIVE CONTROL, RUN TERMINATED.
Remarks: olace.
The RBADHD record shown after the message was out of The RBADHD table must be ahead of the COKPUT record
-(alternate and storm) which uses the hydrograph in the table.
and rerun. faction: Reorder input file
e READHD IN LOCATION x HAS BASEFLDW ( xxxxxx. CFS).
ONE OR MORE VALUES BELOW RUN TERMINATED.
Remarks: The baseflow indicated by the message is the value entered in the 7 READHD 9 record. This baseflow is therefore contained in
-the RBADWD, and the discharge values in the read hydrograph file must be greater than this baseflow value.
Action: Correct values and rerun
. RECORD OUT OF PLACE. RUN TBRMINATED.
Remarks: The record shown after the message is out of place. See Table 3-3 on page 21 for the proper input sequence.
Action: Relocate record in proper place and renm.
l REQUESTED RAINTABLE xx HAS NOT BEEN LOADED. RUN TERMINATED.
Remarks: The raintable (l-9) requested in the COWPUT record has not been either preloaded ,intd the program or defined in the input data, or the label is wrong on the COKPUT record. . Action: Check that the raiatable number requested in the COWPUT
.record is correct. If it is, include properly labeled and defined raintable in the data and :renm.

137
ERRORS RU - STA
. "RUNOFF" CONTAINS BLANK, ZERO OR NEGATIVE VALUE IN DATA FIELD x,-:RUN TERMINATED.
Remarks: The RUNOFF Standard Control has incomplete or incorrect data, and is probably missing Tc, Drainage Area, or curve number data.
Action: Locate incorrect or incomplete data, correct, and rerun.
. RUNOFF CURVE NUMBER EXCEEDS 100, RUN TERMINATED.
kemarks : The runoff curve number on a RUNOFF Standard Control must be between 1 and 100. curve number is 40.
The lowest recommended runoff
Action: Correct entry and rerun.
. 600 STANDARD CONTROL RECORDS EXCEEDED. RUN TERMINATED.
Remarks: The limit for the number of Standard Control records has been exceeded.
Action: Redefine the watershed so that the Standard Controls number less than 600 or use separate TR-20 runs with the READED option.
n STANDARD CONTROL ENCOUNTERED IN EXECUTIVE CONTROL, RUN TERXINATED.
Remarks: Record shown after message is incorrect or out of place. It should be an Executive Control record.
Action: Correct input file and rerun.
. STARTING DISCHARGE OR END AREA IS LESS THAN ZERO. RUB TERXINATED.
Remarks: The first values of the cross section table for discharge and end area should be equal to zero.
.Action: Locite incorrect data, correct, and rerun.
8 STARTING DISCHARGE OR STORAGE IS LESS THAN ZERO. RUN -NATED.
Remarks : The discharge or storage associated with the first elevation ih a structure table is given as a negative value. It must be zero or greater.
Action: Locate incorrect data, correct, and rerun.

138
ERRORS STR - T
n STRUCTURE XX RATING TABLE VALUES (SHOWN BELOW) NOT ALL ZNCREASING. RUN TERMINATED.
Remarks: Entries for elevation, discharge and storage in the STRUCTURE table must be increasing. The increments can be small (0.01).
Action: Correct data and rerun.
i . TABULAR DATA INPUT PROBLM; ON OR AFTER RECORD LISTED BELOW, RUN TBRMINATED.
Remarks: A unacceptable character has been found in a data field.
Action: Example the data entries or run the data through the ~~20 data check program to locate the error. Correct the data and rerun.
a TABULAR DATA PROBLBM; 1) TOO MANY POINTS, 2) DATA CODE NOT "a", OR 3) NO "BNDTBL". RUN TERMINATED.
Remarks: One of the above errors has occurred in a table.
Action : Determine the error, correct the data, and rerun.
. TBRU XSECTION/STRUCTURE ID ON "COHPUT" MISSING, RUN TERMINATED.
Remarks: The "THRU" ID on the COHPUT record shown after the message must have a cross section number (l-200) or a structure number (l- 99) that matches a xsectionfstructure ID in the Standard Control. This message also occurs if a xsectionfstructure ID is used in a set of CoMPUT's with no intervening BWDCHP where the ID's would overlap if the Standard Controls were processed in the given sequence, as in the example n...COKPUT..001...002" followed by " . ..coWPUT..oo2...oo3."
Action: Add appropriate ID and rerun.
l T?IRU XSECTION/STRUCTUFt&ID ON "CDNF'UT" NOT FOUND IN STANDARD CONTROL, RUN TERMINATED.
Remarks: The *THRUn xsection/structure ID on the COHPUT record shown after the message does not match any of the xsection/structure ID's in the Standard Control.
Action: Correct ID and rerun or add missing table and.rerun. . - .

139
ERRORS U - 2
m UNEXPECTED RECORD FOUND IN STANDARD CONTROL, RUN TEZMINATED.
Remarks: Standard Control records must have a 6 in colusn 2. The last Standard Control record must be followed by an BNDATA record. The record shown after the error message is out of place or incorrect. Blank lines are not permitted.
Action: Move, delete, or correct record and rerun.
m XSECTION XXX LOW GROUND (XXXXX.XX) EXCEEDS BANRFULL (xxxxx.XX) .
Remarks: elevation.
The low ground elevation is higher than bankfull JAW ground elevation must be equal to or lower than
bankfull elevation for the interpolation routine to work.
Action: Correct error and rerun.
s XSECTION XXX LOW GROUND (XXXXX.XX) IS LESS TRAN LOWEST ELEV (XXXXX.XX). LOW GROUND REQUIRED WHEN FLOODPLAIN LENGTH ENTERED. RUN TERMINATED.
Remarks: The low ground value entered with cross section data cannot be lower than the lowest elevation assigned to the cross section. When floodplain length is entered on the REACR record, a low ground entry is required in the XSECTION xxx record.
Action: Correct or add data as appropriate and return.
l XSECTIOW NUMBER xxx EXCEEDS MAX. OF 200, RUN TERWINATED.
Remarks: Cross section ID numbers must be between 1 and 200.
Action : Use acceptable ID number for the section, including its rating table if given.
. XSECTION xxx RATING TABLE VALUES (SHOWN BELGW) NOT ALL INCREASING. RUN TERWINATED.
Remarks: Entries for elevation, discharge and end area in the XSECTTON table must be increasing. The increments can be smell (0.01).
Action: Correct data and rerup.

140
WARNINGS A - DIM
5.4.2 Warnings
Allow sufficient disk space for temporary and output files. The irogram disk may be replaced, if necessary, with the input data or scratch disk. If **punch'* output files are generated, they are named with the user selected dri.ve ID and file prefix along with standard program extensions. TR-20 temporary files are written on the default drive.
Remarks: This warning on disk space appears on the screen prior to the request for the input file. If there is not enough space, the
I run will end with a system message when the available space is full. The user specifies the dri.ve, directory path, and file name for the input file. Output files and generated files are assigned according to the user's directions if they are different from the defaults shown. When the output is sent to the~screen, then generated files are automatically named with the input prefix and sent to the input drive. Three temporary files are written to the default drive which is the location the program-is run from. The temporary files are erased at the successful completion of a job.
Action:,~ If the run aborts due to the lack of disk space, make room or specify a different location for the output files. The temporary files on the default drive beginning with 22 will need to be erased by the user.
s ANTECEDENT RUNOFF CONDITION ENTERED AS xx, CONDITION 2 ASSUMED.
Remarks: The only valid antecedent runoff conditions are 1,2, and 3.
Action: If condition 2 Wils not intended, enter the correct value and rerun.
. BARRFULL ELI?.' (xxxxx.X:K FT) EXCEEDS HIGHEST RATING POIRT FOR XSECTION xxx.
Remarka: The elevation given as bankfull elevation for the cross section exceeds the highest elevation given in the rating curve, so that all of tie elevations are within the channel.
Action: Correct the bankfull elevation if it is incorrect or add more elevations to the cross section data to define out-of-bank flow if needed. Remove bankfull elevation if it is not needed to define out-of-hank flow.
s DIM3YD TIME INCRMRNT ENTERED ( XX.XXX%). DIFFERS FROM CONFwmD (xX.xXxX). COMPUTED USED.
Remarks: The increment entered does not agree with the number Of points entered in the DIWRYD table for the total dimensionless time Of 1.0. The program assumes the number of points is correct and

141
WARNINGS DIS - EL
recomputes an increment for comparison. The increment entered is not used. -1
Action: Correct the dimensionless hydrograph table and rerun if the number of points is wrong.
. DISCHARGE EXCEEDS HIGHEST RATING POINT FOR STRUCTURE xx, VALUE EXTRAPOLATED.
Remarks: Structure rating table was extrapolated as a straight line based on the two highest points.
Action: Consider if the extrapolation is reasonable, and if not add points to the high end of the rating curve to encompass the estimated peak outflow and storage required to handle the peak inflow. This message may also indicate an error elsewhere if the expected discharge should not get this high.
s DUPLICATE INTERWEDIATE SECTION ID (xxxxxx) FOUND. DUPLICATE ID IGNORED.
Remarks: Wore then one ID with the same name was in the intermediate peaks input. The second ID and drainage area is ignored.
Action: Correct the intermediates peaks input file and rerun if the data is needed.
s ECON2/URBl "FLOW-FREQ" DATA FOR INTERMEDIATE PEAKS REONDEREO IN DESCENDING ORDER.
Remarks: Storm peak discharges for an alternate were rearranged in the ECON file so the largest is first and the smallest last. This is the required structure of the ECON file including intermediate peaks for all data.
Action: If similar type evaluation storms were input on COMPUT records in descending order of rainfall volume, look for a problem that could cause the reordering. If rainfall volumes were not in descending order, this warning will appear so the user will know the reordering took place and it can be checked.
s ELEVATION OUTPUT OPTION REQUESTED BUT NO OUTPUT ELEVATIONS GIVEN. REQUEST IGNORED.
Remarks: The Standard Control. elevation option requires a cross section or structure rating table with the same ID to be in the input file ahead of the Executive Control that uses it. _
A&ion: ICf elevations ara needed, insert a XSECTN or STRUCT table in the input file. Otherwise, remove the 1 that requests ELEV as an output for that Standard Control.

142
WARNINGS EN - IN
. ENTIRE HYDROGRAPH EXCEEDSBASEFLOW. ALL BASEFLOW ASSIGNED TO OUTFLOW HYDROGRAPH Y:L.
-_ Remarks: Amount of discharge diverted to outflow Yl exceeded the -inflow hydrograph baseflow,, so the entire baseflow is assigned to outflow Il.
faction: If baseflow should have been split, change the divert ~procedure or use dummy reaches to change baseflow.
~I FROM OR THRU XSECTION/S!PRUCTURB NOT FOUND, RECORD IGNORED.
Remarks: Both FROM and THRU ID's have to be saved for Summary Table 1 to be used with intermediate~peaks. An ID could be incorrect or the total number of peaks could exceed the 24,000 summary table peak storage limit.
Action: If the data is needed, correct the intermediate peaks input file ID's in error and rerun, or if the limit is exceeded split the TR-20 into two runs.
.s HIGHEST DISCHARGE (XXXXXXX CFS) AT HYDROGRAPH TRUNCATION.
.Remarks: Above this message, a storage location is identified ~,which contains a hydrograph that was still rising when it was truncated by the program's 400-point limitation. The last discharge is shown in the message and is used in the summary tables as the peak with a footnote that the incomplete hydrograph was still rising.
Action: If then true peak portion of the hydrograph is important when accumulated with other hydrographo downstream, increase the main time increment for the whole or portion of the watershed to capture more of the hydrograph.
. INFLOW DISCHARGE EXCEEDS HIGHEST VALUB OF COMBINED OUTFLOW RATING.
Remarks: Inflow discharge exceeds highest combined discharge at the crose seotiorrratings used. to divide the flow by DIVERT procedure 2.
Action: check if extrapolation is reasonable, if not, extend rating curves and rerun. This message may also indicate an error elsewhere if the inflow discharge is larger than expected.
.

143
WARNINGS IN - NO
. INPUT I4 OUTSIDE ACCEPTABLE RANGE X = xxx.xx and M = xx.xx USED FOR-XSECTION XXX.
Remarks: The program puts practical limits of 1.00 to 2.00 on exponent "mn as shown in the message.
Action: If the reach routing is not satisfactory, check whether the storage and rating for the xsection are satisfactory and representative for the reach.
. INTBRWEDIATE SECTION ID XXXXXX - WITH ARBA OF xxxxxx.x IS NOT BETWEEN xxxxxx.x and xxxxxx.x
Remarks : Drainage area of the intermediate peaks section has to be between the PROM and THRU xsection/structure drainage areas.
Action: Correct the intermediate peaks input file and rerun if the data is needed.
s WAIN TIWB INCREMENT (XX.XXX HRS) IS GREATER THAN 508 OF THE TIWB OF CONCBRTRATION (XX.XX HRS) FOR SUBWATERSHED XSECTION xxx. THIS. WILLRBDUCE THE COMPUTERPEAK BYABOUTxx.xx8.
Remarks: The main the time increment is greater than the recommended .1 or .2 times the time of concentration (Tc) for the cross section shown. However, ratios of 0.3 to 0.5 may be acceptable for occasional subwatersheds with small Tc*s within a system of larger subwatersheds. With over 0.5 the peak value is underestimated.
Action: The~watershed may need to be subdivided again, with a different arrangement of subwatersheds, to have times of concentration more appropriate to the main time increment.
s MAIN TIWE IN- (xx.xxx HRS) IS GREATER THAN 501 OF THE TIWE OF CONCBRTRATION (xx.xx RRS) FOR SUBWATERBHRD ST'RUCTURB xx. THIS WILL RBDUCE THE COMPUTED PEAK BY ABOUT XX.X~.
Remarks : The-main time increment is greater than the recommended .l .2 times the time of concentration (Tc) for the structure shown. However, ratios of 0.3 to 0.5 may be acceptable for occasional subwatersheds With small Tc*s within a system of larger subwatersheds. With over 0.5 the peak value is underestimated.
Action: The watershed may need to be subdivided again, with a different arrangement of subwatersheds, to have times Of concentration more appropriate to the main.time increment.
s NO FLOW DIVBRTED, HYDROGRAPH TRANSLATED TO OUTPUT #I NOT ENOUGH RATING POINTS FOR XSECTIONS (-smucTuRE) xxx or (XBECTION) xxx.

144
WARNINGS NO - RO
Remarks: Cross section or structure rating tables to be used in Divert Procedure 2 have less than 2 points or have cross section numbers out&de of the 1 to 200 range. No flow vas diverted to
:output #2.
Action: Revise the rating tables(s) that caused the problem if flow should have been diverted by adding more points or renaming cross sections to be within 1 - 200 range and rerun.
. NO MAIN TIME INCREMENT WTERED, 0.5 HOUR USED.
~Remarks: In order to run, al main time increment is required. Since the user didn't enter one, the program used 0.5 hour.
Action: Examine the run for messages concerning peak definition, hydrograph truncation, structure and reach routing parameter relationships, and your objectives. Then choose the most ideal main time increment(s) and enter them on an INCREM record ahead of the COMPUT records that will use them and rerun if necessary.
l REACH xx; k* EXCEEDS 10, VALUE SET TO 10. DIVIDE REACH.
Remarks: The length factor k* is set at the practical limit of 10. This means the reach is too long and probably should be shortened for more reasonable results. In practice k* is usually 1 or less so significant division of the reach may be appropriate.
Action: If it is an important reach, consider splitting the reach length in the Standard Control into two reaches if one xsection with two ID's is representative or else add another representative xsection table for a portion of the original reach.
s ROUTING COEFFICIENT (C) EQUALS 1.0, CONSIDER SHALLER HAIN TIRE INCREMENT FOR XSECTION XXX.
Remarks: The hydrograph is not routed when C = 1.0; it is translated through the reach without any attenuation, and the inflow and outflov hydrographs are identical.
Action: An occasional warning of this type may be acceptable, but if it occurs too often, consider using a smaller main time incrusnt for tbe whole or portion of the watershed.
. ROUTING COEFFICIENT (C) (XX.XXXX~XX) BELOW MINIMUPI v&m, 0.01 USED IN ROUTING XSBCTION XXX.
Remarks: The routing coefficient is.at or below the practical minimum.of 0.01. The minimum program limit is 0.01. This . essentially represents a storage situation, vith a large peak reduction.

Act~ion: Consider whether the reach could be representedby a structure routing, or break several reai.. routings.
145
WARNINGS RU - su
more accurately the segment into
. RUNOFF OPTION ON NULL RAINFL TABLE X NOT USED WITH REQUESTED RAINFALL TABLE x ON COWPUT RECORD. CHECK INPUT.
Remarks: The runoff option was not changed because the null (no points) RAINFL table number did not agree with the rainfall table number on the COMPUT record that followed. The ,null RAINFL table must precede the COHPUT ih which it is used.
Action: Correct table numbers or rearrange the input and rerun.
n STRUCTURExx - both
See XSECTION for messages that can apply to structures and cross sections.
a STRUCTURE XX, MAIN TIME INCREMENT EXCEEDS KAXIWUR ALLOWABLE TIME INCRPIENT OF xx.xxx HOURS.
Remarks: This check is made to warn of possible oscillation of outflow hydrograph values during the reservoir routing. The inquality delta t > (2S)jO (see section 3.8.1) must be true throughout the reservoir routing or oscillation will ocour. The maximum allowable main time increment shown should satisfy this inequality. Use the HYD option on the Standard Control to observe the severity of the oscillation.
Action: Reduce the main time increment and rerun if the oscillation has a significant effect on downstream hydrographs.
s STRUCTURE xx, RESERVOIR ROUTING IfAS NEGATIVE DISCHARGES. FIRST NEGATIVE VALUE IS xxxxxx CFS.
Remarks: The reservoir outflow has negative values. This is probably due to oscillation caused by using too large of a main time increment. .See previous warning message discussion.
Action: Reduce the main time increment and rerun if it is a problem. -
s SUWMRY TABLE #3/3A DATA REORDERED IN DESCENDING ORDER FOR ECONZ.
Remarks: storm peak discharges for an alternate were rearranged in the ECGN file so that largest is first and the smallest last. This is the required structure of the ECON file.
Action: If similar type evaluation storm5 were input on COWPUT records in descending order of rainfall volume, look for a problem that could cause the reordering. If rainfall volumes were not in
146
WARNINGS T - UN
descending order, this warning Will appear so the user will know the reordering tobk place and it can be checked.
. TOO MANY COMBINATIONS OF XSECTION/STRUCTURE(xxx), STORM (xx) AND ALTERNATE (XX). FIRST xx ALTERNATES USED.
Remarks: The maximum number of alternatives, storm, and xsections/structures is 24,+300.
Action: Break the job into tsmall number of components by using fewer alternatives in each job.
. TRIANGULAR BASEFMW RISE ,FOR XSECTION xxx TRUNCATED BY MAX POINT LIMIT AT xxxxx CFS (XX Z BASEFLOW PEAK).
Remarks: The time to peak Iof the baseflow hydrograph is greater than 400 times the main tim'e increment. The program stops computing when the maximum point limitation is reached.
Action: Reduce the time to peak and the base time (if important) of the baseflov hydrograph or increase then main time increment.
. TRIANGULAR BASEFLOW TAIL FOR XSECTION xxx TRUNCATED BY MAXPOINT LIMIT AT xxxxx CFS (xx Z BASEFLGWPEAR).
Remarks: The time base of the baseflow hydrograph is greater than 400 times the main time increment. The program stops computing when the maximum point limitation is reached.
Action: Consider reducing the time length of the recession limb of the base flow hydrograph if important.
. UNEXPECTED RECORD(S) ENCOUNTERED WREN LGOKING FOR "JOB" RECORD. INAGES OF FIRST 10 RECORDS IGNORED FOLLOWS:
Remarks: The first record of a new job must be a JOB record or a ENDJOB record was found out of place. Up to 10 records are shown that were read looking for it. also may occur after a job iS terminated due to an error and it is looking for the next job if any.
Action: Revise input file for the job and rerun.
. UNEXPECTED RECORD TYPE FOUND. FOLLOWING RECORD
Remarks: To process an intermediate peaks record, name has to be PEARS or blank. If record shown is
.intermediate peak record, an ENDJOB record must be in the intermediate peaks file.
Action: Correct the intermediate peaks input file data is needed.
IGNORED:
the operation after the last the last record
and rerun if the
147
WARNINGS XS - X.5
. XSECTION XXX CHANNEL TO FLOODPtAIN LENGTH RATIO EXCEEDS 10.
Remarks: T&channel length is 10 or more times that of the _ floodplain length, which is unrealistic even for a highly meandering channel. This message may also appear if the "xH value on the REACH card is omitted, as the program then assumes that the "ma' values is a flood plain length.
Action: Check input data.
. XSECTION XXX, INFLOW EXCEEDS WAX TABLE DISCHARGE, - EXTRAPOIATION USED.
Remarks: The log-log discharge-end area curve at this xsection was extrapolated above the highest point on the rating table. The extrapolation is based on the highest two points.
Action: Consider if the high inflow peak and the extrapolation are reasonable. If the extrapolation is not reasonable, add more rating curve points to the overbank to encompass the inflow peak discharge and rerun. If the peak inflow is unreasonable, look for errors elsewhere.
s XSECTIOW XXX, INSUFFICIENT LOW FLOW RATING, PRAK FLOW LESS THAW 2BD TABLEVALUB. TIiIS REACH ROUTING BAY BE INCORRBCI, UNLESS NEW RATING TABLE VALUES ARE INSERTED.
Remarks: It is important to include the channel rating in the calculation of the exponent %* to improve the routing of low peaks. The log-log discharge-end area curves are extrapolated down based on the lowest 2 points above zero flow. The accuracy of the routing iS best with a detailed channel rating.
Action: Consider if the low inflow peak and the extrapolation are correct. If not, add more rating curve points to the xsection in the channel portion and rerun. A minimum of two points should be in the channel.
n XSECIION ICILX LOW GROUND (xxxxx. xx) EXCEEDS HIGHEST ELEVATION -(mot~x.~x).
Remarks: The specified low ground elevation is too large considering the rest of the cross section data. The low ground elevation should be at or below the lowest channel bank elevation.
Act ion : Correct data in cross section rating table.
'm XSECTION xxx, or STRUCTURE Xx HYDROGRAPH VOLUME T&CATED AT XXXXXX CFS (xxx.2 Of MAX. BYDROGRAPH COORDINATE) RAIN TIME IN- Too SMALL.

148
WARNINGS XS - 2
Remarks: The hydrograph was truncated after its peak due to the program's 490 point storage limitation. The loss in volume is expressed in-terms of percent of the discharge at truncation to-the peak discharge with baseflow subtracted from both. This message is triggered at 102, when the loss of volume might be significant.
Action: The volume is a factor in the routing operations. It is more critical in the structure (storage) routing than in the reach
_ routing. If the volume loss is significant, increase the main time -- increment for part or all of the watershed as needed.
?I XSECTION xxx, or STRUCTURE xx MAIN TIME INCRMBNT TOO LARGE, COMPUTED PEAK EXCEEDS ADJACENT COORDINATE BY XX%.
Remarks: The computed peak exceeds the maximum hydrograph coordinate by at least 52 at this location. The accuracy of the peak computational procedure is questionable much over 52.
Action: If this computed peak is important, a smaller main time increment will usually increase its accuracy. Computed peaks are not used in any of the routing, diversion or adding of hydrographs. They are only computed on the outflow hydrographs and used in Summary Table 1, 3, 3A, 4 and in the ECON file.
. XSECTION xxx, or STRUCTURE xx NO HYDROGRAPH IN INPUT LOCATION x OR x FOR MDHYD OPERATION.
Remarks: No hydrograph is available to add in one or both of the specified hydrograph storage locations.
Action: Revise Standard Control if locations are in error.
s XSECTION xxx, or STRUCTURE xx VOLUME TRUNCATED AT xx% and xx2 WHEN ADDING HYDROGRAPHS IN LOCATIONS x and x.
Remarks: Both hydrographs'were previously truncated or truncated when adjusted to a common time increment. This warning only occurs when both hydrographs are truncated and the discharge at truncation of at least one is 101 or greater of its peak above baseflov.
Action: No action required if loss of volume is not Critical to downstream routing. If it is; rerun vith larger main time increment. . n XSECTION xxx, or
STRUCTURE xx VOLUME TRUNCATED at xx% IN, LOCATION X ADDING HYDROGRAPHS.
Remarks: Specified hydrograph was previously truncated or truncated

when adjusted to a common time increment. This warning only occurs when the discharge at truncation is 10% or greater of its peak above baseflov.
Action: No a&ion required if loss of volume is not critical to downstream routing. If it is, rerun with larger main time increment.

150
MESSAGES A - H
5.4.3 Messages - Informational
l DRAINAGE-AREA EXCEEDS 2!5 SC MI, IS IT CORRECT?
Remarks: it.
The message appl.ies to the record listed immediately after TR-20 was developed for use with small subwatersheds usually
much less than 25 sq. mi. ,in drainage area, although it may be used with caution for larger ones. This is generally the limit of hydrologically homogeneous subareas.
:,Action: If drainage area ,is correct, proceed with program. Beware -of excessive hydrograph truncation if the main time increment is
small.
. "DURING" TABLE ENTERED :BlJT "ECON" OPTION NOT SELECTED.
Remarks: Tha DURING table is not used unless the ECON option is also used.
Action: If flow duration information only is needed proceed with program, but use the DUR option on the Standard Control.
e ENDJOBZ RECORD ASSUBED, RUN CONTINUED.
Remarks: Although no EWDJOB record is provided, data may follow for another job. The program ,will run this as a separate job with the same output and generated file names as the first job, and append the output data to that for the first job.
Action: None needed if this is what was intended.
a HYDROGRAPH CONTAINS NO FLOW. FOR XSECl'ION/STRUCTURE XXX, OPERATION XXXXXX.
Remarks: For some reason the hydrograph stored in the location shown above the message has no significant flow (less than 0.01 CfS) I including baseflow. Less than 0.01 cfs converts to zero.
Action: Determine if it is a true condition due to: no runoff, such as a low curve number; the result of a DIVERT operation where all the flow was diverted the other way; or an input error. If an error is suspected, first check the manipulation of the hydrograph Storage locations in the Standard Control for continuity.
l HYDROGRAPH IS ALL BASEFLOW (xxxxxxx.CFS). FOR XSECTIONJSTFWCTURE XXX, OPERATIDN -XX.
'Remarks: For some reason the hydrograph stored.in the location shown above the message has only a constant baseflow.
Action: Determine if it :LS a true condition due to: no runoff, such as a low curve number; the result of a DIVERT operation where

151
MESSAGES L - N
all the flow except baseflow or a portion of it was diverted the other way,; ok an input error. If the baseflow is in error, first check the manipulation of the hydrograph storage locations in the Standard Control for continuity.
. LENGTH FACTOR (k*) ABOVE 1, CONSIDER DIVIDING REACH LENGTH FOR XSECTION XXX.
Remarks: With the given routing parameters, better reach routing results could be obtained by shortening the reach length. This is normally due to a, large reduction of peak'flow within the reach when k* exceeds 1. The storage in the reach is generally not well- represented by a single valued storage-discharge relation. A warning is given if k* exceeds 10.
Action: Depending on how important this reach is to the project and how often this message occurs, the easiest way to decrease k* is to split the reach in the Standard Control into two reaches.
. NO DATA TO ECON FILE.
Remarks: Not enough data output or options are provided to create an ECON file.
Action: Check that necessary data and instructions are available in input data file.
s NO PEAR CONPUTED (ONLY xx HYDRGGRAPH POINTS).
Remarks: Not enough points were present to compute hydrograph peak.
Action: Check input data and revise if necessary.
s NO HYDROGRAPH POINTS EXCEED TRUNCATED (or BASEFLOW) DISCHARGE (xxxxx.x CFS).
Remarks: Flow duration is not calculated since all hydrograph discharges are at or below the last point or baseflow. Hydrograph is still rising when truncated, or all baseflow.
Action: Do nothing if reasonable. The user might have to increase the main time increment and rerun if the hydrograph is truncated before the peek is reached.
. NO SIGNIFICANT PEAR FOUND, MAX DISCHARGE XXXXXX CFS AT XSECTION/STRK!TURE xx/xxx. .
Remarks: The hydrograph stored in the location shown above the message did not vary in discharge by at least one cfs.

152
MESSAGES 0 - STR
Action: Is the subarea too small for the program? If an input error is suzspected, run the Data Check Program.
- . ORDER OF WAXIMUM PEAK CHANGED WREN REACH ROUTED, XSEC xxx. OUTFLOW PEAK SHIFTED XXX.X HOURS.
Remarks: The multiple peak: inflow hydrograph for X-SEC xxx resulted in a shift in order of the maximum peak when reach routed. If the time shift is negative the maximum outflow peak occurs before the maximum inflow peak due to an earlier inflow peak of lesser
-magnitude. If the time shi.ft is positive, the maximum outflow peak oCCUl.5 at least Six hours tiOllOWing the maximum inflow peak and is
.~related to another inflow peak of lesser magnitude.
Action: Do nothing if multiple peaks are expected. This message can explain a large change in peak times in the summary tables. If multiple peaks are not expected, check input data.
a RESERVOIR ROUTING, STRUCTURE xx, TRUNCATED AT xxx POINTS WITH XxXxX.Xx AC-FT (Xx.Xx WATERSHED INCHES) FX.OOD STORAGE REMAINING IN RESERVOIR AT ELEV. xxxxxx.xx
Remarks: The reservoir routing was truncated at the outflow hydrograph 400 point limitation or, if less than 400 points, the in- flow hydrograph was probably truncated here. The remaining flood storage in the reservair can be added to the outflow hydrograph volume and the sum compared with the inflow hydrograph volume. If the structure has not been drawn down within the point limitation the r8maining volume includes the storage between the start routing elevation and zero discharge elevation in the structure rating table. This message is given when the storage volume remaining exceeds 0.05 inches of runoff.
Action: Do nothing if volumes are reasonable. If not, check the input.
. STRUCTURE xx, USER ENTERED STARTING ELEVATION OR STRUCTURR TABLE STARTS xxx.xx FEET BELOW ASSUNED CREST ELEVATION AT xxxxxx.xx. TBIS CAN DECREASE OUTFLOW WDRCGBAPH VOLUME.
R8sarks: Starting elevation is below the point of significant flow in the structure rating table. This case can occur when a pool is below the principal spillway elevation due to prolonged drought or intense evaporation.
Action: Check if the starting elevation and outflow hydrograph voluple are reasonable.' If not, examine all the parameters used in the routing for the problem.. Since the starting elevation can not be below the first point of the rating table and rating table Points must be increasing in discharge, the program finds the highest Point

153
MESSAGES STR - SU
with insignificant discharge of less than 1 cfs. The crest elevation is-assumed at this point and the routing starts at a pool level below this assumed crest. Thus runoff volume will fill the void between the start routing elevation and the assumed crest elevation before significant outflow occurs.
. STRUCl'URH xx, USER ENTERED STARTING ELEVATION (xXxXx.x FEET) CAN ADD xxx.xxx INCHES OF RUNOFF TO THE OUTFLOW HYDROGRAPH VOLUME.
Remarks: Starting elevation is above the first point of the structure rating table. Volume in the pool at the start of routing will usually be drawn down before inflow exceeds outflow. The volume in the pool can also be drawn down whenever outflow exceeds inflow, especially on the tail of the hydrograph. This total amount of pool~volume drawn down will be added to the runoff volume, increasing the outflow volume. This case may occur when the reservoir storage is still filled with flow from a previous storm. If there is baseflow entering the reservoir the starting elevation can be set such that the baseflow will pass through the principal spillway. The pool is not drained below this starting elevation and' this message will not be displayed.
Action: Check if the outflow volume is reasonable, adding the extra volume in the reservoir and subtracting any truncated outflow hydrograph volume from the inflow hydrograph volume. If not, examine all the parameters used in the routing for the problem.
s SUBWARY TABLE 1 FORMAT SIZE EXCEEDED, XSECTION/STRUCTD?ZE x]cx pXAX=v PEAXTIME = xxxxxx.xx PEAK ELEV. =--xx D.A. = -.xxRDNOFF = XXXXXX.XX STARTHRS. = -.xx
Remarks: One or more of the data items that follow this message contains a value, that due to its magnitude, can exceed the data field size allowed in the file format used to save data for Summary Table 1. To avoid a system error when the file is read and to flag the problem data, dummy values containing all nines with a minus sign are inserted in the file and used in Summary Table 1. The true value, if not. all asterisks, is shown in the message.
Action: Review input data for errors, if value is not reasonable.
. SUMARY TABLE 2 FORMAT SIZE EXCEEDED, XSEC. ID REACH xxx PF.AXINFLOW = xxxxxxxxxx COEFF. (x) = xxxxxx.xxxx PEAK ouTFLCw= xxxxxxxxxx FACTOR (k*) = XXXXXX.XXXX
.Remarks: One or more of the data items that follow this message contains a value; that due to its magnitude, can exceed the data field size allowed in the file format used to save data for Summary Table 1. To avoid a system error when the file is read and to flag

154
MESSAGES T - X
the problem data, dummy positive or negative values containing all nines with a-minus sign if appropriate are inserted in the file-and used in Summary Table 2. The true value, if not all asterisks, is shown in the message.
Action: Review input datai for errors, if value is not reasonable.
. TIME OF CONCENTRATION EXCEEDS 100 HRS, IS IT CORRECT?
= Remarks: Normally with watersheds less than 25 square miles in drainage area, the Tc is less than 100 hours. A review of the input data is indicated (the questionable data is shown after the message). Usually the decimal is missing in the Tc data field and the resultant value is greater than 100.
Action: If the Tc is correct proceed with the program. Houever some consideration should be given to subdividing the watershed.
e XSECTION xxx FLOODPLAIN LENGTH EXCEEDS CHANNEL LENGTH.
Remarks: The floodplain length for a cross section may exceed the channel length when a straiight river reach occurs in a sinuous valley. Floodplain to channel length ratios greater than 1.1 should be checked to verify them.
Action: Redefine reach lengths if in error and rerun.

155
REFERENCES
American Society Hydraul,ics,
of Civil Engineers, Nomenclature for
No. 43, Manuals and Reports on Engineering Practice,
New York, N.Y., 501 pp., 1962.
USDA, Soil Conservation Service, Computer Program for Project Formulation - Structure Site Analysis (DAMSZ, Interim Version), Technical Release No. 48 (TR-48), 1982, (not published).
USDA, Soil Conservation Service, Earth Dams and Reservoirs, Technical Release No. 60 (TR-60), 1985.
USDA, Soil Conservation Service, Economics - Floodwater Damages (ECON 2), 1990.
USDA, Soil Conservation Service, Hydrology, National Engineering Handbook, Section 4, (NEH-4), 1985.
USDA, Soil Conservation Service, Hydrology Note 2, (in preparation).
USDA, Soil Conservation Service, Simplified Dam-Breach Routing Procedure, Technical Release No. 66 (TR-66), 1990.
USDA, Soil Conservation Service, Urban Floodwater Damage Evaluation (URBl), 1990.
USDA, Soil Conservation Service, WSP2 Computer Program, Technical Release No. 61 (TR-61), 1991.
Wylie, C.R., Jr., Advanced Engineering Mathematics, Third Edition, McGraw-Hill Book Co., 813 pp., 1966.
.

156
GLOSSARY
A A- cross sectional or end area, usually in square feet
Acre - a unit of land area: equals 43,560 square feet
Acre foot - A unit of volume equal to the amount of water that will cover one acre to a depth of one foot. Equals 43,560 cubic feet.
Alternate - (1) A system of structural or non-structural measures in a watershed; (2) Index or label number associated with the identification of that system of measures.
Antecedent moisture condition (AK) - The degree of wetness of the soil in a watershed at the beginning of a storm. The literature has used the Roman Numeral designations I, II, and III. runoff condition (ARC).
ABC has been replaced by average
ATT-KIN - See Modified ATT-KIN
Average runoff condition (ARC) - The typical ARC used to develop the runoff curve numbers for a watershed, usually ARC II. The program input range is from 1 to 3.
ASCII - American National Standard Code for Information Interchange - standard code used to exchange information among data processing and communication systems.
B Bankfull - The elevation or capacity of the channel segment of a cross section just before flow is considered to spill over into the floodplain.
Baseflow - The sustained or fair-weather discharge which persists after storm runoff and associated quick return flow have been depleted. It is usually derived from groundwater discharge or gradual snow or ice melt over extended periods of time, but need not be continuous flow. It can be based on annual or seasonal periods depending upon when major floods usually occur.
C cfs - A rate of flow (discharge) in cubic feet per second.
cfs-hours - A unit of volume equal to ah herage flow rate in cfs over one hour of time. For example, 150 cfs flowing for 30 minutes is (150)'(.5) = 75 cfs-hrs. = (75 cfs hrs)(3600 sec/hr) = 270,000 cu. ft.
CN- See runoff curve number (RCN).

157
Composite flood hydrograph - The hydrograph resulting when two or more hydrographs are added. It is computed by summing the incremental hydrograph ordinates.
Cross section (stream or valley) - The shape of a channel stream or valley viewed in the direction of flow. In watershed investigations, it is determined by a line approximately perpendicular to the main path of waterflow along which measurements of distance and elevation are taken to define the cross-sectional or end area.
Cross section rating - The elevation, discharge and end area data representative of a reach.
CSP - A rate of flow; given as cubic feet per second per square mile of drainage area (cfs/mi2).
Cubic feet per second - A rate of flow (cfs).
D Data Code - required number 0 to 9 that signifies the type of data in Column 2 of most input records.
Data Field - group of consecutive columns on an input record used to enter a specific type of data.
Delta D - (1) The unit hydrograph time increment, in hours or (2) the computational increment used to develop a flood hydrograph.
Default drive - The computer drive from which the ~~-20 program is run. For example, c:a:TR20; where c: is the default drive and a: is the drive the program is stored
. give.
Temporary files are always written to the default
Delta T - see main time increment.
Dimensionless hydrograph - Made to represent many unit hydrographs by using the time to peak and the peak rates as basic units and plotting the hydrographs as ratios of them units. See NEIi 4.
Drainage area - The surface area of the watershed draining into a stream at a given point, usually expressed in square miles or acres.
E ECON - option to obtain TR-20 output file for input into the USDA, SCS, ECON2 or DRBl Programs--see references on p. 155.
ECONl - An USDA, SCS economics program to compute average annual damage for agricultural areas--see references on p. 155.

158
H Hydrograph - (1) A graph showing, for a given point on a stream or for a given point in any drainage system, the discharge, stage, velocity or other property of water with respect to time. (2) Also, the tabular data from which the graph can be! plotted.
Hydrograph Coordinates - The discharge values that define the hydrograph tabulated at the main time increment.
Hydrograph storage location - A location within the computer program for storing a hydrograph. There are seven of these locations in which the user may place hydrographs according to the storage location numbers, 1 through 7.
I ID - Abbreviation for identification. Usually represents a cross section or structure identifying name.
Internal time increment - The increment used by the program to develop runoff hydrographs before they are converted to the main time increment.
J Job - The execution of TR-20 from initialization at the JOB record through completion at the first ENDJOB record; may include any number of passes through the watershed.
K ii
- coefficient in the discharge valley storage relation, = kSm, that is applicable for the channel and valley
reach. See Hydrology Note 2.
k* - Nondimensioned reach length factor. Indicates relative amount of attenuation in a reach routing.
L- Reach length in feet of stream or valley. See reach.
L Low ground - The lowest floodplain elevation in a cross section outside of the channel banks. It must be at or below the lowest channel bank.
M m - (1) Exponent in the discharge valley storage relation, Q = kSm, that is applicable for the channel and valley reach. (2) Exponent in the discharge cross sectional area relation, Q = x~*, that is applicable for the channel and valley reach.
Main time increment (IDelta t) - The increment used by the program for all routi:ng computations, adding of hydrographs, and tabulations of hydrograph~coordinates. - _
Xodified ATT-KIN - The Modified Attenuation - Kinematic Flood Routing Method. See Hydrology Note 2.

159
N NEH-4 - SCS National Engineering Handbook, Section 4, Hydrology (see references on p. 155.)
Null Stticture - A non-functional or dummy structure that is used to indicate a potential structure location for use in other alternatives. Useful in Setting up standard Control for without structure alternative.
0 Operation Name and Number - The name (Col. 4 to 9) and required reference number (Col. 11) 0 to 9, on most input records. They dictate the operation to be performed for each type of input data.
0 - Outflow discharge in cfs.
P Pass - Each pass through the Standard Control that ends with an ENDCKP record, includes each storm and alternate combination.
Path - The computer drive, directory tree structure, and file needed to read from or write to a specific file storage location.
Q Delta Q - Incremental runoff volume, in watershed inches.
Q- (1) Total runoff volume, in watershed inches, or (2) Discharge, in cfs.
9 - Discharge, in cfs.
R Rainfall (depth) - The average depth in inches of rainfall occurring over a watershed or subwatershed.
Reach - A length of stream or valley, selected for generally constant hydrologic or hydraulic characteristics for use in a study. See stream reach.
Record - A single line of input data for computer processing. It also can refer to a single line of output data. TR-20 records have a maximum length of 00 characters.
Reservoir - A pond, lake, tank, basin or other space, either natural in its origin or created in whole or in part by the building of engineering struotures, which is used for storage, regulation, and control of water.
Run- A computer processing term; the plading of a program into memory and execution of that program. In TR-20 one or more jobs can be processed within a Nn.
Runoff curve number (CR) - A dimensionless number of 100 or less that relates runoff to the soil-cover Complex of the watershed. Higher numbers mean greater runoff. See NM 4.

160
s s- A measure of volume expressed in acre-feet, cfs-hours or watershed inches; valley storage within a channel reach fpr a selected discharge.
storm -- (1) A meteorological disturbance accompanied by such phenomena as rain, snow, hail, thunder and lightning, and wind. (2) A meteorological disturbance which is either unusual or of great magnitude, rate or intensity.
Stream reach - A length of stream channel or valley selected for use in hydraulic or other computations. Separate reach lengths can Abe used for the channel and flood plain if a significant difference occurs within the reach. See reach.
Subarea - See subwatershed.
Subwatershed - A watershed that is part of larger watershed. It is analyzed separately when necessary in order to improve computational accuracy for results on a whole watershed basis, or to get results for that area separately.
T Delta t - See main time increment.
TC - See time of concentration.
Time of concentration (Tc) - the time, in hours it takes water from the hydraulically most distant point to reach a vatershed outlet. Tc varies with discharge but is often used as constant. See NM 4 for more information.
TR-20 - (1) Technical Release number 20, a publication in the SCS technical release series, which is the user manual for the computer program of the same name; (2) the computer program described in the user manual. See reference list, p. 155.
Travel time - (1) The average time for water to flow through-a reach or other stream or valley length that is less than the total length. A travel time can be pert of a Tc but is never the whole Tc; (2) The time it takes for a specific flov to pass through the entire reach, such as the peak travel time.
u Unit hydrograph - A discharge hydrograph Coming from one inch of direct runoff distributed.uniformly over the watershed, with the direct runoff generated at a uniform rate during the unit storm duration. A vatershed may have l-hour, 2-hour, etc. unit hydrographs.

161
URBl- Ah USDA, SCS economics program to compute average annual floodwater damage for urban areas. See references on p. 155.
W Watershed - See drainage area.
Watershed inch - A unit of volume equal to one inch off water over the watershed. Watershed inches are usually abbreviated as inches. For example, one-half inch of runoff from a 600-acre watershed will be a volume of 0.5 inches or (0.5)(600)(1/12) = 25 acre-feet.
X x - coefficient in the discharge cross sectional area relation, Q = xAm, that is applicable for the channel and valley reach. It is used as a routing coefficient on the REACH record.
Xsectn - See cross section.
2 Zero damage - The highest elevation or capacity at which no significant floodwater damage is considered to occur at a cross section representing a reach. It is usually at or above low ground in the floodplain, but not higher tha~n the highest bankfull elevation.

162
CONVERSIONS
THESE UNITS: MLI,TIPLIED BY: GIVES:
cfs cfs
cfs cfs cfs cfs CfS cfs cfs
CSm
csm
davs -- dais
days per square mile hours hours per square mile
inches per hour 645.3 inches per hour 1.008 inches depth 53.33 inches depth on 1 sq. mi. 53.33 AF (acre feet) 0.5042 AF 12.10 AF 0.01875
AF 0.3258 AF per day 0.5042 AF per square mile 0.01875 U. S. gallons per day 0.002228 million U.S. gallons/day 1.547 feet per second 0.6818 cubic feet 7.481 imperial gallons 1.2~00
inches l 0.0254 inches +25.4 feet l 0.3048 acres 0.40469 acres 4046.9 gallons (Il. S.) 3.7854 pounds 0.45359 cubic metus l 1000.0 acre-f eat 1233.5 cubic feet 0.028317
. square feet 0.09290 square miles 2.590 cfs-hours 101.94. csm 0.010933
1.983 0.03719
0.03719 0.08264 0.001550 1.983 724.0 448.8 0.6463
0.03719 13.57
AF (acre feet) - inches depth on 1
square mile inches depth AF inches depth AF per day Af per year (365 days) U. S. gallons per min. million U. s.
gallons/day inches depth per day inches depth per year
(365 days) csm cfs per acre AF per square mile AF cfs days cfs hours inches depth on 1
sq. mi. million U. S. gallons cfs inches depth cfs cfs miles per hour U. S. gallons U. S. gallons
meters millimeters meters hectares square meters liters kilograms liters cubic meters cubic meters square meters square kilometers cubic ~meters cubic meters/second fsq. kilometer t
+ Exact conversion


APPENDIX A A-l
DESCRIPTION.OF SAMPLE JOBS
SAMPLE JOBS
Five sample jobs based on an example watershed are shown in the Appendices B through F. The jobs are related in that they incremental: increase in content and complexity from first tc last as more features of TR-20 are demonstrated.,
Samnle 2
Samole 3
samle 4
(Appendix B) starts developing a single flood hydrograph on a headwater tributary and routing it through a structure and a reach.
(Appendix C) shows the addition of a downstream intervening area.
(Appendix D) picks up another tributary and includes a diversion of a constant flow.
(Appendix E) uses a READHD from Sample 2 and demonstrates changes in the Tabular data and in the Standard Control.
(Appendix F') is a full watershed analysis with two storms and four alternatives.
Each job begins with a schematic sketch and ends with the TR-20 output listing. TR-20 input forms and the initial computer screens are only displayed for the first sample job. The other sample jobs, to save space, start the output listing with the 80-80 listing of the input. Since the total output for Sample 5 with the options chosen is rather large, only parts have been selected for display.
The following list provides a guide to the program features where they are demonstrated in the Appendices, and where they are referenced in thi manual. The features are listed in alphabetical order by type of input or output and then by the individual operation or items under them. Only the first appearance of a feature is referenced; it may a~lso appeal in subsequent sample jobs. If multiple output pages are shown, the first page refers to the 80-80 list of input if pertinent and the seconc and succeeding pages to the output listing. The reference page is the location in the T'R-20 User's Manual where the feature is discussed.

SAMPLE JOE FEATURE NUMBER
86-80 Li8t Of Input Data BCQN file
PEAR-FLOW Records TIME-FLOW Records
Recutive Control Operations BASFLO
Procedure #I: Constant Procedure 12: Triangular
COMPUTE Multiple for Pass Single for Pass Stores and Alternates
Single Wultiple
Tzero change ENDCNP ENDJOB INCREW
Constant __ .
1
5 5
5 5
3 1
1 5 3 1 1
1 varying not shown
LIST All input not shown All rainfall tables not shown Current Cross Section
and structure tables 5 Current Rainfall table 5 Current Standard Control 5 Dimensionless Hydrograph
Table 5 Flow Duration Increment
Table 5 Flow Duration
with ECON option 5 without ECGN option 3
Qraphias Files not shown Xntarrediato.Peaks
IPEAKS 5 PEARS 5
JOB rocotd 1 ECON 5
Peak Discharge File output 5
ENDPLOT not shown FDLLPRINT 1 GRAPHICS not shown NOPRINT 2 PASS not shown PLOT 3 SumfARY 2
INPDT/ODYPUT REFERENCE eAGE - PAGE
B-10 112
F-48 107, 118 F-48 38, 119
F-6/F-14 F-0/F-30
D-I/D-15 B-7/B-12
B-l/B-12 F-6/F-35 D-4/D-15 B-718-16 B-7/B-19
B-7/B-12
88 a9
92 91
91 91 92 93 33
90 91
88 88
F-6/F-9 F-6/F-12 P-6/ F-13
88 80 80
F-6/F-U
F-6/F-U
F-S/F-40 D-410-14
80
80
31 38,71
30,119
F-0/F-45 F-0/F-45 B-3 F-5
107 107 29 31
F-48
B-3
c-3
D-3/D-5 C-3/C-8
118 33 31 33 32 32 32 32
A-2

FEATURE DMONSTRATED
TR-20 -' WATERSHED ID
Wodify standard control ALTER DELETE INSERT
Tabulu Data DIWHYD Table
Standard Default User Entered
DURINC Table Null structure RAINFL Table
SAMPLE JOB NUKBER
5 not shown
5 3
Actual rainfall table 3 Proqrau defined table 5 Runoff option not shown
READHD Table File Generated by Program 2 File Used in Program 4
STRUCT Table 1 XSECTW Table 1
Bankfull Elevation 1 CFS Discharge 1 CSX Discharge not shown Low Ground Elevation 3 Zero Damage Elevation 3
Summary Tables Tables 1, 2, 3 1 Tables 3A, 4 5
Standard control Operations ADDHYD 2 DIVERT
Procedure #l: constant flow 3
Procedure #2: divide flow 5 ENDATA 1 Output Options
DUR - flow duration data 3 ELEV - hyd=vaPh
elevations 1 FILE - READHD file 2 HYD - hY*ograPh
discharges 1 p/v - peak/volume 1 SUM - include in summary 1
REACH Using Cross Section Data 1 Using *x" and lrmn data 3
A-3
INPUT/OUTPUT REFERENCE PAGE PAGC
B-3 29 B-3 31
F-7/F-21 103 F-7/F-21 103 F-?/F-21 102
F-11
F-5 D-4
43 43 38 42
D-3 F-12
44 44 46
C-3/C-l E-3/E-S B-4 B-5 B-5 B-S
D-3 D-3
71 47 42 40 40 40 40 41 40
B-3/B-17 116, 117 F-S/F-45 118
c-3 /c-s 66
D-4/D-16 68 F-0,"-3C 69 B-6 70
D-4/D-14 71
B-6/B-13 70 c-3 /c-7 71
B-6/8-12 70 B-6/B-12 70 B-6/B-17 71
B-6/B-15 64 D-4/D-12 65

A-4
INPUT/OUTPUT PAGE
REFERENCE PA-
B-6/B-12 63
c-3/c-4 63 D-4/D-9 42 B-618-12 63 D-4/D-11 66 B-3/B-12 33 B-11 113
SAMPLE JOB DEXOikTRAT~ NUMBER
RESVOR Starting elev. given 1
Starting elev. left blardc 2 Null structure 3
RUNOFF 1 SAVNOV 3
TXTL6 1 U8or 6oto8 1

3-i
Contee
Schematic Drawing
Input Data Sheets -~ Computer Screens
Printout
APPENDIX B
SAMPLE JOB NO. 1
B -2
B-3
B -8
B - 10

3-z
SCHEMATIC DRAWING 3F SAMPLE WATERSHED Sample JoD NO. 1
[Structure 1 in place 1
LEGENO
L r Structure Number 1
.f
cross Section Klnber 1
(at dounstreen end of reach1
1
5408 Reech Length - Feet
1.20 Orarnage Aree - Square nlles
7z.331 Runoff Curve Number (Time of Cconcentretlon-Hours)
TR-20 - JOB AND TITLE

U.S. DLPARne4l OF *offIca.T’~-E so,L ccNSEnv*TION SCnVlCE TR-20 STREAM CROSS SECTION ‘DATA w.xwS”FET SCS--EHO-.?70A 2-00
CROSS SECTION NAME aat PREPARED BY @-I DATE 3/6/92 PAGE L
JOE #4aAlu PL CHECKED BY DATE OF -

U.S. O~A”naNT OF AcnIaJLTURE SOIL cmsl%vAlIw SERVICL
TR-20 STRUCTURE DATA
STRUCTURE ID bi PREPARED SK- DATE PAGE 1 ,100 Mwa4 CHECUEO BY DATE OF 1
(0 I 25 - 36 I 31 - 48 I 40 - 60 I 61 - 72 178 - 60 I pJ4]5ls]lalepI11y94p1~I~
I (01 to 99) ! Elevation ! Discharge ! Storoge ! I I , hoer, ,

I

,
. i
c

3-B
SOIL CONSERVATION SERVICE (SCS) U.S. DRPARTMRNT OF AGRICULTURE
!rR-20 PROJECT FORRULATION
HYDROLOGY PCVRRSION 2.04TEST
. . . . . . . . . . . . . . . . . . . . . . . . . . . . DISCLAIRRR . . . . . . . . . . . . . . . . . . . . . . . . . . . . . Although this program has been tested by its contributor, NO warranty,
expressed or implied, is made by the contributor, as to the accuracy and functioning of the Program and related program material nor shall the fact of distribution constitute any such warranty, and NO responsibility is assumed by the contributor in connection therewith.
DO YOU WANT AN INPUT LIST WITH TIiE OUTPUT? (Y or W Y INCLUDE THE LATEST TR-20 USER NOTES IN TNE OUTPUT? (Y or N) Y WRITE ALL WARNINGS ARD NESSAGES TO A SEPARATE FILE? (Y or N) n

SCS TR-20 PROJECT FORMULATION - RYDROLOGY, VERSION 2.04TEST
+*+ WARNING +** Allow sufficient disk space for temporary and output files. The program disk may be replaced, if necessary, with the input data or scratch disk. If *punch*@ output files are generated, they are named with the user selected drive ID and file prefix along with standard program extensions. TR-20 temporary files are written on the default drive.
ENTER INPUT DRIVE ID and FILE NAME: )--> b:al.dat
Output device or file choices: Printer = PRN (Device names) Screen = CON ( =Y vary 1 File, enter drive ID and file name.
ENTER OIJTPDT DEVICE or FILE CHOICE: (Default is b:11.ODT )--7 pm

l ****+rt**+++t+**BO-90 LIST OF INPUT DATA
JOB TR-20 TITLE TITLE
2 XSECTN a a a a a a a a a 9 ENDTBL 3 STRUCT a a a a a a a a a a 9 ENDTBL 6 RUNOFF 6 RESVOR 6 REACH
ENDATA 7 INCREM 7 coH.PuT
ENDCKP ENDJOB
SAXPLE 1 : FULLPRINT l! JOB USES -- 24HR TYPE II STORM, FROM STR 1 TO XSEC 1 2c WITH FULLPRINT, CROSS SECTION DATA,
001 1.00 508.50 503.50 0.0 0.0 505.21 100.00 57.25 506.74 300.00 118.20 508.26 600.00 169.25 508.50 624.56 200.00 509.51 1000.00 364.35 510.37 1500.00 662.99 511.07 2100.00 963.02 511.44 2500.00 1134.18
01 521.5 521.6 521.8 522.0 522.2 522.4 526.2 526.4 526.6 527.2
0.0 3.0 15. 33.
% . 948. 1009. 1071. 1265.
1 01 6 1.2 75. 2 01 6 7 521.5 3 001 7 5 5400.
6 0.1 7 01 001 5.2 .
;
& OUTPUT OPTIONS ON.' 3( 41 5c 6( 7c a( 9(
lO( 11c 12c 13( 14( 15(
17.0 18.0 20.2 22.5 25.0 28.0 70. 7s. 80. 95.
0.33
1.0
16[ 17c la( 19c 2OC 21C 22c 23C 7 i 26C
1 1 27C 11 1 2ac 1 1 29c
3oc 31c
22 01 01 32C 33c 34c
l +*Cl++***,t*,t*+t***,*****.*,***~D OF 80-80 LISTI+**.*+***+**++***.*,*.,,*,*,**

B- i i TR20 ----________________------------------------------ -------------_____ scs - SAMPLE 1 JOB USES - 24HR TYPE II STORM, FROM STR 1 TO XSEC 1 VERSION 03/06/92 WITH FULLPRINT, CROSS SECTION DATA, & OUTPUT OPTIONS ON. 2.04TEST
53:20 PASS 1 JOB NO. 1 PAGE 1
COMPDTER PROGRAM FOR PROJECT FORMULATION - HYDROLCGY USER NOTES -
The Users' Manual for this program is SCS Technical Release 20 (TR-20), dated April 1990. The ~~-20 program is no longer supported on the mainframe since al: post 1986 program changes have only been in the IBM compatable microcomputer environnment.
Compatable input and data check programs are TRZOINPT.EXE, version III, dated 01/30/90 and TR2OCX.EXE, version II, which is forthcoming.
Major changes from the 1986 TR-20 microcomputer version are:
HYDROGRAPH GENERATION: program procedure to develop runoff hydrographs revised to preserve total hydrograph volume as well as the peak discharge. Hydrographs can contain up to four hundred main time increment points from the beginning of runoff.
ATTXIN ROUTING: seperate channel and floodplain lengths can be entered to define additional storage in meandering channels below the representative low ground elevation. Program changes have been made to better handle multiple peaked hydrographs.
F'qW DURATION: can be obtained if requested.
OUTPUT 80 COLIJBNS: Output fits 80 column paper. Hydrograph coordinates over 100 cfs are rounded and shown as whole numbers.
ERRORS, WARNINGS, AND MESSAGES: expanded and updated.
LIST OPTIONS: can print all or selected parts of input data.
INTERMEDIATE PEAKS: requires new IPEAXS record.

B-l-2
TR*ly -------------------_------------------------------------------------ scs
SAMPLE 1 JOB USES - 24HR TYPE II STORM, FROM STR 1 TO XSEC 1 VERSIO! 03/06/92 WITH FULLPRINT, CROSS SECTION DATA, 6 OUTPUT OPTIONS ON. 2.C4TES' 07:53:20 PASS 1 JOB NO. 1 PAGE
EXECUTIVE CONTROL INCRM MAIN TIME INCREMENT = .lOO HOURS 310
EXECUTIVE CONTROL COBIPUT FROM STRU- 1 TO XSECTION 1 320 STARTING TIME = ANT. RUNOFF COND. i"i
RAIN DEPTH = 5.20 RAIN DURATION = 1.00 MAIN TIME INCRMENT = 100 HOURS
ALTERNATE NO. = 1 STORH NO. = 1 'RAIN TABLE NO. = 2
OPERATION RUNOFF STRUCTURE 1 OUTPUTHYDROGRAPH= 6 AREA= 1.20 SQ MI INPUT RUNOFF CURVE = 75. TIME OF CONCENTRATION = .33 HOURS COMPUTED INTERNAL TIME INCREME!NT = -0440 HOURS
PEAK TIME(HRS) PEAK DISCHARGE(CFS) PEAK ELEVATION(FEET; 12.09 2128.1 (RUNOFF)
HYDROGRAPH POINTS FOR ALTERNATE = 1, STORM = 1 HRS MAIN TIME INCREMENT = ,100 hr, DRAINAGE AREA = 1.20 SQ.MI. 0.60 CFS 47 9.40 CFS 8:80
10.20 CFS 22.36 11.00 CFS 58 11.80 CFS 534 12.60 CFS 425 13.40 CFS 175 14.20 CFS 119 15.00 CFS 99.56 15.80 CFS 82.82 16.60 CFS 70.52 17.40 CFS 64.50 18.20 CFS 58.42 19.00 CFS 52.24 19.80 CFS 45.96 20.60 CFS 41.83 21.40 CFS 40.63 22.20 CFS 39.44 23.00 CFS 38.24 23.80 CFS 37.02 24.60 CFS 1.21
1;09 1.92 9.95 11.13
25.18 28.34 65 74
1073 1826 341 288 166 158 115 113
97.48 95.41 80.68 78.56 69.75 69.00 63.75 63.00 57.66 56.89 51.45 50.67 45.16 44.37 41.66 41.51 40.48 40.33 39.29 39.14 38.08 37.93 36.87 36.63
.55 .24
2.90 4.00 5.17 6.40 7.62 12.43 13.95 15.73 17.73 19.91 31.79 35.59 40.01 45.16 Sl.Of-
86 101 119 152 26 2125 1690 1106 752 553
253 229 211 196 185 150 143 136 130 124 110 108 106 104 102
93.33 91.26 89.15 87.05 84.94 76.48 74.67 73.27 72.22 71.33 68.25 67.50 66.76 66.02 65.26 62.24 61.48 60.72 ~59.96 59.19 56.11 55.34 54.57 53.79 53.01 49.89 49.11 48.31 47.53 46.74 43.61 42.97 42.52 42.22 42.00 41.36 41.22 41.07 40.92 40.77 40.18 40.03 39.88 39.74 39.58 38.99 30.84 38.69 38.54 38.38 37.78 37.63 37.48 37.33 37.17 33.31 22.59 11.63 5.42 2.57
RUNOFF ABOVE BASEFLDW (BASEFLDW = .OO CFS) 2.61 WATERSHED INCHES; 2021 CFS-HRS; 167.0 ACRE-FEET.
OPERATION RESVOR .sTRucTuRE 1 INPUT HYDROGRAPH 6 OUTPUT HYDROGRAPH 7 SURFACE ELEVATION = 521.50

%- I 5
TRZO -------------------------------------------------------------------- scs - SAMPLE 1 JOB USES - 24HR TYPE II STORM, FROM STR 1 TO XSEC 1 VERSIOh 03/06/92 WITH FULLPRINT, CROSS SECTION DATA, h OUTPUT OPTIONS ON. 2.04TESI
:53:20 PASS 1 JOB NO. 1 PAGE ?
PEAK TIME(HRS) -: PEAK DISCHARGE(CFS) 12.35
PEAK EL!ZVATION(FEET) 928.9 526.12
HYDROGRAPH POINTS FOR ALTERNATE = 1, STORM = 1 HRS MAIN TIME INCREMENT = .lOO hr. DRAINAGE AREA = 1.20 SO.MI. a.50 CFS a.50 ELEV 9.30 CFS 9.30 ELEV
10.10 CFS 10.16 ELEV 10.90 CFS 10.90 ELEV 11.70 CFS 11.70 ELEV 12.50 CFS 12.50 ELEV 13.30 CFS 13.30 ELEV 14.10 CFS 14.10 ELEV 14.90 CFS 14.90 ELEV 15.70 CFS 15.70 ELEV 16.50 CFS 16.50 ELEV 17.30 CFS 17.30 ELEV la.10 CFS la.10 ELEV la.90 CFS la.90 ELEV 19.70 CFS 19.70 ELm 20.50 CFS 20.50 ELN 21.30 CFS 21.30 ELEV 22.10 CFS 22.10 ELEV 22.90 CFS 22.90 ELEV 23.70 CFS 23.70 ELEV 24.50 CFS 24.50 ELEV 25.30 CFS 25.30 ELEV 26-10 CFS
.oo 521.50
. 61 521.52
2.86 521.60
12.17 521.75
51 522.17
881 525.91
415 523.87
214 522.99
135 522.65
103 522.50
82.45 522.42
75.05 522.37
69.50 522.32
63.71 522.28
57.73 522.23
51.76 522.18
47-31 522.14
44.25 522.11
41.98 522.09
40.17 522.07
33.05 522.00
19.84 521.85
12.71
01 521:50
.79 521.53
3.55 521.61
14.03 521.78
74 522.36
a19 525.64
378 523.71
199 522.93
130 522.62
100 522.49
80.63 522.41
74.37 522.36
68.79 522.32
62.97 522.27
56.97 522.22
51.10 522.17
46.86 522.13
43.93 522.10
41.73 522.08
39.96 522.07
31.10 521.98
18.59 521.84
12.15
. 03 521.50
1.00 521.53
4.44 521.62
16.58~ 521.82
183 522.86
751 525.34
345 523.56
186 522.87
125 522.60
97 522.48
78.99 522.40
73.69 522.36
68.08 522.31
62.23 522.27
56.21 522.22
50.47 522.17
46.44 522.13
43.62 522.10
41.50 522.08
39.76 522.06
29.20 521.96
17.43 521.83
11.61
06 521:50
1.24 521.54
5.43 521.64
19.91 521.85
383 523.73
682 525.04
316 523.44
175 522.82
120 522.58
94 522.47
78.35 522.39
73.00 522.35
67.36 522.31
61.49 522.26
55.45 522.21
49.88 522.16
46.03 522.12
43.33 522.10
41.26 522.08
39.56 522.06
27.40 521.94
16.34 521.81
11.10
.12 .20 521.50 521.51
1.49 1.78 521.55 521.56
6.51 7.71 521.66 521.68
23.69 28.07 521.90 521.95
634 a34 524.82 525.70
617 558 524.75 524.49
291 268 523.33 523.23
165 156 522.78 522.74
116 113 522.56 522.55
92 89 522.45 522.44
77.70 77.05 522.39 522.38
72.31 71.62 522.35 522.34
66.63 65.91 522.30 522.30
60.74 59.99 522.25 522.25
54.69 53.93 522.21 522.20
49.31 48.77 522.16 522.15
45.65 45.28 522.12 522.12
43.04 42.76 522.10 522.09 .41.03 40.81 522.08 522.07
39.25 38.49 522.06 522.05
25.69 24.09 521.92 521.90
15.31 14.55 521.80 521.79
10.61 10.14
.31 521.51
2.10 521.57
9.04 521.70
33.20~ 522.00
923 526.09
505, 524.26
248 523.14
148 522.70
109 522.53
87 522.43
76.39 522.38
70.92 522.34
65.18 522.29
59.24 522.24
53.18 522.19
48.26 522.15
44.92 522.11
42.49 522.09
40.59 522.07
37.06 522.04
22.58 521.88
13.90 521.78
9.69
.44 521.51
2.46 521.58
10.52 521.73
40.06 522.07
924 526.09
457 524.05
230 523.06
141 522.67
106 522.52
84 522.42
75.72 522.37
70.21 522.33
64.45 522.28
58.49 522.24
52.45 522.19
47.77 522.14
44.58 522.11
42.23 522.09
40.38 522.07
35.14 522.02
21.16 521.87
13.29 521.77
9.27

TR20 -------------------------------------------------------------------- s,-s _ SAMPLE 1 JOB USES - 24HR TYPE II STORM, FROM STR 1 TO XSEC 1 VERSIOh 03 /06/92 WITH FULLPRINT, CROSS SECTION DATA, h OUTPUT OPTIONS ON. 2.04TES’ 07:53:20 iS 1
26.10 ELEV 26.90 CFS 26.90 ELF?? 27.70 CFS 27.70 ELEV
,28.50 CFS 28.50 ELEV 29.30 CFS 29.30 ELEV 30.10 CFS 30.10 ELEV 30.90 CFS 30.90 ELFX 31.70 CFS 31.70 ELEV 32.50 CFS 32.50 ELEV 33.30 CFS 33.30 ELEV 34.10 CFS 34.10 ELEV 34.90 CFS 34.90 ELEV 35.70 CFS 35.70 ELEV 36.50 CFS 36.50 ELEV 37.30 CFS 37.30 ELEV 38.10 CFS 38.10 ELE?J 38.90 CFS 38.90 ELF? 39.70 CFS 39.70 ELEX 40.50 CFS 40.50 ELEV 41.30 CFS 41.30 ELEV 42.10 CFS 42.10 ELEV 42.90 CFS 42.90 ELEV 43.70 CFS 43.70 ELEV 44.50 CFS 44.50 ELEV 45.30 CFS 45.30 ELEV
PA6
521.76 521.75 8.-86 a.47
521.70 521.69 6.18 5.90
521.65 521.65 4.31 4.12
521.62 521.62 3.00 2.93
521.60 521.60 2.46 2.40
521.58 521.58 2.02 1.97
521.57 521.57 1.66 1.61
521.56 521.55 1.36 1.32
521.55 521.54 1.11 1.09
521.54 521.54 .91 .89
521.53 521.53 .75 .73
521.52 521.52 .61 -60
521.52 521.52 .50 .49
521.52 521.52
521::: 521.:: .34 :33
JOB NO. 1
521.73 521.73 7.74 7.40
521.68 521.67 5.39 5.16
521.64 521.64 3.76 3.60
521.72 7.07
521.67 4.93
521.63 3.44
521.61 2.65
521.59 2.17
521.57 1.78
521.56 1.46
521.55 1.20
521.54 .98
521.53 .81
521.53 .66
521.52 .54
521.52 .44
521.51 .36
521.51 .30
PAGE
521.51 521.51 .28 .27
521.51 521.51
.48 521.52
.39 521.51
.32 521.51
.26 521.51
.22 521.51
-18 521.51
.15 521.50
.12
.23 .22 521.51 521.51
.19 .I8 521.51 521.51
.&5 .I5 521.51 521.51
.13 .12 521.50 521.50
.21 521.51
.17 521.51
.14 521.50
.12 521.50 521.56
.lO .lO .lO .lO 521.50 521.50 521.50 521.50
521.52
521.74
. 58
a.09
521.52
521.68 5.64
521.64 3.93
-521.62 2.86
521.60 2.34
521.58 1.92
521.56 1.58
521.55 1.29
521.54 1.06
521.54 .a7
521.53 .71
521.61 521.61 2.79 2.72
521.59 521.59 2.28
521.58
521.52
1.87 521.56
.57
1.54
521.52
521.55 1.26
521.54 1.03
521.53 .85
521.53 .69
.47 521.52
.38 521.51
-31
2.23 521.57
1.83 521.56
1.50 521.55
1.23 521.54
1.01 521.53
.83 521.53
.68 521.52
.56 521.52
.46 521.52
.37 521.51
.31 521.51 521.51 521.51
.26 .25 .25 521.51 521.51 521.51
.08 .08 .08 .08 521.50 521.50 521.50 521.50
.07 .07 .07 .06 521.50 521.50 521.50 521.50
.06 .06 .05 .05 521.50 521.50 521.50 521.50
.21 .20 521.51 521.51
.17 .16 521.51 521.51
.14 .14 521.50 521.50
.ll .ll 521.50 521.50
.09 .09 521.50 521.50
.08 .07 521.50 521.50
.06 .06 521.50 521.50
.05 .05 521.50 521.50
521.71 521.70 6.76 - 6.46
521.66 521.66 4.71 4.50
521.63 521.63 3.29 3.14
521.60 521.60 2.59 2.52
521.59 521.58 2.12 2.07
521.57 521.57 1.74 1.70
521.56 521.56 1.43 1.39
521.55 521.55 1.17 1.14
521.54 521.54 .96 .94
521.53 521.53 .79 .77
521.53 521.53 .65 .63
521.52 521.52 .53 .5*
521.52 521.5. .43 .42
521.51 521.51 .36 .35
521.51 521.51 .29 .2a
521.51 521.51 .24 .23
521.51 521.51 .20 19
521.51 521:51 .16 .16
521.51 521.51 .13 .13
521.50 521.50 .ll .ll
521.50 521.50 -09 .09
521.50 521.50 .07 .07
521.50 521.50 .06 .06
521.50 521.50 .05 .05
521.50 521.50

--i-Y -
TR20 ------------______-------------------------------------------------- scs SAMPLE 1 JOB USES - 24HR TYPE II STORM, FROM STR 1 TO XSEC 1 VERSION 03/06/92 WITH FULLPRINT, CROSS SECTION DATA, h OUTPUT OPTIONS ON. 2.04TES
53:20 PASS 1 JOB NO. 1 PAGE
46.10 CFS ,05 .05 04 04 .04 .04 -04 .04 46.10 ELEV 521-50 521.50 521:SO 521:50 521.50 521.50 521.50 521.50
- 46.90 CFS .04 .04 04 .04 .03 .03 03 .03 46.90 ELEV 521.50 521.50 521:50 521.50 521.50 521.50 521:50 521.50 47.70 CFS .03 .03 .03 .03 .03 .03 47.70 ELEV 521.50 .521.50 521.50 521.50 521.50 521.50
RUNOFF ABOVE BASEFLDW (BASEFLOW = .OO CFS) 2.61 WATERSHED INCHES; 2021 CFS-HRS; 167.0 ACRE-FEET.
OPERATION REACH XSECTION 1 INPUT HYDRDGRAeH 7 OUTPUT HYDROGRAPH 5 CHMNEL LENGTH = 5400.00 FT INPUT F RATING CURVE REPRESENTATIVE OF REACH
COMPUTED COEFFICIENTS RELATED TO CROSS SECTION AREA, x= .4x, n = 1.35 MODIFIED ATT-KIN ROUTING COEFFICIENT = .25, PEAK TRAVEL TIME = .40 HOUR
PEAX TIME(HR.9) 12.70
HRS MAIN 9.50 CFS
10.30 CFS 11.10 CFS 11.90 CFS 12.70 CFS 13.50 CFS 14.30 CFS 15.10 CFS 15.90 CFS
PEAK DISCHARGE(CFS) PEAK ELEVATION(FEET 7.3 1. 5 508.79
HYDRDGRAPH POINTS FOR ALTERNATE = 1, STORM = 1 TIME INCREMENT = -100 hr, DRAINAGE AREA =~ 1.20 SQ.M
.57 .73 .92 1.13 1.37 1.64 1.94 2.86 3.49 4.24 5.09 6.07 7.17 8.40
11.47 13.55 16.06 19.02 22.52 26.85 32.90 78 153 272 411 537 633 694
731 719 694 660 622 581 540 462 426 393 362 334 308 285 244 227 212 198 186 175 165 149 142 135 130 125 120 116 108 105 101 98 95 93 90
85.64 83.84 82.32 81.02 79.88 78.85 77.91 76.21 75.42 74.65 73.90 73.16 72.43 71.71 70.27 69.55 68.83 68.11 67.38 66.66 65.93 64.46 63.73 62.99 62.25 61.51 60.76 60.01 58.51 57.75 57.00 56.24 55.48 54.73 54.00 52.59 51.92 51.27 50.65 50.06 49.50 48.96 47.94 47.47 47.02 46.59 46.18 45.78 45.40 44.69 44.35 44.03 43.71 43.41 43.12 42.84 42.30 42.04 41.79 41.55 41.31 41.08 40.85 40.42 40.20 39.97 39.60 38.97 38.03 36.80 33.86 32.26 30.64 29.02 27.43 25.88 24.39 21.59 20.29 19.06 17.95 16.95 16.04 15.22 13.76 13.10 12.48 11.90 11.36 10.84 10.35
9.44 9.02 8.62 8.24 7.87 7.52 7.19 6.57 6.28 6.00 5.74 5.48 5.24 5.01 4.58 4.38 4.18 4.00 3.82 3.65 3.49 3.23 3.12 3.02 2.93 2.84 2.76 2.69 2.55 2.48 2.42 2.36 2.30 2.24 2.19
16.70 CFS 87.82 17.50 CFS 77.04 18.30 CFS 70.99 19.10 CFS 65.20 19.90 CFS 59.26 20.70 CFS 53.28 21.50 CFS 48.44 22.30 CFS 45.04 23.10 CFS 42.57 23.90 CFS 40.63 24.70 CFS 35.39 25.50 CFS 22.96 26.30 CFS 14.46 27.10 CFS. 9.89 27.90 CFS 6.87 28.70 CFS 4.79 29.50 CFS 3.35 30.30 CFS 2.62
.43 2.34 9.79
43 725 500 264 156 112

B-lb TR20 ----------_--------------------------------------------------------- scs SAMPLE 1 JOB USES - 24HR TYPE II STORM, FROM STR 1 TO XSEC 1 VERSI( 03/06/92 WITH FULLPRINT, CROSS SECTION DATA, & OUTPUT OPTIONS ON. 2.04TE' 07:53:20 PASS 1 JOB NO. 1 PAGE
31.10 CFS 31.90 CFS 32.70 CFS 33.50 CFS 34.30 CFS 35.10 CFS 35.90 CFS 36.70 CFS
2..13 2.08 l-.75 1.70 1.43 1.40 1.17 1.14
.96 .94 79
:65 .77 .63
.53 .52
2.03 1.66 1.36 1.12
.92
.75
.62
.50
1.98 1.93 1.88 1.84_ 1.71 1.62 1.58 1.54 1.50 1.4; 1.33 1.30 1.26 1.23 1.2c 1.09 1.06 1.04 1.01 .95
.89 .87 .85 .83 .83
:60 73 .71 .58 -70 .57 .68 .56 .6C .5r .49
RUNOFF ABOVE BASEFLOW (BASEFLOW = .OO CFS) 2.61 WATERSHED INCHES; 2021 CFS-HRB; 167.0 ACRE-FEET.
EXECUTIVE CONTROL END- CONPUTATIONS COMPLETED FOR PASS 1 33c

TQ() ----_--------------------------------------------------------------- scs -
SAMPLE 1 JOB USES - 24HR TYPE II STORM, FROM STR 1 TO XSEC 1 VERSION 03/M/92 WITH FULLPRINT, CROSS SECTION DATA, h OUTPUT OPTIONS ON. 2.04TEST
53:20 SUMMARY, JOB NO. 1 PAGE 7
SUMMARY TABLE1 ----------m__-_
SELECTED RESULTS OF STANDARD AND EXECUTIVE CONTROL IN ORDER PERFORMED. A CHARACTER FOLLOWING THE PEAK DISCHARGE TIME AND RATE (CFS) INDICATES:
F-FLAT TOP HYDROGRAPH T-TRUNCATED HYDROGRAPH R-RISING TRUNCATED HYDROGRAF'EK
XSECTION/ STANDARD PEAK DISCHARGE STRUCTURE CONTROL DRAINAGE RUNOFF ----------------------------------
ID OPERATION G%
AMOUNT ELEVATION TIME RATE RATE (INI (m WV (-9 t-1
RAINFALL OF 5.20 inches AND 24.00 hr DURATION, BEGINS AT .o hrs. RAINTABLE NUMBER 2, ARC 2 MAIN TIME INCREMENT .lOO HOURS
ALTERNATE 1 STORM 1 __-------------------------
STRUCTURE 1 RUNOFF 1.20 2.61 mm- 12.09 2128' 1773.33 STRUCTURE 1 RESVOR 1.20 2.61 526.12 12.35 929 ?FTQ*P XSECTION 1 REACH 1.20 2.61 508.79 12.78 732 61@. 0

,-. L-i r:
l-R20 -------------------------------------------------------------------- c&-s -
SAMPLE 1 JOB USES - 24HR TYPE II STORM, FROM STR 1 TO XSEC 1 VERSION 03/06/92 WITH FULLPRINT, CROSS SECTION DATA, h OUTPUT OPTIONS ON. 2.04TEST 07:53:20 SUKNARY, JOB NO. 1 PAGE
S-Y TABLE 2 ---------------
MODIFIED ATT-KIN REACH ROUTING IN ORDER PERFORMED. QUESTION MARK (1) AFTER: OUTFLOW PEAK - MAX. NultBER ROUTING ITERATIONS USED;
LENGTH FACTOR - VALUE K* GREATER THAN 1.0; ATT-KIN COEFF - VALUE C GREATER THAN 0.667.
HYDROGRAPH INFORMATION ------------------------
FLOOD INFLOW XSEC REACH PLAIN -----------
ID LENGTH LENGTH PEAK TIME (Fm (fi) (CW ow
BASEFLOW IS .O CFS
ALTERNATE 1 STORM 1 ---------------------------
1 5400 924 12.4
OUTFLOW ----------- PEAK TIME CC=) uw
ROUTING PmERS ----_--------------------------
Q-A EQ. PEAK ATT- ----------- LENGTH RATIO KIN COEFF POWER FACTOR Q/I COEFF
w w (k*) (0’) (Cl
731 12.8 .42 1.35 .129 .792 .25

TRtO ---_---------------------------------------------------------------- scs . SAMPLE 1 JOB USES - 24HR TYPE II STORM, FROM STR 1 TO XSEC 1 VERSIOl 03/06/92 WITH FULLPRINT, CROSS SECTION DATA, & OUTPUT OPTIONS ON. 2.04TEST.
53:20 SUMMARY, JOB NO. 1 PAGE :
SUMMARY TABLE 3 ---------------
STORM DISCHARGES (CFS) AT XSECTIONS AND STRUCTURES FOR ALL ALTERNATES QUESTION MARX (1) AFTER: OUTFLOW PEAK - RISING TRUNCATED HYDROGRAPH.
XSECTIONf DRAINAGE STRUCTURE STORM NUMBERS..........
ID (SF%) 1
STRUCTURE 1 1.20 ---------------------------
ALTERNATE 1 929
XSECTION 1 1.20 ---------------------------
ALTERNATE 1 732

TR20 ___----------------------------------------------------------------- $-s - SAMPLE 1 JOB USES - 24HR TYPE II STORM, FROM STR 1 TO XSEC 1 VERSION 03/06/92 WITH FULLPRINT, CROSS SECTION DATA, h OUTPUT OPTIONS ON. 2.04TEST
END OF 1 JOBS IN THIS RUN
scs TR-20, VERSION 2.04TEST SAMPLE 1 FILES
INPUT = b:al.dat , GIVEN DATA FILE OUTPUT = pm , DATED 03/06/92,07:53:20
FILES GENERATED - DATED 03/06/92,07:53:20
NONE !
TOTAL NDBBER OF WARNINGS = 0, MESSAGES = 0
l ** TR-20 RUN COMPLETED l **

Contenta
Schematic Drawing
Printout
C-l
APPENDIX c
SAMPLE JOB NO. 2
c-2
c-3

c-2
SCHEMATIZ DRAWING OF SAMPLE Sample Jots No. 2
(Structure 1 In place1
WATERSbE
LEGENO L r Structure Numixr 1
3-
Croae Section MJmmr 1 let downstrem end of reach1
I
5488 ReeUt Lengtn - Feet
1.20 Oremsge rree - Square nlles
7% .33 1 Runoff Curve NunDer (Tine of Concentretlon-Hours1
Intervening area

c -3
L+*rt*err+*t++*8~-8(J LIST OF INPUT DATA FOR TR-20 HYDROLOGYf**~“t~~‘t**t++tt
JOB TR-20 SAMPLE 2 SUMMARY 1 TITLE JOB USES ‘- 24HR TYPE II STORM, FROM STR 1 TO XSEC 2 2 TITLE WITH NOPRINT, SUMMARY, ADDHYD, & PEAK-VOL, HYD h FILE OPTIOBS.- 3
2 XSECTN 001 1.00 508.50 8 503.50 0.0 0.0 8 505.21 100.00 57.25 8~ 506.74 300.00 118.20 8 508.28 600.00 189.25 8 508.50 624.56 200.00 8 509.51 1000.00 364.35 8 510.37 1500.00 662.99 8 511.07 2100.00 963.82 8 511.44 2500.00 1134.18 9 EBDTBL 2 XSECTN 002 1.00 501.27 8 496.27 0.0 0.0 8 498.24 90.00 66.78 8 499.98 270.00 138.93 8 501.27 441.18 200.00 8 501.66 540.00 235.25 8 502.80 900.00 530.50 8 504.43 1960.00 1237.82 9 EBDTBL .T.. STRUCT 01
521.5 521.6 521.8 522.0 522.2 522.4 526.2 526.4 526.6 527.2
0.0 17.0 3.0 18.0 15. 20.2 33. 22.5 54. 25.0 79. 28.0 948. 70. 1009. 75. 1071. 80. 1265. 95.
9 ENDTBL 6RUNOFFl 01 6 1.20 75. 6 RESVOR 2 016 7 6 REACH 3 001 7 5 5400. 6 RUNOFF 1 001 6 0.46 76. 6 ADDBYD 4 001 567 6REACB 3 002 7 5 3000.
EBDATA 7INCREM6 0.1 7 COMPUT~7 01 002 5.2
EBDCBPl ENDJOB 2
0.33
1.07
1.0
4 5 6 7 8 9
10 11 12 13 14, 15, 16; 17i 18' 19( 2oc 21( 22( 231 24( 25t' 26( 271 281 29( 3oc 31( 32( 33( 34[ 35( 36( 37(
11 38f 1 39( 1 4oc
11 1 41t 42C 43c
2 2 01 01 44c 45c 46(
tttt***+t*,++t*:******.***,**,,**~D OF 80-80 LIST*,+‘+‘++.,‘*+*++*,,**.*****,***

TR20 ---------------_---------------------------------------------------- scs
SAMPLE 2 JOB USES - 24HR TYPE II STORM, FROM STR 1 TO XSEC 2 VERSIC 03/06/92 WITH NOPRINT, SUMMARY, ADDHYD, h PEAK-VOL, HYD h FILE OPTIONS.S.OITEI 07:55:47 PASS 1 JOB NO. 1 PAGE
EXECUTIVE CONTROL INCRE!N NAIN TINE INCRMENT = .lOO HOURS 430
EXECUTIVE CONTROL CONPUT FROM STRUCTURE 1 TO XSECTION 2 440 STARTING TIME = 00 ANT. RUNOFF COND. 2 2
RAIN DEPTH = 5.20 RAIN DURATION = 1.00 MAIN TIME INCRENENT = .lOO HOURS
ALTERNATE NO. = 1 STORM NO. = 1 RAIN TABLE NO. = 2
OPERATIbN REACH
PEAK TIME(HRS) 12.78
HRS MAIN 9.50 CFS
10.30 CFS 11.10 CFS 11.90 CFS 12.70 CFS 13.50 CFS 14.30 CFS 15.10 CFS 15.90 CFS 16.70 CFS 17.50 CFS 18.30 CFS 19.10 CFS 19.90 CFS 20.70 CFS 21.50 CFS 22.30 CFS 23.10 CFS 23.90 CFS 24.70 CFS 25.50 CFS 26.30 CFS 27.10 CFS 27.90 CFS 28.70 CFS 29.50 CFS 30.30 CFS 31.10 CFS 31.90 CPS 32.70 CFS 33.50 CFS 34.30 CFS 35:lO CFS
I
,
XSECTION 1
PEAK DISCHARGE(CFS) PEAK ELEVATION(FEET 731.5 508.79
HYDROGRAPH POINTS FOR ALTERNATE = 1. STORH = 1 TIME INCRMENT = .lOO hr. DRAINAGE AREA = 1.20 SQ.MI
.43 .57 .73 192 '1.13 1.37 2.34 2.86 3.49 4.24 5.09 6.07 9.79 11.47 13.55 16.06 19.02 22.52
43 78 153 272 411 537 725 731 719 694 660 622 500 462 426 393 362 334 264 244 227 212 198 186 156 149 142 135 i30 125 112 108 105 101 98 95
37.82 85.64 83.84 82.32 81.02 79.88 77.04 76.21 75.42 74.65 73.90 73.16 70.99 70.27 69.55 68.83 68.11 67.38 65.20 64.46 63.73 62.99 62.25 61.51 59.26 58.51 57.7s 57.00 56.24 55.48 53.28 52.59 51.92 51.27 SO.65 50.06 48.44 47.94 47.47 47.02 46.59 46.18 45.04 44.69 44.35 44.03 43.71 43.41 42.57 42.30 42.04 41.79 41.55 41.31 40.63 40.42 40.20 39.97 39.60 38.97 35.39 33.86 32.26 30.64 29.02 27.43 22.96 21.59 20.29 19.06 17.95 16.95 14.46 13.76 13.10 12.48 11.90 11.36
9.89 9.44 9.02 8.62 a.24 7.87 6.87 6.57 6.28 6.00 5.74 5.48 4.79 4.58 4.38 4.18 4,.00 3.82 3.35 3.23 3.12 3.02 2.93 2.84 2.62 2.55 2.48 2.42 2.36 2.30 2.13 2.08 2.03 1.98 1.93 1.88 1.75 1.70 1.66 1.62 1.58 1.54 1.43 1.40 1.36 1.33 1.30 1.26 1.17 1.14 1.12 1.09 1.06 1.04
.96 .94 .92 .a9 .87 .85
.79 .77 .75 .73 .71 .70
1.64 1.94 7.17 8.40
26.85 32.90 633 694 581 540 308 28' 175 16 120 116
93 90 78.85 77.91 72.43 71.71 66.66 65.93 60.76 60.01 54.73 54.00 49.50 48.96 45.78 45.40 43.12 42.84 41.08 40.85 38.03 36.80 25.88 24.39 16.04 15.22 10.84 10.35
7.52 7.19 5.24 5.01 3.65 3.49 2.76 2.69 2.24 2.19 1.84 1.79 1.50 1.47 1.23 1.20 1.01 .99
.83 .E
.68 .6r.

TR20 _------------------------------------------------------------------- scs -
SAMPLE 2 JOB USES - 24HR TYPE II STORM, FROM STR 1 TO XSEC 2 VERSIOR 03/06/92 WITH NOPRINT,~SUMHARY, ADDHYD, & PEAX-VOL, HYD h FILE OPTIONS.2.04TEST
55:4-I PASS 1 JOB NO. 1 PAGE 2
35.90 CFS ..65 63 36.70 CFS ‘-53 :52
.62 .60 .58 .57 -56 -54
.50 .49
RUNOFF ABOVE BASEFLOW (BASEFLOW = .OO CFS) 2.61 WATERSHED INCHES; 2021 CFS-HIS; 167.0 ACRE-FEET.
OPERATION RUNOFF XSECTION 1
HYDROGRAPH POINTS FOR ALTERNATE = 1, STORM=1 HRS MAIN TINE INCREMENT = .lOO hr. DRAINAGE AREA = .46 SQ.MI. 8.80 CFS 9.60 CFS
10.40 CFS 11.20 CFS 12.00 CFS 12.80 CFS 13.60 CFS 14.40 CFS 15.20 CFS 16.00 CFS 16.80 CFS 17.60 CFS 18.40 CFS 19.20 CFS 20.00 CFS 20.80 CFS 21.60 CFS 22.40 CFS 23.20 CFS 24.00 CFS 24.80 CFS 25.60 CFS
.37 2.90 7.32
17.63 127 349 124
63.46 43.84 35.62 29.65 26.42 23.93 21.51 19.07 16.99 16.11 15.59 15.11 14.64
6.60 .99
.56 .78 3.33 3.78 8.15 9.08
19.84 22.43 190 263 307 266 112 101
59.72 56.49 42.44 41.27 34.76 33.91 29.13 28.67 26.09 25.78 23.63 23.32 21.21 20.91 18.77 18.47 16.83 16.69 16.04 15.97 15.53 15.47 15.05 14.99 14.48 14.15
5.27 4.13 .78 .61
1.05 4.25
10.11 25.61
331 230
92 53.71 40.23 33.09 28.24 25.46 23.02 20.60 18.17 16.57 15.90 15.41 14.94 13.53
3.23 .48
1.37 1.71 2.09 2.48 4.76 5.30 5.91 6.57
11.28 12.58 14.05 25.72 30.08 37.67 52.48 80.80
380 403 402 382 200 176 156 138
85 78 73 68 51.30 49.17 47.23 45.45 39.24 38.30 37.39 36.50 32.29 31.54 30.85 30.22 27.84 27.46 27.10 26.76 25.15 24.84 24.54 24.23 22.72 22.42 22.12 21.81 20.30 19.99 19.69 19.38 17.89 17.63 17.39 17.18 16.46 16.36 16.27 16.19 15.84 15.77 15.71 15.65 15.35 15.29 15.23 15.17 14.88 14.82 14.76 14.70 12.53 11.19 9.66 8.10
2.55 2.01 1.59 1.25
(BASEFLOW = .oo CFS) 2.70 WATERSHED INCHES; 801 CFS-HRS; 66.2 ACRE-FEET.
RUNOFF ABOVE BASEFLOW
OPERATION ADDHYD XEECTION 1
HYDROGRAPH POINTS FOR ALTERNATE = 1, STORM=1 HRS NAIN TINE INCREMEBT = 100 hr, DRAINAGE AREA = 1.66 8.80 CFS .38 .58 .;)3 1.14 1.50 1.93 2.40 9.60 CPS 3.47 4.06 4.70 5.38 6.13 6.94 7.85
10.40 CPS 10.18 11.64 13.32 15.21 17.34 19.75 22.45, 11.20 CFS 29 33 38 45 53 65 85 12.00 CFS 205 343 534 742 917 1036 1097 12.80 CFS 1080 1026 960 890 822 757 696 13.60 CFS 586 538 494 454 418 386 357 14.40 CFS 308 287 268 252 237 224 212 15.20 CFS 192 184 177 170 164 158 153 16.00 CFS 144 139 135 131 128 124 121 16.80 CFS 115 113 111 109 108 106 105
SQ.HI. 2.91 8.91
25.51 124
1107 639 331 202 148 118 104

TR20 --------------------__________L_________---------------------------- scs SAMPLE 2 JOB USES - 24HR TYPE II STORM, FROM STR 1 TO XSEC 2 VERSIO 03/06/92 WITH NOPRINT, SUHMARY, ADDHYD, & PEAK-VOL, HYD & FILE OPTIONS.2.04TES 07:55:47 PASS 1 JOB NO. 1
17.60 CFS 103 18.40 CFS 94.-20 19.20 CFS 85.98 20.00 CFS 77.58 20.80 CPS 69.58 21.60 CFS 64.06 22.40 CFS 60.27 23.20 CFS 57.41 24.00 CFS 55.06 24.80 CFS 40.47 25.60 CFS 22.58 26.40-CPS 13.89 27.20 CFS 9.44 28.00 CFS 6.57 28.80 CFS 4.58 29.60 CFS 3.23 30.40 CFS 2.55 31.20 CPS 2.08 32.00 CFS 1.70 32.80 CFS 1.40 33.60 CFS 1.14 34.40 CFS .94 35.20 CFS .77 36.00 CFS .63 36.80 CFS .52
102 93.17 84.94 76.52 68.75 63.51 59.88 57.10 54.69 37.53 21.07 13.20
9.02 6.28 4.38 3.12 2.48 2.03 1.66 1.36 1.12
.92
.75 62
:so
10.. 92.15 83.90 75.46 67.96 62.99 59.49 56.79 54.12 34.77 19.67 12.56
8.62 6.00 4.18 3.02 2.42 1.98 1.62 1.33 1.09
.89
.73
.60
.49
PAGE
99 58 97 96 91.13 90.10 89.07 88.04 82.85 81.80 80.75 79.70 74.41 73.37 72.36 71.39 67.22 66.52 65.86 65.23 62.49 62.01 61.55 61.11 59.12 58.76 58.41 58.07 56.49 56.19 55.90 55.61 53.13 51.50 49.21 46.46 32.25 29.98 27.90 25.98 18.42 17.32 16.34 15.45 11.96 11.40 10.87 10.37
8.24 7.87 7.52 7.19 5.74 5.48 5.24 5.01 4.00 3.82 3.65 3.49 2.93 2.84 2.76 2.69 2.36 2.30 2.24 2.19 1.93 1.88 1.84 1.79 1.58 1.54 1.50 1.47 1.30 1.26 1.23 1.20 1.06 1.04 1.01 .99
.87 .85 .83 .81
.71 .70 .68 -66
.58 -57 ..56 .54
95 87.01 78.64 70.46 64.63 60.69 57.74 55.33 43.49 24.21 14.63
9.90 6.87 4.79 3.35 2.62 2.13 1.75 1.43 1.17
.96
.79
.65
.5?
RUNOFF ABOVE BASEFLOW (BASEFLOW = .OO CFS) 2.63 WATERSHED INCHES; 2822 CFS-HRS; 233.2 ACRE-FEET.
OPERATION REACH XSECTION 2
PEAK TIME(HRB) PEAK DISCXARGE(CFS) PEAK ELEVATION(FEET) 13.16 886.3 502.76
HYDROGRAPH POINTS FOR ALTERNATE -1, BTORM=l HRS MAIN TIME INCRElIENT = .lOO hr, DRAINAGE AREA = 1.66 SQ*MI. 9.10 CFS .34 -50 .71 .95 1.24 1.58 1.96 2.38 9.90 CFS 2.85 3.36 3.92 4.53 5.19 5.94 6.80 7.77
10.70 CFS 8.89 10.16 11.61 13.25 15.10 17.20 19.60 22.38 11.50 CFS 26 29 34 40 49 64 93 143 12.30 CFS 222 327 446 565 672 760 824 865 13.10 CFS 884 885 873 849 818 782 743 701 13.90 CFS 659 618 578 539 503 468 436 406 14.70 CFS 378 353 329 308 289 271 255~ 241 15.50 CFS 228 216 206 196 188 180 172 166 16.30 CFS 160 154 149 144 139 135 131 127 17.10 CPS 124 121 118 116 114 112 110 108 17.90 CFS 107 105 104 102 101 100 99 98 18.70 CFS 96.58 95.48 94.39 93.32 92.26 91.20 90.15 89.1 19.50 CFS 88.05 87.00 85.95 84.90 83.86 82.80 81.75 80.7,

TR20 -------------------------------------------------------------------- scs - SAMPLE 2 JOB USES - 24HR TYPE II STORM, FROM STR 1 TO XSEC 2 VERSION 03/06/92 WITH NOPRINT. SUMMARY, ADDHYD, h PEAX-VOL, HYD h FILE OPTIONS.2.04TEST
55147 PASS 1 JOE NO. 1 PAGE 4
78.59 77.54 76.49 70.72 69.87 69.06 64.92 64.33 63.77 60.86 60.44 60.03 57.83 57.50 57.18 55.08 54.36 53.32 41.49 39.17 36.89 25.14 23.57 22.11 15.49 14.66 13.90 10.26 9.78 9.32
7.05 6.73 6.43 4.90 4.68 4.47 3.47 3.34 3.22 2.67 2.59 2.52 2.15 2.10 2.04 1.76 1.71 1.67 1.44 1.40 1.37 1.18 1.15 1.12
.97 .94 .92
.79 .77 .75
.65 .63 .62
.53 .52 .50
74.46 73.47 72.52 67.55 66.85 - 66.17 62.72 62.23 61.75 59.25 58.88 58.52 56.55 56.25 55.94 50.23 48.26 46.10 32.58 30.56 28.65 19.53 18.39 17.34 12.52 11.90 11.32
8.49 8.10 7.73 5.87 5.61 5.36 4.09 3.91 3.75 3.02 2.92 2.83 2.39 2.33 2.27 1.94 1.89 1.85 1.59 1.55 1.51 1.30 1.27 1.24 1.07 1.04 1.01
.87 -85 .a3
.71 .70 -68
.59 .57 .56
20.30 CFS 79.-64 21.10 CF.9 7i.-60 21.90 CFS 65.53 22.70 CFS 61.30 23.50 CFS 58.17 24.30 CFS 55.57 25.10 CFS 43.82 25.90 CFS 26.84 26.70 CFS 16.38 27.50 CFS 10.78 28.30.CFS 7.38 29.10 CFS 5.12 29.90 CFS 3.61 30.70 CFS 2.75 31.50 CFS 2.21 32.30 CFS 1.80 33.10 CFS 1.48 33.90 CFS 1.21 34.70 CFS .99 35.50 CFS .81 36.30 CFS -66 37.10 CFS .54
RUNOFF ABCVE BASEFLOW (BASEFLCW = .OO CFS)
75.46 68.29 63.24 59.63 56.86 51.94 34.69 20.76 13.19
8.89 6.14 4.27 3.12 2.45 1.99 1.63 1.33 1.09
.90
.73 60
149
2.63 WATERSHED INCHES; 2822 CFS-HRS; 233.2 ACRE-FEET.
--- XSECI'ION 2, ALTERNATE 1, STORM 1, HYDRCGRAPH ADDED TO READBD FILE ---
EXECUTIVE CONTROL ENDCMP COMPUTATIONS COMPLETED FOR PASS 1 450

TR20 ----------------------------------------------- --------------------_ scs - SAMPLE 2 JOB USES - 24HR TYPE II STORM, FROM STR 1 TO XSEC 2 VERSIOf 03/06/92 WITH NOPRlNT, SUKKARY, ADDHYD, h PEAK-VOL, HYD h FILE OPTIONS.2.04TES: 07:55:47 SUMMARY, JOB NO. 1 PAGE
SUMMARY TABLE1 ---------e-----
SELECTED RESULTS OF STANDARD AND EXECUTIVE CONTROL IN ORDER PERFORMED. A CBARACTER FOLLOWING THE PEAK DISCHARGE TIME AND RATE (CFS) INDICATES:
F-FLAT TOP HYDROGRAPH T-TRUNCATED HYDROGRAPH R-RISING TRUNCATED BYDROGRAPH
XSECTION/ STANDARD PEAR DISCHARGE STRUCTURE CONTROL DRAINAGE RUNOFF ------------------------------------
ID OPERATION E%
AMOUNT ELEVATION TIME RATE RATE (IN) (m wm CC=) (CSH)
RAINFALL OF 5.20 inches AND 24.00 hr DURATION, BEGINS AT .O hrs. RAINTABLE NUBBER 2, ARC 2 RAIN TIME INCRPIENT .lOO HOURS
ALTERNATE 1 STORM 1 -_-------------------------
STRUCTURE 1 RUNOFF 1.20 2.61 -me 12.09 2128 1773.3 STRUCTURE 1 RESVOR 1.20 2.61 526.12 12.35 929 774.2 XSECTION IREACB 1.20 2.61 508.79 12.78 732 610.0 XSECTION 1 RUNOFF .46 2.70 --- 12.55 406 882.6 XSECTION 1 ADDBYD 1.66 2.63 509.70 12.68 1108 667.5
XSECTION 2 REACH 1.66 2.63 502.76 13.16 886 533.7

TR20 ------------------_------------------------------------------------- scs - SAMPLE2 JOB USES - 24HR TYPE II STORM, FROM STR 1 TO XSEC 2 VERSIOb 03/06/92 WITH NOPRINT, SUMMARY, ADDHYD, & PEAK-VOL, HYD h FILE OPTIONS.2.04TES:
.55:47 SUMMARY, JOB NO. 1 PAGE i
SUMMARY TABLE 2 ----------__---
I¶ODIFIED ATT-KIN REACH ROUTING IN ORDER PERFORMED. QUESTIQN MARK (t) AFTER: OUTFLOW PEAK - MAX. NUMBER ROUTING ITERATIONS USED;
LENGTH FACTOR - VALUE K* GREATER THAN 1.0; ATT-KIN COEFF - VALUE C GREATER THAN 0.667.
HYDROGRAPH INFORMATION ROUTING PARAMETERS _______----------------- -------------------------------
FLOOD INFLOW XSEC REiiCH PLAIN -----------
ID LENGTH LENGTH PEAK TIMB (W (fi) CC=) WW
BASEFLOW IS .O CFS
ALTERNATE 1 STORM 1 _--------------------------
1 5400 924 12.4 2 3000 1107 12.7
OUTFLOW Q-A EQ. PEAK ATT- ----------- ----------- LENGTH RATIO KIN PEAK TIME COEFF POWER FACTOR Q/I COEFF CC=) WW (Xl WI (k*) (Q*) (Cl
731 12.8 .42 1.35 .129 -792 -25 885 13.2 .96 1.09 .165 -799 -20

c-1:
*R*O -------------------------------------------------------------------- scs _
SAMPLE2 JOB U&ES - 24HR TYPE 11 STORM, FROM STR 1 TO XSEC 2 VERSIOK 03/06/92 WITH NOPRINT, SUMHARY, ADDHYD, h PEAK-VOL, HYD h FILE OPTIONS.2.04TES" 07:55:47 SUMMARY, JOB NO. 1 PAGE
SUMMARY TABLE 3 ---------------
STORX DISCHARGES (CFS) AT XSECTIONS AND STRUCTURES FOR ALL ALTERNATES QUESTION MARK (7) AFTER: OUTFLOW PEAR - RISING TRUNCATED HYDRDGRAPH.
XSECTION/ DRAINAGE STRUCTURE STORM NUMBERS.. . . . . . . . .
ID 1
STRUCTURE 1 1.20 ---------------------------
ALTERNATE 1 929
XSECTION 1 1.66 ---------------------------
ALTERNATE 1 1108
XSECTION 2 1.66 ---------------------------
ALTERNATE 1 886

c-i TR20 ------------_---____------------------------------------------------ scs - SAMPLE 2 JOB USES - 24HR TYPE II STORM, FROM STR 1 TO XSEC 2 VERSIOK 03/06/92 WITH NOPRINT, SUKMARY, ADDHYD, 6 PEAK-VOL, HYD h FILE OPTIONS.2.04TEST
END OF 1 JOBS IN THIS RUN
scs TR-20, VERSION 2.04TEST SAMPLE2 FILES
INPUT = b:a2.dat , GIVEN DATA FILE OUTPUT = pm , DATED 03/06/92,07:55:47
FILES GENERATED - DATED 03/06/92,07:55:47
FILE b:aZ.TRD CONTAINS READHD INFORMATION
TOTAL WUHBER OF WARNINGS = 0, MESSAGES = 0
l ** TR-20 RUN COMPLETED l **


Contents
Schematic Drawings
Printout
D-i APPENDIX D
SAMPLE JOB NO. 3
Eiass
D -2
D-3
,:,

D-2 SCHEMATIC DRAWING OF SAMPLE VATERSHED
Sample Job No. 3 I Structure I Null) IStructure 2 Null)

D-3
l +*t*+**t++*t*+**80-80 LIST OF INPIJ'T DATA FOR TR-20 HYDROLOGYf*f++*+++ttrr+rr*r
2-a TR-20 SAMPLE 3 FULLPRINT SUMMARY PLOTS 1 TITLE JOB USES --ACTUAL STORM, FROM STR 1 TO XSEC 6; WITH 2 TITLE FULLPRINT. SUMMARY. PLOTS, XSEC COEFFS, DIVERT, DUR, h TEERO.- 3
5 RAINFL 7 1.0 0.17 0.48 1.74 2.83 7.21 8.43 10.61 11.81 12.16
4 5 6 7 8 9
10 11 12 13 14 15 16 17 18 19 20 21~ 22 23 24 25 26 27 28 29, 30: 311 321 331 341 35i 36~ 371 38t 39! 40! 411. 42i 431 441 45: 46: 47: 48! 49s 501
8 8 8 8 8 8 8 8 8 9 ERDTBL 2 XSECTN 8 8 8 8 8 8 8 8 8
ENDTBL XSECTN
8 8 8 8 8 8 8 9ENDTBL 2 XSECTR 8 8 8 8 8 8 8 8 8 8 8 8 8 9 ENDTBL -) XSECTN
0.00 0.06 0.11 0.14 0.17 0.17 0.17 0.28 1.18 1.42 1.57 1.60 1.74 1.74 1.81 2.08 4.26 5.35 5.98 6.45 7.48 7.88 7.98 8.08 8.83 9.33 9.77 10.32 10.86 11.09 11.30 11.52 12.02 12.06 12.16 12.16
001 1.00 508.50 503.50 0.0 505.21 100.00 506.74 300.00 508.28 600.00 508.50 624.56 509.51 1000.00 510.37 1500.00 511.07 2100.00 511.44 2500.00
002
005
006 1.0 484.3 484.0 484.0
0.0 57.25 118.20 189.25 200.00 364.35 662.99 963.82 1134.18
1.00 501.27 496.27 0.0 498.24 90.00 499.98 270.00 501.27 441.18 501.66 540.00 502.80 900.00 504.43 1960.00
0.0 66.78 138.93 200.00 235.25 530.50 1237.82
1.0 495.5 495.5 490. 0.0 0.0 492. 17. 24. 494. 57. 56. 495. 86. 75. 495.5 106. 96. 496. 132. 138. 496.5 164. 202. 497. 205. 287. 498. 319. 522. 499. 482. 843. 500. 705. 1250. 502. 1362. 2330. 504. 2361. 3770.
495.0

a 480. 8 482. 8 484. 8 485. 8 485.5 a 486. 8 487. 8 488. 8 490. a 492. 9 EUDTEL 6RuNOPFl 01 6 1.20 6 RESVOR 2 01 6 7 521.5 6 REACH 3 001 7 5 5400. 6 RUNOFF 1 001 6 0.46 6 ADDHYD 4 001 567 6 REACH 3 002 7 5 3000. 6 SAVHOV 5 002 5 1 6 RUNOFF 1 02 6 0.44 6 RESVOR 2 026 7 6 REACH 3 003 7 5 4600. 6 RUNOFF 1 003 6 0.31 6 ADDHYD 4 003 567 6 SAVHOV 5 004 7 5
6 SAVMOV 5 6 ADDHYD 4 004 i676 004 6REACH 3 005 7 5 2600. 6 DIVERT 6 005 5 7 1 100. 6 REACH 3 006 7 5 4900. 6 RUNOFF 1 006 6 1.30 6 ADDHYD 4 006 567
ENDATA 7INCRM6 0.25 7 COKPUT 7 01 004 7 colmJT 7 005 006 2.5
ENDQPl ENDJOB 2
0.0 29. 97. 144. 176. 215. 320. 485. 1072. 1971.
75.
76.
78.
1.2 77.
0.0 46. 104. 138. 168. 226. 459. 875. 2060. 3629.
0.33
1.07
0.35
1.1 0.47
8.
1 11 11
11
7 1 01 06 7 1 01 06
5:
;f
54 5L SC 5: SE 55 6C 61 62 62 64 65 66 67 68 69 70 71 72 73 14
7b 77 78 791~ 80' 811 82f 83( 8~4c 85( 86( 87(

TR20 ___________--------------------------------------------------------- SC-S -
SAMPLE 3 JOB USES - ACTUAL STORM, FROM STR 1 TO XSEC 6; WITH VERSION 03/06/92 FULLPRINT, SUMMARY, PLOTS, XSEC COEFFS, DIVERT, DUR, h TZERO. 2.04TEST 0':58:51 PASS 1 JOB NO. 1 PAGE 1
XSECTIOK 1 END AREA VS DISCHARGE -----,,;--------,,------,------------ PLOT DIS- END COMPUTED
L 0 G
D I S C H A R G E
C c L
0
1oooc
lOO(
101
NO. CHARGE AREA (CFS) (Xl FT) .-----------+------------+ ------------ + 1 .O .O 1+-
9. 8.
I+ I B
D+*
7.
+ 6. +
5. 4.
3.
-------- 2.--+---B--------+-----------.
10 100 1000 1000
100.0 300.0 600.0
57.3 118.2 189.3
1.52 1.52 1.52 1.49
624.6 200.0 1.46 1000.0 364.4 1.21 1500.0 663.0 1.03 2100.0 963.8 .99
2500.0 1134.2 1.01
n
LOG END AREA SQ FT NOTE: '*' INDICATES THE COMPUTED M VALUE IS OUTSIDE THE RANGE (1.00 - 2.00). THE CLOSEST LIMITING N VALUE WILL BE USED IN ROUTING.
LEGEND + = GRID REFERENCE . = LOCATION OF PLOTTED VALUE 3 = PLOT NO. (ANY INTEGER) X = MULTIPLE PLOT NUMBERS B = BANEF'ULL (SHOWN ON AXIS)
AREA= 200.0 SQ I3 DISCHARGE= 624.6 CFS

- -
TR*O --------------^----------------------------------------------------- scs .
SAMPLE 3 JOB USES - ACTUAL STORM, FROM STR 1 TO XSEC 6; WITH VERSIOl 03/06/92 FULLPRINT, SUMMARY, PMTS, XSEC COEFFS, DIVERT, DUR, h TZERO. 2.04TES: 07:sa:si PASS 1 JOB NO. PAGE
L 0 G
D I S C H A R G E
c F S
0
XSECTIGN 2 END AREA VS DISCHARGE --------------___------------------
7.
+ 6. +
5. 4.
3.
2. + 4.
PLOT DIS- NO. CHARGE
(CFS) 1 .O 2 90.0 3 270.0 4 441.2
5 540.0 6 900.0 7 1960.0
END CGNPUTED
(Z, I4
.O 1.50 66.8 1.50
138.9 1.50 200.0 1.44
235.3 1.40 530.5 1.09
1237.8. 1.00
LOG END AREA SQ FT NOTE: '*' INDICATES THE CONPUTED M VALUE IS OUTSIDE THE RANGE (1.00 - 2.00). THE CLOSEST LINITING N VALUE WILL B? USED IN ROUTING.
LEGEND + = GRID REFERENCE . - LOCATION OF PLOTTED VALUE 3 = PLOTNO. (ANY INTEGER) X -MULTIPLEPLOTNUNBERS B = BANKFULL (SHOWN ON AXIS)
AREA- 200.0 SQ PT DISCHARGE= 441.2 CFS

TRZO -------_-----------_------------------------- -------___------------- scs - SAMPLE3 JOB USES - ACTUAL STORM, FROM STR 1 TO XSEC 6; WITH VERSION 03/06/92 FULLPRINT, SUMMARY, PLOTS, XSEC COEFFS, DIVERT, DUR, & TZERO. 2.04TEST "':58:51 PASS .1 JOB NO. 1 PAGE 3
L 0 G
D I S C ii A R
E
C
0
XSECTIQN 5 END AREA VS DISCHARGE ------------____-__---------------- PLOT DIS-
NO. CHARGE
10000+------------+------------+--------------+ 1 10000+------------+------------+--------------+ 1
2 2 3 3 4 4
13. 5 5 6 6
12. 7 7 1000+ 1000+
1;. 1;. + 8 + 8
9 9 10. 10. 10 10
9. 9. 11 11 12 12
7.8. 7.8. 6. 6. 13 13
lOOi 5. + i 4.
3.
2.
lo+------------*------------+------------+
t-s) .O
17.0 51.0 86.0
106.0 132.0 164.0 205.0
319.0 482.0 705.0
1362.0
2361.0
END COMPUTED
GET) n
.O 1.43 24.0 1.43 56.0 1.43 75.0 1.42
96.0 1.31 138.0 1.17 202.0 1.06 287.0 .97
522.0 .89 843.0 -88
1250.0 .91 2330.0 .98
3770.0 1.05
10 100 1000 1000
LOG END AREA SQ fi NOTE: '*' INDICATES THE COMPUTED M VALUE IS OUTSIDE THE RANGE (1.00 - 2.00). THE CLOSEST LIMITING bf VALUE WILL BE USED IN ROUTING.
LEGEND + = GRID REFERENCE
; = LOCATION OF PLOTTED VALUE = PLOT NO. (ANY INTEGER)
X = MULTIPLE PLOT NUMBERS B = BANKFULL (SHOWN ON AXIS)
AREA= 96.0 SQ FT DISCXARGE= 106.0 CFS

TR2lJ -------------------------------------------------------------------- 8(-S SAMPLE 3 JOB USES - ACTUAL STORM, FROM STR 1 TO XSEC 6; WITH VERSIC 03/06/92 FULLPRINT, SUMMA.RY, PLOTS, XSEC COEFFS, DIVERT, DUR, h TZERO. 2.04TE-C 07:5a:51 PASS 1 JOB NO. 1 PAGE
XSECTION 6 END AREA VS DISCHARGE ---------______------------*------- PLOT DIS- END &OlsUTED
L 0 G
D I S C H A R G E
C F s
0
10000 +-
1000 +
100 B
10 I+-
------------+------------+------------ +
+
10.
+ 9.
8. 7.
6. 5.
4. 3. +
NO. CHARGE AREA n (CW (SQ W
.O .O 29.0 46.0 97.0 104.0
144.0 138.0
1.48 1.48 1.48 1.45
5 6 7
176.0 168.0 1.37 215.0 226.0 1.25 320.0 459.0 1.02 485.0 875.0 .89
9 1072.0 2060.0 .91 10 1971.0 3629.0 .99
2.
------------+a-----------+------------+
10 100 1000 1000
LQG END AREA SQ E"r NOTE: '** INDICATES THE COXPUTED I4 VALUE IS OUTSIDE THE RANGE (1.00 - 2.00). THE CLOSEST LIMITING M VALUE WILL BP USED IN ROUTING.
LEGEND + = GRID REFERENCE . = WCATION OF PLOTTED VALUE 3 = PLOT NO. (ANY INTEGER) X = =TIPLE PLOT NUMBERS B = m (SHOWN ON AXIS)
AREA= 114.2 SQ FT DISCHARGE= 111.1 CPS

TR2~0 ______-------------------------------------------------------------- p-s _ SAMPLE 3 JOB USES - ACTUAL STORM, FROM STR 1 TO XSEC 6; WITH VERSION 03/06/92 FULLPRINT, SUMMARY, PLOTS, XSEC COEFFS, DIVERT, DUR, h TZERO. 2.04TEST r 58:51 PASS 1 JOB NO. 1 PAGE 5
EXECUTIVE CONTROL INCREM MAIN TIME INCREMENT = .250 HOURS _ 833
EXECUTIVE CONTROL COMPUT FROM STRUCTURE 1 TO XSECTION 4 840 STARTING TIME = .OO RAIN DEPTH = 1.00 RAIN DURATION = 1.00 ANT. RUNOFF COND. = 1 MAIN TIME INCREMENT = .250 HOURS ALTERNATE NO. = 1 STORM NO. = 6 RAIN TABLE NO. = 7
OPERATION RUNOFF STRUCTURE 1 OUTPUT HYDROGRAPH = 6 AREA= 1.20 SD MI INPUT RUNOFF CURVE = 75. mm 0F CONCENTRATION COMPUTED CURVE NO. = 57. ANT. RUNOFF COND. = 1 COMPUTED INTERNAL TIME INCREMENT = .0440 HOURS
PEAR TIME(HRS) Pm DISCHARGE(CFS) 13.88 4.8 20.70 426.7 23.88 400.9 25.88 226.3 30.88 292.2 32.88 342.1 38.80 186.7 41.88 68.0
RUNOFF ABOVE BASEFMW (BASEFLOW = .OO CFS) 6.23 WATERSHED INCHES; 4824 CFS-HRS;
= .33 HOURS
PEAK ELEVAT
I&%% (RUNOF (RUNOF (RDNOF (RUNOF (RUNOF (RUNOF
398.7 ACRE-FEET.
l *a WARNING - MAIN TIME INCREMENT ( .250) IS GREATER THAN 50% OF THE TIME OF CONCENTRATION ( .33) FOR SUBWATERSHED STRtKl'URE 1. THIS WILL REDUCE THE COMPUTED PEAR BY ABOUT -.l?. +t*
OPERATION RESVOR STRUCTURE 1 INPUTHYDRDGRAPH 6 OUTPUT HYDROGRAPH 7 SURFACE ELEVATION = 521.50
PEAR TIME(HRS) PEAK DISCHARGE(CFS) 13.88 4.8 20.70 426.7 23.88 400.9 25.88 226.3 30.88 292.2 32.00 342.1 38.88 186.7 41.80 68.0

TR20 ------------------------------------------------------ -------------- scs SAMPLE 3 JOB USES - ACTUAL STORM, FROM STR 1 TO XSEC 6; WITH VEFLSIC 03/06/92 FULLPRINT, SDKMARY, PLOTS, XSEC COEFFS, DIVERT, DUR, h TZERO. 2.04TE.C 07:50:51 PASS 1 JOB NO. 1
RUNOFF ABOVE BAShFLOW (BASEFLOW = .OO CFS) 6.23 WATERSHED INCHES; 4624 CFS-HRS; 398.7 ACRE-FEET.
OPERATION REACH XSECTION 1 INPUT HYDROGRAPH 7 OUTPUT HYDROGRAPH 5 CHANNEL LENGTH = 5400.00 FT INPUT = RATING CURVE REPRESENTATIVE OF REACH
COMPUTED COEFFICIENTS REIATED TU CROSS SECTION AREA, X = .227, H = 1.50 MODIFIED AlT-KIN ROUTING COEFFICIENT = .53, PEAK TRAVEL TIME = .50 HOUR
PEAK TIKE(HRS) PEAK DISCHARGE(CFS) PEAK ELEVATION(FEET 14.19 4.2 503.57 21.13 429.3 507.40 24.17 375.2 507.13 26.15 213.9 506.06 31.26 264.6 506.62 33.16 328.8 506.69 39.19 180.0 505.62 42.16 62.2 504.56
RUNOFF ABOVB BASEFLOW (BASEFLOW = .OO CFS) 6.23 WATERSHED INCHES; 4624 CFS-HRS; 398.7 ACRE-FEET
OPERATION RUNOFF XSECTION 1 OUTPDT HYDROGRAPH = 6 AREA= .46 SQ MI INPDT RUNOFF CURVE = 76. TIKE OF CONCENTRATION COMPUTED CURVE NO. = 56. ANT. RUNOFF CORD. = 1 COKPDTBD INTERNAL TIME INCREMENT = .1427 HOURS
= 1.07 HOURS
PEAK TIME(HRS) PEAK DISCIiARGE(CFS) 14.21 2.0 21.04 166.0 24.17 137.2 26.10 78.8 31.35 108.6 33.14 122.5 39.22 67.3 42.14 22.1
PEAKELEVA (RUN9 (RUN0 (RDNO (RUN0 (RUN0
IiEz (RUN0
'ION(FEET) W 'F) W 'F) W PF) ?F) 'F)
RUNOFF ABOVE BASEFLOW (BASEFLOW = -00 CFS) 6.39 WATERSHED INCHES; 1896 CFS-HRS;
OPERATION ADDHYD XSECTION 1 INPUT HYDROGRAPHS 5,6 OUTPUT HYDROGRAPH 7
156.7 ACRE-FEET.

TR*O -------------------------------------------------------------------- SC- -
SAMPLE 3 JOB USES - ACTUAL STORM, FROM STR 1 TO XSEC 6; WITH VERSION 03/06/92 FULLPRINT, SUMMARY, PLOTS, XSEC COEFFS, DIVERT, DUR, h TZERO. 2.04TEST Y 58:51 PASS .1 JOB NO. 1 PAGE 7
PEAK TIME(HRS) -- PEAX DISCHARGE(CFS) 14.19 6.1 21.13 595.5 24.17 512.4 26.15 293.2 31.28 393.1 33.16 451.3 39.20 247.3 42.16 84.3
RUNOFF ABOVE BASEFLOW (BASEFLGW = .OO CFS) 6.27 WATERSHED INCHES; 6720 CFS-HRS;
PEAR ELEVATION(FEET) 503.60. 508.26 507.83 506.69 507.22 507.52 506.34 504.94
555.4 ACRE-FEET.
OPERATION REACH XSECTION 2 INPUT HYDROGRAPH 7 OUTFUT HYDROGRAPH 5 CHANNEL LENGTH = 3000.00 FT INPUT = RATING CURVE REPRESENTATIVE OF REACH
COMPUTED COEFFICIENTS RELATED TO CROSS SECTION AREA, X = .314, n = 1.35 MODIFIED ATT-KIN ROUTING COEFFICIENT = .61, PEAR TRAVEL TIME = .28 HOURS
PEAK TIHE(IiRS) PEAK DISCRARGE(CFS) PRAX ELEVATION(FEET) 14.53 5.6 496.39 21.41 588.1 501.81 24.49 489.7 501.46 26.43 284.4 500.09 31.68 386.4 500.86 33.46 439.9 501.26 39.53 241.3 499.70 42.45 80.0 498.02
RUNOFF ABOVE BASEFLOW (BASEFLOW = .OO CFS) 6.27 WATERSHED INCHES; 6720 CFS-HRS;
OPERATION SAVHOV XSEffION 2 INPUT HYDROGRAPH 5 OUTPUT HYDROGRAPH 1
OPERATION RUNOFF STRUCTURE 2 OUTPUT HYDROGRAPH = 6 AREA= .44 SQ HI INPUT RUNOFF CURVE = 78. TIME OF CONCENTRATION COMPUTED CURVE NO. = 60. ANT. RUNOFF COND. = 1 COMPUTED INTERNALTIME IN- = .0467 HOURS
555.4 ACRE-FEET.
= .35 HOURS

TR20 ---------------------------------------------------
SAMPLE 3 ----------------- scs
JOB USES - ACTUAL STORM, FROM STR 1 TO XSEC 6; WITH VERSIO 03/06/92 FULLPRINT, SUMMARY, PMTS, XSEC COEFFS, DIVERT, DUR, & TZERO. 2.04TES 07:58:51 PASS 1 JOB NO. 1 PAGE
PEAK TIME(RRS) -- PEAK DISCHARGE(CFS) 11.88
PEAK KLEVATION(FEET 2.1
13.88 (RUNOFF)
3.9 19.96 178.3
(RUNOFF)
23.88 156.3 (RUNOFF)
25.88 (RUNOFF)
87.3 30.89
(RUNOFF) 112.1
32.88 (RUNOFF)
130.1 38.88
(RUNOFF) 70.6
42.88 (RUNOFF)
25.6 (RUNOFF)
RUNOFF ABOVE BASEFLOW (BASEFLOW = .OO CFS) 6.69 WATERSHED INCHES; 1901 CFS-RRs; 157.1 ACRE-FEET.
l ** WARNING - RAIN TIME INCRPIENT ( .250) IS GREATER TRAN 501 OF THE TIKE OF CONCENTRATION ( .35) FOR SUBWATERSHED STRUCTURE 2. THIS WILL REDUCE THE COMPUTED PEAK BY ABOUT .12. tt.
OPERATION REBVOR STRUCTURF, 2 IRRUTRXDROGRARH6 OUTPUT HYDROGRAPH 7 SURFACE ELEVATION = .oo
PEAK TIME(RRB) PEAK DISCHARGE (CFS) 11.88 2.1 13.88 3.9 19.96 178.3 23.88 156.3 25.88 87.3 30.89 112.1 32.88 130.1 38.88 70.6 41.88 25.6
RUNOFF ABOVE BASEFLGW (BABEFLOW= -00 CFS) 6.69 WATERSHED INCHES; 1901 CFS-HRB;
PEKK ELEVATION(FEE
tz; WJW NJ=) WJW mw (-) WJW (-1
157.1 ACRE-FEET.
OPERATION REACH XSECTION 3 INPUT RYDROGRAPH 7 OUTPUT HYDROGRAPH 5 CHANNEL LENGTH 4600.00 J?T INPUT = COEFFICIENTS RELATED TO XSECTION AREA, x= 1.20, M= 1.10
MODIFIED ATT-KIN ROUTING COEFFICIENT = .34, PEAKTRAVKLTIME== 1.25HOURS

TR TR2 0 ------------------ -------------------------------------------------- - SC- SAMPLE 3 SAMPLE 3 JOB USES - JOB USES - ACTUAL STORM, FROM STR 1 TC ACTUAL STORM, FROM STR 1 TO XSEC 6; WITH VERSION 03/06/92 FULLPRINT, 03/06/92 FULLPRINT, SUMMARY, PLOTS, XSEC COEFF r-*58:51 r-*58:51
SUMMARY, PLOTS, XSEC COEFFS, DIVERT, DUR, 6 TZERO. 2.04TEST PASS 1 PASS 1 JOB NO. 1 JOB NO. 1 PAGE 9
PEAK TIME(HRS) PEAK DISCHARGE(CFS) 12.31 1.5 14.25 3.0 21.18 167.7 24.22 136.7 26.16 81.3 51.44 104.8 33.20 120.3 39.27 65.1 42.17 22.9
RUNOFF ABOVE BASEFLOW (BASEFLOW = .OO CFS) 6.69 WATERSHED INCHES; 1901 CFS-FIRS; 157.1 ACRE-FEET.
OPERATION RUNOFF XSECTION 3 OUTPUTHYDROGRAPH= 6 AREA= .31 SQ MI INPUT RUNOFF CURVE = 77. TIME OF CONCENTRATION = .47 HOURS COMPUTED CURVE NO. = 59. ANT. RUNOFF COND. = 1 COMPUTED INTERNAL TIME INCREMENT = -0627 HOURS
PEAKTIME(HRS) PEAK DISCHARGE(CFS) PEAK ELEVATION(FEET) 13.90 2.1 (RUNOFF) 20.17 119.3 (RUNOFF) 23.89 105.0 (RUNOFF) 25.89 58.8 (RUNOFF) 30.94 77.3 (RUNOFF) 32.89 89.1 (RUNOFF) 38.90 48.6 (RUNOFF) 41.89 17.2 (RUNOFF)
RUNOFF ABOVE BASEFLaOW (BASEFMW = .OO CFS) 6.54 WATERSHED INCHES; 1309 CFS-HRS; 108.1 ACRE-FEET.
l ** WARNING - MAIN TIME INCREMENT ( -25.0) IS GREATER THAN 50% OF TBB TIME OF CONCENTRATION ( .47) FOR SUBWXTERSHED XSECTION 3. THIS WILL REDUCE THE COBPUTED PEAK BY ABOUT .I%. l **
OPERATION ADDHYD XSECTION 3 INPUT HYDRCGRAPHS 5,6 OUTPUT HYDROGRAPH 7

TR*o -------------------------------------------------------------------- ys
SAMPLE 3 JOE USES - ACTUAL STORH, FROM STR 1 TO XSEC 6; WITH VERSIO 03/06/92 FULLPRINT, SUMMARY, PLOTS, XSEC COEFFS, DIVERT, DUR, h TZERO. 2.04TES 07:58:51 PASS 1 JOB NO. 1 PAGE -
PEAR TIME(HRS) -- PEAK DISCHARGE(CFS) 12.17 2.3 14.06 4.7 20.94 282.7 24.00 232.5 25.93 137.1 31.20 179.3 32.97 204.6 39.05 111.3 41.94 38.7
RUNOFF ABOVE BASEFLOW (BASEFLOW = .OO CFS) 6.63 WATERSHED INCHES; 3210 CFS-HRS;
OPERATION SAVNOV XSECTION 4 INPUT HYDROGRAFH 7 OUTPUT HYDROGRAPH
OPERATION SAVNOV XSECTION 4 INPUTHYDROGRAPHl OUTPUT HYDROGRAPH
OPERATION ADDHYD XSECTION 4 INPUT HYDROGRAFHS 5,6 OUTPUT HYDROGRAPH
PEAK TIME(m) PEAK DI.SCHARGE(CFS) 14.29 9.2 21.16 855.7 24.30 682.6 26.15 402.1 31.61 561.1 33.24 622.7 3~9.39 343.8 42.20 109.5
RUNOFF ABOVE BASEFLOW (EASEFLOW = .OO CFS) 6.38 WATERSHED INCHES; 9930 CFS-HRS;
DURATION(?IRS) 3 6 9 12 15 18 FLOW (CFS ) 623 559 446 376 314 275
DURATION(HR.9) 27 30 33 34 F'LOW(CFS) 9 3 1 0
265.2 ACRE-FEET.
820.6 ACRE-FEET.
21 24 160 83

TR*O _------------------------------------------------------------------- scs -
SAMPLE 3 JOB USES - ACTUAL STORM, FROM STR 1 TO XSEC 6; WITH VERSION 03/06/92 FULLPRINT, SUMMARY, PMTS, XSEC COEFFS, DIVERT, DUR, h TZERO. 2.04TEST r 5a:51 PASS 1 JOB NO. 1 PAGE 11
EXECUTIVE CONTROL COMPUT FROM XSECTION 5 TO XSECTION 6 - 850 STARTING TIME = 2.50 RAIN DEPTH = 1.00 RAIN DURATION = 1.00 mm. RUNOFF COND. = 1 MAIN TIME INCREMENT = .250 HOURS ALTERNATE NO. = 1 STORH NO. = 6 RAIN TABLE NO. = 7
OPERATION REACH XSECTION 5 INPUT HYDROCRAPH 7 OUTPUT HYDROGRAPH 5
.CHANMEL LENGTH = 2600.00 FT INPUT = RATING CURVE REPRESENTATIVE OF REACH
COMPUTED COEFFICIENTS RELATED TO CROSS SECTION AREA, X = 570, n = 1.00 MODIFIED ATT-KIN ROUTING COEFFICIENT = .lS, PEAK TRAVEL TIIiE = 1.27 HOURS
PEAKTIWE(HRS) PEAK DISCHARGE(CFS) PEAK ELEVATION(FEET) 15.28 5.8 490.68 22.56 682.9 499.90 25.04 627.8 499.65 34.12 564.9 499.37 40.31 319.3 498.00
HYDROGRAPH POINTS FOR HRS HAIN TIHE INCREMENT = .250
12.00 CFS .35 .64 .99 14.00 CPS 2.29 2.94 3.85 16.00 CFS 4.56 3.94 3.35 18.00 CFS 6.06 9.00 13.24 20.00 CFS 136 191 263 22.00 CFS 650 674 683 24.00 CFS 599 596 605 26.00 CFS 540 512 492 28.00 CFS 331 298 268 30.00 CFS 268 290 313 32.00 CFS 457 476 489 34.00 CFS 564 563 552 36.00 CPS 419 400 383 38.00 CFS 313 306 300 40.00 CFS 317 319 318 42.00 CFS 214 193 178 44.00 CFS 94.26 79.55 66.52 46.00 CFS 21.06 17.30 14.21 48.00 CFS 4.34 3.56 2.92 50.00 CFS .a9 .73 .60
RUNOFF ABOVE BASEFLOW (BASEFLOW = 6.38 WATERSHED INCHES;
ALTERNATE = 1, SToRl4=6 hr, DRAINAGE AREA = 2.41 SQ.tII.
1.32 1.56 1.70 1.79 1.93 4.80 5.48 5.75 5.60 5.15 2.89 2.70 2.82 3.25 4.21
19.58 29.70 45.54 66.96 95.84 342 420 493 557 610 680 669 652 632 612 619 628 623 602 572 475 458 434 403 367 244 229 225 232 248 336 360 384 410 435 500~ 511 524 539 554 533 510 406 462 440 368 355 342 331 321 297 296 290 304 311 313 303 286 264 238 165 154 141 126 110
55.29 45.77 37.7s 31.13 25.61 11.66 9.57 7.86 6.45 5.29
2.39 1.96 1.61 1.32 1.08 .49
.OO CFS) 9930 CFS-HRS; 820.6 ACRE-FE=.

TR20 -------------------------------------------------------------------- scs _ SAMPLE 3 JOB USES - ACTUAL STORM, FROM STR 1 TO XSEC 6; WITH VERSIOI; 03/06/92 FULLPRINT, SUMMARY, PLOTS, XSEC COEFFS, DIVERT, DUR, & TZERO. 2.04TES1 07:5a:51 PASS 1 JOE NO. 1 PAGE *
DUP.ATION(HRS) 4 5;2
8 12 16 20 24 28 32 _ FLOW(CFS) 489 383 313 248 96 13 4
DURATION(HRS) 36 39 FLOW (CFS ) 2 0
ZERO DAMAGE DISCHARGE ( 106 CFS) OCCURS AT 24.1 HOURS FLOW DURATION.
OPERATION DIVERT XSECTION 5 INPUT HYDROGRAPH 5 OUTPUT #lHYDROGRAPH 7
XSECTION 5 XSECTION 5
PEAK TIME(HRB) 15.28 20.00
HRS MAIN 12.00 CPS 14.00 CPS 16.00 CPS 18.00 CPS 20.00 CFS 100.00 100.00 100.00 100.00 22.00 CFS 100.00 100.00 100.00 100.00 24.00 CFS 100.00 100.00 100.00 100.00 26.00 CFS 100.00 100.00 100.00 100.00 28.00 CFS 1~0.00 100.00 100.00 100.00 30.00 CFS 100.00 100.00 100.00 100.00 32.00 CFS 100.00 100.00 100.00 100.00 34.00 CFS 100.00 100.00 100.00~ 100.00 36.00 CFS 100.00 100.00 100.00 100.00 38.00 CFS 100.00 100.00 100.00 100.00 40.00 CFS 100.00 100.00 100.00 100.00 42.00 CFS 100.00 100.00 100.00 100.00 44.00 CFS 94.26 79.55 66.52 55.29 46.00 CFS 21.06 17.30 14.21 11.66 48.00 CFS 4.34 3.56 2.92 2.39 50.00 CFS -89 .73 .60 .49
OUTPUT #lHYDROGRAPH
PEAK DISCHARGE(CFS) PEAR ELEVATION(FEET) 5.8 490.68
100.0 * 495.35 l FIRST POINT OF FLAT PEAK
#2 HYDROGRAPH 1 XSECTION 8
HYDRffiRAPH POINTS FOR ALTERNATE = 1, STORM = 6 'TIM?, INCREHENT = .250 hr, DRAINAGE AREA = -96 SQ.MI.
.35 .64 .99 1.32 1.56 1.70 1.79 1.97 2.29 2.94 3.85 4.80 5.48 5.75 5.60 5.1 4.56 3.94 3.35 2.89 2.70 2.82 3.25 4.2i 6.06 9.08 13.24 19.58 29.78 45.54 66.96 95.84
100.00 100.00 100.00 100.00 100.00 100.00 100.00 100.00 100.00 100.00 100.00 100.00 100.00 100.00 100.00 100.00 100.00 100.00 100.00 100.00 100.00 100.00 100.00 100.00 100.00 100.00 100.00 100.00 100.00 100.00 100.00 100.00 100.00 100.00 100.00 100.00 100.00 100.00 100.00 100.00 100.00 100.00 100.00 100.00 100.00 100.00 100.00 100.00
45.77 37.78 31.13 25.61 9.57 7.86 6.45 5.29 1.96 1.61 1.32 1.08
RUNOFF ABOVE BASEFLOW (BASEPLOW = .OO CFS) 4.22 WATERSHED INCHES; 2628 CFS-HRS; 217.2 ACRE-FEET.

u-1 1
TR20 -------------------------------------------------------------------- SC-. _ SAMPLE 3 JOB USES - ACTUAL STORM, FROM STR 1 TO XSEC 6; WITH VERSION 03/06/92 FULLPRINT, SUMMARY, PLOTS, XSEC COEFFS, DIVERT, DUR, b TEERO. 2.04TEST - 5a:51 PASS 1 JOB NO. 1 PAGE 13
DURATION(HRS) 4 a 12 16 20 24 28 32 FLOW(CFS) 100 100 100 100 100 96 13 4
DURATION(BRS) 36 39 FLOW(CFS) 2 0
i OUTPUT 12 DIVERTED HYDROGRAPH (XSECTION a)
PEAK TIME(HRS) PEAE DISCHARGE(CFS) PEAK ELEVATION(FEET) 22.56 582.9 (D-j
25.04 527.8 34.12 464.9 IES; 40.31 219.3 (DIVERT)
HYDROGRAPH POINTS FOR ALTERNATE = 1, STORM=6 HRS MAIN TIME INCREMENT = .250 hr, DRAINAGE AREA = 1.45 SQ.MI.
19.75 CFS 0 36 91 163 242 21.75 CFS 510 550 574 583 580 23.75 CPS 512 499 496 505 519 25.75 CFS 472 440 412 392 375 27.75 CPS 267 231 198 168 144 29.75 CFS 148 168 190 213 236 31.75 CFS 335 357 376 389 400 33.75 CFS 454 464 463 452 433 35.75 CFS 340 329 300 283 268 37.75 CFS 221 213 206 200 197 39.75 CFS 211 217 219 218 213 41.75 CFS 138 114 93 78 65 43.75 CFS 10.21 .oo
320 393 457 569 552 532 528 523 502 358 334 303 129 125 132 260 284 310 411 424 439 410 386 362 255 242 231 196 198 204 203 186 164
54 41 26
RUNOFF ABOVE BASEFLQW (BASEFLOW = .OO CFS) 7.82 WATERSHED INCHES; 7301 CFS-HRS;
DURATION(HRS) 2 4 6 8 10 12 FLOW (CFS) 523 472 433 389 335 28:
DURATION(HRS) 18 20 22 24 FLQW (CFS ) 197 148 91 0
OPERATION REACli XSECTION 6 INPUTHYDROGRAFH 7 OUTPUTHYDROGRAPH 5 CHANNEL LENGTH = 4900.00 FT INPUT = RATING CURVE REPRESENTATIVE OF REACH
603.4 ACRE-FEEI&.
14 16 231 213
COMPUTED COEFFICIENTS RELATED TO CROSS SECTION AREA, X = .lOl, l4 = 1.48 MODIFIED All'-KIN ROUTING COEFFICIENT = .23, PEAK TRAVEL TINE = 9.75 HOURS

TR20 -------------------------------------------------------------------- scs
SAMPLE 3 JOB USES - ACTUAL STORM, FROM STR 1 TO XSEC 6; WITH VERSIC 03/06/92 FULLPRINT,~ SURHARY, PLOTS, XSEC COEFFS, DIVERT, DUR, & TZERO. 2. OQTEC 07:58:51 PASS 1 JOB NO. 1 PAGE
PEAK TIME(RRS) - PEAK DISCHARGE(CFS) PEAK 16.14 29.75
4.6 . . 100.0 l
l FIRST POINT OF FLAT
ELEVATiON(FEM 480.31. 484.06
PEAR
RUNOFF ABOVE BASEFLCW (BASEFLOW = .OO CFS) 4.22 WATERSHED INCHES; 2628 CFS-HRS; 217.2 ACRE-FEET.
OPERATION RUNOFF XSECTION 6 OUTPUT RYDROGRAPH = 6 AREA= 1.30 SQ nx INFDT RUNOFF CURVE = 79. TIME OF CONCENTRATION COttPtJT’ED CURVE NO. = 62. ANT. RUNOFF COND. = 1 COMFU'I'ED INTERNAL TIME INCREMENT = .2667 HOURS
= 2.00 HOURS
PEARTIME(HRS) PEAX DISCRARGE(CFS) PEAR ELEVATION(FEET 17.11 9.5 (RUNOFF) 24.04 485.5 (RUNOFF) 26.99 373.3 (RUROFP) 35.96 336.5 (RUNOFF) 42.22 183.4 (RUNOFF)
RUNOFF ABOVE BASEFLOW (BASEFLOW = .OO CFS) 7.00 WATERSHED INCHES; 5874 CFS-I-IRS; 485.4 ACRE-FEE9
OPERATION ADDRYD~ XSECTION 6 INFDT HYDRQGRAFHS 5,6 OUTPUT HYDROGRAFR 7
PEAR TIMEERRS) PEAR DISCIiARGE(CFS) PEAR ELEVATION(FEET) 17.03 13.3 480.92 24.05 584.6 488.34 26.99 473.2 487.93 35.96 436.5 487.71 42.22 283.4 486.65
HYDROGRAFH POINTS FOR ALTERNATE = 1, STORM-6 HR.9 HAIN TIHE INCREMENT = .250 hr, DRAINAGE AREA - 2.26 SQ.341.
12.75 CFS .47 .89 1.53 2.36 3.32 4.39 5.64 7.02 14.75 CFS 8.39 9.57 10.33 10.62 10.60 10.63 11.03 11.88 16.75 CFS 12.79 13.28 12.97 11.91 10.50 9.17 8.32 8.34 18.75 CFS 9.49 12.15 16.99 24.91 36.79 53.87 69.97 84.49 20.75 CFS 99 116 138 164 195 236 288 349 22.75 CFS 412 469 518 554 576 584 580 566 24.75 CFS 545 521 496 472 454 444 445 455 26.75 CFS 461 473 467 447 419 390 368 355 28.75 CFS 348 339 324 302 276 251 229 212 30.75 CFS 203 201 208 222 242 263 283 307 32.75 CFS 318 333 349 365 380 392 400 4:

T-20 -----------------__-------------------------------- ----------------- scs - SAMPLE3 JOB USES - ACTUAL STORR, FROM STR 1 TO XSEC 6; WITH VERSIOti 03/06/92 FULLPRINT, SUMMARY, PMTS, XSEC COEFFS, DIVERT, DUR, & TZERO. 2.04TESI ' .58:51 PASS 1 JOB NO. 1 PAGE 15
34.75 CFS 408 36.75 CFS 3-97 38.75 CFS 285 40.75 CFS 259 42.75 CFS 275 44.75 CFS 159 46.75 CFS 45.39 48.75 CFS 9.42 50.75 CFS 1.99 52.75 CFS .43
412 419 426 433 436 431 417 375 355 337 322 311 301 _ 292 279 274 269 265 262 260 250 261 265 271 270 282 283 281 264 249 231 212 195 181 169 148 134 117 100 83 68 56
37.22 30.54 25.05 20.58 16.91 13.91 11.44 7.78 6.42 5.31 4.38 3.60 2.96 2.42 1.64 1.36 1.12 .93 .77 .63 .52
RUNOFF ABOVE BASEFMW (BASEFLOW = 5.82 WATERSHED INCHES;
.OO CFS) 8502 CFS-HRS; 702.6 ACRE-FEET.
DURATION(HRS) 4 8 12 16 20 24 28 32 FLOW(CFS) 447 392 318 274 231 134 25 11
DURATION(IiRS) 36 40 FLOW (CFS) 4 0
ZERO DAMAGE DISCHARGE ( 97 CFS) OCCURS AT 25.3 HOURS FLOW DURATION.
EXECUTIVE CONTROL ENDCMP COMPUTATIONS COMPLETED FOR PASS 1 860

TR*(j -------------------------------------------------------------------- s,ns
SAMPLE 3 JOB USES - ACTUAL STORM, FROM STR 1 TO XSEC 6; WITH VERSI( ;;/;;/;'1 FULLPRINT. SUMHARY; PLOTS, XSEC COEFFS, DIVERT, DUR, h TZERO. 2.04TE!
: : SUXMARY, JOB NO. 1 PAGE
SUMl4ARY TABLE1 ---------------
SELECTED RESULTS OF STANDARD AND EXECUTIVE CONTROL IN ORDER PERFORMED. A CIIARACTER FOLLOWING THE PEAR DISCEARGE TIRE MID RATE (CFS) INDICATES:
F-FLAT TOP HYDROGRAPH T-TRUNCATED HYDROGRAPH R-RISING TRUNCATED HYDROGRAF?
XSECTION/ STANDARD PEAK DISCEARGE STRUCTURE CONTROL DRAINAGE RUNOFF -----------------------------------
ID OPERATION AMOUNT ELEVATION TIME (INI (W VW
RAINFALL OF 12.16 inches AND 42.00 hr DURATION, BEGINS AT RAINTABLENUHBER 7, ARC1 MAIN TIME INCRMENT .250 HOURS
RATE (CFS)
.O hrs.
RATE (CSW
ALTERNATE 1 STORM 6 ---------------------------
STRUCTURE 1 RUNOFF 1.20 6.23 --- 20.70 STRUCTURE .l RESVOR 1.20 6.23 --- 20.70 XSECTION 1REACH 1.20 6.23 507.40 21.13 XSECTION 1 RUNOFF .46 6.39 em- 21.04 XSECTION 1 ADDHYD 1.66 6.27 508.26 21.13
427 355.8 427 355.8 429 357.5 166 360.9 595 358.4
XSECTION 2 REACH 1.66 6.27 501.81 21.41 588 354.2 STRUCTURE 2 RUNOFF -44 6.69 --- 19.96 178 404.5 STRUCTURE 2 RESVOR .44 6.69 --- 19.96 178 404.5 XSECTION 3 REACH .44 6.69 se- 21.18 168 381.8 XSECTION 3 RUNOFF -31 6.54 a-- 20.17 119 383.9
XSECTION 3 ADDEYD .75 6.63 --- 20.94 XSECTION 4 ADDHYD 2.41 6.38 --- 21.16
RAINFALL OF 12.16 inches AND 42.00 hr DURATION, BEGINS AT XSECI'ION 5 REACH 2.41 6.38 499.90 22.56 XSECPION 5 DIVERT .96 4.22 495.35 2O.OOF XSECTION 8 DIVERT 1.45 7.82 --- 22.56
XSECTION 6 REACH .96 4.22 484.06 29.75F XSECTION 6 RUNOFF 1.30 7.00 --- 24.04 XSECTION 6 ADDHYD 2.26 5.82 488.34 24.05
283 377.3 856 355.2
2.5 hrs. 683 1OOF 583
283.4 104.2 402.1
1OOF~ 104.2 485 373.1 585 258.8

TR2O ----------------------------- ____----------------------------------- scs -
SAMPLE 3 JOB USES - ACTUAL STORK, FROM STR 1 TO XSEC 6; WITH VERSION 03_/06/92 FULLPRINT, SUMMARY, PLOTS, XSEC COEFFS, DIVERT, DUR, & TZERO. 2.04TEST
58:51 SUMMARY, JOB NO. 1 PAGE 17
SUMMARY TABLE 2 ---------------
MODIFIED ATT-KIN REACH ROUTING IN ORDER PERFORKED. QUESTION HARK (?) AFTER: OUTFLOW PEAK - MAX. NUMBER ROUTING ITERATIONS USED;
LENGTH FACTOR - VALUE K* GREATER THAN 1.0; ATT-KIN COEFF - VALUE C GREATER THAN 0.667.
HYDROGRAPH INFORHATION ROUTING PARAMETERS ------------------------ -------------------------------
FLOOD INFLOW OUTFLOW Q-A EQ. PEAK ATT- XSEC REACH PLAIN ---------em ----------- ----------- LENGTH RATIO KIN
ID LENGTH LENGTH PEAK TIME PEAK TIME COEFF POWER FACTOR Q/I COEFF cm (='T) (CFS) (iiF CC=) UW (W w (k*) (Q*) CC)
BASEFLOW IS .O CFS
ALTERNATE 1 STORM 6 ----------- .----------------
1 5400 427 20.8 425 21.3 2 3000 589 21.3 586 21.5 3 4600 178 20.0 167 21.3 5 2600 854 21.3 683 22.5
4900 100 20.0 100 29.8
.23 1.50 .013 .996 -53
.31 1.35 .OlO -994 .61 1.20 1.10 .048 -939 -34
.57 1.00 109 :014
.799 .18 .lO 1.48 1.000 .23

TR20 -------------------------------------------------------------------- see
SAMPLE 3 JOB USES - ACTUAL STORM. FROM STR 1 TO XSEC 6: WITH VERSI 03/06/92 FULLPRINT, SUMMARY, PLOTS, &EC COEFFS, DIVERT, DbR, &-&ZERO. 2.04TE 07:5a:51 SUMl4ARY, JOB NO. 1 PAGE
SLMfARY TABLE 3 ---------------
STORN DISCHhRGES (CFS) AT XSECTIONS AND STRUCTURES FOR ALL ALTERNATES QUESTION KARK (?) AFTER: OUTFLOW PEAK - RISING TRUNCATED HYDROGRAPH.
XSECTION/ DRAINAGE STRUCTURE
ID 2%
STRUCXTiRE 2 .44 ---------------------------
ALTERNATE 1
STRUCTURE 1 1.20 ---------------------------
ALTERNATE 1
XSECTION 1 1.66
STORM NUMBERS.......... 6
178
427
ALTERNATE 1
XSECTION 2 1.66 ---------------------------
ALTERNATE 1
XSECTION 3 .?5 ---------------------------
ALTERNATE 1
XSECTION 4 2.41 ---------------------------
ALTERNATE 1
XSECTION 5 .96
595
588
283
856
ALTERNATE 1
XSECTION 6 2.26 ---------------------------
ALTERNATE 1
XSECTION 8 1.45 --_------------------------
ALTERNATE 1
100
585
583

TR20 -----------__-------________i___________---------------------------- scs - SAMPLE 3 JOB USES - ACTUAL STOFU4, FROM STR 1 TO XSEC 6; WITH VERSION 03/06/92 FULLPRINT, SUMHARY, PLOTS, XSEC COEFFS, DIVERT, DUR, h TZERO. 2.04TEST
END OF 1 JOBS IN THIS RUN
scs TR-20, VERSION 2.04TEST SAMPLE 3 FILES
INPUT = b:a3.dat , GIVEN DATA FILE OUTPUT = pm , DATED 03/06/92,07:58:51
FILES GENERATED - DATED 03/06/92,07:58:51
NONE!
TOTAL NolIBER OF WARNINGS = 3, MESSAGES = 0
l ** TR-20 RUN COMPLETED l **


Contents
Schematic Drawing
Printout
E-l APPENDIX E
SAMPLE JOB NO. 4
Ems
E-2
E-3

E-2
SCHEMATIC DRAKING 3F SAMPLE WATE~SHECI Sample Job No. i
(Structure 2 Null)
LEGEND

E-3
'*+*++++****+*+80-80 LIST OF INPUT DATA FOR TR-20 HYDROLOGYt+++***+**rtr+ttr
JOB TR-20 SAKPLE 4 TITLE JOB USES -2 24HR TYPE II STORM, FROM XSEC 2 TO XSEC 4; WITH TITLE NOPRINT, READ DISCH. HYDR. 6 NON STANDARD HYDR. NO. LOCATIONS.
6 RUNOFF 1 02 6 0.44 78. 6 RESVOR 2 026 7 6 REACH 3 003 7 4 4600. 1.2 6 RUNOFF 1 003 6 0.31 77. 6 ADDHYD 4 003 467 6 ADDHYD 4 004 5 7 3
0.35
1.1 0.47
1 1
ENDATA 7 READHD 8 7 REAMDID 8 a 8 8 8 8 8 0 a a a
3
5 9.1000
0. 2. 4. 8.
15. 29. 93.
565. 884. 782. 578. 406. 289. 216. 172. 144. 124. 112. 104.
98. 92. 87. 82. 76. 72. 60. 64. 62. 60. 58. 56. 53. 44. 33. 24. 17. 13. 10.
.lOOO 1.6600 .oooo 1. 1. 1. 2. 2. 3. 5. 5. 6. 9. 10. 12.
17. 20. 22. 34. 40. 49.
143. 222. 327. 672. 760. 824. 885. 873. a49. 743. 701. 659. 539. 503. 468. 378. 353. 329. 271. 255. 241. 206. 196. 188. 166. 160. 154. 139. 135. 131. 121. 118. 116. 110. 108. 107. 102. 101. 100.
97. 95. 94. 91. 90. 89. 86. 85. 84. 81. 00. 79. 75. 74. 73. 71. 70. 69. 67. 66. 66. 64. 63. 63. 61. 61. 60. 59. 59. 59. 57. 57. 57. 56. 56. 55. 52. 50. 48. 41. 39. 37. 31. 29. 27. 22. 21. 20. 16. 15. 15. 13. 12. 11. 10. 9. 9.
1 1 1 1 1
11 1
xs 2, Al S
0 a a a 8 8 a a 8 8 a 8 a 8 8 a a a a 8 a a 8 8
1. 3. 7.
13. 26. 64.
446. 865. 818. 618. 436. 308. 228. 180. 149. 127. 114. 105.
99. 93. 80. 83. 78. 73. 68. 65.. 62. 60. 58. 57. 54. 46. 35. 25. 18. 14. 11.
a.
1 1 1 1 1' 1: 1: 2: 2.
;;
21 2i 21 2’ 21 2: 31 3: 3: 3: 31 3: 3t 3: 31 31 4c 4: 4i 41 41 4: 44 4: 41 4: SC

8 0 a 8 a 8 8 a
: a 8 a 0 8 8 8 8 8 9 ENDTBL 7INCRM6 7co@lPuT7
END-1 ENDJOB 2
_ a. 6. 5. 4. 3. 3. 2. 2. 2. 2. 1. 1. 1. 1. 1. 1. 1. 1. 1.
0.1 02 004
8. 6. 5. 4. 3. 3. 2. 2. 2. 2. 1. 1. 1. 1. 1. 1. 1. 1. 1.
5.2
7. 6. 5. 4. 3. 3. 2. 2. 2. 2. 1. 1. 1. 1. 1. 1. 1. 1. 1.
1.0
7. I. 5 6. 5; 5~ 4. 4. 5: 4. 3. 5~ 3. 3. 5 3. 3. 5 2. 2. 5~ 2. 2. 5 2. 2. 5. 2. 2. 6, 1. 1. 6: 1. 1. 6; 1. 1. 6: 1. 1. 61 1. 1. 6: 1. 1. 6t 1. 1. 6: 1. 1. 6t 1. 0. 65
7c 71
22 01 01 7i 73 -7‘

TR20 -------------------------------------------------------------------- sa - SAMPLE 4 JOB USES - 24HR TYPE II STORK, FROM XSEC 2 TO XSEC 4; WITH VERSION 03/06/92 NOPRINT, READ DISCH. HYDR. & NON STANDARD HYDR. NO. LOCATIONS.2.04TEST
02:33 PASS 1 JOB NO. 1 PAGE I
EXECUTIVE CONTROL READHD
STARTING TIME = 9.10 DRAINAGE AREA = 1.66
a .oo a i 2.00 a 4.00 a 8.00 8 15.00 a 29.00 8 93.00 a 565.00 a 884.00 8 782.00 a 578.00 8 406.00 8 289.00 a 216.00 a 172.00 a 144.00 P 124.00
112.00 b 104.00 0 98.00 8 92.00 8 87.00 8 82.00 8 76.00 a 72.00 a 68.00 8 64.00 a 62.00 a 60.00 8 58.00 a 56.00 0 53.00 8 44.00 8 33.00 a 24.00 a 17.00 a 13.00 8 10.00 a 8.00 a 6.00 a 5.00 a 4.00
3.00
DISCHARGE HYDROGRAPH, IN LOCATION 5
TIME INCREMENT = .lOO BASE FLOW = .oo
1.00 1.00 1.00 1.00 2.00 ,2.00 3.00 3.00 5.00 5.00 6.00 7.00 9.00 10.00 12.00 13.00
17.00 20.00 22.00 26.00 34.00 40.00 49.00 64.00
143.00 222.00 327.00 446.00 672.00 760.00 824.00 865.00 885.00 873.00 849.00 818.00 743.00 701.00 659.00 618.00 539.00 503.00 468.00 436.00 378.00 353.00 329.00 308,OO 271.00 255.00 241.00 228.00 206.00 196.00 188.00 180.00 166.00 160.00 154.00 149.00 139.00 135.00 131.00 127.00 121.00 118.00 116.00 114.00 110.00 108.00 107.00 lOS.00 102.00 101.00 100.00 99.00
97.00 95.00 94.00 93.00 91.00 90.00 89.00 88.00 86.00 85.00 84.00 83.00 81.00 80.00 79.00 78.00 75.00 74.00 73.00 73.00 71.00 70.00 69.00 68.00 67.00 66.00 66.00 65.00 64.00 63.00 63.00 62.00 61.00 61.00 60.00 60.00 59.00 59.00 59.00 58.00 57.00 57.00 57.00 57.00 56.00 56.00 55.00 54.00 52.00 50.00 48.00 46.00 41.00 39.00 37.00 35.00 31.00 29.00 27.00 25.00 22.00 21.00 20.00 18.00 16.00 15.00 15.00 14.00 13.00 12.00 11.00 11.00 10.00 9.00 9.00 8.00
8.00 7.00 7.00 7.00 6.00 6.00 6.00 5.00 5.00 5.00 4.00 4.00 4.00 4.00 4.00 3.00 3.00 3.00 3.00 3.00
xs- 2 03

T*Z(y -------------------------------------------------------------------- SC- SAMPLE 4 JOB USES - 24HR TYPE II STORM, FROM XSEC 2 TO XSEC 4; WITH VERSI(~ o3/06/92 NOPRINT, READ DISCH. HYDR. h NON STANDARD HYDR. NO. LACATIONS.2.04TE' 08:02:33 PASS 1 JOB NO. 1 PAGE
a a a a a a a a a a a a a a 9 ENDTBL
3.00 -i.oo 2.00 2.00 2.00 1.00 1.00 1.00 1.00 1.00 1.00 1.00 1.00 1.00
EXECUTIVE CONTROL INCRM MAIN TIME INCREMENT = .lOO HOURS 710
EXECUTIVE CONTROL COMPUT FROM STRUCTURE 2 TG XSECTION 4 720 STARTING TIM3 = .oo RAIN DBFTH = 5.20 RAIN DURATION - 1.00 ANT. RUROFF COW. = 2 NUN TIME INCRBMEBT = .lOO HOUR8 ALTERNATE NO. = 1 STORM NO. = 1 RAIN TABLE NO. = 2
3.00 2.00 2.00 2.00 2.00 1.00 1.00 1.00 1.00 1.00 1.00 1.00 1.00 1.00
3.00 2.00 2.00 2.00 2.00 1.00 1.00 1.00 1.00 1.00 1.00 1.00 1.00 1.00
3.00 2.00 2.00 2.00 2.00 1.00 1.00 1.00 1.00 1.00 1.00 1.00 1.00 1.00
3.00 2.00 2.00 2.00 2.00 1.00 1.00 1.00 1.00 1.00 1.00 1.00 1.00
OPERATION ADDHYD XSECTION 3
HYDROGRAPH POINTS FOR ALTERNATE = 1, STORN = 1 HRS HAIN TIME INCREMENT = .lOO hr. DRAINAGE ARFA = .75 SQ.MI a.20 CFS 9.00 CFS 9.80 CFS
10.60 CFS 11.40 CFS 12.20 CFS 13.00 CFS 13.80 CFS 14.60 CFS 15.40 CFS 16.20 CFS 17.00 CFS 17.80 CPS 18.60 CFS 19.40 CFS 20;20 CFS 21.00 CFS 21.80 CFS 22.60 CFS 23.40 CFS 24.20 CFS
33 3:67 9.66
20.21 48
615 379 169
97.44 71.17 56.78 48.05 42.98 38.73 34.62 30.53 27.88 26.65 25.77 24.95 22.32
.56 .a5 1;19 1.58 2.02 2.52 3.07 4.32 5.02 5.75 6.50 7.25 8.02 8.82
10.56 11.56 12.64 13.85 15.19 16.69 18.36 22.27 24.62 27.25 30.22 33.57 37.44 42.09
54 64 86 136 232 388 537 636 638 622 582 529 476 425 339 303 272 243 222 202 184 156 144 133 124 116 109 103
92.70 88.52 84.83 81.54 78.58 75.90 73.44 69.05 67.06 65.17 63.36 61.63 59.95 58.33 55.33 54.00 52.77 51.65 50.64 49.70 48.85 47.31 46.61 45.95 45.32 44.71 44.12 43.54 42.43 41.88 41.35 40.82 40.29 39.77 39.25 38.22 37.70 37.19 36.67 36.16 35.65 35.14 34.11 33.60 33.08 32.57 32.05 31.54 31.03 30.07 29.64 29.26 28.92 28.61 28.34 28.10 27.68 27.50 27.34 27.18 27.04 26.90 26.77 26.53 26.42 26.30 26.19 26.08 25.98 25.87 25.66 25.56 25.46 25.36 25.26 25.16 25.05 24.85 24.75 24.65 24.55 24.45 24.34 23.8 20.02 17.67 15.33 13.09 10.98 9.13 7.5.

TR20 -------------------------------------------------------------------- scs _ SAMPLE 4 JOB USES - 24HR TYPE II STORM, FROM XSEC 2 TO XSEC 4;. WITH VERSIOK '-'-f/06/92 NOPRXNT, READ DISCH. BYDR. h NON STANDARD HYDR. NO. LOCATIONS.2.04TES'I
:02:33 PASS 1 JOB NO. 1 PAGE 3
25.00 CFS 6.25 5.17 4.27 3.52 2.91 2.40 1.99 1.65 25.80 CFS i.37 1.13 .94 .76 .64 .53 .44
RUNOFF ABOVE BASEFLQW (BASEFLOW = .oo CFS) 2.84 WATERSHED INCHES; 1375 CFS-HRS; 113.6 ACRE-FEET.
OPERATION ADDHYD XSECTION 4
HYDROGRAPH POINTS FOR ALTERNATE = 1, STORM=1 HRS MAIN TIME INCREMENT = .lOO hr. DRAINAGE AREA = 2.41 SQ.KI. 9.20 CFS .33 .56 .85 1.19 1.58 2.02 9.00 CFS 3.67 4.32 6.02 6.75 7.50 8.25 9.80 CFS 11.66 13.56 14.56 16.64 18.85 20.19
10.60 CFS 28.21 31.27 34.62 39.25 43.22 48.57 11.40 CFS 70 80 93 120 176 281 12.20 CFS 758 858 965 1068 1147 1201 13.00 CFS 1244 1223 1188 1145 1094 1040 13.80 CFS 870 815 762 711 663 619 14.60 CFS 503 471 442 414 390 368 15.40 CFS 312 297 283 271 259 250 16.20 CFS 223 215 208 202 196 190 17.00 CFS 175 171 168 164 161 159 17.80 CFS 151 149 147 145 143 141 18.60 CFS 137 135 133 131 130 120 19.40 CFS 124 122 121 119 118 116 20.20 CFS 112 110 109 107 105 104 21.00 CFS 101 100 99 97 96 95 21.80 CFS 92.65 92.53 91.42 90.30 90.19 89.08 22.60 CFS 87.77 86.66 86.56 85.46 05.36 85.26 23.40 CFS 83.95 82.85 82.75 81.65 81.55 81.45 24.20 CFS 78.32 76.02 72.67 69.33 66.09 62.98 25.00 CFS 52.25 49.17 45.27 42.52 39.91 37.40 25.80 CFS 30.37 28.13 25.94 24.78 22.64 21.53 26.60 CFS 17.30 16.25 15.21 15.17 14.14 13.12 27.40 CFS 11.06 11.05 10.04 10.03 9.03 9.02 28.20 CFS 8.01 7.01 7.01 7.00 6.00 6.00 29.00 CFS 5.00 5.00 5.00 5.00 4.00 4.00 29.80 CFS 4.00 4.00 3.00 3.00 3.00 3.00 30.60 CFS 3.00 3.00 3.00 3.00 3.00 2.00 31.40 CFS 2.00 2.00 2.00 2.00 2.00 2.00 32.20 CFS 2.00 2.00 2.00 2.00 2.00 2.00 33.00 CFS 2.00 1.00 1.00 1.00 1.00 1.00 33.80 CFS 1.00 1.00 1.00 1.00 1.00 1.00 34.60 CFS 1.00 1.00 1.00 1.00 1.00 1.00 35.40 CFS 1.00 1.00 1.00 1.00 1.00 1.00 36.20 CFS 1.00 1.00 1.00 1.00 1.00 1.00 37.00 CFS 1.00 1.00 1.00 1.00 1.00 .oo
2.52 3.07 10.02 10.82 22.69 25.36 54.44 62.09
452 630 1236 1249 984 927 577 539 347 326 240 230 185 180 156 154 140 138 127 125 115 113 102 101 95 94
88.98 97.87 84.16 94.05 81.34 79.83 59.13 55.57 34.99 32.65 20.44 18.36 13.10 12.08
8.02 8.02 6.00 6.00 4.00 4.00 .3.00 3.00 2.00 2.00 2.00 2.00 2.00 2.00 1.00 1.00 1.00 1.00 1.00 1.00 1.00 1.00 1.00 1.00
RUNOFF ABOVE BASEFLOW (BASEFLQW = .OO CFS) 2.70 WATERSHED INCBES; 4196 CFS-HRS; 346.7 ACRE-FEET.

TRZO -------------------------------------------------------------------- scs - SAMPLE 4 JOB USES - 24HR TYPE II STORM, FROM XSEC 2 TO XSEC 4; WITH VERSION 03/M/92 NOPRINT, READ DISCH. HYDR. & NON STANDARD HYDR. NO. LOCATIONS.2.04TES'I 08:02:33 PASS 1 JOB NO. 1 PAGE
DURATION(HRS) -3 6 9 12 15 18 21 24 FLOW(CFS) 390 151 104 83 31 10 3 2
DURATION(HRS) 27 29 FLOW(CFS) 1 0
EXECUTIVE CONTROL ENDCI¶P COMPUTATIONS COMPLETED FOR PASS 1 730

TR20 ________------------------------------------------------------------ scs _ SAMPLE 4 JOB USES - 24HR TYPE II~STORH, FROM XSEC 2 TO XSEC 4; WITH VERSION o3/06/92 NOPRINT, READ DISCH. HYDR. h NON STANDARD HYDR. NO. LOCATIONS.2.CQTEST
02:33 SUMMARY, JOB NO. 1 PAGE 5
SUMXARY TABLE 1 ---------------
SELECTED RESULTS OF STANDARD AND EXECUTIVE CONTROL IN ORDER PEIZFGREBD. A CHARACTER FOLLOWING THE PEAK DISCHARGE TIME MD RATE (CFS) INDICATES:
F-FLAT TOP HYDROGRAPH T-TRUNCATED HYDROGRAPH R-RISING TRUNCATED HYDROGRAFH
XSECTION/ STANDARD PEAK DISCHARGE STRUCTURE CONTROL DRAINAGE RUNOFF ------------------------------------
ID OPERATION (g?I)
AMOUNT ELEVATION TIME RATE RATE (INI (=I (W (CFS) tcsw
RAINFALL OF 5.20 inches AND 24.00 hr DURATION, BEGINS AT .o hrs. RAINTABLE NUMBER 2, ARC 2 MAIN TIME INCREKENT .I00 HOURS
ALTERNATE 1 STORM 1 __-------------------------
STRUCTURE 2 RUNOFF .44 2.88 STRUCTURE 2 RESVOR .44 2.88 XSECTION 3 REACH .44 2.88 XSECTION 3 RUNOFF .31 2.79 XSECTION 3 ADDHYD .75 2.84
:CTION 4 ADDHYD 2.41 2.70
--- 12.10 837 1902.3 --- 12.10 a37 1902.3 --- 12.59 412 936.4 --- 12.17 481 1551.6 --- 12.36 640 853.3
--- 12.92 1249 518.3

e-tc
TR2cJ -------------------------------------------------------------------- scs - SAMPLE 4 JOB USES - 24HR TYPE II STORM, FROM XSEC 2 TO XSEC 4; WITH VERSIO? 03/M/92 NOPRINT, READ DISCH. HYDR. 6 NON STANDARD HYDR. NO. LOCATIONS.2.04TES': 08:02:33 SUMKARY, JOB NO. 1 PAGE
SUMMARY TABLE 2 ---------------
MODIFIED ATT-KIN REACH ROUTING IN ORDER PERFORMED. QUESTION PIARK (1) AFTER: OUTFLOW PEAK - MAX. NUHBER ROUTING ITERATIONS USED;
LENGTH FACTOR - VALUE K* GREATER THAN 1.0; ATT-KIN COEFF - VALUE C GREATER THAN 0.667.
HYDROGRAPH INFORMATION ------------------------
FLOOD XSEC REikH PLAIN
INFLOW OUTFLOW ----------- -----------
ID LENGTH LENGTH PEAK TIME PEAK TIME VW (fi) CC=) (HR) (CW (ml
BASEFLOW IS .O CFS
ALTERNATE 1 STORM 1 ---------------------------
3 4600 837 12.1 412 12.6
ROUTING PARAMETERS -------------------------------
Q-A EQ. PEAK A’IT- ----------- LENGTH RATIO KIN COEFF POWER FACTOR Q/I COEFF
(W w (k*) (Q') (Cl
1.20 1.10 .571 .492 .17

TR20 -------_--------____------------------------------------------------ scs - SAMPLE 4 JOB USES - 24HR TYPE II STORM, FROM XSEC 2 TO XSEC 4; WITH VERSIOK 03/06/92~NOPRINT, READ DISCH. HYDR. h NON STANDARD HYDR. NO. LOCATIONS.2.04TES1
02:33 SUl4MARY, JOB NO. 1
SUMMARY TABLE 3 ---------------
PAGE 7
STORM DISCHARGES (CFS) AT XSECTIONS AND STRUCTURES FOR ALL ALTERNATES QUESTION MARK (I) AFTER: OUTFLOW PEAR - RISING TRUNCATED HYDROGRAPH.
XSECTION/ DRAINAGE STRUCTURE STORM NUMBERS.. . . . . . . . .
ID 1
STRUCTURi 2 .44 ------_--------------------
ALTERNATE 1 037
XSECTION 3 .75 ---------------------------
ALTERNATE 1 640
XSECTION 4 2.41 ---------------------------
ALTERNATE 1 1249

TR20 __________---------------------------------------------------------- SC.
SAMPLE 4 JOB USES - 24HR TYPE II STORM, FROM XSEC 2 TO XSEC 4; WITH VERSIO 03/M/92 NOPRINT, READ DISCH. HYDR. & NON STANDARD HYDR. NO. LOCATIONS.2.04TES'
END OF 1 JOBS IN l'%IS RUN
scs TR-20, VERSION 2.04TEST SAMPLE 4 FILES
INPUT = b:a4.dat , GIVEN DATA FILE ODTPDT J pm , DATED 03/06/92,08:02:33
FILES GENERATED - DATED 03/06/92,08:02:33
NONE !
TQTAL NUMBER OF WARNINGS = 0, MESSAGES =
l ** TR-20 RUN CONPLETED l **
0

Conten-
Schematic Drawings
Printout
APPENDIX F
SAMPLE JOB NO. 5
F-2
F-5

SCHEMATIC DRAWING OF SAMPLE Wb ,TERSHEi! SamDie 40~ No. 5
Alternate i - Existing C;nait;ons Alternate 2 - Structures 1 and 2 aaaeo
LEGENO u
Iiz
Structure NunDBr I
Cross Secrlan Number i
b
let awnstream ena of reacnl 1
I 7980 ) roptionel Floooplaln Length - Feet1
5408 Ream Length - Feet
[1.21[1.11 [End Araa Coeff. xl[Exponent RI 1.28 Oralnege Area - Square nlles
75i.33) Rtnoff Curve Number (Time of Concsntrstlon-Hours1
Q -1 Reference Lmtlon NUmber t
h Intervening ares

SCHEMATIC DRAWING OF SAMPLE WATERSHED
Sample Job No. 5
Alternate 3 Structure 2 moved downstream
and renamea structure 3.
LEGEND

SCHEMATIC DRAUING OF SAMPLE WATERSHED Alternete 4 - Olverslon edded to divide flow
et cross section 5

l *****+*++**++ao-80 LIST OF INPUT DATA FOR TR-20 HYDROLo~Y+*t+***f~**+t+tttt
JOB TR-20 SAMPLE 5 --ECON SUMMARY TITLE
1c JOB USES - 20
TITLE TWO-24HR TYPE II STORMS OVER WATERSHED, WITH ECON,
BF, I4OD. S.C.; ALT'S l=EXIST., 2=SITES, 3=MOVE SITE, 4=DIVIDE 1c 1 DURING 8 9 ENDTBL 2 XSECTN 8 8 8 8 8 8 8 8 a. 9 ENDTBL 2 XSECTN 8 a 8 8 8
HOURS 6.0 12.0 24.0
001 1.00 508.50 503.50 0.0 505.21 100.00 506.74 300.00 508.28 600.00 508.50 624.56 509.51 1000.00 510.37 1500.00 511.07 2100.00 511.44 2500.00
0.0 57.25 118.20 189.25 200.00 364.35 662.99 963.82 1134.18
002 1.00 501.27 496.27 0.0 498.24 90.00 499.98 270.00 501.27 441.18 501.66 540.00 502.80 900.00 504.43 1960.00
0.0 66.78 138.93 200.00 235.25 530.50 1237.82
4c 5c 6C 7c, so 9c
1OC 1lC 12E 1~3% 14c rse 16% 170 180 190 2m 210; 220 230 240 250 260
495.5 ax! 280 2% 300 310 32Q 330 340 35C 36C 3x 38t 39c 4ac 4tc 4% 43E 44c 4% 4 6E 4fC 48C 49c 5OC
9 ENDTBL 2 XSECTN 8 8 8 8 8 8 a 8 a 8 8 8 9 ENDTBL 2 XSECTN a 8 8 8 8 8 a 9
005 1.0 495.5 495.5 490. 0.0 0.0 492. 17. 24. 494. 57. 56. 495. 86. 75. 495.5 106. 96. 496. 132. 138. 497. 205. 287. 498. 319. 522. 499. 482. 843. 500. 705. 1250. 502. 1362. 2330. 504. 2361. 3770.
006 1.0 484.3 484.0 480. 0.0 0.0 482. 29. 46. 484. 97. 104. 485. 144. 138. 485.5 176. 168. 486. 215. 226. 487. 320. 459. 488. 485. 875. 490. 1072. 2060.
484.0

z+****t+++ttrr~**t+t~ea-00 LIST OF INPIJT DATA (CONTINUED)***+**tt+t+*+++t++t*
a 492. 9 ENDTBL 2 XSECTN 007 1.0 a 474. a 475. a 477. a 479. 8 479.5 8 480. a 481. 8 - 483. 0 485. 8 407. 9 ENDTBL 6RUNOFFl 01 6 1.20 6 RESVOR 2 016 7 6 REACH 3 001 7 5 5400. 6 RUNOFF 1 001 6 0.46 6 ADDHYD 4 001 567 6 REACH 3 002 7 1 3000. 6 RUNOFF 1 02 6 0.44 6 RBSVOR 2 026 7 6 RRACH 3 003 7 5 4600. 6 RUNOFF 1 003 6 0.31 6 ADDHYD 4 003 562 6 ADDHYD 4 004 123 6REACH 3005 3 5 2600. 6 SAVHOV 5 006 5 7 6 REACH 3 006 7 5 4900. 6 RUNOFF 1 006 6 1.30 6 ADDHYD 4 006 567 6 RFACH 3 007 7 5 8900. 6 RUNOFF 1 007 6 0.70 6 ADDHYD 4 007 564 6 SAVHOV 5 008 4 1
ENDATA 7 LIST 1. 7 INCREM 6 0.1 7 BASFLO 5 6.0 7 COHPUT 7 01 007
ENDCKPl 7 BASFLD 5 6.0 7 COHPUT 7 01 007
BNDCMPl 3 STRUCT 01 8 521.5 8 521.6 a 521.8 8 522.0 8 522.2
1971. 3629.
479.5 479.5 0. 0. 12. 31. 76. 99. 178. 175. 214. 210. 255. 255. 381. 579. 783. 1337. 1406. 2397. 2214. 3906.
75. 0.33
76. 1.07
78. 0.35
1.2 1.1 77. 0.47
79.
80.
2.0
7900. 1.20
1. 2.
5.2 1.0
2.6 1.0
0.0 17.0 3.0 18.0 15. 20.2 33. 22.5 54. 25.0
479.2
51 52 53 54 SE 5t 5: SE 5s 6C 61
g 66 6:
z; 6E 65 7c 71 72 73 -~
76 77 78 79 80 81 82 a3
1 11 84 85 aa 87 8E 69
2 2 01 01 9c 91 9i
2 2 01 02 93 94 95 9c 9i 9E 95

t++t++tt**+++**+**80-80 LIST OF INPlJT DATA (CONTINUED)*c*+*t*+r*****~~~*~**4
8 8 8 8 8 9 ENDTBL 3 STRUCT 02 8 8 8 8 8 8 8 8 8 8 8 8 8 9 ENDTBL 7 BASFLO 5 7 COKPUT 7 01 02 - COKPUT 7 003 007
ENDCHP 1 7 BASFLO 5 7 COMPUT 7 01 02 7 coKPuT 7 003 007
522.4 79. 28.0 526.2 948. 70. 526.4 1009. 75. 526.6 1071. 80. 527.2 1265. 95.
496. 0.0 16. 498. 210. 27. 500. 252. 40. 502. 294. 62. 504. 336. 85. 506. 378. 112. 508. 420. 145. 509. 441. 176. 510. 556. 190. 512. 1129. 237. 514. 2086. 205. 516. 3288. 340. 517. 4030. 367.
10.0
8.0
ENDCMP 1 3 STRUCT 02 9 ENDTBL 3 STRUCT 03 8 8 0 8 8 8 9 ENDTBL 7 INSERT 2 002 6 RUNOFF 1 03 6 RESVOR 2 03 6 7 DELETE 4' 6 RUNOFF 1 02 6 RESVOR 2 02 7ALTER 3 6 REACH 3 003 7 7 DELETE 4 6 RUNOFF 1 003
ADDHYD 4 003
484. 0.0 5. 488. 32. 8. 492. 40. 14. 495. 45. 27. 498. 48. 48. 500. 52. 80.
6 0.75 7
78. 1.60
2 2000. 1.2 1.1
5.2 5.2
1.0 1.0
2.6 1.0 2.6 1.0
101 102 103 104 10-E 1Qf 10; 1OL 105 11r 111 112 11: 114 115 116 l,li 1lC 115 12c 123 12i
22 02 01 122 22 02 01 124
125 12t:
2 2 02 02 127 2 2 02 02 128
125 130 131 131 132 134 135 13f 13: 13f 135 14c 141 14; 142 144 14: 14t 14: 14s 14s 15c

*csrr+t*.r**rt+*t++t*80-80 LIST OF INPUT DATA (CONTINUED)**++**+*+t++*++~+++*
7 LIST 1.0 7 BASFLO 5 6.0 7 CONPUT 7 01 007
ENDCHP 1 7 BASFLO 5 6.0 7 COHPUT 7 01 007
ENDCMP 1 3 STRUCT 01 9 ENDTBL
~3 STRUqr 03 9 ENDTBL 2 XSECTN 008 1.0 0 492. 8 493. 8 494. a 495. a 496. 8 497. 8 498. a 500. 9 BNDTBL 7 INSERT 2 005 6 DIVERT 6 005 571 7 DELETE 4 6 SAVNOV 5 006 7 INSERT 2 007 6 REACN 3 008 1 2 17000. 6 ADDHYD 4 009 247 7 LIST 1.0 7 BASFLO 5 0.2 7coHPUT7 01 009
ENDCHP 1 7 BASFLO 5 0.1 7 CONPUT 7 01 009
BNDCKPl IPEAKS PEAKS 006 007 7A ENDJOB 2
5.2
2.6
494.5 0.0 21. 64. 133. 232. 360. 515. 827.
0.9
15.0 5.2
. 25.0 1.0
12.0 25.0 2.6 1.0
3.90' 78 4.00
1.0
1.0
494.3 0.0 23. 52. 87. 128. 175. 228. 405.
a.
17200 1
15: 15:
2 2 03 01 15: 15, 15:
2 2 03 02 15! 15. 151 15! 16( 16:
493.3 16: 16: 16~ 16f 16( 16: 161 16: 17c 171 17i
1 1 173 I- 1 176 177
11 11 178 179 180
22 04 01 181, 182 183
.2 2 04 02 184 185~ 186 187 188

F-Y TR2O -------------------------------------------------------------------- scs -
SAMPLE 5 JOB USES - TWO-24HR TYPE II STORMS OVER WATERSHED, WITH ECON, VERSIO? 03/06/92 BF, MOD. S.C.; ALT'S l=EXIST.,
~32~48 2=SITES, 3=MOVE SITE, 4=DIVIDE 2.04TES'.
PASS 1 JOB NO. 1 PAGE :
EXECUTIVE CONTROL LIST 1. 1. 2. 870
LISTING OF CURRENT DATA
XSECTN DRAINAGE BAHKFULL ZERO LOW NO. AREA DAMAGE GROUND
2 XSECTN 1 1.0000 508.5000 . 0000 .oooo
ZNDTBL
2 XSECTN
a 8 8 8 0 8 8 9ENDTBL
ELEVATION DISCHARGE END AREA 503.50 .oo .oo 505.21 100.00 57.25 506.74 300.00 118.20 508.20 600.00 189.25 508.50 624.56 200.00 509.51 1000.00 364.35 510.37 1500.00 662.99 511.07 2100.00 963.82 511.44 2500.00 1134.18
DRAINAGE BANKFULL ZERO LOW NO. AREA DAMAGE GROUND
2 1.0000 501.2700 .oooo .oooo
ELEVATION DISCHARGE END AREA 496.27 .OO .oo 490.24 ~90.00 66.78 499.98 270.00 138.93 501.27 441.18 200.00 501.66 540.00 235.25 502.80 900.00 530.50 504.43 1960.00 1237.82

F-lc
TR*(J _------------------------------------------------------------------- SC- - SAMPLE 5 JOB USES - TWO-24HR TYPE II STORMS OVER WATERSHED, WITH ECON, VERSIOk 03/06/92 BF, MOD. Sic.; ALT'S l=EXIST., Z=SITES, 3=MOVE SITE, 4=DIVIDE 2.04TES' 07:32:48 PASS 1 JOB NO. 1 PAGE
XSECTN DRAINAGE BANKFULL ZERO LOW NO. AREA DAMAGE GROUND
2 XSECTN 5 1.0000 495.5000 495.5000 495.5000
a 8 8 8 8 8 8 8 8 8 8 8 9 ENDTBL
ELEVATION DISCHARGE END AREA 490.00 .oo .oo 492.00 17.00 24.00 494.00 57.00 56.00 495.00 86.00 75.00 495.50 106.00 96.00 496.00 132.00 138.00 497.00 205.00 287.00 498.00 319.00 522.00 499.00 482.00 843.00 500.00 705.00 1250.00 502.00 1362.00 2330.00 504.00 2361.00 3770.00
XSECTN DRAINAGE BANKFULL ZERO LOW NO. AREA DAMAGE GROUND
2 XSECTN 6 1.0000 404.3000 484.0000 484.0000
a 8 a 8 a 8 8 8 8 8 9 ENDTBL
ELEVATION DISCHARGE END AREA 480.00 .oo .oo 482.00 29.00 46.00 484.00 97.00 104.00 485.00 144.00 138.00 485.50 176.00 168.00 486.00 215.00 226.00 487.00 320.00 459.00 488.00 485.00 875.00 490.00 1072.00 2060.00 492 .OO 1971.00 3629.00

j- - II
TR20 --e--e- .------------------------------------------- ---------------___ scs - SA MPLE 5 JOB USES - 03
TWO-24HR TYPE II STORMS OVER WATERSHED, WITH ECoN, VERSION /06/92 BF, MOD. S.C.; ALT'S l=EXIST.,
32:48 2=SITES, 3=MOVE SITE, 4=DIVIDE 2.04TEST
PASS 1 JOB NO. 1 PAGE 3
XSECTN DRAINAGE BANKFULL ZERO LOW
2 XSECTN
8 8 8 8 8 8 8 8 8 8 9 ENDTBL 1 DURING 8 9 ENDTBL
' OIMHYD
8 8 8 8 8 8 8 8 8 8 8 9 ENDTBL
NO. AREA DAMAGE GROUND 7 1.0000 479.5000 479.5000 479.2000
ELEVATION DISCHARGE 474.00 .oo 475.00 12.00 477.00 76.00 479.00 178.00 479.50 214.00 480.00 255.00 481.00 381.00 483.00 783.00 485.00 1406.00 487.00 2214.00
END AREA 00
31:oo 99.00
175.00 210.00 255.00 579.00
1337.00 2397.00 3906.00
HOURS 6.0 12.0 24.0
COMPUTED TIME INCREMENT .0200
.oooo .0300 1000 -4700 .6600 :8200
1.0000 .9900 .9300 :2800 6800 .5600 .2410 .2070 .4600
.1260 .1070 .0910
.0550 0470 .0400
. 0250 :0210 .0180
.OllO .0090 .0080
.0050 .0040 .0030
. 0000 .oooo .oooo
-1900 .9300 .8600 .3900 .1740 .0770 .0340 .0150 .0070 .0020 .oooo
.3100
.9900
.7800
.3300 1470
:0660 .0290 .0130 .0060 .OOlO .oooo
COMPUTED PEAK RATE FACTOR = 484.000

TQfJ -------------------------------------------------------------------- scs -
SAMPLE 5 JO0 USES - TWO-24HR TYPE 11 STORMS OVER WATERSHED, WITH ECON, 2=SITES, 3=MOVE SITE.
VERSIOb 03/06/92 BF, MOD. S.C.; ALT'S l=EXIST., 07:32:48
4=DIVIDE 2.04TES PASS 1 JOB NO. PAGE
TABLE NO. TIME INCREMENT 5 RAINFL 2 .lOOO
8 8 8 8 8 8
,8 8 8 8 8 8 8 8 8 8 8 8 8 8 8 8 8 8 8 8 8 8 8 8 8 8 8 8 8 8 8 8 8 8 8 8 8 8 8 8 8 8
: ENDTBL
0000 :0051 0105
:0161 0220
:0281 .0345 0411
:0480 .0553 .0630 0712
:0800 .0892 .0990 .1093 .1200 . 1322 .1470 1630
:I810 -2040 .2350 .2830 .6630 7350
17720 . 7990 .8200 .8376 -8535 .8676 .8800 .8912 .9018 .9117 -9210 .9297 .9377 .9452 -9520 .9584 .9647 .9709 .9770 .9829 9887
: 9944 1.0000
.OOlO
.0062 0116
:0173 -0232 .0294 .0358 0425
10494 .0568 .0646 0730
:os1s .0912 .lOlO 1114
:1222 .1350 .1502 .1663 .1851 .2094 .2427 .3068 .6820 .7434 .7780 .8036 .8237 .8409 .8565 .8702 .8823 .8934 .9038 .9136 .9228 .9313 .9393 .9466 .9533 .9597 .9660 .9722 .9782 .9841 .9899 .9956
1.0000
.0020
.0072 0127
:0184 .0244 .0306 .0371 . 0439 -0508 .0583 . 0662 .0747 . 0836 .0931 . 1030 .1135 . 1246 .1379 . 1534 . 1697 . 1895 -2152 .2513 .3544 .6986 .7514 .7836 .8080 .8273 -8442 .8594 .8728 .8845 .8955 .9058 .9155 .9245 .9330 .9408 .9480 -9546 .9610 .9672 9734
: 9794 .9853 .9910 -9967
1.0000
0030 :0083 .0138 . 0196 .0257 .0319 .0384 .0452 .0523 .0598 .06-9 .0764 .0855 0950
:1051 1156
:1270 .I408 .1566 1733
:1941 .2214 .2609 .4308 .7130 .7588 .7890 .8122 .8308 -8474 .8622 .8753
?46? .8976 .9078 .9173 .9263 .9346 .9423 .9493 .9559 -9622 .9685 .9746 .9806 .9864 .9922 .9978
1.0000
.0041
.0094
.0150
.0208
.0269
.0332
.0398
.0466
.0538
.0614
.0696
.0782
. 0874
. 0970 1072
:1178 1296
:1438 .1598 1771
:1989 .2280 .2715 .5679 .7252 7656
: 7942 .8162 .8342 .8505 .8649 .8777 .8890 .8997, .9097 .9192 .9280 -9362 .9438 .9507 -9572 .9635 .9697 -9758 .9818 .9876 9933
:9989 1.0000~

TR20 _------------------------------------------------------------------- scs
SAMPLE 5 JOB USES - TWO-24HR TYPE II STORMS OVER WATERSHED, WITH ECON, VERSIO 03106192 BF, MOD. S.C.: ALT'S l=EXIST.. 2=SITES. 3=MOVE SITE, 4=DIVIDE 2.04TES
:32;48 PASS 1 JOB NO. 1 PAGE
6 RUNOFF 1 6 RESVOR 2 6 REACH 3 6 RUNOFF 1 6 ADDBYD 4 6 REACH- 3 6 RUNOFF 1 6 RESVOR 2 6REACH 3 6 RUNOFF 1 6 ADDHYD 4 6 ADDHYD 4 6REACH 3 6 SAVMOV 5 6REACH 3 6 RUNOFF 1 6 ADDIiYD 4 6REACB 3 '- RUNOFF 1
ADDHYD 4 6 SAVHOV 5
EBDATA
~TABDARD CONTROL INSTRUCTIONS
1 6 16 7
17 5 1 6 1 567 2 7 1
2 6 26 7
3 7 5 3 6 3 562 4 123 5 3 5 6 5 7 6 7 5 6 6 6 567 7 7 5 7 6 7 564 a 4 1
1.2000 0000
5400:oooo .4600
3000.0000 .4400 .oooo
4600.0000 .3100
2600.0000
4900.0000 1.3000
8900.0000 .7000
75.0000
.oooo 76.0000
.oooo 78.0000
1.2000 77.0000
.oooo
.oooo 79.0000
.oooo 80.0000
.33000 0 0 0 0 1 000001
00000 0 0 0 0 1 1:07000 0 0 0 0 1
000001 .ooooo 0 0 0 0 1 .35000 0 0 0 0 1
000001 1.10000 0 0 0 0 1
-47000 0 0 0 0 1 000001 000001
. 00000 0 0 0 0 1
00000 0 0 0 0 1 2:ooooo 0 0 0 0 1
000001 7900.00000 0 0 0 0 1
1.20000 0 0 0 0 1 010111
END OF LISTING

F ‘I TR20 --------------*----------------------------------------------------- SC-
SAMPLE 5 JOB USES - TWO-24HR TYPE II STORMS OVER WATERSHED, WITH ECoN, VERSIC 03/06/92 BF, MOD. S.C.; ALT'S l=EXIST., 2=SITES, 3=MOVE SITE, 4=DIVIDE 2.04TE" 07:32:48 PASS 1 JOB NO. 1 PAGE
EXECUTIVE CONTROL INCREM MAIN TIME INCREMENT = .lOO HOURS 880
EXECUTIVE CONTROL BASFLO CONSTANT BASEFLOW = 6.00 CFS 890
EXECUTIVE CONTROL COMPUT FROM STRUCTURE 1 TO XSECTION 7 900 STARTING TIME = 00 ANT. -RUNOFF COND. : 2
RAIN DEPTH = 5.20 RAIN DURATION = 1.00 MAIN TIME INCREMENT = 100 HOURS
ALTERNATE NO. = 1 STORM NO. = 1 'RAIN TABLE NO. = 2
OPERATION ADDHYD XSECTION 7
HYDROGRAPH POINTS FOR ALTERNATE = 1. STORM = 1 HRS MAIN TIME INCREMENT = .lOO hr. 7.60 CFS 6.37 6.55 6.77 7iO2 8.40 CFS 8.76 9.20 9.69 10.24 9.20 CFS 13.84 14.76 15.72 16.73
10.00 CF.5 22.38 23.71 25.17 26.77 10.80 CFS 37.76 40.72 44.02 47.71 11.60 CFS 76 08 110 150 12.40 CFS 630 697 731 736 13.20 CFS 566 538 518 502 14.00 CFS 461 457 454 452 14.80 CFS 452 454 456 459 15.60 CFS 478 482 487 491 16.40 CFS 513 518 522 525 17.20 CFS 542 545 548 550 18.00 CFS 558 559 560 560 18.80 CFS 558 557 556 554 19.60 CFS 544 541 539 536 20.40 CFS 519 516 512 508 21.20 CFS 489 485 481 477 22.00 CFS 456 452 448 443 22.80 CFS 422 418 414 410 23.60 CFS 389 385 381 376 24.40 CFS 354 349 343 337 25.20 CFS 308 303 299 294 26.00 CFS 273 268 264 261 26.80 CFS 242 238 234 231 27.60 CFS 213 210 207 203 20.40 CFS 187 184 181 178 29.20 CFS 163 160 158 155 30.00 CFS 141 139 136 133 30.80 CFS 121 119 116 114 31.60 CFS 103 101 99 97 32.40 CFS 87.59 85.78 84.01 82.27 33.20 CFS 74.03 72.47 70.95 69.45
DRAINAGE AREA = 4.41 SQ.MI, 8.35 7.30
10.83 17.78 28.54 51.85
216 721 490 450 463 496 529 552 560 552 533 505 473 439 405 372 331 290 257 227 200 175 152 131 112
95 80.56 67.99
7.62 11.49 18.86 30.50 56.56
306 689 480 450 466 500 533 554 560 551 530 501 469 435 401 368 325 285 253 224 197 172 149 128 110
93 78.68 66.55
7 :97 12.21 19.97 32.68 61.95
416 646 473 450 470 505 536 556 559 549 526 497 465 431 397 364 319 281 249 220 194 169 146 126 108
91 77.23 65.14
12.99 21.14 35.09 68.19
5? 60.. 466 451 474 509 539 557 559 546 523 493 460 426 393 359 314 277 245 217 191 166 144 123 105
e- 75.c 63.76

TR20 _____--------------------------------------------------------------- scs - SAMPLE 5 JOB USES - TWO-24HR TYPE II STORMS OVER WATERSHED, WITH ECON, vERs1ot "q/06/92 BF, MOD. S.C.; ALT'S l=EXIST., 2=SITES, 3=MOVE SITE, 4=DIVIDE 2.04TES'.
: 3.2 :48 PASS 1 JOB NO. 1 PAGE .:
34.00 CFS 62.41 61.08 59.79 58.52 57.27 56.06 34.80 CFS 52.55
54.86 53.69 51.43 50.34 49.27 48.22 47.20 46.19 45.22
35.60 CFS 44.26 43.32 42.40 41.51 40.63 39.78 30.94 38.12 36.40 CFS 37.32 36.54 35.78 35.04 34.31 33.60 32.90 32.23 37.20 CFS 31.56 30.92 30.29 29.67 29.07 20.48 27.91 27.35 38.00 CFS 26.81 26.27 25.75 25.25 24.75 24.27 23.80 23.34 38.80 CFS 22.89 22.45 22.02 21.61 21.20 20.81 20.42 20.04 39.60 CFS 19.68 19.32 18.97 18.63 18.30 17.97 17.66 17.35 40.,40 CFS 17.05 16.76 16.48 16.20 15.93 15.67 15.41 15.16 41.20 CFS 14.92 14.68 14.45 14.22 14.00 13.79 13.58 13.38 42.09 CFS 13.18 12.99 12.80 12.62 12.44 12.27 12.10 11.93 42.80 CFS 11.77 11.62 11.46 11.32 11.17 11.03 10.90 10.76 43.60 CFS 10.63 10.51 10.39 10.27 10.15 10.04 9.93 9.82 44.40 CFS 9.72 9.61 9.52 9.42 9.32 9.23 9.15 9.06 45.20 CFS 8.98 8.89 8.81 8.73 8.66 8.59 8.52 8.44 46.00 CFS 8.38 8.31 a.25 8.19 8.12 8.06 8.01 7.95
RUNOFF ABOVE FIASEFLOW (BASEFLOW = 6.00 CFS)
DURATION(IiRS) FLOW(CFS)
DURATION(HRS) FLOW(CFS)
2.83 WATERSHED INCHES; 8067 CFS-HRS; 666.7 ACRE-F&ET.
4 8 12 16 20 24 28 32 533 466 364 200 99 48 25 15
36 39 10 8 TRUNCATED
ZERO DAXAGE DISCHARGE ( 214 CFS) OCCURS AT 15.7 HOURS FLOW DURATION.
--- XSECTION 7, ALTERNATE 1, STORM 1, HYDROGRAPH ADDED TO READHD FILE ---
EXECUTIVE CONTROL ENDCMP CONPUTATIONS COMPLETED FOR PASS 1 910
EXECUTIVE CONTROL BASFM CONSTANT BASEFLOW = 6.00 CFS 920
EXECUTIVE CONTROL COMPU’I’ FROM STRUCTURE 1 TO XSECTION 7 930 STARTING TIME = .oo RAIN DEPTH = 2.60 RAIN DURATION = 1.00 ANT. RUNOFF COND. = 2 MAIN TIME INCREMENT = .lOO IiOURS ALTERNATE NO. = 1 STORM NO. = 2 RAIN TABLE NO. = 2
OPERATION ADDHYD XSECTION 7
HYDRDGRAPIi POINTS FOR ALTERNATE = 1, sTDRl4=2 HRS RAIN TIME INCREMENT = .lOO hr, DRAINAGE AREA = 4.41 SQ.341
10.90 CFS 6.39 6.65 7.01 7.50 8.13 a.93 9.99 11.50 11.70 CFS 14 19 30 48 74 107 144 178

TR20 __________---------------------------------------------------------- scs - SAMPLE 5 JOB USES - TWO-24~~ TYPE II STORMS OVER WATERSHED, WITH ECON, VERSIOE; 03/06/92 BF, MOD. S.C.; ALT‘S l=EXIST.. 2=SITES, 3=MOVE SITE, 4=DIVIDE 2.04TES" 07:32:48 PASS 2 -JOB NO. 1 PAGE
12.50 CFS -204 221 13.30 CFS 207 207 14.10 CFS 229 232 14.90 CFS 257 259 15.70 CFS 268 267 16.50 CFS 258 256 17.30 CFS 236 233 18.10 CFS 209 205 18.90 CFS 181 178 19.70 CFS 156 153 20.50-CFS 135 132 21.30 CFS 117 115 22.10 CFS 103 102 22.90 CFS 92.16 90.96 23.70 CFS 83.50 82.56 24.50 CFS 75.18 73.63 25.30 CFS 63.05 61.82 26.10 CFS 53.72 52.59 26.90 CFS 44.67 43.55 27.70 CFS 35.97 34.94 28.50 CFS 28.27 27.40 29.30 CFS 21.96 21.27 30.10 CFS 17.11 16.59 30.90 CFS 13.55 13.18 31.70 CFS 11.04 10.78 32.50 CFS 9.31 9.14 33.30 CFS 8.15 8.03 34.10 CFS 7.37 7.30 34.90 CFS 6.87 6.82 35.70 CFS 6.55 6.51
229 208 236 262 267 253 230 202 175 151 130
~113 100
89.79 81.65 72.00 60.62 51.45 42.44 33.93 26.55 20.61 16.10 12.83 10.54
8.97 7.92 7.23 6.77 6.48
231 228 222 215 209 211 214 217 221 225 240 244 247 251 254 263 265 266 267 267 266 265 264 262 260 251 248 245 242 239 226 223 219 216 212 198 195 191 188 185 172 168 165 162 159 148 145 142 140 137 128 126 123 121 119 112 110 108 106 105
99 97 96 95 93 88.65 87.56 86.49 85.46 84.46 80.77 79.87 78.90 77.83 76.60 70.36 68.75 67.20 65.73 64.34 59.45 58.29 57.14 56.00 54.86 50.32 49.18 48.05 46.92 45.79 41.33 40.23 39.15 38.07 37.01 32.94 31.96 31.01 30.07 29.16 25.73 24.93 24.15 23.40 22.67 19.97 19.36 18.76 18.19 17.64 15.63 15.18 14.75 14.33 13.93 12.50 12.18 11.87 11.58 11.3~ 10.31 10.09 9.88 9.68 9.4.
8.82 8.67 8.53 8.39 8.27 7.82 7.72 7.63 7.54 7.45 7.16 7.09 7.03 6.98 6.92 6.73 6.69 6.65 6.61 6.58
RUNOFF ABOVE BASEFLOW (BASEFLOW = 6.00 CFS)
DURATION (HRS) FLOW(CFS)
OURATION(HRS) FLOW (CFS)
.83 WATERSHED INCHES; 2368 CFS-HRS; 195.7 ACRE-FEET.
3 6 9 12 15 18 21 24 236 195 117 79 44 19 9 7
25 6 BASEFLOW
ZERO DAMAGE DISCHARGE ( 214 CFS) OCCURS AT 4.9 HOURS FLOW DURATION.
--- XSECTION 7, ALTERNATE 1, STORM 2, HYOROGFtAPIi ADDED TO READHO FILE ---
EXECUTIVE CONTROL ENOCMP COMPUTATIONS COMPLETED FOR PASS 2 940

F -ii
TRZ(J -------------------------------------------------------------------- *cs SAMPLE 5 JOB USES - TWO-24HR TYPE II STORMS OVER WATERSHED, WITH ECOB. VERSIO 03/06/92 BF, MOD. S.C.; ALT'S l=EXIST., 2=SITES, 3=MOVE SITE, 4=DIVIDE 2.84TES
:32:4,8 PASS 3 JOB NO. 1 PAGE
STRUCT DATA,
a a a a _ 8 a a a a a 9 ENDTBL
CHANGES TO TABULAR DATA FOLLOW
STRUCT DATA,
; a a a a a a a a a 9 ENDTBL
STRUCTURE 1 ELEVATION
521.50 521.60 521.80 522.00 522.20 522.40 526.20 526.40 526.60 527.20
STRUCTURE 2
EXECUTIVE CONTROL BABFM
EXECUTIVE CQNTROL COMPUT STARTING TIME = .oo ANT. RUNOFF COND. = 2 ALTERNATE NO. = 2
ELEVATION DISCHARGE STORAGE 496.00 .oo 16.00 498.00 210.00 27.00 500.00 252.00 40.00 502.00 294.00 62.00 504.00 336.00 85.00 506.00 378.00 112.00 508.00 420.00 145.00 509.00 441.00 176.00 510.00 556.00 190.00 512.00 1129.00 237.00 514.00 2086.00 285.00 516.00 3288.00 340.00 517.00 4030.00 367.00
DISCHARGE STORAGE .oo 17.00
3.00 18.00 15.00 20.20 33.00 22.50 54.00 25.00 79.00 28.00
948.00 70.00 1009.00 75.00 1071.00 80.00 1265.00 95.00
CONSTANT BASEFLOW = 10.00 CFS l22Q
FROMSTRUCTURE 1 TD STRUCTURE 2. 1230 RAIN DEPTH = 5.20 RAIN DURATION = 2.00 MAIN TINE INCRBBBNT = -100 HOURS STORM NO. = 1 RAIN TABLE NO. = 2

**2(y -------------------------------------------------------------------- scs
SAMPLE 5 JOE USES - TWO-24IiR TYPE If STORMS OVER WATERSHED, WITH ECON, VERSXO 03/06/92 BF, MOD. S.C.; ALT'S l=EXIST., 2=SITES, 3=MOVE SITE, 4=DIVIDE 2.04TES 0?:32:4~8 PASS 3 JOB NO. 1 PAGE
EXECUTIVE CONTROL COMPUT FROX XSECTION 3 TO XSECTION 7 1240 STARTING TIXE = 00
: 2 RAIN DEPTH = 5.20 RAIN DURATION = 1.00
ANT. RUNOFF COND. MAIN TIME INCREMENT = .lOO HOURS ALTERNATE NO. =2 STORM NO. = 1 RAIN TABLE NO. = 2
OPERATION ADDHYD XSECTION 7
HRi HYDROGRLPH POINTS FOR ALTERNATE = 2, STOPS = 1
MAIN TIME INCREMENT = .lOO hr, DRAINAGE AREA = 4.41 SQ.MI 7.60 CFS 10.37 10.55 10.77 11.02 11.30 11.62 11.97 12.35 8.40 CFS 12.76 13.20 13.70 14.24 14.83 15.49 16.21 16.99 9.20 CFS 17.84 18.76 19.73 20.74 21.78 22.86 23.98 25.15
10.00 CFS 26.39 27.73 29.19 30.79 32.57 34.53 36.71 39.12 10.80 CFS 41.80 44.77 48.08 51.77 55.92 60.63 66.03 72.28 11.60 CFS 80 92 114 154 220 310 420 535 12.40 CFS 634 701 736 742 726 693 651 607 13.20 CFS 571 544 523 SO8 496 487 480 474 14.00 CFS 469 465 463 461 459 459 459 459 14.80 CFS 460 ~462 464 467 469 472 475 479 15.60 CFS 482 485 489 493 407 501 505 500 16.40 CFS 512 515 519 522 525 529 532 536 17.20 CFS 537 540 542 544 546 548 549 55 18.00 CFS 551 552 552 553 553 553 552 552 18.80 CFS 551 550 549 547 546 544 542 540 19.60 CFS 538 535 533 530 527 524 521 518 20.40 CFS 514 511 507 504 500 497 493 489 21.20 CFS 485 482 478 474 470 466 462 458 22.00 CFS 454 450 446 442 438 434 430 426 22.80 CFS 422 418 414 410 406 401 397 393 23.60 CFS 390 386 382 378 374 370 366 361 24.40 CFS 356 351 345 339 333 328 322 317 25.20 CFS 311 307 302 297 293 289 285 200 26.00 CFS 276 272 268 265 261 257 253 250 2G.80 CZS 246 242 239 235 232 228 225 222 27.60 CFS 218 215 212 208 205 202 199 196 28.40 CFS 193 190 187 184 181 178 175 172 29.20 CFS 169 167 164 161 159 156 153 151 30.00 CFS 148 146 143 141 138 136 133 131 30.80 CFS 129 127 124 122 120 118 116 114 31.60 CFS 112 109 107 106 104 102 100 98 32.40 CFS 96.16 94.38 92.63 90.90 89.21 87.54 85.90 84.30 33.20 CFS 82.71 81.16 79.64 78.14 76.67 75.22 73.81 72.42 34.00 CFS 71.05 69.71 68.40 67.11 65.84 64.60 63.39 62.19 34.80 CFS 61.03 59.88 58.76 57.66 56.58 55.52 54.49 53.47 35.60 CFS 52.48 51.51 50.55 49.62 48.71 47.81 46.94 46.08 36.40 CFS 45.24 44.42 43.62 42.83 42.06 41.31 40.51 39.85 37.20 CFS 39.15 38.46 37.79 37.13 36.48 35.85 35.24 34.6 38.00 CFS 34.05 33.47 32.91 32.36 31.82 31.30 30.78 30.2.

TR20 -------------------------------------------------------------------- s.s _ sAHPLE 5 JOB USES - TWO-24HR TYPE II STORMS OVER WATERSHED, WITH ECON, VERSION 03/06/92 BF, MOD. S.C.; ALT'S l-EXIST., 2=SITES, 3=HOVE SITE, 4=DIVIDE 2.04TEST
32:48 PASS 3 JOB NO. 1 PAGE 11
38.80 CFS 29.79 29.31 28.85 28.39 27.94 27.51 27.08 26.67 39.60 CFS 26-26 25.86 25.47 25.09 24.73 24.36 24.01 23.67 40.40 CFS 23.33 23.00 22.68 22.37 22.07 21.77 21.48 21.19 41.20 CFS 20.92 20.64 20.38 20.12 19.87 19.62 19.38 19.15 42.00 CFS 18.92 18.70 18.48 18.27 18.06 17.86 17.66 17.47 42.80 CFS 17.28 17.10 16.92 16.75 16.58 16.41 16.25 16.09 43.60 CFS 15.94 15.79 15.64 15.50 15.36 15.23 15.09 14.97 44.40 CFS 14.84 14.72 14.60 14.48 14.36 14.25 14.15 14.04 45.20 CFS 13.94 13.84 13.74 13.64 13.55 13.46 13.37 13.29 46.00 CFS 13.20 13.12 13.04 12.96 12.89 12.81 12.74 12.67
RUNOFF-ABOVE BASEFLOW (BASEFLOW = 10.00 CFS) 2.83 WATERSHED INCHES; 8064 CFS-HRS; 666.4 ACRE-FEET.
DURATION(BRS) 4 8 12 16 20 24 28 32 FLOW (CFS) 530 470 366 205 107 56 32 20
DURATION(BRS) 36 38 FLGW(CFS) 14 13 TRUNCATED
ZERO DAMAGE DISCHARGE ( 214 CFS) OCCURS AT 15.8 HOURS FLOW DURATZON.
--- XSECTION 7, ALTERNATE ,t, STORM 1, HYDROGRAPH ADDED TO READHD FILE --
LnECUTIVE CONTROL ENDCMP COKPUTATIONS COMPLETED FOR PASS 3 la50
EXECUTIVE CONTROL BASFLO CONSTANT BASEFLGW = 8.00 CFS 1260
EXECUTIVE CONTROL COHPUT FROM STRUCTURE 1 TO STRUCTURP 2 1270 STARTING TIME = .oo RAIN DEPTH = 2.60 RAIN DURATION = 1.00 ANT. RUNOFF COND. = 2 MAIN TIHE INCREMENT = .lOO HOURS ALTERNATE NO. = 2 STORH NO. = 2 RAIN TABLE ND. = 2
EXECUTIVE CONTROL COHPUT FROM XSECTION 3 TO XSECTION 7 la80 STARTING TIME = .oo RAIN DEPTH = 2.60 RAIN DURATION = 1.00 ANT. RUNOFF COND. = 2 MAIN TIME INCREMENT = 100 HOURS ALTERNATE NO. = 2 STORM NO. = 2 'RAIN TABLE NO. = 2
OPERATION ADDHYD XSECTION 7
HYDROGRAPH POINTS FOR ALTERNATE = 2, SToRn=t HRS MAIN TIME INCREMENT = .lOO hr, DRAINAGE AREA
10.90 CFS 8.39 8.65 9.01 9.50 10.13 10.94 11.70 CFS 16 21 32 50 76 110
s 4.41 SQ.MI. 11.99 13.51
14t 181

-/ t -
TR20 ----------------------------------------------------------------~--- scs - SAMPLE 5 JOB USES - TWO-24~~ TYPE II STORMS OVER WATERSHED, WITH ECON, VERSIONS 03/M/92 BF, MOD. S.C.; ALT'S l=EXIST., 2=SITES, 3=MOVE SITE, 4=DIVIDE 2.04TES' 07:32:48 PASS 4 JOB NO. PAGE : 1
12.50 CFS 207 225 234 237 235 230 224 220 13.30 CFS 219 220 222 224 227 230 233 236 14.10 CFS 238 241 243 246 248 250 251 253 14.90 CFS 254 255 256 257 257 258 258 257 15.70 CFS 257 256 255 254 253 251 249 247 16.50 CFS 245 243 241 239 236 234 231 228
~17.30 CFS 226 223 220 217 214 211 208 205 18.10 CFS 202 199 196 193 190 187 184 181 18.90 CFS 178 175 173 170 167 164 162 159 19.70 CFS 156 154 151 148 146 144 141 139 20.50.CFS 136 134 132 130 128 126 124 122 21.30 CPS 120 118 116 115 113 111 110 108 22.10 CFS 107 105 104 102 101 100 98 97 22.90 CFS 95.83 94.64 93.49 92.38 91.29 90.23 89.21 88.21 23.70 CFS 87.25 86.31 85.40 84.50 83.59 82.62 81.53 80.28 24.50 CFS 78.85 77.28 75.62 73.95 72.31 70.71 69.18 67.74 25.30 CFS 66.39 65.09 63.82 62.57 61.34 60.12 58.92 57.72 26.10 CFS 56.54 55.36 54.20 53.06 51.92 50.80 49.69 48.60 26.90 CFS 47.52 46.45 45.40 44.37 43.35 42.34 41.35 40.38 27.70 CFS 39.43 38.49 37.58 36.68 35.80 34.93 34.09 33.26 28.50 CFS ~32.45 31.66 30.89 30.14 29.40 28.68 27.99 27.31 29.30 CFS 26.65 26.00 25.38 24.77 24.19 23.61 23.06 22.52 30.10 CFS 22.00 21.50 21.01 20.55 20.09 19.65 19.,23 18.82 30.90 CES 18.42 18.04 17.68 17.32 16.98 16.65 16.34 16.0? 31.70 CFS 15.74 15.46 15.18 14.92 14.67 14.43 14.20 13.9, 32.50 CFS 13.76 13.55 13.35 13.16 12.98 12.81 12.64 12.47 33.30 CFS 12.32 12.17 12.02 11.88 11.75 11.62 11.50 11.38 34.10 CFS 11.27, 11.16 11.05 10.95 10.85 10.76 10.67 10.58 34.90 CFS 10.50 10.41 10.34 10.26 10.19 10.12 10.06 9.99 35.70 CFS 9.93 9.87 9.81 9.76 9.70 9.65 9.60 9.55 36.50 CFS 9.50 9.46 9.42 9.37 9.33 9.29 9.26 9.22 37.30 CFS 9.18 9.15 9.12 9.09 9.05 9.02 8.99 8.97 38.10 CFS 8.94 8.91 8.89 8.86 8.84 8.81 8.79 8.77 38.90 CFS 8.75 8.73 8.71 8.69 8.67 8.65 8.63 8.62 39.70 CFS 8.60 8.58 8.57 8.55 8.54 8.52 8.51 8.49
RUNOFF ABOVE BASEFLOW (BASEFLOW = 8.00 CFS) .83 WATERSHED INCnES; 2368 CFS-?iRS; 195.7 ACRE-FEET.
DURATION(HRS) 3 6 9 12 15 18 21 24 FLOW(CFS) 236 190 120 83 46 23 14 10
DURATION(HRB) 27 29 FLOW(CFS) 9 8 BASEFLOW
ZERO DAMAGE DISCHARGE ( 214 CFS) OCCURS AT 5.2 HOURS FLOW DURATION.
--- XSECTION 7, ALTERNATE 2, STORM 2, HYDROGRAPH ADDED TO READHD FILE ---

TRZO ___-_--------------------------------------------------------------- scs -
SAMPLE 5 JOB USES - TWO-24HR TYPE II STORMS OVER WATERSHED, WITH ECON, VERSIOE "l/06/92 BF, MOD. S.C.; ALT'S l=EXIST., 2=SITES, 3=MOVE SITE, 4=DIVIDE 2.DQTEST
,:32:40 PASS 5 JOE NO. 1 PAGE 1s
EXECUTIVE CONTROL ENDCRP COKPUTATIONS COMPLETED FOR PASS 4 1290
'm20 __-___-------------------------------------------------------------- scs _ SAMPLE 5 JOB USES - TWO-24IiR TYPE II STORMS OVER WATERSHED, WITH ECON, VERSIOZ; 03/06/92 BF, MOD. S.C.; ALT'S l=EXIST., 2=SITES. 3=MOVE SITE, 4=DlVIDE 2.04TESI 07:32:48 PASS 5 -JOB NO. 1 PAGE 3.4
CHANGES TO TABULAR DATA FOLLOW
STRUCT DATA,
- EBDTBL
STRUCT DATA,
8 8 a 8 a a 9 ENDTBL
STRUCTURE 2 ELEVATION
STRUCTURE 3 ELEVATION
484.00 488.00 492.00 495.00 498.00 500.00
DISCHARGE STORAGE
DISCHARGE STORAGE .oo 5.30
32.00 a.00 40.00 14.00 45.00 27.00 48.00 48.00 52.00 80.00

TR2O -------------------------------------------------------------------- scs
SAMPLE 5 JOB USES - TWO-24HR TYPE II STORMS OVER WATERSHED, WITH ECON, VERSIOi 03/06/92 BF, ROD. S.C.; ALT'S l=EXIST., 2=SITES, 3=ROVE SITE, 4=DIVIDE 2.04TEC 07:32:40 PASS 5 JOB NO. 1
CHANGES TO STANDARD- CONTROL LIST FOLLOW
PAGE
EXECUTIVE CONTROL INSERT XSECTION 2
STANDARD CONTROL OPERATION RUNOFF STRUCTURE 3 OUTPUT HYDRDGRAPH = 6 DATA FIELDS = .1500 OUTPUT OPTIONS IN EFFECT SUM
STANDARD CONTROL OPERATION RESVOR STRUCTURE 3 INPUT HYDROGRAPH = 6 OUTPUT HYDRffiRAPH = 7 DATA FIELDS = .oooo OUTPUT OPTIONS IN EFFECT SUM
1400
1410 78.0000 1.6000
1420
.oooo .oooo
EXECUTIVE CONTROL DELETE
STANDARD CONTROL OPERATION RUNOFF STRUCTURE 2
STANDARD CONTROL OPERATION RESVOR STRUCTURE 2
EXECUTIVE CONTROL ALTER
STANDARD CONTROL OPERATION REACH XSECTION 3 INPUT HYDROGRAPH = 7 OUTPUT HYDROGRAPH = 2 DATA FIELDS = 2000.0000 OUTPUT OPTIONS IN EFFECT SUM
1430
1440
1450
146
1470
1.2000 1.1000
EXECUTIVE CONTROL DF.LFTE 1480
STANDARD CONTROL OPERATION RUNOFF XSECTION 3 1490
STANDARD CONTROL OPERATION ADDHYD XSECTION 3 1500

l-R.20 -------------------------------------------------------------------- scs -
SAMPLE 5 JOB USES - TWO-24HR TYPE II STORMS OVER WATERSHED, WITH ECON, VERSIOb -'106/92 BF, MOD. S.C.; ALT'S l=EXIST., 2=SITES, 3=MOVE SITE, 4=DIVIDE 2.04TES".
;32:48 PASS 5 JOB NO. 1 PAGE It
EXECUTIVE CONTROL LIST 1. 0.
LISTING OF CURRENT DATA
6 RUNOFF 1 6 RESVOR 2 6 REACH 3 6 RUNOFF 1 6 ADDHYD 4 6 REACH 3 6 RUNOFF 1 6 RESVOR 2 6REACH 3 6 ADDHYD 4
REACH 3 SAVHOV 5
6REACH 3 6 RUNOFF 1 6 ADDHYD 4 6REACH 3 6 RUNOFF 1 6 ADDHYD 4 6 SAVHOV 5
ENDATA
1 6 16 7
17 5 1 6 1 567 2 71
3 6 36 7
7 2 123
3 4 5 6 6 6 6 7 7 7 8
3 5 5 7 7 5
6 567 7 5
6 564 4 1
STANDARD CONTROL INSTRUCTIONS
1.2000 0000
5400:0000 .4600
75.0000
.oooo 76.0000
3000.0000 .7500 * 0000
2000.0000
.oooo 78.0000
1.2000
2600.0000 .oooo
4900.0000 1.3000
.oooo 79.0000
8900.0000 .oooo .7000 80.0000
0. 1519
.33000 0 0 0 0 1 000001
.ooooo 0 0 0 0 1 '1.07000 0 0 0 0 1
000001 .ooooo 0 0 0 Cl 1
1.60000 0 0 0 0 1 000001
1.10000 0 0 0 0 1 000001
.ooooo 0 0 0 0 1
.ooooo 0 0 0 0 1 2.00000 0 0 0 0 1
000001 7900.00000 0 0 0 0 1
1.20000 0 0 0 0 1 010111
END OF LISTING

TR** ----------------------------------- --------------------------------- scs
SAMF’LE 5 JOB USES - TWO-24HR TYPE II STORMS OVER WATERSHED, WITH ECON, VERSIO 03/06/92 BF, MOD. S.C.; ALT'S l=EXIST., 2=SITES, 3=MOVE SITE, 4=DIVIDE 2.04TE' 07:32:48 PASS 5 JOB NO. 1 PAGE
EXECUTIVE CONTROL BASFLO CONSTANT BASEFLOW = 6.00 CFS 1520
EXECUTIVE CONTROL COBPUT FROM STRUCTURE 1 TO XSECTION 7 1530 STARTING TIHE = 00 ANT. RUNOFF COND. : 2
RAIN DEPTH = 5.20 RAIN DURATION = 1.00 MAIN TIME INCREMENT = .lOO HOURS
ALTERNATE NO. = 3 STORM NO. = 1 RAIN TABLE NO. = 2
OPERATION ADDHYD XSECTION 7
HRS HYDROGRAFH POINTS FOR ALTERNATE = 3, STORM
HAIN TIME INCREMENT = .lOO hr. DRAINAGE AREA = 7.60 CFS 6.37 6.55 6.77 7iO2 7.30 8.40 CFS 8.76 9.21 9.70 10.25 10.84 9.20 CFS 13.87 14.79 15.77 16.78 17.84
10.00 CFS 22.48 23.83 25.30 26.91 28.70 10.80 CFS 37.98 40.97 44.28 47.99 52.16 11.60 CFS 76 89 110 150, 216 12.40 CFS 631 699 734 741 725 13.20 CFS 572 546 526 511 499 14.00 CPS 472 468 465 463 461 14.80 CFS 459 460 461 462 464 15.60 CFS 470 472 474 476 478 16.40 CF.9 484 485 487 488 489 17.20 CPS 492 492 493 493 493 18.00 CFS 491 490 489 488 487 18.80 CFS 480 478 476 474 472 19.60 CFS 461 458 455 452 449 20.40 CFS 436 433 430 426 423 21.20 CFS 409 406 403 399 396 22.00 CFS 383 379 376 373 369 22.80 CFS 357 353 350 347 344 23.60 CFS 332 329 326 323 320 24.40 CFS 306 302 297 292 287 25.20 CFS 269 265 262 258 255 26.00 CFS 242 239 235 232 230 26.80 CFS 218 215 213 210 208 27.60 CFS 197 195 193 190 188 28.40 CFS 179 176 174 172 170 29.20 CFS 162 160 158 156 154 30.00 CFS 146 145 143 141 139 30.80 CFS 133 131 130 128 127 31.60 CFS 121 119 118 117 115 32.40 CFS 110 109 108 106 105 33.20 CFS 101 100 99 98 97 34.00 CFS 92.75 91.83 90.93 90.05 89.19 34.80 CFS 85.89 85.11 84.34 83.59 82.86 35.60 CFS 80.05 79.39 78.74 78.10 77.47
7.62 11.50 18.92 30.67 56.88
307 693 490 460 465 479 490 493 485 469 446 420 393 366 341 317 282 251 227 205 185 168 152 138 125 114 104
96 88.34 82.13 76.86
=1 4.41 SQ.MI
9.35 7.97 L2.23 to.05 32.87 52.30
417 652 483 459 467 481 491 492 484 467 443 416 389 363 338 314 278 248 224 202 183 166 150 136 124 113 103
95 87.51 81.43 76.26
13.02 21.23 35.29 68.57
532 608 477 4: 46. 483 491 492 482 464 440 413 386 360 335 310 273 245 221 200 181 164 148 134 122 111 102
94 86.6" 80.' 75.65

TR*Q -------------------------------------------------------------------- s(.s
SAMPLE 5 JOB USES - TWO-24HR TYPE II STORMS OVER WATERSHED, WITH ECON, VERsxo: 03/06/92 BF, MOD. S.C.; ALT'S l=EXIST., 2=SITES, 3=MOVE SITE, 4=DIVIDE 2.04TES'
132~48 PASS 5 JOB NO. 1 PAGE 1
36.40 CFS 75.09 74.53 73.97 73.43 72.90 72.38 71.86 71.36 37.20 CFS 76.87 70.39 69.92 69.46 69.00 68.56 68.12 67.69 38.00 CFS 67.27 66.86 66.45 66.05 65.66 65.27 64.89 64.52 38.80 CFS 64.16 63.80 63.45 63.10 62.76 62.42 62.09 61.77 39.60 CFS 61.45 61.13 60.82 60.52 60.22 59.92 59.62 59.33 40.40 CFS 59.04 58.76 58.47 58.19 57.91 57.64 57.36 57.09 41.20 CFS 56.82 56.55 56.28 56.01 55.74 55.47 55.19 54.92 42.00 CFS 54.64 54.36 54.07 53.78 53 .48 53.17 52.86 52.54 42.80 CFS 52.22 51.88 51.53 51.18 50.82 50.45 50.07 49.68 43.60 CFS 49.28 48.87 48.45 48.03 47.59 47.15 46.70 46.24 44.49 CFS 45.78 45.31 44.83 44.35 43.86 43.37 42.87 42.37 45.20 CFS 41.86 41.35 40.84 40.33 39.81 39.29 38.78 38.26 46.00 CFS 37.74 37.22 36.70 36.19 35.67 35.16 34.65 34.14
RUNOFF ABOVE BASEFLOW (BASEFLOW = 6.00 CFS) 2.80 WATERSHED INCHES; 7973 CFS-HRS; 658.9 ACRE-FEET.
DURATION(HRS) 3 6 9 12 15 18 21 24 FLOW(CFS) 488 465 409 314 213 148 105 79
DURATION(HRS) 27 30 33 36 FLOW(CFS) 65 57 47 34 TRUNCATED
ZERO DAMAGE DISCHARGE ( 214 CFS) OCCURS AT 15.1 HOURS FLOW DURATION.
--- XSECTION 7, ALTERNATE 3, STORM 1, HYDROGRAPH ADDED TO READHD FILE ---
EXECUTIVE CONTROL ENDCMP COMPUTATIONS COMPLETED FOR PASS 5 1540
EXECUTIVE CONTRh BASFM CONSTANT BASEFLOW = 6.00 CFS 1550
EXECUTIVE CONTROL COMPUT FROM STRUCTURE 1 TO XSECTION 7 1560 STARTING TIHE = .oo RAIN DEPTH = 2.60 RAIN DURATION = 1.00 ANT. RUNOFF COND. = 2 HAIN TIME INCRMENT = .lOO HOURS ALTERNATE NO. = 3 STORM NO. = 2 RAIN TABLE NO. = 2
OPERATION ADDHYD XSECTION 7
HYDROGRAPH POINTS FOR ALTERNATE = 3, STORM=2 HRS MAIN TIMB INCREMENT = -100 hr, DRAINAGE AREA = 4.41 !sQ.nr.
10.90 CFS 6.39 6.65 7.01 7.50 8.13 8.94 9.99 11.52 11.70 CFS 14 19 30 48 74 108 14.5 179 12.50 CFS 205 222 231 233 231 225 218 213 13.30 CFS 211 210 211 212 214 215 217 219 14.10 CFS 221 222 224 225 226 228 229 230

TR20 _------------------------------------------------------------------- scs -
SAMPLE 5 JOB USES - TWO-24HR TYPE II STORMS OVER WATERSHED, WITH ECoN, VERSIOf 03/06/92 BF, UOD. S.C.; ALT'S l=EXIST., 2=SITES, 3=MoVE SITE, 4=DIVIDE 2.04TEC 07.~32~48 PASS 6 JOE NO. 1 PAGE
14.90 CFS -230 15.70 CFS 232 16.50 CFS 223 17.30 CFS 209 18.10 CFS 192 18.90 CFS 175 19.70 CFS 158 20.50 CFS 143 21.30 CFS 131 22.10 CFS 120 22.94 CFS 110 23.70 CFS 100 24.50 CFS 89.82 25.30 CFS 74.76 26.10 CFS 62.69 26.90 CFS 52.01 27.70 CFS 42.57 28.50 CFS 34.38 29.30 CFS 27.50 30.10 CFS 21.95 30.90 CFS 17.67 31.70 CPS 14.48 32.50 CFS 12.17 33.30 CFS 10.51 34.10 CFS 9.32 34.90 CFS 8.48 35.70 CFS 7.88 36.50 CFS 7.44 37.30 CFS 7.11 38.10 CFS 6.87 38.90 CFS 6.69 39.70 CFS 6.55
231 231 222 207 190 172 156 142 129 118 109
99 87.93 73.15 61.28 50.76 41.48 33.45 26.73 21.35 17.22 14.15 11.93 10.34
9.20 8.40 7.82 7.39 7.08 6.85 6.67 6.53
232 230 220 205 187 170 154 140 128 117 107
98 85.95 71.58 59.90 49.53 40.40 32.54 25.99 20.77 16.78 13.83 11.70 10.17
9.09 8.31 7.76 7.35 7.05 6.82 6.65 6.52
232 229 218 203 185 168 153 138 126 116 106
97 83.94 70.04 58.53 48.32 39.35 31.65 25.26 20.21 16.36 13.52 11.48 10.02
8.98 8.23 7.70 7.30 7.01 6.80 6.63 6.50
232 228 216 200 183 166 151 137 125 115 105
96 81.97 68.53 57.19 47.13 38.32 30.77 24.56 19.66 15.96 13.23 11.27
9.87 8.87 8.16 7.64 7.26 6.98 6.77 6.61 6.49
232 227 214 198 181 164 149 135 124 113 104
95 80.04 67.04 55.86 45.96 37.30 29.92 23.88 19.14 15.57 12.95 11.06
9.72 8.77 8.08 7.59 7.22 6.95 6.75 6.60
232 232 226 225 213 211 196 194 179 177 162 160 147 145 134 132 122 121 112 111 103 102
93 92 78.19 76.43 65.57 64.12 54.56 53.27 44.81 43.68 36.31 35.33 29.09 28.29 23.22 22.58 18.63 18.14 15.19 14.83 12.68 12.42 10.87 10.69
9.58 9.4 8.67 8.5. 8.01 7.94 7.53 7.49 7.19 7.15 6.93 6.90 6.73 6.71 6.58 6.56
RUNOFF ABOVE BASEFLOW (BASEFLOW = 6.00 CFS) .84 WATERSHED INCHES; 2378 CFS-HRS; 196.5 AC&-FEET.
DURATION(HBS) 3 6 9 12 15 18 21 24 FLOW(CFS) 221 183 131 95 50 23 12 8
DURATION(IiRS) 27 29 FLOW(CFS) 7 6 BASEFLOW
ZERO DAMAGE DISCHARGE ( 214 CFS) OCCURS AT 3.9 HOURS FLOW DURATION.
--- XSECTION 7, UT-ATE 3, smw 2, HYDROCEUPH ADDED TO mwmi FILE ---

TR20 ----_____----------------------------------------------------------- SC- - SAMPLE 5 JOB USES - TWO-24HR TYPE II STORMS OVER WATERSHED, WITH ECON, VERSIO? n3/06/92 BF, MOD. S.C.; ALT'S l=EXIST., 2=SITES, 3=MOVE SITE, 4=DIVIDE ~2.04TES3
:32:48 PASS 7 JOB NO. 1 PACE 2c
EXECUTIVE CONTROL ENDCMP COMPUTATIONS COMPLETED FOR PASS 6 1570

TR20 ------------------------------------- ---------------___------------- scs -
SAMPLE 5 JOB USES - TWO-24HR TYPE II STORMS OVER WATERSHED, WITH ECON, VERSION 03/06/92 BF, KOD. S.C.; ALT'S l=EXIST., 2=SITES, 3=MOVE SITE, 4=DIVIDE 2.04TE.C- 07~32~48 PASS 7 JOB NO. 1 PAGE
CHANGES TO TABULAR DATA FOLLOW
STRUCT DATA, STRUCTURE 1 ELEVATION DISCHARGE STORAGE
9 ENDTBL
STRUCT DATA, STRUCTURE 3 ELEVATION DISCHARGE STORAGE
9 ENDTBL
XSECT DATA - XSECTION
a 8 a a 8 8 8 8 9 ENDTBL
a DRAINAGE BANKFULL ZERO LOW
AREA DAMAGE GROUND 1.00 494.50 494.30 493.30
ELEVATION DSSCHARGE END AREA 492.00 .oo .oo 493.00 21.00 23.00 494.00 64.00 52.00 495.00 133.00 87.00 496.00 232.00~ 128.00 497.00 360.00 175.00 498.00 515.00 228.00 500.00 827.00 405.00

TR20 __------------------------------------------------------------------ p-s SAMPLE 5 JOB USES - TWO-24HR TYPE II STORMS OVER WATERSHED, WITH ECON, VERSIO! e-/06/92 BF, MOD. S.C.; ALT'S l=EXIST., 2=SITES, 3=MOVE SITE, 4=DIVIDE 2.04TES
.32:48 PASS 7 JOB NO. 1 PAGE 2:
CHANGES TO STAND& CONTROL LIST FOLLOW
EXECUTIVE CONTROL INSERT XSECTION 5
STANDARD CONTROL OPERATION DIVERT XSECTION 5 INPUT HYDROGRAPH = 5 OUTPUT HYDROGRAPHS = 7,l DATA FIELDS =
' 0000
OUTPUT OPTIONS IN EFFECT HYD FILE SUM
1720
1730
.9000 8.0000
EXECUTIVE CONTROL DELETE 1740
STANDARD CONTROL OPERATION SAVMOV XSECTION 6 1750
EXECUTIVE CONTROL INSERT XSECTION 7
STANDARD CONTROL OPERATION REACH XSECTION 8 INPUT HYDROGRAPH = 1 OUTPUT HYDROGRAPH = 2 DATA FIELDS = 17000.0000 OUTPUT OPTIONS IN EFFECT PEAK SUM
1760
1770
.OOOO 17200.0000
l UESShGE - XSECTION 8 FLOODPLAIN LENGTH EXCEEDS CHANNEL LENGTH. +**
STANDARD CONTROL OPERATION ADDHYD XSECTION 9 1780 INPUT HYDROGRAPHS = 2,4 OUTPUT HYDROGRAPH = 7 DATA FIELDS = .oooo .oooo .a000 OUTPUT OPTIONS IN EFFECT PEAK HYD DUR FILE SUM

TR20 _------------------------------------------ -----------------___----- s(-s - SAMPLE 5 JOB USES - TWO-24HR TYPE II STORMS OVER WATERSHED, WITH ECON, VERSION 03/06/92 BF, MOD. S.C.; ALT'S l=EXIST., 2=SITES, 3=MOVE SITE, 4=DIVIDE 2.04TES" 07:32:48 PASS 7 JOB NO. 1 PAGE
EXECUTIVE CONTROL LIST 1. 0. 0. 1790
LISTING OF CURRENT DATA
STANDARD CONTROL INSTRUCTIONS
6 RUNOFF 1 6 RESVOR 2 6 REACH 3 6 RUNOFF 1 6 ADDHYD 4 6REACH 3 6 RUNOFF 1 6 RESVOR 2 6REAcH,3 6 ADDEYD 4 6RFACH 3 6 DIVERT6 6REiACH 3 6 RUNOFF 1 6 ADDHYD 4 6REACH 3 6 RUNOFF 1 6 ADDHYD 4 6 REACH 3 6 ADDHYD 4 6 SAVMOV 5
ENDATA
1 6 16 7
17 5 1 6 1 567 2 7 1
3 3~6 ;
3 7 2 4 123 5 3 5 5 571 6 7 5 6 6 6 567 7 7 5 7 6 7 564 8 12 9 247 8 4 1
1.2000 .oooo
5400.0000 .4600
75.0000
.oooo 76.0000
3000.0000 .7500 .oooo
2000.0000
.oooo 78.0000
1.2000
2600.0000 .oooo
4900.0000 1.3000
.oooo
.9000 0000
79: ooog
8900.0000 .oooo .7000 80.0000
17000.0000 .oooo
.33000 0 0 0 0 1 000001
.ooooo 0 0 0 0 1 1.07000 0 0 0 0 1
000001 .ooooo 0 0 0 0 1
1.60000 0 0 0 0 1 000001
1.10000 0 0 0 0 1 000001
. 00000 0 0 0 0 1 8.00000 1 0 0 1 1
00000 0 0 0 0 1 2:ooooo 0 0 0 0 1
000001 7900.00000 0 0 0 0 1
1.20000 0 0 0 0 1 010111
17200.00001 0 0 0 0 1 110111
END OF LISTING

TR20 ---------------------------------- -----------------__--------------- scs SAMPLE 5 JOE USES - TWO-24HR TYPE II STORMS OVER WATERSHED, WITH ECON, VERSIO -q/06/92 BF, MOD. S.C.; ALT's l=EXIST., 2=SITES, 3=MOVE SITE, 4=DIVIDE 2.04TES
~32~48 PASS 7 JOB NO. 1 PAGE 2
EXECUTIVE CONTROL BASFLO TRIANGLE VOLUME = .20 IN., 1800 PEAX TIME = 15.0 BRS., BASE = 25. HRS.
EXECUTIVE CONTROL COMPUT FROM STRUCTURE 1 TO XSECTION 9 1810 STARTING TIME = .oo RAIN DEPTH = 5.20 RAIN DURATION = 1.00 ANT. RUNOFF COND. = 2 MAIN TIME INCREMENT = 100 HOURS ALTERNATE NO. = 4 STORM NO. = 1 'RAIN TABLE NO. = 2
OPERATION DIVERT XSEmION 5 OUTPUT #l HYDROGRAPH
HRS HYDROGRAPH POINTS FOR ALTERNATE = 4, STORM = 1
MAIN TIME INCREMENT = .lOO hr. DRAINAGE AREA = 2.17 SQ.MI 9.20 CFS .44
10.00 CFS 2.39 10.80 CFS 9.01 11.60 CFS 20.19 12.40 CFS 37 13.20 CFS 138 14.00 CFS 354 14.80 CFS 348 15.60 CFS '256 16.40 CFS 180 17.20 CFS 132 18.00 CFS 102 18.80 CFS 86.28 19.60 CFS 75.79 20.40 CFS 68.65 21.20 CFS 63.32 22.00 CFS 59.18 22.80 CFS 56.28 23.60 CFS 54.29 24.40 CFS 52.85 25.20 CFS 51.32 26.00 CFS 45.67 26.80 CFS 37.78 27.60 CFS 28.91 28.40 CFS 22.94 29.20 CFS 19.21 30.00 CFS 16.54 30.80 CFS 12.99 31.60 CFS 10.19 32.40 CFS 7.78 33.20 CFS 5.60 34.00 CFS 3.76 34.80 CFS 2.31 35.60 CFS 1.29 36.40 CFS .69
55 2:90
68 3:49
10.30 11.71 21.52 22.99
40 44 169 200 366 373 336 324 245 234 173 166 127 123 100 98
84.71 83.22 74.75 73.76 67.91 67.19 62.74 62.17 58.76 58.35 55.99 55.71 54.09 53.89 52.70 52.54 50.93 50.44 44.67 43.66 36.84 35.54 28.00 27.14 22.37 21.84 18.85 18.51 16.04 15.55 12.60 12.23
9.87 9.56 7.49 7.21 5.35 5.11 3.56 3.36 2.15 2.01 1.20 1.11
.64 .59
.85 1.05 4.17 4.94
13.26 14.95 24.62 26.44
50 59 233 265 376 375 313 301 223 213 160 153 119 115
95 93 81.81 80.48 72.82 71.92 66.50 65.83 61.62 61.10 57.97 57.60 55.44 55.19 53.71 53.53 52.38 52.22 49.86 49.17 42.64 41.63 34.29 33.10 26.33 25.57 21.34 20.86 18.19 17.88 15.09 14.64 11.87 11.52
9.25 8.95 6.93 6.65 4.87 4.63 3.17 2.98 1.87 1.74 1.03 .95
.54 .50
1.30 1.60 1.96 5.81 6.77 7.84
16.80 17.90 18.99 28.48 30.82 33.60
72 89 110 292 315 337 372 366 357 290 279 267 203 195 187 14s 142 137 111 108 105
91 90 88 79.21 78.01 76.87 71.05 70.22 69.42 65.17~ 64.54 63.92 60.59 60.10 59.63 57.26 56.93 56.60 54.95 54.72 54.50 53.35 53.18 53.02 52.05 51.85 51.62 48.39 47.54 46.63 40.63 39.66 38.7C 31.96 30.89 29.81 24.85 24.18 23.54 20.42 19.99 19.55 17.58 17.30 17.03 14.20 13.78 13.3E 11.1s 10.84 10.51
8.65 8.35 8.06 6.38 6.11 5.85 4.41 4.19 3.97 2.81 2.63 2.46 1.62 1.50 1.35
.88 .81 .7E

F-31 *RZO -----------------___------------------------------------------------ scs -
SANPLE 5 JOB USES - TWO-24HR TYPE II STORMS OVER WATERSHED, WITH ECON, VERSIOK 03/06/92 BF, MOD. S.C.; ALT'S l=EXIST., 2=SITES, 3=MOVE SITE, 4=DIVIDE 2.04TEST 07:32:40 PASS 7 JOB NO. 1 PAGE Z
RUNOFF INCLUDING-TRIANGULAR BASEFLOW 1.35 WATERSHED INCHES; 1889 CFS-HRS; 156.1 ACRE-FEET.
--- XSECTION 5, ALTERNATE 4, STORK 1, HYDROGRAPH ADDED TO READHD FILE ---
HYDROGRAPH POINTS FOR ALTERNATE = 4. STORM = 1 HRS
11.30 CFS 12.10 CFS 12.90.CFS 13.70 CFS 14.50 CFS 15.30 CFS 16.10 CFS 16.90 CFS 17.70 CFS 18.50 CFS 19.30 CFS 20.10 CFS 20.90 CFS 21.70 CFS 22.50 CFS 23.30 CFS 24.10 CFS 24.90 CFS 25.70 CFS 26.50 CFS 27.30 CFS 28.10 CFS 28.90 CFS 29.70 CFS
MAIN TIME INCRMENT = .lOO hr. .oo .94 2.09
12.06 14.51 17.43 99 139 190
478 510 532 565 ,560 552 476 460 444 357 3~43 329 259 250 240 193 186 180 146 142 138 117 114 111
97.44 95.46 93.56 83.45 al.94 80.47 72.54 71.37 70.26 64.61 63.84 63.13 59.59 59.10 58.63 56.16 55.79 55.43 53.35 52.94 52.43 45.50 43.66 41.70 28.81 26.71 24.66 15.71 14.58 13.51
8.24 7.53 6.87 3.59 3.14 2.72
. 61 .32
3135 21.12
242 548 542 429 316 232 173 134 109
91.73 79.04 69.19 62.46 58.17 55.09 51.79 39.63 22.69 12.50
6.24 2.32
DRAINAGE AREA = .24 SQ.MI. 4.74 6.29
27.61 36.71 297 351 560 566 532 520 414 399 304 292 223 215 167 162 130 126 106 104
89.96 88.26 77.65 76.31 68.18 67.22 61.83 61.23 57.74 57.32 54.75 54.41 50.95 49.91 37.49 35.32 20.83 19.46 11.55 10.65
5.64 5.08 1.94 1.59
8.00 9.91 49.93 69.62
399 441 569 569 506 491 385 371 280 270 207 200 156 151 123 120 102 99
86.60 85.00 75.00 73.75 66.30 65.43 60.65 60.11 56.92 56.5- 54.07 53.7. 48.64 47.16 33.13 30.96 18.15 16.90
9.80 9.00 4.55 4.06 1.25 .92
RUNOFF INCLUDING TRIANGULAR BASEFLOW 16.97 WATERSHED INCHES; 2639 CFS-HR.9 218.1 ACRE-FEET.
--- XSECTION 8, ALTERNATE 4, STORM 1, HYDROGRAPH ADDED TO READHD FILE ---
OPERATION ADDHYD XSECTION 7
HYDROGRAPH POINTS FOR ALTERNATE = 4, STORM=1 HRS MAIN TIME INCRMENT = .lOO hr, DRAINAGE AREA = 4.17 7.40 CFS .42 .5? .?? 1.00 1.28 1.60 1.95 8.20 CFS 2.74 3.19 3.66 4.17 4.73 5.33 5.99, 9.00 CFS 7.50 8.35 9.26 10.24 11.27 12.35 13.46 9.80 CFS 15.79 17.02 18.33 19.74 21.27 22.95 24.81
10.60 CFS 29.10 31.59 34.34 37.38 40.76 44.52 48.73 11.40 CFS 59 65 73 85 107 147 212 12.20 CFS 409 522 618 682 713 716 696 13.00 CFS 620 576 542 517 499 488 479 13.80 CFS 469 467 466 464 463 462 462 14.60 CFS 461 461 462 462 463 464 464
SQ.MI. 2.33 6.71
14.60 26.85 53.49
30' 6f 472 462 465

F-32 TR20 _--__--------------------------------------------------------------- scs - SAMPLE 5 JOB USES - TWO-24HR TYPE 11 STORMS OVER WATERSHED, WITH ECON, VERSION "!06/92 BF, MOD. S.C.; ALT'S l=EXIST., 2=SITES, 3=MOVE SITE, 4=DIVIDE 2.04TEST
.32:48 PASS 7 JOB NO. 1
15.40 CFS -465 465 16.20 CFS 465 464 17.00 CFS 453 451 17.80 CFS 432 429 18.60 CFS 403 399 19.40 CFS 370 366 20.20 CFS 337 333 21.00 CFS 305 302 21.80 CFS 277 274 22.60 CFS 252 249 23.40 CFS 230 227 24.20 CFS 210 207 25.00 CFS 179 176 25.80 CFS 155 153 26.60 CFS 136 134 27.40 CFS 119 117 28.20 CFS 104 102 29.00 CFS 90.05 88.40 29.80 CFS 77.42 75.93 30.60 CFS 66.10 64.77 31.40 CFS 56.00 54.81 32.20 CFS 47.24 46.25 33.00 CFS 39.79 38.93 33.80 CFS 33.36 32.62 34.60 CFS 27.80 27.16 35.40 CFS 22.99 22.43 36.20 CFS 18.84 18.37 37.00 CFS 15.30 14.90 37.80 CFS 12.31 11.98 38.60 CFS 9.83 9.55 39.40 CFS 7.79 7.57 40.20 CFS 6.15 5.97 41.00 CFS 4.82 4.68 41.80 CFS 3.77 3.66 42.60 CFS 2.94 2.85 43.40 CFS 2.29 2.22 44.20 CFS 1.77 1.72 45.00 CFS 1.37 1.33 45.80 CFS 1.06 1.03 46.60 CFS .a2 .79
PAGE 26
466 466 466 466 466 465 463 461 460 458 457 455 448 446 444 441 438 435 425 422 418 415 411 407 395 391 387 383 379 375 362 358 354 349 345 341 329 325 321 317 313 309 298 294 291 287 284 281 271 268 264 261 258 255 246 244 241 238 235 233 225 222 220 218 215 213 204 200 196 192 188 183 172 169 166 163 161 158 150 148 146 143 141 139 132 130 128 125 123 121 115 113 111 110 108 106 100 99 -97 95 93 92
86.78 65.17 83.58 82.01 80.46 78.93 74.47 73.02 71.59 70.19 68.80 67.44 63.46 62.18 60.91 59.65 58.42 57.20 53.65 52.49 51.35 50.30 49.27 48.25 45.27 44.32 43.38 42.46 41.55 40.66 38.09 37.27 36.46 35.66 34.88 34.12 31.89 31.18 30.48 2~9.79 29.11 28.45 26.53 25.91 25.31 24.71 24.13 23.55 21.89 21.36 20.84 20.32 19.82 19.33 17.90 17.44 17.00 16.56 16.13 15.71 14.50 14.12 13.74 13.37 13.01 12.66 11.65 11.32 11.01 10.70 10.41 10.11
9.28 9.02 8.76 8.51 8.26 8.03 7.35 7.13 6.93 6.72 6.53 6.33 5.79 5.62 5.45 5.29 5.13 4.97 4.54 4.40 4.27 4.14 4.01 3.89 3.55 3.44 3.33 3.23 3.13 3.04 2.76 2.68 2.59 2.51 2.44 2.36 2.15 2.08 2.02 1.95 1.09 1.83 1.66 1.61 1.56 1.51 1.47 1.42 1.29 1.25 1.21 1.17 1.13 1.10
.99 .96 .93 .90 .a7 .a4
RUNOFF INCLUDING TRIANGDLAR BASEFLOW 2.24 WATERSHED INCHES; 6022 CFS-HRB; 497.7 ACRE-FEET.
DDl?ATION(HRS) FLoW(CFS)
4 a 12 16 20 24 28 32 461 337 213 110 56 28 13 5
DURATION(HRB) 36 39 FLoW(CFS) 2 1 TRUNCATED

TR20 -------------------------------------------------------------------- scs - SAMPLE 5 JOB USES - TWO-24HR TYPE II STORMS OVER WATERSHED, WITH ECON, VERSIOP 03/06/92 BF, MOD. S.C.; ALT'S l=EXIST., 2=SITES, 3=MOVE SITE, 4=DIVIDE 2.04TE.C' 07:32:48 PASS 7 JOB NO. 1 PAGE .
ZERO DAMAGE DISC&GE ( 214 CFS) OCCURS AT 12.1 HOURS FLOW DURATION.
--- XSECTION 7, ALTERNATE 4, STORM 1, HYDRoGRAPH ADDED TO READHD FILE ---
OPERATION REACH XSECTION 8
PEAK TIME(HRS) PEAK DISCHARGE(CFS) 15,88 409.4
RUNOFF INCLUDING TRIANGULAR BASEFLOW 16.97 WATERSHED INCHES; 2639 CFS-HRS;
OPERATION ADDHYD XSECTION
PEAR TIME(HRS) 12.67 15.87
9
PEAK DISCHARGE(CFS) 723.4 875.3
POINTS FOR ALTERNATE = 4, HYDROGRAPH HRS l4AIN TIME INCREMENT = .lOO hr. 7.40 CFS .42 .57 .77 1;oo 1.28 1.60 8.20 CFS 2.74 3.19 3.66 4.17 4.73 5.33 9.00 CFS 7.50 8.35 9.26 10.24 11.27 12.35 9.80 CFS 15.79 17.02 18.33 19.74 21.27 22.95
10.60 CFS 29.10 31.59 34.34 37.38 40.76 44.52 11.40 CFS 59 65 73 85 107 147 12.20 CFS 411 525 621 686 718 722 13.00 CFS 635 597 570 556 551 555 13.80 CFS 598 618 640 662 683 704 14.60 CFS 763 780 796 811 824 836 15.40 CFS 861 867 871 873 875 875 16.20 CFS 869 865 861 855 848 841 17.OC CFS 817 808 799 789 780 770 17.80 CFS 738 728 717 706 696 685 18.60 CFS 653 642 631 621 611 601 19.40 CFS 571 561 552 542 533 524 20.20 CFS 498 490 482 474 466 459 21.00 CFS 437 430 424 417 411 405 21.80 CFS 387 381 376 370 365 360 22.60 CFS 345 340 335 331 326 322 23.40 CFS 310 306 302 298 295 291 24.20 CFS 281 277 273 268 263 258 25.00 CFS 244 239 235 231 228 224 25.80 CFS 214 211 207 204 200 197 26.60 CFS 186 183 179 175 172 168 27.40 CFS 157 154 151 147 144 141 28.20 CFS 131 128 125 122 119 117 29.00 CFS 108 106 103 101 98 96
PEAK ELEVATION(FEET) 497.32
218.1 ACRE-FEET.
PEAR ELEVATION(FEET) WJW (-1
STORM = 1 = 4.41 SQ.MI.
2.3 1.95 5.99
13.46 24.81 48.73
213 705 565 725 846 874 834 759 674 590~ 516 451 399 355 318 288 253 221 193 164 137 114
94
6.7, 14.60 26.85 53.49
303 674 580 744 854 872 826 749 663 581 507 444 393 350 314 284 248 217 190 161 l?' 1.
91

TR20 -------_-_------_--------------------------------------------------- scs . SAMPLE 5 JOE USES - TWO-24HR TYPE II STORMS OVER WATERSHED, WITH ECON, VERSIO! "1/06/92 BF, MOD. S.C.; ALT'S l=EXIST., 2=SITES, 3=MOVE SITE, 4=DIVIDE 2.04TES
PASS 7 JOB NO. 1 PAGE 2: :32:40
86.80 84.65 71.14 69.42 58.54 57.13 48.42 47.31 40.20 39.28 33.36 32.59 27.59 26.93 22.68 22.12 18.51 18.03 14.98 14.58 12.02 11.69
9.57 9.30 7.58 7.36 5.97 5.79 4.68 4.54 3.66 3.55 2.85 2.76 2.22 2.15 1.72 1.66 1.33 1.29 1.03 .99
.79
82.55 80.50 78.52 76.59 74.73 67.75 66.12 64.53 62.97 61.46 55.15 54.40 53.15 51.93 50.73 46.22 45.15 44.12 43.10 42.11 38.38 37.50 36.63 35.79 34.96 31.83 31.08 30.36 29.64 28.94 26.29 25.66 25.04 24.43 23.84 21.57 21.04 20.51 19.99 19.49 17.57 17.11 16.67 16.23 15.80 14.19 13.80 13.43 13.07 12.71 11.36 11.05 10.74 10.44 10.14
9.03 8.78 8.52 8.28 8.04 7.14 6.93 6.73 6.53 6.33 5.62 5.45 5.29 .5.13 4.97 4.40 4.27 4.14 4.01 3.89 3.44 3.33 3.23 3.13 3.04 2.68 2.59 2.51 2.44 2.36 2.08 2.02 1.95 1.89 1.83 1.61 1.56 1.51 1.47 1.42 1.25 1.21 1.17 1.13 1.10
.96 -93 .90 .87 .84
29.80 CFS 89iOO 30.60 CFS 72.91 31.40 CFS 59.98 32.20 CFS 49.56 33 :OO CFS 41.15 33.80 CFS 34.15 34.60 CFS 28.26 35.40 CFS 23.26 36.20 CFS 18.99 37.00 CFS 15.39 37.80 CFS 12.36 38.60 CFS 9.85 39.40 CFS 7.81 40.20 CF.5 6.15 41.00 CFS 4.82 41.80 CFS 3.77 42.60 CFS 2.94 43.40 CFS 2.29 44.20 CFS 1.77 45.00 CFS 1.37 45.80 CFS 1.06 46.60 CFS .82
RUNOFF INCLUDING TRIANGULAR BASEFLGW 3.04 WATERSHED INCHES; 8661 CFS-HRS; 715.7 ACRE-FEET.
DURATION(HRS) 4 8 12 16 20 24 28 32 FLOW(CFS) 705 490 284 141 59 28 13 5
DURATION(HRS) 36 39 FLGW(CFS) 2 1 TRUNCATED
--- XSECTION 9, ALTERNATE 4, STORM 1, HYDROGRAFH ADDED TO READHD FILE ---
EXECUTIVE CONTROL ENDCMP COMPUTATIONS COMPLETED FOR PASS 7 1826
EXECUTIVE CONTROL BASFLO TRIANGLE VOLUME = .lO IN., 183( PEAR TIME = 12.0 HRS., BASE = 25. HRS.,
EXECUTIVE CONTROL COMPUT FROM STRUCTURE 1 To XSECTIDN 9 184t STARTING TIME = .oo RAIN DEPTH = 2.60 RAIN DURATION = 1.00 ANT. RUNOFF COND. = 2 MAIN TIME INCREMENT = .loo HOURS ALTERNATE NO. = 4 STORM NO. = 2 RAIN TABLE NO. = 2

+ ‘3-q F-35 TR20 ---------_---------------------------------------------------------- scs - SAMPLE 5 JOB USES - TWO-24HR TYPE II STORMS OVER WATERSHED, WITH ECON, VERSIOb 03/06/92 BF, UOD. S.C.; ALT'S l=EXIST., Z=SITES, 3=KOVE SITE, 4=DIVIDE 2.04TES' 07:32:48 S-Y, JOB NO. 1 PAGE :
SUNKARY TABLE 1 ---------------
SELECTED RESULTS OF STANDARD AND EXECUTIVE CONTROL IN ORDER PERFORMED. A CHARACTER FOLLOWING THE PEAK DISCHARGE TIME AND RATE (CFS) INDICATES:
F-FLAT TOP HYDROGRAE'H T-TRUNCATED HYDROGRAPH R-RISING TRUNCATED HYDROGRAPH
XSECTION/ STANDARD PEAK DISCHARGE STRUCTURE CONTROL DRAINAGE RUNOFF ------------------------------------
ID OPERATION AREA AMOUNT ELEVATION TIME (SQ MI) (IN) cm (Hw
RAINFALL OF 5.20 inches AND 24.00 hr DURATION, BEGINS AT RAINTABLE NUMBER 2, ARC 2 MAIN TIME INCREMENT .lOO HOURS
ALTERNATE 1 STORM 1 ---------------------------
STRUCTURE 1 RUNOFF 1.20 2.61 --- 12.09 STRUCTURE 1 RESVOR 1.20 2.61 -mm 12.09 XSECTION 1 REACH 1.20 2.61 509.70 12.55 XSECTION 1 RUNOFF .46 2.70 m-e 12.55 XSECTION 1 ADDliYD 1.66 2.63 510.39 12.55
XSECTION 2 REACH 1.66 2.63 503.07 13.11 STRUCTURE 2 RUNOFF .44 2.88 --- 12.10 STRUCTURE 2 RESVOR .44 2.88 --- 12.10 XSECTION 3 REACH 44 2.88 --- ,12.59 XSECTION 3 RUNOFF :31 2.79 --- 12.17
RATE RATE (CFS) (CSW
.o hrs.
2128 1773.3 2128 1773.3 1111 925.8
406 882.6 1516 913.3
1073 646.k 837 1902.3 837 1902.3 412 936.4 481 1551.6
XSECTION 3 ADDHYD .75 2.84 --- 12.36 640 853.3 XSECTION 4 ADDHYD 2.41 2.70 m-w 12.98 1436 595.9 XSECTION 5 REACH 2.41 2.70 500.62 14.15 910 377.6 XSECTION 6 REACH 2.41 2.70 488.13 16.76 525 217.8 XSECTION 6 RUNOFF 1.30 2.97 me- 13.14 824 633.8
XSECTION 6 ADD?IYD 3.71 2.79 489.24 13.16 849 228.8 XSECTION 7 REACH 3.71 2.79 481.70 18.60 521 140.4 XSECTION 7 RUNOFF .70 3.06 e-m 12.62 658 940.0 XSECTION 7 ADDHYD 4.41 2.83 482.78 12.68 738 167.3
RAINFALL OF 2.60 inches AND 24.00 hr DURATION, BEGINS AT
ALTERNATE 1 STORM 2 ---------------------------
STRUCTUiE 1 RUNOFF 1.20' .71 --- 12.11 STRUCTURE 1 RESVOR 1.20 ..71 --- 12.11 XSECTION 1 REACH 1.20 .71 506.83 12.55 XSECTION 1 RUNOFF .46 .76 m-m 12.60 XSECTION .l ADDHYD 1.66 .72 507.33 12.56
.o hrs.
,527 439.2 527 439.2 317 264.2 102 221.7 415 250.

F- 3C TR20 __-__--------------------------------------------------------------- scs _ SAMPLE 5 JOB USES - TWO-24HR TYPE XI STORMS OVER WATERSHED, WITH ECON, VERSION 0?/06/92 BF, KOD. S.C.; ALT'S l=EXIST., t=SITES, 3=MOVE SITE, 4=DIVIDE 2.04TEST
32~48 SUMMARY, JOB NO. 1 PAGE 35
SUMMARY TABLE 1 ---------------
SELECTED RESULTS OF STANDARD AND EXECUTIVE CONTROL IN ORDER PERFORMED. A CHARACTER FOLLCWING THE PEAK DISCHARGE TIME AND RATE (CFS) INDICATES:
F-FLAT TOP HYDROGRAPH T-TRUNCATED HYDROGRAPH R-RISING TRUNCATED HYDROGRAPH
XSECTION/ STANDARD PEAX DISCHARGE STRUCTURE CONTROL DRAINAGE RUNOFF ------------------------------------
ID OPERATION AREA AMOUNT ELEVATION TIME RATE RATE (SQ MI) (INI (W u=) CC=) (CW
ALTERNATE 1 STORM 2 ---------------------------
XSECTION 2 REACH 1.66 STRUCTURE 2 RUNOFF .44 STRUCTURE 2 RESVOR .44 XSECTION 3 REACH -44 XSECTION 3 RUNOFF .31
XSECTION "-ECTION
ECTION XSECTION XSECTION
XSECTION XSECTION XSECFION XSECTION
ADDBYD .75 ADDHYD 2.41 REACH 2.41 REAcN 2.41 RUNOFF 1.30
ADDHYD REACH RUNOFF ADDBYD
3.71 3.71
70 4:41
RAINFALL OF 5.20 inches AND
.72 500.51 12.88
.a5 V-B 12.11
.a5 -mm 12.11
.a5 -me 12.74
.80 -mm 12.19
.a3 a-- 12.61
.76 as- 12.83
.76 497.53 13.93
.76 485.83 15.06
.91 es- 13.21
:Sl 81 486.89 479.86 13.73 15.89 .96 --- 12.66 .a3 480.10 15.70
24.00 hr DURATION, BEGINS AT
ALTERNATE 2 STORM 1 -------_-------------------
STRUCTURE 1 RUNOFF 1.20 2.61 --- 12.09 STRUCTURE 1 RESVOR 1.20 2.61 526.12 12.35 XSECTION 1REACx 1.20 2.61 508.81 12.79 XSECTION 1 RUNOFF .46 2.70 -we 12.55 XSECTION 1 ADDRYD 1.66 2.63 509.71 12.68
XSECTION 2 REACH 1.66 2.63 502.78 13.16 894 538.6 STRUCTURE 2 RUNOFF .44 2.88 em- 12.10 837 1902.3 STRUCTURE 2 RESVOR .44 2.88 499i74 12.49 247 561.4 XSECTIdN' 3REAcI, .44 2.88 --- '13.54 214 486.4 XSECTION 3 RUNOFF .31 2.79 w-e 12.17 481 1551.6
'ECTION 3 ADDHYD .75 2.84 m-e 12.20 561 748.0 . . ..iECTION 4 ADDHYD 2.41 2.70 --- 13.14 1166 483.8
340 204.8 238 540.9 238 540.9 104 236.4 128 412.9
148 197.3 473 196.3 265 110.0 202 83.8 233 179.2
308 83.0 244 65.8 194 277.1 268 60.8
.o hrs.
2128 1773.3 929 774.2 740 616.7 406 882.6
1116 672.3

F-3 TR20 -------------------_------------------------------------------------ scs . SAMPLE 5 JOB USES - TWO-24HR TYPE II STORMS OVER WATERSHED, WITH ECON, VERSIOl 03/06/92 BF, MOD. S.C.; ALT'S l=EXIST., 2=SITES, 3=MOVE SITE, 4=DIVIDE 2.04TES 07:32:48 SUMMARY, JOB NO. 1 PAGE ?
SUMMARY TABLE 1 ---------------
SELECTED RESULTS OF STANDARD AND EXECUTIVE CONTROL IN ORDER PERFORMED. A CHARACTER FOLIOWING THE PEAK DISCHARGE TIME AND RATE (CFS) INDICATES:
F-FLAT TOP HYDROGRAPH T-TRUNCATED HYDROGRAPH R-RISING TRUNCATED HYDROGRAPH
XSECTION/ STANDARD PEAK DISCHARGE STRUCTURE CONTROL DRAINAGE RUNOFF ----------------------------------~
ID OPERATION (E&)
AMOUNT ELEVATION TIME RATE RATE (INI (m UN (CFS) (CSW
ALTERNATE 2 STORM 1 _--------------------------
XSECTION 5 REACH 2.41 2.70 500.34 14.34 XSECTION 6 REACH 2.41 2.70 488.07 16.87 XSECTION 6 RUNOFS 1.30 2.97 -a- 13.14 XSECTION 6 ADDHYD 3.71 2.79 489.27 13.18 XSECTION 7 REACH 3.71 2.79 481.66 18.61
XSECTION 7 RUNOFF .70 3.06 m-w 12.62 XSECTION 7 ADDHYD 4.41 2.83 482.80 12.68
RAINFALL OF 2.60 inches AND 24.00 hr DURATION, BEGINS AT a
ALTERNATE 2 STORM 2 ---------------------------
816 338.6 504 209.1 824 633.8 859 231.5 514 138.5
658 743
,o hrs.
940.0 168.5.
XSECTION XSECTION XSECTION
1 RUNOFF 1.20 .71 --- 1 RESVOR 1.20 .71 522.72 1 REACH 1.20 .71 505.39 1 RUNOFF .46 .76 --- 1 ADDHYD 1.66 .72 506.01
XSECTION 2 REACH 1.66 .72 499.13 sTRucTuR,E 2 RUNOFF .44 .85 -MS STRUCTURE 2 RESVOR .44 .85 496.95 XSECTION 3 REACH .44 .85 --- XSECTION 3 RUNOFF .31 .80 ---
XSECTION XSECTION XSECTION XSECTION XSECTION
.75 .83 --- 2.41 .76 --- 2.41 .76 496.98 2.41 .76 485.49 1.30 . . 91' ---
XSECTION XSECTION XSECTION XSECTION
3 ADDHYD 4 ADDHYD 5 REACH 6 REACH 6 RUNOFF
6 ADDHYD 7 REACH 7 RUNOFF 7 ADDHYD
3.71 .81 486.94 3.71 .81 479.72
.70 .96 m-e 4.41 .83 480.02
12.11 527 12.54 153 13.14 124 12.60 102 12.80 204
13.23 182 12.11 238 12.42 100 13.09 67 12.19 128
12.23 145 13.14 270 14.10 203 15.19 175 13.21 233 .
13.51 314 15.72 232 12.66 194 15.41 258
439.2 127.5 103.3 221.7 122.9
109.6 540.9 227.3 152.3 412.9
193.3 112.0
84.2 72.6
179.2
84.6' 62.5
277. 58.

F -1
TR*O ___-_---------------___________^________---------------------------- scs
SAMPLE 5 JOB USES - TWO-24HR TYPE II STORMS OVER WATERSHED, WITH ECON, VERSIO '/M/92 BF, MOD. S.C.; ALT'S l=EXIST., 2=SITES, 3=MOVE SITE, 4'DIVIDE 2.04TES
:32:4a S-Y, JOB NO. 1 PAGE 3
SUMMARY TABLE1 --------s------
SELECTED RESULTS OF STANDARD AND EXECUTIVE CONTROL IN ORDER PERFORMED. A CHARACTER FOLLOWING THE PEAK DISCHARGE TIME AND RATE (CFS) INDICATES:
F,-FLAT TOP HYDROGRAPH T-TRUNCATED HYDROGRAPH R-RISING TRUNCATED HYDROGRAPH
XSECTION / STANDARD PEAX DISCHARGE STRUCTURE CONTROL DRAINAGE RUNOFF -----------------------------------
ID OPERATION AMOUNT ELEVATION TIME RATE (INI (E-n uw t-s)
RAINFALL OF 5.20 inches ,AND 24.00 hr DURATION, BEGINS AT -0 hrs.
ALTERNATE 3 STORM 1 _-------_------------------
STRUCTURE 1 RUNOFF 1.20 STRUCTURE 1 RESVOR 1.20 XSECTION 1 REACH 1.20 XSECTION 1 RUNOFF .46 XSECTION 1 ADDHYD 1.66
2.61 e-m 12.09 2128 1773.3 2.61 526.12 12.35 929 774.2 2.61 508.80 12.79 737 614.2 2.70 --- 12.55 406 882.6 2.63 509.70 12.68 1113 670.5
iECTION 2 REACH 1.66 2.63 502.77 13.16 891 536.7 ,FRUCl'URE 3 RUNOFF .75 2.88 m-s 12.88 539 718.7 STRUCTURE 3 RESVOR .75 2.88 499.74 17.2OF SlF 68.0 XSECTION 3 REAcn .75 2.88 -mm 17.5OF flF 68.0 XSECTION 4 ADDHYD 2.41 2.71 -mm 13.17 935 388.0
XSECTION 5 REACH 2.41 2.71 499.54 14.53 602 XSECTION 6 REACH 2.41 2.70 487.42 16.66 389 XSECTION 6 RUNOFF 1.30 2.97 me* 13.14 a24 XSECTION 6 ADDHYD 3.71 2.79 489.24 13.17 848 XSECTION 7 REAui 3.71 2.75 481.34 17.87 450
XSECTION 7 RUNOFF .70 3.06 --- 12.62 658 XSECTION 7 ADDHYD 4.41 2.80 482.79 ~2.68 741
249.8 161.4 633.8 228.6 121.3
940.0 168.0
RAINFALL OF 2.60 inches AND 24.00 hr DURATION, BEGINS AT .o hrs.
ALTERNATE 3 STORM 2 -*-------------------------
STRUCTURE 1 RUNOFF 1.20 :71 --- 12.11 527 STRUCTURE 1 RESVOR 1.20 .71 522.72 12.54 153
RATE (=W
439.2 127.5

I=-33
TR20 -------------------------------------------------------------------- scs - SAMPLE 5 JOB USES - TWO-24HR TYPE II ,STORMS OVER WATERSHED, WITH ECON, VERSION 03/06/92 BF, MOD. S.C.; ALT'S l=EXIST., 2=SITES, 3=MOVE SITE, 4=DIVIDE 2.04TEST 07:32:48 SUXXARY, JOB NO. 1 PAGE :
SUKMARY TABLE1 ---------------
SELECTED RESULTS OF STANDARD AND EXECUTIVE CONTROL IN ORDER PERFORMED. A CHARACTER FOLLOWING THE PEAE DISCHARGE TIME AND RATE (CFS) INDICATES:
F-FLAT TOP HYDROGRAPH T-TRUNCATED HYDROGRAPH R-RISING TRUNCATED HYDR~GRAFH
XSECTION/ STANDARD STRUCTURE CONTROL DRAINAGE
ID OPERATION
ALTERNATE ------mm--
XSECTION 1 XSECTION 1 XSECTION 1 XSECTION 2 STRUCTURE 3
3 STORM 2 -----------------
REACH 1.20 RUNOFF .46 ADDHY'I 1.66 REACH 1.66 RUNOFF .75
.71 76
172 .72 .85
505.37 13.14 121 100.8 --- 12.60 102 221.7
505.99 12.80 202 121.7 499.11 13.23 180 108.4
--- 12.95 147 196.0
STRUCTURE 3 XSECTION 3 XSECTION 4 XSECTION 5 XSECTION 6
RESVOR .75 REACH .75 ADDHYD 2.41
EEi 2.41 2.41
.85 492.89 14.81 41 54.7
.85 -em 15.25 41 54.7
.76 m-e 13.31 214 88.1
.76 496.49 14.35 168 69.7
.76 485.06 15.53 148 61.4
XSECTION 6 RUNOFF 1.30 .91 --- 13.21 233 179.2 XSECTION 6 ADDHYD 3.71 .81 486.58 13.48 276 74.4 XSECTION 7 REACH 3.71 .81 479.40 15.78 207 55.8 XSECTION 7 RUNOFF 70
4141 .96 -em 12.66 194 277.1
XSECTION 7 ADDHYD .84 479.73 12.80 233 52.8
RUNOFF AMOUNT
(INI
PEAE DISCHARGE ------------------------------------ ELEVATION TIME RATE RATE
(fi) uw (CFS) (CSW
RAINFALL OF 5.20 inches AND 24.00 hr DURATION, BEGINS AT
ALTERNATE 4 STORM 1 ---------------------------
STRUCTURE 1 RUNOFF 1.20 2.81 --- 12.09 STRUCTURE 1 RESVOR 1.20 2.81 w-e 12.09 XSECTION 1REACE 1.20 2.81 509.70 12.55 XSECTION 1 RUNOFF .46 2.90 m-e 12.55 XSECTION 1 ADDIIYD I.66 2.83 510.39 12.55
XSECTION 2. REACH 1.66 2.83 5,03.07 13.11 STRUCTURE 3 RUNOFF 75
:75 3.08 --- 12.88
STRUCTURE 3 RESVOR 3.08 m-e 12.88 XSECTION~ 3 REACH .75 3.08 --- 13.18 XSECTION 4 ADDHYD 2.41 2.91 -me 13.13
XSECTION 5 REACH 2.41 2.91 500.73 14.34
.o hrs.
2131 1775.8 2131 1775.8 1109 924.2
407 884.8 1515 912.7
1072 645.8 542 722.7 542 722.7 506 674.7
1577 654.4
946 392-L

TRZO -------_-------------------------------------- ---------------------- scs - SAMPLE 5 JOB USES - TWO-24HR TYPE II STORMS OVER WATERSHED, WITH ECON, VERSION 07/06/92 BF, MOD. S.C.; ALT'S l=EXIST., 2=SITES, 3=MOVE SITE, 4=DIVIDE 2.04TESt
:32:48 SUHHARY, JOB NO. 1 PAGE 39
SUMMARY TABLE 1 _-_------------
SELECTED RESULTS OF STANDARD AND EXECUTIVE CONTROL IN ORDER PERFORMED. A CHARACTER FOLLOWING THE PEAR DISCRARGE TIME AND RATE (CFS) INDICATES:
F-FLAT TOP HYDROGRAPH T-TRUNCATED HYDROGRAPH R-RISING TRUNCATED HYDROGRAPH
XSECTION/ STANDARD STRUCTURE CONTROL DRAINAGE
ID OPERATION
ALTERNATE 4 STORM 1 ---------------------------
XSECTION 5 DIVERT 2.17 XSECTION 0 DIVERT .24 XSECTION 6 REACH 2.17 XSECTION 6 RUNOFF 1.30 XSECTION 6 ADDXYD 3.47
1.35 16.97
1.35 3.17 2.03
498.35 14.34 376 173.3 498.35 14.34 570 2375.0 486.44 15.80 261 120.3
m-m 13.14 829 637.7 409.26 13.16 ass 246.4
XSECTION 7 REACH 3.47 2.03 401.12 16.45 404 116.4 "TECTION 7 RUNOFF .70 3.26 --- 12.62 661 944.3
ECTION 7 ADDHYD 4.17 2.24 482.67 12.66 717 171.9 XSECTION 8 REACH .24 16.97 497.32 15.88 409 1704.2 XSECTION 9 ADDHYD 4.41 3.04 -em 15.87 875 198.4
PEAK DISCHARGE R"')JOFF ------------------------------------ AMOUNT ELEVATION TIME RATE RATE
(IN) (fi) 6-W C-S) (CSW
RAINFALL OF 2.60 inches AND 24.00 hr DURATION, BEGINS AT
ALTERNATE 4 STORM 2 ---------------------------
STRUCTURE STRUCTURE XSECTION XSECTION XSECTION
1 RUNOFF 1 RESVOR 1 REACH 1 RUNOFF 1 ADDHYD
1.20 .81 m-w 12.11 528 440.0 1.20 .81 --- 12.11 520 440.0 1.20 .81 506.78 12.45 308 256.7
.46 .86 me- 12.60 103 223.9 1.66 .a2 507.28 12.48 405 244.0
XSECTION 2 REAc?I 1.66 .a2 500.4s 12.81 332 200.0 STRUCTURE 3 RUNOFF .75 -9s --- 12.9s 148 197.3 STRUCTURE 3 RESVOR .I5 .95 me- 12.95 148 197.3 XSECTION 3 REACH .75 .9s --- 13.28 136 181.3 XSECTION 4 ADDHYD 2.41 .86 --- 12.90 439 182.2
XSECTION 5 RFACH 2.41 .86 497.4s 14.02 256 106.2 XSECTION 5 DIVERT 2.17‘ .51 495.26 14.02 97 44.7 XSECTION 8 DIVERT .24 4,03 495.26 14.02 '159 662.5 XSECTION 6 REACH 2.17 .51 483.47 15.19 79 36.4 YSECTION 6 RUNOFF 1.30 1.01 --- 13.21 234 180.0
..SECTION 6 ADDHYD 3.47 .70 406.41 13.36 258 74.4
.O hrs.

TR20 ------------------__------------------------------------------------ $!cs - SAMPLE 5 JOB USES - TWO-24HR TYPE II STORMS OVER WATERSHED, WITH ECON, VERSIOK 03/06/92 BF, HOD. S.C.; ALT'S l=EXIST., 2=SITES, 3=MOVE SITE, 4=DIVIDE 2.04TES1 07:32:48 SUMMARY, JOB NO. 1 PAGE 4'
SUIQ4ARY TABLE 1 _--------------
SELECTED RESULTS OF STANDARD AND EXECUTIVE CONTROL IN ORDER PERFORMED. A CHARACTER FOLLOWING THE PEAK DISCHARGE TIME AND RATE (CFS) INDICATES:
F-FLAT TOP HYDROGRAPH T-TRUNCATED HYDROGRAPH R-RISING TRUNCATED HYDROGRAPH
XSECTION/ STANDARD PEAX DISCHARGE STRUCTURE CONTROL DRAINAGE RUNOFF ------------------------------------
ID OPERATION AMOUNT ELEVATION TIME RATE RATE (INI (Fw ww CC=) (CSW
ALTERNATE 4 STORM 2 ---------------------------
XSECTION 7 Rlmc!H 3.47 .70 478.90 14.87 173 49.9 XSECTION 7 RUNOFF .70 1.06 --- 12.66 195 278.6 XSECTION 7 ADDHYD 4.17 .76 479.70 12.81 231 55.4 XSECTION 8 REACH .24 4.03 494.39 16.34 91 379.2 XSECTION 9 ADDBYD 4.41 .94 -em 15.53 278 63.0

TR20 ------------------------------------------------------------------- fj&“s
SAMPLE 5 JOE USES - TWO-24HR TYPE 11 STORM OVER WATERSHED, WITH ECUK, VERSTGl 03/06/92 BF, HOD. S.C.; ALT'S l=EXIST., 2=SITES, 3=MOVE SITE, 4=DIVfDE 2.04TES
:32:4a SUMMARY, JOB NO. 1 PAGE 4
_- SUMMARY TABLE 2 ---------------
MODIFIED ATT-KIN REACH ROUTING IN ORDER PERFORMED. QUESTION MARK (7) AFTER: OUTFLOW PEAK - MAX. NUMBER ROUTING ITKRATIDKS USED;
LENGTH FACTOR - VALUE K+ GREATER THAN 1-D; ATT-KIN COEFF - VALUE C GREATER THAN 0.667.
HYDROGRAPH INFORMATION ------------------------
FLQOD INFLOW OUTFLOW XSEC REACH PLAIN ----------_ --------s--
ID LENGTH LENGTH PEAK TIME PEAK TIME cm (fi) (CFS) uw (CFS) WW
BASEFLOW IS 6.0 CFS
ALTERNATE 1 STORM 1 _-_-----------------_______
1 5400 2131 12.1 2 3000 1505 12.6
.SEFLOW IS .O CFS 3 4600 a37 12.1
BASEFMW IS 6.0 CFS 5 2600 1435 13.0 6 4900 909 14.2
7 a900 7900 a48 13.2
ALTERNATE 1 STORM 2 ___------------------------
1 5400 532 12.1 2 3000 413 12.6
BASEFLGW IS .o CPS 3 4600 237 12.1
BASEFLOW IS 6.0 CFS 5 2600 473 12.8 6 4900 265 13.9
7 a900 7900 308 13.7
1103 12.6 1.02 1.15 1073 13.1 1.17 1.05
412 12.6 1.20 1.10 .571 I489
909 14.2 524 16.8
521 18.6
311 12.5 .23 1.50 .326 .579 340 12.9 .19 1.46 .097 ,.820
104 12.7 1.20 1.10 .615 .423
.265 13.9 .63 1.00 :451 -.555 202 15.1 .22 1.27 .216 .756
244 15.9 .12 1.39 .241 .7a7
ROUTING PARAMETERS -----------------------------
Q-A EQ. ----------- LENGTH COEFF POWER FACTOR
(Xl (Ml W)
.509
.248 -516 -712
.59 1.00 .418 -632
.53 1.00 .556 ..574
.52 1.04 .439 .612
PEAK ATT- RATIO KIN
Q/I CmFf IQ’)
BASEFLOW IS 10.0 CFS

F-4: TR20 ___---___-------------------- --------------------------------------- scs _ SAMPLE 5 JOB USES - TWO-24HR TYPE II STORMS OVER WATERSHED, WITH ECON, VERSIOt~ 03/06/92 BF, MOD. S-C.; ALT'S l=EXIST., t=SITES, 3=MOVE SITE, 4=DIVIDE 2.04TES7 07:32:48 SUMMARY, JOB NO. 1 PAGE '
SUMMARY TABLE 2 ---------------
MODIFIED ATT-KIN REACH ROUTING IN ORDER PERFORMED. QUESTION MARE (1) AFTER: OUTFLOW PEAK - MAX. NUMBER ROUTING ITERATIONS USED;
LENGTH FACTOR - VALUE K' GREATER THAN 1.0; ATT-KIN COEFF - VALUE C GREATER THAN 0.667.
HYDROGRAPH INFORRATION ------------------------
FLOOD INFLOW XSEC REACH PLAIN -----------
ID LENGTH LENGTH PEAR TIME (fi) (F'U (CFS) uw
ALTERNATE 2 STORM 1 ---------------------------
1 5400 934 12.4 2 3000 1115 12.7
BASEFLOW IS .O CFS 3 4600 247 12.5
BASEFLOW IS 10.0 CFS 5 2600 1164 13.1 6 4900 816 14.3
7 8900 7900 859 13.2
BASEFLOW IS 8.0 CFS
ALTERNATE 2 STORM 2 -----_---------------------
1 5400 161 12.5 2 3000 204 12.8
BASEFLQW IS .O CFS 3 4600 100 12.4
OUTFI.OW -----------
SPEAR TIME t-s) (HR)
740 12.8 .43 1.35 .131 .790 .25 a93 13.2 .98 1.09 .166 '. 799 .20
214 13.5 1.20 1.10 .168 .862 .15
816 14.3 504 16.9
514 18.6
123 13.1 182 13.2
6-7 13.1
ROUTING PARAMETERS -------------------------------
Q-A EQ. PEAR ATT- ----------- LENGTH RATIO KIN COEFF POWER FACTOR Q/I COEFF w (W (-1 Ih*, (Cl
.58 1.00 .343 .698
.53 1.00 .491 .613
.52 1.04 .440 .594
.08
.04
. 03
.22
. 17
1.20
1.52 -092 .756 .19 1.50 .042 .888 .27
1.10 .260 .639 .14

TR2#J ^“--“‘--“‘-‘--“‘““‘-‘-‘-‘--‘----’----------------------------- 5c-s .
SAMPLE 5 JOB USES - TWO-24HR TYPE II STORMS OVER WATERSHED, WITH ECON, vERsxot "106/92 BF, MOD. S.C.; ALT'S l=EXIST., t=SITES, 3=MOVE SITE, 4=DIVIDE 2.04TES
.32:48 SUMNARY, JOB NO. 1 PAGE 4:
SUMHARY TABLE 2 ---------------
MODIFIED ATT-KIN REACH ROUTING IN ORDER PERFORMED. QUESTION MARK (I) AFTER: OUTFLOW PEAK - MAX. NUMBER ROUTING ITERATIONS USED;
LENGTH FACTOR - VALUE K* GREATER THAN 1.0; 'ATT-KIN COEFF - VALUE C GREATER THAN 0.667.
HYDROGRAPH INFORMATION ROUTING PARAMETERS --p--------------------- -------------------------------
FLOOD INFLOW OUTFLOW Q-A EQ. PEAK ATT- XSEC REACH PLAIN ----------- ----------- ----------- LENGTH RATIO KIN
ID LENGTH LENGTH PEAX TIME PEAK TIME COEFF POWER FACTOR Q/I COEFF (m (W (CFS) (H'W (CFS) (W (W WI (k*) (Q+) (Cl
BASEFLOW IS 8.0 CFS
ALTERNATE 2 STORM 2 ---------------------------
5 2600 270 13.1 203 14.1 6 4900 203, 14.1 175 15.2 7 0900 7900 314 13.5 232 15.7
BASEFLOW IS 6.0 CFS
ALTERNATE 3 STORM 1 ---------------------------
1 5400 930 12.4 736 12.8 2 3000 1112 12.7 890 13.2
BASEFMW IS .O CFS 3 2000 51 17.2 51 17.5
BASEFLOW IS 6.0 CFS 5 2600 934 13.2 602 14.5 6 4900 602 14.5 389 16.7
7 8900 7900 847 13.2 450 17.9
.70 16
:11
1.00 .22a .746 -05 1.36 .124 .856 .l( 1.41 .235 .733 .OC
.43 1.35 .130 .790 .2!
.97 1.09 .165 .799 .2r
1.20 1.10 .008 1.000 .2!
.57
.61
.47
1.00 .278 . 642 .O 1.00 .316 -643 .O
1.06 .418 .528 .O

TR20 --------__--------__--------------------------------- -----------____ scs SAMPLE 5 JOB USES - TWO-24HR TYPE II STORKS OVER WATERSHED, WITH ECON, VERSIC 03/06/92 BF, MOD. S.C.; ALT'S l=EXIST., 2=SITES, 3=MOVE SITE, 4=DIVIDE 2.04TES 07:32:48 SUMMARY, JOB NO. 1 PAGE
SUM?4ARY TABLE 2 ---------------
RODIFIED ATT-KIN REACH ROUTING IN ORDER PERFORMED. QUESTION MARK (1) AFTER: OUTFLOW PEAK - MAX. NUMBER ROUTING ITERATIONS USED;
LENGTH FACTOR - VALUE K* GREATER THAN 1.0; ATT-KIN COEFF - VALUE C GREATER THAN 0.667.
HYDROGRAPH INFORMATION ------------------------
FLOOD INFLOW XSEC REACH PLAIN -----------
ID LENGTH LENGTH PEAK TIME (M-1 (W CC=) OW
ALTERNATE 3 STORM 2 ---------------------------
1 5400 159 12.5 2 3000 202 12.8
OUTFLOW -------s-w- PEAK TIRE CC=) VW
121 13.1 .22 1.52 .092 .755 .15 180 13.2 -17 1.50 .042 .887 .27
BASEFLOW IS .O CFS 3 2000 41 14.8 41 15.2 1.20 1.10 .024 .999 .20
BASEFLOW IS 6.0 CFS 5 2600 214 13.3 6 4900 168 14.3
7 8900 7900 276 13.5
168 14.3 148 15.5
207 15.8
BASEFLOW IS A TRIANGLE
ALTERNATE 4 STORM 1 ---------------------------
1 5400 2128 12.1 2 3000 1505 12.6 3 2000 542 12.9 5 2600 1575 13.1 6 4900 376 14.3
1101 12.6 1072 13.1
506 13.2 945 14.3 261 15.8
7 8900 7900 854 13.2 404 16.4 8 17000 17200 569 14.3 409 15.9
ROUTING PARAMETERS -------------------------------
Q-A EQ. PEAK ATT- ----------- LENGTH RATIO KIN COEPF POWER FACTOR Q/I COEFF
w W) W) (Q+) (C)
.60 1.05 .143 .779 11
. 12 1.43 .082 .878 :11
.088 1.46 .182 .744 .06
1.01 1.16 .467 .517 .20 1.17 1.05 .230 .712 .19 1.20 1.10 .076 .934 .34
.60 1.00 .422 .600 .08
.38 1.13 .282 .695 .07
.44 1.07 .609 .473 .03 -27 1.39 .327 -719 .06

TR20 -------------------------------------------------------------------- scs _ SAMPLE 5 JOE USES - TWO-24HR TYPE II STORMS OVER WATERSHED, WITH ECON, VERSIOK n3/06/92 BF, MOD. S.C.; ALTIS l=EXIST., Z=SITES, 3=MOVE SITE, 4=DIVIDE 2.04TESI
:32:48 SLMHARY, JOB NO. 1 PAGE 4,:
SUHMARY TABLE 2 ---------------
MODIFIED ATT-KIN REACH ROUTING IN ORDER PERFORMED. QUESTION MARK (3) AFTER: OUTFLOW PEAK - MAX. NUMBER ROUTING ITERATIONS USED;
LENGTH FACTOR - VALUE K* GREATER THAN 1.0; ATT-KIN COEFF - VALUE C GREATER THAN 0.667.
FLOOD XSEC REACH PLAIN
ID LENGTH LENGTH (W (F-n
ALTERNATE 4
HYDROGRAPH INFORMATION ------------------------
INFLOW ----------a PEAK TIME t-s) uw
STORM 2 ---------------------------
1 5400 527 12.1 2 3000 405 12.5 3 2000 147 12.9 5 2600 439 12.9 6 4900 97 14.0
305 12.5 332 .12.8 136 13.3 256 14.0
79 15.2
7 8900 7900 258 13.4 173 14.9 8 17000 17200 159 14.0 91 16.3
OUTFLOW ----------- PEAK TIME (CFS) NW
ROUTING PARAMETERS --------------------______I___
Q-A EQ. PEAK ATT- ----------- LENGTH RATIO KIN COEFF POWER FACTOR Q/I COEFF
(Xl (W W) (Q*) Vt
.23 1.50 .268 .578 .26
.19 1.46 .079 -821 .32 1.20 1.10 .075 .922 :3 2
.64 1.00 .368 ,582 -09
.lO 1.48 .091 -818 -10
.069 1.52 .211 .669 -07
.27 1.38 .676 -572 -05

TR20 ___________--------------------------------------------------------- SC.
SAMPLE 5 JOB USES - TWO-24HR TYPE II STORMS OVER WATERSHED, WITH ECON, VERSIO 03/06/92 BF, MOD. S-C.; ALT'S l=EXIST., 2=SITES, 3=MOVE SITE, 4=DIVIDE 2.04TEs 07:32:48 SUMMARY, JOB NO. 1 PAGE f
SUKKARY TABLE 3A
STORM FLOW DURATION DISCHARGES (CFS) AT XSECTIONS/STRUCTURES FOR ALL ALTERNATE A CHARACTER FOLLGWING THE DISCHARGE FOR A STORM-ALTERNATE COMBINATION INDICATE
S-SHORT HYDROGRAPH w/O BASEFLOW T-T RUNCATED HYDROGRAPH B-SHORT HYDROGRAPH W/ BASEFLOW R-RISING TRUNCATED HYDROGRAPH
STORM 1 STORM 2 --------------------------- ------------------________
XSECTION/ DRAINAGE PEAR FLOW DURATION (HRS.) STRUCTURE FLOW
PEAE FLOW DURATION (BRS.) --------------------- FLOW ---------------_____
ID t-s) 6 12 24 CC-) 6 12 24
STRUCTURE 3 .75 -------------------
ALTERNATE 3 ALTERNATE 4
STRUCTURE 2 .44 -------------------
ALTERNATE 1 ALTERNATE 2
STRUCTURE 1 1.20 -------------------
ALTERNATE 1 ALTERNATE 2 ALTERNATE 3 ALTERNATE 4
XSECTION 1 1.66 -------------------
ALTERNATE 1 ALTERNATE 2 ALTERNATE 3 ALTERNATE 4
XSECTION 2 1.66 -------------------
ALTERNATE 1 ALTERNATE 2 ALTERNATE 3 ALTERNATE 4
XSECTION' 3 .7s -------------------
ALTERNATE 1 ALTERNATE 2 ALTERNATE 3 ALTERNATE 4
51 542
837 247
2128 929 929
2131
1516 1116 1113 1515
1073 340 894 182 891 180
1072 332
640 148 561 14s
51 41 506 136

T&TO -----------------------_---------------------~------------------------ scs
SAMPLE 5 JOB USES - TWO-24HR TYPE II STORMS OVER WATERSHED, WITH ECON, VERSIG --fO6/92 BF, MOD. S.C.; ALT'S l=EXIST.,
.32:48 Z=SITES,l3=KOVE SITE, 4=DIVIDE 2.04TES
SUMMARY, JOB NO. PAGE 4
SUMKARY TABLE 3A ----------------
STORM FLOW DURATION DISCHARGES (CFS) AT XSECTIONS/STRUCTURES FOR ALL ALTERNATE A CHARACTER FOLLOWING THE DI.SCHARGE FOR A STORM-ALTERNATE COMBINATION INDICATE
S-SHORT HYDROGRAPH W/O BASEFLOW T-TRUNCATED HYDROGRAPH B-SHORT HYDROGRAPH V/ BASEFLOW R-RISING TRUNCATED HYDROGRAFH
XSECTION/ DRAINAGE STRUCTURE
ID (SE&
XSECTION 4 2.41 -------------------
ALTERNATE 1 ALTERNATE 2 ALTERNATE 3 ALTERNATE 4~
.:SECTION 5 2.17 ----------------- ALTERNATE 1 ALTERNATE 2 ALTERNATE 3 ALTERNATE 4
XSECTION 6 3.47 -------------------
ALTERNATE 1 ALTERNATE 2 ALTERNATE 3 ALTERNATE 4
XSECTION' 7 4.17 -------------------
ALTERNATE 1. ALTERNATE 2 ALTERNATE 3 ALTERNATE 4
XSECTION 0 .24 ------------------
ALTERBATE 4
XSECTION 9 4.41 ------------------
ALTERNATE 4
STORM 1 STORM 2 --------------------------- -----------------_-------- PEAK FLOW DURATION (HRS.) PEAK FLOW DURATION (BRS.) FLOW --------------------- FL&V ------------k,,,,,,-
(CFS) 6 12 24 (CFS) 6 12 24
1436 473 1166 270
935 214 1577 439
910 265 816 203 602 168 376 97
849 308 859 314 848 276 855 258
738 501 364 48 268 195 79 7 743 500 366 56 258 190 83 10 741 465 314 79 233 183 95 8 717 415 213 28 231 130 71 6
409 91
875 598 284 28 278 194 90 6

l- -i
TR20 ------------------____________________L_---------------------------- scs SAMPLE S JOB USES - TWO-24RR TYPE II STORMS OVER WATERSHED, WITH ECON, VERSI( 03/06/92 BF, MOD. S.C.; ALT'S l=EXIST., 2=SITES, 3=MOVE SITE, 4=DIVIDE 2.04T.E 07:32:48 SUMMARY, JOB NO. 1 PAGE
'SUMMARY TABLE 4 _- ---------------
DISCHARGES (CFS) AT INTERMEDIATE SECTIONS FOR ALL STORMS AND ALTERNATES
INTER. DRAINAGE SECT. STORM NUMBERS..........
ID 2% 1 2
7A 3.90 LOCATED BETWEEN SEC 6 & SEC 7 ------------------------------------------------ ALTERNATE 1 777 282 ALTERNAPE 2 783 277 ALTERNATE 3 778 248 ALTERNATE 4 764 240
7B 4.00 LOCATED BETWEEN SEC 6 & SEC 7 ------------------------------------------------ ALTERNATE 1 762 277 ALTERNATE 2 768 270 ALTERNATE 3 764 242 ALTERNATE 4 746 237

ECONZ DATA FILE
ECONZ -LE JOB USES - mO-24HR TYPE II STORMS OVER WATERSHED, WITH ECON, .'LE BF, XOD. S.C.; ALT'S l=EXIST., 2=SITES, 3=MOVE SITE, 4=DIVIDE
DUR-INCT H .O 6.0 6.0 12.0 12.0 24.0 24.0 24.0 FLOW-FREQ -3 FLOW-FREQ -2 FLOW-FREQ -1 FLOW-FREQ 1 FLOW-FREQ 2 FLOW-FREQ 3 FLOW-FREQ 4 FLOW-FREQ 5 FLOW-FREQ 6 FLOW-FREQ 7 TIME-FtiW 7 TIME-FLOW 7 TIXE-FLOW 7 FLOW- FREQ 8 FLOW-FREQ 9 FLOW-FREQ 7A TIME-FLOW 7A FLOW-FREQ 78 TIME-FLOW 7B FLOW-FREQ -3 FLOW-FREQ -2 FLOW-FREQ -1 TOW-FREQ 1
3W-FREQ 2 A uOW-FREQ 3 FLOW-FREQ 4 FLOW-FREQ 5 FLOW-FREQ 6 FLOW-FREQ 7 TIME-FLOW 7 TIME-FLOW 7 TIME-FLDW 7 FLOW-FREQ 8 FMW-FREQ 9 FLOW-FREQ 7A TINE-FLOW 7h FLOW-FREQ 7B TIME-FLOW 7B FLOW-FREQ -3 FLOW-FREQ -2 FLOW-FREQ -1 FLOW-E'REQ 1 FLOW-FREQ 2 FLOW-FREQ 3 FLOW-FREQ 4 FLOW-FREQ 5 FLOW-FREQ 6 FLOW-FREQ 7 ‘TME-FLOW 7 iME-FLOW 7
TIME-FLDW 7 FLOW-F'REQ 8 FLOW-FREQ 9
837. 238. 2128. 527. 1516. 415. 1073. 340.
640. 148. 1436. 473.
910. 265. 849. 308. 738. 268.
6 501. 195. 12 364. 79. 24 48. 7.
l t*****+*t***+*t**** **t*********ttt*t*tt
777. 282. USE TIME-FLOW 7
762. 277. USE TIME-FLOW 7 l *******************
247. 100. 929. 153.
1116. 204. 894. 182. 561. 145.
1166. 270. 816. 203. 859. 314. 743. 258.
6 500. 190. 12 366. 83. 24 56. 10.
.**t***++*t*+***t*t+ *+*t*t*+t*C*t*+tt+t*
783. 277. USE TIME-FLOW 7
768. 270. USE TIME-FLOW 7
51. 41. **+tt+*t*+t*+****+*t
929. 153. 1113. 202.
891. 180. 51. 41.
935. 214. 602. 168. 848. '276< 741. 233.
6 465. 183. 12 314. 95. 24 79. a.
t*+tt+*t+t+*t**t+**t l tt***t****+*+*tt***
ALT 1 ALT 1 ALT 1 ALT 1 ALT 1 ALT 1 ALT 1 ALT 1 ALT 1 ALT~l : ALT 1 : ALT 1 : ALT 1 ALT 1 : ALT 1 ALT 191 ALT 19. ALT 19 ALT 19 ALT 2 ALT 2 ALT 2 ALT 2 ALT 2 ALT 2 ALT 2 ALT 2 ALT 2 ALT 2 ALT 2 ALT 2 ALT 2 ALT 2 UT 2 ALT 2 9 ALT 29 ALT 29 ALT 2 9 ALT 3 ALT 3 ALT 3 ALT 3 ALT 3 ALT 3 SALT 3 ALT 3 ALT 3 ALT 3 ALT 3 ALT 3 ALT 3 ALT 3 ALT 3

FLOW-FREQ 7A TIME-FLOW 7A FLOW-FREQ 70 TIME-FLOW 7B FLOW-FREQ -3 FLOW-FREQ -2 FLOW-FREQ -1 FLOW-FREQ 1 FLOW-FREQ 2 FLOW-FREQ 3 FLOW-FREQ 4 FLOW-FREQ 5 FLOW-FREQ 6 FLOW-FREQ 7 TIME-FLOW 7 TIME-FLOW 7 TIME-FLOW 7 FLOW-FREQ 8 FLOW-FREQ 9 TIWE-FLOW 9 TIME-FLOW 9 TIME-FLOW 9 FLOW-FREQ 7A TIME-FLOW 7A FLOW-FREQ 7B TIME-FLOW 78
778. 248. USE TIME-FLOW 7
764. 242. USE TIME-FLOW 7
542. 148. t**tt*tttt.**+**.*t*
2131. 528. 1515. 405. 1072. 332.
506. 136. 1577. 439.
376. 97. 855. 250. 717. 231.
6 415. 130. 12 213. 71. 24 28. 6.
409. 91. 875. 278.
6 598. 194. 12 284. 90. 24 28. 6.
764. 240. USE TIME-FLOW 7
746. 237. USE TIME-FLOW 7
i J ALT 3 90 ALT 390 ALT 391 ALT 391 ALT 4 ’ ALT 4 ALT 4 4 ALT 4 4 ALT 4 : ALT 4 5 ALT 4 5 ALT 4 5 ALT 4 E ALT 4 E ALT 4 E ALT 4 r ALT 4 E ALT 4 E ALT 4 f ALT 4 c ALT 4 6 ALT 4 C I&T 49C ALT 4 9C ALT 491 ALT 4’91

Tp.ZO ___________---__--_------------------------------------------------- SC5 -
SAMPLE 5 JOB USES - TWO-24HR TYPE II STORMS OVER WATERSHED, WITH ECON, VERSION 03/06/92 BF, MOD. S.C.; ALT'S l=EXIST., 2=SITES, 3=MOVE SITE, 4=DIVIDE 2.04TES'I
END OF 1 JOBS IN THIS RUN
SCS TR-20, VERSION 2.04TEST SAMPLE 5 FILES
INPUT = b:a5.dat , GIVER DATA FILE OUTPUT = pm , DATED 03/06/92,07:32:48
FILES GENERATED - DATED 03/06/92,07:32:48
FILE b:aS.TEC CONTAINS ECON2 INFORMATION
FILE b:a5.TRD CONTAINS READHD INFORMATION
TOTAL NUMBER OF WARNINGS = 0, MESSAGES = 1
l *+ TR-20 RUN COMPLETED l **


G‘ i
APPENDIX G
standard Worksheets
and
Preloaded Tabular Data
Contents
Job and Title Plow Duration for ECON2 Stream Cross Section Data Structure Data Dimensionless Hydrograph Table
Standard 484 Hydrograph Table cumulative Rainfall Table
Table Pl - Type I, 24 hours Table 12 - Type II, 24 hours Table t3 - Type lA, 24 hours Table #4 - Type III, 24 hours Table 15 - Type 2, 48 hours Table #S - Emergency Spillway and
Freeboard Design Standard Control for Watershed
Standard Control Continuation Sheet Executive Control for Watershed
Executive Control Continuation Sheet Modify Standard Control
Read Discharge Hydrograph Intermediate Peaks
G-2 G-4 G-S G-6 G-7 G-0 G-9 G-10 G-11 G-12 G-13 G-14
G-15 G-16 G-17 G-16 G-19 G-20 G-21 G-22 G-23 G-24 G-25

LOCAT ION PAEPARED BY DATE PAGE _
JO0 CHECKED BY DATE OF -
; o&,,on ; Wal;r;had ; ECUI opt Ion
I IF I I Poll,No. ,
JCB~TR-20 u I%4 v/// *Ass -I El lml lzkzm I I I I I I I I
I oP*ro(lon , - - - - - - - - - - Job LIII. (en. r.oord r.qu1r.d . ..o.nd opllmol) - - - - - - - - - -
I Ho..,
I

-- 3’
JOB and TITLE
JOB Record (required)
c01umhs l&3 JOB
columns 5-9 TR-20
c01umrls 11-17 Watershed identification
COlUmns 21-24 ECON
Use only if peak discharge for ECON/URBl is desired.
and/or flow duration outpul Locations for this output
must be selected for inclusion in Summary Tables 1 ant 3 also. Such designation can be made using summary option explained below (columns 51-57) or the 8UM option on Standard Control (column 71), the DURING table, and the DUR Standard Control option (column 67).
Columns 31-39 FULLPRINT Use only if FULLPRINT option is desired.
columns 41-48 PASS-XXX Use only if PASS number, XXX, is greater than 1. XXX is an integer, right, justified.
c01ullIns 51-57 SUMMARY Use only if Summary Tables 1 and 3 are to include all Standard Control operations (except SAVXOV).
columns 61-68 ---- Leave blank if no cross section discharge-end area plots are desired.
ENDPLOT Use if only cross section discharge-end area Plots ar desired with no routinga.
PLOTS Provides discharge-end area plots of Croes section tables with regular output.
GRAPHICS Generates data files for use with SCS graphics programs
Columns 73-80 Optional user'information, printed at top cf-80-80 input listing.
TITLE Records (one required, second is optional)
columns 1-5 TITLE
Columns 11-72 Both titles may be any characters desired.
Columns 73-80 Optional record identification.

U.3. DEPARILENT OF MIAIW!alURL SOIL. cD”PrR”ITIOW SLRVICC
TR-20 FLOW DURATION FOR ECONZ
PREPARED er CnECKED BY
DATE DATE
PAGE _ OF -

U.S. DtpA’ltTLLNl OF AGIIlQJLTURE TR-20 STREAM CROSS SECTION,DATA WSWSHEE, SOIL aN4SEnvAllmJ SCIIVICE SCS-END-270A 1-&w
CROSS SECTION NAME
JOB _
PREPARED BY DATE PAGE _ CHECKED BY DATE OF -
. . LO” Crovd

. .
U.S. OEPA”lhcWl OF *ORIcu.r”RE SOIL cmSEnvAlION SERVICE
TR-20 STRUCTURE DATA’ WRItSHEET SCS-ENG--2eP
co,
STRUCTURE ID PREPARED BY
JOB CHECKED BY. DATE DATE
PAGE _ OF -
I (01 IO 99) : Elevation : Dis;h;rgs i Storage I “.ow,
I feet , I
,acre - feet l I (rr.“,l,l-~
I. Morlnum 01 20 data r*cold*.

U.S. DCP~RlIILNI.OF A6aICULmm6 TR-20 DIMENSIONLESS HYDROGRAPH TABLE WXWSHECT SON. OONSLRVAlION SERVICE SC=-266
1ABLE .m
.~ JCLX OF =
PREPARED BY CHECKED BY _
DATE DATE
PAGE
I “. .- I ._ -- I PI - qqqllzlslrlsl6l7~Blql~zl~4Plq~~lls191ol~~
c

u.m. mehwww ~~~fmrnow~~~~~mcw~a *AO(I’cwnmL TR-20 DIMENSIONLESS HYDROGRAPH TABLE wm
- *
I

U.S. OEPARTIJEH, Or AONICULWRE SOIL WNELnVATION SLRVICE
TR-20 CUMULATIVE RAINFALL TABLE WCF(((SHEE, Scs-fHo-271
4-n‘
LOCAT ION I 0
JOE
PREPARED BY CHECKED BY
,,.r Incrrmnl
DATE DATE
PAGE _ OF -

- -
TABLE HO. TIK!Z INCREXEZNT 5 RAINFL 1 .lOOO
.oooo 0087
:0174 .0262 . 0350 .0442
0540 10647 .0760
8 8 8 8 8 8 8 8 8 8 8 8 8 8 8 8 8 8 8 8 8 8 8 8 8 8 8 8 8 8 8 8 8 8 8 8 8 8 8 8 8 8 8 8 8 8 8 8 ~ci 9 ENDTBL
1.0000
. 0878 '
.lOOO
.1123
.1250
.1391
.1560
.1746
.1940 -2190. .2540 .3030 .5150 .5830 .6230 .6555 .6840 .7092 .7320 .7523 .7700 .7862 .8020 .8173 .8320 .8462 .8600 .8733 .8860 .8982 ;9100 .9212 .9320 .9423 ,. 9520 .9613 .9100 .9783 .9860 .9933
.0017
.0105
.0192
.0260
.0368
.0461
.0561
.0669
.0784
.0902
. 1024
.1148
.1276
.1423
. 1597
. 1784
.1982
.2252
.2623
.3194
.5322
.5919
.6298
.6615
.6892
.7140
.7362
.7560
.7733
.7894
.8051
.8202
.8349
.8490
.8627
.8758
.8885
.9006
.9123
.9234
.9341
.9442
.9539
.9630 -. 9717 .9798 ,.9875 .~9946
1.0000
.0035 0122
:0210 .0297 .0386 .0460 .0582 . 0691 .0807 .0926 .1049 .1174 .1303 .1456 .1633 .1823 .2027 .2318 .2714 .3454 .5476 .6003 .6365 .6674 .6944 .7186 .7404 .7596 .7766 .7926 .8082 .8232 .8378 .8518 .8654 .8784 .8910 .9030 .9146 .9256 .9362 .9462 .9558 .9648 .9734 .9814 .9890 .,9960
1.0000
.0052
.0139
.0227
.0315
.0404
.0500
.0603
.0714
.0831
.0951
.1073
.1199
.1332
.1489
.1671
.1861 -2077 .2388 -2812 -3878 .5612 .6083 .6430 .6731 .6995 .7232 .7444 .7632 .7798 .7958 .8112 .8262 .8406 .8546 .8680 .8810 .8934 .9054 .9168 .9278 .9382 -9482 .9576 .9666 .9750 .9830 .9904 .9974
1.0000 - .
.0070
.0157
.0245
.0332
.0423 0520
:0625 .0737 . 0855
0975 :1098 .1225 .1361
11524 .1708
,. 1901 .2132 .2462 .2917 .4632 .5730 .6159 .6493 .6786 .'I044 .7276 .7484 .7667 .7830 .7989 .8142 .8291 .8434 .8573 -0706 .8835 .8958 .9077 .9190 .9299 .9402 .9501 .9594 -9683 .9766 -9845 .9918 .9987
1.0000

G-‘BO
TABLE NO. TIKE INCREMENT 5 RAINFL 2 .lOOO
8 a 8 a a a a a a a a a a a a a a a a a a a a a . a a a a a a a a a a a a a. a a a a a a
.a a a a. a. a
~9 ENDTBL
.oooo
.0051
.0105
.0161
.0220
.02al
.0345
.0411
.04ao 9
.0553
.0670
.0712
.oaoo
.oa92
.0990
.1093
.1200
.1322
.1470
.1630
.1810
.2040
.2350
.2a30
.6630
.7350
.7720
.7990
.a200
.a376
.a535
.8676
.8aoo ,
.8912
.9018
.9117
.9210
.9297
.9377
.9452
.9520
.95a4
.9647
.9709
.9770
.9829
.9887 ,. 9944
1.0000
0010 :0062 .0116 .0173 .0232 .0294 .035a .0425 .0494 .0568 .0646 .0730 -0818 .0912 .lOlO .x14 .1222 .1350 .1502
1663 :1a51 .2094 .2427 .3068 .6820 .7434 .7780 .8036 .8237 .a409 .8565 .8702 .a823 .a934 .903a .9136 .922a .9313 .9393 .9466 .9533 .9597 .9660 .9722 .97a2 .9a41 .9a99 .9956
1.0.000
.0020
.0072
.0127
.ola4
.0244
.0306
.0371
.0439
.05oa
.05a3
.0662
.0747
.0836
.0931
.1030
.1135
.1246
.1379
.I534
.1697
.la95
.2152
.2513
.3544
.6986
.7514
.7836
.8oao
.8273
.a442
.a594
.8728
.a845
.a955
.905a
.9155
.9245
.9330
.9408
.9480
.9546
.9610
.9672
.9734
.9794
.9as3
.9910
.9967 1.0000
.0030
.ooa3
.013a
.0196 0257
:0319 .03a4 .0452 .0523 .059a .0679 .0764 .oa55 .0950 . 1051
1156 :1270 . 1408 .1566 .1733 .1941 .2214 .2609 .43oa .7130 .75a8 .7a90 .a122 .a308 .a474 .8622 .a753 .a868 .8976 .9078 .9173 .9263 .9346 .9423 .9493 .9559 .9622 -9685 .9746 .9806 .9864 .9922 .997a
1.0000
.0041
.0094
.OlSO
.0208
.0269
.0332
.039a
.0466
.053a
.0614 .0696 .07a2 .oa74- .0970 -1072 .1178
. .1296 .I438
. .159a -1771 .I989 .2280 .27lS .5679 .7252 .7656 .7942 .8162 .a342 .a505 .a649 .8777 .a890 .a997 .9097 .9192 .92ao .9362 .943a .9507 .9572 .9635 .9697 .975a .9ala .9876
. .9933 .99a9
1.0000

TABLE NO. 5 MINFL 3
TIHE INCRMENT -1000
.oooo
.OlOO
.0200
.0350
.0500
.0660
.0820
.0980
.1160
.1350 ,
.1560
.1800
.2060
.2370
.2680
.3100
.4250
.4800
.5200
.5500
.5770
.6010
.6240
.6450
.6640
.6830
.7010
.7190
.7360
.7528
.7692
.7853
.a010
.8163
.a312
.8457
.0590
.8736 -8870 .9000 .9126 .9249 .9368 .9482 .9594 .9701 .9804 .9904
1.0000
.0022
.0118
.0228
.0380
.0531
.0692
.0851
.lOlS
.1197
.1390
. 1606
.1849
.2120
.2429
.2752
.3314
.4394
.4890
.5266
.5556
.5820
.6058
.6284
.6489
.6677
.6866
.7047
.7225
.7394
.7561
.7725
.7685
.8041
.8193
.a341
.8486
.8626
.a763
.a896
.9026
.9151
.9273
.9391 -9505 .9615 .9722 .9825 .9924
1.0000
.0043
. 0137
.0257
.0410
.0563
.0724
.0883 , 1050 .1234 .1431 .1653 .1900 .2181 .2480 .2829 .3547 .4517 .4975 .5329 .5612 .5868 .6104 .6326 .6527 .6715 .6903 .7004 .7259 .7428 .7594, .7757 .7916 .8071 -8223 .a370 .a514 .8654 .a790 -8923 .9051 .9176 .9297 .9414 .9527 .9637
9743 Isa45 ;9943
l.OOOb
.0063
.0157 0287
:0439 .0595 0756
:0915 .1086 .1272 .1473 .1701 . 1952 .2243 .2549 .2912 .37aa .4623 .5055 .5389 .5666 .5916 .6150 .6368 .6565 .6753 .6939 .7120 .7293 .7461 .7627 .7789 .7947 .8102 .a252 .a399 .a542 .8681 .8817 .a949 .9076 .9200 .9321 .9437 .9550 .9658 -9764 .9865 .9962
1.0000'
.0082 0178
:03m .0470 .0628 .0788 .0947 1123
:1311 .1516 1750
:2005 .2306 -2613 .3002 .4026
,.4716 .5130 .5446 .5718 .5964 .6196 .6410 .6603 .6791 .6974 .7155 .7326 .7495 .7660 .7821 .7979 .8132 .8282 .042a .8570~ .a709 .8044 .a974 .9101 .9225 .9344 .9460 .9572 9680
19784 .9804 .9981
1.0000

TABLE NO. 5 RUNFL 4
8 8 8 8 8 8 8 8 8 8 8 8 8 8 a ~8 8 8 8 8 8 8 8 8 8 8 8 8 8 8 8 .' 8 8 8 8 8 8 8 8 8 8 8 9 ENDTBL
_ _
.oooo -
.0050
.OlOO
.0150
. 0200
. 0252
.0308
. 0367
.0430
. 0497
.0567
.0642
.0720
. 0806
.0905
. 1016
.1140
.1284
.1450
.1659
.1890
.2165
.2500
.29aO
.5000
.7020
.7500
.7835
.8110
.8341
.0543
.8716
.8860
.8984
.9095
.9194
.9280
.9358
.9433
.9503
.9570
.9634
.9694 09752 .9808 .9860 .9909 .9956
1.0000
.OOlO
.0060 * 0110 .0160 .0210 , 0263
~.0319 .0379 . 0443 .0511 .0582 . 065.7 .0736 .0825 .0926 . 1040 .1167 . 1317 .1496 .1703 . 1940 .2227 .2578 .3143 .5840 .7134 .7572 .7095 .a158 .a383 . a579 .a747 .8886 .9007 .9116 .9212 .9296 .9373 .9447 .9517 . 9583 .9646 .9706 .9764 .9818 . 9870 .9919 .9965
1.0000
.0020
.0070
.OlZO
.0170 . .0220
.0274
. 0331
.0392
. 0456
. 0525 . . .0597
.0673
.0753
.0844
.0948
.1064
.1194
.1350
.1535
.1748
. 1993
.2292
.2664 -3394 . 6267 .7240 .7641 .7952 .a206 .0425 .8615 .a777 .a911 .9030 .9136 .9230 .9312
..9388 .9461 .9530 .9596 .9658 .9718 .9775 .9829 .9880 .992a .9974
1.0000
.0030
.0080
.0130
. 0180 -0231 . 0285 .0343 . 0404 .0470 .0539 .0612 * 0688 .0770 .0864 .0970 .ioa9 .1223 .I385 .1575 .1794 .204a .2359 .2760 . 3733 .‘6606 .7336 .77oe .a007 .a252
8465 :a650 .a806 .8936 .9052 -9156 .9247 .9327 .9403 . 9475 .9544 -9609 .3670 .9729 .9786 .9839 .9890 .9938 . 9983
1.0000
.004rJ .0090 .0140 .019a .0241 .0296 0355
:0417 .0483 *OS53 .062-l . 0704 . 0786
*.oaa4 .a993 .1114
-.1253 1421
:x17 .1842. 2105
:242a .2866 .4166 .685: .742; .7773 .a060 .8297 .8504 .8683 .a833 .896D .9074 .9175 .9264 .9343 .9418 .9489 .9557 .9621 .9662 .9741 .9797 .9850 .9900 .9947 .9991
1.oqoo


TABLE NO. TIHE INCREMENT ~5 RAINFL'S
a 8 a 8 a 8 a a 0 a- 8 a 8 a a a 8 a a a 9 ENDTBL
.oooo
.0140 .0290 .0440 . 0630 .oa40 .1090 .1400 .1810 .2520 .7290 .a090 .8540 . 8860 .9120 .9330
9530 :9690 . 9840 .9980
.5000-'
.0020 .0050
10320 0170 .0200 .0350 ,.0470 .0510 .0670 0710 .oa90 :0940 -1140 .1200 .1470 . 1540 . 1920 .~ .~ .2040 .2770 .3180 .7520 .7700 .a190 .8290 .8610 .a680 .8920 .a970 .9170 .9210 .9370 .9410 .9570 .9600 .9720 .9750 . 9870 .9900
1.~0000 1.0000
.ooao .OllQ
.0230 .026Q .03ao .0410 .0550 .0590 . 0750 -0790 .0990 .1046 .1260 -1330 -1620 .1710 .2170 .2330 .63aO : 6980 .7850 .7900 .8380 :8460 .8740 .a800 .9020 ,907o .9250 ,. 9290 .9450 . .9490 .9630 -9660 . 9780 .9BlQ .9930 .9960
1.0000 1.0000


TABLE NO. TIXE INCRMENT 5 RAINFL 6 . 0200
0 8 8 8 8 8 8 8 a- 8 8 9 ENDTBL
.oooo
.0425
.0990
.1800
.5300
.7050
.7900
.8561
.9103
.9573 1.0000
.0080
.0524
.1124
.2050 6030
17240 .a043 .a678 .9201 .9661
1.0000
.0162
.0630
.1265
.2550
.6330
.7420
.8180
.a790
.9297
.9747 1.0000
. 0246
.0743
. 1420
.3450
.6600
.7590 .6312 .a098 .9391 .9032
1.0000
.0333 -0863 -1595 .4370 .6840 -7750 -8439 .9002 .9483 -3916
1.0000

i
-1

STANDARD CONTROL
Data Code/Operation
6 RUNOFF 1 Develops a runoff hydrograph using the data from columns 25-36, 37-46, and 49-60.
6 RESVOR 2
6 REACH 3
6 hDDHYD 4
6 SAVMOV 5
6DIVXRT6
Procedure fl
Col. 25-36 COl. 37-48
Col. 49-60
Performs storage indication routing of a hydrograph. columns 25-36 contain the starting elevation for routing to begin. If these are left blank, the routin will begin at the first entry in the STRUCT table.
Performs Modified ATT-KIN reach routing using the reac length in columns 25-36, a cross section rating table, or optionally the end area coefficient, x (CO~UUIS 37 -4S), and the exponent, equation Q = xA*.
III (c01UmnS 49-60) in i&e If values appear in coluxns 37-48
and 49-60, they override use of a XSECTN table.
The floodplain length is a optional entry in, columns 49-60. If it is entered there must be a channel react length in columns 25-36 of this record and a low grour entry in columns 61-72 ~of the 2 XSECTN record.
Adds tvo hydrographs together.
Moves a hydragraph from one storage location to aaothe storage location.
Divides an inflow hydrograph into tvo separate outflor hydrographs. Two procedures are available vith this operaton.
Output fl will contain that portion of the inflow hydrograph below and equal to the discharge given in the columns 25-36. output $2 will contain that portic of the inflow hydrograph above the given discharge in columns 25-36. Maximum discharge in cfs for Output I1 hydrograph. Drainage area split in decimal fraction to retain Witi Output #l hydrograph. If left blank, all drainage arc goes with Output #2 hydrograph. XSECTN ID associated with Output #2 Wdrograph.
. .

Procedure P2
Cal. 13-15
col. 25-36 COl. 37-48 COl. 49-60
output options
Col. 61
Col. 63 Col. 65 Col. 67
Col. 69
COl. 71
Col. 73-80
The inflow hydrograph may be divided proportionally using two elevation vs. discharge rating tables. These tables must be provided by the user as cross sections ID of rating table associated with Output fl hydrograph. Blank or Zero. Same as Procedure #l. Same as Procedure Rl and a rating table must be included for the XSECTW ID.
If a particular option is wanted, put a "1" in the appropriate column.
P/V - Displays peak discharge, peak time, peak elev. (if rating table is available) and runoff volume minus constant basefloo under hydrograph in inches, cfs-hrs, and ac-ft, and current constant baseflow in cfs. Will supply up to ten largest peaks of multi-peaked hydrographs. HYD - Displays hydrograph discharge in tabular form. ELEV - Displays hydrograph elevations in tabular form. DDR - Displays discharge versus duration of time that a discharge is equaled or exceeded. FILE - Generates a file of discharge hydrograph coordinates in machine readable RRRDHD format. son - Requests results of the operation be inssrted in Sumsmry Tables 1 and 3 at the end of the job. RECORD identification. Any characters including blank-

Y
i


EXECUTIVE CONTROL
Data Code/Operation
7 LIST
7 BASFLO 5
COl. 25-36
or
COl. 25-36
COl. 37-48
Col. 49-60
7INCRM6
Col. 25-36
7 COXPUT 7
COl. 13-17
COl. 19-23
Cal. 25-36
The entire set of tabular data and Standard Control (S.C.) instructions in effect or specified portions ar printed.
Baseflow is specified prior to the COMPUT record(s) where it is to be added.
Insert the constant baseflow cfs to be part of the inflow hydrograph in the next and subsequent reach routings until changed by another 7 BASFLO 5 record.
The volume in inches in triangular hydrograph form tha is added to each runoff hydrograph computed. columns 37-48 and columns 49-60 must also be used.
Time in hours that the triangular hydrograph peaks. (Note: If field is left blank or zero, constant baseflow procedure is used).
Time in hours that the triangular hydrograph base extends. (Note: Cannot exceed 398 main time increments). Leave blank for constant baseflow.
Sets the time interval between elements of the hydrograph to be used for subsequent computations. This record must be read before any COMPUT record.
Main time increment in hours; a decimal is required.
Specifies the beginning and ending S.C. instructions t be execut@d. One pass through the watershed (S.C. list) requires one or more COMFUT Records.
Specifies the beginning or FROX location: This must correspond to a cross-section or structure number that appears in the XSECTN/STRUC column of a S.C. instruction.
Specifies the ending or THBU location. The sequence c instruction given by the S.C. is continued until the cross-section or structure specified under thou has been reached-and completed.
The starting,time in hours of each hydrograph developc under this COMPUT. A decimal is,reguired.

Cal. 37-48
COl. 49-60
COl. 61
Cal. 63
COl. 66-67
COl. 70-71
ENDCKP 1
ENDCMP2
The rain depth dimensionless)
to be used. RAINFL table --
If a unit depth is used, enter the total
rain depth in inches. IS an actual storm is used, enter a 1.0. A decimal is required.
Rainfall duration or if actual stars duration is given in RAINFL table enter 1.0. A decimal is required.
The RAINFL table to be used (l-9).
The Antecedent Runoff Condition to be used (1, 2, or 3).
The alternate number (l-99) associated with this COMPul!. Usually reflects changes in the watershed.
The storm number (l-99) to be associated with this COUPUT, with no more than 10 storms per run.
Note: The last two data items are used to order the summary table output data and for generating the peak discharge file in machine readable form.for use in the ECON2 or URBl computer programs.
Resets the program to the beginning of the S.C. list. This record must be used anytime it is desired to start another pass through the watershed.
Terminates routing computations. Causes Summary Tab. I2 to be printed and Summary Tables I1 and #3 if selected. Job is terminated unless PEARS information follows.

i

.J.a. DfPI)17Nml or AGNIGULlUIE TR-20 - MODIFY STANDARD CONTROL MXIKEliLC 1 SOIL wHSEnVAlloH uIIvIC2
SCSfNg275
PREPARED BY n RY
DATE C
PAGE _ OF -
I I
‘~0ffTy1: Uodlftcotlonl rurt br given In the ordw that thry appear on the standard control Ilrt

~MODIFY STANDARD CONTROL
Modify Standard Control is used to insert new instructions, or alter c delete existing instructions in the Standard Control (s.c.) list. The modifications of S.C. are done in sequential order starting at the top of the list with the first S-C. instruction to be modified. After a S.C. instruction is passed, it may not be modified until the program h passed a 7 LIST, or 7 COMPD'I Executive Control record.
Data Code/Operation
7 INSERT 2
COl. 13-15
COl. 16%
7 ALTER 3
7 DELETE 4
Will insert the S.C. instructions that follov into the S.C. list.
The XSECTN/STRUCT identification where the new S.C. instructions are to be inserted. The location in the S.C. list is immediately folloving the end of the firs series or string of S.C. instructions for SECTN/STRuc named. The new S.C. records are filled out in the sar format as described on the S.C. worksheet.
Will substitute the following S-C. records for the S.( instructions that match column l-17 of each new S.C. record. The S.C. records are filled out in ths same format as described on the S.C. vorksheet.
Will delete the S.C. instructions that match column l-17 of the records that follow.

u.,. DcPA”RC”T Of AO(IIQKTu”C SolI. aMpvAll0( l cnvlcc TR-20 READ DISCHARGE HYDROGRAPH IOT(((SHEET
scs-tNo-176 ,P-m1
HYDROGRAPH LOCATION PREPARED BY
JOB CHECKED BY DATE PAGE _ DATE OF -

U.S. DEFu”v?a”T OF AmIaATvRC TR-20 - INTERMEDIATE PEAKS WXWSHELI SOIL cm4SCRVA7Ia4 SERVICE SCS--MO-2 r I
441
PREPARED BY CHECKED BY
DATE DATE
PAGE OF =
JO0 1 12 I 13 - 24 1 25 I 37 - 4n I 4s - 60 I 61 - 72 175 - 80 I -
~~~~~~~~~~~~~~~~~~~~~~~~~~~~~~~~~~~~~~~~~~~~ . . . * 1 I
:Foble: : i I I I I I I
Polnl , D.A. ID ,og. ml.


‘I -H

TOl3UO3 pXPpUO7S 30 t8q=fW 8n d33lOU sa6essam .saq&
o33Jo8ds qno sau3td
*qnduT an 01) uoyaotalr u3 pazs~u8 spxo38l 8n SP qons 'uo3~euuopl~ ~U8U3~8d go rrasn
-<a hq p83~3tusp3 SJbess8m TPUOJ~~~OJUJ metbo;rd ya,ayD ev?p OZ-x~, et42 'hTTmuo333ppy
ax&& u3 se) 86eSn uo 6u3puadap ~a8x.zo~
*paloa;uoo TOU 33 wtboxd 8m 03 pa03 hTpnsn am ha- -JoUJnb8S PaPp 8n U?m?M pZO38t
P Jo 6uyuoya3sod au2 -3~ SmaTqozd ;IO *p;romz andu3 UP ~0 SpTJ33 PlOP ~3zaQmUPqdTP ZO ~3X8UKlU 8742 U?~?M s8yPqS3lo
huS 30 taSn SrIl h3gou qarqn $w hq p8333WI8p~.sloXZZ (T
:8XS &8qJ, *s;rotxa qndur bu~h3puap~ UT l8sn JVt py2 02 ano paW3ld sabessam xoxca 30 sadhz) on& am 8xaqJ,
s33vssW 30 SPdXZ
*ZOZ;r8 UT 8UO 8q7 8q horn Z$SZ33 Jq? q6noqq Ubha 'TWtTmp puo38s 8~ 03 qurod TT~ 2)~ '~~833 P U3 PUno3 ax= sT~m?98p OK+ 3T 'atdmexa a03 'aoala ue p8acteq8p
nwxbo;rd 8qY, 8l8qn au3'T bu3pa~axd-umn~os P 07 w3od 02 p8sn ST (,) sqeze3 alom ~0 au0 30 6~3~~3~~0~ xar+u?od URRI~OO y '2
buoxn aql u3 spua JO suT68q aeq~ eyep uy s;Ioxa bU?WaqaP UT Tn3dT8u ST s?qL *pTaT3 ewp 30 qapTn TTn3 aq2 6uTPualxa
salooslapun 30 say;tas e 30 s~s~suoo srayxom pTaT3 8qL. 'I
t -H

*a~qo~daozm sT mqutnu uoraaas ozaz ~0 2fu[upTq P 'pasn aq aou ~Trn noTJ pazb.zahrp II
'(002 02 T) taqumu uor>)3as ssom e Aq pama;ra;yaz dTTPlaua6 ST r)T *lalFT paon oq rrrn ~0~3 pavaayp ZI - ON32 SI 'ON NOIL23SX HO%? a3W3AICliii
*saqnupsa (m) quauodxa 6uT202 02PIIrD3P ap?Aortd ol paysap ATalenbape aq pTnoqs auam6as TaWZPqa
au 'aTqp3 rju?yzrr m3SX JO wrod abmzqwrp ozaz-uou Z$SXT~ ay7 MoTaq SJ uog)PAaTa 'ITnJquRq aqJ# - LNIOd QNOOPS NW& SSP? NOILVA3P -3iii
'PSOO%f 6 =OVtXN L P 30 SpTSTf PaOp 80m qStF3 Ow UT OX82 Zo anTPA P q atar&) 3~ zoadde OSTP TT?M 11 'STqO> am 0 UT %nTPA
~w6au P ST 8x8- uaqn s;rvadde syq& - XX - XX '@x03 NI 3nlm @xQZrFI1ii+
'PT'ay3 a- UT anpa >oastxoo aa 03 se ayllm ppoo wrbozd aqj leql ssan6 assq aq2 swasazdarr &XX'XXX,, aqa *unoqs ST xaqmnu uogaado PUP aPo3 Pwp arll 02 spuodsaxoo r)eqq amw uoqexado aq~, -teqmnu uo?aexado
=O aPO3 PlPp aa UT zolza UO ST alaq:, ~o,paTT%dSs~m aq d'lTWQD,p XPm amPU uogwad0 - iii dxx xxxu 38 amom &I :3AOEY CXixlnrw Q?3IJ NI 808ki3*1*
*ParrouB? aq UPS a6essam aqq 'auaauy a- sy s~qa ;II 'uoJ~)PcuoJuJ 6ugsTxa aqa azTdaz TTTM oyzp .syq JO uorarppe am,
*pap-T u-q ATsnoraazd seq ea)ep aTqe& - a3avo7 mmim XX mfm NIQ2Kii ~0 'a3avo7 ~crm2im xx 3wmmsiii
'Q3ClQO'I Xl'U3X-R XXX NOIJDWBSXiii
*paxoubr aq UPS a6~ssam syq:, 'aTqy;s;eI 2Tnwap o bursn 31 *papPoT aq vnm ‘pasn ;r '6 0% L saTqe;L
'uz.e;rbozd aq2 UT saTqe% aq2 aprzaho TT?n Aaqa 'waqmnu aTqer+ urerr aSaQ KQ?n ez+ep Touog~ppe TnduT ;rasn aqz& pTnoqS *mozbo;ld 02-u
au2 uT papnT3ur saTqe7 2TneJap axe 9 02 T saTqe& urea 'aTr3 OVP 02-U uy papnT=g 20~ sy aTqe& u?ex paasanbaa - a3ClVOT &ON XX H?EW NIWIiiii
*lolla ue ST pasn ATSnOrA8zd 2.ou ZaqmnU alnzQnzq)s e sasualaJaz qs~qn pzosaz 3&313a P bu?MoTToJ
TOJWO3 PJPpue~S P 10 plro3a;t J,mSNI UY .aTqea bug)oz amwruas e =v6= ?ou saop a;mr)m;r~s TTnN y -6uqno;r qohrrasaa 0 20~ pazTnba;r
s? UOTlelruoju~ amq)snlr2S - aaavo? x7snoIfmd &ON XX 3xacmusiii 9-H