Conservation Genetics for Natural Resources Molecular Approaches in Natural Resource Conservation...
24
Molecular Approaches in Natural Resource Conservation and Management Edited by J. Andrew DeWoody Purdue University John W. Bickham Purdue University Charles H. Michler Purdue University Krista M. Nichols Purdue University Olin E. Rhodes, Jr. Purdue University Keith E. Woeste Purdue University
-
Upload
independent -
Category
Documents
-
view
3 -
download
0
Transcript of Conservation Genetics for Natural Resources Molecular Approaches in Natural Resource Conservation...
Molecular Approachesin Natural ResourceConservation andManagement
Edited by
J. Andrew DeWoodyPurdue University
John W. BickhamPurdue University
Charles H. MichlerPurdue University
Krista M. NicholsPurdue University
Olin E. Rhodes, Jr.Purdue University
Keith E. WoestePurdue University
CAMBRIDGE UNIVERSITY PRESS
Cambridge, New York, Melbourne, Madrid, Cape Town, Singapore,Sao Paulo, Delhi, Dubai, Tokyo, Mexico City
Cambridge University Press32 Avenue of the Americas, New York, NY 10013-2473, USA
www.cambridge.orgInformation on this title: www.cambridge.org/9780521731348
C© Cambridge University Press 2010
This publication is in copyright. Subject to statutory exceptionand to the provisions of relevant collective licensing agreements,no reproduction of any part may take place without the writtenpermission of Cambridge University Press.
First published 2010
Printed in the United States of America
A catalog record for this publication is available from the British Library.
Library of Congress Cataloging in Publication data
Molecular approaches in natural resource conservation and management /edited by J. Andrew DeWoody . . . [et al.].
p. cm.Includes bibliographical references and index.ISBN 978-0-521-51564-1 (hardback) – ISBN 978-0-521-73134-8 (pbk.)1. Biodiversity conservation. 2. Genetic resources conservation.3. Molecular genetics. 4. Conservation of natural resources.I. DeWoody, J. Andrew, 1969– II. Title.QH75.M647 2010333.95′16–dc22 2009050318
ISBN 978-0-521-51564-1 HardbackISBN 978-0-521-73134-8 Paperback
Cambridge University Press has no responsibility for the persistence or accuracy of URLs forexternal or third-party Internet Web sites referred to in this publication and does not guaranteethat any content on such Web sites is, or will remain, accurate or appropriate.
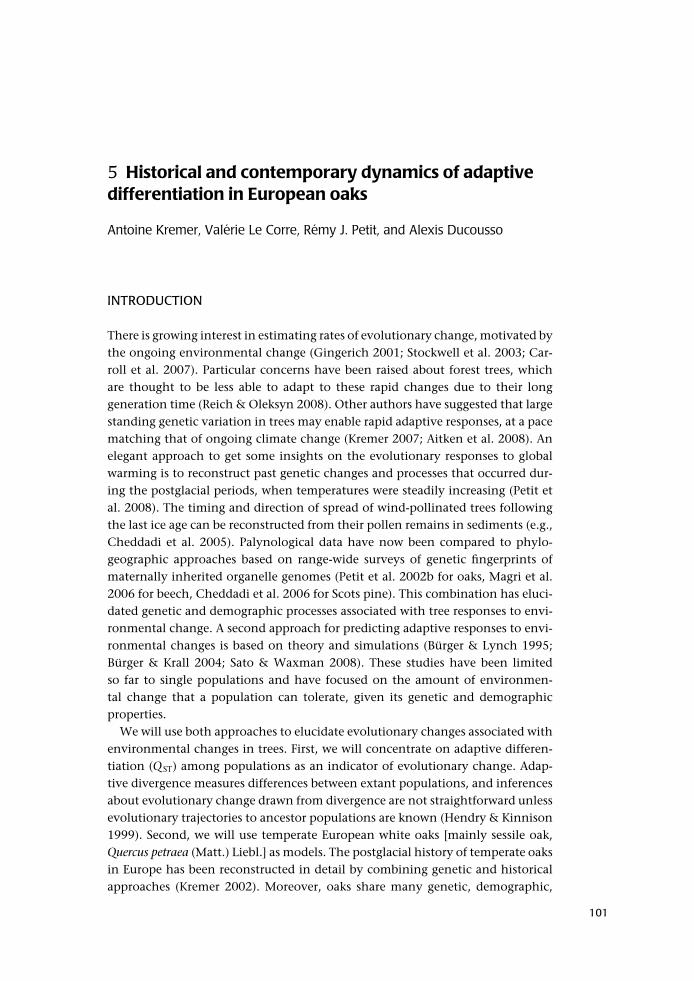
5 Historical and contemporary dynamics of adaptivedifferentiation in European oaks
Antoine Kremer, Valerie Le Corre, Remy J. Petit, and Alexis Ducousso
INTRODUCTION
There is growing interest in estimating rates of evolutionary change, motivated bythe ongoing environmental change (Gingerich 2001; Stockwell et al. 2003; Car-roll et al. 2007). Particular concerns have been raised about forest trees, whichare thought to be less able to adapt to these rapid changes due to their longgeneration time (Reich & Oleksyn 2008). Other authors have suggested that largestanding genetic variation in trees may enable rapid adaptive responses, at a pacematching that of ongoing climate change (Kremer 2007; Aitken et al. 2008). Anelegant approach to get some insights on the evolutionary responses to globalwarming is to reconstruct past genetic changes and processes that occurred dur-ing the postglacial periods, when temperatures were steadily increasing (Petit etal. 2008). The timing and direction of spread of wind-pollinated trees followingthe last ice age can be reconstructed from their pollen remains in sediments (e.g.,Cheddadi et al. 2005). Palynological data have now been compared to phylo-geographic approaches based on range-wide surveys of genetic fingerprints ofmaternally inherited organelle genomes (Petit et al. 2002b for oaks, Magri et al.2006 for beech, Cheddadi et al. 2006 for Scots pine). This combination has eluci-dated genetic and demographic processes associated with tree responses to envi-ronmental change. A second approach for predicting adaptive responses to envi-ronmental changes is based on theory and simulations (Burger & Lynch 1995;Burger & Krall 2004; Sato & Waxman 2008). These studies have been limitedso far to single populations and have focused on the amount of environmen-tal change that a population can tolerate, given its genetic and demographicproperties.
We will use both approaches to elucidate evolutionary changes associated withenvironmental changes in trees. First, we will concentrate on adaptive differen-tiation (Q ST) among populations as an indicator of evolutionary change. Adap-tive divergence measures differences between extant populations, and inferencesabout evolutionary change drawn from divergence are not straightforward unlessevolutionary trajectories to ancestor populations are known (Hendry & Kinnison1999). Second, we will use temperate European white oaks [mainly sessile oak,Quercus petraea (Matt.) Liebl.] as models. The postglacial history of temperate oaksin Europe has been reconstructed in detail by combining genetic and historicalapproaches (Kremer 2002). Moreover, oaks share many genetic, demographic,
101
102 Antoine Kremer, Valerie Le Corre, Remy J. Petit, and Alexis Ducousso
and ecological attributes with other tree species (long-lived and out-crossingspecies, large population size, and asymmetry of seed-to-pollen gene flow).Finally, there is a vast body of data concerning population differentiation atvarious levels in oaks (organelle genomes, nuclear genes, and adaptive traits).To study genetic variation, forest geneticists have traditionally relied on com-mon garden experiments – called provenance tests – by growing populationsfrom various geographic origins in field trials at a common site (see Konig 2005for a review on European trees). In the case of European oaks, provenance testswere first established in 1877 (Kleinschmit 1993), and new tests continue to beestablished today ( Jensen & Hansen 2008).
Combining historical and theoretical approaches can overcome in part theobvious limitations of experimental studies of evolutionary change in long-livedspecies. The historical perspective over the past 15,000 years may disclose long-term trends that can be combined with the findings of the theoretical approach.Both methods may ascertain time frames of past evolution and help identify keydrivers of current adaptive responses of trees to climate.
HISTORICAL DYNAMICS OF ADAPTIVE DIFFERENTIATION
How much evolutionary change has accumulated since the Last Glacial Maxi-mum (LGM), 18,000 years ago? Ideally, assessments of change would comparepast source populations with extant populations. Evolutionary change can hardlybe monitored at the deoxyribonucleic acid (DNA) level unless DNA could beextracted and analyzed from macrofossil remains of oaks. Such assessments areimpossible for traits of adaptive significance. We will instead proceed indirectly,by subdividing differentiation of extant populations, assessed in provenance tests,into historical components (e.g., ancient and recent sources of population diver-gence). Inferring various historical sources is possible due to the detailed knowl-edge of colonization dynamics provided by the combined pollen and chloroplastDNA (cpDNA) analysis in the case of sessile oak.
Ancient differentiation
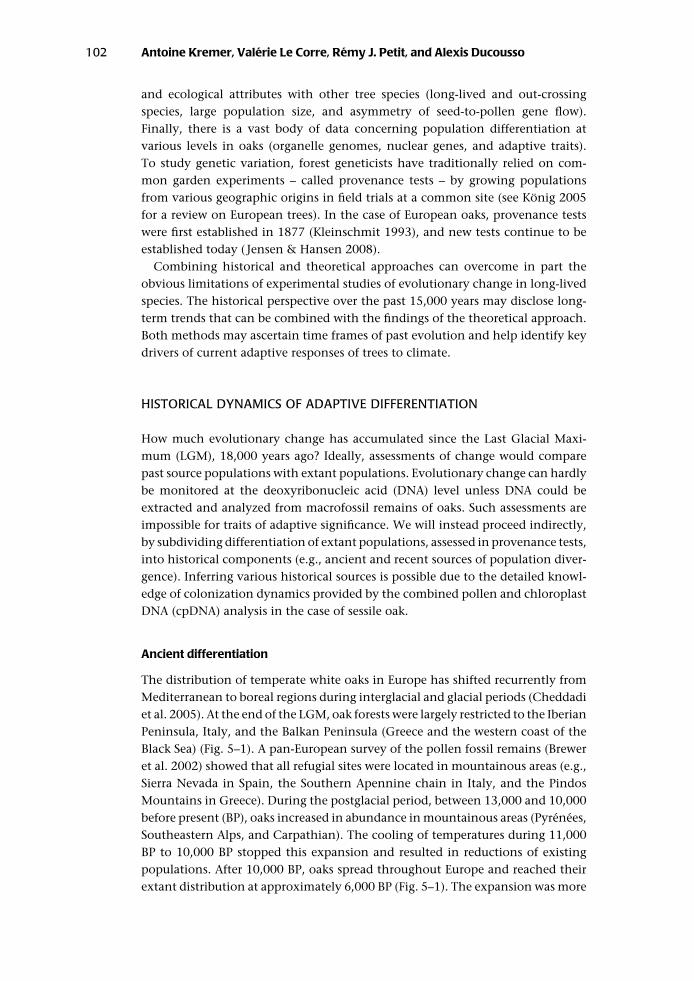
The distribution of temperate white oaks in Europe has shifted recurrently fromMediterranean to boreal regions during interglacial and glacial periods (Cheddadiet al. 2005). At the end of the LGM, oak forests were largely restricted to the IberianPeninsula, Italy, and the Balkan Peninsula (Greece and the western coast of theBlack Sea) (Fig. 5–1). A pan-European survey of the pollen fossil remains (Breweret al. 2002) showed that all refugial sites were located in mountainous areas (e.g.,Sierra Nevada in Spain, the Southern Apennine chain in Italy, and the PindosMountains in Greece). During the postglacial period, between 13,000 and 10,000before present (BP), oaks increased in abundance in mountainous areas (Pyrenees,Southeastern Alps, and Carpathian). The cooling of temperatures during 11,000BP to 10,000 BP stopped this expansion and resulted in reductions of existingpopulations. After 10,000 BP, oaks spread throughout Europe and reached theirextant distribution at approximately 6,000 BP (Fig. 5–1). The expansion was more
Historical and contemporary dynamics of adaptive differentiation 103
9,000 BP 6,000 BP
15,000 BP 13,000 BP
Figure 5–1: Variation of pollen percentages of deciduous oaks as extracted from the EuropeanPollen Database (according to Brewer et al. 2002, Fig. 2). Crosses indicate locations of sites; sizesof the red circles indicate percentages varying from 1% to 50% (1%, 10%, 25%, and 50%). SeeColor Plate V.
rapid in the west and was reduced in the center and east due to the Alps and theCarpathian Mountains.
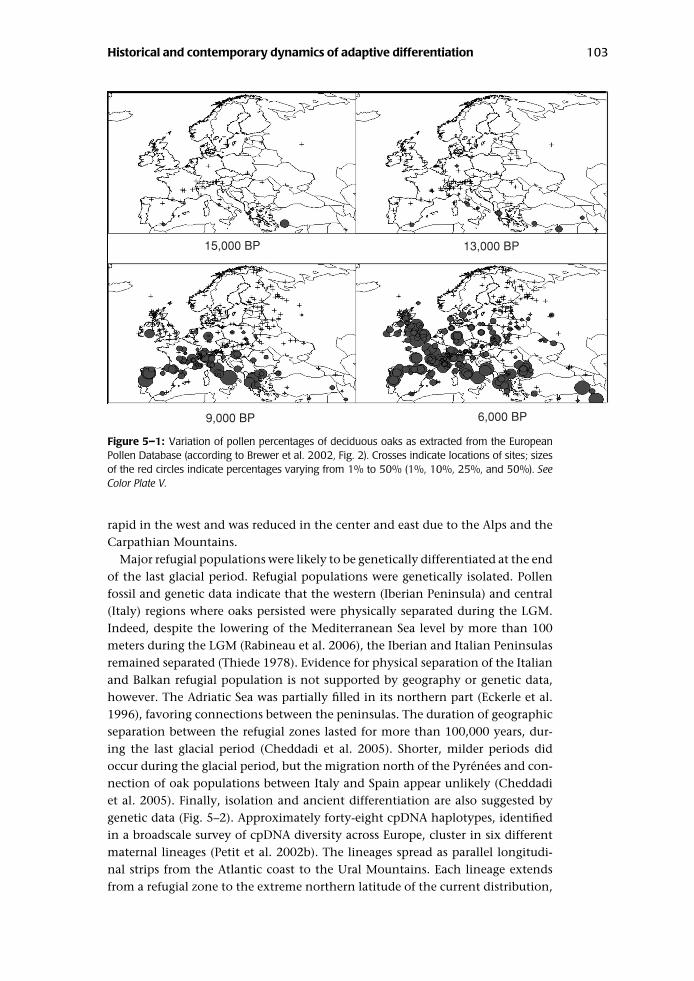
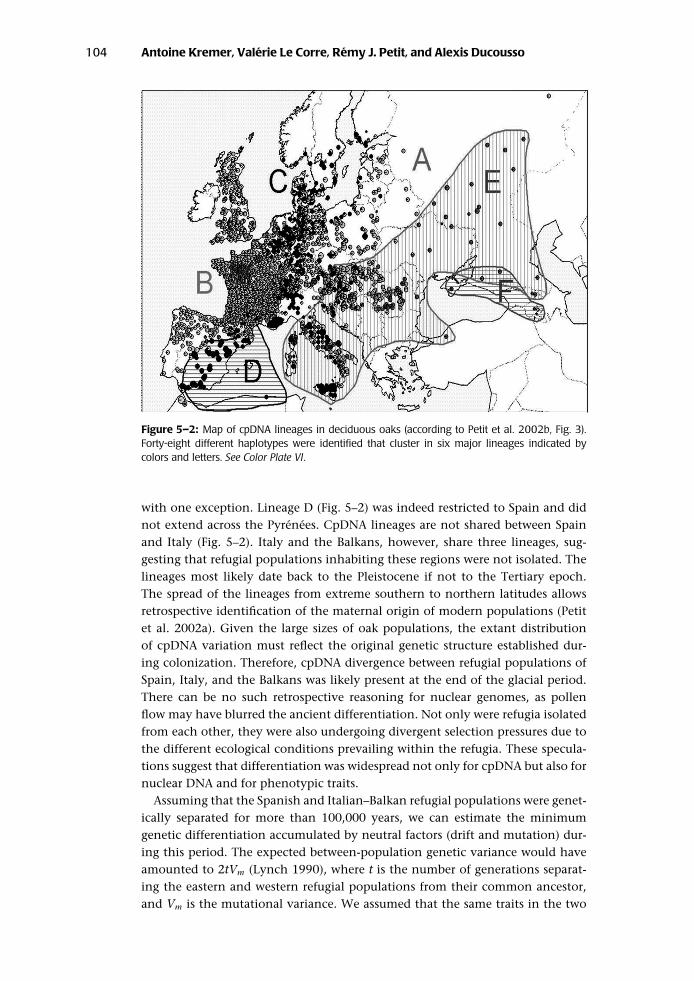
Major refugial populations were likely to be genetically differentiated at the endof the last glacial period. Refugial populations were genetically isolated. Pollenfossil and genetic data indicate that the western (Iberian Peninsula) and central(Italy) regions where oaks persisted were physically separated during the LGM.Indeed, despite the lowering of the Mediterranean Sea level by more than 100meters during the LGM (Rabineau et al. 2006), the Iberian and Italian Peninsulasremained separated (Thiede 1978). Evidence for physical separation of the Italianand Balkan refugial population is not supported by geography or genetic data,however. The Adriatic Sea was partially filled in its northern part (Eckerle et al.1996), favoring connections between the peninsulas. The duration of geographicseparation between the refugial zones lasted for more than 100,000 years, dur-ing the last glacial period (Cheddadi et al. 2005). Shorter, milder periods didoccur during the glacial period, but the migration north of the Pyrenees and con-nection of oak populations between Italy and Spain appear unlikely (Cheddadiet al. 2005). Finally, isolation and ancient differentiation are also suggested bygenetic data (Fig. 5–2). Approximately forty-eight cpDNA haplotypes, identifiedin a broadscale survey of cpDNA diversity across Europe, cluster in six differentmaternal lineages (Petit et al. 2002b). The lineages spread as parallel longitudi-nal strips from the Atlantic coast to the Ural Mountains. Each lineage extendsfrom a refugial zone to the extreme northern latitude of the current distribution,
104 Antoine Kremer, Valerie Le Corre, Remy J. Petit, and Alexis Ducousso
Figure 5–2: Map of cpDNA lineages in deciduous oaks (according to Petit et al. 2002b, Fig. 3).Forty-eight different haplotypes were identified that cluster in six major lineages indicated bycolors and letters. See Color Plate VI.
with one exception. Lineage D (Fig. 5–2) was indeed restricted to Spain and didnot extend across the Pyrenees. CpDNA lineages are not shared between Spainand Italy (Fig. 5–2). Italy and the Balkans, however, share three lineages, sug-gesting that refugial populations inhabiting these regions were not isolated. Thelineages most likely date back to the Pleistocene if not to the Tertiary epoch.The spread of the lineages from extreme southern to northern latitudes allowsretrospective identification of the maternal origin of modern populations (Petitet al. 2002a). Given the large sizes of oak populations, the extant distributionof cpDNA variation must reflect the original genetic structure established dur-ing colonization. Therefore, cpDNA divergence between refugial populations ofSpain, Italy, and the Balkans was likely present at the end of the glacial period.There can be no such retrospective reasoning for nuclear genomes, as pollenflow may have blurred the ancient differentiation. Not only were refugia isolatedfrom each other, they were also undergoing divergent selection pressures due tothe different ecological conditions prevailing within the refugia. These specula-tions suggest that differentiation was widespread not only for cpDNA but also fornuclear DNA and for phenotypic traits.
Assuming that the Spanish and Italian–Balkan refugial populations were genet-ically separated for more than 100,000 years, we can estimate the minimumgenetic differentiation accumulated by neutral factors (drift and mutation) dur-ing this period. The expected between-population genetic variance would haveamounted to 2tVm (Lynch 1990), where t is the number of generations separat-ing the eastern and western refugial populations from their common ancestor,and Vm is the mutational variance. We assumed that the same traits in the two
Historical and contemporary dynamics of adaptive differentiation 105
populations had the same heritability and that the mutational variance rep-resents 10−3 of the environmental variance (Houle et al. 1996). Under theseassumptions, genetic differentiation of traits (Q ST) between the refugial popula-tions would range from 0.75 to 0.92 for a trait whose heritability varies from 0.2to 0.5. For adaptive traits, diversifying selection (or convergent selection) due todifferent (or similar) ecological conditions prevailing in the refugial areas mayhave further increased (or reduced) Q ST. These figures provide a rough estimateof the minimal genetic differentiation created during the last glacial period dueto genetic separation of the refugial areas.
Transient differentiation during colonization
The velocity of oak migration during the postglacial recolonization period(between 15,000 and 6,000 BP) averaged 500 meters/year (Huntley and Birks1983; Brewer et al. 2002), reaching in some cases up to 1,000 meters/year (Breweret al. 2005). These figures are much larger than predicted by diffusion models ofthe advancing wave of the species. If rare long-distance dispersal (LDD) (Nathan2006) events are included in the diffusion models, however, then the overallexpansion results from the combined effects of the advancing wave (diffusion)and the aggregation of the many populations that were founded by the LDDevents. Rates of LDD as low as 10−4 (in probability) may be sufficient to accountfor the rapidity of the expansion as deduced from fossil pollen (Le Corre et al.1997b; Bialozyt et al. 2006). Considering the high fecundity of oaks, LDD mayhave occurred repeatedly even if their frequency was low. It is interesting that theoccurrence of LDD did not only increase the velocity of the colonization, it alsocontributed to the maintaining of the overall diversity of the species (Bialozytet al. 2006). The immediate consequence of LDD is the creation of new popula-tions by a limited number of colonizers generating strong founder effects. Foot-prints of founder effects are easily recognizable in the patchy geographic structureof cpDNA haplotypes (Petit et al. 1997). Ancient differentiation was most likelyincreased by founder events due to LDD. According to theory, recently foundedpopulations at the leading edge of the distribution should increase the overalldifferentiation among populations (Le Corre & Kremer 1998) while colonizationis proceeding. Given that colonization lasted more than 7,000 years, transient dif-ferentiation was maintained and affected organelle and nuclear genes and traits.As the range of a species expands, transient differentiation should decrease (LeCorre & Kremer 1998). After the full size of the range had been reached (6,000BP), gene flow resulted in the decay of differentiation.
Erasing ancient differentiation
As migration proceeded northward from the different source populations, thecolonization routes merged in central Europe and admixture of the different pop-ulations resulted in genetic homogenization. Ancient differentiation was almosttotally erased after full admixture of the migration fronts and extensive pollenflow among populations originating from different refugia. Large-scale analysisof nuclear gene diversity across Europe has consistently found low levels ofgenetic differentiation among modern populations regardless of the markers used
106 Antoine Kremer, Valerie Le Corre, Remy J. Petit, and Alexis Ducousso
Table 5–1. Genetic differentiation between Quercus petraea populations assessed with cytoplasmicand nuclear genetic markers
Number Number GeographicMarker of loci of pops distribution FST Reference
cpDNA 1 (cpDNA molecule) 650 Range-wide 0.835 Petit et al. 2002bIsozymes 13 7 Range-wide 0.032 Zanetto et al. 1994Isozymes 13 81 Range-wide 0.025 Zanetto & Kremer 1995RAPDs 31 21 Western part of 0.024 Le Corre et al. 1997a
natural rangeAFLPs 107 7 Range-wide 0.044 Mariette et al. 2002Microsatellites 6 7 Range-wide 0.023 Mariette et al. 2002
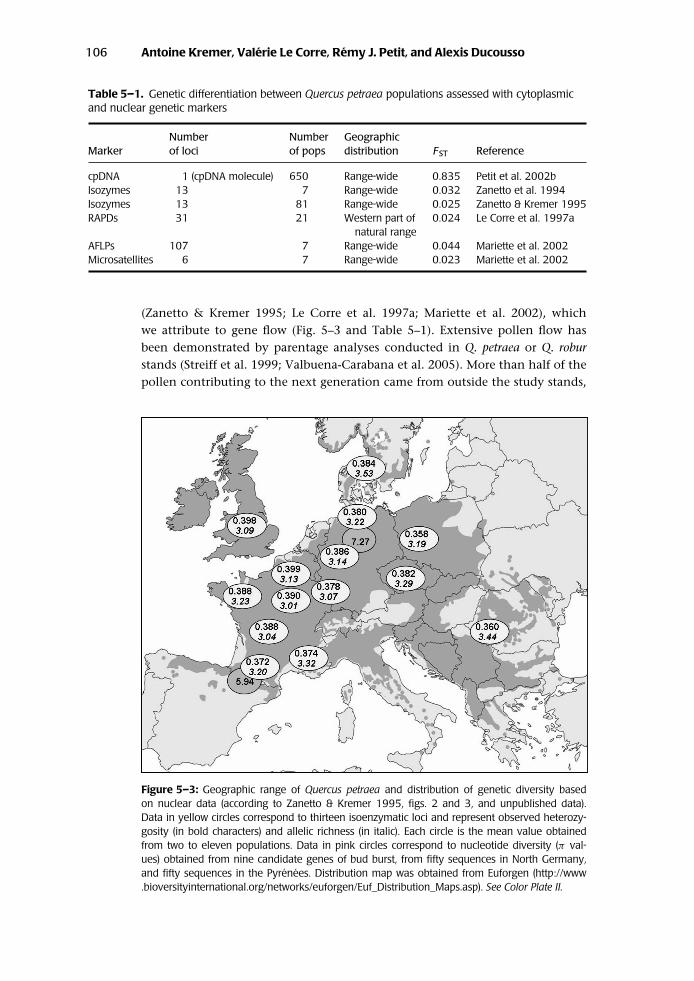
(Zanetto & Kremer 1995; Le Corre et al. 1997a; Mariette et al. 2002), whichwe attribute to gene flow (Fig. 5–3 and Table 5–1). Extensive pollen flow hasbeen demonstrated by parentage analyses conducted in Q. petraea or Q. roburstands (Streiff et al. 1999; Valbuena-Carabana et al. 2005). More than half of thepollen contributing to the next generation came from outside the study stands,
Figure 5–3: Geographic range of Quercus petraea and distribution of genetic diversity basedon nuclear data (according to Zanetto & Kremer 1995, figs. 2 and 3, and unpublished data).Data in yellow circles correspond to thirteen isoenzymatic loci and represent observed heterozy-gosity (in bold characters) and allelic richness (in italic). Each circle is the mean value obtainedfrom two to eleven populations. Data in pink circles correspond to nucleotide diversity (π val-ues) obtained from nine candidate genes of bud burst, from fifty sequences in North Germany,and fifty sequences in the Pyrenees. Distribution map was obtained from Euforgen (http://www.bioversityinternational.org/networks/euforgen/Euf_Distribution_Maps.asp). See Color Plate II.
Historical and contemporary dynamics of adaptive differentiation 107
and pollen-dispersion curves are characterized by long tails. As in the case ofacorns for the colonization of new territories, LDD of pollen may have played animportant role in gene flow. Most investigations based on parentage analysis arelimited at this point to Local Neighborhood Diffusion (LND) (Hengeveld 1989),whereas LDD has received less attention. LDD may be caused by uplifting airmovements into the upper layer of the atmosphere, where the pollen can betransported long distances but is also exposed to high ultraviolet (UV) radiation.A recent study based on an atmospheric model of air movements and taking intoaccount loss of pollen viability due to UV radiation showed that oak pollen canbe transported and maintain viability over 100 kilometers (Schueler et al. 2005;Schueler & Schlunzen 2006).
The persistence of ancient differentiation among the modern populationswas tested by comparing populations belonging to different cpDNA lineages, aseach lineage witnesses the glacial origin of the population. A meta-analysis wasconducted across all provenance tests that were established throughout Europe(Kremer et al. 2002) and for all phenotypic traits that were assessed so far.The analysis compiled data from sixty-two trait–test combinations from sixteenprovenance tests in France, Germany, and England. Each test comprised betweentwenty and ninety-four provenances. Phenotypic traits that were assessed wererelated to growth, phenology, dendrometry, and morphology, most of whichwould affect trees’ fitness. Each provenance was fingerprinted for its cpDNA andwas assigned to one of the maternal lineages. The test for persistence of ancientdifferentiation was made in two different ways: 1) by comparing lineage andpopulation components of variance in a hierarchical analysis of variance; and2) by comparing genetic distances between the haplotypes assigned to popula-tions and their phenotypic divergence using multiple Mantel tests. Among thesixty-two trait–test comparisons, only two exhibited significant associations withmaternal lineage. These results strongly suggest that the ancient differentiation,if it existed, did not persist and was entirely erased by gene flow that followedcolonization, by new selection pressures that occurred since colonization, or bytheir joint actions.
Recent differentiation
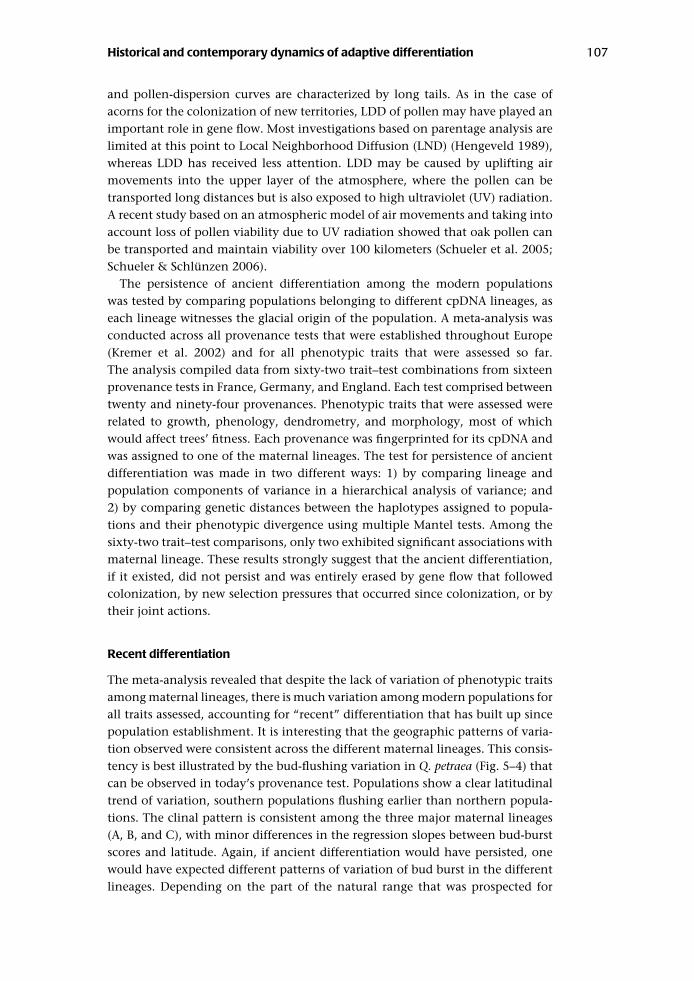
The meta-analysis revealed that despite the lack of variation of phenotypic traitsamong maternal lineages, there is much variation among modern populations forall traits assessed, accounting for “recent” differentiation that has built up sincepopulation establishment. It is interesting that the geographic patterns of varia-tion observed were consistent across the different maternal lineages. This consis-tency is best illustrated by the bud-flushing variation in Q. petraea (Fig. 5–4) thatcan be observed in today’s provenance test. Populations show a clear latitudinaltrend of variation, southern populations flushing earlier than northern popula-tions. The clinal pattern is consistent among the three major maternal lineages(A, B, and C), with minor differences in the regression slopes between bud-burstscores and latitude. Again, if ancient differentiation would have persisted, onewould have expected different patterns of variation of bud burst in the differentlineages. Depending on the part of the natural range that was prospected for
108 Antoine Kremer, Valerie Le Corre, Remy J. Petit, and Alexis Ducousso
0
0.5
1
1.5
2
2.5
3
3.5
4
4.5
42 44 46 48 50 52 54 56 58
0
0.5
1
1.5
2
2.5
3
3.5
4
4.5
42 44 46 48 50 52 54 56 58
0
0.5
1
1.5
2
2.5
3
3.5
4
4.5
42 44 46 48 50 52 54 56 58
Latitude (°C)
Bud-burst scorea
b
c
Figure 5–4: Variation of apical bud phenology of different populations of Quercus petraea inprovenance tests. The analysis was done separately for each different maternal lineage to whichmodern populations belong. (a) yellow (B lineage) according to Fig. 5–2; (b) blue (A lineage)according to Fig. 5–2; (c) red (C lineage) according to Fig. 5–2. Bud development was recordedaccording to bud-burst scores varying from 0 (dormant) to 5 (elongating leaves). See Color PlateVII.
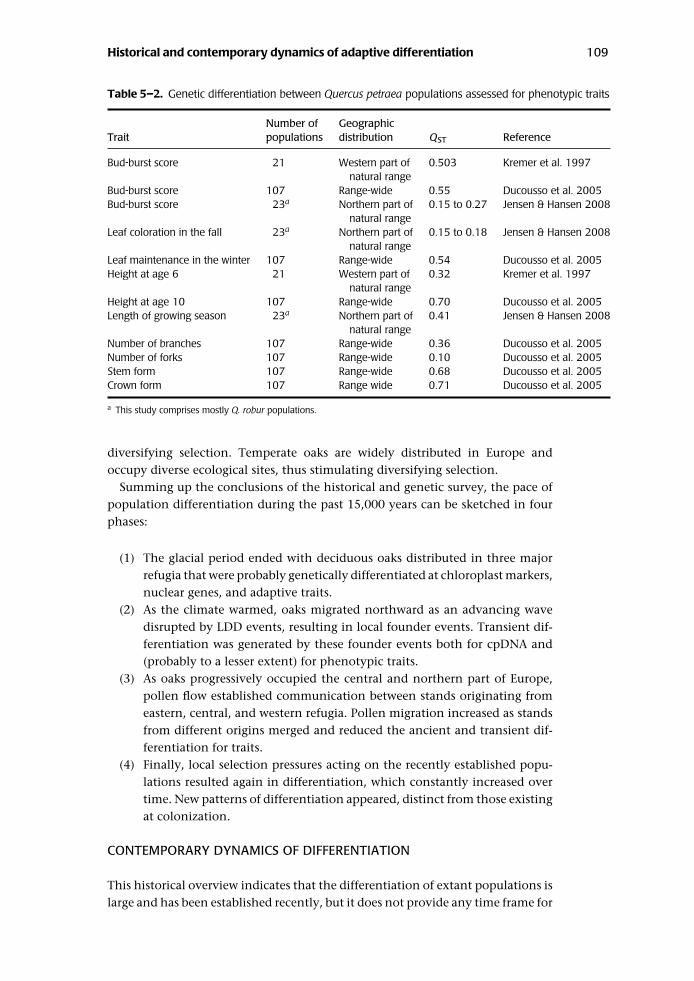
collecting populations to be installed in provenance tests, Q ST values vary from0.15 to 0.7 (Table 5–2). Many earlier studies emphasize the strong populationvariation observed in the provenance tests of sessile oak but did not provide dataof Q ST as this parameter has been used only in the past decade (Kleinschmit1993; Liepe 1993; Ducousso et al. 1996; Jensen 2000). As extensive pollen medi-ated gene flow has homogenized populations across Europe, the differentiationnow observed in provenance tests for adaptive traits was most likely created by
Historical and contemporary dynamics of adaptive differentiation 109
Table 5–2. Genetic differentiation between Quercus petraea populations assessed for phenotypic traits
Number of GeographicTrait populations distribution QST Reference
Bud-burst score 21 Western part of 0.503 Kremer et al. 1997natural range
Bud-burst score 107 Range-wide 0.55 Ducousso et al. 2005Bud-burst score 23a Northern part of 0.15 to 0.27 Jensen & Hansen 2008
natural rangeLeaf coloration in the fall 23a Northern part of 0.15 to 0.18 Jensen & Hansen 2008
natural rangeLeaf maintenance in the winter 107 Range-wide 0.54 Ducousso et al. 2005Height at age 6 21 Western part of 0.32 Kremer et al. 1997
natural rangeHeight at age 10 107 Range-wide 0.70 Ducousso et al. 2005Length of growing season 23a Northern part of 0.41 Jensen & Hansen 2008
natural rangeNumber of branches 107 Range-wide 0.36 Ducousso et al. 2005Number of forks 107 Range-wide 0.10 Ducousso et al. 2005Stem form 107 Range-wide 0.68 Ducousso et al. 2005Crown form 107 Range wide 0.71 Ducousso et al. 2005
a This study comprises mostly Q. robur populations.
diversifying selection. Temperate oaks are widely distributed in Europe andoccupy diverse ecological sites, thus stimulating diversifying selection.
Summing up the conclusions of the historical and genetic survey, the pace ofpopulation differentiation during the past 15,000 years can be sketched in fourphases:
(1) The glacial period ended with deciduous oaks distributed in three majorrefugia that were probably genetically differentiated at chloroplast markers,nuclear genes, and adaptive traits.
(2) As the climate warmed, oaks migrated northward as an advancing wavedisrupted by LDD events, resulting in local founder events. Transient dif-ferentiation was generated by these founder events both for cpDNA and(probably to a lesser extent) for phenotypic traits.
(3) As oaks progressively occupied the central and northern part of Europe,pollen flow established communication between stands originating fromeastern, central, and western refugia. Pollen migration increased as standsfrom different origins merged and reduced the ancient and transient dif-ferentiation for traits.
(4) Finally, local selection pressures acting on the recently established popu-lations resulted again in differentiation, which constantly increased overtime. New patterns of differentiation appeared, distinct from those existingat colonization.
CONTEMPORARY DYNAMICS OF DIFFERENTIATION
This historical overview indicates that the differentiation of extant populations islarge and has been established recently, but it does not provide any time frame for
110 Antoine Kremer, Valerie Le Corre, Remy J. Petit, and Alexis Ducousso
its dynamics. Was evolutionary change generated continuously over the warm-ing period or did it take place faster? How much change can be generated duringshort periods (i.e., fewer than thirty generations)? The historical overview alsoshowed that despite extensive gene flow, differentiation of traits could accumu-late, finally exceeding by far differentiation at neutral markers (Tables 5–1 and5–2). To learn about the dynamics during shorter time frames and to investi-gate the apparent contradiction between differentiation and gene flow, we firstsubdivided complex traits into their elementary components (e.g., genes) to com-pare differentiation at the same level for markers and traits. In a second step, thedynamics of the components of Q ST were monitored under different evolutionaryscenarios mimicking the oak situation.
Components of adaptive differentiation (Q ST)
Using standard quantitative genetics reasoning (e.g., a trait controlled by a setof loci with additive actions of their alleles) and further assuming that eachlocus was biallelic (i.e., each allele having the same effect but of the opposingsign), we obtained the following relationship between population differentiationmeasured at the level of genes (FST, mean value of all genes contributing to thetrait) and of the trait (Q ST) (Le Corre & Kremer 2003).
Q ST = (1 + θB)FST/[(θB − θW)FST + 1 + θW] (1)
As expected, there is a positive relationship between both measures. The rela-tionship is affected, however, by two other parameters (θB and θW), which rep-resent the relative importance of covariances of additive effects of alleles presentat the different loci at the between- (θB) and within- (θW) population level. Ifthere are n genes contributing to the trait, then the genetic variance (VW) ofthe trait within a population can be decomposed into the variance due to alleliceffects at each locus i (σ 2
wi ) and into covariances among allelic effects betweenloci Covwi j :
VW =∑
i
σ 2wi +
∑i
∑j=i
Covwi j , (2)
and θW is the relative contribution of covariance terms to the variance terms:
θW =∑
i
∑j �=i
Covwi j/∑
i
σ 2wi . (3)
Similar reasoning can be followed for the between-population genetic varianceto obtain θB. Equation (1) provides a formal framework to understand the rela-tionships between differentiation of a trait and its elementary components; itextends earlier approaches by decomposing the between- and within-populationtrait variances into covariances and variances of allelic effects (Latta, 1998, 2003;McKay and Latta, 2002).
The relationship between FST and Q ST derived in the simplified two-allele modelholds in a large range of multiallelic cases, as was empirically tested by Le Correand Kremer (2003). The relationship also holds at any point in time, regard-less of equilibrium or non-equilibrium conditions among selection, migration,
Historical and contemporary dynamics of adaptive differentiation 111
and drift. The two θ parameters represent the amount of covariances amongalleles contributing to the additive value of a trait weighted by the genic vari-ances. Covariances themselves depend on the disequilibria among alleles and theproducts of allelic effects, meaning that the θ values are generated by nonran-dom associations of alleles at the between- and within-population level. PositiveθB values indicate that populations tend to assemble alleles with effects of thesame sign regardless of individuals that bear those alleles. Conversely, negativeθB values indicate that alleles with opposite signs are associated in the same pop-ulations, whereas a θB value close to 0 would mean that alleles are randomlyassociated among populations. Similarly, negative θW values indicate that allelesof opposite signs are associated within individuals.
From Equation (1), it can be shown that when θB is greater than θW, then Q ST
will always be greater than FST. Conversely, when θB is less than θW, then Q ST isless than FST. Hence, the comparison of Q ST and FST depends on the comparisonbetween θB and θW. These analytical predictions were confirmed by simulationsof a wide range of evolutionary scenarios with various levels of gene flow andstrength of selection (Le Corre & Kremer 2003). We summarize here the mainconclusions regarding the equilibrium values of the components of Q ST (e.g., θB,θW, and FST) in the case of an outcrossing species with large population sizes, asis usually the case in tree species.
θW is negligible in most scenarios tested, except when the strength of intrapop-ulation selection is strong, in which case slightly negative values can be reached(θW < 0.3). Limited θW is expected for large outcrossing populations, whererecombination will decrease disequilibria at a constant rate over generations.
θB is positive when gene flow is large [Nm (= number of migrant genes perpopulation) > 1] and when diversifying selection occurs (e.g., populations aredriven by selection to different optimal values for the trait investigated), dueto ecological heterogeneity across the landscape, which is the case for foresttrees. It is interesting that θB increases as gene flow increases and as diversify-ing selection is more pronounced. Strength of within-population selection will,however, decrease θB, becoming negative in extreme cases. Overall, θB exceeds 1when migration is high (Nm > 10), diversifying selection is important, and thestrength of within-population selection is weak (Le Corre & Kremer 2003).
FST increases as diversifying selection increases, the strength of within-population selection gets stronger, and gene flow decreases. Under weak selectionintensity, the FST value of genes contributing to the trait undergoing selectionwill remain at the level of that of neutral markers.
These opposing trends for θB and FST in outcrossing species comprising largepopulations and with extensive gene flow among populations are further inflatedwhen the number of loci increases, to the extent that allelic frequencies of genesmay reach the level observed at neutral markers (data not shown).
To sum up, in oaks, θB is the main driver of Q ST, especially for traits con-trolled by a large number of loci. These results suggest that adaptive divergence ismainly caused by covariances among allelic effects and not by variances of allelicfrequencies (Latta 2003). They also provide an interpretation of the persistence oflarge, adaptive divergence in the context of high rates of gene flow (see Chapter 8by Hamrick et al). Intuitively speaking, large gene flow causes constant import
112 Antoine Kremer, Valerie Le Corre, Remy J. Petit, and Alexis Ducousso
of genes, offering new opportunities for associations with resident genes and,hence, increasing θB values.
These conclusions, based on theoretical developments and simulations, wererecently supported by first results where differentiation was assessed at neutralmarkers, candidate genes putatively controlling an adaptive trait, and the traititself, on the same set of populations. In Norway spruce (Heuertz et al. 2006)and in European aspen (Hall et al. 2007), large adaptive divergence was observedfor phenological and growth traits, whereas differentiation for candidate genesamounted to levels similar to those found at neutral markers.
Dynamics of adaptive differentiation
How fast does adaptive differentiation (Q ST) build up? How do the componentscontribute to this trend? To answer these questions, we monitored Q ST in sil-ico using the Metapop simulator (Le Corre et al. 1997b; Le Corre & Kremer2003), available at request of the author. The simulations were designed to mimicthe evolution of a set of oak populations after their installation following colo-nization. Simulations consisted in creating from a large source population a setof twenty-five populations exchanging pollen and seed according to the islandmodel and undergoing different selection scenarios. We considered a trait con-trolled by ten genes located on different chromosomes. We considered large pop-ulation sizes (N = 500), high gene flow (Nm = 10), and uniform mutation rates(10−5 for all loci). These input parameters were chosen to mimic realistic situa-tions for oak forests (large population sizes, extensive gene flow, and moderate-to-low heritability) and were kept constant across all simulations. Contrastingvalues of parameters, mimicking the effects of natural selection, were selectedto test the impact of selection on θB and θW, Q ST, and FST. Selection is modeledin two different ways: 1) Stabilizing selection is considered to occur within pop-ulations, and the strength of selection is driven by ω2 (Turelli 1984) (with ω2
varying between 5 [strong selection] to 50 [weak selection]), and 2) diversifyingselection is driven by VarZopt, the variance of optimal values of the trait thatwere assigned to each population (VarZopt = 1, weak selection to VarZopt = 5,strong diversifying selection). Populations were distributed in a two-dimensionalarray, and optimal values were assigned to populations along a one-dimensionalgradient to reproduce clinal patterns of variation. In these scenarios, the twenty-five populations are at equilibrium at generation 0 (θB and θW = 0, Q ST andFST = 0). Population differentiation was then monitored over generations for aphenotypic trait submitted to selection, for its underlying genes, and for neutralmarkers.
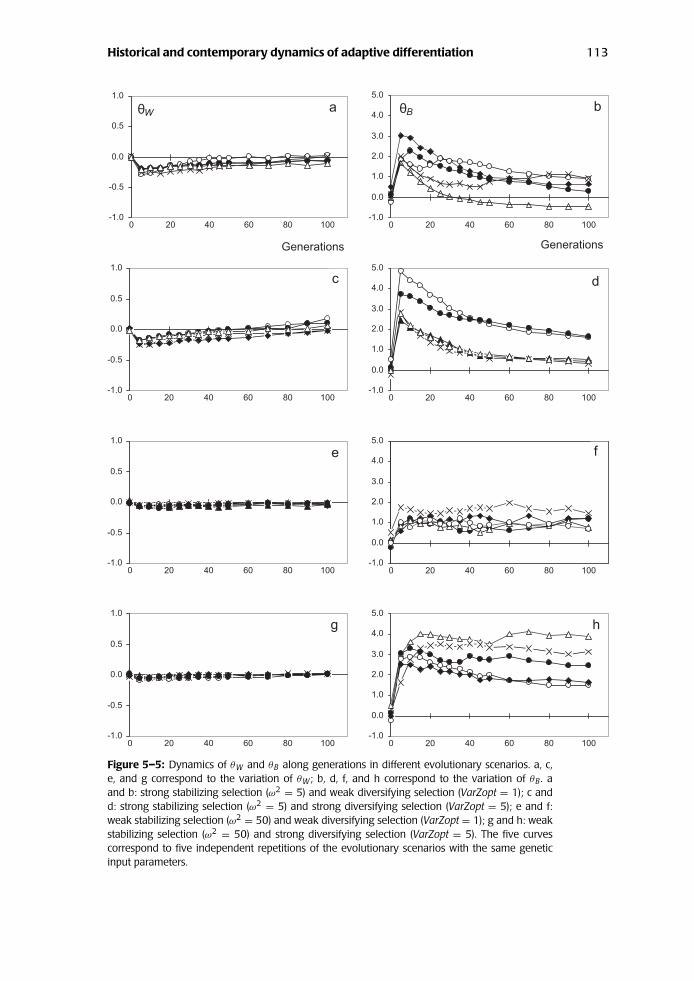
The dynamics of θB and θW show contrasting patterns among generations (Figs.5–5 and 5–6). These figures depict the evolution of Q ST, FST, θB, and θW duringthe first 100 generations, whereas simulations where conducted up to 3,000 gen-erations to obtain equilibrium values. As expected, θW is always extremely low.Disequilibria between alleles at different genes are disrupted at each generationby random mating in large populations. They build up only under strong within-population stabilizing selection, where θW values become slightly negative duringthe first generations when stabilizing selection is strong (Fig. 5–5, a and c). As
Historical and contemporary dynamics of adaptive differentiation 113
-1.0
-0.5
0.0
0.5
1.0
0 20 40 60 80 100
-1.0
0.0
1.0
2.0
3.0
4.0
5.0
0 20 40 60 80 100-1.0
-0.5
0.0
0.5
1.0
0 20 40 60 80 100
-1.0
-0.5
0.0
0.5
1.0
0 20 40 60 80 100-1.0
0.0
1.0
2.0
3.0
4.0
5.0
0 20 40 60 80 100
-1.0
0.0
1.0
2.0
3.0
4.0
5.0
0 20 40 60 80 100
-1.0
-0.5
0.0
0.5
1.0
0 20 40 60 80 100-1.0
0.0
1.0
2.0
3.0
4.0
5.0
0 20 40 60 80 100
Generations
W B
Generations
a b
dc
fe
hg
Figure 5–5: Dynamics of θW and θB along generations in different evolutionary scenarios. a, c,e, and g correspond to the variation of θW; b, d, f, and h correspond to the variation of θB. aand b: strong stabilizing selection (ω2 = 5) and weak diversifying selection (VarZopt = 1); c andd: strong stabilizing selection (ω2 = 5) and strong diversifying selection (VarZopt = 5); e and f:weak stabilizing selection (ω2 = 50) and weak diversifying selection (VarZopt = 1); g and h: weakstabilizing selection (ω2 = 50) and strong diversifying selection (VarZopt = 5). The five curvescorrespond to five independent repetitions of the evolutionary scenarios with the same geneticinput parameters.
114 Antoine Kremer, Valerie Le Corre, Remy J. Petit, and Alexis Ducousso
0
0.2
0.4
0.6
0.8
0 20 40 60 80 1000
0.2
0.4
0.6
0.8
0 20 40 60 80 100
0
0.2
0.4
0.6
0.8
0 20 40 60 80 1000
0.2
0.4
0.6
0.8
0 20 40 60 80 100
0.0
0.2
0.4
0.6
0.8
0 20 40 60 80 1000
0.2
0.4
0.6
0.8
0 20 40 60 80 100
0
0.2
0.4
0.6
0.8
0 20 40 60 80 1000
0.2
0.4
0.6
0.8
0 20 40 60 80 100
a b
d
c
e f
g h
FSTQST
Generations Generations
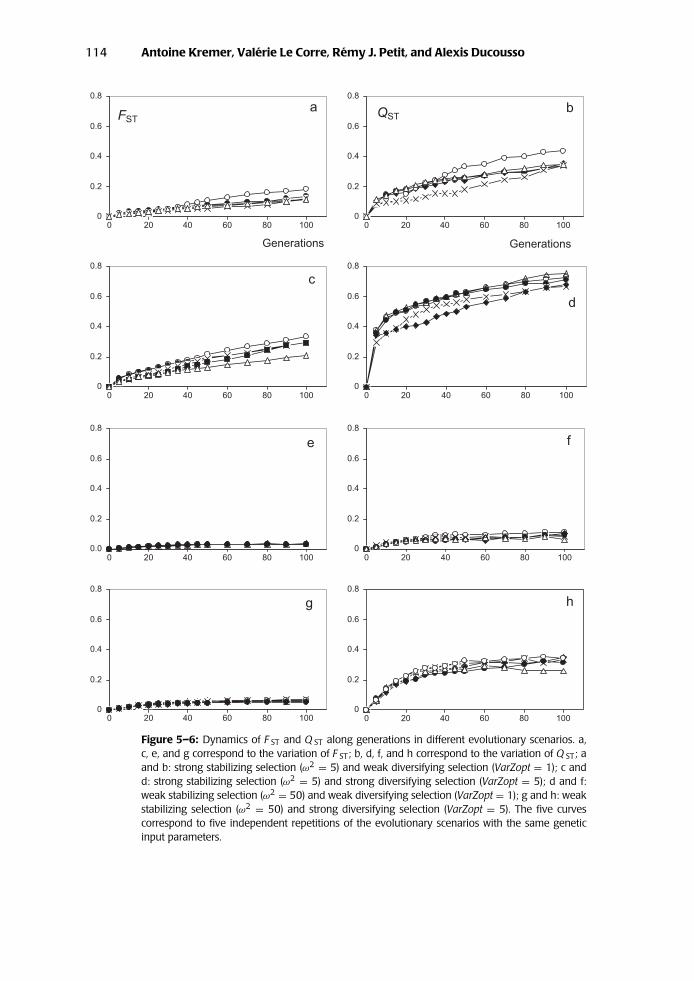
Figure 5–6: Dynamics of F ST and Q ST along generations in different evolutionary scenarios. a,c, e, and g correspond to the variation of F ST; b, d, f, and h correspond to the variation of Q ST; aand b: strong stabilizing selection (ω2 = 5) and weak diversifying selection (VarZopt = 1); c andd: strong stabilizing selection (ω2 = 5) and strong diversifying selection (VarZopt = 5); d and f:weak stabilizing selection (ω2 = 50) and weak diversifying selection (VarZopt = 1); g and h: weakstabilizing selection (ω2 = 50) and strong diversifying selection (VarZopt = 5). The five curvescorrespond to five independent repetitions of the evolutionary scenarios with the same geneticinput parameters.
Historical and contemporary dynamics of adaptive differentiation 115
expected from earlier investigations in single populations, negative correlationsbetween additive values at different genes built up at the early phase of selection(corresponding to the so-called Bulmer effect [Bulmer 1980]). θB values vary quitedifferently: They are in most cases positive and larger than θW. When diversifyingselection is important (Fig. 5–5, d and h), the covariances among allelic effectsare up to 5 times larger than the variances of allelic effects. The most strikingfeature, however, is the rapid increase of Q ST during the early stages. Indeed, Q ST
approaches asymptotic values in fewer than thirty generations, when stabilizingselection is weak (Fig. 5–6, f and h). The increase is more progressive when stabi-lizing selection is stronger (Fig. 5–6, b and d), although 40–60% of the asymptoticvalues of Q ST are reached after thirty generations. The rapid increase of differen-tiation during the first generations is due to the variation of θB. Peak valuesof θB are reached in fewer than fifteen generations regardless of the selectionmodel chosen (Fig. 5–5, b, d, f, and h). After reaching their maximum, θB valuesslightly decrease along generations when stabilizing selection is strong (Fig. 5–5,b and d) but remain close to their maximum when stabilizing selection is weak(Figure 5-5, f and h). In contrast, FST steadily increases over generations. The rateof increase is low when stabilizing selection is weak (Fig. 5–6, e and g); in thiscase, asymptotic values of FST of genes are close to those of FST of neutral markers.The rate is higher and continuous when stabilizing selection is strong (Fig. 5–6,a and c). This finding suggests that diversifying selection generates strong associ-ations between alleles at different loci at the between-population level. To sumup, the dynamics of adaptive differentiation can be decomposed in two stages:1) the early stage (first thirty generations) when Q ST is increasing very rapidly(this pattern is generated by the rapid increase of θB, regardless of the selectionscenario); and 2) the subsequent stage when Q ST continues to increase but atlower rates. In the case of strong stabilizing selection, FST will be the main driverof the increase of Q ST. Under weak stabilizing selection, the increase of Q ST islower and is brought about equally by FST and θB.
Coexistence of strong adaptive differentiation and high gene flow
The following conclusions regarding the tempo of differentiation can be drawnfrom the comparative analysis of the dynamics of Q ST, FST, and their components(θB and θW) along different evolutionary scenarios:
(1) In European oaks, extant genetic differentiation at phenotypic traits islarge, in contrast with differentiation at molecular markers, and involvesmost traits. This differentiation is neither a result of ancient differentia-tion existing prior to the warming period nor the consequence of founderevents at the time of colonization because pollen flow and populationadmixture have been extensive. It has instead accumulated recently bydiversifying selection caused by the ecological heterogeneity across theEuropean continent.
(2) Differentiation (Q ST) of adaptive traits does not solely depend on differ-ences in allelic frequencies (FST) of loci contributing to the traits. Dueto their multilocus structure, covariances among alleles at different loci
116 Antoine Kremer, Valerie Le Corre, Remy J. Petit, and Alexis Ducousso
(θB and θW) are additional components, whose contribution to Q ST exceedsby far the contributions of individual loci (FST).
(3) This trend (e.g., the predominant contribution of θB to Q ST, as opposed to acontribution of individual loci to FST) increases as the number of loci con-tributing to the trait increases. Hence, fitness-related traits that are usuallymore composite than others will exhibit extremely contrasted FST and Q ST.
(4) The important contribution of θB to Q ST solves the apparent contradictionof coexistence of large differentiation in the context of extensive gene flowin trees. θB is increasing as gene flow imports new genes in populations,offering new opportunities to increase covariances between alleles.
(5) When selection (stabilizing or diversifying) starts to operate, the main andimmediate driver of Q ST is θB. For multilocus traits, diversifying selectionis capturing first beneficial allelic associations (θB) distributed among theloci contributing to the trait, prior to modifying allele frequencies. Duringthe early phases of selection and even later under certain evolutionary sce-narios, allelic frequencies may even be insensitive to selection and behaveas neutral markers.
(6) Trees are prone to respond rapidly to selection induced by environmentalchange, as they possess attributes that inflate θB, such as high gene flowand high genetic diversity. Furthermore, the low FST values for loci con-trolling traits suggest that θB can build instantaneously as adaptive allelesare evenly distributed in natural populations.
CONCLUSION
In this review, the historical and contemporary dynamics of differentiation hasfocused mainly on European oaks, where fossil and genetic data have been assem-bled across their entire continental distribution. The conclusions can, however,be extended to many other widespread tree species as they share similar biolog-ical features such as high genetic diversity and gene flow (Petit & Hampe 2006;Savolainen et al. 2007). Another example of population differentiation in the caseof extensive gene flow is illustrated by the acorn barnacle (Box 5 by S. Palumbi2010). Assembling lessons from phylogeography, paleobotany, and simulations,we conclude that long-lived tree species have responded quite rapidly to envi-ronmental change, despite their low evolutionary rate at the gene level (Smith& Donoghue 2008). Indeed, and as suggested by theoretical investigations, thetempo of differentiation is driven by the standing level of genetic diversity andgene flow. In comparison to earlier studies that highlighted these features oftrees (Hamrick 2004), our review shows the mechanisms by which the inter-action between gene flow and local selection pressures accelerates the rate ofdifferentiation, by building up favorable allelic associations among genes con-tributing to fitness-related traits. Intergenic allelic associations are the cause ofthe rapid differentiation, and they explain the coexistence of strong phenotypicdifferentiation in trees (as assessed in provenance tests) and extensive gene flow.
It is likely that these mechanisms were actually favored during the repeatedinterglacial–glacial periods allowing widespread tree species to colonize and adapt
Historical and contemporary dynamics of adaptive differentiation 117
BOX 5: ADAPTIVE SHIFTS IN NATURAL POPULATIONS OF HIGHDISPERSING SPECIES
Stephen R. Palumbi
Problem
Geographic differences in the phenotypes of individuals of a widely distributedspecies can signal the impact of selection (Kremer et al., this volume). How iso-lated from one another do populations have to be to accumulate gene-frequencydifferences due to natural selection? Simple theory of populations connected byimmigration suggests that when the selection coefficient s is much greater thanthe per capita rate of migration among populations m, then local adaptation canresult in significant gene-frequency shifts (Wright 1969). As a result, species withpotentially high gene flow, such as many marine species, are thought to providefewer examples of local adaptation, and these are likely to be limited to exam-ples where selection on single loci is particularly strong (Place & Powers 1979;Schmidt & Rand 1999). How often do open populations of marine species withhigh potential gene flow show adaptive genetic differentiation?
Case Study
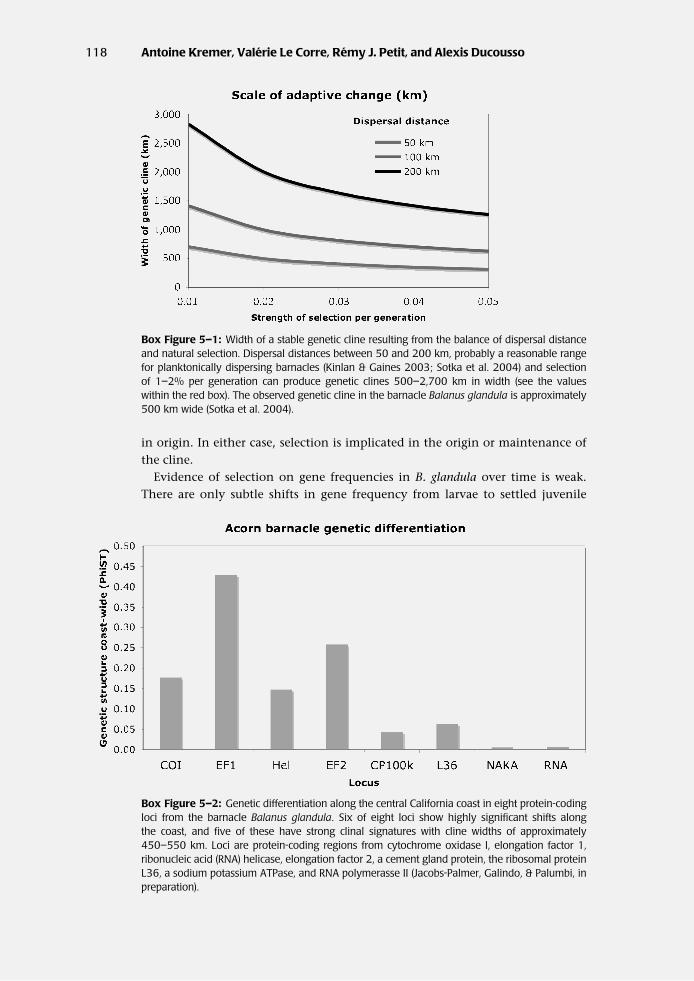
The acorn barnacle (Balanus glandula) is a sessile marine species in the high inter-tidal zone of the west coast of North America. It releases swimming larvae thatspend three to four weeks in the plankton, drifting with prevailing currents untilsettlement occurs on intertidal rocks. The species lives from Baja, California, toAlaska across a strong thermal gradient. How likely is it that adaptation to localconditions can occur? The width of an ideal, stable genetic cline is proportionalto (V/s)1/2, where V is the variance of migration distances from parent to off-spring, and s is the selection differential (Sotka & Palumbi 2006, see also Slatkin1973). For dispersal distances of 50, 100, and 200 km, this relationship suggeststhat selection differentials of only 1–2% can generate a stable cline in gene fre-quencies across 500 to 2,700 km (Box Fig. 5–1). Because the thermal gradientacross which B. glandula lives occurs over this spatial scale, it is possible thatrelatively weak selection can generate stable clines and produce local geneticadaptation.
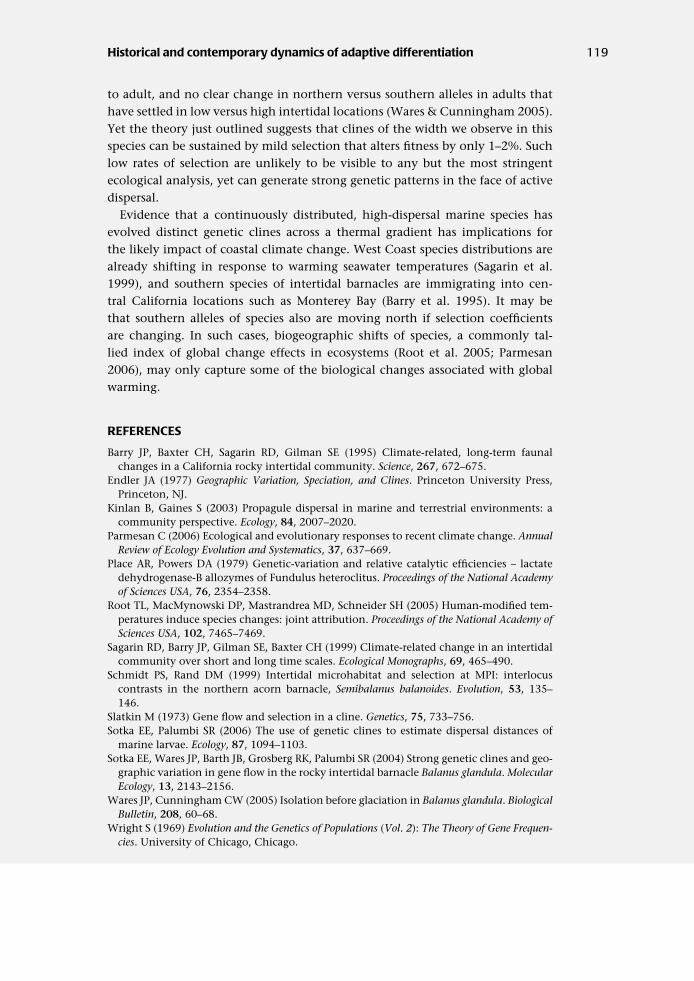
Estimates of gene-frequency shifts at nuclear and mitochondrial loci show evi-dence of such a cline along the California coast (Sotka et al. 2004; Sotka & Palumbi2006), with cline widths of approximately 500 km. Furthermore, an analysis of sixmore nuclear loci show significant genetic structure at four of the six loci and sig-nificant clines at three loci ( Jacobs-Palmer & Palumbi, unpublished data, Box Fig.5–2). Differentiation at many loci could be due to selection acting individuallylocus by locus (see Endler 1977 for a discussion of cline evolution and mainte-nance). Alternatively, southern and northern populations may have diverged inallopatry, producing locally adapted gene pools that are coming together in thepresent day through migration. The spatially variable alleles diverged long ago(Wares & Cunningham 2005), suggesting that the current cline may be ancient
118 Antoine Kremer, Valerie Le Corre, Remy J. Petit, and Alexis Ducousso
Box Figure 5–1: Width of a stable genetic cline resulting from the balance of dispersal distanceand natural selection. Dispersal distances between 50 and 200 km, probably a reasonable rangefor planktonically dispersing barnacles (Kinlan & Gaines 2003; Sotka et al. 2004) and selectionof 1–2% per generation can produce genetic clines 500–2,700 km in width (see the valueswithin the red box). The observed genetic cline in the barnacle Balanus glandula is approximately500 km wide (Sotka et al. 2004).
in origin. In either case, selection is implicated in the origin or maintenance ofthe cline.
Evidence of selection on gene frequencies in B. glandula over time is weak.There are only subtle shifts in gene frequency from larvae to settled juvenile
Box Figure 5–2: Genetic differentiation along the central California coast in eight protein-codingloci from the barnacle Balanus glandula. Six of eight loci show highly significant shifts alongthe coast, and five of these have strong clinal signatures with cline widths of approximately450–550 km. Loci are protein-coding regions from cytochrome oxidase I, elongation factor 1,ribonucleic acid (RNA) helicase, elongation factor 2, a cement gland protein, the ribosomal proteinL36, a sodium potassium ATPase, and RNA polymerasse II (Jacobs-Palmer, Galindo, & Palumbi, inpreparation).
Historical and contemporary dynamics of adaptive differentiation 119
to adult, and no clear change in northern versus southern alleles in adults thathave settled in low versus high intertidal locations (Wares & Cunningham 2005).Yet the theory just outlined suggests that clines of the width we observe in thisspecies can be sustained by mild selection that alters fitness by only 1–2%. Suchlow rates of selection are unlikely to be visible to any but the most stringentecological analysis, yet can generate strong genetic patterns in the face of activedispersal.
Evidence that a continuously distributed, high-dispersal marine species hasevolved distinct genetic clines across a thermal gradient has implications forthe likely impact of coastal climate change. West Coast species distributions arealready shifting in response to warming seawater temperatures (Sagarin et al.1999), and southern species of intertidal barnacles are immigrating into cen-tral California locations such as Monterey Bay (Barry et al. 1995). It may bethat southern alleles of species also are moving north if selection coefficientsare changing. In such cases, biogeographic shifts of species, a commonly tal-lied index of global change effects in ecosystems (Root et al. 2005; Parmesan2006), may only capture some of the biological changes associated with globalwarming.
REFERENCES
Barry JP, Baxter CH, Sagarin RD, Gilman SE (1995) Climate-related, long-term faunalchanges in a California rocky intertidal community. Science, 267, 672–675.
Endler JA (1977) Geographic Variation, Speciation, and Clines. Princeton University Press,Princeton, NJ.
Kinlan B, Gaines S (2003) Propagule dispersal in marine and terrestrial environments: acommunity perspective. Ecology, 84, 2007–2020.
Parmesan C (2006) Ecological and evolutionary responses to recent climate change. AnnualReview of Ecology Evolution and Systematics, 37, 637–669.
Place AR, Powers DA (1979) Genetic-variation and relative catalytic efficiencies – lactatedehydrogenase-B allozymes of Fundulus heteroclitus. Proceedings of the National Academyof Sciences USA, 76, 2354–2358.
Root TL, MacMynowski DP, Mastrandrea MD, Schneider SH (2005) Human-modified tem-peratures induce species changes: joint attribution. Proceedings of the National Academy ofSciences USA, 102, 7465–7469.
Sagarin RD, Barry JP, Gilman SE, Baxter CH (1999) Climate-related change in an intertidalcommunity over short and long time scales. Ecological Monographs, 69, 465–490.
Schmidt PS, Rand DM (1999) Intertidal microhabitat and selection at MPI: interlocuscontrasts in the northern acorn barnacle, Semibalanus balanoides. Evolution, 53, 135–146.
Slatkin M (1973) Gene flow and selection in a cline. Genetics, 75, 733–756.Sotka EE, Palumbi SR (2006) The use of genetic clines to estimate dispersal distances of
marine larvae. Ecology, 87, 1094–1103.Sotka EE, Wares JP, Barth JB, Grosberg RK, Palumbi SR (2004) Strong genetic clines and geo-
graphic variation in gene flow in the rocky intertidal barnacle Balanus glandula. MolecularEcology, 13, 2143–2156.
Wares JP, Cunningham CW (2005) Isolation before glaciation in Balanus glandula. BiologicalBulletin, 208, 60–68.
Wright S (1969) Evolution and the Genetics of Populations (Vol. 2): The Theory of Gene Frequen-cies. University of Chicago, Chicago.
120 Antoine Kremer, Valerie Le Corre, Remy J. Petit, and Alexis Ducousso
to new suited environments. How these mechanisms are acting during ongo-ing climatic change remains to be investigated in detail, but these processes arecritical to predicting how species will adapt to changing environments. Becauseof the changes in levels of gene flow, we anticipate strong differences betweenspecies having continuous distribution and species with scattered distribution.The rate of adaptive differentiation may also be quite different between the lead-ing edge and the rear end of distribution. As suggested by predictive modelsof bioclimatic envelopes (Thuiller et al. 2005), populations at the northern andeastern limit will be at the leading edge of range shifts and may benefit fromimmigrating genes via pollen flow from southern latitudes. In contrast, fitnessof populations at the southern limit (rear end) may suffer from immigratinggenes with lower fitness. The dynamics of differentiation need to be consideredunder different spatial settings of populations, and genetic associations with dif-ferent allelic effects should be integrated into conservation and managementstrategies.
REFERENCES
Aitken SN, Yeaman S, Holliday JA, Wang T, Curtis-McLane S (2008) Adaptation, migration,or extirpation: climate change outcomes for tree populations. Evolutionary Applications,1, 95–111.
Bialozyt R, Ziegenhagen B, Petit RJ (2006) Contrasting effects of long-distance seed dispersalon genetic diversity during range expansion. Journal of Evolutionary Biology, 19, 12–20.
Brewer S, Cheddadi R, De Beaulieu JL, Reille M (2002) The spread of deciduous Quercusthroughout Europe since the last glacial period. Forest Ecology and Management, 156, 27–48.
Brewer S, Hely-Alleaume C, Cheddadi R et al. (2005) Postglacial history of Atlantic oak-woods: context, dynamics and controlling factors. Botanical Journal of Scotland, 57, 41–57.
Bulmer MG (1980) The Mathematical Theory of Quantitative Genetics. Oxford University Press,Oxford.
Burger R, Krall C (2004) Quantitative genetic models and changing environments. In:Evolutionary Conservation Biology (eds. Ferriere R, Dieckmann U, Couvet D), pp. 171–187.Cambridge University Press, Cambridge, UK.
Burger R, Lynch M (1995) Evolution and extinction in a changing environment: a quanti-tative genetic analysis. Evolution, 49, 151–163.
Carroll SP, Hendry AP, Reznick DN, Fox CW (2007) Evolution on ecological time scales.Functional Ecology, 21, 387–393.
Cheddadi R, De Beaulieu JL, Jouzel J et al. (2005) Similarity of vegetation dynamics dur-ing interglacial periods. Proceedings of the National Academy of Sciences USA, 39, 13939–13943.
Cheddadi R, Vendramin GG, Litt T et al. (2006) Imprints of glacial refugia in the moderndiversity of Pinus Sylvestris. Global Ecology and Biogeography, 15, 271–282.
Ducousso A, Guyon JP, Kremer A (1996) Latitudinal and altitudinal variation of bud burstin western populations of sessile oak (Quercus petraea (Matt.) Liebl.). Annales des SciencesForestieres, 53, 775–782.
Ducousso A, Louvet JM, Jarret P, Kremer A (2005) Geographic variations of sessile oaksin French provenance tests. In: Proceedings of the Joint Meeting of IUFRO Working GroupsGenetic of Oaks and Improvement and Silviculture of Oaks (eds. Rogers R, Ducousso A, Kanaza-shi A), pp. 128–138. Tsukuba, Japan. FFPRI (Forestry and Forest Products Research Insti-tute) Scientific Meeting Report 3.
Eckerle M, Chakari A, Meyruis P, Zonneweld KAF (1996) Paleoclimatic reconstruction of thelast deglaciation (18–8ka BP) in the Adriatic Sea region; a land–sea correlation based onpalynological evidence. Palaeogeography, Palaeoclimatology, Palaeoecology, 122, 89–106.
Historical and contemporary dynamics of adaptive differentiation 121
Gingerich P (2001) Rates of evolution on the time scale of the evolutionary process. Genetica,112–113(1), 127–144.
Hall D, Luquez V, Garcia VM et al. (2007) Adaptive population differentiation in phenologyacross a latitudinal gradient in European Aspen (Populus tremula, L.): a comparison ofneutral markers, candidate genes, and phenotypic traits. Evolution, 61, 2849–2860.
Hamrick JL (2004) Response of forest trees to global environmental change. Forest Ecologyand Management, 197, 323–335.
Hendry AP, Kinnison MT (1999) Perspective: the pace of modern life, measuring rates ofcontemporary microevolution. Evolution, 53, 1637–1651.
Hengeveld R (1989) Dynamics of Biological Invasions. Chapman & Hall, London.Heuertz M, De Paoli E, Kallmann T et al. (2006) Multilocus patterns of nucleotide diversity,
linkage disequilibrium, and demographic history of Norway Spruce. Genetics, 174, 2095–2105.
Houle D, Morikawa B, Lynch M (1996) Comparing mutational variabilities. Genetics, 145,1467–1483.
Huntley B, Birks HJB (1983) An Atlas of Past and Present Pollen Maps for Europe: 0–13000Years Ago. Cambridge University Press, London.
Jensen JS (2000) Provenance variation in phenotypic traits in Quercus robur and Quercuspetraea in Danish provenance trials. Scandinavian Journal of Forest Research, 15, 297–308.
Jensen JS, Hansen JK (2008) Geographical variation in phenology of Quercus petraea (Matt.)Liebl. and Quercus robur L. oak grown in a greenhouse. Scandinavian Journal of ForestResearch, 23, 179–188.
Kleinschmit J (1993) Intraspecific variation of growth and adaptive traits in European oakspecies. Annales des Sciences Forestieres, 50, 166s–186s.
Konig AO (2005) Provenance research: evaluating the spatial pattern of genetic variation.In: Conservation and Management of Forest Genetic Resources in Europe (eds. Geburek Th,Turok J), pp. 275–238. Zvolen, Slovakia.
Kremer A, editor (2002) Range-wide distribution of chloroplast DNA diversity and pollendeposits in European white oaks: inferences about colonisation routes and managementof oak genetic resources. Forest Ecology and Management, 156, 1–223.
Kremer A (2007) How well can existing forests withstand climate change? In: Climate Changeand Forest Genetic Diversity: Implications for Sustainable Forest Management in Europe (eds.Koskela J, Buck A, Teissier du Cros E), pp. 3–17. Bioversity International, Rome.
Kremer A, Kleinschmit J, Cottrell J et al. (2002) Is there a correlation between chloroplasticand nuclear divergence, or what are the roles of history and selection on genetic diversityin European oaks? Forest Ecology and Management, 156, 75–87.
Kremer A, Zanetto A, Ducousso A (1997) Multilocus and multitrait measures of differentia-tion for gene markers and phenotypic traits. Genetics, 145, 1229–1241.
Latta RG (1998) Differentiation of allelic frequencies at quantitative trait loci affectinglocally adaptive traits. The American Naturalist, 151, 283–292.
Latta RG (2003) Gene flow, adaptive population divergence and comparative populationstructure across loci. New Phytologist, 161, 51–58.
Le Corre V, Dumolin-Lapegue S, Kremer A (1997a) Genetic variation at allozyme and RAPDloci in sessile oak Quercus petraea (Matt.) Liebl.: the role of history and geography. Molec-ular Ecology, 6, 519–529.
Le Corre V, Machon N, Petit RJ, Kremer A (1997b) Colonization with long-distance seeddispersal and genetic structure of maternally inherited genes in forest trees: a simulationstudy. Genetics Research, 69, 117–125.
Le Corre V, Kremer A (1998) Cumulative effects of founding events during colonisationon genetic diversity and differentiation in an island and stepping-stone model. Journal ofEvolutionary Biology, 11, 495–512.
Le Corre V, Kremer A (2003) Genetic variability at neutral markers, quantitative trait lociand trait in a subdivided population under selection. Genetics, 164, 2005–2019.
Liepe K (1993) Growth chamber trial on frost hardiness and field trial on bud burst of sessileoak (Quercus petraea Liebl.) and Q. robur L. Annales des Sciences Forestieres, 50, 208–214.
Lynch M (1990) The rate of morphological evolution in mammals from the standpoint ofthe neutral expectation. The American Naturalist, 136, 727–741.
122 Antoine Kremer, Valerie Le Corre, Remy J. Petit, and Alexis Ducousso
Magri D, Vendramin GG, Comps B et al. (2006) A new scenario for the quaternary history ofEuropean beech populations: palaeobotanical evidence and genetic consequences. NewPhytologist, 171, 199–221.
Mariette S, Cottrell J, Csaikl UM et al. (2002) Comparison of levels of genetic diversitydetected with AFLP and microsatellite markers within and among mixed Q. petraea (Matt.)Liebl. and Q. robur L. stands. Silvae Genetica, 51, 72–79.
McKay JK, Latta RG (2002) Adaptive population divergence: markers, QTLs and traits. Trendsin Ecology and Evolution, 17, 285–291.
Nathan R (2006) Long-distance dispersal in plants. Science, 313, 786–788.Petit RJ, Brewer S, Bordacs S et al. (2002a) Identification of refugia and post-glacial colonisa-
tion routes of European white oaks based on chloroplast DNA and fossil pollen evidence.Forest Ecology and Management, 156, 49–74.
Petit RJ, Csaikl UM, Bordacs S et al. (2002b) Chloroplast DNA variation in European whiteoaks: phylogeography and patterns of diversity based on data from over 2,600 popula-tions. Forest Ecology and Management, 156, 5–26.
Petit RJ, Hampe A (2006) Some evolutionary consequences of being a tree. Annual Reviewof Ecology Evolution and Systematics, 37, 187–214.
Petit RJ, Hu FS, Dick CK (2008) Forests of the past: a window to future changes. Science, 320,1450–1452.
Petit RJ, Pineau E, Demesure B et al. (1997) Chloroplast DNA footprints of postglacialrecolonization by oaks. Proceedings of the National Academy of Sciences USA, 94, 9996–10001.
Rabineau M, Berne S, Olivet JL et al. (2006) Paleo sea levels reconsidered from direct obser-vation of paleo shoreline position during Glacial Maxima (for the last 500,000 yr). Earthand Planetary Science Letters, 252, 119–137.
Reich PB, Oleksyn J (2008) Climate warming will reduce growth and survival of Scots pineexcept in the far north. Ecology Letters, 11, 588–597.
Sato M, Waxman D (2008) Adaptation to slow environmental change, with apparent antic-ipation to selection. Journal of Theoretical Biology, 252, 166–172.
Savolainen O, Pyhajarvi T, Knurr T (2007) Gene flow and local adaptation of trees. AnnualReview of Ecology, Evolution and Systematics, 38, 595–619.
Schueler S, Schlunzen KH (2006) Modeling of oak pollen dispersal on the landscape levelwith a mesoscale atmospheric model. Environmental Modeling and Assessment, 11, 179–194.
Schueler S, Schlunzen KH, Scholz F (2005) Viability and sensitivity of oak pollen and itsimplications for pollen-mediated gene flow. Trends in Ecology and Evolution, 19, 154–161.
Smith SA, Donoghue MJ (2008) Rates of molecular evolution are linked to life history inflowering plants. Science, 322, 86–89.
Stockwell CA, Hendry AP, Kinnison MT (2003) Contemporary evolution meets conservationbiology. Trends in Ecology and Evolution, 18, 94–101.
Streiff R, Ducousso A, Lexer C et al. (1999) Pollen dispersal inferred from paternity analysisin a mixed oak stand of Quercus robur L. and Q. petraea (Matt.) Liebl. Molecular Ecology, 8,831–841.
Thiede J (1978) A glacial Mediterranean. Nature, 276, 680–683.Thuiller W, Lavorel S, Araujo MB, Sykes MT, Prentice JC (2005) Climate change threats
to plant diversity in Europe. Proceedings of the National Academy of Sciences USA, 102,8245–8250.
Turelli M (1984) Heritable genetic variation via mutation–selection balance: Lerch’s zetameets the abdominal bristle. Theoretical Population Biology, 25, 138–193.
Valbuena-Carabana M, Gonzalez-Martinez SC, Sork VL et al. (2005) Gene flow and hybridi-sation in a mixed oak forest (Quercus pyrenaica Willd. and Quercus petraea (Matts.) Liebl.)in central Spain. Heredity, 95, 457–485.
Zanetto A, Kremer A (1995) Geographical structure of gene diversity in Quercus petraea(Matt.) Liebl. I. Monolocus patterns of variation. Heredity, 75, 506–517.
Zanetto A, Roussel G, Kremer A (1994) Geographical variation of inter-specific differentia-tion between Quercus robur L. and Quercus petraea (Matt.) Liebl. Forest Genetics, 1, 111–123.