TQM FINAL WORK Autosaved
196
CHAPTER ONE INTRODUCTION 1.1 BACKGROUND OF THE STUDY The Nigeria beer and related brewery industry market is becoming increasingly competitive. Before now, consumers only had a few local brands to choose from. In the beer sector, if it was not a product of Nigeria Breweries Plc, then it had to be that of their closest competitor, Guinness Nigeria Plc. Some sectors of the country were not covered by their limited distribution network. Today, the picture is quite different; the consumer is king. The consumer may choose from several local and imported varieties, in a number of packaging formats (bottles, PET, Cans, tetra pack and even kegs), and from any distribution 1
-
Upload
independent -
Category
Documents
-
view
0 -
download
0
Transcript of TQM FINAL WORK Autosaved

CHAPTER ONE
INTRODUCTION
1.1 BACKGROUND OF THE STUDY
The Nigeria beer and related brewery industry
market is becoming increasingly competitive.
Before now, consumers only had a few local brands
to choose from. In the beer sector, if it was not
a product of Nigeria Breweries Plc, then it had to
be that of their closest competitor, Guinness
Nigeria Plc. Some sectors of the country were not
covered by their limited distribution network.
Today, the picture is quite different; the
consumer is king. The consumer may choose from
several local and imported varieties, in a number
of packaging formats (bottles, PET, Cans, tetra
pack and even kegs), and from any distribution
1
outlet. The proliferation of substitutes from
South East Asian companies and opening up of
hitherto shut borders (occasioned by transition
from military rule to civilian rule), further
deepens the market for the consumer. In addition,
the struggle for mind power with nouveau riche
telecommunication companies exacerbated the
situation. The focus from sellers’ to buyers’
orientated market has forced Nigerian Breweries
Plc to transit from production-oriented to market-
oriented perspective.
Transiting from production orientation to market
orientation goes beyond a few slogans and
rhetoric. It meant a total change from top
management to change in processes in the shop
floor. No other platform could better represent
the change in philosophy than Applicability of
2

Total Quality Management, TQM. The TQM approach
attempts to marry excellence in operations with
needs of the market, while maximizing profits.
This philosophy indeed suited the company
completely as it tried to achieve a win-win
situation with its consumers. Applicability of
Total Quality Management is a management concept
that is practiced in a service delivery or
production organization where there is a need to
improve the quality of products/services and the
general staff attitude, all geared towards
improvement in the organizational performance.
Quality is an important consideration for
executive thinking. There is increased quality
awareness for senior executives who have
recognized that quality is an important strategic
tool for all levels in an organization as opined
3

by Crosby (2007:64). Muo (2010:16) asserts that
TQM requires defining and implementing several
quality factors in any research work. These
quality factors involve top management commitment
and involvement, staff empowerment and culture.
These, taken together constitute the so-called
soft aspects of management. Oakland (2010: 72)
emphasized that top management must accept
responsibility for commitment to quality all
through the organization.
In his opinion, Swanson (2011:33) says that to
manage the organizations quality journey, a
quality council led by the general manager should
be setup and a full time quality manager should be
hired to provide support for the quality council.
To support this statement, Deming (2005:60)
emphasizes that, whenever needed, an external
4
Consultant can be appointed to assist in the
implementation process. Senior managers who are
members of the quality council are responsible for
developing a comprehensive policy, based on clear
vision and clear mission statements, including
quality goals deployed effectively at all levels
of the organization. This unites the effort of all
employees and determines the corporate
expectations. James and James (2010:92) observed
that this comprehensive quality policy should be
communicated effectively to ensure common
understanding of the organization’s expectations
and direction so as to achieve organization-wide
commitment. They also mentioned that at
departmental level, quality committees, headed by
departmental heads, be established to implement
quality policies and achieve organizational goals.
5

These committees should have a direct reporting
relationship with the quality council through
committees’ heads. In order to ensure the
commitment and involvement of everyone in the
organization in the quality improvement, top
management should ensure that all employees are
involved in the preparation, implementation and
evaluation of improvement activities. Welech and
Welech (2011:300) theoretically expressed that
practical assistance, training, recognition and
participation are given to all employees in order
to attain quality goals of the organization.
In any organization, there is always tendency to
marshal the resources effectively to achieve the
desired goals. The aim of any enterprise is to
reach out to as many clienteles as possible in
order to control the market. Increased market
6

share beckons on the management to make pertinent
and prompt polices that impact positively on the
organization. These policies have to take
cognizance of the divergent resources available
which include men, materials, money, machines and
information technology. To take a relevant
decision has never, been quite easy at any time.
McDons (2000:11) notes that a good decision has to
come from experienced and well informed analysis
of the resources available and their uses and
explicabilities.
Often times, and as is usually the case, the
decision of the manager when taken solely without
due consultations with stakeholders boomerangs.
According to MacPeters (2010:89), brainstorming
offers management to learn from all that mater in
their respect fields of operation so that friction
7

would be minimized. As noted by Panyom (2010:181),
brainstorming is the secret that guides the
success of emerging management philosophies in
Japan and South Korea. He noted that it helps
management carry everybody along. He also noted
that the only difference in the Far East model
with the rest of the Western nations is that the
bearer of the responsibility is still the
management in the Western model while it is a
collective responsibility in Japan. Otherwise, he
noted, the modus operandi is the same. Nnamdi
(2010:89), opined that brainstorming has to
operate in the framework of managerial competence
of harnessing the resources of the enterprises to
make valuable contributions to foster the course
of the organization. He noted that everybody has
meaningful input to make. Peterside (2011:112),
8

stated that brainstorming places responsibility on
every worker, especially the affected ones, to
make valuable inputs which management cannot
ignore unless it wants to crash; and for
organizations to survive and grow in today’s
business environment, there is always a tendency
to maximize profit, which calls for a total
overhaul of all the management processes and
functions. Total quality management is called into
play to harness all areas for maximum yield. These
include marketing, production, stores, material
sourcing as well as accounts and records. It is
therefore against this background that the
research wishes to x-ray the applicability of
quality management in AMA Breweries PLC.[
1.2 STATEMENT OF THE PROBLEM
9

Total Quality Management has not been fully
understood by AMA Breweries PLC, 9th Mile Corner
Enugu. Lack of full application and/or
understanding of TQM in AMA Breweries has resulted
to poor policy formulation by management which
greatly affects output. Also management has not
fully applied the aspect of TQM which involves
employees in key decision making and this has
retarded employee’s personal creativity.
Management of AMA Breweries has not duly employed
the technique of TQM that calls for brainstorming
with all stakeholders.
Periodic structural adjustment techniques of TQM
have not been fully implemented in AMA Breweries
Plc which has meant that new information
technology techniques that ease production and
improve productivity have not been implemented.
10

AMA Breweries Plc has always monitored quality at
every stage of brewing and packaging. The market
has become fragmented into small market segments.
This in turn, requires greater emphasis on
branding, packaging and promotions, even as total
quality management has become very popular among
manufacturing companies in Nigeria. This is
occasioned by the shift from production
orientation to market orientation. Though the aim
of the business may differ, the consumer remains
the focal point. Adapting to new consumer demands
in a global market is very crucial for long term
success. But TQM involves more than a mere change
of quality control technique.
Variations in TQM practice and implementations
have a difficult proposition in Nigeria. In
addition, because there are no official guides
11

concerning TQM rollout and because TQM is often
only embraced by the big and wealthy companies,
small organizations and enterprises usually make
little or no effort at adopting TQM as a
philosophy. At best the small organizations only
choose and implement the appealing and attractive
components of TQM. The result is a mountain of
burden of cost with no tangible rewards to show
for it. Thus, TQM is seen as white elephant
project by many in the industry. This belief is
not helped by the litany of failures that is the
hallmark of TQM implementation even for the big
organizations in Nigeria. The inevitable outcome
is that Nigeria companies are not able to compete
in the global market place where the customer is
king. Inevitably, this creates a yearning for an
implementation and best- practice guide for TQM
12

philosophy in Nigeria companies. Nigerian
Breweries, with its international affiliation and
penchant for quality brands presents a very good
platform to study TQM in Nigeria.
Management depends on the inputs from the
respective units to make far reaching and valuable
decisions that would effect changes in the
enterprise. Most often, each department submits
its requisitions to management which may not get
to the extent of involvement and the results
expected. Decisions taken in such circumstances
without adequate inputs by the people involved
often boomerang. The processes in management have
to elicit responses from workers whose inputs are
vital to the impeaching decisions. Management may
decide to consult them or leave them; the later
choice has unfolded influences on the progress of
13

the company. In a manufacturing outfit like
Nigerian Breweries, there are many departments and
each department is made up of very many sections
and units. Each section and unit has unique
functions to perform which requires unique
decisions at each stage. The problem has been that
the intricacies of Total Quality Management are
not adequately studied, so that management in
these organizations still very much relies on the
experience of the manager rather than on
collective inputs of the affected employees. This
often makes management loose cohesiveness of its
workforce, not assess and positively influence
customer complaints very well, not discover
ingenuity of workers, not reward workers according
to their productivities, not better assess the
impact of the policies of government and labour on
14

the company product as well as impacting
favourably on customers.
To these effects, the inevitable consequences of
lack of TQM in manufacturing firms include:
- Poor policy formulation and implementation.
- Inadequate employee involvement.
- Poor structural support techniques for TQM
- Inadequate brainstorming to solving contingent
problems
- Poor application of information communication
technology, etc
1.3 THE OBJECTIVES OF THE STUDY
The main objective of the study is to evaluate the
impact of total quality management in the
breweries industry. The specific objective of the
study includes:
15

1. To identify the nature of positive
correlation between policy formulation and
implementation and TQM at AMA Breweries Plc.
2. To access the extent of significant
relationship between employee involvement and
achievement of TQM practices in AMA Breweries
Plc.
3. To verify how structural support techniques
positively improve TQM Practices at AMA
Breweries.
4. To verify how Brainstorming positively
improves TQM practices at
AMA Breweries Plc.
5. To verify the extent of significant
relationship between information
communications technology and achievement
of TQM results at AMA Breweries Plc.
16

1.4 RESEARCH QUESTIONS
The following research questions are formulated
for the study;
1. What is the nature of correlation between
policy formulation and implementation and Total
Quality management at AMA Breweries?
2. How significant is the relationship between
employee involvement and achievement of TQM
practices in AMA Breweries Plc?
3. To what extent do structural support
techniques positively improve
TQM practices at AMA Breweries Plc?
4. How does Brainstorming improve TQM
practices in AMA Breweries Plc?
5. To what extent is the relationship between
information communications technology and
achievement of TQM results at AMA Breweries Plc.
17

1.5 RESEARCH HYPOTHESES
The following hypotheses are formulated:
H1: There is positive correlation between policy
formulation and
implementation and TQM.
H2: There is significant relationship between
employee involvement and achievement of TQM
practices.
H3: Structural support techniques positively
improve TQM practices.
H4: Brainstorming positively improves TQM
practices.
H5: There is significant relationship between
information communications technology and
achievement of TQM results.
1.6 SIGNIFICANCE OF THE STUDY
18
The study shall benefit the management of Nigerian
Breweries, as well as other manufacturing sectors
in understanding how better to handle challenges
facing the application of TQM. It will help them
relate with their workers better as well as
eliciting positive responses among the customers.
Employees shall benefit as management shall
explore the industrial relations policies that
favour its operations. Besides, ingenuity in the
workforce shall be soon discovered for the good of
the enterprise. The Researcher herself and general
public shall find the work very useful in
assessing better ways of increasing efficiency.
1.7 SCOPE OF THE STUDY
This study was concerned with applicability of TQM
in the brewery industry, specifically, the study
shall limit itself to identifying the nature of
19

positive correlation between policy formulation
and implementation and TQM, the extent of
significant relationship between employee
involvement and achievement of TQM practices, how
structural support techniques positively improve
TQM Practices, how Brainstorming positively
improves TQM practices as well as the extent of
significant relationship between information
communications technology and achievement of TQM
results in AMA Breweries Plc.
1.8 LIMITATIONS OF THE STUDY
The respondents initially felt unease responding
to questionnaire. They thought it was a ploy to
pry into their privacies. However, the Public
Relations Department of AMA Breweries helped in
diffusing the fears of the respondents by assuring
them of the academic nature of the questionnaire.
20

This prolonged the time for the completion of the
study.
References
Chase R. B, Aquilano N.J, Jabobs R.F. (2001).Operations Management for Competitive Advantage, 9/eNew York: John Wiley.
Crosby P.B (2002). Quality is free: The art of making Qualitycertain, New York; Prentice-Hall.
Dale, B.G. (2011). TQM: An overview. In B.G. Dale(Eds;), Managing Quality 3rd ed., Oxford, UK:Blackwell-Business.
Drucker P. (2009). Principles of Management New York:McGraw Hill Books Inc.
James, R. Evans and James, Dean (2010). Applicabilityof Total Quality Management organization, 5e NewJersey: Prentice-Hall Inc.
21

Martin B. and Barthol A. (2009). Management, NewYork: McGraw Hill Books Inc.
McDons J. (2010). Management Techniques in the Industry,New York: McGraw Hill Books Inc.
MacPetas B.M.C. (2001) Managing Change, London:Macmillan Publishers.
Muo, IK (2011). Understanding Business Communication.Lagos: Impressed Publisher
Morgan, C., & Murgatroyd, S. (2007). Applicability ofTotal Quality Management in the public sector.Buckingham, UK: Open University Press.
Nnamdi E.S. (2004). Managing Industrial Relations in NigeriaAba: Ngwaland Publishers.
Okes D, Westcott R.T, (2011). Certified QualityManager Handbook, 2/e Milwaukee, Wisconsin: ASQQuality Press.
Oakland J.S (2003). Applicability of Total QualityManagement London:
Open Press.
Pedro C.J. (2011). Brainstorming and Quality ControlLondon: Chapman and Hall Inc.
Robbins S. P, (2010). Organizational Bahaviour 1 l/eNew Dehli: Prentice Hall of Indiai4sPvateCompany.
CHAPTER TWO
REVIEW OF RELATED LITERATURE
22

2.1 THE CONCEPT OF TOTAL QUALITY MANAGEMENT
Quality is everyone’s business is an often quoted
cliché, but ‘Everything is everyone’s business,
and so quality often becomes nobody’s business.
The responsibility for quality often becomes
nobody’s business. The responsibility for quality
begins with the determination of the customer’s
quality requirements and continues until the
service or product is accepted by a satisfied
customer. Total Quality Management technique,
developed by Juran, Crosby and others, helps to
define the real purpose of each department, with
the objective of improving performance and
breaking down departmental barriers. It leads to
an understanding and agreement on the key
processes of each group. The department can then
liaise with its immediate ‘suppliers and
23

‘customers’ often internally, to identify
potential or actual problem areas and
simultaneously carry out an analysis of what
proportion of time it spent on the key activities.
This begins the change from departmental to
process management thinking.
Group discussion during the TQM process usually
yields many good ideas for improvement, either
eliminating wasteful activity or improving the
quality of output from the department. Everyone
becomes and should then remain aware of the prime
purpose of the department, and the focus on
efficiency and reducing waste usually carries
through to all work activities. The manager of the
department, who should run the exercise, must
understand the TQM process and why it is necessary
and important. He/she needs to be open-minded
24

towards change, and to encourage department, who
should run to question whether all their
activities add value to the product, service or
business. One of the greatest barriers to
improvement through TQM is the ‘but we’ve always
done it that way response.’
According to Mctolmes (2006:90), the basic steps
of TQM are: 1. From the TQM group 2. Brainstorm to
list all the departmental tasks 3. Agree to the
five main tasks 4. Define the position and role of
the departmental managers at AMA Breweries Plc 5.
Review the main activities, and for each one
identify the ‘customer(s)’ and supplier(s) at AMA
Breweries Plc 6. Consult the customer (s) and
supplier(s) by means of a suitable questionnaire.
This should be very similar to the list of
questions for interrogating any customer-supplier
25

interface 7. Review the customer-supplier survey
results and brainstorm how improvements can be
made in AMA Breweries Plc 8. Prioritize
improvements to list those to be tracked first,
and plan how. 9. Implement the improvement plan,
maintaining encouragement and support in AMA
Breweries Plc 10.
2.2 APPLICATION OF TOTAL QUALITY MANAGEMENT
TQM has proven itself as a way of managing and
continuously improving quality in an organization.
The successful implementation of TQM in Japanese
firms was responsible for success of Japanese
products all over the world and has set the
benchmark of quality for any made in Japanese
product. Suffice it to say that the Japanese
economy benefited greatly from the successful
implementation of TQM.
26

Globally, the benefits of TQM include greater
competition advantage and massive financial
savings. So many terms and slogans have evolved
from the TQM movement, such as first time right,
zero defects, loss reduction, the internal
customer, competitive bench-marking, cost of
quality, team work, self management, self
inspection etc. Behind the word and concepts are
techniques, actions and methods. Instead of
focusing on products and services in isolation,
they are analysed in their internal connection
with business process and the people who do the
work. The winner in this is the organization and
its customers.
Ho (2005:4) notes that TQM is the totally
integrated effort for gaining competitive
advantage by continuously improving every facets
27

of an organization’s activities. Looking at each
word:
Total - Everyone associated with the company is
involved in continuous improvement (including its
customers and suppliers if feasible).
Quality - Customers’ expressed and implied
requirements are fully met Management - Executives
are fully committed. Ho observes further that TQM
has variants of definitions:
1. TQM is described as the mutual cooperation of
everyone in an organization and association
business processes, in order to produce
products and services which meet and hopefully
exceed the needs and expectations of
customers, (Dale, 2004:15).
28

2. TQM is an approach to improve competitiveness,
efficiency and flexibility for the whole
organization, (Oakland, 2006:62).
3. TQM is an evolving system, consisting of
practices, tools and training methods for
managing organizations in a rapidly changing
context. The system provides customer
satisfaction and improves the performances of
organizations by eliminating product defects
and speeding service delivery, Shiba et al.,
2003:91).
4. TQM is a corporate structure that is
characterized by increased customer
satisfaction through continuous improvement
that involves all employees in the
organization, (Dahlgaard et al. 2004:62)
29

5. TQM is a management philosophy that seeks to
integrate all organizational functions
(marketing, finance, design, engineering
production, customer service, etc) to focus on
meeting customer needs and organizational
objectives, (Khurram and Hashmi, 2007:24)
6. TQM is a method by which management and
employees can become involved in the continuous
improvement of the production of goods and
services. It is combination of quality and
management tools aimed at increasing business and
reducing losses due to wasteful practices.
7. TQM is a management approach for an
organization, centered on quality, based on
the participation of all its members and
aiming at long-term successes through customer
satisfaction and benefits to all members of
30

the organization and to society, (ISO -
International Organization for
Standardization)
From the definition and description above we can
sieve the following as the common denominators
i. Customer focus and satisfaction
ii. Improvement in employees’ competence
iii.Leadership and top management commitment
iv. Team work
v. Employee Innovation
vi. Continuous Improvement and Innovation
vii.Quality information and performance
measurement
According to Bergman and Klefsjo (2003:92), TQM
consists of some core values as illustrated in the
figure 2.1.
31

Fig 2.1: TQM seen as a continuously evolving
management system consisting of values, techniques
and tools.
Values Tools
Top management Focus on people
Affinity diagram Isikawa diagram Commitment Tree diagram Design matrix Base decision on facts
Process maps Design matrix Improve continuously
Control charts
Focus on customers Let everybody be committed ISO
9000
TECHNIQUESQuality circles Bench marking
Quality function Development
Employee Self assessment Development Design of experiments
TOTAL Policy development QUALITY Process management MANAGEMENT Supplier partnership
Source: Helisten U and Klefsjo B. (2000)
32

To fully understand and appreciation TQM, one
needs to explore its historical evolution from
quality management.
2.3 TQM: HISTORICAL PERSPEPTIVE
If there is anything the scholars of TQM are
unanimous about it is the history of TQM at AMA
Breweries. According to Garvin (2008:4), most
manufacturing in the eighteenth and nineteenth
centuries was done by artisans and skilled
craftsmen who had no quality control measures.
Formal inspection becomes necessary only with the
rise of mass production and the need for
interchangeable parts. Jigs, fixtures (devices
that position tools or hold parts while they are
being worked on) and gauging systems were
developed to reduce variations in parts produced.
33

According to Garvin (2008:5), inspection
activities were linked more formally to quality in
the early 1920s. Most writers credit the
publication of Shewhart W. A’s Economic Control of
Manufactured Product which was published in 1931
as a watershed for the quality movement. In this
publication a Shewhart W.A introduced the concepts
of statistical Quality
Control.
Thus, Modern quality management can be traced back
to the mid 1 920s in United States of America and
has since had a profound impact on modern business
history (United Nations Industrial Development
Organization UNIDO’s Roadmap to Quality (Vol. 1,
2007:26). In the 1950s, just after World War II,
Japanese companies, dissatisfied with the quality
of their products, looked to the western experts
34

for solution. Two, largely ignored names came to
fore, W. Edwards Deming and Joseph M. Juran. These
men went to Japan to teach them about statistical
quality control which idea had earlier been
propagated by Sterwhart. W.
In just two decades the Japanese were able to turn
to the situation around.
Japanese products became the epitome of quality.
According to Ho S. K, It was not until the 1 980s
that the quality movement returned to America.
Other important contributors to the quality
movement are Crosby, Feigenbaum and Ishikawa.
Collectively these men are known as the quality
gurus. To develop a good insight into TQM, we
ought to explore the teachings of these quality
gurus and the principles they espoused –
35

2.3.1 Deming’s Philosophy
Deming is possibly the most famous of the quality
gurus. Born at the beginning of the Twentieth
century, he obtained his doctorate in mathematical
physics in 1928. According to Abomihed (2001:
p15), Deming’s began teaching statistical quality
control in Japan shortly after World War II.
Deming’s perspective on quality is based on two
definitions; Quality to him is multidimensional,
to produce a product or to deliver a service that
meet the customer’s expectations so as to ensure
customer satisfaction. The sources of his
arguments are
1. That quality must be defined in terms of
customer satisfaction
2. Quality is multidimensional where it is
impossible to define the quality of a product
36

or service in terms of single characteristics
or agent and
3. There are different degrees of quality,
because quality is essentially equated with
customer satisfaction (Deming, 2003:54).
Deming’s quality philosophy centered on reduction
of variation and uncertainly in the manufacturing
process. Similarly inconsistency in services
resulted in frustrated customers and a battered
image for the; company. In Deming’ s view, higher
quality led to higher productivity, which in turn
led to long term competitive advantage.
The Deming chain reaction theory states that
process improvements lead to lower costs due to
less rework, fewer mistakes, delays and snags and
more efficient sure of materials. Lower costs, in
turn, led to productivity improvements. With
37

better quality and lower prices the firm can
achieve a greater market share and remain
competitive and provide more meaningful rewarding
jobs (Deming, 2003:16)
Deming was also an advocate of change management.
He envisioned the “New Climate” (Organizational
culture) which consists of three elements
Joy in work
Innovation
Co-operation
Deming is most popular for his 14 points for
management (Deming, 2000:91) which he suggested as
the best way to help management understand and
implement the necessary transformation. Scholars
refer to it as Deming’s contribution to TQM.
Deming’s 14 Points
38

1. Create constancy of purpose for improvement of
product and services:
He advocated a radical new definition for a
company’s role. To him, money is better made by
staying in business and providing jobs through
innovation, research, constant improvement and
maintenance.
2. Adopt the new philosophy: Management needs to
take leadership for change into leaning
organization.
3. Cease dependence on mass inspection: Eliminate
the need for mass inspection by building
quality into the products.
4. End awarding business on price: Aim at minimum
total cost and aim towards single supplier.
5. Improve constantly and forever the system of
production and service: Improvement is not a
39

one-time effort. Management is obligated to
continually look for ways to reduce waste and
improve quality.
6. Institute Training: Too often, workers leaner
from others who are not also normally trained.
This way mediocrity is enthroned and perpetuated.
7. Institute Leadership: The job of a supervisor
is not to tell people what to do nor to punish
them but to lead. Leading consists of helping
people do a better job and to learn by objective
methods.
8. Drive out fear: Fear often prevent people from
expressing themselves or challenging existing
stereotypes. To assure better quality and
productivity, it is necessary that people feel
secure.
40

9. Break down barriers between departments: Too
often a company’s department or units are
competing with each other or have KPLs that
conflict. They do not work as a team. They can not
come together and foresee and solve problems
together. Improvement in one department may
have deleterious effect on another department.
10. Eliminate slogans, exhortations and numerical
targets for the workforce: Jobs are not done by
hackneyed and slogans, but by a committed
workforce. Let the workers chose their own
slogans.
11. Eliminate numerical quotas or work standards:
Most quotas take into account numbers without
considering quality or method. Employees strive
to achieve quotas even if it hurts the company in
41

other ways. It is better to enthrone
leadership
12. Remove barriers to taking pride in
workmanship: People are willing to do a good job
and are often distressed when they cannot. Too
often, faulty equipment, defective materials and
misguided supervisors, stand in the way of good
performance. These barriers must be removed.
13. Institute a vigorous program of education:
Both management and the workforce will have to be
educated in new knowledge and technology.
14. Take action to accomplish the transformation:
It requires special top management involvement to
carry out the quality mission. Everyone
stakeholder needs to be adequately mobilized to
realize this.
42

Deming last contribution to the quality movement
was contained in his system of profound knowledge
(Deming, 2003:21). Profound knowledge encompasses
four interrelated dimensions.
• Appreciation of a system
The emphasis here is to understand relationship
between functions and activities. The strategic
aim of the company is for all stakeholders
(employees, shareholders, customers, suppliers and
the environment) to win. While it may be easier to
optimize sub-systems, this may not necessarily
lead to optimization of the entire system.
One major source of sub-optimization is short term
measures like
1. The monthly or quarterly results. Companies
often make them look good by, deferring
repairs/maintenance, payments, orders of
43
materials etc which end up hurting the
company.
2. Ship out everything on hand towards the end of
a financial year even if it does not meet
quality standards
3. Investing pension funds immediately
Knowledge of Statistics
This includes knowledge about variation, process
capability, control charts, interactions and loss
functions. All these needs to be understood to
accomplish effective leadership, teamwork and so
on. There are two causes of variation; special and
common. Special causes of variation in a product,
process or service are those which prevent its
performance from remaining constant. These special
44

causes are often easily assigned, change of
operator, shift or procedure. They can also easily
be eliminated. Common causes on the other hand
those due to design, or the operation of the
process or system which appear after special
causes have been eliminated. These require
management action to be eliminated.
Deming identified two kinds of mistakes
Error 1: To react to any fault, complaint,
mistake, breakdown, accident, shortage as if it
comes from special causes when in fact it comes
from the random variation due to common causes
Error 2: To attribute to common causes any fault,
complaint, mistake, breakdown, accident, shortage
when it comes from special causes
Theory of Knowledge
45

The underlying theory and knowledge must be
understood before success can be effectively
copied. Operational objectives put meaning into
concepts. We need to know precisely what procedure
to use in order to measure or judge something, and
we need and unambiguous decision-rule to tell us
how to act on the result obtained.
Knowledge of Psychology
The science of human interaction must be
understood by management.
Extrinsic motivations must not be allowed to
smother intrinsic motivations. There must be the
desire to learn irrespective of age and position.
2.3.3 Joseph M. Juran’s Philosophy
Joseph Juran was born in the US about 1904. He
started out as an engineer in 1924. Like Deming,
46

Juran went over to Japan in the early 105 Os, just
after World War II. There, he conducted seminars
for top and middle- level executives. His lectures
had a strong managerial flavour and focused on
planning and organizational targets for
improvement. He emphasized that quality control
should be conducted as an integral part of
managerial control.
Juran believed that main quality problems were due
to management rather than workers. The attainment
of quality requires activities in all functions of
a firm. Firm-wide assessment of quality, supplier
quality management, using statistical methods,
quality information system and competitive bench-
marking are essential to quality improvement.
Juran’s approach is emphasis on tams (QC circles
and self managing teams) and project work which
47

can promote quality improvement, improve
communication between management and employee co-
ordination and improvement coordination among
employees. Juran also emphasized the importance of
top management commitment and empowerment,
participation, recognition and rewards (Juran and
Gryna, 2001: 126-128).
It is very important to understand customer needs.
This requirement applies to all involved in
marketing, design, manufacture, and services.
Identifying customer needs requires more vigorous
analysis and understanding to ensure products
specification. Thus, market research is essential
for identifying customer needs. In order to ensure
design quality, he proposed the use of techniques
including quality function deployment,
48

experimental design, reliability engineering and
concurrent engineering.
Juran (2010:30) developed the idea of Quality
Triology: quality planning, quality improvement,
and Quality control. In his view, approach to
managing quality, consists of: the sporadic
problem is detected and acted upon by the process
of quality control. The chronic problem requires a
different process, namely, quality improvement;
such problems are traceable to an inadequate
quality planning process. Juran’s defined
universal sequence of activities for the three
quality processes are listed in table 2.1
Table 2.1: Juran’s Universal Process for Managing
Quality
Quality Planning Quality Control Quality Improvement
49

Establish quality
goals
Identify
customers
Discover customer
needs
Develop product
features
Develop process
features
Establish process
control
Transfer to
operations
Choose control
subjects
Choose units of
measure
Set goals
Create a sensor
Measure actual
performance
Interpret the
difference
Take action on the
difference
Prove the need
Identify projects
Organize project
teams
Diagnose the causes
Provide the
remedies, prove
remedies are
effective
Deal with resistance
to change
Control to hold the
gains
Source: Juran on planning for quality (2007).
Another major contribution of Juran was his four
broad categories for quality costs. The four
quality costs are:
Internal failure costs (scrap, rework, failure
analysis etc), associated with defects found
prior to transfer of products to the customer.
50

External failure costs (warrantee charges,
complaint adjustment, returned material,
allowances etc) associated with defects found
after product is shipped to the customer.
Appraisal cost (incoming, in-process and final
inspection and testing, product quality
audits, equipment calibration costs etc),
incurred in determining the degree of
conformance to quality requirements.
Prevention costs (quality planning, new
product review, quality audits, supplier
quality evaluation training, etc), incurred in
keeping failure and appraisal costs to a
minimum.
2.3.4 Philip Crosby’s Approach
Philip Crosby was born in 1026, began his quality
career as a reliability engineer. He participated
51

in the Martin missile experience that led to the
zero defects movement and later he worked in
quality management for ITT. Crosby’s name is name
is best known in relations to the concepts of Do
it Right First and zero Defects. Crosby defines
quality as conformance to the requirements which
the company itself has established for its
products based directly on its customer’s needs.
Crosby (2007:4) identified a number of important
principles and practices for successful quality
improvement program, which include, for example,
management participation, management
responsibility for quality, employee recognition,
education, reduction of cost of quality
(prevention costs, appraisal costs and failure
costs), emphasis on prevention rather than after-
the-event inspection, doing things right the first
52

time and zero defects. Crosby presented the
quality management maturity grid, which can be
used by firms to evaluate their quality management
maturity. The five stages are:
Uncertainty
Awakening
Enlightenment
Wisdom and
Certainty
These stages can be used to assess progress in a
number of measurement categories such as
management understanding and attitude, quality
organization status, problem handling, cost of
quality as percentage of sales and summation of
sales quality posture.
53

Crosby (2002:41) offers a 14 step program that can
guide firms in pursuing quality improvement. They
are
1. Management commitment: Management stance on
quality should be made clear.
2. Quality improvement team: To facilitate
quality improvement program
3. Quality measurement: To monitor non-
conformance problems in a way that permits
objective evaluation and correction actions.
4. Cost of Quality: To define components of cost
of quality, explain its use as a management
tool.
5. Quality Awareness: To provide a method of
raising the personal concern felt by all
personnel in the company toward the
54

conformance of the product or service and the
quality reputation of the company.
6. Corrective Action: To provide a systematic
method of resolving forever the problems that
are identical through previous action steps.
7. Zero defects Planning: To investigate the
various activities that must be conducted in
preparation for formally launching the zero
defects program
8. Supervisor Training: To define supervisor
training in order to actively carry out their
part of quality improvement program.
9. Zero defects day: To create an event that will
make all employees realize, through a personal
experience that there has been a change.
10. Goal setting: To turn pledges and commitments
into actions by encouraging individuals to
55

establish improvement goals for themselves and
their groups
11. Error causal removal: To give the individual
employee a method of communicating with
management the situation that makes it
difficult for the employee to meet the pledge
to improve.
12. Recognition: To appreciate those who
participate
13. Quality councils: To bring together the
professional people for planned communication
on a regular basis
14. Do it again: To emphasize that the quality
improvement cycle never ends
2.3.5 Armand Feigenbuam’s Approach
Feigenbaum (2004:64), defines Total Quality
Control as an effective system for integrating the
56

quality development, quality maintenance and
quality-improvement efforts of the various groups
in a firm so as to enable, marketing, engineering,
production, and services at the most economical
levels which allow for full customer satisfaction.
He goes on to state that effective quality
management consists of four main stages:
Setting quality standards
Appraising conformance to those standards
Acting when standards are not met
Planning for improvement in these standards.
Feigenbaum established 9 fundamental factors
affecting quality viz Markets, money, management,
men, motivation, materials, machines and
mechanization, modern information methods and
mounting product requirements (Feigenbaum
2002:59). These however, can be reduced to two
57

broad categories; (1) Technological factors
(including processes) and (2) Human factors.
Feigenbaum emphasized that the human factors were
far more significant. He considered top management
commitment, employee participation, supplier
quality management, information system,
evaluation, evaluation, communication, use of
quality costs, and use of statistical technology
to be essential component of TQC. He posited that
effective employee training and education should
focus on the following three main aspects: Quality
attitude, quality knowledge and quality skills.
2.3.6 Kaoru Ishikawa’s Approach
Professor Ishikawa was born in 1915 and by 1939
had graduated from the Engineering Department of
Tokyo University. Ishikawa is best known as a
pioneer of the quality Circle movement in Japan.
58

According to Ishikawa (2005:123), quality
management extends beyond the product; it
encompasses after-sales-service, the quality of
management, the quality of individuals and the
firm itself. Ishikawa advocate employee
participation as the key to the successful
implementation of TQM. Quality circles, he stated,
was an important vehicle in achieving this. He has
been associated with the development and advocacy
of universal education in the seven QC tools. The
tools are
Pareto charts
Cause and effect diagram (Ishikawa diagram)
Stratification chart
Scatter diagram
Check sheets and
Histogram
59

Control chart
Ishikawa (1985) goes on to state that the
assessment of customer requirements serve as a
tool to foster cross-functional cooperation,
selecting supplier should be on the basis of
quality rather than solely on price; cross-
functional teams are effective ways for
identifying and solving quality problems.
Ishikawa’s concept of TQM contains the following
six fundamental principles;
Quality first not short-term profit first.
Customer orientation not producer orientation
The next step is your customer-breaking down
the barrier of
sectionalism
Using facts and Data to make presentations-
utilization of statistical methods
60

Respect for humanity as a management
philosophy, full participatory management
Cross-functional management
2.4 BRAINSTORMING AS A TOTAL QUALITY MANAGEMENT
TECHNIQUE
According to Jones (2002:43-45), teams have a
number of roles to play as a component in a
process of continuous improvement Teams can: Aid
the commitment of people to the principle of TQM
Provide an additional means of communicator
between individuals, management and their direct
reports, across functions with customers and
suppliers Provide the means and opportunity for
people to participate in decision making about how
the business operates. Improve relationships,
develop trust and facilitate co-operative
activity. Help to develop people and encourage
61

leadership traits. Build collective responsibility
and develop a sense of ownership. Develop problem
solving skills Facilitate awareness of improvement
potential, leading to behaviour and attitude
change. Help to facilitate a change in management
style and culture. Solve problem. Facilitate
awareness of improvement potential, leading to
behaviour and attitude change Help to facilitate a
change in management style and culture Imbibe a
sense of accomplishment Improve the adoption of
new products to the production line. Improve the
adoption of new products to the production line.
Improve morale. Improve operating effectiveness as
people work in a common direction through
interaction and synergy. The American Society for
Quality Control (ASQC) (1993) commissioned the
Gallup Organization to assess employee attitudes
62

on teamwork, empowerment and quality improvement.
The survey of 1,293 adults focused on a variety of
topics: including, extent of participation in
quality teams, employee feelings of empowerment,
and effects of technology and teamwork on
empowerment.
Types of Teams
According to McDonnes (2004:69), in the superior
performing organization teamwork is second nature.
For example, the senior management work together
as an effective team, managers of the various
operating and functional units act as a team,
people from different functions co-operate in the
team activities which are needed in Unilever
simultaneous engineering, benchmarking, supplier
development, quality management series
registration and internal audits. In addition to
63

teamwork within functions it is common to find
teams working together across the business.
In some cases (e.g. Crosby methodology 1979) teams
are hierarchal in nature- a corrective action team
is formed on a directive from a quality
improvement team. Unless effective team working
and cohesion is seen at the top of an
organization, it is unlikely that the managers
will be able to encourage their employees to work
effectively in teams. The superior performing
organizations use a variety of ways to facilitate
teambuilding. Improve relations and reinforce the
teamwork ethic. For example Dale and Huke (1996:
125) writing about their experiences in Hong Kong
give examples such as carnivals, team
competitions, social and recreational activities,
and entry into the dragon boat race competition.
64

Project Teams
As discussed earlier why senior executive should
become involved in the drive to improve originates
at the top of an organization. If senior
management identifies the main problems facing the
organization, key improvement issues can be
developed which are then allocated amongst their
membership for consideration as a one-off project.
The project owner selects employees to constitute
a team which will consider the improvement issue.
The owner can either lead the team personally or
act as ‘foster parent’ ‘sponsor’ or ‘guardian
angel’ to the team. Through participation in
project teams, managers better understand the
problem solving process and become more sensitive
to the problems faced by other types of teams. The
65

senior management project team is one example of
this type of team, but there are others.
2.5 QUALITY CONTROL TECHNIQUES
Quality Circle (QCs) when operated in the
classical manner, have characteristic which are
different from other methods of teamwork. They
have been the subject of many books (Huchins 1985,
Mohr and Mohnr 1983 and Robson 1984) and the focus
of much research (Bradley and Hill 1983, Hayward
et al. 1985 and Hill 1986) almost to the exclusion
of research on other types of team activity.
However, QCs, in the classical sense, have not
been too ‘successful’ in Western organizations.
Hayward et al 1985) indicates that this is because
they were introduced at a time in the West when
organization did not fully understand the
principles and practices of TQM. A vast amount of
66

experience was however acquired in the operation
of QCs, much of which has been well documented. It
is suggested that any organization wishing to
develop effective team work and resolve some of
the issue which arise in the operation of teams
should consult the written wisdom on QCs. There
they will find many clues on facilitation, problem
solving skills, organization of meetings and
maintaining the momentum.
2.6 TOTAL QUALITY MANAGEMENT AS ORGANIZED PROBLEM
SOLVING TECHNIQAUES
People work in chains of activities that
collectively form business processes. TQM focused
organizations seek to improve the process of
delivering a service or product than individual or
67

departmental performance or competence. Processes
consist of a chain of customer/supplier
relationships. System failure- when the link in
the chain breaks- when the flow of work is
disturbed. We have all learnt to live with and
accept failures. System failures have become a
standard because we view each step or function of
our activities and not the total process.
Competitive Benchmarking
Comparing one company’s performance with that of
another is a reflex of TQM. Reilly (2006:14)
argues for competitive benchmarking as a
continuous management process that helps firms
assess their competitive capability and
themselves, and to use that knowledge in designing
a practical plan to achieve superiority in the
market place. It also helps firms to strive to be
68
better than the best competitor. The measurement
takes places along the three components of total
quality programme products and services, business
processes and procedures and people. The idea is
to benchmark performance, not only with ones
direct competitors but with other firms as well to
discover best practices and bring such practices
back to ones own company. When done correctly,
competitive benchmarking produces the hard facts
needed to plan and execute effective business
strategies that fully satisfy agreed customers
requirement.
2.7 TOTAL QUALITY MANAGEMENT AS PERFORMANCE
APPRAISAL TECHNIQUES
Relevance of an appraisal process
Folunso (2006:36), noted that any organization
needs to consider the relevance of an appraisal
69

process to its short-and medium-term outlook. For
organizations in deep trouble the introduction of
an appraisal process is unlikely to be a top
priority. If the organization has unacceptably
high staff turnover, the causes need to be
understood before judging whether appraisal will
help. Organization undergoing major changes in
reporting relationships need to settle a little
before appraisal can contribute. However, when
some stability emerges, the introduction of
appraisal can help appraiser and appraise develop
mutual understanding of each other’s roles and
establish a foundation for high performance. The
introduction of appraisal. For the process to have
a chance of operating, there needs to be a
‘critical mass’ of people, particularly at middle-
management level, who agree that the introduction
70

of appraisal will take the organization forward,
even if they agree for different reasons.
2.8 TEAMWORK DYNAMICS AS DECISION SPRINGBOARD
IN TOTAL QUALITY MANAGEMENT
In DPA everybody is involved in the process of
quality management from the managing director down
the ranks of management to the junior office
clerk, the laborer and janitorial staff. Everybody
in the company is responsible for producing
quality goods and services and cutting the cost of
quality. This comprehensive approach to total
quality can capture the creativity and energy of
the entire work force. Usually, this is done in
teams. People are given some total quality
training in the natural work groups and then
unleashed in quality improvement teams.
2.8.1 The Objectives of TQM
71

Total quality management has five objectives but
in the course of this study, emphasis will be laid
on its importance towards employee motivation
which has been considered an important tool for
increased productivity in Nigeria organization.
These objectives include the following:
2.8.2 The Obsession with Quality
The first objective of TQM is to create an
obsession with quality in an organization. This
obsession is created among employees of all kinds
in all areas. Indeed, everything is affected,
inputs, activities, processes, structures,
procedure, relationship, result, everything. At
this stage, it becomes necessary to give a broad
explanation of what is meant by the word quality.
At the heart of TQM is the conviction that it is
possible to achieve defect free work most of the
72

time. This assertion has been framed in different
ways by different authorities of quality
management. According to Edward Deming (1986)
quality could be interpreted in terms of
reliability, and as conformance to specification.
Juran (1990) however disagrees with this
interpretation. He defines quality as ‘fitness for
use or purpose’ and argues for that definition
instead of conformance to specification. In
Crosby’s view quality was defined in terms of zero
defects. He talks about the possibility of doing
things right the first time and all the time. TQM
can only help an organization to create an
obsession with quality first by radically
redefining the meaning of quality and secondly by
enabling an organization to put in place and
sustain a continuous quality improvement. Under
73

TQM, all employees come to understand that quality
means consistently providing defect free products
and services in a way that fully meets or exceeds
the stated’ agreed requirement of he customer.
2.9 FAILURE MODE AND EFFECTS ANALYSIS (FMEA) AS A
PROCESS OF TOTAL QUALITY MANAGEMENT
The technique of FMEA is a systematic and
analytical quality planning tool for identifying
at the product, service and process design stage,
what potentially could be wrong either with a
product during its manufacture or end-use by the
customer or with the provision of service. The use
of FMEA is a powerful aid to advanced quality
planning of new products and services. Its
effective use should lead to a reduction in
defects during the production of initial samples
and in volume production. Customer complaints,
74

failure in the filed, performance-related
deficiencies, warranty claim, improved customer
satisfaction and confidence as products and
services are produced from robust and liable
production and delivery methods.
According to Juran (2001:98), there are two
categories of EMEA: design and process. Design
FMEA assesses what could, if not corrected, go
wrong with the product in service and during
manufacturing as a consequence of a weakness in
the design. Design FMEA also assists in the
identification or confirmation of critical
characteristics. Process FMEA is mainly the design
FMEA also assists in the identification or
confirmation of critical characteristic. Process
FMEA is mainly concerned with the reasons for
potential failure during manufacturing and in
75

service as a result of non-compliance with the
original design intent, or failure to achieve the
design specification.
2.10QUALITY FUNCTION DEPLOYMENT (QFD) AS QUALITY
PROOF IN TOTAL QUALITY MANAGEMENT.
The QFD methodology was developed in Japan at Kobe
Shipyard, at Mitsubishi Heavy Industries. It arose
out of a need to achieve simultaneously a
competitive advantage in Quality Cost and Delivery
(QCD). All the leading companies in Japan use QFD.
It is based on the philosophy that the voice of
the customer’s drives all company operations.
According to Tokyalk (2004:90), the technique
seeks to identify those features of a product or
service which satisfy the real needs and
requirements of customers (market or customer
required quality). This Analysis also takes into
76

account discussions with the people who actually
use the product, to obtain data on issues such as:
What they feel about existing products? What
bothers them? What features should new products
have? What is required to satisfy their needs,
expectations, thinking and ideas? It is usual to
express the customer’s needs in their original
words and then translate these needs into the
technical language of the organization.
The superior performing companies are using QFD to
identify product and service features (including
additional features) which customers will find
attractive, and help to charm and delight them. In
this way differentiating quality characteristics,
features and/or technical advantages can be
established between the organization and its
competition. These requirements, features and
77

specifications are then translated into design
requirements and then deployed through each phase
in the ‘manufacturing’ style to ensure that what
is delivered to the customer truly reflects
his/her wants or needs. It provides the mechanism
to target selected areas where improvement would
enhance competitive advantages. QFD is a
systematic procedure to help build-in quality in
the upstream processes and in the early stages of
new product development. In this way it helps to
avoid problems in the downstream production and
delivery processes and shortens the new
product/service development time. It promotes pro-
active rather than re-active development. QFD
employs a step-by-step approach from customer
needs and expectation through the four planning
phases of: (1) Product planning (2) Product
78

development (3) Process planning (4) Production
planning through to manufactured products and
delivered services.
In endeavoring to meet the objective of delighting
the customer, conflicting issues often arise and
some trade-offs are made in a logical manner.
Translating customer objectives and wants (termed
a what) into product or service design how (i.e.
the produce planning and design concept-phase 1)
this voice of the customer’ is the starting point
for QFD and drives the process.
2.10.1 TQM Concept and Working Framework
Having examined the contribution of the quality
Gurus and the various quality awards, it is now
appropriate to explore this labyrinth called TQM.
Over time the frontiers of TQM has continued to
expand, like a vortex, sucking-up new systems and
79

developing new constructs. Perhaps the ambiguity
in TQM lies in the scope of meaning. Hansen J.
(2003) quoting Helisten and Klefsjo (2000) see TQM
as a management system in continuous change
consisting of values, methodologies and tools.
This model is based on eleven TQM should be
committed to establishing a firm that sees quality
as the first primary goal (Dale, 2007:62).
2.10.2 Supplier Quality Management
Suppliers are major stakeholders in a business and
thus are an important link in its drive towards
TQM. This construct includes all management
initiative aimed at the suppliers to help improve
and sustain quality:
Partnership with suppliers
Supplier selection criteria
Participation in supplier development
80

Supplier performance evaluation
Supplier quality Audits
Supplier Communication Vision and plan
Statement
Vision statement is a detailed visualization of
the desired future state of the overall business
and serves as the target for which all strategies,
goal and standards are established. Corporate
vision is the high level or distant expectations,
goals and aspirations of an organization (Onukogu
2004:25).
This construct compasses all efforts at the
strategic level to embed TQM into the organization
Vision Statement
Quality policy
Overall business performance plan.
Product quality Goal
81

Quality improvement plan
Formation of vision and plan
2.10.3 Evaluation
According to Onukogu (2004:93) strategy deals with
the choice of actions taken in order to achieve
the set objectives defined within the corporate
policies domain. The three levels of strategy
hierarchy: corporate, business and departmental
must be taken into account. Other areas include
Evaluation of strategy
Evaluation of overall business performance
Evaluation of Department’s performance
Evaluation of Employee performance
Quality Audits
Bench-marking
Quality costs
Information systems
82

2.10.4 Process control and Improvement
This construct examines all the activities taken
to control or improve quality in the company; it
includes the following
Shop floor control
Process capability (the extent of the measure
of a firm’s production systems ability to meet
design specifications)
Equipment maintenance innovation
Inventory management
Inspection
Use of Quality tools
2.10.5 Product Design
This involves all effort and activities at the
design stage (e.g. assembly plant layout) aimed at
controlling and improving quality. This construct
includes the following concurrent engineering
83

(corporate relationships throughout process design
stage)
Reliability engineering
Designing for manufacturability
Design of experiments
Quality function deployment
Value Engineering (aimed at reducing
unnecessary cost before producing product or
service)
Computer aided design
2.10.6 Quality System Improvement
This is aimed at the improvement of the quality
system. It examines those activities done to
improve the quality systems and includes
Quality manual
Quality system Procedures
Work Instructions
84

ISO 9000 Certification
2.10.7 Employee Participation
This is aimed at measuring the participation of
employees in quality management. The others
include
Cross-functional teams
Quality control (QC) circle
Within Functional team (team whose aim is to
solve or investigate problems/opportunities
within the same department and is normally
disbanded after the risk is complete).
Information communication
Employee suggestion
Improvement employee commitment
Job rotation
Worker’s congress
85

Trade union
2.10.8 Recognition and reward
Measure how well instituted the recognition and
reward programs are in a firm. The constituent
are:
Recognition and reward programs
Working environment improvement
Salary promotion
Bonus Scheme
Position Promotion
Moral Awards: (Used to recognize the quality
performance of employees or teams, usually in
the form of thank you notes etc)
Penalty
2.10.9 Education and Training
Is a measure of education and training initiative
to foster quality management? It should include:
86

Education and training plan
Team learning
Quality awareness education
Training for quality management Knowledge
Job training
Formal education promotion
2.10.10 Customer Focus
This is a measure of how customer-focused a firm’s
drive for quality management. This construct
includes the following
Customer complaint information
Market investigation
Customer satisfaction survey
Quality warranty
Customer service
Customer information system
87

2.11SUMMARY OF THE REVIEW OF RELATED LITERATURE
What introducing TQM in organization the major
preoccupation is whether lower level employees
would support the process and how the anticipated
resistance would be overcome, According to Iyayi
(1994), 80 percent of resistance to TQM comes from
20 percent of employees located in management
levels. The most important challenge therefore
that TQM pose for any organization in our
environment is overcoming management resistance
not to change but to TQM The commitment to quality
cannot be really taken seriously by employees and
indeed by other managers where a single manager
allows the integrity of operations to be
compromised. The integrity of operations is
compromised when a manager engages in double
standards. It is compromised when; a manager puts
88

pressure on the system to let him or her get away
with things that are obviously wrong. The
integrity of operations is compromised when a
manager does not lead by example and fails to see
himself as the standard by which the quality of
operations is judged. It is compromised when, as a
management team, we build into the environment
work conditions that indicate contempt for lower
level employees.
The TQM gurus provide different dimensions and
flavours to the TQM concept. It must be emphasized
that what we know today as TQM has evolved from
the ideas of these gurus. The common themes in
their ideas is outlined below:
1. It is management’s responsibility to provide
commitment, leadership, empowerment,
encouragement and support to technical and human
89

processes. It is top management’s
responsibility to determine the environment and
framework of operation within a firm. It is
imperative that management foster the
participation of employees in quality
improvement, and develops a quality culture by
changing perception and attitude towards
quality.
2. The strategy, policy and firm-wide evaluation
activities are emphasized
3. The importance of employee education and
training is emphasized in changing employees’
beliefs, behaviour and attitude; enhancing
employees abilities in carrying out their
duties
4. Employees should be rewarded and recognized
for their quality improvement efforts
90

5. It is imperative to control the processes and
improve quality systems and product design. The
emphasis is on prevention of quality defects not
on inspection after the event.
6. Quality is a systematic firm-wide activity
from suppliers to customers. All functional
activities such as marketing, design, engineering,
purchasing, manufacturing, inspection,
installation and services must be involved in
quality improvement efforts.
2.11.1 Quality Management Awards
To underscore the importance of quality
management, several countries have set up
national awards to be given to businesses that
excel in quality management. The essence of
this here is that it highlights the mission
critical areas of quality management and helps us
91

to further narrow the scope and concept of TQM.
While these awards may not explicitly be called
TQM awards it is obvious that the award
criteria are modeled after TQM.
2.11.2 USA’s Malcolm Baldrige National Quality
Award (MBNQA)
The Baidrige Award is given by the president of
the United States to businesses - manufacturing
and service, small and large and to education and
healthcare organizations that apply and are
adjusted to be outstanding in seven areas:
Leadership, strategic planning, customer and
market focus, information and analysis, human
resource focus, process management and business
results (http :/www.
quality.nist.gov/Foundation.htm). The Award is
named after a US secretary of Commencer in 1981-
92

1987, who was a strong proponent of quality
management as a veritable tool to the country’s
prosperity and long-term strength. He died
suddenly after a Rodeo accident. Congress
established the Award program 1987 to recognize
U.S organizations for their achievements in
quality and performance and to raise awareness
about the importance of quality and performance
excellence as a competitive edge. Figure 2.2 shows
a system perspective for the Baldrige criteria for
performance excellence Framework.
93
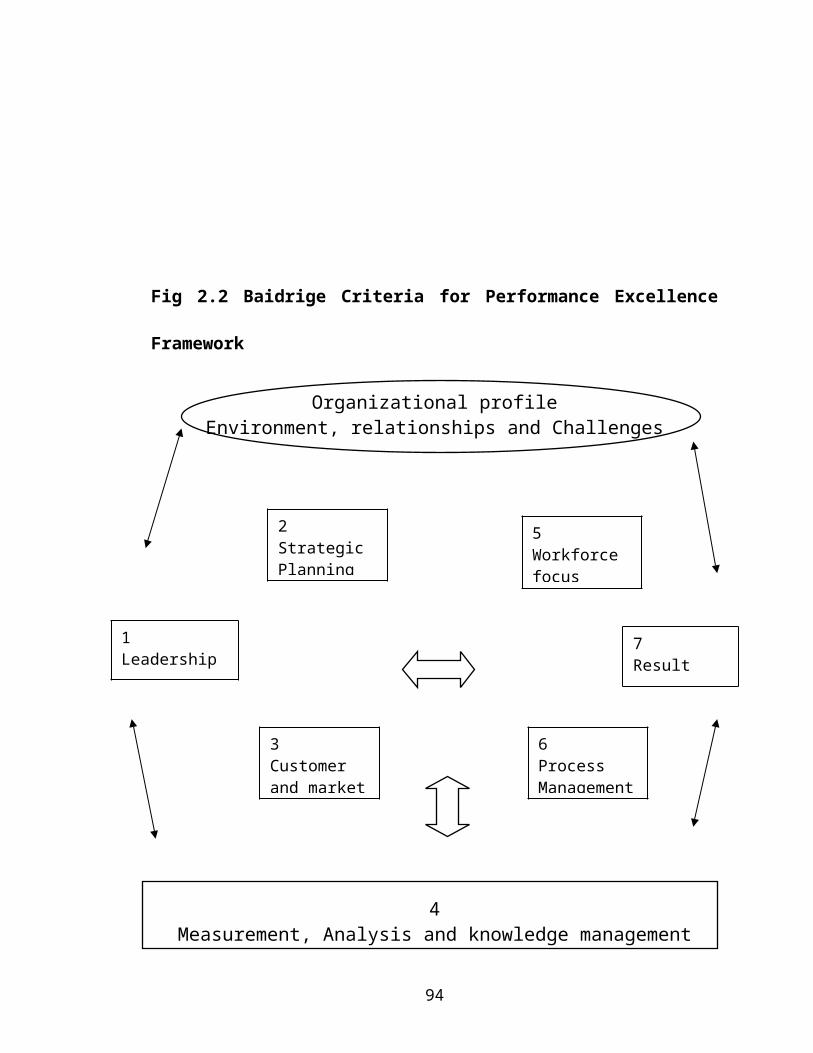
Fig 2.2 Baidrige Criteria for Performance Excellence
Framework
Organizational profileEnvironment, relationships and Challenges
4Measurement, Analysis and knowledge management
94
1Leadership
2Strategic Planning
5Workforce focus
7Result
3Customer and market
6ProcessManagement

Source: Baidrige Criteria for Performance Excellence
Framework (2009)
A system Perspective measurement and analysis
management
The Baldrige criteria fit quite well with the
Deming philosophy of quality. There is a strong
emphasis on the non-procedural aspects of quality
such as leadership. Human resource management,
including employee wellbeing and morale, as well
as customer satisfaction.
Table 2.2: 2008 Criteria for Performance
Excellence-item listing
S/
N
Malcolm Balrige Award Requirement
(2007)
Max. Val Evaluati
on
1 Leadership (120)
Senior Leadership 70
95

Government and social Responsibility 502 Strategic Planning (85)
Strategic Development
Strategy Deployment
40
453 Customer and Market (85)
Customer and market knowledge
Customer relations and satisfaction
40
454 Measurement, Analysis and Knowledge
Management
Measurement, Analysis and improvement
of organizational performance
Measurement of information, Information
Technology, and Knowledge
45
45
5 Work force focus (85)
Work force engagement
Work force environment
35
506 Process management (85)
Product and service outcomes
Work Process management and Improvement
35
507 Result (450)
Product and service outcomes
Customer Focused outcomes
Financial and market outcomes
Work focused outcomes
Process Effectiveness outcomes
Leadership outcomes
100
70
70
70
70
708 Total 1000
Source: http:/www.quality.nist.gov/Foundation.htm.
96

2.11.3 The Deming Prize
The Deming prize was established by the Board of
Directors of the Japanese Union of Scientists and
Engineers, JUSE in 1951 to companies with
outstanding TQM. The prize is given for the
overall performance of the company. In fact the
Deming Prize has been described as the best known
prize with the longest history. The Deming Prize
has proved an effective instrument for spreading
TQM philosophy throughout the Japanese industries.
There are 10 primary elements in the Deming
Application Prize (2001:112), as well as
checklists that are used to evaluate the
performance of senior executives. These items are
listed in table 2.3
97

Table 2.3 Deming Application Prize 10 Primary Elements.
S/N Elements1 Policy
-Quality and quality control policies and their place in
overall business management
-Clarity of policies (target and priority measures)
-Methods and processes for establishing policies;;
Relationship of policies to long-an short term plans
Commitment (deployment) of policies and grasp and
management of achieving policies
Executives and managers leadership2 Organization
- Appropriateness of organizational structure for quality
control and status of
98

employee involvement
- Clarity of authority and responsibility
- Status of interdepartmental coordination
- Status of committees and project team activities
- Relationship with associated companies (group
companies, vendors,
contractors, sales companies etc.)3 Information
-Appropriateness of collection and communication external
information
-Appropriateness of collecting and communicating internal
information
-Status of applying statistical techniques to data
analysis
-Appropriateness of information retention
-Status of utilizing information
-Status of utilizing computers for data processing4 Standardization
-Appropriateness of system of standards
-Procedure for establishing, revising and abolishing
standards
-Actual performance in establishing, revising and
abolishing standards
-Contents of standards
-Status of utilizing and adhering to standards
-Status of systematically developing, accumulating,
handling down and utilizing technologies.5 Human Resources
-Education and training plans and their development and
99

results utilization
-Status of quality consciousness, consciousness in
managing jobs and understanding of quality control
-Status of supporting and motivating self development and
self realization
-Status of understanding and utilizing statistical
concepts and methods
-Status of QC circle development and improvement
suggestions
-Status of supporting the development of human resources
in associated companies6 Quality Assurance
-Status of managing the quality assurance activities
system
-Status of quality control diagnosis
-Status of new products and technology development
(including quality analysis, quality deployment and
design review activities.
-Status of process control
-Status of process analysis and process improvement
(including process
capability studies)
-Status of process analysis and process improvement
(including process capability studies)
-Status of inspection, quality evaluation and quality
audit
-Status of managing production equipment, measuring
instrument and vendors
-Status of packaging, storage, transportation sales and
100

service activities
-Grasping and responding to product usage, disposal
recovery and recycling
-Status of quality assurance
-Grasping of the status of customer satisfaction Status
of assuring reliability, safety, product liability and
environmental
Protection
7 Maintenance
-Rotation of management (PDCA) cycle control activities
-Methods of determining control items and their levels
-In-control situation (status of utilizing control charts
and other tools)
-Status of taking temporary and permanent measures
-Status of operation management systems for cost,
quality, delivery etc.
-Relationship of quality assurance system to other
operating management
Systems
8 Improvement
-Methods of selecting themes (important activities,
problems and priority
issues)
-Linkage of analytical methods and intrinsic technology
-Status of utilizing statistical methods for analysis
-Utilization of analysis results
-Status of confirming improvement results and
transferring them to
101

maintenance/control activities
-Contribution of QC circle activities9 Effects
-Tangible effects (such as quality, delivery, cost,
profit, safety and
environment)
-Intangible effects
Methods for measuring and grasping effects
Customer satisfaction and employee satisfaction
Influence on associated companies
Influence on local and international communities10 Future Plans
-Status of grasping current situation
-Future plans for improving problems
-Projection of changes in social environment and customer
requirement and
future plans based on these projected changes
-Relationships among management philosophy, vision and
long-term plans
-continuity of quality control activities
Concreteness of future plans
Source: http://www.deming.org
2.11.4 The European Foundation for Quality
Management Award
102
The European Quality Award EQA was launched during
the 1991 European Foundation for Quality
Management (EFQM) meeting in Paris. The aim of the
EFQM and of the award is specially geared to
encourage the development of ATQM. The award aims
to recognize organizations who are paying
exceptional attention to total quality, and to
encourage others to follow then like the Japanese
Deming prize Award and the US Mancolm Baldrige
Award (1995; 232). As shown in fig 2.3 the EQA is
divided into two parts; and strategy, resources
and processes. These five aspects steer the
business and facilitate the transformation of
inputs to outputs. The output results are people
satisfaction, customer satisfaction, impact on
society and business results the measure of the
level of output attained by AMA Breweries Plc.
103

Fig 2.3: EFQM Business Excellence Model
Enablers Results
Innovation and learning
Source: http://www.eog.org
2.12 NIGERIA BREWERIES PLC
2.12.1 Brief Historical Background
Nigeria Breweries has its history firmly rooted in
colonial background. First was the formation of
United African Company in 1977 by British
imperialist, George Goldie Taubman. This later
104
Leadership
People
Policy &Strategy
Partnership &
Processes
KeyPerformanceResults
Peopleresult
Customerresult
Societyresult

became the Royal Niger Company after it was
granted a royal charter in 1886. Lever brothers (a
subsidiary of Unilever conglomerate) took over the
shares of the Royal Niger Company in 1921
(Ogunbiyi, 2007: 39). In 1929, feuding British
Africa and Eastern Trade Corporation and French
Compagnie du Niger Francais came together to form
the United African Company UAC, which emerged as
the dominant trading company of the region.
(Ogunbiyi, 2007:40). Heineken, a Dutch brewing
company, was exporting beer to West African
through UAC, but companies were looking for
opportunities to establish a brewery in Nigeria.
According to Ogunbiyi, in the book, 60 years of
wining in Nigeria,
105

“So it was that on 16 November, 1946, UAC and Heineken signed a
contract for the incorporation of Nigeria Breweries Limited in the capital
city of Lagos, with a share capital of £300, 000.”
2.12.2 A Breweries Giant is born
While UAC was responsible for the commercial and
administrative management of the new company,
Heineken was to provide technical control. In June
21 1949, the first Nigeria brewed bottle of beer
rolled off the bottling line in Iganmu. The beer
was called star beer. By 1954 the company reached
the first one million carton units mark and had
captured about 20% of the beer market in Nigeria.
From that time the company has never looked back.
It started producing star in Aba brewery in May
1975. By 1960 the capital base of the company had
106

increased to £1,500,000:00. Kaduna brewery was
commissioned in 1964 and Heineken as a brand was
first produced in 1965. The franchise to produce
Heineken locally lasted for only ten years due to
change in government policy. The civil war years
of 1967 to 1970 brought immense challenge to the
brewery but with its able and dynamic leadership
it emerged from the civil were unscathed. Gulder
as a brand was born immediately after war, 1970.
Its launch was accompanied by expansions in the
existing breweries of Lagos Aba and Kaduna. By
1976 another major brand, this time in the soft
drink category was born. The brand was called
Maltina. Ibadan brewery was commissioned in 1982
to reduce the pressure on the existing breweries
which were stretched to the limits at that time.
Ibadan brewery was the most modern brewery in
107

Africa at the time it was built. This modern
brewery in Africa at the time it was built. This
honour was then passed on to AMA brewery with a
capacity of three million sector liters. AMA was
to produce fifty percent of the company’s total
production.
2.12.3 Brand Portfolio
The company currently has the following products
in its port folio
1. Star beer
2. Gulder beer
3. Gulder Max
4. Heineken beer
5. Legend ale beer
6. Amstel malta
7. Maltina
8. Fayrouz
108

The first two, Star, Gulder are lager beers and
come in 60c1 bottles. Heiniken lager comes in 60c1
bottles and 33c1 bottles. Legend on the other hand
is a dark ale beer that comes in 33c1 bottles.
Maltina is also a soft drink that comes in 33c1
bottles.
2.12.4 Locations
Nigeria breweries have its breweries strategically
distributed in Nigeria. Headquarters is located in
Lagos which also serves as offices for the
directors of the company. The breweries and their
locations are shown in
Table 2.4: Nigeria Breweries Locations
Brewery
Location
Address Installed
Capacity
109
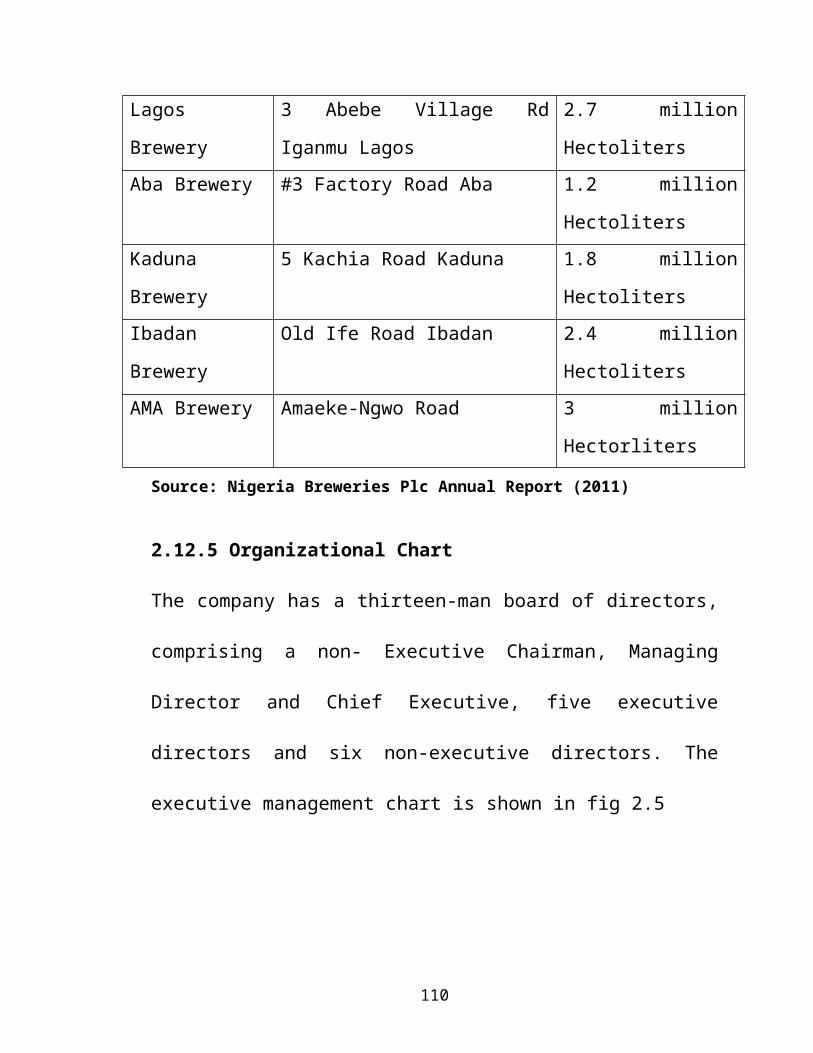
Lagos
Brewery
3 Abebe Village Rd
Iganmu Lagos
2.7 million
HectolitersAba Brewery #3 Factory Road Aba 1.2 million
HectolitersKaduna
Brewery
5 Kachia Road Kaduna 1.8 million
HectolitersIbadan
Brewery
Old Ife Road Ibadan 2.4 million
HectolitersAMA Brewery Amaeke-Ngwo Road 3 million
Hectorliters
Source: Nigeria Breweries Plc Annual Report (2011)
2.12.5 Organizational Chart
The company has a thirteen-man board of directors,
comprising a non- Executive Chairman, Managing
Director and Chief Executive, five executive
directors and six non-executive directors. The
executive management chart is shown in fig 2.5
110

Figure 2.5 Executive Management Chart
Source: Nigeria Breweries Plc Year Book (2011)
Fig 2.6: Organizational Chart of Brewery
Department of NB Plc
Each Brewery location is headed by a Brewery
manager, who reports to the supply chain Director.
The organizational Chart for a Brewery is shown
below in fig 2.6
111
MD/CEO
SalesDirect
Marketing
SupplyChain
Directo
HumanResource
Finance Direc
BreweryManager
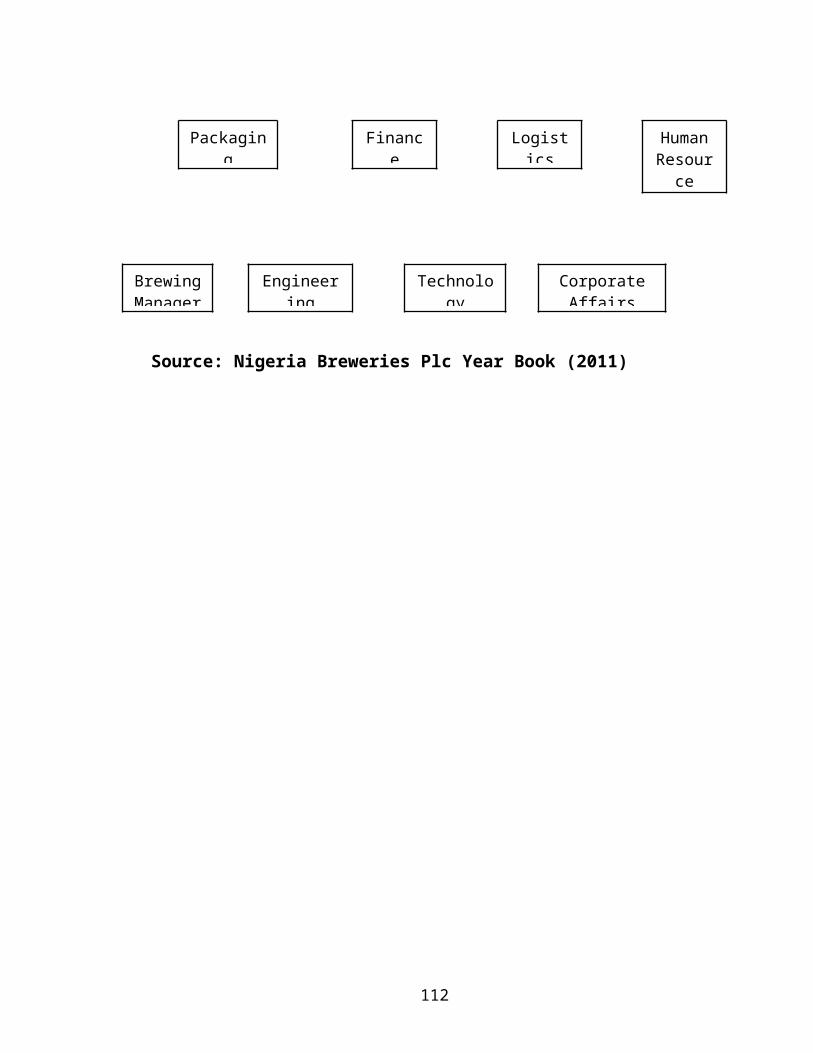
Source: Nigeria Breweries Plc Year Book (2011)
112
Packaging
Finance
Logistics
HumanResource
Brewing Manager
Engineering
Technology
CorporateAffairs

References
Abohimed, B. (2002). Identifying some ManagementApproaches to Applicability of Total QualityManagement, TQM within IndustrialOrganizations, Unpublished Material.
Amaratunga, D.W.; Jones C. and Edwin C. (2012).Research in Behavioural Sciences. New Delhi:Cappa and Debeto Publishers.
Asika, Nnamdi (2012). Research Methodology in theBehavioural Sciences. Lagos: Longman NigeriaPlc.
Benney, H. (2011). ‘’Sustaining qualityimprovement: a study’’, MSc
Thesis, Manchester School of Management, UMISTManchester.
Bergman, B. and Klefsjo, B. (2003). Quality fromCustomer needs Customer satisfaction London: Mc Graw-Hall.
Bradley, K. anmd Hill S. (2010). ‘’After Japan:The Quality Circle
Briggs, R., Palmer, J.and Dale, B.G. (2010).“Quality Improvement Teams: An Examination;proceedings of the Quality and its Application
Conference’’, University of Newcastle Upon-Tyne,September, 101-5.
Carpenter, G. (2002). Customer Relationship MarketingLondon: Chapman and Hall
113

Crosby, P.B. (2009). Quality is free: The art ofMarketing Quality Certain
New York: Penguin Books.
Dahlgaard, J.J., and Kristersen, K. (2003).Fundamentals of Applicability of Total QualityManagement; Process analysis and ImprovementLondon: Champman & Hall.
Dale, B.G. (2002). TQM: An overview. In B. G. Dale (Eds.)Managing quality (3’ ed). Oxford, UK: Blackwell-Business.
Deming, W.E. (2004). Out of Crisis Cambridge:Cambridge University Press.
Deming, W. E. (2003). ‘The new Economic forindustry, Government and Education MIT’’,Centre for Advanced Engineering study, USA.
Deming.org: Internet resource for Deming Award
Denzin, J.B. (2012). Statistical Method inQuantitative research. New York: Dave DickPublishers.
Ebeler, N. (2012). Re-engineering, Maiduguri: BestQuality Press.
Edeh, M. (2003). Tools of change Onitisha: EtikokuPress.
Effiong, B. (2004). Small Scale Enterprises, New York,McGraw Hi;; 1
Books Inc.
114

Feigenbaum, A.V. (2006). Total Quality Control, New York:Prentice Hall
Inc
Garvin, D.A. (2005). Managing Quality; Thestrategic and competitive edge; New York: FreePress.
Gabriel, O. (2004). Cost Information and Management,Aba: Ngwaland
Press
Gozie, F. (2004). Developing Partnerships, Nsukka:Hilltop Publishers.
Hansen, J. (2003). Applicability of Total QualityManagement: Aspects of Implementation andperformance; Unpublished Doctoral Thesis,
Hellsten, U. and Klefsjo B. (2000) “TQM as amanagement systems consisting of valuestechniques and tools” The TQM magazine, Vol.12 No 4)
Igwe, E. (2011). Scatter Diagram and Regression, Aba:Ngwaland
Press.
Internet resource for Macoim Badrige NationalQuality Award (2012), http:/www.quality.Nist.gov/Foundation. ‘Quality Development
procedure’.
Internet resource for European Quality Award(2012), http://www.eoq.org
‘Quality Improvement Techniques’
115

Ishikawa, K. (2003). What is quality control, theJapanese way, New York: Prentice Hall.
Ishikawa, K. (2004). Guide to quality control,Asian Productivity Organization New York:Prentice Hall Inc
Jonah, M. (2003). Strategic Management, Okpu-ala-Ngwa: Calvary
Greetings.
Juran, J.M and Gryna F. M. (2006), Qualityplanning and Analysis, New York: Practice Hall Inc
Nwoye, C. (2005). Information Technology, Enugu: SnaapPress.
Nkwueke, C. (2005). Total Quality Management, Enugu:Smart Link
Publishers.
Nwafor, E. (2011). Teamwork and Competition, Umuahai:Green
House
Nwankwo, J. (2012). Benchmarking, Owerri: VivianPublishers.
Nkem, M. (2011). Inspection- Measurements-Tests, Awka:Press
Freedom.
Nwafor, P. (2004). Service Management and Marketing,Kaduna
116
Heartland Press
Nwaogu, J. (2004). Quality Control Tools, Katrina:Savanna Press.
Oakland, J. S (2006). Applicability of Total QualityManagement, London: Heinemann Butterworth
Ogunjobi, Y. (2007). Sixty years of winning withNigeria: The history of Nigeria Breweries Plc1946 — 2006. Ibadan: University Press
Onwe, O.J. (2010). Elements of Project andDesertification writing: A guide to EffectiveDesertification Report. Lagos: ImpressedPublishers.
Osuala, E. C. (2001). Introduction to Research: AMethodological Approach. Enugu: FourthDimension Publishers.
Peter, A. (2000), Quality Costing, Darussalam:Printing.
Runney, B. (2010). Total Quality Management,Massachusetts:
BlackwellSamuel, K. (2012). TQM An integrated approach,London: MacGraw-Hall
Shiba, D. Graham, A. and Walden, D (2003), A newAmerican TQM: Four
practical Revolutions in Management OregunUSA: Productivity Press Transplant andproduction Efficiency’’, British Journal of IndustrialRelations, 21 (3), 291-311.
117

Udoala, P. (2005). SWOT Analysis, Sokoto: SavannaPress.
Udo, J. (2012). Management, Jos. Plateau PressLtd.
United Nations Industrial Development OrganizationUNIDO:; Vol 1. http://www.inido.org ‘’ Roadmapto Quality’’. Vienna 2007
Zebal, E. J. (2003). Statistics: An Introductionto Beginners. London. Harper and RowPublishers.
118

CHAPTER THREE
RESEARCH DESIGN AND METHODOLOGY
3.1 RESEARCH DESIGN
The design of the study was the survey research
design. As a survey research study, the primary
source of data collection was used through the
administration of questionnaires as well as the
oral interview to elicit the necessary data from
the respondents. The percentage method of data
analysis will also used to analyze the responses
of the respondents. While the hypotheses
formulated in chapter one were tested using the
sample proportion statistics.
119

3.2 POPULATION OF THE STUDY
The population of the study included the
management and staff of Nigerian Breweries Plc, 9th
Mile corner. There are a total of two thousand,
four hundred and forty-six (2,446) including
permanent and casual staff of the company.
3.3 SOURCE OF DATA COLLECTION
The two main sources of data used in this research
study were primary sources and secondary sources.
Primary Sources: The primary sources included the
questionnaire and personal interviews. The
questionnaire contained 27 well structured close
ended questions. The close ended questions
permitted the respondents to choose options which
best suit their opinion to the questions raised.
120

Secondary Sources: This includes data collected
from relevant text books, journals, newspapers,
magazines, published facts and internet.
3.4 SAMPLE SIZE DETERMINATION AND DISTRIBUTION
The sample size is three hundred and forty-three.
It was got from the population using Yameni’s
Statiscal Distribution Formula (1964:57)
N = N 1 + Ne2
Where N = Population
n = Sample Size
e = Allowable Sampling error taken at
5%
2446 = 3431 + 2446 (0.05) (0.05)
We then allocated the sample size to each of the
population stratum, using this formula stated.
121

Senior managers = 27 x 343 = 4
2446 1
Middle managers = 300 x 343 = 42
2446 1
Junior staff = 2119 x 343 = 2972446 1
Total 343
The respondent in each company shall be: managers,
supervisors, factory workers and field workers
(marketers).
3.5 RELIABILITY OF THE STUDY
The questionnaire will be tested for consistency
by using Test and Re-test technique. In this
method, the respondents were given the
questionnaire twice, without their knowledge, in
two separate intervals. Any inconsistent
respondent from the same person to one particular
122

questionnaire is discarded. This method is also
called split half method because it splits the
questionnaire into two batches. Pilot study was
conducted to determine the authenticity of the
research instrument by asking some twenty retired
staff of Ama Breweries whether the study was worth
carrying out. Twelve, representing 60% of success
in the population (p), said it was, with 8
dissenting, representing 40% of population failure
(q).
3.6 VALIDATION OF RESEARCH INSTRUMENT
The questionnaire was given to specialists in Data
Analysis as well as in Measurement and Evaluation
who perused them and made valuable contributions
123

that informed re-writing of many to suit what is
intended.
Finally, the supervisor them before they were
distributed.
3.7 METHOD OF ADMINISTRATION OF RESEARCH INSTRUMENT
A copy of the questionnaire was given to each of
the respondents. They were constructed both
structurally and unstructurally to give variety of
responses to the respondents. In the structured
questionnaire, the respondents are given options
to choose from, while they are not given in the
unstructured one.
Table 3.1: Questionnaire response rateSource: Field Survey, February, 2012
Respondents Distributed
Returned
%Returned
Senior Managers 20 15 75.00Middle Managers 80 65 76.00Junior Staffs 243 220 90.53Total 343 300 87.00124

3.8 AREA OF THE STUDY
The study was carried out at AMA Breweries Plc at
Ninth Mile Corner Enugu the manufacturing site of
the firm. Ninth Mile Corner is in Udi local
government area of Enugu. The position of Ninth
Mile is a high commercial verve center linking the
South East with the Northern part of the country.
3.9 METHOD OF DATA ANALYSIS
The data collected from the study was analyzed
using Percentage Distribution Formula thus:
r x 100n 1
r = number of variable response to each
questionnaire
n = total number of responses to each
questionnaire
125

In testing the hypotheses formulated for the
study, the sample proportion statistics was used:
Ps - ppq n
Ps = proportion of success in the sample
relevant questionnaire
p = proportion of success in the population
from pilot study
= 0.60
Q = 1 – p = proportion of failure in the
population from pilot study
= 0.40
n = observable sample size = number of respondents
to each relevant questionnaire. (See Appendix 11)
DECISION CRITERION
126
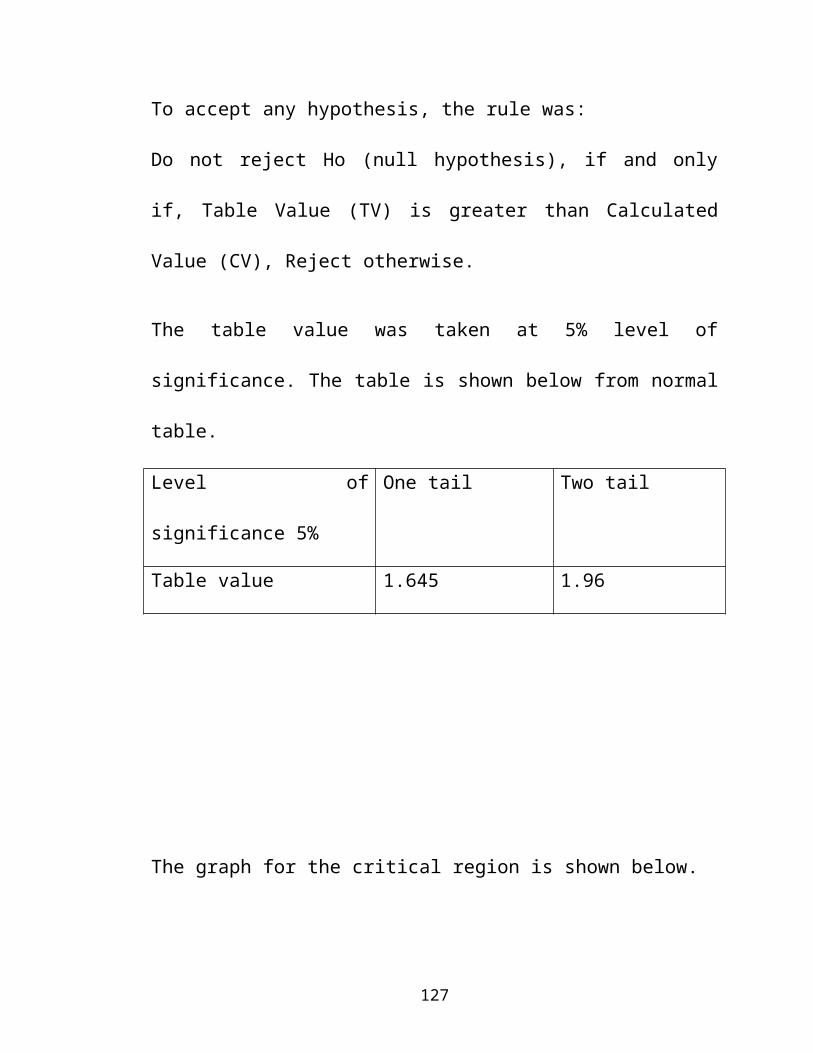
To accept any hypothesis, the rule was:
Do not reject Ho (null hypothesis), if and only
if, Table Value (TV) is greater than Calculated
Value (CV), Reject otherwise.
The table value was taken at 5% level of
significance. The table is shown below from normal
table.
Level of
significance 5%
One tail Two tail
Table value 1.645 1.96
The graph for the critical region is shown below.
127

Do not
Reject HO reject HO
Reject HO
2.5% 2.5%
Questionnaire was distributed to 343 respondents,
out of which 300 returned, representing a response
rate of 87%. The response rate table is given
below.
128
CHAPTER FOUR
PRESENTATION, ANALYSIS AND INTERPRETATION OF DATA
4.1 Introduction
In this chapter, data for this study were analyzed
and presented based on the research questions and
hypotheses that guided the study. Frequency tables
and percentages were used in the presentation.
Each table contains information on the responses
to the research questions. However, the
presentation commenced with the background
information of the respondents.
4.2 Background Information of the Respondents
129

Table 4.1 shows the distribution of length of
service of the respondents in the study area – AMA
Breweries Plc.
Table 4.1 Length of Service of Respondents
Number of years No of
Respondents
Percentage
0 – 5 40 13.336 – 15 178 59.3316 – 25 75 25.00
25 and above 7 2.33Total 300 100.00
Source: Field Study June 2012
Table 4.1 shows that forty (40) respondents
representing 13.3% have served the company between
0 – 5 years, one hundred and seventy eight (178)
respondents representing 59.3% have served the
company between 6 – 15 years, seventy five (75)
respondents representing 25.0% have served the
company between 16 – 25 years, while the balance
130

of seven (7) respondents representing 2.3% have
served the company between 25 and above. The
implication of this is that greater proportion of
the respondents have requisite experience and
knowledge to give a reliable response.
On the other hand, table 4.2 shows the age range
of the respondents:
Table 4.2 Age Range of Respondents
Age Range No of
Respondents
Percentage
0 – 20 50 16.6721 – 29 79 26.3330 – 39 100 33.3340 and above 71 23.67Total 300 100Source: Field Study June 2012
The analysis in table 4.2 shows the age range of
the respondents. One hundred (100) representing
131

33.33% of the respondents are within the age
bracket of 30 – 39years; seventy nine (79)
representing 26.33% of the respondents are within
the age bracket of 21 – 29 years; seventy one (71)
representing 23.67% of the respondents are 40
years and above, while fifty (50) representing
16.67% of the respondents are within the age
bracket of 0 – 20 years. The implication of this
is that greater proportion of the respondents have
requisite knowledge to give a reliable response.
Table 4.3 shows the distributions highest
educational qualifications of respondents in the
study area – AMA Breweries Plc.
Table 4.3 Highest Educational Qualifications of
Respondents
Qualification No of
Respondents
Percentage
132

FSLC 15 5.00O’ LEVEL 90 30.001ST DEGREE 150 50.00HIGHER DEGREE 25 8.33OTHERS 20 6.67Total 300
100.00Source: Field Study June 2012
The analysis from table 4.3 shows that fifteen
(15) representing 5% of the respondents have First
School Leaving Certificate, Ninety (90)
representing 30% have O’ Level. Those with first
Degree or its equivalent were one hundred and
fifty (150) which represent 50% of the
respondents. Twenty five (25) representing 8.33%
of the respondents have other higher degrees,
while the balance of twenty (20) representing
6.67% of the respondents have other qualifications
other than the ones mentioned above. The
133
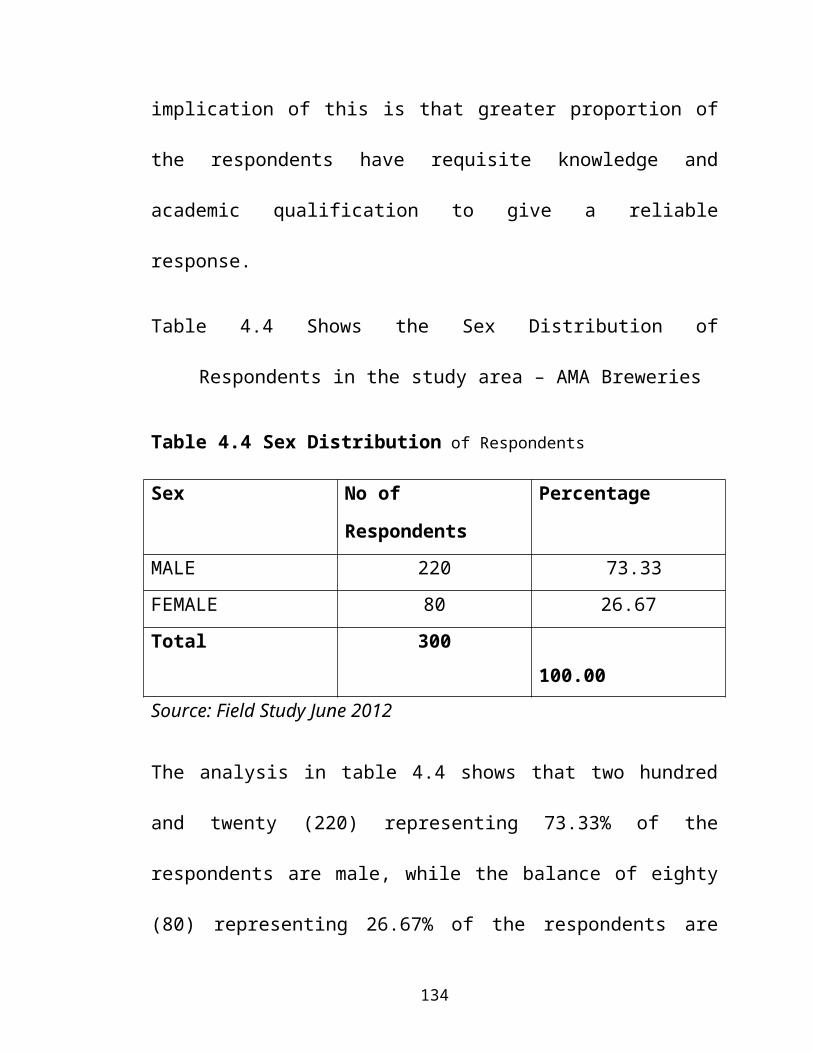
implication of this is that greater proportion of
the respondents have requisite knowledge and
academic qualification to give a reliable
response.
Table 4.4 Shows the Sex Distribution of
Respondents in the study area – AMA Breweries
Table 4.4 Sex Distribution of Respondents
Sex No of
Respondents
Percentage
MALE 220 73.33FEMALE 80 26.67Total 300
100.00Source: Field Study June 2012
The analysis in table 4.4 shows that two hundred
and twenty (220) representing 73.33% of the
respondents are male, while the balance of eighty
(80) representing 26.67% of the respondents are
134

female. The implication of this is that as greater
number of the respondents are male, the result may
be gender biased.
4.3 Nature of Correlation between Policy
Formulation and implementation and TQM in
AMA Breweries.
Table 4.5 shows the distribution of awareness of
TQM of the respondents in the study area – AMA
Breweries Plc.
Table 4.5 Whether the Respondents are Aware of
TQM
Response No of
Respondents
Percentage
YES 180 60.00NO 120 40.00
135
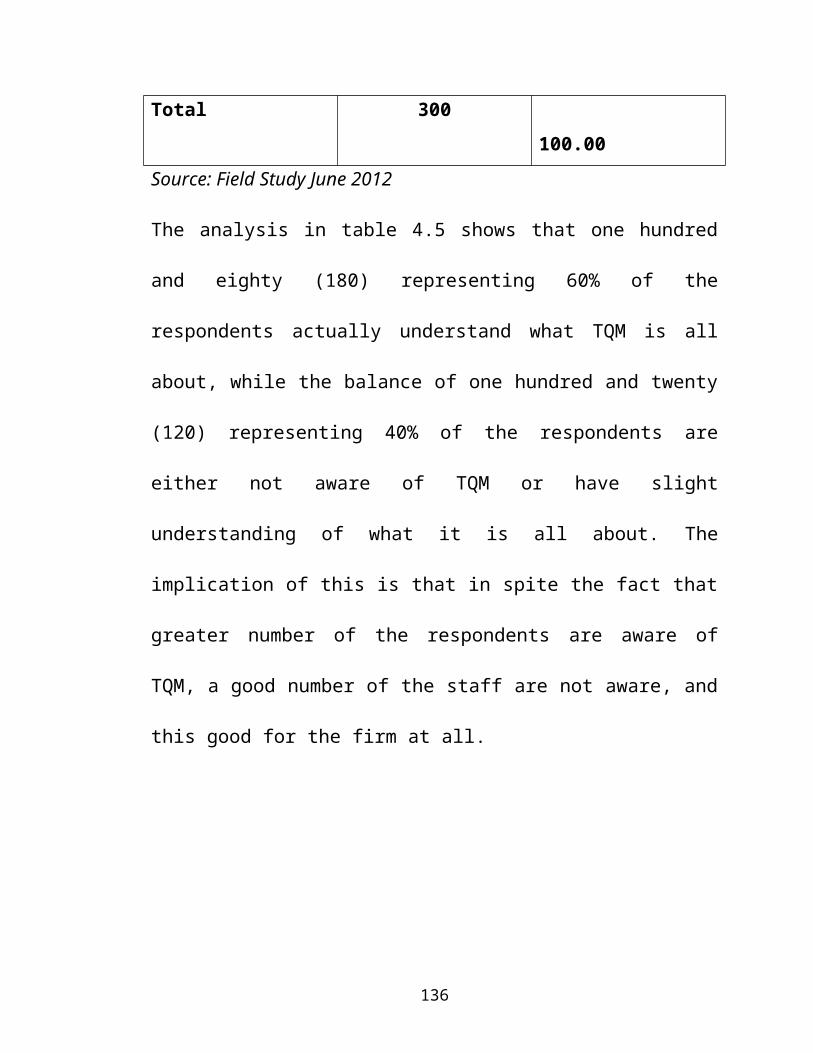
Total 300 100.00
Source: Field Study June 2012
The analysis in table 4.5 shows that one hundred
and eighty (180) representing 60% of the
respondents actually understand what TQM is all
about, while the balance of one hundred and twenty
(120) representing 40% of the respondents are
either not aware of TQM or have slight
understanding of what it is all about. The
implication of this is that in spite the fact that
greater number of the respondents are aware of
TQM, a good number of the staff are not aware, and
this good for the firm at all.
136

Table 4.6 shows the distribution of response to
whether TQM is the concern of every department in
the study area – AMA Breweries Plc.
Table 4.6 Whether TQM Concerns Every Department
Response No of
Respondents
Percentage
QUALITY CONTROL 0 0.00
PRODUCTION 0 0.00
MARKETING 0 0.00
ALL DEPARTMENTS 300 100.00
Total 300
100.00
Source: Field Study June 2012
The analysis in table 4.6 shows that all the
respondents confirmed that there is no special
department that handles TQM, as every department
in the company ensures that TQM is achieved. The
137

implication of this is that TQM is seen as
everybody’s business.
Table 4.7 shows the distribution of how
organizations policies attract TQM in the study
area – AMA Breweries Plc.
Table 4.7 How organization’s policies attract TQM
Response No. of
Respondents
% Response
VERY HIGH 63 21HIGH 44 14.67AVERAGE 40 13.33LOW 27 9
138

VERY LOW 116 38.67NONE 10 3.33Total 300 100
Source: Field Study June 2012
Analysis in table 4.7 shows that sixty three (63)
representing 21% of the respondents rated the
effect the implementation of TQM very high, forty
four (44) representing 14.67% of the respondents
rated it as high, forty (40) representing 13.33%
of the respondents rated it as average, twenty
seven (27) representing 9% of the respondents
rated it as low, one hundred and sixteen rated it
as very low, while the balance of ten (10)
representing 3.33% of the respondents responded
none. The implication of this is that there
significant correlation between formulation and
implementation of TQM at AMA Breweries.
139

Table 4.8 shows the distribution of whether TQM is
everybody’s business in the study area – AMA
Breweries Plc.
Table 4.8 Whether TQM is everybody’s Business in
the firm
Response No of
Respondents
Percentage
SPECIFIC OFFICERS - 0.00EVERY EMPLOYEE - 0.00BOTH 300 100.00Total 300
100.00Source: Field Study June 2012
The analysis in table 4.8 shows that all the
respondents confirmed that the business of TQM is
not left only for special officer saddled with the
responsibility of handling TQM, as everybody in
the company ensures that TQM is achieved. The
140

implication of this is that TQM is seen as
everybody’s business.
Table 4.9 Shows whether TQM Practice in the firm
Change Often
Response No of
Respondents
Percentage
YES 200 66.67NO 40 13.33NOT SURE 60 20.00Total 300
100.00Source: Field Study June 2012
The analysis in table 4.9 shows that two hundred
(200) representing 66.67% of the respondents agree
that TQM practice in the firm changes very often,
forty (40) representing 13.33% disagree, while the
balance of sixty (60) representing 20% of the
respondents were undecided. The implication of
141

this is that majority of the respondents could
actually identify changes in TQM practice in the
firm.
Table 4.10 shows the distribution of whether TQM
practice emphasizes process and quality service
delivery in the study area – AMA Breweries Plc.
Table 4.10 Whether TQM Practice Emphasizes Process
Speed and Quality Service Delivery in the AMA
Breweries.
Response No of
Respondents
Percentage
YES 300 100.00NO - 0.00NOT SURE - 0.00Total 300
100.00Source: Field Study June 2012
142

The analysis in table 4.10 shows that all the
respondents confirmed that TQM practice in the AMA
Breweries emphasizes process speed and quality
service delivery. The implication of this is that
TQM practice in AMA Breweries is comprehensive.
Table 4.11 Analysis How Government Policies Affect
TQM at AMA Breweries Plc.
Rate No of
Respondents
Percentage
GREATLY 200 67.67MODERATELY 90 30.00LITTLE 10 3.33NONE - 0.00Total 300
100.00Source: Field Study June 2012
143
Analysis in table 4.11 shows that two hundred
(200) representing 67.67% of the respondents
believed that government policies affect the
implementation of TQM greatly, ninety (90)
representing 30% of the respondents said
government policies affects it moderate, while the
balance of ten (10) representing 3.33% of the
respondents said it only little effects on it. The
implication of this is that greater percentage of
the staff of AMA Breweries understand the impact
of government policies on TQM practice in the
firm.
4.4 Relationship Between Employee Involvement and
Achievement of TQM Practice in AMA Breweries.
144

Table 4.12 shows how TQM involves a selling Point
for the Products of AMA Breweries.
Response No of
Respondents
Percentage
YES - 100.00NO 300 0.00NOT SURE - 0.00Total 300
100.00Source: Field Study June 2012
The analysis in table 4.12 shows that all the
respondents confirmed that TQM practice in the AMA
Breweries does not involves a selling Point for
the products of AMA Breweries. The implication of
this is that TQM practice in AMA Breweries is
comprehensive.
Table 4.13 shows whether respondents are members
of the TQM Department/Committee of the AMA
Breweries.
145

Response No of
Respondents
Percentage
YES 30 10.00NO 270 90.00Total 300
100.00Source: Field Study June 2012
The analysis in table 4.13 shows that two hundred
and seventy (270) representing 90% of the
respondents are not members/staff TQM
department/committee of the AMA Breweries while
the balance of thirty (30) representing 10% of the
respondents are members/staff TQM
department/committee of the AMA Breweries
emphasizes process speed and quality service
delivery. The implication of this is that TQM
practice in AMA Breweries is comprehensive.
146

Table 4.14 shows whether Employees are allowed to
make input in the Improvement process of TQM
in the AMA Breweries.
Response No of
Respondents
Percentage
YES 300 100.00NO - 0.00NOT SURE - 0.00Total 300
100.00Source: Field Study June 2012
The analysis in table 4.14 shows that all the
respondents confirmed that employees in AMA
Breweries are allowed to make input in the
improvement process of TQM in the organization.
The implication of this is that TQM practice in
AMA Breweries is comprehensive.
147

Table 4.15 Shows how Societal Value and Culture
Affect TQM at AMA Breweries Plc.
Rate No of
Respondents
Percentage
GREATLY 200 67.67MODERATELY 90 30.00LITTLE 10 3.33NONE - 0.00Total 300
100.00Source: Field Study June 2012
The analysis in table 4.15 shows that two hundred
(200) representing 67.67% of the respondents
believed that societal value and culture affect
the implementation of TQM greatly, ninety (90)
representing 30% of the respondents said societal
value and culture affects it moderate, while the
balance of ten (10) representing 3.33% of the
respondents said it only little effects on it. The
148

implication of this is that greater percentage of
the staff of AMA Breweries understand the impact
of societal value and culture on TQM practice in
the firm. Also, the people’s value and culture has
a lot to do with their perception of quality.
Table 4.16 Shows the rate of Application of TQM to
Customer Service and Customer Satisfaction
at AMA Breweries Plc.
Rate No of
Respondents
Percentage
VERY IMPORTANT 200 67.67IMPORTANT 90 30.00AVERAGELY IMPORTANT 10 3.33NOT IMPORTANT - 0.00Total 300
100.00Source: Field Study June 2012
149

The analysis in table 4.16 shows that two hundred
(200) representing 67.67% of the respondents
believed that government policies affect the
implementation of TQM greatly, ninety (90)
representing 30% of the respondents said
government policies affects it moderate, while the
balance of ten (10) representing 3.33% of the
respondents said it only little effects on it. The
implication of this is that greater percentage of
the staff of AMA Breweries understand the impact
of government policies on TQM practice in the
firm.
150

Table 4.17 Shows the relationship between Employee
Involvement and Achievement of TQM Practices in
AMA Breweries
Variable No. of
Respondent
% Response
VERY HIGH 204 68.
00HIGH 33 11.00MODERATE 30 10.00LOW 10 3.33VERY LOW 11 3.67NONE 12 4.00Total 300 100Source: Field Study June 2012
The analysis in table 4.17 shows that two hundred
and seventy (204) representing 68% of the
respondents believed that the relationship between
employee involvement and achievement of TQM
practice in AMA Breweries is very highly, thirty
three (33) representing 11% of the respondents
151

said it is highly, thirty (30) representing 30% of
the respondents said it is moderate. Those who
described it as low, very low and of no effect
were 10, 11 and 12 respectively. The implication
of this is that entire staff understand the
relationship between employee involvement and
achievement of TQM practice in AMA Breweries.
4.5 How Structural Support Techniques Improve
TQM Practice in AMA Breweries.
Table 4.18 Shows the effect of Structural Support
Programme on TQM practice in AMA Breweries
Plc.
Rate No of
Respondents
Percentage
VERY HIGHLY 197 65.67HIGHLY 94 31.33MODERATELY 9 03.00LITTLE - 0.00NONE - 0.00Total 300
152
100.00Source: Field Study June 2012
The analysis in table 4.18 shows that one hundred
and ninety seven (197) representing 65.67% of the
respondents believed that organizational policies
affect the implementation of TQM very highly,
ninety four (94) representing 31.33% of the
respondents rated the effect as highly, while the
balance of thirty (9) representing 3% of the
respondents said it affects it moderately. The
implication of this is that structural support
programmes of the company have significant effect
on TQM practice in AMA Breweries.
153

Table 4.19 Shows the relationship Between
Quality Control and TQM in AMA Breweries
Plc.
Rate No of
Respondents
Percentage
VERY POSITIVE 270 90.00POSITIVE 30 10.00AVERAGE - 0.00LITTLE - 0.00Total 300
100.00Source: Field Study June 2012
The analysis in table 4.19 shows that two hundred
and seventy (270) representing 90% of the
respondents believed that there is very strong
positive relationship between quality control and
TQM, while the balance of thirty (30) representing
10% of the respondents said the relationship is
just positive. The implication of this is that the
154

quality control process of the company has strong
impact on its overall TQM.
Table 4.20 Shows the effect of TQM on
Profitability in AMA Breweries Plc.
Rate No of
Respondents
Percentage
VERY GREAT 250 83.33GREAT 30 10.00AVERAGE 20 6.67LITTLE - 0.00NONE - 0.00Total 300
100.00Source: Field Study June 2012
155

The analysis in table 2.20 shows that two hundred
and fifty (250) representing 83.33% of the
respondents believed TQM has a very great effect
on the company’s profitability, thirty (30)
representing 10% of the respondents said it has a
great effect on profitability, while the balance
of twenty (20) representing 6.67% of the
respondents said its effects is on the average.
The implication of this is that TQM is recognized
as having very significant effect on the
organizations profitability.
Table 4.21 Shows the impact of Public Relation on
TQM at AMA Breweries Plc.
156

Rate No of
Respondents
Percentage
VERY GREAT 270 90.00GREAT 30 10.00MODERATELY - 0.00LITTLE - 0.00NONE - 0.00Total 300
100.00Source: Field Study June 2012
The analysis in table 4.21 shows that two hundred
and seventy (270) representing 90% of the
respondents believed that public relations have
very great impact on TQM, while the balance of
thirty (30) representing 10% of the respondents
said it affects it just great. The implication of
this is that public relations of the company
affect her TQM practice.
157

4.6 How Brainstorming Improve TQM Practice in AMA
Breweries.
Table 4.22 Shows the effects of Brainstorming on
TQM practices in AMA breweries
Variable No. of
Respondents
% Response
Very positive 224 64.06Positive 6
7
22.33
Average
9
3.00
Negative
-
-
None -
158

-Total 300 100Source: Field Study June 2012
The analysis in table 4.22 shows that two hundred
and twenty four (224) representing 64.06% of the
respondents the effect of brainstorming on TQM
very positive, sixty seven (67) representing
22.33% of the respondents rate it as just
positive, while the balance of nine (9)
representing 3% of the respondents rated it as
moderate. The implication of this is that
brainstorming is identified as having significant
positive impact of on TQM in AMA Breweries.
159

Table 4.23 Shows the effect of Departmental
Purpose Assessment on TQM in AMA Breweries
Plc.
Rate No of
Respondents
Percentage
VERY HIGH 240 80.00HIGH 40 13.33ACERAGE 20 6.67LITTLE - 0.00NONE - 0.00Total 300
100.00Source: Field Study June 2012
The analysis in table 4.23 shows that two hundred
and forty (240) representing 80% of the
respondents the effect of departmental purpose
analysis on TQM as very highly, forty (40)
representing 13.33% of the respondents rated it as
high, while the balance of twenty (20)
representing 6.67% of the respondents rated it as
160

average. The implication of this is that
departmental purpose analysis has very positive
effect on TQM in AMA Breweries.
Table 4.24 Shows how Benchmarking affect TQM in
AMA Breweries Plc.
Rate No of
Respondents
Percentage
VERY GREATLY 270 90.00GREATLY 30 10.00MODERATELY - 0.00NEGATIVE - 0.00Total 300
100.00Source: Field Study June 2012
161

The analysis in table 2.24 shows that two hundred
and seventy (270) representing 90% of the
respondents rated the effect of benchmarking on
TQM as very high, while the balance of thirty (30)
representing 10% of the respondents rated it as
just high. The implication of this is that
benchmarking is identified as having strong effect
on TQM.
4.7 Relationship Between Information Communication
Technology and Achievement of TQM Result at
AMA Breweries.
162

Table 4.25 Relationship Between Information
Technology and TQM at AMA Breweries Plc.
Rate No of
Respondents
Percentage
VERY HIGH 206 68.67HIGH 73 24.33AVERAGE 18 6.00LOW 3 1.00VERY LOW - 0.00Total 300
100.00Source: Field Study June 2012
The analysis in table 4.25 shows that two hundred
and six (206) representing 68.67% of the
respondents rated in relationship between
Information Technology and TQM in AMA Breweries as
very high, seventy three (73) representing 24.33%
of the respondents rated it high, eighteen (18)
representing 6% of the respondents rated it as
163

average, while the balance of three (3)
representing 1% of the respondents rated it as
low. The implication of this is that information
technology has significant impact on TQM practice
in AMA Breweries.
Table 4.26 Shows how TQM affect Data Processing
and Analysis at AMA Breweries Plc.
Rate No of
Respondents
Percentage
VERY GREATLY 180 60.00GREATLY 90 30.00AVERAGELY 30 10.00LITTLE - 0.00VERY LITTLE - 0.00Total 300
100.00Source: Field Study June 2012
The analysis in table 2.26 shows that one hundred
and eighty (180) representing 60% of the
164

respondents rated the effect of TQM on data
processing and analysis as very high, ninety (90)
representing 30% of the respondent rated it as
high, while the balance of thirty (30)
representing 10% of the respondents rated it as
average. The implication of this is that TQM has
very significant effect on data processing and
analysis in AMA Breweries.
Table 4.27 Show how Partnering is affected by TQM
at AMA Breweries Plc.
Rate No of
Respondents
Percentage
VERY HIGHLY 240 80.00
165

HIGHLY 60 20.00MODERATELY - 0.00LITTLE - 0.00NONE - 0.00Total 300
100.00Source: Field Study June 2012
The analysis in table shows that two hundred and
forty (240) representing 80% of the respondents
rated the effect of partnering on TQM as very
high, while the balance of sixty (60) representing
20% of the respondents rated it as high. The
implication of this is that TQM has a significant
effect on partnering in AMA Breweries.
166

4.8 Hypotheses Testing
H1: There is positive correlation between policy
formulation and implementation and TQM
This is tested from responses in table 3:
Table 4.28: Correlation between policy formulation
and implementation and TQM
Variable No. of
Respondents
% Response
VERY HIGH 63 21.00HIGH 44 14.67AVERAGE 40 13.33LOW 27 9.00VERY LOW 116 38.67NONE 10 3.33Total 300 100 Source: Field survey, February, 2012
Ps = 63 + 166 = 229 = 0.65
167

300 300
p = 0.60, q = 0.40, n = 300
Z = Ps-p = 0.65-0.60 =2.07
pq 0.60 X 0.40 n
300
Table value = 1.96
Decision
Since 1.96 is not grater than 2.07 H01 is rejected.
This means that there is positive correlation
between policy formulation and implementation and
TQM. (See Appendix 11)
H2: There is significant relationship between
employee involvement and achievement of TQM
practices.
This is tested from responses from table 4:
Table 4: Relationship between employee involvement
and achievement of TQM practices in AMA breweries
168

Variable No. of
Respondent
% Response
VERY HIGH 204 68
.00HIGH 33 11.00MODERATE 30 10.00LOW 10 3.33VERY LOW 11 3.67NONE 12 4.00Total 300 100Source: Field Survey, February, 2012
Ps = 0.6471, P = 0.60, q = 0.40, n = 298
Z = Ps-p = 0.6471-0.60 pq 0.6 x 0.4 n 298
= 1.77
Table value = 1.645
Decision Rule:
Since 1.645 is not greater than 1.77, H02 is
rejected. This means than there is significant
169

relationship between employee involvement and
achievement of TQM practices.
H3: Structural support techniques positively
improve TQM practices.
This is tested from responses in table 5:
Table 5: Effects of structural support techniques on TQMpractices in AMA breweries
Variable No. of
Respondents
% Response
VERY HIGH 19
7
64.37
HIGH
94
31.33
AVERAGE
9
3.00
LOW -
-
NONE -
-
Total 30
0
100
Source: Field Survey, February, 2012
170

Ps = 0.6437,
p = 0.60, q = 0.40, n = 295
Z = Ps-p = 0.6437-0.60pq 0.60 x 0.40n 295
= 1.66
Table value = 1.645
Decision:
Since 1.645 is not greater than 1.66, HO3 is
rejected. This means that Structural support
techniques positively improve TQM practices.
H4: Brainstorming positively improves TQM
practices.
This is tested from responses in table 6:
Table 6: Effects of brainstorming on TQM practices in AMA
breweries
171

Variable No. of
Respondents
% Response
VERY POSITIVE 224 64.06POSITIVE 6
7
22.33
AVERAGE
9
3.00
NEGATIVE
-
-
NONE
-
-
Total 300 100Source: Field Survey, February, 2012
Ps = 0.6406,
P = 0.60, q = 0.40, n = 296
Z = Ps-p = 0.6406 – 0.60pq 0.60 x 0.40n 296
= 1.54
Table value = 1.645
172

Decision:
Since 1.645 is greater than 1.54, HO4 is not
rejected. This means that Brainstorming positively
improves TQM practices.
H5: There is significant relationship between
information communications technology and
achievement of TQM results.
This is tested from responses in table 7:
Table 7: Relationship between information
communications technology and achievement ofTQM results
Variable No. of
Respondents
% Response
VERY HIGH 206 65.33HIGH 73 24.33AVERAGE 18 6.00LOW
3
1.00
VERY LOW -
173

-NONE - -Total 300 100
Source: Field Survey, February, 2012
Ps = 0.6533, p = 0.60, q = 0.40, n = 297
Z = Ps-p = 0.6533 – 0.60pq 0.60 x 0.40n 297
= 2.03
Table value = 1.96
Decision:
Since 1.96 is not greater than 2.03, HO5 is
rejected. This means that there is significant
relationship between information communications
technology and achievement of TQM results.
174

CHAPTER FIVE
SUMMARY OF FINDINGS, CONCLUSION AND
RECOMMANDATIONS
5.1 Summary of Findings
Total quality management is an indispensable
factor in any industrial setting or establishment
if appreciable progress is expected. Hence, Crosby
(2007:64) described it as an important strategic
tool for all levels in an organization. This
175

implies that all levels of the organization,
ranging from policy formulation and implementation
to establishment of different units/departments of
the organization, must be recognized as having
roles to play in total quality management and
progress of the organization. This is in agreement
with the findings of this study that (1) there is
positive correlation between policy formulation
and implementation on one hand and total quality
management on the other hand, and (2) structural
support techniques greatly improves total quality
management practices.
This study also found that there is significant
relationship between employees’ involvement and
brainstorming and achievement of good total
quality management practices. This is in agreement
with the views of Welch and Welch (2011:300), who
176
posited that practical assistance, training,
recognition and participation given to all
employees help to attain quality goals of any
organization.
The recognition and participation are also what
MacPeters (2010:89) meant when he said that
brainstorming offers management the opportunity to
learn from all in their respective fields of
operation to minimize frictions. This exchange or
cross-fertilization of ideas among workers in
brainstorming sessions is usually beneficial to
the company involved. Thus, many learn from each
other, put such valuable ideas into practice and
thus improve the fortunes of the company
positively and reduce frictions among workers.
Minimization of friction also maximizes success,
and this is the secret that guides success in
177

emerging management philosophies (Panyon,
2010:181). This is certain because group
discussions during total quality management
process usually yield many good ideas for
improvement by either eliminating wasteful
activities or improving the quality of output from
each department. Thus, this study discovered that
there was significant relationship between
information communications technology and
achievement of excellent total quality management
results. If this is the same with other
departments of any organization, a success story
must be told about the organization.
5.2 Conclusion
Total Quality Management practices have deep roots
in employees and breweries service delivery. In
178

deed, there are sufficient and strong findings to
believe that Nigerian Breweries Plc – the owner of
AMA breweries, is a quality service driven
company. This finding is indeed good and necessary
information to individuals and corporate
organizations like Nigerian Breweries Plc. Given
the fast changing environment in the company and
other companies, there is no substitute to service
quality practice.
5.3 Recommendations
On the basis of the findings of this research, the
following recommendations are made there from:
(a) The management of Nigerian Breweries Plc and
other similar organizations should create more
awareness of the specific structures that will
support total quality management practices in
Nigerian industries.
179

(b) The policies concerning quality practices
should be documented and published for
employees and other stakeholders for their
education, knowledge and appreciation.
(c) That all employees and department model of TQM
practices should be sustained through the
formal assigning of roles and responsibilities
of total quality operations. Some managers and
structures should be visible and accountable.
(d) Employees’ awareness creation for TQM
practices should be sustained at the tempo of
multiple and complex changes in customers’
needs and expectations.
(e) Employee input in quality improvement should
be encouraged so as to evoke the total
commitment of employees in the operational end
of total service delivery.
180

(f) There should be a clear distinction and
separation between business processes re-
engineering from TQM practices to avoid BPR
swallowing TQM objectives and ambitions.
BIBLIOGRAGHY
Abohhimed Bader (2001), Identifying some Management
Approaches to Total Quality Management, TQM within
Industrial Organizations (Unpublished)
181
Amaratunga, D.W.; Jones C and Edwin C. (2002):
Research in Behavioural Sciences. (New Delhi:
Cappa and Debeto Publishers).
Asika, Nnamdi (2001): Research Methodology in the
Behavioural Sciences. (Lagos: Longman Nigeria
Plc).
Bergman B and Klefsjo B. (2003) Quality from Customer
needs Customer satisfaction (London: McGraw-Hall)
Chase R.B. Aquilano N. J, Jacobs R.F (2001).
Operations Management For Competitive Advantage
9/e (New York: John Wiley)
Crosby P. B. (2005) Quality is free: The art of making
Quality Certain (New York; Prentice-Hall)
Dale, B. G. (2000). TQM : An overview. In B.G. Dale
(Eds.), Managing Quality (3rd Ed.). Oxford, UK:
Blackwell-Business.
Deming W. E.(2003). Out of crisis (Cambridge:
Cambridge University Press)
Deming W.E. (2004) Quality Productivity and
competitive position (Cambridge: Cambridge
University Press)
Deming W. E. (2002). Foundation for management of
Quality in the western world. (New Jersey:
Prentice-Hall)
182

Deming W. E. (2002), The new Economics for industry,
Government, Education (MIT, center for advanced
Engineering study, USA:)
Denzin, J.B. (2000): Statistical Method in
Quantitative Research. (New York: Dave Dick
Publishers).
Feigenbaum, A.V (2001), Total Quality Control (New
York)
Garvin D. A. (2002) Managing Quality; The strategic
and competitive edge;
Hansen J. (2003), Total Quality Management: Aspects of
Implementation and Performance; (Unpublished
Doctoral Thesis,)
Hellsten U. and Klefsjo B. “TQM as a management system
consisting of values techniques and tools” The TQM
magazine, Vol. 12 No 4)
Ho Samuel K, (2001), TQM An integrated approach,
(London: MacGraw- Hill)
Internet resource for Macolm Badridge National Quality
Award: http :/www.quality.nist.gov/Foundation.htm).
Internet resource for Deming Award
http://www.eoq.org , http://www.deming.org:
Internet resource for European Quality Award
http://www.baldrige.com
183
Internet resource for Malcom Baldrige National Quality
Award http://.www.iso.com
Ishikawa K (2003). What is quality control, the
Japanese way (NY: Prentice Hall)
Ishikawa K. (2004). Guide to quality control, Asian
Productivity Organization (NY: Prentice Hall mc)
James, R. Evans and James, W. Dean (2003) Total
Quality Management in Organization 5e (New Jersey:
Prentice-Hall mc)
Juran J. M. and Gryna F. M. (2000): Quality planning
and Analysis, (NY:
MacGraw-Hall mc)
Muo, 1K (2005) Understanding Business communication.
(Lagos: Impressed Publishers)
Morgan, C., & Murgatryd, S. (2007). Total quality
management in the public sector. (Buckingham, UK:
Open University Press)
Poole M & Warner M, (2001) The IEBM Handbook of Human
Resource management, 2/e (London: Thomas Learning)
Oakland J. S (2003) Total quality Management (London:
Open Press)
Okes D, Westcott R. T, (2001) Certified Quality
Manager Handbook, 2/e (Milwaukee, Wisconsin: ASQ
Quality Press)
184

Ogunjobi Y. (2007) Sixty years of winning with
Nigeria: The history of Nigerian Breweries Plc
1946-2006 (Ibadan: University Press)
Onwe, O. J. (2007): Elements of project and
Desertification writing: a guide to Effective
Desertification Report. (Lagos: Impressed
Publishers).
Osuala, E. C. (2002): Introduction to Research: A
methodological Approach. (Enugu: Fourth Dimension
Publishers).
Robbins S. P, (2006) Organizational Behaviour 1l/e
(New Dehli: Prentice
Hall of Indian Private Company).
Shiba, S., Graham, A., AND Walden, D (2000): A New
American TQM:
Four Practical Revolutions in Management (Oregun
USA: Productivity Press)
United Nations Industrial Development Organization
UNIDO: Roadmap to
Quality; Vol. 1 Vienna 2007. http://www.unido.org.
Zebal, E. J. (2003): Statistics: An Introduction to
Beginners. (London. Haper and Row Publishers).
185

APPENDIX ONE
QUESTONNAIRE
INTRODUCTION
Dear Respondent,
A research work is being done on the topic. “The
applicability of Total quality Management in
Nigerian Breweries Industry. A Case Study of Ama
Breweries. TQM, as a technique of efficiency in
the manufacturing sector, is evaluated by the
186

Questionnaires constructed to address the issue
raised. They are for academic documentations only
and not prying unnecessarily into your privacy. So
respond to the best of your knowledge, being rest
assured that any divulged information would be
treated with utmost confidentially.
Yours faithfully,
Name: Ogbodo Veronica Amaka
Reg. No: ESUT/PG/MBA/09/11152
Department: Business Administration
Faculty: Management Sciences
Section B Personal Data
1. How long have you worked in AMA Breweries?
187

a. 0-5 b. 6-15 c.
16-25 d. 25 and above
2. Age bracket less than
a. 20 b. 21 – 29 c. 30
– 39 d. 40 and above
3. Highest education acquired (a) FSLC
(b)O’level
(c) Diploma (d) 1st degree
Others
4. Sex: (a) Male (b) Female:
5. Are you aware of TQM Practice?
A) Yes (B) No
6. If yes, in one above, which department handle
TQM related issues in your organization?
(a) Quality Control Department
(b) Production Department
(c) Marketing Department
188

(d) All Departments handle TQM
Section C: Questionnaire Proper
Please kindly tick in the box, the one that is
appropriate answer to the question.
Research Question One:
What is the nature of positive correlation
between policy formulation and Implementation
and Total Quality management at AMA Breweries?
This is addressed by the following questions:
7. How do organizational policies affect TQM?
(a)Very highly (b)
Highly (c) Moderately
189

(d) Little (e) None
8. In your opinion, is TQM the business of the
following?
(a) Special officers are responsible for TQM
(b) Every employee of the organization
9. Do the TQM practice in your organization
change often?
A) Yes (B) No
10. Do the TQM practice emphasize process speed
and quality service delivery in your
organization?
A) Yes (B) No
11. What impact does Government policies make on
TQM?
(a) Great (b) Moderate
(c) Little (e) None
Research Question Two:
190

How significant is the relationship between
employee involvement and achievement of TQM
practices in AMA Breweries?
This is addressed by the following questions:
12. Is total quality involvement a selling point
for the products of the organization?
A) Yes (B) No
13. Are employees’ members of TQM
department/committee in your organization?
A) Yes (B) No
14. Are employees allowed to make input in the
improvement processes of TQM in your
organization?
A) Yes (B) No
15. How do societal values and culture affect TQM?
Greatly…….. Moderately ….. Little ……
None……
191

16. How do you rate the application of TQM for
customer services and customer satisfaction?
(a) Very important (c) Important
(b) (c) Average important
(d) Not important
Research Question Three:
To what extent do Structural support techniques
positively improve TQM practices at AMA Breweries?
This is addressed by the following questions:
17. How can you access the effect of structural
support programme on TQM practice in AMA
Breweries?
(a) Very High ……... (b) High………..….(c)
Average ……………
(d) Low ………….. (e) None………………….
18. What is the relationship between quality
control and TQM?
192

(a) Very positive ……….(b) Positive ……..… (c)
Average……….
(d). Negative ……. (e) None…….
19. What relationship has TQM on profitability?
(a) Very great………. (b) Great ………..…
(c) Average………….
(d) Little……………. (e)None……………….…
20. What impact does public relations make on
TQM?
(a) Very great ………..… (b) Great..
……...(c) Moderate …….…
(d) Little ………….….. (e) None………….….
Research Question Four:
193

How does Brainstorming positively improve TQM
practices in AMA
Breweries Plc?
This is addressed by the following questions:
21. How would you rate the effect of brainstorming
on TQM?
a) Very Positive ….….. (b) Positive……. …. c)
Average.………. . d) Little ………. . e) None
…………….
22. How would you rate the effect of Departmental
purpose Analysis as tool of TQM?
a) Very High ….….….. (b) High.……. ….. c)
Average.….……. . d) Little ………. . e) None
…………….
23. How does Benchmarking affect TQM?
(a) Very greatly …... (b) Greatly
…….. (c) Averagely ……..
194

(d) Little ……. (e) None………..
Research Question Five:
To what extent is the significant relationship
between information communications technology and
achievement of TQM results at AMA Breweries.
This is addressed by the following questions:
25. What relationship does Information Technology
bear on TQM?
(a) Very high ….. (b) High …... (c)
Average….. (d) Low …….
(e) Very low..
195

26. How does TQM affect data processing and
analysis?
(a) Very greatly….... (b) Greatly ……. (c)
Averagely ……...
(d) Little …... (e) Very little……..
27. How is Partnering affected by TQM?
(a)Very Highly ……….. (b) Highly …...
….. (c) Moderately …….… (d) Little ………..… (e)
None ……………
196