Toxicity characterization of an industrial and a municipal effluent discharging to the marine...
12
Pergamon 0025-326X(94)00242-8 Marine Pollution Bulletin, Vol. 30, No. 8, pp. 524-535, 1995 Elsevier Science Ltd Printed in Great Britain Toxicity Characterization of an Industrial and a Municipal Effluent Discharging to the Marine Environment ROBERT M. BURGESS*T, KAY T. HO*, MARK D. TAGLIABUE*, ANNE KUHN*, RANDY COMELEO~:, PAMELA COMELEO~:, GLEN MODICA~ and GEORGE E. MORRISON* * US Environmental Protection Agency, Environmental Research Laboratory, 27 Tarzwell Drive, Narragansett, R102882, USA ~.Science Applications International Corporation, c/o US Environmental Protection Agency, Environmental Research Laboratory, 27 Tarzwell Drive, Narragansett, R102882, USA tAuthor to whom correspondence should be addressed. Toxicity Identification Evaluation (TIE) methods have proven very useful in characterizing, identifying and confirming toxicants in environmental samples. This report describes the characterization of toxicants present in two effluents, industrial and municipal, dis- charged into the marine environment. A toxicity characterization consists of dividing an effluent sample into several relatively unique chemical fractions. Manipulations used to generate these fractions include aeration, filtration, chelation, oxidant reduction, reverse phase chromatography, and graduated pH adjustments. Marine toxicity tests used include mysids (Mysidopsis bahia), fish (Menidia beryllina and Cyprinodon variegatus) , macroalga ( Champia parvula ) and sea urchins (Arbacia punctulata). Results of this TIE demonstrated that both effluents contained toxicity predominantly due to metals and organic contaminants. Ammonia toxicity in the municipal effluent was sample dependent. This study illustrates that the use of marine toxicity tests, TIE procedures and historical data can be combined to better understand the nature of toxicity discharged to the marine environment. In recent years, the utility of conducting Toxicity Identification Evaluations (TIEs) for determining toxic constituents in environmental samples has been realized. Early discussions of the TIE approach using whole organisms by Parkhurst et al. (1979) and Walsh and Garnas (1983) described step-wise procedures to separate whole sample toxicity into well characterized chemical fractions. Currently, a suite of methods are available for conducting such TIE investigations on freshwater effluents and receiving waters (Gasith et al., 1988; Mount & Anderson-Carnahan, 1988a,b; Burk- hard & Ankley, 1989; Mount, 1989; Norberg-King et al., 1991a, 1992), and sediments (Ankley et al., 524 1992a,b). Reports in the literature detail the success of these, and similar methods for identifying toxicants in municipal effluents (Amato et al., 1992; Ankley & Burkhard, 1992; Burkhard & Jensen, 1993), industrial effluents (Doi & Grothe, 1989; Goodfellow et al., 1989; Schimmel et al., 1989; Jop et al., 1991; Higashi et al., 1992) and receiving waters (Galassi et al., 1988; Norberg-King et al., 1991b). Similarly, the utility of sediment interstitial water TIE methods have been reported (Ankley et alo, 1990a; Schubauer-Berigan & Ankley, 1991; Ankley et al., 1992c). The most common TIE approach, as outlined by Mount and Anderson-Carnahan (1988a), Mount and Anderson-Carnahan (1988b), and Mount (1989), consists of three 'phases' designed to (I) characterize effluent toxicants into specific classes (e.g. metals, non- polar organics, etc.), (II) identify specific toxicants within a characterized toxicant class (e.g. copper, pesticides), and (III) confirm findings of Phases I and II using correlation, spiking studies and other techniques. Phase I (i.e. characterization), the topic of this paper, involves dividing toxic effluent samples into unique chemical fractions. Manipulations used to generate these fractions include aeration to remove volatiles, filtration to eliminate particle-associated toxicants, toxic metals chelation, oxidizing chemical reduction (e.g. chlorine), reverse phase chromatography to separate non-polar organics from samples, and gradu- ated pH adjustment to alter the toxicity of pH dependent toxicants like ammonia. A primary objective of many TIEs is to identify specific toxicants active in an effluent in order for a discharger to comply with a United States National Pollutant Discharge Elimination System (NPDES) permit. These permits define the specific amounts of toxic materials dischargers can release directly into the nation's fresh and marine waters and are determined, in part, based on the toxicity of a given effluent (US EPA,
Transcript of Toxicity characterization of an industrial and a municipal effluent discharging to the marine...

Pergamon 0025-326X(94)00242-8 Marine Pollution Bulletin, Vol. 30, No. 8, pp. 524-535, 1995
Elsevier Science Ltd Printed in Great Britain
Toxicity Characterization of an Industrial and a Municipal Effluent Discharging to the Marine Environment ROBERT M. BURGESS*T, KAY T. HO*, MARK D. TAGLIABUE*, ANNE KUHN*, RANDY COMELEO~:, PAMELA COMELEO~:, GLEN MODICA~ and GEORGE E. MORRISON* * US Environmental Protection Agency, Environmental Research Laboratory, 27 Tarzwell Drive, Narragansett, R102882, USA ~.Science Applications International Corporation, c/o US Environmental Protection Agency, Environmental Research Laboratory, 27 Tarzwell Drive, Narragansett, R102882, USA t A u t h o r to w h o m cor re spondence should be addressed.
Toxicity Identification Evaluation (TIE) methods have proven very useful in characterizing, identifying and confirming toxicants in environmental samples. This report describes the characterization of toxicants present in two effluents, industrial and municipal, dis- charged into the marine environment. A toxicity characterization consists of dividing an effluent sample into several relatively unique chemical fractions. Manipulations used to generate these fractions include aeration, filtration, chelation, oxidant reduction, reverse phase chromatography, and graduated pH adjustments. Marine toxicity tests used include mysids (Mysidopsis bahia), fish (Menidia beryllina and Cyprinodon variegatus ) , macroalga ( Champia parvula ) and sea urchins (Arbacia punctulata). Results of this TIE demonstrated that both effluents contained toxicity predominantly due to metals and organic contaminants. Ammonia toxicity in the municipal effluent was sample dependent. This study illustrates that the use of marine toxicity tests, TIE procedures and historical data can be combined to better understand the nature of toxicity discharged to the marine environment.
In recent years, the utility of conducting Toxicity Identification Evaluations (TIEs) for determining toxic constituents in environmental samples has been realized. Early discussions of the TIE approach using whole organisms by Parkhurst et al. (1979) and Walsh and Garnas (1983) described step-wise procedures to separate whole sample toxicity into well characterized chemical fractions. Currently, a suite of methods are available for conducting such TIE investigations on freshwater effluents and receiving waters (Gasith et al., 1988; Mount & Anderson-Carnahan, 1988a,b; Burk- hard & Ankley, 1989; Mount, 1989; Norberg-King et al., 1991a, 1992), and sediments (Ankley et al.,
524
1992a,b). Reports in the literature detail the success of these, and similar methods for identifying toxicants in municipal effluents (Amato et al., 1992; Ankley & Burkhard, 1992; Burkhard & Jensen, 1993), industrial effluents (Doi & Grothe, 1989; Goodfellow et al., 1989; Schimmel et al., 1989; Jop et al., 1991; Higashi et al., 1992) and receiving waters (Galassi et al., 1988; Norberg-King et al., 1991b). Similarly, the utility of sediment interstitial water TIE methods have been reported (Ankley et alo, 1990a; Schubauer-Berigan & Ankley, 1991; Ankley et al., 1992c).
The most common TIE approach, as outlined by Mount and Anderson-Carnahan (1988a), Mount and Anderson-Carnahan (1988b), and Mount (1989), consists of three 'phases' designed to (I) characterize effluent toxicants into specific classes (e.g. metals, non- polar organics, etc.), (II) identify specific toxicants within a characterized toxicant class (e.g. copper, pesticides), and (III) confirm findings of Phases I and II using correlation, spiking studies and other techniques. Phase I (i.e. characterization), the topic of this paper, involves dividing toxic effluent samples into unique chemical fractions. Manipulations used to generate these fractions include aeration to remove volatiles, filtration to eliminate particle-associated toxicants, toxic metals chelation, oxidizing chemical reduction (e.g. chlorine), reverse phase chromatography to separate non-polar organics from samples, and gradu- ated pH adjustment to alter the toxicity of pH dependent toxicants like ammonia.
A primary objective of many TIEs is to identify specific toxicants active in an effluent in order for a discharger to comply with a United States National Pollutant Discharge Elimination System (NPDES) permit. These permits define the specific amounts of toxic materials dischargers can release directly into the nation's fresh and marine waters and are determined, in part, based on the toxicity of a given effluent (US EPA,

Volume 30/Number 8/August 1995
1991). A limitation to permittees discharging to marine environments has been the lack of specific marine TIE methods for conducting TIEs with marine species. Often dischargers were forced by necessity to perform TIEs on effluents discharged to the marine environment using freshwater TIE methods and a limited selection of marine species (i.e. mysid, Mysidopsis bahia, and fish, Menidia beryllina). This so-called 'surrogate approach' is erroneous because it assumes that freshwater species' sensitivities, to the variety of toxicants present in an effluent, are identical to those of marine species. The truth of this assumption is questionable; for a major proportion of chemicals tested for toxicity, as part of the development of the US EPA's Water Quality Criteria, marine species were shown to have greater sensitivities than freshwater species. Furthermore, application of the 'surrogate approach' results in using freshwater species to predict potential adverse effects in the marine ehvironment. Clearly, protection of the marine environment based on the 'surrogate approach' is remiss and, a need exists to characterize active toxicants in effluents discharged to the marine environ- ment using marine species.
Recently, marine Phase I TIE methods have been developed for several marine species (Burgess et al., 1993). In this study, the toxicity of an industrial and a municipal effluent, both discharged to the marine environment, were characterized using these methods. In these characterizations, five marine NPDES species were used including the macroalga, Champia parvula, the sea urchin, Arbacia punctulata, the mysid, M. bahia, and larval fishes M. beryllina and Cyprinodon varie- gatus. Samples of a treated industrial effluent were collected on 10 occasions between April and November 1991. Similarly, samples of pre- and/or post- chlorinated municipal effluent were collected on 13 occasions between October 1991 and March 1994. This paper details the results of TIE Phase I manipulations (i.e. toxicity characterization) performed on these samples. Some discussion of TIE Phase II (i.e. toxicity identification) concerning the municipal effluent is also presented. The objective of this work was to demonstrate the effectiveness of marine Phase I TIE methods using marine NPDES species.
Materials and Methods
Effluents Effluents were collected from two discharges in the
north-eastern United States. The industrial effluent was from a metals-electroplating plant discharging into a tidal stream. Samples collected for this study had been treated at the plant with coagulants (ferrous sulphate and sodium carbonate) to remove metals from the effluent prior to discharge. Municipal effluent was from a plant in an urban area discharging into a marine embayment. The effluent consists of a mixture of house- hold (i.e. sewage) and industrial wastes, especially wastes from dyeing industries.
Sample collection, storage and preparation Treated industrial effluent was collected by grab.
Municipal effluent samples were either 24-h composites of pre-chlorinated effluent or individual grab samples of pre- and/or post-chlorinated effluents. All samples were placed in plastic Cubitainers TM on ice and returned to the laboratory where they were held at 4°C. In general, toxicity tests were begun within 24 h of collection.
Of the 10 industrial effluent samples collected, five were used for preliminary testing and the later five for TIEs. Of the 13 municipal samples collected, six were used for preliminary toxicity testing purposes and seven samples were used for more extensive TIE and chemical evaluations. All samples had 0-2%0 salinity and were salinity adjusted to 30%0 with hypersaline brine prior to toxicity testing and TIE manipulations. Hypersaline brine and deionized water (DI) were also used to prepare all dilutions (US EPA, 1988).
Toxicity test methods Toxicity test methods used with the industrial
effluent were a hybrid of conventional marine methods (i.e. US EPA, 1988, 1993) and newly developed marine TIE methods described by Burgess et al. (1993). Species tested with the industrial effluent include the red macroalga, C. parvula, reproduction test; the sea urchin, A. punctulata, sperm cell test; the 48 h acute mysid, M. bahia, test; and the 96 h acute larval fishes, M. beryllina and C. variegatus, tests. For the municipal effluent, TIE testing was conducted exclusively using the methods described by Burgess et al. (1993). Toxicity tests included the red macroalga reproduction test, the sea urchin sperm cell test, the 48 h acute mysid test and the 48 h acute larval fish test. Also, a 7 day larval fish survival and growth test with M. beryllina was conducted to assess sublethal effects of the municipal effluent using US EPA (1988) methods.
Toxicity characterization Toxicity characterization was performed using a
design similar to that of Mount & Anderson-Carnahan (1988a). In this design, a series of effluent samples were first tested for magnitude and temporal frequency of toxicity for several months. Following this assessment of effluent toxicity, if justified, toxicity characterization was started. The basic approach for characterization was performance of an initial toxicity test with a given effluent sample followed approximately 24 h later by baseline and TIE manipulations. In general, we con- ducted preliminary or initial toxicity tests within 24 h of sample collection to determine if the sample was toxic and justified conducting a TIE, as well as to determine subsequent test concentrations. Effluents were tested for initial toxicity with all test species except C. parvula. Due to the duration of the algal test (i.e. - 7 days), concentrations for the baseline and manipulations were estimated based on the responses of the other species. Results of the baseline test were compared with the initial test results to l. address toxicity degradation of the effluent sample and 2. to assess alterations in toxicity following TIE manipulations.
All Phase I TIE manipulations used in this study were based on the freshwater TIE methods (Mount &
525
Anderson-Carnahan, 1988a; Norberg-King et al., 1991a) with modifications for marine species and samples (Burgess et al., 1993). For the industrial effluent, five TIE manipulations were used: aeration, filtration, C18 solid phase extraction, chelation and oxidant reduction. The same Phase I TIE manipulations were conducted with the municipal effluent, with the addition of the graduated pH test. Unlike the freshwater TIE methods, all marine TIE manipulations were performed at ambient effluent pHs.
The following section describes the marine TIE manipulations. Aeration was performed using a low capacity pump (e.g. aquaria type) which passed air through a 1 ml borosilicate pipette into an effluent sample for 1 h. For filtration, an effluent sample was vacuum pumped through a glass fibre filter (A/E, 47 mm Gelman Sciences Inc., Ann Arbor, MI). Metal chelation using ethylenediaminetetraacetic acid (EDTA) was performed at three EDTA concentrations with the industrial effluent (83, 42 and 21 mg EDTA 1-1 salinity adjusted effluent) and at one concentration (75 mg EDTA 1-1 salinity adjusted effluent) for the municipal effluent. Similarly, oxidant reduction with sodium thiosulphate (Na2S203) was conducted at three concentrations (58, 29, 15 mg Na2S203 1 -~ salinity adjusted effluent) with the industrial effluent and one concentration (50 mg NazS203 1-1 salinity adjusted effluent) with the municipal effluent. Both EDTA and Na2S203 were added to effluent samples 3 h and 1 h, respectively, before test organisms were added. Solid phase extractions were performed using Water TM Sep- Pak octadecyl (Cls) reverse phase chromatography columns (Milford, MA) at a flowrate of 10 ml rain -l. All columns were activated with HPLC-grade methanol prior to use.
Finally, for the municipal effluent, the graduated pH manipulation was used to determine if effluent toxicity was pH dependent. We adjusted effluent sample pH to 7.0 _+ 0.3 and 9.0 + 0.3 with environmental chambers by altering effluent CO2 equilibrium (Stumm & Morgan, 1981; Mount & Mount, 1992). Ambient (pH 8) treat- ments were maintained under ordinary atmospheric conditions prepared at the same time as the pH 7 and 9 samples. To achieve and maintain pH 7.0, a mixture of 1.5-2.0% CO2 gas and 98% air were mixed and metered into a plexiglass chamber at a flow of approximately 100 ml min-L Similarly, for pH 9, specially prepared air with very low levels of CO2, < 5 ppm (e.g. Zero-Grade s and CO2 Free s , M.G. Industries, Valley Forge, PA), was metered at 150-300 ml rain -~ into a plexiglass chamber. Additionally, for pH 9, effluent samples were adjusted to pH 9.0 with 1 M NaOH prior to being placed into the atmospheric chambers. For both pH 7 and 9, toxicity test exposure chambers containing effluent were placed in the atmospheric chambers approximately 24 h before adding test organisms.
Toxicity identification As noted earlier in the case of the municipal effluent,
preliminary Phase II, toxicity identification (Mount & Anderson-Carnahan, 1988b) work was performed. For
Marine Pollution Bulletin
the 7/14/92 sample, 3 1 of effluent were passed through a preconditioned 5 ml Bond Elut TM C18 cartridge (Varian, Harbor City, CA) at the rate of < 10 ml min-L The cartridge was sequentially eluted with seven solvent mixtures: 50% (v:v% HPLC-grade methanol in de- ionized water), 75, 80, 85, 90, 95, and 100%. The cartridge was eluted with 5 ml of each solvent mixture three times for a total of 15 ml for each solvent mixture. The cartridge was allowed to dry between each aliquot and the 5 ml aliquots of each solvent mixture were combined. Using a N-Evap TM Model No. 111 analytical evaporator (Organomation Associates, South Berlin, MA) (65°C, gentle stream of N2) the 50% fraction was volume reduced to 5 ml, the 75% fraction was reduced to 2 ml and all other fractions were reduced to 1 ml.
Post-C18 fractions were tested for toxicity using the sea urchin, A. punctulata, sperm cell test. Sperm cells were exposed to 2 or 4% concentrations of each fraction representing their tolerance to methanol (Burgess et al., 1993). This resulted in a concentration factor of one for the 50% fraction and six for the other fractions. It should be noted that generally speaking each of the fractionation procedures loses approxim- ately 10% of organic sample constituents.
Post C18 column samples which demonstrated toxicity were further fractionated on a Waters TM 600E HPLC (Bondapak TM C~8 3.9×300 mm) coupled with a Waters TM 700 Satellite WISP injector (Milford, MA). For the 50% and the 75% methanol fractions, 2 ml (four injections at 500 ~tl injection -1) were fractionated. The 50% fraction was eluted by a 16 min linear gradient from 40 to 75% methanol in water at a flow- rate of 1 ml min-L The column was washed with 100% methanol for 3 min then re-equilibrated to 60:40, methanol: water in preparation for the next sample. The 75% fraction was eluted by a 16 min linear gradient from 70 to 85% methanol in water flow-rate of 1 ml min -~. Again, the column was washed with 100% methanol and re-equilibrated to 70: 30, methanol :water in preparation for the next sample. Ten 2 ml fractions were collected. The sea urchin test was also performed on the HPLC fractions at concentrations of either 2 or 4%. These exposures resulted in concentration factors of one for the 50 : 50 fraction and six for the 75:25 and higher methanol concentration fractions.
Chemical analyses Toxic HPLC fractions were analysed using HPLC/
mass spectrometry (MS) at the Finnegan MAT demonstration laboratories in Livingston, New Jersey. Samples were injected into a Waters TM 600LC equipped with a IxBondapak TM C18 3.9X300 mm column (Waters, Milford, MA) which was connected to a Finnegan Model SSQ TM 710 mass spectrometer (MS) (San Jose, CA) via a partcle beam interface. Unknown peaks were identified using the N I S T / E P A / M S D C and Wiley mass spectral databases.
Inorganic analyses of municipal effluent for total metals were performed using Applied Research Laboratories, Inc. Model 3410 inductively coupled plasma atomic emission spectroscopy (ICP) (Valencia,
526

Volume 30 /Number 8 /August 1995
CA). Whole samples (approximately 40 ml) were acidified to pH 2 using 1 M hydrochloric acid (HCI) for at least 48 h before analysis. Ammonia was measured in whole effluent samples using a ion-selective electrode (Orion, Boston).
Statistical analysis All toxicity test exposures were conducted using a
dose-response design except for Ct8 and HPLC fractions which were tested as single samples at the concentrations described earlier. Initial and baseline tests were conducted using the experimental designs described in US EPA (1988, 1993). TIE manipulations were conducted using the marine Phase I TIE experi- mental design (Burgess et al., 1993). This consisted of three treatments and a control with one to two replicates per treatment. Controls for all exposures were a 30%0 solution of hypersaline brine and de- ionized water. For each manipulation blanks/opera- tional controls were used. Except where noted, toxicity test data were summarized as point estimates using trimmed Spearman-Karber for dichotomous data (Hamilton et al., 1977) and the inhibition concentration program (ICp) with quantitative data (Kessler et al., 1989). Point estimates calculated were LCs0s (lethality) and EC~s (sublethal) in units of percent effluent. These values were then transformed to toxic units using the equation: Toxic Units = 100/ECs0 or LCs0.
Results of instrumental organic analyses are single sample replicates. Inorganic analyses are reported as the mean of three replicates +standard deviation, except where indicated.
Results and Discussion
Preliminary toxicity tests Industrial effluent. Preliminary toxicity tests were
conducted approximately weekly and demonstrated consistent toxicity to four of the five marine species. Toxicity tests with the fish C. variegatus always indicated no toxicity (Table 1). Sublethal toxicity to C. parvula was extremely high ranging from > 80 to 240 toxic units (Table 1). Similarly, sublethal toxicity to the sea urchin was high but variable, ranging from 4.7 to > 22 toxic units (Table 1). Toxicity to the mysid, M. bahia, and fish, M. beryllina, was less by comparison but more consistent over the duration of the pre- liminary test series (Table 1). Based on these results, TIEs were performed with the sea urchin, mysid and fish. The first series of TIEs performed with C. parvula were plagued by unacceptable control responses and are not presented.
Municipal effluent. Preliminary toxicity tests with pre-chlorinated effluent, collected 16/10/91, using the four marine species indicated only sublethal toxicity to C. parvula and A. punctulata with < 10 and 1.8 toxic units, respectively (Table 1). Acute tests with M. bahia and M. beryllina resulted in no toxicity. A test of post- chlorinated effluent with A. punctutlata and M. bahia resulted in > 23 and 2.2 toxic units, respectively (Table 1). A second toxicity test with effluent collected 22/10/ 91 using M. beryllina did not elicit any toxicity. A third pre-chlorinated sample collected in February 1992 and tested with C. parvula generated 34 toxic units. Indicating the same pattern observed with prior samples, a pre-chlorinated sample collected 14/4/92 was toxic to all species tested except for the fish, M. beryllina (Table 1). However, the toxicity of this sample demonstrated considerable variability to the sea urchin when retested 7 days later for a TIE (see Table 5). This variability may be due to several alterations to the effluent during storage including toxicant microbial degradation, volatilization, and sorption/desorption on storage container surfaces. Results of a 7-day larval
TABLE 1
Results of preliminary toxicity tests conducted with industrial and municipal effluents with several marine species.
Toxic units (95% confidence limits)
Macroalga Sea urchin Mysid Sample collection Type C. parvula A. punctulata M. bahia
Fish
M. beryllina C variegatus
Industrial 2/4/91 Post-treated > 80 > 22 2.6 (NR) 9/4/91 Post-treated 150 (140-160) 5.0 (4.7-5.2) 3.0 (2.5-3.5) 23/4/91 Post-treated 240 (220-290) 15 (14-15) 3.3 (2.8-3.8) 7 /5/91 Post-treated - 4.7 (4.5-4.8) 3.2 (2.7-3.7) 21/5/91 Post-treated - 13 (13-14) 3.8 (3.1-4.6)
Municipal 16/10/91 Pre-chlorinated < 10 1.8 (1.7-1.9) < 1.4
Post-chlorinated - > 23 2.2 (1.9-2.5) 22/10/91 Pre-chlorinated - - -
Post-chlorinated - - - 11/2/92 Pre-chlorinated 34 (NR) - - 14/4/92 Pre-chlorinated 8,1 (7.2-8.6) 1.7 (1.7-1.7) 2.0 (NR) 13, 15, 17/7/92 Pre-chlorinated - - -
4.7 (4.0-5.6) < 1.4 3.2 (2.8-3.7) < 1.4 4.0 (NR) < 1.4
< 1.4
< 1.4 < 1.4
< 1.4 1.6 (1.4-1.8)* 1.4 (1.4-1.5)~
Note: < 1.4 toxic units indicates effluent is not toxic at highest concentration tested (i.e. 70%). *Toxic units for mortality endpoint from 7-day larval survival and growth test. tToxic units for growth endpoint from 7-day larval survival and growth test. NR: 95% confidence limits are unreliable. -: Not tested.
527

survival and growth test with M. beryllina on samples collected in July 1992 show acute toxicity with 1.6 toxic units and sublethal toxicity with 1.4 toxic units for growth (Table 1). In summary, results of preliminary toxicity tests conducted on samples of municipal effluent demonstrated the macroalga, C. parvula, and the sea urchin, A. punctulata, to be the most sensitive toxicity species to this effluent and so TIEs were conducted with these species.
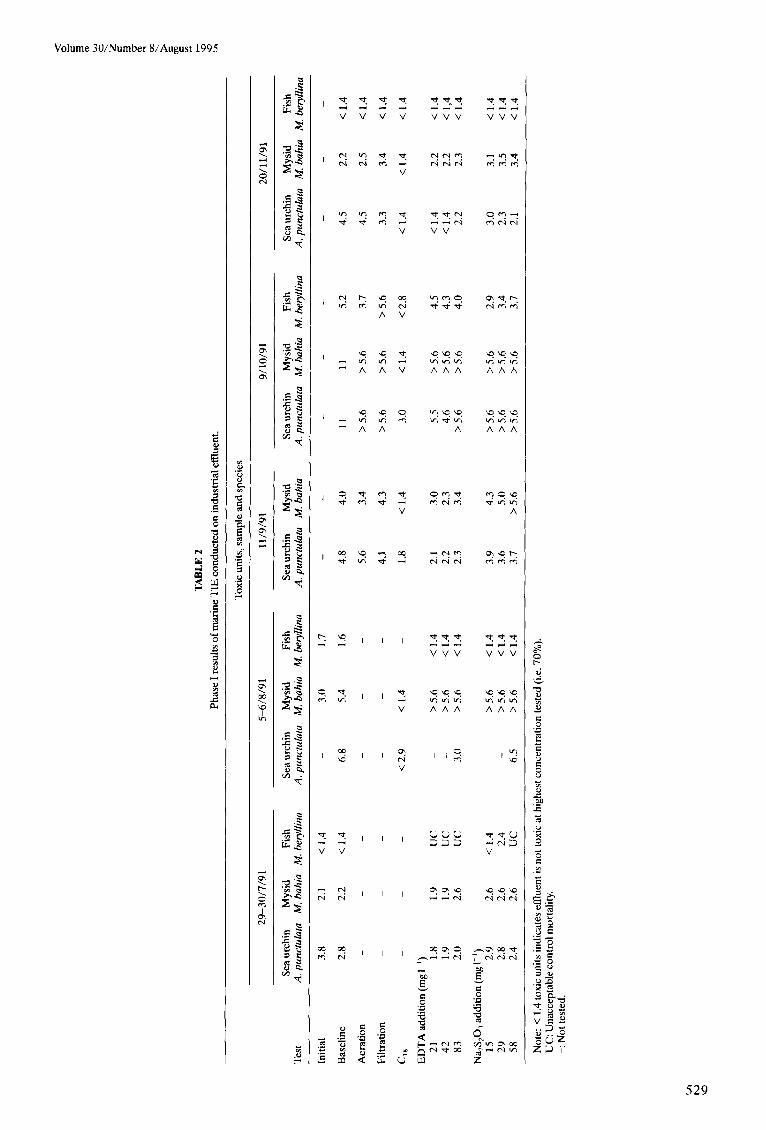
Toxicity characterization Industrial effluent. Phase I TIEs were performed
monthly on the industrial effluent using the three marine species A. punctulata, M. bahia and M. beryllina (Table 2). Of these manipulations the C18 solid phase extraction and EDTA addition tended to have the greatest effects on reducing effluent toxicity to these species. It should be noted that EDTA additions were not always effective at reducing effluent toxicity while the C18 manipulation was always effective. Sodium thio- sulphate and EDTA manipulations performed on the 5/8/91 sample demonstrated greater toxicity to the mysid, with all three concentrations tested (i.e. 15, 29, 58 mg Na2S2031-1 and 21, 42, 83 mg EDTA 1-1), than the unmanipulated sample. Controls for these manip- ulations were acceptable which suggests that the organisms were stressed by the presence of the additive reagents and effluent toxicants in combination more than by the effluent toxicants alone. This anomalous toxicity was not observed elsewhere during this study.
Effectiveness of C~8 solid phase extraction at removing effluent toxicity supports the postulation that non-polar organic toxicants were present. As noted above the effluent tested in this study was 'treated' in the plant. Treatment refers to the addition of coagulants to the effluent stream in order to remove metals. This treatment may explain why EDTA was not always effective in removing toxicity. Plant operators indicated a number of detergents were also added to plant effluent. Solid phase extraction (C18), as used in this TIE, is based on reverse phase chromatography which involves the sorption of non-polar molecules or non- polar functional groups to the C18 media. Detergents often contain surfactants, molecules with both non- polar and polar functionalities, which can be removed from solution by the Cx8 manipulation. The reduction of effluent toxicity by the C18 manipulation suggests that detergents are a probable active class of toxicants in this effluent.
Reinforcing this conclusion are the findings of Ho et al. (1995), who tested the 'untreated' form of this industrial effluent. In that study, the EDTA additions were the only manipulations which reduced effluent toxicity while C18 had no effect. Further, baseline toxicity was much greater than observed with the treated effluent in this study. Untreated effluent elicited 39 toxic units with M. bahia (Ho et al., 1995) compared with about four toxic units with the mysid in this study. Also, Ho et al. (1995) observed that the pH 7 treatment of the graduated pH manipulation demonstrated enhanced toxicity, further supporting the conclusion
528
Marine Pollution Bulletin
that metals were the dominant toxicants present in the untreated effluent (i.e. for some toxic metals, toxicity increases with decreasing pH). Given that this industrial plant performs electroplating, these findings are reasonable and buttress the conclusion of the toxicity characterization, performed in this study, that organic chemical(s) and metal(s) are active toxicants.
Other investigators have described the role of surfactants in effluent toxicity. Ankley and Burkhard (1992) reported the results of a freshwater TIE with a municipal effluent suspected of containing toxic levels of surfactants. They found that the observed toxicity was caused by a combination of chlorine and surfact- ants. In characterizing the effluent toxicity, Ankley and Burkhard (1992) observed aeration, filtration and filtration/C18 reduced toxicity the most effectively. Ankley et al. (1990b) explained the effectiveness of these manipulations at reducing surfactant toxicity as follows: filtration removed suffactants associated with particles, aeration eliminated surfactants by sublation, and filtration/C18 solid phase extracted surfactants from solution through chemical sorption processes. In the current study, we found filtration/Ca8 alone removed the most toxicity with aeration and filtration having little impact. Types of detergents used at this plant were apparently unaffected by physical manipulations (i.e. filtration and aeration). Based on the information provided by the plant operators, the detergents used were predominantly ionic in functionality which may have resulted in reduced sublation and interactions with particles when in seawater. Specifically, concerning particles, this effluent was very clear and contained no observable particles.
Ankley et al. (1990b) and Ankley and Burkhard (1992) also found that toxicity could be eluted from the C18 columns in the 85, 90, 95 and 100% methanol fractions. Similarly, we were able to elute 70% of the observed baseline effluent toxicity from the 100% fraction when tested with the sea urchin.
Following our characterization that detergents may be contributing to effluent toxicity, the plant operators provided us with samples of the detergents used most commonly in plant operations. Results of individual toxicity tests with those detergents are presented in Table 3. For M. bahia, these toxicity values are in the same range reported by Hall et al. (1989) for 17 industrial surfactants tested with the mysid. Plant operators were unable to specify the frequency or quantities of detergents used in a given process so it was not possible to determine from Phase I results and individual detergent LCs0 or ECs0 values which detergents may be causing toxicity. However, based on the toxicity observed in the effluent with the three marine species it is possible to make at least one qualitative correlation to the detergents used. For example, detergent No. 4 was very toxic to M. beryllina and less so to the other two species but the pattern of toxicity observed in the effluent never demonstrates this pattern (Tables 1 and 2) and so this detergent is probably not present. The other four detergents are less easily discriminated from each other for they all show the pattern in toxicity observed in the effluent, with the
TA
BL
E
2
Phas
e I
resu
lts
of m
arin
e T
IE
cond
ucte
d on
ind
ustr
ial
effl
uent
.
Tox
ic
units
, sa
mpl
e an
d sp
ecie
s
29-3
0/7/
91
S-6/
8/91
11
/9/9
1 9/
10/9
1 20
/11/
91
Sea
urch
in
Mys
id
Fish
Se
a ur
chin
M
ysid
Fi
sh
Sea
urch
in
Mys
id
Sea
urch
in
Mys
id
Fish
Se
a ur
chin
M
ysid
Fi
sh
Tes
t A
. pu
nctu
lata
M
. ba
hia
M.
bery
llina
A
. pu
nctu
lata
M
. ba
hia
M.
bety
llina
A
. pu
nctu
lata
M
. ba
hia
A.
punc
tula
ta
M.
bahi
a M
. be
rylli
na
A.
pun&
data
M
. ba
hia
M.
bety
llina
Initi
al
3.8
2.1
Cl.4
3.
0 1.
7 _
_ _
Bas
elin
e 2.
8 2.
2 <
1.4
6.8
5.4
1.6
4.8
4.0
11
11
5.2
4.5
2.2
< 1.
4
Aer
atio
n _
_ 5.
6 3.
4 >
5.6
> 5.
6 3.
7 4.
5 2.
5 <
1.4
Filtr
atio
n _
_ _
_ 4.
1 4.
3 >
5.6
> 5.
6 >
5.6
3.3
3.4
< 1.
4
CI,
_
_ <
2.9
< 1.
4 1.
8 <
1.4
3.0
< 1.
4 <2
.8
< 1.
4 <
1.4
Cl.4
ED
TA
ad
ditio
n (m
g I-
‘)
21
1.8
1.9
UC
_
>5.6
<
1.4
2.1
3.0
5.5
> 5.
6 4.
5 <
1.4
2.2
< 1.
4
42
1.9
1.9
UC
>
5.6
< 1.
4 2.
2 2.
3 4.
6 >
5.6
4.3
< 1.
4 2.
2 <
1,4
83
2.0
2.6
UC
3.
0 >5
.6
< 1.
4 2.
3 3.
4 >
5.6
> 5.
6 4.
0 2.
2 2.
3 <
1.4
Na,
S,O
, ad
ditio
n (m
g I-
‘)
15
2.9
2.6
< 1.
4 _
> 5.
6 <
1.4
3.9
4.3
> 5.
6 >
5.6
2.9
3.0
3.1
< 1.
4 29
2.
8 2.
6 2.
4 >
5.6
< 1.
4 3.
6 5.
0 >
5.6
>5.6
3.
4 2.
3 3.
5 <
1.4
58
2.4
2.6
UC
6.
5 >
5.6
< 1.
4 3.
7 >
5.6
> 5.
6 >
5.6
3.7
2.1
3.4
< 1.
4
Not
e:
< 1.
4 to
xic
units
in
dica
tes
effl
uent
is
not
to
xic
at h
ighe
st
conc
entr
atio
n te
sted
(i
.e.
70%
).
UC
: U
nacc
epta
ble
cont
rol
mor
talit
y.
-: N
ot
test
ed.

TABLE 3
Results of toxicity tests performed with five detergents used to treat industrial effluent.
ECs0 or LCs0* 95% Confidence Detergent Species (ppm) limits
1 Sea urchin A. punctulata 324 301-344 Mysid M. bahia 764 648-883 Fish M. beryllina 515 325-550
2 Sea urchin A. punctulata 827 772-880 Mysid M. bahia > 1000 - Fish M. beryllina > 1000 -
3 Sea urchin A. punctulata 904 803-982 Mysid M. bahia > 1000 - Fish M. beryllina > 1000 -
4 Sea urchin A. punctulata 55.0 54.9- 55.0 Mysid M. bahia 54.0 49.4-55.0 Fish M. beryllina 1.62 0.06-4.00
5 Sea urchin A. punctulata 55.0 54.9-55.0 Mysid M. bahia > 1000 - Fish M. beryllina > 1000 -
*Values estimated using ICp calculation (Kessler et al., 1989).
sea urchin the most sensitive, then the mysid, and the fish the least sensitive (Table 3).
Municipal effluent. A preliminary TIE on pre- chlorinated effluent employing A. punctulata and using EDTA and sodium thiosulphate had no effect on toxicity (Table 4). Conversely, metal chelation and oxidant reduction manipulations performed on the post-chlorinated effluent with A. punctulata resulted in a dramatic decrease in toxic units (Table 4). The most significant reduction in toxicity was attributed to oxidant reduction which returned test results to pre- chlorinated toxicity levels (Table 4). This strongly indicates observed toxicity in post-chlorinated effluent above pre-chlorinated levels was due to chlorination. Ankley and Burkhard (1992) and Burkhard and Jensen (1993) reported similar decreases in toxicity following freshwater TIE oxidant reduction with post-chlorinated effluents which they determined were toxic due, in part, to chlorination.
Marine Pollution Bulletin
TABLE 4
Results of preliminary TIE conducted on municipal effluent collected 16/10/91.
Toxic units, samplesand species
Macroalga Sea urchin Sample/test C. parvula A. punctulata
Pre-chlorinated Baseline < 10 1.8 E D T A addition - 1.5 NazS20 ~ addition - 1.8
Post-chlorinated Baseline - > 23 E D T A addition - > 5.7 Na2S203 addition - 1.8
- : Not tested.
Phase I TIE manipulations were conducted on three pre-chlorinated samples collected 14/4/92, 14/7/92, and 4/8/93 (Table 5) using the macroalga, C. parvula, and sea urchin, A. punctulata. Toxicity of the sample collected 14/4/92 to the sea urchin was quite variable. When preliminarily tested (Table 1) the sample generated 1.7 toxic units. When the sample was retested 1 week later for a TIE it demonstrated < 1.4 toxic units in the initial test and 3.5 in the baseline. This variability is difficult to explain but may involve the behaviour of surface active toxicants which adsorb to the walls of exposure vials and are unavailable to cause toxicity. During the Summer of 1993, three samples of pre- chlorinated effluent were collected. The first of these samples (i.e. 18/6/93) was non-toxic to C. parvula (not presented), results of tests with the second sample, tested 4/8/93, are presented in Table 5, and the third sample was used exclusively for ammonia measure- ments. A final sample collected in March 1994 was used to further examine ammonia toxicity to C. parvula.
Champia parvula demonstrated the greatest sublethal sensitivity to the pre-chlorinated effluent samples with toxicity ranging from 5 to 11 toxic units for baseline tests (Table 5). Conversely, the sea urchin was only
TABLE 5
Phase I TIE conducted on municipal effluent.
Toxic units, sample and species
21, 22 /4 /92 14, 15/7/92 4 /8 /93
Macroalga Sea urchin Macroalga Sea urchin Macroalga Test C. parvula A. punctulata C. parvula A. punctulata C. parvula
Initial - * - 1.9 - Baseline 7.3 3.5 11 1.7 5.0 Aeration 8.1 2.4 6.8 1.7 - Filtration 8.0 1.7 6.5 < 1.4 3.7 C~8 1.7 < 1.4 3.4 < 1.4 < 1.4
E D T A addition 4.8 1.6 4.7 < 1.4 5.0 NazS203 10 2.0 7.1 1.9 6.7 pH 7 7.1 (8.4)t 3.2 (7.3)# 7.4 (8.8)t 1.9 (7.8)t 3.8 (7.2)t pH 8 - - 8.0 (8.5)t - 4.3 (7.7)t p n 9 - 2.8 (8.7)t - 2.0 (8.8)t 4.0 (9.1)t
Note: < 1.4 toxic units indicates the sample was not toxic at highest concentration tested (i.e. 70% effluent). *Toxic units not calculable, 63.5% fertilization at highest effluent concentration. tAverage pH during exposure period. -: Not tested.
530
Volume 30/Number 8/August 1995
marginally sensitive to the effluent samples with about two toxic units on average in initial and baseline tests (Table 5).
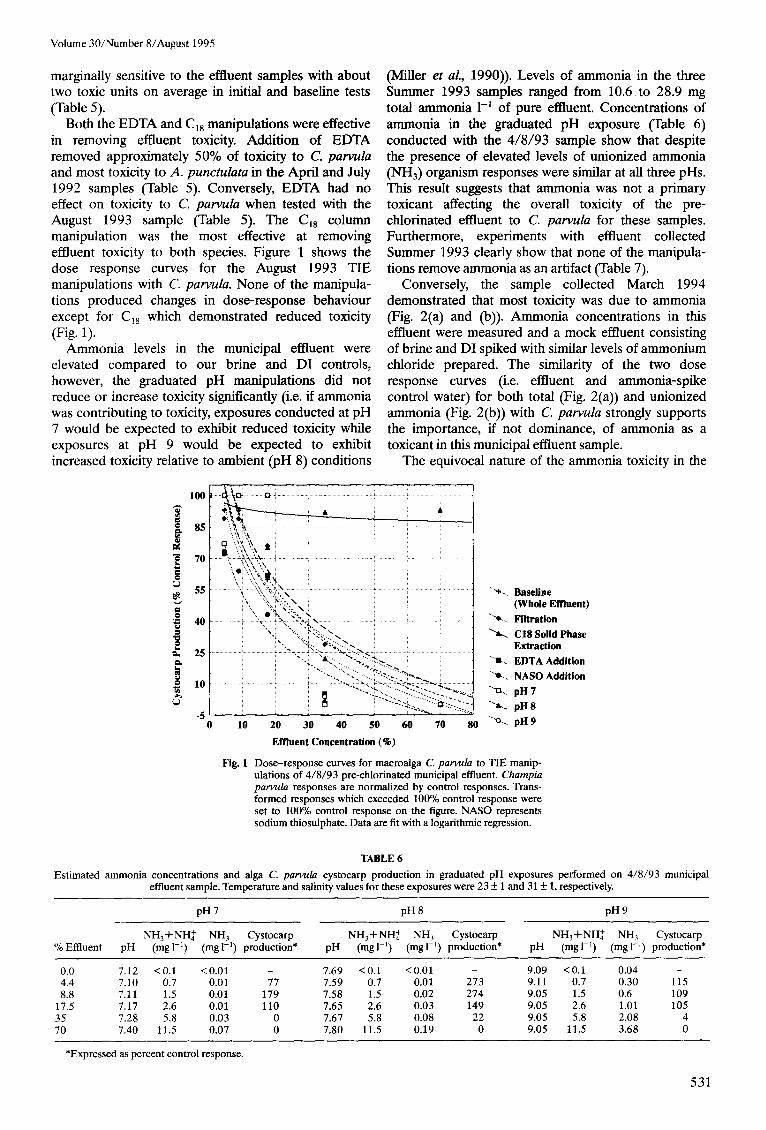
Both the EDTA and C18 manipulations were effective in removing effluent toxicity. Addition of EDTA removed approximately 50% of toxicity to C. parvula and most toxicity to A. punctulata in the April and July 1992 samples (Table 5). Conversely, EDTA had no effect on toxicity to C. parvula when tested with the August 1993 sample (Table 5). The Ct8 column manipulation was the most effective at removing effluent toxicity to both species. Figure 1 shows the dose response curves for the August 1993 TIE manipulations with C. parvula. None of the manipula- tions produced changes in dose-response behaviour except for Ct8 which demonstrated reduced toxicity (Fig. 1).
Ammonia levels in the municipal effluent were elevated compared to our brine and DI controls, however, the graduated pH manipulations did not reduce or increase toxicity significantly (i.e. if ammonia was contributing to toxicity, exposures conducted at pH 7 would be expected to exhibit reduced toxicity while exposures at pH 9 would be expected to exhibit increased toxicity relative to ambient (pH 8) conditions
(Miller et al., 1990)). Levels of ammonia in the three Summer 1993 samples ranged from 10.6 to 28.9 mg total ammonia 1 -~ of pure effluent. Concentrations of ammonia in the graduated pH exposure (Table 6) conducted with the 4/8/93 sample show that despite the presence of elevated levels of unionized ammonia (NH3) organism responses were similar at all three pHs. This result suggests that ammonia was not a primary toxicant affecting the overall toxicity of the pre- chlorinated effluent to C parvula for these samples. Furthermore, experiments with effluent collected Summer 1993 clearly show that none of the manipula- tions remove ammonia as an artifact (Table 7).
Conversely, the sample collected March 1994 demonstrated that most toxicity was due to ammonia (Fig. 2(a) and 09)). Ammonia concentrations in this effluent were measured and a mock effluent consisting of brine and DI spiked with similar levels of ammonium chloride prepared. The similarity of the two dose response curves (i.e. effluent and ammonia-spike control water) for both total (Fig. 2(a)) and unionized ammonia (Fig. 2(b)) with C. parvula strongly supports the importance, if not dominance, of ammonia as a toxicant in this municipal effluent sample.
The equivocal nature of the ammonia toxicity in the
100
85 e s .
~ 7o @
0 '~ 4o []
~, 25
* 10
-5
. . . . ~.~ ~ ............ ........... .................... ....... . . . . . .
cl ~..\,~ " \ -
• .~... ~i~\...~,\ ......... i . . . . . . . . . . . . t
I
t ', '%i ,~.r~ \ /
t ,. ..... ~... ~;....~:,,
. . . . . . . . . . . . . .............. .... ~.=...... ::,.:: .,: ~,..::~.~ ~= . . . . . . . . . . . . . . . . . . . . . . . . : ".~ "~.: .... ~-.,'....~.:..
i " - - , "~',... ""--.. ~",. "~-~ ~",.,..~
10 20 30 40 50 60 70 80
Effluent Concentration (%)
Fig. 1 Dose-response curves for macroalga C parvula to TIE manip- ulations of 4/8/93 pre-chlorinated municipal effluent. Champia parvula responses are normalized by control responses. Trans- formed responses which exceeded 100% control response were set to 100% control response on the figure. NASO represents sodium thiosulphate. Data are fit with a logarithmic regression.
.... ~,..... Baseline (Whole Effluent)
"'~--. Filtration
C18 Solid Phase Extraction
.... i . EDTA Addition
"~-.. NASO Addition
"~.. pH 7
"'A. pH 8
.... o... pH 9
TABLE 6
Estimated ammonia concentrations and alga C. parvula cystocarp production in graduated pH exposures performed on 4/8/93 municipal effluent sample. Temperature and salinity values for these exposures were 23 + 1 and 31 _+ 1, respectively.
pH 7 pH 8 pH 9
NH 3 + NH]- NH3 Cystocarp NH 3 + NH4 + NH 3 Cystocarp NH 3 + NH4 + NH 3 Cystocarp % Effluent pH (rag 1-1) (mg l -l) production* pH (rag 1-1) (mg 1-1) production* pH (rag 1-1) (mg 1-1) production*
0.0 7.12 <0.1 <0.01 - 7.69 <0.1 <0.01 - 9.09 <0.1 0.04 4.4 7.10 0.7 0.01 77 7.59 0.7 0.01 273 9.11 0.7 0.30 115 8.8 7.11 1.5 0.01 179 7.58 1.5 0.02 274 9.05 1.5 0.6 109
17.5 7.17 2.6 0.01 110 7.65 2.6 0.03 149 9.05 2.6 1.01 105 35 7.28 5.8 0.03 0 7.67 5.8 0.08 22 9.05 5.8 2.08 4 70 7.40 11.5 0.07 0 7.80 11.5 0.19 0 9.05 11.5 3.68 0
*Expressed as percent control response.
531

TABLE 7
Concentrations of total ammonia in municipal effluent collected in Summer 1993 before and after TIE manipulations.
Measured total ammonia Sample dilution and manipulation (rag 1-1)
100% 7.4 50% 3.6 25% 1.8 12.5% 0.9 6.3% 0.5 3.1% 0.3 0.0% 0.1 25% post filtration 2.0 25% post E D T A addition 1.9 100% post Cls 7.7 25% post C18 1.9 25% post Na2S2Oa addition 1.9
i • 95
U m,
U ~ kk '
.,. 55 I .................................................
ul
~ 35
~ , | l
~' - 5
e 1 . i ...................... i
0 2 ~
I
!
(a)
. . . . . . . . . . . . . . . . . t
. . . . . . . . . . . . . . . . . . . . . . . . . . . . . . . . . . . . . . . . . . . . . . . . . . . . . . . . . . . . . . . . . . . . . . . . . . . . . . . . . . . . . . . . . . . . . . . . . . . i
. . . . . . . . . . . . . . . . . . . . . . . . . . . . . . . . . . . . . . . . . . . . . . . . . . . . . . . . . . . . . . . . . . . . . . . . . . . . . . . . . . . . . . . . . . . . . . . . . . i
......................................................... 7 t 8 10 12 14
Total Ammonia (rag/L)
(b)
•g9s ................................................................................................................................. i . . . . . . . . . . . . . . . . . . . . . . . . . . . . . . . . . . . . . . . . . . . . . . . . . . . . . . .
- i i \ \" ! i i 55 ............. ::...-4 ............................ .i ............................ ~ ............................ i ............................. i ............................ ~ ............................
= ~ : . ' ~ i i i i i @
[ "'i, i i i i
a_ [ ".., i 1 ~ i [ I " ' , [ [ i I
1 5 - - . ~ . . . . . A . . . . . ~ .................... 7:.:4.:. ................................................................................ , ..........................
~ - i ........... i [ i 1 " ~ * i . . . . . . . .o..i
- 5 ' , , i 1 . 1 ~ . . i . i . " r . . . . . . . .
0 0.2 0.4 0.6 0.8 1 1.2 1.4
Free Ammonia (rag NH3/L)
.... e,... Whole Effluent Ammonia Spiked Control Water
Fig. 2 Response of macroalga C. p a r v u l a to pre-chlorinated municipal effluent Collected 8 /3 /94 and control water spiked with similar levels of (a) total ammonia and (b) unionized ammonia. C h a m p i a p a r v u l a responses are normalized by control responses. Transformed responses which exceeded 100% control response were set to 100% control response on the figure. Data are fit with a logarithmic regression.
Marine Pollution Bulletin
municipal effluent are problematic. Ammonia has been shown to be sublethally toxic to C. parvula at 0.039 mg NH 3 1-1 in laboratory exposures under similar temper- ature, salinity and pH conditions as those used in this study (US EPA, 1989). For comparison, the sea urchin, A. punctulata, is not particularly sensitive to ammonia with an ECs0 of 7.1 mg NH a 1-1 (Bay et al., 1993). Further, ammonia has been identified in TIEs by several workers as a toxicant in municipal and industrial effluents (Schimmel et al., 1989; Jop et al., 1991; Burkhard & Jensen, 1993). In the municipal effluent described here, ammonia toxicity appears to be sample-dependent, that is, in some of the samples we collected ammonia was found to have only minor effects on whole effluent toxicity, while in another sample ammonia was a dominant toxicant. It should be noted that the ammonia speciation model used to calculate the concentration of unionized ammonia (Hampson, 1977) in the municipal effluent was designed for use with natural waters and not processed municipal effluents. It is conceivable that the calculated ammonia concentrations, discussed earlier, are over- estimates because the model does not consider the effects of organic carbon (dissolved and particulate) and complex organic molecule (e.g. dyes) concentra- tions on ammonia behaviour. Similarly, the presence of elevated dissolved organic carbon concentrations may mitigate the toxicity of ammonia. Experiments to address these questions are underway at our laboratory.
Given the observed reduced toxicity in the EDTA manipulations, consideration of metals toxicity in the municipal effluent is also warranted. Total metals analyses conducted on effluent samples (Table 8) show elevated levels (i.e. > 50 pg 1-1) of four of the measured metals: iron, manganese, lead and zinc. Two of these metals (i.e. iron and manganese) occur naturally at high levels and are probably non-toxic to either C. parvula or A. punctulata except at extremely high concentra- tions. Lead is toxic to A. punctulata only at levels exceeding > 1000 ~tg 1 -x (Nacci et al., 1986) but is toxic to C. parvula at approximately 15 pg 1-1 and may contribute to the observed toxicity (Steele & Thursby, 1983). Similarly, zinc may contribute some toxicity to both species, C. parvula and A. punctulata because the ECs0s for zinc are 460 and 121 ~tg 1-1, respectively (Nacci et al., 1986). Given these single chemical toxicity values, C. parvula and A. punctulata responses to municipal effluent may be related to the presence of zinc (96-370 ~tg 1-1) (Table 8). Copper is another metal of concern in this effluent. Total copper concentrations were measured at 16 ttg total copper 1-1 in one sample which is several times greater than the EC50 for C. parvula of 1.4 l~g total copper 1-1 (Morrison et al., 1989).
As mentioned above, the greatest single reduction in toxicity with both species was the C18 solid phase extraction. This manipulation very often completely removed all toxicity to the sea urchin and generally reduced toxicity by over 50% with C. parvula (Table 5). Based on these results, Phase II (i.e. toxicant identifica- tion) efforts were concentrated on toxicants removed from the effluent by the C18 column. Elutions from the
532
Volume 30 /Number 8 /Augus t 1995
TABLE 8
Results of total metal analyses conducted on samples of pre- and post-chlorinated municipal effluent samples.
Metal concentration (ttg 1 -I)
Sample Aluminium Cadmium Copper Chromium Iron Lead Manganese Nickel Silver Zinc
16/10/91 - < 2 < 1 0 < 1 0 260:1:30 54:1:3 530:1:3 < 2 0 270:t:1 1 4 / 4 / 9 2 . . . . . . . . 14/7 /92 <75 < 2 < 1 0 < 1 0 4 4 0 + 1 0 7 5 + 1 0 4 5 0 + 2 < 2 0 < 1 0 3 7 0 ± 1 0 13/10/92 - < 2 1 6 + 2 < 1 0 4 9 0 ± 1 0 < 5 0 4 4 0 ± 5 < 2 0 1 1 0 ± 3
3/8/93* - < 5 < 15 < 17 113 < 70 1350 < 40 < 5 96
*One replicate. -: Not analysed.
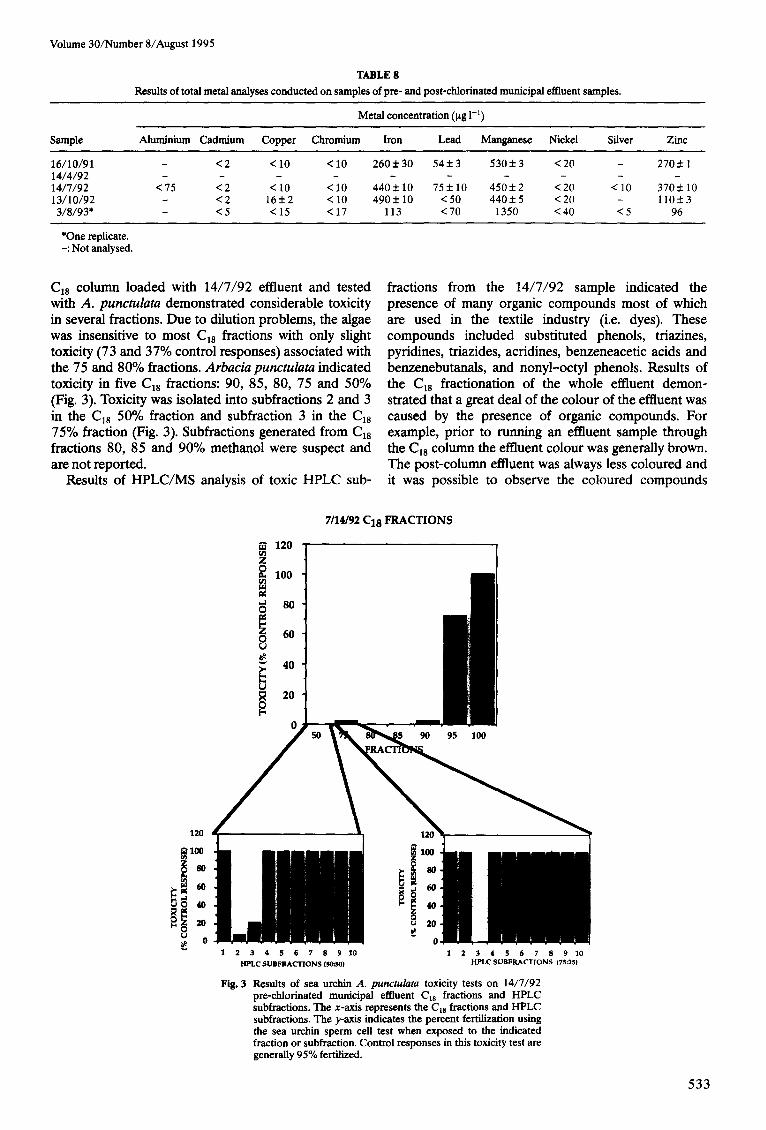
Cls column loaded with 14/7/92 effluent and tested with A. punctulata demonstrated considerable toxicity in several fractions. Due to dilution problems, the algae was insensitive to most Cls fractions with only slight toxicity (73 and 37% control responses) associated with the 75 and 80% fractions. Arbacia punctulata indicated toxicity in five Cla fractions: 90, 85, 80, 75 and 50% (Fig. 3). Toxicity was isolated into subfractions 2 and 3 in the C18 50% fraction and subfraction 3 in the C18 75% fraction (Fig. 3). Subfractions generated from C18 fractions 80, 85 and 90% methanol were suspect and are not reported.
Results of HPLC/2VIS analysis of toxic HPLC sub-
fractions from the 14/7/92 sample indicated the presence of many organic compounds most of which are used in the textile industry (i.e. dyes). These compounds included substituted phenols, triazines, pyridines, triazides, acridines, benzeneacetic acids and benzenebutanals, and nonyl-octyl phenols. Results of the Cls fractionation of the whole effluent demon- strated that a great deal of the colour of the effluent was caused by the presence of organic compounds. For example, prior to running an effluent sample through the Cls column the effluent colour was generally brown. The post-column effluent was always less coloured and it was possible to observe the coloured compounds
120
8O
- 0
1 2 0 rao Z
1 0 0 m ne
.a 80 O
60 8 ~ 4o
o
7 / 1 4 / 9 2 C18 F R A C T I O N S
9 0 9 5 1 0 0
" 110 "I
100 •
~ 20
~ ol , - 1 2 3 4 $ 6 7 8 9 10 1 2 3 4 5 6 7 8 9 10
HPLC SUBFRACTIONS 150:.f*O) HPLC SUBFRACTIONS (75:25)
Fig. 3 Results of sea urchin A. punctulata toxicity tests on 14/7/92 pre-chlorinated municipal effluent C18 fractions and HPLC subfractions. The x-axis represents the Cls fractions and HPLC subfractions. The y-axis indicates the percent fertilization using the sea urchin sperm cell test when exposed to the indicated fraction or subfraction. Control responses in this toxicity test are generally 95% fertilized.
533
accumulate in the column. We were consistently unable to completely remove these coloured compounds from the C18 column. This suggests that some of the remaining, and potentially toxic, compounds were not eluted. Furthermore, for the compounds listed above toxicity values are unavailable and so correlations were not possible.
Summary
Toxicity of an industrial and a municipal effluent was characterized using marine TIEs methods and species. Both effluents demonstrated reduced toxicity when treated with C18 solid phase extraction and EDTA additions. These data together with effluent historical information provide guidance for performance of TIE Phases II and HI studies and remedial activities. For example, toxicity characterizations of both effluents demonstrate that Toxicity Reduction Evaluations (TRE) should include remedial processes that remove metals and organics from effluents. In the case of the municipal effluent, measures should also be considered to reduce ammonia levels. The overall toxic 'behaviour' of the two types of effluents is also notable; the industrial effluent was consistently and predominantly toxic in the organic fraction. Conversely, municipal effluent toxic constituency was variable with time, switching between organics, metals and ammonia. These general toxicity characteristics may relate to sources of pollutants in the effluents. Whereas the industrial effluent had, essentially, a point source, that is, the industrial process, the municipal effluent had several, varying sources of pollutants including house- bold and industrial wastes.
The current study demonstrates that the marine TIE methods are useful tools for characterizing both industrial and municipal effluent toxicity. Further, marine species, in this case the US EPA NPDES species, are shown to be amenable to the conduct of marine TIEs and provide dischargers to the marine environment appropriate tools for characterizing effluent toxicity.
The authors thank the three internal reviewers, James Lake (US EPA), Rick McKinney (US EPA), and Sherry Poucher (Science Applications International Corporation (SAIC), for their insightful comments. The authors appreciate the efforts of our analytical chemistry staff: Rick McKinney and Andrea Helmstetter (SAIC), and Jeff Corbin (Texas Natural Resource Conservation Commission). Also, the industriousness of Edward Boyer (US EPA) is recognized for his construction of our pH chambers. Finally, we thank the staff of the US EPA Environmental Research Laboratory-Duluth for their advice in the conduct of marine TIEs. The described work was supported, in part, under US Environmental Protection Agency contract No. 68-C1- 0005 to Science Applications International Corporation. This report has been reviewed by the US EPA Environmental Research Laboratory, Narragansett, Rhode Island, and approved for publication. Approval does not signify that the contents necessarily reflect the views and policies of the Agency.
Amato, J. R., Mount, D. I., Durhan, E. J., Lukasewycz, M. T., Ankley, G. T. & Robert, E. D. (1992). An example of the identification of Diazinon as a primary toxicant in an effluent. Environ. Toxicol. Chem. 11,209-216.
Ankley, G. T. & Burkhard, L. E (1992). Identification of surfactants as
534
Marine Pollution Bulletin
toxicants in a primary effluent. Environ. Toxicol. Chem. 11, 1235- 1248.
Anldey, G. T., Katko, A. & Arthur, J. W. (1990a). Identification of ammonia as an important sediment-associated toxicant in the lower Fox River and Green Bay, Wisconsin. Environ. Toxicol. Chem. 9, 313-322.
Ankley, G. T., Peterson, G. S., Lukasewycz, M. T. & Jensen, D. A. (1990b). Characteristics of surfactants in toxicity identification evaluations. Chemosphere 21, 3-12.
Ankley, G. T., Schubauer-Berigan, M. K., Dierkes, J. R. & Lukasewycz, M. T. (1992a). Sediment Toxicity Identification Evaluation: Phase I (Characterization), Phase II (Identification) and Phase III (Con- firmation) Modifications of Effluent Procedures (Draft). US EPA Environmental Research Laboratory, Duluth, US EPA Technical Report 08-91. Duluth, MN.
Ankle),, G. T., Lodge, K., Call, D. J., Balcer, M. D., Brooke, L. T., Cook, P. M., Kreis, R. G., Carlson, A. R., Johnson, R. D., Niemi, G. J., Hoke, R. A., West, C. W., Giesy, J. P., Jones, P. D. & Fuying, Z. C. (1992b). Integrated assessment of contaminated sediments in Lower Fox River and Green Bay, Wisconsin. Ecotoxicol. Environ. Safety 23, 46-63.
Anldey, G. T., Schubauer-Berigan, M. K. & Hoke, R. A. (1992c). Use of toxicity identification evaluation techniques to identify dredged material disposal options: a proposed approach. Environ. Manage. 16, 1-6.
Bay, S., Burgess, R. & Nacci, D. (1993) Status and applications of echinoid (Phylum Echinodermata) toxicity test methods. In Environmental Toxicology and Risk Assessment, ASTM STP 1179 (W. G. Landis, J. S. Hughes & M. A. Lewis, eds), pp. 281-302. American Society for Testing and Materials, Philadelphia, PA.
Burgess, R. M., Ho, K. T. & Morrison, G. E. (1993) Marine Toxicity Identification Evaluation Guidance Document: Phase I (Draft). US EPA Environmental Research Laboratory, Narragansett/Office of Research and Development. US EPA Technical Report ERLN No. 1527.
Burkhard, L. E & Ankley, G. T. (1989). Identifying toxicants: NETAC's toxicity based approach. Environ. Sci. Technol. 23, 1438-1443.
Burkhard, L. P. & Jensen, J. J. (1993). Identification of ammonia, chlorine, and Diazinon as toxicants in a municipal effluent. Arch. Environ. Contain. Toxicol. 25,506-515.
Doi, J. & Grothe, D. R. (1989). Use of fractionation and chemical analysis schemes for plant effluent toxicity evaluations. In Aquatic Toxicology and Environmental Fate: Eleventh Volume, ASTM STP 1007 (G. W. Suter II & M. A. Lewis, eds), pp. 123-138. American Society for Testing and Materials, Philadelphia, PA.
Galassi, S., Battaglia, C. & Vigano, L. (1988). A toxicological approach for detecting organic micropollutants in environmental samples. Chemosphere 17,783-787.
Gasith, A., Jop, K. M., Dickson, K. L, Parkerton, E F. & Kaczmarek, S. A. (1988). Protocol for the identification of toxic fractions in industrial wastewater effluents. In Aquatic Toxicology and Hazard Assessment: Tenth Volume, ASTM STP 971 OV. Adams, P. Chapman & W. Landis, eds), pp. 204-215. American Society for Testing and Materials, Philadelphia, PA.
Goodfeliow, W. L., McCulloch, W. L., Boots, J. A., McDearmon, A. G. & Bishop, D. F. (1989). Long-term multispecies toxicity and effluent fractionation study at a municipal wastewater treatment plant. In Aquatic Toxicology and Environmental Fate: Eleventh Volume, ASTM STP 1007 (G. W. Suter II & M. A. Lewis, eds), pp. 139-158. American Society for Testing and Materials, Philadelphia, PA.
Hall, W. S., Patoczka, J. B., Mirenda, R. J., Porter, B. A. & Miller, E. (1989). Acute toxicity of industrial surfactants to Mysidopsis bahia. Arch. Environ. Contain. Toxicol. 18, 765-772.
Hamilton, M. A., Russo, R. C. & Thurston, R. V. (1977). Trimmed Spearman-Karber method for estimating median lethal concentra- tions in toxicity bioassays. Environ. Sci. Technol. 11, 714-719. Correction 12,417 (1978).
Hampson, B. L. (1977). Relationship between total ammonia and free ammonia in terrestrial and ocean waters. J. Cons. Int. Explor. Met 37, 117-122.
Higashi, R. M., Cherr, G. N., Shenker, J. M., Macdonald, J. M. & Crosby, D. G. (1992). A polar high molecular mass constituent of bleached Kraft mill effluent is toxic to marine organisms. Environ. Sci. Technol. 26, 2413-2420.
Ho, K. T., Mitchell, K., Zappala, M. & Burgess, R. M. (1995). Effects of brine addition on effluent toxicity and marine toxicity identification evaluation (TIE) manipulations. Environ. Toxicol. Chem. 14, 245- 249.
Jop, K. M., Kendall, T. Z., Askew, A. M. & Foster, R. B. (1991). Use of fractionation procedures and extensive chemical analysis for toxicity identification of a chemical plant effluent. Environ. Toxicol. Chem. 10, 981-990.
Kessler, F. A., Menkedick, J. R. & Weber, C. I. (1989). The inhibition

Volume 30/Number 8/August 1995
concentration (ICp) method for deriving point estimates of the chronic toxicity of effluents and receiving waters to aquatic organisms (draft). US EPA Technical Report EPA/600/4-89/000. Environmental Monitoring Systems Laboratory, Cincinnati, Cincinnati, OH.
Miller, D. C., Poucher, S., Cardin, J. A. & Hansen, D. J. (1990). The acute and chronic toxicity of ammonia to marine fish and a mysid. Arch. Environ. Contain. Toxicol. 9, 40-48.
Morrison, G. E., Torello, E., Comeleo, R., Walsh, R., Kuhn, A., Burgess, R., Tagliabue, M. & Greene, W. (1989). Intralaboratory precision of saltwater short-term chronic toxicity tests. J. Wat. Pollut. ControlFed. 61, 1707-1710.
Mount, D. I. (1989). Methods for Aquatic Toxicity Identification Evaluations: Phase III Toxicity Confirmation Procedures. US EPA Technical Report EPA/600/3-88/036. Duluth, MN.
Mount, D. 1. & Anderson-Carnahan, L. (1988a). Methods for Aquatic Toxicity Identification Evaluations: Phase I Toxicity Characterization Procedures. US EPA Technical Report EPA/600/ 33-88/034. Duluth, MN.
Mount, D. I. & Anderson-Carnahan, L. (1988b). Methods for Aquatic Toxicity Identification Evaluations: Phase II Toxicity Identification Procedures. US EPA Technical Report EPA/600/3-88/035. Duluth, MN.
Mount, D. R. & Mount, D. I. (1992). A simple method of pH control for static and static-renewal aquatic toxicity tests. Environ. Toxicol. Chem. 11,609-614.
Nacci, D., Jackim, E. & Walsh, R. (1986). Comparative evaluation of three rapid marine toxicity tests: sea urchin early embryo growth test, sea urchin sperm cell toxicity test and Microtox ®. Environ. Toxicol. Chem. 5,521-525.
Norberg-King, T. J., Mount, D. I., Durhan, E., Ankley, G. T., Burkhard, L., Amato, J., Lukasewycz, M. T., Schubauer-Berigan, M. & Anderson-Carnahan, L. (1991a). Methods for Aquatic Toxicity Identification Evaluations: Phase I Toxicity Characterization Procedures (2nd Edn). US EPA Environmental Research Labor- atory, Duluth. US EPA Technical Report EPA/600/6-91/003. Duluth, MN.
Norberg-King, T. J., Durhan, E. J., Ankley, G. T. & Robert, E. D. (1991b). Application of toxicity identification evaluation procedures to the ambient waters of the Colousa basin drain, California. Environ. Toxicol. Chem. 10, 891-900.
Norberg-King, T. J., Mount, D. I., Amato, J. R., Jensen, D. A. & Thompson, J. A. (1992). Toxicity Identification Evaluation:
Characterization of Chronically Toxic Effluents: Phase I. US EPA, Environmental Research Laboratory, Duluth. US EPA Technical Report EPA/600/6-91/005F. Duluth. MN.
Parkhurst, B. R., Gehrs, C. W. & Rubin, I. B. (1979). Value of chemical fractionation for identifying the toxic components of complex aqueous effluents. In Aquatic Toxicology, ASTM STP 667 CL. L. Marking & R. A. Kimerle, eds), pp. 122-130. American Society for Testing and Materials, Philadelphia, PA.
Schimmel, S. C., Thursby, G. B., Heber, M. A. & Chammas, M. J. (1989). Case study of a marine discharge: comparison of effluent and receiving water toxicity. In Aquatic Toxicology and Environmental Fate." Eleventh Volume, ASTM STP 1007 (G. W. Suter II & M. A. Lewis, eds), pp. 159-173. American Society for Testing and Materials, Philadelphia, PA.
Schubauer-Berigan, M. K. & Ankley, G. T. (1991). The contribution of ammonia, metals, and nonpolar organic compounds to the toxicity of sediment interstitial water from an Illinois River tributary. Environ. Toxicol. Chem. 10, 925-939.
Steele, R. L. & Thursby, G. B. (1983). A toxicity test using life stages of Champia parvula (Rhodophyta). In Aquatic Toxicology and Hazard Assessment: Sixth 3~mposium, ASTM STP 802 (W. E. Bishop, R. D. Cardwell & B. B. Heidolph, eds), pp. 73-89. American Society for Testing and Materials, Philadelphia, PA.
Stumm, W. & Morgan, J. J. (1981). Aquatic Chemistry. John Wiley & Sons, NY.
US EPA (1988). Short-Term Methods for Estimating the Chronic Toxicity of Effluents and Receiving Waters to Marine and Estuarine Organisms. US EPA Technical Report EPA/600/4-87-028. Cincin- natti, OH.
US EPA (1989). Ambient Aquatic Life Water Quality Criteria for Ammonia (Salt Water Draft). US EPA Environmental Research Laboratory, Narragansett, RI/Office of Water Technical Report. Washington, DC.
US EPA (1991). Technical Support Document for Water Quality-based Toxics Control. US EPA Technical Report EPA/505/2-90-001. Washington, DC.
US EPA (1993). Methods for Measuring the Acute Toxicity of Effluents and Receiving Waters to Freshwater and Marine Organisms (4th edn). US EPA Technical Report EPA/600/4-90- 027. Cincinnatti, OH.
Walsh, G. E. & Garnas, R. L. (1983). Determination of bioactivity of chemical fractions of liquid wastes using freshwater and saltwater algae and crustaceans. Environ. Sci. Technol. 17, 180-182.
535