Towards the use of Sequential Patterns for Detection and Characterization of Natural and...
11
See discussions, stats, and author profiles for this publication at: https://www.researchgate.net/publication/262261121 Towards the Use of Sequential Patterns for Detection and Characterization of Natural and Agricultural Areas CONFERENCE PAPER in COMMUNICATIONS IN COMPUTER AND INFORMATION SCIENCE · JULY 2014 DOI: 10.1007/978-3-319-08795-5_11 READS 22 5 AUTHORS, INCLUDING: Fabio Guttler University of Strasbourg 13 PUBLICATIONS 10 CITATIONS SEE PROFILE Dino Ienco National Research Institute of Science and … 64 PUBLICATIONS 135 CITATIONS SEE PROFILE Maguelonne Teisseire National Research Institute of Science and … 260 PUBLICATIONS 943 CITATIONS SEE PROFILE Pascal Poncelet Université de Montpellier 255 PUBLICATIONS 1,161 CITATIONS SEE PROFILE Available from: Pascal Poncelet Retrieved on: 14 January 2016
Transcript of Towards the use of Sequential Patterns for Detection and Characterization of Natural and...

Seediscussions,stats,andauthorprofilesforthispublicationat:https://www.researchgate.net/publication/262261121
TowardstheUseofSequentialPatternsforDetectionandCharacterizationofNaturalandAgriculturalAreas
CONFERENCEPAPERinCOMMUNICATIONSINCOMPUTERANDINFORMATIONSCIENCE·JULY2014
DOI:10.1007/978-3-319-08795-5_11
READS
22
5AUTHORS,INCLUDING:
FabioGuttler
UniversityofStrasbourg
13PUBLICATIONS10CITATIONS
SEEPROFILE
DinoIenco
NationalResearchInstituteofScienceand…
64PUBLICATIONS135CITATIONS
SEEPROFILE
MaguelonneTeisseire
NationalResearchInstituteofScienceand…
260PUBLICATIONS943CITATIONS
SEEPROFILE
PascalPoncelet
UniversitédeMontpellier
255PUBLICATIONS1,161CITATIONS
SEEPROFILE
Availablefrom:PascalPoncelet
Retrievedon:14January2016

Towards the Use of Sequential Patterns for
Detection and Characterization of Natural and
Agricultural Areas
Fabio Guttler1, Dino Ienco1, Maguelonne Teisseire1, Jordi Nin2, and PascalPoncelet3
1 IRSTEA, UMR TETIS, Montpellier, France{fabio.guttler,dino.ienco,maguelonne.teisseire}@teledetection.fr
2 Barcelona Supercomputing Center (BSC)Universitat Politecnica de Catalunya (BarcelonaTech), Barcelona, Catalonia, Spain
3 LIRMM, CNRS, Montpellier, [email protected]
Abstract. Nowadays, a huge amount of high resolution satellite imagesare freely available. Such images allow researchers in environmental sci-ences to study the di↵erent natural habitats and farming practices in aremote way. However, satellite images content strongly depends on theseason of the acquisition. Due to the periodicity of natural and agricul-tural dynamics throughout seasons, sequential patterns arise as a newopportunity to model the behaviour of these environments. In this paper,we describe some preliminary results obtained with a new framework forstudying spatiotemporal evolutions over natural and agricultural areasusing k-partite graphs and sequential patterns extracted from segmentedLandsat images.
Keywords: Temporal Patterns, Data Mining and Remote Sensing
1 Introduction
Several regions over the earth are composed of complex landscapes with regardto land cover and land use. Outside urban areas, we commonly observe mo-saics of natural, semi-natural and agricultural areas. In Europe, mapping andmonitoring those areas became a major issue and several procedures have beenestablished for guiding and controlling such tasks. With regard to natural areaswe can cite the Habitats Directive (92/43/EEC) and the associated Natura 2000network of protected sites. In this context, member states must report the con-servation status of the habitats within their territory every six years [5]. Con-cerning agriculture, Land Parcel Identification Systems (LPIS) emerged since1992 (Council Reg. No 3508/1992). LPIS is used as a reference for annual decla-ration by farmers, for administrative and cross-checks, and on the spot controls(including control with remote sensing) [13].

2 F. Guttler, D. Ienco, M. Teisseire, J. Nin and P. Poncelet
The detection of natural and agricultural areas from remote sensing data isa key point for land cover mapping. Image classification is a widespread methodfor mapping land cover. The overall objective is to categorize all pixels in animage into land cover classes [9]. Usually, image classification is based on thedi↵erential spectral response of land surfaces (radiance values recorded at pixellevel). However, most of classifications are based on single image and presentlot of bias in their results, or require extensive ground truth data in order toattempt a high accuracy.
Temporal pattern recognition can furnish complementary information to fea-ture identification. Actually, natural vegetation and agricultural crop presentdistinct evolutions during phenological cycles and growing seasons. In that light,multi-date imagery can enhance the pertinence and the accuracy of land cover de-tection. Time series analysis comprises methods for analysing temporal data [12],several images in our case, in order to extract meaningful statistics and othercharacteristics of the data. Temporal data allows researchers to create a datamodel for analysing past values and forecasting future ones [11]. Specifically, thiswork is focus on natural and agricultural areas modelling over time. Sequentialpattern mining is the part of time series analysis concerned with finding statis-tically relevant patterns between data examples where the values are deliveredin a di↵erent time moments [10].
Optical remote sensing, such as Landsat images are commonly used in envi-ronmental researches. Image processing techniques are usually grouped in Pixelbased analysis or Object based image analysis (OBIA). Several time series pixel-based approaches have been proposed, but OBIA studies rarely uses multi-temporal data [12].
In this paper we combine OBIA with sequential pattern mining to create ak-partite graph to represent natural and agricultural areas. Our approach startssegmenting multi-date satellite images over a same area. From these segmen-tations, a k-partite graph is built considering objects as nodes and represent-ing object image overlap as edges. Later, in order to determine the optimumbounding box of each object and study its dynamics, we propose the creation ofk-partite subgraphs. Finally, subgraphs are supplied to an expert in order to becategorized.
1.1 Paper Organisation
This paper is organised as follows: Firstly, we introduce some concepts aboutoptical remote sensing in Section 2. Section 3 describes k-partite graphs andsequential pattern representation. Our technique to maximise image coverage isintroduced in Section 4. Experimental findings about agricultural and naturalareas are depicted in Section 5. Section 6 concludes and draws future works.
2 Remote Sensing Satellite Images
In general we talk about remote sensing when the acquisition of data is donewithout making any physical contact. This is the case of Earth observation plat-

Title Suppressed Due to Excessive Length 3
forms such as Landsat. The optical sensors onboard Landsat acquires multispec-tral images (composed by multiple bands), each band representing a portion ofthe electro-magnetic spectrum. For this study, we used Landsat Thematic Map-per (TM) images without the thermal band. Remote sensing images are usuallycharacterized by di↵erent resolutions and other technical characteristics, in ourcase they are as follows:
– Spatial resolution. The size of a pixel in a raster image is 30x30 meters.– Spectral resolution. The spectral bands are six: blue, green, red, near
infrared (NIR) and two parts of short wavelength infrared (SWIR-1 and 2).– Radiometric resolution. The sensor is able to distinguish is 256 intensities
of radiation (8 bits).– Swath width. The scene size is a ground square of about 185 x 185 km.
Apart from these parameters another important issue in time-series studies isthe frequency of revisits by the satellite. The revisit time of Landsat is of 16 days,but in practice the number of useful images is lower, mostly due to unsuitablewhether conditions during satellite acquisition. For this study, we selected siximages covering of the same geographic area (the Natura 2000 Lower Aude Valleysite, located in south of France) between February and September 2009.
To avoid errors and misplacement over time, all images were already georef-erenced, as well as radiometrically and atmospherically corrected by CESBIO-CNES [6]. Additional fine spatial positioning corrections were applied in orderto keep the spatial shift between all the time stamps less than one pixel.
2.1 Segmentation
Image segmentation is a fundamental step in OBIA and its consists in mergingpixels into objects clusters [3]. Objects (or segments) are regions generated byone or more criteria of homogeneity in one or more dimensions of a featurespace [4]. The aim of segmentation is to create a new representation of theimage more meaningful and easier to analyse. This approach is similar to humanvisual interpretation of digital images, which works at multiple scales and usescolour, shape, size, texture, pattern and context information [9].
Image segmentation results in a set of objects that collectively cover theentire image without any overlapping. With respect to the homogeneity crite-ria, adjacent objects are expected to be significantly di↵erent between them. Inthis work we use the software eCognition Developer 8.8.1 for image segmentation(multiresolution segmentation algorithm). Only the pixels within the boundariesof the Lower Aude Valley Natura 2000 site (4,842 ha) were used for segmentationand further processing steps. Nine raster layers (radiometric or ’colour’ informa-tion) were used simultaneously for image segmentation. Six of them correspondto the Landsat spectral bands and the other are spectral indices. Spectral in-dices are commonly used in remote sensing as they can be helpful for detectingand characterizing some specific features, like vegetation, soil, water, etc. Weused the Normalized Di↵erence Vegetation Index (NDVI) [8], the Normalized

4 F. Guttler, D. Ienco, M. Teisseire, J. Nin and P. Poncelet
Fig. 1. Segmentation example representing the time stamp of 10 July 2009.
0 5 km Mediterranean Sea
Lower Aude Valley Natura 2000 site
Di↵erence Water Index (NDWI) [7] and the Visible and Shortwave InfraredDrought Index (VSDI) [14]. In order to obtain objects of interest related tonatural and agricultural areas, we conceived a segmentation rule-set composedof 3 main steps:
1. Medium-coarse segmentation to delineate general zones (colour and shapecomponents combined but “color > shape”): about 170-200 objects
2. Very fine segmentation focused on colour component: about 6,000 objects3. Medium-fine segmentation with balanced weights for colour and shape com-
ponents: about 500-600 objects
This process was independently applied for each Landsat image. The lastsegmentation level (3) was then exported from each time-stamp and used asinput for the subsequent processing steps. Figure 1 illustrates the segmentationlayer obtained for the time stamp of 10 July 2009.
3 Sequential Patterns and k-partite Graphs
This section describes the traditional sequential pattern mining problem andhigh-lights the need for a specific way to handle remote sensing temporal infor-mation by using k-partite graphs.
3.1 k-partite Graphs
A k-partite graph is a graph G = (V,E) with vertex set V and edge set E,whose graph vertices V can be partitioned into k disjoint sets Vk so that no twovertices within the same set are adjacent. In this work, we assume that any edgeeij has a weigh equal to wij where i and j correspond to two vertexes vi 2 Vi
and vj 2 Vj in two consecutive sets (layers).
Title Suppressed Due to Excessive Length 5
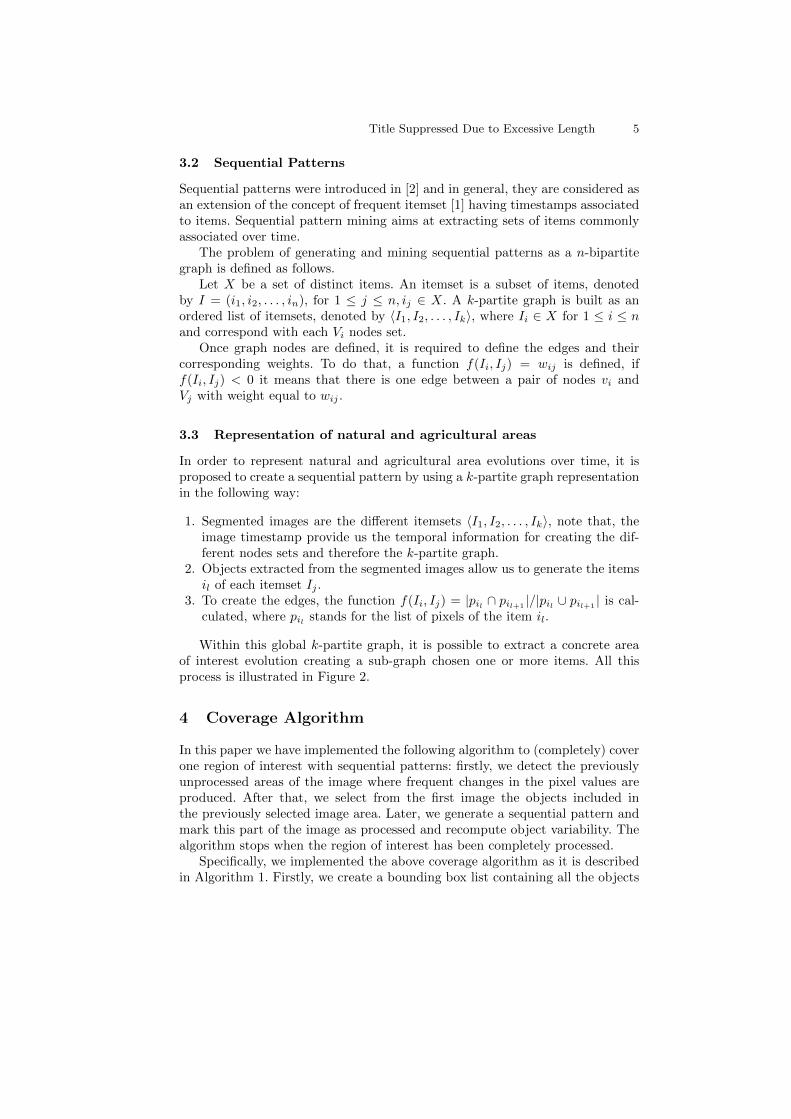
3.2 Sequential Patterns
Sequential patterns were introduced in [2] and in general, they are considered asan extension of the concept of frequent itemset [1] having timestamps associatedto items. Sequential pattern mining aims at extracting sets of items commonlyassociated over time.
The problem of generating and mining sequential patterns as a n-bipartitegraph is defined as follows.
Let X be a set of distinct items. An itemset is a subset of items, denotedby I = (i1, i2, . . . , in), for 1 j n, ij 2 X. A k-partite graph is built as anordered list of itemsets, denoted by hI1, I2, . . . , Iki, where Ii 2 X for 1 i nand correspond with each Vi nodes set.
Once graph nodes are defined, it is required to define the edges and theircorresponding weights. To do that, a function f(Ii, Ij) = wij is defined, iff(Ii, Ij) < 0 it means that there is one edge between a pair of nodes vi andVj with weight equal to wij .
3.3 Representation of natural and agricultural areas
In order to represent natural and agricultural area evolutions over time, it isproposed to create a sequential pattern by using a k-partite graph representationin the following way:
1. Segmented images are the di↵erent itemsets hI1, I2, . . . , Iki, note that, theimage timestamp provide us the temporal information for creating the dif-ferent nodes sets and therefore the k-partite graph.
2. Objects extracted from the segmented images allow us to generate the itemsil of each itemset Ij .
3. To create the edges, the function f(Ii, Ij) = |pil
\ pil+1
|/|pil
[ pil+1
| is cal-culated, where pi
l
stands for the list of pixels of the item il.
Within this global k-partite graph, it is possible to extract a concrete areaof interest evolution creating a sub-graph chosen one or more items. All thisprocess is illustrated in Figure 2.
4 Coverage Algorithm
In this paper we have implemented the following algorithm to (completely) coverone region of interest with sequential patterns: firstly, we detect the previouslyunprocessed areas of the image where frequent changes in the pixel values areproduced. After that, we select from the first image the objects included inthe previously selected image area. Later, we generate a sequential pattern andmark this part of the image as processed and recompute object variability. Thealgorithm stops when the region of interest has been completely processed.
Specifically, we implemented the above coverage algorithm as it is describedin Algorithm 1. Firstly, we create a bounding box list containing all the objects

6 F. Guttler, D. Ienco, M. Teisseire, J. Nin and P. Poncelet
Fig. 2. Overall Sequential Patterns Extraction Process.
Preprocessing – data
standardization (spatial subset,
positioning correction, spectral
indexes, …)
Segmentation and object features
calculation (same rule-set of multiresolution
segmentation by temporal layer)
Bounding box selection
(a set of objects is selected to
constraint the spatial extent of the
graphs)
Subgraphs and patterns
(objects are converted into
nodes of graphs)
T0
T1
Tn
…
Algorithm 1: BoundingBox SelectionData: g: main graph
Result: p: patterns list
1 begin
2 bbList = new BBList;
3 foreach layer l 2 g do
4 foreach node n 2 l do
5 bb = new bb(n, l, importance(n));
6 bbList = bbList [ bb;
7 while !empty(bbList) do
/* 1. Find the corresponding objects in Layer 0 for the most important bounding box */
8 box = bbList.MostImportant();
9 n0 = g.getNodesByBB(0, box);
/* 2. Create the pattern for the selected object with the selected bounding box computing the overlap always
with the selected nodes in Layer 0 */
10 p = p [ newPattern(n0, box);
/* 3. Remove all the objects contained in the patterns from the importance of the BB */
11 bbList.updateImportance(p);
of all the images (lines 2-5), at the same time, we compute the variability ofeach bounding box (object). Bounding box importance is the amount of otherobjects overlapping with at least one pixel with the current bounding box, thiscomputation is described in Algorithm 2.
Once the bounding box list is created, all objects are ranked with regardstheir importance. The importance of a bounding box corresponds with the num-ber of objects in any layer overlapping with at least one pixel with the boundingbox. After that, the most important bounding box is selected (line 7) and re-cover the objects overlapping with such bounding box in the first image (line 8).Then, a new pattern is generated as it is described in Section 3.2 (line 9). Afterthat, we update bounding boxes importance, subtracting the processed objectsfrom the importance of each bounding box, if bounding box importance is equalto 0, it is removed from the list (Algorithm 3). This loop is repeated until thebounding box list is empty.

Title Suppressed Due to Excessive Length 7
Algorithm 2: ImportanceData: g: main graph, b:bounding box
Result: i: importance
1 begin
2 i = 0;
3 foreach layer l 2 g do
4 foreach node n 2 l do
/* if one pixel of node n overlaps
with g */
5 if n.overlap(b) then
6 i + +;
Algorithm 3: updateImportanceData: p: pattern
Result: bb:bounding box list
1 begin
2 foreach boundingBox b 2 bb do
3 foreach layer l 2 p do
4 foreach node n 2 l do
/* if one pixel of node n
overlaps with b */
5 if n.overlap(b) then
6 b.i � �;
7 if b.i == 0) then
8 bb.remove(b);
Figure 3 shows the obtained coverage within the perimeter of our study area.Each polygon represents the spatial extent of a specific bounding box, whatmeans that the associated pattern has a bigger spatial coverage taking intoaccount all temporal layers. Polygon color indicates from which time stamp thebounding box was extracted (as assigned on the legend). In total 331 boundingbox were selected (about 50 - 60 per timestamp), it corresponds to an overallcoverage of 93.56% of the study area.
Fig. 3. Obtained spatial coverage.
0 5 km Mediterranean Sea
Selected bounding box Colour represents time stamp as follows:
T0
T1
T2
T3
T4
T5
5 Experiments
In order to evaluate the pertinence of our approach, graphical results were an-alyzed by a remote sensing expert with field knowledge of the study area. Forthis analysis, all subgraphs (331 in total) were plotted with an associated uniqueID allowing to locate each bounding box in an Geographic Information System(GIS). The expert preselected (without taking into account subgraph results)
8 F. Guttler, D. Ienco, M. Teisseire, J. Nin and P. Poncelet
about 20 regions of interest (ROI) containing both natural and agricultural ar-eas. Then, the subgraphs corresponding to this set of ROI were identified and an-alyzed. The following subsection details the main di↵erences between the graphsrepresenting spatio-temporal evolutions of agricultural and natural areas withinour study area.
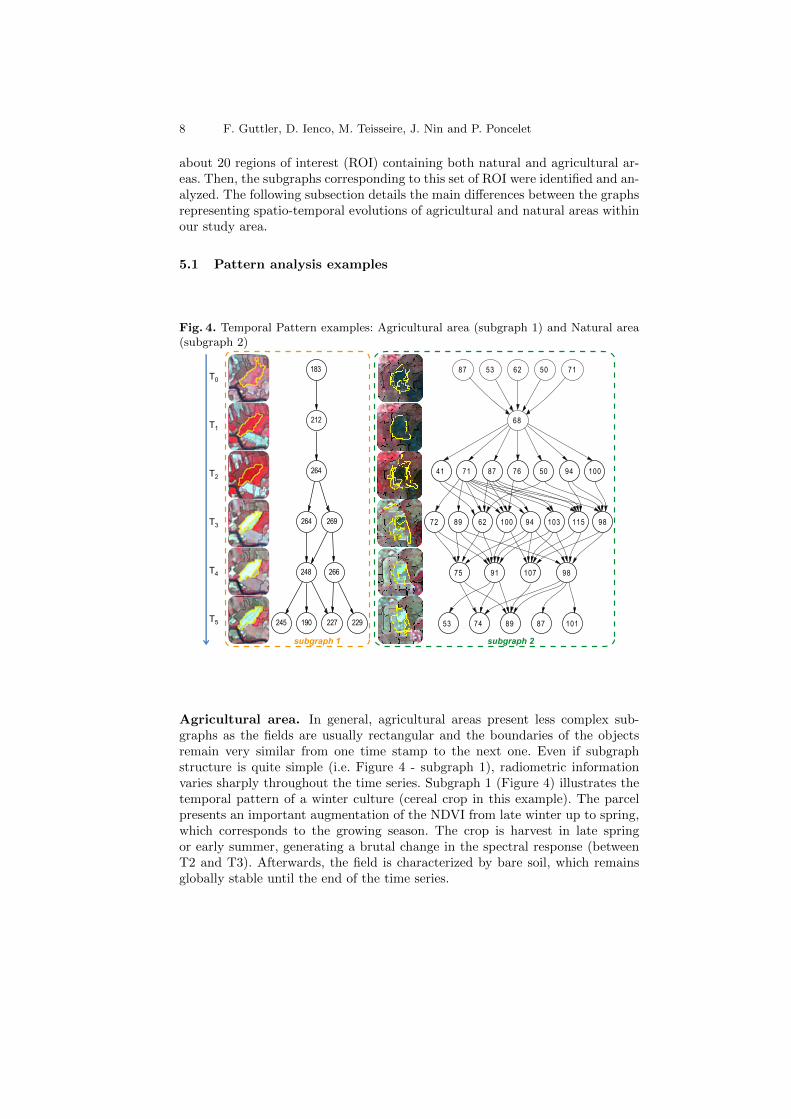
5.1 Pattern analysis examples
Fig. 4. Temporal Pattern examples: Agricultural area (subgraph 1) and Natural area(subgraph 2)
T0
T1
T2
T3
T4
T5
183
212
264
264 269
248 266
190 227245 229
87 53 62 50 71
68
41 5071 7687 94 100
62 100 9894 103 11572 89
75 91 98107
74 8789 10153
subgraph 1 subgraph 2
Agricultural area. In general, agricultural areas present less complex sub-graphs as the fields are usually rectangular and the boundaries of the objectsremain very similar from one time stamp to the next one. Even if subgraphstructure is quite simple (i.e. Figure 4 - subgraph 1), radiometric informationvaries sharply throughout the time series. Subgraph 1 (Figure 4) illustrates thetemporal pattern of a winter culture (cereal crop in this example). The parcelpresents an important augmentation of the NDVI from late winter up to spring,which corresponds to the growing season. The crop is harvest in late springor early summer, generating a brutal change in the spectral response (betweenT2 and T3). Afterwards, the field is characterized by bare soil, which remainsglobally stable until the end of the time series.

Title Suppressed Due to Excessive Length 9
Natural area. In natural areas the boundaries are usually much smootherthan in agricultural fields and the objects rarely have rectangular shapes. As aconsequence, graph structure tends to be more complex and can englobe severalobjects per layer. Such kind of graph can also show some drastic radiometricchanges, but in general it concerns only a small portion of the area covered bythe bounding box. In other words, natural habitats are characterized by moregradual and smoothed evolutions. Subgraph 2 of figure 4 illustrates the temporalpattern of a temporary lake. Usually flooded during winter and spring, this lakebecomes progressively dry starting from early summer. Aquatic natural habitatis gradually replaced by some pioneer terrestrial communities, dominated byannual Salicornia sp. or Suaeda sp. Depending mainly on the local variations ofsoil salinity, the vegetation will cover the former flooded area in di↵erent ways.First developments of such particular habitats can be detected since T2 and theyshould subsist up to the next flood event (usually during late autumn or winter).
5.2 Discussion
Throughout one year, spatio-temporal evolutions of agricultural and natural ar-eas are enough dissimilar and it is possible to an expert to separate them byanalysing the time series of satellite images. In a more automatic way, the sub-graphs generated by our approach synthesizes complex spatio-temporal evolu-tions and can be useful for this kind of time-consuming task. Actually, subgraphstructure associated to temporal behaviour of object’s radiometry provides com-plementary and pertinent information allowing detailed analysis.
At this stage, our coverage algorithm is not able to cover 100% of the studyarea throughout the time series. Most of times, small objects are not includedin the subgraphs. However, this issue should be improved as the spatial gapsconcerns sometimes also medium-size objects representing interesting natural oragricultural areas. Another point to improve is spatial redundancy. We verifiedthat some subgraphs presents high rates of similar objects, what means that thesame area is covered by more than one subgraph. Improving the bounding boxselection should reduce such spatial redundancy.
6 Conclusions
In this paper we have described a complete framework for studying evolvingnatural and agricultural areas using satellite images information and k-partitegraph sequential patterns. We have shown that using our approach is possible tocover a great part of the study area (93.56%) and to analyze in detail a concreteregion of interest. We have also verified with one domain expert that the obtainedsequential patterns are meaningful. As a future work, we would like to developsome clustering algorithms for k-partite graphs to help the expert to post-processthe results providing some groups of patterns with similar behaviour, instead ofindividuals patterns without relation among them.

10 F. Guttler, D. Ienco, M. Teisseire, J. Nin and P. Poncelet
Acknowledgments. This work was supported by public funds received in theframework of GEOSUD, a project (ANR-10-EQPX-20) of the program ”In-vestissements d’Avenir” managed by the French National Research Agency. Thiswork was also partially supported by the Ministry of Science and Technology ofSpain under contract TIN2012-34557 and by the BSC-CNS Severo Ochoa pro-gram (SEV-2011-00067).
References
1. R. Agrawal, R. Imielinski, and A. Swami. Mining association rules between sets ofitems in large databases. SIGMOD Records, 22(2):207–216, 1993.
2. R. Agrawal and R. Srikant. Mining sequential patterns. In ICDE, 1995.3. M. Baatz, C. Ho↵mann, and G. Willhauck. Progressing from object-based to object-
oriented image analysis, chapter 2, pages 29–42. Lecture Notes in Geoinformationand Cartography. Springer Berlin Heidelberg, 2008.
4. T. Blaschke. Object based image analysis for remote sensing. ISPRS J. of Pho-togram. and Rem. Sensing, 65(1):2–16, 2010.
5. J. Vanden Borre, D. Paelinckx, C.A. Mucher, L. Kooistra, B. Haest, G. De Blust,and A. M. Schmidt. Integrating remote sensing in natura 2000 habitat monitoring:Prospects on the way forward. J. for Nat. Conservation, 19(2):116–125, 2011.
6. O. Hagolle and M. Huc. Series temporelles de produits landsat de niveau 2a:Manuel de l’utilisateur des donnees produites au cesbio, 2011.
7. T.J. Jackson, D. Chen, M. Cosh, F. Li, M. Anderson, C. Walthall, P. Doriaswamy,and E. Hunt. Vegetation water content mapping using landsat data derived normal-ized di↵erence water index for corn and soybeans. Remote Sensing of Environment,92(4):475–482, 2004.
8. JW. Rouse Jr, RH. Haas, JA. Schell, and DW. Deering. Monitoring vegetationsystems in the great plains with erts. NASA special publication, 351:309, 1974.
9. T. M. Lillesand. Remote Sens. and Image Interpret. John Wiley & Sons, 2006.10. J. Nin, A. Laurent, and P. Poncelet. Speed up gradual rule mining from stream
data! a b-tree and owa-based approach. JIIS, 35(3):447–463, 2010.11. J. Nin and V. Torra. Towards the evaluation of time series protection methods.
Information Sciences, 29(11):1663–1677, 2009.12. F. Petitjean, C. Kurtz, N. Passat, and P. Gancarski. Spatio-temporal reasoning
for the classification of satellite image time series. Pattern Recognition Letters,33(13):1805–1815, 2012.
13. P. Trojacek and R. Kadlubiec. Detailed mapping of agricultural plots using satelliteimages and aerial orthophoto maps. 2004.
14. N. Zhang, Y. Hong, Q. Qin, and L. Liu. Vsdi: a visible and shortwave infrareddrought index for monitoring soil and vegetation moisture based on optical remotesensing. Int. J. of Rem. Sensing, 34(13):4585–4609, 2013.