Benefit Segmentation of International Travelers to Macau, China
Upload
independentCategory
view
2download
0
This article appeared in a journal published by Elsevier. The attachedcopy is furnished to the author for internal non-commercial researchand education use, including for instruction at the authors institution
and sharing with colleagues.
Other uses, including reproduction and distribution, or selling orlicensing copies, or posting to personal, institutional or third party
websites are prohibited.
In most cases authors are permitted to post their version of thearticle (e.g. in Word or Tex form) to their personal website orinstitutional repository. Authors requiring further information
regarding Elsevier’s archiving and manuscript policies areencouraged to visit:
http://www.elsevier.com/copyright

Author's personal copy
Ecological Indicators 11 (2011) 1584–1593
Contents lists available at ScienceDirect
Ecological Indicators
journa l homepage: www.e lsev ier .com/ locate /eco l ind
Towards rapid bioassessment of wadeable streams in Brazil: Development of theGuapiacu-Macau Multimetric Index (GMMI) based on benthicmacroinvertebrates
Renata B.S. Oliveiraa,b,∗, Darcilio F. Baptistab, Riccardo Mugnaib,c, Carolina M. Castrob, Robert M. Hughesd,e
a Programa de Pós-Graduacão em Ecologia, Universidade Federal do Rio de Janeiro, Cidade Universitária, CCS bloco A s/a 1-08 Ilha do Fundão, 21941-540 Rio de Janeiro, RJ, Brazilb Environmental Health Evaluation and Promotion Group, LAPSA/IOC/FIOCRUZ, Av. Brasil 4365, Manguinhos, Pav. Lauro Travassos, 21045-900 Rio de Janeiro, RJ, Brazilc Programa de Pós-graduacão em Ensino em Biociências, FIOCRUZ, Av. Brasil 4365, Manguinhos, 21045-900 Rio de Janeiro, RJ, Brazild Department of Fisheries and Wildlife, Oregon State University and Amnis Opes Institute, 200 SW35th Street, Corvallis, OR 97333 USAe Programa de Pós-Graduacão em Ecologia Aplicada, Departamento de Biologia, Universidade Federal de Lavras, Lavras, MG, Brazil
a r t i c l e i n f o
Article history:Received 18 July 2010Received in revised form 31 March 2011Accepted 4 April 2011
Keywords:IBIBenthosAssemblage ecologyBiological monitoring
a b s t r a c t
We developed a multimetric index based on macroinvertebrates to assess ecological condition of wade-able streams in Rio de Janeiro State, southeast Brazil. To do so we used a set of 12 reference and 12severely impaired sites sampled in the summer wet season as calibration sites. Nine metrics were selectedbased on their abilities to distinguish between reference and impaired sites and their independence fromother metrics. Metrics retained in the final index were: family richness; Trichoptera family richness;Shannon family diversity; % Plecoptera individuals; % Ephemeroptera, Plecoptera and Trichoptera (EPT)individuals; % mollusk and Diptera individuals; % shredder individuals; proportion Chironomidae/Dipteraindividuals; and proportion Hydropsychidae/Trichoptera individuals. The final 9 metrics were standard-ized; then the Guapiacu-Macau Multimetric Index (GMMI) was calculated, yielding a final index scoreranging from 0 to 100. We validated the index through use of 19 sites subject to different levels of impair-ment, sampled both in summer and in winter. Our final multimetric index distinguished well betweendifferent levels of impairment and was strongly correlated with other disturbance measures. Temporalstability was also tested through use of 8 sites that were sampled in both seasons, and results showedno significant changes in the index final score among seasons. Our research represents one of the firstinitiatives in Brazil to develop a multimetric index for use in a spatially extensive bioassessment programextending across substantial natural and disturbance gradients. It can be a useful tool to help conservestreams in Atlantic forest conservation areas. We suggest that the methodology established here offers afoundation for similar index development and assessments in Brazil.
© 2011 Elsevier Ltd. All rights reserved.
1. Introduction
Macroinvertebrate indexes as indicators of human disturbancehave a long history for use in evaluating sewage pollution in rivers(e.g., Kolkwitz and Marsson, 1909). Those evaluations relied ontaxonomic lists that required experts to interpret, and on taxon tol-erances to pollution that also relied on expert judgment (Whittierand Van Sickle, 2010). Chutter (1972) and Hilsenhoff (1977)developed indices based on weighted averaging of the relativeabundances and numeric tolerance values of benthic macroinver-
∗ Corresponding author at: Environmental Health Evaluation and PromotionGroup, LAPSA/IOC/FIOCRUZ, Av. Brasil 4365, Manguinhos, Pav. Lauro Travassos,21045-900 Rio de Janeiro, RJ, Brazil. Tel.: +55 21 25621530; fax: +55 21 25429208.
E-mail address: [email protected] (R.B.S. Oliveira).
tebrate taxa, but like Kolkwitz and Marsson, they did not explainhow they determined their taxa weights. All three indices mostlyfocused on assessing biological effects of sewage pollution, andwere based on specific taxa unlikely to be found in subtropicalstreams. Diversity indices, combining measures of taxa richnessand evenness, became popular tools for estimating anthropogenicimpacts on aquatic systems following introduction by Shannonand Weaver (1949), but those indices focused on only those twoaspects of assemblage structure. Karr and Dudley (1981) shifted thefocus from sewage pollution to multiple stressors (e.g., flow regime,physical habitat structure, water quality, energy source, biologicalstressors) because anthropogenic stressors are multivariate. AndKarr (1981) proposed assemblage assessments or indices of biolog-ical integrity (IBI) based on multiple biological indicators (richness;abundance; individual health; and habitat, trophic, tolerance, andreproductive guilds). Because anthropogenic disturbances are mul-
1470-160X/$ – see front matter © 2011 Elsevier Ltd. All rights reserved.doi:10.1016/j.ecolind.2011.04.001

Author's personal copy
R.B.S. Oliveira et al. / Ecological Indicators 11 (2011) 1584–1593 1585
tivariate and vary with geographic location, many IBIs have beendeveloped globally and for riparian bird (e.g., O’Connell et al.,2000; Bryce et al., 2002), fish (e.g., Roset et al., 2007; Hughesand Oberdorff, 1999), macroinvertebrate (e.g., Hering et al., 2006;Stoddard et al., 2008), and algae (Hill et al., 2000, 2003) assem-blages.
Recently multimetric indices (MI) have been given priority formaking subcontinent-scale ecological assessments in the EuropeanUnion (Hering et al., 2006; Pont et al., 2006) and the USA (Paulsenet al., 2008; Pont et al., 2009). The development of such tools isbased on comparing biological measurement (metric) values in ref-erence conditions (minimally or least disturbed sites) with those inseverely impaired areas. Hence, sites are classified according to dis-turbance levels, according to several possible criteria a priori, beforeassessing whether the biological metrics respond to anthropogenicdisturbance (Stoddard et al., 2006; Whittier et al., 2007b).
A MI considers multiple impact effects and integrates individualbiological measures into a single value that can be used to assessthe general conditions of the location (Karr, 1981; Hering et al.,2006; Stoddard et al., 2008). The metrics should provide predictableresponses of the biota with increasing impairment, whether this isthe result of a single stressor or from cumulative effects of mul-tiple anthropogenic stressors (deforestation, pesticides, industrialwastewater, sewage, flow and channel alterations). The metricsalso should be easy to measure and interpret (Karr and Chu, 2000)and be assessed for their responsiveness, reproducibility, and inde-pendence (Whittier et al., 2007a; Stoddard et al., 2008). Some mightargue that information is lost from converting lists of taxa abun-dances to an index score, despite the usefulness of biological indicesfor over a century. But the power of a MI approach lies in its abilityto integrate information from several aspects of an assemblage toprovide a general characterization of the level of ecosystem degra-dation, without loss of information from individual metrics. Finalsite evaluations provided by an MI are very important to commu-nicate complex ecological information based on multiple variablesto decision makers and to help establish important conservationactions (Davies and Jackson, 2006; Paulsen et al., 2008). Use of mul-tiple metrics aids both qualitative and quantitative assessments.Because of natural differences in assemblage structure and com-position, MIs must be based on very large reference site data sets(e.g., Pont et al., 2006; Stoddard et al., 2008; Moya et al., 2011), orbe developed for specific geographic regions (e.g., Barbour et al.,1996; Hering et al., 2004; Silveira et al., 2005). Developers of an MIshould consider several issues before selecting metrics, includingconsistent protocols for field sampling, laboratory sample process-ing, and organism identification (Hering et al., 2006; Hughes andPeck, 2008).
The use of biological assessment as a monitoring tool for ecosys-tem condition has been mandated in most developed countries. InBrazil, CONAMA Resolution 357 from 17 March 2005 states that thequality of aquatic environments should be assessed for biologicalcondition when appropriate, using aquatic organisms. This resolu-tion is an important improvement over previous regulations, but itstill does not require biological monitoring of Brazilian water bod-ies. In Brazil, studies aiming to develop tools for biomonitoring havebeen relatively scarce and geographically limited, especially giventhe size and diversity of the country, which has limited the useof biological monitoring for assessing aquatic ecosystems. As else-where, the most commonly used assemblages for assessing streamsin Brazil have been fish (Araújo, 1998; Araújo et al., 2003; Bozzetiand Schulz, 2004; Casatti et al., 2009; Ferreira and Casatti, 2006;Pinto et al., 2006; Pinto and Araújo, 2007) and benthic macroinver-tebrates (Junqueira et al., 2000; Callisto et al., 2001; Silveira et al.,2005; Baptista et al., 2007; Mugnai et al., 2008).
The lotic ecosystems in the Atlantic forest of Rio de Janeirostate are experiencing high anthropogenic pressure and are threat-
ened by diffuse pollution sources, physical habitat disruptions,and deforestation. Generally, the Brazilian public authorities thatare responsible for aquatic ecosystem management only moni-tor chemical and physical water quality. However, to efficientlyand effectively assess aquatic ecosystem condition, it is extremelyimportant to apply an integrated ecological analysis, incorporatingconventional methodological approaches for assessing biologicalassemblages (Rosenberg and Resh, 1993; Karr and Chu, 2000;Hering et al., 2006; Stoddard et al., 2008; Moya et al., 2011).
The development of biological assessment tools is crucial tothe creation and implementation of biological monitoring pro-grams and for regulating and improving the condition of Braziliansurface waters. Our objective in this study was to develop aMI for rapid bioassessment of the aquatic macroinvertebrateassemblages of wadeable streams in Rio de Janeiro state. Todo so we followed guidelines from Europe (Hering et al., 2006)and the USA (Stoddard et al., 2008) for MI development andstandardization.
2. Materials and methods
2.1. Study area
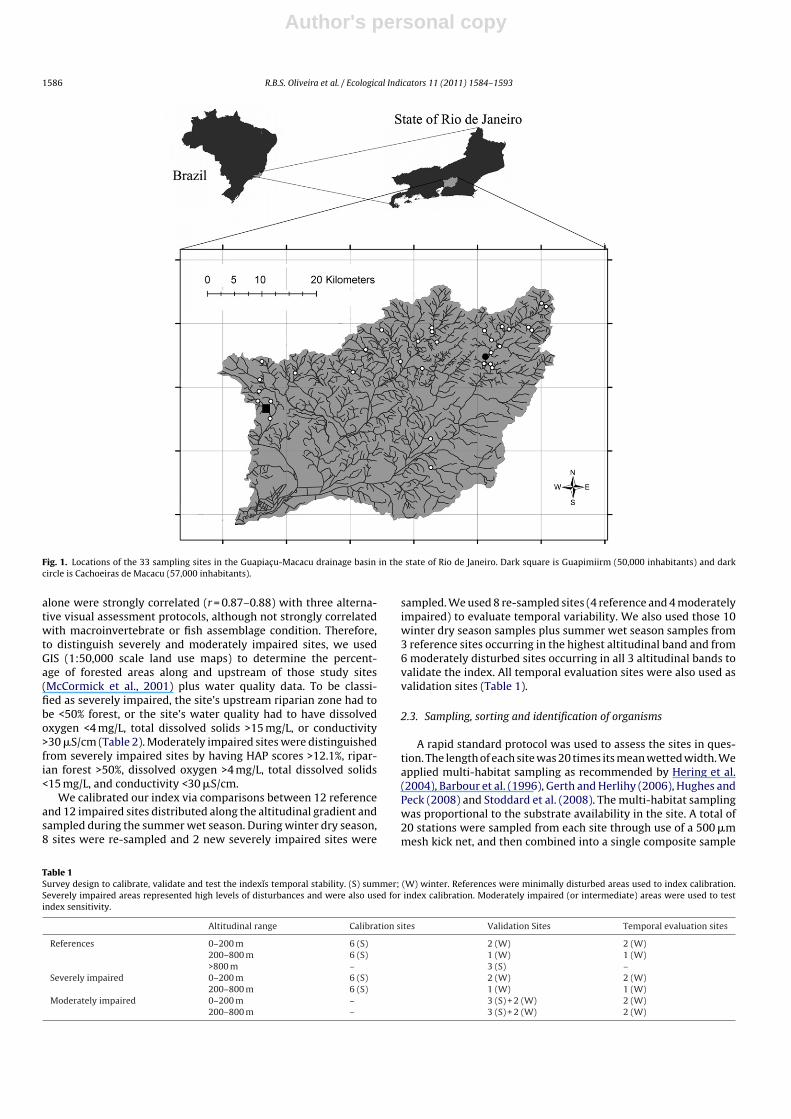
The study sites were located in the Guapiacu and Macacu Riverbasins of the central Serra do Mar coastal forest, which is part of theAtlantic forest domain (Fig. 1). This basin is located between coordi-nates 22◦41′36.4′′S/43◦01′57.9′′ and 22◦14′13.2′′S/42◦31′12.9′′. Thebasins have a combined drainage area of 1640 km2 (JICA, 1994),are part of the Guanabara and Serra do Mar Coastal Forests Bio-diversity Corridor Area, and provide water for about 2.5 millioninhabitants in five municipalities. The area includes forests belong-ing to three Conservation Units (Paraiso Biological Reserve, Serrados Órgãos National Park, and Três Picos State Park). The climatein the area varies from tropical wet forest at lower elevations tomild mesothermal forest in the areas above 1200 m, with averageFebruary temperatures of 15–28 ◦C and average July temperatures<16 ◦C. The mean annual precipitation in this area is 2558 mm. Allthe study sites were coarse bedded mountain streams and 2–23 mwide. The streams in this basin are subject to different pressures,including intensive urbanization and untreated sewage discharges;most sites reflected the influence of multiple chemical and physicalanthropogenic stressors.
2.2. Survey design
We sampled the sites in 2007 during the rainy season monthsof January, February and March (summer), and in July during thedry season (winter). During summer, we sampled a total of 33sites distributed across three altitudinal bands: <200 m, 200–800 mand >800 m (Table 1). We distributed sites in this manner becauseHenriques-Oliveira and Nessimian (in press) reported that streamslocated <200 m.a.s.l. and >800 m.a.s.l. support distinctly differentfaunas.
Before biological sampling, the sites were classified into threelevels of impairment: 15 minimally disturbed (reference) sites, 6moderately impaired sites, and 12 severely impaired sites. Refer-ence sites located >300 m.a.s.l were in nearly pristine catchmentsand those located <300 m.a.s.l. were minimally impaired sites thatmet classification criteria. The a priori classification of streamsin the three impairment classes was based on previous visits,during which we applied the habitat assessment protocol (HAP)adapted from that used by the U.S. Environmental ProtectionAgency (Barbour et al., 1999). Reference sites had to have a HAPscore >15 and <50 fecal coliforms in 100 mL. Hughes et al. (2010)reported that site assessments obtained through use of the HAP
Author's personal copy
1586 R.B.S. Oliveira et al. / Ecological Indicators 11 (2011) 1584–1593
Fig. 1. Locations of the 33 sampling sites in the Guapiacu-Macacu drainage basin in the state of Rio de Janeiro. Dark square is Guapimiirm (50,000 inhabitants) and darkcircle is Cachoeiras de Macacu (57,000 inhabitants).
alone were strongly correlated (r = 0.87–0.88) with three alterna-tive visual assessment protocols, although not strongly correlatedwith macroinvertebrate or fish assemblage condition. Therefore,to distinguish severely and moderately impaired sites, we usedGIS (1:50,000 scale land use maps) to determine the percent-age of forested areas along and upstream of those study sites(McCormick et al., 2001) plus water quality data. To be classi-fied as severely impaired, the site’s upstream riparian zone had tobe <50% forest, or the site’s water quality had to have dissolvedoxygen <4 mg/L, total dissolved solids >15 mg/L, or conductivity>30 �S/cm (Table 2). Moderately impaired sites were distinguishedfrom severely impaired sites by having HAP scores >12.1%, ripar-ian forest >50%, dissolved oxygen >4 mg/L, total dissolved solids<15 mg/L, and conductivity <30 �S/cm.
We calibrated our index via comparisons between 12 referenceand 12 impaired sites distributed along the altitudinal gradient andsampled during the summer wet season. During winter dry season,8 sites were re-sampled and 2 new severely impaired sites were
sampled. We used 8 re-sampled sites (4 reference and 4 moderatelyimpaired) to evaluate temporal variability. We also used those 10winter dry season samples plus summer wet season samples from3 reference sites occurring in the highest altitudinal band and from6 moderately disturbed sites occurring in all 3 altitudinal bands tovalidate the index. All temporal evaluation sites were also used asvalidation sites (Table 1).
2.3. Sampling, sorting and identification of organisms
A rapid standard protocol was used to assess the sites in ques-tion. The length of each site was 20 times its mean wetted width. Weapplied multi-habitat sampling as recommended by Hering et al.(2004), Barbour et al. (1996), Gerth and Herlihy (2006), Hughes andPeck (2008) and Stoddard et al. (2008). The multi-habitat samplingwas proportional to the substrate availability in the site. A total of20 stations were sampled from each site through use of a 500 �mmesh kick net, and then combined into a single composite sample
Table 1Survey design to calibrate, validate and test the indexıs temporal stability. (S) summer; (W) winter. References were minimally disturbed areas used to index calibration.Severely impaired areas represented high levels of disturbances and were also used for index calibration. Moderately impaired (or intermediate) areas were used to testindex sensitivity.
Altitudinal range Calibration sites Validation Sites Temporal evaluation sites
References 0–200 m 6 (S) 2 (W) 2 (W)200–800 m 6 (S) 1 (W) 1 (W)>800 m – 3 (S) –
Severely impaired 0–200 m 6 (S) 2 (W) 2 (W)200–800 m 6 (S) 1 (W) 1 (W)
Moderately impaired 0–200 m – 3 (S) + 2 (W) 2 (W)200–800 m – 3 (S) + 2 (W) 2 (W)

Author's personal copy
R.B.S. Oliveira et al. / Ecological Indicators 11 (2011) 1584–1593 1587
Table 2Sampling site physical, chemical and bacteriological characteristics. HAP is habitat assessment protocol (see Section 2).
Reference(n = 12)Min–Max(Mean; SD)
Severely impaired(n = 12)Min–Max(Mean; SD)
Moderatelyimpaired(n = 6)Min–Max(Mean; SD)
Stream order (1:50,000 scale) 1–5 1–5 1–4(2.8; 1.2) (2.4; 1.2) (2.3; 1.6)
Altitude (m.a.s.l.) 90–700 10–450 50–700(285.9; 206.1) (161.3; 140.2) (233.4; 228.3)
Mean width (m) 2.8–22.7 2.0–20.6 3.1–17(8.5; 4.8) (8.8; 5.9) (9.4; 4.1)
Mean depth (cm) 14.0–59.2 11.0–74.2 19.3–61.4(30.8; 12.1) (31.4; 18.2) (34.3; 11.1)
HAP score 16.1–19.3 1.4–12.1 12.5–14(18.0; 1.3) (4.2; 2.8) (12.7; 0.8)
% Forested riparian area upstream (from the site to the source −1:50,000 map scale) 89.7–100 11.6–75.9 51.2–89.8(97.4; 3.7) (55.9; 24.8) (72.7; 16.7)
Dissolved oxygen (mg/L) 6.9–7.9 3.6–6.9 5.7–7.4(7.2; 0.2) (6.1; 1.1) (6.7; 0.7)
Total alkalinity (mg/L) 20.5–41 30.8–139 28.7–41.1(27.9; 6.6) (53.7; 28.4) (34.2; 4.6)
Conductivity (�S/cm) 15–27 18–106 18–27(19; 3.4) (36.5; 23.3) (21.8; 3.5)
Total dissolved solids (mg/L) 6.7–12.5 7.6–50.2 7.9–13.5(5.6; 1.6) (16.9; 11.2) (10; 1.7)
Fecal coliforms (in 100 mL) 0–45 8–300 6–300(10; 12) (205; 112) (76; 111)
that was preserved in 80% ethanol. Each station represented 1 m2,providing a total sampled area of 20 m2 per site.
In the laboratory, we washed the samples to remove coarsematerials. Following the approach of Oliveira et al. (2011), the restof the 20 m2 sample was homogenized in a tray and sub-sampledthrough use of a 24-quadrat splitter. Six quadrats were taken ran-domly, forming a single sub-sample, which was then sorted toremove all macroinvertebrates present. The mean abundance ina 6-quadrat subsample was 614 individuals. Oliveira et al. (2011)determined that 6 quadrats (with a minimum of 200 organismscounted) produced results sufficiently similar to the total sam-ple for making biological assessments of these stream types. Theorganisms were identified to genus, except for Diptera, Hemipteraand Lepidoptera, which were identified to family. As we had twodifferent taxonomic levels (family and genus) we treated them asoperational taxonomic units (OTU). In circumstances where eco-logical (including biomonitoring) study precedes the taxonomy, theuse of operational or recognizable taxonomic units may be the onlypractical solution possible (Cranston, 1990; Melo, 2005).
2.4. Metric selection
Based on an evaluation of the literature, the followingcandidate metrics were calculated: total OTU richness, familyrichness, Plecoptera OTU richness, Ephemeroptera OTU rich-ness, Ephemeroptera family richness, Trichoptera OTU richness,Ephemeroptera + Plecoptera + Trichoptera (EPT) OTU richness, EPTfamily richness, Shannon OTU diversity, Shannon family diversity, %Coleoptera individuals, % Ephemeroptera individuals, % Plecopteraindividuals, % Diptera individuals, % Trichoptera individuals,% Odonata individuals, % EPT individuals, equitability (Shan-non/log S in family), abundance of Mollusca + Diptera individuals(MOLD), % MOLD individuals, proportion Baetidae/Ephemeropteraindividuals, proportion Hydropsychidae/Trichoptera individuals,Chironomidae abundance, proportion Chironomidae/Diptera indi-viduals, % scraper individuals (periphyton consumers), % shredderindividuals (leaf consumers), % filterer individuals (feed on drift-ing fine particulate organic matter), and extended biotic index-IOC(Mugnai et al., 2008). The extended biotic index-IOC is an adapta-tion of Indice Biotico Esteso (Ghetti, 1997), that uses taxa saprobic
values to asses stream condition. Feeding guild classifications fortaxa were taken from Merrit and Cummins (1984). All these met-rics had been used in previously published macroinvertebrate MI(Baptista et al., 2007; Barbour et al., 1999; Hering et al., 2004).Each was calculated and then evaluated for its suitability for indexinclusion.
Metric selection was conducted in four stages as recommendedby Hering et al. (2006) and Stoddard et al. (2008). (1) We usedbox-plots for each candidate metric to compare reference versusimpaired site values to evaluate metric range, to see if the dis-tribution of values in the two groups overlapped, and to assessthe response direction and effect of increasing impairment. (2)To determine the significance of differences in values betweenreference and impaired sites, a Mann–Whitney test was appliedthrough use of STATISTICA 7.0, as in none of the cases was therehomogeneity of variances as required for parametric approaches.(3) We conducted a redundancy test between the validated met-rics through use of Spearman correlation analysis in STATISTICA7.0. Metrics were considered redundant if their Spearman corre-lation coefficient was >0.7 (Whittier et al., 2007a; Stoddard et al.,2008). The subsequent metric screening aimed at selecting at least2 metrics of each kind (diversity, composition, tolerance and func-tional; Table 4) that were not strongly correlated with each other,with the exception of a trophic metric, from which only 1 of the 3candidate metrics was chosen. From a pair of metrics consideredredundant, the one with the lowest p-value for the Mann–Whitneytest was retained, which best distinguished the reference sites fromthe impaired sites (Stoddard et al., 2008; Whittier et al., 2007a).(4) We also evaluated the level of taxonomic resolution requiredfor metric applicability (e.g., OTU versus family or order). Amongredundant metrics, those that were least difficult to implementwere chosen; that is, those that required identification only to thefamily level.
2.5. Index construction and validation
The raw values of the selected metrics may vary between dif-ferent ranges. For example, the “number of Plecoptera genera” canhave a value between 0 and n, whereas “% shredders” can vary from0 to 100. To combine these individual measures into an integrated

Author's personal copy
1588 R.B.S. Oliveira et al. / Ecological Indicators 11 (2011) 1584–1593
Table 3Results of the sensitivity test of calculated metrics. Mann–Whitney U test comparing metric values between 12 reference sites and 12 severely impaired sites. OTU isoperational taxonomic unit (family or genus); EPT is all Ephemeroptera, Plecoptera, and Trichoptera; MOLD is all Mollusca and Diptera; EBI-IOC is extended biotic index(Mugnai et al., 2008). See text for further metric descriptions.
Calculated candidate metrics Expected metric response with increased disturbance Sensibility test
U p Validity
DiversityTotal OTU richness Decrease 0.001 <0.001 ValidTotal family richness Decrease 3.00 <0.001 ValidPlecoptera richness – OTU Decrease 0.001 <0.001 ValidEphemeroptera richness – OTU Decrease 15 0.001 ValidEphemeroptera richness – family Decrease 38 0.054 (NS) –Trichoptera richness – OTU Decrease 3.5 <0.001 ValidTrichoptera richness – family Decrease 4 <0.001 ValidEPT richness – OTU Decrease 0.001 <0.001 ValidEPT richness – family Decrease 0.5 <0.001 ValidShannon-Wiener diversity – OTU Decrease 0.001 <0.001 ValidShannon-Wiener diversity – family Decrease 6 <0.001 Valid
Composition (individuals)% Coleoptera Decrease 13 <0.001 Valid% Ephemeroptera Variable 39 0.0532 (NS) –% Plecoptera Decrease 0.001 <0.001 Valid% Diptera Increase 12 <0.001 Valid% Trichoptera Variable 27 0.01 Valid% Odonata Variable 37 0.0502 (NS) –% EPT Decrease 10 <0.001 ValidEquitability Decrease 30 0.017 ValidMOLD abundance Increase 44 0.119 (NS) –% MOLD Increase 13 <0.001 Valid
ToleranceIBE-IOC Decrease 0.001 <0.001 ValidBaetidae/Ephemeroptera individuals Increase 67 0.795 (NS) –Hydropsychidae/Trichoptera individuals Increase 18 0.002 ValidChironomidae (abundance) Increase 33 0.032 ValidChironomidae/Diptera individuals Increase 18 0.002 Valid
Functional (individuals)% Scrapers Variable 12 <0.001 Valid% Shredders Variable 13 <0.001 Valid% Filterers Variable 69 0.8852 (NS) –
multimetric index it is essential to standardize metrics via transfor-mation to unitless scores (Hering et al., 2006). We standardized andscored the final selected metrics continuously as recommended byHughes et al. (1998), Blocksom (2003), Klemm et al. (2003), Heringet al. (2006) and Stoddard et al. (2008) to improve index sensitivityand stability. We used the 3rd and 1st quartiles as the upper andlower anchors for standardizing scores, thereby avoiding the inclu-sion of extreme values that are not representative of the bulk of thedata.
For positive raw metrics (those that increased as the environ-ment improved), we used Eq. (1):
TPMS = [(RMV − I25)10] [R75 − I25]−1, (1)
where TPMS is the transformed positive metric score that is used inscoring the GMMI, RMV is the raw metric value from the raw fielddata, I25 is the 25th percentile of the impaired sites, and R75 is the75th percentile of the reference sites.
For negative raw metrics (those that decreased as the environ-ment improved), we used Eq. (2):
TNMS = [(RMV − I75)10] [R25 − I75]−1, (2)
where TNMS is the transformed negative metric score used in theGMMI, RMV is the raw metric value, I75 is the 75th percentile ofthe impaired sites, and R25 is the 25th percentile of the referencesites. Any transformed metric value greater than 10 was consideredas 10 and any lower than 0 was considered as 0. To calculate theGMMI score, we multiplied the sum of the 9 metrics by 1.1 so thatthe GMMI could range from 0 to 99 (see Appendix A for examplecalculations).
We validated the GMMI with data that were not used for indexconstruction; 9 sites were sampled during the rainy season and 10sites were sampled in the dry season. We used PAST (Hammer et al.,2001) to perform a Principal Components Analysis (PCA) throughuse of 19 validation sites and 5 environmental variables related toimpairment (dissolved oxygen, conductivity, total dissolved solids,alkalinity, habitat assessment protocol and fecal coliforms). Priorto analysis, environmental data were standardized by subtractingeach value from its mean and dividing it by its standard deviation,thereby reducing the effects of different scales in different variables(Manly, 1986). Next, we used STATISTICA 7.0 to perform a Pearsoncorrelation to relate site positions on PCA Axis 1 and the GMMI val-idation site scores. To evaluate temporal stability, the index resultsfor the 8 sites sampled in both the dry and the wet seasons werecompared by a paired t-test calculated through use of STATISTICA7.0.
3. Results
3.1. Metric selection and index scoring
The stepwise metric screening process provided an efficientand repeatable process for selecting metrics. The metric sensitiv-ity tests eliminated only 6 metrics, indicating that most candidatemetrics differed significantly between reference and impaired sites(Table 3). The redundancy analysis showed that candidate metricsbelonging to the same category (diversity, composition, toleranceguild, or trophic guild) were generally highly correlated (r > 0.70;p < 0.001), so the 3 alternatives with the lowest p values were

Author's personal copy
R.B.S. Oliveira et al. / Ecological Indicators 11 (2011) 1584–1593 1589
Fig. 2. Final GMMI (Guapiacu-Macau Multimetric Index) metrics. Rectangles delineate the 1st and 3rd quartiles; small squares are medians; circles are extreme points; barsare maxima and minima.
retained all else being equal. Among the remaining metric alter-natives, the family richness metrics were highly correlated withthe OTU richness metrics (r = 0.91; p < 0.001), so family level met-rics were retained. The 9 selected metrics were: family richness(FR), Trichoptera family richness (TFR), Shannon family diversity(SFD), % Plecoptera individuals (%PI), % EPT individuals (%EPTI),% MOLD individuals (%MOLDI), % shredder individuals (%SI), pro-portion Chironomidae/Diptera individuals (PCDI), and proportionHydropsychidae/Trichoptera individuals (PHTI) (Fig. 2). Using the
preceding metric abbreviations, the GMMI is thus calculated as:
GMMI = (FR + TFR + SFD + %PI + %EPTI + %MOLDI + %SI + PCDI
+ PHTI)1.1. (3)
3.2. Index construction and validation
The raw metric values ranged from 0 to 99.72 and the trans-formed metric scores varied from 0 to 17.10 (Table 4). To aid

Author's personal copy
1590 R.B.S. Oliveira et al. / Ecological Indicators 11 (2011) 1584–1593
Table 4Lower and upper anchors used in metric scoring calculated through use of reference and severely impaired sites. Higher raw values in the first 6 variables yield highertransformed metric scores; higher raw values in the last 3 metrics yield lower transformed metric scores. EPT is all Ephemeroptera, Plecoptera, and Trichoptera; MOLD is allMollusca and Diptera. See text for further metric descriptions. Any transformed metric value >10 is scored as 10. The sum of the transformed metric scores is multiplied by1.1 to yield the GMMI (Guapiacu-Macacu multimetric index) score.
Raw value Raw value 25th percentile 75th percentile 25th percentile 75th percentile Transformed TransformedMin. Max. References References Impaired Impaired Score min. Score max.
% Plecoptera 0 15.66 8.41 12.38 0 0.12 0 12.65% EPT 0.27 65.90 33.90 52.69 8.27 27.06 1.79 12.97% Shredders 0 14.30 2.22 8.36 0 0.41 0 17.10Family richness 4.00 32.00 23.00 27.50 11.75 18.00 4.92 12.85Trichoptera richness (families) 1.00 9.00 5.00 6.00 1.00 3.00 0 16.00Shannon diversity (families) 0.35 2.65 2.16 2.51 1.10 1.85 5.33 10.98% MOLD 6.71 99.72 14.40 24.59 41.69 89.17 1.40 11.02Hydropsychidae/Trichoptera 0.02 1.00 0.26 0.62 0.76 1.00 0 13.19Chironomidae/Diptera 0 0.97 0.34 0.73 0.80 0.93 0.67 15.86GMMI 15.52 99.0
Table 5Factor loadings (PCA axis 1) of environmental variables at 19 GMMI (Guapiacu-Macacu multimetric index) validation sites. HAP is habitat assessment protocol;TDS is total dissolved solids.
PCA axis 1
HAP score 0.80Conductivity (�S/cm) −0.88TDS (mg/L) −0.89Total alkalinity (mg/L) −0.79Fecal coliforms (in 100 mL) −0.85Dissolved oxygen (mg/L) 0.72
readers’ understanding of final metric and GMMI calculation, weprovide examples from a reference site and a severely impairedsite (Appendix A). The GMMI, which could range from 0 to 100,was divided into five quality classes each with a 20 point interval(Fig. 3). Colors were attributed to each class to facilitate visual inter-pretation of the results in future communications with managersand the public.
We validated the index by comparing GMMI and PCA scores at19 validation sites and 8 temporal variability sites. All variableswere strongly correlated with PCA axis 1 (factor loadings >0.7 or<−0.7), which explained 62% of total variance (Table 5). The GMMIand environmental PCA axis 1 scores at the validation sites alsowere highly correlated (r = 0.79; p < 0.001) (Fig. 4). For the 8 sitessampled in both dry and wet seasons, a paired t-test indicatedthat winter and summer GMMI scores did not differ significantly(t = 0.53; p = 0.61).
4. Discussion
One critical decision in developing rapid bioassessment pro-tocols and MI is that site disturbance classification should beperformed before or independently of the biological assessment.Quantitative criteria are important for decreasing the subjectiv-ity of this classification (Stoddard et al., 2006; Herlihy et al., 2008;Whittier et al., 2006, 2007b). The criteria we used to classify sitesbeforehand into three impairment levels (HAP, catchment riparianvegetation, water quality variables) also proved to be efficient forboth developing and validating the GMMI.
The issue of which taxonomic identification level to use in bio-logical evaluations of benthic macroinvertebrate assemblages has
Fig. 3. Qualitative classification of GMMI (Guapiacu-Macacu multimetric index)scores.
been widely discussed (e.g., Bailey et al., 2001; Schmidt-Kloiberand Nijboer, 2004; Melo, 2005). The ideal taxonomic resolutionlevel depends on the objective of the study. In the context of devel-oping tools for application in a spatially extensive biomonitoringprogram, it is important that the core metrics facilitate easy, rapid,and consistent calculation. In Brazil, where the taxonomic knowl-edge of benthic macroinvertebrates is still incipient, economy inidentification time is particularly important for applying an index.Metrics based on family or order facilitate index application, andreduce the susceptibility to variations created by natural, tempo-ral gradients and stochastic events (Schmidt-Kloiber and Nijboer,2004). Several of the 9 GMMI metrics that we selected are used in MIin different climatic regions, showing their widespread applicabil-ity (Böhmer et al., 2004; Vlek et al., 2004; Stoddard et al., 2008). TheGMMI metrics, except for % shredders, require identification onlyto family or order. Family-level metrics were as sensitive as genusor species level metrics in other studies (Boonsong et al., 2009;Buss and Vitorino, 2010; Chessman et al., 2007; Melo, 2005). In thecase of metrics based on ecological guilds or traits, information wasnot available or not applicable at more refined taxonomic levels;however, such traits and guilds may reflect important additionalinformation about the ecosystem that should not be disregarded(Moya et al., 2011).
A key problem in biomonitoring is the difficulty of distin-guishing between an impairment gradient and natural spatial andtemporal gradients (Herlihy et al., 2008; Whittier et al., 2006,2007b). This problem is greater when the index application areais large and encompasses a wide range of ecoregions and streamtypes. As in our study area, the altitudinal and longitudinal gra-
Fig. 4. GMMI (Guapiacu-Macacu multimetric index) scores versus PCA axis 1, whichrepresents variation of 5 environmental variables (see Table 5) related to impair-ment at 19 validation sites. PCA axis 1 explained 62% of total multivariate variance;r indicates Pearson product-moment linear correlation significant at 5% level.

Author's personal copy
R.B.S. Oliveira et al. / Ecological Indicators 11 (2011) 1584–1593 1591
dients of mountain streams reflect substantial physical changes inriver and substrate size and water temperature (Hughes et al., 2004;Pont et al., 2009). Henriques-Oliveira and Nessimian (in press)showed that the benthic macroinvertebrate fauna changes in struc-ture and composition along an altitudinal gradient. However, forthe development of a MI, it is necessary to test if the metrics, andnot the fauna as a whole, are strongly related to this gradient. TheGMMI was built with both reference and impaired sites occurringat different altitudes. Visual examination of Fig. 2 indicates thatdespite the variation in each metric there is no overlap betweenthe inter-quartile distributions of impaired and reference sites. Thelack of overlap indicates that the impairment influences the met-ric values more than the natural gradient variation. Our metricsshowed greater separation between impaired and reference sitesthan the mountain stream metrics of Whittier et al. (2006), possiblyas a result of less natural variation, greater impairment range, andsmaller sample size and assemblage differences.
Concerning temporal variability, the GMMI did not vary signifi-cantly between summer and winter. Likewise, Baptista et al. (2007)reported that benthic macroinvertebrate metric values based onabundance, richness and trophic guilds remained stable throughoutthe year in Serra do Mar streams, despite taxonomic changes. Ourresults and theirs indicate that the biological condition of streamscan be assessed by sampling consistently in a single season. BothBozzeti and Schulz (2004) and Pinto et al. (2006) reached a similarconclusion for assessing Brazilian fish assemblages with a MI, andthey recommended sampling in the dry winter season to maximizefishing efficiency and effects of stressors.
The GMMI was built through use of standardized sampling,sample sorting, and metric scoring methods to ensure consistentcomparison among different sites and wider acceptance by waterresource managers (Hughes and Peck, 2008; Stoddard et al., 2008).The GMMI metrics were standardized as suggested by Klemm et al.(2003) and Blocksom (2003), because it gives more sensitivity andstability to the index. Like them, we used the 1st and 3rd quartiles asthe inferior and superior limits for standardization. Stoddard et al.(2008) used the 5th and 95th percentiles in their assessment ofassemblage condition across the conterminous U.S.A., but they hada much greater sample size and study area.
The GMMI combines the characteristics described by Karr andChu (2000) as important for a consistent and applicable MI: (1) itis based on standard and rapid field and laboratory protocols; (2)
its metrics are based on ecological concepts that are sensitive toanthropogenic disturbance and separable from natural gradients;and (3) quantitative results can be obtained at relatively low cost.The practical result of our research is to provide a fast and effi-cient bioassessment protocol, capable of assessing the ecologicalcondition of sites in the river basin studied. The GMMI demon-strated sensitivity to different types of pressures occurring in thebasin and GMMI scores from validation sites correlated stronglywith the increased levels of those pressures and regardless of sea-son. In Brazil, our research represents one of the first initiativesto develop a multimetric index for use in a spatially extensivebioassessment program extending across substantial natural anddisturbance gradients. We believe it offers a useful tool to help con-serve and manage streams in Atlantic forest conservation areas. Wesuggest that the methodology established here offers a foundationfor similar assessments and index development or evaluation inneighboring states or elsewhere in Brazil.
Acknowledgments
This work was supported by Conselho Nacional de Tecnologia(CNPQ/Universal 2006), PAPES V FIOCRUZ, and Fulbright Brasil. Weare grateful to Juliana Jimenez Valencia for graphical assistance,all LAPSA team members for field assistance, and 2 anonymousreviewers for critical reviews.
Appendix A.
Metric and GMMI (Guapiacu-Macacu multimetric index) scor-ing examples for a reference and an impaired site. For the first6 positive raw metrics, use equation: TPMS = [(RMV − I25) 10][R75 − I25]−1, where TPMS is the transformed positive metric scorethat is used in scoring the GMMI, RMV is the raw metric value fromthe raw field data, I25 is the 25th percentile of the impaired sites,and R75 is the 75th percentile of the reference sites. For the last 3negative raw metrics, use: TNMS = [(RMV − I75) 10] [R25 − I75]−1,where TNMS is the transformed negative metric score used in theGMMI, RMV is the raw metric value, I75 is the 75th percentile ofthe impaired sites, and R25 is the 25th percentile of the referencesites. Any transformed metric value >10 is scored as 10 and any <0 isscored as 0. The sum of the transformed metric scores is multipliedby 1.1 to yield the GMMI score.
RawvalueReference
RawvalueImpaired
25thpercentileReferences
75thpercentileReferences
25thpercentileImpaired
75thpercentileImpaired
TransformedscoreReference
TransformedscoreImpaired
% Plecoptera 9.66 0.0 8.41 12.38 0 0.12 7.80 0.0% EPT 45.48 11.24 33.90 52.69 8.27 27.06 8.38 0.67% Shredders 11.13 0.13 2.22 8.36 0 0.41 10.0 0.16Family richness 23 12 23.00 27.50 11.75 18.00 7.14 0.16Trichoptera richness (families) 6 3 5.00 6.00 1.00 3.00 10.0 4.00Shannon diversity (families) 2.20 1.30 2.16 2.51 1.10 1.85 7.80 1.42% MOLD 16.51 88.15 14.40 24.59 41.69 89.17 9.72 0.14Hydropsychidae/Trichoptera 0.27 0.64 0.26 0.62 0.76 1.00 9.86 4.86Chironomidae/Diptera 0.32 0.93 0.34 0.73 0.80 0.93 10.0 0.0Sum 80.7 11.41GMMI score 88.77 12.55

Author's personal copy
1592 R.B.S. Oliveira et al. / Ecological Indicators 11 (2011) 1584–1593
References
Araújo, F.G., 1998. Adaptacão do índice de integridade biótica usando a comunidadede peixes para o rio Paraíba do Sul. Revista Brasileira de Biologia 58, 547–558.
Araújo, F.G., Fichberg, I., Pinto, B.C.T., Peixoto, M.G., 2003. A preliminary index ofbiotic integrity for monitoring the condition of the Rio Paraíba do Sul, southeastBrazil. Environmental Management 32, 516–526.
Bailey, R.C., Norris, R.H., Reynoldson, T.B., 2001. Taxonomic resolution of benthicmacroinvertebrate communities in bioassessments. Journal of the North Amer-ican Benthological Society 20, 280–286.
Baptista, D.F., Buss, D.F., Egler, M., Giovanelli, A., Silveira, M.P., Nessimian, J., 2007.A multimetric index based on benthic macroinvertebrates for evaluation ofAtlantic Forest streams at Rio de Janeiro State, Brazil. Hydrobiologia 575, 83–94.
Barbour, M.T., Gerritsen, J., Griffith, G.E., Frydenbourg, R., McCarron, E., White, J.S.,Bastian, M.L., 1996. A framework for biological criteria for Florida streams usingbenthic macroinvertbrates. Journal of the North American Benthological Society15, 185–211.
Barbour, M.T., Gerritsen, J., Snyder, B.D., Stribling, J.B., 1999. Rapid BioassessmentProtocols for Use in Streams and Wadeable Rivers: Periphyton, Benthic Macroin-vertebrates, and Fish, EPA 841-OB-99-002, Office of Water. US EnvironmentalProtection Agency, Washington.
Blocksom, K.A., 2003. A performance comparison of metric scoring methods for amultimetric index for Mid-Atlantic highlands streams. Environmental Manage-ment 31, 670–682.
Böhmer, J., Rawer-Jost, C., Zenker, A., Meier, C., Feld, C.K., Biss, R., Hering, D.,2004. Assessing streams in Germany with benthic invertebrates: develop-ment of a multimetric invertebrate based assessment system. Limnologica 34,416–432.
Boonsong, B., Sangpradub, N., Barbour, M.T., 2009. Development of rapidbioassessment approaches using benthic macroinvertebrates for Thai streams.Environmental Monitoring and Assessment 155, 129–147.
Bozzeti, M., Schulz, U.H., 2004. An index of biotic integrity based on fish assemblagesfor subtropical streams in southern Brazil. Hydrobiologia 529, 133–144.
Bryce, S.A., Hughes, R.M., Kaufmann, P.R., 2002. Development of a bird integrityindex: using bird assemblages as indicators of riparian condition. EnvironmentalManagement 30, 294–310.
Buss, D.F., Vitorino, A., 2010. Rapid bioassessment protocols using benthic macroin-vertebrates in Brazil: evaluation of taxonomic sufficiency. Journal of the NorthAmerican Benthological Society 29, 562–571.
Callisto, M., Moretti, M., Goulart, M., 2001. Macroinvertebrados bentônicos como fer-ramenta para avaliar a saúde de riachos. Revista Brasileira de Recursos Hídricos6, 71–82.
Casatti, L., Ferreira, C.P., Langeani, F., 2009. A fish-based biotic integrity indexfor assessment of lowland streams in southeastern Brazil. Hydrobiologia 623,173–189.
Chessman, B., Williams, S., Besley, C., 2007. Bioassessment of streams with macroin-vertebrates: effect of sampled habitat and taxonomic resolution. Journal of theNorth American Benthological Society 26, 546–565.
Chutter, F.M., 1972. An empirical biotic index of the quality of the water in SouthAfrican streams and rivers. Water Resources 6, 19–30.
Cranston, P.S., 1990. Biomonitoring and invertebrate taxonomy. EnvironmentalMonitoring and Assessment 14, 265–273.
Davies, S.P., Jackson, S.K., 2006. The biological condition gradient: a descriptivemodel for interpreting change in aquatic ecosystems. Ecological Applications16, 1251–1266.
Ferreira, C.P., Casatti, L., 2006. Integridade biótica de um córrego na bacia do AltoRio Paraná avaliada por meio da comunidade de peixes. Biota Neotropica 6,1–25.
Gerth, W.J., Herlihy, A.T., 2006. Effect of sampling different habitat types in regionalmacroinvertebrate bioassessment surveys. Journal of the North American Ben-thological Society 25, 501–512.
Ghetti, P.F., 1997. Manuale di Applicazione Indice Biotico Esteso (I.B.E.). ProvinciaAutonoma di Trento, Trento, 222 pp.
Hammer, Ø., Harper, D.A.T., Ryan, P.D., 2001. PAST: paleontological statistics soft-ware package for education and data analysis. Palaeontologia Electronica 4, 9,http://palaeo-electronica.org/2001 1/past/issue1 01.htm.
Henriques-Oliveira, A.L., Nessimian, J.L. Aquatic macroinvertebrate diversity andcomposition in streams along an altitudinal gradient in Southeastern Brazil.Biota Neotropica 10(3), in press.
Hering, D., Moog, O., Sandin, L., Verdonschot, P.F.M., 2004. Overview and applicationof the AQEM assessment system. Hydrobiologia 516, 1–20.
Hering, D., Feld, C.K., Moog, O., Ofenböck, T., 2006. Cook book for the developmentof a multimetric index for biological condition of aquatic ecosystems: expe-riences from the European AQEM and STAR projects and related initiatives.Hydrobiologia 566, 311–342.
Herlihy, A.T., Paulsen, S.G., Van Sickle, J., Stoddard, J.L., Hawkins, C.P., Yuan, L., 2008.Striving for consistency in a national assessment: the challenges of applying areference condition approach at a continental scale. Journal of the North Amer-ican Benthological Society 27, 860–877.
Hill, B.H., Herlihy, A.T., Kaufmann, P.R., Stevenson, R.J., McCormick, F.H., BurchJohnson, C., 2000. Use of periphyton assemblage data as an index ofbiotic integrity. Journal of the North American Benthological Society 19,50–67.
Hill, B.H., Herlihy, A.T., Kaufmann, P.R., DeCelles, S.J., Vander Borgh, M.A., 2003.Assessment of streams of the eastern United States using a periphyton indexof biotic integrity. Ecological Indicators 2, 325–338.
Hilsenhoff, W.L., 1977. Use of arthropods to evaluate water quality of streams. In:Technical Bulletin 100. Department of Natural Resources, Madison, WI.
Hughes, R.M., Oberdorff, T., 1999. Applications of IBI concepts and metrics to watersoutside the United States and Canada. In: Simon, T.P. (Ed.), Assessing the Sus-tainability and Biological Integrity of Water Resources using Fish Assemblages.Lewis, Boca Raton, pp. 79–93.
Hughes, R.M., Peck, D.V., 2008. Acquiring data for large aquatic resource surveys:the art of compromise among science, logistics and reality. Journal of the NorthAmerican Benthological Society 27, 837–859.
Hughes, R.M., Kaufmann, P.R., Herlihy, A.T., Kincaid, T.M., Reynolds, L., Larsen,D.P., 1998. A process for developing and evaluating indices of fish assem-blage integrity. Canadian Journal of Fisheries and Aquatic Sciences 55,1618–1631.
Hughes, R.M., Howlin, S., Kaufmann, P.R., 2004. A biointegrity index for coldwa-ter streams of western Oregon and Washington. Transactions of the AmericanFisheries Society 133, 1497–1515.
Hughes, R.M., Herlihy, A.T., Kaufmann, P.R., 2010. An evaluation of qualitativeindexes of physical habitat applied to agricultural streams in ten U.S. states.Journal of the American Water Resources Association 46, 792–806.
JICA (Japan International Cooperation Agency), 1994. The study of recuperation ofthe Guanabara Bay ecosystem. In: Supporting Report, vols. 1–4. Kokusai KogyoCo., Ltd., Tokyo.
Junqueira, M.V., Amarante, M.C., Dias, C.F.S., Franca, E.S., 2000. Biomoni-toramento da qualidade das águas da bacia do Alto Rio das Velhas(MG/Brasil) através de macroinvertebrados. Acta Limnologica Brasiliense 12,73–87.
Karr, J.R., 1981. Assessment of biotic integrity using fish communities. Fisheries 6(6), 21–27.
Karr, J.R., Dudley, D.R., 1981. Ecological perspective on water quality goals. Environ-mental Management 5, 55–68.
Karr, J.R., Chu, E.W., 2000. Sustaining living rivers. Hydrobiologia 423, 1–14.Klemm, D.J., Blocksom, K.A., Fulk, F.A., Herlihy, A.T., Hughes, R.M., Kaufmann, P.R.,
Peck, D.V., Stoddard, J.L., Thoeny, W.T., Griffith, M.B., Davis, W.S., 2003. Devel-opment and evaluation of a macroinvertebrate biotic integrity index (MBII) forregionally assessing Mid-Atlantic highlands streams. Environmental Manage-ment 31, 656–669.
Kolkwitz, R., Marsson, K., 1909. Ökologie der tierischen saprobien: beiträge zur lehrevon des biologischen gewasserbeurteilung. Internationale Revue der GesamtenHydrobiologie und Hydrographie 2, 126–152.
Manly, B.F.J., 1986. Multivariate Statistical Methods: A Primer. Chapman, New York,215 p.
McCormick, F.H., Hughes, R.M., Kaufmann, P.R., Herlihy, A.T., Peck, D.V., 2001. Devel-opment of an index of biotic integrity for the Mid-Atlantic Highlands Region.Transactions of the American Fisheries Society 130, 857–877.
Melo, A.S., 2005. Effects of taxonomic and numeric resolution on the ability to detectecological patterns at a local scale using stream macroinvertebrates. Archivesfür Hydrobiologie 164, 309–323.
Merrit, R.W., Cummins, K.W., 1984. An Introduction to the Aquatic Insects of NorthAmerica. Kendall, Hunt Publication Co., Dubuque, IA.
Moya, N., Hughes, R.M., Dominguez, E., Gibon, F.-M., Goita, E., Oberdorff,T., 2011. Macroinvertebrate-based multimetric predictive models for mea-suring the biotic condition of Bolivian streams. Ecological Indicators 11,840–847.
Mugnai, R., Oliveira, R.B.S., Carvalho, A.L., Baptista, D.F., 2008. Adaptation of theindice biotico esteso (IBE) for water quality assessment in rivers of Serra doMar, Rio de Janeiro State, Brazil. Tropical Zoology 21, 57–74.
O’Connell, T.J., Jackson, L.E., Brooks, R.P., 2000. Bird guilds as indicators of eco-logical condition in the central Appalachians. Ecological Applications 10,1706–1721.
Oliveira, R.B.S., Mugnai, R., Catro, C.M., Baptista, D.F., 2011. Determining subsam-pling effort for the development of a rapid bioassessment protocol using benthicmacroinvertebrates in streams of Southeastern Brazil. Environmental Monitor-ing and Assessment 175, 75–85.
Paulsen, S.G., Mayio, A., Peck, D.V., Stoddard, J.L., Tarquinio, E., Holdsworth, S.M.,Van Sickle, J., Yuan, L.L., Hawkins, C.P., Herlihy, A., Kaufmann, P.R., Barbour,M.T., Larsen, D.P., Olsen, A.R., 2008. Condition of stream ecosystems in the US:an overview of the first national assessment. Journal of the North AmericanBenthological Society 27, 812–821.
Pinto, B.J.T., Araújo, F.G., 2007. Assessing the biotic integrity of the fish communityin a heavily impacted segment of a tropical river in Brazil. Brazilian Archives ofBiology and Technology 50, 489–502.
Pinto, B.C.T., Araújo, F.G., Hughes, R.M., 2006. Effects of landscape and riparian con-dition on a fish index of biotic integrity in a large southeastern Brazil river.Hydrobiologia 556, 69–83.
Pont, D., Hugueny, B., Beier, U., Goffaux, D., Melcher, A., Noble, R., Rogers, C., Roset,N., Schmutz, S., 2006. Assessing river biotic condition at the continental scale:a European approach using functional metrics and fish assemblages. Journal ofApplied Ecology 43, 70–80.
Pont, D., Hughes, R.M., Whittier, T.R., Schmutz, S., 2009. A predictive index of bioticintegrity model for aquatic-vertebrate assemblages of western U.S. streams.Transactions of the American Fisheries Society 138, 292–305.
Rosenberg, D.M., Resh, V.H. (Eds.), 1993. Freshwater Biomonitoring and BenthicMacroinvertebrates. Chapman and Hall, New York.
Roset, N., Grenouillet, G., Goffaux, D., Pont, D., Kestemont, P., 2007. A review of exist-ing fish assemblage indicators and methodologies. Fisheries Management andEcology 14, 393–405.

Author's personal copy
R.B.S. Oliveira et al. / Ecological Indicators 11 (2011) 1584–1593 1593
Schmidt-Kloiber, A., Nijboer, R.C., 2004. The effect of taxonomic resolution on theassessment of ecological water quality classes. Hydrobiologia 516, 269–283.
Shannon, C.E., Weaver, W., 1949. The Mathematical Theory of Communication. Uni-versity of Illinois Press, Urbana.
Silveira, M.P., Baptista, D.F., Buss, D.F., Nessimian, J.L., Egler, M., 2005. Application ofbiological measures for stream integrity assessment in south-east Brazil. Envi-ronmental Monitoring and Assessment 101, 117–128.
Stoddard, J.L., Larsen, D.P., Hawkins, C.P., Johnson, R.K., Norris, R.H., 2006. Settingexpectations for the ecological condition of streams: the concept for referencecondition. Ecological Applications 16, 1267–1276.
Stoddard, J.L., Herlihy, A.T., Peck, D.V., Hughes, R.M., Whittier, T.R., Tar-quinio, E., 2008. A process for creating multimetric indices for large-scaleaquatic surveys. Journal of the North American Benthological Society 27,878–891.
Vlek, H.E., Verdonschot, P.F.M., Nijboer, R.C., 2004. Towards a multimetric index forthe assessment of Dutch streams using benthic macroinvertebrates. Hydrobi-ologia 516, 175–191.
Whittier, T.R., Van Sickle, J., 2010. Macroinvertebrate tolerance values and an assem-blage tolerance index (ATI) for western USA streams and rivers. Journal of theNorth American Benthological Society 29, 852–866.
Whittier, T.R., Stoddard, J.L., Hughes, R.M., Lomnicky, G., 2006. Associations amongcatchment- and site-scale disturbance indicators and biological assemblages atleast- and most-disturbed stream and river sites in the western USA. In: Hughes,R.M., Wang, L., Seelbach, P.W. (Eds.), Landscape Influences on Stream Habitatand Biological Assemblages, vol. 48. American Fisheries Society, Symposium,pp. 641–664.
Whittier, T.R., Hughes, R.M., Stoddard, J.L., Lomnicky, G.A., Peck, D.V., Herlihy, A.T.,2007a. A structured approach for developing indices of biotic integrity: threeexamples from streams and rivers in the western USA. Transactions of the Amer-ican Fisheries Society 136, 718–735.
Whittier, T.R., Stoddard, J.L., Larsen, D.P., Herlihy, A.T., 2007b. Selecting referencesites for stream biological assessments: best professional judgment or objectivecriteria. Journal of the North American Benthological Society 26, 349–360.
Copyright © 2022 FDOKUMEN