Rivers, Streams and Reservoirs 3.1.1 Freshwater Th
34
29 3. Impact assessment on ecosystems 3.1 Impact on freshwater ecosystems – Rivers, Streams and Reservoirs 3.1.1 Freshwater The most common, direct and universal impact of acid rain on freshwater ecosystems includes acidification of surface waters and aluminum toxicity. The Hong Kong Environmental Protection Department (EPD) has already set up a territory-wide monitoring network since 1980s. There are a total of 81 monitoring stations covering 30 watercourses including rivers, streams and open nullahs in the year 1999. However, livestock waste, industrial discharge and domestic sewage have heavily polluted some of these watercourses. With the implementation of the Water Pollution Control Ordinance, industrial pollution to streams and rivers had been effectively controlled at source. In addition, some of the EPD’s monitoring stations are located at the lower course of the watercourses leading to the sea. The chemical characteristics of these stations will be under the great tidal influence. Thus, in assessing the impact of acid deposition per se, a preliminary screening was conducted to eliminate these anthropogenic and topographic influence. A total of 18 stations were selected (Table 3-1). Acidity of surface water The acidity of surface water is directly reflected by its pH. To provide a quick and preliminary assessment on pH changes over time, the following simple protocol was adopted. The annual average pH of the selected watercourses listed in Table 3-1 was firstly calculated for individual year from 1988 to 1999. These annual averages were grouped into two time regimes, 1988 to 1992 and 1993 to 1999. The former serves as reference for the latter, which coincides the time interval of the acid deposition data employed in this study. The mean, median, minimum and maximum values of the annual averages for the two regimes were further calculated and summarized in Table 3-2. As evidenced from Table 3-2, all the mean annual average pH in the watercourse is close to neutral (pH 7). Similar pattern is observed in the median of the annual average pH. When comparing the period of 1993-1999 with 1988-1992, a trend of increase is observed in the mean, median as well as the minimum of the annual average pH. While increase of the mean and median annual average pH is in the range of 0 to 0.60, the minimal annual average has a more significant increase in the range of 0.20 to 0.87. Apparently, no sign of acidification of surface water is indicated. No evidence of water acidification in basins at Kadoorie Agricultural Research Center during storms was also reported (Peart et al., 1995; Peart, 2000). Aluminum level in water The aluminum (Al) mobilization is widely believed to be one of the most important ecological effects of surface water acidification. Al is thus an important parameter for evaluation due to its toxicity to aquatic biota. Al is derived from weathering reactions and abundant in soils. It has a pH-dependent solubility in water. Dissolved Al is particularly toxic in pH range of 5.0 to 5.5, a range in which Al hydrolysis products often constitute a significant fraction of dissolved inorganic Al. The hydrolysed products of aluminium, Al(OH) 2+ and Al(OH) 2 + are considered to be most toxic to fish. Al 3+ is also considered highly toxic to both aquatic organisms and plant roots.
-
Upload
khangminh22 -
Category
Documents
-
view
1 -
download
0
Transcript of Rivers, Streams and Reservoirs 3.1.1 Freshwater Th

29
3. Impact assessment on ecosystems 3.1 Impact on freshwater ecosystems – Rivers, Streams and Reservoirs 3.1.1 Freshwater
The most common, direct and universal impact of acid rain on freshwater ecosystems includes acidification of surface waters and aluminum toxicity. The Hong Kong Environmental Protection Department (EPD) has already set up a territory-wide monitoring network since 1980s. There are a total of 81 monitoring stations covering 30 watercourses including rivers, streams and open nullahs in the year 1999. However, livestock waste, industrial discharge and domestic sewage have heavily polluted some of these watercourses. With the implementation of the Water Pollution Control Ordinance, industrial pollution to streams and rivers had been effectively controlled at source. In addition, some of the EPD’s monitoring stations are located at the lower course of the watercourses leading to the sea. The chemical characteristics of these stations will be under the great tidal influence. Thus, in assessing the impact of acid deposition per se, a preliminary screening was conducted to eliminate these anthropogenic and topographic influence. A total of 18 stations were selected (Table 3-1). Acidity of surface water
The acidity of surface water is directly reflected by its pH. To provide a quick and preliminary assessment on pH changes over time, the following simple protocol was adopted. The annual average pH of the selected watercourses listed in Table 3-1 was firstly calculated for individual year from 1988 to 1999. These annual averages were grouped into two time regimes, 1988 to 1992 and 1993 to 1999. The former serves as reference for the latter, which coincides the time interval of the acid deposition data employed in this study. The mean, median, minimum and maximum values of the annual averages for the two regimes were further calculated and summarized in Table 3-2. As evidenced from Table 3-2, all the mean annual average pH in the watercourse is close to neutral (pH 7). Similar pattern is observed in the median of the annual average pH. When comparing the period of 1993-1999 with 1988-1992, a trend of increase is observed in the mean, median as well as the minimum of the annual average pH. While increase of the mean and median annual average pH is in the range of 0 to 0.60, the minimal annual average has a more significant increase in the range of 0.20 to 0.87. Apparently, no sign of acidification of surface water is indicated. No evidence of water acidification in basins at Kadoorie Agricultural Research Center during storms was also reported (Peart et al., 1995; Peart, 2000). Aluminum level in water
The aluminum (Al) mobilization is widely believed to be one of the most important ecological effects of surface water acidification. Al is thus an important parameter for evaluation due to its toxicity to aquatic biota. Al is derived from weathering reactions and abundant in soils. It has a pH-dependent solubility in water. Dissolved Al is particularly toxic in pH range of 5.0 to 5.5, a range in which Al hydrolysis products often constitute a significant fraction of dissolved inorganic Al. The hydrolysed products of aluminium, Al(OH)2+ and Al(OH)2
+ are considered to be most toxic to fish. Al3+ is also considered highly toxic to both aquatic organisms and plant roots.

30
Table 3-1. Summary of the selected monitoring stations with minimal anthropogenic influence for data analyses. Water Control Zone River/Stream Station Label Description Deep Bay Ha Pak Nai Stream DB1 Pristine stream free from pollution Tai Shui Hang
Stream DB2 Excellent water quality
Southern Mui Wo River MW1,2,3,4,5 History with serious livestock waste pollution and organic pollution from food business. Stopped since 1988 as a result of the Livestock Waste Control Scheme and the Water Pollution Control Ordinance.
Tolo and Channel Kwun Yam Shan KY1 Past suffered from livestock waste, stopped since 1988 as a result of the Livestock Waste Control Scheme.
Shan Liu Stream TR4 Excellent water quality Tung Tze Stream TR6 Excellent water quality Kau Liu Ha
Stream - upstream TR12D Data suggested that these stations
had not been polluted by sludge alum.
Kam Shan TR12E Excellent since 1993 Episodic Al loading due to illegal discharge from a construction site upstream in 1998, hence only data from 1993 to 1997 employed for analysis
Tin Liu Ha Stream - upstream
TR12G Data suggested that these stations had not been polluted by sludge alum.
Kau Liu Ha Stream - upstream
TR12H Data suggested that these stations had not been polluted by sludge alum.
Tai Po Kau Stream
TR14 History with heavy livestock waste pollution, stopped since 1988 as a result of the Livestock Waste Control Scheme.
North Western Tung Chung River
TC1,2,3 Excellent water quality

31
Table 3-2. The summary of the mean, median, minimum and maximum* annual average pH of the selected watercourses with minimal anthropogenic influence in the period of 1988 to 1992 and 1993 to 1999 Water Control Zone
River Year Mean Median Minimum Maximum
Tolo Harbour 88-92 6.83 6.98 6.19 7.09 & Channel 93-99 7.40 7.30 7.06 7.80
Shan Liu Stream (TR4)
Change 0.56 0.31 0.87 0.71
88-92 7.43 7.38 6.90 7.98 93-99 7.52 7.47 7.36 7.78
Tung Tze Stream (TR6)
change 0.09 0.09 0.46 -0.19
88-92 7.05 7.11 6.67 7.20 93-99 7.44 7.35 7.07 7.86
Lam Tsuen River (TR12D)
change 0.39 0.25 0.40 0.66
88-92 7.14 7.22 6.75 7.33 93-99 7.81 7.74 7.43 8.34
Lam Tsuen River (TR12E)
change 0.66 0.52 0.68 1.00
88-92 6.99 7.03 6.67 7.19 93-99 7.37 7.41 7.15 7.62
Lam Tsuen River (TR12G)
change 0.38 0.38 0.48 0.43
88-92 7.18 7.28 6.70 7.41 93-99 7.39 7.41 7.12 7.57
Lam Tsuen River (TR12H)
change 0.22 0.13 0.42 0.16
88-92 7.01 7.05 6.44 7.26 93-99 7.38 7.37 7.11 7.58
Tai Po Kau Stream (TR14)
change 0.37 0.32 0.67 0.33
88-92 7.07 7.09 6.70 7.48 93-99 7.67 7.70 7.28 8.02
Shing Mun River (KY1)
change 0.60 0.61 0.58 0.54
Southern 88-92 7.08 7.07 6.78 7.40 93-99 7.28 7.31 7.14 7.38
Mui Wo River (MW1)
change 0.20 0.24 0.37 -0.02
88-92 7.11 7.21 6.81 7.40 93-99 7.51 7.60 7.25 7.69
Mui Wo River (MW2)
change 0.40 0.39 0.44 0.29
88-92 6.80 6.79 6.58 6.97 93-99 7.17 7.16 6.77 7.51
Mui Wo River (MW3)
change
0.38 0.37 0.19 0.54

32
Table 3-2. Cont’d Water Control Zone River Year Mean Median Minimum 88-92 7.03 7.13 6.47 7.48 93-99 7.25 7.17 7.03 7.50
Mui Wo River (MW4)
change 0.22 0.05 0.55 0.02
88-92 7.06 7.10 6.54 7.38 93-99 7.37 7.39 7.15 7.63
Mui Wo River (MW5) change 0.31 0.29 0.61 0.26
Deep Bay 88-92 6.95 6.97 6.63 7.23 93-99 7.20 7.31 6.80 7.59
Ha Pak Nai Stream (DB1)
change 0.25 0.34 0.16 0.35
88-92 7.02 7.05 6.60 7.39 93-99 7.23 7.08 6.79 7.69
Tai Shui Hang Stream (DB2)
change 0.21 0.03 0.19 0.30 North West 88-92 ND ND ND ND 93-99 7.10 7.10 6.91 7.47
Tung Chung River (TC1) change -- -- -- --
88-92 ND ND ND ND 93-99 7.22 7.12 6.85 7.85
Tung Chung River (TC1) change -- -- -- --
88-92 ND ND ND ND 93-99 7.80 7.58 7.57 8.09
Tung Chung River (TC1)
change -- -- -- --
*mean, median, minimum and maximum referred to the corresponding statistics of the annual average in the year 1988 to 1992 and 1993 to 1999, respectively ND: No Data Al toxicity to aquatic organisms is species specific and life-stage dependent (Sullivan, 2000 for review). Toxicity in terms of the lethal dosage for 50% population mortality (LD50) on fish had been reported in the range of 200 to 300 μg/l Al. The mean, median, minimum and maximum of the annual average Al were determined with a similar protocol as that of pH described above to provide a preliminary assessment of the Al profile in the selected stations (Table 3-3). In the period of 1993-1999, 12 out of the 18 stations have a mean annual average value of Al below 100 μg/l. When the median of the annual average is considered, a total of 15 stations have a median below 100 μg/l. The result reflects that the incidence of high Al level is likely episodic of anthropogenic nature. This is best exemplified by the data in station TR12E. An episodic illegal discharge of muddy water from a construction site upstream of it elevated the October data in 1998 up to a level of 3600 μg/l. As a consequence, the annual average in 1998 was reported with a high value of 1317 μg/l Al. The 1998 annual average was also the maximum annual one in the period 1993-1999. The episodic event in 1998 also raised the mean of the annual average in the period 1993-1999 to 306 μg/l but leaving the median of the annual average at 90 μg/l. The stations, TR14, KY1, DB1 and DB2 show an increase over 30μg/l Al from the mean and/or median of the annual average in the 1993-1999

33
Table 3-3. The summary of the mean, median, minimum and maximum* annual average of Aluminum (μg/l) of the selected watercourses with minimal anthropogenic influence in the period of 1988 to 1992 and 1993 to 1999 Water Control Zone
River Year Mean Median Minimum Maximum
Tolo Harbour 88-92 63.05 58.00 51.67 86.40 & Channel 93-99 89.40 79.17 60.00 185.00
Shan Liu Stream (TR4)
change 26.36 21.17 8.33 98.60
88-92 98.07 98.33 63.33 133.00 93-99 96.42 99.17 70.83 126.67
Tung Tze Stream (TR6)
change -1.64 0.83 7.50 -6.33
88-92 88.83 90.00 50.00 129.17 93-99 99.29 68.33 50.00 275.00
Lam Tsuen River (TR12D)
change 10.45 -21.67 0.00 145.83
88-92 64.30 58.18 50.00 88.33 93-99 306.55 90.00 75.83 1316.67
Lam Tsuen River (TR12E)
change 242.24 31.82 25.83 1228.33
88-92 65.64 59.17 50.91 97.27 93-99 62.26 56.67 50.83 94.17
Lam Tsuen River (TR12G)
change -3.37 -2.50 -0.08 -3.11
88-92 87.57 85.83 58.33 125.00 93-99 76.67 78.33 51.67 110.00
Lam Tsuen River (TR12H)
change -10.90 -7.50 -6.67 -15.00
88-92 88.67 55.00 50.00 176.67 93-99 103.57 90.83 60.83 235.83
Tai Po Kau Stream (TR14)
change 14.9 35.83 10.83 59.16
88-92 65.20 56.67 45.00 116.00 93-99 95.48 97.50 65.83 126.67 change 30.28 40.83 20.83 10.67
Shing Mun River (KY1)
Southern 88-92 81.98 66.36 55.00 152.73 93-99 91.07 69.17 56.67 213.33
Mui Wo River (MW1)
change 9.09 2.80 1.67 60.61
88-92 102.38 70.00 53.33 182.73 93-99 97.86 93.33 67.50 170.83
Mui Wo River (MW2)
change -4.52 23.33 14.17 -11.89
88-92 65.95 57.50 50.00 98.33 93-99 67.14 61.67 52.50 95.00
Mui Wo River (MW3)
change 1.19 4.17 2.50 -3.33

34
Table 3-3. Cont’d Water Control Zone River Year Mean Median Minimum 88-92 132.68 80.00 70.00 273.64 93-99 90.71 81.67 66.67 121.67
Mui Wo River (MW4)
change -41.97 1.67 -3.33 -151.97
88-92 79.13 77.50 50.83 101.82 93-99 90.36 87.50 55.00 122.50
Mui Wo River (MW5)
change 11.23 10.00 4.17 20.68 Deep Bay 88-92 127.92 132.50 86.67 160.00 93-99 168.45 197.50 75.00 291.67
Ha Pak Nai Stream (DB1)
change 40.54 65.00 -11.67 131.67
88-92 83.96 84.58 68.33 98.33 93-99 119.88 120.00 70.83 196.67
Tai Shui Hang Stream(DB2)
change 35.92 35.42 2.50 98.33
North West 88-92 ND ND ND ND 93-99 62.1 54.3 50 170
Tung Chung River (TC1)
change -- -- -- -- 88-92 ND ND ND ND 93-99 102.1 57.1 50 1400
Tung Chung River (TC2)
change -- -- -- -- 88-92 ND ND ND ND 93-99 158.9 105.7 50 130
Tung Chung River (TC3)
change -- -- -- -- *mean, median, minimum and maximum referred to the corresponding statistics of the annual average in the year 1988 to 1992 and 1993 to 1999, respectively ND: No Data period when comparing with the 1988-1992 period. In this regard, the trend analysis to be reported later will provide a better reflection on the trend change. Most of the stations (14 out of 18) show no significant trend change in the mean and median values of the annual average Al level between the period of 1988-1992 and 1993-1999. This level of Al (50 to 100 μg/l) may thus be considered as background level in local freshwaters. Al at this level with a neutral pH is of complex form and suggests no adverse effect on the organisms inhabiting the watercourses. Correlation Analysis for the relationship of pH, conductivity and [Al] to the rainfall
The effect, if any, of acid rain on the freshwater ecosystems will be manifested in the amount of rainfall on the potential affected parameters. Since correlation analysis measures the strength of the association between any two parameters or variables, it was employed to determine the possible association between the daily average rainfall with the pH and Al from 1993-1999. The sample coefficient of correlation (r) and the coefficient of determination (r2) were used as an estimator for the coefficient of correlation (ρ) in this study. Positive value for r indicated a positive correlation while negative r-value implied a negative correlation. The test statistic t with n-2 degree of freedom determined the existence of statistically association between rainfall and pH as well as between rainfall and Al level.

35
Correlation between water pH with rainfall Results of the correlation analysis between pH and rainfall in the 18 selected
stations were summarized in Table 3-4. Generally speaking, there is no significant correlation between pH of river water and monthly average rainfall as evidenced from Table 3-4. It shows that 15 out of the 18 stations have no correlation between water pH and rainfall and the other 3 stations even show a positive correlation, i.e. water pH increases with rainfall. Table 3-4. The result of correlation analysis between pH and monthly average rainfall (mm) Water Control Zone
Station df R r2 t p
KY1 82 0.007 0.000 -0.062 0.951 TR4 83 0.120 0.014 1.095 0.277 TR6 75 0.188 0.036 -1.650 0.103 TR14 82 0.071 0.005 0.644 0.521 TR12D 81 0.147 0.022 1.321 0.190 TR12E 58 0.100 0.010 -0.766 0.447 TR12G 81 0.218 0.048 -2.001 0.049
Tolo Harbor / Channel
TR12H 81 0.158 0.025 -1.427 0.157
MW1 82 0.161 0.026 -1.464 0.147 MW2 81 0.208 0.043 -1.904 0.061 MW3 83 0.078 0.006 0.710 0.480 MW4 83 0.370 0.137 -3.601 0.001
Southern
MW5 82 0.252 0.064 -2.343 0.022
DB1 83 0.134 0.018 -1.501 0.136 Deep Bay DB2 83 0.107 0.011 -0.972 0.334
TC1 41 0.069 0.005 0.432 0.668 TC2 39 0.158 0.025 -0.985 0.331 TC3 37 0.312 0.097 -1.915 0.064
North West
Correlation between Al and rainfall
Al level shows no correlation to rainfall as well in general. A total of 16 out of the 18 stations show no correlation between Al level and rainfall (Table 3-5). A negative correlation is even observed in the remaining 2 stations (MW2 and MW3). Correlation between pH and Al level
The Al level is pH dependent and has a negative correlation with pH if the elevated level is due to rain acidity. The correlation analysis between pH and Al in the 18 stations reveals that the majority (13 out of 18) shows no correlation between pH and Al level while two (DB2 and TC3) show positive correlation and three (TR12G, TR12H and TC2) negative (Table 3-6). It can thus be generally concluded that the Al level in the local freshwaters is not associated with the water pH and hence, not directly influenced by the rain pH. The general conclusion to be drawn is that the pH and Al level in the river water is not correlated with the rain precipitation in the year 1993 to 1999.

36
Table 3-5. The result of correlation analysis of [Al] and monthly average rainfall (mm) Water Control Zone
Station df r r2 t p
KY1 81 0.092 0.009 0.114 0.292 TR4 80 0.005 0.000 0.059 0.953 TR6 74 0.008 0.000 0.083 0.934 TR14 81 -0.072 0.005 -0.646 0.520 TR12D 81 -0.109 0.012 -1.300 0.196 TR12E 58 0.014 0.000 0.123 0.902 TR12G 81 0.109 0.012 1.263 0.209
Tolo Harbor / Channel
TR12H 82 0.070 0.005 0.819 0.414
MW1 82 -0.175 0.031 -1.595 0.115 MW2 79 -0.233 0.054 -2.115 0.038 MW3 82 -0.229 0.052 -2.126 0.037 MW4 82 -0.112 0.013 -1.016 0.313
Southern
MW5 81 -0.028 0.001 -0.251 0.803
DB1 81 -0.108 0.012 -1.195 0.234 Deep Bay DB2 81 -0.053 0.003 -0.582 0.561
TC1 40 0.143 0.021 0.905 0.371 TC2 39 0.015 0.000 0.090 0.929
North West
TC3 36 0.028 0.001 0.167 0.868
Table 3-6. The result of correlation analysis of pH and [Al] Water Control Zone
Station df r r2 t p
KY1 80 0.209 0.044 1.911 0.060 TR4 79 -0.047 0.002 -0.417 0.678 TR6 72 0.150 0.023 1.289 0.202 TR14 79 -0.194 0.038 -1.762 0.082 TR12D 79 -0.095 0.009 -0.849 0.398 TR12E 56 -0.026 0.001 -0.191 0.849 TR12G 79 -0.219 0.048 -1.995 0.050
Tolo Harbor / Channel
TR12H 79 -0.374 0.140 -3.580 0.001
MW1 80 0.094 0.009 0.845 0.400 MW2 76 0.179 0.032 1.582 0.118 MW3 82 0.105 0.011 0.961 0.340 MW4 81 0.163 0.027 1.486 0.141
Southern
MW5 80 0.097 0.009 0.868 0.388
DB1 80 0.105 0.011 0.944 0.348 Deep Bay DB2 80 0.224 0.050 2.051 0.044
TC1 39 -0.216 0.047 -1.379 0.176 TC2 38 -0.463 0.214 -3.220 0.003 TC3 34 0.381 0.145 2.401 0.022
North West

37
Trend of change in pH, conductivity and Al In assessing whether there is a chronic acidification in the freshwater, the long
term relationship of pH and Al against time is analysed for trend change (increase or decrease). Seasonal Kandell’s test for trend analysis was applied to detect the monotonic trend of three parameters in the time period from 1993 to 1999. This test is a well-known method in examining the monotonic trend that is relatively insensitive to fluctuations or uncertainty caused by the seasonality dependence of data, missing data and outliers. Results of the test were summarized in Table 3-7. Table 3-7. Summary of the Seansonal Kandell’s test for the 18 stations. River Station pH [Al] (μg/L) Tolo Harbor/Channel Water Control Zone
S p S p
Kwun Yam Shan Stream KY1 0.448 <0.001 0.149 0.045 Shan Liu Stream TR4 ⎯ ⎯ ⎯ ⎯ Tung Tze Stream TR6 ⎯ ⎯ ⎯ ⎯ Tai Po Kau Stream TR14 0.154 0.038 0.249 0.001
TR12D 0.270 <0.001 ⎯ ⎯ TR12E ∗ ∗ ⎯ ⎯ TR12G 0.172 0.02 ⎯ ⎯
Lam Tsuen River
TR12H ⎯ ⎯ -0.190 0.01 Southern Water Control Zone Mui Wo River MW1 ⎯ ⎯ 0.1684 0.023 MW2 0.326 <0.001 ⎯ ⎯ MW3 0.204 0.006 ⎯ ⎯ MW4 -0.228 0.002 ⎯ ⎯ MW5 ⎯ ⎯ ⎯ ⎯ Deep Bay Water Control Zone Ha Pak Nai Stream DB1 0.302 <0.001 0.222 0.003 Tai Shui Hang Stream DB2 0.236 0.002 ⎯ ⎯ Northern Western Control Zone Tung Chung River TC1 ⎯ ⎯ ⎯ ⎯ TC2 ⎯ ⎯ ⎯ ⎯ TC3 ⎯ ⎯ ⎯ ⎯ *Insufficient data for the Kendall analysis as a result of discarding the year data of 1998 and 1999 due to known anthropogenic pollution source From year 1993 to 1999, 8 stations show an increasing trend in pH and 8 others show no trend of change. Only 1 out of the 18 stations shows a decreasing trend in water pH. The results indicate clearly that chronic acidification of the surface water by natural rain per se is not evidenced. Concerning the Al level, out of 18 stations, 4 (KY1, TR14, MW1 and DB1) show increasing and 1 (TR12H) decreasing trend. The majority, however, does not indicate any trend of change. The decreasing trend of Al in TR12H is likely a natural diluting process over time on some yet unidentified event leading to episodic elevation of the

38
Al level in early 90s. The increasing trend of Al in KY1, TR14 and DB1 are accompanied by a significant increase trend of pH as well. This suggests that the increase of Al level is not induced by acidification in the water in which case, decreasing pH trend should be evidenced instead. This is further supported from results of correlation analysis that shows no correlation between pH and Al in the three mentioned stations (Table 3-6). The same argument applies to DB2. Although the mean of the annual average indicates an increase in the period of 1993-1999 comparing with 1988-1992, no significant statistical trend is indicated (Table 3-7). There is even a significant positive correlation found between the water pH and Al level (Table 3-6). It can thus be concluded that Al in the water has not been elevated directly from the rainfall or indirectly as a result of leaching from soil due to the rain acidity or water acidification. 3.1.2 Reservoir status Three local reservoirs, namely Shek Pik, Tai Tam and Jubilee Reservoirs are identified as reservoirs without the Dong-jiang input. The average values of pH, conductivity and alkalinity measured in these local reservoirs receiving natural rainfall and surface runoff were summarized in Table 3-8. The average pH is in the range of 6.5 to 7.1 in the latest 3 years and is very close to neutrality. All pHs recorded are equal or above 6.0. The reservoirs should be in the high productive group of lakes (pH 6 to 8) according to Howells (1995). The conductivity averages about 50 μS/cm, characteristic of lakes and streams draining areas underlain by un-reactive geology such as granites (Howells, 1995). The values are still, however, well above 25 μS/cm, the critical threshold for acidified waters (Sullivan, 2000). The annual average alkalinity measured in the three reservoirs are all well above 50 μeq/l, a level below which lakes are vulnerable to acidification according to the Stockholm Conference on Acidification of the Environment, 1982. These various lines of evidences conclude that water in Hong Kong reservoirs (fresh water lakes) receiving natural rainfall and surface draining does not exhibit acidification. 3.1.3 Impact on aquatic organisms The most important ecological effect of increasing the acidification of surface waters is the mobilization of aluminum. The acidification of water induces ionoregulation stress while aluminium is toxic to aquatic organisms at elevated level. Table 3-9 summarized the reviews on the potential impact on various freshwater aquatic organisms. Details could be referred to Sullivant (2000), Howells (1995), Mason (1992) and Radojevic and Harrison (1992).

39
Table 3-8. The average, maximum and minimum (in bracket) values of pH, conductivity and alkalinity measured in Hong Kong Reservoirs* (Freshwater lakes) receiving natural rainfall, i.e. no Dong-jiang water input pH Conductivity Alkalinity (CaCO3) uS/cm mg/l μeq/l Shek Pik Reservoir 97/98 6.6
(6.0-8.4) 52
(33-211) 12
(4-67) 240
(80-1340) 98/99 6.5
(6.0-6.9) 43
(37-56) 7
(2-13) 140
(40-260) 99/00 6.5
(6.2-7.0) 47
(39-69) 7
(4-10) 140
(80-200) Tai Tam Reservoir 97/98 6.5
(6.0-7.1) 49
(40-60) 7
(5-8) 140
(100-160) 98/99 6.6
(6.2-7.2) 50
(45-90) 6
(3-8) 120
(60 –160) 99/00 6.6
(6.3-7.5) 59
(48-85) 5
(2-8) 100
(40-160) Jubilee Reservoir 97/98 7.1
(6.9-7.4) 40
(33-45) 8
(6-10) 160
(120-200) 98/99 7.1
(6.6-7.4) 42
(38-56) 10
(8-12) 200
(160-240) 99/00 7.1
(6.5-8.3) 54
(33-201) 8
(4-10) 160
(80-200) *Data from Water Supplies Department Table 3-9. Summary of the pH effect on aquatic organisms pH level Effects 6.0 – 8.0 Healthy freshwater lakes <6.0 Snails, clams can tolerate up to pH 6.0
Shrimps die off below pH5.8 Crayfish exoskeletons become soft at pH 5.7 Bird affected at pH 5.7-6.0 with Al >1000 μg/l
Diversity of mayflies, philopotamid or hydropsychid caddis, molluscs and crustaceans decreases at pH<5.7
<5.5 More deformed adult fish due to lack of nutrients pH 5.5 – Crayfish, Bass and mayflies can tolerate Fish die of suffocation
<5.0 Harmful to effs and fry development of salmonids Can be harmful to common carp Snails and most fish stopped reproduction at pH 5.0 Trout, salamanders can tolerate at pH 5.0 Pearch can tolerate down to pH 4.5 Fry mortality occurs at pH 4.4
<4.0 Lethal to salmonids Frogs can tolerate down to pH 4 without Al toxicity. Poor development in metamorphosis at pH 4.8 with 800 μg/l Al.
<3.5 pH 3.3, minimal pH for survival of adult fish

40
In a study of storm on Al leaching, Peart (2000) concluded that impact of acid deposition was insignificant though Al was elevated slightly in runoff water during storm. The potential Al toxicity was not evidenced as a result of the very small magnitude in its increase in the water and alleviation of the Al toxic effect by the calcium ions co-leached from the soils. The high abundance and species diversity of mayflies in Hong Kong watercourses provide additional evidence that acid deposition has no serious impact upon the streams yet (Dudgeon and Chan, 1992; Dudgeon and Corlett, 1994). The anthropogenic pollution rather than seasonal rainfall was also identified to be the determinant for accounting the abundance of the mayflies in Hong Kong streams (Dudgeon, 1990). Hence, it can be concluded that impact on aquatic organisms inhabiting the Hong Kong streams, rivers or reservoirs is insignificant due to acid deposition per se. 3.2 Impact on coastal waters
The marine water of Hong Kong covers an area of 1700 km2 compared with the total land area of 1100 km2 residing a population of over 6.8 million. Due to its high salt content, marine waters are believed to have buffering capacity for the acidity associated with acid rain and is very seldom assessed for acidification. Marine waters in Hong Kong are used for navigation, marine parks, mariculture, recreation as well as body receiving sewage effluent, surface runoff from land and disposal of marine dredged materials. The western water is under the influence of the Pearl River discharge as well. The natural capacity near the coast and the dumping areas are far more affected by human activities than the natural acid rain. This is demonstrated in the Deep Bay water control zone which natural capacity to degrade pollutants has already been exceeded as reported by HKEPD (1999). As marine water has no boundary, only those monitoring sites deployed by EPD that are relatively free from anthropogenic influence are screened out for assessment of the potential natural impact of acid rain. The screened stations were listed in Table 3-9. The trend of change in the depth-averaged pH was excerpted from the Annual Report on Marine Water Quality in Hong Kong, 1999 (HKEPD, 2000) and summarized in Table 3-10. Majority of the selected station showed no trend on pH change and only 5 out of the 22 screened stations give a pH decrease trend. This suggests that the natural marine water could have maintained its buffering capacity in absence of anthropogenic inputs. Time-series analysis The dynamic interaction between rainfall and marine surface water pH is also reviewed with data from the coastal water time-series monitoring in Port Shelter by the Hong Kong University of Science and Technology. A multi-parameter water quality sonde (YSI 6000 series by Yellow Spring Instruments, Inc.) was deployed at the cold water intake tower of the HKUST chilled water plant. The tower (114016.129”N, 22020.379”E) is situated in Port Shelter just off the campus of HKUST on the east side of Kowloon Peninsula. Coastal water around the station is one of the relatively pollution free and human activities free regions. The sonde was located at a depth of about 1 meter below the water surface. It measured temperature, salinity, turbidity, dissolved oxygen (DO), pH, oxidation-reduction potential (ORP). Data were recorded every 15 minutes.

41
Table 3-9. The list of the marine monitoring stations screened for assessment.
Water Control Zone Station Remark Tolo and Channel TM7 TM8
Channel subzones that are less affected by the discharge from the Shatin and Tai Po sewage discharge
Southern SM5 SM6 SM7 SM13 SM19
Away from the sewage outfalls and dumping grounds.
Port Shelter PM7 PM8 PM9 PM10N
Less affected by development and land
Mirs Bay MM3 MM4 MM5 MM6
Free from sewage discharge
MM7 MM8 MM13 MM14 MM15 MM16 MM17
Less affected by development and land
Table 3-10. Trend of change of the depth-averaged pH as determined by the Seasonal Kendall Test reported by EPD (HKEPD, 2000) Water Control Zone Station pH trend
(Seasonal Kendall Test) Tolo and Channel TM7 No trend TM8 No trend Southern SM5 No trend SM6 No trend SM7 No trend SM13 Decreased SM19 Decreased Port Shelter PM7 Decreased PM8 Decreased PM9 No trend PM10N No trend Mirs Bay MM3 No trend MM4 No trend MM5 No trend MM6 No trend MM7 No trend MM8 No trend MM13 No trend MM14 No trend MM15 No trend MM16 No trend MM17 No trend

42
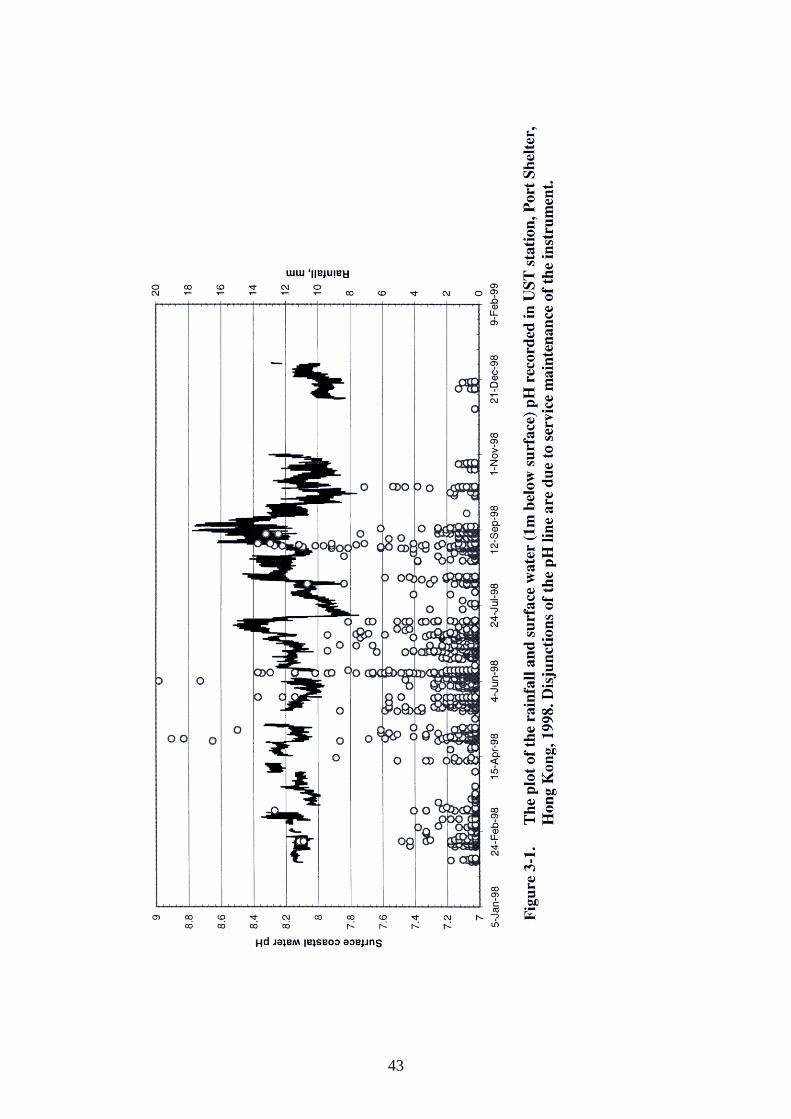
An automatic weather station (AWS) at HKUST near the pier (114016.142”N, 22020.578”E) on the shore of Port Shelter was used for meteorological data. The AWS was about 150 meters form the water intake tower. The meteorological data of temperature, pressure, relative humidity, wind velocity and direction, solar radiation and rainfall were recorded. The logging interval of data was every 15 minutes as well. Figure 3-1 and Figure 3-2 summarized the pH of the surface water and rainfall in the year 1998 and 1999. The surface water pH fluctuates with the modal pH around 8.1 and 8.2 with 0.2 pH units in both years. Most of the surface water pH remains in its range of fluctuation from January to June in both years regardless of the heaviness of the rainfall. Incidences with pH increase and decrease are also observed with heavy rainfalls. The pH increased with rainfall are evidenced in late June to early July, 1998 with a pH increased from the norm of 8.2 to 8.5; in mid September 1998 with a pH increased to 8.76 and in mid July, 1999 with the pH increased to 8.8. Decreased pH in relation to heavy rainfall is found in mid July, 1998 with a pH dropped to 7.75; in early June and early September, 1999 with a pH dropped to 7.55 in both incidences. Despite the drop in pH, the recovery to the norm is found to be within days when raining stopped. The results suggest that there is no clear relationship between rainfall and marine surface water pH. The fluctuations of pH are likely the net result of the far more complex biogeochemical interactions of the coastal waters rather than the natural acid deposition. Such interactions include the extent of photosynthetic activity of the phytoplanktons which utilizes CO2 for photosynthesis and shifting the bicarbonate buffering system to more alkaline pH; the volume of riverine discharge and surface runoff; the oceanic input driven by surface wind and nature of the oceanic current (cool or warm relative to coastal water bodies) and etc. With the present data analysed, it is concluded that coastal waters are not susceptible to acidification of the acid rain per se in its present status quo. Inorganic nitrogen deposition Eutrophication is one of the major issues in coastal water management. The inorganic nitrogen and phosphorus are the two key nutrients of intensive attention. Identification of the potential input sources of the nutrients and quantification of their loadings to the coastal water helps definitely the abatement strategy in the control process, if necessary. Atmospheric deposition is a common source of inorganic nitrogen in terms of nitrate and ammonium. Based on the deposition data from 1993 to 1999, the annual wet, dry and total deposition of NO3
--N and NH4+-N recorded in
Kwun Tong and Central/Western station were summarized in Table 3-11. The annual total inorganic-N deposited were estimated by summing the total NO3
--N and NH4+-N,
regardless the solubility of the dry deposition fraction in marine water. Such assumption will provide the highest end in estimating the total inorganic nitrogen deposition from atmosphere.
43

44

45
Table 3-11. Summary of the atmospheric deposition of inorganic nitrogen at (A) Kuwn Tong and (B) Central/Western (A) Kwun Tong NO3
--N (kg/ha/yr) NH4+-N (kg/ha/yr) Total N*
(kg/ha/yr)Year wet dry total wet dry total 1993 2.40 1.27 3.67 4.21 0.52 4.73 8.40 1994 2.21 0.81 3.02 4.25 0.39 4.63 7.65 1995 1.59 1.35 2.94 3.67 0.19 3.86 6.80 1996 2.75 1.32 4.08 4.67 0.38 5.05 9.13 1997 4.72 1.24 5.96 6.91 0.27 7.18 13.14 1998 4.11 1.31 5.42 6.16 0.17 6.34 11.76 1999 2.24 1.65 3.88 3.36 0.37 3.73 7.61 (B) Central/Western NO3
--N (kg/ha/yr) NH4+-N (kg/ha/yr) Total N*
(kg/ha/yr)Year wet dry total wet dry total 1993 2.46 1.17 3.62 3.96 0.31 4.27 7.89 1994 2.28 0.55 2.83 3.27 0.11 3.38 6.21 1995 1.78 0.94 2.72 3.03 0.31 3.34 6.06 1996 2.15 1.07 3.22 3.47 0.21 3.68 6.90 1997 2.25 0.90 3.15 4.03 0.22 4.25 7.40 1998 2.94 1.25 4.18 4.19 0.36 4.55 8.73 1999 2.33 1.58 3.92 2.44 0.33 2.77 6.69 * Total N is the sum of the total NO3
--N and NH4+-N
Accordingly, the total annual atmospheric deposition of inorganic nitrogen is in the range of 6.80 to 13.14 kg/ha/yr in Kwun Tong and 6.06 to 8.73 kg/ha/yr in Central/Western. Except for the year 1997 and 1998 at Kwun Tong, all are below 10 kg/ha/yr. These values are comparatively much lower than the 20 kg/ha/yr reported for southwest Norway (Torseth and Semb, 1998), 22-51 kg/ha/yr for Switzerland (Eugster et al., 1998) and 15-33 kg/ha/yr for United Kingdom (Fowler et al., 1998). The annual deposition of inorganic nitrogen in Hong Kong is also well below the critical load of 20 kg/ha/yr to most sensitive ecosystems (Fowler et al., 1998). The relative contribution of the atmospheric deposition of inorganic nitrogen to the marine coastal ecosystem could be as high as 50% of the total riverine and direct input to the North Sea (Ibrekk et al., 1991) or one-third in the Baltic Sea as indicated in the Swedish Environmental Protection Agency webpage (0www.internat.environ.se/documents/pollutants/overgod/eutroe.html). With the available data, the relative contribution from atmospheric deposition in Hong Kong is estimated using Tolo Harbour as an example. In the year 1994, it was estimated that a loading of 4000 kg N/day in the Tolo Harbor (HKEPD, 1995). The total area of Tolo Harbor is about 50 km2. Assuming the average of the Kwun Tong and Central/Western to be the territory average, the atmospheric inorganic nitrogen deposition will be 6.93 kg/ha/yr in the year 1994. This is equivalent to a deposition of 6.93 x 100 kg/km2/yr x 50 km2 nitrogen in the Tolo Harbour. This will yield an annual

46
34650 kg N or about 95 kg N/day. Comparing with the 4000 kg N/day loaded from sewage and other sources, the atmospheric deposition of inorganic nitrogen accounts for only 2.4% of the land based loading. In this regard, the atmospheric loading of nitrogen should be less significant than the land based loading in Hong Kong when eutrophication is concerned. 3.3 Impact on agriculture and soil 3.3.1 Impact assessment on agriculture
The main economic crops in Hong Kong include vegetables and flowers, accounting for over 95% of the annual crop production. Both open and greenhouse farming are practiced. Acid deposition can have the direct effect on the foliage and indirect effect on changing the soil characteristics. The indirect effect of acid deposition on the agricultural soil is, however, very insignificant comparing with the common and standard practice of lime and / or fertilizer application by the farmers. The direct physical effect on leaf surfaces is necrosis as a result of the corrosive nature of the rain acidity. The waxy cuticle on the leaf surface probably enhances its resistance to rain acidity. Necrotic lesions or leaf abscission was only observed in a few sensitive crops at pH of 3.0 or below (Radojevic and Harrison, 1992; Howells, 1995; Hao et al., 1998). It is generally accepted that no or little effect on whole plant growth or metabolism in the range of acid rain pH from 5.0 to 3.0. Only ozone is considered to be the significant agent of both crop and forest damage at levels found at present, possibly enhanced by acid rain (Radojevic and Harrison, 1992; Howells, 1995 for reviews).
The chemical constituents of rain have also their effects, but likely beneficial rather than adverse. Anions such as sulfate and nitrate are essential macro-nutrients for plant growth and metabolism and they are not phyto-toxic. Ammonium also supplements some of the essential nitrogen for plant growth. Irving (1991) reviewed that acid deposition is not responsible for reduction in crop yield and there is no consistent association in time or space of damage with the incidence of brief phyto-toxic concentrations in rain.
Irving (1983) had also provided an extensive review on the potential effect of acid rain on agricultural crops in United States. Table 3-11 summarized Irving’s review on the effect of acid rain from controlled environment studies. Out of the 34 crop species studied, 6 (17.6%) showed negative effects, 8 (23.5%) showed positive responses, 17 (50%) showed no response at all and 3 (8.8%) showed both positive and negative responses. Table 3-12 summarized results of the field studies. Out of the 14 crop species, only 1 (7.1%) showed consistent negative response to acid rain, 3 (21.4%) showed a negative response for at least one acidity level, 6 (42.9%) showed positive yield response from at least one acidity level and 7 (50%) showed no effect from exposure to varying levels of acidity. It can be seen that the effect on crops is highly species specific. The majority of crops covered in her review showed no or even positive effect of rain acidity on growth or yield.

47
Table 3-11. Crop responses to acid rain in controlled-environment studies (Irving, 1983) Negative Response
Positive Response No Response Postitive and Netative Response
Pinto bean Alfalfa Wells soybean Rye grass Potato Mustard green
Tomato Spinach Swiss chard Amsoy 71 soybean
Broccoli Green pepper Limestone lettuce Oats Kidney bean Radish Strawberry Cabbage Wheat Beet Corn Cauliflower Barley Carrot Orchard grass Onion Tobacco Timothy Fescue Green pea Oakland lettuce Bluegrass Red clover Bush bean Table 3-12. Crop responses to acid rain in field studies (Irving, 1983) Consistent Negative Response
Negative Response Positive Response No Response
Garden beet Southern Giant Curled mustard green
Champion radish Red kidney bean
Pioneer 3992 field corn
Cherry Belle radish Davis soybean
Amsoy soybean Vernal Alfalfa Wells soybean Alta fescue Cherry Belle radish Beeson soybean Southern Giant Curled
mustard green Williams soybean Improved thick leaf spinach Vernal alfalfa In China, dose-response studies had been conducted in seven provinces to assess the effect of acid rain on the crops as well (Zhang et al., 1998; Hao et al., 1998). The critical pH level reported by Hao et al. (1998) that elicited short-term and long-term effect in single pH effect and in combination with SO2 effect was summarized in Table 3-13. Short-term effect was defined as 5% of the foliage that was visibly damage in forms of withering, dot-shaped, little white spots while long-term effect was defined as 5% yield loss. Zhang et al. (1998) had also assessed the critical rain pH and SO2 concentration singly or combined effects in relation to yield reduction of the crops. The results were summarized in Table 3-14.

48
Table 3-13. Summary of the critical pH that elicit short-term and long-term injury by acidity per se and in combination with SO2 on common crops in China (From Hao et al., 1998)
Crops Short term effect Long term effect Long term effect with multiple factor
pH pH pH SO2 (mg/m3) Wheat 3.0 4.59 4.46 0.166 Corn 3.0 4.1
Cabbage 2.5 5.01 Soybean 2.5 4.49 4.63 0.176
Rice 2.0 <2.8 Kidney bean 2.5
Rape 2.5 5.24 Cucumber 2.5
Tomato 2.5 4.36 Barley 3.0 4.44 Cotton 2.5 4.37 4.54 0.15 Spinach 3.0 Carrot 5.04 Peanut <2.8
Vegetables 4.64-4.79 0.114-0.120 With reference to these published data, it can be inferred that SO2 will likely not induce yield reduction on crops in Hong Kong as the annual average SO2 concentration is in the range of 0.014-0.031 mg/m3 in the year 1993 to 1999. When rain pH is concerned, Hong Kong’s average rain pH lies in 4.54 to 5.10 in the Year 1993 to 1999 (Table 3-15). Accordingly, it is believed that acid rain will not elicit any short-term injury on the vegetations according to Hao et al. (1998). When long-term effect in terms of yield reduction, a 3 to 5% reduction is estimated according to the critical levels listed in Table 3-13 and 3-14. A more quantitative approach in estimating the yield reduction on crops as consequence of acid rain is applying the linear models developed by Zhang et al. (1997). Single and multiple variable linear equations had been developed after simulation studies in assessing the single and combined effect of rain pH and SO2 on the major crops in China (Zhang et al., 1997). In Hong Kong, major economic crops include vegetables and flowers. For simplicity, the linear models for vegetables developed by Zhang et al. (1997) are employed for Hong Kong situation. Flower is also grouped under vegetables in the following assessment.

49
Table 3-14. Critical levels of rain pH and SO2 concentration in relation to crop yield reduction. (From Zhang et al., 1998) Crops Yield
reduction (%)
Rain pH SO2 (mg/m3) Rain pH + SO2 (mg/m3)
3 0.274 Rice 5 No effect for
pH > 2.8 0.459 Not applicable
10
0.914
3 4.99 0.111 4.92 0.099 Wheat 5 4.59 0.186 4.46 0.166 10
3.58 0.371 3.33 0.331
3 4.86 0.119 5.02 0.106 Cotton 5 4.37 0.199 4.63 0.176 10
3.14 0.397 3.66 0.353
3 4.93 0.104 4.96 0.094 Soybean 5 4.48 0.174 4.54 0.157 10
3.38 0.347 3.47 0.313
3 5.25-4.80 0.059-0.080 5.11-5.02 0.068-0.072 Vegetables 5 5.01-4.35 0.098-0.134 4.79-4.64 0.114-0.120 10 4.42-3.12 0.197-0.267 3.98-3.68 0.228-0.240 The linear models for vegetables are:
Y = 31.12-15.81 X1, (3-1) Y=16.85 + 2.71 X2, (3-2) Y=19.40-13.02X1 + 1.83X2 (3-3) where Y is the yield of the vegetable as a function of X1 and X2, X1 is SO2 concentration in mg/m3, and X2 is the pH of the acid rain. Yield loss was estimated by comparing Y with the ideal yield (Yo) with 0 mg/m3 of SO2 and a reference rain pH of 5.6.
Applying these models and fitting Hong Kong data on SO2 concentration and rain pH for the year 1993-1999, the estimated yield as a consequence of the single SO2 and pH effect and their combined were summarized in Table 3-15.

50
Table 3-15. Estimation of the relative yields with respect to Hong Kong’s annual means of SO2 concentration and pH on vegetables and flowers using dose-response equations 3-1 to 3-3. (From Zhang et al., 1997) Year Mean SO2
(mg/m3) Mean rain pH* Estimated Yield
(SO2) (Eqn 3-1)
Estimated Yield (pH)
(Eqn 3-2)
Estimated Yield (SO2+pH) (Eqn 3-3)
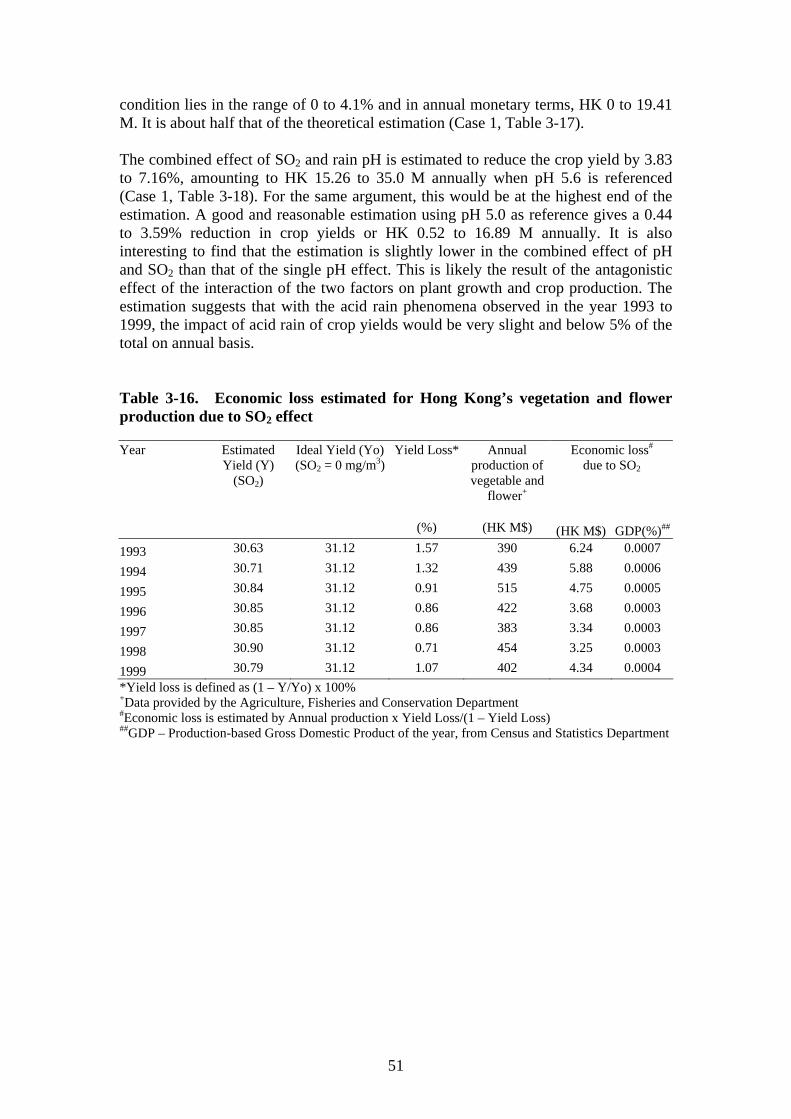
1993 0.031 4.75 30.63 29.72 27.69 1994 0.026 4.87 30.71 30.05 27.97 1995 0.018 5.06 30.84 30.56 28.43 1996 0.017 4.84 30.85 29.97 28.04 1997 0.017 5.1 30.85 30.67 28.51 1998 0.014 4.54 30.90 29.15 27.53 1999 0.021 4.81 30.79 29.89 27.93 *Mean rain pH was the average of the vw-mean pH of the Kwun Tong and Central/Western station In assessing the corresponding yield loss, the ideal or theoretical yield, Yo, (i.e. without acid rain effect) was calculated with zero SO2 level and a reference pH of 5.6. By comparing with this ideal yield, the percentage loss could be estimated as (1 – Y/Yo) x 100%. With input of the annual production of vegetables and flowers, the economic loss was estimated as Economic Loss = Annual Production x Yield Loss/(1 – Yield Loss) Estimation of the economic loss on crop yields as result of SO2, rain pH and combined effect of the two were summarized in Tables 3-16, 3-17 and 3-18, respectively. Yield reduction due to SO2 was very small as evidenced from Table 3-16. The loss accounts for 0.71 to 1.57% of the total yield. The yield loss also drops from 1.57% in 1993 to 0.71% in 1998, and in monetary term from HK 6.24 M to 3.25 M. This is in parallel to the decrease in the SO2 from 1993 to 1998. A slight increase in yield reduction to 1.07% (HK 4.34 M) was observed in 1999 due to an increase of SO2 concentration. The effect of SO2 is thus very small using zero SO2 as reference. It will be even insignificant when taking into account that ambient air will contain a background level of SO2 due to natural biogeochemical cycles such as volcano discharge and eruptions as recorded in pristine unpolluted areas (Howells, 1995). The reference pH used by Zhang et al. (1997) is 5.6. It is the theoretical pH of rainwater in equilibrium with atmospheric CO2. In reality, due to the presence of natural acidic gases such as SO2 from volcanoes, the background pH level of rainwater should be 5.0 as recorded in the pristine regions in the world (Howells, 1995). The present study therefore presented two cases for the economic assessment of rain pH on crop yield, viz. Case 1 with reference pH 5.6 and Case 2 with pH 5.0. Results were summarized in Tables 3-17 and 3-18. In Case 1 when pH 5.6 is taken as background reference, the annual reduction is in the range of 4.23 to 8.97% in the year 1993 to 1999. This amounts to an annual loss in crop yield of HK 16.92 M to 44.73 M, correspondingly. The theoretical background pH of 5.6 will likely provide the highest end of the estimation on yield loss and hence, economic loss. A more reasonable estimation is assessed by referencing to the ambient rain pH of 5.0 recorded in pristine areas (Case 2, Table 3-17). The reduction in crop yield under this
51
condition lies in the range of 0 to 4.1% and in annual monetary terms, HK 0 to 19.41 M. It is about half that of the theoretical estimation (Case 1, Table 3-17). The combined effect of SO2 and rain pH is estimated to reduce the crop yield by 3.83 to 7.16%, amounting to HK 15.26 to 35.0 M annually when pH 5.6 is referenced (Case 1, Table 3-18). For the same argument, this would be at the highest end of the estimation. A good and reasonable estimation using pH 5.0 as reference gives a 0.44 to 3.59% reduction in crop yields or HK 0.52 to 16.89 M annually. It is also interesting to find that the estimation is slightly lower in the combined effect of pH and SO2 than that of the single pH effect. This is likely the result of the antagonistic effect of the interaction of the two factors on plant growth and crop production. The estimation suggests that with the acid rain phenomena observed in the year 1993 to 1999, the impact of acid rain of crop yields would be very slight and below 5% of the total on annual basis. Table 3-16. Economic loss estimated for Hong Kong’s vegetation and flower production due to SO2 effect Year Estimated
Yield (Y) (SO2)
Ideal Yield (Yo)(SO2 = 0 mg/m3)
Yield Loss* Annual production of vegetable and
flower+
Economic loss# due to SO2
(%) (HK M$) (HK M$) GDP(%)##
1993 30.63 31.12 1.57 390 6.24 0.0007
1994 30.71 31.12 1.32 439 5.88 0.0006
1995 30.84 31.12 0.91 515 4.75 0.0005
1996 30.85 31.12 0.86 422 3.68 0.0003
1997 30.85 31.12 0.86 383 3.34 0.0003
1998 30.90 31.12 0.71 454 3.25 0.0003
1999 30.79 31.12 1.07 402 4.34 0.0004 *Yield loss is defined as (1 – Y/Yo) x 100% +Data provided by the Agriculture, Fisheries and Conservation Department #Economic loss is estimated by Annual production x Yield Loss/(1 – Yield Loss) ##GDP – Production-based Gross Domestic Product of the year, from Census and Statistics Department

52
Table 3-17. Economic loss estimated for Hong Kong’s vegetation and flower production due to rain pH effect Year Estimated Yield
(pH) Yield Loss* (%) Annual
production of vegetable and
flower (HK M$)
Economic loss# due to rain pH
(HK M$)
Case 1: pH = 5.6
Yo = 32.026
Case 2: pH = 5.0
Yo = 30.4
Case 1: pH = 5.6
Case 2: pH = 5.0
1993
29.72 7.19 2.23 390 30.23 (0.003%)##
8.89 (0.001%)
1994
30.05 6.18 1.16 439 28.90 (0.003%)
5.15 (0.001%)
1995
30.56 4.57 -0.53 515 24.66 (0.002%)
-2.74 (0%)
1996
29.97 6.43 1.43 422 29.00 (0.003%)
6.11 (0.001%)
1997
30.67 4.23 -0.89 383 16.92 (0.001%)
-3.38 (0%)
1998
29.15 8.97 4.10 454 44.73 (0.004%)
19.41 (0.002%)
1999
29.89 6.68 1.69 402 28.80 (0.003%)
6.93 (0.001%)
*Yield loss is defined as (1 – Y/Yo) x 100% #Economic loss is estimated by Annual production x Yield Loss/(1 – Yield Loss) ##Value in bracket was the percentage of the production-based GDP of the year, -ve value was taken as 0 Table 3-18. Economic loss estimated for Hong Kong’s vegetation and flower production due to combined effect of SO2 and rain pH effect Year Estimated Yield
(SO2+pH)
Yield Loss* (%) Annual production of vegetable and
flower (HK M$)
Economic loss# due to rain pH
(HK M$)
Case 1: pH = 5.6
Yo = 29.65
Case 2: pH = 5.0
Yo = 28.55
Case 1: pH = 5.6
Case 2: pH = 5.0
1993
27.69
6.61
3.02 390 27.59 (0.003%)##
12.13 (0.001%)
1994
27.97
5.65
2.02 439 26.28 (0.003%)
9.05 (0.001%)
1995
28.43
4.12
0.44 515 22.15 (0.002%)
2.26 (0.0002%)
1996
28.04
5.44
1.80 422 24.27 (0.002%)
7.74 (0.001%)
1997
28.51
3.83
0.13 383 15.26 (0.001%)
0.52 (0.000%)
1998
27.53
7.16
3.59 454 35.00 (0.003%)
16.89 (0.001%)
1999
27.93
5.80
2.18 402 24.74 (0.002%)
8.94 (0.001%)
*Yield loss is defined as (1 – Y/Yo) x 100% #Economic loss is estimated by Annual production x Yield Loss/(1 – Yield Loss) ##Value in bracket was the percentage of the production-based GDP of the year

53
It is also a consensus that in order to produce injury symptoms for crops in controlled environment studies, the pH of the simulated acid rain must be reduced to 3.5 or below, which is almost 10 times as acidic as ambient rainfall occurring in the major crop areas (Linzon et al., 1981, Singh and Coote 1985). Similar phenomenon was observed in field studies to obtain injury symptoms using simulated rain (Hofstra 1986). The total deposition used in these studies would therefore be higher than the ambient conditions and the response of the crops could be therefore overestimated. Taking this overestimation into account for the above estimation, the effect of acid rain per se on Hong Kong’s vegetable and flower yield will far less than the 5% estimated. Economic loss on crop yield in Hong Kong as a result of acid rain will hence be concluded to be very minimal (< 0.003%) or even negligible when the local GDP is referenced. The overall assessment was concluded as 'available experimental results appear to indicate that the effects of acidic precipitation on crops are minimal and that when a response occurs it may be positive or negative' by Irving (1983). Huckabee (1983), in another review, arrived with similar conclusion - "At this time we have little indication the acidic deposition is adversely affecting crops in the United States’. Base upon field studies of 13 cultivars across 8 different crops, National Acidic Precipitation Assessment Program (NAPAP, 1987) concluded that the overall impact of acid deposition on US crop production was negligible. The conclusion of the present assessment on effect of acid rain on Hong Kong crops agrees well with the three assessments reported for the United States. 3.3.2 Impact assessment on soil
Soils in Hong Kong can be broadly divided into 3 groups and namely, urban, agricultural and natural. Urban soils cover all the urban and reclaimed areas. Urban soils are strongly alkaline as a result of leachate from calcareous construction wastes and heavily polluted by vehicular exhaust (Jim, 1998 a, b, c). They are less susceptible to acidification due to acid deposition and will not be covered in the present assessment. Agricultural soils are mostly alluvial for cultivation of vegetables and flowers. The common practice of lime and fertilizer application by the farmers in maintaining desired soil pH for cultivation contributes the acidic input to the soil far more than the natural acid deposition. Acid deposition is, therefore, unlikely to cause deterioration in soil quality for properly managed agricultural lands. On the contrary, acid deposition may have potential beneficial effects on agricultural soils, since sulfur and nitrogen compounds in acid deposition are plant nutrients. The nitrogen compounds in acid deposition are small compared to crop requirements of 100-300 kg N/ha/yr and thus reducing the cost of fertilizers and lime applications (Forster, 1993). The natural soils are soils resulted from in situ decomposition of the parent bedrock materials. The natural soils in Hong Kong cover the country parks that account for over 40% of the territory and inhabited by grasses, woodlands or shrubs and some prestige Fung Shui forests. The parent bedrock materials are mainly volcanic and granite, with some sedimentary rocks along the coastline (Lumb, 1962). Volcanic rocks underlain over 50% of the territory, mostly of rhyolitic (Dudgeon and Corlett, 1994). Granites are the second most common rock type and cover one third of Hong Kong. Rhyolite is of similar chemical compositions as granite, but differ from it with much smaller grain size. Hence, the natural soil of Hong Kong is the residual soil

54
produced by in situ decomposition of rhyolite and granite. The chemical weathering of rhyolite and granite are similar, both give a reddish-yellow color to the soil and rich in iron oxides. The general consensus is that Hong Kong soils is acidic, low in organic matter and nutrient poor, with low to very low levels of nitrogen, phosphorus and calcium (Dudgeon and Corlett, 1994). There was no study reported yet on the effect of acid deposition on soil acidification in Hong Kong. Physical and chemical characteristics of the local soils had been reported in relation to agriculture (Grant, 1960), hill fire and succession (Marafa and Chau, 1996, 1999; Chau and Marafa, 1999), urban planting (Jim, 1996, 1998a, b, c), and eating habits of macaques (Bolton et al., 1998). Results of these reported studies were reviewed and summarized in Table 3-19. Soil acidification is a natural ongoing process as a result of a number of physical and biogeochemical interactions apart from the acid deposition. These include natural weathering leading to mineralization of bedrock materials releasing aluminum and ferric ions followed by hydrolysis, oxidation of pyrite in mine spoil and leaching of anions with cations. Microbial actions such as anaerobic fermentation of organic compounds, nitrification of ammonium ions in soil, biological assimilation of ammonium ions form soil also lead to soil acidification. Decomposition process and other plant-microorganisms interaction also forms organic acids and organic matter affecting soil acidity. Anthropogenic activities such as fertilizer application (ammonium and superphosphate) also contribute soil acidity (Kennedy, 1992). Common and major concerns on the effects of soil acidification include (1) lowering soil pH, (2) mobilization of aluminum and its toxicity and (3) reduction of cation exchange capacity (McFee, 1980). Soil pH
From the very limited available data sets (Table 3-19), pH of the agricultural soil (0-10 cm) recorded in 1960s ranges from 4.8-6.7 while that of the natural soil in the 1990s from 4.1-6.5. Though direct comparison is not possible, the agricultural soil pH in the 1960s provides a rough relative reference. The pH range (4.8 to 6.7 vs. 4.1 to 6.5) suggests that soil acidification in the elapsed 30 years would only be very small, if there is any. It could not be conclusive yet since no single sampling sites reported in Table 3-19 could be proved to be same in location and usage. Sampling data is too small to draw such conclusion as well. Reviewed from data sets reported in the 1990s, soil pH varies greatly spatially. While most of the soils reported for Tai Mo Shan country park was in the range of 4.1 to 4.6, that of Kam Shan was in the range of 4.4 to 6.5. Soil pH also increases with depth due to leaching of the exchangeable bases down the profiles (Marafa and Chau, 1996). Nevertheless, soil pHs are well above 4.0 which are characteristics of humid tropical soils (Kennedy, 1992; Chau and Marafa, 1999). At this pH, the local natural soil will be susceptible to periodic aluminum toxicity (Forster, 1993).

55
Table 3-19. Summary of the chemical characteristics of the top-soil (0-10 cm) in Hong Kong reported in literature. (All exchangeable ions and the cation exchange capacity, CEC are in cmol/kg)
Exchangeable cations Sampling site pH CEC Ca Mg Na K H Al base sat (%) Al/CEC(%) Remark (Grant, 1960) Chik Nai Ping, Kam Tim 5 -- 1.66 0.61 0.13 0.12 3.21 -- 67.2 -- imperfectly drained Chik Nai Ping, Kam Tim 5 -- 0.91 0.15 0.29 0.17 7.02 -- 46.1 -- poorly drained Chik Nai Ping, Kam Tim 5.1 -- 1.2 2.02 0.56 0.36 6.52 -- 61.3 -- very poorly drained Tsung Pok Long, Fanling 5 -- 1.55 0.6 0.63 0.11 5.04 -- 48.4 -- freely drained Ping Che, Fanling 5.4 -- 2.03 0.51 0.05 0.04 4.41 -- 46.8 -- poorly drained Ping Che, Fanling 5.1 -- 0.43 0.2 0.13 0.05 7.21 -- 21.9 -- very poorly drained Sun Hing, Lam Ti 6.7 -- 3.77 1.31 0.57 0.51 -- -- 100 -- imperfectly drained Sun Hing, Lam Ti 5.7 -- 6.46 1.27 0.56 0.11 3.28 -- 88.7 -- poorly drained Sha Tin, Hin Tin Village 5.2 -- 1.21 0.07 0.06 0.09 4.37 -- 34.2 -- freely drained Sha Tin, Pak Tin Tsuen 5.3 -- 0.38 0.25 0.07 0.12 3.41 -- 41.3 -- imperfectly drained Sha Tin Agricultural station 4.9 -- 1.38 0.31 0.07 N/A 3.88 -- 36.2 -- poorly drained Sha Tin, Tin Sam 5.2 -- 3.24 0.52 0.17 0.04 3.12 -- 63.1 -- very poorly drained Mai Po, Ha Tsuen 4.9 -- 5.23 2.47 0.55 0.05 7.21 -- 53.1 -- poorly drained Lam Tsuen 5.3 -- 0.47 0.21 0.05 0.18 3.72 -- 42.5 -- imperfectly drained Tai Mo Shan, podosolic 5 -- 0.53 0.21 0.09 0.08 7.53 -- 17.1 -- imperfectly drained Tai Mo Shan, podosolic 4.8 -- 0.185 0.08 0.06 0.09 6.38 -- 11.3 -- freely drained Sha Tau Kok 4.8 -- 0.45 0.59 0.16 0.11 3.42 -- 34.2 -- imperfectly drained (Bolton et al., 1998) Kam Shan Park 5.49 17.86 -- -- -- -- -- -- -- -- control soil sample 6.48 16.21 -- -- -- -- -- 4.43 -- 27.33 control soil sample 4.84 10.93 -- -- -- -- -- 4.24 -- 38.79 control soil sample 4.43 19.07 -- -- -- -- -- 4.63 -- 24.28 control soil sample 5.99 11.62 -- -- -- -- -- 2.83 -- 24.35 Refused sample 6.2 12.7 -- -- -- -- -- 3.94 -- 31.02 Refused sample 4.96 16.68 -- -- -- -- -- 2.49 -- 14.93 Refused sample

56
(Jim, 1996)
Decomposed Granite A 5.35 20.75 0.62 1.30 0.08 0.20 -- -- 10.6 -- Decomposed Granite B 4.64 15.44 1.60 0.36 0.09 0.13 -- -- 14.12 -- (Marafa and Chau, 1996) Tai Mo Shan Country Park 4.5 -- 0.22 0.08 0.06 0.09 2.8 17 -- -- 0 year after fire 4.52 -- 0.18 0.05 0.06 0.19 2.8 24 -- -- 1 year after fire 4.46 -- 0.12 0.13 0.07 0.17 4.4 36 -- -- 3 years after fire 4.6 -- 0.12 0.12 0.07 0.13 6.8 25 -- -- 6 years after fire 4.56 -- 0.62 0.18 0.08 0.14 3.5 32 -- -- 17 years after fire (Marafa and Chau, 1999) Tai Mo Shan Country Park -- 10.6 0.2 0.07 0.03 0.21 -- -- 4.9 -- 0 year after fire -- 11.7 0.13 0.06 0.03 0.23 -- -- 3.8 -- 1 year after fire -- 16.2 0.1 0.11 0.04 0.19 -- -- 2.8 -- 3 years after fire -- 12.4 0.24 0.17 0.07 0.17 -- -- 5.4 -- 6 years after fire -- 13.3 0.52 0.2 0.06 0.18 -- -- 7.3 -- 17 years after fire (Chan and Marafa, 1999) Tai Mo Shan grassland 4.42 -- 0.32 0.14 0.42 0.15 0.11 2.11 31.53 -- Tai Mo Shan Woodland 4.43 -- 0.52 0.2 0.06 0.18 2.11 10.26 7.29 -- Tai Po Kau Nature Reserve 4.41 -- 0.42 0.32 0.42 0.16 0.34 6.62 16.2 -- Lam Tsuen Feng Shui forest 4.14 -- 0.23 0.2 0.32 0.1 1.28 4.36 13.4 -- Mui Tsz Lum Feng Shui forest 4.48 -- 0.63 0.43 0.33 0.2 0.19 0.91 57.6 --
57
Mobilization of aluminum Aluminum (Al) is a predominant cation in most acid tropical soils. This is also
true for Hong Kong soil as evidenced from Table 3-19. Exchangeable Al is high and dominates the exchange sites. According to Marafa and Chau (1996), Al ion accounts for over 65% of the effective cation exchange capacity of these soils. Al leaching is observed in the top-soil of newly burnt soil but not in grassland/scrubland and woodland profiles (Marafa and Chau, 1996). Calcium is believed to relieve the aluminum toxicity. However, the relative high Al level and low Ca level in Hong Kong soils draws special attention to the potential mobilization of Al ions from the soil to surface water in the drainage systems and toxicity to the roots of plants. Despite this, elevated Ca level in surface water was reported in storm time in negating the effect of Al (Peart, 2000). The data from the Freshwater Ecosystem (section 3.1) suggested that there are no significant Al leaching from the soils in the basins drained by the local streams and watercourses free from anthropogenic pollution. In other words, the soil itself has the sufficient buffering capacity in holding the Al. Considering Al toxicity to the roots of plants, the exchangeable Al percentage estimated from available published data (Bolton et al., 1998) lies in range of 14.9 to 38.8% of the cation exchangeable capacity for a total of 6 data points (Table 3-19). Referencing with the threshold value of 30% at which Al toxicity is observed from sensitive plants (Landon, 1991), 4 out of the 6 data points are below the threshold, 1 is marginally above it (31.07%). Base on this very limited data point, Al toxicity appears not to be a general problem. To be more conclusive, further study on this aspect deems necessary. Cation exchange capacity (CEC)
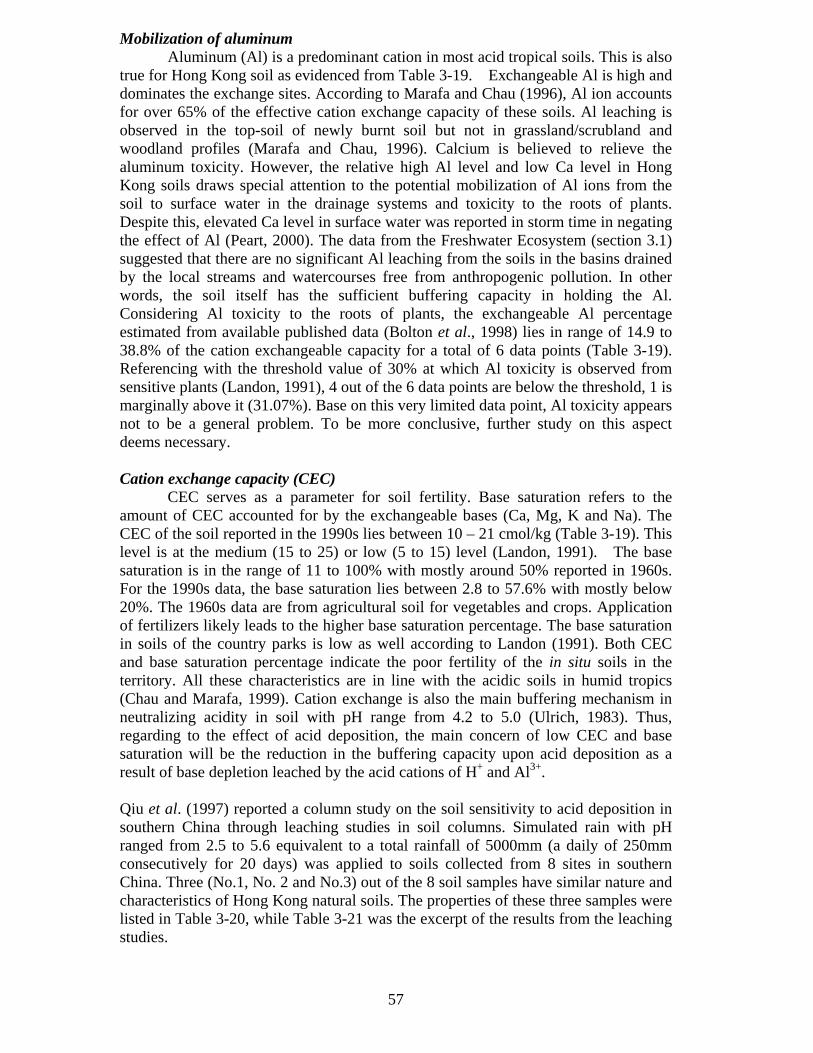
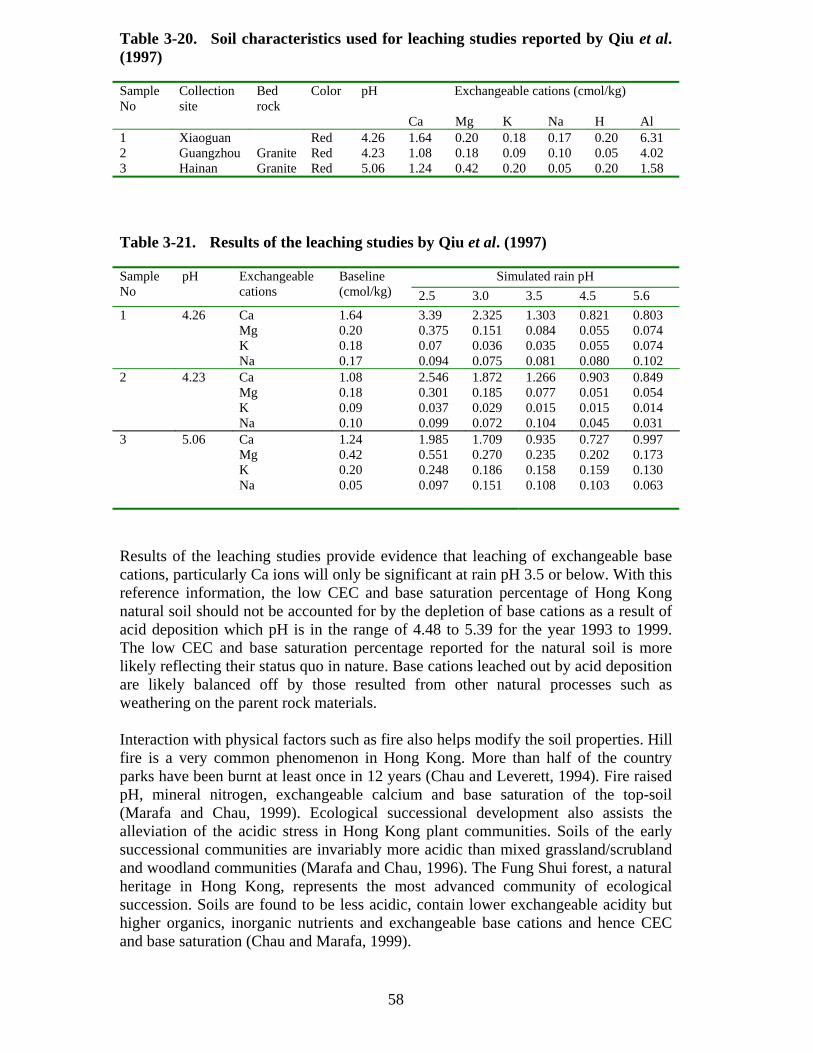
CEC serves as a parameter for soil fertility. Base saturation refers to the amount of CEC accounted for by the exchangeable bases (Ca, Mg, K and Na). The CEC of the soil reported in the 1990s lies between 10 – 21 cmol/kg (Table 3-19). This level is at the medium (15 to 25) or low (5 to 15) level (Landon, 1991). The base saturation is in the range of 11 to 100% with mostly around 50% reported in 1960s. For the 1990s data, the base saturation lies between 2.8 to 57.6% with mostly below 20%. The 1960s data are from agricultural soil for vegetables and crops. Application of fertilizers likely leads to the higher base saturation percentage. The base saturation in soils of the country parks is low as well according to Landon (1991). Both CEC and base saturation percentage indicate the poor fertility of the in situ soils in the territory. All these characteristics are in line with the acidic soils in humid tropics (Chau and Marafa, 1999). Cation exchange is also the main buffering mechanism in neutralizing acidity in soil with pH range from 4.2 to 5.0 (Ulrich, 1983). Thus, regarding to the effect of acid deposition, the main concern of low CEC and base saturation will be the reduction in the buffering capacity upon acid deposition as a result of base depletion leached by the acid cations of H+ and Al3+. Qiu et al. (1997) reported a column study on the soil sensitivity to acid deposition in southern China through leaching studies in soil columns. Simulated rain with pH ranged from 2.5 to 5.6 equivalent to a total rainfall of 5000mm (a daily of 250mm consecutively for 20 days) was applied to soils collected from 8 sites in southern China. Three (No.1, No. 2 and No.3) out of the 8 soil samples have similar nature and characteristics of Hong Kong natural soils. The properties of these three samples were listed in Table 3-20, while Table 3-21 was the excerpt of the results from the leaching studies.
58
Table 3-20. Soil characteristics used for leaching studies reported by Qiu et al. (1997) Sample No
Collection site
Bed rock
Color pH Exchangeable cations (cmol/kg)
Ca Mg K Na H Al 1 Xiaoguan Red 4.26 1.64 0.20 0.18 0.17 0.20 6.31 2 Guangzhou Granite Red 4.23 1.08 0.18 0.09 0.10 0.05 4.02 3 Hainan Granite Red 5.06 1.24 0.42 0.20 0.05 0.20 1.58 Table 3-21. Results of the leaching studies by Qiu et al. (1997)
Simulated rain pH Sample No
pH Exchangeable cations
Baseline (cmol/kg) 2.5 3.0 3.5 4.5 5.6
1 4.26 Ca 1.64 3.39 2.325 1.303 0.821 0.803 Mg 0.20 0.375 0.151 0.084 0.055 0.074 K 0.18 0.07 0.036 0.035 0.055 0.074 Na 0.17 0.094 0.075 0.081 0.080 0.102 2 4.23 Ca 1.08 2.546 1.872 1.266 0.903 0.849 Mg 0.18 0.301 0.185 0.077 0.051 0.054 K 0.09 0.037 0.029 0.015 0.015 0.014 Na 0.10 0.099 0.072 0.104 0.045 0.031 3 5.06 Ca 1.24 1.985 1.709 0.935 0.727 0.997 Mg 0.42 0.551 0.270 0.235 0.202 0.173 K 0.20 0.248 0.186 0.158 0.159 0.130 Na 0.05 0.097 0.151 0.108 0.103 0.063 Results of the leaching studies provide evidence that leaching of exchangeable base cations, particularly Ca ions will only be significant at rain pH 3.5 or below. With this reference information, the low CEC and base saturation percentage of Hong Kong natural soil should not be accounted for by the depletion of base cations as a result of acid deposition which pH is in the range of 4.48 to 5.39 for the year 1993 to 1999. The low CEC and base saturation percentage reported for the natural soil is more likely reflecting their status quo in nature. Base cations leached out by acid deposition are likely balanced off by those resulted from other natural processes such as weathering on the parent rock materials. Interaction with physical factors such as fire also helps modify the soil properties. Hill fire is a very common phenomenon in Hong Kong. More than half of the country parks have been burnt at least once in 12 years (Chau and Leverett, 1994). Fire raised pH, mineral nitrogen, exchangeable calcium and base saturation of the top-soil (Marafa and Chau, 1999). Ecological successional development also assists the alleviation of the acidic stress in Hong Kong plant communities. Soils of the early successional communities are invariably more acidic than mixed grassland/scrubland and woodland communities (Marafa and Chau, 1996). The Fung Shui forest, a natural heritage in Hong Kong, represents the most advanced community of ecological succession. Soils are found to be less acidic, contain lower exchangeable acidity but higher organics, inorganic nutrients and exchangeable base cations and hence CEC and base saturation (Chau and Marafa, 1999).

59
Soil acidification is a complex interaction process between physical and biogeochemical parameters. ‘It would be a mistake to conclude that acid soil conditions are inevitably disastrous as well. A large proportion of Earth’s soils are acid, particularly in tropics where ecosystems even persists with soil pH values of 4 or even less. Plants have a remarkable capacity for adaptation to such conditions’ (Kennedy, 1992). ‘Hong Kong flora are surprisingly rich’ with some 2000 native species and some other 900 exotic ones (AFCD Web Page). This clearly demonstrates Kennedy (1992) statements. To conclude, base on the data and information available to this study, the acidic, low CEC and base saturation nature of Hong Kong natural soils are believed to be as their status quo rather than deteriorated by acid deposition.

60
References Chau K.C. and Marafa L.M., 1999, Vegetation chronosequence in Hong Kong: soil
properties and successional development, Singapore Journal of Tropical Geography, 20(1):24-35.
Dudgeon D., 1990, Determinants of the distribution and abundance of larval Ephemeroptera (Insecta) in Hong Kong running waters. In Campbell I.C. (ed), Mayflies and Stoneflies, pp 221-232.
Dudgeon D. and I.K.K. Chan, 1992, An experimental study of the influence of periphytic algae on invertebrate abundance in a Hong Kong stream. Freshwat. Biol. 27:53-63.
Dudgeon D. and R. Corlett, 1994, Hills and Streams: An Ecology of Hong Kong, Hong Kong University Press, Hong Kong.
Eugster W., Perego S., Wanner H., Leuenberger A., Liechti M., Reinhardt M., Geissbuhler P., Gempeler M. and Schenk J., 1998, Spatial variation in annual nitrogen deposition in a rural region in Switzerland, In van der Hoek K.W., Erisman J.W., Smeulders S., Wisniewski J.R. and Wisniewski J. (eds) Proceedings of the First International Nitrogen Conference, Elsevier Science, Amesterdam, 327-336.
Evans L.S., G.R. Hendry, G.J. Stensland, D.W. Johnson and A.J. Francis, 1981, Acidic precipitation: Consideration for an air quality standard. Water, Air, Soil Pollut. 16:469-509.
Evans L.S., K.F. Lewin, K.A. Santucci and M.J. Patti, 1985, Effects of frequency and duration of simulated acid rainfalls on soybean yields. New Phytol. 100:199-208.
Evans L.S., K.F. Lewin, M.J. Patti and E.A. Cunningham, 1983, Productivity of field-grown soybeans exposed to simulated acidic rain. New Phytol. 93:377-388.
Forster B.A., 1993, The Acid Rain Debate – Science and special interests in policy formation. Iowa State University Press, Ames. 159 p.
Fowler D., Sutton M.A., Smith R.I., Pitcairn C.E.R., Coyle M., Campbell G. and Stedman J., 1998, Regional mass budgets of oxidized and reduced nitrogen and their relative contribution to the nitrogen inputs of sensitive ecosystems. In van der Hoek K.W., Erisman J.W., Smeulders S., Wisniewski J.R. and Wisniewski J. (eds) Proceedings of the First International Nitrogen Conference, Elsevier Science, Amesterdam, 337-342.
Hao J., S. Xie, L. Duan and X. Ye, 1998, Acid deposition and ecosystem sensitivity in China. In Bashkin V. and Park S. (eds), Acid Deposition and Ecosystem Sensitivity in East Asia. Nova Science Publishers, Inc. New York. Ch. 8.
Heagle A.S., R.B. Philbeck, R.G. Feicht and R.E. Ferrell, 1983, Response of soybeans to simulated acid rain in the field. J. Environ. Qual. 12:538-543.
Hong Kong Environmental Protection Department (HKEPD), 1995, Marine water quality in Hong Kong for 1994. Hong Kong Government Printer, Hong Kong, 121 p.
Hong Kong Environmental Protection Department (HKEPD), 1999, Marine water quality in Hong Kong for 1998. Hong Kong Government Printer, Hong Kong.
Hong Kong Environmental Protection Department (HKEPD), 2000, Marine water quality in Hong Kong for 1999. Hong Kong Government Printer, Hong Kong.
Hofstra G., 1986, Acid rain: The effects on agricultural production. Agrologist, (Summer):6-7.
Howells G., 1995, Acid Rain and Acid Waters, 2nd, Ellis Horwood, New York.
61
Huckabee, J., 1983, Effects of acidic deposition on agricultural crops. EPRI J. (July-Aug):51-53.
Ibrekk H.O., Molvaer J. and Faafeng B., 1991, Nutrient loading to Norwegian coastal waters and its contribution to the pollution of the North Sea, Wat. Sci. Tech., 24(10):239-249.
Irving P.M. and J.E. Miller, 1981, Productivity of field-grown soybeans exposed to acid rain and sulphur dioxide, alone and in combination. J. Environ. Qual. 10:473-478.
Irving P.M., 1983, Acidic preicipitation effects on crops: A review and analysis of research. J. Evniron. Qual. 12:442-453.
Irving P., 1991, Acidic Deposition: State of Science and Technology, Summary Report of the NAPAP, Washington, DC, 265 pp.
Jim C.Y., 1996, Edaphic properties and horticultural applications of some common growth media. Comm. Soil Sci. Plant Anal., 1996, 27:2049-2064.
Jim C.Y., 1998a, Soil characteristics and management in an Urban Park in Hong Kong, Environmental Management, 22:683-695.
Jim C.Y., 1998b, Physical and chemical properties of a Hong Kong roadside soil in relation to urban tree growth, Urban Ecosystem, 2:171-181.
Jim C.Y., 1998c, Urban soil characteristics and limitations for landscape planting in Hong Kong, Landscape and Urban Planning, 40:235-249.
Kennedy I.R., 1992, Acid Soil and Acid Rain, 2nd ed., Research Studies Press Ltd., John Wiley & Sons Inc., New York.
Landon J.R., 1991, Booker Tropical Soil Manual, Longman. Linzon S.N., R.G. Pearson, W.I. Gizyn and M.A. Griffith, 1981, Terrestrial effects of
long-range pollutants-crops and soils. In Proceedings of the APCA Conference. Acid Deposition, Knowns and Unknowns: The Canadian Perspective. Montreal , Quebec, April 7-8.
Lumb P, 1962, General nature of soils of Hong Kong, In Hong Kong Joint Group of the Institutions of Civil, Mechanical and Electrical Engineers, Symposium on Hong Kong Soils, pp19-31.
Marafa L. and Chau K.C., 1996, Morphological and chemical characteristics of upland volcanic soils along a vegetation gradient affected by hillfire in Hong Kong, Hong Kong Geologist, 1996(2):67-79.
Marafa L.M. and Chau K.C., 1999, Morphological and chemical properties of soils along a vegetation gradient affected by fire in Hong Kong, Soil Science, 64(9):683-691.
Mason B.J., 1992, Acid Rain, Its Causes and Effects on Inland Waters, Oxford University Press, New York.
National Acidic Precipitation Assessment Program (NAPAP), 1987, Interim Assessment Report. No. 4, Effects of acidic deposition. Ch. 6, Effects on agricultural crops. Washington, D.C.
Peart M.R., L.K. Fung and D. Guan, 1995, Acid rain and surface-water acidity in Hong Kong. Asian Geographer, 14:86-103.
Peart M.R., 2000, Acid Rain, storm period chemistry and their potential impact on stream communities in Hong Kong. Chemosphere, 41:25-31.
Porter P.M., W.L. Banwart, J.J. Hassett and R.L. Finke, 1987, Effects of simulated acid rain on yield of two soybean cultivars. J. Environ. Qual. 16:433-437.
Qiu R., H. Dong, Y. Lui and X. Jiao, 1997, Soil sensitivity to acid deposition in Southern China VII. Cation leaching and buffering mechanisms. Chinese Journal of Environmental Science, 18(5):23-27.

62
Radojevic M. and R.M. Harrison (eds), 1992, Atmospheric Acidity: Source, Consequences and Abatement. Elsevier Applied Science, London.
Singh S.S. and D.R. Coote, 1985, Acid rain: The effect on agriculture. Agrologist, (Spring):23-24.
Sullivant T.J., 2000, Aquatic Effects of Acidic deposition, Lewis Publishers, Boca Raton.
Torseth K. and Semb A., 1998, Deposition of nitrogen and other major inorganic compounds in Norway, 1992-1996. In van der Hoek K.W., Erisman J.W., Smeulders S., Wisniewski J.R. and Wisniewski J. (eds) Proceedings of the First International Nitrogen Conference, Elsevier Science, Amesterdam, 299-304.
Troiano J., L. Colavito, L. Heller and D.C. McCune, 1983, Effects of acidity of simulated rain and its joint action with ambient ozone on measures of biomass and yield in soybeans. Environ. Exp. Bot. 23:113-119.
Ulrich B., 1983, Soil acidity and its relations to acid deposition. In Ulrich B. and Pankrath J. (eds), Effects of accumulation of air pollutants in forest ecosystems. Pp127-136.
Zhang L., H. Cao, Y. Shen, J. Gao, J. Shu, L. Liu and Y. Xiong, 1997, Effect of acidic deposition on agriculture of Jiangsu, Zhejiang, Anhui, Fujian, Hunnan, Hubei and Jiangxi provinces – Assessment of agricultural loss. China Environmental Science, 17(6):489-491.
Zhang L., H.Cao, Y. Shen, J. Gao, J. Shu, L. Lui, Y. Xiong, 1998, Effect of acidic deposition on agriculture of Jiangsu, Zhejiang, Anhui, Fujian, Hunan, Hubei and Jiangxi provinces – Damage to agricultural ecosystem. China Environmental Science, 18(1):12-15.