
Towards Policy Analysis 2.0 - University of Victoria
264
Towards Policy Analysis 2.0 By Justin Longo B.A., University of Victoria, 1991 M.P.A., University of Victoria, 1999 A Dissertation Submitted in Partial Fulfillment of the Requirements for the Degree of DOCTOR OF PHILOSOPHY in Interdisciplinary Studies © Justin Longo, 2013 University of Victoria Licensed under a Creative Commons Attribution-NonCommercial-NoDerivs 2.5 Canada License
-
Upload
khangminh22 -
Category
Documents
-
view
0 -
download
0
Transcript of Towards Policy Analysis 2.0 - University of Victoria
Towards Policy Analysis 2.0
By
Justin LongoB.A., University of Victoria, 1991
M.P.A., University of Victoria, 1999
A Dissertation Submitted in Partial Fulfillment of the Requirements for the Degree of
DOCTOR OF PHILOSOPHY
in Interdisciplinary Studies
© Justin Longo, 2013
University of Victoria
Licensed under a Creative Commons Attribution-NonCommercial-NoDerivs 2.5 Canada License

ii
AbstractOne approach to dealing with complexity in a public policy context is horizontality, the act
of working across the various ministries and divisions of a government in order to harness the organization’s capacity and resources and direct them towards the addressing of complex problems. And one prominent mechanism for promoting horizontality is greater organization-wide collaboration, knowledge sharing and active knowledge seeking amongst a network of government knowledge workers commonly referred to as policy analysts. The emergent use of Web 2.0 tools and approaches within organizations has raised the possibility that we have entered a new knowledge era - Enterprise 2.0 - that can address the horizontality problem, facilitate the sharing of knowledge between policy analysts and across organizations, and promote transformative governance.
This research investigated how policy formulation processes in the government of the Canadian province of British Columbia are being affected by the adoption of Web 2.0 tools internally within the organization as a way to facilitate knowledge sharing and collaboration amongst government policy analysts. Semi-structured interviews with members of corporate policy units in the Government of British Columbia were conducted (n = 14), and an on-line questionnaire was completed by Government of British Columbia policy analysts (n = 129). These mixed methods form the basis for a triangulation approach to assessing the research questions.
Respondents conceptualized policy analysis as rooted in an apolitical synthesis of evidence and best practices from a variety of sources, leading to a recommendation designed to support decision-making. The diversity and reach of the policy analyst’s organizational social network is related to their length of service in the organization and is an important supplement to the analyst’s knowledge base. There was little evidence that technology networks generally, and Web 2.0 tools specifically, play a prominent role in facilitating the knowledge organization; in fact, policy analysts may refrain from sharing knowledge with colleagues using technology networks in order to avoid contributing to their colleagues' information overload. Following the Theory of Planned Behavior (Ajzen, 1991), attitudes, followed by subjective norms, were the strongest and most consistent predictors of the policy analyst’s intention to collaborate and share knowledge with their colleagues. Perceived behavioural control was not a factor, leading to the possibility that while policy analysts may believe and be told that knowledge sharing and collaboration are advantageous, they may not feel they have the authority, latitude or ability to do so. A significant gender result was consistently revealed, that women were found to be less supportive of knowledge sharing and collaboration than men, a result possibly due to a culture dominated by masculine characteristics.
The findings have implications for public sector organizations seeking to provide support for knowledge workers to make effective use of the organizational social network, new collaboration technologies and organizational capacity to address complex public policy problems. Interested readers should consult http://jlphd.wordpress.com for updated versions of this research, and related work.
iii

iv

Table of Contents.......................................................................................Supervisory Committee� ii
...............................................................................................................Abstract � iii.................................................................................................Table of Contents� v.............................................................................................Acknowledgments� vii
............................................................................................................Dedication� ix......................................................................................Chapter 1 - Introduction� 1
....................................1.0 Preparing for the Future of Policy Formulation� 1.......................................................................1.1 Statement of the Problem� 2
.....................................1.2 Purpose, Objectives and Research Questions� 4...........................................................................1.4 Conceptual Framework� 5
..................1.5 Theoretical Framework: The Theory of Planned Behavior� 9......................................................................1.6 Significance of the Study� 11
...........................................................1.7 Organization of the Dissertation� 13...........................................................................Chapter 2 - Literature Review� 15
...........................................................Chapter 3 - Methodology and Methods� 27............................................................................................3.1 Introduction� 27
.................................................3.2 A Short Detour on the Nature of Truth� 27............3.3 Research Approach: Triangulation Through Mixed Methods� 32
...................3.4 Quantitative Approach: The Policy Analyst Perspective� 36............................3.5 Qualitative Approach: The Policy Unit Perspective� 44
..............................................................................................3.6 Limitations� 49..........................................................................3.7 Ethical Considerations� 51
...............................................Chapter 4 - The Contemporary Policy Analyst � 53.................................................................................................4.1 Summary� 53
..................................................................4.2 Background and Objectives� 54...................................................................................................4.3 Methods� 54....................................................................................................4.4 Results� 55
..............................................................................................4.5 Discussion� 63.....................................................Chapter 5 - The Archetypal Policy Analyst� 65
.................................................................................................5.1 Summary� 65..................................................................5.2 Background and Objectives� 66
...................................................................................................5.3 Methods� 66....................................................................................................5.4 Results� 68
..............................................................................................5.5 Discussion� 76.......................................................Chapter 6 - The Policy Analyst�s Network� 79
.................................................................................................6.1 Summary� 79..................................................................6.2 Background and Objectives� 80
...................................................................................................6.3 Methods� 81....................................................................................................6.4 Results� 82
..............................................................................................6.5 Discussion� 90..............................................Chapter 7 - Technology and the Policy Analyst� 93
v

.................................................................................................7.1 Summary� 93..................................................................7.2 Background and Objectives� 94
...................................................................................................7.3 Methods� 95....................................................................................................7.4 Results� 95
............................................................................................7.5 Discussion� 103Chapter 8 - Knowledge Sharing, Collaboration and the Policy Analyst (I) �107
...............................................................................................8.1 Summary� 107............................................................................8.2 Research Objectives� 109
.................................................................................................8.3 Methods� 111..................................................................................................8.4 Results� 113
............................................................................................8.5 Discussion� 126Chapter 9 - Knowledge Sharing, Collaboration and the Policy Analyst (II) �129
...............................................................................................9.1 Summary� 129................................................................9.2 Background and Objectives� 131
.................................................................................................9.3 Methods� 133..................................................................................................9.4 Results� 133
............................................................................................9.5 Discussion� 144..................................................................................Chapter 10 - Conclusion� 147
.............................................................................................10.1 Summary� 147.........10. 2 Strengths, Limitations and Directions for Future Research� 152
........................................................................................................References� 157Appendix A - Who�s a �Policy Analyst�? Participant Identification and
......................................................................................................Recruitment� 197................Appendix B - Initial Email Invitation Sent to Survey Candidates� 203
......................................Appendix C - Respondent / Non-Respondent Data� 206Appendix D - Letters of Support / Permission from British Columbia
.....................................................................................................Government � 209................................................................Appendix E - Online Questionnaire� 213.................................................................Appendix F - Questionnaire Items� 228
.............................................Appendix G - Quantitative Variables Collected� 232................................Appendix H - Email Invitation to Policy Unit Directors� 236
..............................................Appendix I - Semi-Structured Interview Guide� 237.....................................................Appendix J - Short Form Interview Guide� 241
...........................Appendix K - List of Codes for Qualitative Data Analysis� 243
...........................Appendix L - Online Survey Respondent Characteristics� 244
vi
AcknowledgmentsFinancial support was received through the Mitacs Research Cluster Web 2.0 + Web 3.0
Approaches to the Knowledge / Decision Interface at the University of Victoria.
At the University of Victoria, the POLIS Project on Ecological Governance and the Centre for Global Studies provided research space and administrative support. Thanks especially to the Centre’s Research Coordinator, Jodie Walsh.
The Government of British Columbia provided support in numerous ways: as a financial sponsor of the Mitacs Research Cluster; through the interventions and guidance of public servants in the Ministry of Citizen Services and Open Government; the Office of the Deputy Minister to the Premier supported and permitted the research to be conducted on-site; and numerous individual policy analysts took the time to act as research participants.
CSCW Systems Corp., especially Chris Corbett, provided both support for the above noted research cluster and research guidance.
My supervisory committee - Rod Dobell, Bart Cunningham and Melanie Tory - provided invaluable guidance and feedback. Special thanks to Rod Dobell for his guidance and mentorship over nearly two decades of collaboration.
Lastly, to my family - my beautiful wife Julie, and my amazing sons Jack and Tom - for your patience and support. I would be grateful if you would henceforth please address me as “Dr. Longo”.
vii

viii

Dedication
Dr. Thomas N. Longo and Mrs. Margery (Coleman) Longo(he being the only real Dr. Longo I know of)
ix

x
Chapter 1 - Introduction
Government organizations are increasingly being confronted with complex public policy challenges that require a coordinated cross-governmental response that draws upon the input of multiple actors from across the organization. Modern policy problems rarely fall entirely within the organizational divisions established in a government, and individual policy analysts within government are unlikely to have access to the full breadth of relevant intelligence necessary to fully comprehend and address a policy problem. In large multi-actor organizations, open knowledge sharing and collaboration amongst a network of knowledge workers is seen as the basis for enabling a dynamic knowledge organization capable of dealing with complex challenges. However, knowing who to collaborate with, what knowledge is sharable, when knowledge sharing and collaboration are advantageous (both to the organization and the individual and their colleagues), and how to realize the intention to collaborate and share knowledge are all challenges the would-be collaborative knowledge worker must navigate. The following presents the results of an analysis of the policy formulation environment in government, focussed on the impact of new technologies and organizational social networks and the relationship amongst attitudes, norms, and behavioural control on efforts by individual policy analysts to share knowledge and collaborate with colleagues in large governmental organizations grappling with complex policy challenges. Complex policy challenges will only grow in future, and organizations will not likely shrink in their complexity. In order to address these public policy formulation challenges in future, public sector organizations will need to make better use of the knowledge resources embedded in their organizations. While part of the solution lies in new technology platforms that facilitate collaboration and knowledge sharing across the enterprise, the research and results described below show that the significant cultural and organizational barriers that stand in the way of successful adoption of such platforms must be addressed.
1.0 Preparing for the Future of Policy FormulationIn 2010, the Government of British Columbia (BC), issued an organizational strategy
entitled Citizens @ the Centre: BC Government 2.0. One objective of that strategy was to promote the use of new technologies to transform the operations of government, and encourage collaboration and knowledge sharing across organizational and system silos through business process innovations. In penning this strategy, and tying it to the emerging concept of Government 2.0 (referred to here as Gov 2.0), the Technology and Transformation Committee explicitly acknowledged the implications of the social web - Web 2.0 - for the future of public administration. This research explores those implications in the context of policy formulation in the British Columbia Government.
The deputy ministers promoting Citizens @ the Centre are not alone in emphasizing the importance of the social web for the future of public administration, as it represents an
1
important concept that has emerged in recent years in both the practice of public sector governance (Eggers, 2005) and as a technological and cultural phenomenon in its own right (Gøtze & Pedersen, 2009). Built upon the architecture of the social web, Gov 2.0 is defined here as instances where Web 2.0 approaches and technologies are applied to public administration functions, public policy development and governance processes. The use of Web 2.0 technologies and methods by government and in governance settings is an issue of growing interest, and is a research area with multiple facets (Osimo, 2008). As a sub-discipline of the wider e-gov literature, interest in Gov 2.0 is largely focused on the potential for enhanced e-democracy and the use of the Internet as a democratic enabling mechanism and citizen engagement platform (Chadwick, 2009). The impact of Web 2.0 on e-service delivery is also an issue of emerging focus (Dutil, Howard, Langford and Roy, 2010), and the contribution of social media tools to internal administrative functions (e-management) has begun to receive some attention (e.g., Martin, Reddington & Kneafsey, 2009). These uses are certainly important features of Gov 2.0. However, the focus of this present research is on internal–to–government policy formulation activities - e-policy - and how the adoption of Web 2.0 tools is affecting this environment, especially with respect to internal knowledge sharing and collaboration amongst public service knowledge workers. Policy analysis is an important function in government, and the focus of much academic inquiry. Gov 2.0 has the potential to fundamentally affect that environment. In order to prepare for the future of policy analysis, we must both understand the contemporary setting and anticipate as much as possible the implications of the social web for public administration and governance.
Policy analysts play many roles in the policy formulation process - as information agent, knowledge manager, coordinator and collaborator, boundary agent, advocate and gatekeeper. While the implications of Gov 2.0 are currently taking shape and will play out over the next several years, this changing environment carries implications for the future conduct of policy analysis and raises the possibility of an emergent character and role for the modern policy analyst. This research is aimed at describing what policy analysts do, and how they do it, in the midst of this changing environment. The objective is a description of contemporary Gov 2.0-supported policy formulation and the development of a portrait of the emergent practice of policy analysis that I have tentatively labelled ‘Policy Analysis 2.0’.
1.1 Statement of the ProblemPolicy-making is hard, and it can often be made harder still when the issue is complex
(Dror, 1986). Profound uncertainty, rapid emergence and multiple issue interconnected-ness are some of the features of a complex policy environment that challenge public policy makers (Geyer & Rihani, 2010). One approach to dealing with complexity in a public policy context is horizontality, the act of working across the various ministries and divisions of a government in order to harness the organization’s capacity and resources and direct them towards an appropriate response to the complex problem (Parsons, 2004; 6, 2004). One prominent mechanism for addressing the horizontality challenge is the promotion of greater organization-wide collaboration, knowledge sharing and active knowledge seeking amongst a network of knowledge workers (Galbraith, 1973; Weber & Khademian, 2008). Efforts by
2

organizations to improve knowledge transfer and collaboration amongst workers and organizational units have been found to contribute to improved organizational performance in a range of private sector settings (Argote & Ingram, 2000; Darr, Argote & Epple, 1995; Stewart 2002). And in recent years, some evidence that this is also true in the public sector has started to emerge (Binz-Scharf, Lazer & Mergel, 2012; Willem & Buelens, 2007; Yang & Maxwell, 2011).
But how can knowledge sharing and collaboration be promoted by government managers in the context of traditional government structures involving ministries, divisions and branches (Peters, 1998) - structures that can lead to dissonance between the organization’s constituent sub-cultures (Kuh & Whitt, 1988; Scott, 1970)? And how can a collaboration and sharing ethic be promoted across a public service starved of capacity (Clark, 2008), where a bureaucracy asked to ‘do more with less’ (Osborne, 1993) must choose what can be done with the resources available, and where the policy analyst’s value and contribution to the policy formulation process is continually in doubt (Campbell & Wilson, 1995; Kirp, 1992)? What role and impact does new technology have in the quest to remake government as a knowledge organization? How can policy analysts share more knowledge without becoming responsible for adding to their colleagues’ information overload (Edmunds & Morris, 2000; Eppler & Mengis, 2004)? Is knowledge sharing simply a new term for a computerized knowledge management system (KMS) or an electronic knowledge repository (EKR), in which we store information and hope for better search functions and linked datasets (Dawes, Cresswell & Pardo, 2009)? Or is it something different, implying a person-centred system where tacit knowledge (i.e., practical knowledge, intuition and experience, as opposed to explicit knowledge that is easily codified, stored and transmitted to others) is self-organized and shared between knowledge workers using the medium of enterprise social software (Ackerman, Pipek & Wulf, 2003; Collins, 2010)?
The emergence of Web 2.0 tools and approaches has raised the possibility that we have entered a new knowledge management era - Enterprise 2.0 (Cook, 2008; McAfee, 2006) - that can address the horizontality problem (Tapscott & Williams, 2006), facilitate the sharing of knowledge across government (Mergel, 2011) and promote transformative governance (Mergel, Schweik & Fountain, 2010). Does the dawn of the Web 2.0 era herald the emergence of a new breed of policy analyst, the Policy Analyst 2.0, that takes advantage of the capacities of the social web to tap into both external and internal knowledge sources as a supplement to the traditional art and craft of the analyst (Meijera & Thaens, 2010)? Beyond knowledge sharing and seeking, what is collaboration? Is it an admonition that public servants work together? What is the purpose of the organizational structure in which the policy analyst is situated within a branch, in a division, in a ministry, if they are expected to work with colleagues other than those connected to them on the org chart? Alternatively, in promoting the concept and the implied value of collaborating, have we given rise to a ‘cult of collaboration’ that dissipates individual responsibility and risks reducing direct contributions to organizational performance (O’Flynn, 2009)?
3
1.2 Purpose, Objectives and Research QuestionsPart of the task in reviving the policy analysis function and preparing it for the future is to
understand it better. Academics spend a lot of time talking about policy analysis (Enserink, Koppenjan & Mayer, 2013), but - beyond the tautology of “policy analysis is what policy analysts do” (Meltsner, 1976: vii) - surprisingly little is known about what is going on in the contemporary world of the policy analyst: who they are, what they do, and how they do it (Howlett, 2009; Howlett & Lindquist, 2004; Howlett & Walker, 2012; Howlett & Wellstead, 2011; Roy, 2008). Part of the motivation for this research thus lies in addressing the “clear need for better empirical research into the sociology of policy analysis” (Dobuzinskis, Howlett & Laycock, 2007: 8; Colebatch & Radin, 2006).
The purpose of this research is to provide contextual understanding of the contemporary policy formulation environment and an assessment of the potential impact of new Gov 2.0 approaches and technologies on policy formulation processes, in order to provide guidance for future implementation of Gov 2.0 to internal public sector policy formulation. The aim is to better understand the contemporary world of policy analysis and formulation in the British Columbia Government using mixed methods, leading towards a description of the modern policy analysis environment in the context of emerging Gov 2.0 technologies.
Building on previous work that uses the Theory of Planned Behavior (TPB; Ajzen, 1991; see discussion, below at section 1.5) to investigate knowledge sharing and collaboration behaviour, the research investigates how the attitudes and perceived behavioural control of policy analysts, and their beliefs about organizational norms, influence their intentions and behaviour with respect to organization-wide knowledge sharing and collaboration. Factors such as the policy analysts’ conceptualization of their profession and their role in the wider governance environment, computerized knowledge management systems and collaboration technology, organizational social networks and organizational culture were also probed in an effort to understand how they affect the internal-to-government policy formulation system.
In order to focus the analysis, the perspective taken here looks at policy analysis in government as an information-driven enterprise in which it is assumed that greater knowledge sharing and collaboration amongst policy analysts within a government contributes to enhanced organizational effectiveness at developing horizontal policy analysis which, in turn, makes the organization better positioned to address complex policy challenges. This research is aimed at questions of how governments can deal with the challenge of policy complexity by supporting horizontal policy formulation through the promotion of intra-organizational knowledge sharing and collaboration, and what barriers might stand in the way of the sharing of knowledge and efforts by public servants to collaborate with colleagues.
This mixed-methods dissertation is presented as a multi-paper synthesis, with six core chapters used to present the various perspectives taken and their results. Using a non-experimental cross-sectional survey research design, inferences about the relationships among the independent and dependent variables are made using hierarchical regression analysis in an attempt to assess the relevance of the TPB model to the particular setting, and
4
the importance of the additional factors. The following list provides a road-map to these six sections based on the core questions that have guided the research:
• Who is the contemporary policy analyst and what are some characteristics of the profession? (see chapter 4)
• How do practicing policy analysts conceptualize their profession and understand their role in the policy formulation environment? (see chapter 5)
• How does the organizational social network affect pan-organizational knowledge sharing and collaboration, how do organizational social networks serve to build linkages between individual policy analysts and between policy units having similar interests, and what is the role of such networks in the policy formulation environment? (see chapter 6)
• How do policy analysts make use of communications technology in the policy formulation process, how do they evaluate the impact of successive applications of new technology in support of policy formulation, what is their impression of the impact of current technology on the practice of policy analysis, and how do they anticipate future developments in new technology will affect their profession? (see chapter 7)
• Using quantitative methods, how does the Theory of Planned Behavior help to understand the intention of respondents to collaborate and share knowledge with other policy analyst colleagues throughout government? (see chapter 8)
• Using qualitative methods, how does the TPB help to frame the intention of respondents to collaborate and share / seek knowledge? (see chapter 9)
1.4 Conceptual FrameworkGuiding this research is a conceptual framework which views public policy relevant
activities as situated within an environment defined by a formal governance setting where individual policy analysts - some operating within formally defined policy units and some outside - share knowledge and collaborate with other policy analysts in order to address emergent policy issues (see figure 1.1, below). This research focuses on a specific aspect of public sector governance activities labelled here as ‘policy formulation’ (Howlett & Ramesh, 1995). This particular term is used purposefully here, with precision, to distinguish the activities of concern from the larger policy process. My approach follows from Anderson’s (1975: 53) definition of policy formulation as involving “the development of pertinent and acceptable proposed courses of action for dealing with public problems”. And the term ‘formulation’ is explicitly used here to distinguish it from the more-expansive ‘policy formation’ process, which appears in the literature as largely synonymous with ‘the policy process’. Limiting the scope to policy formulation leads us to focus on the early stages of the policy process: from apprehension of the policy problem (‘problem definition’), through to the consideration of alternatives (‘solution analysis’ and ‘option evaluation’) and terminating with a recommendation or other information designed to support decision-making.
The approach taken here looks at policy analysis as an idealized process and activity undertaken within formal government structures, modelled on the policy cycle. The policy
5
analysis literature has identified the ‘stages heuristic’ of the policy cycle as a convenient fiction (Sabatier, 1991), and the policy networks literature has also shattered the notion of the policy process being a closed system within the exclusive domain of governments. Despite these two crumbling foundations, this research proceeds from a conceptual model that views the policy process as an internal-to-government function with a discernible policy formulation stage. This assumption is not particularly heroic: relevant policy actors in the British Columbia Government setting can be identified as clearly being ‘inside’ of government based on their status under the Public Service Act1, and the closed nature of the BC Government’s formal policy formulation process is regulated in part by the confidentiality responsibilities required of public servants.2
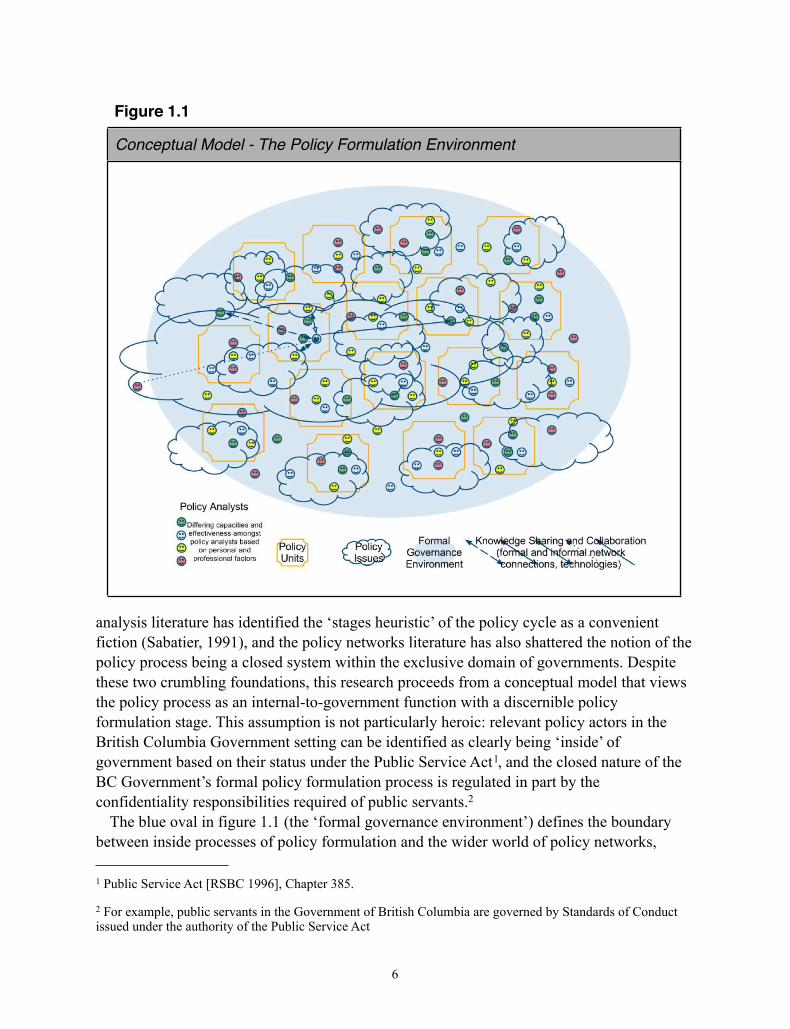
The blue oval in figure 1.1 (the ‘formal governance environment’) defines the boundary between inside processes of policy formulation and the wider world of policy networks,
6
1 Public Service Act [RSBC 1996], Chapter 385.
2 For example, public servants in the Government of British Columbia are governed by Standards of Conduct issued under the authority of the Public Service Act
Figure 1.1
Conceptual Model - The Policy Formulation Environment

advocacy coalitions, external stakeholders and civil society. The boundary is purposely open as an acknowledgement of the permeability of the inside/outside divide and the nature of modern policy analysis. The fact that policy development can frequently operate across this boundary is illustrated through the way that ‘policy issues’ (the cloud shapes) are in some cases wholly within the formal governance environment oval and sometimes straddle both the inside and outside. Policy issue ‘clouds’ can also, of course, arise outside of the formal governmental policy environment and drift into the formal environment; but in order to make the transfer to government policy, regulation or legislation, that issue will necessarily have to be subsumed by the internal-to-government policy formulation environment at some point. This conceptual model is meant to convey a clear definition of the research space: the formal, inside-of-government policy formulation environment which excludes for the most part (for analytical purposes) interactions with actors outside of the formal governance environment. Using that construct, we can clearly identify the constituent parts of the policy environment network under study.
The term ‘policy analyst’ represents a wide-ranging category involving all public servants with a connection to policy analysis and formulation processes in government. They have job titles containing terms such as ‘policy analyst’ and ‘policy advisor’, ‘economist’, ‘project manager’, and ‘information analyst’, and - specific to policy units - ‘manager’, ‘director’, and ‘executive director’. Public servants in these positions may spend a lot of their time dealing with communications issues, planning and reporting, operational concerns and stakeholder management. But they occupy key positions in the public service environment in which they have some direct connection to work that can be called ‘policy analysis’. These ‘policy analysts’ bring differing perspectives, capacities and effectiveness to the policy formulation environment based on their position in the hierarchy and the formal structure, and the professional and personal characteristics they possess. They will be situated within or outside formally defined ‘policy units’, and from time-to-time will find themselves engaged in particular policy issues. Policy analysts also exist outside of the formal governance environment in think tanks, policy advocacy groups and private sector firms, but these policy analysis professionals are not surveyed in this research. Despite the breadth of the policy analyst profession, a principal challenge in this research was in defining and identifying the population of interest. In several related approaches to surveying practicing policy analysts, a comprehensive survey of public service actors connected to the policy analysis function in government has been undertaken (e.g., Howlett & Wellstead, 2011). In the survey portion of this research, however, participation was limited to members of the BC Public Service having titles such as ‘policy analyst’ and ‘policy advisor’ and their variants (e.g., ‘senior policy analyst’) This approach may strike some readers as overly specified and limiting, but is justified based on the intrusive nature of external social science research into the work lives of busy professionals. In preliminary discussions with BC Public Service advisors, I was encouraged to be more targeted in my identification of the population of interest to avoid both a low overall response rate and a self-selection bias from respondents. Chapter 3 describes in detail how policy analysts within the formal British Columbia Government
7
policy formulation environment were recruited for this research, and further explanation of the challenges in identifying the population of interest can be found in Appendix A.
‘Policy units’ within the British Columbia Government, as with most governments, denote work units principally responsible for ‘policy development’ for an entire ministry or division. These units typically have titles such as ‘Policy & Legislation Branch’, ‘Corporate Policy Unit’ or ‘Strategic Policy Branch’. In the conceptual framework diagram, the size and relative position of each policy unit icon conveys its position within the policy environment (e.g., central or peripheral), its position in relationship to other policy units (e.g., closeness, issue gaps) and its connection to particular policy issues (e.g., being enveloped by particular policy issue ‘clouds’). The policy unit perspective in this research is captured through semi-structured interviews with members of these corporate policy units. Again, chapter 3 explains the process used for identifying and recruiting these participants.
‘Policy issues’ are matters of some definition and significance that arise as strategic initiatives originating from within a ministry, in response to an emergent issue originating from outside of government, or as a result of a directive from a Minister or from Cabinet. ‘Policy issue’ processes are defined here so as to draw a clear distinction between administrative routines and and the “most important choices” (Lasswell, 1951: 5) made by governments. At any given time, there will be a number of significant policy issues being pursued within government. Artifacts of these processes may take the form of position papers, consultative documents, strategy statements, decision notes, draft Ministerial orders, proposals for new or amended legislation, regulations or programs, and formal Cabinet submissions or less-formal Cabinet presentations. Even ignoring non-Lasswellian policy analysis - i.e., the ‘less important stuff’ - there is still much policy-related effort expended by policy analysts and within policy units that revolves around less significant daily policy detritus: briefing notes and briefing binders, ministerial and executive correspondence, stakeholder and citizen engagement, inter-governmental relations, conceptual papers and issue monitoring. While the cloud icons shown in the conceptual diagram are meant to convey BIG policy issues, the day-to-day work of the policy analyst lies along a spectrum from the sublime to the “ridiculous” (Hartle, n.d.: 1).
Lastly, the specific focus of this research is on the interactions among policy analysts as knowledge workers in a large organization. Knowledge sharing and collaboration are the central focus of this research, the mechanisms by which the goal of horizontal governance are hypothesized to occur. The interactions of policy analysts within a government will be based on the formal hierarchy and the informal organizational social network, facilitated and foiled by network technologies, amplified and dampened by the approaches and actions of individual actors and the issue under consideration. It is these interactions, the day-to-day work of what it means to be a policy analyst in the contemporary policy formulation environment, that are the core interest of this research: what defines the contemporary policy analyst (chapter 4); how do policy analysts conceptualize their profession and their role in the policy process (chapter 5); how do policy analysts connect with colleagues to address policy issues (chapter 6); how do policy analysts make use of communications technology in the policy formulation process (chapter 7); and what motivates and constrains policy analysts
8
from sharing knowledge and collaborating with colleagues throughout government? (chapter 8 and chapter 9).
1.5 Theoretical Framework: The Theory of Planned BehaviorThe research was conducted with a focus on knowledge sharing and collaboration amongst
policy analysts as activities that support a horizontal approach to policy formulation in the context of complex policy settings. A guiding force in the research has been the Theory of Planned Behavior (TPB; Ajzen, 1991; see figure 1.2, below), a widely-cited and rigorously-tested model from social psychology that persuasively explains what motivates and constrains people in following through on intended behaviour. Rational choice, socio-psychological behavioural models like the TPB are designed to understand behaviour and predict outcomes. In its simplest form, the TPB argues that what a person believes to be true (their attitude towards something), what those who matter to the person believe (their subjective evaluation of norms of behaviour in their organization or community) and the ability of the person to act on what they want to do (their perceived control with respect to the behaviour in question) are all crucial to understanding and predicting whether a person will be successful in forming the intention to perform the desired behaviour, and will be successful in doing so. A common example is the behaviour of quitting smoking: if someone believes they should quit smoking, if their family want them to quit smoking and if they have the ability to quit smoking, the TPB predicts they will form the intention to quit smoking and are likely to be successful in doing so.
The TPB model has been successfully used in empirical research to explain a wide range of behaviours related to issues such as cheating (Beck & Ajzen, 2001), intention to quit smoking (Godin, Valois, LePage & Desharnais, 1992; DeVries, Backbier, Kok & Dijkstra, 1995; Moan & Rise, 2005), technology acceptance 3 (Morris, Venkatesh & Ackerman, 2005; George, 2004), drug use (McMillan & Connor, 2004), condom use (Sheeran & Taylor, 1998), exercise (Hausenblas, Carron & Mack, 1997), and speeding (Elliott, Armitage & Baughan, 2003). As with examples such as quitting smoking and exercising, the TPB model can be applied to situations where a person is trying to avoid a negative behaviour as much as where they are trying to engage in a positive behaviour. In the interests of simplicity, I only refer to the latter in much of what follows. The TPB also provides insights into the possible effects of potential behavioural change initiatives (Fishbein & Ajzen, 2010), insights which can, of course, be of enormous benefit to managers and policy makers.
According to the TPB model, behavioural intent is predicted by three explanatory variables: attitude towards the behaviour; subjective norms; and perceived behavioural
9
3 Adaptations of the TPB model have been developed which are more directly applicable to acceptance and adoption of technology: the technology acceptance model (TAM) (Davis, 1989) adds perceived usefulness and perceived ease of use as explanatory factors; and the unified theory of acceptance and use of technology (UTAUT) proposed four categories of variables that influence ICT acceptance: performance expectancy, effort expectancy, facilitating conditions, and social influence (Venkatesh, 2003). Given the broader interest in knowledge sharing and collaboration behaviour in this research beyond just the use of particular technologies, the TPB model was chosen as being less focussed on technology use and more broadly concerned with intention and behaviour.
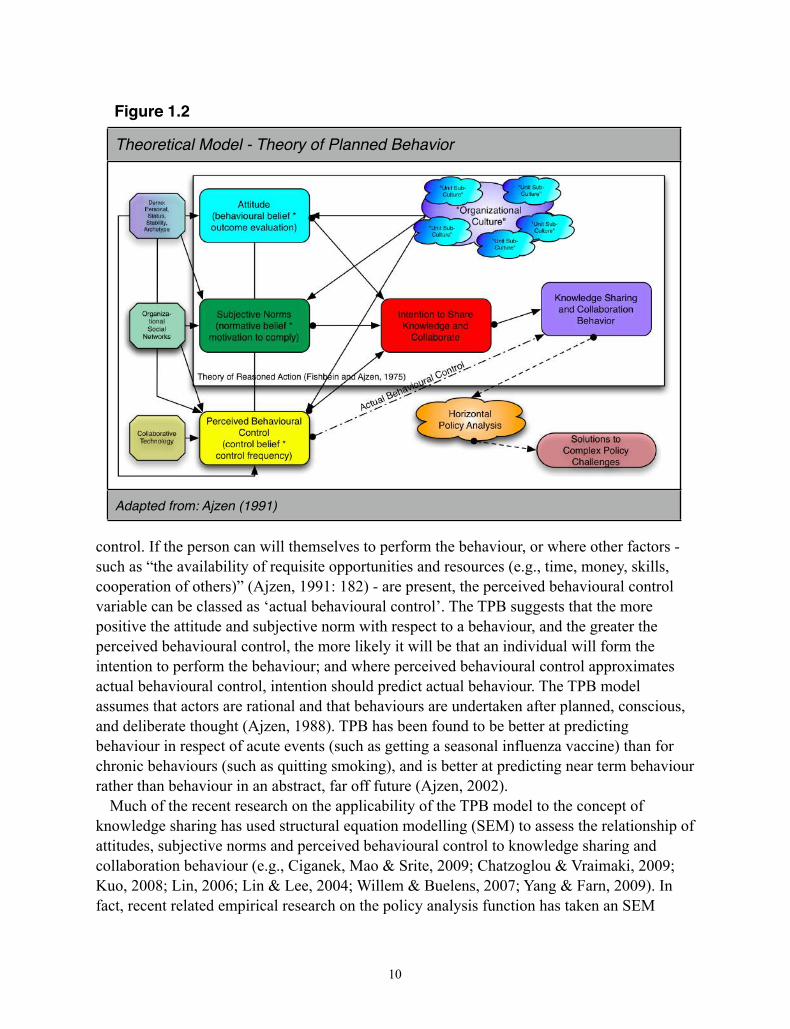
control. If the person can will themselves to perform the behaviour, or where other factors - such as “the availability of requisite opportunities and resources (e.g., time, money, skills, cooperation of others)” (Ajzen, 1991: 182) - are present, the perceived behavioural control variable can be classed as ‘actual behavioural control’. The TPB suggests that the more positive the attitude and subjective norm with respect to a behaviour, and the greater the perceived behavioural control, the more likely it will be that an individual will form the intention to perform the behaviour; and where perceived behavioural control approximates actual behavioural control, intention should predict actual behaviour. The TPB model assumes that actors are rational and that behaviours are undertaken after planned, conscious, and deliberate thought (Ajzen, 1988). TPB has been found to be better at predicting behaviour in respect of acute events (such as getting a seasonal influenza vaccine) than for chronic behaviours (such as quitting smoking), and is better at predicting near term behaviour rather than behaviour in an abstract, far off future (Ajzen, 2002).
Much of the recent research on the applicability of the TPB model to the concept of knowledge sharing has used structural equation modelling (SEM) to assess the relationship of attitudes, subjective norms and perceived behavioural control to knowledge sharing and collaboration behaviour (e.g., Ciganek, Mao & Srite, 2009; Chatzoglou & Vraimaki, 2009; Kuo, 2008; Lin, 2006; Lin & Lee, 2004; Willem & Buelens, 2007; Yang & Farn, 2009). In fact, recent related empirical research on the policy analysis function has taken an SEM
10
Figure 1.2
Theoretical Model - Theory of Planned Behavior
Adapted from: Ajzen (1991)
approach (Wellstead & Stedman, 2010; Wellstead, Stedman & Howlett, 2011). SEM has the advantage of permitting the evaluation of feedback loops amongst the variables (Kaplan, 2008), and allows for the analysis of direct and indirect relationships between dependent and independent variables and among dependent variables (Kline & Klammer, 2001). In the quantitative analysis aspects of this research (see chapter 8, below), hierarchical regression analysis is used following the method proposed by Ajzen (1991), and follows examples such as Ajzen and Madden (1986), Beck and Ajzen (1991), Gupta, Sharma and Ganesh (2009) and Zhang, Cresswell and Thompson (2004). In the qualitative analysis aspects of this work (see chapter 9, below), the TPB is applied as an analytical framework, a distinction meant to convey that the intent is not to test the TPB as a formal hypothesis in the present context, but rather to use the TPB to frame the research questions and data analysis (following, e.g., Fukukawa, 2002; Klobas & Clyde, 2000) and explore in greater depth the respondents’ attitudes, subjective norms, perceived behavioural control and intentions using semi-structured interviews (following, e.g., Bocksnick, 2004; Ouadahi, 2008; Smarkola, 2008; Smith & Biddle, 1999).
The use of the TPB model in this research provides a theoretical framework for assessing what motivates and facilitates efforts by policy analysts to engage in organization-wide knowledge sharing and collaboration. Additional data gathered through the online survey and semi-structured interviews sought to illuminate respondents’ perspectives on the policy formulation process, the influence of information and communications technologies on the policy formulation environment, the impact of the organizational social network, demographic and career status and experience, and organizational culture on knowledge sharing and collaboration behaviour.
1.6 Significance of the StudyThe Government of British Columbia has clearly signalled its interest in using the power of
the social Internet to transform the operations of government (British Columbia, 2010). There is a great deal of enthusiasm for Gov 2.0 - and it has emerged from a range of sources: from political actors who have used social networking services to connect with their constituencies (Westling, 2007; Wyld, 2007) and engage in ‘social listening’ (Slobin and Cherkasky, 2010), to the coalition of bureaucratic, political and non-government actors who are promoting the ‘open data’ agenda (Longo, 2011). Part of the support for Gov 2.0 - and, again, the focus of this research - reflects its potential as a knowledge management tool applied to the policy formulation process within public sector organizations (see Karacapilidis, Loukis & Dimopoulos, 2005 for a pre-Web 2.0 perspective). Popular books such as Wikinomics (Tapscott & Williams, 2006) and Enterprise 2.0 (MacAfee, 2009) hold out the promise that Gov 2.0 can fundamentally improve collaborative work environments. Governments are beginning to experiment with Gov 2.0 in part as a way of improving policy analysis capacity and improving the policy formulation process (Noveck, 2009).
The issue of the effective use of emergent technology provides one basis for undertaking this work. As governments continually deal with budget constraints, innovative technologies will increasingly be presented as cost-effective ways to improve service delivery, engage
11
citizens and make the business of government more efficient. In the absence of understanding how people react and adapt to new technologies, however, those implementations will likely face significant challenges.
Generally, the adoption of a Gov 2.0 approach - whether focused externally on citizen engagement, or internally - represents more of a political or operational investment than would a comparable e-gov initiative requiring a complex combination of hardware, network infrastructure and software. In comparison, Gov 2.0 initiatives generally operate on existing hardware with much of the required software already in place (e.g., Internet browsers), or deployed using open source and freely available or inexpensive software services. While adopting a Gov 2.0 approach within government is relatively inexpensive, it is by no means free (even if the software is) and carries with it its own risks. Those costs and risks largely relate to management of human resources within the public service, and the effective management of the policy process as a core function of government. In the absence of understanding how organizational networks currently collaborate to formulate policy, and how the introduction of Gov 2.0 tools might affect that environment, investment in Gov 2.0 could have unforeseen consequences.
Another motivation is the age profile of the research setting. Like other industries and other settings, the British Columbia government faces a looming demographic challenge with many long-time civil servants set to retire in the coming years. Various knowledge management (KM) systems in the past have attempt to capture tacit knowledge held by long-term employees for use across the organization and after the retiree exits. Enterprise 2.0 (Cook, 2008; MacAfee, 2009), as a particular application of Web 2.0 in corporate environments, is an attempt to address the shortcomings of previous KM systems and harness the power of Web 2.0 platforms for capturing tacit knowledge and sharing knowledge across organizations (McAfee, 2006).
Lastly, in an era of increasingly complex governance challenges, with organizational structures still rooted in public administration traditions over a century old, this research views collaborative policy formulation as an important response to policy complexity. The term policy collaboration represents an evolution of the literature that includes such terms as horizontal governance, holistic governance, joined-up government, cross-cutting policy issue management, coherent and cohesive policy responses, coordination and integration between government agencies, and knowledge management and knowledge sharing across and between governments (6, 2004).
Policy analysis, as a central public sector decision-support and internal communications function, has been dramatically influenced, over decades, by the impacts of changing information and communication technologies (Beer, 1974; Simon et al., 1986; 6, 2004). But the field - and our society - is now possibly on the cusp of transformative change in the context of new ICTs, especially increasing Web 2.0 deployment (Benkler, 2006; Shirky, 2008) and Web3.0 capacity (Cohen, 2006; Till, Dobell, Longo and Driessen, 2012). The 21st century digital economy will continue to see an explosion in the scale of observations, records, data, information, knowledge and opinions that must be taken into account in the development of public policy and governance decisions (Dobell, Longo and Walsh, 2011;
12
Nowotny, Scott and Gibbons, 2001; Pereira and Funtowicz, 2006). For the policy analysis function to continue to assert its relevance in this environment, it must both adopt the emergent technology fuelling this change as well as adapt itself to the changing environment.
1.7 Organization of the DissertationThis dissertation is presented as a multi-paper synthesis. There are ten chapters in total,
with six sub-studies presented as standalone papers that form the core of the work, each addressing different research questions. The following chapter provides a review of the literature and the underlying theoretical framework, and chapter 3 presents a detailed description of the research methodology and methods used. The separate sub-studies follow: chapter 4 describes the contemporary policy analyst surveyed in this research; chapter 5 assesses how the research participants conceptualize the contemporary practice of policy analysis; chapter 6 looks at the organizational social network, and assesses how policy analysis is currently being conducted in practice; chapter 7 takes a focussed look at how technology is affecting the policy process in the current setting; chapter 8 looks at the results from an online survey of practicing policy analysts to assess what motivates and constrains policy analysts from sharing knowledge and collaborating with colleagues from across the government; and chapter 9 looks at the same question using results from semi-structured interviews. Chapter 10 brings together the findings from those six separate studies with a general discussion and conclusions, with implications, limitations and directions for future research identified.
13

14
Chapter 2 - Literature ReviewThis literature review explores components of the conceptual framework (see figure 1.1,
above) and the theoretical framework (see figure 1.2, above) to provide the reader with background on the concepts explored in this research, including: the policy analysis and formulation system; the phenomenon of complex policy problems and the emergence of horizontal policy solutions as a response to this complexity; intra-organizational knowledge sharing and collaboration as particular approaches to achieving horizontality; the impact of new information and communications technologies relevant to policy analysis; and the presence of organizational sub-cultures within larger government institutions. This chapter presents an argument, derived from the various literatures, that complex policy challenges can be addressed through a horizontal policy approach rooted in organization-wide knowledge sharing and collaboration, facilitated by organizational social networks and computer-supported collaborative policy analysis, acknowledging the barriers that differing organizational sub-cultures can pose for building the knowledge organization.
Defining what ‘policy analysis’ is seems unusually problematic, to the point that some explicitly recommend avoiding the attempt (Meltsner, 1976; Wildavsky, 1979). Despite these cautions, suggestions are not hard to find, from the simple - “whatever governments choose to do or not to do” (Dye, 1984: 1) - to broad definitions that encompass the intentional and unintentional consequences of government action and inaction (Heclo, 1972). The use of ‘policy’ here is distinguished from the common organizational use of the term that connotes the rules, routines, procedures and practices of an institutional setting (e.g., ‘departmental policy requires that any person handling hazardous materials shall receive appropriate training prior to doing so’), with a tighter focus on the “important choices” that governments make (Lasswell, 1951: 5). For purposes of definition, the policy process involves the identification and analysis of public problems, decision-making regarding a collective course of action (including inaction), implementation of the decision, and the assessment to what effect the entire process has on the issue or problem.
This research focusses on a subset of this broad policy process, ‘policy formulation’ - involving “the development of pertinent and acceptable proposed courses of action for dealing with public problems” (Anderson, 1975: 53) - as an heuristic strategy for isolating the analytical activities central to policy analysis from the larger decision-making, implementation and evaluation cycle (Howlett & Ramesh, 1995). The focus on policy formulation leads us to the early stages of the policy process: from apprehension of the policy problem, through its analysis and consideration of alternatives and ending with a recommendation design to support decision-making.
Several additional characteristics of these processes are noted: Majone’s (1988) spectrum bounded by ‘two types of policy analysis’ – i.e., proposing options for allocating public resources among competing ends using rational analytical techniques to determine the optimal solution to a given problem, and the development of arguments in support of a proposed policy choice – is helpful for understanding the range of activities that can fall under the ‘policy analysis’ umbrella. Policy formulation is also understood as a dialectic
15
process that promotes the development of new knowledge as an emergent property of the process (Minsky, 1986; Mintzberg & Jorgensen, 1987).
While the above sketches the classical view of the policy analysis function, there appears to have been a profound shift away from these traditional analytical activities undertaken by policy analysts (Klijn, Steijn, & Edelenbos, 2010) towards public management functions (Howlett, 2011) and the providing of support for the political agendas of ruling parties (Cibulka, 1994; Forester, 1995; Horowitz & Katz, 1975; Peters, 1996; Stone, 2007) – the very status Harold Lasswell sought to rescue political economy from over a half-century ago (e.g., Lasswell, 1951). As much as policy analysis is usually considered distinct from politics, the post-positivist policy perspective acknowledges the normative basis of policy analysis and the crucial role that politics plays in the process (Fischer, 1998; Howlett & Lindquist, 2007; Mayer, van Daalen & Bots, 2004; Meltsner, 1976; Mouffe, 2000; Stone, 1997). With Schön and Rein arguing that “the policy analytic movement begun by Harold Lasswell in the early 1950s has largely failed” (1994: xvi), a cautious appraisal is that policy analysis is a “discipline that is in some disarray” (Pal, 1997: x). With the world of the policy analyst marked by “ambiguity, relativism and self-doubt” (Lawlor, 1996: 120), questions about what the role of the public servant as policy analyst is in a political system are continually raised by both researchers and practitioners.
Despite the usefulness of the policy cycle as an heuristic device, contemporary policy processes are understood to emerge from complex actor constellations (both inside formal government and between government actors and external actors), and decisions are often made and implemented in a highly decentralized and informal manner (Kenis & Schneider, 1991). Indeed, policy intentions are only fully realized through discretionary action by individual agents following a long train of interpretation and negotiation flowing from initial statements through many political and organizational layers (Lipskey, 1976; Pressman & Wildavsky, 1973). Despite this, this research focuses on the formal policy analyst function within government in order to bound the study and clearly define the policy community and activity under consideration.
Part of the challenge of understanding the world of the modern policy analyst is tied up in the complexity of policy making (Dror, 1986). Complex public policy challenges are more than just ‘really complicated’ problems; they exhibit conditions such as partial order (Kim, 2012), profound uncertainty (Dryzek, 1983), often rapid emergence that challenges our mental models and predictive capacity (Howlett & Ramesh, 1995), are thermo-dynamically open and non-linear (Homer-Dixon, 2010), have whole-system implications (Kendall, 2000) and have probabilistic rather than deterministic outcomes that are subject to interpretation (Fischer, 2003). While not all policy issues are complex, the modern public policy environment seems increasingly marked by complexity (Geyer & Rihani, 2010; Huxham, Vangen & Eden 2000), a situation requiring an appropriate response from the policy analysis system (Morçöl, 2012) such as agility (Doz & Kosonen, 2008; Hämäläinen, Kosonen & Doz, 2012;), openness (Bertot, Jaeger & Grimes, 2010), acceptance of mistakes and failure (Parsons, 2006; Potts, 2009), learning (Rose, 1993) and adaptation (Gunderson, Holling & Light, 1995).
16
A focus on complexity is not meant to dismiss the variety of ‘tangled’ policy challenges that lie somewhere between the routine administration of government and ‘wicked’4 problems (Dawes, Cresswell & Pardo, 2009). The value in seeing policy environments as complex is that it allows us to abandon the objective of imposing order on a situation without resorting to the despair of wallowing in the “swampy lowlands” of “messy and confusing” problems (Schön, 1995: 28), to understand the limits of our knowledge and accept the implications of uncertainty (Parsons, 2002).
One approach to dealing with complexity in a public policy context is horizontality, the act of working across the various ministries and divisions of a government - indeed, expanding to collaborative work carried out by multiple governments - in order to harness the organization’s capacity and resources and direct them more effectively towards options for responding to the complex problem (Parsons, 2004; 6, 2004). As open systems, complex policy problems are difficult if not impossible to bound, and cannot be easily managed by a single actor or organizational unit. Traditionally, we have dealt with policy problems by breaking the organization up into distinct units, taking a quasi-militaristic hierarchical approach with divisions and branches, in order to make sense of things and to coordinate the work of employees (Weber, 1991). But in complex situations, these divisions create their own problems because issues are often not delineated based on the organizational structure (Atkinson & Coleman, 1992). A complex problem may require action by a number of different government divisions, indeed a range of governmental and non-governmental actors, though the units charged with the responsibility to address the problem were set up precisely so they could work on specialized responsibilities in their isolation.
Acknowledging this, one specific response to a complex policy problem or environment is to seek horizontal policy solutions (Bakvis & Juillet, 2004). Also referred to as joined up government (JUG; Christensen & Laegreid, 2007; 6, Leat, Seltzer & Stoker, 2002), cross-cutting policy issues management (Uberoi, Coutts, McLean & Halpern, 2010) or holistic governance (Pollitt, 2003; 6, 2004), achieving a more coherent policy stance through well-coordinated, whole-of-government responses has been characterized as achievable in a variety of ways. In a world of complex problems, horizontality has become a key strategy for dealing with this complexity: the organization knows what it needs to know to address the complex problem, and has the capacity to tackle the challenge, but that knowledge and capacity is atomized and disorganized.5 No one part of the organization is capable of putting that knowledge together on its own, and central coordinating bodies on their own are incapable of organizing and coordinating the various pieces and players. So horizontality is
17
4 The degree to which the Australian setting seems to have more ‘wicked’ policy problems than other jurisdictions is largely ascribed to the power of culture in determining a community’s perception of reality (Sahlins, 1976), in this case a shared perception that has been largely shaped by a 2007 Australian Public Service Commission publication (APSC, 2007; PPI, 2011) that highlighted the challenge of ‘wicked policy problems’.
5 Lew Platt, the former CEO of Hewlett Packard, is reported to have summed up the challenge of capturing and using all the useful knowledge dispersed in the minds of many individuals in an organization: “If HP only knew what HP knows, we could be 3 times as profitable.” (Sveiby and Simons, 2002, 3).
seen as an organization-wide characteristic that can facilitate what no overt organizational plan can, to allow a bottom-up organic coordination to emerge where an attempt at top-down coordination fails (Argote & Ingram, 2000). But how do we achieve horizontality, getting different parts of the organization talking to each other, especially when one part has no knowledge of what another part may know, or need to know? A range of methods for achieving a more coherent policy stance through well-coordinated, whole-of-governmental responses has been promoted: e.g., through a top-down orchestrated understanding of the complexity of government, led by collegial senior executives orchestrating strategic collaborations (e.g., Canada, 1996); as a situation requiring a fundamental reconceptualization of the structure and incentives of government (e.g., March & Olsen, 1983); or through an Open Method of Coordination (e.g., Radaelli, 2008). All of these perspectives share an approach to coordinated action that responds to situations of fragmented governance, with emphasis placed at different levels in the organization or governance system. However, whether the increasing complexity of policy problems, the opportunities afforded by new technologies and the continued pressures on governments to ‘do more with less’ lead to a renewed emphasis on horizontality remains to be seen (Lindquist, 2012).
While policy making is challenging on its own, adding to the complexity of policy challenges is the complicated nature of government organizations (Mintzberg & Bourgault, 2000). The challenge of the public manager is not just to recognize that knowledge is both ubiquitous and fleeting, but that enabling the flow of knowledge and encouraging collaboration6 throughout an organization requires more that an act of fiat. It also requires providing knowledge workers in the policy domain with the motivations, reinforcements, authorities, capacities and tools needed to regularly and successfully act as a networked knowledge worker. An important step in designing programs, incentives and an environment that promote the sharing of knowledge and efforts to collaborate with colleagues is to determine the underlying factors that explain why policy analysts do or do not share knowledge and collaborate. But how can knowledge sharing/seeking and collaboration be promoted by government managers in the context of traditional government structures involving ministries, divisions and branches (Peters, 1998) that can lead to dissonance between the organization’s constituent sub-cultures (Kuh & Whitt, 1988; Scott, 1970)? Is an admonition to collaborate more, and share more knowledge, irrelevant in an environment starved of capacity (Clark, 2008) where a bureaucracy asked to ‘do more with less’ (Osborne, 1993) and be ‘lean’ (e.g., Dyble, 2012) often responds by ‘doing what can be done with little time and few resources’, and where the policy analyst’s value and contribution to the policy formulation process is increasingly in doubt (Kirp, 1992; Campbell & Wilson, 1995)?
Knowledge sharing in the modern organization represents a double-edged sword: how can policy analysts share more knowledge without becoming responsible for their colleagues drowning in information? Is knowledge sharing simply a new term for a computerized
18
6 Collaboration, the act of working together on an issue or challenge, is defined in greater detail below, though both knowledge sharing and collaboration are treated as conceptually related in this research.
knowledge management system, in which we automate the transfer of knowledge within an organization by making use of better search functions and linked datasets (Dawes, Cresswell & Pardo, 2009)? Or is it something different, implying a person-centred network where tacit knowledge (i.e., practical knowledge and intuition, as opposed to explicit knowledge that is easily codified, stored and transmitted to others) is self-organized and shared amongst knowledge workers (Ackerman, Pipek & Wulf, 2003)? The emergence of Web 2.0 tools and approaches has raised the possibility that we have entered a new knowledge management era (Cook, 2008; MacAfee, 2006) that can solve the horizontality problem (Tapscott & Williams, 2006), facilitate the sharing of knowledge across government (Mergel, 2011) and promote transformative governance (Mergel, Schweik & Fountain, 2010).
Rather than look at horizontality as a coordination challenge to be managed directly, an alternative solution involves the promotion of collaboration and knowledge sharing as fundamental characteristics of the organizational climate (Connelly & Kelloway, 2003; Sveiby & Simons, 2002). In the context of horizontal policy analysis in a complex governance environment, collaboration and knowledge sharing are seen as organizational characteristics that can facilitate what no overt organizational plan can, allowing bottom-up organic coordination to emerge where an attempt at top-down coordination fails (Argote & Ingram, 2000; Ciganeck, Mao & Srite, 2009; Sveiby & Simons, 2002). By sharing knowledge throughout the organization, individuals and separate organizational entities can become ‘smarter’ about the policy challenge and the possible solutions (Argote & Ingram, 2000). Borrowing from research into innovation and effectiveness in private sector settings (e.g., Bock, Zmud, Kim & Lee, 2005; Darr, Argote & Epple, 1995; Dyer & Nobeoka, 2000; Stewart 2001), research into knowledge sharing and collaboration in public sector settings is oriented towards the specific challenges involved in sharing knowledge and collaborating across government organizational structures (e.g., Binz-Scharf, Lazer & Mergel, 2012; Gil-Garcia, Chengalur-Smith & Duchessi, 2007; Pardo & Tayi, 2007; Weber & Khademian, 2008; Willem & Buelens, 2007; Yang and Maxwell, 2011 Zhang & Dawes, 2006; Zhang, Dawes & Sarkis, 2005).
Knowledge in an organizational context is defined as “ information processed by individuals including ideas, facts, expertise, and judgments relevant for individual, team, and organizational performance”, with organizational knowledge sharing focussing on the transfer of contextualized information aimed at assisting and collaborating with others to generate solutions to problems (Wang & Noe, 2010: 117). Another approach sees knowledge transfer within organizations as a process through which one group (e.g., a unit, department, division or ministry) is affected by the experience of another, such that the knowledge or performance of the recipient unit is changed (Argote & Ingram, 2000).
Knowledge has been identified as an important strategic asset of organizations, and knowledge sharing is seen an important element in increasing the efficiency and performance of organizations (Bollinger & Smith, 2001; Davenport & Prusak, 1998). By sharing knowledge throughout the organization as a matter of course - while guarding against the corresponding risk of overwhelming the organization in unimportant information - individual organizational entities can better deal with unexpected and complex problems. Originally
19

conceptualized as Knowledge Management (KM) and largely focussed on the storage and retrieval of information as a precursor to its translation into knowledge (Mårtensson, 2000), the field has evolved as both an established discipline and business practice with the sharing of tacit knowledge between individuals seen as the objective (Connelly & Kelloway, 2003; Stacey, 2002). In knowledge sharing, the prevailing view downplays the importance of technology and promotes a focus on interpersonal transactions (Bartol & Srivastava, 2002; Newell, Robertson, Scarbrough & Swan, 2002) with professionals relying on a community of peers - specifically colleagues they trust, are friends with or whom they respect (Ibarra & Andrews, 1993; Krackhardt & Kilduff, 1999) - for accessing specialized knowledge (Cross, Parker, Prusak & Borgatti, 2001). While in traditional KM, emphasis was placed on technology or the building of systems to process and transfer explicit knowledge (i.e., information), the knowledge sharing model focusses on people, cultural and organizational development issues (Al-Alawi, Al-Marzooqi & Mohammed, 2007).
As much as knowledge sharing should not be thought of as a computer system, we should also be careful not to conflate knowledge with data or information (Dobell, 2011); instead, knowledge results from the interaction of data and information with judgement, insight and imagination, applying experience, values, and context (Iske & Boersma, 2005). It is the result of interpreting information based on understanding, and is influenced by the personality, beliefs, attitude and behaviour of the holder (Lee & Yang, 2000). Goodall & Roberts (2002) cite the growing literature that sees knowledge as socially embedded and mediated, tentative, partial and rhetorical, situated, distributed, enacted and tacit. It is important to distinguish between explicit and tacit knowledge: when codified or documented - knowledge is typically referred to as explicit knowledge (Winter, 1987; Zander & Kogut, 1995) whereas un-codified, un-documented knowledge is categorized as tacit knowledge (Polanyi, 1966). While knowledge originates in the mind, it can also be contained in documents as well as embedded in organizational routine, processes, practices and norms (Gammelgaard & Ritter, 2000). Electronic knowledge sharing is made possible when the knowledge is explicit - i.e., written, drawn, easily verbalized or otherwise articulated (Nonaka, 1994) - whereas tacit knowledge is more difficult to share via a KM system and generally requires direct human interactions between individuals, whether physically present or computer mediated. (Hinds & Bailey, 2003).
Because knowledge is a non-depletable resource, perhaps even a generative one, sharing knowledge with others - especially colleagues within the same organization - would seem commonplace. However, and despite efforts to facilitate, encourage and reward intra-organizational knowledge sharing, challenges still remain (e.g., Bock et al., 2005). A failure to openly share knowledge with colleagues may be either passive (i.e., the holder of the knowledge makes no conscious decision not to share knowledge), or active and intentional. In an organizational setting there are various factors that inhibit sharing knowledge, including: the nature of the hierarchical structure which places more tacit knowledge in the possession of longer-serving employees who can use relationship networks and their understanding of unwritten guides to navigate problems; a missing or misaligned reward structure; mistrust (both between employees, and an employee’s mistrust of an organization);
20

a lack of strategic knowledge sharing policies and procedures; and legitimate reasons, such as legal or organizational imperatives that dictate that under some circumstances particular knowledge sources not be shared internally (Wang & Noe, 2010).
Recent attention has shifted to knowledge hiding in organizations and the consequences for productivity and organizational social capital. Extensive knowledge sharing within organizations still appears to be the exception rather than the rule, which stems from the tendency of people to hoard knowledge, and treat knowledge received from others sceptically (Davenport & Prusak, 1998). Connelly, Zweig, Webster & Trougakos (2012) (2012) establish that purposeful knowledge hiding is comprised of three related behaviours: evasive hiding, rationalized hiding, and playing dumb, each of which is related to mistrust of one’s colleagues or the organization itself. Moreover, many firms and governments unintentionally limit knowledge sharing due to confidentiality concerns and to limit employee diversions (Constant, Kiesler & Sproull, 1994). There can also be unintentional disincentives against knowledge sharing generated through performance pay systems (Huber, 2001).
In order to encourage knowledge sharing, attention has come to focus on encouraging and motivating employees using recognition (Wasko & Faraj, 2005), incentives (Bartol & Srivastava, 2002) or through reference to reciprocity (Ko, Kirsh, & King, 2005), trust (Kankahalli, Tan & Wei, 2005), shared norms (Bock et al., 2005) and enhancing trust through, e.g., greater use of direct contact over electronic communication (Connelly et al., 2012). Establishing clear corporate objectives that focus on knowledge sharing (e.g., lowering costs, reducing errors, improving service, leveraging existing resources), complemented by clear and consistent support from top management, is seen as necessary for initiatives to resonate with employees. Building on these objectives, goals to guide the behaviour of employees, and recognition and rewards based on meeting those goals (e.g., gamification, public acknowledgement, performance management) can serve to motivate and regularize knowledge sharing (Gent & Ash, 2007).
Becoming a ‘knowledge organization’ is not as simple as mandating the sharing of knowledge across the organization, or indeed establishing a computerized knowledge management (KM) system (McDermott, 1999). While knowledge sharing is seen as an important element in increasing the efficiency and performance of organizations, and knowledge has been identified as an important strategic asset of organizations (Davenport & Prusak, 1998; Bollinger & Smith, 2001), it is also understood that knowledge resides within individuals (Nonaka & Konno 1998); thus the movement of knowledge across individual and organizational boundaries depends on the knowledge-sharing behaviour of individuals. Bock et al. (2005) stress the willingness of individuals to share the knowledge they have acquired, requiring a realization that knowledge sharing cannot be forced, but rather must be encouraged and facilitated (Gibbert & Krause 2002).
Under a general heading noting the need for collective action within and across organizations, collaboration involves individuals in organizations working together to address issues and solve problems that are too complex for any individual, department or organization to handle on its own (O’Toole, 1997; Wood & Gray, 1991). Collaboration is poorly defined in the policy practice and academic literature (Thompson, Perry & Miller,
21

2008). Himmelman (2002: 3) defines collaboration as “a process in which organizations exchange information, alter activities, share resources, and enhance each other’s capacity for mutual benefit and a common purpose by sharing risks, responsibilities, and rewards.” In the public policy literature, collaboration is seen as a key mechanism for solving complex, inter-agency, inter-jurisdictional policy problems (O’Flynn, 2009; Bryson, Crosby & Middleton Stone, 2006). Collaboration can confer additional benefits on the organization, including building trust, reducing conflict and taking full advantage of organizational capacity (Entwistle & Martin 2005; Huxham & Vangen, 2005).
Despite the focus in this research on formal institutions of government and internal-to-government communication among policy analysts, the policy formulation environment has long been understood as beyond the exclusive control of closed government bureaucracies (Rhodes, 2006), and policy networks are represented by a robust literature in public administration (Isett, Mergel, LeRoux, Mischen & Rethemeyer, 2011; Provan & Lemaire, 2012). An early influential study in this direction was Heclo and Wildavsky’s (1974) analysis of the British Treasury Department, where the notion of the ‘policy community’ was introduced as a cluster of relationships among major political and administrative actors in a policy area. Heclo (1978) built on this to introduce the phrase ‘issue network’, where the focus was on issue-specific policy networks with governance responsibility dispersed among large numbers of policy intermediaries, as opposed to the concern in the American literature with ‘iron triangles’ (Ripley & Franklin, 1981). Several important summaries of the use of network concepts in the policy analysis literature have been produced in recent years (e.g., Atkinson & Coleman, 1992; Bevir & Richards, 2009; Börzel, 1998; Meek, 2011). Bogason and Toonen (1998), in their introduction to a special issue of the journal Public Administration focussed on networks in public administration scholarship, highlight the importance of external-to-government policy networks as an influence on internal government activity. Rhodes (2008) surveys a vast literature ranging from social network analysis (Scott, 2000) to policy network analysis, a scan complementing the perspective of Kenis and Schneider (1991), arguing that the network concept helps to understand not only formal institutional arrangements but also complex informal relationships in the policy process. However, in government settings, with public servants conscious of the concept of ministerial responsibility and legitimate concern for the performance of their policy unit, engaging in collaborative arrangements that balance the risks and benefits to all parties can be a challenge (Kumar & van Dissel, 1996).
The specific interest in this research is on informal networks and interpersonal relationships embedded in the relationships among actors (Dawes, Cresswell & Pardo, 2009), rather than those motivated or facilitated by a formal network relationship (Mergel, Lazer, & Binz-Scharf, 2008). Also called ‘Public sector knowledge networks’ (PSKNs), such networks are explicitly seen as not ICT-driven but rather are embedded in the relationships between actors (Dawes, Cresswell & Pardo, 2009). The literature indicates that professionals rely on a community of peers for accessing specialized knowledge (Cross et al., 2001), specifically colleagues they trust, are friends with or whom they respect (Ibarra & Andrews, 1993; Krackhardt & Kilduff, 1999).
22

Increasingly, in organizations of significant size, research suggests that collaboration occurs through informal social networks as much as it conforms to the formal organization structures (Cross et al., 2001; Hansen, 2002; Kim & Lee, 2006; Sveiby & Simons, 2002; Willem & Buelens, 2007). The organizational social network perspective has come to focus on the complex social structure of relationships amongst actors, exchange in social relations and the idea that social network connections significantly influence organizational and personal outcomes (Kilduff & Brass, 2010; Kilduff & Tsai, 2003). A fundamental concept underlying this work is that of social capital, which is based on attributes of the relationship among individuals (Coleman, 1988). A person who has high social capital has a rich set of social connections that provides access to information, resources and support. When organizational networks are formed, they rely on the social capital resting on relationships among sets of individuals, although organizations can also be characterized as having high social capital (Andrews, 2010).
Two additional concepts are addressed in closing: the impact of information and communications technologies (ICTs) on the policy analysis environment, and the role of culture in organizations. Enthusiasm for, and skepticism about, the ability of advances in ICTs to improve policy analysis and decision making processes has ebbed and flowed over the past half century of the policy analysis project. From the infiltration of post-war machine-computer advances into automating the business of government (Gammon, 1954) and hope for a technology-enabled improvement of the human condition (Bush, 1945), through a golden age of computer-supported policy analysis (e.g., Bossel, 1977) and bold utopian social experiments (like the Chilean Project Cybersyn; see Beer, 1974), to the present view of Gov 2.0 as a revolutionary ‘governance platform’ (O’Reilly, 2010), this history has been propelled by both the steady advance of technology and the force of visionary personalities. But the history of ‘e-goverment’ also appears to repeatedly follow the technology ‘hype cycle’, including invariable ‘troughs of disillusionment’ that follow ‘peaks of high expectations’ (Fenn & Raskino, 2011). Today, the emergence of a second generation Internet built upon an architecture of user participation (Web 2.0), providing enhanced opportunities for analyst-to-analyst interactions (Madelin, 2012), coupled with ubiquitous cloud computing, advances in semantic data mining capacity and smart network linkages (Web 3.0), powerful mobile devices, massive and open data availability and the continuing promise of artificial intelligence all portend a resurgence in computer-supported policy analysis. Despite the cautions noted above regarding the generally failed history of KM systems built on electronic knowledge repositories (EKRs) (Grundin, 1988), the emergence of Web 2.0 technologies as a social intermediary does raise the possibility that Web 2.0-based knowledge sharing systems can serve to link knowledge workers across the organization, engendering rich and deep knowledge sharing and collaboration networks that are ultimately transformative (Benkler, 2006).
While the adoption of mainframe computing technology into government proceeded during the post-war period, an important shift in technology eras in the policy analysis environment occurred with the transition from the pre-desktop computer era to the period of widespread deployment of personal computers throughout government in the 1980s. The proliferation of
23
desktop computers represents a move from computers as corporate shared resources to computers as a device available to individual civil servants, and intended to enhance their productivity (Ottensmann, 1985). Whether the resulting environment had a positive effect on workplace productivity is, of course, difficult to measure in such a multi-dimensional business as government (Henman, 1996; Lehr & Lichtenberg, 1988). Also during the 1980s, with the increasing proliferation of personal computers throughout government, Decision Support Tools and Management Information Systems (and a derivative - the Ministerial Information System; see Ennals, 1981; Likierman, 1982) became increasingly prominent and further served to put specialized computer tools directly into the hands of decision makers. Efforts were also made to develop computerized decision aids for legislators that could also be used to structure large policy issue decisions (see Hämäläinen, 1988), and collaborative scenario building tools - approaches which combine collaborative on-line scenario building with modelling and simulation - also emerge in the later Web 2.0 setting (Wimmer & Bicking, 2011).
The common emergence of email in the early 1990s first allowed policy analysts to communicate through email - both with internal-to-government colleagues as well as with external stakeholders and clients. Document sharing was often constrained in this early period to plain text transmissions, though increasingly sophisticated encoding protocols allowed for the transmission of more complex documents with graphics. In the mid 1990s, with the development of the World Wide Web and the availability of web browsers, government websites emerged as external communication mechanisms and policy analysts were given first-hand access to the resources of the web. More ambitious attempts to create knowledge sharing and collaboration platforms have emerged over the last 20 years, with the hopes of improving the efficiency of the policy process, though technological and organizational challenges remain.
The later stages of ‘Networked Policy Analysis’ (Goldsmith & Eggers, 2004) now coincide with the emergence of Gov 2.0. The use of the Internet has undergone a fundamental shift in recent years with the adoption of technologies collectively called Web 2.0, which describes recent changes in the use of World Wide Web technology and web design that facilitate enhanced communication and opportunities for participation. Gov 2.0 is defined here as instances where Web 2.0 approaches and technologies are applied to public administration, service delivery, democracy and policy–making functions. Gov 2.0 allows for the monitoring of ideas and sentiment through processes of social listening, as well as for the mounting of platforms of engagement to directly involve stakeholders and collaborators in policy formulation exercises. While the Web 2.0-related opportunities and implications for information workers generally have been explored (e.g., McAfee, 2006), the implications for public policy analysts have received limited attention (Edwards & Hoefer, 2010; McNutt, 2008). Gov 2.0 is having profound effects on collaborative work (McAfee, 2006; Taylor-Smith & Cruickshank, 2010). In this respect, Gov 2.0 represents a continuation of previous CSCW (computer-supported collaborative work) systems and technologies (Koch, 2008); but by virtue of Web 2.0’s open architecture, Gov 2.0 expands the notion of the relevant CSCW-
24

unit to a broader network - both within government and outward to civil society (O’Reilly, 2010).
Lastly, organizational culture can be defined as the shared assumptions that an organization develops while responding to its environment. This culture is reflected in the values, norms , practices and shared artifacts of the organization (Park, Ribiere & Schulte, 2004) and can be delineated along six categories: information systems, people, process, leadership, reward system and organization structure (Gupta & Govindarajan, 2000). Each organization develops its own unique culture based on visible dimensions (e.g., espoused values and mission) and invisible dimensions (e.g., unspoken values) (McDermott & O’Dell, 2001). Within a large hierarchical organization, however, and depending on the strength of the overall organizational culture, the creation of divisions within the organization can lead to the emergence over time of distinct subcultures (Kuh & Whitt, 1988; Scott, 1969).
Drake, Steckler and Cook (2004) investigate high-level subcultures in public sector organizations - politicians, bureaucrats and scientists - in which individuals in one subculture are less likely to share knowledge with individuals in other subcultures. Each subculture tends to see its role in the policy formulation process differently, rely on different knowledge, have different information sources, gather data differently and have different information requirements. The perspective adopted here looks at organizational sub-cultures at a deeper level in the organization as they are revealed in ministries, divisions and individual units (Dellar, 1996; Markland, 2002; Museus, 2007; Scott, 1970), and how these distinct sub-cultures weave together into what Kuh and Whitt (1988) called an ‘invisible tapestry’. Most research characterizes subcultures as detracting from a strong organizational culture (Martin, 1992); however, others propose that subcultures can permit an organization to develop an agile stance that responds to its environment without detracting from internal strength (Boisnier & Chatman, 2003).
25

26
Chapter 3 - Methodology and Methods3.1 Introduction
This chapter presents the foundations that guide this work, and the methods undertaken in conducting the research. I begin with a brief discussion of the epistemological and ontological foundations which led to the choice of a mixed-method quantitative and qualitative design aimed at enhanced understanding of the research setting through methods triangulation (Jick, 1979). Two separate analytical approaches and their methods for addressing the research questions (as set out in chapter 1) are next discussed in turn. First, a largely quantitative approach was taken in an attempt to understand the evolving world of policy analysis from the perspective of the individual policy analyst as a knowledge agent within the broader governmental policy formulation environment. Next, a principally qualitative exercise came at these questions using the ‘corporate policy unit’ as the sample frame. Under both of these headings follows a discussion of the methods proper, starting with the research design and detailing the population and sampling frames, the participants, materials used to collect data and the data analysis procedures. This chapter concludes with reflections on limitations in the chosen methods and ethical considerations in conducting the research.
3.2 A Short Detour on the Nature of TruthI want to start by drawing a distinction between two terms that are frequently conflated:
methodology and methods (6 & Bellamy, 2011). Whereas methodology properly refers to the branch of logic dealing with the general principles of knowledge, the theoretical analysis of methods proper and principles particular to specific branches of knowledge, methodology has increasingly come to be used as a grandiose substitute for the correct term - method - frequently inflated to the even grander methodological when the issue under discussion pertains to research methods. This concern is not simply pedantic (I hope), as the misuse of the term methodology confuses the important difference between the tools and techniques - i.e., the methods - and the principles and philosophical assumptions for considering how and where to use those methods. Behind important choices in conducting research - what data to collect and what procedures to use - lie important philosophical and foundational questions: is there a single, absolute truth or multiple realities? What is more reliable: our senses or our reasoning? Is knowledge waiting to be discovered, or is it constructed through our thinking? (Pallas, 2003). These questions are evaluated within a framework of this researcher’s ontological and epistemological position.
3.2.1 Ontology and EpistemologyAddressing basic questions about how something can be researched (methodology) starts
with deeper questions about how knowledge about the world is revealed (epistemology). This, in turn, rests on a prior question about what is the nature of the world and - more precisely in the context of social research - of human beings (ontology) (Guba & Lincoln, 1994). Ontology is intertwined with epistemology (Crotty, 1998): to study an object requires a reflexive understanding of what we can know about the thing and how we can know about
27

it (epistemology), and what the object of study is (ontology). Ontology describes a philosophical belief system about the underlying structure and nature of social reality, involving “claims about what exists, what it looks like, what units make it up and how these units interact with each other.” (Blaikie, 2000, p. 8). Yet the researcher’s ontology is not simply a philosophical stance, but a framework for the study to guide the creation, understanding and development of knowledge.
Public administration - the discipline casting a shadow across this research - exhibits a wide epistemological scope that accommodates a variety of theoretical perspectives and methodologies (Riccucci, 2010). This is despite the field’s “tendency to believe that the field’s scientific enterprise must be defined by only one of several possible philosophies of knowledge” (Ospina, 2011, p. 958) and a longing for greater and more rigorous “scientificness” (Raadschelders, 2011, p. 917) that pervades the field. A more robust consideration of the ontological foundations of public administration scholarship has recently emerged in the literature (Raadschelders, 2011; Stout, 2012), building on earlier development of the epistemological framework for guiding public administration research (see, e.g., Houston & Delevan, 1994; Raadschelders 1999). Stout (2012) provides a detailed explanation of the ontological foundations available in public administration, how different ontologies imply particular organizational and political forms that shape public administration theory and practices (see figure 3.1, below).
With this framework in place, the challenge left to the researcher is to determine which ontology best fits their world view and experience and then “firmly declare our ontology and all that it implies” (Stout, 2012, p. 6). Based on my experience as a public administration scholar and practitioner, and the persuasiveness of Stout’s arguments, I place myself firmly in the Differentiated Relational camp which provides a particularly useful (and “weak”7) starting point for the research approach undertaken. A differentiated relationality ontology allows for the conceptualization of the policy formulation process as a locus of network activity influenced by multiple interpretations of reality.
Although there are a range of terms that categorize epistemology, these can be considered on a continuum from objectivism to subjectivism. Objectivism rests on the belief that knowledge exists waiting to be discovered, and is obtained through experience and observation (Tashakkori & Teddlie, 1998). At the opposite end of this continuum lies subjectivism, with the belief that knowledge is created, not discovered, and that truth is what each person interprets it to be.
Building from the position of the differentiated relational ontological position, and again rooted in my experience in public administration research and practice, a subjectivist epistemology emerges. This combined ontological / epistemological mix is not situational nor specific to the research setting, but rather embedded in this researcher’s ethos. As March and Furlong (2002) argue, an ontological / epistemological combination is a skin, not a
28
7 “Strong” and “weak” ontologies (White, 2000) refer to the rigidity / fluidity of an ontological stance. “Weak” ontologies are better suited to contemporary society because of their plurality and openness to adaptation. “Strong” ontologies are persuasive because of their certainty.
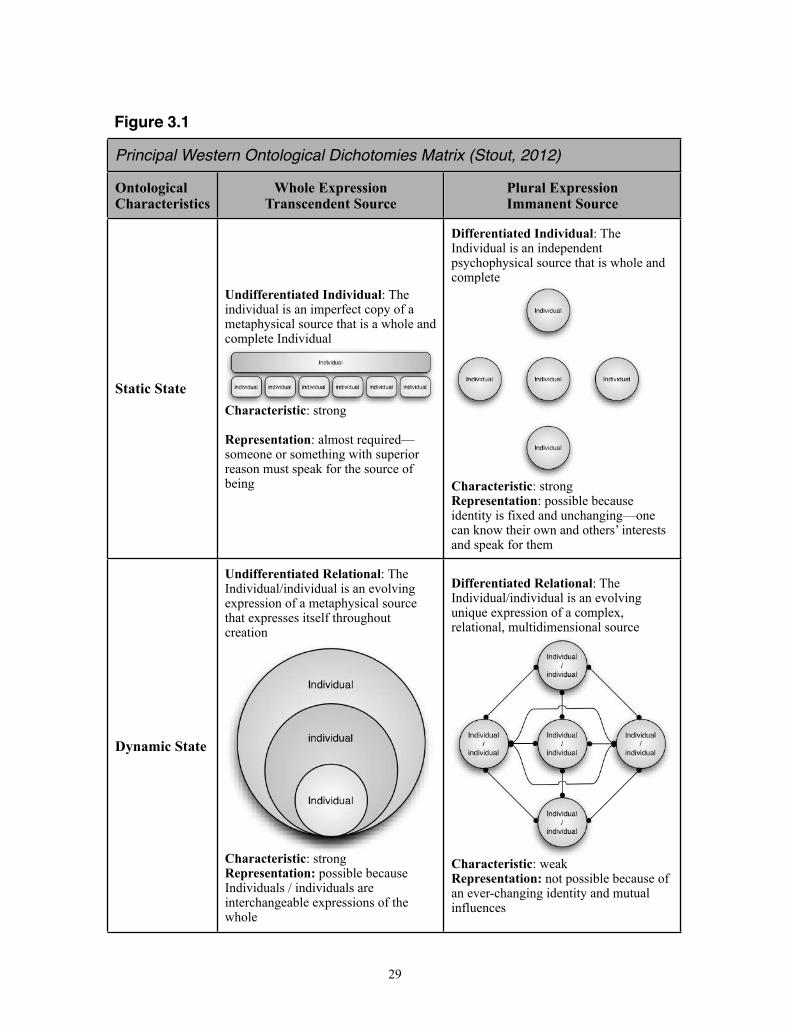
29
Figure 3.1
Principal Westtern Ontological Dichotomies Matrix (Stout, 2012)
Ontological Characteristics
Whole ExpressionTranscendent Source
Plural ExpressionImmanent Source
Static State
Undifferentiated Individual: The individual is an imperfect copy of a metaphysical source that is a whole and complete Individual
Characteristic: strong
Representation: almost required—someone or something with superior reason must speak for the source of being
Differentiated Individual: The Individual is an independent psychophysical source that is whole and complete
Characteristic: strongRepresentation: possible because identity is fixed and unchanging—one can know their own and others’ interests and speak for them
Dynamic State
Undifferentiated Relational: The Individual/individual is an evolving expression of a metaphysical source that expresses itself throughout creation
Characteristic: strong Representation: possible because Individuals / individuals are interchangeable expressions of the whole
Differentiated Relational: The Individual/individual is an evolving unique expression of a complex, relational, multidimensional source
Characteristic: weakRepresentation: not possible because of an ever-changing identity and mutual influences

sweater: it cannot be taken off, and is not a fashion statement, nor can it be used in response to the environment.
Further definition of subjectivism leads to two epistemological stances or approaches that guide my research: interpretivism and post-positivism. Interpretivism attempts to reveal social reality through the perspectives of respondents, which are shaped by their own experiences and backgrounds (Hay, 2004). Post-positivism is similar to positivism, with the difference being that when studying social reality, post-positivism recognizes that researchers cannot be absolutely positive about their knowledge claims (Creswell, 2008). The objective is not to test causal relationships but to use deductive logic and build a plausible body of evidence to support a theory. (Denzin & Lincoln, 2007; Dobuzinskis, 1997).
3.2.2 Theoretical and Methodological PerspectivesThis combination of ontology and epistemology lends itself to three theoretical
perspectives that have informed the conceptual (see figure 1.1, above) and theoretical (see figure 1.2, above) models and methods for this research (see the introductory chapter for a detailed discussion of these foundational perspectives). These are the Theory of Planned Behavior [TPB; Ajzen, 1991], and - specific to the public administration setting germane to this research - new institutionalism and social network theory. Adaptations of the TPB model have been developed which are more directly applicable to acceptance and adoption of technology: the technology acceptance model (TAM) (Davis, 1989) adds perceived usefulness and perceived ease of use as explanatory factors; and the unified theory of acceptance and use of technology (UTAUT) proposed four categories of variables that influence ICT acceptance: performance expectancy, effort expectancy, facilitating conditions, and social influence (Venkatesh, 2003). Given the broader interest in knowledge sharing and collaboration behaviour in this research irrespective of any particular technology implementation, the TPB model was chosen as being more broadly concerned with intention and behaviour as it related to knowledge sharing and collaboration and less oriented towards the adoption and use of any specific technology.
New institutionalism takes a sociological view of institutions -- both with respect to their internal interactions and their effect on society. It involves viewing institutions using non-economic models, and assessing how institutions shape the behaviour of their members (DiMaggio & Powell, 1991). Social network theory views social relationships in terms of nodes (e.g., individuals) and ties (e.g., the relationships between individuals). It differs from traditional sociology by focussing less on the attributes of individuals and more on their relationships and ties with other actors in the network.
As discussed above in the introductory chapter, the Theory of Planned Behavior (see figure 1.2, above) provides the basis for the theoretical model that informs this research. The main dependent construct in the TPB is behavioural intention, from which behaviour is theorized to follow (Ajzen, 1991; 2002). In this specific application of the TPB, the dependent variable is the intention to share knowledge and collaborate with one’s policy analysts colleagues in the public service. The main independent constructs in this model are ‘attitude toward the behaviour’, ‘subjective norms’, and ‘perceived behavioural control’. The basic idea
30
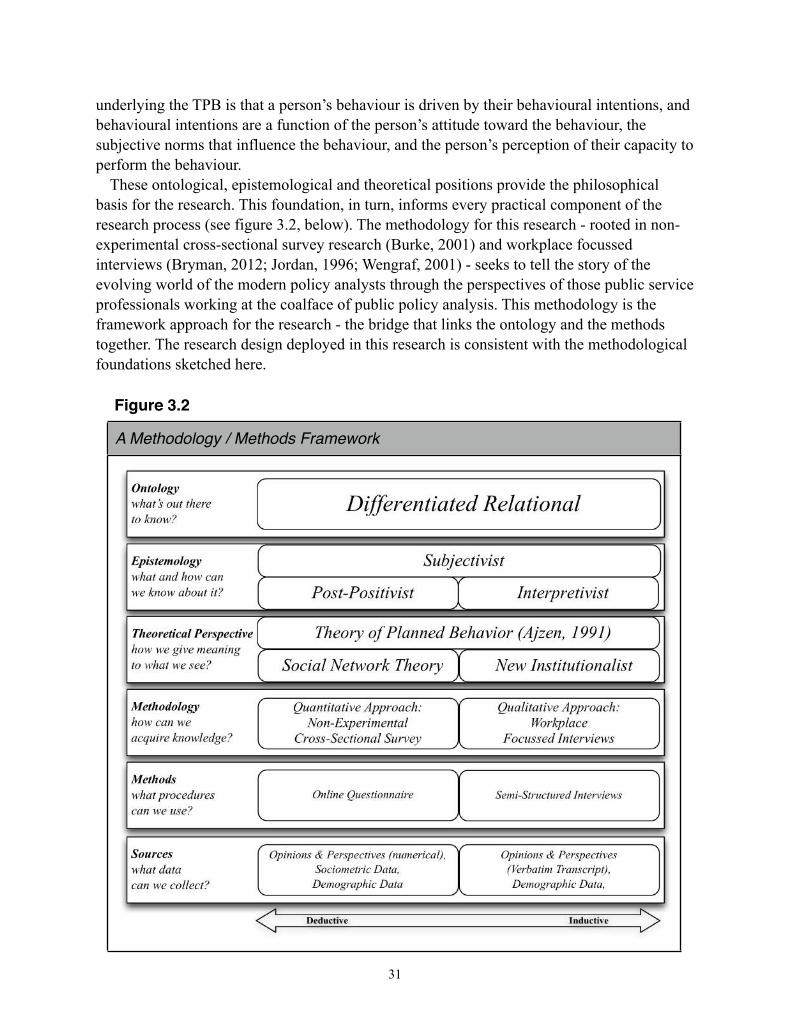
underlying the TPB is that a person’s behaviour is driven by their behavioural intentions, and behavioural intentions are a function of the person’s attitude toward the behaviour, the subjective norms that influence the behaviour, and the person’s perception of their capacity to perform the behaviour.
These ontological, epistemological and theoretical positions provide the philosophical basis for the research. This foundation, in turn, informs every practical component of the research process (see figure 3.2, below). The methodology for this research - rooted in non-experimental cross-sectional survey research (Burke, 2001) and workplace focussed interviews (Bryman, 2012; Jordan, 1996; Wengraf, 2001) - seeks to tell the story of the evolving world of the modern policy analysts through the perspectives of those public service professionals working at the coalface of public policy analysis. This methodology is the framework approach for the research - the bridge that links the ontology and the methods together. The research design deployed in this research is consistent with the methodological foundations sketched here.
31
Figure 3.2
A Methodology / Methods Framework
3.3 Research Approach: Triangulation Through Mixed MethodsThis research adopts a mixed methods approach to evaluating the relationship between the
respondents’ intention to collaborate and share knowledge with policy analysis colleagues throughout the organization (dependent variable) and the key independent constructs of attitude, norms and perceived behavioural control. In addition, respondent perspectives on the contemporary practice of policy analysis, the significance of the organizational social network for facilitating knowledge sharing and collaboration, and the impact of new technology on the policy formulation enterprise are assessed as independent variables. Two separate data gathering activities - a largely quantitative approach focussed on the evolving world of policy analysis from the perspective of the individual policy analyst, and a principally qualitative exercise emerging from a ‘corporate policy unit’ frame - were undertaken.
The philosophical foundation described above provides the ideal framework for theoretical triangulation (Denzin, 1970). Thus the quest to observe and describe the dynamic, networked, subjective environment of the modern policy analyst recommends a methods triangulation approach (Jick, 1979), the approach employed in this study. This research follows a mixed methods design (Tashakkori & Teddlie, 2003), which is a procedure for collecting and analyzing quantitative and qualitative data within a single research process in order to better understand a research problem (Creswell, 2002). The combination of more than one method can create a synergistic research endeavour in which one method enables the other to be more effective. Together, these methods can provide a fuller understanding of the research problem (Greene & Caracelli, 1997). Although I frequently fall into the ‘qualitative / quantitative trap’ (the idea that a researcher should adhere to one method or the other, and preferably the quantitative one), I have been strongly influenced by an essay by Mintzberg (2005: 7-8) in striving to instead focus on the distinction between deductive and inductive reasoning:
… let me try to clarify another confusion, the use of the terms ‘quantative’ [sic] and ‘qualitative’ when we mean ‘deductive’ and ‘inductive’. It is as if all deduction is quantative and all induction is qualitative. Not so. Theories can be assessed without numbers (even, dare I say, judgmentally - which, by the way, is what most seven point scales really amount to), just as numbers can be used to induce theories… This mix-up leaves the impression that ‘quantative’ research is somehow proper (or Propper) - i.e., ‘scientific’ - even if it contributes no insight, while qualitative research is something to be tolerated at best, and then only when exemplary. This is the double standard that pervades our academic journals to their terrible discredit. It also manifests itself destructively in doctoral courses that teach quantative methods (mostly statistics) as rites of passages. Those who cannot handle the fancy techniques cannot get the doctoral degree, even though there is all kinds of wonderful research with no numbers. Why not instead preclude from doctoral program students incapable of coming up with interesting ideas. Imagine that!
32
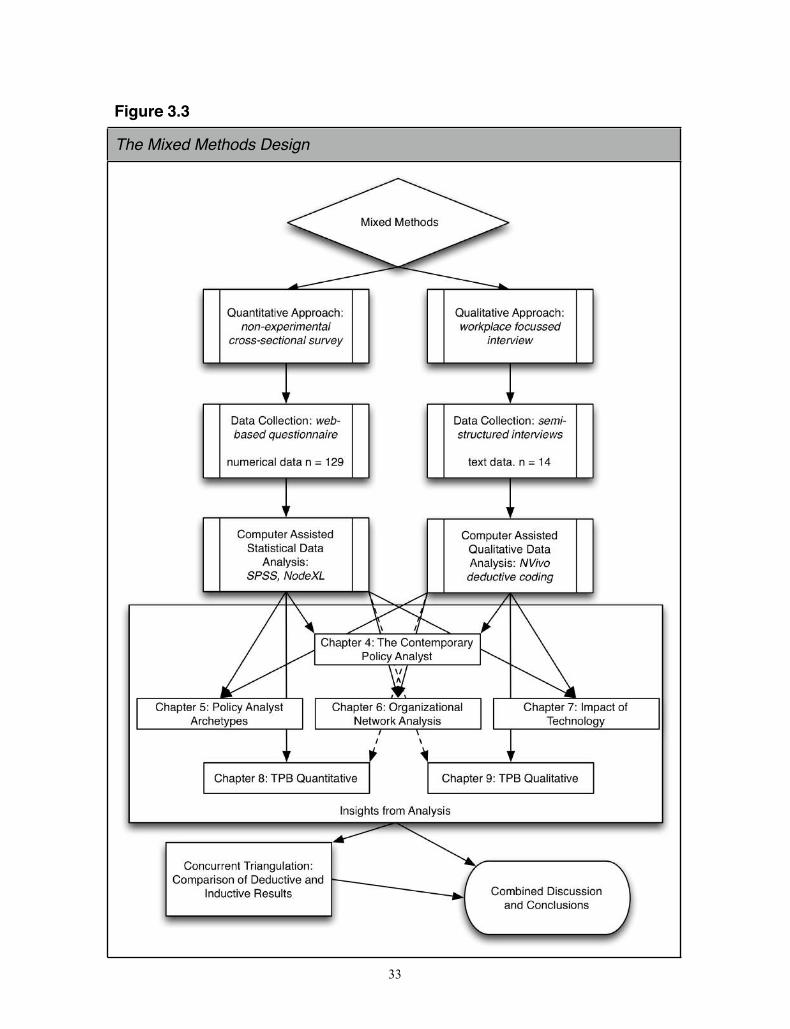
33
Figure 3.3
The Mixed Methods Design
This research also benefits from a unified logic of inference that connects the quantitative and qualitative traditions, as proposed by King, Keohane and Verba (1994). While the styles and methods of quantitative and qualitative research differ, these differences are seen as methodologically and substantively unimportant. What unites these styles is an underlying logic of inference: the goal of making descriptive or explanatory inferences on the basis of empirical observations. Inference in this case means attempting to go beyond the immediate data to something broader than was directly observed, whether that inference is descriptive (using observations to learn about things not observed) or causal (learning about causal effects from what was observed).
In the largely quantitative approach, data was collected using a web-based questionnaire and analyzed using statistical methods (though Mintzberg’s point is well taken, that the majority of the ‘quantative’ data collected there was based on respondents’ quantification of their subjective judgements). The goal of this approach was to identify the potential predictive power of selected variables on the policy analysts’ intention to collaborate and share knowledge throughout the organization. In the largely qualitative approach, respondents’ perspectives were gathered through individual semi-structured interviews with members of government ‘policy units’, supplemented by a brief post-interview demographic questionnaire. The verbatim transcripts of those interviews were analyzed using computer-aided qualitative data analysis software based primarily on a deductive coding approach. A visual model of the procedures for the mixed methods design of this study is presented below (see figure 3.3, above). The overall intention of this triangulation approach is to provide for complementary perspectives in evaluating the research questions set out above in chapter 1.
3.3.2 Research ContextThe fieldwork for this research was conducted with participants drawn from the
Government of the Province of British Columbia. British Columbia is the westernmost Canadian province, with its capital in Victoria and Vancouver its largest city. The province has a population of approximately 4.4 million people (Statistics Canada, 2012) and a GDP of $203 billion (Statistics Canada, 2011).
With an annual budget of $44 billion (with direct in-government, or “Ministry and special office program expenses” accounting for $17.26 billion of that amount8), the Government of British Columbia directly employed approximately 31,700 public servants in 16 Ministries (including boards, commissions, courts and numerous ‘Crown Agencies’) in 2011/2012 (British Columbia 2012a), with salaries and benefits for the directly-employed-in-
34
8 The remainder of the provincial budget is transferred to ‘service delivery agencies’: school districts, post-secondary institutions, health authorities, etc. All values and quotations are from British Columbia (2012a) unless otherwise noted.
government British Columbia Public Service accounting for approximately $2.25 billion of the total provincial budget (British Columbia, 2012b).9
The province has been governed by the right-of-centre Liberal Party for ten years, though a new Premier (Christy Clark) took office in early 2011 following a change in party leadership. The governance setting is characterized by a traditional Westminster / Whitehall model, with a well-regarded professional public service though that tradition suffers the same strains exhibited elsewhere such as politicization and resource constraints (Campbell & Wilson, 1995).
In 2010, the Deputy Minister to the Premier in British Columbia (the highest ranking public servant in the provincial bureaucracy) issued a ‘transformation and technology strategy’ for the British Columbia Public Service entitled Citizens @ the Centre: B.C. Government 2.0 (British Columbia, 2010). This report envisaged the use of new technologies to transform the operations of government, addressing management across organizational and system silos, and introducing new methods for citizen engagement and the incorporation of citizen inputs into government decision making. Building on three principles (i.e., empowering citizens; improving citizens’ access to services; and encouraging collaboration in the public service), ‘Citizens @ the Centre’ was meant as a strategy to deal with the rapidly changing governance and technology environment. It proposed three shifts in the public service’s operating philosophy:
• Citizen Participation: “engaging British Columbians directly with their government, through improved access to government data and information sharing”;
• Service Innovation: “expanding opportunities for citizen self-service”; and• Business Innovation: “a consistent corporate approach to technology planning and
innovation” (British Columbia, 2010).It is toward this third shift – a focus on the changing corporate environment, and the
transformation of internal business practices specifically as they relate to the policy formulation process – that this research is oriented. See also Appendix D for confirmation that this research addressed the interests of the British Columbia Government as articulated through the Citizens @ the Centre strategy.
35
9 Technically, the Government of British Columbia pays this number of full-time equivalents (FTEs), calculated as the “hours of employment paid for in a given period [divided] by the number of hours an individual, full-time person would normally work in that period” (British Columbia, 2012c: 1). Note that this number does not equal the physical number of persons employed (e.g., two 1/2-time employees equals one FTE; alternatively three FTEs may be represented by two people if they were paid for a sufficient number of overtime hours). As FTEs is the only measure that exists in the documents consulted, 27,000 of these FTEs are employed in the government proper, and the remainder are employed in the ‘service delivery agencies’ (see Schedule L [British Columbia, 2012a]). It is unclear how ‘service delivery agencies’ are treated in the ‘Estimates’ (British Columbia, 2012a) and the ‘Supplementary Estimate’ (British Columbia, 2012b) as there are clearly more than 4700 FTEs employed by the province’s school districts, post-secondary institutions, and health authorities (e.g., one of the province’s six health authorities - the mid-sized Vancouver Island Health Authority - has approximately 18,000 FTEs on its own). A separate Ministry of Finance data file contains the footnote: “Service delivery agency FTE amounts do not include SUCH [school districts, universities, colleges and health organizations] sector staff employment” (British Columbia, 2012c: 1), though this does not explain what the number in Schedule L (British Columbia, 2012a) does represent.
3.4 Quantitative Approach: The Policy Analyst PerspectiveThe objective of this approach to the research was to describe the current state and
evolution of the policy analysis and formulation process in government as a knowledge sharing and collaborative enterprise, and to investigate how collaborative technology, workplace social networks, institutional climate and culture, and individual perspectives are reflecting and affecting that system. This approach centred on a survey of public servants directly connected to the policy analysis system in the British Columbia government, using a web-based questionnaire sent to practicing ‘policy analysts’. As a semi-autonomous agent operating in a structured policy environment, the individual policy analyst has a principal mission of accomplishing objectives assigned to them: this may be the completion of an information note on a particular issue, the identification of options for addressing an emergent problem or the assembling of bureaucratic coalitions necessary for later policy formulation and implementation. In order to assemble the knowledge necessary to effectively address the problem under consideration, and to build the collaborative network necessary to support the success of the policy process, the policy analyst will attempt to connect to various knowledge sources within her or his network and collaborate with other actors where warranted.
3.4.1 ParticipantsThe population surveyed in this research included all individuals listed in the British
Columbia Government online directory at <http://dir.gov.bc.ca> as of November 25 2011 whose title contained the phrase ‘policy analyst’ or ‘policy advisor’ (including adjectives such as ‘senior’) and who were employed in the formal ministerial structure. While this approach may strike some as overly restrictive, the intent was to avoid a high non-response rate and respondent self-selection bias inherent in casting a very broad net. This precise definition of the population sought to balance a comprehensive treatment of the policy analysis environment in the British Columbia Government while maintaining a focus on policy analyst professionals. While the original conceptualization of the ‘policy analyst’ population based on job function was much broader (see Appendix A for a full discussion), limitations in the functionality of the online directory, and the difficulty in determining from a person’s organizational unit and job title what their job function entails (B. Dunkley, personal communication, November 3 2011), led to a more limited and precise concept of the population based on occupational title. Using a number of search combinations (e.g., individuals with titles ending in ‘policy analyst’), 280 candidate names were identified using the government directory. Because of the small population size, a census of all identified actors was attempted.
36
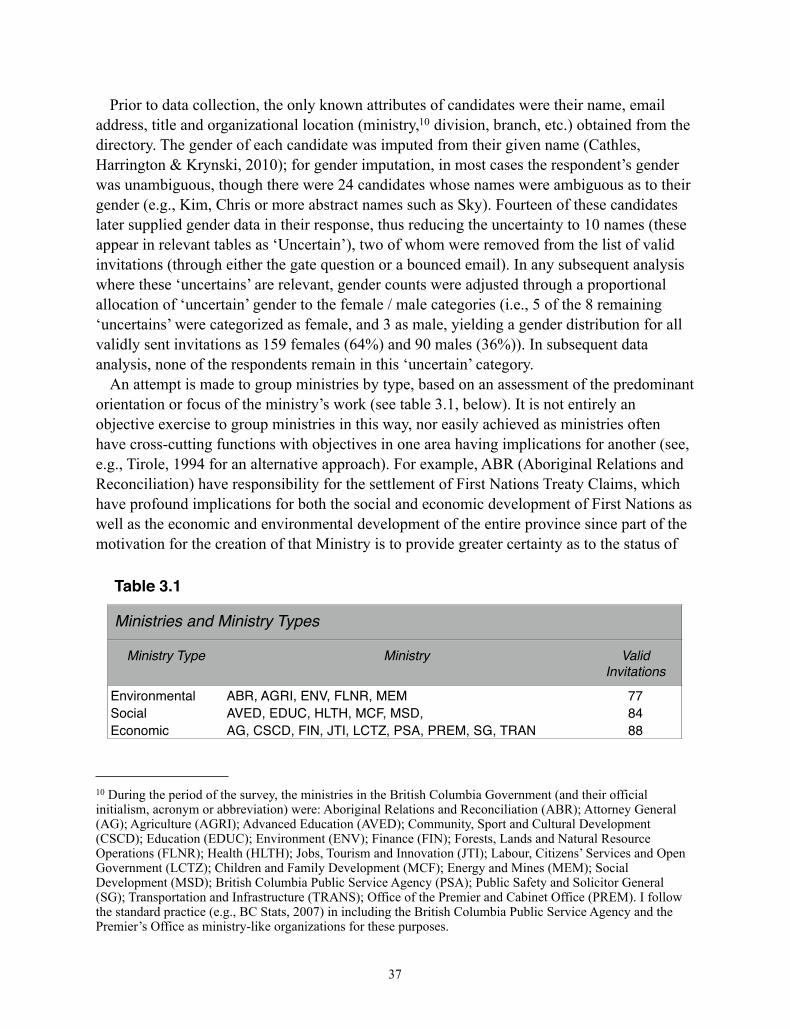
Prior to data collection, the only known attributes of candidates were their name, email address, title and organizational location (ministry,10 division, branch, etc.) obtained from the directory. The gender of each candidate was imputed from their given name (Cathles, Harrington & Krynski, 2010); for gender imputation, in most cases the respondent’s gender was unambiguous, though there were 24 candidates whose names were ambiguous as to their gender (e.g., Kim, Chris or more abstract names such as Sky). Fourteen of these candidates later supplied gender data in their response, thus reducing the uncertainty to 10 names (these appear in relevant tables as ‘Uncertain’), two of whom were removed from the list of valid invitations (through either the gate question or a bounced email). In any subsequent analysis where these ‘uncertains’ are relevant, gender counts were adjusted through a proportional allocation of ‘uncertain’ gender to the female / male categories (i.e., 5 of the 8 remaining ‘uncertains’ were categorized as female, and 3 as male, yielding a gender distribution for all validly sent invitations as 159 females (64%) and 90 males (36%)). In subsequent data analysis, none of the respondents remain in this ‘uncertain’ category.
An attempt is made to group ministries by type, based on an assessment of the predominant orientation or focus of the ministry’s work (see table 3.1, below). It is not entirely an objective exercise to group ministries in this way, nor easily achieved as ministries often have cross-cutting functions with objectives in one area having implications for another (see, e.g., Tirole, 1994 for an alternative approach). For example, ABR (Aboriginal Relations and Reconciliation) have responsibility for the settlement of First Nations Treaty Claims, which have profound implications for both the social and economic development of First Nations as well as the economic and environmental development of the entire province since part of the motivation for the creation of that Ministry is to provide greater certainty as to the status of
37
10 During the period of the survey, the ministries in the British Columbia Government (and their official initialism, acronym or abbreviation) were: Aboriginal Relations and Reconciliation (ABR); Attorney General (AG); Agriculture (AGRI); Advanced Education (AVED); Community, Sport and Cultural Development (CSCD); Education (EDUC); Environment (ENV); Finance (FIN); Forests, Lands and Natural Resource Operations (FLNR); Health (HLTH); Jobs, Tourism and Innovation (JTI); Labour, Citizens’ Services and Open Government (LCTZ); Children and Family Development (MCF); Energy and Mines (MEM); Social Development (MSD); British Columbia Public Service Agency (PSA); Public Safety and Solicitor General (SG); Transportation and Infrastructure (TRANS); Office of the Premier and Cabinet Office (PREM). I follow the standard practice (e.g., BC Stats, 2007) in including the British Columbia Public Service Agency and the Premier’s Office as ministry-like organizations for these purposes.
Table 3.1
Ministries and M Ministry Types
Ministry Type Ministry Valid Invitations
Environmental ABR, AGRI, ENV, FLNR, MEM 77Social AVED, EDUC, HLTH, MCF, MSD, 84Economic AG, CSCD, FIN, JTI, LCTZ, PSA, PREM, SG, TRAN 88

the province’s land base with an eye to encouraging economic development generally. In attempting to group ministries, I follow the general model for sustainability (Daly & Cobb, 1994; Giddings, Hopwood & O’Brien, 2002) that considers three interconnected systems of equal importance: environment, land and resources; social systems; and economy and infrastructure (both physical and facilitative), with a subjective allocation of ministries into these types based on a reading of the ministry’s primary orientation or responsibility (see, e.g., BC, 2012d).
For the 280 candidate names, email invitations were sent on November 28 2011 inviting them to complete the online survey (see Appendix B). Individual emails were sent to candidates via the online survey software provider on behalf of me from my Government of British Columbia email address (provided solely for the purpose of conducting this research), and contained an individualized URL (terminating in a 5 digit mixed-case alphabetical (e.g.: AbCdE) ‘invite code’ for each recipient). This code linked the response to the email, and therefore the name, title and organizational unit of the respondent. While there is no guarantee that the survey was completed by the recipient - i.e., the recipient could forward the email to a colleague to complete it for them - it is not possible for an invite code to have been used by more than one respondent. Follow-up reminders were sent on December 9 2011 and January 6 2012 (see Appendix B) to the remaining valid email addresses from which completed responses had not been received.
This first round of invitations resulted in 13 bounces (invalid emails). Of the remaining 267 recipients, 18 responded to the survey’s ‘gate’ question to say they were improperly included in the population (i.e., though their title was ‘policy analyst’, they claimed to not be involved in policy analysis) thus reducing the number of validly sent invitations to 249. At the close of the online survey, 129 completed responses had been received yielding a 52% response rate to the validly sent invitations; partially completed surveys were not used. Without speculating on how many of the 120 non-responders would have similarly withdrawn from the study had they answered the gate question, of these 249 valid invitations, 106 did not respond to the invitation nor to the two follow-up invitations. Ten (10) responded that they were indeed a ‘policy analyst’, but that were not interested in participating. Four (4) were started but were abandoned at various points in the questionnaire. These are summed to yield 120 total ‘active and passive non-respondents’. No direct survey of non-respondents was undertaken, though previous work (BC Stats, 2007) indicates that time constraints on public servants are a significant contributor to workplace survey non-response (this ‘time constraint’ explanation was reinforced though interactions with potential interview candidates; see section 3.5, below). There were no readily available population statistics such as gender, age or other socio-demographic variables for the British Columbia Public Service to compare to the sample in order to assess nonresponse error (A. Matheson, personal communication, June 4 2012).
Using Fisher's exact test of significance (two-tailed) of whether response / non-response rates were different for females and males as compared to all invitees revealed them to be not statistically significant (p = 0.51); testing whether response / non-response rates were different for each Ministry as compared to all invitees also revealed them to be not
38
statistically significant (p = 0.52). The full table of respondent and non-respondent data by Ministry and gender can be found in Appendix C.
3.4.2 Materials3.4.2.1 Questionnaire
Participants were surveyed using an online browser-based questionnaire,11 which is an appropriate survey medium given the regular workplace access to Internet technology of the target population (Couper, 2008; Sue & Ritter, 2007), and the written approval this research received from the head of the British Columbia Public Service confirming that the survey could be completed by public servants during work hours using government computer resources (see Appendix D).
The web questionnaire (see Appendix E for the full questionnaire) was built around the theoretical model (see figure 1.2, above) and included questions in the following categories:
• demographic characteristics of the respondents and aspects of their British Columbia Public Service career profile were collected (derived from Howlett, [2009], Howlett & Wellstead [2011] and Statistics Canada [2010]) (these results and other high-level analysis of the data are presented in chapter 4);
• views on the policy process, centring on a preference ranking of five policy analyst archetypes (see results in chapter 5);
• an organizational social network name generator (respondents were asked to “name up to five colleagues in the Government of British Columbia that you regularly work with on policy-related issues”). Respondents were asked further sociometric questions regarding the five alters they listed (see details of the sociometric survey and results in chapter 6);
• views on the impacts and importance of technology use in the policy process, with respondents first distinguishing their particular ‘era’ with respect to technology use in support of policy analysis (see results in chapter 7); and
• measures of attitudes, subjective norms and perceived behavioural control regarding knowledge sharing and collaboration practices in the policy process; and measures of knowledge sharing and collaboration intention based on eight scenarios (see results in chapter 8).
The policy analysts archetypes - connector, entrepreneur, listener, synthesizer, technician - and their descriptions, were derived from earlier work by Durning and Osuna (1994), Meltsner (1976) and Morçöl (2001) (see text box 5.1, below). An alternative approach to categorizing policy analysts is found in Howlett and Walker (2012), which examines the behaviour and attitudes of Canadian policy analysts and found three distinct groups of policy workers: Coordinator-Planners, Researcher-Analysts and Director- Managers. As opposed to
39
11 The software service provider Fluid Surveys was selected. While there are several comparable players in this field (e.g., Qualtrics, Survey Gizmo were compared and found to have similar features), Fluid Surveys was chosen principally because it guarantees that all collected data would be stored on severs physically located in Canada, thus reducing implications of the US PATRIOT Act for the confidentiality of respondent data. See section 3.7, below, regarding ethical considerations in this research.
the present sample which included very few ‘management’ positions, action in the policy-making process from a mesa-perspective was found there to vary across the manager–analyst divide with analysts focussing on policy identification, option appraisal, data collection and research, and managers focussing on program delivery and implementation, negotiation, and consultation with key stakeholders (Howlett, 2011). The approach taken here focusses on non-management policy analysts and addresses their role from a micro-perspective.
For the concepts of attitudes, norms and perceived behavioural control, respondents were provided with four statements each related to the ideas of knowledge sharing and collaboration (see text box A1 in Appendix F), and asked in each case to indicate their agreement with the statement along a 7-point Likert scale (from 1 - strongly disagree - to 7 - strongly agree). Two statements were phrased as being unsupportive of internal knowledge sharing and collaboration, and thus involved reverse scoring. All attitude, norm and perceived behavioural control statements were adapted from previously-used validated scales12 (Ajzen, 1991; Bock & Kim, 2002; Lee, 2001; Lin & Lee, 2004; Ma & Yuen, 2011; Ryu et al., 2003; Selwyn, Gorard & Furlong, 2005; Sveiby & Simons, 2002; Taylor & Todd, 1995; Thompson, Perry & Miller, 2008; Venkatesh, Morris & Davis, 2003) - with the wording revised to reflect the target respondents and context (Bradburn, Sudman & Wansink, 2004; Jung et al., 2009) - and developed using the guidelines for structuring a TPB questionnaire (Ajzen, 2002). Statements were presented to each respondent in randomized order (a feature of the survey software) so as to avoid an order-effect bias (Couper, 2008; Perrault, 1975).
One of the most challenging aspects of applying the TPB model involves the measurement of intention and behaviour (Ajzen, 1991). Yi (2009) discusses three existing ways to measure knowledge sharing behaviour: observe what people do (e.g., emails sent to colleagues; additions made to a corporate knowledge database; see Wu & Du, 2012); ask them what they actually do in practice (e.g., using the Critical Incident Technique, e.g., Flanagan, 1954); or ask them what they would do based on a scenario (e.g., Chow, Deng & Ho, 2000; Kamdar et al., 2004; Zarraga & Bonache, 2003). While the criticisms of relying on self-reports - in which respondents can be particularly influenced by a social desirability bias - are noted (Spector, 1994), “there are few, if any, practical alternatives” (Beck & Ajzen, 1991: 291) and self-reports are generally still considered useful.
Based on the advice of Francis et al. (2004), respondents were presented with eight scenarios interspersed throughout the survey- four each related to knowledge sharing and collaboration - set in the context of government policy formulation processes (see text box A2, in Appendix F). All scenarios asked for a ‘Yes’ or ‘No’ response to a direct action
40
12 Specific constructs upon which this approach draws are: Perceived Online Attachment Motivation (POAM) (Hill, 1987) defined as “the degree to which an individual believes that he or she can improve his or her social interaction and the sense of communion with others on an online learning platform”; Perceived Online Relationship Commitment (PORC) (Rusbult, 1998)defined as “the degree to which an individual believes that he or she can persist in a relationship with others on an online learning platform”; and Online Knowledge Sharing Behaviour (OKSB) (Ko, Kirsch & King, 2005) defined as “the online communication of knowledge so that knowledge is learned and applied by an individual.”
question related to the scenario. Respondents were instructed that, in each scenario there was neither a ‘right’ nor ‘wrong’ answer - either answer could be viewed as correct, depending on the respondent’s perspective and values. A free text box was provided should the respondent wish to explain or amplify their response or otherwise comment on the scenario. A listing of all variables collected is in Appendix G.
3.4.2.2 Questionnaire Design and TestingThe wording of the email invitation and reminders was carefully constructed based on
guidance from several sources (e.g., Coupar, 2008; Dillman, 2007) and tested with several trusted advisors who, while currently employed in a policy capacity within the British Columbia Public Service, were not in the population definition. In addition to the careful wording of the invitation email content, participants were provided with an additional incentive to participate: invitees were made aware that, for each web questionnaire that was started (confirmed by the respondent following the link in the invitation email and at least responding to the first ‘gate’ question), $10 (to a project maximum of $1000) would be donated to the Provincial Employees Community Services Fund (PECSF) by me as a personal donation. The advisability of offering some form of compensation was revealed in the literature (Boyle, Heyworth, Landrigan, Mina & Fritschi, 2012; Grant & Sugarman, 2010) and through informal feedback I received from advisors who suggested that most survey requests they conduct (as researchers) or are asked to respond to (as participants) contain some form of honorarium, that the practice has now come to be expected, and the absence of any compensation may have a negative effect on response rates. I considered various forms of compensation including cash provided directly to respondents (e.g., Walinga, 2007) and entry into a prize lottery (e.g., Harrison, 2005) and decided to offer this particular form of compensation for personal reasons and in response to feedback from advisors. Indeed, informal feedback from participants received outside of the questionnaire (e.g., via my academic blog) indicated that some respondents found this form of ‘compensation’ innovative, persuasive and appreciated.
With respect to the design of the web questionnaire, in addition to general principles of usability (Krug, 2006; Nielsen, 1994), some emerging literature on optimal design for questionnaire deployment in a web environment informed the design of the survey (Couper, 2008; Sue & Ritter, 2007). In order to further encourage completion of the survey, additional principles were employed such as: personalization of the questionnaire (through ‘piping-in’ of the respondent’s name into key points of the survey, and from early points in the survey to later points); user control (e.g., the ability for respondents to save their responses and continue at another time); an abundance of on-demand contextual information provided through user-controlled pop-up windows; single-page design (Tesarik, Dolezal & Kollmann, 2008); and the minimization of text as much as possible. Respondents were afforded a high level of control over their use of the system and their responses: they could save progress and continue later on the same or a different Internet-connected device (55 of the respondents took advantage of this feature); they could delete all responses and exit the survey after having started (n.b.: this is not captured in the data; the system codes this as a non-response);
41
and respondents could contact me to request their responses be deleted (though none did). Additional data collection features available through the survey software - browser type, device, platform variables, IP address capture - were disabled.
Content validity was strengthened through questionnaire pre-testing (Bock & Kim, 2002; Zikmund, 2003). A draft questionnaire was pilot tested with 26 volunteers in November 2011. Volunteers were recruited from the student population in the University of Victoria School of Public Administration (a population with both an interest in policy analysis and, usually, experience working in a policy analysis capacity in government), and provided both sample data as well as feedback on the questionnaire content and survey design. A substantial redesign of the survey and reformulation of some survey questions followed this invaluable test period. In addition, feedback from former colleagues working in the British Columbia Government but not in the survey population, my own perspective as a former policy analyst practitioner in the British Columbia Public Service, common sense and an abundance of precaution in reassuring participants and providing encouragement to complete the survey contributed to the overall design and content of the questionnaire (and, I believe, to a strong response rate).
The final form of the questionnaire (see Appendix E) contained 112 questions over 36 ‘pages’, with each page designed to be viewed by most users without the need for page scrolling (i.e., ‘single-page design’). Based on the November 2011 test period and the calculation of the survey software service provider, the estimated amount of time required to complete the questionnaire was 30 minutes (again, this did not require the respondent to complete the survey in one sitting, nor did it require the use of a single Internet-connected device). ‘Average time’ for all respondents is reported by the survey software provider but does not account for open tabs or browser windows that were not actively being worked on, so it is meaningless to report this (e.g., one user is shown as taking over seven hours to complete the survey - which may represent an extremely thoughtful and devoted respondent, though this is perhaps unlikely).
3.4.3 ProcedureThe web questionnaire was launched on November 28 2011 with email invitations sent to
the 280 candidate respondents. For remaining valid emails from which a completed response had not been received, reminder emails were sent December 9 2011 and January 6 2012 (see Appendix B). Responses were received between November 28 2011 and January 9 2012. The survey was closed on January 15 2012 and the data downloaded over SSL on that day. During the data analysis period, the data were stored on an encrypted hard disk and backed-up to a secured encrypted server.
3.4.3.1 Data AnalysisInvitation data - which included the respondent’s ministry, branch and title - was merged
with the response data in order to read-in occupation and location information. Data analysis was undertaken using SPSS (at the time in version 20). All 129 responses were complete (other than optional text boxes and the integrated sociometric questionnaire component),
42

requiring no data imputation; partially completed surveys were not used. Single item indicators were used for 22 variables (workplace / career variables and personal demographic variables; see Appendix G for a listing of all variables collected through the online questionnaire). Respondent rankings of five policy analyst archetypes were analyzed using mean scores, an innovative visual analytics approach and a form of single transferable vote counting using the software program OpenSTV (O’Neill, 2011). The sociometric questionnaire data was analyzed using NodeXL (Smith et al., 2010), an Excel template package developed specifically for the analysis and visualization of social network data. The respondents’ ‘policy analysis technology era’ and corresponding attitude towards technology in the policy process were also assessed.
The variables for attitudes, subjective norms and perceived behavioural control were calculated using Theory of Planned Behavior guidelines (Ajzen, 1991). Analysis methods used for individual Likert questions related to attitudes, norms and perceived behavioural control, as well as perceptions regarding technology-supported policy analysis, include measure of central tendency summarized by mode and non�parametric tests (for differences between females and males, and by ministry type). Validity of the Likert scale items was assessed through factor analysis and reliability of each set of Likert questions was assessed using Cronbach’s � (Ary, Jacobs, Razavieh, & Sorenson, 2006; George and Mallery’s, 2003; Nunnally & Bernstein, 1994).
Cross-product scores within each concept (knowledge sharing and collaboration) were calculated (attitudes = behavioural belief * outcome evaluation; norms = normative beliefs * motivation to comply; perceived behavioural control = control belief *control frequency) based on TPB protocols (Ajzen, 1988) with scores potentially ranging from 1 to 49 (with higher scores indicating stronger support for the concept). Cross products were then summed across each concept yielding a score on a possible range of 2 - 98, and then combined into an overall knowledge sharing and collaboration concept with a possible range of 4 - 196. This overall combined concept is justified as the knowledge sharing and collaboration concepts are closely linked conceptually and combined reliability scores reported below indicate the variables are strongly interrelated.
The dependent variables of behavioural intention for knowledge sharing and collaboration were calculated by taking the total score (‘Yes’ = 1, ‘No’ = 0) across each of the four scenarios for each concept and summed to yield a single latent variable for the combined concept. In the causal model, intention to share knowledge and collaborate was assessed against all other variables that are theorized to lead to intention. Intervening variables significantly related to the intention to share knowledge and collaborate with colleagues across the organization were then assessed against organizational and personal variables. In addition, the free-form text responses to the scenarios are analyzed to draw out from the qualitative responses information that is difficult to articulate in the required ‘Yes / No’ response options.
Forced hierarchical regression analysis was used to determine relationships between behavioural intent (dependent variable) and the independent variables. Hierarchical
43

regression, which is a specialized form of multivariate analysis, involves the sequential entering of independent variables into the analysis in accordance with a theoretical model. The focus of hierarchical regression is on the change in predictability associated with predictor (independent) variables entered later in the analysis over and above that contributed by predictor variables entered earlier in the analysis. The objective is to assess the effect of one or more variables over and above other variables. The forced model was assessed by entering the effect of age and gender first, followed by attitudes and subjective norms next (the two theory components relevant to the TPB precursor - the Theory of Reasoned Action), with perceived behavioural control then added for the TPB model, followed finally by respondent career stability variables (organizational disruptions, lateral career movements and career advancement).
3.5 Qualitative Approach: The Policy Unit PerspectiveThe research conducted under this qualitative approach is based on semi-structured
interviews with fourteen practicing policy analysts as members of five separate corporate policy units in the British Columbia Government. The interviews were transcribed verbatim and, taking a deductive approach based on an a priori list of codes (Miles & Huberman, 1994), were analyzed with the assistance of a computerized qualitative data analysis software program (NVivo 9). The interviews were supplemented by demographic and career profile data collected from respondents through a web-based questionnaire.
The objective of this approach was to assess from a qualitative perspective the current state and evolution of the policy analysis and formulation process in government as a knowledge sharing and collaborative enterprise, and to investigate how collaborative technology, workplace social networks and institutional culture are affecting that system. This perspective sought to survey public servants as members of defined corporate policy units in the British Columbia government, to investigate what factors influence successful collaboration and knowledge sharing within policy units and more broadly across the organization. In a corporate policy unit (this term is used in a general sense and would encompass any organizational unit having ministry-wide or central responsibility for policy analysis and formulation in a Ministry), a typical structure will see it headed by an executive director who reports in turn to an assistant deputy minister (who is usually the head of a division within a ministry). A small number of managers and policy analysts - each responsible for particular programs or issue files - would report to that executive director, with a lesser number of assistants or administrative staff providing support for the entire unit. Typically, the members of this policy unit would be co-located in the same office setting and would benefit from regular face-to-face contact in addition to interaction through information and communications technologies.
Data collection centred on semi-structured interviews complemented by a brief post-interview web-based questionnaire that collected demographic and career-based information. In the interviews, interest was focussed on how individual policy analysts within formal workgroups effectively use technology and social networks to accomplish the work assigned to them, and how their attitudes, subjective norms and perceived behavioural control relate to
44
their ability to identify critical incidents that demonstrate their support for organization-wide knowledge sharing and collaboration.
3.5.1 ParticipantsFifteen British Columbia Government public servants volunteered to participate in this
research, all of whom were members of defined corporate policy units. The identification of the sample used in this research started with a list of central corporate policy units across the British Columbia Government, derived from the government’s online directory <http://dir.gov.bc.ca>. Nineteen units were identified across 16 ministries (all but one ministry appeared to have a corporate policy unit, and three large ministries had corporate policy units in separate divisions). The list of policy units (with the executive director or unit head identified) was randomly sorted and the first five unit leaders were contacted by email requesting the participation of themselves and their policy unit (see introductory email in Appendix H). Depending on whether the recipient accepted, declined or failed to respond, additional unit heads were contacted in order on the randomized list until it was exhausted.
When a unit head agreed in principle to the involvement of her or his policy unit in the research, individual policy unit members were contacted, in most cases based on the nomination of the unit head and in some cases by having individuals volunteer to participate after having been made aware of the opportunity. Individual participants then arranged an interview time. Fifteen corporate policy unit members did so, though one digital audio file was lost; despite numerous attempts, no usable recording is available for this fifteenth interview. Therefore 14 interviews were used in the analysis. The final list of participants is best characterized as a convenience sample of 14 members from five separate corporate policy units in five ministries of the British Columbia Government.
The identity of each participant has been anonymized using a 5 digit mixed-case alphabetical code (e.g.: AbCdE), and Ministry identification is not revealed so as to protect the confidentiality of respondents. In all reporting below, care has been taken to shield the identity of respondents. Where direct quotations are used, they are presented anonymously and details in the quotation that might identify the respondent or their location are removed. In table reporting, where respondents are grouped by anonymized organizational unit (along with gender and job category information), it is possible that the respondents may be able to identify themselves and their colleagues (if they are aware that their colleagues also participated in the interviews); however, it is unlikely that anyone outside of the policy unit will be able to do so. Rather than provide specific job titles (which could possibly be used by readers outside of the participant pool to de-anonymize respondents), I use a simple hierarchical approach of management (e.g., executive directors, directors, managers) and staff (e.g., policy analysts) to categorize participants. While the location, specific title and relationship to other respondents were used in the analysis, I am careful to not report any data that can be used to link a specific respondent to their identification code.
45
3.5.2 MaterialsAn interview guide for the semi-structured interviews was developed following the
constructs in the TPB model (see figure 1.2, above), with questions formed principally using the Critical Incident Technique (CIT) (Chell, 2004; Flanagan, 1954). CIT was originally developed as a research tool from a positivist psychology perspective, but has been more recently developed as as a tool for organizational analysis from an interpretive or phenomenological approach. Flanagan defined CIT as:
a set of procedures for collecting direct observations of human behaviour in such a way as to facilitate their potential usefulness in solving practical problems and developing broad psychological principles. By ‘incident’ is meant any specifiable human activity that is sufficiently complete in itself to permit inferences and predictions to be made about the person performing the act. To be ‘critical’, the incident must occur in a situation where the purpose or intent of the act seems fairly clear to the observer and where its consequences are sufficiently definite as to leave little doubt concerning its effects. (Flanagan, 1954: 327).
The objective of the Critical Incident Technique (CIT) is for respondents to reveal actual behaviour rather than simply belief (Cunningham, 2001; Hettlage & Steinlin, 2006). CIT is related to the behavioural event interview (BEI) developed by David McClelland and colleagues (McClelland, 1987). The participants in these interviews, as BC Government employees, would be familiar with the BEI as this interviewing technique is used in the BC Public Service for assessing job candidates.
The interview guide was pilot tested with 3 volunteers in November 2011. Based on the feedback from these test interviews, the interview protocol was revised and the final form of the interview guide was set (see Appendix I). The interview guide contained 10 questions, each with numerous follow-up probes to be used if warranted. The questions covered the following issues: the respondent’s perspectives on the policy analysis profession; their preference or affinity for one of the five policy archetypes (see text box 5.1, below; see results in chapter 5); their perspective on the functioning of their policy unit and the process of policy analysis in government; an open question inviting the respondent to identify ‘one big idea’ for improving the policy formulation process in government; questions exploring the respondent’s examples of collaboration, knowledge sharing and knowledge seeking (see results in chapter 9); and questions seeking the respondent’s perspectives on the use of technology in the policy process (see results largely in chapter 7) and the value of organizational social networks in the policy formulation process (see results in chapter 6). As a semi-structured interview protocol, not all questions were addressed in all interviews. Participant data was also gathered following the interview using an online questionnaire that mirrored the demographic and career profile aspects of the survey described above (see Appendix E; participant data is presented in chapter 4).
46
3.5.3 ProcedureInterviews were conducted at the workplace of the participant at a time of their choosing
between December 6 2011 and January 9 2012. Participants were sent a short version of the interview guide and background documents in advance of the interview (see Appendix J). Interviews were recorded direct-to-digital using a notebook computer and external microphone, and minimal notes were kept by the interviewer in order to fully engage in the conversation.
The audio file was transcribed verbatim by me following the interview using the transcription assistance program F5. Rather than principally use the keyboard for text input, the voice dictation software Dragon Dictate was used as an intermediary: I would listen to the audio recording and speak what was originally said through the voice dictation facility and into F5. Despite this technique, interview audio generally took six times as long as originally spoken to transcribe (i.e., ten minutes of audio took roughly one hour to transcribe).
The draft transcript was emailed to the interviewee for their review, with an invitation to add to, delete from or amend the transcript (Bayliss, 2007). Only two of the 14 interviewees took advantage of this opportunity, one to correct what were considered by the respondent to be grammatical errors in speech and another to remove reference to a confidential issue. In the same email in which the transcript was transmitted, a link to the web questionnaire was also sent.
3.5.4 Data AnalysisThe data analysis involved a number of steps in order to reduce and synthesize the data,
extract meaning from the interview corpus, evaluate the premise of the underlying theoretical model, consider the interview transcripts in light of the research questions and investigate factors that illuminate the world of the contemporary policy analyst from the perspective of the respondents. Following the transcribing of the audio recording, transcripts were read-through while re-listening to the audio to ensure accuracy of transcription and to mark the transcribed text with important points of inflection and emphasis by the speaker. A re-reading/re-listening was repeated at two intervals, each after a period of discrete analysis of the data.
The interview transcripts were imported into NVivo (a qualitative data analysis software package) and coded based on a preliminary start list of a priori codes (see Appendix K for the start list of codes) developed based on the theoretical framework and research questions (Miles & Huberman, 1994). Coding in NVivo involves highlighting a section of the transcript - whether a word, phase, sentence or paragraph - and identifying that highlighted text using the pre-defined list of codes using the software’s coding function (as an alternative to coding
47
‘on-the-fly’, also referred to in vivo coding. This deductive / etic13 approach allowed for a close comparison of the concepts explored in the interviews and their relationship to the TPB model and the research questions. A deductive approach is further justified by the way that responses were closely aligned with the interview questions (and thus the research questions) despite the semi-structured nature of the interview protocol (see chapter 4, below, for measures of how much responses aligned with the interview questions). Coding of the data (as an activity) was complemented by pattern coding (i.e., explanatory or inferential codes that identify an emergent theme) and memoing (i.e., as observations made during the process of coding, connected to but separate from the text), which served to supplement the semantic value of the data and to aid in further analysis. Following the coding and additional enhancement of the transcripts, two phases of data analysis were undertaken: data reduction and data display (Miles & Huberman, 1994). Data reduction is a process of transforming the mass of data collected into an organized and meaningful reconfiguration. Data display builds on the data reduction to provide an organized assembly of data that permits conclusions to be drawn. Data displays include extended diagrams, charts, matrices, flow charts and models that provide the foundation for discerning systematic patterns in the data. The data was organized using within-case network displays (Miles & Huberman, 1994) which served as the basis for subsequent cross-case analysis.
In addition, quasi-statistical analysis (Miller & Crabtree, 1992), aimed at summarizing the data numerically with descriptive statistics to detect patterns, was undertaken in order to confirm the insights emerging from the qualitative analysis. Quasi-statistical analysis largely focussed on frequency counts of key words and phrases and of specific codes. In assessing the ‘goodness of fit’ of the TPB model, I have employed Quantitative Content Analysis (QCA) as a structured measuring and counting method designed to examine the large amount of content using statistical methods, with the aim of reducing the complexity of the corpus to reveal patterns and themes. By using codes that serve to identify the constructs in the TPB model (i.e., attitudes, subjective norms, perceived behavioural control, and proxy measures for behaviour), inferences about the relationship among the independent and dependent variables are made. QCA has been defined as “a research method for the subjective interpretation of the content of text data through the systematic classification process of coding and identifying themes or patterns” (Hsieh & Shannon, 2005, p.1278) and as a “qualitative data reduction and sense-making effort that takes a volume of qualitative material and attempts to identify core consistencies and meanings” (Patton, 2002, p.453). While QCA is typically applied to media content, it has also been used to analyze interview data (Foster, 2004; Lillis, 1999; Schamber, 1991).
Framework matrices, a method of analysis developed by the National Centre for Social Research (Pope, Ziebland & Mays, 2006; Ritchie, Spencer & O’Connor, 2003), were used to
48
13 Etic (as opposed to emic) in this context refers to an approach to coding for qualitative analysis; etic codes are developed from the literature or prior research and emic codes emerge from the data. An etic approach starts with a theoretical perspective prior to engagement with the data to see if the theoretical perspective applies to the setting or subjects (Lett, 1990). One of the strengths of the etic approach is that it allows for the development of more general cross-cultural concepts (Morris, Leung, Ames & Lickel, 1999).
summarize and condense interview transcripts in grid format with the cases (e.g., interview respondents; policy unit groupings) in rows, and themes in the columns. The purpose of the framework matrix is to allow for comparisons across themes (in columns), comparison of different themes as they relate to each other for a particular individual, and to compare individuals and groups of individuals across rows. Each cell contains a summary of the source content relevant to a case and theme and further analysis is based on reading across the rows (for a particular respondent’s perspective) or down the columns for responses across participants). Each respondent was characterized on four attributes - gender, age, policy unit and title - allowing for the grouping of respondents across these variables. Framework matrices were developed for all elements in the conceptual model (’knowledge seeking’, ‘knowledge sharing’, ‘knowledge management’, ‘collaboration’, ‘technology’, ‘policy analysis’), each of which included coding for attitudes, subjective norms and perceived behavioural control. As well, framework matrices were generated for the following coding: research questions, ‘one big idea’ (i.e., response to a question about what in the present policy formulation system the analyst would change if they had the power to do so) and ‘policy analyst self-description’ which captured how respondents talked about their work.
Queries were used to find and analyze words or phrases in the transcripts, and to find patterns based on coding. Specific queries include: text search (e.g., all occurrences of a word, phrase, or concept); word frequencies; coding queries (e.g., all content coded at selected codes) and matrix coding (e.g., code combinations, or codes / attribute combinations). Models were used to visually explore the data. Additional visualizations included: charts to display coding information for sources; coding by attribute value for sources; coding by attribute value for multiple sources; coding for a node; coding by attribute value for a node; coding by attribute value for multiple nodes; cluster analysis (which is an exploratory technique used to visualize patterns by grouping sources or nodes that share similar words, similar attribute values, or are coded similarly by nodes); tree maps (which show hierarchical data as a set of nested rectangles of varying sizes and can be used, e.g., to compare the number of coding references or attribute value combinations); and word trees (which display the results as a tree with branches representing the various contexts in which the word or phrase occurs). Anonymized direct quotations are presented with the analysis to illuminate and reinforce key points (Corden & Sainsbury, 2006).
3.6 Limitations3.6.1 Quantitative Approach
This perspective takes a deductive approach, grounded in a theoretical model of knowledge sharing and collaboration behavioural intent, that shares many of the analytical techniques of quantitative methods. To demonstrate validity and reliability in this context can be seen as a technical exercise of statistical importance, but ultimately - given the methodological foundations sketched at the outset of this section - rests on the ability of the research to ‘establish trustworthiness’, persuade the reader of the credibility of the research (Shipman, 1988) and is “to a considerable extent a matter of common sense” (Robson, 2002: 100). ‘Valid’ and ‘reliable’ findings are as much about thorough and honest, open and unbiased
49

research as a matter of technical prowess. However, validity and reliability are not guaranteed by good intentions, and concerns remain despite attempts to minimize them.
Validity pertains to the accuracy of the findings. Construct validity pertains to the measures measuring what they were proposed to measure. With respect to the survey questionnaire that was the measurement tool in this quantitative perspective, the scales used to measure attitudes, norms and perceived behavioural control were adaptations of previous scales, thus raising concerns as to their construct validity. The use of scenarios to measure knowledge sharing and collaboration behavioural intention is the most problematic aspect of this research, with knowledge sharing scenario 3 and collaboration scenario 1 appearing to be particularly challenging and the reliability of each scale of concern. The qualitative responses to the scenarios provided interesting additional data, though did not serve to clarify the numerical results. Rather, they generally appear to confirm one of the policy analysts’ commandments: in answering any hard question, ‘it depends’ is usually a good response. And the knowledge sharing and collaboration scenarios have not been validated, raising doubts about whether they are actually measures of behavioural intention. Clearly, from a purist methodological perspective, the construct validity of the survey is problematic. An alternative view, however, is that focussing so single-mindedly on construct validity “can lead to an unhealthy concentration on this aspect of carrying out an enquiry. For many studies there is an intuitive reasonableness to assertions that a certain approach provides an appropriate measure. Anyone way of measuring or gathering data is likely to have its shortcomings, which suggests the use of multiple methods” (Robson, 2002: 103). For this reason, triangulation of research methods was the approach adopted in this research.
Internal validity relates to the relationship between cause and effect. Demonstrating internal validity in non-experimental research is inherently problematic, especially in the inability to randomly assign respondents. External validity relates to the generalizability of the findings. Pertinent threats to external validity in this research include: selection of the participants (i.e., whether the findings are specific to the group studied); selection of the setting (i.e., are the findings specific to the context of the study); and history (i.e., do the experiences of the respondents affect the findings) (LeCompte & Goetz, 1982). Constraints imposed on the study due to resource limits include confining the research to the Government of British Columbia and constraining the population of interest to British Columbia Government public servants with titles similar to ‘policy analyst/advisor’. One strategy for ‘increasing’ the external validity of the research centres on making a persuasive case for the applicability of the research to other similar settings. Lastly, reliability focusses on the stability and consistency in how things were measured. A measure may be unreliable for a variety of reasons: participant error and participant bias are possibilities that are as much caused by the participants themselves as by the design of the research.
3.6.2 Qualitative ApproachDue to the nature of qualitative research, the data obtained may be subject to different
interpretations, leading to a charge of investigator bias. The criteria for judging the ‘validity’ and ‘reliability’ of a qualitative study differ from quantitative research; in qualitative
50

research, the objective is believability and trustworthiness (Lincoln & Guba, 1985). Replicability is unlikely, but a clear articulation of the study’s assumptions and the delineation of thorough and transparent methods can help to enhance trustworthiness (Miles & Huberman, 1994). A case can also be made that the use of qualitative data analysis software in the data analysis process increases the consistency of qualitative research, thus promoting thoroughness (if not transparency) and increasing the believability of the findings (Richards & Richards, 1994).
The reliance on Quantitative Content Analysis (QCA) has been critiqued, principally in the emphasis placed on the value of coding when undertaken by a single researcher and the weight placed on the quantity of the response as opposed to some subjective measure of its ‘quality’ (Rourke & Anderson, 2004). The application of hierarchical regression modelling to the results of QCA is not widely tested (see Foster, 2004; Lillis, 1999; Schamber, 1991 for exceptions). The use of deductive coding has also been criticized as limiting the scope of qualitative data analysis (Fereday & Muir-Cochrane, 2006).
The results are limited to the British Columbia government context and are strongly influenced by the nature of semi-structured interviews and qualitative methods, and by the individuals who consented to participate. Respondents were replying as individuals who are also members of corporate policy units, rather than as representatives of corporate policy units. Future research should focus on corporate policy units as sub-organizational units through methods such as participant observation or workplace ethnography.
3.7 Ethical ConsiderationsApproval from the University of Victoria Human Research Ethics Board to conduct this
research was received in June 2011.14 All conditions identified in that application were adhered to in this research.
For the participants completing the online questionnaire, an abundance of precaution was used to ensure their full control over the process of completing the survey. The survey ‘gate’ question presented in conjunction with the informed consent statement ensured their acceptance of the terms of participation. Respondents had the ability on every page to delete all responses and exit the survey, and respondents could contact me to request their responses be deleted (none did). Caution was also used in handling the data: no data was collected on browser type, device or other platform variables, and IP address capture was disabled. The survey data was downloaded from the software service provider’s secure website over SSL and during the data analysis period the data were stored on an encrypted hard disk and backed-up over SSL to a secured encrypted server.
For the interview participants, a special note regarding informed consent is in order: when a unit head agreed in principle to the involvement of her or his policy unit in the research, individual unit members were contacted, in most cases based on the nomination of the unit head and in some cases by having individuals volunteer to participate after having been made
51
14 The complete application form and certificate of approval can be found at http://jlphdcand.files.wordpress.com/2012/06/ethics-app-form-complete.pdf
aware of the opportunity. Individual members then contacted me by email to arrange an interview time. In all cases, the decision to participate was the prerogative of the individual, not the policy unit head. This two-step agreement to participate - first, by the unit head to allow access to the members of the policy unit, and then by the individual unit members to ensure the free and informed consent of interview participants - is an effect of an ethical approach to research involving human subjects. It did, however, mean that the original design for this perspective - that five policy units in their entirety would be included in the research - was unattainable.
The research was considered to be of minimal risk: all participants were public servants participating in the research in their professional capacity, reflecting on their day-to-day activities as they relate to the research. The study essentially involved public servants talking about their work environment, both in ‘factual’ terms and their perceptions. From the perspective of the individual, the principal concern associated with an individual’s participation in the research would be that a participant’s response could have a negative workplace or career implication if that response were communicated to a colleague, superior or subordinate. Another possible concern is that reflecting on the questionnaire or interview could cause a negative response on the part of the respondent to their work environment, or lead them to engage in behaviour in their work environment that could jeopardize their career prospects. Given the range and depth of questions asked of the participants, and the parallels between the research questions and their day-to-day professional activities, participants were deemed to have the capacity to understand fully the very low probability and limited magnitude of possible harms associated with their participation in the research. With appropriate safeguards taken to assure fully the anonymity of their responses, it was considered reasonable to expect that participants would perceive the risks associated with participation in the research activities as lower than possible harms associated with her or his day-to-day professional activity.
As for any organization that reads this research (and assuming that the findings have some influence on its decision-making), we must confront the possibility that the findings are wrong, or that implementation of the implied or explicit recommendations might have a negative unintended consequence. Responsible research does not stop at the point of interaction with the research subjects, nor at the moment of publication.
52
Chapter 4 - The Contemporary Policy Analyst4.1 Summary
PurposeThis section presents data from mixed methods research to describe the policy analyst
populations surveyed in this work, to begin to sketch who the contemporary policy analyst is.
MethodsThe research employs mixed methods:
Quantitative Approach: British Columbia Government public servants with titles similar to ‘policy analyst’ (n = 129) completed a web-based questionnaire.
Qualitative Approach: semi-structured interviews with practicing policy analysts (n = 14), as members of five separate corporate policy units in the Government of British Columbia, were conducted, transcribed and analyzed.
FindingsPolicy analyst characteristics mirror previous findings from surveys of practicing policy
analysts on variables such as age, education and career experience. The policy analyst’s immediate work environment is relatively stable though they face a frequently shifting supervisory environment. Differences in group means are not statistically significant, though mean scores for women were lower for most variables such as age and career experience. Data from the interviews point to a tentative finding of correspondence between faster speaking rates and a greater willingness on the part of the respondent to speak about issues beyond the interview guide, the antithesis of the caricature of the ‘cautious bureaucrat’.
Research LimitationsThe results are limited to the British Columbia Government context and are strongly
influenced by the nature of semi-structured interviews and qualitative methods, and by the self-selection bias of policy analysts who chose to participate. Survey respondents were replying as public servants who have a job title similar to ‘policy analyst’, though many public servants performing policy analyst functions with different job titles would have been missed in the sampling process.
Practical ImplicationsThe intention of this research is to provide insights for policy unit managers responsible for
cultivating and facilitating the work of policy analysts, and for government organization leaders to help them better understand the characteristics of the contemporary policy analyst.
Originality / ValueThis study contributes to a small but growing literature that seeks to better understand the
contemporary practice of policy analysis in Canada.
KeywordsPolicy analysis, policy analysts, British Columbia, Canada, organizational culture
53
4.2 Background and ObjectivesPublic policy analysis and formulation is broadly concerned with the processes of
identifying and analyzing public issues in response to perceived public problems, the determination of a collective course of action (or, indeed, inaction) by an authoritative decision maker or entity, how effect is given to that decision, and what affect the entire process has on the issue or problem. Dye’s simple definition of policy as “whatever governments choose to do or not to do” (1984: 1) highlights policy choices as involving both action and inaction, and clearly identifies policy as the intentional, conscious choices that governments make. Dror (1989) clearly defines policy as the conscious choices governments make amongst alternatives, and Heclo (1972) cites both the intentional and unintentional consequences of government action as falling under the definition of policy.
However, we should be careful to distinguish between minor, administrative decisions and the “most important choices” (Lasswell, 1951: 5) made by governments - as well as decisions by individuals, firms and institutions that contribute to public policy outcomes(Lasswell, 1971). As a course of action, public policy differs from the common organizational use of the term that connotes the routines, procedures and practices of an organization. Majone’s (1988) distinction between ‘two types of policy analysis’ – i.e., between the use of rational analytical techniques for determining the optimal solution for allocating public resources among competing ends, and the development of arguments in support of a proposed course of action – is also important for the research described here.
The golden age of rational policy analysis (e.g., Quade, 1975) is often characterized as being “free of many of the undesirable connotations clustered about the word political” (Lasswell, 1951: 5). Yet ever since the rational policy perspective gained currency, its appeal within the practitioner community (Morçöl, 2001) has been countered by critiques in the academic literature (e.g., Fischer, 1998). Today, the academic field of policy analysis is characterized by “ambiguity, relativism and self-doubt” (Lawlor, 1996: 120). With Schön and Rein arguing that “the policy analytic movement begun by Harold Lasswell in the early 1950s has largely failed” (1994: xvi), a cautious appraisal is that policy analysis is a “discipline that is in some disarray” (Pal, 1997: x). However, we might just as well ask whether we are witnessing “the end of policy analysis” (Kirp, 1992).
The objective of this research is to investigate the contemporary state of the policy analysis and formulation process, based on the perspectives of practicing policy analysts and data gathered through mixed-method, quantitative / qualitative, empirical fieldwork. Through a survey of public servants embedded in the policy analysis system in the British Columbia Government, and interviews with practicing policy analysts, a preliminary sketch of the contemporary policy analyst is drawn.
4.3 MethodsFor the quantitative approach, 129 participants were surveyed using an online browser-
based questionnaire that collected data for 22 variables (derived from Howlett (2009) and Statistics Canada (2010)) regarding the respondents’ demographic characteristics and aspects of their British Columbia Public Service career profile. The research conducted under the
54

qualitative approach centred on semi-structured interviews with fourteen practicing policy analysts as members of five separate corporate policy units in the British Columbia Government. The interviews were transcribed verbatim and, taking a deductive approach based on an a priori list of codes (Miles & Huberman, 1994), were analyzed with the assistance of a computerized qualitative data analysis software program (NVivo 9). Interview participant data was also gathered following the interviews using an online questionnaire that mirrored the demographic and career profile aspects of the quantitative survey; numerical data analysis was undertaken using SPSS.
4.4 Results4.4.1 Quantitative Approach: Invitees and Respondents
Of the original 280 invitation emails sent, incorrect identification and addressing resulted in 249 valid invitations and 129 completed responses, for a 52% response rate (see table 4.1, below; see additional response data in Appendix C). For all invitees, including non-respondents, four variables are known: gender (imputed based on given name), Ministry, branch and title. Using Fisher’s exact test of significance (two-tailed), response / non-response rate differences for females and males as compared to the sample response rate revealed them to be not statistically significant (p = 0.51).
Respondent representation across Ministries was proportional to the valid invitations sent to 249 policy analysts in 19 Ministries (the list of ministries and their official abbreviation,
55
Table 4.1
Quantitative Approach: Saample Response Rate
Category Invites - adjusted
(% of total)
Valid Invites - adjusted
(% of total)
Non-Response -
adjusted(% of total)
Completions (% of total)
Response Rate
All 280 249 120 129 52%Female 184 (66%) 159 (64%) 80 (67%) 80 (62%) 50%Male 96 (34%) 90 (36%) 40 (33%) 49 (38%) 55%
Table 4.2
Responses bby Ministry Type
Ministry Type Ministry Invitations CompletionsEnvironmental ABR, AGRI, ENV, FLNR, MEM 77 41 (rr = 53%)Social AVED, EDUC, HLTH, MCF, MSD, 84 45 (rr = 54%)
EconomicAG, CSCD, FIN, JTI, LCTZ, PSA, PREM, SG, TRAN 88 43 (rr = 49%)
The difference iChi squared tes
in completion rates across the Ministry types is not sst,.(�2(2, n = 129) = 0.137, p = 0.934).
tatistically significant using

acronym or initialism can be found in Chapter 3, above). Of the 129 responses received, these came from 17 Ministries (no responses were received from the Premier’s Office or from the Ministry of Forests, Lands and Natural Resource Operations). Using the Chi-squared test of significance of whether response / non-response rates were different for each Ministry as compared to the response rate for the sample revealed them to be not statistically significant (�2 (18, n = 129) = 14.925, p = 0.6671).
Ministries are grouped by type based on an assessment of the predominant orientation or focus of the ministry’s work following the general model for sustainability (Daly & Cobb, 1994; Giddings, Hopwood & O’Brien, 2002) that considers three interconnected systems of equal importance: environment, land and resources; social systems; and economy and infrastructure (see table 4.2, below). Chi-squared tests of significance of whether response / non-response rates were different for each Ministry type as compared to the response rate for the sample revealed them to be not statistically significant.
Figure 4.1, below, is presented as a quick visual representation of respondents, grouped by ministry and organizational sub-unit / branch, and coded by ministry type using background text. Individual respondents are denoted by gender and are placed with the colleagues in their branch or organizational unit; the dimensions of the shaded single-walled box are proportional to the number of respondents from that branch. Respondents came from 77 different branches, with at most 5 respondents from one branch, and in 47 cases were the sole respondent from a branch. The organizational unit boxes are grouped together and contained within a double-walled box for the entire ministry. The empty space within each ministry box represents the proportion of non-respondents from each ministry. The overall response rate for each Ministry (e.g., rr = 47%) is shown below its organization code where space permits.
The age distribution of the policy analyst sample shows a mean score of just over the ‘38-42’ age range (M = 5.01, SD = 2.1; respondents were able to select from 11, five-year age ranges; ’38-42’ corresponds to age range 5) with all of the responses falling between age range ‘23-27’ and age range ‘63-67’. However, the responses are not normally distributed, but rather skew towards younger age categories with ‘28-32’ age range representing the mode.15
The academic background of the policy analyst sample reflects previous findings from surveys of Canadian government policy analysts (e.g., Howlett, 2009), with 92% of policy analysts surveyed having a post-secondary (41%) or post-graduate (51%) degree, across a range of administrative sciences, social sciences and humanities.
The career profile of policy analysts shows that most respondents hold permanent positions (95%) though only 13% occupy a supervisory role (and supervise, at most, two others). The ‘length of tenure’ distribution reflects the age distribution of the sample: half of the respondents have 5 or fewer years of experience with the British Columbia Government (M = 8.6 years, SD = 7.4), 61% have 3 or fewer years at their current level (M = 3.9 years, SD = 3.8), and 70% have 3 or fewer years in their current job (M = 3.1 years, SD = 3.2). The respondents report little lateral career movement (i.e., measured as the number of horizontal
56
15 Additional demographic and career data tables and histograms are available in Appendix L.
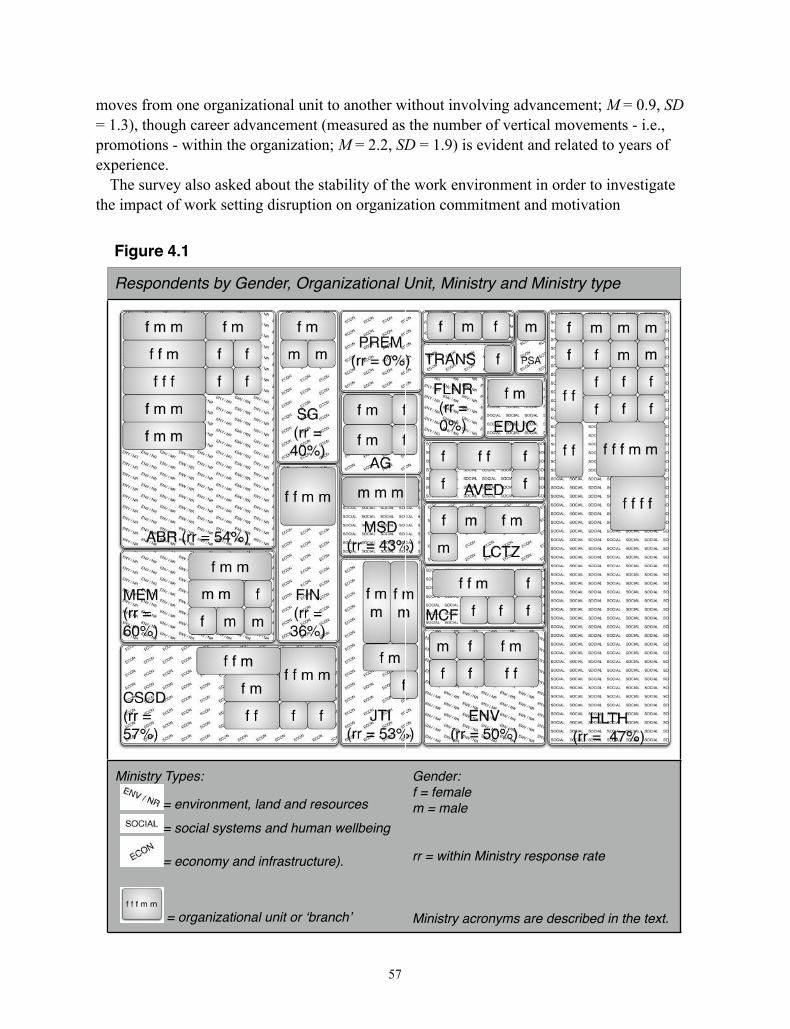
moves from one organizational unit to another without involving advancement; M = 0.9, SD = 1.3), though career advancement (measured as the number of vertical movements - i.e., promotions - within the organization; M = 2.2, SD = 1.9) is evident and related to years of experience.
The survey also asked about the stability of the work environment in order to investigate the impact of work setting disruption on organization commitment and motivation
57
Figure 4.1
Respondents by Gender, Organizational UUnit, Ministry and Ministry type
Ministry Types:
= environment, land and resources
= social systems and human wellbeing
= economy and infrastructure).
= organizational unit or �branch�
Gender:f = femalem = male
rr = within Ministry response rate
Ministry acronyms are described in the text.
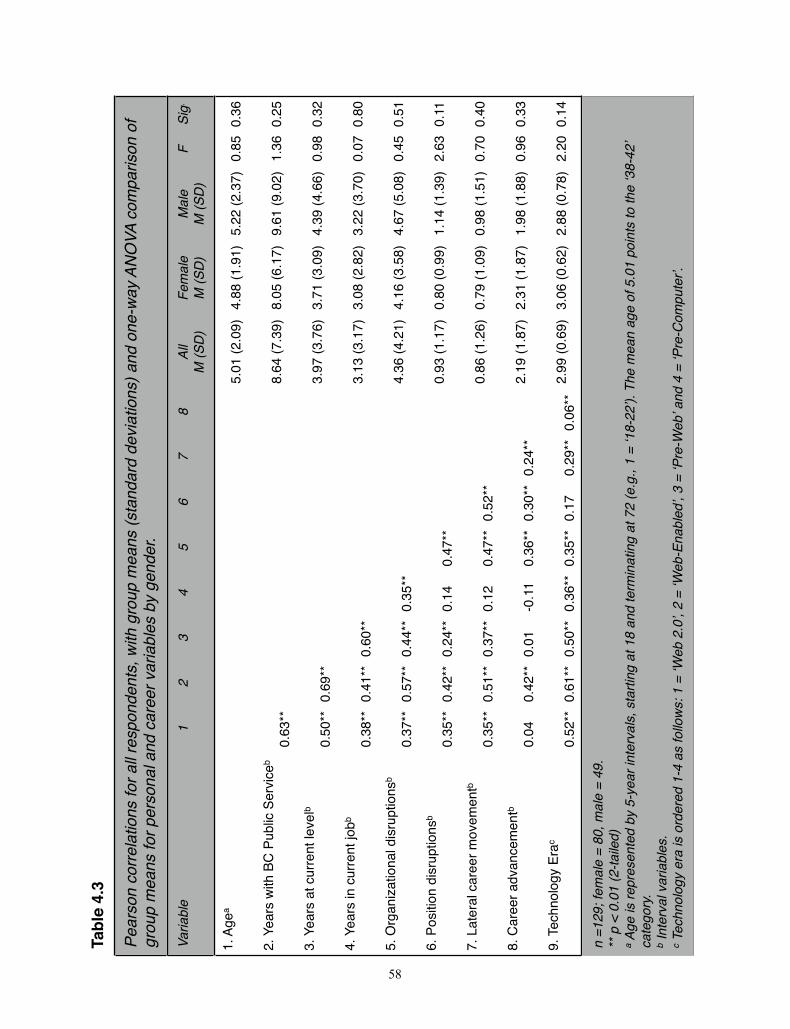
58
Tabl
e 4.
3
Pear
son
corre
latio
ns fo
r all r
grou
p m
eans
for p
erso
nal a
n resp
onnd
car
enden
ts,
eer v
ar with
gria
blesgr
oup
m b
y ge
nmea
ns
nder
. (sta
ndaar
d de
vviatio
nss) a
nd o
nee-w
ay A
NOVA
com
parris
on o o
f
Varia
ble
12
34
56
78
All
M (S
D)
Fem
ale
M (S
D)
Mal
e M
(SD
)F
Sig.
1. A
gea
5.01
(2.0
9)4.
88 (1
.91)
5.22
(2.3
7)0.
850.
36
2. Y
ears
with
BC
Publ
ic Se
rvice
b
0.63
**8.
64 (7
.39)
8.05
(6.1
7)9.
61 (9
.02)
1.36
0.25
3. Y
ears
at c
urre
nt le
velb
0.50
**0.
69**
3.97
(3.7
6)3.
71 (3
.09)
4.39
(4.6
6)0.
980.
32
4. Y
ears
in c
urre
nt jo
bb0.
38**
0.41
**0.
60**
3.13
(3.1
7)3.
08 (2
.82)
3.22
(3.7
0)0.
070.
80
5. O
rgan
izatio
nal d
isrup
tions
b
0.37
**0.
57**
0.44
**0.
35**
4.36
(4.2
1)4.
16 (3
.58)
4.67
(5.0
8)0.
450.
51
6. P
ositio
n di
srup
tions
b
0.35
**0.
42**
0.24
**0.
140.
47**
0.93
(1.1
7)0.
80 (0
.99)
1.14
(1.3
9)2.
630.
11
7. L
ater
al c
aree
r mov
emen
tb0.
35**
0.51
**0.
37**
0.12
0.47
**0.
52**
0.86
(1.2
6)0.
79 (1
.09)
0.98
(1.5
1)0.
700.
40
8. C
aree
r adv
ance
men
tb0.
040.
42**
0.01
-0.1
10.
36**
0.30
**0.
24**
2.19
(1.8
7)2.
31 (1
.87)
1.98
(1.8
8)0.
960.
33
9. T
echn
olog
y Er
ac0.
52**
0.61
**0.
50**
0.36
**0.
35**
0.17
0.29
**0.
06**
2.99
(0.6
9)3.
06 (0
.62)
2.88
(0.7
8)2.
200.
14
n =1
29; f
emal
e =
80, m
ale
= 49
.**
p <
0.0
1 (2
-taile
d)a A
ge is
repr
esen
ted
by 5
-yea
r int
cate
gory
.b I
nter
val v
aria
bles
.c T
echn
olog
y er
a is
ord
ered
1-4
aste
rval
s, s
s fo
llow
sstar
ting
a
s: 1
= �W
at 1
8 an
Web
2.0�,nd
term
in
, 2 =
�Wena
ting
a
Web
-Ena
bt 72
(e.g
bled�,
3 =g.
, 1 =
�1
= �P
re-W18
-22�
). T
Web� a
nd The
mea
n ag
d 4
= �P
re-C
oge o
f 5.0
1 po
i
ompu
ter�.
ints
to th
e �3
88-42�
(following, e.g., Hirsch, 2006; Kover, 1964; Lee & Teo, 2005). Respondents were asked if they had been ‘directly affected by a significant organizational change’. Despite a sample skewed towards a small number of years of experience, organizational disruptions are not uncommon: while 23% of respondents have experienced fewer than two organizational disruptions, 70% have been through between 2 and 10 disruptions (M = 4.4, SD = 4.2). In contrast to organizational disruptions which affect the entire work unit, the survey also asked about position disruptions - i.e., something that happens to the individual, such as a position termination or reassignment (following, e.g., Walker & Chaiken, 1982). These are less frequent, with over 42% having never experienced a disruption to their own position, and the remainder of the sample having gone through a small number of disruptions (M = 0.9, SD = 1.2, min = 1, max = 6).
Respondents were asked about the size of their organizational unit and its relative ‘policy intensity’. The mean number for the size of the organization unit was 11.5 (SD = 7.4), with 52% working in units of 10 or fewer people. The mean number of ‘policy people’ was 6.0 (SD = 4.5) with 68.5% working in units with 6 or fewer colleagues who work primarily in policy roles.
Table 4.3, above, presents Pearson correlations for all respondents, with group means (and standard deviations) and one-way ANOVA comparison of group means (by gender) for personal and career variables. There are positive correlations amongst age and the career variables of: number of years with British Columbia Public Service; years at one’s current level; years in a current job; organizational disruptions; position disruptions; lateral career movements; career advancements (i.e., promotions); and the respondent’s technology era. Relationships of note where, however, the statistical significance was weak include: the correlation of the number of years in a current job with position disruptions; the correlation of lateral career movements and promotions; and the correlation between the number of promotions experienced with age and the number of years in a current job. The only negative correlation - though again not statistically significant - was between the number of years in a current job with the number of promotions experienced, indicating the possibility that some respondents are ‘stuck’ in a particular position. None of the differences in groups means assessed on gender are statistically significant, though men report marginally more position disruptions than women (F = 2.63, p = 0.11).
The final measures of workplace stability looked at the respondent’s supervisory environment, which has particular implications for policy analysts who must adapt to the differing decision-making styles of new superiors. Respondents who have been in their current position for 3 or more years (n = 60) were asked how many different direct supervisors they have had over that period. Forty percent (40%) reported having the same supervisor, with the remainder having between 2 and 6 (M = 2.0, SD = 1.1). A similar question asked about once-removed supervisors (i.e., their supervisor’s supervisor): 22% report that that person has not changed over the three year period, with the remainder experiencing between 2 and 5 different once-removed supervisors (M = 2.3, SD = 1.1).
59
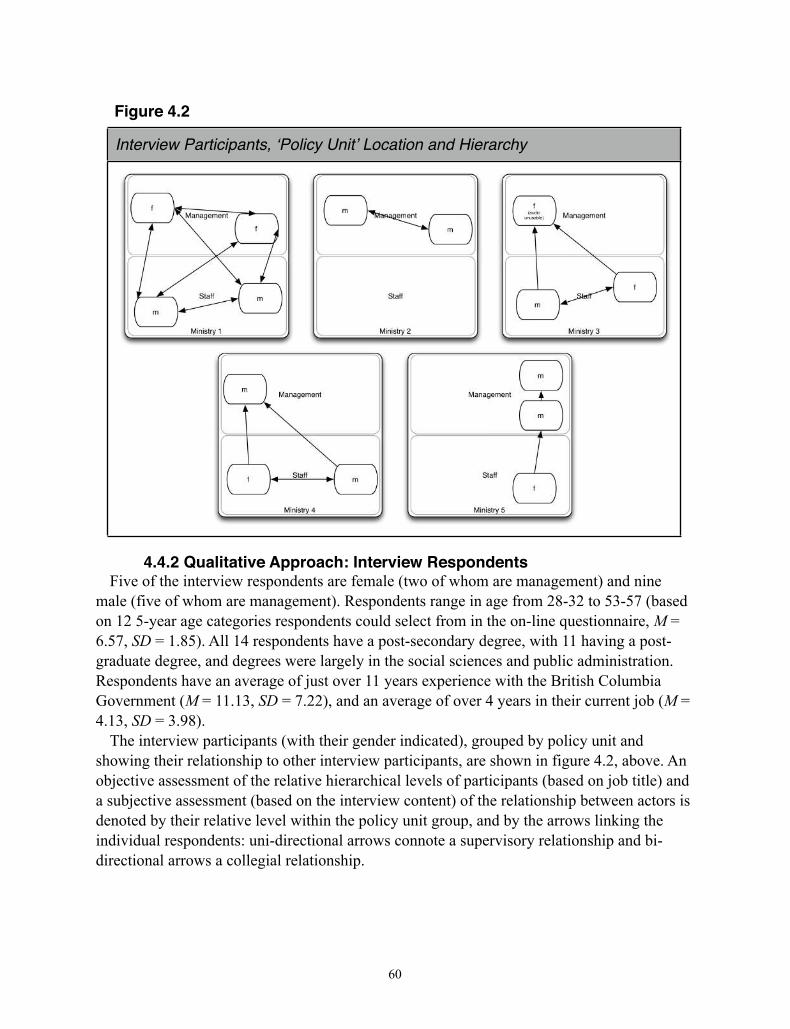
4.4.2 Qualitative Approach: Interview RespondentsFive of the interview respondents are female (two of whom are management) and nine
male (five of whom are management). Respondents range in age from 28-32 to 53-57 (based on 12 5-year age categories respondents could select from in the on-line questionnaire, M = 6.57, SD = 1.85). All 14 respondents have a post-secondary degree, with 11 having a post-graduate degree, and degrees were largely in the social sciences and public administration. Respondents have an average of just over 11 years experience with the British Columbia Government (M = 11.13, SD = 7.22), and an average of over 4 years in their current job (M = 4.13, SD = 3.98).
The interview participants (with their gender indicated), grouped by policy unit and showing their relationship to other interview participants, are shown in figure 4.2, above. An objective assessment of the relative hierarchical levels of participants (based on job title) and a subjective assessment (based on the interview content) of the relationship between actors is denoted by their relative level within the policy unit group, and by the arrows linking the individual respondents: uni-directional arrows connote a supervisory relationship and bi-directional arrows a collegial relationship.
60
Figure 4.2
Interview Participants, �Policy Unit� Location and Hierarchy
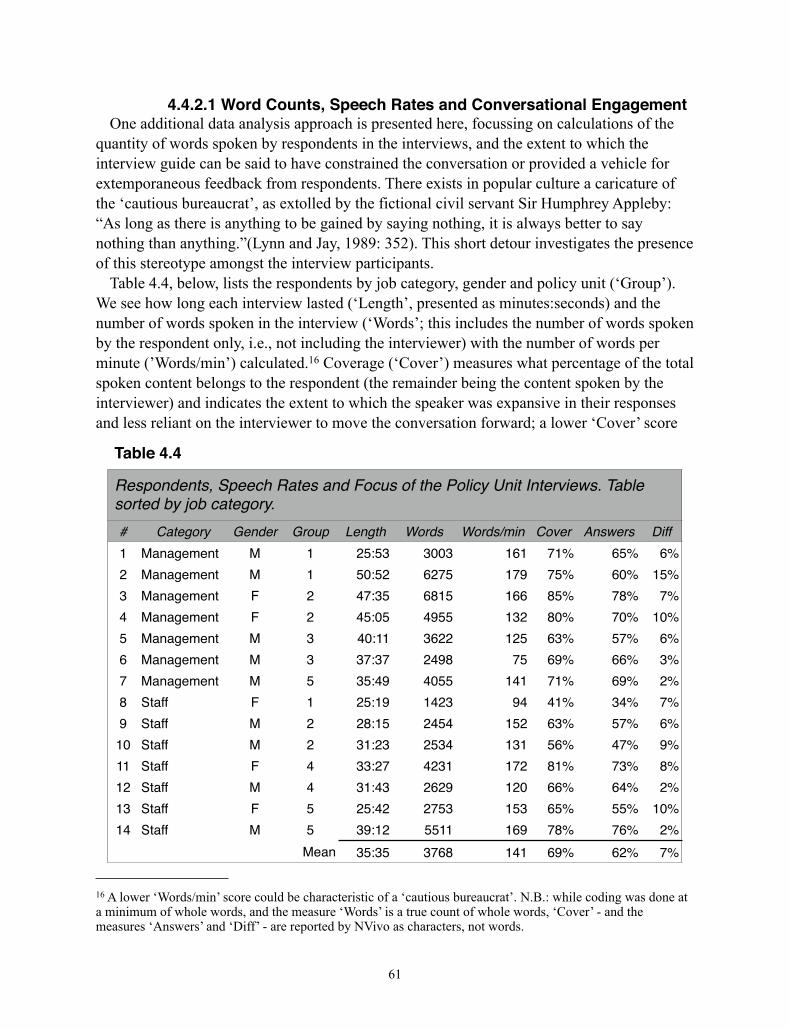
4.4.2.1 Word Counts, Speech Rates and Conversational EngagementOne additional data analysis approach is presented here, focussing on calculations of the
quantity of words spoken by respondents in the interviews, and the extent to which the interview guide can be said to have constrained the conversation or provided a vehicle for extemporaneous feedback from respondents. There exists in popular culture a caricature of the ‘cautious bureaucrat’, as extolled by the fictional civil servant Sir Humphrey Appleby: “As long as there is anything to be gained by saying nothing, it is always better to say nothing than anything.”(Lynn and Jay, 1989: 352). This short detour investigates the presence of this stereotype amongst the interview participants.
Table 4.4, below, lists the respondents by job category, gender and policy unit (‘Group’). We see how long each interview lasted (‘Length’, presented as minutes:seconds) and the number of words spoken in the interview (‘Words’; this includes the number of words spoken by the respondent only, i.e., not including the interviewer) with the number of words per minute (’Words/min’) calculated.16 Coverage (‘Cover’) measures what percentage of the total spoken content belongs to the respondent (the remainder being the content spoken by the interviewer) and indicates the extent to which the speaker was expansive in their responses and less reliant on the interviewer to move the conversation forward; a lower ‘Cover’ score
61
16 A lower ‘Words/min’ score could be characteristic of a ‘cautious bureaucrat’. N.B.: while coding was done at a minimum of whole words, and the measure ‘Words’ is a true count of whole words, ‘Cover’ - and the measures ‘Answers’ and ‘Diff’ - are reported by NVivo as characters, not words.
Tabble 4.4
Ressort
spondents, Sted by job ca
Speech Rtegory.
Rates annd Focuss of the PPolicy Unit IIntervieews. Tablee
# Category Gender Group Length Words Words/min Cover Answers Diff1 Management M 1 25:53 3003 161 71% 65% 6%2 Management M 1 50:52 6275 179 75% 60% 15%3 Management F 2 47:35 6815 166 85% 78% 7%4 Management F 2 45:05 4955 132 80% 70% 10%5 Management M 3 40:11 3622 125 63% 57% 6%6 Management M 3 37:37 2498 75 69% 66% 3%7 Management M 5 35:49 4055 141 71% 69% 2%8 Staff F 1 25:19 1423 94 41% 34% 7%9 Staff M 2 28:15 2454 152 63% 57% 6%10 Staff M 2 31:23 2534 131 56% 47% 9%11 Staff F 4 33:27 4231 172 81% 73% 8%12 Staff M 4 31:43 2629 120 66% 64% 2%13 Staff F 5 25:42 2753 153 65% 55% 10%14 Staff M 5 39:12 5511 169 78% 76% 2%
Mean 35:35 3768 141 69% 62% 7%
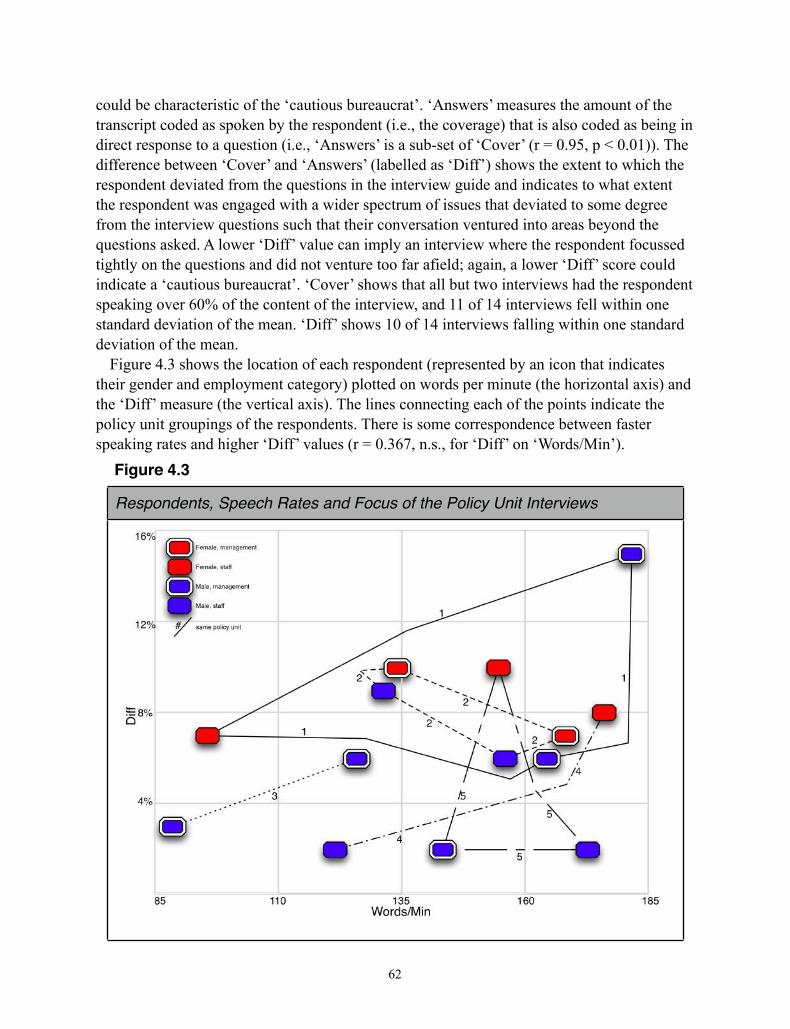
could be characteristic of the ‘cautious bureaucrat’. ‘Answers’ measures the amount of the transcript coded as spoken by the respondent (i.e., the coverage) that is also coded as being in direct response to a question (i.e., ‘Answers’ is a sub-set of ‘Cover’ (r = 0.95, p < 0.01)). The difference between ‘Cover’ and ‘Answers’ (labelled as ‘Diff’) shows the extent to which the respondent deviated from the questions in the interview guide and indicates to what extent the respondent was engaged with a wider spectrum of issues that deviated to some degree from the interview questions such that their conversation ventured into areas beyond the questions asked. A lower ‘Diff’ value can imply an interview where the respondent focussed tightly on the questions and did not venture too far afield; again, a lower ‘Diff’ score could indicate a ‘cautious bureaucrat’. ‘Cover’ shows that all but two interviews had the respondent speaking over 60% of the content of the interview, and 11 of 14 interviews fell within one standard deviation of the mean. ‘Diff’ shows 10 of 14 interviews falling within one standard deviation of the mean.
Figure 4.3 shows the location of each respondent (represented by an icon that indicates their gender and employment category) plotted on words per minute (the horizontal axis) and the ‘Diff’ measure (the vertical axis). The lines connecting each of the points indicate the policy unit groupings of the respondents. There is some correspondence between faster speaking rates and higher ‘Diff’ values (r = 0.367, n.s., for ‘Diff’ on ‘Words/Min’).
62
Figure 4.3
Respondents, Speech Rates and Focus of the Policy Unit Interviews

4.5 DiscussionPolicy analyst characteristics mirror recent findings from surveys of practicing policy
analysts in Canada (e.g., Howlett,2009; Wellstead & Stedman, 2010; Wellstead, Stedman & Howlett, 2011). Respondents from the British Columbia Government are typified as being young and highly-educated from social and administrative science disciplines. The majority of respondents have 5 or fewer years of experience with the British Columbia Government and most have 3 or fewer years at their current level or in their current job. The respondents report little lateral career movement, though promotions are related to years of experience. Also, the policy analyst’s immediate work environment is relatively stable; though organizational disruptions - like significant ministry organizational changes and policy unit re-organizations - are not uncommon, position disruptions affecting the individual were less evident. The results also confirm anecdotal impressions that the policy analysts’ supervisory environment is frequently shifting, with immediate and second-order supervisors changing relatively frequently. Unsurprisingly, a policy analyst’s age is positively correlated with a number of career temporal variables like number of years with British Columbia Public Service and variables that measure experiences in the public service. When grouped by gender, none of the differences in groups means were statistically significant, though mean scores for women were lower for all variables (e.g., age, years in current job) except for career advancement or promotions, where the mean score was marginally higher for women. The small sample included in the qualitative approach included managers and policy unit leaders, which is reflected in the older mean age of the respondents and higher scores career experience.
The data presented on speech rates and interview scope is included in order to provide an alternative picture of the respondents, and to investigate the validity of the popular image of the ‘cautious bureaucrat’ (Bozeman & Kingsley, 1998). It is worth noting that, when speaking with strangers or discussing certain topics, people tend to speak in longer sentences but their speech rate slows, that older people generally have a slower speech rates than younger people, and males tend to speak at a higher rate of speech (Robb, Maclagan & Chen, 2004; Yuan, Liberman & Cieri, 2006). Would we expect more senior policy analysts to speak more slowly than their younger colleagues (implying cautiousness, owing to a heightened perception of the risk of mis-speaking), or more quickly (implying increased competence and confidence)? Does engaging a wider breadth of topics in an interview (as measured by the variable ‘Diff’) imply an expansive view and an ability to draw connections between abstract issues, or a lack of focus? We should be careful, however, not to read too much into the speaker’s speech rate (’W/Min’). While we may be tempted to infer, for example, that a slow rate of speech in speaking about one’s work might correspond to an inherent cautiousness or a guardedness which seeks to avoid errors or divulge confidential information by carefully considering each word or phrase before it is spoken, it may just as much be a function of the speaker’s normal speech pattern (Street, Brady & Putnam, 1983). However, a tentative correspondence between faster speaking rates and higher ‘Diff’ values may indicate that respondents who spoke faster also tended to speak about issues beyond the interview guide, characteristics that are at odds with the caricature of the ‘cautious bureaucrat.’
63

64
Chapter 5 - The Archetypal Policy Analyst5.1 Summary
PurposeThis research is aimed at describing the contemporary world of policy analysis from the
perspective of individual policy analysts situated throughout the Government of British Columbia (BC), through respondents’ reflections on how five policy analyst archetypes resonate with their own interpretation of the practice of policy analysis.
MethodsThe research employs mixed methods:
Quantitative Approach: British Columbia Government public servants with titles similar to ‘policy analyst’ (n = 129) completed a web-based questionnaire. Data were analyzed using mean scores, through the application of Single Transferable Voting (STV) protocols, and visualization of individual rankings.
Qualitative Approach: semi-structured interviews with practicing policy analysts (n = 14), as members of five separate corporate policy units in the Government of British Columbia, were conducted, transcribed and analyzed.
FindingsThe ‘synthesizer’ archetype is ranked consistently high as describing the role and
orientation of policy analysts, followed closely by ‘connector’ and ‘entrepreneur’, with ‘listener’ and ‘technician’ rounding out the rankings. Across all respondents and within all groupings investigated (by gender, and by ministry type), the ‘synthesizer’ archetype was consistently ranked highest. The results are consistent across all analytical approaches, with some differences based on gender and ‘ministry type’.
Research LimitationsThe results are limited to the British Columbia Government context and are strongly
influenced by the nature of semi-structured interviews and qualitative methods, and by the self-selection bias of policy analysts who chose to participate. The naming of each archetype, and the wording used in their definitions, were subject to interpretation by respondents which may not reflect the intended meaning.
Practical ImplicationsThis research should provide insights for policy unit managers responsible for cultivating
and facilitating the work of policy analysts, and for government organization leaders to help them better understand the perspectives of contemporary policy analysts.
Originality / ValueThis study is the first to investigate policy analysts’ affinity with five ‘policy analyst
archetypes’ derived from the policy studies literature, and apply those findings to the British Columbia Government setting.
KeywordsPolicy analysts, policy analysis, archetypes, British Columbia, Canada
65

5.2 Background and ObjectivesAs practiced by the individual policy analyst as a public servant, policy analysis involves a
range of activities in support of policy formulation. This may include: the identification of public problems and the determination of their extent; the assembling of evidence and analysis of the problem; the projecting of outcomes and development of strategies for dealing with trade-offs; the construction and evaluation of options for addressing an emergent problem; the assembling of bureaucratic and civil society coalitions necessary for later policy formulation and implementation; the communication of recommendations to support decision-making; and the evaluation of previously adopted policies to determine effectiveness or value (Bardach, 2004; Pal, 2009; Weimer & Vining, 2010). Policy analysts can be found working both inside and outside of formal government settings. Within governments departments, policy analysts - a category spanning both public servants holding the job title of ‘policy analyst’ and those performing that function under a different title - may spend their day dealing with external communications issues, planning and reporting on government programs, attending to operational concerns and managing stakeholder relations.
Despite greatly exaggerated reports of its demise (Kirp, 1992), many accounts continue to cite the policy analysis function as important for effective governance (e.g., Hird, 2005a, 2005b; James & Jorgensen, 2009; May, 1986; Mayer, van Daalen & Bots, 2004; Nilsson et al., 2008; Saetren, 2005). Embedded in the concept of policy analysis is the belief that ‘good’ policy analysis is a key foundation for a ‘good’ policy decision, or at least that policy analysis could make a positive contribution – to “help (or sometimes influence) a decision-maker to make a better decision in a particular problem situation than he might otherwise have made without the analysis” (Quade, 1976: 13). Whether policy analysis is currently living up to its potential (Klijn, Steijn, & Edelenbos, 2010), many are clearly concerned about its importance and continue to hope for a renaissance (e.g., Bakvis, 2000; Clarke, 2002; Howlett, 2009; Townsend & Kunimoto, 2009; Young, Ashby, Boaz & Grayson, 2002).
While there is a rich literature on what policy analysts should do (e.g., Jenkins-Smith, 1982; Jennings, 1987; Torgerson, 1986), the empirical evidence on what policy analysts actually do in practice is less developed (Durning & Osuna, 1994; Howlett, 2009). Meltsner's (1976) sketch of policy analysts in the bureaucracy is a notable early contribution from a qualitative approach. This chapter presents the findings from research, based on data gathered through mixed-method quantitative / qualitative empirical fieldwork, into how practicing policy analysts in the Government of British Columbia view their profession and their role in the government policy formulation process. The objective of this research is to consider the perspectives of practicing policy analysts based on responses to an online survey and semi-structured interviews in order to better understand the role and value orientation of the archetypal policy analyst in contemporary practice.
5.3 MethodsFor the quantitative approach, 129 participants were surveyed using an online browser-
based questionnaire that asked respondents for their views on the policy process, centreing on a preference ranking of five policy analyst archetypes (see text box 5.1, below). The policy
66
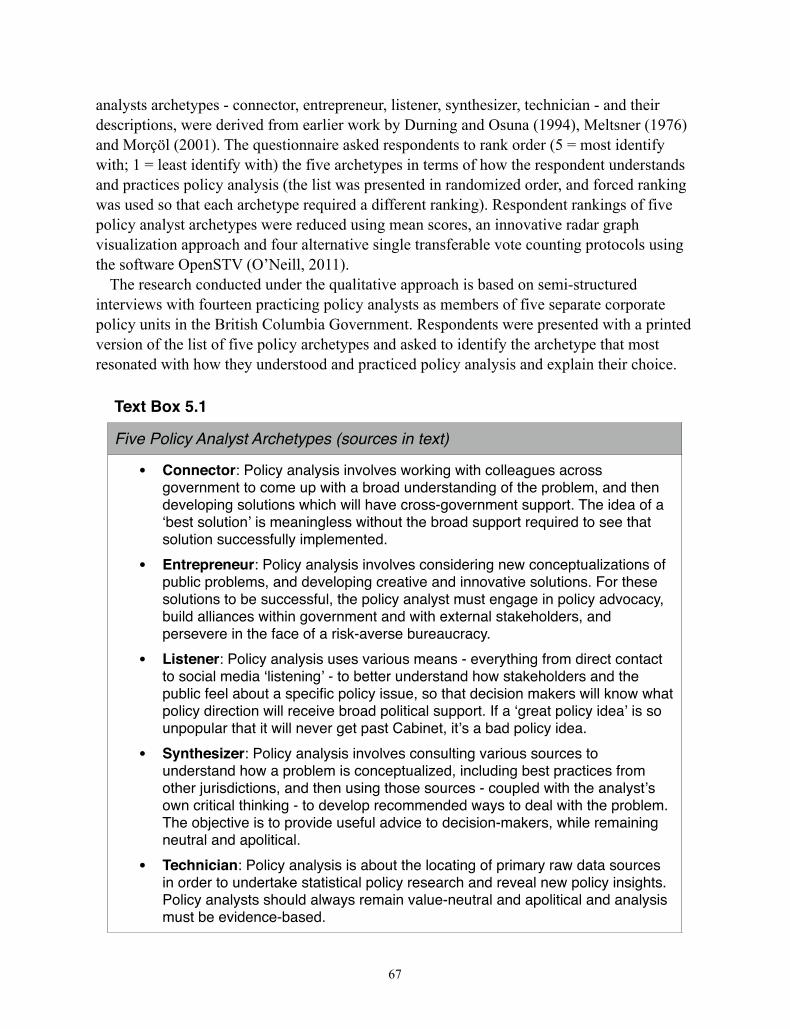
analysts archetypes - connector, entrepreneur, listener, synthesizer, technician - and their descriptions, were derived from earlier work by Durning and Osuna (1994), Meltsner (1976) and Morçöl (2001). The questionnaire asked respondents to rank order (5 = most identify with; 1 = least identify with) the five archetypes in terms of how the respondent understands and practices policy analysis (the list was presented in randomized order, and forced ranking was used so that each archetype required a different ranking). Respondent rankings of five policy analyst archetypes were reduced using mean scores, an innovative radar graph visualization approach and four alternative single transferable vote counting protocols using the software OpenSTV (O’Neill, 2011).
The research conducted under the qualitative approach is based on semi-structured interviews with fourteen practicing policy analysts as members of five separate corporate policy units in the British Columbia Government. Respondents were presented with a printed version of the list of five policy archetypes and asked to identify the archetype that most resonated with how they understood and practiced policy analysis and explain their choice.
67
Text Box 5.1
Five Policy Analyst Archetypes (sources in text)
• Connector: Policy analysis involves working with colleagues across government to come up with a broad understanding of the problem, and then developing solutions which will have cross-government support. The idea of a �best solution� is meaningless without the broad support required to see that solution successfully implemented.
• Entrepreneur: Policy analysis involves considering new conceptualizations of public problems, and developing creative and innovative solutions. For these solutions to be successful, the policy analyst must engage in policy advocacy, build alliances within government and with external stakeholders, and persevere in the face of a risk-averse bureaucracy.
• Listener: Policy analysis uses various means - everything from direct contact to social media �listening� - to better understand how stakeholders and the public feel about a specific policy issue, so that decision makers will know what policy direction will receive broad political support. If a �great policy idea� is so unpopular that it will never get past Cabinet, it�s a bad policy idea.
• Synthesizer: Policy analysis involves consulting various sources to understand how a problem is conceptualized, including best practices from other jurisdictions, and then using those sources - coupled with the analyst�s own critical thinking - to develop recommended ways to deal with the problem. The objective is to provide useful advice to decision-makers, while remaining neutral and apolitical.
• Technician: Policy analysis is about the locating of primary raw data sources in order to undertake statistical policy research and reveal new policy insights. Policy analysts should always remain value-neutral and apolitical and analysis must be evidence-based.
The interviews were transcribed verbatim and, taking a deductive approach based on an a priori list of codes (Miles & Huberman, 1994), were analyzed with the assistance of a computerized qualitative data analysis software program (NVivo 9).
5.4 Results5.4.1 Quantitative Approach
The ‘synthesizer’ archetype was consistently ranked highest, being ranked first by 55% of respondents (n = 71). In contrast, the ‘technician’ and ‘listener’ archetypes were ranked first by just 8 (6%) and 4 (3%) respondents respectively. Sixty respondents (47%) least identified with the ‘technician’ categorization of their work, 30 (23%) least identified with ‘entrepreneur’ and 26 (20%) least identified with ‘listener’. Three techniques for understanding ‘social preference rankings’ (i.e., the ranking of archetypes across the respondents as a community) based on individual ranking are discussed here: mean scores, data visualization and the application of Single Transferable Voting (STV) protocols.
5.4.1.1 Mean ScoresMean scores for all respondents, and separately by gender and across three ministry
types17, for each archetype are shown below in table 5.1, and represented graphically for all respondents and by gender in figure 5.1 below. The ordered ranking based on the mean score is the same for all respondents and for each gender: synthesizer, connector, entrepreneur, listener and technician (n.b.: five letter ordered archetype permutations - in this case, SCELT representing the ordered list: synthesizer, connector, entrepreneur, listener and technician - are used in this discussion). While the SCELT ranking is the same for both genders, the graph in figure 5.1 reveals that for males, ‘connector’ and ‘entrepreneur are evenly match in second place, whereas for females ‘entrepreneur’ and ‘listener’ are closely aligned in third place. The SCELT ranking also holds for the Environment ministry grouping. For the Social ministry grouping, the ordering changes to SCLET with the ranking for ‘entrepreneur’ and ‘listener’ reversed from the Environment ministry grouping. For the Economic ministry group, the ranking is SECLT, with ‘entrepreneur’ moving up the ranking as compared to the other two ministry groupings.
5.4.1.2 Single Transferable Voting ProtocolsA collective social preference ranking of the five archetypes was also computed using
Single Transferable Voting (STV) protocols. Under STV methods, voters rank candidate choices in order of preference. A candidate is deemed selected when they reach a quota of first choice votes. The remaining choices (called surplus votes) made by the first-place candidate’s supporters are added proportionately to the other candidates for whom those voters voted. Successive rounds of vote counting are used to determine the successive preferred candidates (Lakeman & Lambert, 1970). Normally used to determine which of a number of candidates for elected office will fill a smaller number of available positions (with
68
17 ‘Ministry types’ are discussed in Chapter 3.
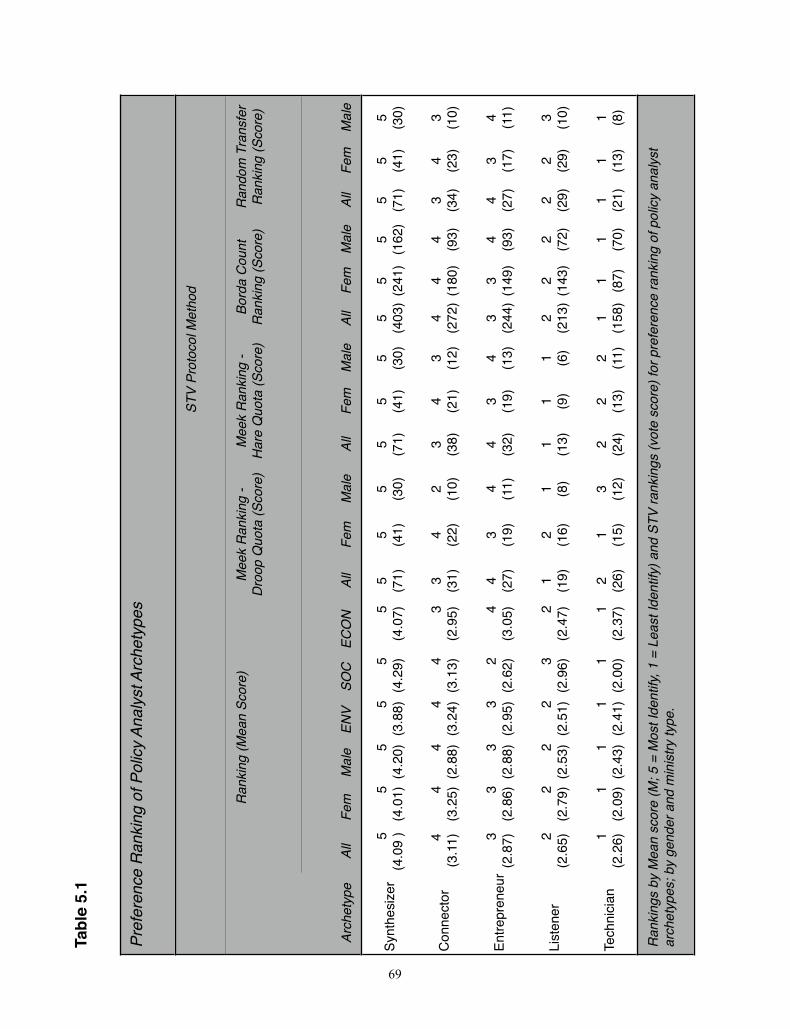
69
Tabl
e 5.
1
Pref
eren
cee R
ankki
ng o
f Pol
icyy
Anal
yyst A
rchhe
type
ss
STV
PProt
ocoll
Met
hod
Rannk
ing
(MMea
n Scc
ore)
Mee
Droo
p ek R
anki
Quo
ta (in
g -
(Sco
re)
Mee
Hare
Qek R
anki
Quo
ta (Skin
g -
Scor
e)Bo
Ranor
da C
onk
ing
(Sount
Sc
ore)
Rand
Rando
m T
rank
ing
(San
sfer
Sc
ore)
Arch
etyp
eAl
lFe
mM
ale
ENV
SOC
ECO
NAl
lFe
mM
ale
All
Fem
Mal
eAl
lFe
mM
ale
All
Fem
Mal
e
Synt
hesi
zer
5 (4
.09
)5
(4.0
1)5
(4.2
0)5
(3.8
8)5
(4.2
9)5
(4.0
7)5 (71)
5 (41)
5 (30)
5 (71)
5 (41)
5 (30)
5 (4
03)
5 (2
41)
5 (1
62)
5 (71)
5 (41)
5 (30)
Con
nect
or4
(3.1
1)4
(3.2
5)4
(2.8
8)4
(3.2
4)4
(3.1
3)3
(2.9
5)3 (31)
4 (22)
2 (10)
3 (38)
4 (21)
3 (12)
4 (2
72)
4 (1
80)
4 (93)
3 (34)
4 (23)
3 (10)
Entre
pren
eur
3(2
.87)
3(2
.86)
3(2
.88)
3(2
.95)
2(2
.62)
4(3
.05)
4 (27)
3 (19)
4 (11)
4 (32)
3 (19)
4 (13)
3 (2
44)
3 (1
49)
4 (93)
4 (27)
3 (17)
4 (11)
List
ener
2(2
.65)
2(2
.79)
2(2
.53)
2(2
.51)
3(2
.96)
2(2
.47)
1 (19)
2 (16)
1 (8)
1 (13)
1 (9)
1 (6)
2 (2
13)
2 (1
43)
2 (72)
2 (29)
2 (29)
3 (10)
Tech
nici
an1
(2.2
6)1
(2.0
9)1
(2.4
3)1
(2.4
1)1
(2.0
0)1
(2.3
7)2 (26)
1 (15)
3 (12)
2 (24)
2 (13)
2 (11)
1 (1
58)
1 (87)
1 (70)
1 (21)
1 (13)
1 (8)
Rank
ings
by
arch
etyp
es; b M
ean
sby
gen
dscor
e (M
der a
nd mM
; 5 =
M m
inist
ryMos
t Ide
ny
type
.nt
ify, 1
== L
east
Idden
tify)
aand
STVV
rank
inggs
(vot
ee sc
ore)
for p
reffe
rencc
e ra
nkinin
g of
pool
icy a
nnalys
t

perhaps a ranking of the winning candidates), here the STV method is used to arrive at a preference ranking for all five candidate archetypes (Mao, Procaccia & Chen, 2012).
Under all STV systems the number of surplus votes is known but there is no universally accepted method for allocating them. There are a number of methods that have been proposed or adopted to govern how surplus votes are transferred from winners to remaining candidates based on the surplus ballots’ ordered preferences. The many alternatives that exist for deciding which votes to transfer, how the transfers are weighted, who is to receive the transferred votes and the order in which surpluses are transferred can each lead to different outcomes (Dietrich, 2011; Woodall, 1982). I use the Meek method (Meek, 1994) for counting when computing the results of this ‘election’ as this method is widely endorsed as the preferred method where more than one selection is being made and the results are computed using mechanical means, not by hand (O’Neill, 2008).18 The principal difference in the Meek
70
18 The Meek method results were found to be similar to many other methods tested (including Bucklin [a.k.a. Grand Junction], ERS97, Fractional Transfer, Green Party of California, Iceland, Minneapolis, Northern Ireland, San Francisco, Scottish, Single Non-Transferable Vote, Supplemental Vote, and Warren - which is the most closely related to Meek [Hill & Warren, 2005]).
Figure 5.1
Mean Score Preference Ranking of Policy Analyst Archetypes, by Gender
Respondents ranked the five archetypes from 5 (Most Identify) to 1 (Least Identify).
Method is that it recomputes the quota on each iteration of the count, and it is the only STV counting method that changes the quota during the counting process. Having decided to use the Meek method, one other significant choice remained, namely the choice of quota method as between the Droop and Hare methods (all other computation settings available in the vote counting software had little or no effect on the results). The differences between these methods is beyond the scope of this present discussion: while the Droop quota is the more commonly used for government STV elections due to some concerns over potentially undemocratic outcomes when using the Hare method, I present the results of both quotas for the Meek method calculations in table 5.1 above. Also, because they produce different results again, I also present the outcomes from using the Borda Count and Random Transfer protocols.19 Using the software program OpenSTV (O’Neill, 2011), the preference rankings of the five policy analysis archetypes emerging from the survey are shown in table 5.1 above, with vote counts shown in parentheses. Note that vote counts are only valid for the point at which the archetype was ‘elected’, thus it is possible for a lower-ranked archetype to have a higher vote count than a higher-ranked, previously ‘elected’, archetype. Vote counts are most relevant when two or more archetypes are ‘elected’ in the same round, allowing for a differentiation of ranking or - in some cases - a determination of a tie. Results are shown for all respondents, and separately by gender.
As with the mean score approach shown in figure 5.1, the SCELT permutation - synthesizer, connector, entrepreneur, listener, technician - was arrived at using the Borda Count protocol for all respondents, and both females and males. This permutation was also found using the Meek method (with the Droop quota) and Random Transfer, though for female respondents only. As with the mean score for the Economic ministry group, the SECLT permutation was found using the Random Transfer protocol for all respondents and for male respondents only.
Other applications of the Meek method produced alternative social preference permutations. The SECTL permutation was found using the Meek method (with Droop quota) for all respondents, and the Meek Method (with Hare quota) produced this permutation for all respondents and for males only. The SETCL permutation was found using the Meek method (with Droop quota) for male respondents. And the SCETL permutation resulted from use of the Meek method (with Hare quota) for female respondents.
5.4.1.3 Data VisualizationOut of 120 total possible five letter ordered archetype permutations (without repetition, i.e.,
5!), 44 emerged through respondents’ rankings. The frequency distribution of these
71
19 Under a Borda Count Method, if there are five candidates then each gets four points for a first ranking, three for a second ranking, etc. Under Random Transfer STV, a number of ballots corresponding to the candidate’s surplus are transferred to their next choices. The results for Cambridge and Coombs STV protocols were similar or identical to the Random Transfer approach. The Coombs Method is a form of Instant Runoff Voting (IRV) where the candidate with the most last place rankings is eliminated in each round. The Cambridge Method is a form of random transfer STV (O’Neill, 2008).
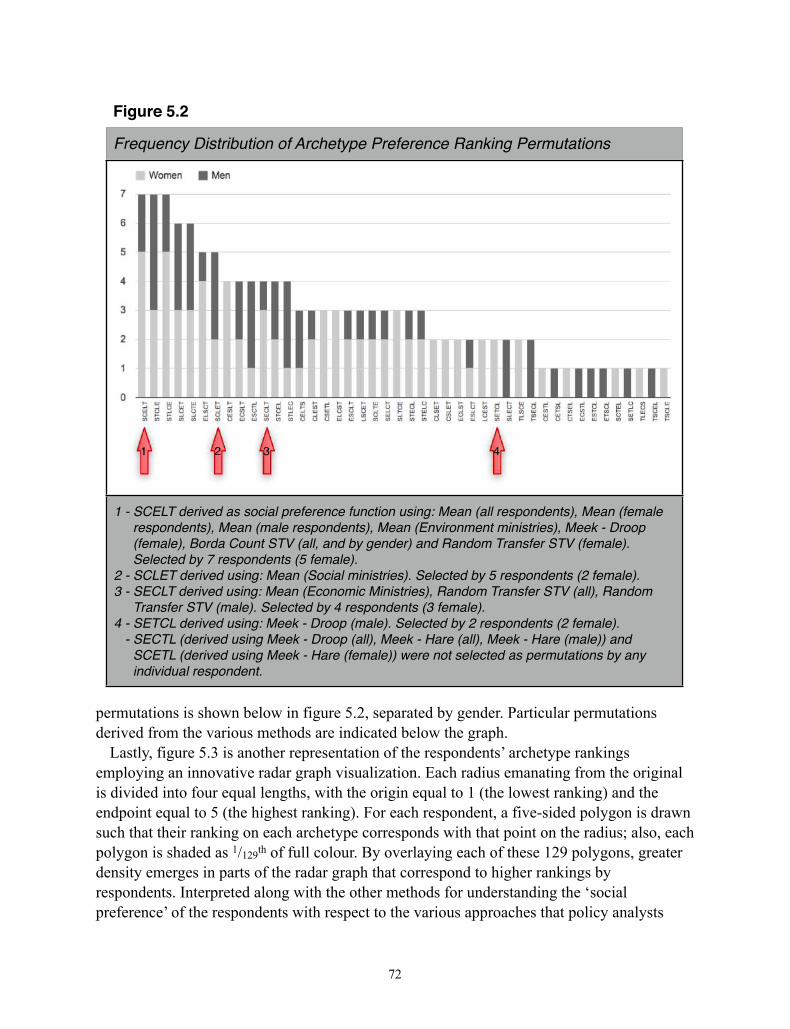
permutations is shown below in figure 5.2, separated by gender. Particular permutations derived from the various methods are indicated below the graph.
Lastly, figure 5.3 is another representation of the respondents’ archetype rankings employing an innovative radar graph visualization. Each radius emanating from the original is divided into four equal lengths, with the origin equal to 1 (the lowest ranking) and the endpoint equal to 5 (the highest ranking). For each respondent, a five-sided polygon is drawn such that their ranking on each archetype corresponds with that point on the radius; also, each polygon is shaded as 1/129th of full colour. By overlaying each of these 129 polygons, greater density emerges in parts of the radar graph that correspond to higher rankings by respondents. Interpreted along with the other methods for understanding the ‘social preference’ of the respondents with respect to the various approaches that policy analysts
72
Figure 5.2
Frequency Distribution of Archetype Preference Ranking Permutations
1 - SCELT derived as social preference function using: Mean (all respondents), Mean (female respondents), Mean (male respondents), Mean (Environment ministries), Meek - Droop (female), Borda Count STV (all, and by gender) and Random Transfer STV (female). Selected by 7 respondents (5 female).
2 - SCLET derived using: Mean (Social ministries). Selected by 5 respondents (2 female).3 - SECLT derived using: Mean (Economic Ministries), Random Transfer STV (all), Random
Transfer STV (male). Selected by 4 respondents (3 female).4 - SETCL derived using: Meek - Droop (male). Selected by 2 respondents (2 female). - SECTL (derived using Meek - Droop (all), Meek - Hare (all), Meek - Hare (male)) and
SCETL (derived using Meek - Hare (female)) were not selected as permutations by any individual respondent.
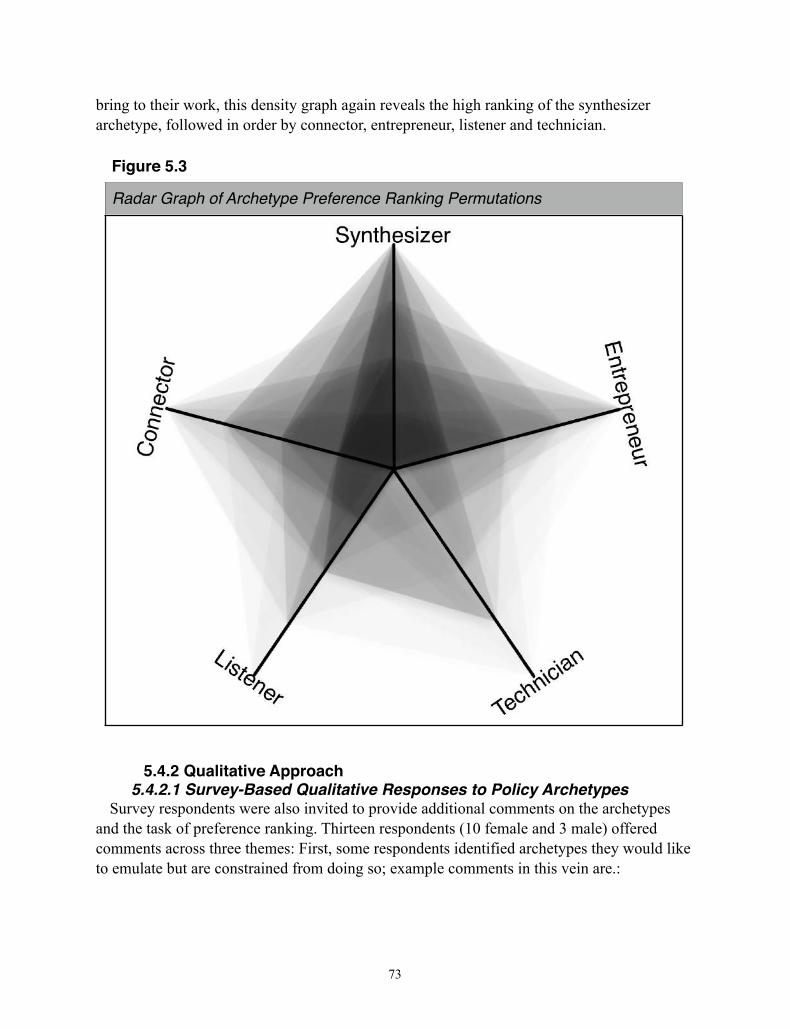
bring to their work, this density graph again reveals the high ranking of the synthesizer archetype, followed in order by connector, entrepreneur, listener and technician.
5.4.2 Qualitative Approach5.4.2.1 Survey-Based Qualitative Responses to Policy Archetypes
Survey respondents were also invited to provide additional comments on the archetypes and the task of preference ranking. Thirteen respondents (10 female and 3 male) offered comments across three themes: First, some respondents identified archetypes they would like to emulate but are constrained from doing so; example comments in this vein are.:
73
Figure 5.3
Radar Graph of Archetype Preference Ranking Permutations
I very much identify with the concept ‘Connectors’.... However, this cross-collaboration rarely happens within ministries never mind across ministries. Individual ministries tend to operate in silos, with some exceptions.
Ideally there would be more opportunity to work as connectors, however unless you are a networker, it is difficult to know where opportunities exist.
Second, questions about the five archetypes and alternative or additional archetype suggestions (project manager; architect; relationship-builder) were offered by some respondents, as three comments indicate:
Architects of social policy and program design that support best practices based on evidence-informed practice and practice-informed evidence, often with significant expertise and experience in the field that is being developed.
First Nations under the New Relationship need to be consulted and engaged outside the mediums of government in ways that are best determined by them before the above policy analysis archetypes. It is pre-plannning, relationship building based on respect.
I have found that in recent years policy analysts have also been asked to take on project management roles - developing project charters for a new policy project, keeping the policy project in scope, updating stakeholders on the status of the project, etc.
Lastly, several respondents felt that it was an artificial construct to be asked to rank the archetypes as their work entails elements of all of them depending on the context (recall that the system used forced ranking so that each archetype required a different ranking, i.e., only one archetype could be ranked first). Two examples of this complaint were:
I identify with all five statements and would have ranked each as ‘5’ if the system would have let me.
This was an interesting question. I would argue that all 5 of these skills used together, would result in the best policy.
5.4.2.2 Interview-Based Responses to Policy ArchetypesInterview respondents were asked which of the five archetypes they most identified with or
that most resonated with how they understood and practiced policy analysis, the near-universal first response was the difficulty in picking just one as many respondents found aspects of each archetype that they identified with. Each respondent did eventually pick their most preferred or identified-with archetype, and their responses are shown below against three other variables for each respondent: gender, job category and policy unit (see figure 5.4, above). The only archetype not selected was the ‘technician’ category, with several respondents explicitly rejecting the contemporary existence of that type of policy analyst, e.g.,:
74
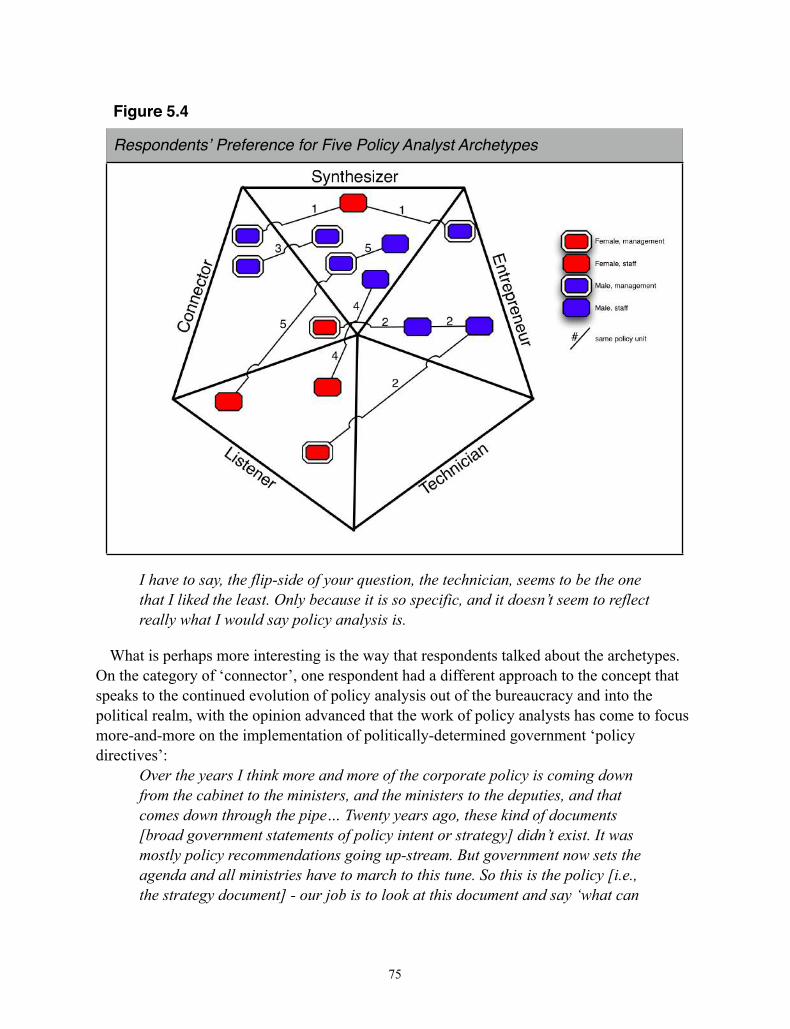
I have to say, the flip-side of your question, the technician, seems to be the one that I liked the least. Only because it is so specific, and it doesn’t seem to reflect really what I would say policy analysis is.
What is perhaps more interesting is the way that respondents talked about the archetypes. On the category of ‘connector’, one respondent had a different approach to the concept that speaks to the continued evolution of policy analysis out of the bureaucracy and into the political realm, with the opinion advanced that the work of policy analysts has come to focus more-and-more on the implementation of politically-determined government ‘policy directives’:
Over the years I think more and more of the corporate policy is coming down from the cabinet to the ministers, and the ministers to the deputies, and that comes down through the pipe… Twenty years ago, these kind of documents [broad government statements of policy intent or strategy] didn’t exist. It was mostly policy recommendations going up-stream. But government now sets the agenda and all ministries have to march to this tune. So this is the policy [i.e., the strategy document] - our job is to look at this document and say ‘what can
75
Figure 5.4
Respondents� Preference for Five Policy Analyst Archetypes
we do to help implement this? What programs can we implement or what can we do with stakeholders to make this happen?’
While the ‘entrepreneur’ definition that was provided to respondents focussed on the need for policy advocacy and alliance building, one respondent spoke to the archetype but from the perspective of pursuing innovative approaches to policy solutions:
True policy is way outside the box, and the key is working with the stakeholders, working with the businesses in our area and the various industry sectors that require policy support from us, and trying to be ahead of them. Because industry moves very quickly these days, and if we don’t move as fast, or faster than them, then they’re developing new technology and we haven’t got the regulations to allow them to use it.
5.5 DiscussionThrough the various methods explored, what clearly emerges is that the ‘synthesizer’
archetype is ranked consistently high as describing the role and orientation of policy analysts, followed closely by ‘connector’ and ‘entrepreneur’, with ‘listener’ and ‘technician’ rounding out the rankings (referred to as the SCELT permutation). Across all respondents and within all groupings investigated (by gender, and by ministry type), the ‘synthesizer’ archetype was consistently ranked highest. In contrast, the ‘technician’ and ‘listener’ archetypes were ranked lowest, with ‘entrepreneur’ and ‘connector’ occupying a middle position. The various methods for deriving a social preference ranking - and the individual rankings of respondents - do yield different rankings, but the results are generally consistent with the SCELT permutation. The results from visualization of the data confirm the basic patterns that emerge from the analysis based on mean scores and the application of STV protocols.
Interesting results when assessed by ministry type emerge that are stereotypical: for the ‘social’ ministries, the ‘listener’ archetype is more highly ranked; for the ‘economic’ ministries, the ‘entrepreneur’ is more prominent (and vice versa). While the various methods do reveal different results when compared by gender, there do not appear to be consistent gender-specific results. The application of STV protocols for determining a social preference ranking reveal that the method and rules of counting have important implications for ordering the archetypes. Other applications of the Meek method produced alternative social preference permutations, though in all cases the ‘synthesizer’ archetype was ranked highest.
From the qualitative interviews, with such a small number of respondents we should not expect significant patterns to emerge, or to read much into any patterns that appear other than through coincidence. To note that all of the respondents that selected ‘entrepreneur’ were male misses the fact that other male respondents explicitly rejected the ‘entrepreneur’ category. All ‘listeners’ were female, though female respondents also selected ‘connector’ and ‘synthesizer’. That all respondents that selected ‘connector’ were management is coincidental and perhaps worth noting; but taking the same approach (following, e.g., Howlett & Walker, 2012) we might expect that all respondents that identified with ‘synthesizer’ would be staff - which is not the case. Finally, no strong policy unit sub-culture
76
themes emerged from this question, with all policy unit groupings (shown using line links in figure 5.4) spanning the boundaries between categories.
While a single social preference ranking will not emerge without first choosing which function to use (i.e., as between mean score ranking, or some form of STV protocol), it is clear that the ‘synthesizer’ archetype is clearly the role that the respondent sample most strongly identifies with. And with some variability, the ‘listener’ and ‘technician’ archetypes are least supported. The low ranking for the technician archetype may reflect the evolution in policy analysis from the highly analytical ‘golden age’ to the present (Parson, forthcoming). Given the need to reach more proactively across ministerial boundaries to connect to knowledge sources and collaborate with colleagues across the organization, the connector archetype - ranked in a second tier with the entrepreneur archetype - would appear to be a valuable characteristic to encourage. While Lasswell’s (1951) objective was to marginalize the ‘listener’ from the policy analyst function, Drury (1975) - while championing the ‘technician’ - would have also supported the need for the analyst to bring ‘listening’ skills on behalf of the minister. The golden age of policy analysis (e.g., Quade, 1975; Weimer & Vining, 2010) strongly resonates with the ‘technician’ (mirroring Meltner’s [1976] findings), though Bardach’s (2004) widely influential ‘policy analysis guidebook’ is clearly in the ‘synthesizer’ camp. It is possible that affinity for the ‘entrepreneur’ and ‘connector’ archetypes reflects new public management (NPM) sentiments, an umbrella term for public choice-oriented economic and managerial reform of government administration (Hood, 1991).
It must be acknowledged, however, that the very act of naming and pre-defining these archetypes, and requiring respondents to rank order them, is both an artificial construct and masks a possible disconnect between the interpretation of the archetypes and the intended meaning of the research. We cannot know, for example, that one respondent’s interpretation of an archetype name and definition was the same as another respondent’s, or that any respondents’ interpretation was what was intended in their drafting. The method used in this research - forced ranking of five pre-defined archetypes - was a function of the limited amount of attention the survey could hope to command from busy respondents. Future efforts, however, that seek to determine a social preference ranking of actor attributes amongst members of a professional class might consider open-ended elicitation (Ryan et al., 2001) or hybrid methods currently being experimented with (e.g., Salganik and Levy, 2012; see http://www.allourideas.org/policyanalyst)
77

78
Chapter 6 - The Policy Analyst’s Network6.1 Summary
PurposeThis research is aimed at describing the contemporary world of policy analysis from the
perspective of individual policy analysts situated throughout the Government of British Columbia (BC) focussed on the use of organizational social networks for facilitating policy analysis and formulation.
MethodsThe research employs mixed methods:
Quantitative Approach: British Columbia Government public servants (n = 64) completed a web-based sociometric questionnaire. Data was analyzed using NodeXL.
Qualitative Approach: semi-structured interviews with practicing policy analysts (n = 14), as members of five separate corporate policy units in the Government of British Columbia, were conducted, transcribed and analyzed using NVivo.
FindingsFemale respondents were more likely to identify other women as alters. Most egos
identified alters from their own ministry. Policy analysts identified more relationships with their superiors than with their colleagues. Social ministry actors had significantly lower betweenness and eigenvector (closeness) scores than those scores in both the economic ministries and the environment ministries. Organizational social networks were found to be strongly related to the respondent’s breadth of exposure to alters in other ministries, their length of service and their predisposition to see such social network interaction as key to policy formulation in the context of issue complexity.
Research LimitationsThe results are limited to the British Columbia Government context and are influenced by
the nature of semi-structured interviews and qualitative methods and by the self-selection bias of policy analysts who chose to participate. The sociometric data represents only a very sparse ego-centric network, with very few reciprocal ties or shared alters.
Practical ImplicationsThe significance of the present findings lies in the implications for public sector
organizations to provide support for knowledge workers to make effective use of the social network and organizational capacity to jointly solve problems. The results should encourage managers and organizations to promote factors that foster more open knowledge sharing and collaboration using social networks.
Originality / ValueThis study investigates policy analysts’ perspectives on the impact of organizational social
networks on intra-organizational knowledge sharing and collaboration.
KeywordsPolicy analysts, knowledge sharing, collaboration, organizational social networks
79

6.2 Background and ObjectivesThis chapter is focussed on the contribution of organizational social networks to the policy
formulation objectives of knowledge sharing and collaboration. Social network theory views social relationships in terms of nodes (i.e., individuals) and ties (i.e., the relationships between individuals). It differs from traditional sociology by focussing less on the attributes of individuals and more on their relationships and ties with other actors in the network. Despite the focus in this research on formal institutions of government and internal-to-government communication among policy analysts, the policy formulation environment has long been understood as beyond the exclusive control of closed government bureaucracies (Rhodes, 2006), and policy networks are represented by a robust literature in public administration (Isett, Mergel, LeRoux, Mischen & Rethemeyer, 2011; Provan & Lemaire, 2012). An early influential study in this direction was Heclo and Wildavsky’s (1974) analysis of the British Treasury Department, where the notion of the ‘policy community’ was introduced as a cluster of relationships among major political and administrative actors in a policy area. Heclo (1978) built on this to introduce the phrase ‘issue network’, where the focus was on issue-specific policy networks with governance responsibility dispersed among large numbers of policy intermediaries, as opposed the concern in the American literature with ‘iron triangles’ (Ripley & Franklin, 1981). Several important summaries of the use of network concepts in the policy analysis literature have been produced in recent years (e.g., Atkinson & Coleman, 1992; Bevir & Richards, 2009; Börzel, 1998; Meek, 2011). Bogason and Toonen (1998), in their introduction to a special issue of the journal Public Administration focussed on networks in public administration scholarship, highlight the importance of external-to-government policy networks as an influence on internal government activity. Rhodes (2008) surveys a vast literature ranging from social network analysis (Scott, 2000) to policy network analysis, a scan which mirrors the perspective of Kenis and Schneider (1991), arguing that the network concept helps to understand not only formal institutional arrangements but also complex informal relationships in the policy process.
The specific interest in this chapter is on informal networks and interpersonal relationships embedded in the relationships among actors (Dawes, Cresswell & Pardo, 2009), rather than those motivated or facilitated by a formal network relationship (Mergel, Lazer, & Binz-Scharf, 2008). Increasingly, in organizations of significant size, research suggests that collaboration occurs through informal social networks as much as it conforms to the formal organization structures (Cross et al., 2001; Hansen, 2002; Kim & Lee, 2006; Sveiby & Simons, 2002; Willem & Buelens, 2007). The organizational social network perspective has come to focus on the complex social structure of relationships amongst actors, exchange in social relations and the idea that social network connections significantly influence organizational and personal outcomes (Kilduff & Brass, 2010; Kilduff & Tsai, 2003). A fundamental concept underlying this work is that of social capital, which is based on attributes of the relationship among individuals (Coleman, 1988). A person who has high social capital has a rich set of social connections that provides access to information, resources and support. When organizational networks are formed, they rely on the social
80
capital resting on relationships among sets of individuals, although organizations can also be characterized as having high social capital (Andrews, 2010).
This chapter presents the findings from mixed-method quantitative / qualitative empirical fieldwork and analysis into how practicing policy analysts in the Government of British Columbia conceptualize their place in the policy formulation process and their relationship to others in that environment. From this perspective, the interest is in how formal workgroups and their individual members effectively use social networks to structure and accomplish the work assigned to them. Through responses to an online sociometric survey, and through semi-structured interviews, this research is aimed at an enhanced understanding of the contemporary policy analyst operating within a large hierarchical networked organization.
6.3 MethodsAn online questionnaire completed by practicing policy analysts in the Government of
British Columbia included an integrated sociometric survey related to the social network analysis component of the research (see Appendix E, survey pages 14-18). The sociometric questionnaire asked participants to respond to five questions:
• Name generator: respondents were asked to “name up to five colleagues in the Government of BC that you regularly work with on policy related issues.”
• Communication modes: These names were then passed to a subsequent page where a matrix of check-boxes allowed respondents to “check all of the ways you communicate with each person - even if it's only infrequent.” The options provided were: face-to-face, phone, email, Twitter / Yammer / etc., Facebook / Google+ / etc., SMS / Text, MS Communicator / Chat, Share-point, Tele-presence / Video-conference, and Other (including a free-text box).
• Ranking, influence: The list of names was again passed to a subsequent page and respondents were asked to “rank the members in this list by selecting the number that best describes how much influence you feel that person has on your own thinking, with 5 indicating that that person (of the people listed) has the most influence on your thinking.”
• Ranking, friendship: The list of names was again passed to a subsequent page and respondents were asked to “rank the members in this list by selecting the number that best describes your feeling of friendship towards that person, with 5 indicating that that person is a close workplace friend.”
• Ranking, value: Lastly, the list of names was again passed to a subsequent page and respondents were asked to “rank the members in this list by selecting the number that best describes how valuable you find your interactions with that person, with 5 indicating that you highly value those interactions.”
The sociometric questionnaire data was analyzed using NodeXL (Smith et al., 2010), an Excel template package developed specifically for the analysis and visualization of social network data. To generate a social network from sociometric data, a one-way link is added between two employees if one employee names another. If both employees name each other, the link is bi-directional. The analysis then focuses on measures such as an employee's
81

centrality (a measure of their importance in a network) and centrality’s three sub-categories: degree centrality (how many employees are connected to that employee), eigenvector centrality (how important that employee is to others in the network) and betweenness centrality (the measure of how many employees are connected to other employees on the network through that employee). Results are reported in tables and visually using cluster maps.
The research conducted under the qualitative approach is based on semi-structured interviews with fourteen practicing policy analysts as members of five separate corporate policy units in the British Columbia Government. Amongst other questions, respondents were asked to qualitatively describe their organizational social network. The interviews were transcribed verbatim and, taking a deductive approach based on an a priori list of codes (Miles & Huberman, 1994), were analyzed with the assistance of a computerized qualitative data analysis software program (NVivo 9).
6.4 Results6.4.1 Quantitative Sociometric Approach
Of the 129 respondents that completed the full survey, 55 completed the sociometric component of the questionnaire (see table 6.1, above). The lower response rate for the sociometric component of the questionnaire is partly to be expected due to the enhanced intrusiveness of sociometry, and partly explained because the first page of the social network section included an opt-out clause (included in response to feedback from pilot testers who felt this section was overly intrusive and onerous) in order to avoid high rates of full-survey attrition; the opt-out selection skipped over survey pages 15-18. The responses from ‘volunteer participants’20 - excluded from the main statistical analysis component - have been
82
20 A supplementary approach envisioned in the original design, that of engaging interested ‘policy analysis’ practitioners through targeted internal advertising and word-of-mouth failed to generate many additional responses. Just 15 completed surveys, with 9 of those completing the embedded sociometric survey, were received. These completions are referred to as ‘volunteer participants’ in the reporting (see Appendix A for a full description of this category of respondents).
Table 6.1
Sociometric Questitionnaire Completioon Statistics
Category Valid Invites (% of total)
Survey Completion (% of total)
Sociometric Survey Completion (% of total)
�Policy Analysts� 249 129 55 Female 160 (64%) 80 (62%) 34 (62%) Male 89 (36%) 49 (38%) 21 (38%)Volunteer Participants
not 15 9
Female not applicable 10 (67%) 6 (67%)
Maleapplicable
5 (33%) 3 (33%)
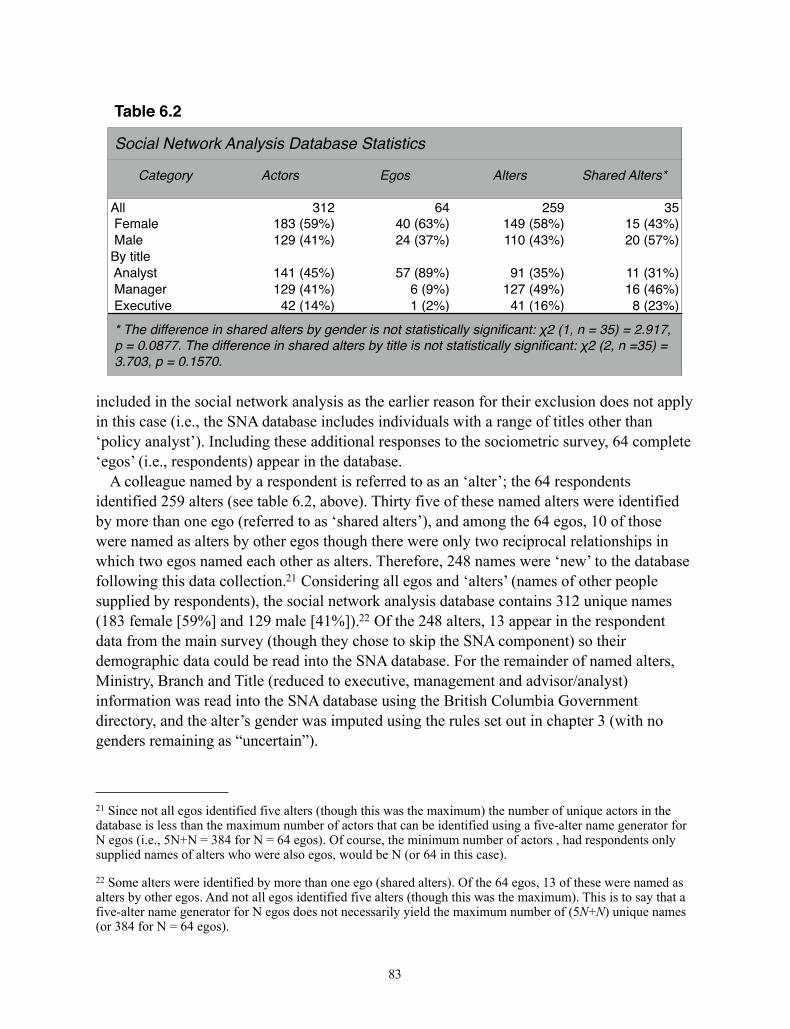
included in the social network analysis as the earlier reason for their exclusion does not apply in this case (i.e., the SNA database includes individuals with a range of titles other than ‘policy analyst’). Including these additional responses to the sociometric survey, 64 complete ‘egos’ (i.e., respondents) appear in the database.
A colleague named by a respondent is referred to as an ‘alter’; the 64 respondents identified 259 alters (see table 6.2, above). Thirty five of these named alters were identified by more than one ego (referred to as ‘shared alters’), and among the 64 egos, 10 of those were named as alters by other egos though there were only two reciprocal relationships in which two egos named each other as alters. Therefore, 248 names were ‘new’ to the database following this data collection.21 Considering all egos and ‘alters’ (names of other people supplied by respondents), the social network analysis database contains 312 unique names (183 female [59%] and 129 male [41%]).22 Of the 248 alters, 13 appear in the respondent data from the main survey (though they chose to skip the SNA component) so their demographic data could be read into the SNA database. For the remainder of named alters, Ministry, Branch and Title (reduced to executive, management and advisor/analyst) information was read into the SNA database using the British Columbia Government directory, and the alter’s gender was imputed using the rules set out in chapter 3 (with no genders remaining as “uncertain”).
83
21 Since not all egos identified five alters (though this was the maximum) the number of unique actors in the database is less than the maximum number of actors that can be identified using a five-alter name generator for N egos (i.e., 5N+N = 384 for N = 64 egos). Of course, the minimum number of actors , had respondents only supplied names of alters who were also egos, would be N (or 64 in this case).
22 Some alters were identified by more than one ego (shared alters). Of the 64 egos, 13 of these were named as alters by other egos. And not all egos identified five alters (though this was the maximum). This is to say that a five-alter name generator for N egos does not necessarily yield the maximum number of (5N+N) unique names (or 384 for N = 64 egos).
Table 6.2
Social Network Analysis Databaase Statistics
Category Actors Egos Alters Shared Alters*
All 312 64 259 35 Female 183 (59%) 40 (63%) 149 (58%) 15 (43%) Male 129 (41%) 24 (37%) 110 (43%) 20 (57%)By title Analyst 141 (45%) 57 (89%) 91 (35%) 11 (31%) Manager 129 (41%) 6 (9%) 127 (49%) 16 (46%) Executive 42 (14%) 1 (2%) 41 (16%) 8 (23%)
* The difference inp = 0.0877. The di3.703, p = 0.1570.
shared alters by geifference in shared a
ender is not statisticaalters by title is not s
ally significant: �2 (1statistically significan
1, n = 35) = 2.917, nt: �2 (2, n =35) =
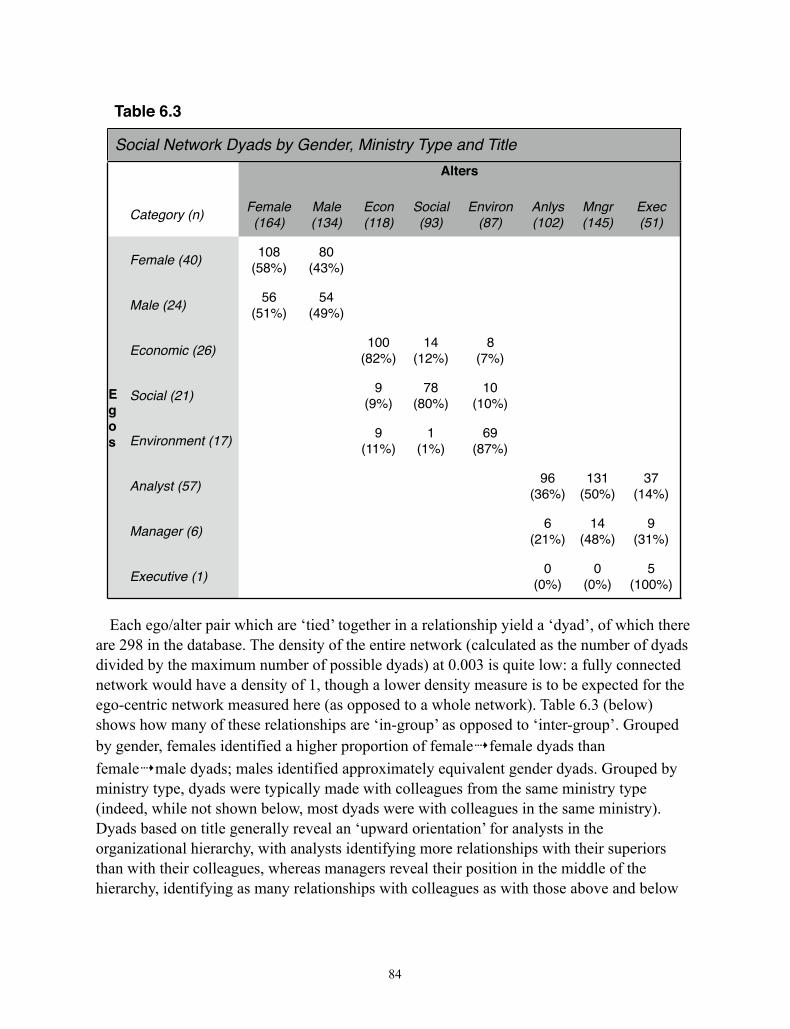
Each ego/alter pair which are ‘tied’ together in a relationship yield a ‘dyad’, of which there are 298 in the database. The density of the entire network (calculated as the number of dyads divided by the maximum number of possible dyads) at 0.003 is quite low: a fully connected network would have a density of 1, though a lower density measure is to be expected for the ego-centric network measured here (as opposed to a whole network). Table 6.3 (below) shows how many of these relationships are ‘in-group’ as opposed to ‘inter-group’. Grouped by gender, females identified a higher proportion of female�female dyads than female�male dyads; males identified approximately equivalent gender dyads. Grouped by ministry type, dyads were typically made with colleagues from the same ministry type (indeed, while not shown below, most dyads were with colleagues in the same ministry). Dyads based on title generally reveal an ‘upward orientation’ for analysts in the organizational hierarchy, with analysts identifying more relationships with their superiors than with their colleagues, whereas managers reveal their position in the middle of the hierarchy, identifying as many relationships with colleagues as with those above and below
84
TTable 6.3
SSocial Network Dy
Category (n)
yads by GGender, Ministrry Type aand TitleAltters
Female (164)
Male (134)
Econ(118)
Social (93)
Environ (87)
Anlys(102)
Mngr (145)
Exec (51)
Female (40)
Male (24)
Economic (26)
Eg
Social (21)gos Environment (17)
Analyst (57)
Manager (6)
Executive (1)
108 (58%)
80 (43%)
56 (51%)
54 (49%)
100 (82%)
14 (12%)
8(7%)
9 (9%)
78 (80%)
10 (10%)
9 (11%)
1 (1%)
69 (87%)
96 (36%)
131 (50%)
37 (14%)
6 (21%)
14 (48%)
9 (31%)
0 (0%)
0 (0%)
5 (100%)
them (n.b., only one executive completed the survey, but that respondent only identified other executives as alters).
To generate a social network cluster map from the data, a one-way link is added between each ego and alter, with the arrow-head pointing towards the alter (see figures 6.1a - 6.1c, below). The three graphs shown below are visual representations of the data presented in table 6.3 above. In the cluster maps, the colour and type of the links, and the colour and shape of the actor nodes, represent additional data. Females are represented in purple with males in orange, and shapes are used to distinguish analysts / advisors (circles), managers (triangles) and executives (squares).
Respondents were asked to rank their list of alters in terms of friendship, influence on their thinking and value they derive from interactions with that person, with the sum of those three rankings23 represented by the colour and type of link (referred to as the ‘edge’): for total scores of 5 or less the edge is solid grey; for total scores between 6 and 10, the edge is dotted black; and for total scores greater than 10, the edge is solid black. Note that for the two reciprocated dyads in this database, the link is bi-directional and shown in red.
In addition to asking respondents to name up to five policy analysis alters, respondents were asked to identify the means they use to communicate with those alters, even those means used infrequently. Six respondents chose not to answer the communication mechanism questions for 23 alters. But for those who did (on 275 dyads), face-to-face and email were near-universal means (95% and 98%, respectively) with 75% citing the telephone as a communication technology. Microsoft Communicator was used in 43% of dyads, 23% used Microsoft Sharepoint (though whether the enhanced collaborative functions available within SharePoint were widely enabled is unclear) and tele-presence / video-conferencing was cited in 14% of relationships.24 SMS (or text messaging) was noted in 5% of relationships, Facebook and its comparators in 4% and Twitter and its comparators in 2%. One additional technology volunteered by respondents through an ‘other’ text box was Zzeem (3 dyads) a document collaboration platform used primarily by the British Columbia Ministry of Justice and Attorney General.
To understand the organizational social network and its members, the location of actors is evaluated using their importance or ‘centrality’ - measured in three ways: degree centrality, betweenness centrality and closeness centrality - to indicate who influences and bridges amongst others, who are at the core of the network and who is on the periphery. Degree centrality measures the number of direct connections a node has, separated into out-degree centrality (the number of ties that an ego directs to alters) and in-degree centrality (the number of ties directed to the alter). The more direct connections an actor has in a network,
85
23 Taking the total of the three rankings is justified as the three measures have high internal reliability (Cronbach’s � for the three measures is 0.775).
24 Two respondents mentioned Microsoft Office Groove through an optional ‘other’ text box. With the release of Microsoft Sharepoint 2010, Groove has formally become one of the collaboration features available within the SharePoint environment, thus these responses are included under the SharePoint category. Microsoft Office Live Meeting was noted in one dyad through the ‘other’ text box. Live Meeting is a web-based a teleconference system and is therefore included with the tele-presence / video-conferencing responses.
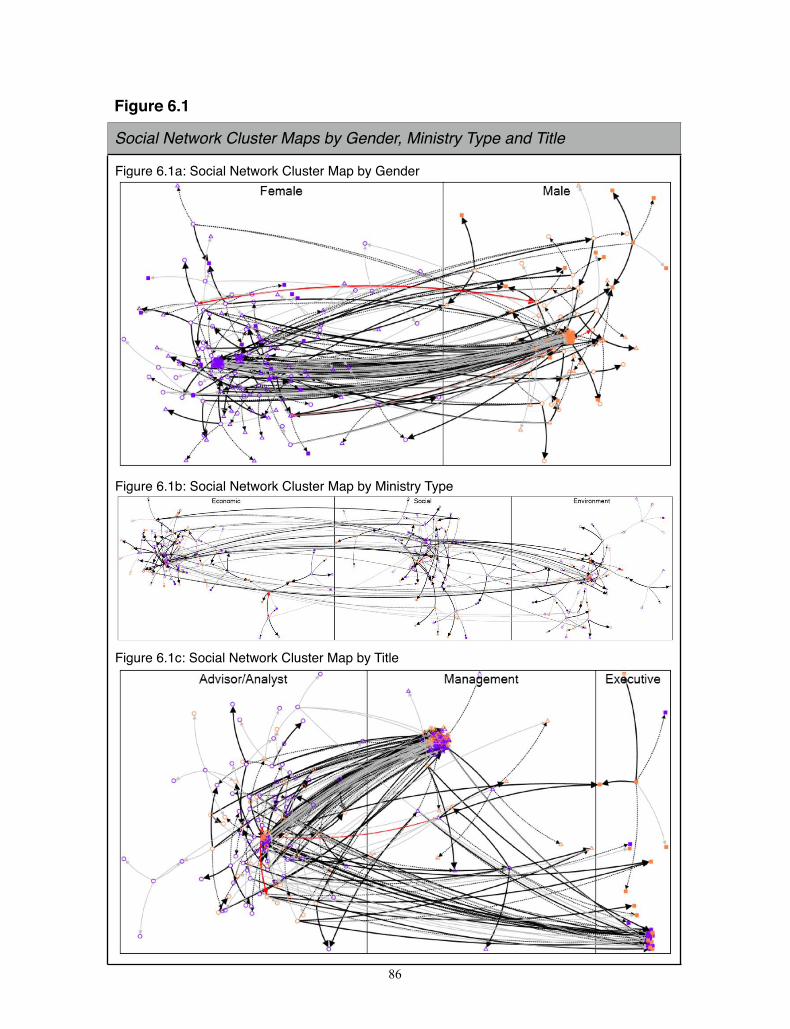
86
Figure 6.1
Social Network Cluster Maps by Gender, Ministry Type and Title
Figure 6.1a: Social Network Cluster Map by Gender
Figure 6.1b: Social Network Cluster Map by Ministry Type
Figure 6.1c: Social Network Cluster Map by Title
the more central that actor is as a ‘connector’ - though the value of those connections depends on and affects other measures of that actor’s centrality. High betweenness centrality identifies brokers in the network who occupy a position between important actors or areas. This position of power can be good for the actor, but potentially bad for a network as they can represent a single point of failure. Closeness centrality measures how quickly an actor can access all other actors in a network i.e., the path with the fewest steps using direct and indirect ties (Freeman, 1977).
In-degree centrality ranges from 0 to 3, with 54 egos not having been named as alters, 222 alters being named once, 30 being named twice and 5 being named by three egos each. Out-degree centrality only pertains to respondents to the survey and whether they nominated fewer than 5 alters; it is not reported here. Betweenness centrality ranges from zero (with 223 of the actors having a zero betweenness score) to 1462 (M = 54.5, SD = 189.66), and closeness centrality ranged from 0.003 to 0.5 (M = 0.062, SD = 0.071). The clustering coefficient, which when measured for actors gives an indication of the embeddedness of an actor, was zero for 287 of 311 actors; for the remainder, it ranged from 0.024 to 1 (M = 0.018, SD = 0.093).
Looking at egos in isolation, their mean betweenness score is higher (M = 201.06, SD = 324.54) which should be unsurprising, reflecting the fact that the network centres on them as survey respondents. The mean betweenness scores for the actors in the social ministries are significantly lower than the mean betweenness scores for actors in both the economic ministries and the environment ministries (F = 12.040, p < 0.001)). Betweenness scores are positively correlated with ministry type (r = .224, p < 0.001), with the social ministries labelled 1, the environment ministries labelled 2 and the economic ministries labelled 3. This results is largely, though not entirely, explained by a large group of Ministry of Health actors (n = 45) having a low mean score for betweenness (M = 56.68) compared to betweenness scores in the economic and environment ministries. The closeness score for egos only was slightly higher than for all actors (M = 0.0795, SD = 0.094) - a result, again related to their role as survey respondents - though none of the grouping variables helps to explain closeness. Closeness scores were notably higher in the Ministry of Labour, Citizen Services and Open Government, and Ministry of Transportation compared to all other ministries. Eigenvector centrality (a particular measure of closeness centrality) is positively correlated with ministry type (r = .198, p < 0.001) (again, the categorical order of the ministry types is social, environment, and economic), largely influenced by high scores in the Ministry of Finance, Ministry of Justice and Attorney General, and Ministry of Energy and Mines: the social ministry eigenvector scores are significantly lower than the eigenvector scores for both the economic ministries and the environment ministries (F = 8.003, p < 0.001).
Looking at alters in isolation, there were no difference based on gender nor based on title (as with viewing egos in isolation). There were significant differences in betweenness and Eigenvector centrality, with scores in the social ministries lower than both the economic and environment ministries (F = 5.183, p < 0.01 for betweenness centrality; F = 5.585, p < 0.01 for Eigenvector centrality). These results appear to be more related to relative high scores in the economic (e.g., Ministry of Finance) and environment (Ministry of Energy and Mines)
87
ministries than to any particular deficiency in the social ministries - though, again, a large group of Ministry of Health alters with lower scores on betweenness and Eigenvector centrality does not help.
Lastly, looking at all dyads and the combined ranking based on friendship, influence on their thinking and value, where both the ego and the alter were both female, the mean combined score is lower than where both were male (M = 7.31 for both female, M = 8.96 for both male; F = 5.214, p< 0.05). This result appears to be mostly affected by the responses based on ‘influence on thinking’. For all dyads and combined rankings, the mean score is significantly higher where both the alter and the ego are from the same ministry (M = 6.47 for different ministries, M = 8.18 for same ministries; F = 9.405, p< 0.01). Mean ranking scores are higher when the dyad does not use the telephone (M = 9.10 for no telephone, M = 7.95 for yes telephone; F = 3.971, p< 0.05). Because of the small numbers of dyads that use Facebook, Twitter and SMS / text, these are not reported (though in each case, the presence of those technologies is strongly associated with higher mean scores for the combined rankings).
6.4.2 Qualitative ApproachAfter the concept of an organizational social network was described, interview respondents
were asked whether their workplace social network was more strongly weighted towards their policy unit or was more dispersed, context-specific and something that they have built - either consciously or not - over time. All respondents noted that linking to knowledge sources and finding collaboration opportunities often required reaching out beyond the confines of the policy unit. The degree to which a respondent’s organizational social network was highly independent of their immediate policy unit was generally a function of the respondent’s length of service in the British Columbia Government, with a longer term of service related to a broader, more dispersed social network throughout government, and younger respondents noting more the importance of their policy unit structure, immediate supervisors and divisional colleagues (Valentine, Staats & Edmondson, 2012):
When you start, you’re connected to people or introduced to other people who you are working with. And then, over time, you learn that if you need the answer to a question about subject X, I go to so-and-so. And I’ll also have people from other program areas who will contact me about something - and I, in turn, will know to contact them.
Two respondents explicitly noted that while organizational structures in government (e.g., ministries, divisions and branches) were necessary for the coordination of work, many policy issues do not conform to those structures, thus the need to reach outside of the policy unit to solve issues. Also, with continued diminishing numbers of analysts in policy units over time, policy analysts have to reach outside of the policy unit by necessity in order to tap additional capacity:
88
Policy shops are generally getting smaller and smaller so sometimes you have to go outside of the policy shop to find answers that you need, to help you in your analysis.
While the question was oriented towards the respondent’s social network within the British Columbia Government, e.g.,
Yeah, it’s all about building networks. I mean, you work in government long enough, and even though we’re what 40,000 strong roughly in BC, I think, it’s actually a small group that’s in the policy world, and you learn to find the people that you need to talk to that can help narrow your direction. So you have a couple of contacts in a different ministry.
four respondents noted how intergovernmental networks of similar policy units were valuable for providing insights and connections to related work on issues such as regulation of commerce, development of industry support initiatives and managing relationships with other orders of government:
So essentially, I’ll pick up the phone and call a person in Ottawa ... and say “I need some help with this.” And he’ll say “well, you should call so-and-so”, or “by the way, there’s a paper that was done 5 years ago.” … So it’s very important to work the network and draw upon the interpersonal relationships rather than the formal relationships.
It was clear that the respondents’ organizational social networks were developed over years of practice and are highly valued by the policy analyst as a resource for knowledge and problem solving. It was also stressed that there was a need to continually cultivate that network by frequently checking in and offering value to contacts who will hopefully respond in kind when needed. One respondent noted that their social network was based on colleagues who demonstrated shared values and have demonstrated trust over time.
I don’t go to the people who are most senior; I go to the people who have displayed values that are in line with my values and generally tend to work cooperatively with the policy shop on issues.
The method for connecting across the network was seen as depending on the nature of the relationship with the alter: the telephone is more acceptable than email if the relationship is based on friendship more than strictly professional association.
All respondents but one related a positive example of knowledge seeking behaviour and only two respondents failed to relate a positive example of knowledge sharing behaviour. Two mechanisms emerge as particularly important: the government directory at <http://dir.gov.bc.ca>, and the use of social networks for navigating different parts of government.
I’ll look at the directory, which is really useful - it’s a great tool because it will show you how divisions are structured, and you can use the ministry websites to
89
see how their departments are structured and you can figure out which branch is responsible for something; that’s really helpful.
I began searching for help, and [asking] people who might know people who might know something about this. And I did that just through phone calls to people I knew already and eventually I fortunately found somebody who happens to be an expert in this specific subject area.
6.5 DiscussionGiven the nature of the egocentric (as opposed to whole) network surveyed through the
web-based sociometric questionnaire, we are not in a position to draw conclusions about the British Columbia Government as a whole, nor about the community of policy analysts within it. We can, however, draw insights into the characteristics of the ‘policy analysts’ that did respond and, from there, draw inferences about the characteristics of the British Columbia Government policy analyst social network.
As shown above in table 6.3 (and the related visual social networks in figure 6.1a - 6.1c), women respondents were more likely to identify other women as alters, whereas men were equally likely to identify colleagues of both genders. When looked at by ministry type - indeed, by ministry - most egos identified alters from their own ministry, an unsurprising outcome as respondents were asked to “name up to five colleagues … that [they] regularly work with on policy related issues.” When assessed based on job classification, policy analysts identified more relationships with their superiors than with their colleagues, whereas managers identified as many relationships with colleagues as with those above and below them. Looking at the actors grouped by ministry type, the betweenness and eigenvector (closeness) scores for actors in the social ministries are significantly lower than those scores in both the economic ministries and the environment ministries (though these are largely related to skewed scores from particular over-represented ministries like the Ministry of Health). Finally, when considering the combined ranking based on friendship, influence on their thinking and value from interactions, where both actors are female the mean combined score is lower than where both are male (based largely on lower female�female ‘influence on thinking’ rankings), and scores are significantly higher where both the alter and the ego are from the same ministry, and where the dyad does not use the telephone to communicate.
From the interview data, while respondents were dedicated to serving the public interest and all exhibited a professional commitment to policy analysis, they did not approach collaboration and knowledge sharing as a matter of principle but rather as a practical consideration. If they were lacking knowledge to address a particular issue, the primary route taken to locate knowledge sources would involve making use of their social network to connect to others who might be able to help them; almost all respondents could provide examples of having used such networks to successful effect. All respondents were able to easily identify organizational social networks that extended beyond their own unit or division, though these networks were more broadly spread across the entire organization the longer was the tenure of the respondent. Respondents noted that the use of first-order social
90
networks was effective in linking to second- and third-order knowledge sources, and that this was often the most efficient route to new knowledge acquisition (much more so than, for example, Internet or Intranet searches). The noted efficiency of the use of social networks over technology network tools supports the prevailing perspective in the literature (e.g., Valentine, Staat & Edmondson; Wang & Noe, 2010), that knowledge sharing cannot be achieved only or even principally through the adoption of a computer-supported knowledge management system, but rather requires a positive attitude towards organization-wide knowledge sharing on the part of individual agents, coupled with the incentives to do so. For the most part, the use of extra-policy unit social networks was facilitated by the use of the telephone and relied on what would be considered personal contacts forged through prior interactions, and explored using tacit knowledge, rather than a process or structure inherent in the organization. References to the telephone as a principal communication device were striking given that - in most other examples given by respondents - the telephone was considered to be a declining technology, largely supplanted by email.
If respondents held knowledge that they believed would be of benefit to others across the government, they would be unlikely to go very far out of their way to make that knowledge available to others, if only because it would be difficult to know who might need that knowledge, and difficult to know what would be considered by the recipient as unimportant. As Perri 6 has noted (6, 2007), in a world of massive data, the challenge of modern governance is not facilitating the flow of more information, but rather developing mechanisms to more intelligently ignore information that does not serve to reduce uncertainty. This task is largely beyond the capacity of current technology-based information management (or even knowledge management) systems, which simply serve to increase the volume of information available; instead, by being cautious about further burdening their colleagues with what might be unneeded information, policy analysts are performing this function (albeit imperfectly) as information filters and gatekeepers.
Organizational social networks as a mechanism to enhance cross-ministry collaboration and knowledge sharing were found to be strongly related to the respondent’s length of service, breadth of exposure to alters in other ministries and to their predisposition to see such social network interaction as key to policy formulation (Valentine, Staats & Edmondson, 2012). Respondents were easily able to identify the benefits of cross-government social networks that were able to bridge between established sub-cultures in order to access knowledge sources. Fewer examples of collaboration opportunities arising out of social network connections were evident, tending to follow from formal linkages and policy problems that were inherently inter-ministerial.
91

92
Chapter 7 - Technology and the Policy Analyst7.1 Summary
PurposeThis research is aimed at describing the use of new information and communications
technologies (ICTs) for facilitating policy analysis and formulation from the perspective of individual policy analysts situated throughout the Government of British Columbia.
MethodsThe research employs mixed methods:
Quantitative Approach: British Columbia Government public servants with titles similar to ‘policy analyst’ (n = 129) completed a web-based questionnaire. Responses regarding the policy analysts’ ‘technology era’, and their perspectives on the impact of technology on the policy formulation process, are analyzed.
Qualitative Approach: semi-structured interviews with practicing policy analysts (n = 14), as members of five separate corporate policy units in the Government of British Columbia, were conducted, transcribed and analyzed.
FindingsA majority of respondents (62%) self-identified with the ‘web-enabled’ policy analysis
technology era, with responses across all eras confirming that the addition of new technologies is generally seen as having had a positive impact on the policy formulation system. There was very little evidence found of the use of Web 2.0-type collaborative technology for collaboration and knowledge sharing, though there were frequent references to email and to the file-sharing capacity of SharePoint, indicating preliminary movement towards a technology-supported approach to policy formulation.
Research LimitationsThe results are limited to the British Columbia Government context and are strongly
influenced by the nature of semi-structured interviews and qualitative methods, and by the self-selection bias of policy analysts who chose to participate.
Practical ImplicationsThe intention of this research is to provide support for organizational leaders considering
the application of current and foreseeable technological developments in support of knowledge sharing and collaboration. Reiterating previous findings from the research literature, this research demonstrates that attempts to impose knowledge management technology solutions from above may face significant barriers if the organizational culture does not support open knowledge sharing and collaboration.
Originality / ValueThis study investigates the perceptions of practicing policy analysts as to the impact and
effectiveness of ICTs on the policy formulation process.
KeywordsPolicy analysts, collaborative technology, Web 2.0, Gov 2.0
93
7.2 Background and ObjectivesA large part of the extensive e-government literature focusses on the potential for new
information and communications technologies to transform the operations of government, and facilitate collaboration and knowledge sharing amongst knowledge workers across organizational boundaries. A sub-component of the general e-government paradigm deals with the implications of the social Internet - Web 2.0 - for the future of public administration. Web 2.0 represents an important concept that has emerged in recent years in both the practice of public sector governance (Eggers, 2005) and as a technological and cultural phenomenon in its own right (Gøtze & Pedersen, 2009). When Web 2.0 technologies and work modes are applied to public administration, public policy development and governance processes, it has typically been referred to as Gov 2.0 - an issue of growing interest and a research area with multiple facets (Osimo, 2008).
Gov 2.0 is largely focused on the use of the Internet as a democratic enabling mechanism and citizen engagement platform (Chadwick, 2009). The impact of Web 2.0 on e-service delivery is also an issue of emerging focus (Dutil et al., 2010) and the contribution of social media tools to internal administrative function has begun to receive some attention (e.g., Martin, Reddington & Kneafsey, 2009). These uses are certainly important features of Gov 2.0. However, the focus of this present chapter is on internal–to–government policy formulation activities and how the adoption of Web 2.0 tools is affecting this environment, especially with respect to internal knowledge sharing and collaboration amongst public service knowledge workers.
The emergence of Web 2.0 tools and approaches has raised the possibility that we have entered a new knowledge management era - Enterprise 2.0 (Cook, 2008; McAfee, 2006) - that can address the horizontality problem (Tapscott & Williams, 2006), facilitate the sharing of knowledge across government (Mergel, 2011) and transform governance (Mergel, Schweik & Fountain, 2010). This research explores how the dawn of the Gov 2.0 era foreshadows a new approach to policy analysis, one takes advantage of the capacities of the social web to tap into both external and internal knowledge sources as a supplement to the traditional craft of the analyst (Meijera & Thaens, 2010).
While the Web 2.0-related opportunities and implications for information workers generally have been explored (e.g., McAfee, 2006), the implications for public policy analysts have received limited attention (Edwards & Hoefer, 2010; McNutt, 2008); it is this limited policy analysis oriented literature that this chapter seeks to supplement. Policy analysis and formulation is an important function in government, and the focus of much academic inquiry, and Gov 2.0 has the potential to fundamentally disrupt that environment. For leaders inside of government to prepare for the future of policy analysis, we must both understand the contemporary setting and anticipate as much as possible the implications of the social web for public administration and governance.
What role and impact does new technology have in the quest to remake the government as a knowledge organization? How can policy analysts share more knowledge without becoming responsible for adding to their colleagues’ information overload (Edmunds & Morris, 2000; Eppler & Mengis, 2004)? Is knowledge sharing simply a new term for a
94
computerized knowledge management system (KMS) or an electronic knowledge repository (EKR), in which we store information within an organization using better search functions and linked datasets (Dawes, Cresswell & Pardo, 2009)? Or is it something different, implying a person-centred system where tacit knowledge (i.e., practical knowledge and intuition, as opposed to explicit knowledge that is easily codified, stored and transmitted to others) is self-organized and shared amongst knowledge workers (Ackerman, Pipek & Wulf, 2003; Collins, 2010)? This chapter provides a contextual understanding of the policy formulation process and an assessment of the potential impact of new Gov 2.0 approaches and technologies on the policy formulation environment, based on the perspectives of practicing policy analysts and data gathered through mixed-method, quantitative / qualitative, empirical fieldwork, in order to provide guidance for future implementation of Gov 2.0 in internal public sector policy formulation processes.
7.3 MethodsFor the quantitative approach, 129 government policy analysts were surveyed using an
online browser-based questionnaire that asked respondents for their views on the impacts and importance of technology use in the policy process, with respondents first distinguishing their particular ‘era’ with respect to technology use in support of policy analysis. The research conducted under the qualitative approach is based on semi-structured interviews with fourteen practicing policy analysts as members of five separate corporate policy units in the British Columbia Government. The interviews were transcribed verbatim and, taking a deductive approach based on an a priori list of codes (Miles & Huberman, 1994), were analyzed with the assistance of a computerized qualitative data analysis software program (NVivo 9). The interview guide questions pertaining to technology sought the the respondent’s perspectives on the use of technology in the policy process.
7.4 Results7.4.1 Quantitative Approach
Respondents first self-identified with different ‘technology eras’ based on the technology in place during the respondents’ earliest exposure to policy work (see table 7.1, below), then evaluated several statements designed to gauge their view as to how succeeding technology advances have affected the policy process over time (see table 7.2, below).
Respondents first selected the particular ‘technology era’ they identified with, which showed that just 4 respondents (3%) had experience with the pre-desktop computer era (Era A), and 15% had experience in the pre-web era (Era B). Sixty-two percent (n = 80) of respondents identified with the web-enabled policy world (Era C), with 20% (n = 26) of respondents claiming significant experience with the extensive use of Web 2.0 technologies in policy formulation (Era D) (or, alternatively, for all Web era respondents - eras C + D - 80 respondents felt they had limited exposure to Web 2.0). Identification with each technology era generally reflects the age profile of the respondents (r = 0.524, p < .01) with the age profile of each group decreasing for each successive technology jump (i.e., older respondents had greater exposure to pre-desktop and pre-web eras than did younger respondents). There
95
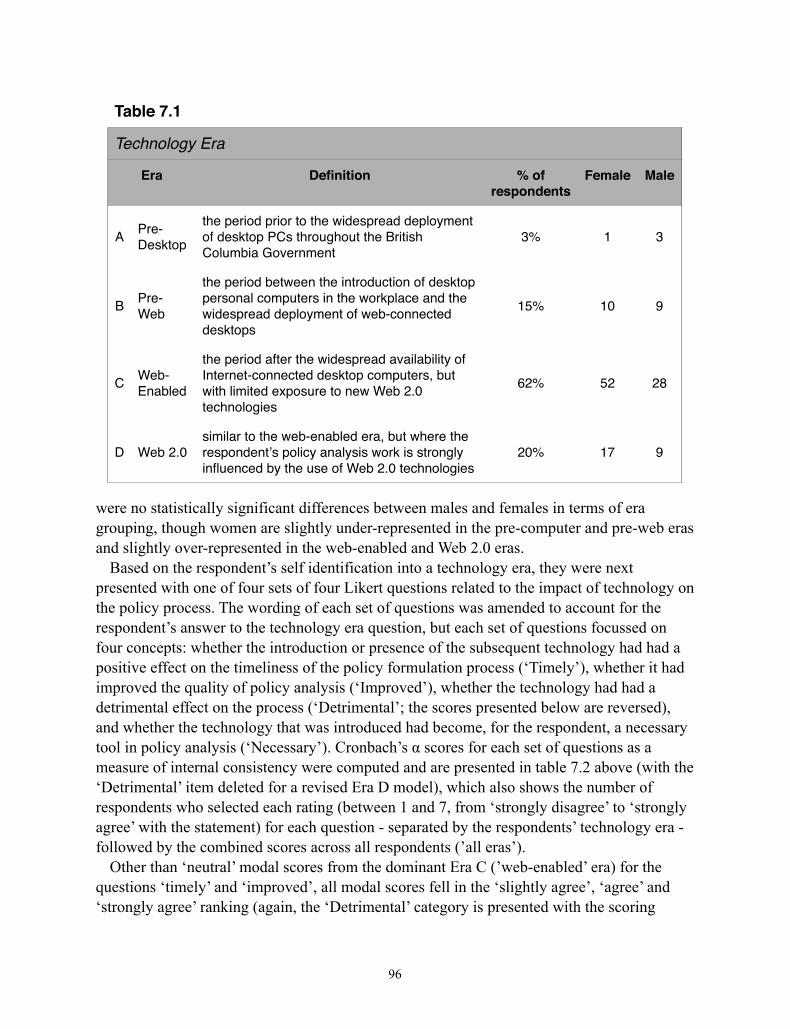
were no statistically significant differences between males and females in terms of era grouping, though women are slightly under-represented in the pre-computer and pre-web eras and slightly over-represented in the web-enabled and Web 2.0 eras.
Based on the respondent’s self identification into a technology era, they were next presented with one of four sets of four Likert questions related to the impact of technology on the policy process. The wording of each set of questions was amended to account for the respondent’s answer to the technology era question, but each set of questions focussed on four concepts: whether the introduction or presence of the subsequent technology had had a positive effect on the timeliness of the policy formulation process (‘Timely’), whether it had improved the quality of policy analysis (‘Improved’), whether the technology had had a detrimental effect on the process (‘Detrimental’; the scores presented below are reversed), and whether the technology that was introduced had become, for the respondent, a necessary tool in policy analysis (‘Necessary’). Cronbach’s � scores for each set of questions as a measure of internal consistency were computed and are presented in table 7.2 above (with the ‘Detrimental’ item deleted for a revised Era D model), which also shows the number of respondents who selected each rating (between 1 and 7, from ‘strongly disagree’ to ‘strongly agree’ with the statement) for each question - separated by the respondents’ technology era - followed by the combined scores across all respondents (’all eras’).
Other than ‘neutral’ modal scores from the dominant Era C (’web-enabled’ era) for the questions ‘timely’ and ‘improved’, all modal scores fell in the ‘slightly agree’, ‘agree’ and ‘strongly agree’ ranking (again, the ‘Detrimental’ category is presented with the scoring
96
Taable 7.1
Teechnologyy Era
Era Definition % of respondents
Female Male
A Pre-Desktop
the period prior to the widespread deployment of desktop PCs throughout the British Columbia Government
3% 1 3
B Pre-Web
the period between the introduction of desktop personal computers in the workplace and the widespread deployment of web-connected desktops
15% 10 9
C Web-Enabled
the period after the widespread availability of Internet-connected desktop computers, but with limited exposure to new Web 2.0 technologies
62% 52 28
D Web 2.0similar to the web-enabled era, but where the respondent�s policy analysis work is strongly influenced by the use of Web 2.0 technologies
20% 17 9
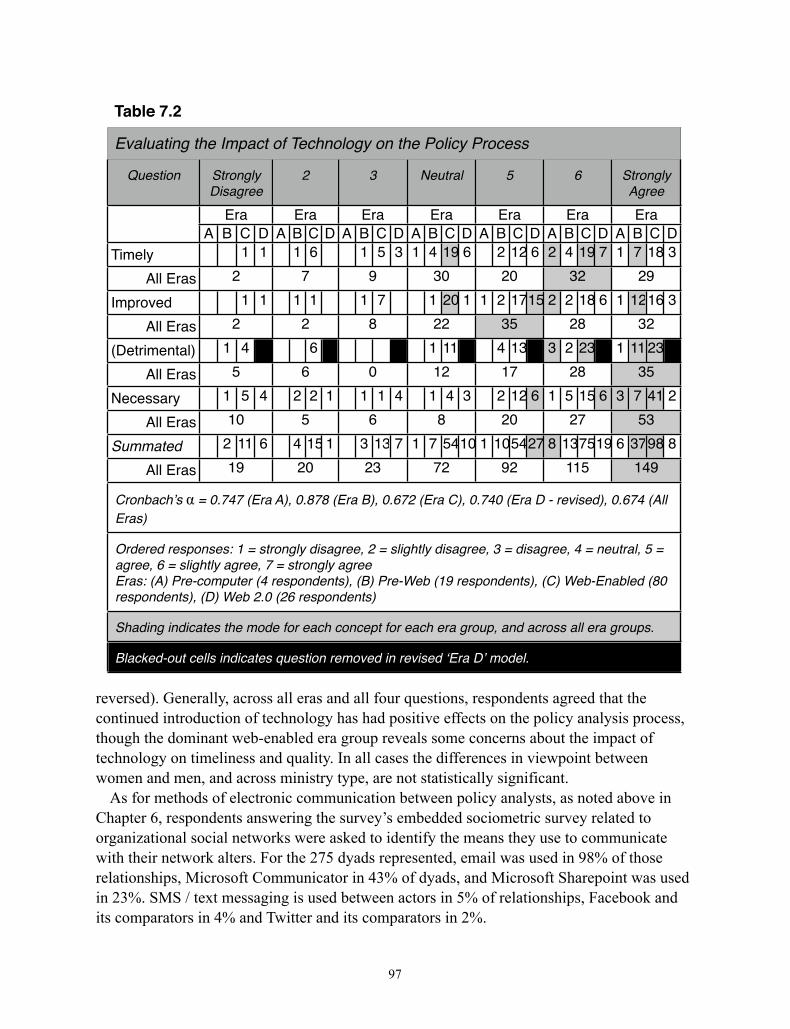
reversed). Generally, across all eras and all four questions, respondents agreed that the continued introduction of technology has had positive effects on the policy analysis process, though the dominant web-enabled era group reveals some concerns about the impact of technology on timeliness and quality. In all cases the differences in viewpoint between women and men, and across ministry type, are not statistically significant.
As for methods of electronic communication between policy analysts, as noted above in Chapter 6, respondents answering the survey’s embedded sociometric survey related to organizational social networks were asked to identify the means they use to communicate with their network alters. For the 275 dyads represented, email was used in 98% of those relationships, Microsoft Communicator in 43% of dyads, and Microsoft Sharepoint was used in 23%. SMS / text messaging is used between actors in 5% of relationships, Facebook and its comparators in 4% and Twitter and its comparators in 2%.
97
Table 7.2
Evaluating th he Immpaact of Teechhnoologgy onn thhe Pooliccy P Prooceesss
Question SDStroDisa
onglyagre
ly ee
22 33 NNeuutraal 55 66 SA
StroAgr
onglree
ly e
Erra Erra Erra Erra Erra Erra ErraA B C D A B C D A B C D A B C D A B C D A B C D A B C D
Timely 1 1 1 6 1 5 3 1 4 19 6 2 12 6 2 4 19 7 1 7 18 3
All Eras 22 77 99 30 20 32 29
Improved 1 1 1 1 1 7 1 20 1 1 2 1715 2 2 18 6 1 1216 3
All Eras 22 22 88 22 35 28 32
(Detrimental) 1 4 6 1 11 4 13 3 2 23 1 11 23
All Eras 55 66 00 12 17 28 35
Necessary 1 5 4 2 2 1 1 1 4 1 4 3 2 12 6 1 5 15 6 3 7 41 2
All Eras 10 55 66 88 20 27 53
Summated 0 2 11 6 0 4 15 1 0 3 13 7 1 7 5410 1 105427 8 137519 6 3798 8
All Eras 19 20 23 72 92 1115 1449
Cronbach�s � =Eras)
= 0.747 (EEra A),, 0..8778 (E(Eraa B)), 0.6772 (E(Eraa C)), 00.7440 ((Eraa DD - rreviisedd), 0.6674 (Alll
Ordered respoagree, 6 = sligEras: (A) Pre-crespondents),
onsehtlycom (D)
es: y agmpu) We
1 =greeuter
Web 2
= stre, 7 (4 r 2.0
rong7 = s res (26
gly strospon6 re
y disongndeesp
saggly entpon
gree agrts), nden
e, 2ree (B)nts)
2 =
) Pr)
slig
re-W
ghtly
Web
ly d
b (1
disa
19 r
agre
resp
ee,
pon
3 =
nde
= dis
ents
isag
s), (
gree
(C)
e, 4
We
4 =
Web-
ne
-En
utra
abl
al, 5
led
5 =
(80
=
0
Shading indicaatess thee mmodede foor eeacch cconnceppt fofor eeacch eera grooupp, annd acrrosss all era g grooupss.
Blacked-out ceells inddicates quuestionn reemooveed inn reevissedd �ErEra DD� mmoddel..
7.4.2 Qualitative ApproachFor the qualitative approach to this issue, the role that emerging ICTs might play in the
policy formulation process, and in supporting knowledge sharing and collaboration as the foundation of horizontal policy solutions, was explored through the semi-structured interviews. While there is much enthusiasm for a Gov 2.0 transformation of governance in the wider literature (e.g., O’Reilly, 2010) and amongst government leaders (e.g., British Columbia, 2010), little evidence of such a transformation was revealed in the interview data. Nonetheless, recent changes in the policy analysts’ technology landscape do point towards the flexibility of that environment should future technology innovations prove to be of demonstrated benefit.
The interview protocol addressed the subject of technology in support of workplace communication, collaboration and knowledge sharing principally by asking respondents for their reaction to a hypothetical scenario: their Deputy Minister had made a decision that the Ministry was suffering from too many emails, and that she was determined to replace the internal email system with a ‘Facebook-like’25 platform. The concept for this question was not entirely fictitious, but was derived from recent moves in a small number of firms to do just that: replacing the reliance on internal email systems with an alternative communication platform.26 In the scenario presented to respondents, this platform was described as a secure internal network limited to British Columbia Government employees, each identified by their true-identity profile (i.e., real names and likenesses), where communications could happen in a number of different, integrated streams: on their ‘wall’ would be the open conversations that anyone in the organization could see and anyone could contribute to; instant messaging would allow for minor interactions and include a presence indicator; normal messaging - which would essentially be email, but integrated into the overall corporate communications platform - would be accommodated; and cloud file-sharing would allow for document sharing and collaboration. While email would still be available for communication with external parties, public servants were expected to principally use the new platform for
98
25 One note of interest is the reaction that some respondents had to the notion of a workplace ‘Facebook-like’ platform, particularly with my use of the shorthand ‘Facebook’ to describe a corporate social networking platform concept. Once we got past the sometimes visceral reaction to Facebook as a time-waster and toy for teenagers (a reaction that did not appear to follow any gender or age stereotypes), we could focus on the concept of a tool having similar features. Perhaps other examples (e.g., Jive, Alfresco, Salesforce Chatter, Socialtext, etc.) might have avoided diverting attention away from the substance of the question, albeit serving as a less-efficient shorthand for the concept. This response is part of a general reflection on the power of language to affect research results, especially where a respondent’s answer may be strongly influenced by the language used in the question (see also chapter 5 for a discussion of the impact of naming and defining the policy analyst archetypes on respondents’ evaluation and ranking of those types.
26 In early 2011, the CEO of the leading European IT firm Atos Origin declared the use of email for intra-firm communication to be ‘unsustainable’, and announced plans to phase-in a ban on internal emails over a three year period. While email would still be used for external communication, internal email would be replaced by collaboration and social media tools (Thompson, 2011). While email filtering (both manual and automated) are necessary advances, one prediction is that by 2014, social networking services will replace email as the principal method of interpersonal communications for 20 per cent of business users. (Nairn, 2011).
internal communication. In addition to their reaction to this scenario, respondents’ references to the impact of technology on the policy formulation process emerged in the context of their comments on other aspects of the interview guide.
Some Enthusiasm for New Technology as Potential Enabler of CollaborationStrong support for a more robust approach to the use of collaboration technology in
support of horizontal policy formulation was voiced by three respondents, each of whom were younger, male and classified as staff. One respondent was strongly supportive of more open sharing and wider access to information (subject to appropriate confidentiality controls and security) and saw open platforms as one mechanism to provide tools to help manage the flood of information and respond to requests for information from throughout the organization. Three respondents from the same Ministry independently noted that they frequently receive similar internal requests for information that could be short-circuited if the requester had access to a prior response they had written:
I find emailing very frustrating in many ways. People are writing stuff all the time and it just disappears out there never to be seen again.
One respondent focussed on the use of social media - principally blogs, RSS feeds, Twitter (e.g., following journalists who cover issues of relevance) and Facebook (to understand issue group perspectives) - as useful for understanding how a particular policy issue is being talked about in civil society.27 Some support for the expanded use of collaboration technologies was articulated by two managers from separate ministries, subject to its use in appropriate circumstances and with targeted purpose - e.g., exploring new policy areas. Specific examples mentioned by one respondent were the government’s @Work and Spark sites, while another management respondent noted that their ministry currently has collaborative technology features that allow staff from across the province to interact through chat rooms that allow for collaborative problem solving and knowledge transfer.
The evolution in the use of computer technology in support of policy analysis was noted by four respondents, with universal access to a common email platform (promoting increased cross-government interaction) and desktop access to the Internet being the principal changes of note:
What did happen in my time was the debate over … what value the Internet was to policy people. So we’ve gone from that, to now where everybody in government has access to the Internet.
99
27 When the respondent was asked, this reference did not extend to the concept of social listening (e.g., Slobin & Cherkasky, 2010; Stavrakantonakis et al., 2012), i.e., the employing of sentiment analysis to social network data as a policy analysis tool (Till et al., 2012).
However, Email is an Indispensable Technology for the Policy AnalystMost responses to the impact of technology on the policy formulation process focussed on
the indispensability of email as a communication and information sharing tool that increased consistency, improved accuracy and ultimately made policy people more productive:
A great deal of the policy record now happens through email… To be able to coordinate all of the people that need to have input into that in the formulation of what potentially is new policy or a new mandate, email is just a brilliant tool to be able to connect simultaneously with that many people…
[Email] also contributes to the consistency in a sense that, if this person has submitted a query ... the next time you have a similar query, it’s done: email, cut-and-paste, here’s your answer.
Two respondents noted that they preferred requests for information to come via email as it allowed them to see a request from someone and contemplate their response, which a direct conversation did not afford:
I prefer to use email because it allows me to see the issue right in front of me, and go over it and pick it apart. Whereas in a discussion, it’s harder to do that. And I find it easier to respond via email, for exactly those same reasons, because you can weigh, and mete out your response exactly as you intended. You can see what you’re saying which is different than just saying it without seeing it.
While one respondent criticized the use of email as a way for some bureaucrats to avoid talking to colleagues directly (see, e.g., Green, 2012; Valentine, Staats & Edmondson, 2012), email was generally seen as having the benefit of largely displacing the use of the telephone as the primary internal communication tool:
Most of the work would be by email. Not so much phone calls anymore. It’s different than it used to be. Twenty years ago it was very much, get on the phone and talk to people. So for the most part that’s the biggest chunk of my day, is just keeping up with emails.
One respondent particularly noted the benefit of email in building ‘a document of record’ at the same time the the issue was being addressed:
The nice thing about an e-mail is that it also serves as a document of record… We’ve had situations here where we’ve managed a process and we’ve seen that through to the end, but something along the way went askew. And the minister’s office would say ‘well what happened here, who said what to whom on what day, and how did this get to that person and not to me?’ So having a trail of e-mails can sometimes save your butt.
For policy formulation processes that move upward through the hierarchy, as a typical briefing assignment does, one respondent noted that the previous hardcopy approval process
100
(a common mechanism used throughout the British Columbia Government as recently as 2008) had been replaced by an email-based electronic approvals process. It was noted that this system works fairly well, saves paper and is faster than the previous system.
The concept of ‘banning email’ was anathema to some respondents: when considering the implications of the ‘Facebook-like platform’ preceded by a corporate decision to ‘ban internal emails’, one respondent felt this would be not only difficult to implement but also counter-productive, both in respect of constraining people from accomplishing their work and also in how the adaptive work-arounds that would be attempted (e.g., increased numbers of phone calls and meetings) would diminish the electronic record that is accumulated through emails.
Existing Tools: SharePoint and CommunicatorPerhaps one of the more surprising findings with respect to technology-themed responses
was the number of independent references to Microsoft SharePoint in response to the interview questions about collaboration technology, when SharePoint was never mentioned by me as the interviewer. The use of SharePoint in the British Columbia Government has indeed increased dramatically in the past five years, with very limited use around 2006 (from my own experience in trying to promote its use both as a public servant and as a consultant to government) to its identification in the interviews by nine of the fourteen respondents as a key collaboration tool, again independent of any prompting from me.
SharePoint was principally seen as a file server solution that allowed for controlled access to common files, and as an outward-dissemination mechanism that facilitated consultation with other parties. One respondent noted that the use of SharePoint as an alternative to using email as a document delivery mechanism followed a move by the government’s information management / technology (IM/IT) infrastructure support system to limit the size of email attachments, which indicates that an IT policy change can ‘nudge’ people in the direction of a wider, even-if-unintended, impact (Thaler & Sunstein, 2008). Internal use of SharePoint was seen as ‘effective’ by one respondent , while another respondent thought that better training in the use of SharePoint would further enhance its use. Some respondents did note the potential for using SharePoint for document co-authoring and more enhanced collaboration but no respondents offered examples of such use (i.e., all respondents that mentioned SharePoint agreed that SharePoint collaboration features in products like WorkSpace, Groove and OneNote were not currently operational in their work environment). While most respondents expressed enthusiasm for SharePoint as a coordinated file-sharing tool, there was some frustration evident where respondents perceived resistance to using SharePoint, especially from senior executives and older colleagues.
Two respondents also made independent reference to the rapid emergence in the British Columbia Government setting of Microsoft Communicator (also referred to as Messenger) as a useful tool within the bureaucracy, and one that was adopted by younger public servants spontaneously and without any apparent strategic intent on the part of the IM/IT infrastructure or the executive. In fact, the speculation was that executive were largely unaware that it existed, or what its features are:
101
I monitor it (i.e., Communicator) when I’m looking to talk to my ADM (Assistant Deputy Minister) and I don’t want to schedule a meeting. Most of them don’t know that they’re logged in on Communicator and I can see when they’re back in the office. And it’s been really really useful to me, grabbing 5 minutes.
The Limited Usefulness of New Technology in the Policy ProcessWhen considering the implications of a fully collaborative technology system (e.g., the
‘Facebook-like platform’ raised in the interview question), some respondents were cautious that such a tool be adopted only when there was a clear case for doing so, and even then would need to overcome organizational and cultural barriers to adoption and general concerns related to productivity and security:
It would be a kind of technical/cultural shift for us because we are not currently using that and I’m not aware of a lot of people who are savvy with that kind of technology to feel confident and adept at that. To take on right away? It would need to be a bit of a gradual thing. I think probably the more pressing concern for us would be the confidentiality issue, and the fact that everyone can look at it… And so, if the technology didn’t have a way of controlling access at different times, that would probably be an issue for us.
Some respondents were more sceptical still, questioning how new Web 2.0 technologies represented an improvement over existing systems:
In terms of policy, I don’t know if it would be useful because most of the policy analysis that we do requires revealed documents, talking to people, searches on the Internet, and I don’t know to what extent Web 2.0 gets you there… in terms of use of the technology, I find it difficult to think how Twitter and Facebook are going to supplant email and SharePoint and phone calls because you need a robust mechanism to go back and forth and have extensive and detailed communications.
On the general question of the capacity of the existing technology in government to support policy formulation, one respondent was particularly critical of the current state of knowledge management:
Not being able to access and find information and knowledge sources readily - that has been a considerable issue for us. While there’s no question that there’s an awful lot of knowledge that exists in the policy department, it’s fragmented, it’s compartmentalized… If you want to know where something is you have to go and ask the particular person that is in charge of that particular issue otherwise, good luck (laughing) navigating the drives to find it.
One of the principal reasons for advocating a slow adoption of technological change was the belief, articulated directly by four respondents, that there would be significant resistance
102
by the bureaucracy to fundamental changes in the supporting technology (Grudin, 1988). This resistance was characterized as fear of the new technology on the part of some colleagues, a preference for existing systems and technologies, the lack of a demonstrated case for more elaborate methods (particularly in small office settings), the movement by some public servants in the FoI-era to ‘not writing anything down’, and a lack of support from the executive during ‘a time and a culture of demotivation or lack of trust’. One example pointing to the challenge of adopting new technologies in the context of a large organization was:
if executive isn’t on board, if they are insisting that stuff gets emailed to them when you are trying to get everybody to start going to a particular [SharePoint] location to get the most recent, up-to-date copy, then you’ll find that … multiple versions of a document can float around in emails and on drives.
As for a ‘Facebook-like platform’, one respondent felt that the open nature of that platform would have the unintended consequence of constraining the ‘frank and fearless’ types of conversations that are necessary for resolving an issue while fully exposing the range of implications and perspectives. Perhaps surprisingly, given the myth of the millennial generation and their affinity for Web 2.0 (Ng, Schweitzer, and Lyons, 2010), two respondents - both millennials - were highly sceptical of the push for using social media as a means for increased knowledge sharing and collaboration in government. Both indicated that that scepticism was linked to general trends of declining trust and disengagement amongst public servants, and cynicism that organizational enthusiasm for Web 2.0 was anything more than the newest management fad. While these respondents spoke in favour of collaboration amongst public servants, they both noted that the new technology could potentially act as an inhibitor of the goal of robust interaction.
7.5 DiscussionThe technology era profile generally follows the respondents’ age distribution. For current
technology, segmentation into ‘web-enabled’ versus ‘Web 2.0’ may reflect the personal preference and interpretation of the term. Regardless of self-identified era, most respondents were supportive of the positive impact of technology on the policy process, though there were some concerns about technology’s contribution to policy analysis timeliness and quality.
Email has become an indispensable communication and information tool in the policy analysis environment. Email serves as a document of record, allowing for a thoughtful and full response to an inquiry, and providing a template for answering similar future inquiries. Email has also, in some respects, replaced the telephone as a technology for communication and information transfer. From several interviews, that observation that the telephone was rapidly declining as a preferred technology was partly ascribed to a prevailing feeling of being overwhelmed and time-limited (Chesley, 2010): email has become the preferred communication means as it was seen as less intrusive than a telephone call and allowed the receiver to respond when it was convenient for them (including during ‘off’ hours, perhaps
103
on a home computer or via their mobile device; see, e.g., Green, 2012). Whether this approach would have a long term negative effect on organizational cohesiveness as public servants forego the building of social networks through direct contact with colleagues, instead relying increasingly on technology networks, is unclear (Valentine, Staats & Edmondson, 2012).
The doubled-edged sword of the rise of email is being felt throughout all knowledge industries: organizations are drowning in email (Allen & Wilson, 2003; Stenmark, 1998), leading to dramatic decisions such as the dismantling of internal email systems in favour of collaborative platforms (Thompson, 2011). Generally, respondents acknowledged that there are emerging problems with email and would appreciate a way of addressing those problems. The principal problems identified were: being overwhelmed with too many unimportant emails; and related, that email was a way for other people to shift a burden from the sender to the receiver(s), i.e., an email containing a request is a low cost action on the part of the sender with a potentially high negative externality imposed on the receiver(s) (Grudin, 1988; Thompson, 2011).
The interview questions explored whether the features of email might be replaced and enhanced by a collaboration platform. Some respondents liked the idea that, if they had answered a question previously, that a ‘Facebook-like platform’ would allow them to avoid having to answer the same question again from someone else if a subsequent questioner could simply find the answer in an open forum. Web 2.0 tools that support intra-organizational knowledge sharing and collaboration have the added benefit of levelling the social capital playing field by making it easier for policy analysts to find knowledge sources and potential collaborators with whom they may not have prior contact (Wellman, 2001). In settings with low social capital - perhaps due to low levels of trust, or high rates of turnover (Putnam, 1993)- being able to locate knowledge sources amongst colleagues outside of one’s social network may be enhanced in an environment supported by a Web 2.0 infrastructure (Donath & boyd, 2004). A small number of respondents indicated that Web 2.0 technology could serve to circumvent the absence of a sharing ethic or strong organizational social network in that the technology could allow for the accessing of knowledge from someone the knowledge seeker does not consider part of their social network without requiring inter-personal contact. In some respects, references to the use of the government directory and shared drives indicate that this already happens. But we should remember that tacit knowledge is held and transferred between people, not computers (Snowden, 2002; Stacey, 2002), thus technology is only part of the solution (Kogut & Zander, 1992). So while new technology can help to facilitate a knowledge organization, an organizational culture of sharing and collaboration, where the incentives to share knowledge align with the rhetoric that promotes it, are crucial to becoming a knowledge organization (Connelly et al., 2012). Overlaying a technology solution to support knowledge sharing in the absence of attending to the people-part of the solution will likely run into barriers (Gudin, 1988). Alternatively, concerns about confidentiality and information control / accountability in the public sector were at the root of most of the opposition to ‘Facebook-like platforms’ from the interview respondents (Connelly et al., 2012).
104
The inefficiencies inherent is emailing uncoordinated versions of attached documents to multiple recipients appear to have been reduced slightly with the widespread uptake of SharePoint as a document coordination and sharing mechanism, a dramatic change - at least in the British Columbia Government setting - as compared to just five years ago. However, behind this enthusiasm appeared early signs of concern: some respondents spoke of belonging to multiple SharePoint sites and beginning to feel overwhelmed by the number of sites that they had to be aware of and monitor (although, new dashboard features available in current versions of SharePoint should alleviate this). There was also the hint of frustration as not all levels of the hierarchy had embraced SharePoint, with some senior executive and older hold-outs appearing to cause difficulties for their subordinates and younger colleagues.
105

106
Chapter 8 - Knowledge Sharing, Collaboration and the Policy Analyst (I)
8.1 SummaryPurpose
This research is aimed at describing the contemporary world of policy analysis from the perspective of individual policy analysts situated throughout the Government of British Columbia (BC), focussing on knowledge sharing and collaboration amongst policy analysts as activities that support a horizontal approach to policy formulation in response to complex policy settings. Building on the Theory of Planned Behavior (TPB) (Ajzen, 1991), the research tests whether the attitudes and perceived behavioural control of policy analysts, and their beliefs about organizational norms, predict their behavioural intentions with respect to organization-wide knowledge sharing and collaboration.
Research HypothesisPolicy analysts who score higher on measures of attitudes, subjective norms and perceived
behavioural control regarding knowledge sharing and collaboration will have greater behavioural intention to share knowledge and collaborate with colleagues throughout the organization.
MethodsBritish Columbia Government public servants with titles similar to “policy analyst” (n =
129) completed a web-based questionnaire. Using a non-experimental cross-sectional survey research design, inferences about the relationships among the independent and dependent variables are drawn using hierarchical regression analysis.
FindingsThe results fail to reject the null hypothesis. Survey results show that for the dependent
variables (behavioural intention to collaborate and share knowledge with colleagues), the Theory of Reasoned Action [the predecessor of the Theory of Planned Behavior; see Fishbein & Ajzen, 1975] helps to understand intention, with 11% of the variance explained by attitudes and organization norms. Perceived behavioural control actually shows negative, though not statistically significant, results. Nonetheless, the TPB model does appear useful in helping us understand what does and does not contribute to a policy analysts’ motivation for, interest in and commitment to sharing knowledge and collaborating with colleagues across the organization. Women’s scores on support for knowledge sharing and collaboration are lower than men’s, a result that is consistent and statistically significant.
Research LimitationsThe results are limited to the British Columbia Government context and may be influenced
by the self-selection bias of policy analysts who chose to participate. Survey respondents were replying as public servants who have a job title similar to ‘policy analyst, though many public servants performing policy analyst functions with different job titles would have been missed in the sampling process. The use of scenarios in the online questionnaire to measure
107
knowledge sharing and collaboration behavioural intention is the most problematic aspect of this research.
Practical ImplicationsThe intention of this research is to provide policy unit managers with insights that can
assist in addressing the organizational challenge of responding to cross-cutting policy issues in the context of the current and foreseeable technological and organizational setting. Reiterating previous findings from the research literature, this research demonstrates that attempts to impose knowledge management (KM) technology solutions from above may face significant barriers where the organizational culture does not support open knowledge sharing and collaboration. The results of this study should provide a foundation for public sector organizations seeking to increase the effectiveness of their knowledge workers in the policy formulation process by identifying factors that can promote and foster more open knowledge sharing and collaboration.
Originality / ValueThis study is the first to investigate knowledge sharing and collaboration practices amongst
Canadian public sector policy analysts using the Theory of Planned Behavior.
KeywordsPolicy analysts, horizontal policy, knowledge sharing, collaboration, organizational culture,
organizational sub-cultures, collaborative technology, Gov 2.0, organizational social networks, Theory of Planned Behavior.
108
8.2 Research ObjectivesThe objective of this research is to investigate the contemporary state and evolution of the
policy analysis and formulation process in the government of the Canadian province of British Columbia. In order to focus the analysis, the perspective taken here looks at policy analysis in government as an information-driven enterprise in which it is assumed that greater knowledge sharing and collaboration amongst policy analysts within a government contributes to enhanced organizational effectiveness. Through a survey of public servants directly connected to the policy analysis system in the British Columbia Government, the aim is to shed light on the policy process in this specific setting by investigating how factors such as collaborative technology, workplace social networks and institutional culture influence collaboration and knowledge sharing across the organization. At the core of this research is a test of the applicability of the Theory of Planned Behavior (TPB; Ajzen, 1991), in which attitudes, organizational norms and perceived behavioural control (as independent variables) are assessed as to their predictive capacity on the behavioural intention of policy analysts to share knowledge and collaborate across the organization (the dependent variable). Using a non-experimental cross-sectional survey research design, inferences about the relationships among the independent and dependent variables are made using hierarchical regression analysis in an attempt to assess the strength of the TPB model to the particular setting.
8.2.1 Research Model and HypothesisThe focus of this chapter is on examining the factors that influence knowledge sharing and
collaboration behaviour amongst policy analysts in the British Columbia Public Service. Specifically, the research question explored here asks how the Theory of Planned Behavior (TPB) helps to understand the intention of respondents to collaborate and share knowledge with other policy analyst colleagues throughout government. The TPB is a widely cited social psychology model that explains individuals’ intentions to engage in certain behaviours (Ajzen, 1991). According to the TPB model (see figure 1.2, above in Chapter 1), behavioural intention is predicted by three explanatory variables: attitude towards the behaviour; subjective norms (i.e., the respondent’s perception of the expectations of other members of the organization who the respondent cares about); and perceived behavioural control. Attitude refers to how the person values or appraises their self-performance of the behaviour in question, and can be measured as the individual’s positive or negative feelings about performing a behaviour. It is determined through an assessment of one’s behavioural beliefs regarding the consequences arising from a behaviour and an outcome evaluation of the desirability of these consequences. Subjective norm is a social (or organizational) factor that refers to the person’s perception of social pressure (e.g., within the organization) to perform the behaviour, defined as “the person’s perception that most people who are important to him think he should or should not perform the behaviour in question” (Fishbein & Ajzen, 1975: 302). Subjective norm is determined as the product of normative beliefs (perceptions about the expectations or hopes of significant others) and motivation to comply with the expectations of others. Perceived behavioural control refers to a person’s perception of the ease or difficulty of performing the behaviour and addresses situations where one’s intentions
109
or behaviours are not under complete volitional control. Perceived behavioural control is determined by the product of control beliefs (the degree of personal control the individual perceives she or he has over the behaviour in the context of barriers to action such as other commitments, technologies, legal requirement, etc.) and control frequency (how often those barriers occur).
The TPB suggests that the more positive the attitude and subjective norm with respect to a behaviour, and the greater the perceived behavioural control, the more likely it will be that an individual will form the intention to perform the behaviour; and where perceived behavioural control approximates actual behavioural control, intention should predict actual behaviour. For a more detailed description of the TPB and its relevance for public administration, see the extended discussion at section 1.5 above.
The TPB is built upon the earlier Theory of Reasoned Action (TRA; Fishbein & Ajzen, 1975), which proposes that a person’s behaviour is determined by her or his intention to perform the behaviour and that this intention is, in turn, a function of the person’s attitude and subjective norm toward the behaviour. Bock and Kim (2002) found the TRA model to be effective in explaining knowledge sharing behaviour in research institutions. The TRA model is premised on rationality and volitional control, though Sheppard, Hartwick and Warshaw (1988) have noted that the predictive power of the TRA model is questionable if the behaviour is not under full volitional control. The TPB model extends the TRA model by incorporating perceived behavioural control to reflect settings where individuals lack volitional control over the targeted behaviour. Even if someone is highly motivated, with strong attitudes and subjective norms supporting the behaviour, that behaviour may not follow if, for example, organizational conditions limit their volitional control.
While the application of explanatory behavioural models to predict knowledge sharing intention and behaviour is well established (Kuo & Young, 2008), with the use of the Theory of Planned Behavior in particular being widely applied (e.g., Bock et al., 2005; Hsu & Lin, 2008; Lin 2007; Lin & Lee, 2004; Ryu, Ho & Han, 2003), application of the TPB model to explain public servants’ behaviour with respect to internal knowledge sharing and collaboration has been more limited (for exceptions, see: Kankanhalli, Tan & Wei, 2005; Willem & Buelens, 2007; Zhang, Cresswell & Thompson, 2005; Zhang & Dawes, 2006), and there appears to be an absence of such application specifically to the policy formulation system. This research is aimed at addressing this gap in the literature by modelling policy analyst knowledge sharing and collaboration behaviour using the TPB.
Examples of the application of the TPB to public sector knowledge sharing have tended to confirm the explanatory power of the model. Kankanhalli, Tan and Wei (2005) indicate that knowledge professionals in public-sector organizations will only access electronic knowledge repositories if they perceive the quality of the information to be found there as high, and only where the nature of the knowledge is explicit, not tacit. Other research has found that if participants’ felt that their organization presented barriers to knowledge sharing, they were less likely to be successful in networking with colleagues for purposes of knowledge sharing (Zhang, Cresswell & Thompson, 2005). Willem and Buelens (2007) focus on the characteristics of public sector organizations that influence interdepartmental knowledge
110
sharing, and point to the importance of lateral coordination and trust; however, government institutions were found to have organizational characteristics (low levels of identification and commitment, and a lack of incentives) that are less conducive for knowledge sharing. Bock and Kim (2002) found that expected benefits strongly affected attitudes toward knowledge sharing, but that expected rewards did not, suggesting that the call for incentives to encourage employees to contribute to corporate knowledge repositories may be misplaced.
Building on the TPB and the above noted research studies (Kankanhalli, Tan & Wei, 2005; Willem & Buelens, 2007; Zhang, Cresswell & Thompson, 2005), the research tests whether the attitudes and perceived behavioural control of policy analysts, and their beliefs about organizational norms, predict their behavioural intentions with respect to organization-wide knowledge sharing and collaboration.
Hypothesis: Policy analysts who score higher on measures of attitudes, subjective norms and perceived behavioural control regarding knowledge sharing and collaboration will have greater behavioural intention to sharing knowledge and collaborate with colleagues throughout the organization.
8.3 MethodsFor this quantitative approach, 129 government policy analysts were surveyed using an
online browser-based questionnaire. The web questionnaire was built around the theoretical model and included questions measuring attitudes, subjective norms and perceived behavioural control regarding knowledge sharing and collaboration practices in the policy process; and measures of knowledge sharing and collaboration intention based on eight scenarios. Additional demographic and career history variables for the respondents were also collected.
In order to measure the independent variables attitudes, norms and perceived behavioural control, respondents were provided with four statements each related to the ideas of knowledge sharing and collaboration (see text box A1, in Appendix F), and asked in each case to indicate their agreement with the statement along a 7-point Likert scale (from 1 - strongly disagree - to 7 - strongly agree). Two statements were phrased as being unsupportive of internal knowledge sharing and collaboration, and thus involved reverse scoring. All attitude, norm and perceived behavioural control statements were adapted from previously-used validated scales (Ajzen, 1991; Bock & Kim, 2002; Lee, 2001; Lin & Lee, 2004; Ma & Yuen, 2011; Ryu et al., 2003; Selwyn, Gorard & Furlong, 2005; Sveiby & Simons, 2002; Taylor & Todd, 1995; Thompson, Perry & Miller, 2008; Venkatesh, Morris & Davis, 2003) - with the wording revised to reflect the target respondents and context (Bradburn, Sudman & Wansink, 2004; Jung et al., 2009) - and developed using the guidelines for structuring a TPB questionnaire (Ajzen, 2002). Statements were presented to each respondent in randomized order so as to avoid an order-effect bias (Couper, 2008; Perrault, 1975).
For the dependent variable - behavioural intention with respect to knowledge sharing and collaboration - respondents were presented with eight scenarios interspersed throughout the survey- four each related to knowledge sharing and collaboration - set in the context of
111
government policy formulation processes (see text box A2, in Appendix F). All scenarios asked for a ‘Yes’ or ‘No’ answer to a direct action question in response to the scenario. Respondents were instructed that, in each scenario there was neither a ‘right’ nor ‘wrong’ answer - either answer could be viewed as correct, depending on the respondent’s perspective and values. A free text box was provided should the respondent wish to explain or amplify their response, or otherwise comment on the scenario (Francis et al., 2004).
The independent variables for attitudes, subjective norms and perceived behavioural control were calculated using Theory of Planned Behavior guidelines (Ajzen, 1991). Cross-product scores within each concept (knowledge sharing and collaboration) were calculated (attitudes = behavioural belief * outcome evaluation; norms = normative beliefs * motivation to comply; perceived behavioural control = control belief *control frequency) based on TPB protocols (Ajzen, 1988) with scores potentially ranging from 1 to 49 (with higher scores indicating stronger support for the concept). Cross products are then summed across each concept yielding a score on a possible range of 2 - 98, and then combined into a single overall knowledge sharing and collaboration concept with a possible range of 4 - 196. This overall combined concept is justified as the knowledge sharing and collaboration concepts are closely linked conceptually and combined reliability scores reported below indicate the variables are strongly related.
The dependent variable of behavioural intention for knowledge sharing and collaboration was calculated by taking the total score (‘Yes’ = 1, ‘No’ = 0) across each of the four scenarios for each concept and summed to yield a single latent variable for the combined concept. In the causal model, intention to share knowledge and collaborate was assessed against all other variables that are theorized to lead to intention. Intervening variables significantly related to the intention to share knowledge and collaborate with colleagues across the organization were then assessed against organizational and personal variables. In addition, the free-form text responses to the scenarios are analyzed to draw out from the qualitative responses information that is difficult to articulate in the required ‘Yes / No’ response options.
Forced hierarchical regression analysis was used following standard practice in hierarchical regression analysis (i.e., entering age and gender first) and the method proposed by Ajzen (1991) and examples such as Ajzen and Madden (1986), Beck and Ajzen (1991), Gupta, Sharma and Ganesh (2009) and Zhang, Cresswell and Thompson (2004) (in which the independent variables in the TPB model are entered next). The objective was to determine relationships between behavioural intention to collaborate and share knowledge (dependent variable) and the independent variables. Hierarchical regression analysis, which is a specialized form of multivariate analysis, involves the sequential entering of independent variables into the analysis in accordance with a theoretical model. The focus of hierarchical regression is on the change in predictability associated with predictor (independent) variables entered later in the analysis over and above that contributed by predictor variables entered earlier in the analysis. The objective is to assess the effect of one or more variables over and above other variables. The forced model was assessed by entering the effect of age and gender first (step 1), followed by attitudes and subjective norms next in step 2 (attitudes and norms are the two theory components relevant to the TPB precursor - the Theory of
112
Reasoned Action; Fishbein & Ajzen (1975)), with perceived behavioural control then added for the TPB model (step 3), followed finally by respondent career stability variables (organizational disruptions, lateral career movements and career advancement) in step 4.
8.4 ResultsThe following four tables summarize how respondents were asked about their attitudes
(table 8.1), subjective norms (table 8.2), perceived behavioural control (table 8.3) and behavioural intention (table 8.4) with respect to internal knowledge sharing and collaboration. For each statement, respondents were asked to to indicate their level of agreement with the statement; the possible range for these responses was from 1 (strongly disagree) to 7 (strongly agree). For all but two statements, agreement with the statement indicates general support for knowledge sharing or collaboration; the remaining two statements were negatively worded such that disagreement with the statement was reverse-coded prior to analysis to indicate support for the concepts of knowledge sharing and collaboration. The tables also present mean scores and standard deviations for the ordered responses of all respondents.
Following Theory of Planned Behavior protocols (Ajzen, 1988), cross-product scores were then calculated for each concept: for attitudes, the product of the individual responses to the ‘outcome evaluation’ and ‘behavioural belief’ statements (as indicated in the tables) were calculated and the mean score for all respondents presented. For norms, the product of the individual responses to ‘normative belief’ and ‘motivation to comply’ statements were calculated and the mean score presented. For perceived behavioural control, the product of the individual responses to ‘control belief’ and ‘control frequency’ statements were calculated. For each of these calculated scores, the possible range is from 1 to 49, with higher scores indicating stronger support of the concept.
The four attitude statements regarding knowledge sharing were combined into one factor explaining 50% of the total variance with a Cronbach’s � = 0.660 (see table 8.1, below). Combining the two cross-product calculated scores produced an overall attitude score toward knowledge sharing behaviour of 48.61 (SD = 21.70) on a scale of 2 to 98, with higher numbers indicating more positive attitudes. The four attitudes statements for collaboration were combined into one factor explaining 59% of the total variance with a Cronbach’s � = 0.750. Overall attitude toward collaboration resulted in a mean score of 68.67 (SD = 21.63). For the combination of knowledge sharing and collaboration (� = 0.779), the mean attitude score was 117.28 (SD = 37.34) on a scale of 4 to 196.
For subjective norms (see table 8.2, below), four statements regarding knowledge sharing were factored together explaining 51% of the total variance with a Cronbach’s � = 0.667. Overall subjective norms toward knowledge sharing yielded a mean score of 64.61 (SD = 20.34), again on a scale of 2 to 98. Subjective norms statements regarding collaboration were factored together explaining 64% of the total variance with a Cronbach’s � = 0.801. Overall subjective norms toward collaboration showed a mean score of 52.13 (SD = 22.61) on a scale of 2 to 98. For the combination of knowledge sharing and collaboration (Cronbach’s � = 0.810), the mean score was 116.77 (SD = 37.79) on a scale of 4 to 196.
113

Perceived behavioural control scores were generally lower than attitudes and subjective norms, ranging from 3.28 – 3.74 for knowledge sharing and 3.33 – 4.97 for collaboration (see table 8.3, below). Calculated perceived behavioural control variables regarding knowledge sharing were factored together explaining 51% of the variance with a Cronbach’s � = 0.661. Overall perceived behavioural control toward knowledge sharing behaviour was calculated resulting in a mean score of 25.6 (SD = 16.3). Calculated perceived behavioural control variables regarding collaboration were factored together explaining 66% of the variance with a Cronbach’s � = 0.824. Overall perceived behavioural control toward collaboration behaviour yielded a mean score of 34.1 (SD = 21.3). For the combination of knowledge sharing and collaboration (Cronbach’s � = 0.344), the mean score was 59.71 (SD = 31.99).
Figure 8.1, below, shows a high-level view of the frequency distribution of individual overall calculated scores for attitudes, norms and perceived behavioural control.
114
Taable 8.1
Atttitudes to Knowledge Sharing and Collaborationa Mb (SD) Mc (SD)
“Though I am assigned to a particular Ministry, my primary policy analysis responsibility is to the BC Government as a whole”d
4.60 (1.77)
“My value as a policy analyst is judged by my contribution to the larger policy efforts of the Government beyond my branch”e
4.33 (1.79)
20.98 (13.38)
“If I acquire information that I think can benefit another part of the Government, I find a way to get it to the right person or branch”d
5.17 (1.52)
“If I go out of my way to share knowledge outside my branch, colleagues throughout government will appreciate my efforts to provide them with that information”e
5.15 (1.40)
27.63 (12.06)
“Working closely with colleagues in other Ministries results in better policy solutions”d
5.67 (1.25)
“Working closely with other policy analysis colleagues makes me a better policy analyst”e
6.02 (1.20)
34.86 (11.60)
“Collaborating with colleagues across government is important for effective policy analysis”d
5.87 (1.22)
“A central part of my job involves working with colleagues on policy analysis problems”e
5.69 (1.35)
33.81 (11.92)
a P
b O
c C
d Oe B
Policy analyst (n = 129) agreement with knowledge sharing statemen0.660) and collaboration statements (Cronbach�s � = 0.750) measuCronbach�s � = 0.779 for all 8 attitude items
Ordered responses: 1 = strongly disagree, 2 = slightly disagree, 3 = d= agree, 6 = slightly agree, 7 = strongly agree
Calculated attitude scores (outcome evaluationsd * behavioural belief49; higher scores indicating more positive attitude
Outcome evaluationBehavioural belief
nts (Cronbachring attitudes
disagree, 4 =
fe) can range
h�s � = s.
= neutral, 5
from 1 to
Kn
ow
led
ge
Sh
ari
ng
Co
lla
bo
rati
on
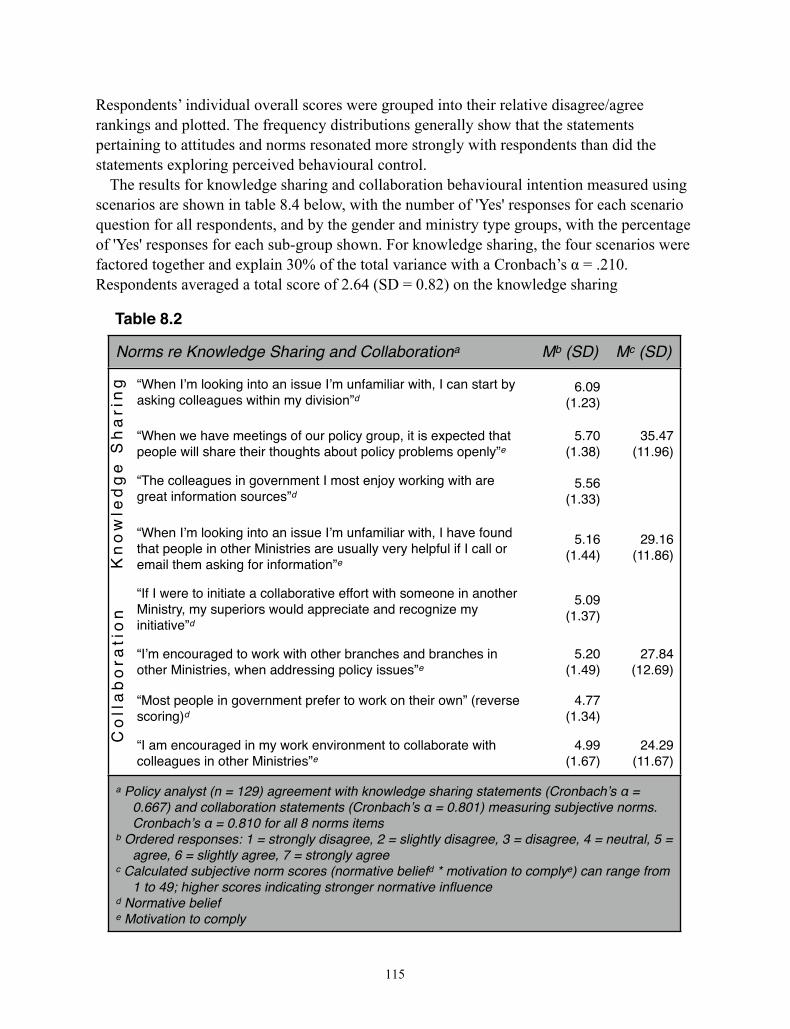
Respondents’ individual overall scores were grouped into their relative disagree/agree rankings and plotted. The frequency distributions generally show that the statements pertaining to attitudes and norms resonated more strongly with respondents than did the statements exploring perceived behavioural control.
The results for knowledge sharing and collaboration behavioural intention measured using scenarios are shown in table 8.4 below, with the number of 'Yes' responses for each scenario question for all respondents, and by the gender and ministry type groups, with the percentage of 'Yes' responses for each sub-group shown. For knowledge sharing, the four scenarios were factored together and explain 30% of the total variance with a Cronbach’s � = .210. Respondents averaged a total score of 2.64 (SD = 0.82) on the knowledge sharing
115
Taable 8.2
Noorms re Knowledge Sharing and Collaborationa Mb (SD) Mc (SD)
“When I�m looking into an issue I�m unfamiliar with, I can start by asking colleagues within my division”d
6.09 (1.23)
“When we have meetings of our policy group, it is expected that people will share their thoughts about policy problems openly”e
5.70 (1.38)
35.47 (11.96)
“The colleagues in government I most enjoy working with are great information sources”d
5.56 (1.33)
“When I�m looking into an issue I�m unfamiliar with, I have found that people in other Ministries are usually very helpful if I call or email them asking for information”e
5.16 (1.44)
29.16 (11.86)
“If I were to initiate a collaborative effort with someone in another Ministry, my superiors would appreciate and recognize my initiative”d
5.09 (1.37)
“I�m encouraged to work with other branches and branches in other Ministries, when addressing policy issues”e
5.20 (1.49)
27.84 (12.69)
“Most people in government prefer to work on their own” (reverse scoring)d
4.77 (1.34)
“I am encouraged in my work environment to collaborate with colleagues in other Ministries”e
4.99 (1.67)
24.29 (11.67)
a P
b O
c C
d Ne M
Policy analyst (n = 129) agreement with knowledge sharing statement0.667) and collaboration statements (Cronbach�s � = 0.801) measurCronbach�s � = 0.810 for all 8 norms items
Ordered responses: 1 = strongly disagree, 2 = slightly disagree, 3 = diagree, 6 = slightly agree, 7 = strongly agree
Calculated subjective norm scores (normative beliefd * motivation to co1 to 49; higher scores indicating stronger normative influence
Normative beliefMotivation to comply
ts (Cronbachring subjective
disagree, 4 = n
omplye) can r
�s � = e norms.
neutral, 5 =
range from
Kn
ow
led
ge
Sh
ari
ng
Co
lla
bo
rati
on
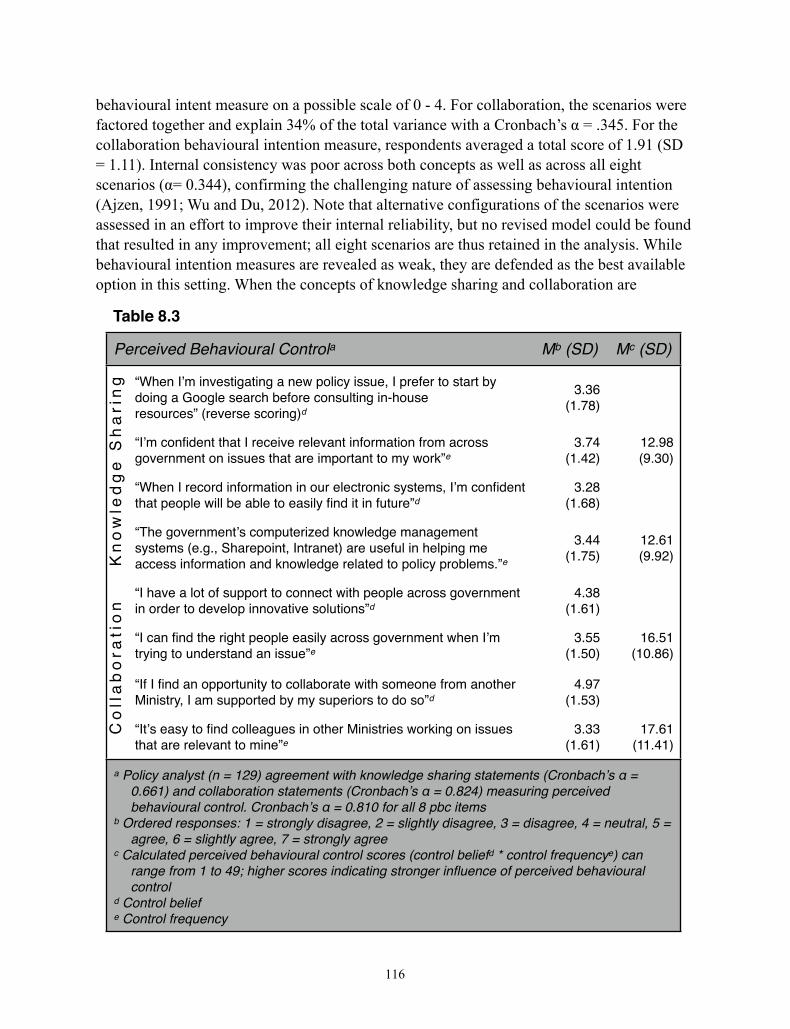
behavioural intent measure on a possible scale of 0 - 4. For collaboration, the scenarios were factored together and explain 34% of the total variance with a Cronbach’s � = .345. For the collaboration behavioural intention measure, respondents averaged a total score of 1.91 (SD = 1.11). Internal consistency was poor across both concepts as well as across all eight scenarios (�= 0.344), confirming the challenging nature of assessing behavioural intention (Ajzen, 1991; Wu and Du, 2012). Note that alternative configurations of the scenarios were assessed in an effort to improve their internal reliability, but no revised model could be found that resulted in any improvement; all eight scenarios are thus retained in the analysis. While behavioural intention measures are revealed as weak, they are defended as the best available option in this setting. When the concepts of knowledge sharing and collaboration are
116
Taable 8.3
Peerceived Behavioural Controla Mb (SD) Mc (SD)
“When I�m investigating a new policy issue, I prefer to start by doing a Google search before consulting in-house resources” (reverse scoring)d
3.36 (1.78)
“I�m confident that I receive relevant information from across government on issues that are important to my work”e
3.74 (1.42)
12.98 (9.30)
“When I record information in our electronic systems, I�m confident that people will be able to easily find it in future”d
3.28 (1.68)
“The government�s computerized knowledge management systems (e.g., Sharepoint, Intranet) are useful in helping me access information and knowledge related to policy problems.”e
3.44 (1.75)
12.61 (9.92)
“I have a lot of support to connect with people across government in order to develop innovative solutions”d
4.38 (1.61)
“I can find the right people easily across government when I�m trying to understand an issue”e
3.55 (1.50)
16.51 (10.86)
“If I find an opportunity to collaborate with someone from another Ministry, I am supported by my superiors to do so”d
4.97 (1.53)
“It�s easy to find colleagues in other Ministries working on issues that are relevant to mine”e
3.33 (1.61)
17.61 (11.41)
a P
b O
c C
d Ce C
Policy analyst (n = 129) agreement with knowledge sharing statement0.661) and collaboration statements (Cronbach�s � = 0.824) measuribehavioural control. Cronbach�s � = 0.810 for all 8 pbc items
Ordered responses: 1 = strongly disagree, 2 = slightly disagree, 3 = diagree, 6 = slightly agree, 7 = strongly agree
Calculated perceived behavioural control scores (control beliefd * contrrange from 1 to 49; higher scores indicating stronger influence of percontrol
Control beliefControl frequency
ts (Cronbaching perceived
isagree, 4 = n
rol frequencyrceived beha
�s � = d
neutral, 5 =
ye) can vioural
Kn
ow
led
ge
Sh
ari
ng
Co
lla
bo
rati
on
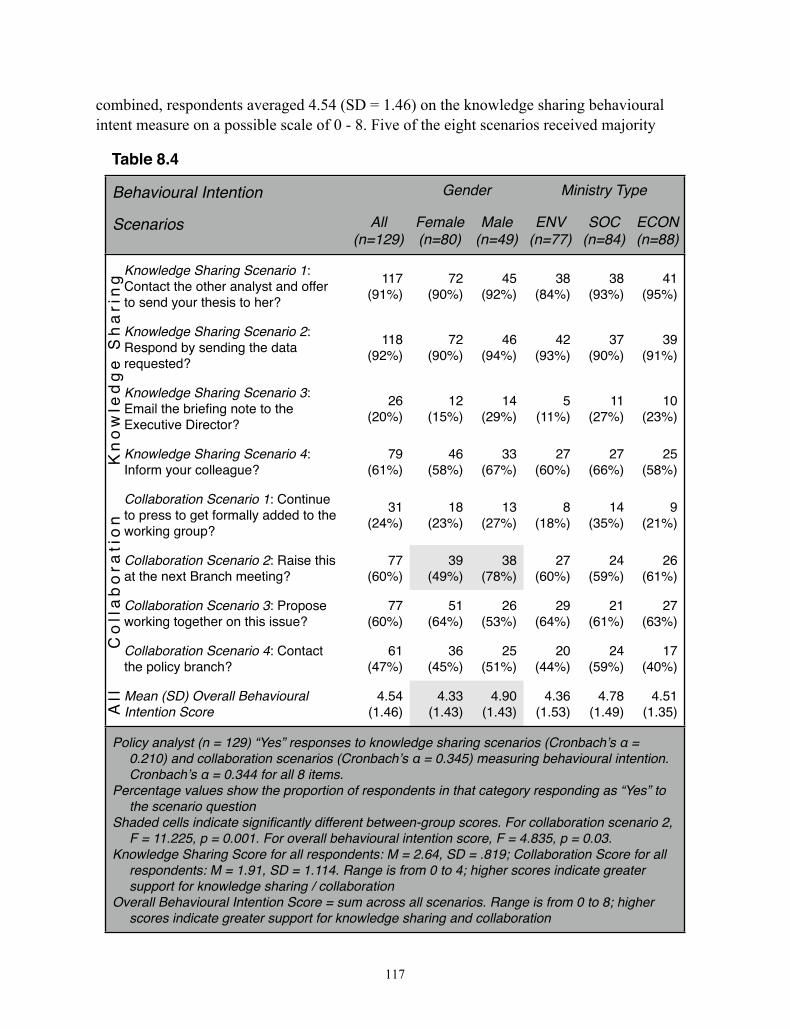
combined, respondents averaged 4.54 (SD = 1.46) on the knowledge sharing behavioural intent measure on a possible scale of 0 - 8. Five of the eight scenarios received majority
117
TTable 8.4
BBehavioural Intention Gennder Miinistry Typype
SScenarios All(n=129)
Female(n=80)
Male(n=49)
ENV(n=77)
SOC(n=84)
ECON(n=88)
Knowledge Sharing Scenario 1: Contact the other analyst and offer to send your thesis to her?
117 (91%)
72(90%)
45 (92%)
38 (84%)
38 (93%)
41 (95%)
Knowledge Sharing Scenario 2: Respond by sending the data requested?
118 (92%)
72 (90%)
46(94%)
42(93%)
37(90%)
39(91%)
Knowledge Sharing Scenario 3: Email the briefing note to the Executive Director?
26 (20%)
12 (15%)
14 (29%)
5 (11%)
11 (27%)
10 (23%)
Knowledge Sharing Scenario 4: Inform your colleague?
79 (61%)
46 (58%)
33 (67%)
27 (60%)
27 (66%)
25 (58%)
Collaboration Scenario 1: Continue to press to get formally added to the working group?
31 (24%)
18(23%)
13(27%)
8 (18%)
14(35%)
9 (21%)
Collaboration Scenario 2: Raise this at the next Branch meeting?
77 (60%)
39 (49%)
38(78%)
27(60%)
24(59%)
26(61%)
Collaboration Scenario 3: Propose working together on this issue?
77 (60%)
51 (64%)
26(53%)
29(64%)
21(61%)
27(63%)
Collaboration Scenario 4: Contact the policy branch?
61 (47%)
36(45%)
25(51%)
20(44%)
24(59%)
17(40%)
Mean (SD) Overall Behavioural Intention Score
4.54 (1.46)
4.33 (1.43)
4.90 (1.43)
4.36 (1.53)
4.78 (1.49)
4.51 (1.35)
P
P
S
K
O
Policy analyst (n = 129) “Yes” responses0.210) and collaboration scenarios (CCronbach�s � = 0.344 for all 8 items.
Percentage values show the proportion the scenario question
Shaded cells indicate significantly differeF = 11.225, p = 0.001. For overall beh
Knowledge Sharing Score for all responrespondents: M = 1.91, SD = 1.114. Rsupport for knowledge sharing / collab
Overall Behavioural Intention Score = suscores indicate greater support for kn
s to knowleCronbach�s of respond
ent betweenhavioural indents: M =
Range is froborationum across anowledge s
edge sharin � = 0.345)
dents in tha
n-group scntention sc= 2.64, SD =om 0 to 4;
all scenarioharing and
ng scenar) measuri
at category
cores. Forcore, F = 4 = .819; Co higher sc
os. Ranged collabora
rios (Croning behav
ry respond
r collabora4.835, p =
Collaboraticores indic
e is from ation
nbach�s � vioural inte
ding as “Y
ation scen= 0.03.ion Scorecate grea
0 to 8; hig
= ention.
Yes” to
nario 2,
for all ter
gher
Kn
ow
led
ge
Sh
ari
ng
All
Co
lla
bo
rati
on
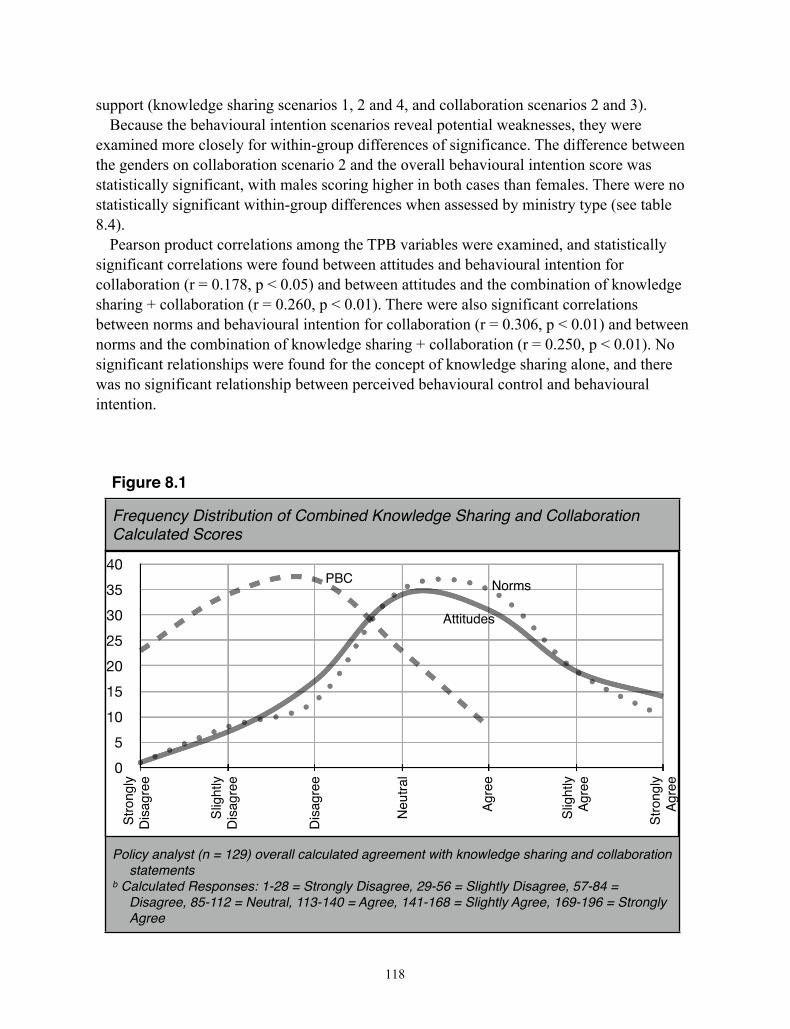
support (knowledge sharing scenarios 1, 2 and 4, and collaboration scenarios 2 and 3). Because the behavioural intention scenarios reveal potential weaknesses, they were
examined more closely for within-group differences of significance. The difference between the genders on collaboration scenario 2 and the overall behavioural intention score was statistically significant, with males scoring higher in both cases than females. There were no statistically significant within-group differences when assessed by ministry type (see table 8.4).
Pearson product correlations among the TPB variables were examined, and statistically significant correlations were found between attitudes and behavioural intention for collaboration (r = 0.178, p < 0.05) and between attitudes and the combination of knowledge sharing + collaboration (r = 0.260, p < 0.01). There were also significant correlations between norms and behavioural intention for collaboration (r = 0.306, p < 0.01) and between norms and the combination of knowledge sharing + collaboration (r = 0.250, p < 0.01). No significant relationships were found for the concept of knowledge sharing alone, and there was no significant relationship between perceived behavioural control and behavioural intention.
118
Figure 8.1
Frequency Distribution of Combined Knowledge Sharing and Collaboration Calculated Scores
Policy analyst (n = 129) overall calculated agreement with knowledge sharing and collaboration statements
b Calculated Responses: 1-28 = Strongly Disagree, 29-56 = Slightly Disagree, 57-84 = Disagree, 85-112 = Neutral, 113-140 = Agree, 141-168 = Slightly Agree, 169-196 = Strongly Agree
0
5
10
15
20
25
30
35
40
Stro
ngly
D
isag
ree
Slig
htly
D
isag
ree
Dis
agre
e
Neu
tral
Agre
e
Slig
htly
Ag
ree
Stro
ngly
Agre
e
PBC Norms
Attitudes
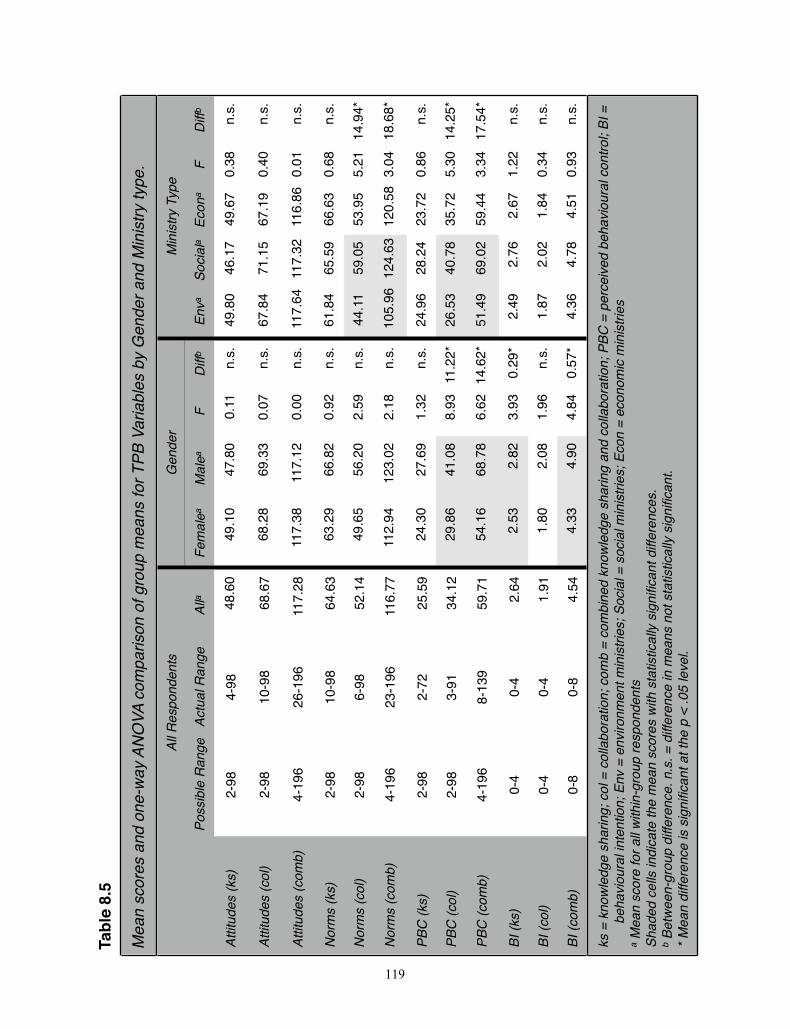
119
Tabl
e 8.
5
Mea
n sc
ores
annd
one
-way
ANOO
VA c
ompa
risson
of g
rouup
mea
ns fo
r TPB
VVar
iabl
ees b
y GG
ende
r aand
Minn
istry
typpe
.
All R
espo
nden
tsG
endee
rM
innis
try T
yppe
Poss
ible
Ran
geAc
tual
Ran
geAl
laFe
mal
eaM
alea
FD
iffb
Enva
Soci
ala
Econ
aF
Diff
b
Attit
udes
(ks)
Attit
udes
(col
)
Attit
udes
(com
b)
Nor
ms
(ks)
Nor
ms
(col
)
Nor
ms
(com
b)
PBC
(ks)
PBC
(col
)
PBC
(com
b)
BI (k
s)
BI (c
ol)
BI (c
omb)
2-98
4-98
48.60
49.10
47.80
0.11
n.s.
49.80
46.17
49.67
0.38
n.s.
2-98
10-98
68.67
68.28
69.33
0.07
n.s.
67.84
71.15
67.19
0.40
n.s.
4-196
26-196
117.28
117.38
117.12
0.00
n.s.
117.64
117.32
116.86
0.01
n.s.
2-98
10-98
64.63
63.29
66.82
0.92
n.s.
61.84
65.59
66.63
0.68
n.s.
2-98
6-98
52.14
49.65
56.20
2.59
n.s.
44.11
59.05
53.95
5.21
14.94*
4-196
23-196
116.77
112.94
123.02
2.18
n.s.
105.96
124.63
120.58
3.04
18.68*
2-98
2-72
25.59
24.30
27.69
1.32
n.s.
24.96
28.24
23.72
0.86
n.s.
2-98
3-91
34.12
29.86
41.08
8.93
11.22*
26.53
40.78
35.72
5.30
14.25*
4-196
8-139
59.71
54.16
68.78
6.62
14.62*
51.49
69.02
59.44
3.34
17.54*
0-4
0-4
2.64
2.53
2.82
3.93
0.29*
2.49
2.76
2.67
1.22
n.s.
0-4
0-4
1.91
1.80
2.08
1.96
n.s.
1.87
2.02
1.84
0.34
n.s.
0-8
0-8
4.54
4.33
4.90
4.84
0.57*
4.36
4.78
4.51
0.93
n.s.
ks =
kno
wle
dge
sha
beha
viou
ral i
nte
a Mea
n sc
ore
for a
lSh
aded
cel
ls in
dica
b Bet
wee
n-gr
oup
di* M
ean
diffe
renc
e isar
ing;
col
= c
olla
bte
ntio
n; E
nv =
env
ll w
ithin
-gro
up re
spat
e th
e m
ean
scor
iffer
ence
. n.s
. = d
iis
sig
nific
ant a
t the
orat
ion;
com
b =
viro
nmen
t min
istr
pond
ents
res
with
sta
tistic
aiff
eren
ce in
mea
e p
< .0
5 le
vel.
com
bine
d kn
ries;
Soc
ial =
ally
sig
nific
anan
s no
t sta
tistno
wle
dge
sh=
soci
al m
ini
nt d
iffer
ence
tical
ly s
ignifiha
ring
and
istri
es; E
con
es.
fican
t.
col
labo
ran
= ec
onat
ion;
PB
omic
minBC
= p
erc
nist
ries
ceiv
ed b
eehav
iour
aal c
ontroo
l; BI
=
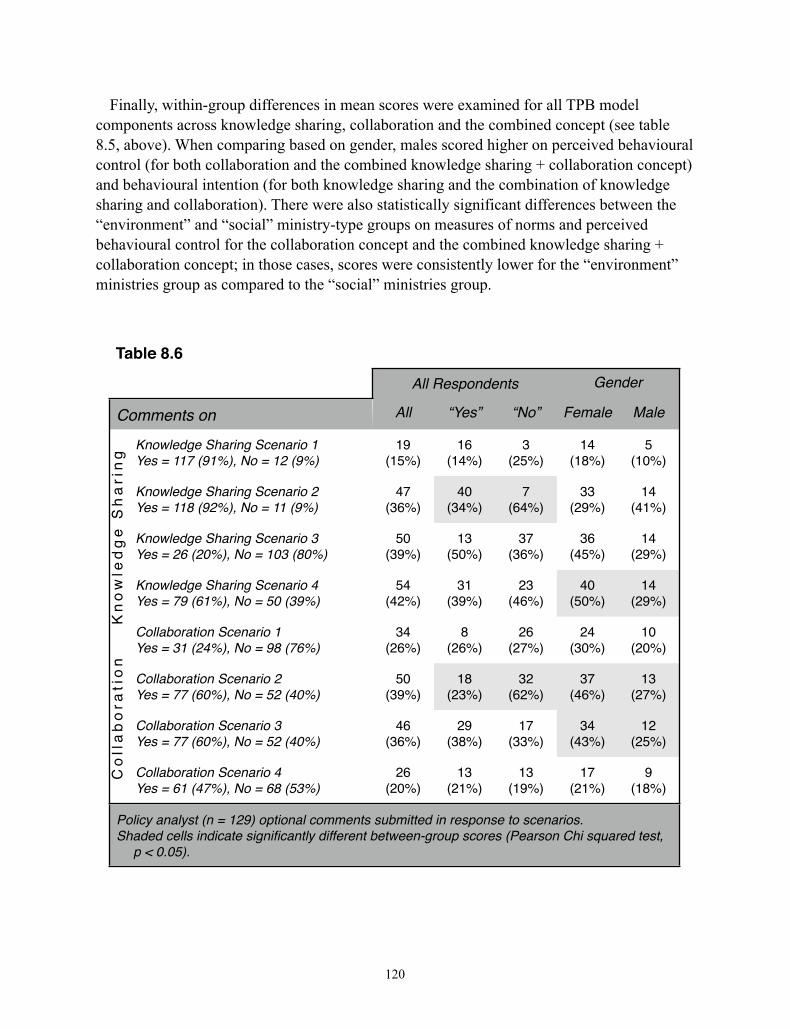
Finally, within-group differences in mean scores were examined for all TPB model components across knowledge sharing, collaboration and the combined concept (see table 8.5, above). When comparing based on gender, males scored higher on perceived behavioural control (for both collaboration and the combined knowledge sharing + collaboration concept) and behavioural intention (for both knowledge sharing and the combination of knowledge sharing and collaboration). There were also statistically significant differences between the “environment” and “social” ministry-type groups on measures of norms and perceived behavioural control for the collaboration concept and the combined knowledge sharing + collaboration concept; in those cases, scores were consistently lower for the “environment” ministries group as compared to the “social” ministries group.
120
Table 8.6
All R Respondeents Gennder
Comments on All “Yes” “No” Female Male
Knowledge Sharing Scenario 1Yes = 117 (91%), No = 12 (9%)
19 (15%)
16 (14%)
3 (25%)
14 (18%)
5 (10%)
Knowledge Sharing Scenario 2Yes = 118 (92%), No = 11 (9%)
47 (36%)
40 (34%)
7 (64%)
33 (29%)
14 (41%)
Knowledge Sharing Scenario 3Yes = 26 (20%), No = 103 (80%)
50 (39%)
13 (50%)
37 (36%)
36 (45%)
14 (29%)
Knowledge Sharing Scenario 4Yes = 79 (61%), No = 50 (39%)
54 (42%)
31 (39%)
23 (46%)
40 (50%)
14 (29%)
Collaboration Scenario 1Yes = 31 (24%), No = 98 (76%)
34 (26%)
8 (26%)
26 (27%)
24 (30%)
10 (20%)
Collaboration Scenario 2Yes = 77 (60%), No = 52 (40%)
50 (39%)
18 (23%)
32 (62%)
37 (46%)
13 (27%)
Collaboration Scenario 3Yes = 77 (60%), No = 52 (40%)
46 (36%)
29 (38%)
17 (33%)
34 (43%)
12 (25%)
Collaboration Scenario 4Yes = 61 (47%), No = 68 (53%)
26 (20%)
13 (21%)
13 (19%)
17 (21%)
9 (18%)
Policy analyst (n = 129) optional comments Shaded cells indicate significantly different b
p < 0.05).
submitted between-gr
in responsroup score
se to scenas (Pearson
arios. n Chi squarred test,
Kn
ow
led
ge
Sh
ari
ng
Co
lla
bo
rati
on

8.4.1 Comments on scenarios “Absolutely.”
“Absolutely NOT!”
- separate respondent comments on the same scenario.
A free text box was provided (in response to commentary received during pilot testing of the survey) in the event that the respondent wished to explain their response or otherwise comment on the scenario or their answer. While this option was originally included with no greater objective than to provide an outlet for the respondent, rich data emerged from this feature. In this brief section, the themes that emerged under each scenario are presented in order to contextualize the numerical summaries presented above. Table 8.6, above, shows how many comments were left in respect of each scenario, whether the comments were made by respondents answering ‘Yes’ to a scenario or ‘No’, and the gender ratios. A close reading of the various comments leads to one general observation: whether the respondent answered 'Yes' or 'No' to the scenario question, the presence of the comment serves a wide range of functions, from emphasizing or reinforcing their answer to justifying or contradicting it.
Knowledge Sharing Scenario 1: This scenario asked whether the respondent would proactively reach out to a colleague elsewhere in their ministry to offer their expertise on a new project. Only 9% of respondents said they would not do so, with 25% of those 'No' respondents commenting on their choice. Those respondents were typically self-deprecating, noted that it would seem presumptuous to assume that their expertise would be of use or welcomed. For respondents who said they would contact the colleague (91% of respondents), just 14% offered comments: these ranged from mirroring the 'No' commenters that they would downplay their professed expertise and instead seek to learn more about their colleague before offering assistance, to other comments that ranged from strangely cautious (e.g., making the expertise available while moving to protect one’s private intellectual property) to enthusiastic (e.g., seeking to become directly involved in the new project).
Knowledge Sharing Scenario 2: In this scenario, respondents were asked about an intra-
Ministry data request from one analyst to another for data that is already electronically available to the requester. Again, most respondents (92%) said they would endeavour to support the work of their colleague, even though it meant having to allocate time to do so. For those who said they would not provide the data directly (9% of respondents), seven respondents provided comments. Most said that, instead of providing the data, they would direct the colleague to the website that contained the data. In fact, many respondents - whether they said they would accede to the data request or not - made a point of wanting to “train” or “empower” the requester to access the date themselves rather than automatically do the work for them. Though the scenario clearly noted that the data was already publicly available, three 'No' respondents noted that they would first seek approval before sending the
121
data. Other 'Yes' respondents noted the tangential benefit of relationship-building across the organization through the act of knowledge sharing, and the efficiency of having data stewards help data consumers access information. The difference in ‘commenter rate’ is statistically significant as between those answering 'Yes' (34%) and those answering 'No' (64%), perhaps highlighting an effort to justify a ‘No’ response. Of the 8 female respondents answering 'No', 75% offered a comment which is significantly greater than the proportion of 'Yes' / female respondents who offered a comment (38%) (�2 (1, n = 129) = 4.178, p = 0.041), indicating again perhaps a perceived need to justify a ‘No’ response.
Knowledge Sharing Scenario 3: This scenario - in which a cross-ministry information request was made outside of normal pathways - pitting traditional values of confidentiality and personal ties against the efficient communication of information across government - was the one most rejected by respondents, with only 20% agreeing that they would share a draft briefing note with a former supervisor in another ministry. From a close reading of the comments, many respondents were categorical in their refusal to share the briefing note with their colleague noting the legal and ethical implications of doing so. Others noted that they would not do so unilaterally, but if their supervisor approved the transmission they would have no qualms about doing so. Still other interpretations hinged on the amount of information to share, where a verbal summary given over the phone was acceptable but emailing a document was not. For respondents who said they would share the document, many noted that they would label the document as a ‘draft’, and instruct the recipient not to circulate it further. Of the 68 female respondents answering 'No', 40% offered a comment - significantly less than the number of 'Yes' / female respondents who offered a comment (75%) (�2 (1, n = 129) = 5.134, p = 0.023), indicating a ‘yes, but’ explanation of their response.
Knowledge Sharing Scenario 4: This final knowledge sharing scenario juxtaposed the value of a ministry’s relationship with an outside stakeholder vis-a-vis the value of information to the government as a whole. Over 39% of respondents indicated that they would not share the information with their governmental colleague. This scenario generated the highest proportion of responses with additional comments, with 42% of respondents further explaining or justifying their answer. Many respondents noted that a relationship with an external stakeholder was of principal importance and would trump a desire to provide information to a colleague. A significant number of respondents - including those who answered in the affirmative - noted that they would first contact the stakeholder to ensure the information could be shared with other branches of government before doing so, even though the scenario clearly indicated that the information had been communicated originally without any expressed or implied confidentiality. The proportion of responses with comments added was significantly higher for females (half of all female respondents) than for males (29%).
Collaboration Scenario 1: In this scenario, the respondent was asked whether they would proactively seek to become involved in a project where a colleague was reluctant to
122
accommodate their involvement or recognize their mutual interests in the project. A majority of respondents noted that they would not reiterate a request if their colleague was not immediately amenable ('No' = 76%), though many - both 'No' and 'Yes' respondents - indicated that they would ask to be kept informed of the working group’s progress and seek future opportunities to collaborate. This scenario generated a relatively low volume of responses with no within-group differences of significance.
Collaboration Scenario 2: This scenario raised the issue of whether a junior staff member with technical expertise would seek to correct a misperception of an executive from a different ministry. A majority of respondents (60%) said they would make an effort to set the record straight either by directly communicating with the executive or doing so through their Ministry hierarchy. A significantly higher proportion of 'No' respondents provided additional comments (62%), as did a higher proportion of female respondents (46%). Comments were quite varied on this scenario, ranging from whether a branch meeting was the appropriate venue to raise the issue to whether the policy analyst should work through their supervisor before approaching an assistant deputy minister from another ministry. Of the 11 male respondents answering 'No', 55% offered a comment, a greater proportion than the 'Yes' / male respondents who offered a comment (18%) (�2 (1, n = 129) = 5.711, p = 0.017). Of the 41 female respondents answering 'No', 63% offered a comment - a statistically significant amount more than the number of 'Yes' / female respondents who offered a comment (28%) (�2 (1, n = 129) = 9.968, p = 0.002). Again, the assumption from these results and the content of the comments is that respondents often sought to justify a ‘No’ response by qualifying their answer.
Collaboration Scenario 3: This scenario pitted the possibility of a mutually beneficial outcome (coupled with a personal friendship) against the possibility that one’s performance measures might suffer from taking on a tangential project. Forty percent of respondents answered 'No', with the predominant concern being the taking-on of an initiative that adds to an already overloaded work agenda. Many respondents - both 'No' and 'Yes' - said they would seek the approval of a supervisor before taking this on. A significantly higher proportion of females (43%) than males (25%) provided comments.
Collaboration Scenario 4: Respondents were evenly split on this final scenario ('Yes' = 47%), which asked whether a technical specialist should 'go over the head' of her manager to bring an issue to the attention of the ministry’s corporate policy unit. Most 'No' respondents felt that the manager’s decision should be respected, and that the technical specialist should focus of their core duties. 'Yes' respondent commenters focussed on 'the public interest' and the need for the technical specialist to find a way to raise the issue without embarrassing their supervisor.
123

8.4.2 The TPB ModelHierarchical regression modelling was used to test the hypothesis that “policy analysts who
score higher on measures of attitudes, subjective norms and perceived behavioural control
124
Table 8.7
HierarKnowl
rchical Regression of Behavioural Inteledge
ention to C Collaboratte and Shhare
Step Variable R2 �R2 � t
1 �Age 0.04 0.04 -0.01 -0.08
�Gender -0.19 -2.19*
2 Age 0.11 0.08** -0.02 -0.27
Gender -0.18 -2.09*
�Attitudes 0.19 1.75
�Norms 0.11 1.01
3 Age 0.11 0.00 -0.02 -0.26
Gender -0.19 -2.13*
Attitudes 0.20 1.77
Norms 0.13 1.09
�Perceived Behavioural Control -0.04 -0.44
4 Age 0.15 0.04 0.02 0.19
Gender -0.21 -2.34*
Attitudes 0.12 1.04
Norms 0.19 1.50
Perceived Behavioural Control -0.06 -0.58
�Organizational Disruptions 0.03 0.25
�Position Disruptions -0.04 -0.39
�Lateral Movements -0.15 -1.42
�Career Advancement 0.17 1.70
�new v variables entered at model step;* p < .05; **pp < .01
regarding knowledge sharing and collaboration will have greater behavioural intention to share knowledge and collaborate with colleagues throughout the organization.” In the causal model, intention to share knowledge and collaborate was assessed against the variables that are theorized to lead to intention, along with personal variables (age and gender) entered first and career variables entered last.
Model results are presented for the combination of knowledge sharing and collaboration (see table 8.7, below). Step 1 assessed the influence of age and gender on knowledge sharing and collaboration behavioural intention (following standard practice in hierarchical regression analysis). The model was not statistically significant and the personal demographic variables explained a total of 4% of the variance in behavioural intention. However, gender showed a statistically significant negative relationship with the dependent variable (�28 (gender) = -0.19, t (129) = -2.19, p = .03), with men scoring higher than women on measures of behavioural intention to collaborate and share knowledge. When the independent variables attitudes and norms were entered into the regression equation together (Step 2), the model was significant (R2 = 0.112, F2,124 = 5.255, p = .006) and the variables together explained a total of 11% of the variance in behavioural intention. The addition of perceived behavioural control in step 3 added nothing to the explanation of total variance. In step 4, the addition of personal career variables did not make the model statistically significant but did increase the total amount of variance explained to 15%.
Pearson Correlations: Individual correlation coefficients were generated for each independent TPB variable with the dependent variables of knowledge sharing and collaboration intention (as measured through the scenarios). For knowledge sharing in isolation, while none of the correlations were statistically significant, there is a positive relationship between attitudes and behavioural intention (r = 0.146, p = 0.1); and it is worth noting weak inverse relationships between norms and behavioural intention (r = -0.023, p = 0.798) and perceived behavioural control and behavioural intention (r = -0.019, p = 0.832) - results that directly contradict the TPB model. For collaboration, Pearson correlations between attitudes and norms with behavioural intention showed positive and statistically significant relationships (attitudes: r = 0.178, p = .043; norms: r = 0.306, p < .001); perceived behavioural control was positive but not significant (r = 0.169, p = .056). For the combined knowledge sharing and collaboration concept, individual correlations of statistical significance between intention and attitudes (r = 0.260, p = .003) and norms (r = 0.250, p = .004) were also found; perceived behavioural control was positive but again not statistically significant (r = 0.129, p = .145).
Gender - in which females were coded as 1 and males as 0 - was negatively correlated with the overall perceived behavioural control score for collaboration (r = -0.256, p = .003), overall perceived behavioural control score for the combination of knowledge sharing and
125
28 � represent standardized beta coefficients, i.e., regression coefficients that are standardized (values can range from -1 to 1 with a mean of 0), and a higher absolute value means a stronger correlation. The beta coefficient for gender was the only independent variable of significance, and was significant in all four models: Model 2: (� (gender) = -0.179, t (129) = -2.09, p = .039); Model 3: (� (gender) = -0.187, t (129) = -2.13, p = .036); Model 4: (� (gender) = -0.209, t (129) = -2.34, p = .021).

collaboration (r = -0.223, p = .011), knowledge sharing intention (r = -0.173, p = .05) and behavioural intention for combined knowledge sharing + collaboration (r = -0.192, p = .03). That is, women had lower perceived behavioural control scores and were found to be less supportive of knowledge sharing and collaboration than were men.
8.5 DiscussionSharing knowledge and collaboration is important for organizational performance. To the
extent that an individual’s attitudes towards knowledge sharing and collaboration, their subjective evaluation of what those people important to them believe about those actions, and their perception about the degree to which they are able to act on their intentions are aligned, the Theory of Planned Behavior predicts that behaviour will follow. Attitudes generally reflect what respondents believe and what their experience tells them about the behaviour, norms reflect what respondents hear from colleagues and superiors, and perceived behavioural control, in this context, measures whether respondents feel they have the authority, facility or capacity to act upon their beliefs and to undertake what they are encouraged to do.
Underlying the research hypothesis tested above was the idea that, if a policy analyst scores higher on measures of their attitudes, subjective norms and perceived behavioural control with respect to knowledge sharing and collaboration, the TPB model predicts that they will be more likely to have greater behavioural intention to share knowledge and collaborate with colleagues throughout the organization. The results of the hierarchical regression analysis do not support this hypothesis, as the addition of perceived behavioural control in step 3 - which completes the test of the TPB model - added nothing to the model over and above step 2 and the model was not statistically significant. However, in step 2, with the entry of the independent variables attitudes and norms - which represents in effect a test of the Theory of Reasoned Action (Ajzen & Fishbein, 1980; Fishbein & Ajzen, 1975) - the model was significant and explained a total of 11% of the variance in behavioural intention. From a theoretical standpoint, these results suggest that the TRA, the precursor to the TPB that does not include perceived behavioural control, was more parsimonious than the TPB in explaining policy analyst behaviour. The conclusion is that what policy analysts believe to be true - in terms of how knowledge sharing and collaboration contribute to effective policy analysis - and what they believe they are encouraged to do by those around them in the organization whose opinion they value, help to explain whether they will be likely to have the intention to share knowledge and collaborate with colleagues in future. This result has important implications for public sector managers and leaders seeking to increase the likelihood that policy analysts will share knowledge and collaborate with their colleagues. Where policy analysts can be encouraged to share knowledge and collaborate, their subjective norms should reflect such encouragement. Less directly, the internalization of such encouragement should have an impact on policy analysts’ attitudes.
While perceived behavioural control did not serve as an explanatory variable of statistical significance in the hierarchical regression model, its weakness was revealed in the mean scores and one-way ANOVA analysis, and in individual Pearson correlations. In practical
126
terms, this weakness allows us to infer what the relationship might be between perceived behavioural control and the intention to share knowledge and collaborate. One possible interpretation is that policy analysts may not feel they have the authority or ability to act in a way that their attitudes and norms would predict. Ability to access and make efficient use of in-house knowledge resources, confidence in being able to connect with colleagues to jointly solve problems, and organizational support to reach out across government appear to be lacking in the results from the mean scores. These results would seem to confirm other findings in the literature related to barriers to knowledge sharing in governmental organizations (e.g., Landsbergen & Wolken, 2001). These barriers arise due to concerns over privacy and confidentiality, statutory authority, public scrutiny risk avoidance, intra- and inter-organizational mistrust, inexperience, lack of awareness of collaboration opportunities and a lack of resources (Andersen & Dawes, 1991). While data interoperability challenges - stemming from incompatible technologies and an absence of data standards - are often the focus of intra- and inter-organizational information sharing efforts, barriers to knowledge sharing and collaboration may be as much (if not more) a function of the organizational setting (Lord & Ranft, 2000) and inter-personal factors (Dawes, Cresswell & Pardo, 2009; Riege, 2005).
Lastly, the counter-intuitive gender result, that women appear to be less supportive of knowledge sharing and collaboration than men, is considered. Several plausible explanations exist: that the measurement was faulty; that the result in this case - that female policy analysts in the British Columbia Government truly are less collaborative, and share knowledge less than their male counterparts - is true, but is an outlier at odds with prevailing wisdom on the subject; or that a closer look at the research literature, and a deeper consideration of the organizational environment, might provide a window into the profound implications of this finding for the future of the policy formulation process in the British Columbia Government and perhaps beyond.
While a preliminary consideration of the role of gender in respect of knowledge sharing and collaboration may lead to a preliminary hypothesis that women will be more sharing and collaborative than men, a consideration of the research literature suggests that it is possible that, on the topic of knowledge sharing, women are less likely to proactively share knowledge with colleagues especially when they are in a real or perceived minority position, or where the forum in which policy analysis occurs takes on masculine characteristics. In a recent study, Karpowitz, Mendelberg and Shaker (2012) discuss several explanations for why women may contribute less and speak with less authority in deliberative settings. One explanation for the gender difference in group influence is that, where women are a numerical minority in a group, they will have lower participation levels and speak with less authority in group discussions (Johnson & Schulman, 1989). Related to this is that gender-based norms and social expectations may inhibit women from interacting in group settings as both genders carry lessons learned in childhood into their professional lives (Wood, 2012). However, this effect is usually dampened when group gender ratios become more balanced or where women are in the majority (Smith-Lovin & Brody 1989). This explanation is challenged in the contemporary British Columbia Government policy analysis community as
127

the population sample showed a majority of women. Indeed, a scan of the Assistant Deputy Minister pool (the second tier in the government bureaucratic hierarchy) in October 2012 showed a roughly equal female / male distribution. However, at the Deputy Minister level (the highest tier in the hierarchy), only four out of 19 DMs are women; while the number of female Deputy Ministers has varied over the years and has approached parity (indeed, a woman served as Deputy Minister to the Premier and Head of the British Columbia Civil Service from 2003 - 2009), this gender imbalance at the top level of the British Columbia Public Service is real, and likely perceived as such.
Another explanation, however, is cultural in nature - both in the sense of the culture of the British Columbia Government as an organization, and contemporary Canadian culture. From this perspective, women may contribute less to group deliberations because men tend to be perceived as more authoritative than women when the topic takes on a perceived masculine character. Since political discussions are typically male-dominated (Burns, Schlozman, & Verba, 2001), when policy analysis is closely linked to political outcomes, women may feel disadvantaged and intimidated in policy discussions (Hansen 1997; Ridgeway & Smith-Lovin 1999). Changing the culture of the policy analysis and formulation environment in the British Columbia Government, if it is indeed at the root of the unexpected gender result in this research, can start with gender parity at the Deputy Minister level, but it will likely take a more concerted effort than one based solely on numbers (Perdue & Perschel, 2012).
Lastly on this topic, it is worth noting research such as O’Neill and O’Reilly (2011) which finds that women learn to adopt masculine characteristics when appropriate in order to advance their careers. If this is true (and recall that the women in this survey report a higher mean number of promotions than the men surveyed), the question for the organization is whether this adaptive strategy, where women learn to behave like they believe their male colleagues would behave when it comes to knowledge sharing and collaboration, is having a negative effect on the ability of the organization to address policy complexity through organic horizontality.
This study is the first to investigate knowledge sharing and collaboration practices amongst Canadian public sector policy analysts using the TPB model. The Theory of Reasoned Action model (a forerunner to the TPB model), with the presence of age and gender variables, explained 11% of variance in the intention to share knowledge and collaborate across the organization. Although the overall model was significant, this is a relatively low proportion in contrast to the variance typically accounted for by the TPB (Armitage & Conner, 2001). Attitudes and subjective norms were found to be predictors of intention, with perceived behavioural control not an important factor. The inference from the above results is that policy analysts believe that knowledge sharing and collaboration are important for effective policy formulation, and the rhetoric of knowledge sharing and collaboration is well-established in government, but that there are organizational and personal constraints on the policy analysts’ ability to act on their beliefs. What respondents believe to be true, and the ability they have to act upon the encouraging messages they hear, are perhaps in conflict.
128
Chapter 9 - Knowledge Sharing, Collaboration and the Policy Analyst (II)
9.1 SummaryPurpose
This research is aimed at describing the contemporary world of policy analysis from the perspective of individual policy analysts situated throughout the Government of British Columbia (BC), focussing on knowledge sharing and collaboration amongst policy analysts as activities that support a horizontal approach to policy formulation in response to complex policy settings. Building on the Theory of Planned Behavior (TPB) (Ajzen, 1991), the research investigates how the attitudes and perceived behavioural control of policy analysts, and their beliefs about organizational norms, motivate, constrain and influence their intentions and behaviour with respect to organization-wide knowledge sharing and collaboration.
MethodsSemi-structured interviews with practicing policy analysts (n = 14), as members of five
separate corporate policy units in the Government of British Columbia, were conducted, transcribed and analyzed based on deductive coding and using computer-supported qualitative data analysis. Quantitative Content Analysis (QCA) is used to analyze the interview transcripts and investigate the relevance of the TPB model to the respondents’ perspectives.
FindingsInterview respondents indicated strong positive attitudes and norms towards the necessity
and benefits of pan-organizational knowledge sharing and collaboration. While there was articulated support from respondents that they have the authority and capacity to act on such attitudes and norms, the evidence indicates that examples of actual behaviour do not always align with those perceptions. Generally, respondents appeared constrained from unilaterally engaging in collaborative initiatives across departmental lines by the limits of their authority and the institutional incentives that promote a focus on their own policy unit or ministry to the exclusion of others. Nonetheless, the TPB model does appear useful in helping us understand what does and does not contribute to a policy analysts’ motivation for, interest in and commitment to sharing knowledge and collaborating with colleagues across the organization.
Research LimitationsThe results are limited to the British Columbia Government context and are strongly
influenced by the nature of semi-structured interviews and qualitative methods, and by the self-selection bias of policy analysts who chose to participate. The use of Quantitative Content Analysis (QCA) for the purpose of scoring qualitative data is not without its critics, and the use of QCA data in exploratory regression modelling is an unproven method. Interview respondents were replying as individuals who are also members of corporate policy units, rather than as representatives of corporate policy units. Future research should focus on
129
corporate policy units as autonomous sub-organizational entities, using methods such as participant observation or workplace ethnography.
Practical ImplicationsThe intention of this research is to provide policy unit managers with insights that can
assist in addressing the organizational challenge of responding to cross-cutting policy issues in the context of the current and foreseeable technological and organizational setting. Reiterating previous findings from the research literature, this research demonstrates that attempts to impose knowledge management (KM) technology solutions from above may face significant barriers where the organizational culture does not support open knowledge sharing and collaboration. The results of this study should provide a foundation for public sector organizations seeking to increase the effectiveness of their knowledge workers in the policy formulation process by identifying factors that can promote and foster more open knowledge sharing and collaboration.
Originality / ValueThis study is the first to use semi-structured interview data to investigate knowledge
sharing and collaboration practices amongst Canadian public sector policy analysts using the Theory of Planned Behavior model as an analytical framework.
KeywordsPolicy analysts, horizontal policy, knowledge sharing, collaboration, organizational culture,
organizational sub-cultures, collaborative technology, Gov 2.0, organizational social networks, Theory of Planned Behavior.
130
9.2 Background and ObjectivesPolicy-making is hard, and it can often be made harder still when it is complex (Dror,
1986). Profound uncertainty, rapid emergence and multiple issue interconnectedness are some of the features of a complex policy environment that challenge public policy makers (Geyer & Rihani, 2010). One approach to dealing with complexity in a public policy context is horizontality, the act of working across the various ministries and divisions of a government in order to harness the organization’s capacity and resources and direct them towards a response to the complex problem (Parsons, 2004; 6, 2004). One prominent mechanism for addressing the horizontality challenge is the promotion of greater organization-wide collaboration, knowledge sharing and active knowledge seeking amongst a network of knowledge workers (Galbraith, 1973; Weber & Khademian, 2008). Efforts by organizations to improve knowledge transfer and collaboration amongst workers and organizational units have been found to contribute to improved organizational performance in a range of private sector settings (Argote & Ingram, 2000; Darr, Argote & Epple, 1995; Stewart 2002). And in recent years, some evidence that this is also true in the public sector has started to emerge (Binz-Scharf, Lazer & Mergel, 2012; Willem & Buelens, 2007; Yang & Maxwell, 2011).
But how can knowledge sharing and collaboration be promoted by government managers in the context of traditional government structures involving ministries, divisions and branches (Peters, 1998) - structures that can lead to dissonance between the organization’s constituent sub-cultures (Kuh & Whitt, 1988; Scott, 1970)? And how can a collaboration and sharing ethic be promoted across a public service starved of capacity (Clark, 2008), where a bureaucracy asked to “do more with less” (Osbourne, 1993) must choose what can be done with the resources available, and where the policy analyst’s value and contribution to the policy formulation process is continually in doubt (Campbell & Wilson, 1995; Kirp, 1992)? How can policy analysts share more knowledge without becoming responsible for adding to their colleagues’ information overload (Edmunds & Morris, 2000; Eppler & Mengis, 2004)? Is knowledge sharing simply a new term for a computerized knowledge management system (KMS) or an electronic knowledge repository (EKR), in which we store information within an organization using better search functions and linked datasets (Dawes, Cresswell & Pardo, 2009)? Or is it something different, implying a person-centred system where tacit knowledge (i.e., practical knowledge and intuition, as opposed to explicit knowledge that is easily codified, stored and transmitted to others) is self-organized and shared amongst knowledge workers (Ackerman, Pipek & Wulf, 2003; Collins, 2010)? The emergence of Web 2.0 tools and approaches has raised the possibility that we have entered a new knowledge management era - Enterprise 2.0 (Cook, 2008; McAfee, 2006) - that can address the horizontality problem (Tapscott & Williams, 2006), facilitate the sharing of knowledge across government (Mergel, 2011) and promote transformative governance (Mergel, Schweik & Fountain, 2010). Does the dawn of the Web 2.0 era herald the emergence of a new breed of policy analyst, the Policy Analyst 2.0, that takes advantage of the capacities of the social web to tap into both external and internal knowledge sources as a supplement to the traditional craft of the analyst (Meijera & Thaens, 2010)? Beyond knowledge sharing and seeking, what is collaboration - a
131
requirement that public servants work together? What is the purpose of the organizational structure in which the policy analyst is situated within a branch, in a division, in a ministry, if they are expected to work with colleagues other than those connected to them on the org chart? Alternatively, in promoting the concept and the implied value of collaborating, have we given rise to a “cult of collaboration” that dissipates individual responsibility and risks reducing direct contributions to organizational performance (O’Flynn, 2009)?
The theoretical perspective is derived from the Theory of Planned Behavior (TPB; Ajzen, 1991), in which attitudes, organizational norms and perceived behavioural control are assessed as to their influence on the behavioural intention of policy analysts to share knowledge and collaborate across the organization. While the following does not involve a formal test of hypotheses involving the TPB, the model is used as an analytical framework for assessing policy analysts’ beliefs and commitments to knowledge sharing and collaboration. The interview data is analyzed using Quantitative Content Analysis (QCA) to investigate the relevance of the TPB model to the respondents’ perspectives.
Based on semi-structured interviews with policy analysts as members of corporate policy units in the Government of British Columbia, this research is aimed at the questions of how governments can deal with the challenge of policy complexity by supporting horizontal policy formulation through the promotion of intra-organizational knowledge sharing and collaboration, and what barriers might stand in the way of the sharing of knowledge and efforts by public servants to collaborate with colleagues.
9.2.1 Research FocusThis research is part of a wider investigation into the contemporary state and evolution of
the policy analysis and formulation process in the Government of British Columbia. In order to focus the analysis, the perspective taken here looks at policy analysis in government as an information-driven enterprise in which it is assumed that greater knowledge sharing and collaboration amongst policy analysts within a government contributes to enhanced organizational and policy effectiveness. The research focus is on what motivates and constrains policy analysts in their efforts to solve complex policy problems through horizontality, where horizontality focusses on internal knowledge sharing and collaboration. Ajzen’s (1991) Theory of Planned Behavior (TPB) is used as an analytical framework in this research, following similar approaches to consider how the attitudes, subjective norms and perceived behavioural control of individual policy analysts influence their organization-wide knowledge sharing and collaboration actions (see, e.g., Bock et al., 2005; Holden, 2010; Holden et al., 2011; Jewels & Ford, 2006; Kankanhalli, Tan & Wei, 2005; Zhang, Cresswell & Thompson, 2005; Zhang & Dawes, 2006). For the assessment of the interview data, the TPB is used to frame the research questions and data analysis (following, e.g., Fukukawa, 2002; Klobas & Clyde, 2000) and explore in greater depth the respondents’ attitudes, subjective norms, behavioural control and intentions using semi-structured interviews (following, e.g., Bocksnick, 2004; Ouadahi, 2008; Smarkola, 2008; Smith & Biddle, 1999).
In the TPB (see figure 1.2, above), the main dependent construct is behavioural intention, from which behaviour is theorized to follow (Ajzen, 1991; 2002). The main independent
132
constructs in this model are attitude toward the behaviour, subjective norms, and perceived behavioural control. The basic idea underlying TPB is that a person’s behaviour is driven by their behavioural intentions, and behavioural intentions are a function of the person’s attitude toward the behaviour, the subjective norms that influence the behaviour, and the person’s perception of their capacity to perform the behaviour.
The use of the TPB model in this research provides a framework for assessing what motivates and facilitates efforts by policy analysts to engage in organization-wide knowledge sharing and collaboration. From the perspective of individual members of corporate policy units in the Government of British Columbia (BC), the interview data focusses on knowledge sharing and collaboration as activities that support policy formulation across government.
9.3 MethodsA convenience sample of fourteen British Columbia Government public servants are
included as interview participants in this research, all of whom were members of defined corporate policy units. An interview guide for the semi-structured interviews was developed following the constructs in the TPB model and included measures of attitudes, subjective norms, perceived behavioural control and behaviour regarding knowledge sharing and collaboration experience in the policy process. Questions were formed principally using the Critical Incident Technique (CIT) (Flanagan, 1954) in order to reveal actual behaviour rather than simply belief (Cunningham, 2001; Hettlage & Steinlin, 2006). Interview participant data was collected using an online browser-based questionnaire completed by participants following their interview.
Verbatim interview transcripts were imported into NVivo (a qualitative data analysis software package) and coded based on a preliminary start list of a priori codes developed based on the theoretical framework and research questions (Miles & Huberman, 1994). The analysis presented here is principally based on quasi-statistical analysis (Miller & Crabtree, 1992), a method aimed at summarizing the data numerically with descriptive statistics to detect patterns. In assessing the “goodness of fit” of the TPB model, Quantitative Content Analysis (QCA) is used as a structured measuring and counting method designed to examine the large amount of content using statistical methods, with the aim of reducing the complexity of the corpus to reveal patterns and themes.
9.4 ResultsFive of the interview respondents are female (two of whom are management) and nine
male (five of whom are management). Respondents range in age from 28-32 to 53-57 (based on 12 5-year age categories respondents could select from in the on-line questionnaire). Attention is focussed here on whether the Theory of Planned Behavior provides insight into the ability of respondents to have collaborated and shared knowledge successfully in the policy process. The questions sought to illuminate what the respondents’ attitudes, subjective norms and perceived behavioural control were with respect to the future intention to share knowledge and collaborate across the organization, and what relationship there was between that intention and incidents identified by the respondents of having actually shared
133
knowledge and collaborated to positive effect. This section addresses the research questions as to how the Theory of Planned Behavior helps us to understand the intention of respondents to collaborate and share / seek knowledge, as well as investigating how respondents conceptualize the knowledge sharing and collaboration culture across the British Columbia Government (and within the individual corporate policy units sampled) and whether they consider such a culture to have a positive influence on horizontal policy formulation.
Table 9.1, below, presents the results of a Quantitative Content Analysis approach to understanding how each respondent spoke about their attitudes, perceived norms, perceived behavioural control and examples of past behaviour with respect to the concepts of collaboration, knowledge sharing and knowledge seeking. Each respondent’s transcript was coded using the a priori start-list of codes (see Appendix K) and the percentage of the transcript spoken by the respondent and coded as such is reported. The coding include both positive values (i.e., comments supportive of the concept) and negative values (e.g., comments that question the value of the concept, or question the presence of the value in the work environment), though only net values are reported (i.e., the positive score minus the negative score). Details of how each concept was measured are presented below, but in all cases the value reported shows the net percentage of the content spoken by the respondent in the interview coded as indicated in that column. An empty cell indicates that the respondent did not say anything that was coded to that concept, and a negative value indicates that the respondent’s negative comments exceeded their positive comments (0% means that both positive and negative scores were roughly equal). Respondents are listed by job category (”Category”), gender (”Gender”) and policy unit (”Group”), and the table is presented sorted on job category.
As an example of how to read the table, for respondent #1 (the first male manager listed in group 1), of the total number of characters in the transcript attributed to the respondent, 46% was coded as revealing a net positive attitude towards collaboration (in this particular case, nothing was coded as indicating a negative attitude towards collaboration). To put that percentage value in context, 46% of this respondent’s 3003 word transcript amounts to approximately 1375 words; a significant amount, to be sure, but one that reflects the focus of the interview and the emphasis of the speaker. The reader should understand that content can have been marked using many codes, so the same content can be counted under multiple headings. The percentage measures are therefore comparable across concepts and between respondents as relative measures of what issues the respondent focussed on and spoke to, and how they assessed those issues - both positively and negatively. The data presented in table 9.1 is relevant to the the following four sub-sections.
9.4.1 AttitudesAttitude toward a behaviour measures the degree to which performance of the behaviour is
positively or negatively valued or supported by the respondent. Respondents generally reflected positive attitudes towards the concepts of collaboration and knowledge sharing / seeking as important elements in the internal-to-government policy formulation process. As noted above, only net scores (i.e., positive scores minus negative scores) are reported in the
134
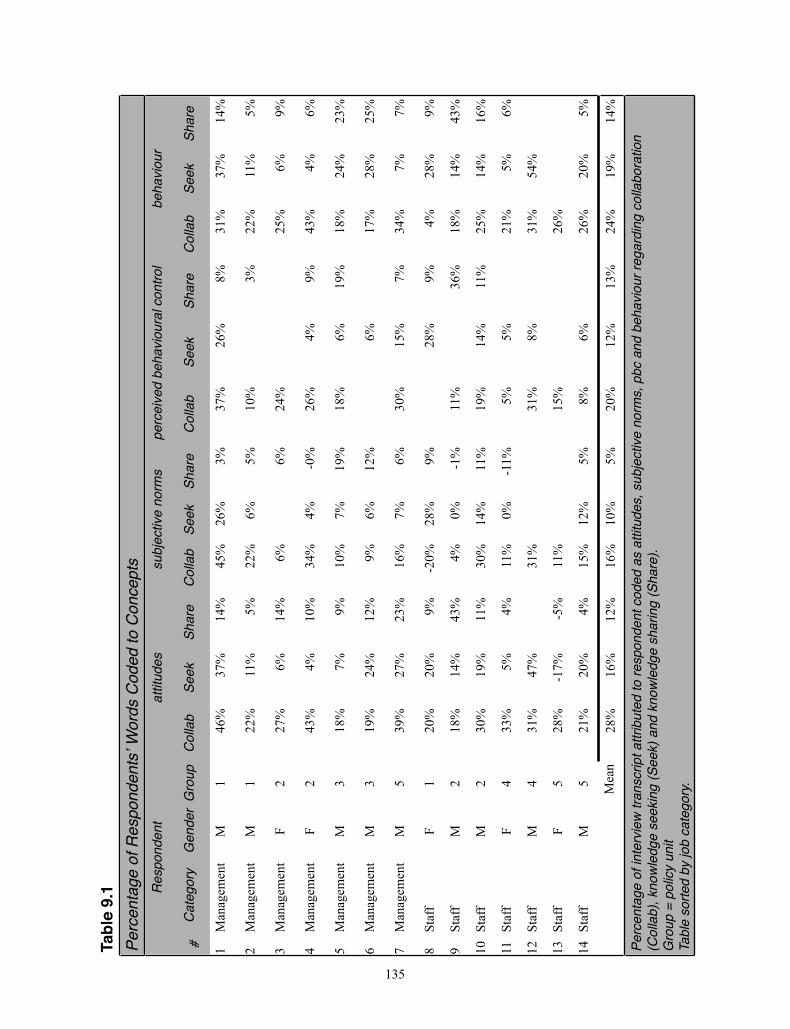
135
Tabl
e 9.
1P ee
rcen
tage
oof R
espoo
nden
tts� W
ordss
Cod
edd to
Con
ccept
sR
espoo
nden
tat
titud
essu
bjeec
tive
norm
spe
rcei
vedd
beha
viou
rral c
ontro
lbbe
havi
ourr
#C
ateg
ory
Gen
der
Gro
upC
olla
bSe
ekSh
are
Col
lab
Seek
Shar
eC
olla
bSe
ekSh
are
Col
lab
Seek
Shar
e
1Management
M1
46%
37%
14%
45%
26%
3%37%
26%
8%31%
37%
14%
2Management
M1
22%
11%
5%22%
6%5%
10%
3%22%
11%
5%
3Management
F2
27%
6%14%
6%6%
24%
25%
6%9%
4Management
F2
43%
4%10%
34%
4%-0%
26%
4%9%
43%
4%6%
5Management
M3
18%
7%9%
10%
7%19%
18%
6%19%
18%
24%
23%
6Management
M3
19%
24%
12%
9%6%
12%
6%17%
28%
25%
7Management
M5
39%
27%
23%
16%
7%6%
30%
15%
7%34%
7%7%
8Staff
F1
20%
20%
9%-20%
28%
9%28%
9%4%
28%
9%
9Staff
M2
18%
14%
43%
4%0%
-1%
11%
36%
18%
14%
43%
10Staff
M2
30%
19%
11%
30%
14%
11%
19%
14%
11%
25%
14%
16%
11Staff
F4
33%
5%4%
11%
0%-11%
5%5%
21%
5%6%
12Staff
M4
31%
47%
31%
31%
8%31%
54%
13Staff
F5
28%
-17%
-5%
11%
15%
26%
14Staff
M5
21%
20%
4%15%
12%
5%8%
6%26%
20%
5%
Mean
28%
16%
12%
16%
10%
5%20%
12%
13%
24%
19%
14%
Pe (Co
Gro
Tabrc
enta
ge o
f in
olla
b), k
now
leou
p =
polic
y u
ble
sorte
d by
jnter
view
ted
ge s
eek
unit
job
cate
g tran
scrip
king
(Se
gory
.
pt a
ttrib
ute
eek)
and
ked to
resp
know
ledg
epond
ent c
oe
shar
ing
(oded
as
a (S
hare
). attit
udes
s,
sub
ject
ive
norm
s, p
bc a
nd b
eehav
iour
reega
rdin
g c col
labo
ratiio
n
table. However, in 40 of 41 valid positive / negative concept pairs (i.e, the combined positive and negative scores for each concept across all respondents; the one instance where no part of the transcript was coded to the concept is not treated as a valid pair), the respondent indicated a positive score toward the concept that exceeded any negative comments that were made (thus only one respondent shows a negative net score, on both knowledge sharing and knowledge seeking), with no negative comments offered in 33 of those instances where a positive score was recorded. However, 6 of 14 respondents did indicate negative scores in some respect. Analysis based on groupings (whether by job category, policy unit or gender) did not reveal definitive patterns, though overall scores for women were slightly lower than for men across all three concepts.
In the context of the interview questions, and the perspective brought to the coding, positive attitudes generally reflected statements that valued the practice, whether as something the respondent saw in themselves, as a value they appreciated in colleagues or in an abstract sense of something that contributed value to the policy formulation process. Two examples from the interviews that reveal a positive attitude to collaboration, one internally focussed and the other external, are:
The other hat that we are responsible for from a policy and legislation perspective is we provide leadership and support to the different offices and branches within our ministry. So, if a particular area ... has a major initiative that’s a government priority, we would come in and actually assist and help.29
Well, in our ... business, stakeholders tend to be more external to government than they are internal. And the services we provide are external to government. So … there are people out there constantly wanting to do things differently. And it’s within our control to either make it happen, or if it’s not [appropriate], then don’t allow it to happen. But, I was taught many years ago, that our job in government is not to say “no, you can’t do that”. Our job in government should be to protect the public interest.
Several of the responses revealed a positive attitude to knowledge seeking, for example:where I am now, it’s much more about looking in the files that we have, doing some external research but also tapping into the knowledge of my colleagues. We have a lot of longevity in [this] department in which my branch is a unit. And so we have people who have been around for 20 or 30 years who are originators of certain elements of the system that we still have, certain innovations in the legislation so I go to them for explanations and context: “why did that happen?” So it’s not about trying to find out the answer on my own anymore but working with them and all the in-house expertise. Calling people up for an answer rather than trying to find it written down somewhere.
136
29 No identifying information is given about the respondent who supplied the quotation so as to not risk de-anonymizing them. For the same reason, the quotations have been edited to remove any content that might identify the respondent or their location.

And as for positive attitudes to knowledge sharing, one of the several examples that stands out is:
in this branch, we have standing monthly staff meetings. And what I’ve done for the past few months is that a standing agenda item for the staff meeting is for somebody in the branch to put together a presentation of a project or issue that they’re working on and present that issue in a 4 or 5 slide PowerPoint presentation to the rest of the staff so they can understand what that issue is and and what it’s all about as a means of them understanding the kind of things we get into throughout this branch.
Responses coded as negative centred on questions raised by the respondent as to the value of the concept in practice. Comments coded as negative on collaboration clustered around the logistics and practicalities of how policy formulation is actually moved forward when the breadth of collaboration is expanded further (which brings together comments coded as “attitudes” with issues of behavioural control and the practical ability to act on one’s attitudes). A notable example in this regard was:
Where I would make the distinction is in the context of decision making … these are such complex issues that it can be tremendously difficult, even to bring say 3 or 4 people to a point of consensus about the best way to proceed. So trying to make those kinds of decisions, essentially, in a more open forum, from a governance perspective would be entirely unmanageable … If we were to expand it beyond that in terms of “well, guys, where should we go with this?”, I can’t see coming to very positive outcomes on that kind of thing.
Though rare, examples of the downsides of “too much” knowledge sharing do emerge from the interview transcripts:
we had one committee … its purpose was to bring people from across government together to talk about what we were doing [on this issue]. I went to a few of those meetings and cried tears of boredom (laughing), right? Because you go there with this horizontal, collaborative intent and it turns into a laundry list of people droning on about their work in a way that’s, you know, it’s difficult to find that balance between what’s interesting and informative and what’s just too freaking detailed, right?
9.4.2 Subjective NormsAjzen (1991) defines subjective norm as how the respondent perceives the expectations of
their environment to engage in (or resist) a behaviour. The measure of subjective norms here is meant to convey how the respondent understands alters in the policy formulation environment value, encourage and reinforce the concept. Table 9.1 (above) shows how each respondent spoke about the concepts and whether they felt the prevailing organizational norms supported or ran counter to the principles of collaboration and open knowledge sharing / seeking (again, only net values are reported). As with the respondents’ own attitudes
137
towards the concepts, respondents generally revealed that prevailing organizational norms amongst their superiors and colleagues, and more widely across the policy formulation environment, encourage positive behaviour with respect to collaboration and knowledge sharing / seeking. However 8 of 14 respondents did indicate negative scores in some respect. In 31 of 37 valid positive / negative concept pairs, the respondent indicated a positive score toward the concept that exceeded any negative comments that were made (three pairs show a net 0% score, meaning their positive and negative scores were roughly equal, and three pairs showed a negative net score), with no negative comments offered in 24 of those instances where a positive score was recorded.
Table 9.1, when sorted into “management” and “staff”, shows similar positive scores on collaboration and knowledge seeking across the two groups, though the net negative scores on collaboration and knowledge sharing were centred in the staff level. When sorted on policy unit (”Groups”), policy unit 2 shows high variability between positive and negative norms on collaboration, knowledge seeking and knowledge sharing. For gender, again, many of the negative and zero scores on all three concepts came from female respondents.
Positive responses generally reflected statements that interpreted colleagues’ behaviour and attitudes, and experience with other aspects of the policy formulation system, as being conducive to a collaborative and open system. One example from the interview transcripts reveals a positive perspective on collaboration typical of several policy units:
I think in our branch, and I would also extend it to the [entire] department, that collaborative model happens in real life, it’s like people go into different offices but there’s no hierarchy … it’s a matrix environment where … it’s an open door policy, if you need something from this person you just go and ask them or they’ll come to you and you’ll have an informal meeting, two people collaborating on a document.
While examples of openness and collaboration were evident from all respondents, the interview discussions surrounding collaboration and knowledge sharing tended to centre on the respondent’s division, rarely venturing beyond the walls of the ministry. Despite the overt themes of the research questions and the interview guide that attempted to direct the conversation towards government-wide knowledge and collaboration networks, respondents tended to refer to intra-ministry mechanisms for knowledge sharing, e.g., regular departmental meetings and division-specific presentations. However, positive norms regarding inter-unit and inter-ministry knowledge seeking did emerge from the transcripts:
I think one of the things we try to do as a small office … [is] I would ask somebody to start off by saying “I’ve got this problem, have you encountered this before?” We would then broaden outside of our office to another office or to another ministry. Over time you build up this network. It’s informal - you have a network of policy directors, a network of people you’ve worked with.
Positive norms re knowledge sharing were also evident:
138
government is already doing that ... government has an intranet site, the @Work site, and there’s a lot of postings on there and there’s different threads... Someone can start the thread and you get lots of comments. In fact, executive are encouraged to go in and have a look at some comments sometimes and look at some threads ... there’s a Yammer site within government. People do post things and you get a string of comments… we had a Spark site that you may be familiar with. It was on innovation, people that had ideas could share them.
Responses coded as negative were varied but one theme that emerged centred on demotivation (whether in respect of specific developments, or in response to longer-term trends in resource cut-backs and continued politicization of the public service):
I think that the organizational health at the time - you know, what’s going on, how engaged and motivated people are feeling as employees, what the the political situation is like and what their executive level management is like - I think has a really tremendous impact on what I would think of as value-added kinds of policy behaviours … it’s very easy to, you know, discharge your responsibilities in a narrow way … versus the kinds of activities that for me require a lot more energy, drive and initiative - like reaching out and going to the community of practice, or contributing to a discussion, or going on discussion forums and typing things or any of that kind of thing when people are feeling kind of deflated.
Another comment related to the environment being inadvertently antagonistic to knowledge sharing noted the risks in being too open within the bureaucracy:
I think it would be great to allow people to submit anonymous policy suggestions through SPARK. I think many people hold back from putting suggestions out there that could be quite innovative but don’t because they feel uncomfortable with the attention or are nervous how the idea would be received.
The government’s approach to knowledge seeking also was noted as facing some challenges, particularly being risk-averse with respect to external stakeholder engagement:
I think we can do a better job at how we engage stakeholders in our processes, solicit their views and obtain evidence from them of what the problem is and what potential solutions are in the evidence that kind of supports or provides the analysis of how effective different solutions may be... I think that within our ministry we could probably do a better job... I get the sense that there’s a bit of risk in doing that and some hesitancy... I think there’s a way you can do it and get some good information about issues.
Lastly, there were occasionally revealed differences in perspective between ministries as to the benefits of open knowledge sharing:
139
there was a push from [colleagues who] said “we really would like to see this used more broadly”… But our sister ministry felt that because things change, mandates change, legislation changes, they were somewhat reluctant to see that out in the public domain as a published piece.
9.4.3 Perceived Behavioural ControlPerceived behavioural control refers to a respondent’s perception of their ability to perform
a given behaviour (in the case of this present research, collaborating and sharing/seeking knowledge across the organization), and is determined by the presence of factors that may facilitate or impede performance of the behaviour. To the extent that perceived behavioural control is an accurate reflection of actual behavioural control (which is the extent to which a person truly has the skills and resources needed to perform a behaviour), perceived behavioural control - in conjunction with intention - can predict what someone will actually do in practice . Perceived behavioural control, however, can be a difficult concept to measure (Ajzen, 2002). One of the challenges in assessing the respondents’ assessment of behavioural control involves disentangling the rhetoric on collaboration and knowledge sharing - what public servants are told and explicitly encouraged to do (assessed above under “subjective norms”) - from the reality of their environment based on the underlying implicit incentive structure or other constraints on knowledge sharing and collaboration(Connelly et al., 2012; Wang & Noe, 2010).
Table 9.1 presents the results of a specific code that was intended to spotlight how the respondents talked about the sub-culture of their policy unit and their ministry in providing the environment and tools that facilitated knowledge sharing and collaborative behaviours and give respondents the latitude to act on opportunities to do so. As with attitudes and subjective norms, respondents were generally positive in their observations about the ability to act upon collaboration and sharing motives. No net negative or net 0% scores were recorded, and valid entries were recorded in 30 cells (in the remaining 12 cells, the respondent offered no commentary - either positive or negative - about the concept). Respondents categorized as “management” had marginally higher scores on collaboration and knowledge seeking. No between-group differences of note emerge when sorted on gender or policy unit.
In the interviews and through coding, perceived behavioural control was addressed with reference to the respondent’s work environment and the wider organizational culture, as a measure of the extent to which a respondent’s supervisors, organizational sub-culture and technology afforded the opportunity to engage in collaboration and organization-wide knowledge sharing / seeking activities. No respondents made reference to a government-wide culture (other than corporate technology initiatives such as Spark and @Work), focussing instead on their own ministry or policy unit. Generally, respondents spoke highly of the support they get for reaching across the wider organization to build collaborative relationships and share knowledge:
My executive director is a really great team player, and I think he’s become known and accepted in the ministry as, often times when there’s … an inter-
140
ministry or intra-ministry issue, often our office will come in to take on that liaison function.
Specific reference to the conduciveness of the environment to knowledge seeking were also made, for example:
if I have a question that maybe might have something to do with [for example] health, even if I know it might have nothing to do with them, I can still send them an e-mail and say “you know, we’re working on this issue, would there be anybody in your ministry that is working on this that you can check?” … And I’ll do that with other governments across the country [too].
However, the antithesis of cross-organizational knowledge sharing - i.e., situations where the organizational structure made connecting outside of one’s unit difficult (Valentine, Staats & Edmondson, 2012)- was acknowledged by respondents, for example:
One problem … is siloing in government. There’s no question that that is an issue, but, pretty much anywhere - although I think it happens to different degrees in different ministries. For instance, in a small one such as this, siloing may be less of a problem. Whereas if you have a massive ministry maybe that could be more of a problem. You know, different people in different departments they may sit right next to each other and they might not know one another’s names.
Additional examples of challenges in knowledge seeking were also revealed:one of the issues that we’re dealing with is precisely those issues … being able to access and find information and knowledge sources readily. That has been a considerable issue for us. While there’s no question that there’s an awful lot of knowledge that exists in the policy department, it’s fragmented, it’s compartmentalized. I mean, it’s all there, on our internal drives, on our internal networks is what I mean, but it’s not in any one source. You might find something about topic A over here, topic B is over here, topic C is over here but there are 7 different versions of it - which one do you pick?
Lastly, the politically sensitive nature of government policy formulation sometimes constrained the best intentions at open knowledge sharing:
In the policy world, sometimes we deal with issues that are sensitive. So in that case, no e-mail - a phone call. Because we’re told (laughing) this is on the QT, we need an answer but we don’t want to necessarily leave a paper trail. It’s not because the issue we’re discussing is a bad thing to do… We want to make a phone call and say “what would you think about this?” And you talk around it and you get a sense of what the stakeholder might think, and that’s what you walk away with. But you don’t want to put that in writing because if you do and give it to them, boom it hits the [newspaper] the next day if they don’t like it.
141

9.4.4 Behaviour Supporting the ConceptUsing the Critical Incidents Technique (Flanagan, 1954), respondents were asked to
provide examples of when they were able to successfully collaborate, share knowledge or connect with knowledge sources across the organization. These responses in the transcripts were coded as “Behaviour Supporting the Concept” against each of the concepts, and those scores are noted in table 9.1 (measured as a percentage of their total contribution to the transcript). All respondents but two were able to provide fairly detailed examples of all categories of workplace collaboration, knowledge sharing and knowledge seeking incidents. As all contributed incidents were framed in positive terms, no net negative or net 0% scores were recorded, and valid entries were recorded in 39 cells (the remaining 3 empty cells indicate that the respondents did not provide an example of knowledge seeking or knowledge sharing). Respondents categorized as “management” had marginally higher scores on collaboration and knowledge seeking behaviour, though as with previous measures reported in table 9.1 this does not represent a subjective evaluation of the incident but rather simply measures how many words (or, more precisely, characters) as a percentage of the total contribution from the respondent were devoted to describing the incident. No between-group differences of note emerge when sorted on gender or policy unit. The degree to which the examples were extensive, detailed or robust, of course, varied across the respondents.
On collaboration, all respondents had something positive to report, which paralleled other statements during the interviews in which respondents were supportive of the concept of collaboration. Respondents generally spoke about collaborating with colleagues within their own ministry, though there were some examples of collaborating across ministry lines and with other orders of government on complex files and especially on multi-jurisdictional issues; two in particular stand out:
So [the previous example is] very typical of the way we do things in terms of bringing in people from outside of government and then working really intensely with subject matter experts where we can find them.
I have more examples dealing with inter-jurisdictional collaboration because of the nature of what we do … a lot of our collaboration work happens between provinces and territories, because of the nature of the [issue] and our particular interests.
All respondents but one related a positive example of knowledge seeking behaviour and only two respondents failed to relate a positive example of knowledge sharing behaviour. Two mechanisms emerge as particularly important: the government directory <http://dir.gov.bc.ca>, and the use of social networks for navigating different parts of government.
I’ll look at the directory, which is really useful - it’s a great tool because it will show you how divisions are structured, and you can use the ministry websites to see how their departments are structured and you can figure out which branch is responsible for something; that’s really helpful.
142
I began searching for help, and [asking] people who might know people who might know something about this. And I did that just through phone calls to people I knew already and eventually I fortunately found somebody who happens to be an expert in this specific subject area.
9.4.5 The TPB ModelAs noted above, the basic idea underlying the TPB is that a person’s behaviour is driven by
their behavioural intentions, and behavioural intentions are a function of the person’s attitude toward the behaviour, the subjective norms that influence the behaviour, and the person’s perception of their capacity to perform the behaviour. With the quantification of the interview data using QCA methods and categorized according to the TPB constructs as shown in table 9.1, we are in a position to consider whether the emphasis that the respondents placed on talking about their attitudes, subjective norms and perceived behavioural control align with the recounting of incidents describing their past behaviour (in respect of collaboration, knowledge sharing and knowledge seeking). That is, if a respondent placed more emphasis (where emphasis is measured simply by talking more, and more positively, about a subject than something else) on their attitudes, subjective norms and perceived behavioural control with respect to a concept, and was able to describe having successfully accomplished the concept in question, we might infer that the TPB model has some relevance in that context. I do no risk overplaying this hand by presenting a table of detailed regression results (as in the previous chapter), but the following provides some indication of the applicability of the TPB model in the context of the present interview data based on an investigation of the relationships amongst the concepts as coded in the data analysis assessed using the framework of the TPB.
Attitudes - whether with respect to collaboration, knowledge seeking or knowledge sharing - appear to show the strongest relationship to examples of having successfully achieved the concept in question, taking all interview respondents together. Only in respect of collaboration do subjective norms appear to have influenced behaviour, and in no case was perceived behavioural control a noticeable element. When assessing between-group variation as between females and males, between managers and staff and between policy unit groupings, there appears to be very little variance of note, with the only feature being differences in attitude generally, and attitudes to knowledge seeking specifically, with scores for females being lower than scores for males. And when considering the relevance of the TPB model and comparing females and males, attitudes were of primary importance for both genders across all concepts except on knowledge seeking and the combination of all three concepts, where subjective norms appear to exert a greater influence on behaviour for women than for men. Comparing respondents based on job category, for management respondents the single relationship of note was between attitudes and behaviour for the concept of collaboration only; whereas for staff, their responses on subjective norms with respect to collaboration were an important correlate with behaviour, though again with respect to knowledge sharing / seeking, attitudes were the element of strongest importance. Note that
143

references to ‘importance’, ‘strength’, ‘relationships’, etc. are inductive reasoning statements and are not meant to be interpreted as statements of statistical significance.
9.5 DiscussionWhile the application of explanatory behavioural models to predict knowledge sharing
intention and behaviour is well established (Kuo & Young, 2008), there has been limited effort to use such models to explain public servants’ behaviour with respect to internal knowledge sharing and collaboration (Bock & Kim, 2002; Kankanhalli, Tan & Wei, 2005; Willem & Buelens, 2007; Zhang, Cresswell & Thompson, 2005), and an absence of such application to the policy formulation system. Rarer still are studies which use qualitative interview data within the framework of the TPB to investigate what compels or motivates behaviour (see Bocksnick, 2004; Ouadahi, 2008; Smarkola, 2008; Smith & Biddle, 1999). Much of the recent research on the applicability to the concept of knowledge sharing has been assessed using quantitative data and structural equation modelling (e.g., Chatzoglou & Vraimaki, 2009; Ciganek, Mao & Srite, 2009; Lin, 2006; Lin & Lee, 2004; Willem & Buelens, 2007; Yang & Farn, 2009). The previous chapter used hierarchical regression analysis following the method proposed by Ajzen (1991), and following examples such as Ajzen and Madden (1986), Beck and Ajzen (1991), Gupta, Sharma and Ganesh (2009) and Zhang, Cresswell and Thompson (2005). Here, using the TPB as an analytical framework, and based on the QCA data presented in table 9.1, this research seeks to understand how the attitudes, subjective norms and the perceived behavioural control of policy analysts compared to their past behaviour with respect to organization-wide knowledge sharing and collaboration. Specifically, the research question addressed how the TPB helps us understand the intention of respondents to collaborate and share / seek knowledge (Fukukawa, 2002; Klobas & Clyde, 2000).
Examples of the application of the TPB to public sector knowledge sharing have tended to confirm the explanatory power of the model. In the present research, attitudes were shown to be important as an influence on incidents of behaviour. Respondents clearly have a positive attitude towards knowledge sharing and collaboration, and with respect to subjective norms their assessment of their environment is that generally there is a rhetoric of collaboration and knowledge sharing that permeates the government. But perhaps surprisingly, subjective norms appeared to be influential in limited circumstances (in respect of collaboration for staff members, and knowledge seeking for women). That subjective norms were not more widely influential suggests that neither direct nor implied messaging from one’s superiors and colleagues is providing policy analysts with a clear signal and encouragement to engage in collaboration and knowledge sharing. What seemed clearer, however, was that perceived behavioural control did not appear in itself to be related to behaviour. As was noted, perceived behavioural control can be as challenging to measure as behaviour, raising the question as to whether policy analysts that claimed to have behavioural control have actual behavioural control. The respondents appeared open to opportunities for collaboration and knowledge sharing but may be faced with some dilemmas: if they are responsible to their Minister, and the performance of their unit, how can that be balanced with the risk and
144
benefit-sharing implicit in collaborative arrangements (Kumar & van Dissel, 1996); and, do they have the authority and freedom to ‘work outside of the box’, to suggest collaborative solutions to colleagues in other ministries, other governments or even outside of government (Kernaghan, 2000)? Again, collaboration was supported in principle but appears difficult to identify in practice when those efforts would have to cross ministry lines or reach beyond the walls of government. The policy analysis system is built on ideas such as: having more knowledge is better than less (Quade, 1975); working together is beneficial for dealing with complexity (Kenis & Schneider, 1991); and the analyst’s stature as a policy team player is enhanced by contributing policy knowledge where it is useful (Lin, 2007). And while the rhetoric of modern government often speaks of innovation (Considine et al., 2009), we often speak of bureaucrats being risk averse (Bozeman & Kingsley, 1998) with a lack of tolerance for mistakes on the part of colleagues, superiors and the audit functions of government bearing much of the blame (Dobell, 1999; Power, 1999). As well, a number of policy-related barriers to sharing among government agencies have been recently documented by Landsbergen & Wolken (2001) including: privacy concerns, ambiguity about statutory authority, openness to public scrutiny, lack of inter-organizational trust, lack of experience, lack of awareness of opportunities to share, lack of resources, outmoded procurement methods, incompatible technologies, and lack of data standards. The respondents’ attitudes (and to some extent their beliefs about organizational norms) align with this complex setting. In seeking to understand the lack of completeness in the model, the disconnect between those attitudes and perceived norms, on the one hand, and perceived behavioural control on the other, our attention is drawn to the question of whether individual policy analysts have actual behavioural control. That is, do they truly have the authority to collaborate, do they have the capacity to seek knowledge and do they have a legal right to share knowledge with their colleagues across government?
145

146
Chapter 10 - Conclusion10.1 Summary
This research explores the role of the policy analyst in contemporary practice, seeking a contextual understanding of the policy formulation process, and assesses the potential impact of new Gov 2.0 approaches and technologies on the policy formulation environment. Governments are beginning to experiment with Gov 2.0 in order to, inter alia, improve their policy analysis capacity in recognition of the special character of complex policy problems. This research reflects a growing enthusiasm for harnessing the power of the social Internet to transform the operations of government and help address the horizontality challenge. My objective here has been to take a critical look at this enthusiasm, to determine where the social collaborative public enterprise is and where it might be heading.
Analysis of the policy formulation environment in government reveals that the rhetoric of the knowledge organization is in conflict with the reality facing the individual policy analyst - a reality mired in role ambiguity, mixed incentives, limited institutional capacity and a risk-averse organizational culture. While there may be some scope for reinvigorating the knowledge organization through new knowledge sharing and collaboration technologies, freeing the organization from the bounds that limit knowledge sharing and collaboration activities by individual actors will require a fundamental reconceptualization of the practice of policy analysis and the culture of the policy formulation environment.
Hypothesizing that horizontal policy formulation approaches offer some positive responses to the challenges of complex policy settings, the focus on knowledge sharing and collaboration amongst practicing policy analysts served to frame and guide the research. Building on the Theory of Planned Behavior, the foregoing details how the attitudes, subjective norms and perceived behavioural control of policy analysts influence their intentions and behaviour with respect to organization-wide knowledge sharing and collaboration. Additional factors - such as how policy analysts conceptualize their profession and their role in the policy formulation process, how computerized knowledge management systems and collaboration technologies are affecting the policy environment, and how the organizational social network contributes to the work of policy analysts - were also explored in order to develop more fully the profile of the contemporary policy analyst.
Based on semi-structured interviews with policy analysts as members of corporate policy units in the Government of British Columbia, and an online survey of public servants directly connected to the policy analysis system in that government, the overall objective of this mixed methods study has been to explore the policy analysis environment in contemporary practice, to consider its current character and begin to map its possible future development. A number of specific questions were used to guide that exploration: what are the characteristics of the contemporary policy analyst, and what do practicing policy analysts themselves think of their profession and their role in the policy process? How does the organizational social network figure into the modern governance environment? How has technology affected the work of the policy analyst, and what might the future hold for the computer-supported policy analyst? And if knowledge sharing and collaboration hold the key
147
to horizontal policy formulation and the unlocking of solutions to complex policy challenges, what are the chances that out of the contemporary policy environment, the knowledge organization can flourish?
As this research sought to address these questions, a number of insights were revealed. Basic statistical characteristics of practicing policy analysts generally confirmed previous findings: young, highly educated and upwardly mobile, the policy analysts surveyed are notable for their commitment to their profession and their interest in their work. When grouped by gender, mean scores for women were lower for all variables (e.g., age, years in current job) except for career advancement or promotions, where the mean score was marginally higher for women. There was little lateral career movement across government ministries, though a notable amount of career advancement within the policy analysts’ ‘home’ ministry that generally follows the age profile. Reports by respondents of organizational disruptions - ministry name changes, shifts in mandate, significant re-organizations - are not uncommon, with some respondents reporting having experienced several such disruptions. However, while more than half of the sample have experienced at least one position disruptions (e.g., a termination or re-assignment), the average number of such personal disruptions was much lower. Rapid change amongst supervisors points toward some instability in the policy analysts’ supervisory channels, but there is no evidence that policy analysts cannot adapt to a changing workplace environment.
As one way for exploring how policy analysts conceptualize their profession and their role in the policy process, the idea of ‘policy analyst archetypes’ was explored. Through the various methods used to draw a social preference function from the individual preference data of respondents, what clearly emerged is that the ‘synthesizer’ archetype was consistently ranked highest as describing the role and orientation of policy analysts, followed closely by ‘connector’ and ‘entrepreneur’, with ‘listener’ and ‘technician’ rounding out the lower end of the rankings. When assessed by ministry type, interesting profiles emerged that reveal the presence of distinct ‘sub-cultures’ across the government and confirm pre-existing stereotypes: ‘social’ ministries value ‘listening’ more, whereas ‘economic’ ministries are more ‘entrepreneurial’. And when assessed by gender, other stereotypes were reinforced: women appear to rank order the five archetypes in line with the sample as a whole though perhaps leaning more towards ‘listener’ than ‘entrepreneur’, while men showed more affinity with the ‘entrepreneur’ and ‘technician’ labels. What is unclear is whether the values and role orientations of policy analysts as revealed through their preferences for particular archetypes is at variance with the expectations and needs of the policy analysis system and the decision-makers for whom the analysis is presented.
While the sociometric data collected on the organizational social network reveals some interesting patterns and confirms some preconceptions, the interview data provides insights into the value of the policy analysts’ social network for being able to connect to knowledge sources and explore collaboration opportunities. Clearly, the more experience the policy analysts had across government, the more varied and extensive their social network was. Nothing in the policy analysts’ current technology toolkit for finding knowledge or potential collaborators compared to the speed and effectiveness of picking up the phone and
148
connecting with a former colleague who might be able to provide at least a link to the necessary knowledge source.
The technology era of the policy analysts - what technology was predominant when they first started working in policy analysis - unsurprisingly follows the respondents’ age profile, except when it comes to those policy analysts who self identify as a ‘Web 2.0 policy analyst’. Having affinity for Web 2.0 technologies appears, both in the survey results and through the interviews, to be a matter of personal interest and unexplored personality factors on the part of respondent rather than some universal ‘Net Generation’ (Espinoza, 2012). Regardless of the technology era however, most respondents were supportive of the idea that successive technological innovations have had a positive impact on the policy process, though there were some emergent concerns about the impact of technology on timeliness and quality. The policy analysts interviewed can be characterized not so much as having a ‘love / hate’ relationship with email as an ‘addiction / hate’ one. Email was identified as an indispensable communication and information management tool in the policy analysis environment, while at the same time the volume and limitations of email were making it increasingly frustrating to work with. However, there was hesitancy to abandon email in favour of a ‘Facebook-like’ platform.
While Web 2.0 tools that support intra-organizational knowledge sharing and collaboration may level the social capital playing field by making it easier for policy analysts to find knowledge sources and potential collaborators with whom they may not have prior contact, we should remember that the history of computerized knowledge management systems is rife with barriers and failures. While there is great enthusiasm for the potential power of social enterprise tools to transform collections of knowledge workers into a knowledge organization, the challenge inherent in asking practicing policy analysts to transform their work-modes so radically should not be underestimated. Issues of inter-personal and intra-organizational trust are paramount, where policy analysts are asked to reveal their work-in-progress to an uncertain cast of lurking collaborators. Rewards and incentives that exist in organizations today are not oriented towards a culture of knowledge sharing and collaboration but rather towards a culture of zero-sum accomplishment. If policy analysts view their colleagues as competitors for promotion through the ranks of the public service, the sharing of knowledge will be seen by some as not only a squandering of valuable personal resources but as a potential boost to the career prospects of ones rivals. The rapid uptake of Sharepoint within the BC Public Service is a heartening indicator that policy analysts can be nudged in the direction of more open and efficient knowledge sharing and collaboration. However, both vertical and hierarchical tensions are evident and it will take a reappraisal of the organization’s recognition and incentive systems, and a commitment from senior executives, for a culture of knowledge sharing to take hold. The overlay of collaboration technology coupled with rhetorical executive promotion will fail if the issues of culture, trust and incentives are not aligned.
Women were found to be less supportive of knowledge sharing and collaboration than men. This unexpected result is, of course, directly reliant on the approach used in this research for measuring behavioural intention; however, this same measurement approach was
149
used for both female and male respondents. The research literature on this subject offered a plausible explanation: since political discussions are typically male-dominated, when policy analysis is closely linked to political outcomes women may feel disadvantaged and intimidated in policy discussions. This does not mean that women are not effective policy analysts or do not contribute to policy development; however, such a tendency might explain why women would be less assertive in sharing knowledge and seeking collaboration opportunities. The purposeful hoarding or hiding of knowledge might also explain this result, and would mirror the general concern highlighted in the foregoing paragraph, over the difficulty in achieving the open knowledge sharing organization. Where the recognition and reward system of an organization provides an incentive to withhold knowledge in order to protect and enhance one’s position, and women perceive a steeper climb up the corporate hierarchy than their male colleagues, women may learn that certain behaviours are key to advancement - and knowledge sharing and collaboration may be the unfortunate victims of these rational strategies. While it is true (as of the time of writing) that the Assistant Deputy Minister level in the BC Government is roughly equal with respect to gender, the Deputy Minister level is heavily male-dominated (though it has been less so in recent years). What is unclear, however, is whether women who excel in the BC Public Service do so through the personification of values typically seen as feminine - including, for example, a commitment to open knowledge sharing and collaboration - or whether female executive members of the BCPS have attained those heights by either learning to suppress such impulses or through not having had such character traits to begin with. An additional alternative approach to explaining this result also rests in an interpretation of knowledge sharing and collaboration as particularly risky behaviours in the context of a cautious public service. The ‘policy analyst archetypes’ results indicate that women were seen as less ‘entrepreneurial’ than their male counterparts; if entrepreneurialism corresponds to a greater penchant for risk taking, and if the dependent variable measures of openness to knowledge sharing and collaboration served as a proxy measure for greater risk taking in the context of policy formulation, what appears as a lack of support for knowledge sharing and collaboration might instead be a reflection of a lower tolerance for engaging in bureaucratically risky behaviour. There are some indications that, in computer-supported collaborative work environments, the gender imbalance that is evident in face-to-face interactions is somewhat mitigated (Caspi, Chajut & Saporta, 2008), raising hopes that a Gov 2.0 policy analysis environment may help to overcome some of this. However, for the less tangible elements of culture, trust and incentives, changing the policy analysis and formulation environment in the British Columbia Government to make it more open to the inclusion of female policy analysts will take a concerted effort by government.
Lastly, to the extent that an individual’s attitudes towards knowledge sharing and collaboration, their subjective evaluation of what people important to them believe about those actions, and their perception about the degree to which they are able to act on their intentions are aligned, the Theory of Planned Behavior predicts that the intention to act will be formed, and actual behaviour will follow. Attitudes generally reflect what respondents believe and what their experience tells them about the behaviour; norms reflect what
150
respondents hear from colleagues and superiors; and perceived behavioural control, in this context, measures whether respondents feel they have the authority, facility or capacity to act upon their beliefs and to undertake what they are encouraged to do. The results show that attitudes and norms were important predictors of behavioural intention with respect to knowledge sharing and collaboration. However, perceived behavioural control - the ability to access in-house knowledge resources, confidence in being able to connect with colleagues to jointly solve problems, and genuine organizational support to reach out across government - appears to be lacking. The interpretation is that policy analysts may not feel they have the authority or ability to act on their beliefs or in a way that they think their colleagues and superiors would support. Coupled with this may be the negative incentives that actually encourage knowledge hoarding and hiding in order to protect one’s position. This result seems directly related to the issues of culture, trust and incentives noted above. Government leaders can reiterate in blog posts and tweets that the success of the knowledge organization hinges on the individual innovations of public servants to find collaboration opportunities, and share knowledge with their colleagues throughout government. But if the actual culture of the organization - not just its climate, something more easily influenced through messaging, but its culture - does not change to reinforce that messaging, if the behaviour of government leaders fails to build a truly horizontal organization that serves as the basis for building trusting relationships amongst public servants, if the incentives - real and perceived - that truly inspire the emergence of a knowledge organization are not embraced, knowledge workers inside the organization will continue to react in rational ways. They may believe it’s the right thing to do; they may hear it’s the right thing to do; but, when it comes to actual knowledge sharing and collaboration, they may decide that policy analysis 2.0 might just have to wait.
This is hardly the ‘golden age of policy analysis’ - a bygone era of nearly a half-century ago. Apparently we have been witnessing the death of policy analysis for some time (e.g., Kirp, 1992) and - without wishing to over-dramatize the situation - the policy analysis profession is facing a ‘perfect storm’ of factors that present an existential challenge for the contemporary policy analyst. With fiscal constraints that are by no means unique to British Columbia - anemic economic growth, weakened revenues, increasing demand for public services and political demand for lower taxes and balanced budgets - there are few champions for a robust reinvigoration of policy capacity in governments. In fact, governments’ policy analysis capacity is often treated as a dispensable luxury, with thinking and analysis seen as the antithesis of citizen service delivery or the New Public Management (NPM) mantra of business-minded administration. Whereas in the past, when the corporate policy unit was seen as the reservist force that could be deployed as a bulwark against unforeseen developments, where analytical depth and reasoned consideration could be harnessed to help the “decision-maker to make a better decision in a particular problem situation” (Quade, 1976: 13), the contemporary setting seems hardly kind to the policy analyst. Instead, respondents in this research reflected findings elsewhere in conveying a sense of abandonment and dispensability, of being displaced by political advisors and communications professionals. While the policy analysts I spoke to were committed
151
professionals dedicated to their craft, we are left with an impression of a profession wondering what policy analysis is for if their audience - the decision makers whom they seek to help - don’t seem to care for their brand of impartiality and dispassionate inquiry.
This work, I will argue, should instead be seen as part of an effort to renew the policy analysis function, to give it new purpose and capacity, and to endow policy analysis with both the mission and the tools to make it more relevant in the post-positivist age of complexity, uncertainty, contestation and constraint. Whether through concepts such as ubiquitous evergreen policy analysis (where all public servants take on the role of ‘policy analyst’ and none are anointed with that title, and where ‘policy analysis’ is an additional output of the work of the public servant and not an isolated activity in its own right), the bringing together of policy-relevant insights from all corners of a geographically diverse federal government (Wellstead & Stedman, 2010), massive data analytics (for disentangling signals from noise, and promoting analysis over intuition [Silver, 2012] and countering the rise of ‘decision-based evidence-making’ [Tingling & Brydon, 2010]), engaging the wisdom of crowds (through new forms of data analysis, public ideation platforms or new mechanisms for citizen engagement [Dobell, Longo and Walsh, 2011]) or engendering the knowledge organization (as was the focus here), the reference to “Towards Policy Analysis 2.0” in the title of this work was not simply meant to focus on the application of Web 2.0 technologies and work modes to the traditional function of policy analysis, but was rather meant to imply a new version of that function, a new articulation of policy analysis, grounded in the past and enhanced - certainly - by new technologies and new modes of social and workplace interaction, but also drawing energy and inspiration from new political realities, new economic consequences and new social expectations. While there is much for the practicing policy analyst to despair over, I for one am very hopeful for continued movement towards policy analysis 2.0.
10. 2 Strengths, Limitations and Directions for Future ResearchA disconnect between the policy analysis academic and the policy analysis practitioner has
been identified in the literature (e.g., Durning & Osuna, 1994; Morçöl, 2001), and the results of this research reinforce this perception. As Parsons (1995: 74) notes in quoting Popay and Williams (1994), while the policy academic is able to explore post-modernism from comfortable heights, there is no comparable retreat for “those for whom the closure of a ward, an accident emergency department, or a whole hospital means something more than the deconstruction of a discursive practice”. For all of the talk of policy complexity and the need for horizontality in policy formulation, the findings indicate that practicing policy analysts are very busy dealing with practical, immediate policy challenges as they are presented through the system - e.g., a request from the Minister’s office that an emerging issue be investigated and a two-page information note be prepared immediately. Whether policy problems are conceptualized as complex, wicked or just the business at hand, the policy analysts interviewed in this research were not concerned with theoretical concepts such as complexity or horizontality, nor with a fundamental re-engineering of the technique or technology of policy analysis. Rather, their concern is with the practical problems presented
152
in the workplace, and finding the most effective means for dealing with them. Whether that involves collaborating with colleagues in the next office or across government, or sharing or obtaining knowledge through a new collaborative technology solution, is immaterial if it does not move the issue towards resolution or improvement in the immediate term. Respondents were interested in technological or procedural adaptations if they could plausibly demonstrate value, but not for the sake of addressing issues of theoretical interest or adopting technology simply because it was the newest new thing (Venkatesh et al., 2003).
This study is the first to investigate knowledge sharing and collaboration practices amongst Canadian public sector policy analysts using the Theory of Planned Behavior. Previous research in policy unit interaction and the actions of individual policy analysts in managing policy formulation challenges tended to view this principally as a knowledge management problem (e.g., Bontis, 2007). The approach taken here, in focussing on the collaboration and knowledge sharing challenge as influenced by the presence of organizational sub-cultures (Drake, Steckler & Cook, 2004), the legal and institutional limits to knowledge transfer and collaboration (Gil-Garcia et al., 2007), and the importance of social networks over technology networks (Robertson, Swan & Newell, 1996), should give pause to any effort to impose a technological solution prior to addressing the cultural, institutional and inter-personal dimensions of intra-organizational knowledge sharing and collaboration, reinforcing previous findings from the literature (e.g., Grudin, 1988, Riege, 2005).
The Theory of Reasoned Action model (a forerunner to the TPB model) with the presence of age and gender variables explained 11% of variance in the intention to share knowledge and collaborate across the organization. Although the overall model was significant, this is a relatively low proportion in contrast to the variance typically accounted for by the TPB (Armitage & Conner, 2001). The use of scenarios to measure knowledge sharing and collaboration behavioural intention is the most problematic aspect of this research, with knowledge sharing scenario 3 and collaboration scenario 1 being particularly challenging and the reliability across all eight scenarios weak. The scenarios approach, however, is defended as being an ambitious attempt to ask the respondents hard questions about their approach to knowledge sharing and collaboration. The qualitative comments on the scenarios provided interesting additional data, though they did not serve to clarify the numerical results; rather, they generally appear to confirm one of the policy analysts’ commandments: in answering any hard question, ‘it depends’ is usually a good response. Despite the challenge of measuring behaviour and behavioural intention, policy analysis system researchers should continue to promote recent trends that use predictive social science models such as the Theory of Planned Behavior to investigate behaviours important to organizational effectiveness. By applying results of these studies, public organizations can further design and modify procedures and organizational effectiveness initiatives with objectives to encourage knowledge sharing and collaboration behaviours amongst knowledge workers.
This research has identified many avenues that could be considered in future work. The impact and potential role of new technology on the policy formulation process remains a central question. As one example, can new collaborative social technology enhance the organizational social network of younger, less experienced policy analysts and level the
153
playing field with their more experienced colleagues? Can intra-organization social capital be enhanced through the use of social networking tools; or, alternatively, will a reliance on social technology diminish the real social fabric of the organization?
It should be noted that attempting to research the impact of new technology on the policy formulation system in the British Columbia Government was hampered because, frankly, there was little evidence that the leading edge of Gov 2.0 technology was being used in late 2011 in that environment. While there were some interesting developments in the expanded use of Sharepoint, examples of true Web 2.0 applications were scarce in both the survey data and from the interviews. I am aware anecdotally of the existence of ‘Web 2.0 policy analysts’ in the BC Government; I just didn’t meet any in the course of this research. This will likely change in future years as new technologies are adopted and Web 2.0 becomes more common. However, we should likely expect that the inherent conservativeness of government bureaucracies will mean they are more likely to be late technology adopters rather than mavens.
There is enormous scope for much more detailed social network analysis that looks at the whole policy formulation network in government. Part of this research had envisioned such an approach based on the electronic network traffic (e.g., email records, and Sharepoint use) of policy analysts inside the bureaucracy, but this proved unfeasible as the information management bureaucracy within the government could not facilitate access to this data. Future researchers should consider whether the map of the policy analysts’ knowledge network can be drawn based on such data and whether it can provide insights into the real world of the policy analyst. That this approach could not be followed raises another observation about the conduct of this research: despite the direct support of the Office of the Deputy Minister to the Premier, the generosity of the research respondents in offering their time and thoughts, and the heroic efforts of members of the public service advocating on my behalf from within the bureaucracy, getting access to senior public service respondents was very challenging and getting access to electronic records was impossible.
Perceived behavioural control regarding knowledge sharing and collaboration was found to be lacking. It was hypothesized that this was largely due to the policy analysts’ uncertainty regarding their authority to share knowledge widely, or their capacity to connect to appropriate knowledge agents throughout government. There are, however, a variety of other possibilities that could be explored: how much of this lack of knowledge sharing is due to evasiveness, rationalizing and ‘playing dumb’ (see Connelly et al., 2012) as strategies used in order to conserve whatever power the unshared knowledge might be thought to offer? Is the implicit reward structure missing or misaligned, such that it fails to adequately encourage knowledge sharing and collaboration? Is the environment marked by mistrust - between employees, or by employees towards the organization? Is a large scale knowledge sharing organization achievable?
Lastly, it is unclear whether the values and role orientations of policy analysts as revealed through their preference for particular archetypes are at variance with the expectations and needs of the policy analysis system. In some ways, the policy capacity of the government is flexible, adapting to the needs of the ministry or government at any given time. If the system
154
needs project management, stakeholder engagement, program oversight or issues management capacity, policy units exist in some respects to maintain at-the-ready those less defined skills and capacities that can be called upon as the need arises. As was clear from the way that respondents approach the question of a single-most preferred archetype with hesitancy, the one constant in the policy analysts’ vocabulary is flexibility. The policy analyst archetypes were derived from literature that is now decades old. What is perhaps needed is to return to the theme explored in the early part of this new millennium, that focussed on the demand-side of the policy formulation market - the senior executives and political decision makers who are the audience for such analysis - and sought to clarify what it is they require and want from the policy analyst.
155

156

ReferencesAckerman, M. S., Pipek, V., & Wulf, V. (2003). Sharing expertise beyond knowledge
management. Cambridge, Mass.: MIT Press.
Ajzen, I. (1988). Attitudes, personality, and behavior. Chicago: The Dorsey Press.
Ajzen, I. (1991). The Theory of Planned Behavior. Organizational Behavior and Human Decision Processes. 50, 179-211.
Ajzen, I. (2002). Perceived Behavioral Control, Self-Efficacy, Locus of Control, and the Theory of Planned Behavior. Journal ofApplied Social Psychology, Vol. 32, no. 4, 665-683.
Ajzen, Icek and Martin Fishbein. (2005). The influence of attitudes on behavior. In D. Albarracín, B. T. Johnson, and M. P. Zanna (eds.),The handbook of attitudes (pp. 173-221). Mahwah, NJ: Erlbaum.
Al-Alawi, Adel Ismail, Nayla Yousif Al-Marzooqi and Yasmeen Fraidoon Mohammed. (2007). Organizational culture and knowledge sharing: critical success factors. Journal of Knowledge Management. Vol. 11 no. 2 2007, pp. 22-42.
Allen, D.K. And T.D. Wilson. (2003). Information overload: context and causes. New Review of Information Behaviour Research, 4, 31-44.
Anderson, J. (1975). Public Policy Making. New York: Praeger.
Andersen, David F., and Sharon S. Dawes. (1991). Government Information: A Primer and Casebook. Englewood Cliffs, NJ: Prentice-Hall.
Andrews, Rhys. (2010). Organizational social capital, structure and performance. Human Relations May 2010 vol. 63 no. 5 583-608.
Angrosino, Michael V. and Kimberly A. Mays dePerez. (2000). Rethinking observation: From method to context. In Norman K. Denzin and Yvonna S. Lincoln (eds.), Handbook of Qualitative Research (2nd edition, pp.673-702), Thousand Oaks, CA: Sage.
APSC (Australian Public Service Commission). (2007). Tackling Wicked Problems: A Public Policy Perspective. Canberra: Australian Public Service Commission.
Argote, Linda and Paul Ingram. (2000). Knowledge Transfer: A Basis for Competitive Advantage in Firms. Organizational Behavior and Human Decision Processes. Vol. 82, No. 1, May, pp. 150–169.
Atkinson, Michael M. and William D. Coleman. (1992). Policy Networks, Policy Communities and the Problems of Governance. Governance: An International Journal of Policy and Administration. Vol. 5, No.2, pp. 154-180.
Aucoin, Peter. (2006). The Staffing and Evaluation of Canadian Deputy Ministers in Comparative Westminster Perspective: A Proposal for Reform. Chapter 7 in
157
Commission of Inquiry Into the Sponsorship Program and Advertising Activities (Gomery Commission): Restoring Accountability - Research Studies: Volume 1 Parliament, Ministers and Deputy Ministers. Ottawa: Government of Canada.
Bailey, Diane and Pamela J. Hinds. (2003). Out of Sight, Out of Sync: Understanding conflict in distributed teams. Organization Science. 14: 615-632.
Bainbridge, J.M., T. Potts and T.G. O’Higgins. (2011). Rapid Policy Network Mapping: A New Method for Understanding Governance Structures for Implementation of Marine Environmental Policy. PLoS ONE 6(10): e26149.
Bakvis, H. (2000). Rebuilding Policy Capacity in the Era of the Fiscal Dividend: A Report from Canada. Governance, Volume 13, no. 1, pp. 71–103.
Bakvis, Herman and Luc Juillet (2004). The Horizontal Challenge: Line Departments, Central Agencies and Leadership. Ottawa: Canada School of Public Service.
Bardach, Eugene. (2004). A Practical Guide For Policy Analysis: The Eightfold Path To More Effective Problem Solving. 2nd Edition. Washington, DC: CQ Press.
Barnhardt, R., Chilcott, J. H., Wolcott, H. F. (1979). Anthropology and Educational Administration. Tucson: Impresora Sahuaro
Bartol, K. and A. Srivastava. (2002). Encouraging Knowledge Sharing. Journal of Leadership and Organizational Studies, 9(1), 64-76.
Beck, L. and Ajzen, I. (1991). Predicting Dishonest Actions Using the Theory of Planned Behavior, Journal of Research in Personality, (25), pp.285-301
Beckman, N. (1977). Policy analysis for the congress. Policy Analysis 39:237-44
Bee, R. L. (1979). The Washington connection. American Indian leaders and American Indian policy. Indian Hist. 12(1):3-11
Beer, Stafford. (1974). Designing Freedom. Toronto: CBC Learning Systems.
Benkler, Yochai. (2006). The Wealth of Networks: How Social Production Transforms Markets and Freedom. New Haven: Yale University Press.
Bernard, H. Russell. (1994). Research methods in anthropology: qualitative and quantitative approaches (2nd edition). Walnut Creek, CA: AltaMira Press.
Bertot, John C., Paul T. Jaeger, Justin M. Grimes. (2010). Using ICTs to create a culture of transparency: E-government and social media as openness and anti-corruption tools for societies. Government Information Quarterly, Volume 27, Issue 3, July 2010, pp. 264-271.
Bevir, M. and Richards, D. (2009), Decentring Policy Networks: A Theoretical Agenda. Public Administration, 87: 3–14.
158

Binz-Scharf, Maria Christina, David Lazer and Ines Mergel. (2012). Searching for Answers: Networks of Practice Among Public Administrators. The American Review of Public Administration March 2012 vol. 42 no. 2 202-225.
Binz-Scharf, Maria Christina. (2003). Exploration and Exploitation: Toward a Theory of Knowledge Sharing in Digital Government Projects. Dissertation. University of St. Gallen.
Bock, Gee-Woo and Young-Gul Kim. (2002). Breaking the myths of rewards: an exploratory study of attitudes about knowledge sharing. Information Resources Management Journal, Vol. 15 No. 2, pp. 14-21.
Bock, Gee-Woo, Atreyi Kankanhalli and Sanjeev Sharma. (2006). Are norms enough? The role of collaborative norms in promoting organizational knowledge seeking. European Journal of Information Systems. Volume 15, no. 4, 357-367.
Bock, Gee-Woo, Robert W. Zmud, Young-Gul Kim and Jae-Nam Lee. (2005). Behavioral Intention Formation in Knowledge Sharing: Examining the Roles of Extrinsic Motivators, Social-Psychological Forces, and Organizational Climate. MIS Quarterly, Vol. 29, No. 1, Special Issue on Information Technologies and Knowledge Management (Mar., 2005), pp. 87-111.
Bocksnick, Jochen G. (2004). Exercising for Health: An Analysis of Semi-Structured Interviews. Activities, Adaptation & Aging, 28: 2, 1-17.
Bogason, P. and T.A. Toonen. (1998). Introduction: Networks in Public Administration. Public Administration, 76: 205–227
Boisnier, Alicia and Jennifer A. Chatman. (2003). The Role of Subcultures in Agile Organizations. Chapter 4 (pp. 87-112) in R. S. Peterson and E. A. Mannix (eds) Leading and Managing People in the Dynamic Organization. Mahwah, NJ: Lawrence Erlbaum.
Bollinger, A. S. and R.D. Smith. (2001). Managing Organizational Knowledge as a Strategic Asset. Journal of Knowledge Management, 5,1, 8-18.
Bonabeau, E. (2009). Decisions 2.0: The Power of Collective Intelligence. MIT Sloan Management Review (50:2) pp. 45-52.
Bontis, N. (2007). Knowledge Management in the Nation’s cCapital. In Borins, S. F., Kenneth Kernaghan, David Brown, Nick Bontis, Perri 6 and Fred Thompson. (2007). Digital state at the leading edge. Toronto: University of Toronto Press.
Boone, M. S. (1979). Committee work in Congress. Practicing Anthropology 1(3):6, 27
Borgatti, Stephen P. and Pacey C. Foster. (2003). The Network Paradigm in Organizational Research: A Review and Typology. Journal of Management 2003 29(6) 991–1013
159

Borins, S. F., Kenneth Kernaghan, David Brown, Nick Bontis, Perri 6 and Fred Thompson. (2007). Digital state at the leading edge. Toronto: University of Toronto Press.
Börzel, T. A. (1998), Organizing Babylon - On the Different Conceptions of Policy Networks. Public Administration, 76: 253–273.
Bossel, H. (ed.) (1977). Concepts and Tools of Computer Assisted Policy Analysis. Birkhauser Verlag.
Boyatzis, R.E. (1998) Transforming qualitative information: Thematic analysis and code development. Thousand Oaks: SAGE.
Boyle, Terry, Jane Heyworth, Jenny Landrigan, Robin Mina and Lin Fritschi. (2012). The Effect of Lottery Scratch Tickets and Donation Offers on Response Fraction : A Study and Meta-Analysis. Field Methods 2012 24: 112.
Bradburn, Norman M., Seymour Sudman, Brian Wansink. (2004). Asking Questions: The Definitive Guide to Questionnaire Design -- For Market Research, Political Polls, and Social and Health Questionnaires. San Fransisco: Jossey-Bass
BC Stats (British Columbia Government Statistics Agency). (2007). A Study of Non-Response Among BC Public Service Employees. (Report prepared by Angela Matheson). Victoria: Government of British Columbia.
British Columbia. (2010). Citizens @ The Centre: B.C. Government 2.0 (A Transformation and Technology Strategy for the British Columbia Public Service). Victoria, British Columbia: Government of the Province of British Columbia. http://www.gov.bc.ca/citz/citizens_engagement/gov20.pdf
British Columbia. (2012a). Estimates: Fiscal Year Ending March 31, 2013. Victoria, British Columbia: Ministry of Finance. http://www.bcbudget.gov.bc.ca/2012/estimates/2012_Estimates.pdf
British Columbia. (2012b). Supplement to the Estimates: Fiscal Year Ending March 31, 2013. Victoria, British Columbia: Ministry of Finance. http://www.bcbudget.gov.bc.ca/2012/estimates/2012_Supplement_to_the_Estimates.pdf
British Columbia. (2012c). BC Finance - Full-Time Equivalents (FTEs), 1999-2000 to 2010-11, Table A2.9; Consumer Price Index. http://www.data.gov.bc.ca/dbc
British Columbia. (2012d). BC Ministry of Finance 2012/13 - 2014/15 Service Plan. http://www.bcbudget.gov.bc.ca/2012/sp/pdf/ministry/fin.pdf
Bryman, A. (2012). Social research methods (4th ed.). Oxford: Oxford University Press.
Bryman, A. and R.G. Burgess (eds). (1994). Analyzing Qualitative Data. London: Routledge.
160
Bryson, J.M., B.C. Crosby and M. Middleton Stone. (2006). The Design and Implementation of Cross-Sector Collaborations: Propositions from the Literature. Public Administration Review 66(s1):44–55
Burns, N., Schlozman, K.L., and Verba, S. (2001). The Private Roots of Public Action: Gender, Equality, and Political Participation. Cambridge, MA: Harvard University Press.
Burt, R.S., and M. Minor. (1983). Applied Network Analysis: A Methodological Introduction. Newbury Park: Sage.
Bush, Vannevar. (1945). As We May Think. Atlantic Monthly.
Campbell, C. and G. K. Wilson. (1995). The End of Whitehall: Death of a Paradigm. London: Blackwell
Canada (1996). Managing Horizontal Policy Issues. Report of the Task Force on Managing Horizontal Policy Issues. Ottawa: Privy Council Office.
Cappe, Mel. (2000). ‘Fonctionnaires sans frontières’: Operating at the Speed of the Public Interest. Notes for an Address by Mel Cappe, Clerk of the Privy Council and Secretary to the Cabinet at the Association of Professional Executives of the Public Service of Canada (APEX) Symposium. May 31, 2000, Ottawa Congress Centre.
Carmeli, Abraham, Revital Shalom and Jacob Weisberg. (2007). Considerations in organizational career advancement: what really matters. Personnel Review, Vol. 36: 2, 190 - 205.
Caspi, A., Chajut, E., and Saporta, K. (2008). Participation in class and in online discussions: Gender differences. Computers & Education, 50(3), 718-724.
Cathles, A., Harrington, D. E. and Krynski, K. (2010). The Gender Gap in Funeral Directors: Burying Women with Ready-to-Embalm Laws? British Journal of Industrial Relations, 48: 688–705.
Chadwick, A. (2009). Web 2.0: New Challenges for the Study of E-Democracy in an Era of Informational Exuberance. I/S: A Journal of Law and Policy for the Information Society, Vol. 5, no.1, pp. 9 - 41.
Chatzoglou, Prodromos D. and Eftichia Vraimaki. (2009). Knowledge-sharing behaviour of bank employees in Greece. Business Process Management Journal, Vol. 15 Iss: 2, pp.245 - 266.
Chen, Shih-Chih, David C. Yen and Mark I. Hwang. (2012).Factors influencing the continuance intention to the usage of Web 2.0: An empirical study. Computers in Human Behavior, Vol. 28, pp. 933–941.
161
Chesley, Noelle. (2010). Technology Use and Employee Assessments of Work Effectiveness, Workload, and Pace of Life. Information, Communication & Society, Vol. 13, Iss. 4, pp. 485-514.
Chong, Eric. (2011). Managerial competencies and career advancement: A comparative study of managers in two countries. Journal of Business Research, Available online 14 September 2011. In Press, Corrected Proof.
Chow, C.W., Deng J.F. and Ho J.L. (2000). The openness of knowledge sharing within organizations: a comparative study of the United States and the People's Republic of China. Journal of Management Accounting Research 12, 65–95.
Christensen, Tom, and Per Laegreid (2007). The Whole-of-Government Approach to Public Sector Reform. Public Administration Review 67 (6): 1059–66.
Cibulka, James G. (1994). Policy analysis and the study of the politics of education. Journal of Education Policy. Volume 9, Issue 5, 105-125.
Ciganek, Andrew P., En Mao and Mark Srite. (2009). Organizational Culture for Knowledge Management Systems: A Study of Corporate Users. Chapter XXIV (pp. 441-456) in George Kelly (ed.) Selected Readings in Information Technology Management: Contemporary Issues. IGI Global.
Clark, Ian D. 2008. Professionalizing Policy Analysis in Canada. Canadian Public Administration, 51: 171–179.
Clinton, William J. (2004). Starr Report: Narrative. Nature of President Clinton's Relationship with Monica Lewinsky. Washington, D.C.: U.S. Government Printing Office.
Cohen, Daniel. (2006). From Babel to Knowledge: Data Mining Large Digital Collections. D-Lib Magazine 12.3.
Colebatch, H.K. and Radin, B.A. (2006). Mapping the Work of Policy. In Colebatch H.K. (ed.) The Work of Policy: An International Survey. New York: Rowman and Littlefield, 217–226.
Coleman, James S. (1988). Social Capital in the Creation of Human Capital. The American Journal of Sociology, Vol. 94, Supplement: Organizations and Institutions: Sociological and Economic Approaches to the Analysis of Social Structure, pp. S95-S120
Connelly, C. and E. Kelloway. (2003). Predictors of employees’ perceptions of knowledge sharing cultures. Leadership & Organization Development Journal, 24(5), 294-301.
Connelly, C. E., D. Zweig, J. Webster, and J. P. Trougakos. (2012). Knowledge hiding in organizations. Journal of Organizational Behaviour, 33: 64–88.
162
Considine, M., J. Lewis, J.M. Lewis, D. Alexander. (2009). Networks, innovation and public policy: politicians, bureaucrats and the pathways to change inside government. London: Palgrave Macmillan
Constable, Rolly, Marla Cowell, Sarita Zornek Crawford, David Golden, Jake Hartvigsen, Kathryn Morgan, Anne Mudgett, Kris Parrish, Laura Thomas, Erika Yolanda Thompson, Rosie Turner, and Mike Palmquist. (2005). Ethnography, Observational Research, and Narrative Inquiry. Writing@CSU. Colorado State University Department of English.
Constant, D., Kiesler, S., & Sproull, L. (1994).What's mine is ours, or is it? A study of attitudes about information sharing. Information Systems Research, 5(4), 400�421.
Cook, Niall. 2008. Enterprise 2.0: How Social Software will Change the Future of Work. London: Ashgate.
Corden, Anne and Roy Sainsbury. (2006). Using verbatim quotations in reporting qualitative social research: researchers’ views. ESRC Working Paper. The University of York.
Cormode, G. and B. Krishanmurthy. (2008). Key differences between Web 1.0 and Web 2.0. FirstMonday - Peer Reviewed Journal of the Internet, 13(6), 1-19.
Couper, Mick. 2008. Designing Effective Web Surveys. Cambridge: Cambridge University Press.
Creswell, J.W. (1998). Qualitative inquiry and research design. Choosing among five traditions. Thousand Oaks, CA: Sage.
Creswell, J.W. (2003). Research design. Qualitative, quantitative and mixed methods approaches. Thousand Oaks, CA: Sage.
Cross, R., Parker, A., Prusak, L and Borgatti, S. (2001). Knowing What We Know: Supporting Knowledge Creation and Sharing in Social Networks. Organizational Dynamics 3(2), pp. 100-120.
Crotty, M. (1998). Foundations of Social Research. Thousand Oaks: Sage.
Cunningham, J. Barton. (2001). Researching Organizational Values and Beliefs: the Echo Approach. Santa Barbara: Greenwood Publishing Group.
Daly, Herman E and John B. Cobb. (1994). For The Common Good: Redirecting the Economy Toward Community, the Environment, and a Sustainable Future. Boston: Beacon Press.
Darr, Eric D., Linda Argote and Dennis Epple. (1995). The Acquisition, Transfer, and Depreciation of Knowledge in Service Organizations: Productivity in Franchises. Management Science. Vol. 41, No. 11 (Nov., 1995), pp. 1750-1762.
163
Davenport, T. H., and L. Prusak. (1998). Working Knowledge. Boston: Harvard Business School Press.
Davis, F. 1989. Perceived usefulness perceived ease of use and user acceptance of information technology. MIS Quarterly, 13, 3, 319–339.
Davis, F. D. 1993. User acceptance of information technology: system characteristics, user perceptions and behavioral impacts. International Journal of Man-Machine Studies, 38, 475 - 487.
Dawes Sharon S., Anthony M. Cresswell and Theresa A. Pardo. (2009). From ‘Need to Know’ to ‘Need to Share’: Tangled Problems, Information Boundaries, and the Building of Public Sector Knowledge Networks. Public Administration Review. Volume 69, Issue 3, pages 392–402, May/June 2009.
Dellar, G. 1996. The Nature of Secondary School Organization and Site Specific Re-Structuring. International Journal of Educational Reform, 5(4), 463-471.
DeLong, David W., and Liam Fahey. (2000). Diagnosing Cultural Barriers to Knowledge Management. Academy of Management Executive 14(4): 113–27.
DeMunck, Victor C. and Elisa J. Sobo (eds.) (1998). Using methods in the field: a practical introduction and casebook. Walnut Creek, CA: AltaMira Press.
Dennison, D. R. (1996). What Is theDifference between Organizational Culture and Organizational Climate? A Native’s Point ofView on a Decade of Paradigm Wars, Academy of Management Review, 21, 3, 619-654.
Denzin, N. K. 1970. The Research Act in Sociology. Chicago: Aldin
Denzin, N.K. and Lincoln, Y. (2000). Introduction: The discipline and practice of qualitative research. In N.K. Denzin and Y. Lincoln (Eds.), Handbook of qualitative research (2nd ed., pp.1-17). Thousand Oaks, CA: Sage.
Denzin, Norman K. and Yvonna S. Lincoln. (2007). Strategies of Qualitative Inquiry. Thousand Oaks, CA: Sage.
DeVries H., Backbier, E., Kok, G., Dijkstra, M. (1995) The impact of social influences in the context of attitude, self efficacy, intention, and previous behavior as predictors of smoking onset. Journal of Applied Social Psychology, 25, 237 – 57.
DeWalt, Kathleen M. and Billie R. DeWalt. (1998). Participant observation. In H. Russell Bernard (Ed.), Handbook of methods in cultural anthropology (pp.259-300). Walnut Creek: AltaMira Press.
Dey, I. 1993. Qualitative Data Analysis: A User-Friendly Guide for Social Scientists. London: Routledge.
164
Dietrich, Franz. (2011). Scoring rules for judgment aggregation. MPRA Paper No. 36892. http://mpra.ub.uni-muenchen.de/36892/
Dillman, Don A. (2007). Mail and Internet Surveys: The Tailored Design Method. 2nd edition. Hoboken, N.J.: John Wiley and Sons.
DiMaggio, Paul J. and Walter W. Powell (eds.). (1991). The New Institutionalism in Organizational Analysis. Chicago: University of Chicago Press.
Dobell, Rodney. 1999. Evaluation and Entitlements: Hartle's Search for Rationality in Government, pp. 79–108 in Richard M. Bird, Michael J. Trebilcock and Thomas A. Wilson, eds., Rationality in Public Policy: Retrospect and Prospect, A Tribute to Douglas G. Hartle. Canadian Tax Paper No. 104. Toronto: Canadian Tax Foundation, 1999.
Dobell, A.R. 1983. Consultation, Conflict Resolution and Social Adjustment. Presentation to the Macdonald Royal Commission. Victoria, B.C.
Dobell, A. R. (2003). The Role of Government and the Government's Role in Evaluating Government: Insider Information and Outsider Beliefs. University of Victoria Panel on the Role of Government Research Paper. August 12, 2003.
Dobell, A. R., Justin Longo and Jodie Walsh. (2011). Techniques, Tools and Toys in the 21st Century. Web-Enabled Platforms for Citizen Science and Civic Engagement in Integrated Coastal and Marine Spatial Planning. Sienna, Italy: Aquatic Ecosystem Health and Management Society.
Dobuzinskis, L., M. Howlett and D. Laycock. (2007). Policy Analysis in Canada: The State of the Art. Toronto: University of Toronto Press.
Dobuzinskis, Laurent. 1997. Historical and epistemological trends in public administration. Journal of Management History, Vol. 3 No. 4, 1997, pp. 298-316.
Donath, J. and d. boyd. (2004). Public Displays of Connection. BT Technology Journal, 22, 4, 71-82.
Dowding, K. (1995), Model or Metaphor? A Critical Review of the Policy Network Approach. Political Studies, 43: 136–158.
Doz, Yves and Mikko Kosonen. 2008. Fast Strategy: How Strategic Agility Will Help You Stay Ahead of the Game. Philadelphia: Wharton School Publishing.
Drake, D. B., N.A. Steckler, and M.J. Koch. (2004). Information sharing in and across government agencies: The role and influence of scientist, politician, and bureaucrat subcultures. Social Science Computer Review, 22(1), 67�84.
165
Dror, Yehezkel. 1986. Policymaking Under Adversity. New Brunswick, N.J.: Transaction Books.
Drury, C.M. (1975). Quantitative Analysis and Public Policy Making. Canadian Public Policy. Vol. 1, no. 1.
Dryzek, John S. 1983. Don't Toss Coins in Garbage Cans: A Prologue to Policy Design. Journal of Public Policy, 3 , pp 345-367.
Ducheneaut, N. and V. Bellotti. (2002). A Study of Email Work Processes in Three Organizations. Journal of Computer Supported Cooperative Work.
Dunleavy, Patrick. (2006). Digital era governance IT corporations, the state, and E-government. Oxford: Oxford University Press.
Dunleavy, Patrick, Helen Margetts, Simon Bastow and Jane Tinkler. (2006). New Public Management Is Dead—Long Live Digital-Era Governance. Journal of Public Administration Research and Theory, 16:467–494.
Durning, D. and W. Osuna. (1994). Policy analysts’ roles and value orientations: An empirical investigation using Q methodology. Journal of policy analysis and management, 13: 629-657.
Durose, C. (2009). Front Line Workers and ‘Local Knowledge’, Public Administration, 87, 1, 35–49.
Dutil, Patrice, Cosmo Howard, John Langford, Jeffrey Roy. (2010). Will Web 2.0 Change Everything. Chapter 6 in The Service State: Rhetoric, Reality and Promise. Ottawa: University of Ottawa Press.
Dyble, John. (2012). Launching a Lean Approach. Email to BC Public Service Employees from John Dyble, Deputy Minister to the Premier and Head of the BC Public Service. May 1, 2012.
Dyer, J. H. and K. Nobeoka, K. (2000). Creating and managing a high-performance knowledge-sharing network: the Toyota case. Strategic Management Journal, 21: 345–367.
Edmunds, Angela and Anne Morris. (2000). The problem of information overload in business organisations: a review of the literature. International Journal of Information Management, Volume 20, Issue 1, pages 17-28.
Edwards, Heather R. and Richard Hoefer. (2010). Are Social Work Advocacy Groups Using Web 2.0 Effectively? Journal of Policy Practice, 9:3, 220-239
166

Elliott, M.A., Armitage, C.J. and Baughan, C.J. (2003) Drivers compliance with speed limits, an application of the theory of planned behavior. Journal of Applied Social Psychology, 30, 964 – 972.
Ely, M., Anzul, M., Friedman, T., Garner, D., and McCormack Steinmetz, A. (1991). Doing qualitative research: Circles within circles. New York: The Falmer Press.
Enserink, Bert, Joop F. M. Koppenjan and Igor S. Mayer. (2013). A Policy Sciences View on Policy Analysis, chapter 2 (pp. 11-40) in W. A. H. Thissen and W. E. Walker (eds.), Public Policy Analysis. International Series in Operations Research & Management Science. New York: Springer.
Entwistle, T. and S. Martin. (2005). From Competition to Collaboration in Public Service Delivery: A New Agenda for Research. Public Administration 83(1):233–242.
Eppler, Martin J. and Jeanne Mengis. (2004). The Concept of Information Overload: A Review of Literature from Organization Science, Accounting, Marketing, MIS, and Related Disciplines. The Information Society. Vol. 20, Iss. 5.
Eshbaugh-Soha, Matthew. (2010). The Importance of Policy Scope to Presidential Success in Congress. Presidential Studies Quarterly, 40: 708–724.
Espinoza, C. (2012). Millennial Integration: Challenges Millennials Face in the Workplace and What They Can Do About Them (Doctoral dissertation, Antioch University).
European Commission. (2005). The European Consensus on Development. Brussels: European Commission.
Fenn, Jackie and Mark Raskino. (2011). Understanding Gartner's Hype Cycles, 2011. Gartner, Inc.
Fenno, R. F. 1990. Watching Politicians: Essays on Participant Observation. Berkeley: University of California, Institute of Governmental Studies.
Fereday, Jennifer and Eimear Muir-Cochrane. (2006). Demonstrating Rigor Using Thematic Analysis: A Hybrid Approach of Inductive and Deductive Coding and Theme Development. International Journal of Qualitatitve Methods, 5, 1.
Fischer, Frank. (2003). Reframing Public Policy: Discursive Politics and Deliberative Practices. New York: Oxford University Press.
Fishbein, M. and I. Ajzen. (1975). Belief, attitude, intention, and behavior : An introduction to theory and research. Reading, Mass.: Addison-Wesley.
Fishbein, M., & Ajzen, I. (2010). Predicting and changing behavior: The reasoned action approach. New York: Psychology Press (Taylor & Francis).
Flanagan, J.C. (1954). The critical incident technique. Psychology Bulletin 51(4):327–58.
167

Forester, John. (1995). Response: Toward a critical sociology of policy analysis. Policy Sciences, 28: 385-396.
Foster, A. (2004). A nonlinear model of information-seeking behavior. Journal of the American Society for Information Science & Technology, 55(3), 228-237.
Francis, Jillian J., Martin P, Eccles, Marie Johnston, Anne Walker, Jeremy Grimshaw, Robbie Foy, Eileen F. S. Kaner, Liz Smith, Debbie Bonetti. (2004). Constructing Questionnaires Based on the Theory of Planned Behaviour: A Manual for Health Services Researchers. University of Newcastle: Centre for Health Services Research.
Freeman, L. (1977). A set of measures of centrality based upon betweenness. Sociometry 40: 35–41.
Freeman, L.C., D.R. White and A.K. Romney. 1989. Research Methods in Social Network Analysis. Fairfax, VA: George Mason University Press.
Fukukawa, Kyoko. (2002). Developing a Framework for Ethically Questionable Behavior in Consumption. Journal of Business Ethics 41: 99–119.
Fukuyama, Francis. (2002). Social capital and development: The coming agenda. SAIS Review 22(1), 23-37.
Gains, Francesca. (2003). Executive Agencies in Government: The Impact of Bureaucratic Networks on Policy Outcomes. Journal of Public Policy, 23 (1), 55–79.
Gains, Francesca. (2011). Elite Ethnographies: Potentials, Pitfalls and Prospects for Getting ‘Up Close and Personal’. Public Administration. Vol. 89, No. 1, 156–166.
Galbraith, J.R. 1973. Designing Complex Organizations. Reading, Mass: Addison-Wesley.
Gammelgaard, J. and T. Ritter. (2004). The Knowledge Retrieval Matrix: Codification and Personification as Separate Strategies. Copenhagen: Department of Management, Politics and Philosophy.
Gammon, Howard. 1954. The Automatic Handling of Office Paper Work. Public Administration Review. Vol. 14, No. 1 (Winter, 1954), pp. 63-73.
Gasser, U. and J. Palfrey. (2008). Born Digital: Understanding the First Generation of Digital Natives. New York: Basic Books.
Geertz, C. 1973. The Interpretation of Cultures. New York: Basic.
Geilhufe, Nancy L. (1979). Anthropology and Policy Analysis. Current Anthropology, Vol. 20, No. 3, pp. 577-579.
Gent, Andrew and Jerry Ash. (2007). A KM Star in Born. IK Magazine. Vol. 10, issue 10, pp. 24-25.
168
George, D. and P. Mallery. (2003). SPSS for Windows step by step: A simple guide and reference, 4th ed. Boston: Allyn and Bacon.
George, J., (2004), The theory of planned behavior and Internet Purchasing, Internet Research, (14:3), pp. 198-212
Geyer, Robert and Samir Rihani. (2010). Complexity and public policy: a new approach to twenty-first century politics, policy and society. New York: Routledge.
Giddings, B., B. Hopwood and G. O'Brien. (2002). Environment, economy and society: fitting them together into sustainable development. Sustainable Development 10: 187–196.
Gil-Garcia, J Ramon. (2012). Enacting Electronic Government Success: An Integrative Study of Government-wide Websites, Organizational Capabilities, and Institutions. New York: Springer.
Gil-Garcia, J Ramon, InduShobha Chengalur-Smith and Peter Duchessi. (2007). Collaborative e-Government: impediments and benefits of information-sharing projects in the public sector. European Journal of Information Systems, Vol. 16, 121–133.
Glaser, James M. 1996. The Challenge of Campaign Watching: Seven Lessons of Participant-Observation Research. PS: Political Science and Politics, Vol. 29, No. 3, pp. 533-537.
Godin, G., Valois, P., LePage, L. and Desharnais, R. (1992) Predictors of smoking behavior – an application of Ajzen’s theory of planned behavior. British Journal of Addiction, 87, 1335 – 43.
Golembiewski, R. T., Billingsly, K., Yeager, S. (1976). Measuring change and persistence in human affairs: types of change generated by OD designs. J. Appl. Behav. Sci. 12:133-57
Gong, Yiwei. (2010). Book Review: Handbook of Research on ICT-Enabled Transformational Government: A Global Perspective, Vishanth Weerakkody. Information Polity: The International Journal of Government & Democracy in the Information Age 15, no. 1/2: 171-173. Academic Search Complete, EBSCOhost (accessed October 18, 2010).
Gøtze, J. and C. B. Pedersen. (2009). State of the EUnion: Government 2.0 and Onwards.
Grant, Ruth W. and Jeremy Sugarman. (2010). Ethics in Human Subjects Research: Do Incentives Matter? Journal of Medicine and Philosophy. Vol. 29, Iss. 6, 2010.
Grundin, Jonathan. (1988). Why CSCW applications fail: problems in the design and evaluationof organizational interfaces. Proceedings of the 1988 ACM Conference on Computer-Supported Cooperative Work, pages 85 - 93.
Guba, G. and D. Lincoln. (1994). Competing paradigms in the qualitative research. Thousand Oaks: Sage.
169
Gunderson, L. H., C. S. Holling, and S. S. Light (editors). (1995). Barriers and bridges to the renewal of ecosystems and institutions. New York: Columbia University Press.
Gupta, A.K. and V. Govindarajan. (2000). Knowledge management social dimension: lessons from Nucor Steel. Sloan Management Review, Vol. 42 No. 1, pp. 71-81.
Gupta, Babita, Subhasish Dasgupta and Atul Gupta. (2008). Adoption of ICT in a government organization in a developing country: An empirical study. The Journal of Strategic Information Systems, Volume 17, Issue 2, June 2008, Pages 140–154
Gupta, Bindu, Narendra K. Sharma and C. Ganesh. (2009). The influence of organisational cultural values, reward, time, self-esteem and job security on knowledge sharing intentions among managers. International Journal of Indian Culture and Business Management. Volume 2, Issue 2, 125-143.
Hämäläinen, Timo, Mikko Kosonen and Yves L. Doz. (2012). Strategic Agility in Public Management. (March 12, 2012). INSEAD Working Paper No. 2012/30/ST. Available at http://ssrn.com/abstract=2020436
Hanneman, Robert A. and Mark Riddle. (2005). Introduction to social network methods. Riverside, CA: University of California, Riverside (published in digital form at http://faculty.ucr.edu/~hanneman/)
Hansen, Morten T. (1999). The Search-Transfer Problem: The Role of Weak Ties in Sharing Knowledge Across Organization Subunits. Administrative Science Quarterly, 44: 82-111.
Hansen, Morten T. (2002). Knowledge Networks: Explaining Effective Knowledge Sharing in Multiunit Companies. Organization Science, Vol. 13, No. 3, pp. 232-248
Hansen, S.B. (1997). Talking about Politics: Gender and Contextual Effects on Political Proselytizing. Journal of Politics 59: 73–103.
Harrison, Yvonne. (2005). Motivated to Adapt: Understanding the Digital Effectiveness Divide (DED) in Volunteerism. Doctoral Dissertation. Victoria, B.C.: University of Victoria.
Hartle, D. n.d. The Draft Memorandum to Cabinet: A Short Story. Mimeograph. Revised version published as D. Hartle. 1993. The Draft Memorandum to Cabinet. Institute of Public Administration of Canada (IPAC) Case C10100E, Student Manual, 2nd edition revised, 1993.
Hausenblas, H.A., Carron, A.V., Mack, D.E. (1997) Applications of the theories of reasoned action and planned behavior to exercise behavior, a meta-analysis. Journal of Sport and Exercise Psychology, 19, 36 – 51.
170
Hay, C. (2011). Interpreting Interpretivism Interpreting Interpretations: The New Hermeneutics of Public Administration. Public Administration, 89: 167–182.
Hay, Colin. (2004). The Return to Interpretivism in Public Administration. Public Administration Vol. 82 No. 2, 2004 (525–545).
Head, Brian. 2008. Wicked Problems in Public Policy Public Policy 3, no. 2: 101-118.
Heart, Tsipi and Efrat Kalderon. (2011). Older adults: Are they ready to adopt health-related ICT? International Journal of Medical Informatics. Available online 11 April 2011. In Press, Corrected Proof. http://dx.doi.org/10.1016/j.ijmedinf.2011.03.002
Heclo, H. and A. Wildavsky. (1974). The Private Government of Public Money. London: Macmillan.
Heclo, Hugh (1978). Issue Networks and the Executive Establishment, in The New American Political System, Anthony King, ed. Washington: American Enterprise Institute.
Hendriks, Paul. 1999. Why Share Knowledge? The Influence of ICT on the Motivation for Knowledge Sharing. Knowledge and Process Management, Volume 6 Number 2 pp 91–100.
Hill, C. A. 1987. Affiliation motivation: people who need people, but in different ways. Journal of Personality & Social Psychology, 52(5), 1008–1018.
Hill, I.D. And C.H.E. Warren. (2005). Meek versus Warren. Voting Matters, 20, 1-5.
Himmelman, A.T. (2002). Collaboration for a Change: Definitions, Decision-Making Models, Roles, and Collaboration Process Guide. Minneapolis: Himmelman Consulting.
Hinshaw, Robert E. 1980. Anthropology, Administration, and Public Policy. Annual Review of Anthropology, Vol. 9 (1980), pp. 497-522.
Hird, John A. (2005a). Policy Analysis for What? The Effectiveness of Nonpartisan Policy Research Organizations. Policy Studies Journal, 33: 83–105.
Hird, John A. (2005b). Power, Knowledge and Politics: Policy Analysis in the States. Washington, DC: Georgetown University Press.
Hirsch, Paul M. and Michaela De Soucey. (2006). Organizational Restructuring and Its Consequences: Rhetorical and Structural. Annual Review of Sociology, Volume 32:171–89
Hofstede, Geert. 1996. Cultures and Organizations: Software of the Mind. New York: McGraw-Hill.
171
Hofstede, Geert. (1998). Identifying Organizational Subcultures: An Empirical Approach. Journal of Management Studies, 35: 1–12.
Hofstede, Geert. (2005). Cultures in Organizations. pp: 373–421 in Culture’s Consequences. New York: Mc Graw-Hill.
Holden, Richard J. (2010). Physicians’ beliefs about using EMR and CPOE: In pursuit of a contextualized understanding of health IT use behavior. International Journal of Medical Informatics. Vol. 7, no. 9, pp. 71–80
Holden, Richard J. 2011a. Cognitive performance-altering effects of electronic medical records: an application of the human factors paradigm for patient safety. Cognition, Technology and Work. Volume 13, Number 1 (2011), 11-29.
Holden, Richard J. 2011b. Social and personal normative influences on healthcare professionals to use information technology: towards a more robust social ergonomics. Theoretical Issues in Ergonomics Science.
Holden, Richard J. 2011c. What Stands in the Way of Technology-Mediated Patient Safety Improvements? A Study of Facilitators and Barriers to Physicians’ Use of Electronic Health Records. Journal of Patient Safety: December 2011 - Volume 7 - Issue 4 - p 193–203
Holden, Richard J., Roger L. Brown, Samuel J. Alper, Matthew C. Scanlon, Neal R. Patel, Ben-Tzion Karsh. (2011). That’s nice, but what does IT do? Evaluating the impact of bar coded medication administration by measuring changes in the process of care. International Journal of Industrial Ergonomics. Volume 41, Issue 4, July 2011, Pages 370–379
Hood, C. (1991). A public management for all seasons?� Public Administration, Volume 69, no. 1, pp. 3-19.
Homer-Dixon, Thomas. (2010). Complexity Science and Public Policy. New Directions Series. Toronto: Institute of Public Administration of Canada.
Houston, David J., and Sybil M. Delevan. (1994). Public Administration Research: An Assessment of Journal Publications. In Research in Public Administration: Reflections on Theory and Practice, edited by Jay D. White and Guy B. Adams, pp. 124–38. Thousand Oaks: Sage.
Howlett, M. (2009). Policy analytical capacity and evidence-based policy-making: Lessons from Canada. Canadian Public Administration, 52: 153–175.
Howlett, M. (2009). A Profile of BC Provincial Policy Analysts: Troubleshooters or Planners? Canadian Political Science Review 3(3): 50-68.
172

Howlett, M. (2011). Public Managers as the Missing Variable in Policy Studies: A Preliminary Empirical Investigation Using Canadian Data. Review of Policy Research, 28(3): 247–63.
Howlett, M. and Lindquist, E. (2004). Policy Analysis and Governance: Analytical and Policy Styles in Canada. Journal of Comparative Policy Analysis: Research and Practice. Volume 6, Issue 3, 225-249.
Howlett, M. and Maragna, A. (2006), How Big Is a Policy Network? An Assessment Utilizing Data From Canadian Royal Commissions 1970–2000. Review of Policy Research, 23: 433–452.
Howlett, M.and Ramesh, M. (1995). Studying Public Policy: Policy Cycles and Policy Subsystems. Toronto: Oxford University Press.
Howlett, M. and Walker, R. M.. (2012). Public Managers in the Policy Process: More Evidence on the Missing Variable? Policy Studies Journal, 40: 211–233.
Howlett, M. and Wellstead, A. (2011). Policy Analysts in the Bureaucracy Revisited: The Nature of Professional Policy Work in Contemporary Government. Politics & Policy. 39: 613–633
Hrubes, D. and Ajzen, I. (2001). Predicting Hunting Intentions and Behavior. An application of the Theory of Planned Behavior, Leisure Sciences, (23), 2001, pp 165-178
Hsieh, H.-F. and S.E. Shannon. (2005). Three approaches to qualitative content analysis. Qualitative Health Research, 15(9), 1277-1288.
Hsu, Chin-Lung and Judy Chuan-Chuan Lin. 2008. Acceptance of blog usage: The roles of technology acceptance, social influence and knowledge sharing motivation Information & Management. Volume 45, Issue 1, pp. 65–74
Huby, Guro, John Harries and Suzanne Grant. (2011). Contributions of Ethnography to the Study of Public Services Management. Public Management Review, 13:2, 209-225
Huxham, Chris and Siv Vangen (eds.). (2005). Managing to Collaborate : The Theory and Practice of Collaborative Advantage. New York: Routledge
Huxham, Chris, Siv Vangen and C. Eden. (2000). The Challenge of Collaborative Governance. Public Management Review 2(2):337–358.
Ibarra, Herminia and Steven B. Andrews. 1993. Power, Social Influence, and Sense Making: Effects of Network Centrality and Proximity on Employee Perceptions. Administrative Science Quarterly, Vol. 38, No. 2 (Jun., 1993), pp. 277-303
Ibarra, Herminia, Martin Kilduff, Wenpin Tsai. (2005). Zooming in and out: Connecting Individuals and Collectivities at the Frontiers of Organizational Network Research.
173
Organization Science. Vol. 16, No. 4, Frontiers of Organization Science, Part 1 of 2 (Jul. - Aug., 2005), pp. 359-371.
Isett, Kimberley R., Ines A. Mergel, Kelly LeRoux, Pamela A. Mischen, and R. Karl Rethemeyer. (2011). Networks in Public Administration Scholarship: Understanding Where We Are and Where We Need to Go. Journal of Public Administration Research and Theory. Vol. 21(suppl 1): i157-i173
Iske, P. and W. Boersma. (2005). Connected brains-question and answer systems for knowledge sharing: concepts, implementation and return on investment. Journal of Knowledge Management, 9(1),126-145.
James, S. 1999. British Cabinet Government (2nd ed.). London: Routledge.
James, Thomas E. and Paul D. Jorgensen. (2009). Policy Knowledge, Policy Formulation, and Change: Revisiting a Foundational Question. Policy Studies Journal, 37: 141–162.
Jenkins-Smith, H. (1982). Professional Roles of Policy Analysts, Journal of Policy Analysis and Management 2(1), pp. 88-100.
Jennings, B. (1987). Policy Analysis: Science, Advocacy, or Counsel? Research in Public Policy Analysis and Management, vol. 4, pp. 121-134.
Jewels, Tony and Marilyn Ford. (2006). Factors Influencing Knowledge Sharing in Information Technology Projects. e-Service Journal, Vol. 5, No. 1 (Fall 2006), pp. 99-117.
Jick, Todd D. (1979). Mixing Qualitative and Quantitative Methods: Triangulation in Action. Administrative Science Quarterly, Vol. 24, No. 4, Qualitative Methodology. (Dec., 1979), pp. 602-611.
Johnson, R.A., and Schulman, G.I.. (1989). Gender-role Composition and Role Entrapment in Decision-making Groups. Gender and Society 3: 355–72.
Jun, Kyu-Nahm and Christopher Weare. (2011). Institutional Motivations in the Adoption of Innovations: The Case of E-Government. Journal of Public Administration Research and Theory, Vol. 21, no. 3, pp. 495-519.
Jung, Tobias; Scott, Tim; Davies, Huw T. O.; Bower, Peter; Whalley, Diane, McNally, Rosalind; Mannion, Russell. (2009). Instruments for Exploring Organizational Culture: A Review of the Literature. Public Administration Review, Volume 69, Number 6, November/December 2009, pp. 1087-1096(10)
Kamdar, D., Nosworthy, G.J., Chia, H.B. and Chay, Y.W. (2004). Giving up the 'secret of fire': The Impact of Incentives and Self-monitoring on Knowledge Sharing. Indian School of Business Working Paper.
174
Kankanhalli, A., Tan, B. C.Y., Wei, K.-K. (2005). Understanding seeking from electronic knowledge repositories: An empirical study. Journal of the American Society for Information Sciences, 56: 1156–1166.
Kaplan, David. 2008. Structural Equation Modeling: Foundations and Extensions. Thousand Oaks, Ca: Sage.
Karacapilidis, N., Loukis E., and Dimopoulos S. (2005). Computer-supported G2G collaboration for public policy and decision making. Journal of Enterprise Information Management, Vol. 18, No 5, 2005, pp. 602-624.
Karpowitz, C.F., Mendelberg, T. & Shaker, L. (2012). Gender Inequality in Deliberative Participation. American Political Science Review, 106, pp 533-547.
Kawulich, Barbara B. (2005). Participant Observation as a Data Collection Method. Forum: Qualitative Social Research. Volume 6, No. 2, Art. 43.
Kendall, Jeremy. (2000). The mainstreaming of the third sector into public policy in England in the late 1990s: whys and wherefores. Policy & Politics, Volume 28, Number 4, 1, pp. 541-562.
Kenis, P., and Schneider, V. (1991). Policy Networks and Policy Analysis: Scrutinizing a New Analytical Toolbox. In B. Marin and R. Mayntz (Eds.), Policy Networks: Empirical Evidence and Theoretical Considerations (pp. 25-59). Boulder, CO: Westview Press.
Kerlinger, F. N. 1986. Foundations of Behavioral Research. 3rd ed. New York: Holt, Reinhart and Winston.
Kernaghan, Ken. (2000). The Post-Bureaucratic Organization and Public Service Values. International Review of Administrative Sciences, 66: 91-104.
Kilduff, Martin and Daniel J. Brass. (2010). Organizational Social Network Research: Core Ideas and Key Debates. The Academy of Management Annals, Vol. 4, Issue 1, 317-357.
Kilduff, Martin and Wendy Tsai. (2003). Social Networks and Organizations. London: Sage.
Kim, Hak-Soo. (2012). Climate Change, Science and Community. Public Understanding of Science. April 2012 vol. 21 no. 3 268-285.
Kim, Soonhee and Hyangsoo Lee. (2006). The Impact of Organizational Context and Information Technology on Employee Knowledge-Sharing Capabilities. Public Administration Review, 66: 370–385.
King, G., Keohane, R. O., & Verba, S. (1994). Designing social inquiry: scientific inference in qualitative research. Princeton: Princeton University Press.
175
Kirp, David L. (1992). The end of policy analysis: With apologies to Daniel (the end of ideology) Bell and Francis (the end of history) Fukiyama. Journal of Policy Analysis and Management, 11: 693–696.
Kline, T.J.B. and J.D. Klammer. (2001). Path model analyzed with ordinary least squares multiple regression versus LISREL. The Journal of Psychology, 135(2), 213-225.
Klobas, J.E. and L.A. Clyde. (2000). Adults Learning to Use the Internet: A Longitudinal Study of Attitudes and Other Factors Associated with Intended Internet Use. Library and Information Science Research.
Ko, D.-G., Kirsch, L. J., and King, W. R. (2005). Antecedents of knowledge transfer from consultants to clients in enterprise system implementations. Management Information Systems Quarterly, 29(1), 59
Koch, Michael (2008). CSCW and Enterprise 2.0 - towards an Integrated Perspective. 21st Bled eConference on eCollaboration: Overcoming Boundaries through Multi-Channel Interaction. June 15 - 18, 2008; Bled, Slovenia
Kogut, Bruce and Udo Zander. (1992). Knowledge of the Firm, Combinative Capabilities, and the Replication of Technology. Organization Science, 3, 3, 383-397.
Kouzmin, A. (2011). Paradigmatic and Ontological Tensions in U.S. Public Administration. Public Administration Review, 71: 803–807.
Kover, Arthur J. 1964. Reorganization in an Advertising Agency: A Case Study of a Decrease in Integration. Human Organization, Volume 22, Number 4 / Winter 1964, pp. 252 - 259.
Kraemer, K. L. and J.L. King. (1995). Computer-based Models for Policy-Making : Uses and Impacts in the U.S. Federal Government. Chapter 7 (pp. 129-146) in Andersen, K.V. (ed.) Information Systems in the Political World: Implementation, Use and Implications of Economic Modeling. IOS Press, Amsterdam.
Kraemer, K., and King, J. L. (2003). Information Technology and Administrative Reform: Will the Time After E-Government Be Different? Paper presented at the Heinrich Reinemann Schrift Fest, Post Graduate School of Administration.
Krug, Steve. (2006). Don’t Make Me Think! A Common Sense Approach to Web Usability, Second Edition. Berkeley, California: New Riders Publishing and available online.
Kuh, George D. and Elizabeth J. Whitt. (1988). The invisible tapestry: culture in American colleges and universities. Washington, D.C. : Association for the Study of Higher Education.
176
Kuo, Feng-Yang and Mei-Lien Young. 2008. Predicting knowledge sharing practices through intention: A test of competing models. Computers in Human Behavior. Volume 24 Issue 6, 2697-2722.
Lakeman, Enid and James Douglas Lambert. 1970. How democracies vote: A study of majority and proportional electoral systems. 3rd, edition. London: Faber
Landsbergen, David and George Wolken. (2001). Realizing the Promise: Government Information Systems and the Fourth Generation of Information Technology. Public Administration Review 61, 2: 206–220.
Lasswell, H.D. (1951). The policy orientation, pp. 3-15 in D. Lerner and H.D. Lasswell (eds.), The Policy Sciences. Stanford, CA: Stanford University Press.
Lau, Alan W., Arthur R. Newman and Laurie A. Broedling. 1980. The Nature of Managerial Work in the Public Sector. Public Administration Review, Vol. 40, No. 5, pp. 513-520.
Lawlor, Edward F. 1996. Book Review: The Argumentative Turn in Policy Analysis and Planning, edited by Frank Fischer and John Forester; Narrative Policy Analysis: Theory and Practice, by Emery Roe; Policy Change and Learning: An Advocacy Coalition Approach, edited by Paul Sabatier and Hank C. Jenkins-Smith. Journal of Policy Analysis and Management, Vol. 15, no 1, pp 110-121.
Lee, Ching Chyi and Jie Yang. (2000). Knowledge value chain. Journal of Management Development, Vol. 19, no. 9, pp.783 - 794.
Lee, Grace and Albert Teo. (2005). Organizational restructuring: impact on trust and work satisfaction. Asia Pacific Journal of Management, 22(1), 23-39.
Lee, J.N. (2001). The impact of knowledge sharing, organizational capability and partnership quality on IS outsourcing success. Information & Management, Vol. 38 No. 5, pp. 323-35.
Lee, Mordecai. (2001). Looking at the Politics-Administration Dichotomy from the Other Direction: Participant Observation by a State Senator. International Journal of Public Administration, 24:4, 363-384.
Lett, J. 1990. Emics and etics: Notes on the epistemology of anthropology. In T.N. Headland, K.L. Pike, and M. Harris (eds.). Emics and etics: The insider/outsider debate. Frontiers of anthropology, v. 7. Newbury Park, Calif: Sage Publications.
Lewins, Ann and Christina Silver. (2009). Choosing a CAQDAS Package, 6th edition April 2009 CAQDAS Networking Project and Qualitative Innovations in CAQDAS Project.
Lewis, Jenny M. (2006). Being around and knowing the players: Networks of influence in health policy. Social Science & Medicine, 62, 9, 2125-2136.
177
Liao, Chechen, Jain-Liang Chen, David C. Yen. (2007). Theory of planning behavior (TPB) and customer satisfaction in the continued use of e-service: An integrated model. Computers in Human Behavior, Volume 23, Issue 6, November 2007, Pages 2804–2822
Lillis, Anne M. 1999. A framework for the analysis of interview data from multiple field research sites. Accounting and Finance 39 (1999) 79-105.
Lin, Hsiu-Fen. (2006). Understanding Behavioral Intention to Participate in Virtual Communities. CyberPsychology & Behavior. Vol. 9(5): 540-547.
Lin, Hsiu-Fen. (2007). Effects of extrinsic and intrinsic motivation on employee knowledge sharing intentions. Journal of Information Science, vol. 33 no. 2 135-149.
Lin, Hsiu-Fen. and Lee, G.G. (2004). Perceptions of senior managers toward knowledge-sharing behaviour. Management Decision, Vol. 42 No. 1, pp. 108-25.
Lincoln, Y.S. and Guba, E.G. (1985). Naturalistic Inquiry. California: SAGE.
Lindquist, E. A. (1992), Public managers and policy communities: learning to meet new challenges. Canadian Public Administration, 35: 127–159.
Lindquist, E. A. (2012), Horizontal Management in Canada Ten Years Later. Optimum Online. Vol. 42, Issue 3.
Lipsky, M. (1979). Street Level Bureaucracy. New York: Russell Sage Foundation.
Longo, J. (2011). #OpenData: Digital-Era Governance Thoroughbred or New Public Management Trojan Horse? Public Policy and Governance Review. Vol. 2, no. 2, pp. 38-51.
Lord, M.D., Ranft, A.L. (2000), Organisational learning about new international markets: exploring the internal transfer of local market knowledge, Journal of International Business Studies, Vol. 31 No.4, pp.573-89.
Lynn, Jonathan and Anthony Jay. (1989). The Complete Yes Prime Minister. London: BBC Books.
Ma, Will W.K. and Allan H.K. Yuen. (2011). Understanding online knowledge sharing: An interpersonal relationship perspective. Computers & Education, Volume 56, Issue 1, January 2011, Pages 210-219
Madelin, Robert. (2012). Closing Remarks. Digital Agenda Assembly 2012. http://ec.europa.eu/information_society/digital-agenda/daa/index_en.htm and http://www.guardian.co.uk/public-leaders-network/blog/2012/jun/21/civil-servants-become-digital-natives.
178
Ryan, M., Scott, D. A., Reeves, C., Bate, A., Van Teijlingen, E. R., Russell, E. M., Napper, M. & Robb, C. M. (2001). Eliciting public preferences for healthcare: a systematic review of techniques. Health technology assessment (Winchester, England), 5(5), 1.
Mansbridge, J. J. (1983). Beyond Adversary Democracy. Chicago: University of Chicago Press.
Mao, Andrew, Ariel D. Procaccia and Yiling Chen. (2012). Social Choice for Human Computation. http://www.cs.cmu.edu/~arielpro/papers/vote4hcomp.pdf
March, James G., and Johan P. Olsen (1983). Organizing Political Life: What Administrative Reorganization Tells Us about Government. American Political Science Review 77 (2): 281–96
Markland, Geoffrey Scott. (2002). A Qualitative Interpretive Study of Collaboration among Staff and Faculty at a Catholic, Marianist Institution. Dissertation. Ohio University. http://etd.ohiolink.edu/send-pdf.cgi/Markland%20Geoffrey%20Scott.pdf?ohiou1235528229&dl=y
Marsh, D. and P. Furlong. (2002). A Skin not a Sweater: Ontology and Epistemology in Political Science. pp. 17–44 in D. Marsh and G. Stoker (eds.) Theory and Methods in Political Science. Basingstoke: Palgrave.
Marsh, D., D. Richards and M.J. Smith. (2001). Changing Patterns of Governance in the United Kingdom. Basingstoke, UK: Palgrave.
Marshall, Catherine and Gretchen B. Rossman. (1989). Designing qualitative research. Newbury Park, CA: Sage.
Marshall, Catherine and Gretchen B. Rossman. (2006). Designing Qualitative Research, Sage Publications, Thousand Oaks California.
Mårtensson, Maria. (2000). A critical review of knowledge management as a management tool. Journal of Knowledge Management, Vol. 4, no. 3 pp. 204 - 216.
Mason, M. (2010). Sample Size and Saturation in PhD Studies Using Qualitative Interviews. Forum: Qualitative Social Research. Volume 11, No. 3, Art. 8. September 2010
May, Peter J. (1986). Politics and Policy Analysis. Political Science Quarterly, Vol. 101, No. 1, pp. 109-125.
Mayer, Igor S., C. Els van Daalen, Pieter W.G. Bots. (2004). Perspectives on policy analyses: a framework for understanding and design. International Journal of Technology, Policy and Management. Volume 4, Number 2, 169-191.
McAfee, Andrew P. (2006). Enterprise 2.0: The Dawn of Emergent Collaboration. MIT Sloan Management Review. Spring 2006, Vol. 47, no. 3.
179
McAfee, A. (2006). Enterprise 2.0: The Dawn of Emergent Collaboration. MIT Sloan Management Review, Spring 2006, Vol.47, No.3.
McCallum, Andrew, Xuerui Wang and Andres Corrada-Emmanuel. (2007). Topic and Role Discovery in Social Networks with Experiments on Enron and Academic Email. Journal of Artificial Intelligence Research 30, 249-272.
McDermott, Richard. 1999. Why Information Technology Inspired But cannot Deliver Knowledge Management. California Management Review. Vol. 41, no. 4, pp. 103-117.
McDermott, Richard and Chris O’Dell. (2001). Overcoming cultural barriers to sharing knowledge. Journal of Knowledge Management, Vol. 5 No. 1, pp. 76-85.
McGregor, S. L. T. (2004), Modeling the Evolution of a Policy Network Using Network Analysis. Family and Consumer Sciences Research Journal, 32: 382–407.
McMillan, B., and Connor, M. (2003) Applying an extended version of the theory of planned behavior to illicit drug use among students, Journal of Applied Social Psychology, 33, 1662 – 83.
McNutt, John G. 2008. Web 2.0 Tools for Policy Research and Advocacy. Journal of Policy Practice, 7:1, 81-85.
McNutt, Kathleen. (2006). Research Note: Do Virtual Policy Networks Matter? Tracing Network Structure Online. Canadian Journal of Political Science, 39, pp 391-405.
Meek, B.L. (1994). A new approach to the Single Transferable Vote. Voting Matters, 1, 1–11.
Meek, Jack W. (2011). Policy Networks. Encyclopedia of Public Administration and Public Policy, Second Edition, 1:1, 1491 - 1494.
Meijera, Albert and Marcel Thaens. (2010). Alignment 2.0: Strategic use of new internet technologies in government. Government Information Quarterly Volume 27, Issue 2, March 2010, Pages 113–121.
Meltsner, A.J. 1976. Policy Analysts in the Bureaucracy. Berkeley, CA: University of California Press.
Mergel, Ines, Charlie Schweik and Jane Fountain. (2010). The Transformational Effect of Web 2.0 Technologies on Government. Working Paper. Electronic copy available at: http://ssrn.com/abstract=1412796 . Permission to cite granted via email October 20 2010.
Mergel, Ines, David Lazer and Maria Christina Binz-Scharf. 2008. Lending a helping hand: Voluntary engagement in a network of professionals. International Journal of Learning and Change (IJLC), Volume 3, Issue 2:5-22.
180
Mergel, Ines. (2011). The Use of Social Media to Dissolve Knowledge Silos in Government. In Rosemary O'Leary, David M. Van Slyke and Soonhee Kim (eds.), The Future of Public Administration Around the World: The Minnowbrook Perspective. Washington, D.C.: Georgetown University Press.
Merriam, Sharan B. (1998). Qualitative research and case study applications in education. San Francisco: Jossey-Bass Publishers.
Miles, M. B. And A.M. Huberman. (1994). Qualitative Data Analysis (2nd ed.). Thousand Oaks, CA: Sage.
Mintzberg, Henry and Jacques Bourgault. (2000). Managing Publicly. Toronto: Institute of Public Administration of Canada / Ottawa: Canadian Centre for Management Development.
Mintzberg, Henry. (1970). Structured Observation as a Method to Study Managerial Work. Journal of Management Studies, 7: 87–104.
Mintzberg, Henry. (1973). The Nature of Managerial Work. New York: Harper and Row.
Mintzberg, Henry. (2005). Developing Theory About the Development of Theory. In Ken G. Smith and Michael A. Hitt (eds.) Great Minds in Management: the Theory of Process Development. New York: Oxford.
Moan, I. S. and Rise, J. (2005). Quitting Smoking: Applying an Extended Version of the Theory of Planned Behavior to Predict Intention and Behavior, Journal of Applied Biobehavioral Research, (10:1), pp. 39-68
Moebius, Michael. (2002). Epistemological triangulation: a typical research approach of the future. Henley Working Paper 0205. University of Reading.
Morçöl, Göktug. (2001). Positivist beliefs among policy professionals: An empirical investigation. Policy Sciences, 34: 381-401.
Morçöl, Göktu�. (2012). A Complexity Theory for Public Policy. New York: Routledge.
Morison, J. (2010). Gov 2.0: Towards a User Generated State? The Modern Law Review, 73: 551–577.
Morris, M. W., Leung, K., Ames, D., and Lickel, B. 1999. Views from inside and outside: Integrating Emic and Etic Insights about Culture and Justice Judgment. Academy of Management Review, 24(4), 781-796.
Morris, M., Venkatesh V., Ackerman, P. (2005). Gender and Age Differences in Employee Decisions About New Technology: An Extension to the Theory of Planned Behavior, IEEE Transactions on Engineering Management (52:1), pp. 69-84
181
Museus, S. D. (2007). Using qualitative methods to assess diverse institutional cultures. New Directions for Institutional Research, 2007: 29–40.
Nairn, Geoff. (2011). The trouble with office email. Financial Times. February 17, 2011 7:52 pm.
Newell, Sue, Maxine Robertson, Harry Scarbrough, and Jacky Swan. (2002). Managing Knowledge Work. Basingstoke, UK: Palgrave.
Nielsen, Jakob. (1994). Heuristic evaluation. In Nielsen, J., and Mack, R.L. (Eds.), Usability Inspection Methods, John Wiley & Sons, New York, NY.
Nilsson, Måns, Andrew Jordan, John Turnpenny, Julia Hertin, Björn Nykvist and Duncan Russel. 2008. The use and non-use of policy appraisal tools in public policy making: an analysis of three European countries and the European Union. Policy Sciences. Volume 41, Number 4, 335-355.
Nonaka, I. (1994). A dynamic theory of organizational knowledge creation. Organization Science, 5, 1, pp 14-37.
Noveck, Beth S. (2009). Wiki Government: How Technology can make Government Better, Democracy Stronger, and Citizens More Powerful. Washington, D.C.: Brookings Institution Press.
Nowotny, Helga, Peter Scotta and Michael Gibbons. (2001). Re-Thinking Science: Knowledge and the Public in an Age of Uncertainty. Cambridge: Polity Press.
Nunnally, J. C. And L. H. Bernstein. (1994). Psychometric theory (3rd ed.). New York: McGraw-Hill.
O’Flynn, Janine. (2009). The Cult of Collaboration in Public Policy. Australian Journal of Public Administration. Volume 68, Issue 1, pages 112–116, March 2009.
O’Neill, Jefferey C. 2008. Which Voting Method Should I Use? Website: http://www.openstv.org/faq#Q2
O’Neill, Jefferey C. (2011). OpenSTV Version 2.0.0. Computer Software. http://www.openstv.org/download
O’Neill, O.A. & O'Reilly, C.A. (2011). Overcoming the Backlash Effect: Self-Monitoring and Women’s Promotions, Journal of Occupational and Organizational Psychology.
O’Reilly, Tim. (2005). What Is Web 2.0: Design Patterns and Business Models for the Next Generation of Software. Sebastopol, CA: O'Reilly Media, Inc.
182
O’Reilly, Tim. (2010). Government as a Platform. In Lathrop, Daniel and Laurel Ruma (eds). (2010). Open Government: Collaboration, Transparency and Participation in Practice. Sebastopol, CA: O'Reilly Media, Inc.
O’Toole, Laurence J. 1997. Treating Networks Seriously: Practical and Research-Based Agendas in Public Administration. Public Administration Review 57(1): 45–52.
Oakeshott, M. 1996. The Politics of Faith and the Politics of Scepticism. New Haven: Yale University Press.
OpenMRS. Nd. Patient Matching Design.
Osborne, D. (1993). Reinventing Government. Public Productivity & Management Review. Vol. 16, No. 4, Summer, 1993.
Osimo, David. 2008. Web 2.0 in Government: Why and How? Luxembourg: Office for Official Publications of the European Communities.
Ospina, S. M. (2011). Public Administration Research and the Field's Identity. Public Administration Review, 71: 957–963.
Ouadahi, Jamal. 2008. A Qualitative Analysis of Factors Associated with User Acceptance and Rejection of a New Workplace Information System in the Public Sector: A Conceptual Model. Canadian Journal of Administrative Sciences. Vol. 25: 201–213.
Pal, Leslie A. (2009). Beyond Policy Analysis: Public Issue Management in Turbulent Times. 4th Edition. Toronto: Nelson.
Pardo, Theresa A. and Giri Kumar Tayi. (2007). Interorganizational information integration: A key enabler for digital government. Government Information Quarterly. Vol. 24, no. 4, 691-715.
Park, H., V. Ribiere and W. Schulte. (2004). ‘Critical attributes of organizational culture that promote knowledge management implementation success. Journal of Knowledge Management, Vol. 8 No. 3, pp. 106-17.
Parson, E.A. (ed.). (2013). A Fine Balance: Expertise, Evidence and Democracy in Policy and Governance, 1960-2011. Forthcoming. Toronto: University of Toronto Press.
Parsons, Wayne. (1995). Policy Analysis. Aldershot: Edward Elgar.
Parsons, Wayne. (2002). From Muddling Through to Muddling Up -Evidence Based Policy Making and the Modernisation of British Government. Public Policy and Administration 2002; 17; 43-60.
Parsons, Wayne. (2004). Not Just Steering but Weaving: Relevant Knowledge and the Craft of Building Policy Capacity and Coherence. Australian Journal of Public Administration, 63: 43–57.
183
Parsons, Wayne. (2006). Innovation in the public sector: spare tyres and fourth plinths. The Innovation Journal: The Public Sector Innovation Journal, Volume 11(2).
Patton, M. Q. 1990. Qualitative evaluation and research methods. (2nd ed) Newbury Park, CA. Sage.
Pereira, Guimarães and Silvio Funtowicz. (2006). Knowledge Representation and Mediation for Transdisciplinary Frameworks to Inform Debates, Dialogues and Deliberation. International Journal of Transdisciplinary Research Vol. 1, No. 1, Pages 34-50.
Perreault, William D. Jr. (1975). Controlling Order-Effect Bias. The Public Opinion Quarterly, Vol. 39, No. 4 (Winter, 1975-1976), pp. 544-551
Perschel A. & Perdue J. (2012). Women and the Paradox of Power: 8 Keys for Transforming Business Culture.
Peters, B. Guy. 1996. The Policy Capacity of Government. Canadian Centre for Management Development, Research Paper No. 8.
Peters, B. Guy. (1998). Managing Horizontal Government: The Politics of Coordination. Research Paper No. 21. Ottawa: Canadian Centre for Management Development.
Phang, Chee Wei, Atrevi Kankanhalli and Rajiv Sabherwal. (2009). Usability and Sociability in Online Communities:A Comparative Study of Knowledge Seeking and Contribution. Journal of the Association for Information Systems Vol. 1, Issue 10 pp. 721-747 October 2009.
Phillips, P.W.B. (2007). Governing Transformative Technological Innovation: Who’s in Charge? Cheltenham: Edward Elgar.
Pitt, D. C.1976. The Social Dynamics of Development. Oxford: Pergamon
Polanyi, Michael. 1966. The Tacit Dimension. New York: Anchor Day.
Policy and Innovation Unit. (2000). Wiring it up: Whitehall’s management of cross-cutting policies and services. London: Cabinet Office.
Pollitt, C. (2003). Joined-up Government: a Survey. Political Studies Review, 1: 34–49.
Popay, J. And G. Williams. (1994). Researching the People’s Health. London: Routledge.
Pope, Catherine, Sue Ziebland and Nicholas Mays. (2006). Analysing Qualitative Data. Chapter 7 in Catherine Pope and Nicholas Mays (editors), Qualitative Research in Health Care. 3rd Edition. London: Blackwell.
Porras, J.I. and Silvers, R.C. (1991). Organizational Development and Transformation. Annual Review of Psychology. Vol. 42:51-78.
184
Potts, Jason. (2009). The innovation deficit in public services: The curious problem of too much efficiency and not enough waste and failure. Innovation: Management, Policy & Practice. Vol. 11, No. 1, pp. 34-43.
PPI (Public Policy Institute). (2011). Wicked Problems Do they exist and does it matter? Policy Update. Issue #2, 23 March 2011
Pressman, Jeffrey L. and Aaron Wildavsky. (1973). Implementation: How Great Expectations in Washington are Dashed in Oakland; or, Why it’s Amazing that Federal Programs Work at All. Berkely: University of California Press.
Provan, Keith G. and Robin H. Lemaire. (2012). Core Concepts and Key Ideas for Understanding Public Sector Organizational Networks: Using Research to Inform Scholarship and Practice. Public Administration Review, Vol. xx, Iss. xx, pp. xx–xx. (early pre-print). DOI: 10.111/j.1540-6210.2012.02595.x.
Putnam, Robert D. (1993). Making Democracy Work: Civic Traditions in Modern Italy. Princeton: Princeton University Press.
Quade, E.S. (1975). Analysis for public decisions. New York: Elsevier.
Raadschelders, Jos C. N. (1999). A Coherent Framework for the Study of Public Administration. Journal of Public Administration Research and Theory 9(2): 281–303.
Raadschelders, Jos C. N. (2011). The Future of the Study of Public Administration: Embedding Research Object and Methodology in Epistemology and Ontology. Public Administration Review, 71: 916–924.
Radaelli, Claudio M. (2008). Europeanization, Policy Learning, and New Modes of Governance. Journal of Comparative Policy Analysis 10 (3): 235–94. Blunch, Niels J. 2008. Introduction to structural equation modelling using SPSS and AMOS. Thousand Oaks, CA: Sage.
Reid, Bill and Justin Longo. (2011). Living the Evolution in Public Policy. Presentation to the British Columbia Government Policy Community of Practice. Victoria, BC. May 27 2011.
Riege, Andreas (2005) Three-dozen knowledge-sharing barriers managers must consider, Journal of Knowledge Management, Vol. 9 Iss: 3, pp.18 - 35.
Rhodes, R. A. W. (2002). Putting the People Back into Networks. Australian Journal of Political Science, 37(3), 399-415.
Rhodes, R. A. W. (2005). Everyday Life in a Ministry : Public Administration as Anthropology. The American Review of Public Administration, 35: 3.
185

Rhodes, R. A. W. (2008). Policy Network Analysis, pp. 425-447 in Michael Moran, Martin Rein and Robert E. Goodin (eds.), The Oxford Handbook of Public Policy.
Rhodes, R. A. W. (2011). Everyday Life In British Government. New York: Oxford.
Rhodes, R. A. W., Paul 't Hart and Mirko Noordegraaf (eds.) (2007). Observing Government Elites: Up Close and Personal. Houndmills, Basingstoke: Palgrave Macmillan
Riccucci, Norma M. (2010). Public Administration: Traditions of Inquiry and Philosophies of Knowledge. Washington, DC: Georgetown University Press.
Richards, Lyn and Tom Richards. (1994). From filing cabinet to computer. In Alan Bryman and Robert G. Burgess (eds.) Analysing Qualitative Data (pp.146-172). London: Routledge.
Ridgeway, C.L., and Smith-Lovin, L. (1999). The Gender System and Interaction. Annual Review of Sociology 25: 191–216.
Riege, Andreas. (2005). Three-dozen knowledge-sharing barriers managers must consider. Journal of Knowledge Management, 9, 3 18 - 35.
Ritchie, J., L. Spencer and W. O’Connor. (2003). Carrying out Qualitative Analysis, in J. Ritchie and J. Lewis (editors), Qualitative Research Practice. London: Sage.
Robertson, M., J. Swan, and S. Newell. 1996. The Role of Networks In the Diffusion of Technological Innovation. Journal of Management Studies, 33, 333–359.
Robb, Michael P., Margaret A. Maclagan and Yang Chen. (2004). Speaking Rates of American and New Zealand Varieties of English. Clinical Linguistics & Phonetics, Vol. 18, no. 1, pp. 1-15.
Robson, Colin. (2002). Real-World Research: A Resource for Social Scientists and Practitioner-Researchers. 2nd edition. Oxford: Blackwell.
Rose, Richard. 1993. Lesson Drawing in Public Policy: A Guide to Learning Across Time and Space. Cambridge: Cambridge University Press.
Rourke, Liam and Terry Anderson. (2004). Validity in Qualitative Content Analysis. Educational Technology Research and Development, 52, 1, 5-18.
Roy, J. (2008). Beyond Westminster governance: Bringing politics and public service into the networked era. Canadian Public Administration, 51: 541–568.
Rudestam, Kjell Erik and Rae R. Newton. (2001). Surviving Your Dissertation. Thousand Oaks, CA: Sage.
Rusbult, C. E., Martz, J. M., and Agnew, C. R. (1998). The investment model scale: measuring commitment level, satisfaction level, quality of alternatives, and investment size. Personal Relationships, 5(4), 357-391
186
Ryu, S., Ho, H.S. and Han, I. (2003). Knowledge sharing behavior of physicians in hospitals. Expert Systems with Applications, Vol. 25 No. 1, pp. 113-22.
Sabatier, P. A. (1991). Political science and public policy. PS: Political Science and Politics, 24(2), 144-147.
Saetren, H. (2005). Facts and Myths about Research on Public Policy Implementation: Out-of-Fashion, Allegedly Dead, But Still Very Much Alive and Relevant. Policy Studies Journal, 33: 559–582.
Sahlins, Marshall. 1976. Culture and Practical Reason. Chicago: University of Chicago Press.
Salganik, Matthew J. and Karen E.C. Levy. (2012). "Wiki surveys: Open and quantifiable social data collection." Working paper.
Sanders, L. (1997). Against Deliberation. Political Theory 25 (3): 347–76.
Savage, P. (1976). Optimism and pessimism in comparative administration. Public Adm. Rev. 36:415-23
Savoie, Donald J. (2004). Searching for Accountability in a Government Without Boundaries. Canadian Public Administration. Vol. 47, no. 1, pp. 1-26.
Schamber, L. (1991). Users’ Criteria for Evaluation in Multimedia Information Seeking and Use Situations. Ph.D. dissertation, Syracuse University.
Schatzki, T. (2003). A New Societist Social Ontology. Philosophy of the Social Sciences, 33 (2), 174-202.
Schmitt, Achim, Stefano Borzillo and Gilbert Probst. (2012). Don't let knowledge walk away: Knowledge retention during employee downsizing. Management Learning 2012 43: 53
Scholz, John T., Ramiro Berardo and Brad Kile. 2008. Do Networks Solve Collective Action Problems? Credibility, Search, and Collaboration. The Journal of Politics, 70, pp 393-406.
Schön, D.A. (1995). Knowing-in-action: The new scholarship requires a new epistemology. Change, 27, 6, 27-34.
Schütten, M. (2009). E-government in municipalities : the relationship between organizational culture, need for closure and commitment to change. Thesis for the Master Communication Studies at Twente University, Enschede, The Netherlands.
Scott, Andrew M. (1969). The Department of State: Formal Organization and Informal Culture. International Studies Quarterly. Vol. 13, No. 1 (Mar., 1969), pp. 1-18.
187
Scott, Andrew M. (1970). Environmental Change and Organizational Adaptation: The Problem of the State Department. International Studies Quarterly. Vol. 14, No. 1 (Mar., 1970), pp. 85-94.
Scott, J. (1991). Social Network Analysis. London: Sage.
Seidman, Harold and Robert Gilmour. (1986). Politics, Position and Power: From the Positive to the Regulatory State, 4th ed. New York: Oxford University Press.
Selwyn, N., S. Gorard and J. Furlong. (2005). Whose internet is it anyway?: Exploring adults’ (non)use of the internet in everyday life. European Journal of Communication 20 (1) 5–26.
Sheeran, P., Taylor, S. (1999) Predicting intentions to use condoms: A meta-analysis and comparison if the theories of reasoned action and planned behavior. Journal of Applied Social Psychology, 29, 1624 – 75.
Sheppard, B.H., Hartwick, J., Warshaw P.R. (1988). The theory of reasoned action: a meta-analysis of past research with recommendations for modifications and future research. Journal of Consumer Research, 15, 3, 325–343.
Shirky, Clay. (2008). Here Comes Everybody: The Power of Organizing Without Organizations. New York: Penguin.
Silver, N. (2012). The Signal and the Noise: The Art and Science of Prediction. Allen Lane.
Silverman, D. And J. Jones. (1976). Organizational work. London: Collier-Macmillan.
Simon, Herbert A., George B. Dantzig, Robin Hogarth, Charles R. Piott, Howard Raiffa, Thomas C. Schelling, Kennth A. Shepsle, Richard Thaier, Amos Tversky, and Sidney Winter. (1986). Decision Making and Problem Solving. In Research Briefings 1986: Report of the Research Briefing Panel on Decision Making and Problem Solving. Washington, DC: National Academy Press.
Smarkola, Claudia. 2008. Efficacy of a planned behavior model: Beliefs that contribute to computer usage intentions of student teachers and experienced teachers. Computers in Human Behavior 24, 1196–1215.
Smith, M., Milic-Frayling, N., Shneiderman, B., Mendes Rodrigues, E., Leskovec, J., Dunne, C., (2010). NodeXL: a free and open network overview, discovery and exploration add-in for Excel 2007/2010, http://nodexl.codeplex.com/ from the Social Media Research Foundation, http://www.smrfoundation.org
Smith, R. Andrew and Stuart J.H. Biddle. 1999. Attitudes and exercise adherence: Test of the Theories of Reasoned Action and Planned Behaviour. Journal of Sports Sciences, 17:4, 269-281.
188
Smith-Lovin, L., and Brody, C. (1989). Interruptions in Group Discussions: The Effects of Gender and Group Composition. American Sociological Review 54: 424–35.
Snowden, Dave. (2002). Complex Acts of Knowing – Paradox and Descriptive Self Awareness. Journal of Knowledge Management, 6, 2, 100–111.
Somerville, K. A. 2008. The key drivers of organizational culture change in the public sector: An analysis of the canadian federal government. Dissertation. Ottawa: Carleton University
Spector, P. E. (1994). Using self-report questionnaires in OB research: A comment on the use of a controversial method. Journal of Organizational Behavior, 15: 385–392.
Spradley, J.P. (1979). The ethnographic interview. New York: Holt, Rinehart and Winston.
Spradley, J.P. (1980). Participant observation. New York: Holt, Rinehart and Winston.
Sprague, D. & Tory, M. (2012). Exploring how and why people use visualizations in casual contexts: Modeling user goals and regulated motivations. Information Visualization, vol. 11 no. 2 106-123.
Stacey, R.D. (2002). The Impossibility of Managing Knowledge. Lecture at the Royal Society of Arts, February 27, in RSA Journal.
Statistics Canada. (2011). System of National Accounts. Ottawa:
Statistics Canada. (2012). Census 2011. Ottawa:
Stavrakantonakis, I., Gagiu, A.-elena, Kasper, H., Toma, I., & Thalhammer, A. (2012). An approach for evaluation of social media monitoring tools. CVM 2012 workshop of ESWC2012 (pp. 1-17).
Stenmark, Dick. (1998). Identifying Problems with Email-based Information Sharing. Preceedings of IRIS21. N. J. Buch, J. Damsgaard, L. B. Eriksen, J. H. Iversen, and P. A. Nielsen (eds.), Department of Computer Science, Aalborg University, Denmark, 1998.
Stewart, Thomas A. (2002). The Wealth of Knowledge: Intellectual Capital and the Twenty-first Century Organization. London: Nicholas Brealey.
Stone, Diane. (2007). Public Policy Analysis and Think Tanks.. Chapter 11 (pp. 149-157) in Frank Fischer, Gerald Miller and Mara S. Sidney (eds.) Handbook of Public Policy Analysis: Theory, Politics, and Methods. Volume 125 of Public Administration and Public Policy. CRC Press.
Stout, M. (2012). Competing Ontologies: A Primer for Public Administration. Public Administration Review.
189
Street, Richard L., Robert M. Brady and William B. Putman. 1983. The Influence of Speech Rate Stereotypes and Rate Similarity or Listeners' Evaluations of Speakers. Journal of Language and Social Psychology, vol. 2 no. 1 pp. 37-56.
Sue, Valerie M. and Lois A. Ritter. (2007). Conducting Online Surveys. Thousand Oaks, CA: Sage.
Sveiby, Karl-Erik and Roland Simons. (2002). Collaborative Climate and Effectiveness of Knowledge Work – an Empirical Study. Journal of Knowledge Management, 6, 5, pp. 420-433.
Tapscott, Don and Anthony D. Williams. (2006). Wikinomics: How Mass Collaboration Changes Everything. New York: Portfolio.
Taylor-Smith, Ella and Peter Cruickshank (2010) Web 2.0 for Collaborative Production. Digital Futures’10, October 11 – 12, 2010, Nottingham, UK.
Tesarik, J., Dolezal, L. & Kollmann, C. (2008). User interface design practices in simple single page web applications, Applications of Digital Information and Web Technologies, 2008. ICADIWT 2008. First International Conference on the , vol., no., pp.223-228, 4-6 Aug. 2008.
Thaler, Richard H. and Cass R. Sunstein. 2008. Nudge:Improving Decisions About Health, Wealth, and Happiness. New Haven: Yale University Press.
Thomas, D.R. (2006). A General Inductive Approach for Analyzing Qualitative Evaluation Data. American Journal of Evaluation, 27(2), p.237-246.
Thompson, Ann Marie, James L. Perry and Theorore K. Miller. 2008. Conceptualizing and Measuring Collaboration. Journal of Public Administration Research and Theory, 19: 23-56.
Thompson, Derek. (2011). The Case For Banning Email at Work. The Atlantic Monthly. DEC 1 2011, 1:35 PM ET
Till, B., A. R. Dobell, J. Longo and P. Driessen. (2012). Self Organizing Maps for Latent Semantic Analysis of Blogospheric Free-Form Text in Support of Public Policy Analysis. Data Mining and Knowledge Discovery, forthcoming.
Tingling, P.M. And M.J. Brydon. (2010). Is Decision-Based Evidence Making Necessarily Bad? MIT Sloan Management Review, Vol. 51, no. 4, pp. 71-76.
Tirole, Jean. (1994). The Internal Organization of Government. Oxford Economic Papers , New Series, Vol. 46, No. 1 (Jan., 1994), pp. 1-29
Torgerson, D. (1986). Between Knowledge and Power: Three Faces of Policy Analysis, Policy Sciences 19, pp. 33-59.
190
Townsend, Thomas and Bob Kunimoto. (2009). Capacity, Collaboration and Culture: The Future of the Policy Research Function in the Government of Canada. Ottawa: Policy Research Initiative.
Traunmüller, R. (2012). Knowledge Management in Government: New Perspectives pp. 1-9 in A. K� et al. (eds.) EGOVIS/EDEM 2012, LNCS 7452.
Tyler, Joshua R., Dennis M. Wilkinson and Bernardo A. Huberman. (2005). E-Mail as Spectroscopy: Automated Discovery of Community Structure within Organizations. The Information Society, 21: 133–141.
Uberoi, Varun, Adam Coutts, Iain McLean and David Halpern (eds.). (2010). Options for Britain II: Cross Cutting Policy Issues - Changes and Challenges. London: Wiley-Blackwell
Ullman, Jodie B. 1996. Structural Equation Modeling. Chapter 14, pp. 709-811 in Barbara G. Tabachnick and Linda S. Fidell (eds.) Using Multivariate Statistics. New York: Harper Collins.
University of Victoria Human Research Ethics Board. n.d. Human Research Ethics Website - FAQs. http://www.uvic.ca/research/conduct/regapproval/humanethics/index.php#section0-172
Valentine, Melissa A., Bradley R. Staats, and and Amy C. Edmondson. (2012). The Rich Get Richer: Enabling Conditions for Knowledge Use in Organizational Work Teams. HBS Working Paper Number: 13-001.
van Vuuren, Sally Jansen. (2011). Inter-Organisational Knowledge Sharing in the Public Sector: The Role of Social Capital and Information and Communication Technology. Doctoral Dissertation. Wellington, New Zealand: Victoria University of Wellington.
Venkatesh V. and Davis F.D. (2000) Theoretical Extension of the Technology Acceptance Model: Four Longitudinal Field Studies. Management Science, Vol. 46, No. 2 (Feb., 2000), pp. 186-204.
Venkatesh,V., Morris, M.G., Davis, G.B., Davis, F.D. (2003). User acceptance of information technology: Toward a unified view. MIS Quarterly, 2003, 27, 3, 425-478.
Vinod, H. D. and Derrick Reagle. (2003). Inference for Negativist Theory Using Numerically Computed Rejection Regions, Computational Statistics & Data Analysis. Vol. 42, 491-512.
Walinga, Jennifer. (2007). The Power of Focus: Unlocking Creative Insight and Overcoming Performance Barriers. Doctoral Dissertation. Victoria, B.C.: University of Victoria.
Walker, Warren E. and Jan M. Chaiken. 1982. The effects of fiscal contraction on innovation in the public sector. Policy Sciences, 15:2, 141-165
191

Wang, Sheng and Raymond A. Noe. (2010). Knowledge sharing: A review and directions for future research. Human Resource Management Review 20, 115–131.
Wasserman, S. and K. Faust. (1994). Social Network Analysis. Cambridge: Cambridge University Press.
Weber , Edward P. and Anne M. Khademian. 2008. Wicked Problems, Knowledge Challenges, and Collaborative Capacity Builders in Network Settings. Public Administration Review. Volume 68, Issue 2, pages 334–349, March|April 2008.
Weber, Max. (1991). From Max Weber: Essays in Sociology. Edited, and with an Introduction, by H.H. Gerth and C. Wright Mills. London: Routledge.
Weimer, David and Aidan R. Vining. (2010). Policy Analysis: Concepts and Practice. 5th Edition. London: Longman.
Wellman, B. (2001). Computer Networks As Social Networks. Science Vol. 293, No. 14.
Wellman, B. and S.D. Berkowitz. (1988). Social Structures: A Network Approach. Cambridge: Cambridge University Press.
Wellstead, A. and Stedman, R. (2010). Policy Capacity and Incapacity in Canada’s Federal Government: The Intersection of Policy Analysis and Street Level Bureaucracy. Public Management Review. 12: 6, 893 - 910.
Wellstead, A., Stedman, R. and Howlett, M. (2011). Policy Analytical Capacity in Changing Governance Contexts: A Structural Equation Model (SEM) Study of Contemporary Canadian Policy Work. Public Policy and Administration, July 2011; vol. 26, 3: pp. 353-373.
Wellstead, A., Stedman, R., Joshi S. & Lindquist, E. (2007). Beyond the National Capital Region: Federal Regional Policy Capacity. A Report Prepared for the Treasury Board Secretariat of Canada.
Welsh, E. (2002). Dealing with Data: Using NVivo in the Qualitative Data Analysis Process. Forum: Qualitative Social Research, 3(2).
Wengraf, T. (2001). Qualitative research interviewing: biographic narrative and semi-structured methods. London ; Thousand Oaks, Calif.: SAGE.
White, Stephen K. (2000). Sustaining Affirmation: The Strengths of Weak Ontology in Political Theory. Princeton, N.J.: Princeton University Press.
Whittaker, S. and C. Sidner. 1996. Email Overload: Exploring Personal Information Management of Email. In Proc. of CHI ’96, pp. 276-283, 1996.
192
Wildavsky, Aaron. (1979). Speaking Truth to Power: The Art and Craft of Policy Analysis. New York: Little, Brown.
Wilkinson, Katy. (2011). Organised Chaos: An Interpretive Approach to Evidence Based Policy Making in Defra. Political Studies, Vol. 59, no. 4, 959-977.
Willem, Annick and Marc Buelens. (2007). Knowledge Sharing in Public Sector Organizations: The Effect of Organizational Characteristics on Interdepartmental Knowledge Sharing. Journal of Public Administration Research and Theory. Vol. 17, no. 4, pp. 581-606.
Willem, Annick. (2010). Trust in whole networks in the public and nonprofit sector: The impact of public sector characteristics? Working Paper.
Willner, D. 1980. For whom the bell tolls: Anthropologists advising on public policy. American Anthropologist. 82(1):79-94
Wilson, W. 1887. The study of administration. Political science quarterly, 2: 197-222.
Winter, Sidney. 1987. Knowledge and competence as strategic assets. In David J. Teece (ed.), The Competitive Challenge: 159-184. Cambridge, MA: Ballinger.
Wolcott, H. 1973. The Man in the Principal's Office: An Ethnography. New York: Holt, Rinehart and Winston.
Wood, Donna J., and Barbara Gray. (1991). Toward a Comprehensive Theory of Collaboration. Journal of Applied Behavioral Science 27(2): 139–62.
Wood, J.T. (2012). Gendered Lives: Communication, Gender, & Culture. 10th edition. Boston, MA: Wadsworth Cengage Learning.
Woodall, D. R. 1982. Computer counting in STV elections. Representation, 23:90, 4-6
Wu, Jiming and Hongwei Du. (2012). Toward a better understanding of behavioral intention and system usage constructs. European Journal of Information Systems,1-19.
Wulff, R. M. (1979). Federal rule making: Processes and access. Practicing Anthropology 1(3):8, 30
Wyld, David C. (2007). The Blogging Revolution: Government in the Age of Web 2.0. Washington, D.C.: IBM Center for the Business of Government.
Yaghoubi, Nour-Mohammad and Ebrahim Bahmani. (2010). Factors Affecting the Adoption of Online Banking: An Integration of Technology Acceptance Model and Theory of Planned Behavior. International Journal of Business and Management Vol. 5, No. 9; September 2010.
193
Yang, Shu-Chen and Cheng-Kiang Farn. (2009). Social capital, behavioural control, and tacit knowledge sharing—A multi-informant design. International Journal of Information Management, Volume 29, Issue 3, Pages 210-218.
Yang, Tung-Mou and Terrence A. Maxwell. (2011). Information-sharing in public organizations: A literature review of interpersonal, intra-organizational and inter-organizational success factors. Government Information Quarterly, Volume 28, Issue 2, April 2011, Pages 164–175.
Yi, Jialin. (2009). A measure of knowledge sharing behavior: scale development and validation. Knowledge Management Research & Practice 7(1), 65-81
Young, J. (2010). In Wired Singapore Classrooms, Cultures Clash Over Web 2.0. The Chronicle of Higher Education. Date posted: September 7 2010. Date accessed: October 18 2010.
Young, Ken, Deborah Ashby, Annette Boaz and Lesley Grayson. (2002). Social Science and the Evidence-based Policy Movement. Social Policy and Society. Vol 1, no. 3, 215-224
Yuan, Jiahong, Mark Liberman, Christopher Cieri. (2006). Towards an Integrated Understanding of Speaking Rate in Conversation. Ninth International Conference on Spoken Language Processing (Interspeech 2006 — ICSLP), Pittsburgh, pp. 541-544.
Zander, Udo and Bruce Kogut. (1995). Knowledge and the speed of transfer and imitation of organizational capabilities: An empirical test. Organization Science, 6: 76-92.
Zarraga, C. and Bonache, J. (2003). Assessing the team environment for knowledge sharing: an empirical analysis. International Journal of Human Resource Management 14(7), 1227–1245.
Zeydi, Isa Mohammadi, Alireza Heydarnia, Shamsedin Niknami and Ali Safari Variani. (2009). The Prediction of Adoption with Correct Sitting Postural Habit: An Application of the Theory of Planned Behavior. European Journal of Scientific Research, Vol.28 No.2, pp.205-214.
Zhang, Jing and Sharon S. Dawes. (2006). Expectations and Perceptions of Benefits, Barriers, and Success in Public Sector Knowledge Networks. Public Performance & Management Review, Vol. 29, No. 4 (Jun., 2006), pp. 433-466.
Zhang, Jing, A. M. Cresswell and F. Thompson. (2005). Participants' expectations and the success of knowledge networking in the public sector in Huang, W., Siau, K., Wei, K.K. (eds), Digital Government: Strategies and Implementation from Developing and Developed Countries, Ideal Group, Inc., Hershey, PA, pp.260-81.
194
Zhang, Jing, Sharon S. Dawes and Joseph Sarkis. (2005). Exploring stakeholders’ expectations of the benefits and barriers of e-government knowledge sharing. Journal of Enterprise Information Management, Vol. 18, iss: 5, pp.548 - 567.
Zikmund, W.G. (2003). Business Research Methods, 7th ed. Mason, OH: Thomson/South-Western.
Zittrain, Jonathan. (2006). The Generative Internet. Harvard Law Review 119: 1974-2040.
6, Perri. (2001). Governing by Technique: Judgement and the Prospects for Governance of and with Technology. In OECD. Governance in the 21st Century. Paris: OECD.
6, Perri. (2004). Joined-Up Government in the Western World in Comparative Perspective: A Preliminary Literature Review and Exploration. Journal of Public Administration Research and Theory: J-PART, Vol. 14: pp103-138.
6, Perri. (2004). E-Governance: Styles of Political Judgement in the Informaton Age Polity. London: Palgrave Macmillan
6, Perri. (2007). Don’t Try this at Home: Lessons from England. Chapter 12 (pp. 325-354) in Sandford Borins, Kenneth Kernaghan, David Brown, Nick Brontis, Perri 6 and Fred Thompson (eds.) Digital State at the Leading Edge. Toronto: University of Toronto Press.
6, Perri and Christine Bellamy. (2011). Principles of Methodology: Research Design in Social Science. London: Sage.
6, Perri, Diana Leat, Kimberly Seltzer, and Gerry Stoker. (2002). Towards holistic governance: The new reform agenda. Basingstoke, UK: Palgrave.
195

196
Appendix A - Who’s a ‘Policy Analyst’? Participant Identification and Recruitment
The ‘policy analyst’ population used in this research included all individuals listed in the British Columbia Government online directory as of November 25 2011 whose title contained the phrase ‘policy analyst’ or ‘policy advisor’ (including adjectives such as ‘senior’). The ‘policy analyst’ population was originally conceptualized much more broadly, however, as all public servants working in British Columbia Government Ministries (i.e., excluding British Columbia Government public servants working for the Office of the Lieutenant-Governor, the Legislative Assembly and Independent Offices, the Judiciary, the Executive Council, Crown Corporations or Public Agencies) who usually or occasionally does what can be described as policy analysis based on the perception or belief of the person responding to the invitation to participate. As such, I had originally adopted a broad functional definition of ‘policy analyst’ to include all public servants with a connection to policy analysis and formulation processes in government, and sought to rely on the respondent to determine whether they are part of the target population (following, e.g., Howlett, 2006).
As an aside, a supplementary approach envisioned in the original design, that of engaging interested ‘policy analysis’ practitioners through targeted internal advertising and word-of-mouth failed to generate many additional responses. For example, the invitation was advertised to the 930 members of the British Columbia Government’s Policy Community of Practice - a voluntary learning community which I have been involved with both as a public servant and as a presenter - which provided a description of the research and a web link to access the survey (see figure A1). By following the link and entering their B.C. Government email address, they would have access to the survey. Given the interests in issues related to policy formulation in the B.C. Government of this group’s membership, an interest in the focus of this research seemed plausible. Though over 900 public servants with an interest in policy analysis received notification of the opportunity to participate, this method resulted in just 14 registrations and 13 completed surveys. In addition, 3 people contacted me by email separately and requested an invite code leading to 2 completed surveys. These completions are referred to as ‘volunteer participants’ in the reporting. What this low response rate from the indirect route also illustrates, I believe, is that some of the measures described in chapter 3 that build on Dillman (2007) - e.g., direct, personalized email invitations and the careful wording of those emails - were instrumental in exceeding the 50% response rate threshold for directly invited participants.
In order to allow the respondent to determine whether they felt they fit within the definition of a ‘policy analyst’, a ‘gate’ question was deployed as the first page of the online questionnaire that advised the respondent that the survey was intended for public servants in the Government of British Columbia who work in policy analysis and, after providing the
197
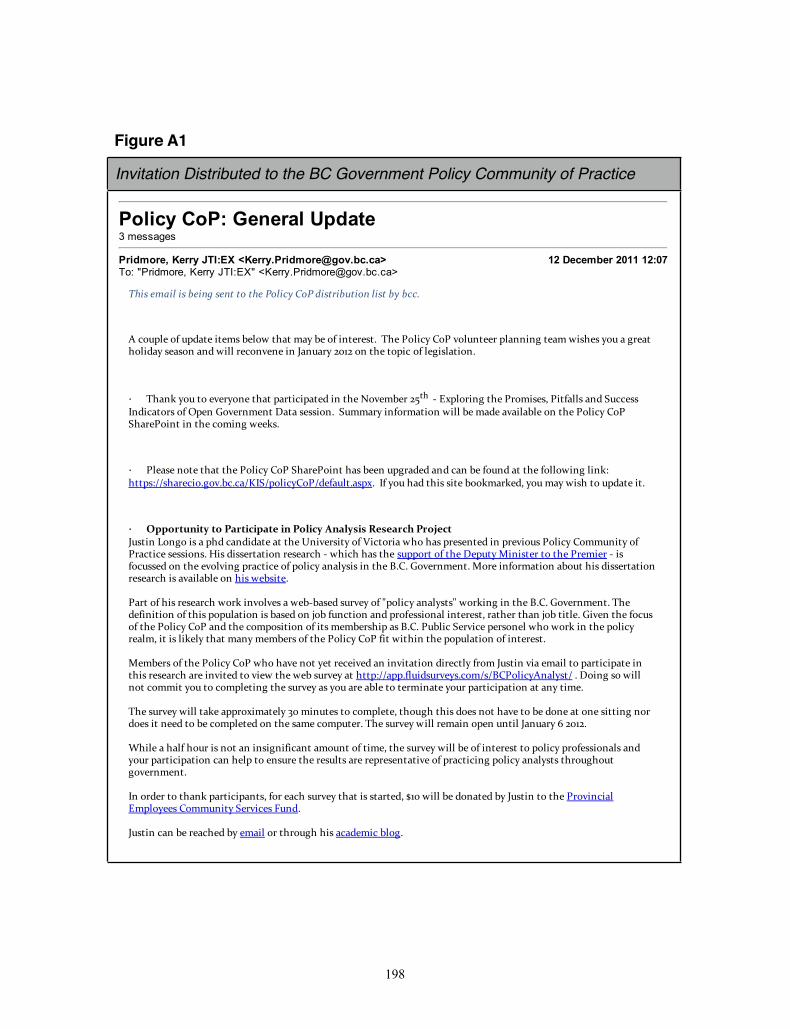
198
Figure A1
Invitation Distributed to the BC Government Policy Community of Practice
Policy CoP: General Update3 messages
Pridmore, Kerry JTI:EX <[email protected]> 12 December 2011 12:07To: "Pridmore, Kerry JTI:EX" <[email protected]>
�������� �������������������� ��������������������� �����������
�
���%*&"��%��*&��)���)�#(���"%,�)��)�#�.����%���$)�'�()1�������%"��.��%��+%"*$)��'�&"�$$�$��)��#�,�(��(�.%*����'��)�%"���.�(��(%$��$��,�""�'��%$+�$���$���$*�'.�9789�%$�)���)%&���%��"���("�)�%$1
�
� ���$!�.%*�)%��+�'.%$��)��)�&�')���&�)����$�)����%+�#��'�9;)���2��-&"%'�$��)����'%#�(�(/���)��""(��$���*���(($����)%'(�%���&�$��%+�'$#�$)���)��(�((�%$1���*##�'.��$�%'#�)�%$�,�""����#�����+��"��"��%$�)����%"��.��%����'��%�$)��$�)����%#�$��,��!(1
�
� �"��(��$%)��)��)�)����%"��.��%�����'��%�$)���(����$�*&�'������$����$�����%*$���)�)����%""%,�$��"�$!0�))&(033(��'���%1�%+1��1��3��3&%"��.�%�3����*")1�(&-1����.%*�����)��(�(�)���%%!#�'!��/�.%*�#�.�,�(��)%�*&��)���)1
�
� ������� ���������������� �������� ����������������������*()�$� %$�%��(���&�����$����)���)�)����$�+�'(�).�%�����)%'���,�%���(�&'�(�$)����$�&'�+�%*(��%"��.��%##*$�).�%��'��)����(�((�%$(1��(���((�')�)�%$�'�(��'���2�,�������(�)���(*&&%')�%��)�����&*).���$�()�'�)%�)����'�#��'�2��(�%�*((���%$�)����+%"+�$��&'��)����%��&%"��.��$�".(�(��$�)����1�1��%+�'$#�$)1��%'���$�%'#�)�%$���%*)���(���((�')�)�%$'�(��'����(��+��"��"��%$���(�,��(�)�1�
��')�%����(�'�(��'���,%'!��$+%"+�(���,��2��(���(*'+�.�%��5&%"��.��$�".()(5�,%'!�$���$�)����1�1��%+�'$#�$)1��������$�)�%$�%��)��(�&%&*"�)�%$��(���(���%$� %���*$�)�%$��$��&'%��((�%$�"��$)�'�()/�'�)��'�)��$� %��)�)"�1���+�$�)����%�*(%��)����%"��.��%���$��)����%#&%(�)�%$�%���)(�#�#��'(��&��(��1�1��*�"�����'+����&�'(%$�"�,�%�,%'!��$�)���&%"��.'��"#/��)��(�"�!�".�)��)�#�$.�#�#��'(�%��)����%"��.��%����)�,�)��$�)���&%&*"�)�%$�%���$)�'�()1
��#��'(�%��)����%"��.��%��,�%���+��$%)�.�)�'����+����$��$+�)�)�%$���'��)".��'%#��*()�$�+����#��"�)%�&�')���&�)���$)��(�'�(��'����'���$+�)���)%�+��,�)���,���(*'+�.��)��))&033�&&1�"*��(*'+�.(1�%#3(3���%"��.�$�".()3�1��%�$��(%�,�""$%)��%##�)�.%*�)%��%#&"�)�$��)���(*'+�.��(�.%*��'����"��)%�)�'#�$�)��.%*'�&�')���&�)�%$��)��$.�)�#�1�
����(*'+�.�,�""�)�!���&&'%-�#�)�".�:7�#�$*)�(�)%��%#&"�)�/�)�%*���)��(��%�(�$%)���+��)%�����%$���)�%$��(�))�$��$%'�%�(��)�$����)%�����%#&"�)���%$�)���(�#���%#&*)�'1�����(*'+�.�,�""�'�#��$�%&�$�*$)�"���$*�'.�<�97891�
���"������"���%*'��(�$%)��$��$(��$�����$)��#%*$)�%��)�#�/�)���(*'+�.�,�""����%���$)�'�()�)%�&%"��.�&'%��((�%$�"(��$�.%*'�&�')���&�)�%$���$���"&�)%��$(*'��)���'�(*")(��'��'�&'�(�$)�)�+��%��&'��)���$��&%"��.��$�".()(�)�'%*��%*)�%+�'$#�$)1�
$�%'��'�)%�)��$!�&�')���&�$)(/��%'������(*'+�.�)��)��(�()�')��/�687�,�""�����%$�)����.��*()�$�)%�)����'%+�$���"�#&"%.��(��%##*$�).���'+���(��*$�1
�*()�$���$����'��������.��#��"�%'�)�'%*�����(������#����"%�1�
�

working definition30 asked: “While you may not have the specific job title of ‘Policy Analyst’, does your work involve what you would call policy analysis?” (see figure A2). Essentially, the ‘gate’ question asked potential respondents a preliminary question about their job function and interest in participating in the research that offered three options: 1. they were correctly identified as a policy analyst, and were interested in participating; 2. they were correctly identified but not interested; and 3. they were improperly identified. Of the invitation recipients who were sent the email requesting their participation, 18 people whose title contained either ‘policy analyst’ or ‘policy advisor’ selected “No - sorry, you've got the wrong person. I don't do policy analysis.” These names were removed from the population of valid email invitations sent.
The challenge in determining the population of ‘policy analysts’ lies in identifying which public servants perform the function of policy analysis without being able to do so with regard to their job title or location in the organization. This note is an attempt to explain this
199
30 What is ‘policy analysis’? Policy-related work can include a range of activities like problem identification, data collection and analysis, environmental scanning, strategic planning, issue tracking, providing evidence-based decision-support, and managing stakeholder relations and public engagement. Policy analysts analyze issues, develop options, recommendations and advice, prepare position papers and draft briefing notes. There are many people who work for the Government of B.C. who do not have the word ‘policy’ in their job title. But ‘policy analysts’ work throughout government in jobs where the titles include words like ‘analyst’, ‘advisor’, ‘coordinator’, ‘planner’, ‘researcher’, ‘research officer’, ‘manager’, ‘director’ or similar terms.
Figure A2
The Survey �Gate� Question
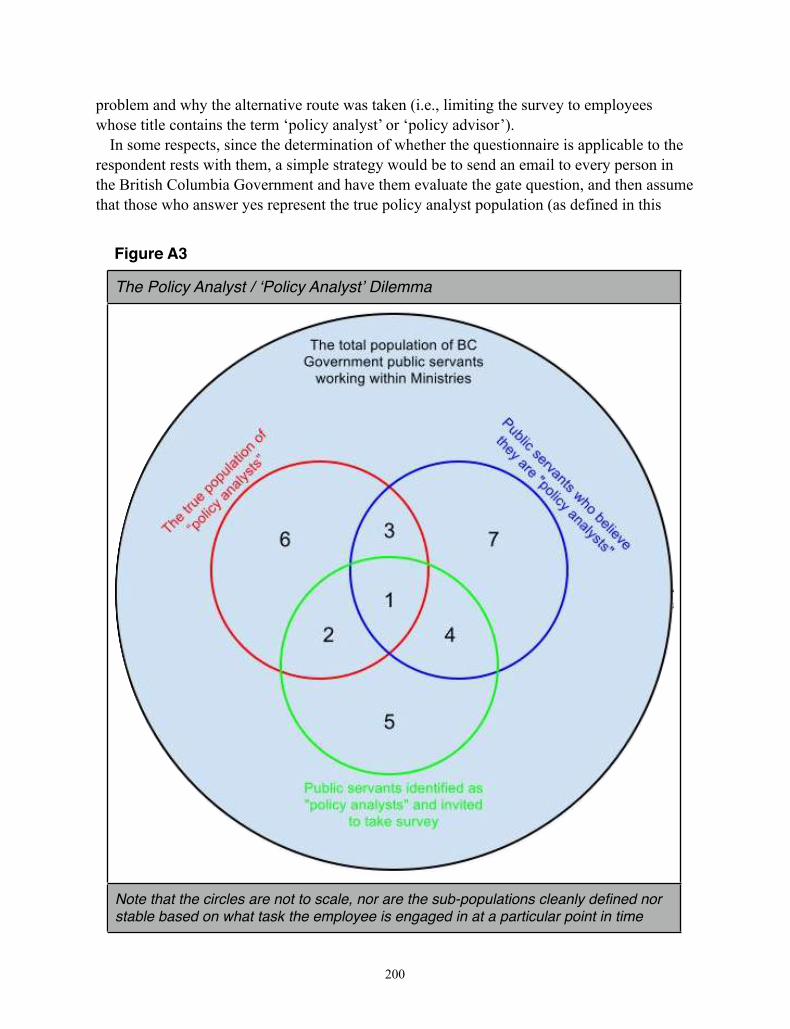
problem and why the alternative route was taken (i.e., limiting the survey to employees whose title contains the term ‘policy analyst’ or ‘policy advisor’).
In some respects, since the determination of whether the questionnaire is applicable to the respondent rests with them, a simple strategy would be to send an email to every person in the British Columbia Government and have them evaluate the gate question, and then assume that those who answer yes represent the true policy analyst population (as defined in this
200
Figure A3
The Policy Analyst / �Policy Analyst� Dilemma
Note that the circles are not to scale, nor are the sub-populations cleanly defined nor stable based on what task the employee is engaged in at a particular point in time
study) and everyone who answers no are outside the study. This approach does not address the problem of what to do about non-responses which would like be very high in such a broad casting of the net. A non-response cannot be distinguished between a “no, this doesn’t apply to me” and a “yes, this applies to me but I’m not going to complete it.”
I had originally talked about a ‘policy analyst’ population in the British Columbia Government of approximately 1000 public servants, based principally on the number of people voluntarily connected to the government's Policy Community of Practice (which, in December 2011, numbered over 900). My intention had been to roll-out successive rounds of invitations broadening the titles for public servants (e.g., people with job titles containing terms such as ‘economist’ (in November 2011 there were 58 of these in the directory), ‘project manager’ (indeterminate, >100), and ‘information analyst’ (approximately 60), and - specific to policy units - ‘manager’, ‘director’, and ‘executive director’ (each greater than the database results limit of 100)). I quickly learned that the first approach - broadening the title search - was both technically impossible given the functional limitations of the directory (only simple searches are permitted), and conceptually problematic given the loose approach the British Columbia government has to job titles. In consultation with the British Columbia Public Service Agency, it became clear that the government has no idea what a particular person does based on their job title.
What I concluded from this was that broadening the definition of the population by expanding the range of titles that were included would certainly yield more invitations but would result in additional strain on the ‘gate’ question to accurately reduce the number of invitations to an accurate population estimate.
There are three populations of relevance in this study, represented conceptually in the following Venn diagram (see figure A3, below) and related flow diagram (see figure A4, below). There is a true population of British Columbia public servants, working within Ministries, that can objectively be determined to fit within a definition of ‘policy analysts’. This population is represented by the red circle; there is a population who believe that they are ‘policy analysts’, represented by the blue circle; lastly, there is a population of public servants identified as being relevant to this survey based on the procedure described above, represented in by the green circle. Seven possible outcomes are shown in the diagram:
1. The ideal population is the combination of all three populations: ‘true’ policy analysts, who believe they are policy analysts are identified as relevant participants. NO ERROR
2. The true population is accurately surveyed, but the recipient believes that they are not relevant to the survey. They demur at the gate. TYPE II ERROR.
3. The policy analyst correctly believes that the survey would apply to them, but the survey fails to reach them. TYPE II ERROR
4.5. The policy analyst believes they are relevant to the survey, and they are identified as
relevant participants when, in reality, they are not. TYPE I ERROR
201

6. Invited participants are neither truly in the population nor believe the survey is relevant to them. They demur at the gate. Researcher error is translated to NO ERROR.
7. True policy analysts are neither contacted nor believe they are relevant to the survey. TYPE II ERROR.
8. Public servants who believe they are relevant to the survey, but in reality are not, are not contacted. NO ERROR
Based on this analysis and the potential errors in a broadly cast approach, a narrower approach was adopted (see Chapter 3, pp. 15-16)
202
Figure A4
Flow Diagram of the Policy Analyst / �Policy Analyst� Dilemma
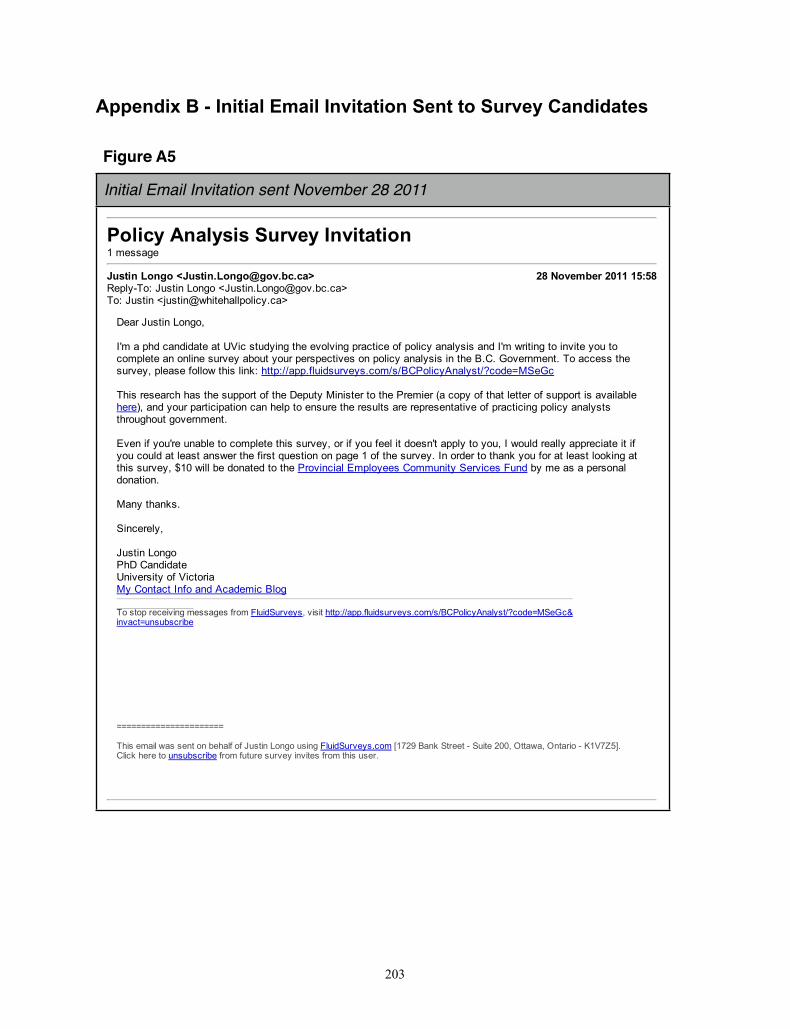
Appendix B - Initial Email Invitation Sent to Survey Candidates
Figure A5
Initial Email Invitation sent November 28 2011
Policy Analysis Survey Invitation1 message
Justin Longo <[email protected]> 28 November 2011 15:58Reply-To: Justin Longo <[email protected]>To: Justin <[email protected]>
Dear Justin Longo,
I'm a phd candidate at UVic studying the evolving practice of policy analysis and I'm writing to invite you tocomplete an online survey about your perspectives on policy analysis in the B.C. Government. To access thesurvey, please follow this link: http://app.fluidsurveys.com/s/BCPolicyAnalyst/?code=MSeGc
This research has the support of the Deputy Minister to the Premier (a copy of that letter of support is availablehere), and your participation can help to ensure the results are representative of practicing policy analyststhroughout government.
Even if you're unable to complete this survey, or if you feel it doesn't apply to you, I would really appreciate it ifyou could at least answer the first question on page 1 of the survey. In order to thank you for at least looking atthis survey, $10 will be donated to the Provincial Employees Community Services Fund by me as a personaldonation.
Many thanks.
Sincerely,
Justin LongoPhD CandidateUniversity of VictoriaMy Contact Info and Academic Blog
To stop receiving messages from FluidSurveys, visit http://app.fluidsurveys.com/s/BCPolicyAnalyst/?code=MSeGc&invact=unsubscribe
======================
This email was sent on behalf of Justin Longo using FluidSurveys.com [1729 Bank Street - Suite 200, Ottawa, Ontario - K1V7Z5].Click here to unsubscribe from future survey invites from this user.
203

Figure A6
First Email Reminder sent December 9 2011
Re: Policy Analysis Survey Invitation1 message
Justin Longo <[email protected]> 9 December 2011 16:39Reply-To: Justin Longo <[email protected]>To: Justin <[email protected]>
This email is being automatically sent to all survey invitees who clicked through on the invitation link sent byemail on November 28, but have not yet completed the questionnaire on the evolving practice of policy analysisin the B.C. Government.
Hi [Name] -
I'm sorry for bothering you with another email, but I wanted to send a follow-up to my earlier note to encourageyou to complete the survey if you still want to. You can resume the survey from where you left off through yourpersonalized invitation link.
(If you started the survey but have decided that you do not want to continue, I wonder if you could either selectthe "discard responses and exit" button in the survey or delete your name from the distribution list by followingthis link:http://app.fluidsurveys.com/s/BCPolicyAnalyst/?code=kAjGN&invact=unsubscribe. This will ensure thatyou do not receive follow-up reminders about this.)
I've been overwhelmed by the positive response to date, but I just wanted to send this reminder to againencourage your participation. As more people like yourself undertake the survey, the likelihood increases that theresults will better represent practicing policy analysts throughout government.
As I said in my previous email, even if you're unable to complete this survey or if you feel it doesn't apply to you,answering the first question on page 1 of the survey is definitely appreciated. Again, in order to thank you for atleast looking at this survey, I will be making a donation to the Provincial Employees Community Services Fundto reflect the number of times that someone clicks through on the invitation link.
Many thanks.
Sincerely,
Justin LongoPhD CandidateUniversity of VictoriaMy Contact Info and Academic Blog
To stop receiving messages from FluidSurveys, visit http://app.fluidsurveys.com/s/BCPolicyAnalyst/?code=kAjGN&invact=unsubscribe
204

Figure A7
Final Email Reminder sent January 6 2012
Justin, the Policy Analysis 2.0 Survey Will Close onJanuary 152 messages
Justin Longo <[email protected]> 6 January 2012 11:29Reply-To: Justin Longo <[email protected]>To: Justin <[email protected]>
Hi Justin -
I'm sorry for bothering you with another email, but I wanted to send a follow-up to the note I sent earlier with afinal reminder to invite you to look at the survey on the evolving practice of policy analysis in the B.C.Government. The survey can be accessed through your personal invitation link and the survey will remain activeuntil midnight on January 15.
The response to date has been very positive, but I just wanted to send this reminder to again encourage yourparticipation. As more people like yourself undertake the survey, the likelihood increases that the results willbetter represent practicing policy analysts throughout government.
As I said in my previous email, even if you're unable to complete this survey or if you feel it doesn't apply to you,answering the first question on page 1 of the survey is definitely appreciated. Again, in order to thank you for atleast looking at this survey, I will be making a donation to the Provincial Employees Community Services Fundto reflect the number of times that someone clicks through on the invitation link.
Many thanks.
Sincerely,
Justin LongoPhD CandidateUniversity of VictoriaMy Contact Info and Academic Blog
To stop receiving messages from FluidSurveys, visit http://app.fluidsurveys.com/s/BCPolicyAnalyst/?code=kAjGN&invact=unsubscribe
205
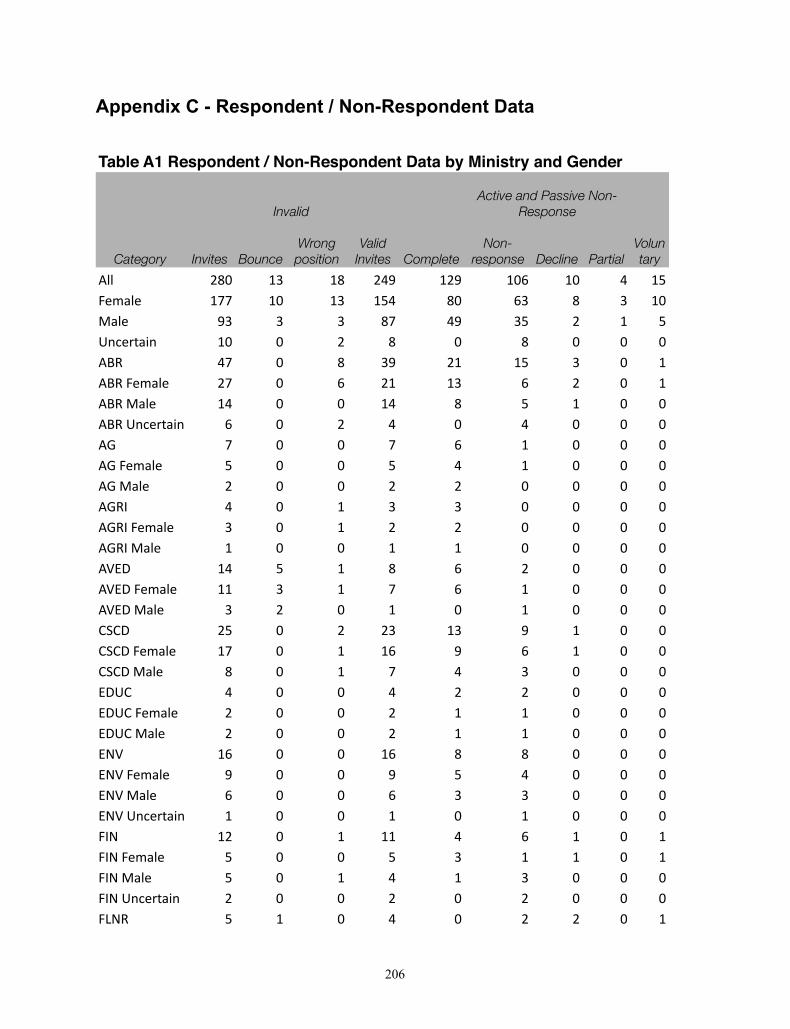
Appendix C - Respondent / Non-Respondent Data
Table A1 Reespondent / Noon-Resppondentt Data by Ministry and Geender
InvvalidActive and
Red Passiveesponse
e Non-
Category Invites BounceWrong position
Valid Invites Complete
Non-response Decline Partial
Voluntary
��� �$� �� �$ � % ��% ��" �� �!������ �## �� �� �! $� "� $ � ������ %� � � $# % �! � � !��������� �� � � $ � $ � � ��� # � $ �% �� �! � � ��� ������� �# � " �� �� " � � ��� ����� � � � � $ ! � � ��� ���������� " � � � � � ��� # � � # " � � � ���������� ! � � ! � � � �������� � � � � � � � � ��� � � � � � � � ��� ������� � � � � � � � � ��� ����� � � � � � � � � ����� � ! � $ " � � � ������������ �� � � # " � � � ���������� � � � � � � � � ����� �! � � �� �� % � � ������������ �# � � �" % " � � ���������� $ � � # � � � ����� � � � � � � ������������ � � � � � � � � ���������� � � � � � � � � ���� �" � � �" $ $ � � ����������� % � � % ! � � ��������� " � � " � � � � �������������� � � � � � � � � ��� �� � � �� " � � ���������� ! � � ! � � � � �������� ! � � � � � � ������������� � � � � � � � � ��� ! � � � � � � �
206
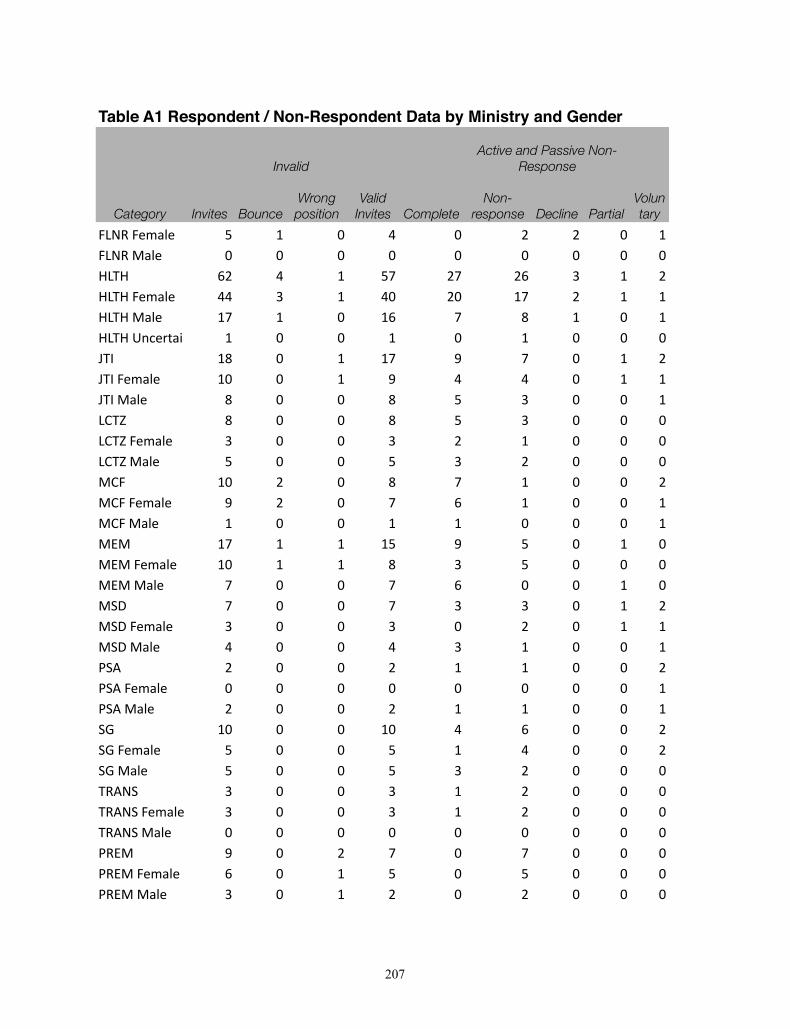
Table A1 Reespondent / Noon-Resppondentt Data by Ministry and Geender
InvvalidActive and
Red Passiveesponse
e Non-
Category Invites BounceWrong position
Valid Invites Complete
Non-response Decline Partial
Voluntary
�� �������� $ � # � ! ! � �� ������ � � � � � � � � ����� %! # $& !& !% " !����������� ## " #� !� & ! ��������� & � % & ' � �������������� � � � � � �� ' � & ( & � !�������� � � ( # # � ������ ' � � ' $ " � � ���� ' � � ' $ " � � ������������ " � � " ! � � ���������� $ � � $ " ! � � ���� � ! � ' & � � !���������� ( ! � & % � � �������� � � � � � ��� & $ ( $ � ����������� � ' " $ � � ��������� & � � & % � � ���� & � � & " " � !���������� " � � " � ! � �������� # � � # " � � ��� ! � � ! � � !���������� � � � � � � � � �������� ! � � ! � � �� � � � � # % � � !��������� $ � � $ # � � !������� $ � � $ " ! � � ���� � " � � " ! � � ���� �������� " � � " ! � � ���� ������ � � � � � � � � ����� ( � ! & � & � � ������������ % � $ � $ � � ���������� " � ! � ! � � �
207
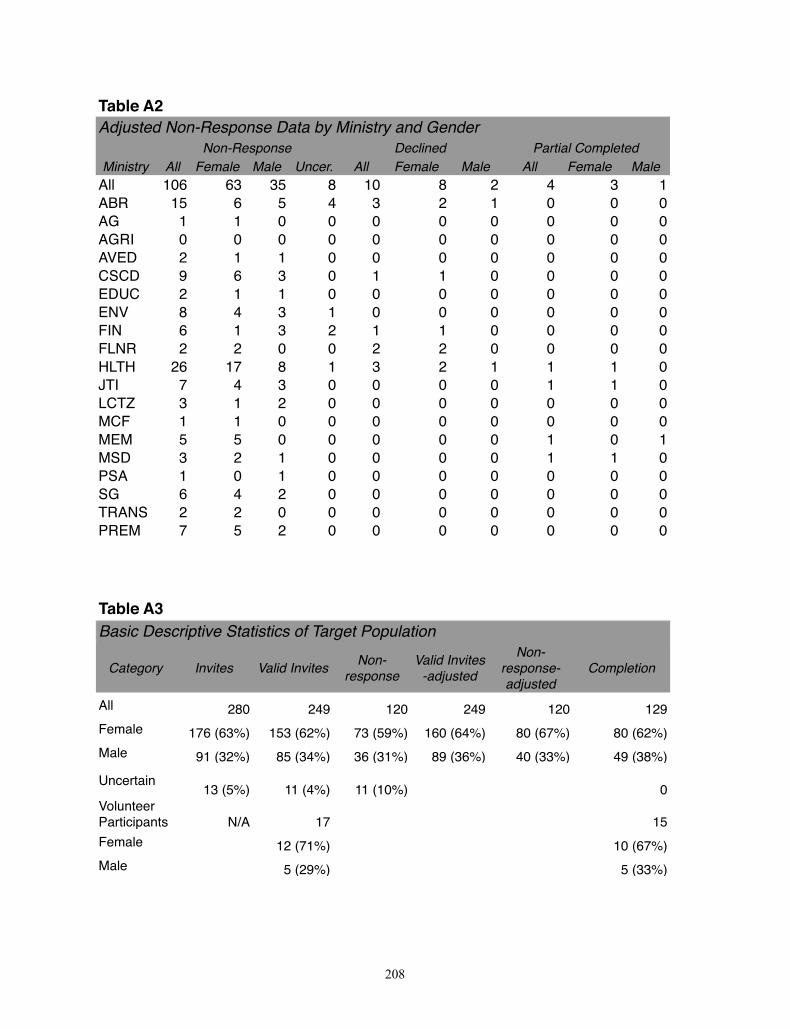
Table A22Adjustedd Nonn-Respoonse Daata by MMinistryry and Gennder
Non-Reesponsee Declined Parttial CompletedMinistry All Female Male Uncer. All Female Male All Female Male
All 106 63 35 8 10 8 2 4 3 1ABR 15 6 5 4 3 2 1 0 0 0AG 1 1 0 0 0 0 0 0 0 0AGRI 0 0 0 0 0 0 0 0 0 0AVED 2 1 1 0 0 0 0 0 0 0CSCD 9 6 3 0 1 1 0 0 0 0EDUC 2 1 1 0 0 0 0 0 0 0ENV 8 4 3 1 0 0 0 0 0 0FIN 6 1 3 2 1 1 0 0 0 0FLNR 2 2 0 0 2 2 0 0 0 0HLTH 26 17 8 1 3 2 1 1 1 0JTI 7 4 3 0 0 0 0 1 1 0LCTZ 3 1 2 0 0 0 0 0 0 0MCF 1 1 0 0 0 0 0 0 0 0MEM 5 5 0 0 0 0 0 1 0 1MSD 3 2 1 0 0 0 0 1 1 0PSA 1 0 1 0 0 0 0 0 0 0SG 6 4 2 0 0 0 0 0 0 0TRANS 2 2 0 0 0 0 0 0 0 0PREM 7 5 2 0 0 0 0 0 0 0
Table A3Basic Desccriptive Stattistics of Tarrget Population
Category Invites Valid Invites Non-response
Valid Invites -adjusted
Non-response- adjusted
Completion
All 280 249 120 249 120 129Female 176 (63%) 153 (62%) 73 (59%) 160 (64%) 80 (67%) 80 (62%)Male 91 (32%) 85 (34%) 36 (31%) 89 (36%) 40 (33%) 49 (38%)Uncertain 13 (5%) 11 (4%) 11 (10%) 0Volunteer Participants N/A 17 15Female 12 (71%) 10 (67%)Male 5 (29%) 5 (33%)
208

Appendix D - Letters of Support / Permission from British Columbia Government
Figure A8
Initial Letter of Support from British Columbia Government
209
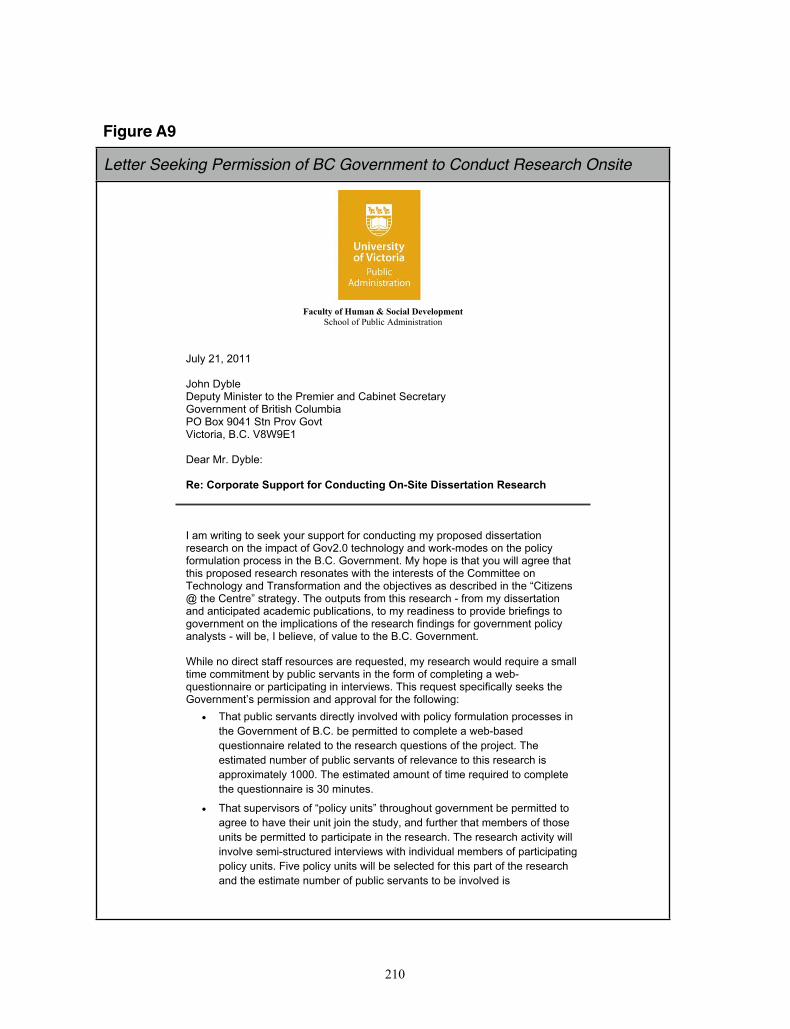
Figure A9
Letter Seeking Permission of BC Government to Conduct Research Onsite
Faculty of Human & Social Development School of Public Administration
July 21, 2011 John Dyble Deputy Minister to the Premier and Cabinet Secretary Government of British Columbia PO Box 9041 Stn Prov Govt Victoria, B.C. V8W9E1 Dear Mr. Dyble: Re: Corporate Support for Conducting On-Site Dissertation Research
I am writing to seek your support for conducting my proposed dissertation research on the impact of Gov2.0 technology and work-modes on the policy formulation process in the B.C. Government. My hope is that you will agree that this proposed research resonates with the interests of the Committee on Technology and Transformation and the objectives as described in the “Citizens @ the Centre” strategy. The outputs from this research - from my dissertation and anticipated academic publications, to my readiness to provide briefings to government on the implications of the research findings for government policy analysts - will be, I believe, of value to the B.C. Government. While no direct staff resources are requested, my research would require a small time commitment by public servants in the form of completing a web-questionnaire or participating in interviews. This request specifically seeks the Government’s permission and approval for the following:
� That public servants directly involved with policy formulation processes in the Government of B.C. be permitted to complete a web-based questionnaire related to the research questions of the project. The estimated number of public servants of relevance to this research is approximately 1000. The estimated amount of time required to complete the questionnaire is 30 minutes.
� That supervisors of “policy units” throughout government be permitted to agree to have their unit join the study, and further that members of those units be permitted to participate in the research. The research activity will involve semi-structured interviews with individual members of participating policy units. Five policy units will be selected for this part of the research and the estimate number of public servants to be involved is
210
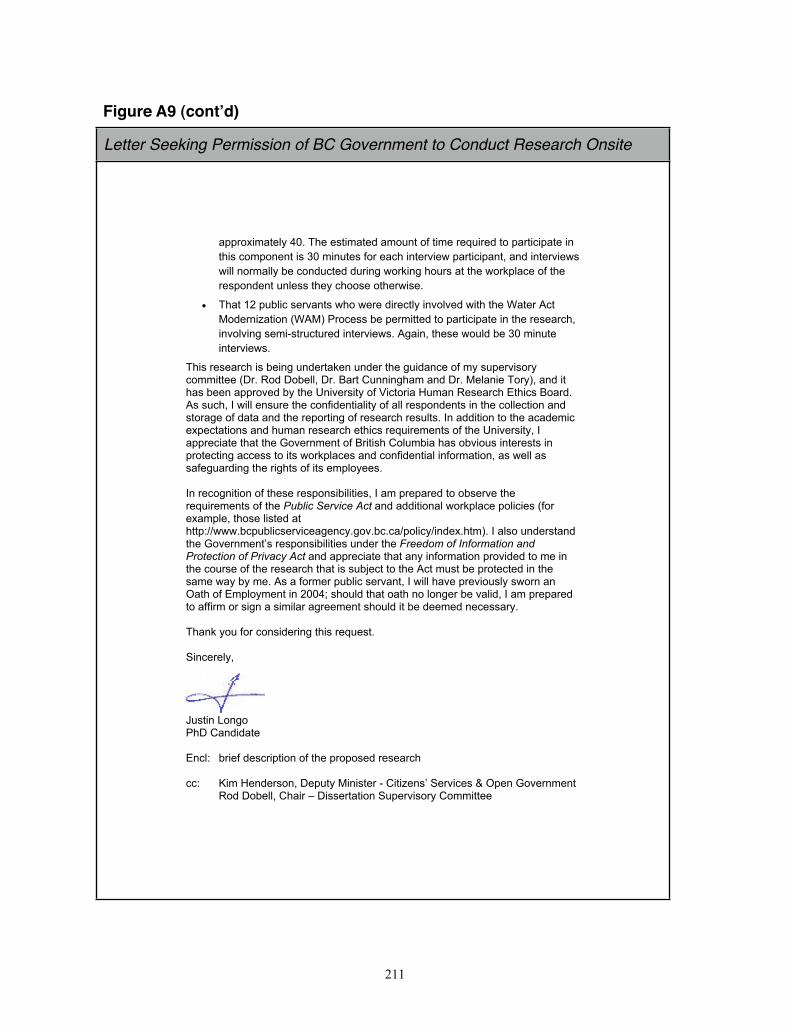
Figure A9 (cont�d)
Letter Seeking Permission of BC Government to Conduct Research Onsite
approximately 40. The estimated amount of time required to participate in this component is 30 minutes for each interview participant, and interviews will normally be conducted during working hours at the workplace of the respondent unless they choose otherwise.
� That 12 public servants who were directly involved with the Water Act Modernization (WAM) Process be permitted to participate in the research, involving semi-structured interviews. Again, these would be 30 minute interviews.
This research is being undertaken under the guidance of my supervisory committee (Dr. Rod Dobell, Dr. Bart Cunningham and Dr. Melanie Tory), and it has been approved by the University of Victoria Human Research Ethics Board. As such, I will ensure the confidentiality of all respondents in the collection and storage of data and the reporting of research results. In addition to the academic expectations and human research ethics requirements of the University, I appreciate that the Government of British Columbia has obvious interests in protecting access to its workplaces and confidential information, as well as safeguarding the rights of its employees. In recognition of these responsibilities, I am prepared to observe the requirements of the Public Service Act and additional workplace policies (for example, those listed at http://www.bcpublicserviceagency.gov.bc.ca/policy/index.htm). I also understand the Government’s responsibilities under the Freedom of Information and Protection of Privacy Act and appreciate that any information provided to me in the course of the research that is subject to the Act must be protected in the same way by me. As a former public servant, I will have previously sworn an Oath of Employment in 2004; should that oath no longer be valid, I am prepared to affirm or sign a similar agreement should it be deemed necessary. Thank you for considering this request. Sincerely, Justin Longo PhD Candidate Encl: brief description of the proposed research cc: Kim Henderson, Deputy Minister - Citizens’ Services & Open Government
Rod Dobell, Chair – Dissertation Supervisory Committee
211
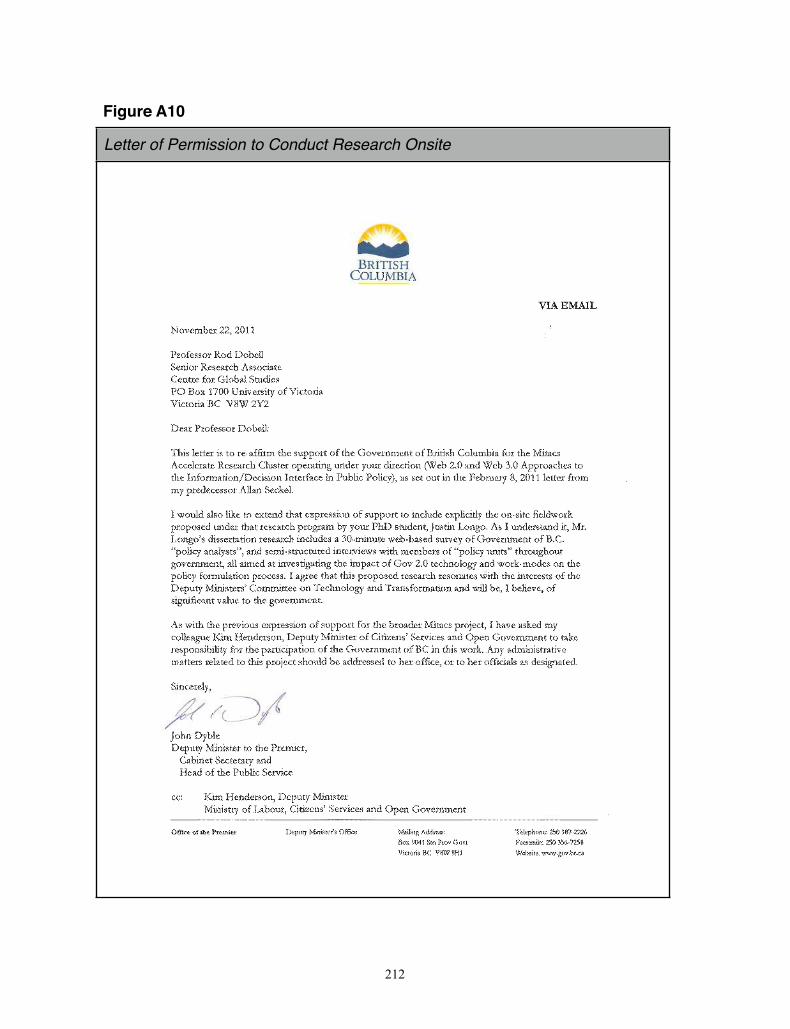
Figure A10
Letter of Permission to Conduct Research Onsite
212
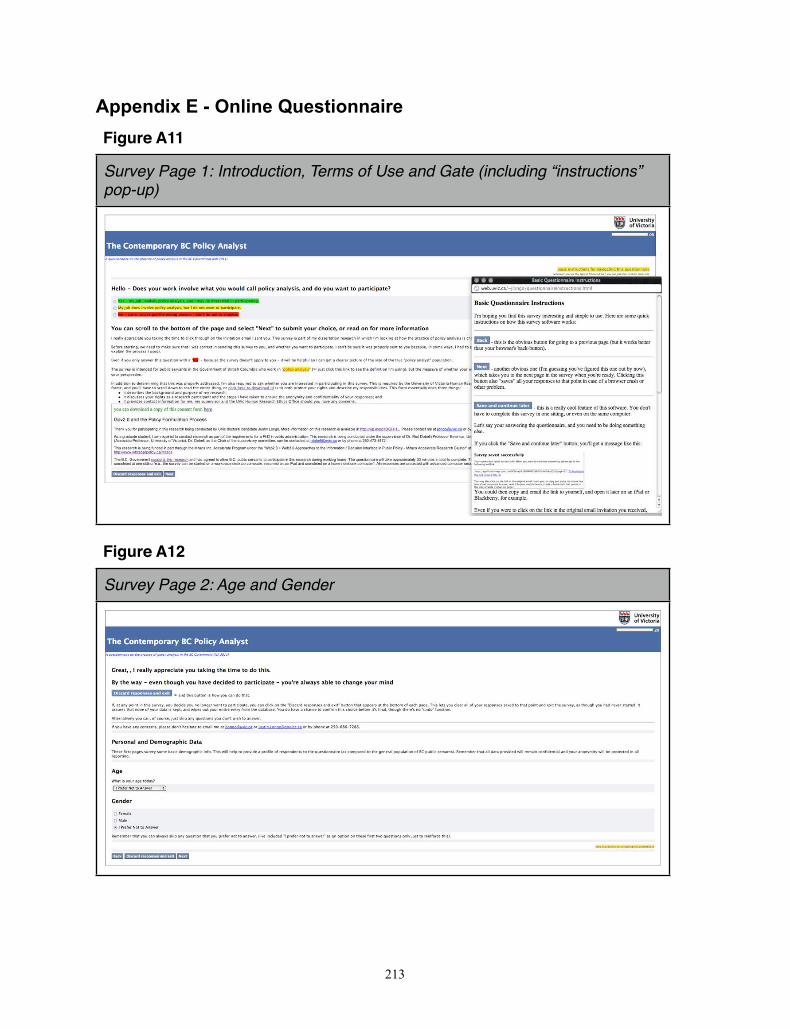
Appendix E - Online QuestionnaireFigure A11
Survey Page 1: Introduction, Terms of Use and Gate (including “instructions” pop-up)
Figure A12
Survey Page 2: Age and Gender
213
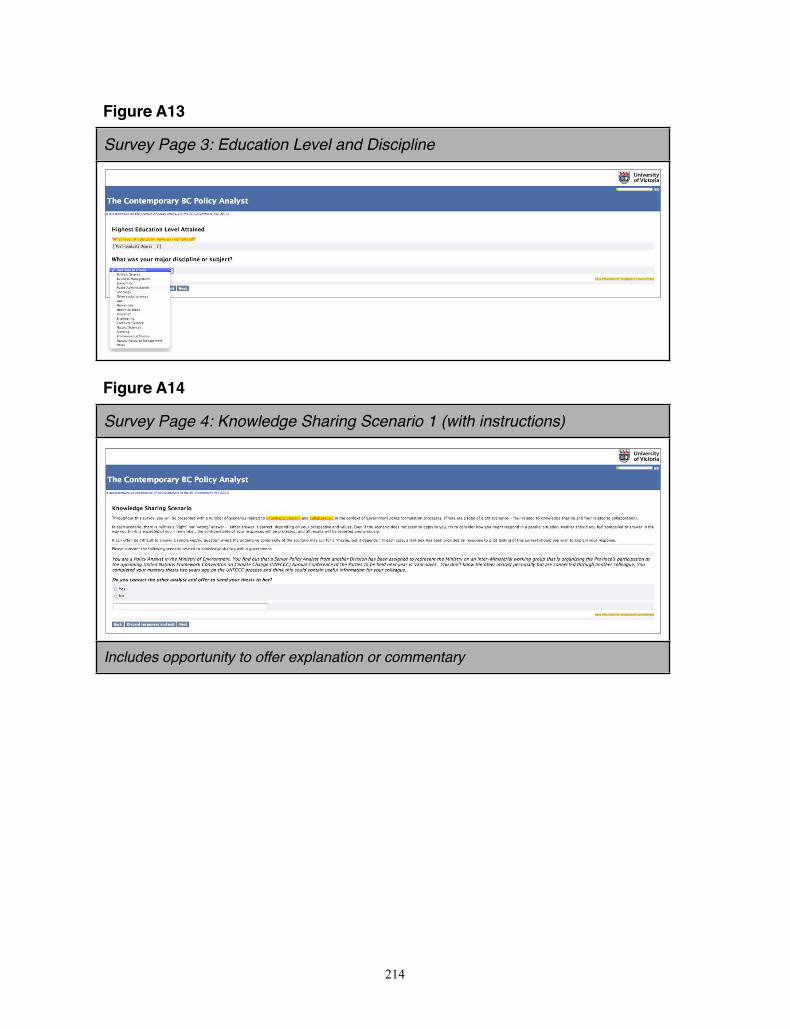
Figure A13
Survey Page 3: Education Level and Discipline
Figure A14
Survey Page 4: Knowledge Sharing Scenario 1 (with instructions)
Includes opportunity to offer explanation or commentary
214
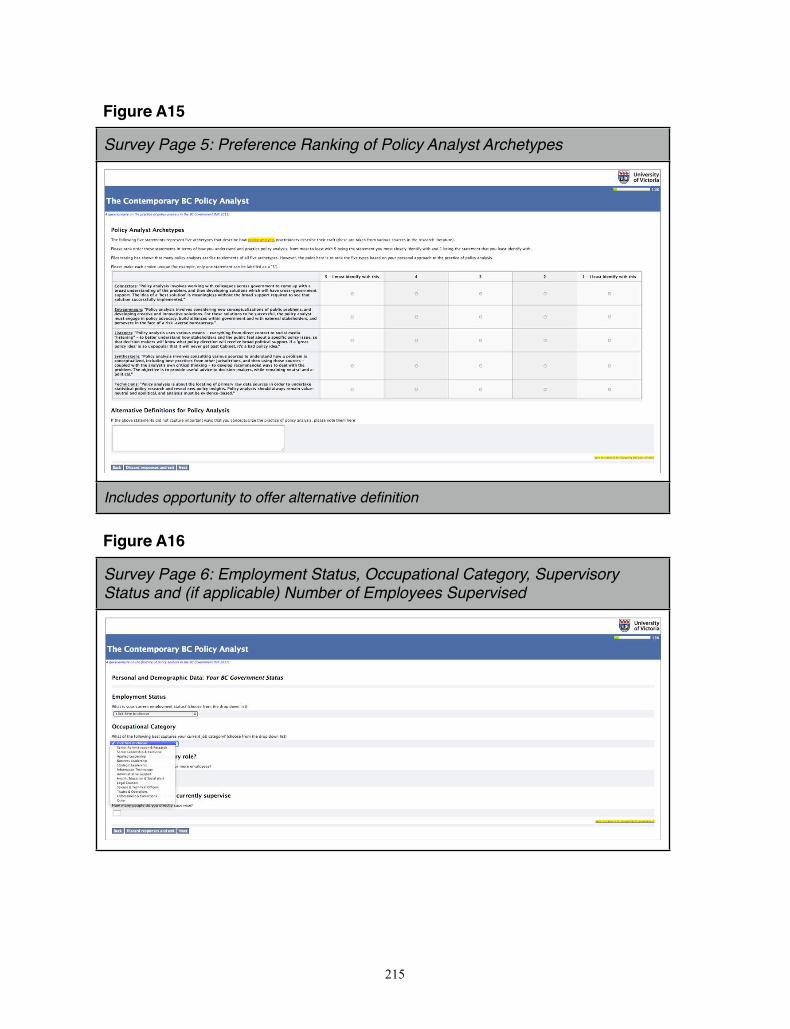
Figure A15
Survey Page 5: Preference Ranking of Policy Analyst Archetypes
Includes opportunity to offer alternative definition
Figure A16
Survey Page 6: Employment Status, Occupational Category, Supervisory Status and (if applicable) Number of Employees Supervised
215

Figure A17
Survey Page 7: Collaboration Scenario 1 (with pop-ups shown)
Figure A18
Survey Page 8: Policy / Technology Era (answer branches to one of the following four pages)
216
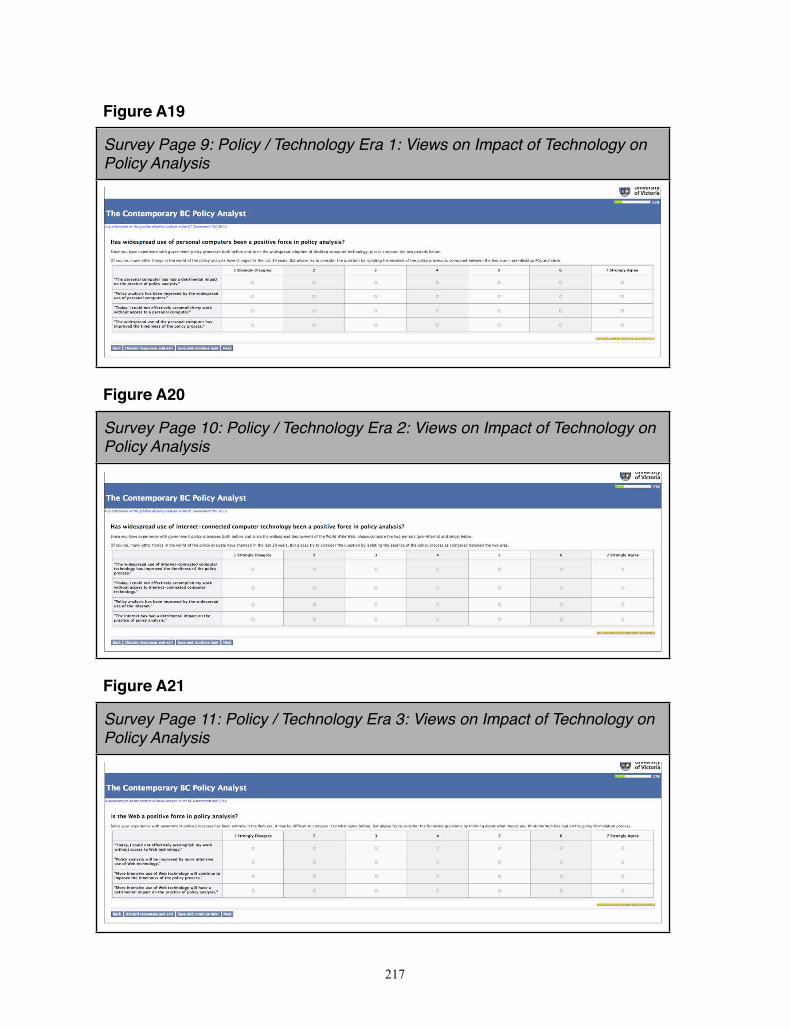
Figure A19
Survey Page 9: Policy / Technology Era 1: Views on Impact of Technology on Policy Analysis
Figure A20
Survey Page 10: Policy / Technology Era 2: Views on Impact of Technology on Policy Analysis
Figure A21
Survey Page 11: Policy / Technology Era 3: Views on Impact of Technology on Policy Analysis
217
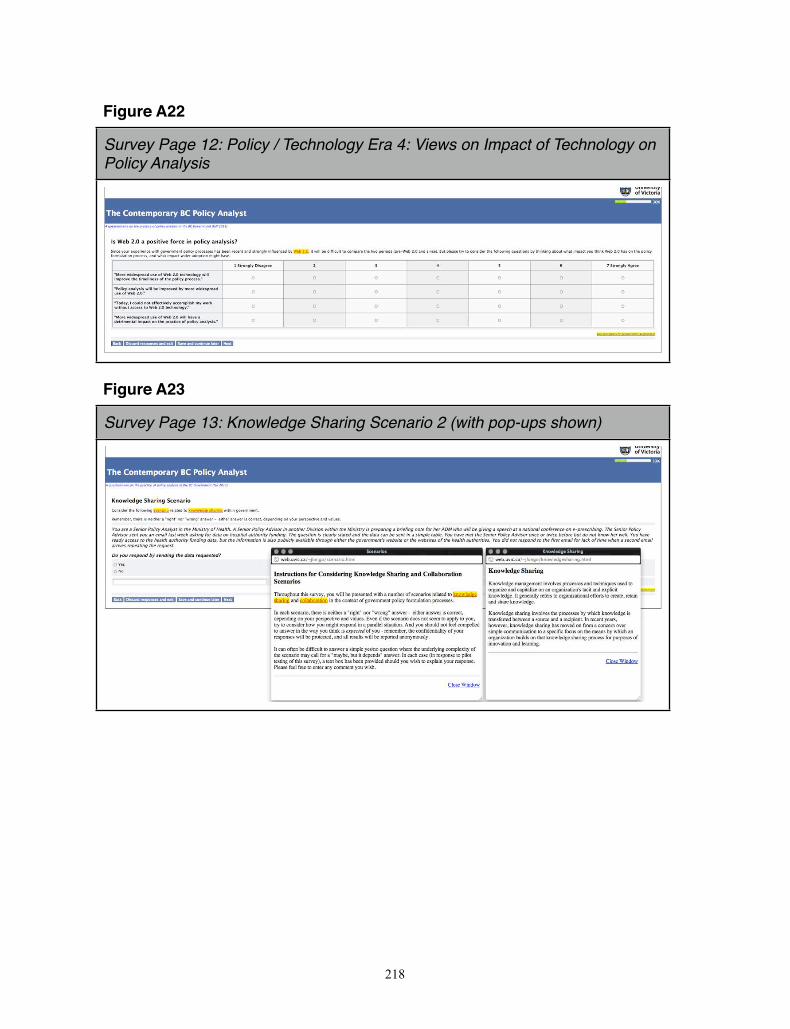
Figure A22
Survey Page 12: Policy / Technology Era 4: Views on Impact of Technology on Policy Analysis
Figure A23
Survey Page 13: Knowledge Sharing Scenario 2 (with pop-ups shown)
218

Figure A24
Survey Page 14: Sociometric Survey - Name Generator (Social Network Analysis Component)
Figure A25
Survey Page 15: Sociometric Survey - Communication Mechanisms (Social Network Analysis Component)
219
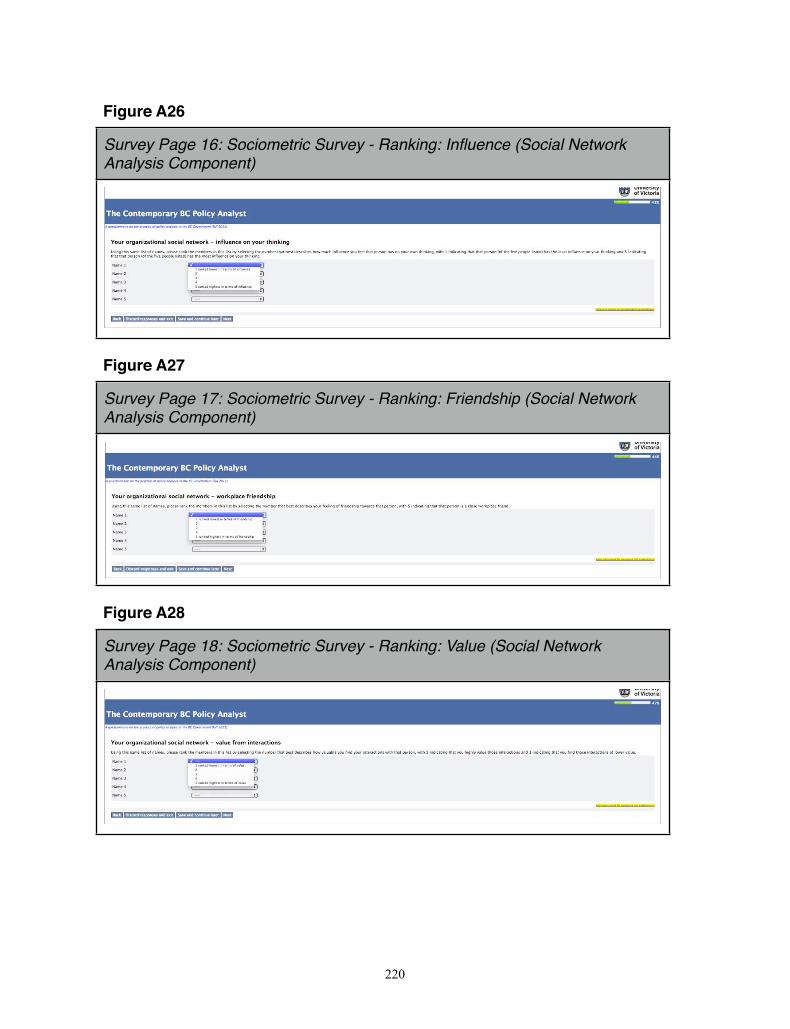
Figure A26
Survey Page 16: Sociometric Survey - Ranking: Influence (Social Network Analysis Component)
Figure A27
Survey Page 17: Sociometric Survey - Ranking: Friendship (Social Network Analysis Component)
Figure A28
Survey Page 18: Sociometric Survey - Ranking: Value (Social Network Analysis Component)
220
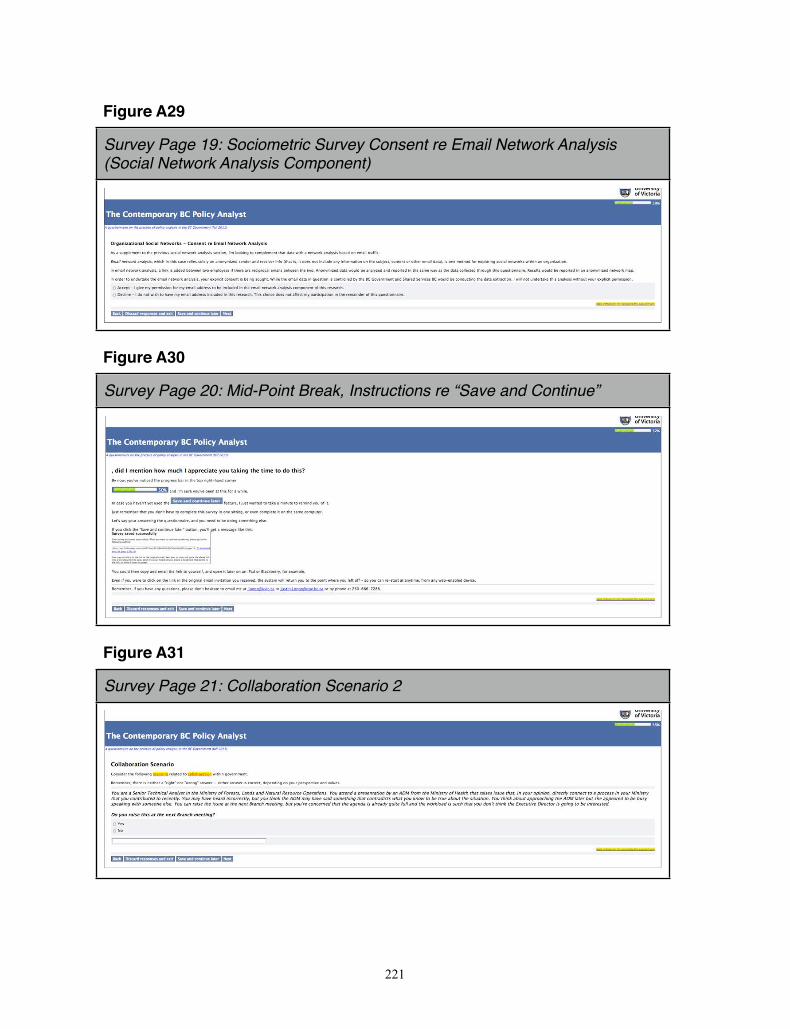
Figure A29
Survey Page 19: Sociometric Survey Consent re Email Network Analysis (Social Network Analysis Component)
Figure A30
Survey Page 20: Mid-Point Break, Instructions re “Save and Continue”
Figure A31
Survey Page 21: Collaboration Scenario 2
221
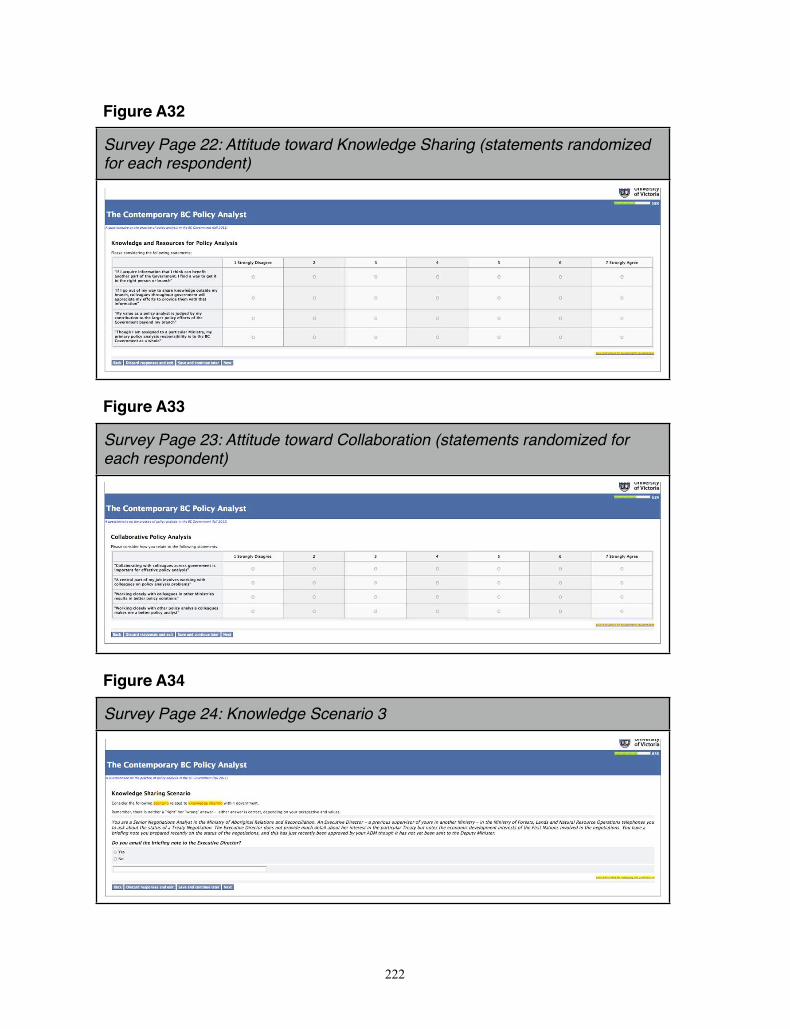
Figure A32
Survey Page 22: Attitude toward Knowledge Sharing (statements randomized for each respondent)
Figure A33
Survey Page 23: Attitude toward Collaboration (statements randomized for each respondent)
Figure A34
Survey Page 24: Knowledge Scenario 3
222
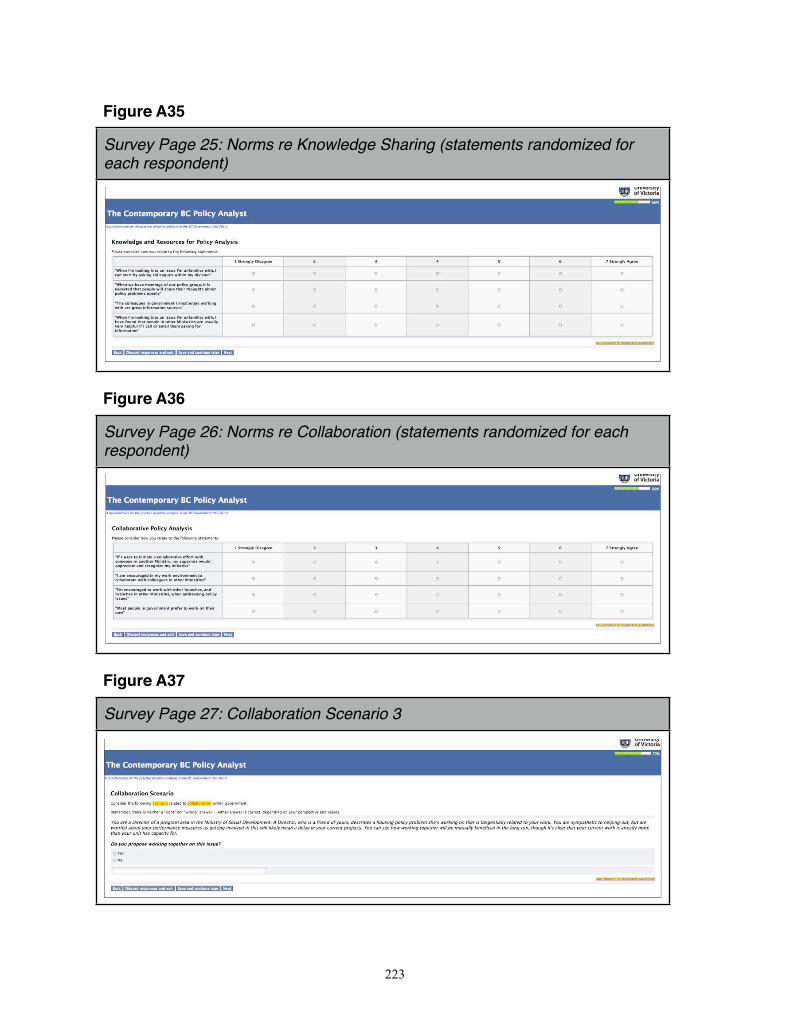
Figure A35
Survey Page 25: Norms re Knowledge Sharing (statements randomized for each respondent)
Figure A36
Survey Page 26: Norms re Collaboration (statements randomized for each respondent)
Figure A37
Survey Page 27: Collaboration Scenario 3
223
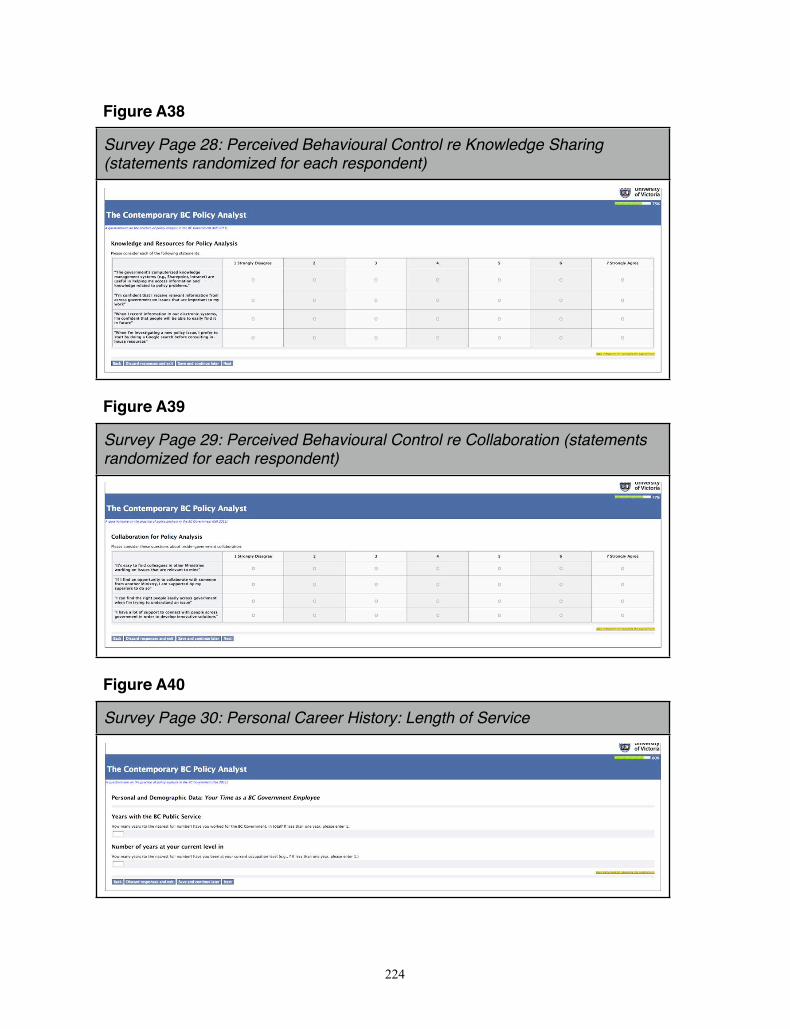
Figure A38
Survey Page 28: Perceived Behavioural Control re Knowledge Sharing (statements randomized for each respondent)
Figure A39
Survey Page 29: Perceived Behavioural Control re Collaboration (statements randomized for each respondent)
Figure A40
Survey Page 30: Personal Career History: Length of Service
224
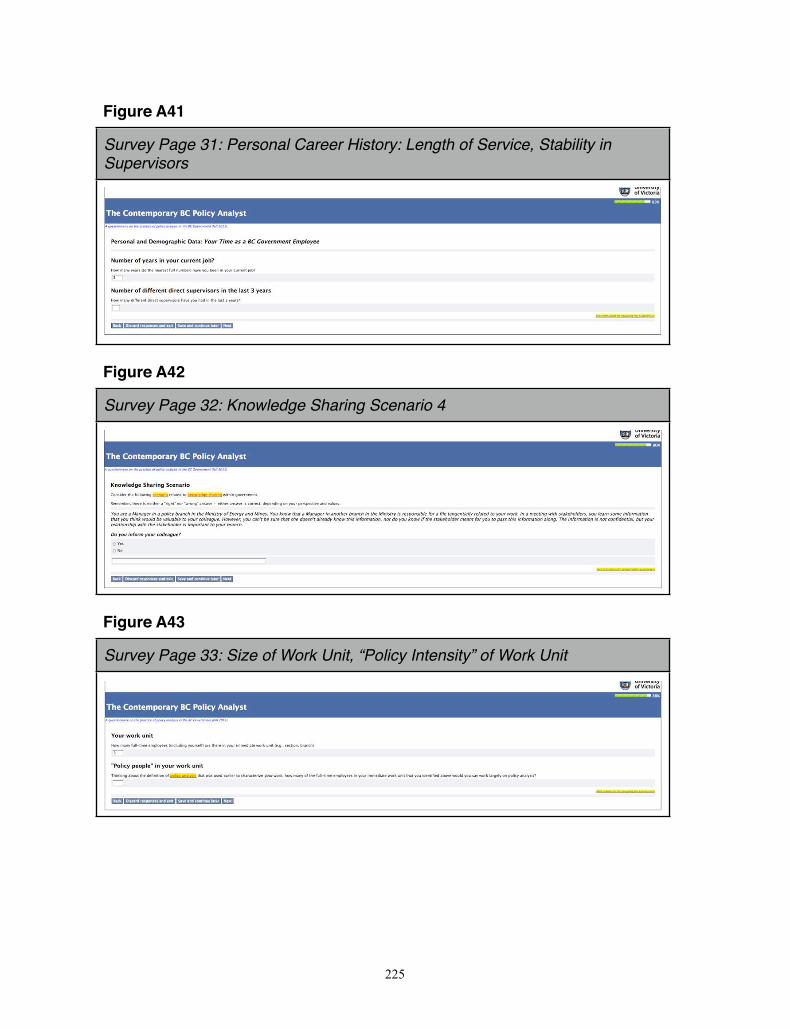
Figure A41
Survey Page 31: Personal Career History: Length of Service, Stability in Supervisors
Figure A42
Survey Page 32: Knowledge Sharing Scenario 4
Figure A43
Survey Page 33: Size of Work Unit, “Policy Intensity” of Work Unit
225
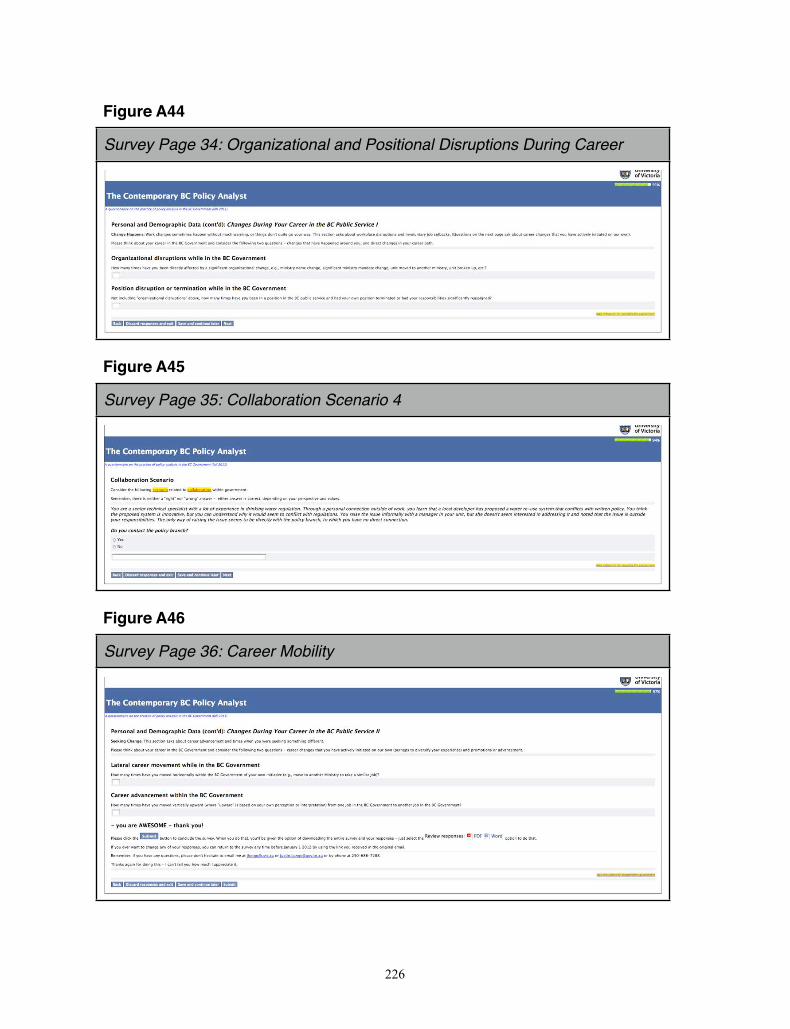
Figure A44
Survey Page 34: Organizational and Positional Disruptions During Career
Figure A45
Survey Page 35: Collaboration Scenario 4
Figure A46
Survey Page 36: Career Mobility
226
Figure A47
Survey Page 37: Post-Submission Page
227
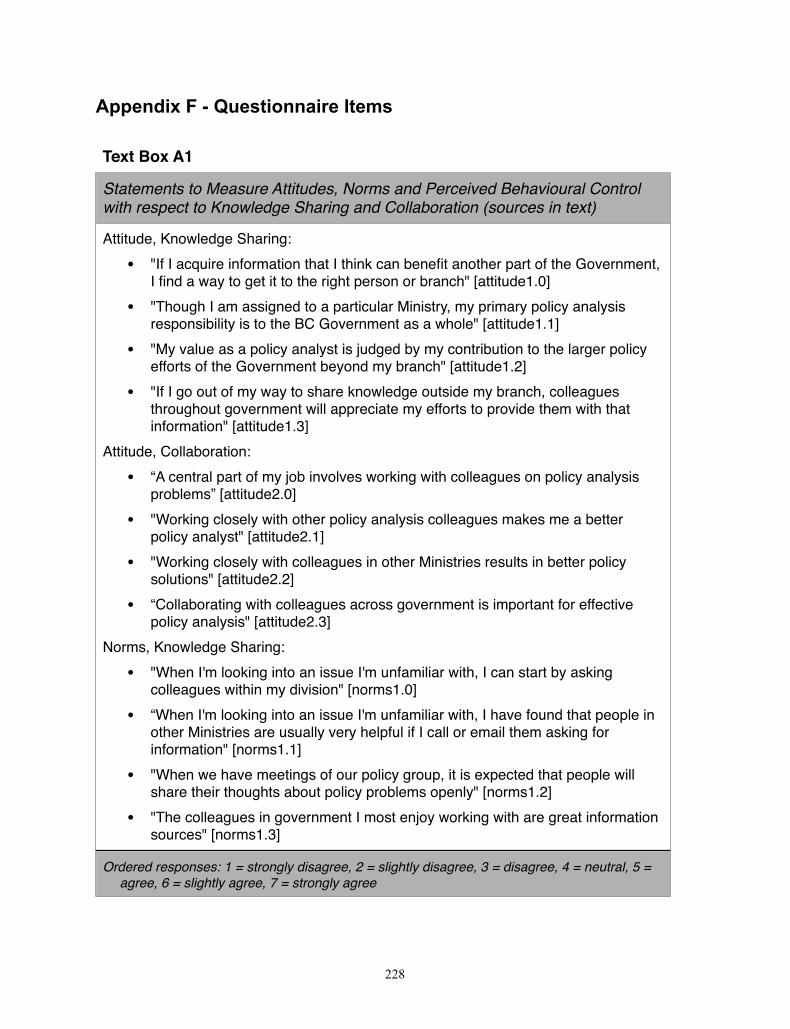
Appendix F - Questionnaire Items
Text Box A1
Statements to Measure Attitudes, Norms and Perceived Behavioural Control with respect to Knowledge Sharing and Collaboration (sources in text)
Attitude, Knowledge Sharing:
• "If I acquire information that I think can benefit another part of the Government, I find a way to get it to the right person or branch" [attitude1.0]
• "Though I am assigned to a particular Ministry, my primary policy analysis responsibility is to the BC Government as a whole" [attitude1.1]
• "My value as a policy analyst is judged by my contribution to the larger policy efforts of the Government beyond my branch" [attitude1.2]
• "If I go out of my way to share knowledge outside my branch, colleagues throughout government will appreciate my efforts to provide them with that information" [attitude1.3]
Attitude, Collaboration:
• “A central part of my job involves working with colleagues on policy analysis problems” [attitude2.0]
• "Working closely with other policy analysis colleagues makes me a better policy analyst" [attitude2.1]
• "Working closely with colleagues in other Ministries results in better policy solutions" [attitude2.2]
• “Collaborating with colleagues across government is important for effective policy analysis" [attitude2.3]
Norms, Knowledge Sharing:
• "When I'm looking into an issue I'm unfamiliar with, I can start by asking colleagues within my division" [norms1.0]
• “When I'm looking into an issue I'm unfamiliar with, I have found that people in other Ministries are usually very helpful if I call or email them asking for information" [norms1.1]
• "When we have meetings of our policy group, it is expected that people will share their thoughts about policy problems openly" [norms1.2]
• "The colleagues in government I most enjoy working with are great information sources" [norms1.3]
Ordered responses: 1 = strongly disagree, 2 = slightly disagree, 3 = disagree, 4 = neutral, 5 = agree, 6 = slightly agree, 7 = strongly agree
228

Text Box A1 (continued)
Statements to Measure Attitudes, Norms and Perceived Behavioural Control with respect to Knowledge Sharing and Collaboration (sources in text)
Norms, Collaboration:
• "I'm encouraged to work with other branches, and branches in other Ministries, when addressing policy issues" [norms2.0]
• "If I were to initiate a collaborative effort with someone in another Ministry, my superiors would appreciate and recognize my initiative" [norms2.1]
• "Most people in government prefer to work on their own" (reverse scoring) [norms2.2]
• “I am encouraged in my work environment to collaborate with colleagues in other Ministries" [norms2.3]
Perceived Behavioural Control, Knowledge Sharing:
• “The government�s computerized knowledge management systems (e.g., Sharepoint, Intranet) are useful in helping me access information and knowledge related to policy problems.” [pbc1.0]
• "When I'm investigating a new policy issue, I prefer to start by doing a Google search before consulting in-house resources" (reverse scoring) [pbc1.1]
• "When I record information in our electronic systems, I'm confident that people will be able to easily find it in future" [pbc1.2]
• "I'm confident that I receive relevant information from across government on issues that are important to my work" [pbc1.3]
Perceived Behavioural Control, Collaboration:
• "I can find the right people easily across government when I'm trying to understand an issue" [pbc2.0]
• “It's easy to find colleagues in other Ministries working on issues that are relevant to mine" [pbc2.1]
• “I have a lot of support to connect with people across government in order to develop innovative solutions” [pbc2.2]
• "If I find an opportunity to collaborate with someone from another Ministry, I am supported by my superiors to do so" [pbc2.3]
Ordered responses: 1 = strongly disagree, 2 = slightly disagree, 3 = disagree, 4 = neutral, 5 = agree, 6 = slightly agree, 7 = strongly agree
229
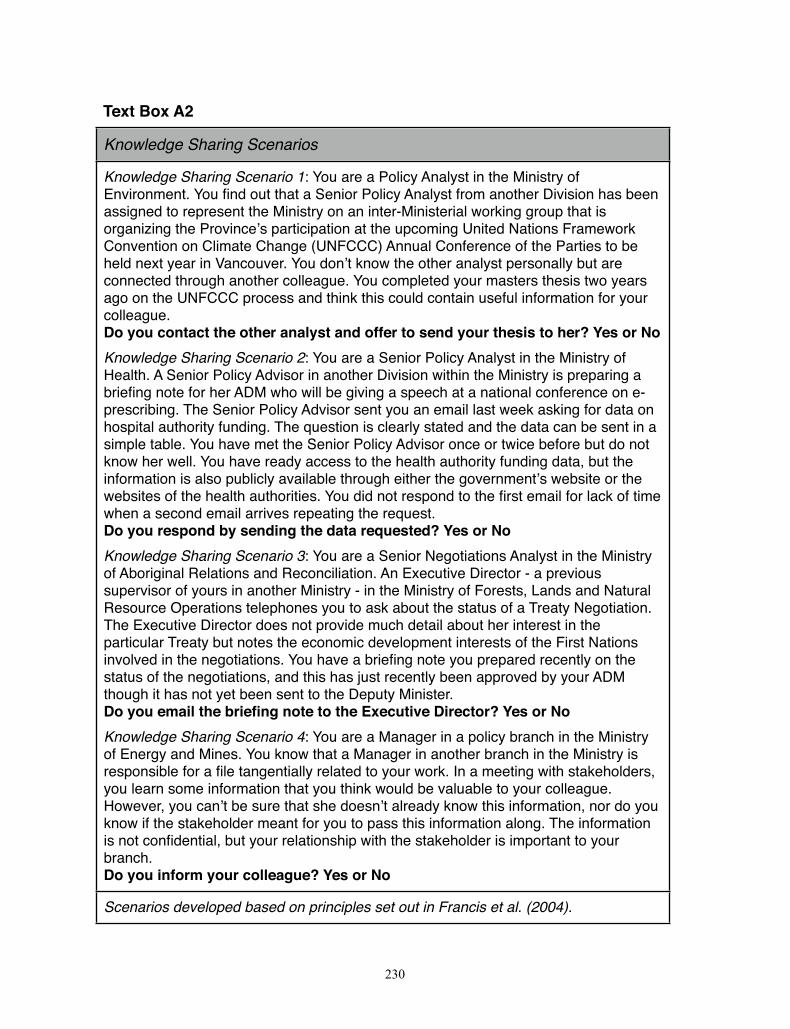
Text Box A2
Knowledge Sharing Scenarios
Knowledge Sharing Scenario 1: You are a Policy Analyst in the Ministry of Environment. You find out that a Senior Policy Analyst from another Division has been assigned to represent the Ministry on an inter-Ministerial working group that is organizing the Province�s participation at the upcoming United Nations Framework Convention on Climate Change (UNFCCC) Annual Conference of the Parties to be held next year in Vancouver. You don�t know the other analyst personally but are connected through another colleague. You completed your masters thesis two years ago on the UNFCCC process and think this could contain useful information for your colleague. Do you contact the other analyst and offer to send your thesis to her? Yes or NoKnowledge Sharing Scenario 2: You are a Senior Policy Analyst in the Ministry of Health. A Senior Policy Advisor in another Division within the Ministry is preparing a briefing note for her ADM who will be giving a speech at a national conference on e-prescribing. The Senior Policy Advisor sent you an email last week asking for data on hospital authority funding. The question is clearly stated and the data can be sent in a simple table. You have met the Senior Policy Advisor once or twice before but do not know her well. You have ready access to the health authority funding data, but the information is also publicly available through either the government�s website or the websites of the health authorities. You did not respond to the first email for lack of time when a second email arrives repeating the request. Do you respond by sending the data requested? Yes or NoKnowledge Sharing Scenario 3: You are a Senior Negotiations Analyst in the Ministry of Aboriginal Relations and Reconciliation. An Executive Director - a previous supervisor of yours in another Ministry - in the Ministry of Forests, Lands and Natural Resource Operations telephones you to ask about the status of a Treaty Negotiation. The Executive Director does not provide much detail about her interest in the particular Treaty but notes the economic development interests of the First Nations involved in the negotiations. You have a briefing note you prepared recently on the status of the negotiations, and this has just recently been approved by your ADM though it has not yet been sent to the Deputy Minister. Do you email the briefing note to the Executive Director? Yes or NoKnowledge Sharing Scenario 4: You are a Manager in a policy branch in the Ministry of Energy and Mines. You know that a Manager in another branch in the Ministry is responsible for a file tangentially related to your work. In a meeting with stakeholders, you learn some information that you think would be valuable to your colleague. However, you can�t be sure that she doesn�t already know this information, nor do you know if the stakeholder meant for you to pass this information along. The information is not confidential, but your relationship with the stakeholder is important to your branch. Do you inform your colleague? Yes or No
Scenarios developed based on principles set out in Francis et al. (2004).
230
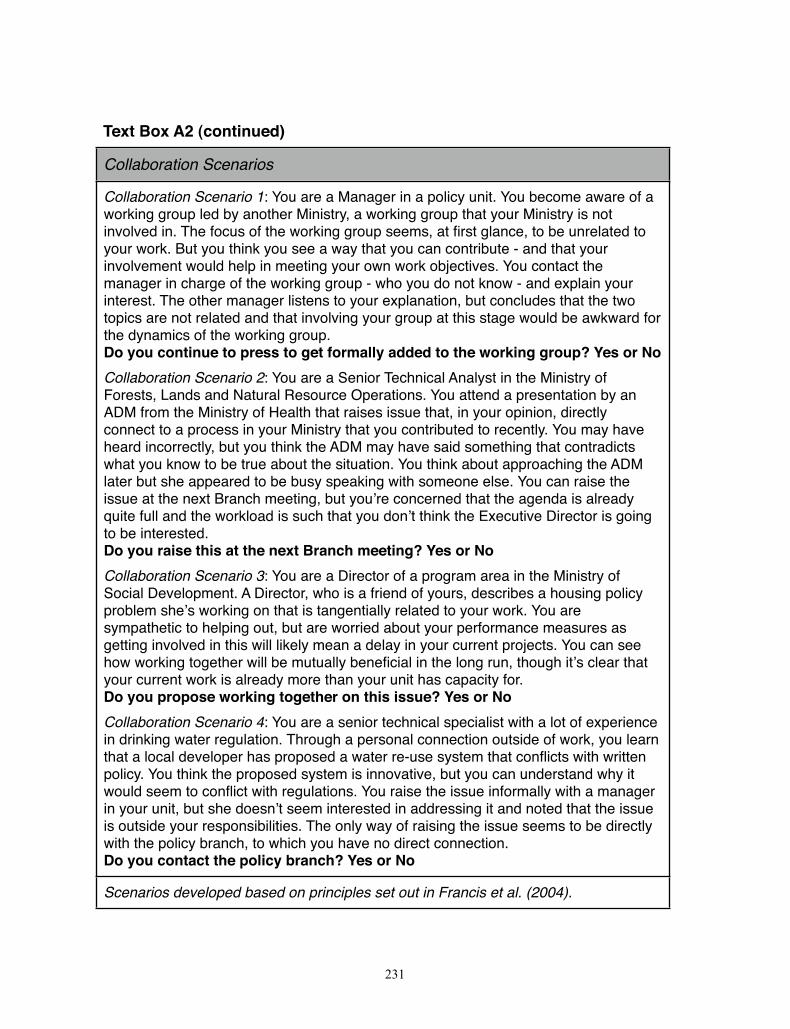
Text Box A2 (continued)
Collaboration Scenarios
Collaboration Scenario 1: You are a Manager in a policy unit. You become aware of a working group led by another Ministry, a working group that your Ministry is not involved in. The focus of the working group seems, at first glance, to be unrelated to your work. But you think you see a way that you can contribute - and that your involvement would help in meeting your own work objectives. You contact the manager in charge of the working group - who you do not know - and explain your interest. The other manager listens to your explanation, but concludes that the two topics are not related and that involving your group at this stage would be awkward for the dynamics of the working group. Do you continue to press to get formally added to the working group? Yes or NoCollaboration Scenario 2: You are a Senior Technical Analyst in the Ministry of Forests, Lands and Natural Resource Operations. You attend a presentation by an ADM from the Ministry of Health that raises issue that, in your opinion, directly connect to a process in your Ministry that you contributed to recently. You may have heard incorrectly, but you think the ADM may have said something that contradicts what you know to be true about the situation. You think about approaching the ADM later but she appeared to be busy speaking with someone else. You can raise the issue at the next Branch meeting, but you�re concerned that the agenda is already quite full and the workload is such that you don�t think the Executive Director is going to be interested. Do you raise this at the next Branch meeting? Yes or NoCollaboration Scenario 3: You are a Director of a program area in the Ministry of Social Development. A Director, who is a friend of yours, describes a housing policy problem she�s working on that is tangentially related to your work. You are sympathetic to helping out, but are worried about your performance measures as getting involved in this will likely mean a delay in your current projects. You can see how working together will be mutually beneficial in the long run, though it�s clear that your current work is already more than your unit has capacity for. Do you propose working together on this issue? Yes or NoCollaboration Scenario 4: You are a senior technical specialist with a lot of experience in drinking water regulation. Through a personal connection outside of work, you learn that a local developer has proposed a water re-use system that conflicts with written policy. You think the proposed system is innovative, but you can understand why it would seem to conflict with regulations. You raise the issue informally with a manager in your unit, but she doesn�t seem interested in addressing it and noted that the issue is outside your responsibilities. The only way of raising the issue seems to be directly with the policy branch, to which you have no direct connection. Do you contact the policy branch? Yes or No
Scenarios developed based on principles set out in Francis et al. (2004).
231

Appendix G - Quantitative Variables Collected31
Table A4: VVariables Collectted Through the Online Questionnaaire
Code Construct Question TypeCode ID Automatically assigned alphanumeric code 5 digit eg A1b2C
MIN Demo | location MIN Categorical
BRANCH Demo | location BRANCH Label
TITLE Demo | location TITLE Categorical
age Demo | personal What is your age today? dropdown, 13 Class Interval
gender Demo | personal What is your gender? multiple choice, 2 Categorical
degree Demo | personal level of education completed? dropdown, 6 Categorical
degreetype Demo | personal major discipline or subject? dropdown, 17 Categorical
status Demo | status current employment status? dropdown, 8 Categorical
category Demo | status current job category? dropdown, 13 Categorical
supervisor Demo | status are you a supervisor? branching ques. Categorical Y/N
supernumber Demo | status number you currently supervise? free text Continuous
yearsBCPS Demo | status years with BC Public Service? free text Continuous
yearslevel Demo | stability years at current level {category}? free text Continuous
year3 Demo | stability years in your current job? branching ques. Continuous
diff3 Demo | stability different direct supervisors? free text Continuous
diff3a Demo | stability diff. once-removed supervisors? free text Continuous
workunit Demo | location work unit size? free text Continuous
policyunit Demo | location work unit “policy” intensity? free text Continuous
orgdisrupt Demo | stability organizational disruptions? free text Continuous
posdisrupt Demo | stability position disruptions? free text Continuous
latmove Demo | stability lateral career movement? free text Continuous
upmove Demo | stability career advancement? free text Continuousmodespa.0 Demo |archetype Policy Analyst Archetypes | Connectors Nom. Rank, 5-1
modespa.1 Demo |archetype Policy Analyst Archetypes | Synthesizers Nom. Rank, 5-1
modespa.2 Demo |archetype Policy Analyst Archetypes | Technicians Nom. Rank, 5-1
modespa.3 Demo |archetype Policy Analyst Archetypes | Listeners Nom. Rank, 5-1
232
31 The data file is available at http://jlphdcand.wordpress.com, though some of the demographic variable have been removed so as to minimize the possibility of de-anonymization (see section 3.7 in the main text).
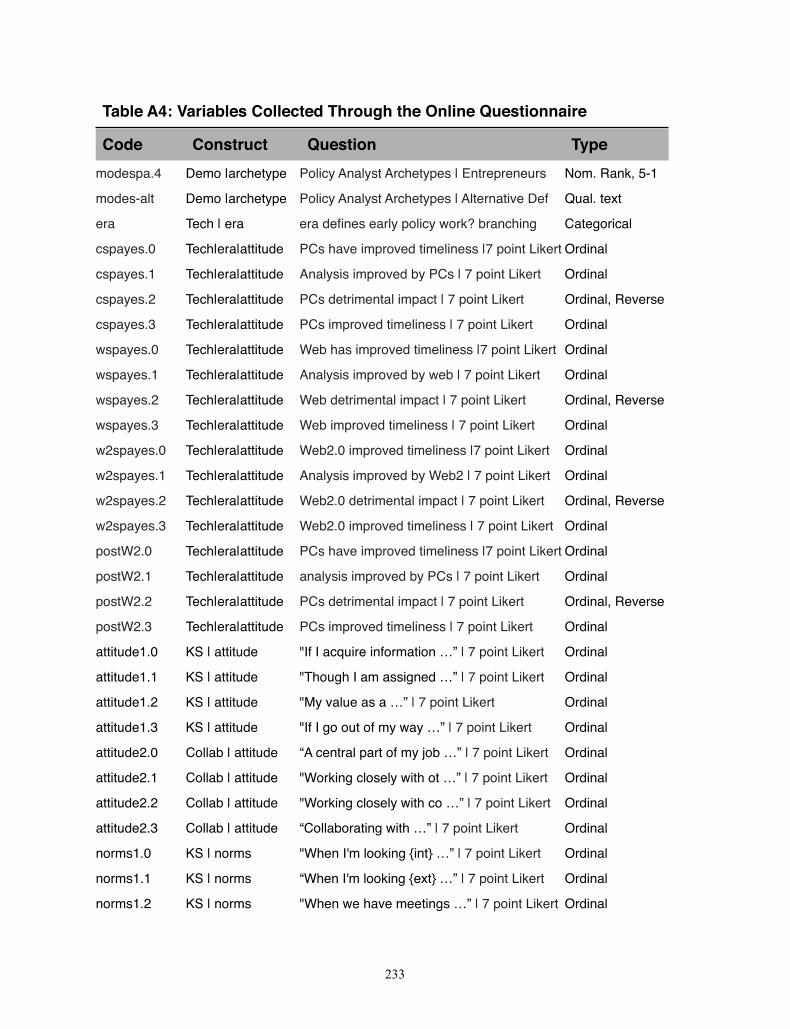
Table A4: VVariables Collectted Through the Online Questionnaaire
Code Construct Question Typemodespa.4 Demo |archetype Policy Analyst Archetypes | Entrepreneurs Nom. Rank, 5-1
modes-alt Demo |archetype Policy Analyst Archetypes | Alternative Def Qual. text
era Tech | era era defines early policy work? branching Categorical
cspayes.0 Tech|era|attitude PCs have improved timeliness |7 point Likert Ordinal
cspayes.1 Tech|era|attitude Analysis improved by PCs | 7 point Likert Ordinal
cspayes.2 Tech|era|attitude PCs detrimental impact | 7 point Likert Ordinal, Reverse
cspayes.3 Tech|era|attitude PCs improved timeliness | 7 point Likert Ordinal
wspayes.0 Tech|era|attitude Web has improved timeliness |7 point Likert Ordinal
wspayes.1 Tech|era|attitude Analysis improved by web | 7 point Likert Ordinal
wspayes.2 Tech|era|attitude Web detrimental impact | 7 point Likert Ordinal, Reverse
wspayes.3 Tech|era|attitude Web improved timeliness | 7 point Likert Ordinal
w2spayes.0 Tech|era|attitude Web2.0 improved timeliness |7 point Likert Ordinal
w2spayes.1 Tech|era|attitude Analysis improved by Web2 | 7 point Likert Ordinal
w2spayes.2 Tech|era|attitude Web2.0 detrimental impact | 7 point Likert Ordinal, Reverse
w2spayes.3 Tech|era|attitude Web2.0 improved timeliness | 7 point Likert Ordinal
postW2.0 Tech|era|attitude PCs have improved timeliness |7 point Likert Ordinal
postW2.1 Tech|era|attitude analysis improved by PCs | 7 point Likert Ordinal
postW2.2 Tech|era|attitude PCs detrimental impact | 7 point Likert Ordinal, Reverse
postW2.3 Tech|era|attitude PCs improved timeliness | 7 point Likert Ordinal
attitude1.0 KS | attitude "If I acquire information …” | 7 point Likert Ordinal
attitude1.1 KS | attitude "Though I am assigned …” | 7 point Likert Ordinal
attitude1.2 KS | attitude "My value as a …” | 7 point Likert Ordinal
attitude1.3 KS | attitude "If I go out of my way …” | 7 point Likert Ordinal
attitude2.0 Collab | attitude “A central part of my job …” | 7 point Likert Ordinal
attitude2.1 Collab | attitude "Working closely with ot …” | 7 point Likert Ordinal
attitude2.2 Collab | attitude "Working closely with co …” | 7 point Likert Ordinal
attitude2.3 Collab | attitude “Collaborating with …” | 7 point Likert Ordinal
norms1.0 KS | norms "When I'm looking {int} …” | 7 point Likert Ordinal
norms1.1 KS | norms “When I'm looking {ext} …” | 7 point Likert Ordinal
norms1.2 KS | norms "When we have meetings …” | 7 point Likert Ordinal
233
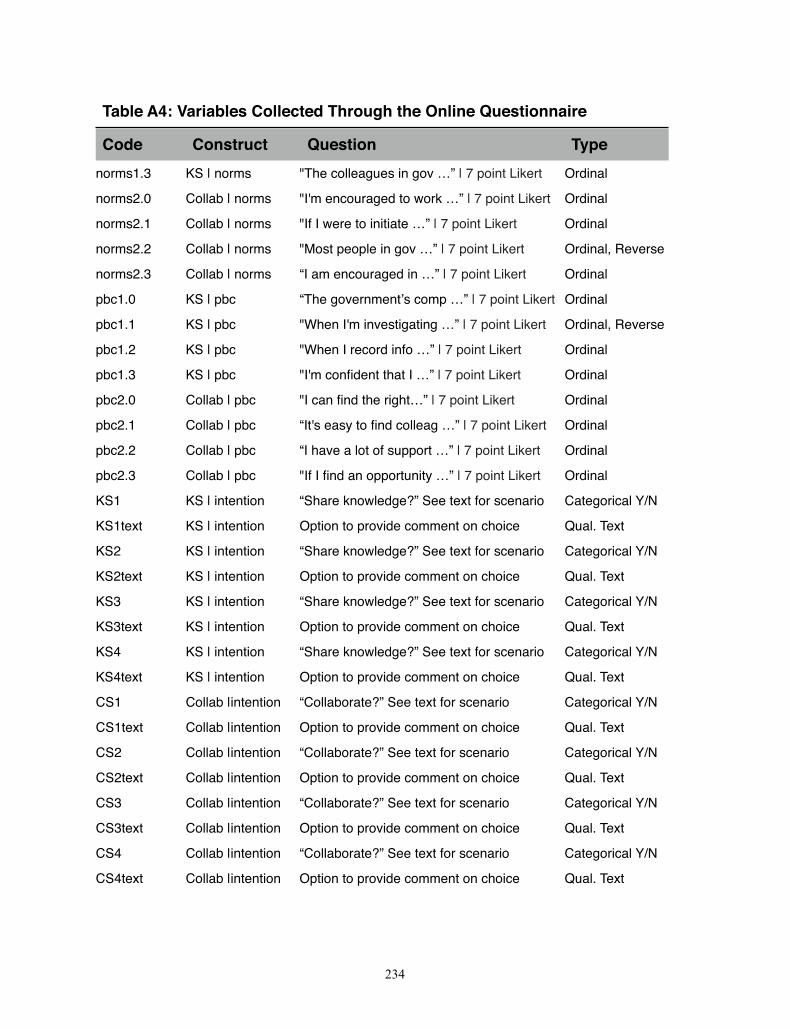
Table A4: VVariables Collectted Through the Online Questionnaaire
Code Construct Question Typenorms1.3 KS | norms "The colleagues in gov …” | 7 point Likert Ordinal
norms2.0 Collab | norms "I'm encouraged to work …” | 7 point Likert Ordinal
norms2.1 Collab | norms "If I were to initiate …” | 7 point Likert Ordinal
norms2.2 Collab | norms "Most people in gov …” | 7 point Likert Ordinal, Reverse
norms2.3 Collab | norms “I am encouraged in …” | 7 point Likert Ordinal
pbc1.0 KS | pbc “The government�s comp …” | 7 point Likert Ordinal
pbc1.1 KS | pbc "When I'm investigating …” | 7 point Likert Ordinal, Reverse
pbc1.2 KS | pbc "When I record info …” | 7 point Likert Ordinal
pbc1.3 KS | pbc "I'm confident that I …” | 7 point Likert Ordinal
pbc2.0 Collab | pbc "I can find the right…” | 7 point Likert Ordinal
pbc2.1 Collab | pbc “It's easy to find colleag …” | 7 point Likert Ordinal
pbc2.2 Collab | pbc “I have a lot of support …” | 7 point Likert Ordinal
pbc2.3 Collab | pbc "If I find an opportunity …” | 7 point Likert Ordinal
KS1 KS | intention “Share knowledge?” See text for scenario Categorical Y/N
KS1text KS | intention Option to provide comment on choice Qual. Text
KS2 KS | intention “Share knowledge?” See text for scenario Categorical Y/N
KS2text KS | intention Option to provide comment on choice Qual. Text
KS3 KS | intention “Share knowledge?” See text for scenario Categorical Y/N
KS3text KS | intention Option to provide comment on choice Qual. Text
KS4 KS | intention “Share knowledge?” See text for scenario Categorical Y/N
KS4text KS | intention Option to provide comment on choice Qual. Text
CS1 Collab |intention “Collaborate?” See text for scenario Categorical Y/N
CS1text Collab |intention Option to provide comment on choice Qual. Text
CS2 Collab |intention “Collaborate?” See text for scenario Categorical Y/N
CS2text Collab |intention Option to provide comment on choice Qual. Text
CS3 Collab |intention “Collaborate?” See text for scenario Categorical Y/N
CS3text Collab |intention Option to provide comment on choice Qual. Text
CS4 Collab |intention “Collaborate?” See text for scenario Categorical Y/N
CS4text Collab |intention Option to provide comment on choice Qual. Text
234
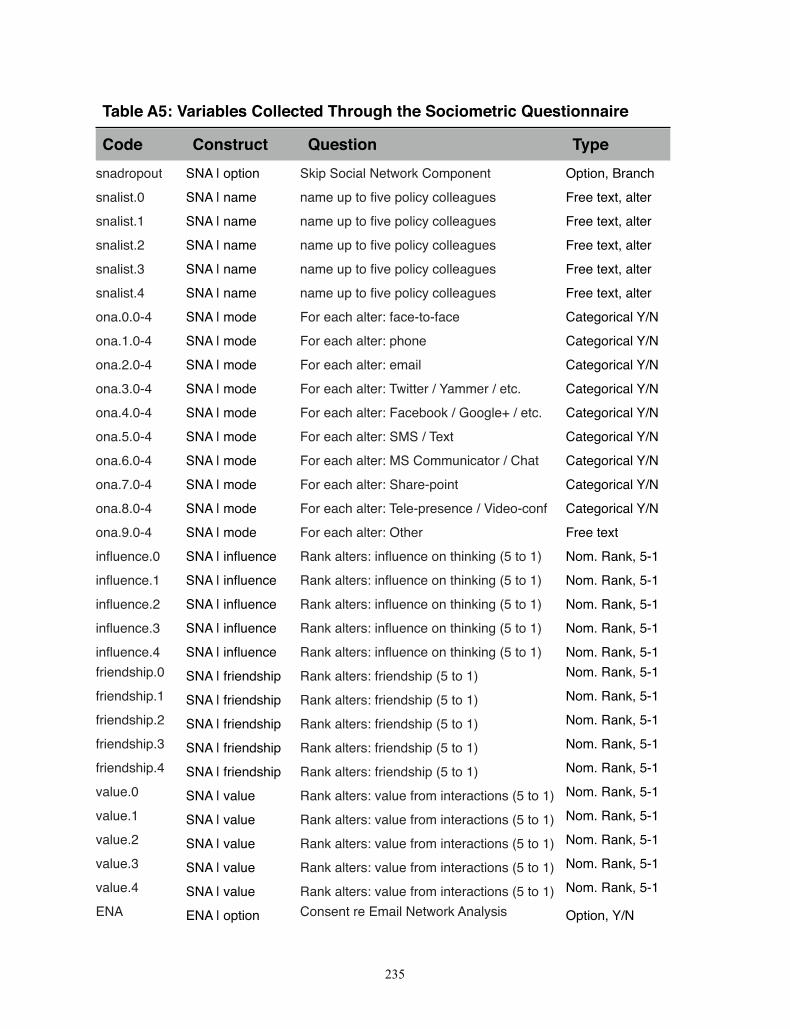
Table A5: VVariables Collectted Through the Sociometric Questtionnaire
Code Construct Question Typesnadropout SNA | option Skip Social Network Component Option, Branchsnalist.0 SNA | name name up to five policy colleagues Free text, altersnalist.1 SNA | name name up to five policy colleagues Free text, altersnalist.2 SNA | name name up to five policy colleagues Free text, altersnalist.3 SNA | name name up to five policy colleagues Free text, altersnalist.4 SNA | name name up to five policy colleagues Free text, alterona.0.0-4 SNA | mode For each alter: face-to-face Categorical Y/Nona.1.0-4 SNA | mode For each alter: phone Categorical Y/Nona.2.0-4 SNA | mode For each alter: email Categorical Y/Nona.3.0-4 SNA | mode For each alter: Twitter / Yammer / etc. Categorical Y/Nona.4.0-4 SNA | mode For each alter: Facebook / Google+ / etc. Categorical Y/Nona.5.0-4 SNA | mode For each alter: SMS / Text Categorical Y/Nona.6.0-4 SNA | mode For each alter: MS Communicator / Chat Categorical Y/Nona.7.0-4 SNA | mode For each alter: Share-point Categorical Y/Nona.8.0-4 SNA | mode For each alter: Tele-presence / Video-conf Categorical Y/Nona.9.0-4 SNA | mode For each alter: Other Free textinfluence.0 SNA | influence Rank alters: influence on thinking (5 to 1) Nom. Rank, 5-1influence.1 SNA | influence Rank alters: influence on thinking (5 to 1) Nom. Rank, 5-1influence.2 SNA | influence Rank alters: influence on thinking (5 to 1) Nom. Rank, 5-1influence.3 SNA | influence Rank alters: influence on thinking (5 to 1) Nom. Rank, 5-1influence.4 SNA | influence Rank alters: influence on thinking (5 to 1) Nom. Rank, 5-1friendship.0 SNA | friendship Rank alters: friendship (5 to 1) Nom. Rank, 5-1friendship.1 SNA | friendship Rank alters: friendship (5 to 1) Nom. Rank, 5-1friendship.2 SNA | friendship Rank alters: friendship (5 to 1) Nom. Rank, 5-1friendship.3 SNA | friendship Rank alters: friendship (5 to 1) Nom. Rank, 5-1friendship.4 SNA | friendship Rank alters: friendship (5 to 1) Nom. Rank, 5-1value.0 SNA | value Rank alters: value from interactions (5 to 1) Nom. Rank, 5-1value.1 SNA | value Rank alters: value from interactions (5 to 1) Nom. Rank, 5-1value.2 SNA | value Rank alters: value from interactions (5 to 1) Nom. Rank, 5-1value.3 SNA | value Rank alters: value from interactions (5 to 1) Nom. Rank, 5-1value.4 SNA | value Rank alters: value from interactions (5 to 1) Nom. Rank, 5-1ENA ENA | option Consent re Email Network Analysis Option, Y/N
235
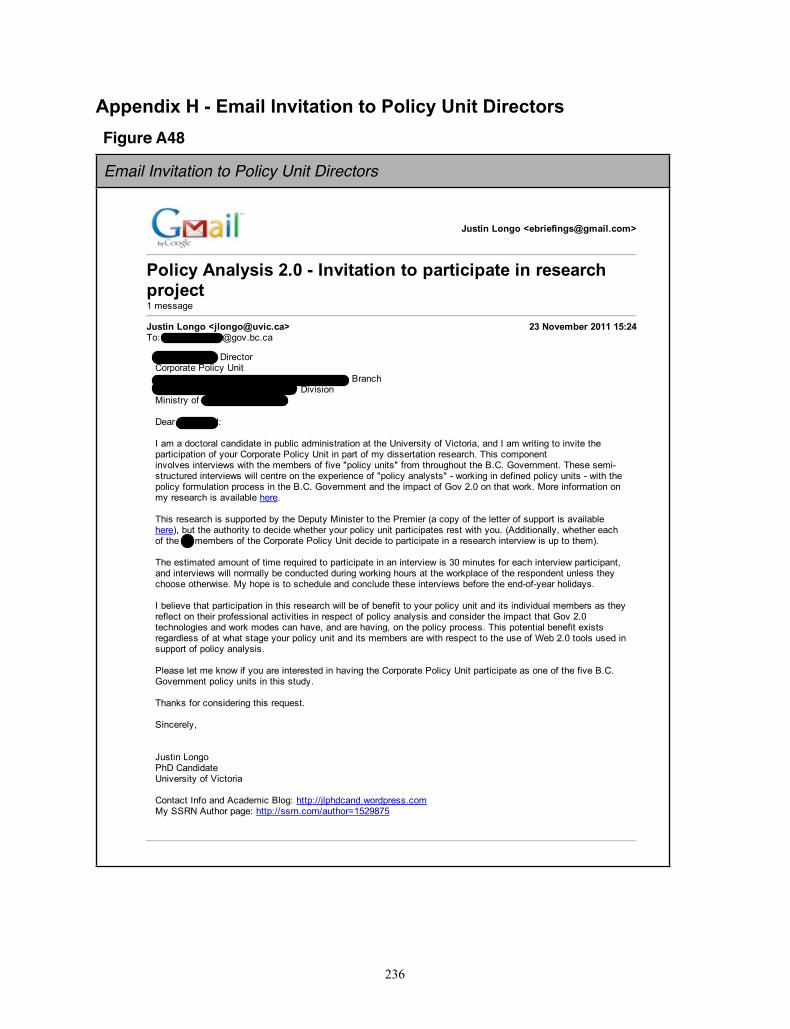
Appendix H - Email Invitation to Policy Unit DirectorsFigure A48
Email Invitation to Policy Unit Directors
Justin Longo <[email protected]>
Policy Analysis 2.0 - Invitation to participate in researchproject1 message
Justin Longo <[email protected]> 23 November 2011 15:24To: [email protected]
Vincent Portal, DirectorCorporate Policy Unit Policy Planning & Intergovernmental Relations Branch Decision Support & Accountability DivisionMinistry of Advanced Education
Dear Mr. Portal:
I am a doctoral candidate in public administration at the University of Victoria, and I am writing to invite theparticipation of your Corporate Policy Unit in part of my dissertation research. This componentinvolves interviews with the members of five "policy units" from throughout the B.C. Government. These semi-structured interviews will centre on the experience of "policy analysts" - working in defined policy units - with thepolicy formulation process in the B.C. Government and the impact of Gov 2.0 on that work. More information onmy research is available here.
This research is supported by the Deputy Minister to the Premier (a copy of the letter of support is availablehere), but the authority to decide whether your policy unit participates rest with you. (Additionally, whether eachof the 10 members of the Corporate Policy Unit decide to participate in a research interview is up to them).
The estimated amount of time required to participate in an interview is 30 minutes for each interview participant,and interviews will normally be conducted during working hours at the workplace of the respondent unless theychoose otherwise. My hope is to schedule and conclude these interviews before the end-of-year holidays.
I believe that participation in this research will be of benefit to your policy unit and its individual members as theyreflect on their professional activities in respect of policy analysis and consider the impact that Gov 2.0technologies and work modes can have, and are having, on the policy process. This potential benefit existsregardless of at what stage your policy unit and its members are with respect to the use of Web 2.0 tools used insupport of policy analysis.
Please let me know if you are interested in having the Corporate Policy Unit participate as one of the five B.C.Government policy units in this study.
Thanks for considering this request.
Sincerely,
Justin LongoPhD CandidateUniversity of Victoria
Contact Info and Academic Blog: http://jlphdcand.wordpress.comMy SSRN Author page: http://ssrn.com/author=1529875
236
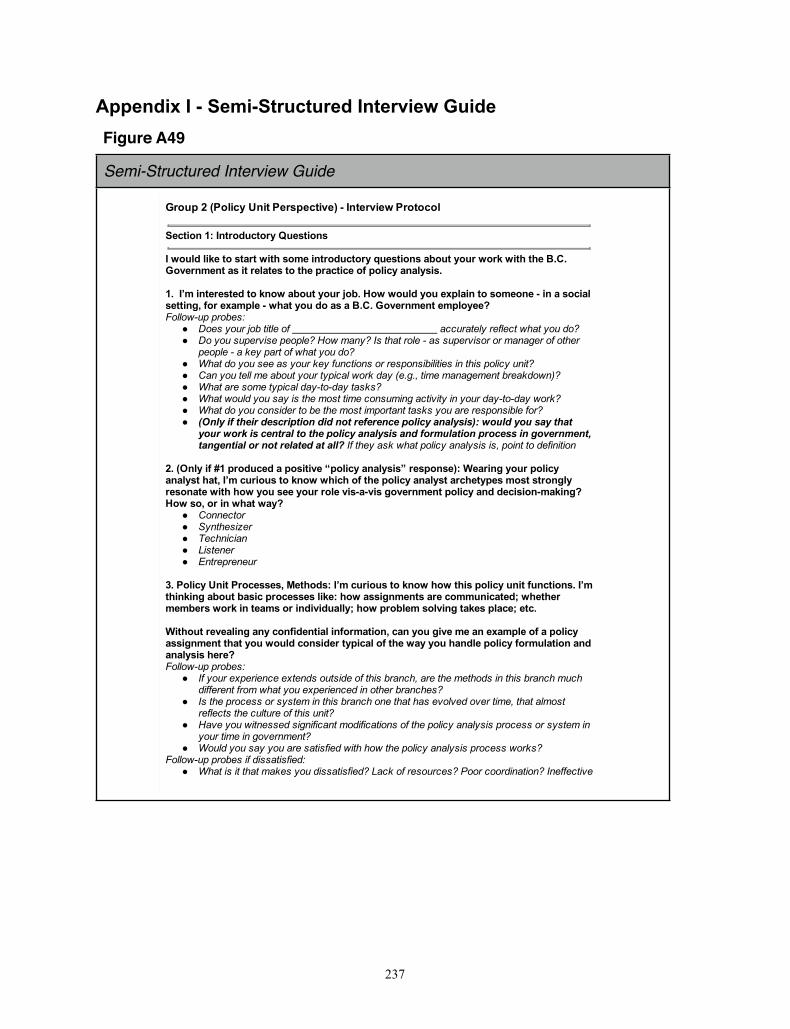
Appendix I - Semi-Structured Interview Guide
Figure A49
Semi-Structured Interview Guide
Group 2 (Policy Unit Perspective) - Interview Protocol
Section 1: Introductory Questions
I would like to start with some introductory questions about your work with the B.C.Government as it relates to the practice of policy analysis.
1. I’m interested to know about your job. How would you explain to someone - in a socialsetting, for example - what you do as a B.C. Government employee?Follow-up probes:
� Does your job title of accurately reflect what you do?� Do you supervise people? How many? Is that role - as supervisor or manager of other
people - a key part of what you do?� What do you see as your key functions or responsibilities in this policy unit?� Can you tell me about your typical work day (e.g., time management breakdown)?� What are some typical day-to-day tasks?� What would you say is the most time consuming activity in your day-to-day work?� What do you consider to be the most important tasks you are responsible for?� (Only if their description did not reference policy analysis): would you say that
your work is central to the policy analysis and formulation process in government,tangential or not related at all? If they ask what policy analysis is, point to definition
2. (Only if #1 produced a positive “policy analysis” response): Wearing your policyanalyst hat, I’m curious to know which of the policy analyst archetypes most stronglyresonate with how you see your role vis-a-vis government policy and decision-making?How so, or in what way?
� Connector� Synthesizer� Technician� Listener� Entrepreneur
3. Policy Unit Processes, Methods: I’m curious to know how this policy unit functions. I’mthinking about basic processes like: how assignments are communicated; whethermembers work in teams or individually; how problem solving takes place; etc.
Without revealing any confidential information, can you give me an example of a policyassignment that you would consider typical of the way you handle policy formulation andanalysis here?Follow-up probes:
� If your experience extends outside of this branch, are the methods in this branch muchdifferent from what you experienced in other branches?
� Is the process or system in this branch one that has evolved over time, that almostreflects the culture of this unit?
� Have you witnessed significant modifications of the policy analysis process or system inyour time in government?
� Would you say you are satisfied with how the policy analysis process works?Follow-up probes if dissatisfied:
� What is it that makes you dissatisfied? Lack of resources? Poor coordination? Ineffective
237
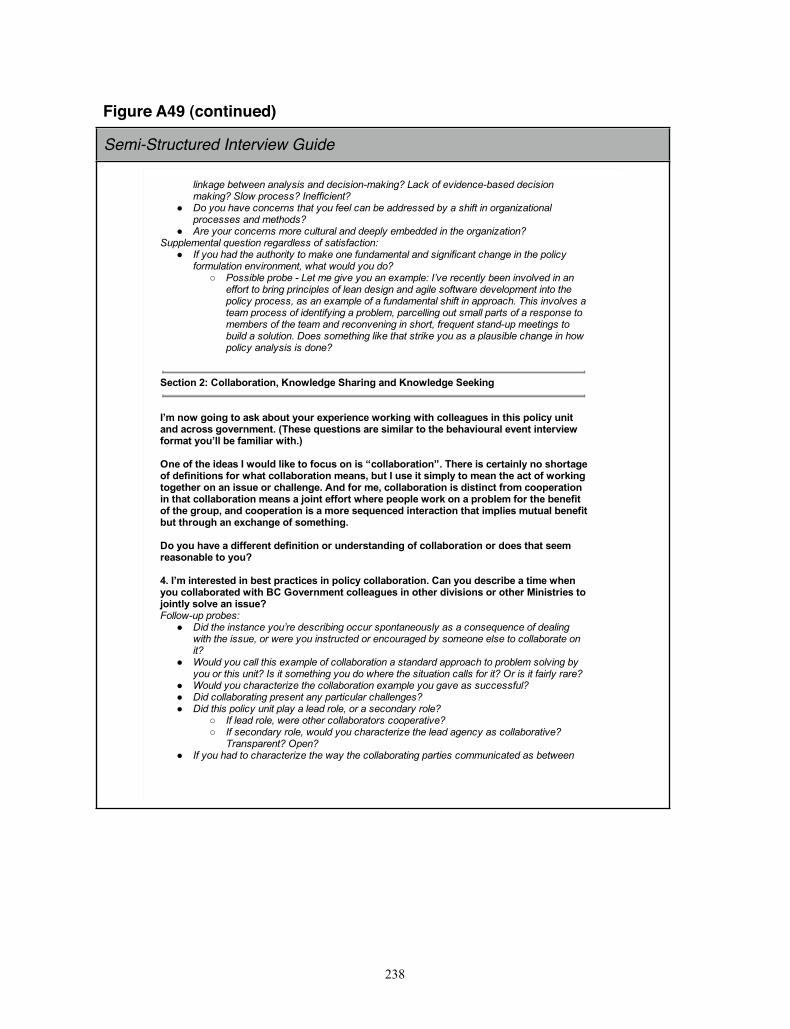
Figure A49 (continued)
Semi-Structured Interview Guide
linkage between analysis and decision-making? Lack of evidence-based decisionmaking? Slow process? Inefficient?
� Do you have concerns that you feel can be addressed by a shift in organizationalprocesses and methods?
� Are your concerns more cultural and deeply embedded in the organization?Supplemental question regardless of satisfaction:
� If you had the authority to make one fundamental and significant change in the policyformulation environment, what would you do?
� Possible probe - Let me give you an example: I’ve recently been involved in aneffort to bring principles of lean design and agile software development into thepolicy process, as an example of a fundamental shift in approach. This involves ateam process of identifying a problem, parcelling out small parts of a response tomembers of the team and reconvening in short, frequent stand-up meetings tobuild a solution. Does something like that strike you as a plausible change in howpolicy analysis is done?
Section 2: Collaboration, Knowledge Sharing and Knowledge Seeking
I’m now going to ask about your experience working with colleagues in this policy unitand across government. (These questions are similar to the behavioural event interviewformat you’ll be familiar with.)
One of the ideas I would like to focus on is “collaboration”. There is certainly no shortageof definitions for what collaboration means, but I use it simply to mean the act of workingtogether on an issue or challenge. And for me, collaboration is distinct from cooperationin that collaboration means a joint effort where people work on a problem for the benefitof the group, and cooperation is a more sequenced interaction that implies mutual benefitbut through an exchange of something.
Do you have a different definition or understanding of collaboration or does that seemreasonable to you?
4. I’m interested in best practices in policy collaboration. Can you describe a time whenyou collaborated with BC Government colleagues in other divisions or other Ministries tojointly solve an issue?Follow-up probes:
� Did the instance you’re describing occur spontaneously as a consequence of dealingwith the issue, or were you instructed or encouraged by someone else to collaborate onit?
� Would you call this example of collaboration a standard approach to problem solving byyou or this unit? Is it something you do where the situation calls for it? Or is it fairly rare?
� Would you characterize the collaboration example you gave as successful?� Did collaborating present any particular challenges?� Did this policy unit play a lead role, or a secondary role?
� If lead role, were other collaborators cooperative?� If secondary role, would you characterize the lead agency as collaborative?
Transparent? Open?� If you had to characterize the way the collaborating parties communicated as between
238
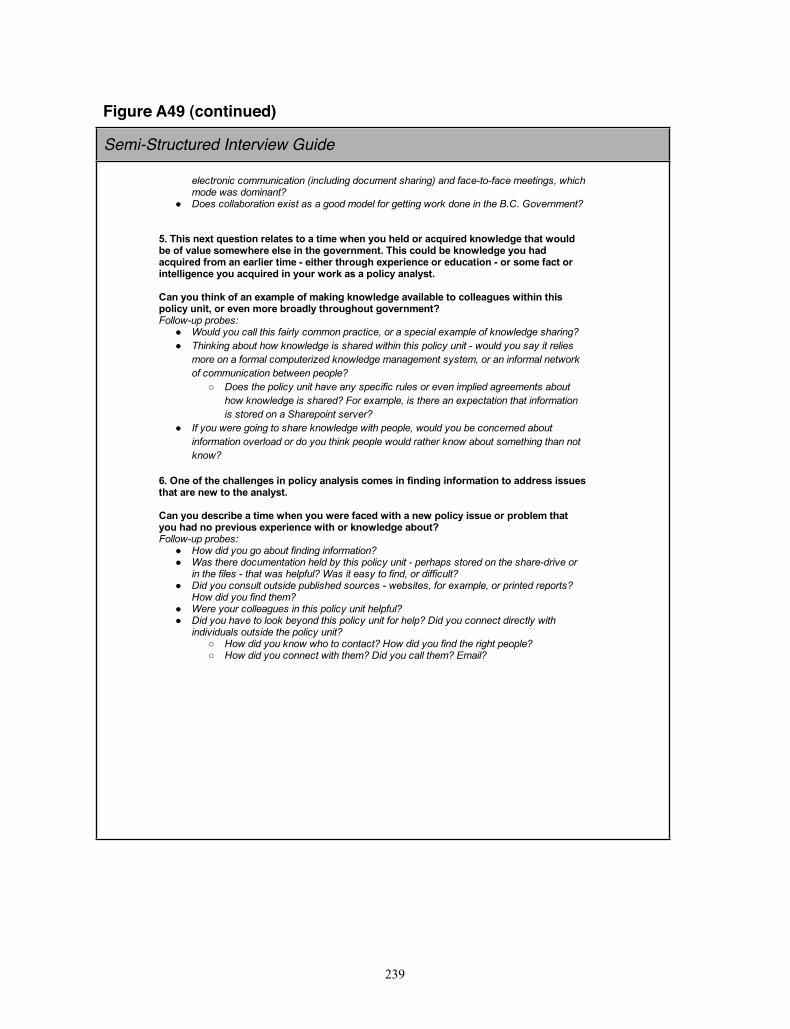
Figure A49 (continued)
Semi-Structured Interview Guide
electronic communication (including document sharing) and face-to-face meetings, whichmode was dominant?
� Does collaboration exist as a good model for getting work done in the B.C. Government?
5. This next question relates to a time when you held or acquired knowledge that wouldbe of value somewhere else in the government. This could be knowledge you hadacquired from an earlier time - either through experience or education - or some fact orintelligence you acquired in your work as a policy analyst.
Can you think of an example of making knowledge available to colleagues within thispolicy unit, or even more broadly throughout government?Follow-up probes:
� Would you call this fairly common practice, or a special example of knowledge sharing?� Thinking about how knowledge is shared within this policy unit - would you say it relies
more on a formal computerized knowledge management system, or an informal networkof communication between people?
� Does the policy unit have any specific rules or even implied agreements abouthow knowledge is shared? For example, is there an expectation that informationis stored on a Sharepoint server?
� If you were going to share knowledge with people, would you be concerned aboutinformation overload or do you think people would rather know about something than notknow?
6. One of the challenges in policy analysis comes in finding information to address issuesthat are new to the analyst.
Can you describe a time when you were faced with a new policy issue or problem thatyou had no previous experience with or knowledge about?Follow-up probes:
� How did you go about finding information?� Was there documentation held by this policy unit - perhaps stored on the share-drive or
in the files - that was helpful? Was it easy to find, or difficult?� Did you consult outside published sources - websites, for example, or printed reports?
How did you find them?� Were your colleagues in this policy unit helpful?� Did you have to look beyond this policy unit for help? Did you connect directly with
individuals outside the policy unit?� How did you know who to contact? How did you find the right people?� How did you connect with them? Did you call them? Email?
239
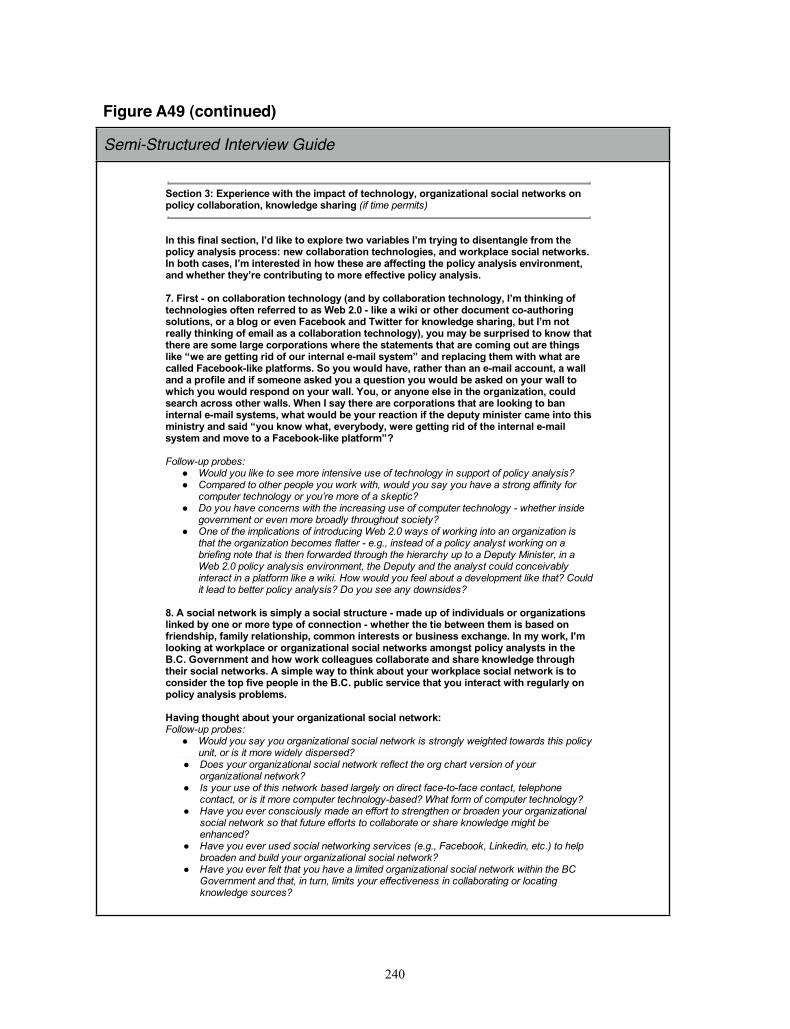
Figure A49 (continued)
Semi-Structured Interview Guide
Section 3: Experience with the impact of technology, organizational social networks onpolicy collaboration, knowledge sharing (if time permits)
In this final section, I’d like to explore two variables I’m trying to disentangle from thepolicy analysis process: new collaboration technologies, and workplace social networks.In both cases, I’m interested in how these are affecting the policy analysis environment,and whether they’re contributing to more effective policy analysis.
7. First - on collaboration technology (and by collaboration technology, I’m thinking oftechnologies often referred to as Web 2.0 - like a wiki or other document co-authoringsolutions, or a blog or even Facebook and Twitter for knowledge sharing, but I’m notreally thinking of email as a collaboration technology), you may be surprised to know thatthere are some large corporations where the statements that are coming out are thingslike “we are getting rid of our internal e-mail system” and replacing them with what arecalled Facebook-like platforms. So you would have, rather than an e-mail account, a walland a profile and if someone asked you a question you would be asked on your wall towhich you would respond on your wall. You, or anyone else in the organization, couldsearch across other walls. When I say there are corporations that are looking to baninternal e-mail systems, what would be your reaction if the deputy minister came into thisministry and said “you know what, everybody, were getting rid of the internal e-mailsystem and move to a Facebook-like platform”?
Follow-up probes:� Would you like to see more intensive use of technology in support of policy analysis?� Compared to other people you work with, would you say you have a strong affinity for
computer technology or you’re more of a skeptic?� Do you have concerns with the increasing use of computer technology - whether inside
government or even more broadly throughout society?� One of the implications of introducing Web 2.0 ways of working into an organization is
that the organization becomes flatter - e.g., instead of a policy analyst working on abriefing note that is then forwarded through the hierarchy up to a Deputy Minister, in aWeb 2.0 policy analysis environment, the Deputy and the analyst could conceivablyinteract in a platform like a wiki. How would you feel about a development like that? Couldit lead to better policy analysis? Do you see any downsides?
8. A social network is simply a social structure - made up of individuals or organizationslinked by one or more type of connection - whether the tie between them is based onfriendship, family relationship, common interests or business exchange. In my work, I'mlooking at workplace or organizational social networks amongst policy analysts in theB.C. Government and how work colleagues collaborate and share knowledge throughtheir social networks. A simple way to think about your workplace social network is toconsider the top five people in the B.C. public service that you interact with regularly onpolicy analysis problems.
Having thought about your organizational social network:Follow-up probes:
� Would you say you organizational social network is strongly weighted towards this policyunit, or is it more widely dispersed?
� Does your organizational social network reflect the org chart version of yourorganizational network?
� Is your use of this network based largely on direct face-to-face contact, telephonecontact, or is it more computer technology-based? What form of computer technology?
� Have you ever consciously made an effort to strengthen or broaden your organizationalsocial network so that future efforts to collaborate or share knowledge might beenhanced?
� Have you ever used social networking services (e.g., Facebook, Linkedin, etc.) to helpbroaden and build your organizational social network?
� Have you ever felt that you have a limited organizational social network within the BCGovernment and that, in turn, limits your effectiveness in collaborating or locatingknowledge sources?
240
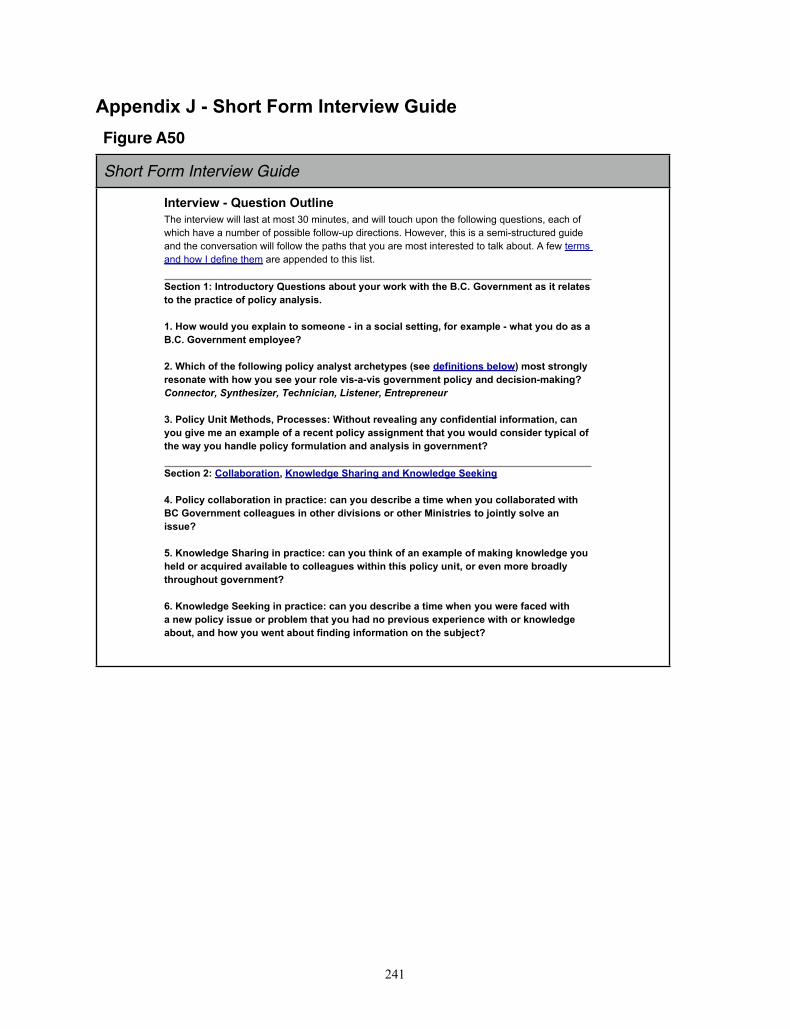
Appendix J - Short Form Interview Guide
Figure A50
Short Form Interview Guide
�)/ -1$ 2����0 ./$*)��0/'$) ����������� � ��������������������������������� ������� ���������������� ����������������� ����� �� ��������������������������������� �������� ��������� ������������������������� �������������������� ������������ ��������� ����������������!������������������������������������������ ������������� ������������������������������������������� �/$*)�� ��)/-*�0�/*-4��0 ./$*).���*0/�4*0-�2*-&�2$/#�/# �������*1 -)( )/��.�$/�- '�/ .�/*�/# �+-��/$� �*!�+*'$�4��)�'4.$.������*2�2*0'��4*0� 3+'�$)�/*�.*( *) ���$)���.*�$�'�. //$)"��!*-� 3�(+' ���2#�/�4*0��*��.���������*1 -)( )/� (+'*4 ������#$�#�*!�/# �!*''*2$)"�+*'$�4��)�'4./��-�# /4+ .��. �� !$)$/$*).�� '*2��(*./�./-*)"'4�- .*)�/ �2$/#�#*2�4*0�. �4*0-�-*' �1$.���1$.�"*1 -)( )/�+*'$�4��)��� �$.$*)�(�&$)"���� ������� ���������� ��� ������ ���� ���� ������*'$�4��)$/�� /#*�.���-*� .. . ��$/#*0/�- 1 �'$)"��)4��*)!$� )/$�'�$)!*-(�/$*)����)�4*0�"$1 �( ��)� 3�(+' �*!���- � )/�+*'$�4��..$")( )/�/#�/�4*0�2*0'���*).$� -�/4+$��'�*!�/# �2�4�4*0�#�)�' �+*'$�4�!*-(0'�/$*)��)���)�'4.$.�$)�"*1 -)( )/��� �/$*)�� ��*''��*-�/$*)���)*2' �" ��#�-$)"��)���)*2' �" �� &$)"����*'$�4��*''��*-�/$*)�$)�+-��/$� ���)�4*0�� .�-$� ���/$( �2# )�4*0��*''��*-�/ ��2$/#�����*1 -)( )/��*'' �"0 .�$)�*/# -��$1$.$*).�*-�*/# -��$)$./-$ .�/*�%*$)/'4�.*'1 ��)�$..0 ������)*2' �" ��#�-$)"�$)�+-��/$� ���)�4*0�/#$)&�*!��)� 3�(+' �*!�(�&$)"�&)*2' �" �4*0�# '��*-���,0$- ���1�$'��' �/*��*'' �"0 .�2$/#$)�/#$.�+*'$�4�0)$/��*-� 1 )�(*- ��-*��'4�/#-*0"#*0/�"*1 -)( )/������)*2' �" �� &$)"�$)�+-��/$� ���)�4*0�� .�-$� ���/$( �2# )�4*0�2 - �!�� ��2$/#���) 2�+*'$�4�$..0 �*-�+-*�' (�/#�/�4*0�#���)*�+- 1$*0.� 3+ -$ )� �2$/#�*-�&)*2' �" ���*0/���)��#*2�4*0�2 )/���*0/�!$)�$)"�$)!*-(�/$*)�*)�/# �.0�% �/��
241
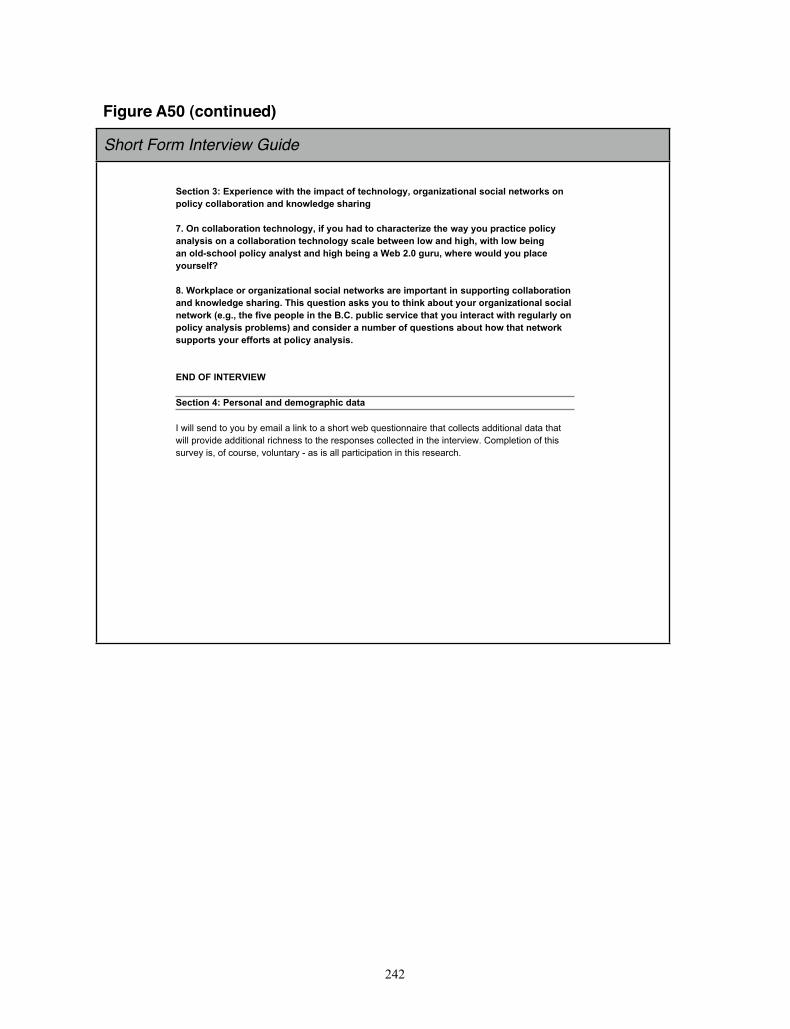
Figure A50 (continued)
Short Form Interview Guide
�!�/%*)� ��3+!-%!)�!�2%/$�/$!�%(+��/�*"�/!�$)*'*#4��*-#�)%5�/%*)�'�.*�%�'�)!/2*-&.�*)�+*'%�4��*''��*-�/%*)��) �&)*2'! #!�.$�-%)#�����)��*''��*-�/%*)�/!�$)*'*#4��%"�4*0�$� �/*��$�-��/!-%5!�/$!�2�4�4*0�+-��/%�!�+*'%�4��)�'4.%.�*)����*''��*-�/%*)�/!�$)*'*#4�.��'!��!/2!!)�'*2��) �$%#$��2%/$�'*2��!%)#��)�*' �.�$**'�+*'%�4��)�'4./��) �$%#$��!%)#����!������#0-0��2$!-!�2*0' �4*0�+'��!�4*0-.!'"������*-&+'��!�*-�*-#�)%5�/%*)�'�.*�%�'�)!/2*-&.��-!�%(+*-/�)/�%)�.0++*-/%)#��*''��*-�/%*)��) �&)*2'! #!�.$�-%)#���$%.�,0!./%*)��.&.�4*0�/*�/$%)&���*0/�4*0-�*-#�)%5�/%*)�'�.*�%�'�)!/2*-&��!�#���/$!�"%1!�+!*+'!�%)�/$!������+0�'%��.!-1%�!�/$�/�4*0�%)/!-��/�2%/$�-!#0'�-'4�*)�+*'%�4��)�'4.%.�+-*�'!(.���) ��*).% !-���)0(�!-�*"�,0!./%*).���*0/�$*2�/$�/�)!/2*-&�.0++*-/.�4*0-�!""*-/.��/�+*'%�4��)�'4.%.���������������������!�/%*)� ��!-.*)�'��) � !(*#-�+$%�� �/������������������������������������������ ����������������������� ������������������������ �������������������������� ��������� ����������������������� ���������������������������� ��������������������������������������������������������������� ��������� ��
242

Appendix K - List of Codes for Qualitative Data AnalysisConceptual Model Collaboration Attitude (Positive, Negative, Neutral, Mixed)
Subjective Norms (PPositive, Negative, Neutral, Mixed)Leadership (Positivee, Negative, Neutral, Mixed)Unit Culture Supportting the ConceptBehaviour Supportinng the ConceptAbility to Successfullly Use the ConceptObservation
Knowledge Seeking Attitude (Positive, Negative, Neutral, Mixed)Subjective Norms (PPositive, Negative, Neutral, Mixed)Leadership (Positivee, Negative, Neutral, Mixed)Unit Culture Supportting the ConceptBehaviour Supportinng the ConceptAbility to Successfullly Use the ConceptObservation
Knowledge Sharing Attitude (Positive, Negative, Neutral, Mixed)Subjective Norms (PPositive, Negative, Neutral, Mixed)Leadership (Positivee, Negative, Neutral, Mixed)Unit Culture Supportting the ConceptBehaviour Supportinng the ConceptAbility to Successfullly Use the ConceptObservation
Policy Analysis Archetype ConnectorEntrepreneurListenerSynthesizerTechnician
Attitude (Positive, Negative, Neutral, Mixed)Behaviour Supportinng the ConceptLeadership (Positivee, Negative, Neutral, Mixed)Subjective Norms (PPositive, Negative, Neutral, Mixed)ObservationUnit Culture Supportting the Concept
Technology Attitude (Positive, Negative, Neutral, Mixed)Behaviour Supportinng the ConceptLeadership (Positivee, Negative, Neutral, Mixed)Subjective Norms (PPositive, Negative, Neutral, Mixed)ObservationObservation\SharePPointObservation\SharePPoint\Other DMS (non-SharePoint)Technology Awareneess, Use, AccessUnit Culture Supportting the Concept
Research Questions Effective CollaborationnEffective Group CulturreEffective Knowledge SSeekingEffective Knowledge SSharingEffective Use of Technnology
243
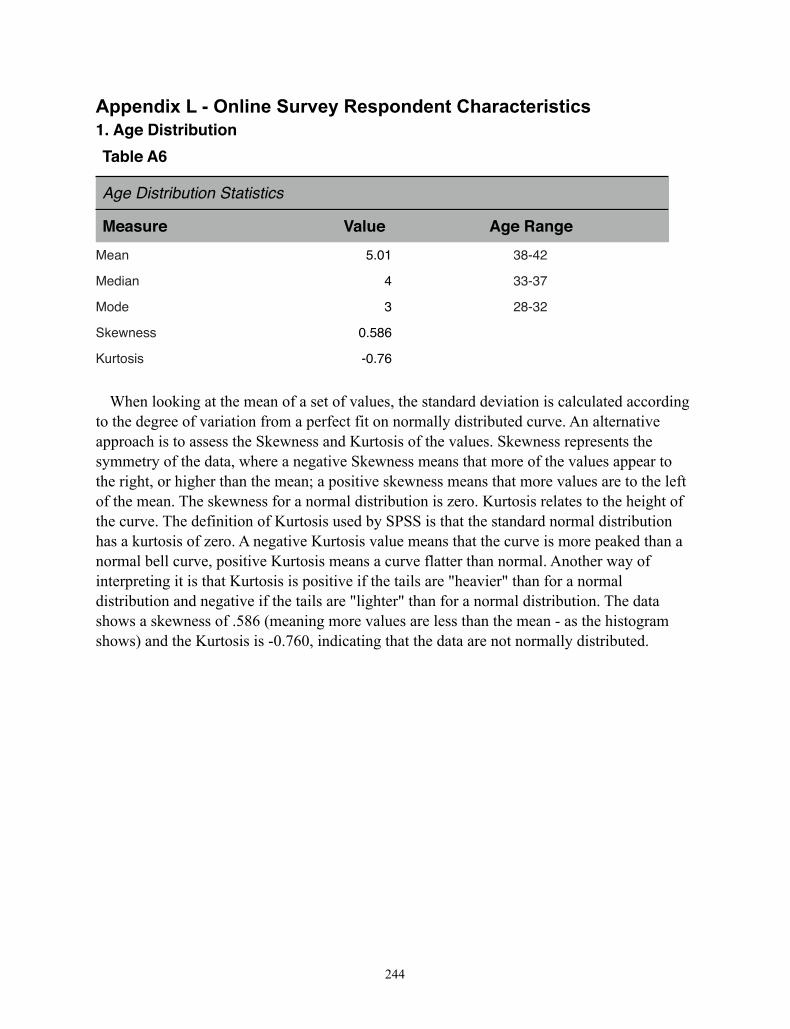
Appendix L - Online Survey Respondent Characteristics1. Age DistributionTable A6
Age Distribution Staatistics
Measure Value Age RangeMean 5.01 38-42
Median 4 33-37
Mode 3 28-32
Skewness 0.586
Kurtosis -0.76
When looking at the mean of a set of values, the standard deviation is calculated according to the degree of variation from a perfect fit on normally distributed curve. An alternative approach is to assess the Skewness and Kurtosis of the values. Skewness represents the symmetry of the data, where a negative Skewness means that more of the values appear to the right, or higher than the mean; a positive skewness means that more values are to the left of the mean. The skewness for a normal distribution is zero. Kurtosis relates to the height of the curve. The definition of Kurtosis used by SPSS is that the standard normal distribution has a kurtosis of zero. A negative Kurtosis value means that the curve is more peaked than a normal bell curve, positive Kurtosis means a curve flatter than normal. Another way of interpreting it is that Kurtosis is positive if the tails are "heavier" than for a normal distribution and negative if the tails are "lighter" than for a normal distribution. The data shows a skewness of .586 (meaning more values are less than the mean - as the histogram shows) and the Kurtosis is -0.760, indicating that the data are not normally distributed.
244
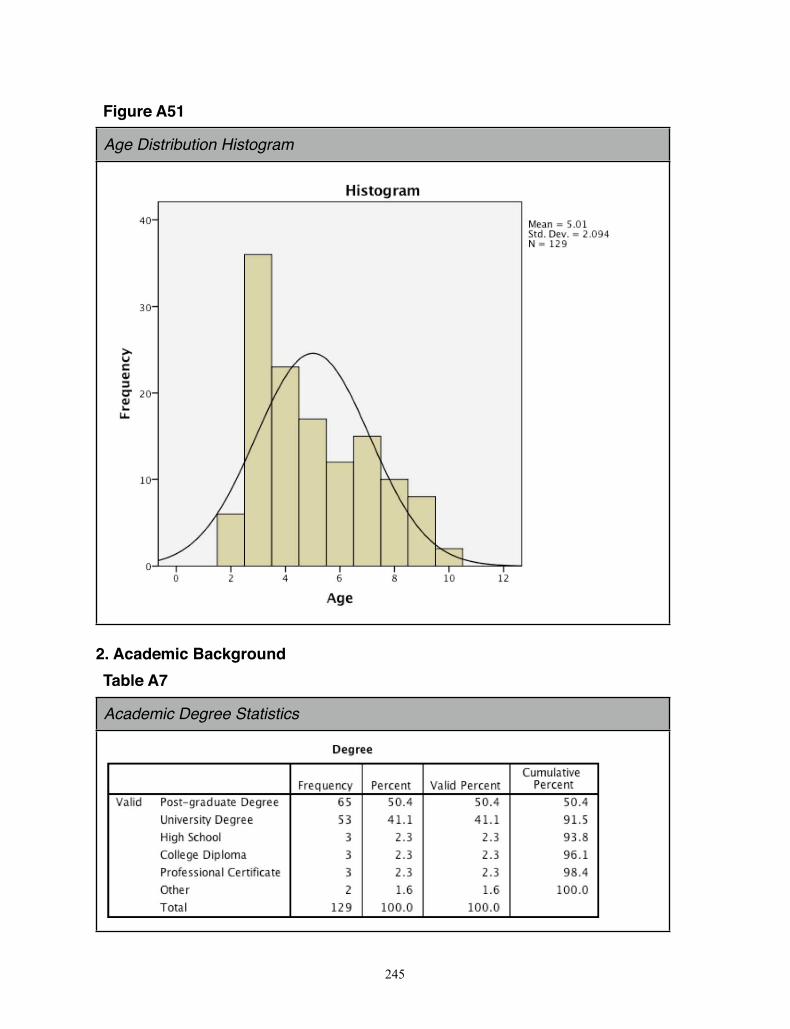
Figure A51
Age Distribution Histogram
2. Academic BackgroundTable A7
Academic Degree Statistics
245
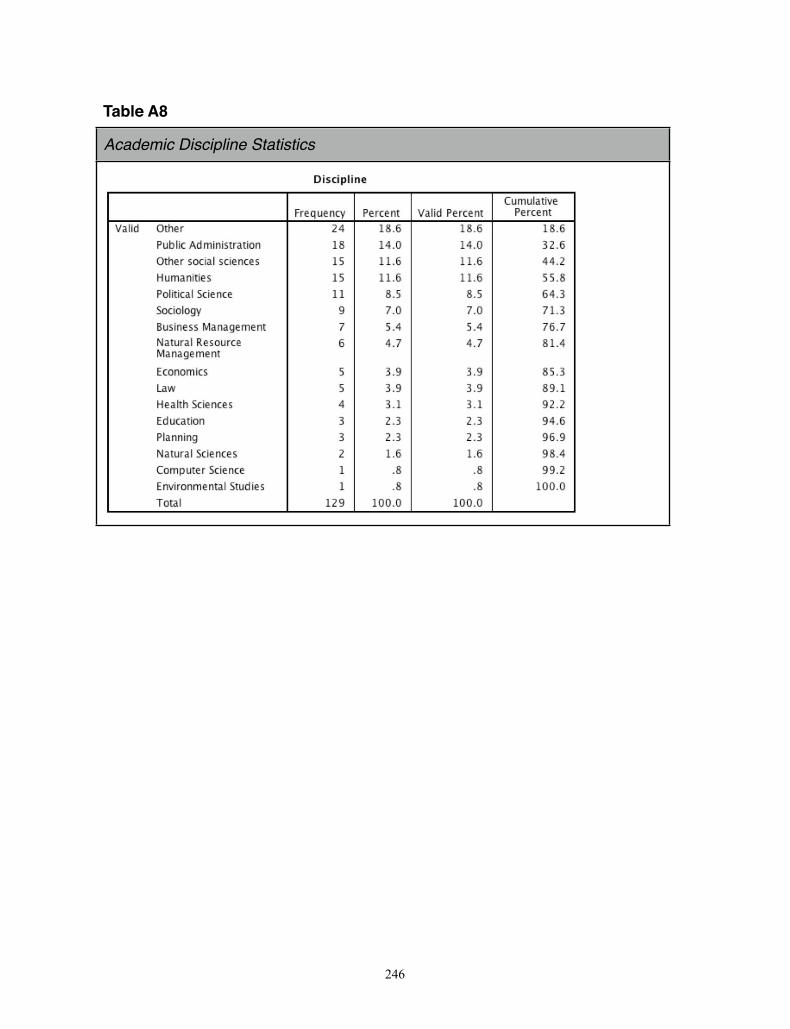
Table A8
Academic Discipline Statistics
246
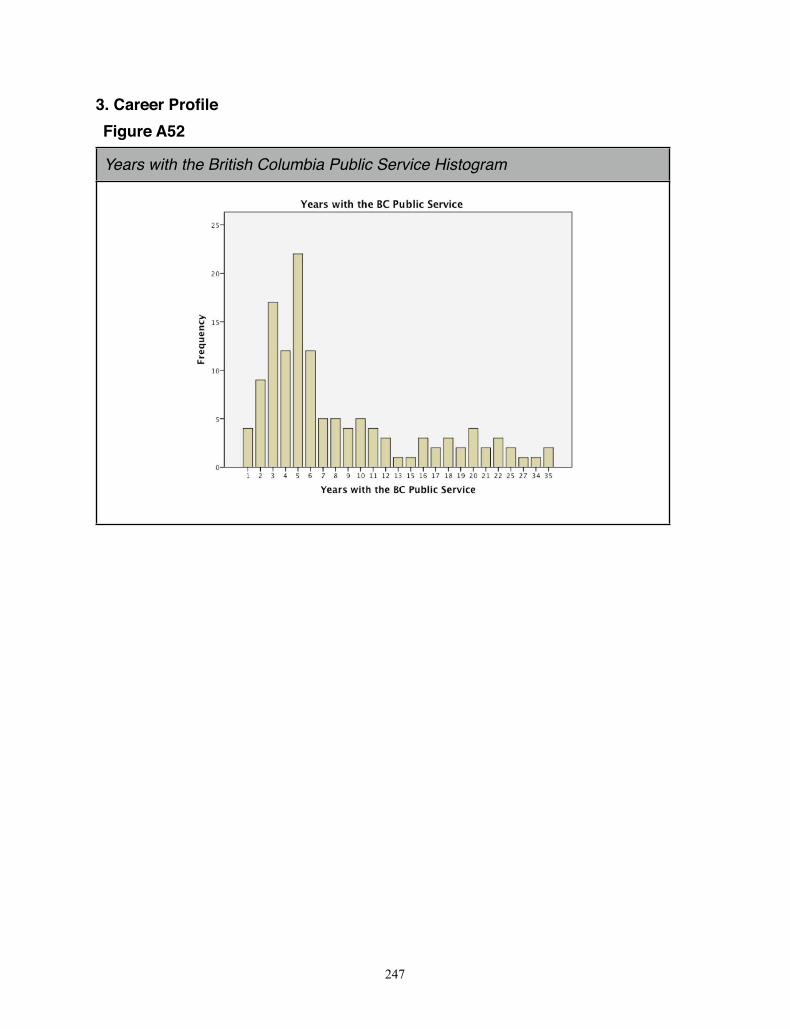
3. Career ProfileFigure A52
Years with the British Columbia Public Service Histogram
247
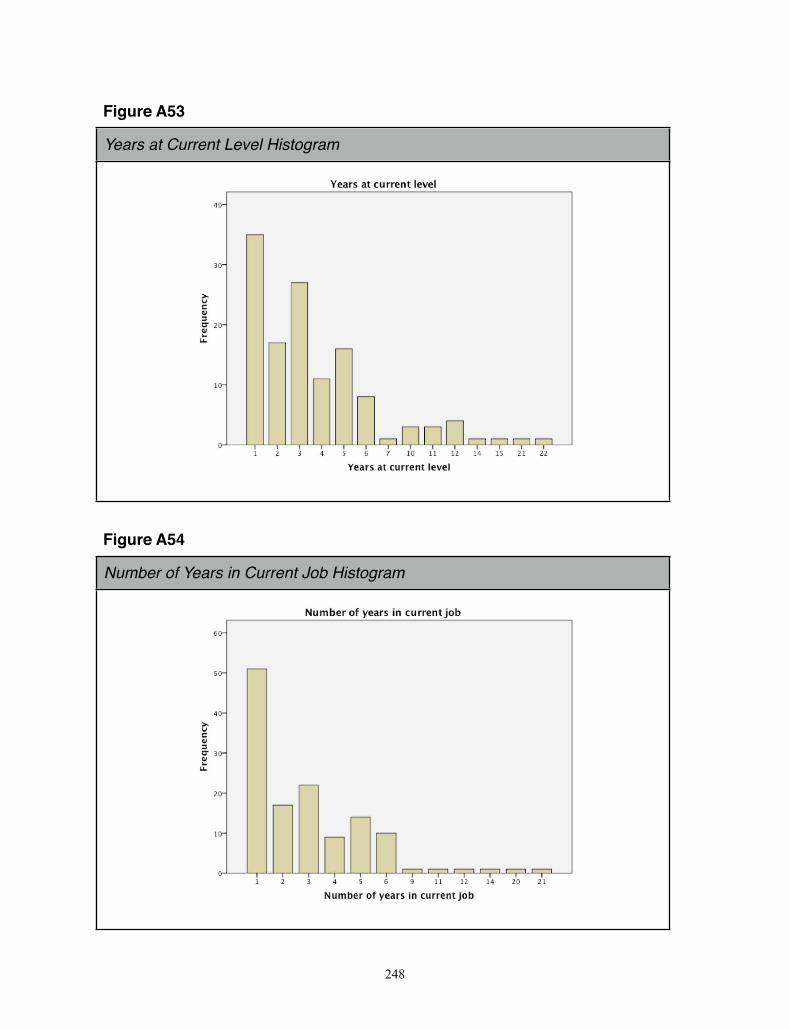
Figure A53
Years at Current Level Histogram
Figure A54
Number of Years in Current Job Histogram
248
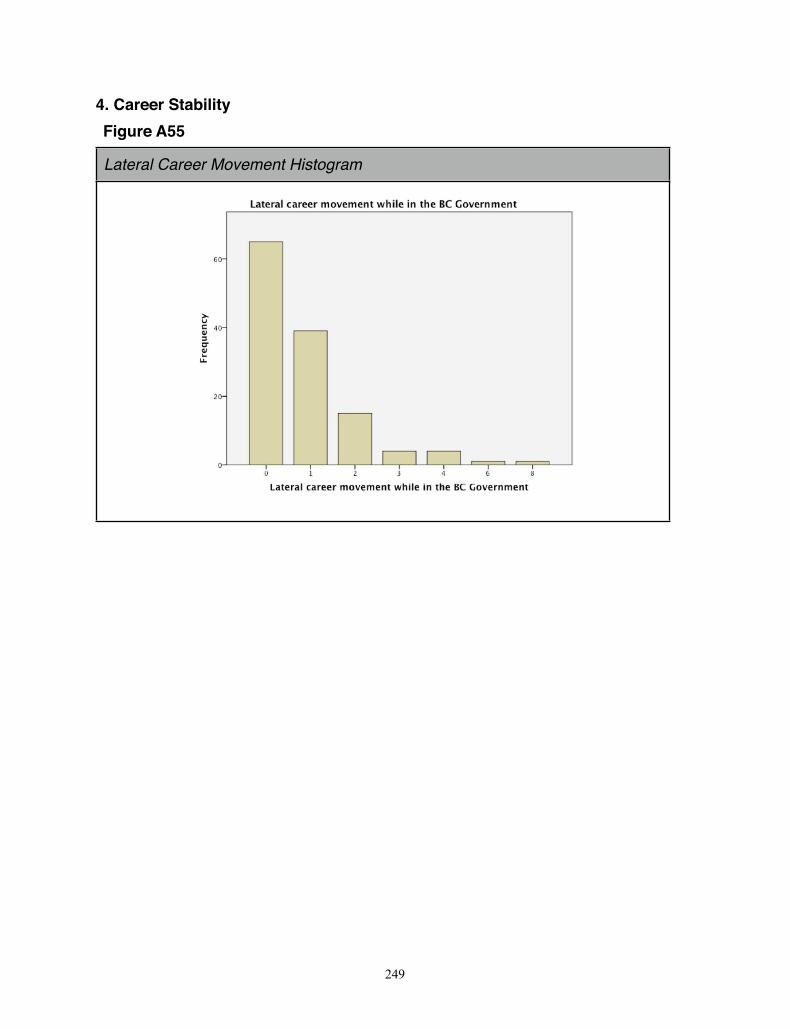
4. Career StabilityFigure A55
Lateral Career Movement Histogram
249
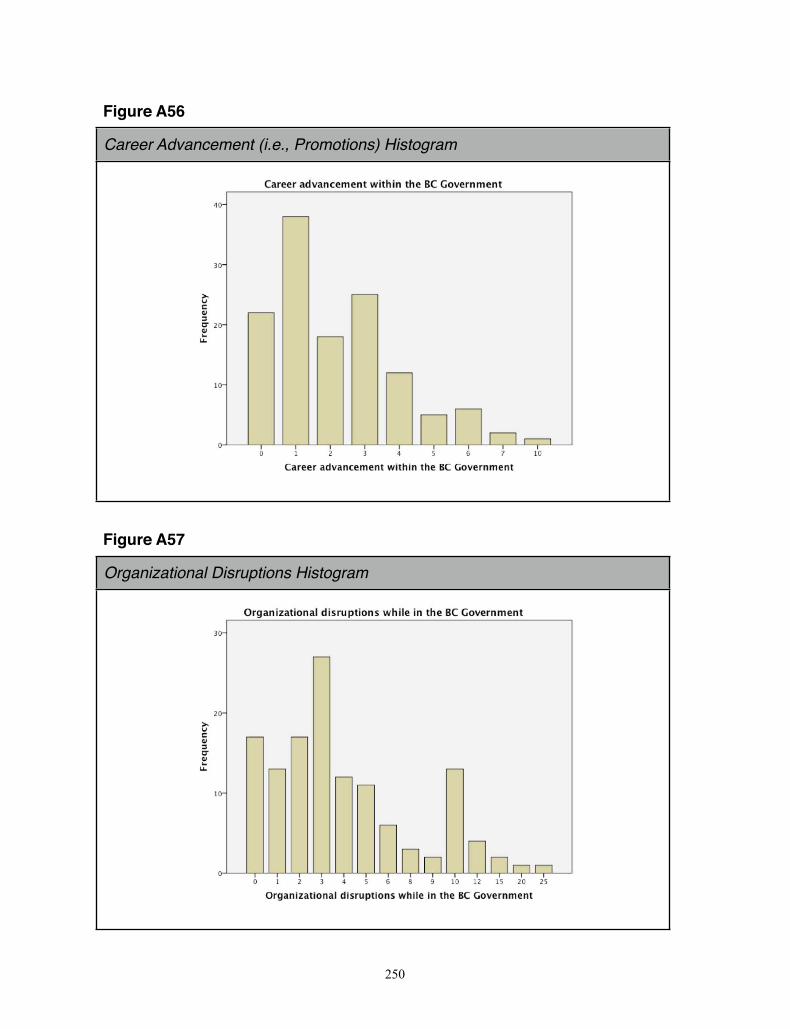
Figure A56
Career Advancement (i.e., Promotions) Histogram
Figure A57
Organizational Disruptions Histogram
250
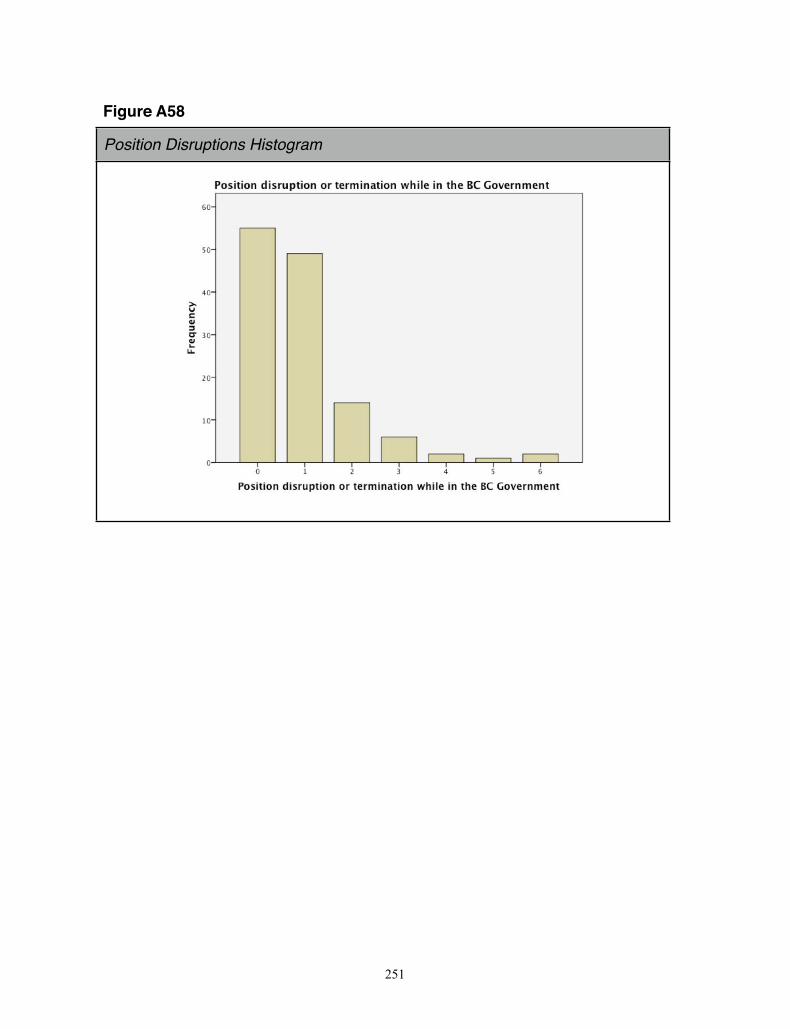
Figure A58
Position Disruptions Histogram
251
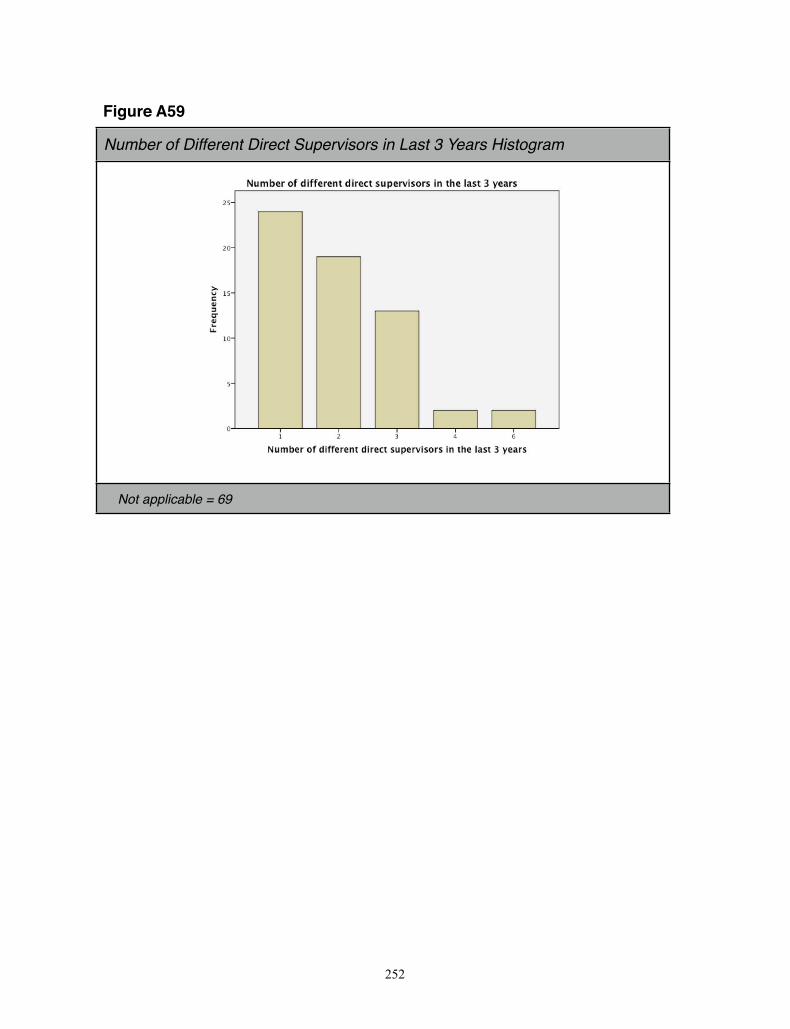
Figure A59
Number of Different Direct Supervisors in Last 3 Years Histogram
Not applicable = 69
252
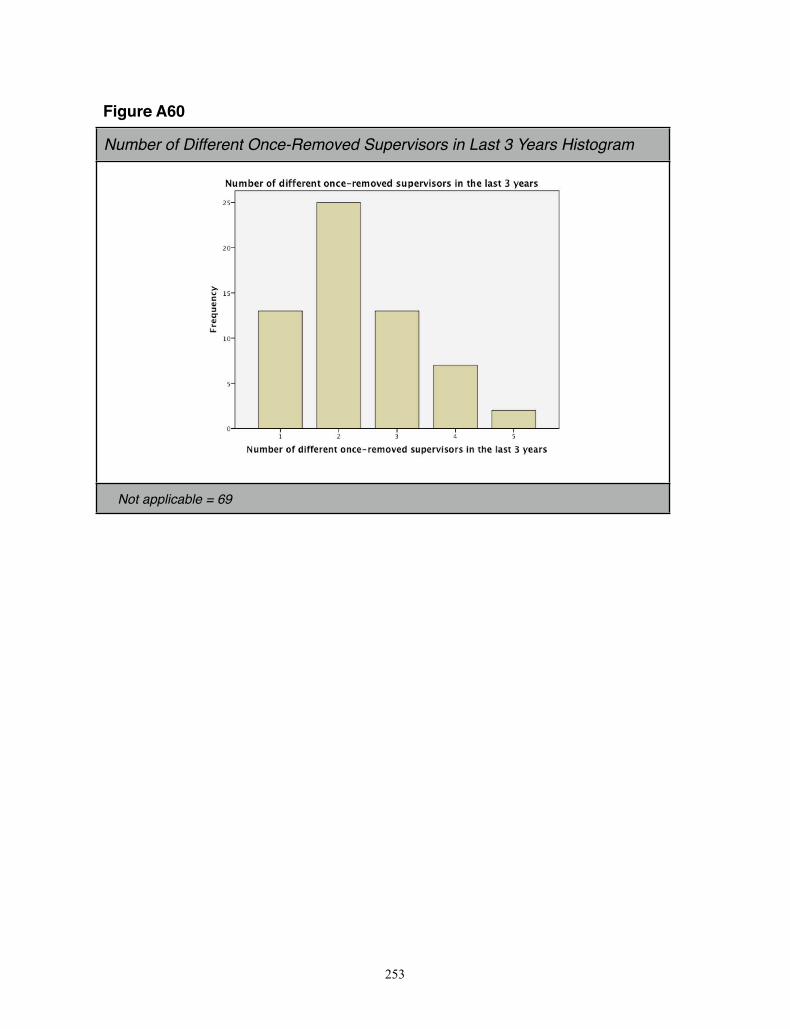
Figure A60
Number of Different Once-Removed Supervisors in Last 3 Years Histogram
Not applicable = 69
253
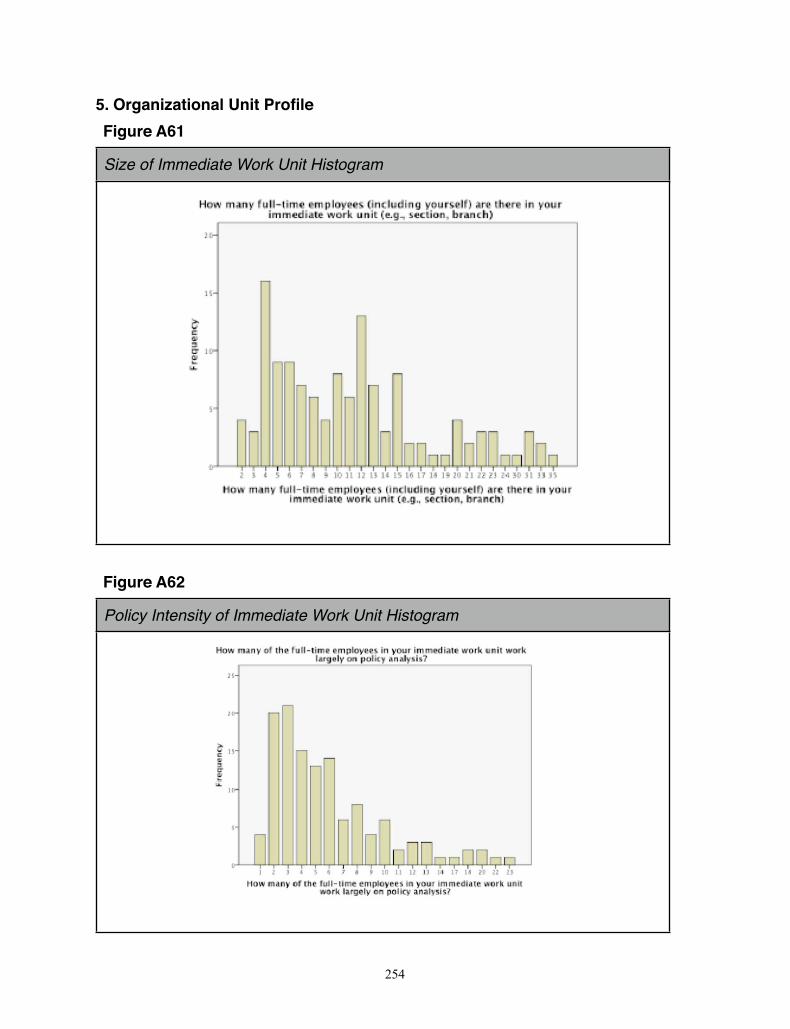
5. Organizational Unit ProfileFigure A61
Size of Immediate Work Unit Histogram
Figure A62
Policy Intensity of Immediate Work Unit Histogram
254