Towards Effective Social Insurance in Latin America: The Importance of Countercyclical Fiscal Policy
62
Inter-American Development Bank Banco Interamericano de Desarrollo (BID) Research Department Departamento de Investigación Working Paper #487 Towards Effective Social Insurance In Latin America: The Importance of Countercyclical Fiscal Policy By Miguel Braun* Luciano di Gresia** * Centro de Implementación de Políticas Públicas para la Equidad y el Crecimiento (CIPPEC) and Universidad de San Andrés **Universidad Nacional de la Plata Prepared for the Seminar “Dealing with Risk: Implementing Employment Policies Under Fiscal Constraints” Annual Meetings of the Board of Governors, Inter-American Development Bank and Inter-American Investment Corporation Milan, Italy March 23, 2003
-
Upload
independent -
Category
Documents
-
view
0 -
download
0
Transcript of Towards Effective Social Insurance in Latin America: The Importance of Countercyclical Fiscal Policy

Inter-American Development Bank Banco Interamericano de Desarrollo (BID)
Research Department Departamento de Investigación
Working Paper #487
Towards Effective Social Insurance In Latin America:
The Importance of Countercyclical Fiscal Policy
By
Miguel Braun*
Luciano di Gresia**
* Centro de Implementación de Políticas Públicas para la Equidad y el Crecimiento (CIPPEC) and Universidad de San Andrés
**Universidad Nacional de la Plata
Prepared for the Seminar
“Dealing with Risk: Implementing Employment Policies Under Fiscal Constraints”
Annual Meetings of the Board of Governors, Inter-American Development Bank and Inter-American Investment Corporation
Milan, Italy March 23, 2003

Cataloging-in-Publication data provided by the Inter-American Development Bank Felipe Herrera Library Braun, Miguel.
Towards effective social insurance in Latin America : the importance of countercyclical fiscal policy / by Miguel Braun, Luciano di Gresia.
p. cm. (Research Department Working Paper ; 487) Prepared for the seminar Dealing with Risk: Implementing Employment Policies Under
Fiscal Constraints Milan, Italy, March 23, 2003. Includes bibliographical references.
1. Fiscal policy--Latin America. 2. Social security—Latin America. 3. Latin America—Social policy. I. Braun, Miguel. II. Di Gresia, Luciano Mario. III. Inter-American Development Bank. Research Dept.
336.3 B738--------dc21 ©2003 Inter-American Development Bank 1300 New York Avenue, N.W. Washington, DC 20577 The views and interpretations in this document are those of the authors and should not be attributed to the Inter-American Development Bank, or to any individual acting on its behalf. The Research Department (RES) produces a quarterly newsletter, IDEA (Ideas for Development in the Americas), as well as working papers and books on diverse economic issues. To obtain a complete list of RES publications, and read or download them please visit our web site at: http://www.iadb.org/res
2

Abstract1
Latin America is a volatile, crisis-prone region, with limited and inadequate social insurance. Therefore, the long-term as well as the recent poor suffer significantly during crises. Furthermore, social spending is procyclical in the region, but less so than total spending, indicating that the effectiveness of compensatory social policies designed to protect those vulnerable to crises is constrained by adjustments during recessions. The causes of procyclical fiscal policy lie in the political constraints on saving during expansions, combined with limited creditworthiness during recessions, and enhanced by economic volatility and a low share of automatic stabilizers in the budget.
We evaluate policy options to reduce procyclicality of fiscal policy, such as stabilization funds, fiscal rules and reform of budget institutions, and argue in favor of integrated policy proposals based on more country-specific analysis, such as the Fiscal Responsibility Law in Brazil. JEL: E62, H62 Keywords: Fiscal policy, social policy, procyclicality, Latin America
1 Miguel Braun, [email protected], Luciano di Gresia, [email protected]. We would like to thank Gustavo Márquez, Carmen Pagés-Serra, Carlos Scartascini and Ernesto Stein for invaluable comments, and Matías Herrera-Dappe for helpful research assistance. The opinions expressed in this paper are the sole responsibility of the authors and should not be attributed to the Inter-American Development Bank, or to any individual acting on its behalf.
3

4

1. Introduction
Following the recent crisis in Argentina, the poverty rate jumped from 35 percent to almost 60
percent in six months. Devaluation and inflation eroded the purchasing power of wages and
pensions, and unemployment reached an unprecedented 23 percent. This pushed almost 9 million
people—twice the population of Norway—below the poverty line. At the same time, government
spending in real terms contracted by 25 percent in 2002, severely limiting efforts to provide
assistance to poor families by means of a massive workfare program. This pattern of increased
poverty, combined with a fiscal adjustment that limits the scope of social policy, is common
during crises in Latin America.
Being poor in Latin America is risky. Apart from the idiosyncratic risks faced by
individuals and families worldwide, including unemployment, illness, or disability, systemic
shocks such as macroeconomic crises or prolonged recessions are common. Furthermore, these
crises are usually deeper and more frequent,2 and hurt the poor more than in rich countries.3
Unfortunately, social insurance mechanisms such as unemployment benefits are less developed
than in OECD countries.4 To make matters worse, the income distribution in the region is such
that middle income brackets, the “middle class,” are at great risk of falling into poverty if hit by a
shock.5 It is therefore not surprising that according to recent surveys, economic insecurity is a
major concern for a large segment of the population in Latin America.6
In this context of high economic insecurity, combined with inadequate private and social
insurance mechanisms, a pro-poor government would save resources during good times. These
savings could then be allocated to social programs during recessions. However, social spending
is strongly procyclical in Latin America. That is, governments tend to increase pro-poor
spending during expansions and reduce it during recessions.7 2 See, for instance, Gavin, Hausmann, Perotti and Talvi (1996), and Gavin and Perotti (1997). 3 Among other differences, the poor in Latin America tend to have informal jobs with no social protection and less access to credit markets so as to smooth the impact of crises; this combination of circumstances puts them at a distinct disadvantage compared to the poor in rich countries. See, for instance, Lustig (1999). 4 See Bourguignon (2000). 5 See Birdsall (2002) for a discussion. 6 A 1999 poll of 14,000 Latin Americans in 14 different countries published in the Wall Street Journal and cited by Rodrik (1999) shows that 73 percent of respondents answered that they would prefer more spending on unemployment insurance, and over 83 percent preferred increased spending on pensions. Rodrik argues that these numbers are relevant because only 32 percent answered that they wanted more defense spending, meaning that respondents distinguish between economic security and national security. 7 Wodon, Hicks, Ryan et al. (2002) find that social spending per poor person falls by 2 percent for each 1 percent reduction in GDP per capita.
5

Paradoxically, social spending is procyclical despite the declarations that governments
and International Financial Institutions (IFIs) have made, especially since the generalization of
democracy during the past two decades in the region, regarding the importance of protecting the
poor during recessions. We find that although social spending as a percentage of total spending
tends to increase during crises, the depth of fiscal adjustment in bad times results in a decline in
real social spending.
If fiscal adjustments are constraining the effectiveness of social policy to protect those
vulnerable during downturns, a major question arises: why is fiscal policy still procyclical in
Latin America? The Inter-American Development Bank has pioneered research in this area. The
1997 Economic and Social Progress Report (IDB, 1997) presents evidence that fiscal policy is
particularly procyclical in Latin America because both the automatic and discretionary responses
of the budget to the cycle are more procyclical than in rich countries. The automatic response is
more procyclical because Latin American governments have a smaller proportion of automatic
stabilizers such as unemployment insurance in their mix. The discretionary response is more
procyclical because volatility, political constraints and weak institutions make saving during
good times difficult.8 Furthermore, limited creditworthiness makes borrowing during recessions
close to impossible, so governments that were unable to save during good times are forced to
adjust spending. In fact, targeted social spending is often the victim of cuts, due to the rigidity of
other budget items such as public sector wages, pensions and debt payments.
What can governments and IFIs do to limit this problem? Proposals and actual country
experience provide us with a menu of policy choices to reduce procyclicality of fiscal policy.
This menu includes among others:
- Fiscal stabilization funds that would collect surpluses during good times
which could be spent during recessions
- Numerical fiscal rules to limit the growth of spending and debt during
expansions
- Reforms to the structure of federal fiscal transfers so as to reduce the
procyclicality of sub-national spending.9 8 See Talvi and Végh (2000), Gavin, Hausmann, Perotti and Talvi (1996), Gavin and Perotti (1997), and Tornell and Lane (1999). 9 For example, making transfers constant, as opposed to linking them to procyclical tax revenues.
6
- Increases in the proportion of automatic stabilizers in total spending.
- GDP-indexed bonds, which would limit the need for fiscal adjustment during
recessions by automatically reducing interest payments.
Unfortunately, the evidence shows that in many cases, isolated measures do not work.
For instance, fiscal rules and stabilization funds in many countries have failed due to unexpected
shocks and politically motivated non-compliance.10 Given that many of the above proposals do
not alter underlying political incentives to increase spending during good times, the mixed results
are not surprising.
Based on promising new developments in some countries, such as Brazil’s Fiscal
Responsibility Law, and on recent research,11 we advocate an integrated, country-specific
approach that takes political constraints seriously.
The plan of the paper is as follows: In Section 2 we introduce the analytical framework
used for discussing the importance of countercyclical fiscal policy as a requirement for
protecting the poor during downturns. In Section 3 we document, by surveying the literature and
by analyzing the data, the cyclical behavior of fiscal policy in Latin America, paying specific
attention to the behavior of social spending in general, and targeted social spending in particular.
We show that social spending is procyclical in Latin America, and significantly more so than in
OECD countries. Furthermore, total spending is more procyclical than social spending,
suggesting that governments attempt to protect the poor during recessions but are constrained by
the need for fiscal adjustment. In Section 4 we explore why fiscal policy is procyclical in Latin
America. In Section 5 we map, using theory and international experience, the available policy
options to reduce procyclicality of fiscal policy, and we evaluate the relative effectiveness of
these policy options. We study the applicability of these policy options to the Latin American
context, paying specific attention to political constraints. Section 6 concludes.
10 This will be discussed further below. See Braun and Tommasi (2002) for a discussion of some failures of fiscal rules in Latin America. 11 Spiller and Tommasi (2000) for instance develop an in-depth analysis of the Argentine political system, and use the framework to propose incentive-compatible policy proposals. Von Hagen, Perotti and Strauch (1997) propose a multi-step process to achieve fiscal sustainability in the EU.
7

2. Why is Countercyclical Fiscal Policy Key Poor During Downturns?
There is abundant literature and country experience showing that economic downturns and crises
affect the poor significantly. This applies both to the “structurally poor,” those with a low
permanent income, and to members of middle income brackets at risk of falling into poverty
during recessions due to loss of employment or other negative shocks to their income. In the rest
of the paper, when we refer to “the poor” we are referring to both groups, unless otherwise
specified. Thus, the focus of the paper is more on social insurance than on strict poverty
alleviation.
Ferreira, Prenushi and Ravallion (1999), Lustig (1999) and Lustig and Walton (1999)
survey the channels through which crises affect poverty. They find that crises tend to reduce
labor demand, change relative prices, and change the rate of return and value of assets. The poor
are usually less able to cope with these shocks12 because they a) have limited access to credit
markets, b) have more informal and unstable jobs, c) do not have diversified assets that they can
sell to smooth consumption, and d) they may suffer long-term effects from recessions, such as a
loss of human capital due to the consequences of malnutrition, loss of health, or loss of
education.
To improve the welfare of the poor over the long term, sustained economic growth is
necessary.13 At the same time, Latin American countries need to find ways to reduce the
volatility of the poor’s well-being. An integrated approach would include 1) reducing economic
volatility in the region, 2) increasing the extent of social insurance mechanisms, and 3)
protecting vulnerable persons from the consequences of crises by means of an adequate safety
net. According to De Ferranti, Perry, Gill et al. (2000), policies in these three dimensions should
be designed taking into account the response of individuals to crises in the form of buying
market insurance, self-insurance (such as savings) and self-protection (engaging in less volatile
professional activities).14
Countercyclical fiscal policy is a key element in all three dimensions of dealing with
crises. Recent proposals to reduce aggregate macro volatility in Latin America are many, and it 12 De Ferranti, Perry, Gill et al. (2000), however, find however that the poor are hurt more than the rich by long or deep downturns, but not during mild recessions. 13 See Dollar and Kraay (2002) for evidence. 14 Ferreira, Prenushi and Ravallion (2002) also favor properly calculating who is affected by crises before designing responses.
8
is beyond the scope of this paper to analyze them.15 However, most of them mention the
importance of the potential stabilizing role of fiscal policy. Gavin, Hausmann, Perotti and Talvi
(1996) argue that the procyclicality of fiscal policy in Latin America contributes to economic
volatility in the region. De Ferranti, Perry, Gill et al. (2000) claim that 15 percent of the excess
volatility of Latin America vis-à-vis industrial and East Asian countries can be explained by
fiscal volatility.
Social insurance requires countercyclical fiscal policy by construction, because it requires
transferring income from good states to bad states, that is, from booms to recessions. For
instance, an adequate unemployment insurance scheme would automatically increase
government expenditure as unemployment increases during a recession, and automatically
reduce expenditure when employment recovers.
Finally, regarding protecting the vulnerable from the negative consequences of crises,
experts and IFIs have recently been proposing the establishment of safety nets. Surveying the
recent literature on crises and poverty,16 a consensus regarding the best way to protect the poor
during downturns seems to be emerging, which can be summarized as follows:
1) Developing countries need a safety net to provide insurance for the poor from
systemic shocks (economic crises) and idiosyncratic shocks (unemployment,
illness, etc).
2) This safety net has a set of desirable characteristics. Among other features
such as targeting and coverage, safety nets should be countercyclical.17 For
this to be feasible, targeted programs should be permanent and based on
effective, pre-existing institutions, and have the capacity to expand rapidly
during a crisis and contract automatically when growth resumes.
3) The programs that seem to conform best to these characteristics are a)
workfare programs that provide temporary employment at below-market
wages such as the Trabajar program in Argentina, and b) transfers targeted to
vulnerable/excluded groups such as Progresa in Mexico or Bolsa Escola in
Brazil. 15 See De Ferranti, Perry, Gill et al. (2000, Chapter 4) for a full discussion. 16 De Ferranti, Perry, Gill et al. (2000) presents the results of a collective research effort by World Bank staff and academics on the subject. See also Lustig (1999), and Márquez (2000).
9

The cyclical behavior of fiscal policy is a key constraint on establishing a well-funded,
countercyclical safety net. If government expenditure must be adjusted during a crisis, unless the
proportion of social spending to total spending increases, then total social spending will fall,
especially if measured in terms of spending per poor person.
The focus of this paper is therefore to analyze how fiscal policy in Latin America can
become countercyclical, and thus contribute to reducing the frequency and depth of downturns,
establishing an effective social insurance scheme, and developing a fiscally sound and
countercyclical social safety net.
To emphasize the importance of countercyclical fiscal policy in establishing an adequate
safety net, we can decompose, following Wodon, Hicks, Ryan et al. (2002), the cyclical response
of targeted social spending per poor person into three main components:
1) Impact of crisis on the number of poor people (the more the crisis increases
poverty, the harder it will be to increase targeted social spending per poor
person)
2) Impact of crisis on fiscal adjustment (the larger the necessary fiscal
contraction during the crisis, the harder it will be to increase targeted social
spending per poor person)
3) Impact of crisis on share of social spending (especially targeted social
spending) in total spending
In terms of elasticities, the elasticity of targeted social spending per poor person to per
capita growth is a function of the elasticities of the poverty rate, total spending as a percent of
GDP, social spending as a percentage of total spending and targeted social spending as a
percentage of social spending to per capita GDP.
)ln(
)ln(
)ln()ln(
)ln()ln(
)ln()ln(1
)ln(
)ln(
NGDP
NPN
NGDPGDPTS
NGDPTSSS
NGDPSSTSS
NGDPPNTSS
∆
∆−
∆∆
+∆∆
+∆∆
+=∆
∆
where TSS is targeted social spending, SS is social spending, TS is total spending, N is total
population, and Np is number of poor people.18 17 See Wodon and Hicks (2000) and De Ferranti, Perry, Gill et al. (2000) for a comprehensive discussion. 18 This decomposition comes from expressing social spending per poor person as
10

In this expression, an ideal safety net would be one in which the elasticity of targeted
social spending per poor person to GDP per capita is at least zero. This would imply that during
a crisis, targeted social spending per poor person would remain constant, counterbalancing the
negative effect of the crisis on the increase in the number of poor families.19 Clearly, a key
requirement for this is that fiscal policy should be countercyclical; that is, the elasticity of total
spending to GDP per capita should be negative (and as large as possible). In the next section we
will show that fiscal policy tends to be actually procyclical in Latin America, thus leading to
higher economic volatility and acting as a constraint on the possibility of establishing an
adequate safety net.
With this in mind, policy should aim at 1) reducing the impact of crises on poverty, 2)
limiting the need for fiscal adjustment during crises, and 3) ideally increasing—and at least
protecting—social spending during crises. In Table 1 we present a sample of policy alternatives
that have been proposed to confront these challenges.
PNN
NGDP
GDPTS
TSSS
SSTSS
PNTSS
= , applying logs, first differences, and rearranging.
19 This would imply that programs on average keep their benefits constant, but increase their coverage. It could be argued that during a crisis, some programs should increase their benefits. In this case, the elasticity of targeted social spending per poor person would be negative.
11

Table 1. Policy Challenges in Establishing a Countercyclical Safety Net
Issue Policy Reduce impact of crisis on poor
Make crises less deep - International portfolio diversification - hedge terms of trade shocks (e.g., commodity
stabilization funds) - Contingent credit lines - Liquidity hoarding - Capital controls (e.g., Chile)
Improve domestic credit markets, especially options for the poor (e.g., microcredit) or unemployed (consumer credit usually requires a wage certificate). Improve income distribution to limit the number of people falling into poverty during crises
Reduce fiscal adjustment during crisis
Increase the role of automatic stabilizers in the budget Improve access to international credit during downturns (e.g., contingent funds, countercyclical IFI lending) Fiscal Stabilization funds GDP-indexed bonds Fiscal rules Sound fiscal institutions: federalism, budget process, etc.
Protect (targeted) social spending during crisis
Establish an adequate safety net (as described above) Earmarking social spending to relatively stable tax revenues such as property taxes. Protect specific pro-poor budget items from cuts ex-ante. Empower the poor to defend social programs during crises
The recent literature on crises and on poverty has widely discussed options to reduce the
volatility of Latin American economies, and the design of adequate safety nets. However, not
much emphasis has been placed on studying specific ways of reducing the procyclical behavior
of fiscal policy. As we saw above, achieving countercyclical fiscal policy is a key element of
both reducing volatility and protecting the poor during crises. Therefore in this paper we focus
mainly on the fiscal policy options (row 2 above) and discuss the design of social safety nets to
the extent that they address the cyclical behavior of fiscal policy.
The bottom line is that if fiscal policy is procyclical, even though governments make
efforts to protect social spending within the budget, total social spending in real terms will
probably decline during downturns. Therefore, procyclical fiscal policy is a constraint on good
social policy that needs to be overcome if the poor are to be protected.
12

In the next sections we show that social spending in Latin America is in fact procyclical,
but less so than total spending. This indicates that in relative terms, the poor are protected during
recessions, but efforts are limited by the need for fiscal adjustment.
3. The Evidence: Social Spending in Latin America is Procyclical As argued above, one would think that in Latin America, a crisis-prone region with relatively
low levels of social insurance, spending on social services and employment programs should
increase when economic conditions worsen. However, the opposite is true. For example, Hicks
and Wodon (2000) show that in both Argentina and Mexico the share of targeted social spending
to GDP fell in the aftermath of the Tequila crisis. Furthermore, as poverty increased, targeted
social spending per poor person fell by 27.9 percent in Argentina and by 23.7 percent in Mexico.
Why does this happen? What can be done about it? We address the first question in the next two
sections, and the second question in the rest of the paper.
To document the procyclical behavior of social policy in Latin America, as compared to
OECD countries, we use the Hodrick-Prescott filter20 to obtain the cyclical component of GDP
and different components of total spending. With these calculations, we proceed to estimate the
cyclical behavior of public spending in general and social spending in particular in Latin
America, and we compare this behavior with that of OECD countries.21 We show, consistent
with previous literature,22 that volatility is highly correlated with procyclical fiscal policy.
Furthermore, we find evidence that social spending is actually less procyclical than total
spending. This result is consistent with the hypothesis that the poor are relatively protected
during crises, but that efforts are limited by the need to adjust spending during downturns. This
finding is also consistent with Wodon, Hicks, Ryan et al. (2002), who find that governments in
seven Latin American countries are pro-poor but short-sighted, in that social spending tends to
increase rapidly during expansions; during contractions, however, “a one percentage point
decrease in GDP reduces targeted public spending per poor person by two percentage points.”
They find that half of this reduction is due to the increase in the number of poor, but the other 20 Martner (1999) discusses different estimation techniques for potential GDP and fiscal variables, and argues in favor of using the H-P filter for Latin America. 21 See Appendix A for details on calculations. 22 See Talvi and Végh (2000) and Gavin, Hausmann, Perotti and Talvi (1996).
13
half can be attributed to a decline in GDP, which reduces spending even though the share of
targeted social spending to GDP remains constant.
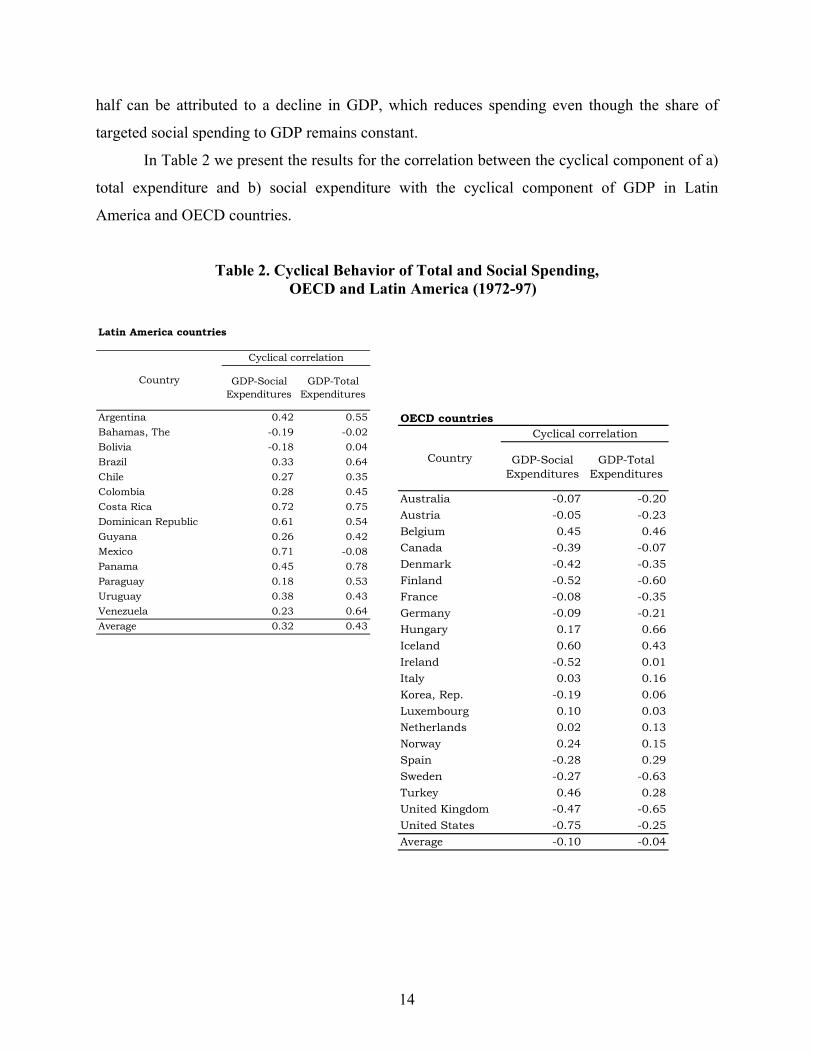
In Table 2 we present the results for the correlation between the cyclical component of a)
total expenditure and b) social expenditure with the cyclical component of GDP in Latin
America and OECD countries.
Table 2. Cyclical Behavior of Total and Social Spending, OECD and Latin America (1972-97)
Latin America countries
GDP-Social Expenditures
GDP-Total Expenditures
Argentina 0.42 0.55Bahamas, The -0.19 -0.02Bolivia -0.18 0.04Brazil 0.33 0.64Chile 0.27 0.35Colombia 0.28 0.45Costa Rica 0.72 0.75Dominican Republic 0.61 0.54Guyana 0.26 0.42Mexico 0.71 -0.08Panama 0.45 0.78Paraguay 0.18 0.53Uruguay 0.38 0.43Venezuela 0.23 0.64Average 0.32 0.43
Cyclical correlation
Country
OECD countries
GDP-Social Expenditures
GDP-Total Expenditures
Australia -0.07 -0.20Austria -0.05 -0.23Belgium 0.45 0.46Canada -0.39 -0.07Denmark -0.42 -0.35Finland -0.52 -0.60France -0.08 -0.35Germany -0.09 -0.21Hungary 0.17 0.66Iceland 0.60 0.43Ireland -0.52 0.01Italy 0.03 0.16Korea, Rep. -0.19 0.06Luxembourg 0.10 0.03Netherlands 0.02 0.13Norway 0.24 0.15Spain -0.28 0.29Sweden -0.27 -0.63Turkey 0.46 0.28United Kingdom -0.47 -0.65United States -0.75 -0.25Average -0.10 -0.04
Country
Cyclical correlation
14

The two main conclusions from Table 2 are 1) that social expenditure and total
expenditure are more procyclical in Latin America than in OECD countries and 2) that in Latin
America, social expenditure appears less procyclical than total expenditure.
Gavin, Hausmann, Perotti and Talvi (1996), Talvi and Végh (2000) and Gavin and Perotti
(1997) argue that volatility is a key determinant of procyclicality of fiscal policy. In Figure 1 we
show a plot of the cyclical correlation of fiscal policy and GDP volatility for a sample of 88
countries for which data was available (see Appendix B for details). The results confirm the
correlation between the two variables in the data found in previous studies.
Figure 1. Procyclicality and Volatility
World data (OECD, LA and rest)Volatility of GDP
Total expend. procyclicality Fitted values
0 .025 .05 .075 .1
1
.5
0
-.5
-1
AUT
PAK
ITA
DEU
FRA
NLD
LKA
AUS
DNK
BELIND
JPN
USA
TON
GBR
NOR
LUXCAN
SWE
COL
GRCNPL
TUNISR
ZAF
COM
EGY
ESP
MAR
SGP
IRL
JAM
KNAHND
SEN
VUT
GTM
KOR
DOM
ISL
MEX
TURHTI
PRT
CRI
FIN
MUSHUN
MYS
VEN
PRY
BOL
MLIBRA
BHR
BRB
BHS
LCA
YEM
ZMB
THA
BLZ
IDNBFA
ETH
NAM
MDV
MMR
PAN
TGO
ROMURY
SYC
GUY
ZWE
PERZARARG
CHL
GNB
CMR
BGR
ANT
CYP
IRNBLR
It is also worth noting that OECD countries tend to have both low volatility and low
procyclicality of fiscal policy, whereas the reverse is true for Latin America.
The positive correlation between volatility and procyclicality also holds within groups of
countries. Figure 2 presents the plot for Latin American countries. Similar results (not reported)
can be found for OECD countries.
15

Figure 2. Procyclicality and Volatility in Latin America
Latin AmericaVolatility of GDP
Total expend. procyclicality Fitted values
0 .025 .05 .075 .1
1
.5
0
-.5
-1
COL
JAM
HND
GTM
DOM
MEX
CRI
VEN
PRY
BOL
BRA
BHS
BLZ
PAN
URYGUY
PERARG
CHL
As shown above, social spending is also procyclical in Latin America. Furthermore, the
degree of procyclicality of social policy is closely correlated with procyclicality of fiscal policy.
We regressed the cyclical correlation of social spending on the cyclical correlation of total
spending, volatility, GDP per capita, size of government, share of income tax revenue in total
revenue and regional dummies.23 (See Appendix B for details). The results show a partial
correlation of 0.54, significant at the 99 percent level, between the cyclical correlations of social
spending and total spending.
Volatility was also positively correlated with procyclicality, although the coefficient was
statistically significant at the 94 percent level. This is consistent with the hypotheses presented
by Talvi and Végh (2000) and Gavin, Hausmann, Perotti and Talvi (1996). It is worth noting that
the regional dummies were not significant, meaning that the differences between Latin America 23 We control for volatility following the literature that argues that volatility is an important determinant of procyclicality, such as Talvi and Végh (2000). GDP per capita controls for the possibility that the overall level of development of a country leads to improved fiscal management. Size of government is included following Rodrik (1998), who argues that countries might increase the size of their governments to protect them from greater economic risk. Finally, we include the share of income tax revenue to control for possible differences in tax base leading to differences in the procyclicality of revenues due to different income elasticities.
16

and OECD countries in the procyclicality of social spending can be explained by the differences
in the behavior of overall fiscal policy.
In Figure 3 we present the fitted values of the correlation between procyclicality of social
and total spending and GDP volatility, for the whole sample and for Latin America only. The
data show once again that social spending tends to be less procyclical than total spending, but
that both are affected similarly by economic volatility.
Figure 3. Fitted Values of Procyclicality of Social and Total Expenditure on Volatility
Latin AmericaVolatility of GDP
Total expend. procycl (fitted) Social expend. procycl (fitted)
0 .025 .05 .075 .1
1
.5
0
-.5
-1
World data (OECD, LA and rest)Volatility of GDP
Total expend. procycl (fitted) Social expend. procycl (fitted)
0 .025 .05 .075 .1
1
.5
0
-.5
-1
17

Our reading of the evidence presented so far is as follows. Latin American countries face
high economic volatility, which contributes to procyclicality of total spending. The need for
fiscal adjustment during recessions (possibly due to limited creditworthiness) forces a reduction
in total spending during bad times.24 Social spending is also reduced, but proportionately less
than other items of spending. This suggests that countries in Latin America attempt to protect the
poor during recessions, but are limited in their efforts by the need for fiscal adjustment. In terms
of the framework presented in the previous section, our results suggest that to improve the
reaction of social spending per poor person during crises, it is key to reduce economic volatility
and procyclicality of total spending in Latin America. Protecting specific items of social
spending during crises is helpful, but evidently limited in scope.
The bottom line then is that in terms of fiscal policy, the key to reducing procyclicality of
social spending in Latin America is reducing the procyclicality of total spending. Less
procyclical fiscal policy will also reduce economic volatility. In the next section we attempt to
understand why fiscal policy is procyclical in Latin America, doing so in order to provide a basis
for proposing specific reforms.
4. Why is Fiscal Policy Procyclical in Latin America? As discussed above, it is unlikely that a country will be able to increase social spending per poor
family in a recession if it is forced to cut total spending. Therefore, countries in Latin America
must strive to achieve the capacity to carry out countercyclical fiscal policy. In the words of
Birdsall (2002), these countries will require “brilliant fiscal management” if they want to
implement a pro-poor social contract. In this section, we discuss the possible causes of
procyclical fiscal policy, before analyzing in the next section the different policy options to
reduce the need for fiscal adjustment during times of recession and crisis.
In a theoretical paper that seeks to explain this phenomenon, Talvi and Végh (2000) argue
that procyclicality of fiscal policy arises from the inability of governments to accumulate fiscal
surpluses during good times because of political pressures to overspend. They assume that political
pressures to spend are an increasing (and convex) function of the budget surplus. This assumption,
embedded in a Lucas and Stokey (1983) type model of optimal fiscal policy, yields the result that 24 This behavior contrasts with developed country experience. Recent studies such as Arreaza, Sorensen and Yosha (1998) and Lane (1999) find a positive correlation between output shocks and the government budget surplus in OECD
18

higher volatility of output leads to more procyclical fiscal policy. The reason is that volatility of
output leads to larger surpluses in good times, and thus invites higher pressures to overspend. The
optimal policy for a benevolent social planner in this context is to reduce tax rates during booms so
as to reduce overspending. This policy response to the inability of saving during good times leads to
more procyclical fiscal policy in countries with higher volatility, and can thus explain why
developing countries, which have more volatile output, face more procyclical fiscal policy than
OECD countries.
An alternative explanation discussed by Velasco (1999) and Tornell and Lane (1999) is the
possibility that developing countries and OECD countries might differ in the extent to which they
suffer from political pressures to overspend in good times due to common pool problems in the
allocation of fiscal resources. The argument is that in developing countries, fiscal resources are like
a “common pool” from which powerful interest groups try to extract the largest possible share.
When tax revenues increase, each group finds it individually rational to push for a larger portion,
because all the other groups are doing this. If a group does not push for a larger share, it will still
suffer the macro consequences of overspending, because all the rest increase their claims, together
with a loss in relative power. The difference between developed and developing countries is then in
the extent to which fiscal resources are a common pool, and the extent to which the demands of
powerful groups can be effectively limited by political institutions and the budget process.
Regarding Latin America, Gavin, Hausmann, Perotti and Talvi (1996) argue that procyclical
fiscal policy is part of a vicious cycle of volatility, procyclicality and limited creditworthiness.
Political pressures make saving during good times difficult. This problem is enhanced by volatility,
because larger surpluses are harder to save. When a recession hits, creditors are unwilling to finance
a fiscal deficit because they fear default. This limited creditworthiness during recessions, combined
with lack of savings during good times, make fiscal adjustments during recessions inevitable. At the
same time, expansive fiscal policy during expansions and fiscal adjustments during recessions
contribute to economic volatility, closing the vicious cycle. Fatás and Mihov (2002) find evidence
consistent with this hypothesis. They show that greater discretion in fiscal policy contributes to
higher economic volatility in a sample of 51 countries.
Stein, Talvi and Grisanti (1997) find that Latin American countries with a larger district
magnitude, which is related to a more proportional electoral system, tend to run more procyclical countries.
19

fiscal policy. They argue that this evidence is consistent with the arguments above, in that larger
district magnitudes may deliver weaker governments, less able to resist spending pressures during
good times.
It is not easy to disentangle the causality and the relative importance of the competing
explanatory factors of procyclicality. However, differences in Latin American and OECD
governments discussed in the recent literature can help understand the causes of procyclical fiscal
policy in Latin America.
Summing up, fiscal policy is probably more procyclical in Latin America because:
a) The automatic response of fiscal policy is less countercyclical than in the
OECD25 because Latin America has
- Smaller governments
- Smaller proportion of automatic stabilizers in public spending (for
instance, very limited unemployment insurance)
b) The discretionary response of fiscal policy (especially spending) is more
procyclical than in OECD because
- high volatility, higher discretionality, political constraints and weak
fiscal institutions make saving in good times harder
- limited creditworthiness (with lack of savings in good times) forces
adjustment in bad times
The discussion above suggests working in the direction of increasing the role of
automatic stabilizers in the budget—as long as this can be done along a sustainable fiscal path—
developing financial instruments to improve access to credit during recessions, and
implementing fiscal institutions that limit discretionary spending and pressures to increase
spending during good times. These topics will be discussed in the next section.
5. What Can (and Do) Countries Do about Procyclical Fiscal Policy? We have seen that fiscal policy in Latin America is procyclical due to the low proportion of
automatic stabilizers in the budget, due to political and institutional limits to fiscal savings 25 Martner (1999) estimates that the average elasticity of the cyclical surplus to growth is of 0.2 percent of GDP in Latin America, compared with estimates closer to 0.5 percent of GDP in the EU.
20

during expansions, and due to limited creditworthiness during recessions. In this section we
explore policy options to improve the performance of Latin American countries along these three
dimensions.
Increasing the Size of Automatic Stabilizers The first issue, increasing the size of automatic stabilizers, is not a simple task. Bourguignon
(2000) shows that Latin America’s “welfare state” is similar in size and scope to that of Europe
in the 1920s and 1930s. Excluding spending on education, Latin American countries spend on
average 10 percent of GDP on social protection, compared to 15 to 33 percent in rich countries.26
It took Europe several decades of post-war economic growth to develop its current welfare state
institutions. Rodrik (1998) argues that more open economies tend to have larger governments
because of the role that government spending has in stabilizing income. As Latin America is an
increasingly open, shock-prone region, we should expect the region to increase the proportion of
public spending to GDP, and at the same time, increase the participation of automatic stabilizers
in the budget, thus contributing to making fiscal policy more countercyclical.
In fact, some of this has happened already. Castañeda (2002) shows that the share of
social spending in GDP in Latin America remained stable during the 1970s and 1980s, but
increased during the 1990s, primarily due to the increase in social security spending. He also
describes the institutional innovations over the past 30 years, such as increased decentralization,
the recent growth in conditional transfer programs, and a growing interest in improving
monitoring and evaluation of social policy. However, there are important limits to this direction,
and clearly it is not a short-term option due to current fiscal constraints in the region.
Furthermore, given the large size of the informal sector in Latin American economies, it
is not easy to fund and control unemployment insurance effectively.27 In addition, Alesina (1999)
argues that developing countries such as those in Latin America are caught in an equilibrium of
inefficiently low size of government due to low quality of public goods and high tax evasion.
Citizens do not want to pay taxes for which they do not see a return, and tax evasion in turn
limits government capacity. Alt, Lassen and Skilling (2001) find evidence consistent with this
hypothesis. They explore the effect of transparency of fiscal institutions on the scale of 26 The conclusion is unchanged if we exclude pensions. Latin American average social spending, excluding education and pensions, is 4.8 percent of GDP, compared with a range of 9.4 percent (United States) to 24 percent (Sweden) in OECD countries.
21

government and gubernatorial popularity in US States between 1986 and 1995. They conclude
“fiscal transparency increases both the scale of government and gubernatorial popularity. The
results […] imply that more transparent budget institutions induce greater effort by politicians, to
which voters give higher job approval, on average. Voters also respond by entrusting greater
resources to politicians where institutions are more transparent, leading to larger size of
government.” This suggests that efforts to improve the efficiency of the public sector, improve
transparency in the budget and fight tax evasion should be promoted by IFIs. The objective
should be helping Latin American countries to “switch” towards a better equilibrium with
improved social protection and lower tax evasion. However, results will probably not be
forthcoming immediately.
Increasing Savings during Good Times In the previous section, we presented arguments showing that procyclical fiscal policy is caused
by the lack of fiscal savings during economic expansions. The causes identified in the literature
are a combination of volatility and politico-institutional constraints. The stylized argument is that
powerful groups struggle for shares of the common pool of fiscal resources. These groups are
unwilling to sacrifice their part when resources increase in favor of future savings, because they
are unsure that they will receive their fair share. This struggle generates pressure for increased
spending during good times. Furthermore, the pressure is greater the larger the fiscal surpluses.
Therefore, volatility, which generates large surpluses in booms and large deficits in recessions,
makes savings during good times even harder.
The conclusion of this analysis is that Latin American countries intent on increasing
spending should 1) reduce economic volatility, and 2) identify the specific causes of political
pressures for overspending in good times, and implement the reforms necessary to limit these
pressures, or at least effectively channel them. As mentioned before, it is beyond the scope of
this paper to discuss ways, other than making fiscal policy less procyclical, of reducing economic
volatility. We will therefore focus on reforms that could limit political pressures to overspend
during good times.
Traditional proposals in this direction can be divided into four categories: 1) fiscal rules,
2) stabilization funds, 3) reform of fiscal institutions, and 4) reform of political institutions. 27 See Márquez (2000) for a discussion of employment protection policies in Latin America.
22

Fiscal rules are an intuitively attractive solution to problems of overspending. Under
perfect enforcement, a well-designed rule—for instance, one that puts a cap on total spending, or
mandates a structural surplus—could automatically solve the problem. It is therefore not
surprising that economists, well trained in principal-agent analysis, have generated a slew of
proposals for fiscal rules of a different nature.28 A good example is the structural surplus (1
percent) rule implemented in Chile (see Appendix C for details) that allows for limited deficits
during recessions.
However, perfect enforcement is rarely the environment in which fiscal rules are applied.
For example, it is not clear that central governments in federal countries have the power to
credibly enforce sub-national fiscal rules. In Box 1 we survey recent Latin American experiences
with fiscal rules. We find that the results are not promising, with two severe episodes of non-
compliance in Peru and Argentina. We will discuss the shortcomings of fiscal rules in more
detail below.
28 See Kopits and Symansky (1998) for a survey. It is worth noting that some of the most common fiscal rules, such as balanced budget amendments in US states, were not designed to reduce procyclicality of spending, but rather to achieve fiscal discipline. In fact, some of these rules can actually increase procyclicality. (See for instance, Bayoumi and Eichengreen, 1995). The argument is that fiscal rules, especially balanced-budget amendments, do not allow borrowing during recessions and thus limit the ability of governments to run countercyclical fiscal policy. However, these rules are usually discussed in the context of countries (or states) with a structural fiscal surplus. Tanner (2003) presents a model in which rules that contribute to fiscal solvency can at the same time reduce procyclicality.
23

Box 1. Recent Fiscal Rules in Latin America Can fiscal rules be the solution to fiscal insolvency and procyclicality of spending? During the last part of the 1990s some Latin American countries, in some cases at the behest of IFIs, have started to implement fiscal rules. This move has received increasing attention from economists and policymakers. Alesina, Hausmann, Hommes and Stein (1999) created an index of fiscal institutions that included a component measuring the existence of fiscal rules limiting the level of debt. They found that the index was negatively correlated with fiscal deficits in a sample of Latin American countries. The study also suggests that transparency clauses and well-structured budget procedures can contribute to fiscal prudence. However, there is a potential problem with endogeneity in this kind of study, since it is plausible that the countries with better budget institutions and fiscal outcomes are countries in which voters prefer fiscal prudence. Therefore, performing an adequate econometric study in order to measure the impact of fiscal rules on fiscal outcomes is not an easy task. Braun and Tommasi (2002) argue that evidence is not yet conclusive regarding the effectiveness of fiscal rules as limits on fiscal profligacy. In this box we present descriptive evidence from five Latin American countries: Argentina, Brazil, Chile, Colombia and Peru. All of these countries have implemented different kinds of fiscal rules during the 1990s. These examples should not be construed as presenting conclusive evidence, but can illustrate the potential benefits and shortfalls of fiscal rules, particularly in Latin American countries. (See Appendix C for more details). We find two episodes, Argentina and Peru, of definite non-compliance with the rule. In other cases, such as Chile and Brazil, the experience looks promising but it is still too early to make a conclusion about the impact of fiscal rules. The countries have not gone through circumstances that really tested the commitment to comply with the fiscal rule. In fact, in the case of Brazil, pressures seem to be mounting on Lula from provincial governors to relax the Fiscal Responsibility Law. A point worth noting is that Chile has a longer tradition of fiscal prudence, so it is harder to argue that good fiscal outcomes are the consequence of a new fiscal rule. Argentina: Fiscal Solvency Law Faced with a deteriorating budget balance and growing debt payments, the Argentine Congress approved a Fiscal Solvency Law in September 1999. Apart from establishing numerical limits for the central government’s fiscal deficit, it also limited the growth of expenditures. Furthermore, the law stipulated the adoption of a three-year budget, the creation of a counter-cyclical Fiscal Fund, and the implementation of transparency measures to increase the availability of information regarding the state of public finances. However, the deficit limits were not respected in any year between 1999 and 2001. (See Appendix C for details). Several sub-national governments followed the national example and passed fiscal solvency rules. These rules differ across provinces in some of their characteristics, as well as in the degree to which they have been adhered to. In fact, only five provinces out of eleven with hard limits on deficits complied in 2000. Brazil: Fiscal Responsibility Law In the 1980s, inconsistent fiscal and monetary management and coordination, despite the start of some economic reforms, caused a volatile environment and several crises. During the 1990s there were also several crises; in many cases, the federal government bailed out the states out, furthering the incentives for fiscal laxity at the local level. In 1998 a new round of rescheduling was accompanied by attempts at hardening state budget constraints. Fiscal targets were placed in budgetary laws. And rules limiting debt were established. Not all of these rules were effective. Therefore, the government sent to Congress a Fiscal Responsibility Law, which was approved with full majority support in the Senate and the Chamber of Deputies. The Brazilian Fiscal Responsibility Law applies to the three levels of government and encompasses the judiciary, legislative and executive branches. This law includes rules concerning revenue, expenditure and debt targets, as well as limits for personnel expenditures and government debt. The law establishes that tax exemptions or benefits and new expenditures must be included in the budget law. The law also includes provisions to increase transparency of fiscal information. Furthermore, the law contemplates sanctions both at the institutional and individual level. The preliminary results are encouraging. However, it is too early to come to a conclusion about the long-term effects on public finances in Brazil. It has not yet been tested by time, and the change in government at the national level is too recent to evaluate its effects.
24

Chile: The New Fiscal Rule In 1985 the government created the Chilean Copper Fund to help stabilize fiscal revenues from the volatility of copper prices. Thanks to this policy, government expenditures have not closely tracked revenue availability. Nevertheless, the Fund has played a limited role in helping to execute countercyclical policies in downturns. In 1999, after the structural balance showed a deficit for the first time in ten years, the government decided to implement a new approach to fiscal policy. At that time a new fiscal rule based on a structural surplus of 1 percent of GDP was introduced to reaffirm and intensify Chile’s commitment to fiscal responsibility. This does not qualify as a fiscal rule in the stricter sense, as it is only a self-imposed measure by the present government to guide fiscal policy. Something to highlight is that this new fiscal policy approach represents not an emergency effort to restore fiscal policy credibility, but to set a sign of how fiscal policy will be conducted over the medium term. As in the case of Brazil, Chile’s new fiscal rule has not yet been tested by time. Colombia: Fiscal Responsibility Rule As a way to increase control over sub-national debt by the central government, the so-called Traffic Light Law was passed in 1997. This law brought into effect a rating system for territorial governments. However, this law has not been fully effective in limiting the behavior of sub-national governments in terms of debt. During the 1980s and 1990s, the government created two stabilization funds, the Colombian Coffee Fund and the Colombian Oil Stabilization Fund. Their objective was to help stabilize fiscal policy. Both funds, however, turned out to be less important than expected in terms of meeting their objectives. Therefore, in 2000, as part of necessary reforms the Colombian government passed the Sub-National Fiscal Responsibility Law. This law includes limits on expenditures and how they should be financed. It also establishes that sub-national governments that do not comply with the limits imposed by the law, must adopt a fiscal rescue program to regain viability within the next two years. In addition, the law promotes transparency through an extensive list of characteristics and requirements for the election of governors, mayors, legislators and their relatives. In this case, it is also too early to tell whether the law has brought about a structural change in fiscal outcomes, but the provisions seem to be a move in the right direction. Peru: Prudence and Transparency Law During most of the 1990s, the main objective of fiscal policy was to generate primary surpluses in order to afford interest payments of the non-financial public sector debt. At the end of this decade fiscal balances showed both an apparent ceiling for revenue collection and increasing public expenditures. By the end of 1999, Congress approved a Prudence and Transparency Law with the goal of establishing guidelines to improve public finance management in order to contribute to economic stability. This law includes numerical limits to the public sector deficit, the rate of increase of expenditures and the public debt. It also establishes a Multi-annual Macroeconomic Framework, which contains macroeconomic and fiscal projections for the next three years. In addition, it creates a Fiscal Stabilization Fund managed by the Ministry of Economy and Finance. The numerical and exception rules set by the law were completely impossible to comply with during recent downturns. In 2000, the non-financial public sector deficit amounted to 3.2 percent of GDP and to 2.5 percent in 2001. This completely violated the exception rule that establishes a maximum 2 percent deficit during recessions.
25

A potential problem with rules that call for surpluses during good times is what to do
with the surpluses to limit pressures for spending them. One option is to force the government to
use the surplus for debt reduction. Another popular alternative is to place surpluses in a fiscal
stabilization fund (see, for example, the provisions in the fiscal responsibility laws of Argentina
and Peru).
This brings us to the second class of proposals. Stabilization funds are often championed
as an option for accumulating savings during good times. In many cases, these funds are
associated with revenues linked to commodities, such as Chile’s Copper Stabilization Fund.
However, in countries with strong pressures to spend, and high levels of poverty and inequality,
the surpluses in these funds might be difficult to sustain politically during good times.
Furthermore, recent evidence regarding commodity stabilization funds shows that they present
several potential problems. Davis, Ossowski, Daniel et al. (2001) argue that, among other
problems, oil funds are not effective in stabilizing oil revenue, because the international price of
oil does not appear to have a constant average. Therefore, it is difficult to distinguish between
permanent and temporary changes in prices, and thus difficult to establish a sustainable rule for
accumulating and spending the resources in the oil fund. They found evidence for a sample of 12
countries producing nonrenewable resources, of which five had stabilization funds, that public
spending both in countries with and without funds usually followed commodity export earnings.
A deeper problem with fiscal rules and stabilization funds discussed in Braun and
Tommasi (2002) is that it is not obvious ex ante why a rule or a fund will change political
incentives to overspend in countries accustomed to not complying with laws and abruptly
changing policy regimes. Perry (2002) argues that fiscal rules can contribute to saving during
good times by increasing the marginal political cost of higher saving, and by giving more power
to a prudent finance minister vis-à-vis spending ministers. Milesi-Ferretti, (2000) however,
argues that in countries with lower levels of budget transparency, fiscal rules can actually lead to
more creative accounting instead of better outcomes. Governments may find it easier to fudge
the numbers than to actually limit spending. He cites examples of creative accounting in France,
Italy and Greece in the run-up to EMU in which fiscal outcomes were “improved” by up to 1
percent of GDP. The evidence presented in Braun and Tommasi (2002) and the cases of rule
non-compliance we cite in Box 1 and Appendix C should warn us against being overly optimistic
regarding the effectiveness of rules to limit procyclicality.
26

These problems, combined with recent evidence on the importance of fiscal and political
institutions on budget outcomes leads many analysts to favor proposals to reform fiscal
institutions such as budget procedures and intergovernmental tax-sharing regimes. Some even go
further and propose changing political institutions such as electoral rules.
Regarding fiscal institutions, the argument is that budget procedures, the structure of
intergovernmental tax sharing schemes, and other institutional characteristics of the fiscal
framework of a country can influence the incentives that the “players” in the fiscal game have
over the cycle. Underlying the argument in Perry (2002) for instance, is the notion that more
hierarchical budget procedures—that give more power to the Executive vis-à-vis the legislature
and the Finance minister vis-a-vis the spending ministers—can contribute to limiting spending
during booms. The idea is that the executive and the finance minister internalize the
intertemporal government budget constraint more than other ministers and the legislature, that
are more worried about securing a portion of the budget for their ministry or region.
Although we share the view that incentives in the budget process are probably a key
element in determining the extent of overspending during good times, as with fiscal rules, a
linear application of general principles seems unwarranted given the current state of knowledge.
Stein, Talvi and Grisanti (1997), for instance, find that budget procedures, measured by the same
index described in Alesina, Hausmann, Hommes and Stein (1999), are not correlated with the
behavior of fiscal policy over the cycle in Latin America. This suggests the need for more
detailed, country-specific analysis, to understand what types of reform to the budget process
would be most effective in different contexts.
With regard to federal fiscal arrangements, there is increasing evidence that these might
be a key factor in understanding the procyclical behavior of fiscal policy in general and social
policy in particular. We illustrate this point in Box 2, where we discuss the tax-sharing regime in
Argentina and the cyclical behavior of expenditure at different levels of government.
27

Box 2. Federalism and Procyclical Spending in Argentina
As shown in Section 3, Argentina has one of the highest levels of procyclicality of total and social expenditure in Latin America. Probably part of this can be explained by the incentives created by federal fiscal arrangements in the country. Argentina has highly centralized tax collection but very decentralized spending. Social spending is particularly decentralized, given that most of the responsibility for health and education expenditures are at the local level.
Furthermore, Piffano, Sanguinetti and Zentner (1998) show that federal government taxes are more income-elastic than taxes collected by sub-national governments. This, together with the fact that most transfers to provinces are automatic, leads to highly procyclical revenues for provinces. Given that provinces have incentives to abuse the common resource of public credit, they often spend more (and even increase debt) when they receive more transfers. A history of bailouts by the central government (see Nicolini, Posadas, Sanguinetti et al., 1999) further erodes incentives for sub-national fiscal prudence during good times. (See Tommasi, Jones and Sanguinett, 1999, for a more comprehensive discussion of the problems of Argentine federalism).
The result, of course, is highly procyclical spending. Below we report correlation matrices for the cyclical components of total and social expenditure by level of government and output. Provincial spending is significantly more procyclical than national spending. Correlation matrix
1 2 3 41- Cycle GDP per capita 1.00 2- Cycle Total Expenditures Level: National 0.35 1.00 3- Cycle Total Expenditures Level: Subnational 0.55 0.42 1.00 4- Cycle Total Expenditures Level: Municipal 0.36 0.37 0.87 1.00 Correlation matrix
1 2 3 41- Cycle GDP per capita 1.00 2- Cycle Social Expenditures Level: National 0.31 1.00 3- Cycle Social Expenditures Level: Subnational 0.51 0.80 1.00 4- Cycle Social Expenditures Level: Municipal 0.36 0.89 0.88 1.00
Clearly, to reduce procyclicality in Argentina, a key element will be dealing with the perverse incentives created by the current tax-sharing regime.
Webb, González and Rosenblatt (2002) discuss the possibility of implementing sub-
national stabilizing transfers as a way to deal with procyclicality in federal countries. As shown
in Box 2 for the Argentine case, transfers to sub-national governments are potentially
destabilizing. The reason is that they are positively correlated with procyclical tax revenues and
can therefore induce procyclical spending at the local level if provinces do not internalize the
importance of sound macroeconomic policy. Webb, González and Rosenblatt further propose
transfers not tied to tax revenues, such as fixed transfers over the cycle. The argument in favor of
these transfers is that they could potentially reduce the inherent procyclicality of spending by
limiting the available funds for sub-national spending during booms (that tend to be spent on
inflexible items such as wages) and reducing the need for adjustment in bad times.
28

Although the experience with stabilizing transfers is recent and limited, the authors find
no clear evidence that these helped in Argentina and Colombia where they were implemented,
vis-à-vis Mexico and Brazil. This does not imply that reforming federal fiscal arrangements is
ineffective for reducing procyclicality of fiscal policy. It does, however, imply that more care
should be taken in the design of proposed reforms.
Other proposals include limiting sub-national borrowing via borrowing rules (especially
prohibiting using future transfers from the central government as collateral), forbidding
borrowing from the domestic financial sector (one way to do this is by increasing the risk
evaluation that the Central Bank places on lending to sub-national governments by banks),
decouple sub-national transfers from procyclical revenues, and even punishing local officials
with jail time or fines if they exceed fiscal limits. The Fiscal Responsibility Law in Brazil is an
interesting case that includes several of these features, but as was mentioned before, it is still too
early to evaluate the effectiveness of the rule.
Finally, results such as those in Stein, Talvi and Grisanti (1997) open the possibility of
discussing reform of political institutions, such as electoral laws, as an avenue to improve fiscal
outcomes. As mentioned above, they find that Latin American countries with a larger district
magnitude tend to run more procyclical fiscal policy. However, their coefficients have limited
statistical significance. In addition, political institutions probably affect many other dimensions of
public policy, so it is not clear that a change is desirable solely for fiscal reasons. Finally, political
institutions significantly influence who “wins” the political game and are therefore very hard to
reform. We believe that a potentially more productive avenue is to design proposals for fiscal rules
and reform of fiscal institutions looking in detail at the politics of each country. (See Box 3 for more
detail, Braun and Tommasi, 2002, for a discussion of this approach regarding fiscal rules, and Stein
and Tommasi, 2002, for a framework to study these issues across countries.)
29

Box 3. Political Leadership as a Requirement for “Brilliant Fiscal Management”
The kind of reforms required to effectively change fiscal policy outcomes might appear daunting. Increasing the size of automatic stabilizers is a long-term effort that required several decades to develop in Europe. On the other hand, reforming the budget process, improving federal fiscal arrangements and implementing credible and flexible fiscal rules require difficult political compromises that generate payoffs in the future. It is therefore not easy for governments in Latin America to focus on these issues.
However, the recent experience with fiscal management in Chile, together with the implementation of the Fiscal Responsibility Law in Brazil, can provide hope, good examples and useful lessons. For example, the central government in Brazil took advantage of the negotiating power it gained from offering to take over the States’ debts to pass a reform that appears to be limiting sub-national spending and debt. Reform-minded governments should seize these opportunities to negotiate sustainable reforms that can reduce the procyclical behavior of spending. The case of Chile highlights the value of building a reputation for prudent fiscal behavior.
Braun and Tommasi (2002)—based on previous work “crystallized”29 in Spiller and Tommasi (2000)—present an application of the country-specific approach to policy design for sub-national fiscal rules in Argentina. Although the proposals are not exclusively aimed at reducing procyclicality, we believe they provide a flavor for the proposed approach. The determinants of poor sub-national fiscal behavior have been diagnosed as i) large vertical fiscal imbalances, ii) a tax-sharing regime with little incentive to raise taxes locally, iii) several bail-out channels from the national government to the provinces, iv) several political motives why the federal government might be willing to bail out provinces, and v) a lack of enforcement of intergovernmental agreements. This suggests a general strategy, which should include the following measures: 1. Reforms of the electoral mechanisms to lower the dependency of national legislators on local party elites (as the
analysis of the previous section suggests, the weakness of national legislators is one key aspect of the poor transactions environment).
2. Reforms of the instruments of legislative interaction between the President and Congress (this could improve the possibility of enforcing, and hence of achieving in the first place, more efficient agreements).
3. Reforms of the budget process to curtail some Executive discretion (as seems to have been instrumented in the Mexican case), limiting the ability to perform bailouts.
4. Institutional reforms of intergovernmental relations (given that these federal transactions will inevitably involve “executive federalism” among the national government and provincial authorities, we want to improve the institutional environment for those transactions).
5. Reforms of the tax-sharing agreement to improve the Wicksellian connection between the taxes raised and the public goods consumed within each jurisdiction
6. Macro-fiscal rules to guide this transition towards a more cooperative (and more sustainable) fiscal stance, including a moving average mechanism to smooth out and make more foreseeable the flow of tax revenue received by the provinces.
Achieving countercyclical fiscal policy is possible in Latin America. However, both country experience
and the complexity of proposals call for superb political leadership as a requirement for achieving the reforms that could lead to improved fiscal management in Latin America.
Improving Creditworthiness During Recessions Several recent proposals related to reducing volatility in Latin America call for better insurance
against shocks. A specific proposal by Borensztein and Mauro (2002) related to this is
converting a significant proportion of debt issued by Latin American countries to GDP-indexed
bonds. The idea is that bonds would pay higher interest when GDP growth is high, and less
during recessions. This would reduce the need for rolling over debt or adjusting spending during
30

recessions. Furthermore, increases in (inflexible) primary spending would be limited during
expansions, because part of the extra surplus would automatically be used to pay debt service.
Therefore, it would limit the problem of lack of creditworthiness and reduce procyclicality of
spending. The role of IFIs is key in this kind of proposal, because the markets for this type of
security are still underdeveloped. (See Caballero, 2003)
Another way for IFIs to contribute to improve creditworthiness during recessions and
limit higher spending during expansions is to make sure that loans are disbursed during
recessions and not during booms.30 Easterly (2000) shows that IFI programs actually contribute
to reducing procyclicality in developing countries. He finds that the growth in poverty was lower
during recessions in countries that were engaged in IMF and World Bank programs.
Furthermore, government transfers were significantly above average during contractions in
countries under adjustment lending, and significantly below average during expansions. This
indicates that the provisions in IFI programs such as social safety nets could be mitigating the
effects of recessions on pro-poor public spending, and thus reducing the impact of recessions on
poverty. This should be applauded and expanded. In fact, some credit lines to developing
countries could be made contingent on recessions, or even increases in poverty. Incentive
problems in reporting would be limited, because governments are not keen on announcing
increases in poverty.
Summing Up
In Table 3 we summarize the policy options presented above to reduce procyclicality of fiscal
policy in Latin America.
29 We borrow this expression from Stein and Tommasi (2002). 30 However, further study is required on the potential moral hazard problems that this policy might create.
31

Table 3. Summary of Policy Options for Reducing Procyclicality
Objective Domestic Policy IFIs Increase Automatic Stabilizers
Unemployment insurance and other policies Increase size of government
Insist on transparency and accountability
Improve savings during good times
Fiscal rules to reduce discretion and limit spending and debt during good times Fiscal stabilization funds Reform fiscal institutions
Countercyclical lending
Improve creditworthiness during bad times
GDP-indexed bonds
Countercyclical lending Contingent credit lines
We have argued that a voluntary approach to fiscal rules and stabilization funds should be
avoided, as the evidence shows that they are no panaceas. More research is needed regarding
what works in different political and economic environments. The same applies for reform of
budget institutions. Probably hierarchical and transparent procedures are a good thing, but we
need more country-specific analysis on how to implement these broad ideas. In federal countries,
it is clear that incentive problems with sub-national spending have to be dealt with. However, the
cases studied by Webb, González and Rosenblatt (2002) seem to indicate that “easy” solutions
such as stabilizing transfers do not necessarily work. On the bright side, there are some
encouraging experiences in the region, such as the Fiscal Responsibility Law in Brazil, and the
structural surplus rule in Chile.
In the long run, Latin American countries would likely benefit from a more developed
welfare state, both through more macroeconomic stability and less risk from aggregate shocks by
the population, and in particular the poor. A step in the right direction is for Central Banks and
technical offices to actually start calculating the cyclical component of fiscal policy, as is
currently done in Chile. However, the road in this direction is long. It will require “brilliant fiscal
management” (Birdsall, 2002), more trust of citizens in government and more transparency and
accountability. For instance, automatic stabilizers such as unemployment insurance in a context
of low transparency and state capacity can be risky. It might be impossible to cut spending
during booms if the government cannot control whether unemployment insurance beneficiaries
are employed in the informal sector.
32

6. Conclusion: Towards Countercyclical Social Policy in Latin America Crises are common and recessions are deep in Latin America, and the poor and middle income
brackets are negatively affected. The recent emphasis on improving safety nets championed by
IFIs is well directed, and in many cases has proven helpful to improve the lot of the poor during
recessions.
However, the procyclical behavior of fiscal policy—apart from increasing economic
volatility—is a constraint on the ability of Latin American governments to protect the poor
during downturns. Efforts must be made to increase savings during expansions, to increase
access to credit during recessions, and to increase the size of automatic stabilizers in the budget.
We have shown that simplistic applications of general principles such as “make budget
procedures more hierarchical,” or “implement fiscal rules to limit spending and deficits” do not
necessarily result in better fiscal outcomes. A more detailed, country-specific analysis is required
to match detailed proposals to specific political contexts. This type of analysis is in its early
stages, but we believe that IFIs should move in this direction.
Policymakers in the region seeking to contribute to protecting the poor will have to
practice “brilliant” fiscal leadership, including efforts to improve fiscal transparency, educating
the public about the importance of saving during expansions (improving cost-benefit analysis of
budget programs, and audit and control institutions would help), and pushing for institutional
reform that will contribute to improved fiscal management, among others. A clear, transparent,
medium-term macrofiscal framework with which to evaluate annual fiscal policy would also be
helpful. For example, the EU countries are guided by the Maastricht criteria and the Stability
and Growth Pact. IFIs could possibly contribute by establishing benchmarks for Latin American
countries.
33

References Acemoglu, D., S. Johnson, J. Robinson and Y. Thaicharoen. 2002. “Institutional Causes,
Macroeconomics Symptoms: Volatility, Crises and Growth.” NBER Working Paper
9124. Cambridge, United States: NBER.
Agénor, P-R. 2002. “Business Cycles, Economic Crisis and the Poor: Testing for Asymmetric
Effects.” Washington, DC, United States: World Bank. Mimeographed document.
Alesina, A., R. Hausmann, R. Hommes and E. Stein. 1999. “Budget Institutions and Fiscal
Performance in Latin America.” Journal of Development Economics 59(2): 253-273.
Alesina, A. 1999. “Too Large and Too Small Governments.” In: V. Tanzi, K-Y. Chu and S.
Gupta, editors. Economic Policy and Equity. Washington, DC, United States: IMF.
Alt, J., D. Lassen and D. Skilling. 2001. “Fiscal Transparency, Gubernatorial Popularity, and the
Scale of Government: Evidence from the States.” EPRU Working Paper 2001/16.
Copenhagen, Denmark: Economic Policy Research Unit.
APEC Finance Ministers. 2001. “Social Safety Nets in Response to Crisis: Lessons and
Guidelines from Asia and Latin America.” Singapore: Asia-Pacific Economic
Cooperation Secretariat. http://www.apecsec.org.sg.
Arreaza, A. B. Sorensen and O. Yosha. 1998. “Consumption Smoothing through Fiscal Policy in
OECD and EU Countries.” NBER Working Paper 6372. Cambridge, United States:
National Bureau of Economic Research.
Auerbach, A. 2002. “Is There a Role for Discretionary Fiscal Policy?” NBER Working Paper
9306. Cambridge, United States: National Bureau of Economic Research.
Barro, R. 1979. “On the Determination of the Public Debt.” Journal of Political Economy
87(5/Part 1): 940-71.
----. 1987. “Government Spending, Interest Rates, Prices, and Budget Deficits in the United
Kingdom, 1701-1918.” Journal of Monetary Economics 20(2): 221-47.
Bayoumi, T., and B. Eichengreen. “Restraining Yourself: The Implications of Fiscal Rules for
Economic Stabilization.” IMF Staff Papers 42(1): 32-48.
Bergoeing, R., and R. Soto. 2000. “Testing Real Business Cycle Models in an Emerging
Economy.” Washington, DC, United States: Georgetown University/ILADES.
Mimeographed document.
34

Birdsall, N. 2002. “From Social Policy to an Open-Economy Social Contract in Latin America.”
Paper presented at the 50th Anniversary Conference of the Brazilian National Bank for
Economic and Social Development, Rio de Janeiro Brazil, September 11-12.
Borensztein, E., and P. Mauro. 2002. “Reviving the Case for GDP-Indexed Bonds.” IMF Policy
Discussion Paper 02/10. Washington, DC, United States: International Monetary Fund.
Bourguignon, F. 2000. “Social Protection in Industrial Countries: Which Lessons for LAC
Countries?” Washington, DC, United States: World Bank. Mimeographed document.
Braun, M., and M. Tommasi. 2002. “Fiscal Rules for Subnational Governments: Some
Organizing Principles and Latin American Experiences.” Paper presented at IMF/World
Bank Conference on Fiscal Rules and Institutions, Oaxaca, Mexico, February.
Caballero, R. 2003. “The Future of the IMF.” Cambridge, United States: Massachusetts Institute
of Technology. Mimeographed document.
Castañeda, T. 2002. “Tendencias de largo plazo en tamaño, eficiencia y focalización del gasto
social en América Latina y el Caribe.” Washington, DC, United States: IDB.
Mimeographed document.
Cline, W. 2002. “Financial Crises and Poverty in Emerging Market Economies.” Center for
Global Development Working Paper 8. Washington, DC, United States: Center for
Global Development.
Davis, J., R. Ossowski, J. Daniel et al. 2001. “Stabilization and Savings Funds for
Nonrenewable Resources: Experience and Fiscal Policy Implications.” IMF Occasional
Paper 205. Washington, DC, United States: IMF.
De Ferranti, D., G. Perry, I. Gill and et al. 2000. Securing our Future in a Global Economy.
Washington, DC, United States: World Bank.
Dillinger, W., G. Perry and S. Webb. 2001. “Is Fiscal Stability Compatible with
Decentralization? The Case of Latin America.” Washington, DC, United States: World
Bank. Mimeographed document.
Dollar, D., and A. Kraay. 2002. “Growth is Good for the Poor.” Journal of Economic Growth
7(3): 193-225.
Easterly, W. 2000. “The Effect of IMF and World Bank Programs on Poverty.” Washington, DC,
United States: World Bank. Mimeographed document.
35

Echavarría, J., C. Renteria and R. Steiner. 2000. “Decentralization and Bailouts in Colombia”.
Washington, DC, United States: Inter-American Development Bank. Mimeographed
document.
Eifert, B., A. Gelb and N.B. Tallroth. 2002. “The Political Economy of Fiscal Policy and
Economic Management in Oil Exporting Countries.” World Bank Policy Research
Working Paper 2899. Washington, DC, United States: World Bank.
Esping-Andersen, G., and M. Regini. 2000. Why Deregulate Labour Markets? Oxford
University Press.
Fatás, A., and I. Mihov. 2001. “Government Size and Automatic Stabilizers: International and
Intranational Evidence.” Journal of International Economics 55: 3-28.
Ferreira, F., G. Prennushi and M. Ravallion. “Protecting the Poor from Macroeconomic Shocks:
An Agenda for Action in a Crisis and Beyond.” Washington, DC, United States: World
Bank. Mimeographed document.
Fiess, N. 2002. “Chile’s New Fiscal Rule.” Washington, DC, United States: World Bank.
Mimeographed document.
Fischer, S. 2002. “Financial Crises and Reform of the International Financial System.” NBER
Working Paper 9297. Cambridge, United States: National Bureau of Economic Research.
Garzón, S. 2003. “XV Seminario Regional de Política Fiscal.” Santiago, Chile: ECLAC.
Gavin, M., and R. Perotti. 1997. “Fiscal Policy in Latin America.” In: B.S. Bernanke and J.
Rotemberg, editors. NBER Macroeconomics Annual 1997. Cambridge, United States: MIT
Press.
Gavin, M., R. Hausmann, R. Perotti and E. Talvi. 1996. “Managing Fiscal Policy in Latin America
and the Caribbean: Volatility, Procyclicality and Limited Creditworthiness.” Research
Department Working Paper 326. Washington, DC, United States: Inter-American
Development Bank, Research Department.
Giavazzi, F., and M. Pagano. 1990. “Can Severe Fiscal Adjustments be Expansionary?” In: O.
Blanchard and S. Fischer, editors. NBER Macroeconomics Annual 1990. Cambridge,
United States: MIT Press.
Heymann, D. 2000. “Grandes perturbaciones macroeconómicas y respuestas de política: algunas
notas.” Revista de la CEPAL 70: 13-29.
36

Hicks, N., and Q. Wodon. 2000. “Economic Shocks, Safety Nets and Fiscal Constraints: Social
Protection for the Poor in Latin America.” Paper presented at the XII Seminario Regional
de Política Fiscal, Santiago, Chile.
Inter-American Development Bank (IDB). 1997. Latin America after a Decade of Reforms.
Economic and Social Progress in Latin America, 1997 Report. Washington, DC, United
States: IDB.
Jack, W. 2000. “The Evolution of Health Insurance Institutions: Theory and Four Examples from
Latin America.” Development Economics Research Group Working Paper. Washington,
DC, United States: World Bank.
Jain, P., and M. Moore. 2003. “What Makes Microcredit Programmes Effective? Fashionable
Fallacies and Workable Realities.” Institute of Development Studies Working Paper 177.
London, United Kingdom: Institute of Development Studies.
Jimenez, F. 2002. “El carácter procíclico de la política fiscal: Notas sobre la ley de prudencia y
transparencia fiscal.” Documento de Trabajo CISEPA No. 215, Departamento de
Economía. Lima, Peru: Pontificia Universidad Catolica del Peru.
Kopits, G., and S. Symansky. 1998. “Fiscal Policy Rules.” IMF Occasional Paper 162.
Washington, DC, United States: IMF.
Lane, P. 1999. “The Cyclical Behavior of Fiscal Policy: Evidence From the OECD.” Cambridge,
United Kingdom: Trinity College. Mimeographed document.
Lane, P., and A. Tornell. 1998. “Why Aren’t Savings Rates in Latin America Procyclical?”
Journal of Development Economics 57(1): 185-99.
Londoño, J.L., and M. Székely. 2000. “Persistent Poverty and Excess Inequality: Latin America
1970-1995.” Journal of Applied Economics 3(1): 93-134.
Lucas, R.E., and N.L. Stokey. “Optimal Fiscal Policy and Monetary Policy in an Economy
without Capital.” Journal of Monetary Economics 12: 55-94.
Lustig, N., 1999. “Crisis and the Poor: Socially Responsible Macroeconomics.” Paper presented
at the Fourth Annual Meeting of the Latin American and Caribbean Economic
Association (LACEA), Santiago de Chile, October 22.
Lustig, N., and A. Legovini. 1999. “Economic Crisis and Social Protection for the Poor: the
Latin American Experience.” Paper presented at the 1999 World Bank Conference on
Evaluation and Poverty Reduction, Washington, DC, June 14.
37

Lustig, N., and M. Walton. 1999. “Crisis and the Poor: A Template for Action.” Paper presented
at the Conference on Social Protection and Poverty, Washington, DC, February 4-5.
MacIsaac, D., and M. Rama. 2000. “Mandatory Severance Pay in Peru: An Assessment of its
Coverage and Effects Using Panel Data.” Washington, DC, United States: World Bank.
Mimeographed document.
Marcel, M., M. Tokman, R. Valdés and P. Benavides. 2001. “Structural Budget Balance:
Methodology and Estimation for the Chilean Central Government 1987-2001.” Santiago,
Chile: Ministerio de Hacienda, Dirección de Presupuestos. Mimeographed document.
Márquez, G. 2000. “Labor Markets and Income Support: What Did We Learn from the Crises?”
Research Department Working Paper 425. Washington, DC, United States: IDB.
Martner, R. 1999. “El papel de los estabilizadores automáticos en la política fiscal en América
Latina.” Documento de trabajo. Santiago, Chile: CEPAL, Dirección de Programación del
Sector Público.
Mejía Acosta, A., and M. Coppedge. 2001. “Political Determinants of Fiscal Discipline in Latin
America, 1979-1998.” Paper prepared for the International Congress of the Latin
American Studies Association, Washington, DC, September 5-8.
Milesi-Ferretti, G.M. “Good, Bad or Ugly? On the Effects of Fiscal Rules with Creative
Accounting.” International Monetary Fund Working Paper WP/00/172. Washington, DC,
United States: International Monetary Fund.
Milesi-Ferretti, G.M., R. Perotti and M. Rostagno. 2002. “Electoral Systems and Public Spending.”
Quarterly Journal of Economics 117(2): 609-657.
Nicolini, J.P., J. Posadas, J. Sanguinetti et al. 1999. “Decentralization, Fiscal Discipline in Sub-
National Governments, and the Bailout Problem: The Case of Argentina.” Washington,
DC, United States: Inter-American Development Bank. Mimeographed document.
Oliva, C. 2001. “Fiscal Responsibility Laws: How Broad Should They Be?” Paper presented at
the International Seminar on Transparency and Fiscal Responsibility, Rio de Janeiro,
Brazil, November 26-27.
Perotti, R. 1999. “Fiscal Policy in Good Times and Bad.” Quarterly Journal of Economics 114(4):
1399-1436.
38

Perry, G. 2002. “Can Fiscal Rules Help Reduce Macroeconomic Volatility in LAC?” Paper
presented at IMF/World Bank Conference on Fiscal Rules and Institutions, Oaxaca,
Mexico, February.
Persson, T. 2001. “Do Political Institutions Shape Economic Policy?” NBER Working Paper 8214.
Cambridge, United States: National Bureau of Economic Research.
Persson, T., and G. Tabellini. 1999. “The Size and Scope of Government: Comparative Politics with
Rational Politicians.” European Economic Review 43: 699-735.
Persson, T., G. Roland and G. Tabellini. 2000. “Comparative Politics and Public Finance.” Journal
of Political Economy 108: 1121-1161.
Piffano, H., J. Sanguinetti and A. Zentner. 1998. “Las Finanzas Provinciales y el Ciclo
Económico.” Documento de Trabajo 3. Buenos Aires, Argentina: Centro de Estudios para
el Desarrollo Institucional (CEDI).
Ravallion, M. 2002. “Who is Protected? On the Incidence of Fiscal Adjustment.” Washington,
DC, United States: World Bank. Mimeographed document.
Rodrik, D. 1998. “Why Do More Open Economies have Bigger Governments.” Journal of
Political Economy 106 (5): 997-1032.
----. 1999. “Why is There so much Economic Insecurity in Latin America?” Cambridge, United
States: Harvard University. Mimeographed document.
Sanguinetti, J. 2002. “Los Determinantes políticos e institucionales de las políticas sociales: un
análisis de los procedimientos presupuestarios.” Documento de Trabajo 65. Buenos
Aires, Argentina: Centro de Estudios para el Desarrollo Institucional, Fundación
Gobierno y Sociedad.
Sedlacek, G., N. Ilahi and E. Gustafsson-Wright. 2000. “Targeted Conditional Transfer Programs
in Latin America: An Early Survey.” Washington, DC, United States: World Bank. Paper
prepared for the Regional Study Securing our Future.
Snyder, J., and I. Yackovlev. 2000. “Political and Economic Determinants of Changes in
Government Spending on Social Protection Programs.” Cambridge, United States:
Massachusetts Institute of Technology. Mimeographed document.
Spiller, P., and M. Tommasi. 2000. “Los determinantes institucionales del desarrollo argentino:
Una aproximación desde la nueva economía institucional.” Documento 33. Buenos
Aires, Argentina: Centro de Estudios para el Desarrollo Institucional.
39
Stein, E., and M. Tommasi. 2002. “Political Institutions, Policymaking Processes, and Policy
Outcomes: A ‘Transactions’ Framework for Policy Analysis.” Washington, DC, United
States: IDB. Mimeographed document.
Stein, E., E. Talvi and A. Grisanti. 1997. “Institutional Arrangements and Fiscal Performance:
The Latin American Experience.” Washington, DC, United States: IDB. Mimeographed
document.
Talvi, E., and C. Végh. 2000. “Tax Base Variability and Procyclical Fiscal Policy.” NBER
Working Paper 7499. Cambridge, United States: National Bureau of Economic Research.
Tommasi, M., M. Jones and P. Sanguinetti. 199. “Politics, Institutions and Spending in the
Argentine Provinces.” In: J.M. Poterba and J. von Hagen, editors. Fiscal Institutions and
Fiscal Performance. Chicago, United States: National Bureau of Economic
Research/University of Chicago Press.
Tornell, A., and P. Lane. 1999. “The Voracity Effect.” American Economic Review 89(1): 22-46.
Velasco, A. 1999. “A Model of Endogenous Fiscal Deficits and Delayed Fiscal Reforms.” In:
J.M. Poterba and J. von Hagen, editors. Fiscal Institutions and Fiscal Performance.
Chicago, United States: National Bureau of Economic Research/University of Chicago
Press.
Von Hagen, J., R. Perotti and R. Strauch. 1997. “Sustainability of Public Finances.” CEPR
Discussion Paper 1781. London, United Kingdom: Centre for Economic Policy Research.
Webb, S.B., C.Y. González and D. Rosenblatt. “Stabilizing Intergovernmental Transfers in Latin
America: A Complement to National/Subnational Rules?” World Bank Working Paper
2869. Washington, DC, United States: World Bank.
Wodon, Q., N. Hicks, B. Ryan et al. 2002. “Are Governments Pro-Poor but Short-Sighted?
Targeted and Social Spending for the Poor during Booms and Busts.” Washington, DC,
United States: World Bank. Mimeographed document.
40

Appendix A. Methodology for Calculating the Cyclical Behavior of Fiscal Policy The Hodrick-Prescott Filter Methodology The first step in this work consists of the definition of the cycle for an economic variable. The methodology consists of adjusting a tendency to the evolution of the logarithm of the variable in analysis (i.e., GDP, social expenditures or total expenditures). The difference between the logarithm of the observed value and the estimated tendency yields the cyclical component.
To obtain the tendency of a time series, the Hodrick-Prescott filter (1997) is frequently used. If the variable under study is yt and the tendency is defined as gt, proceed to minimize the expression [1] selecting gt.
[1] { }
( ) ( )( )( )
−−+−= ∑∑=
−−−=−=
T
ttttt
T
ttt
g
gggggyMinTtt 1
2211
1
2
1
λφ
The method consists of minimizing the variance of y around g, subject to the restrictions
of penalization of the second differences of g. The penalization parameter λ , controls the form of the tendency. With λ higher, the tendency will be smoother and result in more recurrent variations. A clear rule doesn't exist for the determination of the parameter λ , nevertheless the values usually used are:
• 100=λ for annual data. • 1600=λ for quarterly data. • 14400=λ for monthly data.
In this work we use 100=λ , in accordance with the annual data.
Calculating the difference between the original value of the variable’s logarithm, and the logarithmic tendency estimated by the Hodrick-Prescott filter, the cyclical component is obtained. The Procyclicality of Social Expenditures To show how the methodology works, in this section we describe the calculation of procyclicality for two countries: Argentina and United States. First Step: Logarithm of GDP and Social Expenditures per Capita The first step consists of calculating the logarithm of the variables to study. The results are presented in the following tables and figures.
41
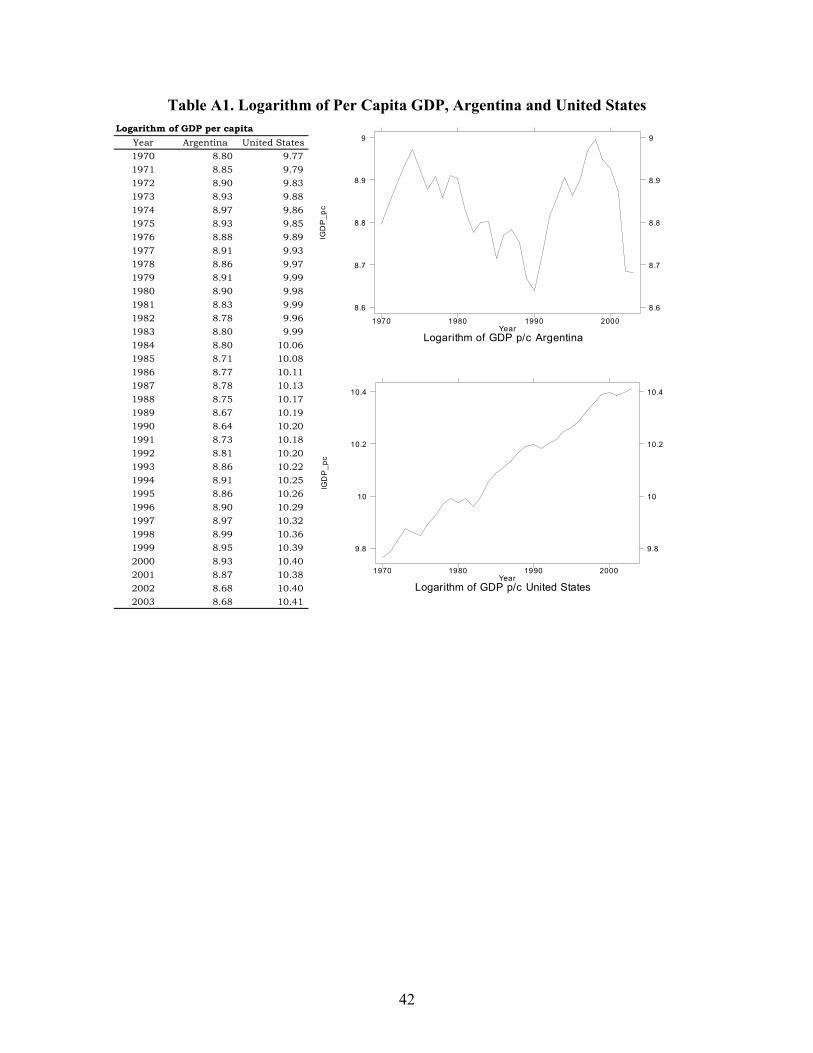
Table A1. Logarithm of Per Capita GDP, Argentina and United States Logarithm of GDP per capita
Year Argentina United States1970 8.80 9.77 1971 8.85 9.79 1972 8.90 9.83 1973 8.93 9.88 1974 8.97 9.86 1975 8.93 9.85 1976 8.88 9.89 1977 8.91 9.93 1978 8.86 9.97 1979 8.91 9.99 1980 8.90 9.98 1981 8.83 9.99 1982 8.78 9.96 1983 8.80 9.99 1984 8.80 10.06 1985 8.71 10.08 1986 8.77 10.11 1987 8.78 10.13 1988 8.75 10.17 1989 8.67 10.19 1990 8.64 10.20 1991 8.73 10.18 1992 8.81 10.20 1993 8.86 10.22 1994 8.91 10.25 1995 8.86 10.26 1996 8.90 10.29 1997 8.97 10.32 1998 8.99 10.36 1999 8.95 10.39 2000 8.93 10.40 2001 8.87 10.38 2002 8.68 10.40 2003 8.68 10.41
lGD
P_p
c
Logarithm of GDP p/c ArgentinaYear
1970 1980 1990 2000
8.6
8.7
8.8
8.9
9
8.6
8.7
8.8
8.9
9
lGD
P_p
c
Logarithm of GDP p/c United StatesYear
1970 1980 1990 2000
9.8
10
10.2
10.4
9.8
10
10.2
10.4
42
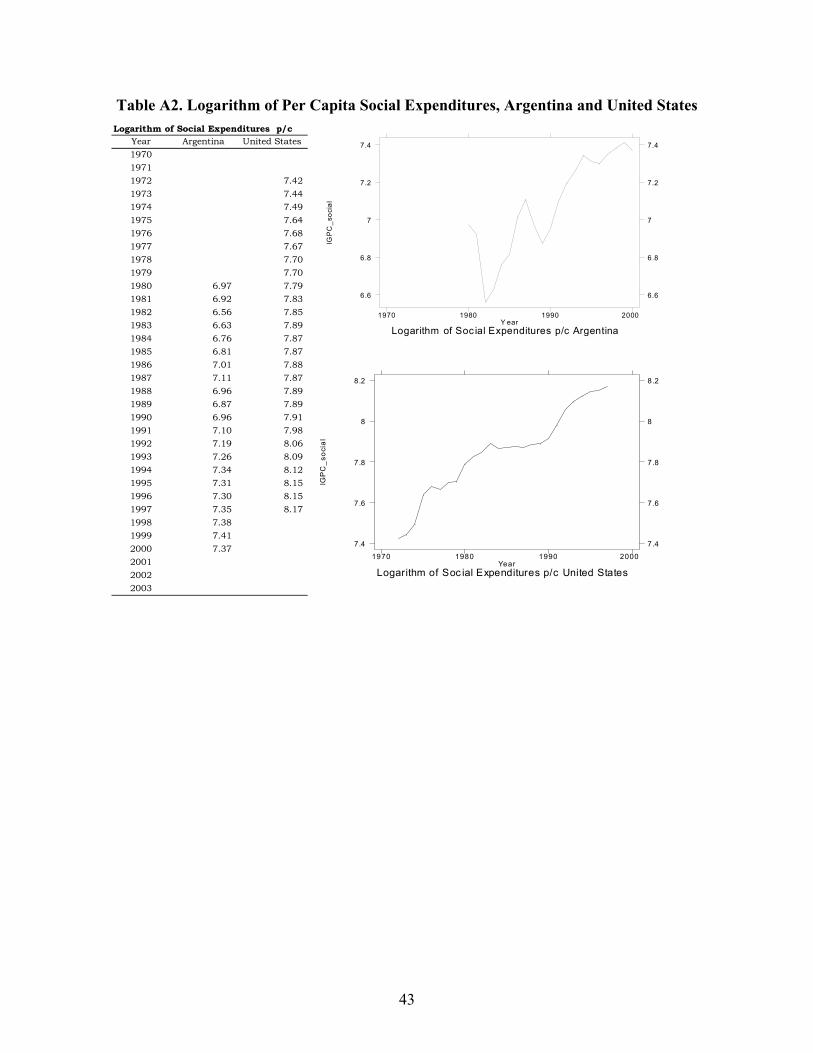
Table A2. Logarithm of Per Capita Social Expenditures, Argentina and United States Logarithm of Social Expenditures p/c
Year Argentina United States197019711972 7.42 1973 7.44 1974 7.49 1975 7.64 1976 7.68 1977 7.67 1978 7.70 1979 7.70 1980 6.97 7.79 1981 6.92 7.83 1982 6.56 7.85 1983 6.63 7.89 1984 6.76 7.87 1985 6.81 7.87 1986 7.01 7.88 1987 7.11 7.87 1988 6.96 7.89 1989 6.87 7.89 1990 6.96 7.91 1991 7.10 7.98 1992 7.19 8.06 1993 7.26 8.09 1994 7.34 8.12 1995 7.31 8.15 1996 7.30 8.15 1997 7.35 8.17 1998 7.38 1999 7.41 2000 7.37 200120022003
lGP
C_s
ocia
l
Logarithm of Soc ial Expenditures p/c United StatesYear
1970 1980 1990 20007.4
7.6
7.8
8
8.2
7.4
7.6
7.8
8
8.2
lGP
C_s
ocia
lLogarithm of Soc ial Expenditures p/c Argentina
Y ear1970 1980 1990 2000
6.6
6.8
7
7.2
7.4
6.6
6.8
7
7.2
7.4
43

Second Step: HP Filter Then we apply the HP filter to the variables in the logarithms to obtain the trend. Table A3 presents the results for Gross Domestic Product per capita.
Table A3. HP-Filtered GDP Trend
Trend of GDP per capita (HP filter)Year Argentina United States1970 8.87 9.78 1971 8.88 9.80 1972 8.89 9.82 1973 8.90 9.84 1974 8.90 9.86 1975 8.90 9.88 1976 8.89 9.90 1977 8.89 9.92 1978 8.88 9.94 1979 8.86 9.96 1980 8.85 9.98 1981 8.83 10.00 1982 8.82 10.01 1983 8.80 10.03 1984 8.79 10.06 1985 8.77 10.08 1986 8.76 10.10 1987 8.76 10.12 1988 8.76 10.14 1989 8.76 10.16 1990 8.77 10.18 1991 8.79 10.20 1992 8.81 10.22 1993 8.83 10.24 1994 8.85 10.26 1995 8.87 10.28 1996 8.88 10.30 1997 8.89 10.32 1998 8.88 10.34 1999 8.88 10.36 2000 8.86 10.38 2001 8.84 10.39 2002 8.82 10.41 2003 8.79 10.43
Trend of GDP p/c ArgentinaYear
lGDP_pc trend_GDP_pc
1970 1980 1990 2000
8.6
8.7
8.8
8.9
9
8.6
8.7
8.8
8.9
9
Trend of GDP p/c United StatesYear
lGDP_pc trend_GDP_pc
1970 1980 1990 2000
9.8
10
10.2
10.4
9.8
10
10.2
10.4
44

Table A4 presents the results for Social Expenditures per capita.
Table A4. HP-Filtered Social Expenditures Trend Trend of Social Expenditures (HP filter)
Year Argentina United States197019711972 7.45 1973 7.49 1974 7.54 1975 7.58 1976 7.62 1977 7.66 1978 7.70 1979 7.73 1980 6.77 7.76 1981 6.78 7.79 1982 6.79 7.82 1983 6.81 7.84 1984 6.84 7.85 1985 6.87 7.87 1986 6.90 7.89 1987 6.94 7.91 1988 6.97 7.92 1989 7.02 7.95 1990 7.06 7.97 1991 7.10 8.00 1992 7.15 8.03 1993 7.20 8.06 1994 7.24 8.09 1995 7.28 8.12 1996 7.31 8.15 1997 7.34 8.18 1998 7.38 1999 7.41 2000 7.44 200120022003
Trend of Social Expenditures United StatesYear
lGPC _s ocial trend_GPC_s ocial
1970 1980 1990 20007.4
7.6
7.8
8
8.2
7.4
7.6
7.8
8
8.2
Trend of Soc ial Expenditures ArgentinaY ear
lGPC_soc ial trend_GPC_s ocial
1970 1980 1990 2000
6.6
6.8
7
7.2
7.4
6.6
6.8
7
7.2
7.4
45

Third Step: Cyclical Component Now we can calculate the cyclical component of the time series, calculated as the difference between the observed value and the estimated trend in the second step. In the following table and figures we present the relationship between the cyclical component of GDP and Social Expenditures.
Table A5. GDP and Social Expenditure Cycles Cycle of GDP and Social Expenditures per capita (observed-trend)
YearGDP Social Exp. GDP Social Exp.
1970 -0.08 -0.011971 -0.03 -0.011972 0.01 0.01 -0.021973 0.04 0.04 -0.051974 0.07 0.00 -0.041975 0.03 -0.03 0.061976 -0.02 -0.01 0.061977 0.02 0.01 0.001978 -0.02 0.03 0.001979 0.05 0.03 -0.031980 0.05 0.20 0.00 0.021981 -0.01 0.14 0.00 0.041982 -0.04 -0.23 -0.05 0.031983 0.00 -0.18 -0.04 0.061984 0.02 -0.08 0.00 0.011985 -0.06 -0.05 0.01 0.001986 0.01 0.11 0.01 -0.011987 0.02 0.17 0.01 -0.031988 -0.01 -0.01 0.02 -0.041989 -0.10 -0.14 0.03 -0.061990 -0.14 -0.10 0.02 -0.061991 -0.06 -0.01 -0.02 -0.021992 0.00 0.04 -0.02 0.031993 0.03 0.07 -0.02 0.031994 0.05 0.10 -0.01 0.031995 0.00 0.03 -0.01 0.031996 0.02 -0.01 -0.01 0.001997 0.08 0.00 0.01 -0.011998 0.11 0.01 0.021999 0.07 0.00 0.032000 0.07 -0.07 0.022001 0.03 -0.012002 -0.13 -0.012003 -0.11 -0.01
Argentina United States
Cycles of GDP and Soc ial Expenditures United StatesYear
Cycle p/c GDP Cycle p/c Social Expenditures
1970 1980 1990 2000
-0.05
0.00
0.05
-0.05
0.00
0.05
Cyc les of GDP and Social Expenditures ArgentinaY ear
Cycle p/c GDP Cy cle p/c Soc ial Expenditures
1970 1980 1990 2000
-0.20
0.00
0.20
-0.20
0.00
0.20
The figures present a preliminary conclusion about the cyclical behavior of the social expenditures. We can see procyclical behavior in Argentina, in contrast with countercyclical behavior in the case of the United States. Fourth Step: Correlation between Cycles Finally, we calculate the correlation between the GDP and social expenditure cycles to establish the degree of procyclicality.
In this case, the correlation values are: 0.63 in Argentina and -0.75 in the United States. The results are consistent with the figures in the previous section.
46

Results in Latin American Countries The panels of the following figure present the results for Latin American countries for which data are available. The correlations are reported in the tables in the text.
Figure A1. Cyclicality of GDP and Social Expenditure in Selected Countries
Cycle p/c GDP Cycle p/c Social ExpendituresArgentina
-0.50
0.00
0.50
Bahamas, The Bolivia Brazil
-0.50
0.50
Chile
-0.50
0.00
0.50
Colombia Costa Rica Dominican Republic
-0.50
0.50
Guyana
-0.50
0.00
0.50
Mexico Panama
1970 1980 1990 2000
Paraguay
1970 1980 1990 2000-0.50
0.50
Uruguay
1970 1980 1990 2000-0.50
0.00
0.50Venezuela
1970 1980 1990 2000-0.50
0.50
47
Appendix B. Description of Data and Sources The source of the data for these calculations is:
• World Economic Outlook Database (International Monetary Fund), September 2002.
Data:
o Real Gross Domestic Product, Constant Prices (billions of local currency
units).
o Gross Domestic Product, Current Prices (billions of local currency units).
o Gross Domestic Product, Current Prices (billions of U.S. dollars).
o Per Capita Gross Domestic Product, Constant Prices (local currency per
person).
• Government Financial Statistics (International Monetary Fund. Data:
o Total expenditures of public sector.
o Expenditures of education, health, social security and welfare, housing and
community amenities.
Period: Variables of Gross Domestic Product: 1970-2002. Expenditures: 1972-1997.
Table B1. Regression Results Reported in Section 3 Dependent Variable: Cyclical Correlation of Social Expenditure
Cyclical correlation of Total exp.
0.542 (3.95)
GDP per capita -5.42 x e-07 (-0.054)
Volatility 5.426 (1.93)
Expenditure / GDP 0.004 (1.29)
Income tax revenue / total rev.
-0.0004 (-0.11)
Latin America dummy 0.057 (0.49)
OECD dummy 0.104 (0.58)
N 59 R - squared 0.44
48

Appendix C. Recent Experience with Fiscal Rules in Latin America This appendix describes some salient examples of recent fiscal rules implemented in Latin America with various degrees of success. The cases of Argentina, Brazil and Colombia draw heavily from Braun and Tommasi (2002). Argentina The Convertibility Plan adopted at the beginning of the 1990s constrained monetary and exchange rate policies. Fiscal pressures have mounted due to the impact of international financial crisis (Tequila effect, Russian and Asian crises) in the 1990s, and a controversial system of transfers to sub-national governments. The economy was also hit by the Brazilian devaluation in 1998. During that decade, the fiscal balance only showed a surplus in 1994, despite a strong economic performance during the first half of the 1990s. Sub-national governments posted a growing deficit of 1.5 percent of GDP in 1999 and the fiscal deficit exceeded US$7 billion.
Faced with a deteriorating budget balance and growing debt payments, the Argentine Congress approved a Fiscal Solvency Law (Ley de Solvencia Fiscal) in September 1999 that contains only eleven articles. Apart from establishing numerical limits for the central government’s fiscal deficit, it also limited the growth of expenditures. Furthermore, the law stipulated the adoption of pluriannual budgeting (a three-year budget), the creation of a Counter-cyclical Fiscal Fund, and the implementation of transparency measures to increase the availability of information regarding the state of public finances. Although the law did not include conditions for sub-national governments, it invited the provinces to pass similar laws at the sub-national level.31 In terms of counter-cyclical policy, the law created a Fiscal Counter-Cyclical Fund managed by the Ministry of Economy. The sources of this fund consist primarily of preset Treasury contributions, fiscal surpluses and 50 percent of the proceeds of the concession programs. Once the Fund reaches the equivalent of 3 percent of GDP, it can be used to cancel external debt.
Regarding the limits on budget deficits, the Law established that fiscal balance had to be reached no later than 2003, and it set nominal ceilings for the non-financial public sector deficit between 1999 and 2002. The Fiscal Solvency Law was modified by the 2001 Budgetary Law, which relaxed the deficit ceilings, and extended the date at which budget balance should be achieved until 2005. Table C1 shows the limits imposed by the Fiscal Solvency Law and its modification, together with the actual budget outcomes between 1999 and 2001. Contrary to the optimism expressed by some analysts of the Argentine case, the rule was broken in every year. 31 The exclusion of limits on sub-national governments was a fundamental weakness of the rule. In a country with a federal fiscal system like the one in Argentina, fiscal rules would only make sense if they encompass all relevant

Table C1. Compliance with the Fiscal Solvency Law
Limits (as % of GDP) Year 1999
Law 2001 Modification32
Observed
1999 1.9% 3.1% 2000 1.1% 2.5% 2001 0.5% 2.5% 3.3% 2002 0.3% 2% 1.9% 2003 0% 1.3% 2004 0% 0.9% 2005 0% 0%
Source: Braun and Tommasi (2002)
At the sub-national level, several governments followed the national example and passed fiscal solvency rules. These rules differ across provinces in some of their characteristics, as well as in the degree to which they have been followed. Table C2 summarizes the main characteristics of the existing sub-national rules.
Table C2. Main Characteristics of Sub-National Fiscal Rules in Argentina
Explicit Limits on Province Law? Date Deficit Public
Debt Current Expenditure
Pluriannual Budget Formulation
Stabiliza-tion Fund
Fiscal Trans-parency
GCBA NO Buenos Aires
NO
Catamarca YES 12/00 Yes Yes Cordoba YES 03/00 Yes Yes Yes Yes Corrientes NO Chaco YES 05/00 Yes Yes Yes Chubut YES - Yes Yes Yes Yes Entre Rios NO Formosa YES 12/99 Yes Yes Yes Yes Yes Yes Jujuy NO La Pampa NO La Rioja NO Mendoza YES 01/00 Yes Yes Misiones YES 05/00 Yes Yes Yes Yes Yes Neuquen YES - Yes Yes Río Negro YES 01/01 Yes Yes Yes Yes Yes Salta YES 05/99 Yes Yes Yes San Juan YES 01/01 Yes Yes Yes
governmental levels. Otherwise, they would simply be non-binding. It would be like telling a person that they can only spend $500 a month using their left hand. 32 Values are estimated, because the Law establishes nominal ceilings for the deficit, not for the deficit as percentage of GDP.
50

Table C2., continued
Province Law? Date Explicit Limits on Pluriannual Budget Formulation
Stabiliza-tion Fund
Fiscal Trans-parency
San Luis YES 08/99 Yes Yes Yes Yes Santa Cruz NO Santa Fe NO Santiago Del Estero
NO
Tucuman YES 09/99 Yes Yes Yes Tierra del Fuego
YES 08/00 Yes Yes
National Govt.
YES 09/99 Yes Yes Yes Yes Yes Yes
Source: Braun and Tommasi (2002). These rules include several of the characteristics favored by the recent literature on fiscal rules, such as clear limits on government debt and requirements regarding the timely and accurate publication of fiscal information. However, compliance with these laws in terms of debt and deficit performance has been uneven. Table C3 shows the deficit and expenditure targets allowed by law in each province and the actual outcomes for the year 2000. Only 5 out of 11 provinces that imposed a hard budget constraint actually fulfilled their commitment. Out of the five that complied with the law, two of these, Cordoba and Tucuman, had been achieving the objective stated in the law for several years, so the law appears more like a reflection of pre-existing underlying political agreements. With respect to limits on expenditure, three out of eight provinces that imposed limits did not comply with them in the year 2000.
Table C3. Degree of Compliance with Provincial Solvency and Fiscal Responsibility Laws
Deficit and Expenditure Goals (Argentina, year 2000)
Prov
ince
Explicit Limit on Deficit Actual deficit
Com
plia
nce
Explicit Limit on Expenditure Observed
Com
plia
nce
Cat
amar
ca For year 2000, 2% of
the average of total expenditure of years 1998 and 1999.
1.9%
Yes
No
Cor
doba
The current deficit must be zero.
158 million
Yes
Current Expenditure cannot grow more than Regional Domestic Product (RDP). If RDP decreases, the Current Expenditure must be held constant.
Current Expenditure grew 2% and the PBG held constant.
No
51

Table C3., continued Pr
ovin
ce
Explicit Limit on Deficit Actual deficit
Com
plia
nce
Explicit Limit on Expenditure Observed
Com
plia
nce
Cha
co
For year 2000: the deficit must be less than 100 millions. Then it must decrease by 20 percent annually.
-171 million
No
No
Chu
but
For year 2000, the primary surplus must be equal to 50% of public debt interest of that year.
The surplus was 70% of public debt interest of that year.
Yes
The Current Expenditure cannot grow more than RDP. If RDP decreases, the Current Expenditure must be held constant.
The first semester 2001 current expenditure decreased 2% compared with first semester 2000. Y
es
Form
osa
For Year 2000, the deficit must be less than the debt amortization of this year.
99 million of budgetary deficit and 234 million of public debt amortization.
Yes
The Primary Expenditure cannot grow more than National Resources. If National Resources decrease, the Primary Expenditure must be held constant.
The Primary Expenditure decreased 15%.
Yes
Men
doza
Not explicit, Fiscal Equilibrium for year 2003.
No
Mis
ione
s
For Year 2000: the deficit must be less than the debt amortization of this year.
134 million of budgetary deficit and 76 million of public debt amortization.
No
The Primary Expenditure cannot grow more than National Resources. If National Resources decrease, the Primary Expenditure must be held constant.
The Primary Expenditure decreased 15%
Yes
Neu
quén
Primary surplus must be 3% of total revenue at year 2001.
In the first semester of 20001 the primary surplus was 20 million.
Yes
Current Expenditures must be lower than 833 million in year 2000.
Current Expenditures were 1,025 million in year 2000.
No
Río
Neg
ro For 2001, the primary
result must be zero. In the first semester of 2001 the primary deficit was 14 million.
No
No
Prov
ince
Explicit Limit on Deficit Actual deficit
Com
plia
nce
Explicit Limit on Expenditure Observed
Com
plia
nce
52

Table C3., continued
Prov
ince
Explicit Limit on Deficit Actual deficit
Com
plia
nce
Explicit Limit on Expenditure Observed
Com
plia
nce
Salta
Fiscal equilibrium The fiscal deficit was 69 million (7% of total revenue).
No
Personnel Expenditure must be lower than 65% of Current Revenue.
Personnel Expenditures were 53% of Current Revenue (MM condic). Y
es
San
Juan
Fiscal equilibrium In the first semester of 2001 the primary deficit was 46 million.
No
Personnel Expenditure must be lower than 65% of Current Revenue.
Personnel Expenditures were 85% of Current Revenue.
No
Tucu
man
The current deficit must be zero
52 million Y
es
The Current Expenditure grow must be lower than the Current revenue growth. If Current revenue decreases, the Current Expenditure must be held constant.
The Current Expenditure decreased 2%.
Yes
Tier
ra d
el
Fueg
o
The fiscal deficit must be equal to the budgeted.
9 million surplus vs. 16 million.
Yes
No
Source: Braun and Tommasi (2002). The tradition of not respecting rules goes beyond these recent cases. Several provincial constitutions contain limits on public debt. In fact, 16 of 24 provinces have constitutional limits regarding the ratio between debt service and total revenue. These limits range between 20 and 25 percent of total revenue. However, in 2000, only 10 of the 16 provinces complied with those limits, with preliminary results for 2001 being much worse (see Table C4).
Table C4. Compliance with Constitutional Debt-Service Rule (Argentine provinces)
Jurisdiction Constitutional limits
Debt service/ Total Revenue Year 2000
G.C.B.A. No limit 3% Buenos Aires No limit 3% Catamarca (a) 20% 24% Córdoba (b) 20% 13% Corrientes 25% 41% Chaco 25% 14% Chubut No limit 12% Entre Ríos 25% 27% Formosa 25% 39%
53
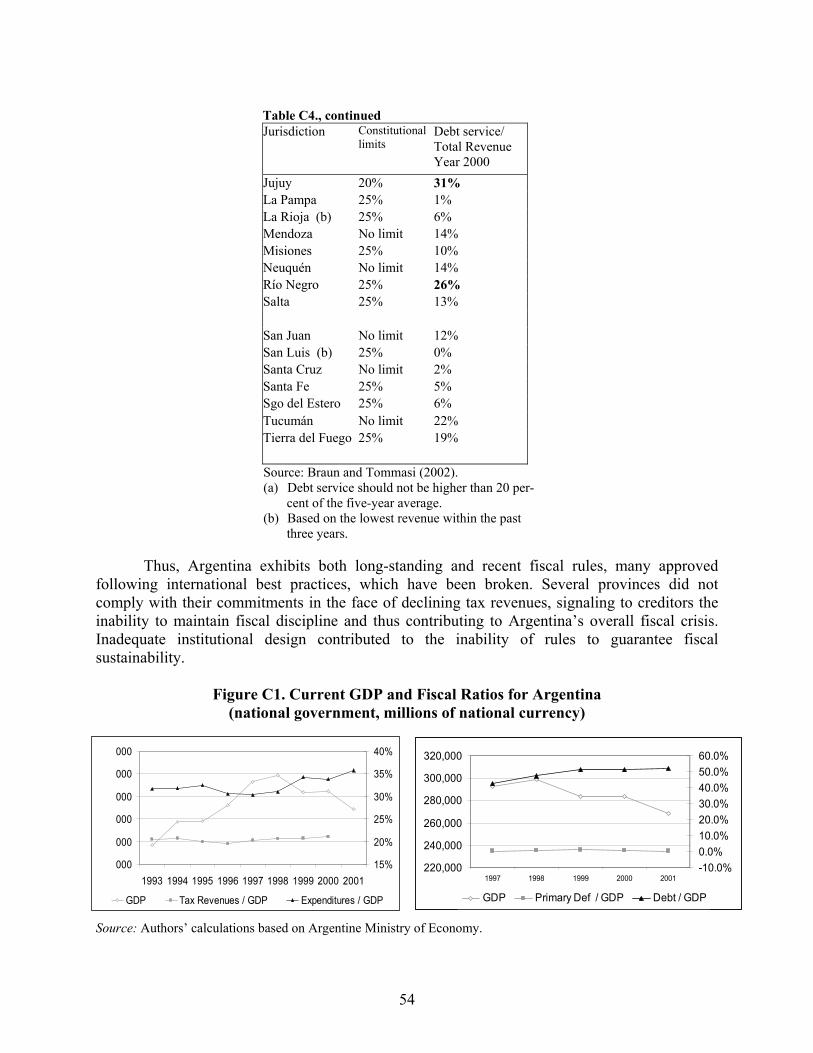
Table C4., continued Jurisdiction Constitutional
limits Debt service/ Total Revenue Year 2000
Jujuy 20% 31% La Pampa 25% 1% La Rioja (b) 25% 6% Mendoza No limit 14% Misiones 25% 10% Neuquén No limit 14% Río Negro 25% 26% Salta 25% 13% San Juan No limit 12% San Luis (b) 25% 0% Santa Cruz No limit 2% Santa Fe 25% 5% Sgo del Estero 25% 6% Tucumán No limit 22% Tierra del Fuego 25% 19%
Source: Braun and Tommasi (2002). (a) Debt service should not be higher than 20 per- cent of the five-year average. (b) Based on the lowest revenue within the past three years.
Thus, Argentina exhibits both long-standing and recent fiscal rules, many approved following international best practices, which have been broken. Several provinces did not comply with their commitments in the face of declining tax revenues, signaling to creditors the inability to maintain fiscal discipline and thus contributing to Argentina’s overall fiscal crisis. Inadequate institutional design contributed to the inability of rules to guarantee fiscal sustainability.
Figure C1. Current GDP and Fiscal Ratios for Argentina (national government, millions of national currency)
320,
300, 280,
260, 240,
220,
000
000
000
000
000
000
1993 1994 1995 1996 1997 1998 1999 2000 200115%
20%
25%
30%
35%
40%
GDP Tax Revenues / GDP Expenditures / GDP
220,000
240,000
260,000
280,000
300,000
320,000
1997 1998 1999 2000 2001-10.0%0.0%10.0%20.0%30.0%40.0%50.0%60.0%
GDP Primary Def / GDP Debt / GDP
Source: Authors’ calculations based on Argentine Ministry of Economy.
54

Brazil In the 1980s, inconsistent fiscal and monetary management and coordination, despite the start of some economic reforms, caused a volatile environment and several crises. The 1988 Constitution in Brazil mandated a large increase in tax sharing. However, Congress rejected a proposal for matching decentralization of expenditure responsibilities. Finally, during the 1990s expenditure decentralization did increase, and at the same time, the federal government increased tax rates on those taxes it was not mandated to share with the states. Therefore, the federal government managed to keep a roughly constant level of deficit as a share of GDP, whereas fiscal mismanagement at the state level led to excessive state deficits and growing debt. There were several state debt crises during the 1990s; on several occasions the federal government bailed the states out, furthering the incentives for fiscal laxity at the local level.
The Real Plan in 1994 started to attack the fiscal front, and the reduction in inflation posed a new challenge to fiscal policy since it was no longer possible to use the inflation tax as a source of financing. The decrease in the availability of external capital inflows due to international crises, together with growing difficulties in sub-national governments’ finances, exerted increasing pressure on Brazilian fiscal policy during the second half of the 1990s.
In 1998, a new round of rescheduling was accompanied by attempts at hardening state budget constraints. Fiscal targets (minimum primary surpluses) were placed in budgetary laws. Senate approval was imposed as a requirement for all sub-national government borrowing operations, and the issue of new bonds was prohibited, as was borrowing from state-owned banks. These rules limiting debt were not fully effective. Therefore, the government started to draft a bill to create a Fiscal Responsibility Law in order to promote a new regime. In December 1998, the bill was made available for public scrutiny and consultation over the Internet, and it was officially sent to Congress in April 1999. The bill was finally approved in May 2000, with full majority support in the Senate and the Chamber of Deputies, which was required because of its being a Supplementary Law.33
The Brazilian Fiscal Responsibility Law applies to the three levels of governments and encompasses the judiciary, legislative and executive branches. The key aspects of this law are the following:
•
•
•
The annual Budgetary Directives Law must include annual targets for revenues, expenditures and public debt for the current and for the two subsequent years and an evaluation of compliance with the previous year’s targets on accrual basis. Tax exemptions or benefits, as well as new expenditure items, must be included in the budget law. Personnel expenditures, excluding severance payments and voluntary separation incentives, cannot exceed certain percentages of net current revenues for each government level. Exceeding the limits creates restrictions
33 Supplementary Laws cannot be changed by an ordinary law (such as the budget law, for instance) or a provisional measure.
55

to personnel management, plus the adoption of a plan to eliminate that excess in the next eight months. The Federal Senate will establish debt limits. The ratio of net debt to current revenue should reach a target of 1.0 over 15 years. The golden rule is: no debt to finance current expenditures.
•
•
•
•
•
Central Bank lending is prohibited. In general, no lending is allowed between different levels of governments. All instruments of fiscal management, including plan, budgets and reports, must be widely disclosed. Different reports about budget execution and fiscal management must be prepared. Stricter limitations for the final year in office for the politicians, in an effort to limit the political business cycle. A state that does not comply with the law may be subject to limits on new credit operations, transfers and guarantees from the central government. At the individual level, a government official can lose her position, lose the right to hold a public sector position for 5 years, and even be arrested and fined.
Figure C2. Current GDP and Fiscal Ratios for Brazil (national government, millions of national currency)
600,000700,000800,000900,000
1,000,0001,100,0001,200,0001,300,000
1995 1996 1997 1998 1999 2000 2001-10%
10%
30%
50%
70%
GDP Primary Def / GDP Debt / GDP
800,000
900,000
1,000,000
1,100,000
1,200,000
1,300,000
1997 1998 1999 2000 200115%
17%
19%
21%
23%
25%
GDP Tax Revenues / GDP Expenditures / GDP
Source: Authors’ calculations based on IMF.
The preliminary results are encouraging. However, it is too early to come to a conclusion about the long-term effects on public finances in Brazil. It has not yet been tested by time, and the change in government at the national level is too recent to evaluate its effects. Chile In 1985 the government created the Chilean Copper Fund to help stabilize fiscal revenues from the volatility of copper receipts. At the beginning of the new democratic period, during a major boom in copper prices, the fund especially helped contain pressures for increased public spending by keeping net surpluses out of sight and out of reach of the normal discretionary budget process. It also tied the hands of the Executive and raised the cost of appropriating savings for additional expenditures, since it would have required a change in the law. Thanks to this policy, government expenditures have not closely tracked revenue availability. Accumulated deposits into the fund reached their peak in 1997, amounting to US$ 3.9 billion.
56

The fund’s saving-spending rules are symmetric and based on a long-term copper reference price. Nevertheless, because the fund does not include an automatic rule for divestitures, it may play a limited role in helping to execute counter-cyclical policies in downturns, as happened in 1999. At that time the government found that previous surpluses and the savings in the CSF were not enough to play a role in counter-cyclical fiscal policy.
After the structural balance showed a deficit for the first time in ten years, in 1999, the government decided to implement a new approach to fiscal policy. At that time a new fiscal rule based on structural surpluses of 1 percent of GDP was introduced to reaffirm and intensify Chile’s commitment to fiscal responsibility. Chile’s new fiscal policy approach represents not an emergency effort to restore fiscal policy credibility where there was none before, but to set a sign of how fiscal policy will be conducted over a medium-term horizon.
The Chilean approach is not a fiscal rule in the strictest sense, as it is not imposed by law. Instead, it is a self-imposed measure by the present government to guide fiscal policy from 2001 to 2005. Nevertheless, this initiative is perceived as highly credible because of Chile’s good track record of fiscal policy.
The calculation of the structural surplus in Chile follows the IMF and OECD methodology modified to capture some peculiarities of the Chilean economy. It is estimated by removing the effects of cycle variations in copper prices, given the importance of copper revenues for public finances, and the economic cycles in revenues but not in expenditures.
The fiscal rule in Chile only applies to the central government. The quasi-fiscal deficit of the central bank, and flows from public enterprises, the military sector and municipalities are excluded from the new structural balance. However, this does not necessarily imply a weakening of the search for fiscal discipline, since they are not ignored from policy considerations.
This rule is supposed to enable Chile to generate large surpluses in good times and thus avoid a procyclical bias in fiscal policy, which was common in the past. Talvi and Végh (2000) and Bergoeing and Soto (2000) provide estimates of procyclicality before the introduction of the fiscal rule.
This rule works well if structural revenues are estimated correctly. If these are overestimated systematically a potential deficit bias in the actual balance is introduced. Another weak point of the fiscal rule is that public sector borrowing requirements need to be met on the basis of the actual and not structural balance. Therefore, a financing problem might arise if, in spite of a structural surplus, a country is running subsequent actual deficits. In emerging economies, deficits and debt sustainability play an important role when evaluating country risk.
57

Figure C3. Current GDP and Fiscal Ratios, Chile (national government, millions of national currency)
25,000,000
30,000,000
35,000,000
40,000,000
45,000,000
1996 1997 1998 1999 2000 20010%2%4%6%8%10%12%14%16%
GDP Primary Def / GDP Debt / GDP
25,000,000
30,000,000
35,000,000
40,000,000
45,000,000
1996 1997 1998 1999 2000 200120%
21%
22%
23%
24%
25%
26%
GDP Revenues / GDP Expenditures / GDP
Source: Authors’ calculations based on IMF.
As Chile’s new fiscal rule is a structural surplus rule and not a structural balance rule, it is difficult to assess potential implications on the size/composition of future public or social expenditures. However, it is possible that the fiscal rule helps smooth public and social expenditures over the cycle. As in the case of Brazil, Chile’s new fiscal rule has not yet been tested by time yet. Colombia Colombia has traditionally been a centralist, unitary state, and its departments and municipalities have less autonomy than Brazilian states or Argentine provinces. However, political decentralization increased in the late 1980s and early 1990s. Mayors started to be directly elected in 1986, and governors in 1991.
Consistent with the centralist tradition, sub-national borrowing in Colombia in the 1980s and before was uncommon, and required approval by the Ministry of Finance. However, in the late 1980s and 1990s the trend towards political decentralization was accompanied by more freedom for domestic borrowing. In particular, there was no effective ex ante control of cash advances from banks, and sub-national debt with the banking sector rose from 2.6 percent of GDP in 1991 to 4.6 percent in 1997.34
As a way to increase control over sub-national debt by the central government, the so-called Traffic Light Law was passed in 1997. This law brought into effect a rating system for territorial governments, based on the ratios of interest to operational savings and of debt to current revenues. Highly indebted local governments (red light) were prohibited from borrowing, and intermediate cases (yellow light) were required to obtain permission from the Ministry of Finance. In this way, the central government would be able to limit the growth of sub-national debt. However, the indebtedness law has not been fully effective. According to Echavarría, Renteria and Steiner (2000), some governments with a red light rating have obtained new
58
34 For further details, see Dillinger, Perry and Webb (2001).

financing without permission of the Ministry of Finance. “Out of 21 departments that required permission for new loans in 1997, 10 received new credit without permission from the Ministry […] In order to be able to violate the law, departments presented defective financial information, and the financial institutions made superficial analysis of it. In addition, the Ministry of Finance gave its authorization in cases where it should have denied it” (Echevarría, Renteria and Steiner, 2000, p. 9). Furthermore, as described by Vice-Minister Catalina Crane, while there was the expectation that departments would transit from yellow to green, they have transited from yellow to red.
The importance of bank lending as a source of financing for sub-national governments in Colombia makes bank regulation an alternative way to control sub-national borrowing. The Superintendency of Banks has altered its requirements regarding provisions against nonperforming territorial loans. After the bank borrowing expanded in 1993-1994, the Superintendency established that any sub-national loan with maturity of over a year had to be considered risky and consequently should require some provisioning. These regulations were relaxed again in 1996, leading to two years of high borrowing. Starting in 1999, the debt of any territory with a red rating in the traffic-light law system must be fully provisioned, increasing the cost of those loans for banks. This combination may make the traffic-light law more effective.
The Colombian Coffee Fund was instituted with the objective of permitting some stabilization in the incomes of coffee growers along the cycle of international prices. Nevertheless, it also had, as a side effect, significant fiscal stabilization properties that became a major objective of government policy in the 1980s and 1990s. As a para-fiscal institution, the Coffee Fund was not included in the budget and was kept out of the normal fiscal process, so surpluses were from political eyes. The Fund lost fiscal importance during the 1990s as coffee became less important from a fiscal point of view, and oil largely took its place.
Therefore, in 1995 the Colombian Oil Stabilization Fund (OSF) was instituted. It uses automatic rules for both savings and withdrawals: it requires saving excess revenues over past moving averages, and permits withdrawals up to the shortfalls of actual revenues from such previous averages. The Fund was designed to tie the hands of authorities and hide from political view the expected surpluses during the impeding increase of oil production and revenues from new discoveries, as excess revenues deposited in the Fund are not included in the budget. The discussion and enactment of the Fund were well before the increase in revenues began to flow in. This approach, together with the adoption of symmetrical rules for National and sub-national governments, facilitates the political consensus. Although the OSF accumulated significant reserves, it turned out to be less important than expected and did not prevent an increase in public expenditures during the boom in non-oil tax revenues (1991-96), which led to a significant increase in the deficit during the subsequent downturn (1996-99).
Since 1995, fiscal balances have been negative and in 1999 the deficit exceeded 6% of the GDP. Multilateral organizations provided fast disbursements and the country had to negotiate a stand-by agreement with the IMF. As part of the necessary reforms, in 2000 Colombia passed
59

Law 617, the so-called Sub-National Fiscal Responsibility Law. The main features of the 96 articles are the following:35
i) Primary current expenditure must be exclusively financed by non-earmarked current revenues, and should not exceed a fixed percentage, depending on the state or municipal category.
ii) Expenditure for state legislatures is limited. iii) Across-the-board cuts should be put in place whenever effective non-
earmarked current revenues are lower than budgeted, and state and municipal central administrations are not allowed to make transfers to their public entities.
iv) There are strict limits to municipality creation. Proven non-viable municipalities have to merge.
v) When sub-national governments do not comply with the limits imposed by the Law, they have to adopt a fiscal rescue program to regain viability within the next two years.
vi) To promote transparency, there is an extensive list of characteristics and requirements for the election of governors, mayors, legislators and their relatives.
Figure C4. Current GDP and Fiscal Ratios, Colombia (national government, billions of national currency)
180,200,
160,
120,140,
020,00040,00060,00080,000
000000000000000000
1993 1995 1997 1999 200120%22%24%26%28%30%32%34%36%38%40%
GDP Revenues / GDP Expenditures / GDP
020,00040,00060,00080,000
100,000120,000140,000160,000180,000200,000
1993 1995 1997 1999 2001-10%
0%
10%
20%
30%
40%
50%
GDP Primary Def / GDP Debt / GDP
100,
Source: Authors’ calculations based on IMF. It is also still too early to tell whether the law brings about a structural change in fiscal outcomes, but the provisions seem to be a move in the right direction. The authorities are also working on a fiscal responsibility law for central government finances. The project has been drafted, but it seems that there is still no consensus, particularly on the issue of sanctions and penalties, since they are perceived as subject to political interference and manipulation.
35 For further details see Oliva (2001).
60

Peru During most of the 1990s, the main objective of fiscal policy was to generate primary surpluses in order to afford interest payments of non-financial public sector debt. Between 1991 and 1996 these interest payments amounted, on average, to 4 percent of the GDP, with average primary surpluses of 1.2 percent and an average global deficit of 2.8 percent. The Asian crisis in 1997 and the Russian crisis of 1998 both hit the Peruvian economy, provoking a recession and causing the country’s fiscal position to weaken. At the end of this decade, fiscal balances showed both an apparent ceiling for revenue collection and increasing public expenditures. By the end of 1999, Congress approved a Prudence and Transparency Law with the goal of establishing guidelines to improve public finance management in order to contribute to economic stability. The passage of this Law was a compromise established in a Sector Loan backed by the Inter-American Development Bank and supported by other multilateral organizations. Fiscal policy recovered its procyclical characteristic but this time in legal terms. The key aspects of this law are the following:
• The Ministry of Economy and Finance will prepare and publish a Multi-annual Macroeconomic Framework, which will contain macroeconomic projections for the next three years, including macroeconomic assumptions, fiscal revenues and expenditures, projected public investment, and public debt stock and profile.
• The consolidated public sector deficit cannot exceed 1 percent of GDP. • The increase in the real general government non-financial public expenditures
cannot surpass the 2% rate. • Public debt cannot increase more than the deficit adjusted by several factors,
such as exchange variations and pension “recognition bonds.” • In election years, there are some limits to the path of non-financial public
expenditures and fiscal deficit. • The congress has the freedom to suspend, for the fiscal year, any of the
numeric rules in cases of national emergency or international crisis, without explicitly defining those events. The congress can also increase the fiscal deficit to a maximum of 2 percent of GDP if there is evidence of recession.
• Fiscal Stabilization Fund is established, managed by the Ministry of Economy and Finance. Its resources come from any ordinary revenues in excess of 0.3 percent of GDP with respect to their last three-year average, adjusted by tax policy changes. In addition, the Fund receives 75 percent of privatization revenues and 50 percent of concession proceeds. Fund resources will be used when ordinary revenues are 0.3 percent of GDP less than the adjusted three-year average and in the case of the exceptions mentioned above.
61

Figure C.5. Current GDP and Fiscal Ratios, Peru (national government, millions of national currency)
2
1
1 1 1 1
80,000
00,000
20,000
40,000
60,000
80,000
00,000
1993 1995 1997 1999 20018%9%10%11%12%13%14%15%16%
GDP Revenues / GDP Expenditures / GDP
80,000
100,000
120,000
140,000
160,000
180,000
200,000
1993 1995 1997 1999 2001-10%
0%
10%
20%
30%
40%
50%
GDP Primary Def / GDP Debt / GDP
Source: Authors’ calculations based on IMF.
It is surprising that the Prudence and Transparency Law passed by the Congress in 1999 did not considered the past behavior of fiscal variables during booms, nor did it predict the performance of the Peruvian economy for the next few years. The numeric and exception rules were completely impossible to comply with during downturns. In 2000, the non-financial public sector deficit reached 3.2 percent of the GDP, and 2.5 percent in 2001. These deficits completely violated the exception rule that set a maximum 2 percent deficit during recessions. This limit appears unreasonable, since interest payments amount on average to 2 percent of GDP.
62