Towards an integrated approach to crowd analysis and crowd synthesis: A case study and first results
33
Towards an Integrated Approach to Crowd Analysis and Crowd Synthesis: a Case Study and First Results Stefania Bandini 1 , Andrea Gorrini 2 , Giuseppe Vizzari 1* 1 Complex Systems and Artificial Intelligence Research centre, Universit`a degli Studi di Milano–Bicocca, Milano, Italy 2 Information Society Ph.D. Program, Department of Sociology and Social Research, Universit`a degli Studi di Milano–Bicocca, Milano, Italy Abstract Studies related to crowds of pedestrians, both those of theoretical nature and application oriented ones, have generally focused on either the analysis or the synthesis of the phenomena related to the interplay between individual pedestrians, each characterised by goals, preferences and potentially relevant relationships with others, and the environment in which they are situated. The cases in which these activities have been systematically integrated for a mutual benefit are still very few compared to the corpus of crowd related literature. This paper presents a case study of an integrated approach to the definition of an innovative model for pedestrian and crowd simulation (on the side of synthesis) that was actually motivated and supported by the analyses of empirical data acquired from both experimental settings and observations in real world scenarios. In particular, we will introduce a model for the adaptive behaviour of pedestrians that are also members of groups, that strive to maintain their cohesion even in difficult (e.g. high density) situations. The paper will show how the synthesis phase also provided inputs to the analysis of empirical data, in a virtuous circle. Keywords: crowd analysis, crowd synthesis, agent–based modelling and simulation, groups * Corresponding author Email address: [email protected], [email protected], [email protected] (Stefania Bandini 1 , Andrea Gorrini 2 , Giuseppe Vizzari 1 ) Preprint submitted to Pattern Recognition Letters March 21, 2013 arXiv:1303.5029v1 [cs.MA] 20 Mar 2013
-
Upload
independent -
Category
Documents
-
view
0 -
download
0
Transcript of Towards an integrated approach to crowd analysis and crowd synthesis: A case study and first results

Towards an Integrated Approach to Crowd Analysis
and Crowd Synthesis: a Case Study and First Results
Stefania Bandini1, Andrea Gorrini2, Giuseppe Vizzari1∗
1Complex Systems and Artificial Intelligence Research centre,Universita degli Studi di Milano–Bicocca, Milano, Italy
2Information Society Ph.D. Program, Department of Sociology and Social Research,Universita degli Studi di Milano–Bicocca, Milano, Italy
Abstract
Studies related to crowds of pedestrians, both those of theoretical nature andapplication oriented ones, have generally focused on either the analysis orthe synthesis of the phenomena related to the interplay between individualpedestrians, each characterised by goals, preferences and potentially relevantrelationships with others, and the environment in which they are situated.The cases in which these activities have been systematically integrated fora mutual benefit are still very few compared to the corpus of crowd relatedliterature. This paper presents a case study of an integrated approach tothe definition of an innovative model for pedestrian and crowd simulation(on the side of synthesis) that was actually motivated and supported by theanalyses of empirical data acquired from both experimental settings andobservations in real world scenarios. In particular, we will introduce a modelfor the adaptive behaviour of pedestrians that are also members of groups,that strive to maintain their cohesion even in difficult (e.g. high density)situations. The paper will show how the synthesis phase also provided inputsto the analysis of empirical data, in a virtuous circle.
Keywords:crowd analysis, crowd synthesis, agent–based modelling and simulation,groups
∗Corresponding authorEmail address: [email protected], [email protected],
[email protected] (Stefania Bandini1, Andrea Gorrini2, Giuseppe Vizzari1)
Preprint submitted to Pattern Recognition Letters March 21, 2013
arX
iv:1
303.
5029
v1 [
cs.M
A]
20
Mar
201
3

2010 MSC: 68T42,68U20
1. Introduction
The modelling and simulation of pedestrians and crowds is a consolidatedand successful application of research results in the more general area of com-puter simulation of complex systems. It is an intrinsically interdisciplinaryeffort, with relevant contributions from disciplines ranging from physics andapplied mathematics to computer science, often influenced by (and sometimesin collaboration with) anthropological, psychological, sociological studies andthe humanities in general. The level of maturity of these approaches wassufficient to lead to the design and development of commercial software pack-ages, offering useful and advanced functionalities to the end user (e.g. CADintegration, CAD-like functionalities, advanced visualisation and analysistools) in addition to a simulation engine1. Nonetheless, as testified by arecent survey of the field by Schadschneider et al. (2009) and by a reportcommissioned by the Cabinet Office by Challenger et al. (2009), there is stillmuch room for innovations in models improving their performances both interms of effectiveness in modelling pedestrians and crowd phenomena, interms of expressiveness of the models (i.e. simplifying the modelling activityor introducing the possibility of representing phenomena that were still notconsidered by existing approaches), and in terms of efficiency of the simula-tion tools. In addition to the above directions, we want to emphasise the factthat one of the sometimes overlooked aspects of a proper simulation projectis related to the calibration and validation of the results of tools relatedto the synthesis of the pedestrians and crowd behaviour in the consideredscenario. These phases are essentially related to the availability of properempirical data about or, at least, relevant to, the considered scenario rangingfrom the pedestrian demand (i.e. an origin–destination matrix), preferencesamong different alternative movement choices (e.g. percentage of personsemploying stairs, escalators and elevators in a multiple–level scenario), butalso the average waiting times at service points (i.e. queues), the averagetime required to cover certain paths, the spatial distribution of pedestrians in
1see http://www.evacmod.net/?q=node/5 for a large although not necessarily completelist of pedestrian simulation models and tools. The list comprises more than 60 models,of commercial and academic nature, general purpose or specifically designed for certainsituations and scenarios, maintained or discontinued.
2
specific environmental conditions that is required to evaluate the so–called“level of service” associated to portions of the environment as defined by Fruin(1971). These data are results of activities of analysis, some of which canbe fruitfully automated given, on one hand, the wide diffusion of camerasemployed for video surveillance of public areas and, on the other, consideringthe level of maturity of video processing and analysis techniques.
An integrated approach to pedestrians and crowd studies encompasses boththe application of analysis and synthesis techniques that, in a virtuous circle,can mutually benefit one from the other, to effectively (i) identify, (ii) faceand (iii) provide innovative solutions to challenges towards the improvementof the understanding of crowding phenomena. This kind of interdisciplinarystudy, in addition to computer science, often employs or directly involvesresearch results in the area of social sciences in general, can be found inthe literature. For instance, Patil et al. (2011) show how computationalfields guiding simulated pedestrians movement in a simulated environmentcan be automatically derived by video footages of actual people moving inthe same space. Moore et al. (2011), instead, employ an hydrodynamicmodel, that (to a certain extent) can represent the flow of pedestrians inmass movement situations, to improve the characterisation of pedestrianflows by means of automatic video analysis. From the perspective of offeringa useful service to crowd managers Georgoudas et al. (2011) describe ananticipative system integrating computer vision techniques and pedestriansimulation able to suggest crowd management solutions (e.g. guidance signals)to avoid congestion situations in evacuation processes. Finally, in Raghavendraet al. (2011) the authors propose the employment of the social force modelby Helbing and Molnar (1995), probably the most successful example of crowdsynthesis model, to support the detection of abnormal crowd behaviour invideo sequences.
An example of identification of a still not considered phenomenology isrelated to a work by Moussaıd et al. (2010) in which the authors have definedan extension to the social force model by that considers the presence of groupsin the simulated population: the motivations and some modelling choices (i.e.the limited size of considered groups and their spatial arrangement) are basedon actual observations and analyses. A related effort, carried out instead bya research group trying to improve crowd analysis techniques, is describedin Leal-Taixe et al. (2011): in this case, the social force model acts as a sortof predictor block in an automated video analysis pipeline, improving thetracking in case of groups within the observed flow. Finally, Schultz et al.
3

(2012b) also focus on groups, as central element of an observation and analysisthat also considers psychometric factors.
It is important to emphasise that anthropological considerations abouthuman behaviour in crowded environments, such as the analysis of spatialsocial interaction among people, are growingly considered as crucial both inthe computerised analysis of crowds as pointed out by Junior et al. (2010)and in the synthesis of believable pedestrian and crowd behaviour, such asin Was (2010) and in Manzoni et al. (2011). In particular, proxemics has aprominent role both in the modelling and analysis of pedestrians and crowdbehaviour. The term was first introduced by Hall (1966) with respect to thestudy of a type of non–verbal behaviour related to the dynamic regulation ofinterpersonal distance between people as they interact.
Within this context the aim of this paper is to provide a comprehensiveframework comprising both the synthesis and analysis of pedestrians andcrowd behaviour: in this schema we suggest both ways in which the resultsof the analysis can provide fruitful inputs to modellers and, on the otherhand, how results of the modelling and simulation activities can contributeto the (automated) interpretation of raw empirical data. The frameworkwill be described in the following section, while an example of unfolding ofthese conceptual and experimental pathways will be described through theintroduction of an adaptive model for group cohesion (Section 3) that wasmotivated and that will effectively be calibrated and validated by means ofanalyses on observed crowd behaviour (Section 4). Conclusions and futureworks will end the paper.
2. An Integrated Framework for Crowd Analysis and Synthesis
A comprehensive framework trying to put together different aspects andaims of pedestrians and crowd dynamics research has been defined in Junioret al. (2010). The central element of this schema is the mutually influencing(and possibly motivating) relationship between the above mentioned effortsaimed at synthesising crowd behaviour and other approaches that are insteadaimed at analysing field data about pedestrians and crowds in order to char-acterise these phenomena in different ways. It must be noted, in fact, thatsome approaches have the goal of producing aggregate level quantities (e.g.people counting, density estimation), while others are aimed at producingfiner-grained results (i.e. tracking people in scenes) and some are even aimedat identifying some specific behaviour in the scene (e.g. main directions, ve-
4
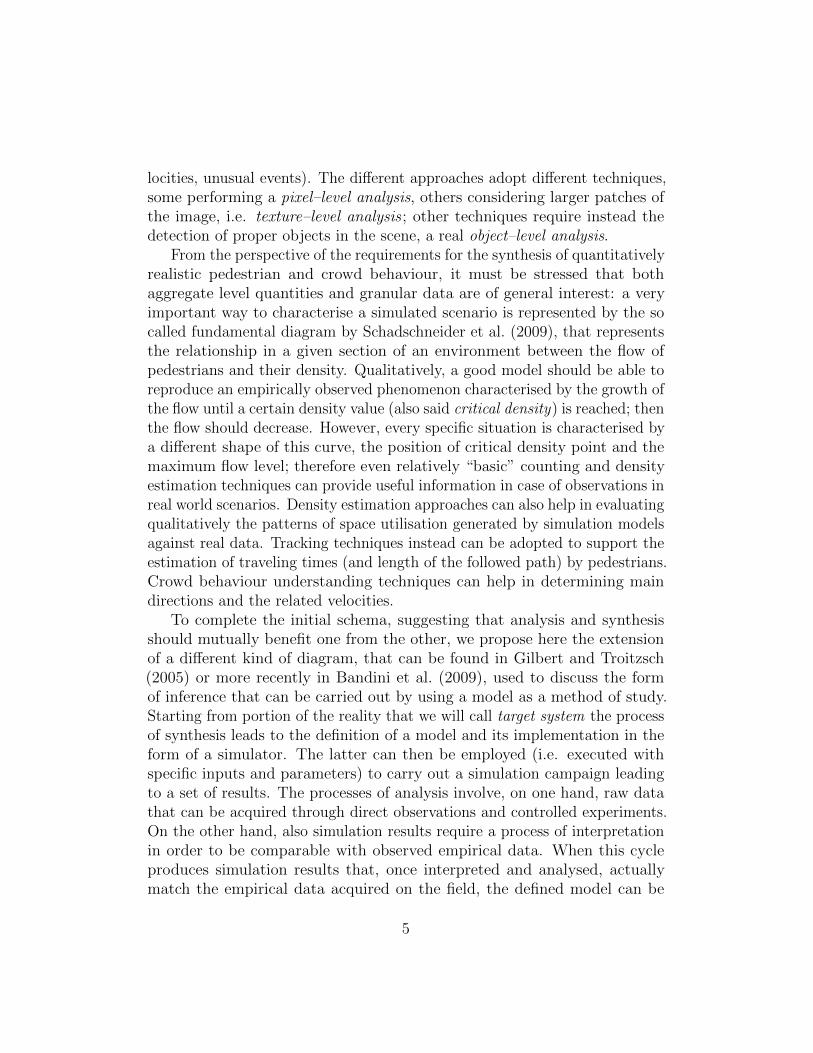
locities, unusual events). The different approaches adopt different techniques,some performing a pixel–level analysis, others considering larger patches ofthe image, i.e. texture–level analysis; other techniques require instead thedetection of proper objects in the scene, a real object–level analysis.
From the perspective of the requirements for the synthesis of quantitativelyrealistic pedestrian and crowd behaviour, it must be stressed that bothaggregate level quantities and granular data are of general interest: a veryimportant way to characterise a simulated scenario is represented by the socalled fundamental diagram by Schadschneider et al. (2009), that representsthe relationship in a given section of an environment between the flow ofpedestrians and their density. Qualitatively, a good model should be able toreproduce an empirically observed phenomenon characterised by the growth ofthe flow until a certain density value (also said critical density) is reached; thenthe flow should decrease. However, every specific situation is characterised bya different shape of this curve, the position of critical density point and themaximum flow level; therefore even relatively “basic” counting and densityestimation techniques can provide useful information in case of observations inreal world scenarios. Density estimation approaches can also help in evaluatingqualitatively the patterns of space utilisation generated by simulation modelsagainst real data. Tracking techniques instead can be adopted to support theestimation of traveling times (and length of the followed path) by pedestrians.Crowd behaviour understanding techniques can help in determining maindirections and the related velocities.
To complete the initial schema, suggesting that analysis and synthesisshould mutually benefit one from the other, we propose here the extensionof a different kind of diagram, that can be found in Gilbert and Troitzsch(2005) or more recently in Bandini et al. (2009), used to discuss the formof inference that can be carried out by using a model as a method of study.Starting from portion of the reality that we will call target system the processof synthesis leads to the definition of a model and its implementation in theform of a simulator. The latter can then be employed (i.e. executed withspecific inputs and parameters) to carry out a simulation campaign leadingto a set of results. The processes of analysis involve, on one hand, raw datathat can be acquired through direct observations and controlled experiments.On the other hand, also simulation results require a process of interpretationin order to be comparable with observed empirical data. When this cycleproduces simulation results that, once interpreted and analysed, actuallymatch the empirical data acquired on the field, the defined model can be
5

Figure 1: A schema putting together activities of modelling and execution of simulationcampaigns (synthesis) and activities related to the interpretation of simulation results,analysis of empirical data observed in reality and their comparison for sake of validation(analysis).
employed for sake of explanation and prediction.Of course it is not immediate to define a model that generates simulation
results matching empirical data, especially since models of complex systemsare generally characterised by a number of parameters even when the modellertries to keep the model as simple and elegant as possible. It is this need ofactually calibrating model parameters for achieving a model validation, asdescribed by Klugl (2008), that actually introduces the first type of synergeticcollaboration between analysis and synthesis: the analysis of raw data aboutthe simulated phenomenon leads to the possibility of identifying values orat least intervals for model parameters. This is not actually the only caseof influence of the analysis on the definition of models: in fact, it is theobservation of the system that leads to the identification of phenomenologiesthat are not currently represented and managed by a model and that canrepresent the motivations and goals for model innovation.
The potential outcomes of the modelling and simulation phases that can
6

have an influence on the analysis activities are related to two categoriesof contributions: on one hand, the need to create a mechanism for thegeneration of an observed phenomenon leads to its formalisation, that couldbe instrumental also in the creation of additional mechanisms for its automatedanalysis. On the other hand, even long before reaching the necessary level ofmaturity of the simulator, the modeller and developer of a simulation systemactually needs to define and develop metrics, indicators and techniques toevaluate the outcomes of the modelling phases. These by-products of thesynthesis activity can also represent a starting point for the actual developmentof automated analysis approaches.
The following sections actually represent an unfolding of this kind ofconceptual and experimental process. In particular, Section 3 introduces amodel for pedestrian and group behaviour representing the evolution of afirst approach that was started to face issues raised by an unstructured andnon-systematic observation of crowd patterns and movements in a real worldscenario2 described by Vizzari et al. (2012). In this line of research, a modelencompassing groups as a fundamental element influencing the overall systemdynamics was designed and implemented and a metric for the evaluation ofgroup cohesion (and, therefore, also its dispersion) was defined. This metricled to the understanding that the first version of the model was unable topreserve the cohesion of groups and therefore it was instrumental in therealisation of a new model described in Vizzari et al. (2013 - in press) thatendows pedestrians that are also members of specific types of group withan adaptive mechanism to preserve their cohesion even in difficult situations(e.g. presence of obstacles or high density environments). This research effortalso led to the identification of new observations and analyses to back-upsimulation results with empirical data; the dispersion metric was also thestarting point for the formal definition of measurements to be executed inthe analysis of the acquired raw data. These activities will be described inSection 4.
2In particular, the crowd management procedures adopted in the Arafat I station inSaudi Arabia, that adopt the notion of group as a way to organize the flow of pilgrimstowards the station.
7

3. An Adaptive Model for Group Cohesion
This section introduces a model representing pedestrian behaviour in anenvironment, considering the impact of the presence of simple and structuredgroups. The model is characterised by a discrete representation of the envi-ronment and time evolution, and it is based on the floor-field mechanism ofexisting CA approaches. However, the pedestrian behaviour is so articulated,comprising an adaptive mechanism for the preservation of group cohesion,to the point that the model is more properly classified as agent-based. Thedifferent elements of the model will now be introduced, then some results ofits application to sample simulation scenarios will be given to show the modelcapabilities and the requirements in terms of empirical data to completethe calibration of the group cohesion adaptive mechanism. A more detailedformal introduction of the model and additional simulation results can befound in Vizzari et al. (2013 - in press).
3.1. Representation of the Environment
The physical environment is represented in terms of a discrete grid of squarecells: Env = c0, c1, c2, c3, ... where ∀ci : ci ∈ Cell. The size of every cell is40cm×40cm according to standard measure used in the literature and derivedfrom empirical observation and experimental procedure shown in Weidmann(1993) and Fruin (1971). Every cell has a row and a column index, whichindicates its position in the grid: Row(ci), Col(ci) : Cell→ N. Consequently,a cell is also identified by its row and column on the grid, with the followingnotation: Envj,k = c : (c ∈ Env) ∧ (Row(c) = j) ∧ (Col(c) = k). Everycell is linked to other cells, that are considered its neighbours according to theMoore neighbourhood. Cells are annotated and virtual grids are superimposedon the base environmental representation to endow the environment with thecapability to host pedestrian agents and support their perception and action.
3.1.1. Definition of Spatial Markers
Markers are sets of cells that play particular roles in the simulation. Threekinds of marker are defined in the model: (i) start areas, places (sets ofcells) were pedestrians are generated; they are characterised by informationfor pedestrian generation both related to the type of pedestrians and to thefrequency of generation. In particular, a start area can generate different kindsof pedestrians according to two approaches: (a) frequency-based generation,in which pedestrians are generated during all the simulation according to a
8

frequency distribution; (b) en-bloc generation, in which a set of pedestrians isgenerated at once in the start area when the simulation starts; (ii) destinationareas, final places where pedestrians might want to go; (iii) obstacles, non-walkable cells defining obstacles and non-accessible areas.
3.1.2. Definition of Floor Fields
Adopting the approach of the floor field model by Nishinari et al. (2004),the environment of the basic model is composed also of a set of superimposedvirtual grids, structurally identical to the environment grid, that containsdifferent floor fields that influence pedestrian behaviour.
The goal of these grids is to support long range interactions by representingthe state of the environment (namely, the presence of pedestrians and theircapability to be perceived from nearby cells). In this way, a local perceptionfor pedestrians actually simply consists in gathering the necessary informationin the relevant cells of the floor field grids.
Floor fields are either static (created at the beginning and not changingduring the simulation) or dynamic (changing during the simulation). Threefloor fields are considered in the model:
• the path field assigned to each destination area: this field indicatesfor every cell the distance from the destination, and it acts thus asa gradient, a sort of potential field that drives pedestrians towards it(static floor field);
• the obstacles field, that indicates for every cell the fact that an obstacleor a wall is within a limited distance, being maximum in cells adjacentto an obstacle and decreasing with the distance (static floor field);
• the density field that indicates for each cell the pedestrian density inthe surroundings at the current time-step, analogous to the concept ofcumulative mean density (CMD) indicating the density experienced bypedestrians in a portion of the environment, first introduced by ? andelaborated for discrete environments by ? (dynamic floor field).
3.2. Simulation Time and Update Strategy
Simulation time is modelled in a discrete way by dividing time into stepsof equal duration: we assume that a pedestrian moves (at most, since it ispossible to decide to stand still) 1 cell per time step. The average velocity ofa pedestrian, which can be estimated in real observations or experiments as
9

performed by Fruin (1971) in about 1.2 ms−1, will thus determine the durationof the each time step: considering that the size of the cell is 40 cm× 40 cm,the duration of each time step is 0.33s.
When running a CA-based pedestrian model, three update strategies arepossible ?:
• parallel update, in which cells are updated all together;
• sequential update, in which cells are updated one after the other, alwaysin the same order;
• shuffled sequential update, in which cells are updated one after the other,but with a different order every time.
The second and third update strategies lead to the definition of asyn-chronous CA models (see Bandini et al. (2012) for a more thorough discussionon types of asynchronicity in CA models). In crowd simulation CA mod-els, parallel update is generally preferred, as mentioned by Schadschneideret al. (2009), even if this strategy can lead to conflicts that must be solved.Nonetheless, we currently adopted a shuffled sequential update scheme for afirst evaluation of the group cohesion mechanism without adding additionalmechanisms and parameters to be calibrated for the management of potentialconflicts between agents’ movements.
3.3. Groups
We focus on two types of group: simple and structured. Simple or informalgroups are generally made up of friends or family members and they arecharacterised by a high cohesion level, moving all together due to sharedgoals and to a continuous mechanism of adaptation of the chosen paths totry to preserve the possibility to communicate, as discussed by Costa (2010).Structured groups, instead, are more complex entities, usually larger thansimple groups (more than 4 individuals) and they can be considered as beingcomposed of sub-groups that can be, in turn, either simple or structured.Structured groups are often artificially defined with the goal of organisingand managing a mass movement (or some kind of other operation) of a set ofpedestrians.
Groups can be formally described as:
Groupj = 〈Id, [Group1, . . . , Groupm], [Ped1, . . . , P edn]〉
10
Structured groups include at least one subgroup, while simple groups onlycomprise individual pedestrians. We will refer to the group an agent a directlybelongs to as Ga, that is also the smallest group he belongs to; the largestgroup an agent a belongs to will instead be referred to as Ga. It must benoted that Ga = Ga only when the agent a is member of a simple groupthat is not included in any structured group. These sets are relevant for thecomputation of influences among members of groups of different type (simpleor structured).
3.4. Pedestrians
In this model, a pedestrian is defined as an utility-based agent with state.Functions are defined for utility calculation and action choice, and rules aredefined for state-change. Pedestrians are characterised as:
Pedestrian : 〈Id,GroupId, State, Actions,Destination〉
where: (i) Id ∈ N is the agent identification number and GroupId ∈ N isthe identification number of the group to which the pedestrian directly belongsto (for pedestrians that are not member of any group this value is null); (ii)State is defined as: State = 〈Position, PrevDirection〉 where Position indi-cates the current cell in which the agent is located, and PrevDirection is thedirection followed in the last movement; Actions is the set of possible actionsthat the agent can perform, essentially movements in one of the eight neigh-bouring cells (indicated as cardinal points), plus the action of remaining in thesame cell (indicated by an ‘X’): Actions = N,S,W,E,NE, SE,NW,SW,X;Destination is the goal of the agent in terms of destination area. Thisterm identifies the current destination of the pedestrian: in particular, ev-ery destination is associated to a particular spatial marker. Consequently,Destination is used to identify which path field is relevant for the agent:currentPathF ield = PathField(Destination) where PathField is the pre-cise path field associated to Destination and currentPathF ield is the pathfield relevant for the agent.
All these elements take part in the mechanism that manages the move-ment of pedestrians: agents associate a desirability value, a utility to everymovement in the cell neighbourhood, according to a set of factors that concurin the overall decision.
11

3.4.1. Mechanism of Action Evaluation
In Algorithm 1 the agent life-cycle during all the simulation time isproposed: every time step, every pedestrian perceives the values of path field,obstacle field and density field for all the cells that are in its neighbourhood.On the basis of these values and according to different factors, the agentevaluates the different cells around him, associating an utility value to everycell and selects the action for moving into a specific cell.
Algorithm 1 Agent life-cycle
for all timestep ∈ SimulationT ime dofor all p ∈ Pedestrian do
Utility[]for all c ∈ neighbours(Position) do
pf← V al(PathF, c)of← V al(ObsF, c)df ← V al(DensF, c)Utility[c]← Evaluation(pf, of, df)
end fora = Choice(Utility[])Move(a)
end forend for
As previously suggested, the action selection strategy starts gathering thevalue of floor fields in cells included in the neighbourhood of agent’s currentposition. The obtained values will be used in the evaluation of the movementtowards the related cell.
After acquiring the perceived information from the environment, the agentelaborates a desirability value for each of the admissible actions (movements),according to several factors, that will be described later on. Given the list ofpossible actions and associated utilities, an action is chosen with a probabilityproportional to its utility. In particular, the probability for an agent a ofchoosing an action associated to the movement towards a cell c is given by theexponential of the utility, normalised on all the possible actions the pedestriancan take in the current turn:
pa(c) = N · eUa(c)
12

where N is the normalisation factor and c is the currently considereddestination cell. The utility function Ua(c) of a destination cell c whichcorresponds to an action/direction for agent a, that takes the form of aweighted sum of components associated to the behavioural specification of anagent:
Ua(c) =κgG(c) + κobOb(c) + κsS(c) + κdD(c) + κovOv(c) + κcCa(c) + κiIa(c)
d
where d is the distance of the new cell from the current position, that is1 for cells in the Von Neumann neighbourhood (vertically and horizontallyneighbour cells) and
√2 for diagonal cells: the factor is introduced to penalise
the diagonal movements.The different components of the utility value for a given movement consider
the following factors:
• the desire to move towards a goal, a destination in the environment,represented by the G(c) function;
• the tendency to stay at a distance from the obstacles (e.g. walls,columns), that are perceived as repulsive, represented by the Ob(c)function;
• the desire to stay at a distance from other individuals, especially thosethat are not members of the same simple group, an effect of proxemicseparation, represented by the S(c) function;
• a direction inertia factor, increasing the desirability of performingstraight forms of movement, represented by the D(c) function;
• the penalisation of those movements that cause an overlapping event,the temporary sharing of the same cell by two distinct pedestrians,represented by the Ov(c) function;
• two contributions related to the tendency to preserve group cohesion,respectively devoted to simple and structured groups, respectively rep-resented by the Ca(c) and the Ia(c) functions.
Note that κg, κob, κs, κd, κov, κc, κi ∈ [0, 100]: the use of these parameters,in addition to allowing the calibration and the fine tuning of the model,
13

also supports the possibility of describing and managing different types ofpedestrian, or even different states of the same pedestrian in different momentsof a single simulated scenario.
3.4.2. Adaptation Mechanism for Group Cohesion Preservation
While the above elements are sufficient to generate a pedestrian modelthat considers the presence of groups, even structured ones, the introducedmechanisms are not sufficient to preserve the cohesion of simple groups, asdiscussed in a previous work adopting a very similar approach (see Bandiniet al. (2011)). This is mainly due to the fact that in certain situationspedestrians adapt their behaviour in a more significant way than what issupported by simple and relatively small modifications of the perceivedutility of a certain movement. In certain situations pedestrians perform anadaptation that appears in a much more decisive way a decision: they cansuddenly seem to temporarily loose interest in what was previously considereda destination to reach and they instead focus on moving closer to (or at leastdo not move farther from) members of their group, generally whenever theyperceive that the distance from them has become excessive. In the following,we will discuss a metric of group dispersion that we adopted to quantify thisperceived distance and then we will show how it can be used to adapt theweights of the different components of the movement utility computation topreserve group cohesion.Group Dispersion Metrics – Intuitively, the dispersion of a group can beseen as the degree of spatial distribution of their members. In the area ofpedestrian modelling and simulation, the estimation of different metrics forgroup dispersion has been discussed in Bandini et al. (2011) in which differentapproaches are compared to evaluate the dispersion of groups through theirmovement in the environment. In particular, two different approaches arecompared here: (i) dispersion as occupied area and (ii) dispersion as distancefrom the centroid of the group. This topic was also considered in the contextof computer vision algorithms such as in Schultz et al. (2012b), in whichhowever essentially only line abreast patterns were analysed. Therefore wewill focus on the former approach.
Formally, the above introduced formulas of group dispersion for eachapproach are defined as follows:
Disp(Group) =Area(Group)
Size(Group)(Area method)
14

Disp(Group) =
∑Size(Group)i=1 distance(centroid, ai)
Size(Group)(Centroid method)
with Area(Group) as the area occupied by the group, Size(Group) as thenumber of its members, centroid as its centroid.
The second metric appears much more straightforward when a continuousrepresentation of the environment is possible or at least not in contrast withthe adopted modelling approach: in the case of a discrete and relativelycoarse discretisation its results are not particularly different from the firstmetric, but they are sometimes counterintuitive especially when describingparticular group shapes (e.g. river-like lanes that are often present in highdensity situations).
The first metric defines the dispersion of the group as the portion of spaceoccupied by the group with respect to the size of the group: the first step ofthe procedure of computation for this metric builds a convex polygon withthe minimum number of edges that contain all the vertices (representing theposition of a pedestrian); the second step computes the area of this polygon.The dispersion value is calculated as the relationship between the polygonarea and the size of the group.Utility Parameters Adaptation – The adopted approach is characterisedby a trade-off process between the goal attraction value and the intra/intercohesion value in the utility computation: in the situation in which the spatialdispersion value is low, the cohesion behaviour has to influence pedestrian’soverall behaviour less than the goal attraction. On the contrary, if the level ofdispersion of a group is high, the cohesion component for the members mustbecome more important than the goal attraction. An adaptation of the twoparameters in the utility computation is necessary, by means of a Balance(k)function that can be used to formalise these requirements:
Balance(k) =
13· k + (2
3· k ·DispBalance) if k = kc
13· k + (2
3· k · (1−DispBalance)) if k = kg ∨ k = ki
k otherwise
where ki, kg and kc are the weighted parameters Ua(c) and
DispBalance = tanh
(Disp(Group)
δ
)
15
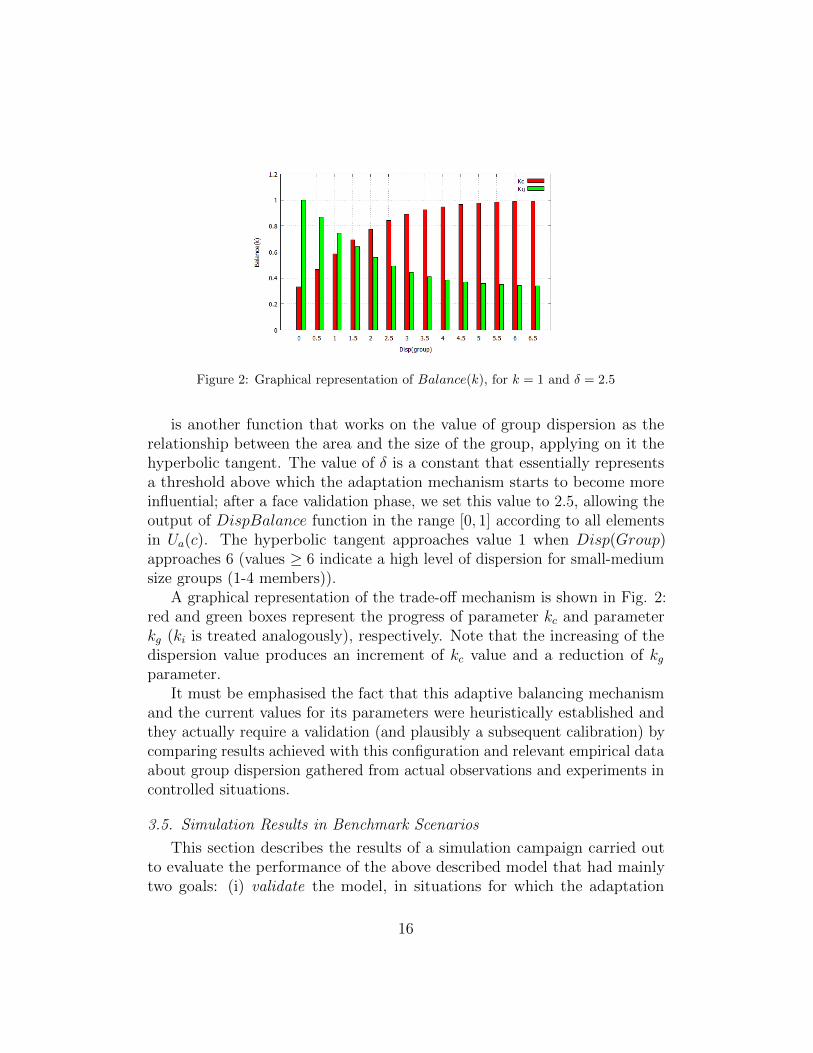
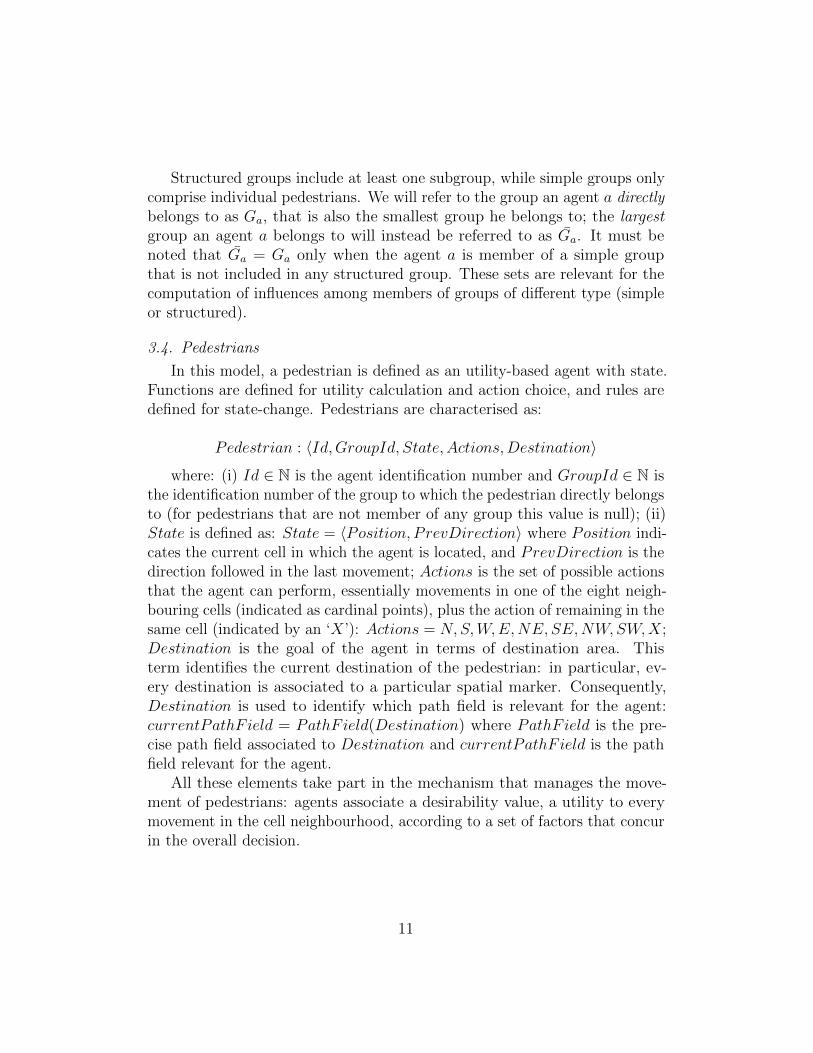
Figure 2: Graphical representation of Balance(k), for k = 1 and δ = 2.5
is another function that works on the value of group dispersion as therelationship between the area and the size of the group, applying on it thehyperbolic tangent. The value of δ is a constant that essentially representsa threshold above which the adaptation mechanism starts to become moreinfluential; after a face validation phase, we set this value to 2.5, allowing theoutput of DispBalance function in the range [0, 1] according to all elementsin Ua(c). The hyperbolic tangent approaches value 1 when Disp(Group)approaches 6 (values ≥ 6 indicate a high level of dispersion for small-mediumsize groups (1-4 members)).
A graphical representation of the trade-off mechanism is shown in Fig. 2:red and green boxes represent the progress of parameter kc and parameterkg (ki is treated analogously), respectively. Note that the increasing of thedispersion value produces an increment of kc value and a reduction of kgparameter.
It must be emphasised the fact that this adaptive balancing mechanismand the current values for its parameters were heuristically established andthey actually require a validation (and plausibly a subsequent calibration) bycomparing results achieved with this configuration and relevant empirical dataabout group dispersion gathered from actual observations and experiments incontrolled situations.
3.5. Simulation Results in Benchmark Scenarios
This section describes the results of a simulation campaign carried outto evaluate the performance of the above described model that had mainlytwo goals: (i) validate the model, in situations for which the adaptation
16
Figure 3: Screenshots of the simulated corridor (A) with groups of different size in lowdensity situations
mechanism was not activated (i.e. no simple groups were present in thesimulated population), (ii) evaluate the effects of the introduction of simplegroups, performing a qualitative face validation of the introduced adaptationmechanism considering available video footages of the behaviour of groups inreal and experimental situations.
The chosen situations are relatively simple ones and they were chosendue to the availability of relevant and significant data from the literature. Inparticular, we describe here a linear scenario: a corridor in which we test thecapability of the model to correctly reproduce a situation in which two groupsof pedestrians enter from one of the ends and move towards the other. Thissituation is characterised by a counterflow causing local situations of highdensity and conflicts on the shared space3. We essentially evaluate and validatethis scenario by means of a fundamental diagram as defined by Schadschneideret al. (2009): it shows how the average velocity of pedestrians in a section(e.g. one of the ends of a corridor) varies according to the density of theobserved environment. Since the flow of pedestrians is directly proportional totheir velocity, this diagram is sometimes presented in an equivalent form thatshows the variation of flow according to the density. In general, we expectto have a decrease in the velocity when density grows, due to the growingfrequency of “collision avoidance” movements by the pedestrians; the flow,instead, initially grows, since it is also directly proportional to the density,until a certain threshold value is reached (also called critical density), then it
3The term conflict used here is not associated to the issues arising from a parallel updatein a CA approach: actual conflicts are prevented by the shuffled sequential update strategy.However, the choices of pedestrians are limited by the actions of the others, so this conflictis actually a conceptual one.
17

Figure 4: Comparison among fundamental diagrams on aggregate data with respect togroups of different size in corridor A
decreases. Despite being of great relevance, different experiments gathereddifferent values of empirical data: while there is a general consensus on theshape of the function, the range of the possible values has even significantdifferences from different versions.
We investigated this scenario with a significant number of simulations,varying the level of density by adjusting the number of pedestrians presentin the environment, so as to analyse different crowding situations. For everyscenario, in terms of environmental configuration and level of density, aminimum of 3 and a maximum of 8 simulations were executed, accordingto the variability of the achieved results (more simulations were run whenthe variability was high, generally around levels of density close to thecritical thresholds). Every simulation considered at least 1800 simulationturns, corresponding to 10 minutes of simulated time. The rationale wasto observe a good number of complete paths of pedestrians throughout theenvironment, that was configured to resemble a torus (e.g. pedestrianscompleting a movement through it re-entered the scenario from their startingpoint), therefore simulations of situations characterised by a higher densitywere also set to last longer.
As suggested above, we adopted two different experiment settings: inthe first one, the individual pedestrians belonging to a given flow (i.e. allthe pedestrians entering the corridor) are represented as members of a largestructured group, but no simple groups are present. This first part of theexperimentation was also necessary to perform a proper calibration of the
18

Figure 5: Comparison among corridor widths: fundamental diagrams in case of groups incorridors A, B and C
model, for the parameters not involved in simple group modelling. In thesecond experimental setting, we included a variable number of simple groups(based on the total number of pedestrians in the environment and accordingto available data on the frequency of groups of different size in a crowd asmentioned in Moussaıd et al. (2010) and Federici et al. (2012))4 first of all tocalibrate and qualitatively validate the adequacy of the adaptation mechanismand then to explore its implications on the overall crowd dynamics.
We actually simulated the linear counterflow situation in three differentcorridors, of growing width: their size is respectively 2.4 m × 20 m (A), 3.6m × 13.2 m (B) and 4.8 m × 10 m (C). Note that the variation in terms ofwidth and height were applied according to the choice of maintaining the totalarea at a level about 48 m2 in every scenario. A screenshot of the simulationscenario in low density situations including groups of different size is shown inFigure 3. The choice of evaluating the influence of groups in different linearscenarios was also inspired by Zhang et al. (2011), in which a comparison interms of pedestrians flow from experimental data among three corridors ofwidth 1.8 m, 2.4 m and 3.0 m is presented. In this case, authors show that,in conformance with Hankin and Wright (1958), above a certain minimum of
4Groups of size 2 include about 28% of the total number of pedestrians, groups of size3 about 24% and groups of size 6 about 12%.
19

about 1.22 m, the maximum flow is directly proportional to the width of thecorridors.
The model was calibrated to achieve, in situations not including simplegroups, results in tune with empirical data available from the literature. Wewill now focus on some partly counterintuitive results in presence of simplegroups. To do so, data related to the different types of simulated groupswere aggregated, and a comparison among the related fundamental diagramswas performed for the movement of groups in corridor A. As summary,Fig. 4 represents on the same chart all group contributions: the depictedpoints represent the average flow achieved for that kind of group in the totalsimulated time, and generally more points are available (representing differentsimulation runs) for the same configuration. The overall flow of individuals isgenerally higher than that of groups in almost all situations, and in generalwith the growth of the size of a simple group we observe a decrease of itsoverall flow. Moreover, differences tend to decrease and almost disappearafter the critical density (about 1.5 pedestrians per square metre) is reached.
We also analysed the effect of the width of the corridor on the flow ofgroups (and in general on the overall pedestrian flow): Figure 5 shows thedifferent fundamental diagrams associated to all simple groups (irrespectivelyof their size) in corridors A, B and C. It is apparent that the critical densitymoves to higher levels with the growth of the corridor width, in tune withthe already mentioned results discussed in Hankin and Wright (1958).
Finally, we analysed how the level of group dispersion, computed by meansof the same function employed to manage the adaptive mechanism for groupcohesion, varies with a changing density in the environment. The motivationsof this analysis are twofold: first of all, we wanted to understand if theadaptive mechanism for group cohesion is effective, then we wanted to gatherempirical data to understand if it produces plausible results, in line withobserved data that, at the moment of the simulation campaign, were still notavailable. Figure 6 shown the variation of the level of dispersion for groupsof size 6 in corridors A, B and C: we can conclude that the mechanism forpreserving the cohesion of simple groups is actually effective, since the growthof density does not cause a significant growth of the dispersion. On the otherhand, at that moment we could not conclude that the model produces realisticresults.
20

Figure 6: Comparison among the level of dispersions for group of six members in corridorA, B and C
4. An Analysis of Field Data About Pedestrian Crowd Dynamics
This Section comprises several empirical studies aimed at investigatingpedestrian crowd dynamics in the natural context by using on-field observation.In particular the survey was aimed at studying the impact of grouping andproxemics behaviour on the whole crowd pedestrian dynamics. Data analyseswere focused on: (i) level of density and service, (ii) presence of groups withinthe pedestrian flows, (iii) group proxemic spatial arrangement, (iv) trajectoriesand walking speed of both singles and group members. Furthermore thespatial dispersion of group members while walking was measured in orderto propose an innovative empirical contribution for a detailed description ofgroup proxemics dynamics while walking.
The survey was performed the last 24th of November 2012 from about 2:50pm to 4:10 pm. It consisted in the observation of the bidirectional pedestrianflows within the Vittorio Emanuele II gallery, a popular commercial-touristicwalkway situated in the Milan city centre (Italy). The gallery was chosenas a crowded urban scenario, given the large amount of people that passthrough it during the weekend for shopping, entertainment and visitingtouristic-historical attractions in the centre of Milan.
The team performing the observation was composed of four people. Severalpreliminary inspections were performed to check the topographical features ofthe walkway. The balcony of the gallery, that surrounds the inside volume of
21

Figure 7: From the left: an overview of the Vittorio Emanuele II gallery, the streamingof passerby within the walkway and a snapshot of the recorded video images with thesuperimposed grid for data analysis
the architecture from about ten meters in height, was chosen as location thanksto possibility to (i) position the equipment for video footages from a quasi-zenithal point of view and (ii) to avoid as much as possible to influence thebehaviour of observed subjects, thanks to a railing of the balcony partly hidingthe observation equipment. The equipment consisted of two professional fullHD video cameras with tripods. The existing legislation about privacy wasconsulted and complied in order to exceed ethical issues about the privacy ofthe people recorded within the pedestrian flows.
Two independent coders performed a manual data analyses, in order toreduce errors by crosschecking their results. A squared portion of the walkwaywas considered for data analysis: 12.8 meters wide and 12.8 meters long(163.84 squared meters). In order to perform data analyses, the inner spaceof the selected area was discretised in cells by superimposing a grid5 on thevideo (see Fig. 7); the grid was composed of 1024 squares 0.4 meters wideand 0.4 meters long.
5The grid was design by using Photoshop CS5 (according to the perspective of the videoimages). An alphanumeric code (from 1 to 32 on both left and right sides, and from A toFf on both top and bottom sides) was added on the sides of the grid. Finally, the grid witha transparent background was superimposed to a black-white version of the video imagesby means of iMovie. To perform counting activities, the video was reproduced by usingVLC player thanks to its possibility to: playback the images in slow motion and/or frameby frame and to use an extension time format that included hundredths of a seconds.
22

4.1. Level of Density and Service
The bidirectional pedestrian flows (from North to South and vice versa)were manually counted minute by minute: 7773 people passed through theselected portion of the Vittorio Emanuale II Gallery from 2:50 pm to 4:08pm. The average level of density within the selected area (defined as thequantitative relationship between a physical area and the number of peoplewho occupy it) was detected considering 78 snapshots of video footages,randomly selected with a time interval of one minute. The observed averagelevel of density was low (0.22 people/squared meter). Despite it was notpossible to analyse continuous situations of high density, several situationof irregular and local distribution of high density were detected within theobserved scenario.
According to the Highway Capacity Manual by Milazzo II et al. (1999),the level of density in motion situation was more properly estimated takinginto account the bidirectional walkway level of service criteria: counting thenumber of people walking through a certain unit of space (meter) in a certainunit of time (minute). The average level of flow rate within the observedwalkway scenario belongs to a B level (7.78 ped/min/m) that is associatedwith an irregular flow in low-medium density condition.
4.2. Flow Composition
The second stage of data analysis was focused on the detection of groupswithin the pedestrian flows, the number of group members and the groupproxemics spatial arrangement while walking. The identification of groups inthe streaming of passerby was assessed on the basis of verbal and nonverbalcommunication among members: visual contact, body orientation, gesticula-tion and spatial cohesion among members. To more thoroughly evaluate allthese indicators the coder was actually encouraged to rewind the video andtake the necessary time to tell situations of simple local (in time an space)similar movements, due to the contextual situation, by different pedestriansfrom actual group situations. The whole video was sampled considering oneminute every five: a subset of 15 minutes was extracted and 1645 pedestrianswere counted (21.16% of the total bidirectional flows). Concerning the flowcomposition, 15.81% of the pedestrians arrived alone, while the 84.19% arrivedin groups: 43.65% of groups were couples, 17.14% triples and 23.40% largergroups (composed of four or five members). Large structured groups, suchas touristic committees, that were present in the observed situation, wereanalysed considering sub-groups.
23
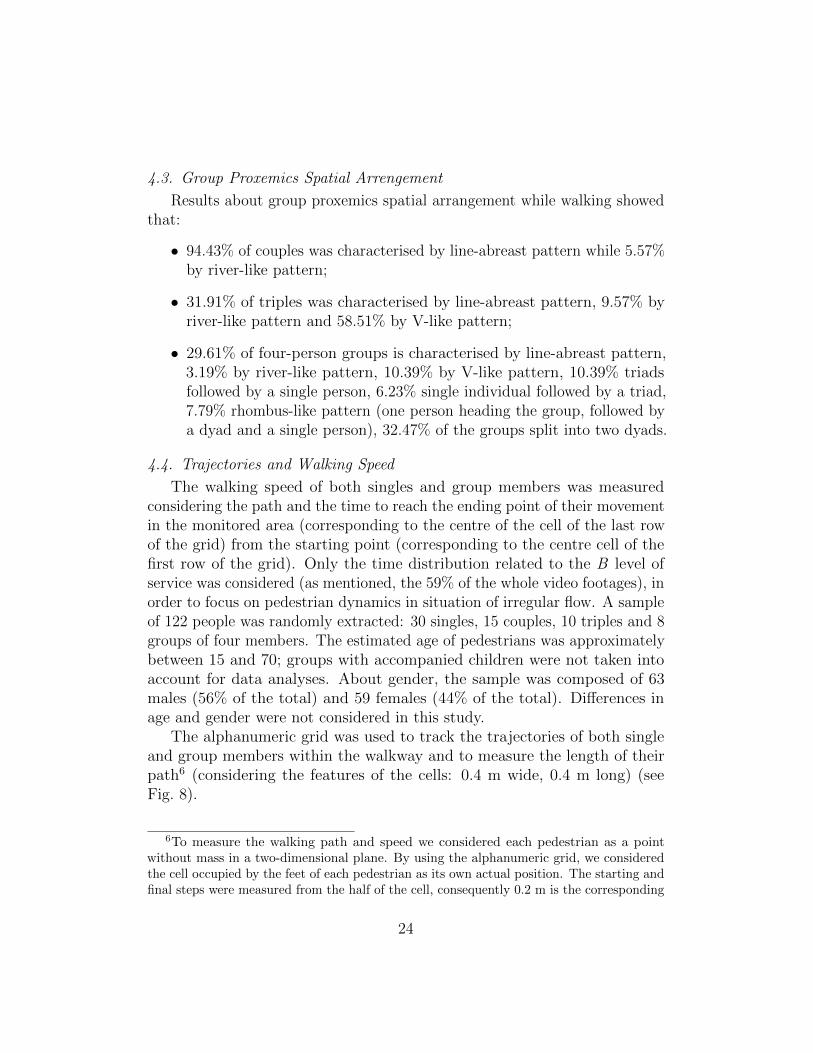
4.3. Group Proxemics Spatial Arrengement
Results about group proxemics spatial arrangement while walking showedthat:
• 94.43% of couples was characterised by line-abreast pattern while 5.57%by river-like pattern;
• 31.91% of triples was characterised by line-abreast pattern, 9.57% byriver-like pattern and 58.51% by V-like pattern;
• 29.61% of four-person groups is characterised by line-abreast pattern,3.19% by river-like pattern, 10.39% by V-like pattern, 10.39% triadsfollowed by a single person, 6.23% single individual followed by a triad,7.79% rhombus-like pattern (one person heading the group, followed bya dyad and a single person), 32.47% of the groups split into two dyads.
4.4. Trajectories and Walking Speed
The walking speed of both singles and group members was measuredconsidering the path and the time to reach the ending point of their movementin the monitored area (corresponding to the centre of the cell of the last rowof the grid) from the starting point (corresponding to the centre cell of thefirst row of the grid). Only the time distribution related to the B level ofservice was considered (as mentioned, the 59% of the whole video footages), inorder to focus on pedestrian dynamics in situation of irregular flow. A sampleof 122 people was randomly extracted: 30 singles, 15 couples, 10 triples and 8groups of four members. The estimated age of pedestrians was approximatelybetween 15 and 70; groups with accompanied children were not taken intoaccount for data analyses. About gender, the sample was composed of 63males (56% of the total) and 59 females (44% of the total). Differences inage and gender were not considered in this study.
The alphanumeric grid was used to track the trajectories of both singleand group members within the walkway and to measure the length of theirpath6 (considering the features of the cells: 0.4 m wide, 0.4 m long) (seeFig. 8).
6To measure the walking path and speed we considered each pedestrian as a pointwithout mass in a two-dimensional plane. By using the alphanumeric grid, we consideredthe cell occupied by the feet of each pedestrian as its own actual position. The starting andfinal steps were measured from the half of the cell, consequently 0.2 m is the corresponding
24
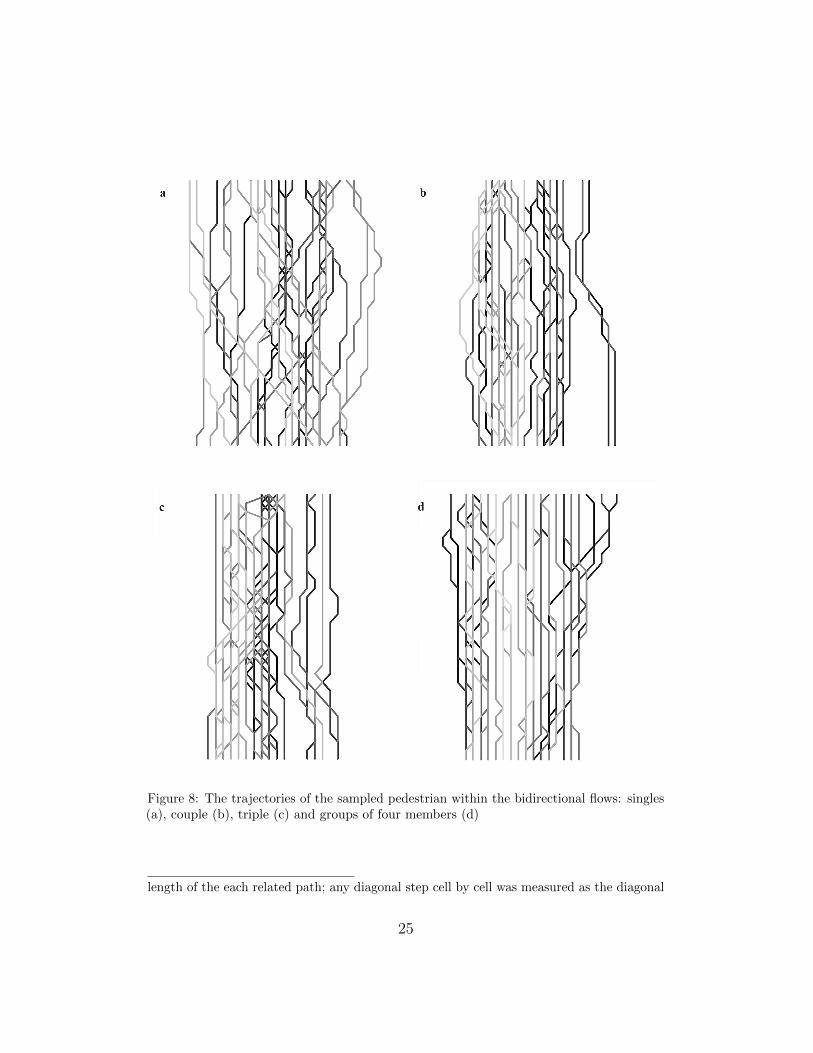
Figure 8: The trajectories of the sampled pedestrian within the bidirectional flows: singles(a), couple (b), triple (c) and groups of four members (d)
length of the each related path; any diagonal step cell by cell was measured as the diagonal
25

A first analysis was devoted to the identification of the length of theaverage walking path of singles (M=13.96 m, ±1.11), couples (M=13.39 m,± 0.38), triples (M=13.34 m, ± 0.27) and groups of four members (M=13.16m, ± 0.46). Then, the two tailed t-test analyses were used to identifydifferences in path among pedestrian. Results showed a significant differencein path length between: singles and couples (p value<0.05), singles andtriples (p value<0.05), singles and groups of four members (p value<0.05).No significant differences were detected between path length of couples andtriples (p value>0.05), triples and groups of four members (p value>0.05),couples and groups of four members (p value>0.05). The results showed thatthe path of singles is 4,48% longer than the average path of group members(including couples, triples and groups of four members).
The walking speed of both singles and group members was detectedconsidering the path of each pedestrian within the flows and the time toreach the ending point from their starting point. A first analysis was devotedto the identification of the average walking speed of singles (M=1.22 m/s,± 1.16), couples (M=0.92 m/s, ± 0.18), triples (M=0.73 m/s, ± 0.10) andgroups of four members (M=0.65 m/s, ± 0.04). Then, the two tailed t-testanalyses were used to identify differences in walking speed among pedestrian.Results showed a significant difference in walking speed between: singlesand couples (p value<0.01), singles and triples (p value<0.01), singles andgroups of four members (p value<0.01), couples and triples (p value<0.01),triples and groups of four members (p value< 0.05). In conclusion, the resultsshowed that the average walking speed of group members (including couples,triples and groups of four members) is 37.21% lower than the walking speedof singles.
The correlated results about pedestrian path and speed showed that insituation of irregular flow singles tend to cross the space with more frequentchanges of direction in order to maintain their velocity, avoiding perceivedobstacles like slower pedestrians or groups. On the contrary, groups tend tohave a more stable overall behaviour, adjusting their spatial arrangementand speed to face the contextual conditions of irregular flow: this is probablydue to (i) the difficulty in coordinating an overall change of direction and(ii) the tendency to preserve the possibility of maintaining cohesion and
between the two cells (0.56 m); any straight step was measured as the segment betweenthe centre of two cells (0.4 m).
26

communication among members.
4.5. Group Proxemics Dispersion
In order to improve the understanding of pedestrian proxemics behaviourthe last part of the study is focused on the dynamic spatial dispersion of groupmembers while walking. The dispersion among group members was measuredas the summation of the distances between each pedestrian and the centroid(the geometrical centre of the group) all normalised by the cardinality ofthe group. The centroid was obtained as the arithmetic mean of all spatialpositions of the group members, considering the alphanumeric grid. In orderto find the spatial positions, the trajectories of the group members belongingto the previous described sample (15 couples, 10 triples and 8 groups of fourmembers) were further analysed. In particular, the positions of the groupmembers were detected analysing the recorded video images every 40 frames(the time interval between two frames corresponds to about 1.79 seconds,according to the quality and definition of the video images) starting fromthe co-presence of the all members on the alphanumeric grid. This kind ofsampling permitted to consider 10 snapshots for each groups.
A first analysis was devoted to the identification of the average proxemicsdispersion of couples (M=0.35 m, ± 0.14), triples (M=0.53 m, ± 0.17) andgroups of four members (M=0.67 m, ± 0.12). Then, the two tailed t-testanalyses were used to identify differences in proxemics dispersion amongcouples, triples and groups of four members. Results showed a significantdifference in spatial dispersion between: couples and triples (p value<0.05),couples and groups of four members (p value<0.01). No significant differencesbetween triples and groups of four members (p value> 0.05). In conclusion,the results showed that the average spatial dispersion of triples and groups offour members while walking is 40.97% higher than the dispersion of couples.
In order to be able to provide useful indications for the calibration of theadaptive simple group cohesion mechanism we also evaluated the averagedispersion of the observed groups in terms of area covered by the group: dueto the discretisation of the pedestrian localisation mechanism, we were ableto essentially count the occupied cells by a sort of convex hull computedconsidering the positions of pedestrians as vertexes, analogously as for thedispersion metric defined and employed in the simulation model. The resultsof this operation estimated the dispersion of couples (Ma=0.6 m2), triples(Ma=0.8 m2) and groups of four (Ma=1.3 m2). These values are currently
27

being employed to calibrate and validate the simple group cohesion mechanismin the conditions of relatively low density and irregular flow.
Starting from the achieved results about group proxemics dispersion, wefinally focused on a quantitative and detailed description of group spatiallayout while walking. The normalised positions of each pedestrian withrespect to the centroid and the movement direction were detected by meansof a sample of 10 snapshots for each groups (15 couples, 10 triple and 8groups of four members) and then further analysed in order to identify themost frequent group proxemics spatial configurations, taking into account thedegree of alignment of each pedestrian (see Figure 9). Result showed thatcouple members tend to walk side by side, aligned to the each other with adistance of 0.4 m (36% of the sample) or 0.8 m (24% of the sample), forming aline perpendicular to the walking direction (line abreast pattern); triples tendto walk with a line abreast layout (13% of the sample), with the membersspaced of 0.60 m. Regarding groups of four members it was not possible todetect a typical spatial pattern: the reciprocal positions of group membersappeared much more dispersed than in the case of smaller groups, probablyto due the continuous arrangements in spatial positioning while walking.The results are in line with the previously described spatial arrangementsrelated to the total observed pedestrian flows (see Section 4.2), representingan innovative contribution for the understanding of group proxemics dynamicsin motion situation, once again in situations characterised by a relatively lowdensity and irregular flow.
Empirical data about high density situations would be necessary to actu-ally tune the mechanism in moderate and high density situations, but in thiskind of scenario this observation and analysis framework would very likelybe inappropriate and ineffective. A more sophisticated and at least partlyautomated (employing computer vision techniques and maybe machine learn-ing approaches to support the detection of groups) controlled experiments(given the high density situation, some help to the tracking and detectionapproaches would probably be necessary in terms, for instance, of markers tohighlight the heads of group members) is probably needed to actually facethe challenges of acquiring empirical evidences about the behaviour of groupsin high density situations. The participation of psychologists in the definitionof such an experimental observation setting would also help in managing anykind of tiring and learning effect due to the experimental procedure.
28

5. Conclusion and Future Developments
The paper discussed an integrated approach to the analysis and synthesisof pedestrian and crowd behaviour, in which the two aspects are actuallyset in an integrated framework and they mutually benefit in different ways.A general schema describing the conceptual pathways connecting modellingand analysis steps was described. A case study in which modelling andsimulation approaches, specifically focused on adaptive group behaviourenabling the cohesion of simple groups, produced a research question and someusable techniques to crowd analysis approaches was also introduced. On theother hand, a subsequent observation and analysis about the phenomenologyrepresented in the model was also described. Currently the empirical evidencesresulting from this analysis activity are being used to validate and calibratethe model for group cohesion. In particular the simulation model correctlyreproduces some of the observed phenomena, in particular, lower walkingspeeds for groups and tendency to preserve cohesion (although this aspect isundergoing a further calibration). Additional elements that are now beingevaluated are related to the capability of the model to generate spatial patternsresulting from the analysis.
Moreover, the analysis of the gathered video footage also highlightedadditional phenomenologies that are now being more thoroughly analysed:in particular, patterns of “leader–follower” behaviour within groups weredetected and the introduced simulation model presents all the necessaryelements and mechanisms to represent this kind of pattern. Future works arealso aimed at supporting innovative automated analysis techniques based oncomputer vision and machine learning approaches.
Acknowledgements
The authors would like to thank Milano’s Municipality for granting thenecessary authorisations to carry out the observation in the Vittorio EmanueleII Gallery.
References
Bandini, S., Bonomi, A., Vizzari, G., 2012. An analysis of different typesand effects of asynchronicity in cellular automata update schemes. NaturalComputing 11 (2), 277–287.
29

Bandini, S., Manzoni, S., Vizzari, G., 2009. Agent based modeling andsimulation: An informatics perspective. Journal of Artificial Societies andSocial Simulation 12 (4), 4.
Bandini, S., Rubagotti, F., Vizzari, G., Shimura, K., 2011. An agent modelof pedestrian and group dynamics: Experiments on group cohesion. In:Pirrone, R., Sorbello, F. (Eds.), AI*IA. Vol. 6934 of Lecture Notes inComputer Science. Springer, pp. 104–116.
Challenger, R., Clegg, C. W., Robinson, M. A., 2009. Understanding crowdbehaviours: Supporting evidence. Tech. rep., University of Leeds.
Costa, M., 2010. Interpersonal distances in group walking. Journal of Nonver-bal Behavior 34, 15–26, 10.1007/s10919-009-0077-y.URL http://dx.doi.org/10.1007/s10919-009-0077-y
Federici, M. L., Gorrini, A., Manenti, L., Vizzari, G., 2012. Data collectionfor modeling and simulation: Case study at the university of milan-bicocca.In: Sirakoulis, G. C., Bandini, S. (Eds.), ACRI. Vol. 7495 of Lecture Notesin Computer Science. Springer, pp. 699–708.
Fruin, J. J., 1971. Pedestrian planning and design. Metropolitan Associationof Urban Designers and Environmental Planners.
Georgoudas, I. G., Sirakoulis, G. C., Andreadis, I., 2011. An anticipativecrowd management system preventing clogging in exits during pedestrianevacuation processes. IEEE Systems Journal 5 (1), 129–141.
Gilbert, N., Troitzsch, K. G., 2005. Simulation for the Social Scientist (secondedition). Open University Press.
Hall, E. T., 1966. The Hidden Dimension. Anchor Books.
Hankin, B., Wright, R., 1958. Passenger flow in subways. Operational ReserachJournal 9 (2), 81–88.
Helbing, D., Molnar, P., May 1995. Social force model for pedestrian dynamics.Phys. Rev. E 51 (5), 4282–4286.
Junior, J. C. J., Musse, S. R., Jung, C. R., sept. 2010. Crowd analysis usingcomputer vision techniques. IEEE Signal Processing Magazine 27 (5), 66–77.
30

Klugl, F., 2008. A validation methodology for agent-based simulations. In:Menezes, R., Viroli, M. (Eds.), Symposium on Applied Computing. ACMPress, pp. 39–43.
Leal-Taixe, L., Pons-Moll, G., Rosenhahn, B., 2011. Everybody needs some-body: Modeling social and grouping behavior on a linear programmingmultiple people tracker. In: ICCV Workshops. IEEE, pp. 120–127.
Manzoni, S., Vizzari, G., Ohtsuka, K., Shimura, K., 2011. Towards an agent-based proxemic model for pedestrian and group dynamics: Motivations andfirst experiments. In: Tumer, Yolum, Sonenberg, Stone (Eds.), Proc. of 10thInt. Conf. on Autonomous Agents and Multiagent Systems – InnovativeApplications Track (AAMAS 2011). pp. 1223–1224.
Milazzo II, J. S., Rouphail, N. M., Hummer, J. E., Allen, D. P., 1999. Quality ofservice for interrupted-flow pedestrian facilities in highway capacity manual2000. Transportation Research Record: Journal of the TransportationResearch Board 1678 (-1), 25–31.
Moore, B. E., Ali, S., Mehran, R., Shah, M., 2011. Visual crowd surveillancethrough a hydrodynamics lens. Commun. ACM 54 (12), 64–73.
Moussaıd, M., Perozo, N., Garnier, S., Helbing, D., Theraulaz, G., 04 2010.The walking behaviour of pedestrian social groups and its impact on crowddynamics. PLoS ONE 5 (4), e10047.URL http://dx.doi.org/10.1371%2Fjournal.pone.0010047
Nishinari, K., Kirchner, A., Namazi, A., Schadschneider, A., 2004. Extendedfloor field ca model for evacuation dynamics. IEICE Transactions on infor-mation and systems 87 (3), 726–732.
Patil, S., van den Berg, J. P., Curtis, S., Lin, M. C., Manocha, D., 2011. Di-recting crowd simulations using navigation fields. IEEE Trans. Vis. Comput.Graph. 17 (2), 244–254.
Raghavendra, R., Bue, A. D., Cristani, M., Murino, V., 2011. Abnormalcrowd behavior detection by social force optimization. In: Salah, A. A.,Lepri, B. (Eds.), HBU. Vol. 7065 of Lecture Notes in Computer Science.Springer, pp. 134–145.
31
Schadschneider, A., Klingsch, W., Klupfel, H., Kretz, T., Rogsch, C., Seyfried,A., 2009. Evacuation dynamics: Empirical results, modeling and applica-tions. In: Meyers, R. A. (Ed.), Encyclopedia of Complexity and SystemsScience. Springer, pp. 3142–3176.
Schultz, M., Roßger, L., Fricke, H., Schlag, B., 2012a. Group dynamic behaviorand psychometric profiles as substantial driver for pedestrian dynamics. In:Pedestrian and Evacuation Dynamics 2012 (PED2012).URL http://arxiv.org/abs/1210.5553
Schultz, M., Roßger, L., Fricke, H., Schlag, B., 2012b. Group dynamic behaviorand psychometric profiles as substantial driver for pedestrian dynamics. In:Pedestrian and Evacuation Conference (PED2012).URL http://arxiv.org/abs/1210.5553
Vizzari, G., Manenti, L., Crociani, L., 2013 - in press. Adaptive pedestrian be-haviour for the preservation of group cohesion. Complex Adaptive SystemsModeling 1 (1).
Vizzari, G., Manenti, L., Ohtsuka, K., Shimura, K., 2012. An Agent-BasedApproach to Pedestrian and Group Dynamics: Experimental and RealWorld Scenarios. In: Proceedings of the 7th International Workshop onAgents in Traffic and Transportation.URL http://www.ia.urjc.es/att2012/papers/att2012_submission_
1.pdf
Was, J., 2010. Crowd dynamics modeling in the light of proxemic theories.In: Rutkowski, L., Scherer, R., Tadeusiewicz, R., Zadeh, L. A., Zurada,J. M. (Eds.), ICAISC (2). Vol. 6114 of Lecture Notes in Computer Science.Springer, pp. 683–688.
Weidmann, U., 1993. Transporttechnik der fussganger - transporttechnis-che eigenschaftendes fussgangerverkehrs (literaturstudie). Literature Re-search 90, Institut fuer Verkehrsplanung, Transporttechnik, Strassen- undEisenbahnbau IVT an der ETH Zurich.
Zhang, J., Klingsch, W., Schadschneider, A., Seyfried, A., 2011. Transitionsin pedestrian fundamental diagrams of straight corridors and t-junctions.Journal of Statistical Mechanics: Theory and Experiment 2011 (06), P06004.
32

(a)
(b)
(c)
Figure 9: A diagram showing most frequent positions, normalised with respect to thecentroid and the movement direction, assumed by members of couples (a), triples (b) andgroups of four members (c).
33