
Handling the Crowd - sonar.ch
244
Handling the Crowd An Explorative Study on the Implications of Prosumer-Consumer Communities on the Value Creation in the future Electricity Network Dissertation zur Erlangung der Würde eines Doktors der Wirtschafts- und Sozialwissenschaften, vorgelegt an der Wirtschafts- Sozialwissenschaften Fakultät der Universität Freiburg (Schweiz) von Mario Gstrein Schwaz in Tirol, Österreich genehmigt von der Fakultät der Wirtschafts- und Sozialwissenschaften am 26.09.2016 auf Antrag von Professor Dr. Stephanie Teufel (Erste Referentin) und Professor Dr. Andreas Meier (Zweiter Referent) Fribourg, Schweiz 2016
-
Upload
khangminh22 -
Category
Documents
-
view
1 -
download
0
Transcript of Handling the Crowd - sonar.ch

Handling the Crowd
An Explorative Study on the Implications of Prosumer-Consumer Communities on the Value
Creation in the future Electricity Network
Dissertation
zur Erlangung der Würde eines Doktors der Wirtschafts- und Sozialwissenschaften,
vorgelegt an der Wirtschafts- Sozialwissenschaften Fakultät der Universität Freiburg
(Schweiz)
von
Mario Gstrein
Schwaz in Tirol, Österreich
genehmigt von der Fakultät der Wirtschafts- und Sozialwissenschaften am 26.09.2016
auf Antrag von
Professor Dr. Stephanie Teufel
(Erste Referentin)
und
Professor Dr. Andreas Meier
(Zweiter Referent)
Fribourg, Schweiz 2016

iimtDissertations
The iimt University Press, Series on Management in Technology focuses on the following:
1. iimt Best Paper Award2. iimt Executive MBA and Executive Diploma Papers 3. iimt Executive Certificate Papers4. iimt Institute Reports5. iimt Dissertations6. Smart Environment
Based on its location in the centre of Europe and due to the innovativeness of its main target sectors, ICT and Utility Management, iimt University Press publishes papers in English, French and German.

Mario Gstrein
Handling the CrowdAn Explorative Study on the Implications of Prosumer-Consumer Communities on the Value Creation in the future Electricity Network
iimt Dissertations

iimtDissertations
iimt University Press Series on Management in TechnologyEdited by Prof. Dr. Stephanie Teufel
iimt Series on Management in Technology

Publisher:Prof. Dr. Stephanie Teufel
Author:Mario Gstrein
iimt Dissertations Handling the Crowd - An Explorative Study on the Implications of Prosumer-Consumer Communities on the Value Creation in the future Electricity NetworkMario Gstrein - Fribourg: iimt University Press, 2016(Series on Management in Technology)
© Copyright by iimt University Press, Fribourg / SwitzerlandISBN 978-3-905814-58-3
No part of this work may be reproduced or transmitted in any form or by any means, electronic or mechanical, including photocopying and recording, or by any information storage or retrieval system without the prior written permission of iimt University Press unless such copyright is expressly permitted by federal copyright law.
The use of general descriptive names, registered names, trademarks, etc. in this publi-cation does not imply, even in the absence of a specific statement, that such names are exempt from the relevant protective laws and regulations and therefore free for general use.
iimt University Press cannot attest to the accuracy of this information. Use of a term in this book should not be regarded as affecting the validity of any trademark or service mark.

II
Mit der Annahme einer Dissertation beabsichtigt die Wirtschafts- und
Sozialwissenschaftliche Fakultät der Universität nicht zu darin enthaltenen
wissenschaftlichen Meinungen der Verfassers Stellung zu nehmen. (Fakultätsbeschluss
vom 23. Januar 1990

III
„You never change things by fighting the existing reality. To change something,
build a new model that makes the existing model obsolete.”
- R. Buckminister Fuller -

Acknowledgement
IV
Acknowledgement
Every thesis is a journey requiring considerable time and effort, many steps, and travelling
through phases of delight and low in spirit. Such a journey cannot be done without the
support of a loving girlfriend, a beloved family, colleagues, and friends. I would like to
express my sincere and deepest gratitude to all of them. You helped me in one way or
another to finish my PhD journey. Nevertheless, there are some people I would like to
express my special thanks to.
My deepest gratitude goes to Annic, not particularly for her expertise in electricity market
or value networks, but for her moral support in listening to my stories and the adventures
of a PhD journey. She has always believed in the success and has been around despite
working long hours and fighting death every day.
It is an honour to express my sincere thanks to my supervisors Prof. Dr. Stephanie Teufel
and Prof. Dr. Andreas Meier. Both are an inspiration for doing research. Prof. Teufel, as a
mentor and supervisor, has had confidence in my finishing my PhD and vouched for me
from the beginning, especially with the troubles during the application process. She has
provided help and advice, and with her open-mind she has encouraged and supported me
to be innovative and approach new subjects. Thus, I am proud to be part of the new
Crowd Energy research field. Prof. Meier, as my second supervisor, has likewise been an
inspiration and support throughout this journey. His open-mind and curiosity for new areas
like the electricity industry have spurred my motivation. He has provided valuable input
and I have appreciated him as a conversation partner. Our discussions also included
private matters and I still have to visit Lenzerheide.
During my research at the iimt, I have had the privilege to be part of a great team creating
remarkable memories and moments. Particularly, I would like to express my sincere
thanks to Dr. Bernd Teufel and Yves Hertig. Both have been brilliant counterparts in
discussing subjects. They have offered new ways of thinking or just listened to my
explanations/monologs and hence have helped me order my thoughts. Besides
professional subjects, I have appreciated discussing private matters, sometimes
accompanied by a couple of beers and Yves: another one is always possible.
Also, I would like to express my sincere thanks to the decision support and operation
research group for providing expertise in the area of supply chain optimisation.
In particular, my deepest gratitude goes to Dr. Reinhard Bürgi with his in-depth experience
in creating optimisation models. He has always been kind and supportive despite his

Acknowledgement
V
preparation to leave for Canada with his family to start a Post Doc. Additionally, I would
like to thank Prof. Dr. Bernard Ries and Prof. Dr. Tony Hürlimann who have spared no
efforts to provide tools, knowledge and feedback.
Special thanks go to the partners in crime in doing a PhD, Marcel Wehrle and Alexander
Denzler. Being in the same boat has allowed sharing worries, success, and progress.
I have appreciated spending time together and for those who still have time to go, I wish
the best. Likewise, I would like to thank them for being supportive in providing the
development environment for the optimisation model. Not directly a partner in crime but an
idol for finishing a PhD was Dr. Caroline Biewer. I express my deepest gratitude for her
expertise in statistic but also for showing me ways to work off stress. Surprisingly, she
was right that hitting a small rubber ball with a racket against a wall can be quite relaxing.
Finally, I would like to thank the Friday Social Club, namely Stefan, Lena, Sian, Robert,
Bruno, and all other visitors for having very funny and also serious conversations.
Mario Gstrein
Fribourg, July 2016

Table of Contents
VI
Table of Contents
Acknowledgement ......................................................................................................... IV
Table of Contents .......................................................................................................... VI
List of Figures ................................................................................................................. X
List of Tables................................................................................................................ XIII
List of Abbreviations .................................................................................................... XV
1 Introduction .............................................................................................................. 1
1.1 Research Methodology ........................................................................................................ 3
1.2 Aims and Objectives ............................................................................................................ 7
1.2.1 Outline of the Thesis ....................................................................................................... 8
1.3 Publications ........................................................................................................................ 11
2 The Evolution of the Electricity Market .................................................................13
2.1 The Electricity Network Today .......................................................................................... 13
2.1.1 The Electricity Value Chain .......................................................................................... 15
2.1.2 Production .................................................................................................................... 20
2.1.3 Transmission and Distribution ...................................................................................... 22
2.1.4 Consumption ................................................................................................................ 28
2.2 The Smart Grid Initiative .................................................................................................... 29
2.3 De- and Re-alignment of the Low Voltage Grid through Micro-Grids ........................... 33
2.3.1 Functionalities of an intelligent DER ............................................................................. 36
2.3.2 A Reference Model for Micro-Grids .............................................................................. 37
2.3.3 A proposed Value Network Design .............................................................................. 40
2.3.4 Beyond the Micro-Grid Value Network ......................................................................... 43
3 Crowd Energy, the new Paradigm in the Electricity Market .................................46
3.1 The Idea of the Crowd Energy Concept ........................................................................... 46
3.2 iGSL Structure .................................................................................................................... 47

Table of Contents
VII
3.3 The Impact of Crowd Energy on the Current Value Chain ............................................. 49
4 The Value Network: the Theoretical Background for the Electricity Industry
of the Future ............................................................................................................52
4.1 From Supply Chain to Value Network .............................................................................. 52
4.1.1 Supply Chain Management .......................................................................................... 53
4.1.2 A Value Network Perspective ....................................................................................... 55
4.1.3 The Networks Involved and their Purposes ................................................................. 58
4.2 Value Creation from Intangibles ....................................................................................... 60
4.2.1 Types of Value .............................................................................................................. 61
4.2.2 Roles and their Relevance of Value Exchange ............................................................ 63
4.2.3 The Decision Making of Individuals .............................................................................. 65
4.3 Summary of Literature Review .......................................................................................... 68
5 A Research Framework for a Crowd-Based Value Network .................................70
5.1 The Crowd Value Network Design .................................................................................... 70
5.1.1 Define Network and Objectives .................................................................................... 71
5.1.2 Identify Network Entities and Map Network Influences ................................................ 74
5.1.3 Identifying Value Dimensions of the Network Participants ........................................... 77
5.1.4 Shape and Analysis ...................................................................................................... 81
5.2 Assessment of Crowd’s coherency.................................................................................. 84
5.2.1 Factors of Crowd Strength ........................................................................................... 84
5.2.2 Factors of Crowd Potential ........................................................................................... 87
5.3 Summary of Strength and Potential Factors ................................................................... 91
6 A Survey on Crowd Strength .................................................................................93
6.1 Generating an Online Survey ............................................................................................ 93
6.1.1 Basic Structure of Questionnaire .................................................................................. 93
6.1.2 Finalising the Online Survey ......................................................................................... 96
6.2 Results of Crowd Strength .............................................................................................. 100
6.2.1 Composition of Responses ........................................................................................ 100
6.2.2 Internal Structure Asset .............................................................................................. 102
6.2.3 Findings Internal Structure Asset ............................................................................... 108
6.2.4 Human Competences ................................................................................................. 110

Table of Contents
VIII
6.2.5 Findings Human Competence Asset .......................................................................... 118
6.2.6 Brand and Relationships ............................................................................................ 120
6.2.7 Findings Brand and Relationship Asset ..................................................................... 123
7 Simulation of Crowd Potential ............................................................................. 125
7.1 Modelling and Simulation of Crowd Potential ............................................................... 125
7.1.1 Formulate a Conceptual Model .................................................................................. 126
7.1.2 Translating the Abstract to a Computerised Model .................................................... 128
7.2 Results of Crowd Potential .............................................................................................. 130
7.2.1 General Simulation Settings ....................................................................................... 130
7.2.2 Description of Transformer Station ............................................................................. 132
7.2.3 Meaning of Model Variables Related to Framework Factors ..................................... 135
7.2.4 Current Scenario ........................................................................................................ 136
7.2.5 Comparing Season Results of the Current Scenario ................................................. 150
7.2.6 Potential in a Future Scenario .................................................................................... 157
7.2.7 Findings Crowd Potential............................................................................................ 162
8 Conclusions and Recommendations for Future Research ................................ 165
8.1 Conclusions of a Crowd Energy Value Network ........................................................... 165
8.1.1 A crowd-based Network Design ................................................................................. 166
8.1.2 Conclusions of Crowd Strength .................................................................................. 168
8.1.3 Conclusions of Crowd Potential ................................................................................. 170
8.2 Limitations of the Thesis ................................................................................................. 172
8.3 Recommendations for Future Research ........................................................................ 173
9 Bibliography .......................................................................................................... 175
10 Appendix ............................................................................................................... 191
10.1 Questionnaire ................................................................................................................... 191
10.2 Modelling and Simulation Specifications ...................................................................... 198
10.2.1 Sun Radiation Profile Spiez ........................................................................................ 198
10.2.2 Standard Load Profiles ............................................................................................... 198
10.2.3 R Program Code for Data Preparation ....................................................................... 199
10.2.4 LPL Optimisation Code............................................................................................... 204
10.2.5 Numeric Test of Optimisation Model .......................................................................... 205

Table of Contents
IX
10.3 Results Current Scenario ................................................................................................ 210
10.4 Results Future Scenario .................................................................................................. 216

List of Figures
X
List of Figures
Figure 1: Scientific research approach of this dissertation ................................................. 6
Figure 2: Outline of dissertation chapters according to scientific approach ........................ 9
Figure 3: History of the Swiss electricity industry (adapted from Infel AG, 2010) .............. 14
Figure 4: The current electricity value chain ..................................................................... 16
Figure 5: Composition of electricity prices in selected European countries
(Eurostat, 2016) ........................................................................................ 18
Figure 6: The electricity production, per type, of selected European countries in 2014
(BFE, 2014a) ............................................................................................. 20
Figure 7: Schemata of the Swiss electricity network (adapted from AEE, 2015) ............... 23
Figure 8: The main synchronous grids of Europe (Kreusel, 2015) .................................... 25
Figure 9: Electricity consumption of EU-27 according to sectors (Kearney, 2016) ............ 28
Figure 10: Conceptual layout of micro-grids in Smart Grids
(Leonardo ENERGY, 2016) ....................................................................... 34
Figure 11: The Smart Grid Architecture Model (SGAM) (Biester, 2012) ........................... 38
Figure 12: Shifts of characteristics in the electricity industry (adapted from
Peppard & Rylander, 2006) ....................................................................... 40
Figure 13: The new Value Chain Design based on Micro-Grid Structures ........................ 41
Figure 14: Crowd Energy based on an iGSL cell (adapted from Teufel &
Teufel, 2014) ............................................................................................. 48
Figure 15: Antecedents and Consequences of Supply Chain Management
(adapted from Mentzer et al., 2001) .......................................................... 54
Figure 16: A supply chain management model (Mentzer et al., 2001) .............................. 55
Figure 17: Mapping the value exchange (Allee, 2000) ..................................................... 62
Figure 18: Value conversion strategy model (Allee, 2008, p. 10) ..................................... 63
Figure 19: A prospect theory matrix (Kahneman, 2012) ................................................... 66
Figure 20: Objectives assigned to electricity network participants .................................... 72
Figure 21: Crowd Energy objective matrix ........................................................................ 74
Figure 22: Future electricity value network with roles and relationships ........................... 75
Figure 23: Internal and external currencies between crowd and external roles ................ 79
Figure 24: Internal and external currencies between individuals and external roles ......... 81
Figure 25: Network value map of a crowd-based electricity industry ................................ 82

List of Figures
XI
Figure 26: Linkage between production profile and dominant decision making
behaviour .................................................................................................. 86
Figure 27: An abstract Crowd Energy model .................................................................... 88
Figure 28: Inclusive factors in sequence of target categories ........................................... 94
Figure 29: The beginning of the survey stating concept, objectives, and
introduction to the field .............................................................................. 97
Figure 30: Explanatory notes and animation for storage related questions ...................... 98
Figure 31: Layout for a set of questions for a specific group ............................................ 99
Figure 32: Relevance of an intelligent decentralised system .......................................... 102
Figure 33: Incentives to provide storage capacity for external usage ............................. 104
Figure 34: Assigned responsibility for electricity management ....................................... 106
Figure 35: Perception of distribution of value during surplus periods .............................. 111
Figure 36: Distribution of price determination during surplus period ............................... 112
Figure 37: Surplus decisions on distribution for sunny and bad weather forecast ........... 114
Figure 38: Distribution of decisions during extracting period for sunny and
bad weather forecasts ............................................................................. 116
Figure 39: Decision making behaviour in prospect of weather forecast matrix ............... 119
Figure 40: Considered preferences for crowd size ......................................................... 121
Figure 41: Factors for participation in a crowd-based network ....................................... 122
Figure 42: Abstract optimisation model of a crowd ......................................................... 127
Figure 43: Process of creating a computerised model .................................................... 129
Figure 44: Objects and network structure of transformer station .................................... 133
Figure 45: Overview of flows, names, and dependencies .............................................. 135
Figure 46: Crowd potential overview winter current scenario ......................................... 138
Figure 47: Crowd potential overview transition period current scenario .......................... 141
Figure 48: Consumer storage behaviour ........................................................................ 144
Figure 49: Crowd potential overview summer ................................................................ 147
Figure 50: Distance of electricity distribution among cells during transition period ......... 154
Figure 51: Distance of electricity distribution among cells during summer period ........... 155
Figure 52: Alterations of categories in seasons .............................................................. 156
Figure 53: Categorisation of cells seasons future scenario ............................................ 160
Figure 54: Distance of electricity distribution among cells (transition week,
future scenario) ....................................................................................... 161

List of Figures
XII
Figure 55: Distance of electricity distribution among cells (transition week,
limited storage) ....................................................................................... 161
Figure 56: Sun radiation profile Spiez - in percentage of annual sun radiation ............... 198
Figure 57: Standard load profile ..................................................................................... 198
Figure 58: Source code for generating production and consumption lists of
all objects ................................................................................................ 203
Figure 59: Source code for generating network according to TSP.................................. 204
Figure 60: LPL optimisation code ................................................................................... 205
Figure 61: Results current scenario (in kW) - winter week (1) ........................................ 210
Figure 62: Results current scenario (in kW) - winter week (2) ........................................ 211
Figure 63: Results current scenario (in kW) - transition week (1) ................................... 212
Figure 64: Results current scenario (in kW) - transition week (2) ................................... 213
Figure 65: Results current scenario (in kW) - summer week (1) ..................................... 214
Figure 66: Results current scenario (in kW) - summer week (2) ..................................... 215
Figure 67: Results future scenario (in kW) - winter week (1) .......................................... 216
Figure 68: Results future scenario (in kW) - winter week (2) .......................................... 217
Figure 69: Results future scenario (in kW) - transition week (1) ..................................... 218
Figure 70: Results future scenario (in kW) - transition week (2) ..................................... 219
Figure 71: Results future scenario (in kW) - summer week (1) ....................................... 220
Figure 72: Results future scenario (in kW) - summer week (2) ....................................... 221

List of Tables
XIII
List of Tables
Table 1: Main objectives and the required tasks for a Smart Grid (EPRI, 2014) ............... 31
Table 2: Micro-grid architectures (adapted from Driesen & Katiraei, 2008) ...................... 35
Table 3: Factors for evaluating crowd strength ................................................................. 85
Table 4: Factors for evaluating crowd potential ................................................................ 88
Table 5: Target questions and responses for Decision Making ........................................ 95
Table 6: Categories and groups of the questionnaire ....................................................... 98
Table 7: Distribution property and obtain electricity from PV facility ............................... 101
Table 8: Minimum storage period and relevance to fill capacity ..................................... 103
Table 9: Average depletion levels at which respondents would reduce consumption
or buy electricity ...................................................................................... 105
Table 10: Challenges to electricity management according to property .......................... 107
Table 11: Findings of internal structure asset ................................................................. 108
Table 12: Value perceptions according to property and obtaining PV electricity ............. 111
Table 13: Responses of value preferences in surplus and extraction phases ................ 112
Table 14: Responses of price preferences in surplus and extraction phase ................... 113
Table 15: Sunny and bad weather response matrix for surplus period ........................... 115
Table 16: Sunny and bad weather response matrix for extracting period ....................... 117
Table 17: Findings of human competence asset ............................................................ 118
Table 18: Crowd characteristics and average importance .............................................. 122
Table 19: Finding of brand and relationship asset .......................................................... 123
Table 20: Simulation settings ......................................................................................... 131
Table 21: Parameters for simulation .............................................................................. 132
Table 22: Overview of annual production and consumption for all cells ......................... 134
Table 23: Total number of crowd flow winter .................................................................. 137
Table 24: Flows according to cell categories in winter period ......................................... 138
Table 25: Total amount of crowd flow transition current scenario ................................... 140
Table 26: Flows according to cell categories in transition period current scenario .......... 141
Table 27: Total number of crowd flows in summer current scenario ............................... 145
Table 28: Flows according to cell categories in summer period ..................................... 148
Table 29: General key figures for winter, transition, and summer periods ...................... 151
Table 30: Key figures of flows current scenario .............................................................. 152

List of Tables
XIV
Table 31: General key figures of seasons between current and future scenario ............. 157
Table 32: Key figures of for flows and season in current and future scenario ................. 158
Table 33: Findings of crowd potential ............................................................................. 163
Table 34: Randomised consumption of five cells ........................................................... 206
Table 35: Results of the numeric test scenario............................................................... 207
Table 36: Flows of scenario for cell two ......................................................................... 208
Table 37: Results of the numeric test by reduced production and limited storage .......... 208

List of Abbreviations
XV
List of Abbreviations
AC Alternating currency
ADA Advanced distribution automation
AMI Advanced Metering Infrastructure
CE Crowd Energy
CHF Confederation Helvetica Franc
CHP Combined Heat and Power
CO2 Carbon Dioxide
CPP Critical Peak Pricing
DC Direct currency
DER Distributed Energy Resources
DG Decentralised Generation
DMS Distributed Management System
DNI Direct Normal Irradiance
DR Demand Response
DRM Demand Response Management
DS Decentralised Storage
DSM Demand Side Management
DSO Distribution System Operators
EDF Électricité De France
EEG Erneuerbare-Energien-Gesetz
EEX European energy exchange
GDP Gross Domestic Production
GHG Green House Gas
GWH Giga Watt per Hour
ICT Information and Communication Technology
iGSL Intelligent Generation-Storage-Load
KEV Kostendeckende Einspeisevergütung
kW Kilo Watt

List of Abbreviations
XVI
kWh Kilo Watt per hour
kW/y Kilo Watt per year
LP Linear Programming
LPL Linear Programming Language
M Mean
MAS Multi-agent system
M&S Modelling and Simulation
MCF Minimum Cost Flow
MIP Mixed Integer Programming
MLP Multi-level Perspective
NaS Sodium sulphur
NVA Network Value Analysis
PV Photovoltaic
RES Renewable Energy Sources
RTP Real Time Pricing
SA Smart Applications
SCM Supply Chain Management
SD Standard Deviation
SGAM Smart Grid Architecture Model
SLP Standard Load Profile
SNA Social Network Analysis
STS Socio-technological System
TOU Time of Use
TP Time Points
TSO Transmission System Operators
TSP Travel Salesman Problem
UK United Kingdom
VAT Value added taxes

Introduction
1
1 Introduction
„We can do everything – even 100%” (Janzing, 2011) is a manifestation to accept
challenges of unrestrained and unsustainable handling of electricity in society.
The manifestation demonstrates a terrestrial project, the energy turnaround, intending to
re-design an entire industry on economic, political, and social levels. The transition was
nudged by environmental pollution or nuclear accidents in Fukushima questioning
sustainability of electricity networks. The growing public awareness of electricity
production and consumption starts to modify the acceptance of climate damaging
production units as nuclear or thermal power plants are increasingly in the spotlight of
critics. Recent undertaken efforts like the last climate conference in Paris in 2015 are
signals and reinforcements to reduce CO2 emissions or to abolish energy forms
(i.e. nuclear exit). These efforts are not solely concessions on paper which show the
example of economic disinvestments initiative in coal (Henn & Dubois, 2015), respectively
announcement of Allianz (Esser, Hua, & Morawietz, 2015). Big challenges are ahead due
to decades of neglected care and attention.
The challenges cause ramifications on existing electricity industry and current vivid
discussions demonstrate the need for a vision of future network as well to perform
transition to the next stage. For that purpose, stakeholders define the concept of a Smart
Grid. In general, it describes a synchronised production and consumption of electricity
through advanced metering and digital information and communication technologies.
The concept plans a vast scope of actions and for example intends a reconfiguration of
the macro level (Verbong & Geels, 2010). Leaving electricity industry pretty much
unchanged, on a micro level – mainly demand side contribution – experiences a radical
change and is important to achieve strategic objectives (BFE, 2013). Thereby, the major
objective is the integration of the black box “consumption” to build a holistic and
continuous value network. To this end, technical connection and information exchange are
central topics for sustainability, reliability, and performance. Initial ideas tackle integration
by introduction load management programs to peak, fill, or shift demand and balance with
production capacities (Bellarmine, 2000). However, load management is a single aspect
and further views must be added.
The addressed 100% refers to a total electricity production from renewables redefining the
regional value creation. This requires more advanced concept of micro-grids and implies a
re-decentralisation and promotion of on-site production. With cellular structuring, a
profound integration is expected and simultaneously promotes dramatic implications in the
low-voltage network. The result is a complex, interconnected, interactive, and adaptive

Introduction
2
network. An essential driver is a recognisable decentralisation trend supported by internal
technological developments in the electricity sector, e.g. photovoltaic, and external influx
of information and communication technologies (ICT). The latter one introduces new
possibilities of value creation but also implicate different mind-sets for innovation.
Furthermore, value capturing opportunities expands to other participants e.g. communities
(Nürnberger, 2015). Such novel factors implicate a commotion in the current electricity
system causing a transition pathway of de- and re-align the supply chain (Verbong &
Geels, 2010); thereby the de-alignment expresses the disengagement of traditional
concepts and mind-sets. This kind of socio-technological transition is a continuously
incremental approach rather an upfront planned schedule. In the emerging uncertainty,
struggles for power is common and influence transition as stakeholders act in favour of
own interests. An authoritative part has the suppliers’ and distributors’ side (later called
also called electricity provider or only provider) defending their existing revenue stream of
selling quantity. The opposing attitude of providers to the Smart Grid concept brings
controversial contributes to discussions. Providers accelerate load management
objectives to reduce electricity waste keeping influence of demand side under control.
Simultaneously, an improved consumption behaviour cuts of lucrative stream and would
throttle own profit. The willingness of profound alterations from provider side must be
questioned.
Consequentially, present disputes are predetermined and lack on a sufficient
consideration of future consumer role and accompanied duties and rights.
The technological decentralisation entails that consumer strengthen their position in the
value network by investments in production and storage equipment. By becoming a
prosumer, temporary independency diminishes claims from the overall grid (Teufel &
Teufel, 2014). Such an individual independency is greatly feared, but will undoubtedly
occur. It would also be folly to state that there will be at one side independent individuals
and at the other side the overall grid. It is likely that centralised and decentralised
elements exist and incorporate for a sustainable network. Nevertheless, the appearance
of prosumers permanently modifies the network and especially value creation because of
a different behaviour contrary to business driven counterparts. New relationships and
decision making patterns emerge and sharing of electricity and information reshape
traditional constructs. Meanwhile, the dominance of intangibles, e.g. knowledge or internal
structure, modifies value creation and stakeholders depend upon the connectivity to and
among demand side. Thus, research from a prosumer perspective is highly
recommendable.

Introduction
3
For that reason, this dissertation elaborates on the new research field of Crowd Energy
(Teufel & Teufel, 2014). Crowd Energy takes the micro-grid concept further and
investigates upon so called intelligent generation-storage-load cells (iGSL) (Teufel &
Teufel, 2014). These three cell functionalities provide a range for actions in regard to
produce electricity surpluses and hence to sustain own demand or support neighbouring
cells through delivering electricity. By pooling functionalities of several houses, collective
effort creates a virtual crowd. This provides several advantages. First, a crowd approach
improves resource allocation between surplus and shortage locations but also allocation
through time. Furthermore, the local to local principle shortens the transportation distance
and hence the losses for transformation. Secondly, the local flexibility of exchange
provides reliability for the overall grid. In case of black outs, crowds can preserve
availability through self-produced electricity. Additionally, crowd resources can provide
storage space to balance load. These arguments proclaim an advanced technical,
automated integration similar to the crowd sourcing methods but extend these approaches
by including social related subjects. A last advantage of Crowd Energy is the
consideration of human behaviour to influence cell functionalities and consequential the
dynamics of a crowd. Subjects like sharing behaviour, decision making patterns or trust
and commitments, are decisive for creating and maintaining crowd structures as well for
completing successful demand side integration.
The bottom up approach of a Crowd Energy is a new research field and requires
investigations to answer basic questions. A major area is designing the future electricity
value network under a Crowd Energy paradigm. Important points are of peculiar interest:
role description of prosumers, position in the value network, types of relationships and
value creation through prosumers respectively crowds. Latter point contains several
significances due to value creation through tangible and non-tangible assets and hence
related quality of outcomes. Another question is potential outcome of crowds in terms of
electricity production. There are several simulations of micro-grid contributions, mostly in
the light of top-down views (Baños et al., 2011), but the crowd-based concept focuses on
optimal exchange among members. So, the potential of exchange considers minimisation
of transportation and is an indicator for independency of the crowd in the value network.
1.1 Research Methodology
Investigations in design, strength, and potential of crowd-based value networks require
pioneer work to introduce a new perspective on the electricity industry. The new concept

Introduction
4
applies and integrates various aspects like technical (e.g. micro-grid structure), social
(e.g. sharing), and processual (e.g. crowd sourcing). The combination of these aspects
permits to elaborate a different understanding of future electricity production and
consumption with a central focus on a local production-consumption principle. Along with
this new research field, many research questions occur that require immediate attention.
The amount of questions and directions tempt to start randomly and the familiarity of
research subjects misleads to do it without considerations. A professional research
strategy to gain insights is hence beneficial.
The object under study is Crowd Energy, which does not exist yet, and implies that
implementation and behaviour of a community in a system are uncertain or ambiguous. In
particular, the idea of communities alters value network design defining new technical
integration, information exchange routines, and responsibility of individuals. Such a
temporarily involvement through customisation is already known in practice and literature,
but a permanent integration of the prosumer role shifts value creation process beyond
recognised concepts. For example, prosumers provide production and distribution for
themselves and simultaneously are responsible for functioning of a larger infrastructure –
the crowd. Prosumers are located between individualism and community thinking. This
controversy affects decision making of self-produced electricity: keep it or share it.
Those choices will also be based on business but social factors. Research can follow
certain theories to define and explain Crowd Energy, however, a profound picture of the
situation is missing as well as directions for future needs to be uncovered. Such a
research problem proclaims an explorative research design and this dissertation
investigates Crowd Energy from a community perspective.
An exploratory research design applies on research problems with few or no earlier
studies for referencing or undertaken when concepts are in a preliminary stage (Cooper &
Schindler, 2008). Preliminary stage includes that theories and concept are not
established. The exploratory idea has inherent characteristics (Cooper & Schindler, 2008).
Research objectives are among others familiarity to gain background information on a
particular topic, provide further research questions and directions, addresses research
questions of all types (what, why, how), and to define new terms and clarify existing
concepts. On the contrary, exploratory studies utilise small sample sizes and hence
results cannot be generalised. Additionally, the explorative nature provides firsts insights
in fields and inhibits to make definitive conclusions about results. A certain freedom and
flexibility underpins the process causing often to an unstructured methodology. This leads
to tentative results which has limited validity. In comparison, descriptive research, where a

Introduction
5
clear formalised standard exists, forces to define hypothesis or investigative questions,
verify them, methods for gathering data, and analysis (Cooper & Schindler, 2008). Thus, it
is necessary to secure research quality of explorative studies by clarifying the procedure
in detail.
The dissertation follows a deductive approach which is the process of reasoning from one
or more statements to reach a logically certain conclusion (Snieder & Larner, 2009, p. 16).
Reasoning is from top to down starting with a theory and leading to new hypothesis or
investigative questions. On this regard, deductive approach for an explorative study relies
on a profound description of the underlying situation, reference to future scenarios or
trends, and statement of shortcomings in the current discussions. Furthermore, the
background must provide the object of study (i.e. the new concept Crowd Energy) and the
research perspective for further investigations. The outcome of the background is
requirements for the framework and later on discussions. Thereafter, research questions
are deduced from the background and are formulated in operational terms. Operational
refers to provide arguments for research importance. The verification of questions lies in
the discussion of future trends and the examination of secondary data.
A next step involves exploring known literature to explain characteristics,
interrelationships, and behaviour of the research object. This is done as exploratory
provide new insights but do not necessarily must develop new theory (Thornberg, 2012).
In other words, the new concept alters profoundly existing knowledge rather replacing it
entirely (Thornberg, 2012). Further argument is that the object under study does not exist
in a vacuum and close related general theories are a starting point for establishing
insights (Thornberg, 2012). So far, used language is descriptive meaning that reasoning
describes the actual, sometimes unconscious rules of existence.
From the gained knowledge of background and general theories, a framework is
established and outlines variables for further statistical investigating. The language
becomes prescriptive defining future goals and purposes of the object under study – how
it should be. Arguments and requirements are deduced from background and theories.
The proposed factors are tested by applying relevant quantitative or qualitative method(s).
Generally, exploratory studies are often classified as qualitative research according to the
way of gathering information (e.g. secondary data analysis, experiences surveys, or focus
groups) (Cooper & Schindler, 2008, p. 146). Subjectiveness, non-representativeness, and
non-systematic design produce biased results and minimise quality of outcomes.
Criteria for quality depends on designing and executing research, but also quantitative

Introduction
6
techniques can additionally reduce biases by using statistics and more structured
techniques.
The above mentioned scientific process is related to real phenomena and hence follows
the critical rationalism approach (Popper, 2002). Rationalism emphasises theoretical
thinking whereas critical indicates the ability to falsify statements. The critical rationalism
is a synthesis of rationalism (i.e. insights are gained by deduction based on rational
premises) and empiricism (i.e. insights are gained by induction through observations).
Figure 1: Scientific research approach of this dissertation
Despite regarding different sources of knowledge, both approaches have similarities and
the idea of exclusive deduction or induction is outdated (Kornmeier, 2011). The results of
a critical rationalism process concern with the real phenomena and involve practical
applicable results. As a consequence, the dissertation follows the tradition of
Schmalenbach (Schmalenbach, 1911/1912) rather Rieger’s position of a strictly
theoretical science (Rieger, 1984). The tradition defines empirical facts is translated in
practical normative recommendations. Both, scientific process and results, requires being
coherent. A synthesis of critical rationalism and normative recommendations is proposed

Introduction
7
by (Brodbeck, 2007) and defines descriptive-empirical approach resulting in normative
recommendations for action. The dissertation follows this approach and is summarised in
Figure 1.
1.2 Aims and Objectives
The perspective of a community defines an in-between position of individuals and
traditional roles of electricity producer or distributors. Finding conclusions about crowd-
based networks have to investigate in two directions. First, a value network view
describes general relationships of community with the rest of the value network.
This includes structure of the future value network defining the roles, relationships, and
exchange types. The second view focuses on internal features of a community.
In particular, two main features can be noticed a) cooperation among members (i.e.
strength of communities) and b) exchange of electricity to become independent from
external linkages (i.e. potential of communities). Strength is the possibility of prosumers to
convert tangible and intangible assets into deliverables whereas potential states
produced, stored, and exchanged electricity of crowd members. The latter is important to
support leverage of communities in the value network in the light of future electricity
strategies according to (BFE, 2013). Therefore, aims of this dissertation can be
summarised in three main and several sub-questions:
1) What does the design of the new value network in a Crowd Energy paradigm look
like?
a) How is a community interrelated with other roles?
b) What values are exchanged between roles?
2) How does a prosumer define the conversion of tangible and intangible assets into
deliverables?
a) What are the factors for assessing asset conversion?
b) How does a prosumer evaluate the conversion of assets?
3) What is the potential of Crowd Energy?
a) Which production and storage potential can a crowd achieve?
b) What is the effective electricity exchange rate within a community?
The above aims will be accomplished by fulfilling the following research objectives:

Introduction
8
Review literature elaborating requirements for future electricity by describing
current market situation, trends in the industry, and the shortcomings in
discussions.
Provide a description of the Crowd Energy concept and arguments for research
questions.
Formulate theoretical background explaining activities for an integrated value
network management philosophy.
Establish a crowd-based value network framework by considering requirements
and theories. The first contribution is a holistic value network including description
of roles, types of value exchanges, and behaviour. The second contribution
focuses on strength of a crowd (i.e. coherency of a crowd) and defines factors
assessing prosumer’s conversion of tangible and intangible values into
deliverables. The last contribution describes factors for the potential electricity
exchange among crowd members.
Investigate in perceptions and attitudes to assess crowd strength from prosumers
perspective by using statistics. Answers are given to factors like storage
management, willingness to be part of a crowd, decision patterns for storing or
sharing of self-production, value and price of self-produced electricity, and
challenges for crowd participation.
Calculating electricity production and storage as well as optimising exchange
based on real consumption and production data. Comparing current and future
scenario. The scenarios involve winter, summer, and transition periods.
Drawing conclusion about a Crowd Energy value network and provide
recommendations for further research in the field of Crowd Energy.
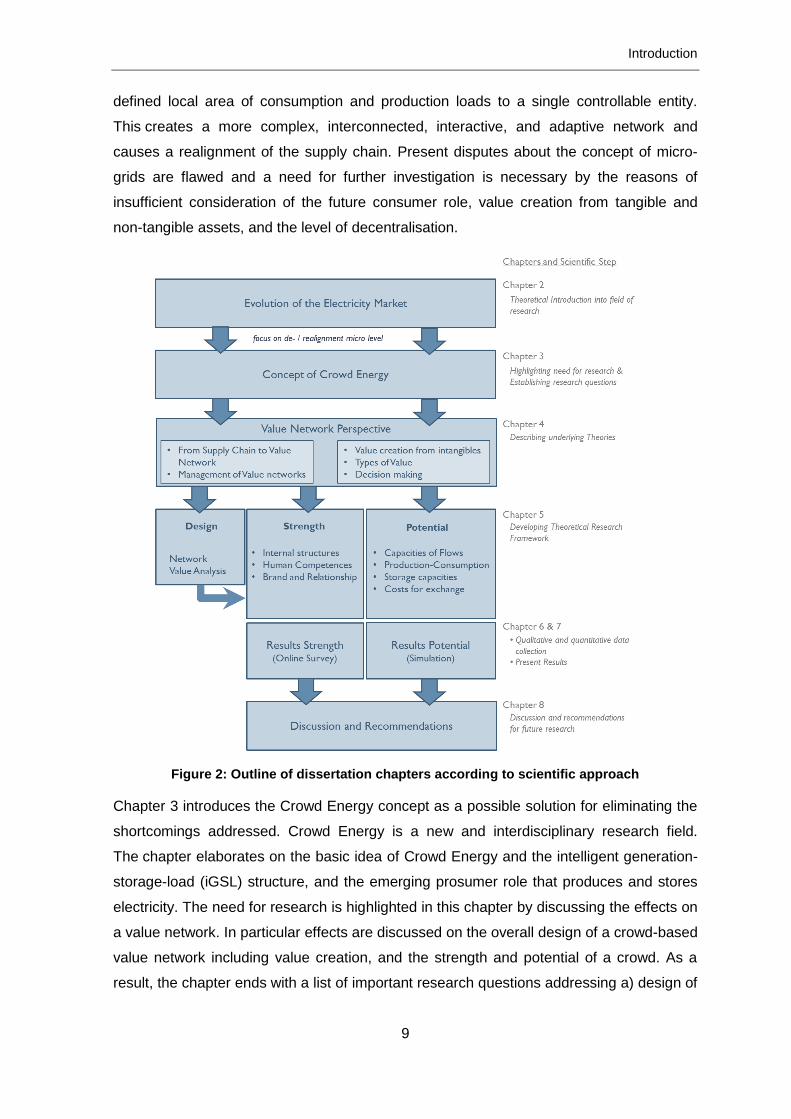
1.2.1 Outline of the Thesis
The outline of the dissertation addresses research design requirements as well as aims
and objectives. The chapters address different scientific research steps (see Figure 1) and
hence an interlinked outline emerges. An overview of the thesis structure is summarised
in Figure 2 and will be discussed in the following paragraphs.
Chapter 2 introduces to the field of research by describing the current electricity markets
in Europe and highlights the current characteristic of the industry. Based on these
features, the chapter discusses the next evolutionary step of Smart Grids and the
implications for the low voltage layer transition to create a sustainable electricity network.
Especially, the concept of micro-grids has tremendous implications by bundling a clear
Introduction
9
defined local area of consumption and production loads to a single controllable entity.
This creates a more complex, interconnected, interactive, and adaptive network and
causes a realignment of the supply chain. Present disputes about the concept of micro-
grids are flawed and a need for further investigation is necessary by the reasons of
insufficient consideration of the future consumer role, value creation from tangible and
non-tangible assets, and the level of decentralisation.
Figure 2: Outline of dissertation chapters according to scientific approach
Chapter 3 introduces the Crowd Energy concept as a possible solution for eliminating the
shortcomings addressed. Crowd Energy is a new and interdisciplinary research field.
The chapter elaborates on the basic idea of Crowd Energy and the intelligent generation-
storage-load (iGSL) structure, and the emerging prosumer role that produces and stores
electricity. The need for research is highlighted in this chapter by discussing the effects on
a value network. In particular effects are discussed on the overall design of a crowd-based
value network including value creation, and the strength and potential of a crowd. As a
result, the chapter ends with a list of important research questions addressing a) design of

Introduction
10
the future value network and b) the strength and potential of a crowd generated by
electricity exchange among members. These research areas are described separately
due to the different theories and methods used.
Chapter 4 describes the underlying and essential theories which support the framework.
The chapter starts with development from a supply chain to a value network approach to
highlight crowd-based value network characteristics and management principles.
Subsequently, this chapter elaborates on value networks by discussing both elements
separately – value and network design. This involves among other things, a description of
roles and connections, context for exchange, and changing exchange content by adding
new types of value. In particular, the chapter turns its focus to the social roles of the
prosumer and value conversion from tangible and intangible assets to deliverables;
therefore the decision making process is a crucial element.
Chapter 5 builds upon the theoretical backgrounds and establishes a framework for
further investigations. The stated framework is the conceptual contribution to the field of
research. The absent of crowd structures in the electricity industry does not permit to
study the object under real environment. Thus, the prescriptive language of network value
analysis (NVA) supports to describe a possible future situation of roles and types of
linkages according to established background and theories. The chapter develops a
conceptual Crowd Energy value network to provide a context in which a crowd structure
acts. The outlined value network is a possible scenario and a verification of the new value
network design is not further supported by a research method. Nevertheless, the crowd-
based network provides the context for investigation into strength and potential.
The chapter defines factors for strength which is the ability to create value from tangible
and intangible assets. Strength is a prosumer perspective and an assessment requires
the adaption of the strategic conversion model respectively the inherent factors internal
structure, human competence, brand and relationship, and financial assets. The last part
of the framework concerns with the potential of crowds and refers to the asset electricity.
Potential describes the capability of exchange self-produced electricity among crowd
members and simultaneously reduce dependency from external suppliers. Thus, the
chapter formulises appropriate factors like capacity of different flows, production
performance, generated surplus, and capacity to store electricity. The described factors
are applied, analysed, and discussed in the following chapters.
Chapter 6 deals with the crowd strength. The chapter starts with a description of the
online survey concerning with creation of questionnaire, response strategy, and

Introduction
11
integration to a holistic self-guided survey. Eventually, the results and findings of crowd
strength are presented.
Chapter 7 illustrates the crowd potential. The chapter starts with a description of the
abstract model for optimising transportation costs of electricity. Furthermore, the chapter
presents the necessary input, parameters, and constants of the model. Eventually, the
results and findings are presented. For that purpose, a simulation experiment with the
minimum cost flow model of a transformer station in Spiez was executed.
Finally, chapter 8 opens up the discussion of results and conciliate both streams to
generate a general picture of Crowd Energy value network. The goal is to present findings
and by doing so to answer the proposed research questions. The chapter provides an
outlook for further research.
1.3 Publications
During research at the iimt, several papers related to the topic of crowd energy are
published.
Aldabas, M., Gstrein, M., & Teufel, S. (2015). Changing Energy Consumption Behaviour:
Individuals' Responsibility and Government Role. Journal of Electronic Science and
Technology, 13(4), 343–348. doi:10.11989/JEST.1674-862X.505263
Craven, J., Derevyanko, E., Gstrein, M., & Teufel, B. (2015). Influence of Taxation on
Supply and Demand in Tomorrow’s Crowd Energy Paradigm. Journal of Electronic
Science and Technology, 13(3), 237–245. doi:10.11989/JEST.1674-862X.505011
Egger, S., Gstrein, M., & Teufel, S. (2015). Impact of Business Practices on Individual
Energy Consumption. Journal of Electronic Science and Technology, 13(4), 349–354.
doi:10.11989/JEST.1674-862X.505242
Gstrein, M., & Teufel, S. (2014). The changing decision patterns of the consumer in a
decentralized smart grid. In 11th International Conference on the European Energy
Market (EEM) (pp. 1–5). doi:10.1109/EEM.2014.6861216
Gstrein, M., & Teufel, S. (2015). Crowd Energy Management: New Paradigm for the
Electricity Market. Journal of Electronic Science and Technology, 13(3), 165–205.
doi:10.11989/JEST.1674-862X.505091

Introduction
12
Vereshchagina, V., Gstrein, M., & Teufel, B. (2015). Analysis of the Stakeholder
Engagement in the Deployment of Renewables and Smart Grid Technologies. Journal
of Electronic Science and Technology, 13(3), 221–228. doi:10.11989/JEST.1674-
862X.505121

The Evolution of the Electricity Market
13
2 The Evolution of the Electricity Market
This chapter describes the current situation and the development of European electricity
markets. Both, the initial situation and the impact of development, outlines the
shortcomings in recent discussions and highlights the arguments for a Crowd Energy
value network. This chapter represents the environment of this research (see Figure 2).
The current situation of the European electricity industry in chapter 2.1 elaborates the
characteristics of the electricity value chain and the three areas of production, distribution
and consumption. It will be shown that European markets follow a top down approach and
attach little importance to integrate demand side. Please note that a European perspective
is chosen due to provide the largest maximum of electricity industry characteristics.
A common definition is a difficult task due to the variety of electricity networks
configurations in Europe. To ensure a certain amount of objectivity, the general features of
an electricity market including the value chain, will be described according to the Swiss
electricity market; thereby this market becomes a reference point. Any derivations from
this reference point configuration in other European electricity markets will be outlined
within the text.
The next evolutionary step of Smart Grids is descried in chapter 2.2 and highlights the
implications for the low voltage layer to create a sustainable electricity network.
In particular, the micro-grid concept transforms the perspective on decentralised
production resources and the chapter outlines the critical factors for successful
implementation and management.
The effects of micro-grids on the value network electricity is the integration of demand
side in operations of load, however, the chapter 2.3 shows that shortages of discussions
concerning subjects like degree of decentralisation, the new prosumer role, value
creation, and address social and individual behaviour.
2.1 The Electricity Network Today
The electricity market is infrastructure based following the concept of building up
infrastructure to handle capacities. By capacity, it is meant the existing demand. Thus, the
development of demand is tightly connected with the size of the infrastructure. A current
electricity infrastructure represents the result of a continuous and interminable process.
Largely the infrastructure evolved in following steps (see Figure 3). Initially, the
infrastructure contained so called single closed structures of “Block-/Stadtzentralen” each
local centre supplies nearby collateral buildings with electricity, e.g. lighting of the city

The Evolution of the Electricity Market
14
Lausanne in 1882 (Haemmerle, 2001). Around the 19th century production and
consumption was separated due to accessing more promising production locations, e.g. in
mountain regions, to cover the increasing demand. By doing so, the development of a
distribution network was initiated allowing short transports.
Figure 3: History of the Swiss electricity industry (adapted from Infel AG, 2010)
The expansion of the distribution network continued to keep abreast with demand several
significant events happened which led to features of industry. The distribution network
introduced higher national power lines capacities, so called transmission lines, with a
current of 220 kV, respectively 380 kV (Haemmerle, 2001). The distinction between
transmission and distribution is still made, especially at discussion of responsibilities for
the specific network layer. The transmission lines guaranteed the flow of electricity within
a nation and simultaneously initiated cooperation beyond a nation’s border. A milestone of
internationalisation was a coalition of the 220 kV networks of France, Germany, and
Switzerland in Laufenburg in 1958 creating the business of electricity import and export
(Haemmerle, 2001; SwissGrid, 2010). The internationalisation of networks provided
access to additional production units as well demand – foreign markets. The growing
demand and the access to foreign markets forced production to increase outcome and
was achieved by introducing the first nuclear power stations, e.g. in Beznau (Switzerland),
Kahl (Germany), or Marcoule (France) (IAEA, 2016). A further event in the
internationalisation phase was the establishing of trading at stock markets like the
European Energy Exchange (EEX) in the late 80s.
Today the electricity industry is at the point of a new development step which is the
implementation of a European electricity network including the establishing of a Smart
Grid. The development represents organic rather physical growth and a change in
principles of the market. Before explaining the Smart Grid concept, a more in-depth

The Evolution of the Electricity Market
15
discussion of the current market principles will help to understand obstacles and
possibilities of future direction or solutions.
By the end of the 1970s the electricity infrastructure (power lines, power plants, etc.) was
mostly established (Infel AG, 2010). The physical growth potential of the electricity
network from an infrastructural point of view had slowly reached its maximum. So, it can
be said that infrastructure has been maintained for more or less 50 years. During this long
period, processes, roles, behaviour, and mind-sets have been established, specifying the
unique characteristics of the value chain. Infrastructure is designed to operate at
maximum consumption, although this is usually only necessary at a single time point.
Every other aspect of the electricity network is influenced by capacity thinking.
Profitability is achieved by utilising as much capacity as possible for as long as possible.
Hence, capacity sets the limits of revenue. Any shortage due to capacity limitation is
removed through investments, but only if long-term profitability is guaranteed by that
capacity being utilised. Furthermore, progressive transformation of the system is always
carried out with considerations of how to handle various vulnerabilities. This consists of:
superior management of security criteria technology (e.g. adverse behaviour of protective
devices), natural forces (e.g. extreme weather conditions), people (e.g. human failure), or
system maintenance and development (e.g. construction work) (Zio & Aven, 2011).
Any adaptations to the electrical system, reducing vulnerabilities and enhancing output or
capacity utilisation, require an evolution of priorities – mostly, they are business-driven but
adapt with the maturation of the grid. In general, the priorities of the system can be
summarised as: reliability, controllability, profitability, and scalability (Arnold, Rui, &
Wellssow, 2011). The latter defines its ability to adapt to changes in basic settings in the
long term, e.g. infrastructure provision and improvements. The motivations for change are
immanent, but deliberately established.
2.1.1 The Electricity Value Chain
The central roles in this value chain are producers, grid operators, and consumers.
The roles are strictly separated and each has specific purposes. To add to the picture, IT
companies or manufacturers providing components for production or distribution, as well
as the government, are also part of an extended value chain, but they will not be
described further here (see Figure 4). The linkage between the major roles is
straightforward. Any demand at a specific location extracts electricity from the network
which is fed in by production from a different location. The grid operators “settle”
differences by transporting electricity and transforming voltage gradually. In the process,

The Evolution of the Electricity Market
16
grid operators plan ahead in order to balance input and output. The simple schema below
demonstrates a dominant principle of this system: “production follows demand”.
Figure 4: The current electricity value chain
In Europe, the Swiss electricity market, with around 8.3 million inhabitants (BfS, 2015b), is
small and comprises around 250’000 kilometres of power lines (VSE, 2016a) and is a
fraction of the size of one of the biggest markets, Germany with around 81 million
inhabitants (Destatis, 2016) and 1,679,000 kilometres of power lines (BMWI, 2015).
Despite its small size, Switzerland has a highly heterogeneous and fragmented market
with around 730 electricity companies (VSE, 2016a) – Germany has more than
1,100 electricity suppliers (BDEW, 2013). Moreover, territorial monopoles characterise the
structure and six electricity companies dominate the market providing 80% of the
production capacity. Furthermore, players are vertical and horizontal integrated (Becker,
Wichmann, & Bader, 2012) and can be roughly distinguished, according to VSE, in
15% pure production, 53% grid operators and 28% mixed (includes production,
transmission, distribution, and trade) (VSE, 2016b). By contrast, numerous small and local
producers and operators have different goals focusing on local areas. For the most part,
they are pure retailers and administrate by cities or communities (Flatt, 2010).
Their intentions are locally orientated and often their provision of electricity is just one of
several other community tasks – “not-their-core-business” behaviour. This fragmentation
of a small market with distinct players does not allow for a unified energy strategy and
actions that might result from this. Thus, some experts believe that the first step towards a
more efficient, lower-cost future electricity network is consolidation (Schellekens,
McDonnell, Battaglini, Lilliestam, & Patt, 2013).
The Swiss market is partly liberalised meaning that the majority of consumers (below a
consumption of 100 MWh/y) cannot choose their electricity providers and represents an

The Evolution of the Electricity Market
17
intermediate stage of liberalisation degrees. The other markets are totally liberalised like
the Germany market allowing consumers to choose from around 102 electricity suppliers
(BDEW, 2013). A non-liberalised market exists in France with one privatised company
namely Électricité De France (EDF) (EDF, 2015). Other markets define them as
liberalised, however, the example of Austria shows that “…electricity business […] is still
characterised by a heavily federal structure of the providers, owners and markets …”
(Hofbauer, 2006). In other words, the markets are liberal but “…marked by the powerful
dominance of the respective companies in their old provider areas.” (Hofbauer, 2006).
An explanation for the state of liberalisation and possible obstacles to change current
position derives from the composition of prices. The price structure indicates the flow of
revenues and the level influences from the regulatory side. For that purpose, the final
prices for the end-consumer becomes an important instrument and creates certain
behaviour in developing the electricity industry. Generally, a final electricity price is
composed of four elements: network tariff, energy tariff, taxes for communities, and taxes
to support renewable energy (ElCom, 2015). The latter is either defined as a separate
share like Erneuerbare-Energien-Gesetz (EEG) in Germany or Kostendeckende
Einspeisevergütung (KEV) in Switzerland. Otherwise renewables are subsidised by
regular taxes, e.g. United Kingdom (UK) or Austria. Each of these parts is designed to
nurture financial support for administration, maintenance, new investments, and revenues.
For example, the network tariff is split up between grid operators whereas the energy tariff
is the commission for electricity producers.
In Switzerland the a rule of thumb is that a price is comprised of around 50% network
tariffs (transmission 7%, distribution 43%) and around 45% energy tariffs. Taxes for
communities make up only 3%, and taxes for renewables 2% (SwissGrid AG, 2015c).
The majority of the revenue goes to electricity providers (producers and distributors).
The minor share of taxes and levies indicates that the responsibility for investment is
delegated to electricity providers. This is manifested in regulations such as the Swiss
“Stromversorgungsgesetz” (StromVG) based on the “Stromversorgungsverordnung”
(StromVV). The same concept can be seen in the UK. Figure 5 presents a comparison of
electricity price composition for households lower than 1,000 kWh per year. The figure
shows that another concept exists in the European markets. The majority of revenue is
directed to governmental institutes through increased taxes and levies. For example, the
final price for the end-consumer in Germany is divided as follows: 21.4% for electricity,
24.6% for transportation, and 54.0% for taxes and levies (BDEW, 2016a). The situation is
similar in Austria with 31.5% of the price paid for the electricity 27.3% for transportation
and 41.1% for taxes and levies (E-Control, 2016). With the augmented share, taxes are

The Evolution of the Electricity Market
18
used to subsidise but simultaneously reduce the investment in the industry. Furthermore,
the greater participation of regulative institutions is obligatory and increases the
complexity of finding a consensus.
Figure 5: Composition of electricity prices in selected European countries (Eurostat, 2016)
A further characterisation of the value chain is price creation and dynamics between the
price components. Price creation in Switzerland or in markets labelled as “liberalised” is
dominated by electricity suppliers whereas markets (e.g. Germany) with a competitive
pricing mechanism represent an exception rather than a majority. Thus, to speak of a
general and sophisticated pricing strategy from electricity providers would be an
exaggeration. In fact, pricing depends on the “cost-by-cause” principle allowing shifting
costs to the next participant in the chain rather than managing sophisticated product
portfolios including price segmentations. A passing on costs without limit to the end-
consumer is impossible as any price determination or adjustments is regulated by law
using regulations such as the “Stromversorgungsgesetz” and is supervised by the
independent state supervisory authority (see ElCom, 2015) which monitors tariffs and
intervenes if price increases get out of hand. Similar institutes carrying out the same tasks
have been established in European electricity markets, for example ElCom in Switzerland,
Bundesnetzagentur in Germany, E-Control in Austria, or Commission de régulation de
l'énergie in France. Ceiling prices and supervision of changes increases pressure on
electricity suppliers which already receive a small portion of the final electricity price.
To ameliorate benefit-cost ratio, electricity providers are focused on cost minimisation as
well as looking for more profitable foreign markets.
In European, electricity prices are in range of approximately 11 to 33 Euro-cents per kWh
where Switzerland’s prices are roughly average (Eurostat, 2016). The price differential
among countries creates a preference of exporting electricity to countries with a higher

The Evolution of the Electricity Market
19
price level. For example, for Switzerland direct neighbours as Germany and Austria have
higher prices (Eurostat, 2016). This increases attractiveness for Swiss suppliers to export
electricity. The expansion of the transmission power lines becomes urgent
(SwissGrid AG, 2015a). On the other hand, the potential of exports and revenues is
limited and so electricity providers rely also on domestic market price development.
The ceiling of domestic prices by regulators shifts the focus to discuss the distribution of
shares. The support of necessary expansion project in the networks leads to increase
network tariffs at the expense of energy tariffs (BDEW, 2016a, p. 39; ElCom, 2015, p. 25).
The alteration intensifies conflicts between stakeholders. Additional conflicts emerge from
outside the value chain as a country is generally interested in lower electricity prices.
However, the increasing demand requires investments which are capture by lower final
prices extending the break-even point for amortisation further into the future. The current
discussions of the disastrous prices situation indicate that this is insufficient to guarantee
profitability; value capturing is unsatisfactory (BFE, 2011b). The industry even speaks of
price collapse leading to decommission on completion of new power plants
(ElCom, 2015). Nevertheless, price development directly shapes alterations in the value
chain and a challenge is a balance between necessary raises and compliance with
policies (ElCom, 2015).
As a summary the European electricity markets have a common value chain structure with
various configurations creating a kaleidoscope of market settings. A major characteristic
factor of electricity markets is the different liberalisation levels and the related prices.
In particular, the ability to create prices and the dynamics between price components
defines the scope of investments and hence activities of a market. Another strong
influence on the underlying market structure and hence price development has the
assimilation of different European electricity markets (Atukeren, Busch, & Simmons-Süer,
2011; Meister, 2008). Overall, the electricity industry evolves into a competition-based
market (ElCom, 2015). Based on offer and demand, prices are dynamically created and
calculations of profit require different skills. Additionally, flexibility to adjust capacity to
volatile market situations is decisive for competition. By contrast, open market includes
accessibility for end-consumer meaning that they are allowed to choose from a range of
offerings. This implies demand side integration on price sensitivity and contradicts current
price and market policy.
The changes in structure, as well in price constellation, have different effects on the three
areas of production, distribution, and consumption. Therefore, in order to gain adequate
understanding of the research issue, it will be appropriate to investigate the assigned roles

The Evolution of the Electricity Market
20
within the value chain process, dealing with alterations and the inherent potential of each
area.
2.1.2 Production
Currently, 1,200 Swiss power plants are responsible for electricity production and the
portfolio has certain notable features. It has a high share of renewables, with 58.6% hydro
power plants and 3.8% other renewables (sun, wind, biogas, etc.) (BFE, 2014a, p. 3).
Residual electricity production comes from nuclear plants (37.9%) and conventional
thermic plants (1.9%) (BFE, 2014a, p. 3). In comparison with other European countries,
only Norway and Austria produce more electricity through renewables (see Figure 6).
Figure 6: The electricity production, per type, of selected European countries in 2014
(BFE, 2014a)
On the other hand Sweden, France, Italy, and Germany define the general picture of
production in Europe where 60% and more of electricity is produced through non-
renewable sources. Consequential, Switzerland, Norway, and Austria are strongly
independent of international oil and coal prices. In general, the production structure of
European countries has a pyramid form where numerous small and medium performant
units build up foundations and a few high performant units are at the peak. For example,
Swiss production relies on 186 big power plants which are responsible for 90% of total
GWH: vast facilities with considerable capacities. In terms of numbers, five nuclear power
plants contribute 40% and show a beneficial performance per unit ratio. The 99 river

The Evolution of the Electricity Market
21
power plants produce 22% of the total and besides nuclear, they are predominantly
responsible for band energy. With a 29% contribution, storage power plants represent the
last major production area, mostly providing peak energy. A further feature, besides
renewability, is flexibility – responding to demand variations. For example, hydro
production has small start-up costs, maximum change and ramp time compared to other
production forms (NEA & OECD, 2012).
The current production portfolio of Norway and Austria provides quite a good foundation
for meeting future objectives of the energy strategy 2050. Therefore, the strategy for
essential alterations is the expansion in renewables and improvements of existing
production forms. A different strategy pursues countries which have to replace a larger
portion of non-renewables units. For example, Switzerland fosters domestic production on
large and small scale as well as investing in production in foreign locations. The domestic
production capacities are increased by private owned new renewables, like sun, wind, and
biogas. This area has grown sharply in the last three years (Kaufmann, 2015, p. 7) and
two policy instruments, “Kostendeckende Einspeisevergütung” (KEV) and
“Eigenverbrauchsvergütung” (BFE, 2014b), nurture small hydro and photovoltaic facilities
encompassing around 1,060,590m2 of photovoltaic surface area and feeding in around
841,570 MWh (Hostettler, 2015, p. 12).
On a bigger scale, Swiss energy suppliers invest in renewables and put together
investment strategies of around 9.7 billion Swiss francs (Windisch, Friedrich, Wanner, &
Wüstenhagen, 2011). These investments focus heavily on foreign locations due to limited
available locations in Switzerland, better physical conditions (e.g. sun radiation), and
easier approval procedures (Windisch et al., 2011). If the renewable sources strategy is
successfully implemented, the industry will cover an additional 17.8% of consumption by
2020 (Windisch et al., 2011), expanding an already renewable-orientated production
portfolio. The subsidisation of constant production behaviour through more volatile
production profiles will bring challenges in terms of balancing. Thus, the creation of
additional storage power plants shows the importance of hydro in the Swiss production
portfolio (Alpiq AG, 2011; Axpo Power AG, 2013; BFE, 2011a). In summary, the alteration
of production portfolio depends strongly on the exploration and exploitation of domestic
and foreign production locations, e.g. Germany with wind offshore in the East/Nord Sea or
Spain with photovoltaic facilities. Furthermore, volatile production forms entail the
implementation of stable production forms.
A different strategy for increased production capacities is non-infrastructural and
comprises enhanced trading and import/export activities. The latter is already an important
production factor as despite the high performance of its power plants, for example

The Evolution of the Electricity Market
22
Switzerland still depends on imported electricity for five to six months per year – mainly
because of water restrictions in winter periods (BFE, 2014a; Meister, 2008). The trading,
on the other hand, follows economic principles and different marginal costs of power
plants in the various countries. Thus, it can be more beneficial to import electricity rather
creating a new power plant. Furthermore, countries like Germany and France are main
exporters of electricity within Europe, but rely heavily on non-renewables. Adjustments in
the portfolio and possible shortages would lead to a reduced export. Either way, a
stronger dependency on the production strategies of the country’s neighbours is
developing (Meister, 2008) and creating transnational competition as well as lending
transnational influence to foreign policy decisions, e.g. the energy transition in Germany
and the exploding availability of renewable energy (Meister, 2014).
With a changing production portfolio, revenue streams and profitability change too, raising
questions for production planning, in particular: “at what time-point should specific sources
be activated to deliver electricity with the lowest marginal costs?” In general, the cost-
shifting paradigm dictates that compensation is based on different production costs or
marginal costs. As a rule of thumb, nuclear, hydro, and solar have lower marginal costs
whereas thermal and storage have higher marginal costs. Additionally, decisions based
on marginal costs are leveraged due to priority feed-in of renewables which mean that
they receive preferential treatment regardless of cost. In small quantities, renewables
have tolerable prices, but saturation of electricity in low-voltage grids can cause temporary
overproduction and lead to negative prices (IASS, 2015). Furthermore, subsidies support
renewables and lead to a distortion of the market. Electricity companies want this
distortion to be removed and for remuneration rates to be adjusted accordingly
(BFE, 2014b) so that decentralised production units are compensated according to current
market prices (BFE, 2015). Despite doubts that renewables can cover shortages
(Meister, 2008), the increase of private ownership forces profitability discussions as non-
economic behaviour and decision-making enter the value network.
Consequential, a competition among production types, even among renewables, on bases
of minimised production costs occurs (Forster, 2015) challenging production side to create
a portfolio that is competitive, sustainable, secure, and provides necessary flexibility.
Players may depart from traditional mind-set of “dictating prices” and adopting a waiting
attitude might have an adverse impact (Schicht et al., 2012).
2.1.3 Transmission and Distribution
The transportation of electricity involves absorbing electricity capacity from power sources
and allocating it to end-consumers. Therefore, the size of a grid is defined by these two

The Evolution of the Electricity Market
23
parameters. Naturally, it is common to speak of a network, however, a closer look at the
outline of the system reveals a hierarchical structure with four distinct grids and three
transformation layers (see Figure 7). The layering originates from voltage discrepancy
between the source and the point of consumption. Improvements in the performance of
production sources favour production at the higher layers. As the majority of consumers
are located on the lower level (BfS, 2015a), a vertical flow from top to down and a strong
interconnection between the layers is incentivised. Depending on the size of the grids and
the involved business create various environments. For example, there are 671 grid
operators managing 250,000 km in Switzerland (ElCom, 2015, p. 15), 930 grid operators
in Germany handling 1,679,000 km. In any case, the networks are highly organised
meaning that an allocation of responsibilities for infrastructure in balancing and
maintenance to keep the pressure at a constant level of 50 MHz (Neidhöfer, 2008) is
given.
Figure 7: Schemata of the Swiss electricity network (adapted from AEE, 2015)
Grid operators handle load by defining supply and demand in advance (balance groups).
The flow of electricity is executed according to these schedules and any asymmetries are
corrected by activating or deactivating sources temporarily. Any derivation from the

The Evolution of the Electricity Market
24
reference value causes different network conditions (Vaterlaus & Wild, 2001) – secure,
endangered, deranged, or critical – which affects either the entire grid or small areas
thereof. Hence, the top priorities of the network are reliability and sustainability, including
an obligatory management of 24 hours for 365 days a year. To deal with complexity, the
physical electricity network is separated into transmission and distribution power lines with
different duties assigned.
Transmission power lines are responsible for transferring large bulks of energy over a
long distance, acting as the “motorways” of the electrical network. It implies that large
power stations feed-in and transmission power lines distribute the electricity to lower
levels or to other transmission lines. At the transmission layers no end-consumers like
business or households exist. These power lines refer to the top layers – 380 kilovolts
(kV) or 220kV – containing a small share in the overall length of the network (e.g.
6,700 km in Switzerland or 77,000 km in Germany) (BMWI, 2015; SwissGrid AG, 2015b).
Mostly, the power lines are installed above the surface due to cost efficiency
(SwissGrid AG, 2015b). The primary task is to handle asynchronous national production
according to current demand by load management. Controlling load entails establishing
enhanced base load and peak load capabilities, with safety and fault tolerance margins.
Load management proceeds normally through an advanced build schedule which gathers
all the information about supply and demand from all balance groups. Any deviation from
the schedule, due to unexpected events or miscalculations, leads to the regulation or
shutdown of generation sources or storage capacities (mostly hydro storage power plants)
(Vaterlaus & Wild, 2001). Weather-dependent renewables which do not achieve
calculated performances have an increasing influence on variation.
To ensure safe and predictable operation, a comprehensive information technology (IT)
infrastructure creates a real-time control system and a small network like the Swiss
transmission grid already involves 40,000 data points of which 10,000 are refreshed every
20 seconds (SwissGrid AG, 2015b). This results in a vast amount of data which is
processed for management or decision-making. The processing is done by automated
management systems and creates an intelligent complex environment. The automated
system is responsible for the management of national and of transnational activities
involving other European states. National management is an own field of responsibility,
however, Switzerland, and other countries, experiences an increasing involvement with
load handling with European asynchronous grids (SwissGrid AG, 2015b).
This involvement is growing as the European Union exerts leverage on countries,
demanding an “… establishment of the internal market in the electricity sector [which]
must favour the interconnection and interoperability of systems” (Richtlinie 96/92/EG des

The Evolution of the Electricity Market
25
Europäischen Parlaments und des Rates). A first step is the agreement to form
transnational synchronised transmission grids (see Figure 8) (Kreusel, 2015) to follow
these rulings in order to have access to European electricity sources and customers
(Meister, 2008). In particular Switzerland depends on the connectivity to other countries
because of the future hub position and hence grid operators are initiating network projects
to transport electricity from north to south as well as from west to east
(SwissGrid AG, 2015a); Switzerland’s location marks it out as a “switchboard” in the
emerging European electricity network, providing a link between remote production
locations and end-consumers. Eventually, the transmission layer, and hence the entire
Swiss electricity grid, will become progressively involved with macro-level problems and
challenges.
Figure 8: The main synchronous grids of Europe (Kreusel, 2015)
This European transmission “super-grid” is still in its early stages, but the intention to
create a transnational grid is clear. Before this is possible, however, several details must
be addressed. Making agreements for the unimpeded flow of electricity between high-
voltage grids is an immense task. Striking such a deal at the negotiation table is difficult
because the physical flow of electricity is not straightforward and controllable. Its grid-
boundedness means that, from the north, electricity may flow over several different paths
to the south. For example, recent problems in handling the capacity of large offshore wind
facilities in the Baltic Sea impacted not only Germany’s but also Poland’s transmission
grid, acting as a pressure compensating valve (Uken, 2011). In compensating for
Germany’s overproduction, the Polish grid endangers national supply security.
Consequently, risk and insufficiency are transferred, creating conflict between national
and European interests.

The Evolution of the Electricity Market
26
Another detail that must be addressed is value capture in a European context.
Any transmission grid is funded according to different national guidelines and funding is
ring-fenced, e.g. in Switzerland 40% must go towards capital costs and more than 40% to
operational costs (ElCom, 2015, p. 17). However, transferring electricity from the Baltic
Sea to Spain requires transfer through several grid operators, each of which would like to
have their share. As more players enter the game, transportation costs increase and
economic efficiency becomes questionable.
Closely related to capture is the design of organisational structure, as a European
transmission grid entails a diffusion of leverage between players. In Switzerland, the
transmission grid is in the hand of SwissGrid whose only purpose is to unbundle
generation, transmission, and distribution and avoid any discrimination, cross-
subsidisation, or distortion of competition. SwissGrid AG is a conglomeration of all Swiss
suppliers and distributors (SwissGrid AG, 2015b). In contrast, France’s transmission grid
is similar but in the hands of the French state, which holds more than 84.9% of the shares
(EDF, 2015). The German situation is more complex with four transmission operators
(BMWI, 2015). Notwithstanding, transmission grid operators are obligated by law to
secure the transfer of electricity, so diversity of institutions (companies, states, or
associations) as well as their inherent purposes (profit or non-profit) create a formidable
challenge on a macro level. Which solutions prove best for the reconfiguration process
remains to be seen, but the issue is decisive for access to national distribution grids and
to corresponding foreign markets.
Distribution grids have the same essential function as transmission grids: regulating
pressure on the system by scheduling input and output. However, their purpose and
structure are different from the extra high-voltage grid. The purpose of each layer is either
to pass electricity to the next level down or to keep it within the same layer without
changing the voltage. A vertical and horizontal distribution emerges due to the necessity
of providing different voltages for various consumers. The direct linkage to consumers
brings another perspective for management. The difference compared to other industries
is that future consumption is calculated through forecasting or concluded agreements –
mostly with larger purchasers. The integration of consumers is based on a hierarchical
outline of high-, medium-, and low-voltage grids and the reach of the specific network
layer decreases with a descending sequence of national, regional, and local geographical
coverage. Within this outline, several grid operators are established, claiming ownership
of grids. There is no sharing of organisational rights and duties, e.g. responsibility for
maintenance. Hence, numerous organisations are involved, from big national players to
small, locally based grid operators. Therefore, absorbing capacity and transporting

The Evolution of the Electricity Market
27
electricity require considerations of other levels as well as production units on the same
level.
In recent years, the complexity of load management has changed progressively with
negative effects on the accuracy of scheduling, modifying coordination efforts for a stable
network, and making a stronger interconnection. Firstly, the driver for distribution is
external and depends on the number of new production and consumption units.
For example, in 2013 around 50,000 new apartments required a connection to the grid
(BfS, 2015a). Secondly, the increase in smaller production sources (e.g. photovoltaics,
wind) on the low voltage grids causes a lower demand from higher levels – sometimes
even changing the direction of load flux(IASS, 2015). Finally, the mode of dealing with
small units already altered from feed in to local consumption, e.g.
Eigenverbrauchsvergütung (BFE, 2014b), initiating discussions about transport distances
and the doctrine of top-down. A de- and realignment of the supply chain is occurring,
which in turn initiates an alteration of the changing revenue stream.
A major change to the revenue stream is the reduced distribution quantities as a result of
the increasing number of small and private production facilities. A lower distribution quota
affects revenue as grid operators can claim less money for the transportation of electricity.
Infrastructure becomes less profitable requiring rethinking of business models. A similar
development has happened in the telecommunications sector. Reductions in profit from
infrastructure can be immense, for example in Switzerland where 43% of the final price is
designated for transportation. Other European distributors face losses too; a maximum of
a third of the final price. The reduction of revenue causes fear of the availability of
sophisticated infrastructure leading to disputes over adequate taxation to adjust prices to
cover rising costs. Arguments for an increase in taxation include: a) necessary
investments that must be made in the grid (mostly transmission); b) higher costs for
service systems (e.g. maintenance of power lines); c) liberalisation costs (according to
European general agreements); and d) grid integration of renewable energy
(BFE, 2011b, p. 23). The latter argument acknowledges problems on lower grid levels,
especially private PV owners require less electricity. These demand adaptations are
dynamic and, in the short term, pressurise operators as the flexibility of price adjustments
implies “longer-term” discussions with the regulator. Absorbing this discrepancy is a
challenge for the future supply chain on a distribution level and is tightly connected with
the understanding of consumers.

The Evolution of the Electricity Market
28
2.1.4 Consumption
Consumption represents the end of the supply chain and is the starting point for capacity
thinking and the principle of “production follows demand”. Generally, consumption varies
with the time of day and season, making it uncontrollable and unpredictable
(Strbac, 2008). This causes uncertainty and suppliers as well as providers define capacity
according to the maximum peak of demand (Strbac, 2008). Starting from maximum, a
rough assessment, defined by factors like weather, season, and number of buildings, is
sufficient. Accessibility of data is guaranteed and small derivations can be absorbed by
back-up capacity. In 2014, Switzerland consumed 57.4 billion MWh, with the following
distribution of recipients: 31.8% private households, 31.4% industry, 27.0% services,
8.1% transport, and 1.7% agriculture (see Figure 9) (BFE, 2014a, p. 4). Switzerland has a
similar distribution according to sectors as the EU-27. Furthermore, the forecast of
consumption for the year 2020 assumes an increase in the services and households
sector and a slight reduction in the industry sector (Kearney, 2016).
Figure 9: Electricity consumption of EU-27 according to sectors (Kearney, 2016)
The principal usage categories are: process and drives, process heat, climate and air
conditioning, and lighting (Kemmler et al., 2014, p. 22). Overall, total demand has
increased since 1990 and is mostly influenced by the size of the population and economy,
both of which have grown steadily (Capros, Mantzos, Tasios, Vita, & Kouvaritakis, 2010;
DOE/EIA, 2015). It is widely assumed that the upward trend for electricity demand will
continue (Abhari, Andersson, Banfi, Bébié, & Boulouchos, 2012).
This trend is accompanied by an alteration in usage characteristics, which show complex
and heterogeneous patterns. These patterns, in turn, are strongly influenced by social
developments like individual lifestyles, increased mobility, shared economy, or urban

The Evolution of the Electricity Market
29
farming. Meanwhile, the new value of sustainability is becoming a central driver in society.
This starts with “green” electricity products and extends to a sustainable value chain
questioning the efficiency of consumption but also production types, e.g. nuclear phase-
out or CO2 certifications for thermal power plants (Abhari, Andersson, Banfi, Bébié, &
Boulouchos, 2012; Keith, Jackson, Napoleon, Comings, & Ramey, 2012). Simultaneously,
electricity is substituting other energy forms: for example, hybrid or electrical cars are
promoted on the basis of sustainable consumption. Additionally, the upwards trend
intensifies as electrification increases the availability of previously non-electrical
appliances like e-bikes. These new possibilities for consumption increase the complexity
of prediction beyond currently known areas and define various time-points, amounts, and
reasons (Abhari et al., 2012).
Currently, the accuracy of daily consumption prediction is very high, thanks to the skills
and experience of electricity providers. For decades, electricity providers have minimised
demand considerations, limiting calculation to an annual reading of mechanical meters.
Further information exchange with consumers is limited to yearly consumption figures and
an address for billing. Even integration of private PV facilities has had no effect on this
behaviour, with consumers still considered consumers, with tiny add-ons to the vast
capacities of the grid. The demand side has evolved into a black box and – a fact that is
unthinkable in other industries – electricity providers are barely aware of consumers’
preferences. It is no wonder that the electricity network is struggling more and more to
define demand and hence outline capacity for the supply chain. Nevertheless, the
changes in demand characteristics, including the role of the demand side, are realigning
the underlying processes and creating an electricity network that functions more
cooperatively, responsively and organically (UVEK, 2015). The evolution of the demand
side is tightly connected to the maturation of a Smart Grid and vice versa.
With the consumption, the description of the today’s electricity network characteristics
ends. The following paragraphs describe the development of the electricity network to
Smart Grid initiative, with particular focus on the micro-grid concept, and its impact on the
current low voltage network. The characteristics of a future network provide the foundation
for the discussion of the Crowd Energy in chapter 3.
2.2 The Smart Grid Initiative
The term “Smart Grid” stands for the next evolutionary step of the electricity network and
combines tangible and non-tangible benefits to society to create more complex,
interconnected, interactive, and adaptive networks. There are various triggers for the

The Evolution of the Electricity Market
30
initiative and inherent energy turnaround, consisting of different environmental change
types, e.g. regular, hyper turbulence, or avalanches, varying in their impacts (Suarez &
Olivia, 2005). For the energy turnaround, events like external shocks (e.g. accidents),
policy and regulations (e.g. energy efficiency, reduction of CO2 emissions, nuclear exit),
internal industrial development (e.g. sectorial requests for more flexible energy allocation),
and innovation developments in other industries (e.g. ICT, photovoltaics) define the scope
of development directions (IEA, 2011). Hence, drivers involve technological, sociological,
economic, environmental, and political factors (Openshaw, Strbac, & Ault, 2011).
In general, a Smart Grid is an electrical system including metering and digital ICT to
ensure the efficient exchange of electricity between sources and consumers (UVEK,
2015). In other words, the network integrates intelligently “… the actions of all users
connected to it – generators, consumers and those that do both – in order to efficiently
deliver sustainable, economic and secure electricity supplies” (ETP SmartGrids, 2016).
Eventually, such a system can account for the needs of all market participants
(BFE, 2010).
These definitions leave ample scope for various objectives, and different ones may be
emphasised depending on the stakeholder in question; additionally, definitions of
objectives are influenced by stakeholders and are constantly reshaped. However, several
main objectives arise repeatedly in discussions and can be summarised as follows
(see Table 1) (EPRI, 2014; ETP SmartGrids, 2006). First, the optimisation of electricity
management, including streamlining electricity allocation throughout the value chain, is
being contemplated by grid operators in order to secure supply and reliability. The process
commands a high degree of automation, featuring advanced monitoring and control
elements.
Objective Key tasks
Optimisation of
electricity
management
Improvement of grid cooperation between Transmission System
Operators (TSOs), Distribution System Operators (DSOs),
Measuring point operators, Measuring service providers, Energy
marketplace operators, and other players.
Improvement of grid monitoring and control for automation.
Integration of power flow management, balance and
contingencies analysis of the distribution systems and lower
levels.
Optimisation of grid topologies and implementation of smart
systems to the grid.

The Evolution of the Electricity Market
31
Increasing
transport
capacity
New infrastructure projects – mostly at the transmission level – to
optimise infrastructures.
Introducing new technology developments, e.g. superconducting.
Integration of
intermittent
sources
Improved grid responsiveness to transport the energy generated
by volatile renewables, e.g. wind and photovoltaic.
Improving grid responsiveness to energy storage systems.
Advanced
information &
communication
management
Development of secure and flexible communication
infrastructures.
Standardisation of data types and protocols.
Architecture for information security.
Distribution of bi-directional interface devices between
participants.
Optimisation of
market
New market models for active demand integration.
Generating sophisticated service offerings including quicker
problem identification and faster service restoration.
Encouraging interplay between new entrants and existing players.
Engaging
consumers
Spreading information on energy saving and energy efficiency.
Provision of incentives for behaviour change.
Table 1: Main objectives and the required tasks for a Smart Grid (EPRI, 2014)
A second focus of the European Smart Grid concept is augmented transport capacity, the
ability to transfer unfettered electricity. Another objective is the integration of intermittent
resources like photovoltaics (PV) or wind. This involves balancing volatility using
resources like storage, and raises challenges for electricity management and the
optimisation of processes. Additional communication is also necessary and requires an
advanced ICT infrastructure. Therefore, ICT must be an adaptive infrastructure which
reacts to variance in the electricity network. A crucial point is the communication and
interaction between buildings and humans, which implies new topics such as the
architecture of information security and standardisation of protocols. A further objective
concerns emerging market structure and active demand integration. Key tasks include
real-time price-setting. This involves a restructuring of the value chain due to new
entrants, and changing the focus of value creation. A servitisation of the industry is
dominant and reacts to decreasing quantity sales. Servitisation is “[a]ny strategy that
seeks to change the way in which a product functionality is delivered to its markets (Lewis,

The Evolution of the Electricity Market
32
Portioli Staudacher, & Slack, 2004) [by a]dding extra service components to core products
(Verstrepen, Deschoolmeester, & van den Berg, Roelof J., 1999) [and to create a]n
integrated bundle of both goods and services” (Robinson, Clarke-Hill, & Clarkson, 2010).
The final objective which is repeatedly mentioned relates to the engagement of
consumers with the value chain process. Currently, this involves spreading information on
electricity efficiency through feedback and visualisation based on advanced ICT.
Additionally, more deliberate points include behaviour change and consequently the
control of demand through incentives. It is for these reasons that the industry is
experiencing an influx of social topics, e.g. changing routines, the accountability of
electricity, and decision-making processes.
This richness of objectives points towards two main kinds of development, namely macro
and micro, in the evolution of a Smart Grid. It is important to define the perspective which
is preferred, since the macro and micro orientations have both complementary and
divergent points for the direction of evolution. Furthermore, a clearly defined approach
allows for the characteristics of transition pathways – and hence the ramifications on the
current electricity network – to be defined (Geels, 2004).
Macro development is primarily concerned with the reconfiguration of the socio-
technological system (STS) (Geels, 2004), i.e. suppliers build up capacities and expand
the infrastructure towards a European Grid (ETP SmartGrids, 2006). By recognising user-
centric and distributed elements, and tasks to manage distributed energy resources
(DER), the main vision and strategy concentrate on the interoperability of European
electricity networks, politics and regulatory aspects, and liberalised markets
(ETP SmartGrids, 2006; IEA, 2011). This favours existing capacity thinking and improving
marginal cost by increasing scale, e.g. transmission network expansion in Germany and
Switzerland to improve transfer (Sterner, 2015; SwissGrid AG, 2015a). It also points
towards new solutions for stabilisation provided by hydro pump storage power plants.
Initially, these power plants were regarded as a major factor for energy transition, but due
to developments at the micro level, changes in network tariffs, and the drying-up of the
revenue stream, profitability is lower and a rethinking of investments is underway
(Asendorpf, 2013; Meister, 2011). Nevertheless, the macro perspective adheres to
traditional business remuneration philosophy – allocating large quantities – sustaining
profitability and the paradigm of “production follows demand”. It also reinforces the
centralised network structure in which big power plants are responsible for supply.
Micro development relies on local elements like decentralised generation (DG), storage
(DS), and demand side management (DSM) to achieve its objectives, i.e. building a
cellular system including DER and user-centric methods like demand response (DR)

The Evolution of the Electricity Market
33
(ETP SmartGrids, 2006; IEA, 2011). Its major goal is the integration of the demand side in
the production process. Micro development follows a de-/re-alignment transition pathway
and includes fundamental adaptations due to DER growth (Verbong & Geels, 2010).
Based on cellular structures, so called micro-grids, the electricity network locates
production closer to the point of consumption, causing a decentralisation and a reduction
of dependency on centralised units; micro-grid roadmaps represent a supplement to the
centralised system rather than a replacement of it (ETP SmartGrids, 2006; IEA, 2011).
A de-alignment initially deconstructs the existing centrally focused supply chain, and then
realigns processes including decentralised components; the constitutional complexity of
this is characteristic of a network rather a chain. The modified, interconnected network
creates value differently and contradicts the macro business philosophy through a
reduction of transportation and centralised production. A more decentralised structure
answers calls for sustainability by using renewable generation sources. So, the benefits of
DER are reduction of emissions, higher efficiency, improved human health, and
conservation of electricity despite increased demand (Akorede, Hizam, & Pouresmaeil,
2010; Driesen & Katiraei, 2008). Such a transition pathway profoundly alters the
characteristics of the industry and has many implications for system innovation (Verbong
& Geels, 2010). Further, willingness to undergo transition is fostered by the possibility of
new, profitable revenue streams for both existing and new participants (Giordano &
Fulli, 2012).
Macro and micro developments are happening simultaneously, being complementary and
divergent on certain points. Nevertheless, immediate micro development has a promising
potential and is worthy of further investigation.
2.3 De- and Re-alignment of the Low Voltage Grid through Micro-Grids
Micro-grids represent a way to re-decentralise the electricity industry and invigorate
decentralised concepts of single-side generation, backup, or emergency constructs
(see Figure 10), the latter two representing particularly strong advantages. In contrast to
former decentralised structures, micro-grids entail the clustering of numerous generation,
load and storage sources to project outwardly a controllable entity (Lasseter, 2001).
It represents a modification of traditional mind-sets because it involves incorporating
electricity exchange at the distribution level by including consumers and making them part
of operation optimisation in the process (Lasseter, 2001). For a cluster to qualify as a
micro-grid, however, it requires the ability to operate in both grid-connected and island
modes, a smooth transition between un-/intentional mode switches without load

The Evolution of the Electricity Market
34
interruptions, relaying and protection, and assurance of power quality (Sapar, Gan,
Ramani, & Shamshiri, 2014; Xu, Li, & Tolbert, 2012; Zhichun, Jian, Kaipei, & Wei, 2011).
Thus, “[a] micro-grid is a group of interconnected loads and distributed energy resources
within clearly defined electrical boundaries that acts as a single controllable entity with
respect to the grid and that connects and disconnects from such grid to enable it to
operate in both grid-connected or ‘island’ mode” (DOE, 2011). Furthermore, management
of micro-grids requires internal organisation among the members of a cluster but also
orchestrate between separate micro-grids to build a sustainable network.
Figure 10: Conceptual layout of micro-grids in Smart Grids (Leonardo ENERGY, 2016)
The description of micro-grids still indicates a traditional architecture from a top down view
to serve industrial, commercial, or residential customers. Possible architecture types
include utility (urban networks, rural feeders), single or multi-facility industrial/commercial,
and remote micro-grids (see Table 2) (Driesen & Katiraei, 2008). The characterisation
depends on application according to geographically or infrastructural dependent areas,
the main drivers for installation, and load types that emerge within micro-grids
(Driesen & Katiraei, 2008). An urban network, in this case, consists of a district in a city
utilising numerous renewable sources to avoid the interruption impacts inherent in the
main grid. Ancillary services comprise a local supply of reactive power and premium
power quality. However, industrial and commercial micro-grids are more vulnerable to
interruptions and demand a higher degree of reliability. Therefore, management strategies
include distributed control and automation to reduce the influence of the main grid or other
micro-grid users. Another case is the remote micro-grid, which refers to the electrification
of distinct areas and a simultaneous shift away from fuel dependency. The aim is to

The Evolution of the Electricity Market
35
change the system and provides a stable single network, rather than integrating into the
residual network. In each type of micro-grids a connection to another system, such as
heating, exists and shows the necessity to think beyond electricity.
Utility Industrial /Commercial Remote
Application - Downtown areas
(urban networks)
- Planned islanding
(rural feeders)
- Multi-facility: Industrial
parks, university campus,
shopping centres
- Single Facility: Commercial
and residential building
Remote
communities and
geographical island
Main
Drivers
- Outage
management,
- Renewable energy
sources (RES)
integration
- Power quality
enhancement, reliability
and energy efficiency
- Electrification of
remote areas and
reduction of fuel
consumption
Benefits - Greenhouse gas
(GHG) reduction
- Supply mix
- Congestion
management
- Upgrade deferral
- Ancillary services
- Premium power quality
- Service differentiation
(reliability levels)
- Combined heat and power
(CHP) integration
- Demand response
management (DRM)
- Supply availability
- RES integration
- GHG reduction
- DRM (Demand
Response
Management)
Operating
modes
- Dependent
- Independent and
autonomous
- Isolated
- Dependent
- Independent and
autonomous
- Isolated
- Isolated
Table 2: Micro-grid architectures (adapted from Driesen & Katiraei, 2008)
All named micro-grids applications commonly employ distributed energy resource
methods to orchestrate DG and DS as well as a more efficient electricity allocation
(Driesen & Katiraei, 2008). This entails a physical integration of devices into existing
electricity management. Thus, it is assumed that devices have the capabilities necessary
for power sharing, utilisation of well-sized storage, and load control and prioritisation.
The optimal micro-grid – seen from the perspective of grid-operators – is an external
control of input variables. For example, a higher PV penetration would be dangerous and

The Evolution of the Electricity Market
36
corrective actions would be either a reduction of PV penetration or the activation of
storage to compensate surpluses. Customer integration and participation in micro-grids is
reflected in DR methods, emphasising the benefits of load customisation (Driesen &
Katiraei, 2008). In other words, individual units respond to given instructions (price- or
event-dependent) from external supervisors, e.g. grid operators, to reduce net load or to
provide sources to other micro-grids (Shariatzadeh, Mandal, & Srivastava, 2015).
Hence, demand response management (DRM) is an integrative framework handling
demand response at the building or micro-grid level, adding to the functional requirements
of distributed energy resources (Shariatzadeh et al., 2015).
2.3.1 Functionalities of an intelligent DER
An intelligent DER has a cellular structure that masters micro-grid- and network-specific
functionalities. A variety of functionalities exists and can be categorised into four groups:
visualisation, forecasting, interoperability, and distributed intelligence methods
(Wakefield, 2011). The level of performance in each of these four categories defines the
intelligence of the micro-grid and consequently the Smart Grid (Wakefield, 2011).
Visualisation involves the “slicing and dicing” of data levels from an aggregate to a
substation unit, and improves the comprehensibility of the distributed system.
Furthermore, visual representations are the intersection between customer and system
allowing changing undesired habits through feedback and learning (Mezirow, 1990).
Visualisation should support meaning to be created through the information received
(Mezirow, 1990). Thereby, the “horizon of expectations” broadens and “… significantly
affect[s] the activities of perceiving, comprehending, and remembering meaning within the
context of communication” (Mezirow, 1990).
Forecasting encompasses functionalities that predict consumption and production
(Wakefield, 2011). The latter employs well-established methods from the domain of
weather forecasting. By contrast, consumption, especially in the private household
domain, is a more significant challenge, as it entails predicting minutely detailed based
patterns which are dependent not only on technological factors (e.g. types of device) but
even more on segmentation according to socio-demographic and lifestyle factors (Asare-
Bediako, Kling, & Ribeiro, 2014; Fischer, Härtl, & Wille-Haussmann, 2015; Hayn, Bertsch,
& Fichtner, 2014; Seo & Hong, 2014). Currently, small-scale consumers or businesses are
subject to standardised load profiles (SLP) (BDEW, 2016b).
Interoperability is the ability of components, applications, devices or even several micro-
grids to communicate with each other through a managing system; to exchange and to

The Evolution of the Electricity Market
37
process information for pursuing load, infrastructure, and error handling (Wakefield, 2011).
The interchange of information may proceed securely and effectively (Wakefield, 2011).
The visualisation has a significant impact on interoperability between human and machine
communication. It becomes the Achilles’ heel for the quality and smartness of the micro-
grid as the variety of data requires sophisticated data management, comprising tasks
such as metering, monitoring, and analysis (Barenghi, Bertoni, Breveglieri, Fugini, &
Pelosi, 2011; Kaufmann, Koller, Kurchkina, & Stoffel, 2013).
Finally, distributed intelligence functionality is the ability to process data and make
decisions on individual and system-based levels to deliver electricity at the right place and
the right time (Wakefield, 2011). The purpose of real distributed intelligence is the
optimised planning of capacities with “… typically no centralised control dictating the
behaviour of the individuals, local interactions among the individuals often caus[ing] a
global pattern to emerge” (Engelbrecht, Li, Middendorf, & Gambardella, 2009). A case in
point is swarm intelligence (Meng, Dong, & Qiao, 2013) or the crowdsourcing approach
(Gstrein & Teufel, 2015; Teufel & Teufel, 2014). The benefit of distributed intelligence lies
in improved failure modes as it is less disruptive (Wakefield, 2011) requiring new mind-
sets, advanced methods and tools for management (Teufel & Teufel, 2014). Despite DER
models still being in an early stage of development, the distributed system is regarded as
a driving force for an integrated grid, enabling better coordination between utility projects,
and improving cooperation between various service providers (EPRI, 2014).
DER development is, however, reliant on advanced information and communication
technology (ICT) infrastructure transforming the energy sector in the 21st century (Teufel &
Teufel, 2014).
2.3.2 A Reference Model for Micro-Grids
A corresponding reference model for managing functionalities is an interdisciplinary model
between the domains of electrical process and structural zones (see Figure 11)
(Biester, 2012). Structural zones are hierarchical levels of electricity management
whereas electrical process refers to the electrical supply chain. On top of those two
dimensions, five layers address interoperability between different systems from basic
connectivity components to economic and regulatory policy (Biester, 2012).
The interoperability categories are organisational, informational and technical aspects
(The GridWise Architecture Council, 2008). The business layer combines two points,
namely business objectives and policy, to map the business model, portfolio, capabilities,
market structure and/or regulatory situation. The function layer identifies the architectural
design of functions and services including relationships. The information layer describes

The Evolution of the Electricity Market
38
the information usage of functions, services, and components and focuses on the relevant
business context and semantic understanding topics to enable interoperable information
exchange through communication. The communication layer describes technical aspects
of protocols and mechanisms to support information exchange and describes syntactic
and network interoperability. The last layer, the component layer, is concerned with all the
components which are necessary for physical distribution. By merging all three
dimensions into one framework, cross-cutting topics can be addressed and tackled on
different layers. Such a structure implies various possible smart network implementations
and it is no wonder that European Smart Grid initiatives vary as greatly as do
accompanying research agendas (El-hawary, 2014; Hübner & Prüggler, 2011).
Figure 11: The Smart Grid Architecture Model (SGAM) (Biester, 2012)
The reference model increases horizontal and vertical complexity for management and
especially processing of information for the value network and value creation.
ICT becomes the key for smartness as it is central to technical implementation and
shapes functionalities and the scope of actions. A heterogeneous ICT architecture across
vertical layers (Zaballos, Vallejo, & Selga, 2011) provides a “… two-way communication
network for sensing, monitoring, and dispersion of information on energy consumption”
(Bari, Jiang, Saad, & Jaekel, 2014).

The Evolution of the Electricity Market
39
This demands high standards of corresponding architecture, reliability, robustness,
availability, scalability, and service quality (Gungor et al., 2011; Kuzlu, Pipattanasomporn,
& Rahman, 2014). Such standards make computation and communication in real-time
possible, allowing for a near-instantaneous allocation of electricity between various units.
As well as shortening the time scale, the ICT system may also consider localised decision
priorities, in some cases, to be autonomous, at the same time applying centralised control
decisions. Furthermore, the needs of stakeholders are changing as the nature of
transmission and distribution and the role of local system operators evolve. New roles are
also emerging, such as measuring point operator, measuring service provider, energy
marketplace operator, or end-customer (Kießling & Khattabi, 2011). It is mentioned that
the customer will be integrated in the process, however, integration is based on
technology and automation rather than on personal responsibility of consumers.
Crucial for interconnection and eventually stability is the degree of standardisation and
current progress in this area is strong (Basso, Hambrick, & DeBlasio, 2012). On the other
side, interconnection means also the capability of scalability to integrate numerous
elements in the grid (Gungor et al., 2011). A smooth extension capability is the ability to
grow in size and fit in seamlessly through adequate configuration. Additionally, good
service quality allows communication behaviour between elements to be specified.
Questions of average delay, jitter, and connection outage probability are central to the
sensing and monitoring of units as well as to the interplay among them (Gungor et al.,
2011). Minimised outages assure the operation-readiness of elements and determine the
performance of the ICT.
These standards rely on information exchange, and the large number of different access
points within the ICT infrastructure gives rise to growing security concerns
(Gungor et al., 2011; Teufel & Teufel, 2015). Security management is becoming
increasingly essential as data leakages can cause a disruption of energy network
operations (Egozcue, Rodríguez, Ortiz, Villar, & Tarrafeta, 2012). Technical
implementations of authentication, encryption, or malware removal tools ensure smooth
operation (Bari et al., 2014) but also create new challenges in terms of information
management, e.g. which information may be shared and which is private (Teufel &
Teufel, 2015). This very question of security defines the accessibility of information and
the creation of knowledge. In turn, generating knowledge from information created by
diverse components offers further space for innovations in big infrastructures
(Nightingale, 2003).
Big infrastructures contain an inherent incentive to minimise deficits and improve
collaboration between intangible services and tangible manufacturing (Nightingale, 2003).

The Evolution of the Electricity Market
40
In other words, time constraints on service delivery force technologies to synthesise,
leading to an interwoven, integrative structure in order to achieve distributed intelligence.
The advanced distribution automation (ADA) copes with the variety of decisions to make
under new network priorities. The requirements on ADA arouse attention to automation
technology and especially to algorithm implementation. Control through algorithm
excellence provides an advantage for the grid and for single players similar to a high-
frequency trading system (Gomber, Arndt, Lutat, & Uhle, 2011). Therefore, it is the
centrepiece of the architecture and steers ICT infrastructure. Additionally, elimination of
failures triggers a constant adaptation and innovation cycle and the pace is derived from
the ICT industry. Substitutions of ICT technologies advance in shorter circles remoulding
technology portfolio constantly. On the other hand, ICT represents an entry point for
additional, as yet unknown areas and social trends like the sharing economy (Hamari &
Ukkonen, 2013) to gradually enter and present challenges. Therefore, experts have noted
the need for the alignment of technology with the objectives which are in place, in order to
avoid unintended developments within the value network (UVEK, 2015, p. 43).
2.3.3 A proposed Value Network Design
De- and realignment through the micro-grid creates new underlying market settings and a
new value creation process. The fundamental shifts in environment redefine the main
features of the market in a similar way to recent transitions in the telecommunications
domain (Peppard & Rylander, 2006). New characteristics must be established to cope
with the challenges ahead: in a nutshell, what is required is a shift away from
infrastructure thinking towards product and service offerings (Figure 12).
Figure 12: Shifts of characteristics in the electricity industry (adapted from Peppard &
Rylander, 2006)

The Evolution of the Electricity Market
41
Of course, infrastructure remains important, but profit will be generated via customisation
and benefits created through additional offerings besides the single product of electricity.
New services will include the management of electricity to support comfort for consumers
and simultaneously improve efficiency. To achieve this, a customer-centric approach is
inevitable and to assure quality, an economics of excellence will be crucial in order to
guarantee competitive advantage. Furthermore, this customer-centric approach will permit
the integration of the consumer into the production process. Cooperation between
business-driven and non-profit units will be a necessary consequence as the intelligence
of the process becomes peripheral. Hence, valuable information will increasingly be
produced at the local level and must be exchanged in a transparent and simple way.
The effect on the value creation process is to cause an extension from a “direct” to an
“ultimate” supply chain (see Figure 13) (Mentzer et al., 2001, pp. 4–5). All participants are
included in upstream and downstream flows of electricity and system-relevant services.
In addition, the entire network may synchronise capabilities and this fosters an integrative
philosophy. Thus, tasks like capacity and security management move downstream to the
demand side through outage management and demand response. Furthermore, activities
such as sharing information, sharing risks and rewards, and long-term relationship
building are consistent with this philosophy (Mentzer et al., 2001). Meanwhile, new
business activities arising from the existence of micro-grids establish a market-driven
approach at the lower network level and force adjustments to the business modelling
mind-set as well as product and service portfolios (Blaschke, Suhrer, & Engel, 2013).
A new value creation process enables new revenue streams.
Figure 13: The new Value Chain Design based on Micro-Grid Structures

The Evolution of the Electricity Market
42
The traditional value stream of selling electricity still exists, but four new revenue streams
are created which support the economic feasibility of micro-grid implementation.
First, demand response programs manipulate the capacity of consumption in a region
(Shariatzadeh et al., 2015). Implemented Regarded price-based or event-based programs
offer the possibility of defining specific rates for specific time frames, e.g. Time-of-Use
(TOU) rates, Critical Peak Pricing (CPP) and Real-Time Pricing (RTP)
(Shariatzadeh et al., 2015). Flexibility influences load allocation but also makes it possible
to play with margins generated between buying and selling. The second revenue stream
emerges from the consumers’ desire for resilience against outages. Beneficial behaviour
from the consumer to avoid outages is incentivised or supplier can provide premiums to
guarantee supply (Willis & Garrod, 1997).
The first two revenue streams show a variation on already existing management tasks
which is tightly linked to the micro-grid idea. An additional revenue stream originates from
additional DG and opportunities to export power back to the overall grid; micro-grids
evolve to a production capacity (Stadler et al., 2015). The micro-grid institution (operator)
negotiates with utility companies on the same level. Value creation is captured through a
variety of agreements under export conditions and feed-in tariffs. This stream is highly
situation-dependent (Stadler et al., 2015). Another notable feature of this stream is that
within it, tariffs are subject to negotiation for the first time.
The export of electricity to other micro-grids (excluding electricity providers) is also
possible, and represents the final revenue stream: the emergence of local energy
markets. The primary idea is to trade electricity between micro-grids. This minimises costs
for transportation and electricity losses. Local exchange also provides a mechanism for
coping with a rise in renewable penetration rates. Local trading includes several streams
and hence investigations are vigorously carried out in order to define instruments under
demand-supply market rules (Rosen & Madlener, 2013). A common stream is the
potential for cost savings on final electricity bills (Maity & Rao, 2010), but even further-
reaching potential lies in auction-based market design (Rosen & Madlener, 2013). With
consecutive bidding, clearing, and pricing procedure (Marzband, Sumper, Ruiz-Álvarez,
Domínguez-García, & Tomoiagă, 2013), revenues are generated by skilful buying and
selling capabilities. It is a replication of the European Energy Exchange (EEX), only on a
smaller scale. How well trading works is a question of time and the establishment of
micro-grids.
Eventually, these streams consolidate the technical integration of micro-grids in the overall
process. This also supports a reduction of distance between generation and demand
through decentralisation. Current design discussions led by traditional suppliers and

The Evolution of the Electricity Market
43
distributors show a promising direction of movement towards a sustainable network, but
seem to be influenced by traditional mind-sets. Hence, the occurrences of particular
situations are predetermined and particular results are anticipated.
2.3.4 Beyond the Micro-Grid Value Network
The characteristics of the new, competitive industry described above provide sufficient
reasons to create more far-reaching solutions than those currently discussed under the
supplier-dominant top-down view. The proposed designs mainly lack more radical
discussions of decentralisation, the role of the consumer, and value creation from
intangibles. These shortcomings require a reconditioning for a value network that better
incorporates crowdsourcing.
The first inadequacy of decentralisation concerns the autonomy of single units of the
demand side. From a micro-grid perspective the unit refers to a building and current
discussions focus on top-down structure and management practice. It is assumed that a
centralised system offers a steady connection for supply, control, and information.
There are no doubts as to the need for top-level units and interaction with bottom-level
units, but there is value in going beyond this. First, the implementation of a decentralised
subsystem promotes further decentralisation and strengthens the development of Smart
Homes (Alanne & Saari, 2006; Bohn, 2005). Secondly, decentralisation entails a
relocation of electricity generation closer to the point of consumption and hence a
shortening of allocation distances (Alanne & Saari, 2006). The shortest transportation
distances are realised by buildings which are self-supportive and require no
interconnections among themselves or to the public network, a principle it can already be
seen at work in hospitals which depend on security of supply at all times. This implies that
the entire electricity supply chain be integrated into a building (Dunn, 2002).
Lastly, buildings extend their functionality for electricity management by adding
decentralised storage (DS). The potential of DS is to break off maximum peaks by
buffering surplus and releasing it when needed. It can be achieved through optimal
charging and discharging times, balancing the sharp ramp time of PV (Alam, Muttaqi, &
Sutanto, 2013). Thus, a building takes responsibility for the emergency and backup roles
assigned in micro-grid management. Nonetheless, this still raises the essential question:
is it more beneficial for the network to calibrate an individual building’s consumption,
production, and storage before considering these functionalities for the network?
The importance of each individual building makes it a preferable level for investigation,
which therefore favours a bottom-up approach, investigating the building’s potential and
then grouping in order to minimise transportation. It should be mentioned that factors of

The Evolution of the Electricity Market
44
scale and efficiency of electricity allocation provide a definite answer to this question and
research on, for example, central batteries (ABB, 2012) or plug-in hybrid electric vehicles
(Galus, Koch, & Andersson, 2011) are moving in promising directions.
The centrality of buildings in micro-grid concept means that the existing role of the
consumer changes from a passive receiver of services to an active participant. By making
individual investment decisions, consumers develop into “prosumers” (Teufel &
Teufel, 2014). Managing prosumers from within the supplier’s integrative philosophy
means dispensing output through solely technically focused implementations. The
prosumer’s contribution is to support load or error management by handing over
ownership of electricity or sometimes (temporarily) facilities. However, the prosumer also
claims ownership of self-produced electricity and the electricity industry must be able to
adapt to the individual’s decision to “keep” it or share it (Gstrein & Teufel, 2014), the latter
option entailing providing electricity to the micro-grid. Community behaviour evolves and
cooperation between micro-grid members creates a system with its own dynamics.
This has extensive effects on the fundamental understanding of roles, relationships and
value exchange.
Current disputes assume that socio-political and market acceptance (Wüstenhagen,
Wolsink, & Bürer, 2007) is sufficient to explain the willingness of prosumers. In reality, this
is simply how they have to act in order to achieve, for example, maximisation of profit.
This also applies to micro-grids. Existing arguments short-sightedly neglect the community
aspect and hence the third dimension of social acceptance (Wüstenhagen et al., 2007).
The motives for community behaviour can also be non-technical and non-economic
(Wüstenhagen et al., 2007). The inherent dynamics of a community are less market-
orientated and loyalty is achieved by respectful behaviour. Elements like trust,
commitment, and procedural and distributional justice become central to participation
(Wüstenhagen et al., 2007). Community-based research is a human-centric approach
which studies behaviour and engagement of the demand side rather than a purely
technical micro-grid view (EPRI, 2014). More adequate methods and processes address
individual bad habits affecting trust and commitment in communities (Aldabas, Gstrein, &
Teufel, 2015; Egger, Gstrein, & Teufel, 2015).
Furthermore, community acceptance increases awareness of the perceived value of
electricity. With production in people’s “back yard” and a highly visible electricity value
chain process, a better understanding is easily obtained. Similar phenomena are
observable in the food industry, where consumers now have an enhanced awareness of
ecological and sustainable food production (Smith, 2006). Hence, both extrinsic and
intrinsic values are important for community dynamics, although intrinsic ones are crucial

The Evolution of the Electricity Market
45
for participation as they have a stronger integrative potential (Ryan & Deci, 2000) as the
purely financial factors (Abrahamse, Steg, Vlek, & Rothengatter, 2005; Almeida, Fonseca,
Schlomann, & Feilberg, 2011).
The integration of the demand side requires extensive information and an economy of
excellence requires a sophisticated management of social and business driven
participants within a layer. Thereby, the importance of information grows, creating a
knowledge-based industry and modifying the nature of value and consequentially of value
creation (Davis & Botkin, 1999). Competitive advantage is achieved by acquiring more
knowledge and translating it into new offerings. Internal mechanisms become essential,
including a dynamical learning cycle to continually increase agent’s knowledge base
(Davis & Botkin, 1999). Eventually, value creation increasingly happens via intangible
assets and affects content as well as exchange philosophies (Allee, 2008). At present,
discussions are restricted to top-down information management, e.g. cost savings on
electricity bills (Maity & Rao, 2010) or trading according to an auction-based market
design (Rosen & Madlener, 2013). By assuming unlimited availability of information,
suppliers and distributors underestimate barriers deriving from the demand side.
Electricity provider imposes voluntarily information exchange without concerning privacy
matters (Teufel & Teufel, 2015). The availability is influenced by the willingness of the
demand side to share information and hence becomes an object for exchange. A top-
down imposition of information exchange might be contradictive for willingness.
On the other side, the demand side cannot withhold information as the efficiency of the
network depends upon it. A sophisticated information management is necessary to ensure
interests of all stakeholders. The influence of availability and exchange-willingness of
information adjusts the value creation behaviour in the value network. There is an
increasing need for an analysis of value creation and insights must be gained in the fields
of which role generates value, which types of values are necessary the quality of value
outputs, the constraints on value creation, and adequate resource deployment for output.
These existing debates concerning the degree of decentralisation, consumer roles, and
value creation, demonstrate the need for a concept which refines the level of demand side
integration, addresses social and individual behaviour, and simultaneously constructs
micro-grid structures with optimised distribution. The Crowd Energy concept provides the
possibility to address the new requirements on the future electricity network.
This dissertation refers to the Crowd Energy concept and hence the next chapter will
describe the concept and highlights important research questions which will be answered
at the end of the dissertation.

Crowd Energy, the new Paradigm in the Electricity Market
46
3 Crowd Energy, the new Paradigm in the Electricity Market
After the theoretical introduction in the research field of electricity market and the
establishing of the shortcomings in discussions, this chapter highlights the research need
for a Crowd Energy network (see Figure 2, page 9). Crowd Energy (CE) is based upon the
micro-grid idea and is a sophisticated concept of a future electricity network and provides
a solution for the extensive integration of all stakeholders to create value. This chapter
objective is to define the foundation for the research questions stated in chapter 1.2.
Chapter 3.1 elaborates on CE concept defining a collaborative community based on
integrated processes, cooperation, shared goals and values, and mutuality in rewards and
risk sharing. A socio-technological approach is the core of the CE concept. The iGSL
(intelligent generation-storage-load) structure in chapter 3.2 describes the underlying
functionalities of a building. These functionalities can be pooled together with other
buildings and consequently creates a crowd. Please note that buildings refer to a specific
address and hence can inherit several end-consumers. Also, the terms cell or object are
synonyms for a building. The last chapter 3.3 describes the impact of CE concept on the
current value network. In particular, the chapter highlights major adaptations of involved
roles, relationships between roles, and the value creation context.
3.1 The Idea of the Crowd Energy Concept
CE is based on the previously described concept of micro-grids and the SGAM
framework, new building standards (Kylili & Fokaides, 2015), technological solutions to
integrate consumers through Smart Homes (Chan, Campo, Estève, & Fourniols, 2009), or
advanced data processing and management to handle the increase in coordination efforts
(Felden, 2013). The significant difference with other concepts is the change in
perspective; from a top-down to a bottom-up view (Teufel & Teufel, 2014). The bottom-up
view has an integrative character, avoiding separation of parts in the electricity network or
avoiding excluding specific stakeholders in a value network to increase efficiency and
sustainability of resources, this works best when the entire value network is included.
The value network must have an integrative philosophy and involves integrated
processes, cooperation, shared goals and values, and mutuality in rewards and risk
sharing (Gstrein & Teufel, 2015). This all becomes even more important in light of the new
Smart Cities development. Incipient stages of integration exist in concepts such as the
shared economy or crowd sourcing, however, these concepts lack of profound integration.
For example, crowd sourcing partially integrates a community in the process just for a

Crowd Energy, the new Paradigm in the Electricity Market
47
specific phase or for single tasks (Howe, 2009). The shared economy is defined by
sharing resources within a specific time period (Botsman & Rogers, 2010).
Both approaches are partially reflected in CE, however, the CE concept involves more
profound and sustainable integration and cooperation among members of a community.
The CE concept promotes a crowdsourced electricity network where crowdsourcing is
defined as “the collective effort of individuals or profit or non-profit organisations, or both,
pooling their resources through online information and communication technology-
applications (ICT applications)” (Teufel & Teufel, 2014). The collective efforts, made by
members of a crowd, rely on cooperation and willingness to achieve energy strategies and
visions. Therefore the CE concept is one of the main drivers of energy transition (Teufel &
Teufel, 2014). Sustainable cooperation among all stakeholders means that the current
paradigm of the electricity industry must be altered from “TO-YOU” to “WITH-YOU”
(Teufel & Teufel, 2014).
The paradigm change induces an extended understanding of electricity beyond the
tradeable good aspect (Hertig & Teufel, 2016). The CE includes further aspects of
electricity which are strategic means, ecological sources, social imperative, and
interpersonal construct. The latter characterises the cooperative behaviour within a crowd
based on a local production, storage, distribution, and consumption of electricity among
members. To ensure cooperation in CE, the concept is based on the intelligent
generation-storage-load’s (iGSL) cellular structure which will be elaborated on in the next
paragraph.
3.2 iGSL Structure
Crowd Energy is founded on a cellular structure. A cell refers to a building, and each cell
has three functions: generation, storage, and load (iGSL cell) (Teufel & Teufel, 2014).
All three functions are performed via a sophisticated information and technology
infrastructure to ensure communication and security of supply (see Figure 14). At this
level, individual cells are profiled according to patterns of consumption, PV production
profile, and storage size, allowing them to be tailored for specific management activities.
The optimisation of individual buildings is an important preliminary step for the creation of
a micro-grid, because producing or saving enough electricity reduces load balancing
efforts. By pooling iGSL cells and their functions, a sustainable network is created and this
establishes a local production-consumption principle.

Crowd Energy, the new Paradigm in the Electricity Market
48
Figure 14: Crowd Energy based on an iGSL cell (adapted from Teufel & Teufel, 2014)
The local production-consumption principle implies that the load management tasks
required for balancing and allocation need to be redefined. Within the crowd, the
allocation of electricity to shortage locations and surplus locations, in the short as well the
long term, generates an independent micro-grid and relieves higher network levels.
Furthermore, cooperation improves stability by spreading load balancing issues, e.g. the
sharp ramp time of PV production, between several cells. Load balancing can also be
achieved by pooling production or storage capacity, for example, using a neighbour’s
storage capacity when one’s own storage is not available reduces production loss and
provides operation scope. In other words, production and/or storage capacities are
installed in optimum locations, economically and technically speaking, to improve the
smartness of electricity allocation.
Such a building-level perspective enables a bottom-up network in which crowdsourcing
activities apply complementary actions defined by the top-down approaches.
Crowd Energy’s local production-consumption principle moves beyond the current
characterisation of micro-grids as purely technical counter-measures for unwanted
incidents. In Crowd Energy thinking local areas support each other, leading to
transportation distance to be reduced. Short distance allocation dominates and shorter
distances to travel reduce transportation costs for electricity. The exchange of electricity in
a local network affects electricity price and it will decrease but this also means that the
transmission and distribution revenue will decrease significantly. The reduced final price of
electricity leads to questions being asked on how maintenance of the transmission and
distribution networks will be secured in the future. Those networks need to be maintained
as transmission and distribution grids are the backbone. At the same time, CE is a good
way of introducing a smarter way of distributing electricity locally postulating optimisation
solutions for exchange rather than solutions involving artificial intelligence. It illustrates a
way of “working with what we have already” rather than implementing extensive network
expansion policies. In a Crowd Energy model, distribution is decentralised and the low-

Crowd Energy, the new Paradigm in the Electricity Market
49
voltage grid relieves higher network layers by allocating electricity horizontally. All of this
renders investments in high-voltage network expansion projects questionable.
Eventually, the iGSL structure described provides benefits for the electricity network but
also requires changes to be made to the value network structure, value creation and the
management of the value network.
3.3 The Impact of Crowd Energy on the Current Value Chain
The iGSL structure leads to a further differentiation of the low voltage layer and describes
two domains: a building, which has individual characteristics, and a crowd, which has the
characteristics of a community. Both domains have specific requirements and they need
to be respected. Furthermore, the new role of the prosumer defines and influences both
domains and eventually alters the value network. In general, prosumers and their iGSL
system are the backbone of a crowd. This includes the utilisation of the iGSL system for
individual and community purposes. It should be remarked that not all end-consumers turn
into a prosumers who produce and store electricity, however, there are a certain number
of prosumers in the network leading to changes in the value network. The following
paragraphs highlight the critical points for further research from a value network
perspective.
To define a crowd in a value network, two main characteristics exists. The crowd potential
refers to the ability of the crowd to produce surpluses for sharing. The crowd strength is
the ability of the crowd to work together through sharing. The potential is a technical
related supply chain subject which incorporates a local production and consumption
network and the optimal allocation of electricity among those units to create independence
from external supply. The strength of a crowd relies on cooperation which is the
conversion of tangible and intangible assets into deliverables. The conversion involves
social and psychological aspects. For example, providing value to the crowd requires,
amongst other things, the willingness to share electricity. The willingness of prosumers is
based on rational and irrational factors like moral values creating various individual
personalities. The willingness for sharing also concerns information and assets, storage in
particular, which is needed for the functionality of a crowd. Nevertheless, willingness is
essential for the construction of a crowd, otherwise a prosumer is acting as an individual.
Consequentially, Crowd Energy considers individuals and community interests, both must
be addressed, and it also demands nurturing the relationship between prosumers and a
crowd. Both characteristics of a crowd, strength and potential, are interrelated and

Crowd Energy, the new Paradigm in the Electricity Market
50
together determine how cohesive a crowd is and the relationship with other stakeholders
in the value network.
The crowd’s ability to create cohesion causes a shift to a more leading position among the
current roles of producer, transmission and distributors, 2nd enabler, reshaping the basic
structure and relationships. In the future network, a crowd will be involved earlier in the
value creation process which means it has to carry out load management tasks.
For example, the availability of self-produced electricity within a crowd must be allocated.
This will reduce the need to buy electricity from commercial suppliers. At the same time,
the crowd requires infrastructure and management systems to allocate electricity which is
furnished by ICT and facilities’ manufacturers of small decentralised solutions. The quality
of crowd functionality depends on provided decentralised equipment and hence a closer
interaction will be pursued to ensure that innovation is fostered and consequently a
crowd’s potential is improved.
Nevertheless, management of a crowd, and its members, requires load balancing skills
and capabilities which create a window of opportunity for business. Providing services for
a crowd creates a new role within the value network. The role of a service provider is
distinguished it from the traditional producers and distributors by focusing on the
sophisticated management of electricity which implies further factors such as comfort or
efficiency. The quality of a service provider, which can be expressed in business
excellence, will be crucial for the relationship between a crowd and the rest of the value
network. Sophisticated business excellence is repaid with loyalty by the crowd and a tight
interrelationship between Service Provider and crowd emerges. The closeness between
the roles permits to speak of an extended crowd perspective. Besides roles and
relationships, the emerging prosumer changes value creation, in particular exchange and
content (Lepak, Smith, & Taylor, 2007), by adding new tradeable value types.
The new types of values emerge as a result of enhanced cooperation and the recently
created social role of the prosumer. First, cooperation leads to more exchanges of
information; thereby information become valuable and an object for exchange itself.
In other words, information is the content for value creation and obtains an equivalent
value. The social role of prosumers, on the other hand, acts differently as existing
business driven stakeholders of the network and introduces intangible values like
commitment, trust, loyalty, or sense for community. These intangible values are necessary
for cooperation among crowd members and crucial for conversion of tangible and
intangible assets into deliverables. Eventually, the complexity of value creation is
increasing and creates challenges for enhanced electricity management (Gstrein &
Teufel, 2015).

Crowd Energy, the new Paradigm in the Electricity Market
51
The previous paragraphs addressed some emerging issues which require further
investigation. In particular, research is needed into the overall design of crowd-based
value networks including value creation, and the strength and potential of a crowd. These
three subjects are the objectives of this study and are expressed as the research
questions stated in chapter 1.2. The proposed questions require a theoretical foundation
before a conceptual framework of a crowd-based value network can be presented.

The Value Network: the Theoretical Background for the Electricity Industry of the Future
52
4 The Value Network: the Theoretical Background for the Electricity
Industry of the Future
This literature chapter describes the underlying and essential theoretical background for
the defined research field (see Figure 2, page 9). A theoretical description of a crowd-
based value network concerns with following subject areas: a) design and dynamics of
networks, b) value creation process, and c) the influence of roles on value creation.
All three areas describe the quality of a value network, i.e. the achievement of value
network goals. The objective of this chapter is to provide foundations for the Crowd
Energy framework (see chapter 5) defining an overall value network design, and crowd
strength and potential.
Chapter 4.1 provides a value network perspective and starts with the development from a
supply chain to a value network approach highlighting necessary crowd-based value
network characteristics and management principles. Subsequently, this chapter
elaborates on design of value networks discussing involved roles and relationships. From
a general value network description the chapter investigates in the specific area of value
creation. In particular, the chapter 4.2 turns its focus to the social role of the prosumer and
their strategy to convert tangible and intangible assets to deliverables. Besides that,
prosumer introduce new types of value and altering context for exchange. Additionally, a
theoretical description of decision making should highlight arguments in favour of sharing
or storing electricity.
4.1 From Supply Chain to Value Network
The concept of a supply chain has been well known in the field of economics for several
decades and is commonly mentioned in the literature; the idea was first discussed in the
domain of logistics management. The economics behind this initial mind-set entails the
optimisation of planning, implementing, and controlling of efficient and cost-effective flows
(Cooper, Lambert, & Pagh, 1997). The traditional and more mechanical approach requires
defining the considered stakeholders corresponding to the upstream and downstream in
the chain. The specified scope determines the degree of supply chain complexity.
There are three types of supply chain complexity which can be identified: direct, extended,
and ultimate supply chains (Mentzer et al., 2001, pp. 4–5). A direct supply chain has the
smallest complexity, consisting of a supplier, business, and customer relationship.
An extended chain includes the suppliers of suppliers and if the customer is an
intermediary, their customers. An ultimate supply chain represents the highest degree of

The Value Network: the Theoretical Background for the Electricity Industry of the Future
53
complexity by considering all players involved in the flows of products, services, finance,
and information.
The delivery of products and services in the current electricity system requires the
integration of several players and hence can be described as an ultimate supply chain.
The complexity of an ultimate chain illustrates that many functions enable a variety of
supply chain configurations. Another development concerns the redirection of flows. In
recent years, suppliers have been dedicating production steps to the end-consumer and
have consequently been offering customised products and services. Both impacts lead to
a more appropriate definition: a supply chain is “… a set of three or more [independent]
entities (organizations or individuals) directly involved in the upstream and downstream
flows of products, services, finances, and/or information from a source to a customer…”
(Mentzer et al., 2001). The enforced management within the supply chain is intentional as
the quality of the outcome is tightly related to it (Mentzer et al., 2001). Thus, supply chain
management (SCM) can be seen as a deliberate effort to handle activities and
relationships.
4.1.1 Supply Chain Management
This emerging complexity renders outdated the traditional, purely operational, mechanical
view of SCM; more integrative management positively affects performance (Cox, 1999).
Hence, SCM is the sum of management activities undertaken for orientation
(Mentzer et al., 2001). Supply chain orientation is a type of management philosophy
recognising the strategic or systematic implications of the various upstream and
downstream flows (Mentzer et al., 2001). In this paper, SCM refers in a broader sense to
both streams and is specified as “…the systemic, strategic coordination of the traditional
business functions and the tactics across these business functions within a particular
company and across businesses within the supply chain, for the purposes of improving
the long-term performance of the individual companies and the supply chain as a whole
…” (Mentzer et al., 2001). The corresponding set of management activities express a
more connected view. It implies an integrated behaviour and mind-set, mutually shared
information, mutually shared risks and rewards, cooperation on several levels, defining the
same goal and the same focus on serving the customer, and a physically integrated
process. The establishment of these management activities requires time and hence are
only executed under a long-term partnership maxim.
To create a complete model of SCM, the framework must consider the antecedents and
the consequences of the SCM and supply chain orientation (see Figure 15)

The Value Network: the Theoretical Background for the Electricity Industry of the Future
54
(Mentzer et al., 2001). These elements are necessary for steering the performance and
alignment of activities. The antecedents shape the orientation and consist of several
factors (Mentzer et al., 2001). The willingness to address questions of trust and
commitment is the basic ground for cooperation: this is crucial to overcoming difficulties
(Morgan & Hunt, 1994). Moreover, it involves the handling of influential positive as well as
negative factors. The acknowledgement of interdependency defines the willingness to
negotiate about functional transfer for operational planning (Bowresox, Closs, &
Stank, 2003). The function’s transfer scope relates to traditional businesses of marketing,
sales, research and development, forecasting, production, procurement, logistics,
information technology, and finance (Cooper et al., 1997).
Figure 15: Antecedents and Consequences of Supply Chain Management (adapted from
Mentzer et al., 2001)
An inter-functional coordination evolves and requires an internal and external perspective
to streamline the flows. This encompasses organisational decision-making based on a
defined supply chain identity and a willingness to coordinate between corporations.
Organisational compatibility is an important pre-condition: players must have
complementary objectives, operational philosophies, and cultures (Bucklin &
Sengupta, 1993). Additionally, a common agreement on vision and on key processes
improves the competitive strength of the supply chain (Grant & Lambert, 2006). The final
factor is support through top management, as this drives the organisation’s value,
orientation, and direction (Mentzer et al., 2001). Thus, the accomplishment of successful
SCM relies on the alignment of top management. Results may include system-related
outcomes, e.g. lower costs and competitive advantage, or customer-related outcomes,
e.g. higher value and improved satisfaction. Finally, a sophisticated supply chain
management model has at its core inter-functional and inter-corporate coordinated
business processes aligning supply chain flows to produce supply chain- and customer-
related outcomes (see Figure 16).

The Value Network: the Theoretical Background for the Electricity Industry of the Future
55
Figure 16: A supply chain management model (Mentzer et al., 2001)
The chain is nested in a global socio-technological environment (including policy,
regulations, and industry settings), influencing the configuration of individual players and
the organisational scope of SCM. The organisational scope involves strategic partnerships
or alliances (Cooper et al., 1997) erecting complex, multifaceted organisational structures
(Webster, 1992). At this point, the chain approach shows limitation and a network
perspective is more appropriate.
4.1.2 A Value Network Perspective
Parallel to the supply view, a value view exists and defines the flow of revenue; in general
it defines the up-stream from the end-consumer to the supplier (Cox, 1999).
An appropriate value is determined for each particular supply chain resource and these
are combined into a final price for the customer or a sales price for a partner.
Both perspectives are interrelated and a specific supply chain functions yields specific
values (Cox, 1999). For example, supply chain functions are defined according to
operational excellence and so functions (or activities) are constantly evaluated through
key performance indicators (Tsiakis & Papageorgiou, 2008). Thus, efficiency from supply
chain discussions influences value formation. The crucial twist of view is that a value
perspective focuses on the validation of the quality of outcome made by the customer.
Eventually, the customer’s request becomes the source of all actions and influences
supply chain key performance indicators (Ramsay, 2005). This complementary value

The Value Network: the Theoretical Background for the Electricity Industry of the Future
56
approach is now well established in research literature and represents a process view on
a business unit level as well as illustrating a way of carrying out activities (Porter, 1985).
Value chain activities (which generate value and hence profit) can be either primary or
secondary. Porter (1985) defines primary activities as logistics, operations, marketing and
sales, and services to generate value. Secondary activities have a supportive character
and consist of activities in the fields of firm infrastructure, human resource management,
technology, and procurement (Porter, 1985). Clearly, the value chain follows the same
logic of transferring products from supply to demand by focusing on essential business
processes. The difference with regard to the supply chain, however, is in the coordinated
chain of activities adding more value to the outcome than the single activities can produce
(Porter, 1985). Thus, competitive advantage derives from discrete activities designed to
produce a final value, but also allows each activity to be a source of differentiation
(Porter, 1985). The firm’s activities are part of a larger construct and the stream of
activities is called an industry value chain or value system (Porter, 1985). A value system
identifies and dictates the required activities by focusing on the value of the customer and
how the customer creates value (Normann & Ramirez, 2000).
The value system forces an alignment of all necessary activities to generate sophisticated
offerings respectively the inherent value; this creates new ways of sharing and of co-
production, including customer participation and extended offer customisation (Normann &
Ramirez, 2000). Thus, a customer’s value-creation logic dictates the constellation and
hence a constellation does not exist in a vacuum (Normann & Ramirez, 2000). Successful
companies will understand the implications of this and shift strategic analysis onto the
value-creating system itself rather than onto the company or even the industry. A mutual
influence emerges and enhances the firm’s produced value as well as the value creation
process. Moreover, the value-creating system involves many actors. Norman et al. (2000)
postulate that the focus should go beyond the direct customer or supplier. The system
develops an analysis scope on an all-embracing level as the system mobilises value
creation through constant improvement and reconfiguration cycles of roles, skills, and
relationships. Involved stakeholders consider the health of the system and of individual
partners equal to their own (Iansiti & Levien, 2004). Thereby, the quality of value quality is
subject to a benchmark of performance which is achieved by a sophisticated management
of business processes and by coordination between them. In doing so, the same
principles of supply chain management are applied including antecedents, philosophy,
and activities (Katsamakas, 2014). The difficulty now lies in the management of a
constellation rather than a simple chain.

The Value Network: the Theoretical Background for the Electricity Industry of the Future
57
The concept of a constellation develops from the idea of a limited linear flow to that of an
interwoven web in which flows are bi-directional and a management of activities has an
integrative, flexible, and long-term character (Ramsay, 2005; Soliman & Sherer, 2005).
Eventually, a constellation can be referred to as a value network – also known as a
business network (Ford, Gadde, Hakansson, & Snehota, 2011), strategic network (Gulati,
Nohria, & Zaheer, 2000), value web (Tapscott, Lowy, & Ticoll, 2000) or business
ecosystem (Iansiti & Levien, 2004). An example of this new logic is illustrated by IKEA,
which mobilises customers to create their own value from the company’s various offerings
(Normann & Ramirez, 2000), moving beyond pure consumption and marketing thinking.
All steps involved in interior design are reflected by activity-based products and service
offerings. Even the handover of some activities to the customer, e.g. the manufacturing
step of reassembling furniture, or transport to the home, is covered in a straightforward
manner. The mobilisation of customers to create value is a key factor and under this logic,
it is offerings, more than companies, that are in direct competition (Normann &
Ramirez, 2000). Hence, offerings, and their included values, set high quality expectations
and the management of activities in the network must be sophisticated.
A remarkable influence on the development of high quality value networks has been
exerted by the information and communication industry. Information and communication
technology (ICT) supports the coordination of activities between players and have gained
significantly in importance in the last decade. This influx of ICT is leading to a redesign of
processes and flows, especially of information, and primarily serves to fulfil customer
needs (Soliman & Sherer, 2005). This induces a sequential mode and a linear emphasis
(Soliman & Sherer, 2005); however, ICT has the ability to integrate the value network and
produce sophisticated value beyond customer needs. Furthermore, ICT complements the
integration of other networks, particularly social and technical, to deal with socio-technical
requirements.
Thus, when speaking of a value network, this dissertation in fact imply the interaction of
several networks, which partly overlap, extend, or supplement each other in certain areas,
to produce value for individuals, businesses, government, and society in general. In other
words, a value network is an abstract and superficial description of structure and
relationships drawing on underlying networks. To counter this abstraction, the following
chapters describe the characteristics of networks, the types of value exchange, and the
possibility of value creation from tangible and intangible assets.

The Value Network: the Theoretical Background for the Electricity Industry of the Future
58
4.1.3 The Networks Involved and their Purposes
The value network theory emphasises values and defines the corresponding network
according to the participants and linkages who contributes to it. This is sufficient from a
business perspective, however, the CE value network is more complex and demands a
refinement of the term network within a CE. In particular, it is necessary to investigate in
social networks to highlight their influences on value creation.
The network approach investigates the structure and patterns of interconnected elements
in varying categories such as social, technology, or information (Newman, 2003). In each
case, the network theory analyses single small graphs and their properties as well as
large-scale ones, towards which there has been a shift in popularity in recent years, driven
by the availability of ICT (Newman, 2003). In general, a network is a set of vertices (nodes
or actors) connected through edges (links or ties) (Newman, 2003). These links can be
either directed, meaning the orientation between edges is in a specific direction, or
undirected, meaning the orientation is possible in either direction (Newman, 2003).
Any structure of edges and vertices has a set of properties which defines the degree of
links, degree of distribution, clustering of nodes, level of resilience to vertex removals, or
diameter of a network by calculating the length of the longest geodesic path
(Newman, 2003). According to these properties an examination of the structure and
behaviour of real-world networks can be done which are non-random and use a certain
mechanism (Newman, 2003). Additionally, networks are dynamic systems which include
dynamic linkages which can carry multiple types of value. These statistical properties
grant a characterisation and a prediction of behaviour (though only in combination with
local rules governing vertices) (Newman, 2003). Given the non-randomness of the
networks, the purpose of incorporation is to help distinguish network types and
characteristics, and to understand the purpose of their existence, namely the exchange of
value.
Three networks of incorporation can be recognised in a socio-technical environment:
technological, social, and information (Newman, 2003). A technological network is
constituted by the distribution of commodities like electricity and, in return, money.
Such networks imply a connection between physical components and present an outline
of the fundamental system. By contrast, a social network is a connection among people or
groups of people based on affiliation factors. Individuals within a group have the same
context and the quality of communities is measured by strength of connections
(i.e. measurements of distance or exchange frequency between nodes (Newman, 2003).
According to these parameters, several subsystems emerge in an ecosystem.

The Value Network: the Theoretical Background for the Electricity Industry of the Future
59
Predominately, affiliation factors are social structures (e.g. friendships, family or business
relationships), commonalities (e.g. interests, preferences, or lifestyle), or common
collaboration objectives (Newman, 2003). Collaboration is especially apt to generate
stable communities by giving people common objectives that they can achieve by working
together. Moreover, the community structures flourish through social trends like the
sharing economy (Botsman & Rogers, 2010). Technological and social networks rely on
the exchange of data and hence information features prominently in the value network.
From the information exchange conclusions about social and technological structures can
be drawn and hence distribution, centres, availability and interlinking of information
exchange allow making statements about the technological usage and social engagement
of individuals. Broadly speaking, an information network refers commonly to web-based
information exchange between several entities, mostly ICT components (Newman, 2003).
In an electricity grid, ICT components dictate the design and, likewise, the exchange
relationships, as information is fundamental to control and decision-making. The applied
ICT components describe information creation points and limitation or possibilities is
determined by the technological system. Information is also created by the interaction of
actors with the physical system, and this generates profiles of consequential preferences
indicating the strength of likes and dislikes. Besides people-to-object linkages, these
preference profiles are influenced by non-related system information like lifestyle. Non-
related information contributes to the amount of information in the system and adds
additional perspectives beyond the commodities of electricity production or consumption.
The availability of electricity-related and non-related information makes it possible for
actors within the network to gain further knowledge and hence supports an evolution
towards a knowledge network (Davis & Botkin, 1999). This knowledge launches a
dynamic cycle of learning, continually increasing actors’ knowledge bases (Davis &
Botkin, 1999). The consequences of this include a higher customisation of offerings, real-
time activities, and short-cycled developments (Davis & Botkin, 1999). In such a
knowledge-based value network a deconstruction of existing structures and the formation
of hyperarchical forms is likely (Evans B. & Wurster S., 1999) accompanied by the dis-/re-
aggregation of values (Davis & Botkin, 1999). A critical factor for knowledge-based
systems is the availability of information and the restriction of access by the provider of
information.
The accessibility (and hence the availability) of information is determined by the behaviour
of actors, which defines the existence and intensity of edges. From a social exchange
theory point of view, actors possess the ability to negotiate and to create any value from
exchange, but always act within a structured situation (Cook, Cheshire, Rice, &

The Value Network: the Theoretical Background for the Electricity Industry of the Future
60
Nakagawa, 2013). At the same time, it implies that the consequences and conditions of
their actions are influenced by larger, non-controlled relationships (Cook et al., 2013).
The formation of structures defines the scope of actions, but the vitality of the network
depends on the potential of actions to convert value (Allee, 2008). On the other hand, the
conversion of value in a knowledge-based network depends on the ability to use
intangible values, like information, to create negotiable offerings (Allee, 2008).
Eventually, the behaviour of actors, and their ability to convert value, are critical and lead
to reformulate the previously stated value network definition to “…any set of roles and
interactions in which people engage both tangible and intangible exchanges to achieve
economic or social good” (Allee, 2008). A summary is that an increased influence of social
roles in a CE value network has two implications. First, the main assets in the electricity
industry shift towards intangibles and change the nature of value. Secondly, social roles
introduce different methods of conversion strategy.
4.2 Value Creation from Intangibles
Value creation is commonly defined as the raison d'être for any business and includes all
necessary actions that provide “better value” for others. Improved value creation
manifests itself in the form of tangible (e.g. products) and/or intangible outcomes (e.g.
services) and improvements are attained via innovation (Teece, 2010).
This understanding is propagated in organisational theory or strategic management, and
in recent years, the value creation of services has been gaining more attention as the
servitisation of industries introduces a shift in the design of offerings (Baines, Lightfoot,
Benedettini, & Kay, 2009). This requires, on the one hand, more elaborate processing
capabilities, but on the other hand, the ability to convert these intangibles into deliverables
(Allee, 2008). In order to convert intangibles, a medium for exchange, e.g. money or credit
items, is required in order to define a value of deliverables (Allee, 2008). A common unit of
measure for intangibles is advantageous but the conversion of every intangible type
creates the extreme of “micro-credits for ideas” (Allee, 2008). Thus, some intangibles are
not converted at all or are exchanged within the intangible realm.
The conversion and utilisation of intangible assets is becoming an important challenge for
future electricity markets. A central issue lies in the inherent value experiences of
customers, which can generate a discrepancy between potential and realised value
(Ramsay, 2005). Increasingly, value creation originates not only at the organisational
collective level but also from individuals. The resultant non-profit orientation creates

The Value Network: the Theoretical Background for the Electricity Industry of the Future
61
specific social roles and assigned capabilities, building in further antecedent factors for the
management of value creation. Therefore, an explanation of new value creation must
begin with individuals (Teppo & Hesterly, 2007). These changes in the nature of outcomes
imply that the concept of value creation, in particular content and exchange, alters as well
as the understanding of roles and their utilisation of assets.
4.2.1 Types of Value
To begin the investigation into value creation, two concepts must be defined: content and
exchange. Value content is “… the specific quality of a new […] product or service as
perceived by users in relation to their needs …” (Lepak et al., 2007). This implies that
experienced value is subjective and individual (Bowman & Ambrosini, 2000). On the other
hand, experienced value can at least be interpreted as the user’s willingness to exchange
one relative value for another value (Lepak et al., 2007). The willingness to exchange on
the part of both producer and user is generally dependent on two conditions. First, the
value in return must exceed the producer’s costs, and secondly, the monetary amount
spent by the user for the new service received must be lower than that of the next
alternative (Lepak et al., 2007). The creation of value is an emergent property of two
participants and shaped by the design and functioning of the value network (Allee, 2008).
Such context-specific offerings require an agreement on the deliverables, i.e. they must
include all contracted, mandated or expected deliveries (Allee, 2008). In this regard,
delivery streams beyond the final product and/or service emerge, and a refinement of
deliverables according to the perspective of negotiable value becomes more suitable
(Allee, 2008). This form of value is created by the conversion of tangible and intangible
assets into a deliverable which enters the market. The exchange of deliverables requires
a medium of exchange (conventionally, money) (Allee, 2008). This mainstream mind-set
has prevailed for a long time in research, but other forms, such as alternative currencies
(e.g. air miles), knowledge, or favours prompt a rethink of classes of exchange medium
(Allee, 2008). To this end, three currencies can be distinguished as shown in Figure 17.
The conventional stream (the green line) represents the exchange of products and
services for money, e.g. electricity for money. The second intangible stream emerges from
the novelty and appropriateness of subjective value and strongly depends on the
distribution of knowledge. The particular role of knowledge is crucial for deciding to
participate in an exchange and has three conditions (Amabile, 1996). Firstly, the user
must have knowledge of all options and their inherent value. Secondly, the user must be
capable of understanding the meaning of all the options. Lastly, the choice of an option

The Value Network: the Theoretical Background for the Electricity Industry of the Future
62
depends on the social and cultural context into which the new value is introduced.
A critical aspect is the information asymmetry between participants, which makes it
doubtful that individuals will make the optimal decision (Greenwald & Stiglitz, 1986).
The value gained in return consists of information about the user using further to provide
personalised offers. Thus, source and user agree on the necessary information for
strategy, planning, process, technical know-how, design, and policy which surrounds the
core product as well as existing in the value network (Allee, 2000). This would imply that
within CE value network information like service offerings or utilisation of devices are
exchanged.
Figure 17: Mapping the value exchange (Allee, 2000)
The third intangible stream goes beyond services and knowledge, and eludes traditional
financial measures (Allee, 2000); it is comprised of intrinsic motivations or social values
such as a sense of community which are paid in return for the customer’s loyalty.
Additionally, intangible values can be used in an exchange, e.g. provide electricity for the
community and in return obtain commitment and trust, but even more, intangible values
are an indicator of willingness to participate in an exchange. The absent of trust or
commitment would peril the exchange of electricity. In summary, intangible values are
exchanged among each other, are used as a counter value for other value streams, or
disrupts exchange in the lack of absent.
These different types of value exceed the traditional agreement of content value and
willingness to exchange in the crowd-based value network. Moreover, the subjective and
context-specific nature of value creation results in competing views on valuable options
among various stakeholders. To consider all three value types is necessary for explaining
new deliverables from the emerging role of prosumer and exchanges based on non-

The Value Network: the Theoretical Background for the Electricity Industry of the Future
63
rational or non-economic behaviour. Eventually, types of value can be used to recognise
social roles and in knowledge of a different asset conversion into deliverables.
4.2.2 Roles and their Relevance of Value Exchange
The ability of a network to convert assets into value is heavily dependent on the role
producing deliverables from tangible and intangible assets (see Figure 18).
Tangible assets refer to all system relevant technology to produce, store, and consume
electricity. This includes technologies which are interlinked direct or indirect, e.g. mobiles
to show statistics, with the production and management of electricity. On the other side,
intangible assets define skills and abilities to apply tangible assets to produce
deliverables. In general, assets can be private and/or public resources and are
categorised in four main groups: financial assets, human competences, brand and
relationships, and internal structure (Allee, 2008). In more detail, financial assets refer to
the investment potential in a system, human competences are skills, capabilities and
knowledge, brand and relationship defines the self-awareness of a role and their
relationships, and internal structure mainly refers to tangible assets. Such a strict
distinction might not be possible. For example, internal structure also inherits certain
knowledge about usage. This knowledge is bound to the internal structures, however,
could be assigned to human competences.
Figure 18: Value conversion strategy model (Allee, 2008, p. 10)
The implementation and execution of value conversion from assets is strongly
characterised by the type of role, namely organisation, society or individual
(Lepak et al., 2007). Organisational roles generate new value and thus create competitive
advantage by being innovative – finding new approaches, materials, or technologies
(Tidd & Bessant, 2013); they also allow organisations to acquire new skills and the ability
The Value Network: the Theoretical Background for the Electricity Industry of the Future
64
to organise internal knowledge of value delivery (Teece, 2010). A strong orientation
towards customers emerges and becomes part of value creation, e.g. business modelling
of customers’ “pains and gains” (Osterwalder, Pigneur, & Clark, 2010).
Thus, organisations are capable of finding, developing, and combining information to
generate knowledge for the exploration and exploitation of opportunities (Smith, Collins, &
Clark, 2005). Compensation is either of a financial nature or delivered through intense
cooperation in an increasingly intangible value network. Finding equal value for intangible
exchange depends on the utilisation of openings to improve competitiveness.
Meanwhile, society as a role for value creation employ different tangible and intangible
assets and is less business driven, maybe more altruistic (Lepak et al., 2007). This means
that the production of deliverables occurs simultaneously with the activities of
organisational and individual roles. Furthermore, these deliverables serve the purpose of
improving value conversion for both of the other roles. Hence, society receives success or
failure feedback and stimulates inherent capabilities, skills and knowledge. Such roles are
on higher collective levels and can be either institutionalised in governments or defined as
society in general. Both, convert assets differently and also deliver different values.
For example, institutional deliverables are regulative rules considering the welfare of all
participants within and outside the value network (Scott, 2014). They describe all types of
formal rules, laws, sanctions, incentive structures, cost structures, power systems,
standards, and protocols. Societal deliverables are normative rules and are morally
governed (Scott, 2014). Hence, deliverables of values, norms, role expectations, systems
of authority, a sense of duty, and codes of conduct, are produced and begin to interact
with existing regulative rules. The overall objective is the stimulation of the internal value
creation cycle. Thereafter, organisations and individuals may begin to consider objectives
such as sustainability deriving from normative rules (Breuer & Lüdecke-Freund, 2014).
Individuals are increasingly sources for value creation, developing novel and appropriate
tasks and processes to pursue personal interests. Achieving individual objectives is
distinguished from the organisation-centric, more economic theory-based view in its
acknowledgement of social relationships and their philosophy of exchange with their
environment (Cook et al., 2013). Applying social exchange theory provides an economic
metaphor for these social relationships. In social exchange situations, individuals assess
value and the resulting exchange happens in accordance with the two central properties
of self-interest and interdependence (Lawler, 2001). Self-interest defines individuals’
motivation to maximise rewards and to avoid potential costs (McDonell, Strom-Gottfried, &
Burton, 2006). So it is assumed that individuals are rational and engaged in weighting
options to finally make a decision. In recognising self-interest as an entity, individuals are

The Value Network: the Theoretical Background for the Electricity Industry of the Future
65
motivated to fulfil basic needs through the improvement of interactions between several
individuals. In other words, individuals seek relationships to promote both own and others’
needs through mutually beneficial behaviour. Individuals or groups of individuals show a
high level of goal-orientation. Furthermore, exchanges happen in a non-competitive
system and that kind of collaboration requires different forms of interdependency like
reciprocal control or punishment (Andreoni, Harbaugh, & Vesterlund, 2003). To this end,
participants establish mutual and complementary arrangements built on fairness, emotion,
trust, and commitment (Baxter & Braithwaite, 2008; Cook, Cheshire, Rice, & Nakagawa,
2013). Such social exchanges are more flexible and rarely involve explicit bargaining
(Baxter & Braithwaite, 2008). The value in return may come in the form of recognition or
status rather than just money (Amabile, 1996).
The main determiner of social exchange, however, is still the decision of whether or not to
exchange according to cost and reward, and in which quantity (Lawler, 2001). Eventually,
the decision-making process, and the risk-averse or risk-seeking behaviour involved,
determine to a large extent how dynamic and lively exchange will be.
4.2.3 The Decision Making of Individuals
A common theory for economic reasoning is Bernoulli’s expected utility model
(Bernoulli, 1954). The mathematical expression of each possible outcome weighted by its
probability expresses, in terms of numbers, a difference in preferences and finally
provides a scope for actions (Bernoulli, 1954). In other words, rationality hinges on the
ability to describe benefits and costs in monetary terms. Moreover, preferences can be
represented as utility functions, implying a mathematical optimisation towards an
objective. This central point of the theory has helped to establish it in political
(Petracca, 1991), sociological (Hechter & Kanazawa, 1997), and economic (Simon, 1979)
science due to its simple handling of a complex situation.
Later, the emergence of the concept of value expectation in decisions altered the
mathematical model to a moral expectation model (Bernoulli, 1954), which recognises that
individuals’ benefits and costs can go beyond financial assets and involve expectations on
various levels, e.g. comfort or sense of time. Expected utility theory still assumes optimal
decision-making between risk; however, the normative interpretation fails to explain
derivations in the adaption of individuals’ decision-making. Individuals often adapt their
choices and violate the rational choice axiom raising doubt of the intelligence of “rational”
economic agents (Kahneman, 2012). In particular, the fact that irrationality can originate

The Value Network: the Theoretical Background for the Electricity Industry of the Future
66
from perceptions, habits, beliefs, and desires, is barely even considered in this theory
(Boudon, 1998).
Kahneman’s prospect theory attempts to improve the accuracy of decision-making
behaviour modelling (Kahneman, 2012). Based on the gambling metaphor, the theory
enriches the elementary axiom of rationality by allocating risk-averse and risk-seeking
choices to a matrix of the prospect of changes and the probability of occurrence
(see Figure 19) (Kahneman, 2012). The emerging fourfold pattern extends expected utility
theory and emphasises the prospect of change and the evaluation of positive or negative
change in comparison with a reference point (Kahneman, 2012).
Figure 19: A prospect theory matrix (Kahneman, 2012)
Contrary to Bernoulli’s assumed equality of individuals’ preconditions, Kahneman notes
that individuals have different starting points and consider choices with reference to their
current situation and the expected impact of the change on their future situation
(Kahneman, 2012). For example, the prospect of increasing electricity production by
1,000 kW per year (kW/y) is not perceived in the same way by a prosumer, with a yearly
production of 5,000 kW/y, and a prosumer, with a yearly production of 15,000 kW/y.
Furthermore, the expected response to gains is generally weaker than that for losses,
meaning that people normally exhibit loss aversion and are willing to fight harder when
facing the prospect of a loss (Kahneman, 2012). This asymmetry is in a ratio of about 1:2
(Kahneman, 2012). Additionally, the endowment effect influences the prospect of changes
by creating variation in tastes: people apply the “thinking like a trader” concept if the
reference point is higher (Kahneman, 2012). For example, prosumers with a higher
reference point (i.e. higher surpluses) perceive higher losses if selling at a lower price
than expected. Thus, the current market price matters and may drive prosumers to spend
more time selling their surplus. Meanwhile, people with lower reference points are

The Value Network: the Theoretical Background for the Electricity Industry of the Future
67
indifferent to trading habits, but their choices are between different losses. No endowment
effect occurs and any treatment of expenses is considered a loss.
The dimension of probability of occurrence encompasses both an assessment of the
likelihood of events and their expected impact (Kahneman, 2012). Familiar events are
easier to weight as experience and knowledge are sufficient for assessing the impact of
the event; people tend to risk more in such situations (Kahneman, 2012). In contrast, rare
events are much more difficult to predict, e.g. outages of supply through nuclear melt-
down, and individuals tend to worry about their ability to deal with the consequences.
If rare events seize individuals’ attention, it is likely that they will exaggerate their
probability (Kahneman, 2012). This habit derives from flawed, limited knowledge, and is
beyond the realm of normal expectations. The Black Swan metaphor characterises this
problem (Taleb, 2008). However, estimates of probability of occurrence are also affected
by the “possibility” (low probability) effect and the “certainty” (high probability) effect.
Normally, one would expect the effect of a 5% change to the probability of increasing
electricity production to be equal regardless of whether the probability increased from
0% to 5% or from 95% to 100%. But, as shown by (Kahneman, 2012, p. 314), the decision
weights are disproportional to the probability of change and hence do not depend solely
on quantitative probabilities.
The prospect of unlikely outcomes is weighted excessively highly (Kahneman, 2012).
This possibility effect explains insurances and lotteries in which people pay higher prices
for a small chance to avoid losses or to win a large prize. In an electricity industry context,
this would mean that individuals would pay maintenance services for rare events such as
storage or photovoltaic outages. On the other hand, the certainty effect causes lower
decision weights than the probability justifies (Kahneman, 2012). This is attributed to the
fact that people are risk-averse when facing the prospect of certain gain (Bernoulli’s
expected utility) and accept lower risk in order to avoid disappointment. For example, the
certainty of producing electricity indicates that the fear of disappointment, which is not
benefiting from the surplus, leads to storing electricity. The option to sell and to have a
financial benefit from surplus would also be plausible, but the disappointment caused by
the current electricity prices is much higher. By contrast, in “certain loss” situations,
deciding between bad options, a risk-seeking behaviour occurs in a bid to avoid losses.
The negative prospect of a sure loss is less desirable than the gamble. Such certain loss
situations occur when the benefit of self-produced surpluses diminishes, e.g. production is
offline or storage level is low. To avoid losses less beneficial options, e.g. buying from
external sources, are considered in the decision making.

The Value Network: the Theoretical Background for the Electricity Industry of the Future
68
The strength of prospect theory lies in its explanation of decision-making using a
reference point, which opens up possible outcome areas (see Figure 19). In the light of
prospect and probability dimensions, the fourfolded pattern explains underlying fears and
hopes of prosumers to deal with decisions about self-produced electricity. For this reason,
Kahneman’s approach might be closer to reality for decision-making of social roles in a
crowd-based value network than the rational choice theorem. However, prospect theory
cannot explain all influential factors which alter choices. It is also to note that the prospect
theory frames choices according to risk definition. Other framing approaches, like attribute
or goal framing, may produce different outcomes (Levin, Schneider, & Gaeth, 1998).
The complexity of the decision-making process is immense and prospect theory does not
claim to provide a complete understanding of it.
4.3 Summary of Literature Review
The literature review presented the theoretical background for defining a Crowd Energy
value network. The review started with outlining the basic management principles of a
value network, i.e. integrated process, sharing risk and rewards, cooperation, by
describing supply chain theory. Most of today’s understanding of value networks derives
from the supply chain approach, however, differences between theoretical concepts were
addressed by highlighting the value perspective and the existence of different networks to
create value. In particular, ICT contributed to the development of a value network and
enhanced the exchange of information. Thus, information gained importance as a type of
value for exchange. Additionally, the review characterised the prosumer as a social role
with different perspectives on value and value creation. The value perspective of a
prosumer introduces a new type of value – intangible values (e.g. sense of community,
loyalty or commitment).
The literature review also provided the theory for prosumer value creation depending on
the value conversion model, whereby tangible and intangible assets are converted into
deliverables. Intangible assets, in particular are crucial for conversion and include the
prosumer (human) competences of decision making on self-produced electricity and the
asset of internal structure to utilise storage. The above assets describe the strength of a
crowd. The factors involved in crowd potential in the review state that potential refers to
traditional supply chain optimisation tasks. The subordinate treatment was deliberate as
optimisation requires the supply chain to be defined, e.g. production, storage and
consumption units or network, these depend on the design of the network. As a Crowd

The Value Network: the Theoretical Background for the Electricity Industry of the Future
69
Energy value network has not been defined yet, the factors for assessing potential will be
described by the model and the objective of optimisation. In the case of Crowd Energy,
this refers to the optimal flow of electricity within and between buildings. A description of
factors in the model will be provided in the next chapters. Nevertheless, the theoretical
insights of this chapter allow a Crowd Energy framework to be created.

A Research Framework for a Crowd-Based Value Network
70
5 A Research Framework for a Crowd-Based Value Network
This chapter defines a Crowd Energy framework based upon the highlighted research
need in chapter 3 and the theoretical foundation in chapter 4 (see Figure 2, page 9).
The chapter’s objective is to develop a conceptual framework for analysing and
interpreting crowd’s coherency, namely strength and potential, and the effects on a value
network (see chapters 5.2.1and 5.2.2).
To do so, chapter 5.1 develops a general Crowd Energy value network according to value
network principles outlined in the literature chapter 4. In particular, the value network
design includes the specification of network objectives, roles, relationships and
deliverables. Therefore, an achievement of this chapter is that it has provided a value
network design. The proposed design builds the context in which discussions of crowd
strength and potential will take place. Chapter 5.2.1 presents crowd strength factors
according to the value conversion model, discussed in chapter 4.2.2. Strength, i.e.
working together as a community, includes factors without limitations, such as willingness
to work within a crowd and decision to share or to keep self-produced electricity.
The crowd potential can be summarised as the ability to create and sustain crowd
independence from external electricity suppliers through a high availability of self-
produced electricity. Thus, chapter 5.2.2 describes supply flow factors like electricity
production, consumption, sharing, and storage capacities.
5.1 The Crowd Value Network Design
A powerful tool for creating Crowd Energy value network is the network value analysis
(NVA) which builds on social network analysis (SNA) (Pinheiro, 2011) and social
exchange theory (Cook et al., 2013). NVA allows representing a value network’s
complexity by using a non-financial and non-linear taxonomy meaning that it assesses
participants’ capabilities for value creation and hence business modelling beyond
monetary factors (Allee, 2008). Furthermore, NVA analysis a value network on a business
level and the investigation of value creation linkages with strategic partners and other
stakeholders. Besides outlining the design, NVA provides the possibility to discover new
types of business relationships, structural gaps or bottlenecks. Defining the structure
including critical or new situations, capture and increases the understanding of beneficial
or supportive elements in a value network. This goes beyond traditional business

A Research Framework for a Crowd-Based Value Network
71
transactions and includes intangible values as they are key to creating trust. It also
provides opportunities for innovation (Allee, 2008).
So, a careful elaboration produces valuable insights and answers the basic questions
rising in a Crowd Energy value network:
1. What is the position of crowds, prosumer, and consumer in the value network?
2. How do relationships alter due to changes in the nature of value?
3. Which value types are decisive for value exchange?
4. What are the underlying business logics for different stakeholders (depending on
their roles in the new network)?
5. What roles (or groups of players) are benefiting most in the new configuration?
The outcome of NVA is a network map showing flows, bottlenecks, and the importance of
roles or relationships. The creation of the map is an incremental procedure and comprise
following stages:
1. Define network and objectives
2. Identify network entities and map network influences
3. Define the value each entity perceives from being a network member
4. Analyse and shape
The above stages are explained in detail in the following chapters.
5.1.1 Define Network and Objectives
The comprehensive description starts with a definition of the focal and setting analysis
boundaries. The focal is a crowd structured network and defines virtual geographical
areas containing both prosumers and consumers. Theses crowds act independently but
must align with overall network premises. This means there is interdependence between a
crowd and the network and they both determine various (and maybe divergent) goals.
Traditionally, an electricity network, inclusive of crowds, accomplishes five objectives:
economic performance, safety, technological performance, being environmentally friendly,
and product quality (Rui, Arnold, & Wellssow, 2012). The relationships between these
goals can be supportive, neutral or contradictory. In general, it can be said that not all
objectives can be fully achieved simultaneously, hence some are favoured and are
attained at the expense of others. Therefore, it is necessary to prioritise objective(s) for all
participants at value network level. For example, being environmentally friendly postulates

A Research Framework for a Crowd-Based Value Network
72
sustainable production initiatives based on more volatile renewables and requisites
enhanced balance efforts to secure supply.
In a traditional sense, electricity network objectives dictate a crowd’s behaviour and define
measurements according to crowd characteristics and level. For example, wasteful
behaviour is considered as heedless lighting or leaving devices in standby mode but eco-
friendly behaviour requires these inefficiencies to be reduced. The crowd’s sphere of
actions describes all measurements at a low-voltage level and related factors referring to
life-style, mind-set, and patterns. These are community-based factors providing guidance
and describe the priorities of a crowd. The liberty to set priorities distinguishes crowds and
one crowd could emphasise environmental friendliness whereas another would prefers
technological security. In this study it is assumed that a crowd’s highest priorities are
security of supply and economic viability (see Figure 20). These two objectives play a
major role in the conventional value stream and are subject to both risk averse and risk
seeking decision making.
Figure 20: Objectives assigned to electricity network participants
The introduction of crowd-based objectives implies that there is a certain strategy of
independence and all activities are aligned to it. Thereby, collective effort derives from
individuals and their trust in and commitment to the community (Gstrein & Teufel, 2015).
A community’s strength lies in the management of various forms of altruism and egoism
(Hunt & Beister, 1992). One difficulty is to determine a balance between altruism and
egoism, which coexist in any case, and implies that a balance needs to be struck between
individual and collective objectives. It should be noted that individuals might have different
goals but require aligning to a community. Nevertheless, appropriate measurements to
deal with negative individual behaviour are necessary. How difficult this is shows storing
behaviour of cells. Considering it on a community level, others would require the stored

A Research Framework for a Crowd-Based Value Network
73
electricity and it would be egoistic. But with this bad behaviour, the cell creates
independency and would not require any assistance, at a later time-period, from the
community. To deal with that all crowds define additional goals and values, which are
accepted by the participants (Gstrein & Teufel, 2015). These goals and values differ from
traditional values in the supply chain, e.g. the introduction of the principles of the sharing
economy (Botsman & Rogers, 2010; Hamari & Ukkonen, 2013).
From the description above a crowd is conflicted when trying to satisfy members of the
community as well as obey network rules. This conflict of objectives characterises
behaviour, relationships, and position in the value network. To understand how they work
it is necessary to investigate a crowd’s scope of actions which can be determined
according to two dimensions: the goals that are pursued and who are contributing to attain
them.
In a crowd, tasks can be distinguished as being subjective or functional. These tasks
achieve certain objectives and hence goals can be distinguished as being subjective and
functional. Functional refers to necessary tasks to be performed to create a stable
network, e.g. load balancing whereas subjective comprises tasks that support individual
objectives, e.g. selling electricity at a certain price. This assumes that crowd members
formulate objectives which might not be achieved in all cases. A strict line between
subjective and functional cannot be drawn as each crowd sets priorities differently, in
addition subjective and functional objectives can match. Eventually, competition between
subjective and functional objectives emerges. The other dimension specifies how
objectives are achieved by considering contributions from all (aggregated) or a part
(filtered) of members. Aggregation consists of each member’s contribution to execute a
task. On the other hand, filtering defines a subset of a member’s contribution. In the
intersection of those two dimensions four areas emerge and each segment has its own
characteristics (see Figure 21).
The left hand side of Figure 21 illustrates crowd dominated objectives and can be divided
in two main areas. The bottom left corner represents objectives which are important for
functionality of the crowd electricity networks, e.g. load balancing, and involves all crowd
members. A separation into micro tasks distributes the burden evenly. Any appeals from
crowd members are ignored and contradictive actions are punished. The top left area is
less interfering in control mechanism as it requires all members to contribute by satisfying
individual’s objectives. The challenge lies in the creation of alternatives of attaining goals.
For example, individual pricing preferences entails certain schedule to execute them.

A Research Framework for a Crowd-Based Value Network
74
Raising conflicts between these preferences means either to adjust individual preferences
or to reschedule execution.
Figure 21: Crowd Energy objective matrix
The right side of the figure illustrates the decision making among preferences to attain
objectives from individuals. The filtration of contributions creates competition among
preferences and implies an adjustment to less preferable ones. Preferences compete
according to the criteria for choices of preference and the difference is represented by the
top right and the bottom right areas. The top right corner distinguishes choices according
to the composition of preferences between members. The set of preferences can have
high conformity or a high heterogeneity. The reality is somewhere in between those two
extremes, however, the likelihood that a preference is considered increases if a single
preference fits in the composition to attain objectives, mostly crowd specific ones.
The bottom right corner disagrees with the similarity of preferences to functionality of the
crowd. In other words, a crowd selects convergent individual preferences to the overall
objectives before others.
5.1.2 Identify Network Entities and Map Network Influences
The next step identifies all participants, influencing the value for end-consumers, starting
from the focal objectives and characteristics of a crowd. Starting from the focal, it is
important to describe all actors, communities, and organisations according to their

A Research Framework for a Crowd-Based Value Network
75
characteristics and functionality within the network. Besides role description, this step
includes identifying the type of linkages between actors. The outcome is a preliminarily
value network map (see Figure 22). The following paragraphs synthesise with the
description of the chapter 3 and hence restate the main characteristics of the crowd and
will elaborate more on the extended value network.
Figure 22: Future electricity value network with roles and relationships
The iGSL cellular structure allows allocating of electricity between local production and
consumption locations. A crowd becomes the provider and receiver of electricity
simultaneously. The duality of provider and receiver derives from prosumers by supplying
new production and storage capabilities, allowing them to temporarily acquire the role of
electricity suppliers. Success rests, in particular, on prosumers’ willingness to share
electricity and sharing includes that prosumers relinquish some-independence for others.
Nevertheless, the relationships between prosumers-consumers (or prosumers-prosumers)
are defined by the role type which can be either private individuals, business (they have
no core competences in electricity business), or municipals. The relationships are marked
by social, economic, and regulatory aspects and exchanges happen according to the
traditional value stream electricity for money. This includes mainly temporary contracting.
On the other hand, relationships also become more emotional due to the fact that roles

A Research Framework for a Crowd-Based Value Network
76
participate voluntarily or show commitment to a community. These are non-business
based relationships and include social and psychological factors. Eventually, the
relationship can be defined as affectional. The characteristic of a crowd has some
influences on the extended supply chain perspective and roles outside the crowd are
redefined, reinforced, or created.
The future electricity industry expects traditional roles, orange fields in Figure 22, to
comply with the electricity value chain flow. It redefines traditional roles to have a
backbone functionality and supply and distribute electricity throughout the market. This
definition has a distinctive impact on the producer and distributor stakeholders. General,
load management tasks are still a responsibility of producers and distributors, however,
both stakeholders are pushed back from the central location of events. The consequence
is that relationships with other roles including the crowd are mainly based on temporary
purchasing contracts, e.g. buying and ordering electricity. Additionally, traditional roles
might pursue more long-term contracts like partnership with service provider. Its purposes
can be development of new products, to secure market shares, or to create long-term
ventures.
Besides traditional, supportive roles already work in the industry and, through
technological upgrades, on the demand side, i.e. Smart Home, they have reinforced their
leverage in the value network. These players are ICT companies, manufacturers of small
electricity facilities, and appliance producers originating from other industry settings. They
introduce or enhance certain functions, like flexibility of portfolio, shorter innovation cycles,
service excellence, or customer-orientation. Such functions are beneficial for reinforcing
linkages and locating them closer to the end-consumer as they provide devices to carry
out daily tasks, such as cooking or washing. These supportive roles are essential for
crowd performance as they define how well a crowd is equipped. Linkage between
supportive roles and crowds is based on temporary contracting (e.g. buying appliances).
Between supportive roles, (e.g. PV manufacturer and ICT business), partnerships may
develop to synthesise capabilities for defining sophisticated solutions. The collaboration
has an indirect linkage to electricity providers and generates competition for access to
consumers and prosumers.
The newly created role of a service provider plays a central role in the value network.
The role unifies traditional and new business characteristics as the major task is to
manage electricity for crowds and their members. The hallmark of service providers is a
high level of customer orientation, capabilities to deal with information and skills to convert
intangibles to deliverables (i.e. services and/or knowledge). Service providers rely on ICT

A Research Framework for a Crowd-Based Value Network
77
infrastructure, flexibility to adjust service portfolio (offering and pricing), and short
innovation cycles to respond to new requirements. This description applies to players
which have been working with real time systems for a long time and it is not surprising that
telecommunication companies can catch up quickly, e.g. Swisscom Energy Solution
(Millischer, 2012).
The room for manoeuvre is determined by network rules for service providers, however,
the linkage to crowd or members provides windows of opportunity for creating business. A
significant characteristic of linkages are dependencies and the willingness of crowds and
their members to share information (Gstrein & Teufel, 2015). This has a direct influence
on the quality of service offerings. At the same time, offerings are contracted by crowd
and sophisticated services require information. Competition between contracting and
dependency emerges and the availability of information is defined by the necessity for
security of supply and economic viability. At any level of availability, a service provider
becomes a hotspot for information and knowledge related to electricity management.
Service providers have a central position and define linkages to almost every other role.
The linkage to traditional electricity providers is contractual or partnership like (vertical
integration) due to the regulative environment of the industry. A tight relationship with
distributors emerges due to the influence on load management – this is the realm of
electricity providers. Towards supportive roles, linkages are basically contractual through
exchanging services, infrastructure or knowledge. However, services for electricity
management are complementary offers (same with electricity providers) and hence
promote partnership linkages, e.g. alliances or vertical integration.
Before identifying the value dimensions, a short remark to regulatory roles must be made.
The NVA ignores regulatory roles as they exert influence at multiple levels and in different
forms, e.g. subvention of PV (e.g. KEV), smart meter regulation, or supervision of prices.
Regulation, in this dissertation, is seen that the government attend to create benefits for
all players and to create a sustainable Smart Grid.
5.1.3 Identifying Value Dimensions of the Network Participants
The layout of the future electricity network construct in Figure 22 demonstrates the basic
requirements for creating value. The next step adds details to the layout by defining value
types (can also be called value dimensions) which are desired by roles. The objective of
this chapter is to capture the perceived values of linkages. The perception of values
implies reasons for being in a network and inherent opinions that guide behaviour (Flint,
Woodruff, & Gardial, 1997). For example, a trigger event of a new supply channel through

A Research Framework for a Crowd-Based Value Network
78
a service provider changes the perception of value – customers evaluate new values –
leading to an alteration in customer satisfaction and retention. Furthermore, perception of
values provides reasoning for hibernating or missing values (Gstrein & Teufel, 2015).
Another insight of value dimensions is the planning and prioritising of the value
abundance. The result is that the value delivery strategy and priorities are aligned with
network objectives. Besides strategy, a subsequent analysis allows us to look at how a
role adds value, e.g. conversion of intangibles. Last but not least, tracking any changes in
values or improvements and how to deliver them are opportunities for innovation and
subject to business modelling.
The focal of a crowd implies a collaborative environment, including information sharing
(Gstrein & Teufel, 2015). Collaboration is an inherent characteristic throughout the
network to achieve sustainability. Thus, identifying values of participants concerns all
values that are involved in security of supply and economic viability. To satisfy the
reasons for being in a network, the framework applies to the three currencies of values
investigating beyond the traditional value streams (see chapter 4.2). Additionally, the
description of “intangibles” currency is necessary to explain the conversion of them.
The following paragraphs focus on the focal crowd and describe linkages between:
prosumer and consumer (creating a crowd)
crowd and external roles (supportive, traditional, and service provider),
individual external roles (supportive, traditional, and service provider)
For simplification, the analysis bellow assumes a crowd with a prosumer and a consumer
dummy.
Linkage: Prosumer and Consumer
The collaboration between prosumer and consumer describes the core of any crowd-
based structure. The inner circle of currencies (see Figure 23) consists of essential
exchanges, i.e. electricity for money, to incarnate a crowd. The traditional exchange
proves existence and expresses a regular value stream of a localised market. Between
prosumers, exchange can be based solely on electricity, meaning to provide electricity
and receive the same amount later like a bank account. Distributors remedy any
deficiencies in the crowd. The gathering of the prosumers’ supply and the consumer’s
demand assumes willingness to share information in the second stream. Prosumers
provide information about current electricity availability meaning current production and
storage depletion. They also provide technical information regarding infrastructure.
Other information that can be provided covers amongst over things, consumption

A Research Framework for a Crowd-Based Value Network
79
preferences and decision-making for sharing. In addition, consumers share information
about preferences. This includes range of purchasing prices, technical information about
appliances, consumption patterns, and information closely related to usage. In particular,
pattern recognition draws a blurred line between vitally and trivial data about electricity
management. For example, data concerning usage of appliances is required for load
management but also for profiling customer preferences. The definition of data type and
quantity to be exchanged is closely linked to predefined crowd objectives and moral
values.
Figure 23: Internal and external currencies between crowd and external roles
Among these roles the third stream of value is mainly used and intangible values
represent the lubrication oil for collaboration and nurture engagements (Gstrein & Teufel,
2015). Trust and commitment are the key factors and management involves rewarding
positive behaviour whereas negative behaviour is penalised (Morgan & Hunt, 1994).
A prosumer shows a sense of community by providing electricity for a crowd rather than
selling it externally. To do that, independence is relinquished in favour of community
welfare. This generates a certain leverage position as prosumers are the source of
sustainability. So, the benefit must be noticeable for prosumers but they must not abuse
the system otherwise consumers would leave. If prosumers are trustworthy and
committed the consumers will remain loyal. Furthermore, consumer’s signals loyalty by
adapting a sustainable behaviour and mind-set. This calls for actions which are aligned
with the set of crowd objectives, e.g. contribution to reduce waste.

A Research Framework for a Crowd-Based Value Network
80
Linkage: crowd and external roles (supportive, traditional and service provider)
The performance of the inner circle determines the quality of linkages to a service provider
and supportive roles (see Figure 23). A crowd manifests itself as an association or
institute which represents the interests of a collective. As a representative, a crowd buys
services for managing electricity from service provider. The traditional business
relationship comprises offerings to support load management including ordering electricity
(delivered by distributors). Additional services comprise administrative tasks such as
billing, business intelligence i.e. pattern recognition, and customer relationship
management, including consulting or reward system. Furthermore, services entail
optimising consumption, production and storage functionalities to deal with the functional
tasks in the Crowd Energy objective matrix (see Figure 21).
Services are the carrier for information and mutual learning. For instance, the crowd gains
insight into the possibilities of dealing with load as well as how the system works overall.
Through this improvements and optimisation through learning is possible. Meanwhile, the
service provider gains knowledge about collective demand, production, storage and
transaction patterns. Additional information about collective preferences allows crowd to
be characterised. A service provider evolves into an information hotspot. This knowledge
is a critical input for load management.
The existence of intangible values between crowd and service provider depends on the
closeness of relationship. Closeness is related to location of management. It can be inside
or outside a crowd. Inside management leads to a sense of community which is repaid
with a certain amount of loyalty (see Figure 24). At this point a service provider can be
seen as an extended crowd. Outside management also requires a sense of community
which must be proven, however, it is less intense compared to an inside management as
the relationship is based on business excellence. So, crowd’s loyalty is replied by brand
awareness and unwillingness to change provider.

A Research Framework for a Crowd-Based Value Network
81
Figure 24: Internal and external currencies between individuals and external roles
The linkage to a supportive role, which offers decentralised solutions, is based on
business objectives allowing for independence on the one hand and increasing market
share by selling products and maintenance services on the other. Corresponding
information about product design and functionalities are provided by the supportive role.
By utilising devices, supportive roles gain knowledge and carry out innovation to provide
more sophisticated products and services. This fosters mutual learning and innovation.
5.1.4 Shape and Analysis
The previous chapter provided insights into crowd related value dimensions. It is now
beneficial to open up the perspective and form a value map to provide an overview of the
entire network. An analysis of value creation in the entire value network entails drawing
conclusions regarding design and the effects of discrete events on the network. Figure 25
shows the value dimensions of all participants and outlines dependency between roles
and is the basis for discussion. Before starting, it is assumed that the role of a service
provider is quite influential on flows and in regard to the analysis it is considered as
independent in business terms as well as in taking actions. This might be different due to
regulatory interventions on delivery of all electricity related information to distribution
system operators (DSO).

A Research Framework for a Crowd-Based Value Network
82
Figure 25: Network value map of a crowd-based electricity industry
A quality of the network value map is the investigation of how well it is defined. For that
reason, a coherent logic and flow of values throughout the system must be discussed.
A crowd-based value network considers a flow of electricity according to existing
infrastructure. As mentioned, it is possible that orders of electricity can occur between
crowd and service provider, the real exchange, however, happens through distributors.
The traditional paths are integral and no parallel infrastructure exists. Meanwhile, the flow
of information might take other paths. The major stream exists between crowd, and its

A Research Framework for a Crowd-Based Value Network
83
members, and service providers identifying the crowd as the source. There are additional
knowledge flows to support and traditional roles. The first flow is caused by the increasing
importance of technological and decentralisation development. The second one satisfies
traditional planning processes as the electricity system requires certain stability in
forecasting. This might be influenced by some real-time adjustments through unexpected
events, such as more sun radiation than expected or a lower consumption pattern than
expected. Service providers are capable of immediately reacting in accordance with
information management. In addition, service providers satisfy different end-customer
types as well as different preference settings without disturbing security of supply.
Successful business in the value network means understanding crowd’s and their
member’s expectations which are not network related subjects like the complex
decentralised systems, distribution networks or revenue sharing agreements between
stakeholders. Expectations are rather possibilities of choices, service quality, relevance to
lifestyle, ease of use, fair and easy to understand pricing, as well as good support.
The delivery of service offerings which addresses these expectations becomes profitable
and must occur within a specific timeframe – mostly real time. Thereby, the service
provider produces knowledge through business intelligence. This becomes valuable for
other players in the network too. Such knowledge increases the portfolio of content and
services and hence drives revenue growth.
Meanwhile, service sophistication indicates coordinating between external roles. Service
providers address partnerships in traditional and supportive roles producing holistic
solutions and in return distribute knowledge. Nevertheless, alignment of upstream
processes and conversion of emotional values, e.g. sense of community or loyalty,
improves time-to-market of new offerings. Service providers, as well as other players
expand their business portfolio for crowd segments and reach a break-even-point.
Eventually, service offerings are crucial for success rather infrastructure and hence a
conclusion can be drawn that service provider benefits at the expense of traditional roles.
The translation of crowd expectation into service offerings flourishes the value network
and also the quality of translation dynamic in the value network. The quality of translation,
however, depends upon the skills and capability of stakeholders to produce the adequate
deliverables and also the crowd’s coherence. The crowd’s coherence and high internal
strength indicates a strong community and little dependence on external support. Limited
services from outside are required and help is just needed for basic tasks such as
allocation or optimisation of electricity. This affects less traditional business processes –
apart from profitability reduction – as this is business as usual. On the other hand, a

A Research Framework for a Crowd-Based Value Network
84
crowd’s strong coherency flourishes internal flows and all internal value dimensions.
Any disruption from outside is disadvantageous and crowds are vigilant in protecting flows
and all involved values. These values are the foundation of crowd existence. For the
residual network, this implies that accessibility of values is reduced and limits value
creation of others. Eventually, the importance of service provider to translate expectations
into services and the coherency of a crowd defines the intersection between both parties
as the bottleneck of the value network.
5.2 Assessment of Crowd’s coherency
The crowd’s coherency, defined by strength and potential, implies dependency
(or independency) to external stakeholders. The assessment of both characteristics allows
drawing conclusions about the dynamic within the value network. Thus, the first part of
this chapter illustrates factors for crowd strength which are based upon the value
conversion model defined in the literature review. This includes factors without limitation
decision making about self-produced electricity, storage management, or willingness to
work within a crowd. The second part defines crowd potential which concerns with supply
chain parameters like production capacities, storage capacities and flows for optimisation.
These factors are based upon the design of the crowd which refers to the network of iGSL
cells.
5.2.1 Factors of Crowd Strength
The quality of conversion can be identified by the value conversion strategy model and
constitutes four areas: internal structure, human competences, brand and relationships,
and financial. The model is generally used in a business-orientated environment,
however, in this chapter factors for these areas are defined and described according to
the prosumer’s perspective. Thus, the factors evolve in the light of a crowd-based
structure and iGSL structure. The following paragraphs provide factors for evaluation and
discussions are lead in relation to an integrated philosophy of supply chain management.
A summary of factors to identify crowd strength can be found in Table 3.
The first asset of internal structure relates to the iGSL, namely generation, storage, and
load, and defines the concept of prosumer management these functionalities. It is
necessary to understand the importance of producing and storing electricity. These two
functions are new in contrast to the demand side’s initial inherent purpose of consuming.

A Research Framework for a Crowd-Based Value Network
85
Asset Factors
Internal Structure Importance of iGSL
Storage management
Electricity Management
Human Competence Individual value of self-produced electricity
Price of self-produced electricity
Decision Making (storing or sharing)
Brand and Relationship (to
a crowd)
Willingness
Size of a crowd
Conditions for participation
Characteristic for an ideal community
Financial Assets Budget to invest in iGSL infrastructure
Budget for maintenance
Table 3: Factors for evaluating crowd strength
In particular, storage management has potential for self-sustainability of the prosumer and
the crowd. Capacities utilised only for self-preservation entails no conversion efforts, but
sharing of stored electricity requires management principles for conversion.
The corresponding storage management must address subjects like minimum capacity of
storage, importance of filling storage to 100%, compensation to provide capacities for
external usage and type of compensation, or efforts at a certain depletion level.
Another factor is the orchestration of iGSL and the electricity management involved, this is
a question of whether prosumers prefer automation or self-management. This affects
integration in a crowd. Self-managed buildings can be seen as seclusion whereas
automation requires a responsible authority to manage the iGSL system. Furthermore, the
most important challenges of electricity management define the critical functionalities of
integrating a crowd-based structure.
The human competences of prosumers rely on making decisions about self-produced
electricity and the capability to define individual value and price for self-production.
Prosumers have to first develop an understanding of individual value and price for self-
produced electricity to assess different options. This new skill requires differences
between self-produced and external electricity to be determined. Individual value refers to
personal preferences, rather than monetary aspects, and becomes an obstacle when
misapplied by external roles. On the other hand, price finding by prosumers is influenced
by storage and the ability to transfer cheap electricity over time. Any dynamic adaptation

A Research Framework for a Crowd-Based Value Network
86
of perceptions during charging and extracting is important for the electricity market as
prosumer prices are in competition with market prices.
An established awareness of value and price is necessary for decisions concerning any
surplus generated. As highlighted in the literature review, decisions are made between
two options, a risk averse option, i.e. charging storage or consuming, or a risk seeking
option, i.e. sharing or considering other options. Both options occur at surplus situation,
otherwise any production is used for covering own demand. This implies that decisions
depend upon the production and consumption profiles. Any made choice, storing or
sharing, alters the status quo of a prosumer which can be defined as the capability to
cover demand through own production. The status quo refers to the future possibility to
continue production and hence depends upon the weather forecast. So, a surplus will be
evaluated against the need for self-sustainability.
The illustrated situation occurs numerous and for simplification of decision making
behaviour, the dissertation applies the concept of (Gstrein & Teufel, 2014) illustrating the
linkage between production profile and dominant decision making behaviour (see Figure
26). The basic assumption is that all prosumers would prefer saving electricity – showing
risk averse behaviour – when production is at maximum which is in the case for PV
production during lunch time. On the other hand, risk seeking behaviour would occur
when the option of having a surplus is not available meaning during production offline.
Expectation of sunny weather allows for continuous production whereas bad weather
would lead to an interruption. Consequentially, as a result of bad weather forecasts
prosumers commonly favour more restrictive sharing than in sunny weather.
Figure 26: Linkage between production profile and dominant decision making behaviour
A prosumer utilises brand and relationship assets to define contributions in a crowd and
evaluates their acceptance of a crowd-based network to share electricity by defining roles

A Research Framework for a Crowd-Based Value Network
87
and under what conditions exchanges happen. This involves additional non-technical and
non-economic perspectives (Gstrein & Teufel, 2015). The brand refers to a prosumer´s
personality and will not be further considered as a variety of personalities exists. Insights
must be found in relationship perspectives and consist of several factors. The conviction
to want to be part of and the willingness to contribute to a community is a critical factor for
the crowd’s coherency. It is an overall statement and a prosumer’s positive perspective.
Further factors which define the willingness are the size of a crowd, conditions for
participation, and characteristics of an ideal community. The size sets the aims for a
community where smaller groups have the advantage of mutual confidentially
(Thelen, 1949). So, do prosumers like to act in a more anonymous or more familiar
environment? Meanwhile, conditions for participation define overall aspects on how to
relate to others. These requirements must be fulfilled before considering any exchange.
On the other hand, the characteristic of ideal community describe arguments to stay in a
relationship and hence the willingness to maintain a crowd.
Lastly, financial assets refer to private or business budgets for investing and maintaining
iGSL infrastructure. The economic wealth of individuals and business determines whether
technological developments are pursued and hence whether the infrastructure is up-to-
date. It is important to mention that financial assets are described for completeness, but
are not further investigated and for this discussion it is assumed that investments and
maintenance are secured.
5.2.2 Factors of Crowd Potential
As mentioned in the beginning of this chapter, the potential of crowds defines the optimal
flow within and between buildings. An extensive description of the Crowd Energy concept
is provided in chapter 3, however, it is beneficial to summarise the basic elements of the
supply chain (see Figure 27).

A Research Framework for a Crowd-Based Value Network
88
Figure 27: An abstract Crowd Energy model
The iGSL functionalities are the basic components which refer to the performance of
production, the capacities of storage facilities and the level of demand. In general, a cell´s
production is limited, i.e. sun radiation or wind, whereas storage depends on the amount
of surplus generated, which is production minus consumption. Any adaptation in
consumption of production influences capacities for storage. It is supposed that
consumption is sustainable and necessary, and this framework leaves it to other research
to investigate consumption efficiency programs. So, the supply chain is only influenced by
production and storage and decisively determines building internal and crowd related
flows. Based on that, the essential factors for the crowd potential and the necessary
parameters for flow optimisation can be defined. A summary of potential factors is
provided in Table 4 and will be elaborated in more detail.
Factors
iGSL potential Missing flow and overflow
Ratio Production to Consumption
Generated surplus (kWh and no of time-points)
Storage capacity (kWh and no of time-points)
Flow quantity of internal exchange
Costs for internal exchange
Table 4: Factors for evaluating crowd potential
By generating a surplus, a crowd strengthens its internal competences and creates a local
consumption-production paradigm which allocates individual capacities. Under the
assumption that all members are sharing voluntarily, this requires the orchestration of

A Research Framework for a Crowd-Based Value Network
89
electricity flows and a principal of this assumption is optimisation. Optimised flows
between and within cells minimises the crowd’s expenditure leading to a reduction of
consumption coverage from commercial electricity suppliers. A low value of these missing
flows indicates that the ratio between production and consumption is close to 1:1. Higher
ratios could lead to overflows, meaning that a crowd is capable of sustaining its own
demand as well as feeding into the general electricity network.
Equal or high production-consumption ratios generate more of a surplus, higher storage
capacities, and flourishing internal flow between cells. These effects are valuable factors
needed to improve a crowd’s potential. The surplus produced defines the quantity needed
for storing and sharing and suggests, on a superficial level, the potential a crowd has to
cover demand. Besides quantity measures, generated surplus can be seen at time-points
when surplus is available. More in-depth conclusions about potential can be drawn by
setting the number of surplus time-points to the maximum time-points. Combined with
quantity, the figure expresses the potential of building up independence.
From an hourly perspective, patterns of surplus generation can exist. The effect of storing
electricity can be expressed in the factor of storage capacities and the related quantity of
electricity held by the crowd or cells. In particular, sufficient capacity suggests sustainable
coverage of demand, as well as in extreme situations, autarky. These capacities represent
electricity for future references and in this regard, the number of time-points from which a
cell discharges electricity creates more independence from external supply. By setting
these time-points in relation to the maximum number of time-points, a degree of
independence can be achieved.
The last effect of the production-consumption ratio is on the flow of electricity between
cells. The quantity of internal flows represents the crowd’s value exchange and indicates
the internal allocation between demand and supply locations. The factor of sharing
quantities is one way but sharing potential can also be expressed as the coverage of
consumption through sharing. By comparing sharing with consumption, the number
defines the distribution of surplus and can be set in relation to other flows like storing.
All of the aforementioned factors allow general conclusions to be drawn at crowd level,
however, cell and time-point perspectives are necessary and applicable as cells define a
crowd.
The final factor concerns with accruing costs of flows which should represent the holistic
effort for sharing, storing, and buying. In general, costs represent financial compensation
for using distribution lines but also network specific conditions like power losses or
technical bottlenecks in the network. The Crowd Energy model contains three categories

A Research Framework for a Crowd-Based Value Network
90
of flows: building internal, between members of a crowd and from members of a crowd to
external electricity providers. The difference flows demands a variation in costs leading
certain flows to be preferential over others. Besides flow categories, costs must consider
the distance, i.e. the flow in a close range should be cheaper than in a wider range.
So, the cost factor should consider categories and transport distance which will eventually
be minimised. The difficulty for determining the total costs for a flow is to answer
questions of how much costs a transport, what is the costs for losses, or what is the costs
for a unit self-produced or external electricity. The variations for converting these
questions into costs create a difficult and exhaustive task. Another way to build up a cost
structure is to use a neutral unit and use it in a ratio starting from the costs for electricity
exchange between houses.
A part of above factors, e.g. generated surplus or storage capacities, are the contribution
of prosumers to the community. Besides determining the potential of a crowd, these
factors can be used to categorise prosumer. The categorisation has advantages. First, a
category provides a profile name for cells which allow summarising but even more
defining similarities. In addition, a category includes an abstract description and hence
increases the understanding of results. Another effect of categories is to provide a
dimension to present results more sophisticated. Consequently, comparison between
cells and between periods involves transition of cells from one category to another.
In particular, it is necessary as consumption and production pattern of different periods
influence decisively surplus situations. Lastly, the created categories are a refinement of
the term prosumer.
For that purpose, the Crowd Energy framework introduces six categories: prosumer with
reduced consumption, low or high temporary independent prosumers, and low or high
autarkic prosumers. The categorisation also considers the group of consumers which are
locations of electricity shortages and hence are receivers of electricity. Prosumer with
reduced consumptions never achieve any surplus entailing that the cell has no flows to
storage or flows to other cells. There is an immediately usage of production.
They represent the lower end of the scale. Furthermore, they belong to the group of
sharing receiver.
The group of temporary prosumers categorises all cells which generates certain surplus
but cannot store enough to sustain offline periods. The group distinguishes in low and
high temporary prosumers where low describes cells which have a production-
consumption percentage below 50%. The low temporary also receive electricity from other
cells but are not likely to supply other cells. The high temporary prosumers have a

A Research Framework for a Crowd-Based Value Network
91
production-consumption percentage between 50% and 100%. This group are not yet
autarkic but are close to the threshold of the 100% mark implying that a cell produces
electricity exactly the amount of consumption. A small distinguishing of high temporary
prosumer is made by stating cells with a plus which are supply electricity to other cells.
The group of high and low autarkic prosumer are beyond the production-consumption
percentage of 100%. This means that all autarkic prosumers produce more electricity as
they can consume. Again the group was separated in a low and high where low describes
a production-consumption percentage between 100% and 150%. The high autarkic
prosumer have a percentage above 150%. Both autarkic categories are self-sustainable
and the main supplier for sharing. The provided criteria for categorisation are based on
observation and qualitative judgment of the current scenario results.
5.3 Summary of Strength and Potential Factors
The previous paragraphs presented the step-by-step development of a conceptual Crowd
Energy value network. The description highlighted roles, relationships and value
dimensions. Furthermore, the chapter discussed characteristics of relationships between
single roles and also the overall dynamics in the Crowd Energy value network. The
resulting map is a possible future value network and provides a context for describing its
strength, i.e. working together, and potential, i.e. producing surpluses for sharing in a
crowd. Both strength and potential define the crowd’s coherency which is a measure of
the position and relationship within the value network. Strong coherency indicates less
dependence on other stakeholders.
Subsequently, the chapter elaborates on the factors used to assess strength according to
the value conversion model. In particular, the human ability of decision making on self-
produced electricity and the management of storage are key for defining strength.
The potential of a crowd refers to the supply chain task of optimising flows. Thus, the
factors are related to production, consumption and storage quantities. Furthermore,
potential factors consider different flows, namely internal flows in buildings, flows between
members (also known as sharing), and flows from external electricity suppliers. The flow
differentiation allows applied cost structures to be minimised.
The presented strength and potential factors are taken for further investigation and bear
the value network map in mind for later discussions. The analysis of crowd strength and
potential pursue different objectives and to support readability, strength and potential are
separately shown. Therefore, chapter 6 will show the results found for crowd strength and

A Research Framework for a Crowd-Based Value Network
92
chapter 7 will show the results of crowd potential. This also allows describing the different
research methods, namely survey and optimisation. The results of both chapters are
synthesised in the discussion provided in chapter 8.

A Survey on Crowd Strength
93
6 A Survey on Crowd Strength
The conceptual framework developed in chapter 5 provided the factors for analysing the
crowd strength, this chapter presents now the empirical results (see Figure 2, page 9).
The objective of this chapter is to elaborate on characteristics of value conversion from a
prosumer perspective. The utilisation of tangible and intangible assets to generate
deliverables depends upon individual preferences, opinions, and behaviour. Therefore, an
online survey was chosen as the adequate research method to gather and measure data.
The development steps for an online survey in chapter 6.1. shows how data was collected
and should support the quality of applying the research tool. The chapter describes in
particular two main tasks: generating and structuring questions, and creating a screening
process. The screening process was important to explain the unknown CE concept to
respondents without influencing answers. Chapter 6.2. shows the results of
154 respondents. The analysis was made for the internal structure (chapter 6.2.2), human
competences (chapter 6.2.4), and brand and relationship (chapter 0). Summaries of the
most important results of each asset are stated at the end of each chapter.
6.1 Generating an Online Survey
This chapter provides a short discussion of the development process of the online survey
for measuring crowd strength. The development follows the process according to
(Cooper & Schindler, 2008) and included two main steps: structuring questions and
creating a screening process. Such a process owns requirements for a survey like clarity
in language, questions and explanatory notes are essential, providing simple and
comprehensible terminology for non-experts. Functionality of visual aids during the
questionnaire is desired to support clarity, however should not influence the respondents
and hence measure biased answers. For respondents, the real purpose of a question
should be obvious – these are undisguised questions. Accurate measuring of values
requires that respondents are able to clearly define answers which will be ensured by
using closed questions.
6.1.1 Basic Structure of Questionnaire
Considering these requirements, the survey for crowd strength must allow respondents to
develop an opinion, especially, when the Crowd Energy value network is unknown yet.
Thus, respondents must be familiar with iGSL functions and the possibility of generating a

A Survey on Crowd Strength
94
surplus before they can make a decision about it. Afterwards, respondents can be
introduced to the principle of sharing with your neighbour including decision making for
self-produced electricity. The logic of questions starts initially from a building internal
perspective and adds then the view of a crowd. Eventually, the outline of the survey
emerges following a strict order and contains three target question groups, namely the
iGSL system, decision making, and crowd. The classification and administrative questions
for the respondents finalise the outline which is summarised in Figure 28.
Figure 28: Inclusive factors in sequence of target categories
The sequence of target categories outlines the general flow of questions and requires
questions to now be formulated so that they meet the objectives, encourage respondents
to answer willingly and adequately. Bearing these points in mind the process started with
developing initial questions, similar to a brain-storming session. The basic logic in each
section goes from general (i.e. warm up, easy to answer) to more specific questions.
In the second step, the purposefulness of questions was inquired. Incomplete or
unfocused questions were discussed and either adapted or deleted from the catalogue.
The catalogue generated included draft questions which were iterative so they were
refined, combined, or deleted. An intra-category structure was established and similar
questions were grouped together, they were also supported by visual aids. Eventually,
28 target and nine classification and administration questions were drafted for the survey.
An example of the questions and responses can be found in Table 5 and the entire list is
in appendix 10.1. Developing terminology regarding the Crowd Energy concept introduced
as well as the iGSL system was challenging.

A Survey on Crowd Strength
95
Question Answer Notes
1 Which electricity has a higher value for
you during the surplus period?
self-generated
from the electricity provider
neither
G1
Max 1
2 Which price would you assign to the
electricity in the storage during surplus
period?
Electricity price during the
discharging of the storage
Electricity price during the current
surplus period
Other value
G1
Max 1
3a Note: Storage allows creating an
independency from the residual electricity
network. We would like to know which
basic decision approach would you prefer
during the surplus period.
What would be your decision on your
self-generated electricity, if you know in
advance that the tomorrow weather will
be sunny?
I play it safe and store any surplus
I would feed in any surplus to the grid
G2
3b What would be your decision on your
self-generated electricity, if you know in
advance that the tomorrow weather will
be very bad and you could not charge
your storage completely?
I play it safe and store any surplus
I would feed in any surplus to the grid
G2
4 If you know that you have some storage
space left (any surplus is left), would you
buy electricity from the electricity
provider?
Yes, at any rate
Yes, if financial advantageous
Yes, if I cannot cover my
requirements over night
No, in any case
G2
Max 1
Table 5: Target questions and responses for Decision Making
The wording of the questions presented a challenge as words concerning crowd or
intelligent generation-storage-load systems are not used in common language. Two points
were important, explaining things in layman’s terms and creating a common
understanding of terminology. A further challenge was generating terms which have the
same meaning in German, English and French. The choice of languages depended upon
the coverage of DACH countries. Responding to this requirement, terms were either
translated, e.g. crowd energy in a neighbouring system or explained with explanatory
notes. Efforts were made to ensure terminology was accurate as well as to ensure general
understanding and to receive opinions from a participant’s perspective.
The response strategy in the online survey considers the investigative factors, desired
conclusions and meaningful results by using dichotomous, multiple choice, paired

A Survey on Crowd Strength
96
comparison, checklists, and Likert type questions (Cooper & Schindler, 2008).
The response strategy for the survey on crowd strength does not necessitate recall
knowledge to be recalled (i.e. the respondent does not have to memorise previous
answers or situations) and aims to ensure clear responses, e.g. statement of a maximum
numbers of answers. The fixing of response types provides some clarity for drawing
conclusions and defines adequate statistical measurements.
6.1.2 Finalising the Online Survey
The generated questionnaire is wrapped into a screening process, considering multiple
steps such as questionnaire sequences, preparing explanatory notes, and testing (Cooper
& Schindler, 2008). The screening process is the story board of the survey and the
objective is a logical sequence where the process reveals sufficient information about
current and forthcoming questions. It should make the respondents feel comfortable and
remain motivated.
A critical point for Crowd Energy survey is the introduction to as respondent’s judge
survey quality and decide on their willingness to participate. Some important information
must be provided: a) the main concept, i.e. Smart Grids: how would you decide as a
consumer? b) the three objectives c) the survey objectives (see Figure 29). The survey
started by introducing the little known iGSL system using an animation and additional
notes on production, consumption, storage, electricity provider and metering.
The animation is used throughout and will be explained in more detail later. Starting in this
way allowed the respondent to take time to adjust and read about the study objectives
before answering any questions.

A Survey on Crowd Strength
97
Figure 29: The beginning of the survey stating concept, objectives, and introduction to the
field
The next step developed an internal sequence by identifying and establishing different
groups. Moreover, sequencing ensures flow throughout by connecting the introduction
and conclusion of a survey. The internal logic follows a general to specific paradigm
allowing topics to be explained before reaching specific and sometimes difficult questions.
Such an approach guarantees a smooth transition between groups. Furthermore, good
logic ensures that respondents reach central questions quickly and keeps up
concentration and motivation. A critical element for grouping was the balance between the
number of questions per page (i.e. length of page) and the number of clicks between
pages. Too many questions per page can be regarded as overwhelming and too many
clicks result in slow progress and demotivate respondents so that they may not finish the
survey. An additional difficulty was that skipping any questions was not permitted.
Finally, seven groups were created to represent the internal logic (see Table 6).

A Survey on Crowd Strength
98
Category Groups (headings in the survey)
iGSL system The decentralised electricity network – production, consumption and storage
The decentralised electricity network – storage
Decentralised electricity – metering
Decision Making During the day - decision making and electricity value
During the night - decision making and electricity value
Crowd Crowd Energy Idea
Administration & classification
General Information (split in two pages)
Table 6: Categories and groups of the questionnaire
The advantage of groups is that they open up the possibility to create specific explanatory
notes. Explanatory notes are made short and easy for two reasons: so that the
respondent can understand things and they ensure that the answers are objective.
The animation is an extra element and is used for reducing written text and especially to
show movements of an intangible good (i.e. flow of electricity). It follows rules of
objectivity. The animation’s story book follows the sequence logic – from general picture
to specific elements – and respondents do not have to memorise a lot of information.
Special masks are utilised and elements are highlighted (see Figure 30). The pictures are
simple drawings, such as a sketch of a house and connections which allow conclusions to
be reached immediately, e.g. that metering is used to measure house’s electricity status
and connects to an external grid. The comic-like drawings should add a certain aspect of
fun to explain serious matters without being ridiculous. The familiarity produced with the
animation in the introduction helped people not to be distracted, as it was. a new and
surprising element and helped them to spot differences immediately.
Figure 30: Explanatory notes and animation for storage related questions

A Survey on Crowd Strength
99
The resulting layout of the online survey with explanatory area at the top and questions
below (see Figure 31) was implemented in lime survey. Before mailing started, the survey
was tested by five iimt employees and written feedback was received. As well as feedback
for the survey, the cover letter addressing mail recipients was sent to testers.
All comments were discussed and content and wording were adjusted when necessary.
Moreover, the test entries in lime survey were verified and the expected values were
recorded. The total time to answer the survey was 12 to 14 minutes on average.
This represents an ideal duration as 77.6% of respondents are likely to complete a survey
within 11 to 15 minutes (Cooper & Schindler, 2008, p. 350). Experience shows that the
ideal survey length is five minutes or less but for this topic’s complexity and scope of
measurements this would not be realistic.
Figure 31: Layout for a set of questions for a specific group
The above description explained the process of implementing the online survey for
recording opinions and preferences of individuals. The paragraphs should support the
credibility of data collection for the results of the crowd strength.

A Survey on Crowd Strength
100
6.2 Results of Crowd Strength
The result chapter is organised according to the structure of crowd strength assets,
namely:
Internal iGSL structure (chapter 6.2.2),
Human competences of decision making and pricing of self-generated electricity
(chapter 6.2.4)
Brand and relationship with a crowd (chapter 6.2.6)
Each section provides detailed findings on opinions, behaviour, and relationships.
Key findings are stated at the end of each chapter to help provide an overview of results.
Before presenting the results, a short description of the online survey facts and sampling
should facilitate understanding of the gathered and measured data.
6.2.1 Composition of Responses
The online survey was created and published using LimeSurvey. This web application
displays questions and measures answers according to the created guideline.
The respondents had to answer 37 questions in total, on the following topics: 11 on the
iGSL system, 11 on human competences, and six on brand and relationship. Additionally,
nine questions referred to administration and classification. A full description of questions
and values measured can be found in appendix 10.1. The gathered data are exported,
manipulated and analysed in IBM® SPSS® Statistics Version 22.
The initial recipients of the survey comprises around 1’350 contacts. The selected
contacts are located in Switzerland, Germany and Austria. The survey was carried out
over two months (May – June 2015). The only restriction for participation is that
respondents must be aged eighteen or over. Contacts received a cover letter and a
reminder was sent two weeks later. Despite having a recipients’ list, the survey was open
and there was no tracking through personalised tokens. Further advertisements were
placed in newsletters, on websites and on social media.
There were 294 responses in total to the survey divided into 191 complete and
103 uncomplete responses. The majority of uncomplete responses (n = 89) were
registered on the first page but no answers were recorded for these responses. The
procedure to start the survey by clicking on the button “Take the survey” favours such
recordings. It is uncertain whether people stopped taking the survey or it was robots that
registered. The set of complete responses consist of 154 for Switzerland, 30 for Germany,
four for Austria, two for Ghana, and one for other (Question: In which country do you

A Survey on Crowd Strength
101
live?). A comparison between Germany, Austria, and Switzerland countries is not
applicable due to insufficient answers and in the case of Germany due to a remarkable
difference in response sizes. Therefore, further analysis only considers respondents living
in Switzerland.
An 11.41% response rate for the Switzerland set allows speaking of a good survey quality
(Sauermann & Roach, 2013). Furthermore, the 14 incomplete responses represent
6.83% of the total number of respondents who entered the survey (completion rate
is 93.17%) showing a very good balanced between survey design and motivation to finish
the survey (Nulty, 2008; Sánchez-Fernández, Muñoz-Leiva, & Montoro-Ríos, 2012).
The sample size was 154 responses, besides the respondents living in Switzerland, they
had the following features. The sample contained responses from 135 males (75%) and
39 females (25%) this is not the same as the Swiss gender distribution of 49.5% to 50.5%
(STATPOP, 2016). Recorded ages ranged from 22 to 79 years old and 67 participants
were aged between 20 and 39 years old, 82 participants were aged between 40 and
64 years old and 5 participants were aged 65 and over (m = 42.40; sd = 12.4). There is no
conformity with Swiss age distribution (STATPOP, 2016). 18.2% live in a one-person
household, 31.8% in a two-person household, 16.9% in a three-person household,
22.7% in a four-person household, 9.1% in a five-person household, and 1.3% in six or
more person household. The sample mainly included three-/four-person households and
significantly underrepresented one-person households (see STATPOP, 2014).
Obtain electricity PV facility
Yes No Total
Tenant 3 65 68
Apartment owner 2 10 12
House owner 21 53 74
Total 26 128 154
Table 7: Distribution property and obtain electricity from PV facility
An interesting classification parameter is the property situation, there were 68 tenants,
12 apartment owners and 74 house owners (see Table 7). It is of interest to see
differences and similarities in house owners, who can invest in their property, and tenants,
who lack this possibility. Another grouping parameter for further investigation is the
procurement of self-produced electricity. 26 responses or 27.54% of total responses
stated that they obtained self-produced electricity from a shared or owned PV facility. The

A Survey on Crowd Strength
102
perspective of obtaining electricity from a PV facility indicates that these respondents have
some knowledge and experiences of producing electricity. In light of the investment
required to buy a property, it is no wonder that the majority of people who obtain electricity
from a PV facility are house owners.
6.2.2 Internal Structure Asset
The results on the internal structure focus in particular on a single production,
consumption, and storage system. By emphasising the role of a consumer is more
involved in the future electricity grid, each respondent was asked to assess acceptance of
such iGSL systems, management of electricity, and management of storage.
The findings on the internal structure focus, in particular, on a single production,
consumption and storage system. By emphasising the role of a consumer who will be
more involved in the future electricity grid, each respondent was asked to assess
acceptance of such iGSL systems, management of electricity, and management of
storage.
Acceptance of iGSL Systems
A first result is that respondents assign high relevance to intelligent decentralised iGSL
systems (m = 5.24; sd = 0.98). The frequency of responses supports this positive attitude
towards a localised system (see Figure 32). With regards to the functionalities for
producing and storing electricity, findings show that respondents consider both
functionalities as relevant assets (m = 4.97; sd = 1.30 and m = 5.03; sd = 1.29).
Furthermore, in general respondents evaluate the intelligent system higher than a single
functionality. This situation is also established in the groups of “living as” (i.e. tenants,
owners) and obtaining electricity from a PV facility (i.e. yes or no).
Figure 32: Relevance of an intelligent decentralised system

A Survey on Crowd Strength
103
Storage Management
Storage is a new functionality for the electricity grid, along with capacity and management
they can influence a crowd. A crucial factor is the size of storage which considers the
minimum time period to cover demand by storage. The frequency of responses seems to
be scattered but there are the highest numbers of responses for storage capacities is one
day or one week (see Table 8). Findings show different views on capacity without a
tendency towards the best option of one week. On average, the minimum capacity tends
to be two days (m = 4.15; sd = 1.48) but house owners have slightly higher capacity
requirements (m = 4.28; sd = 1.49) than tenants (m = 4.04; sd = 1.50).
Minimum storage capacity Fill-to-capacity
(1) very irrelevant – (6) very relevant
N % Mean
For 6 hours 4 2.6% 4.50
One night 18 11.7% 3.50
One day 39 25.3% 3.90
Two days 24 15.6% 4.38
Three days 27 17.5% 4.26
One week 42 27.3% 4.40
Total 154 100.0% 4.14
Table 8: Minimum storage period and relevance to fill capacity
The importance of filling storage to capacity has an overall tendency to the middle of
answer options (m = 3.14; sd = 4.15), but shows the increasing importance of only
considering responses per group. Between minimum storage capacity and relevance to fill
storage, a moderate positive Spearman’s rho correlation of .227 exists (Bühner &
Ziegler, 2009) and respondents with higher capacity requirements tend to have a more
distinct need for storage to be filled to 100%.
Besides self-produced electricity, storage management includes the concept of providers
using capacity for temporary storage. Leaving capacity for external custom is an
abandonment of personal use. The willingness to share capacity exists among
respondents and makes up around a half of the storage capacity per household
(m = 51.56%; sd = 23.44%). The highest percentage of responses is at the 50% mark
(n 54, 35.06%) where 35.71% favour capacity provision below the 50% mark and above

A Survey on Crowd Strength
104
29.22%. The distribution and tendency to the 50% mark, however, suggests that findings
should be regarded with care.
With respect to capacity provision, respondents were asked their preferred compensation
type for providing capacity (see Figure 33). A 36% share of 260 responses (multiple
answers) prefer a price reduction on electricity, this is an indirect financial reimbursement.
Furthermore 31% favours direct financial reimbursement and together with indirect,
financial compensation dominates. The result is hardly surprising as answers which could
be chosen are made up of financial and non-financial options. A remarkable finding is that
29% of responses consider compensation with electricity to be acceptable. It implies that
electricity is a potential tradeable object. A slightly different ranking exists in the two
groups of people who obtain electricity from a PV. Price reduction is the most preferred
method of compensation in both groups. But people, who obtain PV, prefer to receive the
same amount of electricity (31.7%) over financial compensation (29.3%), whereas the
non-obtaining PV group favour financial compensation (31.5%) over the same amount of
electricity (27.9%).
Figure 33: Incentives to provide storage capacity for external usage
Any leftover capacity can be used to fill up from external sources and it is interesting to
know under what circumstances a prosumer would buy the electricity. Findings suggest
that respondents would mainly fill residual capacity if it is financial advantageous (n = 85,
55.19% of 260 responses). The strong financial aspect supports more restraint when
buying electricity. Furthermore, previously mentioned incentives emphasise that physical
capacity is regarded as an instrument for financial reimbursement (see Figure 33). Around
a third of the responses (n = 46, 29.87%) mention security of supply as a reason for
buying and electricity is bought when storage cannot cover demand overnight. These

A Survey on Crowd Strength
105
respondents evaluate buying for social factors rather financial ones, but it does not
indicate unrestrained behaviour. Absolute decision making is expressed by the “yes, at
any rate” option which only received 6.49% of answers (n = 10). Therefore the security of
supply group considers other factors when making buying decisions. A small group of
13 respondents (8.44%) would not replenish electricity at all. The above results also show
that minimum capacity does not have any links to buying circumstances and answers are
well distributed. Eventually, it can be said that people with a higher need would not
necessarily prefer to buy without less restrictions.
Besides fill-to-capacity, storage management includes extracting electricity these actions
are taken, in particular, when storage runs low. Therefore, respondents were asked at
which depletion level they are likely to reduce consumption or to buy electricity. The
general findings suggest that respondents would reduce consumption (m = 37.73%;
sd = 23.31%) before considering buying (m = 21.88 %; sd = 20.63%) from external
resources (see Table 9). This implies people are self-supplying and they have a
preference for using electricity from their own sources. Moreover, it reflects the fact that
respondents are self-reflecting and are active (i.e. I do something) before taking the easy
way out and buying electricity. House owners seem to take action at very low depletion
levels (m = 34.53%; m = 19.53%) followed by tenants (m = 40%; m = 23.16%) and by
apartment owners (m = 45%; m = 27.27%). Respondents, who obtain electricity from a
PV, demonstrate more active behaviour and consider consumption reduction much earlier
(m = 39.42%; sd = 21.92%) than when buying from external sources (m = 18.27%;
sd =16.05%).
Reduce consumption Buy electricity
Mean % SD Mean % SD
Tenant 40.00 21.30 23.16 20.89
House Owner 34.53 22.77 19.53 17.81
Apartment Owner 45.00 36.26 27.27 33.27
Total 37.73 23.31 21.88 20.63
Table 9: Average depletion levels at which respondents would reduce consumption or buy
electricity
The challenges for using storage technology show a clear picture for improvements.
From 360 measured responses (multiple answers, maximum of three options), the most
important challenges are storage performance (n = 123), a better cost-benefit ratio

A Survey on Crowd Strength
106
(n = 93), and sufficient technical integration (n = 68). Subvention and tax rebates (n = 43)
are financial support and stated in fourth place. The order of priority suggests that
improvements are mainly technically and economically driven. Less activity is expected
from the policy and regulation side and hence administrative challenges are positioned at
the end of the list referring to sufficient legal regulations (n = 10) and reduced
administrative efforts (n = 23). In short, the ranking demonstrates that storage technology
is in a phase of early innovation before entering the mass market.
Electricity Management
The survey confronts respondents with the subject of enhanced electricity management
as a result of the iGSL’s functionalities. Competences and duties of managing electricity
by the iGSL are primarily assigned from a general perspective to electricity providers
(n = 51) followed by independent service providers (n = 37) and autonomous
management (n = 37) (see Figure 34). Less trust to take responsibility exists in
associations or clubs (n = 29). Nevertheless, assigned responsibilities vary between the
groups of obtaining electricity from a PV. People obtaining electricity from a PV consider
autonomous management and associations or clubs as a possible way of managing
electricity. This is a stronger expression of a self-managing attitude and equivalent to the
external responsible role of electricity providers. In contrast, the non-obtaining group
respects external roles like service providers and electricity providers as more competent
than self-management.
Figure 34: Assigned responsibility for electricity management

A Survey on Crowd Strength
107
Any iGSL system requires a more sophisticated load balancing. As a result automated
management and supporting coordination between the numerous units to secure the
stability of the electricity grid is enhanced. One of the survey’s findings suggests that
automated management is essential (m = 5.10; sd = 0.97). The self-management view of
the obtaining group manifests in less necessity for automation (m = 4.88; sd = .99)
allowing one to conclude that experience shapes management expectations.
The challenge for automated management is, in general and within groups, transparency
in electricity management (27.9% of 384 responses in total – multiple answers, maximum
of three). Transparency allows gaining an overview of processes and exchange of
information and is a precondition for developing trust and commitment (see Table 10).
The challenges of constraints for individual decision making (also individual driven) and
technical performance go head to head. Among the property groups, house owners
regard technical performance (22.2%) as more important than constraints for individuals
(18.4%). Apartment owners regard both options as equivalent (21.9%) whereas tenants
see constraints of individual (20.4%) as a higher challenge than technical performance
(16.8%). It is also the only group which considers technical handling of conflicts (19.8%)
as a bigger challenge than performance. Another finding is that challenges, originating
from individuals and technology, are by far more important than administration or legal
regulations. They trail behind (at 8.6% and 7.8% respectively) and are placed least
important.
Tenant
Apartment Owner
House Owner
Total
Challenges N % N % N % N %
Technical Performance 28 16.8 7 21.9 41 22.2 76 19.8
Handling of conflicts 33 19.8 4 12.5 26 14.1 63 16.4
Transparency of Mgmt. 47 28.1 11 34.4 49 26.5 107 27.9
Constraints for individuals 34 20.4 7 21.9 34 18.4 75 19.5
Administrative efforts 12 7.2 1 3.1 20 10.8 33 8.6
Legal regulations 13 7.8 2 6.3 15 8.1 30 7.8
Total 167 32
185
384
Table 10: Challenges to electricity management according to property
Both the obtaining and non-obtaining groups consider transparency of management as to
be a challenge to tackle, however, a slightly different ranking emerges. The obtaining

A Survey on Crowd Strength
108
group consider transparency and technical performance challenges as the most important
challenges (each 23.4%) followed by constraints for individuals (20.3%). It seems that
experience in producing electricity indicates a higher awareness of technical
requirements. This is also supported by a higher rating for handling conflicts using
technology from the obtaining group (18.8%) than from the non-obtaining (15.9%).
The non-obtaining group evaluates, as described before, technical performance and
constraints of individuals to be in second place behind transparency. Respondents also
provided more specific challenges by using the “other” answer option. Entries showed
sophisticated knowledge about the electricity network and answers mention abuse,
optimisation of control to individual disadvantage, short durability of control systems and
electrical components, lack of predictability, additional handling charges, clear separation
between producer and distributor, data piracy and cyber-attacks, and data management.
6.2.3 Findings Internal Structure Asset
The following paragraphs describe the findings of the internal structure asset and are
summarised in Table 11.
Internal Structure
A. High acceptance of production-storage systems exists.
B. A minimum storage capacity is not linked to the best option. If someone
expresses a best option it means that there is a need to fill the storage to 100%.
C. Incentives for providing storage capacity to external roles refer primarily to
financial compensation. Electricity also becomes an object for exchange.
D. Prosumer reduce consumption to prolong storage availability before buying
electricity.
E. Electricity management is predominantly assigned to electricity suppliers.
F. Transparency in electricity management is the key challenge.
Table 11: Findings of internal structure asset
The expressed high relevance of iGSL systems indicates an established willingness to
build up internal structure. Furthermore, the high acceptance of production and storage

A Survey on Crowd Strength
109
functionalities suggest that both functionalities are necessary elements of the system.
In general, this means that installing internal structure for value conversion is well
established among respondents.
The utilisation of the storage functionality shows some remarkable findings. A minimum
storage capacity is not linked to the best option. This means that prosumers would tend to
cover demand for two days in average. To fill the preferred storage capacity to 100% is
moderately pursued. Higher capacities installed – as the two days – show that there is a
stronger need to fill the storage to 100%. In conclusion, higher capacities indicate a more
self-centric behaviour. On the other hand, self-centric behaviour indicates that these
capacities are less likely to be provided for other purposes like temporary load balancing.
Nevertheless, a sense of willingness to share capacities for external usage is expressed
by prosumers. Related incentives for providing storage capacity to external roles refer
primarily to financial compensation. This includes either direct compensation for losses of
self-produced electricity or a reduction on the electricity bill. It is remarkable that electricity
is regarded as compensation. Electricity becomes an object for exchange and introduces
non-financial forms.
Another finding concerns the utilisation of storage capacity during the extraction of
electricity, in particular the changes in behaviour if a certain depletion level emerges.
Prosumers reduce consumption to prolong storage availability before buying electricity.
This implies that a prosumer sustains the storage asset for as long as possible and
relinquishes to consume electricity. Furthermore, prosumers regard storage management
as a technology in an early innovation phase. Major challenges for storing are related to
performance and cost-benefit ratio. Less challenge is seen in the area of administration
and hence efforts must come from the manufacturer rather than from regulation.
A finding in the field of electricity management suggests that prosumers consider an
automated management system as essential for an iGSL system. This indicates that
automation becomes a key driver for establishing internal structure. A major challenge for
electricity management is transparency defining traceability of process, decisions and
information. Another challenge refers to constraints for individuals indicating negative
implications of general management decisions on prosumers. Both transparency and
constraints concern the relationship between management and prosumer.
Another finding is concerned with the responsibility for managing electricity. Prosumers
predominantly assign responsibility to electricity suppliers. Further roles taking over
responsibility can be the service provider or the prosumer him- or herself. This shows that

A Survey on Crowd Strength
110
prosumers are aware of their own competences but also accept other roles besides the
traditional electricity providers for managing electricity.
6.2.4 Human Competences
Human competences refer to the ability to make decisions regarding self-produced
electricity. Decision options involve sharing or storing electricity, this occurs at surplus
time points. A correlation between production profile and decision making exists and
despite a variety of personalities existing, competences rely on iGSL performance
influenced by the specific characteristics of surplus and extraction phases.
On the other hand, decision making indicates that people need an understanding of the
value and price of their self-produced electricity. Only then is a comparison between
electricity types possible. The difference between value and price is that value refers to a
personal evaluation whereas price is a monetary assessment. Value and price are
influenced by the characteristics of surplus and extraction periods and evaluation of both
factors can vary or change. To address the emerging complexity, the following sections
discuss the findings on value, price and decision making factors and present results for
both surplus and extraction periods.
Value of self-produced Electricity
The sample assigned a higher value to self-generated electricity during surplus periods
(61.69%) rather than to electricity from suppliers (5.19%) (see Figure 35). On the other
hand, around 33% of the sample could not decide which type of electricity has a higher
value. The option “neither” is provided to show current decision capabilities of
respondents and to avoid falsifying results by forcing a respondent to make a decision.
The “neither” shows that respondents have trouble to define value. Reasons for this could
be a general indifference to types of electricity, people are not aware of electricity, or it is
difficult to distinguish between types. The latter reason could be a result of lack of
experience and knowledge.

A Survey on Crowd Strength
111
Figure 35: Perception of distribution of value during surplus periods
A more detailed investigation into “neither” and “self-generated” groups shows that
experience and ownership positively influence capabilities and distinguish groups as well
as respondents who tend towards the self-generation option (see Table 12). A remarkable
result is that in the obtaining PV group the majority (84.62%) considers own electricity as
more valuable. Likewise the house owner group (66.2%) favours self-generation more
than tenants do (51.2%). Favouring of self-generation by the obtaining group and house
owner group is a result of the fact that the majority of PV facilities are possessed by house
owners. Table 12 suggests that groups of non-obtaining PV or tenants tend to value self-
generated electricity but have a less clear idea of value.
Living as Obtain PV electricity
Tenant House owner Yes No
N % N % N % N %
self-generated 35 51.50 49 66.22 22 84.62 73 57.03
neither 29 42.60 22 29.70 4 15.38 47 36.72
Table 12: Value perceptions according to property and obtaining PV electricity
The value perception during the extraction phase demonstrates a marginally different
picture. Results still show a 58.44% (n = 90) majority who prefer self-generated electricity,
however, electricity from suppliers is slightly more popular (see Table 13). The size of
“neither” group levels out at the same percentage. The majority retain their perspective on
value whether they are in the obtaining or non-obtaining PV groups. Some respondents
(n = 20) modify their opinions in a random pattern.

A Survey on Crowd Strength
112
Extraction phase
Surplus phase self-generated supplier neither Total
self-generated 84 5 6 95
supplier 1 6 1 8
neither 5 1 45 51
Total 90 12 52 154
Table 13: Responses of value preferences in surplus and extraction phases
Price of self-produced Electricity
The results for price assignment are discussed under specific settings. The concept for
evaluation consists of assigning a current or an expected price (i.e. it will be generated in
the near future). There are various reasons for using this procedure for evaluation.
The lack of knowledge on price per kWh provides no basis for comparison, meaning to
state e.g. a 20% higher price in the future would require the respondent to know what the
current price is. Also price varies throughout the day. Furthermore, there is a strong
influence by price increase definitions, e.g. a 10% or 30% increase. Different price
increase definitions could result in false interpretation and could lead to responses being
falsified. Moreover, the survey forces people to decide a price for stored electricity by
excluding the answer option “neither”. This might have a drawback but the comparison
between two options – without specific knowledge – is acceptable and executable.
The results suggest a clear price picture (see Figure 36).
Figure 36: Distribution of price determination during surplus period

A Survey on Crowd Strength
113
During a surplus period 62.34% (n = 96) of responses would assign the price which is
expected to be charged in the next discharging phase of the storage (or extraction) period.
Around 34% (n = 53) set electricity price at the current market price. Other suggestions for
setting the price are according to the distribution fee or energy release. In any case,
results imply that storage increases the range of prices at a specific time-point and shows
that price discussions consider current situations but mainly future expectations.
These results are also seen with tenants and house owners, as well as in the obtaining
and non-obtaining PV groups.
The overall price perception in the extraction phase shows very different results.
A majority of 81.82% (n = 126) would set the price of storage according to the current
price in the extraction phase. A minority of 14.94% (n = 23) evaluates storage according to
the price of the next surplus period. The popularity of current discharging prices is the
consequence of price preference alterations (see Table 14). Regardless of phase, over
half of all responses (53.25%, n = 82) always take price into account. In particular, tenants
(57.35%) seem to have a more steady perception than house owners (48.65%).
Extraction phase
Surplus phase Other
Current discharging
Next surplus Total
Other 4 1 0 5
Next discharging 0 82 14 96
Current surplus 1 43 9 53
Total 5 126 23 154
Table 14: Responses of price preferences in surplus and extraction phase
Around 27.92% (n = 43) alter the price definition from current in the surplus to current in
discharging period. Within these responses, a contrasting picture in the constant group
emerges and it seems 31.08% of house owners and 26.47% of tenants would alter their
price perceptions. It can be said that the group of shifting perception would do this once
only. On the other hand, a small group of 9.09% (n = 14) would assign the prices of the
next phase. In short, it seems that a majority defines prices according to the discharging
of storage period.
Decision making for self-produced Electricity
Decision making for self-produced electricity includes the option of sharing or storing
electricity at surplus time points. It is decisive to estimate the risk to secure the status quo

A Survey on Crowd Strength
114
of owning enough self-produced. This depends upon forecast of production (i.e. cover
demand and/or refresh storage with electricity). Furthermore, it is necessary to show if
there is dominant decision making behaviour for the surplus phase and if yes, does the
behaviour differ in the extraction phase. The survey replicates the above risk estimation
scenarios by asking the same question about decision making twice, once for sunny
weather and once for bad weather expectations. These two questions were asked for
once during a surplus period and once during an extraction period.
In a surplus period, the distribution between extremes, namely to play safe and keep
electricity (1) or to feed in and to share electricity (6), shows distinct results for sunny and
bad weather (see Figure 37). For sunny forecasts, respondents tend to be more in a
sharing and risk seeking mind-set (m = 4.12; sd = 1.34). Whereas for bad weather
forecasts, decisions are more risk averse (m = 2.08; sd = 1.22) and electricity is stored
rather shared. Answers show slightly more conformity than when sunny weather is
expected.
Figure 37: Surplus decisions on distribution for sunny and bad weather forecast
The distribution of both response sets indicates certain correlation and hence they are
further analysed showing a moderate correlation of .258 according to Spearman
(Bühner & Ziegler, 2009). Considering the responses measured, the correlation should be
negative as the opposite behaviour is expected. Table 15 shows responses in a matrix
and reveals two distinguishable groups. Group one shows indifferent adaptation behaviour
and they are mostly risk averse (orange area). Group two adapts their choices more
significantly and behaves according to the distribution in Figure 37. The boundary
between answer options three and four determines answer values which tend to be more

A Survey on Crowd Strength
115
risk averse (i.e. values from one to three) and values which show more risk seeking
behaviour (i.e. values from four to six).
The adaptive group contains 101 responses where the absolute (n = 100) shows a pattern
of a risk seeking behaviour with sunny weather (m = 4.64; sd = .76) and risk averse
behaviour with bad weather (m = 1.87; sd = .72). It is of further interest to know whether
there is a correlation between the two response sets (sunny and bad) determining a
pattern which applies to the adaptive group. There is no correlation (coefficient -.168
according to Spearman) within the adaptive group. The indifferent group contains
53 responses deciding on average between averse and risk seeking behaviour during
sunny forecasts (m = 3.13; sd =1.62) and tend to take more risk averse decisions when
bad weather is expected (m = 2.49; sd = 1.77). The response sets of the indifferent group
shows a strong correlation in decision making behaviour (coefficient .748 according to
Spearman) (Bühner & Ziegler, 2009). The calculations made allow some conclusions to
be drawn, however, further investigation into specific quarters of the matrix in Table 15
should be beneficial for gaining more insight into decision making behaviour.
Bad weather
Sunny weather play safe (1) 2 3 4 5 feed in (6) Total
play safe (1) 9 2 1 0 1 0 13
2 2 1 0 0 0 0 3
3 13 6 4 0 0 0 23
4 11 25 7 3 0 0 46
5 12 29 5 2 3 0 51
feed in (6) 7 2 2 1 0 6 18
Total 54 65 19 6 4 6 154
Table 15: Sunny and bad weather response matrix for surplus period
The results for the adaptive group change slightly as the majority of the group is
concentrated in the bottom left corner (see Table 15). Distinct risk seeking behaviour
exists for sunny expectations (m = 4.68 and sd = .66) and the group tend to make very
risk averse decisions for bad weather expectations (m = 1.84; sd = .64). Still, there is no
correlation between both response sets (coefficient of -.137) (Bühner & Ziegler, 2009).
On the other hand, the allocation of the indifferent group shows that there are two sub
categories where decision making behaviour is dominant regardless of the weather

A Survey on Crowd Strength
116
outlook. The only risk averse group (n = 38) is rigorously averse (m = 1.50; sd = .93) for
bad weather forecasts and takes a less risk averse attitude (m = 2.29; sd = .73), when
sunny weather is expected. The answers are stable, but vary more than in the adaptive
group. The indifferent averse group shows no correlation between response sets with a
coefficient of .184 (Bühner & Ziegler, 2009). The second indifferent group (n = 15) shows
throughout a risk seeking behaviour by taking more risks during sunny weather (m = 5.27;
sd = .80) than during bad weather (m = 5.00; sd =. 93). A strong correlation between
response sets exists with a coefficient of .783 according to Spearman (Bühner &
Ziegler, 2009). This group shows, as the only exception, a correlation between responses.
The survey asked the same questions twice, for the extraction period when production is
offline. The aim is to define decision making behaviour for two extremes, namely to extract
electricity from storage (1) or to buy electricity from a supplier (6). The extremes define
again the risk assessment outcomes. Extracting from storage represents a risk averse
behaviour whereas buying is risk seeking between varying options. Distribution also
shows distinct results for sunny and bad weather (see Figure 38). For sunny forecasts,
respondents are willing to extract (m = 2.05; sd = 1.21). When bad weather is expected,
decisions tend to be more risk seeking (m = 3.50; sd = 1.42) and electricity is bought
rather extracted. Answers show moderate conformity albeit less than for when sunny
weather is expected.
Figure 38: Distribution of decisions during extracting period for sunny and bad weather
forecasts
The two response sets in Figure 38 show no correlation (coefficient .119 Spearman),
however, further investigations have been conducted by splitting the set into indifferent

A Survey on Crowd Strength
117
and adaptive groups. This is possible because the risk assessment outcomes have been
aligned with the extremes of the surplus period. The matrix, shown in Table 16, presents a
more balanced distribution between the indifferent (n 74) and the adaptive (n 80) group.
At the group level, indifferent members prefer extracting from storage without considering
the weather, regardless of whether it is sunny (m = 2.16; sd = 1.44) or bad weather
(m = 2.55; sd = 1.27). The strong correlation of .636 according to Spearman (Bühner &
Ziegler, 2009) suggests that responses for sunny and bad weather sets are similar. So,
the extraction phase seems to induce a more rigorous risk averse mind-set, just as during
a surplus period. On the other hand, the adaptive group shows distinguishable decision
behaviours for sunny (m = 1.91; sd = .93) and bad (m = 4.37; sd = .89) weather forecasts.
Both averages are similar to the averages shown in the surplus period. Furthermore, it
seems that both response sets are moderately correlated with a coefficient of -.445
(according to Spearman) (Bühner & Ziegler, 2009), supporting risk seeking behaviour in
bad weather and risk averse behaviour for sunny weather forecasts. As previously shown
in the surplus period results, further investigation into specific quarters of Table 16 should
provide more insights into decision making behaviour.
Bad weather
Sunny weather extract (1) 2 3 4 5 buy (6) Total
extract (1) 17 7 11 11 10 5 61
2 0 3 10 23 21 0 57
3 2 4 10 4 0 0 20
4 0 2 1 3 0 0 6
5 1 1 1 1 2 0 6
buy (6) 0 0 0 0 1 3 4
Total 20 17 33 42 34 8 154
Table 16: Sunny and bad weather response matrix for extracting period
The allocation of responses for the adaptive group shows a majority in the top-right corner
(n = 74) but seems less stringent as during surplus period (see Table 16). The small
number of just six responses can be neglected for further investigation. Despite the
dispersion, it seems that there is predominantly a pattern of deciding to extract during
sunny weather in the adaptive group (m = 1.70; sd = .57) and buying (m = 4.55; sd = .62)
when there is a bad weather forecast. Furthermore, a small correlation of -.255 (according
to Spearman) between the response sets supports the pattern (Bühner & Ziegler, 2009).

A Survey on Crowd Strength
118
It confirms the correlation found in the overall group. The indifferent group contains
80 responses in total, and a concentration of 64 responses exists in the top-left corner.
The ten responses in the bottom-right area will not be considered further due to the small
size of the group. The indifferent group is characterised by more risk averse behaviour
and it decides to extract more when it is sunny (m = 1.70; sd = .85) and considers buying
when bad (m = 2.19; sd = .87) weather is expected. Likewise in the overall indifferent
group, a moderate correlation of .398 (according to Spearman) proves a relationship
between the sunny and bad weather response sets (Bühner & Ziegler, 2009).
6.2.5 Findings Human Competence Asset
The following paragraphs describe the findings of the human competence asset and are
summarised in Table 17.
Human Competences
A. Self-produced electricity is more prominent than externally produced electricity.
However people have some difficulties assigning value to it.
B. The price for electricity in storage is the price paid during discharging.
C. A group of prosumers shows no adaptation of decision making behaviour. They
act mainly in a risk averse manner.
D. A group of prosumers adapt decisions and prefer storing in the case of bad
weather forecast and sharing when sunny weather is expected. The choice
strategy is reversed when electricity is discharged from storage.
Table 17: Findings of human competence asset
A finding is that prosumers generally assign a higher value to self-produced electricity.
Thus, prosumers distinguish between electricity types and show accountability for
decision making. The finding does not indicate that this might be true for all prosumers as
some had difficulties assigning value. It seems that some prosumers have not yet
established a notion of value for electricity.
The notion of price definition of self-produced electricity is well established among
prosumers. Prosumers define price for self-produced electricity according to the extraction
period of the storage (during the night). Price definition does not change dynamically.

A Survey on Crowd Strength
119
From an economic perspective, this implies that stored electricity has an advanced price
expectation during the day and a current price expectation during the night. Consequently,
the difference in price expectation between the prosumer and the market during the day
can cause issues in dealing with loads. If the market price of electricity during the day
converges with the price levels of the night, or even falls below that level, it is less
beneficial to sell or buy for all stakeholders.
The human competence to make decisions about self-produced electricity, mainly whether
to store it or share it, shows various patterns. Some prosumers will always act risk averse.
Any decision made aims at securing the benefit from self-produced electricity regardless
of the weather forecast or time period. Such prosumers will store any surplus to sustain
personal interests. This implies that giving up electricity is tightly related to emotional
rather than rational factors. Thus, compensation (financial or non-financial) for losses
must outweigh personal interests.
The findings in human competences also reveal that some prosumers will adapt their
decisions according to the weather forecast. The decision making strategy of prosumers
in Figure 39 can be summarised as followed: in general, during surplus periods prosumers
act more risk averse when the weather forecast is bad and more risk seeking when the
weather will be sunny. A reverse behaviour emerges during offline production,
i.e. extracting electricity from storage, meaning risk averse behaviour when weather will
be sunny and risk seeking when bad weather is expected. The adaption of the behaviour
confirms two things. First, weather forecast can be a factor in decision making.
Second, the adaption proves that there is a linkage between production profile and
dominant decision making behaviour.
Figure 39: Decision making behaviour in prospect of weather forecast matrix
When the adaptive group shows risk averse behaviour, it is assumed that the same
decision making strategy exists according to the non-adaptive group. Personal interests
are prevailing and decisions are based upon more fear of disappointment or losses.

A Survey on Crowd Strength
120
On the other hand, the risk seeking dominant periods show hope to large gain or hope to
avoid losses. This implies that giving up electricity is tightly related to positive emotional
factors. Any compensation (financial or non-financial) must fulfil the hope.
6.2.6 Brand and Relationships
The brand and relationships are assets which determine contributions in a crowd and
evaluate the acceptance of crowd-based network structures. Sharing electricity is
influenced by the prosumer’s perspective on its own role, community, and under what
conditions exchanges happen. It includes additional non-technical and non-economic
perspectives defining willingness, size of a crowd, conditions for participation, and
characteristics of an ideal community.
The starting point for assessment of a crowd-based network is how respondents are
related to the concept of a crowd. The general results show that respondents assign high
relevance (m = 4.60; sd = 1.48) to a local crowd network. Tenants (m = 4.85; sd = 1.37)
and apartment owners (m = 4.91; sd = 1.31) rate local crowd networks as more relevant
than house owners (m = 4.32; sd = 1.56) on average. The obtaining and non-obtaining PV
groups shoes that people with experience of a PV regard local crowd networks as slightly
more relevant (m = 4.77; sd = 1.27) than the non-obtaining set (m = 4.57; sd = 1.52), but
the difference is marginal. The personal willingness to contribute to a crowd defines the
relationship between prosumer and community.
The results show a moderately willingness is relevant for contributing to a crowd
(m = 4.21; sd = 1.56). The relevance of personal willingness is higher rated by tenants
(m = 4.54; sd = 1.46) and apartment owners (m = 4.58; sd = 1.62) than by house owners
(m = 3.85; sd = 1.58). The obtaining PV group sees willingness for contributing to a crowd
slightly more relevant (m = 4.57; sd = 1.52) than by non-obtaining group (m = 4.20;
sd = 1.58). From the results in the house owner group, it seems that property possession
reduces the relevance of working in and with a community.
The size of a crowd indicates community strength by allowing a large number of people to
work together. It seems that respondents prefer to work in a more anonymous
environment (see Figure 40). For more than a quarter of respondents the ideal crowd size
is a block/suburb (n = 65, 42.11%), but they would accept larger villages and cities
(n = 52, 33.77%) and counties (n = 16, 10.39%). In contrast only 9.09% (n = 14) would
consider a street to be the ideal crowd size or with 4.55% (n = 7) direct neighbours.
The statement implies that some kind of awareness of the specific size needed for a

A Survey on Crowd Strength
121
functional crowd seems to exist among the respondents. The results are uniform in the
various groups of property possession and supply by PV. This increases strength and
potential for production and storage in a crowd but also is more problematic for
management. Thus, over two thirds (n = 106, 68.83%) think that management should be
located inside a crowd rather outside (n = 48, 31.17%). Any solutions provided by external
sources, e.g. electricity or independent service providers, require the challenge of defining
highly localized and customised electricity management services to be met.
This increases the complexity of service portfolios.
Figure 40: Considered preferences for crowd size
The survey includes an assessment of characteristics for an ideal crowd system. It states
the factors which are important to run a system; a relationship with a crowd must be
maintained. All 154 respondents evaluated each factor and the results (see Table 18)
suggest that transparency in management (m = 4.34; sd = 1.42) is the most important
characteristic, followed by quality (m = 4.25; sd = 1.30) and confidence/trust (m = 4.21;
sd = 1.34). The averages are within a small range. It can be assumed that respondents
have had difficulty assigning a value. This explains the higher standard deviation. Another
reason can be that factors are equally important. Such a reason is supported by the fact
that overall respondents assigned a moderate importance of characteristics. Furthermore,
results show uniform and moderate importance regardless the property possession
(house owner or tenant) and non-/obtaining PV groups.

A Survey on Crowd Strength
122
Factors Mean SD
Quality 4.25 1.30
Performance 4.13 1.25
Security 4.06 1.38
Profitability 4.19 1.43
Confidence 4.21 1.34
Transparency 4.34 1.42
Table 18: Crowd characteristics and average importance
Another brand and relationship factor is defined by the conditions for participation.
These points need to be addressed by the crowd in advance; a relationship is only
created when pre-assets for participation are considered. The categories can include
technical, managerial, economic or social aspects and multiple answers were allowed.
In general, the findings give high importance to transparency in electricity management
(n = 91), followed by a small gap for technical security (n = 71), automated systems
(n = 63), and legal regulations (n = 61). The ranking of characteristics shows a mix and no
preference for a specific category. Figure 41 shows the overall ranking and distribution
between obtaining and non-obtaining groups.
Figure 41: Factors for participation in a crowd-based network
The overall order of points can be applied to the non-obtaining group whereas there is a
slightly different ranking for the obtaining group. This group gives priority to transparency,
technical security, legal regulations and incentives to exchange electricity. Lower-rankings

A Survey on Crowd Strength
123
are given to automated systems, personal engagement, financial support and normative
values. In summary, transparency is a major necessity for building and maintaining a
relationship between individuals and crowds. Security seems to be a factor which is
important for maintaining a relationship rather for creating one.
6.2.7 Findings Brand and Relationship Asset
The following paragraphs describe the findings of the brand and relationship asset and
are summarised in Table 19.
Brand and Relationship
A. High acceptance of a crowd based network exists.
B. The relevance of personal willingness indicates that prosumer introduce
intangible values (e.g. emotions)
C. The preferred size of a crowd is a block/suburb or village/city.
D. The electricity management for a crowd is preferred inside a crowd.
E. A transparent value network is important for participating in and sustaining a
crowd.
Table 19: Finding of brand and relationship asset
The high acceptance of crowd based networks indicates that a positive relationship
between a prosumer and a crowd exists. By accepting a crowd, prosumers share
electricity or resources, like storage capacity. Additionally, it can be said that prosumers
have an advance of trust in the CE concept. Another finding is that personal willingness is
relevant in a crowd. Willingness expresses an emotional binding of the prosumer to the
crowd and establishes linkages based upon intangible values. The finding suggests that
intangible values become crucial for exchange: as a precondition to start an exchange
and as an object of exchange.
The preferred size of a crowd, in which a prosumer would like to be, involves a decent
number of buildings. The finding of a block/suburb crowd size suggests that prosumers
consider a larger area as necessary to benefit from a community. Taking the second
biggest share of a village/city, even larger crowds are acceptable. Therefore, crowds are

A Survey on Crowd Strength
124
not a clannish small group. It also seems that a certain anonymity is desired and thus
leaving the level of intimate communities. The referred management of such crowd sizes
should be inside a crowd. This finding indicates that the management of a crowd is close
to the members. But also, it suggests that management focus is on a local area
addressing specific requirements.
Transparency is the most important factor for participating and maintaining a relationship
with a community. It is integral and covers many aspects like process or information.
Furthermore, a transparent crowd network supports community acceptance and includes
procedural and distributional justice, as well as building trust. Eventually, transparency
stimulates intangibles values and influences the dynamic of exchanges. Other factors for
participating and maintaining a relationship with a community are the technical
requirements. The basic requirement of security expresses that there are still doubts and
uncertainties regarding the crowd structure

Simulation of Crowd Potential
125
7 Simulation of Crowd Potential
This chapter presents the empirical results of the crowd potential based on the factors
developed in the conceptual framework in chapter 5 (see Figure 2, page 9). The objective
of this chapter is to show the potentials of producing and sharing electricity of a crowd
during different time periods (winter, transition, and summer). An assessment of potential
relates to optimizing supply chain factors like production capacities and distribution of
electricity. Therefore, the potential of crowds requires supply chain optimisation and the
standard method is done through modelling and simulation.
The development of model for simulation is described in chapter 7.1 and shows how data
was produced as well as should show the accuracy of applying the research tool.
A mathematical model is formulated in chapter 7.1.1. and provides an understanding of
the scope of model’s functionalities. Furthermore, the model is optimised according to
costs rather capacities. Hence the chapter introduces a cost structure for flows
distinguishing three costs: cell internal flows, crowd flows (sharing), and flows from
external suppliers. Chapter 7.1.2 explains the process to translate the abstract model into
a computerised one. The chapter highlights the used software and programming
languages for simulation.
The produced results from the simulation are presented in chapter 7.2. The chapter shows
first the simulation for a current scenario of a transformer station in Spiez. A current
scenario is used as a starting point. As the CE concept represents a future electricity
network, a simulation with future production and consumption quantities should provide
insights in the upcoming crowd potential. These results are presented in chapter 7.2.6.
Before going to discuss strength and potential results (see chapter 8), the gained insights
in the crowd potential are summarised in chapter 7.2.7.
7.1 Modelling and Simulation of Crowd Potential
A discussion about the potential of crowds, in regard to electricity distribution among
members, necessitates modelling and simulation tasks. Simulations are used for different
purposes, e.g. systems engineering support or training and education support, however,
this dissertation applies simulation to analyse the potential in electricity exchange of
crowds and to support the position crowds within a value network. This is a quantitative
approach and input is known in advance by calculating production and consumption
pattern. Therefore, the model can be classified as deterministic, dynamic, continuous and

Simulation of Crowd Potential
126
local. The absence of crowd structures (i.e. the absence of behaviour insights and data)
and the objective of reaching potential conclusions require a deterministic model which
provides sufficient valuable insights to explore the potential of the basic exchange idea.
It is mentioned that future research should use stochastic modelling when insights are
available.
Any modelling and simulation must secure good quality results and guarantee that this
dissertation follows the simulation development process according to (Sargent, 2005).
This includes certain procedural steps and related methods to show proof of accuracy.
The steps are as follows:
1. Describe problem entity / situation (see chapter 3)
2. Formulate a conceptual model – Calibration (see chapter 7.1.1)
3. Translating the abstract to a computerised model – Verification (see chapter 7.1.2)
4. Running simulation (see chapter 7.2.4 and 7.2.6)
7.1.1 Formulate a Conceptual Model
The conceptual model represents a local network of buildings. Each building is
represented by a node in the network and owns consumption, production, and storage
capacities. A building can cover demand by production and/or storage. Any shortage of
electricity of a building is covered by an external electricity provider. If demand is covered
and surplus is produced, the node can store electricity up to a specific capacity, share
electricity with other buildings or feed in to the external network. Electricity can directly be
shared among all nodes within the crowd network. The cost of sharing electricity is
defined according to a chain structure stringing up buildings and defining same length of
linkages. Determining the costs of sharing between two buildings means to count the
linkages between houses. The model is discretised implying that a building’s capacities
exist for a specific time-point. Only electricity in the storage is passed to the next time-
period. The above description is outlined in Figure 42.
Let 𝐺 = (𝑉, 𝐴) be a graph where 𝑉 is a set of nodes and 𝐴 is a set of arcs. We introduce
the following nodes. The node 𝑧𝑡 represents the external electricity supplier. The node 𝑣𝑡𝑟
represents a building 𝑟 in a time period 𝑡. Every node 𝑣𝑡𝑟 contains obligatory demand 𝑑𝑣𝑡
𝑟
for a specific time-point. Demand is covered by internal production and storage, or by
external source 𝑧𝑡.
Furthermore, we introduce the following arcs. An arc (𝑧𝑡 , 𝑣𝑡𝑟) represents the electricity
obtained from the external source by a building during a time period when a shortage of

Simulation of Crowd Potential
127
electricity occurs, also called missing flow. An arc (𝑣𝑡𝑟, 𝑧𝑡) defines the electricity feed in to
the general network by a building. Such a flow represents an overflow and implies that a
building produces surpluses and storage is filled to capacity. An arc (𝑣𝑡𝑟, 𝑣𝑡
𝑟’) describes the
sharing of electricity between two buildings within a crowd where 𝑣𝑡𝑟 ≠ 𝑣𝑡
𝑟’. The node 𝑣𝑡𝑟 is
the supplier and 𝑣𝑡𝑟’ is the receiver of electricity.
Figure 42: Abstract optimisation model of a crowd
The optimisation problem of the model consists in minimising total cost of flows within a
crowd. For each arc (𝑣𝑡𝑟, 𝑣𝑡
𝑟’) ∈ 𝐴, we introduce a variable 𝑥(𝑣𝑡𝑟,𝑣𝑡
𝑟’), defining the units of
electricity flow between two buildings, and has an unlimited capacity. The sharing
between two houses induces costs including financial compensation for exchange, fee for
power line or money for electricity, or losses occurring during exchange. Hence costs can
be seen as the efforts for transportation. The determination of total costs is affected by
distance and longer haul is more expensive. The model assumes that buildings are
positioned in a line; houses have at least one neighbour and a maximum of two
neighbours. This ordered collection of buildings can be expressed as a finite sequence of
arcs (𝑣𝑡1, 𝑣𝑡
2, … 𝑣𝑡𝑟𝑖−1 , 𝑣𝑡
𝑟𝑖). Consequentially, each arc can be assigned a cost value which in
this model is a fixed cost 𝑐1 (see Figure 42). The unit cost of an exchange can be
determined as 𝐶𝑣𝑡
1 → 𝑣𝑡
𝑟𝑖 = (𝑖 − 1) 𝑐1. For example, the unit cost for a flow from node 𝑣𝑡1 to
node 𝑣𝑡4 (through node 𝑣𝑡
2 and 𝑣𝑡3) can be represented as 𝐶𝑣𝑡
1 → 𝑣𝑡4 = (4 − 1) 𝑐1. Thus, the
total cost of transporting 𝑥(1,4) units of flow is 3 𝑐1 𝑥(1,4).

Simulation of Crowd Potential
128
For each arc (𝑧𝑡 , 𝑣𝑡𝑟) ∈ 𝐴, we introduce a variable 𝑥(𝑧𝑡,𝑣𝑡
𝑟), defining the units of electricity
flow to cover a shortage of a building through an external source (so called missing flow),
and has an unlimited capacity. Also, for each arc (𝑣𝑡𝑟, 𝑧𝑡) ∈ 𝐴, we introduce a variable
𝑥(𝑣𝑡𝑟,𝑧𝑡), defining the units of electricity flow sent by a building to an external source (so
called overflow), with unlimited capacity. Both, missing flow and overflow are penalised as
the objective is to calculate the maximum potential of crowd flows. Thus, every unit of
transporting 𝑥(𝑧𝑡,𝑣𝑡𝑟) or 𝑥(𝑣𝑡
𝑟,𝑧𝑡) has a fixed cost value 𝑐2.
For simplification of the internal building flows, we introduce a variable 𝑥𝑣𝑡𝑟 representing
the storage level of a node 𝑣𝑡𝑟 at the end of a time period 𝑡. The storage level at the
beginning of a time-period is 𝑥𝑣𝑡−1𝑟 . Any storing has a fixed cost value 𝑐0. The storage
capacity of a node is limited by 𝑘𝑣𝑡𝑟.
All cost values are time-independent and remain constant. The optimisation is calculated
for each time point where consumption and production numbers derive from input files.
By establishing the network and flow properties, the objective function of the minimisation
problem can be stated as
min 𝑐0 ∑ 𝑥(𝑣,𝑣),𝑡
𝑣∈𝑉
+ ∑ 𝑐𝑣 → 𝑤 𝑥(𝑣,𝑤),𝑡
(𝑣,𝑤)∈𝐴
+ 𝑐2 ∑(𝑥(𝑧,𝑣),𝑡 + 𝑥(𝑣,𝑧),𝑡)
𝑣∈𝑉
subject to
constraints of inwards and outwards flow of a cell to keep flow balance between arcs
∑ 𝑥(𝑤,𝑣),𝑡
𝑤∈𝑉
+ 𝑥(𝑣,𝑣),𝑡−1 + 𝑥(𝑧,𝑣),𝑡 = ∑ 𝑥(𝑣,𝑤),𝑡
𝑣∈𝑉
+ 𝑥(𝑣,𝑣),𝑡 + 𝑑𝑣,𝑡 + 𝑥(𝑣,𝑧),𝑡
Constraint of flows for the first period
𝑥𝑣1𝑟 + ∑ 𝑥(𝑤,𝑣),1
𝑤∈𝑉
+ 𝑥(𝑧,𝑣),1 = ∑ 𝑥(𝑣,𝑤),1
𝑣∈𝑉
+ 𝑥(𝑣,𝑣),1 + 𝑑𝑣,1 + 𝑥(𝑣,𝑧),1
Constraint of storage capacity
𝑥𝑣𝑡𝑟 ≤ 𝑘𝑣𝑡
𝑟
7.1.2 Translating the Abstract to a Computerised Model
The translation into a computer program contains several steps which are aligned with
expected outputs. The process outputs produce files with hourly entries containing
missing flows to and from external suppliers flows within a community, and storage

Simulation of Crowd Potential
129
capacity (see Figure 43). Output is achieved through the main steps: data preparation,
modelling, and problem solving involving separate development environments.
Figure 43: Process of creating a computerised model
The aim of data preparation is to generate input files for the model by manipulating the
raw dataset supplied by an electricity provider. The dataset contains yearly consumption
and production of single objects (buildings) which was translated into hourly production
and consumption profiles through sun radiation and standard load profiles (SLP).
Furthermore, the preparation tasks include the generation of a network structure as there
was no access to such kind of data. This was achieved by using the travel sales problem
(TSP) algorithm in R. The preparation tasks were implemented in R code and mysql.
Verification of accuracy is achieved by comparing raw data with output or using
established algorithm of R packages. The model, defined in Linear Programming
Language (LPL), represents the core and describes the basic structure of the network,
calculates constraints for the model, and contains the minimisation function. Verification of
code is done by LPL and the model’s functionality, by running the model with the dummy
data from a smaller sample size. LPL is responsible for creating a model but not for
problem solving. For minimising a function, online solver Gurobi is used, it takes a model
provided, minimises it, and sends the solution back to LPL. A good solution is obtained
when objective (upper and lower) bounds have the same value. All codes and log files can

Simulation of Crowd Potential
130
be found in appendix 10.2.3 and 10.2.4. A numeric test of the model is provided in
appendix 10.2.5.
The modelling and simulation process does not compare different applications as
performance questions are negligible and out of scope. The reasons for using these
applications are based on recommendations rather than quantitative figures. All three
applications are established in research. In particular, R has the advantage that it is able
to manipulate large datasets, especially for matrices. The LPL program was applied in
several optimisation environments including Swiss ice hockey schedule planning
(Hürlimann & Hürlimann, 2016). Additionally, using LPL allows the broad expertise in the
field of flow optimisation, as well as in linear programming, to be accessed. To this end,
the choice of Gurobi is the result of experience as well as good connectivity between LPL
and Gurobi.
7.2 Results of Crowd Potential
The experiment step, within the modelling & simulation process, involves running the
model and simulating various scenarios to generate results and to provide a basis for
discussion. Before presenting the results for crowd potential, the chapter provides an
understanding of the general simulation parameters and variables. Furthermore, the
beginning of this chapter provides an outline of the transformer station in Spiez and a
short description of model variables related to framework factors. Subsequently, the
chapter presents the results for a current scenario and a future scenario. The decision to
present a current and future scenario was made as a current scenario would demonstrate
the crowd potential which would be realised if a crowd was implemented. The future
scenario should demonstrate technological development and the effects on crowd
potential.
7.2.1 General Simulation Settings
The simulations were run for three regular weeks from Monday to Sunday without bank
holidays (see Table 20). The weeks represent particular seasons (winter, transition, and
summer period) and important due to volatile performance of PV production and
difference in consumption patterns.

Simulation of Crowd Potential
131
Settings
Time-points 24 h/day, for a week 168 in total
Weeks 09.12. – 15.12. 08.04. – 14.04. 12.08. – 18.08.
Table 20: Simulation settings
The simulation requires further parameters to determine the potential and an overview is
provided in Table 21. Each parameter is constant for each scenario and if there were any
adjustments made for investigating a specific situation, they have been stated accordingly.
Each cell has zero initial storage due to the objective of defining potential after a week in a
particular season. Statements about the first time-points consider this fact. Also, each cell
has unlimited storage capacity as the aim of this dissertation is to explore full electricity
potential. Thus, storage is set to large capacity and is adjusted in specific cases to
simulate more realistic storage behaviour. The new settings are stated at the relevant
position in the text. The exchange cost 𝑐1 between neighbouring cells is stated as one and
hence the distance of cells in the chain determines the costs of exchange. This can be
expressed as |𝑣 – 𝑤| ∗ 𝑐1.
The exchange cost between cells affects the other costs for installation, missing flow,
overflow and storage. In general, costs are set into a ratio to support the definition of
certain behaviour, i.e. the “first cell then crowd then external network” principle. Another
argument for a ratio construct is the divergence of costs and the duration of simulation.
Installation of a PV (40 m2) costs around 20,000 to 30,000 CHF (Electrosuisse, 2015).
Compared to compensation per kWh, which is 36.1 centimes Rappen/kWh
(Electrosuisse, 2015), amortisation would be achieved within a decade/decades. The
maximum simulated time period is a week and hence real costs would make discussion
about installation obsolete and consequently electricity would not be shared. As a
consequence, costs are normalised and set in relationship to each other.

Simulation of Crowd Potential
132
Parameter Value
Initial storage size 0 kW
Storage capacity 800 kWh
Installation costs for a PV 1,000 CHF
Costs for missing flow or overflow
100 CHF
Costs for flow to/from storage
0.01 CHF
Costs for exchange between cells
|𝑣 – 𝑤| ∗ 𝑐1
where 𝑐1 = 1 CHF
Table 21: Parameters for simulation
The model designed can be applied to all location and considers different characteristics
(e.g. sun radiation and number of buildings). However, the following results refer to a
transformer station in Spiez. Please note that the original dataset was anonymised.
7.2.2 Description of Transformer Station
The transformer station is located near to Spiez main train station in Berner-Oberland
(see Figure 44). The distribution of houses is scattered around the transformer and holds
in total 91 objects. Each object has a specific address and summarises all measure
points, deriving from flats, within a building. The majority are private households in the
rural residential area, except one business which is a mixed-building (i.e. business with
flats). The satellite map reveals that the single family house building category is dominant
in the eastern, southern and western part. The northern part contains mainly multi-family
houses (16 objects). This particular location was chosen as there is a mixture of buildings,
it’s a rural environment, and current PV productions (marked with a flash in Figure 44)
According to the original dataset, there are other locations with similar conditions but
picking the presented transformer station was a personal choice.

Simulation of Crowd Potential
133
Figure 44: Objects and network structure of transformer station
The assignment of buildings to a transformer is, contrary to general opinion, not straight
forward. In other words, a transformer does not necessary connects entire streets or
blocks according to landmarks. Additionally, transformers are randomly located.
For example, transformer is positioned more or less in the centre (see Figure 44).
Providing an explanation for the positioning transformer stations in a specific way
concerns electricity distributors and cannot be explained here. To solve the issue of
network design, a network was created according travel salesman algorithm. It should
present an optimal path through the set of objects indicated as yellow line in Figure 44.
This is the underlying electricity network with the buildings one and 91 representing each
end of the chain. Any electricity exchange follows this tour.
A general description of the annual production and consumption of 2013 provides an idea
of the situation concerning crowd’s potential (see Table 22). Please note that there was no
access to more up-to-date dataset, however, it can be assumed the dataset represents an
adequate current situation as the total consumption of Switzerland in 2016 is slightly
reduced. Furthermore, there have been any structural changes in the area. Currently eight
buildings (yellow) have a PV facility installed and the figures represent their current
performance. The randomly assignment of production potential to the residual buildings
shows following picture. A good potential (green) is assigned to 20 buildings, medium
potentials (blue) own 24 objects, and poor potential (red) are allocated to 22 buildings.
The 17 entries marked in white have no production potential due to insufficient potential

Simulation of Crowd Potential
134
settings or lack of willingness to invest. In total, the production capacity of the crowd is in
total 525,312 kWh/y and 7,099 kWh/y on average.
Object Prod. Cons. Object Prod. Cons. Object Prod. Cons.
1 4,800 13,913 31 - 390 61 4,800 2,337
2 4,800 11,898 32 6,975 4,295 62 - 897
3 4,800 4,101 33 6,975 4,720 63 6,975 6,894
4 - 9,787 34 4,800 7,563 64 4,800 10,430
5 7,935 26,918 35 9,600 20,151 65 12,500 18,922
6 4,800 12,666 36 - 3,391 66 9,600 17,186
7 9,600 9,245 37 6,975 7,735 67 9,600 11,547
8 6,975 17,279 38 6,975 4,083 68 9,600 22,984
9 4,911 21,954 39 6,975 8,751 69 4,031 12,933
10 4,800 1,292 40 4,800 3,421 70 - 12,288
11 4,800 12,025 41 - 2,660 71 - 6,934
12 1,834 4,009 42 9,600 4,818 72 14,712 22,142
13 9,600 4,960 43 10,028 11,420 73 4,800 5,209
14 6,975 11,386 44 4,800 3,893 74 4,800 21,060
15 4,800 11,628 45 4,800 4,015 75 - 17,621
16 6,975 7,061 46 9,600 7,712 76 - 1,483
17 6,975 5,597 47 6,975 6,642 77 9,600 22,533
18 9,600 6,420 48 - 4,278 78 4,800 13,562
19 9,600 7,500 49 4,800 6,933 79 - 3,466
20 9,600 16,217 50 9,600 3,529 80 6,975 15,119
21 6,975 7,981 51 6,975 4,163 81 9,600 12,756
22 6,975 46,112 52 6,975 8,122 82 6,975 9,850
23 4,361 24,550 53 9,600 3,970 83 - 13,854
24 9,600 9,410 54 - 5,298 84 4,800 9,638
25 6,975 24,381 55 - 3,068 85 6,975 17,838
26 9,600 7,742 56 9,600 4,927 86 6,975 16,008
27 6,975 4,080 57 - 2,817 87 - 13,541
28 4,800 6,229 58 4,800 4,231 88 4,800 12,220
29 - 46 59 6,975 3,841 89 6,975 8,385
30 4,800 15,294 60 9,600 4,847 90 6,975 8,988
91 9,600 18,469
Table 22: Overview of annual production and consumption for all cells

Simulation of Crowd Potential
135
Crowd consumption totalled 914,459 kWh/y (10,049 kWh/y on average) in 2013 and
exceeded production by almost twice as much. Model designers might be tempted to
fudge figures and add more potential to the crowd, however, the figures seem to describe
a realistic situation. In more detail, object no. 22 has the maximum consumption of
46,112 kWh/y and together with object no. 5 (26,918 kWh/y). Both belong to a large group
of 36 objects which consume more than 10,000 kWh/y. Multi-family houses in the northern
part are members of this group, however, it seems that single-family houses constitute the
majority and they are also at the top of the list. These observations come from satellite
pictures. At the other end of the list, around a third (n = 35) consumes less than
6,500 kWh/y. In short, there is a wide range in annual consumption.
7.2.3 Meaning of Model Variables Related to Framework Factors
To support the understanding of findings, the following paragraph establishes names and
relationships between model variables and how they are related to the framework. Some
variables reflect framework factors and others are a combination of variables. Figure 45
provides an overview of the basic operating numbers, flows, corresponding names and
dependencies. The variables can reflect a crowd or a cell but also can be discussed in
total or for each single time-point. Moreover, the sum of all flows plus storage at the end of
the week should be zero.
Figure 45: Overview of flows, names, and dependencies
The difference between production and consumption is the first key figure which reflects a
crowd’s or a cell’s capability either to produce a surplus or to have shortage in the
observed period. The difference is stated in total kilowatts (kW) or as a percentage where

Simulation of Crowd Potential
136
100% implies that a cell produces exactly the same amount of electricity as is consumed.
A negative difference must be covered and can be done using missing flows (from
external suppliers), sharing activities, or discharging from the storage. The discharging
figure is expressed in terms of how often (time-points) storage has positive entries.
The total of kW in storage at the end of week defines overproduction left in the storage
after the observed period.
The second important figure is the amount of surplus created. It represents all positive
time-points where production is higher than consumption. A surplus is shared between
corresponding flows and can either stay within a cell by charging storage or released by
sharing activities or overflow. The sharing activities are represented as negative values.
The single flows can be set in relation to production or consumption to illustrate shares.
In this thesis, several percentages are presented: percentage of surplus from production,
percentages of sharing activities and missing flow from total consumption, and percentage
of time-points from the total time-points.
7.2.4 Current Scenario
The current scenario represents the year 2013 and is the initial situation for further
scenarios. A full overview of results is given in the appendix 10.3.
Winter
The optimisation outcome of the winter period 09th to 15th December has an optimal
solution and produces definite findings in which high missing flows, low storage activities,
and few internal exchanges dominate. In other words, the potential for creating
independence through self-sustainability barely exists. As a consequence, the dominance
of missing flow raises total costs to 1,677,164.97 CHF.
The objects in this crowd have a total consumption of 20,121.6 kilowatt (kW) and produce
around 3,350.5 kW (see Table 23). This leads to a total shortage of 16,771.0 kW. In more
detail, the crowd has a shortage peaking at 11.7 kW whereas the 1.4 kW indicates that a
small surplus is produced during the week. On average, the crowd has a shortage of
1.1 kW. The shortage is 83.35% of total consumption, in other words the crowd covers
16.65% of their consumption through their own production. A small surplus of 568.4 kW is
produced which is 16.96% of total production. The available surplus is generated by
40 cells during 28 time-points (TP) on average. This is around 16.80% of all 168 time-
points. On average the crowd creates a surplus of 14.2 kW and produces a maximum
surplus of 41.1 kW, and a minimum of 0.3 kW.

Simulation of Crowd Potential
137
Consumption 20,121.6 (kW)
Production 3,350.5
Total Min Max Average TP
Diff. Prod-Cons - 16,771.0 - 11.7 1.4 - 1.1 -
Surplus 568.4 0.3 41.1 14.2 28
Flows Total Min Max Average TP
Missing 16,771.0 0.001 11.7 1.2 147
Storage 565.3 0.0002 6.2 0.5 49
Sharing 3.1 0.4 0.5 0.005 7
Table 23: Total number of crowd flow winter
The specific characteristic of the winter week defines the flows. The missing flow is
frequently used during 147 time-points (on average) and external suppliers deliver 1.2 kW
on average and a maximum of 11.7 kW. The majority of the surplus, 565.3 kW in total or
99.46%, flows to individual storages and is fully utilised by the cell. On average, storage is
charged with 0.5 kW and has positive capacity during 49 time-points (28.88% of total
TPs). It seems that surplus allows cells to benefit from discharging electricity for longer
than it takes to charge storage, yet there is no electricity left at the end of the week.
A small share of 0.54% is exchanged during seven time-points. The sharing of 3.1 kW
occurs solely between two objects and represents 0.02% of total consumption.
The winter week implies a distinct cell categorisation with a concentration on the lower
end of the prosumer ranking (see Figure 46). The majority of productive buildings (n = 65)
are categorised as either prosumer with reduced consumption (n = 34) or low temporary
(n = 31). By adding the consumer category (n = 17), the vast majority of buildings wholly
depend on or highly depend on the support of an electricity supplier. The figures also
imply some individual self-sustainability through storage, however, this barely contributes
to the community. More detailed results of categorisation and key figures are provided in
appendix 10.3.

Simulation of Crowd Potential
138
Figure 46: Crowd potential overview winter current scenario
The group of prosumers with reduced consumption consumes 12,438.0 kW on average
and produces 1,442 kW leading to a deficit of 10,996.0 kW (see Table 24). On average,
87.41% of a cell’s consumption is covered by missing flows defining a capacity of
10,992.9 kW during 168 time-points (or 323.4 kW on average per time-point). A member
benefits from the sharing activities covering 0.64% of the cell’s consumption.
Co
nsu
me
r
Pro
s. re
d.
C.
Pro
s. T
em
p.
L.
Pro
s. T
em
p.
H.
Pro
s. A
ut. L
.
Pro
s. A
ut. H
.
Diff. Total - 2,243.7 - 10,996.0 - 3,243.8 - 289.7 2.1 -
Members 17 34 31 8 1 -
Surplus Total kW - - 292.7 252.4 23.2 -
Aver. kW - - 9.4 31.6 23.2 -
TP - - 26 35 35
Flows
Missing Total kW 2,243.7 10,992.9 3,243.8 289.7 1.0 -
Aver. kW 132.0 323.3 104.6 36.2 1.0 -
TP 168 168 131 89 9
Storage Total kW - - 292.7 252.4 20.1 -
TP - - 37 79 152 -
Sharing (R) Total kW - - - - - 3.1 -
TP - - - - 7 -
Sharing (S) Total kW - 3.1 - - - -
TP - 7 - - - -
Table 24: Flows according to cell categories in winter period
There is a total difference of 289.7 kW between consumption (91.5 kW) and production
(55.1 kW) for the eight high temporary prosumers and they only require external support
during 89 time-points, on average. As a result, the group reduces time-dependency for
missing flows to 52.97% of all TPs. This leads to better performance of production which
Categories Key Figures
Cons
umer
Pros
. red
. C.
Pros
. Tem
p. L
.Pr
os. T
emp.
H. (
+)Pr
os. A
ut. L
.Pr
os. A
ut. H
.Pr
od-C
ons
Cons
-Mis
sing
Cons
-Sha
ring
Surp
lus
to S
tora
geSh
arin
g
% ti
me
surp
lus
exis
ts
% ti
me
stor
age
posi
tive
Total 17 34 31 8 1 - 16.65% 83.35% 0.02% 99.46% 0.54% 16.80% 28.88%
(0)
Total

Simulation of Crowd Potential
139
covers 38.98% of demand. Furthermore, the group generates a total surplus of 252.4 kW,
on average 31.6 kW, and all of it is stored. Positive storage allows electricity to be
discharged during 79 TPs on average. Object no. 50 achieves a maximum discharge at
111 or 66.07% of TPs. By comparing charging and discharging TPs, it can be said that a
discrepancy between 35 (20.83%) charging TPs and 79 (46.65%) discharging TPs exists.
The storage capacity of this group is 4.8 kW on average and has a maximum range of
2.6 kW to 6.2 kW.
The cell only requires assistance from missing flow during 9 TPs (3.34%). The total
surplus of 23.2 kW is generated during 35 TPs on average, this implies that consumption
plays a crucial role in the positive outcome as the high temporary group has a higher than
average surplus. The charging flow contains 86.67% (20.1 kW) of the surplus and 13.33%
(3.1 kW) is shared with the neighbouring object. The large amount of electricity for
charging allows the cell to discharge during 90.48% or 152 time-points.
Transition period
The optimisation outcome of the transition period from 08th to 15th April has an optimal
solution and shows more in storing and sharing activities. The increase in activity is
attributed to higher production performance (more sun radiation) as well as more
surpluses. In summary, the potential for creating independence through self-sustainability
exists although it is not persistent throughout the week. Increased storage and sharing
within the crowd reduces total costs to 547,562.53 CHF.
The crowd model has a reduced consumption of 18,066.4 kW and increased production of
around 12,735.9 kW in total (see Table 25). The effect is that the crowd can sustain
70.50% of consumption with its own PV facilities. The shortage amounts to 5,330.5kW in
total and the biggest shortage is of 9.3 kW. The maximum electricity of 2.9 kW indicates
that a surplus is produced. The crowd produces a minuscule shortage of 0.3 kW on
average. Moreover, a surplus of 5,084.8 kW is produced. This is almost 40% of total
production. Compared to the winter period, a transition period has 10 times more
surpluses available. The available surplus is generated by 68 cells during 66 TPs on
average. This is in around 39% of total time-points. During these time-points, the crowd
creates a surplus of 75.0 kW on average and there is a maximum of 193.1 kW and a
minimum of 0.027 kW.

Simulation of Crowd Potential
140
Consumption 18,066.4 (kW)
Production 12,735.9
Total Min Max Average TP
Diff. Prod-Cons - 5,330.5 - 9.3 2.9 - 0.3 -
Surplus 5,084.8 0.027 193.1 75.0 66
Flows Total Min Max Average TP
Missing 5,330.5 0.002 9.3 0.7 46
Storage 2,595.6 0.0014 23.1 3.5 106
Sharing 2,489.2 0.0012 15.2 0.6 43
Table 25: Total amount of crowd flow transition current scenario
The flows reflect the improved capacity of self-produced electricity. The missing flow has a
capacity of 5,330.5 kW and is utilised during 46 TPs on average (27.38% of total TPs).
External suppliers deliver 0.7 kW on average and have a maximum flow of 9.3 kW. The
usable surplus is almost equally distributed between charging and storage at 2,595.6 kW
(51.04%) and supplying to others at 2,489.2 kW (48.96%). Charging of storage happens
using 3.5 kW on average and has a maximum flow of 23.1 kW. There is positive storage
during 106 TPs (63.33% of total TPs) on average and it is clearly above the
50% threshold. Therefore the crowd benefits for much longer from discharging electricity
than the time required to charge. A good charging-discharging ratio can be assumed.
Although more electricity is available, the crowd has no electricity left in storage at the end
of the week. The sharing activities cover 13.78% of demand and occur during a quarter of
all time-points (43 TPs, 25.59%). On average, 0.6 kW flows between cells and reaches a
maximum of 15.2 kW at any given time-point.
The situation affects cell categorisation distributing cells more evenly throughout the
categories (see Figure 47). Remarkably is that cells are categorised in the upper two
ranks, namely high (n = 21) and low (n = 15) prosumer autarkic, showing from their
autarkic behaviour in their characteristics. This implies self-sustainability as well as that
they support others by sharing electricity. Furthermore, the categorisation reveals an
admirable number of temporary high prosumers with 22 objects from which 5 objects
exhibit self-sustainability as well as sharing behaviour. In short, internal suppliers and
receivers of electricity are 41 objects. It can be assumed that a community has been

Simulation of Crowd Potential
141
established. More detailed results of categorisation and key figures are provided in
appendix 10.3.
Figure 47: Crowd potential overview transition period current scenario
The group of prosumers with reduced consumption contains six members and the
production performance of 871.8 kW reduces demand of 3,260.3 kW to an electricity
shortage of 2,388.5 kW (see Table 26). The difference is covered by 87.41% of the
missing flows defining a capacity of 1,831.6 kW or 305.3 kW on average during 133 time-
points. The six members benefit from sharing activities to cover the residual electricity
shortage (556.9 kW, 23.31%). This occurs during almost a third of TPs (53 TPs).
Co
nsu
me
r
Pro
s. re
d.
C.
Pro
s. T
em
p.
L.
Pro
s. T
em
p.
H.
Pro
s. A
ut. L
.
Pro
s. A
ut. H
.
Diff. Total kW - 2,012.2 - 2,388.5 - 1,508.8 - 1,835.5 377.3 2,037.1
Members 17 6 10 22 15 21
Surplus Total kW - - 8.0 872.5 1,331.2 2,873.1
Aver. kW - - 0.8 39.7 88.7 136.8
TP - - 11 61 84 84
Flows
Missing Total kW 1,471.5 1,831.6 1,083.8 877.4 35.6 30.6
Aver. kW 86.6 305.3 108.4 39.9 2.4 1.5
TP 80 133 104 36 6 6
Storage Total kW - - 8.0 863.8 918.3 805.4
TP 78 23 47 115 142 137
Sharing (R) Total kW 540.6 556.9 425.0 966.7 - -
TP 57 53 39 31 - -
Sharing (S) Total kW - - - - 8.7 - 412.9 - 2,067.7
TP - - - 2 29 58
Table 26: Flows according to cell categories in transition period current scenario
Key FiguresCategoriesCo
nsum
erPr
os. r
ed. C
.Pr
os. T
emp.
L.
Pros
. Tem
p. H
. (+)
Pros
. Aut
. L.
Pros
. Aut
. H.
Prod
-Con
s
Cons
-Mis
sing
Cons
-Ext
erna
l
Surp
lus
to S
tora
geSu
rplu
s to
Ext
erna
l%
tim
e su
rplu
s
exis
ts
% ti
me
stor
age
posi
tive
Total 17 6 10 22 15 21 70.50% 29.50% 13.78% 51.04% 48.96% 39.20% 63.33%
(5)
Total

Simulation of Crowd Potential
142
The low temporary prosumers consume 2,759.3 kW and produce 1,250.5 kW in total
resulting in a difference of 1,508.8 kW. Production covers 45.31% of total consumption.
A small surplus of 8.0 kW produced during 11 TPs indicates that production performance
mainly helps to reduce consumption. All member cells store to 100% resulting in a
discharging duration of 47 TPs. The required storage capacity for the group ranges from
0.1 kW to 12.1 kW with around 3.5 kW on average. The charging-discharging ratio is
impressive, however, it must be regarded with care. This group receives 425.0 kW in total
and closer inspection shows that not every kW obtained is used immediately. The majority
of the difference between production and consumption is covered by the missing flow of
1,083.8 kW (71.83%). External suppliers support during 104 TPs and supply in 108.4 kW
on average.
The high temporary prosumer group comprises 22 cells of which 5 are marked with a plus
indicating that these members are involved in sharing activities. The group produces
4,046.3 kW and consumes 5,881.8 kW within a week resulting in a negative difference of
1,835.5 kW. The difference is slightly higher than in the low temporary group but can be
explained by the variance of group size. Production performance allows 71.32% of
consumption to be covered and produces an additional surplus of 872.5 kW.
Excess production occurs during 61 TPs on average and amounts to 39.7 kW. The vast
majority (99.39% or 863.8 kW in total) is stored and discharging occurs during 115 TPs on
average. Required storage capacity for the group ranges between 1.4 kW and 19.6 kW
with around 10.6 kW on average. Only a fraction of the surplus (8.7 kW) is supplied to
other cells. A characteristic of this group is the large share of receiving electricity,
966.7 kW. This positively affects storage availability. The increased share led to closer
inspection of sharing activities showing that the group is bipartite. A subgroup of 13 cells
requires marginal support of 51.7 kW from electricity suppliers. Consequently, the missing
flow covers 1.58% of consumption. This is accounted for by the model’s settings, cells
start with no available electricity hence they require support in the first six time-points.
The low dependence on the missing flow is not attributed to an improved production-
consumption ratio (71.23%) but the cell receives the vast majority of kW shared, 958.8 kW
in total during 40 TPs on average. The other 9 members barely benefit from sharing
activities (91.47 kW in total) and requires to higher dependency on the missing flow with
825.7 kW in over 80 TPs on average. The larger and smaller subgroups have around 36%
of time-points where surplus is generated (36.08% and 36.57%), however, another
distinctive feature is in the time-points when there is positive storage. The 13 cells show a
much higher average value of 79.72% (134 TPs) than the smaller group with 52.45%

Simulation of Crowd Potential
143
(88 TPs). A final remark on the high temporary group is that it is the only group which
receives and supplies electricity.
The next group, the low autarkic prosumers, contains 15 cells which have a total
consumption of 2,213.3 kW and a total production of 2,590.6 kW. The group’s description
specifies a range for the production-consumption ratio which is, on average, 120.28%.
The difference is positive and totals in 377.3 kW. Furthermore, the group is capable of
generating a surplus of 1,331.2 kW which is an average of 88.7 kW during 84 TPs.
The missing flow of 35.6 kW is caused by the model’s design and hence the group is
autarkic. The accrued surplus is unevenly distributed. The supply to other cells accounts
for 31.16% (412.9 kW) whereas 68.84% (918.3 kW) is charged to the storage.
The storage provides electricity during 142 TPs (84.52% of all TPs) on average and
charged in 84 time-points (50%) on average. The required storage capacity for the group
ranges between 16.4 kW and 5.3 kW with around 11.6 kW on average. Due to the
difference between charging and discharging TPs and the lack of received electricity, it
can be assumed that stored electricity is essential to independency.
The high autarkic prosumer group has 21 members which consume 1,939.6 kW and
produce 3,976.67 kW in total. A positive difference of 2,037.1 kW exists and the group has
the highest average production-consumption ratio allowing the group to cover demand by
221.52%. As a result, a missing flow only exists at the beginning of the simulation
(30.6 kW). Furthermore, a surplus of 2,873.1 kW, 136.8 kW during 84 TPs on average, is
generated and unequally distributed between charging storage and sharing. Less than a
third (28.98% or 837 kW) is stored during 137 TPs on average. Extracting electricity from
storage is possible in 81.26% of all time-points. The group has considerable storage
capacity and average maximum storage size is 15.1 kW, ranging from 1.7 kW to 20.9 kW.
Such quantities could still be handled by current flow or NaS storage solutions (Mahnke,
Mühlenhoff, & Lieblang, 2014). The majority of the surplus (71.02% or 2,067.7 kW) is
provided to other cells and makes autarkic prosumers the biggest supplier to the crowd.
On average electricity is supplied during 58 TPs. There is no external support from other
cells hence it can be said that this group is self-maintaining. In short, the label of high
autarkic prosumer has been well chosen.
Consumers benefit from sharing activities receiving 540.6 kW in total during 57 TPs on
average. The consequences are the installation of storage capacity. Of all members, only
five cells do not store any electricity. The remaining 12 cells require storage capacity, on
average 4.1 kW ranging from 0.1 kW to 7.3 kW. Capacity also leads to reduced
dependence on missing flow and it is reduced to 1,471.5 kW. Six objects require support

Simulation of Crowd Potential
144
at the beginning of the simulation showing an average positive storage of 1.1 kW during
102 TPs (60.71% of all TPs). Eight objects require missing flow during 163 TPs on
average, but three objects have a small storage capacity and discharge an average of
1.6 kW during 8 TPs.
The simulation shows further details about the behaviour of the model. First, the number
of time-points when electricity is shared differs substantially between receivers (180 times)
and suppliers (89 times) indicating that a single supplier provides electricity for more than
one house at simultaneously. For example, object no. 3 delivered electricity on
08/04/2013 at the ninth time-point, 954.9 watts in total, to object no. 2 (145.1 watt) and no.
3 (809.8 watt).
Figure 48: Consumer storage behaviour
The sharing behaviour shown in Figure 48 higher indicates that more electricity is
exchanged than the current time-point requires. For example, object no. 31 receives
173.4 watt at the eleventh time-point, splitting electricity to cover a 53.9 watt demand and
storing 119.5 watt for use at the next two time-points. As a consequence, consumers
require their own storage functionality. Optimisation shows that consumers benefit from
storage an average of 78 times. This comes as a result of the defined cost structure
where exchange is more expensive than the internal flows of cells. Eventually, consumers
discharge electricity during 55 time-points meaning that they are either fully or partially
Object No. 31 Prod: No (all values in watt)
Date Time Diff P-C Missing Storage External (S) External ( R)
08/04/2013 0 - 27.0 27.0 - - -
08/04/2013 1 - 19.9 19.9 - - -
08/04/2013 2 - 18.0 18.0 - - -
08/04/2013 3 - 17.5 17.5 - - -
08/04/2013 4 - 17.9 17.9 - - -
08/04/2013 5 - 21.3 21.3 - - -
08/04/2013 6 - 37.6 - - - 37.6
08/04/2013 7 - 52.5 - - - 52.5
08/04/2013 8 - 55.6 - - - 55.6
08/04/2013 9 - 55.0 - - - 55.0
08/04/2013 10 - 53.4 - - - 53.4
08/04/2013 11 - 53.9 - 119.5 - 173.4
08/04/2013 12 - 60.5 - 58.9 - -
08/04/2013 13 - 58.9 - - - -
08/04/2013 14 - 51.3 - 88.9 - 140.2
08/04/2013 15 - 45.9 - 43.0 - -
08/04/2013 16 - 43.0 - - - -
08/04/2013 17 - 47.1 - - - 47.1
08/04/2013 18 - 58.6 - - - 58.6
08/04/2013 19 - 69.6 - 68.0 - 137.6
08/04/2013 20 - 68.0 - - - -
08/04/2013 21 - 63.1 - - - 63.1
08/04/2013 22 - 54.9 - - - 54.9
08/04/2013 23 - 40.6 - - - 40.6

Simulation of Crowd Potential
145
independent from external supply (missing flow). The same phenomenon is valid for all
categories but will mainly affect lower ranked groups such as the prosumer with reduced
consumption group (44 time-points) and the low temporary prosumer group (47 time-
points).
Summer
The outcome of optimisation in the transition period which lasted from 12th to 18th August
shows a very dynamic crowd with regards to storing and sharing activities. The dynamic is
attributed to higher sun radiation during summer, leading to more surplus as well as a shift
of cells, categorisation to high and low autarkic prosumers. Eventually, cells display more
autarkic behaviour. In summary, potential independence is achieved through self-
sustainability and persistent for all members of the crowd. The more self-sustainable a
crowd is, the bigger effect it has on the total costs for optimisation showing a value of
107,679.02 CHF.
Consumption (14,696.0 kW) and production (14,293.2 kW) as stated in Table 27 is
balanced in the crowd model. Therefore the crowd can sustain 97.26% of consumption
with its own PV facilities. The shortage of 402.8 kW is just a fraction of its overall
consumption and production, this also applies to previous periods. The balanced situation
is expressed in a miniscule shortage of 0.03 kW on average reaching 6.7 kW at the time-
point with the biggest shortage. Half of production is surplus with 7,148.5 kW in total
produced on average by 70 cells during 78 TPs. Compared to a transition week, cells
have surplus electricity of around 2,100 kW week.
Consumption 14,696.0 (kW)
Production 14,293.2
Total Min Max Average TP
Diff. Prod-Cons - 402.8 - 6.7 3.3 - 0.03 -
Surplus 7,148.5 0.456 226.2 102 78
Flows Total Min Max Average TP
Missing 617.2 0.001 2.7 0.5 10
Storage 2,927.5 0.0017 32.2 5.1 133
Sharing 4,221.0 0.0019 18.2 0.9 46
Table 27: Total number of crowd flows in summer current scenario

Simulation of Crowd Potential
146
The flows are characterised by the higher availability of self-produced electricity.
The missing flow delivers the amount of 617.2 kW and is utilised during 10 TPs on
average. Model design means that 83 cells have missing flows in the first 6 TPs and eight
cells require supply through the missing flow from 15 to 150 TPs. External suppliers
deliver 0.5 kW on average with a maximum of 2.7 kW. The variation of production-
consumption difference and missing flow figures exist due to the fact that electricity is left
in storage (214.4 kW) after the week.
The available surplus is divided into 2,595.6 kW (40.95%) for charging storage and
4,221.0 kW (59.05%) for supplying other objects. It can be assumed that the additional
2,100 kW, compared to the transition week, is mainly used for sharing activities.
Moreover, it can be said that cells are sufficiently strengthened through internal flows and
it is cheaper to share electricity rather than to store it for self-interest. The model satisfies
the behaviour of an optimal cell before crowd before external behaviour. The charging of
storage occurs with 3.5 kW on average and has a maximum flow of 23.1 kW. Positive
storage exists, on average, during 106 TPs (63.33% of total TPs) and is clearly above the
50% threshold. Therefore the crowd benefits from discharging electricity for much longer
than it requires charging and a good charging-discharging ratio can be assumed.
The increased sharing activities cover 28.72% of demand and occur during a quarter of all
time-points (46 TPs, 27.38%). Despite more electricity for sharing, it seems that the
additional amount is not necessarily delivered over many more TPs (the transition period
shows an average of 43 TPs). This causes flows between cells to rise to a maximum of
18.2 kW.
Self-sustainability and supporting others affects the cell categorisation with increasing
numbers of cells categorised as low or high autarkic prosumers (see Figure 49). The shift
comes at the expense of low temporary prosumers and prosumers with reduced
consumption. Furthermore, the categorisation shows the same number of high temporary
prosumers with 22 objects of which 7 objects display self-sustainability and sharing
behaviour. Half of the group are categorised as high temporary regardless of whether it’s
a transition or summer period. Additionally, internal suppliers of electricity, in total
50 objects, outweigh receivers, with 44 objects. The self-sustainability of cells and the
increased sharing activities allows saying that the community is autarkic. More detailed
results of categorisation and key figures are provided in appendix 10.3.

Simulation of Crowd Potential
147
Figure 49: Crowd potential overview summer
All groups improve the figures by contributing in their scope of action to create
independence. This means reduced consumption, higher production and lower missing
flows, increased charging and discharging, and enhanced sharing activities in particular.
The group of prosumers with reduced consumption contains four members and production
of 572.6 kW reduces demand of 1,821.4 kW to a negative difference of 1,248.7 kW (see
Table 28). Production constitutes 33.14 % of consumption. The resulting difference is
marginal and covered by missing flow (30.3 kW) over 6 TPs, this represents the first time-
points in the simulation. The vast majority of 1,218.4 kW (97.57%) is provided by other
members of the crowd. Supply of electricity through sharing happens 92 TPs on average
indicating that more electricity is delivered than demanded at certain time-points.
The additional electricity is temporarily stored allowing it to be discharged during 105 TPs
(62.35%), on average.
The group of low temporary prosumers contains just one member consuming 390.6 kW
and producing 189.8 kW in total. Production covers 48.58% of consumption leading to a
shortage of 200.8 kW. A small surplus of 0.5 kW produced during 7 TPs indicates that
production performance mainly helps to reduce consumption. The cell stores all surpluses
resulting in electricity being discharged in 111 TPs. The charging-discharging ratio is
impressive, however, must be regarded with care. In total the group receives 194.4 kW
during 65 TPs on average and closer inspection shows that not all kW obtained are used
immediately. The electricity which is temporarily stored increases available storage to
66.07% of total TPs. At 6 TPs, at the beginning of the simulation, consumption is covered
by the missing flow (6.5 kW).
Categories Key Figures
Cons
umer
Pros
. red
. C.
Pros
. Tem
p. L
.Pr
os. T
emp.
H. (
+)Pr
os. A
ut. L
.Pr
os. A
ut. H
.Pr
od-C
ons
Cons
-Mis
sing
Cons
-Ext
erna
l
Surp
lus
to S
tora
geSu
rplu
s to
Ext
erna
l%
tim
e su
rplu
s
exis
ts
% ti
me
stor
age
posi
tive
Total 17 4 1 22 16 31 97.26% 4.20% 28.72% 40.95% 59.05% 46.29% 79.15%
(3)
Total

Simulation of Crowd Potential
148
Co
nsu
me
r
Pro
s. re
d.
C.
Pro
s. T
em
p.
L.
Pro
s. T
em
p.
H.
Pro
s. A
ut. L
.
Pro
s. A
ut. H
.
Diff. Total - 1,631.4 - 1,248.7 - 200.9 - 1,659.9 678.0 3,660.2
Members 17 4 1 22 16 30
Surplus Total kW - - 0.5 687.7 1,804.3 4,656.0
Aver. kW - - 0.5 31.3 112.8 150.2
TP - - 7 60 84 89
Flows
Missing Total kW 208.5 30.3 6.5 281.3 47.2 43.4
Aver. kW 12.3 7.6 6.5 12.8 3.0 1.4
TP 15 6 6 16 6 6
Storage Total kW - - 0.5 681.1 1,111.5 1,134.4
TP 109 105 111 129 151 145
Sharing (R) Total kW 1,423.0 1,218.4 194.4 1,385.2 - -
TP 53 92 64 31 - -
Sharing (S) Total kW - - - - 6.6 - 692.8 - 3,521.6
TP - - - 2 25 49
Table 28: Flows according to cell categories in summer period
The group of high temporary prosumers is consistently the same size and is made up of
22 objects, three of which are marked with a plus indicating that these members are
involved in sharing activities. The group produces 3,746.7 kW and consumes 5,406.6 kW
within a week, resulting in a negative difference of 1,659.9 kW. Production performance
covers 69.99% of consumption and provides an additional surplus of 681.1 kW. Excess
production, 31.3kW, occurs, on aver0age, during 60 TPs. A bulk of surplus is stored
(98.96% or 681.1 kW in total) and is discharged during 129 TPs on average. Only a
fraction of the surplus (6.6 kW) is supplied to other cells. The intense storage utilisation in
this group means that a storage capacity of between 4.6 kW and 21.1 kW is needed, with
around 12.6 kW on average. A characteristic of this group is the considerable proportion
of members who are receiving electricity (1,385.2 kW). The proportion increases during
the transition period by 418.5 kW hence it positively increases storage availability to
129 TPs on average. Once again, the group is bipartite showing a greater divergence in
subgroup size. The subgroup of 17 cells requires the marginal addition of 73.3 kW from
external electricity suppliers. Consequently, the missing flow covers 1.66% of
consumption at the beginning of the simulation. Low dependence on missing flow is not

Simulation of Crowd Potential
149
attributed to an improved production-consumption ratio but rather to receiving a vast
majority of shared kW – 1,249.1 kW in total. The other five members barely benefit from
the sharing activities (136.1 kW in total) and this causes a higher capacity of missing flow
(208.0 kW) to be required over 43 TPs on average. Surplus is generated by the larger and
smaller subgroups in around 36% of time-points, however, another distinctive feature is
large number of time-points of positive storage. The 17 cells show a much higher average
time-points (80.95%, 136 TPs) than the 5 cells (62.5%, 105 TPs). Finally, it is the only
group which receives and supplies electricity.
The low autarkic prosumer group contains 16 cells which consume a total of 2,839.1 kW
and produce 3,517.1 kW. As indicated in the group’s description, the production-
consumption ratio is 126.7% on average resulting in a positive difference of 678.0 kW.
Furthermore, the group has a slightly higher surplus in the transition period and generates
a 1,804.3 kW surplus which is 112.8 kW on average during 84 TPs. The missing flow of
47.2 kW is caused by the model’s design and hence the group is autarkic. The accrued
surplus is unevenly distributed. The supply to other cells averages 37.31% (692.8 kW)
but 62.69% (1,111.5 kW) on average is charged to storage. The storage provides
electricity during 151 TPs (89.62% of all TPs) on average and it is charged in 84 time-
points (50%) on average. These numbers suggest that low autarkic prosumer show
endogenous autarkic behaviour by storing electricity. At the end of the week, 32.5 kW of
electricity remains in storage. The required storage capacity for the group ranges from
8.1 kW to 26.9 kW, and it is around 16.6 kW on average.
The group of high autarkic prosumers experiences a considerable increase of members
and comprises 31 cells. These cells consume 2,606.7 kW and produce 6,266.9 kW in
total. A positive difference of 3,660.2 kW exists and shows the highest of all groups
production-consumption ratio allowing them to cover 264.85% of demand, on average.
There are three extraordinary production-consumption ratios within the set. Two objects
have a ratio of over 400%, namely object no. 50 (consuming 56.5 kW, producing
261.2 kW) and object no. 53 (consuming 63.6 kW, producing 261.2 kW). The last object
no. 10 has a ratio of 630% (consuming 20 kW, producing 130 kW). All of them have an
assigned production potential. It can be argued that assigned production levels are too
high for these objects, however, it can also be argued that these objects should be
considered first when designing a crowd.
The ratio means that missing flow only exists at the beginning of the simulation (43.4 kW).
Furthermore, the group has an increased surplus which is accounted for by more sun
radiation rather than by the larger group size. A cell provides 150 kW on average during

Simulation of Crowd Potential
150
summer compared to 137 kW in a transition period. The even stronger independency
permits a higher surplus of 4,656.0 kW, 150.2 kW on average to be generated during 89
TPs, this is roughly distributed in a ratio of one to four between charging storage and
sharing. Around 24.36% or 1,134.4 kW is used for charging and it ensures that electricity
can be extracted during 145 TPs on average or in 86.31% of total time-points. Some
electricity remains in storage (181.9 kW) at the end of the week. It suggests that the
missing flow shown would be further reduced if a new week started and the crowd could
maintain the same production and consumption levels. Moreover, the average maximum
storage size is 19.7 kW and sizes range from 11.5 kW to 32.2kW. By considering existing
storage solutions, cells could still apply the simulated storage functionality, hence limited
storage size for simulation is not necessary in this scenario. The increased sharing of
3,521.6 kW (75.64%) to other cells undoubtedly leads to the conclusion that the high
autarkic group is the source for crowd independence. Electricity is supplied during 49 TPs
on average. The sharing behaviour from high autarkic prosumers (and also other sharing
suppliers) shows that quantities of exchange are higher than the electricity demanded at a
specific time-point. This effect is more noticeable in the transition period. There is no
external support from other cells hence it can be said that highly autarkic prosumers are
self-maintaining. Eventually, the label of highly autarkic prosumer is established.
Consumers benefit from increased sharing activities receiving 1,423.0 kW in total during
53 TPs on average. During a summer week all consumers require storage capacity and
maximum ranges are between 0.2 kW and 16.0 kW. On average, the group needs a
storage capacity of 6.3 kW. Capacity means that dependence on the missing flow is
reduced to 208.5 kW. Sixteen objects required support at the beginning of the simulation
(6 TPs) indicating, on average, a positive storage of 68.30% of total TPs. One object
required missing flow during 150 TPs on average and had few possibilities for discharging
during 7.14% (12 TPs) of total TPs.
7.2.5 Comparing Season Results of the Current Scenario
Interesting results have been found for the aforementioned seasons and more findings
can be discovered by comparing seasons. Table 29 shows that production and
consumption have convergent development reducing the difference from 16,771 kW to
671.2 kW. A reason for this is that there is more sun radiation during summer (see
appendix 10.2.1) as well as lower demand in summer, e.g. less light being used, no
heating. Production grows, on average by 10,942.7 kW and is four times higher than in an
average winter week. Conversely, consumption decreases by 5,425.6 kW or 27%. As a
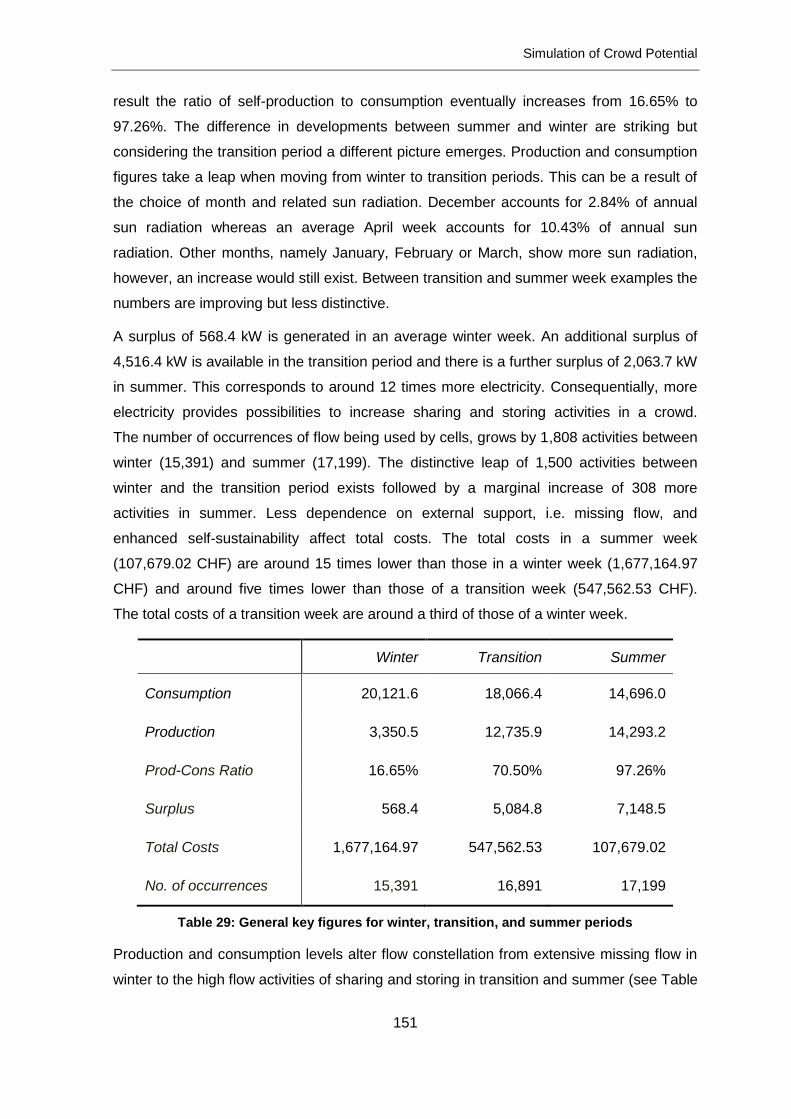
Simulation of Crowd Potential
151
result the ratio of self-production to consumption eventually increases from 16.65% to
97.26%. The difference in developments between summer and winter are striking but
considering the transition period a different picture emerges. Production and consumption
figures take a leap when moving from winter to transition periods. This can be a result of
the choice of month and related sun radiation. December accounts for 2.84% of annual
sun radiation whereas an average April week accounts for 10.43% of annual sun
radiation. Other months, namely January, February or March, show more sun radiation,
however, an increase would still exist. Between transition and summer week examples the
numbers are improving but less distinctive.
A surplus of 568.4 kW is generated in an average winter week. An additional surplus of
4,516.4 kW is available in the transition period and there is a further surplus of 2,063.7 kW
in summer. This corresponds to around 12 times more electricity. Consequentially, more
electricity provides possibilities to increase sharing and storing activities in a crowd.
The number of occurrences of flow being used by cells, grows by 1,808 activities between
winter (15,391) and summer (17,199). The distinctive leap of 1,500 activities between
winter and the transition period exists followed by a marginal increase of 308 more
activities in summer. Less dependence on external support, i.e. missing flow, and
enhanced self-sustainability affect total costs. The total costs in a summer week
(107,679.02 CHF) are around 15 times lower than those in a winter week (1,677,164.97
CHF) and around five times lower than those of a transition week (547,562.53 CHF).
The total costs of a transition week are around a third of those of a winter week.
Winter Transition Summer
Consumption 20,121.6 18,066.4 14,696.0
Production 3,350.5 12,735.9 14,293.2
Prod-Cons Ratio 16.65% 70.50% 97.26%
Surplus 568.4 5,084.8 7,148.5
Total Costs 1,677,164.97 547,562.53 107,679.02
No. of occurrences 15,391 16,891 17,199
Table 29: General key figures for winter, transition, and summer periods
Production and consumption levels alter flow constellation from extensive missing flow in
winter to the high flow activities of sharing and storing in transition and summer (see Table

Simulation of Crowd Potential
152
30). During a winter week, missing flows cover 83.35% of consumption and was used
13,340 times. In summer, missing flows occur 908 times with 4.20% consumption
coverage. This is a reduction of 12,432 occurrences. Once more, there is a large
decrease between winter and transition (11,440.5 kW, 9,134 occurrences) followed by a
small adaption of occurrences between transition and summer (4,713.3 kW,
3,298 occurrences). On the other hand, sharing and storing flows increase between winter
and summer. In a winter week, almost all surpluses are stored (99.46%) this decreases to
51.04% in a transition week and decreases further to 40.95% in a summer week. Despite
a reduction in surplus for storing, the quantity of this flow increases by 2,030.3 kW (winter-
transition) and by 331.9 kW (transition-summer). Additionally, the number of storing
occurrences increases by 10,159 activities (winter-summer) and would imply that storing
flows are highly utilised. This alteration of activities amounts to 83.95% of summer
capacity. Storage activities are intensified but not necessarily the amount of electricity
charged per occurrence. The amount charged to the storage per occurrence is 0.2912 kW
in winter, 0.2870 kW in transition, and 0.2419 kW in summer.
Winter Transition Summer
Missing - 16,771.0 kW - 5,330.5 kW - 617.2 kW
Occurrence 13,340 4,206 908
Cons-Missing 83.35% 29.50% 4.20%
Storage 565.3 kW 2,595.6 kW 2,927.5 kW
Occurrence 1,941 9,043 12,100
Surplus to storage 99.46% 51.04% 40.95%
Sharing 3.1 kW 2,489.3 kW 4,221.0 kW
Occurrence receiver 7 1,748 2,024
Occurrence supply 7 1,654 1,927
Surplus for sharing 0.54% 48.96% 59.05%
Cons-Sharing 0.02% 13.78% 28.72%
Table 30: Key figures of flows current scenario

Simulation of Crowd Potential
153
The share of surplus used for sharing grows from 0.54% in winter to 48.96% in transition
and finally to 59.05% in summer. The sharing capacity grows between winter and
transition by 2,486.2 kW and increases again between transition and summer by
1,731.7 kW. Sharing activities are capable of covering a maximum of 28.72% of
consumption in the summer period. Along with more kW, the flow intensifies by 1,920
sharing occurrences (winter to summer). Internal suppliers provide around 0.44 kW
electricity per occurrence in a winter week, 1.51 kW in a transition week, and 2.19 kW in a
summer week. Both, sharing and storing increases in number of occurrence but in amount
flowing per occurrence both have opposing behaviour. Furthermore, sharing activities
indicates that there are more receivers than suppliers and hence there are more
beneficiaries per occurrence. Production same Locations of overproduction exists within
the crowd.
Another perspective on sharing behaviour can be seen by considering the distance that
electricity sent travels through the network. Figure 50 shows sharing and storing amounts
during a transition week. The dark blue bar indicates that the 2,595.6 kW of stored
electricity, which is at node 0, means electricity stays at the object. Nodes are a synonym
for object. The 2,489.3 kW of electricity for sharing is distributed according to the bars
shown where number of nodes is counted for number of nodes between supplier and
receiver. The negative nodes mean that electricity is sent to receiver nodes before the
supplier node and positive nodes mean that electricity is sent to receiver nodes after the
supplier node in the network. Around 1,165.72 kW is sent to a node before and
1,323.56 kW is sent after a supplier node. Before or after a node, the maximum distance
is around 21 to 23 nodes. Furthermore, the distribution pattern shows that 51.8% of
sharing happens within the first three nodes to either side of a building, to a close distance
around production cells. 83.2% of sharing takes place within ten nodes. 31.4% of
electricity is shared between the third and tenth node and 16.8% sharing takes place
beyond the tenth node.

Simulation of Crowd Potential
154
Figure 50: Distance of electricity distribution among cells during transition period
Sharing activities during summer week differ from the transition week mainly due to
electricity being dispersed throughout the network and the preference to share electricity
(see Figure 51). The total amount of electricity shared, 4,221.0 kW is almost equally
distributed in both directions, with 2,177.95 kW being distributed before and 2,043.06 kW
being distributed after the supply node. However, it seems that the network sends
electricity farther after a supply node (maximum of 40 nodes) than before a supply node
(maximum 22 nodes). The difference in maximum distance gives the graph its particular
shape showing skewness before and after distribution. The dispersion of electricity among
the first three nodes is 26.0% and increases to 58.0% within the first ten nodes.
Almost three quarters (73.6%) of sharing happens within the first 15 nodes. The sharing of
electricity does not follow a normal distribution shape and several peaks occurs (e.g. at
node 4, 15 and -20).

Simulation of Crowd Potential
155
Figure 51: Distance of electricity distribution among cells during summer period
A comparison of prosumer categories in winter and summer shows upwards development
from low to higher prosumer profiles (see Figure 52). Only four objects in the group of
prosumers with reduced consumption are in the same category, besides consumers,
regardless of whether it is a winter or a summer period. 69 objects are categorised
otherwise and it seems that at least two category groups are in between. The majority of
prosumers with reduced consumption develops into high temporary prosumers (22 out of
34 objects). Seven objects are even categorised as low autarkic prosumers. All prosumers
categorised as low temporary either become low autarkic prosumers (9 objects) or high
autarkic prosumers (22 objects) in a winter week. Every high temporary prosumer
becomes a high autarkic prosumer.
The difference in prosumer categorisation between winter and transition requires closer
investigation into the change in categories between the seasons. Figure 52 displays the
changes showing augmented categorisation of prosumers between winter and transition.
18 objects, which are categorised, in winter, as prosumers with reduced consumption,
become high temporary prosumers whereas 10 objects become low temporary
prosumers. Six objects remain in the same category. All objects categorised as low
temporary prosumers in a winter week develop to higher levels. In transition week four
objects are grouped as high temporary prosumers, 15 objects are categorised as low
autarkic prosumers and 12 objects are categorised as high autarkic prosumers. Members

Simulation of Crowd Potential
156
who are categorised as part of the high temporary and low autarkic groups in a winter
week are later categorised in the high autarkic group.
Figure 52: Alterations of categories in seasons
There are fewer changes to categories between transition and summer indicating that
more objects are remaining in the same category and that upwards development is mostly
to the next highest category. All 10 objects which are categorised as low temporary
prosumers in transition become high temporary prosumers. Half of objects classified as
high temporary remain in the group and the other half are low autarkic prosumers in
summer. A third (five objects) remains in the low autarkic group whereas two thirds
(10 objects) move up to the high autarkic prosumer group. All 21 high autarkic members
remained in the group as they had already reached the highest category.
The above paragraphs presented the results of the current scenario considering different
season. A summary of these results will be provided after showing the results of the future
scenario. The reason is that current and future scenarios allow providing more in-depth
insights in the crowd potential.

Simulation of Crowd Potential
157
7.2.6 Potential in a Future Scenario
The model is applied to a future scenario using different inputs for production and
consumption. A simulation of future potential should provide some insight into model
behaviour under development perspectives. In particular, developments based on
improved input variables which are envisioned by various policy makers. So, the future
scenario calculates with an 11% reduction in consumption and an increased production
performance of 43% due to technological development. The changes in consumption and
production are based on forecasts from the report (BFE, 2013), however, the development
in countries with more advanced decentralisation like Germany suggests that the future
scenario might be realised in a shorter time period like five to ten years.
The overview presented in Table 31 shows the general key figures for the future scenario
and compares the figures from current scenario. The reduction of consumption and
increase in production has a positive effect on the independence of the crowd. The crowd
is capable of reducing supply from electricity suppliers. Total autarky is not achieved due
to the lack of production performance in the winter week. The table shows that a winter
week in future scenario is similar to a winter week in current scenario except more
surpluses are available for sharing and for storing.
Winter Transition Summer
Future Current Future Current Future Current
Consumption 18,008.8 20,121.6 16,169.5 18,066.4 13,152.9 14,696.0
Production 4,791.2 3,350.5 18,212.4 12,735.9 20,439.3 14,293.2
Prod-Cons Ratio
26.61% 16.65% 112.63% 70.50% 155.40% 97.26%
Surplus 1,568.1 568.4 10,508.9 5,084.8 13,514.8 7,148.5
Total Costs 1,322,009.53 1,677,164.97 59,639.84 547,562.53 39,464.88 107,679.02
No. of occurrences
15,441 15,391 16,612 16,891 16,344 17,199
Table 31: General key figures of seasons between current and future scenario
The distribution of flow capacity is similar with 96.26% of surplus being charged and
3.74% being used for sharing (see Table 32). Furthermore, the crowd produces surplus
electricity during 17.97% of all TPs and storage is filled in 39.07% of all TPs.
The additional electricity leads to an increase in the number of activities occurrences.

Simulation of Crowd Potential
158
The improved availability of self-produced electricity reduces total costs by 355,155.44
CHF. Different results are gained in the transition and summer weeks demonstrating the
independence of a crowd and the potential beyond crowd requirements.
Winter Transition Summer
Future Current Future Current Future Current
Missing kW - 13,217.6 - 16,771.0 - 256.0 - 5,330.5 - 219.6 - 617.2
Occurrence 11,471 13,340 546 4,206 546 908
Cons-Missing
73.39% 83.35% 1.58% 29.50% 1.67% 4.20%
Storage kW 1,509.4 565.3 6,191.6 2,595.6 11,063.8 2,927.5
Occurrence 3,741 1,941 13,344 9,043 13,781 12,100
Surplus to storage
96.26% 99.46% 58.92% 51.04% 81.86% 40.95%
kW in storage
- - 2,299.0 - 7,506.0 214.4
Sharing kW 58.7 3.1 4,317.3 2,489.3 2,451.1 4,221.0
Occurrence receiver
67 7 1,265 1,748 888 2,024
Occurrence supply
66 7 1,217 1,654 880 1,927
Surplus to sharing
3.74% 0.54% 41.08% 48.96% 18.14% 59.05%
Cons-Sharing
0.33% 0.02% 26.70% 13.78% 18.64% 28.72%
Table 32: Key figures of for flows and season in current and future scenario
Both weeks in a future scenario produce a positive difference of 2,042.9 kW (transition)
and 7,286.4 kW (summer), sufficient for covering demand by own production by 112.63%
in transition and by 155.40% in summer. The ratio beyond the 100% threshold indicates
that the crowd exceeds its own requirements and this has several results. Surplus is
doubled, leaving potential for sharing and storing activities. The number of sharing and
storing occurrences in transition week is slightly lower but suggests that activities are at

Simulation of Crowd Potential
159
the same level as in current scenario. Reduced activity (difference of 855) shows that
there is less activity in a summer week despite additional electricity. A more detailed
investigation into flows and activities is provided in the next paragraph. Eventually, in both
weeks total costs crucially decrease by 487,922.69 CHF and by 68,214.14 CHF which
means expenses are roughly nine times and three times lower respectively.
The missing flow in transition and summer is used in the beginning of the simulation and
hence shows 546 occurrences in total (91 objects multiplied by 6 TPs). The coverage of
demand by missing flow is reduced to a minimum. In both cases, the generated surplus is
mainly stored and less kW is shared. In total 6,191.6 kW or 58.92% of surplus during a
transition week is charged to storage providing positive storage during 87.28% of total
TPs on average. At the end of the week, 2,299.0 kW is still available in storage for further
future use. The 41.08% or 4,317.3 kW of the surplus is used for sharing and covers
26.70% of the consumption. The focus on storing activities results in an increasing
number of occurrences of storage activities (47.56%) and a reduction in sharing activities
(26.42% of supplier occurrences).
The picture is even distinctive during a summer week. The majority of electricity, (81.86%,
11,063.8 kW) is stored whereas 18.14% (2,451.1 kW) is used for sharing. The future
scenario indicates a considerable reduction in sharing (54.33% supplier occurrence) and
an increase of storing activities (13.89%). The reduced number of sharing activities means
that 18.64% of demand is covered by sharing. Increased storage capacity leads to
positive storage during 90.14% of total TPs on average. Furthermore, the crowd has
7,506.0 kW of available electricity in storage at the end of the week. The reason for
transition and summer surplus in storage is an unlimited capacity of storage. The average
storage capacity is around 17.6 kW (transition) and 46.5 kW (summer) and some cell
capacities go beyond current storage solutions, hence simulations for both periods were
carried out with a limited capacity of 30 kW.
The consequence is that dominant storage is reduced and activities are shifting to
sharing. In more detail it means that during transition the surplus is distributed between
49.80% for storing and 50.20% for sharing. Sharing covers 32.63% of demand.
Storage holds, on average, 15.5 kW and provides electricity for 91.50% TPs in total.
Additionally, an overflow of 3.4 kW is generated. The varied storage capacities raise total
costs to 98,319.29 CHF. Storage limits have a stronger effect on the simulation results
during a summer week. The share for storing decreases to 74.79% leaving 25.21% for
sharing. The shift means that storage holds, on average, 12.7 kW and provides electricity
for 78.21% of all TPs. The enhanced sharing activities cover 25.90% of total consumption.

Simulation of Crowd Potential
160
Eventually, storage facilities reach maximum capacity and demand is saturated by
exchange. Therefore the crowd produces a 333.9 kW surplus and according to model
design, penalising overflow, increases the total costs to 535,039.59 CHF.
The categorisation reflects enhanced production performance (see Figure 53).
Fifty objects are defined as having a lower prosumer profile, i.e. there are 19 objects with
reduced consumption and 31 low temporary objects in a winter week. A considerable
increase happens in the temporary high category with 21 objects compared to current
scenario which had eight objects in this category. Growth occurs at the expense of less
prosumers in the reduced consumption category.
Figure 53: Categorisation of cells seasons future scenario
The transition week distinctively shifts objects to the upper categories minimising
prosumer with reduced consumption and low temporary categories. There is an immense
increase in the high autarkic prosumer and a decent increase in the low autarkic group.
High temporary prosumer groups have a stable number of members. The upwards trend
of categorisation continues in the summer week leaving lower categories almost empty.
The high temporary group shrinks to eight objects whereas low and high autarkic groups
increase by six and seven members respectively. The final picture shows a shift to the two
upper categories with 64 objects in total.
The sharing behaviour among the objects during a transition period in a future scenario
shows specific distribution behaviour (see Figure 54). Electricity is shared slightly more
often after a supply node (2,578.9 kW) than before a supply node (1,738.5 kW).
This tendency is also reflected in the fact that sharing distance reaches a maximum 35
nodes after a supply node whereas 16 nodes is the maximum before a supply node.
Furthermore, sharing is concentrated very close to a supply node 60.4% (2,607.1 kW)
within the first four nodes and 75.8% (3,274.3) within the first 10 nodes.
Categories
Cons
umer
Pros
. red
. C.
Pros
. Tem
p. L
.
Pros
. Tem
p. H
. (+)
Pros
. Aut
. L.
Pros
. Aut
. H.
Winter 17 19 31 21 (6) 2 1
Transition 17 2 2 21 (6) 10 39
Summer 17 - 2 8 (1) 16 48

Simulation of Crowd Potential
161
Figure 54: Distance of electricity distribution among cells (transition week, future scenario)
A slightly different situation in sharing behaviour exists when a limitation on storage is
implemented generating a higher exchange in amount and longer exchange distance for
electricity (see Figure 55). There is still a tendency to deliver electricity after a node
(maximum 44) rather before a node (maximum 28). The shared amount within the first
four nodes is 1,706.1 kW and corresponds to 32.3% of total sharing. Slightly more than
half of all exchanges (55.1% or 2,910.3 kW) happen within the first ten nodes. More than
three quarters (78.3% or 4,141.5 kW) of sharing activities take place within the first
20 nodes, showing a wider dispersion of exchange behaviour.
Figure 55: Distance of electricity distribution among cells (transition week, limited storage)

Simulation of Crowd Potential
162
The unlimited storage scenario results in unique sharing behaviour during summer.
The exchange of electricity is concentrated around four to six nodes around a supply
node. Furthermore, 80.9% (1,983.8 kW) of electricity is delivered within the first two
nodes. By considering the production-consumption ratio of cells and a strong
independency of cells this means that electricity can be shared with nodes which are
close by. This might also result from the constellation of production performance and
demand locations. Nevertheless, the distance is significantly reduced. Using the
simulation the same summer scenario with limited storage, sharing changes to more
distributed behaviour. There is still a concentration around nodes four to six, however
deliveries extend to nodes -25 and 40 with a skewness to after a supply node.
The dispersion implies that 56.7% (1,846.6 kW) of electricity is exchanged within the first
two nodes and at a distance of five nodes 87.0% (2,832.5 kW) of electricity has already
been delivered. The residual electricity (575.6 kW) is exchanged beyond node five.
7.2.7 Findings Crowd Potential
The objective of the model was to determine the potential of a crowd by minimising the
costs for electricity distribution. A specified cost structure, preferring local production-
consumption over feeding into the external network, was established leading to certain
storing and sharing behaviour within a crowd. Thus, the model design specifies the
context in which findings can be discussed. The following paragraphs describe the
findings of the crowd potential according to the model design and are summarised in
Table 33.
The results of the current scenario were expected to show a heavy dependency on
external supplies (missing flows) in a winter week, a mixed picture using external, sharing
and storing flows in the transition period, and mainly storing and sharing flows in a
summer week. A first conclusion is that the potential to create independency of a crowd
from external electricity suppliers exists for specific points in time and seasons.
The simulation also suggests that independency throughout the year could not be
achieved by adapting production and consumption numbers according to a future
scenario. The effect is that independency from external suppliers will only be sustained for
longer, meaning that a crowd already shows independent behaviour during the transition
period. Therefore, a crowd which would like to achieve independency throughout the year,
cannot solely rely on PV facilities and must implement less volatile production forms.
By minimising transportation costs, the simulation shows that an object is earlier and
longer independent than a crowd independency. The cell’s independency derives from

Simulation of Crowd Potential
163
enhanced storing activities. This implies that an enforced “ego-centric” behaviour has no
negative impacts on a crowd’s independency. It minimises the demand of electricity from
the crowd. Consequently, a cell indirectly supports the crowd’s independency; thereby the
cell’s independency becomes a crucial factor for electricity management, besides the
active sharing of electricity.
Potential
A. Independency of a crowd from external electricity supplier exists for specific
points in time and seasons.
B. In a future scenario, independency throughout the year will not be able to be
achieved either. However, independency will be sustained for longer.
C. In general, independency of single cells is achieved earlier and is maintained
longer than crowd independency.
D. Sharing is a deliberate activity.
E. Sharing means that higher quantities are delivered immediately and are
gradually consumed.
F. The production-consumption ratio influences the favouring of storing or sharing
and can be defined as follows:
a. A low ratio (>75% self-maintenance) favours storing activities
b. A ratio closer to independency (100% self-maintenance) favours sharing
activities
c. A ratio above 100% favours storing activities.
G. The categorisation of prosumers is dynamic and depends upon the time of
observation
Table 33: Findings of crowd potential
On the other hand, sharing behaviour in a crowd shows some specific characteristics.
In general, sharing makes a smaller contribution to covering the consumption within a
crowd. The simulations show that sharing should be applied when it is needed rather
applied constantly. The need derives from the necessity to avoid shortages in the crowd

Simulation of Crowd Potential
164
and this is possible when electricity is available for sharing. Thus, sharing is a deliberate
activity. Furthermore, the simulations indicate that a sharing activity at a specific point in
time can involve the delivery of higher quantities. The shared quantity is stored and is
gradually consumed. Such a sharing behaviour occurs multiple times within the simulated
weeks and indicates that the determination of sharing quantities considers the current and
future demand of other crowd members. Thus, delivery time and utilisation of shared
electricity become crucial in the electricity management.
Another finding of the simulations is that the overall production-consumption ratio of a
crowd favours either storing or sharing activity. Hence, certain ratios define storing and
sharing dominance and can be summarised according to the following pattern. First, the
simulation shows that a low ratio favours storing activities. The reason is that the small
amount of available surplus is used to maintain electricity within a cell. The results
suggest that a low ratio would roughly be defined below 75%. Secondly, a ratio closer to
100% self-maintenance of a crowd with self-produced electricity shows that sharing
activities are favoured. The reason is that some cells are self-maintaining and are
constantly producing surpluses. These cells develop to a source for sharing; the crowd
establishes a surplus and shortage locations. A crowd, being close to self-maintenance,
establishes maximum sharing activities in distance and quantities. Lastly, the simulation
shows that a production-consumption ratio above 100% – a total maintenance with self-
produced electricity exists – favours storing activities. The reason is that each cell is self-
supporting and produces enough surpluses, even those who were not able to cover their
own demands before, and hence less electricity must be exchanged. Exchanges only
occur to those objects which have no production. The crowd shows an overflow of
electricity and would be able to provide it to other crowds.
A last finding from the simulation concerns the prosumer categorisation which supports
the understanding of a crowd potential from a member perspective. A finding in regard to
categorisation is that a building can be assigned to various prosumer categories
depending on the time of observation. Thus, categorisation of buildings should be
dynamic. Another conclusion is that parameters of production-consumption ratio, surplus
quantity, and quantity for supplying sharing activities are good indicators for
categorisation.

Conclusions and Recommendations for Future Research
165
8 Conclusions and Recommendations for Future Research
This chapter synthesises the findings presented in chapter 6.2 and 7.2 and constitutes the
closing step according to the outline of the dissertation (see Figure 2, page 9).
The chapter elaborates on the Crowd Energy concept (see chapter 3, page 46) from a
value network perspective and the sustainable integration of all stakeholders, in particular
crowds and their members. By pooling resources together, a crowd generates an internal
coherency. Furthermore, a crowd’s coherency, defined by strength (i.e. working together)
and potential (i.e. producing enough electricity), shows dependency (or independency) of
external stakeholders.
As a result, the closing chapter’s objective is to answer the proposed research questions
by characterising a CE value network (chapter 8.1.1), crowd strength (chapter 8.1.2) and
potential (chapter 8.1.3). Finally, the chapter describes the limitations of this explorative
research study (chapter 8.2) and provides recommendations for future research
(chapter 8.3).
8.1 Conclusions of a Crowd Energy Value Network
This thesis contributes to the Crowd Energy research field by investigating a smart value
energy network and the sustainable integration of all stakeholders, in particular crowds
and their members. This research study showed that a crowd-based network contributes
to a sustainable future value network by introducing a local production-consumption
principle. Crowd Energy becomes the decisive concept for the energy turn around.
The bottom-up approach depends upon the behaviour of prosumers to contribute to a
community by converting tangible and intangible assets to deliverables. Thus, to build a
CE value network, the electricity industry must recognise that the value network turns into
a socio-technological system. Besides technological and economic factors, social and
individual aspects are increasingly becoming the drivers for value creation. Eventually, a
crowd-based value network is a more complex environment for value creation, defining
interrelated creation processes and various value conversion strategies, and introducing
new value types for exchange. The following paragraphs elaborate the stated conclusion
in more detail.

Conclusions and Recommendations for Future Research
166
8.1.1 A crowd-based Network Design
The de- and realignment of the existing value creation caused by the prosumer requires
investigation into the new design including the stakeholders involved and the relationships
and types of values they exchange. Therefore, this dissertation contributes to the Crowd
Energy research field by proposing a CE value network. In order to do so, the study raised
the following research question: What does the design of the new value network in a
Crowd Energy paradigm look like? To answer the research question, a Crowd Energy
value network was conceptualised according to a network value analysis approach
(see chapter 5.1.4, p. 81). The gained insights from the various findings for crowd strength
and potential allow to confirm some conceptual considerations.
A first affirmation is that a crowd will be created and hence a restructuring of the value
network will be initiated. There are two factors which assume a crowd development:
First, the emergence of the prosumer role. The stated willingness of individuals to invest in
infrastructure indicates that consumers get to like the idea of being a prosumer (see Table
11, p. 108). They assign a high relevance to an iGSL system. Second, individuals stated a
willingness to work together in a crowd (see Table 19, p. 123). It shows that a prosumer
role concerns itself with individual and community related questions. The emergence of
crowds in the value network means that a further stakeholder enters the market; thereby
the crowd gains some leverage. Table 19 (p. 123) indicates that a crowd can have a
dominant influence on the value network because of its size of a block/suburb or even
village. Depending on the potential of a crowd, this could mean less dependency (e.g.
electricity providers) or high importance due to a very lucrative business (e.g. service
provider). External stakeholders are confronted with a partner who presents or even
dictates challenges. This leads to an increase of service offerings and complexity. As a
consequence, a restructuring of the value network is initiated and eventually alters roles
and relationships.
The proposed crowd-based network in chapter 5.1.4 emphasises such a decentralisation
of value creation and certain structure alterations can be affirmed. Even though
responsibility is assigned to the electricity provider, the results of the crowd potential
(see chapter 7.2, p. 130) suggests that, overall, the dependency of crowds on electricity
providers will be reduced. Hence, in a crowd-based structure, electricity providers are
required as a backbone. On the other hand, prosumers recognise the service provider as
a role responsible for electricity management (see Table 11, p. 108). From the conceptual
service provider role description, i.e. translation of expectations of a crowd into services
and support of the crowd coherency, it can be expected that a close relationship will be

Conclusions and Recommendations for Future Research
167
established as electricity management is located inside a crowd. Provided services are
highly customised. All managing tasks are canalised through the service provider and
cause additional reduction of dependency on electricity suppliers. For the relationship
between a crowd and supportive roles (i.e. manufacturers of decentralised solutions and
appliances) no evidences could be established. However, it can be assumed that the
linkages are based upon mutually beneficial business aspects. Manufacturers are
required for the creation of innovative products and services, and the crowd is interested
in obtaining excellent solutions to support independency of a crowd from external
suppliers.
Besides the structure of the crowd-based value network, findings suggest essential
requirements for cooperation in and with a crowd. A crowd establishes specific
characteristics, which defines the requirements for the formation of a crowd.
In consequence, these requirements are, likewise, the driver for defining interrelationships
with other stakeholders. The findings regarding strength and potential lead to the
conclusion that the following crowd characteristics are essential for relationships. First, a
community shows a certain protective behaviour about their deliverables (i.e. electricity)
by assigning a higher value to self-produced electricity (see Table 17, p. 118). Such an
endowment indicates that electricity management prefer the handling of self-produced
over external electricity. Negative impacts on the availability of self-produced electricity
will be avoided. The second characteristic of a crowd is a transparent cooperation.
Transparency emphasises a critical factor for participating and maintaining a relationship
(see Table 19, p. 123) and refers to a transparent process for electricity and information
exchange. A last characteristic of a crowd refers to an increased exchange based upon
intangible values (e.g. emotions). The influx of intangibles derives from the following
findings: a) relevance of personal willingness in a crowd (see Table 19, p. 123),
b) requirements of transparency which supports trust and hence stimulates intangibles
values, and c) decision making of prosumers to share or to store (see Table 17, p. 118).
In conclusion, the value creation requires the addressing of these criteria. Furthermore,
specification of these criteria, e.g. what is expected and what is non-permissible, by
stakeholders is mandatory. An insufficient consideration by any stakeholder builds up a
barrier, minimising cooperation and eventually negatively influencing the dynamic of the
entire value network.

Conclusions and Recommendations for Future Research
168
8.1.2 Conclusions of Crowd Strength
The insight of a crowd-based network development indicates the close examination of the
ability of prosumers to convert values to deliverables. Deliverables, i.e. electricity and
infrastructural resources (e.g. storage), constitute the backbone of a crowd and depend
upon the prosumer’s preference. Thus, this research study contributes to the CE research
field by proposing and answering the research question: How does a prosumer define the
conversion of tangible and intangible assets into deliverables? To answer the question,
factors for the crowd strength were defined (see chapter 5.2.1, p. 84) according to the
value conversion model, data were gathered through an online survey and findings were
presented in chapters 6.2.2 (p. 102), 6.2.5 (p. 118) and 6.2.7 (p. 123). The following
paragraphs elaborate on the findings of the prosumer’s value conversion strategy in more
detail.
As mentioned in chapter 8.1.1, prosumers are willing to invest in infrastructure and
cooperate within a community, and these are both preconditions to convert tangible and
intangible assets into deliverables. A further condition is transparency, emphasising a
critical factor for maintaining conversion. Introduced intangible values are a further factor
for stimulating conversion. An insufficient consideration of such values causes minimised
efforts to convert assets into deliverables and eventually negatively influences the
dynamic of the crowd.
Prosumers prefer to participate in a local production-consumption community, the size of
a block or suburb. The preferred size for participation indicates a less clannish group.
It was expected that familiarity with members of the crowd was necessary, which is more
established in smaller groups. Instead, it seems that prosumers desire certain anonymity
when contributing. However, anonymity is not favoured in all areas of a crowd.
Transparency of electricity management, including the adequate sharing of information, is
the common characteristic for dynamic and active participation. So, participation and
hence the delivery of value is determined by anonymity and transparency.
Besides the crowd’s size, the preference of prosumers for self-produced electricity
influences the conversion strategy. The endowment of self-produced electricity places a
greater value on self-produced electricity when a prosumer has established ownership.
Thus, conversion of tangible and intangible assets occurs only for prosumer’s benefit by
consuming or storing. A prosumer might show protective behaviour; negative impacts are
avoided at any circumstances. To secure sharing, a crowd must establish moral concepts
to influence the prosumer’s conversion strategy by associating the same value to self-
produced as to crowd produced electricity. An endowment of all self-produced electricity

Conclusions and Recommendations for Future Research
169
within the crowd emerges and strengthens crowd cooperation. As a conclusion, a
conversion strategy depends not only on the quality of the individual value perception but
also on the quality of a crowd to establish moral concepts.
The decision making of a prosumer has a significant influence on the delivery of values to
the value network. Thus, this research pays particular attention to decision making
behaviour. Table 17 (p. 118) confirms that different decision making strategies exist and
prosumers are distinguished into two groups: adaptive and non-adaptive. Prosumers with
non-adaptive decision making behaviour will act in a risk averse manner, i.e. showing
mainly autonomous behaviour, regardless of weather forecasts. The adaptive group alters
decisions from a risk seeking to a risk averse behaviour depending on the dimensions of
the weather forecast and the time period. In general, prosumers in the adaptive group are
risk averse when bad weather and risk seeking when sunny weather is expected.
These dimensions create a decision matrix shown in Figure 39 (p. 119). Nevertheless, the
occurrence of risk averse and risk seeking behaviour suggests that prosumers will have
different strategies to convert assets. Furthermore, both behaviours indicate different
reasoning for prosumer’s decision making.
The risk averse behaviour of non-adaptive prosumers expresses decision making
accompanied by negative feelings (i.e. fear of disappointment or losses). Probably, the
endowment of self-produced electricity is more distinctive. A conversion strategy is
restrictive and self-centric. Any compensation for losses must outweigh personal interests;
financial offers might show a low impact. Restraints, through regulations set by the crowd,
could have an unfavourable effect on cooperation. The crowd must rather achieve
influence by the previously mentioned moral concept, thus addressing fears through
providing security of supply through a community. This is also applicable for adaptive
prosumers when they show risk averse behaviour. Risk seeking behaviour expresses
decision making accompanied by positive feelings (i.e. hope to gain or hope to avoid
losses). The conversion strategy is also self-centric but unrestrictive. External options are
considered in the decision making and can include buying electricity but also sharing and
expecting a benefit later. Thus, options must fulfil the hope of large gain or avoid losses.
To sum up, influencing the conversion strategy of prosumers means addressing fears and
hopes.
A different conversion strategy of prosumers to deliver value is applied for storage
capacities. Findings suggest the following characteristics: In general, a prosumer with
higher storage capacities expresses a higher need to fill to capacity. This implies that a
cell would store all electricity until storage capacity was reached. On the other hand,

Conclusions and Recommendations for Future Research
170
prosumers reduce consumption to extend the benefit of storage before buying electricity
from external suppliers. This indicates that stored electricity seems to be valuable.
The intention to buy capacities from prosumers requires financial compensation.
Electricity as compensation object would be acceptable but less dominant than financial
ones. The compensation for the prosumer is determined by the price they would obtain
during discharging storage. Such an expected price perception from the prosumer can
differ from the current market price; most likely on sunny summer days. This leads to the
following implications: a) prosumers are restricted to sell electricity and b) there are
minimised storage capacities available for general load balancing tasks. Thus, the finding
proposes to consider the factor “storage level” in price determination models and in
dynamic pricing algorithms.
8.1.3 Conclusions of Crowd Potential
The foundation of a crowd is the ability to produce enough electricity for exchange and
balance load between surplus and shortage locations. The effect is a certain
independency from external resources. The exchange can be regarded as the
optimisation of flows among members or rather the minimisation of transportation costs.
As on these terms, the research study contributes to the CE research field by proposing
and answering the research question: What is the potential of Crowd Energy? To answer
the question, factors for crowd potential were defined according to supply chain
optimisation (see chapter 5.2.2, p. 87), data were gathered through simulation of a
transformer station and findings were presented in chapter 7.2.7 (p. 162). The following
paragraphs elaborate on the findings of crowd potential in more detail.
The simulation of the crowd potential shows that independence of a crowd can be
achieved for specific points in time in transition periods (around lunch time) or throughout
a summer week. The potential is achieved with a well-resourced but not fully fitted crowd.
This means that not all objects have installed infrastructure for production or must
necessarily have excellent production performances. Based on future consumption and
production and the same infrastructure, independence of a crowd will already be achieved
in transition periods. But, to create absolute independency, a crowd must install more
production capacity, or less volatile production forms to compensate low production
periods. Nevertheless, by following the local production-consumption principle, a crowd
contributes to the energy turnaround and reduces the demand from external resources.
The conclusion contradicts studies like (Bouffard & Kirschen, 2008; MIT, 2011; Pudjianto,

Conclusions and Recommendations for Future Research
171
Ramsay, & Strbac, 2007) indicating that a decentralised system is insufficient for the
energy turnaround.
The potential of a crowd is achieved by well-managed storing and sharing activities.
In general, a crowd should regard storing as a basic activity whereas sharing becomes
essential in specific situations. The conclusion is based on the optimisation of
transportation costs where shorter distances are preferred, indicating that flows within
cells are favoured (i.e. storing), over flows between crowds (i.e. sharing). Consequentially,
the crowd should show enhanced storing activities. An effect is that storing supports the
fortification of cells and reduces the number of requests made to the crowd. Thus, an
insight is that a cell’s independency becomes a value delivered to the network.
Nevertheless, the simulation proved that storing is indeed a basic activity. However, the
dominance of storage diminishes, and even sharing becomes dominant, depending on the
overall production-consumption ratio of a crowd. The simulation suggests that the highest
number of sharing activities occurs when there is a close production-consumption ratio.
In situations where crowd potential is insufficient, a crowd mainly lacks the availability of
electricity rather than decision choices. In situations where production exceeds demand,
sharing activities and the need for decision making is likewise reduced due to the
increased independency of cells.
The gained insight in the storing-sharing activities pattern according to the production-
consumption ratio is beneficial for the development of an electricity management strategy.
The model assumed no restrictions for sharing from individuals, however, discussing
potential implies the consideration of the decision making behaviours (see chapter 8.1.2).
The insight that prosumers show less risk seeking behaviour suggest a reduced sharing
behaviour depending on few adaptive prosumers and occurring when sunny weather is
forecast. It does not necessarily mean that a crowd’s independency would be negatively
affected. But, a prosumer ideally chooses to share when sharing is required from an
optimisation perspective. It is likely that both are not always aligned. Hence, a future
crowd electricity management must consequentially accomplish several things for
ensuring sharing activities. Firstly, a crowd must ensure that individuals build up sufficient
infrastructure. This depends on the characteristics of buildings and the area. Support from
a crowd for individuals is necessary. Secondly, a crowd ensures independency by
addressing a prosumer’s motivation for sharing. The goal is to generate affection and
prosumers are self-motivated to share electricity. This is achieved by offering benefits,
and defining common objectives and moral values. Lastly, a crowd must also introduce
community-based regulations focusing on crowd welfare and overruling individual

Conclusions and Recommendations for Future Research
172
preferences at specific times. Such rules must be openly communicated and accepted by
the prosumers.
In regard to infrastructure to ensure potential, two conclusions of the optimisation can be
drawn to design a crowd. Consumers likewise require the installation of storage
capacities. This is because of the delivery of higher quantities of electricity which are
consumed only gradually over time. Therefore, storage management involves all
members of a crowd. The approach of “higher quantities as needed” requires less
interference in prosumer decision making and crowd request for sharing. The approach
may reduce conflicts between a prosumer and the crowd. Eventually, all objects in a
crowd are involved in generating independency, even if not necessarily all objects
produce electricity. Another suggestion for crowd design is that the imperative storage
capacity intention, as big as possible, is inconclusive from a prosumer perspective.
Prosumers neglect the best option proposing a new perspective of defining required
storage capacity. A crowd’s endeavour to increase storage capacities entails convincing
prosumers of the common rather than the individual benefit.
A last finding drawn from the simulation concerns the prosumer’s contribution to the
crowd. The prosumer categorisation suggests a broad variety of contributions.
The considering factors of individual production-consumption ratio, the amount of surplus
realised, and storing and sharing activities, show that the contribution of a prosumer
varies over time and season. Hence, the categorisation of prosumers and their potential is
dynamic. It also implies that the current notion of prosumer must be extended to providing
different types of prosumer.
8.2 Limitations of the Thesis
The research conducted gained insights into the Crowd Energy value network and
answered the questions raised. However, any research has to acknowledge its limitations
and these will be addressed in the following paragraphs.
A limitation concerns the limited experiences and knowledge of prosumers converting
tangible and intangible assets into deliverables. A reason is the absence of crowd-based
value networks. Another is the passivity of the current demand side in the value creation.
Furthermore, the complexity of the crowd-based value network induces a certain difficulty
to understand crowd dynamics. The second limitation concerns the online survey.
The small number of respondents does not allow to generalise the results for crowd
strength. The last limitation refers to the model which allows drawing conclusions about

Conclusions and Recommendations for Future Research
173
potential. However, results cannot be generalised or more in-depth insights of crowd
potential are non-admissible.
8.3 Recommendations for Future Research
This research study recommends elaborating on the prosumer behaviour in regard to
value conversion of deliverables. It is necessary to develop more in-depth knowledge
about relevant factors for converting assets. In particular, research should focus on
decision making regarding sharing and storing. An investigation into relevant factors for
altering decisions beyond the financial realm would be beneficial. Furthermore, it is
recommended to investigate in negative effects, e.g. free-rider problematic, on the
behaviour of crowd members. It is also of interest to conduct research regarding the
influence of intangible values on regulating or controlling negative behaviour. In order to
generalise results for value conversion strategy, it is necessary to create a greater
sample. A strategy would be to work together with electricity providers, governmental
institutions or other associations in the electricity industry. However, to deal with the
complexity of crowd-based value networks, this research recommends utilising simulation
experiments rather than surveys. Experiments permit to generate a crowd-based
environment which allows individuals to understand and reflect on actions. Additionally,
experiments ensure the investigation on more complex questions like the effects of free
rider problematic on decision making.
Another recommendation for future research is to look at information and its role as a
currency for exchange. In particular, the evaluation of information and hence the definition
of value for exchange is an emerging field; thereby research should consider differences
in evaluation between social, business and governmental roles. Additionally, the barriers
and negative effects of information as a currency with regard to securing crowd
functionalities should be explored. Investigations should consider a flexible information
management approach where all stakeholders’ perspectives on information are
considered. A critical element of the information management approach is the
establishment of an information culture and embedding it in the existing environment.
Finally, this research recommends exploring the modelling and simulation of crowds.
The defined model in this research achieved to show the crowd potential by minimising
transportation costs. But, the exploration of the potential requires more in-depth insights.
A first improvement of the model is the integration of non-adaptive and adaptive decision
making behaviour; thereby the model takes account of social and individual aspects.

Conclusions and Recommendations for Future Research
174
Furthermore, a refinement of the cost structure would be beneficial to the investigation of
scenarios of various price constellations and possible pricing strategies for sharing within
crowds. Lastly, to show valuable insights for engineering, the model should consider
network configuration and related factors like capacities of wiring or transformers.
Furthermore, technical parameters like the charging of storages would allow to refine the
gained insights. Consequently, conclusions about the specific efforts for exchange can be
calculated.

Bibliography
175
9 Bibliography
ABB Schweiz and Elektrizitätswerk Zürich. (2012). EKZ und ABB nehmen grösste Batterie der Schweiz in Betrieb. Zürich and Switzerland. Retrieved from http://www.ekz.ch/content/ekz/de/ueberuns/medien/medienmitteilungen/archiv2012/batteriespeicher/jcr:content/contentPar/download/downloadList/23\textunderscore 1331541986751/file.res/2%20%20MM-Batteriespeicher.pdf
Abhari, R., Andersson, G., Banfi, S., Bébié, B., & Boulouchos, K. (2012). Zukunft Stromversorgung Schweiz. Retrieved from Akademien der Wissenschaften Schweiz website: http://proclimweb.scnat.ch/portal/ressources/2402.pdf
Abrahamse, W., Steg, L., Vlek, C., & Rothengatter, T. (2005). A review of intervention studies aimed at household energy conservation. Journal of Environmental Psychology, 25(3), 273–291. doi:10.1016/j.jenvp.2005.08.002
AEE. (2015). Funktionsweise der Stromversorgung. Retrieved from http://www.unendlich-viel-energie.de/mediathek/grafiken/funktionsweise-der-stromversorgung
Akorede, M. F., Hizam, H., & Pouresmaeil, E. (2010). Distributed energy resources and benefits to the environment. Renewable and Sustainable Energy Reviews, 14(2), 724–734. doi:10.1016/j.rser.2009.10.025
Alam, M. J. E., Muttaqi, K. M., & Sutanto, D. (2013). Mitigation of Rooftop Solar PV Impacts and Evening Peak Support by Managing Available Capacity of Distributed Energy Storage Systems. IEEE Transactions on Power Systems, 28(4), 3874–3884. doi:10.1109/TPWRS.2013.2259269
Alanne, K., & Saari, A. (2006). Distributed energy generation and sustainable development. Renewable and Sustainable Energy Reviews, 10(6), 539–558. doi:10.1016/j.rser.2004.11.004
Aldabas, M., Gstrein, M., & Teufel, S. (2015). Changing Energy Consumption Behaviour: Individuals' Responsibility and Government Role. Journal of Electronic Science and Technology, 13(4), 343–348. doi:10.11989/JEST.1674-862X.505263
Allee, V. (2000). Reconfiguring the Value Network. Journal of Business Strategy, 21(4), 36–39. doi:10.1108/eb040103
Allee, V. (2008). Value network analysis and value conversion of tangible and intangible assets. Journal of Intellectual Capital, 9(1), 5–24. doi:10.1108/14691930810845777
Almeida, A. de, Fonseca, P., Schlomann, B., & Feilberg, N. (2011). Characterization of the household electricity consumption in the EU, potential energy savings and specific policy recommendations. Energy and Buildings, 43(8), 1884–1894. doi:10.1016/j.enbuild.2011.03.027
Alpiq AG. (2011). Feierlicher Baubeginn für das neue Kraftwerk von Veytaux. Veytaux. Retrieved from http://www.alpiq.com/de/news-storys/medienmitteilungen/media_releases.jsp?news=tcm:96-85527&
Amabile, T. M. (1996). Creativity in context: Update to "The Social Psychology of Creativity". Boulder, CO: Westview Press.

Bibliography
176
Andreoni, J., Harbaugh, W. T., & Vesterlund, L. (2003). The Carrot or the Stick: Rewards, Punishments and Cooperation. SSRN Electronic Journal. doi:10.2139/ssrn.436500
Arnold, M., Rui, H., & Wellssow, W. H. (2011). An approach to Smart Grid metrics. In 2011 2nd IEEE PES International Conference and Exhibition on Innovative Smart Grid Technologies (ISGT Europe) (pp. 1–7). Piscataway, N.J.: IEEE. doi:10.1109/ISGTEurope.2011.6162662
Asare-Bediako, B., Kling, W. L., & Ribeiro, P. F. (2014). Future residential load profiles: Scenario-based analysis of high penetration of heavy loads and distributed generation. Energy and Buildings, 75, 228–238. doi:10.1016/j.enbuild.2014.02.025
Asendorpf, D. (2013). Wende rückwärts: Speicherkraftwerke, wichtig für die Energiewende, lohnen sich immer weniger. Die Zeit Online, Retrieved from http://www.zeit.de/2013/17/pumpspeicherkraftwerke-energiewende
Atukeren, E., Busch, C., & Simmons-Süer, B. (2011). Elastizitäten und Substitutionsmöglichkeiten: Literaturübersicht mit besonderem Fokus auf den Schweizer Strommarkt - Studie im Auftrag der Economiesuisse (KOF Studies No. 26). Zürich.
Axpo Power AG. (2013). Zukunft Wasserkraft – Linthal 2015: Kraftwerke Linth-Limmern AG (No. 5. Auflage). Baden. Retrieved from https://www.axpo.com/content/dam/axpo/switzerland/erleben/dokumente/130429_Axpo_Zukunft_Wasserkraft_5Aufl.pdf
Baines, T. S., Lightfoot, H. W., Benedettini, O., & Kay, J. M. (2009). The servitization of manufacturing: A review of literature and reflection on future challenges. Journal of Manufacturing Technology Management, 20(5), 547–567.
Baños, R., Manzano-Agugliaro, F., Montoya, F. G., Gil, C., Alcayde, A., & Gómez, J. (2011). Optimization methods applied to renewable and sustainable energy: A review. Renewable and Sustainable Energy Reviews, 15(4), 1753–1766. doi:10.1016/j.rser.2010.12.008
Barenghi, A., Bertoni, G. M., Breveglieri, L., Fugini, M. G., & Pelosi, G. (2011). Smart Metering in Power Grids: Application Scenarios and Security. In 2011 IEEE PES Innovative Smart Grid Technologies. IEEE PES ISGT Asia 2011 Conference: Smarter Grid for Sustainable and Affordable Energy Future: November 13th-16th Perth, Australia. Piscataway, N.J.: IEEE.
Bari, A., Jiang, J., Saad, W., & Jaekel, A. (2014). Challenges in the Smart Grid Applications: An Overview. International Journal of Distributed Sensor Networks, 2014(4), 1–11. doi:10.1155/2014/974682
Basso, T., & DeBlasio, R. (2011). IEEE Smart Grid Series of Standards IEEE 2030 (Interoperability) and IEEE 1547 (Interconnection) Status. In Grid-Interop 2011 (NREL/CP-5500-53028, pp. 1–9).
Baxter, L. A., & Braithwaite, D. O. (2008). Engaging theories in interpersonal communication: Multiple perspectives / Leslie A. Baxter, Dawn O. Braithwaite, editors. London: SAGE.

Bibliography
177
Bundesverband der Energie- und Wasserwirtschaft e.V., BDEW. (2013). Vielfalt im Energiemarkt. Berlin. Retrieved from https://www.bdew.de/internet.nsf/id/5512898B85FDC9C1C12579C2004225A8/$file/Marktteilnehmer%20Energie%20aktuell_online_o_halbjaehrlich_Ki_10042015.pdf
BDEW. (2016a). BDEW-Strompreisanalyse Mai 2016. Retrieved from Bundesverband der Energie- und Wasserwirtschaft e.V. website: https://www.bdew.de/internet.nsf/id/bdew-strompreisanalyse-de?open&ccm=500030060
BDEW. (2016b). Standardlastprofile Strom. Retrieved from Bundesverband der Energie- und Wasserwirtschaft e.V. website: https://www.bdew.de/internet.nsf/id/DE_Standartlastprofile
Becker, D., Wichmann, J., & Bader, N. (2012). Effizienzmodell für Schweizer Stromlieferanten: Endbericht. Berlin. Retrieved from website: https://jus.swissbib.ch/Record/320388034
Bellarmine, G. T. (2000). Load management techniques. In IEEE SoutheastCon 2000. 'Preparing for The New Millennium' (pp. 139–145). Nashville. doi:10.1109/SECON.2000.845449
Bernoulli, D. (1954). Exposition of a New Theory on the Measurement of Risk. Econometrica, 22(1), 23. doi:10.2307/1909829
BFE. (2010). Positionspapier zu «Smart Grids». Bern. Retrieved from Bundesamt für Energie (BFE) website: http://www.bfe.admin.ch/smartgrids/
BFE. (2011a). UVEK erteilt Zusatzkonzession für das Pumpspeicherkraftwerk Nant de Drance. Bern. Retrieved from https://www.news.admin.ch/message/?lang=de&msg-id=38651
BFE. (2011b). Strompreisentwicklung in der Schweiz: Bericht des Bundesrates in Erfüllung des Postulates 08.3280 Stähelin vom 4. Juni 2008. Bern.
BFE. (2013). Energieperspektiven 2050: Zusammenfassung. Bern. Retrieved from Bundesamt für Energie (BFE) website: http://www.bfe.admin.ch/php/modules/publikationen/stream.php?extlang=de&name=de_280919633.pdf&endung=Annahmen%20und%20Methoden%20diverser%20Studien%20zu%20Energieperspektiven
BFE. (2014a). Schweizerische Elektrizitätzsstatisik 2014. Bern. Retrieved from Bundesamt für Energie (BFE) website: http://www.bfe.admin.ch/themen/00526/00541/00542/00631/index.html?lang=de&dossier_id=00763
BFE. (2014b). Faktenblatt Einmalvergütung und Eigenverbrauch für kleine Photovoltaik - Anlagen (No. 3). Bern. Retrieved from Bundesamt für Energie (BFE) website: http://www.news.admin.ch/NSBSubscriber/message/attachments/37149.pdf
BFE. (2015). Richtlinie kostendeckende Einspeisevergütung (KEV): Art. 7a EnG (No. 1.5). Bern. Retrieved from Bundesamt für Energie (BFE) website: http://www.bfe.admin.ch/themen/00612/02073/index.html?lang=de&dossier_id=02168

Bibliography
178
BfS. (2015a). Bau- und Wohnungswesen - Die wichtigsten Zahlen. Retrieved from Bundesamt für Statistik (BfS) website: http://www.bfs.admin.ch/bfs/portal/de/index/themen/09/01/key.html
BfS. (2015b). Szenarien zur Bevölkerungsentwicklung der Schweiz 2015–2045. Retrieved from Bundesamt für Statistik (BfS) website: http://www.bfs.admin.ch/bfs/portal/de/index/themen/01/22/publ.Document.194809.pdf
Siemens AG, Infrastructure & Cities Sector Smart Grid Division. (2012). Siemens entwickelt europäisches Architekturmodell für Smart Grids: Methodik zum Aufbau von Smart-Grid-Projekten für Energieversorger und Industrie. Nürnberg. Retrieved from http://www.siemens.com/press/pi/ICSG201205018d
Blaschke, R., Suhrer, S., & Engel, D. (2013). Serviceoerientierte Architekturen für Smart Grids. In C. Felden (Ed.), HMD - Praxis der Wirtschaftsinformatik: Vol. 291. IT für Smart Grids. Smart Data Centers; Datenschutz durch Pseudonymität; IT-Architekturen für Smart Grids; IT-Servicekonzepte für dezentrale Energieversorgung ; Mobile Lernanwendungen für Smart Home (1st ed., HMD 291, pp. 16–25). Heidelberg: dpunkt.-Verl.
BMWI. (2015). Stromnetze der Zukunft. Berlin. Retrieved from Bundesministerium für Wirtschaft und Energie (BMWI) website: http://www.bmwi.de/DE/Themen/Energie/Netze-und-Netzausbau/stromnetze-der-zukunft.html
Bohn, D. (2005). Decentralised energy systems: state of the art and potentials. International Journal of Energy Technology and Policy, 3(1/2), 1. doi:10.1504/IJETP.2005.006736
Botsman, R., & Rogers, R. (2010). What’s mine is yours: The rise of collaborative consumption (1st ed.). New York: Harper Business.
Boudon, R. (1998). Limitations of Rational Choice Theory. American Journal of Sociology, 104(3), 817–828. Retrieved from http://www.jstor.org/stable/10.1086/210087
Bouffard, F., & Kirschen, D. S. (2008). Centralised and distributed electricity systems. Energy Policy, 36(12), 4504–4508. doi:10.1016/j.enpol.2008.09.060
Bowman, C., & Ambrosini, V. (2000). Value Creation Versus Value Capture: Towards a Coherent Definition of Value in Strategy. British Journal of Management, 11(1), 1–15. doi:10.1111/1467-8551.00147
Bowresox, D. J., Closs, D. J., & Stank, T. P. (2003). How to master cross-enterprise collaboration. Supply Chain Management Review, 7(4), 18–27.
Breuer, H., & Lüdecke-Freund, F. (2014). Normative Innovation for Sustainable Business Models in Value Networks. In K. Huizingh, S. Conn, M. Torkkeli, & I. Bitran (Eds.), The Proceedings of XXV ISPIM Conference - Innovation for Sustainable Economy and Society.
Brodbeck, K.-H. (2007). ABC der Wissenschaftstheorie für Betriebswirte. Würzburg-Schweinfurt. Retrieved from Hochschule für Angewandte Wissenschaften Würzburg-Schweinfurt website: https://opus4.kobv.de/opus4-fhws/frontdoor/index/index/docId/77

Bibliography
179
Bucklin, L. P., & Sengupta, S. (1993). Organizing Successful Co-Marketing Alliances. Journal of Marketing, 57(2), 32–46. doi:10.2307/1252025
Bühner, M., & Ziegler, M. (2009). Statistik für Psychologen und Sozialwissenschaftler. Ps Psychologie. München: Pearson Studium.
Capros, P., Mantzos, L., Tasios, N., Vita, A. d., & Kouvaritakis, N. (2010). EU energy trends to 2030: Update 2009 (Manuscript completed on 4 august 2010). Luxembourg: Publ. Office of the European Union.
Chan, M., Campo, E., Estève, D., & Fourniols, J.-Y. (2009). Smart homes - current features and future perspectives. Maturitas, 64(2), 90–97. doi:10.1016/j.maturitas.2009.07.014
Cook, K. S., Cheshire, C., Rice, E. R. W., & Nakagawa, S. (2013). Social Exchange Theory. In J. DeLamater & A. Ward (Eds.), Handbooks of Sociology and Social Research. Handbook of Social Psychology (pp. 61–88). Dordrecht: Springer Netherlands. doi:10.1007/978-94-007-6772-0
Cooper, D. R., & Schindler, P. S. (2008). Business research methods (10th ed.). New York: McGraw-Hill / Irwin; [London : McGraw-Hill.
Cooper, M. C., Lambert, D. M., & Pagh, J. D. (1997). Supply Chain Management: More Than a New Name for Logistics. The International Journal of Logistics Management, 8(1), 1–14. doi:10.1108/09574099710805556
Cox, A. (1999). Power, value and supply chain management. Supply Chain Management: An International Journal, 4(4), 167–175. doi:10.1108/13598549910284480
Davis, S., & Botkin, J. (1999). The Coming of Knowledge-Based Business. In D. Tapscott (Ed.), The Harvard business review book series: II. Creating value in the network economy (3-12). Boston, Mass., Great Britain: Harvard Business School Press.
Destatis. (2016). Bevölkerungsentwicklung, Demografischer Wandel. Retrieved from Statistische Bundesamt Deutschland website: https://www.destatis.de/DE/ZahlenFakten/GesellschaftStaat/Bevoelkerung/Bevoelkerung.html
DOE. (2011). Summary Report: 2012 DOE Microgrid Workshop. Chicago, Illinois. Retrieved from U.S. Department of Energy website: http://energy.gov/oe/downloads/2012-doe-microgrid-workshop-summary-report-september-2012
DOE/EIA. (2015). Annual Energy Outlook 2015: with projections to 2040. Washington, D.C. Retrieved from U.S. Energy Information Administration website: http://www.eia.gov/analysis/reports.cfm#/T128
Driesen, J., & Katiraei, F. (2008). Design for distributed energy resources. IEEE Power and Energy Magazine, 6(3), 30–40. doi:10.1109/MPE.2008.918703
Dunn, S. (2002). Hydrogen futures: toward a sustainable energy system. International Journal of Hydrogen Energy, 27(3), 235–264. doi:10.1016/S0360-3199(01)00131-8

Bibliography
180
E-Control. (2016). Preiszusammensetzung. Retrieved from Energie-Control Austria website: https://www.e-control.at/konsumenten/strom/strompreis/preiszusammensetzung
EDF. (2015). The EDF adventure: A global electricity generator in the spotlight. Retrieved from Electricité de France (EDF) website: https://www.edf.fr/en/the-edf-group/world-s-largest-power-company/history
Egger, S., Gstrein, M., & Teufel, S. (2015). Impact of Business Practices on Individual Energy Consumption. Journal of Electronic Science and Technology, 13(4), 349–354. doi:10.11989/JEST.1674-862X.505242
Egozcue, E., Rodríguez, D. H., Ortiz, J. A., Villar, V. F., & Tarrafeta, L. (2012). Smart Grid Security: Annex II. Security aspects of the smart grid. Greece.
ElCom. (2015). Report on the activities of ElCom 2014. Bern. Retrieved from Swiss Federal Electricity Commission ElCom website: http://www.elcom.admin.ch/?lang=en
Electrosuisse. (2015). Energie-Sonnenklar: Photvoltaik: Technik und Infrastruktur. Fehraltorf. Retrieved from Electrosuisse website: https://www.electrosuisse.ch
El-hawary, M. E. (2014). The Smart Grid‐-State-of-the-art and Future Trends. Electric Power Components and Systems, 42(3-4), 239–250. doi:10.1080/15325008.2013.868558
Engelbrecht, A., Li, X., Middendorf, M., & Gambardella, L. M. (2009). Editorial Special Issue: Swarm Intelligence. IEEE Transactions on Evolutionary Computation, 13(4), 677–680. doi:10.1109/TEVC.2009.2022002
EPRI (2014). The Smart Grid Experience: Applying Results, Reaching Beyond: Summary of Conference Proceedings. In The Smart Grid Experience: Applying Results, Reaching Beyond. California: Electric Power Research Institute.
Esser, C., Hua, S., & Morawietz, M. (Author) (2015, November 24). Allianz will Investments aus der Kohleindustrie abziehen [Television broadcast]. Frontal 21, ZDF. Retrieved from http://www.zdf.de/frontal-21/allianz-ausstieg-aus-der-kohle-41104912.html
ETP SmartGrids. (2006). Vision and strategy for Europe's electricity networks of the future: European Smartgrids Technology Platform (EUR 22040). Community research (European Commission). Luxembourg: Office for Official Publications of the European Communities.
ETP SmartGrids. (2016). The SmartGrids European Technology Platform. Retrieved from The European Technology Platform (ETP) SmartGrids website: http://www.smartgrids.eu/ETPSmartGrids
Eurostat. (2016). Electricity prices components for domestic consumers - annual data (from 2007 onwards). Retrieved from European Comission website: http://ec.europa.eu/eurostat/web/products-datasets/-/nrg_pc_204_c
Evans B., P., & Wurster S., T. (1999). Strategy and the New Economics of Information. In D. Tapscott (Ed.), The Harvard business review book series: II. Creating value in the

Bibliography
181
network economy (13-34). Boston, Mass., Great Britain: Harvard Business School Press.
Felden, C. (Ed.). (2013). HMD - Praxis der Wirtschaftsinformatik: Vol. 291. IT für Smart Grids: Smart Data Centers; Datenschutz durch Pseudonymität; IT-Architekturen für Smart Grids; IT-Servicekonzepte für dezentrale Energieversorgung; Mobile Lernanwendungen für Smart Home (1. Auflage). Heidelberg: dpunkt.-Verl.
Fischer, D., Härtl, A., & Wille-Haussmann, B. (2015). Model for electric load profiles with high time resolution for German households. Energy and Buildings, 92, 170–179. doi:10.1016/j.enbuild.2015.01.058
Flatt, M. (2010). Segmentberichterstattung von Stromverteilnetzbetreibern - unter besonderer Berücksichtigung des buchhalterischen Unbundling im Rahmen der Schweizer Strommarktliberalisierung (Dissertation). Universität St. Gallen, Hochschule für Wirtschafts-, Rechts- und Sozialwissenschaften (HSG), St. Gallen, Schweiz. Retrieved from http://www1.unisg.ch/www/edis.nsf/vEDISByTitleDE/2FBE4059B4DE44DFC125769B004BFB56
Flint, D. J., Woodruff, R. B., & Gardial, S. F. (1997). Customer value change in industrial marketing relationships: A call for new strategies and research. Industrial Marketing Management, 26(2), 163–175. doi:10.1016/S0019-8501(96)00112-5
Ford, D., Gadde, L.-E., Hakansson, H., & Snehota, I. (2011). Managing business relationships (3rd ed.). Chichester, West Sussex, U.K.: Wiley.
Forster, C. (2015). Subventionen für bestehende Wasserkraftwerke. Neue Züricher Zeitung. Retrieved from http://www.nzz.ch/schweiz/subventionen-fuer-bestehende-wasserkraftwerke-1.18599280
Galus, M. D., Koch, S., & Andersson, G. (2011). Provision of Load Frequency Control by PHEVs, Controllable Loads, and a Cogeneration Unit. IEEE Transactions on Industrial Electronics, 58(10), 4568–4582. doi:10.1109/TIE.2011.2107715
Geels, F. W. (2004). From sectoral systems of innovation to socio-technical systems: Insights about dynamics and change from sociology and institutional theory. Research Policy, 33(6-7), 897–920. doi:10.1016/j.respol.2004.01.015
Giordano, V., & Fulli, G. (2012). A business case for Smart Grid technologies: A systemic perspective. Energy Policy, 40, 252–259. doi:10.1016/j.enpol.2011.09.066
Gomber, P., Arndt, B., Lutat, M., & Uhle, T. E. (2011). High-Frequency Trading. SSRN Electronic Journal. doi:10.2139/ssrn.1858626
Grant, D. B., & Lambert, D. M. (2006). Fundamentals of logistics management (European ed. / David B. Grant … [et al.]). London: McGraw-Hill.
Greenwald, B. C., & Stiglitz, J. E. (1986). Externalities in Economies with Imperfect Information and Incomplete Markets. The Quarterly Journal of Economics, 101(2), 229–264. Retrieved from http://www.jstor.org/stable/1891114

Bibliography
182
Gstrein, M., & Teufel, S. (2014). The changing decision patterns of the consumer in a decentralized smart grid. In 11th International Conference on the European Energy Market (EEM) (pp. 1–5). doi:10.1109/EEM.2014.6861216
Gstrein, M., & Teufel, S. (2015). Crowd Energy Management: New Paradigm for the Electricity Market. Journal of Electronic Science and Technology, 13(3), 165–205. doi:10.11989/JEST.1674-862X.505091
Gulati, R., Nohria, N., & Zaheer, A. (2000). Strategic networks. Strategic Management Journal, 21(3), 203–215. doi:10.1002/(SICI)1097-0266(200003)21:3<203::AID-SMJ102>3.0.CO;2-K
Gungor, V. C., Sahin, D., Kocak, T., Ergut, S., Buccella, C., Cecati, C., & Hancke, G. P. (2011). Smart Grid Technologies: Communication Technologies and Standards. IEEE Transactions on Industrial Informatics, 7(4), 529–539. doi:10.1109/TII.2011.2166794
Haemmerle, L. (2001). Geschichte des Schweizer-Stromnetzes. Zürich. Retrieved from ETH Zürich, Power Systems & High Voltage Laboratories website: https://www.eeh.ee.ethz.ch/uploads/tx_ethpublications/pps_ws00_01_geschichte.pdf
Hamari, J., & Ukkonen, A. (2013). The Sharing Economy: Why People Participate in Collaborative Consumption. SSRN Electronic Journal. doi:10.2139/ssrn.2271971
Hayn, M., Bertsch, V., & Fichtner, W. (2014). Electricity load profiles in Europe: The importance of household segmentation. Energy Research & Social Science, 3, 30–45. doi:10.1016/j.erss.2014.07.002
Hechter, M., & Kanazawa, S. (1997). Sociological Rational Choice Theory. Annual Review of Sociology, 23, 191–214. doi:10.1146/annurev.soc.23.1.191
Henn, J., & Dubois, C. (2015). Divestment Commitments Pass the $3.4 trillion Mark at COP21. Paris. Retrieved from Fossil Free Europe website: http://gofossilfree.org/press-release/divestment-commitments-pass-the-3-4-trillion-mark-at-cop21/
Hertig, Y., & Teufel, S. (2016). Prosumer Communities: Electricity as an Interpersonal Construct. In 2016 International Conference on Smart Grid and Clean Energy Technologies (ICSGCE).
Hofbauer, I. (2006). Liberalisation, privatisation and regulation in the Austrian electricity sector. Vienna, Austria.
Hostettler, T. (2015). Markterhebung Sonnenenergie 2014: Teilstatistik der Schweizerischen Statistik der erneuerbaren Energien. Bern. Retrieved from Bundesamt für Energie (BFE) website: http://www.bfe.admin.ch/themen/00526/00541/00543/05525/index.html?dossier_id=05528&lang=de
Howe, J. (2009). Crowdsourcing: Why the power of the crowd is driving the future of business (1st paperback ed.). New York: Three Rivers Press.
Hübner, M., & Prüggler, N. (2011). Smart Grids Initiatives in Europe: Country Snapshots and Country Fact Sheets (No. 22). Wien.
Hunt, M., & Beister, H. (1992). Das Rätsel der Nächstenliebe: Der Mensch zwischen Egoismus und Altruismus (1. Auflage). Frankfurt [u.a.]: Campus-Verl.

Bibliography
183
Hürlimann, T. & Hürlimann C. (2016). Mathematical Optimization. Retrieved from http://www.virtual-optima.com/en/index.html
IAEA. (2016). The Database on Nuclear Power Reactors. Vienna, Austria. Retrieved from International Atomic Energy Agency (IAEA) website: https://www.iaea.org/PRIS/
Iansiti, M., & Levien, R. (2004). The keystone advantage: What the new dynamics of business ecosystems mean for strategy, innovation, and sustainability / Marco Iansiti. Roy Levien. Boston, Mass.: Harvard Business School; London : McGraw-Hill.
IASS. (2015). Strom umsonst? Negative Strompreise und ihre Auswirkungen. Potsdam. Retrieved from Institute for Advanced Sustainability Studies (IASS) website: http://www.iass-potsdam.de/de/forschungscluster/globaler-gesellschaftsvertrag-fur-nachhaltigkeit-gcs/news/strom-umsonst-negative
IEA. (2011). Technology Roadmap: Smart Grid. Paris. Retrieved from International Energy Agency (IEA) website: https://www.iea.org/publications/freepublications/publication/smartgrids_roadmap.pdf
Infel AG. (2010). Sehen und verstehen: Wie sich das Schweizer Stromnetz entwickelte. Retrieved from http://strom-online.ch/geschstromnetz_schaubild.html
Janzing, B. (2011). Schwaben können sogar 100 Prozent. taz Verlags u. Vertriebs GmbH. Berlin. Retrieved from http://www.taz.de/!5125338/
Kahneman, D. (2012). Thinking, fast and slow. London: Penguin.
Katsamakas, E. (2014). Value network competition and information technology. Human Systems Management, 33(1/2), 7–17.
Kaufmann, M., Koller, T., Kurchkina, D., & Stoffel, K. (2013). Induktive unscharfe Datenassoziierung - Fallstudie enersis suisse AG. In A. Meier & M. Blattner (Eds.), HMD - Praxis der Wirtschaftsinformatik: H. 293. Web Monitoring (1st ed., pp. 45–55). Heidelberg, Neckar: dpunkt.
Kaufmann, U. (2015). Schweizerische Statistik der erneuerbaren Energien: Ausgabe 2014 (Vorabzug). Bern. Retrieved from Bundesamt für Energie (BFE) website: http://www.bfe.admin.ch/themen/00526/00541/00543/?dossier_id=00772&lang=de
Kearney, A. T. (2016). Prognose zum Stromverbrauch der EU-27 für die Jahre 2010, 2015 und 2020 nach Sektoren (in Terrawattstunden). Retrieved from http://de.statista.com/statistik/daten/studie/12512/umfrage/prognose-zum-stromverbrauch-der-eu-27-bis-2020/
Keith, G., Jackson, S., Napoleon, A., Comings, T., & Ramey, J. A. (2012). The Hidden Costs of Electricity: Comparing the Hidden Costs of Power Generation Fuels: Prepared for the Civil Society Institute. Cambridge, US.
Kemmler, A., Piégsa, A., Ley, A., Wüthrich, P., Keller, M., Jakob, M., & Catenazzi, G. (2014). Analyse des schweizerischen Energieverbrauchs 2000 - 2013 nach Verwendungszwecken. Bern. Retrieved Bundesamt für Energie (BFE) from http://www.bfe.admin.ch/themen/00526/00541/00542/02167/index.html?dossier_id=02169&lang=en

Bibliography
184
Kießling, A., & Khattabi, M. (2011). Cellular System Model for Smart Grids Combining Active Distribution Networks and Smart Buildings. In N. Hatziargyriou, A. Dimeas, T. Tomtsi, & A. Weidlich (Eds.), Lecture Notes of the Institute for Computer Sciences, Social Informatics and Telecommunications Engineering. Energy-Efficient Computing and Networking (Vol. 54, pp. 225–242). Springer Berlin Heidelberg. doi:10.1007/978-3-642-19322-4\textunderscore
Kornmeier, M. (2011). Wissenschaftlich schreiben leicht gemacht (4th ed.). Berne: Haupt.
Kreusel, J. (2015). Entering a new epoch: A brief history of the electric power supply. Retrieved from Transmission & Distribution World website: http://tdworld.com/sponsored-articles/entering-new-epoch
Kuzlu, M., Pipattanasomporn, M., & Rahman, S. (2014). Communication network requirements for major smart grid applications in HAN, NAN and WAN. Computer Networks, 67, 74–88. doi:10.1016/j.comnet.2014.03.029
Kylili, A., & Fokaides, P. A. (2015). European smart cities: The role of zero energy buildings. Sustainable Cities and Society, 15, 86–95. doi:10.1016/j.scs.2014.12.003
Lasseter, B. (2001). Microgrids [distributed power generation]. In Power Engineering Society Winter Meeting (Vol. 1, pp. 146–149). doi:10.1109/PESW.2001.917020
Lawler, E. J. (2001). An Affect Theory of Social Exchange. American Journal of Sociology, 107(2), 321–352. doi:10.1086/324071
Leonardo ENERGY. (2016). Smart grid: A grid suitable for renewable energy. Retrieved from http://www.leonardo-energy.org/blog/smart-grid-grid-suitable-renewable-energy
Lepak, D. P., Smith, K. G., & Taylor, S. M. (2007). Introduction to Special Topic Forum: Value Creation and Value Capture: A Multilevel Perspective, 32(1), 180–194. doi:10.2307/20159287
Levin, I. P., Schneider, S. L., & Gaeth, G. J. (1998). All Frames Are Not Created Equal: A Typology and Critical Analysis of Framing Effects. Organizational Behavior and Human Decision Processes, 76(2), 149–188. doi:10.1006/obhd.1998.2804
Lewis, M., Portioli Staudacher, A., & Slack, N. (2004). Beyond products and services: opportunities and threats in servitization. In IMS International Forum (Vol. 1, pp. 162–170).
Mahnke, E., Mühlenhoff, J., & Lieblang, L. (2014). Strom Speichern (No. 75). Berlin. Retrieved from Agentur für Erneuerbare Energien e.V. (AEE) website: https://www.unendlich-viel-energie.de/media/file/382.75_Renews_Spezial_Strom_speichern_Dez2014_online.pdf
Maity, I., & Rao, S. (2010). Simulation and Pricing Mechanism Analysis of a Solar-Powered Electrical Microgrid. IEEE Systems Journal, 4(3), 275–284. doi:10.1109/JSYST.2010.2059110
Marzband, M., Sumper, A., Ruiz-Álvarez, A., Domínguez-García, J. L., & Tomoiagă, B. (2013). Experimental evaluation of a real time energy management system for stand-alone microgrids in day-ahead markets. Applied Energy, 106, 365–376. doi:10.1016/j.apenergy.2013.02.018

Bibliography
185
McDonell, J., Strom-Gottfried, K. J., & Burton, D. L. (2006). Behaviorism, social learning, and exchange theory. In S. P. Robbins, P. Chatterjee, & E. R. Canda (Eds.), Contemporary human behavior theory. A critical perspective for social work / Susan P. Robbins, Pranab Chatterjee, Edward R. Canda (2nd ed., pp. 349–385). Boston, London: Pearson/A&B.
Meister, U. (2008). Strategien für die Schweizer Elektrizitätsversorgung im europäischen Kontext. Zürich. Retrieved from Avenir Suisse website: http://www.avenir-suisse.ch/wp-content/uploads/2008/06/Stromversorgung_final_3.pdf
Meister, U. (2011). Pumpspeicherwerke - Investitionen mit hohen Risiken. Zürich. Retrieved from Avenir Suisse website: http://www.avenir-suisse.ch/12403/pumpspeicherwerke-investitionen-mit-hohen-risiken/
Meister, U. (2014). Überschätzter Einfluss der deutschen Energiewende auf die Schweizer Wasserkraft: Dünne Faktenbasis für zusätzliche Subventionen. Retrieved from Avenir Suisse website: http://www.avenir-suisse.ch/39307/ueberschaetzter-einfluss-der-deutschen-energiewende-auf-die-schweizer-wasserkraft/
Meng, K., Dong, Z. Y., & Qiao, Y. (2013). Swarm Intelligence in Power System Planning. International Journal of Clean Coal and Energy, 02(02), 1–7. doi:10.4236/ijcce.2013.22B001
Mentzer, J. T., DeWitt, W., Keebler, J. S., Min, S., Nix, N. W., Smith, C. D., & Zacharia, Z. G. (2001). Defining Supply Chain Management. Journal of Business Logistics, 22(2), 1–25. doi:10.1002/j.2158-1592.2001.tb00001.x
Mezirow, J. (1990). Fostering critical reflection in adulthood: A guide to transformative and emancipatory learning / Jack Mezirow and associates. Jossey-Bass management series. San Francisco: Jossey-Bass Publishers.
Millischer, S. (2012). Swisscom steigt ins Stromgeschäft ein. Handelszeitung. Zürich. Retrieved from http://www.handelszeitung.ch/unternehmen/swisscom-steigt-ins-stromgeschaeft-ein
MIT. (2011). The future of the electric grid: An interdisciplinary MIT study. Cambridge, MA.
Morgan, R. M., & Hunt, S. D. (1994). The Commitment-Trust Theory of Relationship Marketing. Journal of Marketing, 58(3), 20–38. doi:10.2307/1252308
NEA, & OECD. (2012). Nuclear energy and renewables: System effects in low-carbon electricity systems. Nuclear development. Paris: OECD.
Neidhöfer, G. (2008). Der Weg zur Normfrequenz: Wie aus einem Wirrwarr von Periodenzahlen die Standardfrequenz 50 Hz hervorging (Bulletin SEV/AES No. 17). Aarau.
Newman, M. E. J. (2003). The Structure and Function of Complex Networks. SIAM Review, 45(2), 167–256. doi:10.1137/S003614450342480
Nightingale, P. (2003). Of Barnacles and Banking: Innovation in Financial Services. In J. Tidd & F. M. Hull (Eds.), Series on technology management: Vol. 9. Service Innovation: Organizational responses to technological opportunities & market imperatives (Chapter 10). London: Imperial College Press.

Bibliography
186
Normann, R., & Ramirez, R. (2000). From Value Chain to Value Constellation: Designing Interactive Strategy. In The Harvard business review paperback series. Harvard business review on managing the value chain (pp. 185–220). Boston, Mass., Great Britain: Harvard Business School Press.
Nulty, D. D. (2008). The adequacy of response rates to online and paper surveys: What can be done? Assessment & Evaluation in Higher Education, 33(3), 301–314. doi:10.1080/02602930701293231
Nürnberger, C. (2015). Die verkaufte Demokratie: Wie unser Land dem Geld geopfert wird. München: Ludwig.
Openshaw, D., Strbac, G., & Ault, G. (Eds.) 2011. Distributed Generation and Energy Efficiency: Special Report Session 4: CIRED. Retrieved from http://www.cired.net/publications/cired2011/part2/search.html
Osterwalder, A., Pigneur, Y., & Clark, T. (2010). Business model generation: A handbook for visionaries, game changers, and challengers / written by Alexander Osterwalder and Yves Pigneur ; editor and contributing co-author, Tim Clark. Hoboken, N.J.: John Wiley & Sons.
Peppard, J., & Rylander, A. (2006). From Value Chain to Value Network. European Management Journal, 24(2-3), 128–141. doi:10.1016/j.emj.2006.03.003
Petracca, M. P. (1991). The Rational Choice Approach to Politics: A Challenge to Democratic Theory. The Review of Politics, 53(2), 289–319. Retrieved from http://www.jstor.org/stable/1407756
Pinheiro, C. A. R. (2011). Social network analysis in telecommunications. Wiley and SAS business series. Hoboken, N.J.: Wiley.
Popper, K. R. (2002). The logic of scientific discovery. Routledge classics. London, New York: Routledge.
Porter, M. E. (1985). Competitive advantage: Creating and sustaining superior performance. New York and London: Free Press and Collier Macmillan.
Pudjianto, D., Ramsay, C., & Strbac, G. (2007). Virtual power plant and system integration of distributed energy resources. IET Renewable Power Generation, 1(1), 10. doi:10.1049/iet-rpg:20060023
Ramsay, J. (2005). The real meaning of value in trading relationships. International Journal of Operations & Production Management, 25(6), 549–565. doi:10.1108/01443570510599719
Richtlinie 96/92/EG des Europäischen Parlaments und des Rates vom 19. Dezember 1996 betreffend gemeinsame Vorschriften für den Elektrizitätsbinnenmarkt, Europäischen Parlaments und des Rates 30.01.1997. 31996L0092
Rieger, W. (1984). Einführung in die Privatwirtschaftslehre (3., unveränd. Aufl.). Erlangen: Palm & Enke.
Robinson, T., Clarke-Hill, C. M., & Clarkson, R. (2010). Differentiation through Service: A Perspective from the Commodity Chemicals Sector. The Service Industries Journal, 22(3), 149–166. doi:10.1080/714005092

Bibliography
187
Rosen, C., & Madlener, R. (2013). An auction design for local reserve energy markets. Decision Support Systems, 56, 168–179. doi:10.1016/j.dss.2013.05.022
Rui, H., Arnold, M., & Wellssow, W. H. (2012). Synthetic Medium Voltage Grids for the Assessment of Smart Grid Techniques. In 2012 3rd IEEE PES Innovative Smart Grid Technologies Europe (ISGT Europe) (pp. 1–8). Berlin: IEEE PES.
Ryan, R. M., & Deci, E. L. (2000). Intrinsic and Extrinsic Motivations: Classic Definitions and New Directions. Contemporary educational psychology, 25(1), 54–67. doi:10.1006/ceps.1999.1020
Sánchez-Fernández, J., Muñoz-Leiva, F., & Montoro-Ríos, F. J. (2012). Improving retention rate and response quality in Web-based surveys. Computers in Human Behavior, 28(2), 507–514. doi:10.1016/j.chb.2011.10.023
Sapar, A. F., Gan, C. K., Ramani, A. N., & Shamshiri, M. (2014). Modelling and simulation of islanding detection in microgrid. In 2014 IEEE Innovative Smart Grid Technologies - Asia (ISGT ASIA) (pp. 641–646). doi:10.1109/ISGT-Asia.2014.6873867
Sargent, R. G. (2005). Verification and validation of simulation models. In Winter Simulation Conference (pp. 130–143). Orlando, Florida: I E E E.
Sauermann, H., & Roach, M. (2013). Increasing web survey response rates in innovation research: An experimental study of static and dynamic contact design features. Research Policy, 42(1), 273–286. doi:10.1016/j.respol.2012.05.003
Schellekens, G., McDonnell, J., Battaglini, A., Lilliestam, J., & Patt, A. (2013). 100% renewable electricity: A roadmap to 2050 for Europe and North Africa. United Kingdom.
Schicht, R., Müller, M., Niemeyer, C., Frank, M., Stefan, M., & Meier, M. (2012). Schweizer Stromwirtschaft zwischen Abwarten und Aktivismus. Standortbestimmung der Schweizer Energieversorgungsunternehmen. Zürich.
Schmalenbach, E. (1911/1912). Die Privatwirtschaftslehre als Kunstlehre. Zeitschrift für handelswissenschaftliche Forschung, 6, 304–316.
Scott, W. R. (2014). Institutions and organizations: Ideas, interests, and identities / W. Richard Scott, Stanford University (Fourth edition). London: Sage Publications Ltd.
Seo, Y.-K., & Hong, W.-H. (2014). Constructing electricity load profile and formulating load pattern for urban apartment in Korea. Energy and Buildings, 78, 222–230. doi:10.1016/j.enbuild.2014.03.007
Shariatzadeh, F., Mandal, P., & Srivastava, A. K. (2015). Demand response for sustainable energy systems: A review, application and implementation strategy. Renewable and Sustainable Energy Reviews, 45, 343–350. doi:10.1016/j.rser.2015.01.062
Simon, H. A. (1979). Rational Decision Making in Business Organizations. The American Economic Review, 69(4), 493–513. Retrieved from http://www.jstor.org/stable/1808698
Smith, A. (2006). Green niches in sustainable development: the case of organic food in the United Kingdom. Environment and Planning C: Government and Policy, 24(3), 439–458. doi:10.1068/c0514j

Bibliography
188
Smith, K. G., Collins, C. J., & Clark, K. D. (2005). Existing Knowledge, Knowledge Creation Capability, and the Rate of New Product Introduction in High-Technology Firms. The Academy of Management Journal, 48(2), 346–357. doi:10.2307/20159660
Snieder, R., & Larner, K. L. (2009). The art of being a scientist: A guide for graduate students and their mentors. Cambridge, New York: Cambridge University Press.
Soliman, K. S., & Sherer, S. A. (2005). From supply‐chain management to value network advocacy: Implications for e‐supply chains. Supply Chain Management: An International Journal, 10(2), 77–83. doi:10.1108/13598540510589151
Stadler, M., Cardoso, G., Mashayekh, S., Forget, T., DeForest, N., Agarwal, A., & Schönbein, A. (2015). Value streams in microgrids: A literature review (No. LBNL-1003608). California.
STATPOP. (2014). Privathaushalte nach Gemeinde und Haushaltsgrösse. Neuchatel. Retrieved from Bundesamt für Statistik website: http://www.bfs.admin.ch/bfs/portal/de/index/themen/01/04/blank/key/01/05.html
STATPOP. (2016). Bilanz der ständigen Wohnbevölkerung nach Kantonen. Neuchatel. Retrieved from Bundesamt für Statistik website: http://www.bfs.admin.ch/bfs/portal/de/index/themen/01/02/blank/key/raeumliche_verteilung/kantone__gemeinden.html
Sterner, M. (2015). Netzausbau ist die mit Abstand günstigste Option. Die Zeit Online. Hamburg. Retrieved from http://www.zeit.de/wirtschaft/2015-02/energiewende-stromtrassen-bayern-seehofer
Strbac, G. (2008). Demand side management: Benefits and challenges. Energy Policy, 4419–4426.
Suarez, F. F., & Olivia, R. (2005). Environmental change and organizational transformation. Industrial and Corporate Change, 14(6), 1017–1041. doi:10.1093/icc/dth078
SwissGrid AG. (2010). 50 Jahre Stern von Laufenburg: Basis für eine nachhaltige Stromzukunft in der Schweiz und Europa. Frick. Retrieved from SwissGrid website: https://www.swissgrid.ch/dam/swissgrid/current/media/media_releases/2010/documents/D100819_Stern_von_Laufenburg_factsheet_de.pdf
SwissGrid AG. (2015a). Netzprojekte. Retrieved from SwissGrid website: https://www.swissgrid.ch/swissgrid/de/home/grid/grid_expansion.html
SwissGrid AG. (2015b). Stromdrehscheibe Schweiz. Retrieved from SwissGrid website: https://www.swissgrid.ch/swissgrid/de/home/reliability/power_market/power_hub_ch.html
SwissGrid AG. (2015c). Strompreis. Retrieved from SwissGrid website: https://www.swissgrid.ch/swissgrid/de/home/company/electricity_price_2015/electricity_price.html
Taleb, N. N. (2008). The Black Swan: The impact of the highly improbable. London: Penguin Books Ltd; [distributor] Penguin Books Ltd.

Bibliography
189
Tapscott, D., Lowy, A., & Ticoll, D. (2000). Digital capital: Harnessing the power of business webs / Don Tapscott, David Ticoll, Alex Lowy. Boston: Harvard Business School Press.
Teece, D. J. (2010). Business Models, Business Strategy and Innovation. Long Range Planning, 43(2-3), 172–194. doi:10.1016/j.lrp.2009.07.003
Teppo, F., & Hesterly, W. S. (2007). The Knowledge-based View, Nested Heterogeneity, and New Value Creation: Philosophical Considerations on the Locus of Knowledge. The Academy of Management Review, 32(1), 195–218. doi:10.2307/20159288
Teufel, S., & Teufel, B. (2014). The Crowd Energy Concept. Journal of Electronic Science and Technology, 12(3), 263–269. doi:10.3969/j.issn.1674-862X.2014.03.005
Teufel, S., & Teufel, B. (2015). Smart Living – an Innovation and Research Agenda. In IET 2015 (Ed.), 2015 World Conference on Innovation, Engineering, and Technology (pp. 1–15). Kyoto, Japan.
The GridWise Architecture Council. (2008). GridWise® Interoperability Context-Setting Framework. Richland, USA.
Thelen, H. (1949). Group Dynamics in Instruction: Principle of Least Group Size. University of Chicago Press, 57(3), 139–148. Retrieved from http://www.jstor.org/stable/1082755
Thornberg, R. (2012). Informed Grounded Theory. Scandinavian Journal of Educational Research, 56(3), 243–259. doi:10.1080/00313831.2011.581686
Tidd, J., & Bessant, J. (2013). Managing innovation: Integrating technological, market and organizational change (Fifth edition): Wiley.
Tsiakis, P., & Papageorgiou, L. G. (2008). Optimal production allocation and distribution supply chain networks. International Journal of Production Economics, 111(2), 468–483. doi:10.1016/j.ijpe.2007.02.035
Uken, M. (2011). Deutschland nervt Polen mit der Energiewende. Die Zeit Online. Hamburg. Retrieved from http://www.zeit.de/wirtschaft/2011-11/stromnetz-ringfluesse
UVEK. (2015). Smart Grid Roadmap Schweiz: Wege in die Zukunft der Schweizer Elektrizitätsnetze. Bern. Retrieved from Eidgenössisches Departement für Umwelt, Verkehr, Energie und Kommunikation (UVEK) website: http://www.news.admin.ch/NSBSubscriber/message/attachments/38814.pdf
Vaterlaus, S., & Wild, J. (2001). Die schweizerische Elektrizitätswirtschaft vor der Marktöffnung. Zeitschrift für Energiewirtschaft, 25(3), 190-205.
Verbong, G., & Geels, F. W. (2010). Exploring sustainability transitions in the electricity sector with socio-technical pathways. Technological Forecasting and Social Change, 77(8), 1214–1221. doi:10.1016/j.techfore.2010.04.008
Verstrepen, S., Deschoolmeester, D., & van den Berg, Roelof J. (1999). Servitization in the automotive sector: creating value and competitive advantage through service after sales. In K. Mertins, O. Krause, & B. Schallock (Eds.), IFIP - The International Federation for Information Processing: Vol. 24. Global Production Management. IFIP WG5.7 International Conference on Advances in Production Management Systems

Bibliography
190
September 6-10, 1999, Berlin, Germany (Vol. 24, pp. 538–545). Boston, MA: Springer US.
VSE. (2016a). Fakten. Retrieved from Verband Schweizerische Elektrizitätsunternehmen (VSE) website: http://www.strom.ch/de/energie/stromnetz/fakten.html
VSE. (2016b). Für eine sichere Stromversorgung. Retrieved from Verband Schweizerische Elektrizitätsunternehmen (VSE) website: http://www.strom.ch/de/verband/mitglieder.html
Wakefield, M. P. (2011). Smart distribution system research in EPRI’s Smart Grid Demonstration Initiative. In Energy Society General Meeting. The Electrification of Transportation & the Grid of the Future (pp. 1–4). doi:10.1109/PES.2011.6039386
Webster, F. E. (1992). The Changing Role of Marketing in the Corporation. Journal of Marketing, 56(4), 1–17. doi:10.2307/1251983
Willis, K. G., & Garrod, G. D. (1997). Electricity supply reliability. Energy Policy, 25(1), 97–103. doi:10.1016/S0301-4215(96)00123-1
Windisch, R., Friedrich, E., Wanner, A., & Wüstenhagen, R. (2011, October 1). 9,7 Milliarden Franken für Strom aus erneuerbaren Quellen: Analyse der Investitionsstrategien Schweizer nergieversorger bei der regenerativen Stromproduktion. VSE Bulletin, pp. 20–24. Retrieved from http://www.bulletin-online.ch/uploads/media/1112s_Seite_020-023.pdf
Wüstenhagen, R., Wolsink, M., & Bürer, M. J. (2007). Social acceptance of renewable energy innovation: An introduction to the concept. Energy Policy, 35(5), 2683–2691. doi:10.1016/j.enpol.2006.12.001
Xu, Y., Li, H., & Tolbert, L. M. (2012). Inverter-based microgrid control and stable islanding transition. In 2012 IEEE Energy Conversion Congress and Exposition (ECCE) (pp. 2374–2380). doi:10.1109/ECCE.2012.6342458
Zaballos, A., Vallejo, A., & Selga, J. (2011). Heterogeneous communication architecture for the smart grid. IEEE Network, 25(5), 30–37. doi:10.1109/MNET.2011.6033033
Zhichun, Y., Jian, L., Kaipei, L., & Wei, C. (2011). Preliminary study on the technical requirements of the grid-connected microgrid. In 2011 4th International Conference on Electric Utility Deregulation and Restructuring and Power Technologies (DRPT) (pp. 1656–1662). doi:10.1109/DRPT.2011.5994163
Zio, E., & Aven, T. (2011). Uncertainties in smart grids behavior and modeling: What are the risks and vulnerabilities? How to analyze them? Energy Policy, 39(10), 6308–6320. doi:10.1016/j.enpol.2011.07.030

Appendix
191
10 Appendix
10.1 Questionnaire
The objectives of the questionnaire are decision making pattern, acceptance of an iGSL
structure, value of self-produced electricity, acceptance and willingness to work in a
neighbourly network.
The online-survey is non-guided through an interviewer and hence respondents must
understand the subject in hand. A storyboard was created to provide details about the
procedure and information necessary for answering the questions. In particular, the
understanding of a neighbourly system is not known yet. The structure of the
questionnaire aims for successive sections starting from a single household to the
neighbourly system. So, target questions focus on a specific area. Classification and
administration questions are answered at the end of the questionnaire. In total a
respondent answered 37 questions which all of them are obligatory.
Section: iGSL system – Production, storage, and consumption
Nr Question Answer Condition/Group
1 How do you evaluate the possibility to produce autonomously electricity?
very irrelevant
very relevant
G1
2 What is your opinion about the necessity of such intelligent electricity networks?
very irrelevant
very relevant
G1
3 How do you assess the possibility to store self-produced electricity?
very irrelevant
very relevant
G1
4 Which challenges have to be met for storing electricity?
Increase of storage performance
Sufficient technical integration
Better cost-benefit ratio
Available subvention
Reduced administrative efforts
Sufficient legal regulations
Max. 3
Categories:
technical
administrative
economical
G2

Appendix
192
Others
5 What minimum time period would you like to be covered with the storage capacity?
For 6 hours
For one night
One day
Two days
Three days
One week
Max. 1
G2
6 How relevant is it for you to have a 100% charged storage at the end of the day?
very irrelevant
very relevant
G2
7 Which incentives for providing your storage to an electricity provider would you expect to obtain?
Price reduction on purchased electricity
Financial compensation
Same amount of electricity (kWh)
Other goods like vouchers, appliances etc.
No compensation
Max. 2
Categories:
Financial
Immaterial
G2
8 How much of your storage capacity would you provide to an electricity supplier?
0% 100% G2
9 Such an enhanced system of decentralised photovoltaic and storage units requires a higher degree of organisational efforts. Therefore, an augmented automatisation supports the coordination among the numerous units to secure the stability of the entire electricity grid.
How do you assess an enhanced automated management?
very irrelevant
very relevant
G3
10 Who should, in your view, undertake the duties of the electricity management?
Autonomous
Association, Club
Service provider
Electricity provider
Max. 1 G3
11 Which challenges should be met for an automated electricity management?
Technical vulnerability
Handling of conflicts
Transparency of electricity management
Max. 3
Categories:
technical
personal
G3

Appendix
193
Constraints of individual decision-making
Administrative efforts
Legal regulations
Others
administrative/ legal
Section: Decision making, value of electricity – Day time
Nr Question Answer Condition/Group
1 Which electricity has a higher value for you during the surplus period?
self-generated
from the electricity provider
neither
G1
2 Which price would you assign to the electricity in the storage during surplus period?
Electricity price during the discharging of the storage
Electricity price during the current surplus period
Other value
G1
3a Storage allows creating an independency from the residual electricity network. We would like to know which basic decision approach would you prefer during the surplus period.
What would be your decision on your self-generated electricity, if you know in advance that the tomorrow weather will be sunny?
I play it safe and store any surplus
I would feed in any surplus to the grid
G2
3b What would be your decision on your self-generated electricity, if you know in advance that the tomorrow weather will be very bad and you could not charge your storage completely?
I play it safe and store any surplus
I would feed in any surplus to the grid
G2
4 If you know that you have some storage space left (any surplus is left), would you buy electricity from the electricity provider?
Yes, at any rate
Yes, if financial advantageous
Yes, if I cannot cover my requirements over night
No, in any case
Max. 1 G2

Appendix
194
Section: Decision making, value of electricity – Night time
Nr Question Answer Condition/Group
1 Which electricity has a higher value for you during the discharging of the storage?
self-generated
from the electricity provider
neither
G1
2 Which price would you assign to the electricity in the storage during discharging of the storage?
Electricity price during the discharging of the storage
Electricity price during the next surplus period
Other value
G1
3a Storage allows creating an independency from the residual electricity network. We would like to know which basic decision approach would you prefer during the discharging of the storage.
What would be your decision on your self-generated electricity, if you know in advance that the tomorrow weather will be sunny?
I extract any electricity from the storage
I would buy electricity from the electricity provider
G2
3b What would be your decision on your self-generated electricity, the tomorrow weather will be very bad?
I extract any electricity from the storage
I would buy electricity from the electricity provider
G2
4 If the storage cannot meet your requirements during the night:
At which depletion level of the storage would you consider to reduce your consumption?
0% 100% G2
5 If the storage cannot meet your requirements during the night:
At which depletion level of the storage would you consider to buy electricity from your electricity provider?
0% 100% G2

Appendix
195
Section: Neighbourly system, exchange of electricity – Crowd Energy idea
Nr Question Answer Condition/Group
1 What is your opinion on such a neighbourly network which supports the local “production-storage-consumption” principle?
very irrelevant
very relevant
G1
2 How relevant do you believe is the personal willingness to invest in such a neighbourly network?
very irrelevant
very relevant
G1
3 Where would you define the boundaries of a neighbourly network?
Direct neighbours Street Quarter Village / City Canton
G1
4 Where should the neighbourly electricity management be located?
Inside the neighbourly network
Outside the neighbourly network
Max. 1 G2
5 How would you asses the following characteristics of the neighbourly network?
very low
very high
Characteristics:
quality,
performance,
security,
profitability,
confidence,
transparency
G2
6 Under which conditions would you participate in a neighbourly network?
Financial support Incentives to exchange electricity
Automated system Technical security Transparency in the electricity management
Legal regulations (e.g. contractual agreements)
Personal engagement of participants
Normative values/guidelines
Others
Max. 3
financial
social
organis-ational
technical
G2

Appendix
196
Section: Classification and administration
Nr Questions Answer Condition/Group
1 Do you obtain electricity from an own or shared photovoltaic facility?
Yes
No
G1
2 Please state your consumption levels at home during a typical workday
very low
very high
Time slots:
00:00 – 06:00,
06:00 – 09:00,
09:00 – 11:00,
11:00 – 13:00,
13:00 – 16:00,
16:00 – 19:00,
19:00 – 22:00,
22:00 – 00:00
G1
3 Please state your consumption levels at home during a typical weekend
very low
very high
Time slots:
00:00 – 06:00,
06:00 – 09:00,
09:00 – 11:00,
11:00 – 13:00,
13:00 – 16:00,
16:00 – 19:00,
19:00 – 22:00,
22:00 – 00:00
G1
4 How many persons live in your household?
1 2 3 4 5 6+
Max. 1 G2
5 I currently live as … Tentant Appartment owner House owner Others
Max. 1 G2
6 In which country do you live currently?
Please state your post-code / zip code
G2
7 What is your current job situation? Full-time employment Max. 1 G2

Appendix
197
(incl. self-employment)
Part-time employment (incl. self-employment)
Training/Education
House wife/man
Retired
Others
8 Please state your gender Male
Female
G2
9 Please state your age
Min 18
Max 99
G2

Appendix
198
10.2 Modelling and Simulation Specifications
10.2.1 Sun Radiation Profile Spiez
Figure 56 shows the hourly sun radiation profile of Spiez according to DNI stated in
percentage. The percentage refers to the annual total sun radiation.
Figure 56: Sun radiation profile Spiez - in percentage of annual sun radiation
10.2.2 Standard Load Profiles
Two standard consumption profiles were used one for business and one for private
households (see Figure 57).
Figure 57: Standard load profile
Time January February March April May June July August SeptemberOctober November December
01:00
02:00
03:00
04:00
05:00
06:00 0.003557 0.004672 0.004778 0.005230 0.004301
07:00 0.005416 0.006610 0.006557 0.006690 0.007619 0.007380 0.005973 0.00223
08:00 0.005283 0.007646 0.008442 0.007778 0.008044 0.009265 0.009424 0.008628 0.005867
09:00 0.005017 0.007354 0.00884 0.009583 0.008575 0.008946 0.010406 0.010752 0.010247 0.008044 0.005256312 0.004539542
10:00 0.006345 0.008442 0.009504 0.010274 0.009053 0.009557 0.011150 0.011575 0.011203 0.009291 0.006557116 0.005574876
11:00 0.006955 0.008999 0.009849 0.010645 0.009318 0.009875 0.011548 0.012026 0.011681 0.009929 0.007194245 0.006026175
12:00 0.007115 0.009132 0.009929 0.010725 0.009398 0.009955 0.011628 0.012132 0.011813 0.010088 0.007353527 0.006158911
13:00 0.006849 0.008893 0.009796 0.010566 0.009291 0.009822 0.011468 0.011946 0.011601 0.009822 0.007088056 0.005946534
14:00 0.006079 0.00823 0.009371 0.010141 0.008973 0.009424 0.010990 0.011415 0.01099 0.009026 0.006291646
15:00 0.006929 0.008601 0.009345 0.008415 0.008761 0.010168 0.010460 0.009902 0.007592 0.004778465
16:00 0.004513 0.007221 0.008044 0.007513 0.007752 0.008920 0.008999 0.008097 0.005124
17:00 0.00454 0.005973 0.006159 0.006265 0.007088 0.006743 0.005044
18:00 0.004062 0.004194 0.004486 0.003345
19:00
20:00
21:00
22:00
23:00
00:00
Zeitraum Werktage Samstag Sonntag Werktage Samstag Sonntag Werktage Samstag Sonntag
00:00 - 01:00 0.2747 0.3087 0.262 0.2703 0.307 0.2654 0.2447 0.2965 0.2401
01:00 - 02:00 0.24 0.3076 0.227 0.2312 0.3002 0.2276 0.2101 0.2933 0.2116
02:00 - 03:00 0.2212 0.2788 0.1954 0.2146 0.2743 0.2049 0.1935 0.2595 0.1847
03:00 - 04:00 0.2224 0.2719 0.1788 0.2165 0.2677 0.1923 0.1991 0.2555 0.1697
04:00 - 05:00 0.2643 0.2813 0.1746 0.26 0.278 0.1862 0.238 0.2642 0.1675
05:00 - 06:00 0.3002 0.2902 0.181 0.2852 0.2899 0.1847 0.2672 0.2827 0.1762
06:00 - 07:00 0.3249 0.2992 0.1819 0.3009 0.3071 0.188 0.3222 0.32 0.1982
07:00 - 08:00 0.4313 0.4548 0.1996 0.4085 0.4545 0.2125 0.4612 0.4727 0.2052
08:00 - 09:00 0.6973 0.6743 0.213 0.6544 0.6431 0.2152 0.7539 0.6784 0.1969
09:00 - 10:00 0.8453 0.7491 0.244 0.7935 0.704 0.2345 0.9165 0.7745 0.2217
10:00 - 11:00 0.8567 0.7641 0.2763 0.8117 0.7215 0.2656 0.9297 0.8153 0.264
11:00 - 12:00 0.8829 0.7802 0.3073 0.8347 0.7399 0.289 0.9568 0.8297 0.2912
12:00 - 13:00 0.8214 0.7683 0.3311 0.7858 0.7219 0.3093 0.8794 0.7889 0.3111
13:00 - 14:00 0.6996 0.675 0.3252 0.6858 0.6326 0.3164 0.7354 0.6898 0.3203
14:00 - 15:00 0.6608 0.5036 0.2969 0.6601 0.4714 0.2921 0.691 0.5168 0.2979
15:00 - 16:00 0.7153 0.3795 0.2674 0.7018 0.3557 0.2564 0.7623 0.3826 0.2646
16:00 - 17:00 0.7315 0.3159 0.2481 0.7039 0.3087 0.2405 0.8035 0.3345 0.2495
17:00 - 18:00 0.7179 0.3194 0.2898 0.6812 0.3014 0.2701 0.8162 0.3649 0.3159
18:00 - 19:00 0.5766 0.3366 0.3211 0.5585 0.3146 0.3016 0.6726 0.3878 0.3677
19:00 - 20:00 0.4062 0.3466 0.3365 0.3926 0.3188 0.3151 0.4673 0.3875 0.3761
20:00 - 21:00 0.3644 0.3646 0.3532 0.3557 0.3384 0.3324 0.3824 0.3745 0.3568
21:00 - 22:00 0.3446 0.3517 0.3322 0.3491 0.3414 0.327 0.3352 0.3414 0.3131
22:00 - 23:00 0.3267 0.3213 0.2914 0.3233 0.3137 0.2973 0.3043 0.3078 0.2805
23:00 - 00:00 0.3137 0.2915 0.2599 0.3051 0.2882 0.2631 0.2847 0.2744 0.2469
Übergangsperiode ( 21.3. - 14.5. und 15.9 - 31.10. ) Sommermonate ( 15.5 - 14.9. ) Wintermonate ( 1.11. - 20.3. )

Appendix
199
The travel salesman problem (TSP) is a way to define an optimal path between a
numbers of nodes which the salesman wants to visit. This classical algorithmic problem is
based on minimising both travel costs and distances. To this end, TSP is used to minimise
distances between nodes and hence the emerging network can be seen as a shortest
path. During modelling and testing, TSP shows a good mixture between following
infrastructure and the manner of object arrangement around a transformer. TSP is a
typical class of "hard" optimization problems and solving requires experiences and for that
reason R provides a TSP package. There are any in-depth investigations in quality of
algorithm, only a visual verification of the path.
10.2.3 R Program Code for Data Preparation
The data preparation was done in R and the following figures present the code. For further
investigation the attached files can be consultated. The source code contains three files
ini.R, calucationCellStatus2.R, and distance.R providing specific functionalities to create
the final consumption and production profiles.
The ini.R contains parameters, data frames, sql statements, and necessary R packages
for the data preparation.
The second file is calucationCellStatus2.R which calculates all necessary production and
consumption profiles of provided objects. To start the calculations, the function
generateAbschlussobjektTable() has to be called and every further process is done
automatically. The procedure has a specific sequence starting to load all objects from the
database (MySQL) into the aoData dataframe. After some refinements, e.g. remove zero
entries in the consumption, entries in the aoData are re-clustered meaning that the
various electricity provider defined clusters (i.e. H1, H2,…) overwritten with either H0 or
G0. Afterwards, production potential is assigned to objects without current production.
Eventually, hourly production and consumption profiles are calculated and written to files.
The entire code can be found in Figure 58.

Appendix
200
calucationCellStatus2.R File

Appendix
201

Appendix
202

Appendix
203
Figure 58: Source code for generating production and consumption lists of all objects
In the Distance.R file there are more functions as presented here. During coding several
other possibilities for network generation were elaborated, e.g. star construct with the
transformer in the centre. Nevertheless, for the simulation a network according to TSP
was used and the code can be found in Figure 59.

Appendix
204
Figure 59: Source code for generating network according to TSP
10.2.4 LPL Optimisation Code
The preparation for optimisation, e.g. calculating constraints, and presentation of the
optimisation feedback received from Gurobi was done by LPL. The following source code
shows the parameters, constraints, minimisation functionality, and output (see Figure 60).

Appendix
205
Figure 60: LPL optimisation code
10.2.5 Numeric Test of Optimisation Model
The previous chapter establishes a model with the cells, functionalities of production,
consumption and storage as well as interaction between cells by defining various flows.
The consequential optimisation should provide insights into flows and capacities but
before doing so, it is necessary to establish credibility for the results by running a numeric
test. Operational validation includes intense testing and evaluation as it determines the
applicability of the model as well as providing valuable insights into the situation at hand.
Through interpreting the results of the tests one should be able to see correct calculations

Appendix
206
and behaviour. Furthermore, it should be proved that the model is solvable through
optimisation.
V time
1 2 3 4 5 6 7 8 9 10
1 89 1 - 40 2 24 85 55 83 46
2 57 20 19 95 38 34 84 28 5 69
3 58 95 47 54 72 55 97 92 72 18
4 53 9 60 31 94 8 72 76 20 61
5 69 13 72 36 61 46 73 74 66 34
Table 34: Randomised consumption of five cells
The numeric test contains five cells 𝑣 ∈ 𝑉 with a randomised consumption pattern over
ten time-points (see Table 34). The small set allows each step to be verified more easily.
The outcome produced can be discussed in more detail according to the desired model
behaviour. In this case, behaviour is mainly influenced by the aforementioned cost
structure defining a “first cell than crowd than external gird” principle. Additionally,
specified scenarios help to understand the outcome. The first scenario is an autarkic
crowd which means that the crowd produces enough to sustain itself, storing is infinite,
and no/minimised missing flow or overflow occurs throughout the time periods. This
example is defined as follows:
The costs 𝑏𝑣 for realised production installation at a cell are 1,000 units. The missing flow
and overflow 𝑥𝑣,𝑧 is assigned with costs 𝑐2 of 10 units. The transport costs 𝑐1 between
cells 𝑥𝑣,𝑤 are defined as |v − w|. Costs for internal flows 𝑐0 have a value of zero units.
Each cell has a storage capacity 𝑘𝑣 of infinite kWh and starts with a storage level 𝑠𝑣 of 40
kWh in the first time period. For each time period a constant cell production 𝑝𝑣 of 150 units
is assumed.
The constant production induces that two production cells exist within the crowd. The
decision to have two production cells is defined by the amount of electricity to cover total
consumption. Any further production units would be too expensive as a) installation costs
must be paid and b) overflow would lead to additional costs. The optimisation of the model
using a simple input generates an optimal solution with the total costs of 3,497.46. Table
35 presents the result of flows within and among cells and states the amount of electricity
that is exchanged at a specific time point. Optimisation requires two production cells,
namely 𝑣2 and 𝑣5. Besides covering own demand, both production cells supply specific

Appendix
207
cells, i.e. 𝑣2 supplies 𝑣1 and 𝑣3 whereas 𝑣5 supplies solely 𝑣4. Exchange of electricity
concerns solely time-dependent consumption meaning that a non-producing cell demands
the amount of electricity which is required for a specific time-point. Eventually, there is no
missing flow or overflow. The red rows in the table below show storage levels which are
only realised by production units. The high figures indicate that production exceeds
demand but any surplus is stored rather fed into the external grid. The results can be
verified by investigating the flows of a cell.
From to Time
v w 1 2 3 4 5 6 7 8 9 10
2 1 49 1 40 2 24 85 55 83 46
2 2 66 100 184 145 183 220 104 79 69 86
2 3 18 95 47 54 72 55 97 92 72 18
5 5 108 236 254 337 332 428 433 433 497 552
5 4 13 9 60 31 94 8 72 76 20 61
Table 35: Results of the numeric test scenario
Table 36 shows the first time periods of 𝑣2 and is interpreted that at time-point one 150
units are produced adding 40 units to those which are already in the storage. From that
amount, own demand of 57 units and 67 units of supplies to 𝑣1 and 𝑣3 are subtracted
leaving 26 units to charge the storage. The storage reaches a level of 66 units which is
the initial storage level for time-point two. This way of calculating is one way of defining
storage flow. It must be noted that any missing flow, overflow or flows from other cells
must also be subtracted. A simpler way of determining storage flow is by subtracting
storage levels, i.e. 𝑠𝑣,𝑡−1 minus 𝑠𝑣,𝑡. For example, time period three has a flow of 84 units
which is a subtraction of 𝑠2,3 (184 units) from 𝑠2,2 (100 units).
The example shows that the model works according to the model design. Sufficient
production and unlimited storage is less realistic and there will be missing flows. Therefore
a more realistic scenario would be to adjust following parameters: 𝑝𝑣 to 120 units, no initial
storage 𝑠𝑣 at the first time period, and limiting storage capacity 𝑘𝑣 to 80 kWh. The
optimisation with adjusted inputs generates an optimal solution with total costs of
23,646.91. The crowd has also two production cells but differs from the previous outcome
(see Table 37). A relocation of production from 𝑣5 to 𝑣4 seems to be optimal. Both supply
own demand and show a different support preferences where cell 𝑣2 supports 𝑣1 and 𝑣3,

Appendix
208
whereas 𝑣4 supplies electricity to 𝑣3 and 𝑣5. It seems that 𝑣3 benefits from the position in
the centre of the network.
Time Prod. Initial Storage Demand Flow to 1,3 Flow Storage
1 150 + 40 - 57 - 67 (49 + 18) - 26 = 0
2 150 + 66 - 20 - 96 (1 + 95) - 34 = 0
3 150 + 100 - 19 - 47 (0 + 47) - 84 = 0
4 150 + 184 … … … …
… … … … … … …
Table 36: Flows of scenario for cell two
Reducing production leads to missing flows as the production cells are not able to supply
enough electricity. The model works accordingly as the two production cells cannot build
up enough storage to fully cover shortages in these periods. The consequence is that
non-production cells must buy electricity from external sources. These results in higher
total costs as missing flows and overflow are penalised. Yet production cells can partially
supply at the first and seventh to ninth time-periods without charging the storage. It seems
at these time-periods production exceeds consumption. Charging storage mostly occurs
from the second to sixth time-points, these are lower consumption periods. Both
production cells reach maximum capacity (in the second and sixth time-points) where an
overflow of fourteen units is produced by cell two in the second period.
From to Time
v w 1 2 3 4 5 6 7 8 9 10
2 1 5 1 40 2 24 74 55 77 46
2 2 8 62 47 55 80 5
2 3 58 77 47 72 37 42 37 38
4 3 18 54 18 55 34 18
4 4 80 68 67 32 80 7
4 5 67 13 72 36 61 46 73 44 66 34
Table 37: Results of the numeric test by reduced production and limited storage
It is not possible to explain the overflow from the figures as storage capacity in 𝑣2 would
be available. In particular, this behaviour occurs once (also with more time-points). An

Appendix
209
explanation could be that the solver considers an overflow at that time-point as the optimal
solution over all flows rather storing it. The log file indicates that this is one optimal
solution in which the solver states an optimum but upper (23,646.9) and lower (23,491.50)
bounds converge rather correspond. This depends upon the multi-integer programming
(MIP) where the optimal solution is not an extreme point rather within an area below the
constraints.
As a consequence, the model is refined. Firstly, storage possibilities are expanded to all
cells. Therefore, non-producing cells can store electricity, this allows more electricity to be
demanded than current consumption would require. Consequentially, future demand is
considered in the optimisation process. This functionality is necessary in light of a time-
dependent cost structure. Secondly, the decision on where production location is situated
will be replaced by randomly assigned production potential to a cell. This converts the
model to a linear programming problem. Nevertheless, the numeric tests show that the
design and functionalities of the model allow conclusions to be drawn concerning the
crowd’s potential.

Appendix
210
Ke
y Fi
gure
sC
on
sP
rod
Po
t. S
urp
lus
Sto
rage
Mis
sin
gEx
tern
al T
oEx
tern
al F
rom
The
se f
igu
res
are
all
kW
!!!!
!!!
The
se f
igu
res
are
all
kW
!!!!
!!!
% time storage positive
Object
Prod
Total
Total
Diff Prod-
Cons
Min
Max
Average
No of occ.
Total
Status End
of week
Min
Max
Average
No of occ.
Total
Min
Max
Average
No of occ.
Total
Min
Max
Average
No of occ.
Total
Min
Max
Average
No of occ.
Tota
lM
inM
axA
vera
geN
o o
f o
cc.
Tota
l Act
ivit
ies
Dif
f P
rod
- C
on
s
1Ye
s 3
06,5
83.7
30,
615.
1-
275,
968.
6-
3,52
8.5
- 63
8.6
- 1,
642.
7-
-
0
-
-
-
- 2
75,9
68.6
638
.6 3
,528
.5 1
,642
.7 1
68-
-
-
-
-
-
-
-
-
-
2Ye
s 2
62,1
81.6
30,
615.
1-
231,
566.
5-
3,01
7.5
- 54
6.1
- 1,
378.
4-
-
-
0-
-
-
-
231
,566
.5 5
46.1
3,0
17.5
1,3
78.4
168
-
-
-
-
- -
-
-
-
-
3Ye
s 9
0,36
8.7
30,
615.
1-
59,7
53.6
- 1,
040.
1 3
55.7
- 35
5.7
32
7,3
06.3
- 0
1.3
1,3
58.5
576
.4 4
3 5
9,75
3.6
59.
6 1
,040
.1 4
78.0
125
-
-
-
-
- -
-
-
-
-
4 N
o 2
15,6
64.1
-
- 21
5,66
4.1
- 2,
482.
1-
449.
2-
1,28
3.7
- -
0-
-
-
-
215
,664
.1 4
49.2
2,4
82.1
1,2
83.7
168
-
-
-
-
- -
-
-
-
-
5Ye
s 5
93,1
58.9
50,
610.
6-
542,
548.
3-
6,82
6.7
- 1,
235.
6-
3,22
9.5
- -
- 0
-
-
-
- 5
42,5
48.2
1,2
35.6
6,8
26.7
3,2
29.5
168
-
-
-
-
- -
-
-
-
-
6Ye
s 2
79,1
05.1
30,
615.
1-
248,
490.
0-
3,21
2.2
- 58
1.4
- 1,
479.
1-
-
0
-
-
-
- 2
48,4
90.0
581
.4 3
,212
.2 1
,479
.1 1
68-
-
-
-
-
-
-
-
-
-
7Ye
s 2
03,7
20.7
61,
230.
2-
142,
490.
5-
2,34
4.6
564
.6-
848.
2 2
8 9
,807
.9-
0 3
4.5
1,9
50.1
848
.2 3
4 1
42,4
90.5
94.
8 2
,344
.6 1
,063
.4 1
34-
-
-
-
-
-
-
-
-
-
8Ye
s 3
80,7
56.1
44,
487.
6-
336,
268.
5-
4,38
2.1
- 79
3.1
- 2,
001.
6-
-
-
0-
-
-
-
336
,268
.5 7
93.1
4,3
82.1
2,0
01.6
168
-
-
-
-
- -
-
-
-
-
9Ye
s 4
83,7
73.3
31,
323.
1-
452,
450.
2-
5,56
7.8
- 1,
007.
7-
2,69
3.2
- -
0-
-
-
-
449
,354
.0 1
,007
.7 5
,567
.8 2
,674
.7 1
68-
-
-
-
-
3,0
96.3
405
.9 4
86.3
442
.3 7
10Ye
s 2
8,47
0.2
30,
615.
1 2
,144
.9-
327.
7 7
52.7
12.
8 3
5 2
3,22
5.4
0 2
8.6
3,2
03.5
1,3
09.1
152
951
.4 5
9.3
205
.2 1
05.7
9-
3,09
6.3
- 48
6.3
- 48
6.3
- 44
2.3
7-
-
-
-
-
11Ye
s 2
64,9
80.1
30,
615.
1-
234,
365.
0-
3,04
9.7
- 55
2.0
- 1,
395.
0-
-
0
-
-
-
- 2
34,3
65.0
552
.0 3
,049
.7 1
,395
.0 1
68-
-
-
-
-
-
-
-
-
-
12Ye
s 8
8,34
1.4
11,
697.
5-
76,6
43.9
- 1,
016.
7-
184.
0-
456.
2-
-
0
-
-
-
- 7
6,64
3.9
184
.0 1
,016
.7 4
56.2
168
-
-
-
-
- -
-
-
-
-
13Ye
s 1
09,2
97.4
61,
230.
2-
48,0
67.2
- 1,
257.
9 1
,167
.8-
286.
1 3
5 3
2,86
1.1
- 0
236
.7 5
,100
.5 2
,511
.1 7
3 4
8,06
7.2
227
.7 1
,257
.9 5
06.0
95
-
-
-
-
- -
-
-
-
-
14Ye
s 2
50,8
99.3
44,
487.
6-
206,
411.
7-
2,88
7.6
- 24
7.2
- 1,
228.
6-
-
0
-
-
-
- 2
06,4
11.7
247
.2 2
,887
.6 1
,228
.6 1
68-
-
-
-
-
-
-
-
-
-
15Ye
s 2
56,2
31.9
30,
615.
1-
225,
616.
8-
2,94
9.0
- 53
3.8
- 1,
343.
0-
-
-
0-
-
-
-
225
,616
.8 5
33.8
2,9
49.0
1,3
43.0
168
-
-
-
-
- -
-
-
-
-
16Ye
s 1
55,5
94.6
44,
487.
6-
111,
107.
0-
1,79
0.7
361
.8-
661.
4 2
1 5
,798
.7 0
0.4
1,1
77.6
582
.7 2
7 1
11,1
07.0
6.0
1,7
90.7
788
.0 1
41-
-
-
-
-
-
-
-
-
-
17Ye
s 1
23,3
34.2
44,
487.
6-
78,8
46.6
- 1,
419.
5 5
67.9
- 46
9.3
33
12,
507.
4-
0 1
6.8
2,2
40.4
905
.7 5
0 7
8,84
6.6
1.6
1,4
19.5
668
.2 1
18-
-
-
-
-
-
-
-
-
-
18Ye
s 1
41,4
69.6
61,
230.
2-
80,2
39.4
- 1,
628.
2 9
62.3
- 47
7.6
35
24,
510.
5 0
307
.5 4
,027
.1 1
,867
.8 5
8 8
0,23
9.5
173
.9 1
,628
.2 7
29.4
110
-
-
-
-
- -
-
-
-
-
19Ye
s 1
65,2
68.3
61,
230.
2-
104,
038.
1-
1,90
2.1
810
.2-
619.
3 3
5 1
8,33
3.3
0 1
22.8
3,2
33.0
1,3
53.5
51
104
,038
.1 3
44.3
1,9
02.1
889
.2 1
17-
-
-
-
-
-
-
-
-
-
20Ye
s 3
57,3
54.1
61,
230.
2-
296,
123.
9-
4,11
2.8
- 41
7.0
- 1,
762.
6-
-
0
-
-
-
- 2
96,1
23.9
417
.0 4
,112
.8 1
,762
.6 1
68-
-
-
-
-
-
-
-
-
-
21Ye
s 1
75,8
67.5
44,
487.
6-
131,
379.
9-
2,02
4.1
232
.2-
782.
0 2
0 3
,040
.1-
0 1
37.5
636
.1 4
07.1
20
131
,379
.8 1
37.5
2,0
24.1
887
.7 1
48-
-
-
-
-
-
-
-
-
-
22Ye
s 1
,016
,113
.5 4
4,48
7.6
- 97
1,62
5.9
- 11
,694
.5-
2,11
6.6
- 5,
783.
5-
-
-
0-
-
-
-
971
,625
.8 2
,116
.6 1
1,69
4.5
5,7
83.5
168
-
-
-
-
- -
-
-
-
-
23Ye
s 5
40,9
78.2
27,
815.
1-
513,
163.
1-
6,22
6.1
- 1,
126.
9-
3,05
4.5
- -
0-
-
-
-
513
,163
.1 1
,126
.9 6
,226
.1 3
,054
.5 1
68-
-
-
-
-
-
-
-
-
-
24Ye
s 2
07,3
56.6
61,
230.
2-
146,
126.
4-
2,38
6.5
541
.3-
869.
8 2
8 9
,104
.2-
0 1
0.0
1,8
28.8
764
.8 3
4 1
46,1
26.4
129
.4 2
,386
.5 1
,090
.5 1
34-
-
-
-
-
-
-
-
-
-
25Ye
s 5
37,2
54.1
44,
487.
6-
492,
766.
5-
6,18
3.3
- 1,
119.
1-
2,93
3.1
- -
0-
-
-
-
492
,766
.6 1
,119
.1 6
,183
.3 2
,933
.1 1
68-
-
-
-
-
-
-
-
-
-
26Ye
s 1
70,6
00.9
61,
230.
2-
109,
370.
7-
1,96
3.5
776
.2-
651.
0 3
3 1
7,01
2.8
- 0
5.1
3,0
55.1
1,2
47.3
49
109
,370
.7 2
0.6
1,9
63.5
919
.1 1
19-
-
-
-
-
-
-
-
-
-
27Ye
s 8
9,90
5.9
44,
487.
6-
45,4
18.4
- 1,
034.
7 7
81.5
- 27
0.3
35
21,
151.
7 0
158
.8 3
,355
.7 1
,605
.5 6
6 4
5,41
8.4
187
.3 1
,034
.7 4
45.3
102
-
-
-
-
- -
-
-
-
-
28Ye
s 1
37,2
60.8
30,
615.
1-
106,
645.
7-
1,57
9.7
56.
1-
634.
8 6
256
.1 0
1.8
57.
9 3
4.5
12
106
,645
.7 0
.8 1
,579
.7 6
83.6
156
-
-
-
-
- -
-
-
-
-
29 N
o 1
,013
.6-
-
1,01
3.6
- 11
.7-
2.1
- 6.
0-
-
-
0-
-
-
-
1,0
13.6
2.1
11.
7 6
.0 1
68-
-
-
-
-
-
-
-
-
-
30Ye
s 3
37,0
15.1
30,
615.
1-
306,
400.
0-
3,87
8.7
- 70
2.0
- 1,
823.
8-
-
0
-
-
-
- 3
06,4
00.0
702
.0 3
,878
.7 1
,823
.8 1
68-
-
-
-
-
-
-
-
-
-
31 N
o 8
,594
.0-
-
8,59
4.0
- 98
.9-
17.9
- 51
.2-
-
0
-
-
-
- 8
,594
.0 1
7.9
98.
9 5
1.2
168
-
-
-
-
- -
-
-
-
-
32Ye
s 9
4,64
3.6
44,
487.
6-
50,1
56.1
- 1,
089.
3 7
51.2
- 29
8.5
35
19,
922.
0-
0 9
.0 3
,197
.6 1
,526
.9 6
2 5
0,15
6.0
9.9
1,0
89.3
473
.2 1
06-
-
-
-
-
-
-
-
-
-
33Ye
s 1
04,0
08.8
44,
487.
6-
59,5
21.3
- 1,
197.
0 6
91.4
- 35
4.3
35
17,
491.
1-
0 2
14.0
2,8
85.1
1,3
17.0
58
59,
521.
2 2
03.4
1,1
97.0
541
.1 1
10-
-
-
-
-
-
-
-
-
-
34Ye
s 1
66,6
56.5
30,
615.
1-
136,
041.
4-
1,91
8.1
- 13
1.7
- 80
9.8
- -
- 0
-
-
-
- 1
36,0
41.4
131
.7 1
,918
.1 8
09.8
168
-
-
-
-
- -
-
-
-
-
35Ye
s 4
44,0
42.8
61,
230.
2-
382,
812.
6-
5,11
0.5
- 92
5.0
- 2,
278.
6-
-
0
-
-
-
- 3
82,8
12.7
925
.0 5
,110
.5 2
,278
.6 1
68-
-
-
-
-
-
-
-
-
-
36 N
o 7
4,72
3.3
-
- 74
,723
.3-
860.
0-
155.
7-
444.
8-
-
-
0-
-
-
-
74,
723.
3 1
55.7
860
.0 4
44.8
168
-
-
-
-
- -
-
-
-
-
37Ye
s 1
70,4
46.7
44,
487.
6-
125,
959.
1-
1,96
1.7
266
.9-
749.
8 2
0 3
,768
.4 0
171
.9 7
80.9
496
.2 2
0 1
25,9
59.1
91.
4 1
,961
.7 8
51.1
148
-
-
-
-
- -
-
-
-
-
38Ye
s 8
9,97
2.1
44,
487.
6-
45,4
84.5
- 1,
035.
5 7
81.0
- 27
0.7
35
21,
134.
5 0
154
.2 3
,353
.5 1
,603
.0 6
6 4
5,48
4.5
187
.4 1
,035
.5 4
45.9
102
-
-
-
-
- -
-
-
-
-
39Ye
s 1
92,8
35.0
44,
487.
6-
148,
347.
4-
2,21
9.3
123
.8-
883.
0 1
5 8
51.0
0 2
9.7
192
.9 1
28.1
20
148
,347
.5 2
61.4
2,2
19.3
1,0
02.3
148
-
-
-
-
- -
-
-
-
-
40Ye
s 7
5,38
4.4
30,
615.
1-
44,7
69.3
- 86
7.6
451
.4-
266.
5 3
5 1
1,04
8.4
0 1
0.1
1,8
58.4
858
.0 5
3 4
4,76
9.3
3.1
867
.6 3
89.3
115
-
-
-
-
- -
-
-
-
-
41 N
o 5
8,61
5.2
-
- 58
,615
.2-
674.
6-
122.
1-
348.
9-
-
-
0-
-
-
-
58,
615.
1 1
22.1
674
.6 3
48.9
168
-
-
-
-
- -
-
-
-
-
42Ye
s 1
06,1
68.3
61,
230.
2-
44,9
38.1
- 1,
221.
9 1
,187
.8-
267.
5 3
5 3
3,67
3.3
- 0
480
.4 5
,204
.9 2
,638
.7 7
3 4
4,93
8.1
215
.8 1
,221
.9 4
73.0
95
-
-
-
-
- -
-
-
-
-
43Ye
s 2
51,6
48.5
63,
960.
1-
187,
688.
4-
2,89
6.2
341
.5-
1,11
7.2
20
4,5
31.6
0 2
05.3
946
.5 6
05.0
20
187
,688
.5 1
87.5
2,8
96.2
1,2
68.2
148
-
-
-
-
- -
-
-
-
-
44Ye
s 8
5,78
5.3
30,
615.
1-
55,1
70.1
- 98
7.3
385
.0-
328.
4 3
3 8
,391
.5 0
1.0
1,5
11.4
636
.5 4
7 5
5,17
0.2
9.3
987
.3 4
56.0
121
-
-
-
-
- -
-
-
-
-
45Ye
s 8
8,47
3.6
30,
615.
1-
57,8
58.5
- 1,
018.
2 3
67.8
- 34
4.4
33
7,7
54.1
0 1
6.1
1,4
21.7
624
.0 4
3 5
7,85
8.5
6.0
1,0
18.3
462
.9 1
25-
-
-
-
-
-
-
-
-
-
10.3 Results Current Scenario
Figure 61: Results current scenario (in kW) - winter week (1)

Appendix
211
Figure 62: Results current scenario (in kW) - winter week (2)
Ke
y Fi
gure
sC
on
sP
rod
Po
t. S
urp
lus
Sto
rage
Mis
sin
gEx
tern
al T
oEx
tern
al F
rom
The
se f
igu
res
are
all
kW
!!!!
!!!
The
se f
igu
res
are
all
kW
!!!!
!!!
% time storage positive
Object
Prod
Total
Total
Diff Prod-
Cons
Min
Max
Average
No of occ.
Total
Status End
of week
Min
Max
Average
No of occ.
Total
Min
Max
Average
No of occ.
Total
Min
Max
Average
No of occ.
Total
Min
Max
Average
No of occ.
Tota
lM
inM
axA
vera
geN
o o
f o
cc.
Tota
l Act
ivit
ies
Dif
f P
rod
- C
on
s
46Ye
s 1
69,9
39.9
61,
230.
2-
108,
709.
6-
1,95
5.8
780
.4-
647.
1 3
3 1
7,16
9.5
- 0
13.
3 3
,077
.2 1
,241
.0 5
0 1
08,7
09.6
12.
0 1
,955
.8 9
21.3
118
-
-
-
-
- -
-
-
-
-
47Ye
s 1
46,3
61.6
44,
487.
6-
101,
874.
0-
1,68
4.5
420
.8-
606.
4 2
9 7
,454
.7-
0 3
6.2
1,4
72.1
654
.3 3
4 1
01,8
74.0
53.
2 1
,684
.5 7
60.3
134
-
-
-
-
- -
-
-
-
-
48 N
o 9
4,26
9.0
-
- 94
,269
.0-
1,08
4.9
- 19
6.4
- 56
1.1
- -
- 0
-
-
-
- 9
4,26
9.0
196
.4 1
,084
.9 5
61.1
168
-
-
-
-
- -
-
-
-
-
49Ye
s 1
52,7
74.0
30,
615.
1-
122,
158.
9-
1,75
8.3
- 43
.0-
727.
1-
-
0
-
-
-
- 1
22,1
59.0
43.
0 1
,758
.3 7
27.1
168
-
-
-
-
- -
-
-
-
-
50Ye
s 7
7,76
4.2
61,
230.
2-
16,5
34.0
- 89
5.0
1,3
69.3
- 98
.4 3
5 4
1,04
5.8
- 0
4.0
6,1
52.6
2,8
07.9
111
16,
534.
0 8
.7 5
67.2
290
.1 5
7-
-
-
-
-
-
-
-
-
-
51Ye
s 9
1,73
4.9
44,
487.
6-
47,2
47.3
- 1,
055.
8 7
69.8
- 28
1.2
35
20,
676.
9 0
32.
7 3
,294
.7 1
,537
.9 6
6 4
7,24
7.4
191
.1 1
,055
.8 4
63.2
102
-
-
-
-
- -
-
-
-
-
52Ye
s 1
78,9
74.5
44,
487.
6-
134,
486.
9-
2,05
9.8
212
.4-
800.
5 2
0 2
,622
.6-
0 1
17.8
553
.1 3
56.0
20
134
,486
.9 1
63.8
2,0
59.8
908
.7 1
48-
-
-
-
-
-
-
-
-
-
53Ye
s 8
7,48
2.0
61,
230.
2-
26,2
51.8
- 1,
006.
8 1
,307
.2-
156.
3 3
5 3
8,52
3.5
- 0
4.0
5,8
28.4
2,9
50.2
88
26,
251.
7 2
2.4
793
.9 3
28.1
80
-
-
-
-
- -
-
-
-
-
54 N
o 1
16,7
45.5
-
- 11
6,74
5.5
- 1,
343.
6-
243.
2-
694.
9-
-
0
-
-
-
- 1
16,7
45.6
243
.2 1
,343
.6 6
94.9
168
-
-
-
-
- -
-
-
-
-
55 N
o 6
7,60
5.7
-
- 67
,605
.7-
778.
1-
140.
8-
402.
4-
-
0
-
-
-
- 6
7,60
5.8
140
.8 7
78.1
402
.4 1
68-
-
-
-
-
-
-
-
-
-
56Ye
s 1
08,5
70.2
61,
230.
2-
47,3
40.0
- 1,
249.
5 1
,172
.5-
281.
8 3
5 3
3,04
9.8
- 0
293
.3 5
,124
.8 2
,540
.7 7
3 4
7,34
0.0
226
.2 1
,249
.5 4
98.3
95
-
-
-
-
- -
-
-
-
-
57 N
o 6
2,07
4.8
-
- 62
,074
.8-
714.
4-
129.
3-
369.
5-
-
-
0-
-
-
-
62,
074.
7 1
29.3
714
.4 3
69.5
168
-
-
-
-
- -
-
-
-
-
58Ye
s 9
3,23
3.3
30,
615.
1-
62,6
18.2
- 1,
073.
0 3
37.4
- 37
2.7
30
6,6
82.0
0 3
4.6
1,2
62.9
545
.8 4
0 6
2,61
8.2
6.6
1,0
73.0
489
.2 1
28-
-
-
-
-
-
-
-
-
-
59Ye
s 8
4,63
9.4
44,
487.
6-
40,1
51.8
- 97
4.1
815
.1-
239.
0 3
5 2
2,51
8.7
- 0
364
.3 3
,531
.4 1
,800
.0 6
6 4
0,15
1.8
62.
9 9
74.1
393
.6 1
02-
-
-
-
-
-
-
-
-
-
60Ye
s 1
06,8
07.4
61,
230.
2-
45,5
77.2
- 1,
229.
2 1
,183
.8-
271.
3 3
5 3
3,50
7.4
0 4
30.6
5,1
83.6
2,6
12.6
73
45,
577.
2 2
22.5
1,2
29.3
479
.8 9
5-
-
-
-
-
-
-
-
-
-
61Ye
s 5
1,49
7.6
30,
615.
1-
20,8
82.5
- 59
2.7
604
.1-
124.
3 3
5 1
7,24
8.4
- 0
26.
1 2
,655
.4 1
,365
.7 7
4 2
0,88
2.5
56.
8 5
92.7
222
.2 9
4-
-
-
-
-
-
-
-
-
-
62 N
o 1
9,76
6.1
-
- 19
,766
.1-
227.
5-
41.2
- 11
7.7
- -
- 0
-
-
-
- 1
9,76
6.1
41.
2 2
27.5
117
.7 1
68-
-
-
-
-
-
-
-
-
-
63Ye
s 1
51,9
14.6
44,
487.
6-
107,
427.
0-
1,74
8.4
385
.3-
639.
4 2
6 6
,373
.4 0
1.8
1,2
86.8
543
.0 3
3 1
07,4
27.0
1.2
1,7
48.4
795
.8 1
35-
-
-
-
-
-
-
-
-
-
64Ye
s 2
29,8
33.1
30,
615.
1-
199,
218.
0-
2,64
5.2
- 47
8.8
- 1,
185.
8-
-
-
0-
-
-
-
199
,217
.9 4
78.8
2,6
45.2
1,1
85.8
168
-
-
-
-
- -
-
-
-
-
65Ye
s 4
16,9
60.9
79,
726.
9-
337,
234.
0-
4,79
8.8
- 23
4.1
- 2,
007.
3-
-
-
0-
-
-
-
337
,234
.0 2
34.1
4,7
98.8
2,0
07.3
168
-
-
-
-
- -
-
-
-
-
66Ye
s 3
78,7
06.8
61,
230.
2-
317,
476.
5-
4,35
8.5
- 55
3.5
- 1,
889.
7-
-
0
-
-
-
- 3
17,4
76.6
553
.5 4
,358
.6 1
,889
.7 1
68-
-
-
-
-
-
-
-
-
-
67Ye
s 2
54,4
47.0
61,
230.
2-
193,
216.
8-
2,92
8.4
240
.5-
1,15
0.1
20
2,5
19.1
- 0
110
.5 5
44.5
356
.6 2
0 1
93,2
16.8
286
.8 2
,928
.4 1
,305
.5 1
48-
-
-
-
-
-
-
-
-
-
68Ye
s 4
77,2
18.6
61,
230.
2-
415,
988.
4-
4,34
9.1
- 63
3.2
- 2,
476.
1-
-
0
-
-
-
- 4
15,9
88.4
633
.2 4
,349
.1 2
,476
.1 1
68-
-
-
-
-
-
-
-
-
-
69Ye
s 2
84,9
88.6
25,
710.
3-
259,
278.
3-
3,27
9.9
- 59
3.7
- 1,
543.
3-
-
-
0-
-
-
-
259
,278
.3 5
93.7
3,2
79.9
1,5
43.3
168
-
-
-
-
- -
-
-
-
-
70 N
o 2
70,7
75.6
-
- 27
0,77
5.6
- 3,
116.
4-
564.
0-
1,61
1.8
- -
- 0
-
-
-
- 2
70,7
75.6
564
.1 3
,116
.4 1
,611
.8 1
68-
-
-
-
-
-
-
-
-
-
71 N
o 1
52,7
96.0
-
- 15
2,79
6.0
- 1,
758.
5-
318.
3-
909.
5-
-
0
-
-
-
- 1
52,7
96.1
318
.3 1
,758
.5 9
09.5
168
-
-
-
-
- -
-
-
-
-
72Ye
s 4
87,9
16.0
93,
835.
3-
394,
080.
7-
5,61
5.4
- 25
7.5
- 2,
345.
7-
-
0
-
-
-
- 3
94,0
80.8
257
.5 5
,615
.4 2
,345
.7 1
68-
-
-
-
-
-
-
-
-
-
73Ye
s 1
14,7
84.3
30,
615.
1-
84,1
69.2
- 1,
321.
1 1
99.7
- 50
1.0
20
2,9
30.9
- 0
134
.3 6
04.5
382
.8 2
0 8
4,16
9.2
41.
6 1
,321
.1 5
68.7
148
-
-
-
-
- -
-
-
-
-
74Ye
s 4
64,0
73.3
30,
615.
1-
433,
458.
2-
5,34
1.0
- 96
6.7
- 2,
580.
1-
-
-
0-
-
-
-
433
,458
.2 9
66.7
5,3
41.0
2,5
80.1
168
-
-
-
-
- -
-
-
-
-
75 N
o 3
88,2
92.3
-
- 38
8,29
2.3
- 4,
468.
9-
808.
8-
2,31
1.3
- -
- 0
-
-
-
- 3
88,2
92.3
808
.8 4
,468
.9 2
,311
.3 1
68-
-
-
-
-
-
-
-
-
-
76 N
o 3
2,67
9.0
-
- 32
,679
.0-
376.
1-
68.1
- 19
4.5
- -
0-
-
-
-
32,
679.
1 6
8.1
376
.1 1
94.5
168
-
-
-
-
- -
-
-
-
-
77Ye
s 4
96,5
32.0
61,
230.
2-
435,
301.
8-
5,71
4.6
- 1,
034.
3-
2,59
1.1
- -
0-
-
-
-
435
,301
.8 1
,034
.3 5
,714
.6 2
,591
.1 1
68-
-
-
-
-
-
-
-
-
-
78Ye
s 2
98,8
49.1
30,
615.
1-
268,
234.
0-
3,43
9.5
- 62
2.5
- 1,
596.
6-
-
-
0-
-
-
-
268
,234
.0 6
22.5
3,4
39.5
1,5
96.6
168
-
-
-
-
- -
-
-
-
-
79 N
o 7
6,37
6.0
-
- 76
,376
.0-
879.
0-
159.
1-
454.
6-
-
0
-
-
-
- 7
6,37
6.0
159
.1 8
79.0
454
.6 1
68-
-
-
-
-
-
-
-
-
-
80Ye
s 3
33,1
58.8
44,
487.
6-
288,
671.
2-
3,83
4.3
- 69
4.0
- 1,
718.
3-
-
0
-
-
-
- 2
88,6
71.3
694
.0 3
,834
.3 1
,718
.3 1
68-
-
-
-
-
-
-
-
-
-
81Ye
s 2
81,0
88.3
61,
230.
2-
219,
858.
1-
3,23
5.1
70.
2-
1,30
8.7
5 2
97.5
- 0
48.
9 7
0.2
59.
5 5
219
,858
.1 6
.1 3
,235
.1 1
,348
.8 1
63-
-
-
-
-
-
-
-
-
-
82Ye
s 2
17,0
52.3
44,
487.
6-
172,
564.
8-
2,49
8.1
- 30
.9-
1,02
7.2
- -
- 0
-
-
-
- 1
72,5
64.8
30.
9 2
,498
.1 1
,027
.2 1
68-
-
-
-
-
-
-
-
-
-
83 N
o 3
05,2
83.6
-
- 30
5,28
3.6
- 3,
513.
5-
635.
9-
1,81
7.2
- -
- 0
-
-
-
- 3
05,2
83.5
635
.9 3
,513
.5 1
,817
.2 1
68-
-
-
-
-
-
-
-
-
-
84Ye
s 2
12,3
80.8
30,
615.
1-
181,
765.
6-
2,44
4.3
- 42
3.9
- 1,
081.
9-
-
0
-
-
-
- 1
81,7
65.7
423
.9 2
,444
.3 1
,081
.9 1
68-
-
-
-
-
-
-
-
-
-
85Ye
s 3
93,0
74.1
44,
487.
6-
348,
586.
5-
4,52
3.9
- 81
8.8
- 2,
074.
9-
-
-
0-
-
-
-
348
,586
.4 8
18.8
4,5
23.9
2,0
74.9
168
-
-
-
-
- -
-
-
-
-
86Ye
s 3
52,7
48.6
44,
487.
6-
308,
261.
0-
4,05
9.8
- 73
4.8
- 1,
834.
9-
-
0
-
-
-
- 3
08,2
61.1
734
.8 4
,059
.8 1
,834
.9 1
68-
-
-
-
-
-
-
-
-
-
87 N
o 2
98,3
86.4
-
- 29
8,38
6.4
- 3,
434.
1-
621.
6-
1,77
6.1
- -
0-
-
-
-
298
,386
.4 6
21.6
3,4
34.1
1,7
76.1
168
-
-
-
-
- -
-
-
-
-
88Ye
s 2
69,2
77.1
30,
615.
1-
238,
662.
0-
3,09
9.1
- 56
0.9
- 1,
420.
6-
-
-
0-
-
-
-
238
,662
.0 5
60.9
3,0
99.1
1,4
20.6
168
-
-
-
-
- -
-
-
-
-
89Ye
s 1
84,7
69.9
44,
487.
6-
140,
282.
4-
2,12
6.5
175
.4-
835.
0 2
0 1
,843
.9 0
81.
0 3
98.3
260
.7 2
0 1
40,2
82.4
207
.7 2
,126
.5 9
47.9
148
-
-
-
-
- -
-
-
-
-
90Ye
s 1
98,0
57.5
44,
487.
6-
153,
569.
9-
2,27
9.4
90.
5-
914.
1 9
437
.5-
0 0
.2 1
01.8
51.
7 1
7 1
53,5
69.9
3.4
2,2
79.5
1,0
17.0
151
-
-
-
-
- -
-
-
-
-
91Ye
s 4
06,9
78.7
61,
230.
2-
345,
748.
4-
4,68
3.9
- 73
4.1
- 2,
058.
0-
-
0
-
-
-
- 3
45,7
48.5
734
.1 4
,683
.9 2
,058
.0 1
68-
-
-
-
-
-
-
-
-
-

Appendix
212
Figure 63: Results current scenario (in kW) - transition week (1)
Co
ns
Pro
dP
ot.
Su
rplu
sSt
ora
geM
issi
ng
Exte
rnal
To
Exte
rnal
Fro
mD
iff
Pro
d-
Co
ns
% time storage positive
Object
Prod
Total
Total
Diff Prod-
Cons
Min
Max
Average
No of occ.
Total
Status End
of week
Min
Max
Average
No of occ.
Total
Min
Max
Average
No of occ.
Total
Min
Max
Average
No of occ.
Total
Min
Max
Average
No of occ.
Tota
lM
inM
axA
vera
ge
1Ye
s 2
74,9
50.0
116
,373
.7-
158,
576.
3-
2,80
4.5
131
.7-
943.
9 1
131
.7-
0 1
31.7
131
.7 1
31.7
1 1
58,5
76.2
77.
3 2
,804
.5 9
49.6
167
-
-
-
-
-
-
-
-
-
-
2Ye
s 2
35,1
29.3
116
,373
.7-
118,
755.
6-
2,39
8.3
265
.8-
706.
9 2
4 1
,679
.1 0
13.
5 2
90.3
106
.4 3
1 1
16,2
67.3
21.
6 2
,398
.3 9
45.3
123
-
-
-
-
-
2,4
88.3
1.2
288
.0 1
31.0
19
3Ye
s 8
1,04
4.3
116
,373
.7 3
5,32
9.4
- 82
6.7
1,1
44.8
210
.3 8
4 7
0,25
9.5
0 2
6.5
5,3
83.0
2,1
72.2
113
1,2
78.0
183
.8 2
83.7
213
.0 6
- 36
,607
.3-
-
1,14
4.8
- 74
7.1
49
-
-
-
-
-
4 N
o 1
93,4
11.6
-
- 19
3,41
1.6
- 2,
062.
0-
429.
5-
1,15
1.3
- -
-
0 1
33.3
133
.3 1
33.3
1 1
59,2
92.5
76.
2 1
,972
.8 9
53.8
167
-
-
-
-
-
34,
119.
0 1
83.0
1,1
44.8
775
.4 4
4
5Ye
s 5
31,9
55.9
192
,380
.3-
339,
575.
7-
5,42
6.0
- 43
.1-
2,02
1.3
- -
0
-
-
-
- 3
39,5
75.7
43.
1 5
,426
.0 2
,021
.3 1
68-
-
-
-
- -
-
-
-
-
6Ye
s 2
50,3
06.6
116
,373
.7-
133,
932.
9-
2,55
3.1
214
.7-
797.
2 6
293
.2-
0 1
8.6
1,6
58.8
706
.4 4
6 1
12,9
20.9
374
.3 2
,553
.1 1
,129
.2 1
00-
-
-
-
- 2
1,01
2.0
19.
4 2
,359
.3 5
67.9
37
7Ye
s 1
82,7
00.5
232
,747
.4 5
0,04
6.9
- 1,
863.
5 2
,147
.5 2
97.9
84
128
,791
.0 0
194
.4 1
3,77
2.1
5,3
27.4
144
2,8
81.0
414
.3 6
39.5
480
.2 6
- 52
,927
.9-
3,39
8.5
- 3,
398.
5-
1,17
6.2
45
-
-
-
-
-
8Ye
s 3
41,4
69.2
169
,105
.5-
172,
363.
6-
3,48
3.0
386
.9-
1,02
6.0
24
2,4
70.2
- 0
24.
2 2
,596
.9 5
70.2
49
140
,447
.8 8
1.9
3,4
83.0
1,5
60.5
90
-
-
-
-
-
31,
915.
8 1
04.3
3,1
04.0
997
.4 3
2
9Ye
s 4
33,8
56.9
119
,064
.8-
314,
792.
1-
4,42
5.3
- 37
9.0
- 1,
873.
8-
-
0 1
1.4
396
.3 2
30.7
8 2
23,6
01.1
68.
2 4
,425
.4 1
,760
.6 1
27-
-
-
-
- 9
1,19
1.1
51.
1 1
,982
.7 1
,169
.1 7
8
10Ye
s 2
5,53
2.6
116
,373
.7 9
0,84
1.1
- 26
0.4
1,5
27.3
540
.7 8
4 1
01,8
45.7
- 0
56.
8 1
,695
.9 5
80.2
117
402
.6 5
7.9
89.
4 6
7.1
6-
91,2
43.7
- 1,
982.
7-
1,98
2.7
- 1,
169.
8 7
8-
-
-
-
-
11Ye
s 2
37,6
39.1
116
,373
.7-
121,
265.
4-
2,42
3.9
257
.3-
721.
8 2
2 1
,314
.2 0
10.
4 7
,731
.9 4
,265
.9 8
3 7
0,80
9.6
158
.4 2
,423
.9 8
85.1
80
-
-
-
-
-
50,
455.
9 1
48.9
4,4
06.1
1,8
68.7
27
12Ye
s 7
9,22
6.2
44,
464.
5-
34,7
61.8
- 80
8.1
137
.3-
206.
9 4
7 3
,174
.7-
0 2
0.3
4,9
62.5
1,0
23.7
134
1,2
49.3
179
.7 2
77.3
208
.2 6
-
-
-
-
-
33,
512.
4 2
1.9
4,4
99.2
1,1
96.9
28
13Ye
s 9
8,02
0.0
232
,747
.4 1
34,7
27.4
- 99
9.8
2,7
31.0
801
.9 8
4 1
76,9
74.1
- 0
473
.0 1
8,64
3.0
5,7
62.5
133
1,5
45.7
222
.3 3
43.1
257
.6 6
- 13
6,27
3.1
- 6,
178.
8-
6,17
8.8
- 2,
163.
1 6
3-
-
-
-
-
14Ye
s 2
25,0
11.2
169
,105
.5-
55,9
05.6
- 2,
295.
1 9
24.4
- 33
2.8
78
42,
847.
9 0
4.2
11,
308.
6 4
,631
.6 1
36 3
,548
.2 5
10.3
787
.6 5
91.4
6-
-
-
-
- 5
2,35
7.5
254
.7 6
,178
.8 1
,689
.0 3
1
15Ye
s 2
29,7
93.6
116
,373
.7-
113,
419.
9-
2,34
3.9
283
.8-
675.
1 3
1 2
,590
.6-
0 6
2.5
14,
438.
7 5
,186
.0 1
35 3
,623
.6 5
21.1
804
.4 6
03.9
6-
-
-
-
- 1
09,7
96.3
88.
4 5
,538
.5 1
,960
.6 5
6
16Ye
s 1
39,5
40.1
169
,105
.5 2
9,56
5.4
- 1,
423.
3 1
,513
.4 1
76.0
84
89,
707.
3-
0 3
10.6
11,
638.
2 4
,446
.6 1
41 2
,200
.4 3
16.4
488
.5 3
66.7
6-
31,7
65.8
- 2,
839.
2-
2,83
9.2
- 1,
323.
6 2
4-
-
-
-
-
17Ye
s 1
10,6
08.4
169
,105
.5 5
8,49
7.1
- 1,
128.
2 1
,712
.8 3
48.2
84
106
,169
.4 0
246
.2 1
4,36
1.2
4,2
94.4
139
1,7
44.2
250
.8 3
87.2
290
.7 6
- 60
,241
.3-
5,53
8.5
- 5,
538.
5-
1,77
1.8
34
-
-
-
-
-
18Ye
s 1
26,8
72.6
232
,747
.4 1
05,8
74.8
- 1,
294.
1 2
,532
.2 6
30.2
84
160
,557
.0 0
20.
7 2
0,99
6.7
6,1
85.3
131
2,0
00.6
287
.7 4
44.1
333
.4 6
- 10
7,87
5.4
- 6,
533.
2-
6,53
3.2
- 1,
926.
3 5
6-
-
-
-
-
19Ye
s 1
48,2
15.7
232
,747
.4 8
4,53
1.7
- 1,
511.
8 2
,385
.1 5
03.2
84
148
,412
.8-
0 3
29.9
14,
950.
3 5
,408
.7 1
25 2
,337
.2 3
36.1
518
.8 3
89.5
6-
86,8
68.9
- 5,
032.
7-
5,03
2.7
- 1,
809.
8 4
8-
-
-
-
-
20Ye
s 3
20,4
81.8
232
,747
.4-
87,7
34.4
- 3,
268.
9 1
,198
.0-
522.
2 6
8 5
3,59
9.0
- 0
14.
7 1
9,58
7.0
6,0
69.6
128
5,0
53.7
726
.8 1
,121
.8 8
42.3
6-
1,50
1.7
- 37
3.5
- 37
3.5
- 30
0.3
5 8
4,18
2.5
34.
9 7
,451
.7 1
,830
.1 4
6
21Ye
s 1
57,7
21.2
169
,105
.5 1
1,38
4.3
- 1,
608.
8 1
,388
.2 6
7.8
84
79,
362.
3-
0 3
51.0
10,
476.
0 4
,442
.6 1
40 2
,487
.1 3
57.7
552
.1 4
14.5
6-
13,8
71.4
- 3,
920.
5-
3,92
0.5
- 53
3.5
26
-
-
-
-
-
22Ye
s 9
11,2
69.5
169
,105
.5-
742,
164.
0-
9,29
5.0
- 1,
315.
6-
4,41
7.6
- -
0
4,6
38.7
10,
903.
4 8
,381
.2 3
621
,859
.3 3
15.9
9,2
95.0
4,2
30.3
147
-
-
-
-
-
120
,304
.7 3
72.1
12,
841.
7 3
,341
.8 3
6
23Ye
s 4
85,1
59.3
105
,730
.4-
379,
429.
0-
4,94
8.6
- 62
3.6
- 2,
258.
5-
-
- 0
13.
9 7
,738
.7 3
,284
.4 1
1 2
94,1
14.7
149
.4 4
,948
.6 2
,028
.4 1
45-
-
-
-
- 8
5,31
4.3
19.
6 8
,010
.7 1
,854
.7 4
6
24Ye
s 1
85,9
61.3
232
,747
.4 4
6,78
6.1
- 1,
896.
8 2
,125
.0 2
78.5
84
126
,935
.6-
0 1
27.7
12,
351.
7 4
,971
.3 1
31 2
,932
.4 4
21.7
651
.0 4
88.7
6-
49,7
18.6
- 3,
829.
8-
3,82
9.8
- 1,
343.
7 3
7-
-
-
-
-
25Ye
s 4
81,8
19.5
169
,105
.5-
312,
714.
0-
4,91
4.6
- 85
.8-
1,86
1.4
- -
0
376
.5 2
0,90
3.0
7,1
15.0
91
89,
281.
8 1
42.6
4,9
14.6
1,5
39.3
58
-
-
-
-
-
223
,432
.2 7
5.0
15,
212.
9 3
,191
.9 7
0
26Ye
s 1
52,9
98.1
232
,747
.4 7
9,74
9.3
- 1,
560.
6 2
,352
.2 4
74.7
84
145
,691
.6-
0 3
40.5
16,
789.
6 4
,756
.0 1
33 2
,412
.6 3
47.0
535
.6 4
02.1
6-
82,1
61.9
- 8,
519.
4-
8,51
9.4
- 2,
220.
6 3
7-
-
-
-
-
27Ye
s 8
0,62
9.3
169
,105
.5 8
8,47
6.2
- 82
2.4
1,9
19.4
526
.6 8
4 1
23,2
27.5
0 1
79.5
12,
651.
6 3
,571
.5 1
28 1
,271
.4 1
82.9
282
.2 2
11.9
6-
89,7
47.6
- 6,
496.
4-
6,49
6.4
- 2,
301.
2 3
9-
-
-
-
-
28Ye
s 1
23,0
98.1
116
,373
.7-
6,72
4.4
- 1,
255.
6 8
55.0
- 40
.0 7
8 4
6,52
1.8
- 0
22.
7 7
,233
.3 2
,959
.0 1
48 1
,941
.1 2
79.2
430
.9 3
23.5
6-
1,18
6.0
- 1,
186.
0-
1,18
6.0
- 1,
186.
0 1
5,9
69.3
24.
9 1
,459
.0 4
59.2
13
29 N
o 9
09.1
-
- 90
9.1
- 9.
7-
2.0
- 5.
4-
-
0 2
.0 6
1.0
15.
3 9
2 1
4.3
2.1
3.2
2.4
6-
-
-
-
- 8
94.7
2.0
63.
5 1
2.8
70
30Ye
s 3
02,2
41.4
116
,373
.7-
185,
867.
7-
3,08
2.9
39.
8-
1,10
6.4
1 3
9.8
0 1
71.1
12,
166.
0 4
,458
.9 1
09 4
,766
.0 6
85.4
1,0
58.0
794
.3 6
-
-
-
-
-
181
,101
.7 1
08.3
11,
091.
8 2
,235
.8 8
1
31 N
o 7
,707
.2-
-
7,70
7.2
- 82
.2-
17.1
- 45
.9-
-
0 1
7.1
1,1
18.1
286
.0 8
3 1
21.5
17.
5 2
7.0
20.
3 6
-
-
-
-
-
7,5
85.7
17.
2 1
,144
.7 9
6.0
79
32Ye
s 8
4,87
8.2
169
,105
.5 8
4,22
7.4
- 86
5.8
1,8
90.1
501
.4 8
4 1
20,8
09.9
- 0
190
.9 1
7,39
9.5
5,9
16.0
143
1,3
38.4
192
.5 2
97.1
223
.1 6
- 85
,565
.8-
11,0
91.8
- 11
,091
.8-
983.
5 8
7-
-
-
-
-
33Ye
s 9
3,27
7.1
169
,105
.5 7
5,82
8.5
- 95
1.4
1,8
32.3
451
.4 8
4 1
16,0
31.0
- 0
207
.6 1
5,06
0.5
5,0
26.8
142
1,4
70.9
211
.5 3
26.5
245
.1 6
- 77
,299
.4-
7,16
2.8
- 7,
162.
8-
1,93
2.5
40
-
-
-
-
-
34Ye
s 1
49,4
60.7
116
,373
.7-
33,0
87.0
- 1,
524.
5 6
73.3
- 19
6.9
78
32,
376.
5 0
39.
6 9
,158
.1 2
,920
.6 1
40 2
,356
.8 3
38.9
523
.2 3
92.8
6-
-
-
-
- 3
0,73
0.2
149
.4 4
,212
.0 1
,181
.9 2
6
35Ye
s 3
98,2
25.9
232
,747
.4-
165,
478.
5-
4,06
1.9
774
.2-
985.
0 4
8 2
1,71
3.0
- 0
264
.5 1
6,19
0.6
6,0
58.8
118
6,2
79.6
903
.1 1
,394
.0 1
,046
.6 6
-
-
-
-
-
159
,198
.8 1
29.8
9,5
59.4
2,3
41.2
68
36 N
o 6
7,01
3.2
-
- 67
,013
.2-
714.
4-
148.
8-
398.
9-
-
0 4
8.6
7,3
28.6
1,7
62.3
93
1,0
56.7
152
.0 2
34.6
176
.1 6
-
-
-
-
-
65,
956.
5 1
07.4
5,3
17.4
879
.4 7
5
37Ye
s 1
52,8
59.8
169
,105
.5 1
6,24
5.8
- 1,
559.
2 1
,421
.7 9
6.7
84
82,
128.
5 0
56.
1 1
2,14
6.9
5,1
20.3
150
2,4
10.4
346
.7 5
35.1
401
.7 6
- 18
,656
.2-
4,51
8.8
- 4,
518.
8-
848.
0 2
2-
-
-
-
-
38Ye
s 8
0,68
8.6
169
,105
.5 8
8,41
6.9
- 82
3.0
1,9
19.0
526
.3 8
4 1
23,1
93.8
- 0
188
.1 1
5,48
0.7
5,4
58.9
148
1,2
72.4
183
.0 2
82.5
212
.1 6
- 89
,689
.3-
8,71
2.1
- 8,
712.
1-
1,75
8.6
51
-
-
-
-
-
39Ye
s 1
72,9
38.0
169
,105
.5-
3,83
2.5
- 1,
764.
0 1
,283
.3-
22.8
78
70,
788.
6 0
4.4
11,
132.
8 4
,782
.7 1
51 2
,727
.1 3
92.2
605
.4 4
54.5
6-
2,46
8.3
- 1,
839.
9-
1,83
9.9
- 61
7.1
4 3
,573
.8 7
.6 2
,352
.0 3
24.9
11
40Ye
s 6
7,60
6.1
116
,373
.7 4
8,76
7.6
- 68
9.6
1,2
37.4
290
.3 8
4 7
7,90
5.9
0 1
50.5
10,
763.
7 3
,797
.6 1
45 1
,066
.1 1
53.3
236
.7 1
77.7
6-
49,8
33.7
- 4,
194.
0-
4,19
4.0
- 1,
158.
9 4
3-
-
-
-
-
41 N
o 5
2,56
7.2
-
- 52
,567
.2-
560.
4-
116.
7-
312.
9-
-
0 1
16.7
4,5
49.3
1,0
79.9
104
828
.9 1
19.2
184
.0 1
38.2
6-
-
-
-
- 5
1,73
8.2
73.
9 4
,959
.1 8
21.2
63
42Ye
s 9
5,21
3.7
232
,747
.4 1
37,5
33.7
- 97
1.2
2,7
50.4
818
.7 8
4 1
78,5
70.9
- 0
221
.9 2
0,02
7.7
7,4
21.1
144
1,5
01.4
215
.9 3
33.3
250
.2 6
- 13
9,03
5.1
- 9,
559.
4-
9,55
9.4
- 1,
829.
4 7
6-
-
-
-
-
43Ye
s 2
25,6
83.1
243
,124
.1 1
7,44
1.0
- 2,
302.
0 2
,003
.2 1
03.8
84
114
,710
.6-
0 1
04.0
16,
531.
8 7
,157
.6 1
51 3
,558
.8 5
11.8
790
.0 5
93.1
6-
20,9
99.8
- 3,
178.
0-
3,17
8.0
- 72
4.1
29
-
-
-
-
-
44Ye
s 7
6,93
3.8
116
,373
.7 3
9,43
9.9
- 78
4.7
1,1
73.1
234
.8 8
4 7
2,59
8.4
0 1
79.3
10,
579.
7 3
,699
.7 1
44 1
,213
.2 1
74.5
269
.3 2
02.2
6-
40,6
53.0
- 4,
319.
0-
4,31
9.0
- 1,
098.
7 3
7-
-
-
-
-
45Ye
s 7
9,34
4.8
116
,373
.7 3
7,02
8.9
- 80
9.3
1,1
56.5
220
.4 8
4 7
1,22
6.6
- 0
38.
3 1
0,13
5.5
3,8
57.4
146
1,2
51.2
179
.9 2
77.7
208
.5 6
- 38
,280
.1-
4,35
7.3
- 4,
357.
3-
1,09
3.7
35
-
-
-
-
-

Appendix
213
Figure 64: Results current scenario (in kW) - transition week (2)
% time storage positive
Object
Prod
Total
Total
Diff Prod-
Cons
Min
Max
Average
No of occ.
Total
Status End
of week
Min
Max
Average
No of occ.
Total
Min
Max
Average
No of occ.
Total
Min
Max
Average
No of occ.
Total
Min
Max
Average
No of occ.
Tota
lM
inM
axA
vera
ge
46Ye
s 1
52,4
05.2
232
,747
.4 8
0,34
2.2
- 1,
554.
5 2
,356
.3 4
78.2
84
146
,028
.9 0
405
.6 1
6,03
9.5
6,1
37.3
136
2,4
03.3
345
.6 5
33.5
400
.5 6
- 82
,745
.4-
5,46
1.8
- 5,
461.
8-
1,53
2.3
54
-
-
-
-
-
47Ye
s 1
31,2
59.8
169
,105
.5 3
7,84
5.7
- 1,
338.
9 1
,570
.5 2
25.3
84
94,
418.
8 0
292
.1 1
3,44
1.4
4,3
21.1
142
2,0
69.8
297
.7 4
59.5
345
.0 6
- 39
,915
.5-
3,73
8.1
- 3,
738.
1-
1,28
7.6
31
-
-
-
-
-
48 N
o 8
4,54
2.2
-
- 84
,542
.2-
901.
3-
187.
7-
503.
2-
-
- 0
83.
5 5
,942
.9 1
,816
.4 1
32 1
,333
.1 1
91.7
295
.9 2
22.2
6-
-
-
-
- 8
3,20
9.1
188
.2 5
,095
.1 1
,698
.1 4
9
49Ye
s 1
37,0
10.6
116
,373
.7-
20,6
36.9
- 1,
397.
5 7
59.1
- 12
2.8
78
39,
056.
8 0
124
.4 9
,100
.4 2
,856
.8 1
47 2
,160
.5 3
10.7
479
.6 3
60.1
6-
-
-
-
- 1
8,47
6.4
89.
6 4
,768
.3 1
,231
.8 1
5
50Ye
s 6
9,74
0.4
232
,747
.4 1
63,0
07.0
- 71
1.4
2,9
25.9
970
.3 8
4 1
93,0
65.2
0 1
62.5
15,
661.
8 5
,758
.1 1
35 1
,099
.7 1
58.2
244
.1 1
83.3
6-
164,
106.
7-
4,84
1.3
- 4,
841.
3-
1,69
1.8
97
-
-
-
-
-
51Ye
s 8
2,26
9.6
169
,105
.5 8
6,83
6.0
- 83
9.2
1,9
08.1
516
.9 8
4 1
22,2
94.2
- 0
183
.1 1
4,86
1.6
5,0
24.5
134
1,2
97.3
186
.6 2
88.0
216
.2 6
- 88
,133
.3-
5,36
5.1
- 5,
365.
1-
1,39
8.9
63
-
-
-
-
-
52Ye
s 1
60,5
07.7
169
,105
.5 8
,597
.8-
1,63
7.2
1,3
69.0
51.
2 8
4 7
7,77
6.8
0 4
39.2
12,
516.
2 5
,136
.3 1
49 2
,531
.0 3
64.0
561
.9 4
21.8
6-
11,1
28.9
- 1,
960.
6-
1,96
0.6
- 61
8.3
18
-
-
-
-
-
53Ye
s 7
8,45
5.5
232
,747
.4 1
54,2
91.9
- 80
0.2
2,8
65.9
918
.4 8
4 1
88,1
06.3
0 1
74.6
17,
884.
5 5
,829
.2 1
36 1
,237
.2 1
77.9
274
.6 2
06.2
6-
155,
529.
1-
8,35
1.9
- 8,
351.
9-
1,78
7.7
87
-
-
-
-
-
54 N
o 1
04,6
99.6
-
- 10
4,69
9.6
- 1,
116.
2-
232.
5-
623.
2-
-
0 2
38.4
5,6
31.2
1,5
74.4
105
1,6
51.0
237
.4 3
66.5
275
.2 6
-
-
-
-
-
103
,048
.6 1
0.4
5,6
03.8
1,5
15.4
68
55 N
o 6
0,63
0.1
-
- 60
,630
.1-
646.
4-
134.
6-
360.
9-
-
- 0
62.
1 4
,956
.8 1
,637
.6 1
14 9
56.1
137
.5 2
12.2
159
.3 6
-
-
-
-
-
59,
674.
0 1
34.6
5,0
27.3
1,0
28.9
58
56Ye
s 9
7,36
7.8
232
,747
.4 1
35,3
79.6
- 99
3.2
2,7
35.5
805
.8 8
4 1
77,3
45.2
- 0
161
.9 1
6,87
8.9
6,9
93.7
138
1,5
35.4
220
.8 3
40.8
255
.9 6
- 13
6,91
5.0
- 5,
746.
2-
5,74
6.2
- 1,
875.
5 7
3-
-
-
-
-
57 N
o 5
5,66
9.8
-
- 55
,669
.8-
593.
5-
123.
6-
331.
4-
-
- 0
124
.8 4
,063
.1 1
,330
.3 9
3 8
77.9
126
.2 1
94.9
146
.3 6
-
-
-
-
-
54,
791.
9 1
23.6
4,4
44.8
740
.4 7
4
58Ye
s 8
3,61
3.4
116
,373
.7 3
2,76
0.3
- 85
2.9
1,1
27.1
195
.0 8
4 6
8,79
7.7
0 1
86.1
9,3
91.0
3,5
97.6
145
1,3
18.5
189
.6 2
92.7
219
.7 6
- 34
,078
.8-
3,96
8.8
- 3,
968.
8-
1,09
9.3
31
-
-
-
-
-
59Ye
s 7
5,90
6.2
169
,105
.5 9
3,19
9.3
- 77
4.2
1,9
52.0
554
.8 8
4 1
25,9
15.0
- 0
90.
7 1
5,61
9.3
5,0
16.4
141
1,1
97.0
172
.1 2
65.7
199
.5 6
- 94
,396
.3-
10,4
53.2
- 10
,453
.2-
1,81
5.3
52
-
-
-
-
-
60Ye
s 9
5,78
6.8
232
,747
.4 1
36,9
60.6
- 97
7.0
2,7
46.4
815
.2 8
4 1
78,2
44.8
- 0
213
.2 1
9,03
5.2
7,4
38.7
135
1,5
10.5
217
.2 3
35.3
251
.7 6
- 13
8,47
1.0
- 8,
985.
3-
8,98
5.3
- 2,
472.
7 5
6-
-
-
-
-
61Ye
s 4
6,18
4.0
116
,373
.7 7
0,18
9.7
- 47
1.1
1,3
85.0
417
.8 8
4 9
0,09
5.0
- 0
102
.8 1
0,87
8.6
2,9
83.7
140
728
.3 1
04.7
161
.7 1
21.4
6-
70,9
18.0
- 6,
693.
6-
6,69
3.6
- 1,
729.
7 4
1-
-
-
-
-
62 N
o 1
7,72
6.6
-
- 17
,726
.6-
189.
0-
39.4
- 10
5.5
- -
0
39.
5 9
45.2
249
.8 9
2 2
79.5
40.
2 6
2.1
46.
6 6
-
-
-
-
-
17,
447.
1 3
9.6
1,0
70.8
245
.7 7
1
63Ye
s 1
36,2
39.8
169
,105
.5 3
2,86
5.7
- 1,
389.
6 1
,536
.2 1
95.6
84
91,
585.
2 0
371
.4 1
3,20
4.0
5,0
80.6
145
2,1
48.4
309
.0 4
76.9
358
.1 6
- 35
,014
.0-
4,71
5.7
- 4,
715.
7-
1,45
8.9
24
-
-
-
-
-
64Ye
s 2
06,1
18.6
116
,373
.7-
89,7
44.9
- 2,
102.
4 3
63.5
- 53
4.2
47
8,6
87.6
0 6
7.6
11,
241.
3 3
,688
.8 1
23 3
,250
.3 4
67.4
721
.5 5
41.7
6-
-
-
-
- 8
6,49
4.6
51.
2 9
,224
.4 1
,572
.6 5
5
65Ye
s 3
73,9
38.3
303
,056
.5-
70,8
81.8
- 3,
814.
2 1
,858
.7-
421.
9 7
8 9
2,51
3.8
0 2
26.3
23,
086.
9 9
,053
.4 1
45 5
,896
.6 8
48.0
1,3
09.0
982
.8 6
-
-
-
-
-
64,
985.
2 3
15.6
6,1
77.9
1,8
56.7
35
66Ye
s 3
39,6
31.3
232
,747
.4-
106,
883.
9-
3,46
4.2
1,0
66.0
- 63
6.2
65
44,
946.
0 0
2.3
17,
856.
2 6
,947
.3 1
32 5
,355
.6 7
70.2
1,1
88.9
892
.6 6
-
-
-
-
-
101
,528
.3 1
63.4
7,3
06.9
2,1
15.2
48
67Ye
s 2
28,1
92.9
232
,747
.4 4
,554
.5-
2,32
7.6
1,8
34.0
27.
1 8
4 1
02,9
05.9
- 0
507
.9 1
6,35
2.9
6,8
79.3
150
3,5
98.4
517
.5 7
98.8
599
.7 6
- 8,
152.
9-
2,68
1.5
- 2,
681.
5-
679.
4 1
2-
-
-
-
-
68Ye
s 4
49,0
20.8
232
,747
.4-
216,
273.
4-
3,35
1.2
1,1
04.9
- 1,
287.
3 1
4 1
0,00
9.9
0 7
3.3
13,
335.
4 4
,153
.3 1
04 8
,252
.9 1
,200
.0 1
,581
.5 1
,375
.5 6
-
-
-
-
-
208
,020
.5 1
82.6
13,
169.
8 2
,506
.3 8
3
69Ye
s 2
55,5
83.1
97,
729.
7-
157,
853.
4-
2,60
7.0
27.
5-
939.
6 1
27.
5 0
153
.8 9
,203
.4 2
,739
.3 9
8 2
6,47
5.6
567
.5 2
,607
.0 1
,103
.1 2
4-
-
-
-
- 1
31,3
77.9
294
.3 8
,985
.3 2
,153
.7 6
1
70 N
o 2
42,8
36.6
-
- 24
2,83
6.6
- 2,
588.
9-
539.
2-
1,44
5.5
- -
0
249
.3 3
,722
.0 1
,856
.7 9
197
,846
.2 1
33.7
2,4
76.9
1,3
64.5
145
-
-
-
-
-
44,
990.
4 2
82.2
5,7
27.2
1,6
66.3
27
71 N
o 1
37,0
30.3
-
- 13
7,03
0.3
- 1,
460.
9-
304.
3-
815.
7-
-
- 0
253
.3 7
,298
.8 2
,937
.2 1
3 1
19,8
44.2
304
.3 1
,397
.7 7
99.0
150
-
-
-
-
-
17,
186.
1 3
22.2
8,1
50.0
2,4
55.2
7
72Ye
s 4
37,5
72.2
356
,685
.4-
80,8
86.8
- 4,
463.
2 2
,205
.1-
481.
5 7
8 1
10,2
46.9
0 2
61.0
18,
386.
5 8
,363
.1 1
06 7
6,60
9.9
285
.0 3
,320
.9 1
,255
.9 6
1-
-
-
-
- 4
,277
.0 6
6.7
2,6
74.2
611
.0 7
73Ye
s 1
02,9
40.7
116
,373
.7 1
3,43
3.0
- 1,
050.
0 9
93.9
80.
0 8
4 5
7,80
0.5
0 2
29.1
6,8
37.4
2,8
67.1
134
1,6
23.3
233
.4 3
60.3
270
.5 6
- 15
,056
.2-
1,59
8.4
- 1,
598.
4-
501.
9 3
0-
-
-
-
-
74Ye
s 4
16,1
89.6
116
,373
.7-
299,
815.
9-
4,24
5.1
- 34
4.0
- 1,
784.
6-
-
- 0
1,4
31.7
2,3
08.3
1,8
70.0
2 2
63,1
21.2
430
.3 4
,245
.1 1
,708
.6 1
54-
-
-
-
- 3
6,69
4.7
227
.7 4
,181
.8 1
,048
.4 3
5
75 N
o 3
48,2
27.8
-
- 34
8,22
7.8
- 3,
712.
4-
773.
3-
2,07
2.8
- -
-
0-
-
-
-
348
,227
.7 7
73.3
3,7
12.4
2,0
72.8
168
-
-
-
-
-
-
-
-
-
-
76 N
o 2
9,30
7.2
-
- 29
,307
.2-
312.
4-
65.1
- 17
4.4
- -
-
0-
-
-
-
29,
307.
2 6
5.1
312
.4 1
74.4
168
-
-
-
-
-
-
-
-
-
-
77Ye
s 4
45,2
99.2
232
,747
.4-
212,
551.
8-
4,54
2.1
615
.6-
1,26
5.2
34
7,9
32.1
0 9
1.3
1,4
31.3
645
.0 4
7 2
12,5
51.8
25.
0 4
,542
.1 1
,756
.6 1
21-
-
-
-
- -
-
-
-
-
78Ye
s 2
68,0
13.5
116
,373
.7-
151,
639.
8-
2,73
3.7
155
.0-
902.
6 1
155
.0-
0 1
55.0
155
.0 1
55.0
1 1
51,6
39.7
24.
5 2
,733
.7 9
08.0
167
-
-
-
-
-
-
-
-
-
-
79 N
o 6
8,49
5.4
-
- 68
,495
.4-
730.
2-
152.
1-
407.
7-
-
- 0
-
-
-
- 6
8,49
5.4
152
.1 7
30.2
407
.7 1
68-
-
-
-
- -
-
-
-
-
80Ye
s 2
98,7
83.0
169
,105
.5-
129,
677.
5-
3,04
7.6
530
.7-
771.
9 4
7 1
2,84
9.0
- 0
67.
5 2
,328
.5 1
,092
.2 5
9 1
28,0
44.0
18.
9 3
,047
.6 1
,174
.7 1
09-
-
-
-
- 1
,633
.5 1
,633
.5 1
,633
.5 1
,633
.5 1
81Ye
s 2
52,0
85.2
232
,747
.4-
19,3
37.8
- 2,
571.
3 1
,669
.3-
115.
1 7
8 8
9,88
3.7
0 9
9.0
13,
515.
6 6
,024
.1 1
28 2
0,97
1.3
73.
6 1
,513
.2 5
37.7
39
- 1,
633.
5-
1,63
3.5
- 1,
633.
5-
1,63
3.5
1-
-
-
-
-
82Ye
s 1
94,6
56.6
169
,105
.5-
25,5
51.1
- 1,
985.
5 1
,133
.6-
152.
1 7
8 5
9,13
5.1
0 5
7.9
8,9
71.5
4,2
58.3
114
25,
551.
1 3
0.7
1,3
89.7
473
.2 5
4-
-
-
-
- -
-
-
-
-
83 N
o 2
73,7
84.0
-
- 27
3,78
4.0
- 2,
918.
8-
607.
9-
1,62
9.7
- -
0
-
-
-
- 2
73,7
84.1
608
.0 2
,918
.8 1
,629
.7 1
68-
-
-
-
- -
-
-
-
-
84Ye
s 1
90,4
67.0
116
,373
.7-
74,0
93.3
- 1,
942.
8 4
16.2
- 44
1.0
54
13,
802.
3 0
42.
5 2
,419
.3 1
,042
.1 7
1 7
4,09
3.3
3.4
1,9
42.8
763
.8 9
7-
-
-
-
- -
-
-
-
-
85Ye
s 3
52,5
16.2
169
,105
.5-
183,
410.
6-
3,59
5.7
349
.7-
1,09
1.7
16
1,0
75.1
- 0
8.6
349
.7 8
1.8
21
183
,410
.6 1
.8 3
,595
.7 1
,247
.7 1
47-
-
-
-
- -
-
-
-
-
86Ye
s 3
16,3
51.5
169
,105
.5-
147,
246.
0-
3,22
6.8
471
.5-
876.
5 4
3 7
,530
.3-
0 4
.0 1
,381
.0 6
33.2
50
147
,246
.0 4
.5 3
,226
.8 1
,247
.8 1
18-
-
-
-
- -
-
-
-
-
87 N
o 2
67,5
98.5
-
- 26
7,59
8.5
- 2,
852.
9-
594.
2-
1,59
2.8
- -
0
-
-
-
- 2
67,5
98.5
594
.2 2
,852
.9 1
,592
.8 1
68-
-
-
-
- -
-
-
-
-
88Ye
s 2
41,4
92.7
116
,373
.7-
125,
119.
0-
2,46
3.2
244
.4-
744.
8 1
7 8
51.8
- 0
1.4
858
.5 1
48.5
29
118
,472
.8 5
.4 2
,463
.2 8
77.6
135
-
-
-
-
-
6,6
46.2
64.
5 1
,697
.3 5
11.2
13
89Ye
s 1
65,7
05.1
169
,105
.5 3
,400
.4-
1,69
0.2
1,3
33.1
20.
2 8
4 7
4,81
9.5
0 1
2.8
11,
137.
6 4
,523
.2 1
47 3
,336
.9 3
55.2
580
.0 4
17.1
8-
6,73
7.3
- 1,
697.
3-
1,69
7.3
- 39
6.3
17
-
-
-
-
-
90Ye
s 1
77,6
21.7
169
,105
.5-
8,51
6.1
- 1,
811.
7 1
,251
.0-
50.7
78
68,
275.
5-
0 4
9.4
10,
228.
2 4
,345
.2 1
38 1
0,30
5.9
2.8
768
.7 3
55.4
29
- 1,
880.
9-
1,88
0.9
- 1,
880.
9-
1,88
0.9
1 9
1.1
18.
2 2
7.4
22.
8 4
91Ye
s 3
64,9
86.0
232
,747
.4-
132,
238.
6-
3,72
2.9
891
.3-
787.
1 6
3 3
4,00
9.0
0 3
5.5
5,8
05.3
2,7
23.1
80
130
,357
.8 3
33.5
3,7
22.9
1,4
81.3
88
-
-
-
-
-
1,8
80.9
1,8
80.9
1,8
80.9
1,8
80.9
1

Appendix
214
Figure 65: Results current scenario (in kW) - summer week (1)
Co
ns
Pro
dP
ot.
Su
rplu
sSt
ora
geM
issi
ng
Exte
rnal
To
Exte
rnal
Fro
mD
iff
Pro
d-
Co
ns
Object
Prod
Total
Total
Diff Prod-
Cons
Min
Max
Average
No of occ.
Total
Status End
of week
Min
Max
Average
No of occ.
Total
Min
Max
Average
No of occ.
Total
Min
Max
Average
No of occ.
Total
Min
Max
Average
No of occ.
Tota
lM
inM
axA
vera
geN
o o
f o
cc.
1Ye
s 2
22,9
25.9
130
,603
.2-
92,3
22.8
- 2,
020.
6 3
61.6
- 54
9.5
49
9,0
83.5
0 6
.6 8
,019
.6 1
,395
.2 8
0 5
9,46
9.9
15.
4 2
,020
.6 8
37.6
71
-
-
-
-
-
32,
852.
9 4
4.1
5,3
38.4
1,1
73.3
28
2Ye
s 1
90,6
39.9
130
,603
.2-
60,0
36.7
- 1,
727.
9 5
15.1
- 35
7.4
65
21,
583.
3-
0 5
4.6
8,6
50.4
2,2
85.8
126
4,1
92.6
70.
8 7
00.2
465
.8 9
-
-
-
-
-
55,
844.
1 9
0.2
5,7
48.7
1,5
51.2
36
3Ye
s 6
5,70
9.7
130
,603
.2 6
4,89
3.5
- 59
5.6
1,3
97.1
386
.3 9
0 8
9,94
6.4
0 7
1.9
13,
276.
2 5
,176
.1 1
50 1
,093
.2 1
53.9
241
.4 1
82.2
6-
65,9
86.7
-
- 5,
748.
7-
1,73
6.5
38
-
-
-
-
-
4 N
o 1
56,8
15.6
-
- 15
6,81
5.6
- 1,
653.
3-
367.
3-
933.
4-
-
0 1
78.0
9,5
96.4
2,1
44.3
97
2,6
08.9
367
.3 5
76.0
434
.8 6
-
-
-
-
-
154
,206
.8 8
2.1
10,
980.
9 2
,002
.7 7
7
5Ye
s 4
31,3
03.1
215
,903
.4-
215,
399.
7-
3,90
9.3
377
.7-
1,28
2.1
16
1,4
32.5
0 5
.5 1
6,82
5.1
5,8
92.0
125
7,1
75.6
1,0
10.3
1,5
84.2
1,1
95.9
6-
-
-
-
- 2
08,2
24.2
16.
2 9
,766
.9 3
,017
.7 6
9
6Ye
s 2
02,9
45.4
130
,603
.2-
72,3
42.3
- 1,
839.
5 4
34.3
- 43
0.6
63
16,
275.
2-
0 1
9.6
9,8
60.4
3,2
01.9
134
3,3
76.4
475
.4 7
45.4
562
.7 6
-
-
-
-
-
68,
965.
9 1
69.8
6,8
05.5
2,2
24.7
31
7Ye
s 1
48,1
31.3
261
,206
.3 1
13,0
75.1
- 1,
342.
6 2
,675
.9 6
73.1
85
169
,771
.1 0
364
.7 2
0,27
0.2
7,6
56.7
149
2,4
64.5
347
.0 5
44.1
410
.7 6
- 11
5,53
9.5
- 10
,980
.9-
10,9
80.9
- 2,
888.
5 4
0-
-
-
-
-
8Ye
s 2
76,8
58.8
189
,782
.7-
87,0
76.1
- 2,
509.
4 7
49.6
- 51
8.3
65
31,
437.
0-
0 1
59.8
13,
529.
2 5
,257
.2 1
36 4
,606
.1 6
48.5
1,0
16.9
767
.7 6
-
-
-
-
-
82,
470.
0 1
30.0
13,
311.
8 2
,749
.0 3
0
9Ye
s 3
51,7
65.7
133
,623
.4-
218,
142.
3-
3,18
8.4
- 63
.5-
1,29
8.5
- -
0
20.
1 1
3,11
7.1
3,9
52.6
109
5,8
52.3
824
.0 1
,292
.0 9
75.4
6-
-
-
-
- 2
12,2
90.0
34.
0 1
0,63
1.3
2,6
87.2
79
10Ye
s 2
0,70
1.5
130
,603
.2 1
09,9
01.6
- 18
7.6
1,7
15.7
654
.2 9
1 1
17,7
84.4
0 5
1.0
15,
938.
1 6
,636
.4 1
48 3
44.4
48.
5 7
6.0
57.
4 6
- 11
0,24
6.1
- 13
,311
.8-
13,3
11.8
- 2,
826.
8 3
9-
-
-
-
-
11Ye
s 1
92,6
74.8
130
,603
.2-
62,0
71.6
- 1,
746.
4 5
01.8
- 36
9.5
63
20,
699.
6 0
90.
1 1
0,36
9.5
3,6
47.5
140
3,2
05.5
451
.3 7
07.7
534
.3 6
-
-
-
-
-
58,
866.
1 5
8.2
7,0
75.9
2,1
02.4
28
12Ye
s 6
4,23
5.6
49,
901.
3-
14,3
34.3
- 58
2.2
256
.9-
85.3
78
12,
354.
0 0
19.
9 4
,577
.2 1
,385
.6 1
41 1
,068
.7 1
50.5
235
.9 1
78.1
6-
-
-
-
- 1
3,26
5.6
59.
2 2
,710
.9 6
03.0
22
13Ye
s 7
9,47
3.3
261
,206
.3 1
81,7
33.0
- 72
0.3
3,1
61.8
1,0
81.7
91
211
,995
.0-
0 2
36.3
23,
256.
9 8
,281
.8 1
43 1
,322
.2 1
86.2
291
.9 2
20.4
6-
183,
055.
2-
9,61
4.6
- 9,
614.
6-
2,81
6.2
65
-
-
-
-
-
14Ye
s 1
82,4
36.2
189
,782
.7 7
,346
.5-
1,65
3.6
1,4
14.9
43.
7 8
4 8
0,72
2.3
0 7
4.1
14,
594.
1 5
,988
.3 1
57 3
,035
.2 4
27.3
670
.1 5
05.9
6-
10,3
81.7
- 2,
900.
6-
2,90
0.6
- 1,
297.
7 8
-
-
-
-
-
15Ye
s 1
86,3
13.7
130
,603
.2-
55,7
10.5
- 1,
688.
7 5
43.7
- 33
1.6
66
23,
535.
0-
0 6
8.5
11,
153.
9 3
,630
.8 1
40 3
,099
.7 4
36.4
684
.3 5
16.6
6-
-
-
-
- 5
2,61
0.9
62.
2 5
,784
.8 1
,594
.3 3
3
16Ye
s 1
13,1
37.3
189
,782
.7 7
6,64
5.4
- 1,
025.
5 1
,905
.2 4
56.2
85
120
,179
.0-
0 1
50.3
16,
096.
8 6
,650
.0 1
47 1
,882
.3 2
65.0
415
.6 3
13.7
6-
78,5
27.6
- 6,
805.
5-
6,80
5.5
- 2,
122.
4 3
7-
-
-
-
-
17Ye
s 8
9,67
9.9
189
,782
.7 1
00,1
02.8
- 81
2.9
2,0
71.2
595
.9 9
1 1
34,2
51.3
- 0
220
.8 1
7,69
8.7
6,3
99.7
143
1,4
92.0
210
.1 3
29.4
248
.7 6
- 10
1,59
4.8
- 7,
075.
9-
7,07
5.9
- 2,
477.
9 4
1-
-
-
-
-
18Ye
s 1
02,8
66.7
261
,206
.3 1
58,3
39.6
- 93
2.4
2,9
96.2
942
.5 9
1 1
97,5
09.4
- 0
253
.2 2
4,35
8.1
8,5
05.1
139
1,7
11.4
241
.0 3
77.8
285
.2 6
- 16
0,05
1.1
- 8,
317.
9-
8,31
7.9
- 2,
500.
8 6
4-
-
-
-
-
19Ye
s 1
20,1
71.4
261
,206
.3 1
41,0
35.0
- 1,
089.
2 2
,873
.8 8
39.5
91
186
,794
.1-
0 1
08.1
24,
608.
8 8
,223
.1 1
42 1
,999
.3 2
81.5
441
.4 3
33.2
6-
143,
034.
2-
11,4
48.1
- 11
,448
.1-
2,80
4.6
51
-
-
-
-
-
20Ye
s 2
59,8
42.6
261
,206
.3 1
,363
.8-
2,35
5.2
1,8
85.5
8.1
84
106
,125
.0 0
63.
1 1
8,56
7.6
7,9
82.1
159
4,3
23.0
608
.7 9
54.4
720
.5 6
- 5,
686.
8-
2,64
8.4
- 2,
648.
4-
1,89
5.6
3-
-
-
-
-
21Ye
s 1
27,8
78.4
189
,782
.7 6
1,90
4.4
- 1,
159.
1 1
,800
.9 3
68.5
84
111
,761
.5-
0 3
32.7
14,
672.
8 5
,509
.3 1
50 2
,127
.5 2
99.5
469
.7 3
54.6
6-
64,0
31.9
- 6,
631.
1-
6,63
1.1
- 2,
134.
4 3
0-
-
-
-
-
22Ye
s 7
38,8
45.7
189
,782
.7-
549,
063.
0-
6,69
6.8
- 92
8.5
- 3,
268.
2-
-
0 6
2.1
19,
548.
4 7
,060
.9 1
02 1
2,29
2.1
1,7
30.6
2,7
13.8
2,0
48.7
6-
-
-
-
- 5
36,7
70.9
194
.0 1
8,18
8.2
4,5
87.8
117
23Ye
s 3
93,3
61.0
118
,658
.4-
274,
702.
6-
3,56
5.4
- 34
0.2
- 1,
635.
1-
-
- 0
5.0
14,
579.
6 4
,321
.0 1
17 6
,544
.3 9
21.4
1,4
44.8
1,0
90.7
6-
-
-
-
- 2
68,1
58.2
141
.5 1
2,51
9.1
3,2
30.8
83
24Ye
s 1
50,7
75.0
261
,206
.3 1
10,4
31.3
- 1,
366.
6 2
,657
.2 6
57.3
85
168
,250
.2 0
78.
4 2
3,69
3.9
8,1
95.3
149
2,5
08.4
353
.2 5
53.8
418
.1 6
- 11
2,93
9.7
- 13
,981
.5-
13,9
81.5
- 4,
343.
8 2
6-
-
-
-
-
25Ye
s 3
90,6
53.1
189
,782
.7-
200,
870.
4-
3,54
0.8
291
.6-
1,19
5.7
7 4
56.2
0 2
4.8
16,
621.
8 5
,016
.3 1
11 6
,499
.3 9
15.1
1,4
34.9
1,0
83.2
6-
-
-
-
- 1
94,3
71.2
14.
7 1
5,78
1.7
3,0
37.0
64
26Ye
s 1
24,0
48.9
261
,206
.3 1
37,1
57.4
- 1,
124.
4 2
,846
.4 8
16.4
90
184
,395
.1 0
322
.7 2
5,05
4.8
9,3
78.4
146
2,0
63.8
290
.6 4
55.6
344
.0 6
- 13
9,22
1.2
- 15
,170
.0-
15,1
70.0
- 3,
314.
8 4
2-
-
-
-
-
27Ye
s 6
5,37
3.2
189
,782
.7 1
24,4
09.5
- 59
2.5
2,2
43.2
740
.5 9
1 1
49,3
02.5
- 0
160
.9 2
3,92
1.4
7,7
20.3
148
1,0
87.6
153
.1 2
40.1
181
.3 6
- 12
5,49
7.1
- 12
,519
.1-
12,5
19.1
- 3,
302.
6 3
8-
-
-
-
-
28Ye
s 9
9,80
6.3
130
,603
.2 3
0,79
6.8
- 90
4.6
1,1
55.8
183
.3 8
4 7
0,19
5.6
583
176
.2 1
2,43
2.4
4,4
54.9
150
1,6
60.5
233
.8 3
66.6
276
.7 6
- 31
,874
.4-
6,73
5.8
- 6,
735.
8-
1,44
8.8
22
-
-
-
-
-
29 N
o 7
37.1
-
- 73
7.1
- 7.
8-
1.7
- 4.
4-
-
0 1
.8 2
71.4
97.
3 1
52 1
2.3
1.7
2.7
2.0
6-
-
-
-
- 7
24.8
1.9
275
.8 7
2.5
10
30Ye
s 2
45,0
53.5
130
,603
.2-
114,
450.
3-
2,22
1.1
284
.0-
681.
3 2
5 3
,148
.6-
0 3
1.2
16,
297.
4 5
,303
.1 1
24 4
,076
.9 5
74.0
900
.1 6
79.5
6-
-
-
-
- 1
10,3
73.3
95.
2 1
8,07
1.0
2,3
99.4
46
31 N
o 6
,248
.9-
-
6,24
8.9
- 65
.9-
14.6
- 37
.2-
-
0 1
5.3
820
.2 2
10.9
132
104
.0 1
4.6
23.
0 1
7.3
6-
-
-
-
- 6
,145
.0 3
0.5
843
.1 2
04.8
30
32Ye
s 6
8,81
8.1
189
,782
.7 1
20,9
64.6
- 62
3.8
2,2
18.8
720
.0 9
1 1
47,1
69.3
9,3
31 1
38.0
26,
487.
2 9
,153
.1 1
50 1
,144
.9 1
61.2
252
.8 1
90.8
6-
112,
778.
4-
21,7
41.9
- 21
,741
.9-
2,96
7.9
38
-
-
-
-
-
33Ye
s 7
5,62
7.9
189
,782
.7 1
14,1
54.9
- 68
5.5
2,1
70.7
679
.5 9
1 1
42,9
52.6
17,
614
186
.2 2
0,31
8.6
8,0
67.3
145
1,2
58.2
177
.2 2
77.8
209
.7 6
- 97
,799
.2-
9,88
5.8
- 9,
885.
8-
2,87
6.4
34
-
-
-
-
-
34Ye
s 1
21,1
80.8
130
,603
.2 9
,422
.3-
1,09
8.4
1,0
04.6
56.
1 8
4 5
8,03
5.2
205
70.
3 8
,071
.2 3
,481
.8 1
54 2
,016
.1 2
83.9
445
.1 3
36.0
6-
11,2
33.8
- 1,
757.
8-
1,75
7.8
- 1,
021.
3 1
1-
-
-
-
-
35Ye
s 3
22,8
76.5
261
,206
.3-
61,6
70.1
- 2,
926.
5 1
,439
.5-
367.
1 7
8 7
1,84
1.4
0 6
9.9
17,
738.
0 6
,704
.8 1
44 5
,371
.7 7
56.3
1,1
85.9
895
.3 6
-
-
-
-
-
56,
298.
5 2
44.7
6,9
77.6
2,2
51.9
25
36 N
o 5
4,33
3.5
-
- 54
,333
.5-
572.
8-
127.
3-
323.
4-
-
0 1
33.8
6,0
53.3
1,9
21.5
126
903
.9 1
27.3
199
.6 1
50.7
6-
-
-
-
- 5
3,42
9.6
135
.3 5
,950
.8 1
,370
.0 3
9
37Ye
s 1
23,9
36.8
189
,782
.7 6
5,84
6.0
- 1,
123.
4 1
,828
.8 3
91.9
84
114
,004
.0 4
,723
305
.1 1
6,35
9.1
6,1
99.3
147
2,0
61.9
290
.3 4
55.2
343
.7 6
- 63
,184
.7-
9,52
4.2
- 9,
524.
2-
2,25
6.6
28
-
-
-
-
-
38Ye
s 6
5,42
1.3
189
,782
.7 1
24,3
61.4
- 59
3.0
2,2
42.9
740
.2 9
1 1
49,2
72.7
18,
896
161
.1 2
1,23
5.4
6,6
78.5
147
1,0
88.4
153
.2 2
40.3
181
.4 6
- 10
6,55
4.1
- 9,
533.
6-
9,53
3.6
- 2,
732.
2 3
9-
-
-
-
-
39Ye
s 1
40,2
16.0
189
,782
.7 4
9,56
6.8
- 1,
270.
9 1
,713
.6 2
95.0
84
104
,742
.4 9
,502
278
.5 1
5,17
1.6
6,5
69.5
151
2,3
32.8
328
.4 5
15.0
388
.8 6
- 42
,397
.1-
5,18
0.5
- 5,
180.
5-
1,76
6.5
24
-
-
-
-
-
40Ye
s 5
4,81
4.2
130
,603
.2 7
5,78
9.0
- 49
6.8
1,4
74.2
451
.1 9
1 9
6,66
1.3
11,
542
134
.9 1
3,90
1.6
4,8
49.3
142
911
.9 1
28.4
201
.3 1
52.0
6-
65,1
59.4
- 9,
946.
1-
9,94
6.1
- 1,
810.
0 3
6-
-
-
-
-
41 N
o 4
2,62
0.8
-
- 42
,620
.8-
449.
4-
99.8
- 25
3.7
- -
-
0 3
4.0
4,8
31.5
1,7
02.5
135
709
.1 9
9.8
156
.5 1
18.2
6-
-
-
-
- 4
1,91
1.7
110
.4 4
,677
.5 1
,352
.0 3
1
42Ye
s 7
7,19
8.1
261
,206
.3 1
84,0
08.2
- 69
9.7
3,1
77.9
1,0
95.3
91
213
,403
.9 2
2,49
9 1
90.0
25,
260.
4 8
,727
.0 1
49 1
,284
.3 1
80.8
283
.5 2
14.1
6-
162,
793.
2-
15,6
46.3
- 15
,646
.3-
2,80
6.8
58
-
-
-
-
-
43Ye
s 1
82,9
81.0
272
,851
.8 8
9,87
0.8
- 1,
658.
5 2
,595
.4 5
34.9
84
161
,175
.5 1
5,99
9 4
14.2
22,
627.
9 9
,223
.9 1
51 3
,044
.3 4
28.6
672
.1 5
07.4
6-
76,9
16.4
- 6,
977.
6-
6,97
7.6
- 2,
330.
8 3
3-
-
-
-
-
44Ye
s 6
2,37
7.0
130
,603
.2 6
8,22
6.2
- 56
5.4
1,4
20.7
406
.1 9
0 9
1,98
2.2
10,
824
162
.3 1
3,05
4.7
5,4
34.7
147
1,0
37.8
146
.1 2
29.1
173
.0 6
- 58
,440
.2-
6,33
8.7
- 6,
338.
7-
1,66
9.7
35
-
-
-
-
-
45Ye
s 6
4,33
1.7
130
,603
.2 6
6,27
1.4
- 58
3.1
1,4
06.8
394
.5 9
0 9
0,78
8.2
10,
578
110
.0 1
2,87
9.1
4,5
54.3
145
1,0
70.3
150
.7 2
36.3
178
.4 6
- 56
,763
.4-
4,59
8.3
- 4,
598.
3-
1,32
0.1
43
-
-
-
-
-

Appendix
215
Figure 66: Results current scenario (in kW) - summer week (2)
Co
ns
Pro
dP
ot.
Su
rplu
sSt
ora
geM
issi
ng
Exte
rnal
To
Exte
rnal
Fro
mD
iff
Pro
d-
Co
ns
Object
Prod
Total
Total
Diff Prod-
Cons
Min
Max
Average
No of occ.
Total
Status End
of week
Min
Max
Average
No of occ.
Total
Min
Max
Average
No of occ.
Total
Min
Max
Average
No of occ.
Total
Min
Max
Average
No of occ.
Tota
lM
inM
axA
vera
geN
o o
f o
cc.
46Ye
s 1
23,5
68.2
261
,206
.3 1
37,6
38.1
- 1,
120.
0 2
,849
.8 8
19.3
91
184
,690
.7 2
1,79
6 2
68.0
26,
215.
8 8
,023
.2 1
39 2
,055
.8 2
89.4
453
.9 3
42.6
6-
117,
897.
4-
8,39
3.3
- 8,
393.
3-
1,81
3.8
65
-
-
-
-
-
47Ye
s 1
06,4
23.8
189
,782
.7 8
3,35
9.0
- 96
4.6
1,9
52.8
496
.2 8
5 1
24,0
41.3
5,1
38 9
.8 2
6,45
5.7
6,9
06.4
153
1,7
70.6
249
.3 3
90.9
295
.1 6
- 79
,991
.8-
10,8
16.5
- 10
,816
.5-
1,99
9.8
40
-
-
-
-
-
48 N
o 6
8,54
5.8
-
- 68
,545
.8-
722.
7-
160.
6-
408.
0-
-
0 1
68.2
8,3
94.4
2,0
37.1
123
1,1
40.4
160
.6 2
51.8
190
.1 6
-
-
-
-
-
67,
405.
4 1
62.1
6,6
90.6
1,4
34.2
47
49Ye
s 1
11,0
86.4
130
,603
.2 1
9,51
6.7
- 1,
006.
9 1
,076
.0 1
16.2
84
63,
778.
1 4
,706
120
.0 9
,314
.6 4
,290
.3 1
53 1
,848
.1 2
60.2
408
.0 3
08.0
6-
16,6
58.4
- 2,
872.
5-
2,87
2.5
- 87
6.8
19
-
-
-
-
-
50Ye
s 5
6,54
4.6
261
,206
.3 2
04,6
61.7
- 51
2.5
3,3
24.0
1,2
18.2
91
226
,192
.9 3
0,21
4 1
39.2
32,
236.
1 9
,079
.7 1
42 9
40.7
132
.5 2
07.7
156
.8 6
- 17
5,38
8.6
- 8,
059.
4-
8,05
9.4
- 2,
138.
9 8
2-
-
-
-
-
51Ye
s 6
6,70
3.1
189
,782
.7 1
23,0
79.6
- 60
4.6
2,2
33.8
732
.6 9
1 1
48,4
79.0
18,
735
173
.5 2
1,12
0.3
6,9
62.5
146
1,1
09.7
156
.2 2
45.0
185
.0 6
- 10
5,45
4.6
- 7,
204.
6-
7,20
4.6
- 1,
787.
4 5
9-
-
-
-
-
52Ye
s 1
30,1
37.6
189
,782
.7 5
9,64
5.1
- 1,
179.
6 1
,785
.0 3
55.0
84
110
,476
.2 1
,526
320
.4 1
5,64
6.6
6,0
20.9
147
2,1
65.1
304
.8 4
78.0
360
.8 6
- 60
,283
.8-
7,67
9.3
- 7,
679.
3-
1,43
5.3
42
-
-
-
-
-
53Ye
s 6
3,61
0.7
261
,206
.3 1
97,5
95.6
- 57
6.6
3,2
74.0
1,1
76.2
91
221
,817
.4-
0 7
3.9
17,
523.
0 7
,080
.9 1
36 1
,058
.3 1
49.0
233
.6 1
76.4
6-
198,
653.
9-
10,3
97.4
- 10
,397
.4-
2,25
7.4
88
-
-
-
-
-
54 N
o 8
4,88
9.1
-
- 84
,889
.1-
895.
0-
198.
8-
505.
3-
-
0 5
6.2
6,7
22.4
1,6
38.8
113
1,4
12.3
198
.8 3
11.8
235
.4 6
-
-
-
-
-
83,
476.
8 7
5.7
6,1
07.1
1,3
91.3
60
55 N
o 4
9,15
8.1
-
- 49
,158
.1-
518.
3-
115.
1-
292.
6-
-
0 1
20.2
4,5
38.9
1,1
22.3
110
817
.8 1
15.2
180
.6 1
36.3
6-
-
-
-
- 4
8,34
0.3
115
.9 4
,654
.6 8
78.9
55
56Ye
s 7
8,94
4.6
261
,206
.3 1
82,2
61.7
- 71
5.5
3,1
65.5
1,0
84.9
91
212
,322
.4-
0 1
73.4
19,
269.
0 7
,594
.8 1
39 1
,313
.4 1
84.9
290
.0 2
18.9
6-
183,
575.
2-
6,19
3.3
- 6,
193.
3-
1,89
2.5
97
-
-
-
-
-
57 N
o 4
5,13
6.4
-
- 45
,136
.4-
475.
9-
105.
7-
268.
7-
-
- 0
106
.1 4
,468
.4 1
,613
.5 1
22 7
50.9
105
.7 1
65.8
125
.2 6
-
-
-
-
-
44,
385.
4 1
13.7
4,2
42.6
986
.3 4
5
58Ye
s 6
7,79
2.7
130
,603
.2 6
2,81
0.5
- 61
4.5
1,3
82.4
373
.9 9
0 8
8,67
4.0
0 1
76.4
12,
441.
7 4
,182
.5 1
49 1
,127
.9 1
58.8
249
.0 1
88.0
6-
63,9
38.3
- 7,
244.
6-
7,24
4.6
- 1,
826.
8 3
5-
-
-
-
-
59Ye
s 6
1,54
3.8
189
,782
.7 1
28,2
39.0
- 55
7.8
2,2
70.3
763
.3 9
1 1
51,6
73.7
0 6
.9 1
5,87
4.4
4,7
88.5
140
1,0
23.9
144
.2 2
26.1
170
.7 6
- 12
9,26
2.8
- 7,
201.
4-
7,20
1.4
- 2,
308.
3 5
6-
-
-
-
-
60Ye
s 7
7,66
2.8
261
,206
.3 1
83,5
43.6
- 70
3.9
3,1
74.6
1,0
92.5
91
213
,116
.2-
0 1
91.2
20,
477.
7 7
,049
.9 1
31 1
,292
.1 1
81.9
285
.3 2
15.3
6-
184,
835.
7-
9,95
1.4
- 9,
951.
4-
2,10
0.4
88
-
-
-
-
-
61Ye
s 3
7,44
5.4
130
,603
.2 9
3,15
7.8
- 33
9.4
1,5
97.1
554
.5 9
1 1
07,4
16.3
- 0
92.
2 1
2,58
7.7
4,4
38.6
141
623
.0 8
7.7
137
.5 1
03.8
6-
93,7
80.8
- 11
,692
.1-
11,6
92.1
- 2,
084.
0 4
5-
-
-
-
-
62 N
o 1
4,37
2.5
-
- 14
,372
.5-
151.
5-
33.7
- 85
.6-
-
0 3
3.8
1,3
36.3
357
.1 1
14 2
39.1
33.
7 5
2.8
39.
9 6
-
-
-
-
-
14,
133.
4 3
5.2
1,3
89.4
288
.4 4
9
63Ye
s 1
10,4
61.5
189
,782
.7 7
9,32
1.2
- 1,
001.
2 1
,924
.2 4
72.1
85
121
,718
.4-
0 5
6.7
16,
730.
2 6
,295
.7 1
43 1
,837
.7 2
58.7
405
.7 3
06.3
6-
81,1
59.0
- 10
,220
.2-
10,2
20.2
- 1,
726.
8 4
7-
-
-
-
-
64Ye
s 1
67,1
18.3
130
,603
.2-
36,5
15.2
- 1,
514.
7 6
79.5
- 21
7.4
78
32,
870.
8-
0 5
6.7
8,7
60.6
3,3
62.4
136
2,7
80.3
391
.5 6
13.8
463
.4 6
-
-
-
-
-
33,
734.
8 1
50.1
3,7
41.3
1,2
04.8
28
65Ye
s 3
03,1
84.4
340
,112
.4 3
6,92
8.0
- 2,
748.
0 2
,703
.8 2
19.8
84
158
,182
.5-
0 2
44.1
23,
163.
6 9
,630
.5 1
52 5
,044
.1 7
10.2
1,1
13.6
840
.7 6
- 41
,972
.1-
5,65
7.8
- 5,
657.
8-
1,99
8.7
21
-
-
-
-
-
66Ye
s 2
75,3
68.7
261
,206
.3-
14,1
62.4
- 2,
495.
9 1
,775
.6-
84.3
79
97,
377.
1 0
311
.2 1
7,18
5.0
7,7
98.5
152
4,5
81.3
645
.0 1
,011
.4 7
63.6
6-
2,73
2.2
- 2,
113.
6-
2,11
3.6
- 1,
366.
1 2
12,
313.
3 1
4.8
3,7
18.9
1,0
26.1
12
67Ye
s 1
85,0
15.9
261
,206
.3 7
6,19
0.5
- 1,
677.
0 2
,415
.0 4
53.5
84
148
,695
.6 0
427
.0 2
3,90
5.2
8,1
00.8
149
3,0
78.1
433
.4 6
79.6
513
.0 6
- 79
,268
.6-
12,2
56.8
- 12
,256
.8-
2,33
1.4
34
-
-
-
-
-
68Ye
s 4
12,0
12.5
261
,206
.3-
150,
806.
2-
2,48
8.9
1,5
64.5
- 89
7.7
27
18,
711.
9 0
96.
5 1
5,33
4.4
5,2
19.3
119
7,7
62.7
1,1
26.3
1,4
89.4
1,2
93.8
6-
3,73
2.7
- 2,
133.
4-
2,13
3.4
- 93
3.2
4 1
46,7
76.2
69.
2 1
0,62
8.2
2,3
67.4
62
69Ye
s 2
07,2
23.5
109
,679
.5-
97,5
44.1
- 1,
878.
3 2
33.5
- 58
0.6
25
2,4
20.5
0 2
2.5
12,
209.
8 3
,398
.5 1
29 3
,447
.6 4
85.4
761
.1 5
74.6
6-
-
-
-
- 9
4,09
6.6
19.
0 8
,578
.4 2
,188
.3 4
3
70 N
o 1
96,8
88.8
-
- 19
6,88
8.8
- 2,
075.
8-
461.
2-
1,17
2.0
- -
0
38.
7 1
0,84
3.1
2,9
96.0
104
3,2
75.6
461
.2 7
23.2
545
.9 6
-
-
-
-
-
193
,613
.2 8
1.7
11,
692.
1 2
,390
.3 8
1
71 N
o 1
11,1
02.4
-
- 11
1,10
2.4
- 1,
171.
4-
260.
2-
661.
3-
-
- 0
143
.0 7
,233
.1 1
,995
.0 1
12 1
,848
.4 2
60.2
408
.1 3
08.1
6-
-
-
-
- 1
09,2
54.0
169
.9 8
,249
.9 1
,707
.1 6
4
72Ye
s 3
54,7
78.0
400
,298
.7 4
5,52
0.7
- 3,
215.
7 3
,196
.8 2
71.0
84
187
,345
.3-
0 1
54.4
26,
944.
8 1
1,45
9.0
151
5,9
02.4
831
.0 1
,303
.1 9
83.7
6-
51,4
23.2
- 8,
461.
0-
8,46
1.0
- 1,
512.
4 3
4-
-
-
-
-
73Ye
s 8
3,46
3.0
130
,603
.2 4
7,14
0.1
- 75
6.5
1,2
71.5
280
.6 8
4 7
9,49
3.7
- 0
197
.1 1
1,46
8.8
4,4
99.6
146
1,3
88.6
195
.5 3
06.6
231
.4 6
- 48
,528
.7-
5,52
3.2
- 5,
523.
2-
1,67
3.4
29
-
-
-
-
-
74Ye
s 3
37,4
41.2
130
,603
.2-
206,
838.
1-
3,05
8.5
- 39
.7-
1,23
1.2
- -
-
0 3
19.1
13,
060.
5 3
,521
.9 9
1 5
,614
.0 7
90.4
1,2
39.4
935
.7 6
-
-
-
-
-
201
,224
.1 3
9.7
8,2
40.9
2,2
35.8
90
75 N
o 2
82,3
38.7
-
- 28
2,33
8.7
- 2,
976.
7-
661.
3-
1,68
0.6
- -
0
54.
6 1
6,01
0.5
4,2
17.8
102
4,6
97.3
661
.3 1
,037
.0 7
82.9
6-
-
-
-
- 2
77,6
41.4
616
.3 1
5,32
3.3
3,3
45.1
83
76 N
o 2
3,76
1.9
-
- 23
,761
.9-
250.
5-
55.7
- 14
1.4
- -
0
59.
4 2
,836
.2 6
84.3
111
395
.3 5
5.7
87.
3 6
5.9
6-
-
-
-
- 2
3,36
6.6
55.
9 2
,731
.3 4
40.9
53
77Ye
s 3
61,0
42.9
261
,206
.3-
99,8
36.6
- 3,
272.
5 1
,169
.4-
594.
3 6
6 5
2,31
7.4
0 5
3.1
21,
067.
4 7
,384
.3 1
40 6
,006
.6 8
45.7
1,3
26.1
1,0
01.1
6-
-
-
-
- 9
3,82
9.9
49.
5 1
0,22
0.2
2,6
06.4
36
78Ye
s 2
17,3
01.9
130
,603
.2-
86,6
98.7
- 1,
969.
6 3
81.3
- 51
6.1
49
10,
911.
9 0
30.
9 1
0,02
3.0
3,1
27.1
123
3,6
15.3
509
.0 7
98.1
602
.5 6
-
-
-
-
-
83,
083.
5 7
4.9
8,3
09.8
1,7
30.9
48
79 N
o 5
5,53
5.2
-
- 55
,535
.2-
585.
5-
130.
1-
330.
6-
-
- 0
130
.7 3
,526
.6 1
,154
.1 9
9 9
23.9
130
.1 2
04.0
154
.0 6
-
-
-
-
-
54,
611.
3 1
38.3
3,9
14.9
827
.4 6
6
80Ye
s 2
42,2
49.5
189
,782
.7-
52,4
66.8
- 2,
195.
7 9
91.7
- 31
2.3
78
48,
084.
5-
0 8
6.3
14,
263.
8 4
,771
.5 1
44 4
,030
.3 5
67.4
889
.8 6
71.7
6-
-
-
-
- 4
8,43
6.5
215
.2 8
,461
.0 2
,018
.2 2
4
81Ye
s 2
04,3
87.5
261
,206
.3 5
6,81
8.8
- 1,
852.
5 2
,277
.9 3
38.2
84
137
,674
.7-
0 1
67.8
15,
513.
4 5
,870
.8 1
47 3
,400
.4 4
78.8
750
.7 5
66.7
6-
60,2
19.2
- 4,
837.
3-
4,83
7.3
- 1,
771.
2 3
4-
-
-
-
-
82Ye
s 1
57,8
25.1
189
,782
.7 3
1,95
7.6
- 1,
430.
5 1
,589
.0 1
90.2
84
94,
724.
2 0
195
.8 1
5,29
3.2
5,4
46.3
147
2,6
25.7
369
.7 5
79.7
437
.6 6
- 34
,583
.3-
5,26
5.1
- 5,
265.
1-
1,44
1.0
24
-
-
-
-
-
83 N
o 2
21,9
80.6
-
- 22
1,98
0.6
- 2,
340.
3-
520.
0-
1,32
1.3
- -
-
0 1
79.9
13,
239.
5 3
,888
.4 8
4 4
,799
.4 5
20.0
815
.3 5
99.9
8-
-
-
-
- 2
17,1
81.2
82.
4 1
0,81
6.5
2,2
62.3
96
84Ye
s 1
54,4
28.2
130
,603
.2-
23,8
25.1
- 1,
399.
7 7
69.3
- 14
1.8
78
39,
684.
7-
0 9
0.5
8,8
90.7
3,1
28.1
126
12,
416.
8 3
1.6
1,1
53.4
459
.9 2
7-
-
-
-
- 1
1,40
8.3
88.
1 2
,925
.7 7
60.6
15
85Ye
s 2
85,8
15.6
189
,782
.7-
96,0
32.9
- 2,
590.
6 6
90.8
- 57
1.6
63
27,
565.
5-
0 5
1.2
14,
445.
5 3
,433
.2 9
8 6
5,96
2.8
193
.7 2
,590
.6 1
,099
.4 6
0-
-
-
-
- 3
0,07
0.1
187
.9 7
,668
.5 2
,004
.7 1
5
86Ye
s 2
56,4
93.8
189
,782
.7-
66,7
11.1
- 2,
324.
8 8
90.9
- 39
7.1
69
40,
727.
9 0
1.7
10,
056.
7 3
,733
.5 9
7 6
1,61
0.4
0.9
1,9
83.0
880
.1 7
0-
-
-
-
- 5
,100
.7 1
,010
.4 2
,840
.0 1
,700
.2 3
87 N
o 2
16,9
65.4
-
- 21
6,96
5.4
- 2,
287.
5-
508.
2-
1,29
1.5
- -
-
0 1
19.3
6,9
61.8
2,4
94.3
12
183
,841
.5 6
.0 1
,985
.6 1
,225
.6 1
50-
-
-
-
- 3
3,12
3.9
150
.5 5
,355
.6 1
,577
.3 2
1
88Ye
s 1
95,7
99.2
130
,603
.2-
65,1
96.1
- 1,
774.
7 4
81.2
- 38
8.1
63
19,
353.
7-
0 1
3.8
7,8
18.7
1,8
75.0
124
8,5
19.0
35.
4 1
,160
.7 5
67.9
15
-
-
-
-
-
56,
677.
0 1
15.9
5,0
38.4
1,4
53.3
39
89Ye
s 1
34,3
51.6
189
,782
.7 5
5,43
1.1
- 1,
217.
8 1
,755
.1 3
29.9
84
108
,078
.8 0
11.
0 1
5,21
5.2
6,2
49.6
144
2,2
35.2
314
.7 4
93.5
372
.5 6
- 57
,666
.3-
5,03
8.4
- 5,
038.
4-
1,69
6.1
34
-
-
-
-
-
90Ye
s 1
44,0
13.4
189
,782
.7 4
5,76
9.3
- 1,
305.
3 1
,686
.8 2
72.4
84
102
,582
.0 0
259
.9 1
4,34
2.0
5,6
04.2
147
2,3
95.9
337
.3 5
29.0
399
.3 6
- 48
,165
.2-
6,00
3.9
- 6,
003.
9-
2,00
6.9
24
-
-
-
-
-
91Ye
s 2
95,9
26.0
261
,206
.3-
34,7
19.7
- 2,
682.
2 1
,630
.2-
206.
7 7
8 8
6,31
2.3
- 0
141
.0 1
9,16
2.9
7,4
06.2
154
4,9
23.3
693
.2 1
,086
.9 8
20.6
6-
150.
5-
150.
5-
150.
5-
150.
5 1
29,
946.
9 1
13.1
6,0
03.9
2,7
22.4
11

Appendix
216
10.4 Results Future Scenario
Figure 67: Results future scenario (in kW) - winter week (1)
Ke
y Fi
gure
sC
on
sP
rod
Po
t. S
urp
lus
Sto
rage
Mis
sin
gEx
tern
al T
oEx
tern
al F
rom
The
se f
igu
res
are
all
kW
!!!!
!!!
The
se f
igu
res
are
all
kW
!!!!
!!!
% time storage positive
Object
Prod
Total
Total
Diff Prod-
Cons
Min
Max
Average
No of occ.
Total
Status End
of week
Min
Max
Average
No of occ.
Total
Min
Max
Average
No of occ.
Total
Min
Max
Average
No of occ.
Total
Min
Max
Average
No of occ.
Tota
lM
inM
axA
vera
geN
o o
f o
cc.
Tota
l Act
ivit
ies
Dif
f P
rod
- C
on
s
1Ye
s 2
74,3
92.4
43,
779.
6-
230,
612.
8-
3,15
8.0
- 41
8.8
- 1,
372.
7-
-
- 0
-
-
-
- 2
30,6
12.7
418
.8 3
,158
.0 1
,372
.7 1
68-
-
-
-
- -
-
-
-
-
2Ye
s 2
34,6
52.5
43,
779.
6-
190,
872.
9-
2,70
0.6
- 16
4.9
- 1,
136.
1-
-
- 0
-
-
-
- 1
90,8
72.9
164
.9 2
,700
.6 1
,136
.1 1
68-
-
-
-
- -
-
-
-
-
3Ye
s 8
0,88
0.0
43,
779.
6-
37,1
00.4
- 93
0.9
817
.6-
220.
8 3
5 2
2,78
6.5
0 1
1.7
3,5
55.7
1,7
75.9
69
37,
100.
4 6
.9 9
30.9
378
.6 9
8-
-
-
-
- -
-
-
-
-
4 N
o 1
93,0
19.4
-
- 19
3,01
9.4
- 2,
221.
5-
402.
1-
1,14
8.9
- -
0
-
-
-
- 1
93,0
19.4
402
.1 2
,221
.5 1
,148
.9 1
68-
-
-
-
- -
-
-
-
-
5Ye
s 5
30,8
77.2
72,
373.
2-
458,
504.
0-
6,10
9.9
- 1,
105.
9-
2,72
9.2
- -
-
0-
-
-
-
458
,504
.0 1
,105
.9 6
,109
.9 2
,729
.2 1
68-
-
-
-
- -
-
-
-
-
6Ye
s 2
49,7
99.0
43,
779.
6-
206,
019.
4-
2,87
4.9
- 26
1.7
- 1,
226.
3-
-
0-
-
-
-
206
,019
.5 2
61.7
2,8
74.9
1,2
26.3
168
-
-
-
-
-
-
-
-
-
-
7Ye
s 1
82,3
30.0
87,
559.
2-
94,7
70.8
- 2,
098.
4 1
,503
.7-
564.
1 3
5 4
0,23
3.8
- 0
174
.1 6
,425
.1 3
,007
.6 6
5 9
4,77
0.8
58.
3 2
,098
.4 9
20.1
103
-
-
-
-
-
-
-
-
-
-
8Ye
s 3
40,7
76.7
63,
617.
2-
277,
159.
5-
3,92
2.0
- 23
8.4
- 1,
649.
8-
-
0-
-
-
-
277
,159
.5 2
38.4
3,9
22.0
1,6
49.8
168
-
-
-
-
-
-
-
-
-
-
9Ye
s 4
32,9
77.1
44,
792.
0-
388,
185.
1-
4,98
3.1
- 90
1.9
- 2,
310.
6-
-
- 83
6-
-
-
-
369
,034
.8 3
79.9
4,9
83.2
2,1
96.6
168
-
-
-
-
-
18,
314.
6 3
10.9
1,0
74.5
872
.1 2
1
10Ye
s 2
5,48
0.8
43,
779.
6 1
8,29
8.8
- 29
3.3
1,1
83.9
108
.9 3
5 3
7,16
5.8
836
118
.5 2
,867
.2 1
,184
.0 1
37 8
51.5
53.
1 1
83.7
94.
6 9
- 18
,661
.7-
1,17
1.5
- 1,
171.
5-
888.
7 2
1 3
47.0
347
.0 3
47.0
347
.0 1
11Ye
s 2
37,1
57.2
43,
779.
6-
193,
377.
6-
2,72
9.4
- 18
0.9
- 1,
151.
1-
-
0-
-
-
-
193
,377
.6 1
80.9
2,7
29.5
1,1
51.1
168
-
-
-
-
-
-
-
-
-
-
12Ye
s 7
9,06
5.6
16,
727.
5-
62,3
38.1
- 91
0.0
4.7
- 37
1.1
4 9
.5-
394
0.1
176
.5 3
7.2
5 6
1,94
4.0
1.4
910
.0 3
80.0
163
-
-
-
-
-
-
-
-
-
-
13Ye
s 9
7,82
1.2
87,
559.
2-
10,2
62.0
- 1,
125.
8 2
,043
.6-
61.1
35
62,
168.
8 6
42 2
80.9
9,2
44.7
4,0
31.7
137
10,
904.
2 7
5.3
713
.5 3
76.0
29
- 1,
359.
6-
1,35
9.6
- 1,
359.
6-
1,35
9.6
1 1
,359
.6 1
,359
.6 1
,359
.6 1
,359
.6 1
14Ye
s 2
24,5
54.9
63,
617.
2-
160,
937.
6-
2,58
4.4
504
.2-
958.
0 2
1 7
,998
.6-
248
32.
2 1
,629
.1 8
43.2
25
160
,689
.6 2
5.2
2,5
84.4
1,1
39.6
141
- 38
4.4
- 38
4.4
- 38
4.4
- 38
4.4
1 3
84.4
384
.4 3
84.4
384
.4 1
15Ye
s 2
29,3
27.6
43,
779.
6-
185,
548.
0-
2,63
9.3
- 13
0.9
- 1,
104.
5-
-
- 0
-
-
-
- 1
85,5
48.0
130
.9 2
,639
.3 1
,104
.5 1
68-
-
-
-
- -
-
-
-
-
16Ye
s 1
39,2
57.1
63,
617.
2-
75,6
39.9
- 1,
602.
7 1
,049
.2-
450.
2 3
5 2
7,47
1.8
0 3
06.7
4,4
41.9
2,1
62.2
59
75,
640.
0 2
11.2
1,6
02.7
693
.9 1
09-
-
-
-
- -
-
-
-
-
17Ye
s 1
10,3
84.1
63,
617.
2-
46,7
66.9
- 1,
270.
4 1
,233
.7-
278.
4 3
5 3
4,96
6.0
- 0
493
.1 5
,405
.2 2
,738
.4 7
3 4
6,76
6.8
229
.9 1
,270
.4 4
92.3
95
-
-
-
-
-
-
-
-
-
-
18Ye
s 1
26,6
15.3
87,
559.
2-
39,0
56.1
- 1,
457.
2 1
,859
.7-
232.
5 3
5 5
4,69
5.0
0 5
10.9
8,2
84.0
4,2
43.2
86
39,
056.
2 1
08.0
1,1
92.6
476
.3 8
2-
-
-
-
- -
-
-
-
-
19Ye
s 1
47,9
15.1
87,
559.
2-
60,3
55.9
- 1,
702.
4 1
,723
.6-
359.
3 3
5 4
9,16
6.5
- 0
21.
1 7
,573
.3 3
,879
.8 7
4 6
0,35
5.9
216
.8 1
,702
.4 6
42.1
94
-
-
-
-
-
-
-
-
-
-
20Ye
s 3
19,8
31.9
87,
559.
2-
232,
272.
7-
3,68
1.0
625
.2-
1,38
2.6
20
9,5
17.9
0 4
37.7
1,9
54.6
1,2
33.8
20
232
,272
.7 3
7.5
3,6
81.0
1,5
69.4
148
-
-
-
-
-
-
-
-
-
-
21Ye
s 1
57,4
01.4
63,
617.
2-
93,7
84.2
- 1,
811.
5 9
33.3
- 55
8.2
35
22,
762.
3 0
171
.0 3
,836
.5 1
,794
.2 5
2 9
3,78
4.2
22.
7 1
,811
.5 8
08.5
116
-
-
-
-
-
-
-
-
-
-
22Ye
s 9
09,4
21.6
63,
617.
2-
845,
804.
3-
10,4
66.6
- 1,
894.
4-
5,03
4.5
- -
0
-
-
-
- 8
45,8
04.4
1,8
94.4
10,
466.
6 5
,034
.5 1
68-
-
-
-
- -
-
-
-
-
23Ye
s 4
84,1
75.5
39,
775.
6-
444,
399.
9-
5,57
2.4
- 1,
008.
6-
2,64
5.2
- -
0
-
-
-
- 4
44,3
99.9
1,0
08.6
5,5
72.4
2,6
45.2
168
-
-
-
-
-
-
-
-
-
-
24Ye
s 1
85,5
84.2
87,
559.
2-
98,0
24.9
- 2,
135.
9 1
,482
.9-
583.
5 3
5 3
9,38
9.2
0 2
6.9
6,3
16.5
2,9
81.6
63
98,
025.
0 9
.8 2
,135
.9 9
33.6
105
-
-
-
-
-
-
-
-
-
-
25Ye
s 4
80,8
42.4
63,
617.
2-
417,
225.
2-
5,53
4.0
- 1,
001.
6-
2,48
3.5
- -
0
-
-
-
- 4
17,2
25.2
1,0
01.6
5,5
34.0
2,4
83.5
168
-
-
-
-
-
-
-
-
-
-
26Ye
s 1
52,6
87.8
87,
559.
2-
65,1
28.6
- 1,
757.
3 1
,693
.1-
387.
7 3
5 4
7,92
7.7
- 0
619
.4 7
,414
.1 3
,738
.0 7
3 6
5,12
8.6
318
.1 1
,757
.3 6
85.6
95
-
-
-
-
-
-
-
-
-
-
27Ye
s 8
0,46
5.8
63,
617.
2-
16,8
48.6
- 92
6.1
1,4
24.8
- 10
0.3
35
42,
731.
6-
0 1
.2 6
,403
.5 2
,885
.9 1
13 1
6,84
8.6
25.
5 5
86.9
306
.3 5
5-
-
-
-
- -
-
-
-
-
28Ye
s 1
22,8
48.4
43,
779.
6-
79,0
68.8
- 1,
413.
9 5
49.4
- 47
0.6
33
11,
958.
2-
0 5
1.4
2,1
55.4
945
.8 4
5 7
9,06
8.8
3.3
1,4
13.9
642
.8 1
23-
-
-
-
- -
-
-
-
-
29 N
o 9
07.2
-
- 90
7.2
- 10
.4-
1.9
- 5.
4-
-
0-
-
-
-
907
.3 1
.9 1
0.4
5.4
168
-
-
-
-
-
-
-
-
-
-
30Ye
s 3
01,6
28.5
43,
779.
6-
257,
848.
9-
3,47
1.5
- 59
2.9
- 1,
534.
8-
-
- 0
-
-
-
- 2
57,8
48.9
592
.9 3
,471
.5 1
,534
.8 1
68-
-
-
-
- -
-
-
-
-
31 N
o 7
,691
.6-
-
7,69
1.6
- 88
.5-
16.0
- 45
.8-
-
0-
-
-
-
7,6
91.6
16.
0 8
8.5
45.
8 1
68-
-
-
-
- -
-
-
-
-
32Ye
s 8
4,70
6.1
63,
617.
2-
21,0
88.8
- 97
4.9
1,3
97.7
- 12
5.5
35
41,
631.
0 0
121
.8 6
,262
.0 3
,062
.4 9
8 2
1,08
8.9
40.
6 6
22.4
301
.3 7
0-
-
-
-
- -
-
-
-
-
33Ye
s 9
3,08
7.9
63,
617.
2-
29,4
70.7
- 1,
071.
4 1
,344
.2-
175.
4 3
5 3
9,45
5.4
- 0
267
.6 5
,982
.3 3
,030
.2 8
6 2
9,47
0.7
187
.5 8
76.8
359
.4 8
2-
-
-
-
- -
-
-
-
-
34Ye
s 1
49,1
57.6
43,
779.
6-
105,
378.
0-
1,71
6.7
381
.3-
627.
2 2
8 6
,335
.8-
0 1
.1 1
,277
.6 5
26.2
34
105
,378
.0 1
01.0
1,7
16.7
786
.4 1
34-
-
-
-
- -
-
-
-
-
35Ye
s 3
97,4
18.3
87,
559.
2-
309,
859.
1-
4,57
3.9
129
.4-
1,84
4.4
5 5
71.3
0 4
.5 1
29.4
76.
1 9
309
,859
.1 1
1.2
4,5
73.9
1,9
48.8
159
-
-
-
-
-
-
-
-
-
-
36 N
o 6
6,87
7.4
-
- 66
,877
.4-
769.
7-
139.
3-
398.
1-
-
- 0
-
-
-
- 6
6,87
7.4
139
.3 7
69.7
398
.1 1
68-
-
-
-
- -
-
-
-
-
37Ye
s 1
52,5
49.8
63,
617.
2-
88,9
32.5
- 1,
755.
7 9
64.3
- 52
9.4
35
24,
021.
6-
0 1
10.9
3,9
98.4
1,7
58.1
58
88,
932.
5 3
17.8
1,7
55.7
808
.5 1
10-
-
-
-
- -
-
-
-
-
38Ye
s 8
0,52
5.0
63,
617.
2-
16,9
07.7
- 92
6.8
1,4
24.4
- 10
0.6
35
42,
716.
2 0
21.
5 6
,401
.5 2
,908
.0 1
12 1
6,90
7.8
5.5
587
.3 3
01.9
56
-
-
-
-
-
-
-
-
-
-
39Ye
s 1
72,5
87.4
63,
617.
2-
108,
970.
1-
1,98
6.3
836
.2-
648.
6 3
5 1
8,82
0.6
- 0
120
.8 3
,329
.9 1
,380
.6 5
1 1
08,9
70.1
359
.5 1
,986
.3 9
31.4
117
-
-
-
-
-
-
-
-
-
-
40Ye
s 6
7,46
9.0
43,
779.
6-
23,6
89.4
- 77
6.5
903
.2-
141.
0 3
5 2
6,26
7.4
- 0
307
.9 4
,003
.1 2
,072
.5 8
0 2
3,68
9.4
63.
7 6
35.5
269
.2 8
8-
-
-
-
- -
-
-
-
-
41 N
o 5
2,46
0.6
-
- 52
,460
.6-
603.
8-
109.
3-
312.
3-
-
- 98
2 8
0.8
582
.7 3
31.8
2 5
1,47
8.6
109
.3 6
03.8
310
.1 1
66-
-
-
-
- -
-
-
-
-
42Ye
s 9
5,02
0.7
87,
559.
2-
7,46
1.5
- 1,
093.
6 2
,061
.5-
44.4
35
62,
895.
7 9
82 3
2.9
9,3
38.1
4,0
89.2
141
8,4
43.4
4.2
693
.0 3
37.7
25
- 1,
378.
2-
1,37
8.2
- 1,
378.
2-
1,37
8.2
1 1
,378
.2 1
,378
.2 1
,378
.2 1
,378
.2 1
43Ye
s 2
25,2
25.4
91,
462.
9-
133,
762.
5-
2,59
2.1
1,3
48.6
- 79
6.2
35
33,
003.
6 0
29.
4 5
,551
.5 2
,562
.8 5
3 1
33,7
62.6
10.
0 2
,592
.1 1
,163
.2 1
15-
-
-
-
- -
-
-
-
-
44Ye
s 7
6,77
7.8
43,
779.
6-
32,9
98.2
- 88
3.6
843
.8-
196.
4 3
5 2
3,85
1.2
0 2
75.9
3,6
92.6
1,8
51.3
73
32,
998.
2 1
59.9
883
.6 3
47.3
95
-
-
-
-
-
-
-
-
-
-
45Ye
s 7
9,18
3.9
43,
779.
6-
35,4
04.3
- 91
1.3
828
.4-
210.
7 3
5 2
3,22
6.7
0 8
8.6
3,6
12.3
1,7
53.2
73
35,
404.
3 1
65.0
911
.3 3
72.7
95
-
-
-
-
-
-
-
-
-
-

Appendix
217
Figure 68: Results future scenario (in kW) - winter week (2)
Ke
y Fi
gure
sC
on
sP
rod
Po
t. S
urp
lus
Sto
rage
Mis
sin
gEx
tern
al T
oEx
tern
al F
rom
The
se f
igu
res
are
all
kW
!!!!
!!!
The
se f
igu
res
are
all
kW
!!!!
!!!
% time storage positive
Object
Prod
Total
Total
Diff Prod-
Cons
Min
Max
Average
No of occ.
Total
Status End
of week
Min
Max
Average
No of occ.
Total
Min
Max
Average
No of occ.
Total
Min
Max
Average
No of occ.
Total
Min
Max
Average
No of occ.
Tota
lM
inM
axA
vera
geN
o o
f o
cc.
Tota
l Act
ivit
ies
Dif
f P
rod
- C
on
s
46Ye
s 1
52,0
96.2
87,
559.
2-
64,5
37.0
- 1,
750.
5 1
,696
.9-
384.
1 3
5 4
8,08
1.3
0 6
65.5
7,4
33.8
3,7
62.1
73
64,
537.
0 3
16.8
1,7
50.5
679
.3 9
5-
-
-
-
- -
-
-
-
-
47Ye
s 1
30,9
93.6
63,
617.
2-
67,3
76.4
- 1,
507.
6 1
,102
.0-
401.
0 3
5 2
9,61
6.7
0 5
9.7
4,7
17.6
2,2
06.1
66
67,
376.
4 2
72.9
1,5
07.6
660
.6 1
02-
-
-
-
- -
-
-
-
-
48 N
o 8
4,37
0.8
-
- 84
,370
.8-
971.
0-
175.
8-
502.
2-
-
- 0
-
-
-
- 8
4,37
0.8
175
.8 9
71.0
502
.2 1
68-
-
-
-
- -
-
-
-
-
49Ye
s 1
36,7
32.7
43,
779.
6-
92,9
53.1
- 1,
573.
7 4
60.7
- 55
3.3
30
8,8
32.2
- 1,
547
8.0
4,7
36.6
2,6
44.0
61
72,
667.
0 4
8.5
1,5
73.7
679
.1 1
07-
-
-
-
- 1
8,73
8.8
244
.6 1
,802
.9 1
,338
.5 1
4
50Ye
s 6
9,59
9.0
87,
559.
2 1
7,96
0.2
- 80
1.0
2,2
36.3
106
.9 3
5 6
9,49
4.2
1,5
47 3
23.8
7,8
31.4
3,2
89.4
144
2,3
25.9
145
.0 5
01.7
258
.4 9
- 20
,770
.8-
2,03
2.0
- 2,
032.
0-
1,38
4.7
15
2,0
32.0
2,0
32.0
2,0
32.0
2,0
32.0
1
51Ye
s 8
2,10
2.7
63,
617.
2-
18,4
85.5
- 94
4.9
1,4
14.4
- 11
0.0
35
42,
306.
7 0
20.
6 6
,348
.8 2
,946
.2 1
07 1
8,48
5.5
6.4
598
.8 3
03.0
61
-
-
-
-
-
-
-
-
-
-
52Ye
s 1
60,1
82.2
63,
617.
2-
96,5
65.0
- 1,
843.
5 9
15.5
- 57
4.8
35
22,
040.
5-
0 1
3.5
3,7
43.7
1,7
11.2
52
96,
564.
9 1
83.7
1,8
43.5
832
.5 1
16-
-
-
-
- -
-
-
-
-
53Ye
s 7
8,29
6.4
87,
559.
2 9
,262
.8-
901.
1 2
,174
.9 5
5.1
35
67,
236.
7 6
95 3
64.2
8,8
10.1
3,5
98.9
152
2,6
16.5
163
.1 5
64.4
290
.7 9
- 11
,184
.2-
1,16
3.8
- 1,
163.
8-
588.
6 1
9-
-
-
-
-
54 N
o 1
04,4
87.2
-
- 10
4,48
7.2
- 1,
202.
5-
217.
7-
621.
9-
-
- 69
5-
-
-
-
92,
607.
9 1
19.6
1,2
02.6
597
.5 1
55-
-
-
-
- 1
1,18
4.2
52.
1 1
,163
.8 5
88.6
19
55 N
o 6
0,50
7.1
-
- 60
,507
.1-
696.
4-
126.
0-
360.
2-
-
- 0
-
-
-
- 6
0,04
6.7
126
.0 6
96.4
359
.6 1
67-
-
-
-
- 4
60.4
460
.4 4
60.4
460
.4 1
56Ye
s 9
7,17
0.4
87,
559.
2-
9,61
1.2
- 1,
118.
3 2
,047
.8-
57.2
35
62,
337.
8 2
61 8
.4 9
,266
.4 4
,038
.9 1
38 1
0,33
2.3
8.8
708
.7 3
69.0
28
- 1,
824.
3-
1,36
3.9
- 1,
363.
9-
912.
2 2
1,3
63.9
1,3
63.9
1,3
63.9
1,3
63.9
1
57 N
o 5
5,55
6.9
-
- 55
,556
.9-
639.
4-
115.
7-
330.
7-
-
- 26
1-
-
-
-
55,
296.
2 1
15.7
639
.4 3
29.1
168
-
-
-
-
-
-
-
-
-
-
58Ye
s 8
3,44
3.8
43,
779.
6-
39,6
64.2
- 96
0.4
801
.2-
236.
1 3
5 2
2,12
1.0
- 13
3 6
0.0
3,4
70.2
1,7
76.0
66
39,
530.
9 1
43.0
960
.4 3
91.4
101
- 45
0.1
- 45
0.1
- 45
0.1
- 45
0.1
1 4
50.1
450
.1 4
50.1
450
.1 1
59Ye
s 7
5,75
2.3
63,
617.
2-
12,1
35.0
- 87
1.8
1,4
54.9
- 72
.2 3
5 4
3,95
5.1
0 1
8.8
6,5
60.7
2,8
01.4
130
12,
034.
0 7
.9 5
52.5
325
.2 3
7-
-
-
-
- 1
01.0
101
.0 1
01.0
101
.0 1
60Ye
s 9
5,59
2.6
87,
559.
2-
8,03
3.4
- 1,
100.
2 2
,057
.9-
47.8
35
62,
747.
3 8
12 1
94.4
9,3
19.0
4,1
21.6
139
8,9
45.9
4.5
697
.2 3
31.3
27
- 1,
475.
4-
1,37
4.4
- 1,
374.
4-
737.
7 2
1,3
74.4
1,3
74.4
1,3
74.4
1,3
74.4
1
61Ye
s 4
6,09
0.3
43,
779.
6-
2,31
0.7
- 53
0.5
1,0
39.8
- 13
.8 3
5 3
1,81
6.4
324
22.
8 4
,716
.4 2
,093
.4 1
45 2
,974
.0 1
.0 3
32.2
141
.6 2
1-
1,03
7.8
- 69
8.5
- 69
8.5
- 51
8.9
2 6
98.5
698
.5 6
98.5
698
.5 1
62 N
o 1
7,69
0.6
-
- 17
,690
.6-
203.
6-
36.9
- 10
5.3
- -
-
1,00
2 1
22.2
698
.3 3
30.1
6 1
6,34
9.1
36.
9 2
03.6
102
.8 1
59-
189.
3-
189.
3-
189.
3-
189.
3 1
528
.6 1
89.3
339
.3 2
64.3
2
63Ye
s 1
35,9
63.6
63,
617.
2-
72,3
46.3
- 1,
564.
8 1
,070
.2-
430.
6 3
5 2
8,32
6.7
- 0
8.8
4,5
51.8
2,2
34.2
60
72,
346.
3 1
.5 1
,564
.8 6
69.9
108
-
-
-
-
-
-
-
-
-
-
64Ye
s 2
05,7
00.6
43,
779.
6-
161,
921.
0-
2,36
7.4
20.
1-
963.
8 5
61.
0 0
4.4
20.
1 1
2.2
5 1
61,9
21.0
56.
6 2
,367
.4 9
93.4
163
-
-
-
-
-
-
-
-
-
-
65Ye
s 3
73,1
80.0
114
,009
.4-
259,
170.
6-
4,29
4.9
1,0
90.5
- 1,
542.
7 2
9 1
9,49
0.1
0 1
05.6
3,8
36.0
1,7
20.4
34
259
,170
.6 1
18.1
4,2
94.9
1,9
34.1
134
-
-
-
-
-
-
-
-
-
-
66Ye
s 3
38,9
42.5
87,
559.
2-
251,
383.
3-
3,90
0.9
503
.1-
1,49
6.3
20
6,9
50.1
0 3
16.3
1,4
44.2
919
.5 2
0 2
51,3
83.4
209
.5 3
,900
.9 1
,698
.5 1
48-
-
-
-
- -
-
-
-
-
67Ye
s 2
27,7
30.1
87,
559.
2-
140,
170.
9-
2,62
1.0
1,2
13.6
- 83
4.4
35
28,
449.
8 0
242
.4 4
,910
.3 2
,187
.9 5
1 1
40,1
70.9
393
.0 2
,621
.0 1
,198
.0 1
17-
-
-
-
- -
-
-
-
-
68Ye
s 4
27,1
10.6
87,
559.
2-
339,
551.
4-
3,89
2.4
226
.6-
2,02
1.1
5 7
98.6
0 1
85.4
798
.6 5
05.3
5 3
39,5
51.5
889
.1 3
,892
.4 2
,083
.1 1
63-
-
-
-
- -
-
-
-
-
69Ye
s 2
55,0
64.8
36,
765.
7-
218,
299.
1-
2,93
5.5
- 50
9.1
- 1,
299.
4-
-
0-
-
-
-
218
,299
.1 5
09.1
2,9
35.6
1,2
99.4
168
-
-
-
-
-
-
-
-
-
-
70 N
o 2
42,3
44.1
-
- 24
2,34
4.1
- 2,
789.
1-
504.
8-
1,44
2.5
- -
-
0-
-
-
-
242
,344
.0 5
04.8
2,7
89.2
1,4
42.5
168
-
-
-
-
-
-
-
-
-
-
71 N
o 1
36,7
52.5
-
- 13
6,75
2.5
- 1,
573.
9-
284.
9-
814.
0-
-
- 0
-
-
-
- 1
36,7
52.5
284
.9 1
,573
.9 8
14.0
168
-
-
-
-
-
-
-
-
-
-
72Ye
s 4
36,6
84.9
134
,184
.5-
302,
500.
4-
5,02
5.8
1,2
99.6
- 1,
800.
6 2
9 2
3,45
2.3
- 0
141
.3 4
,599
.3 2
,083
.0 3
4 3
02,5
00.3
115
.0 5
,025
.8 2
,257
.5 1
34-
-
-
-
- -
-
-
-
-
73Ye
s 1
02,7
32.0
43,
779.
6-
58,9
52.4
- 1,
182.
3 6
77.9
- 35
0.9
35
17,
114.
6-
0 2
07.6
2,8
26.6
1,2
83.6
58
58,
952.
3 2
14.0
1,1
82.4
535
.9 1
10-
-
-
-
- -
-
-
-
-
74Ye
s 4
15,3
45.6
43,
779.
6-
371,
566.
0-
4,78
0.2
- 86
5.2
- 2,
211.
7-
-
- 0
-
-
-
- 3
71,5
66.0
865
.2 4
,780
.2 2
,211
.7 1
68-
-
-
-
- -
-
-
-
-
75 N
o 3
47,5
21.6
-
- 34
7,52
1.6
- 3,
999.
6-
723.
9-
2,06
8.6
- -
-
0-
-
-
-
347
,521
.6 7
23.9
3,9
99.6
2,0
68.6
168
-
-
-
-
-
-
-
-
-
-
76 N
o 2
9,24
7.7
-
- 29
,247
.7-
336.
6-
60.9
- 17
4.1
- -
-
0-
-
-
-
29,
247.
7 6
0.9
336
.6 1
74.1
168
-
-
-
-
-
-
-
-
-
-
77Ye
s 4
44,3
96.2
87,
559.
2-
356,
836.
9-
5,11
4.6
- 17
0.7
- 2,
124.
0-
-
0-
-
-
-
356
,837
.0 1
70.7
5,1
14.6
2,1
24.0
168
-
-
-
-
-
-
-
-
-
-
78Ye
s 2
67,4
70.0
43,
779.
6-
223,
690.
4-
3,07
8.3
- 37
4.6
- 1,
331.
5-
-
0-
-
-
-
223
,690
.4 3
74.6
3,0
78.3
1,3
31.5
168
-
-
-
-
-
-
-
-
-
-
79 N
o 6
8,35
6.5
-
- 68
,356
.5-
786.
7-
142.
4-
406.
9-
-
- 0
-
-
-
- 6
8,35
6.4
142
.4 7
86.7
406
.9 1
68-
-
-
-
- -
-
-
-
-
80Ye
s 2
98,1
77.1
63,
617.
2-
234,
559.
9-
3,43
1.7
33.
8-
1,39
6.2
5 1
12.1
0 1
1.2
33.
8 2
2.4
5 2
34,5
60.0
77.
6 3
,431
.7 1
,439
.0 1
63-
-
-
-
- -
-
-
-
-
81Ye
s 2
51,5
74.0
87,
559.
2-
164,
014.
8-
2,89
5.4
1,0
61.3
- 97
6.3
33
22,
523.
1 0
24.
3 4
,114
.8 1
,780
.6 4
4 1
64,0
14.8
104
.5 2
,895
.4 1
,322
.7 1
24-
-
-
-
- -
-
-
-
-
82Ye
s 1
94,2
61.8
63,
617.
2-
130,
644.
6-
2,23
5.8
697
.7-
777.
6 3
0 1
3,77
3.5
0 6
6.9
2,6
06.7
1,1
20.9
40
130
,644
.6 1
7.6
2,2
35.8
1,0
20.7
128
-
-
-
-
-
-
-
-
-
-
83 N
o 2
73,2
28.8
-
- 27
3,22
8.8
- 3,
144.
6-
569.
2-
1,62
6.4
- -
-
0-
-
-
-
273
,228
.8 5
69.2
3,1
44.6
1,6
26.4
168
-
-
-
-
-
-
-
-
-
-
84Ye
s 1
90,0
80.8
43,
779.
6-
146,
301.
2-
2,18
7.6
119
.8-
870.
8 1
5 8
06.2
- 0
27.
3 1
83.7
120
.9 2
0 1
46,3
01.2
259
.3 2
,187
.7 9
88.5
148
-
-
-
-
-
-
-
-
-
-
85Ye
s 3
51,8
01.3
63,
617.
2-
288,
184.
1-
4,04
8.9
- 30
8.8
- 1,
715.
4-
-
- 0
-
-
-
- 2
88,1
84.0
308
.8 4
,048
.9 1
,715
.4 1
68-
-
-
-
- -
-
-
-
-
86Ye
s 3
15,7
10.0
63,
617.
2-
252,
092.
8-
3,63
3.5
- 78
.2-
1,50
0.6
- -
0
-
-
-
- 2
52,0
92.8
78.
2 3
,633
.5 1
,500
.6 1
68-
-
-
-
- -
-
-
-
-
87 N
o 2
67,0
55.8
-
- 26
7,05
5.8
- 3,
073.
6-
556.
3-
1,58
9.6
- -
-
0-
-
-
-
267
,055
.8 5
56.3
3,0
73.6
1,5
89.6
168
-
-
-
-
-
-
-
-
-
-
88Ye
s 2
41,0
03.0
43,
779.
6-
197,
223.
4-
2,77
3.7
- 20
5.5
- 1,
173.
9-
-
- 0
-
-
-
- 1
97,2
23.4
205
.5 2
,773
.7 1
,173
.9 1
68-
-
-
-
- -
-
-
-
-
89Ye
s 1
65,3
69.1
63,
617.
2-
101,
751.
9-
1,90
3.2
882
.3-
605.
7 3
5 2
0,69
4.2
- 0
176
.8 3
,570
.7 1
,592
.3 5
1 1
01,7
51.9
280
.4 1
,903
.2 8
69.7
117
-
-
-
-
-
-
-
-
-
-
90Ye
s 1
77,2
61.5
63,
617.
2-
113,
644.
2-
2,04
0.1
806
.4-
676.
5 3
3 1
7,67
3.7
0 4
.8 3
,173
.9 1
,295
.6 4
9 1
13,6
44.2
21.
9 2
,040
.1 9
55.0
119
-
-
-
-
-
-
-
-
-
-
91Ye
s 3
64,2
45.9
87,
559.
2-
276,
686.
7-
4,19
2.1
341
.4-
1,64
6.9
20
3,5
50.3
0 1
55.6
768
.2 5
03.5
20
276
,686
.7 4
12.7
4,1
92.1
1,8
69.5
148
-
-
-
-
-
-
-
-
-
-

Appendix
218
Figure 69: Results future scenario (in kW) - transition week (1)
Co
ns
Pro
dP
ot.
Su
rplu
sSt
ora
geM
issi
ng
Exte
rnal
To
Exte
rnal
Fro
mD
iff
Pro
d-
Co
ns
% time storage positive
Object
Prod
Total
Total
Diff Prod-
Cons
Min
Max
Average
No of occ.
Total
Status End of
week
Min
Max
Average
No of occ.
Total
Min
Max
Average
No of occ.
Total
Min
Max
Average
No of occ.
Total
Min
Max
Average
No of occ.
Tota
lM
inM
axA
vera
ge
1Ye
s 2
46,0
80.2
166
,414
.4-
79,6
65.8
- 2,
510.
0 7
39.9
- 47
4.2
64
30,
708.
2 0
138
.6 8
,603
.0 2
,913
.0 1
38 3
,880
.4 5
58.1
861
.4 6
46.7
6-
-
-
-
-
75,
785.
4 1
51.2
9,0
00.1
2,8
06.9
27
2Ye
s 2
10,4
40.8
166
,414
.4-
44,0
26.4
- 2,
146.
5 9
85.5
- 26
2.1
78
48,
062.
6 0
84.
4 1
2,96
4.0
5,1
78.2
148
3,3
18.4
477
.2 7
36.6
553
.1 6
-
-
-
-
- 4
0,70
8.0
14.
5 7
,062
.6 2
,035
.4 2
0
3Ye
s 7
2,53
4.7
166
,414
.4 9
3,87
9.7
- 73
9.9
1,9
35.8
558
.8 8
4 1
25,1
42.2
- 0
161
.4 2
1,05
2.2
7,3
38.3
152
1,1
43.8
164
.5 2
53.9
190
.6 6
- 95
,023
.5-
-
10,0
49.6
- 3,
393.
7 2
8-
-
-
-
-
4 N
o 1
73,1
03.4
-
- 17
3,10
3.4
- 1,
845.
4-
384.
4-
1,03
0.4
- -
0
111
.7 2
0,34
8.2
4,8
27.4
134
2,7
29.7
392
.6 6
05.9
454
.9 6
-
-
-
-
- 1
70,3
73.7
385
.3 2
1,65
7.0
3,8
72.1
44
5Ye
s 4
76,1
00.6
275
,103
.8-
200,
996.
8-
4,85
6.2
896
.8-
1,19
6.4
48
23,
971.
1 0
191
.8 1
7,13
9.1
5,6
72.7
136
7,5
07.6
1,0
79.7
1,6
66.6
1,2
51.3
6-
-
-
-
-
193
,489
.2 1
90.3
11,
814.
1 4
,116
.8 4
7
6Ye
s 2
24,0
24.4
166
,414
.4-
57,6
10.0
- 2,
285.
1 8
91.9
- 34
2.9
74
40,
799.
4-
0 1
37.0
14,
853.
8 5
,312
.9 1
44 3
,532
.6 5
08.0
784
.2 5
88.8
6-
-
-
-
-
54,
077.
4 7
.8 1
0,70
7.5
2,8
46.2
19
7Ye
s 1
63,5
17.0
332
,828
.8 1
69,3
11.8
- 1,
667.
9 3
,744
.5 1
,007
.8 8
4 2
39,7
87.8
- 0
125
.3 2
6,89
4.9
10,
579.
2 1
48 2
,578
.5 3
70.8
572
.4 4
29.7
6-
171,
890.
4-
12,5
40.8
- 12
,540
.8-
3,73
6.7
46
-
-
-
-
-
8Ye
s 3
05,6
14.9
241
,820
.9-
63,7
94.0
- 3,
117.
3 1
,433
.3-
379.
7 7
8 6
9,93
8.6
0 1
16.0
20,
822.
2 7
,530
.1 1
50 4
,819
.2 6
93.1
1,0
69.8
803
.2 6
-
-
-
-
- 5
8,97
4.8
303
.5 1
1,57
5.9
4,2
12.5
14
9Ye
s 3
88,3
01.9
170
,262
.7-
218,
039.
2-
3,96
0.7
239
.7-
1,29
7.9
1 2
39.7
0 1
54.4
14,
267.
3 4
,169
.3 1
24 6
,123
.1 8
80.6
1,3
59.2
1,0
20.5
6-
-
-
-
-
211
,916
.1 8
0.3
12,
635.
4 3
,418
.0 6
2
10Ye
s 2
2,85
1.7
166
,414
.4 1
43,5
62.7
- 23
3.1
2,2
78.2
854
.5 8
4 1
53,4
11.8
- 0
50.
9 1
9,69
6.0
7,7
70.4
144
360
.3 5
1.8
80.
0 6
0.1
6-
143,
923.
1-
12,6
35.4
- 12
,635
.4-
3,06
2.2
47
-
-
-
-
-
11Ye
s 2
12,6
87.0
166
,414
.4-
46,2
72.6
- 2,
169.
4 9
70.0
- 27
5.4
78
46,
857.
4 0
69.
1 1
4,50
6.3
4,6
20.7
152
3,3
53.9
482
.3 7
44.5
559
.0 6
-
-
-
-
- 4
2,91
8.8
220
.4 9
,931
.6 3
,901
.7 1
1
12Ye
s 7
0,90
7.5
63,
584.
2-
7,32
3.3
- 72
3.3
442
.0-
43.6
78
23,
460.
5 0
29.
9 4
,454
.4 1
,850
.0 1
51 1
,118
.1 1
60.8
248
.2 1
86.4
6-
190.
3-
190.
3-
190.
3-
190.
3 1
6,3
95.5
16.
1 1
,672
.9 6
39.6
10
13Ye
s 8
7,72
7.9
332
,828
.8 2
45,1
00.9
- 89
4.8
4,2
66.8
1,4
58.9
84
282
,911
.7 1
2,14
1 2
39.1
37,
885.
9 1
2,46
2.4
145
1,3
83.4
198
.9 3
07.1
230
.6 6
- 23
4,34
3.6
- 21
,657
.0-
21,6
57.0
- 4,
421.
6 5
3-
-
-
-
-
14Ye
s 2
01,3
85.0
241
,820
.9 4
0,43
5.9
- 2,
054.
1 2
,151
.5 2
40.7
84
127
,233
.0 7
,268
207
.1 1
7,75
0.5
8,0
18.5
151
3,1
75.6
456
.7 7
04.9
529
.3 6
- 36
,343
.9-
4,73
7.2
- 4,
737.
2-
1,65
2.0
22
-
-
-
-
-
15Ye
s 2
05,6
65.3
166
,414
.4-
39,2
50.9
- 2,
097.
8 1
,018
.4-
233.
6 7
8 5
0,62
5.0
- 0
111
.5 1
3,98
2.2
5,1
24.3
150
3,2
43.1
466
.4 7
19.9
540
.5 6
-
-
-
-
- 3
6,00
7.7
182
.4 8
,818
.8 2
,769
.8 1
3
16Ye
s 1
24,8
88.4
241
,820
.9 1
16,9
32.5
- 1,
273.
9 2
,678
.7 6
96.0
84
170
,759
.5 1
8,88
3 2
78.0
32,
781.
9 1
2,82
4.1
153
1,9
69.3
283
.2 4
37.2
328
.2 6
- 10
0,01
9.3
- 18
,750
.4-
18,7
50.4
- 3,
846.
9 2
6-
-
-
-
-
17Ye
s 9
8,99
4.5
241
,820
.9 1
42,8
26.4
- 1,
009.
7 2
,857
.1 8
50.2
84
185
,493
.1 3
5,47
5 2
70.9
39,
634.
5 1
6,14
3.7
155
1,5
61.0
224
.5 3
46.5
260
.2 6
- 10
8,91
2.6
- 13
,536
.3-
13,5
36.3
- 4,
356.
5 2
5-
-
-
-
-
18Ye
s 1
13,5
51.0
332
,828
.8 2
19,2
77.8
- 1,
158.
2 4
,088
.8 1
,305
.2 8
4 2
68,2
18.4
24,
886
252
.7 2
9,65
7.7
7,7
46.7
145
1,7
90.6
257
.5 3
97.5
298
.4 6
- 19
6,18
2.0
- 21
,273
.1-
21,2
73.1
- 9,
342.
0 2
1-
-
-
-
-
19Ye
s 1
32,6
53.0
332
,828
.8 2
00,1
75.8
- 1,
353.
1 3
,957
.2 1
,191
.5 8
4 2
57,3
49.3
0 2
95.2
35,
188.
6 9
,266
.4 1
50 2
,091
.8 3
00.8
464
.3 3
48.6
6-
202,
267.
5-
29,0
01.5
- 29
,001
.5-
14,4
47.7
14
-
-
-
-
-
20Ye
s 2
86,8
31.2
332
,828
.8 4
5,99
7.6
- 2,
925.
7 2
,894
.7 2
73.8
84
169
,622
.1-
0 2
33.0
23,
439.
4 8
,743
.7 1
50 4
,523
.0 6
50.5
1,0
04.0
753
.8 6
- 50
,520
.6-
10,0
82.0
- 10
,082
.0-
2,97
1.8
17
-
-
-
-
-
21Ye
s 1
41,1
60.5
241
,820
.9 1
00,6
60.4
- 1,
439.
8 2
,566
.5 5
99.2
84
161
,500
.7-
0 3
14.2
27,
558.
8 7
,435
.9 1
45 2
,226
.0 3
20.1
494
.1 3
71.0
6-
102,
886.
4-
18,9
15.7
- 18
,915
.7-
5,41
5.1
19
-
-
-
-
-
22Ye
s 8
15,5
86.2
241
,820
.9-
573,
765.
3-
8,31
9.0
- 54
8.9
- 3,
415.
3-
-
0 1
15.9
53,
301.
0 1
8,03
5.9
146
12,
860.
9 1
,849
.5 2
,854
.9 2
,143
.5 6
-
-
-
-
- 5
60,9
04.4
19.
9 3
2,66
0.6
10,
198.
3 5
5
23Ye
s 4
34,2
17.6
151
,194
.4-
283,
023.
2-
4,42
9.0
- 88
.2-
1,68
4.7
- -
-
0 3
07.5
31,
662.
8 8
,539
.0 1
38 6
,847
.1 9
84.7
1,5
20.0
1,1
41.2
6-
-
-
-
-
276
,176
.0 1
,236
.5 1
6,94
5.2
6,2
76.7
44
24Ye
s 1
66,4
35.3
332
,828
.8 1
66,3
93.5
- 1,
697.
6 3
,724
.4 9
90.4
84
238
,127
.2 0
370
.4 2
2,27
3.8
6,6
87.7
141
2,6
24.5
377
.4 5
82.6
437
.4 6
- 16
9,01
8.0
- 16
,945
.2-
16,9
45.2
- 6,
500.
7 2
6-
-
-
-
-
25Ye
s 4
31,2
28.5
241
,820
.9-
189,
407.
6-
4,39
8.5
745
.5-
1,12
7.4
47
17,
157.
0-
0 1
42.9
35,
049.
2 1
2,76
5.2
145
6,8
00.0
977
.9 1
,509
.5 1
,133
.3 6
-
-
-
-
- 1
82,6
07.5
270
.8 3
8,52
6.6
6,5
21.7
28
26Ye
s 1
36,9
33.3
332
,828
.8 1
95,8
95.5
- 1,
396.
7 3
,927
.7 1
,166
.0 8
4 2
54,9
13.8
4,6
48 3
04.8
29,
238.
8 9
,401
.4 1
46 2
,159
.3 3
10.5
479
.3 3
59.9
6-
193,
406.
8-
14,9
35.1
- 14
,935
.1-
4,60
4.9
42
-
-
-
-
-
27Ye
s 7
2,16
3.2
241
,820
.9 1
69,6
57.7
- 73
6.1
3,0
42.0
1,0
09.9
84
200
,760
.1 6
5,38
9 2
,285
.9 6
8,42
1.2
31,
066.
5 1
59 1
,137
.9 1
63.7
252
.6 1
89.7
6-
105,
406.
7-
32,4
37.4
- 32
,437
.4-
8,10
8.2
13
-
-
-
-
-
28Ye
s 1
10,1
72.8
166
,414
.4 5
6,24
1.6
- 1,
123.
8 1
,676
.4 3
34.8
84
103
,726
.2 3
0,27
4 7
62.0
38,
789.
6 1
9,06
9.0
161
1,7
37.3
249
.8 3
85.7
289
.5 6
- 27
,704
.9-
26,6
88.0
- 26
,688
.0-
9,23
5.0
3-
-
-
-
-
29 N
o 8
13.6
-
- 81
3.6
- 8.
7-
1.8
- 4.
8-
-
0 3
.9 7
35.9
356
.4 1
60 1
2.8
1.9
2.9
2.1
6-
-
-
-
-
800
.8 5
9.9
740
.8 4
00.4
2
30Ye
s 2
70,5
06.1
166
,414
.4-
104,
091.
7-
2,75
9.2
601
.4-
619.
6 5
6 2
0,42
2.4
0 1
.0 2
9,17
5.7
9,3
20.1
145
4,2
65.6
613
.4 9
46.9
710
.9 6
-
-
-
-
- 9
9,82
6.1
6.3
29,
247.
3 4
,991
.3 2
0
31 N
o 6
,898
.0-
-
6,89
8.0
- 73
.5-
15.3
- 41
.1-
-
0 4
5.2
6,3
20.5
3,1
33.8
156
108
.8 1
5.6
24.
2 1
8.1
6-
-
-
-
-
6,7
89.2
33.
3 6
,368
.3 1
,131
.5 6
32Ye
s 7
5,96
6.0
241
,820
.9 1
65,8
54.9
- 77
4.9
3,0
15.8
987
.2 8
4 1
98,5
96.3
87,
342
2,1
59.4
90,
774.
9 4
1,59
3.2
159
1,1
97.9
172
.3 2
65.9
199
.7 6
- 79
,711
.1-
29,2
47.3
- 29
,247
.3-
3,46
5.7
23
-
-
-
-
-
33Ye
s 8
3,48
3.0
241
,820
.9 1
58,3
37.9
- 85
1.5
2,9
64.0
942
.5 8
4 1
94,3
19.2
159
,654
775
.2 1
63,1
62.3
84,
895.
2 1
62 1
,316
.4 1
89.3
292
.2 2
19.4
6-
-
-
-
-
-
-
-
-
-
34Ye
s 1
33,7
67.3
166
,414
.4 3
2,64
7.1
- 1,
364.
4 1
,513
.8 1
94.3
84
90,
300.
9 1
3,94
7 6
01.2
20,
358.
0 1
0,66
2.8
161
2,1
09.4
303
.4 4
68.2
351
.6 6
- 20
,809
.4-
8,10
3.9
- 8,
103.
9-
1,89
1.8
11
-
-
-
-
-
35Ye
s 3
56,4
12.2
332
,828
.8-
23,5
83.4
- 3,
635.
4 2
,415
.2-
140.
4 7
8 1
30,7
17.4
2,5
57 4
9.0
23,
865.
9 9
,612
.9 1
52 5
,620
.2 8
08.3
1,2
47.6
936
.7 6
- 28
9.4
- 28
9.4
- 28
9.4
- 28
9.4
1 2
0,80
9.4
85.
7 8
,103
.9 1
,891
.8 1
1
36 N
o 5
9,97
6.9
-
- 59
,976
.9-
639.
4-
133.
2-
357.
0-
-
- 0
165
.4 2
0,27
0.0
6,0
45.1
151
945
.8 1
36.0
210
.0 1
57.6
6-
-
-
-
-
59,
031.
1 2
89.4
20,
630.
9 4
,540
.9 1
3
37Ye
s 1
36,8
09.5
241
,820
.9 1
05,0
11.4
- 1,
395.
5 2
,596
.5 6
25.1
84
163
,976
.4 4
8,42
7 2
22.1
54,
175.
7 2
4,07
1.7
160
2,1
57.3
310
.3 4
78.9
359
.6 6
- 58
,741
.7-
20,6
30.9
- 20
,630
.9-
4,89
5.1
12
-
-
-
-
-
38Ye
s 7
2,21
6.3
241
,820
.9 1
69,6
04.6
- 73
6.6
3,0
41.7
1,0
09.6
84
200
,729
.9 1
70,7
43 8
30.2
173
,777
.9 9
0,41
2.8
162
1,1
38.8
163
.8 2
52.8
189
.8 6
-
-
-
-
- -
-
-
-
-
39Ye
s 1
54,7
79.6
241
,820
.9 8
7,04
1.4
- 1,
578.
8 2
,472
.7 5
18.1
84
153
,751
.5 8
9,48
2 4
27.2
95,
985.
8 4
9,97
9.2
162
2,4
40.7
351
.0 5
41.8
406
.8 6
-
-
-
-
- -
-
-
-
-
40Ye
s 6
0,50
7.5
166
,414
.4 1
05,9
06.9
- 61
7.2
2,0
18.7
630
.4 8
4 1
31,9
85.7
106
,861
518
.6 1
09,4
03.6
56,
925.
5 1
62 9
54.1
137
.2 2
11.8
159
.0 6
-
-
-
-
- -
-
-
-
-
41 N
o 4
7,04
7.6
-
- 47
,047
.6-
501.
6-
104.
5-
280.
0-
-
- 0
227
.0 3
7,40
5.7
16,
581.
4 1
56 7
41.9
106
.7 1
64.7
123
.6 6
-
-
-
-
- 4
6,30
5.7
229
.7 3
7,77
3.8
7,7
17.6
6
42Ye
s 8
5,21
6.3
332
,828
.8 2
47,6
12.5
- 86
9.2
4,2
84.1
1,4
73.9
84
284
,340
.8 2
02,6
51 9
82.2
206
,231
.3 9
2,37
4.8
162
1,3
43.8
193
.3 2
98.3
224
.0 6
- 46
,305
.7-
37,7
73.8
- 37
,773
.8-
7,71
7.6
6-
-
-
-
-
43Ye
s 2
01,9
86.3
347
,667
.4 1
45,6
81.1
- 2,
060.
3 3
,696
.6 8
67.1
84
232
,737
.3 1
48,8
66 7
14.4
157
,353
.5 8
1,91
5.0
162
3,1
85.1
458
.1 7
07.0
530
.9 6
-
-
-
-
- -
-
-
-
-
44Ye
s 6
8,85
5.8
166
,414
.4 9
7,55
8.6
- 70
2.3
1,9
61.2
580
.7 8
4 1
27,2
35.5
98,
644
477
.8 1
01,5
37.7
52,
837.
1 1
62 1
,085
.8 1
56.2
241
.0 1
81.0
6-
-
-
-
-
-
-
-
-
-
45Ye
s 7
1,01
3.6
166
,414
.4 9
5,40
0.8
- 72
4.3
1,9
46.3
567
.9 8
4 1
26,0
07.7
96,
521
467
.3 9
9,50
4.6
51,
780.
3 1
62 1
,119
.8 1
61.0
248
.6 1
86.6
6-
-
-
-
-
-
-
-
-
-

Appendix
219
Figure 70: Results future scenario (in kW) - transition week (2)
Co
ns
Pro
dP
ot.
Su
rplu
sSt
ora
geM
issi
ng
Exte
rnal
To
Exte
rnal
Fro
mD
iff
Pro
d-
Co
ns
% time storage positive
Object
Prod
Total
Total
Diff Prod-
Cons
Min
Max
Average
No of occ.
Total
Status End of
week
Min
Max
Average
No of occ.
Total
Min
Max
Average
No of occ.
Total
Min
Max
Average
No of occ.
Total
Min
Max
Average
No of occ.
Tota
lM
inM
axA
vera
ge
46Ye
s 1
36,4
02.7
332
,828
.8 1
96,4
26.1
- 1,
391.
3 3
,931
.3 1
,169
.2 8
4 2
55,2
15.8
198
,577
962
.0 2
04,3
08.6
106
,315
.1 1
62 2
,150
.9 3
09.3
477
.5 3
58.5
6-
-
-
-
-
-
-
-
-
-
47Ye
s 1
17,4
77.5
241
,820
.9 1
24,3
43.4
- 1,
198.
3 2
,729
.8 7
40.1
84
174
,976
.3 5
1,93
9 3
20.2
56,
875.
4 2
2,40
1.1
161
1,8
52.5
266
.4 4
11.2
308
.7 6
- 74
,256
.8-
30,8
60.4
- 30
,860
.4-
3,09
4.0
24
-
-
-
-
-
48 N
o 7
5,66
5.3
-
- 75
,665
.3-
806.
7-
168.
0-
450.
4-
-
- 0
365
.1 3
0,59
9.5
10,
657.
2 1
39 1
,193
.2 1
71.6
264
.9 1
98.9
6-
-
-
-
-
74,
472.
1 3
69.3
30,
860.
4 3
,103
.0 2
4
49Ye
s 1
22,6
24.5
166
,414
.4 4
3,78
9.9
- 1,
250.
8 1
,590
.6 2
60.7
84
96,
641.
2 4
5,50
8 6
77.1
50,
660.
9 2
6,45
3.0
161
1,9
33.7
278
.1 4
29.2
322
.3 6
- 21
5.3
- 21
5.3
- 21
5.3
- 21
5.3
1-
-
-
-
-
50Ye
s 6
2,41
7.7
332
,828
.8 2
70,4
11.1
- 63
6.7
4,4
41.2
1,6
09.6
84
297
,313
.2 2
71,3
95 1
,323
.1 2
74,0
18.1
142
,547
.7 1
62 9
84.3
141
.6 2
18.5
164
.0 6
-
-
-
-
- -
-
-
-
-
51Ye
s 7
3,63
1.3
241
,820
.9 1
68,1
89.6
- 75
1.0
3,0
31.9
1,0
01.1
84
199
,924
.8 1
55,4
89 1
,696
.2 1
58,5
83.2
81,
628.
5 1
61 1
,161
.1 1
67.0
257
.7 1
93.5
6-
13,8
61.5
- 4,
385.
9-
4,38
5.9
- 1,
980.
2 7
-
-
-
-
-
52Ye
s 1
43,6
54.4
241
,820
.9 9
8,16
6.5
- 1,
465.
3 2
,549
.4 5
84.3
84
160
,081
.7 1
6,52
9 3
34.8
22,
685.
2 9
,616
.1 1
47 2
,265
.3 3
25.8
502
.9 3
77.5
6-
83,9
02.9
- 11
,298
.5-
11,2
98.5
- 2,
893.
2 2
9-
-
-
-
-
53Ye
s 7
0,21
7.7
332
,828
.8 2
62,6
11.1
- 71
6.2
4,3
87.4
1,5
63.2
84
292
,875
.0 2
6,98
8 1
15.4
32,
082.
9 1
1,55
0.6
138
1,1
07.3
159
.2 2
45.8
184
.5 6
- 23
6,73
0.5
- 17
,398
.4-
17,3
98.4
- 3,
114.
9 7
6-
-
-
-
-
54 N
o 9
3,70
6.1
-
- 93
,706
.1-
999.
0-
208.
1-
557.
8-
-
0 2
08.1
13,
267.
9 3
,788
.7 1
31 1
,477
.6 2
12.5
328
.0 2
46.3
6-
-
-
-
-
92,
228.
5 2
08.6
12,
172.
7 2
,427
.1 3
8
55 N
o 5
4,26
3.9
-
- 54
,263
.9-
578.
5-
120.
5-
323.
0-
-
0 1
20.8
11,
661.
5 3
,044
.9 1
46 8
55.7
123
.1 1
90.0
142
.6 6
-
-
-
-
- 5
3,40
8.3
241
.3 6
,810
.5 1
,978
.1 2
7
56Ye
s 8
7,14
4.2
332
,828
.8 2
45,6
84.6
- 88
8.9
4,2
70.8
1,4
62.4
84
283
,243
.8 2
3,68
0 1
94.0
27,
844.
0 8
,381
.2 1
35 1
,374
.2 1
97.6
305
.0 2
29.0
6-
223,
378.
8-
11,5
72.6
- 11
,572
.6-
2,75
7.8
81
-
-
-
-
-
57 N
o 4
9,82
4.5
-
- 49
,824
.5-
531.
2-
110.
6-
296.
6-
-
0 1
10.9
6,8
35.3
2,0
73.9
128
785
.7 1
13.0
174
.4 1
30.9
6-
-
-
-
-
49,
038.
8 1
17.2
5,3
27.5
1,3
25.4
37
58Ye
s 7
4,83
4.0
166
,414
.4 9
1,58
0.4
- 76
3.3
1,9
20.0
545
.1 8
4 1
23,8
33.9
14,
271
174
.4 1
7,41
5.2
5,2
83.5
146
1,1
80.0
169
.7 2
62.0
196
.7 6
- 78
,489
.7-
8,96
2.6
- 8,
962.
6-
2,37
8.5
33
-
-
-
-
-
59Ye
s 6
7,93
6.0
241
,820
.9 1
73,8
84.9
- 69
2.9
3,0
71.2
1,0
35.0
84
203
,165
.4 2
6,02
5 1
58.3
28,
880.
0 8
,119
.8 1
45 1
,071
.3 1
54.1
237
.8 1
78.5
6-
148,
930.
7-
14,0
66.3
- 14
,066
.3-
3,30
9.6
45
-
-
-
-
-
60Ye
s 8
5,72
9.2
332
,828
.8 2
47,0
99.6
- 87
4.4
4,2
80.5
1,4
70.8
84
284
,048
.9 3
6,79
5 1
25.4
40,
397.
2 9
,680
.0 1
36 1
,351
.9 1
94.4
300
.1 2
25.3
6-
211,
656.
5-
10,0
44.1
- 10
,044
.1-
3,25
6.3
65
-
-
-
-
-
61Ye
s 4
1,33
4.7
166
,414
.4 1
25,0
79.7
- 42
1.6
2,1
50.8
744
.5 8
4 1
42,8
95.0
7,1
05 2
3.1
19,
037.
6 6
,500
.6 1
49 6
51.8
93.
7 1
44.7
108
.6 6
- 11
8,62
6.4
- 13
,005
.7-
13,0
05.7
- 3,
041.
7 3
9-
-
-
-
-
62 N
o 1
5,86
5.3
-
- 15
,865
.3-
169.
1-
35.2
- 94
.4-
-
- 0
35.
3 2
,500
.7 7
69.5
140
250
.2 3
6.0
55.
5 4
1.7
6-
-
-
-
-
15,
615.
1 7
7.4
2,6
20.7
709
.8 2
2
63Ye
s 1
21,9
34.7
241
,820
.9 1
19,8
86.2
- 1,
243.
7 2
,699
.0 7
13.6
84
172
,440
.2-
0 2
71.4
22,
988.
7 6
,928
.7 1
43 1
,922
.8 2
76.5
426
.8 3
20.5
6-
121,
809.
1-
14,2
73.4
- 14
,273
.4-
3,12
3.3
39
-
-
-
-
-
64Ye
s 1
84,4
76.1
166
,414
.4-
18,0
61.8
- 1,
881.
7 1
,164
.4-
107.
5 7
8 6
1,99
4.4
- 0
73.
0 1
3,41
4.5
5,4
93.3
154
2,9
09.0
418
.3 6
45.8
484
.8 6
- 63
6.8
- 38
0.2
- 38
0.2
- 31
8.4
2 1
5,78
9.5
83.
2 5
,031
.0 1
,973
.7 8
65Ye
s 3
34,6
74.7
433
,370
.8 9
8,69
6.1
- 3,
413.
7 4
,036
.5 5
87.5
84
242
,941
.2-
0 1
09.3
31,
209.
0 1
2,05
2.3
145
5,2
77.5
759
.0 1
,171
.5 8
79.6
6-
103,
973.
5-
11,9
04.5
- 11
,904
.5-
2,88
8.2
36
-
-
-
-
-
66Ye
s 3
03,9
70.0
332
,828
.8 2
8,85
8.8
- 3,
100.
5 2
,776
.6 1
71.8
84
159
,870
.1 0
155
.2 2
8,42
5.8
11,
640.
0 1
57 4
,793
.3 6
89.3
1,0
64.0
798
.9 6
- 33
,652
.1-
13,0
57.3
- 13
,057
.3-
2,80
4.3
12
-
-
-
-
-
67Ye
s 2
04,2
32.6
332
,828
.8 1
28,5
96.2
- 2,
083.
2 3
,463
.9 7
65.5
84
216
,620
.6 0
282
.1 3
0,96
2.8
10,
108.
9 1
49 3
,220
.5 4
63.2
714
.9 5
36.8
6-
131,
816.
7-
13,4
79.6
- 13
,479
.6-
3,21
5.0
41
-
-
-
-
-
68Ye
s 4
01,8
73.6
332
,828
.8-
69,0
44.8
- 2,
999.
4 2
,725
.0-
411.
0 7
4 8
0,82
5.1
- 0
11.
1 1
8,65
7.9
6,2
60.8
143
7,3
86.3
1,0
74.0
1,4
15.4
1,2
31.1
6-
14,0
94.6
- 4,
999.
4-
4,99
9.4
- 2,
349.
1 6
75,
753.
1 1
24.0
9,9
17.9
3,6
07.3
21
69Ye
s 2
28,7
46.9
139
,753
.4-
88,9
93.5
- 2,
333.
2 4
99.8
- 52
9.7
54
16,
569.
9-
0 1
70.7
12,
674.
9 3
,600
.4 1
36 3
,607
.1 5
18.7
800
.7 6
01.2
6-
-
-
-
-
85,
386.
4 4
.2 7
,361
.7 2
,439
.6 3
5
70 N
o 2
17,3
38.7
-
- 21
7,33
8.7
- 2,
317.
0-
482.
6-
1,29
3.7
- -
0
364
.6 2
6,56
8.7
9,0
17.2
120
3,4
27.2
492
.9 7
60.8
571
.2 6
-
-
-
-
- 2
13,9
11.5
94.
0 1
7,39
8.4
3,5
06.7
61
71 N
o 1
22,6
42.1
-
- 12
2,64
2.1
- 1,
307.
5-
272.
3-
730.
0-
-
0 2
73.0
12,
612.
3 3
,396
.8 1
28 1
,933
.9 2
78.1
429
.3 3
22.3
6-
-
-
-
-
120
,708
.3 2
67.7
11,
457.
7 2
,874
.0 4
2
72Ye
s 3
91,6
27.1
510
,060
.1 1
18,4
33.0
- 3,
994.
6 4
,766
.5 7
05.0
84
287
,224
.6-
0 5
90.2
32,
375.
2 1
2,69
5.0
139
6,1
75.6
888
.1 1
,370
.9 1
,029
.3 6
- 12
4,60
8.6
- 9,
743.
1-
9,74
3.1
- 2,
651.
2 4
7-
-
-
-
-
73Ye
s 9
2,13
2.0
166
,414
.4 7
4,28
2.4
- 93
9.7
1,8
00.8
442
.2 8
4 1
13,9
91.4
- 0
205
.1 1
3,08
1.6
5,2
07.8
144
1,4
52.8
208
.9 3
22.5
242
.1 6
- 75
,735
.3-
6,90
3.1
- 6,
903.
1-
2,04
6.9
37
-
-
-
-
-
74Ye
s 3
72,4
89.7
166
,414
.4-
206,
075.
3-
3,79
9.4
258
.0-
1,22
6.6
1 2
58.0
- 0
131
.2 2
4,77
6.2
6,7
86.0
124
5,8
73.8
844
.7 1
,303
.9 9
79.0
6-
-
-
-
-
200
,201
.5 2
22.3
13,
479.
6 3
,393
.2 5
9
75 N
o 3
11,6
63.9
-
- 31
1,66
3.9
- 3,
322.
6-
692.
1-
1,85
5.1
- -
0
3.4
27,
807.
3 9
,635
.2 1
41 4
,914
.6 7
06.8
1,0
91.0
819
.1 6
-
-
-
-
- 3
06,7
49.3
65.
0 1
4,21
0.9
5,1
99.1
59
76 N
o 2
6,22
9.9
-
- 26
,229
.9-
279.
6-
58.2
- 15
6.1
- -
0
58.
4 2
,747
.4 7
55.6
124
413
.6 5
9.5
91.
8 6
8.9
6-
-
-
-
-
25,
816.
3 5
9.3
2,9
21.4
645
.4 4
0
77Ye
s 3
98,5
42.8
332
,828
.8-
65,7
14.0
- 4,
065.
1 2
,124
.9-
391.
2 7
8 1
08,1
11.5
- 0
20.
3 2
3,24
1.4
9,7
96.5
142
6,2
84.6
903
.8 1
,395
.1 1
,047
.4 6
-
-
-
-
- 5
9,42
9.4
288
.3 6
,749
.3 2
,201
.1 2
7
78Ye
s 2
39,8
72.0
166
,414
.4-
73,4
57.7
- 2,
446.
7 7
82.7
- 43
7.2
65
33,
457.
1-
0 8
9.1
11,
075.
0 4
,504
.6 1
35 3
,782
.5 5
44.0
839
.7 6
30.4
6-
-
-
-
-
69,
675.
1 9
6.9
8,4
83.8
2,1
11.4
33
79 N
o 6
1,30
3.4
-
- 61
,303
.4-
653.
6-
136.
1-
364.
9-
-
0 1
36.4
9,9
88.1
2,5
35.0
130
966
.7 1
39.0
214
.6 1
61.1
6-
-
-
-
-
60,
336.
7 1
44.1
10,
044.
1 1
,547
.1 3
9
80Ye
s 2
67,4
10.8
241
,820
.9-
25,5
89.9
- 2,
727.
6 1
,696
.5-
152.
3 7
8 9
0,43
7.6
0 3
76.2
16,
385.
4 7
,168
.8 1
49 4
,216
.8 6
06.4
936
.1 7
02.8
6-
1,00
7.6
- 1,
007.
6-
1,00
7.6
- 1,
007.
6 1
22,
380.
7 1
03.0
8,1
46.8
1,7
21.6
13
81Ye
s 2
25,6
16.3
332
,828
.8 1
07,2
12.5
- 2,
301.
3 3
,316
.5 6
38.2
84
204
,453
.3 0
377
.9 1
8,94
5.5
6,8
10.5
141
3,5
57.7
511
.6 7
89.8
593
.0 6
- 11
0,77
0.2
- 10
,475
.9-
10,4
75.9
- 3,
164.
9 3
5-
-
-
-
-
82Ye
s 1
74,2
17.6
241
,820
.9 6
7,60
3.3
- 1,
777.
0 2
,338
.7 4
02.4
84
142
,691
.2 0
338
.7 1
6,77
4.3
6,1
55.9
146
2,7
47.2
395
.1 6
09.8
457
.9 6
- 70
,350
.5-
6,88
1.3
- 6,
881.
3-
2,70
5.8
26
-
-
-
-
-
83 N
o 2
45,0
36.7
-
- 24
5,03
6.7
- 2,
612.
3-
544.
1-
1,45
8.6
- -
0
295
.0 1
5,04
9.4
4,9
51.4
128
3,8
64.0
555
.7 8
57.7
644
.0 6
-
-
-
-
- 2
41,1
72.7
164
.3 1
0,47
5.9
3,4
45.3
70
84Ye
s 1
70,4
68.0
166
,414
.4-
4,05
3.6
- 1,
738.
8 1
,260
.9-
24.1
78
69,
510.
7-
0 1
1.9
10,
796.
2 4
,425
.0 1
55 2
,688
.1 3
86.6
596
.7 4
48.0
6-
2,39
3.6
- 2,
229.
4-
2,22
9.4
- 1,
196.
8 2
3,7
59.1
18.
2 1
,697
.6 6
26.5
6
85Ye
s 3
15,5
02.0
241
,820
.9-
73,6
81.0
- 3,
218.
1 1
,365
.1-
438.
6 7
8 6
4,63
3.5
0 4
8.6
19,
479.
0 6
,650
.2 1
41 4
,975
.1 7
15.5
1,1
04.4
829
.2 6
-
-
-
-
- 6
8,70
5.9
232
.0 6
,890
.3 2
,544
.7 2
7
86Ye
s 2
83,1
34.6
241
,820
.9-
41,3
13.7
- 2,
888.
0 1
,588
.2-
245.
9 7
8 8
2,00
0.8
- 0
269
.1 1
8,01
7.2
7,9
65.7
147
4,4
64.7
642
.1 9
91.1
744
.1 6
-
-
-
-
- 3
6,84
9.0
183
.7 5
,462
.3 2
,047
.2 1
8
87 N
o 2
39,5
00.6
-
- 23
9,50
0.6
- 2,
553.
3-
531.
8-
1,42
5.6
- -
-
0 6
6.4
13,
182.
8 3
,313
.5 9
2 3
,776
.7 5
43.1
838
.4 6
29.4
6-
-
-
-
-
235
,723
.9 1
79.4
14,
154.
7 2
,709
.5 8
7
88Ye
s 2
16,1
36.0
166
,414
.4-
49,7
21.6
- 2,
204.
6 9
46.2
- 29
6.0
78
45,
006.
8 0
40.
2 1
6,32
3.1
5,3
38.4
146
3,4
08.2
490
.1 7
56.6
568
.0 6
-
-
-
-
- 4
6,31
3.4
229
.2 9
,345
.5 2
,315
.7 2
0
89Ye
s 1
48,3
06.1
241
,820
.9 9
3,51
4.8
- 1,
512.
7 2
,517
.3 5
56.6
84
157
,434
.9-
0 1
82.4
19,
467.
9 6
,927
.6 1
52 2
,338
.6 3
36.3
519
.1 3
89.8
6-
95,8
53.5
- 11
,728
.7-
11,7
28.7
- 2,
904.
7 3
3-
-
-
-
-
90Ye
s 1
58,9
71.4
241
,820
.9 8
2,84
9.5
- 1,
621.
5 2
,443
.8 4
93.2
84
151
,366
.3-
0 2
1.3
19,
120.
4 7
,779
.4 1
51 2
,506
.8 3
60.5
556
.5 4
17.8
6-
85,3
56.3
- 9,
345.
5-
9,34
5.5
- 2,
371.
0 3
6-
-
-
-
-
91Ye
s 3
26,6
62.5
332
,828
.8 6
,166
.3-
3,33
2.0
2,6
20.2
36.
7 8
4 1
46,9
58.1
- 0
33.
3 2
5,38
8.1
10,
127.
0 1
58 5
,151
.1 7
40.8
1,1
43.5
858
.5 6
- 11
,317
.4-
3,53
0.4
- 3,
530.
4-
1,41
4.7
8-
-
-
-
-

Appendix
220
Figure 71: Results future scenario (in kW) - summer week (1)
Co
ns
Pro
dP
ot.
Su
rplu
sSt
ora
geM
issi
ng
Exte
rnal
To
Exte
rnal
Fro
mD
iff
Pro
d-
Co
ns
% time storage positive
Object
Prod
Total
Total
Diff Prod-
Cons
Min
Max
Average
No of occ.
Total
Status End
of week
Min
Max
Average
No of occ.
Total
Min
Max
Average
No of occ.
Total
Min
Max
Average
No of occ.
Total
Min
Max
Average
No of occ.
Tota
lM
inM
axA
vera
geN
o o
f o
cc.
1Ye
s 1
99,5
18.7
186
,762
.5-
12,7
56.2
- 1,
808.
4 1
,251
.0-
75.9
78
68,
193.
4 1
,623
343
.7 1
5,99
8.9
7,2
17.0
158
3,3
19.4
467
.4 7
32.8
553
.2 6
-
-
-
-
- 1
1,06
0.0
22.
0 2
,714
.4 1
,228
.9 9
2Ye
s 1
70,6
22.7
186
,762
.5 1
6,13
9.8
- 1,
546.
5 1
,455
.4 9
6.1
84
84,
506.
9 5
,252
97.
2 1
3,48
5.7
5,5
63.6
155
2,8
38.7
399
.7 6
26.7
473
.1 6
- 13
,726
.3-
-
2,71
4.4
- 1,
055.
9 1
3-
-
-
-
-
3Ye
s 5
8,81
0.2
186
,762
.5 1
27,9
52.3
- 53
3.1
2,2
46.6
761
.6 9
1 1
50,3
46.2
1,6
16 5
9.1
9,7
94.8
2,9
29.7
117
978
.4 1
37.8
216
.0 1
63.1
6-
127,
314.
9-
-
10,9
53.4
- 1,
929.
0 6
6-
-
-
-
-
4 N
o 1
40,3
50.0
-
- 14
0,35
0.0
- 1,
479.
7-
328.
8-
835.
4-
-
- 0
255
.2 1
5,73
3.5
6,2
56.1
136
2,3
35.0
328
.8 5
15.5
389
.2 6
-
-
-
-
- 1
38,0
14.9
119
.6 1
0,95
3.4
1,9
16.9
72
5Ye
s 3
86,0
16.3
308
,741
.8-
77,2
74.5
- 3,
498.
8 1
,670
.4-
460.
0 7
8 8
2,56
2.9
0 4
51.5
58,
024.
6 2
8,35
6.1
160
6,4
22.1
904
.2 1
,417
.8 1
,070
.4 6
-
-
-
-
- 7
0,85
2.3
310
.7 3
4,72
7.1
4,4
28.3
16
6Ye
s 1
81,6
36.2
186
,762
.5 5
,126
.4-
1,64
6.3
1,3
77.5
30.
5 8
4 7
8,24
1.1
- 0
61.
1 1
2,49
0.4
5,2
64.8
154
3,0
21.9
425
.5 6
67.1
503
.6 6
- 8,
148.
2-
2,38
9.6
- 2,
389.
6-
1,01
8.5
8-
-
-
-
-
7Ye
s 1
32,5
77.5
373
,525
.1 2
40,9
47.6
- 1,
201.
7 4
,387
.4 1
,434
.2 9
1 2
91,4
30.7
172
,415
392
.8 1
77,1
56.9
72,
314.
1 1
54 2
,205
.7 3
10.5
487
.0 3
67.6
6-
70,7
37.9
- 34
,727
.1-
34,7
27.1
- 6,
430.
7 1
1-
-
-
-
-
8Ye
s 2
47,7
88.7
271
,389
.3 2
3,60
0.6
- 2,
245.
9 2
,116
.0 1
40.5
84
122
,883
.0 8
,529
165
.9 2
1,98
4.2
8,5
68.2
158
4,1
22.5
580
.4 9
10.1
687
.1 6
- 19
,194
.0-
8,30
9.6
- 8,
309.
6-
3,83
8.8
5-
-
-
-
-
9Ye
s 3
14,8
30.3
191
,081
.4-
123,
748.
9-
2,85
3.6
568
.7-
736.
6 5
2 1
7,02
4.3
0 8
7.7
61,
031.
4 2
5,54
0.2
148
5,2
37.8
737
.5 1
,156
.4 8
73.0
6-
-
-
-
-
118
,511
.1 1
53.1
18,
651.
9 4
,558
.1 2
6
10Ye
s 1
8,52
7.9
186
,762
.5 1
68,2
34.7
- 16
7.9
2,5
40.5
1,0
01.4
91
175
,289
.7 6
9,22
6 5
5.1
72,
909.
1 2
2,54
8.4
153
308
.2 4
3.4
68.
1 5
1.4
6-
99,3
17.1
- 18
,651
.9-
18,6
51.9
- 4,
514.
4 2
2-
-
-
-
-
11Ye
s 1
72,4
43.9
186
,762
.5 1
4,31
8.6
- 1,
563.
0 1
,442
.5 8
5.2
84
83,
470.
8 1
7,18
8 1
10.2
23,
714.
1 1
2,66
7.5
162
2,8
68.9
403
.9 6
33.4
478
.2 6
-
-
-
-
- -
-
-
-
-
12Ye
s 5
7,49
0.9
71,
358.
8 1
3,86
8.0
- 52
1.1
610
.6 8
2.5
84
36,
670.
1 1
4,82
4 8
3.1
16,
964.
3 8
,944
.3 1
62 9
56.5
134
.7 2
11.2
159
.4 6
-
-
-
-
- -
-
-
-
-
13Ye
s 7
1,12
8.6
373
,525
.1 3
02,3
96.4
- 64
4.7
4,8
22.2
1,8
00.0
91
329
,480
.9 3
03,5
80 1
,557
.2 3
06,1
23.6
159
,141
.4 1
62 1
,183
.4 1
66.6
261
.3 1
97.2
6-
-
-
-
-
-
-
-
-
-
14Ye
s 1
63,2
80.4
271
,389
.3 1
08,1
08.9
- 1,
480.
0 2
,713
.9 6
43.5
85
170
,996
.5 1
10,8
25 5
86.5
116
,665
.0 6
1,07
8.5
162
2,7
16.5
382
.5 5
99.7
452
.7 6
-
-
-
-
- -
-
-
-
-
15Ye
s 1
66,7
50.8
186
,762
.5 2
0,01
1.8
- 1,
511.
4 1
,482
.8 1
19.1
84
86,
709.
8 2
2,78
6 1
38.0
29,
072.
7 1
5,45
0.1
162
2,7
74.2
390
.6 6
12.5
462
.4 6
-
-
-
-
- -
-
-
-
-
16Ye
s 1
01,2
57.9
271
,389
.3 1
70,1
31.4
- 91
7.8
3,1
52.8
1,0
12.7
91
208
,688
.6 1
71,8
16 8
89.3
175
,437
.4 9
1,39
3.5
162
1,6
84.6
237
.2 3
71.9
280
.8 6
-
-
-
-
- -
-
-
-
-
17Ye
s 8
0,26
3.5
271
,389
.3 1
91,1
25.8
- 72
7.5
3,3
01.4
1,1
37.7
91
221
,688
.7 1
92,4
61 9
91.8
195
,331
.7 1
01,6
55.0
162
1,3
35.4
188
.0 2
94.8
222
.6 6
-
-
-
-
- -
-
-
-
-
18Ye
s 9
2,06
5.7
373
,525
.1 2
81,4
59.4
- 83
4.5
4,6
74.0
1,6
75.4
91
316
,516
.3 2
82,9
91 1
,455
.0 2
86,2
83.7
148
,907
.9 1
62 1
,531
.7 2
15.7
338
.2 2
55.3
6-
-
-
-
-
-
-
-
-
-
19Ye
s 1
07,5
53.4
373
,525
.1 2
65,9
71.7
- 97
4.9
4,5
64.4
1,5
83.2
91
306
,926
.1 2
36,1
57 1
,128
.0 2
40,0
03.2
114
,069
.8 1
60 1
,789
.4 2
51.9
395
.0 2
98.2
6-
31,6
04.3
- 12
,704
.5-
12,7
04.5
- 3,
160.
4 1
0-
-
-
-
-
20Ye
s 2
32,5
59.1
373
,525
.1 1
40,9
66.0
- 2,
107.
9 3
,679
.9 8
39.1
84
230
,848
.0 4
,273
572
.5 4
7,41
8.3
18,
585.
9 1
57 3
,869
.1 5
44.7
854
.2 6
44.8
6-
140,
561.
9-
26,0
15.3
- 26
,015
.3-
4,53
4.3
31
-
-
-
-
-
21Ye
s 1
14,4
51.1
271
,389
.3 1
56,9
38.2
- 1,
037.
4 3
,059
.4 9
34.2
91
200
,519
.1 0
281
.8 5
5,90
7.1
16,
109.
2 1
54 1
,904
.1 2
68.1
420
.4 3
17.4
6-
158,
842.
3-
33,5
92.1
- 33
,592
.1-
4,96
3.8
32
-
-
-
-
-
22Ye
s 6
61,2
66.9
271
,389
.3-
389,
877.
6-
5,99
3.7
57.
4-
2,32
0.7
1 5
7.4
- 0
102
.4 3
1,77
2.8
9,1
66.8
92
11,
001.
5 1
,548
.9 2
,428
.8 1
,833
.6 6
-
-
-
-
- 3
78,8
76.1
478
.7 3
3,59
2.1
4,8
57.4
78
23Ye
s 3
52,0
58.1
169
,681
.5-
182,
376.
5-
3,19
1.0
251
.0-
1,08
5.6
6 3
13.7
- 0
123
.1 2
1,85
5.5
5,5
91.0
103
5,8
57.2
824
.7 1
,293
.1 9
76.2
6-
-
-
-
-
176
,519
.4 2
3.7
21,
842.
8 2
,674
.5 6
6
24Ye
s 1
34,9
43.6
373
,525
.1 2
38,5
81.4
- 1,
223.
1 4
,370
.6 1
,420
.1 9
1 2
89,9
65.5
16,
439
400
.5 4
1,77
3.5
14,
385.
1 1
51 2
,245
.1 3
16.1
495
.6 3
74.2
6-
224,
387.
0-
21,8
42.8
- 21
,842
.8-
2,95
2.5
76
-
-
-
-
-
25Ye
s 3
49,6
34.5
271
,389
.3-
78,2
45.2
- 3,
169.
1 1
,395
.3-
465.
7 7
8 6
7,03
3.1
- 0
113
.3 6
6,46
8.5
33,
446.
5 1
60 5
,816
.8 8
19.0
1,2
84.2
969
.5 6
-
-
-
-
- 7
2,42
8.4
323
.5 1
7,83
4.3
7,2
42.8
10
26Ye
s 1
11,0
23.8
373
,525
.1 2
62,5
01.3
- 1,
006.
3 4
,539
.9 1
,562
.5 9
1 3
04,7
77.2
191
,920
1,0
38.9
195
,890
.6 8
0,58
0.7
154
1,8
47.1
260
.1 4
07.8
307
.9 6
- 72
,428
.4-
17,8
34.3
- 17
,834
.3-
7,24
2.8
10
-
-
-
-
-
27Ye
s 5
8,50
9.0
271
,389
.3 2
12,8
80.3
- 53
0.3
3,4
55.3
1,2
67.1
91
235
,159
.5 2
13,8
54 1
,098
.0 2
15,9
46.2
112
,288
.0 1
62 9
73.4
137
.1 2
14.9
162
.2 6
-
-
-
-
- -
-
-
-
-
28Ye
s 8
9,32
6.7
186
,762
.5 9
7,43
5.9
- 80
9.6
2,0
30.7
580
.0 9
0 1
31,4
56.7
69,
362
264
.7 7
2,55
6.5
30,
211.
3 1
53 1
,486
.1 2
09.2
328
.1 2
47.7
6-
29,5
60.2
- 9,
361.
5-
9,36
1.5
- 1,
847.
5 1
6-
-
-
-
-
29 N
o 6
59.7
-
- 65
9.7
- 7.
0-
1.5
- 3.
9-
-
0 2
.0 4
51.2
183
.8 1
53 1
1.0
1.6
2.4
1.8
6-
-
-
-
-
648
.7 3
.2 4
55.9
72.
1 9
30Ye
s 2
19,3
22.9
186
,762
.5-
32,5
60.3
- 1,
987.
9 1
,110
.8-
193.
8 7
8 5
7,55
9.6
- 0
385
.3 2
9,13
7.6
14,
105.
5 1
61 3
,648
.9 5
13.7
805
.6 6
08.1
6-
-
-
-
-
28,
911.
5 3
14.8
9,3
61.5
2,8
91.1
10
31 N
o 5
,592
.8-
-
5,59
2.8
- 59
.0-
13.1
- 33
.3-
-
0 1
6.6
3,2
66.3
1,2
47.5
148
93.
1 1
3.1
20.
5 1
5.5
6-
-
-
-
-
5,4
99.7
34.
3 3
,306
.8 3
92.8
14
32Ye
s 6
1,59
2.2
271
,389
.3 2
09,7
97.1
- 55
8.3
3,4
33.5
1,2
48.8
91
233
,250
.3 2
05,3
22 9
80.0
207
,524
.8 1
06,9
07.7
162
1,0
24.7
144
.3 2
26.2
170
.8 6
- 5,
499.
7-
3,30
6.8
- 3,
306.
8-
392.
8 1
4-
-
-
-
-
33Ye
s 6
7,68
6.9
271
,389
.3 2
03,7
02.4
- 61
3.5
3,3
90.3
1,2
12.5
91
229
,476
.3 2
04,8
28 1
,053
.2 2
07,2
49.2
107
,802
.1 1
62 1
,126
.1 1
58.6
248
.6 1
87.7
6-
-
-
-
-
-
-
-
-
-
34Ye
s 1
08,4
56.8
186
,762
.5 7
8,30
5.7
- 98
3.0
1,8
95.3
466
.1 8
5 1
19,9
23.4
80,
110
422
.7 8
3,98
8.9
43,
942.
7 1
62 1
,804
.4 2
54.1
398
.4 3
00.7
6-
-
-
-
-
-
-
-
-
-
35Ye
s 2
88,9
74.4
373
,525
.1 8
4,55
0.6
- 2,
619.
2 3
,280
.7 5
03.3
84
198
,752
.0 8
8,75
0 4
93.5
100
,055
.1 5
2,65
8.1
162
4,8
07.7
676
.9 1
,061
.4 8
01.3
6-
608.
1-
343.
3-
343.
3-
304.
0 2
-
-
-
-
-
36 N
o 4
8,62
8.5
-
- 48
,628
.5-
512.
7-
113.
9-
289.
5-
-
0 1
44.6
13,
796.
7 4
,493
.5 1
44 8
09.0
113
.9 1
78.6
134
.8 6
-
-
-
-
- 4
7,81
9.4
237
.4 1
4,07
0.2
2,6
56.6
18
37Ye
s 1
10,9
23.4
271
,389
.3 1
60,4
65.9
- 1,
005.
4 3
,084
.4 9
55.2
91
202
,703
.6 1
15,1
00 6
04.7
119
,067
.0 5
8,91
2.5
162
1,8
45.4
259
.8 4
07.4
307
.6 6
- 47
,211
.4-
14,0
70.2
- 14
,070
.2-
2,95
0.7
16
-
-
-
-
-
38Ye
s 5
8,55
2.1
271
,389
.3 2
12,8
37.2
- 53
0.7
3,4
55.0
1,2
66.9
91
235
,132
.8 2
13,8
11 1
,097
.8 2
15,9
05.4
112
,267
.0 1
62 9
74.1
137
.2 2
15.1
162
.4 6
-
-
-
-
- -
-
-
-
-
39Ye
s 1
25,4
93.3
271
,389
.3 1
45,8
96.0
- 1,
137.
5 2
,981
.3 8
68.4
91
193
,681
.6 1
47,9
84 7
71.0
152
,472
.0 7
9,54
7.8
162
2,0
87.8
294
.0 4
60.9
348
.0 6
-
-
-
-
- -
-
-
-
-
40Ye
s 4
9,05
8.7
186
,762
.5 1
37,7
03.8
- 44
4.7
2,3
15.6
819
.7 9
1 1
56,3
84.5
101
,009
526
.4 1
02,7
63.6
42,
826.
6 1
62 8
16.2
114
.9 1
80.2
136
.0 6
- 37
,511
.0-
28,2
21.8
- 28
,221
.8-
5,35
8.7
7-
-
-
-
-
41 N
o 3
8,14
5.6
-
- 38
,145
.6-
402.
2-
89.4
- 22
7.1
- -
-
0 2
07.7
27,
921.
9 1
2,02
3.3
155
634
.6 8
9.4
140
.1 1
05.8
6-
-
-
-
-
37,
511.
0 1
86.3
28,
221.
8 5
,358
.7 7
42Ye
s 6
9,09
2.3
373
,525
.1 3
04,4
32.8
- 62
6.2
4,8
36.6
1,8
12.1
91
330
,741
.9 3
05,5
82 1
,567
.1 3
08,0
53.3
160
,136
.7 1
62 1
,149
.5 1
61.8
253
.8 1
91.6
6-
-
-
-
-
-
-
-
-
-
43Ye
s 1
63,7
68.0
390
,178
.0 2
26,4
10.1
- 1,
484.
4 4
,404
.1 1
,347
.7 9
1 2
88,7
70.0
229
,135
1,1
89.8
234
,991
.7 1
22,5
06.7
162
2,7
24.6
383
.6 6
01.5
454
.1 6
-
-
-
-
- -
-
-
-
-
44Ye
s 5
5,82
7.4
186
,762
.5 1
30,9
35.2
- 50
6.0
2,2
67.7
779
.4 9
1 1
52,1
93.2
131
,864
679
.7 1
33,8
60.6
69,
666.
6 1
62 9
28.8
130
.8 2
05.1
154
.8 6
-
-
-
-
- -
-
-
-
-
45Ye
s 5
7,57
6.9
186
,762
.5 1
29,1
85.6
- 52
1.9
2,2
55.3
769
.0 9
1 1
51,1
09.9
130
,144
671
.1 1
32,2
02.7
68,
811.
5 1
62 9
57.9
134
.9 2
11.5
159
.7 6
-
-
-
-
- -
-
-
-
-

Appendix
221
Figure 72: Results future scenario (in kW) - summer week (2)
Co
ns
Pro
dP
ot.
Su
rplu
sSt
ora
geM
issi
ng
Exte
rnal
To
Exte
rnal
Fro
mD
iff
Pro
d-
Co
ns
% time storage positive
Object
Prod
Total
Total
Diff Prod-
Cons
Min
Max
Average
No of occ.
Total
Status End
of week
Min
Max
Average
No of occ.
Total
Min
Max
Average
No of occ.
Total
Min
Max
Average
No of occ.
Total
Min
Max
Average
No of occ.
Tota
lM
inM
axA
vera
geN
o o
f o
cc.
46Ye
s 1
10,5
93.6
373
,525
.1 2
62,9
31.5
- 1,
002.
4 4
,542
.9 1
,565
.1 9
1 3
05,0
43.5
264
,771
1,3
64.5
268
,726
.7 1
39,8
51.9
162
1,8
39.9
259
.1 4
06.2
306
.7 6
-
-
-
-
- -
-
-
-
-
47Ye
s 9
5,24
9.3
271
,389
.3 1
76,1
40.0
- 86
3.3
3,1
95.3
1,0
48.5
91
212
,409
.2 1
30,1
25 9
18.6
133
,531
.5 6
0,14
9.5
162
1,5
84.7
223
.1 3
49.9
264
.1 6
- 47
,599
.7-
42,7
95.6
- 42
,795
.6-
23,7
99.8
2-
-
-
-
-
48 N
o 6
1,34
8.5
-
- 61
,348
.5-
646.
8-
143.
7-
365.
2-
-
- 0
167
.2 4
2,39
7.6
16,
928.
5 1
58 1
,020
.7 1
43.7
225
.3 1
70.1
6-
-
-
-
-
60,
327.
8 4
66.8
42,
795.
6 7
,541
.0 8
49Ye
s 9
9,42
2.4
186
,762
.5 8
7,34
0.2
- 90
1.2
1,9
59.2
519
.9 9
0 1
25,2
89.7
76,
266
294
.6 7
9,82
1.9
36,
955.
8 1
58 1
,654
.1 2
32.9
365
.2 2
75.7
6-
12,7
28.1
- 6,
345.
3-
6,34
5.3
- 2,
121.
4 6
-
-
-
-
-
50Ye
s 5
0,60
7.5
373
,525
.1 3
22,9
17.6
- 45
8.7
4,9
74.5
1,9
22.1
91
342
,188
.0 3
23,7
60 1
,657
.4 3
25,5
69.5
169
,171
.6 1
62 8
42.0
118
.5 1
85.9
140
.3 6
-
-
-
-
- -
-
-
-
-
51Ye
s 5
9,69
9.3
271
,389
.3 2
11,6
90.0
- 54
1.1
3,4
46.9
1,2
60.1
91
234
,422
.4 2
12,6
83 1
,092
.2 2
14,8
18.3
111
,706
.2 1
62 9
93.2
139
.8 2
19.3
165
.5 6
-
-
-
-
- -
-
-
-
-
52Ye
s 1
16,4
73.1
271
,389
.3 1
54,9
16.2
- 1,
055.
7 3
,045
.1 9
22.1
91
199
,267
.0 1
56,8
54 8
15.0
161
,019
.5 8
3,95
6.6
162
1,9
37.8
272
.8 4
27.8
323
.0 6
-
-
-
-
- -
-
-
-
-
53Ye
s 5
6,93
1.6
373
,525
.1 3
16,5
93.5
- 51
6.0
4,9
24.7
1,8
84.5
91
338
,272
.0 2
42,8
29 1
68.7
244
,865
.0 1
06,2
59.5
152
947
.2 1
33.4
209
.1 1
57.9
6-
74,7
11.7
- 15
,436
.4-
15,4
36.4
- 5,
747.
1 1
3-
-
-
-
-
54 N
o 7
5,97
5.7
-
- 75
,975
.7-
801.
0-
178.
0-
452.
2-
-
- 0
413
.6 5
3,99
5.4
29,
797.
1 1
59 1
,264
.0 1
78.0
279
.1 2
10.7
6-
-
-
-
-
74,
711.
7 6
51.0
15,
436.
4 5
,747
.1 1
3
55 N
o 4
3,99
6.5
-
- 43
,996
.5-
463.
9-
103.
1-
261.
9-
-
0 2
39.5
31,
478.
9 1
3,40
8.6
156
732
.0 1
03.1
161
.6 1
22.0
6-
-
-
-
-
43,
264.
6 2
14.8
31,
641.
0 6
,180
.7 7
56Ye
s 7
0,65
5.4
373
,525
.1 3
02,8
69.7
- 64
0.4
4,8
25.5
1,8
02.8
91
329
,774
.0 2
21,0
56 2
09.4
223
,582
.6 9
2,52
7.7
156
1,1
75.5
165
.5 2
59.5
195
.9 6
- 82
,989
.5-
31,6
41.0
- 31
,641
.0-
8,29
9.0
10
-
-
-
-
-
57 N
o 4
0,39
7.1
-
- 40
,397
.1-
425.
9-
94.6
- 24
0.5
- -
-
0 3
0.4
28,
236.
3 1
6,21
0.6
161
672
.1 9
4.6
148
.4 1
12.0
6-
-
-
-
-
39,
725.
0 1
,344
.7 1
8,67
2.5
6,6
20.8
6
58Ye
s 6
0,67
4.5
186
,762
.5 1
26,0
88.1
- 54
9.9
2,2
33.4
750
.5 9
1 1
49,1
91.8
127
,098
656
.0 1
29,2
67.5
67,
297.
5 1
62 1
,009
.4 1
42.1
222
.9 1
68.2
6-
-
-
-
-
-
-
-
-
-
59Ye
s 5
5,08
1.7
271
,389
.3 2
16,3
07.6
- 49
9.3
3,4
79.5
1,2
87.5
91
237
,281
.7 2
17,2
24 1
,114
.8 2
19,1
94.0
113
,963
.2 1
62 9
16.4
129
.0 2
02.3
152
.7 6
-
-
-
-
- -
-
-
-
-
60Ye
s 6
9,50
8.2
373
,525
.1 3
04,0
16.9
- 63
0.0
4,8
33.7
1,8
09.6
91
330
,484
.4 3
05,1
73 1
,565
.1 3
07,6
59.2
159
,933
.4 1
62 1
,156
.4 1
62.8
255
.3 1
92.7
6-
-
-
-
-
-
-
-
-
-
61Ye
s 3
3,51
3.6
186
,762
.5 1
53,2
48.9
- 30
3.8
2,4
25.6
912
.2 9
1 1
66,0
10.3
141
,162
1,4
17.4
142
,360
.2 7
1,53
7.6
161
557
.6 7
8.5
123
.1 9
2.9
6-
12,6
44.9
- 8,
973.
3-
8,97
3.3
- 1,
053.
7 1
2-
-
-
-
-
62 N
o 1
2,86
3.4
-
- 12
,863
.4-
135.
6-
30.1
- 76
.6-
-
- 0
38.
1 8
,889
.8 3
,449
.7 1
50 2
14.0
30.
1 4
7.3
35.
7 6
-
-
-
-
- 1
2,64
9.4
4.5
8,9
73.3
973
.0 1
3
63Ye
s 9
8,86
3.1
271
,389
.3 1
72,5
26.2
- 89
6.1
3,1
69.7
1,0
26.9
91
210
,171
.5 1
74,1
67 9
01.0
177
,702
.3 9
2,55
9.5
162
1,6
44.8
231
.6 3
63.1
274
.1 6
- 4.
5-
4.5
- 4.
5-
4.5
1-
-
-
-
-
64Ye
s 1
49,5
70.9
186
,762
.5 3
7,19
1.6
- 1,
355.
7 1
,604
.4 2
21.4
84
96,
483.
8 3
9,68
0 2
21.9
45,
242.
7 2
3,84
7.2
162
2,4
88.4
350
.4 5
49.4
414
.7 6
-
-
-
-
- -
-
-
-
-
65Ye
s 2
71,3
50.0
486
,360
.7 2
15,0
10.7
- 2,
459.
5 5
,014
.2 1
,279
.8 8
7 3
18,6
88.6
219
,525
1,1
54.9
229
,229
.8 1
19,8
54.5
162
4,5
14.4
635
.6 9
96.7
752
.4 6
-
-
-
-
- -
-
-
-
-
66Ye
s 2
46,4
55.0
373
,525
.1 1
27,0
70.1
- 2,
233.
8 3
,581
.6 7
56.4
84
222
,942
.3 1
21,9
09 1
,674
.3 1
30,8
13.5
66,
853.
5 1
61 4
,100
.3 5
77.3
905
.2 6
83.4
6-
9,26
1.8
- 6,
374.
8-
6,37
4.8
- 2,
315.
5 4
-
-
-
-
-
67Ye
s 1
65,5
89.2
373
,525
.1 2
07,9
35.9
- 1,
500.
9 4
,153
.8 1
,237
.7 9
1 2
70,9
89.3
32,
565
121
.6 3
8,48
6.9
10,
856.
8 1
40 2
,754
.9 3
87.9
608
.2 4
59.1
6-
178,
126.
0-
11,0
30.8
- 11
,030
.8-
2,69
8.9
66
-
-
-
-
-
68Ye
s 3
68,7
51.2
373
,525
.1 4
,773
.8-
2,22
7.6
3,2
91.5
28.
4 7
9 1
29,0
07.9
14,
661
340
.7 3
1,11
6.9
10,
591.
8 1
57 6
,947
.6 1
,008
.1 1
,333
.0 1
,157
.9 6
- 12
,635
.8-
4,95
3.3
- 4,
953.
3-
1,26
3.6
10
15,
575.
8 5
31.8
7,5
90.0
2,2
25.1
7
69Ye
s 1
85,4
65.1
156
,841
.6-
28,6
23.4
- 1,
681.
0 9
23.8
- 17
0.4
78
47,
651.
1 0
123
.5 1
1,05
7.3
3,9
41.8
149
3,0
85.6
434
.4 6
81.2
514
.3 6
-
-
-
-
- 2
5,53
7.9
108
.7 4
,723
.5 1
,502
.2 1
7
70 N
o 1
76,2
15.5
-
- 17
6,21
5.5
- 1,
857.
8-
412.
8-
1,04
8.9
- -
-
0 4
32.5
15,
045.
1 4
,505
.7 1
08 2
,931
.7 4
12.8
647
.2 4
88.6
6-
-
-
-
-
173
,283
.8 5
6.2
11,
030.
8 2
,548
.3 6
8
71 N
o 9
9,43
6.7
-
- 99
,436
.7-
1,04
8.4
- 23
2.9
- 59
1.9
- -
0
244
.8 1
0,03
1.1
3,1
41.1
134
1,6
54.3
232
.9 3
65.2
275
.7 6
-
-
-
-
- 9
7,78
2.4
486
.3 1
0,73
5.8
3,1
54.3
31
72Ye
s 3
17,5
26.3
572
,427
.1 2
54,9
00.9
- 2,
878.
0 5
,914
.5 1
,517
.3 9
0 3
76,1
96.0
- 0
67.
8 3
5,92
4.6
12,
431.
1 1
37 5
,282
.7 7
43.8
1,1
66.3
880
.4 6
- 26
0,18
3.5
- 16
,549
.3-
16,5
49.3
- 3,
335.
7 7
8-
-
-
-
-
73Ye
s 7
4,69
9.4
186
,762
.5 1
12,0
63.1
- 67
7.1
2,1
34.2
667
.0 9
1 1
40,5
07.3
0 1
3.1
14,
839.
9 3
,885
.5 1
30 1
,242
.8 1
75.0
274
.4 2
07.1
6-
113,
305.
9-
8,34
3.2
- 8,
343.
2-
2,06
0.1
55
-
-
-
-
-
74Ye
s 3
02,0
09.9
186
,762
.5-
115,
247.
4-
2,73
7.4
575
.8-
686.
0 5
3 1
8,64
9.4
- 0
21.
4 1
8,38
5.6
7,5
44.4
132
5,0
24.5
707
.4 1
,109
.3 8
37.4
6-
-
-
-
-
110
,222
.9 1
6.1
14,
174.
6 2
,449
.4 4
5
75 N
o 2
52,6
93.1
-
- 25
2,69
3.1
- 2,
664.
1-
591.
9-
1,50
4.1
- -
-
0 2
5.7
10,
255.
0 2
,779
.4 7
3 4
,204
.0 5
91.9
928
.1 7
00.7
6-
-
-
-
-
248
,489
.0 2
4.7
10,
093.
3 2
,279
.7 1
09
76 N
o 2
1,26
6.9
-
- 21
,266
.9-
224.
2-
49.8
- 12
6.6
- -
0
53.
0 3
,139
.5 6
88.2
105
353
.8 4
9.8
78.
1 5
9.0
6-
-
-
-
-
20,
913.
1 5
2.4
3,1
89.6
360
.6 5
8
77Ye
s 3
23,1
33.4
373
,525
.1 5
0,39
1.7
- 2,
928.
9 3
,039
.0 3
00.0
84
179
,318
.2-
0 7
6.6
24,
228.
3 1
0,50
0.2
150
5,3
76.0
756
.9 1
,186
.9 8
96.0
6-
55,7
67.6
- 7,
557.
1-
7,55
7.1
- 96
1.5
58
-
-
-
-
-
78Ye
s 1
94,4
85.2
186
,762
.5-
7,72
2.7
- 1,
762.
8 1
,286
.6-
46.0
81
70,
936.
9 0
2.6
11,
401.
4 4
,914
.6 1
55 3
,235
.6 4
55.6
714
.3 5
39.3
6-
2,25
5.4
- 77
5.6
- 77
5.6
- 37
5.9
6 6
,742
.4 1
.9 2
,090
.7 8
42.8
8
79 N
o 4
9,70
4.0
-
- 49
,704
.0-
524.
0-
116.
4-
295.
9-
-
0 1
22.4
15,
069.
4 5
,740
.3 1
38 8
26.9
116
.4 1
82.6
137
.8 6
-
-
-
-
- 4
8,87
7.1
40.
0 1
2,65
1.2
1,2
86.2
38
80Ye
s 2
16,8
13.3
271
,389
.3 5
4,57
6.0
- 1,
965.
2 2
,335
.1 3
24.9
84
140
,505
.6 7
,014
519
.3 2
0,00
9.0
7,8
35.1
145
3,6
07.1
507
.9 7
96.3
601
.2 6
- 51
,169
.5-
5,61
5.6
- 5,
615.
6-
1,08
8.7
47
-
-
-
-
-
81Ye
s 1
82,9
26.8
373
,525
.1 1
90,5
98.3
- 1,
658.
0 4
,031
.1 1
,134
.5 9
0 2
60,3
02.9
112
,620
137
.0 1
19,1
62.4
57,
949.
4 1
56 3
,043
.3 4
28.5
671
.9 5
07.2
6-
81,0
21.5
- 12
,651
.2-
12,6
51.2
- 2,
383.
0 3
4-
-
-
-
-
82Ye
s 1
41,2
53.4
271
,389
.3 1
30,1
35.9
- 1,
280.
3 2
,869
.8 7
74.6
90
184
,028
.3 0
367
.5 1
7,19
8.9
5,6
97.8
127
2,3
50.0
330
.9 5
18.8
391
.7 6
- 13
2,48
5.9
- 16
,962
.5-
16,9
62.5
- 2,
880.
1 4
6-
-
-
-
-
83 N
o 1
98,6
72.6
-
- 19
8,67
2.6
- 2,
094.
6-
465.
4-
1,18
2.6
- -
-
0 2
2.4
25,
361.
6 8
,008
.4 1
32 3
,305
.3 4
65.4
729
.7 5
50.9
6-
-
-
-
-
195
,367
.3 1
92.8
16,
962.
5 3
,005
.7 6
5
84Ye
s 1
38,2
13.3
186
,762
.5 4
8,54
9.3
- 1,
252.
8 1
,684
.8 2
89.0
84
102
,945
.4 5
,402
274
.1 2
2,08
4.0
8,5
28.0
158
2,2
99.4
323
.8 5
07.7
383
.2 6
- 45
,446
.9-
10,9
88.2
- 10
,988
.2-
2,52
4.8
18
-
-
-
-
-
85Ye
s 2
55,8
05.0
271
,389
.3 1
5,58
4.3
- 2,
318.
6 2
,059
.2 9
2.8
84
118
,322
.4 0
126
.5 1
7,34
9.7
7,6
58.9
153
4,2
55.8
599
.2 9
39.6
709
.3 6
- 19
,840
.1-
3,89
4.6
- 3,
894.
6-
1,16
7.1
17
-
-
-
-
-
86Ye
s 2
29,5
61.9
271
,389
.3 4
1,82
7.4
- 2,
080.
7 2
,244
.9 2
49.0
84
133
,252
.6 0
565
.1 3
9,19
8.8
15,
179.
4 1
55 3
,819
.2 5
37.7
843
.2 6
36.5
6-
45,6
46.6
- 25
,981
.2-
25,9
81.2
- 3,
511.
3 1
3-
-
-
-
-
87 N
o 1
94,1
84.1
-
- 19
4,18
4.1
- 2,
047.
3-
454.
8-
1,15
5.9
- -
-
0 1
61.6
26,
971.
3 6
,665
.0 1
26 3
,230
.6 4
54.9
713
.2 5
38.4
6-
-
-
-
-
190
,953
.4 1
6.2
28,
063.
5 3
,182
.6 6
0
88Ye
s 1
75,2
40.3
186
,762
.5 1
1,52
2.2
- 1,
588.
4 1
,422
.7 6
8.6
84
81,
879.
9 0
92.
5 1
3,62
5.5
5,4
26.7
155
2,9
15.5
410
.5 6
43.7
485
.9 6
- 14
,437
.7-
2,08
8.3
- 2,
088.
3-
1,03
1.3
14
-
-
-
-
-
89Ye
s 1
20,2
44.7
271
,389
.3 1
51,1
44.6
- 1,
089.
9 3
,018
.5 8
99.7
91
196
,931
.6 4
0,98
4 3
56.3
45,
906.
8 1
1,59
4.0
148
2,0
00.5
281
.7 4
41.7
333
.4 6
- 11
2,16
0.8
- 14
,663
.4-
14,6
63.4
- 3,
618.
1 3
1-
-
-
-
-
90Ye
s 1
28,8
92.0
271
,389
.3 1
42,4
97.3
- 1,
168.
3 2
,957
.3 8
48.2
90
191
,579
.3 1
44,6
42 7
54.4
149
,251
.4 7
7,88
6.6
162
2,1
44.4
301
.9 4
73.4
357
.4 6
-
-
-
-
- -
-
-
-
-
91Ye
s 2
64,8
53.8
373
,525
.1 1
08,6
71.3
- 2,
400.
6 3
,451
.4 6
46.9
84
212
,474
.8 1
13,0
78 6
11.3
122
,758
.0 6
4,45
3.5
162
4,4
06.4
620
.4 9
72.8
734
.4 6
-
-
-
-
- -
-
-
-
-

Thank you for reading this ebook. You can order further publications from the
iimt University Press
iimt University Press Webshop: www.shop.iimt.ch/catalog
incl. free downloadmanagement summaries
and indexes of the projects!
Contact:[email protected] directly via
+41 26 300 84 30 phone+41 26 300 97 94 fax
With best regards,the iimt University Press Team
iimt University PressOrder Information
Webshop

Founded in 1995, the international institute of management in technology (iimt) has an outstanding position in the field of specialist education for ICT and Utility Management. The Institute, which is accredited by the SUC (Swiss University Conference) and affiliated to the University of Fribourg, Switzerland, offers the following types of executive programmes:
• Executive MBA in ICT or Utility Management• Executive Diploma in ICT or Utility Management• Executive CAS in ICT or Utility Management• Executive Specialised Courses in ICT or Utility Management• Power Packages in ICT or Utility Management• Customised Company Courses in ICT or Utility Management
The iimt was established as a joint venture between the University of Fribourg and former Swiss Telecom/PTT. Since then other industrial companies have joined the iimt as partners. The iimt is an active member of the most important ICT and Utility organisations: asut, ITValley, ICT Switzerland, Münchner Kreis, Electrosuisse and efmd.
The iimt course programme is directed at managers specialising in the field of ICT or Utility who are desirous of continuing their professional development. All programmes are delivered in English and the flexibility of the course programmes allow participants to choose the length of their studies individually.
The institute has a wide network of contacts in over 65 Universities and other renowned institutes in Switzerland and internationally, including more than 110 expert professors and other specialists in ICT and Utility. Thus our participants not only benefit from the best possible education, but can also powerfully extend their own private network of contacts.
The iimt is one of the leading educational centres in Switzerland which offers a wide selection of training programmes in an environment of active research.
Further information can be obtained at
iimt tel. +41 26 300 84 30University of Fribourg fax +41 26 300 97 94Bd de Pérolles 90 [email protected] CH- 1700 Fribourg www.iimt.ch
iimtat a glance

international institute of management in technology
University of Fribourg
Boulevard de Pérolles 90CH - 1700 FribourgSwitzerland
Phone: +41 26 300 84 30Fax: +41 26 300 97 94E-Mail: [email protected]: www.iimt.ch
ISBN 978-3-905814-58-3