
Globetrotters and Exotic Creatures: The Imaginary Others in ...

arX
iv:p
hysi
cs/0
7012
24v1
[ph
ysic
s.in
s-de
t] 1
9 Ja
n 20
07
Magnetic field stabilization for high-accuracy mass
measurements on exotic nuclides
M. Marie-Jeanne1∗, J. Alonso3, K. Blaum3,4, S. Djekic3,
M. Dworschak4, U. Hager5, A. Herlert2†, Sz. Nagy3,
R. Savreux4, L. Schweikhard6, S. Stahl7, C. Yazidjian4
1Universite de Caen Basse-Normandie, 14032 Caen Cedex, France
2CERN, Physics Department, 1211 Geneva 23, Switzerland
3Johannes Gutenberg-Universitat, Institut fur Physik, 55099 Mainz, Germany
4GSI, Planckstr. 1, 64291 Darmstadt, Germany
5University of Jyvaskyla, Department of Physics, P.O. Box 35 (YFL), 40014 Jyvaskyla, Finland
6Ernst-Moritz-Arndt-Universitat, Institut fur Physik, 17487 Greifswald, Germany
7Elektronik-Beratung Dr. Stefan Stahl, Kellerweg 23, 67582 Mettenheim, Germany
February 2, 2008
submitted to NIMA
Abstract
The magnetic-field stability of a mass spectrometer plays a crucial role in precision mass
measurements. In the case of mass determination of short-lived nuclides with a Penning trap,
major causes of instabilities are temperature fluctuations in the vicinity of the trap and pressure
fluctuations in the liquid helium cryostat of the superconducting magnet. Thus systems for the
temperature and pressure stabilization of the Penning trap mass spectrometer ISOLTRAP at the
ISOLDE facility at CERN have been installed. A reduction of the fluctuations by at least one order
of magnitude downto ∆T ≈ ±5mK and ∆p ≈ 50 mtorr has been achieved, which corresponds to
a relative frequency change of 2.7 × 10⁻⁹ and 1.5 × 10⁻¹⁰, respectively. With this stabilization
the frequency determination with the Penning trap only shows a linear temporal drift over several
hours on the 10 ppb level due to the finite resistance of the superconducting magnet coils.
Keywords: Penning trap, magnetic field, precision mass spectrometry, stabilization
∗Present address: CERN, Physics Department, 1211 Geneva 23, Switzerland†Corresponding author, email: [email protected]
1

1 Introduction
The exact masses of stable and exotic nuclides are important input values for many areas of physics.
Since the mass defect is intrinsically connected to the binding energy of the nucleus, the nuclear
properties are reflected by the nuclear masses and mass differences, e.g. the Q-values of nuclear
decays. Mass values can therefore contribute to tests of nuclear models and nuclear structure [1],
where especially nuclides far from the valley of stability are of interest. Low production rates and
half-lives of only a few tens of milliseconds make high-accuracy mass measurements for these exotic
nuclides a challenge.
Depending on the respective application of mass values, the required relative mass uncertainty
ranges from 10−6 in nuclear physics to 10−11 in atomic physics and metrology [2, 3]. One example is
the precise and accurate determination of atomic masses for nuclides that exhibit a superallowed beta
decay, where besides the half-life, the branching ratio, and theoretical corrections, the Q-value and
thus the mass contributes to a test of the unitarity of the Cabibbo-Kobayashi-Maskawa quark-mixing
matrix of the Standard Model [4, 5, 6, 7, 8, 9].
Mass measurements at this level of precision are possible with Penning traps [10], where the
cyclotron frequency
νc =1
2π
qB
m(1)
of the stored ions with mass m and charge q in a strong homogeneous magnetic field B can be
monitored, e.g, with a time-of-flight (TOF) detection technique [11].
The magnetic field amplitude B is calibrated by measuring the cyclotron frequency of a stable
nuclide with well-known mass. Usually the magnetic field is sampled before and after the frequency
measurement of the nuclide of interest, and the field amplitude is linearly interpolated between the
two reference measurements [12]. Any fluctuation of the field can thus lead to a deviation of the
deduced cyclotron frequency from the actual value and therefore to the loss of accuracy. Especially
in the case of exotic nuclides with low production yields, for which a frequency measurement can last
up to several tens of minutes or even a few hours, a stable magnetic field is crucial.
The amplitude of the magnetic field of a superconducting magnet is influenced by internal and
external environmental parameters and thus, if these are not constant, the B-field may vary as a
function of time. For the superconducting magnets of the ISOLTRAP experiment [13, 14] there is a
decay of the field strength due to the finite resistance of the superconducting coils (flux creep [15]). In
addition, temperature fluctuations in the room temperature bore of the magnet lead to fluctuations
of the magnetic field amplitude, since the magnetic susceptibility of the material inside the B-field
changes as a function of temperature. Furthermore, pressure fluctuations in the helium recovery line
also influence the magnetic field strength, because the temperature of the liquid helium, in which the
2

superconducting coils are located, depends on the pressure in the cryostat of the magnet.
Recently, regulations of both the helium reservoir pressure and the temperature in the warm bore
of the superconducting magnet have been installed and tested at the SMILETRAP Penning trap mass
spectrometer for highly-charged stable ions [16]. In the present work, a similar implementation of both
regulation systems at the ISOLTRAP on-line mass spectrometer for short-lived ions is described and
the reduction of fluctuations is specified with respect to future improvements in the mass determination
of exotic nuclides.
2 Experimental setup and frequency determination
For the preparation and high-accuracy mass measurement of radionuclides a combination of three
ion traps is used at ISOLTRAP (see Fig. 1). The experimental setup has been described in detail in
[13, 14] and here only a brief summary is given.
The first ion trap is a radiofrequency quadrupole (RFQ) structure in a helium buffer-gas envi-
ronment [17], which stops, cools, and bunches the continuous 60-keV radioactive ion beam from the
target/ion-source system of ISOLDE [18]. The ion bunch is transferred to the preparation Penning
trap [19] for further cooling and removal of contaminating isobaric ions with a buffer-gas cooling tech-
nique [20]. The mass-selected ensemble of ions is finally transferred to the precision Penning trap for
mass measurement with the TOF cyclotron-resonance detection technique [11].
The measurement principle includes first a dipolar radiofrequency (rf) excitation of the low-
frequency magnetron motion and second a quadrupolar rf excitation. If the quadrupolar excitation is
in resonance with the cyclotron frequency, i.e. νrf = νc, the magnetron motion is converted into the
high-frequency cyclotron motion of the same radius and thus the ions gain maximum radial kinetic
energy [21, 22]. The ions are ejected from the trap and slowly drift upstream towards an ion detec-
tor. Along the way the ions drift through a magnetic field gradient where the initial radial energy is
converted into axial kinetic energy due to the coupling of the magnetic moment to the field gradient
[11]. Thus resonantly excited ions experience a larger acceleration than non-excited ones and therefore
reach earlier the detector.
By scanning the excitation frequency around the expected cyclotron frequency, a TOF cyclotron
resonance curve is obtained, as shown for 133Cs+ in the inset of Fig. 1. Due to the finite excitation
duration the resonance curve exhibits a characteristic shape which is related to the Fourier transform.
The shape of the curve is well known [22] and can be fitted to the data points (solid line). For the
investigation of the temperature and pressure dependence, the cyclotron frequencies νc of 85Rb+ and
133Cs+ ions from the alkali reference ion source of ISOLTRAP have been monitored as a function of
time.
3

3 Magnetic field stabilization
3.1 Temperature-frequency correlation
The correlation between the temperature in the warm bore of the superconducting magnet and the cy-
clotron frequency of ions stored in the precision Penning trap has been observed recently at ISOLTRAP
[23]. The temperature change was monitored with the change of the resistance of a Pt100 sensor
(platinum resistance thermometer) mounted in the vicinity of the Penning trap vacuum tube. The
cyclotron frequency of 85Rb+ and the measured resistance are plotted as a function of time in Fig. 2.
The variation of the cyclotron frequency and of the resistance, and thus of the temperature, shows a
strong correlation. If the resistance data points are scaled relative to the frequency data and if a linear
temporal drift of the magnetic field strength is taken into account, i.e. a linear drift of the cyclotron
frequency, the two curves nicely match as shown in Fig. 2 (bottom). The frequency can be described
by
νc(R, t) = a(R − R0) − bt + c, (2)
where R0 = 109.5 Ω, a = 0.617(5)HzΩ−1, b = 0.0685(6)Hzd−1, and c = 1069831.132(3)Hz. The
linear field drift is thus of the order of
1
B
dB
dt= −
b
c= (−2.67 ± 0.02)× 10−9 h−1. (3)
Note that the previously reported linear drift of the magnetic field of ISOLTRAP with a value of
(−2.30 ± 0.03)× 10−8 h−1 [12] has most likely a wrong exponent.
3.2 Temperature stabilization
Although the ISOLDE experimental hall is equipped with an air condition, large temperature fluctua-
tions of about 0.5K are observed during a day. At ISOLTRAP these lead to a change of the cyclotron
frequency of the order of e.g. 0.1Hz for 133Cs+ or a relative frequency change of almost 100 ppb.
Therefore, a temperature regulation is advantageous for the investigation of radionuclides with a low
production yield, for which long measurement periods of more than one hour are needed to record a
sufficiently large number of ions to obtain a cyclotron resonance.
The layout of the temperature stabilization system is shown in Fig. 3. A closed aluminum tube
is attached to both sides of the room temperature bore of the magnet. The tube encloses a heater,
two fans, and three temperature sensors. These integrated circuit transducers (AD590 from Analog
Device) produce an output current proportional to the absolute temperature. For a supply voltage in
the range between 4V and 30V each sensor acts as a high-impedance constant-current regulator with
1µA/K. The devices are calibrated to 298.2 µA output at a temperature of 298.2K. In the present
4
system a flatpack model was applied which fits between the magnet bore and the vacuum tube and
has a good contact with the vacuum tube surface.
In addition to the first sensor at the position of the Penning trap (see Fig. 3), and to the second
and third at the top and bottom of the superconducting magnet bore, a fourth one has been installed
in the vicinity of the magnet for the room temperature measurement. The central sensor is used to
measure the temperature for the control loop. The sensors are read out with a multichannel digital
multimeter (Keithley data acquisition system, model 2700), which is connected via a GPIB (General
Purpose Interface Bus) interface to a computer.
The temperature regulation system is controlled by a LabVIEW program, which implements a
PID (for Proportional, Integral, and Derivative) regulation routine [24]: The temperature reading
from the central temperature sensor is compared to a set temperature value and the required heating
power is supplied from a Keithley power supply (model 2303) with a maximum output of 45W to a
50W resistor inside a heater box. The applied current is controlled by the PID regulation in order to
maintain the constant set bore temperature, while the air is constantly circulated by use of two fans.
In Fig. 4 the room temperature and the bore temperature are shown as a function of time. Without
the PID regulation the center temperature (bottom) roughly follows the variation of the room temper-
ature (top). Once turned on, the center temperature is stabilized (depending on the PID parameters),
in the present case to ∆T = ±20mK.
3.3 Helium pressure stabilization
For the stabilization of the pressure in the helium cryostat of the superconducting magnet a commercial
system from MKS has been implemented. Without regulation the pressure shows a behavior as
plotted in Fig. 5 (top). Such pressure fluctuations are due to changes in the atmospheric pressure and
changes in the gas load of the helium-recovery line at ISOLDE. A Fourier transform reveals the fastest
significant periodic changes with a period of T = 12h, i.e., a regulation system as presented in the
following is suitable for these slow variations.
The layout of the regulation system is shown in Fig. 6. The helium exhaust line of the magnet
cryostat is connected to a regulation valve (MKS, model 248), which is controlled by a regulation
system (MKS, model 250E), that uses a PID regulation loop. The pressure is determined by a
pressure transducer (MKS, Baratron 627B), which is temperature stabilized in order to allow reliable
pressure readings independent of the room temperature fluctuations.
The PID controller compares the measured pressure at the helium exhaust line with the desired set
point and adjusts the gas flow through the regulation valve in order to reach the requested pressure.
Note that the set point for the pressure in the cryostat must be higher than the pressure in the recovery
line to prevent backstreaming of the helium into the cryostat. For security reasons a bypass valve is
5

opened during the refilling of the liquid helium cryostat to allow a fast release of the larger amount
of evaporated helium into the recovery line.
The three PID regulation parameters [24] are manually adjusted with two front panel potentiome-
ters: one for the proportional gain, which is internally combined with the integral parameter, and one
for the derivative gain (or phase lead). As an example, the regulated pressure is shown as a function
of time in Fig. 7 (top) for three different gain values for the response to the pressure difference. With
the appropriate phase lead being set according to the rapidity in pressure changes, a gain value of 75
gives the fastest recovery of the system in the present case. Once set, the pressure remains constant
as shown in Fig. 7 (middle) where the pressure variation lies within ∆p(FWHM) = 45mtorr.
4 Results and discussion
4.1 Temperature and pressure dependence
In order to specify the stability of the temperature and the pressure regulation and therefore the
stability of the frequency determination, either the temperature or the pressure is deliberately changed
while the other parameter is kept fixed. The change of the cyclotron frequency is monitored by
examining stable 133Cs+ ions from the alkali reference ion source.
In Fig. 8 (a) the temperature in the center of the room temperature bore of the superconducting
magnet is shown as a function of time. For the following test measurement the set temperature has
been changed deliberately from 295.9K to 296.4K, i.e., an increase by 0.5K, and after about 5 hours
it was reset to 295.9K. The resulting change of the cyclotron frequency νc of 133Cs+ is shown in
Fig. 8 (b). Each data point includes about 700 ions for a quadrupolar rf-excitation of 900ms in order
to keep the statistical uncertainty well below the observed frequency shift caused by the temperature
change.
As expected a correlation of the temporal behavior of the temperature and the cyclotron frequency
is observed. Taking the linear temporal drift of the magnetic field into account, the expected cyclotron
frequency at a temperature T in the room temperature bore for a fixed and stabilized helium reservoir
pressure can be expressed by
νc(T, t) = a(T − T0) − bt + c, (4)
which is the analogue expression to the one in Eq. (2). From a χ2-minimization with a fixed value
T0 = 295.9K the parameters a = 0.182(13)HzK−1, b = 0.0018(4)Hzh−1, and c = 683486.135(6)Hz,
are deduced for the 133Cs data. The field drift is thus
1
B
dB
dt= −
b
c= (−2.6 ± 0.6)× 10−9 h−1 (5)
in agreement to the previously determined value.
6

For a 0.5K temperature change, the observed change of the 133Cs+ cyclotron frequency is 91mHz
(see Fig. 8 (b)). Assuming a linear dependence, this yields a temperature coefficient of 0.182mHz/mK
and for the planned stabilization of the temperature to ±5mK this results in a relative frequency
change of 2.7 × 10⁻⁹.
A similar measurement has been performed for the change of the pressure in the liquid helium
cryostat. The result is shown in Fig. 9. The set pressure of the regulation system has been changed by
30 torr. A fit to the data points of a linear relation in analogy to Eq. (4), νc(p, t) = a(p− p0)− bt + c,
yields a frequency change of 1 mHz/torr. Thus, for a stabilization of the pressure to ±0.1 torr a
relative frequency change of 2.9 × 10⁻¹⁰ can be achieved. Note that in contrast to the averaged
experimental data in case of a temperature change (Fig. 8 (c), thin line), the averaged data for a
pressure change (Fig. 9 (c), thin line) shows a slight delay as compared to the expected behavior (thick
line). Nevertheless, this might be an artefact and has no significant influence.
4.2 Other effects
In addition to magnetic field variations that are correlated to temperature and pressure changes, the
magnetic field strength can also be influenced by ferromagnetic metallic objects in the vicinity of the
superconducting magnet, which can distort the magnetic field. In the case of ISOLTRAP the beam of
a bridge crane mounted at the ceiling of the experimental hall of ISOLDE can cause large frequency
shifts if it is placed above the superconducting magnet of the precision Penning trap.
In Fig. 10 a consecutive series of measurements of the cyclotron frequency of 85Rb+ ions is shown.
When the steel beam of the bridge crane was moved over the magnet, the cyclotron frequency dropped
about 600mHz due to the distortion of the magnetic field. This corresponds to a relative change of
5.6 × 10⁻⁷. As soon as the bridge crane is moved away from the magnet, the cyclotron frequency
returns to its previous value. There is no attempt to compensate for this change, rather it is avoided
to move the beam of the bridge crane over the magnet during data collection.
4.3 Stabilized frequency measurement
Fig. 11 shows a measurement of the cyclotron frequency of 133Cs+ for which a temperature stabilization
to ±5mK has been achieved. Within the statistical uncertainty the frequency data points show only
the linear temporal drift due to the residual resistance of the superconducting coils. Note that the room
temperature fluctuations have been well below 500mK during the data taking. Since the optimal PID
paramaters have not been found yet, the general performance of the stabilization system still needs to
be investigated and only the influence of the temperature variations on the frequency measurements
can be deduced.
7

Figure 12 shows cyclotron frequency data from 85Rb+ and 133Cs+ that were measured as references
during a beam time for the determination of the mass of neutron-rich Sn nuclides. The masses of
these stable nuclides are known with a relative uncertainty δm/m = 1.4 × 10⁻¹⁰ and 1.8 × 10⁻¹⁰,
respectively [25]. The current limit for the mass determination at ISOLTRAP is δm/m = 8 × 10⁻⁹
[12], i.e. any fluctuation or systematic shifts can be probed with the two reference nuclides. The
lines in Fig. 12 are weighted linear fits to the data points. The B-field drifts for 85Rb+ and 133Cs+
are (−2.2 ± 0.2) × 10−9 h−1 and (−2.1 ± 0.1) × 10−9 h−1, respectively. The fits also yield the offsets
(at t = 0) νc = 1 069 815.730(15)Hz and 683491.5769(37)Hz, respectively, and therefore a frequency
ratio 0.638 887 200 6(96), where the uncertainty is mainly due to the low statistics of the 85Rb+ data.
From the literature values a frequency ratio 0.638 887 196 90(15) is expected, i.e. the measured value
agrees within the uncertainties.
Finally, the linear drift of the magnetic field as deduced from the various investigations in the
present work can be compared to the value given in [12]. A summary is shown in Fig. 13. There is
a good agreement except in the case of the data presented in Fig. 2, for which a significant shift is
observed. Possibly the uncertainty is underestimated. In addition, the linear drift must not necessarily
have a constant value within several years. Nevertheless, a value of −2.30 × 10⁻⁹ h−1 seems to be a
reasonable estimate for the linear drift.
5 Summary and outlook
The magnetic field in the vicinity of the precision Penning trap of ISOLTRAP has been stabilized with
respect to the temperature in the room-temperature bore of the magnet as well as to the pressure
in the helium cryostat. A strong correlation of the cyclotron frequency to the temperature of the
vacuum tube around the Penning trap has been observed. With a stabilization down to ±5mK only a
negligible linear decrease of the cyclotron frequency due to the finite resistance of the superconducting
coils was observed within the statistical limits. The parameters of the PID temperature regulation
are currently under investigation to further decrease the remaining small oscillations of the regulated
temperaturea and to obtain a more robust system which is capable of stabilizing the center temperature
to ±5mK also for larger room-temperature fluctuations. In addition, a stabilization of the pressure in
the liquid helium reservoir of the magnet to less than ±50mtorr was achieved. With these stabilization
systems fluctuations of the magnetic field have been reduced by a factor 4 below the current limit of
accuracy of ISOLTRAP. The improvement with respect to the ISOLTRAP mass measurements will
be investigated soon.
8
Acknowledgements
This work was supported by the German Ministry for Education and Research (BMBF) under con-
tracts 06GF151 and 06GF181I, the European Commission under contracts HPMT-CT-2000-00197
(Marie Curie Fellowship) and RII3-CT-2004-506065 (EURONS/TRAPSPEC), and by the Helmholtz
association of national research centres (HGF) under contract VH-NG-037. We also acknowledge
stimulating discussions with T. Fritioff from the University of Stockholm, Sweden.
References
[1] D. Lunney, J.M. Pearson, C. Thibault, Rev. Mod. Phys. 75 (2003) 1021.
[2] K. Blaum, Phys. Rep. 425 (2006) 1.
[3] L. Schweikhard, G. Bollen (eds.), ”Ultra-accurate mass spectrometry and related topics”, Special
issue of Int. J. Mass Spectrom. Vol. 251, issues 2-3, Elsevier, 2006
[4] J.C. Hardy, I.S. Towner, Phys. Rev. C 71 (2005) 055501.
[5] A. Kellerbauer, G. Audi, D. Beck, K. Blaum, G. Bollen, B.A. Brown, P. Delahaye, C. Guenaut,
F. Herfurth, H.-J. Kluge, D. Lunney, S. Schwarz, L. Schweikhard, C. Yazidjian Phys. Rev. Lett.
93 (2004) 072502.
[6] M. Mukherjee, A. Kellerbauer, D. Beck, K. Blaum, G. Bollen, F. Carrel, P. Delahaye, J. Dilling,
S. George, C. Guenaut, F. Herfurth, A. Herlert, H.-J. Kluge, U. Koster, D. Lunney, S. Schwarz,
L. Schweikhard, C. Yazidjian, Phys. Rev. Lett. 93 (2004) 150801.
[7] G. Bollen, D. Davies, M. Facina, J. Huikari, E. Kwan, P.A. Lofy, D.J. Morrissey, A. Prinke, R.
Ringle, J. Savory, P. Schury, S. Schwarz, C. Sumithrarachchi, T. Sun, L. Weissman, Phys. Rev.
Lett. 96 (2006) 152501.
[8] G. Savard, F. Buchinger, J.A. Clark, J.E. Crawford, S. Gulick, J.C. Hardy, A.A. Hecht, J.K.P.
Lee, A.F. Levand, N.D. Scielzo, H. Sharma, K.S. Sharma, I. Tanihata, A.C.C. Villari, Y. Wang,
Phys. Rev. Lett. 95 (2005) 102501.
[9] T. Eronen, V. Elomaa, U. Hager, J. Hakala, A. Jokinen, A. Kankainen, I. Moore, H. Penttila, S.
Rahaman, S. Rinta-Antila, A. Saastamoinen, T. Sonoda, J. Aysto, A. Bey, B. Blank, G. Canchel,
C. Dossat, J. Giovinazzo, I. Matea, N. Adimi, Phys. Lett. B 636 (2006) 191.
[10] G. Bollen, Eur. Phys. J. A 15 (2002) 237.
[11] G. Graff, H. Kalinowsky, J. Traut, Z. Phys. A 297 (1980) 35.
9

[12] A. Kellerbauer, K. Blaum, G. Bollen, F. Herfurth, H.-J. Kluge, M. Kuckein, E. Sauvan, C.
Scheidenberger, L. Schweikhard, Eur. Phys. J. D 22 (2003) 53.
[13] G. Bollen, S. Becker, H.-J. Kluge, M. Konig, R.B. Moore, T. Otto, H. Raimbault-Hartmann, G.
Savard, L. Schweikhard, H. Stolzenberg, the ISOLDE Collaboration, Nucl. Instrum. Meth. A 368
(1996) 675.
[14] F. Herfurth, F. Ames, G. Audi, D. Beck, K. Blaum, G. Bollen, A. Kellerbauer, H.-J. Kluge, M.
Kuckein, D. Lunney, R.B. Moore, M. Oinonen, D.Rodrıguez, E. Sauvan, C. Scheidenberger, S.
Schwarz, G. Sikler, C. Weber, the ISOLDE Collaboration, J. Phys. B: At. Mol. Opt. Phys. 36
(2003) 931.
[15] P.W. Anderson, Y.B. Kim, Rev. Mod. Phys. 36 (1964) 39.
[16] I. Bergstrom, C. Carlberg, T. Fritioff, G. Douysset, J. Schonfelder, R. Schuch, Nucl. Instrum.
Meth. A 487 (2002) 618.
[17] F. Herfurth, J. Dilling, A. Kellerbauer, G. Bollen, S. Henry, H.-J. Kluge, E. Lamour, D. Lunney,
R.B. Moore, C. Scheidenberger, S. Schwarz, G. Sikler, J. Szerypo, Nucl. Instrum. Meth. A 469
(2001) 254.
[18] E. Kugler, Hyperfine Interact. 129 (2000) 23.
[19] H. Raimbault-Hartmann, D. Beck, G. Bollen, M. Konig, H.-J. Kluge, E. Schark, J. Stein, S.
Schwarz, J. Szerypo, Nucl. Instrum. Meth. B 126 (1997) 378.
[20] G. Savard, St. Becker, G. Bollen, H.-J. Kluge, R.B. Moore, Th. Otto, L. Schweikhard, H. Stolzen-
berg, U. Wiess, Phys. Lett. A 158 (1991) 247.
[21] G. Bollen, R.B. Moore, G. Savard, H. Stolzenberg, J. Appl. Phys. 68 (1990) 4355.
[22] M. Konig, G. Bollen, H.-J. Kluge, T. Otto, J. Szerypo, Int. J. Mass Spectrom. Ion Process. 142
(1995) 95.
[23] K. Blaum, G. Audi, D. Beck, G. Bollen, M. Brodeur, P. Delahaye, S. George, C. Guenaut, F.
Herfurth, A. Herlert, A. Kellerbauer, H.-J. Kluge, D. Lunney, M. Mukherjee, D. Rodrıguez, S.
Schwarz, L. Schweikhard, C. Yazidjian, J. Phys. G: Nucl. Part. Phys. 31 (2005) S1775.
[24] T.K. Kiong, C.H. Chang, Q.G. Wang, Advances in PID control, Springer, New York, 1999.
[25] M.P. Bradley, J.V. Porto, S. Rainville, J.K. Thompson, D.E. Pritchard, Phys. Rev. Lett. 83
(1999) 4510.
10
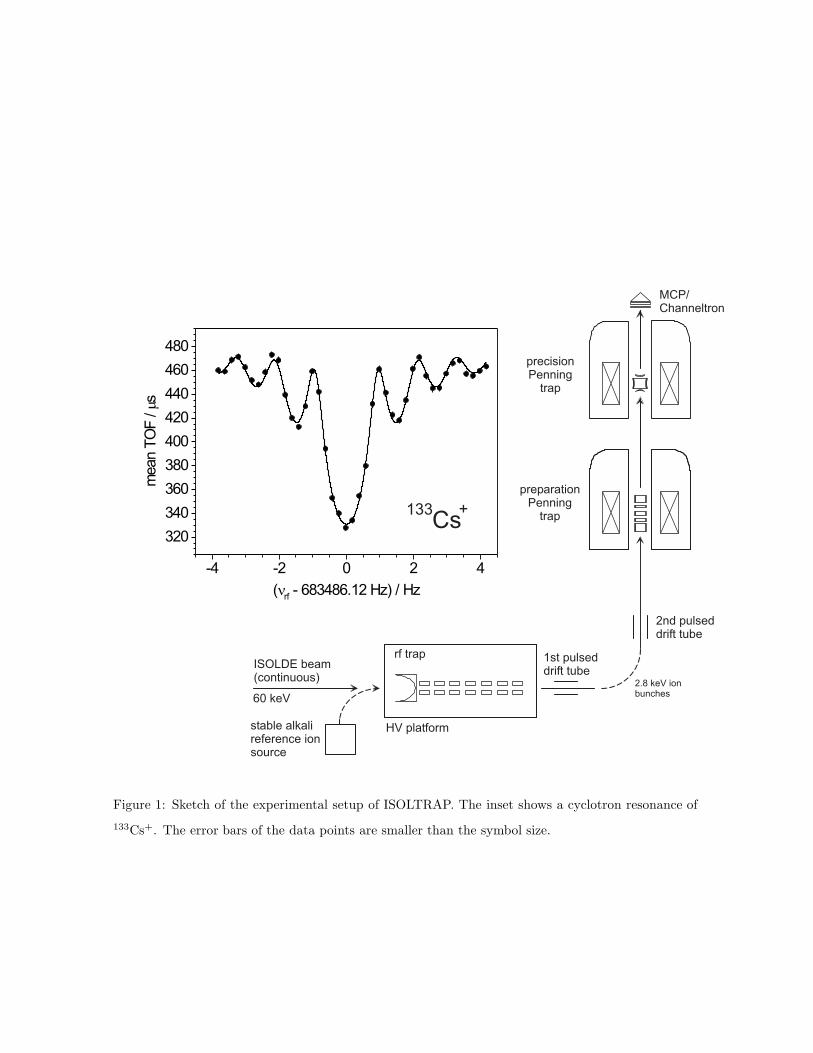
Figure 1: Sketch of the experimental setup of ISOLTRAP. The inset shows a cyclotron resonance of
133Cs+. The error bars of the data points are smaller than the symbol size.
11

Figure 2: Top: Cyclotron frequency of 85Rb+ as a function of time (data from [23]). Center: Resistance
of a Pt100 sensor mounted in the vicinity of the Penning trap vacuum tube. Bottom: Expected
behavior (solid line) of the cyclotron frequency (open circles, same data as in the top graph) as
deduced from a χ2-minimization of Eq. (2).
12

Figure 3: Layout of the temperature regulation system. The middle temperature sensor is used for
the PID regulation. The other two monitor the heat flow through the warm bore of the magnet.
13

Figure 4: Room temperature (top) and the temperature in the vicinity of the Penning trap vacuum
tube (bottom) as a function of time as measured by a AD590 sensor. At about t = 80h the PID
regulation was turned on. The solid line shows the set temperature, T = 295.9K and the dashed lines
give the range of the temperature variations, i.e. ±20mK.
14

Figure 5: Top: Pressure in the helium cryostat of the superconducting magnet of the precision Penning
trap, measured in the exhaust line as a function of time without regulation. Bottom: Frequency
spectrum of the pressure variations.
15

Figure 6: Layout of the pressure regulation system.
16

Figure 7: Top: Regulated pressure in the helium exhaust line as a function of time for three different
gain values. The three curves have been aligned along the time axis with respect to the maximum
value. Center: Regulated pressure for a gain value of 75 as a function of time. Bottom: Enlarged view
on the pressure values, where the dashed line indicates the mean pressure with a FWHM of 45mTorr
of the respective distribution.
17

Figure 8: (a) Temperature in the vicinity of the Penning trap as a function of time. At t = 3.3 h and
t = 9.8 h the set value of the PID regulation has been shifted and reset, respectively. (b) Cyclotron
frequency of 133Cs+ (circles) and the expected frequency as deduced from the temperature behavior
by fitting Eq. (4) (solid line). The dashed lines show the linear drift as a function of time for the
two outmost temperature settings. (c) Same as (b) for averaged frequency data (thin line) taking
10 neighboring data points into account. The drop between t = 8 h and 9 h is due to a bridge crane
movement over the superconducting magnet (see also Fig. 10).
18

Figure 9: (a) Pressure in the helium exhaust line as a function of time. At t = 24.2 h and t = 28.7h the
set value of the pressure regulation has been shifted by 30 torr and reset, respectively. (b) Cyclotron
frequency of 133Cs+ (circles) and the expected frequency as deduced from the pressure behavior by
fitting an analogue expression of Eq. (4) (solid line). The dashed lines show the linear drift as a
function of time for the two outmost pressure settings. (c) Same as (b) for averaged frequency data
(thin line) taking 10 neighboring data points into account.
19

Figure 10: Cyclotron frequency of 85Rb+ for subsequent measurements (total data collection time
about 1 minute in each case) when a bridge crane was moved close to the superconducting magnet at
the measurement time of data points 78 − 86. Before and after the crane was placed in far distance.
20

Figure 11: Center temperature (top) and cyclotron frequency of 133Cs+ (bottom) as a function of
time. The solid line is a linear fit to the frequency data points.
21

Figure 12: Cyclotron frequency of 85Rb+ (top) and 133Cs+ (bottom) as a function of time. The solid
lines are linear fits to the data points.
22

Figure 13: Magnetic field drift (1/B)(dB/dt) as given in Ref. [12] (value (1), corrected), and as deduced
from the data shown in: (2) Fig. 2, (3) Fig. 8, (4) Fig. 11, (5) Fig. 12 for 85Rb+, and (6) Fig. 13 for
133Cs+. The dashed line shows the corrected value of [12] as a reference.
23
Copyright © 2022 FDOKUMEN