
Towards a Li-ion photo-rechargeable battery
232
HAL Id: tel-02994615 https://tel.archives-ouvertes.fr/tel-02994615 Submitted on 8 Nov 2020 HAL is a multi-disciplinary open access archive for the deposit and dissemination of sci- entific research documents, whether they are pub- lished or not. The documents may come from teaching and research institutions in France or abroad, or from public or private research centers. L’archive ouverte pluridisciplinaire HAL, est destinée au dépôt et à la diffusion de documents scientifiques de niveau recherche, publiés ou non, émanant des établissements d’enseignement et de recherche français ou étrangers, des laboratoires publics ou privés. Towards a Li-ion photo-rechargeable battery Olivier Nguyen To cite this version: Olivier Nguyen. Towards a Li-ion photo-rechargeable battery. Material chemistry. Sorbonne Univer- sité, 2018. English. NNT : 2018SORUS437. tel-02994615
-
Upload
khangminh22 -
Category
Documents
-
view
5 -
download
0
Transcript of Towards a Li-ion photo-rechargeable battery

HAL Id: tel-02994615https://tel.archives-ouvertes.fr/tel-02994615
Submitted on 8 Nov 2020
HAL is a multi-disciplinary open accessarchive for the deposit and dissemination of sci-entific research documents, whether they are pub-lished or not. The documents may come fromteaching and research institutions in France orabroad, or from public or private research centers.
L’archive ouverte pluridisciplinaire HAL, estdestinée au dépôt et à la diffusion de documentsscientifiques de niveau recherche, publiés ou non,émanant des établissements d’enseignement et derecherche français ou étrangers, des laboratoirespublics ou privés.
Towards a Li-ion photo-rechargeable batteryOlivier Nguyen
To cite this version:Olivier Nguyen. Towards a Li-ion photo-rechargeable battery. Material chemistry. Sorbonne Univer-sité, 2018. English. �NNT : 2018SORUS437�. �tel-02994615�
Sorbonne Université
Ecole doctorale 397 : Physique et Chimie des Matériaux
Laboratoire de Chimie de la Matière Condensée de Paris
Towards a Li-ion photo-rechargeable battery
By Olivier Nguyen
PhD thesis in Materials Chemistry
Directed by Christel Laberty-Robert
Planned on November 6th, 2018
In front of the jury:
Prof. Fabien Miomandre Professor Referee
Dr. Jean-Pierre Pereira-Ramos CNRS Research Director Referee
Dr. Véronique Balland Associate Professor Examiner
Dr. Ivan Lucas Associate Professor Examiner
Dr. Natacha Krins Associate Professor Co-supervisor
Prof. Christel Laberty-Robert Professor Director

3
TABLE of CONTENTS
General Introduction ………………………………………………......…………….….... 9
Chapter 1 – Solar-powered electrochemical energy storage: state of the art
& new approach
I - Converting and storing solar energy: a new approach ............................................. 19
I.1 - Photovoltaic cells combined with rechargeable batteries .................................. 19
I.2 - Solar energy storage in capacitors .................................................................... 22
I.3 - Solar energy storage in Li-ion intercalative electrodes ...................................... 24
I.4 – Solar energy storage in lithium-ion rechargeable batteries ............................... 29
I.5 - Solar energy storage in lithium-oxygen rechargeable batteries .......................... 31
I.6 - Solar energy storage in lithium-sulfur rechargeable batteries ............................ 33
I.7 - Solar energy storage in lithium-iodide rechargeable batteries ........................... 34
I.8 - Solar energy storage in dual-liquid redox batteries ........................................... 35
I.9 - State of the art: conclusions ............................................................................. 41
I.9.1 - Photo-charge or photo-assisted charge? ..................................................... 42
I.9.2 – Choice of the electrolyte............................................................................ 45
II - Converting and storing solar energy: a new approach ............................................ 48
II.1 - Pioneering works on bifunctional electrodes .................................................... 48
II.2 - The recent and very recent developments on bifunctional electrodes .............. 50
III - Thesis objectives and challenges ........................................................................... 55
Bibliography ................................................................................................................ 57
Chapter 2 – Mesoporous TiO2 thin film electrodes: fabrication
& characterizations
I – Introduction ........................................................................................................... 69
II – Presentation of the electrodes ............................................................................... 71
II.1 – Fabrication methods ....................................................................................... 71

4
II.2 – Control of thin films architecture ................................................................... 74
II.2.1 – Thin film thickness .................................................................................. 74
II.2.2 – Inorganic walls and porous networks ....................................................... 76
III – Thin films structural characterizations ................................................................ 78
III.1 – Spectroscopic Ellipsometry ............................................................................ 78
III.1.1 – Adaptation for porous thin films ............................................................ 78
III.1.2 – Environmental Ellipsometric Porosimetry .............................................. 79
III.2 – Glancing Angle X-Ray Diffraction ................................................................ 85
IV – Reconstruction of TiO2 electrode energetic diagram ............................................. 92
IV.1 – Band gap determination by UV-Visible Spectroscopy ................................... 92
IV.2 – Flat-band potential estimated by Mott-Schottky experiment ........................ 95
V – Conclusion ............................................................................................................ 97
Bibliography ................................................................................................................ 99
Chapter 3 – Mesoporous TiO2 thin films as photo-rechargeable Li-ion
battery electrode materials: photo-electrochemical characterizations
I – Introduction ......................................................................................................... 107
II – Cell design and photo-electrochemical set-up ...................................................... 107
III – How light impacts the discharge and charge of the TiO2-based battery electrode:
observations ............................................................................................................... 109
III.1 – Galvanostatic experiments .......................................................................... 109
III.2 – Cyclic voltammetry experiments ................................................................. 113
IV – Evaluation of the photo-current intensity .......................................................... 115
IV.1 – Potentiostatic experiments .......................................................................... 115
IV.2 – Open circuit voltage experiments ................................................................ 117
V – Adjusting the rates of simultaneous electrode discharge and photo-recharge ....... 119
VI – Conclusion ......................................................................................................... 121
Bibliography .............................................................................................................. 122

5
Chapter 4 – Photo-induced mechanisms: investigation
I - Introduction .......................................................................................................... 127
II – Photo-induced mechanisms: dependence on the electrode architecture and role of
the electrolyte ............................................................................................................ 128
II.1 – Dependence on the electrode architecture ..................................................... 128
II.1.1 – Influence of the electrode thickness ........................................................ 128
II.1.2 – Influence of the porous network ............................................................. 131
II.2 – Role of the electrolyte .................................................................................. 137
II.2.1 – TiO2 photo-electrode in an ionic liquid-based electrolyte ....................... 137
II.2.2 – TiO2 photo-electrode in a “water-in-salt” electrolyte .............................. 144
III – Post mortem analysis of the photo-electrode ...................................................... 149
III.1 – FEG-SEM and complementary EDX analysis ............................................. 149
III.2 –Probing the electrode surface with XPS ....................................................... 154
III.3 –Analysing the electrolyte by NMR spectroscopy........................................... 162
IV – TiO2 photo-electrode: operando characterizations .............................................. 168
IV.1 – Electrochemical Impedance Spectroscopy (EIS) .......................................... 168
IV.1.1 – Nyquist plots and equivalent circuits.................................................... 168
IV.1.2 – Results of the fits and analysis ............................................................. 171
IV.2 – Investigations by means of Electrochemical Quartz Crystal Microbalance
(EQCM) ................................................................................................................ 174
IV.2.1 – Principle of Quartz Crystal Microbalance (QCM) ................................ 174
IV.2 – EQCM and F(Δm/ΔQ) function .............................................................. 175
IV.2.3 – EQCM study for Li-ion photo-battery electrode ................................... 177
V – Conclusion .......................................................................................................... 191
Bibliography .............................................................................................................. 193
General Conclusion …………………………...…………………………………………201

6
ANNEX
Annex I –Figures .......................................................................................................... V
Annex I.1 – TiO2 (PB-PEO, TiCl4 1M/2M) pore size distribution ............................ V
Annex I.2 – FTO and LP30 UV-Visible absorption spectra .................................... VI
Annex I.3 – In situ evolution of UV-Vis absorption spectra for anatase TiO2
electrode (PB-PEO, 2M in TiCl4, 10 dipped layers) ............................................... VII
Annex I.4 – CVs in dark and light for different film architecture ......................... VIII
Annex I.5 – Chopped potentiostatic experiment in dark and light for different film
architecture............................................................................................................. IX
Annex I.6 – EDX qualitative analysis of TiO2 electrode surface for different cycling
conditions in LP30 electrolyte ................................................................................... X
Annex I.7 – Reaction scheme of LiPF6 degradation suggested by Wiemers-Meyers
et al. NMR study .................................................................................................... XI
Annex I.8 – Nyquist plots fits using RC and Randles circuits ................................. XI
Annex I.9 – Nyquist plots fits using equivalent circuit with CPE (dark) ............... XII
Annex I.10 – Nyquist plots fits using equivalent circuit with CPE (light) ............ XIII
Annex I.11 – F(dm/dq) function for TiO2 film during CVs in LP30 ..................... XIV
Annex II – Anatase thin film fabrication ................................................................... XV
Annex III – Technics of characterization .................................................................XVII
III.1 - Electrochemical and Photo-Electrochemical measurements ........................XVII
III.2 – Glancing Angle X-Ray Diffraction .............................................................. XX
III.3 - Ellipsometry ................................................................................................ XX
III.4 - Field-Emission-Gun Scanning-Electron-Microscopy and Energy-dispersive
X-Ray Spectroscopy .............................................................................................. XXI
III.5 - X-Ray Photoelectron Spectroscopy ............................................................. XXI
III.6 - Nuclear Magnetic Resonance Spectroscopy ................................................. XXI
III.7 - UV-Visible spectroscopy ............................................................................XXII
III.8 - Electrochemical Quartz Crystal Microbalance ......................................... XXIII
Bibliography ........................................................................................................... XXV

7
GENERAL INTRODUCTION

General Introduction
9
General Introduction
The access to Energy has probably become one of the major issues of the 21st century
and raises crucial questions: how to produce energy, how to consume it, and at what
environmental costs?
Supplying the increasing world energy demand while reducing our carbon impact on
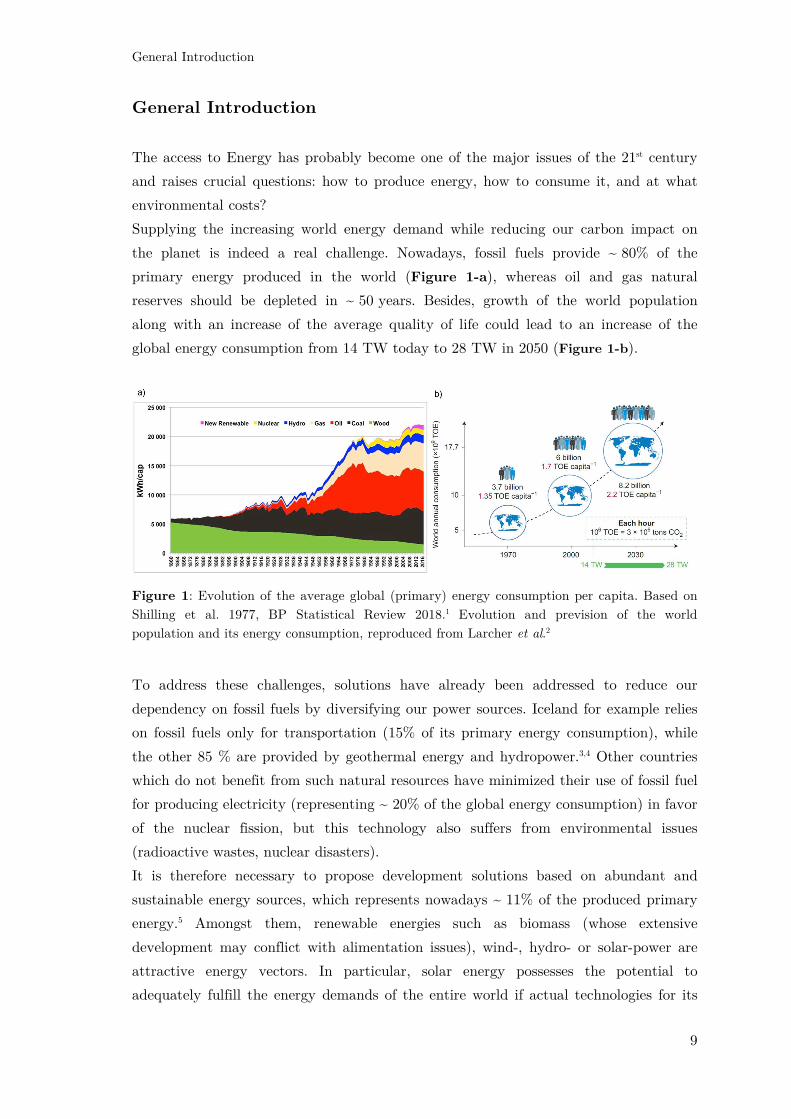
the planet is indeed a real challenge. Nowadays, fossil fuels provide ~ 80% of the
primary energy produced in the world (Figure 1-a), whereas oil and gas natural
reserves should be depleted in ~ 50 years. Besides, growth of the world population
along with an increase of the average quality of life could lead to an increase of the
global energy consumption from 14 TW today to 28 TW in 2050 (Figure 1-b).
Figure 1: Evolution of the average global (primary) energy consumption per capita. Based on
Shilling et al. 1977, BP Statistical Review 2018.1 Evolution and prevision of the world
population and its energy consumption, reproduced from Larcher et al.2
To address these challenges, solutions have already been addressed to reduce our
dependency on fossil fuels by diversifying our power sources. Iceland for example relies
on fossil fuels only for transportation (15% of its primary energy consumption), while
the other 85 % are provided by geothermal energy and hydropower.3,4 Other countries
which do not benefit from such natural resources have minimized their use of fossil fuel
for producing electricity (representing ~ 20% of the global energy consumption) in favor
of the nuclear fission, but this technology also suffers from environmental issues
(radioactive wastes, nuclear disasters).
It is therefore necessary to propose development solutions based on abundant and
sustainable energy sources, which represents nowadays ~ 11% of the produced primary
energy.5 Amongst them, renewable energies such as biomass (whose extensive
development may conflict with alimentation issues), wind-, hydro- or solar-power are
attractive energy vectors. In particular, solar energy possesses the potential to
adequately fulfill the energy demands of the entire world if actual technologies for its
General Introduction
10
harvesting and supplying were readily available.6 In fact, ~ 0.01% of the solar energy
reaching the earth is theoretically sufficient to cover the world energy demand, and
could be harvest with an already existing technology of solar panels working with a
global efficiency of 10% and covering 0.1% of the planet (which represents more or less
Spain area). Despite of this huge potential, the contribution to solar energy to the
global energy supply is still less than 1%.3,5 Amongst other possible technological or
geopolitical drawbacks, this technology indeed suffers from the intermittence of the
solar radiation. This intrinsic limitation obliges the exploitation of sun light only during
a part of the day, and raises the question of the development of electrical “smart grid”,
including hybrid structure with energy conversion/storage compartments.
In the case of stationary or domestic applications, photovoltaic devices are generally
connected to an electrical grid. The latter receives the produced solar energy from
photovoltaic systems, and can in return supply electrical installations when needed.
The grid-connected photovoltaic system can also be supplemented with a battery
backup, which can store the energy surplus and allow the smoothing between the
supply and the demand. However, in some cases, for instance in areas having unreliable
or inexistent power from the grid, the need for an energy storage system coupled with
the photovoltaic device really becomes essential.
There are many ways to store energy according to its nature (thermal, mechanical,
electrical, nuclear, etc.). As it also involves electron transfer, the chemical energy is a
natural choice to store electricity. “Electrochemistry” is the field encompassing all
chemical reactions driven by or resulting from an electrical current flowing at a given
potential. It includes numerous technologies dedicated to energy storage, such as fuel
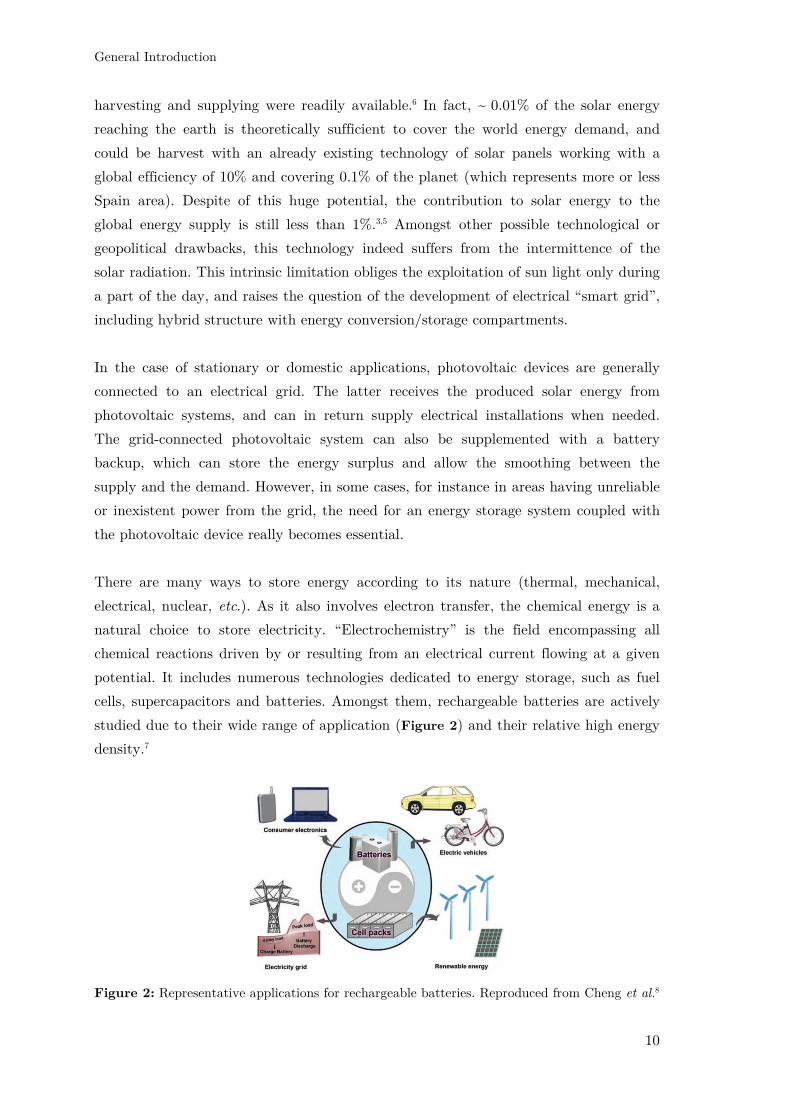
cells, supercapacitors and batteries. Amongst them, rechargeable batteries are actively
studied due to their wide range of application (Figure 2) and their relative high energy
density.7
Figure 2: Representative applications for rechargeable batteries. Reproduced from Cheng et al.8

General Introduction
11
After a fast development at the beginning of the 21st century, the battery market had
an average growth of ~ 8% per year from 2006 to 2016.9 The market is still dominated
by the lead-acid technology, used as start light and ignition batteries, owing to its low
cost and long cycle-life (Figure 3-a). However, this technology is not suitable for
portable applications, in which the gravimetric and volumetric energy densities prevail
above all.4,7 Over one decade, this segment has been conquered by the Li-ion
technology, which equips 100% of the portable electronic devices such as cellular,
laptops, tablets, cameras, and other handy devices (Figure 3-b). Due to the increasing
functionalities and resulting energy needs required by such portable devices10, seeking
for the better autonomy has become one of the major selling argument for the
constructors in every domains of the Li-ion battery industry (cell phones, laptops,
rechargeable vehicles, etc.). This technology is indeed still deeply dependent of the
access to an electronic grid, which has become an important strategic issue for example
in the electric vehicles industry.
Figure 3: The worldwide battery market in 2016 (a) and Li-ion battery forecast for portable
electronic devices by application up to 2025 (b). Adapted from Pillot et al. for Avicenne Energy
2017 study.9
In addition to the appealing scientific dimension, the design of a device that is
simultaneously a solar energy convertor and a rechargeable battery therefore represents
a paradigm-shifting concept, which could be valuable for both domains of solar energy
conversion (need for energy storage due to solar intermittence) and Li-ion battery
energy storage (lack of autonomy in regards to increasing energy demands).
In this thesis, Chapter I will be discussing in different approaches considered by the
scientific community to convert solar energy and store it simultaneously. The state of
the art of solar powered electrochemical energy storage is mainly based on hybrid
devices, which address the challenge of converting and storing energy by two separated
General Introduction
12
compartments. In this work, we will propose to investigate another approach to harvest
and store solar energy simultaneously into a single device, using a TiO2 bi-functional
Li-ion battery photo-electrode. A patent for this system has already been proposed.11
To go further in the system design, a better understanding of the underlying
mechanisms is needed, and will constitute an important part of the work of this thesis.
Chapter II will be dedicated to the fabrication methods of the electrode. We will
present the synthesis of the mesoporous thin film electrodes obtained using sol-gel
coupled dip-coating process combined with the “evaporation induced self-assembly”
(EISA) approach, as well as the associated characterizations (environmental
ellipsometric porosimetry, glancing angle X-Ray diffraction, UV-Visible spectroscopy,
and Mott Schottky experiments).
In the Chapter III, mesoporous TiO2 thin film will be tested as photo-rechargeable Li-
ion battery electrode materials. Comparison of the electrochemical response of the
electrode in dark conditions and under illumination will allow to discuss the properties
of the electrode photo-recharge as well as its mechanism.
In the Chapter IV, photo-induced mechanisms will be further investigated using several
ways: (1) by playing with the electrode architecture and the electrolyte in order to
analyze their potential influence on the fate of the photo-generated charges (2) by
tracking these photo-generated charges and their potential reaction with the electrolyte
through post mortem analysis of the electrode surface and the electrolyte (3) by
realizing operando measurements (electrochemical impedance spectroscopy,
electrochemical quartz crystal microbalance) to study the electrical and gravimetric
properties of the system in real time upon the illumination.
General Introduction
13
Bibliography
1. Manicore - URL:http://www.manicore.com/documentation/energie.html.
2. Larcher, D. & Tarascon, J.-M. Towards greener and more sustainable batteries for
electrical energy storage. Nat. Chem. 7, 19–29 (2015).
3. Connaissance des énergies - URL: https://www.connaissancedesenergies.org/fiche-
pedagogique/chiffres-cles-production-d-energie.
4. Lepoivre, F. Study and improvement of non-aqueous Lithium-Air batteries via the
development of a silicon-based anode. (Université Pierre et Marie Curie-Paris VI,
2016).
5. BP Statistical Review of World Energy June 2017.
6. Kabir, E., Kumar, P., Kumar, S., Adelodun, A. A. & Kim, K.-H. Solar energy:
Potential and future prospects. Renew. Sustain. Energy Rev. 82, 894–900 (2018).
7. Tarascon, J.-M. & Armand, M. Issues and challenges facing rechargeable lithium
batteries. Materials for Sustainable Energy 171–179 (2010).
8. Cheng, F., Liang, J., Tao, Z. & Chen, J. Functional materials for rechargeable
batteries. Adv. Mater. 23, 1695–1715 (2011).
9. Pillot, Sanders. The Rechargeable Battery Market and Main Trends 2016-2025 -
Avicenne Energy - September 2017.
10. Choi, J. W. & Aurbach, D. Promise and reality of post-lithium-ion batteries with
high energy densities. Nat. Rev. Mater. 1, 16013 (2016).
11. Sauvage, F., Andriamiadamanana, C. & Laberty-Robert, C. Photorechargeable
battery: turning light energy into chemical energy and then electric energy, French
patent. (FR1361775).

General Introduction
14

15
CHAPTER 1
Solar-powered electrochemical energy storage:
state of the art & new approach


Chapter 1 – Solar-powered electrochemical energy storage: state of the art & new approach
17
TABLE of CONTENTS
I - Converting and storing solar energy: a new approach ............................................. 19
I.1 - Photovoltaic cells combined with rechargeable batteries .................................. 19
I.2 - Solar energy storage in capacitors .................................................................... 22
I.3 - Solar energy storage in Li-ion intercalative electrodes ...................................... 24
I.4 – Solar energy storage in lithium-ion rechargeable batteries ............................... 29
I.5 - Solar energy storage in lithium-oxygen rechargeable batteries .......................... 31
I.6 - Solar energy storage in lithium-sulfur rechargeable batteries ............................ 33
I.7 - Solar energy storage in lithium-iodide rechargeable batteries ........................... 34
I.8 - Solar energy storage in dual-liquid redox batteries ........................................... 35
I.9 - State of the art: conclusions ............................................................................. 41
I.9.1 - Photo-charge or photo-assisted charge? ..................................................... 42
I.9.2 – Choice of the electrolyte............................................................................ 45
II - Converting and storing solar energy: a new approach ............................................ 48
II.1 - Pioneering works on bifunctional electrodes .................................................... 48
II.2 - The recent and very recent developments on bifunctional electrodes .............. 50
III - Thesis objectives and challenges ........................................................................... 55
Bibliography ................................................................................................................ 57

Chapter 1 – Solar-powered electrochemical energy storage: state of the art & new approach
18

Chapter 1 – Solar-powered electrochemical energy storage: state of the art & new approach
19
I - Converting and storing solar energy: a new approach
The design of a device that is able to simultaneously convert solar energy and store it
like a battery represents a paradigm-shifting energy storage concept that allows
charging a battery without any external power supply.1–3
The first solar-powered electrochemical energy storage (SPEES) was proposed in 1976
by Hodes et al.4 using a three-electrode system composed of cadmium selenide/sulfur/
silver sulfide (CdSe/S/Ag2S). Since then, different combinations of solar cells and
storage devices have been developed. In such hybrid systems, research has been mostly
focused on combining dye-sensitized solar cells (DSSCs) for the photo-conversion, and
capacitors or tungsten trioxide-based electrodes for the energy storage. More recently,
other hybrid devices combining photo-electrodes with Li-ion batteries, Li-S batteries,
Li-O2 batteries and redox-flow batteries have also been investigated.
In this section, we first propose to describe the state of the art of SPEES systems,
which are based until very recently and to the best of our knowledge almost exclusively
on separate technologies.
I.1 - Photovoltaic cells combined with rechargeable batteries
The most well-known technology to convert solar energy into electric energy is the
silicon-based solar cell. Solar cells using crystalline silicon can achieve efficiencies of
about 25 % and dominate at the moment the field of commercial photovoltaic
modules.5,6 However, the intermittency of solar energy has been a major drawback
conflicting the permanent electric energy needs.
On the other side, even Li-ion batteries, which stand as the most established
rechargeable accumulators, still suffer from their lack of autonomy in regards to
increasing energy demands.7
Therefore, it seems quite natural, as a first approach to overcome their respective
weaknesses, to try to combine the two most reliable and commercialized technologies
for energy conversion (silicon photovoltaic cells) and storage (Li-ion rechargeable
batteries), using electrical wiring.
In 2006, Kan et al.8 observed that the direct charging of a Li-ion battery takes longer
for a solar cell (about 4 times longer for their system in comparison to an electrical
charge). The battery capacity also decreases faster than in standard use. In order to
improve the energy transfer, the authors propose to add supercapacitors between the

Chapter 1 – Solar-powered electrochemical energy storage: state of the art & new approach
20
photovoltaic cell and the accumulator. The energy is first quickly collected by the
capacitors, then slowly restored to the batteries. The capacitors act as a buffer against
the photovoltaic current variations induced by the fluctuated incident solar radiations.
This control over the current restitution should thus improve the lifetime of the
battery. However, the authors note that this advantage is only possible at the expense
of increased weight and volume of the storage system.
In order to test the performances of a battery designed for electric vehicles, Gibson et
al.9 investigated for General Motors the charge of iron phosphate-based Li-ion cells
using externally wired amorphous silicon photovoltaic modules. The whole system
could be charged at a rate of up to 1.5 C (theoretical discharge completed in
60 / 1.5 h) with an average voltage of 3.4 V. The optimized solar charging system
reaches a 14.5 % efficiency by combining a photovoltaic system with 15 % solar to
electric efficiency and a nearly 100 % storage efficiency battery module. This high
system efficiency is achieved with no intervening electronics. It is obtained by matching
the photovoltaic maximum power point voltage to the battery charging voltage at the
desired maximum state of charge for the battery using an optimum 15-cell battery
module (Figure 1).
Figure 1: Solar energy to battery charge conversion efficiency comparison for 10-, 12-, 13-, 14-, 15-, and 16-cell modules. The optimum efficiency was approximately 14.5 % when the battery charge voltage was equal to the photovoltaic maximum power point (Vmpp/Vbattery charging near unity).9
Thus, working on the optimal match between the photovoltaic system and the battery
is a very important step to optimize the system overall performances, and could limit
the addition of increasing weight electronics.

Chapter 1 – Solar-powered electrochemical energy storage: state of the art & new approach
21
In 2015, Xu et al.10 demonstrated the use of perovskite solar cells (PSC) packs with
four single CH3NH3PbI3-based solar cells connected in series to photo-charge a lithium-
ion battery (LIB) assembling a LiFePO4 cathode and a Li4Ti5O12 anode (Figure 2).
Figure 2: Schematic diagram of the PSC-LIB system.10
The authors show a maximal overall photo-electric conversion and storage efficiency of
7.8 % at 0.1 C and about 7 % at 0.5 C, and a discharging capacity decreasing from
140.4 mAh.g-1 to 111.6 mAh.g-1 (79.5 % of initial capacity) after 10 cycles. In order to
further improve the efficiency of such perovskite-powered systems, Gurung et al.11
firstly introduced in 2017 a direct current-direct current (DC-DC) boost converter into
the PSCs for photo-charging a Li4Ti5O12-LiCoO2 battery. The converter boosts the low
input voltage of a single junction solar cell to charge the lithium ion cell, which leads to
a high overall efficiency of 9.4 % and average storage efficiency of 77.2 % at 0.5 C. In
addition, the discharging capacity decreases from 151.3 mAh.g-1 to 134.4 mAh.g-1 (89 %
of initial capacity) after 10 cycles.
The wire-connected strategy has many advantages including the freedom of selecting
the type of individual units and their assembly. However, although associations with
external solar cells have achieved feasible conversion and storage of solar energy in
rechargeable batteries, there are still some challenges in these systems for the practical
applications. As major drawback, the extra photovoltaic modules and external wires
considerably enlarge the volume and weight of the entire device in comparison to a
single rechargeable battery. They also increase the cost of energy storage.12
To avoid this issue, both energy conversion and storage parts could be integrated into
one hybrid device. Researchers have been focusing on integrating capacitors and
intercalative electrode into DSSCs (section I.2-I.3), or photo-electrodes into
Chapter 1 – Solar-powered electrochemical energy storage: state of the art & new approach
22
rechargeable batteries (sections I.4-I.8). In this chapter, there will be no mention of
organic- or polymer-based SPEES systems,1,2,12,13 we will focus on the advances on
inorganic-based SPEES, which are particularly relevant to our own approach of the
SPEES. In each section, we will illustrate some examples of representative devices in
order to highlight their specificities. They will be summarized in section I.9.
I.2 - Solar energy storage in capacitors
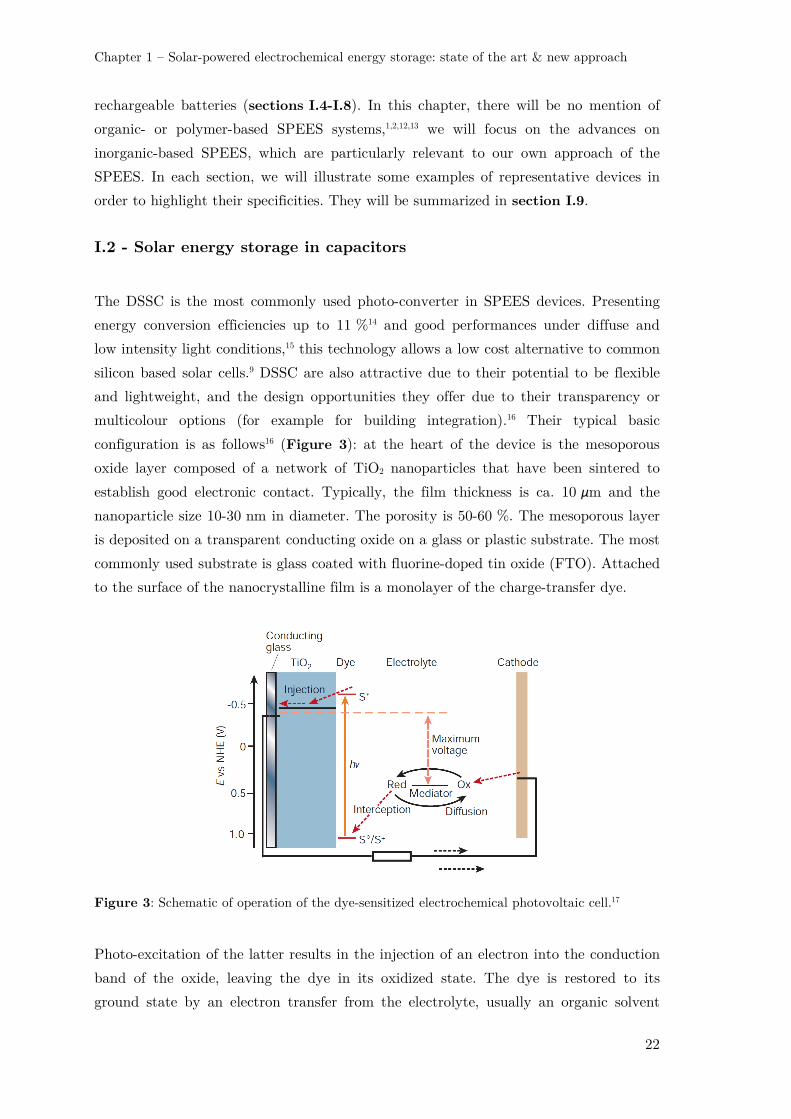
The DSSC is the most commonly used photo-converter in SPEES devices. Presenting
energy conversion efficiencies up to 11 %14 and good performances under diffuse and
low intensity light conditions,15 this technology allows a low cost alternative to common
silicon based solar cells.9 DSSC are also attractive due to their potential to be flexible
and lightweight, and the design opportunities they offer due to their transparency or
multicolour options (for example for building integration).16 Their typical basic
configuration is as follows16 (Figure 3): at the heart of the device is the mesoporous
oxide layer composed of a network of TiO2 nanoparticles that have been sintered to
establish good electronic contact. Typically, the film thickness is ca. 10 μm and the
nanoparticle size 10-30 nm in diameter. The porosity is 50-60 %. The mesoporous layer
is deposited on a transparent conducting oxide on a glass or plastic substrate. The most
commonly used substrate is glass coated with fluorine-doped tin oxide (FTO). Attached
to the surface of the nanocrystalline film is a monolayer of the charge-transfer dye.
Figure 3: Schematic of operation of the dye-sensitized electrochemical photovoltaic cell.17
Photo-excitation of the latter results in the injection of an electron into the conduction
band of the oxide, leaving the dye in its oxidized state. The dye is restored to its
ground state by an electron transfer from the electrolyte, usually an organic solvent

Chapter 1 – Solar-powered electrochemical energy storage: state of the art & new approach
23
containing the iodide (I-)/ triiodide (I3-) redox system. The I3
- ions, formed by oxidation
of I- ions, diffuse along a short distance (<50 μm) through the electrolyte to the
counter electrode, which is coated with a thin layer of platinum catalyst. The
regenerative cycle is completed by the reduction of I3- to I- at the counter electrode, the
circuit being completed via electron migration through the external load.
By combining the DSSC with an electron storage device, the electrons can be stored
after photo-generation. In 2004, Miyasaka et al.18 developed a device combining a
photo-electrode made of dye sensitized TiO2 nanoparticules and an activated carbon
double layer with a specific surface area of about 1000-2500 m2g-1 (Figure 4). After
photo-generation of electron-hole pairs, electrons and holes are accumulated at each of
the two activated carbon electrodes (AC layer). These two carbon layers are separated
by an organic electrolyte of high concentration ((CH3CH2)4NBF4, 15 wt% in propylene
carbonate), which provides the counter-ions needed for the charge compensation at the
carbon surface.
Figure 4: Schematic illustration for the two-electrode photo-capacitor.18
At charged state, the photo-capacity provides a voltage of 0.45 V for a discharge
capacitance of 43 F.g-1 (0.69 F.cm-2 for 16 mg of activated carbon at the counter
electrode). It is comparable to carbon-based electrode material reported in the
literature, which roughly presents capacities between 10 F.g-1 and 300 F.g-1 depending
on the nature of the electrode (typically 40 F.g-1 for activated carbon).19,20 However, this
two-electrode system suffers from a big internal resistance: electrons returning to the
photo-electrode should go through the space charge Schottky barrier at the TiO2 layer,
which delays the discharge process. For this reason, Miyasaka et al. improved the
device using a three-electrode device21 to obtain energy densities 5 times higher than
the 2-electrode one for a delivered voltage of 0.8 V (Figure 5).

Chapter 1 – Solar-powered electrochemical energy storage: state of the art & new approach
24
Figure 5: Structure of the three-electrode photo-capacitor. The cell consists of a dye-sensitized TiO2 photo-electrode (PE), a Pt-plate inner electrode (IE) and a Pt-coated glass counter-electrode (CE) covered with activated carbon (AC), spacer, separator, and redox (A) and redox-free (B) electrolytes.21
Instead of activated carbon, carbon nanotubes have also been used for the storage in
these hybrid systems. In 2013, Yang et al22 published a study on a system comparable
to the 2-electrode device proposed by Miyasaka. Films of multi-wall carbon nanotubes
are aligned to form the 2 electric storage layers. The authors obtain a photo-electric
conversion efficiency of 6.1 %, a specific capacitance of 48 F.g-1, a storage efficiency of
84 % for a global photo-electric conversion and storage conversion of about 5.1 %.
When introducing polyaniline in the carbon nanotubes, the specific capacitance goes to
208 F.g-1, but the storage efficiency goes down to about 70 % for a global efficiency of
4.3 %. The authors explain this efficiency decrease by the chemical reactions that
occurred within the carbon-polyaniline composite during the charge / discharge process.
In the context of developing flexible and lightweight photo-capacitors for mobile or
wearable electronic devices23, researchers have investigated wire-shaped electrode design
instead of the classical planar structure: braided fibers24, multi-wall fibers25 or braided
sheath / core fibers26 have thus been developped to be integrated into textiles or other
deformable structures for self-powering applications. Performances of the described
solar capacitors are resumed in Table 1 (page 28).
I.3 - Solar energy storage in Li-ion intercalative electrodes
The energy produced by a DSSC can also be stored by another way. Photo-generated
electrons can be driven to an insertion electrode material able to accommodate small
metallic cations (typically Li+). During the photo-charge, the electrode material
reduction (induced by the electrons flow) is electrically compensated by cations
insertion. During the discharge, the spontaneous opposite electron flow induces the re-
oxidation of the storage material and the de-insertion of the cations. This way, the
photo-generated electrons can be stored by charge compensation thanks to a host
lattice electrode able to reversibly intercalate cations.

Chapter 1 – Solar-powered electrochemical energy storage: state of the art & new approach
25
The first example of such hybridization was published by Hauch et al. in 2002.27 The
authors adopt a 2-electrode system, which integrates an intermediate storage layer of
WO3, electroactive with regards to lithium ion intercalation. The WO3 layer is directly
in contact with the photo-active sensitized TiO2 layer (Figure 6). These mesoporous
layers are deposited by screen-printing by analogy with DSSC fabrication process.
Figure 6: Schematic diagram of the proposed 2 electrode tungsten photo-capacitor.27
During the open circuit photo-charge process, electrons provided after illumination of
the photo-active sensitized TiO2 layer are transferred and stored into WO3, which is
able to be reduced (W6+ into W5+) while inserting Li+ to form LixWO3 (equation 1).
(1) xLi+ + WO3 + xe- → LixWO3
During the discharge, an external circuit connects the two electrodes. The current
induces W5+ oxidation into W6+ in LixWO3, together with Li+ extraction and the I2
regeneration at the counter electrode.
After one hour of photo-charge (1000 W.m-2), the device provides an open current
voltage of 0.6 V and a discharge capacity of 1.8 C.cm-2. After conversion, this capacity
corresponds to 0.5 mAh.cm-2, i.e. 28 mAh.g-1 for a 50 μm-thick electrode and a
theoretical density of 7.16 g.cm-3 for WO3, which is around five times smaller than usual
Li-ion battery capacities. The authors estimate that the accumulator capacity is limited
by the low concentration of Li+ in the electrolyte. They attribute the observed self-
discharge process to the electron transfer from TiO2 or WO3 in the electrolyte. The
authors also highlight the colour change between WO3 and LixWO3, which could be a
useful property for a photo-electrochromic device.28
Chapter 1 – Solar-powered electrochemical energy storage: state of the art & new approach
26
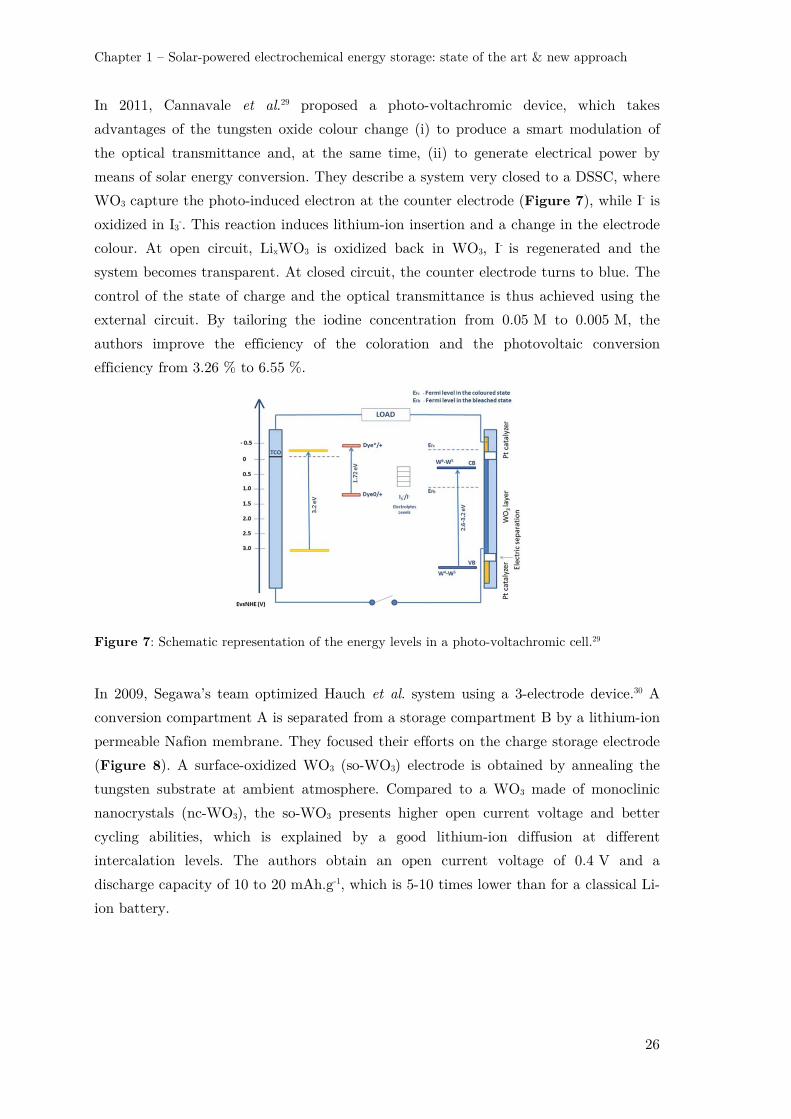
In 2011, Cannavale et al.29 proposed a photo-voltachromic device, which takes
advantages of the tungsten oxide colour change (i) to produce a smart modulation of
the optical transmittance and, at the same time, (ii) to generate electrical power by
means of solar energy conversion. They describe a system very closed to a DSSC, where
WO3 capture the photo-induced electron at the counter electrode (Figure 7), while I- is
oxidized in I3-. This reaction induces lithium-ion insertion and a change in the electrode
colour. At open circuit, LixWO3 is oxidized back in WO3, I- is regenerated and the
system becomes transparent. At closed circuit, the counter electrode turns to blue. The
control of the state of charge and the optical transmittance is thus achieved using the
external circuit. By tailoring the iodine concentration from 0.05 M to 0.005 M, the
authors improve the efficiency of the coloration and the photovoltaic conversion
efficiency from 3.26 % to 6.55 %.
Figure 7: Schematic representation of the energy levels in a photo-voltachromic cell.29
In 2009, Segawa’s team optimized Hauch et al. system using a 3-electrode device.30 A
conversion compartment A is separated from a storage compartment B by a lithium-ion
permeable Nafion membrane. They focused their efforts on the charge storage electrode
(Figure 8). A surface-oxidized WO3 (so-WO3) electrode is obtained by annealing the
tungsten substrate at ambient atmosphere. Compared to a WO3 made of monoclinic
nanocrystals (nc-WO3), the so-WO3 presents higher open current voltage and better
cycling abilities, which is explained by a good lithium-ion diffusion at different
intercalation levels. The authors obtain an open current voltage of 0.4 V and a
discharge capacity of 10 to 20 mAh.g-1, which is 5-10 times lower than for a classical Li-
ion battery.

Chapter 1 – Solar-powered electrochemical energy storage: state of the art & new approach
27
Figure 8: Operation scheme of the 3-electrode ES-DSSC system. Compartment A is the DSSC section, and compartment B is the section containing the charge-storage electrode.30
In 2012, Yan et al.31 proposed a comparable battery where the Pt counter electrode is
replaced by a Ti counter electrode covered by TiN nanotubes, and where the storage
electrode is made in combining so-WO3 and carbone nanotubes (Figure 9). After the
photo-charge, they obtain a discharge capacity of 0.124 mAh.cm-2 against 0.2 mAh.cm-2
after a classical electrochemical charge, which corresponds to a complete photo-charge
efficiency of 69.5 %. Performances of the described devices are resumed in Table 1
(page 28).
Figure 9: Schematic illustration of the 3-electrode DSSC // Ti/TiN // WO3/CNTs system.31

Cha
pter
1 –
Sol
ar-p
ower
ed e
lect
roch
emic
al e
nerg
y st
orag
e: s
tate
of th
e ar
t &
new
app
roac
h
28
Table
1: Su
mm
ary
of r
epor
ted
sola
r ca
paci
tors
and
int
erca
lati
ve e
lect
rode
s
Sola
r
cell
type
Energ
y
stora
ge
devic
e
Act
ive
mate
rial
(sto
rage)
Ele
ctro
lyte
(st
ora
ge)
D
evic
e
geom
etr
y
Dis
charg
e
volt
age
Capaci
ty /
Energ
y d
ensi
ty
Test
ed
cycl
ing
num
bers
Convers
ion
effic
iency
Sto
rage
effic
iency
Ref
DSS
C
capa
cito
r ac
tiva
ted
carb
on o
n P
t el
ectr
ode
prop
ylen
e ca
rbon
ate
2 el
ectr
odes
∼0
.4 V
0.
69 F
.cm
-2,
(43
F.g
-1)
0.09
mW
.h.c
m-2
10 c
ycle
s ∼8
6 %
cap
a.
rete
ntio
n
- 59
%
18
acti
vate
d ca
rbon
on
Pt
elec
trod
e
prop
ylen
e ca
rbon
ate
3 el
ectr
odes
∼0
.72
V
0.65
F.c
m-2,
(41
F.g
-1)
0.4
7 m
W.h
.cm
-2
- -
42 %
21
Car
bon
nano
tube
s P
VA
/H3P
O4
3 el
ectr
odes
∼0
.75
V
48 F
.g-1
100
cycl
es
∼80
% c
apa.
re
tent
ion
6.1
%
84 %
22
Car
bon
nano
tube
s P
VA
/H3P
O4
Bra
ided
fib
ers
∼0
.6 V
0.
6 m
F.c
m-2 /
1.
5.10
-7 W
.h.c
m-2
- 2.
2 %
68
.4 %
24
Car
bon
nano
tube
s P
VA
/H3P
O4
Mul
ti-w
all fibe
rs
∼0.6
3 V
3.
32 m
F.c
m-2 /
0.
27 m
W.c
m-2
1000
cyc
les
88.2
%
effici
ency
re
tent
ion
2.73
%
75.7
%
25
Car
bon
nano
tube
s P
VA
/H3P
O4
Bra
ided
she
ath
/ co
re
∼0.7
V
∼20
F.g
-1
50 c
ycle
s un
der
20 %
st
rain
1.8
% (
glob
al e
ffic
ienc
y)
26
DSS
C
Inte
rcal
ativ
e el
ectr
ode
WO
3 pr
opyl
ene
carb
onat
e 2
elec
trod
es
∼0
.6 V
1.
8 C
.cm
-2
(0.5
mA
h.cm
-2
28 m
Ah.
g-1 )
- -
- 27
W
O3
acet
onit
rile
2
elec
trod
es
∼0
.7 V
-
- 6.
55 %
-
29
so-W
O3/
Pt
coat
ed W
3-m
etho
xypr
opio
nitr
ile
3 el
ectr
odes
∼0
.4 V
∼2
0 m
Ah.
g-1
- -
- 30
WO
3 C
NT
s/
TiN
,Ti m
esh
prop
ylen
e ca
rbon
ate
3 el
ectr
odes
∼0
.7 V
0.
124
mA
h.cm
-2
10cy
cles
∼8
6 %
cap
a.
rete
ntio
n
- -
31

Chapter 1 – Solar-powered electrochemical energy storage: state of the art & new approach
29
I.4 – Solar energy storage in lithium-ion rechargeable batteries
Lithium-ion battery (LIBs) has been developed as one of the most efficient devices for
the electrical energy storage. LIB technology has now surpassed other previously
competitive battery because of their high gravimetric energy density and long cycle
durability.7 During the charge step, LIB electrodes can store the provided electrical
current via reversible Li+ intercalation. If an additional photo-electrode can now
harvest light and convert incident photon energy into electrochemical energy, the
converted photo-energy could be used to directly recharge the battery.
In 2012, Guo et al.32 reported for the first time a device where a DSSC is directly
associated with a Li-ion battery. The device is based on a common bifacial titanium
electrode, which is shared by the DSSC and the battery. This electrode is
functionalized on both sides by TiO2 nanotubes, which are perpendicularly grown to
the electrode surface (Figure 10). Here, it is important to note that the photo-
electrode and the battery electrode are nevertheless distinct electrodes, even if they
share the same current collector.
This study echoed Mor et al. work on a titanium sheet anodization to fabricate stiff or
flexible dye-sensitized cells.33 In these systems, it has been shown that reducing the
photo-electrode particles size can lead to an enhancement of the efficiency of photo-
induced charge collection.34
Figure 10: Schematic representation of an integrated power pack system based on double-sided TiO2 nanotube arrays.32
When sunlight irradiates the DSSC, the photo-generated electrons from the light-
absorbing dye are injected into the conduction band of TiO2 nanotubes and transported
along the Ti foil to the TiO2 anode of lithium-ion battery (Figure 10). In the
meantime, the photo-generated holes accumulate at the Pt electrode. At the anode, the

Chapter 1 – Solar-powered electrochemical energy storage: state of the art & new approach
30
excited electrons induce the following chemical process: TiO2 + xLi+ + xe- → LixTiO2.
At the cathode, the reaction LiCoO2 → Li1-xCoO2 + xLi+ + xe− releases free electrons
that flow to the counter electrode of the DSSC through an external circuit to combine
with the holes in the Pt electrode. By using this hybrid structure, the system delivers a
2 V voltage for a discharge capacity of about 39 µAh under a discharge current density
of 100 µA. The total energy and storage efficiency is reported up to 0.82 %.
Performances of all the described systems in this section have been summarized in
Table 2 pages 39-40.
In 2015, Li et al.35 reported a novel photo-assisted chargeable Li-ion battery consisting
of a LiFePO4 cathode, a metallic lithium anode and a TiO2 photo-electrode coupled
with an iodide ion redox shuttle for saving electric energy (Figure 11).
Figure 11: (a) Schematic illustration and (b) energy diagram of a photo-assisted chargeable LIB with a three- electrode system. (c) The charge curves of the photo-assisted chargeable LIB (red line) and the LIB (black line) at a current density of 0.02 mA.cm-2. (d) The discharge curves of the photo-assisted chargeable LIB (red line) and the LIB (black line) at a current density of 0.01 mA.cm-2. (e) The light response of the charging voltage of a photo-assisted chargeable LIB when illumination was switched from “on” to “off”.35
During the photo-assisted charging process, the photo-excited electrons of TiO2 are
transferred to the anode, reducing Li+ to Li metal using an extra applied voltage to
compensate the actual required charging voltage. Meanwhile, the I- redox mediator is
oxidized to I3- by the photo-excited holes and then, in turn, oxidizes the LiFePO4. In
the process, I3- is reduced back to I-. Due to the contribution of the photo-voltage, the
c d e

Chapter 1 – Solar-powered electrochemical energy storage: state of the art & new approach
31
charging voltage of the LiFePO4 cathode is experimentally reduced to 2.78 V, which is
lower than the discharge voltage of 3.41 V, resulting in about 19% input electric energy
saving. Interestingly, this photo-assisted rechargeable battery exhibits a fast photo-
response behaviour and could be discharged at a stable voltage plateau of 3.41 V after
10 cycles. If this system allows energy saving, it is to mention that it is not fully
autonomous, in contrast to the previous example.
I.5 - Solar energy storage in lithium-oxygen rechargeable batteries
The use of O2 molecules from the air as an active material, instead of solid materials,
promises a drastic improvement in the energy density (∼3550 Wh.kg−1).12 Typically, a
Li-O2 battery is composed of a lithium metal anode, a porous carbon cathode and a Li+
ion conductive electrolyte. Li–O2 cells operate in both aqueous and non-aqueous
electrolytes on the basis of two governing reactions:
2 Li+ + 2 e− + ½ O2 + H2O → 2 LiOH, E = 3.45 V vs Li+/Li (aqueous) and
2 Li+ + 2e− + O2 → Li2O2, E = 2.96 V vs Li+/Li (non-aqueous).7
In 2014, Yu et al.36 introduced the approach of using a redox shuttle to couple a photo-
electrode with the oxygen electrode in non-aqueous Li–O2 batteries, which enables
photo-assisted charging process. The device integrates a dye-sensitized TiO2 photo-
electrode with the oxygen electrode via the linkage of the triiodide/iodide redox shuttle.
On charging under illumination, the photo-electrode generates triiodide ions that
subsequently diffuse to the oxygen electrode surface and oxidize Li2O2 (Figure 12).
The main interest of this system is to deliver a tension corresponding to the energy
difference between the Li+/Li and O2/Li2O2 redox couples while only paying the energy
cost corresponding to the difference between Li+/Li redox potential and the quasi-
Fermi level of electrons in TiO2. This way, the photo-voltage generated on the TiO2
photo-electrode allows the system to be charged at an input voltage of 2.8 V under
illumination instead of 4.0 V in a conventional Li–O2 battery.

Chapter 1 – Solar-powered electrochemical energy storage: state of the art & new approach
32
Figure 12: a) Schematic illustration of a photo-assisted chargeable Li-O2 battery with TiO2 as photo-electrode b) representative scheme of the photo-assisted process c) Energy diagram of the
photo-assisted recharge.36
Based on a similar mechanism, Liu et al.37 presented in 2015 a photo-assisted
rechargeable Li–O2 battery by integrating carbon nitride on carbon paper as photo-
catalyst instead of TiO2 photo-electrode (Figure 13). Upon charging under
illumination, the I- ions in the electrolyte are oxidized to I3- ions by photo-excited holes
from the g-C3N4 photo-catalyst. The resultant I3- ions subsequently diffuse to the
oxygen electrode and oxidize Li2O2 to Li+ and O2. Meanwhile, the photo-excited
electrons of g-C3N4 are transferred to the anode to reduce Li+ to Li with the help of a
charging voltage of 1.9V. This charging voltage is lower than the discharging voltage
(effective discharge voltage of 2.7 V).

Chapter 1 – Solar-powered electrochemical energy storage: state of the art & new approach
33
Owing to the potential photo/thermal instability of the redox shuttle in electrolytes,
Liu et al.38 suggested further improvements by demonstrating that g-C3N4-carbon paper
photo-catalyst could realize the direct photo-oxidation of Li2O2 without any redox
mediators. With the suitable design, this system reduces the charge voltage of the Li–
O2 battery to 1.96 V without any redox mediator, which could pave the way for the
design of photo-charging all-solid state batteries.
Figure 13: Schematic illustration of a photo-rechargeable Li-O2 battery with g-C3N4 as photo-electrode.37 Theoretical photo-charging voltage is 1.7 V, effective photo-charging voltage of 1.9 V was achieved.
I.6 - Solar energy storage in lithium-sulfur rechargeable batteries
Sulfur is one of the most promising active materials because of its high theoretical
capacity (1675 mAh.g-1), low cost and natural abundance7. Sulfur undergoes series of
structural changes described by the redox reaction of S8 + 16 Li → 8 Li2S (∼2.15 V vs.
Li/Li+) during the discharging and charging processes.39
In 2015, Li et al.40 reported a prototype of a solar-driven chargeable lithium-sulfur
battery, which enabled photo-assisted charging process. The capture and storage of
solar energy is realized by oxidizing S2- ions to polysulfide ions in aqueous solution with
a Pt-modified CdS photo-catalyst (Figure 14). After 2 h of photo-charge, the battery
can deliver a specific capacity of 792 mAhg-1 with a discharge potential of around
2.53 V. A specific capacity of 199 mAhg-1, reaching the level of conventional lithium-ion
batteries, can be achieved after only 10 min of photo-charge. The charging process of
the battery is also accompanied with hydrogen generation. The produced gas is
monitored and quantified by gas chromatography, but the discrepancy of the hydrogen
evolution rate measured from the photocatalytic water splitting system and that
calculated from the stored electrons in the Li-S battery is not well understood. The
system presents a capacity retention of 92.5 % after 10 cycles, but the capacity
decreases with a prolonged irradiation. As explanation, the authors suggest the

Chapter 1 – Solar-powered electrochemical energy storage: state of the art & new approach
34
generation of solid-state S8, which is a consequence of the over-oxidation of S2- ions by
Pt/CdS photo-catalyst. The insoluble S8 species would not allow recovering electrons
from the current collector and can consequently cause the capacity loss. Therefore,
overcharging should be avoided by controlling the optimal light irradiation time, which
is determined to be 2 h in this study.
Figure 14: a) Schematic illustration of a photo-rechargeable Li-S battery b) representative scheme of discharge and photo-charge processes.40
I.7 - Solar energy storage in lithium-iodide rechargeable batteries
In the continuity of their work on Li-O2,36 Yu et al.41 demonstrated in 2015 the photo-
assisted charging concept for a solar-powered Li-I flow battery by incorporation of a
dye sensitized TiO2 photo-electrode into a Li-I redox flow battery (Figure 15). The Li
anode and I3-/I- catholyte are separated by a ceramic Li-ion conductive separator. The
catholyte composition includes guanidine thiocyanate and chenodeoxycholic acid
additives, which facilitate the surface-wetting between the hydrophilic I3-/I- catholyte
and the hydrophobic dye sensitized. To the best of our knowledge, it is the first time
that a DSSC photo-electrode is immerged into an aqueous catholyte, which constitutes
an important step towards the coupling of this electrode with redox-flow systems.
The discharging process is similar to that of conventional Li−I batteries:
electrochemical oxidation of Li to Li+ on the anode side and reduction of I3− to I− on
the counter-electrode side give an electricity output of 3.3 V. Upon illumination, dye
molecules, which are chemically adsorbed on the TiO2 semiconductor surface, get
photo-excited and inject electrons into the conduction band of TiO2 (steps 1 and 2 in
Figure 15.c). The oxidation of I− to I3− then takes place by regenerating oxidized dye

Chapter 1 – Solar-powered electrochemical energy storage: state of the art & new approach
35
molecules (step 3 in Figure 15.c). By applying an additional external voltage, Li+ ions
pass meanwhile through the ceramic separator and are reduced to metallic Li on the
anode side (step 4 in Figure 15.c), completing the full photo-assisted charging process.
Figure 15: (a) Schematic of a Li−I flow battery with the three-electrode configuration (b) energy diagram for the photo-assisted charging process (c) photo-electrochemical half reactions.41
Similar to previously described photo-assisted charging devices in Li-O2 technology, the
main interest of this system is to deliver a tension corresponding to the energy
difference between the Li+/Li and I3-/I- redox couples while only paying the energy cost
corresponding to the difference between Li+/Li redox potential and the quasi-Fermi
level of electrons in TiO2. This way, the device could be discharged at 3.3 V while
being charged at 2.9 V, thus allowing energy savings up to 20 %. This system shows a
good cycling ability with a stable charging voltage plateau conserved after 25 cycles,
but presents a slow rate of photo-charge (16.8 hours for 0.1 mL of catholyte).
In 2016, Nikiforidis et al.42 demonstrated photo-assisted lithium−iodine redox cells
integrated with a hematite photo-electrode replacing the TiO2 dye sensitized photo-
electrode. The energy efficiency for the photo-assisted charge process is ∼95.4 %, which
is ∼20 % higher than that in the absence of illumination at a current rate of
0.075 mA.cm−2. The hematite is remarkably stable in aqueous I3-/I- catholyte and
exhibits over 600 hours of cycling without noticeable performance decay and photo-
corrosion. Nevertheless, the expensive LISICON separator and the durability for
effectively avoiding the redox-shuttle have still to be developed in these systems.12
I.8 - Solar energy storage in dual-liquid redox batteries
In contrast with other rechargeable batteries employing the solid or gas materials on
the active electrodes, the dual-liquid redox batteries enable to store electrical energy
via two liquid redox-couple electrolytes (anolyte and catholyte). This option avoids
safety issues for the use of metal anode (Li, Na and K etc.). Besides, dual electrolytes
can be stored in external reservoirs for different volumes.12 Redox batteries can be
interesting for their flexibility, high lifetimes, high reliability, relatively low operation

Chapter 1 – Solar-powered electrochemical energy storage: state of the art & new approach
36
costs, as well as the potential to store a large amount of energy. Furthermore, the
power and energy output are independent of the storage capacity, which offers a
separate control over the energy and the power, resulting in a highly flexible system.2
Figure 16: Reduction potentials of some couples considered relative to their thermodynamic stability window of water at neutral pH (white region). The lines coloured in red, green and blue are for couples stable in acidic (1M acid), neutral and basic (1M base) conditions, respectively. BV, benzyl viologen; EV, ethyl viologen; HV, heptyl viologen; MV, methyl viologen; SCE, standard calomel electrode.43
The redox potentials of common redox-couples are shown in Figure 16.43 The first
solar battery was introduced in a redox battery with the Ag2S/Ag ad S/S2− respectively
as anode and cathode active materials, with a CdSe photo-electrode integrated in the
catholyte’s compartment in 19764. Since then, different kinds of redox-couples have
been investigated for photo-rechargeable redox-flow batteries. All vanadium systems,44–
48 iodide-,49–51 quinone-52–54 and polysulfide-based55,56 systems are amongst the most
studied redox couples for photo-assisted recharge. Detailed device descriptions can be
find in recent reviews.1,2,12 Performances of few of these systems have been summarized
in Table 2 pages 39-40.
Here, we will only illustrate the photo-rechargeable redox-flow batteries technology
using a typical all-vanadium system based on the aqueous couples V3+/V2+ (- 0.26 V vs
ESH) and VO2+/VO2+ (1.0 V vs ESH). These redox couples present high charge
transfer kinetics and count among the most used and studied redox couples for
stationary storage energy applications.57
In 2012, Liu et al. studied the effect of vanadium redox species on the photo-
electrochemical behavior of TiO2 and hybrid TiO2/WO3 photo-electrodes in a photo-
water splitting cell.44 They observe a strong improvement of the electrode photo-
response when VO2+ is added to the aqueous electrolyte. They attribute this
phenomenon to the redox properties of VO2+, which would trap holes and limit exciton
recombinations. On the basis of this study, Wei et al.45 proposed a cell integrating a
TiO2 photo-electrode into an all-vanadium redox-flow battery (Figure 17).

Chapter 1 – Solar-powered electrochemical energy storage: state of the art & new approach
37
During the photo-charge, the photo-generated holes diffuse from TiO2 electrode to the
photo-electrode/electrolyte interface and oxidized VO2+, whereas electrons get
transported through external circuit to reduce V3+ at the Pt counter-electrode. In the
dark, the battery discharges as a regular redox battery with V2+ oxidation and VO2+
reduction. A Nafion membrane allows the separation of the two compartments and
ensures the ionic conductivity by protons transfer into an aqueous electrolyte (H2SO4,
3 mol.L-1). Even if it is thermodynamically possible to decompose water in this device,
the required multi-electronic reactions are too slow in comparison to the single electron
transfer process involved in the vanadium couples redox reactions (Figure 17).
Figure 17: (left) Schematic illustration of the all-vanadium redox PEC storage cell (right) band positions of TiO2 and corresponding photo-electrochemical reactions in a) photo-catalytic water splitting and b) an all-vanadium redox PEC storage cell. CB and VB refer to conduction band and valence band, respectively. The energy differences between the semiconductor band edges and thermodynamic redox reactions are indicated in the figures.45
This battery can be continuously photo-recharged for long time (>25 h) and delivers a
0.8 V open circuit voltage in the dark. Compared to other photo-electrodes materials,
TiO2 shows a remarkable stability in acid conditions and allows a good electric
conversion efficiency of 12 % at 350 nm. However, its large band gap (3.2 V) in absence
of dye limits the light absorption at shorter wavelengths.
In another study, the same authors replace the TiO2 electrode by a hybrid electrode
TiO2/WO3.48 Because WO3 band gap is smaller (2.6 V) than TiO2, its association with
TiO2 aims to extend the photo-electrode absorption window. Besides, the WO3 valence
and conduction bands position are such that electrons and holes should naturally be
transferred from TiO2 to WO3 (Figure 18).

Chapter 1 – Solar-powered electrochemical energy storage: state of the art & new approach
38
In this system, the photo-generated charge carriers can follow different paths at the
semiconductor/electrolyte interface. Electrons and holes can reduce V3+ and oxidize
VO2+, or they can recombine. Electron transfer can also occur from TiO2 to WO3
reducing W6+ in W5+ and forming HxWO3, H+ can be reversibly extracted from this
structure. This formation of HxWO3 can be interpreted as an additional storage for the
electrons, which could be then given back during the discharge. The higher photo-
currents were observed with 12% mass percentage in WO3. For smaller percentages,
WO3 content would not offer enough insertion sites for the electrons to avoid
recombination, whereas for higher WO3 mass content, HxWO3 formation would compete
with vanadium redox reactions.
Figure 18: Schematic representation of proposed electron storage mechanism and charge transfer pathways for the hybrid WO3/TiO2 electrode in the all-vanadium photo-electrochemical
storage cell.48
Cha
pter
1 –
Sol
ar-p
ower
ed e
lect
roch
emic
al e
nerg
y st
orag
e: s
tate
of th
e ar
t &
new
app
roac
h
39
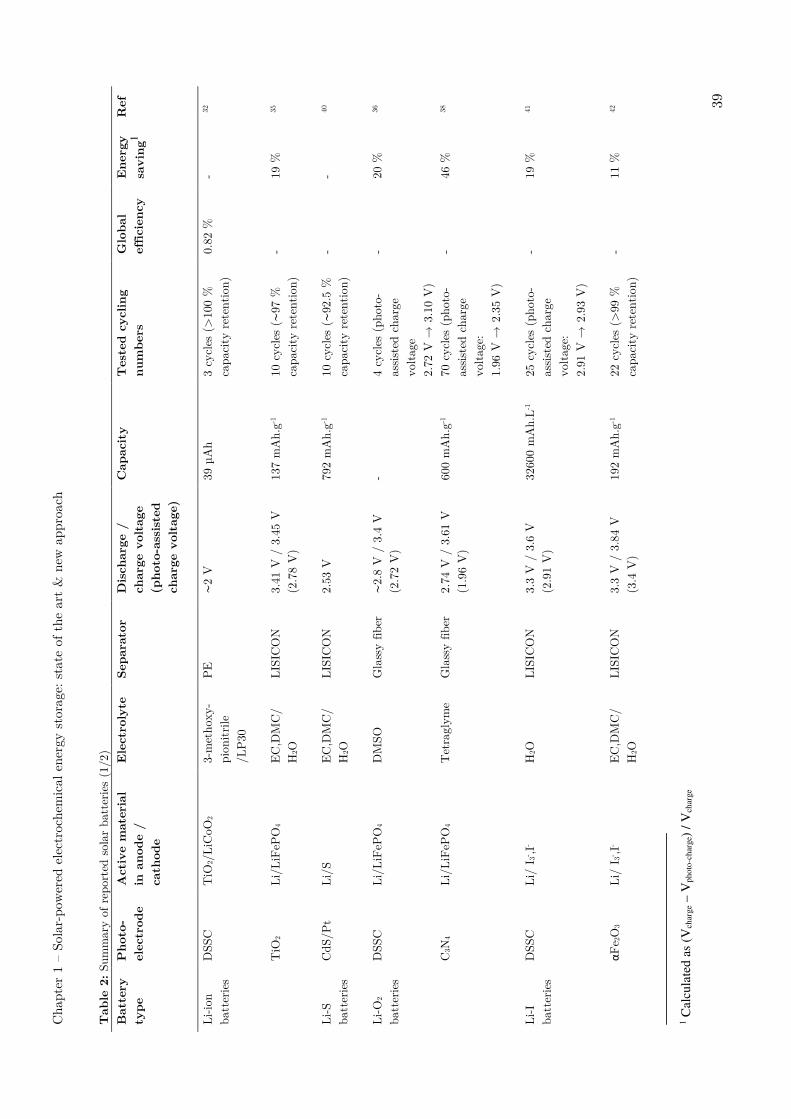
Table
2: Su
mm
ary
of r
epor
ted
sola
r ba
tter
ies
(1/2
)
Batt
ery
type
Photo
-
ele
ctro
de
Act
ive m
ate
rial
in a
node /
cath
ode
Ele
ctro
lyte
Separa
tor
Dis
charg
e /
charg
e v
oltage
(photo
-ass
iste
d
charg
e v
oltage)
Capaci
ty
Test
ed c
ycl
ing
num
bers
Glo
bal
effic
iency
Energ
y
R
ef
savin
g1
Li-io
n ba
tter
ies
DSS
C
TiO
2/LiC
oO2
3-m
etho
xy-
pion
itri
le
/LP
30
PE
∼2
V
39 µ
Ah
3 cy
cles
(>
100
%
capa
city
ret
enti
on)
0.82
%
- 32
T
iO2
Li/
LiF
ePO
4 E
C,D
MC
/ H
2O
LIS
ICO
N
3.41
V /
3.4
5 V
(2
.78
V)
137
mA
h.g-
1 10
cyc
les
(∼97
%
capa
city
ret
enti
on)
- 19
%
35
Li-S
batt
erie
s C
dS/P
t Li/
S E
C,D
MC
/ H
2O
LIS
ICO
N
2.53
V
792
mA
h.g-
1 10
cyc
les
(∼92
.5 %
ca
paci
ty r
eten
tion
) -
- 40
Li-O
2 ba
tter
ies
DSS
C
Li/
LiF
ePO
4 D
MSO
Gla
ssy
fibe
r ∼2
.8 V
/ 3
.4 V
(2
.72
V)
- 4
cycl
es (
phot
o-as
sist
ed c
harg
e vo
ltag
e
2.72
V →
3.1
0 V
)
- 20
%
36
C
3N4
Li/
LiF
ePO
4 T
etra
glym
e G
lass
y fibe
r 2.
74 V
/ 3
.61
V
(1.9
6 V
) 60
0 m
Ah.
g-1
70 c
ycle
s (p
hoto
-as
sist
ed c
harg
e vo
ltag
e:
1.96
V →
2.3
5 V
)
- 46
%
38
Li-I
batt
erie
s D
SSC
Li/
I3- ,I
- H
2O
LIS
ICO
N
3.3
V /
3.6
V
(2.9
1 V
) 32
600
mA
h.L
-1
25 c
ycle
s (p
hoto
-as
sist
ed c
harg
e vo
ltag
e:
2.91
V →
2.9
3 V
)
- 19
%
41
αF
e 2O
3 Li/
I3- ,I
- E
C,D
MC
/ H
2O
LIS
ICO
N
3.3
V /
3.8
4 V
(3
.4 V
) 19
2 m
Ah.
g-1
22 c
ycle
s (>
99 %
ca
paci
ty r
eten
tion
) -
11 %
42
1 C
alcu
late
d a
s (V
char
ge –
Vphoto
-char
ge)
/ V
char
ge
Cha
pter
1 –
Sol
ar-p
ower
ed e
lect
roch
emic
al e
nerg
y st
orag
e: s
tate
of th
e ar
t &
new
app
roac
h
40
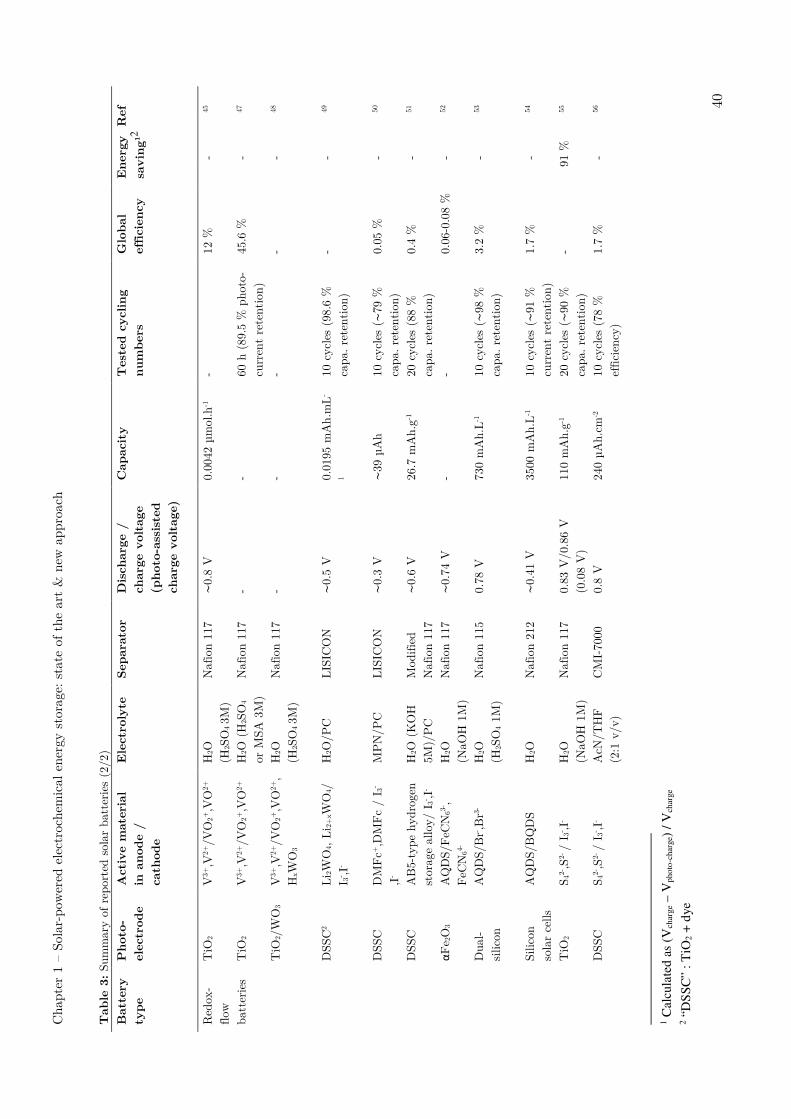
Table
3: Su
mm
ary
of r
epor
ted
sola
r ba
tter
ies
(2/2
)
Batt
ery
type
Photo
-
ele
ctro
de
Act
ive m
ate
rial
in a
node /
cath
ode
Ele
ctro
lyte
Separa
tor
Dis
charg
e /
charg
e v
oltage
(photo
-ass
iste
d
charg
e v
oltage)
Capaci
ty
Test
ed c
ycl
ing
num
bers
G
lobal
effic
iency
Energ
y
Ref
savin
g12
Red
ox-
flow
ba
tter
ies
TiO
2 V
3+,V
2+/V
O2+
,VO
2+
H2O
(H
2SO
4 3M
)
Naf
ion
117
∼0.8
V
0.00
42 µ
mol
.h-1
- 12
%
- 45
TiO
2 V
3+,V
2+/V
O2+
,VO
2+
H2O
(H
2SO
4
or M
SA 3
M)
Naf
ion
117
- -
60 h
(89
.5 %
pho
to-
curr
ent
rete
ntio
n)
45.6
%
- 47
TiO
2/W
O3
V3+
,V2+
/VO
2+,V
O2+
,
HxW
O3
H2O
(H
2SO
4 3M
)
Naf
ion
117
- -
- -
- 48
DSS
C2
Li 2W
O4, L
i 2+
xWO
4/
I 3- ,I
- H
2O/P
C
LIS
ICO
N
∼0.5
V
0.01
95 m
Ah.
mL
-
1 10
cyc
les
(98.
6 %
ca
pa. re
tent
ion)
- -
49
DSS
C
DM
Fc+
,DM
Fc
/ I 3
-
,I-
MP
N/P
C
LIS
ICO
N
∼0.3
V
∼39 µA
h 10
cyc
les
(∼79
%
capa
. re
tent
ion)
0.
05 %
-
50
DSS
C
AB
5-ty
pe h
ydro
gen
stor
age
allo
y/ I
3- ,I-
H2O
(K
OH
5M
)/P
C
Mod
ifie
d N
afio
n 11
7 ∼0
.6 V
26
.7 m
Ah.
g-1
20 c
ycle
s (8
8 %
ca
pa. re
tent
ion)
0.
4 %
-
51
αFe 2
O3
AQ
DS/
FeC
N63-
, FeC
N64-
H
2O
(NaO
H 1
M)
Naf
ion
117
∼0.7
4 V
-
- 0.
06-0
.08
%
-
52
Dua
l-si
licon
A
QD
S/B
r-,B
r3-
H2O
(H
2SO
4 1M
)
Naf
ion
115
0.78
V
730
mA
h.L
-1
10 c
ycle
s (∼
98 %
ca
pa. re
tent
ion)
3.
2 %
-
53
Silic
on
sola
r ce
lls
AQ
DS/
BQ
DS
H2O
N
afio
n 21
2 ∼0
.41
V
3500
mA
h.L
-1
10 c
ycle
s (∼
91 %
cu
rren
t re
tent
ion)
1.
7 %
-
54
TiO
2 S 4
2-,S
2- /
I3- ,I
- H
2O
(NaO
H 1
M)
Naf
ion
117
0.83
V/0
.86
V
(0.0
8 V
) 11
0 m
Ah.
g-1
20 c
ycle
s (∼
90 %
ca
pa. re
tent
ion)
-
91 %
55
DSS
C
S 42-,S
2- /
I3- ,I
- A
cN/T
HF
(2:1
v/v
) C
MI-
7000
0.
8 V
24
0 µA
h.cm
-2
10 c
ycle
s (7
8 %
ef
fici
ency
) 1.
7 %
-
56
1 C
alcu
late
d a
s (V
char
ge –
Vphoto
-char
ge)
/ V
char
ge
2 “
DS
SC
” :
TiO
2 +
dye

Chapter 1 – Solar-powered electrochemical energy storage: state of the art & new approach
41
I.9 - State of the art: conclusions
The strategy, which consists in externally wiring a battery with solar cells in order to
recharge it, is up to now the most mature technology. In fact, it benefits from two well-
known and established technologies for conversion (solar cell technology) and storage
(Li-ion battery technology). Good performances could be reached by working on the
good match (buffer against the photovoltaic current variations8, matching the
photovoltaic maximum power point voltage to the battery charging voltage9, boost
converter11) between solar cells and storage devices (when optimized, up to 14.5 % of
overall efficiencies for amorphous silicon photovoltaic modules9 and 9 % for perovskite
solar cells).10,11 However, it has shown practical limitations: the extra photovoltaic
modules and external wires considerably enlarge the volume and weight of the entire
device, and increase the cost of energy storage.12 In fact, no work has been undertaken
on the system design to try to make the device more suitable for portable applications.
In order to design an appropriate compact device for both converting and storing
energy, two main strategies have been described in this chapter.
The first strategy consists in hybridizing a DSSC with capacitors in order to directly
store the photo-generated energy. Compared to solar batteries, solar capacitors
responsiveness to photo-current storage is expected to be quicker because of the
inherent fast-charging nature of the capacitor component.1 In this strategy, research
has mostly been focused on the engineering aspects of designing more efficient,
compact, portable, and flexible devices. Performances of these devices (reported in
Table 1 (page 28)) show that amongst the different tested geometries to assemble
conversion and storage compartments, the three-electrode device with carbon
nanotubes22 seems to remain highly performing system in regards to discharge voltage,
conversion and storage efficiencies. Flexibility24–26 has thus a little cost in terms of
performances, even if all the systems roughly have similar performances.
The second strategy consists in introducing photo-electrodes into lithium-based
rechargeable battery in order to allow either a photo-charge or a photo-assisted charge.
One more time, DSSC are quite commonly used. Storage capacities and output voltage
are coherent with what could be expected from battery technologies: high voltage for
Li-based batteries, and high capacities for post-lithium technologies (Li-S and Li-O2)
and redox-flow batteries. In these systems, report of the conversion and storage
efficiencies is far from being systematic. Very little information is given more
specifically on the global efficiency of lithium-based photo-batteries.

Chapter 1 – Solar-powered electrochemical energy storage: state of the art & new approach
42
It can be useful to remind here that almost all the reported devices have been
published within the last 5 years. Hence, instead of comparing efficiencies of devices
still far from their maturity point, it may be more relevant to analyse and compare the
operation principle of these SPEES devices.
I.9.1 - Photo-charge or photo-assisted charge?
The nature of the charge under light exposure (photo-charge or photo-assisted charge)
depends on the amount of energy required to reverse the spontaneous reactions
occurring between the cathode (or catholyte) and the anode (or anolyte). The energy
diagram in Figure 19 is representative for systems where typically a DSSC is coupled
with a storage electrode.
Figure 19: Schematic energy diagram for the photo-charging (in red) and discharge (in green) processes of a typical {DSSC + WO3} system.
After illumination, photo-generated electrons flow from the photo-electrode (typically
TiO2) to the counter electrode (typically WO3, or polymers like PEDOT58,59), where it
is stored through ion intercalation. The obtained output discharge voltage corresponds
to the difference between the Fermi level of the chosen active storage material
(typically WO3, or polymers like PEDOT58,59) and the potential of the mediator redox
potential (I- / I3- in a DSSC). In this case, the discharge voltage (also called output
voltage) is limited by the position of the conduction band of the photo-electrode, which
determines the electron highest energy level. It is the reason why the discharge voltage

Chapter 1 – Solar-powered electrochemical energy storage: state of the art & new approach
43
in the {DSSC + capacitors system} system generally don’t exceed 0.6-0.7 V
(ECB,TiO2 ∼ -0.2 V vs ESH,60 E Iodine / iodide ∼ 0.4 V vs ESH16). In this configuration, no
additional voltage needs to be applied for the photo-charge.
The energy diagram in Figure 20 is representative for systems working with a metallic
Li electrode as counter electrode (typically in Li-O2,36–38 Li-S,40 Li-I batteries,41,42 or in a
half cell Li-ion battery configuration35). In this case, the output voltage is generally
high (around 2-3 V against 0.7 V generally in a {DSSC + capacitors system}), and
light exposure doesn’t bring enough energy to realize a complete photo-charge.
However, it allows a photo-assisted charge by reducing the charging voltage under light
exposure.
Figure 20: Schematic energy diagram for the photo-assisted charging (in red) and discharge (in green) processes of systems typically working with a metallic Li electrode as counter electrode.
The main interest of these systems is to deliver a tension corresponding to the energy
difference between Li+/Li and the redox active material at the cathode / catholyte
while only paying the energy cost corresponding to the difference between Li+/Li redox
potential and the quasi-Fermi level of electrons in the photo-electrode (TiO2,35,36,41,55
αFe2O342 or C3N4
37,38).

Chapter 1 – Solar-powered electrochemical energy storage: state of the art & new approach
44
In most cases, I- / I3- redox couple is used as mediator to transfer photo-generated holes
from the photo-electrode allowing the mediated oxidation of the cathode / catholyte
during the photo-assisted charge. In some cases, the photo-oxidation is unmediated, as
in Li-I systems where I- / I3- is the catholyte41,42 itself or in a Li-O2 battery study.38 For
cathode / catholyte as LiFePO4, Li2O2 or I3-, which have comparable reduction
potential around 0.4 V vs ESH, the charging voltage is expected to be reduced from
0.6-0.7 V for TiO2, 0.45 V for αFe2O3 and 1.65 V for C3N4 photo-electrodes (see Table
2 pages 39-40). The ideal energy alignment should thus minimize the energy difference
(V1) between the anode and the quasi-Fermi level of electrons in the photo-electrode
for smaller photo-assisted charge voltage, maximize (V2) the energy difference between
the anode and the cathode for larger discharge voltage output, but also minimize (V3)
the photo-electrode band-gap for a better sunlight harvesting.
The last energy diagram (Figure 21) is typical for redox-flow batteries, where no
additional voltage needs to be applied for the photo-charge. After illumination, both
photo-generated holes and electrons have to react with the discharged redox species to
ensure a complete photo-recharge. The ideal catholyte-photo-electrode alignment
should maximize (V2) = Eanolyte - Ecatholyte for larger discharge voltage output, meanwhile
minimize photo-electrode band gap (V1) for better sunlight harvesting.1
Figure 21: Schematic energy diagram for the photo-charging (in red) and discharge (in green) processes of redox-flow batteries employing two soluble redox species.

Chapter 1 – Solar-powered electrochemical energy storage: state of the art & new approach
45
I.9.2 – Choice of the electrolyte
The choice of the electrolyte and of the eventual associated dissolved species is a real
challenge in order to develop solar powered electrochemical energy storage devices. In
fact, they should (1) be adapted for the usual charges and discharges of the chosen
battery technology, but also (2) be adapted to operate under light exposure.
(1) to be adapted for usual charges and discharges of the battery
Amongst many criteria, the solvent should have an adapted electrochemical window, so
that electrolyte degradation would not occur within the range of the working potentials
of both the cathode and the anode. In this regard, organic solvents or ionic liquids can
provide wide electrochemical windows in comparison to aqueous solvents, which are not
suitable for high voltage application (see the 1.23V-limited water stability window in
Figure 21). Nevertheless, compared to organic solvents, aqueous solvents can be an
interesting solution in regards to their low toxicity, low cost and higher evaporation
temperature.
Obviously, criterion (1) strongly depends on the battery technology. For instance, for
the post-lithium-ion batteries, which promise high energy densities such as Li-S or Li-
O2 batteries, designing a suitable electrolyte is already a big challenge, even under dark
conditions.
In Li−S batteries for example, unlike those in traditional lithium-ion batteries, the
charge and discharge processes of a lithium–S system involve series of intermediate
redox polysulfide species, which are highly soluble into liquid electrolytes.7,61 Under the
working conditions (for charge and discharge) of lithium–sulfur batteries, the soluble
polysulfide species tend to migrate from the cathode through the porous separator to
chemically react with lithium metal at the anode. This polysulfide shuttle behavior
severely lowers the cycling efficiency of the cells and induces capacity fade during
cycling.62
As studied alternatives, polymer and solid-state electrolytes are more favorable than
liquid electrolytes in terms of their capability of reducing the solubility of polysulfides
and blocking the shuttle of polysulfides in Li−S batteries. Besides, they could protect
the lithium metal anode and minimize dendrite formation, which is beneficial for
improving the safety and life cycle of Li−S batteries. However, polymer and solid-state
electrolytes usually have low ionic conductivity because of the high viscosity of
polymers and high energy barrier for Li-ion transport in solid-state electrolytes.61

Chapter 1 – Solar-powered electrochemical energy storage: state of the art & new approach
46
In Li-O2 batteries, the electrolyte is also key component and one of the main challenges
at present. It must be stable both to O2 and its reduced species, as well as to the LiOx
compounds that form on discharge; it must exhibit sufficient Li+ conductivity, O2
solubility and diffusion to ensure satisfactory rate capability, as well as wet the
electrode surface and possess low volatility to avoid evaporation at the cathode.
In the aqueous operation, the discharging process produces a soluble product, LiOH,
which does not readily decompose during charging and can also precipitate63,64 above
~5 M, impairing the energy density and cyclability.
Electrolytes based on organic carbonates (for example, LiPF6 in propylene carbonate)
have so far been widely used in non-aqueous Li–O2 cells, because of their low volatility,
compatibility with Li metal and high oxidation stability (>4.5 V vs. Li+/Li). However,
studies also show that organic carbonates are vulnerable to the nucleophilic attack
reduced O2 species.63
Hence, design of suitable electrolytes is already a tough challenge for technologies as Li-
O2 and Li-S for example.
(2) to be adapted to operate under light exposure
As SPEES systems are meant to work under light exposure, it seems important to
figure out if created excitons could trigger unexpected degradative side reactions. In the
described SPEES devices (sections I.2-I.8), information is often given concerning the
battery capacity retentions after illumination, but up to now, very little information is
given concerning the effect of light illumination during the photo-(assisted)-charge on
the eventual degradation of the constitutive elements of the battery.
Many SPEES devices are based on DSSC technology whose stability under light has
already been discussed.65,66 The most commonly used electrolyte is the iodide/triiodide
redox couple in an organic matrix, generally acetonitrile. Experimental studies
indicated that exposure of DSSCs to UV light can degrade their performance during
long-term operation as it can generate a number of degradation mechanisms. For
instance, UV light can cause TiO2 direct band excitation, which may lead to oxidation
of the dye.67,68 Using optical spectroscopy, it was found that UV light can cause
irreversible reaction of iodine leading to the bleaching of the electrolyte.67 Furthermore,
electrolyte bleaching was also reported resulting in the high temperatures (T > 50 °C)
under one Sun illumination even in the absence of UV light and under both indoor and
outdoor ageing conditions in the presence of UV filter with a cut-off wavelength at 397
nm.69 Also, active oxygen species (such as hydroxyl groups and OH radicals), water or

Chapter 1 – Solar-powered electrochemical energy storage: state of the art & new approach
47
other impurities in the electrolyte and sublimation of iodine due to inadequate sealing
barriers are the other factors in the I3- degradation mechanisms.70
Hence, we could yet keep in mind that dye and dissolved redox species can be
particularly sensible to light exposure. Finding a way to limit their utilization could
then conduct to more stable devices.

Chapter 1 – Solar-powered electrochemical energy storage: state of the art & new approach
48
II - Converting and storing solar energy: a new approach
Up to now, the challenge of combining solar energy harvesting and energy storage
have been addressed in hybridizing two separated technologies. In fact, conversion and
energy storage compartments have been externally wired,9,8,10,11 or have been
incorporated into a two compartments device sharing a common electrode as described
in section I.
In this work, we propose a different approach to harvest and store the solar energy into
a single device. The idea here is to explore the possibility of converting and storing the
solar energy within a single bifunctional electrode. In fact, such a bifunctional electrode
could be integrated into photo-rechargeable Li-ion batteries, where intercalating storage
electrodes could be directly recharged by light irradiation. As developed, photo-
rechargeable Li-ion batteries could offer several advantages.
First, they are inherently simple systems since they do not require complex installation
for the storage and distribution of fuels, e.g., solar fuels. Second, they are potential
energy efficient devices in that they utilize a single material photo-active host electrode
for the dual functionalities of energy harvesting and storage, thereby eliminating any
possibility of energy losses associated with charge transfer. Third, they can be highly
robust if they are developed as small and portable energy devices with capacities to
bridge the energy needs of a day and night cycle.71
II.1 - Pioneering works on bifunctional electrodes
The concept of solar intercalation batteries was first introduced by Tributsch et al. in
the 1980s on the basis of theoretical considerations and supporting experiments.72–76 In
his pioneering work published in 1980,72 zirconium- and hafnium-dichalcogenides are
used as p-type semiconductors in HCl aqueous electrolyte (for H+ insertion) or in
LiClO4.3H2O containing acetonitrile (for Li+ insertion). Under light exposure, an
additional cathodic photo-current is observed. As layer-type transition metal
compounds of Groups IV.B and V.B are well-known to intercalate ions, the author
attribute this phenomenon to cation insertion. At this early stage, experimental efforts
did not conduct to a working photo-intercalation solar cell due to the insufficient p-
type conductivity of transition metal dichalcogenides. Besides, aqueous electrolytes are
little suited to ion exchange with this kind of host materials. In fact, co-intercalation of
water products make intercalation partially irreversible and lead to corrosion. In
addition, host electrodes could be partially reduced with formation of H2S and H2Se.
However, this pioneering work shows the feasibility of inserting cations under light
exposure when using p-type semiconductor photo-electrode.
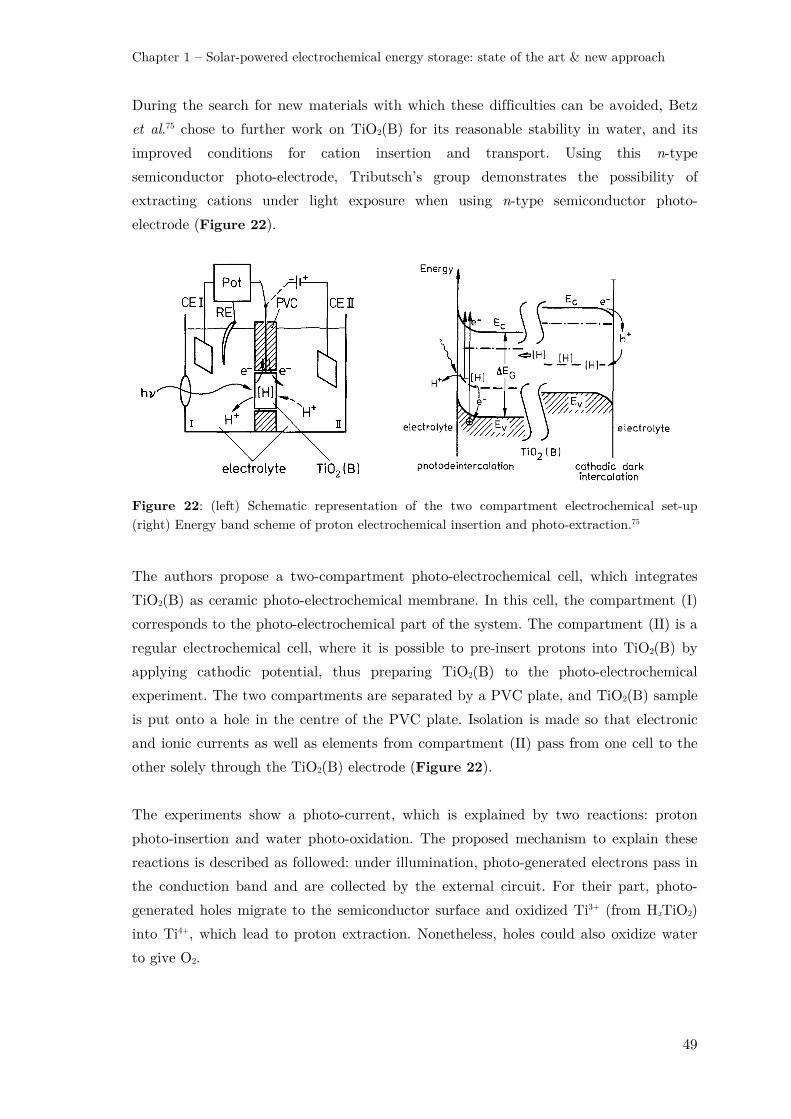
Chapter 1 – Solar-powered electrochemical energy storage: state of the art & new approach
49
During the search for new materials with which these difficulties can be avoided, Betz
et al.75 chose to further work on TiO2(B) for its reasonable stability in water, and its
improved conditions for cation insertion and transport. Using this n-type
semiconductor photo-electrode, Tributsch’s group demonstrates the possibility of
extracting cations under light exposure when using n-type semiconductor photo-
electrode (Figure 22).
Figure 22: (left) Schematic representation of the two compartment electrochemical set-up (right) Energy band scheme of proton electrochemical insertion and photo-extraction.75
The authors propose a two-compartment photo-electrochemical cell, which integrates
TiO2(B) as ceramic photo-electrochemical membrane. In this cell, the compartment (I)
corresponds to the photo-electrochemical part of the system. The compartment (II) is a
regular electrochemical cell, where it is possible to pre-insert protons into TiO2(B) by
applying cathodic potential, thus preparing TiO2(B) to the photo-electrochemical
experiment. The two compartments are separated by a PVC plate, and TiO2(B) sample
is put onto a hole in the centre of the PVC plate. Isolation is made so that electronic
and ionic currents as well as elements from compartment (II) pass from one cell to the
other solely through the TiO2(B) electrode (Figure 22).
The experiments show a photo-current, which is explained by two reactions: proton
photo-insertion and water photo-oxidation. The proposed mechanism to explain these
reactions is described as followed: under illumination, photo-generated electrons pass in
the conduction band and are collected by the external circuit. For their part, photo-
generated holes migrate to the semiconductor surface and oxidized Ti3+ (from HxTiO2)
into Ti4+, which lead to proton extraction. Nonetheless, holes could also oxidize water
to give O2.

Chapter 1 – Solar-powered electrochemical energy storage: state of the art & new approach
50
Interestingly, colour changes are observed during proton insertion (the electrode goes
from white to blue). This coloration could allow the reduced phase to absorb light in
the visible range, thus increasing the light absorbance at cathodic potentials. These
phenomenons of electrochemical insertion and photo-extraction are summarized in
Figure 22.
II.2 - The recent and very recent developments on bifunctional
electrodes
To our knowledge, after Tributsch’s works, this particular aspect of photo-
electrochemistry has received very little research attention in the energy domain,
compared to the global research interest on fuel-producing photo-electrochemical
reactions (e.g. H2 from watersplitting77 or more complex hydrocarbons from CO2
reduction78).
In 2013, F. Sauvage, C. Andriamiadamanana and C. Laberty-Robert79 patented the
idea of using a single transparent photo-rechargeable electrode that can simultaneously
store energy and be recharged under illumination (Figure 23). The imagined device
comprises a positive electrode based on TiO2 anatase nanoparticles, a negative electrode
based on metallic lithium, and LiPF6 (1M) dissolved in a mixture of ethylene carbonate
/ dimethyl carbonate (1:1 vol) as electrolyte.
Figure 23: Operation scheme of a single transparent photo-rechargeable electrode that could simultaneously store energy and be recharged under illumination.79

Chapter 1 – Solar-powered electrochemical energy storage: state of the art & new approach
51
The authors elaborate preliminary electrochemical experiments to test the impact of
light on lithiated TiO2 electrodes. Observed photo-currents under illumination have
been interpreted using Tributsch mechanistic hypothesis, where photo-generated holes
oxidize Ti3+ (from LixTiO2) into Ti4+, which lead to lithium-ion extraction. Nonetheless,
the theoretical knowledge of photo-electrochemical behaviour of insertion materials is
still limited. Amongst other issues, fate of generated photo-charges and electrolyte
potential degradation still have to be addressed.
Very recently, some reports have been published on bifunctional electrodes, showing
the new-born interest of this approach to address the issue of converting and storing
energy in a single electrode.
In 2017, Paolella et al.80 introduce a two-electrode system involving direct photo-
oxidation of LiFePO4 nanocrystals by light irradiation in the presence of the N719 dye
as hybrid photo-cathode and metal Li as anode (Figure 24).
Using regular lithium hexafluorophosphate in carbonate-based electrolyte, the photo-
electrode is studied as positive electrode in a Li-ion battery half-cell configuration.
According to the authors, dye-sensitization generates electron-hole pairs with the holes
aiding the delithiation of lithium iron phosphate (LFP), thus photo-charging the
cathode. On their side, photo-generated electrons might be involved in the formation of
a solid electrolyte interface at the metal Li anode via oxygen reduction and peroxide
formation in the electrolyte.
The overall two-electrode cell efficiency for energy conversion and storage is calculated
to be in the range of 0.06-0.08 %. Such low current efficiency has been attributed by
the authors to the large charge recombination losses at the LFP/dye/electrolyte
interface, and still needs to be addressed. As expected for an LFP cathode material, the
device offers high output voltage (3.4 V), but the voltage plateau decreases to 2.8 V
after the 5th cycle.

Chapter 1 – Solar-powered electrochemical energy storage: state of the art & new approach
52
Figure 24: (left) Schematic representation of the FTO/LFP NPs/DYE electrode (right) energy band alignment of the photo-cathode components80 (bottom) schematic representation of LFP photo-recharge (Li-ion photo-extraction) and hypothesis on the fate of the electron.

Chapter 1 – Solar-powered electrochemical energy storage: state of the art & new approach
53
A few months later, Lou et al.71 proposed a bifunctional material for solar-rechargeable
Sodium-ion battery applications. Interestingly, the authors worked on a negative photo-
electrode (MoO3) in association with a MnO2 positive electrode in an aqueous solvent
(Figure 25).
Figure 25: Photo-charging and discharging mechanisms in an aqueous Na-ion solar-intercalation battery, with MoO3 as negative photo-electrode and MnO2 as positive electrode.71
When illuminated under the sun, MoO3 undergoes photo-excitation and generated
electron-hole pairs (Equation (1)). The photo-generated electrons are neutralized and
stored in the lattice structure of the MoO3 through the intercalation of Na+ ions
(Equation (2)). Photo-generated holes migrate to the electrode surface where they
oxidize water to oxygen (Equation (3)). During the discharge process, electrons flow
from MoO3 electrode to the MnO2 or Pt electrode simultaneously extracting Na+ ions
(Equation (4)). During a discharge at 10 µA, the potential gradually decreases from
around 0.6 V to 0.4 V in 2h.
(1) MoO3 + hv → MoO3* + e−(hv) + h+(hv)
(2) MoO3* + xe−(hv) + xNa+ → NaxMoO3
(3) 4 h+(hv) + H2O → 4H+ + O2
(4) NaxMoO3 → MoO3 + xNa+ + xe−
This mechanism is proposed by studying the structural evolution of MoO3 during light-
induced intercalation processes and during de-intercalation process. The demonstrated
feasibility of nanocrystalline MoO3 as photo-intercalating host material could here pave
the way for aqueous Na-ion photo-batteries based on bifunctional electrodes.
Metal oxides are not the only materials that have been investigated as bifunctional
electrode. In 2018, Podjsaki et al.81 reported a 2D cyanamide (NCN-)-functionalized

Chapter 1 – Solar-powered electrochemical energy storage: state of the art & new approach
54
polyheptazine imide (NCN-PHI) as negative photo-electrode, which is described by the
authors as a pseudo-capacitor able to store light-induced charge for hours in the form
of trapped electrons (Figure 26). After light exposure, photo-generated electrons
reduce the carbon nitride backbone. Charge compensation is then realized by adsorbing
alkali metal ions within the NCN layers.
Figure 26: a) Concept of a traditional solar battery or solar photocapacitor. b)
Proposed monolithic solar battery based on NCN-PHI. Photoabsorption and electron
storage occurs within the same material.81
The photo-anode is here studied in a half cell configuration: in order to mimic a
cathode that swiftly takes up the photo-generated holes, the authors extract them
chemically by using aqueous 4-methylbenzyl alcohol as sacrificial reducing agent.
Interestingly here, the material band gap of 2.76 eV is presented as a reasonable trade-
off between visible light absorption and output cell voltage (0.7 V).
Chapter 1 – Solar-powered electrochemical energy storage: state of the art & new approach
55
III - Thesis objectives and challenges
The pioneering work of Tributsch showed the feasibility of photo-extracting
protons out of bulk TiO2(B) material75. However, the observed photo-currents were
very low, and until very recently,71,79–81 the process was not further explored as a
potential technology for converting and storing solar energy.
So far, the challenge of combining solar energy harvesting and energy storage has been
addressed in hybridizing two distinct technologies. In this project, our goal is to
develop a bifunctional Li-ion battery electrode able to simultaneously convert and store
solar energy.
Since the selected electrode active material should be able to harvest light energy and
store it as a Li-ion battery electrode, our strategy is to use transition metal oxide-based
semiconductors. These semiconductors are primary candidates because their
oxidation/reduction can be driven by light, and some of them offer crystallographic
sites for cation accommodation (Li+/Na+).74,82,83 Amongst the various transition metal
oxide-based semiconductors,84–86 TiO2 has demonstrated to combine both good light
absorption and the ability to reversibly host Li+.87 On one hand, in rechargeable Li-ion
storage devices, TiO2 is a well-known candidate for the negative electrode88–90 because it
exhibits cycling stability at a high charging rate and reasonable capacity. In particular,
among the numerous titania polymorphs, anatase TiO2 is known to be an efficient
electroactive host for Li intercalation-deintercalation.88,91
On the other hand, for photo-electrochemical applications anatase TiO2 is also a very
attractive electrode material due to its band gap of 3.2 eV, allowing 4% of the incident
solar energy to be absorbed.92 In addition, the electron mobility of TiO2 in a
nanoparticle-based film is about 0.01 cm2V-1s-1,95 which is high compared to that of
other semi-conductors.
As the chosen photo-electrode will undergo Li+ insertion during the battery charge and
discharge cycles, it is important to mention that making the choice of TiO2 will imply
to deal with titania lithiated phases. In fact, studies have shown that during Li
insertion, the bulk anatase TiO2 spontaneously phase separates into a Li-rich phase
(Li∼0.5+y(TiO2)) and Li-poor phase (Li∼0.01(TiO2)) on a scale of several tens of
nanometers in the material.96,97,90,91 This two-phase equilibrium is maintained until all of
the Li-poor phase is converted into the Li-rich phase up to the completion of Li
insertion.88 As the lithium rich phase (Li0.5+yTiO2) is expected to absorb light in the
visible range and to be a better electronic conductor,98,99 we could therefore take
Chapter 1 – Solar-powered electrochemical energy storage: state of the art & new approach
56
advantage of the TiO2 optoelectronic modifications during lithiation to increase the
light harvesting and the electronic transport.
Taking into account all of these attributes, anatase TiO2 has been selected as a
potential electrode material for photo-rechargeable Li-ion battery.
In this work, the full electrochemical device investigated will use TiO2 as a positive
electrode, while metallic lithium or graphite carbon is used as the negative electrode.
This unusual choice for the positive electrode has been made to study the TiO2
electrode in a configuration where the Li+ extraction at the TiO2 electrode corresponds
to the charging reaction. In fact, as the feasibility of photo-extracting protons from
TiO2 has been shown, we would like to study the Li+ photo-extraction reaction as the
photo-charging reaction, which implies to consider TiO2 as the positive electrode (Ti3+
oxidation and simultaneous Li+ extraction during the charge step).
The resulting voltage in this system is thus lower than in usual Li-ion batteries.
However, the high operating potential of TiO2 is relatively high compared to that of
graphite. Therefore, it should allow output voltage around 1.75 V vs. Li+/Li0, which is
still high compared to most SPEES systems limited around 0.7 V vs. Li+/Li0 (see
Table 2 pages 39-40).
At this early stage of the bifunctional electrode technology, one of the main goal of this
project is also to better understand the mechanisms behind the observed cations photo-
insertion / photo-extraction. In fact, it is worth noting that the reaction sequence
involving photo-generated excitons (Figure 22) has been proposed as hypothesis to
account for the experimental observations. And even in the very recent developments
on the subject,71,80 the fate of photo-generated charges often remains a real challenge.
The second big challenge comes from the constant reorganization of the lithiated / non
lithiated interface during the battery operation depending on the state of charge during
Li+ insertion / extraction. In fact, when studying the light effect on a material (for
example in watersplitting or photo-catalysis), the photo-electrode usually has a unique
composition. Here on the contrary, photo-analysis will be performed on a composition
changing electrode due to the lithiation / delithiation. Optoelectronic properties of the
material will therefore probably depend on the state of charge of the electrode.
In the next chapter, we will present the fabrication methods and characterizations of
the mesoporous TiO2 thin film electrodes, which will be used and studied in the
following chapters as photo-rechargeable Li-ion battery electrode.

Chapter 1 – Solar-powered electrochemical energy storage: state of the art & new approach
57
Bibliography
1. Yu, M. et al. Solar-powered electrochemical energy storage: an alternative to solar
fuels. J. Mater. Chem. A 4, 2766–2782 (2016).
2. Schmidt, D., Hager, M. D. & Schubert, U. S. Photo-Rechargeable Electric Energy
Storage Systems. Adv. Energy Mater. 6, 1500369 (2016).
3. Zhu, Y. G. et al. Proton enhanced dynamic battery chemistry for aprotic lithium–
oxygen batteries. Nat. Commun. 8, 14308 (2017).
4. Hodes, G., Manassen, D. & Cahen, D. G. Hodes, J. Manassen and D. Cahen,
Nature, 1976, 261, 403–404. Nature 261, 403–404 (1976).
5. Gaudiana, R. Third-Generation Photovoltaic Technology − The Potential for Low-
Cost Solar Energy Conversion. J. Phys. Chem. Lett. 1, 1288–1289 (2010).
6. Olivares-Amaya, R. et al. Accelerated computational discovery of high-performance
materials for organic photovoltaics by means of cheminformatics. Energy Environ.
Sci. 4, 4849 (2011).
7. Choi, J. W. & Aurbach, D. Promise and reality of post-lithium-ion batteries with
high energy densities. Nat. Rev. Mater. 1, 16013 (2016).
8. Kan, S. Y., Verwaal, M. & Broekhuizen, H. The use of battery–capacitor
combinations in photovoltaic powered products. J. Power Sources 162, 971–974
(2006).
9. Gibson, T. L. & Kelly, N. A. Solar photovoltaic charging of lithium-ion batteries. J.
Power Sources 195, 3928–3932 (2010).
10. Xu, J., Chen, Y. & Dai, L. Efficiently photo-charging lithium-ion battery by
perovskite solar cell. Nat. Commun. 6, (2015).
11. Gurung, A. et al. Highly Efficient Perovskite Solar Cell Photocharging of Lithium
Ion Battery Using DC-DC Booster. Adv. Energy Mater. 7, 1602105 (2017).
12. Li, Q., Liu, Y., Guo, S. & Zhou, H. Solar energy storage in the rechargeable
batteries. Nano Today 16, 46–60 (2017).
13. Luo, B., Ye, D. & Wang, L. Recent Progress on Integrated Energy Conversion and
Storage Systems. Adv. Sci. 4, (2017).
14. Yum, J.-H., Chen, P., Grätzel, M. & Nazeeruddin, M. K. Recent Developments in
Solid-State Dye-Sensitized Solar Cells. ChemSusChem 1, 699–707 (2008).
15. Bomben, P. G., Borau-Garcia, J. & Berlinguette, C. P. Three is not a crowd:
efficient sensitization of TiO2 by a bulky trichromic trisheteroleptic cycloruthenated
dye. Chem. Commun. 48, 5599 (2012).
16. Grätzel, M. Dye-sensitized solar cells. J. Photochem. Photobiol. C Photochem. Rev.
4, 145–153 (2003).
17. Grätzel, M. Photoelectrochemical cells. nature 414, 338 (2001).

Chapter 1 – Solar-powered electrochemical energy storage: state of the art & new approach
58
18. Miyasaka, T. & Murakami, T. N. The photocapacitor: An efficient self-charging
capacitor for direct storage of solar energy. Appl. Phys. Lett. 85, 3932–3934 (2004).
19. Zhang, Y. et al. Progress of electrochemical capacitor electrode materials: A review.
Int. J. Hydrog. Energy 34, 4889–4899 (2009).
20. Gu, W. & Yushin, G. Review of nanostructured carbon materials for
electrochemical capacitor applications: advantages and limitations of activated
carbon, carbide-derived carbon, zeolite-templated carbon, carbon aerogels, carbon
nanotubes, onion-like carbon, and graphene: Nanostructured carbon materials for
electrochemical capacitor applications. Wiley Interdiscip. Rev. Energy Environ. 3,
424–473 (2014).
21. Murakami, T. N., Kawashima, N. & Miyasaka, T. A high-voltage dye-sensitized
photocapacitor of a three-electrode system. Chem. Commun. 3346 (2005).
22. Yang, Z. et al. An integrated device for both photoelectric conversion and energy
storage based on free-standing and aligned carbon nanotube film. J Mater Chem A
1, 954–958 (2013).
23. Jost, K., Dion, G. & Gogotsi, Y. Textile energy storage in perspective. J. Mater.
Chem. A 2, 10776 (2014).
24. Chen, T. et al. An Integrated ‘Energy Wire’ for both Photoelectric Conversion and
Energy Storage. Angew. Chem. Int. Ed. 51, 11977–11980 (2012).
25. Chen, X. et al. A novel ‘energy fiber’ by coaxially integrating dye-sensitized solar
cell and electrochemical capacitor. J Mater Chem A 2, 1897–1902 (2014).
26. Yang, Z. et al. Self-Powered Energy Fiber: Energy Conversion in the Sheath and
Storage in the Core. Adv. Mater. 26, 7038–7042 (2014).
27. Hauch, A., Georg, A., Krašovec, U. O. & Orel, B. Photovoltaically Self-Charging
Battery. J. Electrochem. Soc. 149, A1208 (2002).
28. Hauch, A., Georg, A., Baumgärtner, S., Krašovec, U. O. & Orel, B. New
photoelectrochromic device. Electrochimica Acta 46, 2131–2136 (2001).
29. Cannavale, A. et al. Highly efficient smart photovoltachromic devices with tailored
electrolyte composition. Energy Environ. Sci. 4, 2567 (2011).
30. Saito, Y., Uchida, S., Kubo, T. & Segawa, H. Surface-oxidized tungsten for energy-
storable dye-sensitized solar cells. Thin Solid Films 518, 3033–3036 (2010).
31. Yan, N. F., Li, G. R., Pan, G. L. & Gao, X. P. TiN nanotube arrays as
electrocatalytic electrode for solar storable rechargeable battery. J. Electrochem.
Soc. 159, A1770–A1774 (2012).
32. Guo, W., Xue, X., Wang, S., Lin, C. & Wang, Z. L. An Integrated Power Pack of
Dye-Sensitized Solar Cell and Li Battery Based on Double-Sided TiO2 Nanotube
Arrays. Nano Lett. 12, 2520–2523 (2012).

Chapter 1 – Solar-powered electrochemical energy storage: state of the art & new approach
59
33. Mor, G. K., Shankar, K., Paulose, M., Varghese, O. K. & Grimes, C. A. Use of
Highly-Ordered TiO2 Nanotube Arrays in Dye-Sensitized Solar Cells. Nano Lett. 6,
215–218 (2006).
34. Sauvage, F. et al. Hierarchical TiO2 Photoanode for Dye-Sensitized Solar Cells.
Nano Lett. 10, 2562–2567 (2010).
35. Li, Q., Li, N., Ishida, M. & Zhou, H. Saving electric energy by integrating a
photoelectrode into a Li-ion battery. J. Mater. Chem. A 3, 20903–20907 (2015).
36. Yu, M., Ren, X., Ma, L. & Wu, Y. Integrating a redox-coupled dye-sensitized
photoelectrode into a lithium–oxygen battery for photoassisted charging. Nat.
Commun. 5, 5111 (2014).
37. Liu, Y. et al. Reducing the charging voltage of a Li–O2 battery to 1.9 V by
incorporating a photocatalyst. Energy Environ. Sci. 8, 2664–2667 (2015).
38. Liu, Y. et al. Lowering the charge voltage of Li–O2 batteries via an unmediated
photoelectrochemical oxidation approach. J. Mater. Chem. A 4, 12411–12415
(2016).
39. Liao, K. et al. Stabilization of polysulfides via lithium bonds for Li–S batteries. J.
Mater. Chem. A 4, 5406–5409 (2016).
40. Li, N., Wang, Y., Tang, D. & Zhou, H. Integrating a Photocatalyst into a Hybrid
Lithium-Sulfur Battery for Direct Storage of Solar Energy. Angew. Chem. Int. Ed.
54, 9271–9274 (2015).
41. Yu, M. et al. Aqueous Lithium–Iodine Solar Flow Battery for the Simultaneous
Conversion and Storage of Solar Energy. J. Am. Chem. Soc. 137, 8332–8335
(2015).
42. Nikiforidis, G., Tajima, K. & Byon, H. R. High Energy Efficiency and Stability for
Photoassisted Aqueous Lithium–Iodine Redox Batteries. ACS Energy Lett. 1, 806–
813 (2016).
43. Chun, S.-E. et al. Design of aqueous redox-enhanced electrochemical capacitors
with high specific energies and slow self-discharge. Nat. Commun. 6, (2015).
44. Liu, D., Liu, F. & Liu, J. Effect of vanadium redox species on photoelectrochemical
behavior of TiO2 and TiO2/WO3 photo-electrodes. J. Power Sources 213, 78–82
(2012).
45. Wei, Z., Liu, D., Hsu, C. & Liu, F. All-vanadium redox photoelectrochemical cell:
An approach to store solar energy. Electrochem. Commun. 45, 79–82 (2014).
46. Liu, D., Wei, Z., Hsu, C., Shen, Y. & Liu, F. Efficient Solar Energy Storage Using
A TiO2/WO3 Tandem Photoelectrode in An All-vanadium Photoelectrochemical
Cell. Electrochimica Acta 136, 435–441 (2014).
47. Liu, D. et al. Ultra-long electron lifetime induced efficient solar energy storage by
an all-vanadium photoelectrochemical storage cell using methanesulfonic acid. J.
Mater. Chem. A 3, 20322–20329 (2015).

Chapter 1 – Solar-powered electrochemical energy storage: state of the art & new approach
60
48. Liu, D. et al. Reversible Electron Storage in an All-Vanadium Photoelectrochemical
Storage Cell: Synergy between Vanadium Redox and Hybrid Photocatalyst. ACS
Catal. 5, 2632–2639 (2015).
49. Yan, N. F., Li, G. R. & Gao, X. P. Solar rechargeable redox flow battery based on
Li2WO4/LiI couples in dual-phase electrolytes. J. Mater. Chem. A 1, 7012 (2013).
50. Liu, P. et al. A Solar Rechargeable Flow Battery Based on Photoregeneration of
Two Soluble Redox Couples. ChemSusChem 6, 802–806 (2013).
51. Lei, B., Li, G.-R., Chen, P. & Gao, X.-P. A solar rechargeable battery based on
hydrogen storage mechanism in dual-phase electrolyte. Nano Energy 38, 257–262
(2017).
52. Wedege, K., Azevedo, J., Khataee, A., Bentien, A. & Mendes, A. Direct Solar
Charging of an Organic-Inorganic, Stable, and Aqueous Alkaline Redox Flow
Battery with a Hematite Photoanode. Angew. Chem. Int. Ed. 55, 7142–7147
(2016).
53. Liao, S. et al. Integrating a dual-silicon photoelectrochemical cell into a redox flow
battery for unassisted photocharging. Nat. Commun. 7, 11474 (2016).
54. Li, W. et al. Integrated Photoelectrochemical Solar Energy Conversion and Organic
Redox Flow Battery Devices. Angew. Chem. Int. Ed. 55, 13104–13108 (2016).
55. Li, Q., Li, N., Liu, Y., Wang, Y. & Zhou, H. High-Safety and Low-Cost
Photoassisted Chargeable Aqueous Sodium-Ion Batteries with 90% Input Electric
Energy Savings. Adv. Energy Mater. 6, 1600632 (2016).
56. Mahmoudzadeh, M. A. et al. A high energy density solar rechargeable redox
battery. J. Mater. Chem. A 4, 3446–3452 (2016).
57. Weber, A. Z. et al. Redox flow batteries: a review. J. Appl. Electrochem. 41, 1137–
1164 (2011).
58. Chen, H.-W. et al. Plastic dye-sensitized photo-supercapacitor using electrophoretic
deposition and compression methods. J. Power Sources 195, 6225–6231 (2010).
59. Liu, P., Yang, H. X., Ai, X. P., Li, G. R. & Gao, X. P. A solar rechargeable
battery based on polymeric charge storage electrodes. Electrochem. Commun. 16,
69–72 (2012).
60. Kapilashrami, M., Zhang, Y., Liu, Y.-S., Hagfeldt, A. & Guo, J. Probing the
Optical Property and Electronic Structure of TiO2 Nanomaterials for Renewable
Energy Applications. Chem. Rev. 114, 9662–9707 (2014).
61. Manthiram, A., Fu, Y., Chung, S.-H., Zu, C. & Su, Y.-S. Rechargeable Lithium–
Sulfur Batteries. Chem. Rev. 114, 11751–11787 (2014).
62. Manthiram, A., Yu, X. & Wang, S. Lithium battery chemistries enabled by solid-
state electrolytes. Nat. Rev. Mater. 2, 16103 (2017).
63. Bruce, P. G., Freunberger, S. A., Hardwick, L. J. & Tarascon, J.-M. Li–O2 and Li–
S batteries with high energy storage. Nat. Mater. 11, 19–29 (2012).

Chapter 1 – Solar-powered electrochemical energy storage: state of the art & new approach
61
64. Shao, Y. et al. Making Li-Air Batteries Rechargeable: Material Challenges. Adv.
Funct. Mater. 23, 987–1004 (2013).
65. Asghar, M. I. et al. Review of stability for advanced dye solar cells. Energy
Environ. Sci. 3, 418 (2010).
66. Mozaffari, S., Nateghi, M. R. & Zarandi, M. B. An overview of the Challenges in
the commercialization of dye sensitized solar cells. Renew. Sustain. Energy Rev.
71, 675–686 (2017).
67. Hinsch, A. et al. Long-term stability of dye-sensitised solar cells. Prog. Photovolt.
Res. Appl. 9, 425–438.
68. Sommeling, P. M., Späth, M., Smit, H. J. P., Bakker, N. J. & Kroon, J. M. Long-
term stability testing of dye-sensitized solar cells. J. Photochem. Photobiol. Chem.
164, 137–144 (2004).
69. Macht, B. et al. Patterns of efficiency and degradation in dye sensitization solar
cells measured with imaging techniques. Sol. Energy Mater. Sol. Cells 73, 163–173
(2002).
70. Figgemeier, E. & Hagfeldt, A. Are dye-sensitized nano-structured solar cells stable?
An overview of device testing and component analyses. International Journal of
Photoenergy (2004).
71. Lou, S. N. et al. An Operando Mechanistic Evaluation of a Solar-Rechargeable
Sodium-Ion Intercalation Battery. Adv. Energy Mater. 7, 1700545 (2017).
72. Tributsch, H. Photo-intercalation: Possible application in solar energy devices.
Appl. Phys. 23, 61–71 (1980).
73. Tributsch, H. Photoelectrochemical energy conversion involving transition metal d-
states and intercalation of layer compounds. in Solar Energy Materials 127–175
(Springer, 1982).
74. Tributsch, H. Photo-electrochemical studies on intercalation and semiconducting
intercalation compounds. Solid State Ion. 9, 41–57 (1983).
75. Betz, G., Tributsch, H. & Marchand, R. Hydrogen insertion (intercalation) and
light induced proton exchange at TiO2 (B)-electrodes. J. Appl. Electrochem. 14,
315–322 (1984).
76. Tributsch, H. Interfacial processes involving strong electronic interactions in solar
energy conversion and storage. J. Photochem. 29, 89–113 (1985).
77. Walter, M. G. et al. Solar Water Splitting Cells. Chem. Rev. 110, 6446–6473
(2010).
78. Kumar, B. et al. Photochemical and Photoelectrochemical Reduction of CO2. Annu.
Rev. Phys. Chem. 63, 541–569 (2012).
79. Sauvage, F., Andriamiadamanana, C. & Laberty-Robert, C. Photorechargeable
battery: turning light energy into chemical energy and then electric energy, French
patent. (FR1361775).
Chapter 1 – Solar-powered electrochemical energy storage: state of the art & new approach
62
80. Paolella, A. et al. Light-assisted delithiation of lithium iron phosphate nanocrystals
towards photo-rechargeable lithium ion batteries. Nat. Commun. 8, 14643 (2017).
81. Podjaski, F., Kröger, J. & Lotsch, B. V. Toward an Aqueous Solar Battery: Direct
Electrochemical Storage of Solar Energy in Carbon Nitrides. Adv. Mater. 1705477
(2018).
82. Judeinstein, P., Chemseddine, A. & Sanchez, C. Propriétés photoélectrochimiques
des gels d’oxyde de tungstène. J. Chim. Phys. 89, 1469–1476 (1992).
83. Zhai, T. et al. Centimeter‐Long V2O5 Nanowires: From Synthesis to Field‐Emission,
Electrochemical, Electrical Transport, and Photoconductive Properties. Adv.
Mater. 22, 2547–2552 (2010).
84. Chen, S. & Wang, L.-W. Thermodynamic Oxidation and Reduction Potentials of
Photocatalytic Semiconductors in Aqueous Solution. Chem. Mater. 24, 3659–3666
(2012).
85. Li, J. & Wu, N. Semiconductor-based photocatalysts and photoelectrochemical cells
for solar fuel generation: a review. Catal. Sci. Technol. 5, 1360–1384 (2015).
86. Zhao, J., Wang, X., Xu, Z. & Loo, J. S. C. Hybrid catalysts for
photoelectrochemical reduction of carbon dioxide: a prospective review on
semiconductor/metal complex co-catalyst systems. J. Mater. Chem. A 2, 15228
(2014).
87. van de Krol, R., Goossens, A. & Schoonman, J. Spatial Extent of Lithium
Intercalation in Anatase TiO2. J. Phys. Chem. B 103, 7151–7159 (1999).
88. Reddy, M. V., Subba Rao, G. V. & Chowdari, B. V. R. Metal Oxides and Oxysalts
as Anode Materials for Li Ion Batteries. Chem. Rev. 113, 5364–5457 (2013).
89. Kim, C., Buonsanti, R., Yaylian, R., Milliron, D. J. & Cabana, J. Carbon-Free
TiO2 Battery Electrodes Enabled by Morphological Control at the Nanoscale. Adv.
Energy Mater. 3, 1286–1291 (2013).
90. Wagemaker, M., Borghols, W. J. H. & Mulder, F. M. Large Impact of Particle Size
on Insertion Reactions. A Case for Anatase LixTiO2. J. Am. Chem. Soc. 129, 4323–
4327 (2007).
91. Yang, Z. et al. Nanostructures and lithium electrochemical reactivity of lithium
titanites and titanium oxides: A review. J. Power Sources 192, 588–598 (2009).
92. O’Regan, B. & Grätzel, M. A low-cost, high-efficiency solar cell based on dye-
sensitized colloidal TiO2 films. Nature 353, 737–740 (1991).
93. Fujishima, A. & Honda, K. Electrochemical Photolysis of Water at a
Semiconductor Electrode. Nature 238, 37–38 (1972).
94. Krol, R. van de, Liang, Y. & Schoonman, J. Solar hydrogen production with
nanostructured metal oxides. J. Mater. Chem. 18, 2311–2320 (2008).

Chapter 1 – Solar-powered electrochemical energy storage: state of the art & new approach
63
95. Hendry, E., Koeberg, M., O’Regan, B. & Bonn, M. Local Field Effects on Electron
Transport in Nanostructured TiO2 Revealed by Terahertz Spectroscopy. Nano
Lett. 6, 755–759 (2006).
96. Lunell, S., Stashans, A., Ojamäe, L., Lindström, H. & Hagfeldt, A. Li and Na
Diffusion in TiO2 from Quantum Chemical Theory versus Electrochemical
Experiment. J. Am. Chem. Soc. 119, 7374–7380 (1997).
97. Wagemaker, M., Kentgens, A. P. M. & Mulder, F. M. Equilibrium lithium
transport between nanocrystalline phases in intercalated TiO2 anatase. Nature 418,
397–399 (2002).
98. Dinh, N. N., Oanh, N. T. T., Long, P. D., Bernard, M. C. & Hugot-Le Goff, A.
Electrochromic properties of TiO2 anatase thin films prepared by a dipping sol–gel
method. Thin Solid Films 423, 70–76 (2003).
99. Özer, N. Reproducibility of the coloration processes in TiO2 films. Thin Solid Films
214, 17–24 (1992).
100. He, T. & Yao, J.-N. Photochromism in transition-metal oxides. Res. Chem.
Intermed. 30, (2004).

Chapter 1 – Solar-powered electrochemical energy storage: state of the art & new approach
64

65
CHAPTER 2
Mesoporous TiO2 thin film electrodes:
fabrication & characterizations


Chapter 2 – Mesoporous TiO2 thin film electrodes: fabrication & characterizations
67
TABLE of CONTENTS
I – Introduction ........................................................................................................... 69
II – Presentation of the electrodes ............................................................................... 71
II.1 – Fabrication methods ....................................................................................... 71
II.2 – Control of thin films architecture ................................................................... 74
II.2.1 – Thin film thickness .................................................................................. 74
II.2.2 – Inorganic walls and porous networks ....................................................... 76
III – Thin films structural characterizations ................................................................ 78
III.1 – Spectroscopic Ellipsometry ............................................................................ 78
III.1.1 – Adaptation for porous thin films ............................................................ 78
III.1.2 – Environmental Ellipsometric Porosimetry .............................................. 79
III.2 – Glancing Angle X-Ray Diffraction ................................................................ 85
IV – Reconstruction of TiO2 electrode energetic diagram ............................................ 92
IV.1 – Band gap determination by UV-Visible Spectroscopy ................................... 92
IV.2 – Flat-band potential estimated by Mott-Schottky experiment ........................ 95
V – Conclusion ............................................................................................................ 97
Bibliography ................................................................................................................ 99

Chapter 2 – Mesoporous TiO2 thin film electrodes: fabrication & characterizations
68

Chapter 2 – Mesoporous TiO2 thin film electrodes: fabrication & characterizations
69
I – Introduction
Li-ion battery electrodes are usually synthesized in mixing electrode active material
with carbon to enhance the electrode electronic conductivity. A binder is usually added
to hold the active material within the electrode together and maintain a good
connection between the electrode and the contacts. The resulting electrode presents
various interfaces, together with uncontrolled porosity and interconnections between
the particles.
By contrast to a conventional battery electrode, we have chosen to work with a model
electrode, whose composition is as simple as possible. In fact, the aim is to study the
photo-electrochemical behavior of such an electrode and previous studies1 generally add
to their electrode composition carbon for the conductivity and dye for the photo-
absorbance, which could complicate the analysis of the photo-electrochemical behavior
of the electrode. In this study, the TiO2 electrode is carbon- and dye-free. As the
lithium rich phase (Li0.5+yTiO2) is expected to absorb light in the visible range and to
be a better electronic conductor,2,3 we could therefore take advantage of the TiO2
optoelectronic modifications during lithiation to increase the light harvesting and the
electronic transport without additional carbon or dye.
The recombination, diffusion, or reaction processes of the photo-generated charges
could be particularly influenced by parameters such as TiO2 crystallites size, particles
connectivity, or by their distance to the current collector. Therefore, the electrode
architecture, on which such parameters depend, should also be as well-defined as
possible. For this reason, we have chosen to work with mesoporous thin film electrodes
using sol-gel coupled dip coating process combined with the “evaporation induced self-
assembly” (EISA) approach, which allows to easily tune the architectural properties of
the electrode.
In section II, the fabrication methods are presented. The conditions of the multilayer
dip-coating process and the various films obtained using different co-polymers as
templating agents or different titania concentration are described.
In section III, structural characterization of the architecture-controlled TiO2 electrode is
then addressed using techniques adapted for mesoporous thin film characterization, as
environmental ellipsometric porosimetry (EEP) and glancing angle X-Ray diffraction
(G-XRD). Thin film thickness, porosity, specific surface area, crystallite size and their
homogeneity in the whole film are investigated.
In section IV, energy diagram of TiO2 electrode is determined, using UV-Visible
spectroscopy (band-gap determination) and Mott Schottky experiment (flat-band

Chapter 2 – Mesoporous TiO2 thin film electrodes: fabrication & characterizations
70
potential). Knowledge of the energy diagram could indeed constitute an important
starting point to consider reactivity of the photo-generated charges at the TiO2
electrode / electrolyte interface.

Chapter 2 – Mesoporous TiO2 thin film electrodes: fabrication & characterizations
71
II – Presentation of the electrodes
Mesoporous TiO2 thin film electrodes are obtained by combining sol-gel chemistry with
the dip-coating process and the “evaporation induced self-assembly” (EISA) approach.
Sol-gel solutions are solutions made of metal salts dissolved in organic solvent. Through
a careful control of pH, aging time, water content, solvent and concentration in the sol-
gel solution, hydrolysis and condensation reactions occur to form a starting sol that can
be deposited by dip coating, but also by spin coating, drop casting or doctor blade.4–8
Block co-polymers and organic additives such as polybutadiene-b-ethylene oxide (PB-
PEO) can be added to the solution to form and tune a nano/mesoporous
microstructure. Upon final heat treatment, metal oxide is calcined and carbon elements
of the block co-polymer are decomposed, leaving physical vacancies and thus forming a
porous microstructure. Its decomposition should occur after the crystallization of the
inorganic network occurs otherwise, the porous network could collapse. The size of the
pore and the inorganic wall can be tuned changing various parameters including the
nature of the block-co-polymer (the contrast between hydrophilic/hydrophobic blocks
and their respective size), the nature of the solvent and the inorganic precursor
concentration.9
II.1 – Fabrication methods
In our case, a solution containing the TiCl4 precursor is first prepared by mixing TiCl4
and ethanol (EtOH) with a molar ratio 1(TiCl4):5(EtOH), and will be referred as
“precursor solution”. When stored at 4°C, this precursor solution can be used for
several months. Then, 100 mg of Poly(1,4-butadiene)-b-poly(ethylene oxide) (PB-b-
PEO:P4515-BdEO, M.W. (PB)=11800 g.mol-1 and M.W. (PEO)=13500 g.mol-1) is
dissolved in a mixture of 5.0 g EtOH and 0.4 g H2O. Referred in this thesis as “PB-
PEO” polymers, P4515-BdEO polymers was purchased from Polymer Source and was
used without any further purification. Polydispersity of the chosen polymers should be
small enough (typically 1.15) to avoid dissolution issues and obtain homogenous
solutions. A heat treatment of 70°C for 2 hours is necessary to complete the dissolution.
After cooling at room temperature, the inorganic precursor solution containing TiCl4
precursor is added dropwise into the solution of PB-PEO. The concentration of TiCl4 in
the final solution is typically around 1-2 mol.L-1 in titanium (0.8-1.6 g of precursor
solution). The as-prepared solution is aged for 1 night under stirring to generate
hydrolyzed, slightly condensed hybrid species. This step could be necessary to pre-
organize the titanium clusters around the block copolymers in the starting sol
(inorganic precursors are coordinated by the PEO functions of the polymer polar
chains). In such solution using voluminous PB-PEO polymers, concentration in

Chapter 2 – Mesoporous TiO2 thin film electrodes: fabrication & characterizations
72
surfactants has already reached the equivalent of a critical micellar concentration, and
hybrid micelles are pre-formed in solution.
Deposition of the sol-gel is done by dip-coating because it is a relatively simple,
reproducible and low energy synthesis. As the mesoporous thin films will be dedicated
to photo-electrochemical applications, fluorine-doped tin oxide (FTO) - coated
substrates are used. These conductive and transparent substrates were purchased from
SOLEMS (YSUB/ASASHI 120/1: 10 x 30 mm / resistivity: 80 !.cm-2, thickness of the
FTO layer: 80 nm). The substrates are first cleaned with EtOH and acetone, then
dipped into a fully filled small tank containing around 2 mL of the sol-gel solution in a
dry atmosphere (<5% relative humidity) at ambient temperature. A withdrawal speed
of 2.5 mm.s-1 is applied to deposit the hybrid solution on top of the FTO substrate.
Upon withdrawal, the organic volatile solution evaporates, triggering the self-assembly
process: micelles are stacked and evaporation of HCl (and resulting pH increase)
induces the full condensation of the inorganic network. The dry atmosphere favours the
fast evaporation of HCl, EtOH and H2O.
The hybrid, homogenous film is then placed for 1h in a furnace at 500°C in air (static
atmosphere) to (i) induce crystallization of the anatase and (ii) decompose the block-
copolymer. The different steps of the formation of the films are summarized in Figure
1.
Figure 1: Sol-gel dip coating thin film fabrication process. Adapted from Hilliard.9
After final heat treatment, mesoporous thin films can be observed by FEG-SEM in
order to image the porous network (planar and cross sections observations) and
estimate the film thickness (cross sections observations). Figure 2 shows a typical TiO2
mesoporous thin film obtained at 1 mol.L-1 (1M) in titanium precursors. The three-
dimensionally interconnected porosity develops a well-defined electrode–electrolyte
interface. Anatase TiO2 nanocrystals (detailed XRD characterization in section III.2)

Chapter 2 – Mesoporous TiO2 thin film electrodes: fabrication & characterizations
73
constitute a continuous inorganic backbone coupled with a homogenous, crack-free
porous network (characterized by environmental ellipsometric porosimetry in section
III.1) according to SEM-FEG images.
Figure 2: FEG-SEM pictures of the same TiO2 thin film (TiCl4 at 1M, 5 layers, calcined for 1h at 500°C) with planar observations for 4 different magnifications (a)-(d), cross section (e) and tilted cross section (f) observations.
5.00µm 1.00µm
500nm 200nm
300nm 500nm FTO FTO
TiO2 TiO2
a) b)
c) d)
e) f)

Chapter 2 – Mesoporous TiO2 thin film electrodes: fabrication & characterizations
74
II.2 – Control of thin films architecture
The recombination, diffusion, or reaction processes of the photo-generated charges
could be particularly influenced by parameters such as TiO2 crystallites size, particles
connectivity, or by their distance to the current collector. Therefore, the electrode
architecture on which such parameters depend, could be important to control. In this
section, we present how thin film thickness and porous network can be controlled by
combining sol-gel chemistry with the dip-coating process and the “evaporation induced
self-assembly” (EISA) approach.
II.2.1 – Thin film thickness
The film thickness depends on multiple controllable parameters: withdrawal speed,
temperature, humidity, and inorganic precursor concentration in the starting sol-gel
solution.
Thickness of the thin film can also be increased by consecutively dipping the substrate
in the solution. Between each film, an intermediate heat-treatment is applied to favor
layer adhesion between each deposition and avoid the last dipped film to re-dissolve in
the sol-gel solution.
Recently, it has been demonstrated in the laboratory that the tank configuration and
filling level can have a strong impact on the film thickness and optical quality when
coating large substrates. These geometrical parameters influence the solvent relative
pressure gradients (coming from solvent evaporation).10 Consequently, the same tank
has been used for all the dips. As the solution filling level decreases during the dip
coating process, the solution should be theoretically refilled after each dip to guarantee
an ideal reproducibility between each dipped layer. In practice, as the FTO substrate is
quite small (dipped part: around 2 cm x 1 cm), the filling level is not drastically
modified after each dip, contrary to large substrates. Every 5 dips, fresh sol-gel solution
is stirred with the remaining one from the tank under smooth heating for a few
minutes. The latter solution is then used to refill the tank for the next 5 dips. Between
each successive dipped layer, the back of the substrate is cleaned with ethanol in order
to only dip the face of the substrate coated with FTO.
The intermediate heat-treatment has been chosen in order to avoid cracks and
inhomogeneities between each layers. Decreasing the intermediate heat-treatment from
450°C for 5 min to 350°C for 3 min gave homogeneous thin films (Figure 3).

Chapter 2 – Mesoporous TiO2 thin film electrodes: fabrication & characterizations
75
By using a multi-layering process, mesoporous thin films were obtained with a
thickness ranging between 110 nm (1 layer) and 1500 nm (14 layers) (Figure 4) when
using the sol-gel solution at 2 mol.L-1 in titanium precursor. As the relation between
the number of dipped layers and the film thickness is almost linear, it is quite easy,
using this process, to choose and predict the films thickness.
Figure 3: FEG-SEM pictures of TiO2 thin films (2M, 6 dipped layers) after final heat treatment (500°C, 1h) with intermediate heat treatments between each dipped layer of 5 min at 450°C (left) and of 3 min at 350°C (right) cross sections.
Figure 4: FEG-SEM pictures of TiO2 thin films (2 mol.L-1) cross sections. The film thickness is 110 nm for 1 layer (a), 520 nm for 5 layers (b), 1500 nm for 14 layers (c).
FTO
TiO2
FTO
TiO2
FTO
TiO2 FTO
TiO2
FTO
TiO2
a) b) c)

Chapter 2 – Mesoporous TiO2 thin film electrodes: fabrication & characterizations
76
II.2.2 – Inorganic walls and porous networks
Thickness of the titania inorganic walls as well as porous network can be controlled by
changing the structuring agent or the titanium precursor concentration. In Figure 5 is
reported the influence of the nature of the block-copolymer and of the titanium
precursor concentration. Films were prepared with PB-PEO using titania precursors
solution at 1 mol.L-1 (a) and 2 mol.L-1 (b), with Pluronic F127 (TiCl4 1M) and without
any polymers (d).
Figure 5: FEG-SEM pictures of TiO2 planar using block-copolymer PB-PEO with titania precursors solution at 1M (a), 2M (b), with Pluronic F127 (TiCl4 1M) (c), without polymer (d).
By modifying the concentration from 1 mol.L-1 to 2 mol.L-1, the thickness of the
inorganic walls went from around 12 (a) to 25 nm (b), with pores diameter around 26
nm1. It also changes the thickness of the film, which doubles from 50-60 nm (at
1 mol.L-1) to 100-110 nm (at 2 mol.L-1) for one layer.
1 Average values evaluated with IMAGE-J on FEG-SEM photos (Figure 5) for samples of
623 points (1M) and 2181 points (2M). Pore size distribution are presented in Annex Figure A.1.1.
500nm 500nm
500nm 500nm
(a) (b)
(c) (d)
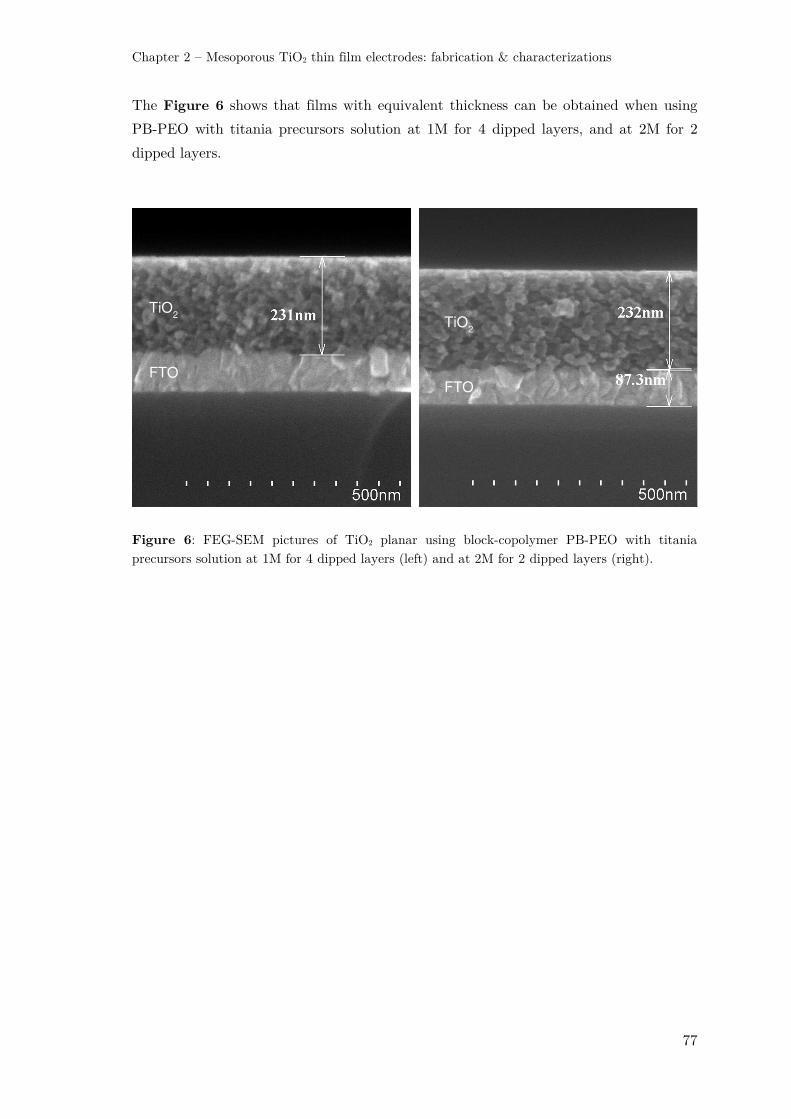
Chapter 2 – Mesoporous TiO2 thin film electrodes: fabrication & characterizations
77
The Figure 6 shows that films with equivalent thickness can be obtained when using
PB-PEO with titania precursors solution at 1M for 4 dipped layers, and at 2M for 2
dipped layers.
Figure 6: FEG-SEM pictures of TiO2 planar using block-copolymer PB-PEO with titania precursors solution at 1M for 4 dipped layers (left) and at 2M for 2 dipped layers (right).
FTO
TiO2
FTO
TiO2

Chapter 2 – Mesoporous TiO2 thin film electrodes: fabrication & characterizations
78
III – Thin films structural characterizations
In this section, structural characterizations of the architecture-controlled TiO2 electrode
are addressed using environmental ellipsometric porosimetry (EEP) and glancing angle
X-Ray diffraction (G-XRD). Thin film thickness, porosity, specific surface area,
crystallite size and their homogeneity in the whole film are investigated.
III.1 – Spectroscopic Ellipsometry
The refractive index and the thickness of final films were measured, after the stabilizing
thermal treatment, by spectroscopic ellipsometry performed on a UV-IR (240 1000 nm)
variable angle spectroscopic ellipsometer (VASE) M2000DI from Woollam. Data
analysis was performed with the CompleteEASE software.
Ellipsometry is an optical technique where a polarized light wave changes its
polarization state when reflected by a surface. This change depends of the optical
properties of the reflecting material, which can be extrapolated from the ellipsometric
measurement. This can be done using an optical dispersion model of the analyzed film.
Its parameters are varied to match the experimental data as closely as possible. For
dielectric transparent materials, the most common employed model is a Cauchy
dispersion, described by the equation (1):
! = # + &'(
(1)
where A and B are the variable parameters and n is the refractive index. This model
will be used in this thesis to describe the titania thin films deposed on silicon or FTO
substrates.
III.1.1 – Adaptation for porous thin films
Porous thin films are a composite material, they alternate the backbone material with
empty volume (pores filled with air). Therefore, Effective Medium Approximations
(EMA) model can be applied to calculate the porous volume of the layer. EMA treats
the optical layer properties as a mix of the properties of its constituents, considering
the respective volume fractions, and allows the linear approximation described by
equation (2):
) * = +,. ),̃ + +/. )/̃ (2)
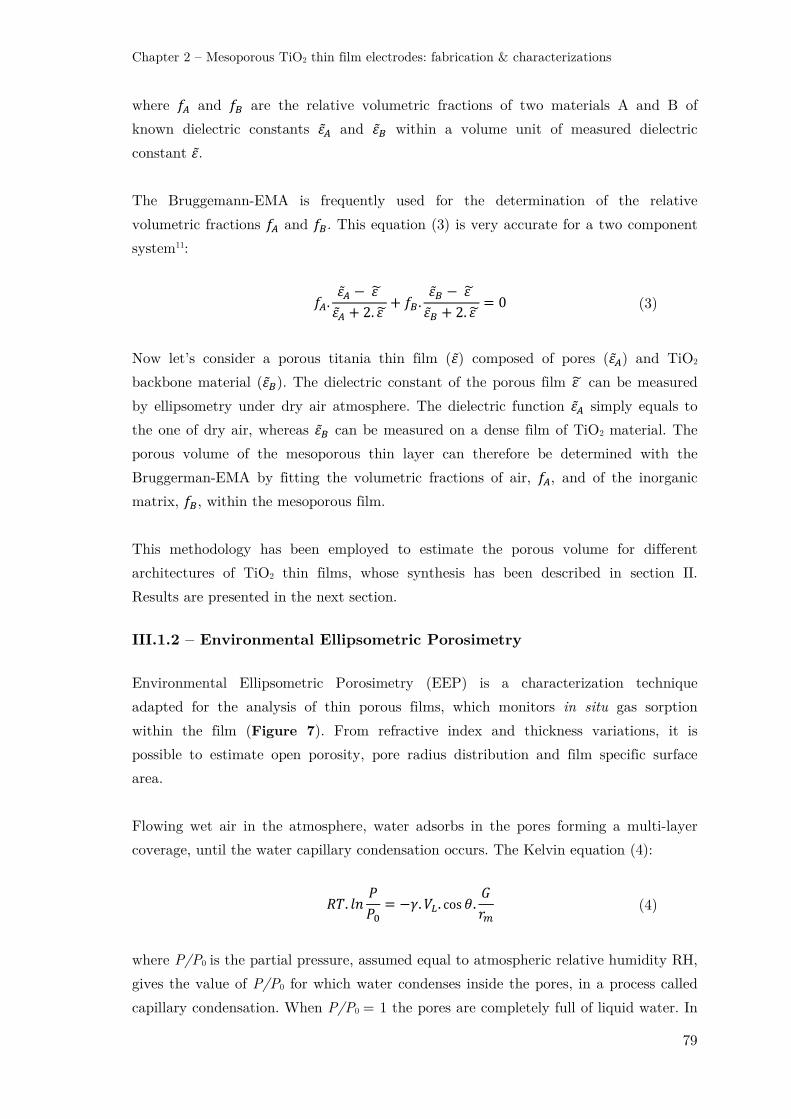
Chapter 2 – Mesoporous TiO2 thin film electrodes: fabrication & characterizations
79
where +, and +/ are the relative volumetric fractions of two materials A and B of
known dielectric constants ),̃ and )/̃ within a volume unit of measured dielectric
constant )̃.
The Bruggemann-EMA is frequently used for the determination of the relative
volumetric fractions +, and +/. This equation (3) is very accurate for a two component
system11:
+,.),̃ 0 ) *),̃ + 2. ) * + +/.
)/̃ 0 ) *)/̃ + 2. ) * = 0 (3)
Now let’s consider a porous titania thin film ()̃) composed of pores (),̃) and TiO2
backbone material ()/̃). The dielectric constant of the porous film ) * can be measured
by ellipsometry under dry air atmosphere. The dielectric function ),̃ simply equals to
the one of dry air, whereas )/̃ can be measured on a dense film of TiO2 material. The
porous volume of the mesoporous thin layer can therefore be determined with the
Bruggerman-EMA by fitting the volumetric fractions of air, +,, and of the inorganic
matrix, +/, within the mesoporous film.
This methodology has been employed to estimate the porous volume for different
architectures of TiO2 thin films, whose synthesis has been described in section II.
Results are presented in the next section.
III.1.2 – Environmental Ellipsometric Porosimetry
Environmental Ellipsometric Porosimetry (EEP) is a characterization technique
adapted for the analysis of thin porous films, which monitors in situ gas sorption
within the film (Figure 7). From refractive index and thickness variations, it is
possible to estimate open porosity, pore radius distribution and film specific surface
area.
Flowing wet air in the atmosphere, water adsorbs in the pores forming a multi-layer
coverage, until the water capillary condensation occurs. The Kelvin equation (4):
34. 5!667
= 08. 9:. cos >.? !
(4)
where P/P0 is the partial pressure, assumed equal to atmospheric relative humidity RH,
gives the value of P/P0 for which water condenses inside the pores, in a process called
capillary condensation. When P/P0 = 1 the pores are completely full of liquid water. In

Chapter 2 – Mesoporous TiO2 thin film electrodes: fabrication & characterizations
80
the Kelvin equation, 8 is the surface tension, VL is the molar volume of water, > is the
wetting angle and rm is the curvature radius of the liquid/vapor interface. G is a
geometric factor accounting for the pores shape, it has a value of 2 for a sphere and 1
for a cylinder. The geometric factor can be calculated also for elliptic pores, knowing
their anisotropy factor, as reported by Boissière et al.11
Figure 7: Experimental setup employed in environmental ellipsometric porosimetry, reproduced from Boissière et al.11
The measured radius rm is not exactly equal to the pore radius, r, since the capillary
condensation occurs only after the adsorption of a water layer covering completely the
pore walls. The thickness, t, of this deposit can be measured on non-porous samples of
the analyzed material. The pore radius, r, can be calculated as follow: = ! + t.
The evolution of the film refractive index, n, and the thickness, d, as a function of the
environmental relative humidity (RH = P/P0), are measured by EEP. The capillary
condensation pressure P/P0 is measured and the pore radius distribution can be
obtained using the Kelvin equation. Isotherms usually present hysteresis, meaning that
two different values of P/P0 are associated with adsorption and desorption (Figure 8).
Hysteresis is originated from the fact that the interface curvature is not the same
during adsorption and desorption. After capillary condensation, a liquid meniscus is
formed inside the pores, and it has a different curvature compared to the starting
adsorbed layer. Therefore, the desorption curve is shifted towards smaller P/P0.
Another reason that causes hysteresis in the porosimetry curves is that in many cases
the access to larger pores is limited by smaller pores and they are not drained until the
desorption condition of the bottleneck is met. Then, both the neck and the large pore

Chapter 2 – Mesoporous TiO2 thin film electrodes: fabrication & characterizations
81
are rapidly emptied. From the desorption isotherm, it is thereby possible to obtain the
pore radius of the restrictions that access the larger cavities, also called bottlenecks.
Figure 8: Representation of sorption isotherms and scheme of respective situation in the pore system. Adsorption cycle is in solid lines, desorption cycle in dashed lines. The capillary condensation corresponds to phase 3. Adapted from Löbmann12.
From EEP data, the surface area values can be estimated by taking into account the
total mesoporous volume and pores dimensions. With a geometrical model of a
spherical pore with 4 connections per pore, specific surface area S can be estimated
using equation (5):
" =9#
9#$%&. '"#$%& 0 4. ")*++,-.-/012 (5)
Ratio between the porous volume Vp and the volume of one pore Vpore gives the number
of pores. The geometrical volume of a pore, Vp, the surface of a pore, Spore, and of
an inter-pore connection, Sbottlenecks, are determined from the EEP determination of the
pores and bottlenecks dimensions. Surface area values obtained with this methodology
are presented in the next section.
In our study, analysis of our electrodes by Environmental Ellipsometric Porosimetry
(EEP) measurements led to isotherms (Figure 9 and Figure 10) presenting
phenomenon of capillary condensation characteristic of mesoporous materials.
Adsorption-desorption cycles were performed with water for F127 films and with
isopropanol for PB-PEO films (for PB-PEO big pores, isopropanol surface tension is
more adapted to measure P/P0 at capillary condensation).

Chapter 2 – Mesoporous TiO2 thin film electrodes: fabrication & characterizations
82
Analysis of these isotherms showed that mesoporous films have an average porous
volume ranging between ≃ 12% and ≃ 36% (Table 1). These values were obtained as
the ratio between the volumic fraction of air, fA, and of TiO2, fB, using equation (3)
(section III.1.1), with )̃ (porous titania thin) and )/̃ (dense itania) measured for
P/P0 = 0 (dry air).
PB-PEO thin films prepared with a higher Ti/polymers ratio (1M vs. 2M) are denser,
which could be expected for films with thicker titania walls (II.2.2 Figure 5). At fixed
titania precursor concentration, a thicker film has a higher average density. In fact, a
more precise EEP analysis realized in the laboratory13 using a 3 layers model for a
similar mesoporous 280-thick film showed a porosity gradient along the film, where
inner layers are significantly denser than surface layer.13 Indeed, as the films are dipped
using a multi-layering process, we could expect that layer number, n, is partially filled
with sol-gel solution when dipping the layer number n+1. Besides, in comparison to
surface layers, first dipped layers undergo multiple intermediate heat treatments, which
could also possibly reduce the porous volume due to crystallite growth.
The determination of P/P0 at capillary condensation during the adsorption cycle
(Figure 9, solid lines) allows the estimation of pore diameters, which are found
≃ 10 nm for F127 films, and ≃ 26 nm, whatever the conditions for PB-PEO films.
These dimensions are in a good agreement with those evaluated by FEG-SEM analysis
(section II.2.2).
The determination of P/P0 at capillary condensation during the desorption cycle
(Figure 9, dashed lines) allows the estimation of pore bottleneck dimensions, whose
dimension could be crucial in terms of electrolyte diffusion. Pore restrictions seem to
slightly decrease when increasing the Ti/polymers ratio or the thickness of PB-PEO
films (≃ 10-13 nm), and is smaller for F127 films (≃ 8 nm).

Chapter 2 – Mesoporous TiO2 thin film electrodes: fabrication & characterizations
83
Figure 9: Evolutions of refractive index n of mesoporous titania films (TiCl4, 1M) as a function of P/P0. Adsorption (solid lines)-desorption (dashed lines) cycles were performed with isopropanol for PB-PEO films and with water for F127 films. Thickness of the film are indicated in the sample name.
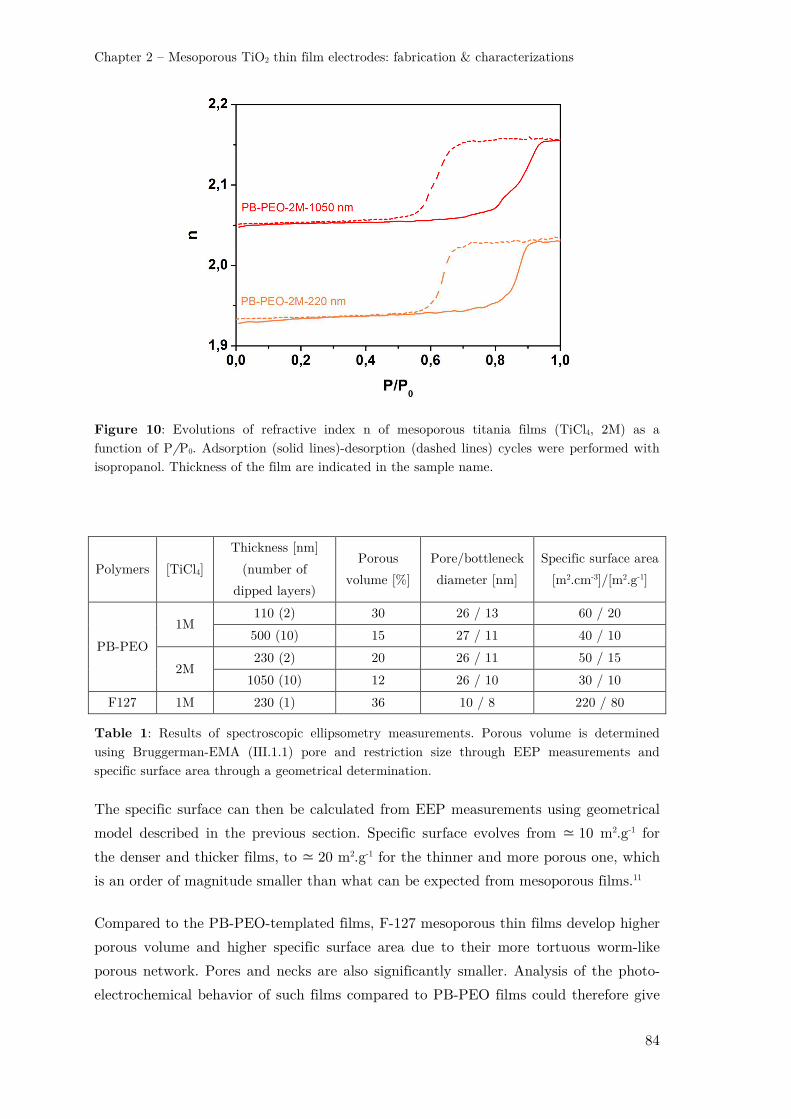
Chapter 2 – Mesoporous TiO2 thin film electrodes: fabrication & characterizations
84
Figure 10: Evolutions of refractive index n of mesoporous titania films (TiCl4, 2M) as a function of P/P0. Adsorption (solid lines)-desorption (dashed lines) cycles were performed with isopropanol. Thickness of the film are indicated in the sample name.
Polymers [TiCl4]
Thickness [nm]
(number of
dipped layers)
Porous
volume [%]
Pore/bottleneck
diameter [nm]
Specific surface area
[m2.cm-3]/[m2.g-1]
PB-PEO
1M 110 (2) 30 26 / 13 60 / 20
500 (10) 15 27 / 11 40 / 10
2M 230 (2) 20 26 / 11 50 / 15
1050 (10) 12 26 / 10 30 / 10
F127 1M 230 (1) 36 10 / 8 220 / 80
Table 1: Results of spectroscopic ellipsometry measurements. Porous volume is determined using Bruggerman-EMA (III.1.1) pore and restriction size through EEP measurements and specific surface area through a geometrical determination.
The specific surface can then be calculated from EEP measurements using geometrical
model described in the previous section. Specific surface evolves from ≃ 10 m2.g-1 for
the denser and thicker films, to ≃ 20 m2.g-1 for the thinner and more porous one, which
is an order of magnitude smaller than what can be expected from mesoporous films.11
Compared to the PB-PEO-templated films, F-127 mesoporous thin films develop higher
porous volume and higher specific surface area due to their more tortuous worm-like
porous network. Pores and necks are also significantly smaller. Analysis of the photo-
electrochemical behavior of such films compared to PB-PEO films could therefore give
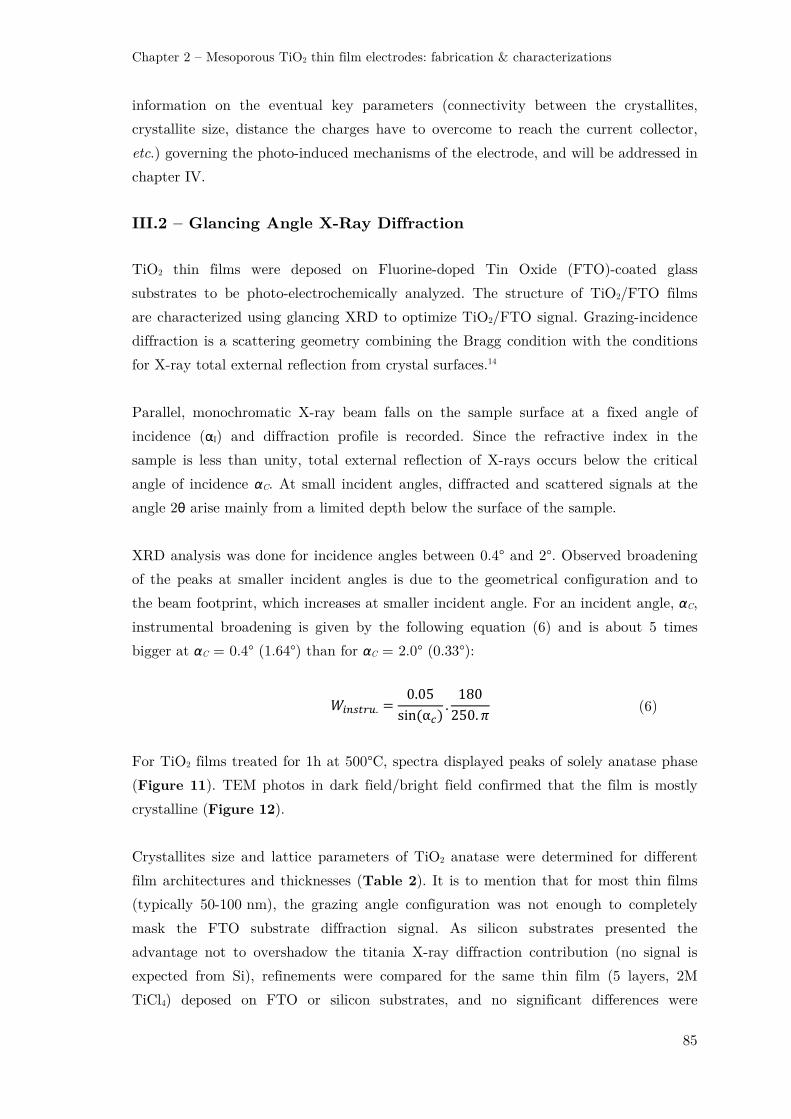
Chapter 2 – Mesoporous TiO2 thin film electrodes: fabrication & characterizations
85
information on the eventual key parameters (connectivity between the crystallites,
crystallite size, distance the charges have to overcome to reach the current collector,
etc.) governing the photo-induced mechanisms of the electrode, and will be addressed in
chapter IV.
III.2 – Glancing Angle X-Ray Diffraction
TiO2 thin films were deposed on Fluorine-doped Tin Oxide (FTO)-coated glass
substrates to be photo-electrochemically analyzed. The structure of TiO2/FTO films
are characterized using glancing XRD to optimize TiO2/FTO signal. Grazing-incidence
diffraction is a scattering geometry combining the Bragg condition with the conditions
for X-ray total external reflection from crystal surfaces.14
Parallel, monochromatic X-ray beam falls on the sample surface at a fixed angle of
incidence (αI) and diffraction profile is recorded. Since the refractive index in the
sample is less than unity, total external reflection of X-rays occurs below the critical
angle of incidence αC. At small incident angles, diffracted and scattered signals at the
angle 2θ arise mainly from a limited depth below the surface of the sample.
XRD analysis was done for incidence angles between 0.4° and 2°. Observed broadening
of the peaks at smaller incident angles is due to the geometrical configuration and to
the beam footprint, which increases at smaller incident angle. For an incident angle, αC,
instrumental broadening is given by the following equation (6) and is about 5 times
bigger at αC = 0.4° (1.64°) than for αC = 2.0° (0.33°):
45678%9. =0.05
sin 'α>2.180
250. A (6)
For TiO2 films treated for 1h at 500°C, spectra displayed peaks of solely anatase phase
(Figure 11). TEM photos in dark field/bright field confirmed that the film is mostly
crystalline (Figure 12).
Crystallites size and lattice parameters of TiO2 anatase were determined for different
film architectures and thicknesses (Table 2). It is to mention that for most thin films
(typically 50-100 nm), the grazing angle configuration was not enough to completely
mask the FTO substrate diffraction signal. As silicon substrates presented the
advantage not to overshadow the titania X-ray diffraction contribution (no signal is
expected from Si), refinements were compared for the same thin film (5 layers, 2M
TiCl4) deposed on FTO or silicon substrates, and no significant differences were

Chapter 2 – Mesoporous TiO2 thin film electrodes: fabrication & characterizations
86
observed (Table 2). Values of crystallite size and lattice parameters can therefore be
reasonably compared on FTO or silicon substrates.
After final heat treatment (1h, 500°C), films obtained with Pluronic F127 and PB-PEO
polymers for the same TiCl4 concentration (1M) gave comparable crystallite size (about
7-8 nm). For the electrode prepared at 2M in TiCl4, crystallite size was bigger and
slightly increased with the film thickness (12-15 nm).
Figure 11: XRD diagram of mesoporous PB-PEO TiO2 (2M, 520 nm-thick) for incident angle
from 0.4° to 2.0° (a) and anatase crystal structure (b).
(a) (b)
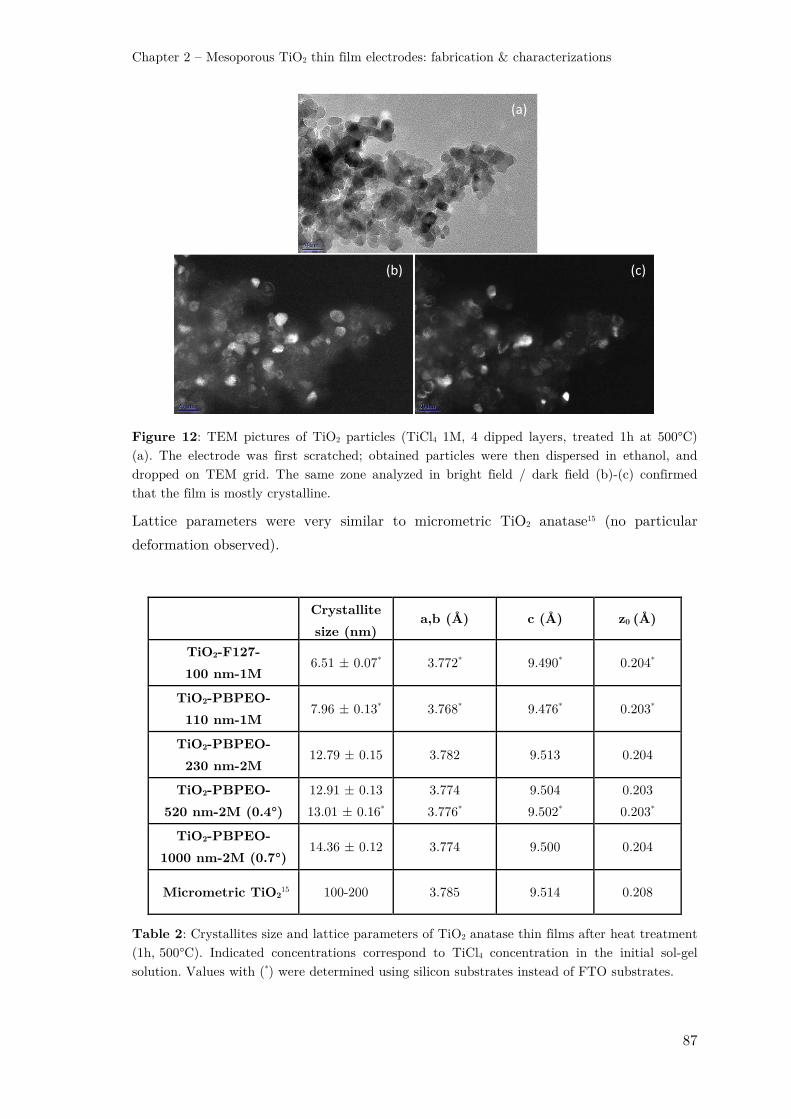
Chapter 2 – Mesoporous TiO2 thin film electrodes: fabrication & characterizations
87
Figure 12: TEM pictures of TiO2 particles (TiCl4 1M, 4 dipped layers, treated 1h at 500°C) (a). The electrode was first scratched; obtained particles were then dispersed in ethanol, and dropped on TEM grid. The same zone analyzed in bright field / dark field (b)-(c) confirmed that the film is mostly crystalline.
Lattice parameters were very similar to micrometric TiO2 anatase15 (no particular
deformation observed).
Crystallite
size (nm) a,b (Å) c (Å) z0 (Å)
TiO2-F127-
100 nm-1M 6.51 ± 0.07* 3.772* 9.490* 0.204*
TiO2-PBPEO-
110 nm-1M 7.96 ± 0.13* 3.768* 9.476* 0.203*
TiO2-PBPEO-
230 nm-2M 12.79 ± 0.15 3.782 9.513 0.204
TiO2-PBPEO-
520 nm-2M (0.4°)
12.91 ± 0.13
13.01 ± 0.16*
3.774
3.776*
9.504
9.502*
0.203
0.203*
TiO2-PBPEO-
1000 nm-2M (0.7°) 14.36 ± 0.12 3.774 9.500 0.204
Micrometric TiO215 100-200 3.785 9.514 0.208
Table 2: Crystallites size and lattice parameters of TiO2 anatase thin films after heat treatment (1h, 500°C). Indicated concentrations correspond to TiCl4 concentration in the initial sol-gel solution. Values with (*) were determined using silicon substrates instead of FTO substrates.
(a)
(b) (c)

Chapter 2 – Mesoporous TiO2 thin film electrodes: fabrication & characterizations
88
The more the incident angle increased, the more X-ray diffracted signal of FTO
substrate became visible (Figure 11). For each incidence angle, the X-rays penetration
depth into the sample can be estimated.
First, critical angle αC of the sample was determined by X-Ray Reflectivity (XRR)
using the Fresnel equation13. At 2 αC, the corresponding reflectivity value is Imax/2,
where Imax is the maximum of the reflectivity plateau. For example, for a typical
mesoporous PB-PEO thin films (TiCl4 2M, 230 nm-thick), αC is found to be 0.243°
(Figure 13).
By using small angle approximation in Snell law, αC can be expressed as a linear
function of the square root of the material density. As the theoretical density of anatase
and the corresponding αC (0.297°) are known, density of the sample was then estimated
using equation (7). For example, the density of PB-PEO mesoporous thin films (TiCl4
2M, 230 nm-thick) was estimated at ≃ 67 %, which was in good agreement with the
≃ 30 % porosity estimated though ellipsometric measurements (see section III.1.2).
B7C!#D& = B8E&$%&85>CD. FG>,7C!#D&
G>,8E&$%&85>CDI(
(7)
Knowing αC and titania density, X-Ray attenuation length as a function of the incident
glancing angle can finally be determined using tabulated values14 (Figure 12). The
attenuation length Latt corresponds to the depth into the material measured along the
surface normal where the intensity of X-rays falls to 1/e of its value at the surface
(Beer-Lambert law). In other terms, 67% of the X-rays are stopped at this depth. At
4 Latt, 98% of the X-rays (attenuation of 1/e4) are stopped. For a given incident
glancing angle, we could consider that the probed depth of the sample corresponds to
about 4 times the attenuation length. Above a depth of 4 Latt, the X-Ray diffraction
signal is almost entirely attenuated (diffracted signal intensity less than 2% of its value
at the surface).

Chapter 2 – Mesoporous TiO2 thin film electrodes: fabrication & characterizations
89
Figure 13: Reflectivity of mesoporous PB-PEO TiO2 (TiCl4 1M, 230 nm-thick), deducted value of αC is found to be 0.243° (left). Attenuation length as a function of the incident glancing angle for mesoporous PB-PEO TiO2 (TiCl4 2M, 230 nm-thick) (right).
Multilayered mesoporous films were therefore probed at multiple incident angles to
allow selective analysis of the material on a depth of hundreds of nanometers. In
particular, homogeneity of the crystal structure and of the crystallite size was checked
for the thicker films, which have been synthesized by a multi-layering process using
sometimes more than 10 layers.
Figure 14 shows XRD analysis of a 1000 nm-thick film for incidence angles between
0.4° and 1°. The probed depth was about 450 nm at 0.4°, 660 nm at 0.5°, 1000 nm at
0.7° and 1480 nm at 1°. The probed depth values correspond to 4 Latt for each incident
angle. FTO signal was clearly visible at 1°. Refinements at 0.4°, 0.5°, 0.7° and 1°
showed monophasic anatase with very similar crystallite size and lattice parameters
(Table 3).

Chapter 2 – Mesoporous TiO2 thin film electrodes: fabrication & characterizations
90
Figure 14: XRD diagram of mesoporous PB-PEO TiO2 (2M, 1 µm--thick) for incident angle from 0.4° to 1.0° (a). Corresponding FEG-SEM cross section (b). Corresponding attenuation length function for a density of 85% (αC = 0.273°) (c).
500nm
(a)
(b) (c)
FTO
TiO2
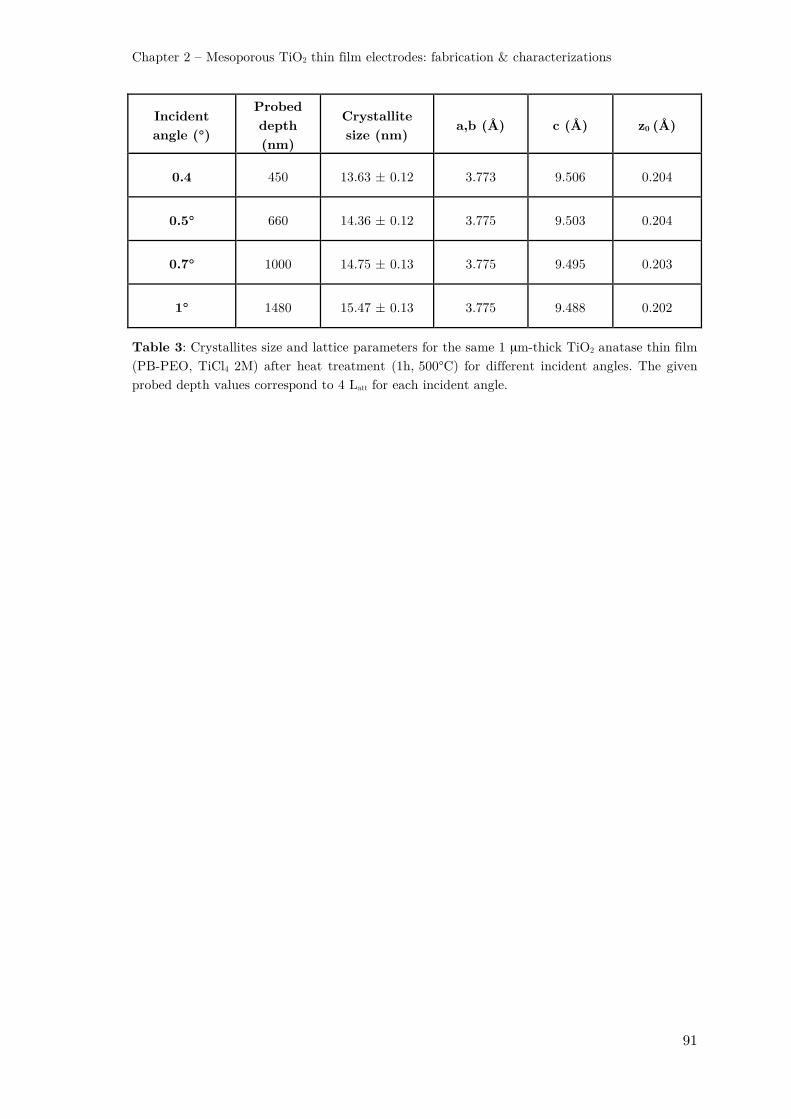
Chapter 2 – Mesoporous TiO2 thin film electrodes: fabrication & characterizations
91
Incident angle (°)
Probed depth (nm)
Crystallite size (nm)
a,b (Å) c (Å) z0 (Å)
0.4 450 13.63 ± 0.12 3.773 9.506 0.204
0.5° 660 14.36 ± 0.12 3.775 9.503 0.204
0.7° 1000 14.75 ± 0.13 3.775 9.495 0.203
1° 1480 15.47 ± 0.13 3.775 9.488 0.202
Table 3: Crystallites size and lattice parameters for the same 1 µm-thick TiO2 anatase thin film (PB-PEO, TiCl4 2M) after heat treatment (1h, 500°C) for different incident angles. The given probed depth values correspond to 4 Latt for each incident angle.

Chapter 2 – Mesoporous TiO2 thin film electrodes: fabrication & characterizations
92
IV – Reconstruction of TiO2 electrode energetic diagram
In this section, energy diagram of TiO2 electrode is determined. Band-gap is first
evaluated by UV-Visible spectroscopy. The flat-band potential is then estimated by
means of Mott Schottky measurements. The knowledge of the energy diagram could
constitute an important starting point to consider reactivity of the photo-generated
charges at the TiO2 electrode / electrolyte interface in the following chapters.
IV.1 – Band gap determination by UV-Visible Spectroscopy
The bandgap of semiconductor materials can be determined by measurement of optical
transitions using following equation (8):
# =&'ℎK 0 LM2!
ℎK (8)
where A is the absorption coefficient, B a constant, hv the light energy from Planck’s
constant (h) and frequency (v) determined by the speed of light (3 x 10⁸ m.s-1) over the
wavelength (λ in nm) by the Planck-Einstein relation. For direct semiconductors
m = ½, whereas for indirect, m = 2. Extrapolation of (Ahv)1/m vs. hv yields a Tauc
plot, indicating the band gap value from the x-axis intercept from the linear feature of
the absorption edge.16
In order to determine the band gap of TiO2 thin film as a function of lithium content in
the electrode, UV-Vis absorption spectroscopy was acquired in situ for different
potentials imposed during a CV experiment in a two-electrode configuration, using an
argon-tight cuvette designed and fabricated for the experiment (Figure 15).
Absorbance is measured on an Agilent Technologies Cary Series 5000
spectrophotometer in a double beam configuration with another cuvette containing an
FTO/glass film in the used electrolyte as a zero. Absorbance of the substrate and the
electrolyte separately are presented in Annex Figure A.1.2.

Chapter 2 – Mesoporous TiO2 thin film electrodes: fabrication & characterizations
93
The Figure 16 presents the evolution of absorbance of a TiO2 electrode (PB-PEO, 1M
in TiCl4, 5 dipped layers) during lithiation (2.6 V to 1.4 V vs. Li+/Li0, 2 mV.s-1) and
delithiation (1.4 V to 2.6 V vs. Li+/Li0, 2 mV.s-1) in LP30.
Figure 15: TiO2 thin film (used as working electrode) and Li foil (used as counter- and ref. electrode) in argon-tight cuvette containing LP30 electrolyte (a) same cell in UV-Vis spectrophotometer (b) observed blue color of TiO2 film after film lithiation (c).
Figure 16: In situ evolution of UV-Vis absorption spectra for anatase TiO2 electrode (PB-PEO, 1M in TiCl4, 5 dipped layers) during Li+ insertion (CV from 2.6 V to 1.4 V) (a) and Li+ extraction (CV from 1.4 V to 2.6 V) (b) in LP30 using air-tight cuvette in a two-electrode configuration. Associated CV experiment between 2.6 V to 1.4 V vs. Li+/Li0 at 2 mV.s-1 (insert) and Tauc plots corresponding to the discharge experiment (c)-(d).
(a) (b)
(c) (d)
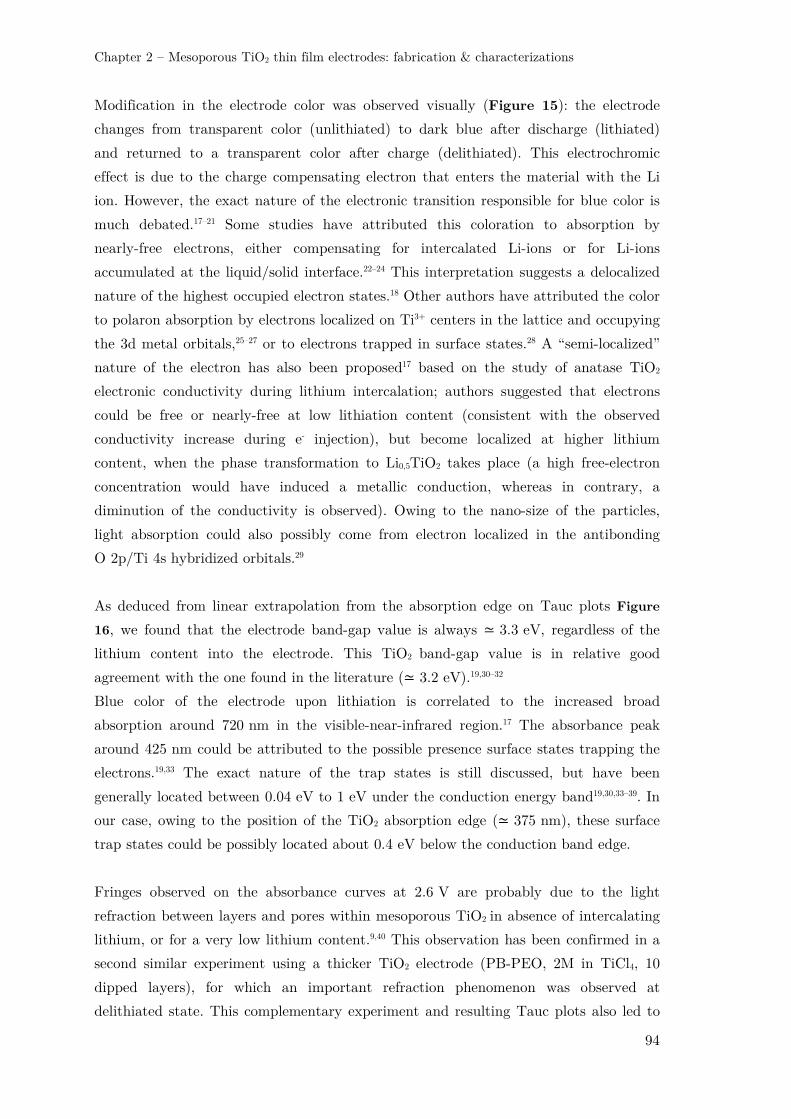
Chapter 2 – Mesoporous TiO2 thin film electrodes: fabrication & characterizations
94
Modification in the electrode color was observed visually (Figure 15): the electrode
changes from transparent color (unlithiated) to dark blue after discharge (lithiated)
and returned to a transparent color after charge (delithiated). This electrochromic
effect is due to the charge compensating electron that enters the material with the Li
ion. However, the exact nature of the electronic transition responsible for blue color is
much debated.17–21 Some studies have attributed this coloration to absorption by
nearly-free electrons, either compensating for intercalated Li-ions or for Li-ions
accumulated at the liquid/solid interface.22–24 This interpretation suggests a delocalized
nature of the highest occupied electron states.18 Other authors have attributed the color
to polaron absorption by electrons localized on Ti3+ centers in the lattice and occupying
the 3d metal orbitals,25–27 or to electrons trapped in surface states.28 A “semi-localized”
nature of the electron has also been proposed17 based on the study of anatase TiO2
electronic conductivity during lithium intercalation; authors suggested that electrons
could be free or nearly-free at low lithiation content (consistent with the observed
conductivity increase during e- injection), but become localized at higher lithium
content, when the phase transformation to Li0,5TiO2 takes place (a high free-electron
concentration would have induced a metallic conduction, whereas in contrary, a
diminution of the conductivity is observed). Owing to the nano-size of the particles,
light absorption could also possibly come from electron localized in the antibonding
O 2p/Ti 4s hybridized orbitals.29
As deduced from linear extrapolation from the absorption edge on Tauc plots Figure
16, we found that the electrode band-gap value is always ≃ 3.3 eV, regardless of the
lithium content into the electrode. This TiO2 band-gap value is in relative good
agreement with the one found in the literature (≃ 3.2 eV).19,30–32
Blue color of the electrode upon lithiation is correlated to the increased broad
absorption around 720 nm in the visible-near-infrared region.17 The absorbance peak
around 425 nm could be attributed to the possible presence surface states trapping the
electrons.19,33 The exact nature of the trap states is still discussed, but have been
generally located between 0.04 eV to 1 eV under the conduction energy band19,30,33–39. In
our case, owing to the position of the TiO2 absorption edge (≃ 375 nm), these surface
trap states could be possibly located about 0.4 eV below the conduction band edge.
Fringes observed on the absorbance curves at 2.6 V are probably due to the light
refraction between layers and pores within mesoporous TiO2 in absence of intercalating
lithium, or for a very low lithium content.9,40 This observation has been confirmed in a
second similar experiment using a thicker TiO2 electrode (PB-PEO, 2M in TiCl4, 10
dipped layers), for which an important refraction phenomenon was observed at
delithiated state. This complementary experiment and resulting Tauc plots also led to

Chapter 2 – Mesoporous TiO2 thin film electrodes: fabrication & characterizations
95
same conclusions concerning the unchanged TiO2 anatase band-gap upon electrode
lithiation, regardless to the electrode thickness, and the used electrolyte (PYR13TFSI,
0.2M in LiTFSI) (see Annex Figure A.1.3).
IV.2 – Flat-band potential estimated by Mott-Schottky experiment
In order to complete the energy diagram of the TiO2 thin film electrode, value of flat-
band potential can be calculated by means of electrochemical impedance spectroscopy
(EIS). The double layer capacity at the semiconductor/electrolyte interface can be
measured as a function of the applied potential. The flat band potential (Efb) can then
be extrapolated using the Mott-Schottky relation described by equation (9):
1N( = O
2P)7)%Q#(R ST9 0 L+UV 0
W&4P
X (9)
where C is the differential capacitance of the space-charge region, e the elementary
charge (1.60 x 10⁻¹⁹ C), )7 the permittivity of vacuum (8.85 x 10⁻¹² F.m-1), )% the
dielectric constant of the semiconductor, N the doping density, A the surface area of
the sample, V the electrode potential, Efb the flat-band potential, W& the Boltzmann
constant (1.38 x 10⁻²³ J.K-1) and T the absolute temperature (293 K).
Mott-Schottky plot at 1 kHz for TiO2 electrode (PB-PEO, TiCl4 1M, 5 layers) is
presented in Figure 17. Positive slope of 1/C2 graph as a function of the potential
shows the n-type of the semiconductor. Intercept to the potential axis obtained by
extrapolation of the linear part of the 1/C2 function gives an estimation of the flat
band potential Efb ≃ 2.84 V vs. Li+/Li0, with an additional incertitude W/4 (0.025 eV at
293 K).
It is to mention that a small frequency dependence phenomenon on the Mott-Schottky
experiments has been experienced inducing an additional incertitude of ≃ 0.1 eV. In
addition to the experimental error, it could be due to several parameters, which are not
considered in the Mott-Schottky model, as the nano-crystalline nature of the
semiconductor, its mesoporous structure, the presence of surface states, or even the
influence of the conductive substrate.41–43
The flab-band potential of the mesoporous TiO2 electrode is thus estimated at
Efb ≃ -0.16 V ± 0.125 V vs. NHE, which is close from values ≃ -0.5V to 0V vs.
NHE found in the literature (generally reported in water for watersplitting application,
with a dependence to pH or to the presence of surface states).42–45

Chapter 2 – Mesoporous TiO2 thin film electrodes: fabrication & characterizations
96
Figure 17: Mott-Schottky experiment at 1 kHz (5 mV.s-1) for TiO2 electrode (PB-PEO, TiCl4 1M, 5 layers) in LP30 (left). Frequency dependence on the flat-band potential (right).
Combined with band-gap determination through UV-Vis measurements determined in
section IV.1, the energy diagram of TiO2 anatase electrode is drawn (see Figure 18).
The knowledge of the energy diagram of our electrode could constitute an important
starting point to consider reactivity of the photo-generated charges at the TiO2
electrode / electrolyte interface.
Figure 18: Schematic energetic diagram of TiO2. Band gap value is deduced from UV-Vis measurements and flat band potential from Mott-Schottky experiment at 1 kHz.

Chapter 2 – Mesoporous TiO2 thin film electrodes: fabrication & characterizations
97
V – Conclusion
In this chapter, we have presented the synthesis of TiO2 mesoporous thin film electrode
using multilayer dip coating process. By contrast to a conventional battery electrode,
the mesoporous film is not composed of any binder, which could prevent excessive light
trapping and avoiding possible carrier deceleration across multiple interfaces.
PB-PEO-templated thin films have been characterized using ellipsometric spectroscopy,
glancing-angle X-ray diffraction, TEM and FEG-SEM analysis. They present a three-
dimensionally interconnected porosity, which develops a well-defined electrode–
electrolyte interface.
TiO2 nanocrystals constitute the inorganic backbone of the photo-electrode and are
connected to form a continuous network, according to FEG-SEM images. For the same
final heat treatment (500°C, 1h), their size can vary from 7 nm for the thinner
electrode and the less concentrated in titania precursors one, to 15 nm for the thicker
and more concentrated one.
If pores diameter is quite constant (about 26 nm), porous volume (30 to 12%) pore
restrictions (13 to 10 nm) and specific surface (20 to 10 m2.g-1) decrease when the film
is getting thicker and when the ratio between titania precursors/polymers increases.
More precisely, gradient in porosity has been observed across the film, where inner
layers are getting denser as at the surface. When carefully controlled (ambient
humidity and temperature, filling of the tank) the multilayer dip-coating process
presents the advantage of being predictive and tunable concerning the film thickness.
Crystallite size seems to be quite homogeneous along the film, which could indicated
that the main reason of the porosity gradient is the filling of the first dipped layers
with the sol-gel solution during the multilayer process rather than crystallite growth
due to the additional heat treatments.
F127-templated thin films present a worm-like porous network with smaller pore size.
This more tortuous porous architecture thus provides higher porous volume and smaller
bottlenecks size. It could therefore constitute an interesting alternative to PB-PEO
films to test the eventual geometrical limiting factors for the electrolyte impregnation
and photo-charge carrier transport.
In the last section, we have reconstructed the energy diagram of TiO2 mesoporous thin
film electrode (PB-PEO, 1M in TiCl4, 5 layers), which is comparable to the energy
diagram expected for anatase TiO2.19,30–32 The deducted schematic energetic diagram
will be used in particular in chapter IV to consider reactivity of the photo-generated
charges at the TiO2 electrode / electrolyte interface.

Chapter 2 – Mesoporous TiO2 thin film electrodes: fabrication & characterizations
98
In the next chapter, PB-PEO-templated mesoporous TiO2 thin film (200/500 nm-thick,
TiCl4 1M/2M) will be photo-electrochemically tested and studied in LP30 electrolyte as
photo-rechargeable Li-ion battery electrode materials.

Chapter 2 – Mesoporous TiO2 thin film electrodes: fabrication & characterizations
99
Bibliography
1. Paolella, A. et al. Light-assisted delithiation of lithium iron phosphate nanocrystals towards photo-rechargeable lithium ion batteries. Nat. Commun. 8, 14643 (2017).
2. Dinh, N. N., Oanh, N. T. T., Long, P. D., Bernard, M. C. & Hugot-Le Goff, A. Electrochromic properties of TiO2 anatase thin films prepared by a dipping sol–gel method. Thin Solid Films 423, 70–76 (2003).
3. Özer, N. Reproducibility of the coloration processes in TiO2 films. Thin Solid Films 214, 17–24 (1992).
4. Lu, Y. et al. Continuous formation of supported cubic and hexagonal mesoporous films by sol–gel dip-coating. Nature 389, 364–368 (1997).
5. Sanchez, C. et al. ‘Chimie douce’: A land of opportunities for the designed construction of functional inorganic and hybrid organic-inorganic nanomaterials. Comptes Rendus Chim. 13, 3–39 (2010).
6. Grosso, D. et al. Fundamentals of Mesostructuring Through Evaporation-Induced Self-Assembly. Adv. Funct. Mater. 14, 309–322 (2004).
7. Grosso, D. et al. Periodically ordered nanoscale islands and mesoporous films composed of nanocrystalline multimetallic oxides. Nat. Mater. 3, 787–792 (2004).
8. Krins, N. et al. NbVO5 Mesoporous Thin Films by Evaporation Induced Micelles Packing: Pore Size Dependence of the Mechanical Stability upon Thermal Treatment and Li Insertion/Extraction. Chem. Mater. 23, 4124–4131 (2011).
9. Hilliard, S. Water Splitting Photoelectrocatalysis. (2016). 10. Bindini, E., Naudin, G., Faustini, M., Grosso, D. & Boissière, C. Critical Role of
the Atmosphere in Dip-Coating Process. J. Phys. Chem. C 121, 14572–14580 (2017).
11. Boissiere, C. et al. Porosity and Mechanical Properties of Mesoporous Thin Films Assessed by Environmental Ellipsometric Porosimetry. Langmuir 21, 12362–12371 (2005).
12. Löbmann, P. Characterization of sol–gel thin films by ellipsometric porosimetry. J. Sol-Gel Sci. Technol. 84, 2–15 (2017).
13. Nguyen, O. et al. Shedding light on the light-driven lithium ion de-insertion reaction: towards the design of a photo-rechargeable battery. J. Mater. Chem. A 5, 5927–5933 (2017).
14. Stepanov, S. Grazing-incidence X-ray diffraction. 3rd Autumn Sch. X-Ray Scatt.
Surf. Thin Layers 1–4 (1997). 15. Structural and thermal parameters for rutile and anatase - Howard - 1991 - Acta
Crystallographica Section B - Wiley Online Library. 16. Tauc, J., Grigorovici, R. & Vancu, A. Optical Properties and Electronic Structure
of Amorphous Germanium. Phys. Status Solidi B 15, 627–637 (1966). 17. van de Krol, R., Goossens, A. & Meulenkamp, E. A. Electrical and optical
properties of TiO2 in accumulation and of lithium titanate Li0.5TiO2. J. Appl. Phys. 90, 2235–2242 (2001).
18. Structure and dynamics of lithium in Anatase TiO2: study of interstitial Li-ion intercalation in anatase TiO2 at the atomic level - Wagemaker M. thesis, 2003.

Chapter 2 – Mesoporous TiO2 thin film electrodes: fabrication & characterizations
100
19. Ardo, S. & Meyer, G. J. Photodriven heterogeneous charge transfer with transition-metal compounds anchored to TiO2 semiconductor surfaces. Chem Soc Rev 38, 115–164 (2009).
20. Khomenko, V. M., Langer, K., Rager, H. & Fett, A. Electronic absorption by Ti3+ ions and electron delocalization in synthetic blue rutile. Phys. Chem. Miner. 25, 338–346 (1998).
21. Naldoni, A. et al. Effect of Nature and Location of Defects on Bandgap Narrowing in Black TiO2 Nanoparticles. J. Am. Chem. Soc. 134, 7600–7603 (2012).
22. Enright, B. & Fitzmaurice, D. Spectroscopic Determination of Electron and Hole Effective Masses in a Nanocrystalline Semiconductor Film. J. Phys. Chem. 100, 1027–1035 (1996).
23. Boschloo, G. & Fitzmaurice, D. Electron accumulation in nanoporous-nanocrystalline TiO2 electrodes. Proc Electrochem Soc 97–20, 84–87 (1997).
24. Kavan, L. Nanocrystalline TiO2 (Anatase) Electrodes: Surface Morphology, Adsorption, and Electrochemical Properties. J. Electrochem. Soc. 143, 394 (1996).
25. Cao, Y., Chen, Y., Sun, X., Zhang, Z. & Mu, T. Water sorption in ionic liquids: kinetics, mechanisms and hydrophilicity. Phys. Chem. Chem. Phys. 14, 12252 (2012).
26. Södergren, S. et al. Lithium intercalation in nanoporous anatase TiO2 studied with XPS. J. Phys. Chem. B 101, 3087–3090 (1997).
27. Wagemaker, M., Lützenkirchen-Hecht, D., van Well, A. A. & Frahm, R. Atomic and Electronic Bulk versus Surface Structure: Lithium Intercalation in Anatase TiO2. J. Phys. Chem. B 108, 12456–12464 (2004).
28. Kang, T.-S. Time-Dependent Electrochromism of Nanocrystalline TiO2 Films in Propylene Carbonate Solution of LiClO4. J. Electrochem. Soc. 145, 1982 (1998).
29. Vayssieres, L., Persson, C. & Guo, J.-H. Size effect on the conduction band orbital character of anatase TiO2 nanocrystals. Appl. Phys. Lett. 99, 183101 (2011).
30. Berger, T., Monllor-Satoca, D., Jankulovska, M., Lana-Villarreal, T. & Gómez, R. The Electrochemistry of Nanostructured Titanium Dioxide Electrodes. ChemPhysChem 13, 2824–2875 (2012).
31. Chen, S. & Wang, L.-W. Thermodynamic Oxidation and Reduction Potentials of Photocatalytic Semiconductors in Aqueous Solution. Chem. Mater. 24, 3659–3666 (2012).
32. Kapilashrami, M., Zhang, Y., Liu, Y.-S., Hagfeldt, A. & Guo, J. Probing the Optical Property and Electronic Structure of TiO2 Nanomaterials for Renewable Energy Applications. Chem. Rev. 114, 9662–9707 (2014).
33. Boschloo, G. & Fitzmaurice, D. Spectroelectrochemical Investigation of Surface States in Nanostructured TiO2 Electrodes. J. Phys. Chem. B 103, 2228–2231 (1999).
34. Bisquert, J. et al. A review of recent results on electrochemical determination of the density of electronic states of nanostructured metal-oxide semiconductors and organic hole conductors. Inorganica Chim. Acta 361, 684–698 (2008).

Chapter 2 – Mesoporous TiO2 thin film electrodes: fabrication & characterizations
101
35. Westermark, K. et al. Determination of the electronic density of states at a nanostructured TiO2/Ru-dye/electrolyte interface by means of photoelectron spectroscopy. Chem. Phys. 285, 157–165 (2002).
36. Fabregat-Santiago, F., Mora-Seró, I., Garcia-Belmonte, G. & Bisquert, J. Cyclic Voltammetry Studies of Nanoporous Semiconductors. Capacitive and Reactive Properties of Nanocrystalline TiO2 Electrodes in Aqueous Electrolyte. J. Phys.
Chem. B 107, 758–768 (2003). 37. Wagemaker, M. et al. Thermodynamics of spinel LixTiO2 from first principles.
Chem. Phys. 317, 130–136 (2005). 38. Jankulovska, M., Berger, T., Lana-Villarreal, T. & Gómez, R. A comparison of
quantum-sized anatase and rutile nanowire thin films: Devising differences in the electronic structure from photoelectrochemical measurements. Electrochimica Acta 62, 172–180 (2012).
39. Jankulovska, M., Berger, T., Wong, S. S., Gómez, R. & Lana-Villarreal, T. Trap States in TiO2 Films Made of Nanowires, Nanotubes or Nanoparticles: An Electrochemical Study. ChemPhysChem 13, 3008–3017 (2012).
40. Hong, W. Q. Extraction of extinction coefficient of weak absorbing thin films from special absorption. J. Phys. Appl. Phys. 22, 1384 (1989).
41. Rajeshwar, K. Fundamentals of semiconductor electrochemistry and photoelectrochemistry. Encycl. Electrochem. (2007).
42. Ge, H. et al. Influence of Surface States on the Evaluation of the Flat Band Potential of TiO2. ACS Appl. Mater. Interfaces 6, 2401–2406 (2014).
43. Cardon, F. & Gomes, W. P. On the determination of the flat-band potential of a semiconductor in contact with a metal or an electrolyte from the Mott-Schottky plot. J. Phys. Appl. Phys. 11, L63 (1978).
44. Radecka, M., Rekas, M., Trenczek-Zajac, A. & Zakrzewska, K. Importance of the band gap energy and flat band potential for application of modified TiO2 photoanodes in water photolysis. J. Power Sources 181, 46–55 (2008).
45. Krol, R. van de, Goossens, A. & Schoonman, J. Mott‐Schottky Analysis of Nanometer‐Scale Thin‐Film Anatase TiO2. J. Electrochem. Soc. 144, 1723–1727 (1997).

Chapter 2 – Mesoporous TiO2 thin film electrodes: fabrication & characterizations
102

103
CHAPTER 3
Mesoporous TiO2 thin films as photo-rechargeable
Li-ion battery electrode materials:
photo-electrochemical characterizations


Chapter 3 – Mesoporous TiO2 thin films as photo-rechargeable Li-ion battery electrode
materials: photo-electrochemical characterizations
105
TABLE of CONTENTS
I – Introduction ......................................................................................................... 107
II – Cell design and photo-electrochemical set-up ...................................................... 108
III – How light impact the discharge and charge of the TiO2-based battery electrode:
observations ............................................................................................................... 109
III.1 – Galvanostatic experiments .......................................................................... 109
III.2 – Cyclic voltammetry experiments ................................................................. 113
IV – Evaluation of the photo-current intensity .......................................................... 115
IV.1 – Potentiostatic experiments .......................................................................... 115
IV.2 – Open circuit voltage experiments ................................................................ 117
V – Adjusting the rates of simultaneous electrode discharge and photo-recharge ....... 119
VI – Conclusion ......................................................................................................... 121
Bibliography .............................................................................................................. 122

Chapter 3 – Mesoporous TiO2 thin films as photo-rechargeable Li-ion battery electrode
materials: photo-electrochemical characterizations
106
Chapter 3 – Mesoporous TiO2 thin films as photo-rechargeable Li-ion battery electrode
materials: photo-electrochemical characterizations
107
I – Introduction
Based on their observations of the effect of light on pre-protoned TiO2(B), Tributsch et
al.1 proposed a mechanism, where photo-generated holes oxidize Ti3+ (from HxTiO2)
into Ti4+, which lead to lithium-ion extraction. This interpretation has also been
adopted by Zaghib et al.2 in their recent study on lithium iron phosphate as photo-
rechargeable electrode.
In the case of our study, analysing how light impacts the electrochemical response of
the battery electrode for different electrochemical experiments could provide essential
information about the characteristics and the mechanisms of the TiO2 electrode photo-
recharge. By using a more simple composition of the electrode (carbon- and dye-free
electrode) in comparison to the usual Li-ion battery systems or dye-sensitized systems,
we hope to facilitate the comprehension of the observed light-induced phenomena,
which will be compared to Tributsch mechanistic hypothesis.
In this chapter, mesoporous TiO2 thin film is tested as a photo-rechargeable Li-ion
battery electrode materials. As regards to the choice of the experiments, it is to
mention that in the case of photo-rechargeable battery testing, a precise methodology is
not established (in comparison to the one in Li-ion battery domain for example).
At this very early stage of development of the bifunctional electrode technology, the
few reported photo-recharge experiments2,3 are essentially based on the analysis of open
current voltage experiments under illumination. In this study, we will try to play with
other simple experiments, which are more inspired by the methodology applied in other
domains studying effects of illumination (e.g. photo-watersplitting), using chopped
illumination for example.
In the first section, we will described the cell and the photo-electrochemical set-up. The
following sections report our observations and deductions on the electrochemical
response of TiO2 electrode upon illumination for different electrochemical experiments
(galvanostatic, cyclic voltammetry, open current voltage, potentiostatic under chopped
illumination experiments).

Chapter 3 – Mesoporous TiO2 thin films as photo-rechargeable Li-ion battery electrode
materials: photo-electrochemical characterizations
108
II – Cell design and photo-electrochemical set-up
Electrochemical measurements were performed in a three-electrode cell, made of a
sealed glass container (transparent in the visible range), assembled in an Ar-glove box
(H2O content < 0,1ppm). Two foils of lithium were used as counter and reference
electrodes respectively. The mesoporous anatase TiO2 film on FTO substrate was used
as working electrode and was oriented such as the TiO2 film faces the light. The
electrolyte was 1M LiPF6 EC/DMC=50/50 (v/v) (LP30). Cyclic voltammograms (CV),
chronopotentiometric (charge-discharge) and chronoamperometric experiments were
performed in the electrochemical window of 2.6 V-1.4 V vs Li+/Li° using Solartron
Analytical Modulab potentiostat. The illumination of the electrochemical cell was
performed with a Xenon lamp (Oriel) operating at 280 W, coupled with a water−filled
Spectra−Physics 6123 NS liquid filter to eliminate infra-red radiations. The spectrum
of the lamp is presented in Annex III.1. The distance between the lamp and the cell
was set to 45 cm. Dark conditions were obtained by wrapping the cell into an
aluminum foil. For prolonged exposure to light, a water-cooled glass cell was used to
prevent the illumination to heat the cell (Figure 1).
Figure 1: Experimental set-up. Optical bench (left) and water-cooled glass cell (right).
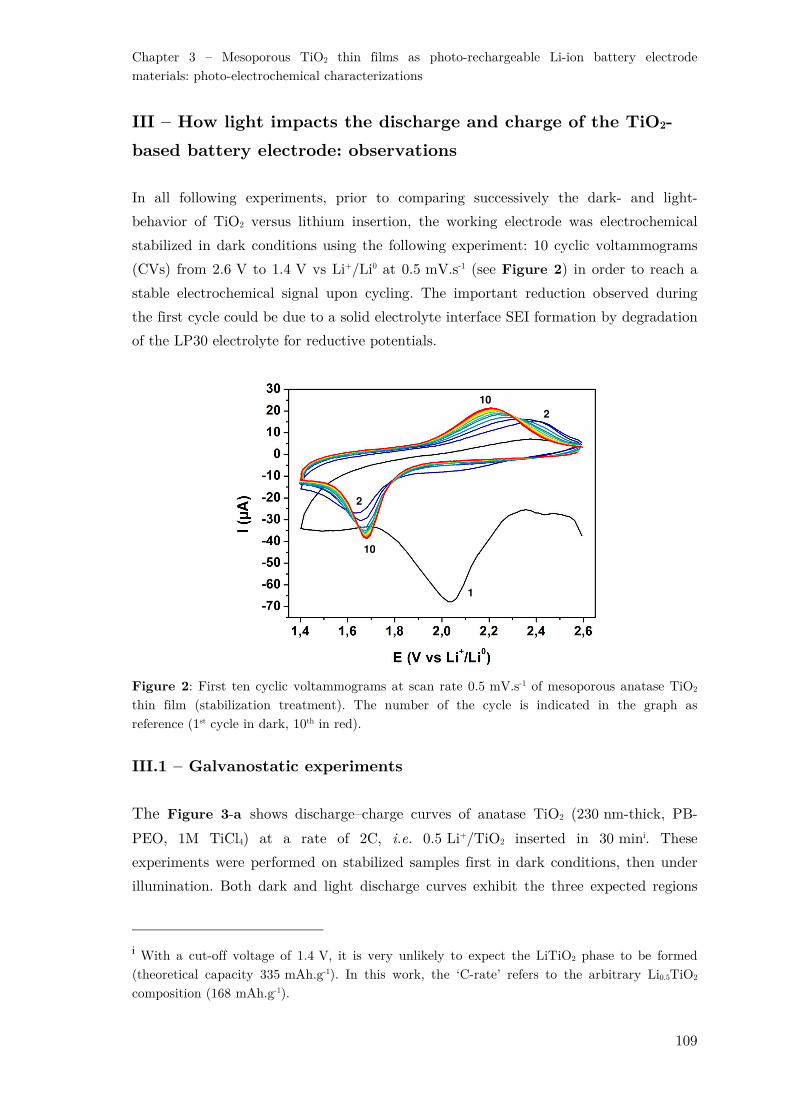
Chapter 3 – Mesoporous TiO2 thin films as photo-rechargeable Li-ion battery electrode
materials: photo-electrochemical characterizations
109
III – How light impacts the discharge and charge of the TiO2-
based battery electrode: observations
In all following experiments, prior to comparing successively the dark- and light-
behavior of TiO2 versus lithium insertion, the working electrode was electrochemical
stabilized in dark conditions using the following experiment: 10 cyclic voltammograms
(CVs) from 2.6 V to 1.4 V vs Li+/Li0 at 0.5 mV.s-1 (see Figure 2) in order to reach a
stable electrochemical signal upon cycling. The important reduction observed during
the first cycle could be due to a solid electrolyte interface SEI formation by degradation
of the LP30 electrolyte for reductive potentials.
Figure 2: First ten cyclic voltammograms at scan rate 0.5 mV.s-1 of mesoporous anatase TiO2
thin film (stabilization treatment). The number of the cycle is indicated in the graph as
reference (1st cycle in dark, 10th in red).
III.1 – Galvanostatic experiments
The Figure 3-a shows discharge–charge curves of anatase TiO2 (230 nm-thick, PB-
PEO, 1M TiCl4) at a rate of 2C, i.e. 0.5 Li+/TiO2 inserted in 30 mini. These
experiments were performed on stabilized samples first in dark conditions, then under
illumination. Both dark and light discharge curves exhibit the three expected regions
i With a cut-off voltage of 1.4 V, it is very unlikely to expect the LiTiO2 phase to be formed
(theoretical capacity 335 mAh.g-1). In this work, the ‘C-rate’ refers to the arbitrary Li0.5TiO2
composition (168 mAh.g-1).
1
2
10
2 10

Chapter 3 – Mesoporous TiO2 thin films as photo-rechargeable Li-ion battery electrode
materials: photo-electrochemical characterizations
110
for TiO2 anatase inserting lithium ions.4 First, a large voltage decrease (I) associated to
both insertion of a small amount of Li+ within the anatase phase to form Li0.1TiO2.
Second, a plateau region (II) at around 1,75 V is the electrochemical signature of a
biphasic process due to the coexistence of a Li-poor phase (tetragonal LiαTiO2) and a
Li-rich phase (orthorhombic Li0.5TiO2).5,6 Third, the slope region (III) after the plateau
indicates the addition of extra Li+ to the Li-rich phase.
In this work, the use of an FTO-based substrate limits the discharge voltage to a rather
high cut-off voltage of 1.4 V in order to prevent SnO2 reduction to Sn0. Consequently,
it is not expected to access the full theoretical capacity of nano-sized anatase TiO2,
reported as LiTiO2 (335 mAh.g-1).7
The charge curves highlight the reversibility of processes (I), (II) and (III), through the
regions (I’)-sloped increase potential, (II’)-plateau at 1.95 V and (III’)-sloped increase
up to the voltage cut at 2.6 V. Thanks to the present set-up (as opposed to coin cells
or Swagelok-type cells), we were also able to observe the reversible color changes of the
electrode: from a completely transparent state to a dark blue state (Figure 3-b, c, d).
The blue color is clearly assigned to the presence of Ti3+ centers resulting from Li+
insertion, however the nature of the electronic transition responsible for the absorption
in the orange range is yet unclear.8,9
Figure 3: (a) Potential versus Capacity evolution (discharge-charge at 2C-rate) of TiO2
mesoporous films (230 nm-thick, PB-PEO, 1M TiCl4) in dark condition (black) and under light
(red). (b, c, d) Pictures of the cell at the beginning of zone II and at the end of zone III.
Li0,5TiO2 corresponds to a capacity of 168 mAh.g-1.

Chapter 3 – Mesoporous TiO2 thin films as photo-rechargeable Li-ion battery electrode
materials: photo-electrochemical characterizations
111
According to Figure 3-a illumination appears to impact the total charge stored:
193 mAh.g- 1 under light (curve n°2) against 160 mAh.g-1 in the dark (curve n°1). The
“dark” capacity at 2C is very close to the theoretical capacity for Li0.5TiO2 (168 mAh.g-
1).
The impact of light on the capacity is yet important (≃ 21 % of extra capacity). The
higher capacity mainly results from the increase in the plateau’s length in both charge
and discharge curves (regions II and II’, respectively), suggesting that the extra-
capacity comes from the lithiation/delithiation of TiO2. Expected light-induced
reactions are presented in Figure 4.
Upon photon-excitation, electron-hole pairs are created at the electrode surface (Figure
4-eq. 1). The separation of excitons then occurs in the space charge layer and the
charge carriers diffuse, either to the electrode/electrolyte interface for the hole, or to
the electrode/substrate interface for the electron. The holes are expected to be
responsible for the light-induced oxidation of Ti3+ to Ti4+ (Figure 4-eq. 2), which
results in lithium ions photo-extraction.
Figure 4: Expected reactions responsible for Li-ion photo-extraction at the positive electrode in
TiO2//Li0 electrochemical cell.
When charging the TiO2 electrode under light (Figure 3-curve n°2), two phenomena
should happen simultaneously (Figure 5):
1) Li-ion extraction, imposed by the electrochemical charge process,
2) Li-ion photo-extraction, induced by the illumination (as described in Figure 4).
The polarization between the discharge and charge curves is reduced upon illumination:
from 190 to 160 mV (Figure 3-a). This mostly results from the decrease in potential
of the “light charge plateau” (II’), suggesting a faster charging process. In terms of
light-matter interactions, these observations directly witness the participation of photo-
carriers in the processes involved in charge storage. The photo-generated charges would
allow faster Li+ and/or e- transport across the nanoparticles, which could enhance the
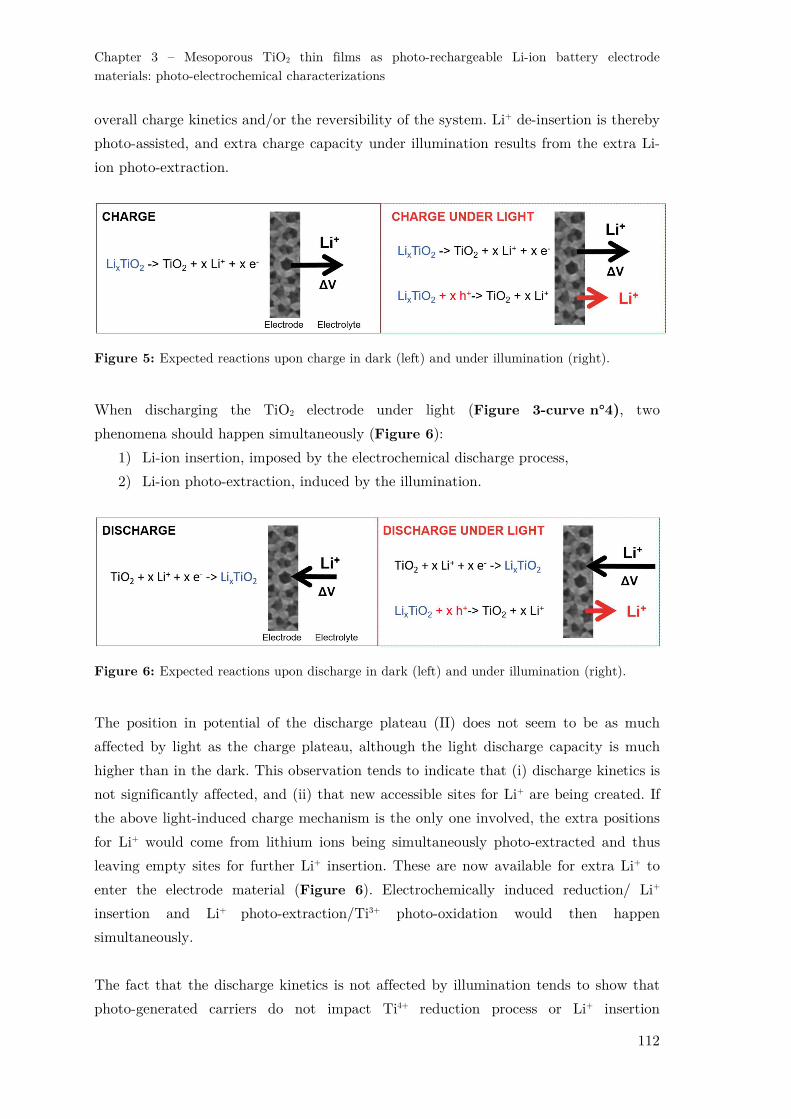
Chapter 3 – Mesoporous TiO2 thin films as photo-rechargeable Li-ion battery electrode
materials: photo-electrochemical characterizations
112
overall charge kinetics and/or the reversibility of the system. Li+ de-insertion is thereby
photo-assisted, and extra charge capacity under illumination results from the extra Li-
ion photo-extraction.
Figure 5: Expected reactions upon charge in dark (left) and under illumination (right).
When discharging the TiO2 electrode under light (Figure 3-curve n°4), two
phenomena should happen simultaneously (Figure 6):
1) Li-ion insertion, imposed by the electrochemical discharge process,
2) Li-ion photo-extraction, induced by the illumination.
Figure 6: Expected reactions upon discharge in dark (left) and under illumination (right).
The position in potential of the discharge plateau (II) does not seem to be as much
affected by light as the charge plateau, although the light discharge capacity is much
higher than in the dark. This observation tends to indicate that (i) discharge kinetics is
not significantly affected, and (ii) that new accessible sites for Li+ are being created. If
the above light-induced charge mechanism is the only one involved, the extra positions
for Li+ would come from lithium ions being simultaneously photo-extracted and thus
leaving empty sites for further Li+ insertion. These are now available for extra Li+ to
enter the electrode material (Figure 6). Electrochemically induced reduction/ Li+
insertion and Li+ photo-extraction/Ti3+ photo-oxidation would then happen
simultaneously.
The fact that the discharge kinetics is not affected by illumination tends to show that
photo-generated carriers do not impact Ti4+ reduction process or Li+ insertion

Chapter 3 – Mesoporous TiO2 thin films as photo-rechargeable Li-ion battery electrode
materials: photo-electrochemical characterizations
113
transport. In conclusion, among the photo-generated charge, holes appear to play a
predominant role in photo-charging, through Ti3+ oxidation and Li+ extraction kinetics
enhancement.
III.2 – Cyclic voltammetry experiments
The analysis of CVs performed at 0.5 mV.s-1 in dark and under illumination (Figure 7)
highlights the same conclusions concerning the improved behavior under light. The
oxidation peak (Ti3+ in Ti4+) associated with Li+ extraction also increases in intensity,
and its position shifts towards lower potential (dark: 2.24 V to light: 2.16 V). This
80mV-shift points towards improved kinetics for the oxidation process/ Li+ extraction
process under light stimulation.
Figure 7: Cyclic voltammograms (CV) at 0.5 mV.s-1 under dark (black) and light (red)
conditions with TiO2 (230 nm-thick, PBPEO, 1M TiCl4) as working electrode.
On the other hand, the reduction peak (Ti4+ in Ti3+), which corresponds to Li-insertion
(1.61 V), increases in intensity under light, while its position remains unchanged,
suggesting no improvement in Li+ transport kinetics upon lithium ion insertion but
“extra Li+ inserted”.
Similarly to the discharge-charge experiment, we expect the enhancement of the
reduction peak intensity to result from extra Li+ insertion into sites freed during the
simultaneous Li+ photo-extraction. It is to mention that the CV was performed in
water-cooled cell, showing that an increase in temperature cannot be fully responsible
for improved kinetics.

Chapter 3 – Mesoporous TiO2 thin films as photo-rechargeable Li-ion battery electrode
materials: photo-electrochemical characterizations
114
The impact of the sweep rate onto charge−discharge processes was studied under dark
and light conditions (Figure 8).
Figure 8: Specific charge inserted as a function of CV scan rate.
As expected, in the dark, the evolution of the capacity as function of scan rate exhibits
two distinct regions: (i) at low scan rate (below 10 mV/s), the capacity is dominated
by the faradaic-insertion reactions and lithium insertion into the anatase structure and
(ii) at a high scan rate (higher than 10 mV/s) the capacity represents the contribution
of capacitive charge storage. Under light, these two distinct regions are also present but
the impact of light is solely observed for low sweep rates, where charge storage is
mainly due to faradaic contribution. At high sweep rate, the cell resistance becomes too
large, mostly due to the slow diffusion of Li+ in the electrolyte, and the photo-
generated electrons cannot compensate for the kinetic limitations.10 This result could
indicate that here light affects the insertion capacity and not the capacitive charge
storage.

Chapter 3 – Mesoporous TiO2 thin films as photo-rechargeable Li-ion battery electrode
materials: photo-electrochemical characterizations
115
IV – Evaluation of the photo-current intensity
IV.1 – Potentiostatic experiments
The contribution of anodic and cathodic photocurrent was also highlighted through
potentiostatic experiments where light was switched on/off every 1 min (Figure 9).
Starting from the fully lithiated state Li0,5+yTiO2, the potential was set to 1.95 V
(Figure 9-curve n°1). This value corresponds to the beginning of the oxidation peak
observed on the CV curve (Figure 7).
Figure 9: Potentiostatic experiments under chopped illumination, light is switch on and off
every 1 min for E set at 1.95 V (blue) and 1.72 V (green).

Chapter 3 – Mesoporous TiO2 thin films as photo-rechargeable Li-ion battery electrode
materials: photo-electrochemical characterizations
116
An oxidation current corresponding to Li+ extraction was observed, and the film got
progressively transparent. When the light was switched on, the current increased
quickly in about 25 sec. and tended to reach saturation after 1 min.
This observation can again be explained by the fact that under illumination, holes are
generated and participate to the oxidation of Ti3+ to Ti4+, accelerating thereby the
kinetic of Li+ extraction.11 When the film got progressively transparent during the Li+
extraction and photo-extraction, photo-currents progressively decreased. In fact, as the
light promoted Li+ photo-extraction, light effects became inexistent when the anatase
electrode got progressively fully delithiated.
Starting from the lithium anatase poor phase, the potential was set to 1.72 V (Figure
9-curve n°2). A reduction current was observed as expected for Ti4+ to Ti3+ reduction
and the film got progressively blue. When light was switched on, the current increased
and reached a maximum value after about 25 s of illumination.
Photo-generated holes are expected to participate to the extraction of Li+, whereas in
this case the applied potential encourages Li+ insertion. The photo-extraction of Li+
releases new sites, which are now available to be electrochemically filled, therefore
giving rise to larger reduction current, which is coherent with the galvanostatic and CV
experiments previously analyzed.
Photo-current intensities can be exploited in order to estimate the amount of photo-
extracted Li+ during 1 minute of illumination for a 500 nm-thick PB-PEO (TiCl4 2M)
mesoporous anatase electrode. By integration (Figure 10), the average photo-capacity
for 1 minute under light is estimated at 0.3 mC, which is 8.10-5 mAh (Table 1). This
value represents ≃ 0.3% of the total electrode capacity, when Li0.5TiO2 is taken as the
100% lithiated reference (Table 2). If Li+ photo-extraction is the only phenomenon
responsible for the observed photo-current, it means that ≃ 0.3% of the total amount of
lithium in Li0.5TiO2 is extracted in 1 min under illumination. On the base of this quick
estimation, a 500 nm-thick anatase electrode Li0.5TiO2 could thus be fully delithiated in
about 6.2 h under illumination.

Chapter 3 – Mesoporous TiO2 thin films as photo-rechargeable Li-ion battery electrode
materials: photo-electrochemical characterizations
117
Figure 10: Potentiostatic experiments under chopped illumination, light is switch on and off
every 1 min for E set at 1.72 V. Red area corresponds to the integrated photo-charge.
Photo-capacity
for 1 min under light 0.3 mC/8.10-5 mAh
Photo-current 5 μA
Table 1: Estimation of the average photo-capacity and photo-current based on the integration
of the photo-current for a 50 min potentiostatic experiment at 1.72 V.
Electrode thickness 500 nm
Electrode surface 1.0 cm2
Electrode porosity ≃ 15%
Electrode mass 0.18 mg
Li0.5TiO2 theoretical capacity 168 mAh.g-1
Electrode capacity 3.10-2 mAh
Table 2: Electrode characteristics and calculated electrode capacity.
IV.2 – Open circuit voltage experiments
In order to test this estimation, Open Circuit Voltage (OCV) experiment was
performed under illumination after a sequence of discharge-charge-discharge
galvanostatic experiment at ±30 μA (Figure 11). During relaxation under light
(Figure 11-curve n°1), Li+ got photo-extracted, potential of lithiated anatase got from
1.5 V to 2.5 V in about 8 h, with a coexistence of lithium rich phase and poor phase
during about 4 h (cf. the plateau potential Figure 11). This 500 nm-thick electrode
(1 cm2, TiCl4 2M) can therefore be photo-recharged in a period of time which is

Chapter 3 – Mesoporous TiO2 thin films as photo-rechargeable Li-ion battery electrode
materials: photo-electrochemical characterizations
118
coherent in regards to the estimated photo-capacity under chopped illumination
(6.2 h). Relaxation in dark conditions (Figure 11-curve n°2) allows the electrode to
reach 2.1 V in about 1 day, which is probably due to the self-delithiation of the system.
Figure 11: Open Circuit Voltage (OCV) experiment under illumination (curve n°1) and in dark
conditions (curve n°2) after a discharge-charge-discharge galvanostatic experiment at ± 30 μA.
Experiment is realized in a water-cooled glass cell.
The average photo-current Ilight (≃ 5 μA) was estimated as followed:
"#$%&' ( *#$%&',,-./060 (7)
where Clight,60sec (in μC) is the photo-capacity obtained during 60 sec. under light based
on the integration of the photo-current for a 50 min potentiostatic experiment at
1.72V.

Chapter 3 – Mesoporous TiO2 thin films as photo-rechargeable Li-ion battery electrode
materials: photo-electrochemical characterizations
119
V – Adjusting the rates of simultaneous electrode discharge and
photo-recharge
If this estimation is correct (Ilight ≃ 5 μA for a 500 nm-thick electrode of 1 cm2 using
titania precursor solution at 2M, i.e. ≃ 0.3 mA.g-1), and if the described two coexisting
reactions (i.e. Li+-electrochemical insertion and Li+-photo-extraction) do happen during
the discharge under illumination (Figure 6), it means that we could adjust the
discharge rate to be exactly compensated by the photo-charge of the electrode.
At -8 μA (≃ C/2.5) (Figure 12), comparison of the galvanostatic experiments under
dark (Figure 12-curve n°1) and light (Figure 12-curve n°2) clearly indicates a
drastic enhancement of the capacity under light (375 mAh.g-1).
Figure 12: Galvanostatic experiment at - 8 μA (≃ C/2.5) under dark (1) and light (2)
conditions for a 520 nm-thick TiO2 mesoporous electrode. Illumination is stopped during step
(3). Experiment is realized in a water-cooled glass cell.
This capacity even exceeds the theoretical capacity of LiTiO2 (335 mAh.g-1), which
could anyway not be reached at this reduction potential. For this slower discharge rate
(-8 μA), Li+ photo-extraction is fast enough to compensate for the Li+-electrochemical
insertion. In these conditions, the photo-charge of the electrode can thus
counterbalance the slow discharge of the electrode. After about 8 h under light, the

Chapter 3 – Mesoporous TiO2 thin films as photo-rechargeable Li-ion battery electrode
materials: photo-electrochemical characterizations
120
illumination is then stopped (3), and discharge can be completed down to 1.5 V vs
Li+/Li.
In order to check the stability of the electrode, charge-discharge cycles at ± 20 μA have
been compared before and after the galvanostatic experiment at -8 μA under light
(Figure 13).
Figure 13: Galvanostatic discharge-charge experiment (± 20 μA) before and after slow
discharge under light (- 8 μA) for a 520 nm-thick TiO2 mesoporous electrode.
The observed unchanged capacities do not show particular signs of electrode
modifications or degradations. FEG-SEM observation of the film after the experiment
also tends to confirm the good conservation of the film porous structure, which did not
collapse during the charge-discharge sequences (Figure 14).
Figure 14: FEG-SEM pictures of TiO2 thin films planar sections before (left) and after (right)
stabilization step and galvanostatic experiments. Electrodes were washed using water and
flushed with N2 for 10 sec. before analysis. Be aware that potential SEI degradation products are
here not visible due to their solubilization in water.

Chapter 3 – Mesoporous TiO2 thin films as photo-rechargeable Li-ion battery electrode
materials: photo-electrochemical characterizations
121
VI – Conclusion
In this chapter, we have performed experiments to characterize the photo-
electrochemical behavior of TiO2 electrode considered as a positive electrode in a 3-
electrode configuration (TiO2 // LP30 // Li, Li).
Comparison of the electrochemical studies performed under light and dark conditions
clearly indicates that light enhances the electrochemical charge/discharge properties.
These results highlight that photo-induced de-insertion mechanism has been achieved
for carbon- and dye-free TiO2 based mesoporous film electrode. Light induces the
formation of electron/hole pairs and those charge carriers influence the mobility of
lithium ion and/or participate in the oxidation of Ti3+ and facilitate Li+ de-insertion.
Order of magnitude of photo-currents intensities (Ilight ≃ 5 μA for a 500 nm-thick
electrode of 1 cm2 using titania precursor solution at 2M and PB-PEO, i.e. ≃ 30 mA.g-
1) has been estimated through potentiostatic experiments under chopped illumination
and have been confirmed by OCV experiments and galvanostatic experiments under
light. In fact, by adjusting the estimated kinetics of the photo-charge (Li+-photo-
extraction) to an equivalent opposite Li+-electrochemical insertion (electrochemical
discharge), apparent “infinite” capacity could be achieved during galvanostatic
experiments under light (Figure 12). This phenomenon validates, in a simple and
efficient way, the hypothesis of the compensation of the electrode electrochemical
discharge by the photo-induced electrode recharge, and thereby confirms the
mechanism of Li-ion photo-induced extraction for TiO2 mesoporous electrode.
Nonetheless, in this chapter, we have not considered yet the eventual reaction of the
photo-generated charges with the electrolyte. Can for example TiO2 also plays the role
of a photo-catalyst for the electrolyte? More broadly, what parameters could influence
the photo-induced phenomena (from the generation to the recombination/reaction) and
what could be the consequences for the TiO2 photo-recharge?
In the next chapter, photo-induced mechanisms are therefore further investigated using
several ways: (1) by playing with the electrode architecture and the electrolyte in order
to analyze their influence on the fate of the photo-generated charges (2) by probing the
electrode and the electrolyte through post mortem analysis to find eventual traces of
electrolyte degradation (3) by realizing operando measurements to study the system in
real time upon illumination.

Chapter 3 – Mesoporous TiO2 thin films as photo-rechargeable Li-ion battery electrode
materials: photo-electrochemical characterizations
122
Bibliography
1. Betz, G., Tributsch, H. & Marchand, R. Hydrogen insertion (intercalation) and
light induced proton exchange at TiO2 (B)-electrodes. J. Appl. Electrochem. 14,
315–322 (1984).
2. Paolella, A. et al. Light-assisted delithiation of lithium iron phosphate nanocrystals
towards photo-rechargeable lithium ion batteries. Nat. Commun. 8, 14643 (2017).
3. Lou, S. N. et al. An Operando Mechanistic Evaluation of a Solar-Rechargeable
Sodium-Ion Intercalation Battery. Adv. Energy Mater. 7, 1700545 (2017).
4. Guo, Y.-G., Hu, Y.-S. & Maier, J. Synthesis of hierarchically mesoporous anatase
spheres and their application in lithium batteries. Chem. Commun. 0, 2783–2785
(2006).
5. Wagemaker, M., Lützenkirchen-Hecht, D., van Well, A. A. & Frahm, R. Atomic
and Electronic Bulk versus Surface Structure: Lithium Intercalation in Anatase
TiO2. J. Phys. Chem. B 108, 12456–12464 (2004).
6. Lafont, U., Carta, D., Mountjoy, G., Chadwick, A. V. & Kelder, E. M. In Situ
Structural Changes upon Electrochemical Lithium Insertion in Nanosized Anatase
TiO2. J. Phys. Chem. C 114, 1372–1378 (2010).
7. van de Krol, R., Goossens, A. & Schoonman, J. Spatial Extent of Lithium
Intercalation in Anatase TiO2. J. Phys. Chem. B 103, 7151–7159 (1999).
8. Khomenko, V. M., Langer, K., Rager, H. & Fett, A. Electronic absorption by Ti3+
ions and electron delocalization in synthetic blue rutile. Phys. Chem. Miner. 25,
338–346 (1998).
9. Naldoni, A. et al. Effect of Nature and Location of Defects on Bandgap Narrowing
in Black TiO2 Nanoparticles. J. Am. Chem. Soc. 134, 7600–7603 (2012).
10. Augustyn, V. et al. High-rate electrochemical energy storage through Li+
intercalation pseudocapacitance. Nat. Mater. 12, 518–522 (2013).
11. Usui, H., Miyamoto, O., Nomiyama, T., Horie, Y. & Miyazaki, T. Photo-
rechargeability of TiO2 film electrodes prepared by pulsed laser deposition. Sol.
Energy Mater. Sol. Cells 86, 123–134 (2005).

123
CHAPTER 4
Photo-induced mechanisms: investigation

Chapter 4 – Photo-induced mechanisms: investigation
125
TABLE of CONTENT
I - Introduction .......................................................................................................... 127
II – Photo-induced mechanisms: dependence on the electrode architecture and role of
the electrolyte ............................................................................................................ 128
II.1 – Dependence on the electrode architecture ..................................................... 128
II.1.1 – Influence of the electrode thickness ........................................................ 128
II.1.2 – Influence of the porous network ............................................................. 131
II.2 – Role of the electrolyte .................................................................................. 137
II.2.1 – TiO2 photo-electrode in an ionic liquid-based electrolyte ....................... 137
II.2.2 – TiO2 photo-electrode in a “water-in-salt” electrolyte .............................. 144
III – Post mortem analysis of the photo-electrode ...................................................... 149
III.1 – FEG-SEM and complementary EDX analysis ............................................. 149
III.2 –Probing the electrode surface with XPS ....................................................... 154
III.3 –Analysing the electrolyte by NMR spectroscopy........................................... 162
IV – TiO2 photo-electrode: operando characterizations .............................................. 168
IV.1 – Electrochemical Impedance Spectroscopy (EIS) .......................................... 168
IV.1.1 – Nyquist plots and equivalent circuits.................................................... 168
IV.1.2 – Results of the fits and analysis ............................................................. 171
IV.2 – Investigations by means of Electrochemical Quartz Crystal Microbalance
(EQCM) ................................................................................................................ 174
IV.2.1 – Principle of Quartz Crystal Microbalance (QCM) ................................ 174
IV.2 – EQCM and [F(Δm/ΔQ)] function ............................................................ 175
IV.2.3 – EQCM study for Li-ion photo-battery electrode ................................... 177
V – Conclusion .......................................................................................................... 191
Bibliography .............................................................................................................. 193

Chapter 4 – Photo-induced mechanisms: investigation
126

Chapter 4 – Photo-induced mechanisms: investigation
127
I - Introduction
The fate of the photo-generated charges results from the competition between charge
recombination and charge diffusion and/or reaction. It is expected to be strongly
influenced by (1) the electrode architecture (crystallite size, crystallite connectivity,
grain boundaries, electrode thickness, etc.), or by (2) the choice of the electrolyte
(which imposes the species at the electrode/electrolyte interface). In this first section,
we will first propose to play with the electrode architecture in order to identify
structural parameters that could directly influence the Li+ photo-extraction. This study
is allowed by the mesoporous electrode, whose architecture is well-defined and easily
tunable using sol-gel coupled dip coating process combined with the “evaporation
induced self-assembly” (EISA) approach. We will then compare the photo-
electrochemical behavior of the electrode in three different kinds of electrolyte (organic,
ionic liquid, “water-in-salt”-based electrolytes). In each case, photo-induced phenomena
at the electrode/electrolyte interface is discussed in order to yield a more consistent
picture of the fate of generated-excitons.
Illumination of the electrode upon cycling could potentially led to electrolytes
degradation. In the second section, post mortem analyses are performed on both the
electrode and the electrolyte in order to detect the possible species formed in dark and
light conditions. Electrode surfaces are analyzed at different steps of the electrode
(photo)-electrochemical cycling by means of FEG-SEM, EDX, and XPS techniques.
Evolution of the electrolyte is also complementarily probed by NMR spectroscopy. The
adequation of the post mortem study with the analysis made in the first section is
discussed.
In the third section, photo-induced mechanisms are investigated in real time by means
of operando measurements. The system is first analyzed by EIS measurements, in order
to probe the electrical properties of the material in dark conditions, and compare them
under illumination. We then propose a preliminary work dedicated to the analysis of
the gravimetric response of a TiO2-coated piezoelectric substrate (GaPO4) when
coupled to electrochemical and photo-electrochemical measurements. Here, a new
specially designed experimental setup is proposed to study the nature of species
involved at the electrode/electrolyte interface upon photo-electrochemical cycling.

Chapter 4 – Photo-induced mechanisms: investigation
128
II – Photo-induced mechanisms: dependence on the electrode
architecture and role of the electrolyte
II.1 – Dependence on the electrode architecture
II.1.1 – Influence of the electrode thickness
Electrochemical and photo-electrochemical responses of titania films were compared for
different electrode thicknesses obtained using the multilayered dip-coating process
described in Chapter 2.II.1. For this purpose, photo-electrodes were performed in a 3-
electrode configuration using TiO2 as working electrode, metallic lithium foils as
reference and counter-electrodes, and LP30 as electrolyte.
Anatase TiO2 thin films were prepared with PB-PEO at 2M in TiCl4 with thicknesses
varying between 110 nm and 1500 nm (Figure 1).
Figure 1: FEG-SEM photos of TiO2 (PBPEO, 2M in TiCl4) cross-sections. The film thickness in nm and the number of dipped layers (in brackets) are: 110 (1), 230 (2), 520 (5), 1050 (10), 1320 (12), 1500 (14) (from (a) to (f)).
Capacities under dark (black) and light (red) conditions were evaluated by integration
of the i(t) function (i for current intensity), which was deducted from cyclic
voltammetry experiments performed at 0.5 mV.s-1 between 2.6 V and 1.4 V versus
Li+/Li0.
1.00um 1.00um
1.00um 1.00um
1.00um
1.00um
(a) (b) (c)
(d) (e) (f)

Chapter 4 – Photo-induced mechanisms: investigation
129
In Figure 2, dark capacities are plotted as a function of the TiO2 film thickness, with a
normalization by the electrode mass.i For the same scan rate (0.5 mV.s-1), mass
capacities were reduced by a factor 2.5 (155 to 62 mAh.g-1) when the electrode
thickness is multiply by a factor 14 (110 to 1500 nm). This diminution could be due (1)
to the more important distance that electrons have to overcome from the current
collector to the electrode/electrolyte interface when increasing the film thickness, or (2)
to restricted diffusion of the electrolyte into the first dipped TiO2 layers of the film,
near the FTO (referred as “inner layers”). In fact, as inner layers are expected to be
less porous than the surface layers (9% vs. 26% for example for a 280 nm-thick TiO2
film dipped with 5 layers1), their accessibility for the electrolyte could limit the
complete development of the electrode/electrolyte interface in the entire thickness of
the film.
Figure 2: Mass discharge capacity calculated from CVs at 0.5 mV.s-1 (2.6 V to 1.4 V vs. Li+/Li0) under dark conditions, plotted as a function of the film thickness.
Photo-current intensities (Figure 3, in black) and photo-current normalized by the
electrode thickness (Figure 3, in green) were calculated from potentiostatic
experiments (1.72 V vs. Li+/Li0) under chopped illumination (light on/off every
30 sec.).
Photo-current intensities (in dark) increase with the film thickness, but do not evolve
linearly; the photo-current for a 1500 nm-thick electrode (≃ 8 µA) is not 14 time higher
than photo-current for a 110 nm-thick electrode (≃ 1 µA). Additionally, a slight
i Plotted error bars report the standard deviation obtained for a film thickness of 230 nm (sample of 4 different films). The corresponding error percentage (≃ 11% here e.g. for the capacities) is then reported for all the other thickness values to approximate the standard deviation for each thickness. The same methodology will be applied for others functions (capacity enhancement under light, photo-currents, etc.)
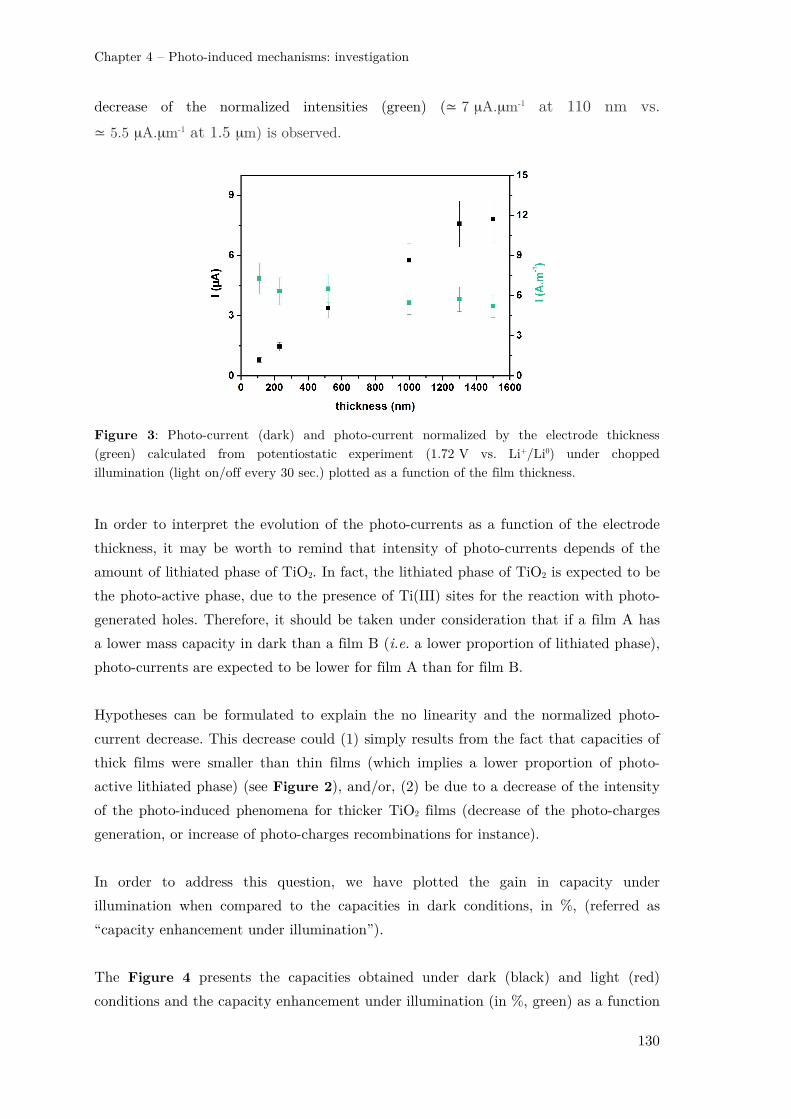
Chapter 4 – Photo-induced mechanisms: investigation
130
decrease of the normalized intensities (green) (≃ 7 µA.µm-1 at 110 nm vs.
≃ 5.5 µA.µm-1 at 1.5 µm) is observed.
Figure 3: Photo-current (dark) and photo-current normalized by the electrode thickness (green) calculated from potentiostatic experiment (1.72 V vs. Li+/Li0) under chopped illumination (light on/off every 30 sec.) plotted as a function of the film thickness.
In order to interpret the evolution of the photo-currents as a function of the electrode
thickness, it may be worth to remind that intensity of photo-currents depends of the
amount of lithiated phase of TiO2. In fact, the lithiated phase of TiO2 is expected to be
the photo-active phase, due to the presence of Ti(III) sites for the reaction with photo-
generated holes. Therefore, it should be taken under consideration that if a film A has
a lower mass capacity in dark than a film B (i.e. a lower proportion of lithiated phase),
photo-currents are expected to be lower for film A than for film B.
Hypotheses can be formulated to explain the no linearity and the normalized photo-
current decrease. This decrease could (1) simply results from the fact that capacities of
thick films were smaller than thin films (which implies a lower proportion of photo-
active lithiated phase) (see Figure 2), and/or, (2) be due to a decrease of the intensity
of the photo-induced phenomena for thicker TiO2 films (decrease of the photo-charges
generation, or increase of photo-charges recombinations for instance).
In order to address this question, we have plotted the gain in capacity under
illumination when compared to the capacities in dark conditions, in %, (referred as
“capacity enhancement under illumination”).
The Figure 4 presents the capacities obtained under dark (black) and light (red)
conditions and the capacity enhancement under illumination (in %, green) as a function

Chapter 4 – Photo-induced mechanisms: investigation
131
of the electrode thickness. Results show that gain in capacities are higher for films with
a thickness above ≃ 500 nm (capacities enhancement of ≃ 30-35%) than for film with a
thickness below ≃ 500 nm (capacities enhancement of ≃ 15-20%). As thicker films are
in average denser than thin films (porous volume of ≃ 12% for a 1 µm-thick film and
≃ 20% for a 200 nm-thick electrode, see chapter 1 section III.1.2), this increased
density could maybe promote a better photo-charges separation (leading to a better
photo-electron evacuation for example) and eventually explain the higher gains.
Figure 4: Capacity calculated from CVs at 0.5 mV.s-1 (2.6 V to 1.4 V vs. Li+/Li0) under dark (black) and light (red) conditions are plotted as a function of the film thickness for electrode of 1 cm2. Capacity enhancement under illumination (green) is calculated as the gain in capacity (%) when comparing capacities in light vs. in dark.
Hence, in order to study the electrodes with sufficiently high photo-currents (thick
films), but also with limited electrolyte/photo-charges diffusion eventual issues (thin
films), we will typically work with films between 200 nm and 500 nm.
Based only on these first observations, we could also mention that in order to develop
the “ideal” bi-functional electrode for energy conversion storage, thickness compromises
will probably need to be found to obtain both high dark capacity and high photo-
current. For example, in our case, thin films are better candidates to reach high specific
capacity, but thick film seem more interesting to get higher photo-currents. Thick films
could also be more adapted if the surface capacity matters (rather than mass capacity
for example), depending on targeted application.
II.1.2 – Influence of the porous network
Photo-electrochemical response was also compared for different kind of porous networks
(Figure 5). Anatase TiO2 thin films were prepared with PB-PEO at 1M in TiCl4

Chapter 4 – Photo-induced mechanisms: investigation
132
(4 dipped layers), at 2M in TiCl4 (2 dipped layers) and with Pluronic F127 (2 dipped
layer) polymers. By adapting the number of dipped layers for each polymer and TiCl4
concentration used, films were compared at a fixed thickness of 230 nm (Figure 5 and
Figure 6). Films characteristics are presented in Table 1. The potential influence of
the porous network on the photo-electrochemical response can thereby be de-correlated
from the electrode thickness.
Figure 5: FEG-SEM photos of TiO2 planar and cross-sections prepared with PB-PEO at 1M in TiCl4 dipping 4 layers (top), at 2M in TiCl4 dipping 2 layers (middle) and with Pluronic F127 dipping 2 layers (down).
Polymers [TiCl4] Thickness
[nm]
Crystallites
size [nm]
Porous
volume [%]
Pore diameter
[nm]
PB-PEO 2M 230 12.8 20 26
1M 230 8.2 24 26
F127 1M 230 6.8 32 10
Table 1: Characteristic of the TiO2 films. Thickness is determined by FEG-SEM analysis, porous volume, pore/bottleneck diameters and specific surface area are estimated by
TiO2
TiO2
TiO2
FTO
FTO
FTO
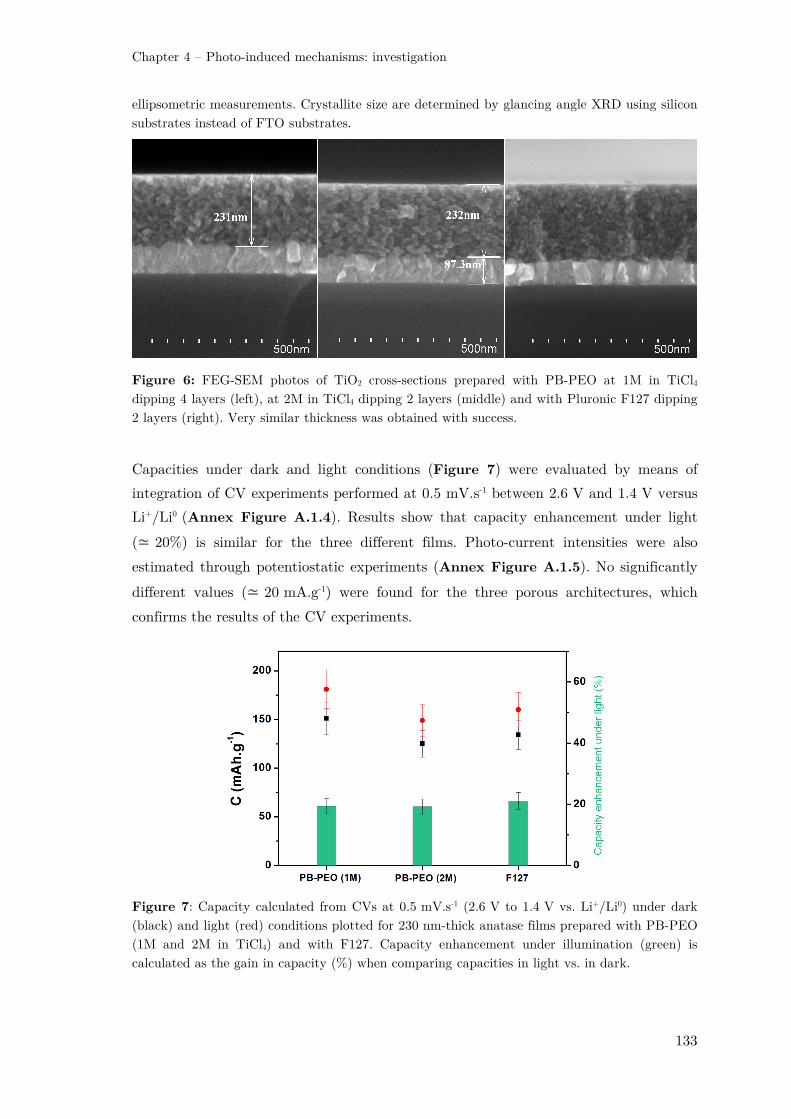
Chapter 4 – Photo-induced mechanisms: investigation
133
ellipsometric measurements. Crystallite size are determined by glancing angle XRD using silicon substrates instead of FTO substrates.
Figure 6: FEG-SEM photos of TiO2 cross-sections prepared with PB-PEO at 1M in TiCl4 dipping 4 layers (left), at 2M in TiCl4 dipping 2 layers (middle) and with Pluronic F127 dipping 2 layers (right). Very similar thickness was obtained with success.
Capacities under dark and light conditions (Figure 7) were evaluated by means of
integration of CV experiments performed at 0.5 mV.s-1 between 2.6 V and 1.4 V versus
Li+/Li0 (Annex Figure A.1.4). Results show that capacity enhancement under light
(≃ 20%) is similar for the three different films. Photo-current intensities were also
estimated through potentiostatic experiments (Annex Figure A.1.5). No significantly
different values (≃ 20 mA.g-1) were found for the three porous architectures, which
confirms the results of the CV experiments.
Figure 7: Capacity calculated from CVs at 0.5 mV.s-1 (2.6 V to 1.4 V vs. Li+/Li0) under dark (black) and light (red) conditions plotted for 230 nm-thick anatase films prepared with PB-PEO (1M and 2M in TiCl4) and with F127. Capacity enhancement under illumination (green) is calculated as the gain in capacity (%) when comparing capacities in light vs. in dark.

Chapter 4 – Photo-induced mechanisms: investigation
134
These experiments show that the Li+ photo-extraction has comparable efficiencies in
these 3 different kinds of porous networks. It could show that (1) porous architecture in
this studied range of parameters is not critical for the intensity of photo-induced
mechanisms, or (2) parameters, which could have opposite effects on the photo-
extraction, simultaneously change from one film to another. For example, when the
film density increases from F127 to PBPEO (TiCl4 2M) to PBPEO (TiCl4 1M) films
(see Table 1), crystallite size also simultaneously decreases.
If we make the hypothesis that a higher film density allows higher photo-currents (as it
has been suggest in the previous section), comparable efficiencies for the 3 films could
suggest that bigger crystallite size reduces the efficiency Li+ photo-extraction.
It is indeed generally thought that the smaller the particle, the wider the charge
depletion layer and thereby the more space it occupies within the all TiO2 nanoparticle
volume. As the electric field generated in the depletion zone allows the separation of
the photo-charges, the number of photo-carriers involved in the redox mechanism
should be maximized for small particles2, which could even become smaller than the
hole diffusion length (as order of magnitude, it has been estimated at around 10 nm for
rutile TiO2 single crystals3).
In order to give some response elements, three different heat treatments (1h, 2h and 3h
at 500°C) were applied to anatase TiO2 thin films (PB-PEO, 2M in TiCl4) in order to
see the possible influence of the crystallite size on the photo-extraction efficiency. A
crystallite size augmentation was observed for prolonged heat treatment (see
refinements results in Table 1). It could be due to a possible reorganization and fusion
of the crystallites during the prolonged heat treatment (see Figure 8).

Chapter 4 – Photo-induced mechanisms: investigation
135
Figure 8: FEG-SEM photos of anatase TiO2 (PB-PEO, 2M in TiCl4) treated for 1h (up), 2h (left) and 3h (right) at 500°C.
CV experiments and deducted capacity enhancement under light showed that photo-
capacities significantly decreased with extending the heat treatment (see Figure 9).
These result could confirm the fact that small crystallites are more adapted for a more
efficient use of light. Nonetheless, crystallite size is not the only factor changing when
prolonging the heat treatment. In order to get a more consistent picture of the
electrode evolution, further investigations and film characterization could be useful to
figure out how the connectivity between the particles (grain boundaries), the specific
surface area, or the films density change during the heat treatment.
1h 500°C 2h 500°C 3h 500°C
Crystallite size (nm) 12.5 ± 0.2 18.8 ± 0.2 25.6 ± 0.2
Table 1: Results of the refinements after X-Ray diffraction measurements. Films were dipped on silicon substrates for the XRD analysis.

Chapter 4 – Photo-induced mechanisms: investigation
136
Figure 9: Capacity calculated from CV experiments at 0.5 mV.s-1 (2.6 V to 1.4 V vs. Li+/Li0) under dark (black) and light (red) conditions plotted for anatase films (PB-PEO, 2M in TiCl4) treated for 1h, 2h and 3h at 500°C. Photo-capacity is calculated as the difference between light and dark capacity.
In this section, we have tried to play with the electrode structure in order to see how
much it could impact the photo-induced mechanisms. No drastic differences were
observed in the range of mesoporous architectures used in this work. For the future
investigations, use of dense TiO2 (without polymers) or complete different architectures
could be considered to study the active material differently shaped.
When analyzing the fate of photo-generated charges, which depends on the competition
between charge recombination, diffusion and/or reaction at an electrode/electrolyte
interface, it seems also crucial to picture the electrode in interaction with the
surrounding electrolyte. In the next section, our investigations will be focused on the
role played by the electrolyte during photo-induced mechanisms.
Chapter 4 – Photo-induced mechanisms: investigation
137
II.2 – Role of the electrolyte
II.2.1 – TiO2 photo-electrode in an ionic liquid-based electrolyte
Up to now, in this study, LP30 was the electrolyte. LP30 solvent is a widely used
electrolyte in Li-ion battery. It is composed of LiPF6 salts (1M) dissolved in a mixture
of ethylene carbonate and dimethyl carbonate (50/50 in volume). Alkyl carbonates are
generally chosen due to their acceptable anodic stability for the 4 V cathodes used in
Li-ion batteries, together with other properties such as high polarity and good
conductivity of their solutions, a reasonable temperature range between freezing and
boiling points and acceptable toxicity.4 The LiPF6 salt is known to present well-
balanced properties when evaluated against the requirements that battery environment
places on electrolyte components (solubility, mobility, electrochemical stability).5
Nonetheless, LiPF6 salt is also known to decompose in LiF and PF5, and the latter
readily hydrolyzes to form HF and POF3.4,6,7 These two hydrolysis products are highly
reactive and their unavoidable presence in LiPF6 solutions has a detrimental impact on
the electrode performances.8
Besides, safety concerns still surround the use of these flammable electrolytes.9
Improvement could be expected by excluding liquids and using solvent-free, polymer
electrolytes. However, the battery in a solid-state version operates well only at
temperatures higher than 50°C, which limits their range of application.10
Hence, the use of ionic liquids is generally presented as an interesting alternative, as
they are practically non-flammable and have high thermal stability. Apart from the
fact that these characteristics could be valuable for photo-rechargeable battery
application, in our case, this electrolyte is studied above all with the aim of
investigating the fate of the photo-charges in an other electrolyte than LP30.
Ionic liquids are low-temperature molten salts, i.e. liquids composed of ions only. The
salts are characterized by weak interactions, owing to the combination of a large cation
and a charge delocalized anion. This combination gives a fluid with an ion conductivity
comparable to many organic electrolyte solutions and an absence of decomposition up
to about 300-400°C. As lithium salts have high solubility in ionic liquids, their
association as electrolyte have become very interesting in Li-ion batteries applications.9
In order to observe the photo-electrochemical response of TiO2 electrode in a
completely different electrolyte, TiO2 photo-electrode was electrochemically tested in
ionic liquid using the same methodology as the previous study in LP30 electrolyte.
Electrolyte was prepared by dissolving lithium bis(trifluoromethanesulfonyl)imide salt
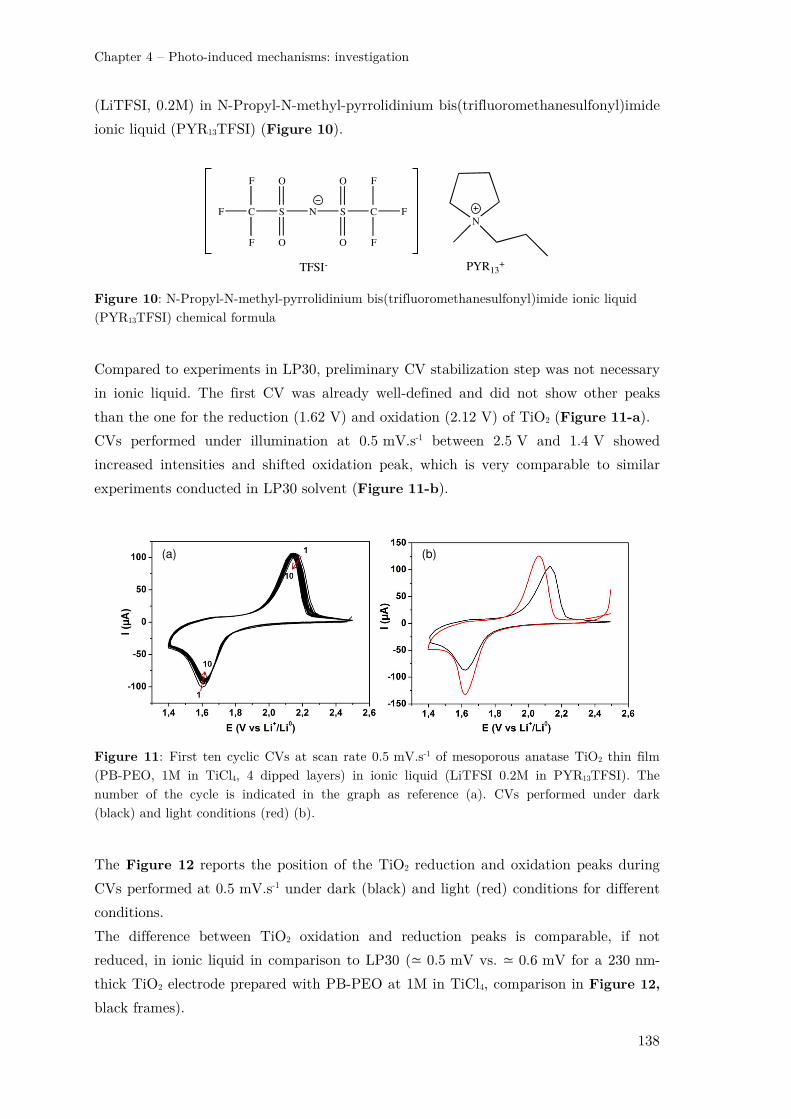
Chapter 4 – Photo-induced mechanisms: investigation
138
(LiTFSI, 0.2M) in N-Propyl-N-methyl-pyrrolidinium bis(trifluoromethanesulfonyl)imide
ionic liquid (PYR13TFSI) (Figure 10).
Figure 10: N-Propyl-N-methyl-pyrrolidinium bis(trifluoromethanesulfonyl)imide ionic liquid (PYR13TFSI) chemical formula
Compared to experiments in LP30, preliminary CV stabilization step was not necessary
in ionic liquid. The first CV was already well-defined and did not show other peaks
than the one for the reduction (1.62 V) and oxidation (2.12 V) of TiO2 (Figure 11-a).
CVs performed under illumination at 0.5 mV.s-1 between 2.5 V and 1.4 V showed
increased intensities and shifted oxidation peak, which is very comparable to similar
experiments conducted in LP30 solvent (Figure 11-b).
Figure 11: First ten cyclic CVs at scan rate 0.5 mV.s-1 of mesoporous anatase TiO2 thin film (PB-PEO, 1M in TiCl4, 4 dipped layers) in ionic liquid (LiTFSI 0.2M in PYR13TFSI). The number of the cycle is indicated in the graph as reference (a). CVs performed under dark (black) and light conditions (red) (b).
The Figure 12 reports the position of the TiO2 reduction and oxidation peaks during
CVs performed at 0.5 mV.s-1 under dark (black) and light (red) conditions for different
conditions.
The difference between TiO2 oxidation and reduction peaks is comparable, if not
reduced, in ionic liquid in comparison to LP30 (≃ 0.5 mV vs. ≃ 0.6 mV for a 230 nm-
thick TiO2 electrode prepared with PB-PEO at 1M in TiCl4, comparison in Figure 12,
black frames).
NNS S
O
O
C
O
C
O
F
F
F
F
F
F
TFSI- PYR13+
(a) (b)

Chapter 4 – Photo-induced mechanisms: investigation
139
In ionic liquid, capacities in dark are comparable, if not better, to those in LP30 (see
Figure 13). Comparison between organic electrolyte and ionic liquids for their use in
Li-ion battery has already been reported. Authors have for example compared the
performances of LTO anode in LP30 vs. LiTFSI-PYR14TFSI11,12 or TiO2 in LiTFSI-
EC/DEC vs. LiTFSI-PYR13TFSI.12,13 Results show very comparable surtensions and
capacities, sometimes slightly better in ionic liquids, especially after the 10th cycle or at
higher temperature.
Figure 12: Comparison of TiO2 oxidation and reduction peak position during CVs (0.5 mV.s-1)
performed under dark (black) and light (red) conditions. Data are reported for TiO2 photo-electrode in LP30 (PB-PEO, 2M in TiCl4, 110 nm-thick to 1500 nm-thick) (230 nm-thick for PBPEO at 1M/2M and F127 at 1M in TiCl4) and in PYR13TFSI (LiTFSI 0.2M) (230 nm-thick, PB-PEO, 1M in TiCl4). Films with comparable thickness (230 nm) are in black frames.
Figure 13: Capacity calculated from CV experiments at 0.5 mV.s-1 under dark (black) and light (red) conditions compared in LP30 and in ionic liquid (IL) for 230 nm-thick mesoporous anatase electrodes.

Chapter 4 – Photo-induced mechanisms: investigation
140
Interestingly, capacities enhancement under light are also significantly more intense in
ionic liquid than in LP30 for the same film architecture (PB-PEO, 1M in TiCl4, 4
dipped layers). Comparison of dark and light capacities showed that intensities under
illumination are ≃ 33% higher than under dark conditions in ionic liquid, against 20%
in LP30 for the same electrode architecture (Figure 13).
Hence, intensity of photo-induced phenomena seems to be higher in ionic liquid
(LiTFSI, 0.2M) than in EC/DMC carbonates solvent (LiPF6, 1M).
This observation was confirmed by potentiostatic experiments under chopped
illumination. Results obtained for sequences of 30 sec. in dark / 30 sec. in light were
compared for LP30 and ionic liquid electrolytes. The shape of the photo-current curve
suggests that periods of 30 sec. of illumination are too short in ionic liquid to reach a
saturated photocurrent at the end of the transitory regime, which leads the photo-
current to its maximal intensity value (Figure 14). By realizing the same experiment
for a chopped illumination every 90 sec., shape of the photo-current became comparable
to the one in LP30 experiment for 30 sec. of illumination. In this case, transitory
regime is long enough to reach maximal values of photo-current (Figure 15).
Calculated intensities of photo-currents confirmed the bigger light effect when using
LiTFSI (0.2M) in ionic liquids instead of LP30 as solvent (Figure 16).
Figure 14: Potentiostatic experiments under chopped illumination, light is switched on/off every 30 sec. for E set at 1.90 V (blue) and 1.72 V (green).
ON
ON
OF
OFF

Chapter 4 – Photo-induced mechanisms: investigation
141
Figure 15: Potentiostatic experiments under chopped illumination, light is switched on and off every 90 sec for E set at 1.90 V (blue) and 1.72 V (green).
Figure 16: Potentiostatic experiments under chopped illumination, light is switched on (red) and off (dark) every 30 sec for E set at 1.72 V, in LP30 (a) and PYR13TFSI (LiTFSI 0.2M) (b). Resulting photo-currents were compared in LP30 and in ionic liquid for 230 nm-thick mesoporous anatase electrodes (c).
ON
ON
OFF
OFF
Ionic Liquid LP30
(a) (b)
(c)
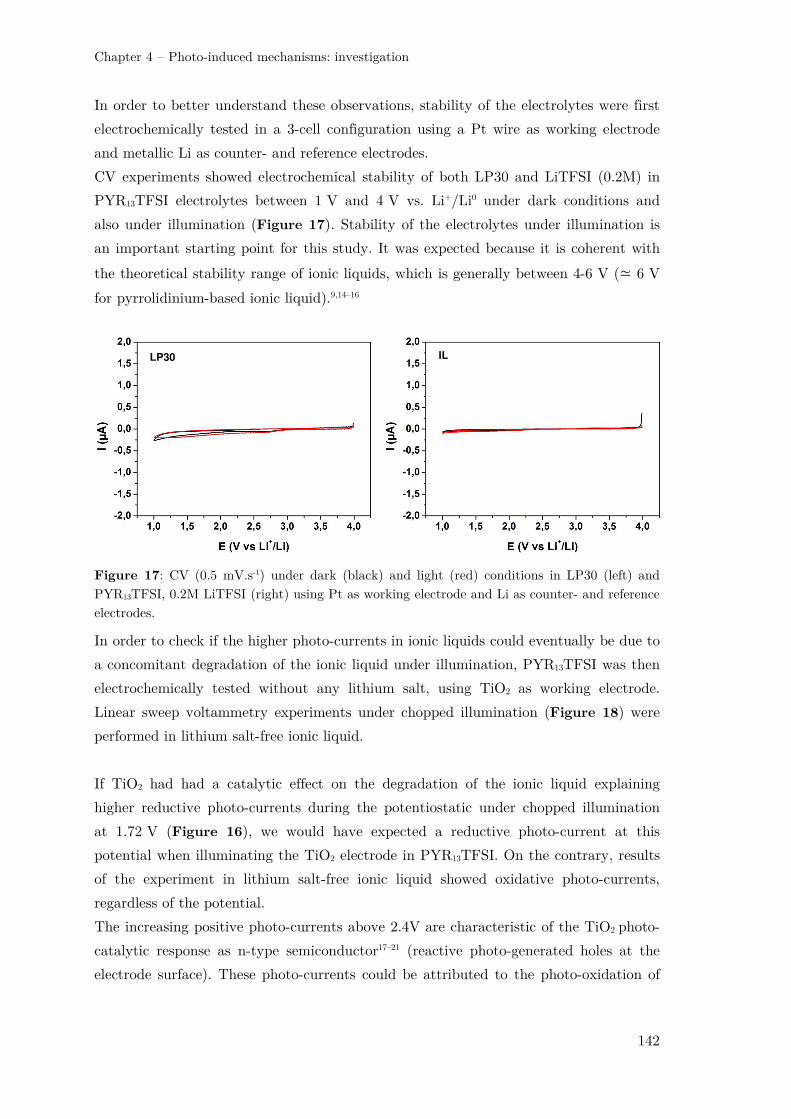
Chapter 4 – Photo-induced mechanisms: investigation
142
In order to better understand these observations, stability of the electrolytes were first
electrochemically tested in a 3-cell configuration using a Pt wire as working electrode
and metallic Li as counter- and reference electrodes.
CV experiments showed electrochemical stability of both LP30 and LiTFSI (0.2M) in
PYR13TFSI electrolytes between 1 V and 4 V vs. Li+/Li0 under dark conditions and
also under illumination (Figure 17). Stability of the electrolytes under illumination is
an important starting point for this study. It was expected because it is coherent with
the theoretical stability range of ionic liquids, which is generally between 4-6 V (≃ 6 V
for pyrrolidinium-based ionic liquid).9,14–16
Figure 17: CV (0.5 mV.s-1) under dark (black) and light (red) conditions in LP30 (left) and PYR13TFSI, 0.2M LiTFSI (right) using Pt as working electrode and Li as counter- and reference electrodes.
In order to check if the higher photo-currents in ionic liquids could eventually be due to
a concomitant degradation of the ionic liquid under illumination, PYR13TFSI was then
electrochemically tested without any lithium salt, using TiO2 as working electrode.
Linear sweep voltammetry experiments under chopped illumination (Figure 18) were
performed in lithium salt-free ionic liquid.
If TiO2 had had a catalytic effect on the degradation of the ionic liquid explaining
higher reductive photo-currents during the potentiostatic under chopped illumination
at 1.72 V (Figure 16), we would have expected a reductive photo-current at this
potential when illuminating the TiO2 electrode in PYR13TFSI. On the contrary, results
of the experiment in lithium salt-free ionic liquid showed oxidative photo-currents,
regardless of the potential.
The increasing positive photo-currents above 2.4V are characteristic of the TiO2 photo-
catalytic response as n-type semiconductor17–21 (reactive photo-generated holes at the
electrode surface). These photo-currents could be attributed to the photo-oxidation of
LP30 IL
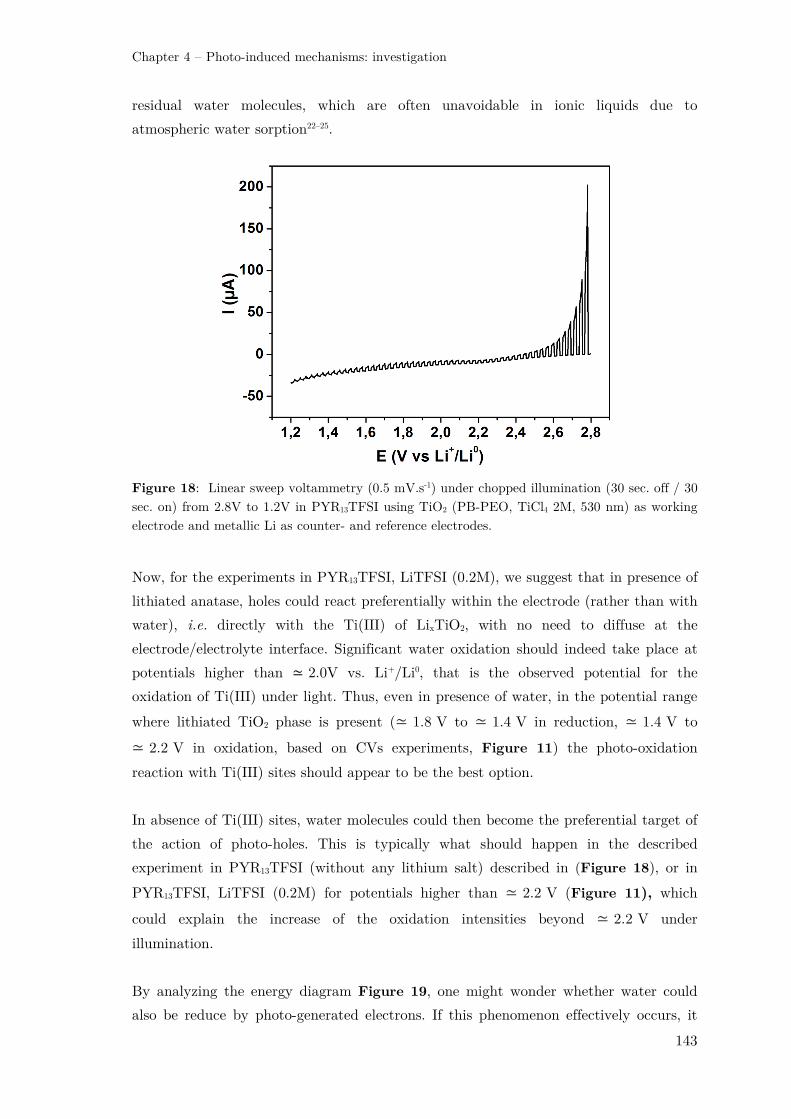
Chapter 4 – Photo-induced mechanisms: investigation
143
residual water molecules, which are often unavoidable in ionic liquids due to
atmospheric water sorption22–25.
Figure 18: Linear sweep voltammetry (0.5 mV.s-1) under chopped illumination (30 sec. off / 30 sec. on) from 2.8V to 1.2V in PYR13TFSI using TiO2 (PB-PEO, TiCl4 2M, 530 nm) as working electrode and metallic Li as counter- and reference electrodes.
Now, for the experiments in PYR13TFSI, LiTFSI (0.2M), we suggest that in presence of
lithiated anatase, holes could react preferentially within the electrode (rather than with
water), i.e. directly with the Ti(III) of LixTiO2, with no need to diffuse at the
electrode/electrolyte interface. Significant water oxidation should indeed take place at
potentials higher than ≃ 2.0V vs. Li+/Li0, that is the observed potential for the
oxidation of Ti(III) under light. Thus, even in presence of water, in the potential range
where lithiated TiO2 phase is present (≃ 1.8 V to ≃ 1.4 V in reduction, ≃ 1.4 V to
≃ 2.2 V in oxidation, based on CVs experiments, Figure 11) the photo-oxidation
reaction with Ti(III) sites should appear to be the best option.
In absence of Ti(III) sites, water molecules could then become the preferential target of
the action of photo-holes. This is typically what should happen in the described
experiment in PYR13TFSI (without any lithium salt) described in (Figure 18), or in
PYR13TFSI, LiTFSI (0.2M) for potentials higher than ≃ 2.2 V (Figure 11), which
could explain the increase of the oxidation intensities beyond ≃ 2.2 V under
illumination.
By analyzing the energy diagram Figure 19, one might wonder whether water could
also be reduce by photo-generated electrons. If this phenomenon effectively occurs, it

Chapter 4 – Photo-induced mechanisms: investigation
144
could compete the electrons and holes recombination, thus promoting holes reactions
with Ti(III) when lithiated titania phase is present. Li+ photo-extraction could thereby
be more important when photo-electrons are used for an other reaction (e.g. here,
reaction with water).
Figure 19: Schematic energy diagram of TiO2 (deducted from our UV-Vis and Mott-Schottky experiments). Stability range of LP30 and PYR13TFSI (0.2M LiTFSI) deducted from our CV’s experiment between 1 V and 4 V vs. Li+/Li (here underestimated).
In order to verify which photo-oxidation could be the most likely in simultaneous
presence of Ti(III) sites and water, and test our mechanistic hypothesis in a third
electrolyte, TiO2 photo-electrode was tested in a “water-in-salt” electrolyte.
II.2.2 – TiO2 photo-electrode in a “water-in-salt” electrolyte
Aqueous electrolyte could resolve safety issues (flammable solvent, LiPF6 thermal
instability and toxicity), but their electrochemical stability window (1.23 V) is too
narrow to support most of the electrochemical couples used in Li-ion batteries. In 2015,
Suo et al.26 proposed a highly concentrated aqueous electrolyte based on mixtures of
LiTFSI (>20 mol.kg-1) in water, yielding an expanded voltage stability of 3.0 V, which
has become very interesting for Li-ion storage applications (Figure 20).27 This high
voltage stability has been attributed to the electrochemical reduction of TFSI- at the
anode surface, which forms a protective SEI layer consisting primarily of LiF, and is
accompanied by a shift in the oxygen evolution reaction to higher voltages.27,28 This
particular reduction of the TFSI- anion has been explained by analyzing the
relationship between the solution structure and the electrochemical properties from

Chapter 4 – Photo-induced mechanisms: investigation
145
molecular dynamics simulations. For dilute solutions (< 5 mol.kg-1), Suo et al.26 showed
that Li+ remains well hydrated in its primary solvation sheath with sufficient free water
molecules available. The authors explained that in such electrolytes, attempts to
lithiate the anode, whose lithiation potential is below that of water reduction, would
lead to preferential reduction of water in hydrogen, which would prevent Li+
intercalation and any possible reduction of TFSI-. However, when LiTFSI
concentrations beyond 20 mol.kg-1 are employedi, molecular dynamics simulation
predicts that on average two TFSI- anions would be observed in each Li+ primary
solvation sheath, and such a high probability of presence of TFSI– would lead to an
interphase chemistry dominated by the reduction of TFSI– (see Figure 20).26,28
Figure 20: Voltage stability limits of organic, water-in-salt, and aqueous electrolytes compared to the chemical potential of various lithium intercalation materials (left).27 Illustration of the evolution of the Li+ primary solvation sheath in diluted and water-in-salt solutions (right).26
In this work, this electrolyte is studied above all with the aim of investigating the fate
of the photo-charges in presence of a different electrode/electrolyte interfacial
environment. “Water-in-salt” electrolyte presents the advantage of containing both
LiTFSI salt and water to test our mechanistic hypothesis about the preferential photo-
oxidation of Ti(III) above water. Besides, for high LiTFSI concentration, our system
could be tested in conditions where electrochemical Li+ intercalation/extraction is
enough quantitative (in comparison to a classical “salt-in-water” electrolyte) to be
comparable to our previous experiments in LP30 and IL.
CV experiments (0.5 mV.s-1) were obtained in a three-electrode configuration using
mesoporous TiO2 (PB-PEO, 2M in TiCl4, 2 layers) as working electrode, Pt wire as
counter-electrode and saturated Ag/AgCl as reference electrode. Water-in-salt
i the molality in [mol.kg-1], will be referred as “m”. Molality is more adapted than concentration (in [mol.L-1], “M”) to describe high concentrated water-in-salt electrolyte, where the volume of the added salt is often higher than volume of water.

Chapter 4 – Photo-induced mechanisms: investigation
146
electrolytes were prepared by dissolving LiTFSI salts in water, for 3 different
concentrations (2.1, 10.5 and 21 mol.kg-1).
CVs presented in Figure 21 show that the reduction of water is progressively shifted
to lower potentials when the proportion of free water in the electrolyte decreases (dark
curves). At low LiTFSI concentration (2.1 mol.kg-1), TiO2 electrochemical response does
not show any well-defined peaks for the Ti(IV) reduction or the Ti(III) oxidation, and
is logically more comparable to the kind of CV obtained in classical diluted conditions
in water (a). At 21 mol.kg-1, the proportion of free water seems low enough to observe
reduction (≃ 1.5 V vs. Li+/Li0) and oxidation (≃ 1.9 V vs. Li+/Li0) peaks of TiO2
(which began to be visible at 10.5 m).
Figure 21: CVs (0.5 mV.s-1) for TiO2 (PB-PEO, 2M in TiCl4, 2 layers), using Pt and sat. Ag/AgCl as counter and ref. electrodes, in water with: a dissolved mixture of LiCl (3.5M)/Li2SO4(0.25M) (a), LiTFSI at 2.1 (b), 10.5 (c) and 21 mol.kg-1 (d). Cycling under dark conditions (black) and under illumination (red).
In comparison to identical experiments in IL or in LP30, CVs in light conditions (red
curves) seem to be globally shifted to more negative intensities and more particularly
during the reverse oxidation scan. Regardless of this intensity shift, usual intensity
LiTFSI 21 m LiTFSI 10.5 m
LiTFSI 2.1 m LiCl 3.5M / Li2SO4 0.25 M in water
(a) (b)
(c) (d)

Chapter 4 – Photo-induced mechanisms: investigation
147
increase and shift of the oxidation peaks can be guessed. At this point, we do not know
yet the reason of the intensity shift phenomenon. One of the difficulties in analyzing
such system, in this range of potentials, is to succeed in de-correlating phenomena
associated with water reduction, from phenomena related to ions (Li+, as well as H+)
intercalation/extraction/adsorption. Protons are also known to adsorb on- or even
intercalate in- TiO2 electrode depending on the applied bias and pH conditions.29–35
Under illumination, H+ as well as Li+, could therefore directly contribute to the
observed photo-currents, depending on the applied potentials and the water-in-salt
electrolyte concentration (pH notion here are also uneasy to define).
Linear sweep voltammetry (LSV) experiment at 0.5 mV.s-1 (from 0 V to -1.9 V vs.
saturated Ag/AgCl) under chopped illumination confirms the delayed water reduction
in more concentrated water-in-salt (" ≲ $1.65 * vs. Ag/AgCl at 21 mol.kg-1) in
comparison to diluted electrolyte (" ≲ $1.5 * vs. Ag/AgCl at 2.1 mol.kg-1) (Figure
22).
Figure 22: (LSV) experiment at 0.5 mV.s-1 under chopped illumination (30 sec. on/off) with initial scan 1 (from 0 V to -1.9 V vs. Ag/AgCl) (left) and reverse scan 2 (from -1.9 V to 0 V vs. Ag/AgCl) (right) for LiTFSI in water at 21 m (red) and 2.1 m (blue). Zooms corresponding to the oxidation potentials in blue frame.
This experiment also highlights two kinds of photo-responses that TiO2 electrode can
exhibit (photo-oxidation of Ti(III) or of water) depending on the applied potential, and
consequently on its lithium content. Let’s consider the experiment at 21 mol.kg-1 (red
curve):
- when TiO2 is in its intercalated state (from " ≲ $1.2 * vs. Ag/AgCl in initial scan
1 (left) to " ≲ $0.8 * in the reverse scan 2 (right)), in presence Ti(III) sites, the
photo-current, which has “triangular” shape as in LP30 or IL during Li+ photo-

Chapter 4 – Photo-induced mechanisms: investigation
148
extraction, could be attributed to Ti(III) photo-oxidation. In the presence of Ti(III)
sites, photo-generation could therefore lead to preferential Li+/H+ photo-extraction
through Ti(III) photo-oxidation. This is the photo-response, which has already been
typically observed in LP30 and PYR13TFSI (0.2M LiTFSI) when the electrode is
lithiated.
- when TiO2 is ‘unlithiated’ (" ≳ $1.2 * in initial scan 1 (left), then E ≳ $0.8 V in the
reverse scan 2 (right)), in absence of Ti(III) sites, holes photo-generation lead to
photo-oxidation of available water molecules. These water molecules can be more or
less available, as in water-in-salt, depending on the concentrated or diluted nature of
the electrolyte. They can also simply be residual water molecules, as observed in
absence of LiTFSI in hygroscopic PYR13TFSI. In this case, the photo-current has a
“rectangular” shape (see the blue frames), which are more characteristic of the TiO2
photo-catalytic response during the water oxidation in solar watersplitting systems.17–21
The difference between the two different shapes of photo-current (“triangular” for the
Li+ photo-extraction/“rectangular” for the water oxidation) could also give an
information about the kinetics of both phenomena. In fact, photo-stimulated reaction
are usually expected to happen very fast, as suggested by the rectangular photo-current
observed in solar watersplitting systems14–18 for example. In the case of Li+ photo-
extraction, photo-induced processes could be limited by the Li+ diffusion in the
electrode, which could explain the “triangular” shape of the photo-current. In this section, mechanistic hypothesis has been drawn to explain the fate of the photo-
generated charges depending on the presence, or not, of Ti(III) sites. In particular, in
ionic liquids-based electrolyte, we have proposed that photo-holes could react
preferentially within the Ti(III) of LixTiO2 (rather than with residual water). Photo-
electrons could also potentially be scavenged by residual water. This phenomenon could
compete the electrons and holes recombination, thus promoting holes reactions with
Ti(III) when lithiated titania phase is present, and eventually contributing to the higher
photo-currents observed in ionic liquids.
In the case of LP30 electrolyte, questions about the fate of the photo-charges should
also be addressed by considering the potential reaction with the electrolyte.
To get more insight about the possible species formed under illumination by reaction
with the photo-generated charges, we will focus in the next section on the post mortem
analysis of the electrode surfaces and of the electrolytes (LP30 and PYR13TFSI-based
ionic liquid).

Chapter 4 – Photo-induced mechanisms: investigation
149
III – Post mortem analysis of the photo-electrode
In the previous section, we have suggested that PYR13TFSI (0.2M LiTFSI) is protected
from an eventual photo-degradation due to the presence of residual water molecules; in
the case of LP30, questions about the fate of the photo-charges should also be
addressed by considering the potential reaction with the electrolyte.
In order to get more insight about the possible species formed under illumination by
reaction with the photo-generated charges in the case of LP30, and confirm non
degradation of PYR13TFSI (0.2M LiTFSI) under illumination, electrode surfaces are
probed in this section by means of FEG-SEM, EDX and XPS techniques. Analysis of
the electrolytes (LP30 and PYR13TFSI-based ionic liquid) will also be addressed by
NMR spectroscopy as complementary study. In particular, it could confirm or not the
presence of residual water in PYR13TFSI (0.2M LiTFSI), as well as the possible
degradation products formed in LP30.
III.1 – FEG-SEM and complementary EDX analysis
In order to detect potential traces of electrolyte degradation at the electrode surface,
FEG-SEM photos were taken at different steps of the electrode (photo)-electrochemical
cycling. For this post mortem analysis, electrodes were cleaned by manually shaking
them for 1-2 minutes in a beaker containing dimethyl carbonate, in order to wash the
remaining lithium salts or solvent present at their surface. TiO2 electrodes (PB-PEO,
2M in TiCl4, 2 dipped layers) were analyzed regarding their interaction with
PYR13TFSI (at 0.2M in LiTFSI):
(a) after 1 night in the solvent without any electrochemical cycling
(b) after 10 CVs (2.6 V to 1.4 V vs. Li+/Li0, 0.5 mV.s-1) under dark conditions
(c) after 10 CVs (2.6 V to 1.4 V vs. Li+/Li0, 0.5 mV.s-1) under continuous illumination
(d) after 45 CVs (2.6 V to 1.4 V vs. Li+/Li0, 0.5 mV.s-1) under dark conditions.
For each of these different steps, no visible differences were observed at the electrode
surface. PYR13TFSI (0.2M LiTFSI) seemed thus electrochemically stable between 2.6V
and 1.4V vs. Li+/Li0 in dark conditions as well as under illumination (Figure 23).

Chapter 4 – Photo-induced mechanisms: investigation
150
Figure 23: FEG-SEM photos of planar TiO2 sections use in PYR13TFSI (0.2M LiTFSI) after 1 night with no cycling (a), after 10 CV’s (2.6V to 1.4V vs. Li+/Li0, 0.5 mV.s-1) in dark (b) and in light (c), and after 45 CV’s (2.6V to 1.4V vs. Li+/Li0, 0.5 mV.s-1) in dark (d).
By contrast, important changes were observed during cycling in LP30 (Figure 24 and
Figure 25) In this electrolyte, TiO2 films (PB-PEO, 2M in TiCl4, 2 dipped layers) were
analyzed:
(a) after 1 night in the solvent without any electrochemical cycling (green)
(b) after the first CV (2.6 V to 1.4 V vs. Li+/Li0, 0.5 mV.s-1) under dark conditions
(yellow)
(c) after 10 CVs (2.6 V to 1.4 V vs. Li+/Li0, 0.5 mV.s-1) under dark conditions (orange)
(d) after 10 CVs (2.6 V to 1.4 V vs. Li+/Li0, 0.5 mV.s-1) under continuous illumination
(red)
(e) after 20 CVs (2.6 V to 1.4 V vs. Li+/Li0, 0.5 mV.s-1) under dark conditions (blue).
(a) (b)
(c) (d)
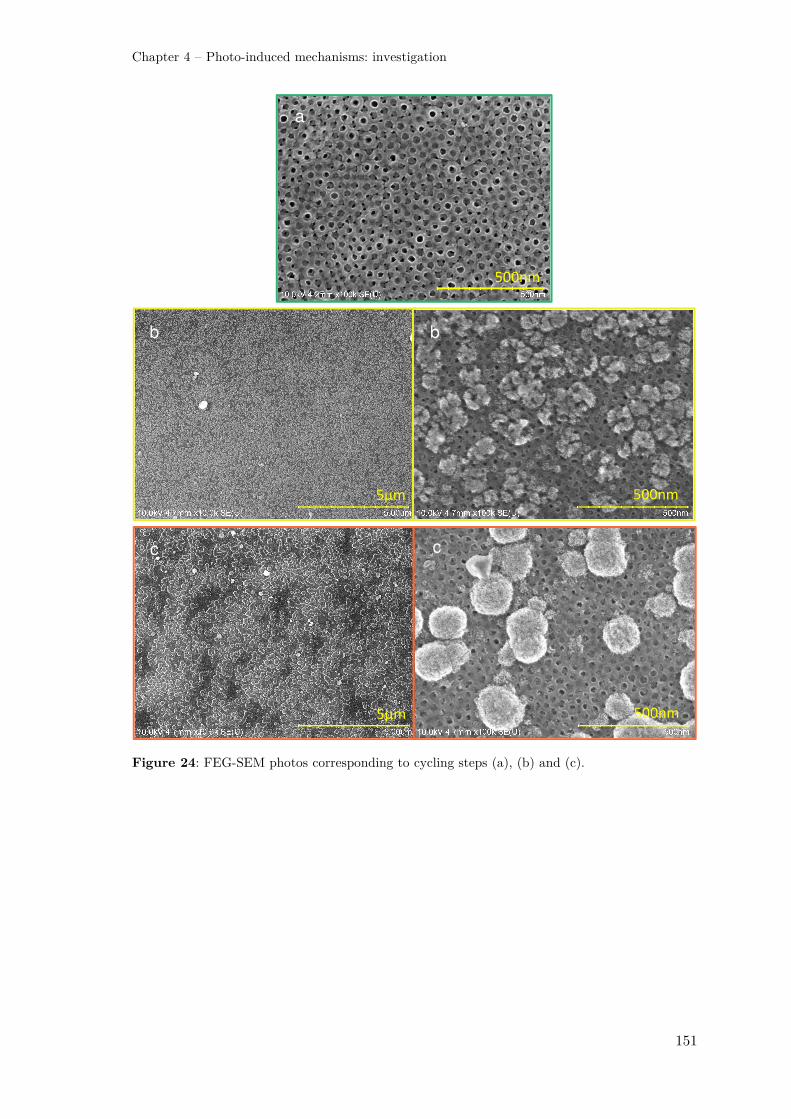
Chapter 4 – Photo-induced mechanisms: investigation
151
Figure 24: FEG-SEM photos corresponding to cycling steps (a), (b) and (c).
500nm
a
500nm 5μm
b b
500nm 5μm
c c
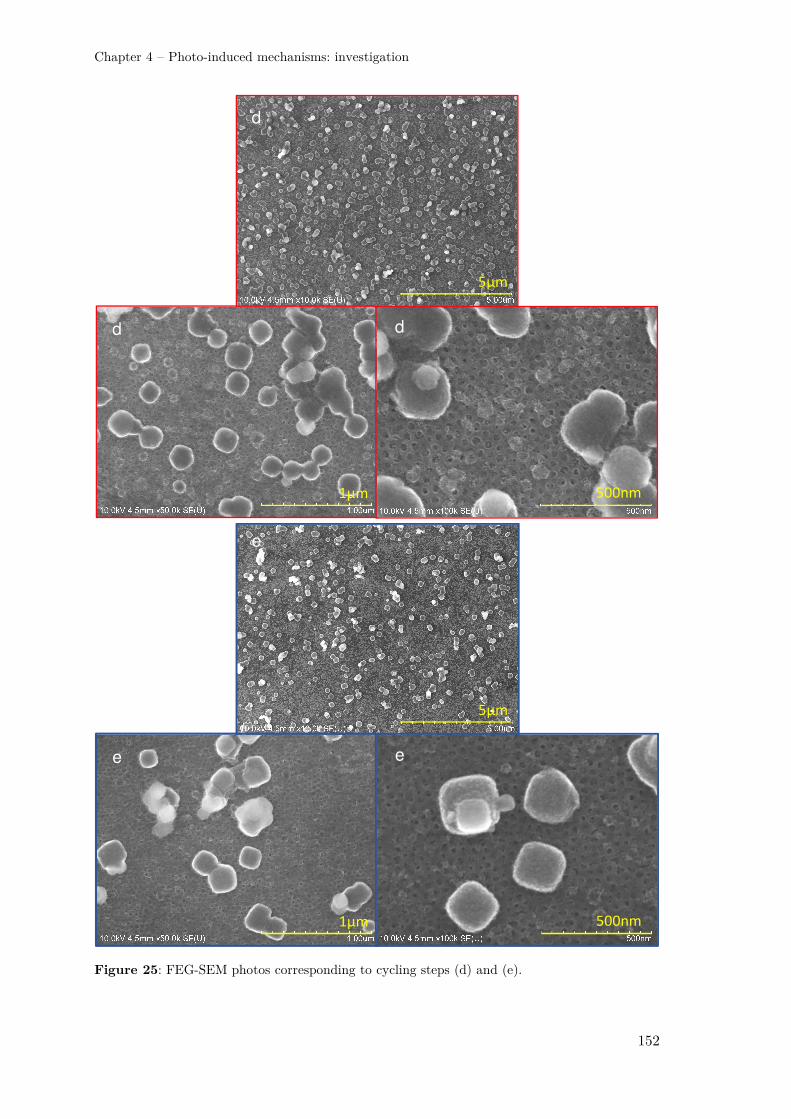
Chapter 4 – Photo-induced mechanisms: investigation
152
Figure 25: FEG-SEM photos corresponding to cycling steps (d) and (e).
500nm 1μm
d d
5μm
d
500nm 1μm
e e
5μm
e
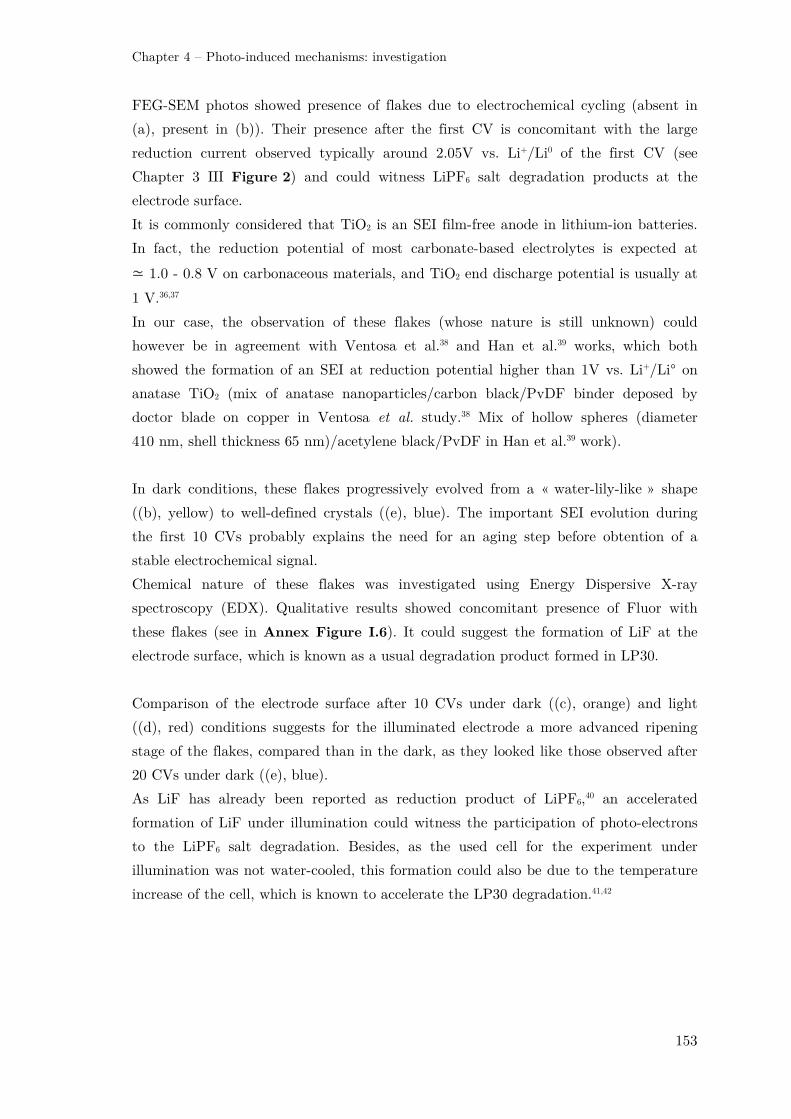
Chapter 4 – Photo-induced mechanisms: investigation
153
FEG-SEM photos showed presence of flakes due to electrochemical cycling (absent in
(a), present in (b)). Their presence after the first CV is concomitant with the large
reduction current observed typically around 2.05V vs. Li+/Li0 of the first CV (see
Chapter 3 III Figure 2) and could witness LiPF6 salt degradation products at the
electrode surface.
It is commonly considered that TiO2 is an SEI film-free anode in lithium-ion batteries.
In fact, the reduction potential of most carbonate-based electrolytes is expected at
≃ 1.0 - 0.8 V on carbonaceous materials, and TiO2 end discharge potential is usually at
1 V.36,37
In our case, the observation of these flakes (whose nature is still unknown) could
however be in agreement with Ventosa et al.38 and Han et al.39 works, which both
showed the formation of an SEI at reduction potential higher than 1V vs. Li+/Li° on
anatase TiO2 (mix of anatase nanoparticles/carbon black/PvDF binder deposed by
doctor blade on copper in Ventosa et al. study.38 Mix of hollow spheres (diameter
410 nm, shell thickness 65 nm)/acetylene black/PvDF in Han et al.39 work).
In dark conditions, these flakes progressively evolved from a « water-lily-like » shape
((b), yellow) to well-defined crystals ((e), blue). The important SEI evolution during
the first 10 CVs probably explains the need for an aging step before obtention of a
stable electrochemical signal.
Chemical nature of these flakes was investigated using Energy Dispersive X-ray
spectroscopy (EDX). Qualitative results showed concomitant presence of Fluor with
these flakes (see in Annex Figure I.6). It could suggest the formation of LiF at the
electrode surface, which is known as a usual degradation product formed in LP30.
Comparison of the electrode surface after 10 CVs under dark ((c), orange) and light
((d), red) conditions suggests for the illuminated electrode a more advanced ripening
stage of the flakes, compared than in the dark, as they looked like those observed after
20 CVs under dark ((e), blue).
As LiF has already been reported as reduction product of LiPF6,40 an accelerated
formation of LiF under illumination could witness the participation of photo-electrons
to the LiPF6 salt degradation. Besides, as the used cell for the experiment under
illumination was not water-cooled, this formation could also be due to the temperature
increase of the cell, which is known to accelerate the LP30 degradation.41,42

Chapter 4 – Photo-induced mechanisms: investigation
154
III.2 –Probing the electrode surface with XPS
Complementary analyses were then performed by means of X-ray photoelectron
spectroscopy (XPS). Electrode surface characterization of TiO2 films (PB-PEO, 2M
TiCl4, 2 dipped layers) were conducted for both the LP30 and the 0.2M LiTFSI
PYR13TFSI electrolytes. Before analysis, films were cleaned by manually shaking them
for 1-2 minutes in a beaker containing dimethyl carbonate, using a glove bag under
argon atmosphere to limit possible surface contamination under air exposure.
In both electrolytes, the XPS spectra were compared for different conditions:
(a) after 1 night in the solvent without any electrochemical cycling (green)
(b) after 10 CVs (2.6V to 1.4V vs. Li+/Li0, 0.5 mV.s-1) under dark conditions (yellow)
(c) after 10 CVs (2.6V to 1.4V vs. Li+/Li0, 0.5 mV.s-1) under continuous illumination
(orange)
(d) after 45 CVs (2.6V to 1.4V vs. Li+/Li0, 0.5 mV.s-1) under dark conditions (red).
A TiO2 film (no polymer, 1M in TiCl4, 1 dipped layer, 135 nm-thick) was also analyzed
as reference without having been in contact with any electrolyte (ref).
General survey exhibited regions characteristic for the C1s, O1s, Ti2p and F1s regions
(Figure 26 for LP30 and Figure 27 for ionic liquid).
Figure 26: XPS survey spectra for the surface of TiO2 films (PB-PEO, 2M TiCl4, 2 dipped layers) in LP30 electrolyte for cycling steps (a)-(d).
F1s O1s Ti2p C1s
(ref) (a) (b) (c) (d)
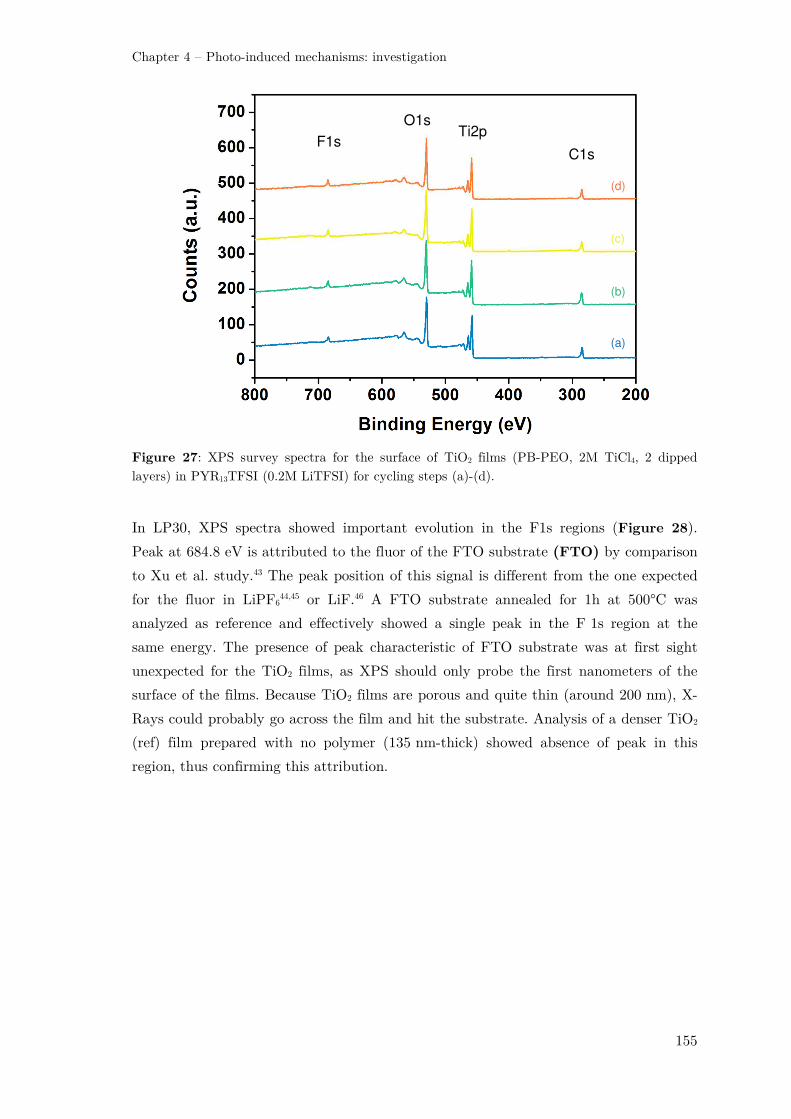
Chapter 4 – Photo-induced mechanisms: investigation
155
Figure 27: XPS survey spectra for the surface of TiO2 films (PB-PEO, 2M TiCl4, 2 dipped layers) in PYR13TFSI (0.2M LiTFSI) for cycling steps (a)-(d).
In LP30, XPS spectra showed important evolution in the F1s regions (Figure 28).
Peak at 684.8 eV is attributed to the fluor of the FTO substrate (FTO) by comparison
to Xu et al. study.43 The peak position of this signal is different from the one expected
for the fluor in LiPF644,45 or LiF.46 A FTO substrate annealed for 1h at 500°C was
analyzed as reference and effectively showed a single peak in the F 1s region at the
same energy. The presence of peak characteristic of FTO substrate was at first sight
unexpected for the TiO2 films, as XPS should only probe the first nanometers of the
surface of the films. Because TiO2 films are porous and quite thin (around 200 nm), X-
Rays could probably go across the film and hit the substrate. Analysis of a denser TiO2
(ref) film prepared with no polymer (135 nm-thick) showed absence of peak in this
region, thus confirming this attribution.
F1s O1s Ti2p C1s
(a) (b) (c) (d)

Chapter 4 – Photo-induced mechanisms: investigation
156
Figure 28: F1s XPS for the surface of TiO2 films (PB-PEO, 2M TiCl4, 2 dipped layers) in LP30 for cycling steps (a)-(d), for the surface of a FTO substrate annealed for 1h at 500°C (FTO) and for the surface of a TiO2 film prepared without polymer (ref).
The peak observed at 688.0 eV after 1 night in LP30 without any electrochemical
cycling ((a), dark blue) is absent on a native TiO2 electrode, which was not in contact
with the electrolyte (ref). This peak is characteristic for the F1s electron binding energy
of remaining native LiPF6 salt at the electrode surface.44,45
After cycling, this peak is shifted at 686.2 – 686.5 eV ((b), (c), (d), light blue). It
witnesses the presence of LiF (reported at 685.0,45,47 685.5,44 68638 and from 685.9 to
686.5 eV in Verma et al. review46) as degradation product of LP30. It could confirm the
nature of the previously observed growing flakes during the FEG-SEM and EDX
experiments described in the previous section. Progressive electrolyte degradation upon
electrochemical cycling is confirmed by the increase of the peak intensity after 45 CVs
(d) in comparison to the intensity after 10 CVs.
Increase of the characteristic peak for LiF after 10 CVs under illumination (c)
compared to the same experiment in dark conditions (b) also tends to confirm the
accelerated LP30 degradation under illumination.
The XPS spectra of O1s region showed a two-band structure (Figure 29). The
dominant peak 529.8 - 529.9 eV is characteristic of the O1s electron binding energy in
TiO2.48 The second O1s peak around 531.1 - 531.2 eV may be attribute to different
oxidized hydrocarbons48 and/or to OH-groups from chemisorpted H2O at the electrode
surface.49
(ref) (a) (b)
(c) (d) (FTO)
F1s
Chapter 4 – Photo-induced mechanisms: investigation
157
After long electrochemical cycling in dark conditions (d), the secondary peak
significantly increased. It can be attributed to additional presence of carbonates like
Li2CO3 or ROCO2Li, which have already been proposed as SEI components on anatase
TiO2 Li-ion battery electrode surface38,39 and in the SEI composition of LiPF6-based
electrolytes.44,46 This secondary peak is very comparable between dark (b) and light (c)
experiments.
Figure 29: O1s XPS for the surface of TiO2 films (PB-PEO, 2M TiCl4, 2 dipped layers) in LP30 for cycling steps (a)-(d) and for the surface of a TiO2 film prepared without polymer (ref).
In the C1s regions (see Figure 30), XPS spectra displayed three components, which
were already present in the native TiO2 before any contact with the electrolyte (ref).
These observed carbon peaks are probably due to incomplete decomposition of the
carbon in the starting mesoporous thin film. The dominant peak at 284.4 - 284.5 eV
can be attributed to C-C binding from hydrocarbon species.48 The second and third
smaller peaks at ≃ 285.9 eV and ≃ 288.5 eV correspond to hydroxyl groups (C-OH)
and carboxyl groups (O=C-OH).38,47,48
(ref) (a) (b)
(c) (d) O1s
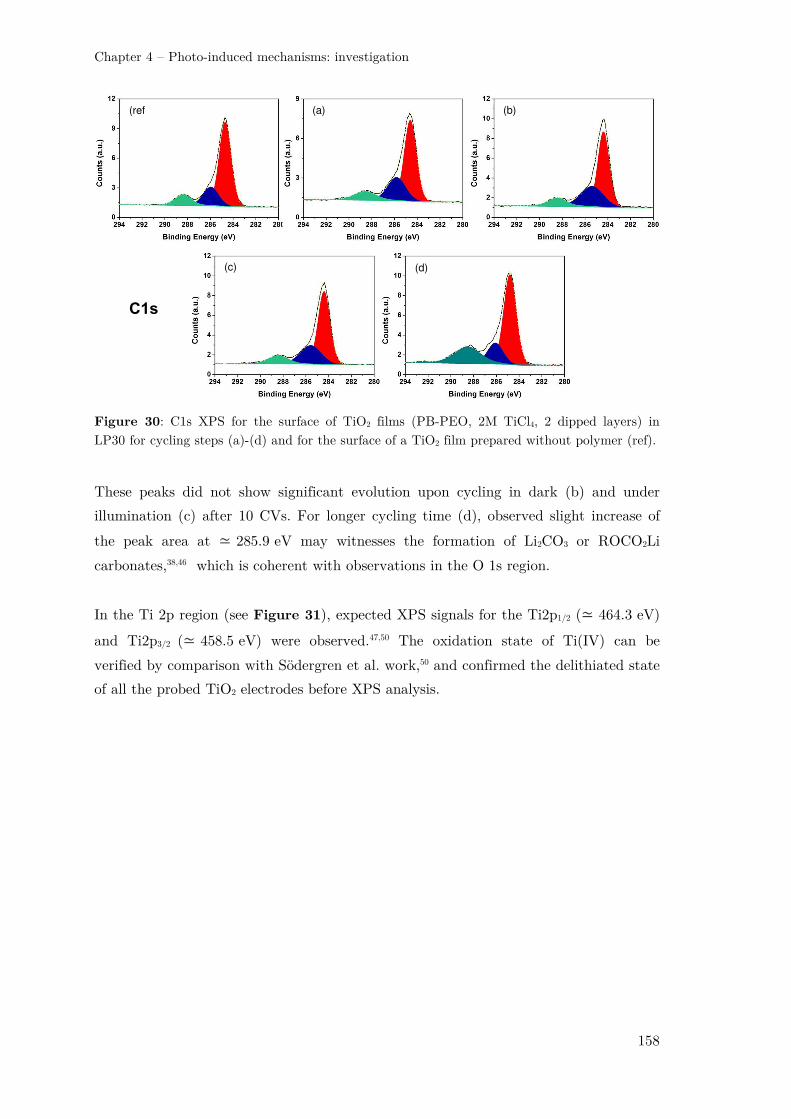
Chapter 4 – Photo-induced mechanisms: investigation
158
Figure 30: C1s XPS for the surface of TiO2 films (PB-PEO, 2M TiCl4, 2 dipped layers) in LP30 for cycling steps (a)-(d) and for the surface of a TiO2 film prepared without polymer (ref).
These peaks did not show significant evolution upon cycling in dark (b) and under
illumination (c) after 10 CVs. For longer cycling time (d), observed slight increase of
the peak area at ≃ 285.9 eV may witnesses the formation of Li2CO3 or ROCO2Li
carbonates,38,46 which is coherent with observations in the O 1s region.
In the Ti 2p region (see Figure 31), expected XPS signals for the Ti2p1/2 (≃ 464.3 eV)
and Ti2p3/2 (≃ 458.5 eV) were observed.47,50 The oxidation state of Ti(IV) can be
verified by comparison with Södergren et al. work,50 and confirmed the delithiated state
of all the probed TiO2 electrodes before XPS analysis.
(ref (a) (b)
(c) (d) C1s

Chapter 4 – Photo-induced mechanisms: investigation
159
Figure 31: Ti2p XPS for the surface of TiO2 films (PB-PEO, 2M TiCl4, 2 dipped layers) in LP30 for cycling steps (a)-(d) and for the surface of a TiO2 film prepared without polymer (ref).
Comparatively, in PYR13TFSI (0.2M LiTFSI) ionic liquid, XPS spectra showed no
significant evolution for the F1s, O1s, Ti2p and C1s, regions (see Figure 32 and
Figure 33).
In particular, in the F1s region, XPS peak at 688.8 - 688.9 eV is characteristic for the
C-F3 binding from the native TFSI- anion.45 This peak did not shift upon cycling, in
dark as well as under light conditions. By opposition to what happened in LP30,
characteristic XPS signal for Li-F is absent, which is coherent with the observed
unmodified electrode surface after use in ionic liquid (see section III.1). Hence, no sign
of electrolyte degradation was observed at the electrode surface in PYR13TFSI (0.2M
LiTFSI) in these cycling conditions.
(ref) (a) (b)
(c) (d) Ti2p

Chapter 4 – Photo-induced mechanisms: investigation
160
Figure 32: F1s and O1s XPS for the surface of TiO2 films (PB-PEO, 2M TiCl4, 2 dipped layers) in PYR13TFSI (0.2M LiTFSI) for cycling steps (a)-(d).
F1s
(a) (b)
(c) (d)
O1s
(a) (b)
(c) (d)

Chapter 4 – Photo-induced mechanisms: investigation
161
Figure 33: Ti2p and C1s XPS for the surface of TiO2 films (PB-PEO, 2M TiCl4, 2 dipped layers) in PYR13TFSI (0.2M LiTFSI) for cycling steps (a)-(d).
Ti2p
(a) (b)
(c) (d)
C1s
(a) (b)
(c) (d)
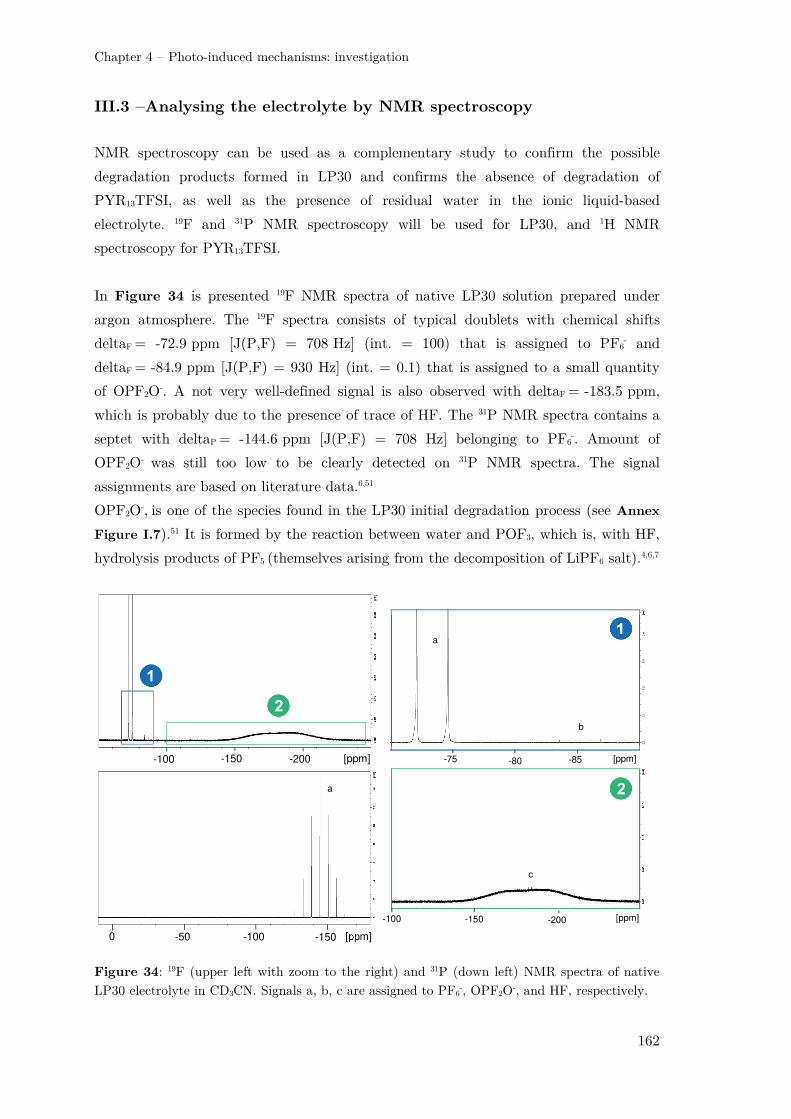
Chapter 4 – Photo-induced mechanisms: investigation
162
III.3 –Analysing the electrolyte by NMR spectroscopy
NMR spectroscopy can be used as a complementary study to confirm the possible
degradation products formed in LP30 and confirms the absence of degradation of
PYR13TFSI, as well as the presence of residual water in the ionic liquid-based
electrolyte. 19F and 31P NMR spectroscopy will be used for LP30, and 1H NMR
spectroscopy for PYR13TFSI.
In Figure 34 is presented 19F NMR spectra of native LP30 solution prepared under
argon atmosphere. The 19F spectra consists of typical doublets with chemical shifts
deltaF = -72.9 ppm [J(P,F) = 708 Hz] (int. = 100) that is assigned to PF6- and
deltaF = -84.9 ppm [J(P,F) = 930 Hz] (int. = 0.1) that is assigned to a small quantity
of OPF2O-. A not very well-defined signal is also observed with deltaF = -183.5 ppm,
which is probably due to the presence of trace of HF. The 31P NMR spectra contains a
septet with deltaP = -144.6 ppm [J(P,F) = 708 Hz] belonging to PF6-. Amount of
OPF2O- was still too low to be clearly detected on 31P NMR spectra. The signal
assignments are based on literature data.6,51
OPF2O-, is one of the species found in the LP30 initial degradation process (see Annex
Figure I.7).51 It is formed by the reaction between water and POF3, which is, with HF,
hydrolysis products of PF5 (themselves arising from the decomposition of LiPF6 salt).4,6,7
Figure 34: 19F (upper left with zoom to the right) and 31P (down left) NMR spectra of native LP30 electrolyte in CD3CN. Signals a, b, c are assigned to PF6
-, OPF2O-, and HF, respectively.
1
2
-100 -150 -200 [ppm]
2
-100 -150 -200 [ppm]
1
-75 -80 -85 [ppm]
[ppm] -150 0 -50 -100
a
b
c
a

Chapter 4 – Photo-induced mechanisms: investigation
163
After 10 CVs (2.6 V to 1.4 V vs. Li+/Li0, 0.5 mV.s-1) under dark (Figure 35) and light
(Figure 36) conditions using TiO2 (PB-PEO, TiCl4 at 2M, 2 dipped layers) as working
electrode and Li° at reference and counter electrodes, NMR signals belonging to PF6-
and OPF2O- were also observed on 19F. Ratios between PF6- and OPF2O- deducted from
19F NMR integration signals are (100/0.4) in dark and (100/0.5) under light, versus
(100/0.1) in the native LP30. At the time scale of our experiments (time of full
illumination less than 14h), the electrochemical cycling of the electrode is thus the
predominant phenomenon responsible for the electrolyte degradation. If it is significant,
the slight increase of OPF2O- amount under light in comparison to dark conditions is
coherent with the increasing formation under illumination of LiF at the electrode
surface, observed through SEM-FEG and EDX analysis in section III.1. In fact, in the
LP30 degradation process, formation of LiF is concomitant with formation of PF5,
which is a precursor for the formation of OPF2O- (Annex Figure I.7).
Figure 35: 19F (upper left with zoom to the right) and 31P (down left) NMR spectra of LP30 electrolyte in CD3CN after 10 CV (2.6 V to 1.4 V vs. Li+/Li0, 0.5 mV.s-1) under dark conditions. Signals a and b are assigned to PF6
-, OPF2O-, respectively.
1
2
-100 -150 -200 [ppm]
1
2
-100 -150 -200 [ppm]
-75 -80 -85 [ppm]
[ppm] -150 0 -50 -100
a
b
a
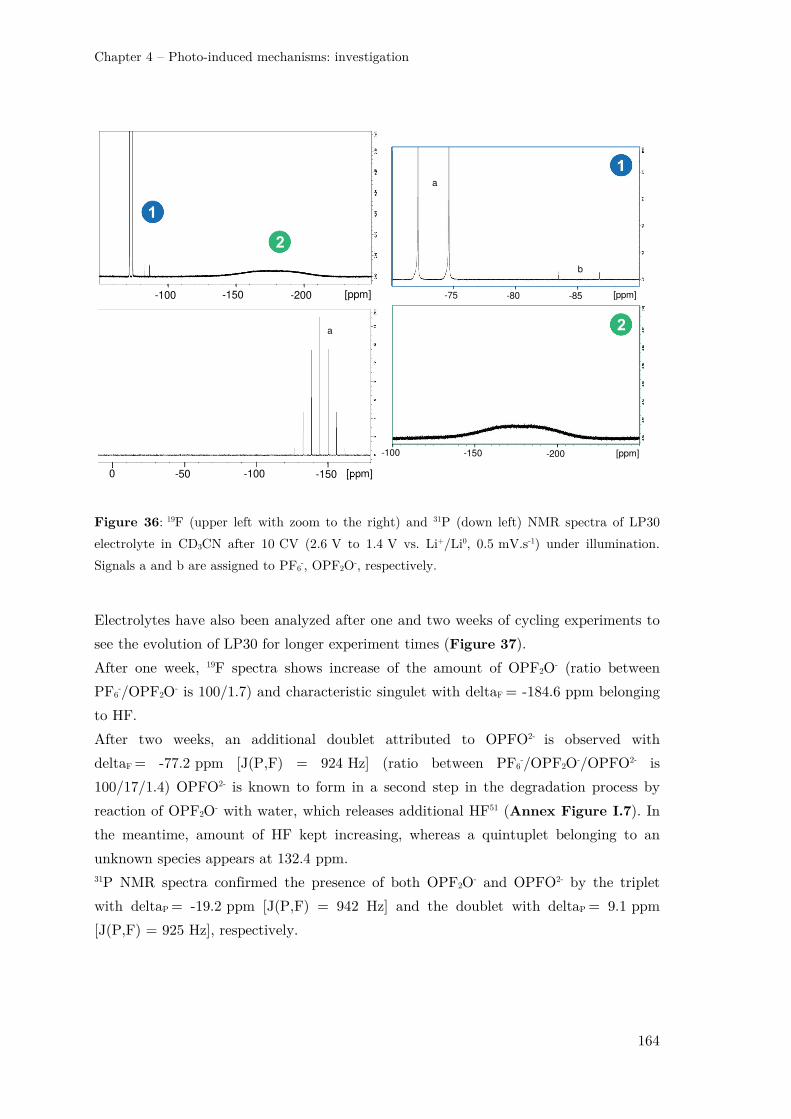
Chapter 4 – Photo-induced mechanisms: investigation
164
Figure 36: 19F (upper left with zoom to the right) and 31P (down left) NMR spectra of LP30
electrolyte in CD3CN after 10 CV (2.6 V to 1.4 V vs. Li+/Li0, 0.5 mV.s-1) under illumination.
Signals a and b are assigned to PF6-, OPF2O-, respectively.
Electrolytes have also been analyzed after one and two weeks of cycling experiments to
see the evolution of LP30 for longer experiment times (Figure 37).
After one week, 19F spectra shows increase of the amount of OPF2O- (ratio between
PF6-/OPF2O- is 100/1.7) and characteristic singulet with deltaF = -184.6 ppm belonging
to HF.
After two weeks, an additional doublet attributed to OPFO2- is observed with
deltaF = -77.2 ppm [J(P,F) = 924 Hz] (ratio between PF6-/OPF2O-/OPFO2- is
100/17/1.4) OPFO2- is known to form in a second step in the degradation process by
reaction of OPF2O- with water, which releases additional HF51 (Annex Figure I.7). In
the meantime, amount of HF kept increasing, whereas a quintuplet belonging to an
unknown species appears at 132.4 ppm. 31P NMR spectra confirmed the presence of both OPF2O- and OPFO2- by the triplet
with deltaP = -19.2 ppm [J(P,F) = 942 Hz] and the doublet with deltaP = 9.1 ppm
[J(P,F) = 925 Hz], respectively.
1
2
-100 -150 -200 [ppm]
1
2
-100 -150 -200 [ppm]
-75 -80 -85 [ppm]
[ppm] -150 0 -50 -100
a
b
a

Chapter 4 – Photo-induced mechanisms: investigation
165
Figure 37: 19F and 31P NMR spectra of LP30 electrolyte in CD3CN after 1 week (up) and 2 weeks (down) in electrochemical cell. Signals a, b, c and d are assigned to PF6
-, OPF2O-, OPFO2- and HF, respectively.
-100 -150 -200 [ppm]
1
2
-100 -150 -200 [ppm]
-75 -80 -85 [ppm]
1
2
[ppm] -150 0 -50 -100
a
b
a
c
b
1
2
-100 -150 -200 [ppm]
1
2
-100 -150 -200 [ppm]
-75 -80 -85 [ppm]
[ppm] -150 0 -50 -100
a b
a d
c
e
b
c
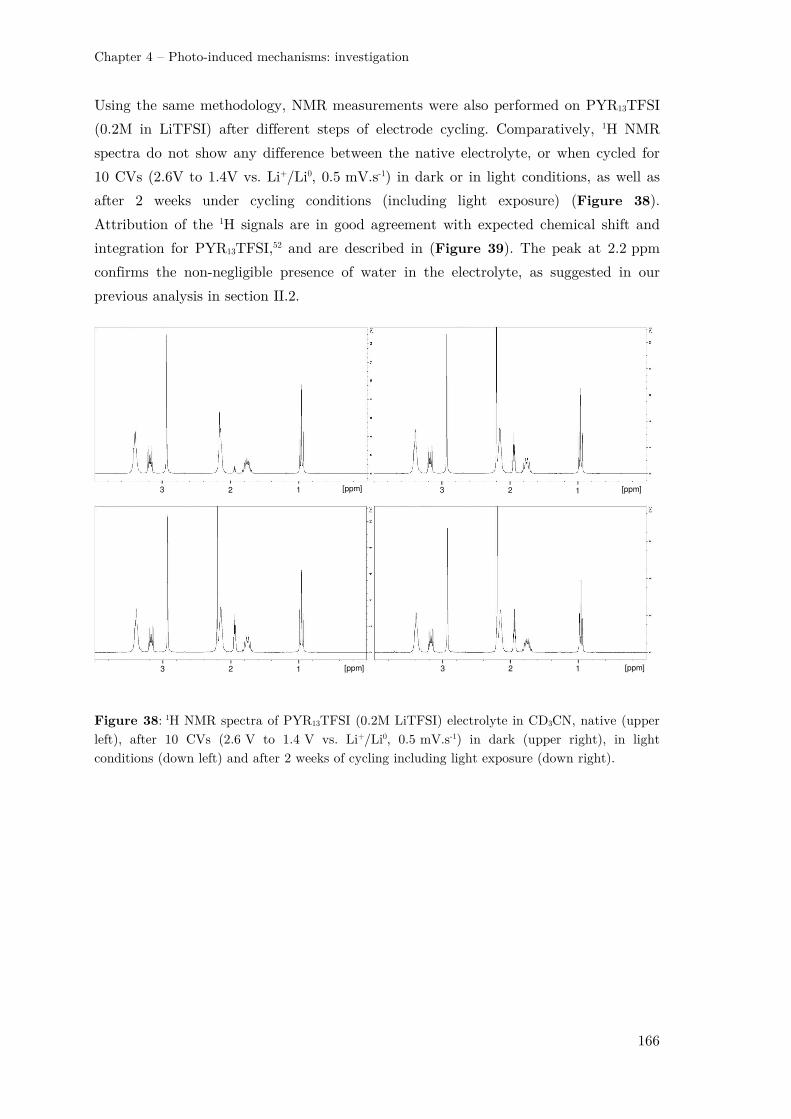
Chapter 4 – Photo-induced mechanisms: investigation
166
Using the same methodology, NMR measurements were also performed on PYR13TFSI
(0.2M in LiTFSI) after different steps of electrode cycling. Comparatively, 1H NMR
spectra do not show any difference between the native electrolyte, or when cycled for
10 CVs (2.6V to 1.4V vs. Li+/Li0, 0.5 mV.s-1) in dark or in light conditions, as well as
after 2 weeks under cycling conditions (including light exposure) (Figure 38).
Attribution of the 1H signals are in good agreement with expected chemical shift and
integration for PYR13TFSI,52 and are described in (Figure 39). The peak at 2.2 ppm
confirms the non-negligible presence of water in the electrolyte, as suggested in our
previous analysis in section II.2.
Figure 38: 1H NMR spectra of PYR13TFSI (0.2M LiTFSI) electrolyte in CD3CN, native (upper left), after 10 CVs (2.6 V to 1.4 V vs. Li+/Li0, 0.5 mV.s-1) in dark (upper right), in light conditions (down left) and after 2 weeks of cycling including light exposure (down right).
1 2 3 [ppm] 2 1 3 [ppm]
2 1 3 [ppm] 2 1 3 [ppm]

Chapter 4 – Photo-induced mechanisms: investigation
167
Figure 39: Peak assignments for PYR13TFSI. Peak (a) corresponds to the deuterated solvent impurity, peak (b) to water.53
In this section, questions about the fate of the photo-charges have been addressed by
considering their potential reaction with the electrolyte.
In the case of LP30, under dark conditions, usual electrolyte degradation products were
found on the electrode surface (LiF) and in the electrolyte (OPF2O-, OPFO2- and HF).
Possible accelerated formation of LiF under illumination and cycling conditions
(10 CVs between 2.6 V to 1.4 V vs. Li+/Li0, 0.5 mV.s-1) could (1) be due to an eventual
temperature increase of the non water-cooled cell under continuous illumination,
and/or (2) witness the participation of photo-electrons to the LiPF6 salt reduction.
In the case of PYR13TFSI (0.2M LiTFSI), no degradation product, neither from TFSI-
anion, nor from the pyrrolidium cation, were observed during electrochemical cycling in
dark conditions as well as under illumination. Presence of residual water molecules,
which has been suggested in the previous section, was confirmed by NMR study.
In order to further investigate the properties of the system, we now propose to study
TiO2 materials by means of operando techniques. In the next section, EIS
measurements will be performed in order to probe the electrical properties of the
material in dark and light conditions.
N
PYR + 1
1
2
2 3
3 4 5
5
5 4
6
6
6
6
a
b

Chapter 4 – Photo-induced mechanisms: investigation
168
IV – TiO2 photo-electrode: operando characterizations
IV.1 – Electrochemical Impedance Spectroscopy (EIS)
Electrochemical Impedance Spectroscopy (EIS) is an analytical technique, which allows
to study electrochemical and electrical properties of a material (e.g. the conduction
properties, the corrosion, or the chemical reaction occurring at its surface or interfaces).
In particular, EIS measurements can provide qualitative information about the
resistive, capacitive or diffusive phenomena at an electrode/electrolyte interface, and
can be helpful in order to distinguish their origin depending on the frequency range
(e.g. electrolyte or material intrinsic resistance, resistance due to intern interfaces,
resistance due to the processes at the electrode/electrolyte interfaces, etc.).
EIS analysis consists in (1) applying a sinusoidal perturbation with constant amplitude
and variable frequency (v(t) = Vm.cos(ωt)) to the studied system, and (2) monitoring
its answer (i(t) = Im.cos(ωt-ϕ)).
- At the applied tension, v(t), is associated the complex number v(ω) = Vm.ejωt.
- At the resulting intensity, i(t), is associated the complex number i(ω) = Im.ej(ωt-
φ).
The complex impedance is then defined as Z(ω) = v(ω)/i(ω), with the notation
Z(ω) = Z’+jZ”, where Z’ = Re(Z) and Z” = Im(Z). The representation mode
associated to the formalism where -Z” = f(Z’) is called Nyquist diagram. For each
pulsation ω, only the extremity of the 1⃗(ω) vector is represented. The combination of
all the reunited points forms the characteristic curve of the studied system.
IV.1.1 – Nyquist plots and equivalent circuits
Anatase electrode (PB-PEO, 2M in TiCl4, 2 layers) was analyzed using impedance
measurements in order to follow the evolution of electrical properties of the
electrochemical cell upon cycling using the usual 3-electrode configuration in LP30
electrolyte.
Figure 40 and Figure 41 represent the Nyquist diagrams obtained at different
potentials during a galvanostatic discharge (-30 µA)/charge (30 µA) experiment under
dark (black curve) and light (red curve) conditions. Prior to this experiment, 10 CVs
(2.6 V to 1.4 V vs. Li+/Li0, 0.5 mV.s-1) were applied to the TiO2 electrode in order to
reach stable electrochemical response.

Chapter 4 – Photo-induced mechanisms: investigation
169
Figure 40: Galvanostatic discharge (-30 µA)/charge (30 µA) experiment under dark (black curve) and light (red curve) conditions with simultaneous EIS measurements at different potentials corresponding to Nyquist plots in Figure 41.
Figure 41: Nyquist diagrams (200 kHz to 0.1 Hz, amplitude 10 mV, orthonormal diagrams) obtained at different potentials during the galvanostatic discharge presented in Figure 40 in dark conditions (up). Same experiment under light (down). Discharges are plotted to the left, and charges to the right.
1
2
3
4
5
6
7
8
9
DISCHARGE CHARGE
DARK
LIGHT

Chapter 4 – Photo-induced mechanisms: investigation
170
Different equivalent circuits were successively tested to simulate the impedance spectra
(Figure 42).
In the equivalent circuit (a), an ohmic resistance (R") was used to describe the
cumulative resistance of the electrolyte and cell components. A parallel circuit
combining a capacitance and a resistance was taken for the double-layer capacitance
(CDL) and the charge transfer resistance (RCT). A Warburg element (ZW) is added to
describe the diffusion of Li+ into the electrode. The as-described Randles circuit is a
commonly used equivalent circuit for the interpretation of impedance spectra at an
electrode/electrolyte interface.54 In particular, it has already been used to describe
lithium diffusion in nano-sized rutile TiO2,55 rutile MnO256 or WO3 thin films.57
Figure 42: Equivalent circuits used for EIS data fits. Randles circuit (a), modified Randles circuit constant phase element (b).
In our case, this model was insufficient to properly fit the impedance data (Annex
Figure A.I.8). In fact, upon cycling, the Nyquist plots mostly evolve in the diffusion
zone (low frequencies zone) described by the Warburg element. As the Warburg
element has constant phase at 45° from the real Z axe, it was not completely well
suited in our case to fit and compare Nyquist plots presenting curves with changing
slopes (slightly different from 45°) in the diffusion area.
Thus, a second equivalent circuit (b) was proposed by replacing the Warburg element
by a constant-phase element (CPE). Models invoking CPEs are more often used to
replace the double-layer capacitance, when solid/electrolyte interfaces reveal non-
capacitive double layer properties, which arises in a broad range of experimental
systems.58–61 However, it has also been used in replacement of the Warburg element to
describe diffusion phenomena (e.g. Na+ diffusion in MnO2,62 Li+ diffusion in rutile
TiO2,63 or in MnO2 supercapacitors61).
The CPE impedance is expressed in terms of model parameters α and Q as:
1345 6 7 189:;<=> (1)
where ? is the CPE exponent and Q [ . !"8#"<; or Ω"#!<] the CPE parameter.
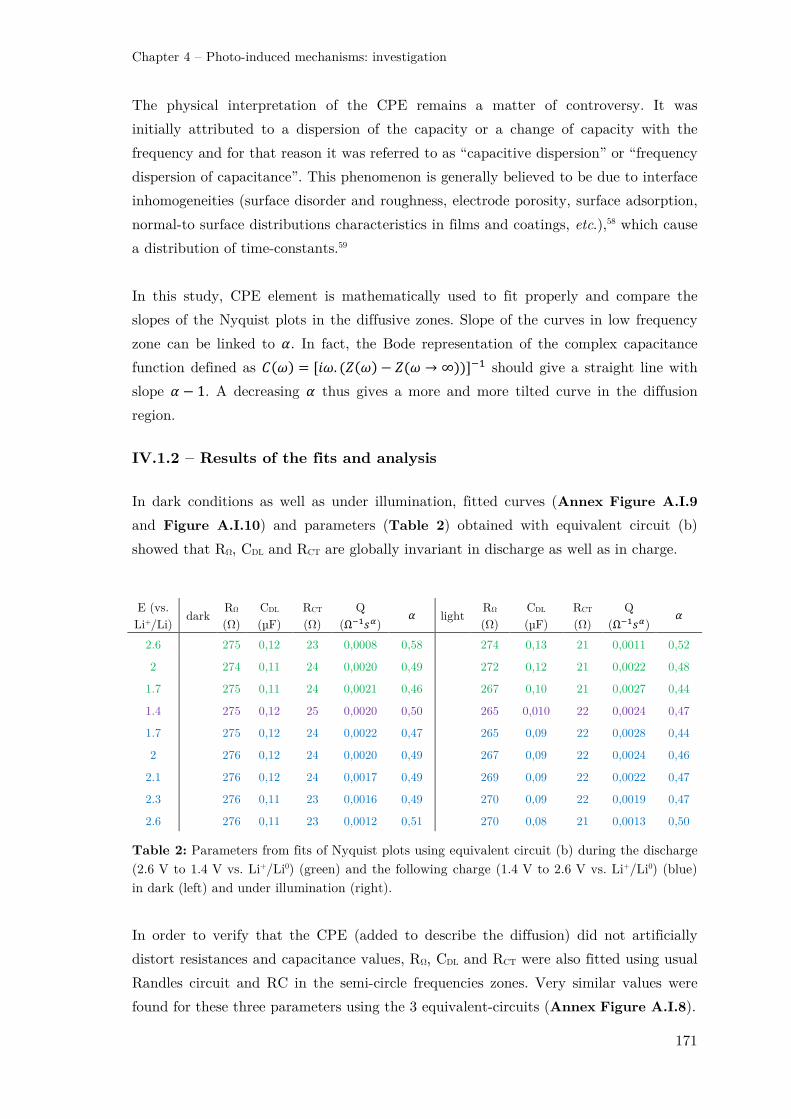
Chapter 4 – Photo-induced mechanisms: investigation
171
The physical interpretation of the CPE remains a matter of controversy. It was
initially attributed to a dispersion of the capacity or a change of capacity with the
frequency and for that reason it was referred to as “capacitive dispersion” or “frequency
dispersion of capacitance”. This phenomenon is generally believed to be due to interface
inhomogeneities (surface disorder and roughness, electrode porosity, surface adsorption,
normal-to surface distributions characteristics in films and coatings, etc.),58 which cause
a distribution of time-constants.59
In this study, CPE element is mathematically used to fit properly and compare the
slopes of the Nyquist plots in the diffusive zones. Slope of the curves in low frequency
zone can be linked to ?. In fact, the Bode representation of the complex capacitance
function defined as %8:; 6 [':. 818:; $ 18: → ∞;;]"# should give a straight line with
slope ? $ 1. A decreasing ? thus gives a more and more tilted curve in the diffusion
region.
IV.1.2 – Results of the fits and analysis
In dark conditions as well as under illumination, fitted curves (Annex Figure A.I.9
and Figure A.I.10) and parameters (Table 2) obtained with equivalent circuit (b)
showed that R", CDL and RCT are globally invariant in discharge as well as in charge.
Table 2: Parameters from fits of Nyquist plots using equivalent circuit (b) during the discharge (2.6 V to 1.4 V vs. Li+/Li0) (green) and the following charge (1.4 V to 2.6 V vs. Li+/Li0) (blue) in dark (left) and under illumination (right).
In order to verify that the CPE (added to describe the diffusion) did not artificially
distort resistances and capacitance values, R", CDL and RCT were also fitted using usual
Randles circuit and RC in the semi-circle frequencies zones. Very similar values were
found for these three parameters using the 3 equivalent-circuits (Annex Figure A.I.8).
E (vs. Li+/Li)
dark R" (")
CDL (µF)
RCT (")
Q (Ω"#!<)
? light R" (")
CDL (µF)
RCT (")
Q (Ω"#!<)
?
2.6 275 0,12 23 0,0008 0,58
274 0,13 21 0,0011 0,52
2 274 0,11 24 0,0020 0,49
272 0,12 21 0,0022 0,48
1.7 275 0,11 24 0,0021 0,46
267 0,10 21 0,0027 0,44
1.4 275 0,12 25 0,0020 0,50
265 0,010 22 0,0024 0,47
1.7 275 0,12 24 0,0022 0,47
265 0,09 22 0,0028 0,44
2 276 0,12 24 0,0020 0,49
267 0,09 22 0,0024 0,46
2.1 276 0,12 24 0,0017 0,49
269 0,09 22 0,0022 0,47
2.3 276 0,11 23 0,0016 0,49
270 0,09 22 0,0019 0,47
2.6 276 0,11 23 0,0012 0,51
270 0,08 21 0,0013 0,50

Chapter 4 – Photo-induced mechanisms: investigation
172
As the lithium content + in our electrodes is < 0.5 in our electrode, The value of
RCT (≃ 20 ") and its relative invariance upon cycling is comparable with previous
studies (a different evolution could be observed for higher lithium content).55,56,63
In dark as in light conditions, ? globally decreased during the discharge, then
progressively re-increased during the charge.
It is however not easy to directly interpret the physical meaning of ? coefficient. For
example, in Pfanzelt et al. study,63 which uses the same equivalent circuit to describe
rutile TiO2 during discharge and charge, authors observed the same trend for ? as in
our study, but do not comment the evolution of the CPE coefficient.
In Bach et al. study,56 it has been shown for nano-size rutile TiO2 that chemical
diffusion coefficient decreased vs. the lithium content. This analysis was made from a
Randles equivalent circuit by determining the Warburg impedance prefactor A (defined
by $-.81; 6 /:"#/1), which is inversely proportional to the square root of diffusion
coefficient.55,57
In order to try to use in a simple way this ? coefficient (which could be simply used as
the parameter allowing to fit the slope of the Nyquist plot in the diffusion zone), we
have attempted to exploit the EIS fits in the diffusion area, by treating them as a
“Warburg-like” element with a slight correction of the exponent ? with a range 0.46 <? < 0.58 instead ? 6 0.5 (ideal Warburg element is a CPE ? 6 0.5). In this approximation, the “Warburg-like” diffusion coefficient is the slope of the
–Im(Z) curve plotted as a function of :"<. Results presented in (Figure 43) showed
that “Warburg-like” coefficient, referred as Aα, decreases with increasing lithium
content until E = 1.7 V (≃ Li0.2TiO2, with Li content evaluated through the
galvanostatic discharge), but is then higher at 1.4 V (≃ Li0.5TiO2).
At this point, we will not risk to over-interpret our results due to difficulty that
represents the interpretation of the ? coefficient. But if the analysis by means of this
model is correct, it could potentially mean that the diffusion of Li+ is facilitated at
relative low lithium content (+ ≲ 0.2 in LixTiO2, in discharge) then becomes harder at
higher lithium content (+ ≳ $0.2, in discharge). This trend would be in part consistent
with Bach et al.55 ‘s analysis for the high lithium content, but differs from their
observations at small lithium content, as they described a continuous decrease of the
apparent chemical diffusion with lithium insertion. It is also to mention that we have
compared here the “Warburg-like” coefficients and not directly the diffusion coefficient
of lithium DLi. In fact, the determination of the absolute value of diffusion coefficient of
lithium DLi is based on multiple parameters (e.g. slope (dE/dx)x of equilibrium potential

Chapter 4 – Photo-induced mechanisms: investigation
173
function as a function of the lithium content x, applied current density, geometrical
parameters), which should necessitate a more careful investigation.55,57
Figure 43: determination of Aα from –Im(Z”( :"<)) plot as a function of the potential during the discharge. Lithium content is estimated through galvanostatic discharge capacity
From this study in dark conditions, we will first remember that the charge transfer
resistance is globally invariant with the lithium content (for 0 < + < 0.5 in LixTiO2).
Under illumination, TiO2 electrode has very similar behavior. Results presented in
Table 2 do not seem significantly different from those in dark. The comparison
between dark and light experiment could also be complicated by the fact that lithium
content is not necessarily the same at a given potential between dark and light. From
this experiment, we could suggest that light does not significantly influence the
diffusion of Li+. Experiments realized on thicker electrodes or reaching more important
lithium contents could be interesting for the future investigations.
In the next section, we propose to further study the system using operando
measurements. A preliminary work is dedicated to the analysis of the gravimetric
response of a TiO2-coated piezoelectric substrate (GaPO4) when coupled to
electrochemical and photo-electrochemical measurements. A specially designed
experimental setup is thereby developed to study the nature of species involved at the
electrode/electrolyte interface upon photo-electrochemical cycling.

Chapter 4 – Photo-induced mechanisms: investigation
174
IV.2 – Investigations by means of Electrochemical Quartz Crystal
Microbalance (EQCM)
IV.2.1 – Principle of Quartz Crystal Microbalance (QCM)
The piezoelectric effect is a property of certain materials that become electrically
charged when a mechanical stress is applied. Conversely, these materials can be
deformed under the action of an external electrical field.64 Consequently, by applying
an electrical potential, dipoles reorganize in the acentric material causing its
deformation.65 Quartz (empirical formula SiO2) and GaPO4 are some of the members of
a family of crystals that experience the piezoelectric effect, where quartz is the most
commonly used one. The specific cut of the quartz crystal, with respect to its
crystallographic axes, as well as his thickness, determine the mode of vibration and its
frequency domain.64 By deposing electrodes on each side of a quartz crystal disk,
alternative voltage can be applied between the two electrodes. Consequently, the upper
and the lower faces of the active zone oscillate parallel to each other (Figure 44). A
stationary acoustic wave is generated throughout the quartz crystal. The frequency of
this wave is called the resonant frequency of the quartz resonator.66 This resonant
frequency then varies under the effect of changes in the mass, viscoelasticity and shape
of the electrode surface. This constitutes the basic principle of the microbalance
operation.
Figure 44: Schematic representation of the converse piezoelectric effect for shear motion. Direction of shear is dependent upon the applied potential while the extent of sear strain depends on the magnitude of the applied potential.65
A quartz crystal microbalance (QCM) is based on a thin quartz crystal linked to an
electrical circuit that is strong enough to create vibrational motion of the crystal at its
resonant frequency.65 The microbalance frequency may be followed over time, the
precision depending on the measuring parameters and the stability of the
microbalance.67 This high precision instrument permits the measurement of a mass

Chapter 4 – Photo-induced mechanisms: investigation
175
sample deposited on the surface of a quartz resonator through the change of its
resonance frequency, using Sauerbrey equation68 (2):
∆4 6 56. ∆.7 6 $8 294:1
7;<=>=? . ∆. (2)
where ∆4 is the measured shift in frequency (Hz), ∆. is the mass change (g), <= is the
quartz density (2.648 g.cm-3), >= is the shear modulus of a shear AT quartz crystal
(2.947 x 10¹¹ g.s-2.cm-1), 4: is the fundamental resonant frequency of the quartz (Hz), 7 is the active surface on the quartz corresponding to the metal electrode surface
deposited on it (cm2), n is the overtone number (9 6 1 in our case) and 56 is the
theoretical sensitivity factor (Hz.g-1.cm2). For example for a 6 MHz quartz resonator,
theoretical sensitivity factor is 8.14 x 10⁷ Hz.g-1.cm2.69
IV.2 – EQCM and [F(Δm/ΔQ)] function
The electrochemical quartz crystal microbalance (EQCM) has emerged as a very
powerful “in situ” technique to complement electrochemical experiments. It is based on
the coupling of the electrochemical methods (cyclic voltammetry or galvanostatic
charge/discharge) and gravimetric measurements through a QCM. This method has
been used to investigate diverse phenomena, for example, metal electrodeposition,70–72
and any mass changes associated with the electrolyte-ion movement, such as
electrochromic reactions,73 intercalation,74 and electro-adsorption.75,76 Basically, a metal-
patterned quartz crystal resonator (the metal being used as electrode) is inserted in an
electrochemical cell (called electrogravimetric cell) and connected to a specific
electronic circuit, the whole system being called an oscillator. Thus, it is possible to
monitor the evolution of microbalance frequency in the course of electrochemical
measurements in real time.
The simultaneous measurement of ∆m and of the electrochemical charge ∆Q gives the
mass per mole of electrons (MPE) exchanged in distinct electrochemical processes. This
MPE can be converted into equivalent weights of specific surface species that are
inserted, expulsed, deposited or dissolved via a single or multi electron processes.
Specifically, it is possible to quantify small mass changes (of the order of a
few nanograms64) occurring at the electrode/electrolyte interface during an
electrochemical process. During an interval of time, where the mass changes and the
electrical charge passed is ∆=, then the apparent mass of the ions involved in the
charge compensation can be estimated by means of the mass/charge ratio
[F(∆./∆=)],77 where F is the Faraday constant (96 500 C.mol-1), using equation (3):
Chapter 4 – Photo-induced mechanisms: investigation
176
@A" 6 . ∆.∆= (3)
The same analysis can be done punctually at any potential by77:
@A" 6 . B.B= 6 . B./BCB=/BC 6 . B./BC- (4)
These functions are negative for mass increase during cathodic processes (dm>0,
dQ<0) or mass decrease during anodic processes (dm<0, dQ>0) and positive for mass
increase during anodic processes (dm>0, dQ>0) or mass decrease during cathodic
processes (dm<0, dQ<0).
The MPE = F(∆m/∆Q) calculated from the EQCM data can provide indications of
the nature of transferred species during cycling. If only one species is involved in the
charge storage process, the value of MPE would be its molar mass. The cation and
anion contributions lead to negative and positive signs of MPE values, respectively.
That way, the function [F(∆./∆=)] can give information about the species that
participate in the charge compensation reaction at different potentials.78
Demonstration of this relation64,79 is given considering the insertion reaction of a
monovalent cation C+ in an electrode free site. When a potential variation, ∆E, is
applied to the electrochemical system, mass and charge variations may occur according
to the equation (5):
6 B=B9 6 B=
B.@3D (5)
where dQ is the charge variation during the insertion of C+ and dn the variation of the
number of moles of C+. It implies equation (6):
@3D 6 B.B= (6)
This proof was made considering only one cation contribution. The same methodology
can be applied when only one anion is involved in the electrochemical process. If there
are other species participating in the charge compensation process, the limitation of
this method appears as only an average molar mass that represents the contribution of
all species can be estimated.
Chapter 4 – Photo-induced mechanisms: investigation
177
However, in electrochemical systems, it is also important to consider uncharged species
such as the free solvent molecules that may participate indirectly in the electrochemical
process. This participation could produce mass changes but their motion does not cause
an electrical charge flux and, therefore, no faradaic current is associated. Nonetheless,
the participation of these species could modify the obtained mass/charge ratio.80
Conversely, other reactions associated with a faradaic current could take place in the
outer medium without implying a mass change at the electrode.77
IV.2.3 – EQCM study for Li-ion photo-battery electrode
The remarkable sensitivity of the EQCM technique has attracted particular attention
in the energy storage community (super-capacity, Li-ion battery), since “discrete”
events like intercalation (and/or adsorption of ions in/on active materials) can be
detected.75,81 EQCM has already been employed to investigate the electrolyte/electrode
interface for Li-ion batteries82–84 and in particular to analyze the solid electrolyte
interface (SEI).46 However, to the best of our knowledge, EQCM has not been reported
yet as an operando technique to investigate photo-induced phenomena at the
electrode/electrolyte interface of a Li-ion photo-battery. This section presents a
preliminary study towards developing operando EQCM measurements applied for the
analysis of TiO2 photo-electrode. Results presented in this section were obtained in
collaboration with Ozlem Sel and Hubert Perrot from the Laboratoire Interfaces et
Systèmes Electrochimiques (LISE).
IV.2.3.1 – Electrode fabrication
Anatase TiO2 electrodes were prepared by adapting the dip-coating process described in
Chapter 2 to EQCM substrates. As the final step of the anatase electrode fabrication
requires a heat treatment at 500°C for 1h, precautions should be taken with the
substrate. In fact, the absolute limit temperature for the microbalance measurements
with a quartz crystal is the Curie point at 573 °C. The quartz crystal irreversibly loses
all its piezoelectric properties above this point.69 Therefore, a more robust piezoelectric
crystal, gallium orthophosphate (GaPO4), was used instead of quartz. GaPO4 is a
quartz structure analogue, Si atoms being replaced by Ga and P atoms in the quartz
structure. GaPO4 shows outstanding thermal properties, as it can be used up to a Curie
transition temperature of 930 °C.69
The suitable electrode layers were deposited on the neat GaPO4 resonators in the LISE
laboratory. Two different types of electrode geometries are used (Figure 45). The
resonators were prepared by depositing platinum keyhole electrodes (surface area of

Chapter 4 – Photo-induced mechanisms: investigation
178
0.4 cm2 (a) or 1.2 cm2 (b)) by evaporation techniques on both sides of the GaPO4 with
a titanium adhesion sublayer. TiO2 mesoporous active material (PB-PEO, 2M in TiCl4,
1 dipped layer) was then deposited, by dip-coating, on only one side of the Pt
electrodes (face A). The rest of the crystal (not covered with Pt) and the entire face B
were immediately cleaned with an ethanol soaked cotton bud. Heat treatment of 500°C
was finally applied to obtain the TiO2/Pt/GaPO4 electrodes for EQCM measurements,
where TiO2 is deposited only on the Pt electrode of the selected face of the resonator.
Figure 45: Schematic representation of the TiO2/Pt/GaPO4 substrates (surface area of 0.4 cm2 (a) or 1.2 cm2 (b)). Electrical contact points for EQCM measurements are indicated by arrows.

Chapter 4 – Photo-induced mechanisms: investigation
179
FEG-SEM analysis in Figure 46 show the expected mesoporous structure with a
formation of 240 nm-thick TiO2 electrode. In comparison to FTO substrate, the surface
of the substrate is hillier, due to the rough Ti interlayer.
Figure 46: FEG SEM planar sections of TiO2/Pt/GaPO4 at different magnifications (a)-(c) and Pt/GaPO4 before the TiO2 deposit dip (d). TiO2/Pt/GaPO4 cross section (e)-(f).
5.00 µm 1.00 µm
500 nm 5.00 µm
5.00 µm 500 nm
TiO2
Ti
Pt
TiO2 TiO2
TiO2
Pt TiO2
GaPO4 Pt
(a) (b)
(c) (d)
(e) (f)
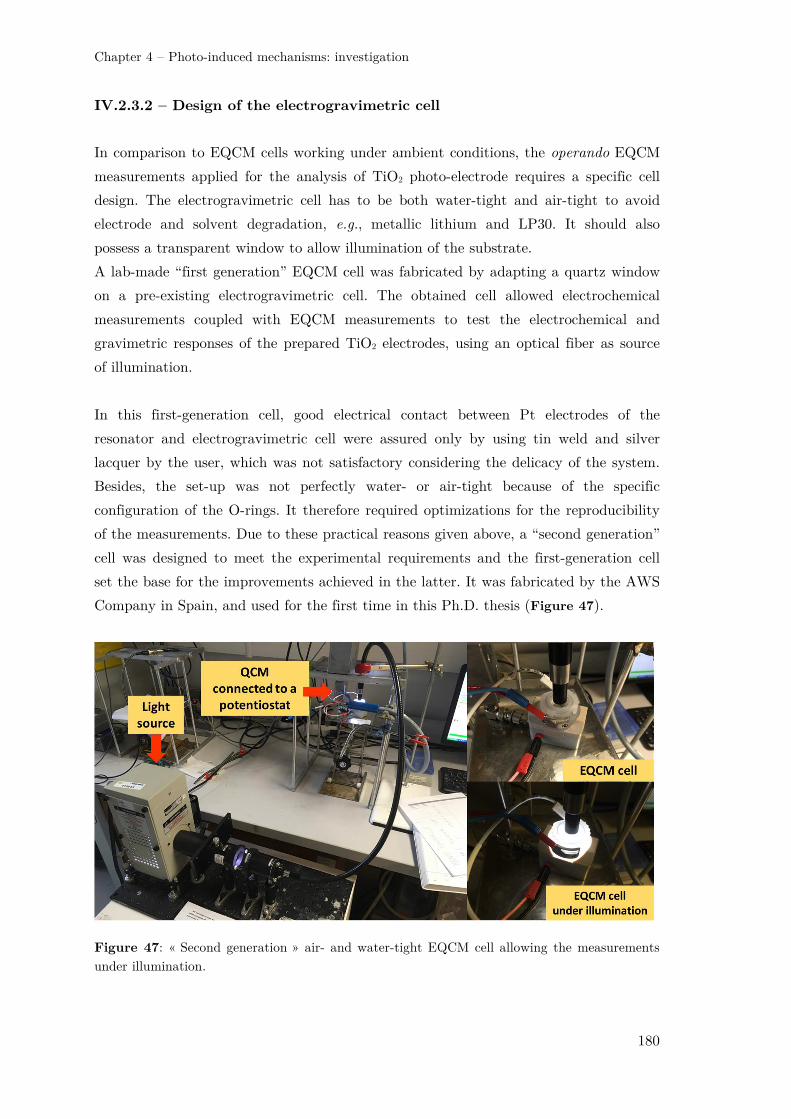
Chapter 4 – Photo-induced mechanisms: investigation
180
IV.2.3.2 – Design of the electrogravimetric cell
In comparison to EQCM cells working under ambient conditions, the operando EQCM
measurements applied for the analysis of TiO2 photo-electrode requires a specific cell
design. The electrogravimetric cell has to be both water-tight and air-tight to avoid
electrode and solvent degradation, e.g., metallic lithium and LP30. It should also
possess a transparent window to allow illumination of the substrate.
A lab-made “first generation” EQCM cell was fabricated by adapting a quartz window
on a pre-existing electrogravimetric cell. The obtained cell allowed electrochemical
measurements coupled with EQCM measurements to test the electrochemical and
gravimetric responses of the prepared TiO2 electrodes, using an optical fiber as source
of illumination.
In this first-generation cell, good electrical contact between Pt electrodes of the
resonator and electrogravimetric cell were assured only by using tin weld and silver
lacquer by the user, which was not satisfactory considering the delicacy of the system.
Besides, the set-up was not perfectly water- or air-tight because of the specific
configuration of the O-rings. It therefore required optimizations for the reproducibility
of the measurements. Due to these practical reasons given above, a “second generation”
cell was designed to meet the experimental requirements and the first-generation cell
set the base for the improvements achieved in the latter. It was fabricated by the AWS
Company in Spain, and used for the first time in this Ph.D. thesis (Figure 47).
Figure 47: « Second generation » air- and water-tight EQCM cell allowing the measurements under illumination.
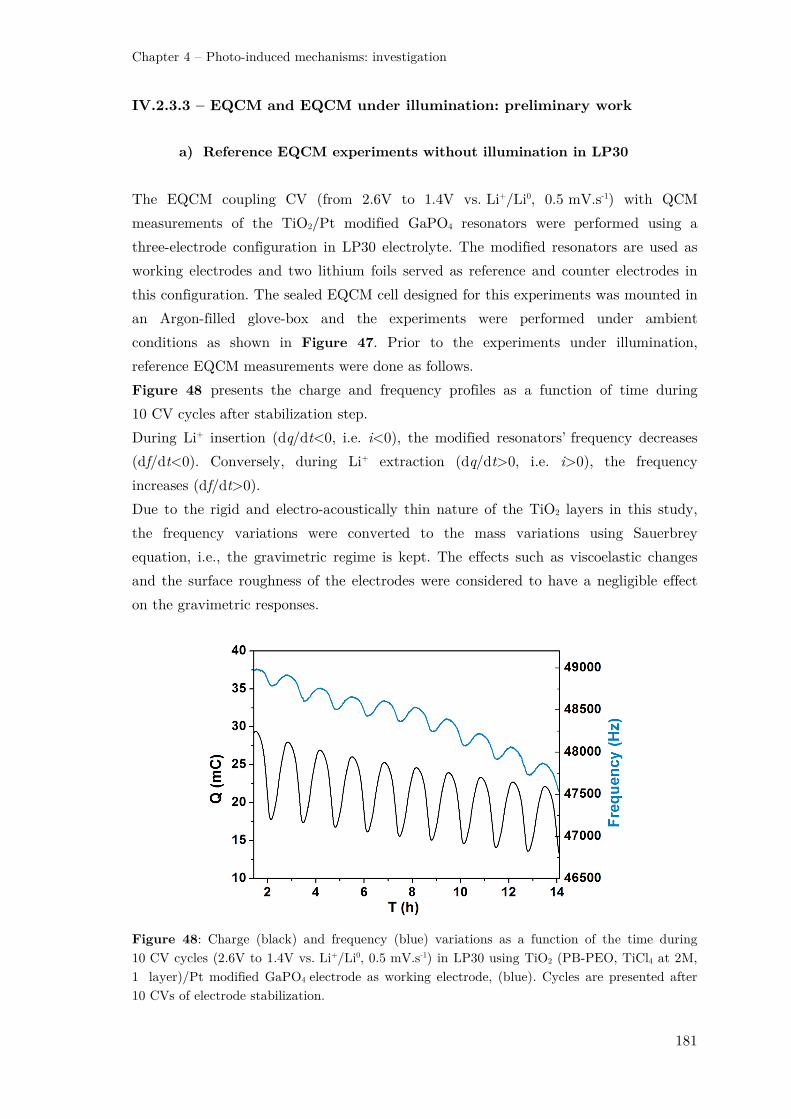
Chapter 4 – Photo-induced mechanisms: investigation
181
IV.2.3.3 – EQCM and EQCM under illumination: preliminary work
a) Reference EQCM experiments without illumination in LP30
The EQCM coupling CV (from 2.6V to 1.4V vs. Li+/Li0, 0.5 mV.s-1) with QCM
measurements of the TiO2/Pt modified GaPO4 resonators were performed using a
three-electrode configuration in LP30 electrolyte. The modified resonators are used as
working electrodes and two lithium foils served as reference and counter electrodes in
this configuration. The sealed EQCM cell designed for this experiments was mounted in
an Argon-filled glove-box and the experiments were performed under ambient
conditions as shown in Figure 47. Prior to the experiments under illumination,
reference EQCM measurements were done as follows.
Figure 48 presents the charge and frequency profiles as a function of time during
10 CV cycles after stabilization step.
During Li+ insertion (dq/dt<0, i.e. i<0), the modified resonators’ frequency decreases
(df/dt<0). Conversely, during Li+ extraction (dq/dt>0, i.e. i>0), the frequency
increases (df/dt>0).
Due to the rigid and electro-acoustically thin nature of the TiO2 layers in this study,
the frequency variations were converted to the mass variations using Sauerbrey
equation, i.e., the gravimetric regime is kept. The effects such as viscoelastic changes
and the surface roughness of the electrodes were considered to have a negligible effect
on the gravimetric responses.
Figure 48: Charge (black) and frequency (blue) variations as a function of the time during 10 CV cycles (2.6V to 1.4V vs. Li+/Li0, 0.5 mV.s-1) in LP30 using TiO2 (PB-PEO, TiCl4 at 2M, 1 layer)/Pt modified GaPO4 electrode as working electrode, (blue). Cycles are presented after 10 CVs of electrode stabilization.

Chapter 4 – Photo-induced mechanisms: investigation
182
As mass and frequency evolve in opposite directions according to Sauerbrey equation
(eq. 2), we thus observe an expected mass uptake at the electrode surface during Li+
insertion and mass loss during Li+ extraction.
An average molecular weight of the inserted species (when dQ/dt<0) and of the
extracted species when (dQ/dt>0) can first be roughly estimated by calculating the
F(Δm/ΔQ) function for an entire time period where i<0 or where i>0.
In average, for the 10 cycles presented in Figure 48:
- during discharge, ΔQ -9.8 mC for a frequency variation Δf -280 Hz.
- during charge, ΔQ -9.1 mC for a frequency variation Δf -150 Hz.
Corresponding mass variations Δm can then be calculated using Sauerbrey equation for
GaPO4 substrates with a theoretical sensitivity factor, Ks = 8.14 x 10⁷ Hz.g-1.cm2
(ρ = 3.570 g.cm-3, f0 = 5.8 MHz, = 2.147 × 10¹¹ g.s-2.cm-1, and S = 0.4 cm2).
Thus, it is found that:
- average molecular weight of species inserted during discharge is 14 g.mol-1
- average molecular weight of species extracted during charge is 8 g.mol-1.
F(Δm/ΔQ) value obtained for the species extracted during oxidation ( 8 g.mol-1) is in
a good agreement with the molecular weight of lithium ion, which is 7 g.mol-1.
However, during reduction, a higher average molecular weight ( 14 g.mol-1) was
obtained which indicates that lithium ions may not be the only species inserted or
deposited at the electrode surface. An SEI formation during the reduction process may
be the origin of the deviation of the F(Δm/ΔQ) value from the exact molecular weight
of Li+. It is very likely that due to electrolyte degradation (LP30) during reduction, the
formation of LiF and carbonates on the electrode surface may result in this additional
mass variation (see Figure 49 for the microscopy images of the electrodes before and
after the cycling in LP30), as seen in section II.
The instantaneous analysis of EQCM data by means of the F(Δm/ΔQ) function can
give a more precise vision of the evolution of the average molecular weight of species
involved in the charge compensation. This representation presents the advantage to
give the instantaneous M.P.E. at each potential during a voltammetric scan. As the
asymptotic behavior of the F(Δm/ΔQ) function near the zero current zones affects the
interpretation of molecular weight,77 no conclusion can be drawn in this zones (Annex
Figure I.11).

Chapter 4 – Photo-induced mechanisms: investigation
183
Figure 49: FEG SEM planar sections of TiO2/Pt/GaPO4 before (a) and after (b) use in LP30.
Figure 50 presents the F(Δm/ΔQ) function for 2 successive CVs of a EQCM
experiment in LP30 between 2.6V and 1.4V vs. Li+/Li0 at 0.5 mV.s-1 (cycles n°12 and
n°13 corresponding to time experiment between 3h30 to 6h in Figure 48 and Annex
Figure I.11). Curves 1 and 2 correspond to the first charge and first discharge,
respectively. Curves 3 and 4 correspond to the second charge and second discharge,
respectively. The experiments under electrochemical oxidation (Li+ extraction) are
plotted in green, and the experiment under electrochemical reduction (Li+ insertion) are
plotted in blue. Plots do not include uninterpretable zones near zero current.
These results confirm that species extracted during the charge has a molecular weight,
which is in very good agreement with that of Li+ (green curves). Conversely, the higher
average molecular weight (≃ 13 g.mol-1) persistently observed during discharges (blue
curves) shows that Li+ is not the only species inserted at the electrode surface during
the reduction. This value of average molecular weight stays relatively constant during
all potential range where reduction takes place, showing that LiF and carbonates are
deposited continuously on the electrode upon Li+ insertion. This indicates that the
degradation of the electrolyte does not seem to be triggered at a particular low
potential, and seems to occur continuously for the reductive potential range (at least
between 1.9 V and 1.5 V).
500 nm 500 nm
(a) (b)

Chapter 4 – Photo-induced mechanisms: investigation
184
Figure 50: -F(Δm/ΔQ) function calculated from the EQCM data corresponding to the average molecular weight of the species involved in the charge compensation as a function of the potential for a mesoporous TiO2 film (PB-PEO, TiCl4 at 2M, 1 layer) deposited on the GaPO4 resonators. The measurements were done in LP30 and showing 2 successive CVs (n°12 and n°13) at 2.6V and 1.4V vs. Li+/Li0 (0.5 mV.s-1). First “charge” (1)-“discharge” (2) / second “charge” (3)-“discharge” (4). Molecular weight of lithium is drawn in red.
1 2
3 4

Chapter 4 – Photo-induced mechanisms: investigation
185
The fact that the SEI formation has been suspected which resulted in the additional
mass variation during reduction of each cycle and continuous mass increase during
cycling (Figure 48), the initial 10 CV cycles of the EQCM necessary to obtain a
stabilized electrochemical response merits deeper analysis (see Figure 51).
Figure 51: Initial CVs at 2 mV.s-1 for a TiO2/Pt/GaPO4 electrode (PB-PEO, TiCl4 at 2M,
1 layer) in LP30 (a). Associated frequency changes of the resonator as a function of the time
and plotted for the 5 first cycles (b).
As on FTO substrate, large reduction peak observed around 2 V can be attributed to
the electrolyte decomposition and thus initial SEI formation during the first reduction
cycle. It is concomitant with an important frequency diminution. If all the mass uptake
observed during the first cycle between 2.8 V and 1.5 V is attributed to initial SEI
formation, the calculated mass change of the electrode is found as m 3.4 μg (using
Sauerbrey equation with an electrode surface of S = 1.2 cm2). If we correct this value
by subtracting the mass of inserted Li+ during this first cycle (assuming that the same
amount of Li+ is inserted during this 1st cycle and during the 10th cycle for example),
the calculated mass corresponds to a SEI layer thickness of h 10 nm.i
Then, during the first oxidation (from 5 to 10 min), the calculated average molecular
weight of released species is -F(Δm/ΔQ) 25 g.mol-1. This value is about 3 times
higher than the one obtained during the other oxidation steps after the stabilization
( 8 g.mol-1). It could suggest that the SEI formed during the first reduction (from 0 to
5 min) is partially reversible or mechanically removed during lithium extraction. This
SEI then continues to form during 4-5 CV cycles, as suggested by the presence of the
reduction peak around 2 V for 4-5 cycles.
i Calculated as h = m/(ρ.S) with a value for ρ 2 g.cm-3 corresponding to an average molecular
mass of the possible SEI products deposited in LP30 electrolyte referred in Trahey study,85 with
S = 1.2 cm2.
(a) (b)

Chapter 4 – Photo-induced mechanisms: investigation
186
These experiments without illumination has allowed to better identify the species
involved during the charge and discharge of TiO2 electrode. It has also permitted to
test for the first time the newly designed EQCM cell, and the strict criteria of air- and
water-tightness were validated which is also a prerequisite for an operando study under
illumination.
The preliminary experiments which also validated of the EQCM cell led us to study
photo-rechargeable electrode under illumination to get more precise information about
the effect of light on the species’ insertion/extraction in/from the electrode. It is
important to highlight the specifications of these electrogravimetric measurements in
comparison to the substantial photo-electrochemical characterization performed until
here. In addition to the geometrical configuration changes inherent to the EQCM cell,
Pt metal has replaced FTO and illumination is here mediated by an optical fiber. In
this configuration, the light power was found to be about 10 times smaller than on the
optical bench (see Annex III.8).
b) EQCM experiments under illumination in LP30
In order to test the TiO2/Pt/GaPO4 response under illumination in LP30 electrolyte,
EQCM measurements were performed. During CVs (after stabilization step, 2 mV.s-1
between 2.8 V and 1.4 V vs. Li+/Li0), simultaneous frequency changes of the resonator
were monitored under light for 1 cycle and compared to experiment without
illumination (see Figure 52).
Figure 52: CVs at 2 mV.s-1 for a TiO2/Pt/GaPO4 electrode (PB-PEO, TiCl4 at 2M, 1 layer) in LP30 in dark (black) and under light (red) (a) after stabilization step. Associated frequency changes of the resonator as a function of the time with cycle under illumination (red) (b).
(a) (b) ON
ON OFF
OFF

Chapter 4 – Photo-induced mechanisms: investigation
187
Under illumination (curves in red), frequencies undergo an immediate increase
(Δf ≃ +40 Hz). When the illumination is stopped, frequencies undergo an immediate
decrease (Δf ≃ -40 Hz). This frequency change was found too fast and too important
(the global frequencies variations between the charge and discharge states is only about
70 Hz) to be attributed to an effective important and quick mass change at the TiO2
electrode surface.
Then, the frequencies variation of a neat Pt/GaPO4 substrate was thus monitored
during an open circuit voltage (OCV) experiment under illumination (Figure 53). The
frequency increase/decrease (≃ 150 Hz) were also observed immediately when the light
is switched ON/OFF. This transitory response observed during the experiment could
thus be attributed the response of Pt/GaPO4 substrate under illumination.
Figure 53: Frequencies variations of GaPO4 substrate at OCV under illumination.
Gravimetric response of TiO2/Pt/GaPO4 electrode was then tested when coupled to a
galvanostatic discharge/discharge measurement (Figure 54). With these kinds of
experiments, the possible changes of the frequency variation were followed and plotted
as a function of time during illumination of the electrode.
ON
OFF

Chapter 4 – Photo-induced mechanisms: investigation
188
Figure 54: Galvanostatic discharge at -3 µA for a TiO2/Pt/GaPO4 electrode (PB-PEO, TiCl4 at 2M, 1 layer) in LP30. Associated frequency changes of the resonator as a function of the time. Curves are plotted in red during the illumination.
During galvanostatic experiments at -3 µA, the electrode underwent mass uptake
(frequency diminution) due to the electrode lithiation.
TiO2/Pt/GaPO4 electrode was illuminated during the potential plateau region (curves
in red). The fast transitory response (Δf ≃ +50 Hz) was also observed in this
measurements with similar magnitude of Δf changes as in Figure 52. A closer look at
the frequency response region plotted in red (Figure 54) indicates that the absolute
value of the slope of the frequency plotted as a function of time gradually increased.
This slope change may suggest that the mass uptake progressively decreases under
illumination when the film gets progressively lithiated.
Further experiments are required to confirm that this change is significant and not due,
for example, to the end of the transitory response of the GaPO4 under illumination. If
so, this slope change could be attributed to the simultaneous Li+ photo-extraction
phenomenon, which is effectively expected to become more significant when the film
gets progressively lithiated.
It is also important to mention that, for a complete analysis, additional effects that
may contribute to the gravimetric response should be pondered, i.e., mass loss due to
photo-extraction can be counterbalanced by the possible mass uptake due to the
expected increased formation of LiF (decomposition product of the LP30) under
illumination.
When the light was switched off, after the transitory response of the GaPO4 substrate
(Δf ≃ -50 Hz), absolute value of the slope immediately increased: in absence of Li+
photo-extraction to compensate the imposed Li+ galvanostatic-insertion, more Li+
ON
OFF

Chapter 4 – Photo-induced mechanisms: investigation
189
should be effectively inserted into the electrode and mass uptake become bigger at the
end of the plateau without the illumination.
c) EQCM experiments: first tests in ionic liquid
Preliminary experiments have been realized by changing the electrolyte from LP30 to
PYR13TFSI (LiTFSI at 0.2M). EQCM is less frequently conducted in ionic liquid
electrolyte mainly due to their high viscosity which may interface with the gravimetric
measurements. Nonetheless, certain ILs have already been employed to study the ionic
dynamics in nanoporous carbons,75 electrodeposition,86 or electropolymerization.87
The choice of ionic liquid type electrolyte in EQCM measurements of our study is
considered to be highly relevant as it may constitute a system free from the SEI
formation, and allow to focus the analysis on the Li+ insertion/extraction mechanisms
under illumination.
The EQCM data in the absence of illumination are presented in Figure 55 as a
reference. First of all, the large reduction peak observed around 2 V which was
attributed to the electrolyte decomposition and thus initial SEI formation during the
first reduction cycle in LP30 (Figure 51) is absent when cycled in PYR13TFSI (LiTFSI
at 0.2M). The corresponding charge and frequency profile as a function of time is
shown in Figure 55-b). First rough estimation of the -F(Δm/ΔQ) function for two
cycles of the CVs (2 mV.s-1) gives an average molecular weight of about 5 g.mol-1, in
reduction as well as in oxidation, which is slightly inferior but not far from the
expected value for Li+ in a first approximation.
Although there is no significant irreversible mass was detected during cycling, one can
notice that frequency response is delayed from the current response. This delay can be
attributed to the slower kinetics of ions movement in comparison to the kinetics of the
faradic processes, maybe due to relatively high viscosity of the ionic liquid.14
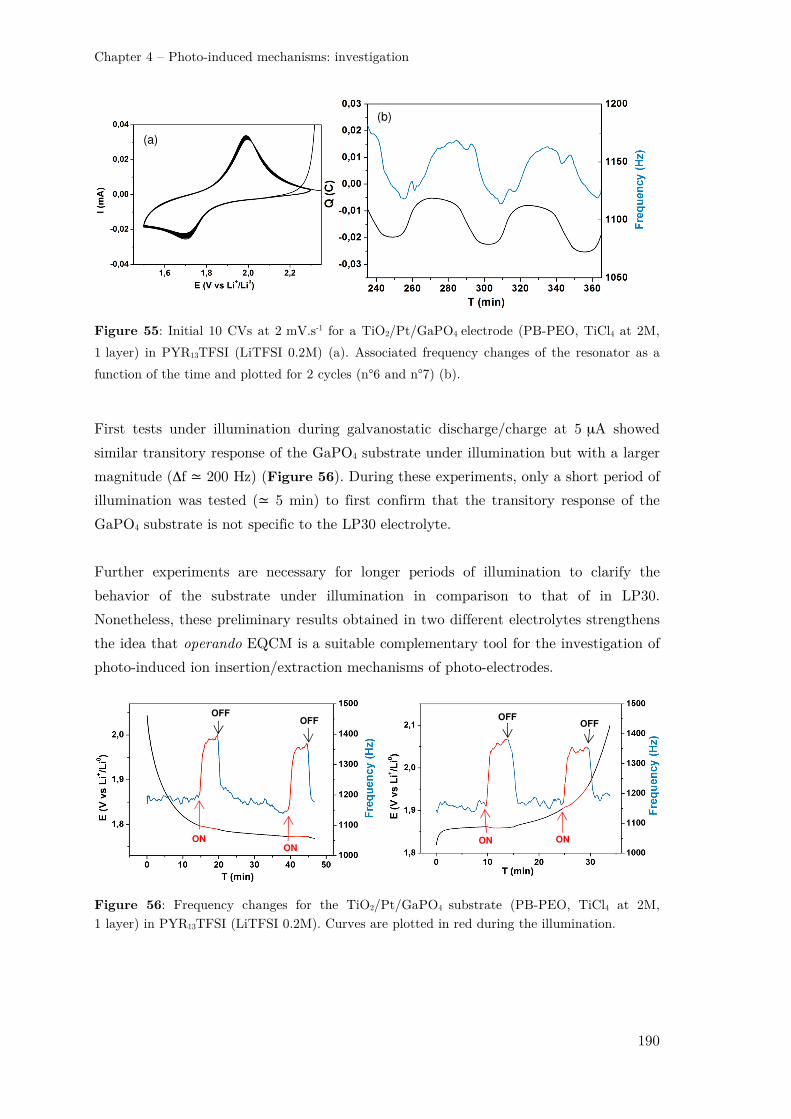
Chapter 4 – Photo-induced mechanisms: investigation
190
Figure 55: Initial 10 CVs at 2 mV.s-1 for a TiO2/Pt/GaPO4 electrode (PB-PEO, TiCl4 at 2M,
1 layer) in PYR13TFSI (LiTFSI 0.2M) (a). Associated frequency changes of the resonator as a
function of the time and plotted for 2 cycles (n°6 and n°7) (b).
First tests under illumination during galvanostatic discharge/charge at 5 µA showed
similar transitory response of the GaPO4 substrate under illumination but with a larger
magnitude (Δf ≃ 200 Hz) (Figure 56). During these experiments, only a short period of
illumination was tested (≃ 5 min) to first confirm that the transitory response of the
GaPO4 substrate is not specific to the LP30 electrolyte.
Further experiments are necessary for longer periods of illumination to clarify the
behavior of the substrate under illumination in comparison to that of in LP30.
Nonetheless, these preliminary results obtained in two different electrolytes strengthens
the idea that operando EQCM is a suitable complementary tool for the investigation of
photo-induced ion insertion/extraction mechanisms of photo-electrodes.
Figure 56: Frequency changes for the TiO2/Pt/GaPO4 substrate (PB-PEO, TiCl4 at 2M, 1 layer) in PYR13TFSI (LiTFSI 0.2M). Curves are plotted in red during the illumination.
(a) (b)
ON ON
OFF OFF
ON ON
OFF OFF

Chapter 4 – Photo-induced mechanisms: investigation
191
V – Conclusion
In this chapter, photo-induced mechanisms were studied by means of different
approaches.
First, we have played with the electrode architecture (mesoporous structure and
thickness) in order to see how much it could impact the photo-induced mechanisms.
Thinner films were found to present the more interesting mass capacities, whereas
thicker one (above 500 nm) allowed to obtain higher photo-current intensities. No
drastic differences were observed in the range of mesoporous architectures used in this
work.
We have then compared the photo-electrochemical behavior of the electrode in LP30
and in PYR13TFSI (0.2M LiTFSI), with complementary tests in “water-in-salt”
electrolyte. With the support of post mortem analysis, we have tried to picture the
possible fate of generated-excitons at the electrode/electrolyte interface. Here are our
main conclusions:
- In the case of LP30, under dark conditions, usual electrolyte degradation products
were found on the electrode surface (LiF) and in the electrolyte (OPF2O-, OPFO2- and
HF). Possible accelerated formation of LiF under illumination and cycling conditions
(10 CVs between 2.6 V to 1.4 V vs. Li+/Li0, 0.5 mV.s-1) (1) could be due to an eventual
temperature increase of the non-water-cooled cell under continuous illumination,
and/or (2) could witness the participation of photo-electrons to the LiPF6 salt
reduction.
- In the case of (PYR13TFSI, 0.2M LiTFSI), comparison of the electrochemical studies
performed under light and dark conditions showed a behavior qualitatively comparable
to the one in LP30 electrolyte. In simultaneous presence of Ti(III) sites and water in
the electrolyte (both susceptible to be photo-oxidized), study of TiO2 electrode in a
“water-in-salt” electrolyte suggested that photo-generation should lead to preferential
cations photo-extraction through Ti(III) photo-oxidation. Photo-electrons could for
their part eventually be scavenged by water molecules (whose presence in ionic liquid
was confirm by NMR study). This phenomenon could eventually limit the photo-
charges recombination and promoting the holes reaction with Ti(III), thereby
participating to the higher photo-currents observed in ionic liquid in comparison to
LP30.
Chapter 4 – Photo-induced mechanisms: investigation
192
In the last section, photo-induced mechanisms were then further investigated by means
of operando measurements.
From the EIS study in dark conditions, we observed that the charge transfer resistance
of the electrode is globally invariant with the lithium content (for 0 < + < 0.5 in
LixTiO2). The comparison between dark and light experiments for TiO2 (PB-PEO, 2M
in TiCl4, 2 layers) suggests that light does not significantly influence the diffusion of
Li+.
We then performed a preliminary work dedicated to the analysis of the gravimetric
response of a TiO2-coated piezoelectric substrate (GaPO4) when coupled to
electrochemical and photo-electrochemical measurements. A new specially designed
experimental setup was therefore proposed to study the nature of species involved at
the electrode/electrolyte interface upon photo-electrochemical cycling.
In LP30 electrolyte, results under dark conditions confirmed that species extracted
during the charge has a molecular weight very closed from the one of Li+. Conversely,
the higher average molecular weight (≃ 13 g.mol-1) observed during discharges shows
that Li+ is not the only species inserted/deposited at the electrode surface during the
reduction. The cell design was then tested and found adapted for operando
measurements under illumination. First results showed in particular that transitory
response arising from the GaPO4 substrate under illumination should be de-correlated
from the one of TiO2 for a proper analysis of the photo-induced mechanisms using these
substrates.
Chapter 4 – Photo-induced mechanisms: investigation
193
Bibliography
1. Nguyen, O. et al. Shedding light on the light-driven lithium ion de-insertion reaction: towards the design of a photo-rechargeable battery. J. Mater. Chem. A 5, 5927–5933 (2017).
2. Ardo, S. & Meyer, G. J. Photodriven heterogeneous charge transfer with transition-metal compounds anchored to TiO2 semiconductor surfaces. Chem Soc Rev 38, 115–164 (2009).
3. Salvador, P. Hole diffusion length in n ‐TiO2 single crystals and sintered electrodes: Photoelectrochemical determination and comparative analysis. J. Appl. Phys. 55, 2977–2985 (1984).
4. Aurbach, D. et al. Design of electrolyte solutions for Li and Li-ion batteries: a review. Electrochimica Acta 50, 247–254 (2004).
5. Xu, K. Electrolytes and Interphases in Li-Ion Batteries and Beyond. Chem. Rev. 114, 11503–11618 (2014).
6. Plakhotnyk, A. V., Ernst, L. & Schmutzler, R. Hydrolysis in the system LiPF6—propylene carbonate—dimethyl carbonate—H2O. J. Fluor. Chem. 126, 27–31 (2005).
7. Sloop, S. E., Pugh, J. K., Wang, S., Kerr, J. B. & Kinoshita, K. Chemical Reactivity of PF5 and LiPF6 in Ethylene Carbonate/Dimethyl Carbonate Solutions. Electrochem. Solid-State Lett. 4, A42 (2001).
8. Aurbach, D. et al. The Study of Surface Phenomena Related to Electrochemical Lithium Intercalation into LixMOy Host Materials (M = Ni, Mn). J. Electrochem.
Soc. 147, 1322–1331 (2000). 9. Armand, M., Endres, F., MacFarlane, D. R., Ohno, H. & Scrosati, B. Ionic-liquid
materials for the electrochemical challenges of the future. Nat. Mater. 8, 621–629 (2009).
10. Tarascon, J.-M. & Armand, M. Issues and challenges facing rechargeable lithium batteries. in Materials for Sustainable Energy 171–179 (2010).
11. Kim, G. T. et al. Use of natural binders and ionic liquid electrolytes for greener and safer lithium-ion batteries. J. Power Sources 196, 2187–2194 (2011).
12. Appetecchi, G. B., Montanino, M. & Passerini, S. Ionic Liquid-Based Electrolytes for High Energy, Safer Lithium Batteries. in Ionic Liquids: Science and
Applications 1117, 67–128 (American Chemical Society, 2012). 13. Mun, J. et al. Electrochemical stability of bis(trifluoromethanesulfonyl)imide-based
ionic liquids at elevated temperature as a solvent for a titanium oxide bronze electrode. J. Power Sources 194, 1068–1074 (2009).
14. Lewandowski, A. & Świderska-Mocek, A. Ionic liquids as electrolytes for Li-ion batteries—An overview of electrochemical studies. J. Power Sources 194, 601–609 (2009).
15. Kazemiabnavi, S., Zhang, Z., Thornton, K. & Banerjee, S. Electrochemical Stability Window of Imidazolium-Based Ionic Liquids as Electrolytes for Lithium Batteries. J. Phys. Chem. B 120, 5691–5702 (2016).
Chapter 4 – Photo-induced mechanisms: investigation
194
16. Appetecchi, G. B., Montanino, M. & Passerini, S. Ionic liquid-based electrolytes for high-energy lithium batteries. Ion. Liq. Sci. Appl. (2013).
17. Abe, R. Recent progress on photocatalytic and photoelectrochemical water splitting under visible light irradiation. J. Photochem. Photobiol. C Photochem. Rev. 11, 179–209 (2010).
18. Zhang, Z., Zhang, L., Hedhili, M. N., Zhang, H. & Wang, P. Plasmonic Gold Nanocrystals Coupled with Photonic Crystal Seamlessly on TiO2 Nanotube Photoelectrodes for Efficient Visible Light Photoelectrochemical Water Splitting. Nano Lett. 13, 14–20 (2013).
19. Pu, Y.-C. et al. Au Nanostructure-Decorated TiO2 Nanowires Exhibiting Photoactivity Across Entire UV-visible Region for Photoelectrochemical Water Splitting. Nano Lett. 13, 3817–3823 (2013).
20. Hejazi, S., Nguyen, N. T., Mazare, A. & Schmuki, P. Aminated TiO2 nanotubes as a photoelectrochemical water splitting photoanode. Catal. Today 281, 189–197 (2017).
21. Mazare, A., Paramasivam, I., Lee, K. & Schmuki, P. Improved water-splitting behaviour of flame annealed TiO2 nanotubes. Electrochem. Commun. 13, 1030–1034 (2011).
22. Cao, Y., Chen, Y., Sun, X., Zhang, Z. & Mu, T. Water sorption in ionic liquids: kinetics, mechanisms and hydrophilicity. Phys. Chem. Chem. Phys. 14, 12252 (2012).
23. Cuadrado-Prado, S. et al. Experimental measurement of the hygroscopic grade on eight imidazolium based ionic liquids. Fluid Phase Equilibria 278, 36–40 (2009).
24. Francesco, F. D. et al. Water sorption by anhydrous ionic liquids. Green Chem. 13, 1712 (2011).
25. Reid, J. E. S. J., Walker, A. J. & Shimizu, S. Residual water in ionic liquids: clustered or dissociated? Phys. Chem. Chem. Phys. 17, 14710–14718 (2015).
26. Suo, L. et al. ‘Water-in-salt’ electrolyte enables high-voltage aqueous lithium-ion chemistries. Science 350, 938–943 (2015).
27. Smith, L. & Dunn, B. Opening the window for aqueous electrolytes. Science 350, 918–918 (2015).
28. Suo, L. et al. ‘Water-in-Salt’ electrolytes enable green and safe Li-ion batteries for large scale electric energy storage applications. J. Mater. Chem. A 4, 6639–6644 (2016).
29. Berger, T., Monllor-Satoca, D., Jankulovska, M., Lana-Villarreal, T. & Gómez, R. The Electrochemistry of Nanostructured Titanium Dioxide Electrodes. ChemPhysChem 13, 2824–2875 (2012).
30. Kim, Y.-S. et al. Evidencing Fast, Massive, and Reversible H + Insertion in Nanostructured TiO2 Electrodes at Neutral pH. Where Do Protons Come From? J. Phys. Chem. C 121, 10325–10335 (2017).
31. Berger, T., Anta, J. A. & Morales-Flórez, V. Spectroscopic properties of electrochemically populated electronic states in nanostructured TiO2 films: anatase versus rutile. Phys. Chem. Chem. Phys. 15, 13790–13795 (2013).

Chapter 4 – Photo-induced mechanisms: investigation
195
32. Berger, T., Anta, J. A. & Morales-Flórez, V. Electrons in the Band Gap: Spectroscopic Characterization of Anatase TiO2 Nanocrystal Electrodes under Fermi Level Control. J. Phys. Chem. C 116, 11444–11455 (2012).
33. Fabregat-Santiago, F. et al. High Carrier Density and Capacitance in TiO 2 Nanotube Arrays Induced by Electrochemical Doping. J. Am. Chem. Soc. 130, 11312–11316 (2008).
34. Chen, B., Hou, J. & Lu, K. Formation Mechanism of TiO2 Nanotubes and Their Applications in Photoelectrochemical Water Splitting and Supercapacitors. Langmuir 29, 5911–5919 (2013).
35. Meekins, B. H. & Kamat, P. V. Got TiO2 nanotubes? Lithium ion intercalation can boost their photoelectrochemical performance. ACS Nano 3, 3437–3446 (2009).
36. Bryngelsson, H., Stjerndahl, M., Gustafsson, T. & Edström, K. How dynamic is the SEI? J. Power Sources 174, 970–975 (2007).
37. Zampardi, G., La Mantia, F. & Schuhmann, W. Determination of the formation and range of stability of the SEI on glassy carbon by local electrochemistry. RSC
Adv. 5, 31166–31171 (2015). 38. Ventosa, E. et al. Solid Electrolyte Interphase (SEI) at TiO2 Electrodes in Li-Ion
Batteries: Defining Apparent and Effective SEI Based on Evidence from X-ray Photoemission Spectroscopy and Scanning Electrochemical Microscopy. ACS Appl.
Mater. Interfaces 9, 3123–3130 (2017). 39. Han, C. et al. Hollow titanium dioxide spheres as anode material for lithium ion
battery with largely improved rate stability and cycle performance by suppressing the formation of solid electrolyte interface layer. J. Mater. Chem. A 3, 13340–13349 (2015).
40. Parimalam, B. S. & Lucht, B. L. Reduction Reactions of Electrolyte Salts for Lithium Ion Batteries: LiPF6, LiBF4, LiDFOB, LiBOB, and LiTFSI. J.
Electrochem. Soc. 165, A251–A255 (2018). 41. Campion, C. L., Li, W. & Lucht, B. L. Thermal Decomposition of LiPF6-Based
Electrolytes for Lithium-Ion Batteries. J. Electrochem. Soc. 152, A2327 (2005). 42. Lux, S. F. et al. The mechanism of HF formation in LiPF6 based organic carbonate
electrolytes. Electrochem. Commun. 14, 47–50 (2012). 43. Xu, J., Ao, Y., Fu, D. & Yuan, C. Low-temperature preparation of F-doped TiO2
film and its photocatalytic activity under solar light. Appl. Surf. Sci. 254, 3033–3038 (2008).
44. Ensling, D., Stjerndahl, M., Nytén, A., Gustafsson, T. & Thomas, J. O. A comparative XPS surface study of Li2FeSiO4/C cycled with LiTFSI- and LiPF6-based electrolytes. J. Mater. Chem. 19, 82–88 (2008).
45. Yamada, Y. et al. Hydrate-melt electrolytes for high-energy-density aqueous batteries. Nat. Energy 1, 16129 (2016).
46. Verma, P., Maire, P. & Novák, P. A review of the features and analyses of the solid electrolyte interphase in Li-ion batteries. Electrochimica Acta 55, 6332–6341 (2010).

Chapter 4 – Photo-induced mechanisms: investigation
196
47. Steiner, D., Auer, A., Portenkirchner, E. & Kunze-Liebhäuser, J. The role of surface films during lithiation of amorphous and anatase TiO2 nanotubes. J.
Electroanal. Chem. 812, 166–173 (2018). 48. Atashbar, M. Z., Sun, H. T., Gong, B., Wlodarski, W. & Lamb, R. XPS study of
Nb-doped oxygen sensing TiO2 thin films prepared by sol-gel method. Thin Solid
Films 326, 238–244 (1998). 49. Sham, T. K. & Lazarus, M. S. X-ray photoelectron spectroscopy (XPS) studies of
clean and hydrated TiO2 (rutile) surfaces. Chem. Phys. Lett. 68, 426–432 (1979). 50. Södergren, S. et al. Lithium intercalation in nanoporous anatase TiO2 studied with
XPS. J. Phys. Chem. B 101, 3087–3090 (1997). 51. Wiemers-Meyer, S., Winter, M. & Nowak, S. Mechanistic insights into lithium ion
battery electrolyte degradation – a quantitative NMR study. Phys. Chem. Chem.
Phys. 18, 26595–26601 (2016). 52. Nicotera, I., Oliviero, C., Henderson, W. A., Appetecchi, G. B. & Passerini, S.
NMR Investigation of Ionic Liquid−LiX Mixtures: Pyrrolidinium Cations and TFSI - Anions. J. Phys. Chem. B 109, 22814–22819 (2005).
53. Fulmer, G. R. et al. NMR Chemical Shifts of Trace Impurities: Common Laboratory Solvents, Organics, and Gases in Deuterated Solvents Relevant to the Organometallic Chemist. Organometallics 29, 2176–2179 (2010).
54. Orazem, M. E. & Tribollet, B. Electrochemical Impedance Spectroscopy. (John Wiley & Sons, 2017).
55. Bach, S., Pereira-Ramos, J. P. & Willman, P. Investigation of lithium diffusion in nano-sized rutile TiO2 by impedance spectroscopy. Electrochimica Acta 55, 4952–4959 (2010).
56. Bach, S., Pereira-Ramos, J. P. & Willmann, P. A kinetic study of electrochemical lithium insertion in nanosized rutile β-MnO2 by impedance spectroscopy. Electrochimica Acta 56, 10016–10022 (2011).
57. Ho, C., Raistrick, D. & Huggins, A. Application of A-C Techniques to the Study of Lithium Diffusion in Tungsten Trioxide Thin Films. J. Electrochem. Soc. 127, 343 (1980).
58. Hirschorn, B. et al. Constant-Phase-Element Behavior Caused by Resistivity Distributions in Films. J. Electrochem. Soc. 157, C452 (2010).
59. Córdoba-Torres, P. et al. On the intrinsic coupling between constant-phase element parameters α and Q in electrochemical impedance spectroscopy. Electrochimica
Acta 72, 172–178 (2012). 60. Tröltzsch, U., Kanoun, O. & Tränkler, H.-R. Characterizing aging effects of lithium
ion batteries by impedance spectroscopy. Electrochimica Acta 51, 1664–1672 (2006).
61. Roberts, A. J. & Slade, R. C. T. Effect of specific surface area on capacitance in asymmetric carbon/α-MnO2 supercapacitors. Electrochimica Acta 55, 7460–7469 (2010).
62. Yoon, S.-B., Jegal, J.-P., Roh, K. C. & Kim, K.-B. Electrochemical Impedance Spectroscopic Investigation of Sodium Ion Diffusion in MnO2 Using a Constant

Chapter 4 – Photo-induced mechanisms: investigation
197
Phase Element Active in Desired Frequency Ranges. J. Electrochem. Soc. 161, H207–H213 (2014).
63. Pfanzelt, M., Kubiak, P., Fleischhammer, M. & Wohlfahrt-Mehrens, M. TiO2 rutile. An alternative anode material for safe lithium-ion batteries. J. Power
Sources 196, 6815–6821 (2011). 64. Escobar Teran, F. D. A new approach towards understanding the ion transfer
dynamics in nanostructured carbon-based thin films for energy storage applications. (Université Pierre et Marie Curie).
65. Buttry, D. A. & Ward, M. D. Measurement of interfacial processes at electrode surfaces with the electrochemical quartz crystal microbalance. Chem. Rev. 92, 1355–1379 (1992).
66. Perrot, H. Piezoelectric Transduction (QCM). in Chemical Sensors and Biosensors 71–91 (Wiley-Blackwell, 2013).
67. Rodriguez-Pardo, L., Rodriguez, J. F., Gabrielli, C., Perrot, H. & Brendel, R. Sensitivity, noise, and resolution in QCM sensors in liquid media. IEEE Sens. J. 5, 1251–1257 (2005).
68. Sauerbrey, G. Verwendung von Schwingquarzen zur Wägung dünner Schichten und zur Mikrowägung. Z. Für Phys. 155, 206–222 (1959).
69. Jakab, S. et al. Study of the Dissolution of Thin Films of Cerium Oxide by Using a GaPO4 Crystal Microbalance. Anal. Chem. 81, 5139–5145 (2009).
70. Hepel, M., Kanige, K. & Bruckenstein, S. In situ underpotential deposition study of lead on silver using the electrochemical quartz crystal microbalance: Direct evidence for lead(II) adsorption before spontaneous charge transfer. J. Electroanal.
Chem. Interfacial Electrochem. 266, 409–421 (1989). 71. Hepel, M. & Bruckenstein, S. Tracking anion expulsion during underpotential
deposition of lead at silver using the quartz microbalance. Electrochimica Acta 34, 1499–1504 (1989).
72. Bruckenstein, S. & Swathirajan, S. Potential dependence of lead and silver underpotential coverages in acetonitrile using a piezoelectric crystal oscillator method. Electrochimica Acta 30, 851–855 (1985).
73. Ostrom, G. S. & Buttry, D. A. Quartz crystal microbalance studies of deposition and dissolution mechanisms of electrochromic films of diheptylviologen bromide. J. Electroanal. Chem. Interfacial Electrochem. 256, 411–431 (1988).
74. Arias, C. R. et al. New Insights into Pseudocapacitive Charge-Storage Mechanisms in Li-Birnessite Type MnO2 Monitored by Fast Quartz Crystal Microbalance Methods. J. Phys. Chem. C 118, 26551–26559 (2014).
75. Tsai, W.-Y., Taberna, P.-L. & Simon, P. Electrochemical Quartz Crystal Microbalance (EQCM) Study of Ion Dynamics in Nanoporous Carbons. J. Am.
Chem. Soc. 136, 8722–8728 (2014). 76. Sigalov, S., Levi, M. D., Salitra, G., Aurbach, D. & Maier, J. EQCM as a unique
tool for determination of ionic fluxes in microporous carbons as a function of surface charge distribution. Electrochem. Commun. 12, 1718–1721 (2010).
77. Agrisuelas, J. et al. Usefulness of F(dm/dQ) Function for Elucidating the Ions Role in PB Films. J. Electrochem. Soc. 154, F134 (2007).

Chapter 4 – Photo-induced mechanisms: investigation
198
78. Benito, D. et al. Study by EQCM on the voltammetric electrogeneration of poly(neutral red). The effect of the pH and the nature of cations and anions on the electrochemistry of the films. Electrochimica Acta 48, 4039–4048 (2003).
79. Giménez-Romero, D., Garcı ́a-Jareño, J. & Vicente, F. Materiales y Procesos Electródicos (I), Chap. 3, Burjassot (2002).
80. Giménez-Romero, D. et al. Mechanism for Interplay between Electron and Ionic Fluxes in KhFek[Fe(CN)6]l·mH2O Compounds. J. Phys. Chem. B 110, 2715–2722 (2006).
81. Levi, M. D., Salitra, G., Levy, N., Aurbach, D. & Maier, J. Application of a quartz-crystal microbalance to measure ionic fluxes in microporous carbons for energy storage. Nat. Mater. 8, 872–875 (2009).
82. Kwon, K., Kong, F., McLarnon, F. & Evans, J. W. Characterization of the SEI on a Carbon Film Electrode by Combined EQCM and Spectroscopic Ellipsometry. J. Electrochem. Soc. 150, A229–A233 (2003).
83. Li, J.-T., Chen, S.-R., Fan, X.-Y., Huang, L. & Sun, S.-G. Studies of the Interfacial Properties of an Electroplated Sn Thin Film Electrode/Electrolyte Using in Situ MFTIRS and EQCM. Langmuir 23, 13174–13180 (2007).
84. Pralong, V. Electrochemical study of nanometer Co3O4, Co, CoSb3 and Sb thin films toward lithium. Solid State Ion. 166, 295–305 (2004).
85. Yang, Z., Dixon, M. C., Erck, R. A. & Trahey, L. Quantification of the Mass and Viscoelasticity of Interfacial Films on Tin Anodes Using EQCM-D. ACS Appl.
Mater. Interfaces 7, 26585–26594 (2015). 86. Borisenko, N. et al. In situ STM and EQCM studies of tantalum electrodeposition
from TaF5 in the air- and water-stable ionic liquid 1-butyl-1-methylpyrrolidinium bis(trifluoromethylsulfonyl)amide. Electrochimica Acta 54, 1519–1528 (2009).
87. Schneider, O. et al. An EQCM Study of the Electropolymerization of Benzene in an Ionic Liquid and Ion Exchange Characteristics of the Resulting Polymer Film. J. Phys. Chem. B 109, 7159–7168 (2005).

199
GENERAL CONCLUSION

General Conclusion
201
General Conclusion
In this work, we have studied another approach to harvest and store solar energy
simultaneously into a single device, using a TiO2 bi-functional Li-ion battery photo-
electrode.
The apprehension of an electrode undergoing simultaneous light absorption and Li+
intercalation/extraction is very rich in terms of potentialities. However, at the same
time, the various facets of the electrode evolution are very challenging to track and
understand. For this reason, we have chosen to work with a model electrode, whose
composition is as simple as possible (carbon and dye-free electrode): a mesoporous TiO2
anatase thin film electrode. It was prepared by combining the sol-gel chemistry with
the dip-coating process, using the “evaporation induced self-assembly” (EISA) approach
to obtain the mesoporosity. The careful control of the porous architecture and the
electrode thickness (typically between 100 nm and 1500 nm) provided a well-defined
and highly reproducible active material in terms of crystallite size and interconnection,
and also in terms of electrode/electrolyte interface. All these parameters are known to
dictate the electrode behavior, their fine control will then allow for trustworthy
interpretation.
Mesoporous TiO2 thin films deposed on FTO substrate were studied as a positive
(photo)-electrode in a classical Li-ion battery configuration, using LP30 as an
electrolyte, either Li foil or C as counter-electrode, and Li foil as reference electrode.
The TiO2-electrode behaviour was first investigated in dark conditions. The thinner
TiO2 electrode exhibited the expected capacities (≃ 160 mAh.g-1 for an electrochemical
range between 1.4 V and 2.6 V vs. Li+/Li0). Mass capacities were nonetheless found to
decrease when increasing the film thickness, which was probably due to the harder
electrolyte penetration and/or harder electrons diffusion throughout the inorganic
network.
During the first cycles, a SEI was found to be formed at the electrode surface (CVs) at
reductive potentials. The analysis of the F(dm/dQ) function in EQCM measurements
confirmed an important mass gain after the first reduction sweep. SEM pictures after
the first cycle also exhibits the presence of a layer at the surface of the electrode,
partially covering the porous structure. Elemental analyses, like XPS performed on the
electrode surface and liquid NMR (1H, 19F, 31P) recorded on the electrolyte solution,
after cycling, could highlight the presence of LiF on the electrode surface and of
OPF2O-, OPFO2- and HF in solution. It is however difficult to clearly address their
origin, in particular for LiF (SEI related or simple hydrolysis product).
General Conclusion
202
The illumination of the cell then allowed to highlight the photo-induced processes. A
first observation was that light enhances the electrochemical charge and discharge
capacities. These results lead to a first conclusion that the mechanism previously
suggested by Tributsch et al.,1,2 reporting a photo-induced Li+ de-insertion, is actually
taking place for the here-studied carbon- and dye-free TiO2 based mesoporous film
electrode. Light induces the formation of electron/hole pairs and those charge carriers
could participate in the oxidation of Ti3+ and facilitate Li+ de-insertion. The most
striking proof of Li+ photo-extraction was provided for a galvanostatic discharge
experiment under light by adjusting the electrochemical discharge rate (Li+-
electrochemical insertion) to the estimated kinetics of the photo-charge (Li+-photo-
extraction). The capacity obtained under light largely exceeded the theoretical capacity
of TiO2. Continuing to illuminate in these conditions, we could hope for an apparent
“infinite” capacity. Order of magnitude of photo-currents intensities (Ilight ~ 30 mA.g-1
for a 500 nm-thick electrode of 1 cm2 using titania precursor solution at 2M and PB-
PEO) has been estimated through potentiostatic experiments under chopped
illumination and have been confirmed by OCV experiments and galvanostatic
experiments under light.
From post mortem analysis of both the electrode and the electrolyte, usual electrolyte
degradation products were found on the electrode surface (LiF) and in the electrolyte
(OPF2O-, OPFO2- and HF). Possible accelerated formation of LiF under illumination
and cycling conditions (10 CVs between 2.6 V to 1.4 V vs. Li+/Li0, 0.5 mV.s-1) (1)
could be due to an eventual temperature increase of the non-water-cooled cell under
continuous illumination, and/or (2) could witness the participation of photo-electrons
to the LiPF6 salt reduction. The exact fate of the electrons still remains unknown. As
suggested in Zaghib study on LiFePO4 photo-electrode,3 photo-electrons could also
possibly be involved in the reduction of dissolved O2, leading to peroxide generation
and thereby to an SEI formation at the counter-electrode. Probing the counter-
electrode by post mortem analysis or the formation of radicals through electron
paramagnetic resonance could give valuable information for future investigations.
In order to investigate in real time the nature of species involved at the
electrode/electrolyte interface upon photo-electrochemical cycling, a preliminary work
was dedicated to the analysis of the gravimetric response of a TiO2-coated GaPO4 when
coupled to photo-electrochemical measurements. First results showed that transitory
response arising from the GaPO4 substrate under illumination should be de-correlated
from the one of TiO2 for a proper analysis of the photo-induced mechanisms using these
substrates. Besides, LP30 might not be the simplest electrolyte to analyze the photo-
General Conclusion
203
induced phenomena due to the LiPF6 salt degradation and the resulting gravimetric
changes that are uneasy to de-correlate from Li+ insertion/extraction phenomena.
Mesoporous TiO2 thin film electrode was also studied in a different electrolyte, using
(PYR13TFSI, 0.2M LiTFSI) ionic liquid.
In dark conditions, no SEI formation was detected on TiO2 electrode (CVs, EQCM) for
a potential range between 2.6 V and 1.4 V. Under illumination, no degradation product
was found, neither from TFSI- anion at the electrode surface (FEG-SEM, XPS), nor
from the pyrrolidium cation in the electrolyte (NMR).
The potential of the bifunctional electrode was also tested in ionic liquid. Results
showed that it behaves qualitatively the same as in LP30 electrolyte, but higher photo-
currents were observed. Water, whose presence in ionic liquid was confirmed by NMR,
could possibly act as a scavenger for photo-electrons and explain the higher
photocurrent. Water photo-oxidation is not likely to interfere with Ti(III) as shown by
tests performed in “water-in-salt” electrolyte. In comparison to the study in LP30, this
work in ionic liquid has allowed to confirm the mechanism of photo-extraction in the
absence of electrolyte degradation, which is unavoidable in LP30 electrolyte. This
system also presents the advantage to not present any SEI, this could highly facilitate
the operando analysis of Li+ insertion/extraction mechanisms under illumination using
EQCM measurements.
We also investigate electrode architecture (mesoporous structure and film thickness) in
order to understand how it could impact the photo-induced mechanism. In comparison
to the changes obtained by switching the electrolytes, no critical differences were
observed in the range of architecture used in this study. Study using the cheaper F127
polymers could therefore be considered for further investigations.
In this work, we focused our attention on one electrode trying to understand how
photo-holes could trigger the reaction of photo-recharge. In order to design a complete
photo-rechargeable system, it is now necessary to investigate how photo-generated
electrons could be wisely used to trigger the complementary charging reaction at the
counter-electrode.
To that aim, more insight should be provided on the exact nature of the electronic
transitions involved within LixTiO2 semiconductor under illumination. In fact, as the
photo-active phase is the lithiated anatase (since it is active under visible light), more
attention should be paid to the energy levels occupied by the injected electrons, and
how they can behave upon cycling and under illumination. The transport of the photo-

General Conclusion
204
generated species is even more interesting and complicated to apprehend since the
material is composed of a gradient of Li0.5TiO2-TiO2 with dynamic boundaries. UV-Vis
NIR operando measurements could therefore be performed to better understand the
electronic transitions involved within LixTiO2 semiconductor under illumination.
Dynamics of the charge carriers could also be studied by time-resolved microwave
conductivity to get information about life-time and diffusion length of the photo-
generated charges.
At this very early stage of the development of bifunctional electrode for energy
conversion and storage, there is still much progress to be made in order to fully control
the fate of the photo-generated charges, and obtain a complete photo-rechargeable
system. Search for new electrode candidates amongst the existing semiconductor
electrodes able to intercalate Li+ (WO3, Nb2O5, LiMn2O4, etc.) could therefore be very
helpful in order to develop this challenging technology. In association with TiO2 or
another photo-electrode, the combination could indeed allow to study the photo-
electrodes in a complete photo-rechargeable system, which is key in the development of
the future of photo-rechargeable Li-ion battery.

General Conclusion
205
Bibliography
1. Tributsch, H. Photo-intercalation: Possible application in solar energy devices.
Appl. Phys. 23, 61–71 (1980).
2. Sauvage, F., Andriamiadamanana, C. & Laberty-Robert, C. Photorechargeable
battery: turning light energy into chemical energy and then electric energy, French
patent. (FR1361775).
3. Paolella, A. et al. Light-assisted delithiation of lithium iron phosphate nanocrystals
towards photo-rechargeable lithium ion batteries. Nat. Commun. 8, 14643 (2017).

General Conclusion
206

I
ANNEX


Annex
III
TABLE of CONTENTS
Annex I –Figures .......................................................................................................... V
Annex I.1 – TiO2 (PB-PEO, TiCl4 1M/2M) pore size distribution ............................ V
Annex I.2 – FTO and LP30 UV-Visible absorption spectra .....................................VI
Annex I.3 – In situ evolution of UV-Vis absorption spectra for anatase TiO2
electrode (PB-PEO, 2M in TiCl4, 10 dipped layers) ............................................... VII
Annex I.4 – CVs in dark and light for different film architecture ......................... VIII
Annex I.5 – Chopped potentiostatic experiment in dark and light for different film
architecture .............................................................................................................IX
Annex I.6 – EDX qualitative analysis of TiO2 electrode surface for different cycling
conditions in LP30 electrolyte ................................................................................... X
Annex I.7 – Reaction scheme of LiPF6 degradation suggested by Wiemers-Meyers et
al. NMR study .........................................................................................................XI
Annex I.8 – Nyquist plots fits using RC and Randles circuits ..................................XI
Annex I.9 – Nyquist plots fits using equivalent circuit with CPE (dark) ............... XII
Annex I.10 – Nyquist plots fits using equivalent circuit with CPE (light) ............ XIII
Annex I.11 – F(dm/dq) function for TiO2 film during CVs in LP30 ..................... XIV
Annex II – Anatase thin film fabrication ................................................................... XV
Annex III – Technics of characterization ................................................................. XVII
III.1 - Electrochemical and Photo-Electrochemical measurements ........................ XVII
III.2 – Glancing Angle X-Ray Diffraction .............................................................. XX
III.3 - Ellipsometry ................................................................................................ XX
III.4 - Field-Emission-Gun Scanning-Electron-Microscopy and Energy-dispersive X-
Ray Spectroscopy ................................................................................................. XXI
III.5 - X-Ray Photoelectron Spectroscopy ............................................................. XXI
III.6 - Nuclear Magnetic Resonance Spectroscopy ................................................. XXI
III.7 - UV-Visible spectroscopy ............................................................................ XXII
III.8 - Electrochemical Quartz Crystal Microbalance ......................................... XXIII
Bibliography ............................................................................................................XXV

Annex
IV

Annex
V
Annex I –Figures
Annex I.1 – TiO2 (PB-PEO, TiCl4 1M/2M) pore size distribution
Figure A.I.1: Pore size distribution of TiO2 mesoporous thin films prepared with PB-PEO
polymers with TiCl4 at 1M (left) and 2M (right). Distribution were obtained by analyzing SEM-
FEG pictures with IMAGE-J (analysis in contrast) for samples of 623 points (1M) and 2181
points (2M).
1M 2M
500 nm 1.00 μm
1M 2M

Annex
VI
Annex I.2 – FTO and LP30 UV-Visible absorption spectra
Figure A.I.2: UV-Vis absorption spectra of FTO/glass substrate (blue), LP30 (orange)
compared anatase TiO2 electrode (PB-PEO, 2M in TiCl4, 10 dipped layers) absorption spectra
(green).

Annex
VII
Annex I.3 – In situ evolution of UV-Vis absorption spectra for
anatase TiO2 electrode (PB-PEO, 2M in TiCl4, 10 dipped layers)
Figure A.I.3: In situ evolution of UV-Vis absorption spectra (a) for anatase TiO2 electrode
(PB-PEO, 2M in TiCl4, 10 dipped layers) during galvanostatic discharge (-15 µA) in
PYR13TFSI (0.2M in LiTFSI) (b). Associated Tauc plots (c). Comparison between absorbance
at initial OCV (3.3 V) and after discharge (-15 µA) / charge (30 µA) (d).

Annex
VIII
Annex I.4 – CVs in dark and light for different film architecture
Figure A.I.4: CVs at 0.5 mV.s-1 in LP30 electrolyte under dark (black) and light (red)
conditions for 230 nm-thick anatase films prepared with PB-PEO (1M and 2M in TiCl4) and
with F127. Counter and reference electrodes are metallic Li foils.
PB-PEO (TiCl4 1M) PB-PEO (TiCl4 2M)
F127 (TiCl4 1M)
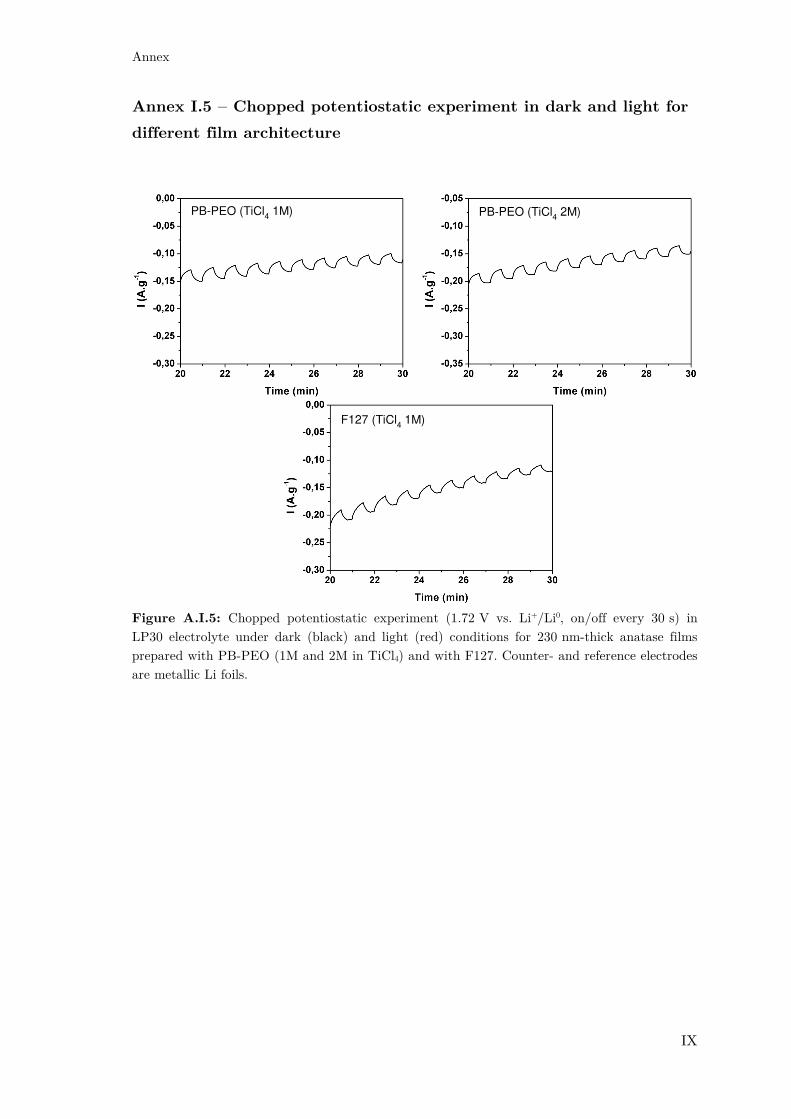
Annex
IX
Annex I.5 – Chopped potentiostatic experiment in dark and light for
different film architecture
Figure A.I.5: Chopped potentiostatic experiment (1.72 V vs. Li+/Li0, on/off every 30 s) in
LP30 electrolyte under dark (black) and light (red) conditions for 230 nm-thick anatase films
prepared with PB-PEO (1M and 2M in TiCl4) and with F127. Counter- and reference electrodes
are metallic Li foils.
PB-PEO (TiCl4 1M) PB-PEO (TiCl4 2M)
F127 (TiCl4 1M)

Annex
X
Annex I.6 – EDX qualitative analysis of TiO2 electrode surface for
different cycling conditions in LP30 electrolyte
Figure A.I.6: EDX spectra corresponding to the following steps:
(a) after 1 night in the solvent without any electrochemical cycling
(b) after the first CV (2.6 V to 1.4 V vs. Li+/Li0, 0.5 mV.s-1) under dark conditions
(c) after 10 CV’s (2.6 V to 1.4 V vs. Li+/Li0, 0.5 mV.s-1) under dark conditions
(d) after 10 CV’s (2.6 V to 1.4 V vs. Li+/Li0, 0.5 mV.s-1) under continuous illumination
(e) after 20 CV’s (2.6 V to 1.4 V vs. Li+/Li0, 0.5 mV.s-1) under dark conditions
a
b
c
d
e

Annex
XI
Annex I.7 – Reaction scheme of LiPF6 degradation suggested by
Wiemers-Meyers et al. NMR study
Figure A.I.7: Proposed reaction scheme of PF6- degradation by Wiemers-Meyers et al.1 NMR
study. Species detected in our study are indicated in red frame.
Annex I.8 – Nyquist plots fits using RC and Randles circuits
Figure A.I.8: Fits of the Nyquist plots using equivalent RC circuit (a) (left) and Randles
circuit (b) (right) for anatase electrode (PB-PEO, 2M in TiCl4, 2 layers) in dark at 2.6 V.
(b) (a)
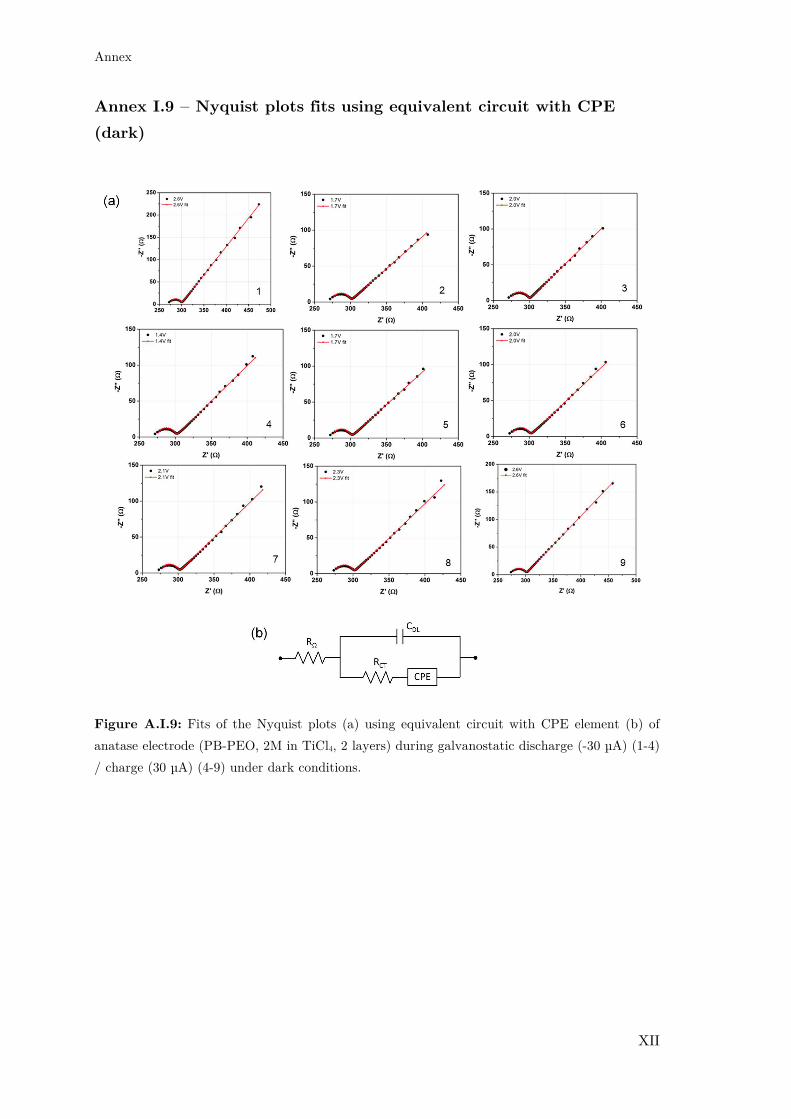
Annex
XII
Annex I.9 – Nyquist plots fits using equivalent circuit with CPE
(dark)
Figure A.I.9: Fits of the Nyquist plots (a) using equivalent circuit with CPE element (b) of
anatase electrode (PB-PEO, 2M in TiCl4, 2 layers) during galvanostatic discharge (-30 µA) (1-4)
/ charge (30 µA) (4-9) under dark conditions.

Annex
XIII
Annex I.10 – Nyquist plots fits using equivalent circuit with CPE
(light)
Figure A.I.10: Fits of the Nyquist plots (a) using equivalent circuit with CPE element (b) of
anatase electrode (PB-PEO, 2M in TiCl4, 2 layers) during galvanostatic discharge (-30 µA) (1-4)
/ charge (30 µA) (4-9) under light conditions.
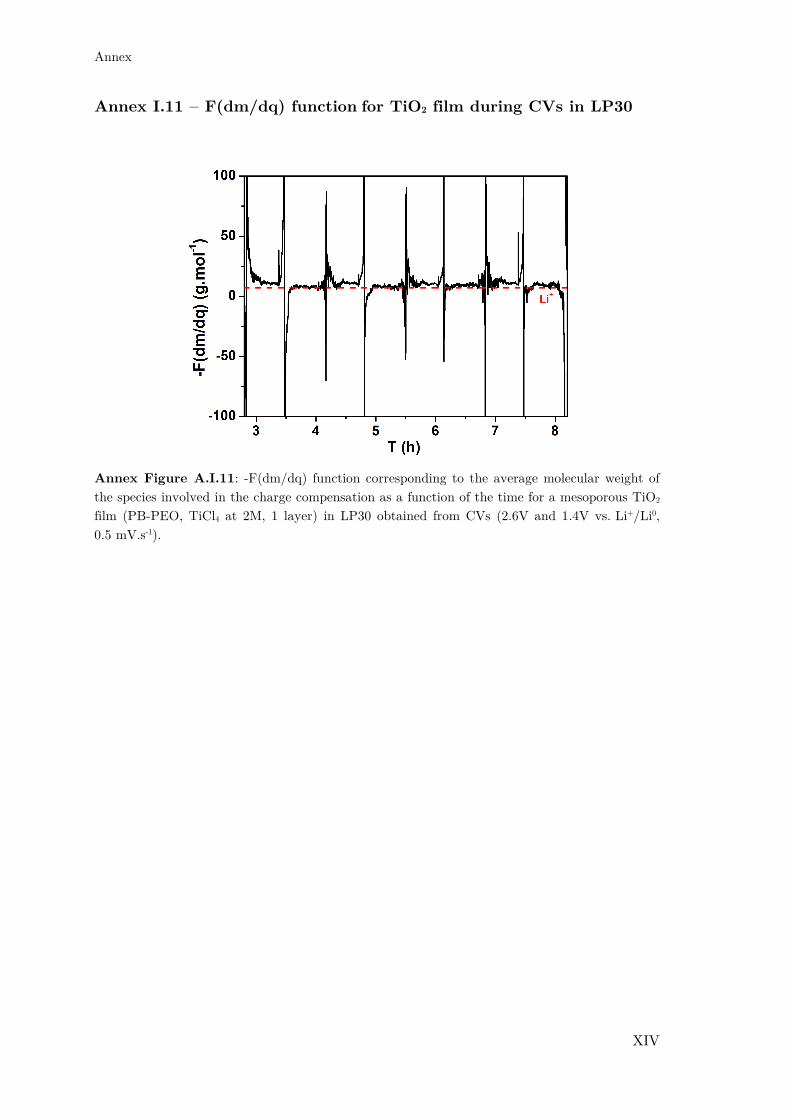
Annex
XIV
Annex I.11 – F(dm/dq) function for TiO2 film during CVs in LP30
Annex Figure A.I.11: -F(dm/dq) function corresponding to the average molecular weight of
the species involved in the charge compensation as a function of the time for a mesoporous TiO2
film (PB-PEO, TiCl4 at 2M, 1 layer) in LP30 obtained from CVs (2.6V and 1.4V vs. Li+/Li0,
0.5 mV.s-1).
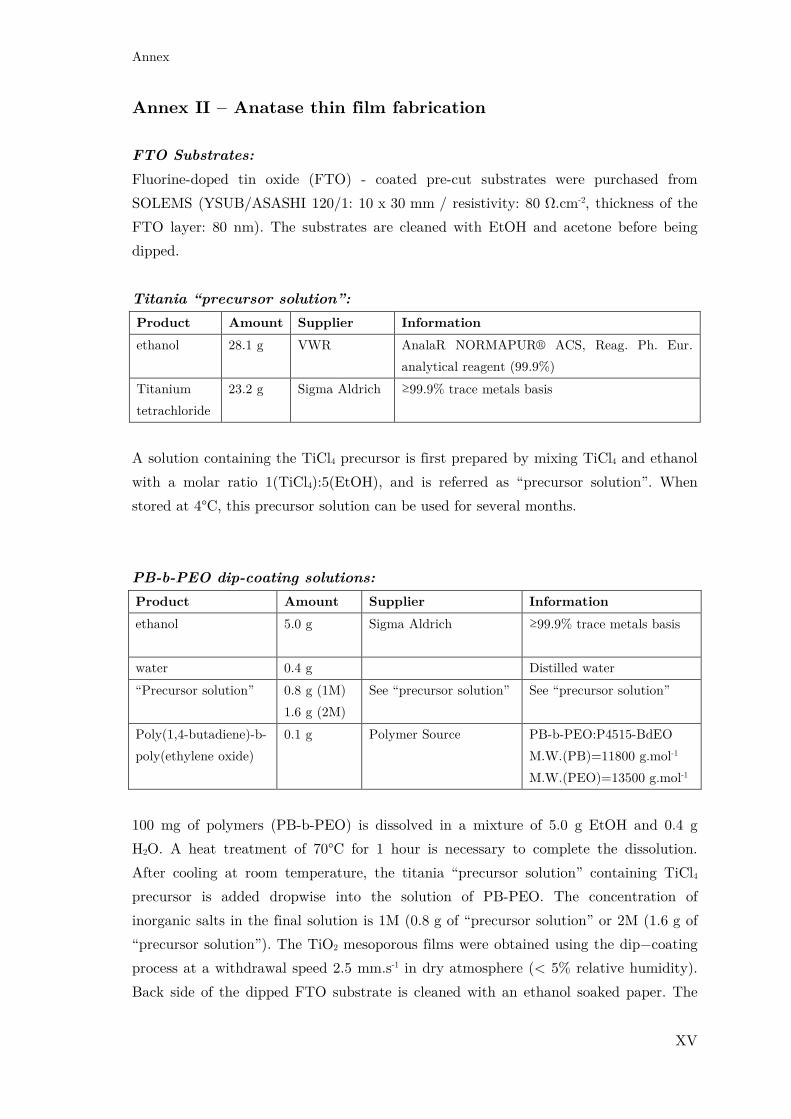
Annex
XV
Annex II – Anatase thin film fabrication
FTO Substrates:
Fluorine-doped tin oxide (FTO) - coated pre-cut substrates were purchased from
SOLEMS (YSUB/ASASHI 120/1: 10 x 30 mm / resistivity: 80 ".cm-2, thickness of the
FTO layer: 80 nm). The substrates are cleaned with EtOH and acetone before being
dipped.
Titania “precursor solution”:
Product Amount Supplier Information
ethanol 28.1 g VWR AnalaR NORMAPUR® ACS, Reag. Ph. Eur.
analytical reagent (99.9%)
Titanium
tetrachloride
23.2 g Sigma Aldrich ≥99.9% trace metals basis
A solution containing the TiCl4 precursor is first prepared by mixing TiCl4 and ethanol
with a molar ratio 1(TiCl4):5(EtOH), and is referred as “precursor solution”. When
stored at 4°C, this precursor solution can be used for several months.
PB-b-PEO dip-coating solutions:
Product Amount Supplier Information
ethanol 5.0 g Sigma Aldrich ≥99.9% trace metals basis
water 0.4 g Distilled water
“Precursor solution” 0.8 g (1M)
1.6 g (2M)
See “precursor solution” See “precursor solution”
Poly(1,4-butadiene)-b-
poly(ethylene oxide)
0.1 g Polymer Source PB-b-PEO:P4515-BdEO
M.W.(PB)=11800 g.mol-1
M.W.(PEO)=13500 g.mol-1
100 mg of polymers (PB-b-PEO) is dissolved in a mixture of 5.0 g EtOH and 0.4 g
H2O. A heat treatment of 70°C for 1 hour is necessary to complete the dissolution.
After cooling at room temperature, the titania “precursor solution” containing TiCl4
precursor is added dropwise into the solution of PB-PEO. The concentration of
inorganic salts in the final solution is 1M (0.8 g of “precursor solution” or 2M (1.6 g of
“precursor solution”). The TiO2 mesoporous films were obtained using the dip−coating
process at a withdrawal speed 2.5 mm.s-1 in dry atmosphere (< 5% relative humidity).
Back side of the dipped FTO substrate is cleaned with an ethanol soaked paper. The

Annex
XVI
hybrid film is then placed for 1h in a furnace pre−heated at 500°C in air (static
atmosphere) to (i) induce crystallization of the anatase and (ii) decompose the
block−copolymer to obtain the TiO2/FTO electrode.
For the multilayered process, between each layer dipped layer, an intermediate heat
treatment of 3 min in the furnace pre−heated at 350°C is necessary. After the final
dipped layer, final heat treatment at 500°C is applied.
Pluronic F127 dip-coating solutions:
Product Amount Supplier Information
ethanol 8.1 g Sigma Aldrich ≥99.9% trace metals basis
water 0.9 g Distilled water
“Precursor solution” 2.1 g See “precursor solution” See “precursor solution”
Pluronic F-127 0.335 g Sigma Aldrich BioReagent, suitable for cell
culture
335 mg of polymers (F127) is dissolved in a mixture of 8.1 g EtOH and 0.9 g H2O. A
heat treatment of 70°C for 1 hour is necessary to complete the dissolution. After
cooling at room temperature, the titania “precursor solution” containing TiCl4
precursor (2.1 g) is added dropwise into the solution of F127. The TiO2 mesoporous
films were obtained using the dip−coating process at a withdrawal speed 2.5 mm.s-1 in
dry atmosphere (< 5% relative humidity). Back side of the dipped FTO substrate is
cleaned with an ethanol soaked paper. The hybrid film is then placed for 1h in a
furnace pre−heated at 500°C in air (static atmosphere) to (i) induce crystallization of
the anatase and (ii) decompose the block−copolymer to obtain the TiO2/FTO
electrode.
For the multilayered process, between each layer dipped layer, an intermediate heat
treatment of 3 min in the furnace pre−heated at 350°C is necessary. After the final
dipped layer, final heat treatment at 500°C is applied.
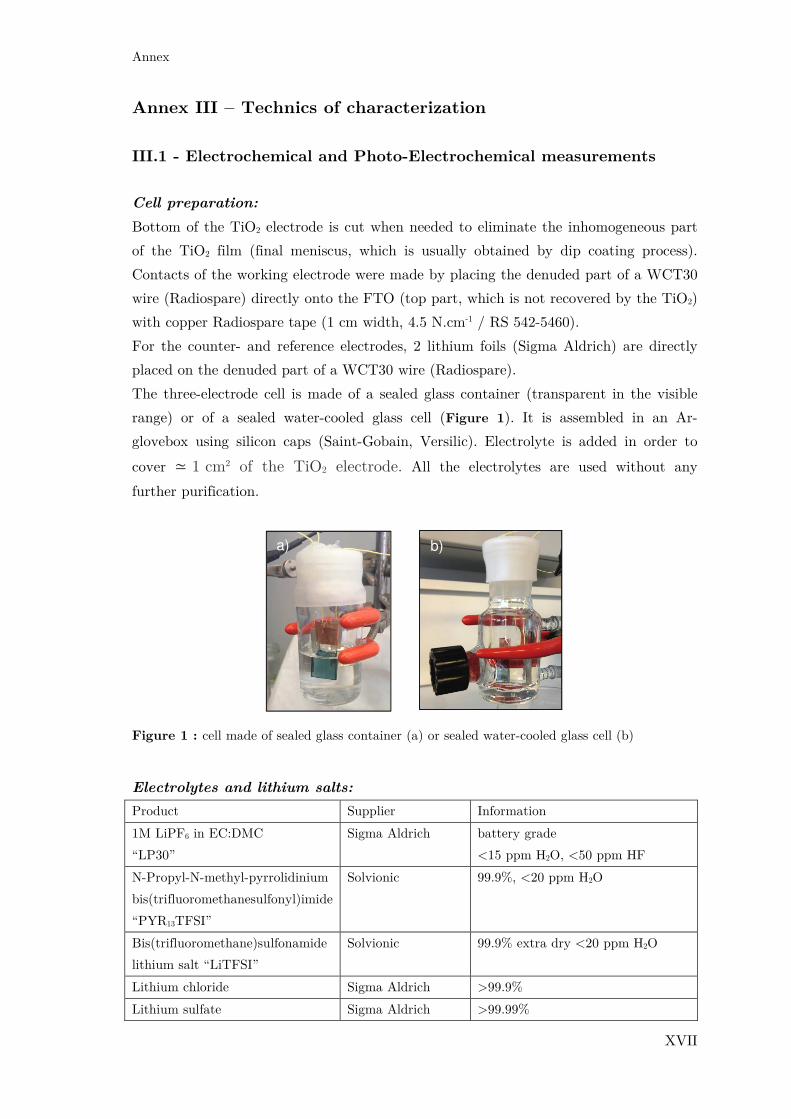
Annex
XVII
Annex III – Technics of characterization
III.1 - Electrochemical and Photo-Electrochemical measurements
Cell preparation:
Bottom of the TiO2 electrode is cut when needed to eliminate the inhomogeneous part
of the TiO2 film (final meniscus, which is usually obtained by dip coating process).
Contacts of the working electrode were made by placing the denuded part of a WCT30
wire (Radiospare) directly onto the FTO (top part, which is not recovered by the TiO2)
with copper Radiospare tape (1 cm width, 4.5 N.cm-1 / RS 542-5460).
For the counter- and reference electrodes, 2 lithium foils (Sigma Aldrich) are directly
placed on the denuded part of a WCT30 wire (Radiospare).
The three-electrode cell is made of a sealed glass container (transparent in the visible
range) or of a sealed water-cooled glass cell (Figure 1). It is assembled in an Ar-
glovebox using silicon caps (Saint-Gobain, Versilic). Electrolyte is added in order to
cover ≃ 1 cm2 of the TiO2 electrode. All the electrolytes are used without any
further purification.
Figure 1 : cell made of sealed glass container (a) or sealed water-cooled glass cell (b)
Electrolytes and lithium salts:
Product Supplier Information
1M LiPF6 in EC:DMC
“LP30”
Sigma Aldrich battery grade
<15 ppm H2O, <50 ppm HF
N-Propyl-N-methyl-pyrrolidinium
bis(trifluoromethanesulfonyl)imide
“PYR13TFSI”
Solvionic 99.9%, <20 ppm H2O
Bis(trifluoromethane)sulfonamide
lithium salt “LiTFSI”
Solvionic 99.9% extra dry <20 ppm H2O
Lithium chloride Sigma Aldrich >99.9%
Lithium sulfate Sigma Aldrich >99.99%
a) b)

Annex
XVIII
Potentiostat:
AMETEK Solartron pstat 1 MS/s, Bio-logic SP300 and Princeton 273A were used for
electrochemical characterization. AMETEK Solartron pstat 1 MS/s was used for all the
photo-electrochemical measurements and electrochemical impedance spectroscopy
measurements. Princeton 273A was used for all the electrochemical UV-Visible coupled
measurements.
Lamp:
A Newport xenon arc lamp was used throughout photo-electrochemical experiments
(spectrum in Figure 2-a). Newport model 6258 300 W ozone free lamp working was
used at 280 W for photo-electrochemical measurements in an Arc Lamp Housing
enclosure, model 67001. This was powered by a Newport power supply 69911 in
junction with an Oriel liquid filter 61945 (250-950 nm transmission) filled with water in
order to filter the IR light and resultant heat (spectrum in Figure 2-b).
All photo-electrochemical measurements were done 45 cm away from the arc lamp
source. Light output was verified by a 1918-R Newport power meter 918D-UV-OD3R,
UV Silicon Detector (200 – 1100 nm) in two configurations: through direct lightning or
through optical fiber lightning (see Figure 3).
Figure 2: Newport 300W Xe arc lamp ozone free spectrum (model 6258) (a) and Oriel liquid
filter 61945 transmission (250-950 nm) (b).
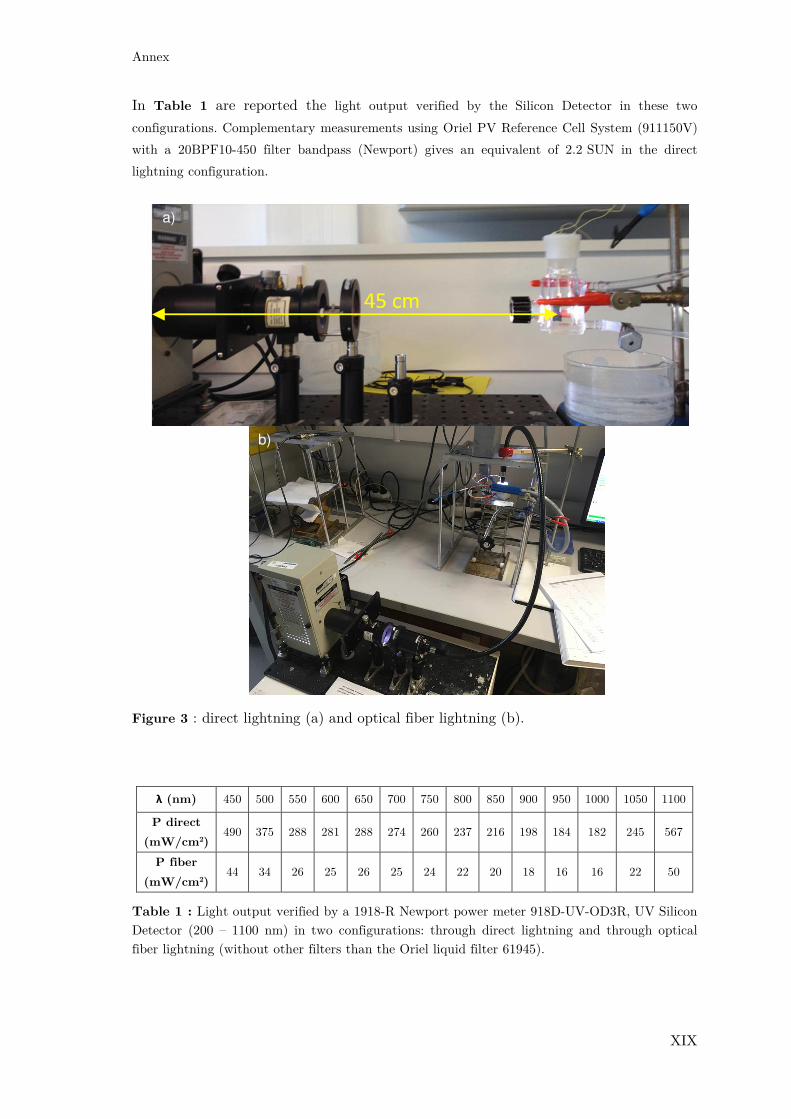
Annex
XIX
In Table 1 are reported the light output verified by the Silicon Detector in these two
configurations. Complementary measurements using Oriel PV Reference Cell System (911150V)
with a 20BPF10-450 filter bandpass (Newport) gives an equivalent of 2.2 SUN in the direct
lightning configuration.
Figure 3 : direct lightning (a) and optical fiber lightning (b).
λ (nm) 450 500 550 600 650 700 750 800 850 900 950 1000 1050 1100
P direct
(mW/cm2) 490 375 288 281 288 274 260 237 216 198 184 182 245 567
P fiber
(mW/cm2) 44 34 26 25 26 25 24 22 20 18 16 16 22 50
Table 1 : Light output verified by a 1918-R Newport power meter 918D-UV-OD3R, UV Silicon
Detector (200 – 1100 nm) in two configurations: through direct lightning and through optical
fiber lightning (without other filters than the Oriel liquid filter 61945).
a)
b)

Annex
XX
Electrochemical Impedance Spectroscopy:
Mott Schottky measurements were performed with TiO2/FTO as working electrode,
and lithium foils at counter- and reference-electrodes in LP30 electrolyte. Scans were
done between 3.5 V and 2.3 V vs. Li+/Li0 with 10 mV amplitude from 3.5 V to 2.3 V at
frequencies varying from 0.1 kHz to 10 kHz.
Nyquist diagrams were obtained during galvanostatic discharge/charge (30 µA) under
dark and light conditions at different potentials (2.6 V, 2.0 V, 1.7 V, 1.4 V, 1.7 V,
2.1 V, 2.3 V, 2.6 V) for frequencies between 200 kHz to 0.1 Hz, for an amplitude of
10 mV. Fits were obtained from BioLogic using the Z-Fit software.
All the EIS measurements were performed on AMETEK Solartron pstat 1 MS/s.
III.2 – Glancing Angle X-Ray Diffraction
The structure of the mesoporous thin films was studied by using a Bruker AXS D8
Discover X-ray diffractometer. The measurements in glancing geometry were performed
using a line focus copper X-ray tube and a parabolic multilayer Göbel mirror to obtain
an almost parallel X-ray CuKa impinging beam. A primary slit of 0.1 mm x 6 mm was
used to obtain a square footprint on the sample for a 1° glancing angle. The samples
were mounted on a motorized X, Y, Z stage, supported by an Eulerian cradle, to obtain
an accurate alignment of the samples at the goniometer center. A 1D position sensitive
detector Lyn- xEye (2° angular opening) was used to speed up the data collection.
Diagrams were analyzed by Rietveld method using the XND software. This study was
performed in collaboration with BALDINOZZI Gianguido from the Laboratoire de
Structure, Propriétés et Modélisation des Solides, UMR CNRS CEA 8580 (SPMS),
Commissariat de l’Energie Atomique de Saclay.
III.3 - Ellipsometry
Ellipsometry measurements were performed on a UV-visible (from 240 to 1000 nm)
variable angle spectroscopic ellipsometer (VASE – 2000 U Woollam), and the data
analyses were performed with the CompleteEASE software using Cauchy models.
Environmental ellipsometric porosimetry was performed through a water
adsorption/desorption isotherm using an atmospheric control chamber as described in
Boissiere et al.2 Pore size dimensions were calculated using a model based on spherical
geometry in the adapted Kelvin's equation. The specific surface area evaluation takes
into account both mesopores and micropores, it is based on the pore dimensions and
total porous volume obtained by EEP analysis.

Annex
XXI
III.4 - Field-Emission-Gun Scanning-Electron-Microscopy and
Energy-dispersive X-Ray Spectroscopy
The microstructure of the films and film thickness were observed by Field Emission
Gun Scanning Electron Microscopy (FEG- SEM) on a SU-70 Hitachi FEG-SEM,
instruments facilitated by the IMPC (Institut des Matériaux de Paris Centre FR2482)
financially supported by the C'Nano projects of the Region Ile-de-France. FEG-SEM
images were collected under 10 kV tension.
EDX measurements were performed on a X-Max Oxford EDX detector using 5 kV with
a silicon standard for quantification. Measurements under 1% atomic were considered
below the limit of detection and therefore considered unreliable.
Measurements were performed with MONTERO David from the IMPC (Institut des
Matériaux de Paris Centre FR2482).
III.5 - X-Ray Photoelectron Spectroscopy
Films were prepared in Ar-glovebox in cells made of a sealed glass container. After
cycling, cells were de-assembled in a glove bag under argon atmosphere to limit
possible surface contamination under air exposure. films were cleaned by manually
shaking them for 1-2 minutes in a beaker containing dimethyl carbonate (Sigma
Aldrich, >99.9%), and conserved if needed before analysis in Ar-glovebox.
XPS measurements were done using an ESCA+ d'Omicron Nano Technology with an
Al Kα (hν = 1486.6 eV) X-ray source. These measurements were completed at the
Unversité de Pierre et Marie Curie (Paris VI) Laboratoires de l’Institut des Matériaux
de Paris Centre (IMPC, FR 2482) in association by the Centre national de la recherche
scientifique (CNRS) at Laboratoire de Réactivité de Surface (LRS) by MICHE
Antoine.
III.6 - Nuclear Magnetic Resonance Spectroscopy
Cells made of a sealed glass container were prepared in Ar-glovebox, with about 2 mL
of electrolytes (LP30 or PYR13TFSI, 0,2M LiTFSI). Cells were de-assembled in a glove
bag under argon atmosphere to limit possible surface contamination under air exposure.
For LP30 electrolyte, 50 or 200 µL of electrolyte was completed with 550 or 400 µL of
deuterated CD3CN (Sigma Aldrich, >99.8% atom % D) in NMR tubes for the 19F and 31P analysis.
For PYR13TFSI, 0,2M LiTFSI electrolyte, 50 µL of LP30 was completed with 550 µL of
deuterated CD3CN in NMR tubes for the 19H analysis.
NMR measurements were performed in a Brucker AVIII 300 spectrometer (7.05 T).
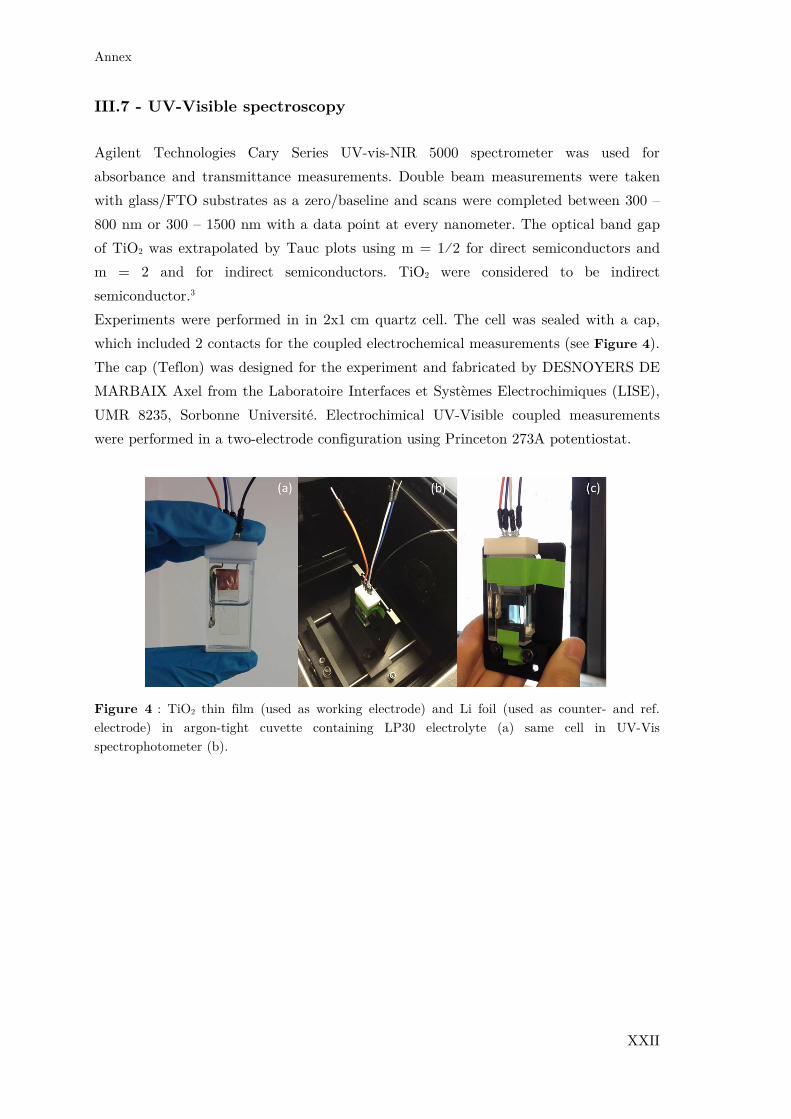
Annex
XXII
III.7 - UV-Visible spectroscopy
Agilent Technologies Cary Series UV-vis-NIR 5000 spectrometer was used for
absorbance and transmittance measurements. Double beam measurements were taken
with glass/FTO substrates as a zero/baseline and scans were completed between 300 –
800 nm or 300 – 1500 nm with a data point at every nanometer. The optical band gap
of TiO2 was extrapolated by Tauc plots using m = 1⁄2 for direct semiconductors and
m = 2 and for indirect semiconductors. TiO2 were considered to be indirect
semiconductor.3
Experiments were performed in in 2x1 cm quartz cell. The cell was sealed with a cap,
which included 2 contacts for the coupled electrochemical measurements (see Figure 4).
The cap (Teflon) was designed for the experiment and fabricated by DESNOYERS DE
MARBAIX Axel from the Laboratoire Interfaces et Systèmes Electrochimiques (LISE),
UMR 8235, Sorbonne Université. Electrochimical UV-Visible coupled measurements
were performed in a two-electrode configuration using Princeton 273A potentiostat.
Figure 4 : TiO2 thin film (used as working electrode) and Li foil (used as counter- and ref.
electrode) in argon-tight cuvette containing LP30 electrolyte (a) same cell in UV-Vis
spectrophotometer (b).

Annex
XXIII
III.8 - Electrochemical Quartz Crystal Microbalance
TiO2 film preparation:
Pt-patterned GaPO4 crystal resonator substrates (6 MHz, diameter of 1.5 cm,
purchased as neat crystals from TEMEX, France or AWS, Spain) were prepared by
deposing platinum keyhole electrodes by evaporation techniques on both sides of the
GaPO4 with a titanium adhesion sublayer. Pt active surface area is 0.4 cm2 or 1.2 cm2
depending on the pattern (see Figure 5).
TiO2 mesoporous films were then deposited on Pt-patterned GaPO4 substrate using the
“evaporation induced micelles packing” process. First, a solution containing the TiCl4
precursor is prepared by mixing TiCl4 and ethanol (EtOH) (molar ratio 1:5). Then, 100
mg of poly(1,4-butadiene)-b-poly(ethylene oxide) (PB-b-PEO:P4515-BdEO, M.W.
(PB)=11800 g.mol-1 and M.W. (PEO)=13500 g.mol-1) is dissolved in a mixture of 5.0 g
EtOH and 0.4 g H2O. A heat treatment of 70°C for 1 hour is necessary to complete the
dissolution. After cooling at room temperature, the titania “precursor solution”
containing TiCl4 precursor (2.1 g) is added dropwise into the solution of PB-PEO. The
concentration of inorganic salts in the final solution was 2 mol.l-1. The concentration of
inorganic salts in the final solution was 2 mol.l-1. The TiO2 mesoporous films were
obtained using the dip−coating process22 at a withdrawal speed of 2.5 mm.s-1 in dry
atmosphere (< 5% relative humidity). Deposit of TiO2 on a selected Pt surface is
assured by cleaning the Pt-uncovered surface of the chosen face as well as the entire
rear face with an ethanol soaked cotton bud. The hybrid film was then placed for 1h in
a furnace pre−heated at 500°C in air (static atmosphere) to (i) induce crystallization of
the anatase and (ii) decompose the block−copolymer template to obtain the
mesoporous TiO2/Pt/GaPO4 electrodes for EQCM measurements.
Figure 5: Schematic representation of the TiO2/Pt/GaPO4 substrates (surface area of 0.4 cm2
(a) or 1.2 cm2 (b)). Electrical contact points for EQCM measurements are indicated by arrows.

Annex
XXIV
EQCM set-up:
EQCM tests were conducted by coupling cyclic voltammetry (CV) and galvanostatic
charge/discharge (GCD) with QCM to track the simultaneous microbalance frequency
changes of the electrode during cycling. The set-up used for measuring gravimetric
changes is a lab made microbalance developed at the LISE laboratory (UMR8235, SU)
(see Figure 6). The TiO2/Pt/GaPO4 modified crystal resonators were used as working
electrode in an electrochemical cell designed in our group (collaboration between
LCMCP and LISE) and fabricated by AWS Company (Spain). This air-tight
electrochemical cell, used for the first time in this Ph.D. thesis, contains a quartz
window dedicated for a front illumination of the TiO2 electrode through the electrolyte.
Two lithium foils were used as counter- and reference electrode, using either LP30 or
PYR13TFSI (0.2M LiTFSI) as electrolytes.
The electrochemical measurements were performed by using a potentiostat (Biologic
SP200) and the frequency changes of the modified crystal (GaPO4 in these
measurements) were monitored by a frequencymeter (Yokogawa).
Figure 6: « Second generation » air- and water-tight EQCM cell allowing the measurements
under illumination (a). Sketch of the EQCM set-up (b).4
(b)
(a)

Annex
XXV
Bibliography
1. Wiemers-Meyer, S., Winter, M. & Nowak, S. Mechanistic insights into lithium ion
battery electrolyte degradation – a quantitative NMR study. Phys. Chem. Chem.
Phys. 18, 26595–26601 (2016).
2. Boissiere, C. et al. Porosity and Mechanical Properties of Mesoporous Thin Films
Assessed by Environmental Ellipsometric Porosimetry. Langmuir 21, 12362–12371
(2005).
3. Ardo, S. & Meyer, G. J. Photodriven heterogeneous charge transfer with transition-
metal compounds anchored to TiO 2 semiconductor surfaces. Chem Soc Rev 38,
115–164 (2009).
4. Vives, A. A. Piezoelectric Transducers and Applications. (Springer Science &
Business Media, 2008).