
TOWARDS A GLOBAL MODEL OF VENTURE CAPITAL?
59
TOWARDS A GLOBAL MODEL OF VENTURE CAPITAL? William L. Megginson * The University of Oklahoma Current draft: December 31, 2001 * University of Oklahoma. This paper is based on Chapter 15, “Venture Capital and Private Equity,” of Scott B. Smart, William L. Megginson and Larry J. Gitman, Corporate Finance (South-Western Publishing Company, Cincinnati, 2003). Earlier versions of the material in this paper were presented at the Shanghai Seminar on Venture Capital Development, Fudan University, Shanghai, PRC in December 1999, at the Chinese University of Hong Kong in October 2000, and in various graduate and undergraduate classes in the engineering and business schools of the University of Oklahoma. I am very grateful to participants in these seminars and classes for their specific comments and recommendations. Please address correspondence to: William L. Megginson Professor & Rainbolt Chair in Finance Price College of Business 307 West Brooks, 205A Adams Hall The University of Oklahoma Norman, OK 73019-4005 Tel: (405) 325-2058; Fax: (405) 325-1957 e-mail: [email protected] website: http://faculty-staff.ou.edu/M/William.L.Megginson-1
-
Upload
khangminh22 -
Category
Documents
-
view
1 -
download
0
Transcript of TOWARDS A GLOBAL MODEL OF VENTURE CAPITAL?
TOWARDS A GLOBAL MODEL OF VENTURE CAPITAL?
William L. Megginson * The University of Oklahoma
Current draft: December 31, 2001
* University of Oklahoma. This paper is based on Chapter 15, “Venture Capital and Private Equity,” of Scott B. Smart, William L. Megginson and Larry J. Gitman, Corporate Finance (South-Western Publishing Company, Cincinnati, 2003). Earlier versions of the material in this paper were presented at the Shanghai Seminar on Venture Capital Development, Fudan University, Shanghai, PRC in December 1999, at the Chinese University of Hong Kong in October 2000, and in various graduate and undergraduate classes in the engineering and business schools of the University of Oklahoma. I am very grateful to participants in these seminars and classes for their specific comments and recommendations. Please address correspondence to:
William L. Megginson Professor & Rainbolt Chair in Finance Price College of Business 307 West Brooks, 205A Adams Hall The University of Oklahoma Norman, OK 73019-4005 Tel: (405) 325-2058; Fax: (405) 325-1957 e-mail: [email protected] website: http://faculty-staff.ou.edu/M/William.L.Megginson-1

TOWARDS A GLOBAL MODEL OF VENTURE CAPITAL?
Abstract
This paper examines whether a truly global market for venture capital and private equity is emerging or
whether the current situation of segmented national markets is likely to endure. We document phenomenal
growth in venture capital fund raising and investment over the past decade in the United States, western
Europe and in certain Asian countries, but not in Japan or in most developing countries. We compare
contracting practices, investment patterns and returns between the U.S. and Europe, and find that there has
been considerable convergence between these two large VC markets, particularly over the past four years.
This convergence is likely to continue. Nonetheless, we conclude that the major national markets will remain
effectively segmented and suggest that venture capital will continue to be much more important in common
law countries than in civil law countries for the foreseeable future.
TOWARDS A GLOBAL MODEL OF VENTURE CAPITAL?
Whenever someone or something has been the recipient of a great deal of favorable attention from
journalists and other commentators, one often says that they have had a “good press.” By any measure,
venture capital has enjoyed an extremely good press over the past decade. It has been embraced as a key tool
for economic and technological development by policy-makers, academics and business commentators alike,
and the U.S. venture capital industry is often held up as the model other nations should attempt to replicate.
However, very little research or commentary has been directed towards answering whether it is possible
(much less desirable) to mimic the American model of venture capital. This paper is a first crack at
addressing this issue.
Defined broadly, “venture capital” has been a fixture of western civilization for many centuries. In
this context, the decision by Spain’s Ferdinand and Isabella to finance Christopher Columbus’ voyage of
exploration can be considered one of history’s most profitable venture capital investments (at least for the
Spanish). However, modern venture capital--defined as a professionally managed pool of money raised for
the sole purpose of making actively-managed direct equity investments in rapidly-growing private companies,
and with a well-defined exit strategy--is a much more recent financial innovation, and one that has until very
recently been almost exclusively American.
There can be little doubt that the total volume of venture capital flowing through the financial
systems of almost all developed countries has risen very sharply over the past decade, and especially since
1995. While the U.S venture capital industry still represents about two-thirds of the world’s total, and is still
4-6 times the size of Western Europe’s, other countries have indeed been adopting many American
investment and fund-raising practices and at least a superficial case for convergence in venture capital
techniques can be made. On the other hand, striking differences remain between American and European
practices, and indeed between VC practices in different European markets. We therefore ask the question: “Is
a truly global, integrated market for venture capital and private equity investment now emerging, or will the
“global” venture capital industry continue to consist of segmented national markets with distinctive fund
raising and investment practices?” Much will ride on the answer to this question.
This paper is organized as follows. Section 1 discusses the economic impact of venture capital
investment and section 2 presents an overview of the global venture capital and private equity market in
2000. This section also examines whether the national differences are related to legal systems and/or
differences in the use of capital markets versus intermediated financing. Section 3 describes key features of
the world’s largest venture capital market, the United States. Section 4 describes Western Europe’s private
equity market, while section 5 discusses venture capital practices in other OECD countries (especially Japan
4
and Canada) and briefly surveys venture capital’s role in the developing countries of Latin America, Africa
and Asia. Section 6 summarizes and presents our conclusions about whether a global market is emerging and
about the transferability of America’s venture capital practices.
1. The Economic Impact of Venture Capital Investing
It is not hard to understand why policy-makers are so fond of venture capital (VC). Both academic
and practitioner-oriented research now clearly demonstrates that VC investing adds value. A recent study by
the National Venture Capital Association (NVCA) [www.nvca.com] documents the scale and economic
impact of 30 years of VC investment in the United States. Key details of this study are reproduced in Table 1.
Over the three decades 1970-2000, American venture capitalists invested no less than $273.3 billion into
companies in all 50 states. These firms now employ 7.6 million people and generate over $1.3 trillion in
annual sales revenue, representing 5.9% and 13.1% of the respective U.S. national totals. The NVCA study
finds that on average every $36,000 in VC investment creates one new job.
Similarly, A study by the European Private Equity and Venture Capital Association (EVCA)
[www.evca.com], entitled “The Economic Impact of Venture Capital in Europe,” found that VC-backed
European companies generated significantly higher growth rates in sales, research spending, exports and job
creation during the 1990-1995 period than did otherwise comparable non-VC-backed companies. Recent
updates of this study find that European VCs invested € 34.9 billion ($31.4 billion) in over 10,400
companies in 2000 and achieved similarly impressive results.
Though academic studies tend not to focus on the direct economic impact of VC investment, several
have examined how VCs help overcome the significant problems involved in funding entrepreneurial growth
companies. These firms have great difficult obtaining external financing both because they must invest in
risky growth options (intangible assets) and because there is pervasive informational asymmetry between
entrepreneur and financier. Early studies by Tybejee and Bruno (1984), Sahlman (1988, 1990) and Gorman
and Sahlman (1989), plus later studies by Admati and Pfleiderer (1994), Barry (1994), Lerner (1995) and
Hellmann (1998) all document significant value creation by VCs. Two recent papers also make important
contributions to our understanding of how VCs influence firm growth and development. Hellmann and Puri
(2000) show that “innovator firms” are much more likely to obtain VC funding than are “imitator firms” and
that the innovative companies are able to bring products to market much significantly faster than other
companies. Kaplan and Strömberg (2001b) find that VCs help overcome principal-agent contracting
problems through sophisticated contracting, pre-investment screening and post-investment monitoring and
advising. Commentators of the venture capital scene frequently encapsulate how VCs create value by saying
that they are active investors who bring much more than money to their portfolio companies.
5
2. An Overview of the Global Market for Venture Capital
Trends in the global market are described in Figures 1 and 2. These show that the total value of
venture capital raised and invested worldwide grew very rapidly between 1995 and 2000. The fastest growing
sector has been high technology. Additionally, increasing fractions of the total were allocated to “true”
venture capital in 2000 than in 1998, as the fraction allocated to buyouts shrank while early state and
expansion stage investment increased. Furthermore, the amount of total investment allocated to high
technology worldwide increased from $25 billion in 1998 to $113 billion in 2000, which implies an average
annual growth rate of 114%!
Table 2 describes the total amount of private equity raised and invested in the 20 top recipient
countries during the year 2000. This table also details the six-year average annual growth rate in investment.
Several trends are immediately apparent. First, the total amount of VC and private equity funding raised
globally in 2000 ($225 billion) exceeded total investment ($177 billion) by $48 billion, and this pattern held
for most individual countries as well as in the aggregate. While there is always a difference between the
amount of fund raising and investment, the difference in 200 was especially large. Second, VC investment
spending grew very rapidly in most of the large national markets over the five-year period 1995-2000. While
spending increased at a very respectable average annual rate of 37% per year in the U.S., spending surged by
more than 100% per year in Israel, Sweden, Switzerland and India. Finally, the two largest VC markets in
2000 were, as usual, the U.S. and Great Britain, followed by France, Germany, Canada and Israel. France
knocked Germany from third to fourth place for the first time in 2000.
Absolute levels of VC fund raising and investment, though informative, do not really address the
relative importance of venture financing in different countries. Panel A of Table 3 attempts to do this by also
showing, for the top 20 recipient countries, the year 2000 levels of gross domestic product, year-end stock
market capitalization and national research and development spending in 1999 (the most recent year
available). The table then computes VC spending, stock market capitalization and R&D spending in terms of
percent of GDP. This table reveals dramatic variations in the relative importance of venture capital, stock
market valuations, and R&D spending among these twenty countries. Venture capital spending as a percent
of GDP ranges from a trivial 0.05% in Japan and 0.11% in India to 1.33% in the U.S, 1.38% in Hong Kong,
1.41% in Singapore and an amazing 3.17% of Israel’s GDP.1 Stock market capitalization as a percent of
GDP varies between lows of 33.1% in India and 36.5% in Korea to 181.8% in the United States and 203.5%,
233.7%, 268.0% and 383.3% in Britain, Singapore, Switzerland and Hong Kong, respectively. Finally,
1 Jeng and Wells (2000) present a case study analysis of the factors contributing to Israel’s success as a market
for venture capital fund raising and investment. Their study highlights the catalytic role government policy can play in promoting VC spending, though their analysis of Germany’s much less successful development program also points to the drawbacks of an active governmental role. As it happens, Dow Jones reported in early 2002 that Israel’s VC market contracted by over a third (about $1 billion) during 2001, so even successful venture capital innovators can be hit by global recession [Financial Times, January 3, 2002, p. 21].
6
research spending varies from lows of 0.22% , 0.51% and 0.52% of the GDPs of Hong Kong, India and
Argentina, respectively, to highs of 3.12%, 3.26%, and 3.69% for Switzerland, Japan and Sweden. America’s
R&D spending to GDP ratio is 2.66%.
As a further step in analyzing the international differences in venture financing, Panel B of Table 3
ranks the top 20 recipient countries by VC funding as a percent of GDP, and also presents separate rankings
for market capitalization and R&D spending relative to national output. The key innovation of this table,
however, is to also present the legal family each country’s commercial code is based on. This listing comes
from the “Law and Finance” literature, pioneered by LaPorta, López-de-Silanes, Shleifer and Vishny (1997,
1998, 2000), which documents that countries with English common law codes offer greater protection to
investors and thus have much larger capital markets than do countries with commercial codes based on the
German, Scandinavian and French families of civil law (all of which are ultimately drawn from Roman law
and can be considered civil law countries). The results in Table 3 strongly support the importance of legal
family on both the relative importance of stock markets and, especially, venture capital funding. However,
there is no significant difference regarding R&D spending. The average venture capital spending to GDP
ratio for the eight English common law countries is 1.14%, almost three times the 0.31% ratio of the twelve
civil law countries. Likewise, the stock market capitalization to GDP ratios for the common law countries,
166.4%, is two-thirds higher than the 10.5.0% capitalization to GDP ratio for civil law nations. On the other
hand, R&D spending relative to GDP is actually higher in civil law (2.10%) than in common law (1.60%)
countries. This clearly suggests that civil and common law countries invest similar proportions of national
income in R&D as a way to create growth opportunities, but common law countries rely much more heavily
on financial markets in general, and venture capitalists in particular, to fund that research spending.
Two other academic studies examining international differences in venture capital usage, Black and
Gilson (1998) and Jeng and Wells (2000), find that venture capital is much more important in countries with
large domestic capital markets. Jeng and Wells show that later-stage VC funding levels are especially
sensitive to the health and size of that country’s IPO market. Their regression analyses also show that venture
financing is significantly less important in civil law than in common law countries.
3. Venture Capital Financing in the United States
Within the United States, the importance of a vibrant entrepreneurial sector has been steadily
growing during the 1990s. In fact, almost one-third of all the expansion in business activity since 1991 has
been accounted for by the growth of the high technology sector, which encompasses primarily information-
processing industries such as telecommunications and computer hardware and software. Furthermore, recent
research indicates both that American business is finally learning how to turn information-processing
technology into sustainable competitive advantage and that the profitability of such investment is now
significantly higher than more traditional investment spending.
7
As discussed in depth in Gompers and Lerner (2001), the formal birth of America’s venture capital
industry is usually traced to the American Research and Development Company that began operating in New
York City shortly after the end of World War II, though funds associated with wealthy families--such as the
fund established by the Rockefeller family, Venrock Associates--began operating many years earlier. From its
birth through the late 1970s, the total pool of venture capital was quite small and most of the active funds
were sponsored either by financial institutions (i.e., Citicorp Venture Capital) or non-financial corporations
such as Xerox. Most of the money raised by these funds came from their corporate backers and from wealthy
individuals or family trusts. While many of these features would soon be rendered anachronistic, there were
two features of early venture capital funds that remain equally applicable today: (1) most of the investments
made by these funds were intermediate-term, equity-related investments targeted at technology-based private
companies and (2) the venture capitalists played a unique role as active investors, contributing both capital
and expertise to portfolio companies while exercising real managerial oversight. Also, from the very start,
venture capitalists looked to invest in companies with the potential of going public or being acquired at a
premium within a reasonable time frame (3-7 years), and which offered investment returns of 25-50 percent
per year, depending upon the stage of company development.
A fundamental change in the U.S. venture capital market occurred during the late 1970s, and this can
be traced to two seemingly unrelated public policy innovations. First, Congress lowered the top personal
income tax rate on realized capital gains from 35 to 28 percent in 1978, thereby significantly increasing the
effective return to value-creating entrepreneurship. In 1979, the Labor Department relaxed its “Prudent Man
Rule,” thus effectively authorizing pension fund managers to allocate up to five percent of fund assets to
private equity investments. While neither of these changes appears revolutionary, the effect of their
implementation on venture capital funding was dramatic. Total funding increased from $68.2 million in 1977
to $978.1 million in 1978 (both figures are in 1987 dollars). A further capital gains tax reduction in 1981 saw
total venture capital funding grow from $961.4 million in 1980 to $5.1 billion in 1983. Funding then
remained in the $2-5 billion range for the rest of the 1980s. After falling to $1.3 billion in 1991, venture
capital funding began a steady climb to a record $106.8 billion in 2000, but then fell back to “only” $34.0
billion during the first three quarters of 2001. To put the recent surge into perspective, the peak second
quarter 2000 fund raising total of $31.7 billion (into 185 funds) was larger than any annual fund raising total
prior to 1999. Key patterns observed in VC investment are discussed in more depth in section 3.2 below.
3.1. Types of Venture Capital Funds
In discussing venture capital, one must carefully differentiate between institutional venture capital
funds and angel capitalists. Venture capitalists are formal business entities with full-time professionals
dedicated to seeking out and funding promising ventures, while angel capitalists (or business angels, as they
are sometimes called) are wealthy local businesspeople who make private equity investments on a more ad-
hoc basis and who do not generally operate as formal business entities. A vibrant market for this angel

8
capital exists and routinely provides over $50 billion per year in total equity investment to private businesses
in the United States.2 Until very recently, angel capitalists provided far more total investment to
entrepreneurial companies each year than did institutional venture capital firms. Nonetheless, we focus on the
latter group throughout this paper since these firms operate nationally and provide the performance
benchmark against which all private equity investment is compared.
There are four basic categories of institutional venture capital funds, as described in Pratt (1997).
First, Small Business Investment Companies (SBICs) are federally chartered corporations that were
established as a result of the Small Business Administration Act of 1958. Since then, SBICs have invested
over $14 billion in approximately 80,000 small firms.3 Historically, these venture capitalists have relied on
their unique ability to borrow money from the U.S. Treasury at very attractive rates. SBICs were thus the only
types of venture capitalist that preferred to structure their investments as debt rather than equity. This feature
seriously hampered their flexibility, but a revision of the law in 1992 has made it possible for SBICs to
obtain equity capital from the Treasury in the form of preferred equity interests, and also to organize
themselves as limited partnerships. The evidence thus far suggests that this change, by itself, will not be
enough for SBICs to regain venture capital market share.
Second, financial venture capital funds are subsidiaries of financial institutions, particularly
commercial banks. These are generally set up both to nurture portfolio companies that will ultimately become
profitable customers of the corporate parent and to earn high investment returns by leveraging the financial
expertise and contacts of existing corporate staff. Though many financial VC funds are organized as SBICs,
their orientation is sufficiently specialized that they are generally classified separately. Third, corporate
venture capital funds are subsidiaries or stand-alone firms established by non-financial corporations. These
are generally established by industrial firms eager to gain access to emerging technologies by making early-
stage investments in high-tech firms. Finally, venture capital limited partnerships are funds established by
professional venture capital firms, which act as the general partners organizing, investing, managing, and
ultimately liquidating the capital raised from the limited partners. While most venture capital limited
partnerships have a single-industry focus, the firms themselves are not associated with any single corporation
or group.
While all four types of venture capitalists are active, the industry has long been dominated by limited
partnerships, at least partly because these are the only group which do not bring a separate agenda to venture
2 The angel capital market is discussed in Freear (1994), Lerner (1998), Sohl (1999), Freear, Sohl and Wetzel (2000) and Wong (2001). Some of the pitfalls that can be encountered by entrepreneurs seeking funding are described in Gruner (1998), while Weisul (2001) lists several of the larger angel capital organizations active today. Finally, Campbell (2001a) cites a Global Entrepreneurship Monitor 2001 report suggesting that informal investors (angels) provide about $196 billion to start-up and early stage companies in 29 countries each year.
3 SBICs are discussed in more depth in Brewer and Genay (1994), Kinn and Zaff (1997) and Birnbaum (1999). A Federal Reserve Board study of SBIC investment behavior and the financial characteristics of the firms in which they invest is available at http://fedinprint.frbsf.org/cgi/dtbcgi.exe.
9
investments. The SBICs have been hampered both by their historical reliance on an inappropriate funding
sources for venture capital investing, and by the myriad regulations that go with being a government-
sponsored company. The financial and corporate funds tend to suffer because their ultimate loyalty is to the
interests of the corporate parents, rather than the portfolio companies, which often leads to conflicts of
interest between financier and entrepreneur and between the corporate funds and other venture capital
investors. Further, both financial and non-financial corporate funds have found it difficult to adopt
appropriate compensation packages for their venture capital professionals, since these contracts are both
more lucrative and more performance-based than is typical for professionals elsewhere in their parent
companies. For all these reasons, the venture capital limited partnerships now control over 75 percent of total
industry resources, and their sway over fund-raising seems to be increasing. Gompers and Lerner (2001)
provide a detailed history of the development of the U.S. venture capital industry and describe the key
comparative advantages of limited partnerships as organizational vehicles.
Before proceeding, we should point out one other important problem with corporate venture
investing. Both financial and non-financial corporate funds have histories of only intermittent commitment to
venture capital investing, and both have shown a tendency to cut back on funding during down cycles. While
corporate VC investment is clearly surging once again, many of these corporations are electing to make their
venture investments by participating as limited partners in VC funds rather than by establishing their own
funds. Additionally, non-financial corporations in many high-tech industries are opting for strategic
partnerships and joint ventures with start-up firms rather than making strictly financial investments in these
firms. This is often a highly synergistic arrangement, since the established company gains access to
promising new technologies, while the smaller firm gains access to the marketing and technological resources
of the larger company.4
3.2. Investment Patterns of U.S. Venture Capital Firms
Given the amount of media and political attention lavished on venture capital in the United States,
most people are surprised to learn just how small the industry actually was before 1998. The total amount of
capital invested each year from 1989 through 2001 is detailed in Figure 3. Annual disbursements naturally
differ from total fund-raising since the total amount of money available for investment is the sum of realized
investment returns (from IPOs and mergers of portfolio companies) and new fund inflows from investors. As
Figure 3 makes clear, total investments by institutional venture capitalists never exceeded $6 billion per year
until 1996, but then total investment spending surged to an astonishing $106 billion spread over 5,606
companies in 2000. This average investment of $11.69 million per company was almost three times larger
than the $4.42 million average investment per company in 1995. Average investment per company grew
4 An early discussion of the failings of corporate VC investing is provided in Hardymon, DeNino and Salter
(1983), while the contemporary European corporate venture capital market is discussed in Campbell (2001b).
10
steadily between 1995 and 2001, but has declined to $11.69 million during the first three quarters of 2001.
Total VC spending peaked at $28.5 billion in the third quarter of 2000, and has declined every quarter since,
falling to $7.7 billion ($8.84 million per company) during 3Q2001. The full year 2001 investment figures
will probably come in around $40 billion. If so, this would represent a sharp fall, but from an exceptional
height, and 2001 would still represent the third highest annual level of investment ever. The true question is
whether total VC investment spending will again surge past $100 billion per year or will stabilize at half that
level—or even lower. This will not become clear until spending stabilizes and at least two up quarters are
registered.5
Whereas the bulk of venture capital funding once came either from corporate sponsors (in the case of
financial or corporate funds) or wealthy individuals, institutional investors have become by far the dominant
sources of funding today. As shown in table 4, pension funds alone typically account for 30-45% of all new
moneys raised by institutional venture capital firms, though their share in 1999 fell to only 18%, and these
investors are especially important for VC limited partnerships. In spite of the fact that few pension funds
allocate more than one or two percent of their total assets to private equity funding, their sheer size makes
them extremely important investors, and their long-term investment horizons make them ideal partners for
venture capital funds. Financial and non-financial corporations usually represent the second largest
contributors of capital to venture funds, accounting for 15-30 percent of the total. The corporate share of the
total was 20% in 1995, but rose to 27% in 1995. The recent surge in corporate funding seemingly represents
another cycle of corporate venture capital investing, so it remains to be seen whether the current phase will
prove any more lasting than previous ones. Foundations and endowments are the third important source of
venture capital funding, usually accounting for 10-25 percent of the total (22% in 1995 and 15% in 1999).
Foreign investors have become increasingly important recently, and (in combination with “other” investors)
accounted for 22% of 1999’s total funding. Individuals and family trusts are the final major group of venture
capital investors. While these two groups together generally contribute 10-25 percent of the total venture
capital funding (17% in 1995 and 19% in 1999), it should be noted that the absolute size of the pool of
capital under management is much larger than it was in early years when family money dominated the
industry.6
5 A number of academic studies have examined how various factors—especially the incidence and levels of personal and corporate taxation—influence the amount of money raised and invested by American venture capital funds each year. Gompers and Lerner (1998a) find that decreases in capital gains tax rates appear to have a positive and important impact on commitments to new venture capital funds. This is actually rather surprising, since the dominant investors in VC funds are untaxed pension funds. Gompers and Lerner conclude that the relationship between taxation and VC commitments is an induced one—in that reductions in tax rates cause more entrepreneurs to start companies and thus demand private equity financing. The findings of Gentry and Hubbard (2000) also suggest that the entrepreneurship entry decision is highly sensitive to tax rates.
6 One venture capital firm, Technology Funding (www.technlogyfunding.com), announced in 1997 that it was
launching a $100 million fund aimed at an unusual group of sponsors: small investors. As described in Weisul (1997), the firm planned to use the internet to raise capital over a two-year period, and accepted subscriptions as small as $1,000 (versus the $1,000,000 minimum typical in venture capital limited partnerships).
11
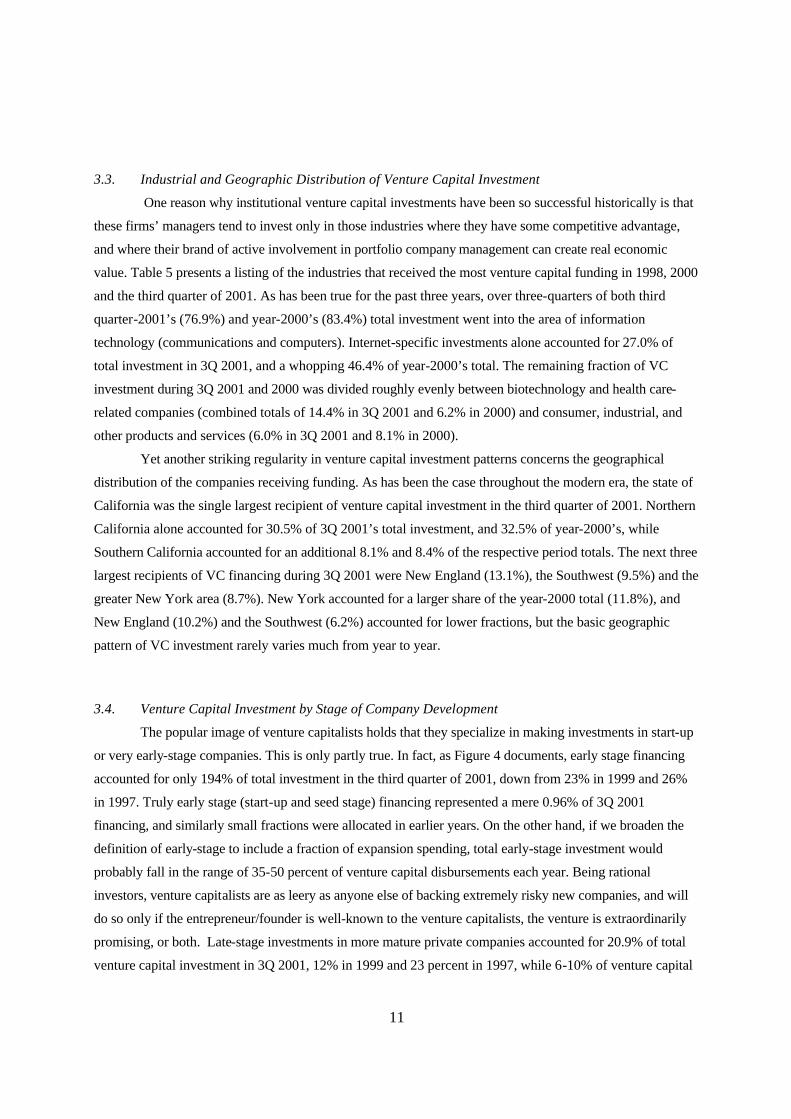
3.3. Industrial and Geographic Distribution of Venture Capital Investment
One reason why institutional venture capital investments have been so successful historically is that
these firms’ managers tend to invest only in those industries where they have some competitive advantage,
and where their brand of active involvement in portfolio company management can create real economic
value. Table 5 presents a listing of the industries that received the most venture capital funding in 1998, 2000
and the third quarter of 2001. As has been true for the past three years, over three-quarters of both third
quarter-2001’s (76.9%) and year-2000’s (83.4%) total investment went into the area of information
technology (communications and computers). Internet-specific investments alone accounted for 27.0% of
total investment in 3Q 2001, and a whopping 46.4% of year-2000’s total. The remaining fraction of VC
investment during 3Q 2001 and 2000 was divided roughly evenly between biotechnology and health care-
related companies (combined totals of 14.4% in 3Q 2001 and 6.2% in 2000) and consumer, industrial, and
other products and services (6.0% in 3Q 2001 and 8.1% in 2000).
Yet another striking regularity in venture capital investment patterns concerns the geographical
distribution of the companies receiving funding. As has been the case throughout the modern era, the state of
California was the single largest recipient of venture capital investment in the third quarter of 2001. Northern
California alone accounted for 30.5% of 3Q 2001’s total investment, and 32.5% of year-2000’s, while
Southern California accounted for an additional 8.1% and 8.4% of the respective period totals. The next three
largest recipients of VC financing during 3Q 2001 were New England (13.1%), the Southwest (9.5%) and the
greater New York area (8.7%). New York accounted for a larger share of the year-2000 total (11.8%), and
New England (10.2%) and the Southwest (6.2%) accounted for lower fractions, but the basic geographic
pattern of VC investment rarely varies much from year to year.
3.4. Venture Capital Investment by Stage of Company Development
The popular image of venture capitalists holds that they specialize in making investments in start-up
or very early-stage companies. This is only partly true. In fact, as Figure 4 documents, early stage financing
accounted for only 194% of total investment in the third quarter of 2001, down from 23% in 1999 and 26%
in 1997. Truly early stage (start-up and seed stage) financing represented a mere 0.96% of 3Q 2001
financing, and similarly small fractions were allocated in earlier years. On the other hand, if we broaden the
definition of early-stage to include a fraction of expansion spending, total early-stage investment would
probably fall in the range of 35-50 percent of venture capital disbursements each year. Being rational
investors, venture capitalists are as leery as anyone else of backing extremely risky new companies, and will
do so only if the entrepreneur/founder is well-known to the venture capitalists, the venture is extraordinarily
promising, or both. Late-stage investments in more mature private companies accounted for 20.9% of total
venture capital investment in 3Q 2001, 12% in 1999 and 23 percent in 1997, while 6-10% of venture capital

12
investment has been allocated to buyouts, acquisitions and other investments in recent years. Later-stage
investments cover funding for marketing programs, major production plant expansions, and financing made
in preparation for accessing the public capital markets. This has accounted for 12-23% of total investment
over the past four years.
While the actual distribution between early and later stage funding varies from year to year, one
principle of venture capital funding never changes: the earlier the development stage of the portfolio
company, the higher must be the expected return on the venture capitalist’s investment. Professional venture
capitalists typically demand compound annual investment returns in excess of 50 percent on start-up
investments, but are often willing to accept returns of 20-30 percent per year on later-stage deals, since the
risk of the investment is far lower in more established portfolio companies. As we will see when the
mechanics of venture investment pricing are discussed later in this section, the higher the required return, the
greater the fraction of his or her company an entrepreneur must surrender in order to obtain funding.
On the other hand, it is usually not a stark choice between early and late stage investments. Most
venture capital funds that invest in a company during its early years remain committed to the firm as it
develops, and will often participate in second, third, fourth, and higher-round financing as the portfolio
company matures. Each subsequent round is generally at a higher price, embodying a lower required return,
unless funding must be obtained under conditions of duress. In this sense, the most famous recent venture
capital backed U.S. company, Amazon.com, was somewhat unusual in that it received only one round of
venture capital funding from Kleiner Perkins Caulfield & Byers in July 1996, though this did bring the firm
no less than $8 million.7
3.5. Organization and Funding of Venture Capital Limited Partnerships
As mentioned earlier, venture capital limited partnerships have come to dominate the institutional
venture capital industry. This demonstrated survival value is based on several factors, two of which stand out
as especially important. First, these partnerships can focus totally on the financing and development of
portfolio companies as stand-alone ventures, unlike corporate and financial venture capital funds that must
balance the competing interests of the portfolio company and the corporate parent. Second, as described in
Gompers and Lerner (2001), the limited partnership has advantages of limited life and limited liability for
investors, as well as tax advantages, over the corporate form of organization. The fact that a relative handful
of funds dominate venture capital fund-raising every year suggests both the comparative advantage of limited
partnerships in general, and the value of experience and reputation in particular.
Most of the top venture capital firms are organized as general partnerships, and many of these are
7 These investments were funneled through two of KPCB’s funds, Kleiner Perkins Caulfield & Byers VIII and
KPCB Information Sciences Zaibatsu Fund II. In addition, L. John Doerr, who is easily the best known and most respected of the current generation of venture capitalists, became an Amazon.com director as part of the investment agreement (see Peltz (1996)).
13
concentrated in California’s Silicon Valley outside of San Francisco.8 These firms usually begin the venture
financing process by creating a distinct limited partnership fund, typically with a target amount of capital to
be raised and often with a dedicated investment target, such as funding internet start-ups. The year 1998
witnessed the successful launch of two mega-funds: Warburg, Pincus Equity Partners, L.P. and Hicks, Muse,
Tate & Furst Equity Fund IV, L.P. These two funds raised $5 billion and $4 billion, respectively. As the
Roman numeral after the Hicks, Muse fund name implies, this firm has launched many previous successful
funds, and both of the funds listed above were easily subscribed by investors (the companies were able to
raise the amounts intended). Even in the more challenging period of 2000-2001, Gupta (2001) reports that
J.P. Morgan Capital partners raised two funds with a combined total value of $13 billion.
While some of the largest venture funds are created by public offerings of limited partnership
interests (which can then be freely traded), most venture funds are organized and capitalized by private
negotiation between the fund’s sponsor and a well-established group of institutional investors.9 To say that a
fund is “capitalized” at its inception is something of a misnomer. In actual practice, the limited partners make
capital commitments, which the general partner then draws on over time as the fund becomes fully invested.
In addition to organizing the limited partnership, the sponsoring firm acts as the general partner (and has
unlimited liability) over the fund’s entire life, which is generally designed to be 7-10 years. As general
partner, the VC firm is responsible for (1) seeking out investment opportunities for the fund’s capital and
negotiating the terms upon which these investments will be made; (2) monitoring the performance of the
portfolio companies and providing additional funding and expertise as these private firms develop; (3)
finding an attractive exit opportunity, such as an IPO or a merger, that will allow the fund to liquidate its
investment in the portfolio companies; and (4) distributing the realized cash returns from these exit
opportunities to the limited partners and then terminating the fund’s existence. For its services, the sponsor
generally receives a percentage claim on the realized return (almost always 20 percent) as well as an annual
management fee equal to 1-3 percent (usually 2.5 percent) of the fund’s total committed capital.
Not surprisingly, the relationship between venture capitalists and investors is fraught with agency
problems. Investors must commit large amounts of money for long-term, illiquid, non-transparent
investments in private partnerships over which they can exercise no direct control without forfeiting their
limited liability. Venture capitalists have clear incentives to expropriate the limited partner’s wealth, and have
many opportunities to do so—including setting up new funds (that exclude the old limited partners) to finance
8 In particular, Sand Hill Road in the city of Menlo Park is considered venture capital’s Ground Zero. This
street is home to no less than 50 venture capital firms, as well as a large number of accounting, legal, and investment banking firms. In spite of this, Niedorf (1998) reports many VC firms prefer to set up in less expensive (and more private) digs elsewhere in the region.
9 Huemer (1992) presents a discussion of how regulation hampers the potential popularity of public VC funds, although two early empirical studies of venture capital performance [Martin and Petty (1983) and Brophy and Guthner (1988)] used data from public venture funds in their analyses.
14
the most promising companies and making side deals with the best portfolio companies. Reputational
considerations help control this problem, but numerous covenants are also inserted into the limited
partnership agreements between investors and VCs to control these agency conflicts. The covenants most
frequently inserted into VC investment agreements are described in Table 6.
Many senior partners at top venture capital firms have become legendary for their skill in finding,
nurturing, and bringing to market many famous high-tech companies. Examples include John Doerr of
Kleiner Perkins, Caulfield, and Byers, William Hambricht of Hambricht and Quist, and Sam Rosen of Rosen
Partners. While these industry leaders have become extraordinarily wealthy, even “ordinary” venture
capitalists have done quite well during the current boom.10 Partners and associates in venture capital firms
quite often are engineers or other technically trained professionals who themselves worked in high-tech
companies before becoming full-time venture capitalists. This experience gives them in-depth knowledge of
both the technological and business aspects of the industries they invest in, and this expertise, along with
capital and contacts, is what entrepreneurs look for when they approach a venture capitalist for funding. For
example, Mr. Doerr of Kleiner Perkins Caulfied & Byers has bachelors and masters degrees in electrical
engineering (plus an MBA from Harvard Business School), and worked for Intel Corporation for five years
before becoming a professional venture capitalist.
3.6. How Venture Capitalists Structure Their Investments
Although one should be careful in describing anything as idiosyncratic as a venture capital
investment contract as “standard,” numerous industry commentators have described regularities that are
observed in almost all real funding agreements between entrepreneurs and venture capitalists. Kaplan and
Strömberg (2001b) present what is probably the most comprehensive academic analysis of how VCs contract
with entrepreneurs to allocate cash flow and control rights between the firm and the VC fund. In the interest
of space, only the most important of these typical features are covered here. However, the real world of
finance offers few more interesting examples of sophisticated financial contracting.11
First and foremost, venture capital investment agreements are legal contracts that allocate risk,
return, and ownership rights between the entrepreneur (and other existing owners of a portfolio company) and
the venture capital fund making the financial investment. The actual distribution of rights and responsibilities
depends on (1) the experience and reputation of the entrepreneur; (2) the attractiveness of the portfolio
company as an investment opportunity; (3) the stage of the company’s development; (4) the negotiating skills
10 An academic examination of the determinants of venture capitalist compensation is provided in Gompers
and Lerner (1999a).
11 If one can only read a single academic article about how and why venture capital is invested as discussed here, the paper chosen must be Sahlman (1988). We also draw heavily on Testa (1988), Sahlman (1990), Gompers (1995) and Lerner (1995) in our discussion here.
15
of the contracting parties; and (5) the overall state of the venture capital market.12 If a respected and
experienced entrepreneur is approaching a venture capitalist with an opportunity to invest in an established
company with a promising technology, at a time (such as the late 1990s) when competition between venture
capital funds is fierce, the entrepreneur will be able to secure financing on very attractive terms. Gompers and
Lerner (2000) present striking evidence of the impact of unusually heavy cash inflows into the VC industry,
as Figure 5 makes clear. During the periods 1987-1990 and 1992-1995, large inflows significantly inflated
investee company valuations, and this impact was greatest in VC-intensive regions (especially California and
Boston) and for later stage companies that could profitably employ larger cash infusions. If, on the other
hand, an inexperienced entrepreneur asks for start-up funding at a time when little venture capital is being
raised (such as the early 1990s), the entrepreneur will have to accept fairly onerous contract terms if he or she
is able to attract funding at all.
The first step in any private equity financing is invariably for the parties to agree on a current
valuation for the portfolio company, prior to the venture capitalist’s investment. This will be based on the
company’s past R&D efforts, its current level of sales revenue and tangible assets, and the present value of
expected future profits if the company obtains new capital for growth. This valuation is also critical to
determining how much of the company the venture capital fund will receive in exchange for its investment.
Next, the parties must agree on the amount of new funding the venture capitalist will provide and the
required return on that investment.13 Naturally, the higher the perceived risk the higher the required return,
and this is usually inversely related to the stage of the portfolio company’s development. As mentioned
above, many venture capitalists demand a compound annual return of 50 percent or more on early-stage
investments, but are satisfied with half that on later-stage deals. The pricing of venture capital funding is
discussed more fully later in this section.
One key method of minimizing investment risk is to use staged financing. To illustrate how this
works, assume that a company expects to need $25 million in private funding in order to fully commercialize
a promising new technology. Rather than invest the entire amount at once, the venture capitalist is far more
likely to initially invest only enough (say, $5 million) to fund the company to its next development stage (i.e.,
to develop a working prototype), and to demand a very high required return on that initial investment tranche.
Once the company successfully achieves the promised outcome, the venture capitalist will provide funding for
12 The actual process of VC investment screening and decision-making is examined empirically in Kaplan and
Strömberg (2000), and they show that many factors—market size, business strategy, the firm’s technology and customer base and potential competition—all influence the investment decision. Kaplan and Strömberg also describe how the allocation of control rights between VC and entrepreneur is determined, while Baker and Gompers (2001) examine how board seats are allocated and Christopher (2001) describes several of the important legal hurdles VCs must confront when evaluating an investment opportunity.
13 Entrepreneurs wishing to determine how much capital they should try to obtain from VCs should read the
classic Harvard Business school article by Stancill (1987), “How Much Money Does your New Venture Need?”.
16
the next development stage, and since the risk has been reduced the funding will be provided at a higher per-
share price (a lower required return). Staged financing is not only a very efficient way to minimize risk for
the venture capitalist, it also gives the venture fund an extremely valuable option to deny or delay additional
funding. This cancellation option places the maximum feasible amount of financial risk onto the
entrepreneur, but in return allows him or her to obtain funding at a less onerous price than it would otherwise
be offered. Staged financing also provides tremendous incentives for the entrepreneur to create value, since at
each new funding stage capital will be provided on increasingly attractive terms.
Gompers (1995) provides two classic examples of how staged financing should work in the
development of private companies: Apple Computer and Federal Express. Apple received three rounds of
private equity funding. In the first round venture capitalists purchased stock at $0.09 per share, but this rose
to $0.28 per share in the second and then $0.97 per share in the third round. Needless to say, all of these
investments proved spectacularly profitable when Apple went public at $22 per share in 1980. On the other
hand, investors in Federal Express used staged financing with more telling effect during their three rounds of
private equity financing. The investors purchased stock for $204.17 per share in round one, but the firm’s
early performance was much poorer than anticipated. In the second round, shares were purchased for $7.34
each, but the company’s finances continued to deteriorate so a third financing round, at $0.63 per share was
required. As we know, Fedex eventually became a roaring success, and went public at $6 per share in 1978,
but staged financing allowed venture capitalists to intervene decisively during the firm’s problematic early
development.
A distinguishing characteristic of venture capital investment contracts is their extensive and very
sophisticated use of positive and negative covenants. These are contract clauses that mandate certain things
that the portfolio firm’s managers must do (positive covenants) and must not do (negative covenants). Some
of these covenants are found in many standard bond and loan financing contracts, such as covenants which
specify maximum acceptable leverage and dividend payout ratios, require the firm to carry certain types of
business insurance, and/or restrict the firm’s ability to acquire other firms or sell assets without prior investor
approval. Amazon.com provides an example of this; the firm’s bank required the company’s founder, Jeffry
Bezos, to personally guarantee all the company’s borrowing prior to its IPO. Other covenants, however, are
found only in private equity investment contracts. These include:
1. Ownership right agreements, which not only specify how equity ownership will be apportioned after
the initial venture investment is made, but also specify that the venture capital investment group will
be allocated a certain number of seats on the firm’s board of directors, and will enjoy pre-specified
voting rights. These often include the right to veto major corporate actions, and even remove the
management team if performance goals aren’t met. Cole and Sokol (1997) discuss the importance of
venture capitalist control rights. Since venture capitalists are active investors, they also demand
contract provisions ensuring their ongoing access to the firm’s accounts and facilities.
17
2. Ratchet provisions protect the venture group’s ownership rights in the event that the firm is forced to
sell new equity under duress. Generally, these provisions ensure that the venture capital group’s
share values will be adjusted so that the penalty of selling low-priced new stock is borne more by the
entrepreneur than by the venture capital funds. For example, if the venture fund purchased shares
initially valued at $1 each, and the firm is subsequently required to sell new stock at $0.50 per share,
a “full ratchet” provision mandates that the venture group be allocated one additional new share for
each one currently held to compensate them for the decline in stock value (a “partial ratchet” only
partially compensates the venture group). Obviously, not many rounds of such financing would be
required to completely wipe out a management team’s ownership stake, since they have no ratchet
protection.14 While Frederick Smith’s ownership stake in Federal Express was not wiped out by the
multiple rounds of distressed financing, it was much reduced.
3. Registration, participation, and repurchase rights preserve attractive exit opportunities for venture
capital investors. Although entrepreneurs are frequently content to remain private, if they can also
remain independent, this is anathema to venture capitalists. Demand registration rights give the
venture fund the right to force the firm to register shares with the SEC for a public offering--at the
firm’s expense. As an example, the venture capital investors in Amazon.com had such a demand
registration right. Participation rights ensure that the venture fund is able to participate in any
private sale of stock the firm’s managers arrange for themselves. The venture group will usually also
insist on a contract provision mandating that their ownership stake be repurchased by the firm if the
company is unable to execute an IPO or arrange a private sale within a specified time frame.
4. Stock option plans are typically provided for current and prospective managers. Venture capitalists
usually insist that a large pool of stock be set aside to compensate current managers for superior
performance and to attract talented new managers as the company grows. Setting stringent
performance targets for these options ensures that the interests of management and venture
capitalists are properly aligned. Once again, Amazon.com provides an example of this contracting
feature. At the time of the firm’s IPO, no less than 10.8 million shares were reserved under two
stock option plans, and over 4 million had already been allocated to the firm’s executives.
The listing of covenants typically found in venture capital investment contracts presented above is by
no means comprehensive. Other covenants lay out the terms under which additional funding will be provided
by the venture capital funds and further specify how ownership rights can be exercised by the contracting
parties. These include termination and golden parachute rights for the entrepreneur if he or she is forced out.
14 For a simple discussion of ratchet provisions, see Hoffman and Blakey (1987). The critical importance of the
lead venture capitalist being able to retain a proportionate share in multi-round financings is described theoretically in Admati and Pfleiderer (1994).
18
However, the most fascinating and distinguishing feature of venture capital investment contracts is
unquestionably their almost exclusive reliance on convertible securities (particularly convertible preferred
stock) as the investment vehicle of choice.
3.6.1. Why convertible securities are used in venture capital financing
Most people assume that, because venture capitalists are known as equity investors, they simply
purchase the common stock of the portfolio companies in which they decide to finance. In fact, venture
investments are almost never funded with common stock or with non-convertible preferred stock or debt.15
Instead, venture capitalists almost invariably fund their investment with either convertible debt or (much
more frequently) convertible preferred stock, for several reasons. First, since corporate law requires that all
shareholders be treated equally, venture capitalists would only be able to exercise effective voting control
with common stock if they were to purchase a majority of a firm’s common shares, and to purchase these at
the same price as other investors. This would be both extremely expensive and would place far more of the
firm’s business risk on the venture group than on the entrepreneur. Since convertible debt or preferred stock
is a separate class of security from common stock, contract terms and covenants specific to that issue can be
negotiated. Furthermore, since multiple classes of convertible debt or preferred stock can be created,
extremely complex and sophisticated contracting arrangements can be worked out between the firm and many
different investor groups [Gompers (1998)].16
A second reason why venture capitalists prefer convertible debt or preferred stock to common stock
as an investment vehicle is that this makes their claim senior to that of the entrepreneur and other existing
owners. Since this forces the entrepreneur to bear most of the firm’s business risk, the senior status of
convertible preferred stock or debt provides the maximum feasible protection for the venture group’s
investment. On the other hand, preferred stock or subordinated debt is a junior claim to debt, so funding a
company in this way also preserves its borrowing capacity, thus making it easier for the firm to arrange trade
credit or bank loans. The fact that the coupon rate on these convertible securities is typically set at zero (or a
very low percentage rate) clearly implies that venture capitalists are structuring their investments in this way
for contract flexibility reasons, rather than to earn a positive cash flow on their private company investments.
The primary rationale for using convertible securities is to give the venture capital group a claim on the
portfolio company’s earnings and market value in the event the firm is highly successful. In point of fact,
15 As mentioned earlier, SBICs have historically been an exception to this rule, since their funding patterns
dictated they structure their investments as loans. This will probably change, since they can now obtain their own funding via a security that is effectively preferred stock. Additionally, Wong (2001) shows that angel capitalists generally use only common stock in their investments.
16 Numerous theoretical studies have attempted to explain the use of convertibles by venture capitalists. These include Admati and Pfleiderer (1994), Hellmann (1998) Berglöf (1994) and, most recently, Bascha and Walz (2001). To our knowledge, however, Gompers (1997) is the only empirical academic study of convertible usage.
19
most convertible securities are converted into common stock before venture-backed companies execute initial
public offerings, partly to present an uncluttered balance sheet to prospective investors and partly to lock in
common equity stakes (and capital gains) before inviting in new stockholders.17
One final, and perhaps decisive, motivation for using convertible preferred stock as an investment
vehicle rather than any type of debt security is the fact that a creditor who attempts to exercise corporate
control with a debt security is exposed to significant potential legal liability. Creditors generally wish only to
lend a firm money and be repaid; they do not seek operational control of the firm, and if they are proven to be
exercising such control (through contract terms or through demands made upon management) they can held
legally accountable for the management’s actions and the firm can lose the tax-deductibility of its interest
payments. By structuring its investment as preferred stock, the venture capital group is able to avoid these
legal problems and retain the ability to exercise effective oversight without fear of legal challenges. For all of
these reasons, the venture capitalists backing Amazon.com structured their entire investment (in June 1996)
as convertible preferred stock, for which they paid $14.05 per share. Two of the firm’s directors, who
purchased convertible preferred stock in a much smaller financing round in early 1997, paid $40 per share.
3.7. The Pricing of Venture Capital Investments
As mentioned above, one of the critical factors to be determined in negotiations between
entrepreneur and venture capitalist is the pricing of the new investment funding. The pricing of VC
investments is discussed in several academic and practitioner articles.18 Unfortunately, there is no general
consensus as to specific methodology, so the material presented here should be taken as illustrative only.
Actual contract terms will be much more idiosyncratic. The impact of required return on the fraction of her
company an entrepreneur must exchange for a given dollar investment can be profound, as the following
example illustrates. Assume that the president and founder of the start-up company Internet Concepts
Corporation (ICC), approaches a technology-oriented venture capital fund for $5,000,000 in new funding to
support her firm’s rapid growth. After intense negotiations, the parties agree that ICC is currently (prior to
VC investment) worth $10,000,000 and that the risk of the firm is such that the venture capitalist is entitled
to a 50% compound annual (expected) return. Assume further that both parties agree that ICC should plan to
execute an IPO in five years, at which time the firm is expected to have net profits of $4,000,000 and to sell
at a price-to-earnings ratio of 20 times, which will value the company at $80,000,000. The promised value of
the venture capitalist’s stake in five years is calculated using basic future value computations, with an initial
17 Since most existing stockholders are prohibited by law (Rule 144) or by their investment bankers from
selling their shares during a firm’s IPO, and for up to two years thereafter, there is an additional reason to convert quasi-equity claims such as convertible debt and preferred stock into common stock well before the initial offering. Doing so starts the holding-period clock that much sooner.
18 This example is based on information presented in Schilit and Willig (1996b). Additional discussion of the pricing of VC investments is presented in Morris (1988) and Katz (1990).
20
investment amount (A) of $5 million, a required return (r) of 50 percent, and an investment horizon (n) of
five years:
FV = A (1 +r)n = $5,000,000 (1.50)5 = $5,000,000 (7.6) = $38,000,000 (Eq. 1)
To determine what fraction of the ICC’s equity (% Equity) that the venture capitalist will receive, this future
value (FV) is divided by ICC’s expected market valuation (Exp MV) at the time of the IPO:
% Equity = FV ÷ Exp MV = $38,000,000 ÷ $80,000,000 = 0.475 (Eq. 2)
This means that the venture capital fund will receive 47.5% of ICC’s equity in exchange for its $5
million investment. If the required return on investment had instead been established as 40%, rather than
fifty, the promised value of the venture capitalist’s share at the time of the IPO would have been $26.9
million and the fund would have claimed only one-third (33.6%) of ICC’s equity, rather than almost half.
From the venture capitalist’s point of view, one particularly attractive result of demanding a high required
return is that doing so will discourage entrepreneurs who really do not believe their own rosy sales and
earnings growth projections, since only the most confident entrepreneur will agree to a funding strategy that
promises to enrich the financier in full before any value is allocated to him or her.
3.8. The Profitability of Venture Capital Investments
By their very nature, as illiquid investments in rapidly growing private companies, venture capital –
backed companies are difficult to value prior to realization (through IPO, merger, or liquidation). It is thus
quite hard to make any sweeping generalizations about the profitability of these investments over time.
Nonetheless, it seems clear that investments made by venture capital funds during the middle 1990s, and
which matured during the 1999-2000 period, earned average compound annual returns of up to 30%.
Gompers and Lerner (2001) document repeated examples of boom and bust investment cycles, in which very
high realized returns prompt excessive new capital inflows into VC funds, which in turn cause returns to drop
sharply over the next harvest cycle. Although the 30% annual return was typical for venture capital funds
during the 1970s and early 1980s, Figure 6 makes clear that such a level of profitability was not achieved
even once from 1984 to 1996. Returns were again at target levels in 1995 and 1996, and then surged in 1999
and 2000. However, more recent returns following the collapse of the NASDAQ market in March 2000 have
been uniformly negative, as Table 7 demonstrates. A key question is whether the massive influx of new
venture capital that occurred during the 1998-2000 period will have the same negative impact on returns over
the next five years.
On the other hand, there is a strongly positive correlation between venture returns and those on small
stock funds (not shown), which highlights the importance of a healthy public stock market for small stocks in
21
general and for initial public offerings in particular. Since IPOs are the preferred exit opportunity for venture
capital investors, and because the “recycling” of realized returns is an important source of new venture capital
funding, any decline in investor appetite for new issues has an immediate negative impact on the venture
capital industry.19
3.9. Exit Strategies Employed by Venture Capitalists
VCs are not long-term equity investors; their objective is to add value to a private company and then
to harvest their investment once the company is mature enough. There are three principal methods of exiting
an investment: (1) through an initial public offering (IPO) of shares to outside investors; (2) by selling the
portfolio company directly to another company [the merger, or M&A option]; and (3) by selling the company
back to the entrepreneur/founders [the redemption option, described in Fellers (2001a,b)]. IPOs are by far
the most profitable and prestigious option for the venture capitalists. It is also a very realistic option; during
the 1990-2000 period, 5,803 companies executed IPOs on American capital markets, and these issues raised
$419.5 billion. Figures 7 A&B demonstrate that the importance of venture capital-backed IPOs grew steadily
over the decade, to the point where well over half of all IPOs in 1999 were VC-backed, and these represented
almost half of the then-record $71.0 billion raised in that year. VCs also create value at the IPO, by attracting
prestigious underwriters and by certifying that all relevant information is being disclosed to investors. Barry,
et al (1990) and Megginson and Weiss (1991) find that VC backing reduced the level of underpricing in IPOs
during the 1980s, though Beatty and Welch (1996) find that this relationship is reversed during the 1990s.
Perhaps surprisingly, VCs do not exit at the time of an IPO. Instead they retain shares for several
months or even years and then typically distribute shares back to the limited partners. These distributions are
usually not anticipated by investors, so their announcement is a surprise. Figure 8 shows that distributions
typically occur after a period of sharply rising stock prices, and that the average stock price response to
distribution announcements is significantly negative. The studies by Gompers and Lerner (1998b) and
Bradley, Jordan, Yi and Roten (2001) both document this negative return.20
3.9. Government Support for Venture Capital in the United States
It is perhaps appropriate to end our discussion of American venture capital with a brief survey of
government-sponsored venture capital funding programs in the United States. As we have seen, the most
successful American private equity investment programs are those that are structured as limited partnerships
19 The role of venture capitalists in deciding when to take a portfolio company public is detailed in Lerner
(1994) and Gompers (1996), while the difficulties encountered by entrepreneur/founders of non-venture backed firms in trying to arrange an acquisition for their firms are described in Bianchi (1992).
20 According to an NVCA press release on October 16, 2001, the value of cash and stock distributed to limited partners by VCs grew from $1.88 billion during the first quarter of 1999 to an astounding $18.72 billion during the first quarter of 2000, but then fell steadily back to $2.10 billion during 2Q 2001.

22
and organized by professional venture capitalists. Since it would be difficult to imagine an environment more
alien to public-sector rules and regulations, it is tempting to conclude that governments have never been and
can never be valuable partners in sponsoring entrepreneurial investment. The truth, however, is much more
nuanced.
Economic historians document that the federal government has played a key direct or catalytic role in
developing many of the most important technologies that underpin modern industrial society--from aerospace
engineering to material science to computers (especially computers). Additionally, federally-chartered Small
Business Investment Companies accounted for two-thirds of all the venture capital funding allocated to
American business from the 1950s to 1969, and continued to play an important role even after private
partnerships rose to preeminence. Finally, Lerner (1999) documents that one of the most important and
visible federal programs, the Small Business Innovation Research (SBIR) grant program, has proven very
successful at fostering technological innovation and corporate growth. Firms which received SBIR grants
grew significantly faster than a matched set of non-awardees, suggesting that these grants allowed firms to
overcome financing constraints which otherwise would have proven binding. On the other hand, Lerner’s
finding that the positive effects of SBIR wards were confined to firms based in zip codes with substantial
private venture capital activity suggests that government programs are only effective when they supplement,
rather than attempt to supplant or promote, private fund-raising and investment.
4. The European Market for Venture Capital and Private Equity
Although “classic” venture capital investment by privately financed partnerships in early-stage
entrepreneurial growth companies has traditionally been a distinctly American phenomenon, private equity
financing has long been an established financial specialty in Western Europe. Since this continent is the
birthplace both of the industrial revolution and of modern capitalism, it is not surprising that a highly
sophisticated method of funneling growth capital to private (often family-owned) companies should be
observed. In fact, private equity fund-raising in Europe compared quite well with the United States in total
annual amounts raised and invested until 1997, and showed far less annual variability. The chief differences
between European and American venture capital lie in: (1) the principal sources of funds for venture capital
investing, (2) the organization of the venture funds themselves, (3) the development stage of the portfolio
companies able to attract venture financing, and (4) the principal method of harvesting venture capital
investments. As we will see, these differences are all related, and help explain why venture capital is widely
believed to be more successful in the United States than it is in Europe--both from the standpoint of
promoting rapid technological development and as a private investment vehicle for individual and
23
institutional investors.21
Before proceeding, we should point out a definitional difference between Europe and the United
States. Whereas American commentators tend to refer to all professionally managed, equity-based
investments in private, entrepreneurial growth companies as venture capital, European commentators tend to
sharply differentiate between venture capital and private equity investment. Where necessary, we will
maintain this distinction, but in general we will refer to both private equity and venture capital (high-tech)
investment simply as European venture capital.
4.1. European Venture Capital and Private Equity Fund Raising and Investment
As in the United States, VC fund raising and investment has grown rapidly since the mid-1990s.
Figure 9 describes the growth in total VC investment over the period 1989-2000. According to data
published by the European Private Equity and Venture Capital Association (EVCA, www.evca.com), total
investment grew from a stable level of about € 5 billion per year during the 1989-1996 period to €25 billion
in 1999 and €34.9 billion (invested in some 10,440 companies) in 2000. Disbursements dropped somewhat
to €11.1 billion during the first half of 2001, but this annualized pace would still make 2001 the third highest
investment year ever. Fund raising grew even more dramatically over this period, rising from about €5 during
1995 to nearly €48 billion in 2000. Since the early 1980s, a cumulative total of more than €125 billion has
been raised for investment in European private equity.
Historically, European VC has been funneled to different industries and different types of companies
than in the United States, though this has been changing of late. As recently as 1996, less than one-fourth of
European venture capital went into high technology investments; by 2000, the fraction allocated to high tech
industries topped 54%. Table 8 describes the industry breakdown of European private equity investments in
technology for the years 1999 and 2000. As in the U.S., roughly 80% of European high tech VC investment
is funneled into computers and communications businesses.
In one important respect, venture capital funding patterns in Europe and America have long been
very similar in that both are highly concentrated geographically. Some 38% of year-2000’s total investment,
and no less than 45% percent of 1999’s total, was targeted at British companies. In 2000, France (15% of the
total) displaced Germany (14%) to become the second largest recipient of European VC investment, though
both countries experienced very strong growth in investment inflows. Italy accounted for an additional 8.8%
of the total, and small countries such as Sweden, the Netherlands, and Switzerland were disproportionately
well represented.
4.2. The Changing Source of Funding for European Venture Capital
21 The discussion in this section draws heavily on Black and Gilson (1998), Schilit and Willig (1996a), Jeng
and Wells (2000) and Arundale (2000).
24
The sourcing of European venture capital funds differs from their American counterparts primarily in
the Europe’s greater reliance on financial institutions (which tend to be very powerful in Europe) and lesser
reliance on pension funds, which generally play a much smaller role in the old world than in the new. Banks,
insurance companies, and other corporate investors account for almost half (45.5%) of all European venture
funding, whereas pension fund money represents less than a quarter (24.2%) of total fund-raising, and
American pension funds contribute about half of this total. Although governments account for only a 5.6%
share of total capital raised, their influence is far greater (and generally more pernicious) than its absolute
level might indicate, as European governments are much fonder of direct regulatory intervention in business
development than are America’s federal, state, and local governments.
For a mix or cultural and legal reasons, European venture capital funds are rarely if ever organized as
stand-alone limited partnerships sponsored by specialist venture capital firms staffed by technically trained
professionals, as is the model in the United States. Instead, funds are generally organized as investment
companies under various national laws, and their approach to dealing with portfolio companies is much more
akin to the reactive style of U.S. mutual fund managers than to the proactive style of America’s venture
capitalists. The relative lack of a vibrant entrepreneurial high-technology sector in Europe also hampers
continental venture capitalists’ efforts to attract technologically savvy fund managers or
entrepreneur/founders who wish to achieve rapid corporate growth.
4.3. European VC Investment by Stage of Company Development
Partly for the reasons detailed above, European venture capital has historically been less focused on
early-stage investments than has America’s though, as in other areas, this is changing fast. The breakdown of
European venture capital investment by stage of portfolio company development over the period 1996-2000
is presented in Figure 11. Although buyouts still account for almost 40% of European private equity
investment, early stage companies now attract roughly 20% of the total. This figure is comparable to recent
American levels, and indicates that the risk appetite of European VCs has been increasing steadily. The true
test, of course, will be how well this new risk tolerance holds up during the current down cycle in global VC
investment and returns.
4.4. Investment Returns for European VC Investment
Yet another historical difference between U.S. and European venture capital was in the mostly
disappointing returns European private equity investors earned. Figure 12 and Table 9 clearly show that
European VC funds performed abysmally over the 1981-1994 period, especially in comparison to the high
returns earned by buyout funds. Since 1995, however, European VC fund returns have been steadily rising,
and were truly stellar during the period from 1997 to year-end 2000. During this period, VC fund returns beat
all other types of private equity funds, and were much higher than the returns earned by investors in publicly
traded European stocks, which had a dismal 2000. Unfortunately, the collapse of Europe’s public stock
25
markets after March 2000 augurs very badly for future VC returns, as we now discuss.
4.5. Exit Strategies of European Venture Capitalists
One of the greatest disappointments of European policy-makers wishing to duplicate America’s
success in high-technology development has been the continent’s failure, until very recently, to establish a
large, liquid market for the stock of entrepreneurial growth firms. Although several stock markets exist, and
these collectively rival U.S. exchanges in total capitalization of listed companies, no European market
emerged as serious alternatives to America’s NASDAQ or NYSE as a market for initial public offerings until
the German Neuer Markt (www.neuer-markt.de), the pan-European EASDAQ (www.easdaq.com) and other
markets such the French Nouveau Marche (www.bourse-de-paris.fr) reached critical mass in the late 1990s.
This had a direct impact on the exit strategies that European venture capitalists followed in harvesting their
investments in portfolio companies. Whereas IPOs are the preferred method of exit for American venture
funds, public offerings accounted for only 21% of European venture capital divestments in 1996, and
comparable fractions in previous years. The number of European IPOs surged after these markets matured,
especially the Neuer Markt, which had attracted over 300 listings by early 2000.22 Unfortunately, the Neuer
Markt collapsed almost as fast as it took off, as Figure 13 makes all too clear. By the end of 2001, the
market’s total capitalization had fallen by over 90% from its March 2000 peak, amid a series of accounting
scandals and great acrimony. As of January 2002, the European IPO market is effectively closed to all but the
most well-established and profitable companies, though a few European (and a great many Israeli) technology
companies have been able to execute IPOs on U.S markets.
4.6. Public Sector Support for European Venture Capital: Boon or Bane?
Perhaps not surprisingly, European governments have long taken an activist approach to the
promotion and support of VC investment. These programs are described in Lerner (2000), Jeng and Wells
(2000) and, in most detail, in Gompers and Lerner (1997). Unfortunately, both academic research and
anecdotal evidence indicates that government efforts to promote a robust entrepreneurial sector would
probably be better focused on eliminating regulatory roadblocks, lowering taxes, and providing a more
favorable overall business climate than on attempting to directly identify and fund “sunrise” industries. The
EVCA explicitly addressed the need for governments to provide a better regulatory environment for
entrepreneurship in two recent White Papers (see www.evca.com). Tellingly, the EVCA called for
governments to provide direct financial support only when matched by private financing. Government can
support entrepreneurship, but ultimately only a vibrant private sector can create net new wealth.
22 Fischer (2000) provides an analysis of the reasons why German entrepreneurs decided to go public on the
Neuer Markt, and Holmén and Högfeldt (2001) provide a “Law and Finance” explanation of the ownership structures adopted by the entrepreneurs of all the Swedish IPOs executed over the past quarter-century.
26
5. Venture Capital Outside the United States and Western Europe
We conclude with an analysis of venture capital financing in markets outside the US and Western
Europe. This includes Canada, Israel and Japan, as well as non-Japan Asia. VC markets in South America,
Africa, the Middle East (outside Israel) are still too small to warrant individual attention, but we do conclude
with an overview of VC in developing countries generally.
5.1. Venture Capital in Israel and Canada
Venture capital in Israel and Canada differs dramatically from other advanced countries. Canadian
government policies have resulted in its venture capital system being based on funds sponsored by labor
unions [see Fineberg (1997)]. Recent growth in Canada’s VC market [see Christopher (2001)] has weakened
the union funds’ grip on VC funding, however, and total investment has grown at a compound annual rate of
60% since 1994. In 2000, Canada was the world’s fifth largest recipient of VC financing, and attracted
almost as much as Germany ($4.3 billion versus $4.4 billion). Canadian strength in telecommunications
technology has been a particular boon to VC investment.
In a relative sense, Israel has achieved even greater success, since it was the sixth largest recipient of
VC in 2000 and was the world’s largest recipient expressed as venture capital funding as a percent of GDP.
At least part of Israel’s success can be traced to deliberate policy decisions by the Likud government in the
early 1990s, which took concrete steps to commercialize defense-related technology developed with public
funding. The influx of trained engineers and scientists from the former Soviet Union also helped, as did the
pioneering steps taken by Israeli entrepreneurs to go public in the United States, since this opened a path to
public markets others could and did follow.
5.2. Venture Capital in Asia
Figures 14-16 detail the growth of venture capital in Asia. Figure 14, in particular, highlights the
vibrant growth (albeit from a low base) of venture capital funding everywhere in Asia except for Japan, the
region’s largest and most developed economy. As discussed in Packer (1996) and Hamao, Packer and Ritter
(2000), Japan has a financial specialty referred to as “venture capital,” but most of the firms involved are
commercial or investment bank subsidiaries that make very few truly entrepreneurial investments. Venture
capital shows no real sign of taking root in Japan, and the world’s second largest economy attracted only $2.0
billion (0.05% of GDP) in venture funding in 2000. As noted, venture capital is growing rapidly elsewhere in
Asia, but it remains rudimentary by American or European standards. Countries such as China lack much of
the basic legal and accounting infrastructure needed to support a vibrant VC market, and the entire region
suffers from the lack of an efficient IPO market that could serve as an exit mechanism.

27
5.3. Venture Capital in Developing Countries
Although up-to-date figures are extremely hard to obtain, the evidence that exists suggests that venture
capital fund-raising and investment in developing countries has been growing steadily in recent years, though
again from a low base. Panel A of Figure 17 shows the evolution in the stock of venture capital in developing
countries over the 1990-1995 period, while Panel B expresses this data in terms of annual flows. Either way,
the small totals are depressing, especially compared to the total values of foreign direct investment that
flowed to developing countries over the same period. Aylward (1998) also points out that much of what
passes for “venture capital” in developing countries is actually high-risk debt financing. For the foreseeable
future, incremental growth from a tiny base is probably all that can be expected for developing country
venture capital.
6. Conclusion: Is a Global Market for Venture Capital Emerging?
So, is a global market for venture capital emerging? At least a superficial case can be made that this
is occurring among the Atlantic economies of Western Europe and North America, since recent years have
witnessed significant convergence in funding levels, investment patterns and realized returns. Nonetheless, we
must conclude that no integrated global venture capital market is emerging, nor is one likely to emerge for the
foreseeable future. Instead, we will probably continue to see what we’ve seen over the past decade—
continued growth in financing in the total value of VC funding and investment, but with this growth occurring
in largely segmented national markets. And for the immediate future (until the current recession ends,
hopefully by the end of 2002), there is likely to be continued contraction in absolute levels of VC funding and
investment.
Several factors contribute to this rather downbeat assessment of the prospects for global venture
capital. First, experience has shown that even vastly larger public capital markets can remain effectively
segmented from each other, despite massive cross-border capital flows. Additionally, since national public-
equity markets are much more segmented from each other than are national debt markets, it only stands to
reason that national private-equity markets like venture capital will be even less globally integrated. Finally,
the Law and Finance literature clearly shows that huge differences in the relative national importance of stock
and bond markets result from differences in legal systems and regulatory environments. The failure to date of
every major IPO-oriented continental European stock market suggests how fiendishly difficult it will be for
even advanced civil law countries to develop truly robust markets for venture capital. Rather than end on such a depressing note, however, it is worth spelling out what countries can do to
encourage entrepreneurship and private equity financing. Though the U.S. is often considered the “model”
venture capital system, there are in fact several generic economic, cultural and legal features that are
characteristic of nations such as Canada, Israel, Great Britain and Switzerland, which have vibrant venture
capital industries. These include the following:

28
• A tradition of entrepreneurship & risk-taking
• A well-established legal system, with good investor protection
• A supportive, but non-interventionist, government
• A stable regulatory system, that doesn’t penalize start-ups
• A free (and mobile) labor market, rich in engineering talent
• A non-punitive taxation regime that allows use of stock options
• A strong R&D culture--especially in universities or national labs
• A vibrant IPO market, though this could be a result, rather than a precursor of a strong VC industry.
• A funded pension system, with risk-tolerant institutional investors.
References Admati, Anat R. and Paul Pfleiderer, “Robust Financial Contracting and the role of Venture Capitalists,” Journal of
Finance 49 (June 1994), pp. 371-402. Arundale, Keith, “Entrepreneurship and Venture Capital: The State of the Venture Capital Market in Europe,”
PriceWaterhouseCoopers presentation (December 3, 2001). Aylward, Anthony, “Trends in Venture Capital Finance in Developing Countries,” IFC Discussion Paper # 36, World Bank
(Washington, July 1998). Baker, Malcolm and Paul A. Gompers, “The Determinants of Board Structure at the Initial Public Offering,” Working
paper, Harvard Business School (May 2001). Barry, Christopher B., “New Directions in Research on Venture Capital Finance,” Financial Management 23 (Autumn
1994), pp. 3-15. Barry, Christopher, Chris Muscarella, John Peavy and Michael Vetsuypens, “The Role of Venture Capital in the Creation of
Public Companies: Evidence from the Going Public Process,” Journal of Financial Economics 27 (1990), pp. 447-471.
Bascha, Andreas and Uwe Walz, “Convertible Securities and Optimal Exit Decisions in Venture Capital,” Journal of
Corporate Finance 7 (September 2001), pp. 285-306. Beatty, Randolph and Ivo Welch, “Issuer Expenses and Legal Liability in Initial Public Offerings,” Journal of Law and
Economics 39 (December 1996), pp. 545-602. Berglof, E. , “A Control Theory of Venture Capital Finance,” Journal of Law, Economics and Organization 10 (1994), pp.
447-471. Bianchi, Alessandra, “Why You Won’t Sell Your Business,” Inc. (August 1992), pp. 58-63. Birnbaum, Jeffrey H., “Uncle Sam, Venture Capitalist,” Fortune (May 24, 1999), p. 66. Black, Bernard S. and Ronald J. Gilson, “Venture Capital and the Structure of Capital Markets: Banks Versus Capital
Markets,” Journal of Financial Economics 47 (March 1998), pp. 243-277. Bradley, Daniel J., Bradford D. Jordan, Ha-Chin Yi and Ivan C. Rohen, “Venture Capital and IPO Lockup Expiration: An
Empirical Analysis,” Journal of Financial Research 24 (Winter 2001), pp. 465-492. Brewer, Elijah III and Hesna Genay, “Small Business Investment Companies: Financial Characteristics and Investments,”
Federal Reserve Bank of Chicago, Working Paper Series No. 94-10 (July 1994). Brophy, David J. and Mark W. Guthner, “Publicly Traded Venture Capital Funds: Implications for Institutional ‘Fund of
Funds’ Investors,” Journal of Business Venturing 3 (Summer 1988), pp. 187-206. Campbell, Katharine, “Informal Financing Totals $196bn a Year,” Financial Times (November 15, 2001), p. 31. Campbell, Katharine, “Corporate Venture Capital Grows in Importance,” Financial Times (November 22, 2001), p. 26. Christopher, Alistair, “VC and the Law: Potential Legal Hurdles Involved in Funding the Next Big Thing,” Venture
Capital Journal (February 2001), pp. 43-45. Cole, Jonathan E. and Albert L. Sokol, “Structuring Venture Capital Investments” and Stanley C. Golder, “Structuring the
Financing,” in Pratt’s Guide to Venture Capital Sources (Securities Data Publishing; New York, 1997).
30
Echikson, William, “Startups Grow at an Escargot’s Pace,” Business Week (July 19, 1999), p. 6. Fellers, Charles R., “Making an Exit: VCs Examine their Options,” Venture Capital Journal (May 2001), pp. 40-42. Fellers, Charles R., “With Companies Faltering, VCs Look at Redemption Exit,” Venture Capital Journal (June 2001), pp.
34-38. Fineberg, Seth, “Canada’s Labor Funds Adapt to Tighter Regs,” Venture Capital Journal (March 1997), pp. 28-30. Fischer, Christoph, “Why do Companies go Public? Empirical Evidence from Germany’s Neuer Markt,” Working paper,
University of Munich (Munich, Germany, May 2000). Freear, John, “The Private Investor Market for Venture Capital,” The Financier 1 (May 1994), pp. 7-15. Freear, John, Jeffrey E. Sohl and William E. Wetzel, Jr., “The Informal Venture Capital Market: Milestones Passed and the
Road Ahead,” in Donald L. Sexton and Raymond W. Smilor, editors, Entrepreneurship 2000 (Upstart Publishing Company, Chicago, 2000).
Gentry, William M. and R. Glenn Hubbard, “Tax Policy and entry Into Entrepreneurship,” Working paper, Columbia
University (New York, November 2000). Gompers, Paul A., “Optimal Investment, Monitoring, and the Staging of Venture Capital,” Journal of Finance 50
(December 1995), pp. 1461-1489. Gompers, Paul A., “Grandstanding in the Venture Capital Industry,” Journal of Financial Economics 42 (September
1996), pp. 133-156 Gompers, Paul A. and Josh Lerner, “Ownership and Control in Entrepreneurial Firms: An Examination of Convertible
Securities in Venture Capital Investments,” Harvard Business School working paper (September 1997). Gompers, Paul and Josh Lerner, “The Use of Covenants: An Empirical Analysis of Venture Partnership Agreements,”
Journal of Law and Economics 39 (October 1996), pp. 463-498. Gompers, Paul and Josh Lerner, “What Drives Venture Capital Fundraising?”, Brookings Papers on Economic Activity—
Microeconomics (1998a), pp. 149-192. Gompers, Paul and Josh Lerner, “Venture Capital Distributions: Short-Run and Long-Run REactions,” Journal of Finance
53 (December 1998b), pp. 2161-2183. Gompers, Paul and Josh Lerner, “An Analysis of Compensation in the U.S. Venture Capital Partnership,” Journal of
Financial Economics 51 (January 1999), pp. 3-44. Gompers, Paul and Josh Lerner, “Conflict of Interest in the Issuance of Public Securities: Evidence from Venture Capital,”
Journal of Law and Economics 42 (April 1999), pp. 1-28. Gompers, Paul and Josh Lerner, “Money Chasing Deals? The Impact of Fund Inflows on Private Equity Valuations,”
Journal of Financial Economics 55 (February 2000), pp. 281-325. Gompers, Paul and Josh Lerner, “The Venture Capital Revolution,” Journal of Economic Perspectives 15 (Spring 2001),
pp. 145-168. Gorman, Michael and William A. Sahlman, “What do Venture Capitalists Do?,” Journal of Business Venturing 4 (1989),
pp. 231-248. Gruner, Stephanie, “The Trouble With Angels,” Inc. (February 1998), pp. 47-49.
31
Gupta, Udayan, “Truth in Numbers?”, Venture Capital Journal (May 2001), p. 35. Hamao, Yasushi, Frank Packer, and Jay Ritter, “Institutional Affiliation and the Role of Venture Capital: Evidence from
Initial Public Offerings in Japan,” Pacific-Basin Finance Journal 8 (2000), pp. 529-558. Hardymon, G. Felda, Mark J. DeNino, and Malcolm S. Salter, “When Corporate Venture Capital Doesn’t Work,” Harvard
Business Review (May/June 1983), pp. 114-120. Hellmann, Thomas, “The Allocation of Control Rights in Venture Capital Contracts,” Rand Journal of Economics (Spring
1998), pp. 57-76. Hellmann, Thomas and Manju Puri, “The Interaction Between Product Market and Financing Strategy: The Role of Venture
Capital,” Review of Financial Studies 13 (Winter 2000), pp. 959-984. Hoffman, Harold M. and James Blakey, “You Can Negotiate With Venture Capitalists,” Harvard Business Review (March-
April 1987), pp. 16-24. Holmén, Martin and Peter Högfeldt, “A Law and Finance Analysis of Initial Public Offerings,” Working paper, Stockholm
University (Stockholm, Sweden, June 2001). Huemer, Jason, “Public Venture Capital: Huge Market Goes Largely Untapped,” Venture Capital Journal (February 1992),
pp. 38-44. Jeng, L.A. and P.C. Wells, “The Determinants of Venture Capital Funding: Evidence Across countries,” Journal of
Corporate Finance 6 (September 2000), pp. 241-289. Kaplan, Steven and Per Strömberg, “How do Venture Capitalists Choose Investments?”, Working paper, University of
Chicago (August 2000). Kaplan, Steven and Per Strömberg, “Venture Capitalists as Principals: Contracting, Screening, and Monitoring,” American
Economic Review 91 (May 2001a), pp. 426-430. Kaplan, Steven and Per Strömberg, “Financial Contracting Theory Meets the Real World: An Empirical Analysis of
Venture Capital Contracts,” Working paper, University of Chicago (September 2001b). Katz, David J., “Solving the Dilemna of Pricing Secondaries,” Venture Capital Journal (October 1990), pp. 21-33. Kinn, Bruce A. and Arnold M. Zaff, “The Benefits of a Revitalized SBIC Program,” in Pratt’s Guide to Venture Capital
Sources (Securities Data Publishing; New York, 1997), pp. 105-107. La Porta, Rafael, Florencio López-de-Silanes, Andrei Shleifer, and Robert W. Vishny, “Legal Determinants of External
Finance,” Journal of Finance 52 (July 1997), pp. 1131-1150. La Porta, Rafael, Florencio López-de-Silanes, Andrei Shleifer, and Robert W. Vishny, “Law and Finance,” Journal of
Political Economy 106 (1998), pp. 1113-1150. LaPorta, Rafael Florencio Lopez-de-Silanes, Andrei Shleifer and Robert W. Vishny, “Agency Problems and Dividend
Policies Around the World,” Journal of Finance 55 (February 2000), pp. 1-33. Lerner, Josh, “The Syndication of Venture Capital Investments,” Financial Management 23 (Autumn 1994), pp. 16-27. Lerner, Josh, “Venture Capitalists and the Decision to go Public,” Journal of Financial Economics 35 (June 1994), pp.
293-316. Lerner, Josh, “Venture Capitalists and the Oversight of Private Firms,” Journal of Finance 50 (March 1995), pp. 301-318.
32
Lerner, Josh, “Angel Financing and Public Policy: An Overview,” Journal of Banking and Finance 22 (August 1998), pp. 773-783.
Lerner, Josh, “The Government as Venture Capitalist: The Long-Run Effects of the SBIR Program,” Journal of Business 72
(July 1999), pp. 285-318. Lerner, Josh, Venture Capital and Private Equity: A Casebook (New York, John Wiley & Sons, 2000). Martin, John D. and J. William Petty, “An Analysis of the Performance of Publicly Traded Venture Capital Companies,”
Journal of Financial and Quantitative Analysis 18 (September 1983), pp. 401-410. Merchant, Khozem, “India Continues to Attract Deal Makers,” Financial Times (September 1, 2000), p. 22. Morris, Jane Koloski, “The Pricing of a Venture Capital Investment,” in in Pratt’s Guide to Venture Capital Sources
(Securities Data Publishing; New York, 1988), pp. 55-61. Niedorf, Shawn, “Leaving Home,” Venture Capital Journal (March 1998), pp. 38-40. Frank Packer, “Venture Capital, Bank Shareholding, and IPO Underpricing in Japan,” in Mario Levis, ed., Empirical
Issues in Raising Equity Capital (North Holland, 1996), pp. 191-214. Peltz, Michael, “High Tech’s Premier Venture Capitalist,” Institutional Investor (June 1996), pp. 89-98. Pratt, Stanley E., “The Organized Venture Capital Community,” in Pratt’s Guide to Venture Capital Sources (Securities
Data Publishing; New York, 1997), pp. 75-80. Sahlman, William A., “Aspects of Financial Contracting in Venture Capital,” Journal of Applied Corporate Finance 1
(Summer 1988), pp. 23-36. Sahlman, William A., “The Structure and Governance of Venture Capital Organizations,” Journal of Financial Economics
27 (September 1990), pp.473-524. Schilit, W. Keith and John T. Willig, editors, “The Globalization of Venture Capital,” in Fitzroy Dearborn International
Directory of Venture Capital Funds, 2nd ed. (Fitzroy Dearborn Publishers: Chicago, IL, 1996a), pp. 79-80. Schilit, W. Keith and John T. Willig, editors, “Structuring the Venture Capital Deal,” in Fitzroy Dearborn International
Directory of Venture Capital Funds, 2nd ed. (Fitzroy Dearborn Publishers: Chicago, IL, 1996b), pp. 71-77. Shleifer, Andrei and Robert W. Vishny, 1997, A Survey of Corporate Governance, Journal of Finance 52, 737-783. Stancill, James McNeill, “How Much Money Does Your New Venture Need?,” Harvard Business Review (May-June
1987), pp. 122-139. Testa, Richard J., “The Legal Process of Venture Capital Investment,” in Pratt’s Guide to Venture Capital Sources
(Securities Data Publishing; New York, 1988), pp. 66-77. Tyebjee, Tyzoon T. and Albert V. Bruno, “A Model of Venture Capitalist Investment Activity,” Management Science 30
(September 1984), pp. 1051-1066. Weisul, Kimberly, “Tech Funding Wants to Bring Venture Capital to the Masses,” Investment Dealers’ Digest (July 21,
1997), p.18. Wong, Andrew, “Angel Finance: The Other Venture Capital,” Working paper, University of Chicago (November 2001).
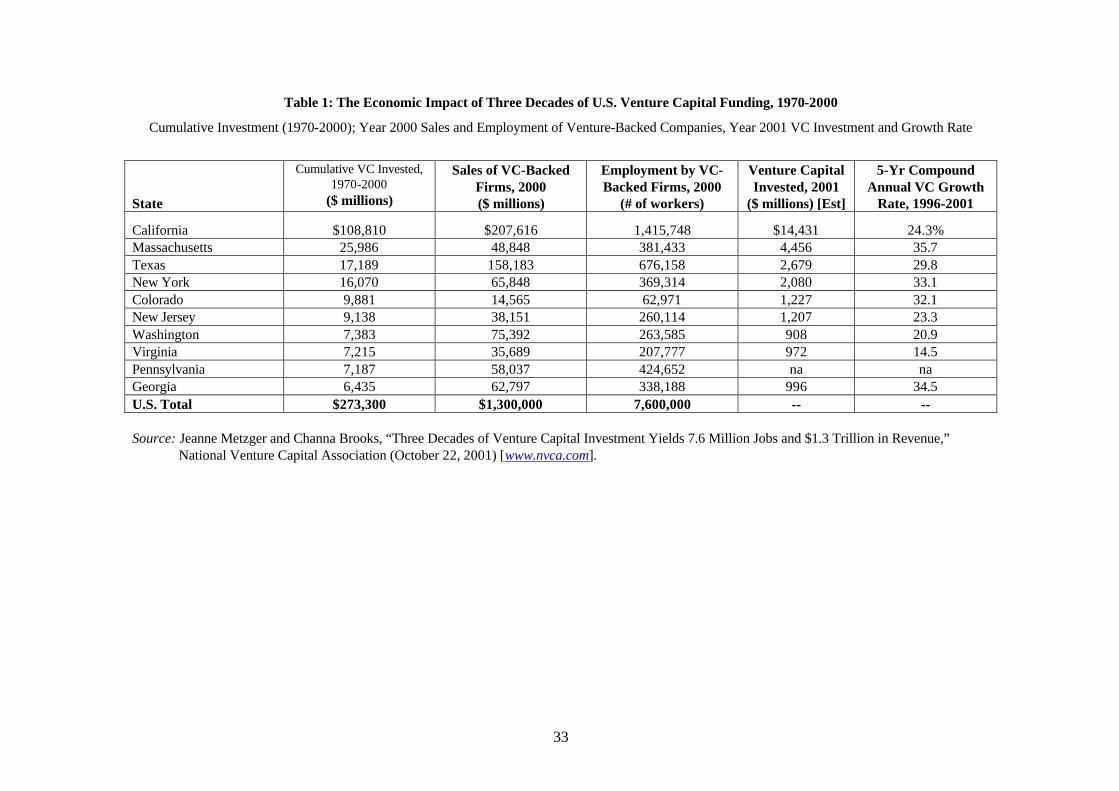
33
Table 1: The Economic Impact of Three Decades of U.S. Venture Capital Funding, 1970-2000
Cumulative Investment (1970-2000); Year 2000 Sales and Employment of Venture-Backed Companies, Year 2001 VC Investment and Growth Rate
State
Cumulative VC Invested, 1970-2000
($ millions)
Sales of VC-Backed Firms, 2000 ($ millions)
Employment by VC-Backed Firms, 2000
(# of workers)
Venture Capital Invested, 2001
($ millions) [Est]
5-Yr Compound Annual VC Growth
Rate, 1996-2001
California
$108,810
$207,616
1,415,748
$14,431
24.3% Massachusetts 25,986 48,848 381,433 4,456 35.7 Texas 17,189 158,183 676,158 2,679 29.8 New York 16,070 65,848 369,314 2,080 33.1 Colorado 9,881 14,565 62,971 1,227 32.1 New Jersey 9,138 38,151 260,114 1,207 23.3 Washington 7,383 75,392 263,585 908 20.9 Virginia 7,215 35,689 207,777 972 14.5 Pennsylvania 7,187 58,037 424,652 na na Georgia 6,435 62,797 338,188 996 34.5 U.S. Total $273,300 $1,300,000 7,600,000 -- -- Source: Jeanne Metzger and Channa Brooks, “Three Decades of Venture Capital Investment Yields 7.6 Million Jobs and $1.3 Trillion in Revenue,”
National Venture Capital Association (October 22, 2001) [www.nvca.com].
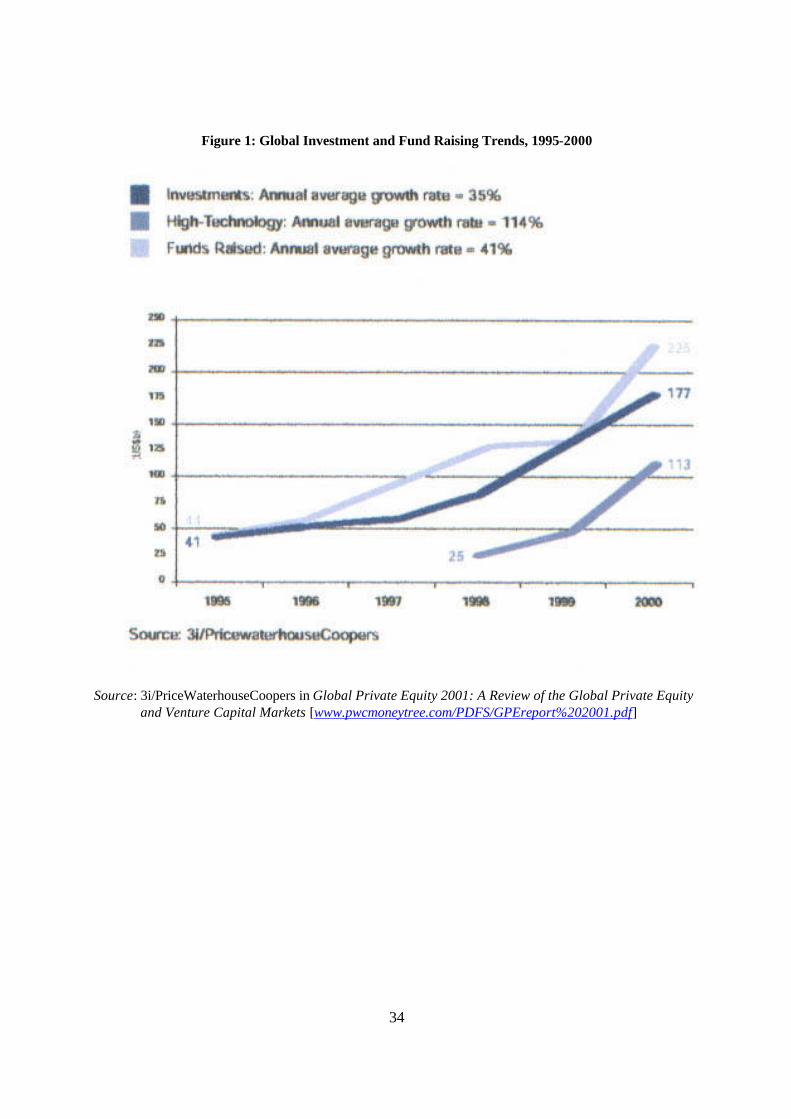
34
Figure 1: Global Investment and Fund Raising Trends, 1995-2000
Source: 3i/PriceWaterhouseCoopers in Global Private Equity 2001: A Review of the Global Private Equity
and Venture Capital Markets [www.pwcmoneytree.com/PDFS/GPEreport%202001.pdf]
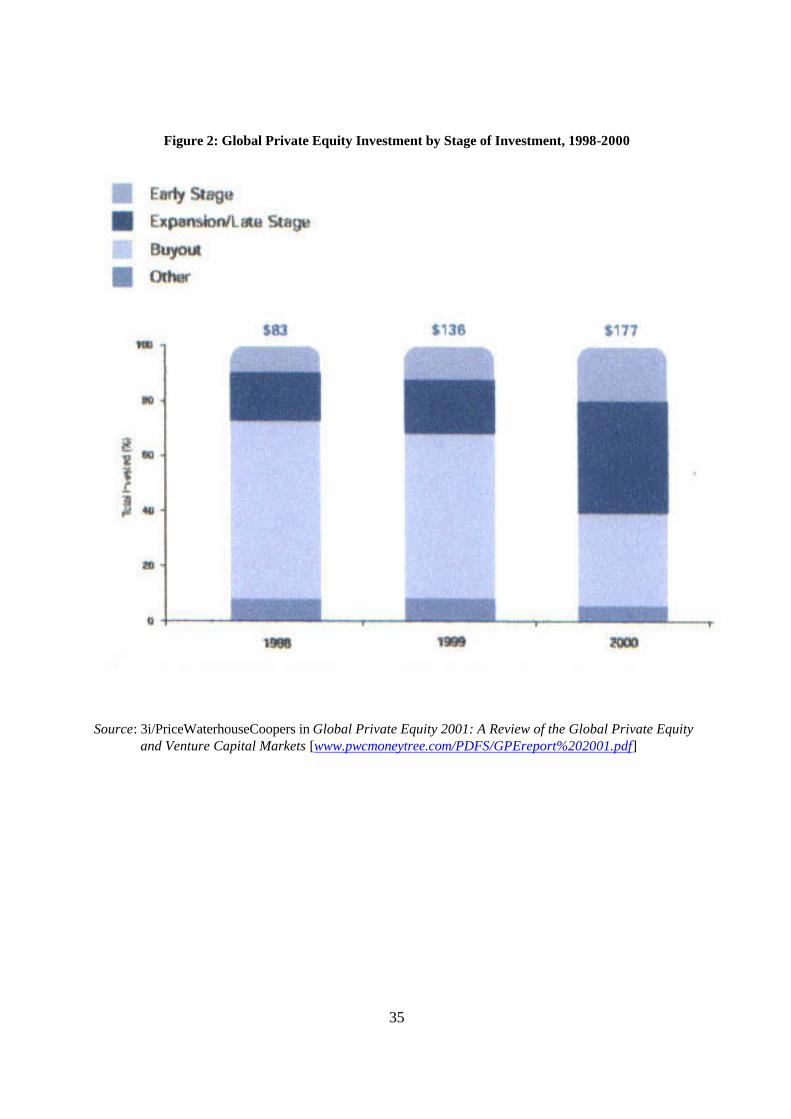
35
Figure 2: Global Private Equity Investment by Stage of Investment, 1998-2000
Source: 3i/PriceWaterhouseCoopers in Global Private Equity 2001: A Review of the Global Private Equity
and Venture Capital Markets [www.pwcmoneytree.com/PDFS/GPEreport%202001.pdf]
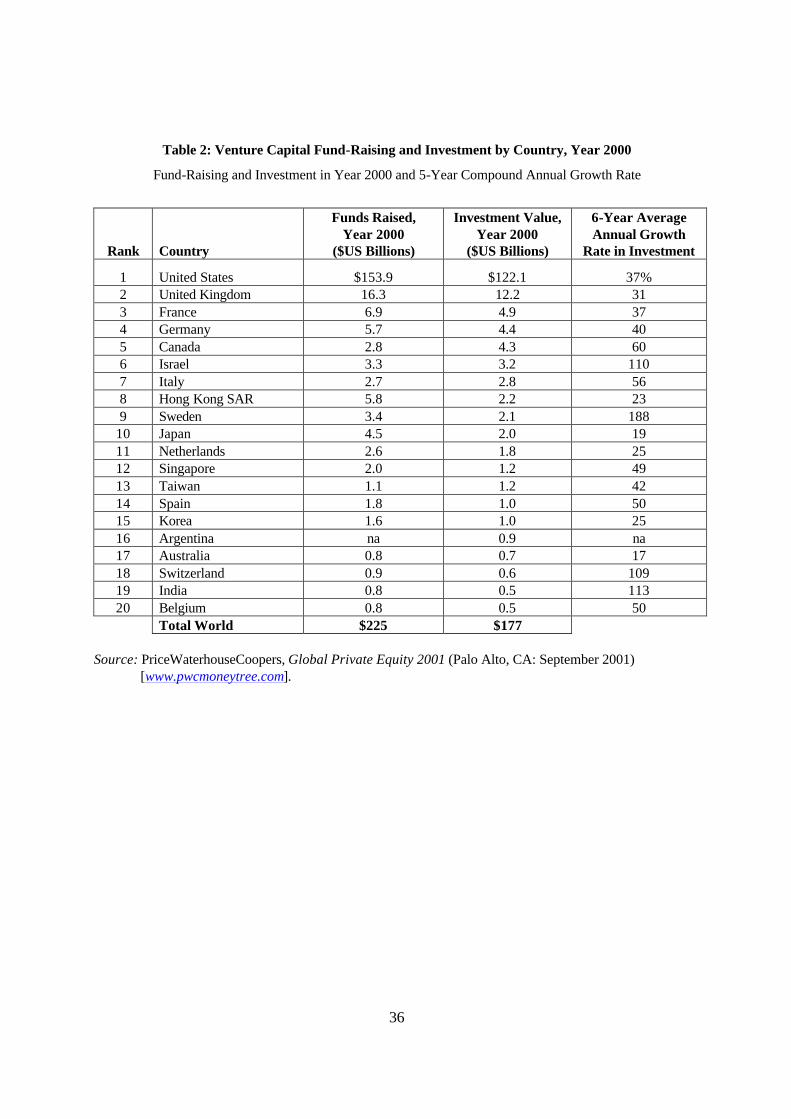
36
Table 2: Venture Capital Fund-Raising and Investment by Country, Year 2000
Fund-Raising and Investment in Year 2000 and 5-Year Compound Annual Growth Rate
Rank
Country
Funds Raised, Year 2000
($US Billions)
Investment Value, Year 2000
($US Billions)
6-Year Average Annual Growth
Rate in Investment
1
United States
$153.9
$122.1
37% 2 United Kingdom 16.3 12.2 31 3 France 6.9 4.9 37 4 Germany 5.7 4.4 40 5 Canada 2.8 4.3 60 6 Israel 3.3 3.2 110 7 Italy 2.7 2.8 56 8 Hong Kong SAR 5.8 2.2 23 9 Sweden 3.4 2.1 188
10 Japan 4.5 2.0 19 11 Netherlands 2.6 1.8 25 12 Singapore 2.0 1.2 49 13 Taiwan 1.1 1.2 42 14 Spain 1.8 1.0 50 15 Korea 1.6 1.0 25 16 Argentina na 0.9 na 17 Australia 0.8 0.7 17 18 Switzerland 0.9 0.6 109 19 India 0.8 0.5 113 20 Belgium 0.8 0.5 50
Total World $225 $177 Source: PriceWaterhouseCoopers, Global Private Equity 2001 (Palo Alto, CA: September 2001)
[www.pwcmoneytree.com].
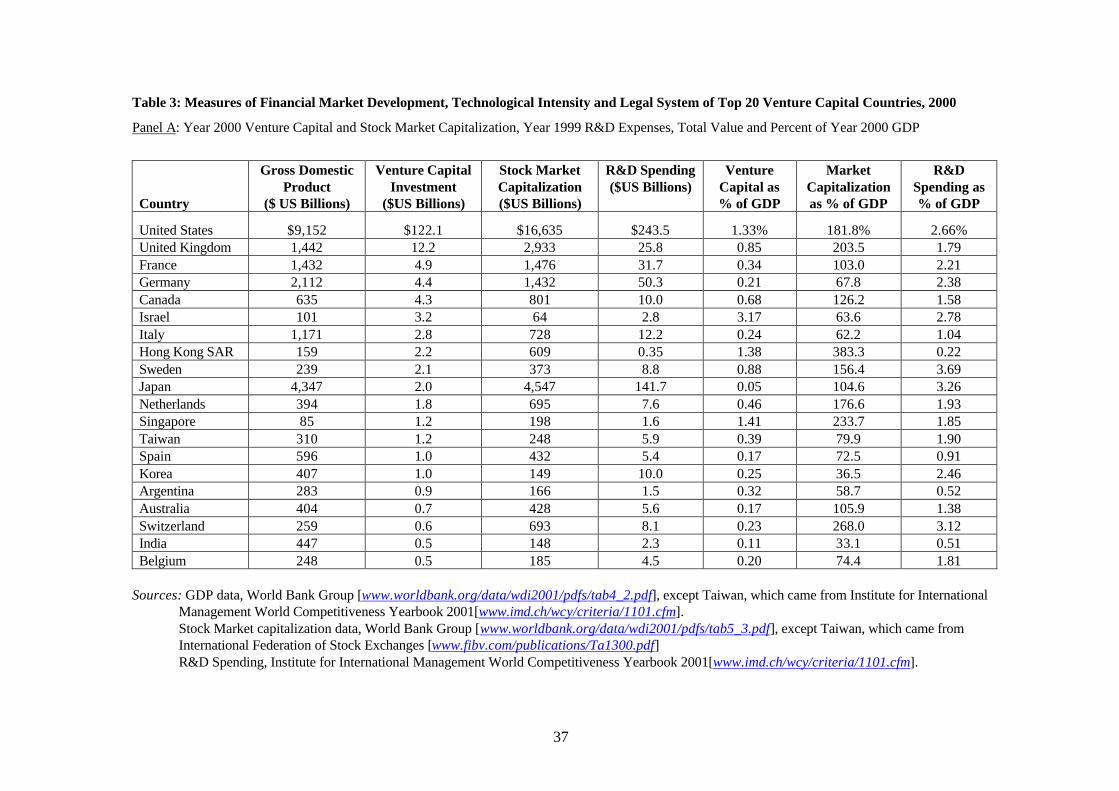
37
Table 3: Measures of Financial Market Development, Technological Intensity and Legal System of Top 20 Venture Capital Countries, 2000
Panel A: Year 2000 Venture Capital and Stock Market Capitalization, Year 1999 R&D Expenses, Total Value and Percent of Year 2000 GDP
Country
Gross Domestic Product
($ US Billions)
Venture Capital Investment
($US Billions)
Stock Market Capitalization ($US Billions)
R&D Spending ($US Billions)
Venture Capital as % of GDP
Market Capitalization as % of GDP
R&D Spending as % of GDP
United States
$9,152
$122.1
$16,635
$243.5
1.33%
181.8%
2.66% United Kingdom 1,442 12.2 2,933 25.8 0.85 203.5 1.79 France 1,432 4.9 1,476 31.7 0.34 103.0 2.21 Germany 2,112 4.4 1,432 50.3 0.21 67.8 2.38 Canada 635 4.3 801 10.0 0.68 126.2 1.58 Israel 101 3.2 64 2.8 3.17 63.6 2.78 Italy 1,171 2.8 728 12.2 0.24 62.2 1.04 Hong Kong SAR 159 2.2 609 0.35 1.38 383.3 0.22 Sweden 239 2.1 373 8.8 0.88 156.4 3.69 Japan 4,347 2.0 4,547 141.7 0.05 104.6 3.26 Netherlands 394 1.8 695 7.6 0.46 176.6 1.93 Singapore 85 1.2 198 1.6 1.41 233.7 1.85 Taiwan 310 1.2 248 5.9 0.39 79.9 1.90 Spain 596 1.0 432 5.4 0.17 72.5 0.91 Korea 407 1.0 149 10.0 0.25 36.5 2.46 Argentina 283 0.9 166 1.5 0.32 58.7 0.52 Australia 404 0.7 428 5.6 0.17 105.9 1.38 Switzerland 259 0.6 693 8.1 0.23 268.0 3.12 India 447 0.5 148 2.3 0.11 33.1 0.51 Belgium 248 0.5 185 4.5 0.20 74.4 1.81
Sources: GDP data, World Bank Group [www.worldbank.org/data/wdi2001/pdfs/tab4_2.pdf], except Taiwan, which came from Institute for International
Management World Competitiveness Yearbook 2001[www.imd.ch/wcy/criteria/1101.cfm]. Stock Market capitalization data, World Bank Group [www.worldbank.org/data/wdi2001/pdfs/tab5_3.pdf], except Taiwan, which came from
International Federation of Stock Exchanges [www.fibv.com/publications/Ta1300.pdf] R&D Spending, Institute for International Management World Competitiveness Yearbook 2001[www.imd.ch/wcy/criteria/1101.cfm].
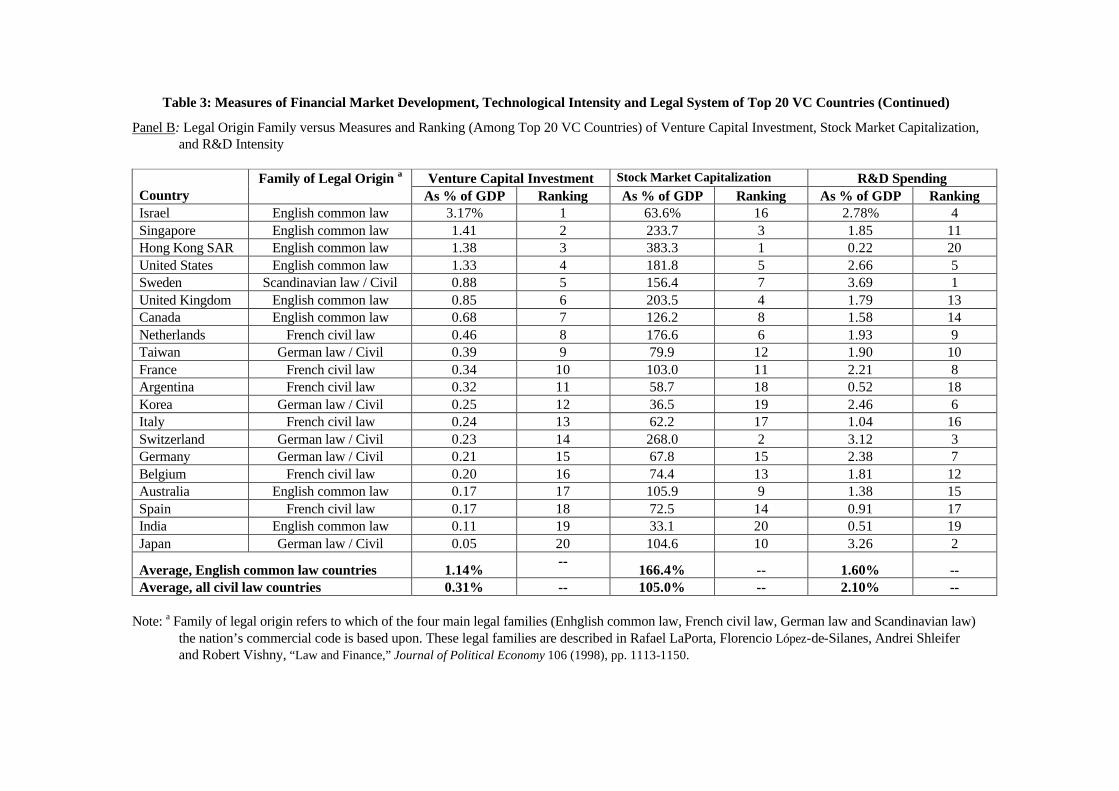
Table 3: Measures of Financial Market Development, Technological Intensity and Legal System of Top 20 VC Countries (Continued)
Panel B: Legal Origin Family versus Measures and Ranking (Among Top 20 VC Countries) of Venture Capital Investment, Stock Market Capitalization, and R&D Intensity
Venture Capital Investment Stock Market Capitalization R&D Spending
Country Family of Legal Origin a
As % of GDP Ranking As % of GDP Ranking As % of GDP Ranking Israel English common law 3.17% 1 63.6% 16 2.78% 4 Singapore English common law 1.41 2 233.7 3 1.85 11 Hong Kong SAR English common law 1.38 3 383.3 1 0.22 20 United States English common law 1.33 4 181.8 5 2.66 5 Sweden Scandinavian law / Civil 0.88 5 156.4 7 3.69 1 United Kingdom English common law 0.85 6 203.5 4 1.79 13 Canada English common law 0.68 7 126.2 8 1.58 14 Netherlands French civil law 0.46 8 176.6 6 1.93 9 Taiwan German law / Civil 0.39 9 79.9 12 1.90 10 France French civil law 0.34 10 103.0 11 2.21 8 Argentina French civil law 0.32 11 58.7 18 0.52 18 Korea German law / Civil 0.25 12 36.5 19 2.46 6 Italy French civil law 0.24 13 62.2 17 1.04 16 Switzerland German law / Civil 0.23 14 268.0 2 3.12 3 Germany German law / Civil 0.21 15 67.8 15 2.38 7 Belgium French civil law 0.20 16 74.4 13 1.81 12 Australia English common law 0.17 17 105.9 9 1.38 15 Spain French civil law 0.17 18 72.5 14 0.91 17 India English common law 0.11 19 33.1 20 0.51 19 Japan German law / Civil 0.05 20 104.6 10 3.26 2
Average, English common law countries
1.14% --
166.4%
--
1.60%
-- Average, all civil law countries 0.31% -- 105.0% -- 2.10% --
Note: a Family of legal origin refers to which of the four main legal families (Enhglish common law, French civil law, German law and Scandinavian law)
the nation’s commercial code is based upon. These legal families are described in Rafael LaPorta, Florencio López-de-Silanes, Andrei Shleifer and Robert Vishny, “Law and Finance,” Journal of Political Economy 106 (1998), pp. 1113-1150.
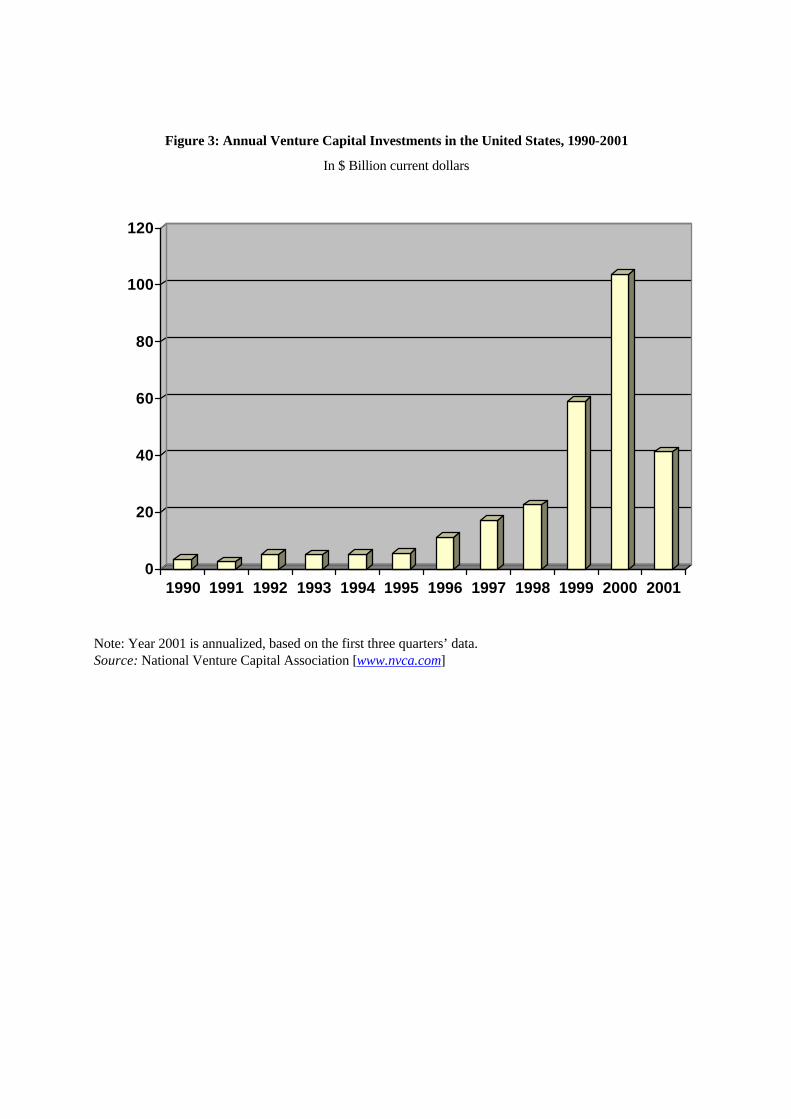
Figure 3: Annual Venture Capital Investments in the United States, 1990-2001
In $ Billion current dollars
0
20
40
60
80
100
120
1990 1991 1992 1993 1994 1995 1996 1997 1998 1999 2000 2001
Note: Year 2001 is annualized, based on the first three quarters’ data. Source: National Venture Capital Association [www.nvca.com]
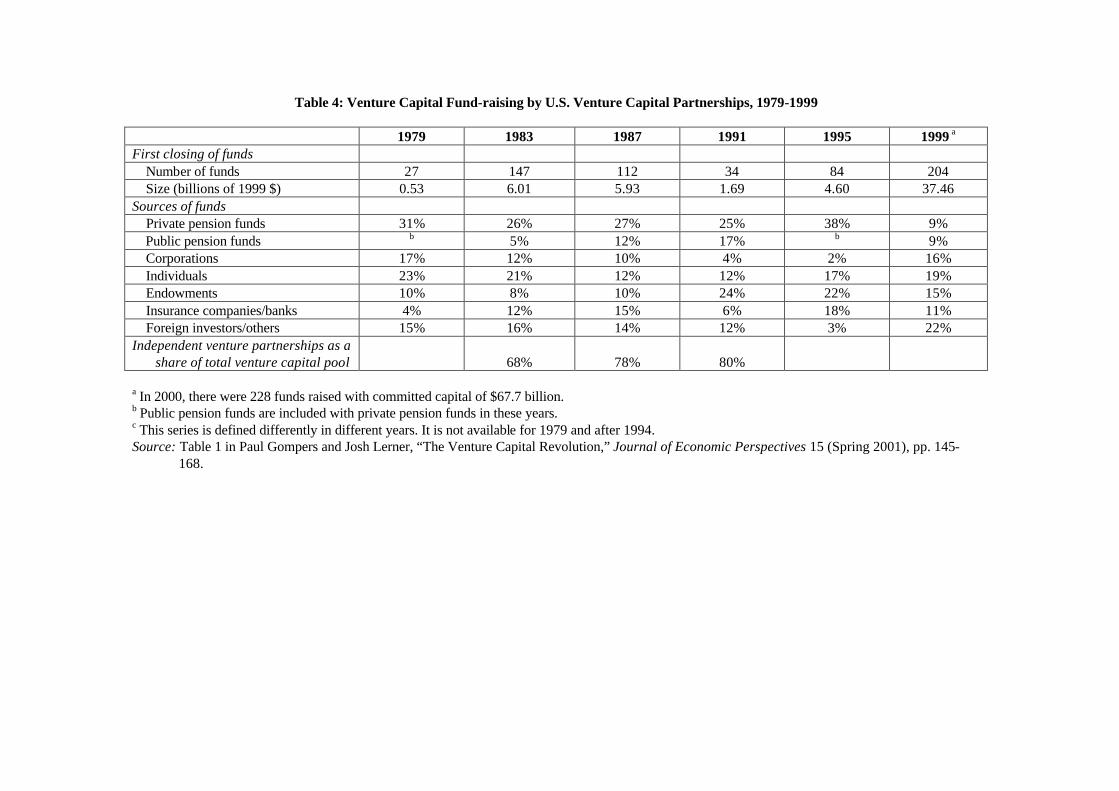
Table 4: Venture Capital Fund-raising by U.S. Venture Capital Partnerships, 1979-1999 1979 1983 1987 1991 1995 1999 a First closing of funds Number of funds 27 147 112 34 84 204 Size (billions of 1999 $) 0.53 6.01 5.93 1.69 4.60 37.46 Sources of funds Private pension funds 31% 26% 27% 25% 38% 9% Public pension funds b 5% 12% 17% b 9% Corporations 17% 12% 10% 4% 2% 16% Individuals 23% 21% 12% 12% 17% 19% Endowments 10% 8% 10% 24% 22% 15% Insurance companies/banks 4% 12% 15% 6% 18% 11% Foreign investors/others 15% 16% 14% 12% 3% 22% Independent venture partnerships as a
share of total venture capital pool
68%
78%
80%
a In 2000, there were 228 funds raised with committed capital of $67.7 billion. b Public pension funds are included with private pension funds in these years. c This series is defined differently in different years. It is not available for 1979 and after 1994. Source: Table 1 in Paul Gompers and Josh Lerner, “The Venture Capital Revolution,” Journal of Economic Perspectives 15 (Spring 2001), pp. 145-
168.
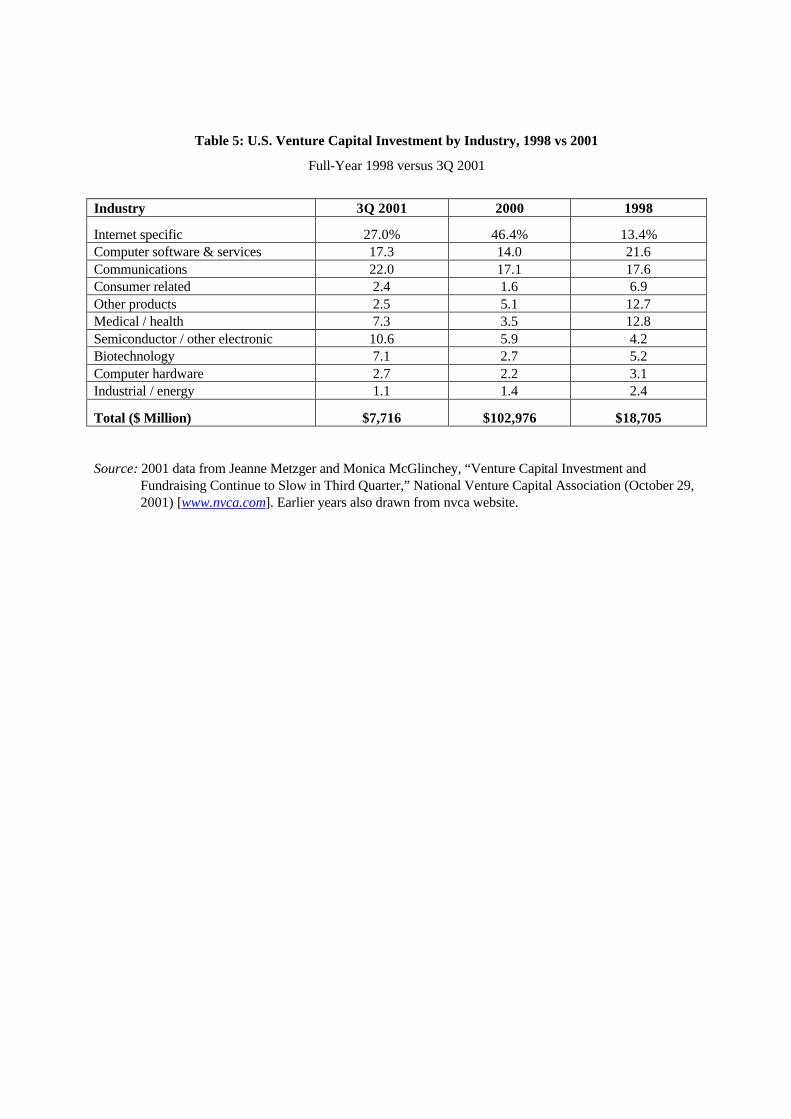
Table 5: U.S. Venture Capital Investment by Industry, 1998 vs 2001
Full-Year 1998 versus 3Q 2001
Industry 3Q 2001 2000 1998
Internet specific
27.0%
46.4%
13.4% Computer software & services 17.3 14.0 21.6 Communications 22.0 17.1 17.6 Consumer related 2.4 1.6 6.9 Other products 2.5 5.1 12.7 Medical / health 7.3 3.5 12.8 Semiconductor / other electronic 10.6 5.9 4.2 Biotechnology 7.1 2.7 5.2 Computer hardware 2.7 2.2 3.1 Industrial / energy 1.1 1.4 2.4
Total ($ Million)
$7,716
$102,976
$18,705 Source: 2001 data from Jeanne Metzger and Monica McGlinchey, “Venture Capital Investment and
Fundraising Continue to Slow in Third Quarter,” National Venture Capital Association (October 29, 2001) [www.nvca.com]. Earlier years also drawn from nvca website.
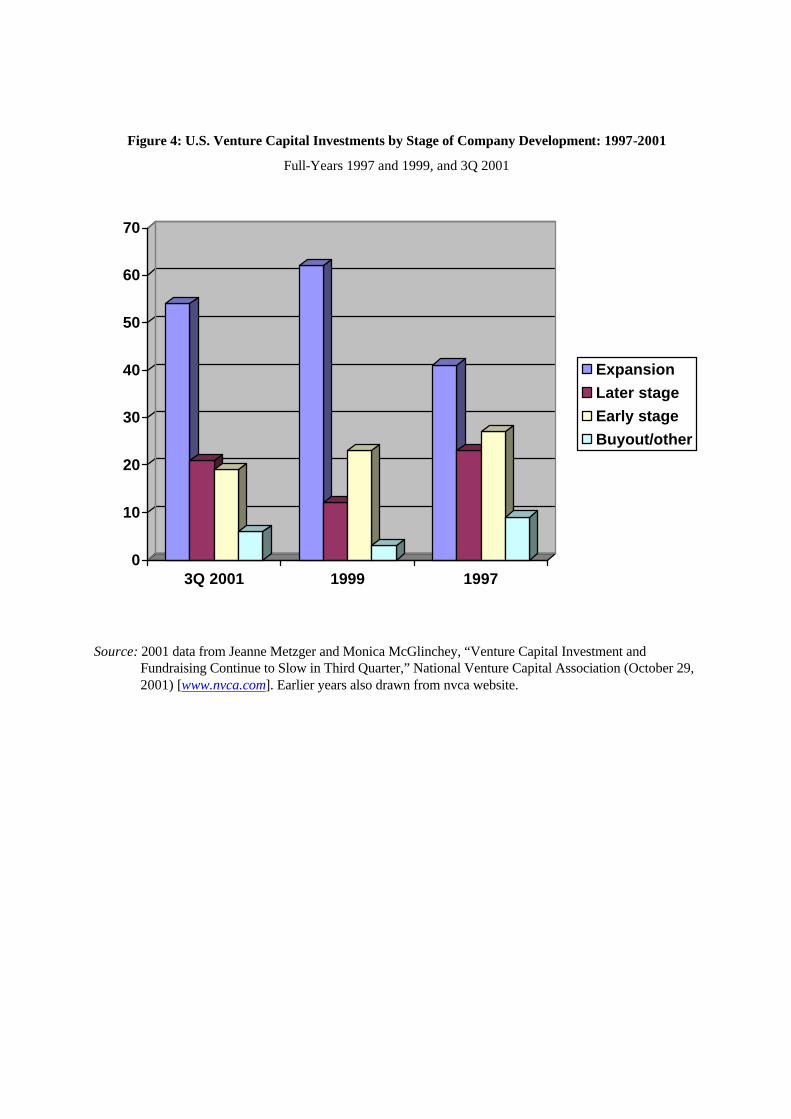
Figure 4: U.S. Venture Capital Investments by Stage of Company Development: 1997-2001
Full-Years 1997 and 1999, and 3Q 2001
0
10
20
30
40
50
60
70
3Q 2001 1999 1997
ExpansionLater stageEarly stageBuyout/other
Source: 2001 data from Jeanne Metzger and Monica McGlinchey, “Venture Capital Investment and
Fundraising Continue to Slow in Third Quarter,” National Venture Capital Association (October 29, 2001) [www.nvca.com]. Earlier years also drawn from nvca website.

Table 6: Covenant Usage in Venture Capital Investment Contracts
The Number of Covenants in 140 Venture Partnership Agreements, by Year
Source: Table 3 in Paul Gompers and Josh Lerner, “The Use of Covenants: An Empirical Analysis of
Venture Partnership Agreements,” Journal of Law and Economics 39 (October 1996), pp. 463-498.
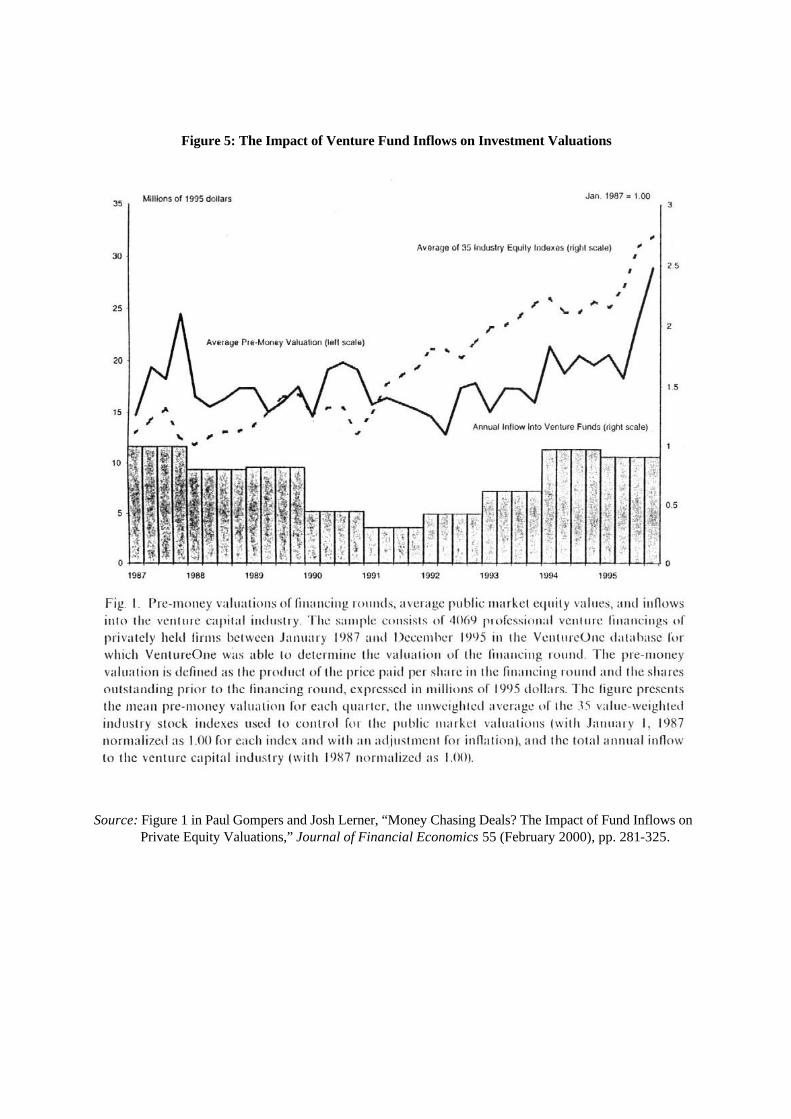
Figure 5: The Impact of Venture Fund Inflows on Investment Valuations
Source: Figure 1 in Paul Gompers and Josh Lerner, “Money Chasing Deals? The Impact of Fund Inflows on
Private Equity Valuations,” Journal of Financial Economics 55 (February 2000), pp. 281-325.

Figure 6: Average Annual Rate of Return to Investors in U.S Venture Capital Funds, 1974-1999
Source: Data from Venture Economics as reported in Figure 2 of Paul Gompers and Josh Lerner, “The Venture Capital Revolution,” Journal of
Economic Perspectives 15 (Spring 2001), pp. 145-168.
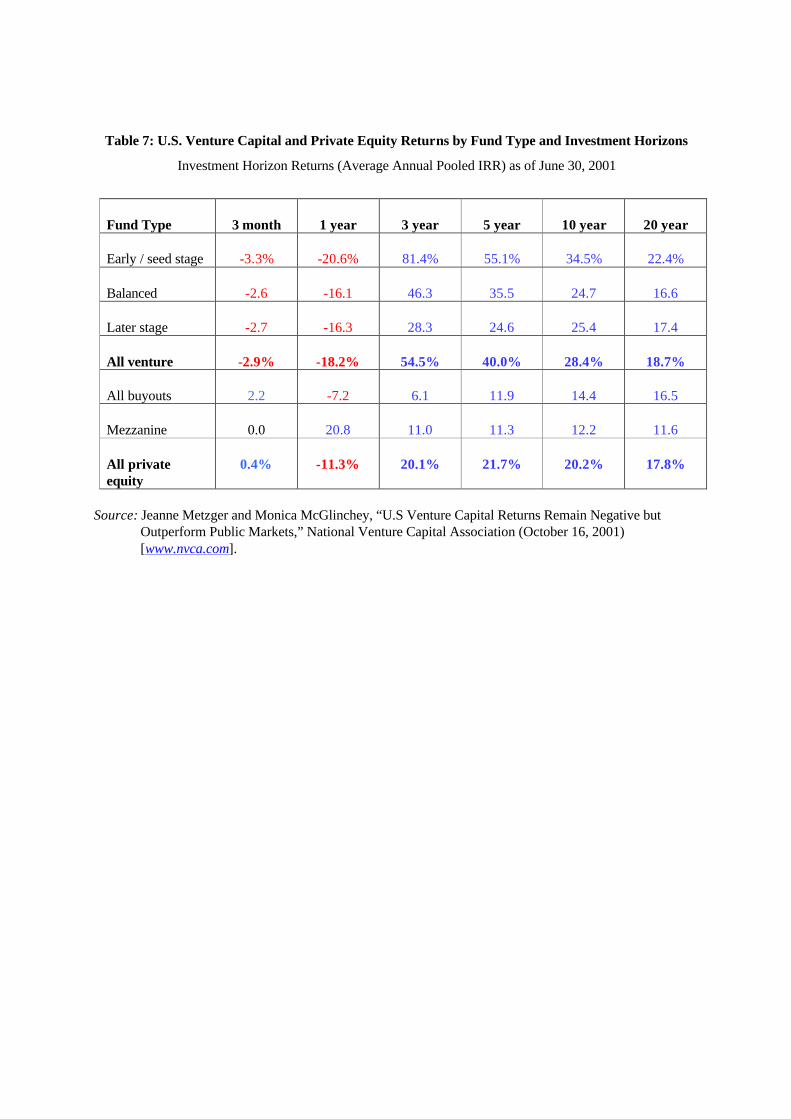
Table 7: U.S. Venture Capital and Private Equity Returns by Fund Type and Investment Horizons
Investment Horizon Returns (Average Annual Pooled IRR) as of June 30, 2001
Fund Type
3 month
1 year
3 year
5 year
10 year
20 year
Early / seed stage
-3.3%
-20.6%
81.4%
55.1%
34.5%
22.4%
Balanced
-2.6
-16.1
46.3
35.5
24.7
16.6
Later stage
-2.7
-16.3
28.3
24.6
25.4
17.4
All venture
-2.9%
-18.2%
54.5%
40.0%
28.4%
18.7%
All buyouts
2.2
-7.2
6.1
11.9
14.4
16.5
Mezzanine
0.0
20.8
11.0
11.3
12.2
11.6
All private equity
0.4%
-11.3%
20.1%
21.7%
20.2%
17.8%
Source: Jeanne Metzger and Monica McGlinchey, “U.S Venture Capital Returns Remain Negative but
Outperform Public Markets,” National Venture Capital Association (October 16, 2001) [www.nvca.com].
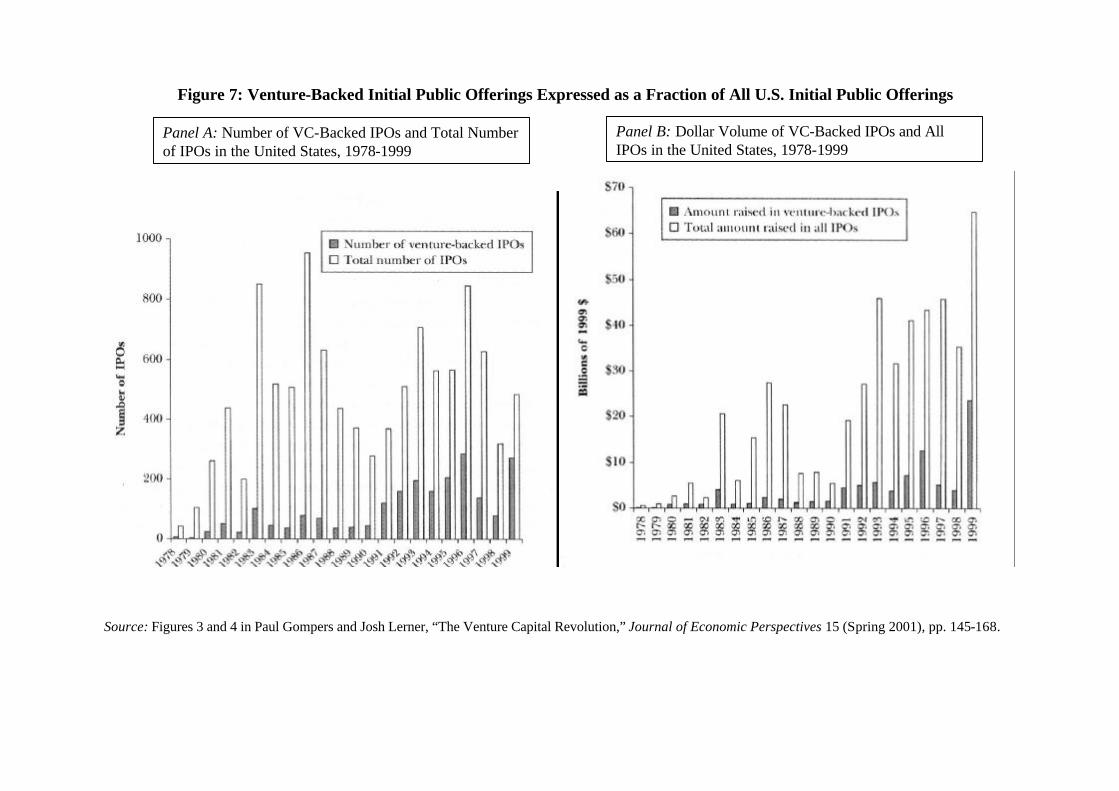
Figure 7: Venture-Backed Initial Public Offerings Expressed as a Fraction of All U.S. Initial Public Offerings
Source: Figures 3 and 4 in Paul Gompers and Josh Lerner, “The Venture Capital Revolution,” Journal of Economic Perspectives 15 (Spring 2001), pp. 145-168.
Panel A: Number of VC-Backed IPOs and Total Number of IPOs in the United States, 1978-1999
Panel B: Dollar Volume of VC-Backed IPOs and All IPOs in the United States, 1978-1999

Figure 8: Stock Price Reactions Around Distribution of Equity by Venture Capitalists
Source: Paul Gompers and Josh Lerner, “Venture Capital Distributions: Short-Run and Long-Run Reactions,” Journal of
Finance 53 (December 1998), pp. 2161-2183.
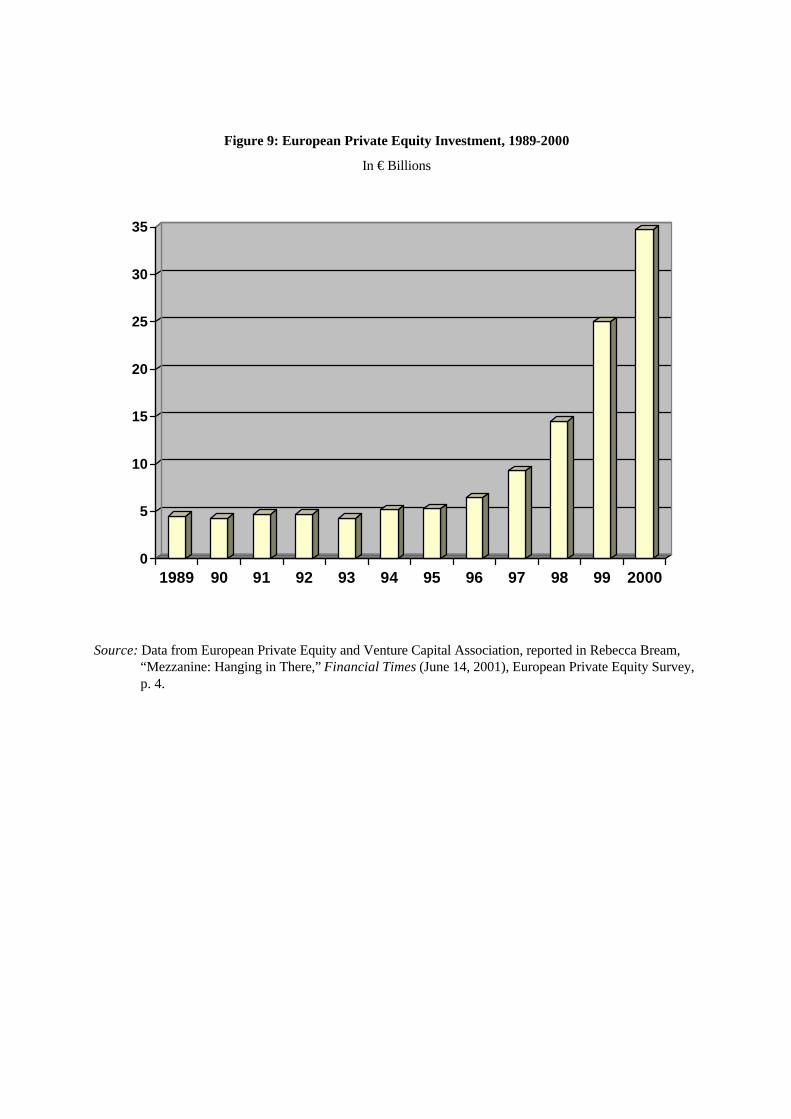
Figure 9: European Private Equity Investment, 1989-2000
In € Billions
0
5
10
15
20
25
30
35
1989 90 91 92 93 94 95 96 97 98 99 2000
Source: Data from European Private Equity and Venture Capital Association, reported in Rebecca Bream,
“Mezzanine: Hanging in There,” Financial Times (June 14, 2001), European Private Equity Survey, p. 4.
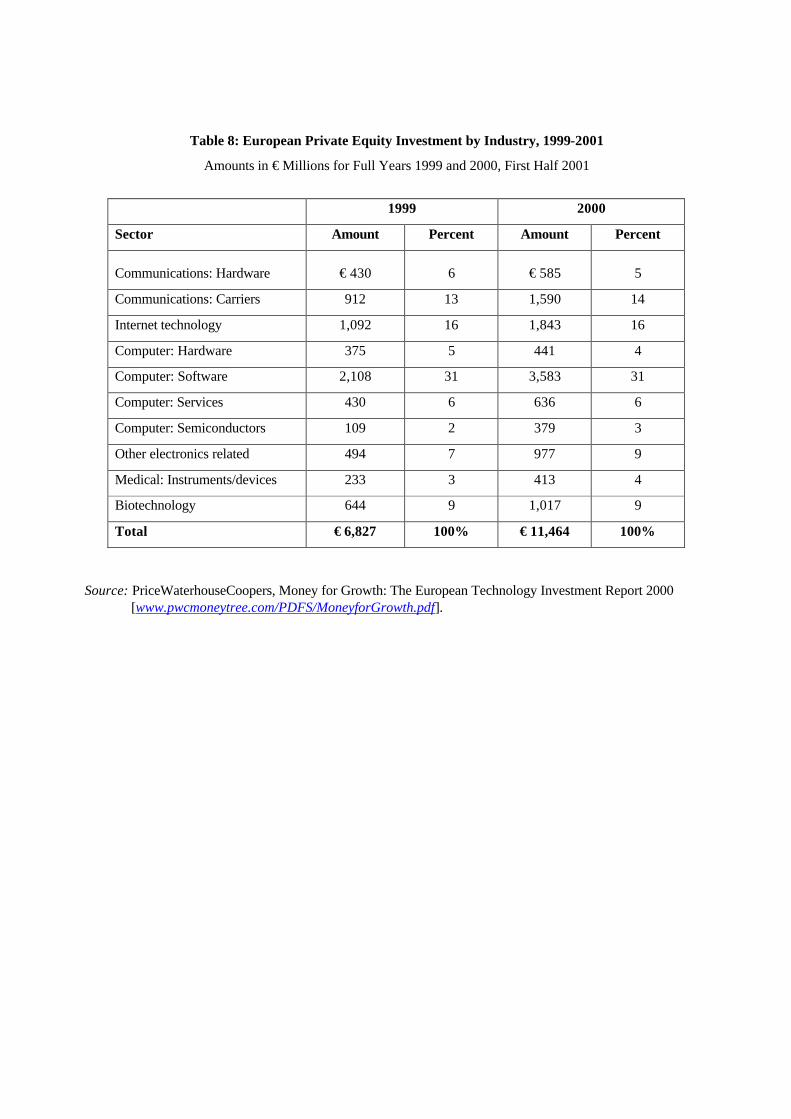
Table 8: European Private Equity Investment by Industry, 1999-2001
Amounts in € Millions for Full Years 1999 and 2000, First Half 2001
1999 2000
Sector Amount Percent Amount Percent
Communications: Hardware
€ 430
6
€ 585
5
Communications: Carriers 912 13 1,590 14
Internet technology 1,092 16 1,843 16
Computer: Hardware 375 5 441 4
Computer: Software 2,108 31 3,583 31
Computer: Services 430 6 636 6
Computer: Semiconductors 109 2 379 3
Other electronics related 494 7 977 9
Medical: Instruments/devices 233 3 413 4
Biotechnology 644 9 1,017 9
Total € 6,827 100% € 11,464 100%
Source: PriceWaterhouseCoopers, Money for Growth: The European Technology Investment Report 2000
[www.pwcmoneytree.com/PDFS/MoneyforGrowth.pdf].
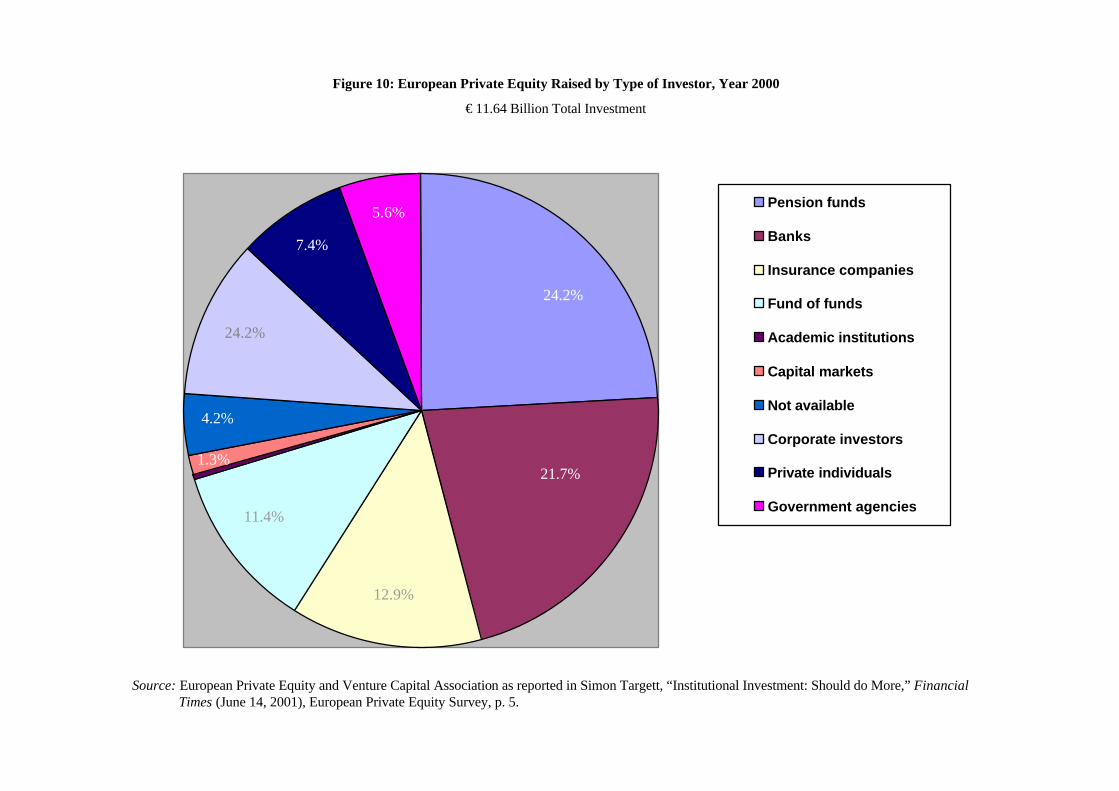
Figure 10: European Private Equity Raised by Type of Investor, Year 2000
€ 11.64 Billion Total Investment
Pension funds
Banks
Insurance companies
Fund of funds
Academic institutions
Capital markets
Not available
Corporate investors
Private individuals
Government agencies
Source: European Private Equity and Venture Capital Association as reported in Simon Targett, “Institutional Investment: Should do More,” Financial
Times (June 14, 2001), European Private Equity Survey, p. 5.
24.2%
21.7%
12.9%
11.4%
1.3%
4.2%
24.2%
5.6%
7.4%
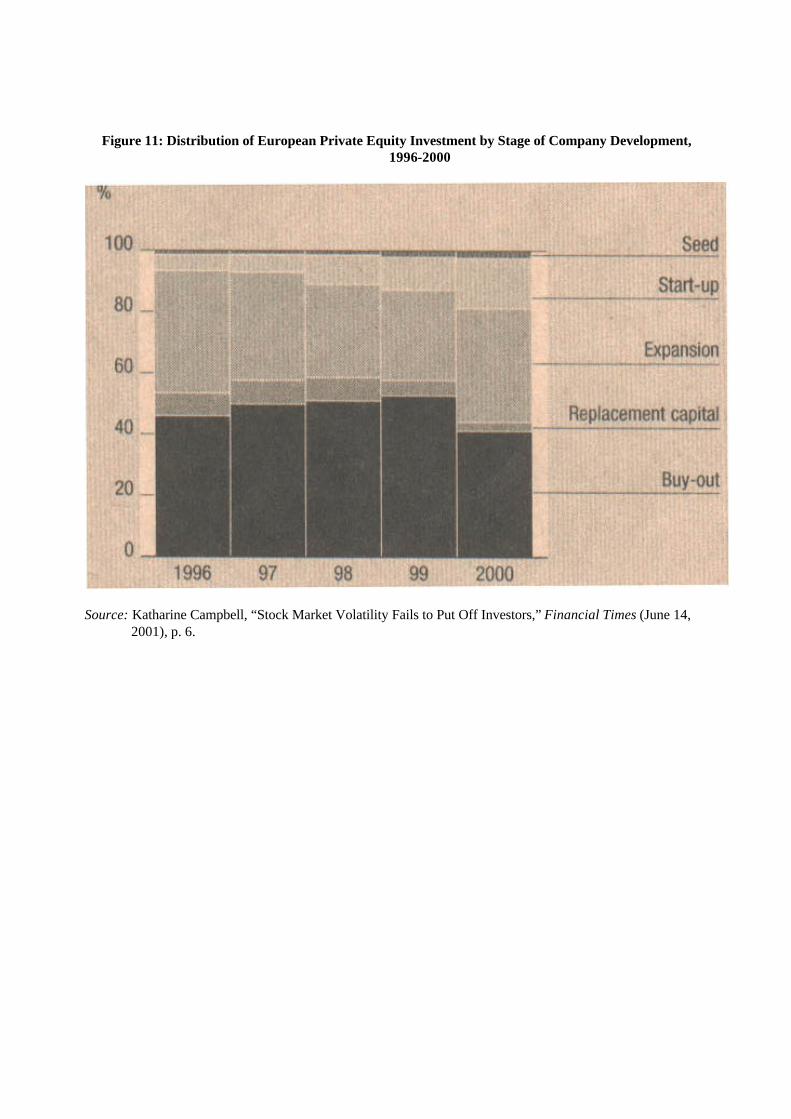
Figure 11: Distribution of European Private Equity Investment by Stage of Company Development, 1996-2000
Source: Katharine Campbell, “Stock Market Volatility Fails to Put Off Investors,” Financial Times (June 14,
2001), p. 6.
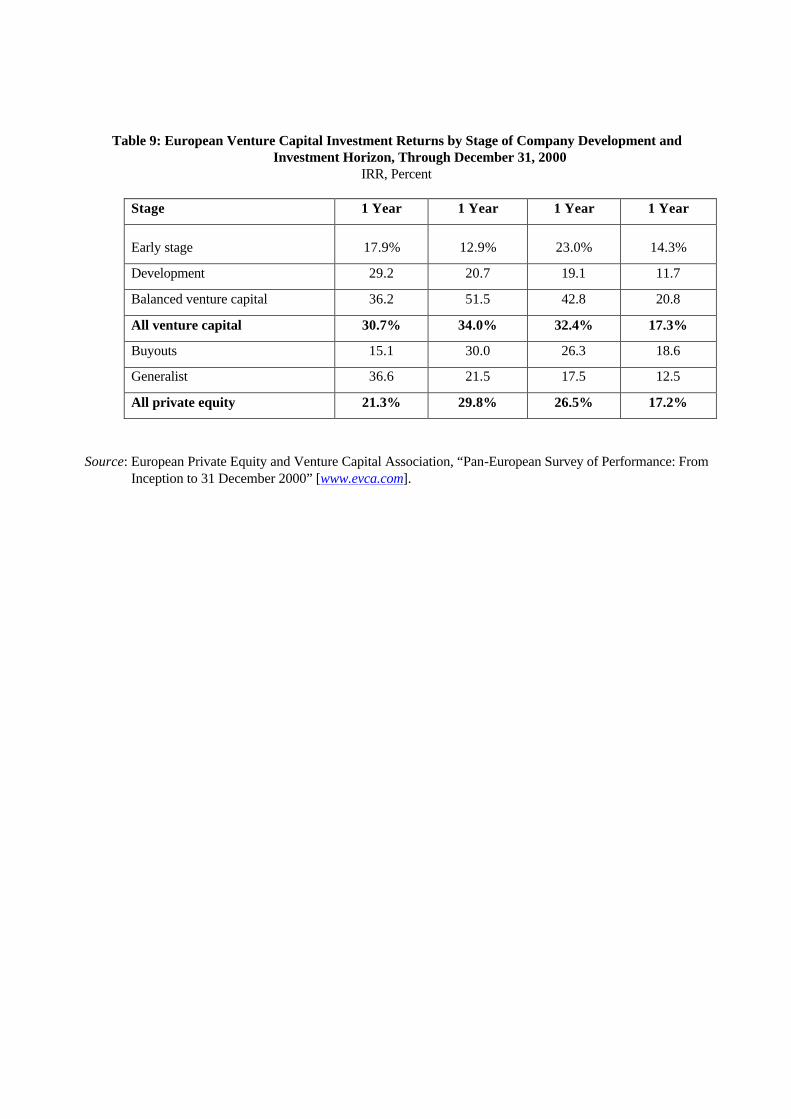
Table 9: European Venture Capital Investment Returns by Stage of Company Development and Investment Horizon, Through December 31, 2000
IRR, Percent
Stage 1 Year 1 Year 1 Year 1 Year
Early stage
17.9%
12.9%
23.0%
14.3%
Development 29.2 20.7 19.1 11.7
Balanced venture capital 36.2 51.5 42.8 20.8
All venture capital 30.7% 34.0% 32.4% 17.3%
Buyouts 15.1 30.0 26.3 18.6
Generalist 36.6 21.5 17.5 12.5
All private equity 21.3% 29.8% 26.5% 17.2%
Source: European Private Equity and Venture Capital Association, “Pan-European Survey of Performance: From
Inception to 31 December 2000” [www.evca.com].

Figure 12: Investment Returns to Categories of European Private Equity Investment, 1980-2000
5-Year Rolling Internal Rate of Return
Source: European Private Equity and Venture Capital Association, “Pan-European Survey of Performance:
From Inception to 31 December 2000” [www.evca.com].

Figure 13: The Neuer Markt’s Meteoric Rise and Fall
The Neuer Markt All-Share Index, March 1987-June 2001
Source: Thomson Financial Datastream, as reported in Bertrand Benoit, “Neuer Markt Starts to Feel Squeeze,”
Financial Times (July 11, 2001), p. 19.
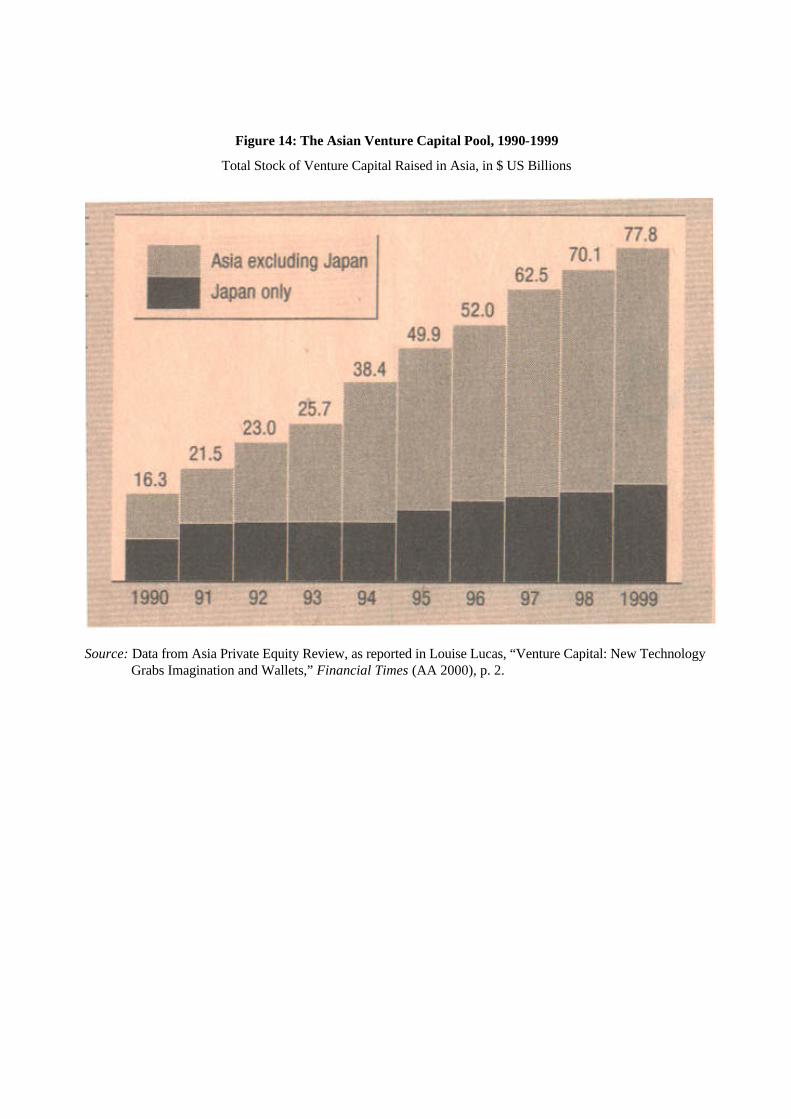
Figure 14: The Asian Venture Capital Pool, 1990-1999
Total Stock of Venture Capital Raised in Asia, in $ US Billions
Source: Data from Asia Private Equity Review, as reported in Louise Lucas, “Venture Capital: New Technology
Grabs Imagination and Wallets,” Financial Times (AA 2000), p. 2.
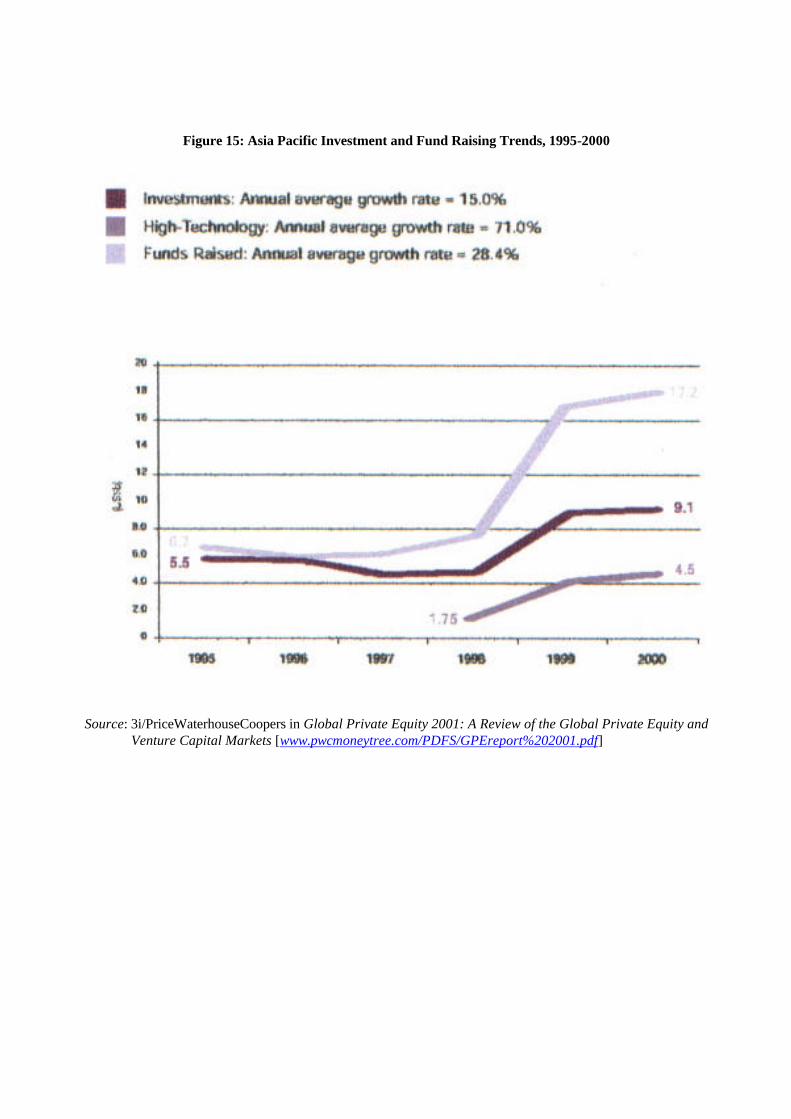
Figure 15: Asia Pacific Investment and Fund Raising Trends, 1995-2000
Source: 3i/PriceWaterhouseCoopers in Global Private Equity 2001: A Review of the Global Private Equity and
Venture Capital Markets [www.pwcmoneytree.com/PDFS/GPEreport%202001.pdf]
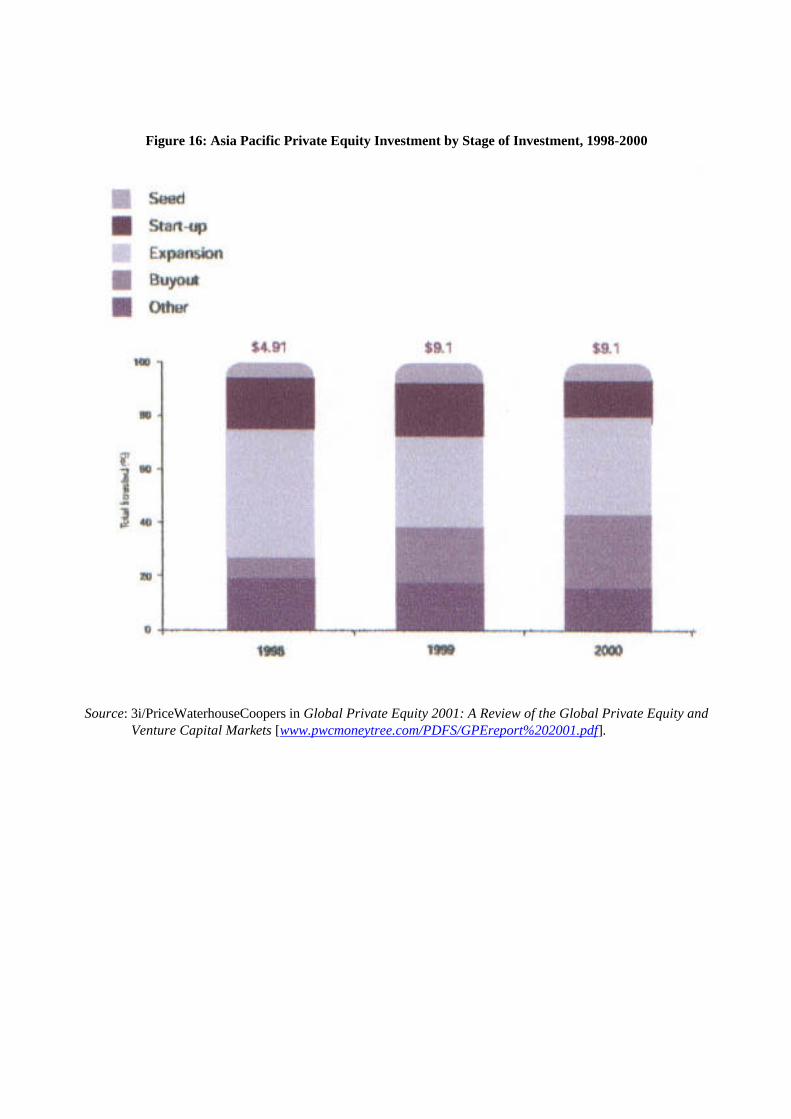
Figure 16: Asia Pacific Private Equity Investment by Stage of Investment, 1998-2000
Source: 3i/PriceWaterhouseCoopers in Global Private Equity 2001: A Review of the Global Private Equity and
Venture Capital Markets [www.pwcmoneytree.com/PDFS/GPEreport%202001.pdf].
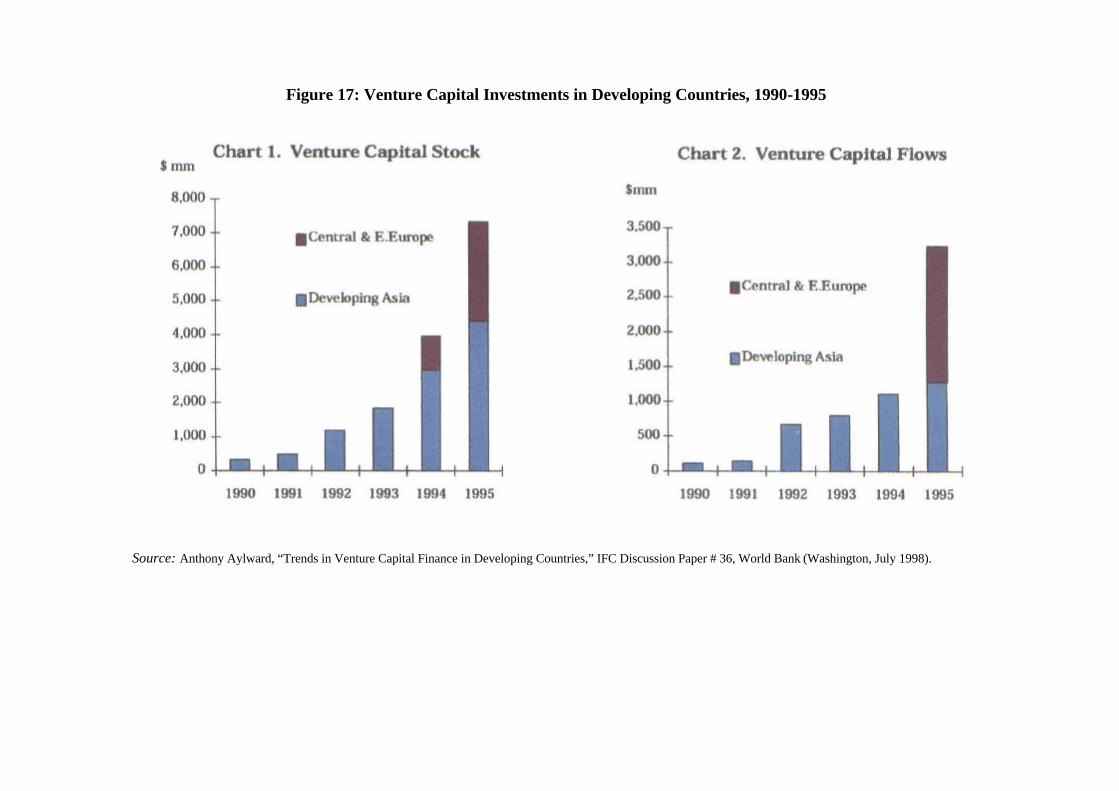
Figure 17: Venture Capital Investments in Developing Countries, 1990-1995
Source: Anthony Aylward, “Trends in Venture Capital Finance in Developing Countries,” IFC Discussion Paper # 36, World Bank (Washington, July 1998).